Apple MacBook Air 2020: Core i3 daha iyi bir seçim mi?
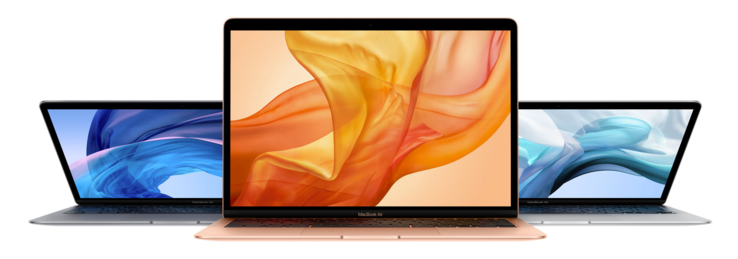
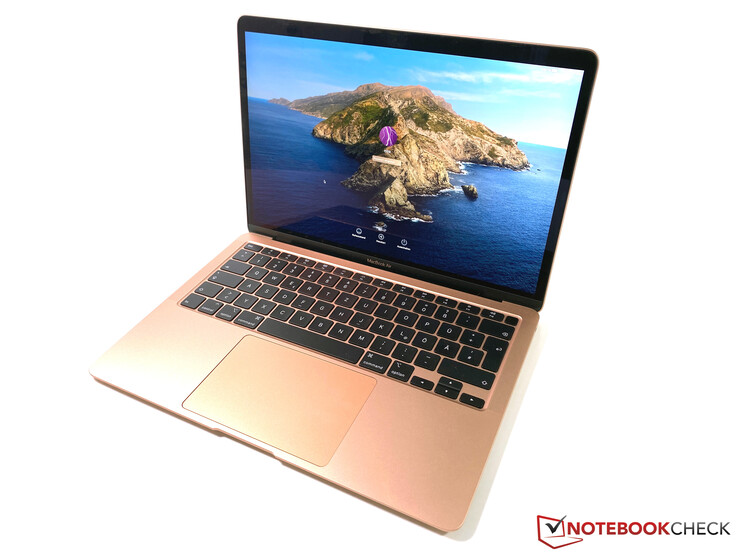
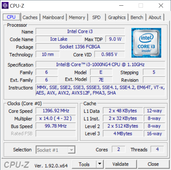
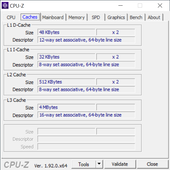
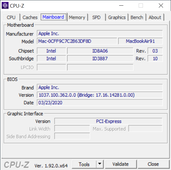
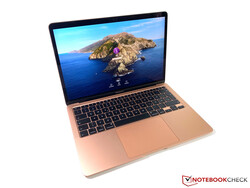
Dört çekirdekli MacBook Air hakkındaki son incelememizden sonra, daha yavaş Core i3 işlemcisi ile giriş seviyesi SKU'ya daha yakından bakıyoruz. Sadece iki CPU çekirdeği içeriyor ve bu nedenle bize önceki MacBook Air'in (MY 2019 ve daha eski) birçoğunu hatırlatıyor. Özellikle emisyonlarla ilgileniyoruz, çünkü dört çekirdekli modeli gözden geçirirken fan gürültüsü bir sorun haline geldi. Altın test birimimiz 1199 Euro (~ 1298 $) için giriş seviyesi spesifikasyonudur. Core i3 işlemciye ek olarak, müşteriler 8 GB RAM ve 256 GB SSD depolama alanına sahip olur. Ayrıca bir kez daha geleneksel bir makas mekanizması kullanan güncellenmiş klavyeyi (Magic Keyboard) alırsınız. Son inceleme birimimize kıyasla şasi, bağlantı veya giriş aygıtları arasında fark yoktur, bu nedenle bu konular hakkında daha fazla bilgi için lütfen MacBook Air 2020 Core i5 ile ilgili kapsamlı incelememize bakın. Giriş seviyesi işlemcinin performansına ve bu makaledeki emisyonlara odaklanacağız.
Derecelendirme | Tarih | Modeli | Ağırlık | Yükseklik | Boyut | Çözünürlük | Fiyat |
|---|---|---|---|---|---|---|---|
| 89.6 % v7 (old) | 06/2020 | Apple MacBook Air 2020 i3 i3-1000NG4, Iris Plus Graphics G4 (Ice Lake 48 EU) | 1.3 kg | 16.1 mm | 13.30" | 2560x1600 | |
| 88 % v7 (old) | 05/2020 | Apple MacBook Air 2020 i5 i5-1030NG7, Iris Plus Graphics G7 (Ice Lake 64 EU) | 1.3 kg | 16.1 mm | 13.30" | 2560x1600 | |
| 85.6 % v7 (old) | 02/2020 | Apple Macbook Air 2019 i5-8210Y, UHD Graphics 617 | 1.3 kg | 15.6 mm | 13.30" | 2560x1600 | |
| 88.8 % v7 (old) | 03/2020 | Dell XPS 13 9300 i5 FHD i5-1035G1, UHD Graphics G1 (Ice Lake 32 EU) | 1.2 kg | 14.8 mm | 13.40" | 1920x1200 | |
| 87 % v7 (old) | 02/2020 | Acer Swift 3 SF313-52-71Y7 i7-1065G7, Iris Plus Graphics G7 (Ice Lake 64 EU) | 1.2 kg | 16.6 mm | 13.50" | 2256x1504 | |
| 84 % v7 (old) | 03/2020 | Microsoft Surface Laptop 3 13 Core i5-1035G7 i5-1035G7, Iris Plus Graphics G7 (Ice Lake 64 EU) | 1.3 kg | 14.5 mm | 13.50" | 2256x1504 |
Top 10
» Top 10 Multimedia Notebook listesi
» Top 10 oyun notebooku
» Top 10 bütçeye uygun Ofis/İş Notebook Listesi
» Top 10 Premium Ofis/İş notebookları
» Top 10 Çalışma istasyonu laptopları
» Top 10 Subnotebook listesi
» Top 10 Ultrabooklar
» En iyi 10 dönüştürülebilir modeli
» Seçimi en iyi 10 tablet
» Notebookcheck Top 10 Windows Tabletleri
» Top 10 Subnotebook listesi
» NotebookCheck tarafından incelenen en iyi Notebook ekranları
» Notebookcheck'in 500 Euro altındaki en iyi 10 Notebook listesi
» NotebookCheck tarafından seçilen 300 Euro altındaki en iyi 10 Notebook
» Notebookcheck'in 500 Euro altındaki en iyi 10 Notebook listesi
» Notebookcheck'in Top 10 akıllı telefon listesi
» Notebookcheck'in Top 10 hafif oyun notebookları
Boyut Karşılaştırma
Ekran - Windows'u kullandığınızda Retina Ekran daha parlaktır
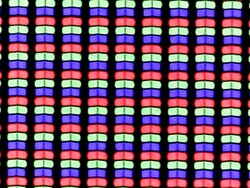
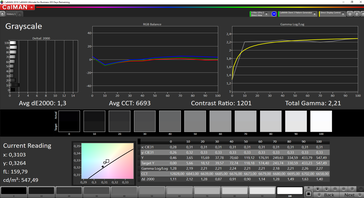
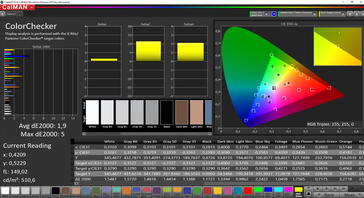
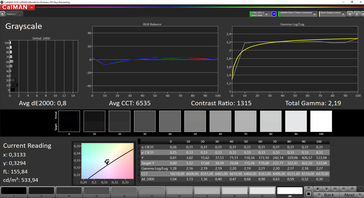
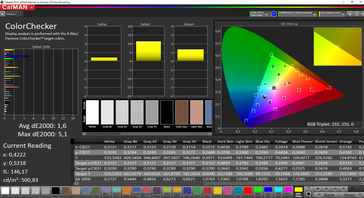
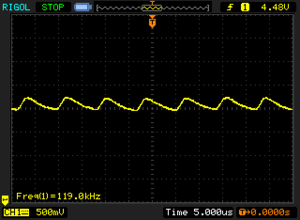
Ekran, önceki inceleme birimine çok benzer. Panel kimliği bir kez daha APPA042 ve çözünürlük 2560 x 1600 piksel. Sübjektif olarak, resim izlenimi çok iyidir ve ölçüm sonuçları son test modelimizle neredeyse aynıdır (sadece küçük sapmalar). Sapmalar sadece ölçüm cihazları ile belirlenir, çıplak gözle değil. Ölçüm sonuçlarımız ~ 400 nit'de ve kontrast oranı 1200: 1'den fazla, ancak bazı Windows rakipleri çok daha iyi sonuçları yönetiyor. PWM titremesini% 75 veya daha düşük bir parlaklıkta belirleyebiliriz, ancak frekans son derece yüksektir. 119 kHz. Daha pahalı MacBook Pro modellerine benzer şekilde, küçük MacBook Air, Parlaklık sensörünün yanı sıra True Tone'u (ortam ışığına göre renk sıcaklığının otomatik olarak ayarlanması) destekler.
| |||||||||||||||||||||||||
Aydınlatma: 95 %
Batarya modunda parlaklık: 414 cd/m²
Kontrast: 1224:1 (Siyah: 0.34 cd/m²)
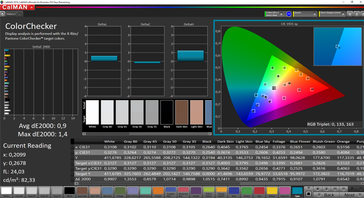
ΔE ColorChecker Calman: 0.9 | ∀{0.5-29.43 Ø4.77}
calibrated: 0.6
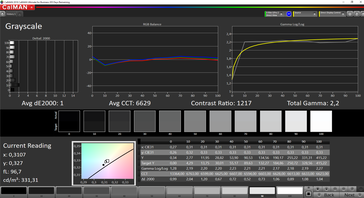
ΔE Greyscale Calman: 1 | ∀{0.09-98 Ø5}
97.6% sRGB (Argyll 1.6.3 3D)
63.9% AdobeRGB 1998 (Argyll 1.6.3 3D)
71.6% AdobeRGB 1998 (Argyll 3D)
98% sRGB (Argyll 3D)
70.3% Display P3 (Argyll 3D)
Gamma: 2.2
CCT: 6629 K
| Apple MacBook Air 2020 i3 APPA042, IPS, 2560x1600, 13.3" | Apple MacBook Air 2020 i5 APPA042, IPS, 2560x1600, 13.3" | Apple Macbook Air 2019 APPA041, IPS, 2560x1600, 13.3" | Dell XPS 13 9300 i5 FHD SHP14CB, IPS, 1920x1200, 13.4" | Acer Swift 3 SF313-52-71Y7 BOE, NE135FBM-N41, IPS, 2256x1504, 13.5" | Microsoft Surface Laptop 3 13 Core i5-1035G7 Sharp LQ135P1JX51, IPS, 2256x1504, 13.5" | |
|---|---|---|---|---|---|---|
| Display | 0% | -3% | 2% | 0% | -4% | |
| Display P3 Coverage (%) | 70.3 | 70.4 0% | 67.4 -4% | 71.5 2% | 70.1 0% | 65.7 -7% |
| sRGB Coverage (%) | 98 | 97.7 0% | 94.7 -3% | 99.4 1% | 99.8 2% | 98.6 1% |
| AdobeRGB 1998 Coverage (%) | 71.6 | 71.7 0% | 69.1 -3% | 73.5 3% | 71.2 -1% | 67.8 -5% |
| Response Times | -4% | -7% | -37% | -26% | -50% | |
| Response Time Grey 50% / Grey 80% * (ms) | 38.4 ? | 38.7 ? -1% | 42.4 ? -10% | 60 ? -56% | 55 ? -43% | 59.2 ? -54% |
| Response Time Black / White * (ms) | 28.4 ? | 30.44 ? -7% | 29.6 ? -4% | 33.2 ? -17% | 31 ? -9% | 41.6 ? -46% |
| PWM Frequency (Hz) | 119000 ? | 117000 ? | 111100 ? | 2500 ? | 208 ? | 21740 ? |
| Screen | -45% | -27% | -97% | -95% | -17% | |
| Brightness middle (cd/m²) | 416 | 430 3% | 421 1% | 619 49% | 474 14% | 403.4 -3% |
| Brightness (cd/m²) | 403 | 405 0% | 393 -2% | 591 47% | 426 6% | 397 -1% |
| Brightness Distribution (%) | 95 | 89 -6% | 88 -7% | 91 -4% | 82 -14% | 89 -6% |
| Black Level * (cd/m²) | 0.34 | 0.32 6% | 0.34 -0% | 0.35 -3% | 0.29 15% | 0.34 -0% |
| Contrast (:1) | 1224 | 1344 10% | 1238 1% | 1769 45% | 1634 33% | 1186 -3% |
| Colorchecker dE 2000 * | 0.9 | 1.8 -100% | 1.5 -67% | 3 -233% | 2.38 -164% | 0.94 -4% |
| Colorchecker dE 2000 max. * | 1.4 | 4.6 -229% | 3.8 -171% | 8.2 -486% | 5.88 -320% | 2.92 -109% |
| Colorchecker dE 2000 calibrated * | 0.6 | 1.6 -167% | 1 -67% | 2.69 -348% | 0.99 -65% | |
| Greyscale dE 2000 * | 1 | 1.1 -10% | 1.2 -20% | 5.2 -420% | 3.75 -275% | 0.9 10% |
| Gamma | 2.2 100% | 2.21 100% | 2.14 103% | 2.37 93% | 2.13 103% | |
| CCT | 6629 98% | 6644 98% | 6694 97% | 6340 103% | 6466 101% | 6620 98% |
| Color Space (Percent of AdobeRGB 1998) (%) | 63.9 | 64.2 0% | 61.3 -4% | 66.9 5% | 65 2% | 62.3 -3% |
| Color Space (Percent of sRGB) (%) | 97.6 | 97.6 0% | 94.6 -3% | 99.3 2% | 100 2% | 98.7 1% |
| Toplam Ortalama (Program / Ayarlar) | -16% /
-31% | -12% /
-20% | -44% /
-71% | -40% /
-69% | -24% /
-18% |
* ... daha küçük daha iyidir
Profesyonel CalMAN yazılımı ve X-Rite i1 Pro 2 spektrofotometre ile yaptığımız analiz, kutunun dışında çok hassas bir kalibrasyon olduğunu ortaya koyuyor. Renk gölgesi yoktur ve sapmalar açıkça 3'ün önemli işaretinin altındadır. Sonuçları sadece kendi kalibrasyonumuzla biraz iyileştirmeyi başardık, bu nedenle kullanıcı tarafından ek bir kalibrasyon gerekli değildir. Küçük sRGB gamı tamamen kapsanır, bu nedenle resim düzenleme sorunu yoktur. Bu arada, daha geniş P3 renk gamını hedefleyen daha pahalı MacBook Pro 13 kardeşlerine kıyasla bu bir fark.
Testlerimiz sırasında, Windows'u kullandığınızda maksimum parlaklığın çok daha yüksek olduğunu fark ettik. Test birimimiz% 30'dan fazla daha parlaktı, bu oldukça fazla. Bununla birlikte, siyah değer de daha yüksektir, bu nedenle elde edilen kontrast oranı 1200: 1'de benzerdir. Bu varyasyonun olası nedenleri hakkında zaten özel bir makale yayınladık. Windows renk doğruluğu açısından biraz daha kötü performans gösterir ve bazı renkler 3'ün önemli değerini kaçırır (kalibrasyondan sonra bile).
Yanıt Sürelerini Görüntüle
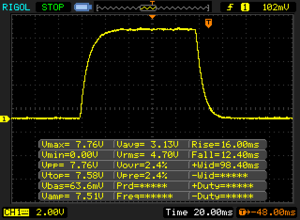
| ↔ Tepki Süresi Siyahtan Beyaza | ||
|---|---|---|
| 28.4 ms ... yükseliş ↗ ve sonbahar↘ birleşimi | ↗ 16 ms yükseliş | |
| ↘ 12.4 ms sonbahar | ||
| Ekran, testlerimizde nispeten yavaş yanıt oranları gösteriyor ve oyuncular için çok yavaş olabilir. Karşılaştırıldığında, test edilen tüm cihazlar 0.1 (minimum) ile 240 (maksimum) ms arasında değişir. » Tüm cihazların 74 %'si daha iyi. Bu, ölçülen yanıt süresinin test edilen tüm cihazların ortalamasından (20.1 ms) daha kötü olduğu anlamına gelir. | ||
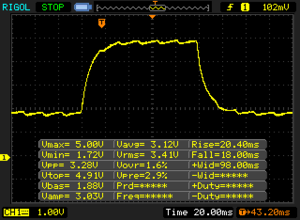
| ↔ Tepki Süresi %50 Griden %80 Griye | ||
| 38.4 ms ... yükseliş ↗ ve sonbahar↘ birleşimi | ↗ 20.4 ms yükseliş | |
| ↘ 18 ms sonbahar | ||
| Ekran, testlerimizde yavaş yanıt oranları gösteriyor ve oyuncular için yetersiz olacaktır. Karşılaştırıldığında, test edilen tüm cihazlar 0.165 (minimum) ile 636 (maksimum) ms arasında değişir. » Tüm cihazların 57 %'si daha iyi. Bu, ölçülen yanıt süresinin test edilen tüm cihazların ortalamasından (31.5 ms) daha kötü olduğu anlamına gelir. | ||
Ekran Titremesi / PWM (Darbe Genişliği Modülasyonu)
| Ekran titriyor / PWM algılandı | 119000 Hz | ≤ 75 % parlaklık ayarı | |
Ekran arka ışığı 119000 Hz'de titriyor (en kötü durum, örneğin PWM kullanılması) 75 % ve altındaki parlaklık ayarında titreme algılandı. Bu parlaklık ayarının üzerinde titreme veya PWM olmamalıdır. 119000 Hz frekansı oldukça yüksektir, bu nedenle PWM'ye duyarlı çoğu kullanıcı herhangi bir titremeyi fark etmemelidir. Karşılaştırıldığında: Test edilen tüm cihazların %53 %'si ekranı karartmak için PWM kullanmıyor. PWM tespit edilirse, ortalama 8042 (minimum: 5 - maksimum: 343500) Hz ölçüldü. | |||
Performans - Core i3 MacBook Air'de yeterli mi?
MacOS kıyaslamalarına ek olarak, her zamanki test paketimizi çalıştırmak ve Windows cihazlarıyla belirli bir karşılaştırılabilirliği sağlamak için Windows 10'u BootCamp aracılığıyla yükledik. Ancak, lütfen BootCamp sürücülerinin Apple tarafından mükemmel şekilde optimize edilmediğini unutmayın. Windows'u kullanmak sorun değil, ancak karşılaştırma sonuçları her zaman gerçek performansı göstermiyor. Windows'u kullandığınızda güç tüketimi de belirgin şekilde daha yüksektir.
İşlemci - Ice Lake Core i3 ile MacBook Air
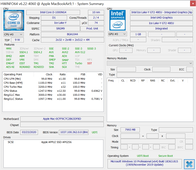
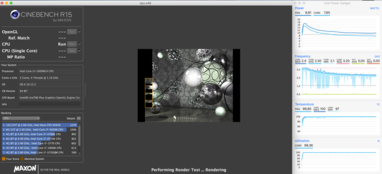
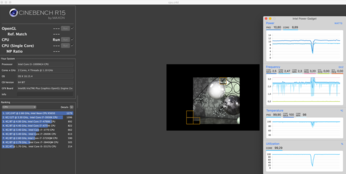
MacBook Air 2020'nin temel modeli de modern bir Buz Gölü işlemcisi alıyor, ancak Core i3-1000NG4, Core i5 ve Core i7 ile karşılaştırıldığında sadece iki çekirdek (4 iplik) sunuyor, bu yüzden 2018'den eski MacBook Air'e daha yakın ve 2019 ham CPU performansı açısından. Yeni Core i3, öncekilerdeki eski Core i5-8210Y'den biraz daha hızlı, ancak avantaj çok büyük değil.Perfor çok hızlı düşüyor: 18 Watt'a (2x 3,2 GHz) kadar maksimum güç tüketimi görüyoruz ancak bu değer birkaç saniye içinde yalnızca 10-11 Watt'a (2x 2,3-2,4 GHz) düşer. Cinebench Multi loop'umuz da benzer bir güç kullanımı ile sonuçlanır. Dört çekirdekli i5 ile MacBook Air incelememiz sırasında daha büyük dalgalanmalar fark ettik. İkincisinin tüm çekirdekleri kullandığınızda% 35 civarında bir avantajı vardır, ancak günlük görevlerde hala önemli olan tek çekirdekli performans aslında i3 ve i5 arasında aynıdır. Pil gücünde performans daha da azalmaz. Tüm Windows rakipleri 15W CPU'ları ile çok daha fazla CPU performansı sunuyor.
Cinebench R15: CPU Single 64Bit | CPU Multi 64Bit
Blender: v2.79 BMW27 CPU
7-Zip 18.03: 7z b 4 -mmt1 | 7z b 4
Geekbench 5.5: Single-Core | Multi-Core
HWBOT x265 Benchmark v2.2: 4k Preset
LibreOffice : 20 Documents To PDF
R Benchmark 2.5: Overall mean
| Cinebench R20 / CPU (Single Core) | |
| Sınıf ortalaması Subnotebook (128 - 826, n=66, son 2 yıl) | |
| Acer Swift 3 SF313-52-71Y7 | |
| Microsoft Surface Laptop 3 13 Core i5-1035G7 | |
| Dell XPS 13 9300 i5 FHD | |
| Apple MacBook Air 2020 i5 | |
| Apple MacBook Air 2020 i5 | |
| Apple MacBook Air 2020 i3 | |
| Ortalama Intel Core i3-1000NG4 (n=1) | |
| Apple Macbook Air 2019 | |
| Cinebench R20 / CPU (Multi Core) | |
| Sınıf ortalaması Subnotebook (579 - 8541, n=66, son 2 yıl) | |
| Microsoft Surface Laptop 3 13 Core i5-1035G7 | |
| Dell XPS 13 9300 i5 FHD | |
| Acer Swift 3 SF313-52-71Y7 | |
| Apple MacBook Air 2020 i5 | |
| Apple MacBook Air 2020 i5 | |
| Apple Macbook Air 2019 | |
| Apple MacBook Air 2020 i3 | |
| Ortalama Intel Core i3-1000NG4 (n=1) | |
| Cinebench R15 / CPU Single 64Bit | |
| Sınıf ortalaması Subnotebook (72.4 - 322, n=66, son 2 yıl) | |
| Acer Swift 3 SF313-52-71Y7 | |
| Microsoft Surface Laptop 3 13 Core i5-1035G7 | |
| Dell XPS 13 9300 i5 FHD | |
| Apple MacBook Air 2020 i3 | |
| Ortalama Intel Core i3-1000NG4 (n=1) | |
| Apple MacBook Air 2020 i5 | |
| Apple Macbook Air 2019 | |
| Cinebench R15 / CPU Multi 64Bit | |
| Sınıf ortalaması Subnotebook (327 - 3345, n=66, son 2 yıl) | |
| Microsoft Surface Laptop 3 13 Core i5-1035G7 | |
| Dell XPS 13 9300 i5 FHD | |
| Dell XPS 13 9300 i5 FHD | |
| Acer Swift 3 SF313-52-71Y7 | |
| Apple MacBook Air 2020 i5 | |
| Apple MacBook Air 2020 i3 | |
| Ortalama Intel Core i3-1000NG4 (n=1) | |
| Apple Macbook Air 2019 | |
| Blender / v2.79 BMW27 CPU | |
| Apple MacBook Air 2020 i3 | |
| Ortalama Intel Core i3-1000NG4 (n=1) | |
| Apple Macbook Air 2019 | |
| Apple MacBook Air 2020 i5 | |
| Acer Swift 3 SF313-52-71Y7 | |
| Microsoft Surface Laptop 3 13 Core i5-1035G7 | |
| Dell XPS 13 9300 i5 FHD | |
| Sınıf ortalaması Subnotebook (159 - 2271, n=69, son 2 yıl) | |
| 7-Zip 18.03 / 7z b 4 -mmt1 | |
| Sınıf ortalaması Subnotebook (2643 - 6442, n=68, son 2 yıl) | |
| Acer Swift 3 SF313-52-71Y7 | |
| Microsoft Surface Laptop 3 13 Core i5-1035G7 | |
| Dell XPS 13 9300 i5 FHD | |
| Apple MacBook Air 2020 i5 | |
| Apple MacBook Air 2020 i3 | |
| Ortalama Intel Core i3-1000NG4 (n=1) | |
| Apple Macbook Air 2019 | |
| 7-Zip 18.03 / 7z b 4 | |
| Sınıf ortalaması Subnotebook (11668 - 77867, n=66, son 2 yıl) | |
| Microsoft Surface Laptop 3 13 Core i5-1035G7 | |
| Dell XPS 13 9300 i5 FHD | |
| Acer Swift 3 SF313-52-71Y7 | |
| Apple MacBook Air 2020 i5 | |
| Apple Macbook Air 2019 | |
| Apple MacBook Air 2020 i3 | |
| Ortalama Intel Core i3-1000NG4 (n=1) | |
| Geekbench 5.5 / Single-Core | |
| Sınıf ortalaması Subnotebook (726 - 2350, n=61, son 2 yıl) | |
| Acer Swift 3 SF313-52-71Y7 | |
| Dell XPS 13 9300 i5 FHD | |
| Apple MacBook Air 2020 i5 | |
| Apple MacBook Air 2020 i5 | |
| Apple MacBook Air 2020 i3 | |
| Ortalama Intel Core i3-1000NG4 (n=1) | |
| Geekbench 5.5 / Multi-Core | |
| Sınıf ortalaması Subnotebook (2557 - 17218, n=61, son 2 yıl) | |
| Acer Swift 3 SF313-52-71Y7 | |
| Dell XPS 13 9300 i5 FHD | |
| Apple MacBook Air 2020 i5 | |
| Apple MacBook Air 2020 i5 | |
| Apple MacBook Air 2020 i3 | |
| Ortalama Intel Core i3-1000NG4 (n=1) | |
| HWBOT x265 Benchmark v2.2 / 4k Preset | |
| Sınıf ortalaması Subnotebook (0.97 - 25.1, n=66, son 2 yıl) | |
| Acer Swift 3 SF313-52-71Y7 | |
| Microsoft Surface Laptop 3 13 Core i5-1035G7 | |
| Dell XPS 13 9300 i5 FHD | |
| Apple MacBook Air 2020 i5 | |
| Apple Macbook Air 2019 | |
| Apple MacBook Air 2020 i3 | |
| Ortalama Intel Core i3-1000NG4 (n=1) | |
| LibreOffice / 20 Documents To PDF | |
| Apple MacBook Air 2020 i5 | |
| Apple MacBook Air 2020 i3 | |
| Ortalama Intel Core i3-1000NG4 (n=1) | |
| Sınıf ortalaması Subnotebook (38.5 - 220, n=65, son 2 yıl) | |
| R Benchmark 2.5 / Overall mean | |
| Apple MacBook Air 2020 i5 | |
| Apple MacBook Air 2020 i5 | |
| Apple MacBook Air 2020 i3 | |
| Ortalama Intel Core i3-1000NG4 (n=1) | |
| Dell XPS 13 9300 i5 FHD | |
| Acer Swift 3 SF313-52-71Y7 | |
| Sınıf ortalaması Subnotebook (0.403 - 1.456, n=67, son 2 yıl) | |
* ... daha küçük daha iyidir
Sistem Performansı - Temel görevler için yeterince hızlı MacBook Air
Karşılaştırma sonuçları bir şeydir, ancak özellikle ilk sıradan kullanıcılar için tasarlanmış MacBook Air gibi bir cihaz kullandığınızda öznel performans izlenimi çok daha önemlidir. Açıkçası her kullanıcının kendi rutini vardır, ancak inceleme süremiz boyunca tipik uygulamaları kullandığımızda herhangi bir sınırlama fark etmedik. Bu, posta yazma, Skype veya Discord üzerinden sohbetler, web'de gezinme, YouTube videolarının oynatılması veya video akışı (Netflix, Amazon Prime Video veya Disney gibi) gibi şeyleri içerir. MacBook Air, bu senaryolarda hızlı SSD ve güçlü video kod çözücüden kesinlikle yararlanır. CPU performansı da bu tür işler için tamamen yeterlidir.Ancak, aynı anda çok fazla çoklu görev yapmamalı veya çok fazla tarayıcı sekmesi kullanmamalısınız, aksi takdirde bazı küçük kekemeleri fark edebilirsiniz. MacBook Air zaten güç kullanıcıları için pek uygun değil ve bu da dört çekirdekli işlemcilere sahip daha pahalı SKU'lar için de geçerli. MacBook Pro 13, örneğin daha zorlu uygulamalar için çok daha iyi bir cihazdır.
| PCMark 8 Home Score Accelerated v2 | 2701 puan | |
| PCMark 8 Creative Score Accelerated v2 | 3619 puan | |
| PCMark 10 Score | 2229 puan | |
Yardım | ||
GPU Performance – Iris Plus Graphics G4
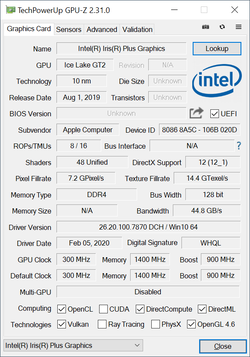
The Core i3 processor is equipped with a slower version of the Intel Iris Plus Graphics compared to the optional quad-core chips. The G4 iGPU only features 48 shader units; the faster G7 version 64. However, the graphics performance is further limited by the low TDP, because other G4 iGPUs in our database are between 30-70% faster depending on the benchmark. The MacBook Air 2020 with the G7 iGPU is about 50% faster, but the overall performance level is still low. You will not notice this difference in practice and the slower iGPU is sufficient. Playback of high-resolution videos, for example, is no problem at all, but the MacBook Air is usually too slow for gaming. Only very simple titles run smoothly at lowest settings, but the performance also drops after a while. The Fire Strike stress test is not passed at just 70%, so the gaming performance will suffer when you play for a couple of minutes. The graphics performance is not further reduced on battery power.
| Unigine Valley 1.0 - 1920x1080 Extreme HD Preset OpenGL AA:x8 | |
| Sınıf ortalaması Subnotebook (18.5 - 26.2, n=3, son 2 yıl) | |
| Apple MacBook Air 2020 i5 | |
| Ortalama Intel Iris Plus Graphics G4 (Ice Lake 48 EU) (7.1 - 9.3, n=2) | |
| Apple MacBook Air 2020 i3 | |
| Unigine Heaven 4.0 - Extreme Preset OpenGL | |
| Sınıf ortalaması Subnotebook (27.1 - 30.7, n=2, son 2 yıl) | |
| Ortalama Intel Iris Plus Graphics G4 (Ice Lake 48 EU) (8.1 - 11.8, n=2) | |
| Apple MacBook Air 2020 i5 | |
| Apple MacBook Air 2020 i3 | |
| 3DMark 06 Standard Score | 6413 puan | |
| 3DMark Vantage P Result | 5516 puan | |
| 3DMark 11 Performance | 1980 puan | |
| 3DMark Fire Strike Score | 839 puan | |
Yardım | ||
| düşük | orta | yüksek | ultra | |
|---|---|---|---|---|
| BioShock Infinite (2013) | 34 | 22.6 | 20.3 | 9.1 |
| The Witcher 3 (2015) | 9.1 | |||
| Dota 2 Reborn (2015) | 48.2 | 23.4 | 14.7 | 14.1 |
| Rise of the Tomb Raider (2016) | 10.2 | |||
| Overwatch (2016) | 8 | |||
| Rocket League (2017) | 53.2 | 22.7 | ||
| X-Plane 11.11 (2018) | 17.8 | 9.32 | 9.16 | |
| Shadow of the Tomb Raider (2018) | 9 |
Emissions
System Noise – Dual-Core MacBook Air is quieter
Compared to the quad-core model of the MacBook Air, it takes longer for the fan to reach its maximum speed. The fan is also noticeably quieter overall. Medium workloads (also gaming) will also result in the maximum fan noise, but this process will take a couple of minutes. Still, the passive cooling in combination with the additional chassis fan is anything but great. Other manufactures can handle such a processor with a completely passive cooling solution.
Ses yüksekliği
| Boşta |
| 29 / 29 / 29 dB |
| Çalışırken |
| 31.6 / 39.4 dB |
 | ||
30 dB sessiz 40 dB(A) duyulabilirlik 50 dB(A) gürültülü |
||
min: | ||
| Apple MacBook Air 2020 i3 Iris Plus Graphics G4 (Ice Lake 48 EU), i3-1000NG4, Apple SSD AP0256 | Apple MacBook Air 2020 i5 Iris Plus Graphics G7 (Ice Lake 64 EU), i5-1030NG7, Apple SSD AP0512 | Apple Macbook Air 2019 UHD Graphics 617, i5-8210Y, Apple SSD AP0256 | Dell XPS 13 9300 i5 FHD UHD Graphics G1 (Ice Lake 32 EU), i5-1035G1, Toshiba XG6 KXG60ZNV512G | Acer Swift 3 SF313-52-71Y7 Iris Plus Graphics G7 (Ice Lake 64 EU), i7-1065G7, Intel SSD 660p 1TB SSDPEKNW010T8 | Microsoft Surface Laptop 3 13 Core i5-1035G7 Iris Plus Graphics G7 (Ice Lake 64 EU), i5-1035G7, SK hynix BC501 HFM256GDGTNG | |
|---|---|---|---|---|---|---|
| Noise | -12% | -3% | 3% | 0% | 3% | |
| kapalı / ortam * (dB) | 29 | 30 -3% | 29.5 -2% | 29.3 -1% | 30.3 -4% | 28.5 2% |
| Idle Minimum * (dB) | 29 | 30 -3% | 29.5 -2% | 29.3 -1% | 30.3 -4% | 28.5 2% |
| Idle Average * (dB) | 29 | 30 -3% | 29.5 -2% | 29.3 -1% | 30.3 -4% | 28.5 2% |
| Idle Maximum * (dB) | 29 | 30 -3% | 29.5 -2% | 29.3 -1% | 30.3 -4% | 28.5 2% |
| Load Average * (dB) | 31.6 | 45.5 -44% | 34 -8% | 30 5% | 31.7 -0% | 28.5 10% |
| Load Maximum * (dB) | 39.4 | 45.8 -16% | 41 -4% | 32.4 18% | 32.7 17% | 40.4 -3% |
| Witcher 3 ultra * (dB) | 40.4 |
* ... daha küçük daha iyidir
Temperature – Core i3 SKU stays cooler
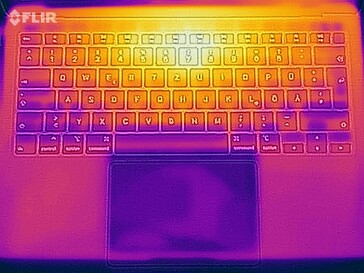
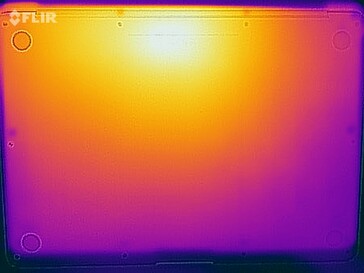
The entry-level model of the MacBook Air also has an advantage in terms of surface temperatures, and the hotspot at the top of the keyboard in particular stays a couple of degrees cooler. You will notice up to 44 °C (111.2 °F) when you type on the keyboard, but there are no limitations. Up to 40 °C (104 °F) at the bottom is no problem, either. Less demanding tasks usually result in a lukewarm device, if at all.
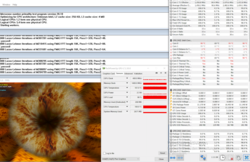
Similar to pure CPU load, the power consumption of the SoC will level off at around 11 Watts during our stress test. However, both the CPU and the iGPU are stressed now, which results in lower clocks. The CPU only runs at 2x 1.5 GHz and the iGPU at 400 MHz. The performance is not limited immediately after the stress test.
(±) Üst taraftaki maksimum sıcaklık, 35.9 °C / 97 F ortalamasına kıyasla 44.3 °C / 112 F'dir. , Subnotebook sınıfı için 21.4 ile 59 °C arasında değişir.
(±) Alt kısım, 39.3 °C / 103 F ortalamasına kıyasla maksimum 40.9 °C / 106 F'ye kadar ısınır
(+) Boşta kullanımda, üst tarafın ortalama sıcaklığı 23.4 °C / 74 F olup, cihazın 30.8 °C / 87 F.
(+) Avuç içi dayanakları ve dokunmatik yüzey, maksimum 29.1 °C / 84.4 F ile cilt sıcaklığından daha soğuktur ve bu nedenle dokunulduğunda soğuktur.
(±) Benzer cihazların avuç içi dayanağı alanının ortalama sıcaklığı 28.2 °C / 82.8 F (-0.9 °C / -1.6 F) idi.
Energy Management – Efficient Ice Lake SoC
Power Consumption
The Core i3 MacBook Air is a slightly more efficient in our idle measurements, but there is no difference in our load tests. This once again shows that the TDP setting or the cooling solution, respectively, is the limiting factor for the performance.
| Kapalı / Bekleme modu | |
| Boşta | |
| Çalışırken |
|
Key:
min: | |
| Apple MacBook Air 2020 i3 i3-1000NG4, Iris Plus Graphics G4 (Ice Lake 48 EU), Apple SSD AP0256, IPS, 2560x1600, 13.3" | Apple MacBook Air 2020 i5 i5-1030NG7, Iris Plus Graphics G7 (Ice Lake 64 EU), Apple SSD AP0512, IPS, 2560x1600, 13.3" | Dell XPS 13 9300 i5 FHD i5-1035G1, UHD Graphics G1 (Ice Lake 32 EU), Toshiba XG6 KXG60ZNV512G, IPS, 1920x1200, 13.4" | Acer Swift 3 SF313-52-71Y7 i7-1065G7, Iris Plus Graphics G7 (Ice Lake 64 EU), Intel SSD 660p 1TB SSDPEKNW010T8, IPS, 2256x1504, 13.5" | Microsoft Surface Laptop 3 13 Core i5-1035G7 i5-1035G7, Iris Plus Graphics G7 (Ice Lake 64 EU), SK hynix BC501 HFM256GDGTNG, IPS, 2256x1504, 13.5" | Ortalama Intel Iris Plus Graphics G4 (Ice Lake 48 EU) | Sınıf ortalaması Subnotebook | |
|---|---|---|---|---|---|---|---|
| Power Consumption | -15% | -43% | 11% | -64% | -32% | -63% | |
| Idle Minimum * (Watt) | 2.1 | 2.4 -14% | 3.4 -62% | 1.8 14% | 4.4 -110% | 3.26 ? -55% | 3.94 ? -88% |
| Idle Average * (Watt) | 6.2 | 6.8 -10% | 6 3% | 4.6 26% | 7.5 -21% | 7.28 ? -17% | 6.83 ? -10% |
| Idle Maximum * (Watt) | 7 | 10.5 -50% | 10.2 -46% | 6.1 13% | 7.8 -11% | 8.66 ? -24% | 8.41 ? -20% |
| Load Average * (Watt) | 24.7 | 25.7 -4% | 36.6 -48% | 27.4 -11% | 41.9 -70% | 34.4 ? -39% | 43.8 ? -77% |
| Load Maximum * (Watt) | 30.6 | 30.4 1% | 49.3 -61% | 27 12% | 63.9 -109% | 38.9 ? -27% | 66.7 ? -118% |
| Witcher 3 ultra * (Watt) | 24.5 | 40.8 |
* ... daha küçük daha iyidir
Battery Runtime – macOS with a distinct advantage
The battery runtime is a bit better compared to the MacBook Air with the quad-core i5 processor. Both our Wi-Fi test and the video test (macOS, both at 150 nits) run for about 11 hours. The runtime in the Wi-Fi test is reduced to 7:17 hours (macOS) when we use the maximum display brightness.
We also performed the Wi-Fi test with Windows, and as expected, the results are much shorter. At 150 nits, we record about 7.5 hours, and just little more than 4 hours at the maximum brightness.
| Apple MacBook Air 2020 i3 i3-1000NG4, Iris Plus Graphics G4 (Ice Lake 48 EU), 49.9 Wh | Apple MacBook Air 2020 i5 i5-1030NG7, Iris Plus Graphics G7 (Ice Lake 64 EU), 49.9 Wh | Apple Macbook Air 2019 i5-8210Y, UHD Graphics 617, 49.9 Wh | Dell XPS 13 9300 i5 FHD i5-1035G1, UHD Graphics G1 (Ice Lake 32 EU), 52 Wh | Acer Swift 3 SF313-52-71Y7 i7-1065G7, Iris Plus Graphics G7 (Ice Lake 64 EU), 54.5 Wh | Microsoft Surface Laptop 3 13 Core i5-1035G7 i5-1035G7, Iris Plus Graphics G7 (Ice Lake 64 EU), 45 Wh | Sınıf ortalaması Subnotebook | |
|---|---|---|---|---|---|---|---|
| Pil Çalışma Süresi | -5% | 5% | 18% | -6% | -25% | 38% | |
| H.264 (h) | 11.1 | 10.7 -4% | 14.4 30% | 10.5 -5% | 16.9 ? 52% | ||
| WiFi v1.3 (h) | 11 | 10.3 -6% | 11.5 5% | 11.7 6% | 10.3 -6% | 8.3 -25% | 13.5 ? 23% |
| Load (h) | 2.9 | 3.4 | 2.3 | 1.9 | 1.948 ? | ||
| Reader / Idle (h) | 21.4 | 34.4 | 30.7 ? |
Artılar
Eksiler
Verdict – The Core i3 is the better choice for everyday tasks
With all the discussions about the performance of the new quad-core CPUs, you should not forget that the MacBook Air is still primarily a device for casual users with simple workloads. This includes basic things like writing mails, video playback, or web browsing. The MacBook Air is great for this stuff, also thanks to the fast SSD storage. Because of the limited TDP configuration, the entry-level MacBook Air is even on par with the supposedly faster quad-core i5 when it comes to the single-core performance, which is still important for everyday tasks. There are also noticeable advantages in terms of the emissions, and especially the fan is much quieter with a slower maximum speed. This means the i3 MacBook Air is quieter for longer periods of time, even when you stress it.
The MacBook Air with the dual-core i3 processor is the better device for basic workloads. The subjective performance impression is very good in these scenarios, the fan is quieter, and you can still enjoy the good display as well as the improved keyboard.
There are still drawbacks, because the overall level of performance is just very low. This would not be a huge problem, but why does Apple not manage to create a completely passively cooled device? A silent MacBook Air would be a great, but we have the suspicion that Apple limits the Air on purpose. This step might be reserved for future models with the heavily speculated ARM SoCs.
The price is another problem, because you can get Windows laptops with much more performance for 1200 Euros (~$1298). Still, thanks to the high-quality case, the good panel, and the good optimization for macOS, the MacBook Air is a very well-balanced package for your basic tasks. If you need more performance or if you already know that you will stress the components a lot, however, we believe you should skip the more expensive quad-core models of the Air and just get a MacBook Pro 13 (or something similarly powerful) instead.
Apple MacBook Air 2020 i3
- 05/13/2020 v7 (old)
Andreas Osthoff


