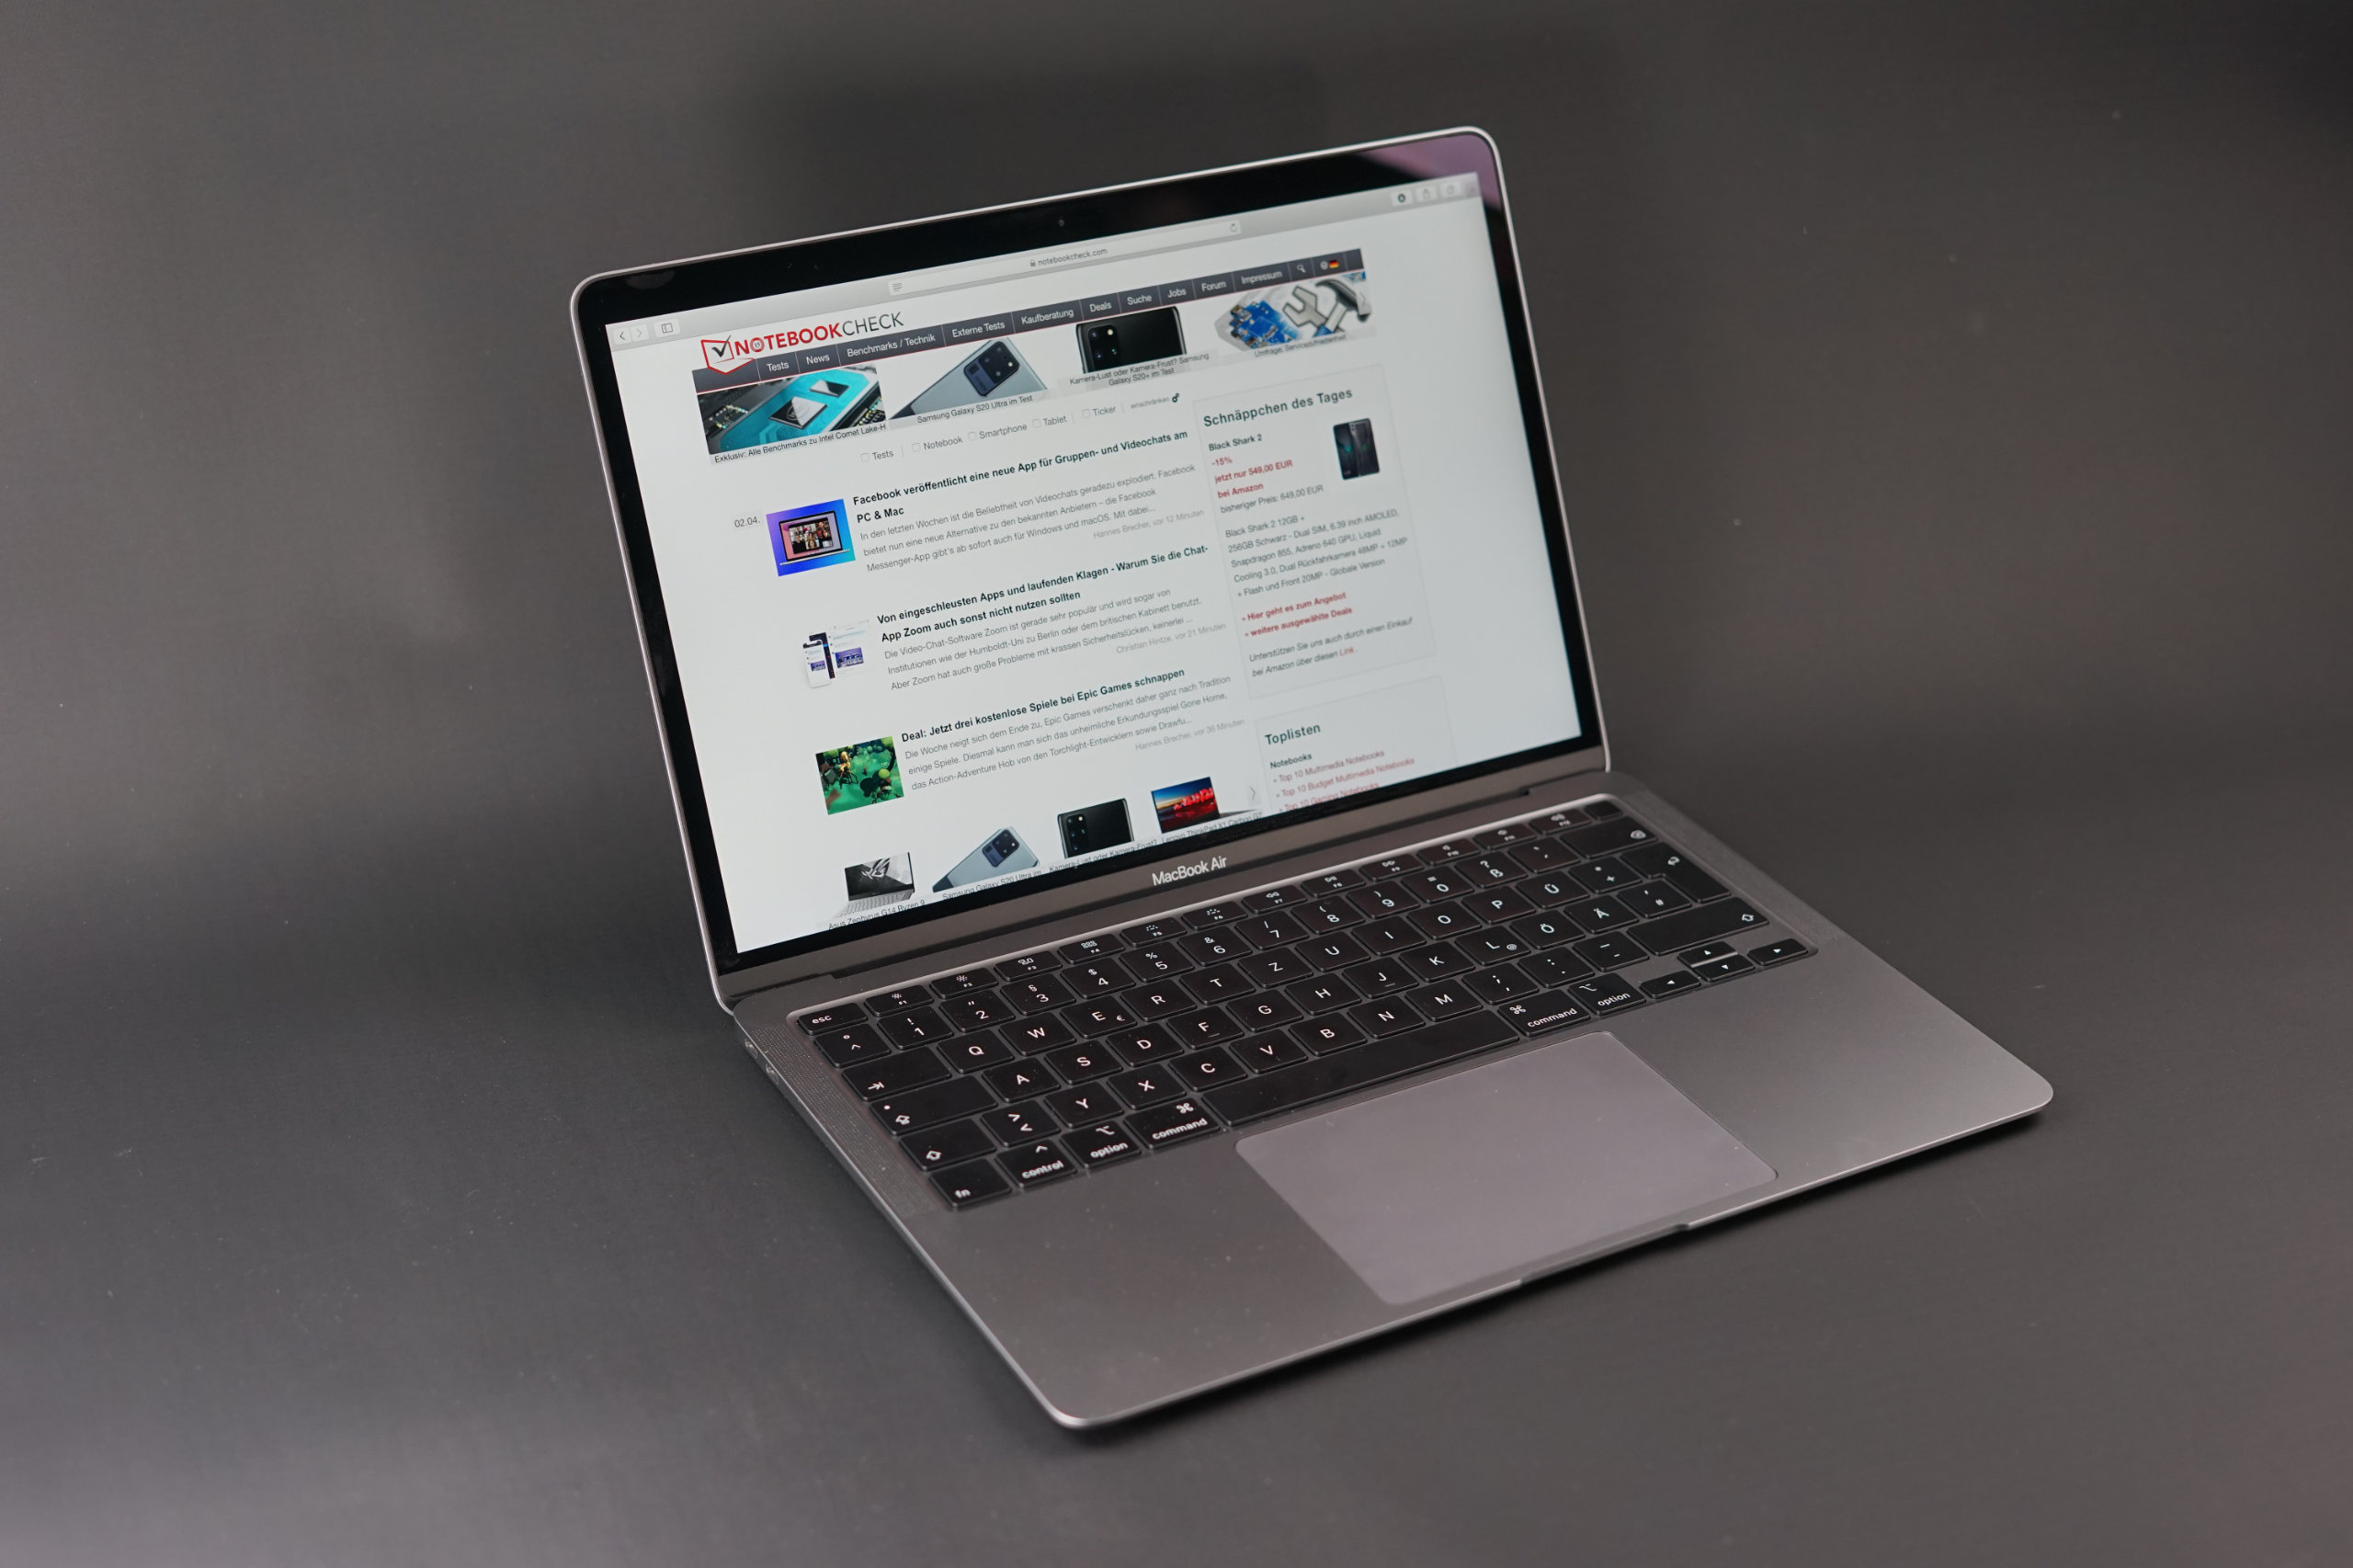
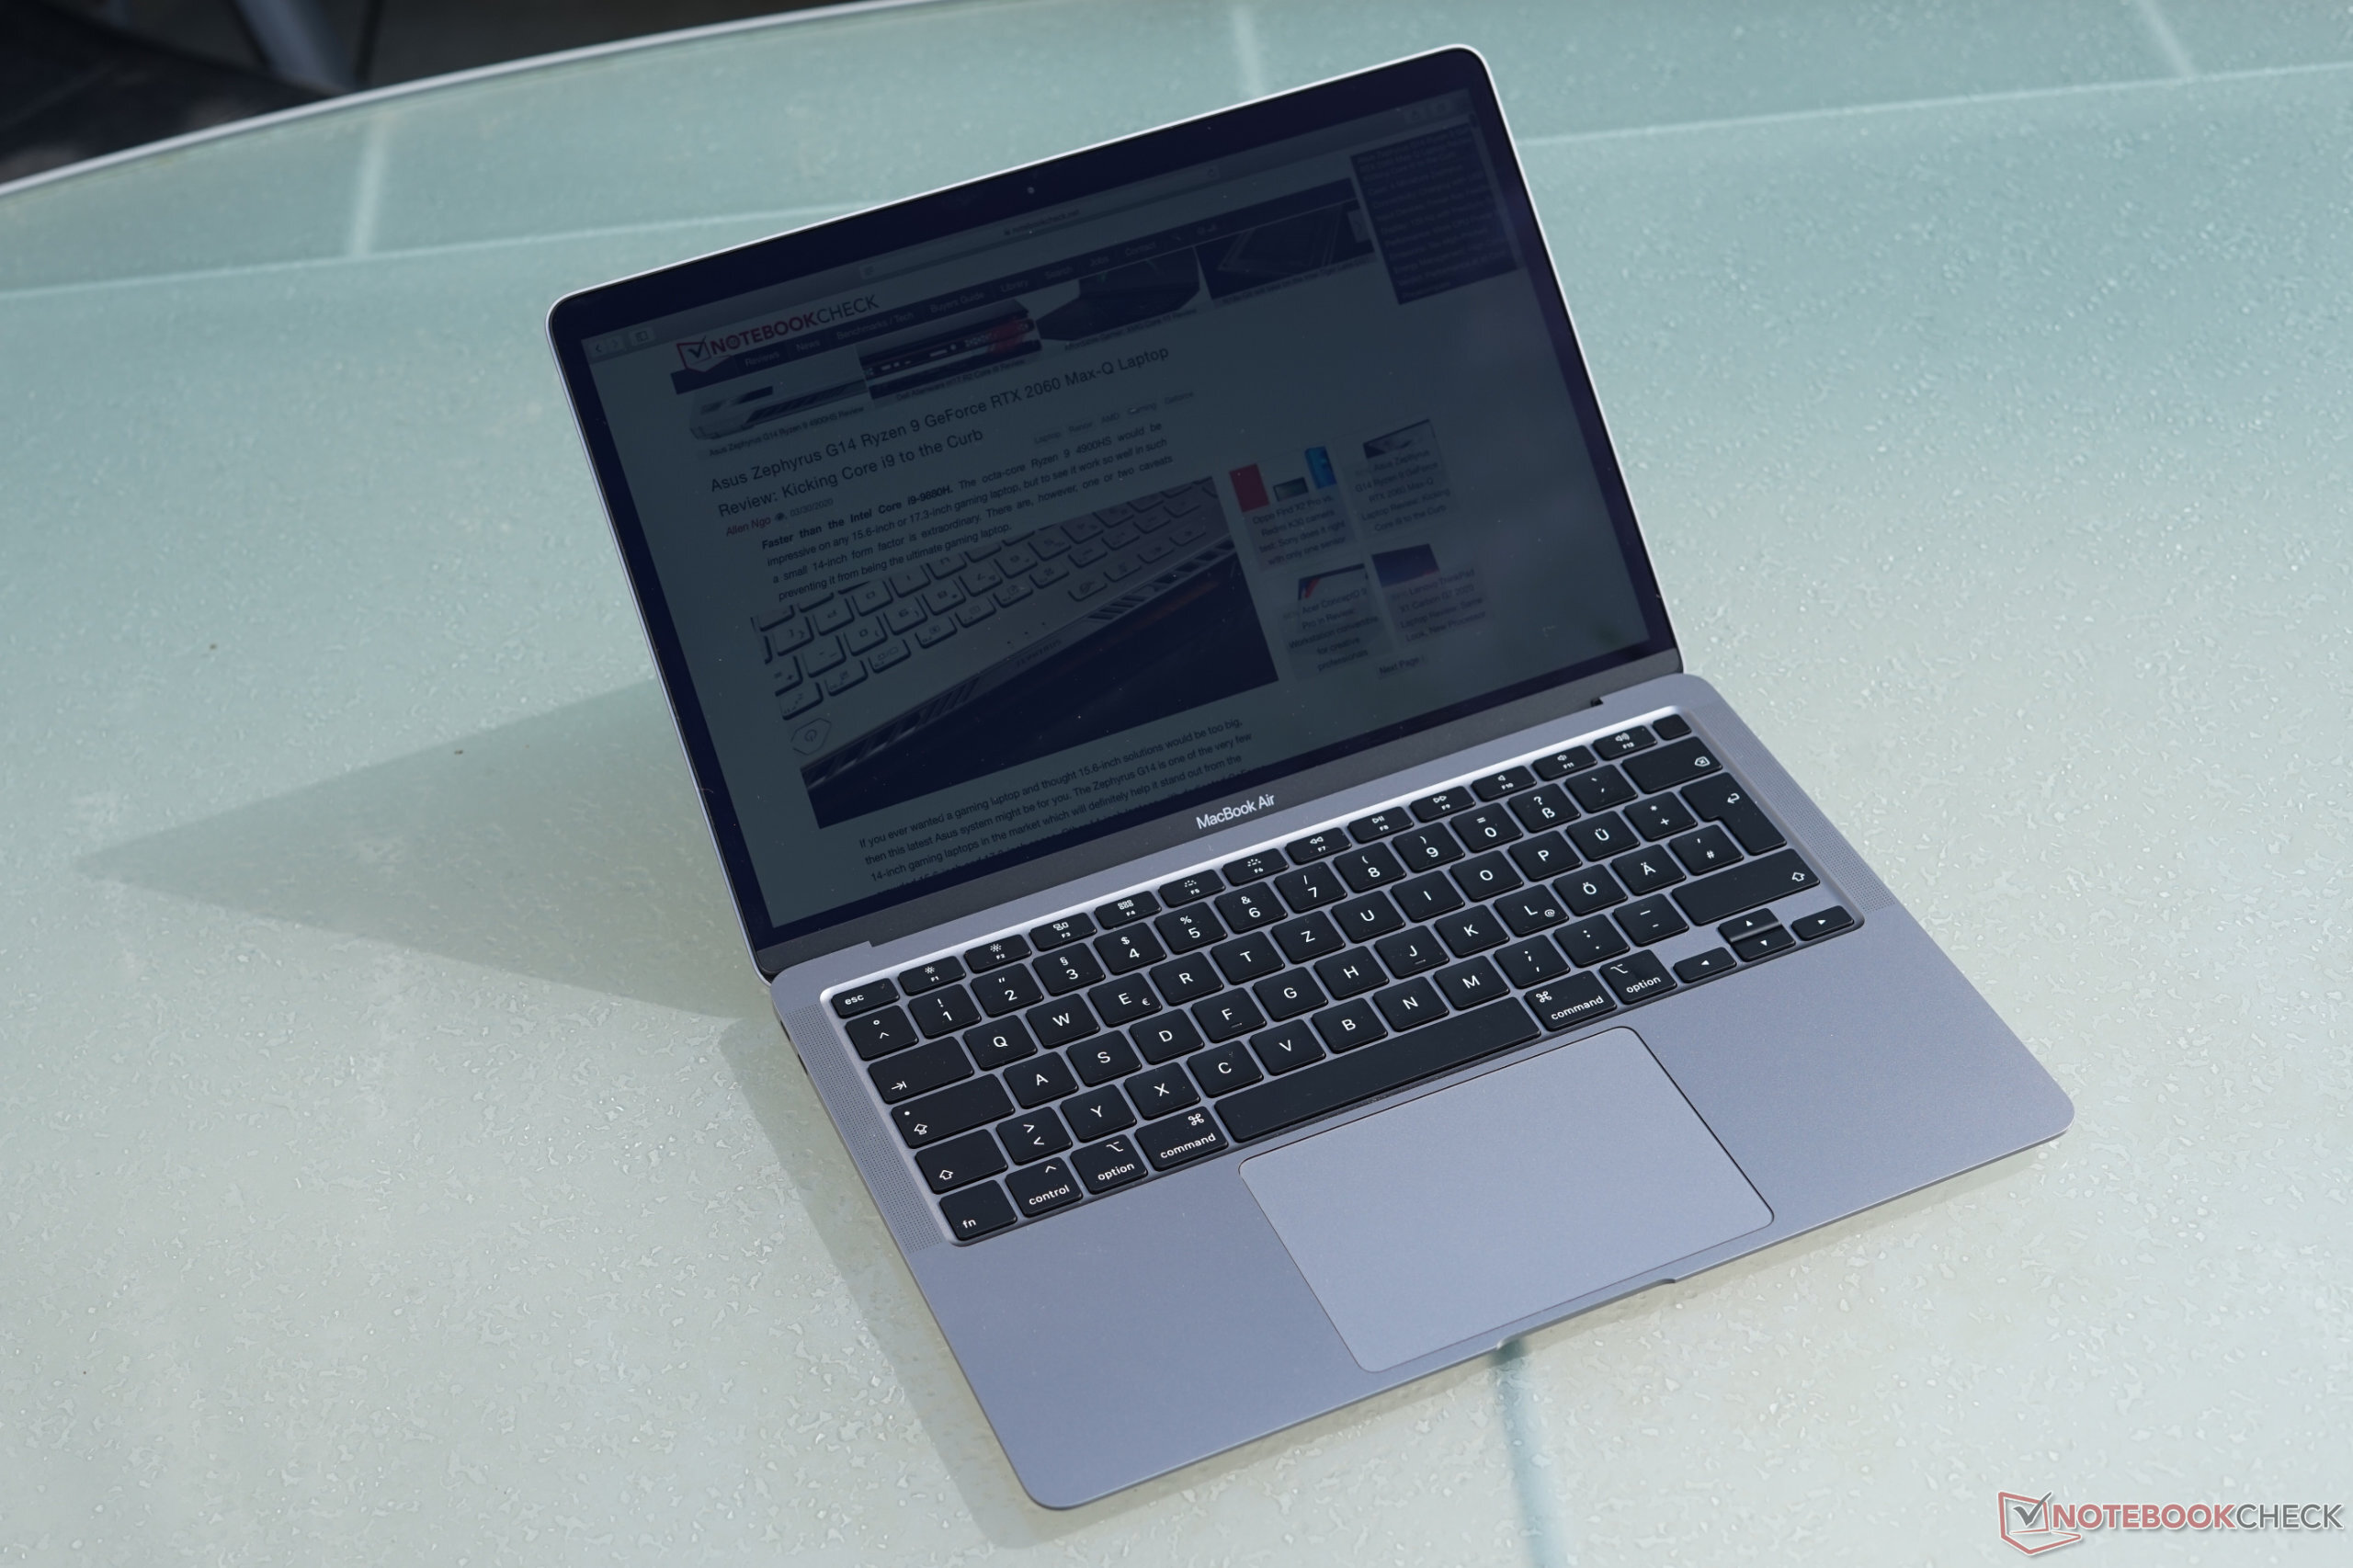
Apple MacBook Air 2020 Core i5 incelemesi – Alabileceğiniz en iyi MacBook mu? Hayır.
Yeni MacBook Pro 16 geleneksel bir klavye tasarımıyla donatıldıktan sonra, Apple şimdi kompakt MacBook Air'deki sorunlu Kelebek klavyenin yerini alıyor. Yine de daha fazla alan gerektirir, bu nedenle 2020 MacBook Air'in durumu aslında eskisinden biraz daha kalın. Ayrıca Intel'den düşük güçlü Y serisine dayanan özel işlemciler de alabilirsiniz, ancak şimdi daha yeni Ice Lake mimarisine dayanıyor ve ilk kez dört çekirdekli CPU'lu bir MacBook Air alabiliyorsunuz . Apple ayrıca yeni modeldeki hoparlörleri geliştirdi, depolama kapasitesini iki katına çıkardı ve fiyatı biraz düşürdü.Aksi takdirde, çok fazla şey değişmedi, bu nedenle daha fazla bilgi için önceki MacBook Air modellerine ilişkin kapsamlı incelemelerimizi öneriyoruz. Dört çekirdekli i5 SKU'yu Apple'ın çevrimiçi mağazasında satın aldığımız 1499 Euro (1299 ABD Doları) için inceliyoruz (basın örneği yok). Bu model, dört çekirdekli, 8 GB RAM ve 512 GB SSD depolama alanına sahip yukarıda belirtilen Core i5 CPU ile donatılmıştır. Yeni MacBook Air şu anda çoğu kullanıcı için gerçekten en iyi MacBook mu yoksa bu tür paralar için bir Pro modeli mi almanız gerekiyor? Apple MacBook Air 2019 İncelemesi
Derecelendirme | Tarih | Modeli | Ağırlık | Yükseklik | Boyut | Çözünürlük | Fiyat |
|---|---|---|---|---|---|---|---|
| 88 % v7 (old) | 05/2020 | Apple MacBook Air 2020 i5 i5-1030NG7, Iris Plus Graphics G7 (Ice Lake 64 EU) | 1.3 kg | 16.1 mm | 13.30" | 2560x1600 | |
| 85.6 % v7 (old) | 02/2020 | Apple Macbook Air 2019 i5-8210Y, UHD Graphics 617 | 1.3 kg | 15.6 mm | 13.30" | 2560x1600 | |
| 90.6 % v7 (old) | 02/2020 | Apple MacBook Pro 13 2019 2TB3 i5-8257U, Iris Plus Graphics 645 | 1.4 kg | 14.9 mm | 13.30" | 2560x1600 | |
| 84 % v7 (old) | 03/2020 | Microsoft Surface Laptop 3 13 Core i5-1035G7 i5-1035G7, Iris Plus Graphics G7 (Ice Lake 64 EU) | 1.3 kg | 14.5 mm | 13.50" | 2256x1504 | |
| 87 % v7 (old) | 02/2020 | Acer Swift 3 SF313-52-71Y7 i7-1065G7, Iris Plus Graphics G7 (Ice Lake 64 EU) | 1.2 kg | 16.6 mm | 13.50" | 2256x1504 | |
| 88.8 % v7 (old) | 03/2020 | Dell XPS 13 9300 i5 FHD i5-1035G1, UHD Graphics G1 (Ice Lake 32 EU) | 1.2 kg | 14.8 mm | 13.40" | 1920x1200 |
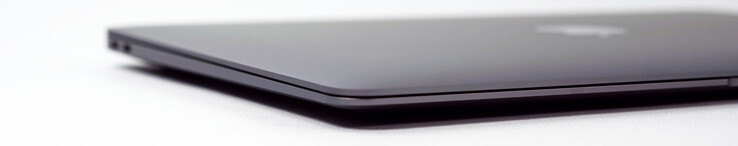
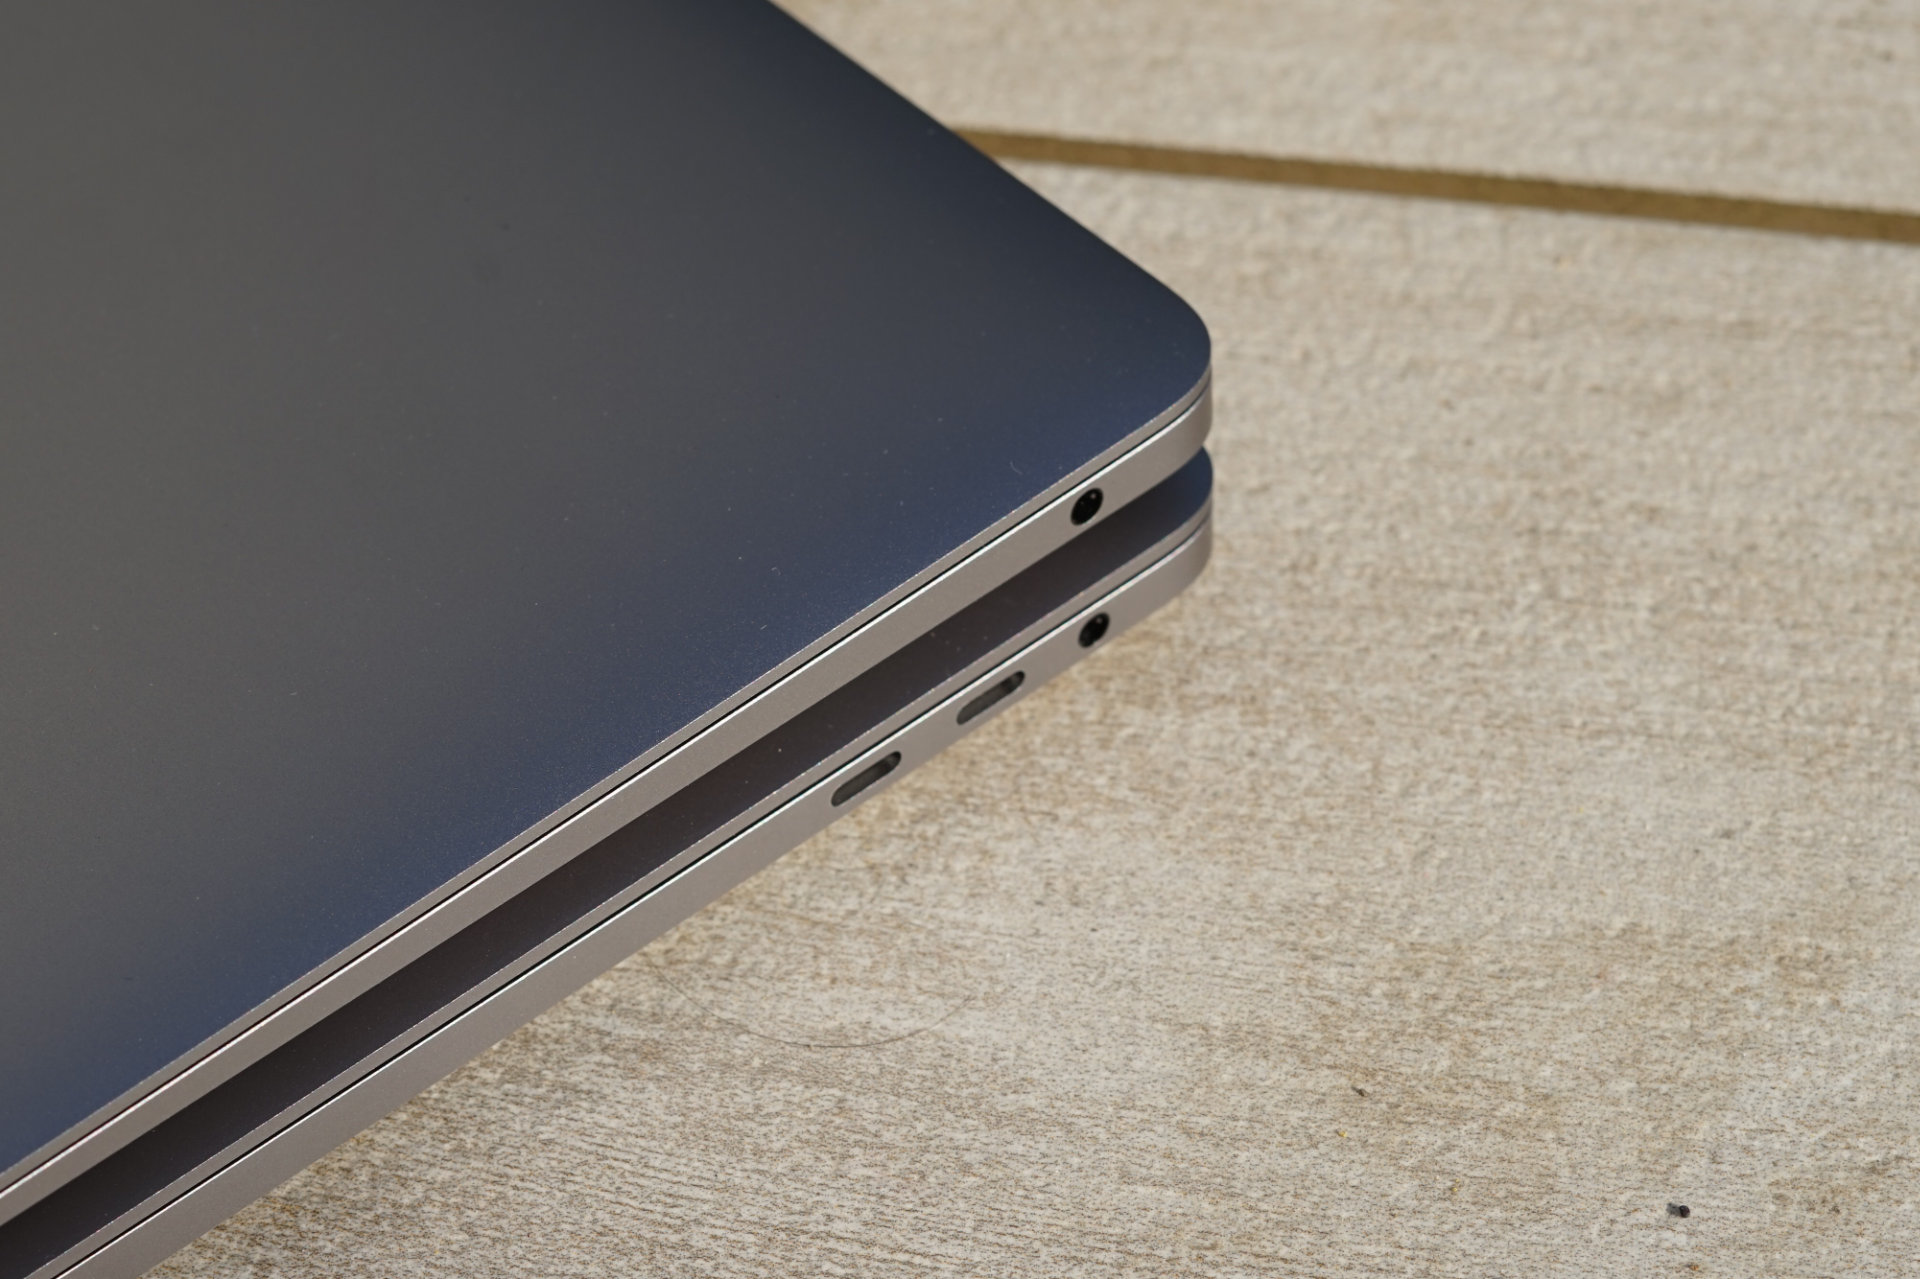
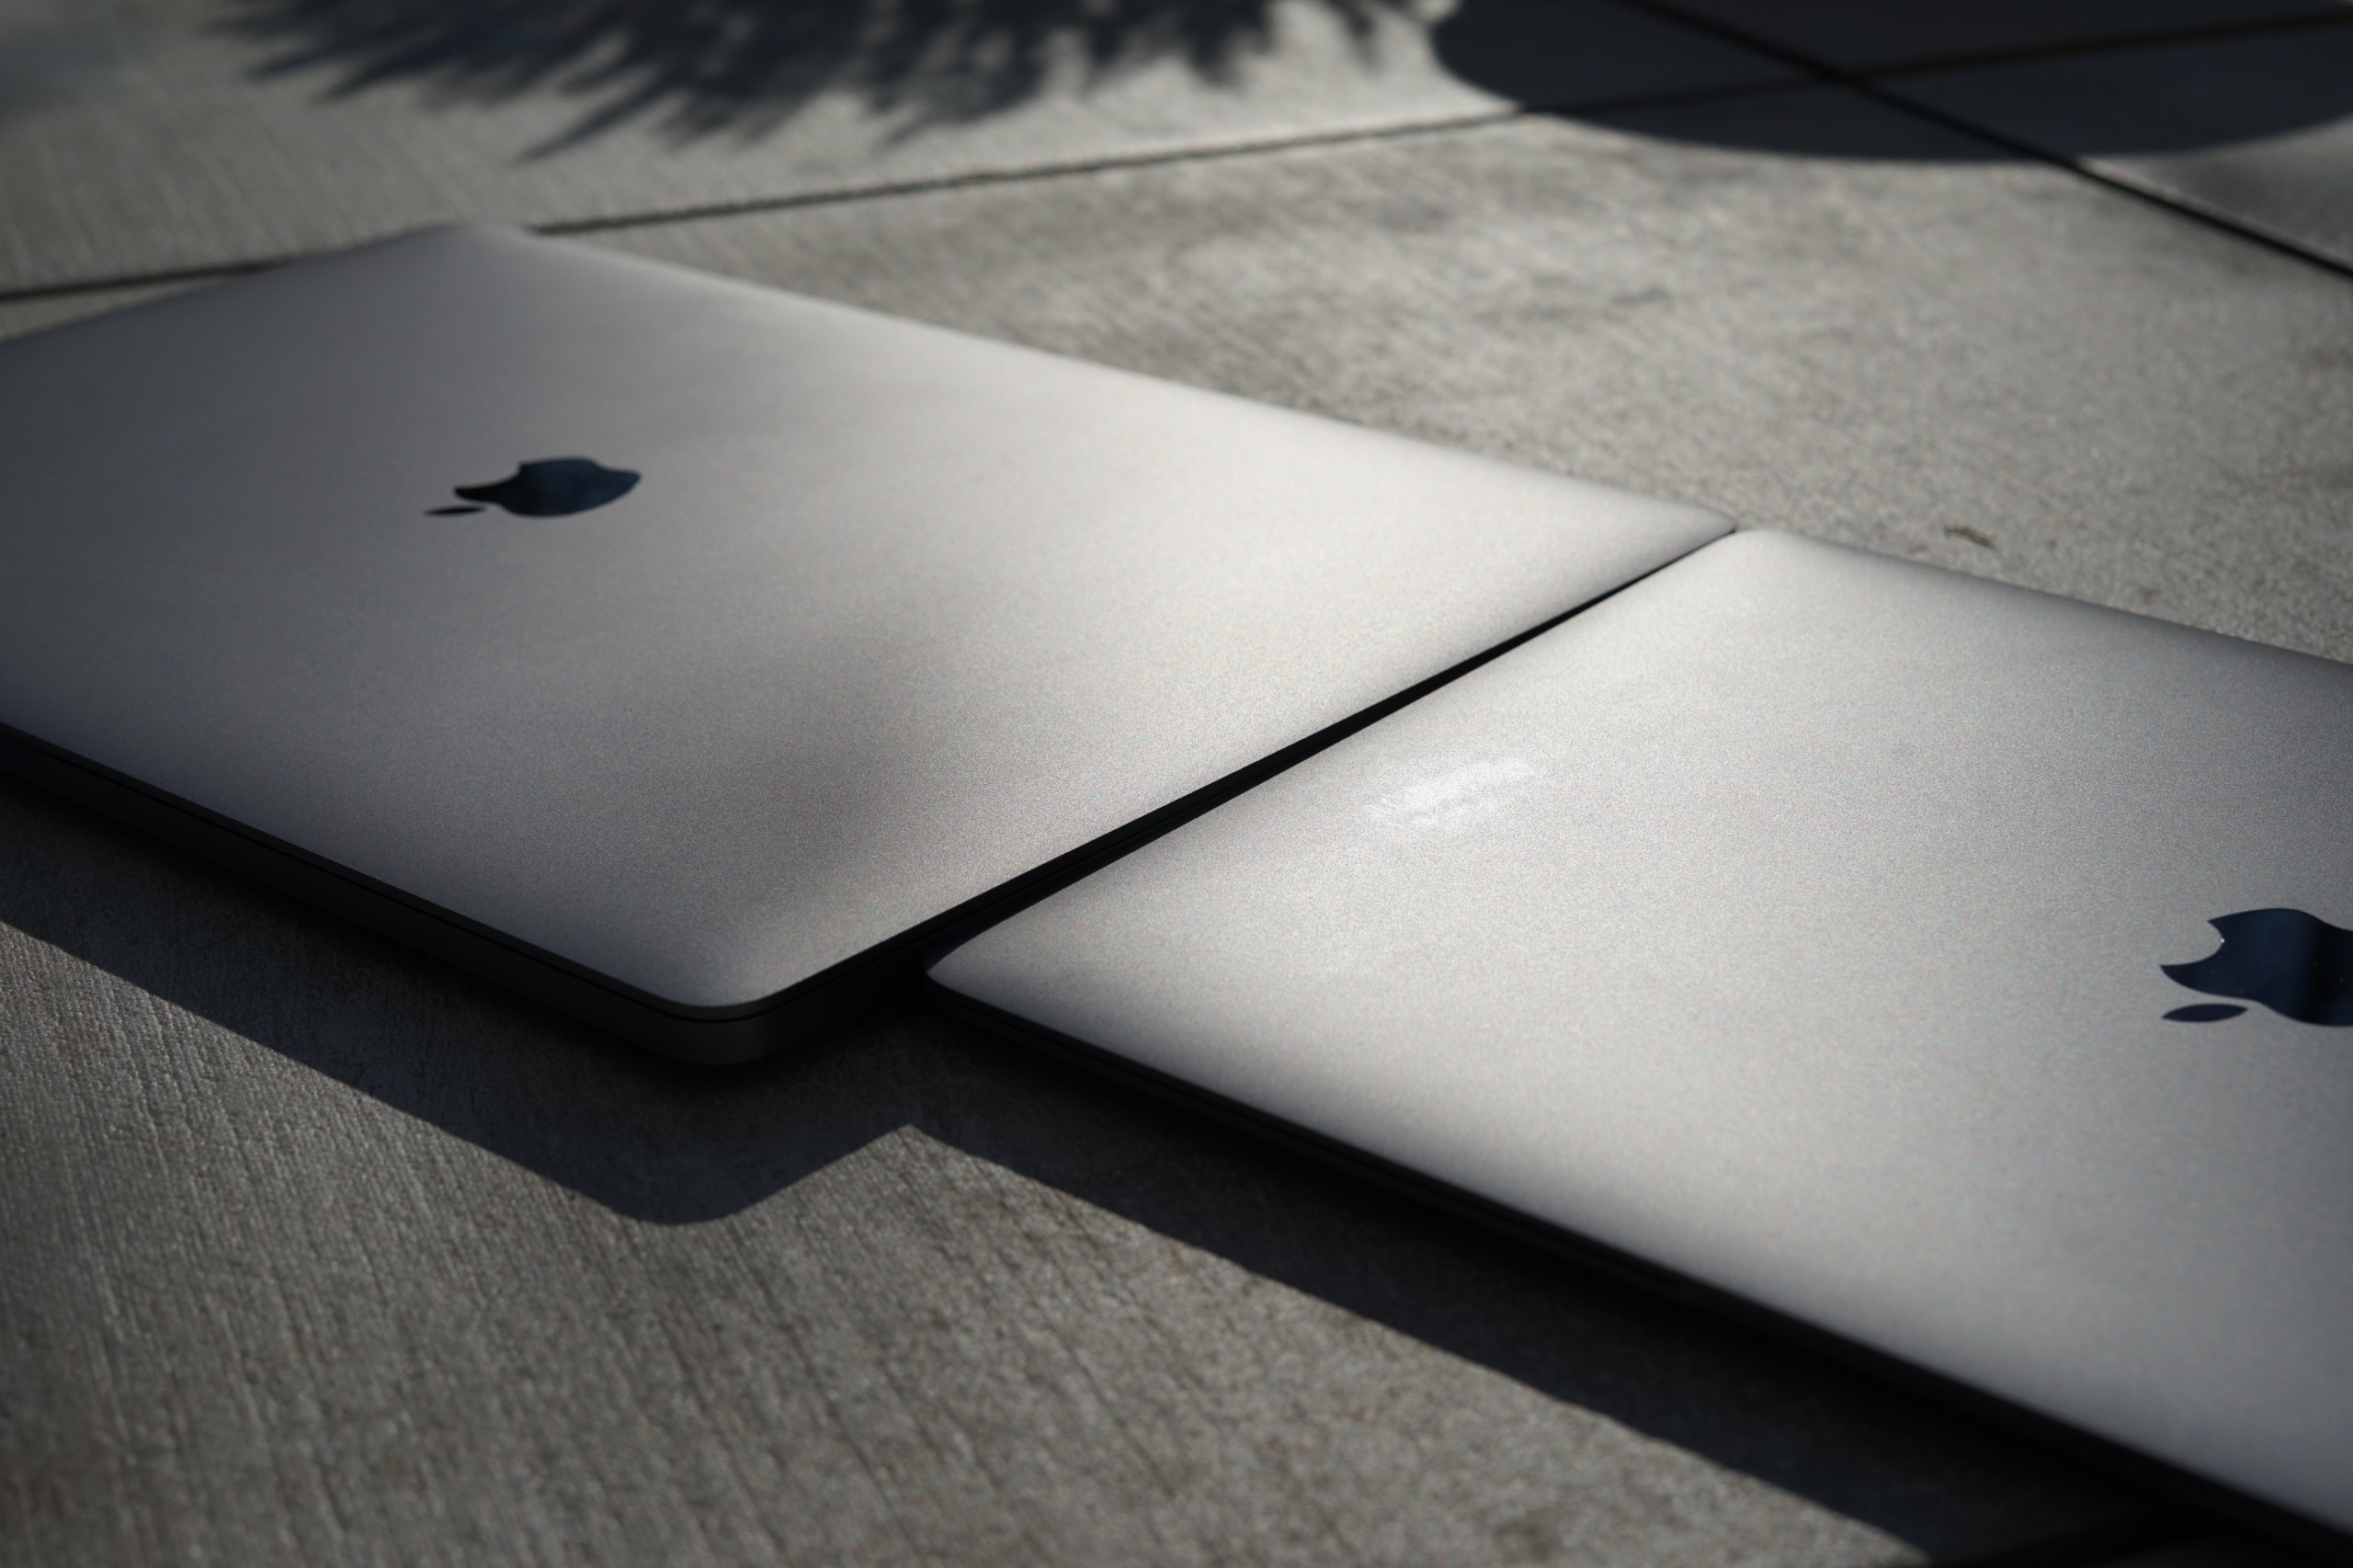
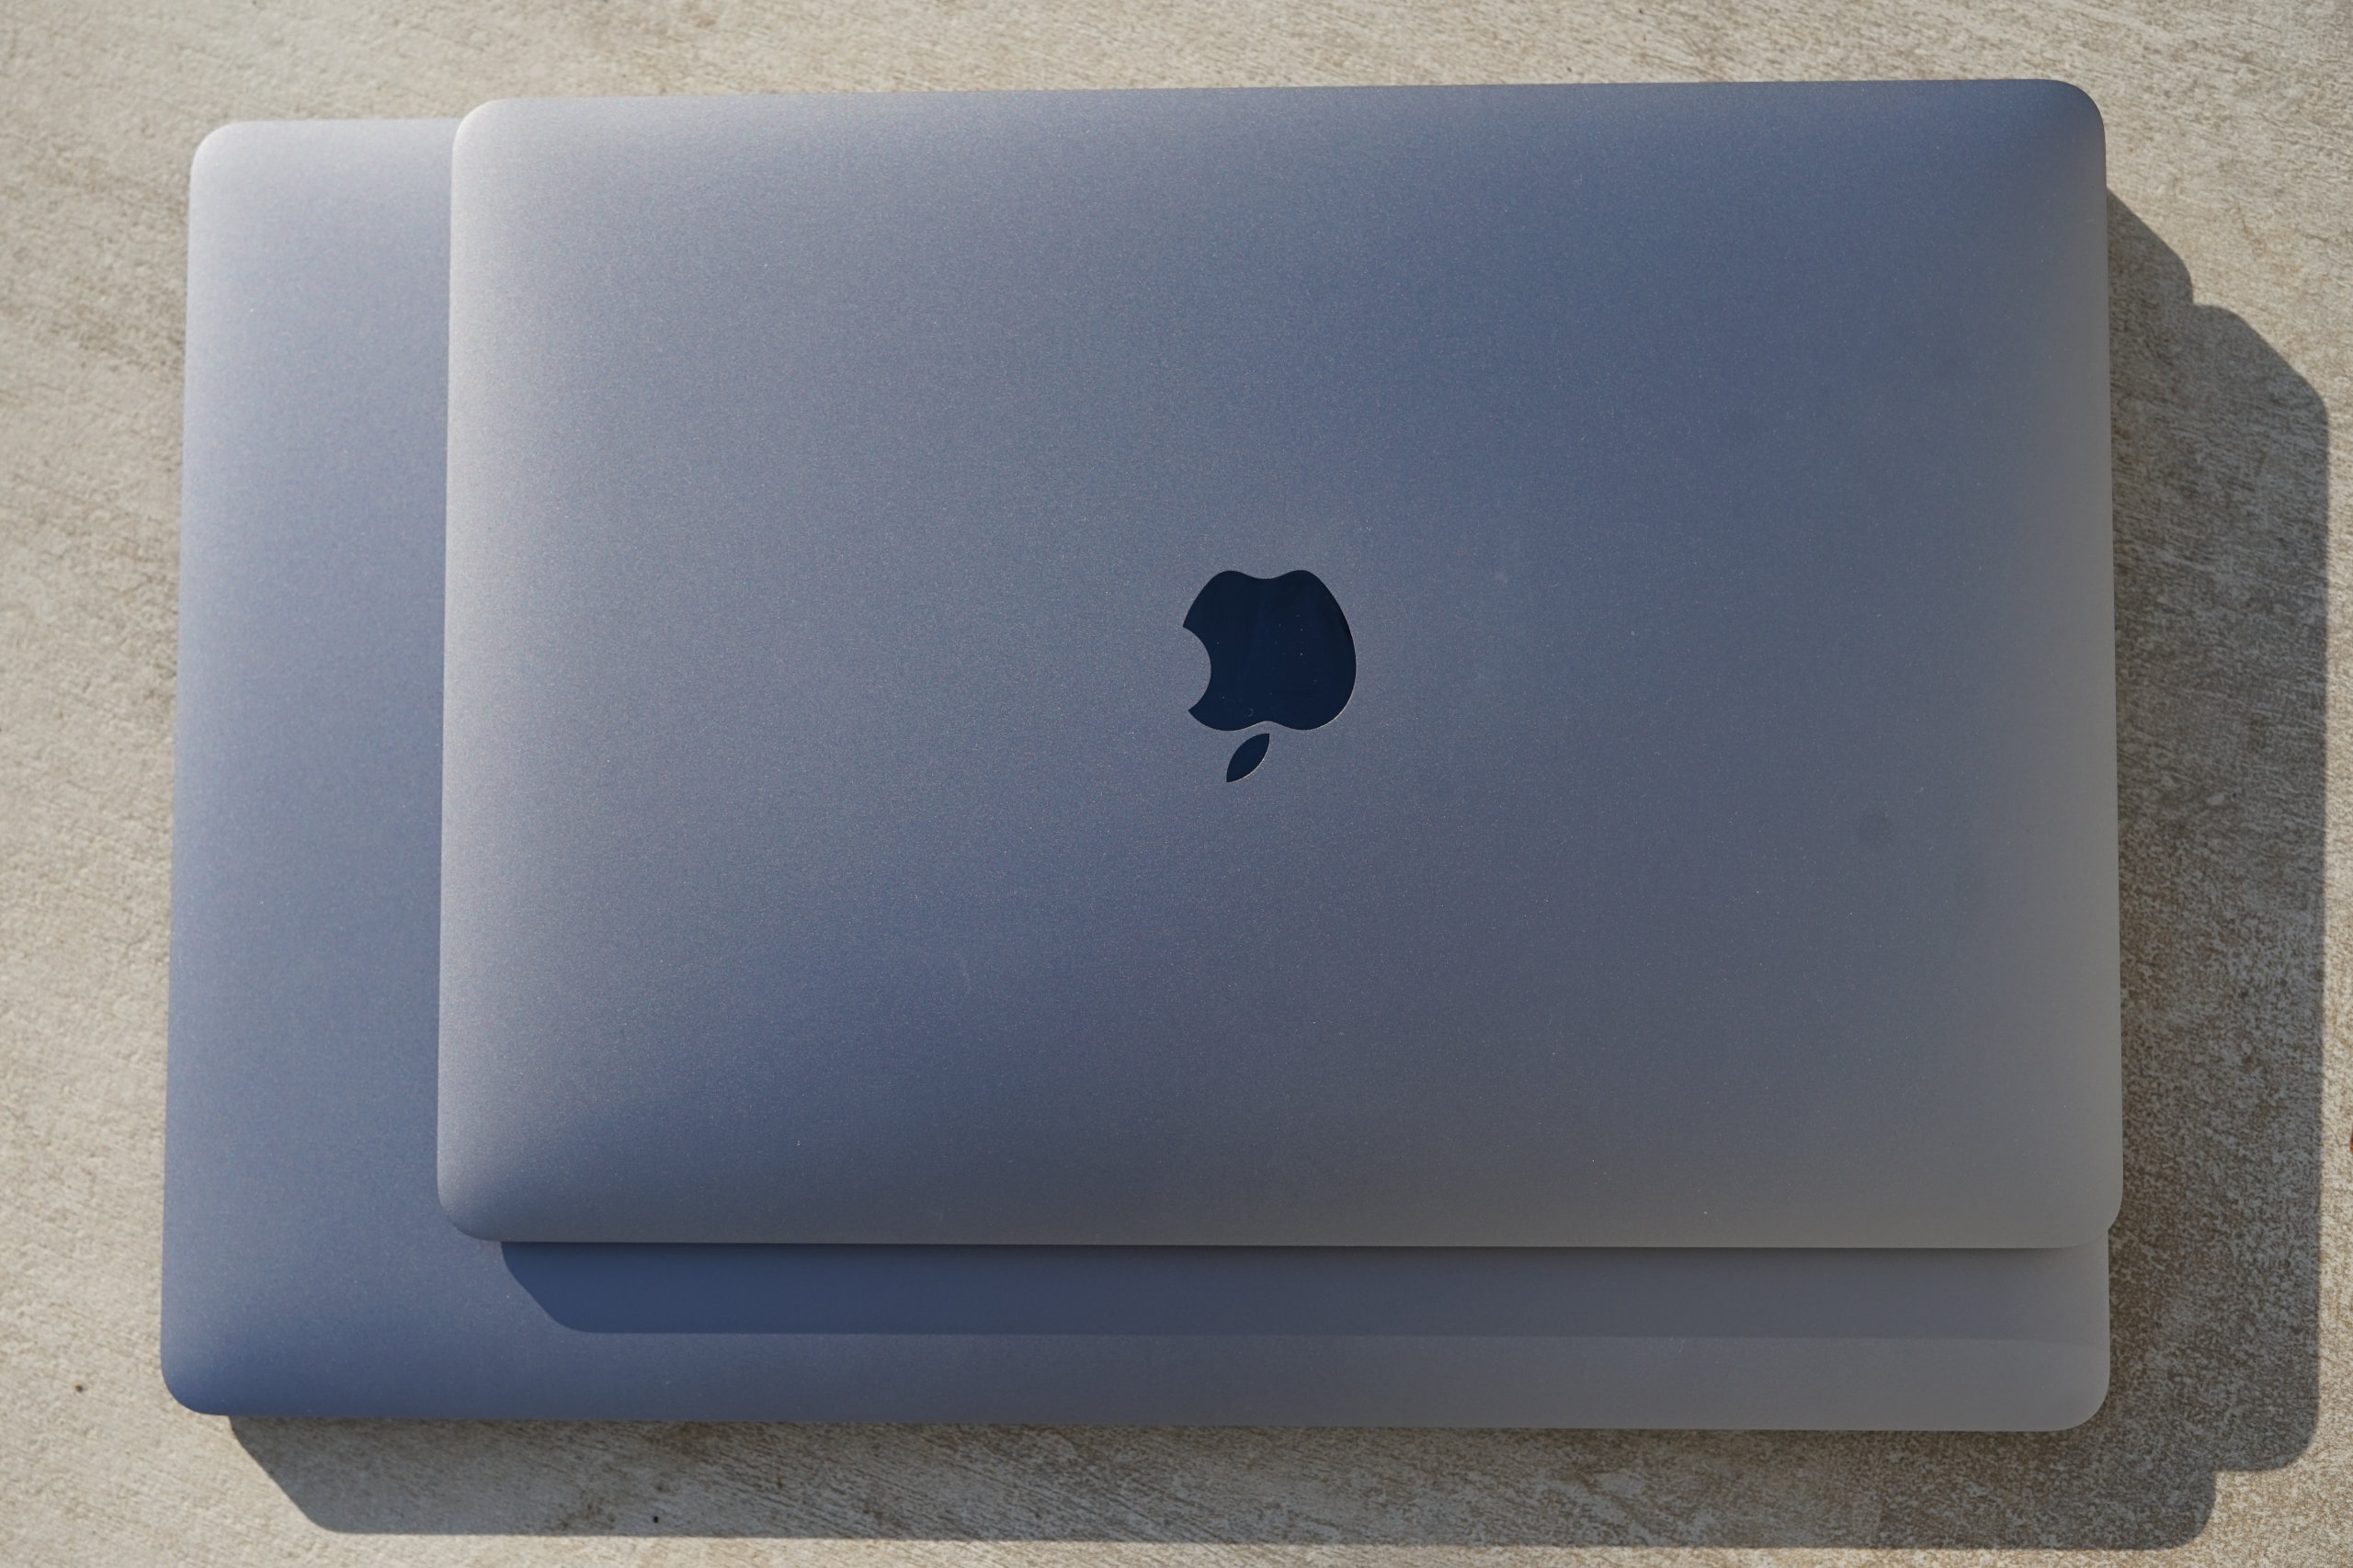
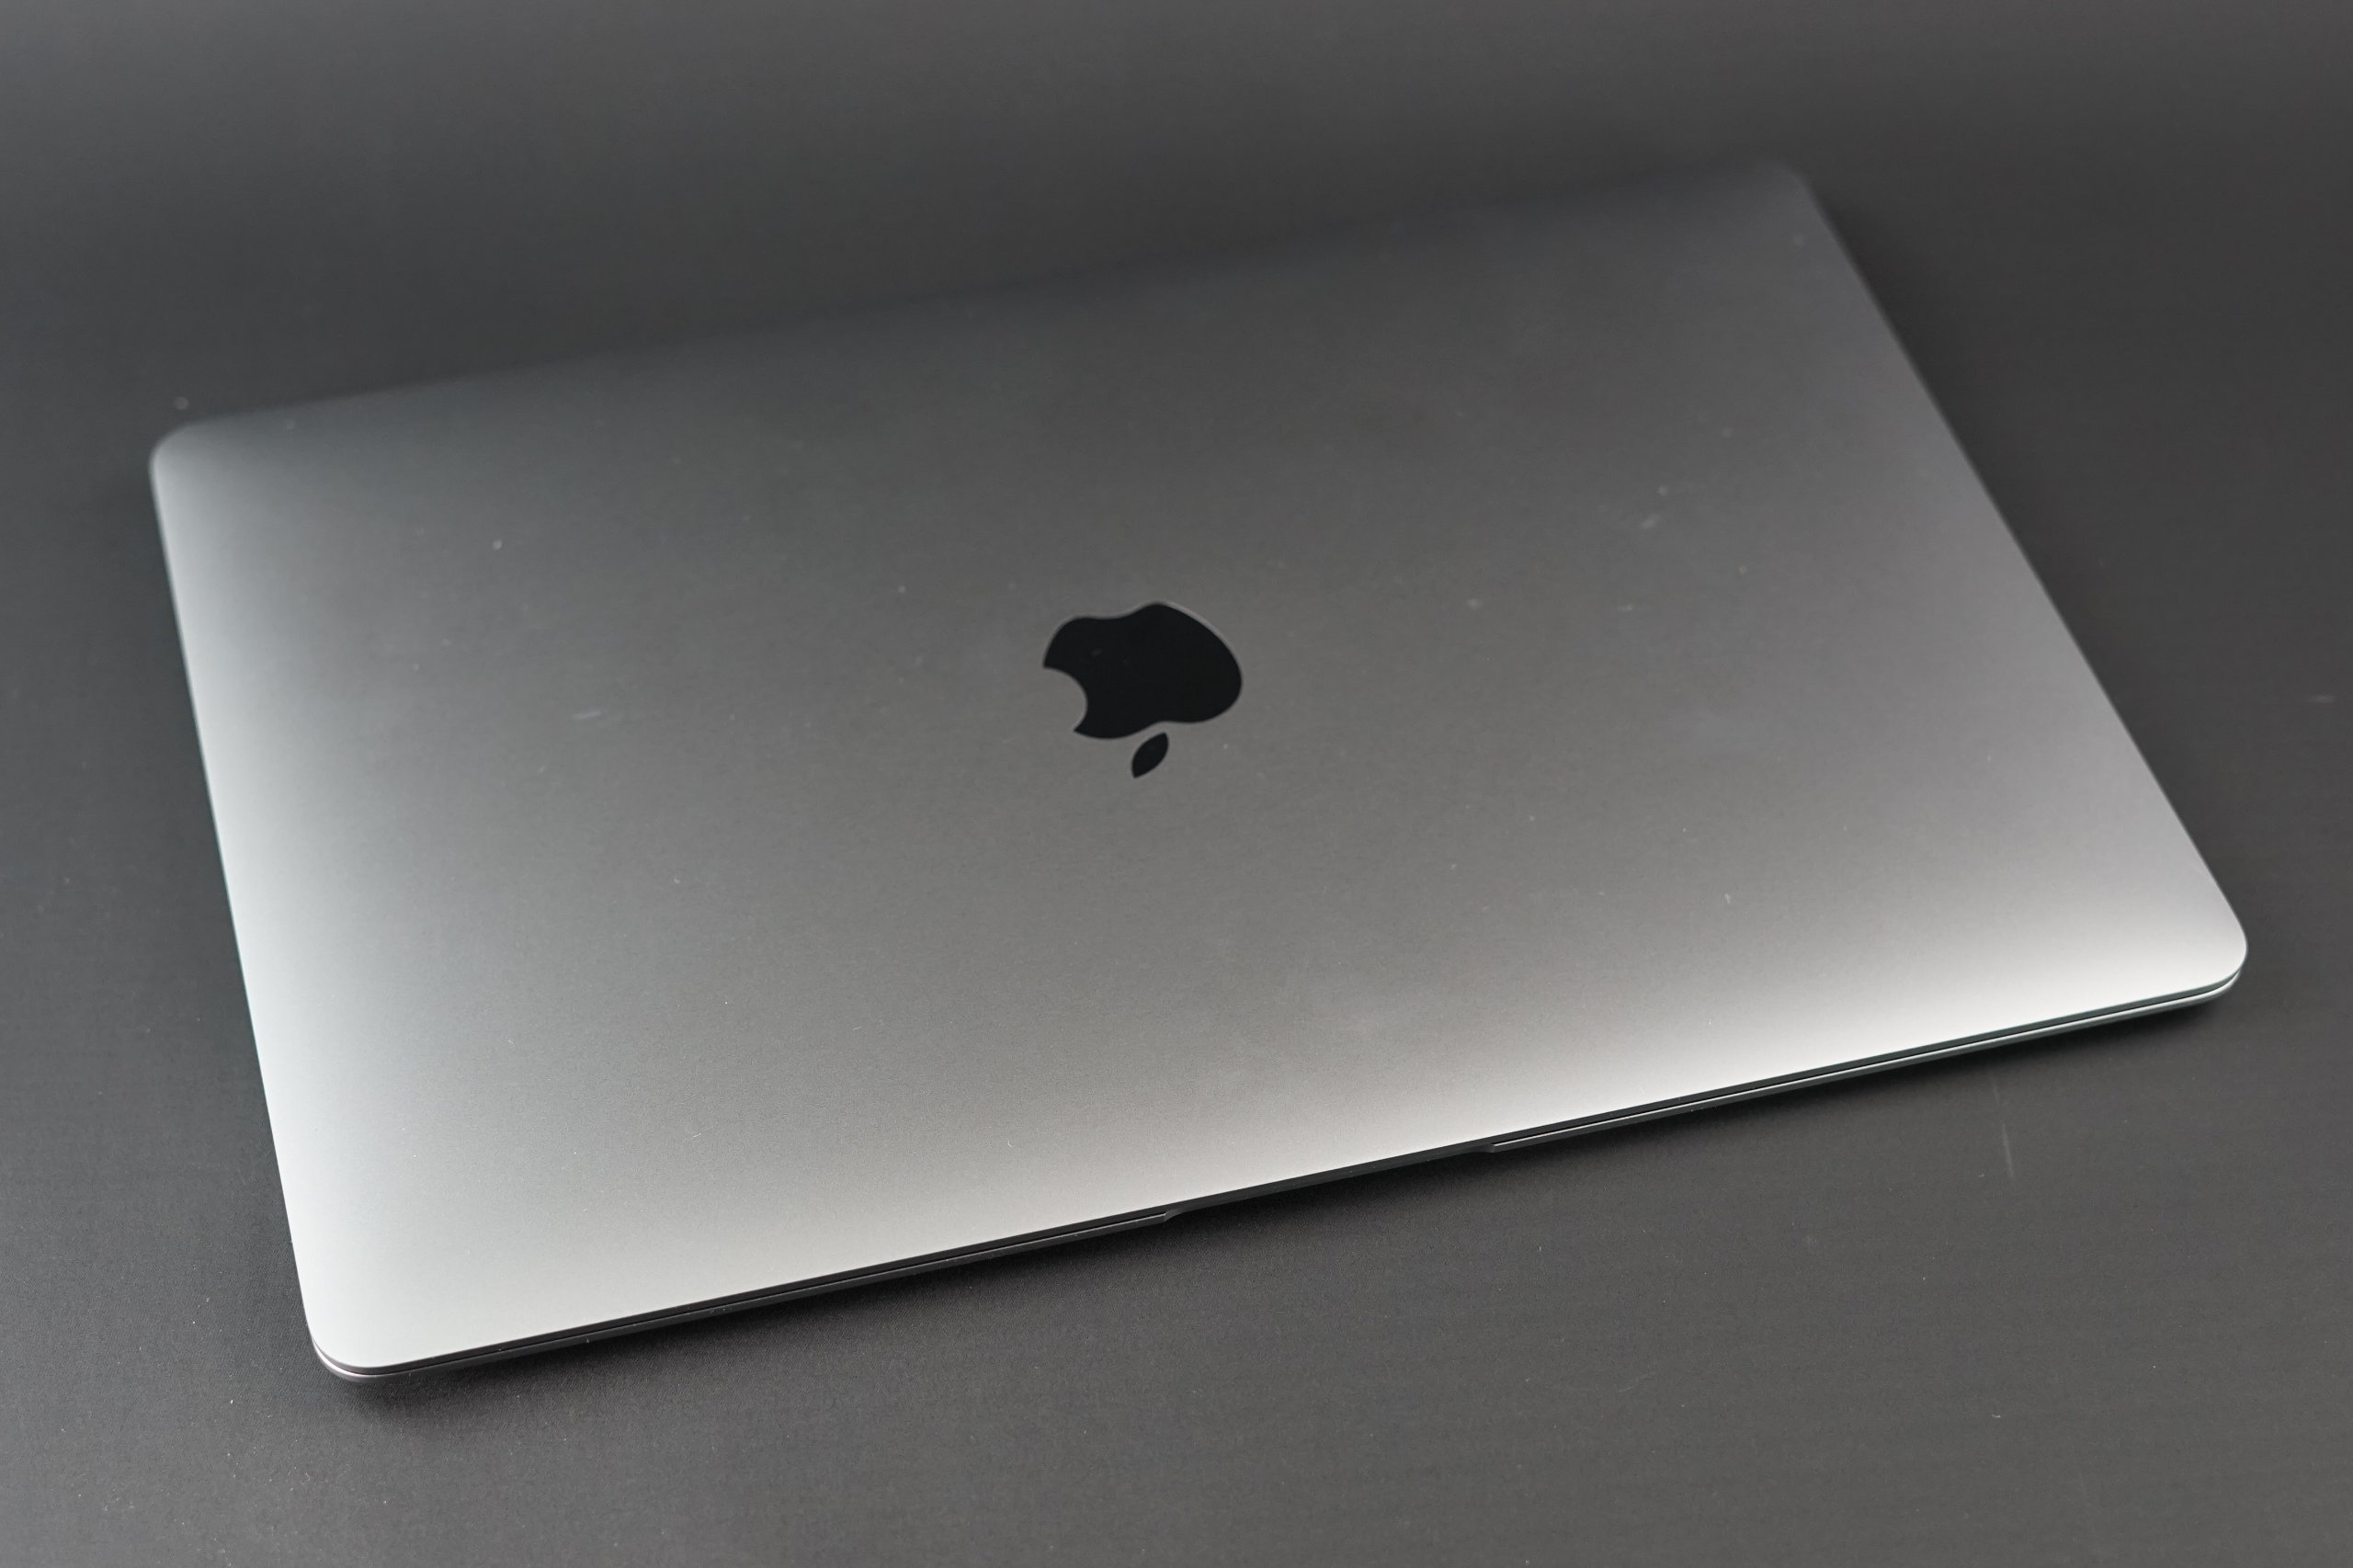
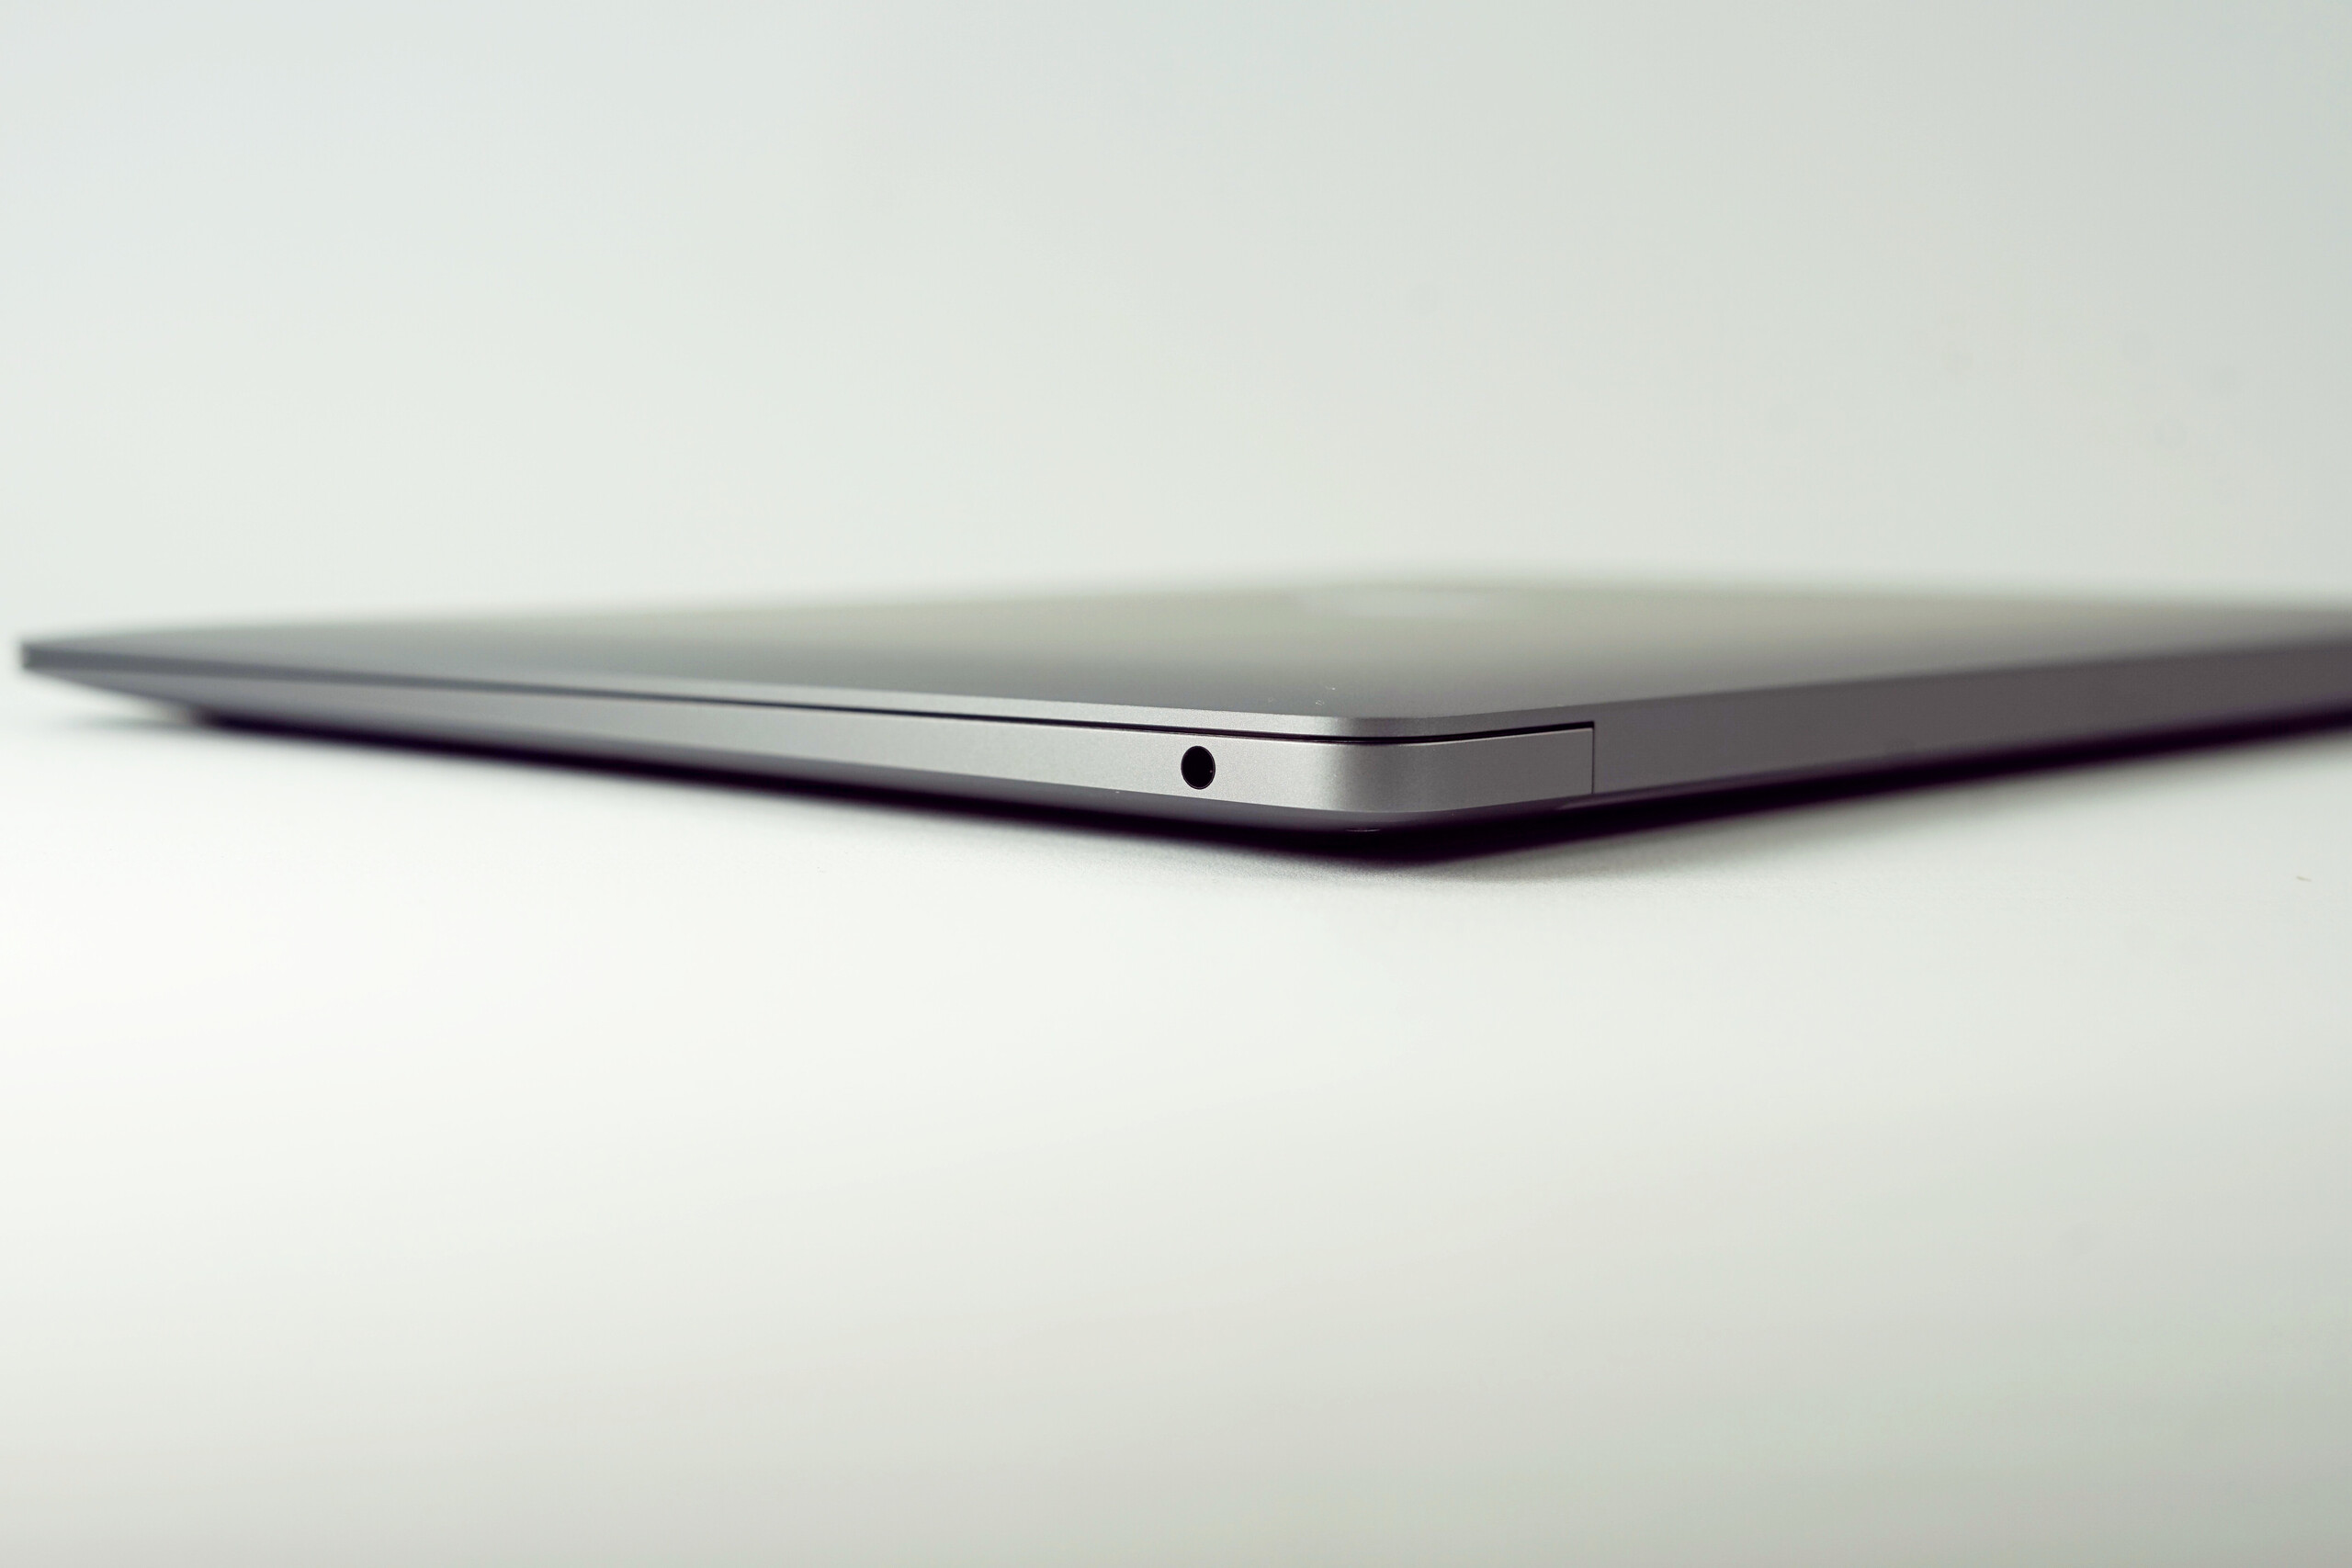
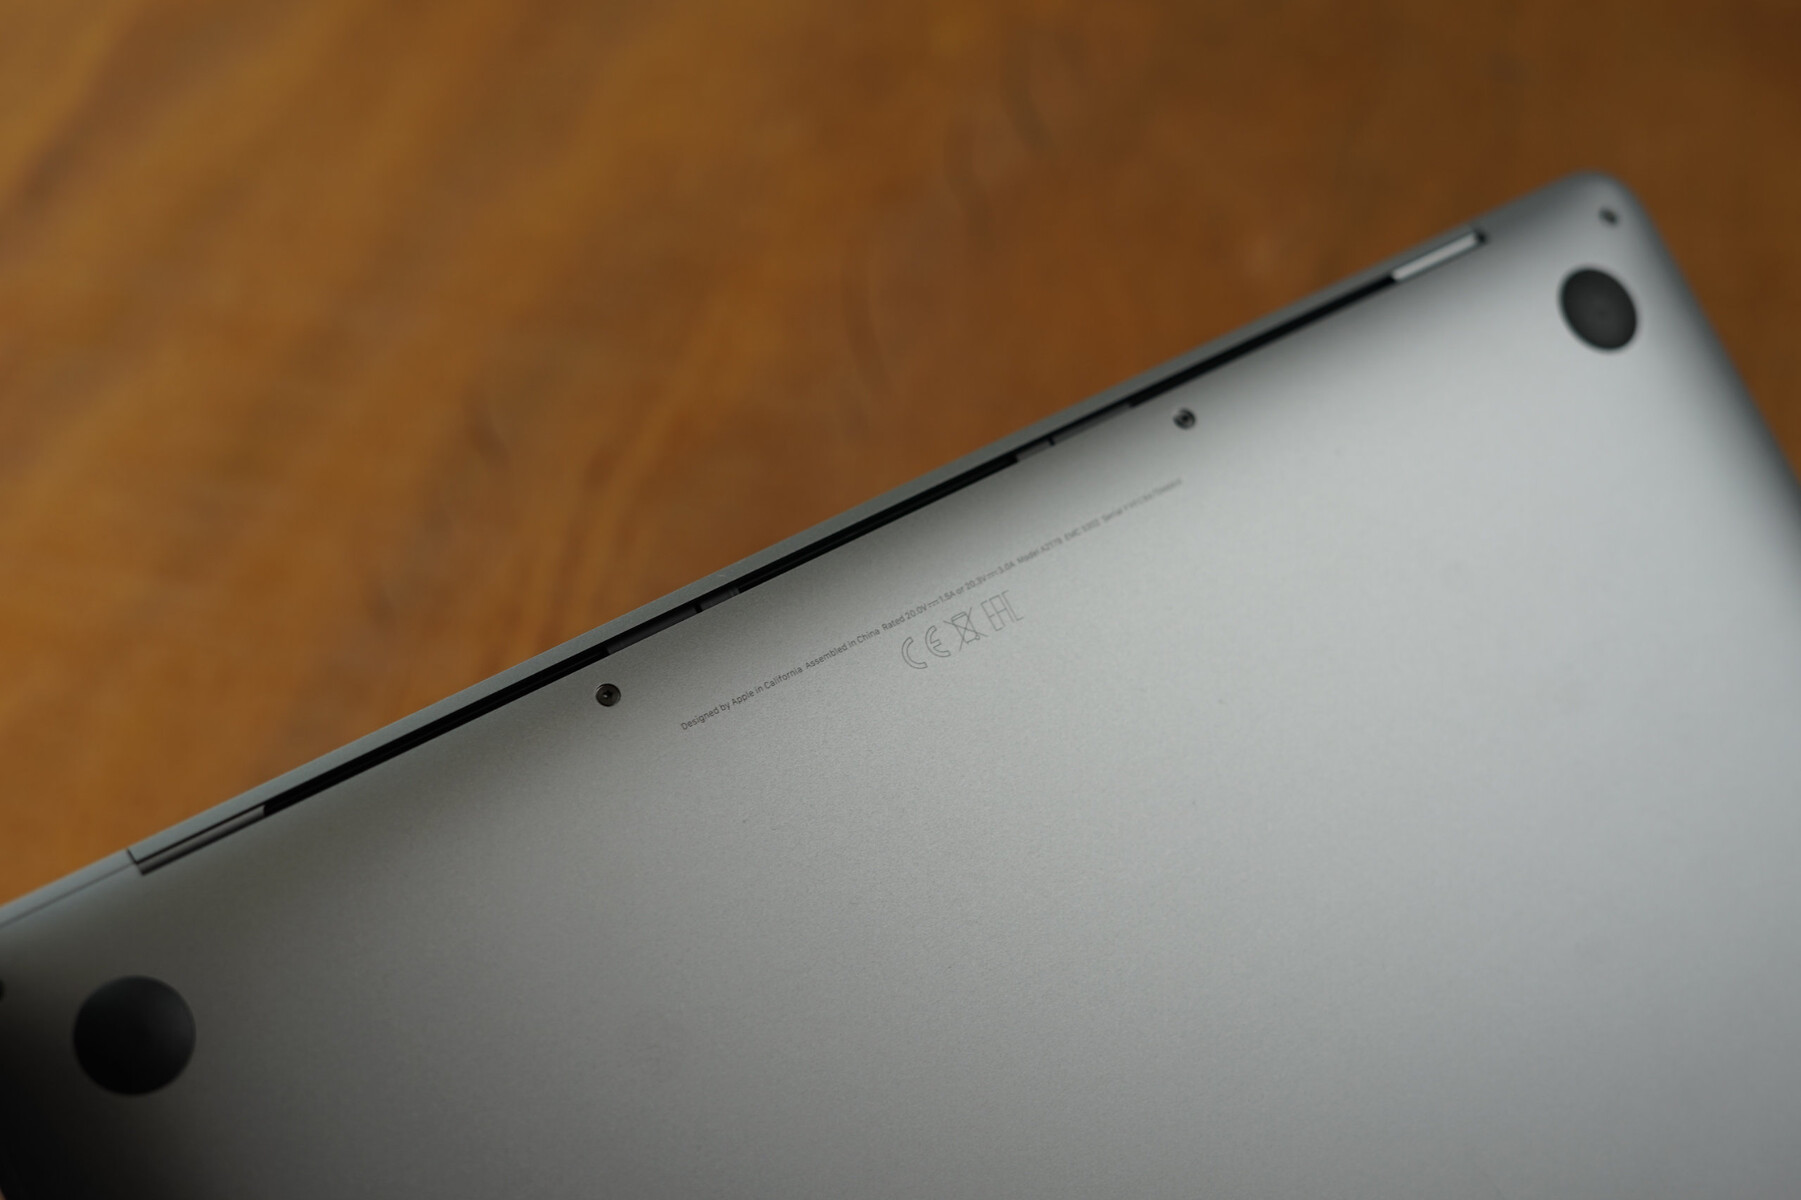
Kasa - MacBook Air öncekinden daha kalın
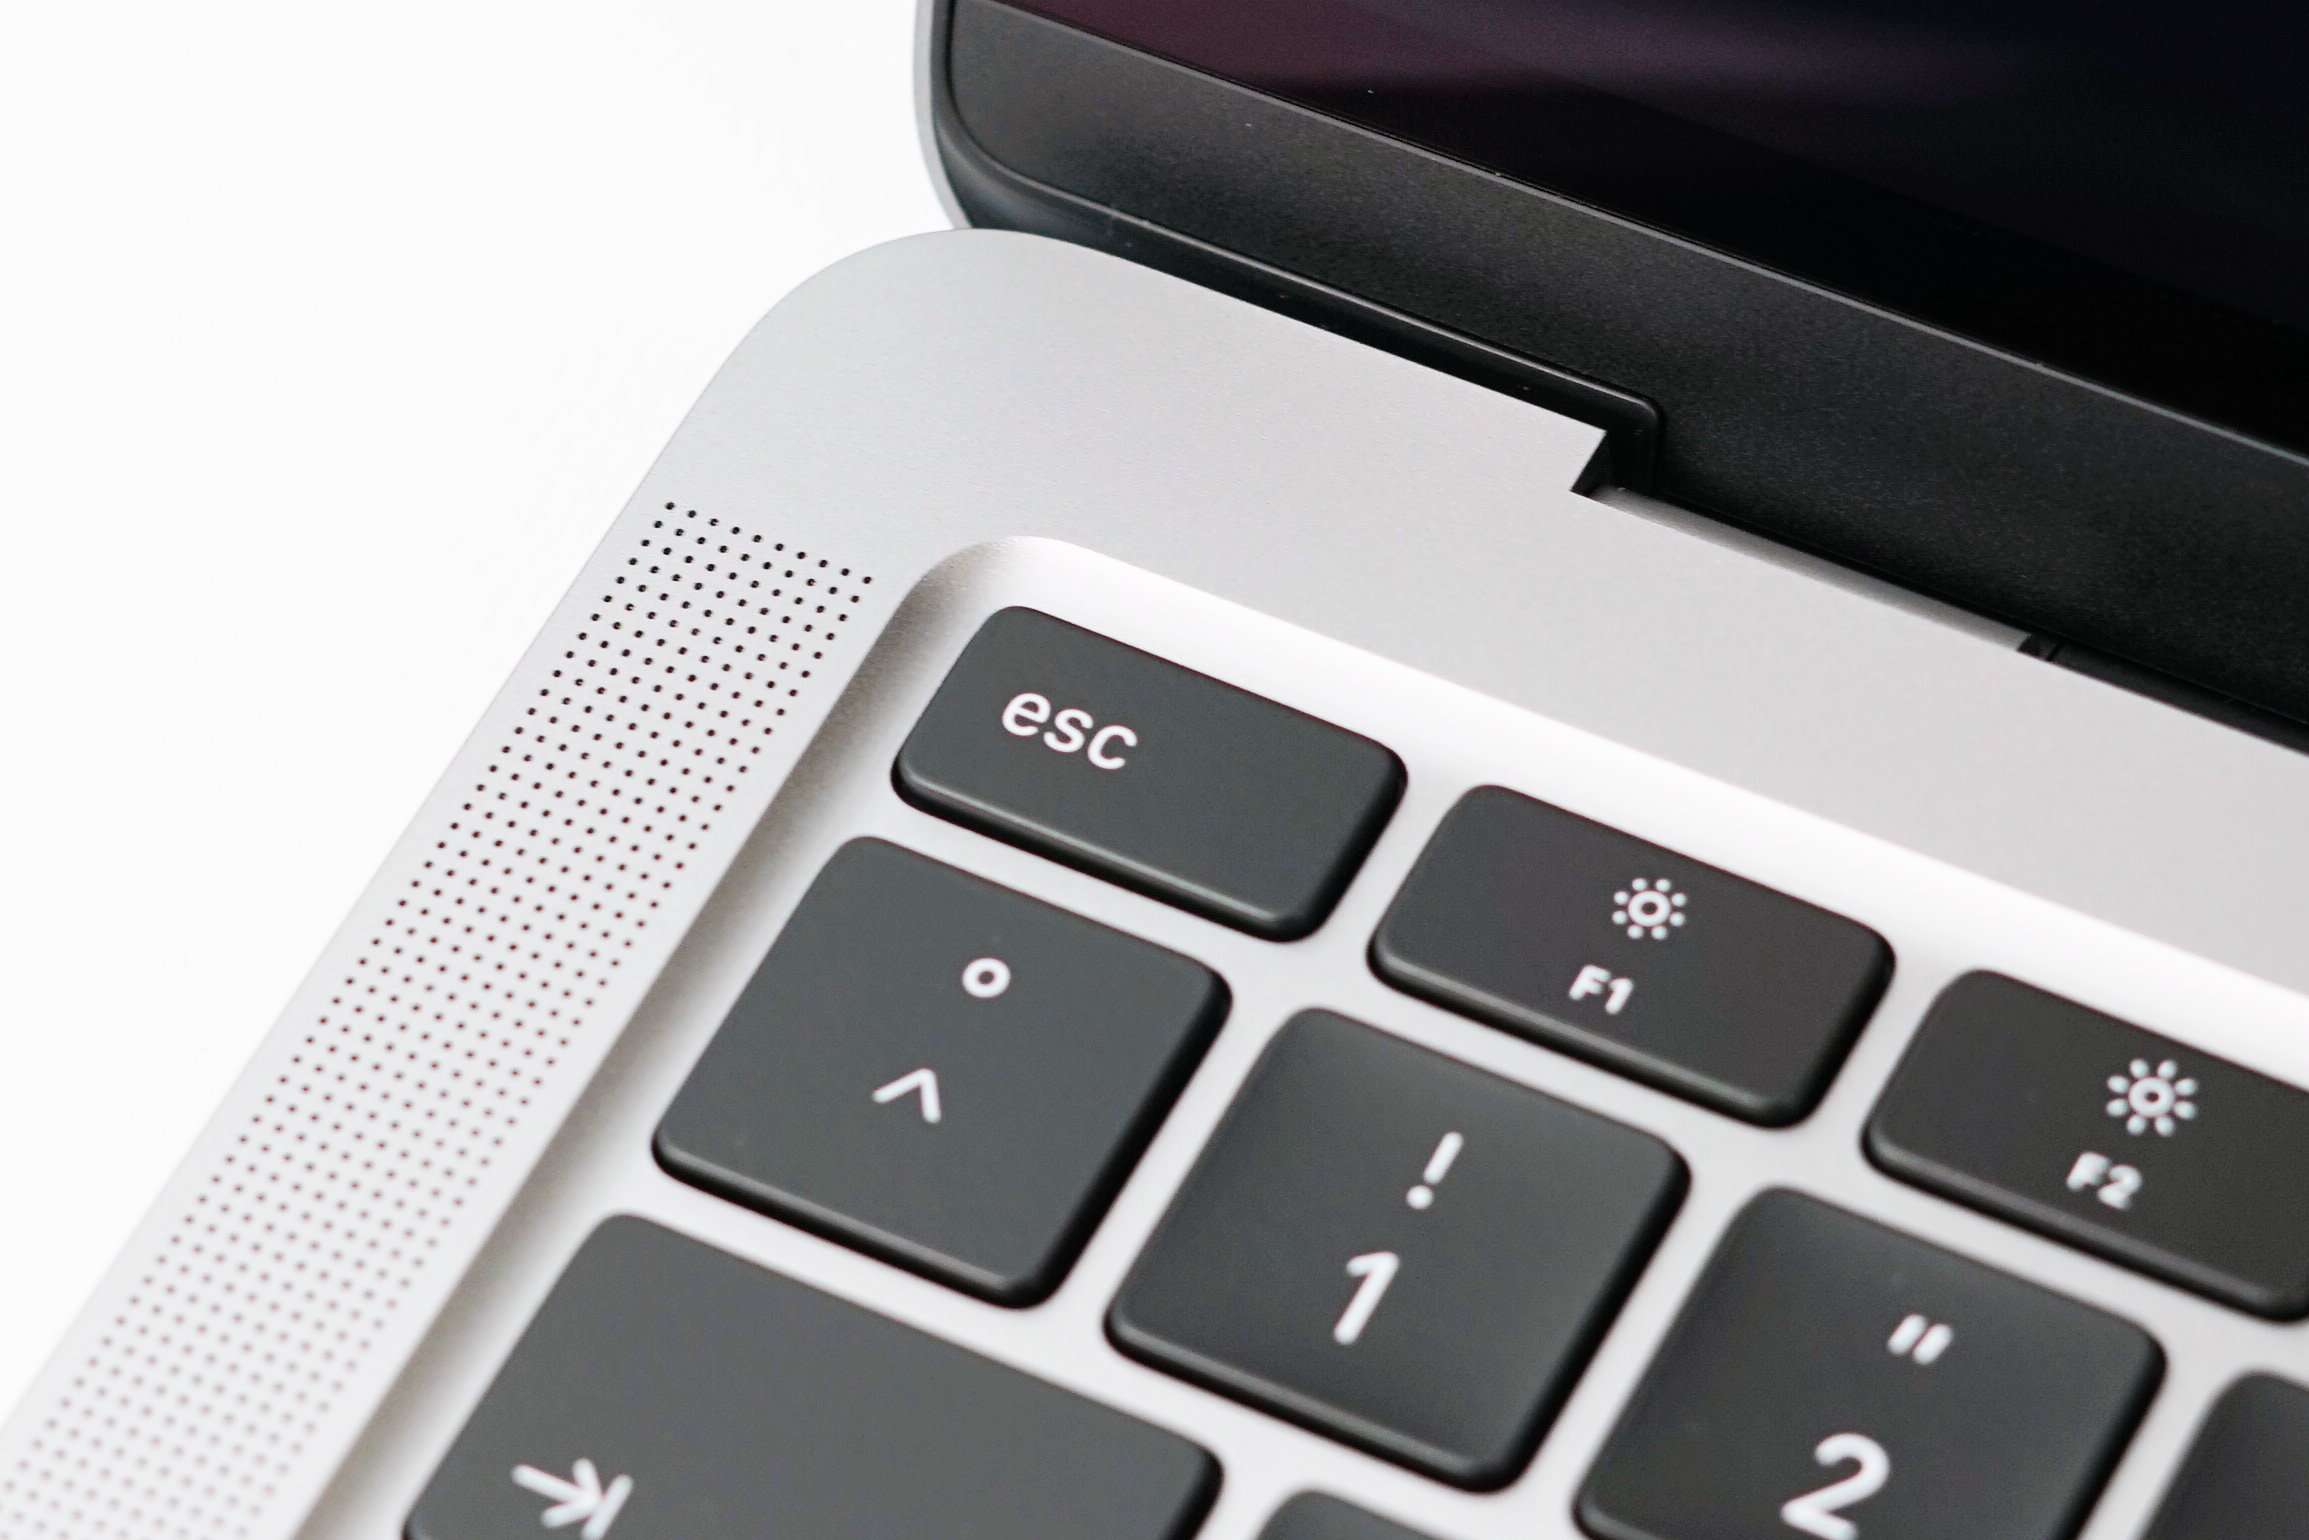
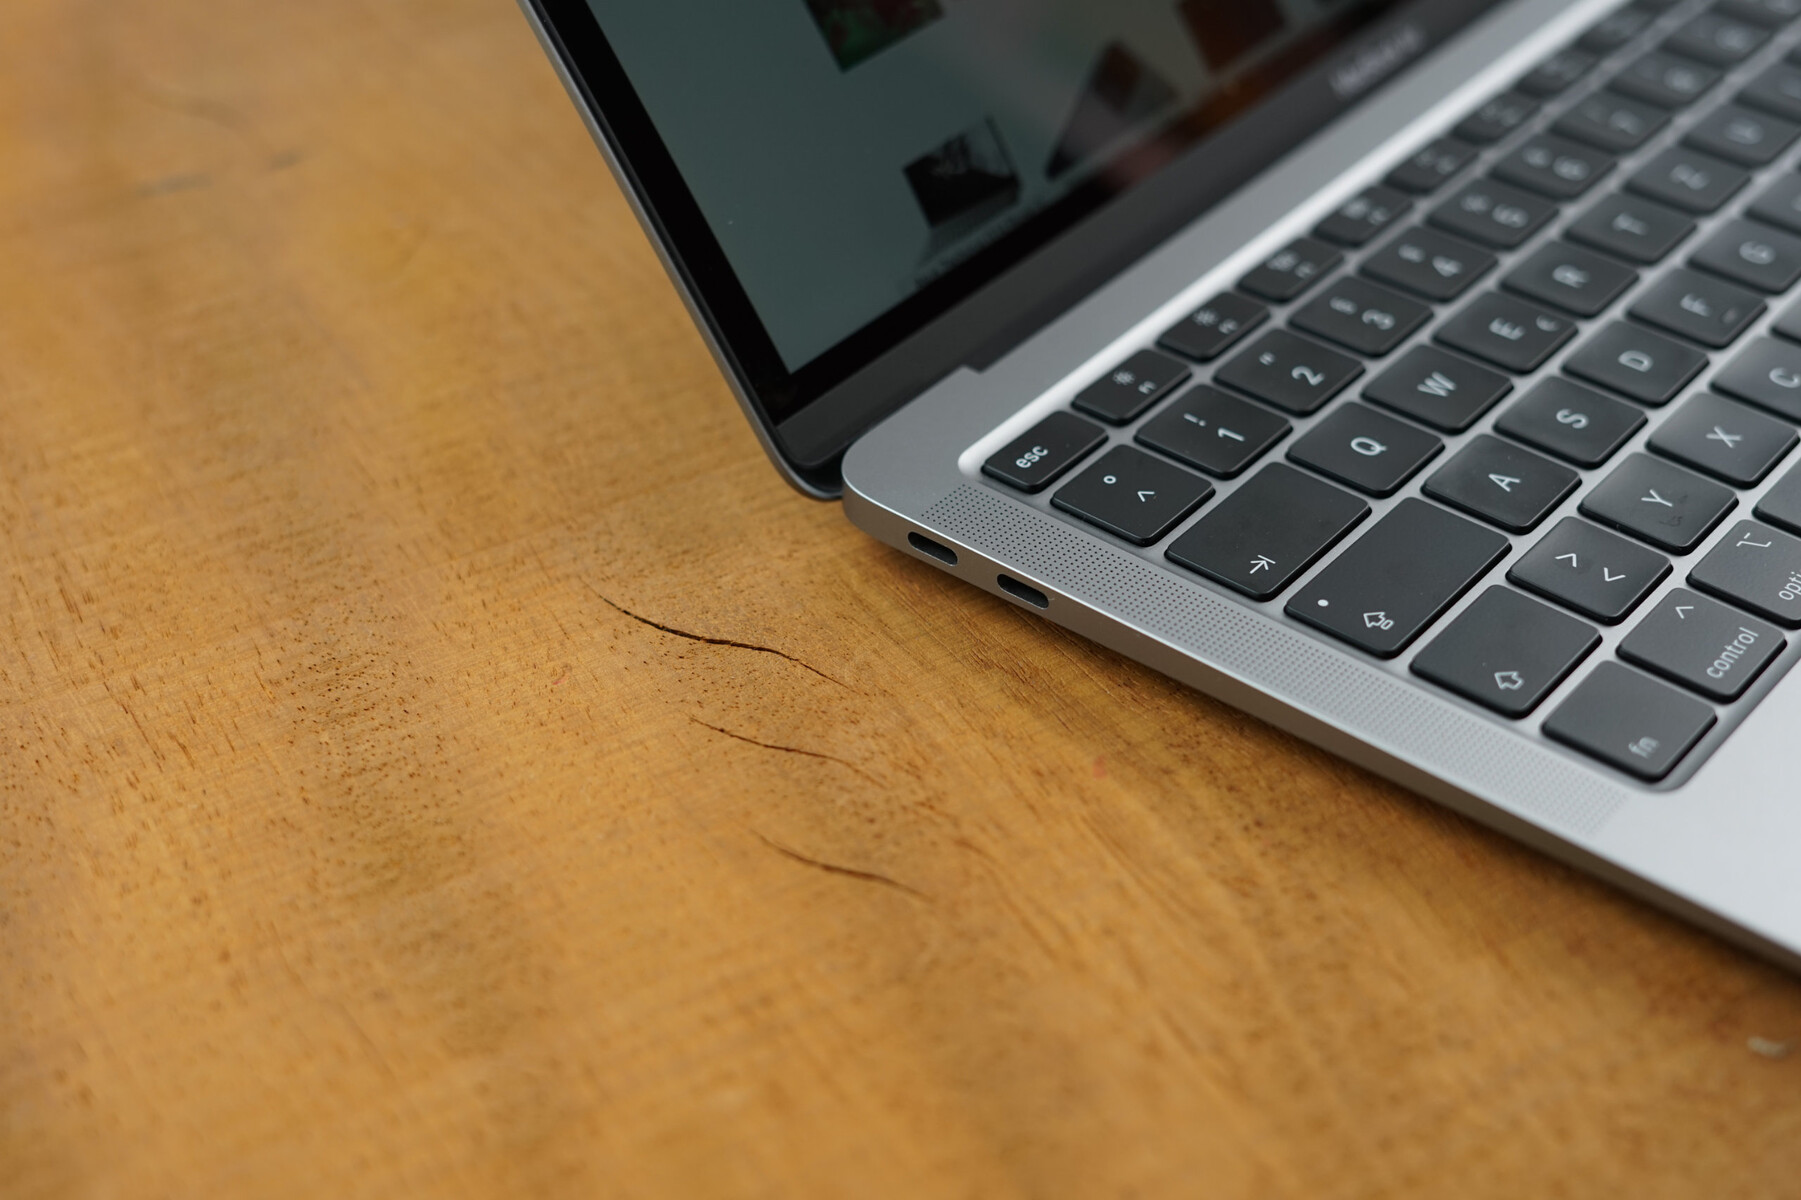
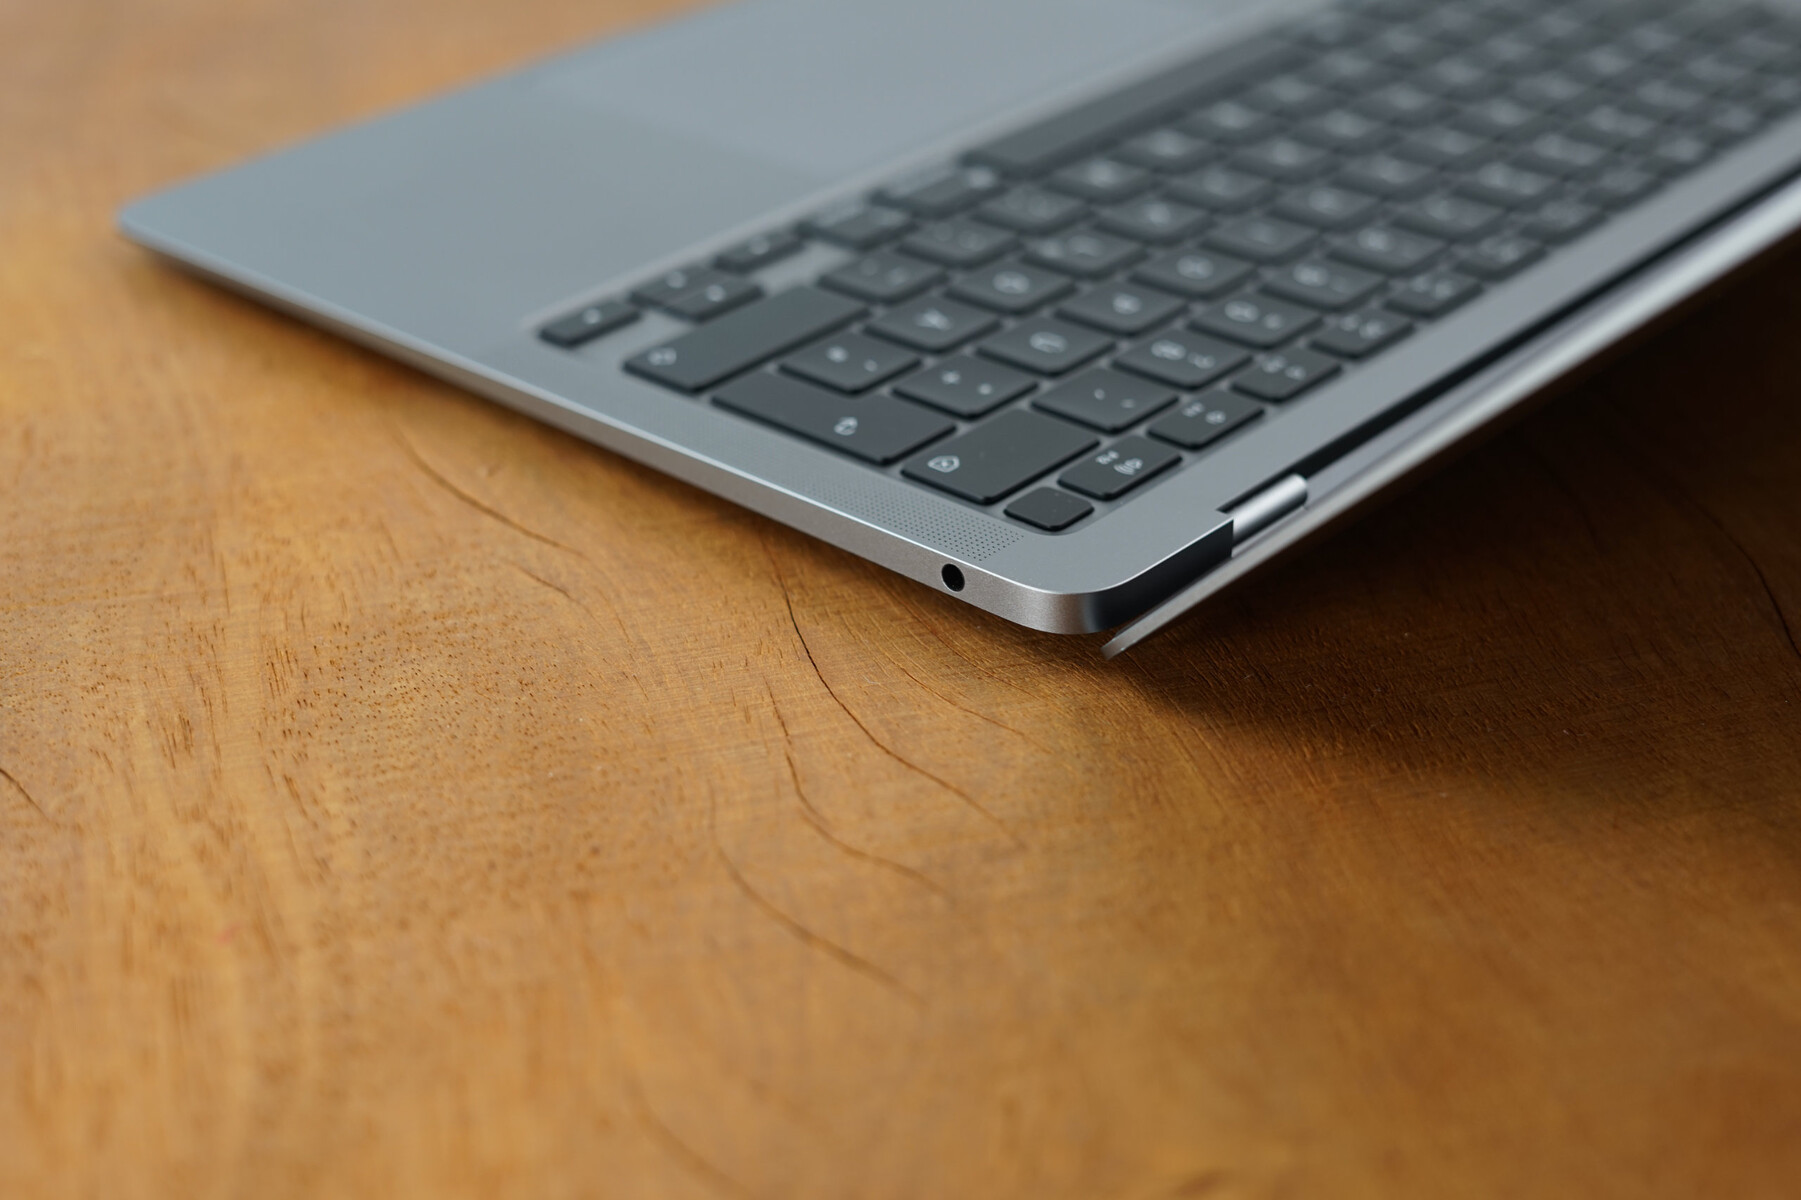
Kasa temel olarak MacBook Air'in önceki sürümüyle aynı. hala çok kompakt, hafif ve ince bir dizüstü bilgisayar. Bununla birlikte, 2020 modeli arkada biraz daha kalın, ancak gerçek dünyada 16.1 ila 15.9 mm (~ 0.634 x 0.625 inç) arasındaki farkı fark etmekte zorlanacaksınız. Alüminyum şasinin kalitesi bir kez daha mükemmel . Mükemmel yapı kalitesi, sofistike yüzeyler ve iyi stabilite. Bilinen üç renk seçeneği arasından seçim yapabilirsiniz: Uzay Grisi, Altın veya Gümüş.Daha pahalı Pro modellerine kıyasla, kasanın konik önünü seviyoruz. Dizüstü bilgisayar olduğundan daha ince görünüyor, ancak daha da önemlisi, uzun yazma oturumları sırasında önkollarınıza zarar verebilecek keskin bir kenar yok. İkincisi aslında MacBook Pro modellerinde bir sorundur.
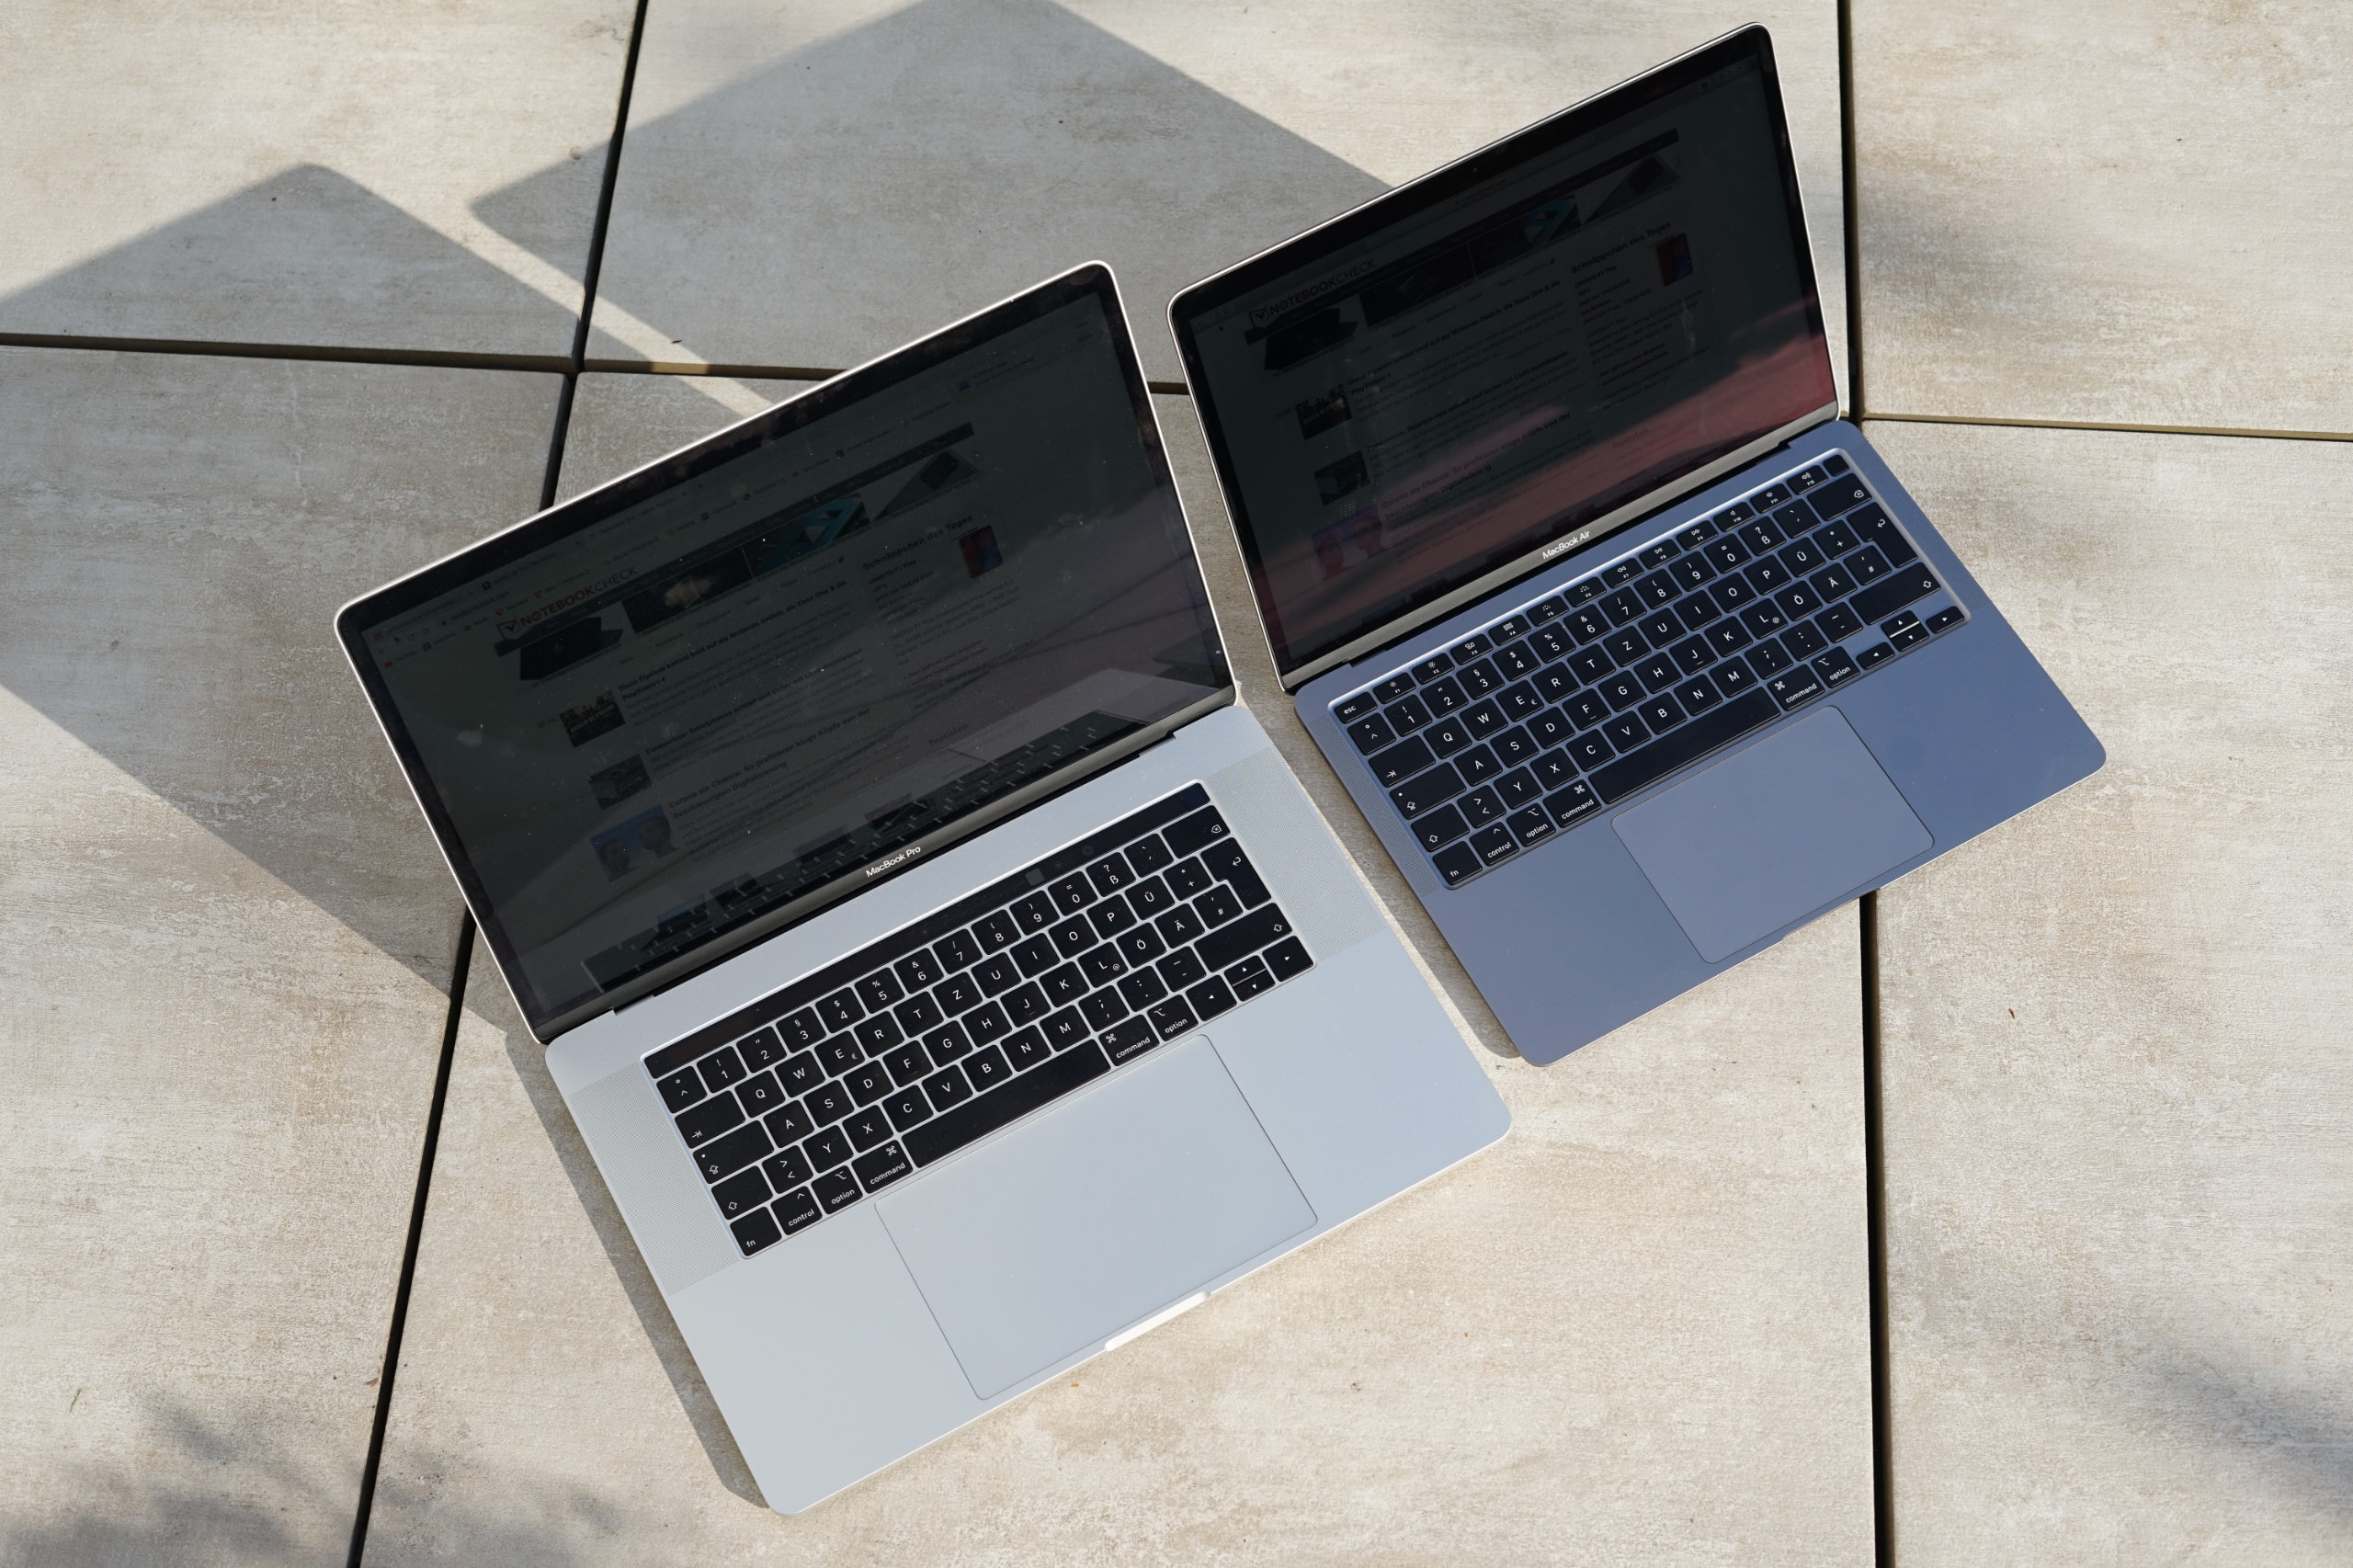
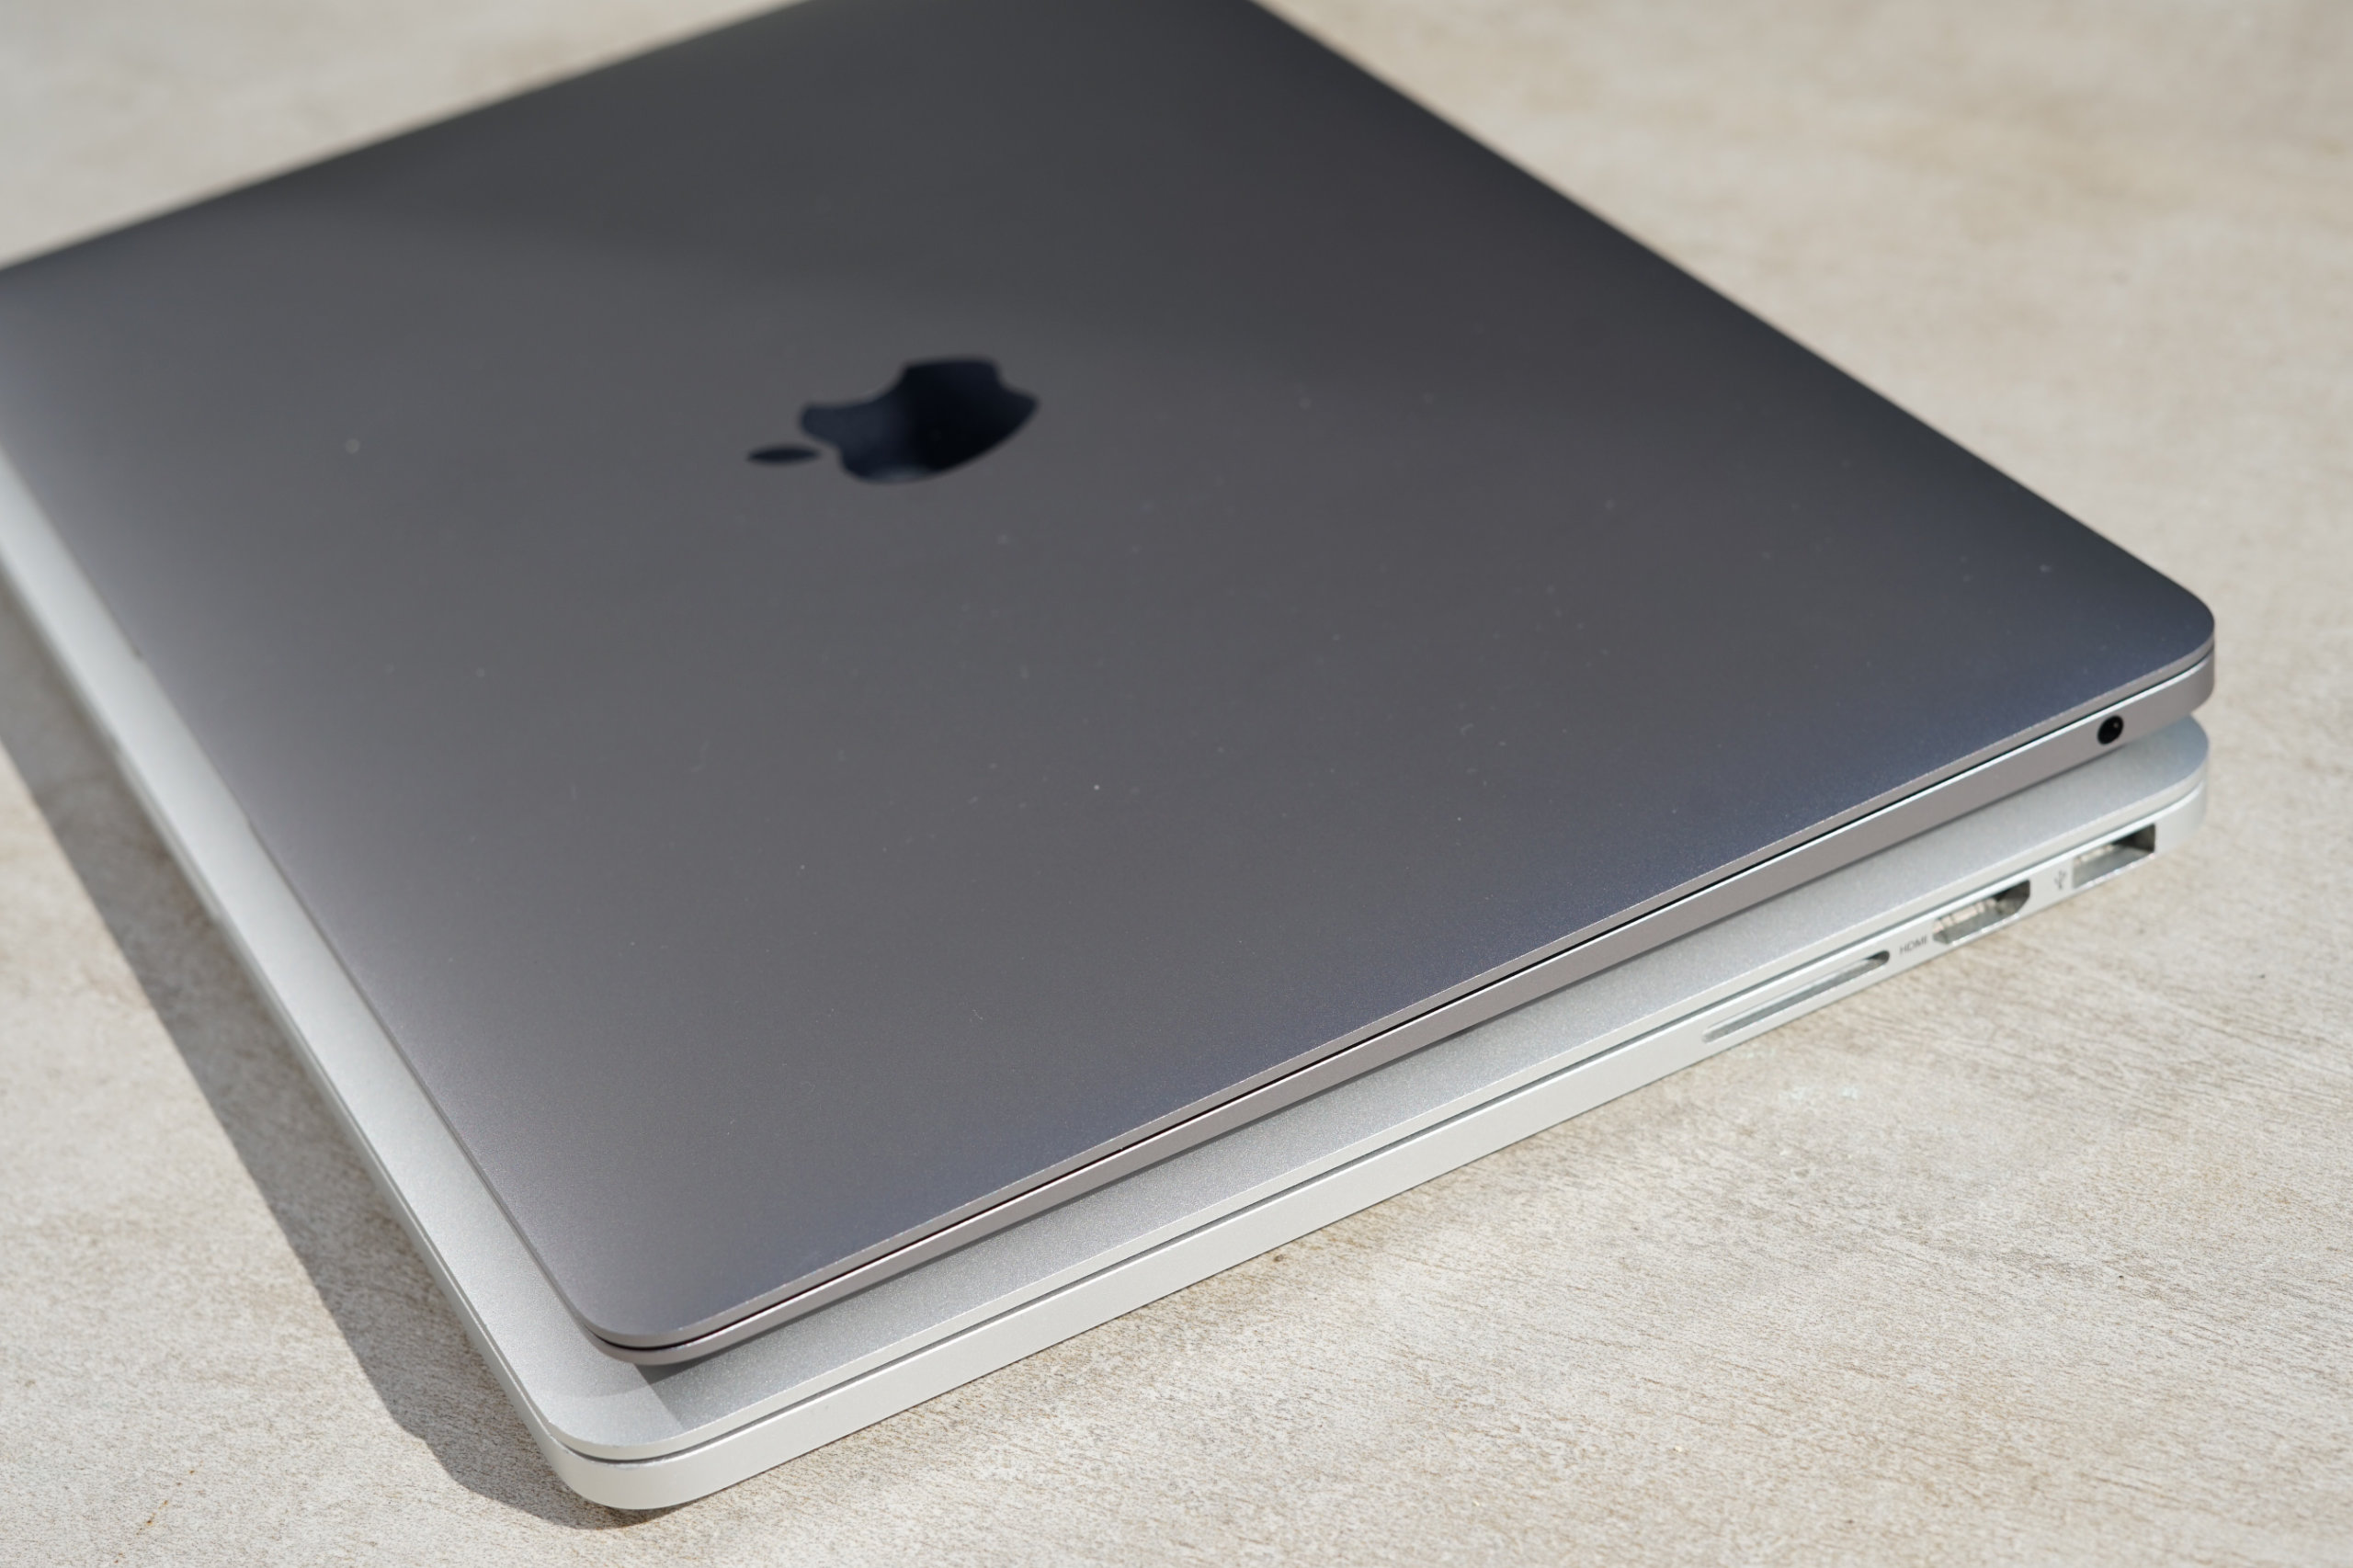
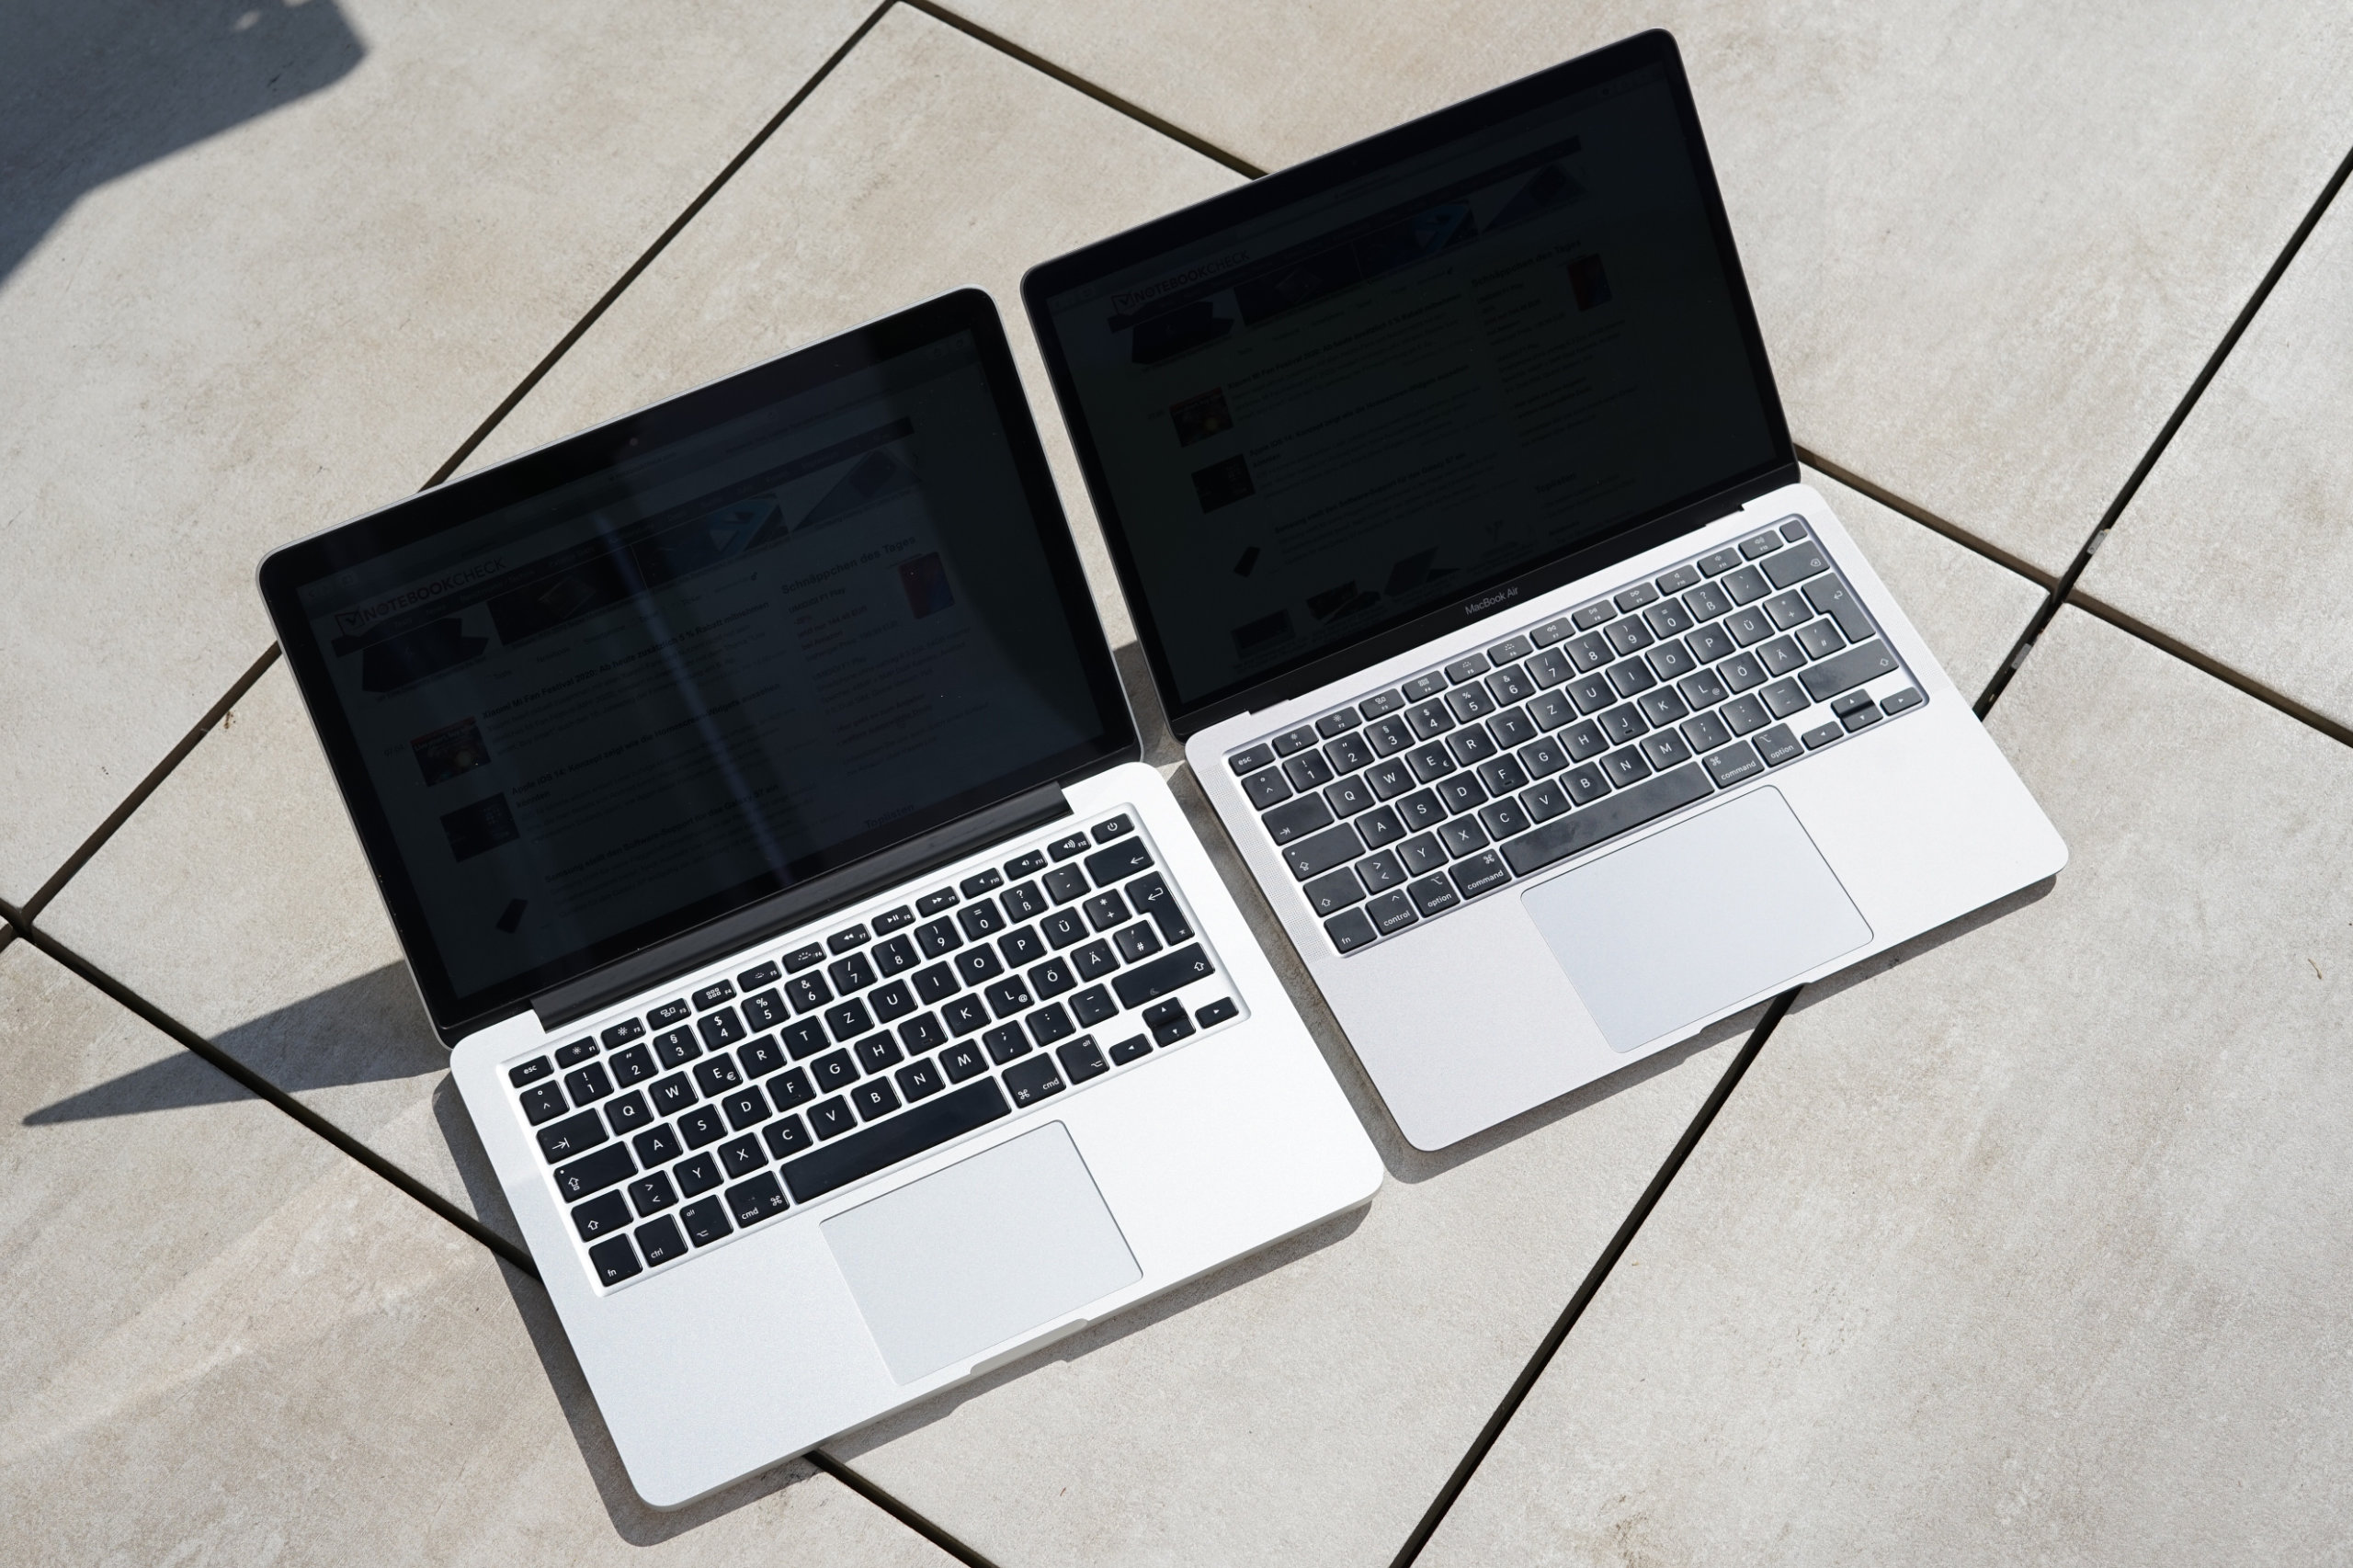
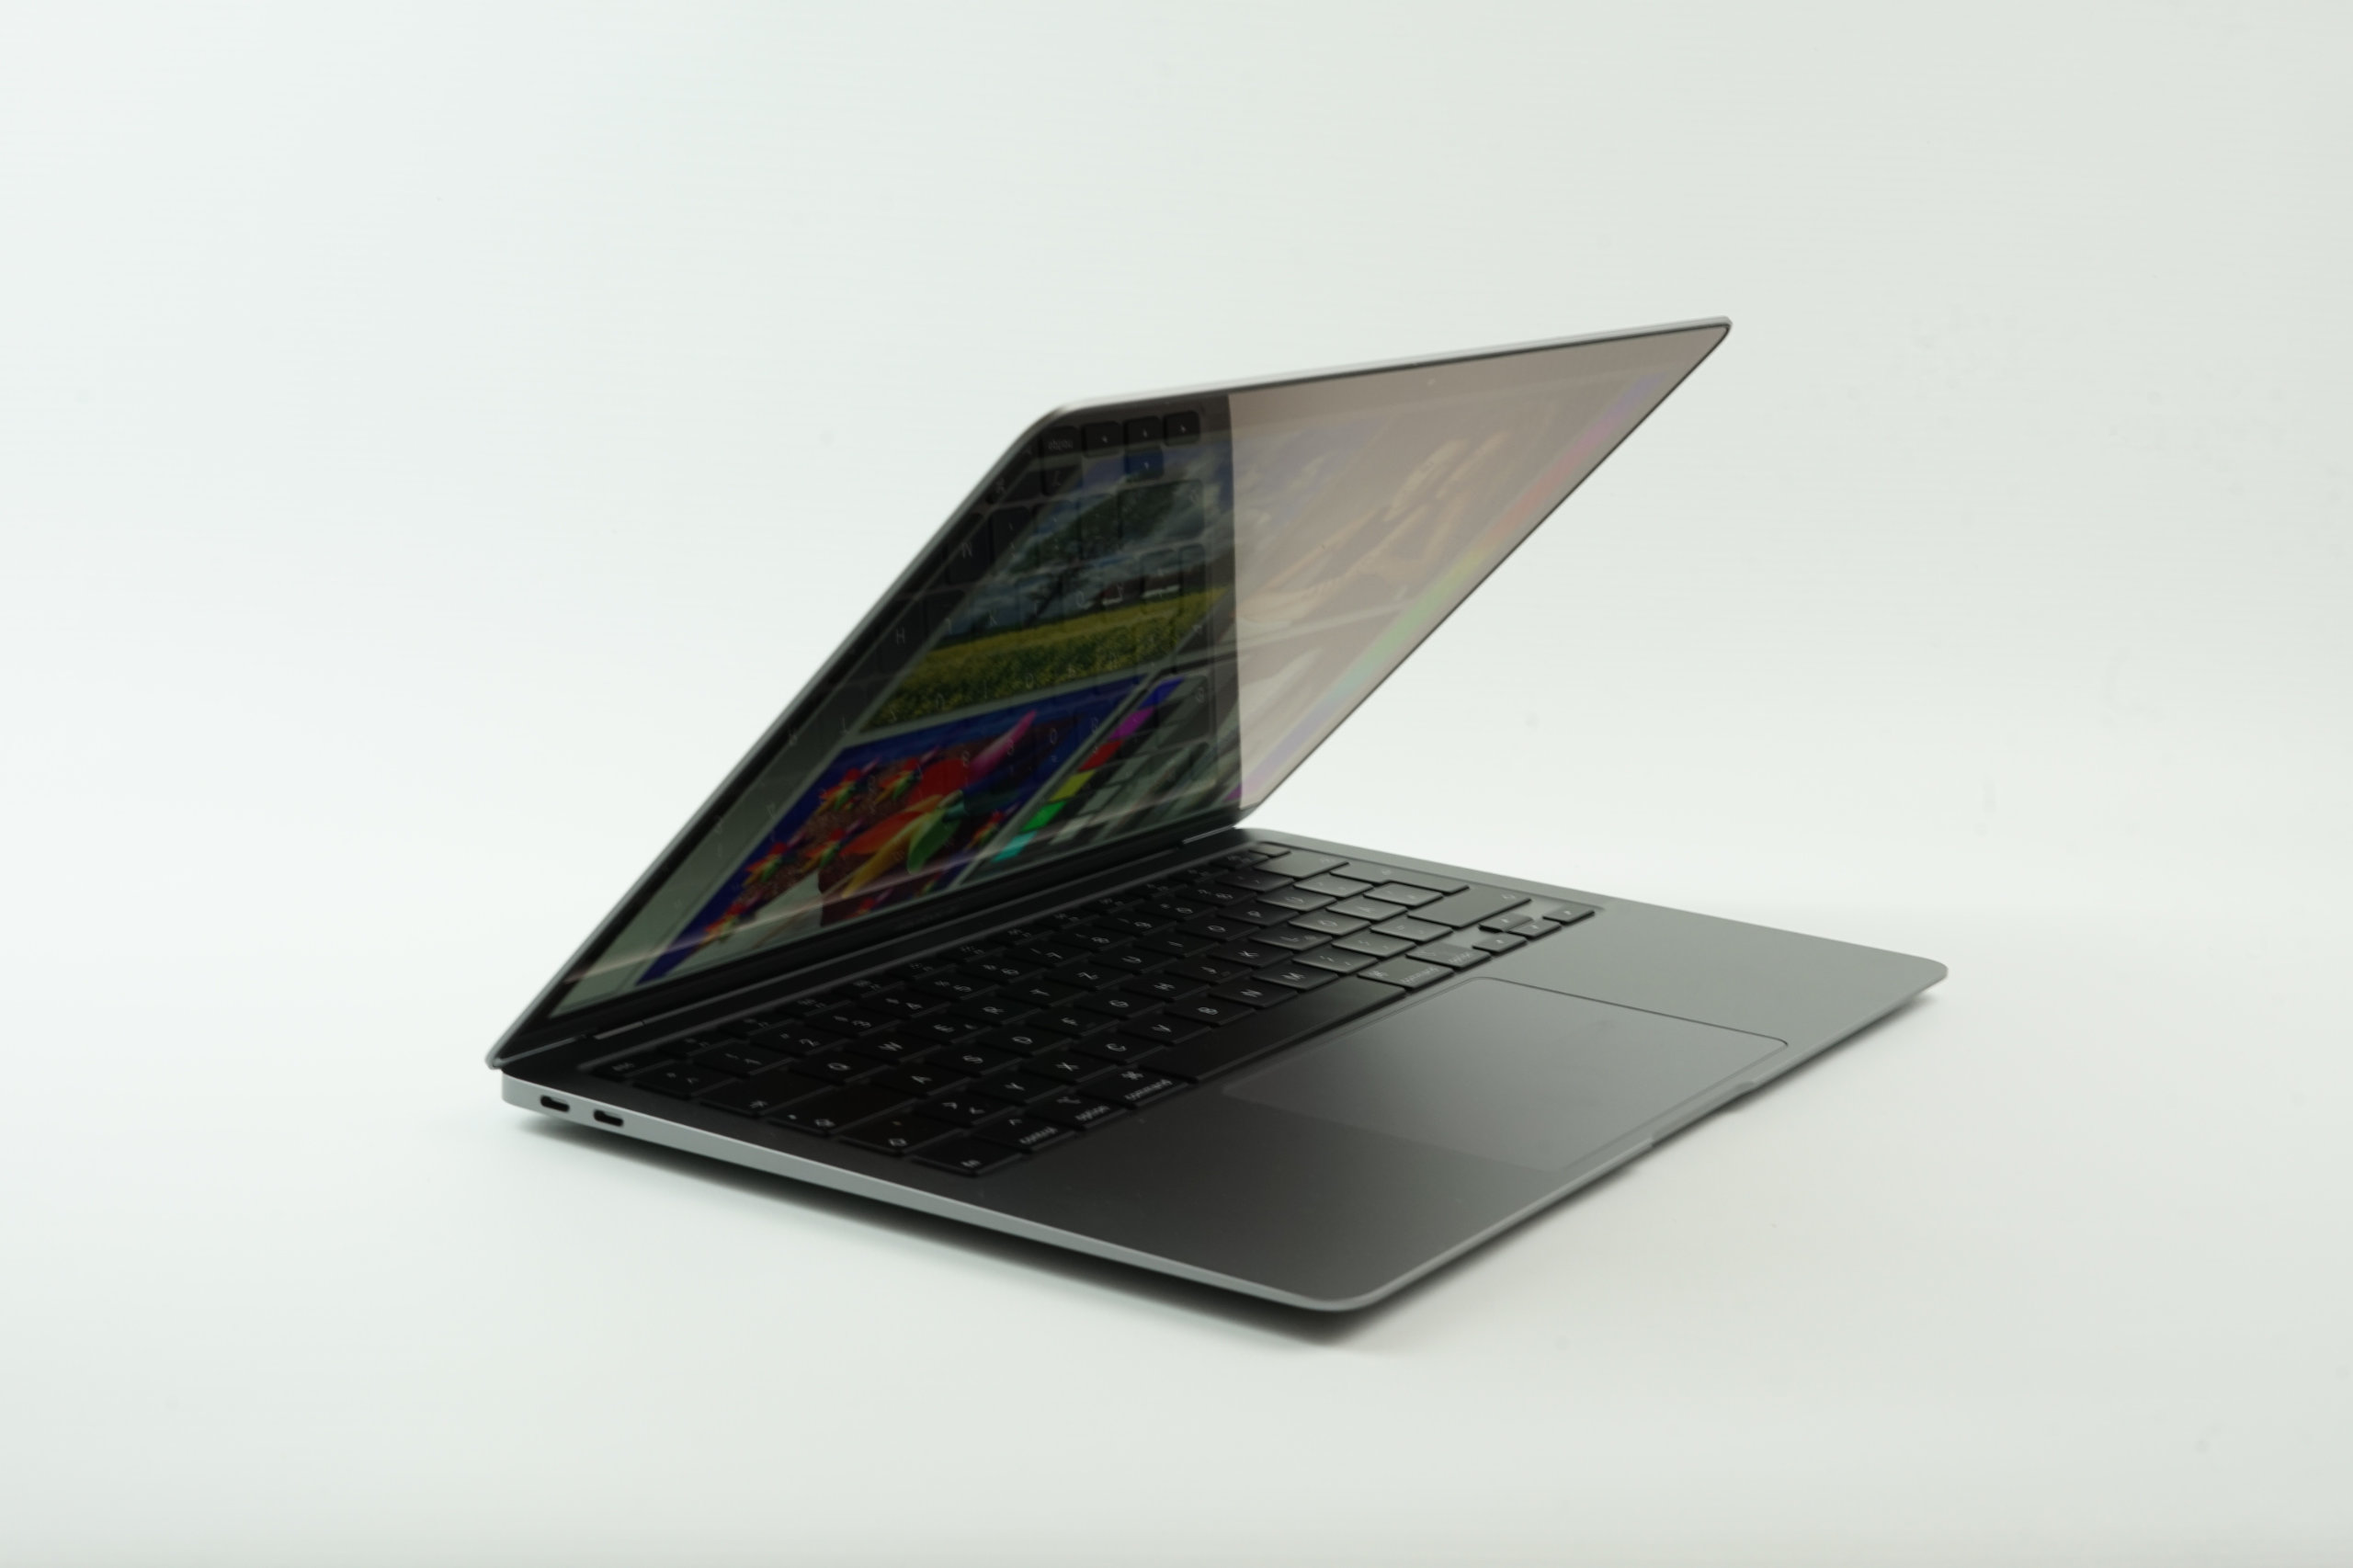

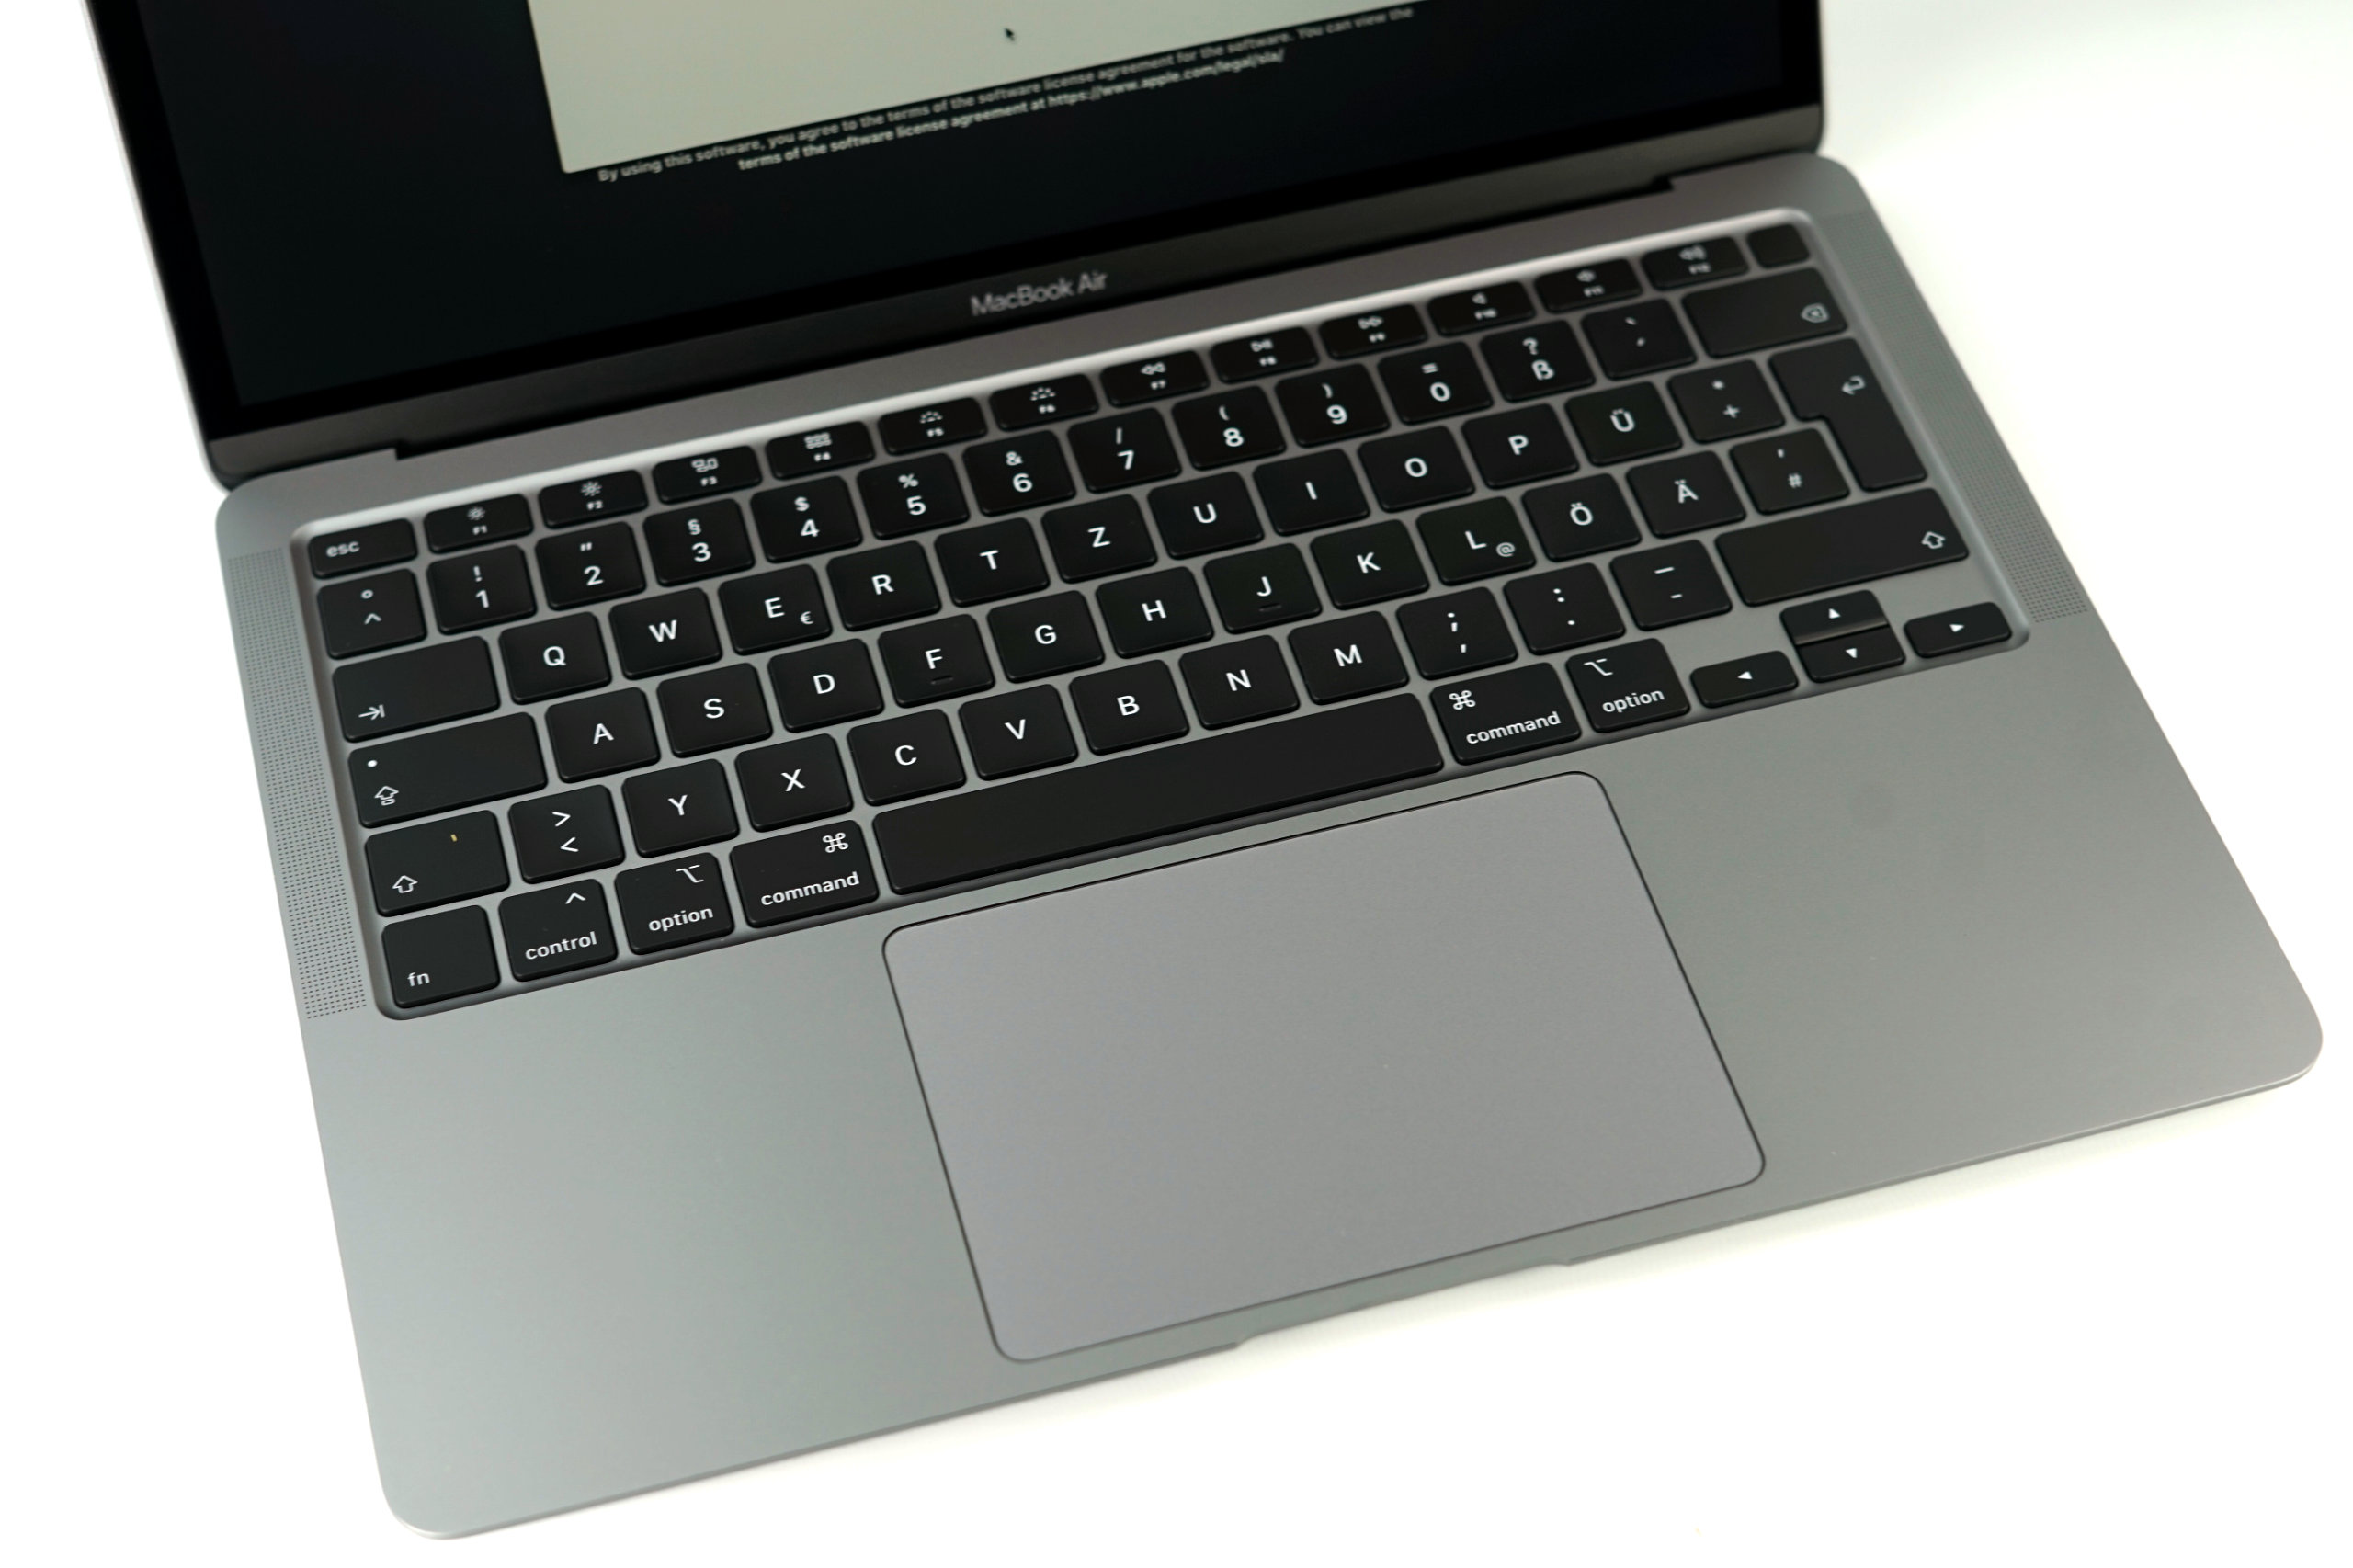
MacBook Air'in ayak izi hala daha hızlı MacBook Pro 13 ile aynı. Bu, yeni Dell XPS 13 9300'ün kesinlikle bir avantajı olduğu ve hem Dell hem de Acer Swift 3'ün ağırlığının daha düşük olduğu bir alandır. Tek bir alüminyum parçadan yapılmış sağlam şasi kesinlikle daha yüksek ağırlığın pahasına gelir.
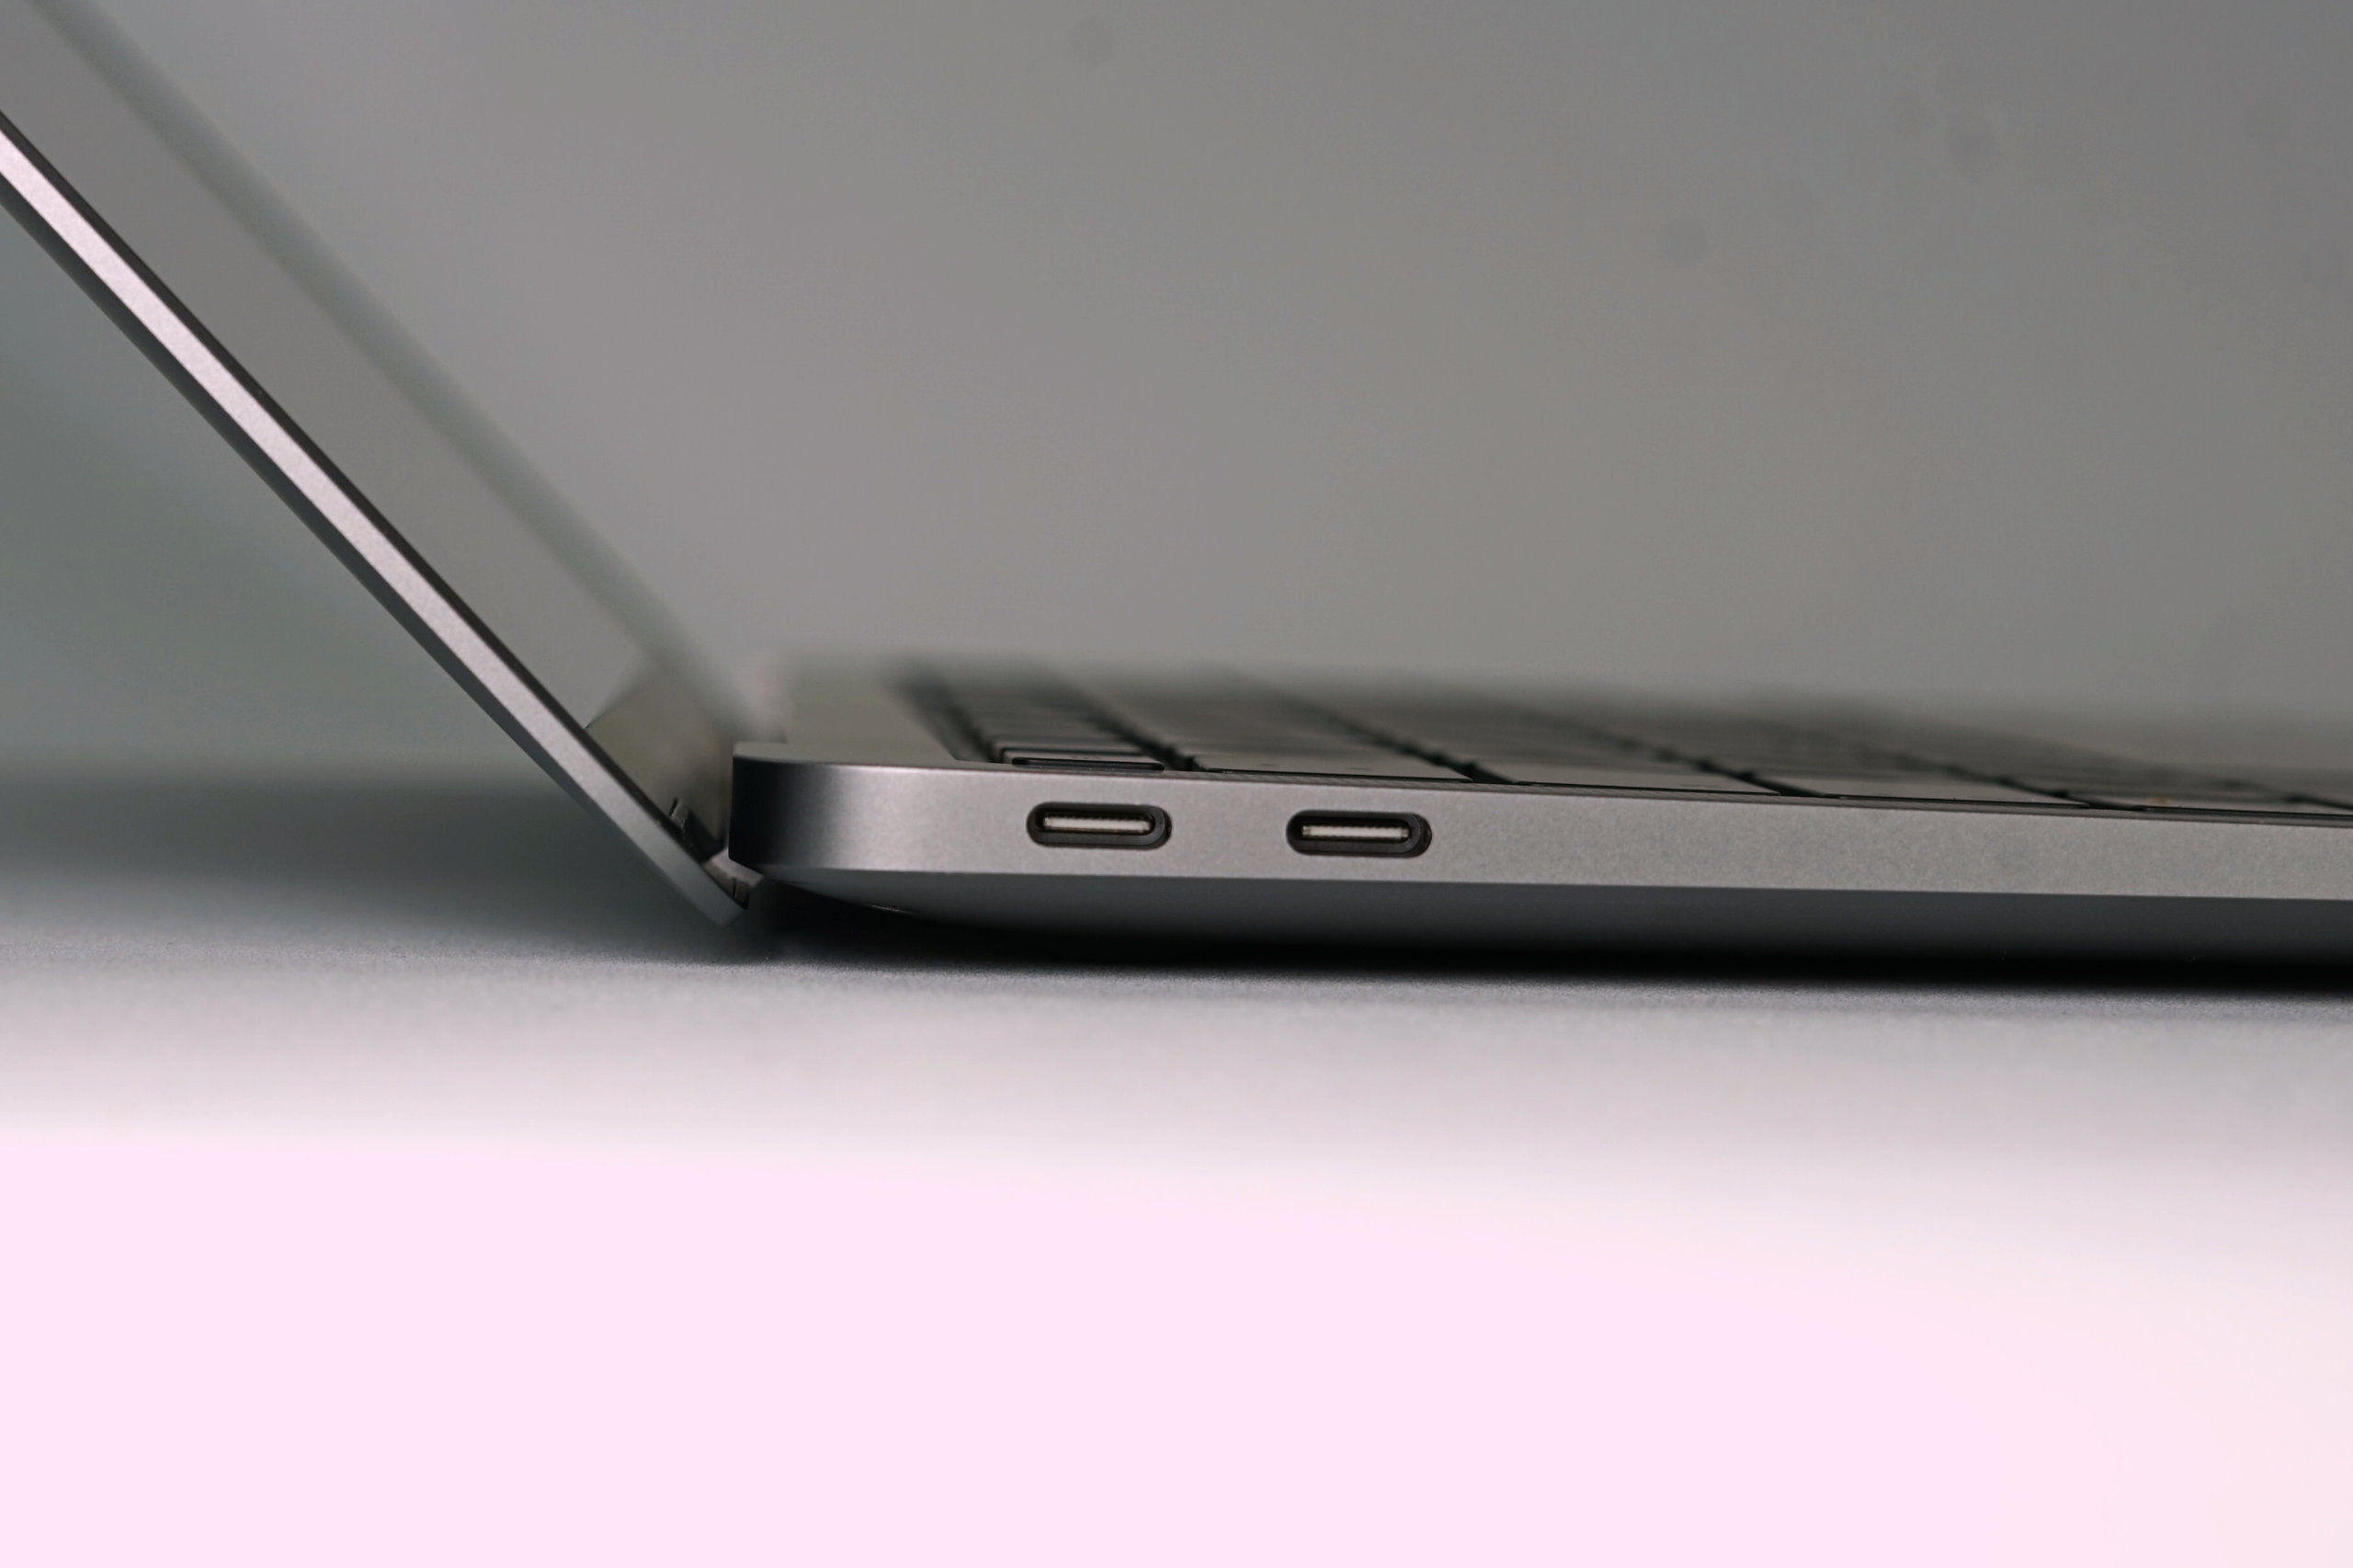
Bağlantı - Wi-Fi olmadan MacBook Air 6
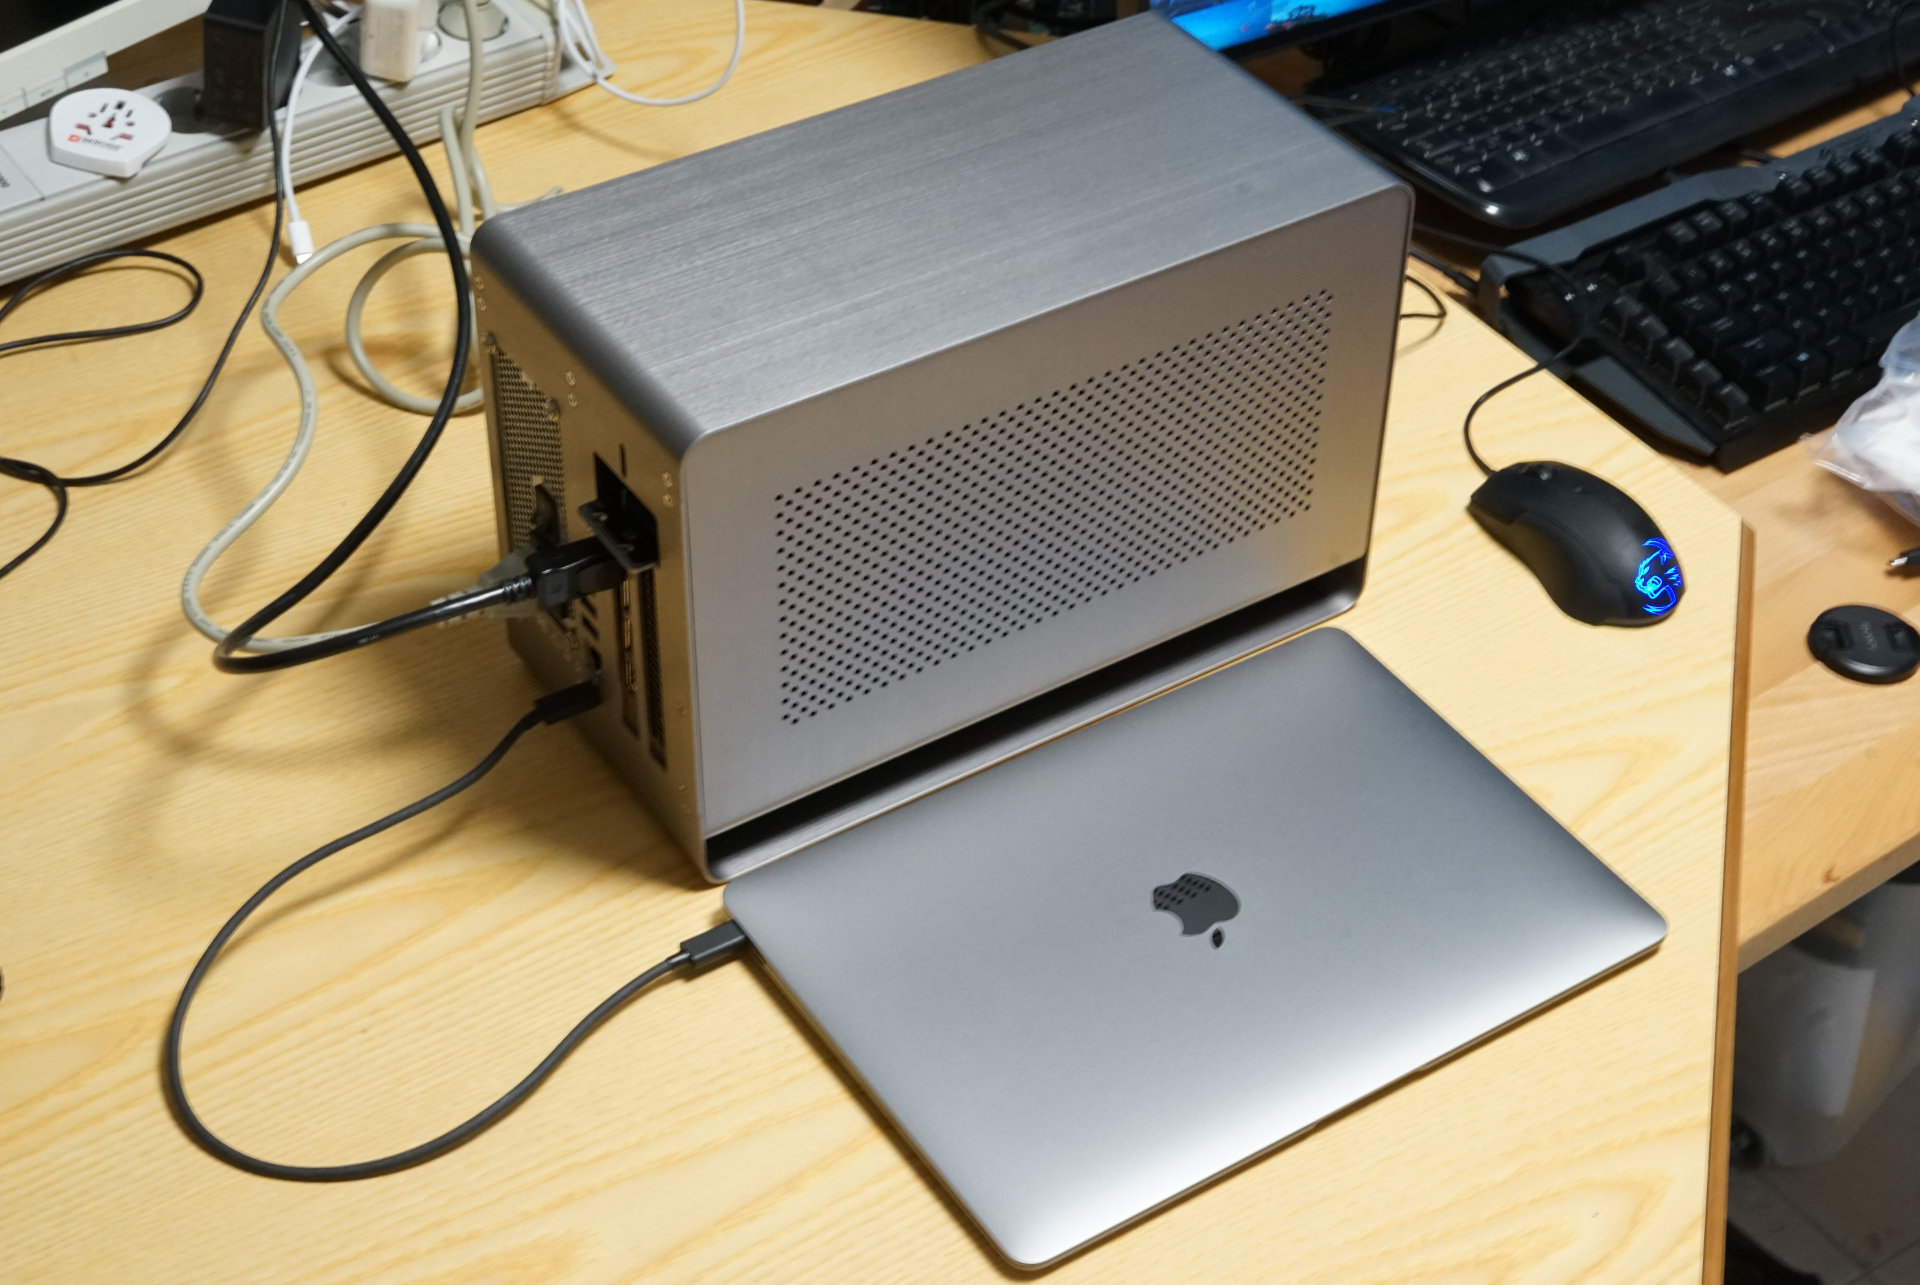
Burada kısa tutabiliriz, çünkü eski MacBook Air ile karşılaştırıldığında hiçbir değişiklik yok. İki Thunderbolt 3 konektörü çok yönlüdür, ancak aynı zamanda adaptör gerektirir. İletişim modülü hala hızlı Wi-Fi 6 standardını desteklemiyor. Hem Thunderbolt 3 bağlantı noktaları hem de test süremiz boyunca sorunsuz çalıştı. Harici bir Samsung T5 2 TB SSD'den 10 GB büyüklüğünde bir dosyayı ortalama 438 MB / s hızında kopyalamayı başardık. Büyük Philips 329P9, USB 2.0 hub ve güç dağıtımı dahil 4K (60 Hz) ile iyi çalıştı. Aynı şey hub ve güç dağıtımı da dahil olmak üzere LG 27UD88-W için de geçerli. Mantiz Titan Thunderbolt Dock da hemen tanındı ve grafik performansını artırmak için Mantiz Venus eGPU'yu RX 480 ile birlikte kullanabildik. Ancak, Ethernet bağlantı noktası Asix'ten ek sürücüler gerektiriyordu.
İletişim
MacBook Pro 16 incelememize benzer şekilde, veri aktarımının zaman zaman kesintiye uğradığı Wi-Fi 5 WLAN ve iperf testiyle bir kez daha sorun yaşadık. Ancak, bir FritzBox 7590 ile bağlantı iyi bir dizi ile iyi çalıştı. Sonuçlar 2019'daki MacBook Pro 13'ün biraz altında ve temel olarak 2019 MacBook Air ile aynı. Intel Wi-Fi 6 AX201 veya Killer AX1650 gibi mevcut üst düzey WLAN modülleri ile karşılaştırıldığında, büyük bir fark görebiliriz ve Hava bu dizüstü bilgisayar sınıfında maalesef sadece ortalamadır.
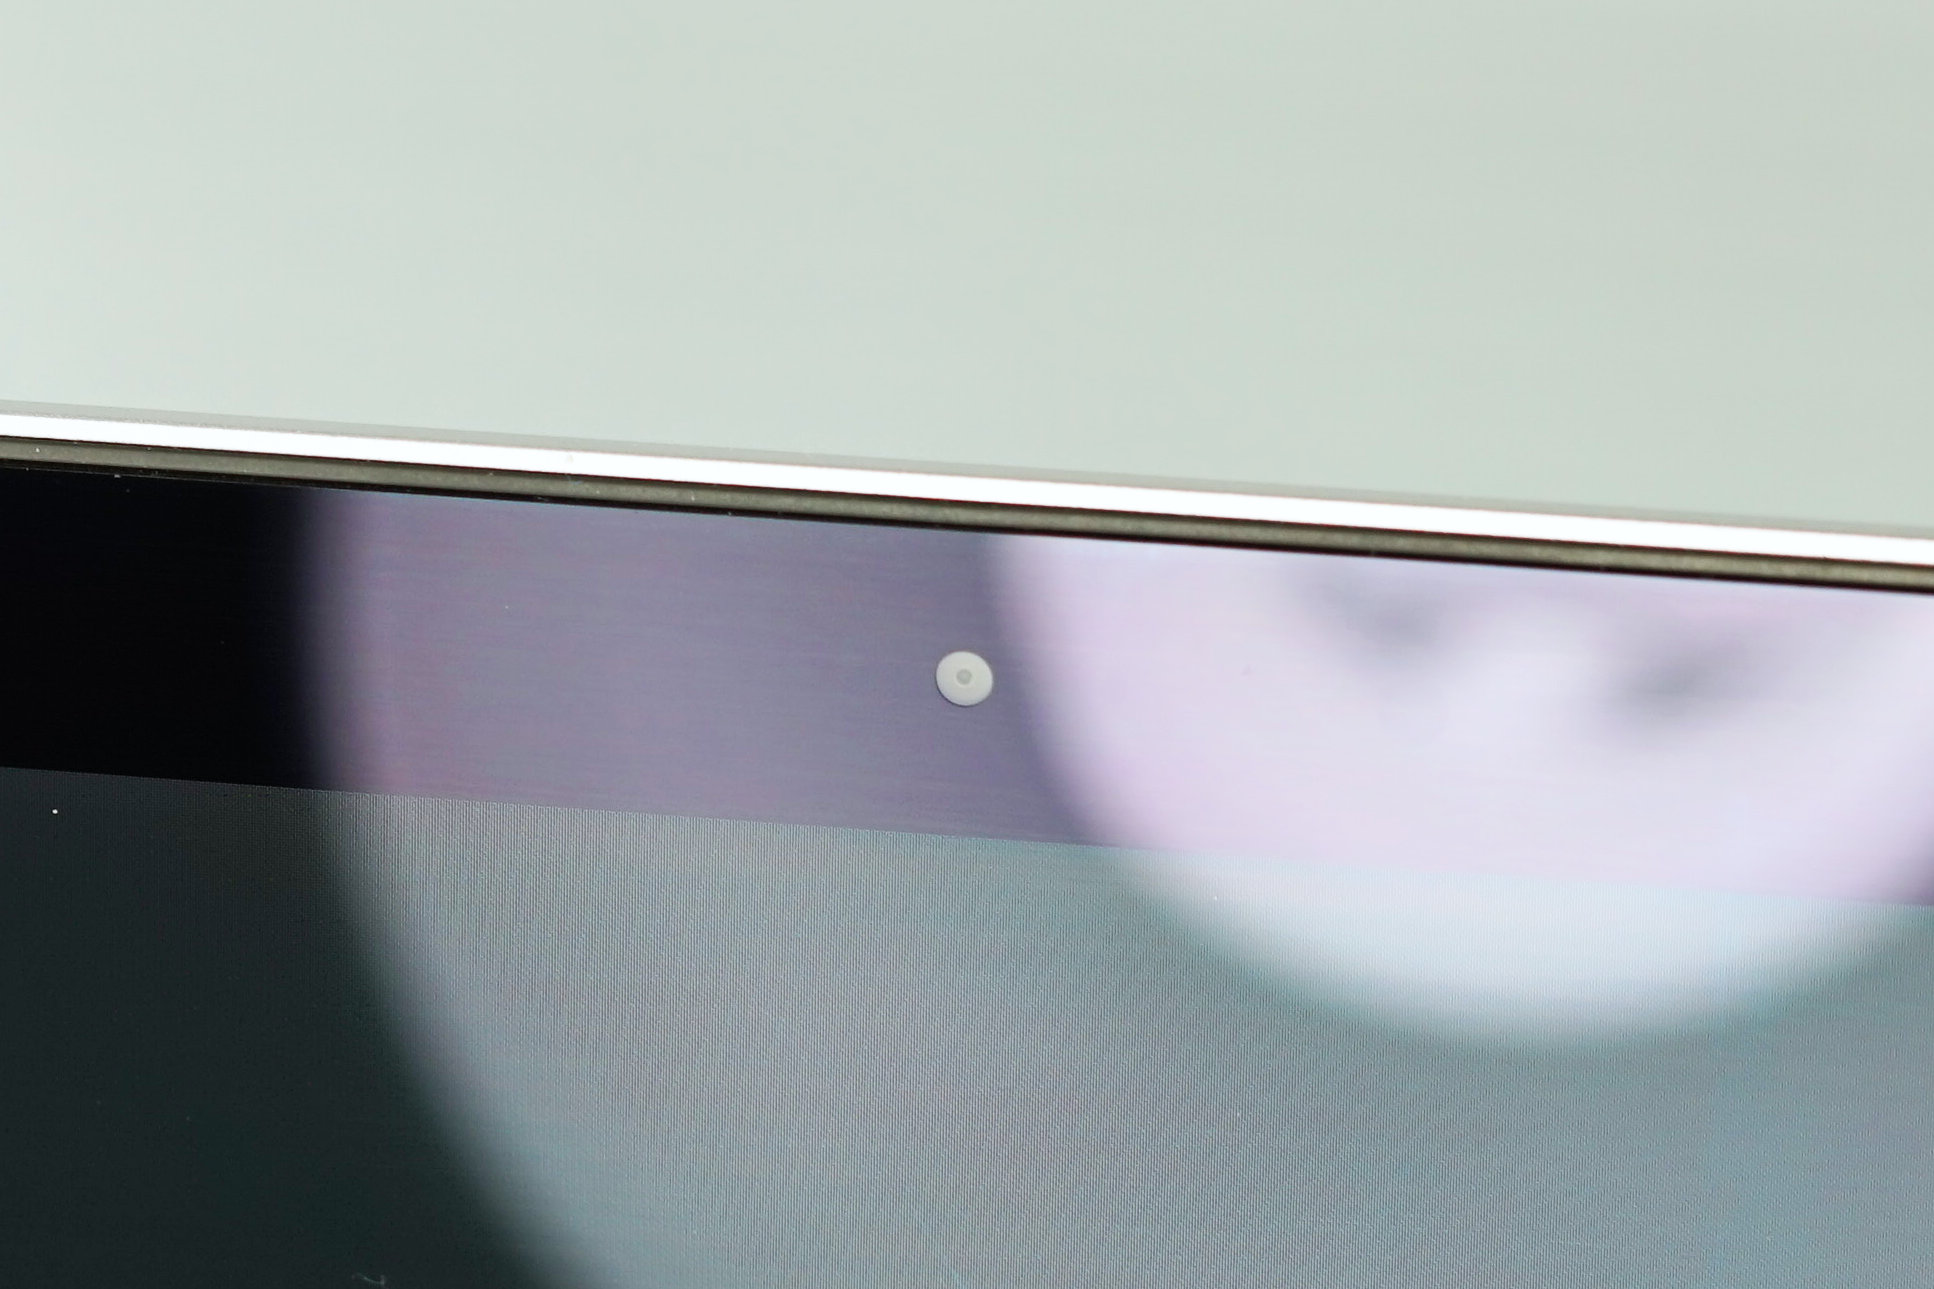
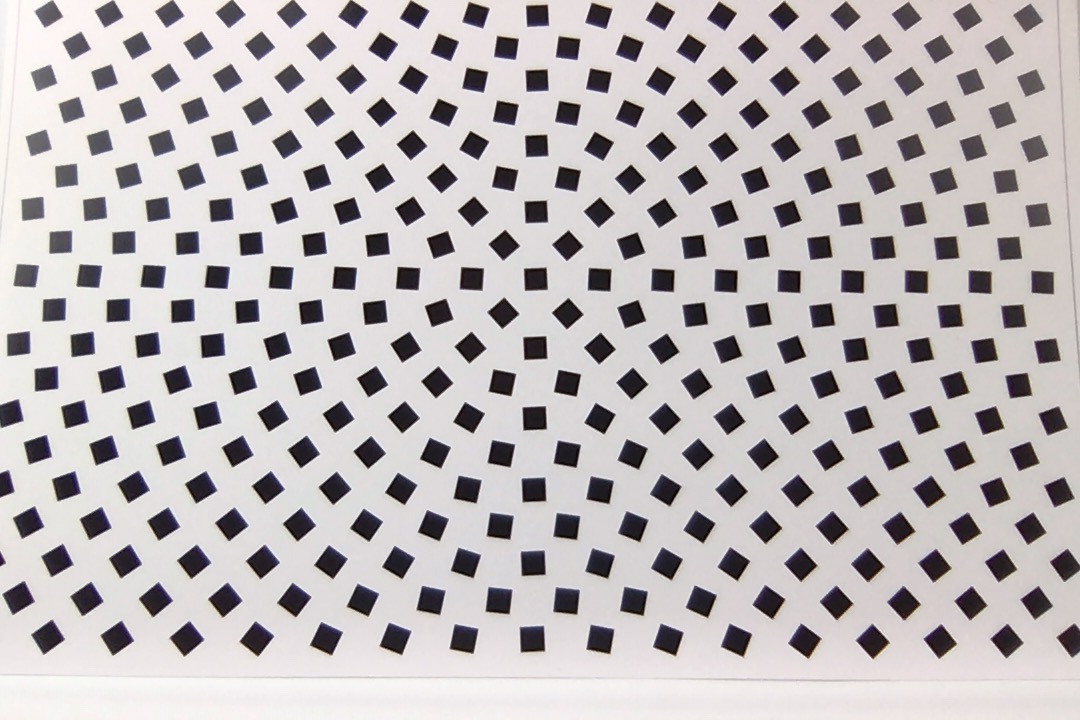
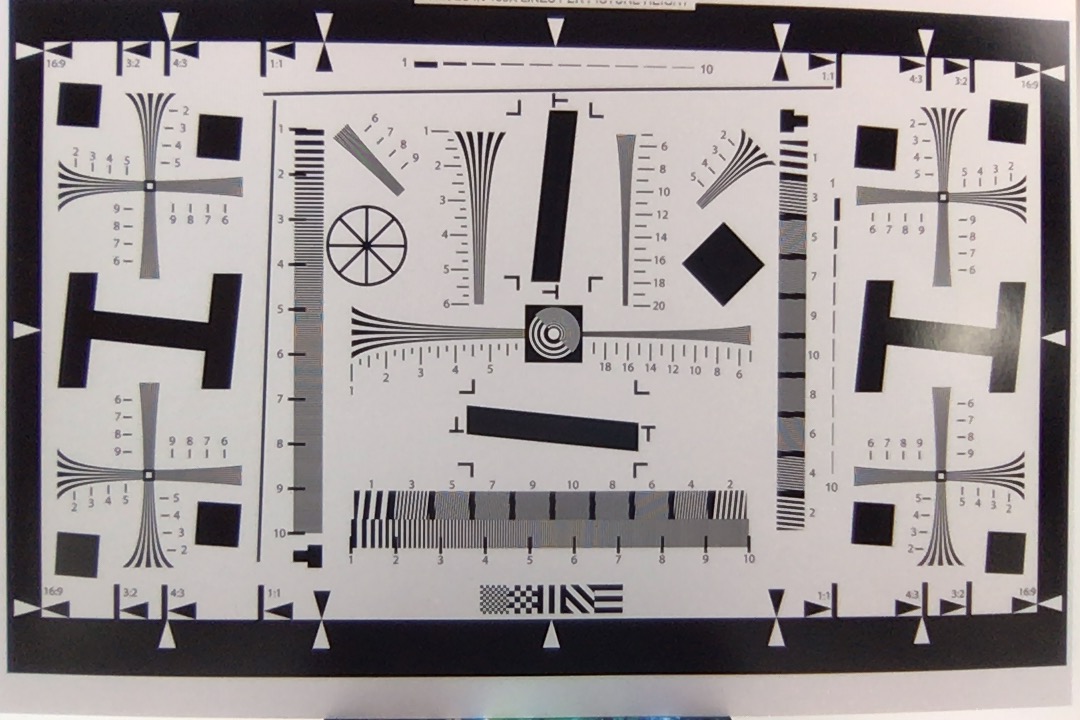
Web kamerası - 720p düşük çözünürlüklü hava
Apple, harika kameralara sahip akıllı telefonlar sunuyor, ancak dizüstü bilgisayarlarındaki kameraları görmezden geliyor. Ve 720p kameranın piyasaya sürülmesinden bu yana bir gelişme olmadığını düşünüyoruz. Giderek daha fazla ev ofisi ve video konferansı olan zamanlarda, görüntü kalitesi ne yazık ki çok kötü. Apple, dizüstü bilgisayar yarışması arasında hala ortalama, ancak bu performanstan memnun olamazsınız.


, i5-1030NG7, Apple SSD AP0512")
, i5-1030NG7, Apple SSD AP0512")
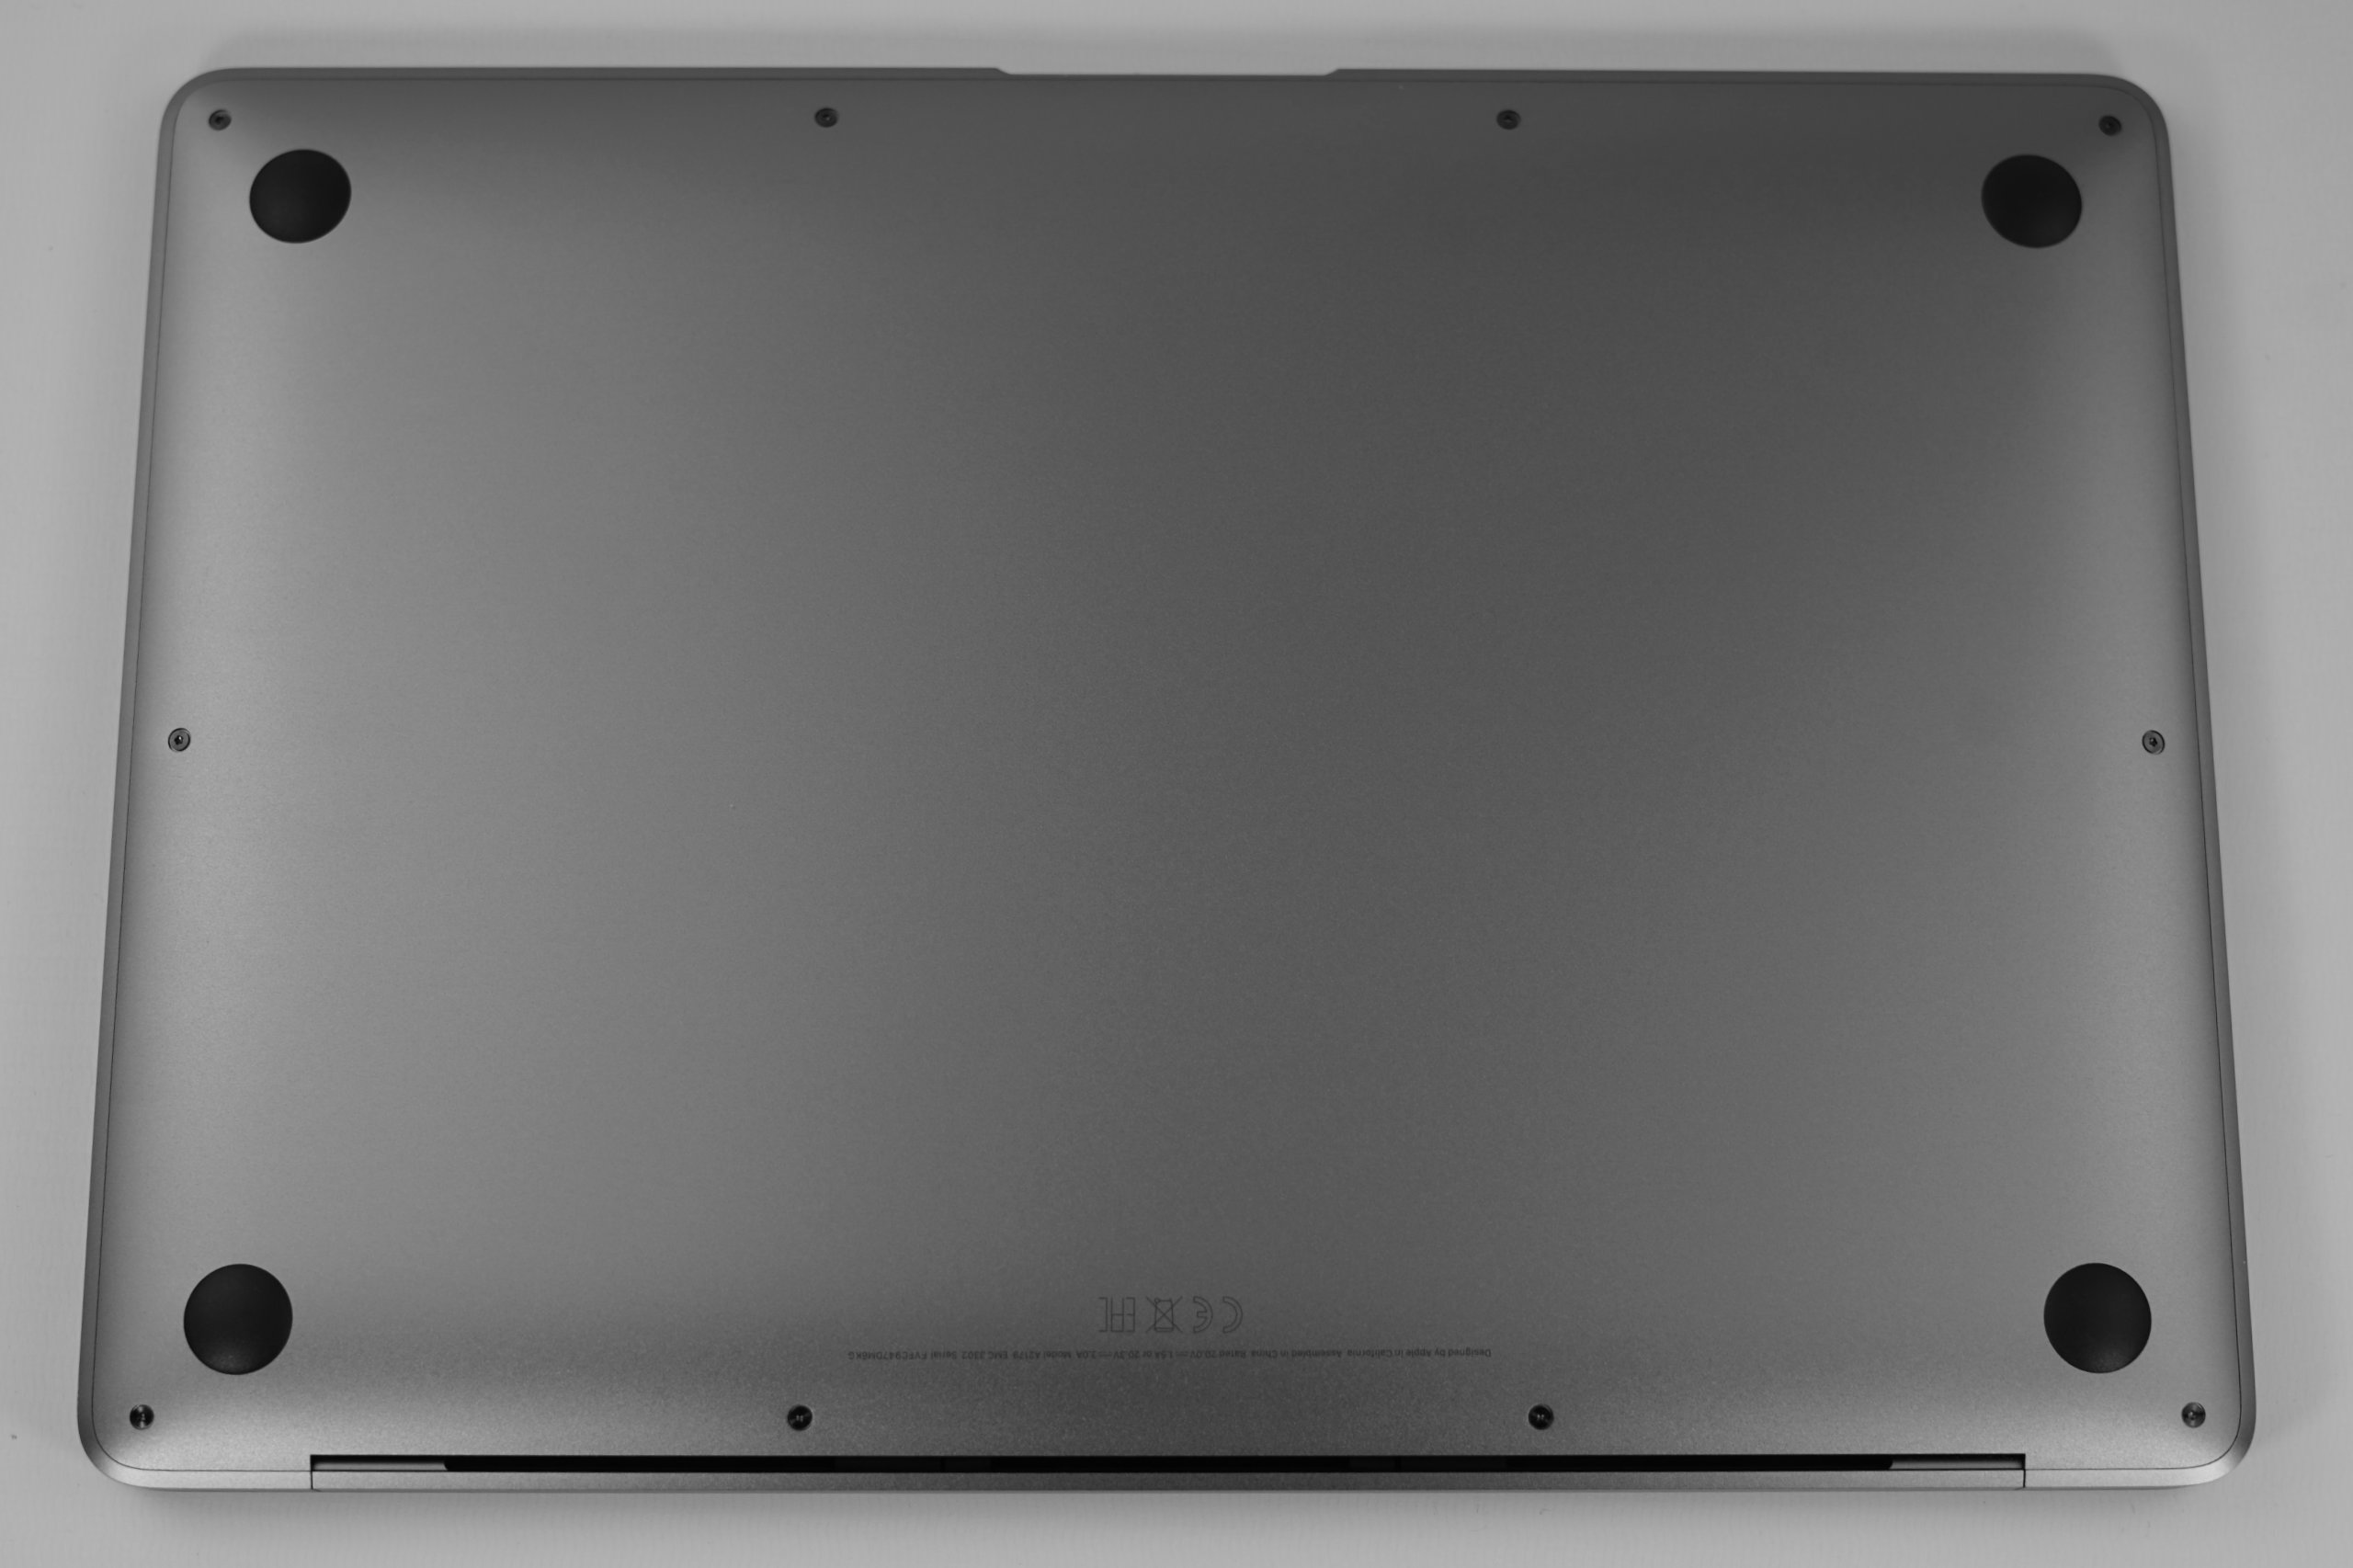
Bakım
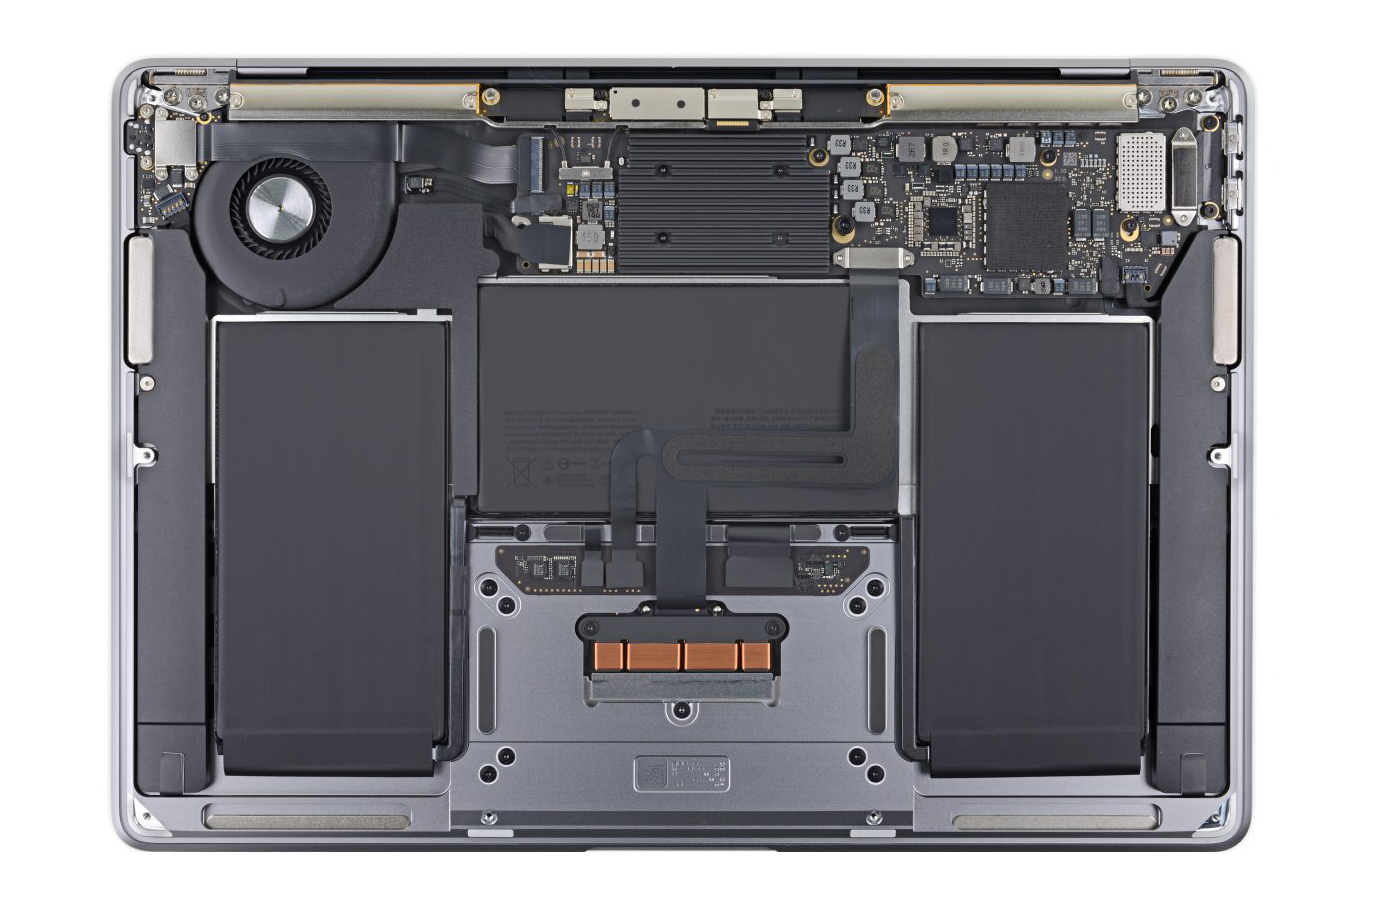
İFixit'teki çalışma arkadaşlarımızın yırtılması MacBook Air'in hiçbir parçasını yükseltemeyeceğinizi gösteriyor. SSD, RAM ve Wi-Fi modülü ana karta lehimlenmiştir. En azından fanı kolayca temizleyebilirsiniz (doğru tornavidaya sahipseniz). Ancak pil değişimi öncekinden daha kolay, bu kesinlikle iyi bir şey.
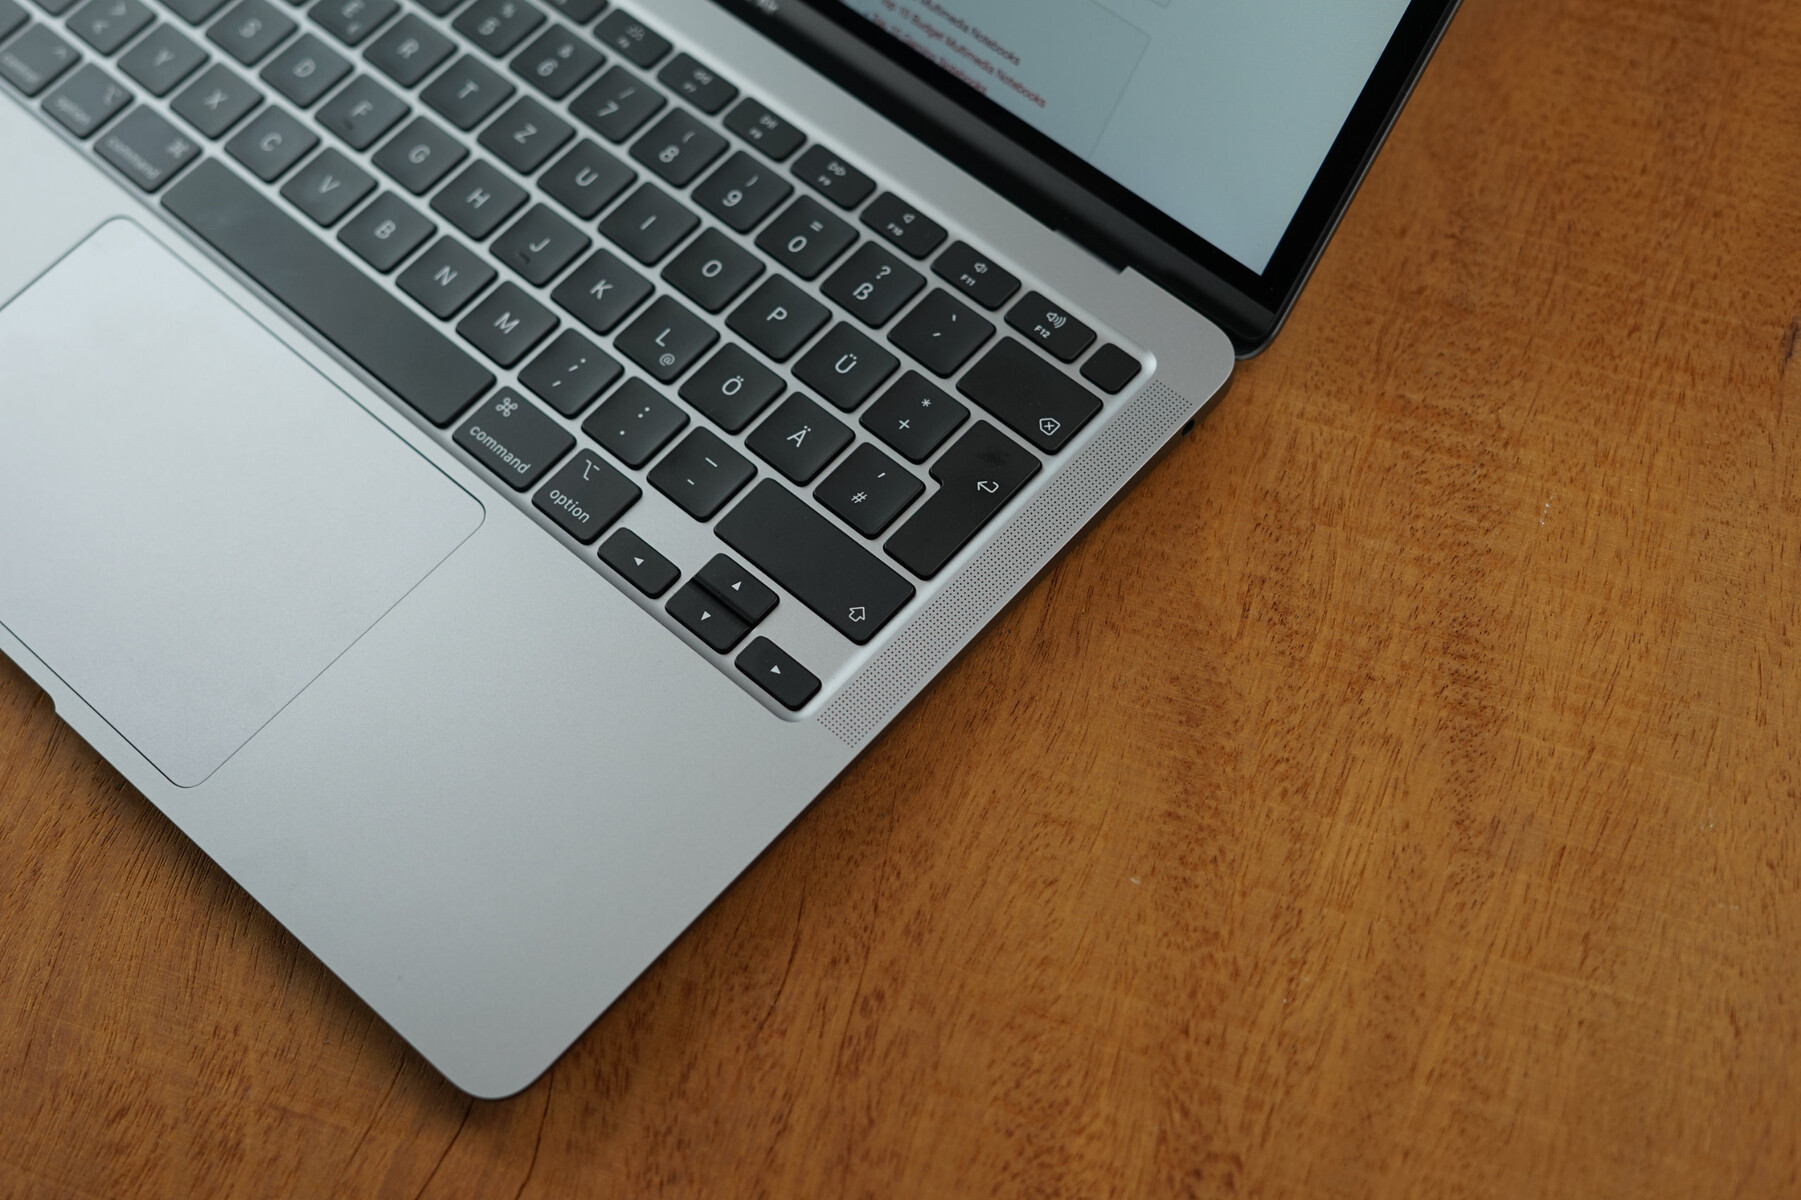
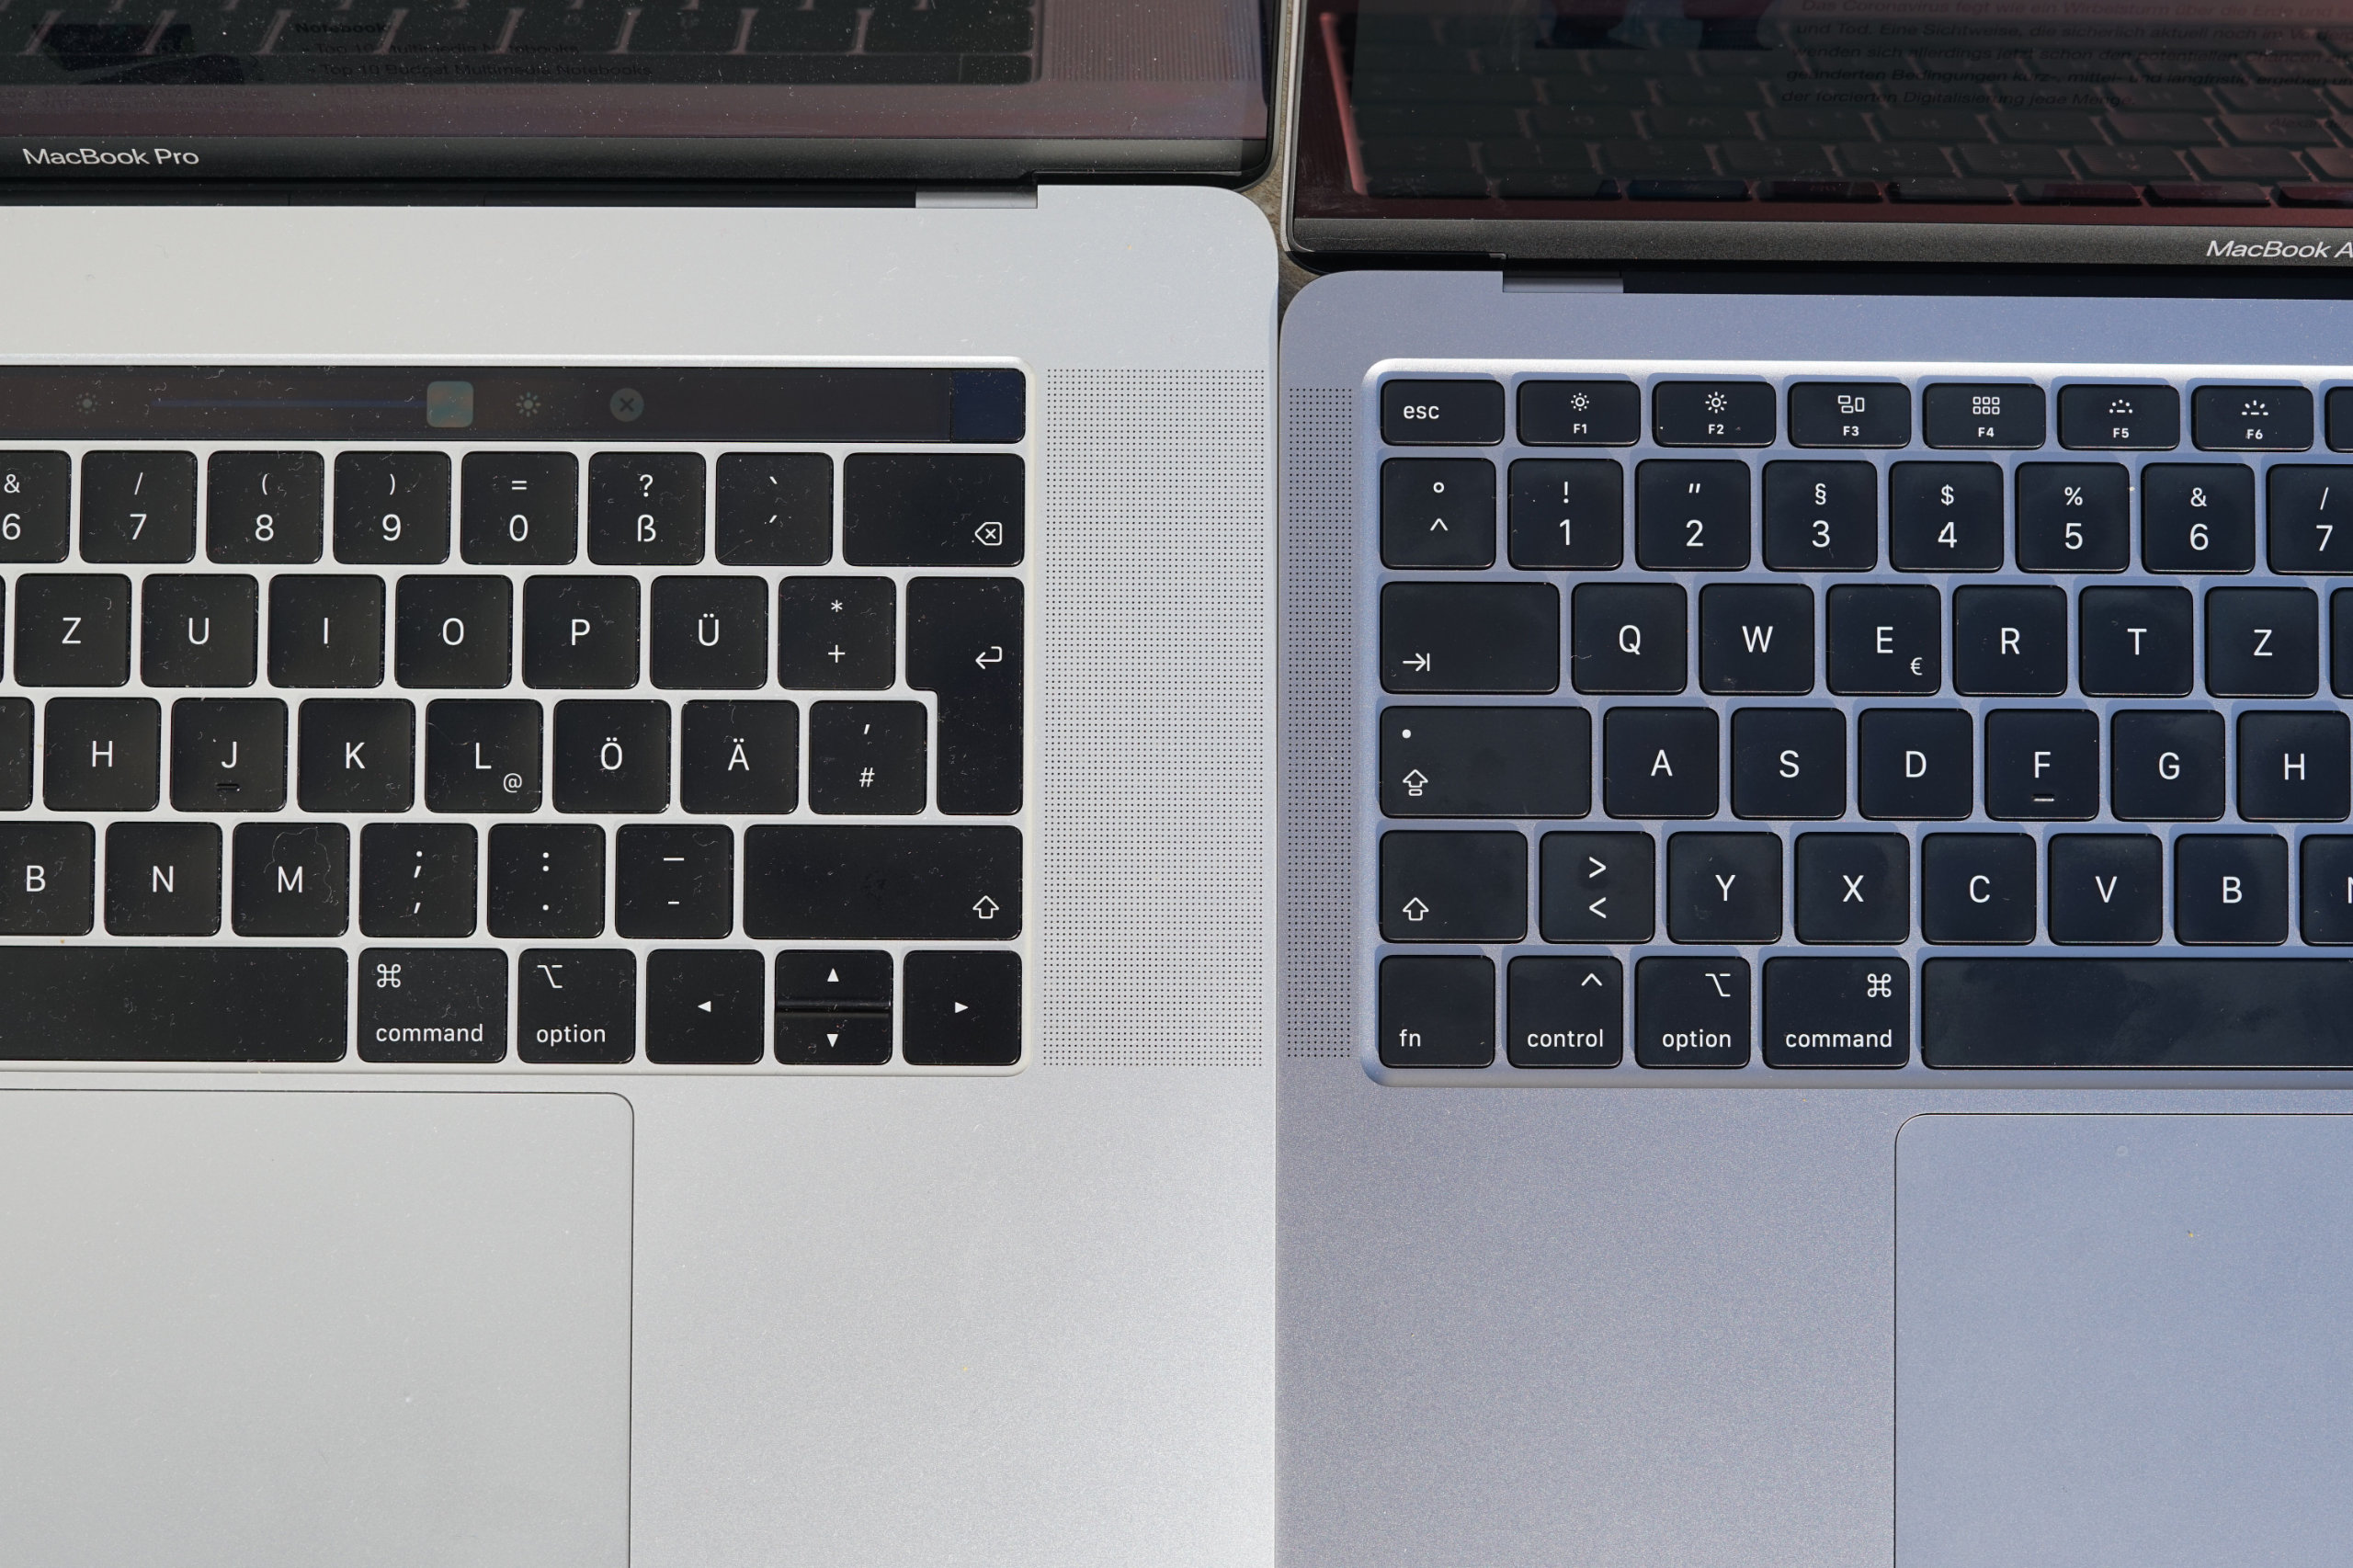
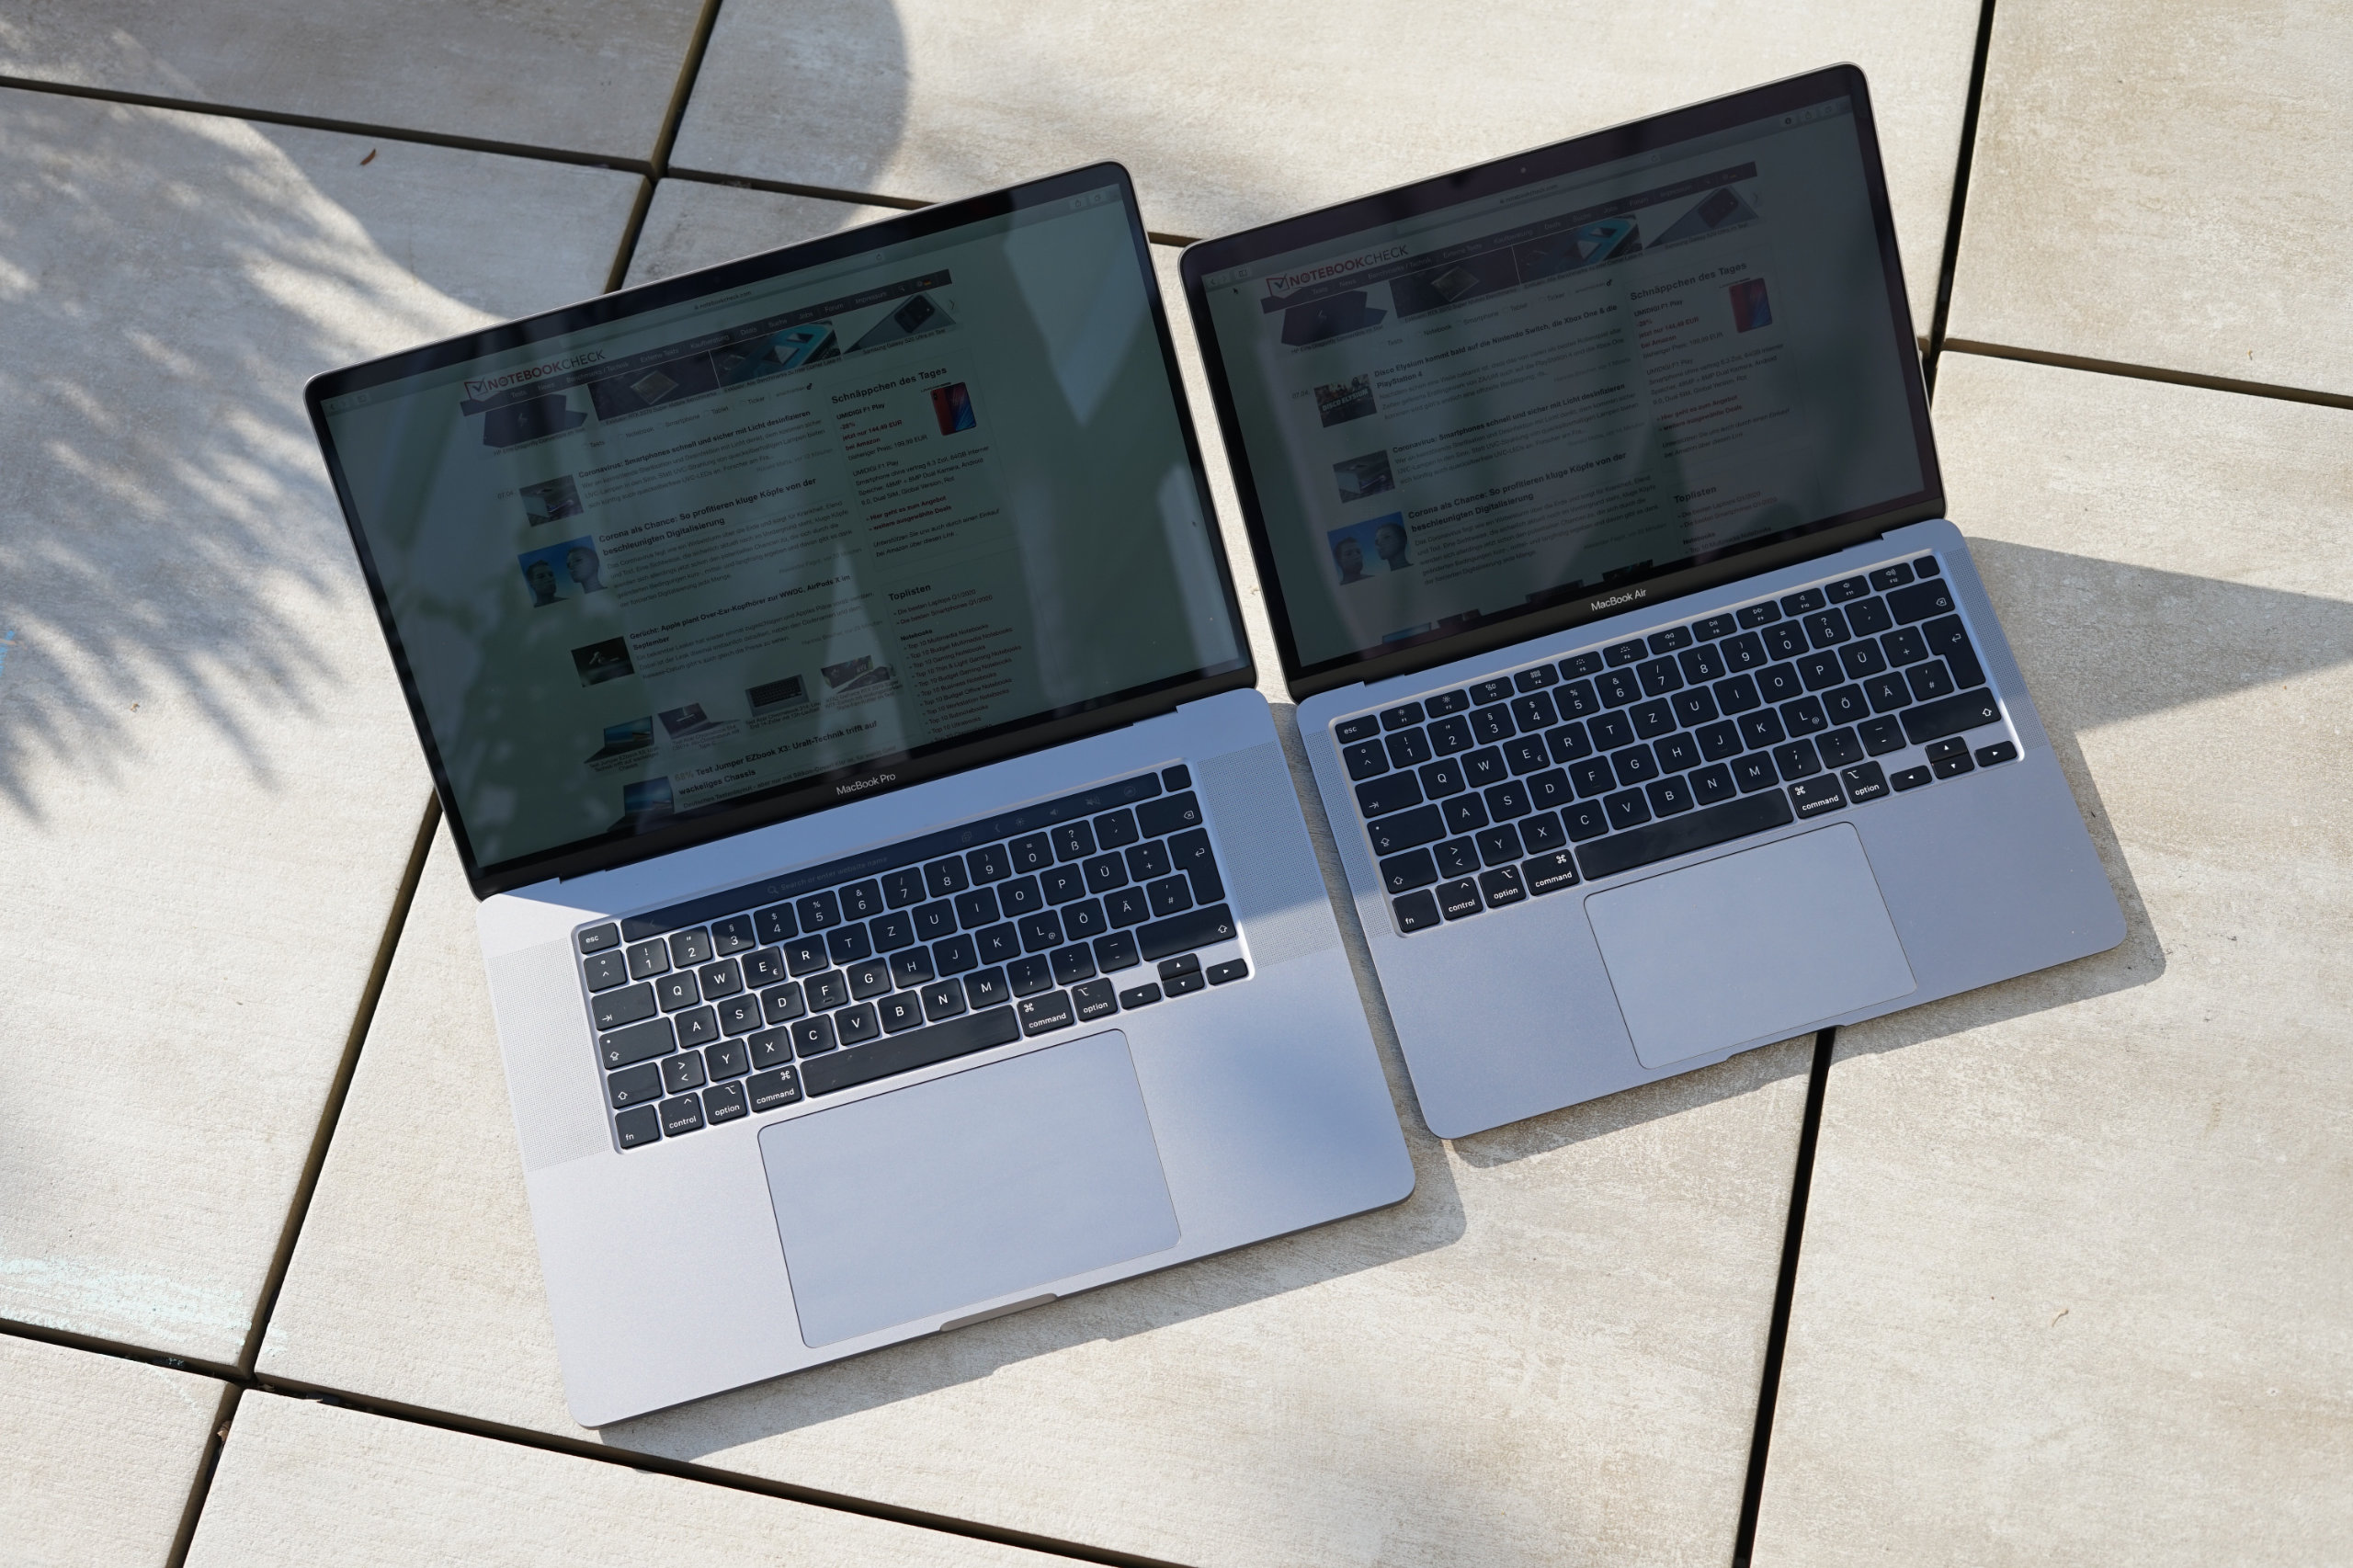
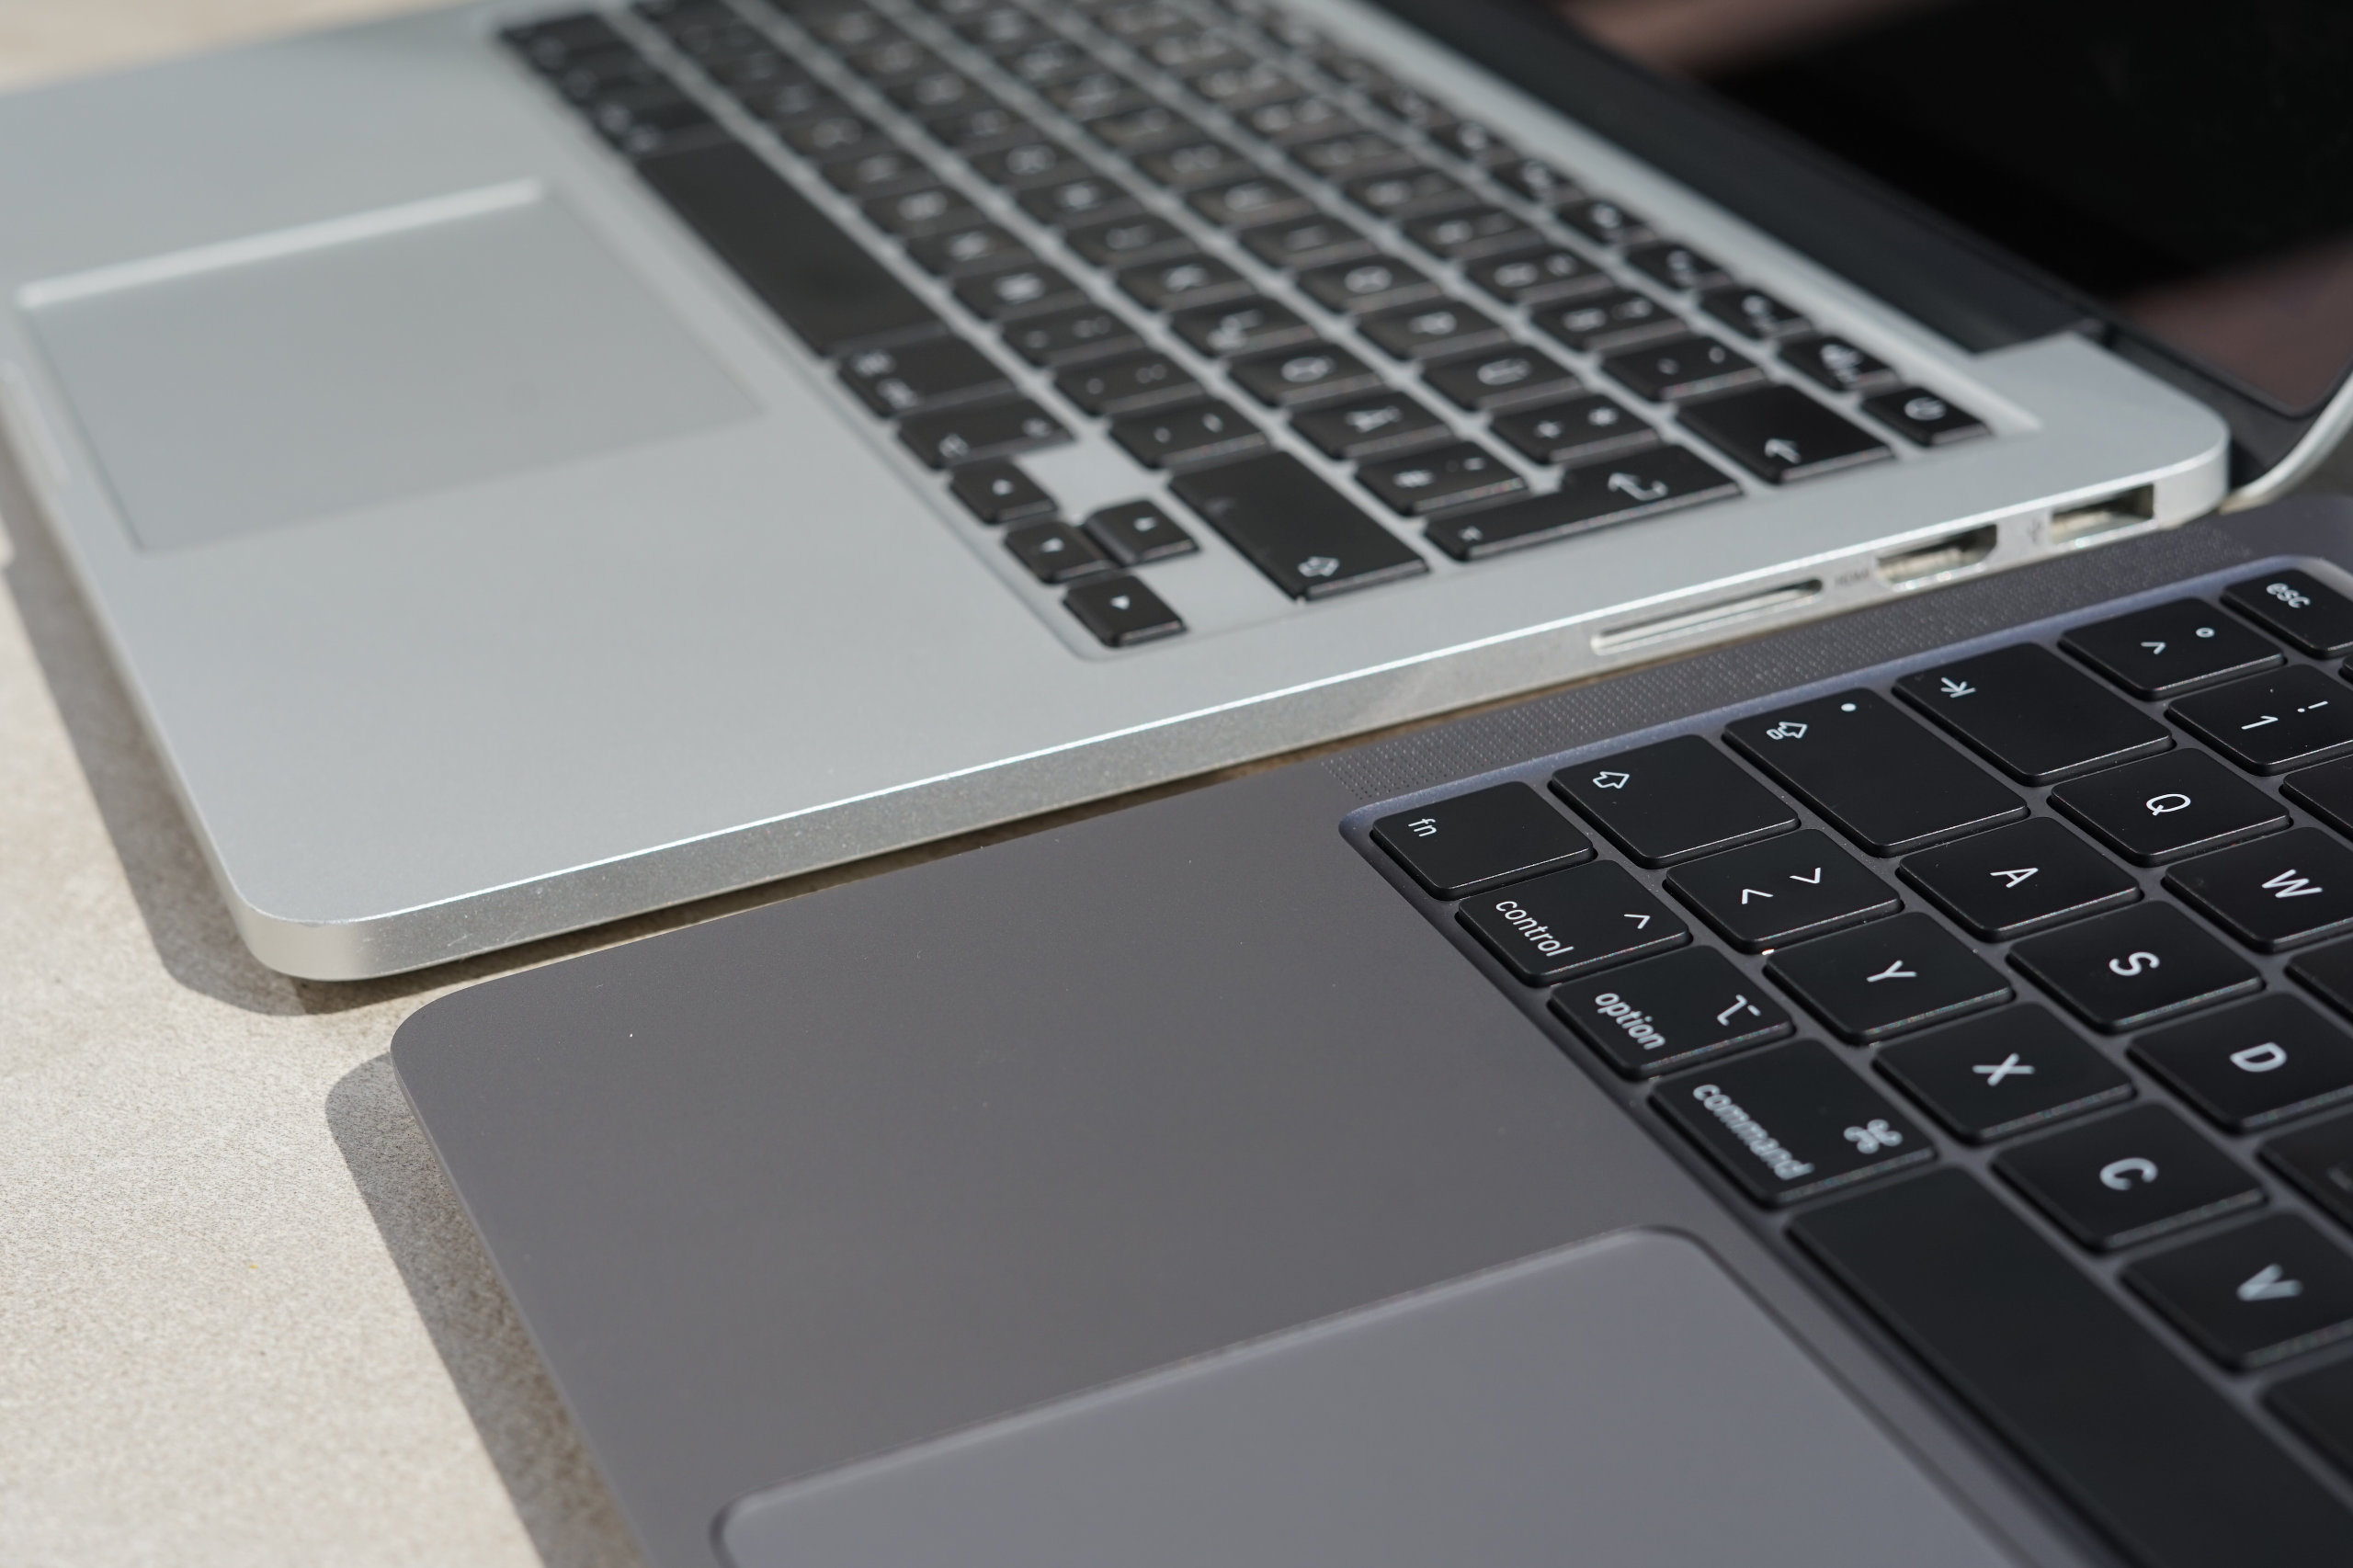
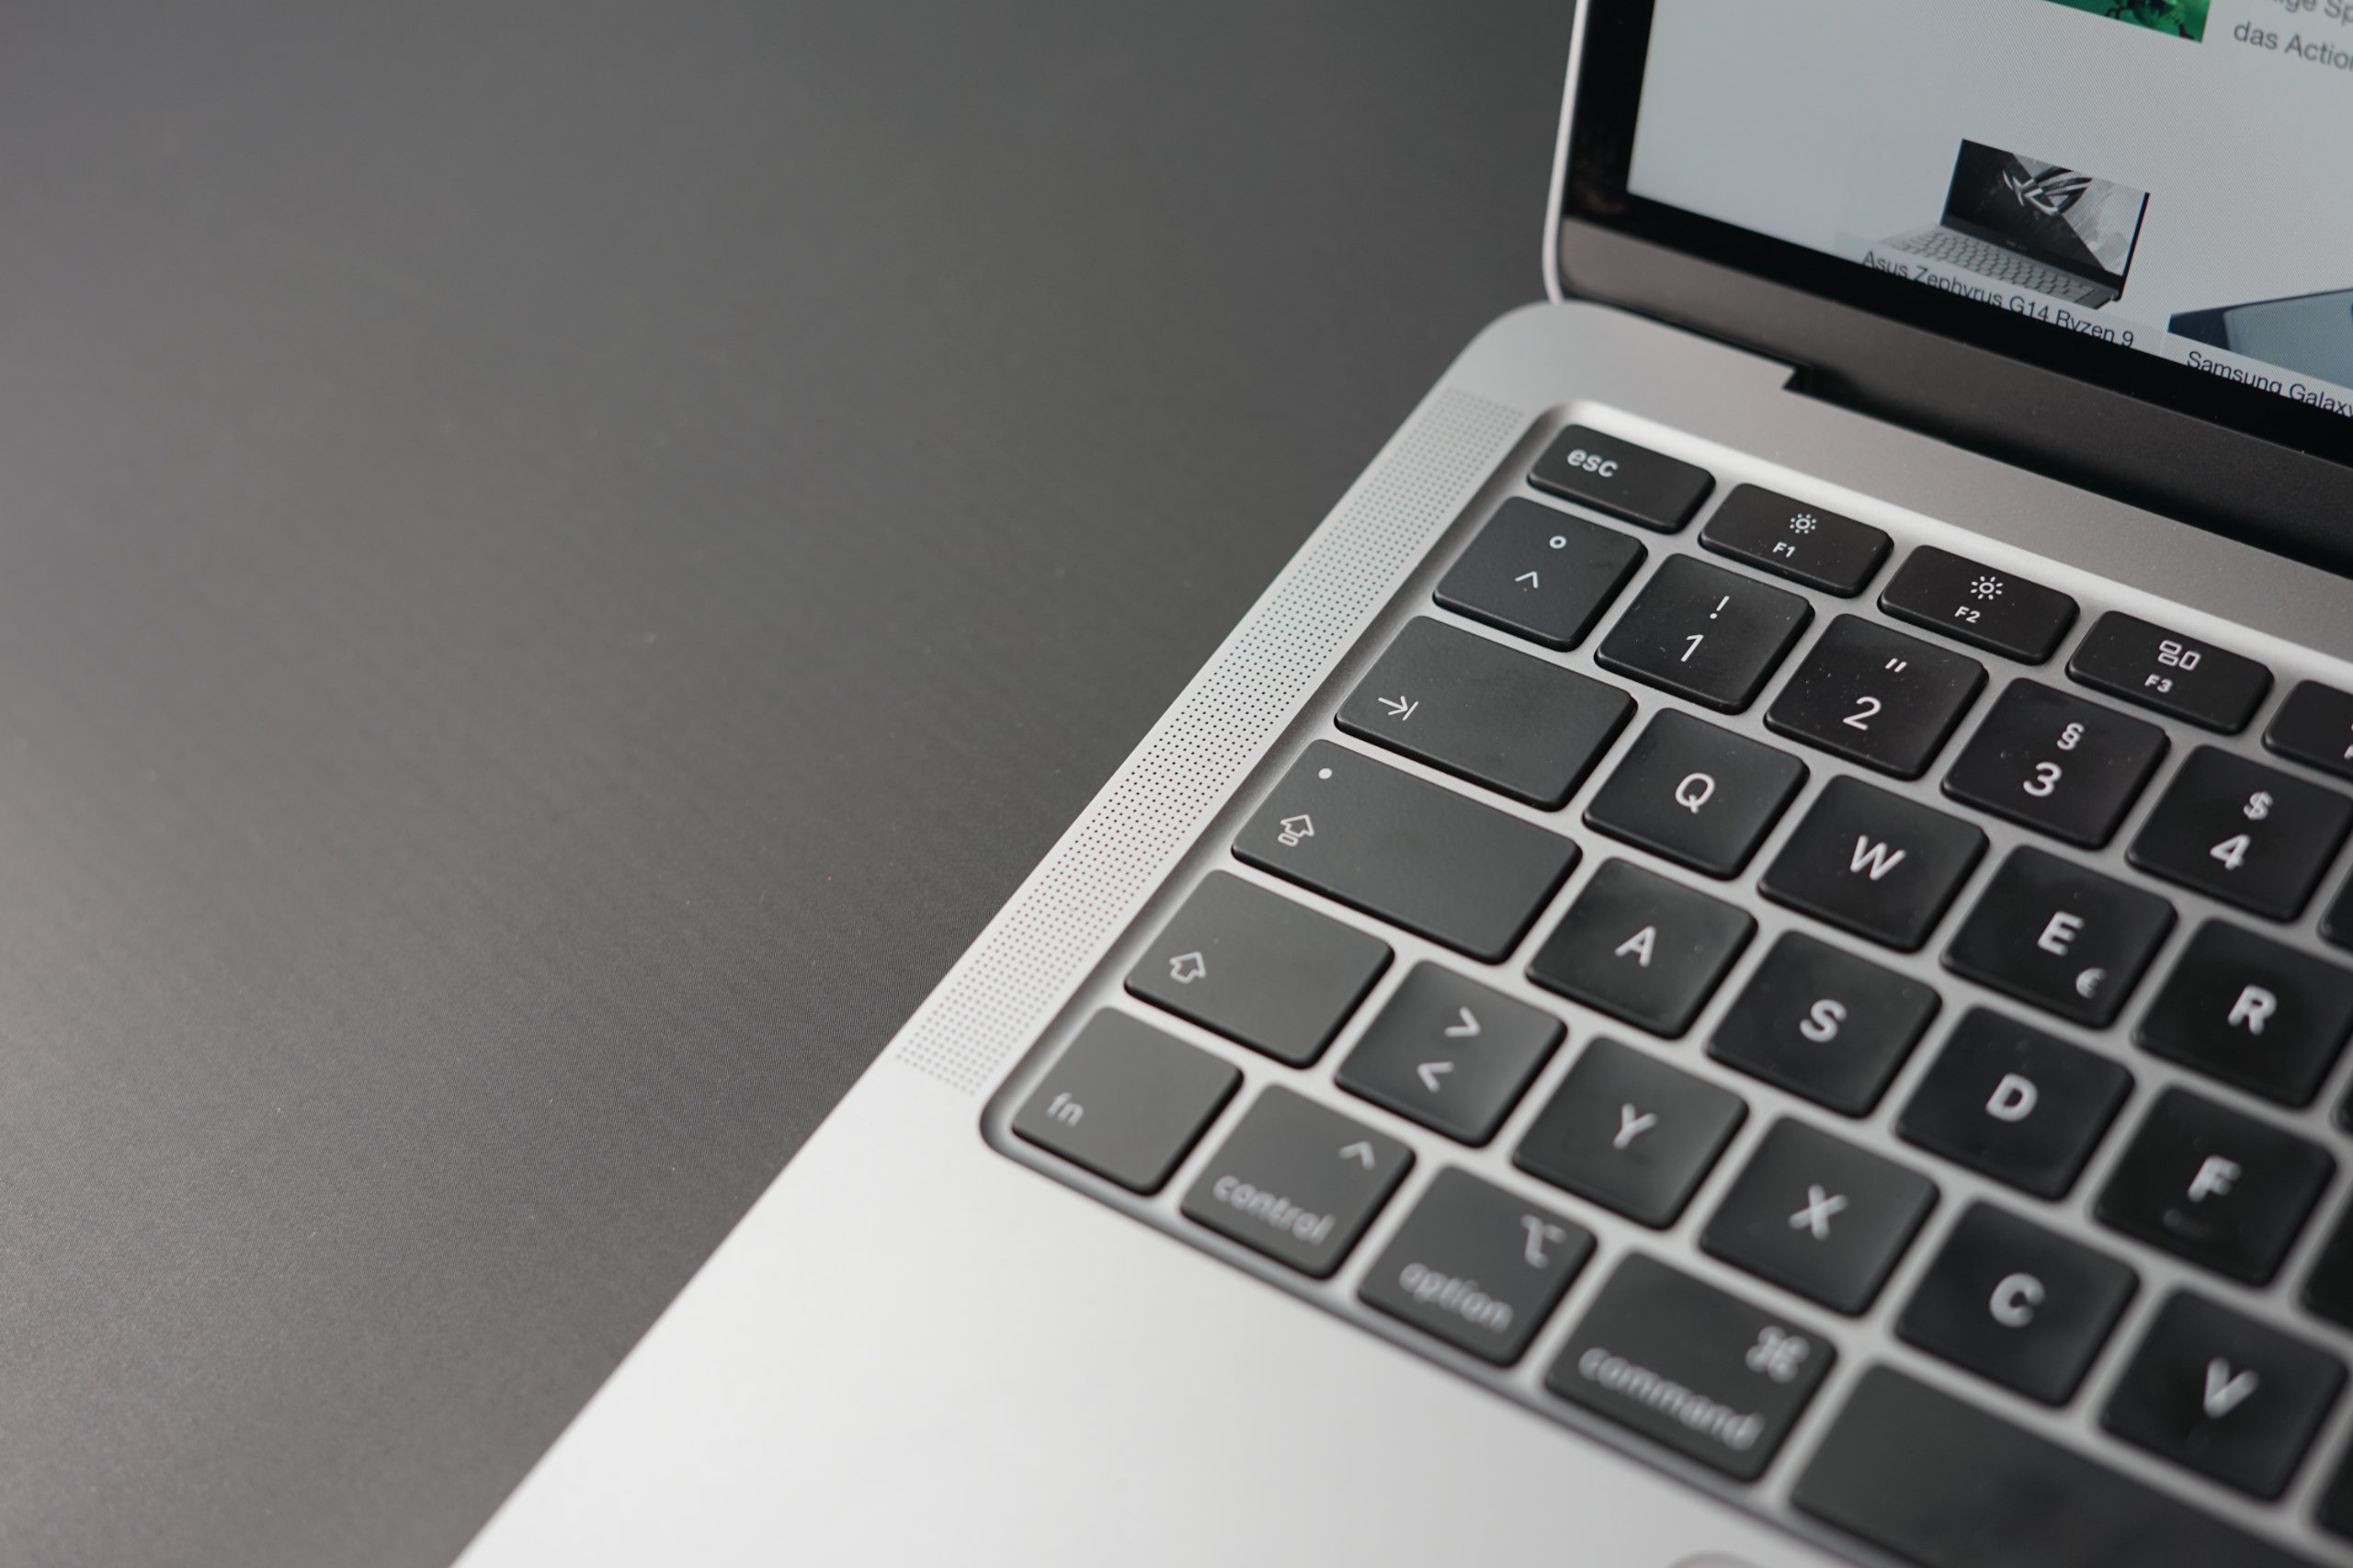
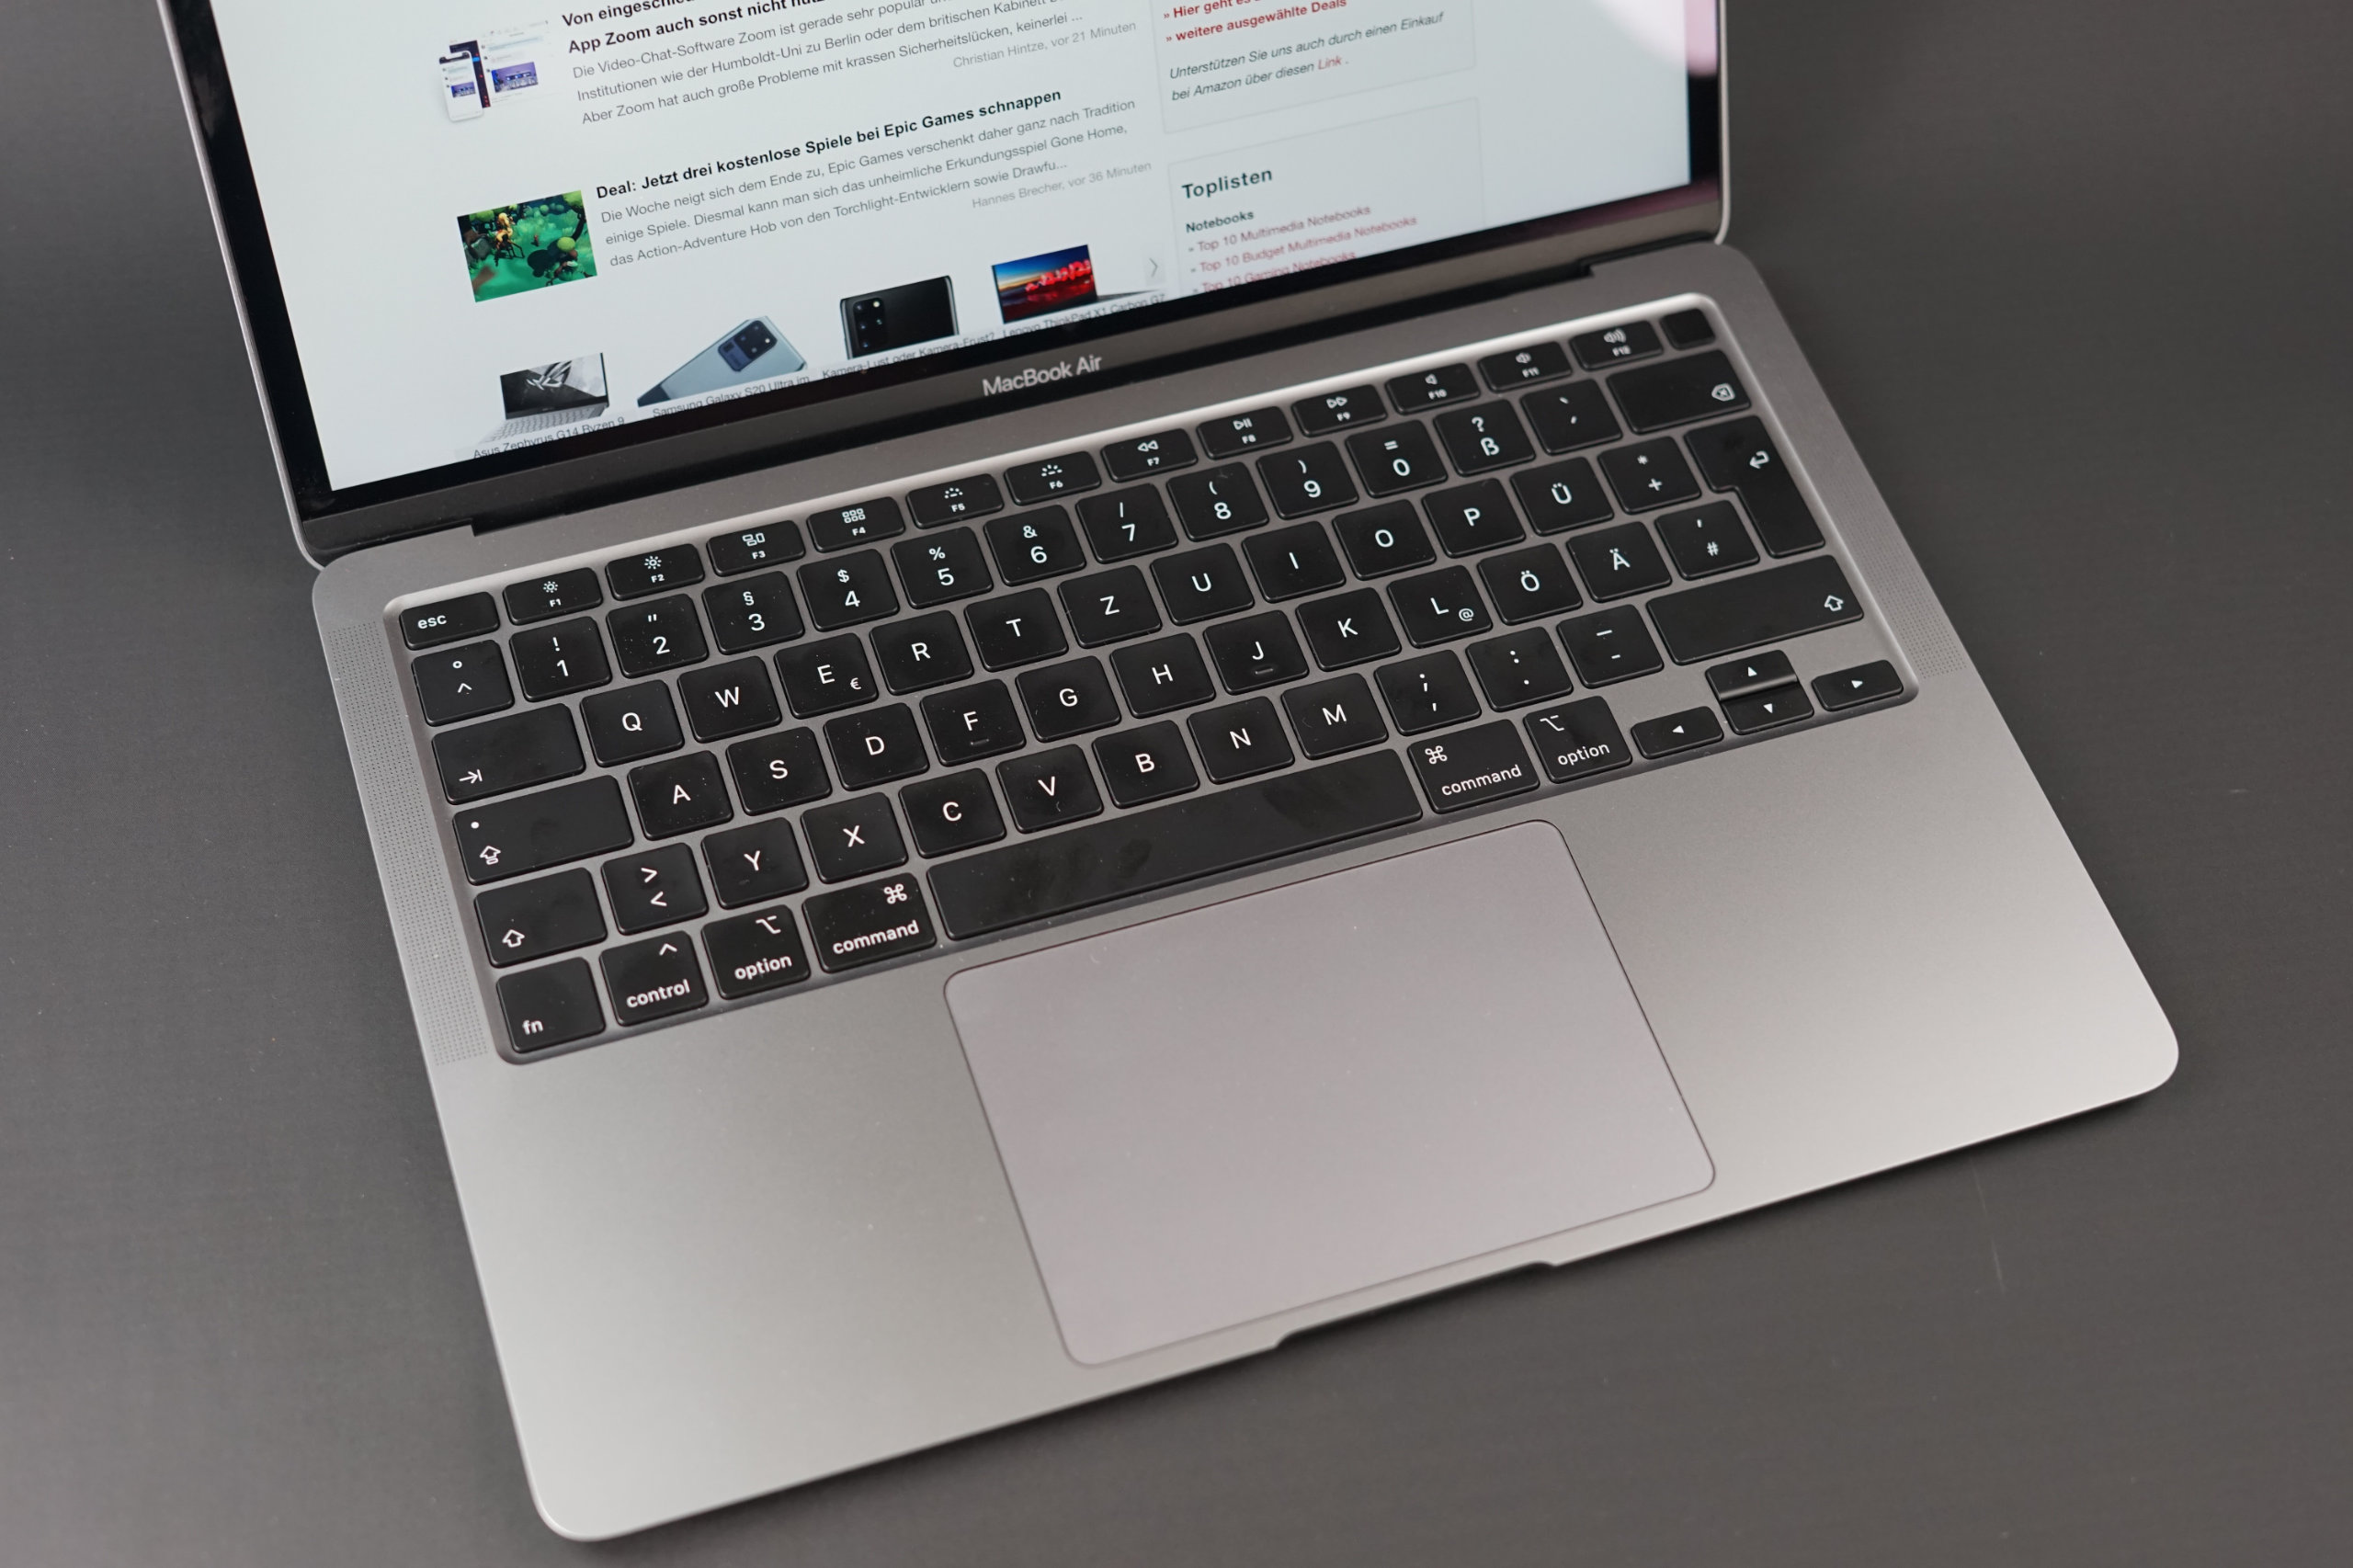
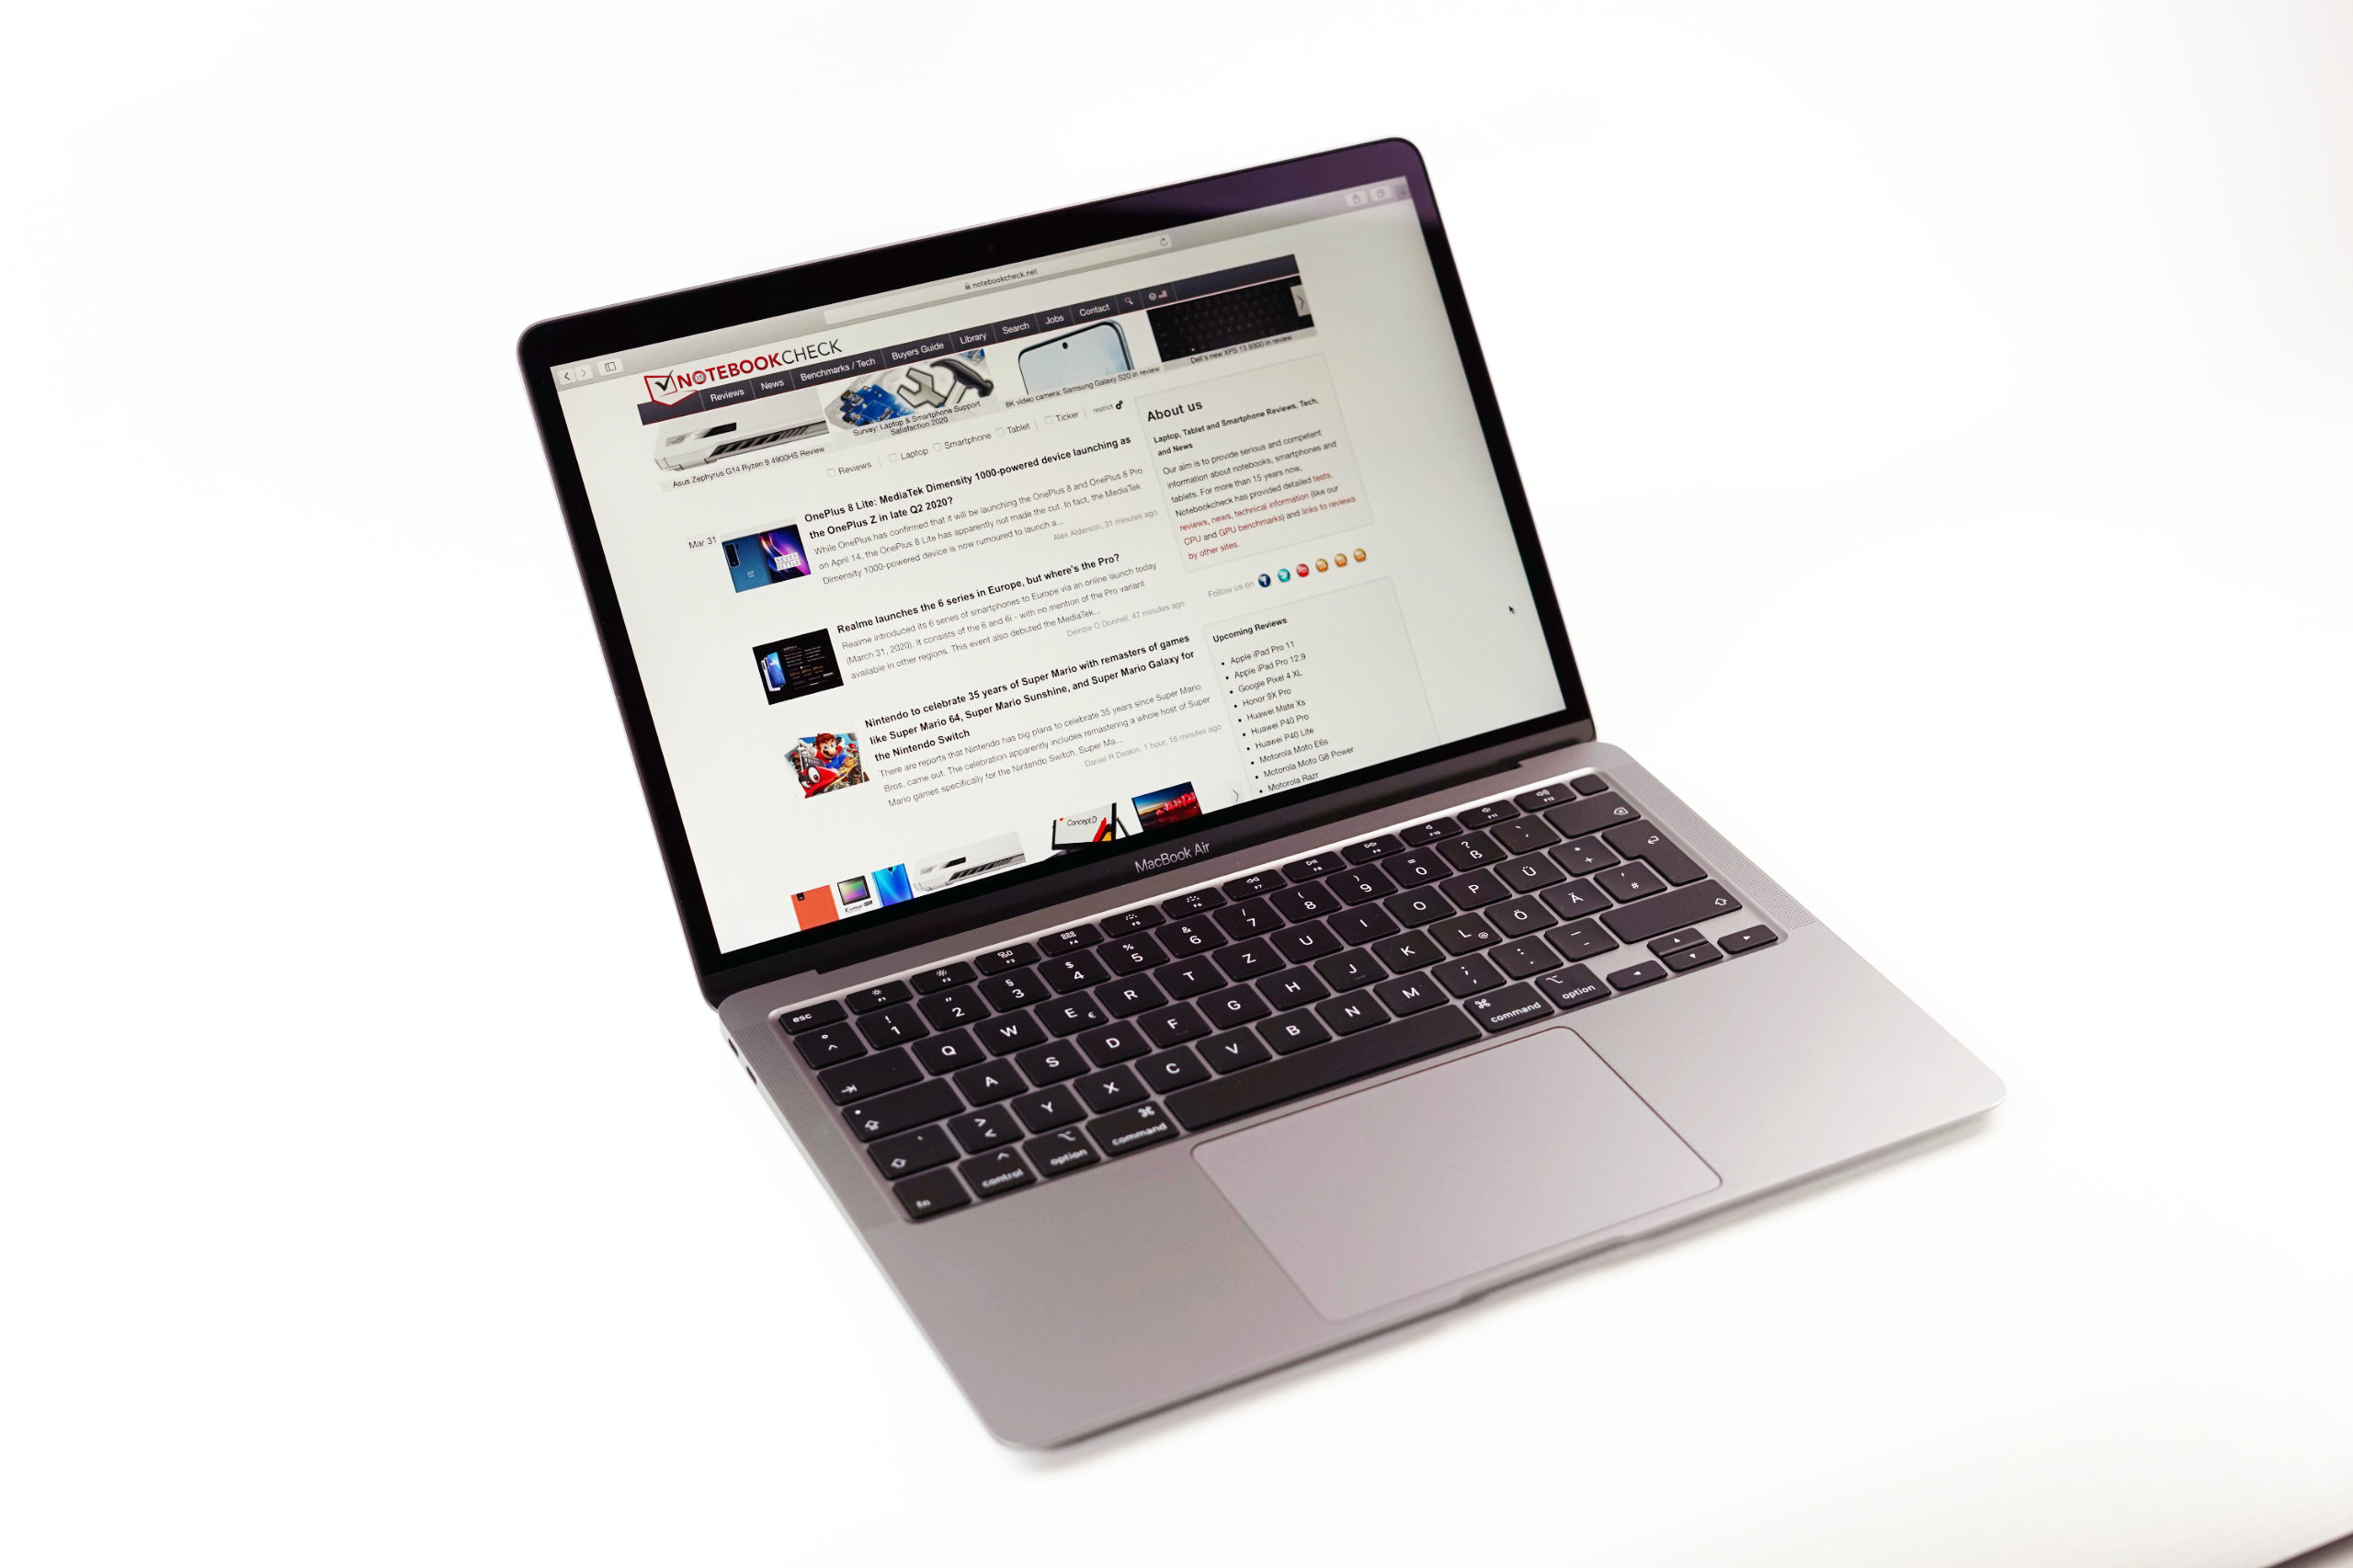
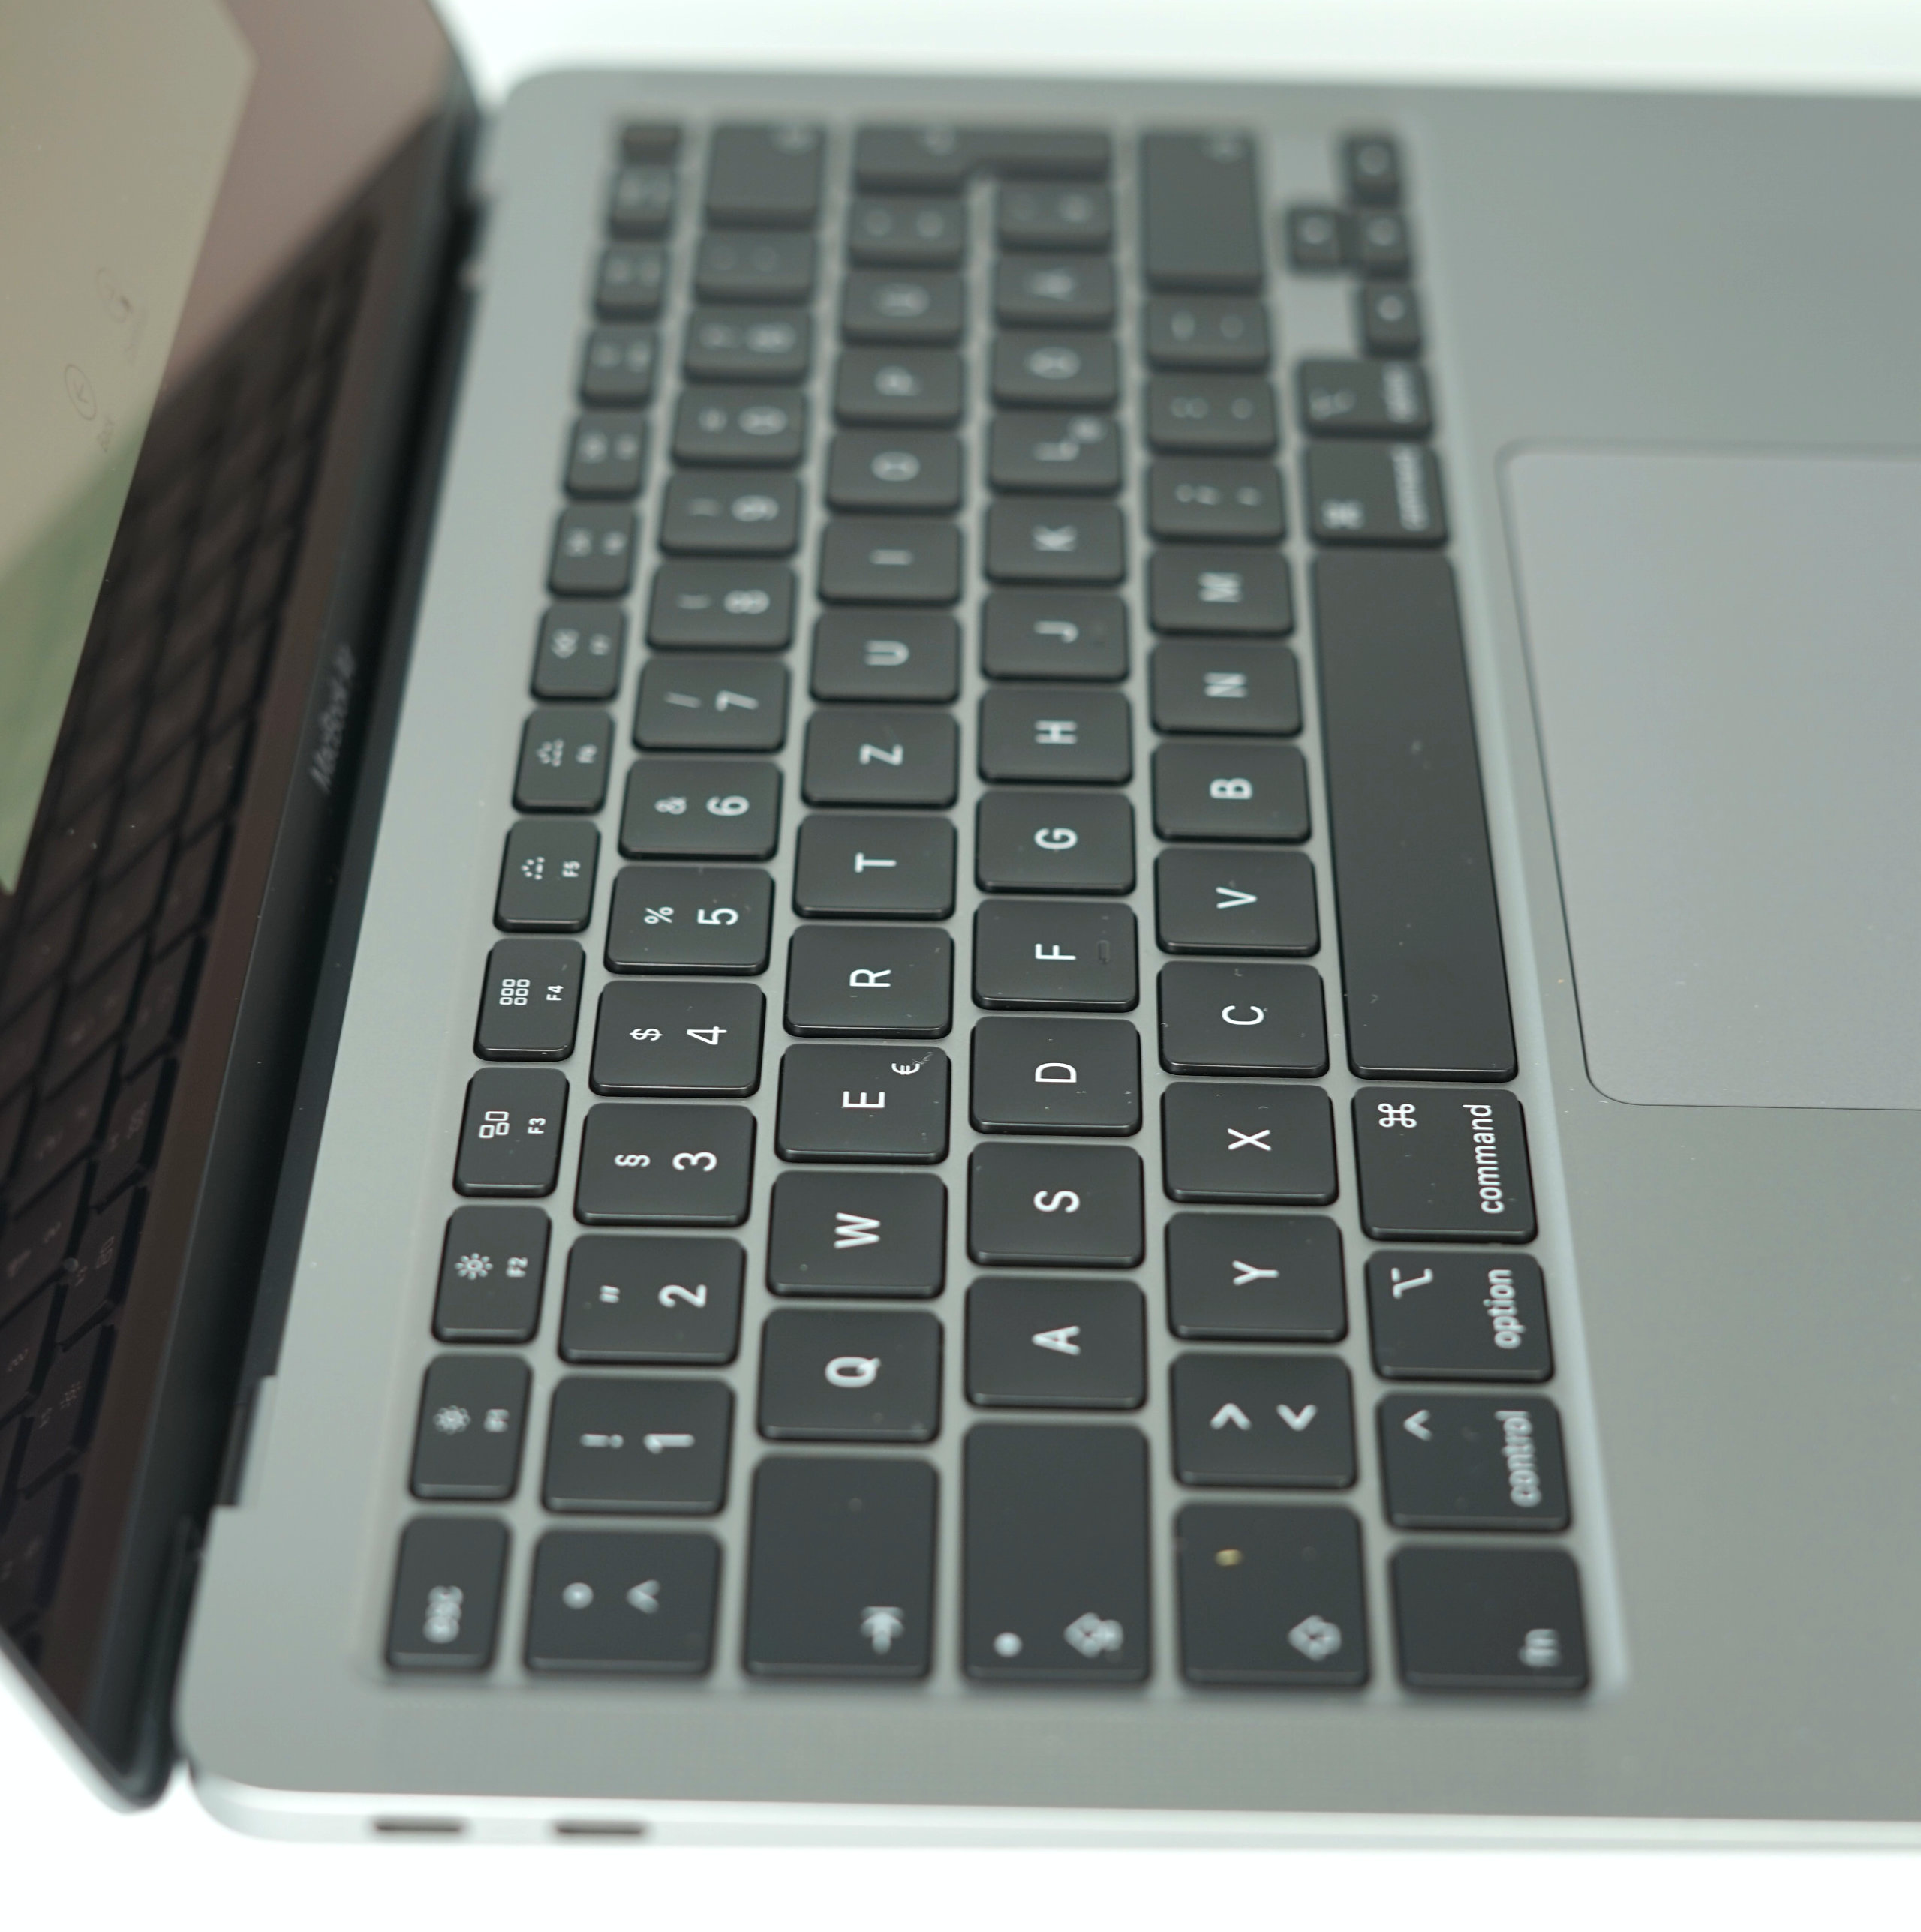
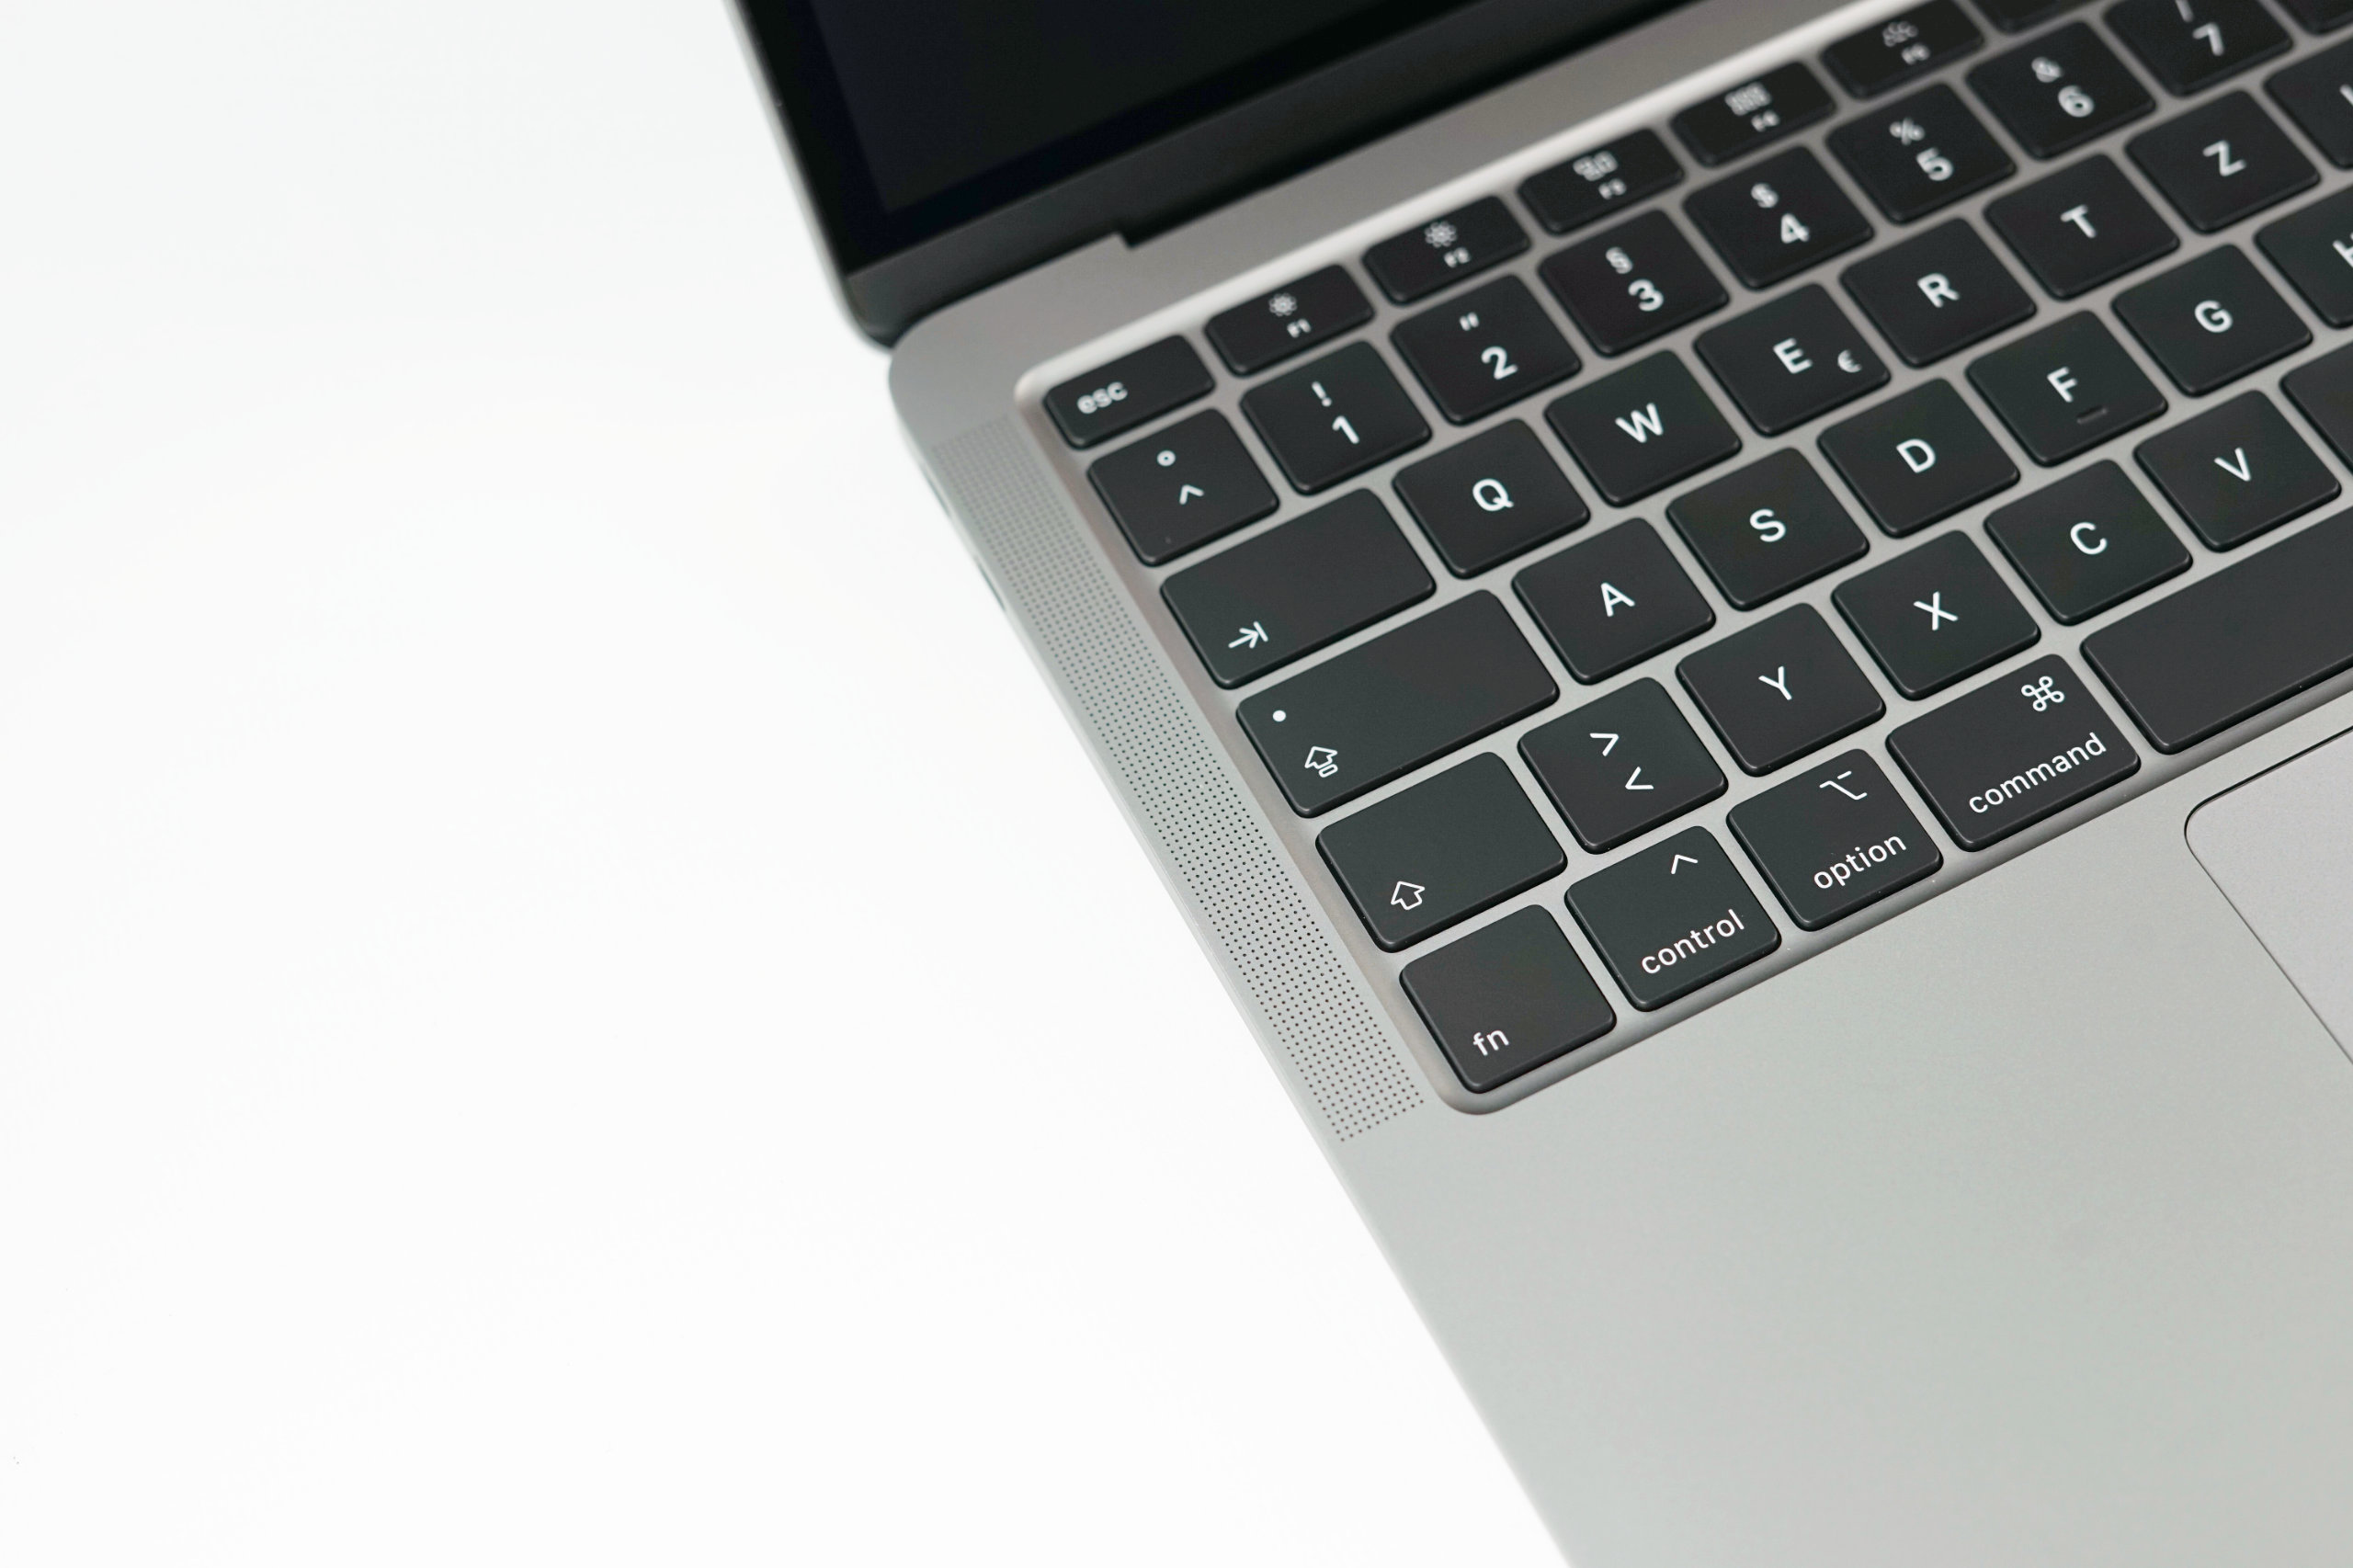
Giriş Aygıtları - Kelebek anahtarsız MacBook Air
Yeni klavyenin 2020 MacBook Air'deki en büyük değişiklik olduğunu daha önce belirtmiştik. Apple makas anahtarlarına geri döner ve ağır eleştirilen kelebek anahtarlarını kaldırır. Şahsen, yazar, kesin tuş vuruşu ve iyi tanımlanmış basınç noktası sayesinde MacBook Pro 15'teki kelebek klavyeyi takdir etti. 2018 modelleriyle, toz parçacıkları nedeniyle göz ardı edilen tuşlarla ilgili hiçbir sorun yoktu. Yeni "Sihirli Klavye" yine de daha fazla kullanıcıyı memnun edecek ve önümüzdeki yıllar için daha güvenilir bir seçenek olmalıdır. Özellikle eski MacBook kullanıcıları, yeni bir klavyeye alışmak ve benzer bir düzenin yanı sıra tanıdık bir yazma deneyimi elde etmek zorunda değildir.
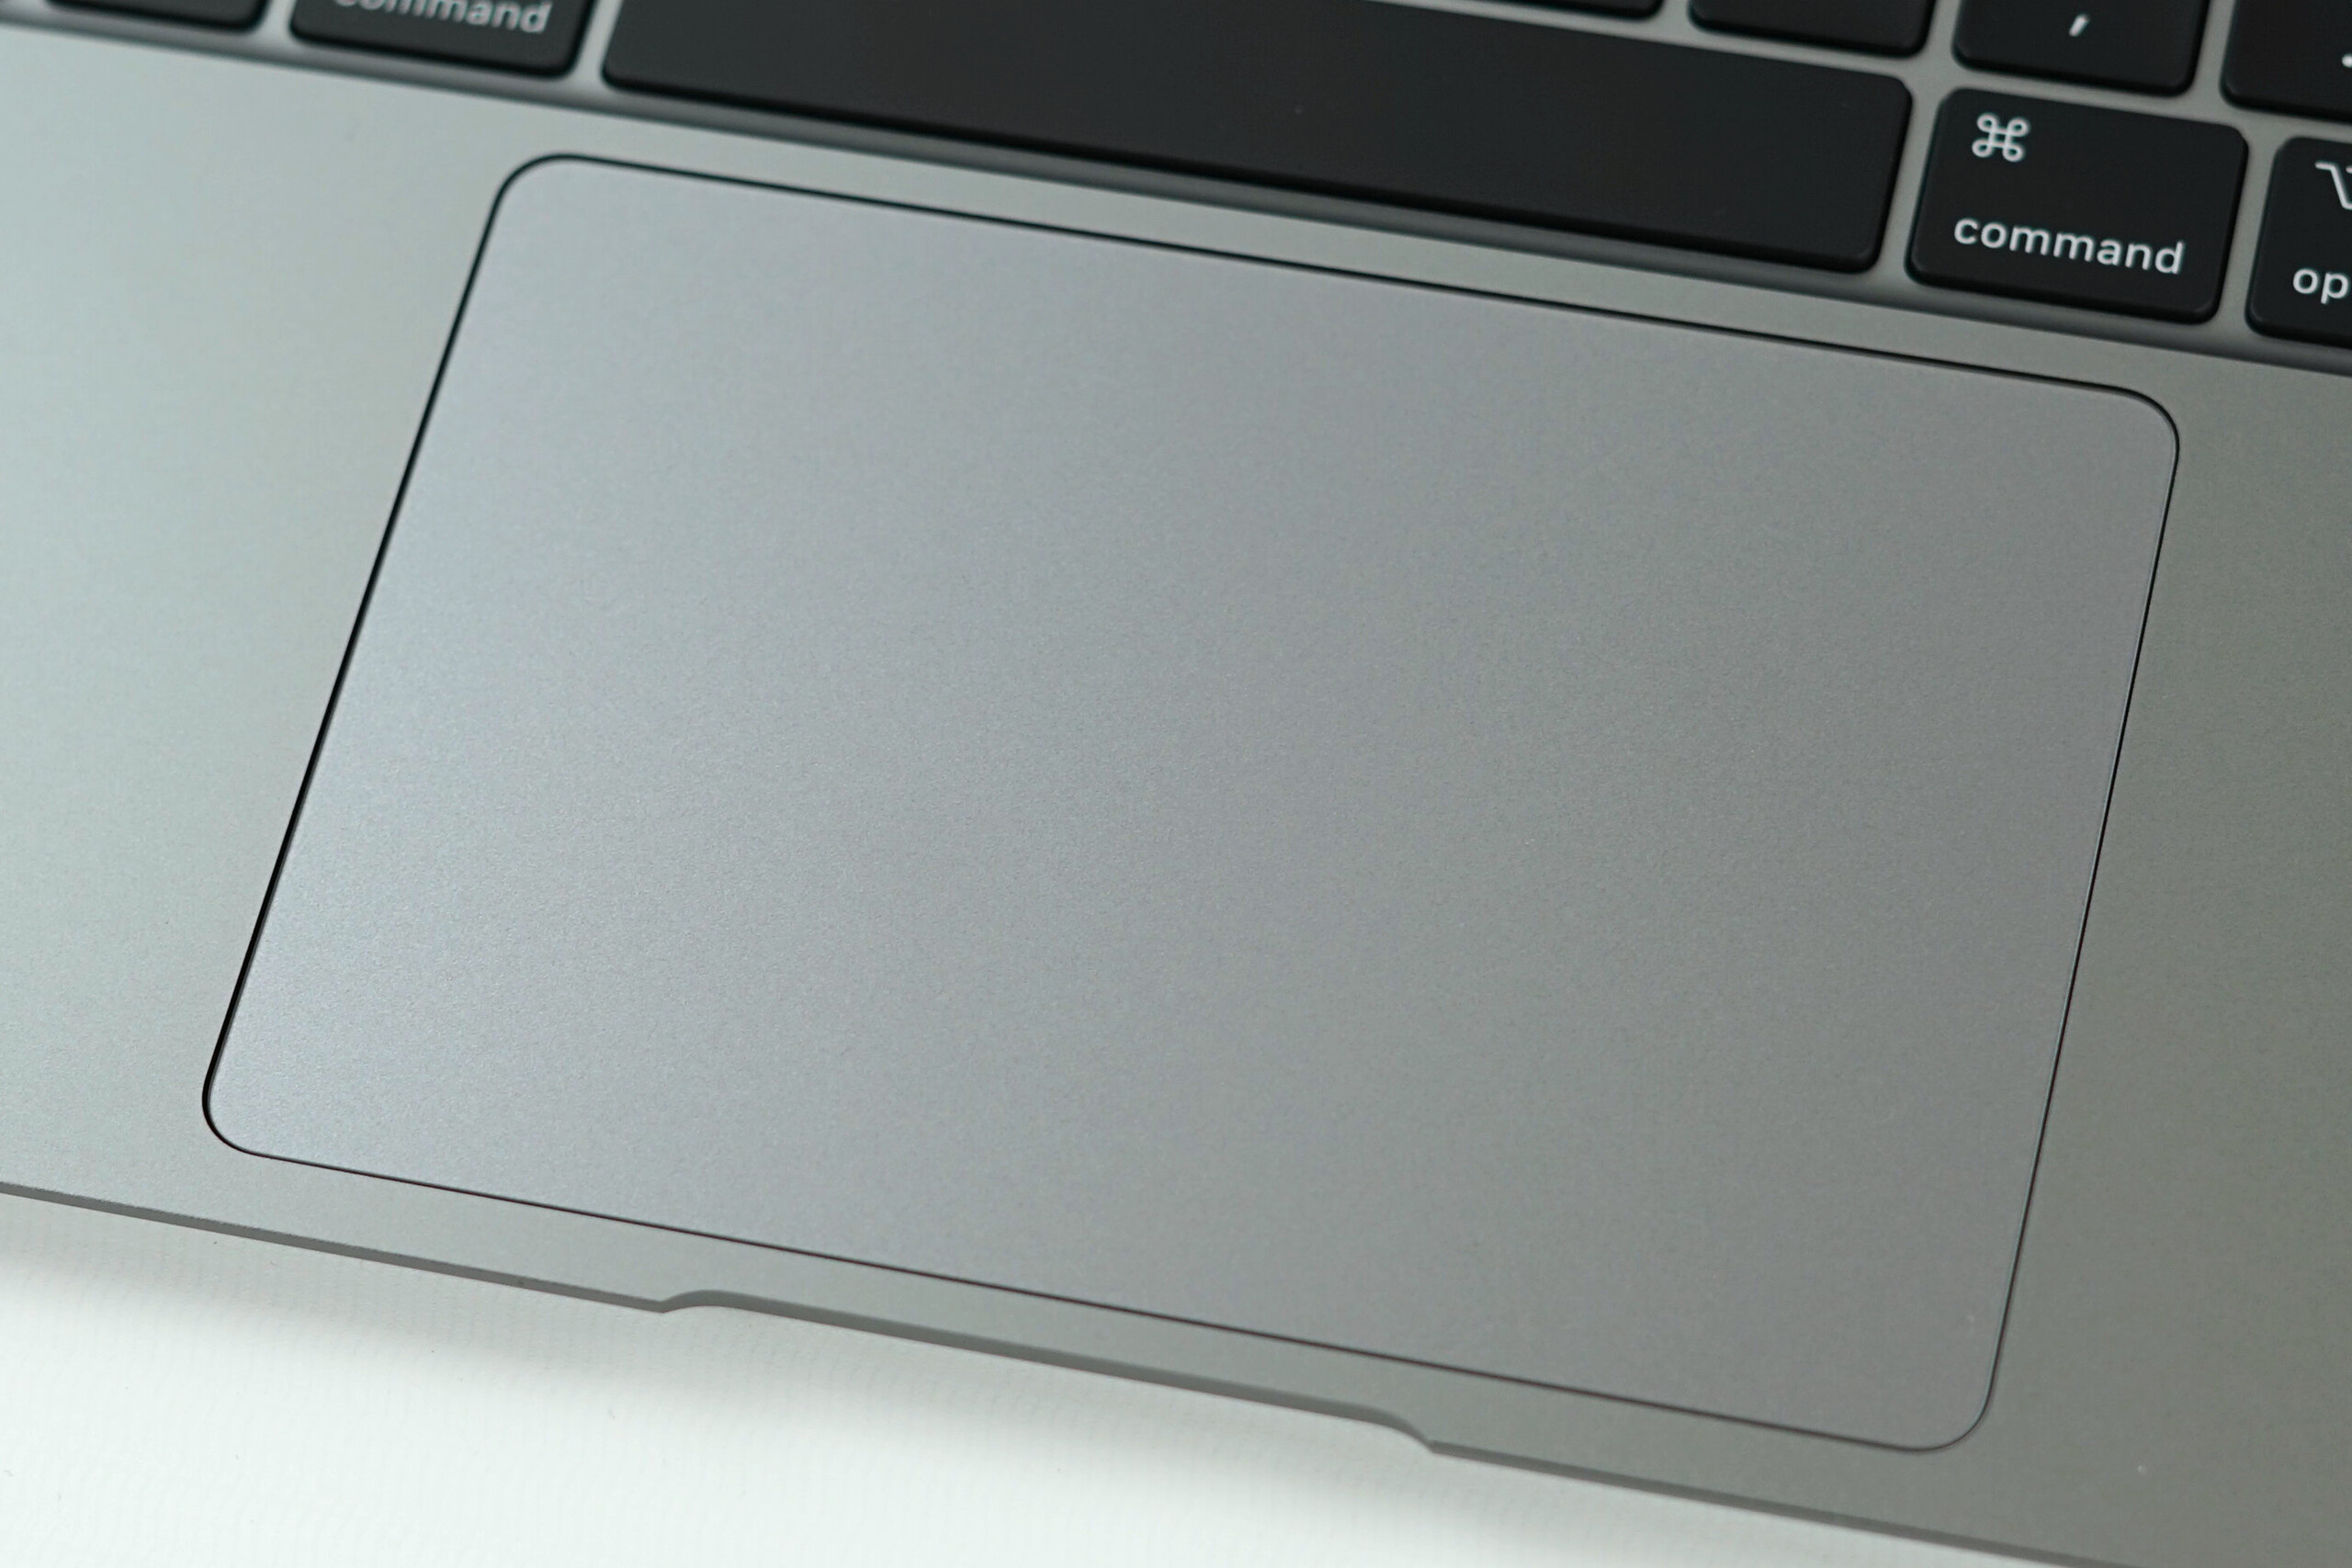
Dokunmatik
Her zaman olduğu gibi, büyük Force Touch izleme dörtgeni, mükemmel kayma özellikleri ve hala benzersiz Force Touch sayesinde kullanımı keyifli. Burada herhangi bir sorun bulamıyoruz.
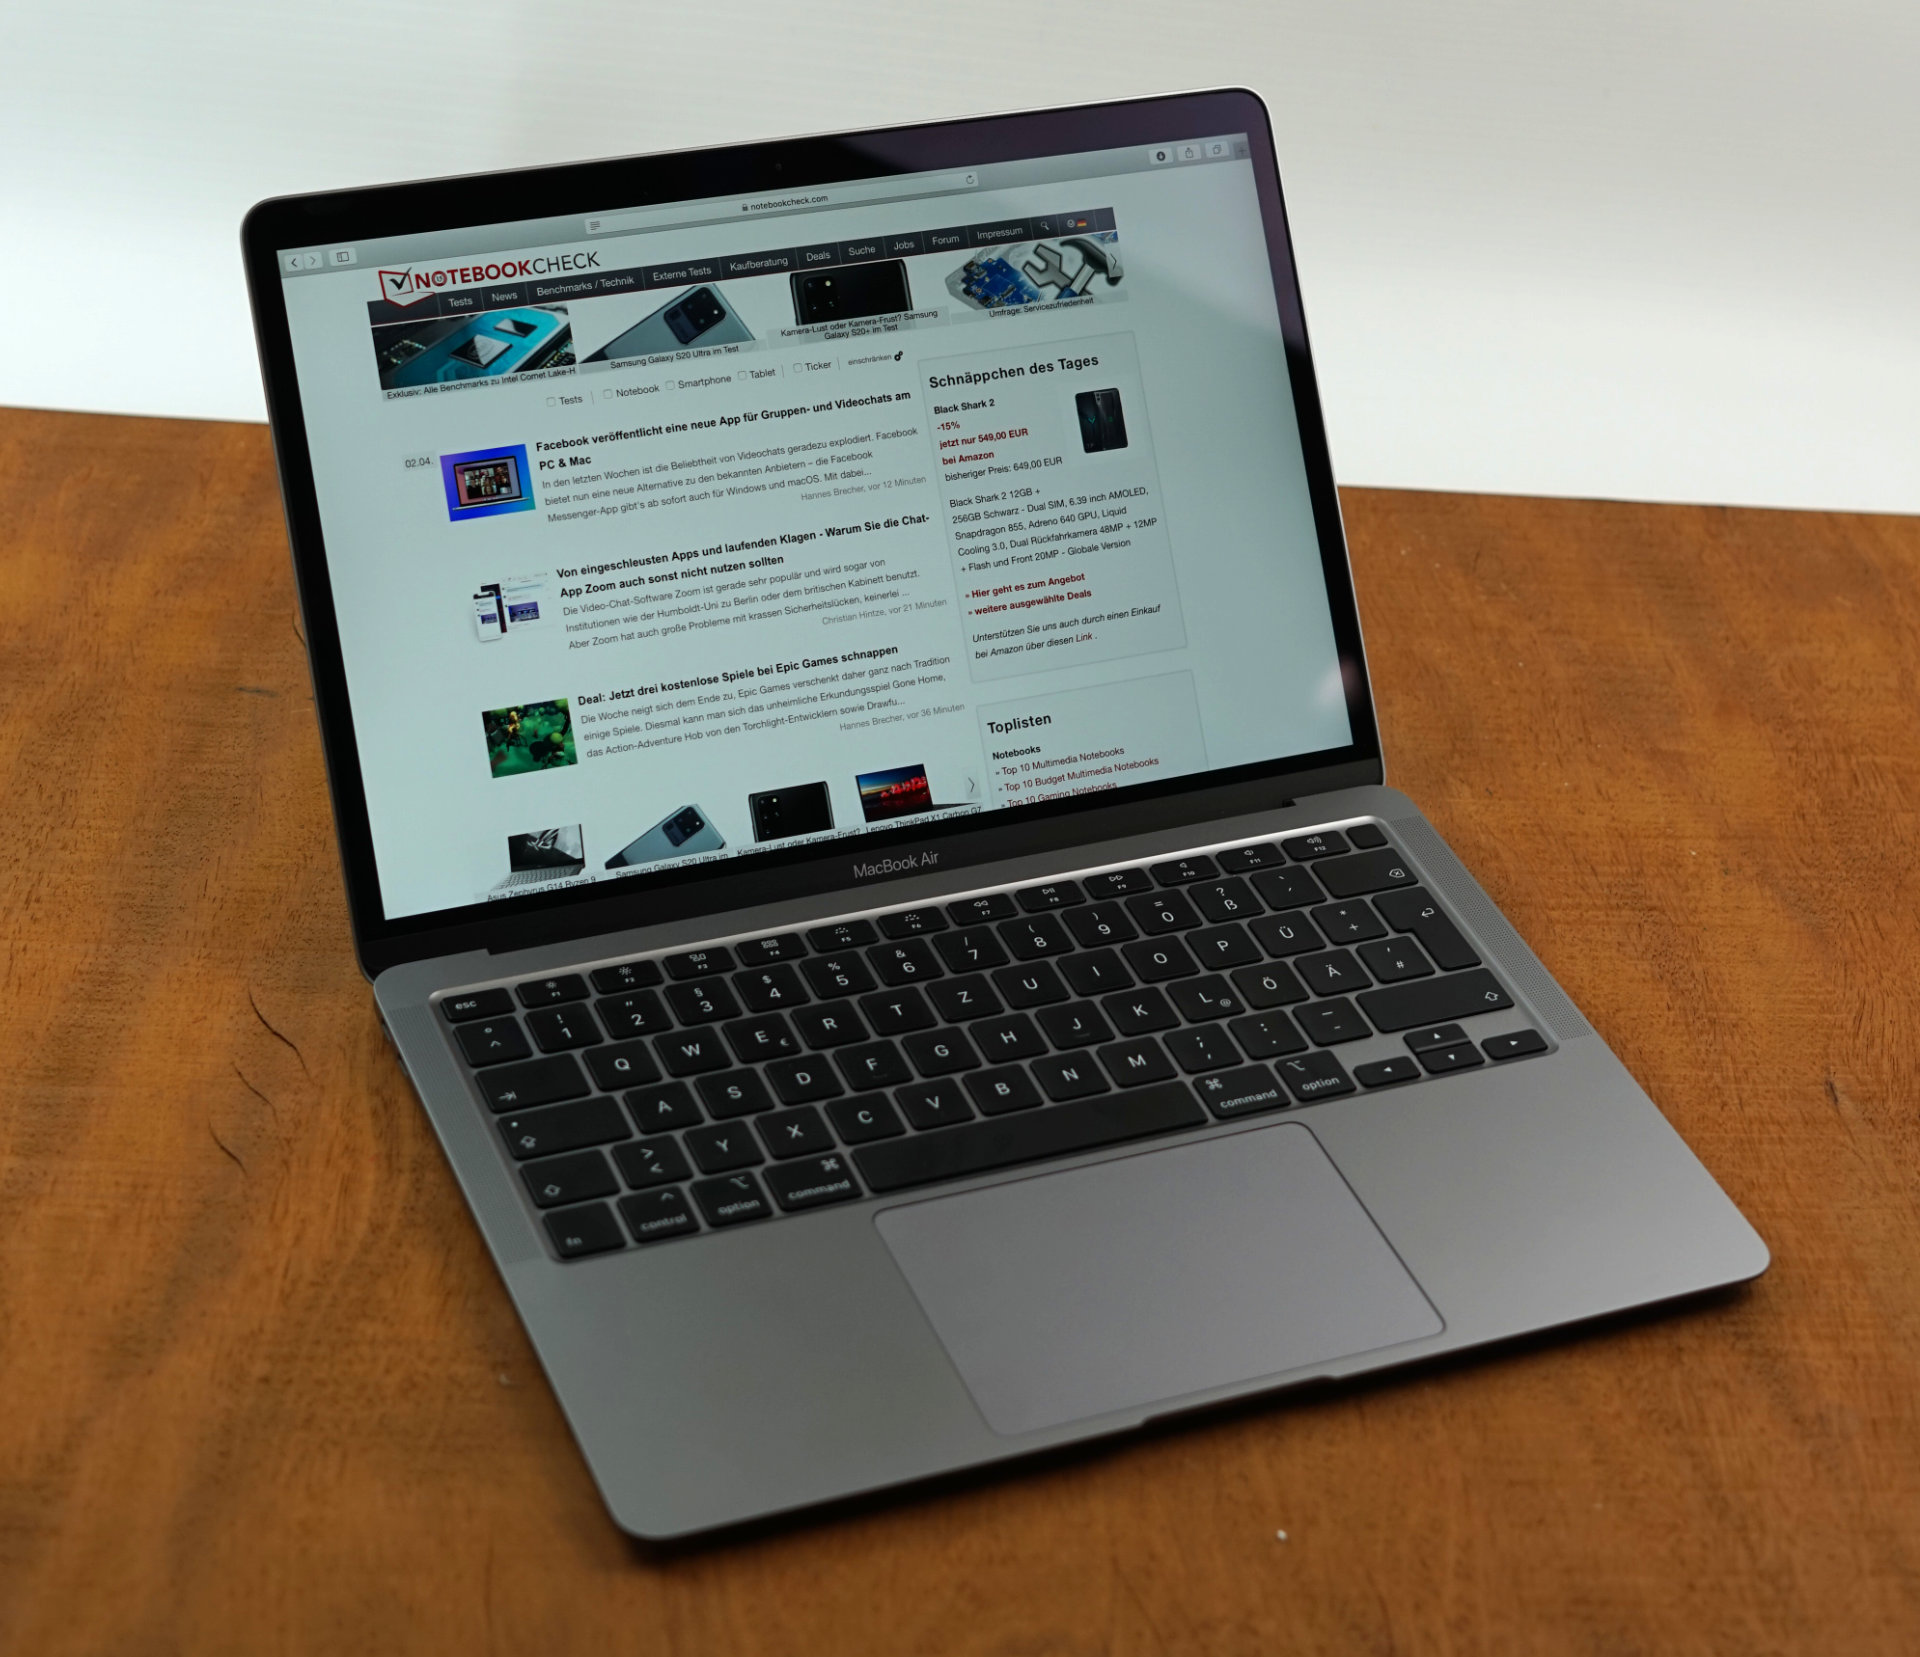
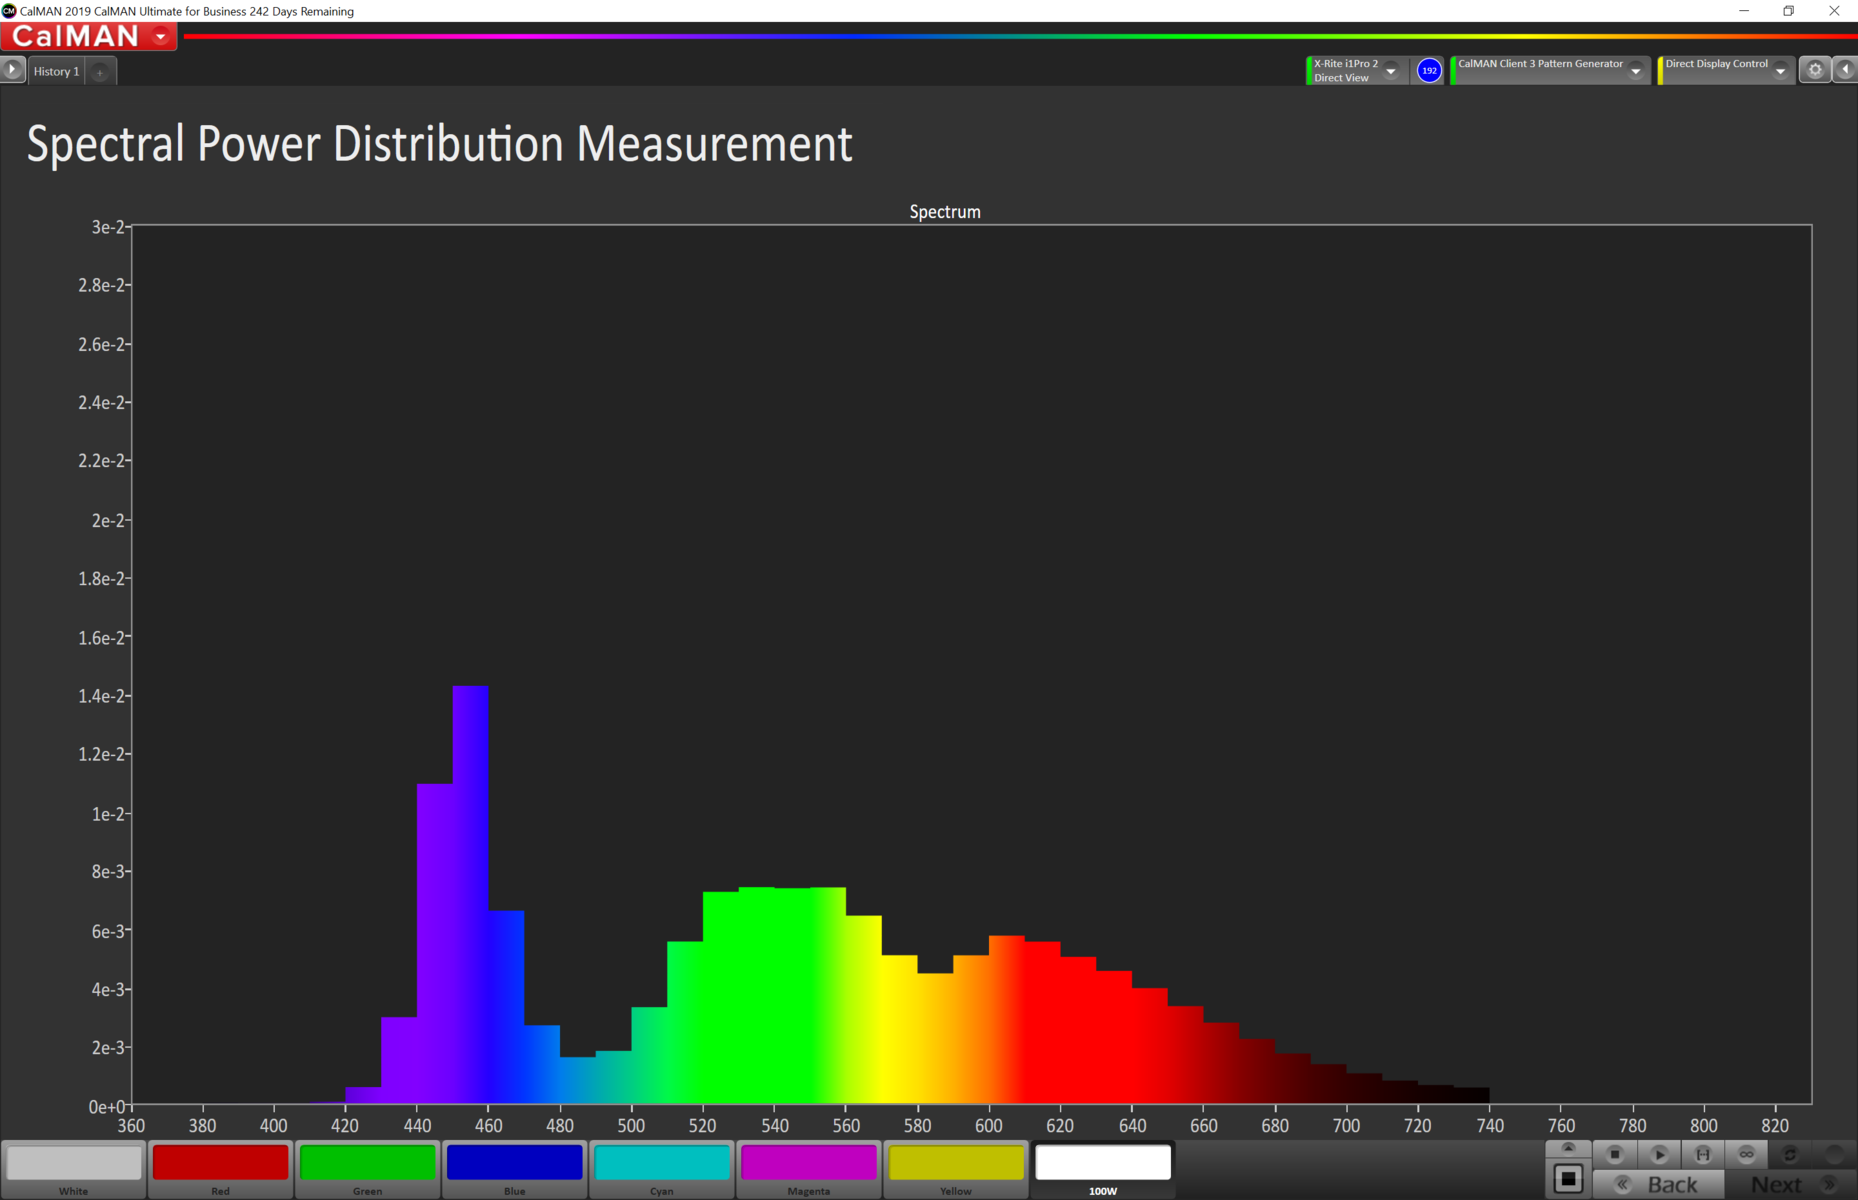
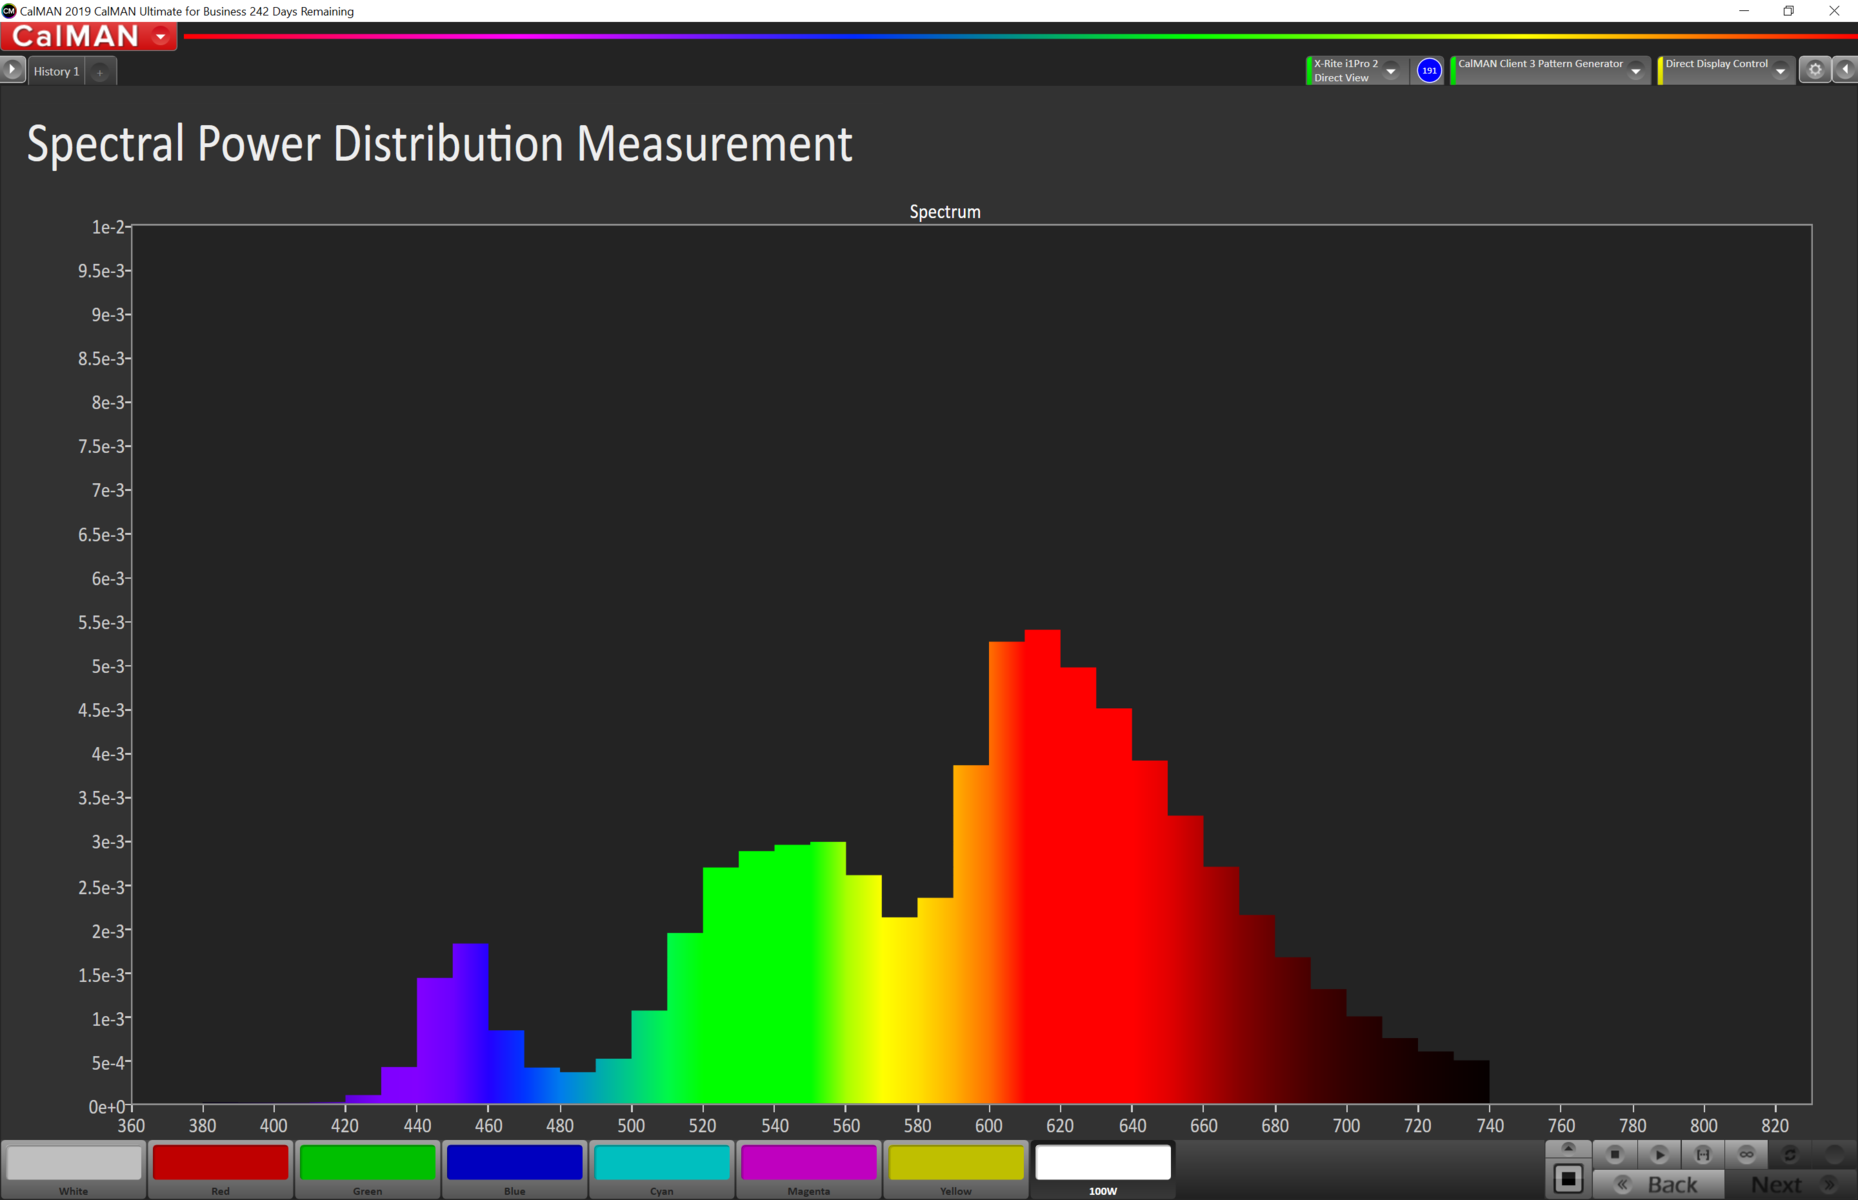
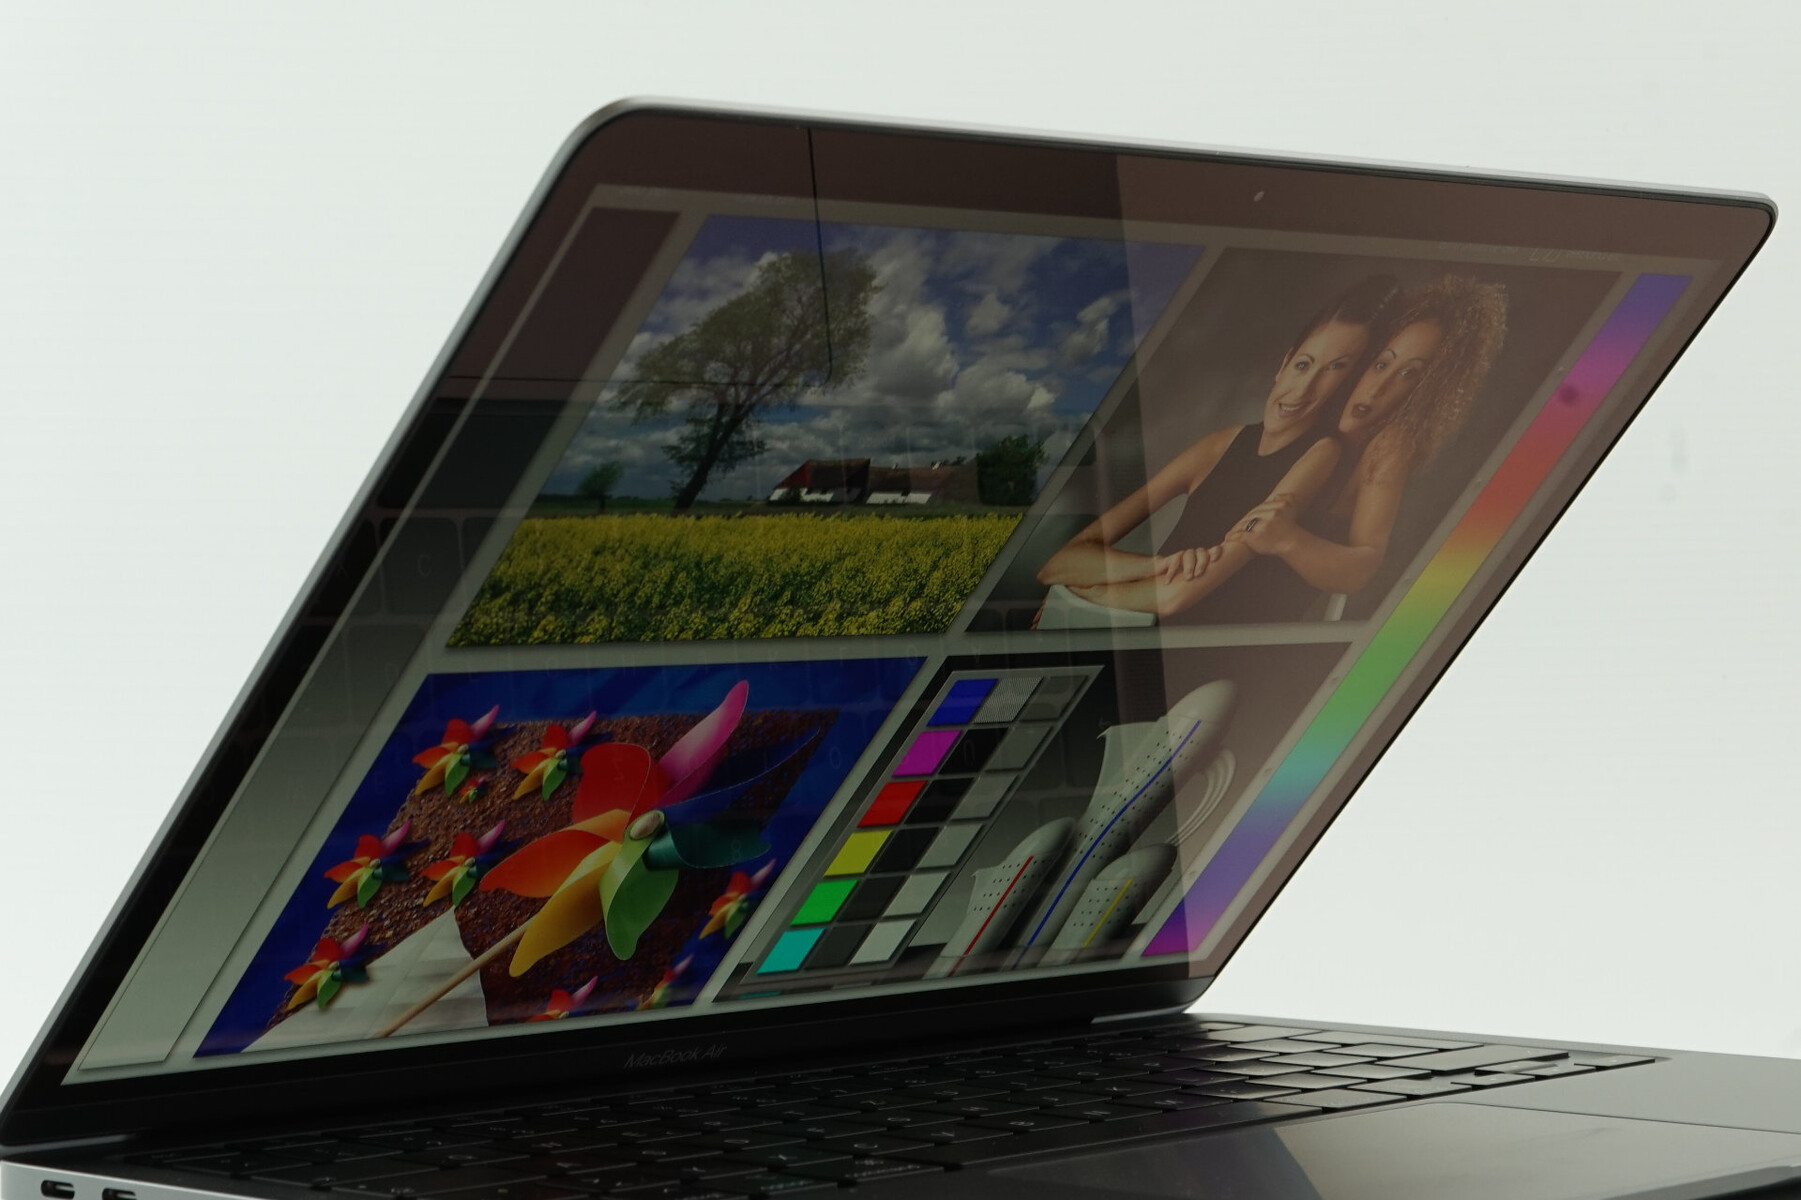
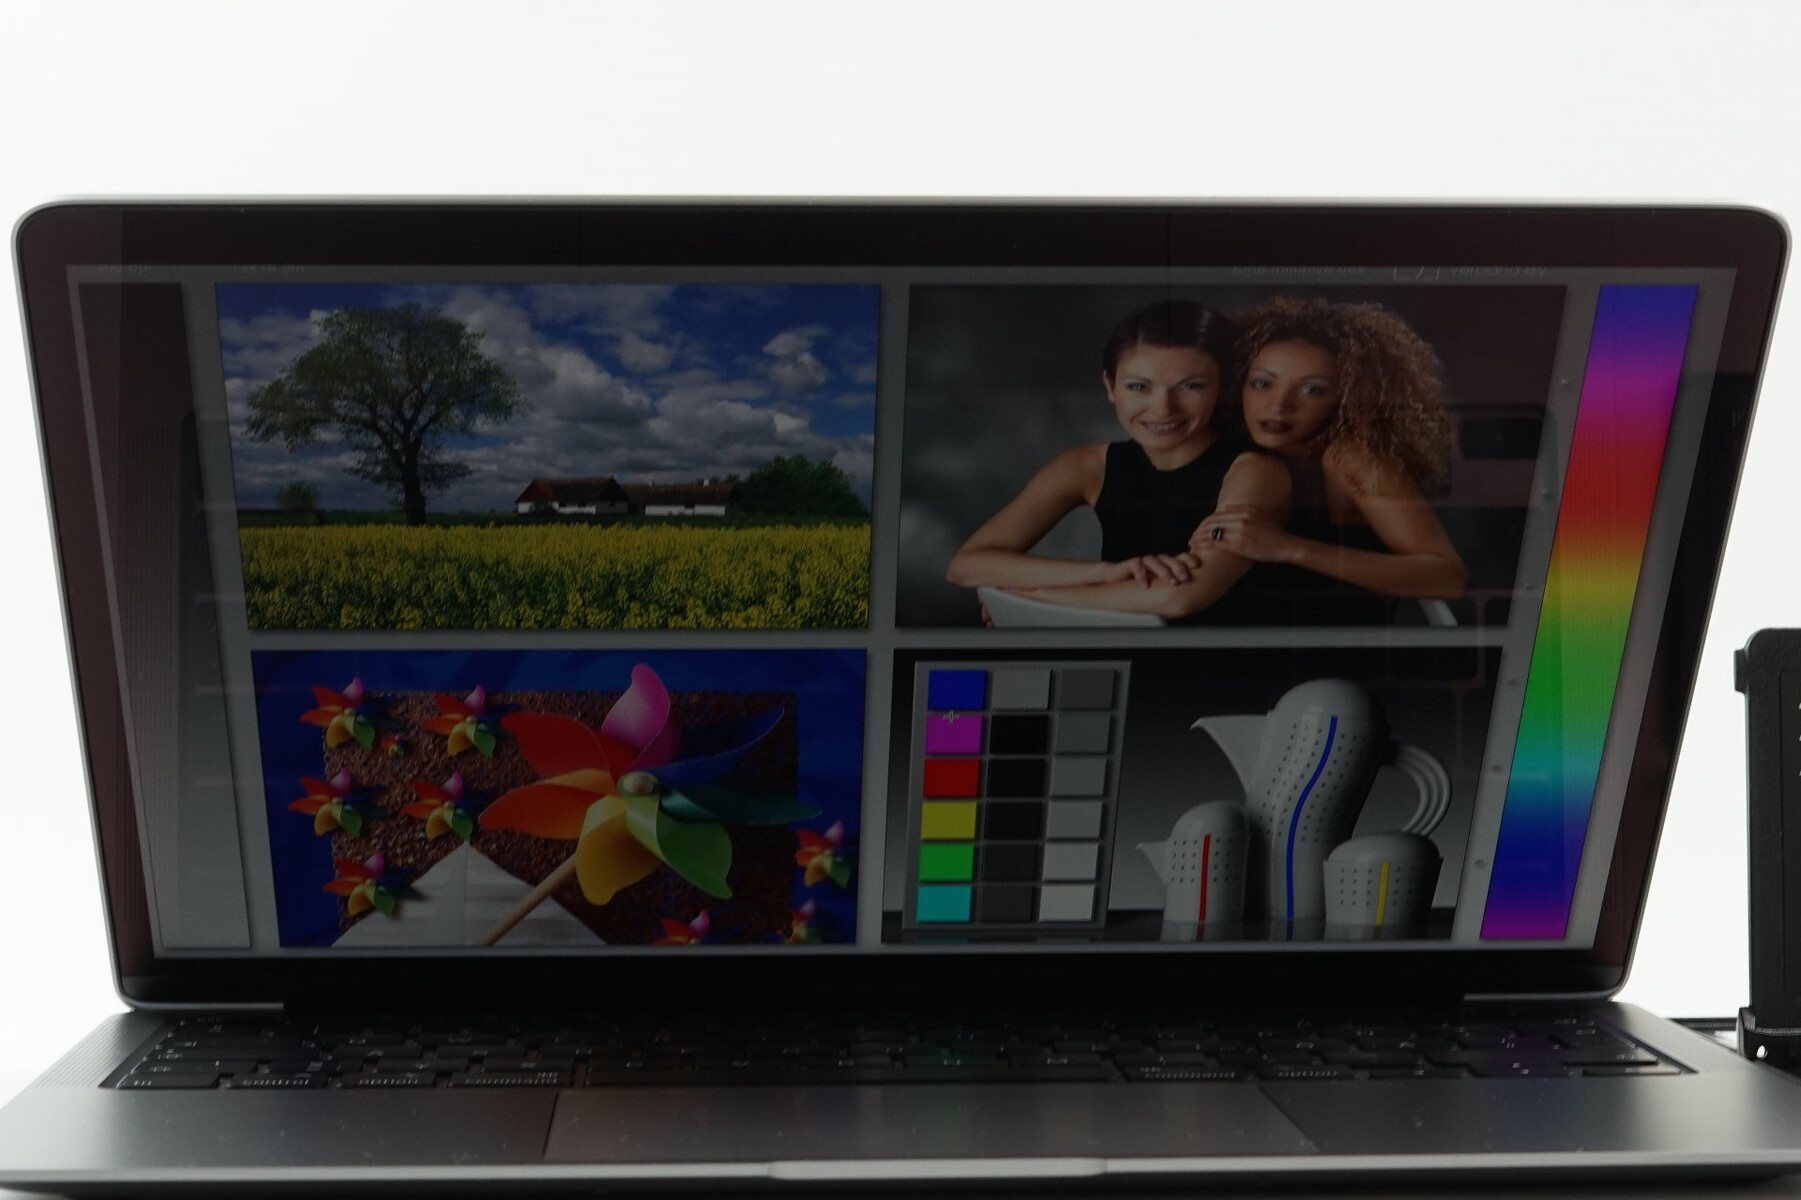
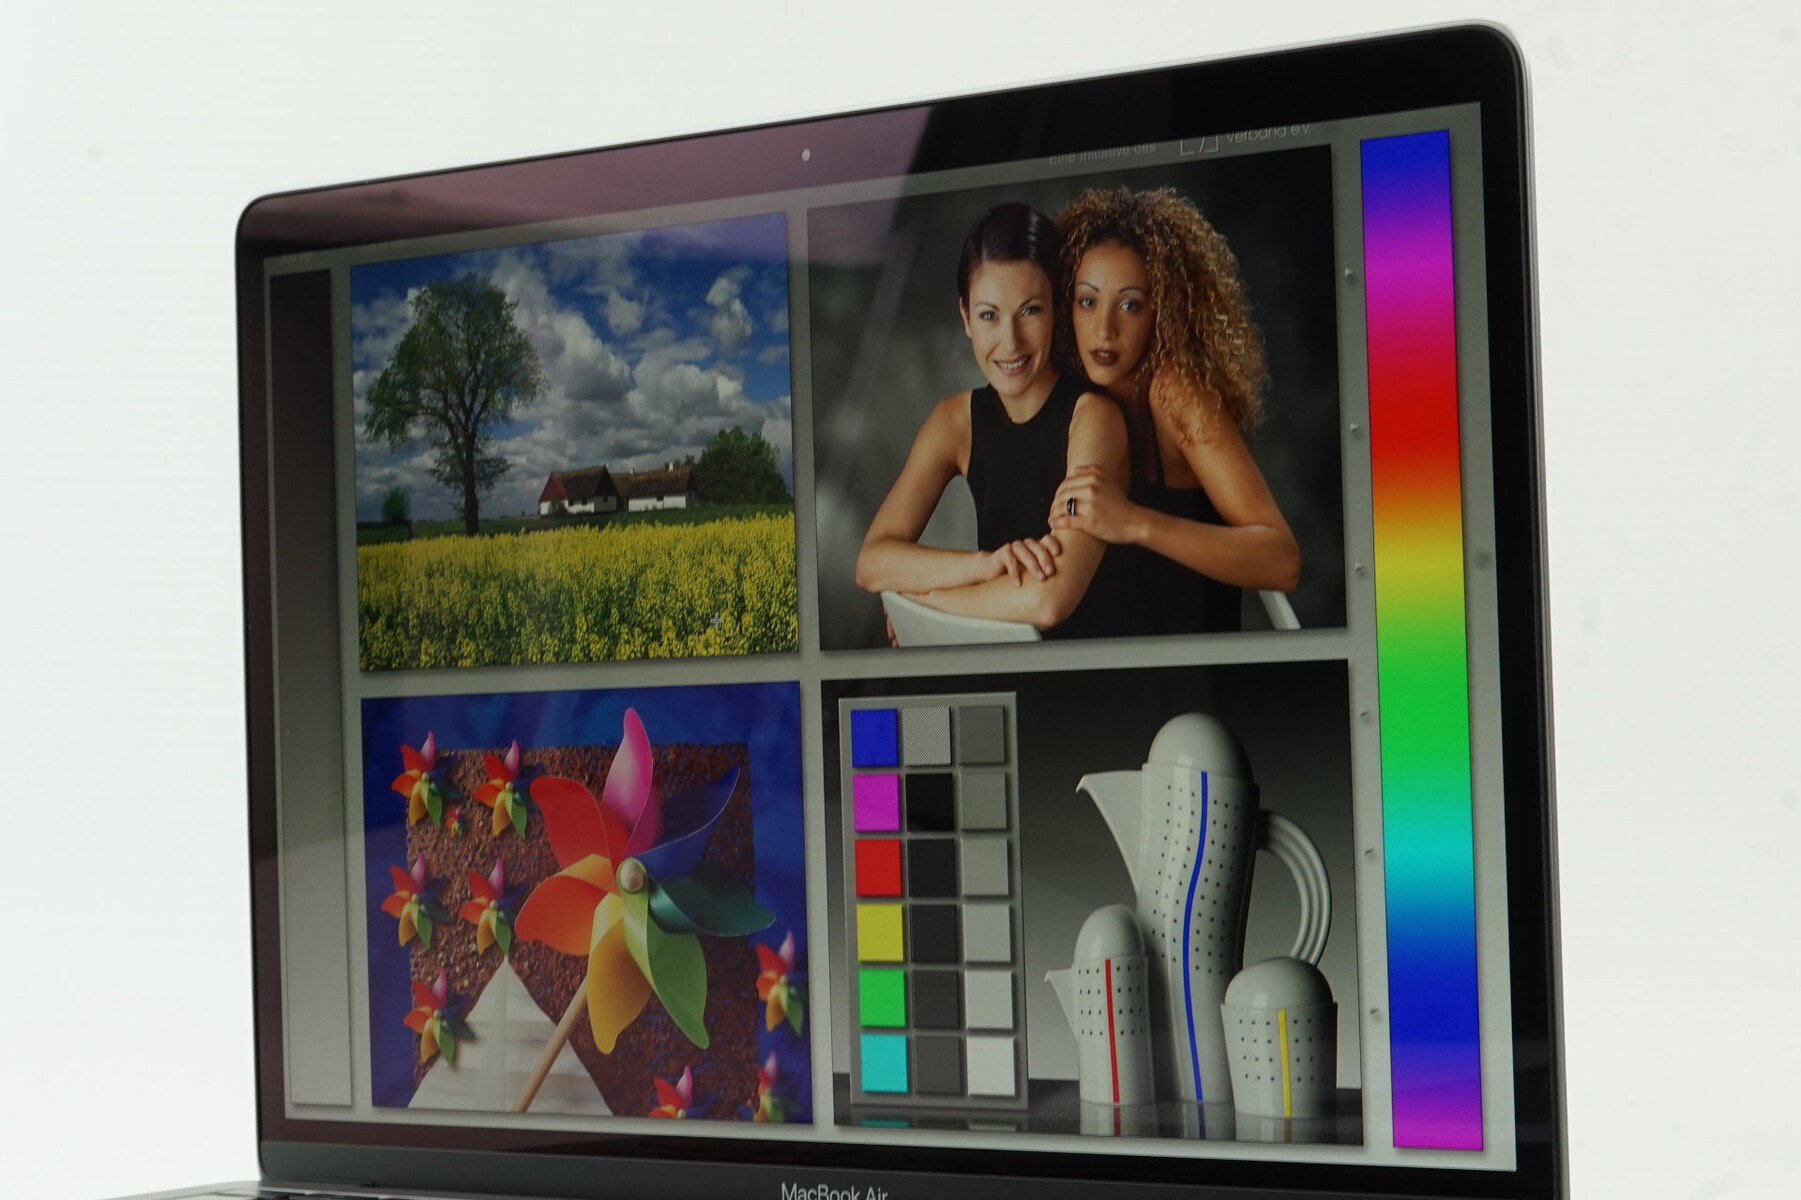
Ekran - Gerçek Tonlu Retina
Ekranın değişmediği görülüyor: IPS, 16:10, 2560 x 1600 piksel ve parlak bir yüzey, Apple'ın ekranları aslında bu konuda oldukça iyi ve diğer birçok panel / dokunmatik ekran kadar parlak olmasa da (teşekkürler) yansıtıcı bir tabakaya). Apple'ın giriş seviyesi dizüstü bilgisayarı, renk sıcaklığını ortama göre otomatik olarak ayarlayan True Tone teknolojisini de destekler. Panel kimliği eski modele (şimdi APPA042) kıyasla değişti, ancak ölçümlerimizde önemli bir değişiklik yok. Ortalama parlaklık 400 nits civarındadır ve kontrast oranı 1300: 1'i aşmaktadır. Sübjektif resim izlenimi çok iyi, ancak rekabet en azından aynı seviyede ve parlaklık gibi bazı açılardan daha iyi. Apple, parlaklığı% 75 veya daha düşük bir seviyede düzenlemek için PWM kullanıyor. 100 kHz'in üzerinde çok yüksek bir frekans belirledik, ancak en son MacBook'ların bazılarında çalışırken sorunlu kullanıcılardan birden fazla posta aldık. PWM titremesine karşı hassassanız, cihazı güvenli tarafta olmak için mümkün olduğunca uzun süre test etmenizi öneririz.
| |||||||||||||||||||||||||
Aydınlatma: 89 %
Batarya modunda parlaklık: 427 cd/m²
Kontrast: 1344:1 (Siyah: 0.32 cd/m²)
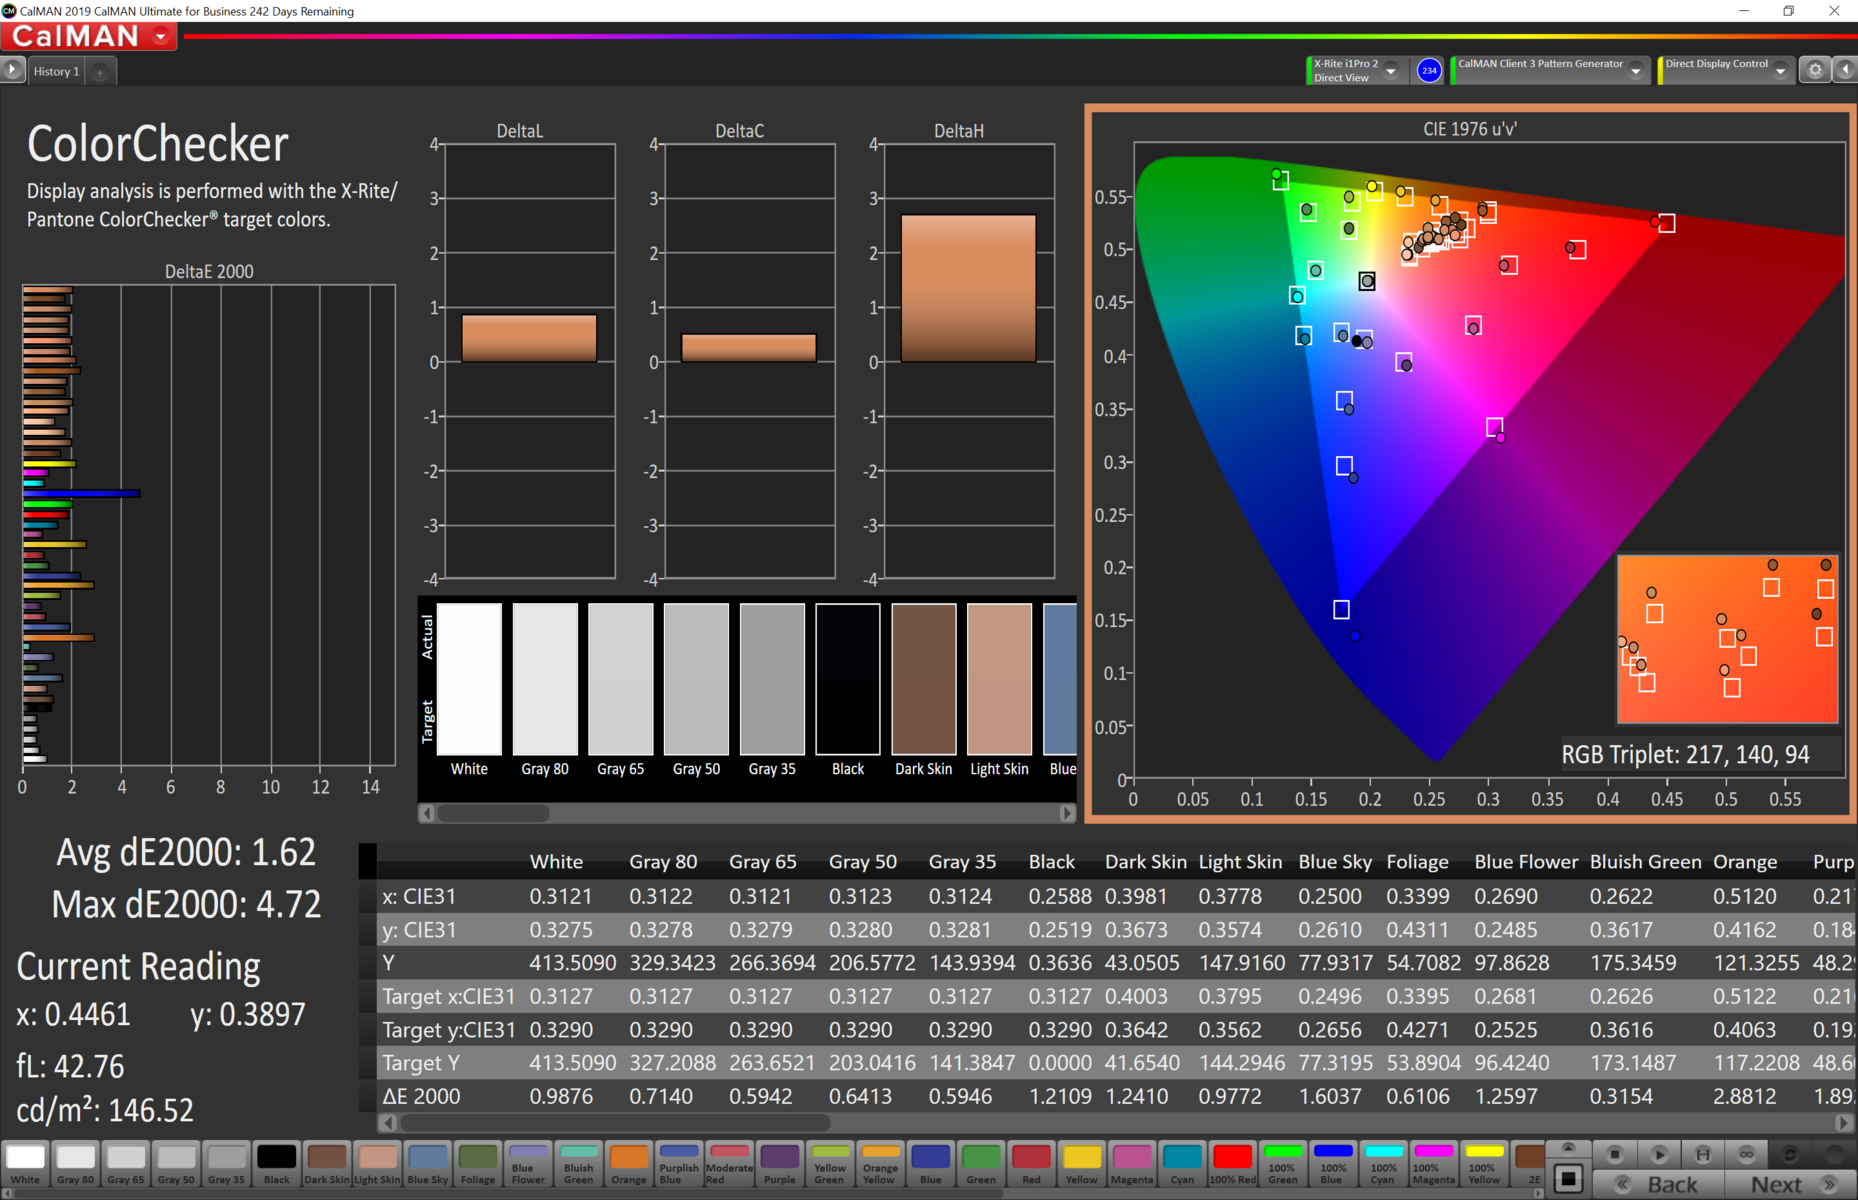
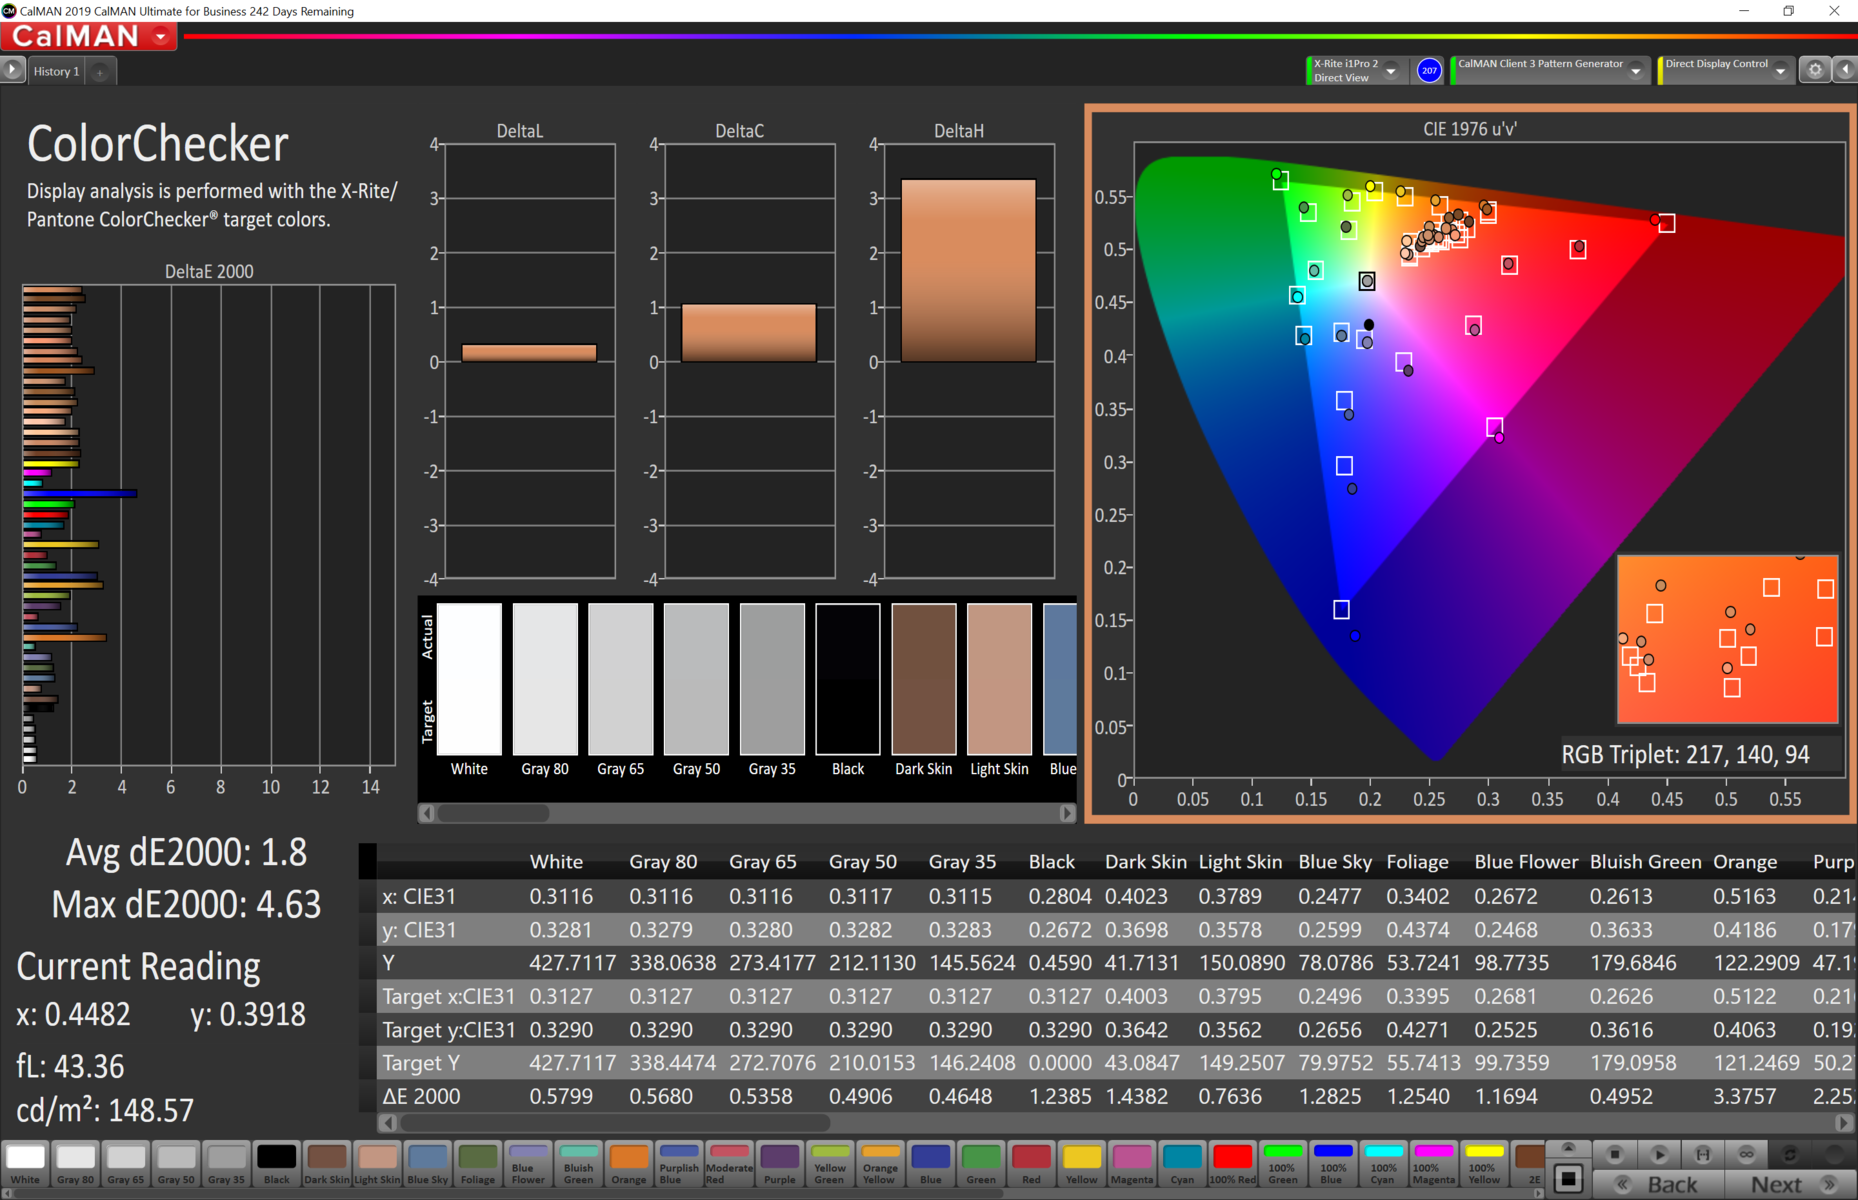
ΔE ColorChecker Calman: 1.8 | ∀{0.5-29.43 Ø4.71}
calibrated: 1.6
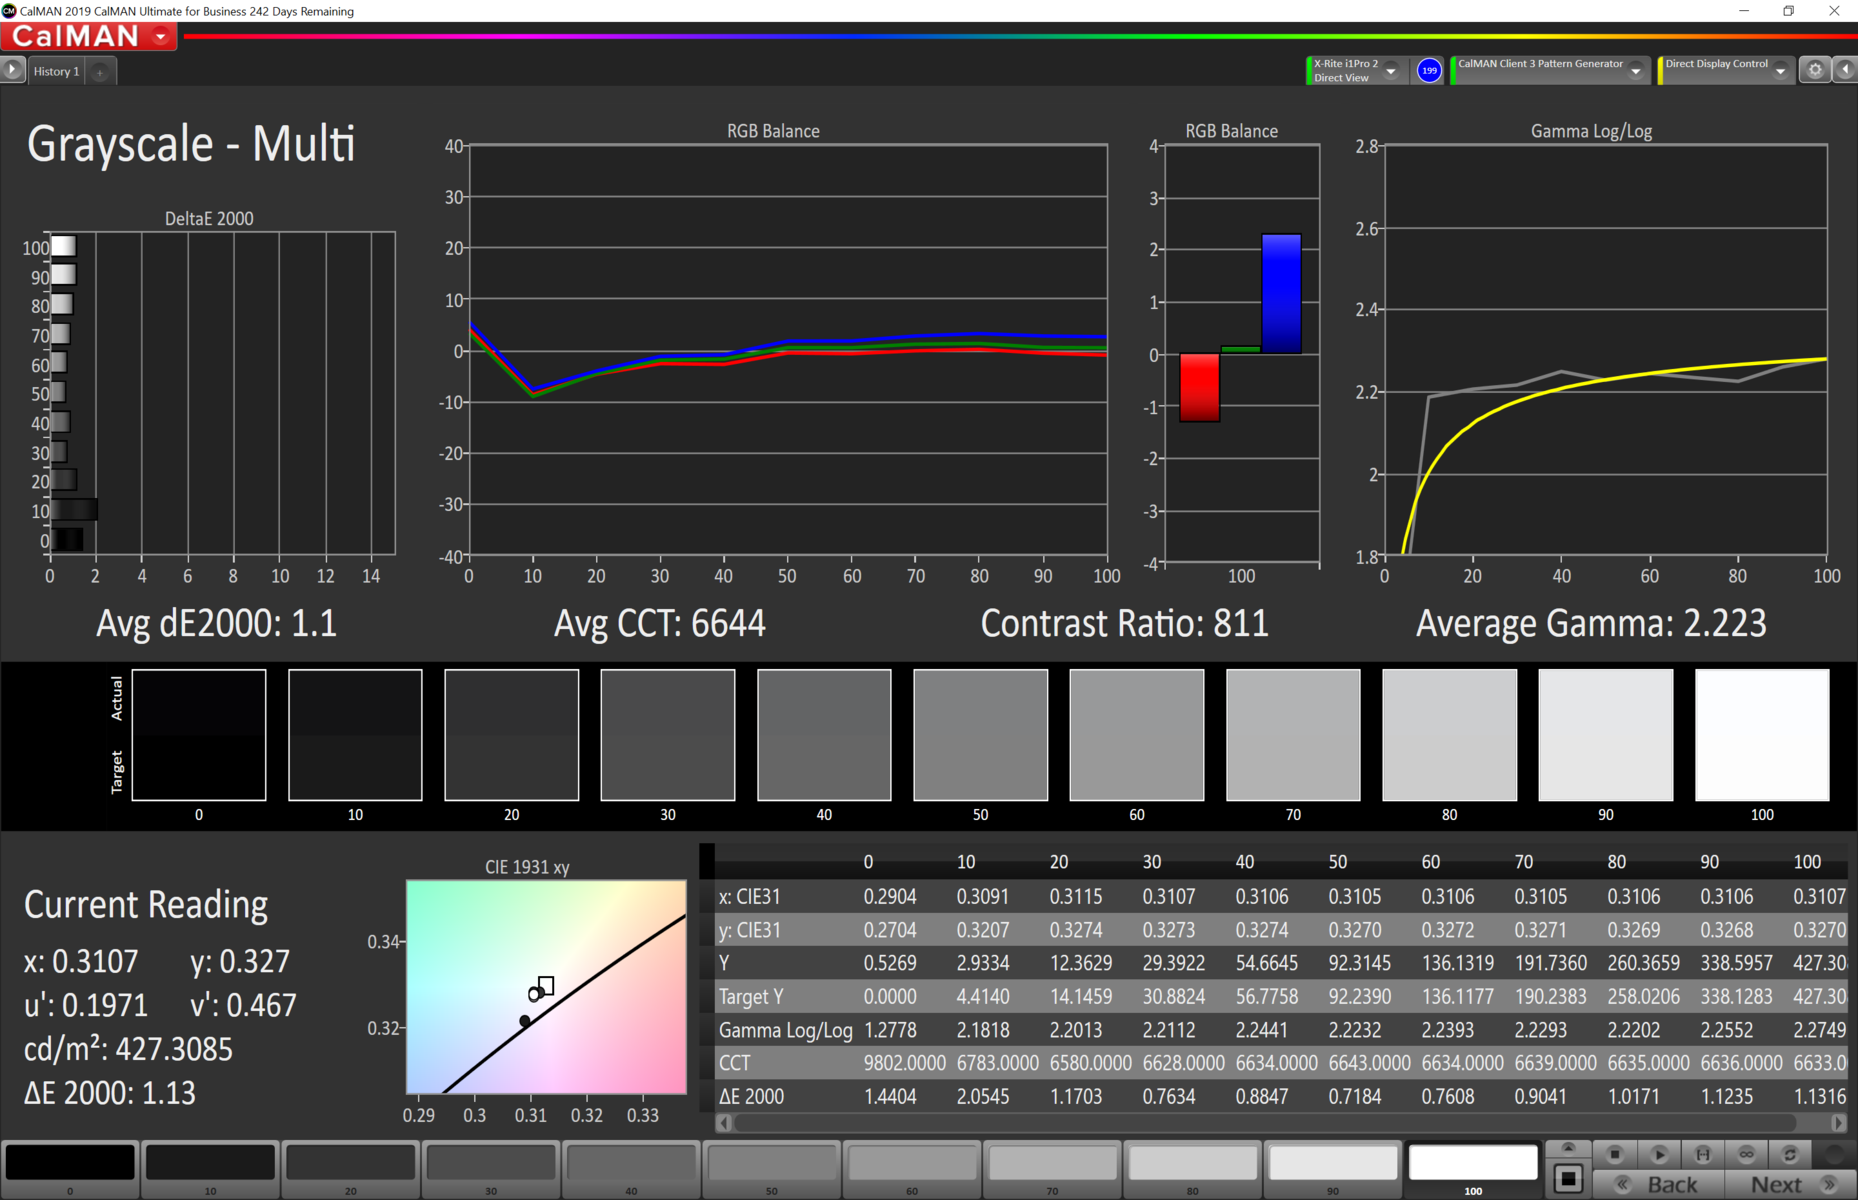
ΔE Greyscale Calman: 1.1 | ∀{0.09-98 Ø4.96}
98.3% sRGB (Calman 2D)
97.6% sRGB (Argyll 1.6.3 3D)
64.2% AdobeRGB 1998 (Argyll 1.6.3 3D)
71.7% AdobeRGB 1998 (Argyll 3D)
97.7% sRGB (Argyll 3D)
70.4% Display P3 (Argyll 3D)
CCT: 6644 K
| Apple MacBook Air 2020 i5 APPA042, IPS, 2560x1600, 13.3" | Apple Macbook Air 2019 APPA041, IPS, 2560x1600, 13.3" | Apple MacBook Pro 13 2019 2TB3 APPA03D, IPS, 2560x1600, 13.3" | Microsoft Surface Laptop 3 13 Core i5-1035G7 Sharp LQ135P1JX51, IPS, 2256x1504, 13.5" | Acer Swift 3 SF313-52-71Y7 BOE, NE135FBM-N41, IPS, 2256x1504, 13.5" | Dell XPS 13 9300 i5 FHD SHP14CB, IPS, 1920x1200, 13.4" | |
|---|---|---|---|---|---|---|
| Display | -4% | 19% | -4% | 0% | 2% | |
| Display P3 Coverage (%) | 70.4 | 67.4 -4% | 96.1 37% | 65.7 -7% | 70.1 0% | 71.5 2% |
| sRGB Coverage (%) | 97.7 | 94.7 -3% | 99.4 2% | 98.6 1% | 99.8 2% | 99.4 2% |
| AdobeRGB 1998 Coverage (%) | 71.7 | 69.1 -4% | 85.6 19% | 67.8 -5% | 71.2 -1% | 73.5 3% |
| Response Times | -4% | -23% | -45% | -22% | -32% | |
| Response Time Grey 50% / Grey 80% * (ms) | 38.7 ? | 42.4 ? -10% | 50.4 ? -30% | 59.2 ? -53% | 55 ? -42% | 60 ? -55% |
| Response Time Black / White * (ms) | 30.44 ? | 29.6 ? 3% | 35.2 ? -16% | 41.6 ? -37% | 31 ? -2% | 33.2 ? -9% |
| PWM Frequency (Hz) | 117000 ? | 111100 ? | 116300 ? | 21740 ? | 208 ? | 2500 ? |
| Screen | -0% | 12% | 10% | -30% | -33% | |
| Brightness middle (cd/m²) | 430 | 421 -2% | 603 40% | 403.4 -6% | 474 10% | 619 44% |
| Brightness (cd/m²) | 405 | 393 -3% | 577 42% | 397 -2% | 426 5% | 591 46% |
| Brightness Distribution (%) | 89 | 88 -1% | 92 3% | 89 0% | 82 -8% | 91 2% |
| Black Level * (cd/m²) | 0.32 | 0.34 -6% | 0.35 -9% | 0.34 -6% | 0.29 9% | 0.35 -9% |
| Contrast (:1) | 1344 | 1238 -8% | 1723 28% | 1186 -12% | 1634 22% | 1769 32% |
| Colorchecker dE 2000 * | 1.8 | 1.5 17% | 1.7 6% | 0.94 48% | 2.38 -32% | 3 -67% |
| Colorchecker dE 2000 max. * | 4.6 | 3.8 17% | 3.1 33% | 2.92 37% | 5.88 -28% | 8.2 -78% |
| Colorchecker dE 2000 calibrated * | 1.6 | 0.7 56% | 0.99 38% | 2.69 -68% | 1 37% | |
| Greyscale dE 2000 * | 1.1 | 1.2 -9% | 2.1 -91% | 0.9 18% | 3.75 -241% | 5.2 -373% |
| CCT | 6644 98% | 6694 97% | 6843 95% | 6620 98% | 6466 101% | 6340 103% |
| Color Space (Percent of AdobeRGB 1998) (%) | 64.2 | 61.3 -5% | 76.7 19% | 62.3 -3% | 65 1% | 66.9 4% |
| Color Space (Percent of sRGB) (%) | 97.6 | 94.6 -3% | 99.4 2% | 98.7 1% | 100 2% | 99.3 2% |
| Gamma | 2.21 100% | 2.18 101% | 2.13 103% | 2.37 93% | 2.14 103% | |
| Toplam Ortalama (Program / Ayarlar) | -3% /
-1% | 3% /
9% | -13% /
1% | -17% /
-23% | -21% /
-26% |
* ... daha küçük daha iyidir
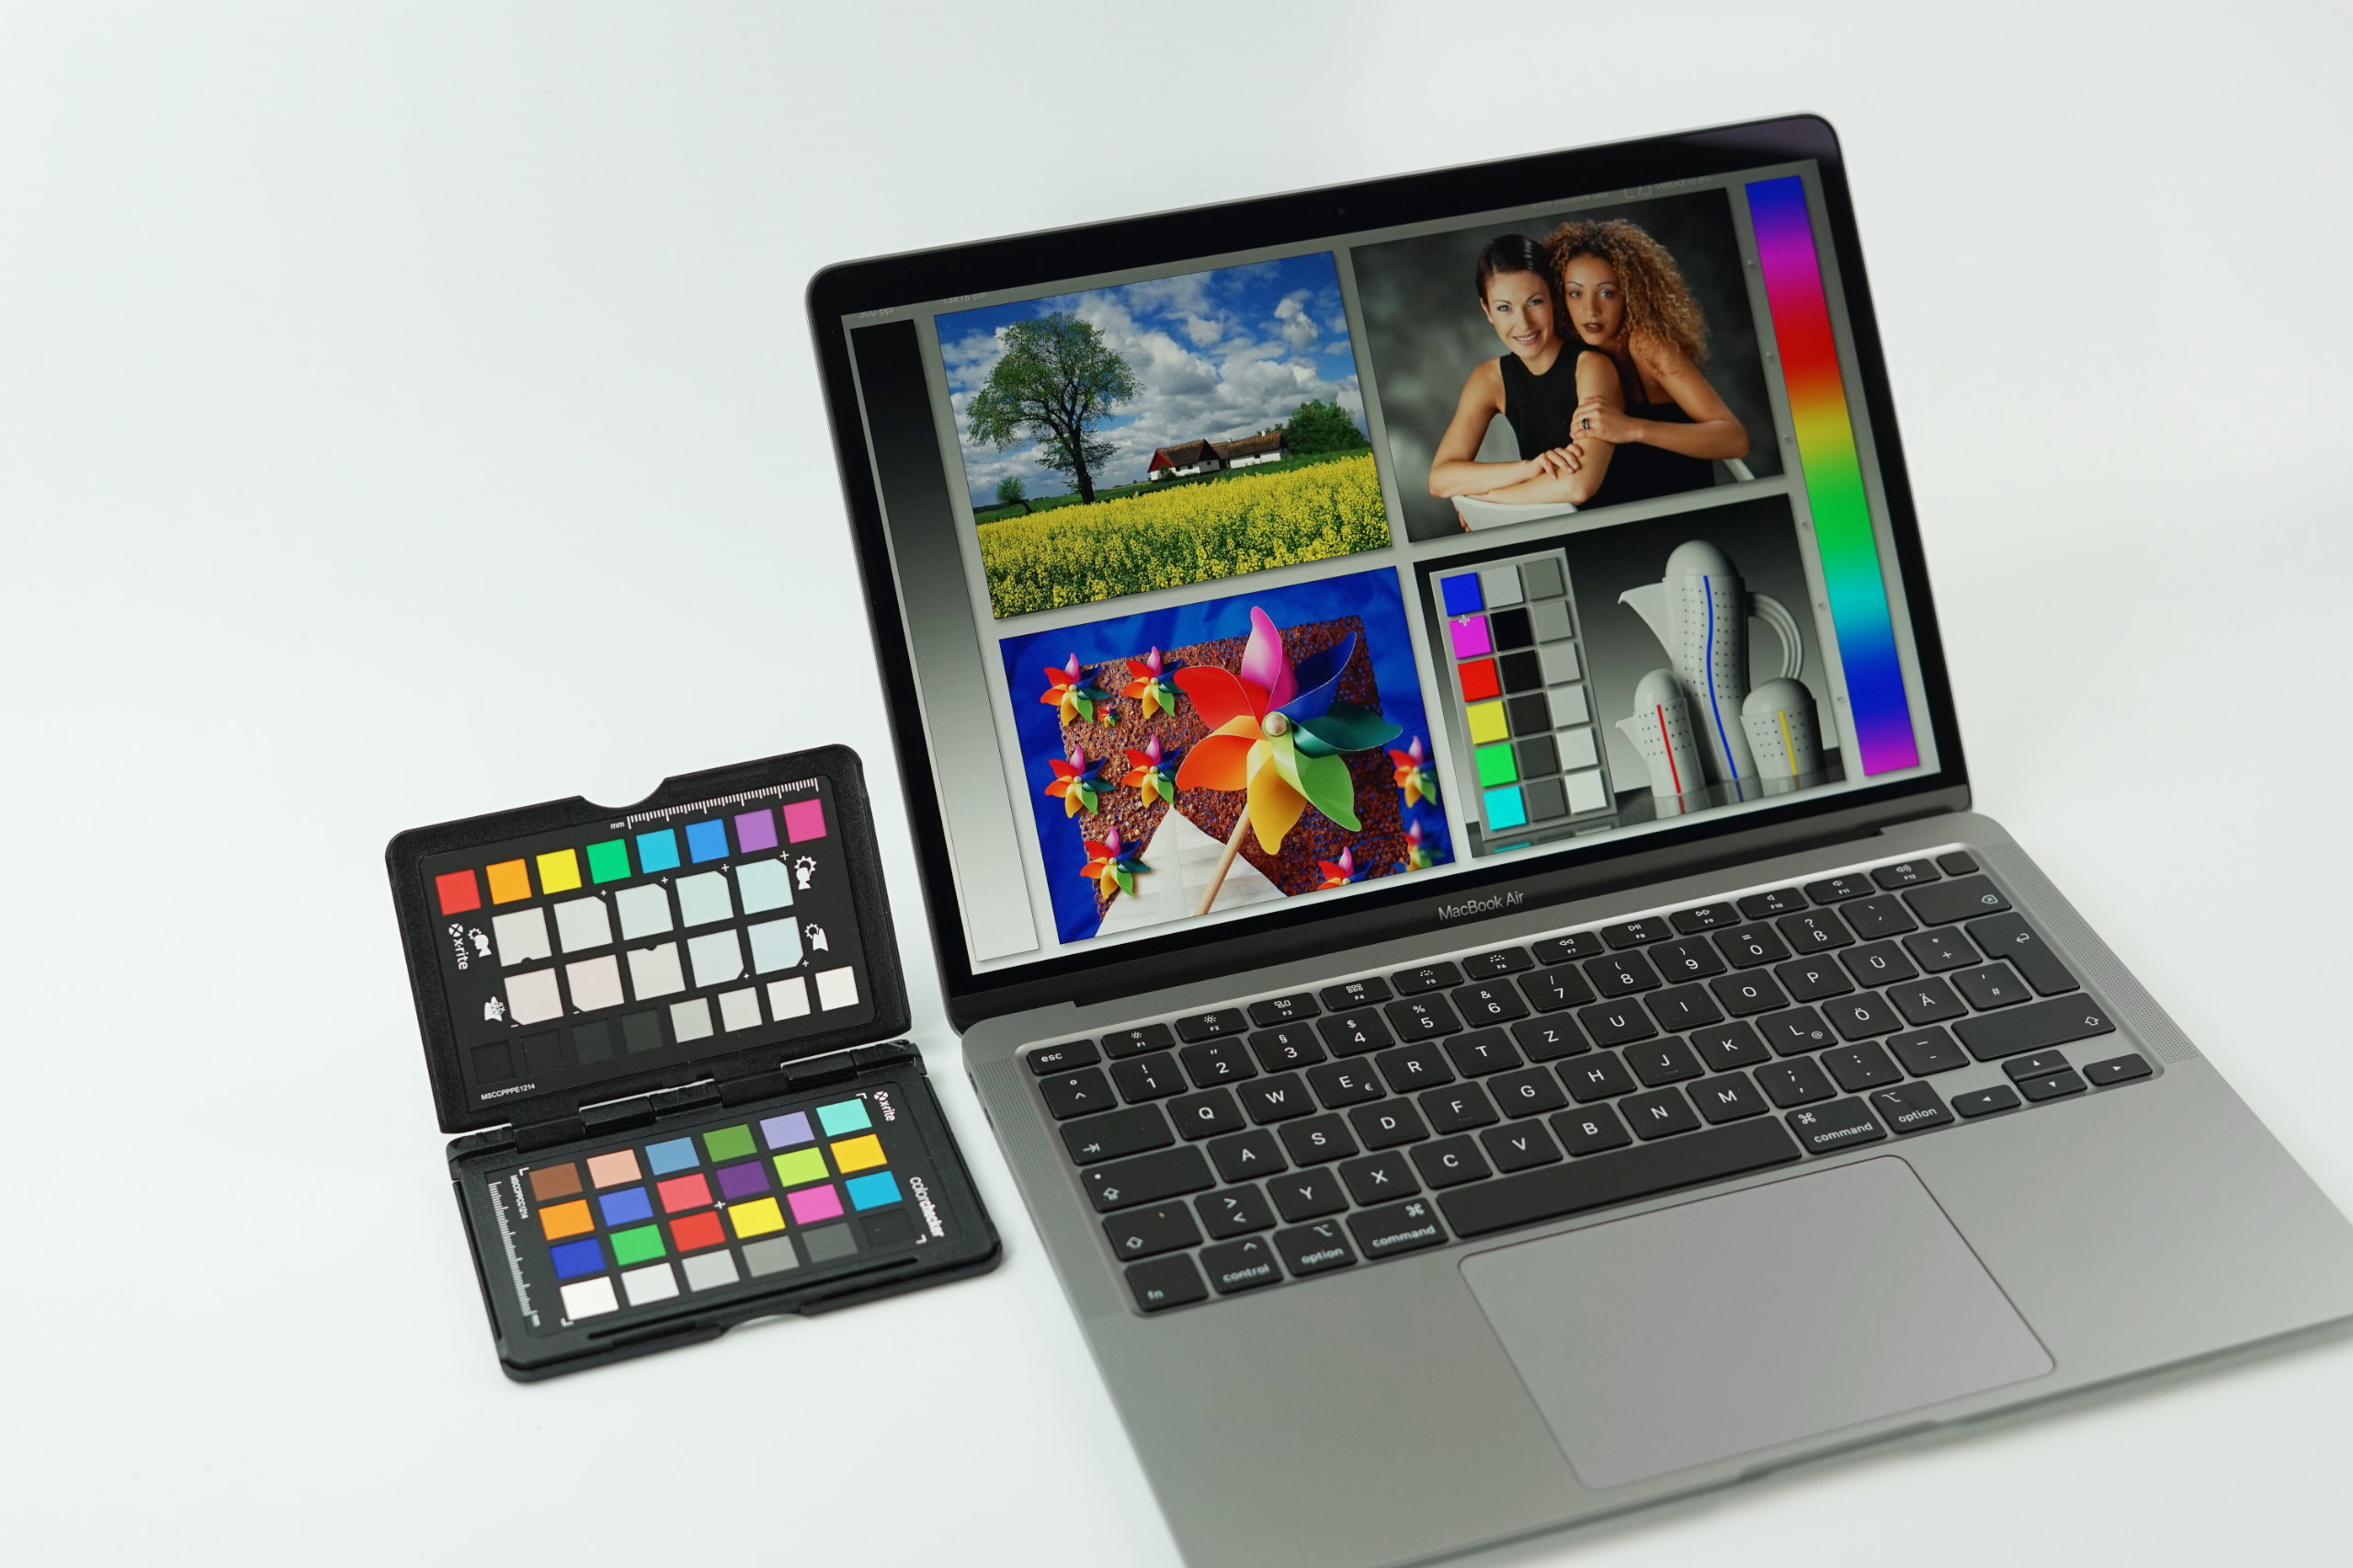
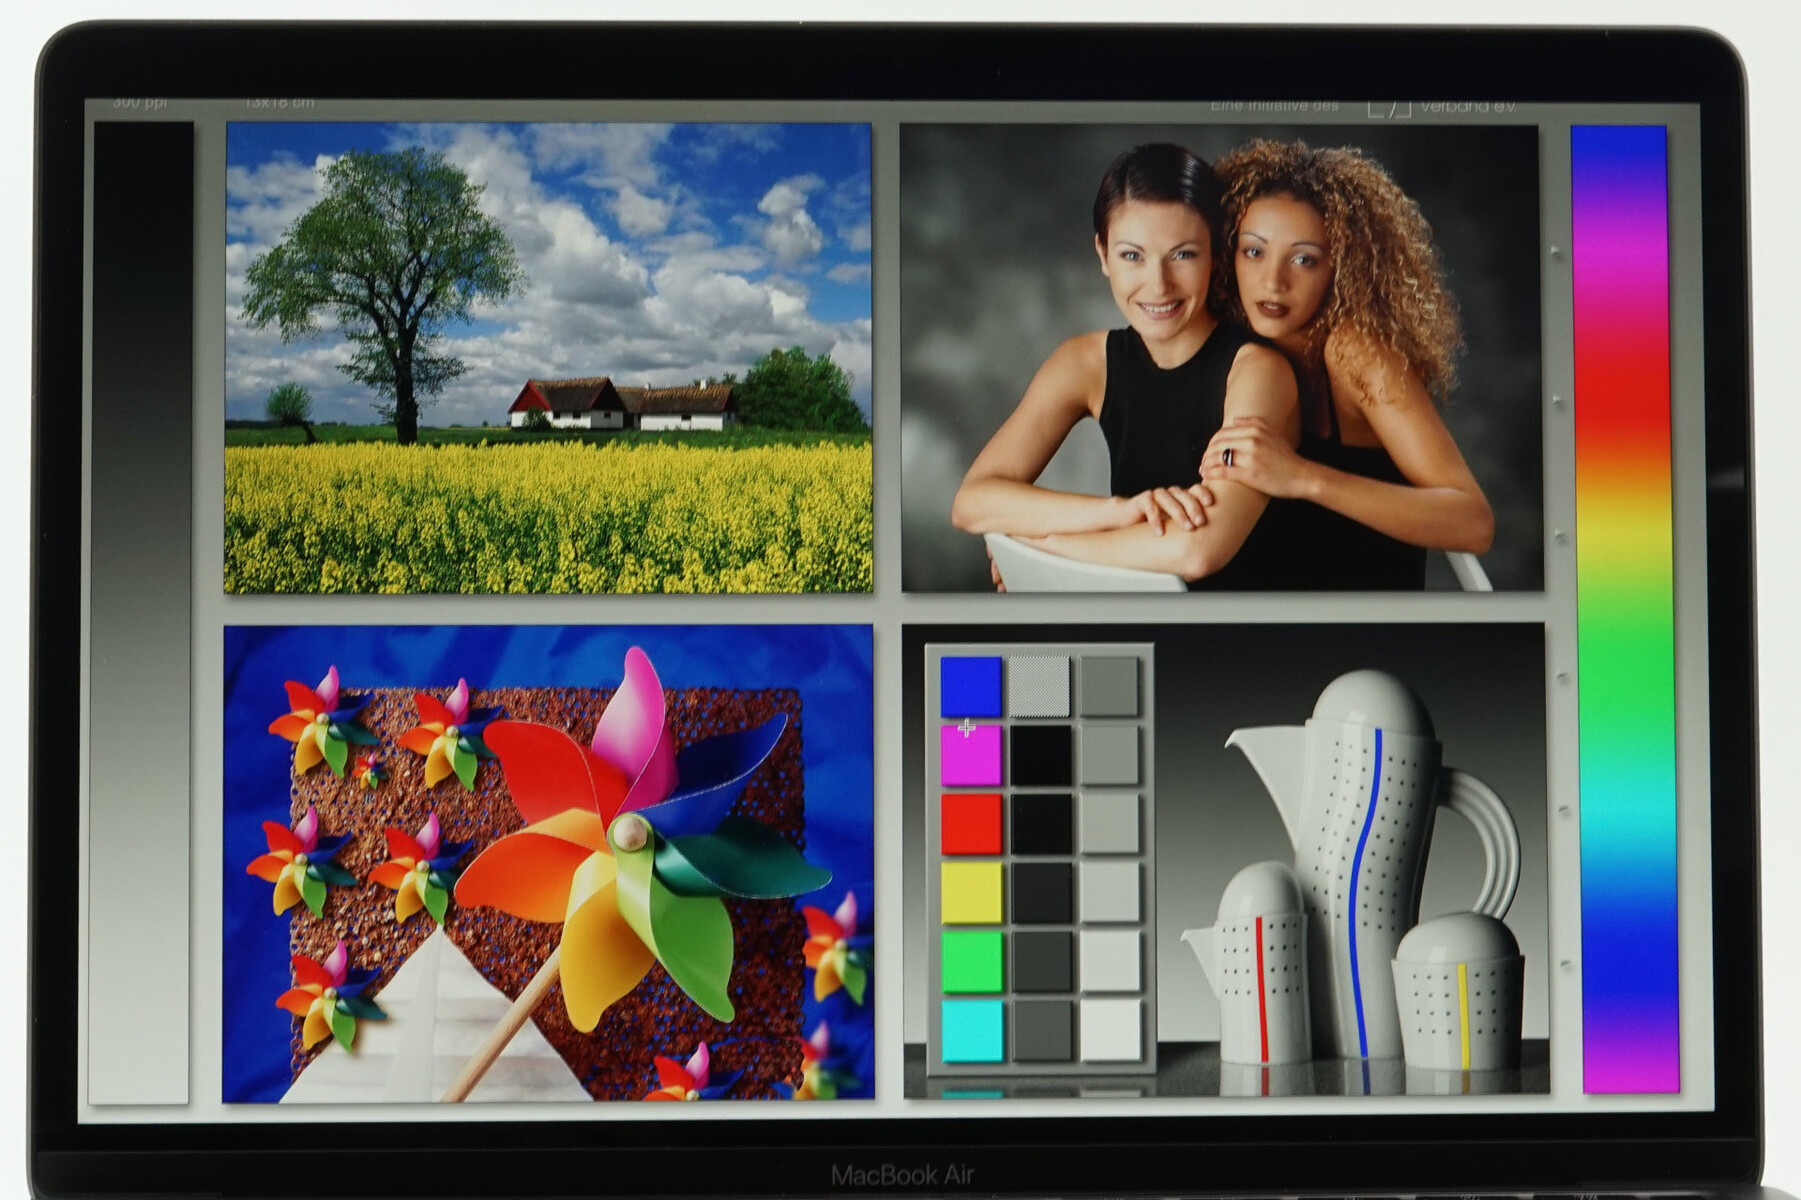
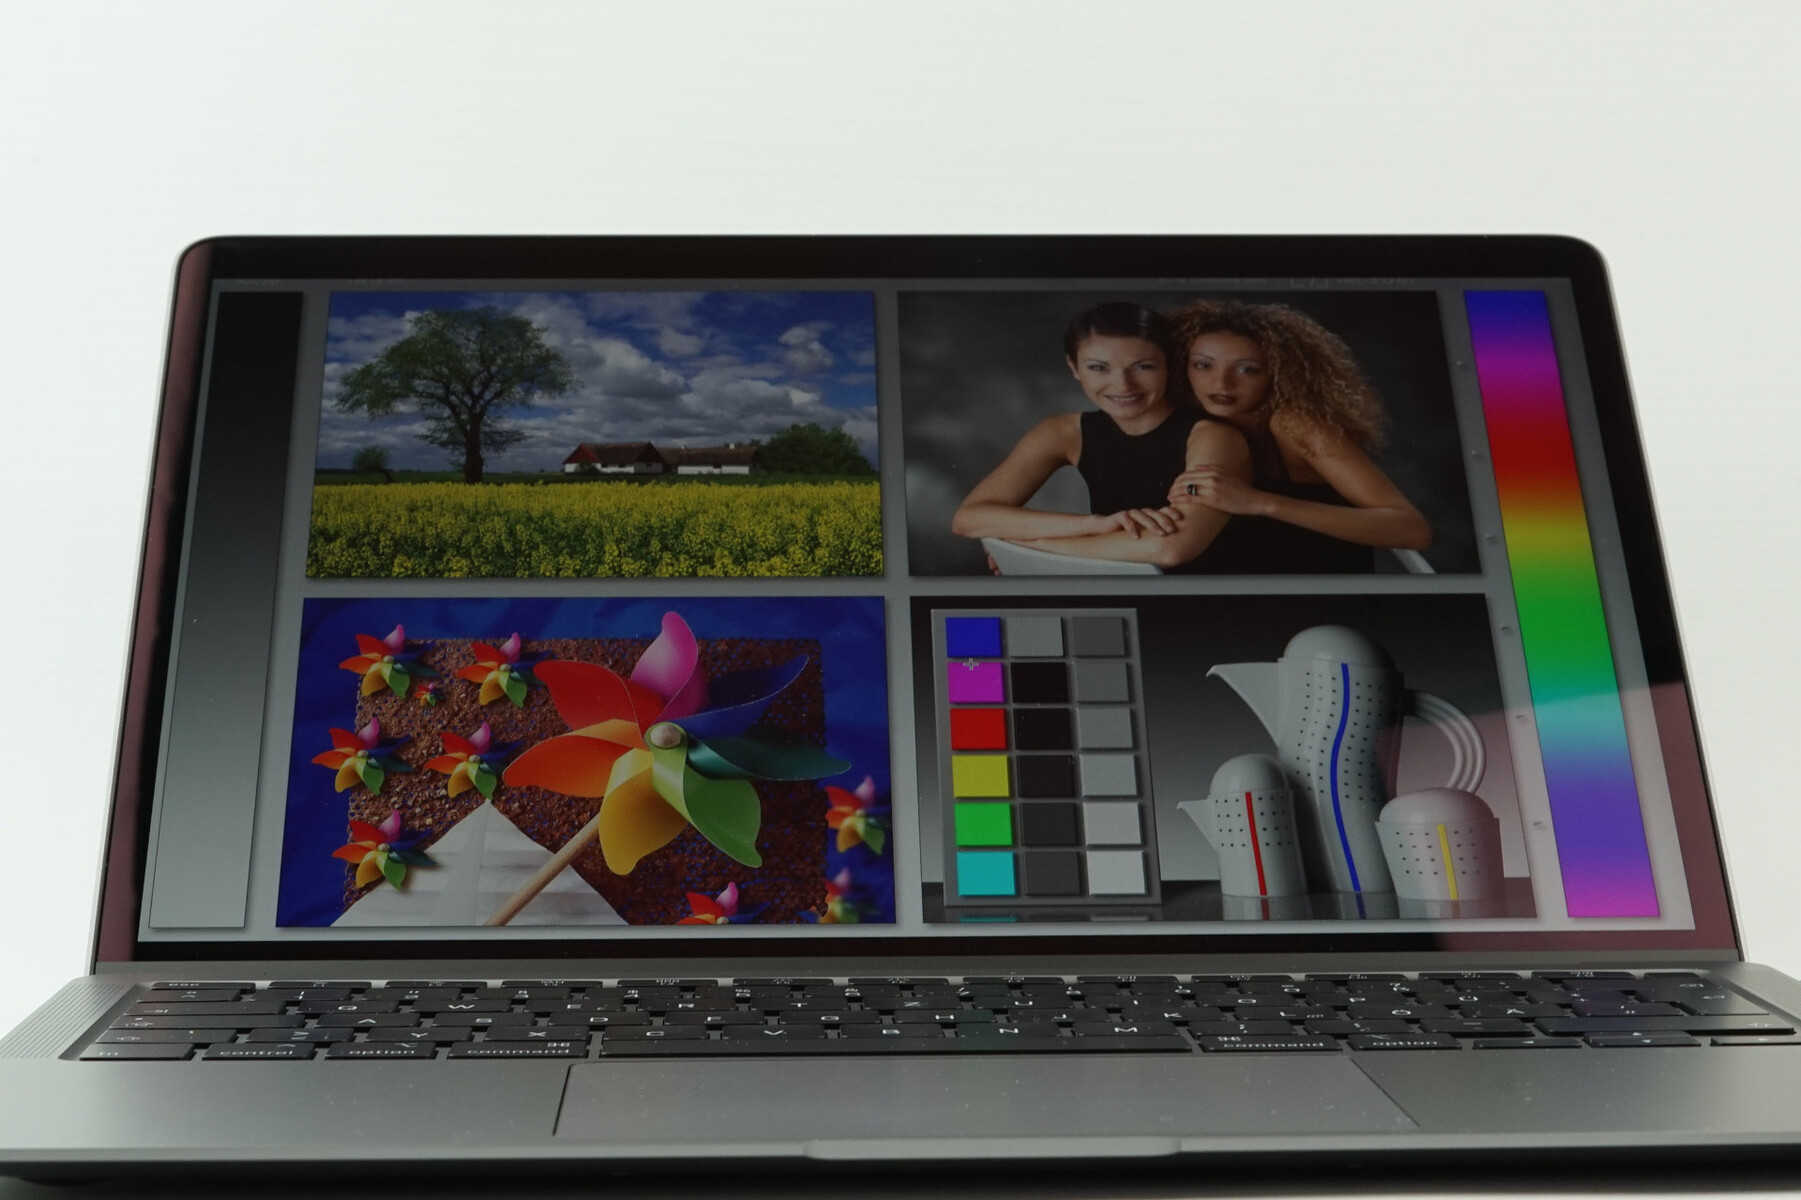
MacBook Air'in ekranı kutudan çok iyi kalibre edilmiştir ve neredeyse tüm değerler hedef aralıktadır. Paneli X-Rite i1 Pro 2 spektrofotometre ve profesyonel CalMAN yazılımı ile kalibre ettik (icm profili yukarıdaki kutuya bağlanmıştır), ancak bu gerçekten gerekli değildir. MacBook Pro modelleri daha geniş P3 renk alanını hedeflerken, MacBook Air hala daha küçük sRGB gamını tamamen kaplarken,% 100 mavi değer 3'ün hedef sapmasının biraz üzerindedir.


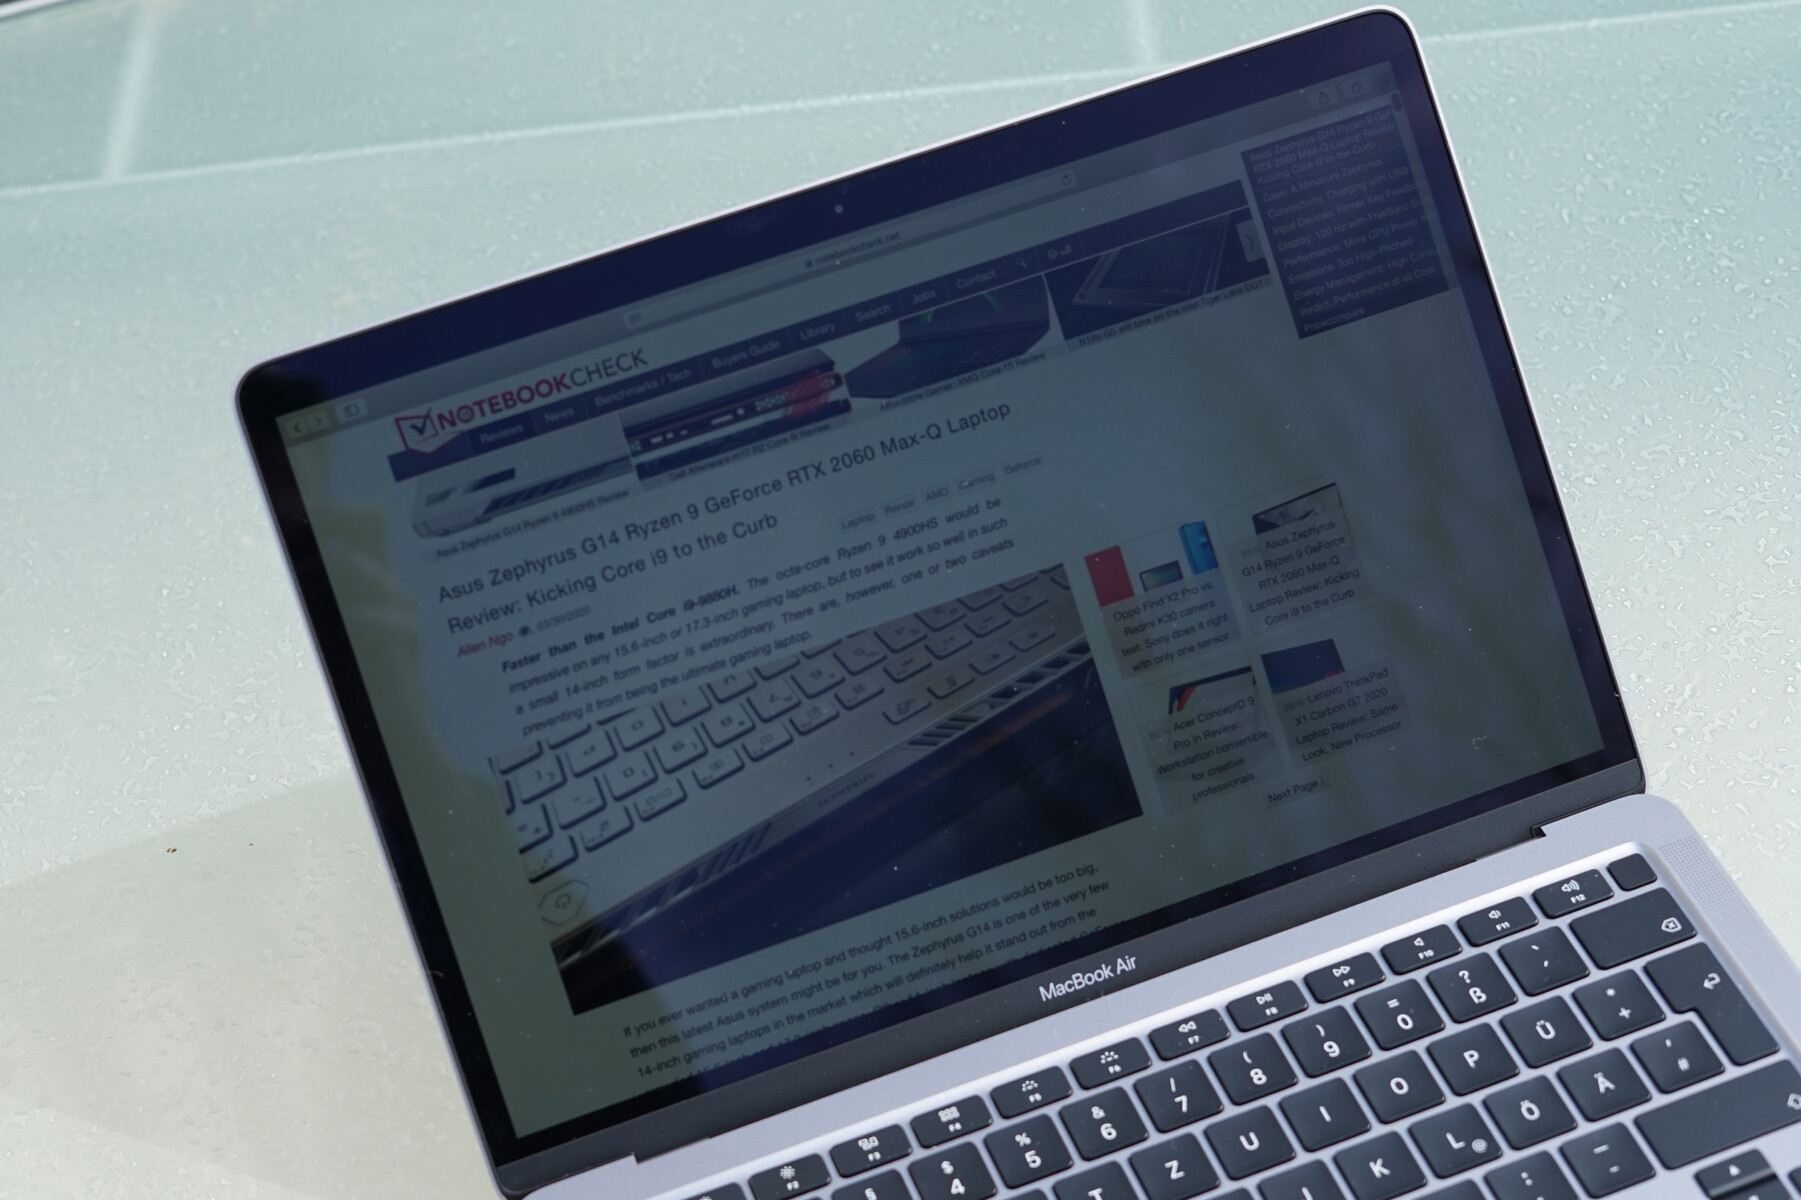
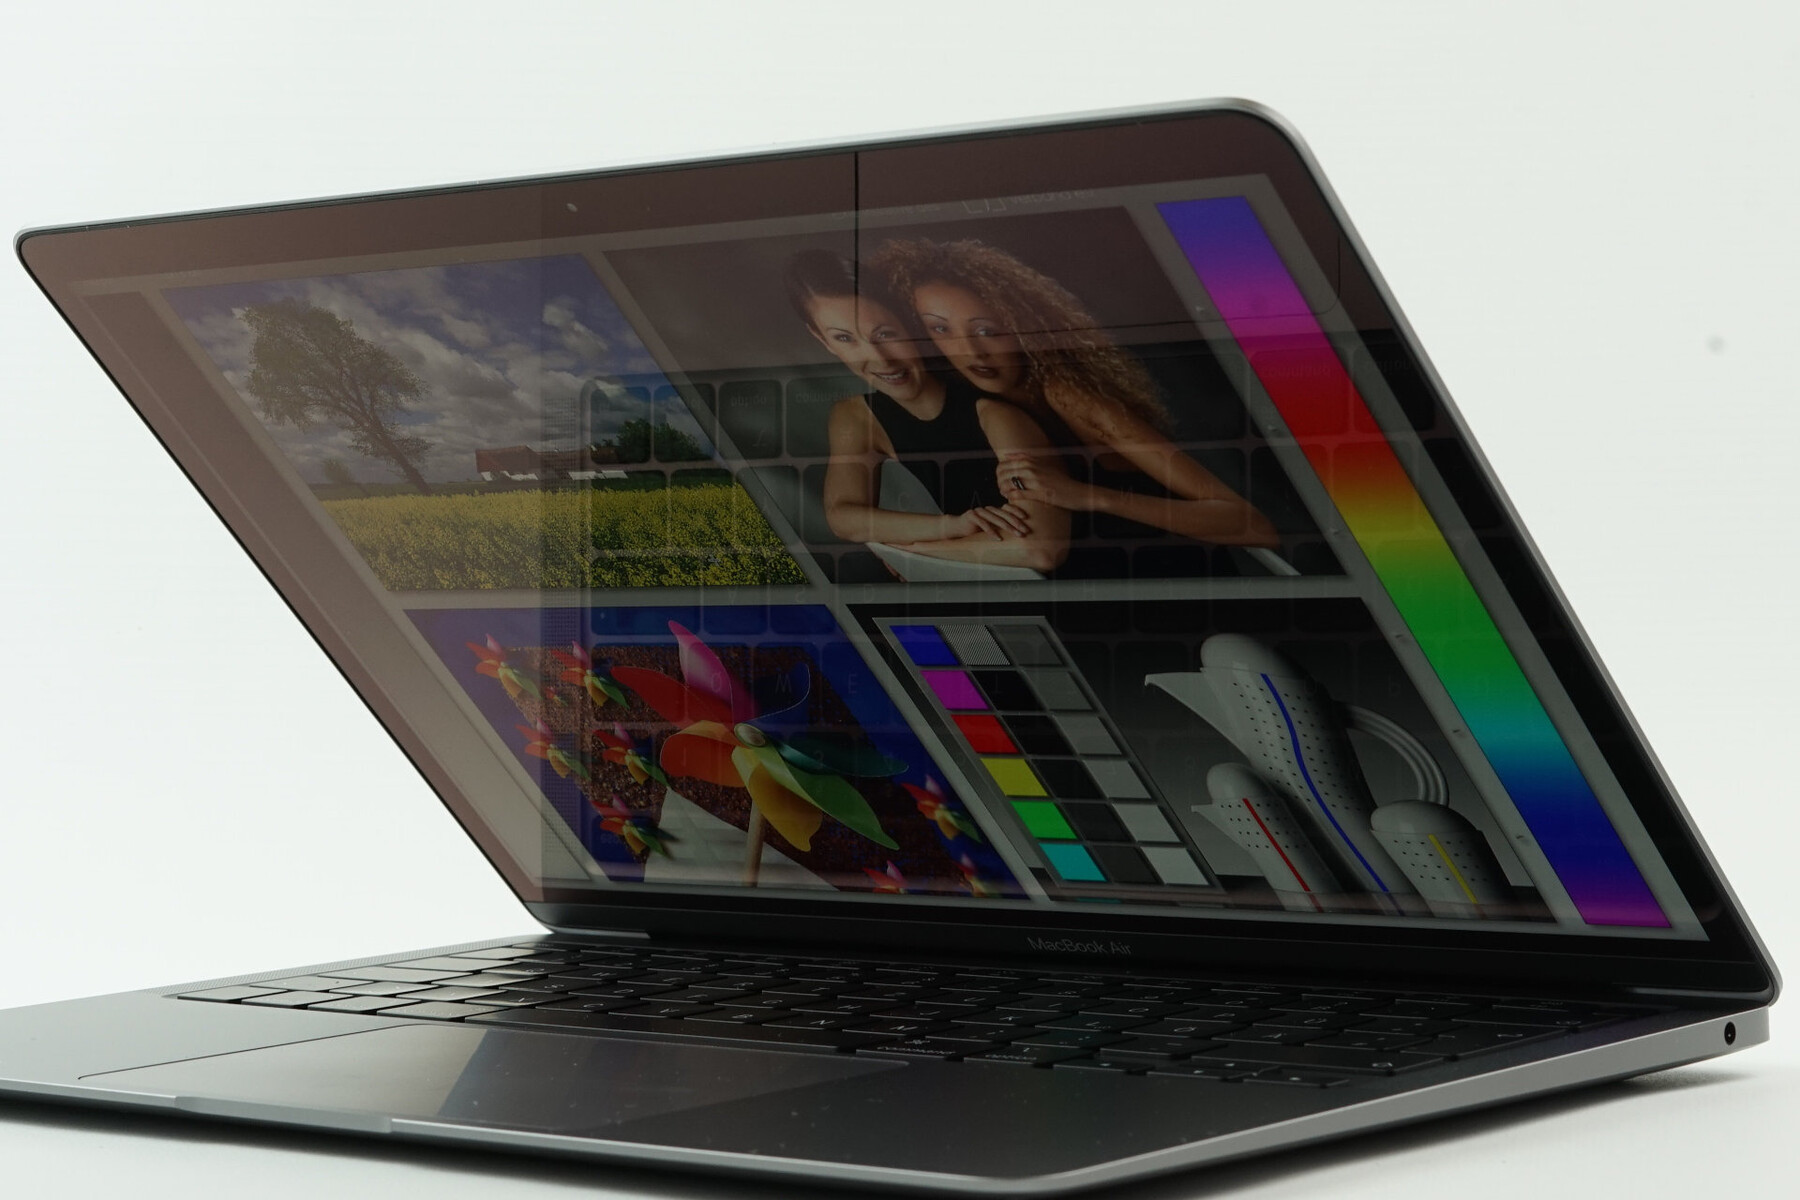
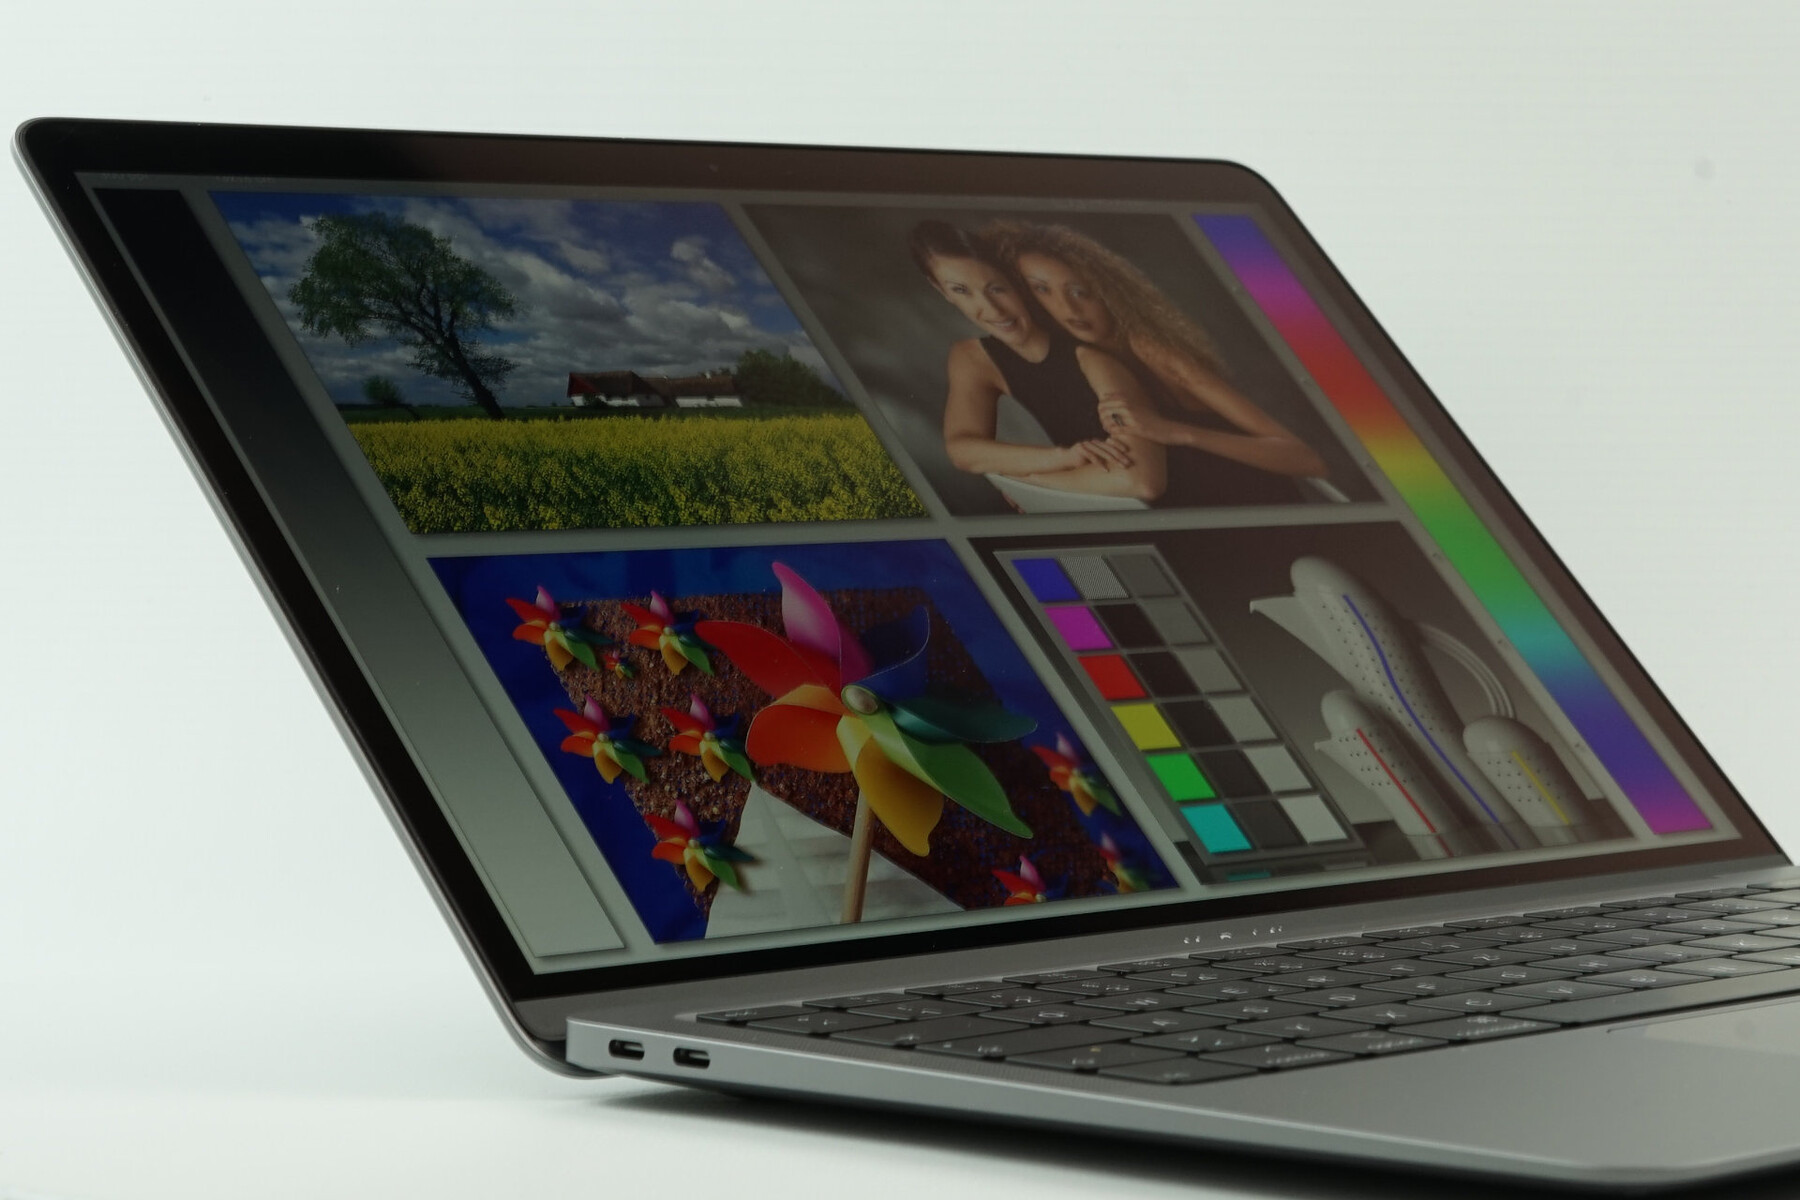
Açık havada, 400 nit ekran ne yazık ki sadece gölgede gerçekten yeterli. Arka plan aydınlatması doğrudan güneş ışığındaki yansımaları telafi edemez. Daha parlak panelleri olan Pro modelleri, mevcut Dell XPS 13 9300 gibi bu açıdan daha iyidir.
Yanıt Sürelerini Görüntüle
| ↔ Tepki Süresi Siyahtan Beyaza | ||
|---|---|---|
| 30.44 ms ... yükseliş ↗ ve sonbahar↘ birleşimi | ↗ 17.9 ms yükseliş | 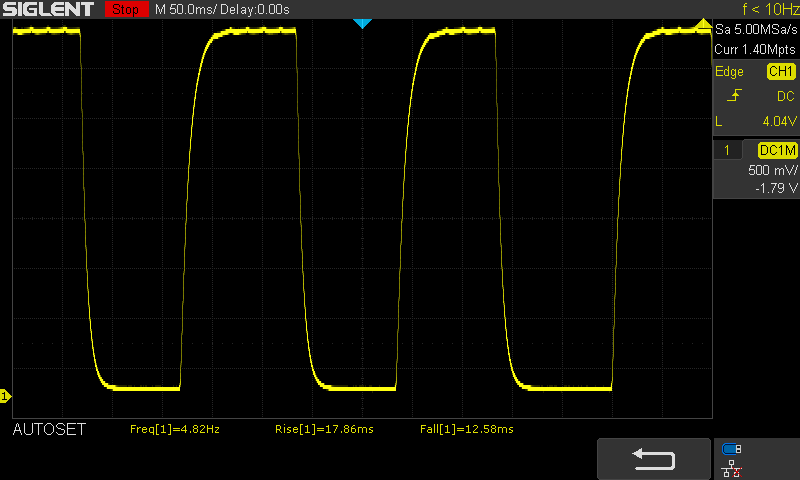 |
| ↘ 12.6 ms sonbahar | ||
| Ekran, testlerimizde yavaş yanıt oranları gösteriyor ve oyuncular için yetersiz olacaktır. Karşılaştırıldığında, test edilen tüm cihazlar 0.1 (minimum) ile 240 (maksimum) ms arasında değişir. » Tüm cihazların 83 %'si daha iyi. Bu, ölçülen yanıt süresinin test edilen tüm cihazların ortalamasından (19.8 ms) daha kötü olduğu anlamına gelir. | ||
| ↔ Tepki Süresi %50 Griden %80 Griye | ||
| 38.7 ms ... yükseliş ↗ ve sonbahar↘ birleşimi | ↗ 19.6 ms yükseliş | 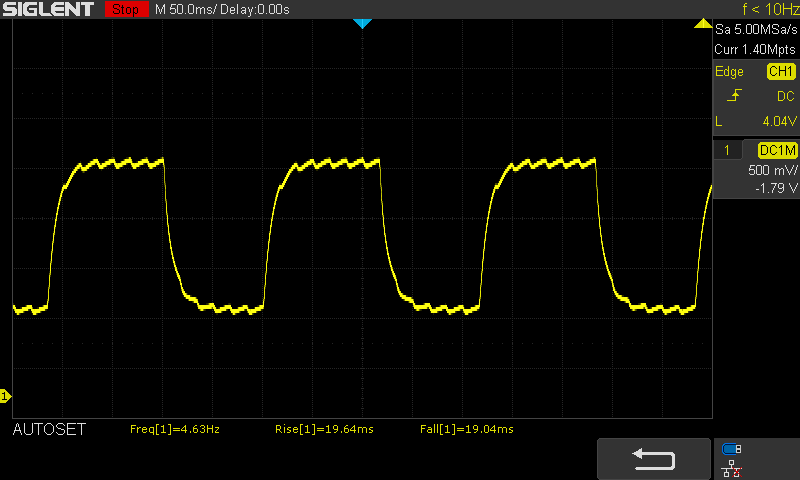 |
| ↘ 19 ms sonbahar | ||
| Ekran, testlerimizde yavaş yanıt oranları gösteriyor ve oyuncular için yetersiz olacaktır. Karşılaştırıldığında, test edilen tüm cihazlar 0.165 (minimum) ile 636 (maksimum) ms arasında değişir. » Tüm cihazların 58 %'si daha iyi. Bu, ölçülen yanıt süresinin test edilen tüm cihazların ortalamasından (30.9 ms) daha kötü olduğu anlamına gelir. | ||
Ekran Titremesi / PWM (Darbe Genişliği Modülasyonu)
| Ekran titriyor / PWM algılandı | 117000 Hz | ≤ 75 % parlaklık ayarı | 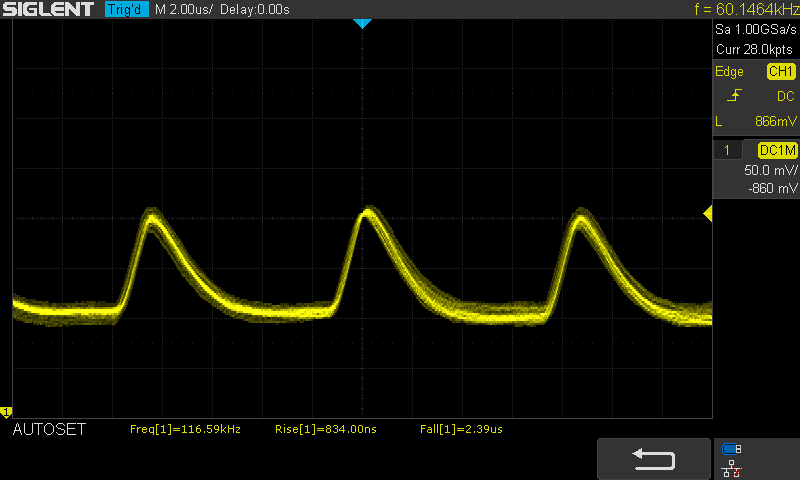 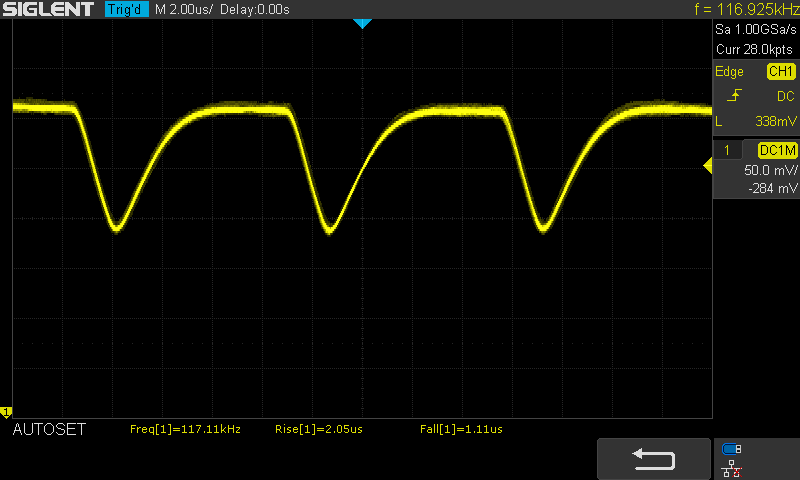 |
Ekran arka ışığı 117000 Hz'de titriyor (en kötü durum, örneğin PWM kullanılması) 75 % ve altındaki parlaklık ayarında titreme algılandı. Bu parlaklık ayarının üzerinde titreme veya PWM olmamalıdır. 117000 Hz frekansı oldukça yüksektir, bu nedenle PWM'ye duyarlı çoğu kullanıcı herhangi bir titremeyi fark etmemelidir. Karşılaştırıldığında: Test edilen tüm cihazların %52 %'si ekranı karartmak için PWM kullanmıyor. PWM tespit edilirse, ortalama 7744 (minimum: 5 - maksimum: 343500) Hz ölçüldü. | |||
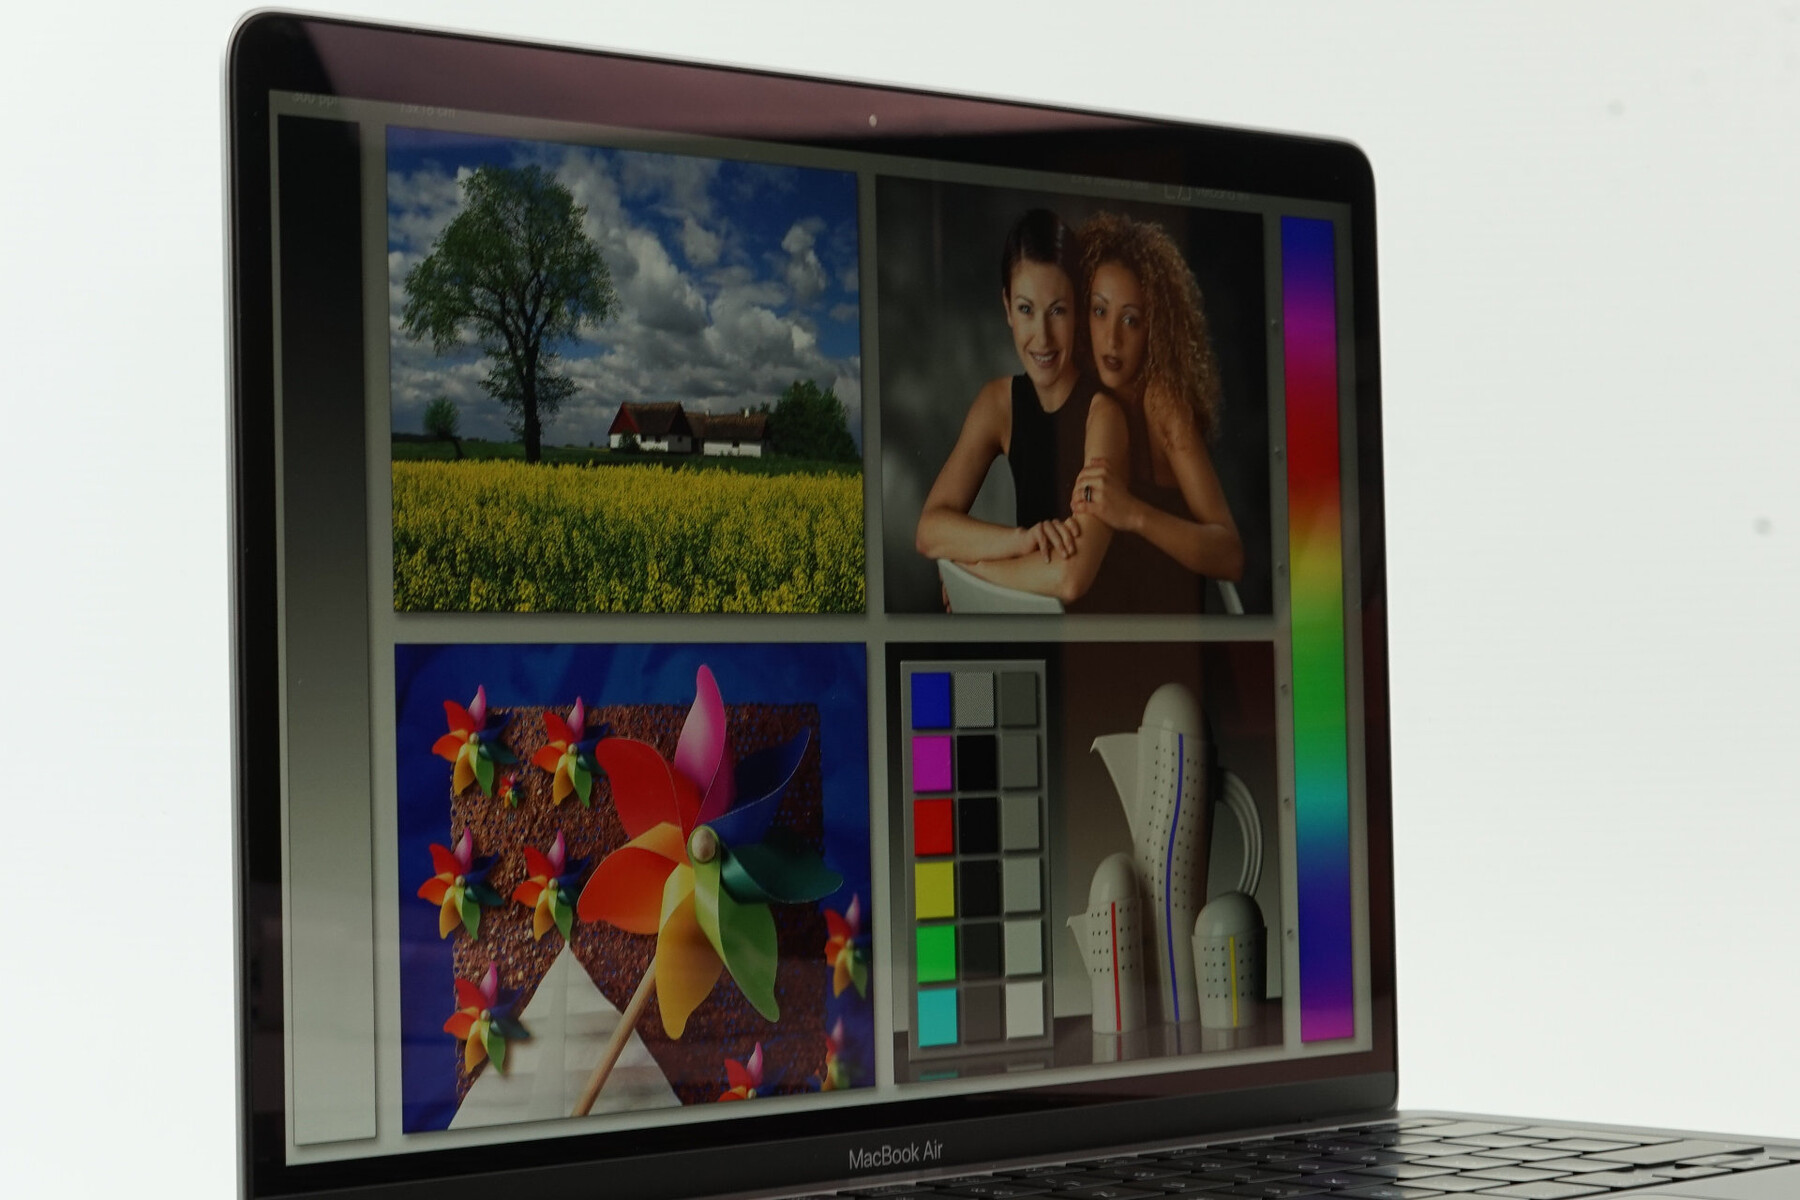
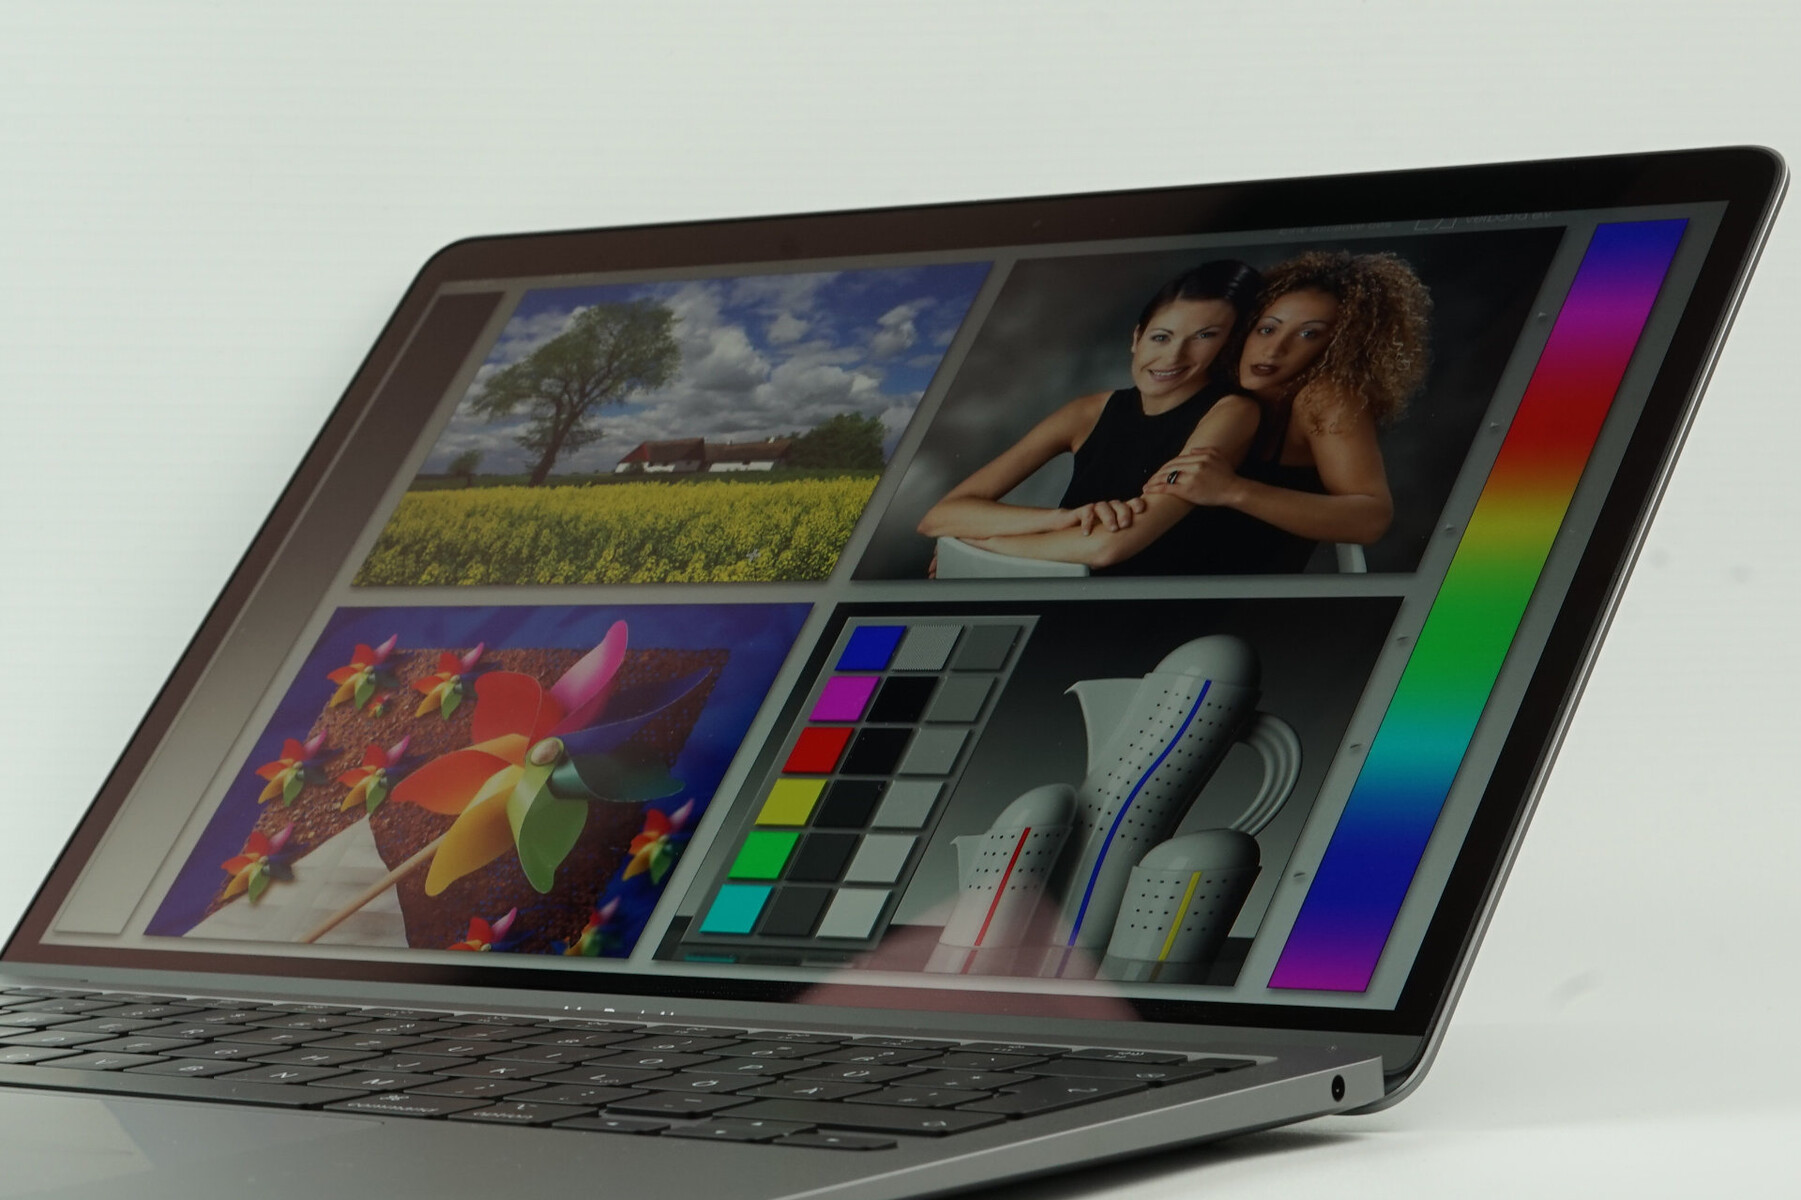
Yansımalar dışında, IPS ekranının görüş açısı kararlılığı ile ilgili herhangi bir sorun yoktur. Renkler kararlıdır ve parlaklık düşüşü alışılmadık derecede güçlü değildir.
Performans - MacBook Air yalnızca hafif iş yükleri için
Dört çekirdekli işlemci, yeterli RAM ve hızlı PCIe-SSD: Teknik özelliklere bakın, özellikle fiyatla birlikte pratikte elde edemeyeceğiniz bir performans seviyesi. Evet, yeni dört çekirdekli işlemciler sayesinde bir performans iyileştirmesi var, ancak MacBook Air hala bazı postalar yazmak, web'e göz atmak, video akışı yapmak veya ara sıra hafif resim düzenleme yapmak isteyen sıradan kullanıcıları hedefliyor. Core i3'ten (2 çekirdek) Core i5'e (4 çekirdek) ek fiyat, Apple standartları için 50 Euro'da (100 ABD Doları) oldukça düşüktür, bu nedenle bu güncellemeyi kesinlikle öneririz.Not: Bazı karşılaştırmalı testlerimiz çalışıyor Karşılaştırma amacıyla Windows 10 (Bootcamp). Alternatif işletim sistemini kullanmak sorun değil, ancak Apple tarafından ne kadar optimizasyon yapıldığını bilmiyoruz. Özellikle güç tüketimi rakamlarımız, işletim sistemleri arasında hala büyük farklılıklar olduğunu göstermektedir. Platformlar arası karşılaştırmalar (Geekbench gibi) de macOS için bir performans avantajı gösterir.
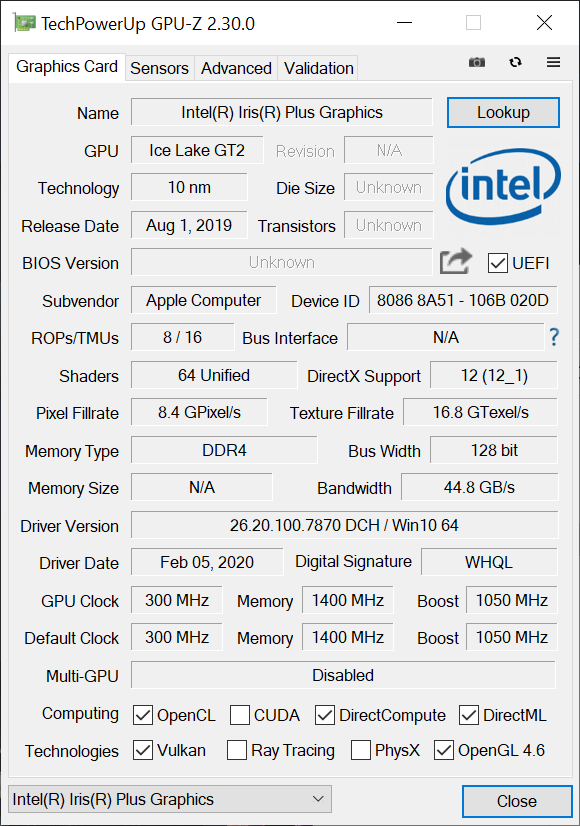
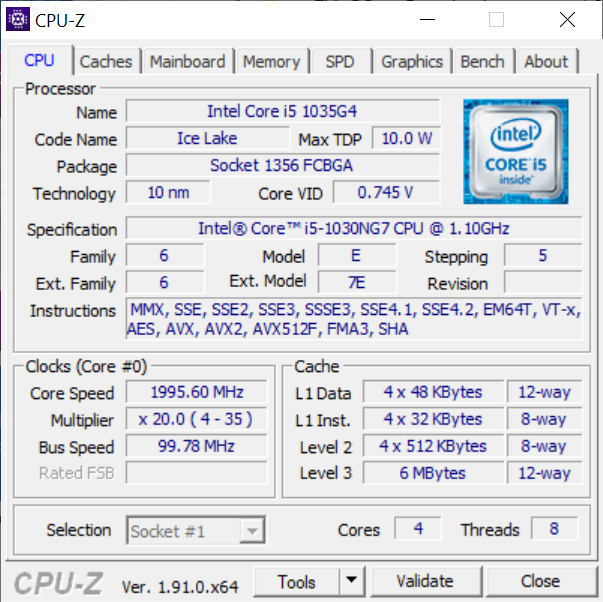
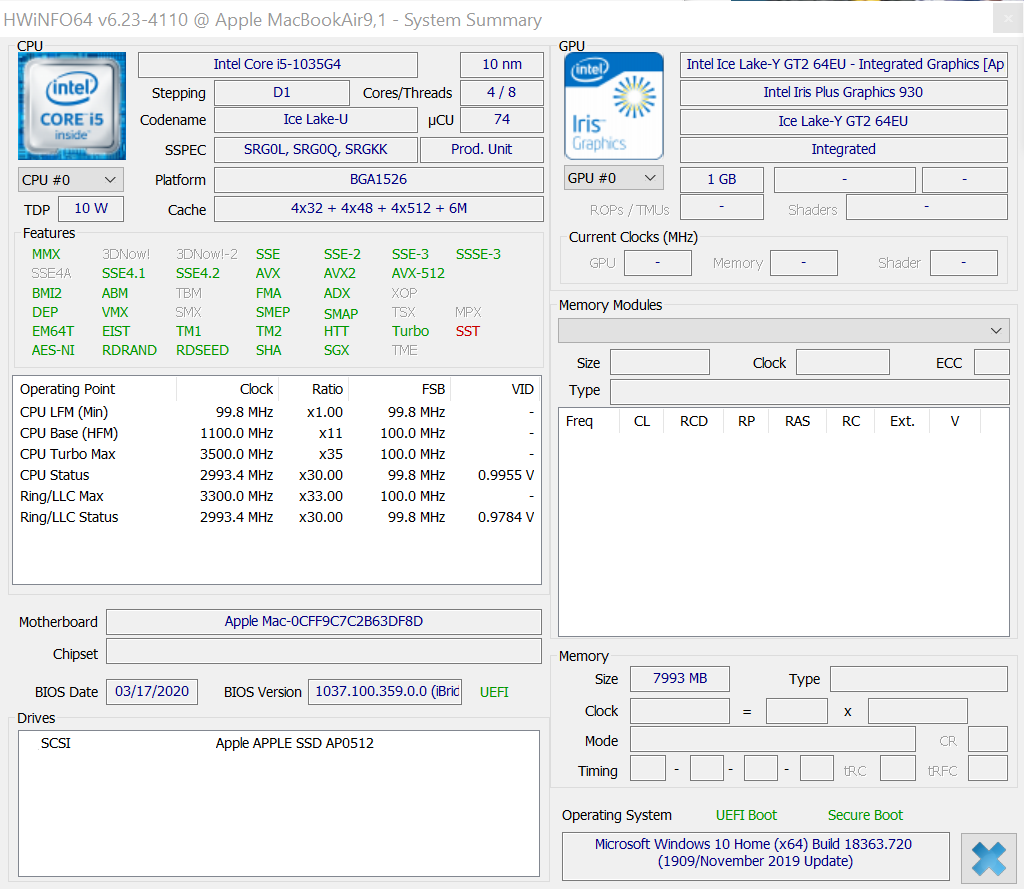
İşlemci - 4 çekirdekli Core i5 Buz Gölü-Y
MacBook Air, Apple'ın Intel'den 10nm çip ile donatılmış ilk dizüstü bilgisayarıdır. Core i5-1030NG7, ultra düşük voltajlı Buz Gölü-Y jenerasyonunun bir parçasıdır. Apple için biraz daha küçük bir paket boyutunda özel bir SoC'dir ve atamada "N" içermeyen standart yonga ile karşılaştırıldığında 1W daha yüksek bir TDP (şimdi 10W) vardır. Daha fazla teknik ayrıntı için lütfen teknik bölümümüze bakın.Çift çekirdekli i5-8210Y ile eski MacBook Air'e kıyasla, çok çekirdekli performansın arttığını görüyoruz, ancak Hava hala yaygın olan tipik 15W çiplere karşı yetersiz kalıyor bu ultrabookların fiyat aralığı. Birkaç saniye sonra, yaklaşık% 10'luk bir performans düşüşü de gözlemleyebiliriz. Performans en azından pil gücüyle aynıdır.
Kompakt MacBook Air, Geekbench testlerinde biraz daha iyi performans gösteriyor, özellikle tek çekirdekli sonuç rekabette daha küçük bir boşluk gösteriyor. Yine de, Core i5-1030NG7 tüm çekirdekleri vurguladığımızda bir kez daha ayak uyduramıyor. Sonucu, her iki testte de MacBook Air'den daha hızlı olan iPad Pro 11 ile karşılaştırmak oldukça ilginç. Havanın Apple'ın kendi ARM işlemcileriyle birlikte gönderilmesi sadece bir zaman meselesi gibi görünüyor.
| Cinebench R15 | |
| CPU Single 64Bit | |
| Sınıf ortalaması Subnotebook (72.4 - 322, n=57, son 2 yıl) | |
| Apple MacBook Pro 16 2019 i9 5500M (macOS 10.15.1) | |
| Apple MacBook Pro 16 2019 i9 5500M | |
| Acer Swift 3 SF313-52-71Y7 | |
| Microsoft Surface Laptop 3 13 Core i5-1035G7 | |
| Dell XPS 13 9300 i5 FHD | |
| Apple MacBook Pro 13 2019 2TB3 | |
| Apple MacBook Air 2020 i5 (macOS 10.15) | |
| Apple Macbook Air 2019 | |
| CPU Multi 64Bit | |
| Sınıf ortalaması Subnotebook (327 - 3345, n=57, son 2 yıl) | |
| Apple MacBook Pro 16 2019 i9 5500M (macOS 10.15.1) | |
| Apple MacBook Pro 16 2019 i9 5500M (Win 10) | |
| Microsoft Surface Laptop 3 13 Core i5-1035G7 | |
| Dell XPS 13 9300 i5 FHD (Ultra-Performance) | |
| Dell XPS 13 9300 i5 FHD (Optimized) | |
| Apple MacBook Pro 13 2019 2TB3 | |
| Acer Swift 3 SF313-52-71Y7 | |
| Apple MacBook Air 2020 i5 (macOS 10.15) | |
| Apple Macbook Air 2019 | |
| Blackmagic RAW Speed Test - 12:1 8K CPU | |
| Sınıf ortalaması Subnotebook (22 - 49, n=5, son 2 yıl) | |
| Apple MacBook Pro 16 2019 i9 5500M | |
| Apple MacBook Air 2020 i5 | |
| R Benchmark 2.5 - Overall mean | |
| Apple MacBook Air 2020 i5 (macOS) | |
| Apple MacBook Air 2020 i5 (Win 10) | |
| Dell XPS 13 9300 i5 FHD | |
| Acer Swift 3 SF313-52-71Y7 | |
| Apple MacBook Pro 16 2019 i9 5500M (macOS) | |
| Apple MacBook Pro 16 2019 i9 5500M (Win 10) | |
| Sınıf ortalaması Subnotebook (0.4024 - 1.456, n=58, son 2 yıl) | |
* ... daha küçük daha iyidir
Bu bizi iki alternatif işlemcinin sorusuna bırakıyor. Core i3-1000NG4, iki çekirdekli geçen yılki Core i5-8210Y'den biraz daha hızlı olmalı ve entegre grafik kartının daha yavaş G4 versiyonuna sahip olmalı. MacBook Air'inizle sadece temel şeyleri yaptığınızı biliyorsanız, Core i3 yeterli olmalı, ancak 4 çekirdekli Core i5 için ek fiyat, gelecek yıllar düşünülerek ödenmelidir. Diğer yandan Core i7-1060NG7, en azından çok kısa bir süre için biraz daha yüksek tek çekirdekli performanstan faydalanmalıdır. Bununla birlikte, günlük iş yüklerinizde bu farkı fark edeceğinizden şüpheleniyoruz. İki alternatif işlemciyi mümkün olan en kısa sürede incelemeye çalışacağız.
Sistem performansı
MacOS için iyi bir sistem kıyaslaması yoktur, bu yüzden MacBook Air'i Windows 10 üzerinde çalışan Furturemark'ın PCMark ürünleriyle test ediyoruz. Sonuçlar biraz şaşırtıcı: Core i5'e sahip 2020 modeli ortalama olarak i5 modelinden daha hızlı değil 2019'dan itibaren - 2 ek çekirdek, yeni 10nm süreci ve yeni mimariye rağmen. MacBook Pro 13'te hala bir fark var ve Windows yarışması çok daha hızlı. Burada soğutma sisteminin sınırlamasını açıkça görebiliriz ve Apple (kasıtlı olarak) giriş seviyesi serisinin performansını sınırlar.
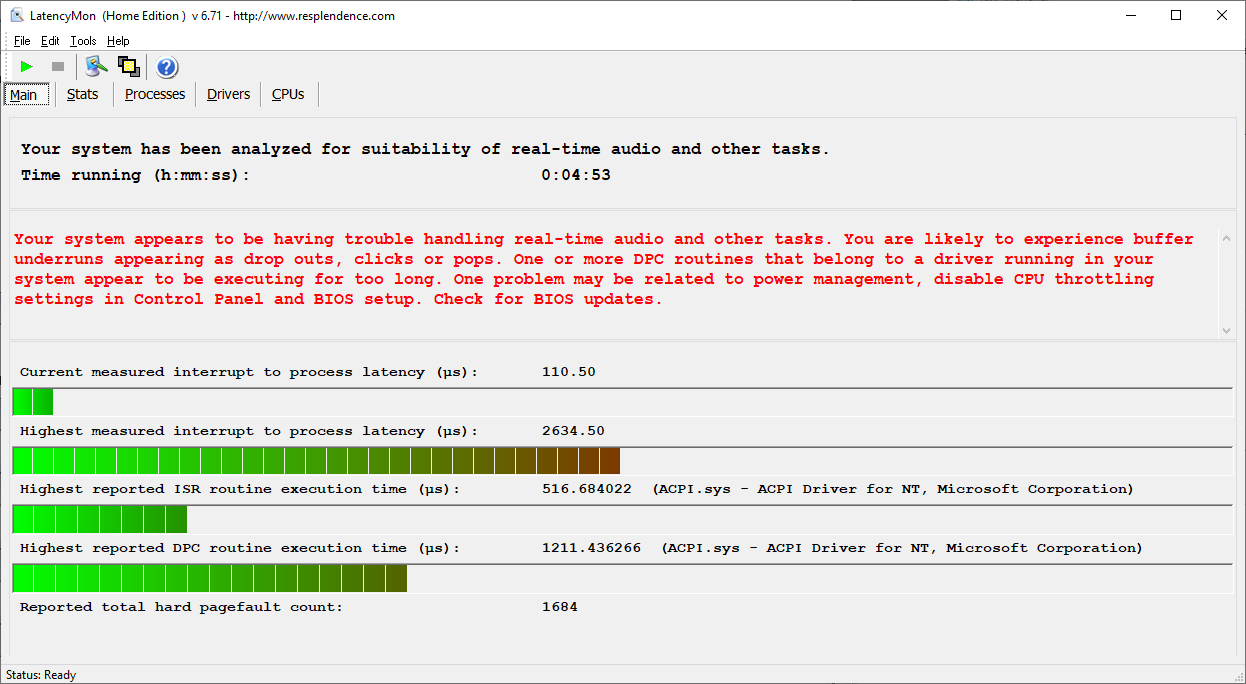
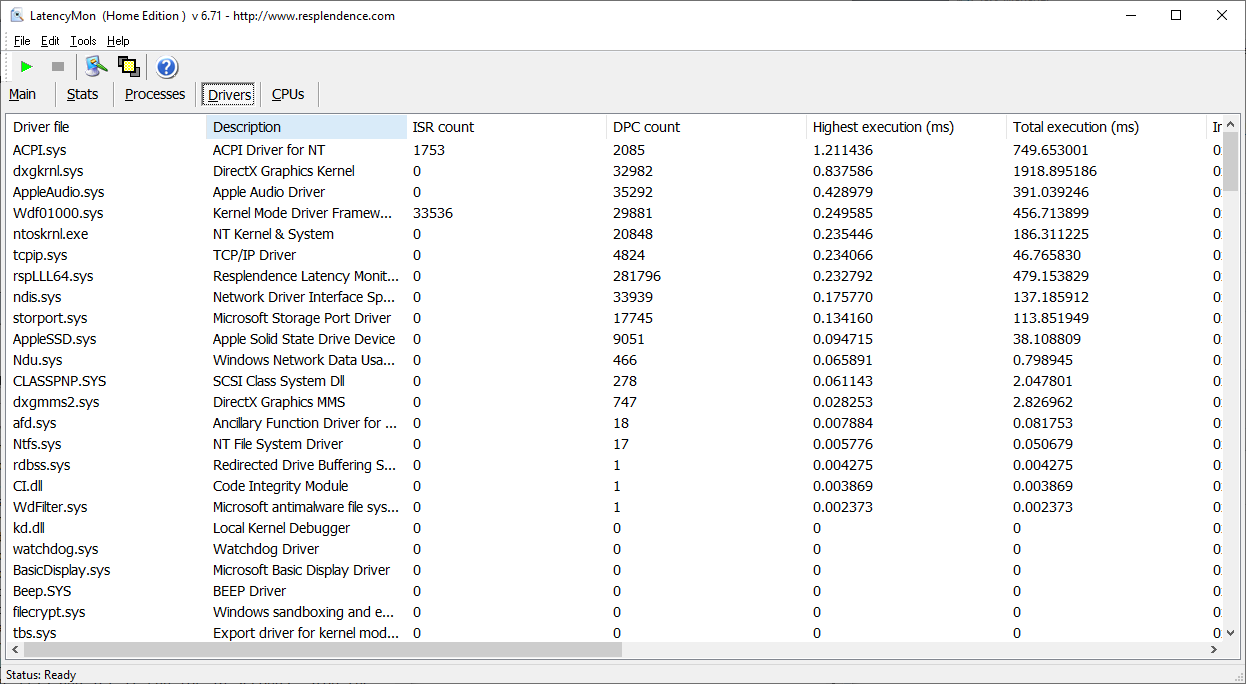
DPC Gecikmeleri Windows
LatencyMon ve test dizimiz aracılığıyla ölçülen DPC gecikmeleri (web'de gezinme, YouTube videosu, CPU yükü) yalnızca vasat bir sonuç gösterir. Apple'ın Windows sürücülerini gerçekten optimize etmediği açıktır. Yine de testler için uygun bir araca sahip olmadığımız sonucu macOS'a aktaramazsınız.
| DPC Latencies / LatencyMon - interrupt to process latency (max), Web, Youtube, Prime95 | |
| Dell XPS 13 9300 Core i7-1065G7 | |
| Lenovo ThinkPad X1 Carbon G7 20R1-000YUS | |
| Eve-Tech Eve V i7 | |
| Asus Zephyrus G14 GA401IV | |
| Apple MacBook Air 2020 i5 | |
| Schenker VIA 14 | |
| BMAX MaxBook Y11 H1M6 | |
| Sınıf ortalaması Subnotebook (316 - 8148, n=41, son 2 yıl) | |
| Dell XPS 13 9300 i5 FHD | |
| LG Gram 14T90N | |
| Dell XPS 13 2016 9350 (FHD, i7-6560U) | |
* ... daha küçük daha iyidir
Entegre NVMe-SSD - En hızlı sürücü değil
Apple, farklı SKU'lar için depolama kapasitesini iki katına çıkardı, ancak SSD performansı hala en iyi ortalama ve Acer Swift 3 veya MacBook Pro 16'daki daha hızlı sürücülerin arkasında açıkça ortada. Bu dizüstü bilgisayar kategorisinin ortalaması biraz daha iyi. Üst düzey SSD'lerin daha hızlı performansını fark edip etmediğiniz başka bir sorudur ve kullanım senaryosuna da bağlıdır.
| Apple MacBook Air 2020 i5 Apple SSD AP0512 | Apple Macbook Air 2019 Apple SSD AP0256 | Apple MacBook Pro 13 2019 2TB3 Apple SSD AP0256 | Microsoft Surface Laptop 3 13 Core i5-1035G7 SK hynix BC501 HFM256GDGTNG | Acer Swift 3 SF313-52-71Y7 Intel SSD 660p 1TB SSDPEKNW010T8 | Dell XPS 13 9300 i5 FHD Toshiba XG6 KXG60ZNV512G | Apple MacBook Pro 16 2019 i9 5500M Apple SSD AP1024 7171 | Sınıf ortalaması Subnotebook | |
|---|---|---|---|---|---|---|---|---|
| AS SSD | -16% | -4% | 50% | 139% | 218% | 194% | 292% | |
| Seq Read (MB/s) | 1153 | 933 -19% | 974 -16% | 1387 20% | 1703 48% | 2328 102% | 2531 120% | 4521 ? 292% |
| Seq Write (MB/s) | 1367 | 1139 -17% | 1340 -2% | 504 -63% | 1373 0% | 1137 -17% | 2289 67% | 2953 ? 116% |
| 4K Read (MB/s) | 12.95 | 10.53 -19% | 11.35 -12% | 42.35 227% | 56.8 339% | 48.07 271% | 15.85 22% | 59.2 ? 357% |
| 4K Write (MB/s) | 24.52 | 15.03 -39% | 15.95 -35% | 120 389% | 164.4 570% | 120.6 392% | 39.88 63% | 164.4 ? 570% |
| 4K-64 Read (MB/s) | 665 | 534 -20% | 643 -3% | 497.4 -25% | 584 -12% | 899 35% | 1267 91% | 859 ? 29% |
| 4K-64 Write (MB/s) | 159.5 | 181.6 14% | 163 2% | 354.9 123% | 783 391% | 1220 665% | 1749 997% | 1702 ? 967% |
| Score Read (Points) | 793 | 638 -20% | 752 -5% | 678 -15% | 811 2% | 1180 49% | 1536 94% | 1369 ? 73% |
| Score Write (Points) | 321 | 311 -3% | 313 -2% | 525 64% | 1085 238% | 1455 353% | 2018 529% | 2161 ? 573% |
| Score Total (Points) | 1528 | 1283 -16% | 1465 -4% | 1520 -1% | 2313 51% | 3189 109% | 4317 183% | 4166 ? 173% |
| Copy ISO MB/s (MB/s) | 1433 | 1205 -16% | 1404 -2% | 764 -47% | 1401 -2% | 1995 39% | 2586 ? 80% | |
| Copy Program MB/s (MB/s) | 363 | 302.1 -17% | 406.9 12% | 256.1 -29% | 480.4 32% | 584 61% | 812 ? 124% | |
| Copy Game MB/s (MB/s) | 725 | 627 -14% | 850 17% | 368.4 -49% | 820 13% | 1135 57% | 1783 ? 146% |

GPU Performansı - 64 Gölgelendiricili Ice-Lake-GPU
Intel'in yeni Ice Lake işlemcileri çok daha hızlı tümleşik GPU'larla donatılmıştır. İki dört çekirdekli model, 64 AB'li Iris Plus Graphics G7; giriş seviyesi Core i3 sadece 48 AB iGPU'sudur. Sentetik karşılaştırmalar, önceki MacBook Air'e kıyasla neredeyse iki kat GPU performansı ve 2019 MacBook Pro 13 (2x TB3) ve Iris Plus Graphics 645 ile hemen hemen aynı performans seviyesini gösteriyor. Ancak, performans sabit değil, çünkü 3DMark stres testi yaklaşık% 20'lik bir performans düşüşü gösterir.
| Unigine Valley 1.0 - 1920x1080 Extreme HD Preset OpenGL AA:x8 | |
| Apple MacBook Pro 16 2019 i9 5500M | |
| Sınıf ortalaması Subnotebook (4.7 - 26.2, n=6, son 2 yıl) | |
| Apple MacBook Pro 13 2018 Touchbar i5 | |
| Apple MacBook Pro 13 2017 Touchbar i5 | |
| Apple MacBook Air 2020 i5 | |
| Ortalama Intel Iris Plus Graphics G7 (Ice Lake 64 EU) (n=1) | |
| Basemark GPU 1.2 | |
| 3840x2160 Metal High Offscreen | |
| Apple iPad Pro 11 2020 | |
| Apple MacBook Pro 16 2019 i9 5500M | |
| Apple MacBook Air 2020 i5 | |
| Ortalama Intel Iris Plus Graphics G7 (Ice Lake 64 EU) (n=1) | |
| 1920x1080 Metal Medium Offscreen | |
| Apple MacBook Pro 16 2019 i9 5500M | |
| Apple iPad Pro 11 2018 | |
| Apple iPad Pro 11 2020 | |
| Apple MacBook Air 2020 i5 | |
| Ortalama Intel Iris Plus Graphics G7 (Ice Lake 64 EU) (n=1) | |
| 3DMark 06 Standard Score | 8821 puan | |
| 3DMark 11 Performance | 2848 puan | |
| 3DMark Fire Strike Score | 1605 puan | |
| 3DMark Time Spy Score | 587 puan | |
Yardım | ||
Oyun Performansı
Oyun performansı CPU veya daha kesin olarak düşük TDP yapılandırması ile kesinlikle sınırlıdır. İGPU'nun kendisi oldukça güçlü, ancak eski oyunları oynamak istediğinizde bile en düşük ayrıntılarla sınırlısınız. Bununla birlikte, bir süre sonra düşük performansla ilgili sorun hala var, bu da Witcher 3 döngümüzde de görülüyor (bu durumda Min ön ayarı ile). MacBook Air güçlü 40 fps ile başlar, ancak hızlı bir şekilde sadece ~ 20 fps'ye düşer, bu yüzden artık sorunsuz bir şekilde oynatılamaz.
| The Witcher 3 - 1024x768 Low Graphics & Postprocessing | |
| Sınıf ortalaması Subnotebook (38.8 - 176, n=12, son 2 yıl) | |
| Microsoft Surface Laptop 3 13 Core i5-1035G7 | |
| Ortalama Intel Iris Plus Graphics G7 (Ice Lake 64 EU) (28.2 - 58, n=20) | |
| Apple MacBook Air 2020 i5 | |
| Shadow of the Tomb Raider - 1280x720 Lowest Preset | |
| Sınıf ortalaması Subnotebook (41 - 109, n=7, son 2 yıl) | |
| Ortalama Intel Iris Plus Graphics G7 (Ice Lake 64 EU) (15.6 - 33, n=13) | |
| Microsoft Surface Laptop 3 13 Core i5-1035G7 | |
| Apple MacBook Air 2020 i5 | |
| düşük | orta | yüksek | ultra | |
|---|---|---|---|---|
| BioShock Infinite (2013) | 55.6 | 33.5 | 29.1 | 10.9 |
| GTA V (2015) | 24.8 | |||
| The Witcher 3 (2015) | 28.2 | 5.13 | ||
| Dota 2 Reborn (2015) | 59.4 | 30.7 | 20.5 | 19.8 |
| Rocket League (2017) | 22.1 | 24.9 | ||
| X-Plane 11.11 (2018) | 24 | 11.6 | 10.8 | |
| World of Tanks enCore (2018) | 92.9 | 14.6 | ||
| Far Cry 5 (2018) | 11 | |||
| Shadow of the Tomb Raider (2018) | 15.6 | |||
| Battlefield V (2018) | 7.87 | |||
| Anno 1800 (2019) | 19 | |||
| FIFA 20 (2019) | 0 oyun başlamıyor |
MacOS ile yaptığımız testler, Windows karşılaştırmalarimizden alınan sonuçları doğrulamaktadır. İncelediğimiz dört çekirdekli SKU bile, düşük soğutma performansı ve sürekli iş yükleri için düşük TDP limitleri nedeniyle iyi oyun performansı sunamıyor. Fortnite, Counterstrike GO ve Dota 2, sistem gereksinimleri çok yüksek olmasa da sinir bozucu kekemelere maruz kaldı. Fortnite neredeyse hiç oynanamazdı, diğer iki oyun sadece sınırlamalarla. League of Legends en düşük ayarlarda iyi koştu ve çok iddiasız Hearthstone en iyi oyun deneyimini sağladı. Orta çözünürlükte veya maksimum ayrıntılarla ve 1440 x 900 pikselle birlikte doğal çözünürlükte çalışır.
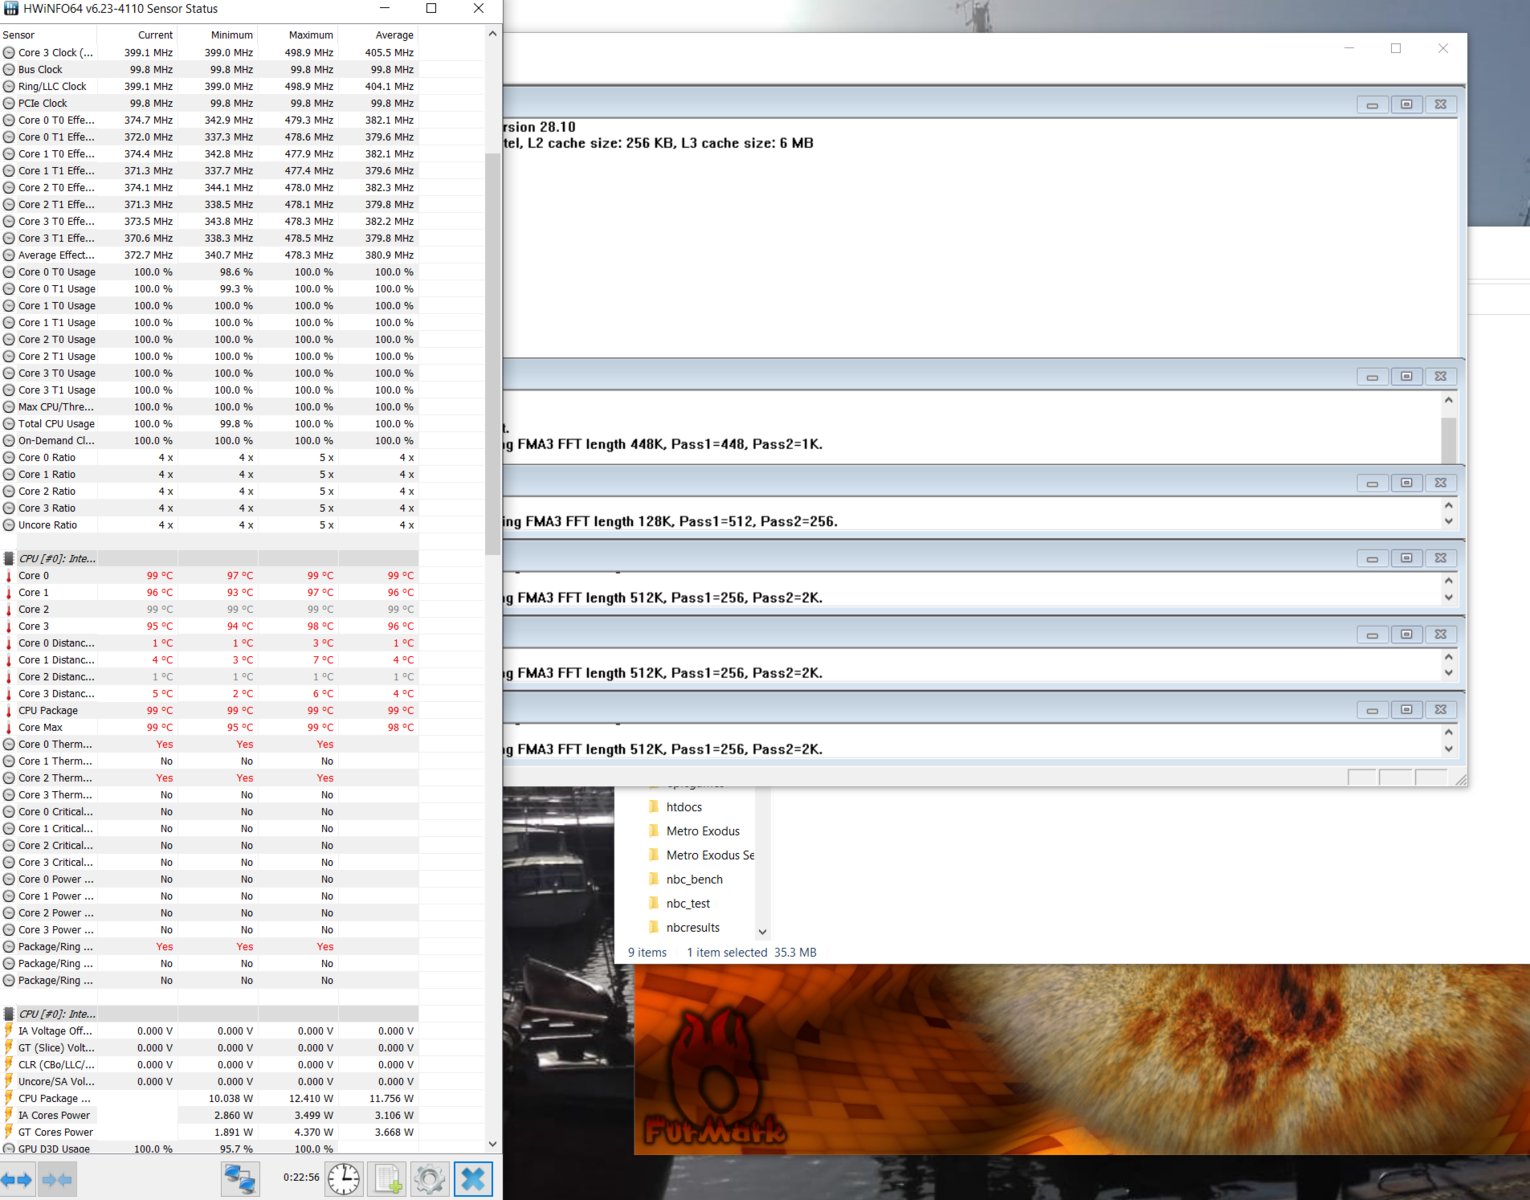
Emisyonlar - MacBook Air çok yüksek
Sistem Gürültüsü
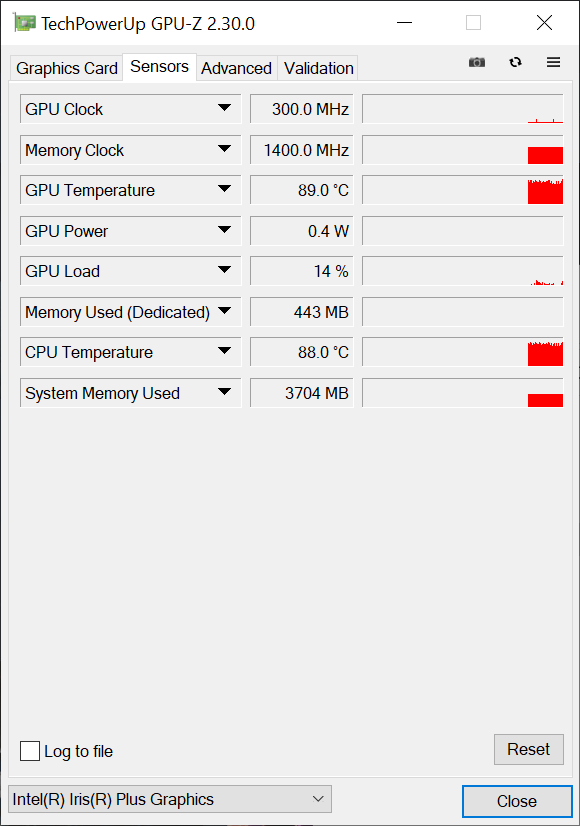
Temel soğutma sistemi değişmedi, bu da MacBook Air'in işlemcisinin hala pasif olarak soğutulduğu anlamına geliyor. Kasanın içinde küçük bir fan var, ancak işlemciden gelen ısı emici ile doğrudan bağlantı yok. Fanın tek görevi şasi içindeki hava sirkülasyonunu iyileştirmektir. Bununla birlikte, yeni dört çekirdekli Core i5 işlemci, eski çift çekirdekten çok daha fazla ısı üretiyor ve biraz daha büyük ısı emici de gerçekten yardımcı olmuyor. Önceki modele kıyasla, bu fanın daha sık çalıştığı ve aynı zamanda daha yüksek olduğu anlamına gelir. Sadece aşırı yük senaryolarından değil, uygulamaların veya işletim sistemi güncellemelerinin yüklenmesi gibi günlük konulardan bahsediyoruz. 40 dB (A) 'dan fazla olduğunda, küçük fan sürekli iş yükleri altında net bir şekilde duyulabilir. Genellikle, dizüstü bilgisayarın normal çalışma mesafesinden hala duyulamadığı harici bir monitör ve hafif çoklu görev (örn. YouTube video ve web'de gezinme) ile yaklaşık 2700 rpm gördük. Affinity Photo (JPG) ile hafif resim düzenleme bile fanın etkinliği olmadan mümkündür. İşlemciyi ve hatta grafik kartını strese sokmaya başladığınızda, fan birkaç dakika içinde maksimum 8100 rpm'ye ve 45,8 dB (A) yüksekliğine kadar hızlanacaktır. Nispeten yavaş bir cihaza ek olarak, yüksek bir cihaz ve 100 ° C (212 ° F) çip sıcaklığı ile de yaşamak zorundasınız.
Ses yüksekliği
| Boşta |
| 30 / 30 / 30 dB |
| Çalışırken |
| 45.5 / 45.8 dB |
 | ||
30 dB sessiz 40 dB(A) duyulabilirlik 50 dB(A) gürültülü |
||
min: | ||
| Apple MacBook Air 2020 i5 Iris Plus Graphics G7 (Ice Lake 64 EU), i5-1030NG7, Apple SSD AP0512 | Apple Macbook Air 2019 UHD Graphics 617, i5-8210Y, Apple SSD AP0256 | Apple MacBook Pro 13 2019 2TB3 Iris Plus Graphics 645, i5-8257U, Apple SSD AP0256 | Microsoft Surface Laptop 3 13 Core i5-1035G7 Iris Plus Graphics G7 (Ice Lake 64 EU), i5-1035G7, SK hynix BC501 HFM256GDGTNG | Acer Swift 3 SF313-52-71Y7 Iris Plus Graphics G7 (Ice Lake 64 EU), i7-1065G7, Intel SSD 660p 1TB SSDPEKNW010T8 | Dell XPS 13 9300 i5 FHD UHD Graphics G1 (Ice Lake 32 EU), i5-1035G1, Toshiba XG6 KXG60ZNV512G | |
|---|---|---|---|---|---|---|
| Noise | 7% | 9% | 12% | 9% | 12% | |
| kapalı / ortam * (dB) | 30 | 29.5 2% | 29.5 2% | 28.5 5% | 30.3 -1% | 29.3 2% |
| Idle Minimum * (dB) | 30 | 29.5 2% | 29.5 2% | 28.5 5% | 30.3 -1% | 29.3 2% |
| Idle Average * (dB) | 30 | 29.5 2% | 29.5 2% | 28.5 5% | 30.3 -1% | 29.3 2% |
| Idle Maximum * (dB) | 30 | 29.5 2% | 29.5 2% | 28.5 5% | 30.3 -1% | 29.3 2% |
| Load Average * (dB) | 45.5 | 34 25% | 31.1 32% | 28.5 37% | 31.7 30% | 30 34% |
| Load Maximum * (dB) | 45.8 | 41 10% | 39.3 14% | 40.4 12% | 32.7 29% | 32.4 29% |
| Witcher 3 ultra * (dB) | 40.4 |
* ... daha küçük daha iyidir
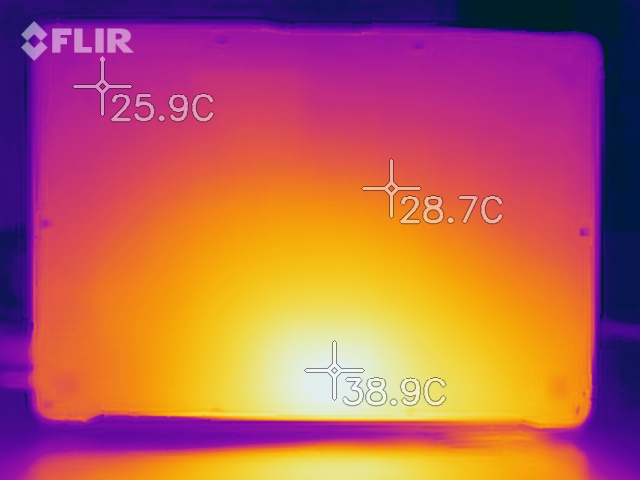
Sıcaklık
İç sıcaklıkların aksine, alüminyum şasinin dış sıcaklıkları tamamen iyidir. Bir saatlik aşırı yükten sonra bile, ana ünitenin üstünde yalnızca 42 ° C'ye (107.6 ° F) kadar ölçüm yapabiliriz. Rölantide veya hafif iş yükleri sırasında şasi rahatça serin kalır ve sıcak nokta kasanın üst kısmındadır, bu nedenle avuç içi dayanakları asla çok sıcak olmaz.
(-) Üst taraftaki maksimum sıcaklık, 35.9 °C / 97 F ortalamasına kıyasla 48 °C / 118 F'dir. , Subnotebook sınıfı için 21.4 ile 59 °C arasında değişir.
(±) Alt kısım, 39.2 °C / 103 F ortalamasına kıyasla maksimum 40 °C / 104 F'ye kadar ısınır
(+) Boşta kullanımda, üst tarafın ortalama sıcaklığı 27.7 °C / 82 F olup, cihazın 30.8 °C / 87 F.
(±) The Witcher 3 oynarken, üst tarafın ortalama sıcaklığı 32.8 °C / 91 F olup, cihazın 30.8 °C / 87 F.
(+) Avuç içi dayanakları ve dokunmatik yüzey, maksimum 29 °C / 84.2 F ile cilt sıcaklığından daha soğuktur ve bu nedenle dokunulduğunda soğuktur.
(±) Benzer cihazların avuç içi dayanağı alanının ortalama sıcaklığı 28.2 °C / 82.8 F (-0.8 °C / -1.4 F) idi.
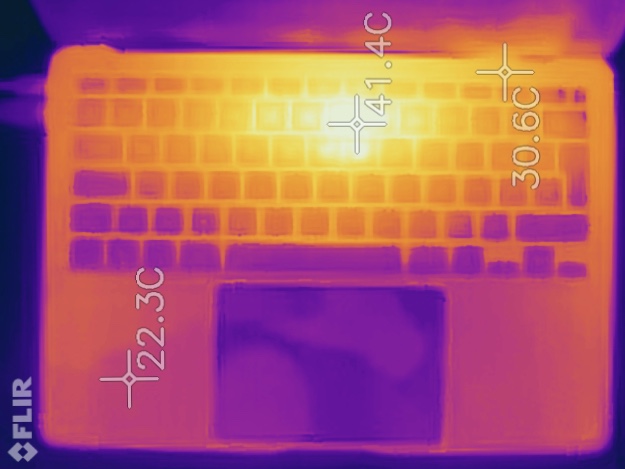
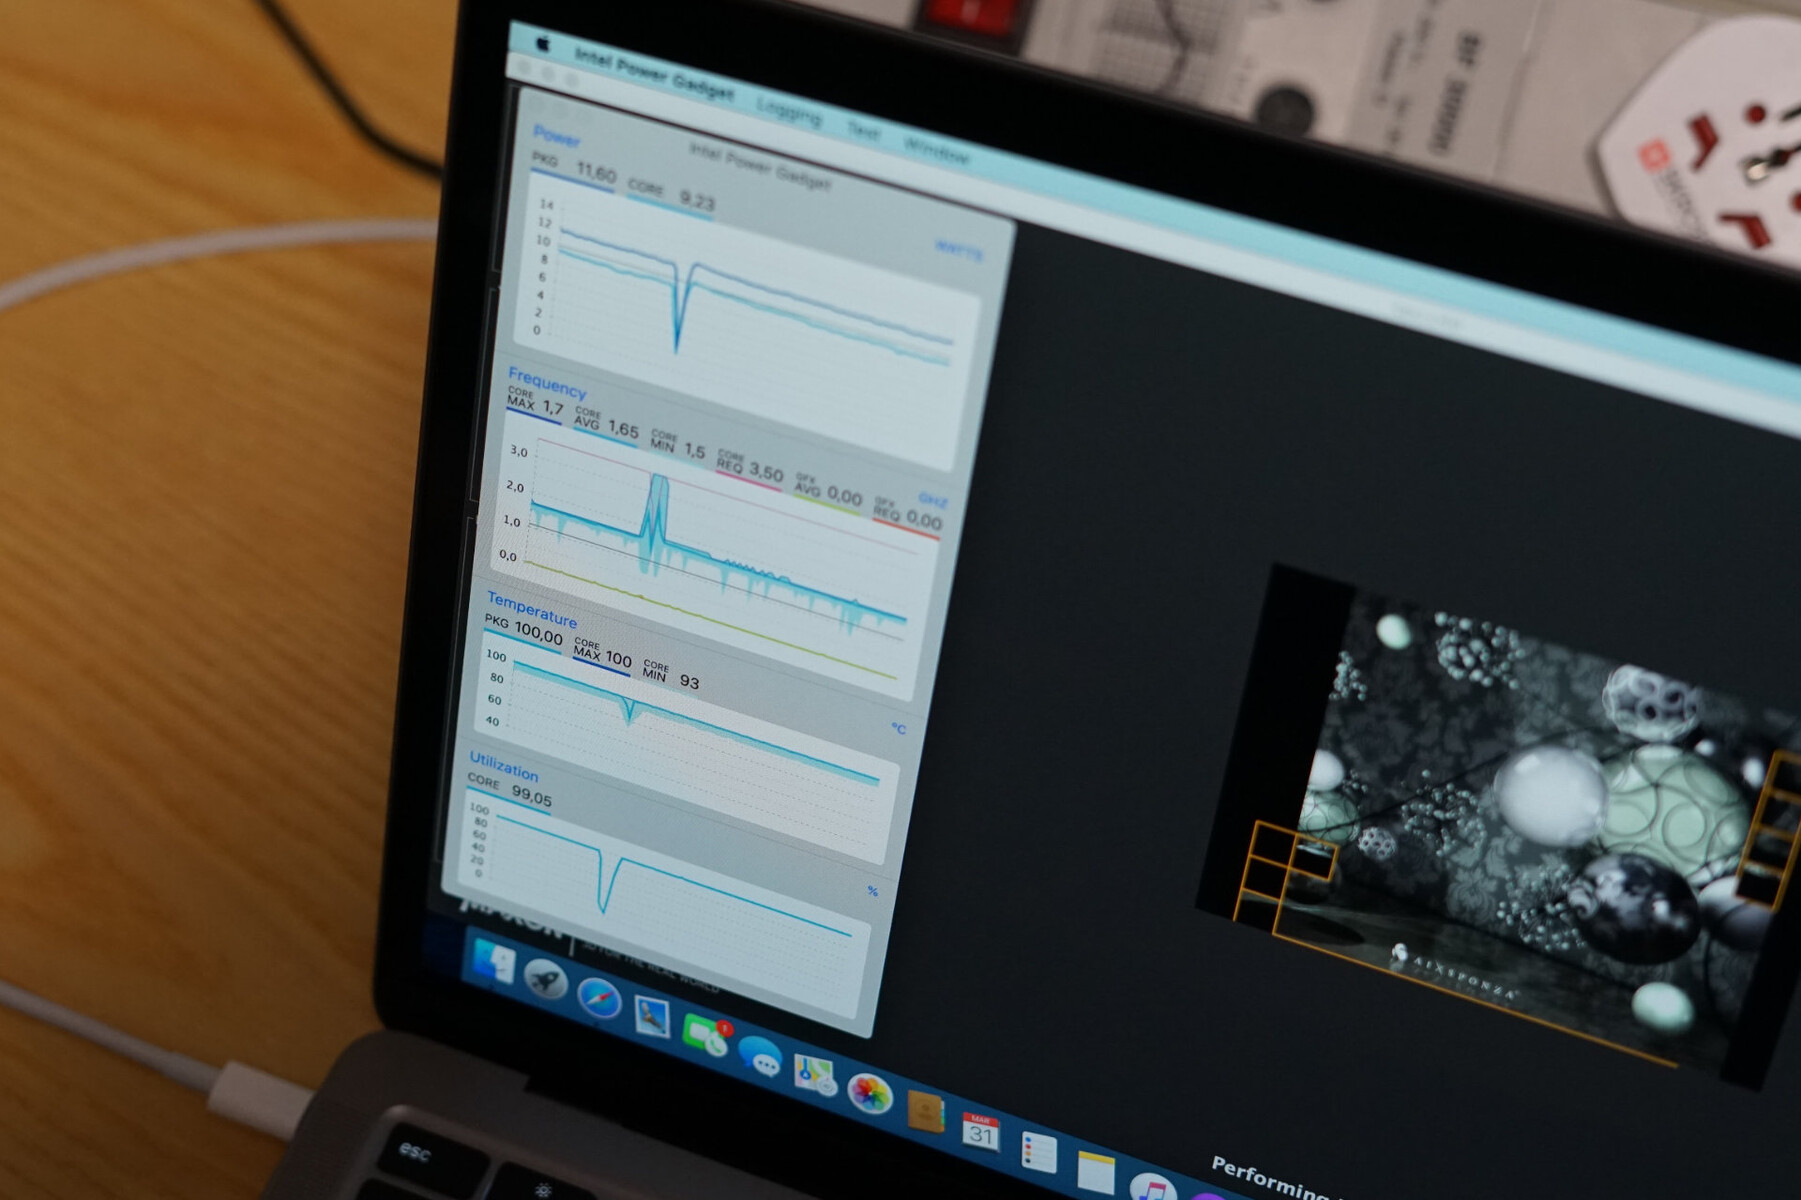
The internal temperatures are a different story. The CPU and therefore also the integrated graphics adapter quickly reach 100 °C (212 °F), even during short peak load. This is not a great indicator for the durability. Apple just implemented a weak cooling system to keep the distance to the Pro models under sustained workloads.
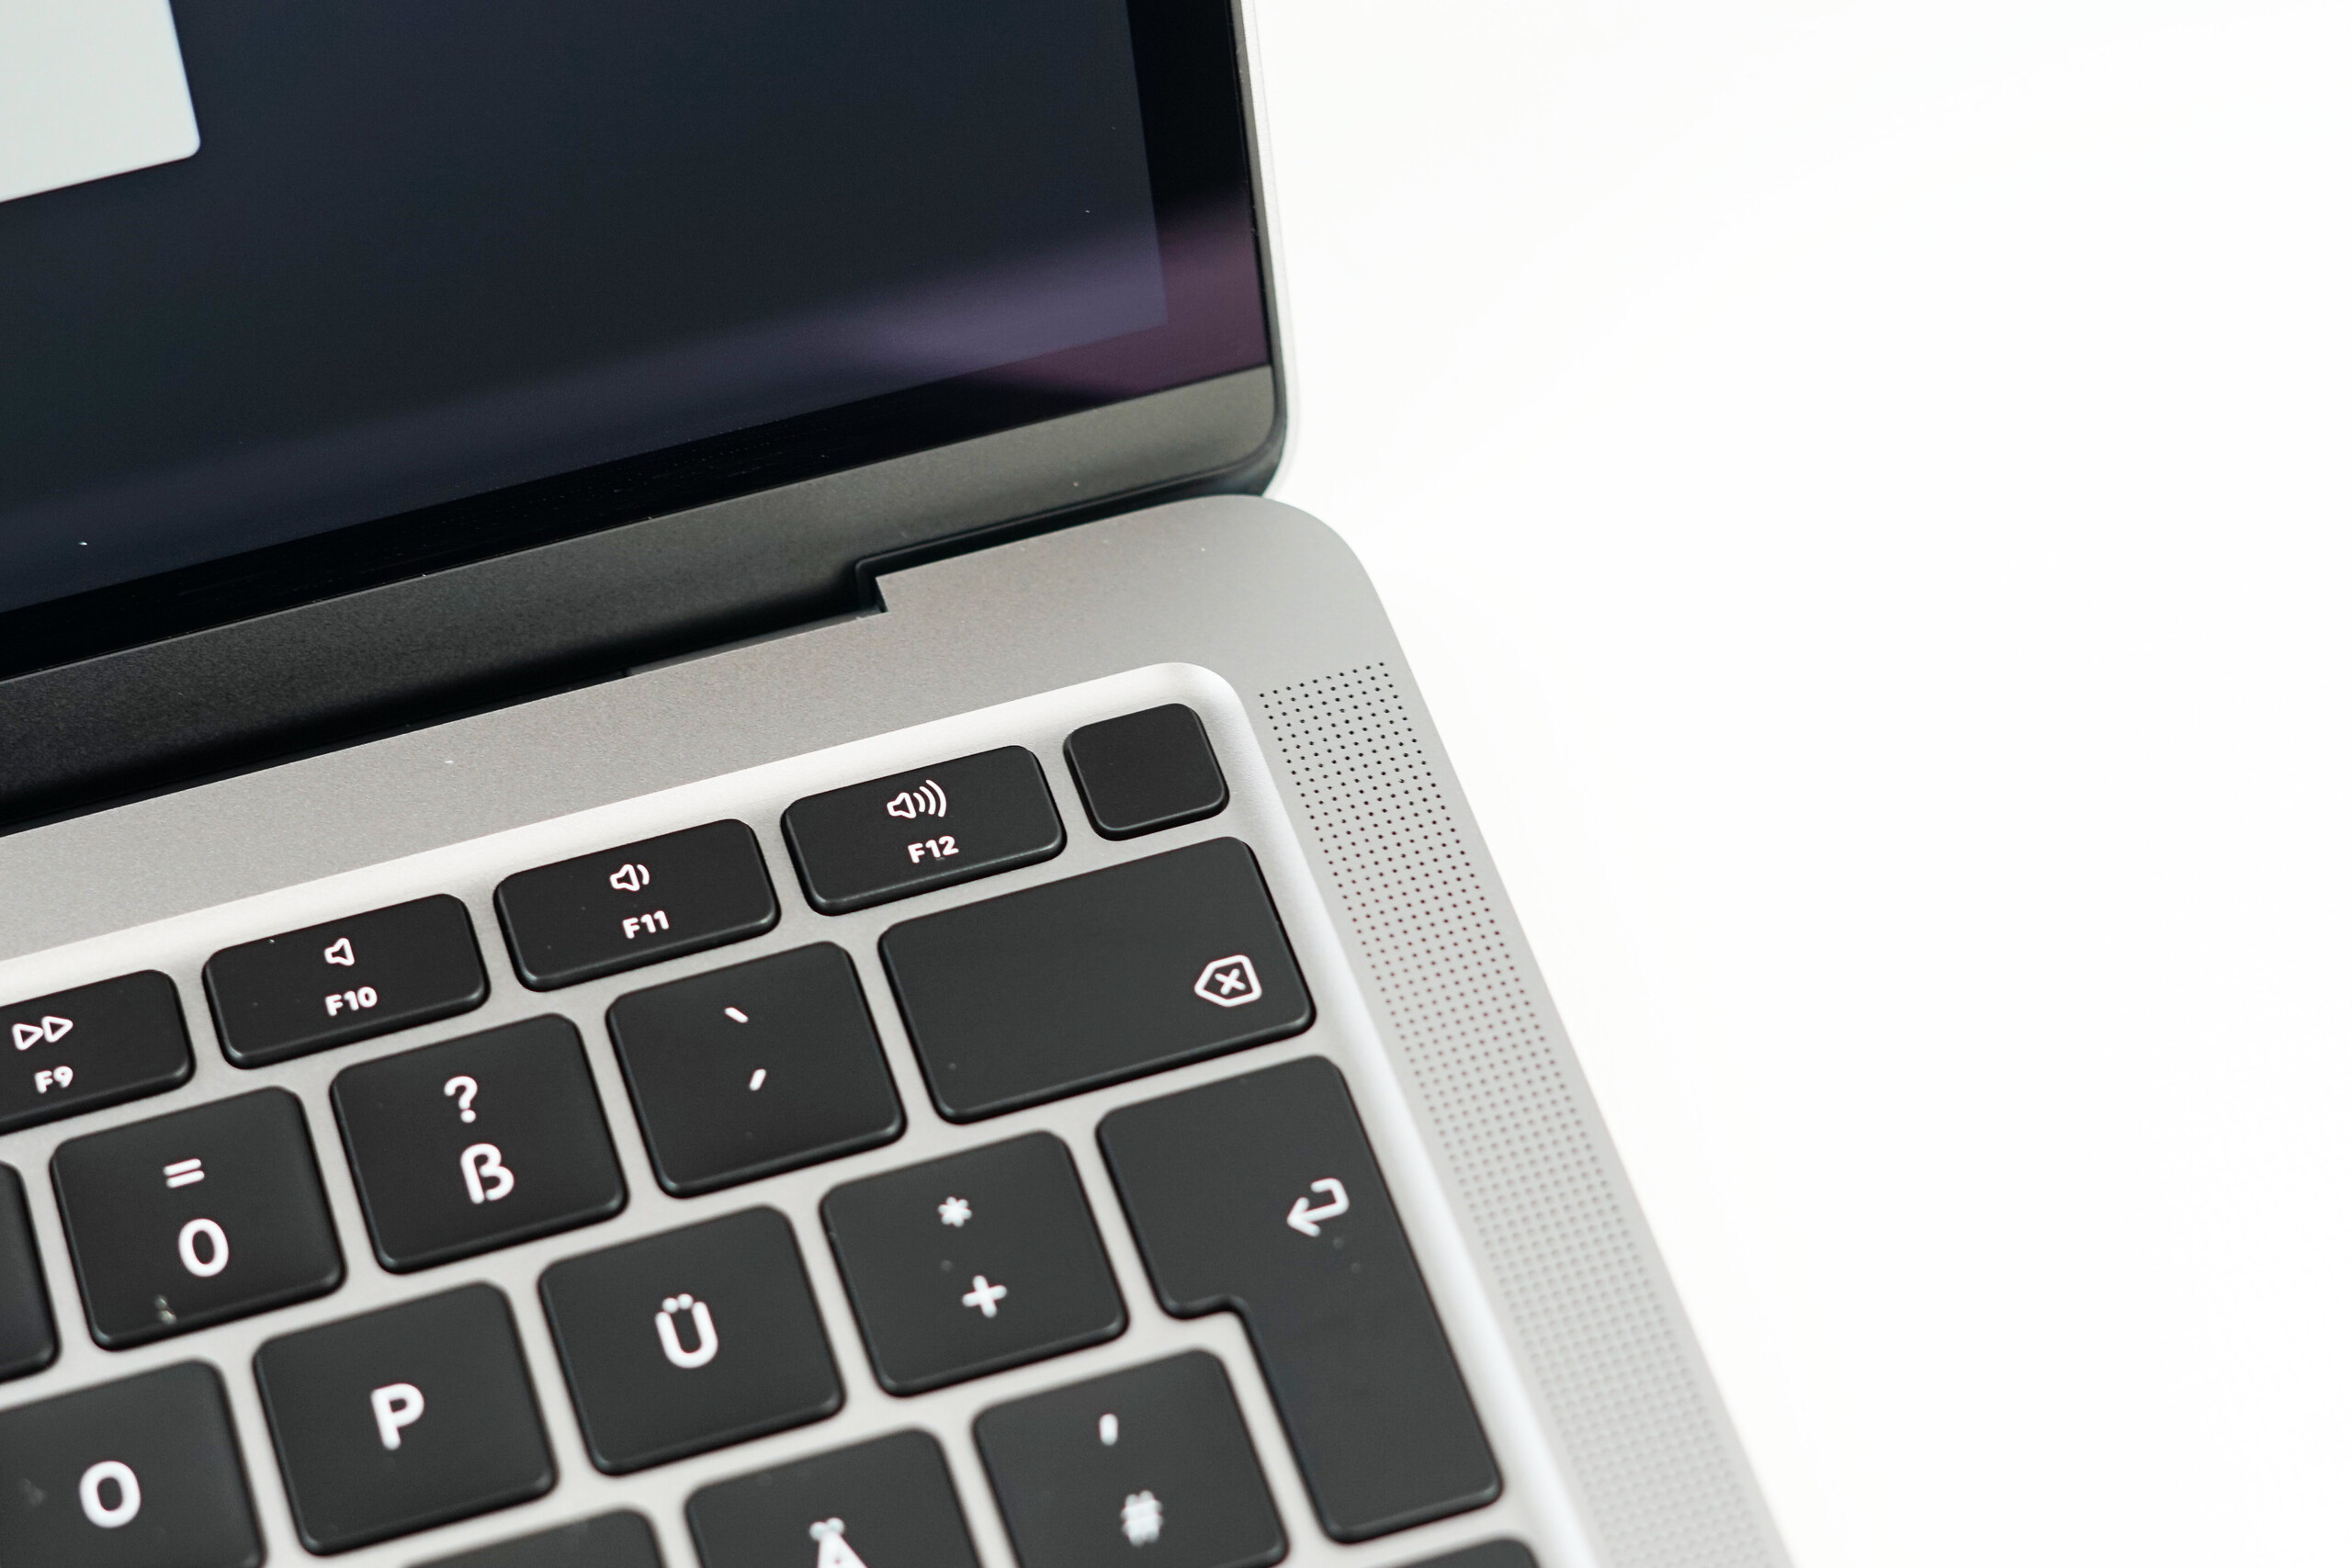
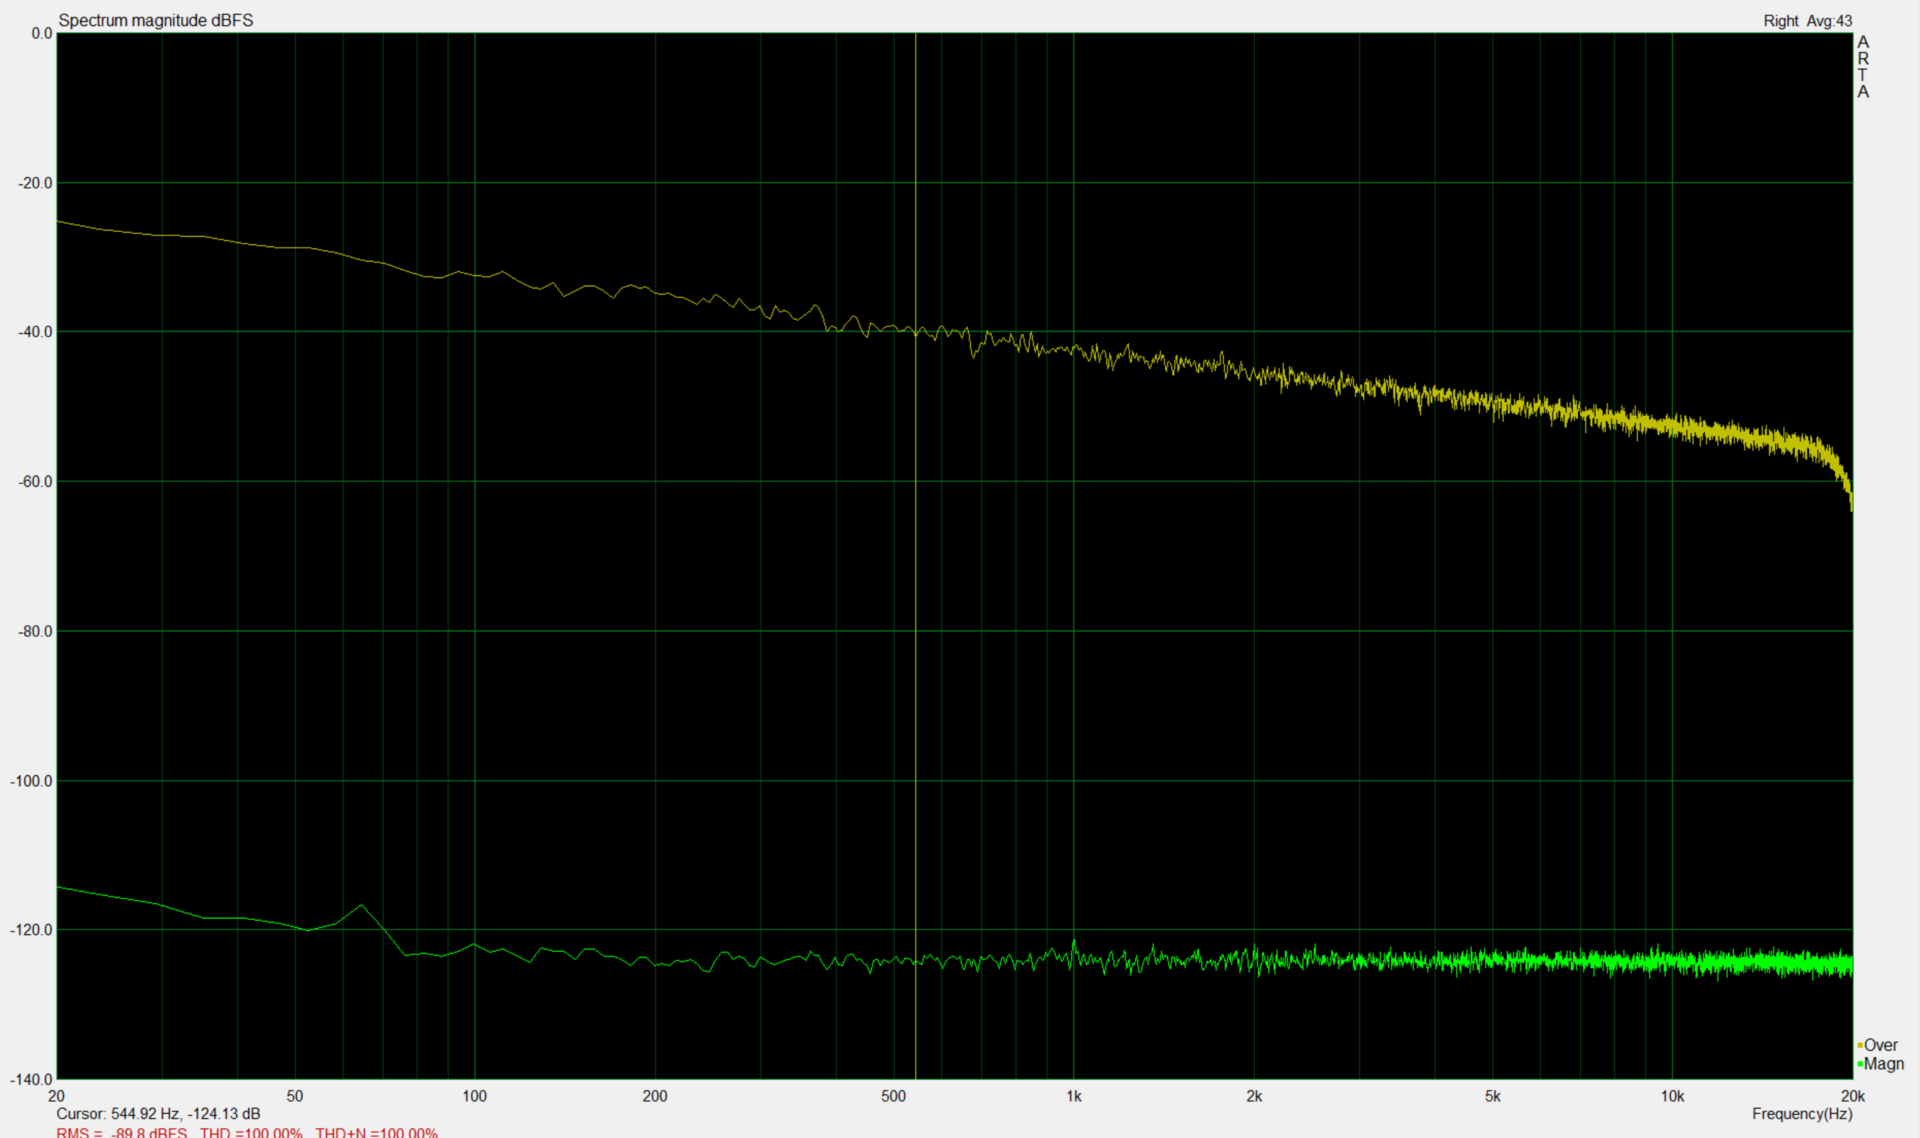
Speakers
Apple also improved the stereo speakers of the 2020 MacBook Air. It looks like the manufacturer uses the slightly thicker chassis of the notebook for better speaker modules. The frequency diagram shows a much more linear curve across the audible frequencies very similar to the Surface Laptop 3. The Dell XPS 13 and typical notebooks are clearly beaten, but the current MacBook Pro 16 is still the best laptop in terms of notebook speakers.
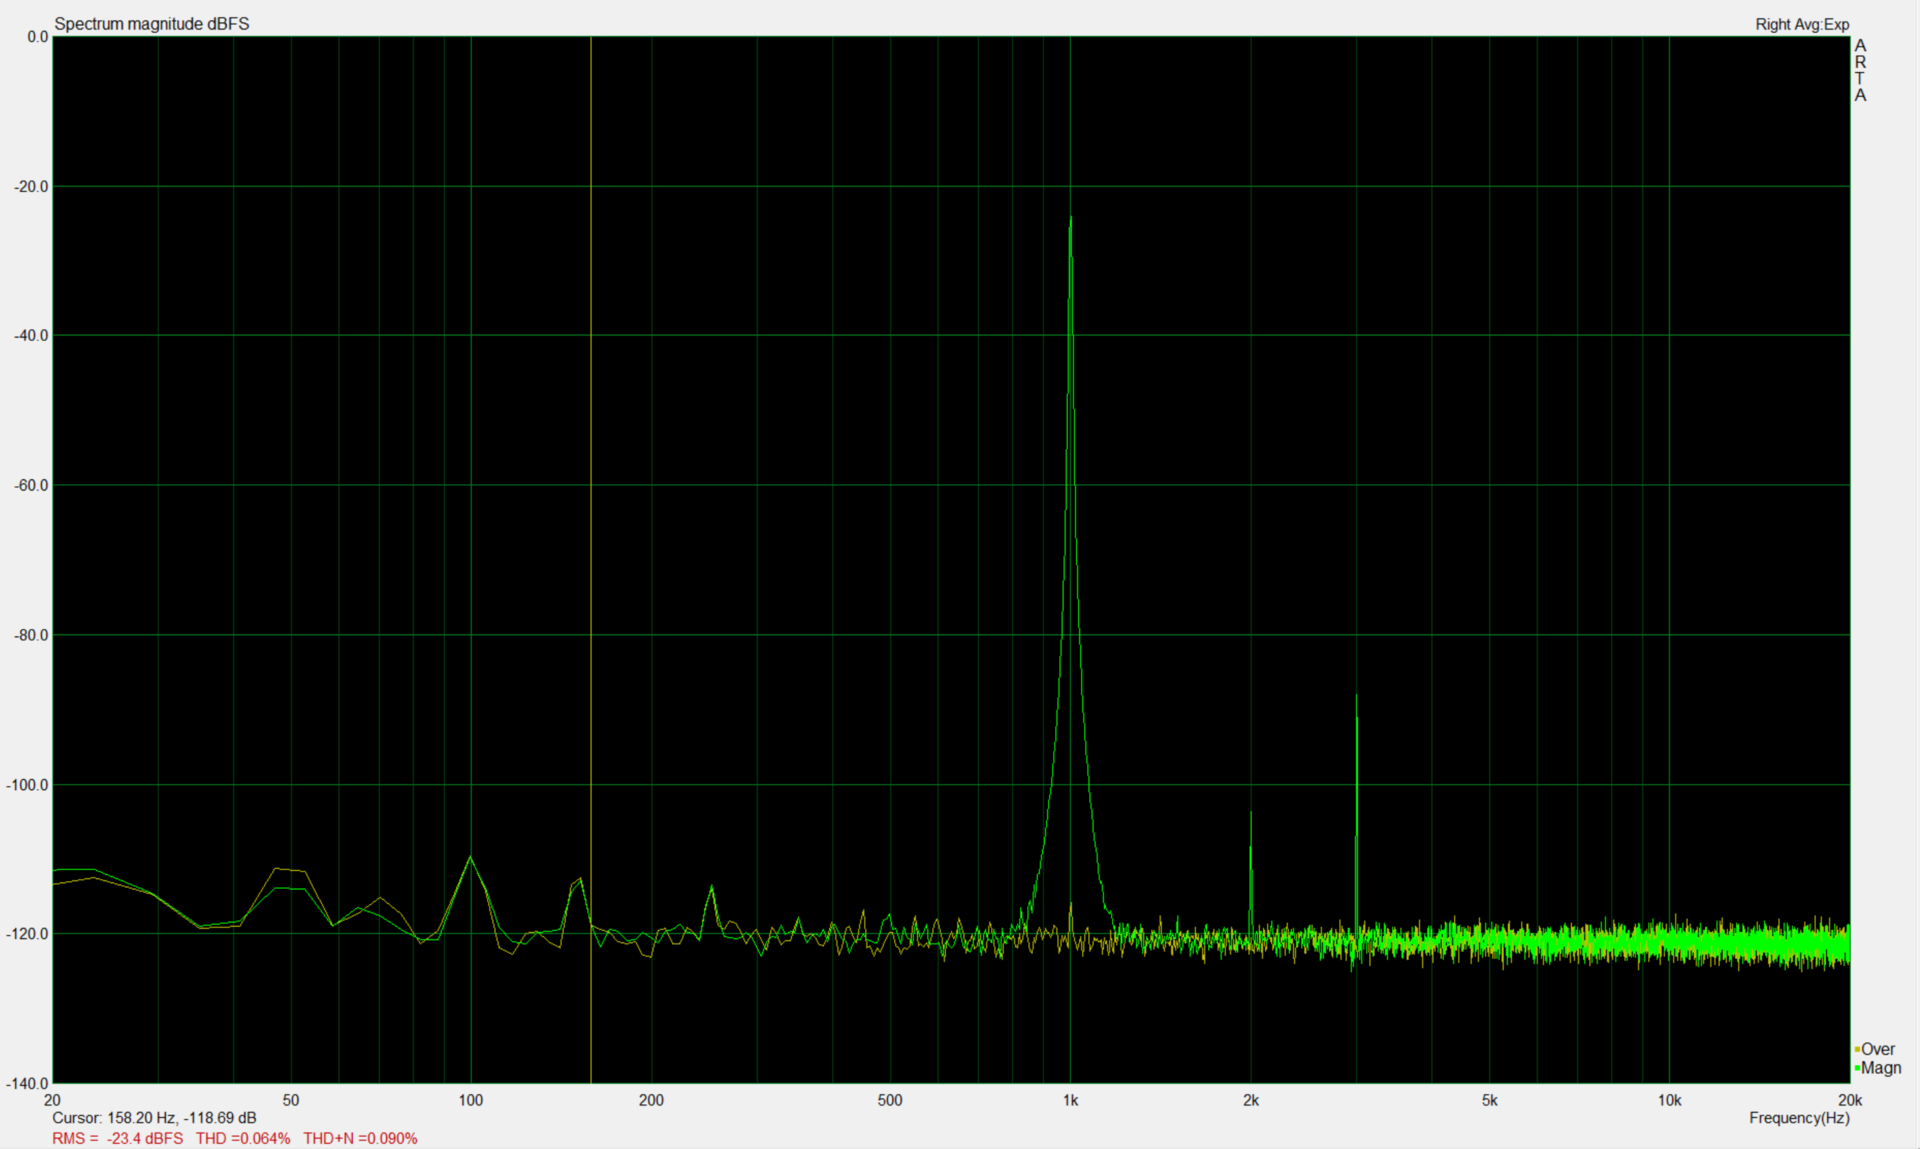
Apple MacBook Air 2020 i5 ses analizi
(±) | hoparlör ses yüksekliği ortalama ama iyi (78.1 dB)
Bas 100 - 315Hz
(+) | iyi bas - medyandan yalnızca 4.3% uzakta
(±) | Bas doğrusallığı ortalamadır (11.5% delta - önceki frekans)
Ortalar 400 - 2000 Hz
(+) | dengeli ortalar - medyandan yalnızca 3.4% uzakta
(+) | orta frekanslar doğrusaldır (6.2% deltadan önceki frekansa)
Yüksekler 2 - 16 kHz
(+) | dengeli yüksekler - medyandan yalnızca 2% uzakta
(+) | yüksekler doğrusaldır (3.7% deltadan önceki frekansa)
Toplam 100 - 16.000 Hz
(+) | genel ses doğrusaldır (9.9% ortancaya göre fark)
Aynı sınıfla karşılaştırıldığında
» Bu sınıftaki tüm test edilen cihazların %7%'si daha iyi, 1% benzer, 92% daha kötüydü
» En iyisinin deltası 5% idi, ortalama 18% idi, en kötüsü 53% idi
Test edilen tüm cihazlarla karşılaştırıldığında
» Test edilen tüm cihazların %4'si daha iyi, 1 benzer, % 95 daha kötüydü
» En iyisinin deltası 4% idi, ortalama 23% idi, en kötüsü 134% idi
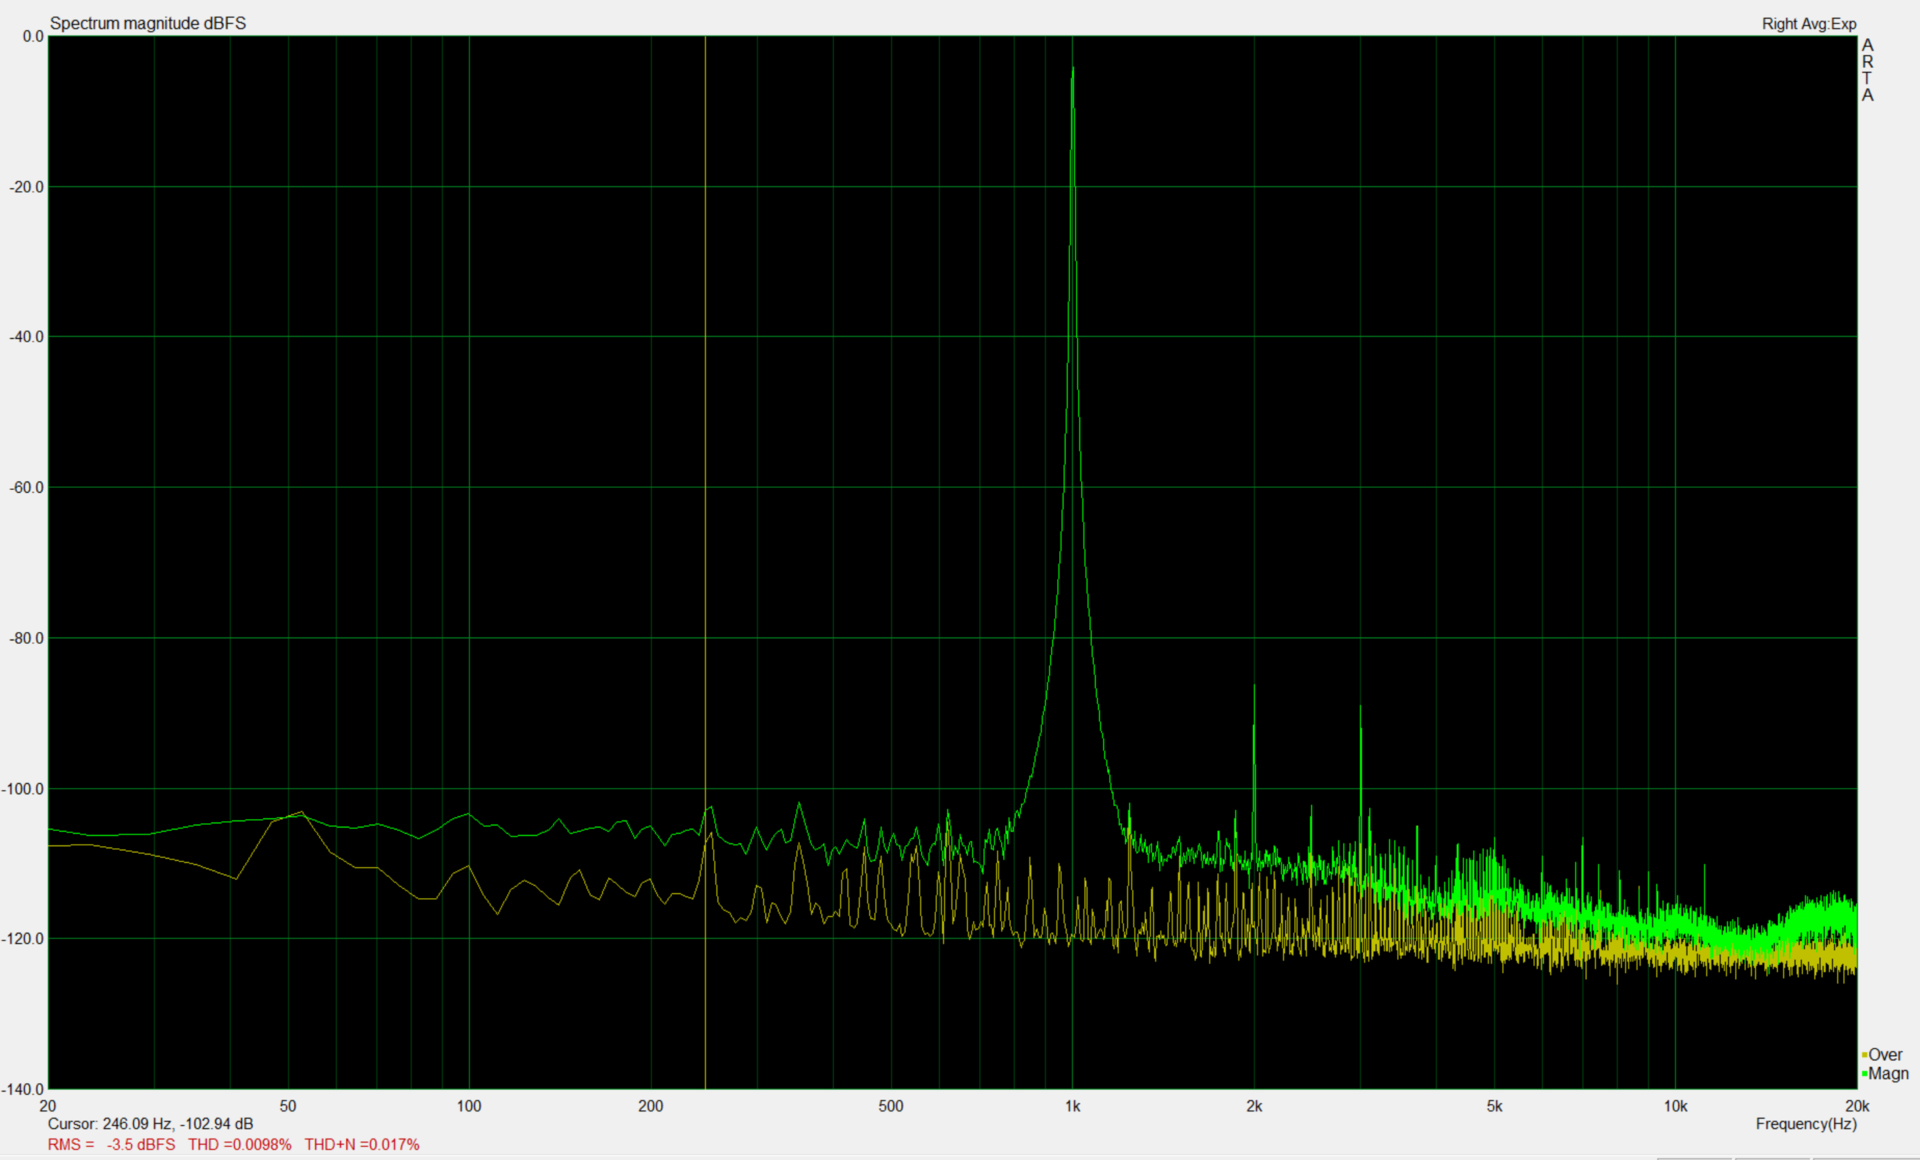
Apple Macbook Air 2019 ses analizi
(±) | hoparlör ses yüksekliği ortalama ama iyi (75.8 dB)
Bas 100 - 315Hz
(±) | azaltılmış bas - ortalama olarak medyandan 8.9% daha düşük
(±) | Bas doğrusallığı ortalamadır (11.6% delta - önceki frekans)
Ortalar 400 - 2000 Hz
(+) | dengeli ortalar - medyandan yalnızca 3% uzakta
(+) | orta frekanslar doğrusaldır (5.1% deltadan önceki frekansa)
Yüksekler 2 - 16 kHz
(+) | dengeli yüksekler - medyandan yalnızca 2.9% uzakta
(+) | yüksekler doğrusaldır (4.7% deltadan önceki frekansa)
Toplam 100 - 16.000 Hz
(+) | genel ses doğrusaldır (14.3% ortancaya göre fark)
Aynı sınıfla karşılaştırıldığında
» Bu sınıftaki tüm test edilen cihazların %28%'si daha iyi, 6% benzer, 65% daha kötüydü
» En iyisinin deltası 5% idi, ortalama 18% idi, en kötüsü 53% idi
Test edilen tüm cihazlarla karşılaştırıldığında
» Test edilen tüm cihazların %18'si daha iyi, 4 benzer, % 78 daha kötüydü
» En iyisinin deltası 4% idi, ortalama 23% idi, en kötüsü 134% idi
Apple MacBook Pro 16 2019 i9 5500M ses analizi
(+) | hoparlörler nispeten yüksek sesle çalabilir (82.3 dB)
Bas 100 - 315Hz
(+) | iyi bas - medyandan yalnızca 2.3% uzakta
(+) | bas doğrusaldır (5% delta ile önceki frekans)
Ortalar 400 - 2000 Hz
(+) | dengeli ortalar - medyandan yalnızca 2.7% uzakta
(+) | orta frekanslar doğrusaldır (3.4% deltadan önceki frekansa)
Yüksekler 2 - 16 kHz
(+) | dengeli yüksekler - medyandan yalnızca 2.1% uzakta
(+) | yüksekler doğrusaldır (2.6% deltadan önceki frekansa)
Toplam 100 - 16.000 Hz
(+) | genel ses doğrusaldır (6.9% ortancaya göre fark)
Aynı sınıfla karşılaştırıldığında
» Bu sınıftaki tüm test edilen cihazların %5%'si daha iyi, 1% benzer, 94% daha kötüydü
» En iyisinin deltası 5% idi, ortalama 17% idi, en kötüsü 45% idi
Test edilen tüm cihazlarla karşılaştırıldığında
» Test edilen tüm cihazların %1'si daha iyi, 0 benzer, % 99 daha kötüydü
» En iyisinin deltası 4% idi, ortalama 23% idi, en kötüsü 134% idi
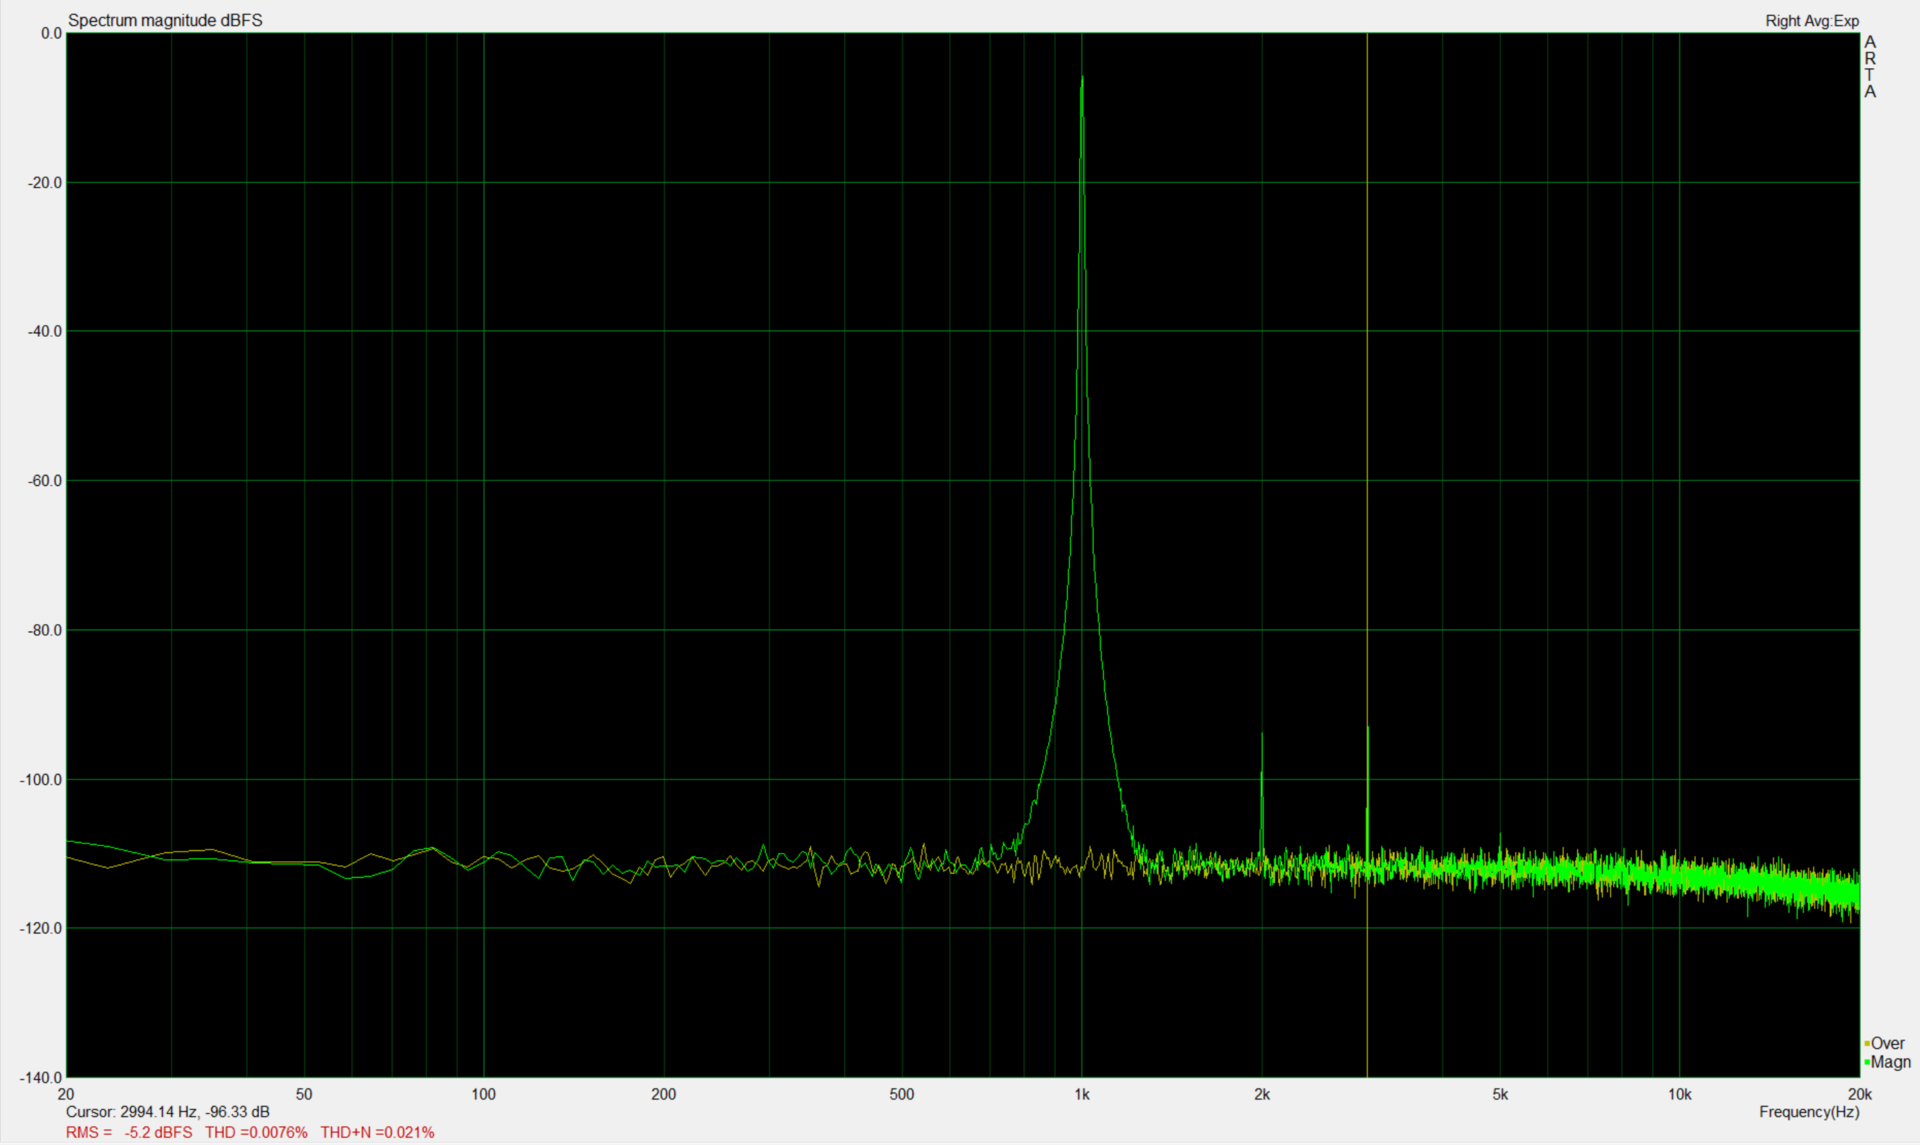
Microsoft Surface Laptop 3 13 Core i5-1035G7 ses analizi
(±) | hoparlör ses yüksekliği ortalama ama iyi (79 dB)
Bas 100 - 315Hz
(+) | iyi bas - medyandan yalnızca 4.2% uzakta
(±) | Bas doğrusallığı ortalamadır (10.5% delta - önceki frekans)
Ortalar 400 - 2000 Hz
(+) | dengeli ortalar - medyandan yalnızca 3.6% uzakta
(±) | Ortaların doğrusallığı ortalamadır (7.1% delta - önceki frekans)
Yüksekler 2 - 16 kHz
(+) | dengeli yüksekler - medyandan yalnızca 1.8% uzakta
(+) | yüksekler doğrusaldır (6.5% deltadan önceki frekansa)
Toplam 100 - 16.000 Hz
(+) | genel ses doğrusaldır (11.4% ortancaya göre fark)
Aynı sınıfla karşılaştırıldığında
» Bu sınıftaki tüm test edilen cihazların %3%'si daha iyi, 2% benzer, 95% daha kötüydü
» En iyisinin deltası 7% idi, ortalama 21% idi, en kötüsü 53% idi
Test edilen tüm cihazlarla karşılaştırıldığında
» Test edilen tüm cihazların %7'si daha iyi, 2 benzer, % 90 daha kötüydü
» En iyisinin deltası 4% idi, ortalama 23% idi, en kötüsü 134% idi
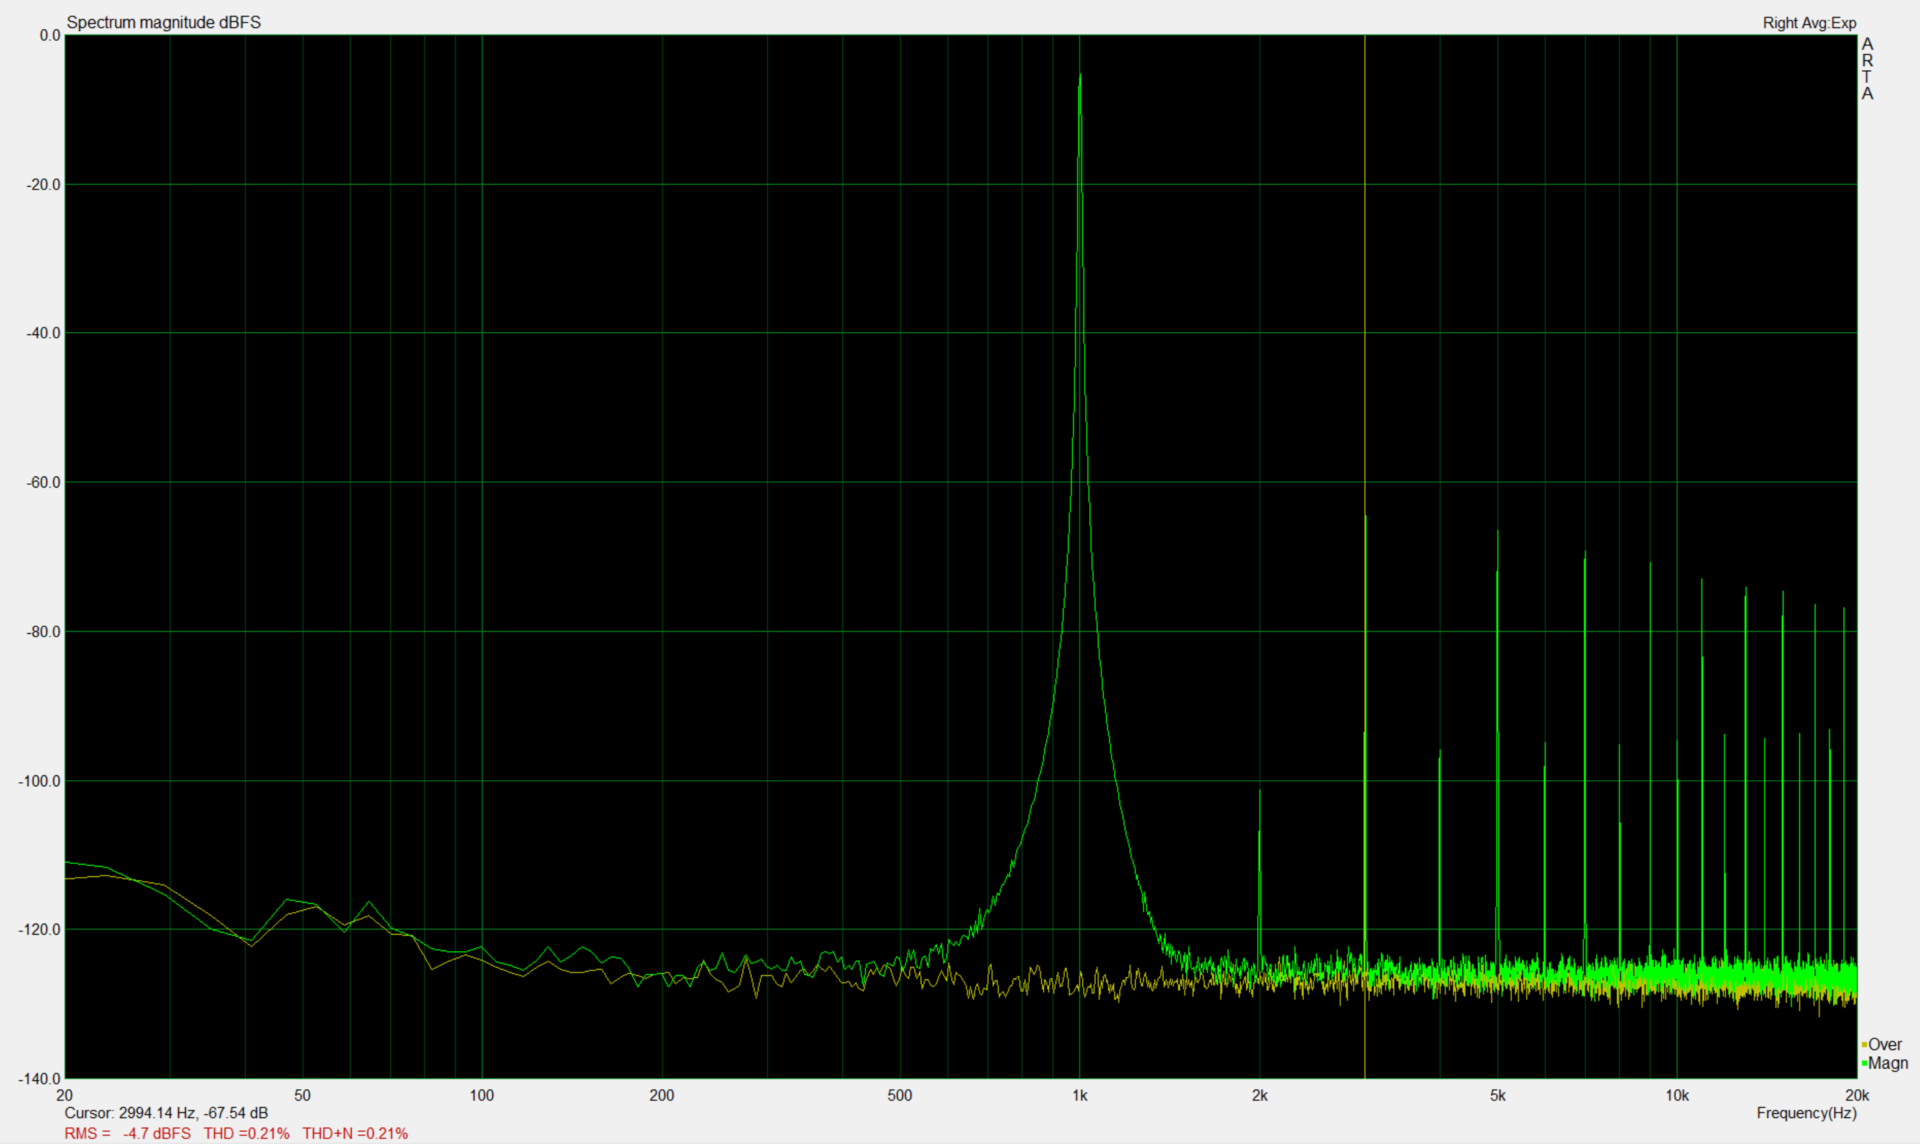
Dell XPS 13 9300 i5 FHD ses analizi
(±) | hoparlör ses yüksekliği ortalama ama iyi (78.4 dB)
Bas 100 - 315Hz
(±) | azaltılmış bas - ortalama olarak medyandan 9.4% daha düşük
(±) | Bas doğrusallığı ortalamadır (12.5% delta - önceki frekans)
Ortalar 400 - 2000 Hz
(±) | daha yüksek ortalar - ortalama olarak medyandan 6.7% daha yüksek
(+) | orta frekanslar doğrusaldır (5.6% deltadan önceki frekansa)
Yüksekler 2 - 16 kHz
(+) | dengeli yüksekler - medyandan yalnızca 4% uzakta
(+) | yüksekler doğrusaldır (5% deltadan önceki frekansa)
Toplam 100 - 16.000 Hz
(±) | Genel sesin doğrusallığı ortalamadır (19.8% ortancaya göre fark)
Aynı sınıfla karşılaştırıldığında
» Bu sınıftaki tüm test edilen cihazların %63%'si daha iyi, 7% benzer, 31% daha kötüydü
» En iyisinin deltası 5% idi, ortalama 18% idi, en kötüsü 53% idi
Test edilen tüm cihazlarla karşılaştırıldığında
» Test edilen tüm cihazların %51'si daha iyi, 7 benzer, % 42 daha kötüydü
» En iyisinin deltası 4% idi, ortalama 23% idi, en kötüsü 134% idi
We are less convinced by the integrated headset port. Our measurements with the external sound card Steinberg UR22 do not show a very good SNR (signal to noise ratio). Audiophile users will not be happy with the Air, but casual users should not notice any problems with the quality.
Energy Management
Power Consumption
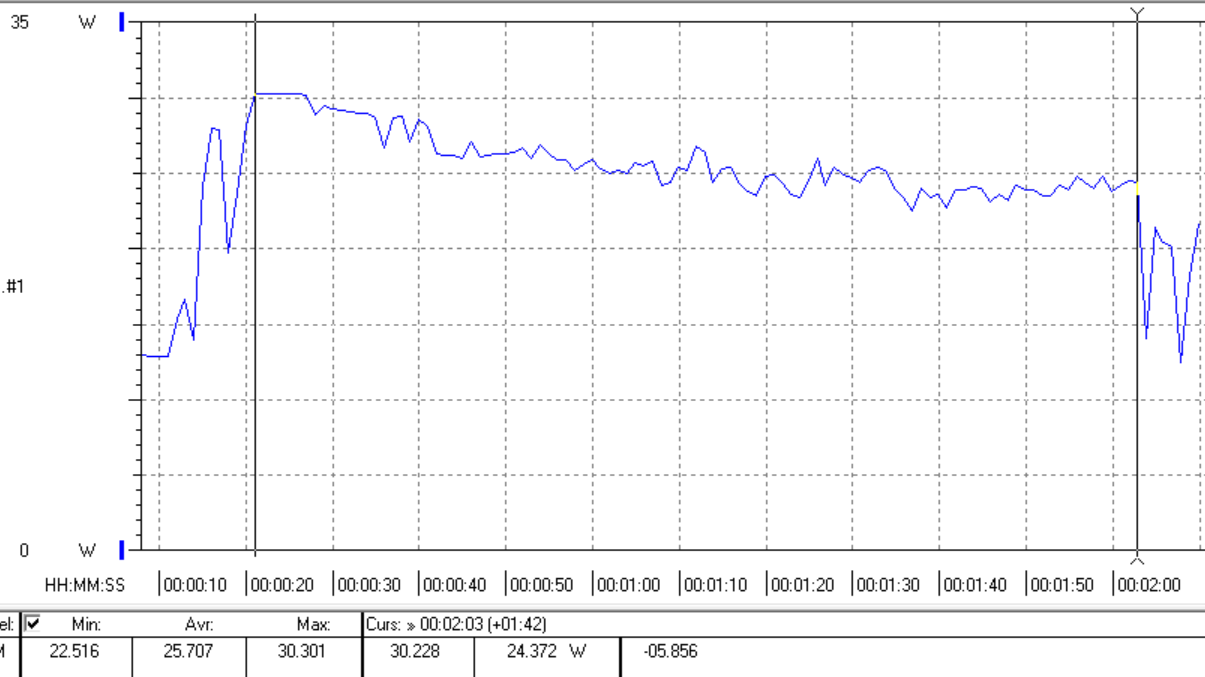
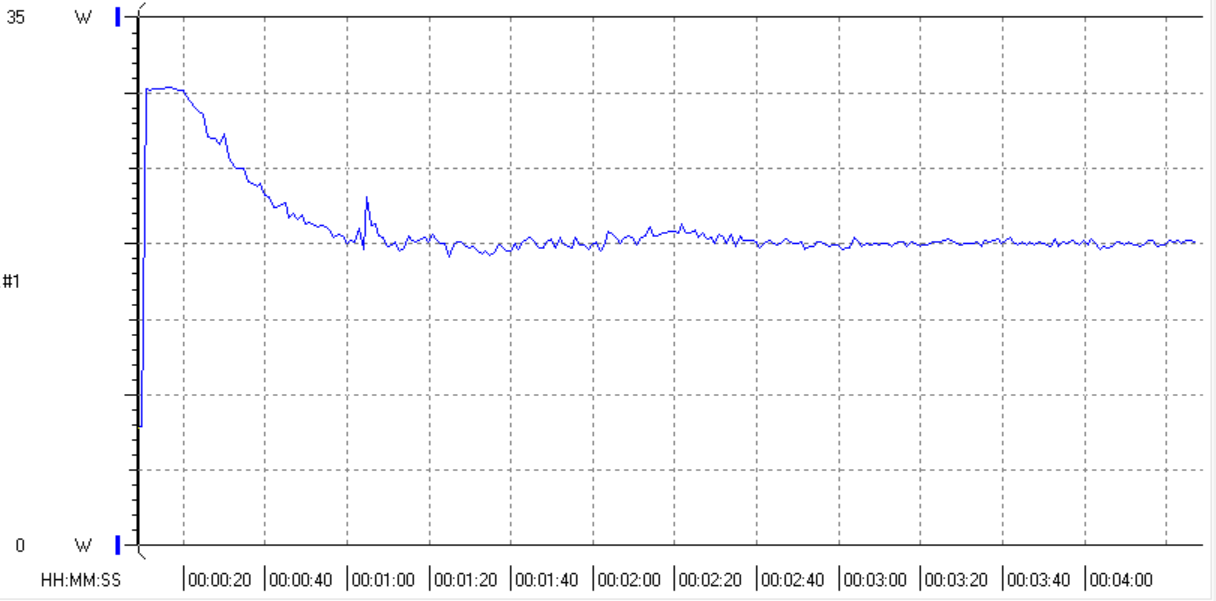
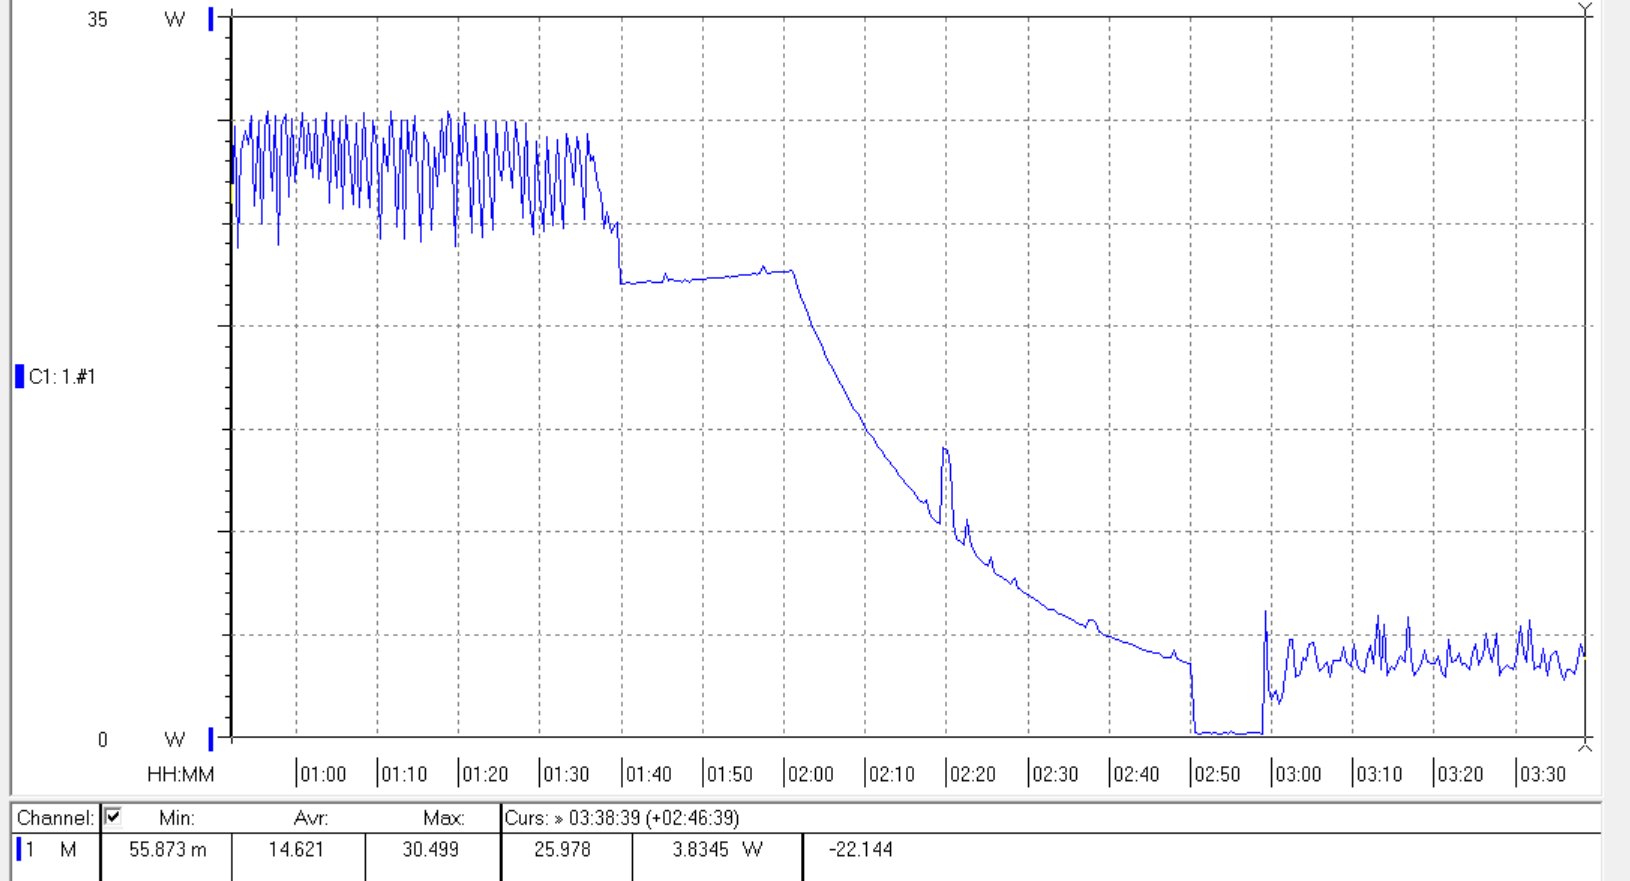
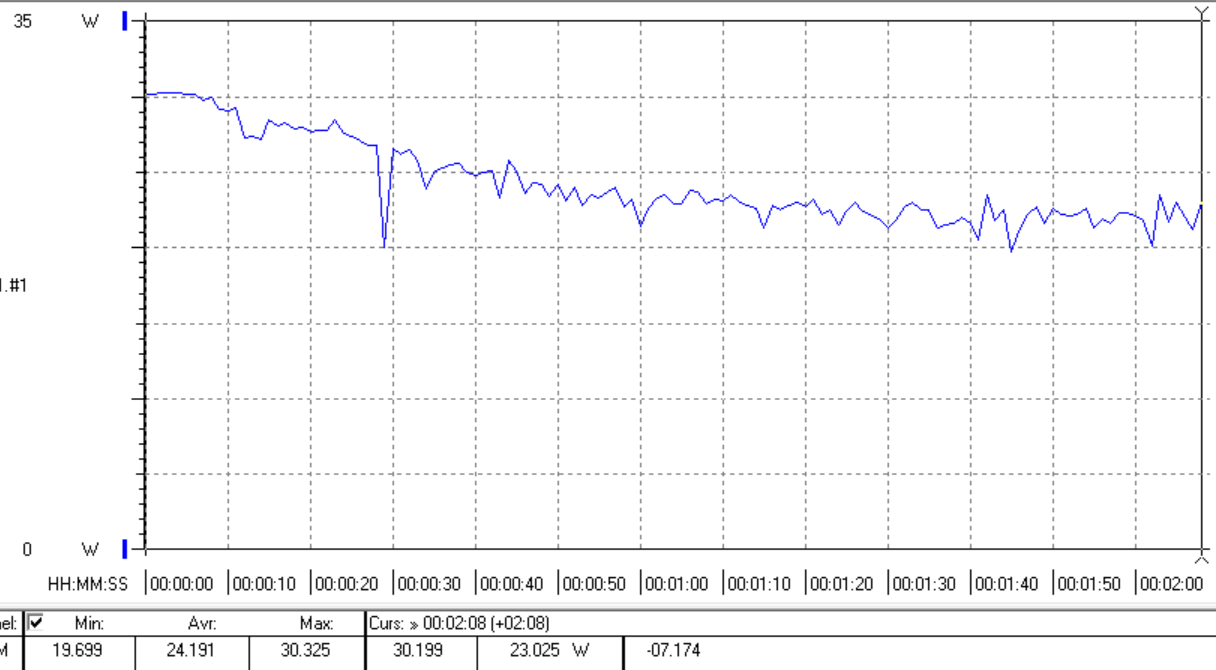
Despite the addition of the quad-core processor, we can see very similar consumption values compared to the 2019 model. Here we can see that the TDP configuration dictates the power consumption under load, not the CPU itself. The Air is very efficient compared to more powerful rivals like the XPS 13 or the class average, only the Acer Swift 3 is even more efficient.
The idle consumption for Windows 10 (Bootcamp) is surprisingly high. The MacBook Air consumes much more power compared to macOS, so you should expect significantly shorter battery runtimes. For example: We measure idle values between 7 and 12.8 W (min - max).
| Kapalı / Bekleme modu | |
| Boşta | |
| Çalışırken |
|
Key:
min: | |
| Apple MacBook Air 2020 i5 i5-1030NG7, Iris Plus Graphics G7 (Ice Lake 64 EU), Apple SSD AP0512, IPS, 2560x1600, 13.3" | Apple MacBook Air 2018 i5-8210Y, UHD Graphics 617, Apple SSD AP0256, IPS, 2560x1600, 13.3" | Apple MacBook Pro 13 2019 2TB3 i5-8257U, Iris Plus Graphics 645, Apple SSD AP0256, IPS, 2560x1600, 13.3" | Microsoft Surface Laptop 3 13 Core i5-1035G7 i5-1035G7, Iris Plus Graphics G7 (Ice Lake 64 EU), SK hynix BC501 HFM256GDGTNG, IPS, 2256x1504, 13.5" | Acer Swift 3 SF313-52-71Y7 i7-1065G7, Iris Plus Graphics G7 (Ice Lake 64 EU), Intel SSD 660p 1TB SSDPEKNW010T8, IPS, 2256x1504, 13.5" | Dell XPS 13 9300 i5 FHD i5-1035G1, UHD Graphics G1 (Ice Lake 32 EU), Toshiba XG6 KXG60ZNV512G, IPS, 1920x1200, 13.4" | Ortalama Intel Iris Plus Graphics G7 (Ice Lake 64 EU) | Sınıf ortalaması Subnotebook | |
|---|---|---|---|---|---|---|---|---|
| Power Consumption | 5% | -28% | -51% | 21% | -26% | -35% | -41% | |
| Idle Minimum * (Watt) | 2.4 | 2.2 8% | 2.1 12% | 4.4 -83% | 1.8 25% | 3.4 -42% | 3.91 ? -63% | 3.71 ? -55% |
| Idle Average * (Watt) | 6.8 | 5.7 16% | 6.9 -1% | 7.5 -10% | 4.6 32% | 6 12% | 7.33 ? -8% | 6.54 ? 4% |
| Idle Maximum * (Watt) | 10.5 | 10.3 2% | 7.8 26% | 7.8 26% | 6.1 42% | 10.2 3% | 9.16 ? 13% | 7.89 ? 25% |
| Load Average * (Watt) | 25.7 | 25.6 -0% | 42 -63% | 41.9 -63% | 27.4 -7% | 36.6 -42% | 39.2 ? -53% | 42.1 ? -64% |
| Witcher 3 ultra * (Watt) | 24.5 | 40.8 -67% | ||||||
| Load Maximum * (Watt) | 30.4 | 30.6 -1% | 64.5 -112% | 63.9 -110% | 27 11% | 49.3 -62% | 49.8 ? -64% | 65.1 ? -114% |
* ... daha küçük daha iyidir
Battery Runtime
The battery capacity is unchanged at 49.9 Wh, so the slightly thicker chassis was mainly used for the new keyboard. The runtimes in our practical scenarios (WLAN and video) are a bit shorter, so the quad-core seems to affect the results a bit. We once again notice that you get much longer runtimes when you use the full-screen mode. Our WLAN test, for example, runs more than 1.5 hours longer in full-screen mode, and the H.264 test 107 minutes longer. You should keep that in mind when there is no socket around.
| Apple MacBook Air 2020 i5 i5-1030NG7, Iris Plus Graphics G7 (Ice Lake 64 EU), 49.9 Wh | Apple MacBook Air 2018 i5-8210Y, UHD Graphics 617, 50.3 Wh | Apple Macbook Air 2019 i5-8210Y, UHD Graphics 617, 49.9 Wh | Apple MacBook Pro 13 2019 2TB3 i5-8257U, Iris Plus Graphics 645, 58.2 Wh | Microsoft Surface Laptop 3 13 Core i5-1035G7 i5-1035G7, Iris Plus Graphics G7 (Ice Lake 64 EU), 45 Wh | Acer Swift 3 SF313-52-71Y7 i7-1065G7, Iris Plus Graphics G7 (Ice Lake 64 EU), 54.5 Wh | Dell XPS 13 9300 i5 FHD i5-1035G1, UHD Graphics G1 (Ice Lake 32 EU), 52 Wh | Sınıf ortalaması Subnotebook | |
|---|---|---|---|---|---|---|---|---|
| Pil Çalışma Süresi | -0% | 12% | 26% | -27% | -8% | 22% | 16% | |
| H.264 (h) | 10.7 | 12.3 15% | 10.5 -2% | 14.4 35% | 15.3 ? 43% | |||
| WiFi v1.3 (h) | 10.3 | 11.1 8% | 11.5 12% | 13 26% | 8.3 -19% | 10.3 0% | 11.7 14% | 14.1 ? 37% |
| Load (h) | 2.9 | 2.2 -24% | 1.9 -34% | 2.3 -21% | 3.4 17% | 1.998 ? -31% | ||
| Reader / Idle (h) | 34.4 | 21.4 | 28.6 ? |
Artılar
Eksiler
Verdict – Performance is still the Achilles heel of the MacBook Air

You can currently read many reports that say the new MacBook Air is the best MacBook you can get right now. After our comprehensive review, we cannot confirm these statements. Yes, the keyboard is now better and the performance is a bit higher, but Apple still (unnecessarily) limits the capabilities with the cooling system. The small chassis fan is just not very efficient, because it cannot prevent a performance drop. It is also really loud under more demanding workloads.
It actually makes sense for Apple to implement a slower processor and keep a distance to the MacBook Pro 13. And this is not a bad thing in general, because the performance is sufficient for basic tasks without a lot of multi-tasking. However, we would have liked to see a completely passively cooled device. A completely silent device would have made it much easier to accept the lower performance figures. Maybe Apple wants to reserve this step for upcoming generations with its own ARM processors (which have been rumored for a long time).
The price is just too high: The processor of the new MacBook Air is just not competitive in a machine for 1500 Euros (~$1641) and the cooling system is too noisy under load. If you still want the new MacBook Air, we recommend you wait for special offers.
The problem is the high price, because you can get much more powerful laptops for 1500 Euros (~$1641), including Apple's own MacBook Pro 13. But the Windows competition, like the new Dell XPS 139300 or the Acer Swift 3 do not have to hide and even offer more features like Wi-Fi 6 in addition to higher performance figures.
If you can live with the performance of the MacBook Air and only need it for basic stuff, but require a great chassis, good display, and long battery runtimes, then you will once again get a very good mobile companion with the new MacBook Air.
There is also definitely a lot to like about the new 2020 MacBook Air, and the product name alone will attract many customers. The performance is currently completely sufficient for basic stuff, display and chassis are still very good, the keyboard was finally improved and the reliability issues are hopefully a thing of the past. If it has to be the new MacBook Air, we would recommend to wait for special offers or discounts, which will definitely be available.
Apple MacBook Air 2020 i5
- 04/08/2020 v7 (old)
Klaus Hinum, Andreas Osthoff
Price comparison

