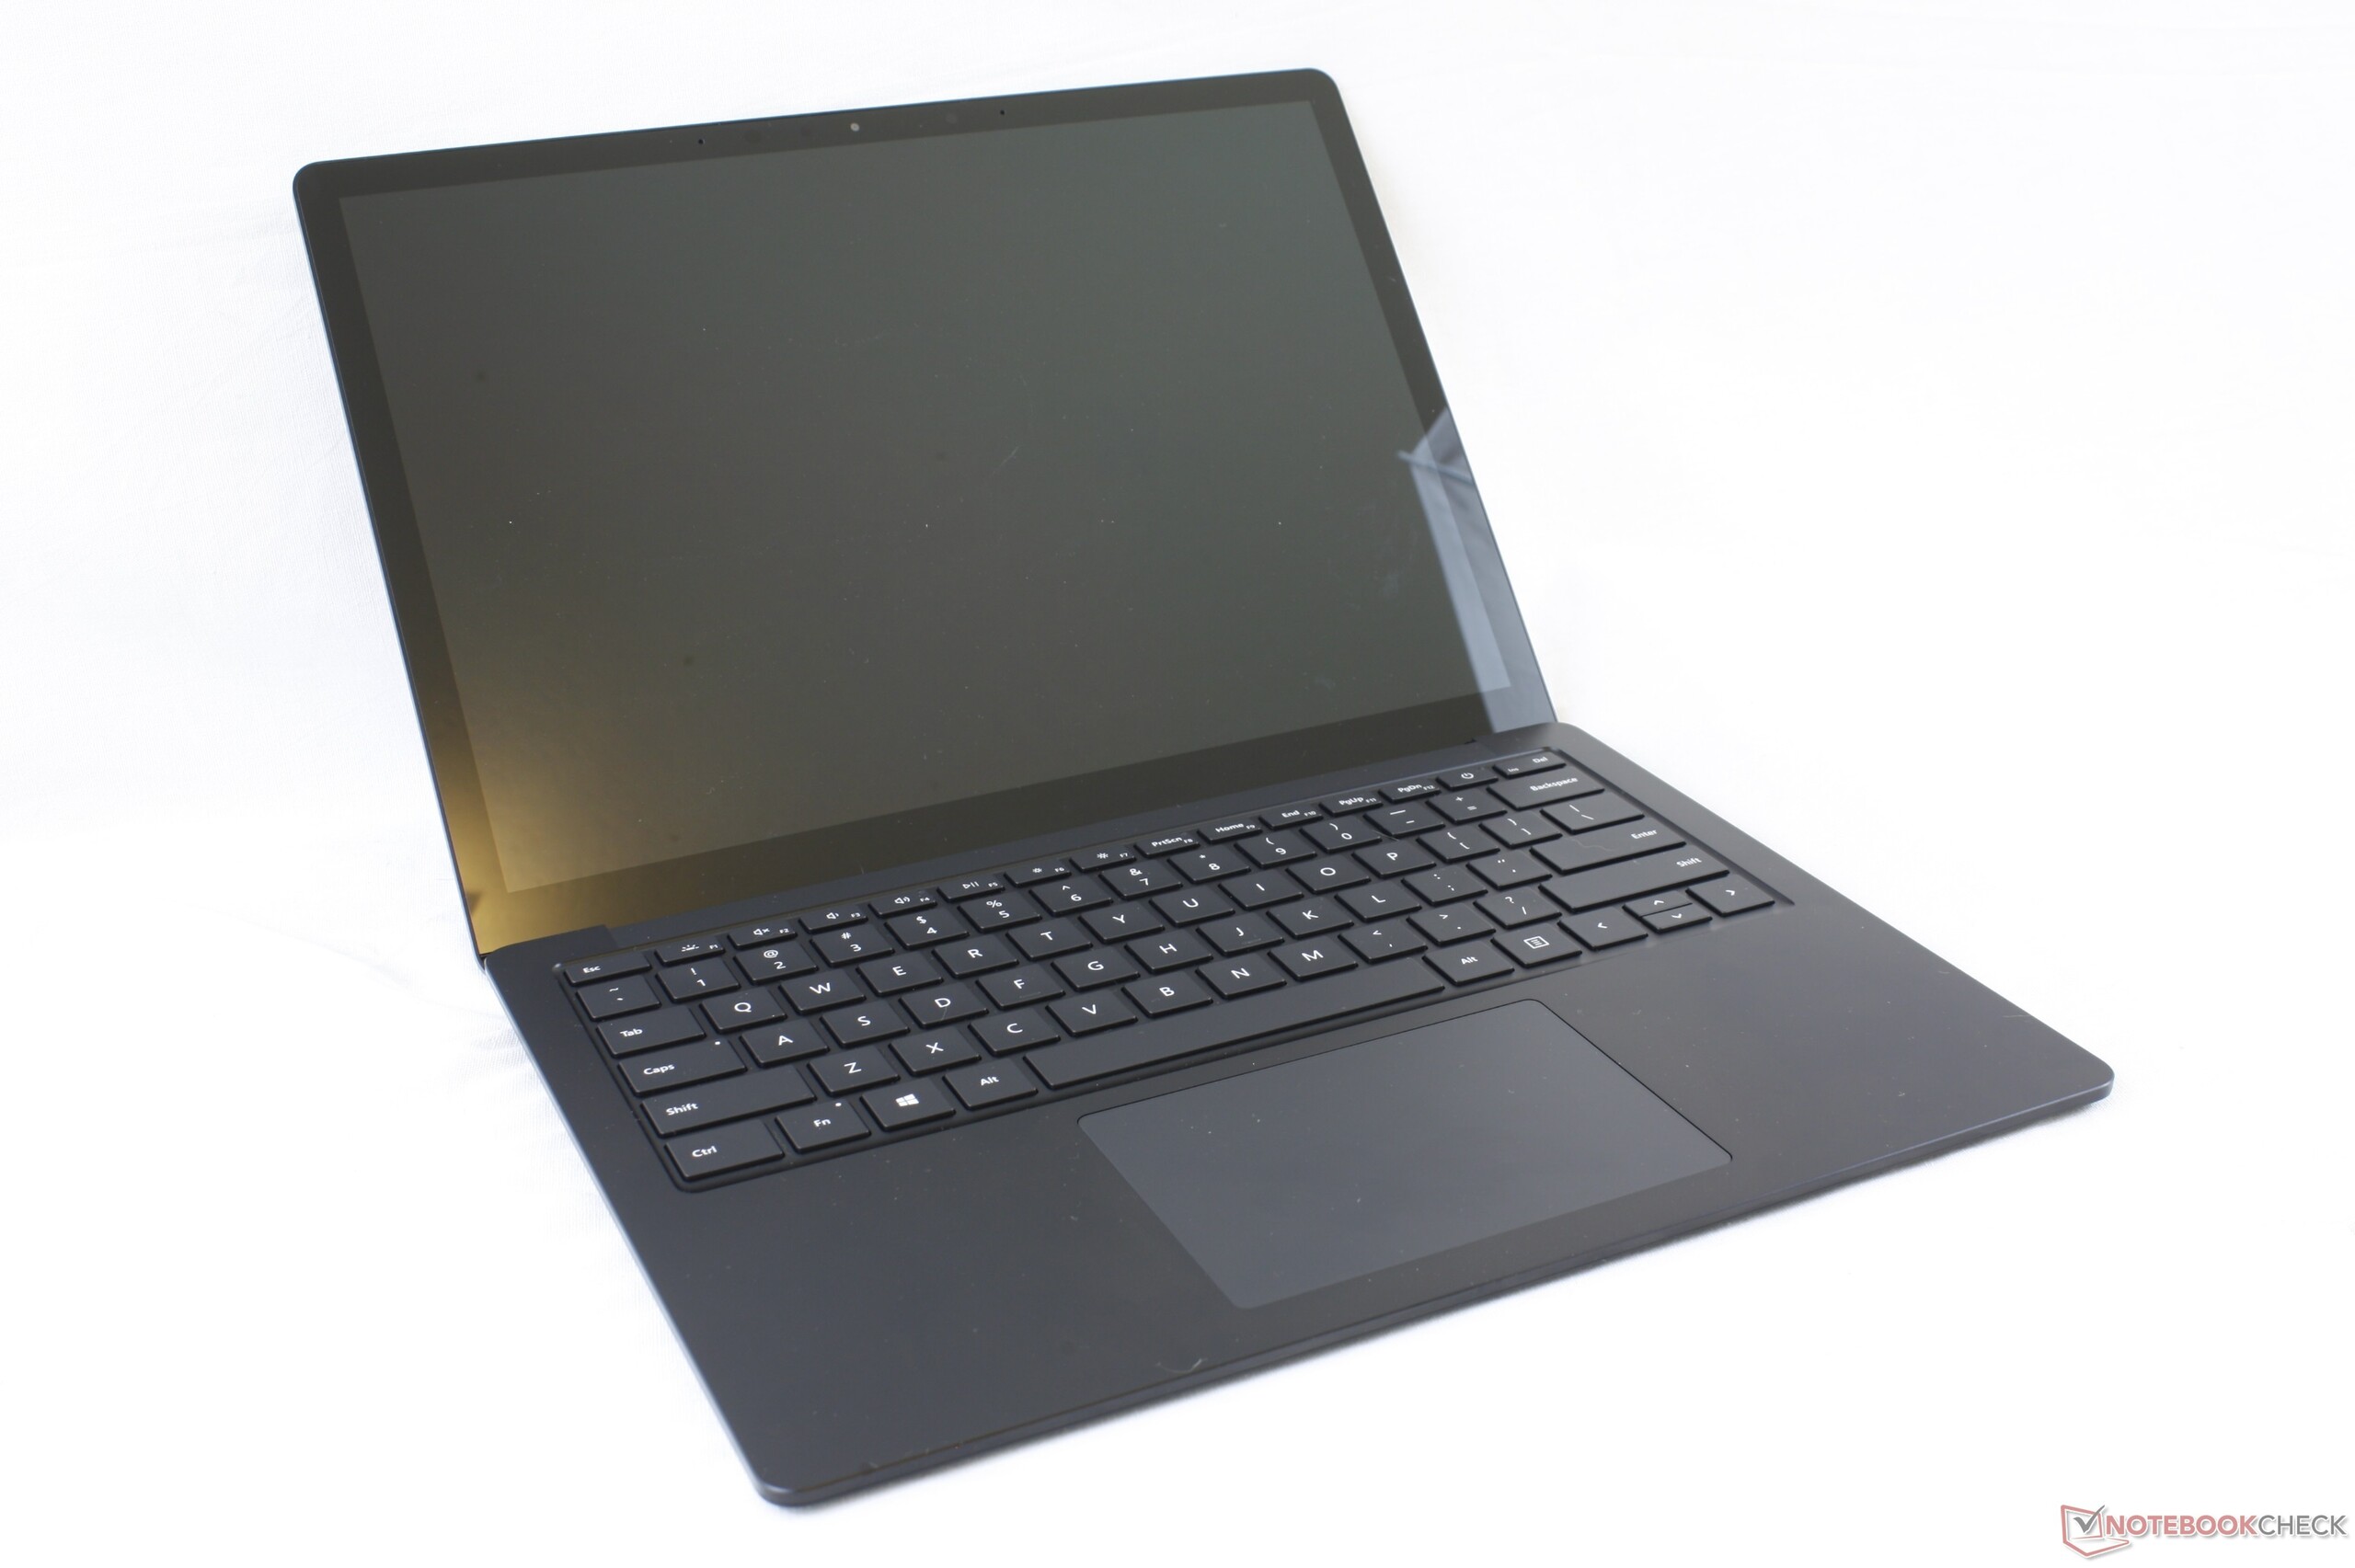
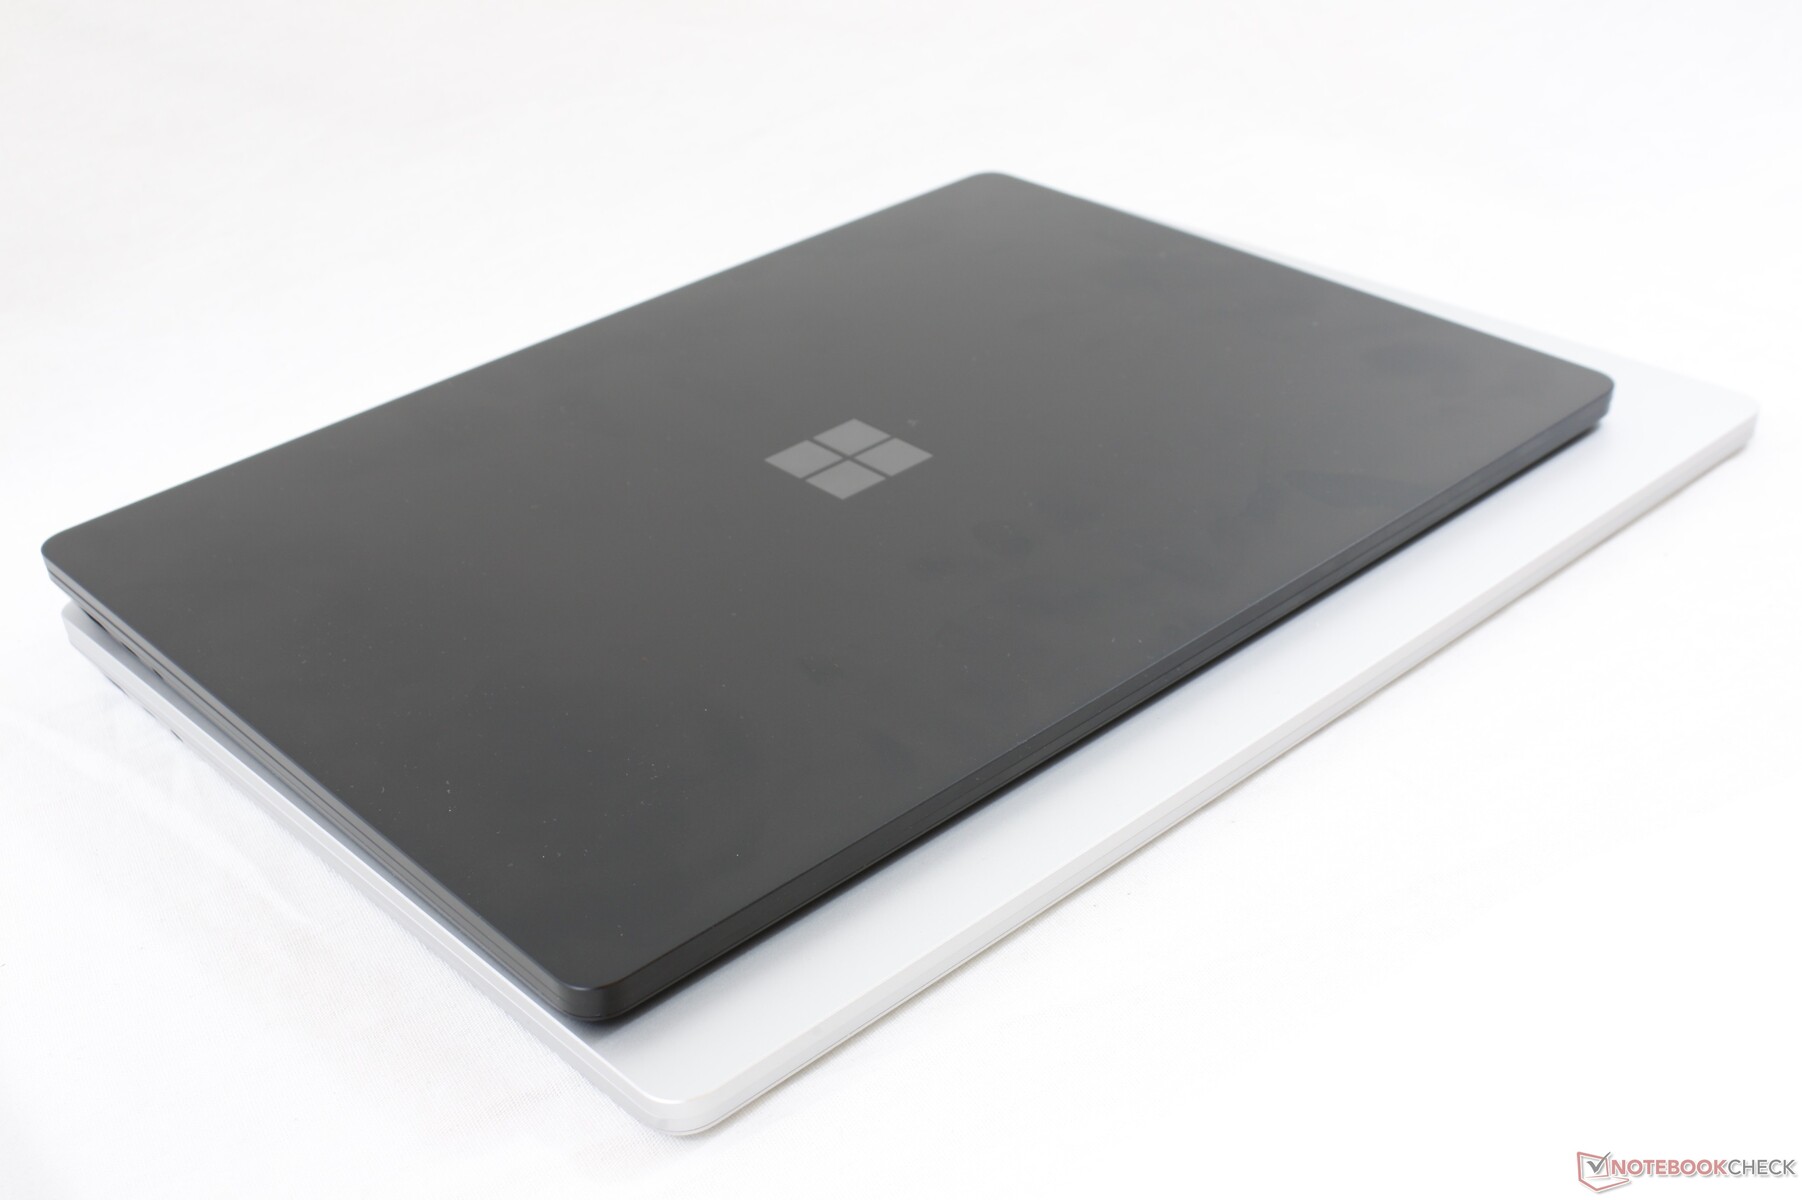
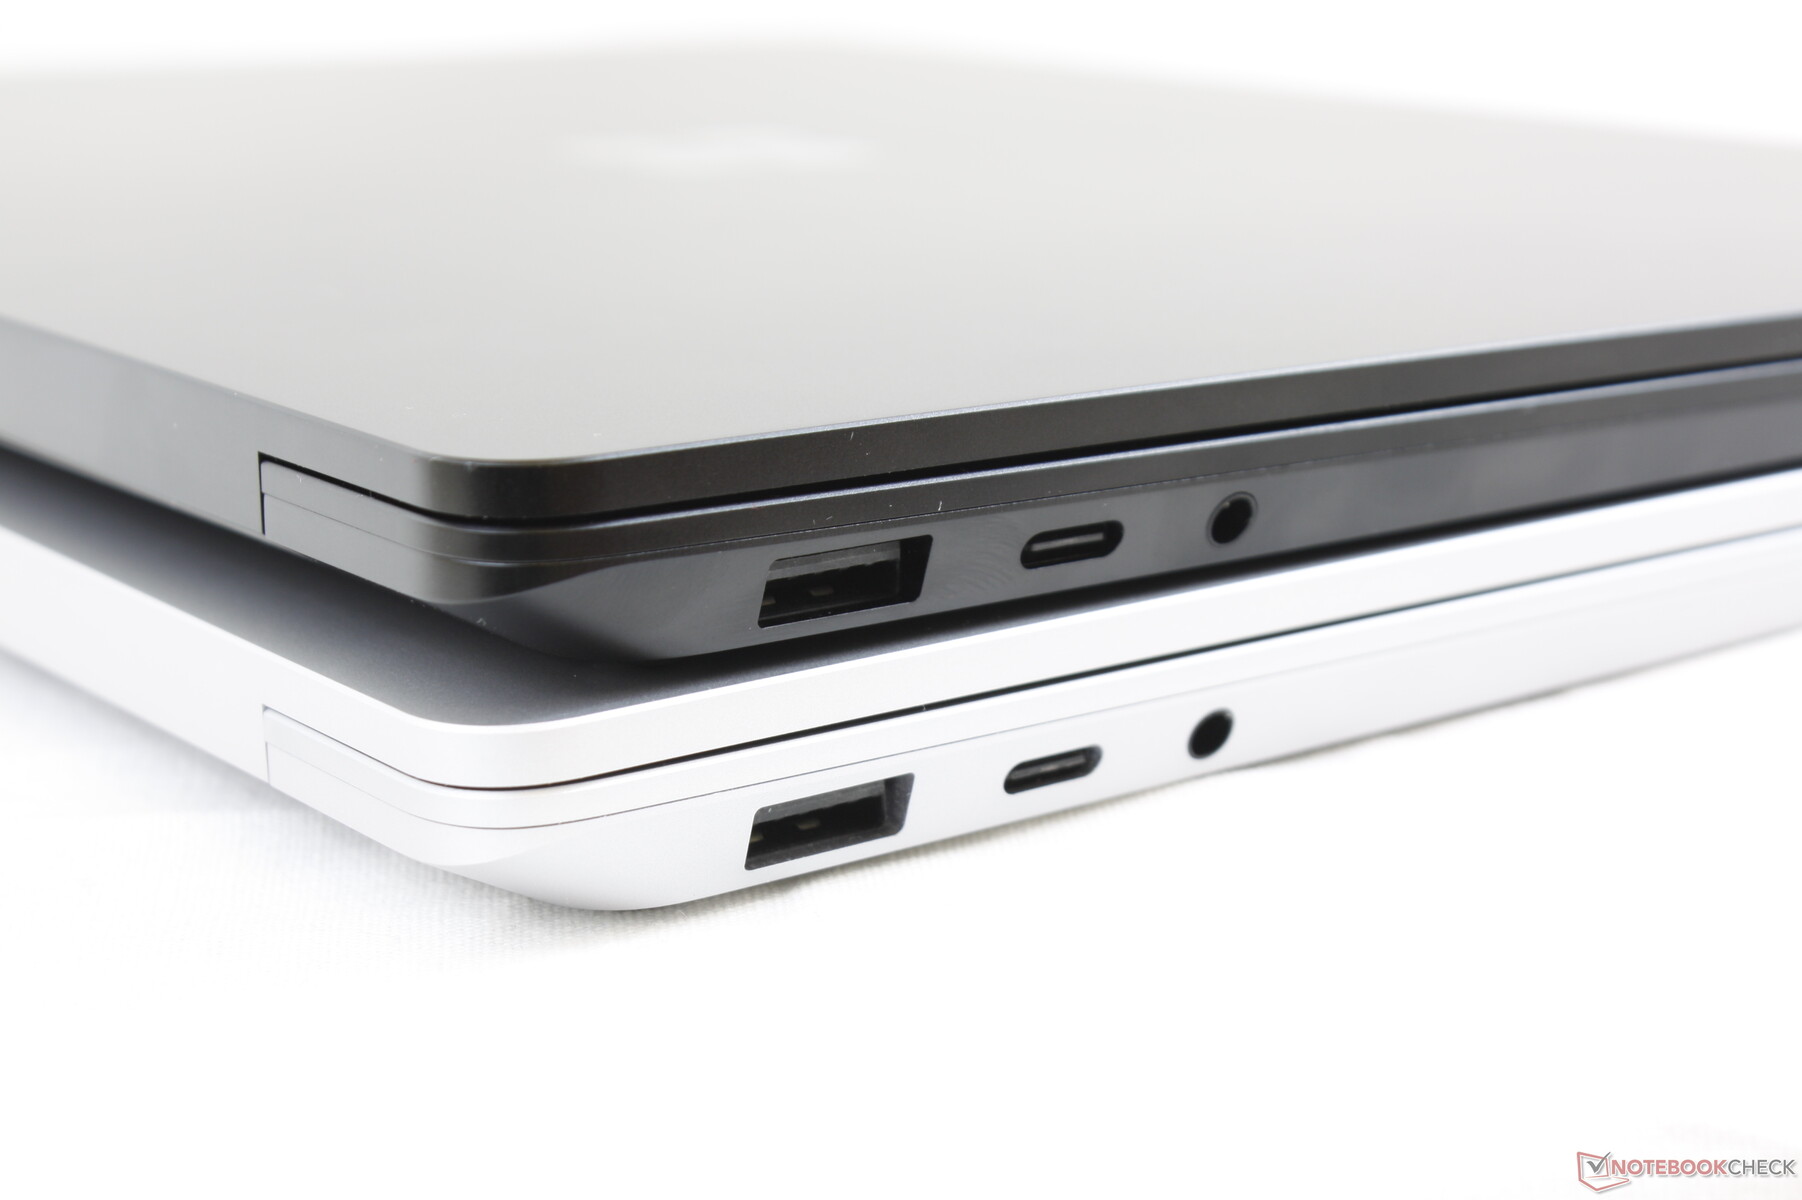
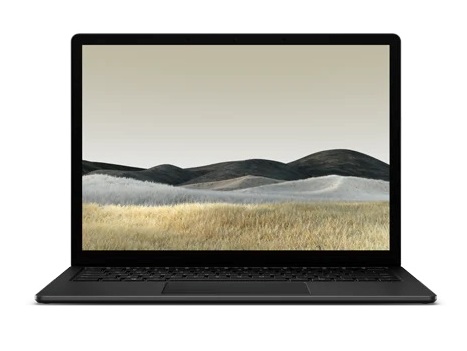
Sayonara, Alcantara: Microsoft Surface Laptop 3 13.5-inch Core i5
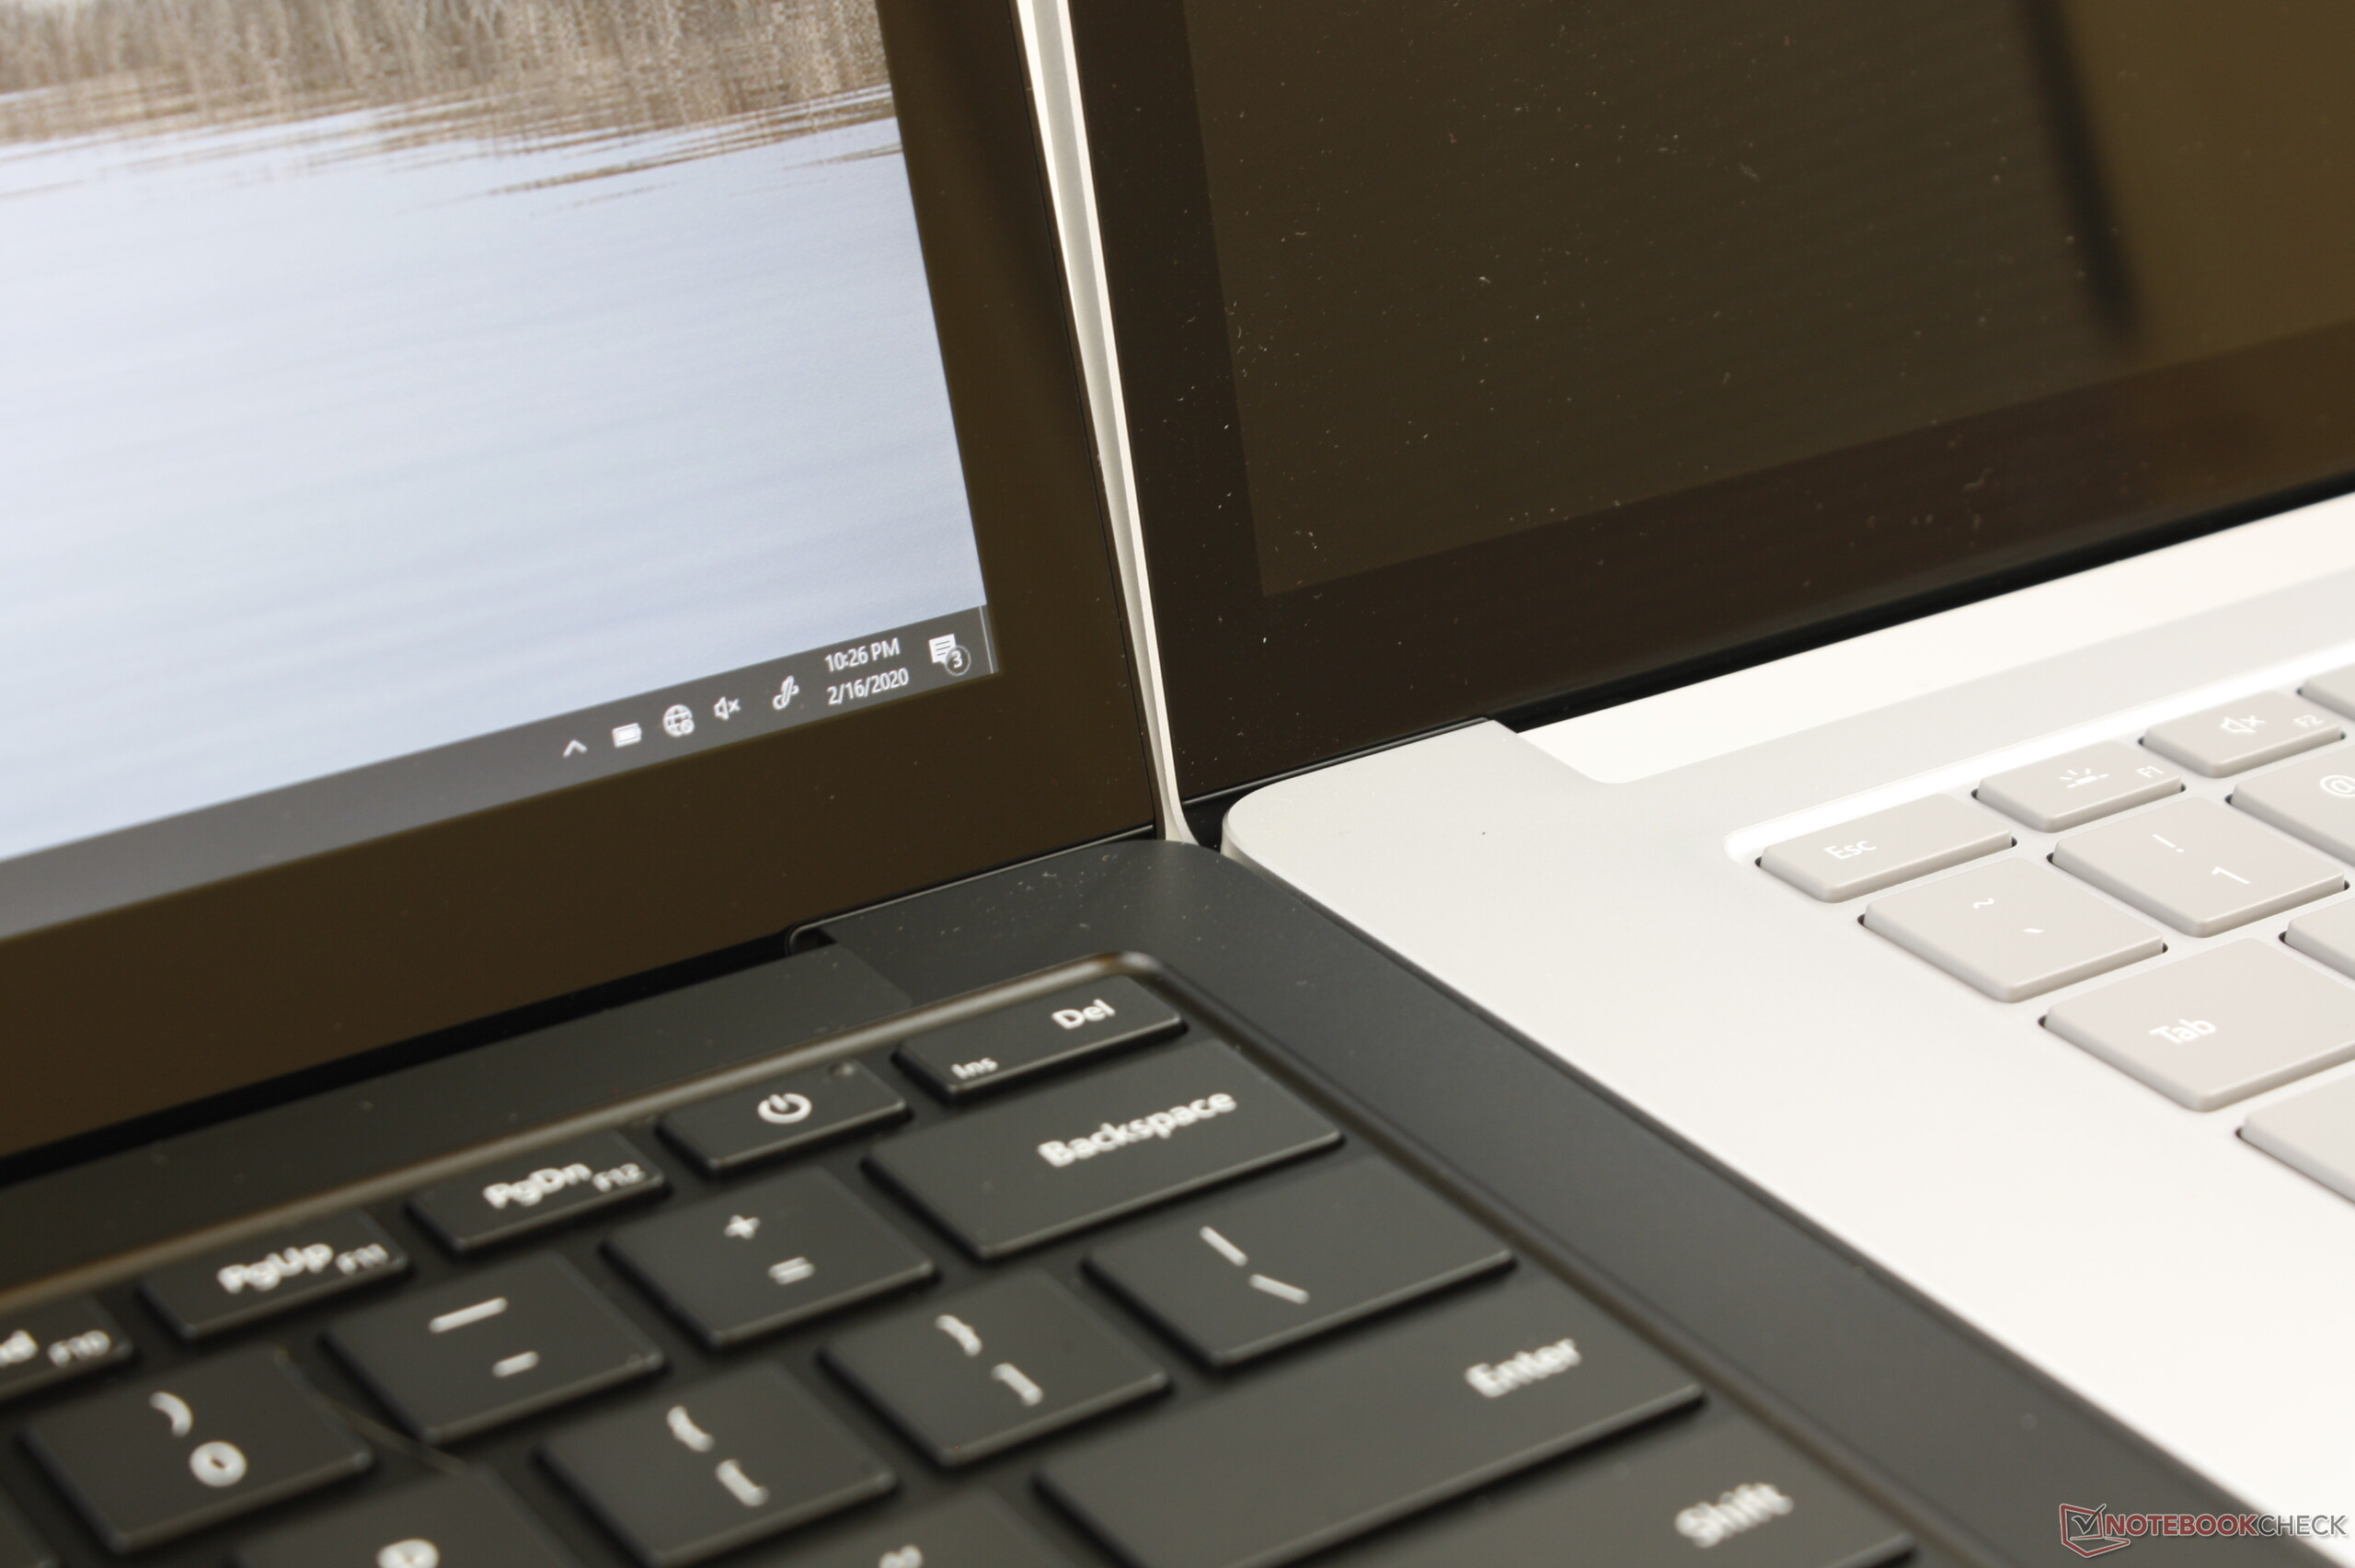
 vs. White 15-inch Surface Laptop 3 (bottom)")
Surface Laptop 2, Ekim 2018'de 14 nm Intel Kaby Lake-R CPU'lar ve orijinal 2017 Surface Dizüstü Bilgisayar ile aynı şasi tasarımı ile piyasaya sürüldü. Surface Laptop 3, bir yıl sonra 10 nm Buz Gölü CPU'ları ve orijinal modele benzer bir şasi tasarımı ile piyasaya sürüldü. Bununla birlikte, bu sefer kullanıcılar daha "MacBook benzeri" bir his için klasik Alcantara kaplama veya yeni bir metal kaplama arasında seçim yapabilirler.Burada birimimiz Core i5-1035G7 CPU ile donatılmış siyah metal Surface Laptop 3 13.5, 8 1000 dolarlık perakende satış fiyatı için GB LPDDR4x RAM ve 256 GB SSD. AMD Ryzen seçenekleri bu yazı itibariyle yalnızca 15 inçlik Surface Laptop 3 15 için kullanılabilir. Surface Dizüstü Bilgisayarın benzersiz satış noktası, tipik 16: 9 Ultrabook veya 16:10 MacBook'un aksine nadir 3: 2 2256 x 1504 ekranı olmaya devam ediyor. Yerel çözünürlük Surface Laptop 2'den değişmese de, aşağıda not edeceğimiz ekran farklılıkları hala var. Surface Laptop 3 13.5, Dell XPS 13, Asus ZenBook S13 veya Lenovo Yoga dahil olmak üzere diğer üst düzey alt not defterleriyle doğrudan rekabet ediyor S940 ve Huawei MateBook X Pro veya Acer Swift 3 SF313 gibi bazı 3: 2 alternatifler.Daha fazla Microsoft Surface yorum: Surface Pro 7Surface Laptop 3 15Surface Laptop 2Surface LaptopSurface Book 2
Derecelendirme | Tarih | Modeli | Ağırlık | Yükseklik | Boyut | Çözünürlük | Fiyat |
|---|---|---|---|---|---|---|---|
| 84 % v7 (old) | 03/2020 | Microsoft Surface Laptop 3 13 Core i5-1035G7 i5-1035G7, Iris Plus Graphics G7 (Ice Lake 64 EU) | 1.3 kg | 14.5 mm | 13.50" | 2256x1504 | |
| 90.6 % v7 (old) | 02/2020 | Apple MacBook Pro 13 2019 2TB3 i5-8257U, Iris Plus Graphics 645 | 1.4 kg | 14.9 mm | 13.30" | 2560x1600 | |
| 86.3 % v7 (old) | 10/2019 | Dell XPS 13 7390 2-in-1 Core i7 i7-1065G7, Iris Plus Graphics G7 (Ice Lake 64 EU) | 1.3 kg | 13 mm | 13.40" | 1920x1200 | |
| 90.1 % v7 (old) | 10/2019 | Lenovo ThinkPad X1 Carbon 2019-20QE000VGE i7-8665U, UHD Graphics 620 | 1.1 kg | 14.9 mm | 14.00" | 2560x1440 | |
| 83.9 % v7 (old) | 01/2020 | Microsoft Surface Laptop 3 15 i7-1065G7 i7-1065G7, Iris Plus Graphics G7 (Ice Lake 64 EU) | 1.5 kg | 14.7 mm | 15.00" | 2496x1664 |
Durum
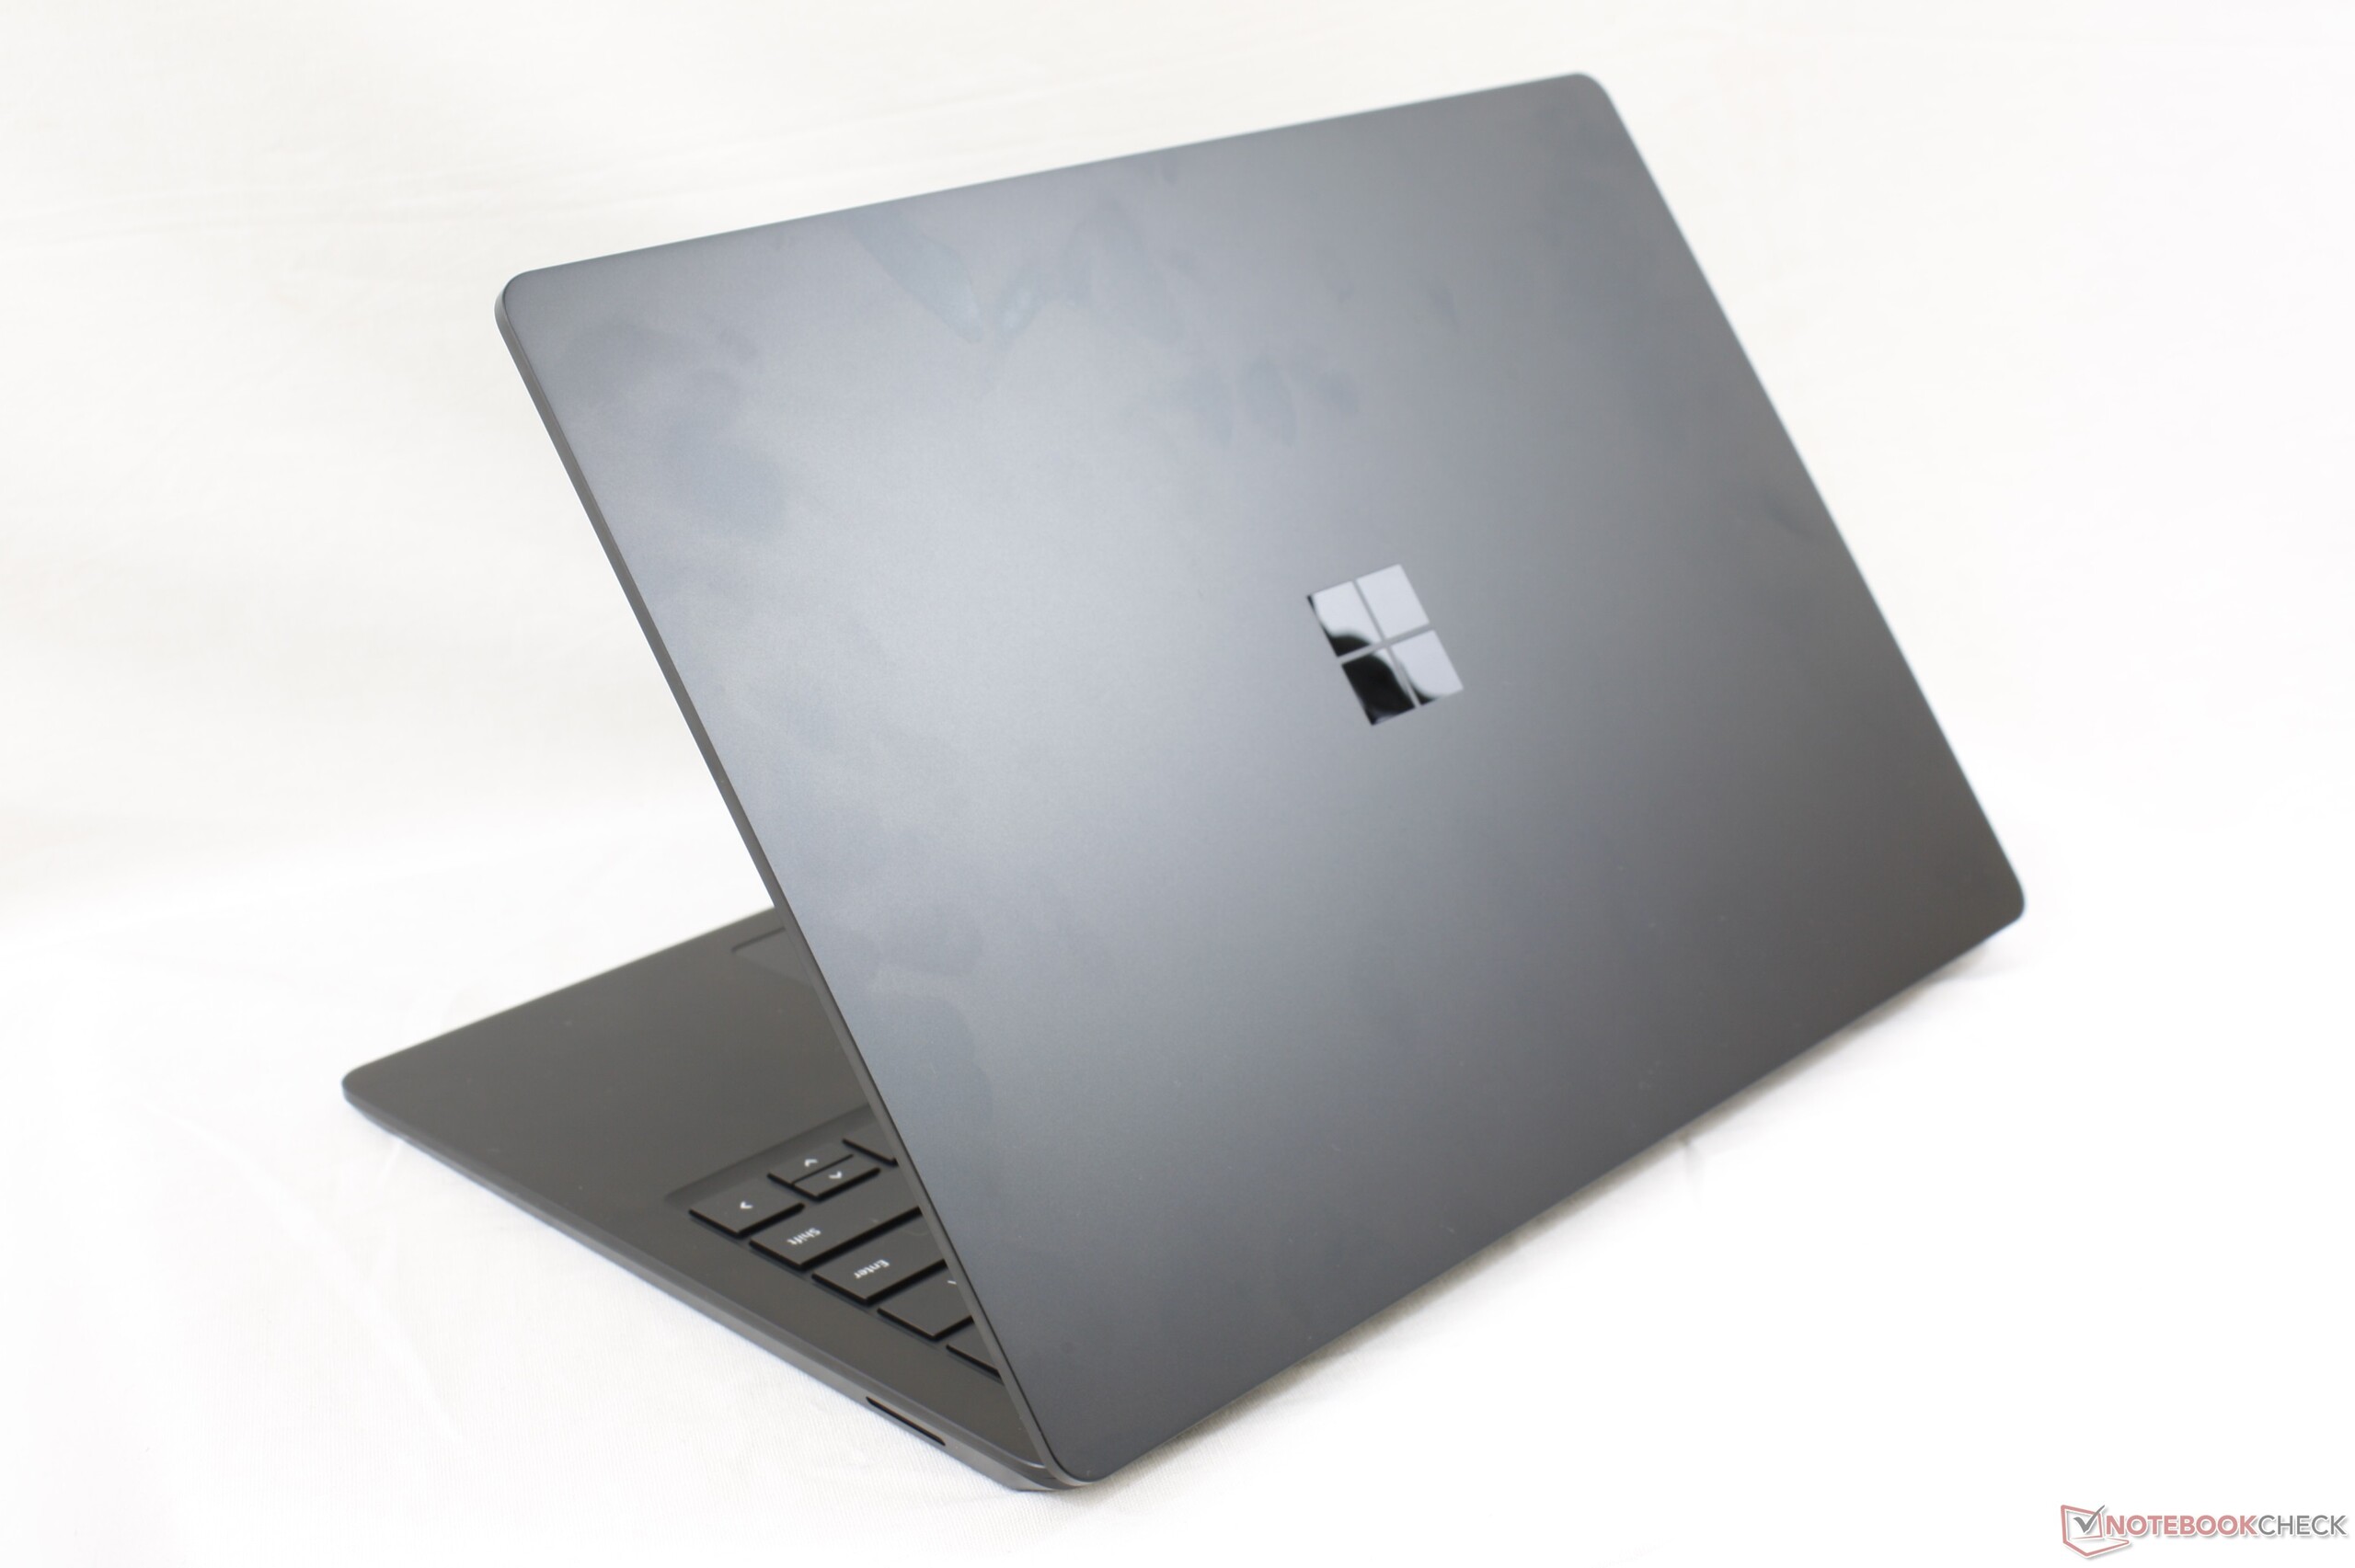
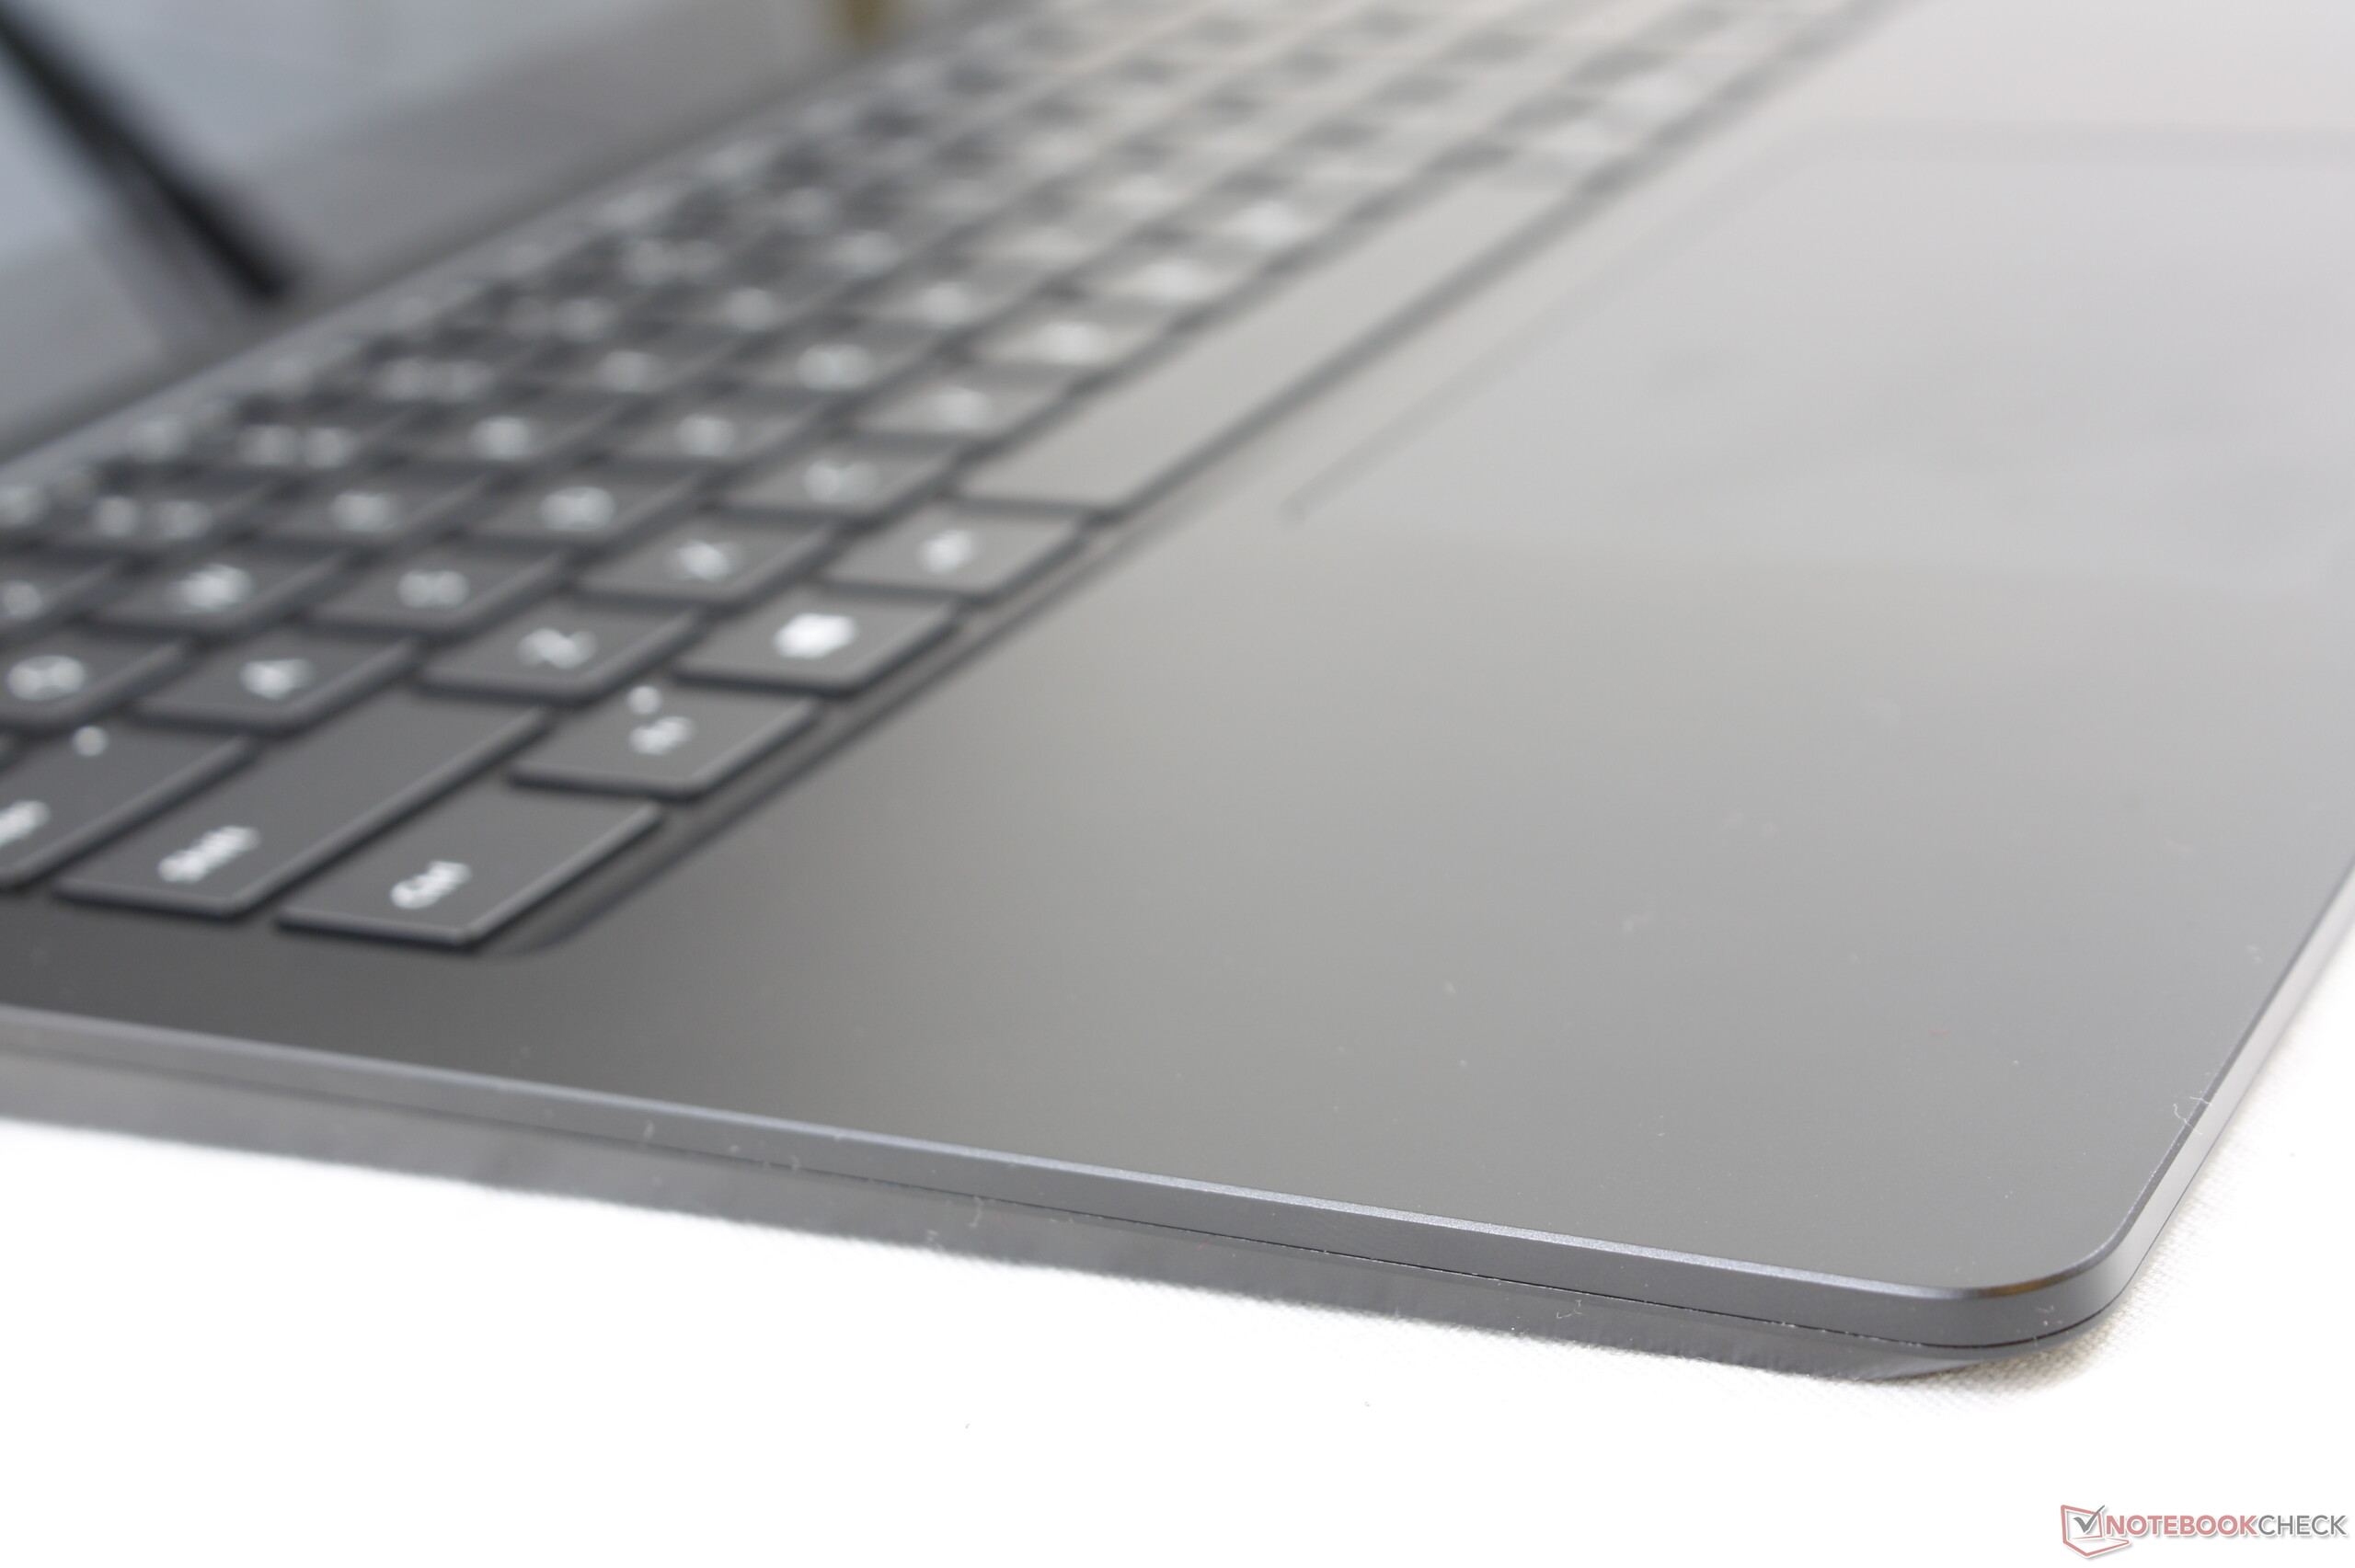
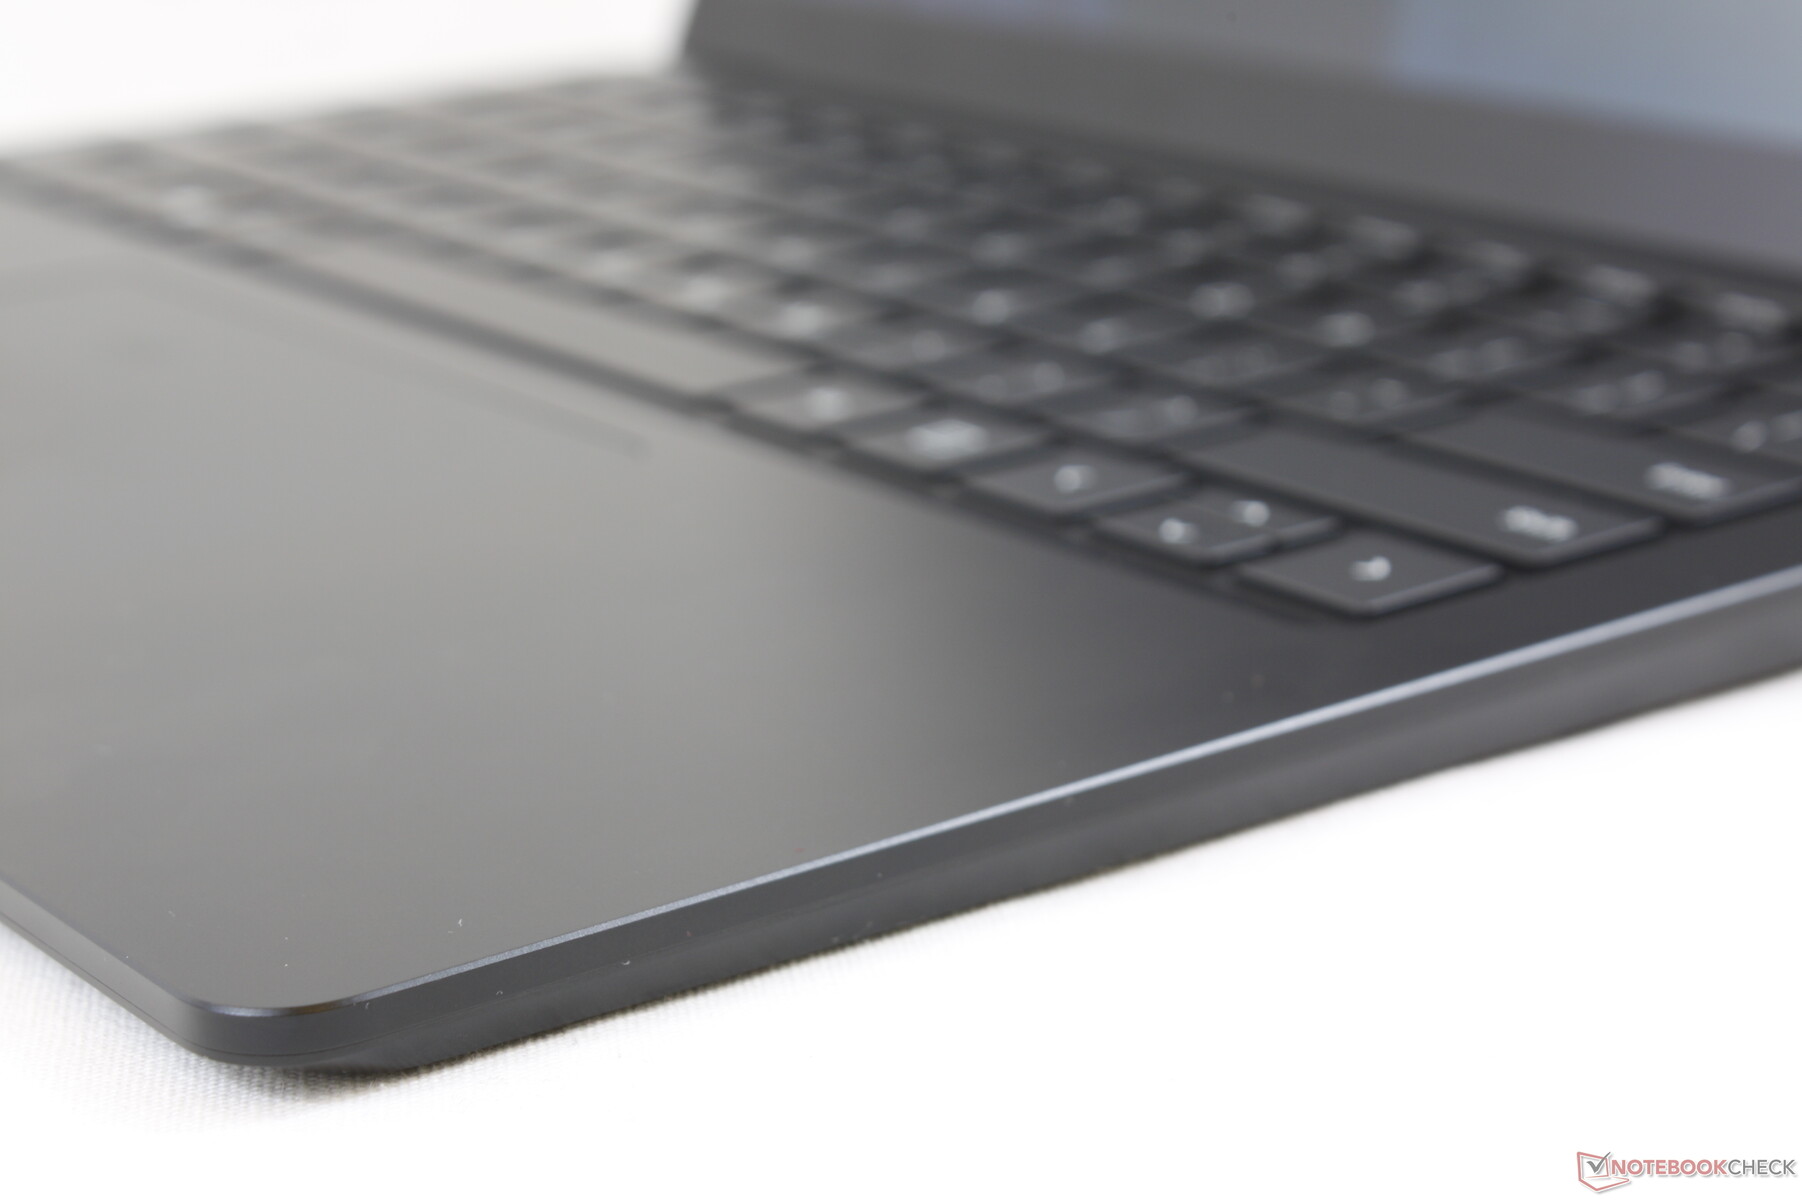
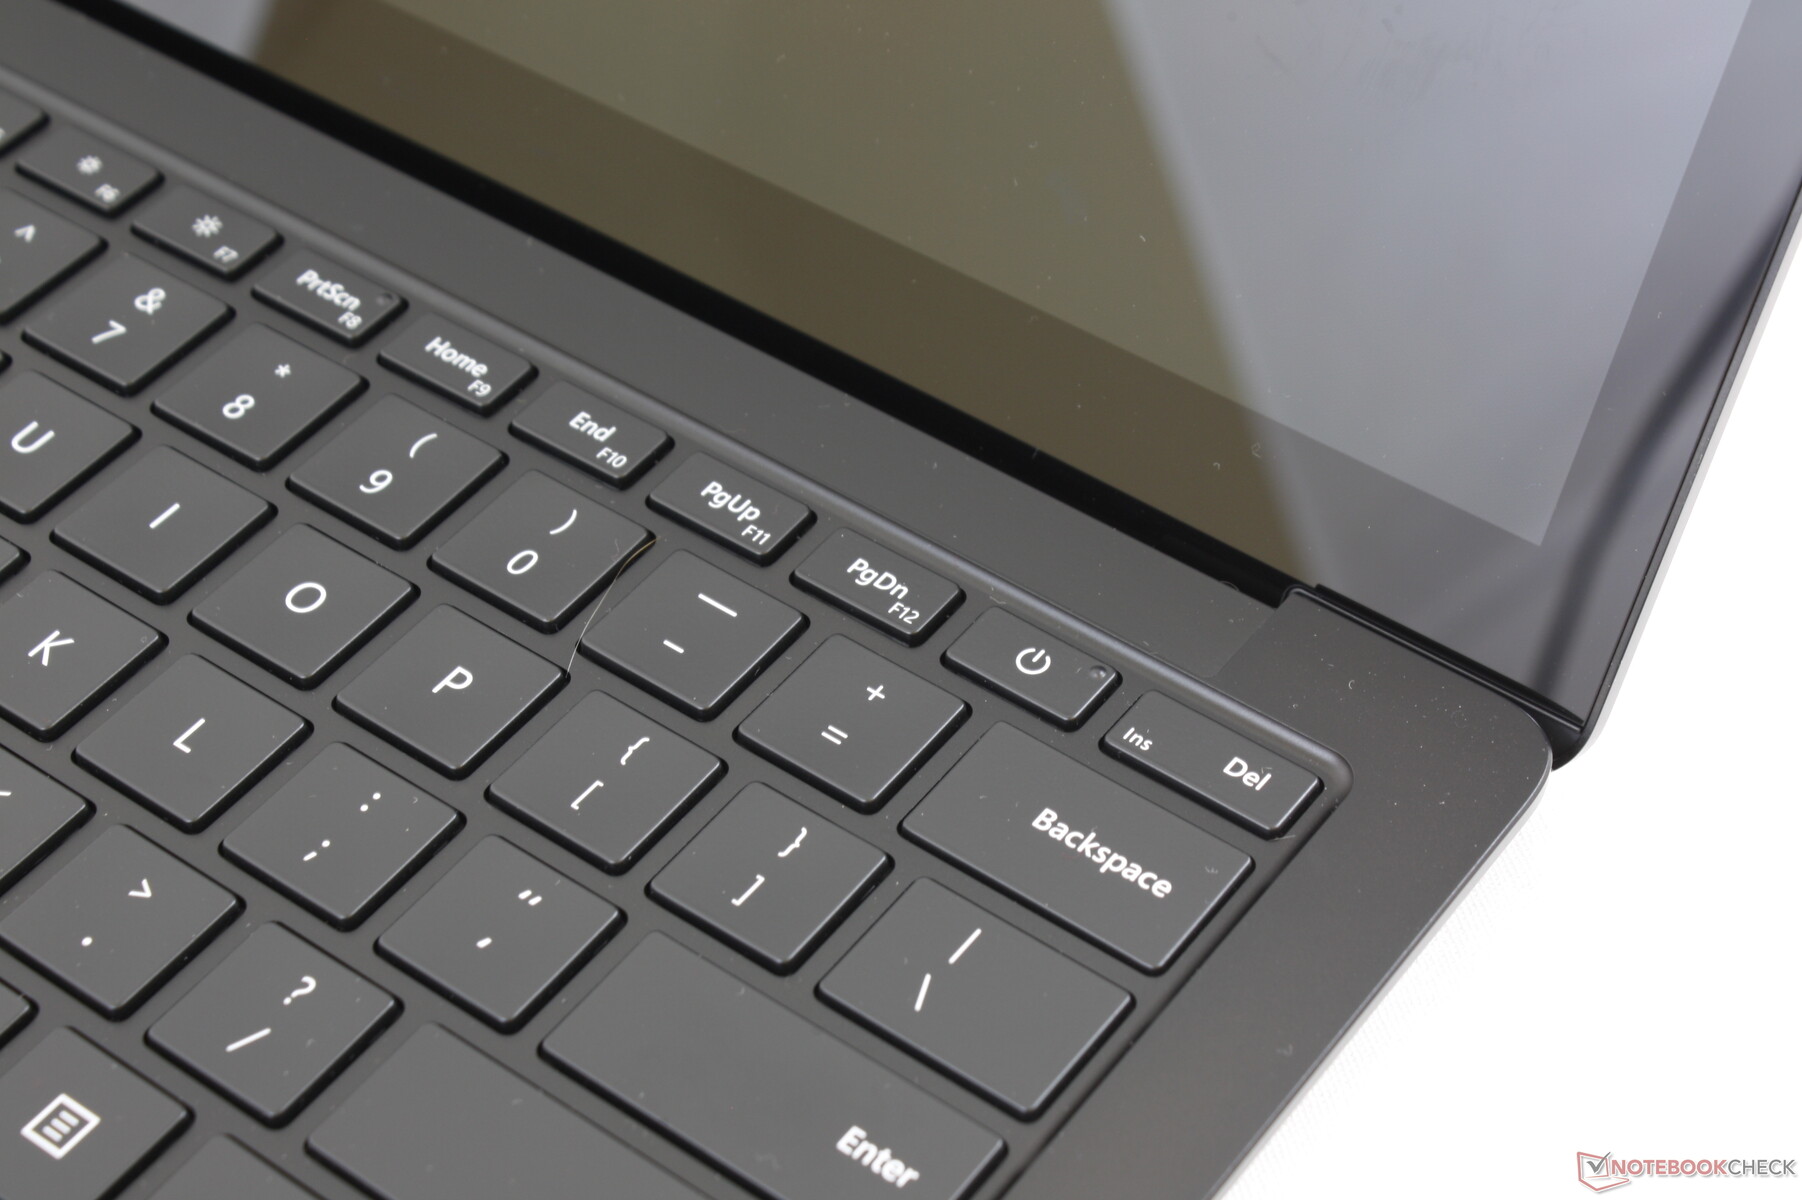
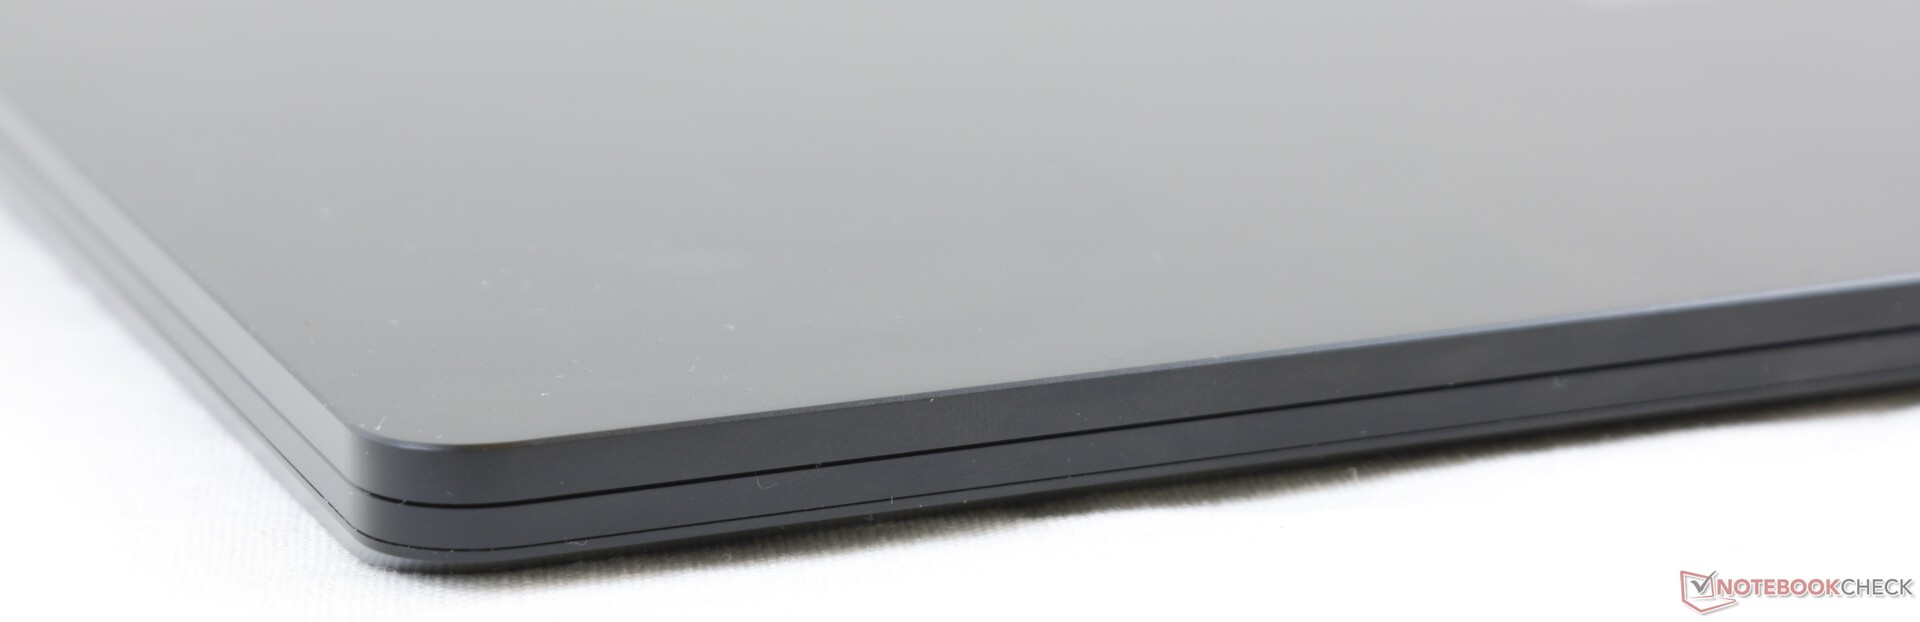
Microsoft ilk Surface Laptop'u üç yıl önce piyasaya sürdüğünde, Alcantara yüzeyini geleneksel metal Ultrabook'lara göre benzersiz bir satış noktası olarak gördüler. Alcantara, dokuda daha yumuşaktır ve anodize magnezyum veya alüminyum alaşımından farklı renklerde sunulması daha kolaydır. Bununla birlikte, sorun, Alcantara'nın zaman içinde çirkin gres toplama eğilimi ile zarar görmesi ve temizlenmesi daha zor olmasıdır.Metal bir seçenek için istila eden Yüzey Dizüstü bilgisayar fanları artık 13.5 inç Yüzey Dizüstü Bilgisayarında 3 dileğiyle. mat alüminyum doku artık hepimizin alıştığımız metal Apple MacBook, Razer Blade veya Huawei MateBook X Pro gibi hissettiriyor. Alcantara ile karşılaştırıldığında, sistem daha sert ve daha kaliteli bir yekpare tasarım gibi hissediyor. Hem taban hem de kapak bükmeye çalışırken çok az eğrilir. Bununla birlikte, test birimimiz, üretimin daha iyi olabileceğini göstermek için ekran açısını ayarlarken menteşelerin etrafında biraz gıcırdadı. Yeni metal şasinin dezavantajı büyük ölçüde yüzeysel. Surface Laptop'u görsel olarak benzersiz kılan şeyi bırakarak, alüminyum Surface Laptop 3 zaten piyasadaki diğer Ultrabook'ların çoğuna benziyor. Bu, özellikle Huawei MateBook X Pro ile karşılaştırılırsa geçerlidir, çünkü her ikisi de ultra ince 3: 2 Windows Ultrabook'lardır. Yine de, klasik Alcantara versiyonunu neredeyse kuşkusuz geride bırakacak fiziksel olarak daha güçlü bir şasi elde etmeyi düşünerek ödemek için küçük bir fiyat.
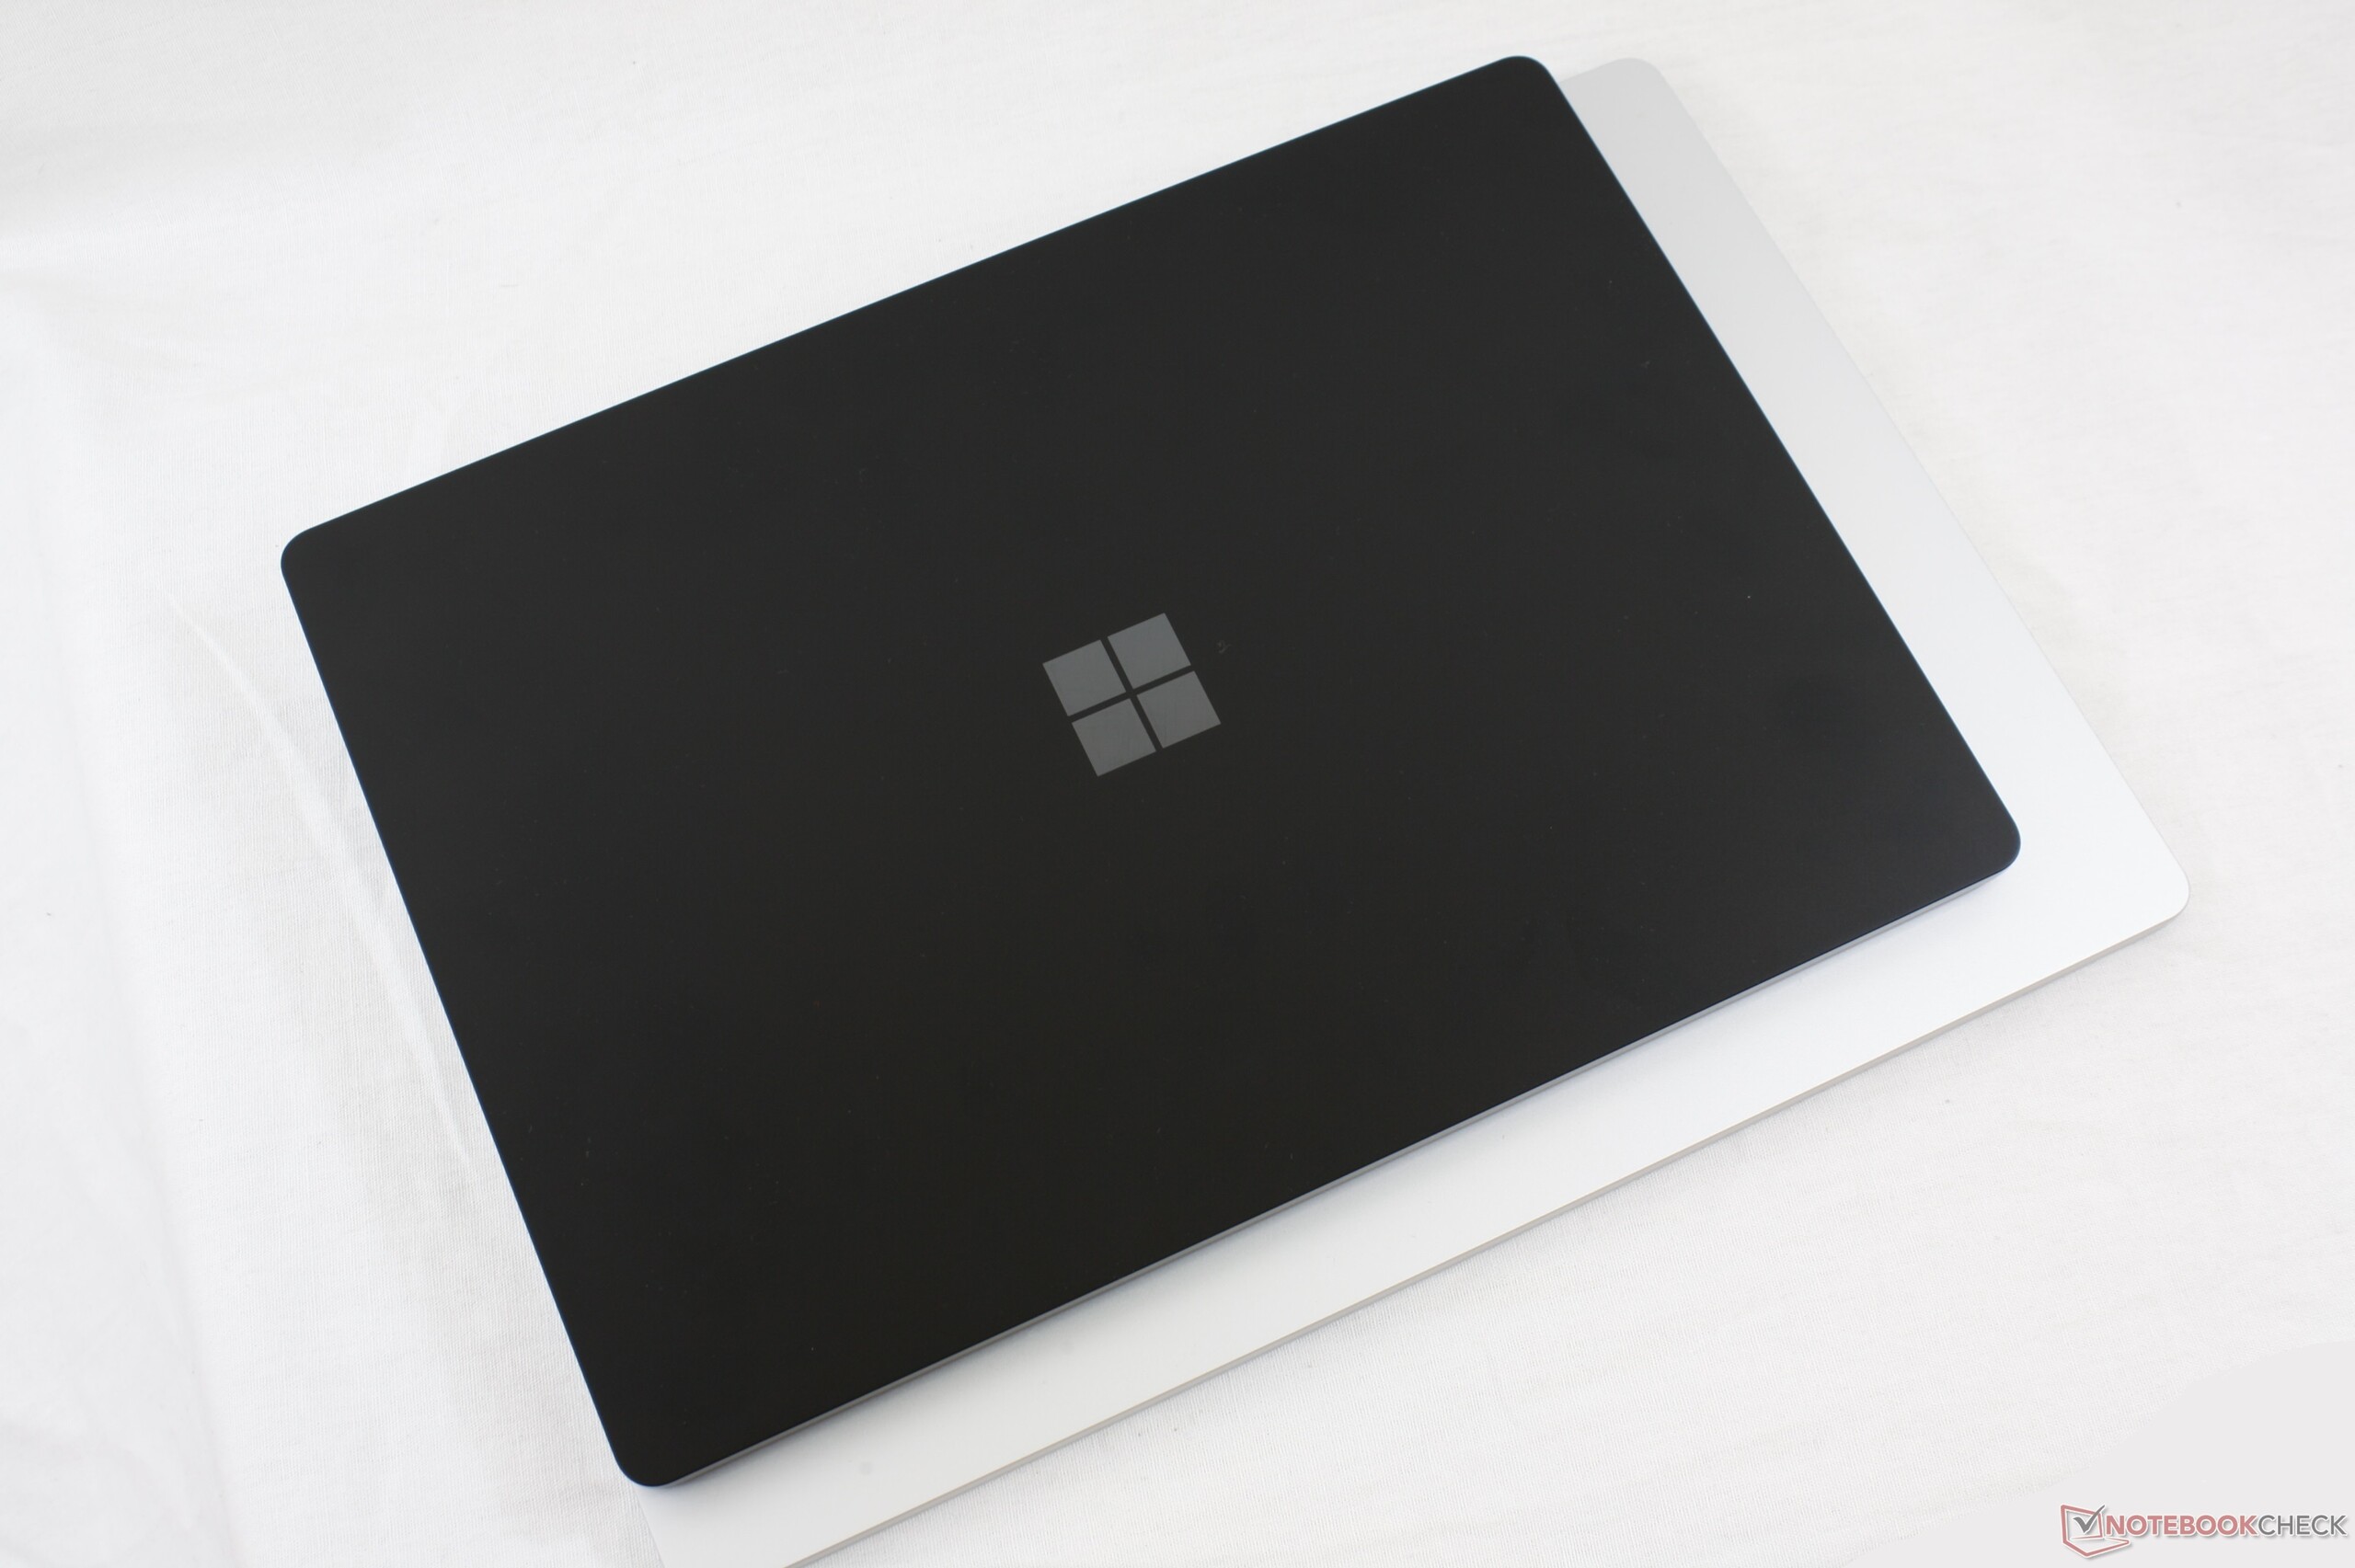
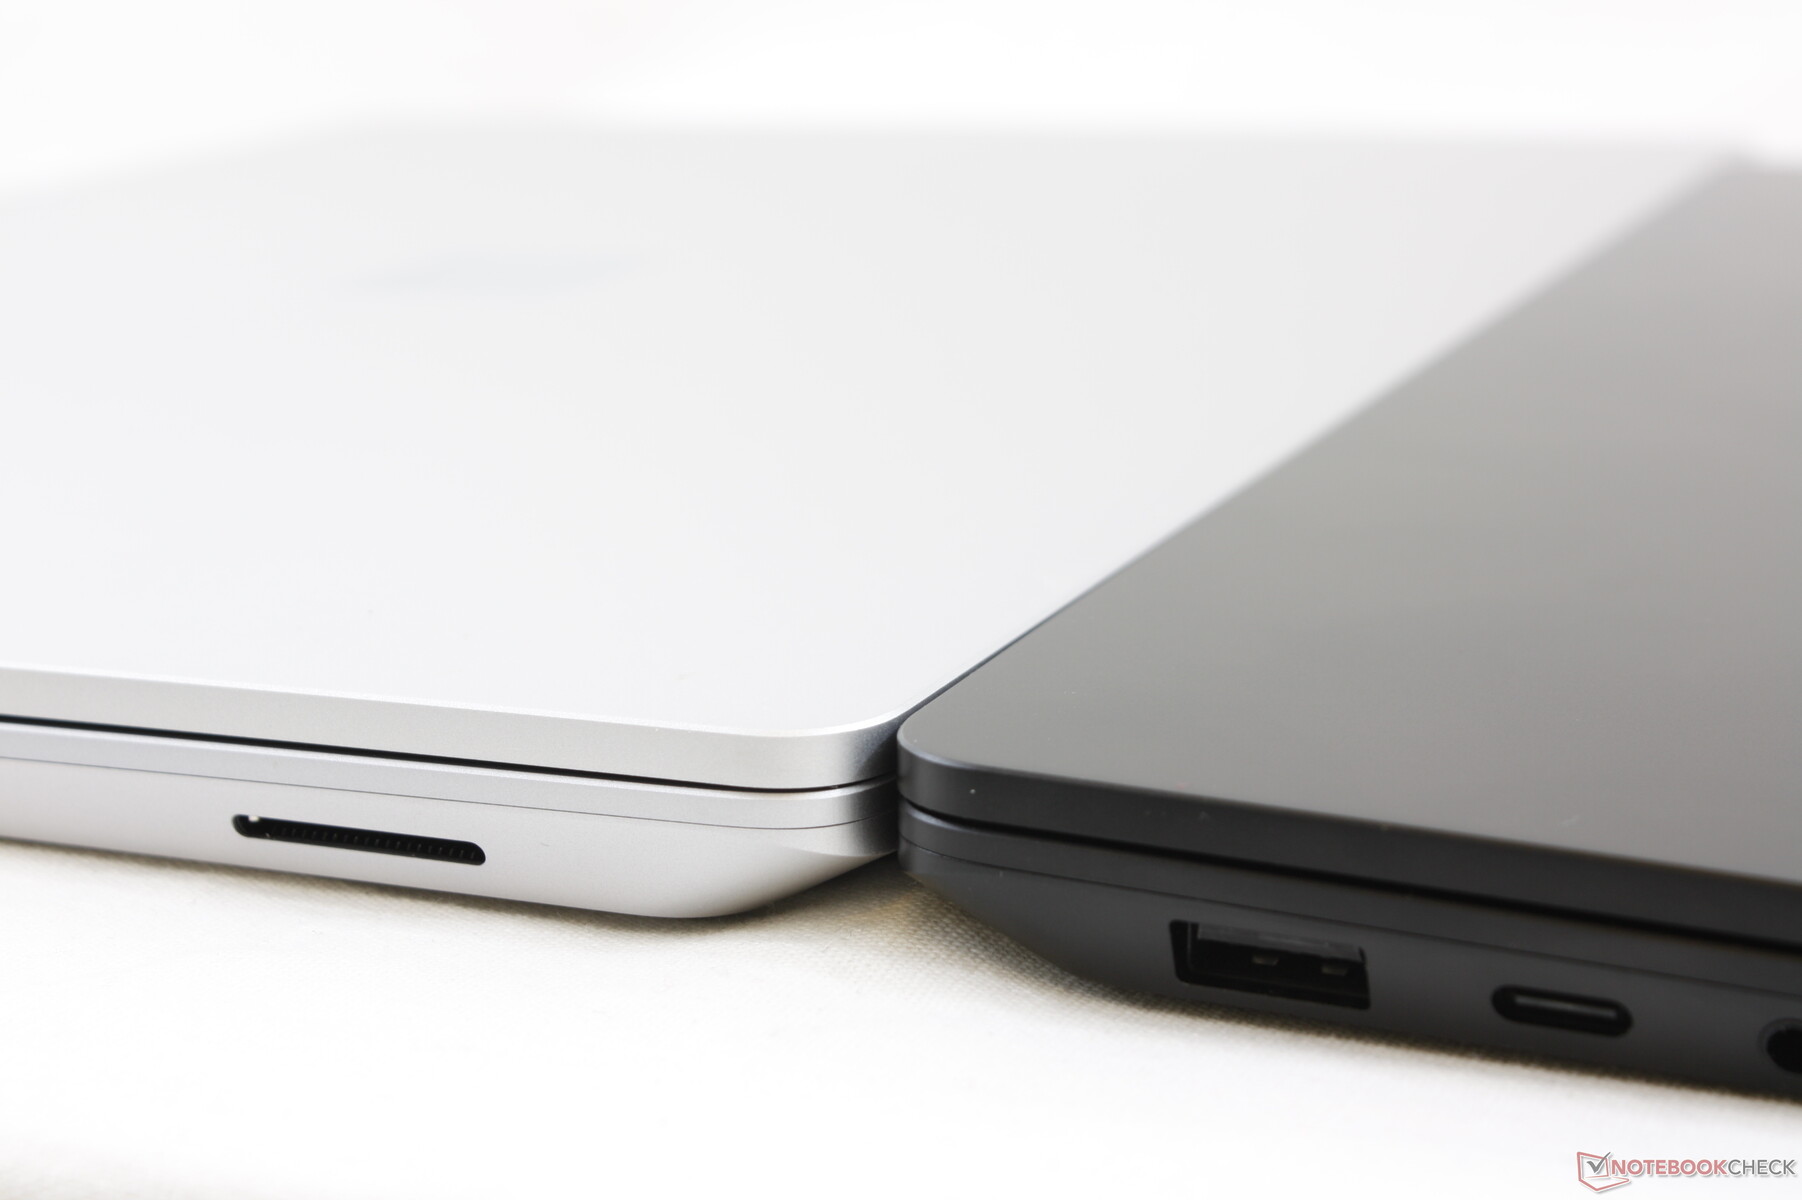
Şasi boyutları, benzer olmayan malzeme yapısına rağmen Alcantara ve metal seçenekleri arasında aynıdır. Microsoft, metal SKU'ların Alcantara SKU'lardan (1.288 kg'a karşı 1.265 kg) biraz daha ağır olacağını, ancak farkın o kadar küçük olduğunu, günlük kullanımda aslında ihmal edilebileceğini söyledi. Microsoft dizüstü bilgisayar, kısmen Surface Dizüstü Bilgisayar 3'ün kalın çerçevelerinden dolayı hem 3: 2 Huawei MateBook X Pro hem de Dell XPS 13 2'si 1 arada bilgisayarlardan daha büyük.
Bağlantı
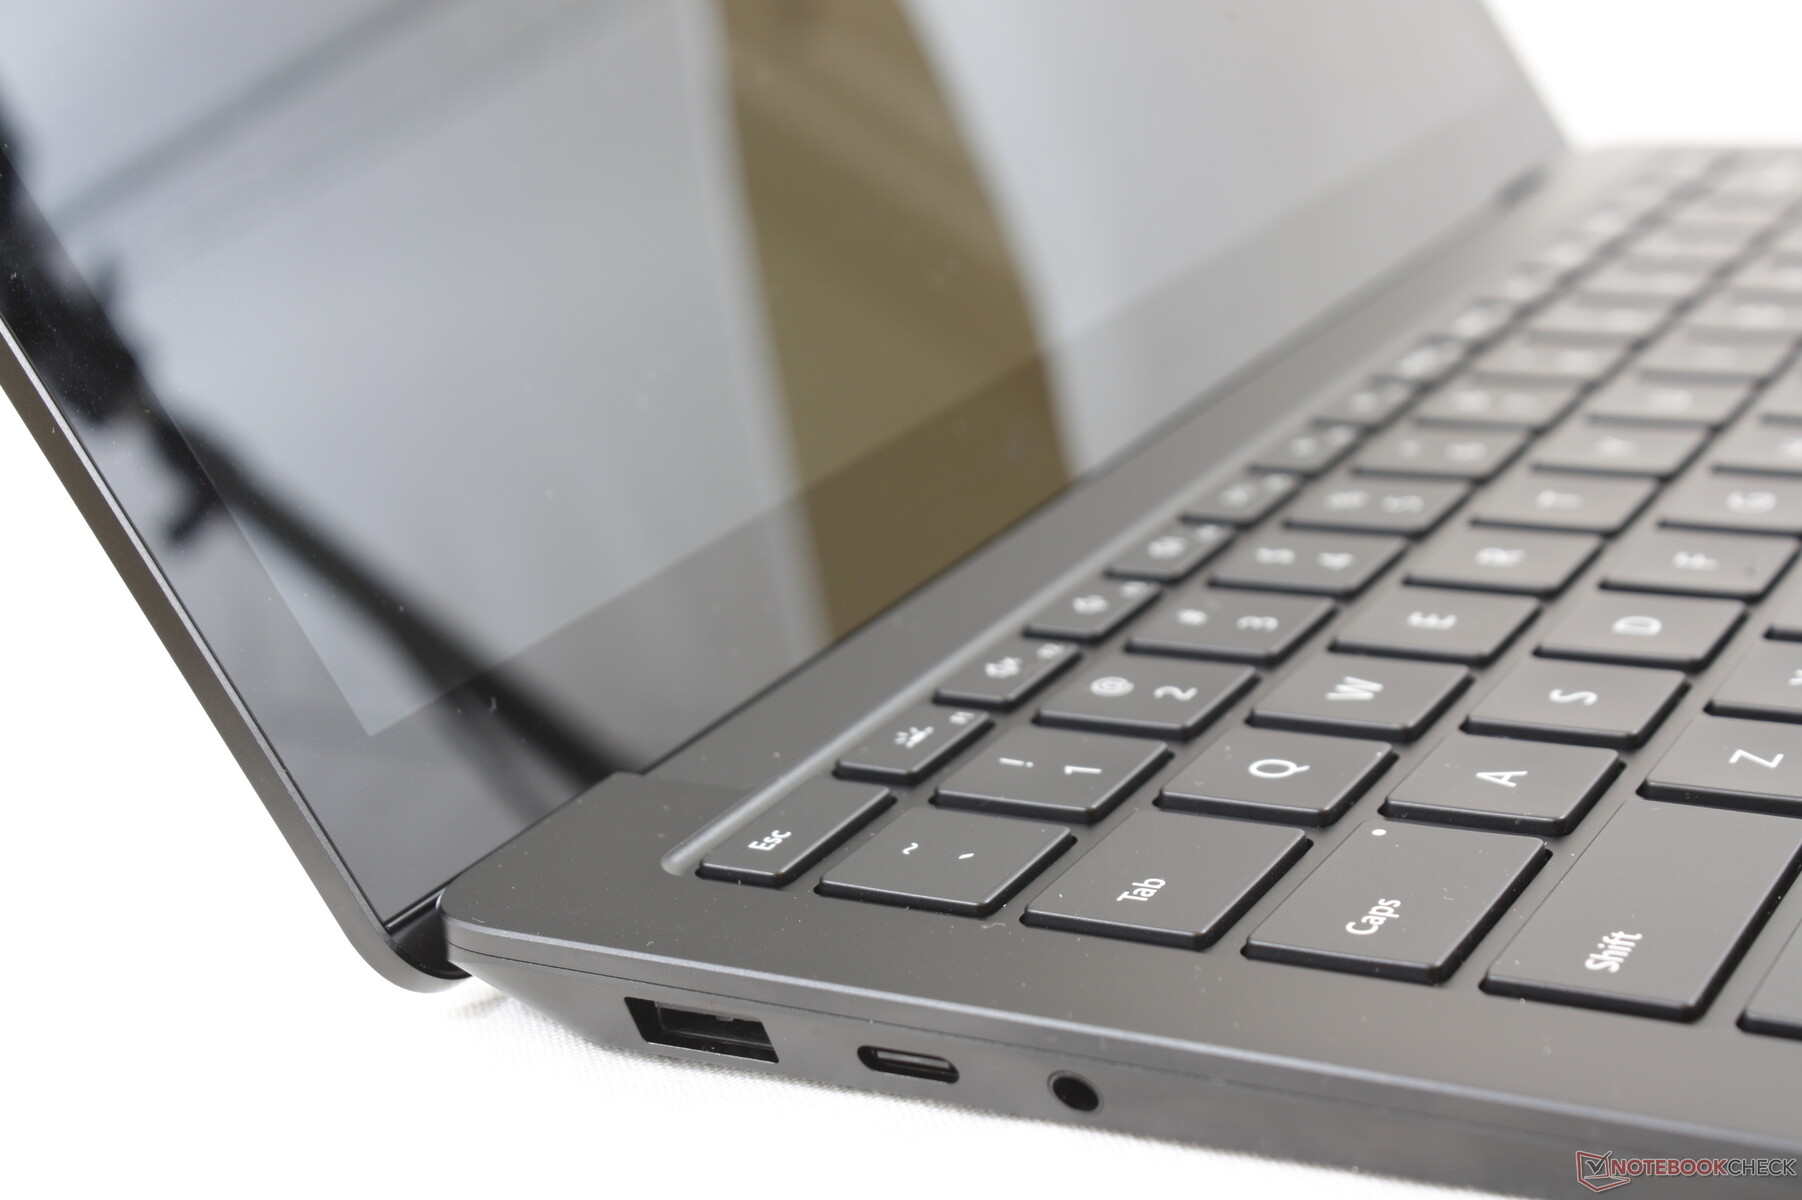
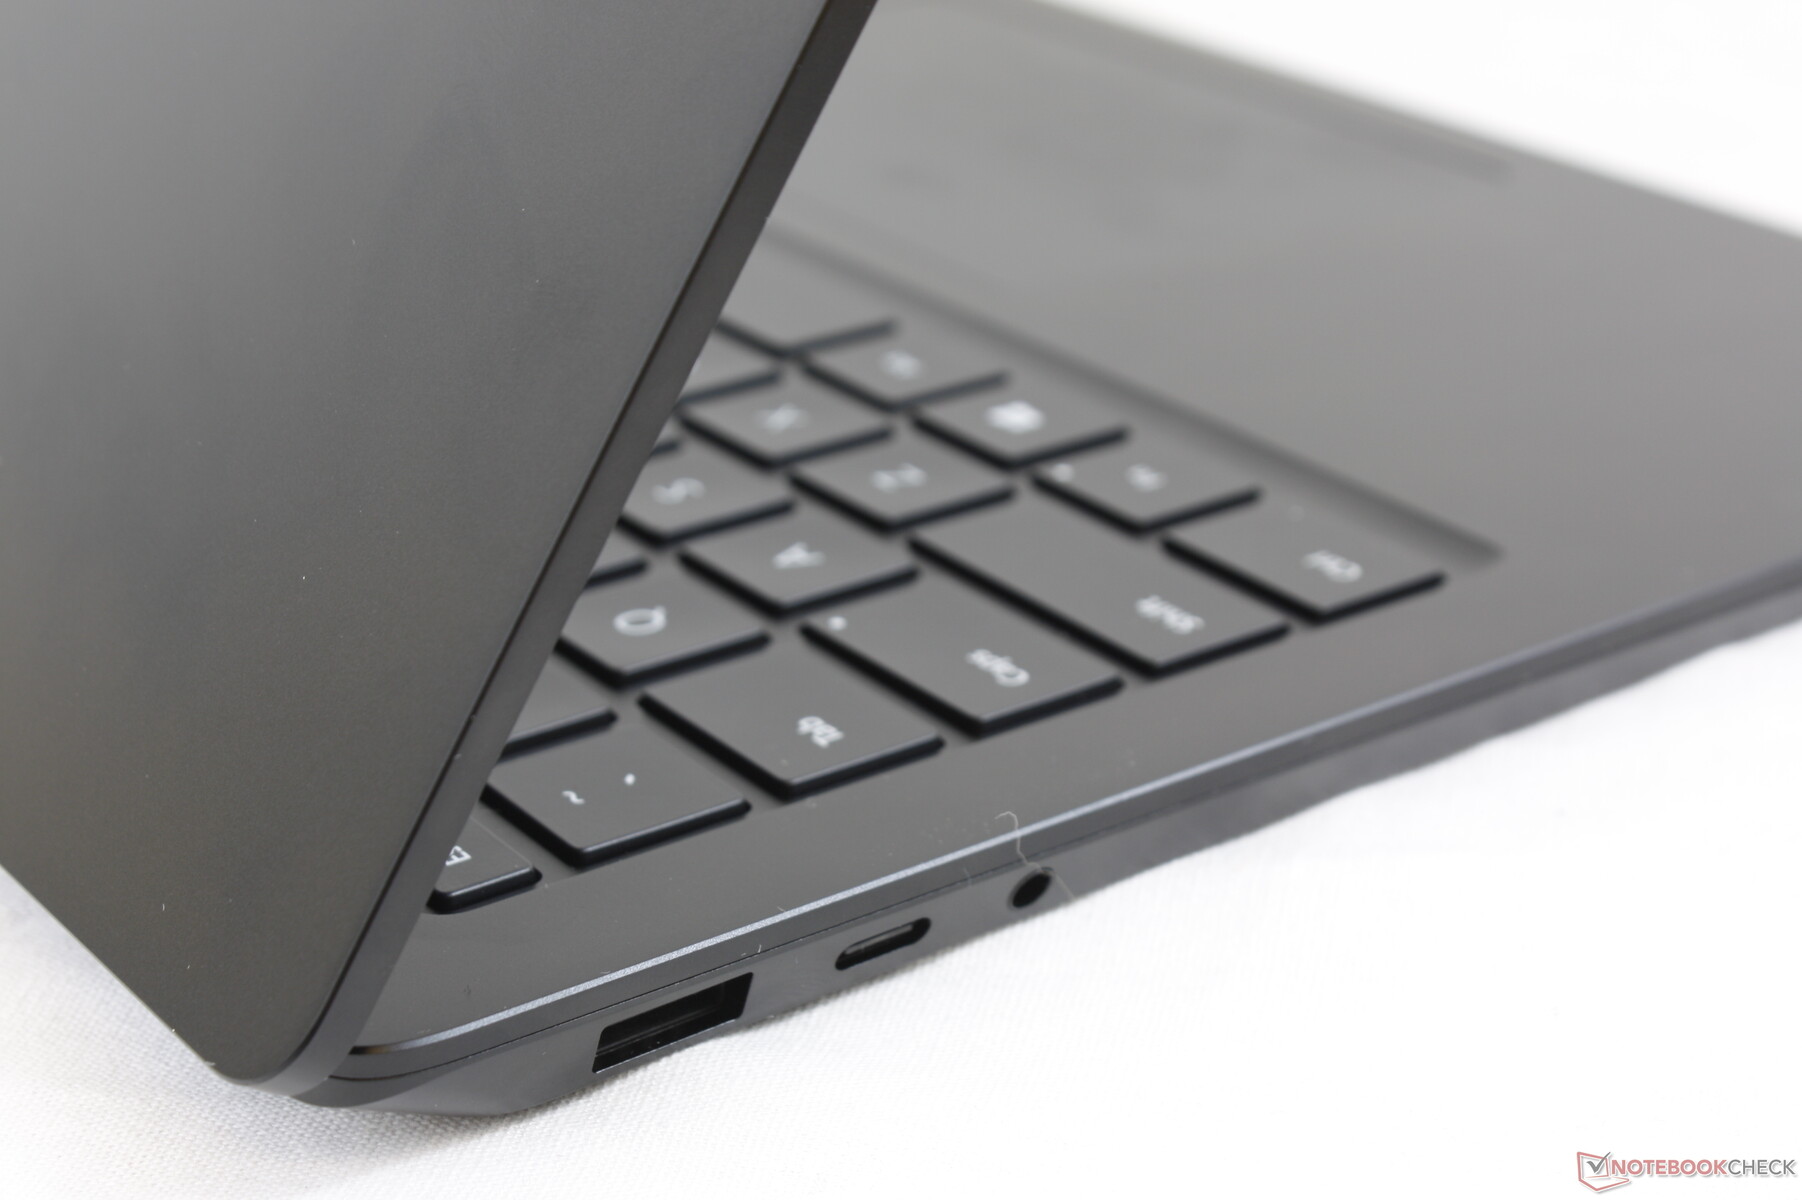
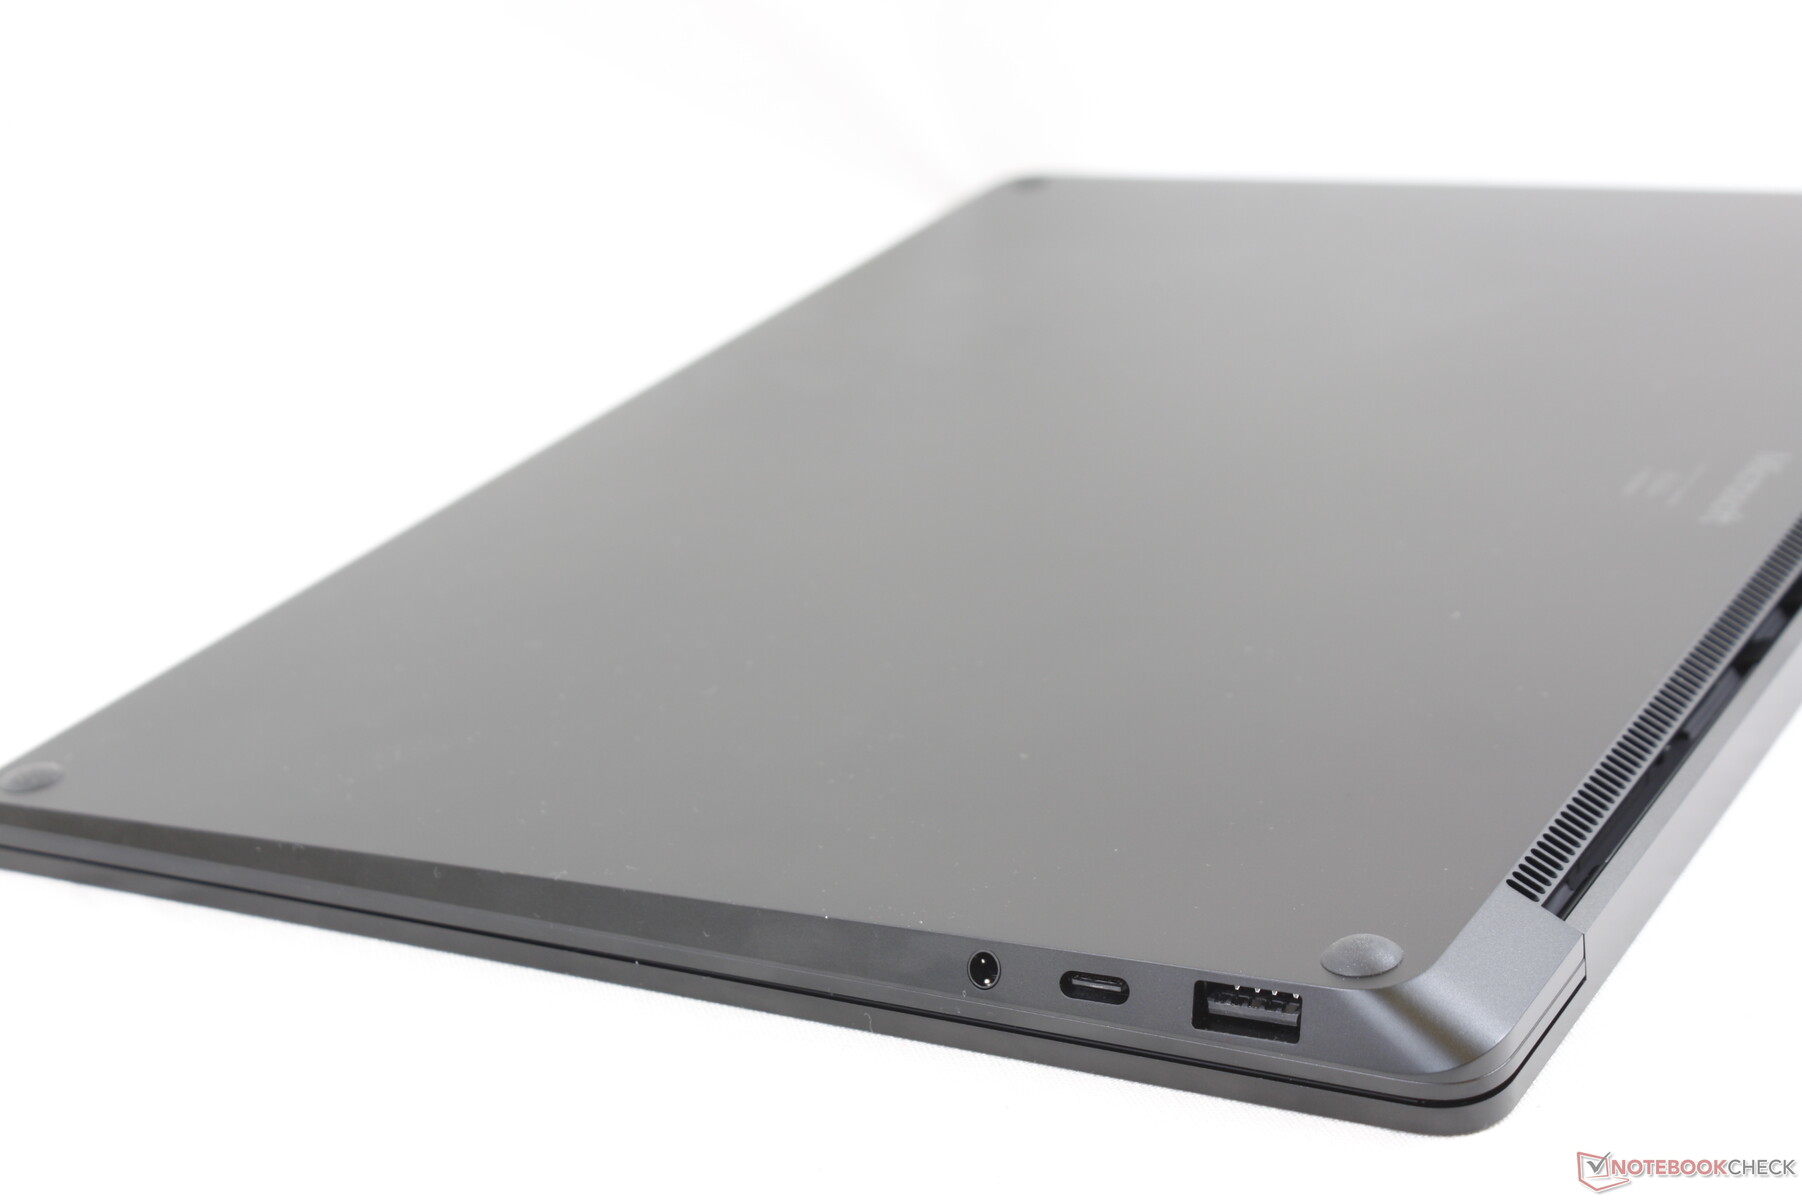
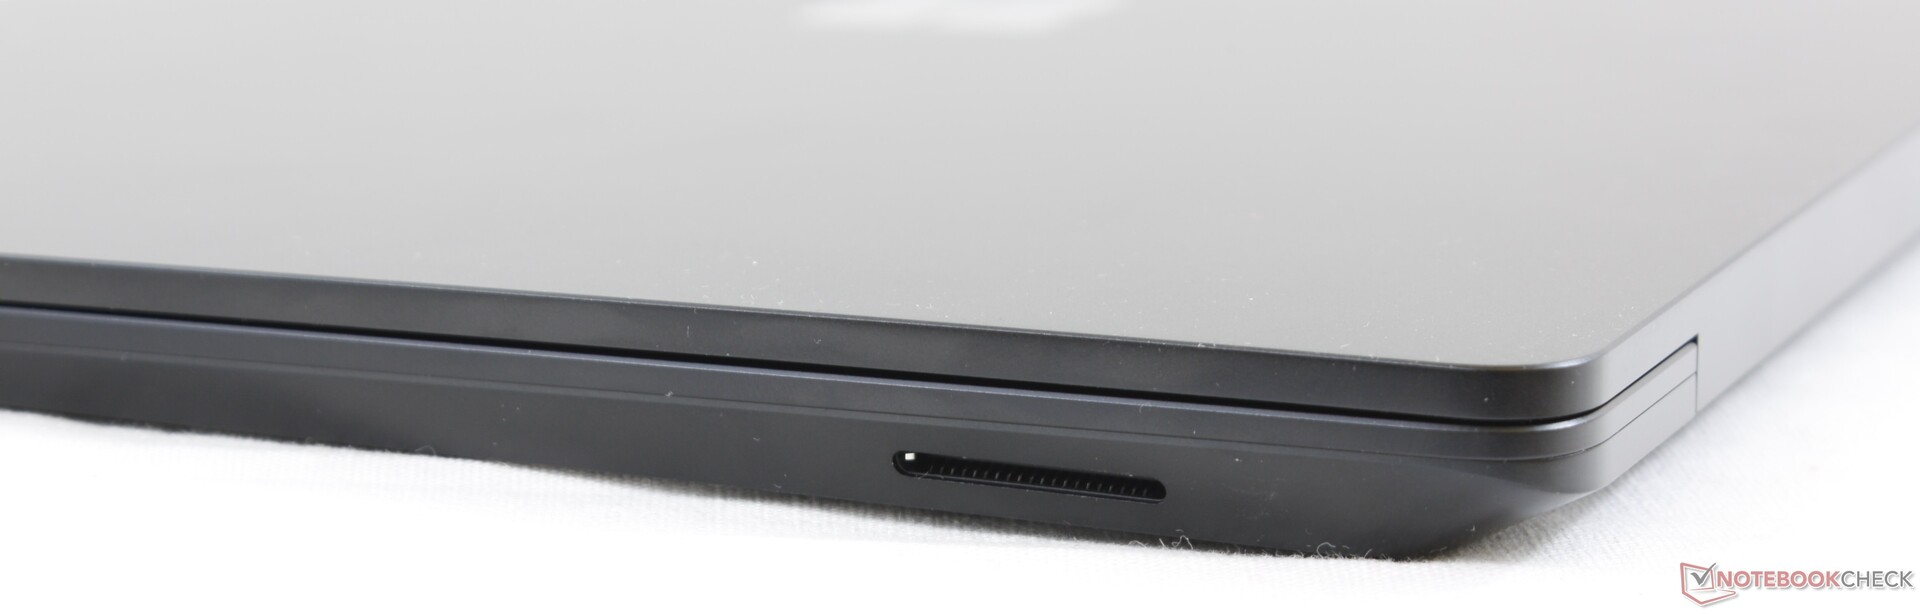
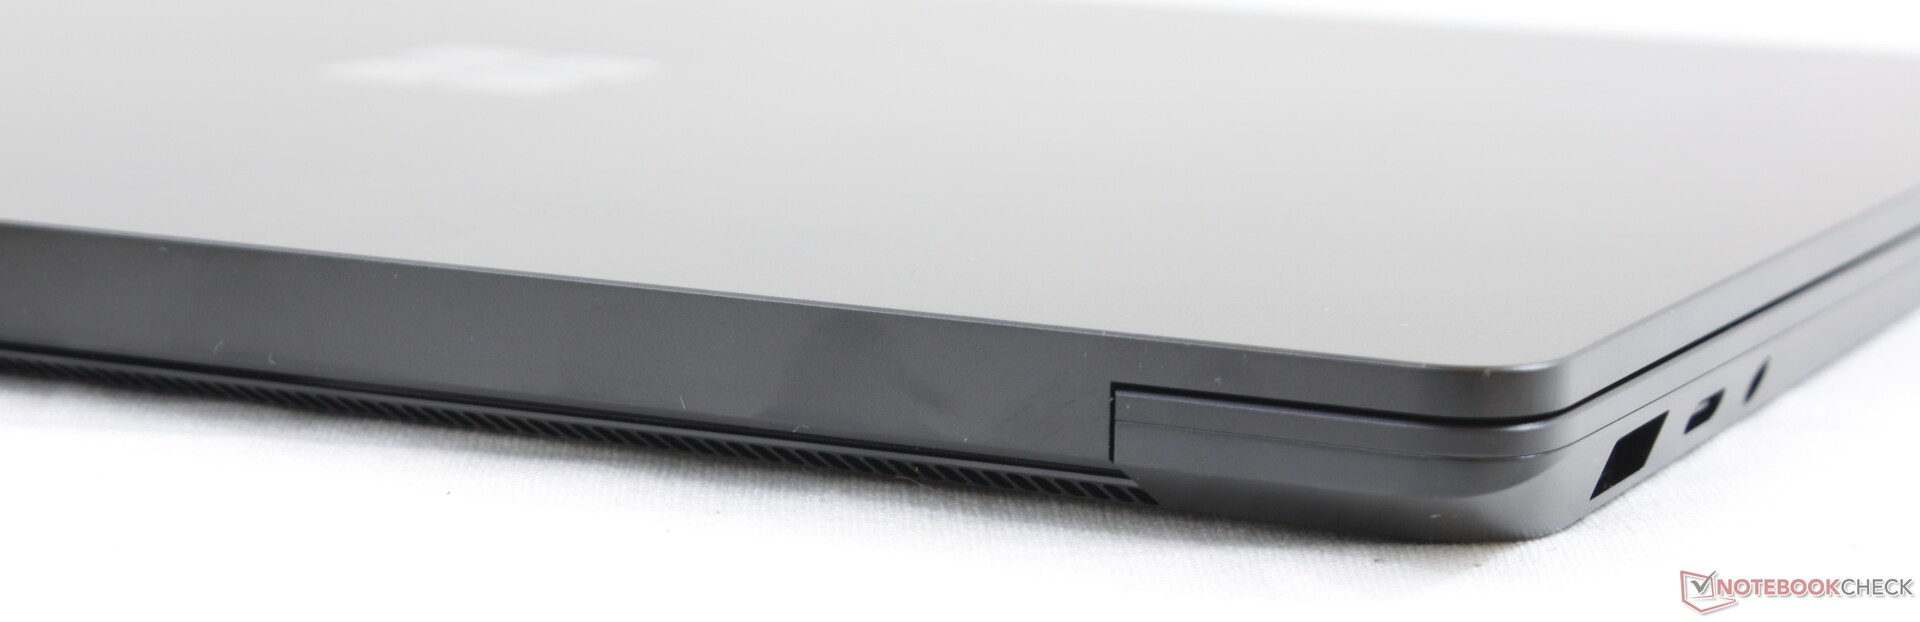
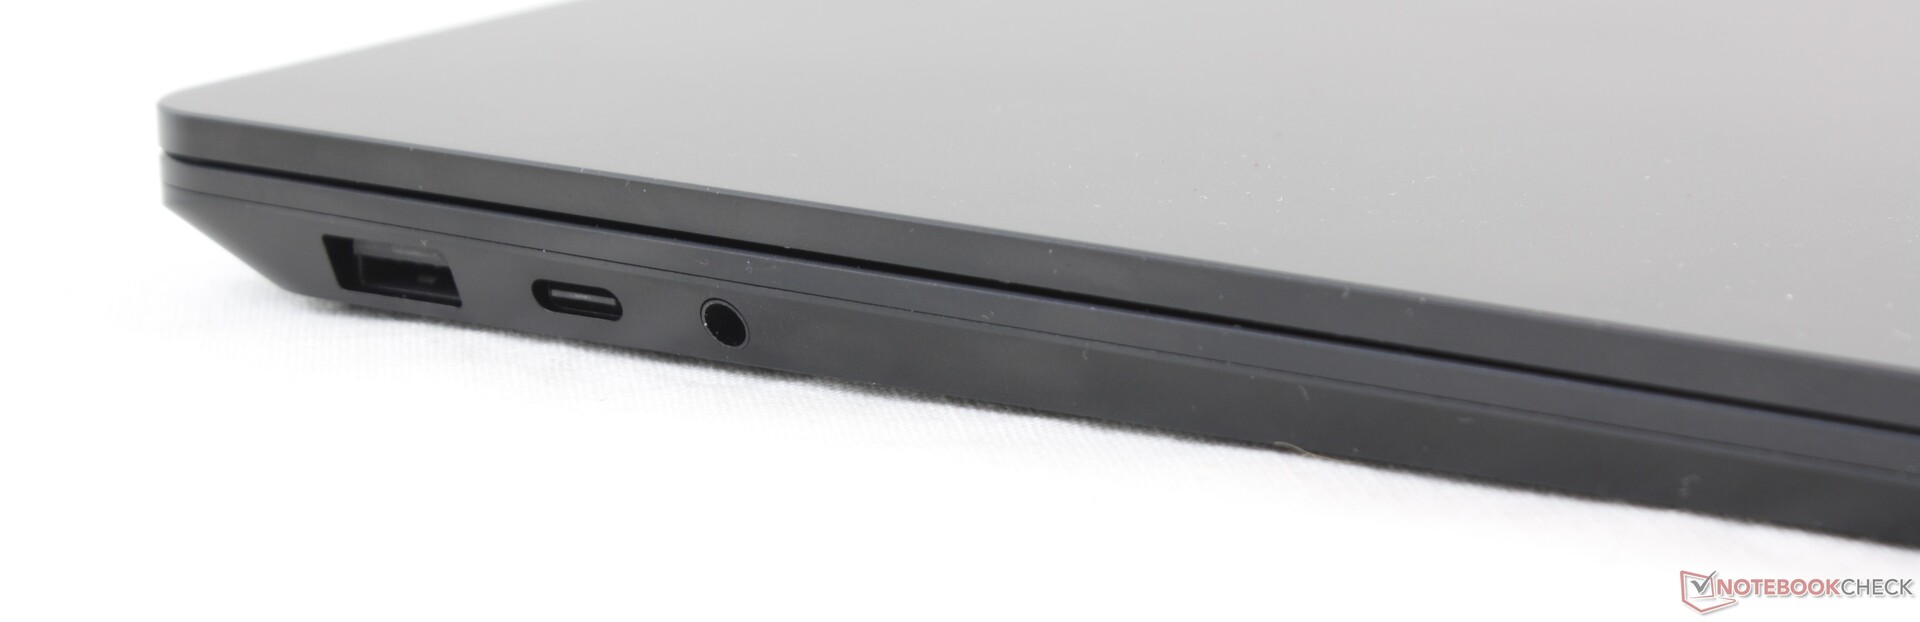
Bağlantı noktası seçenekleri 15 inçlik Yüzey Dizüstü Bilgisayarı 3 ile aynıdır. Şimdiden, Thunderbolt 3, HDMI veya hatta bir SD kart okuyucuyu görmeyi tercih ettiğimiz gibi Surface Connect'in işe yaramazlığı hakkında zaten sıraladık. Huawei MateBook X Pro veya Razer Blade Stealth gibi diğer alt defterlerin bu konuda Surface Laptop 3'e göre bir avantajı var.
İletişim
Tüm Surface Dizüstü Bilgisayar Intel SKU'ları, 15 inçlik daha büyük Surface Dizüstü Bilgisayar 3 de dahil olmak üzere 802.11ax veya Wi-Fi 6 Intel AX201 kartlarla birlikte gelir. Bu arada, AMD SKU'lar "yalnızca" 802.11ac veya Wi-Fi 5 modülleriyle takılır. Her iki seçenek de günlük ev veya ofis çalışanı için fazlasıyla yeterli olacaktır. 2,5 Gbps sunucu hattına bağlı Netgear RAX200 yönlendiricimizden bir metre uzakta durduğunuzda yaklaşık 1,4 Gbps ortalama aktarım hızlarını kaydedebiliyoruz.
Web kamerası

Bakım
Alt panel, sıkıca yapıştırılmış kauçuk pedlerin altına gizlenmiş dört vida ile sabitlenmiştir. RAM, nadiren M.2 2230 form faktöründe de olsa yükseltilebilirken lehimlenir. iFixit'in model üzerinde kullanışlı bir sökme videosu vardır, ancak genel olarak servis kolaylığı, özellikle profesyonel bir dizüstü bilgisayar için olması gerekenden daha zordur.
Aksesuarlar ve Garanti
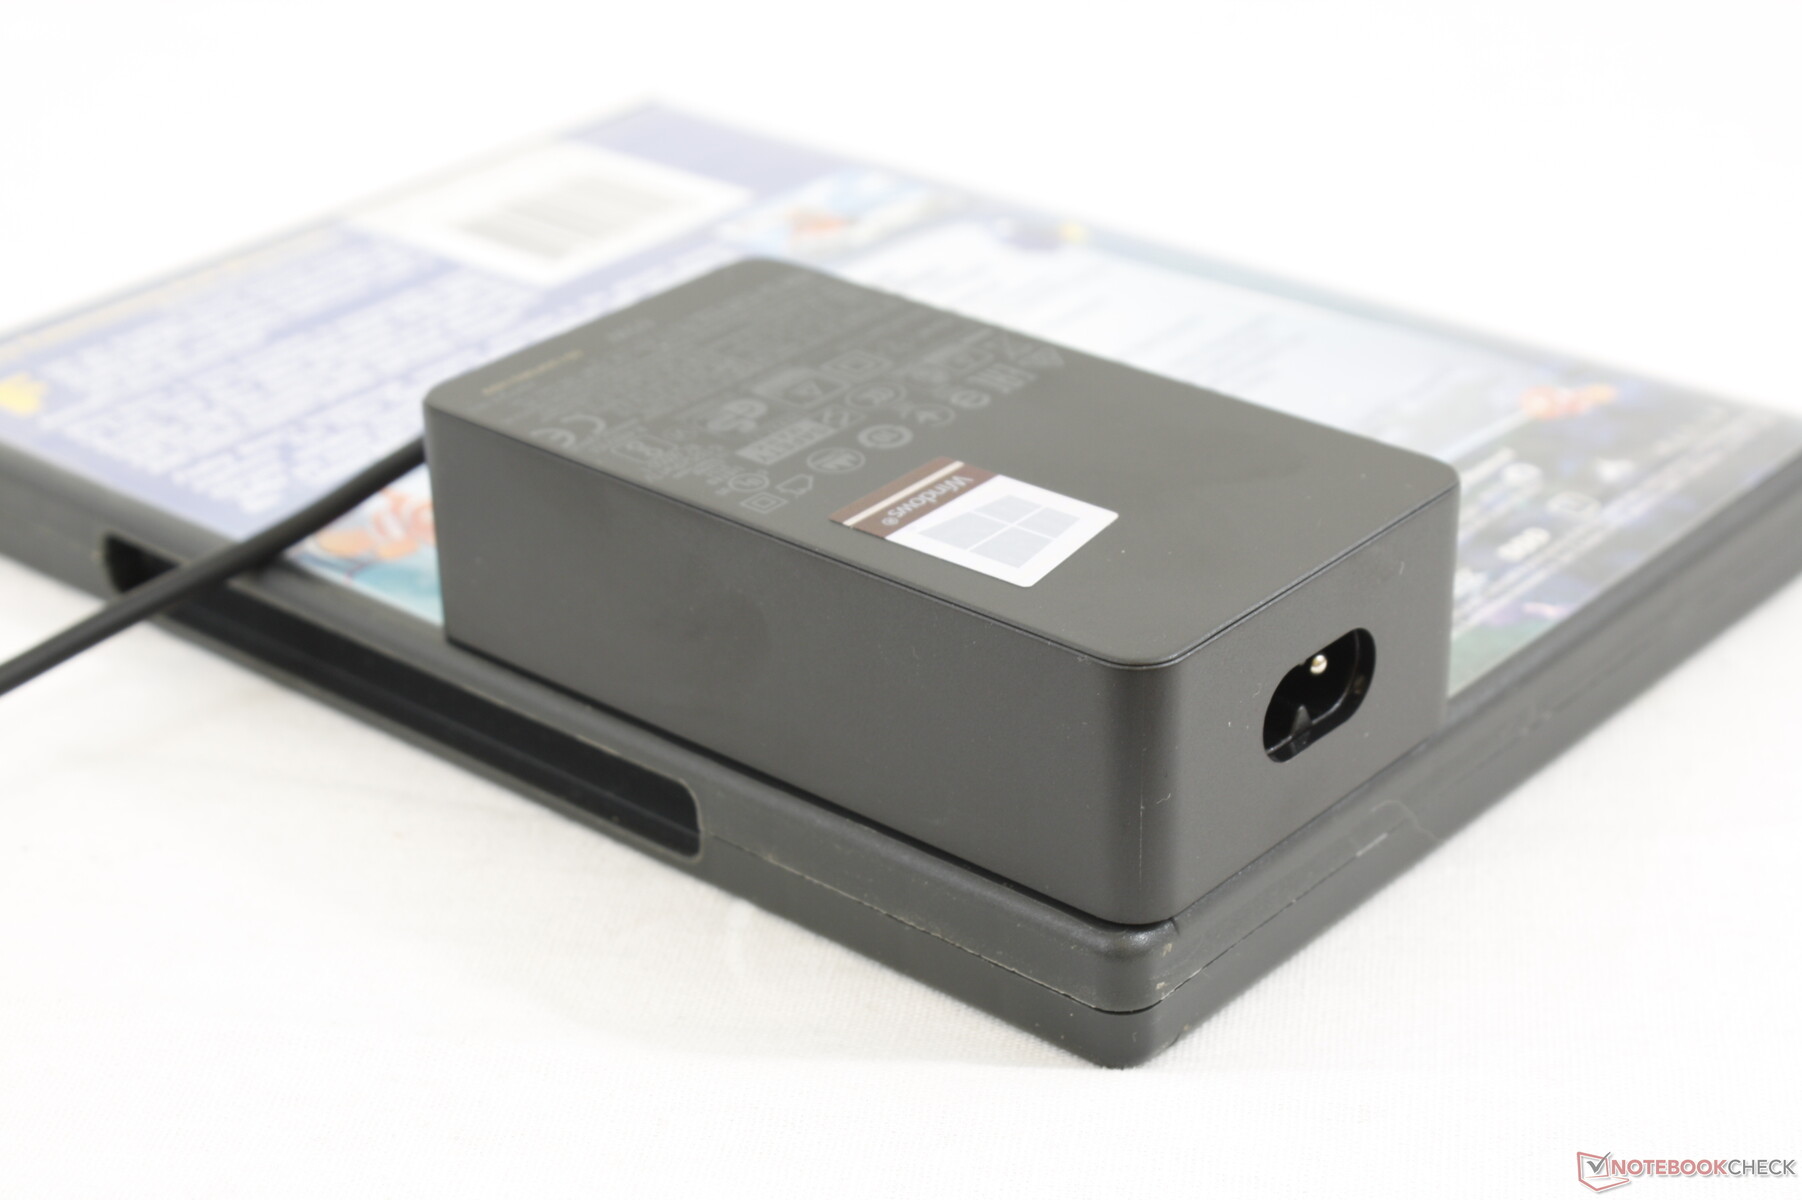
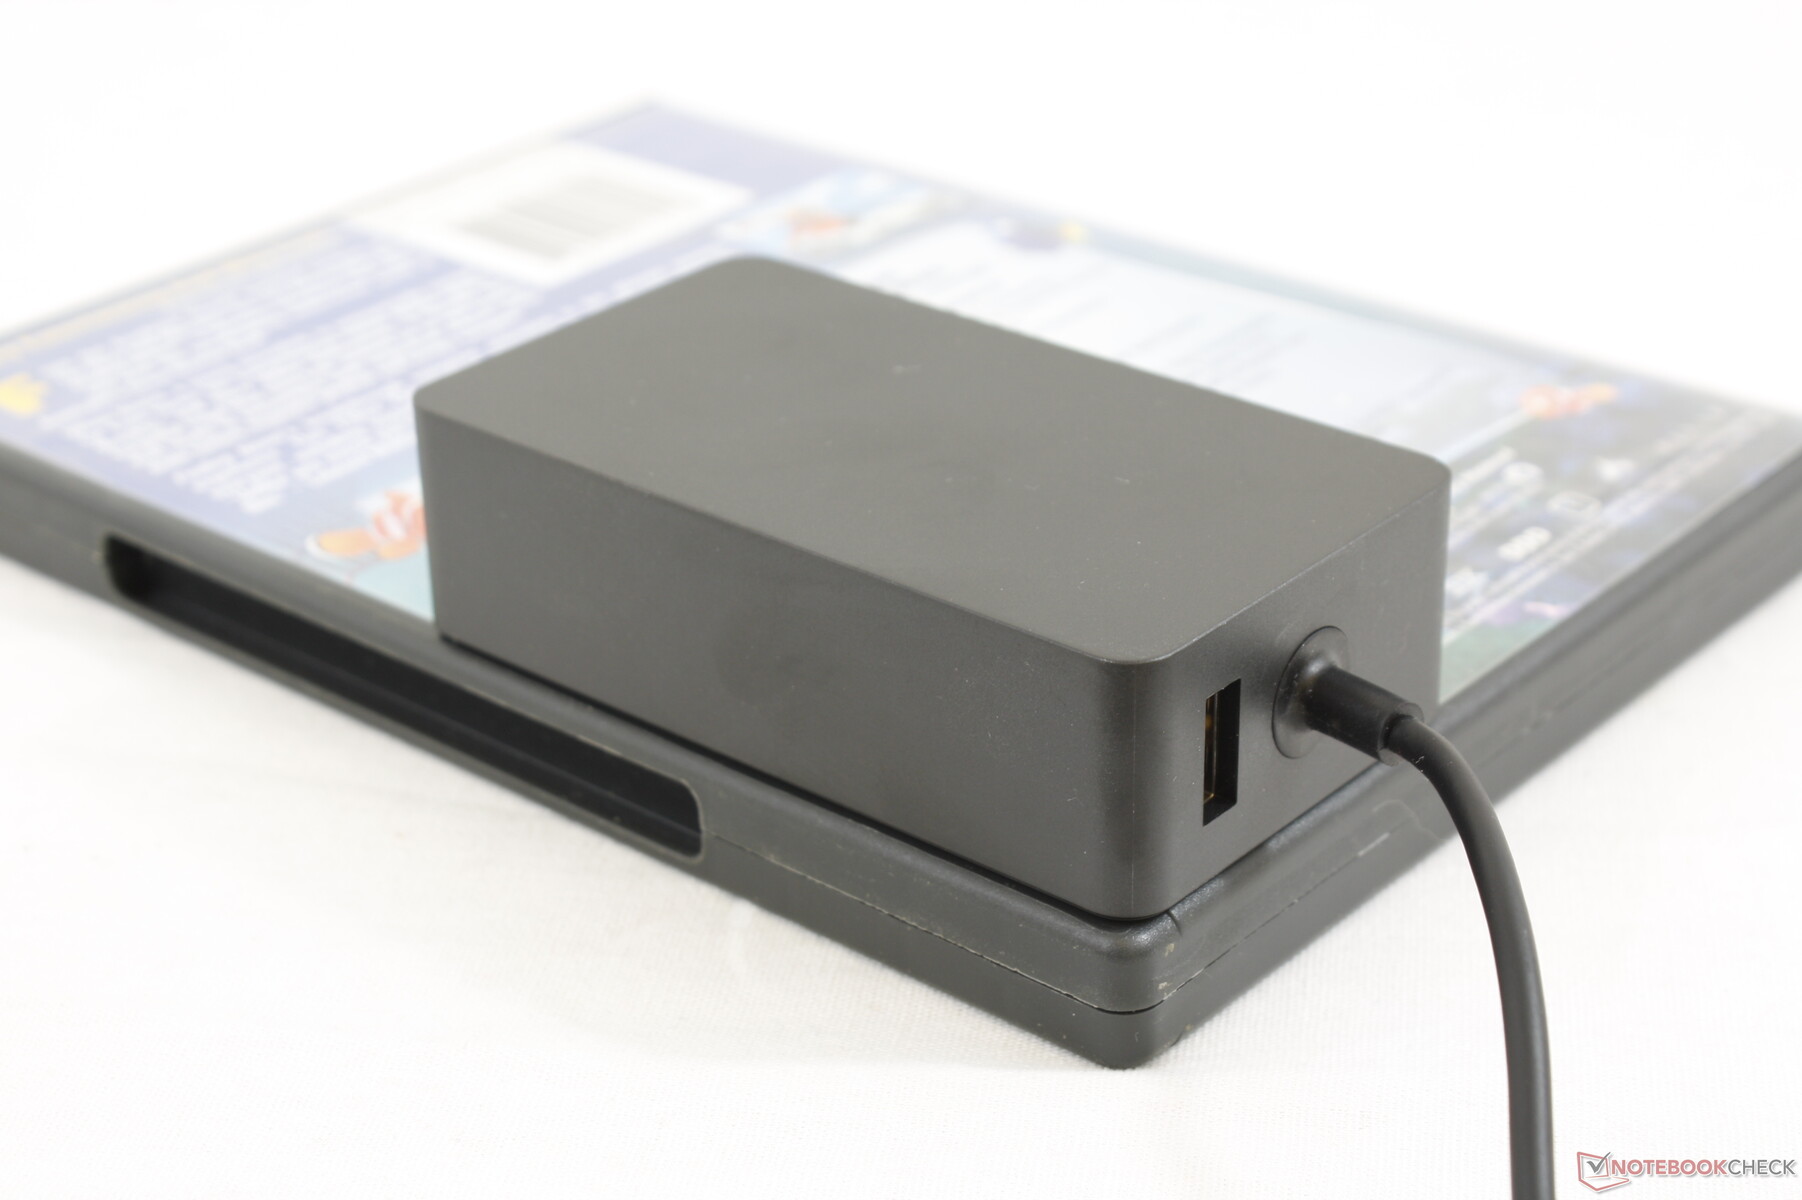
Kutuda, bazı evrak işleri ve AC adaptörü dışında hiçbir ekstra yoktur. Buna karşılık, Asus ZenBook S13 ve HP Spectre 13'ün her birinde suni deri taşıma kılıfları bulunur. USB C Tipi rıhtım veya Microsoft'un tescilli Surface Dock'u ile ek portlar genişletilebilir. Standart bir yıllık sınırlı garanti geçerlidir.
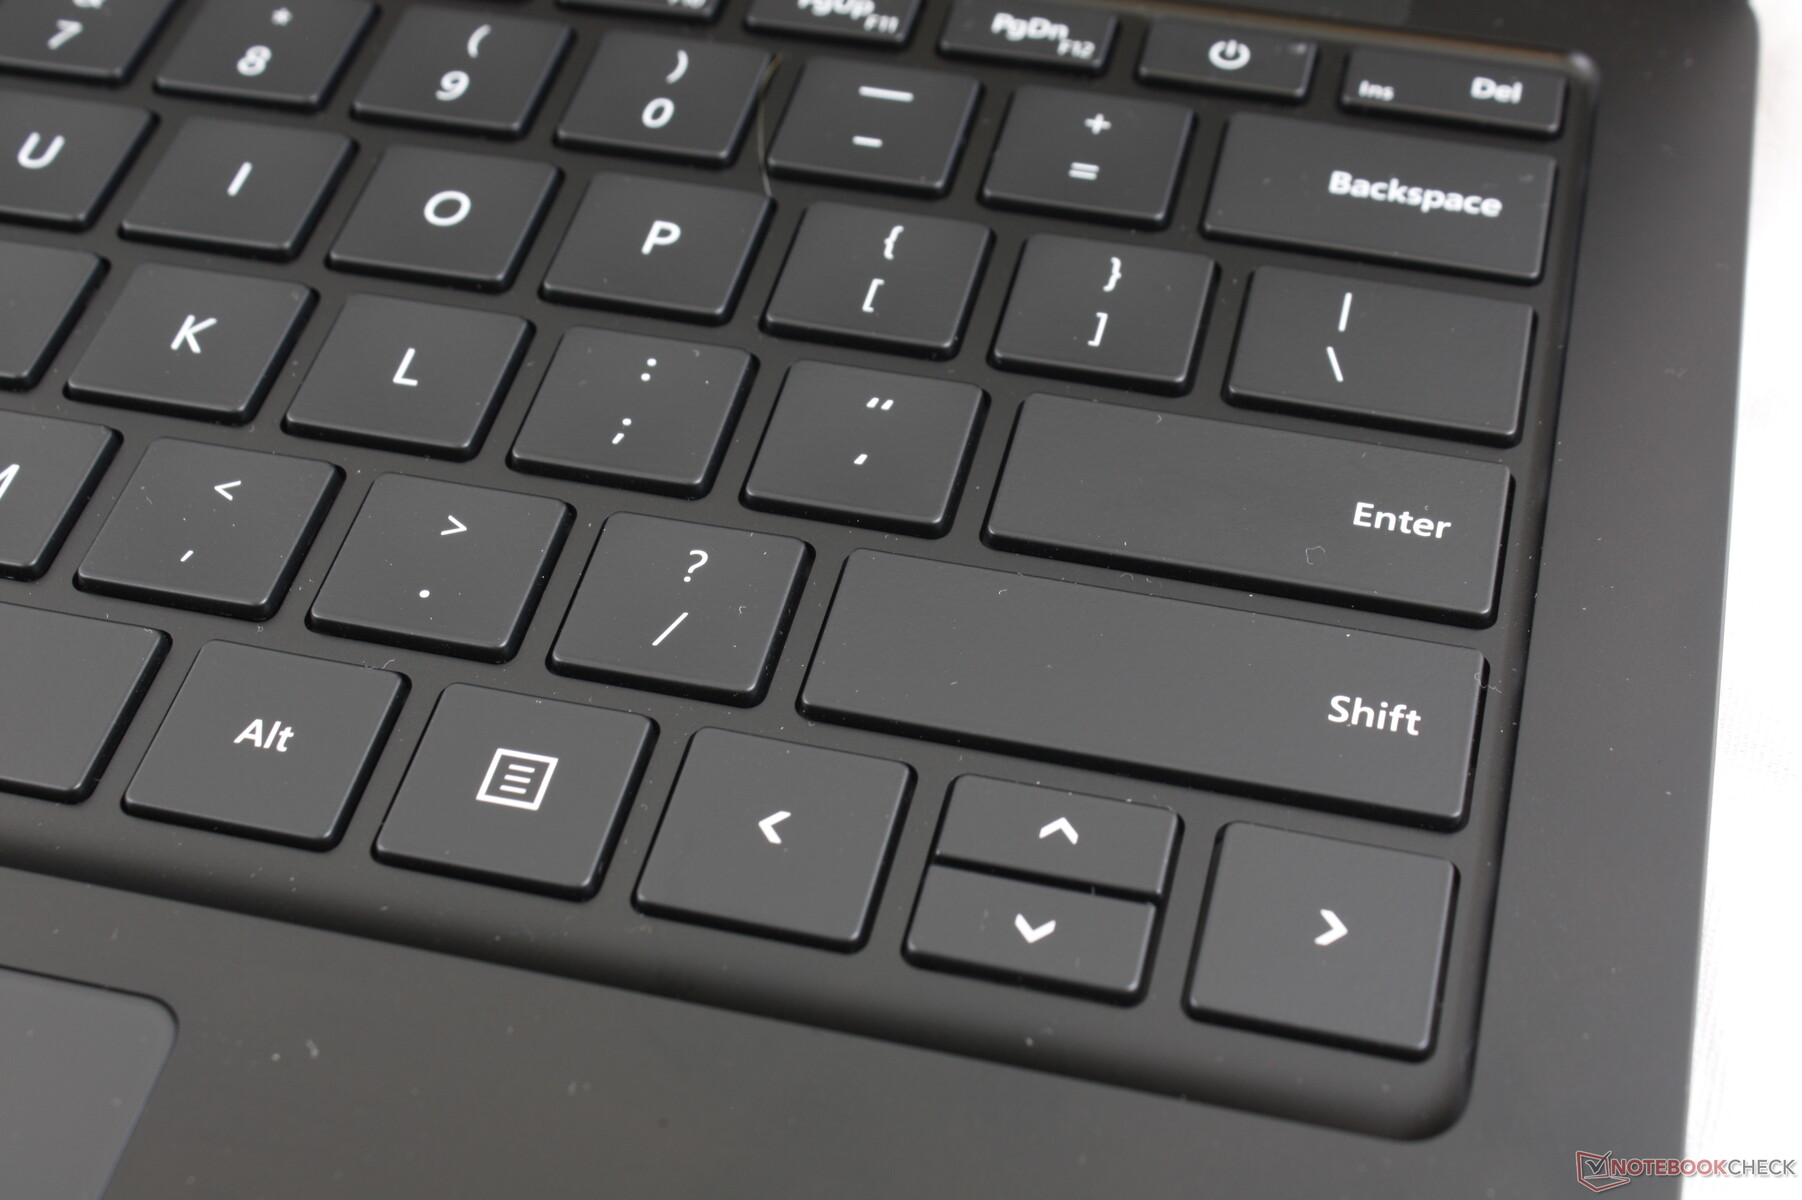
Giriş cihazları
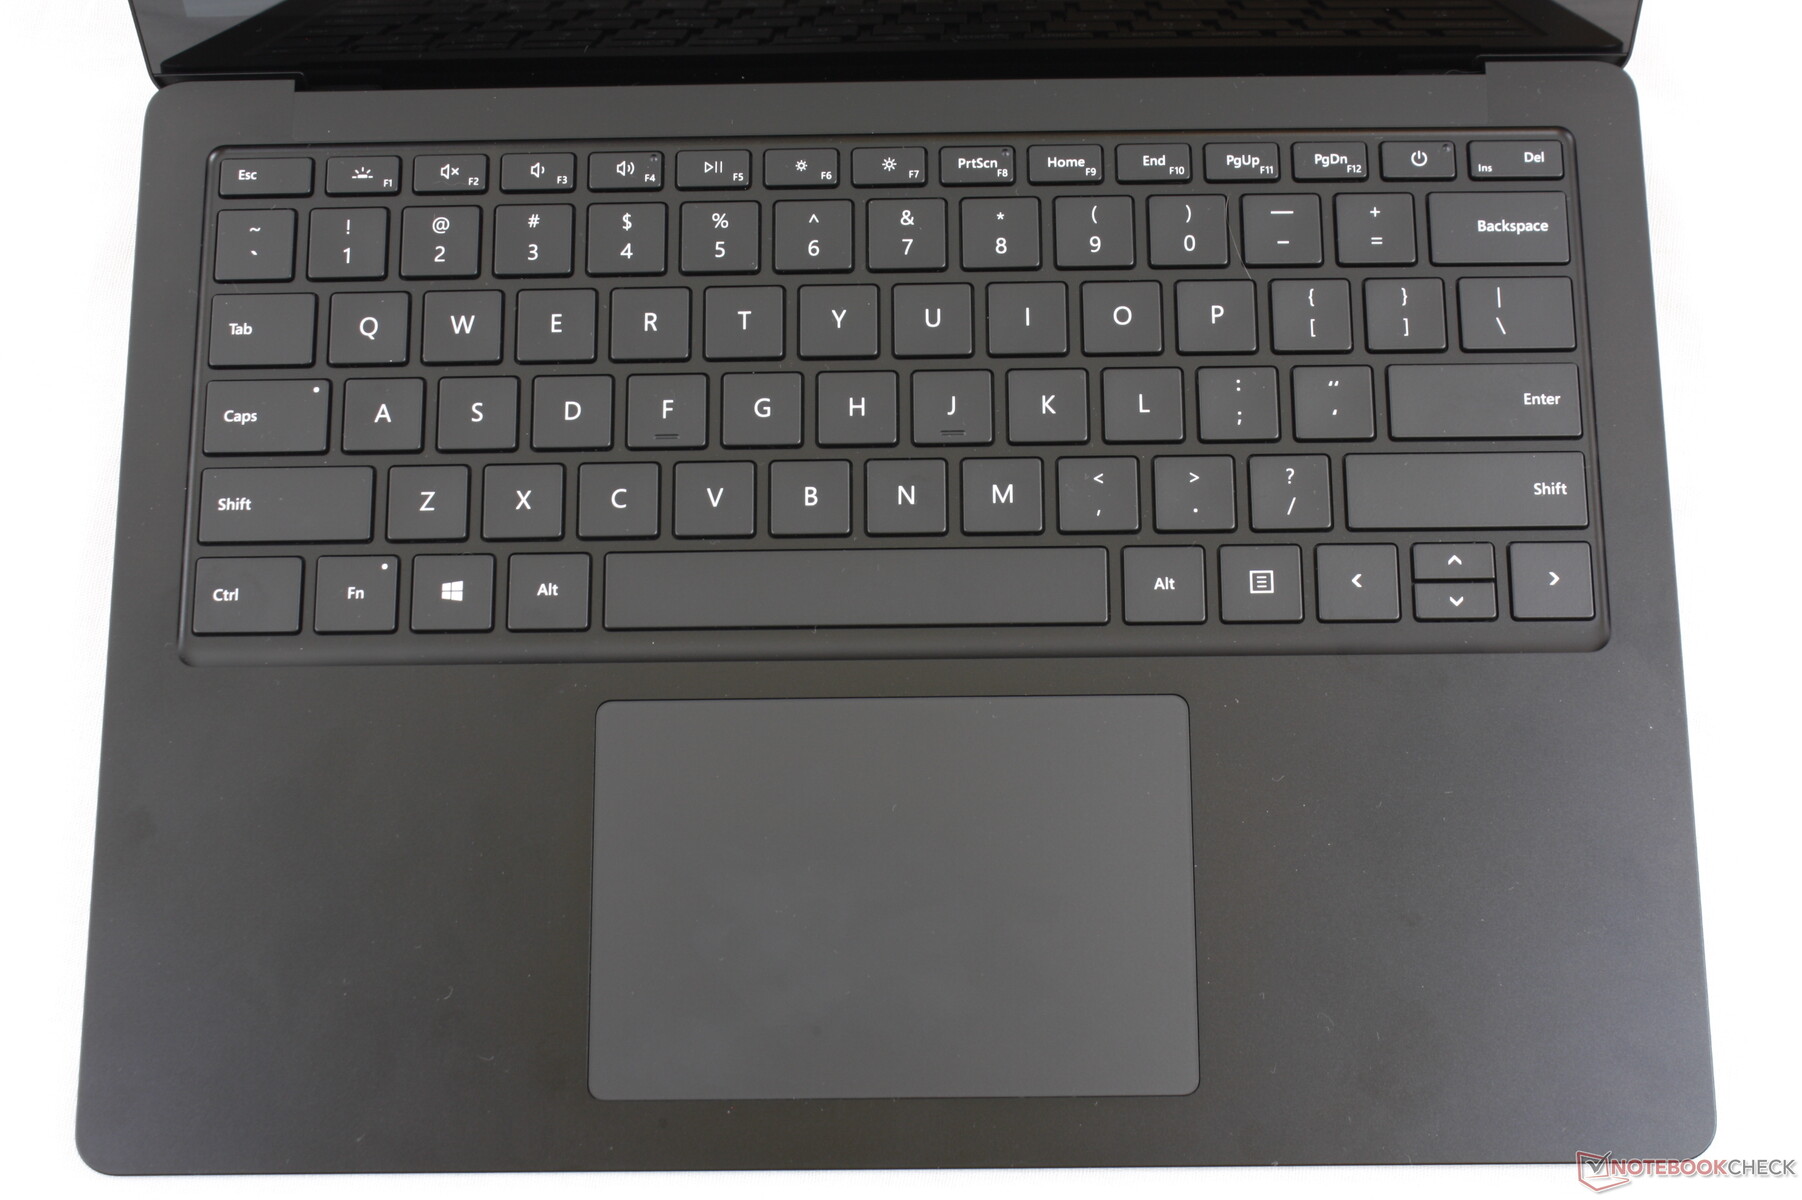
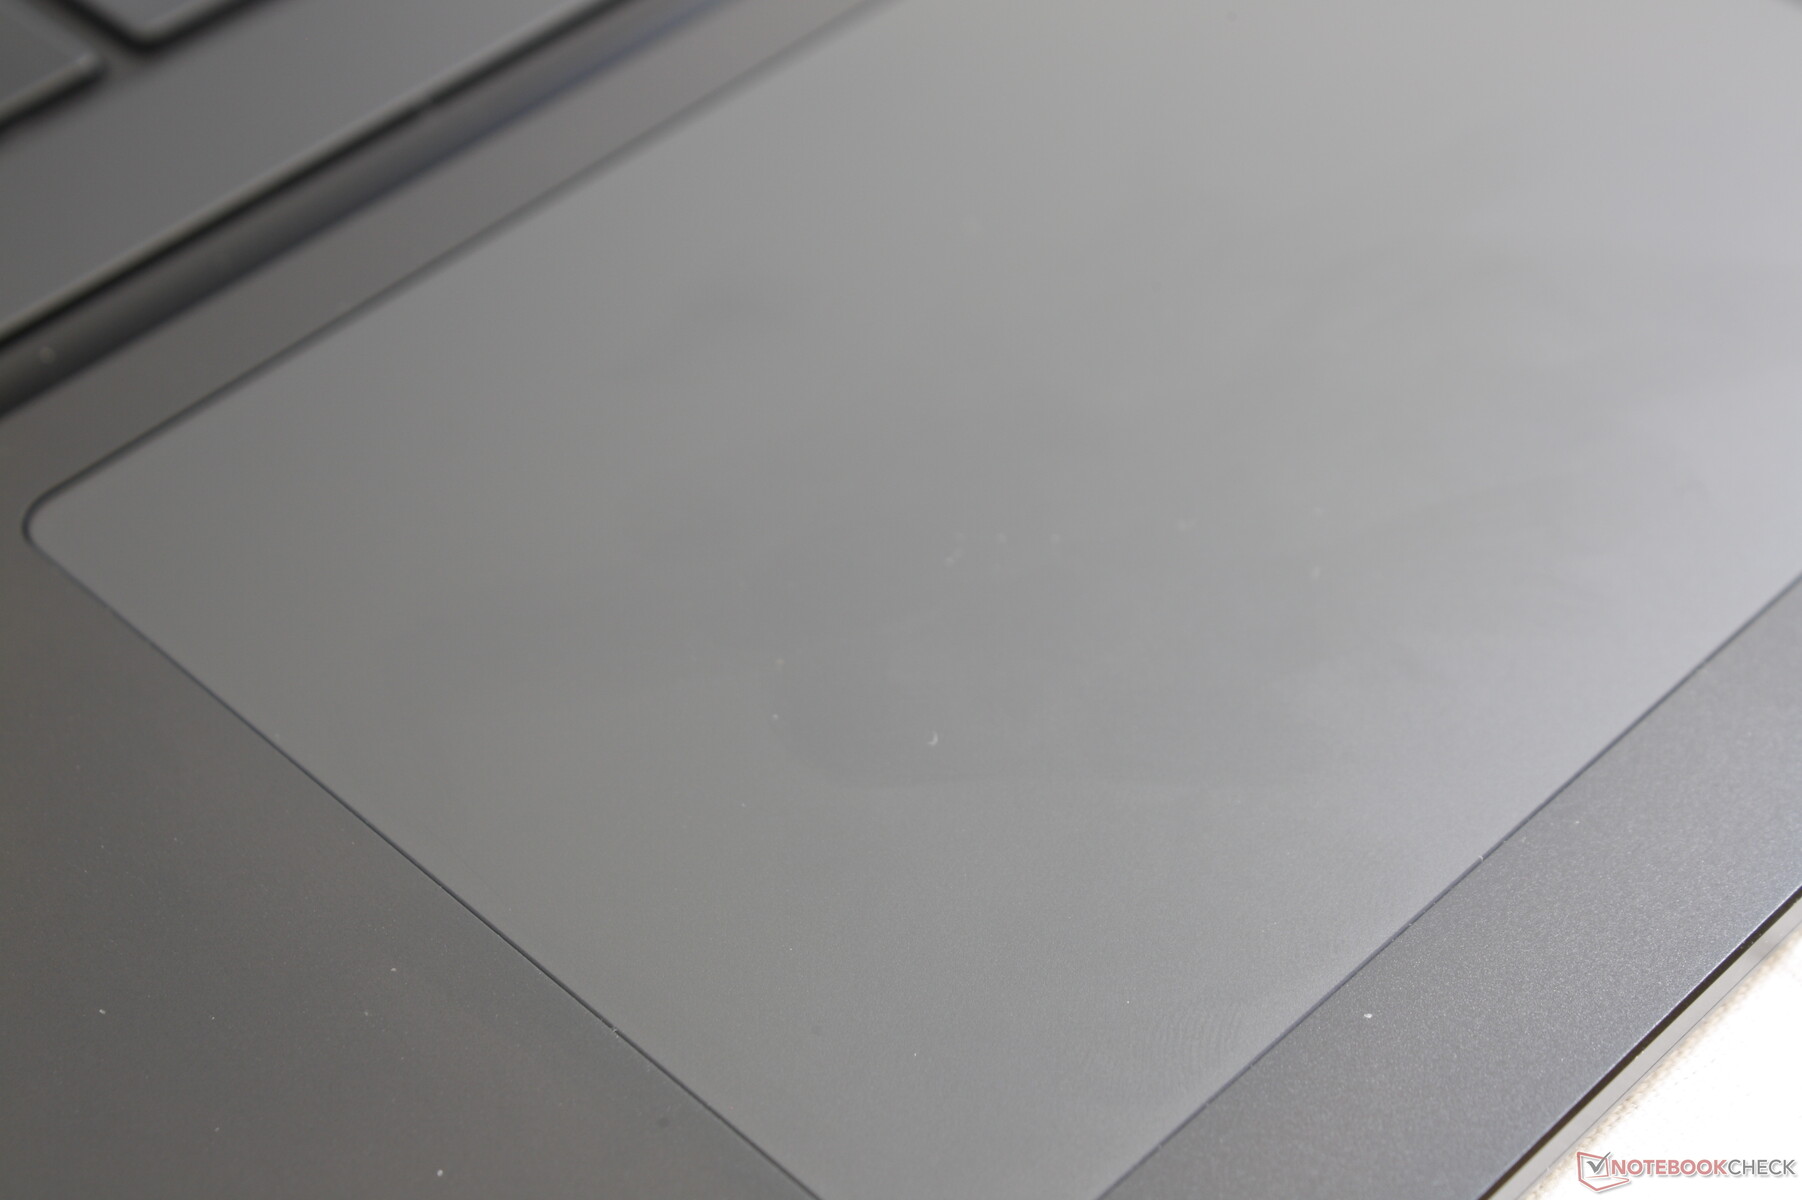
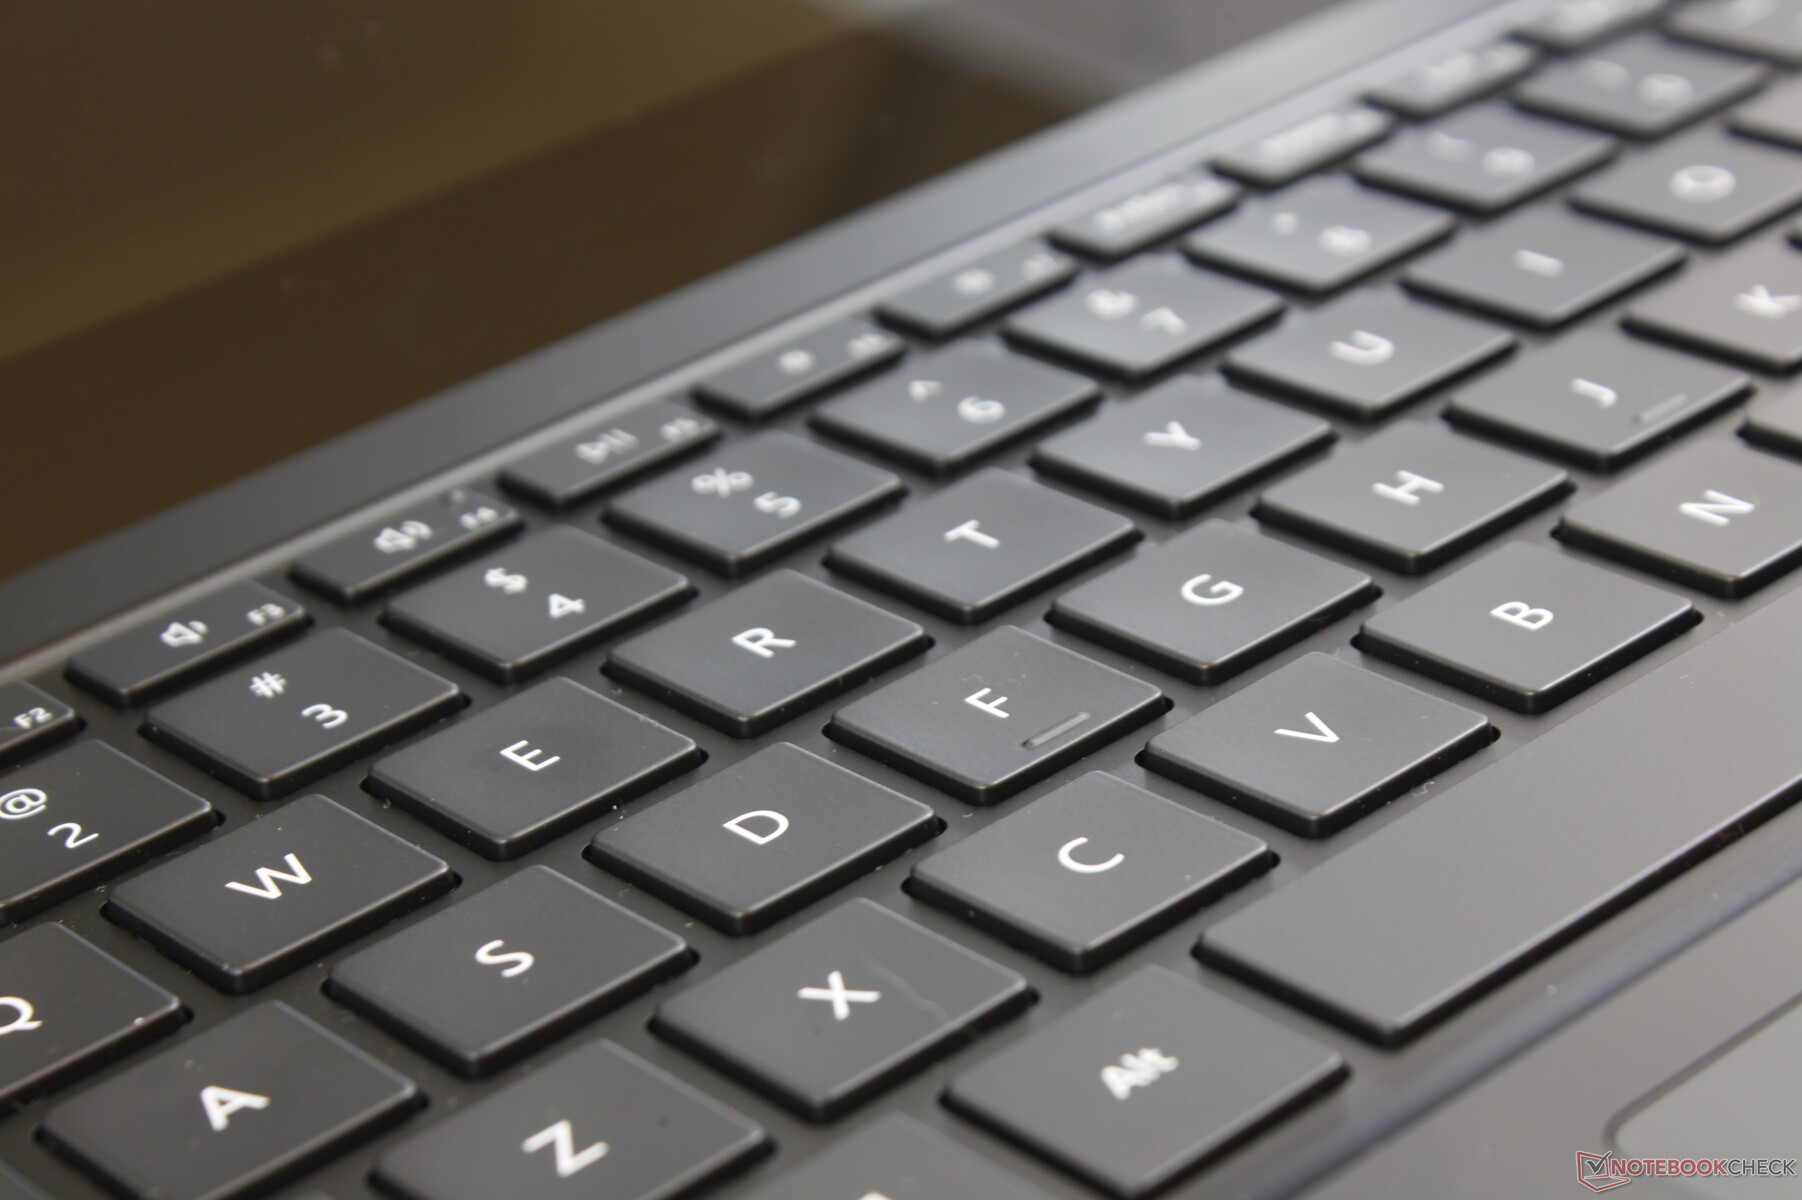
Klavye ve Dokunmatik Yüzey Klavye ve tıklatma paneli, 15 inçlik daha büyük Surface Dizüstü Bilgisayar 3 ile aynıdır 15. Tuşların ve tıklatma alanı yüzeyinin (~ 11,5 x 7,6 cm) boyutu bile aralarında aynıdır. Bu nedenle, Surface Laptop 3 15'teki giriş aygıtları hakkındaki mevcut yorumlarımız, tatmin edici geri bildirim, orta derecede ses ve sıkışık Ok tuşları da dahil olmak üzere 13.5 inçlik model için geçerlidir. HP Spectre veya Lenovo ThinkPad T serisinde yazma deneyimini daha sıkı ve daha derin geri bildirimlerle buluyoruz.
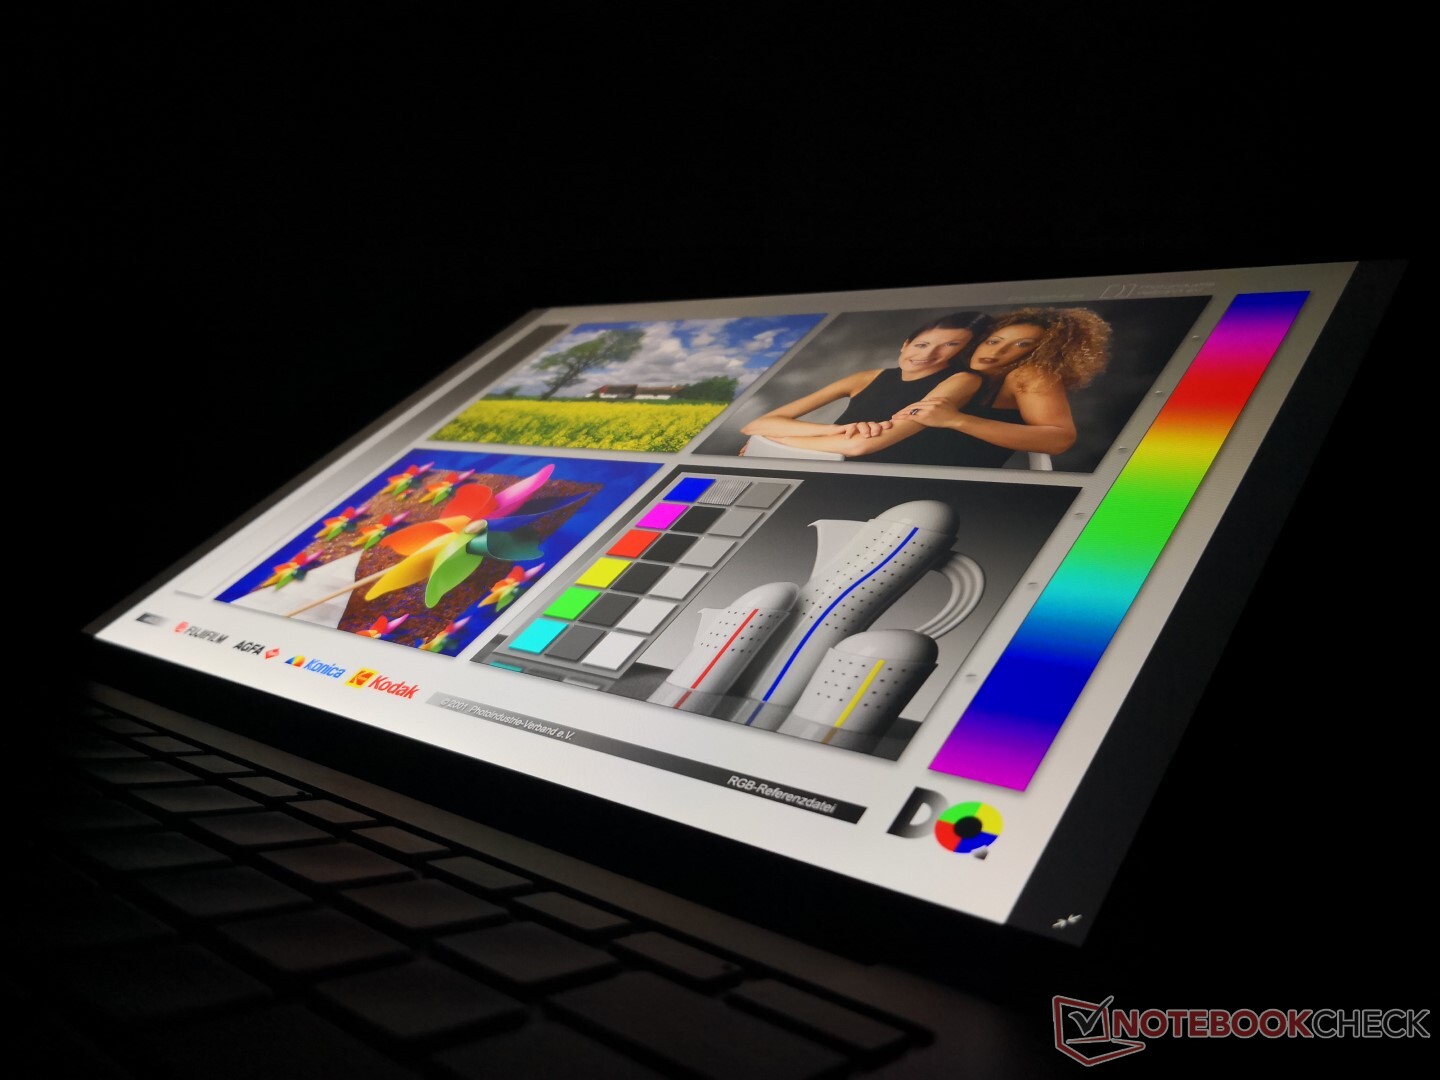
Görüntüle
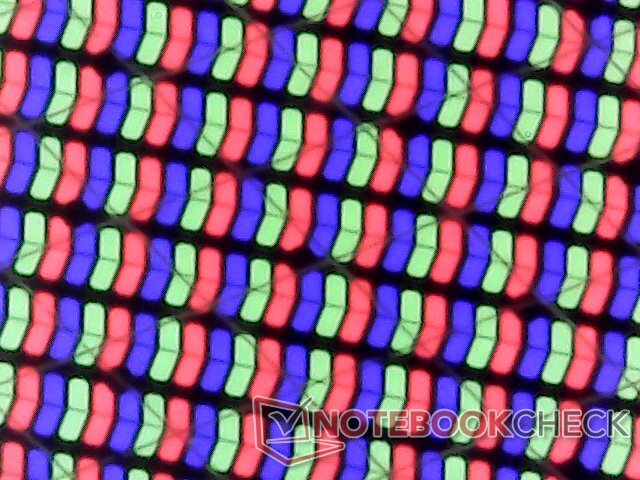
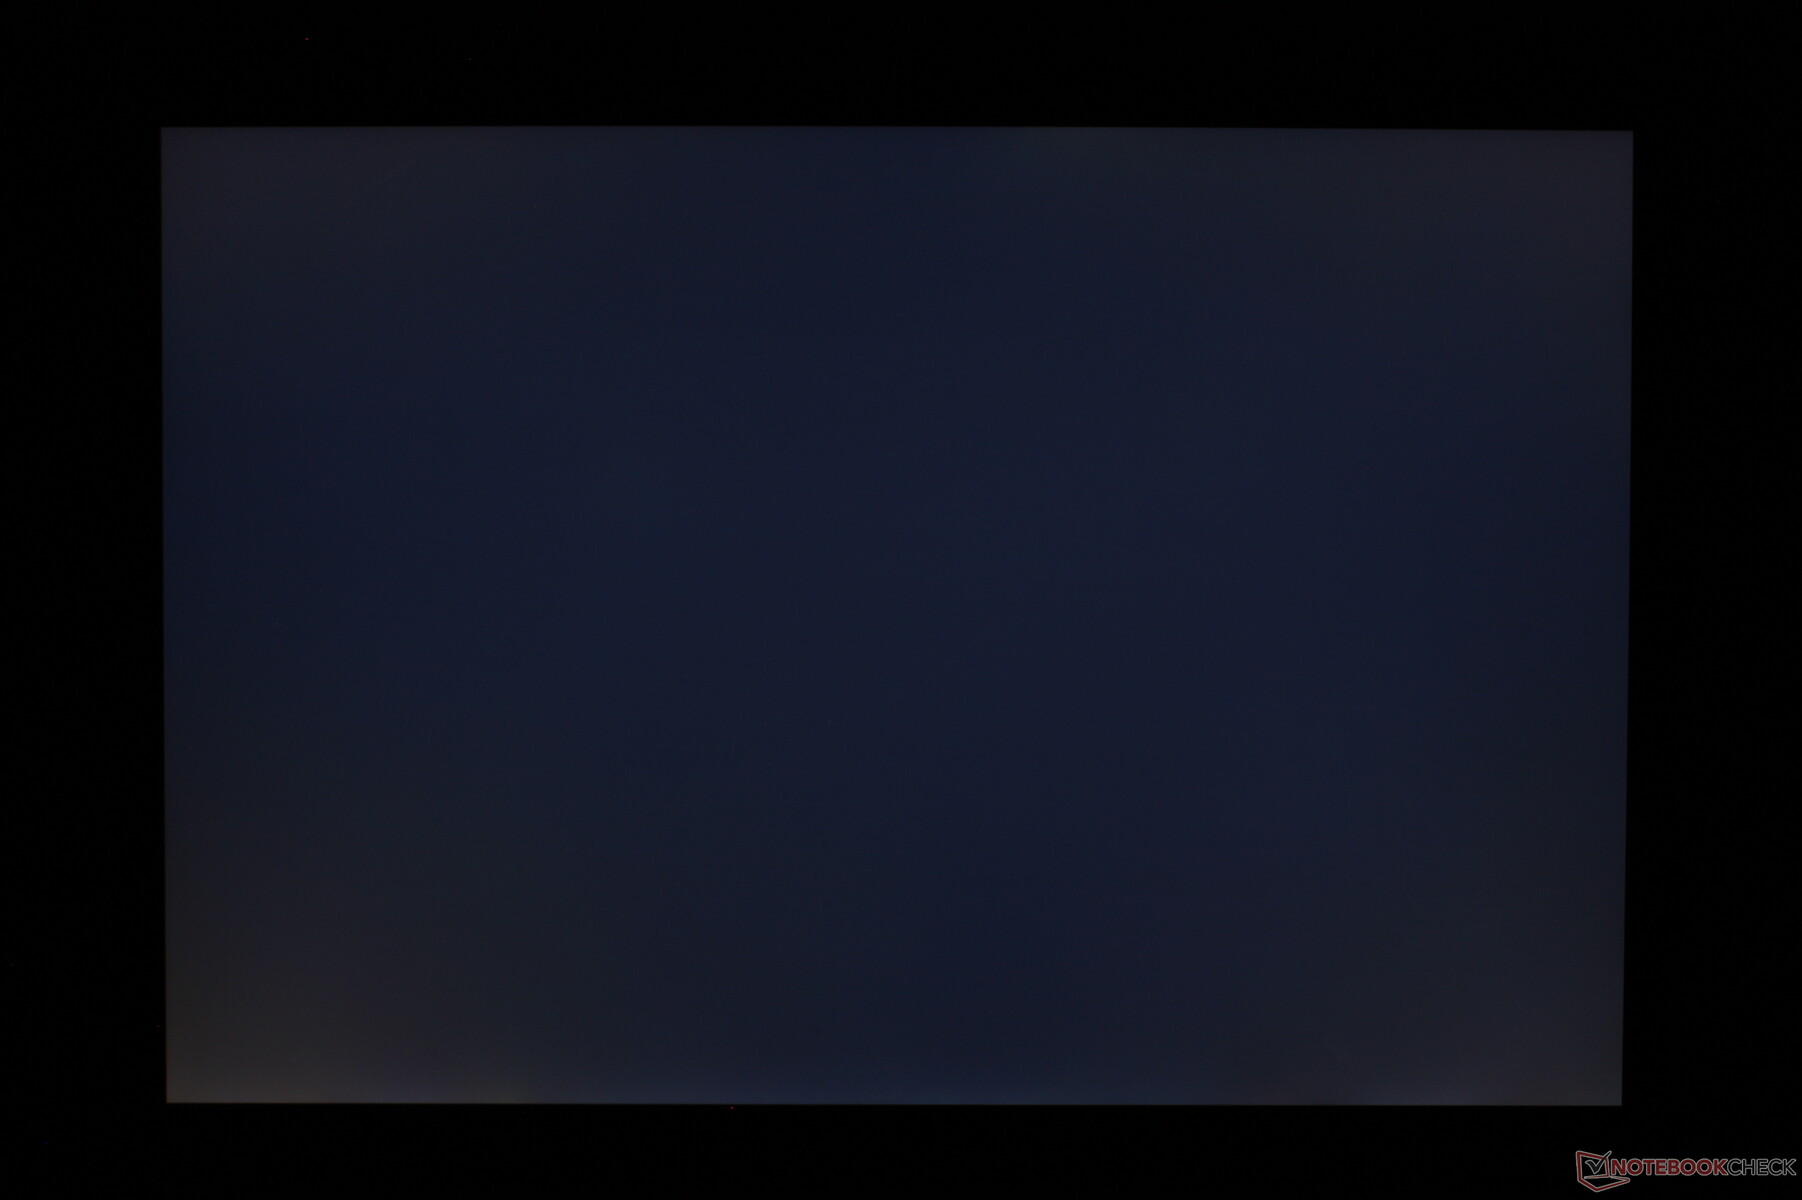
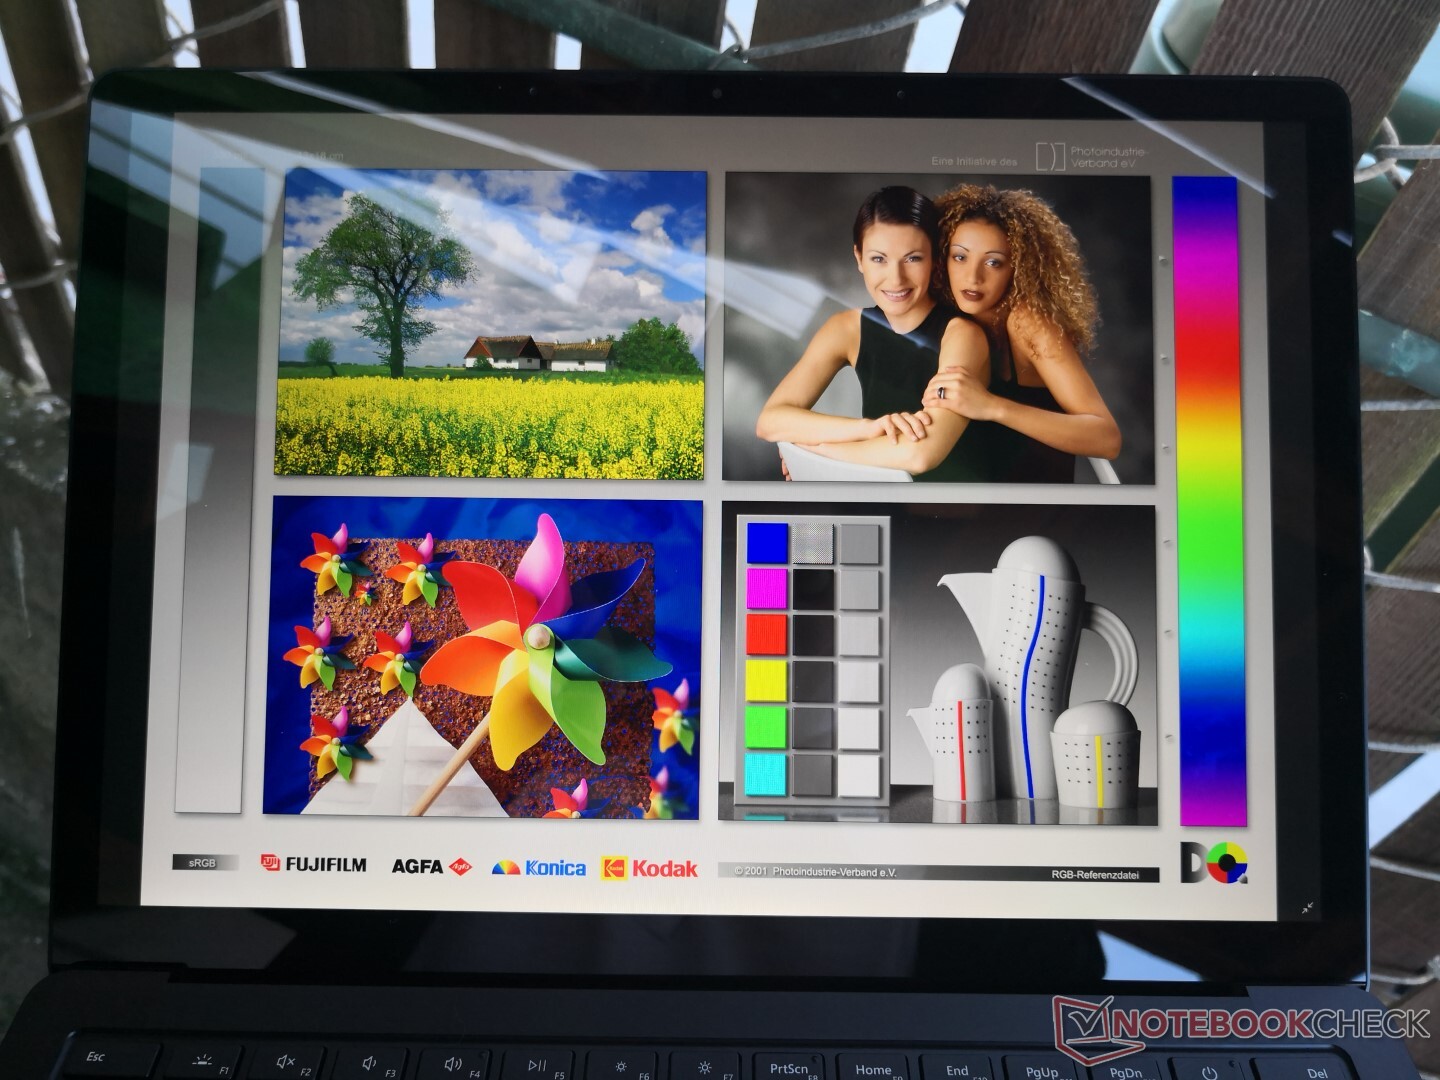
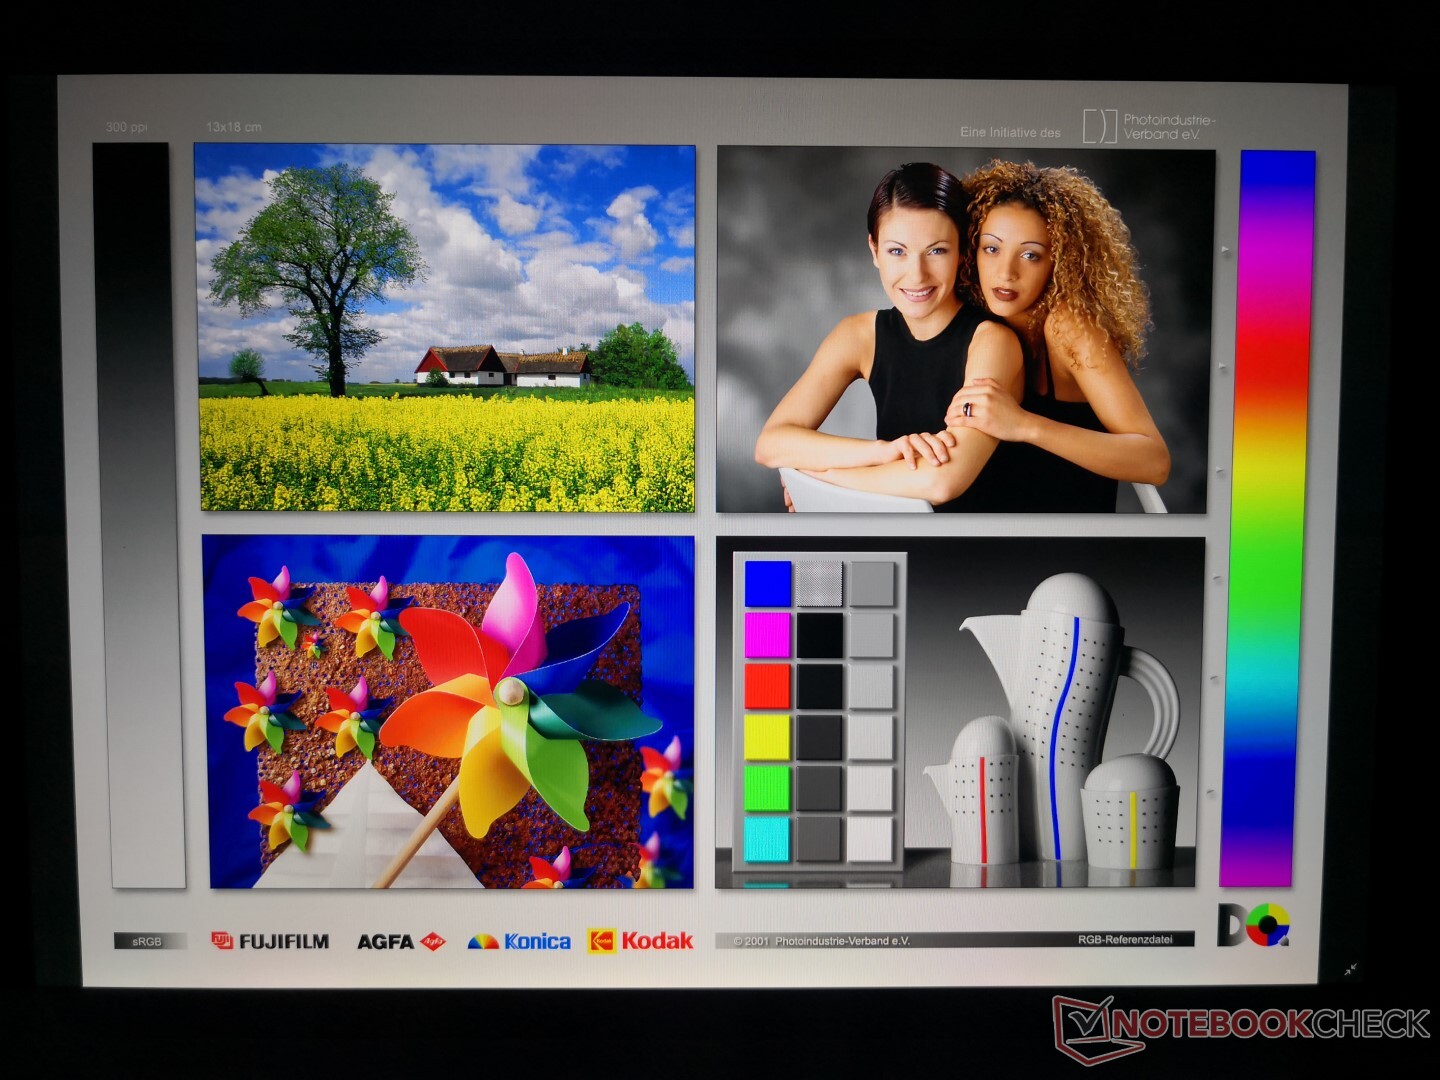
Microsoft, görünüşe göre en yeni Surface Dizüstü Bilgisayarı için panel sağlayıcılarını değiştirdi. Surface Laptop 2 bir Panasonic VVX14T092N00 panel ile birlikte gelirken, Surface Laptop 3 ürünümüzde bunun yerine Sharp LQ135P1JX51 kullanılmaktadır. Keskinlik süreleri Sharp panelinde biraz daha hızlıdır, ancak parlaklık ve gamut söz konusu olduğunda her iki ekran da neredeyse aynıdır. Netlik ve genel görsel kalite, XPS 13, Yoga C940, Spectre 13 veya ZenBook S13 gibi amiral gemisi Ultrabook'lara rakiptir. Nitpick olacaksak, ekran yanıt süreleri hala yavaştır, yani gölgelenme fark edilir. Hem darbe genişliği modülasyonu hem de hafif düzensiz arka ışık kanaması da mevcuttur. MacBook Pro 13, XPS 13 2'si 1 arada, Samsung Notebook 9 ve HP EliteBook x360 1040 dahil daha iyi dış mekan görünürlüğü için bir dizi alternatif daha parlak ekranlara sahiptir.

| |||||||||||||||||||||||||
Aydınlatma: 89 %
Batarya modunda parlaklık: 403.4 cd/m²
Kontrast: 1186:1 (Siyah: 0.34 cd/m²)
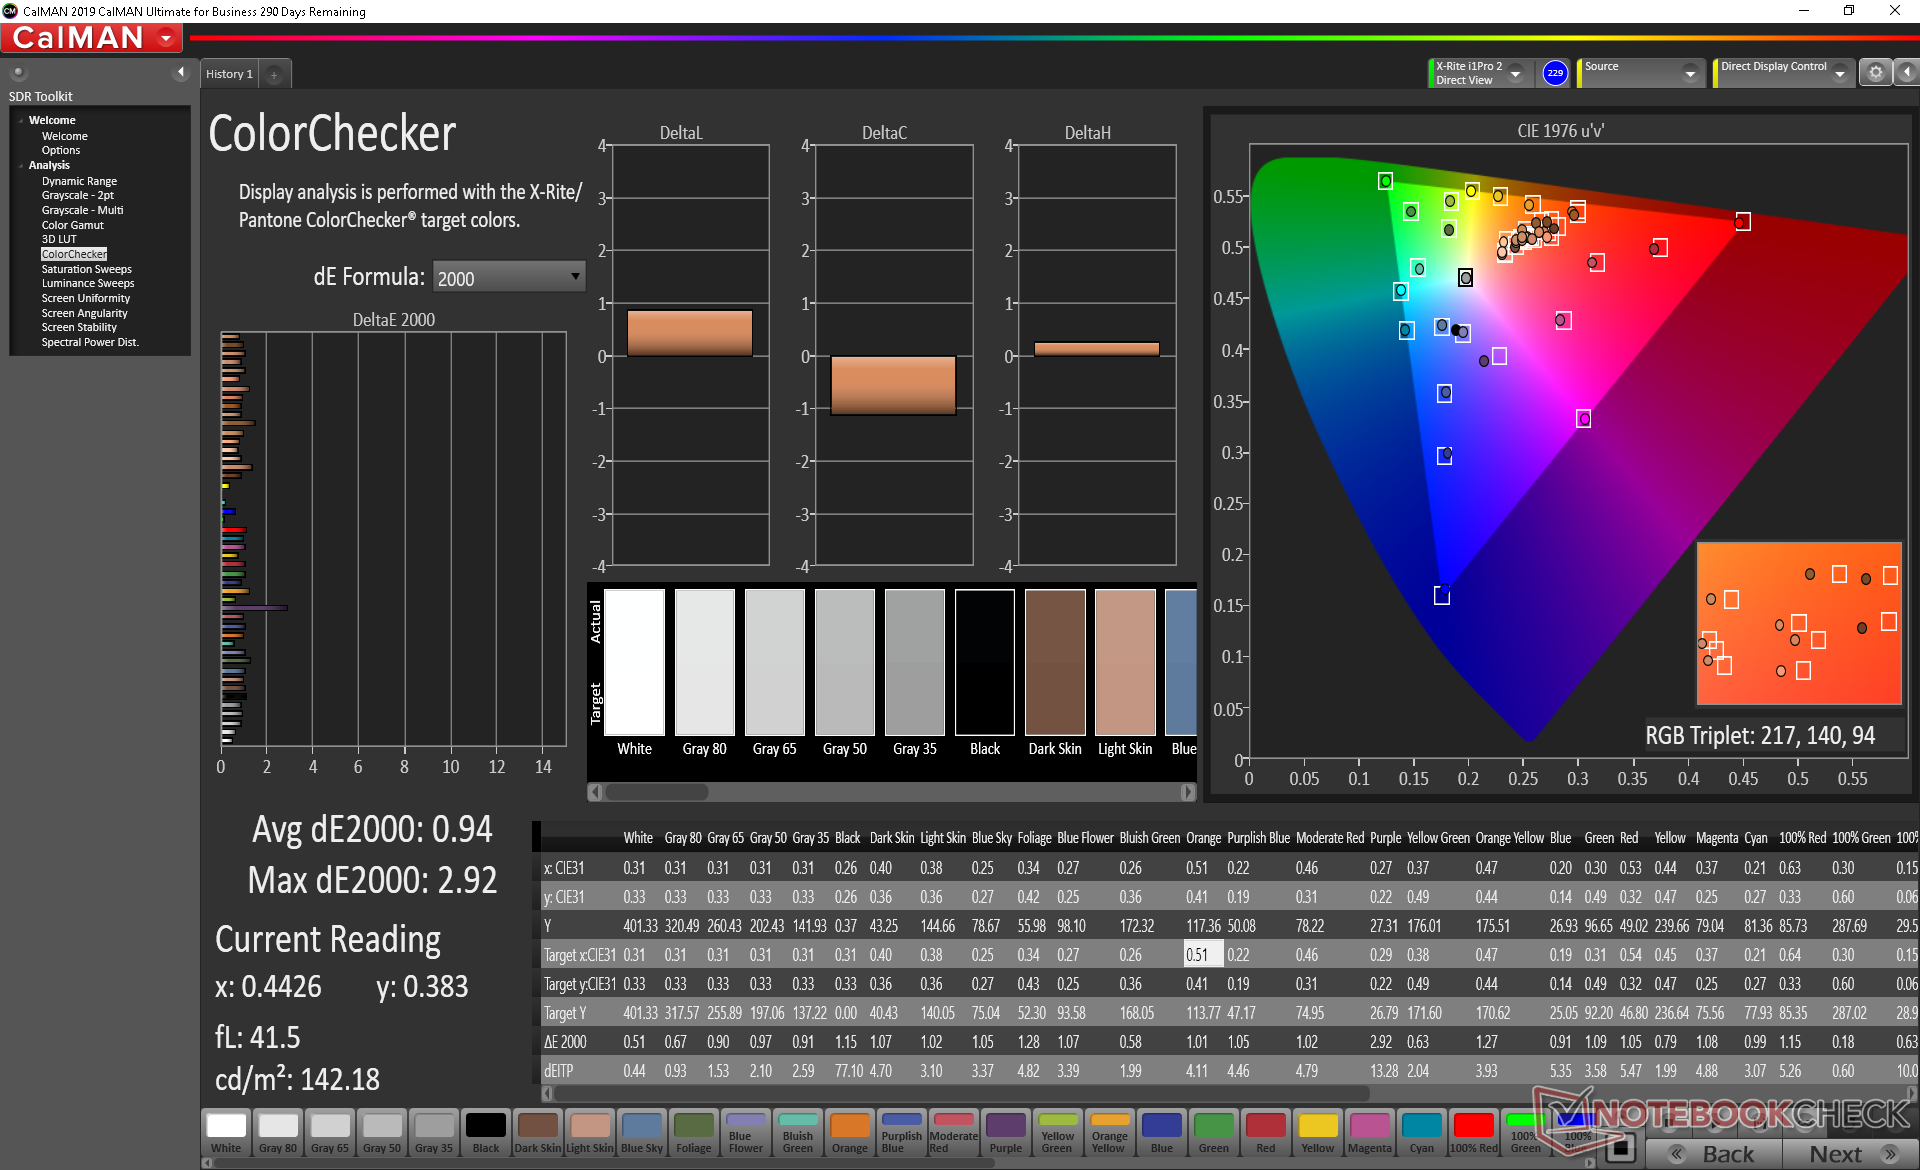
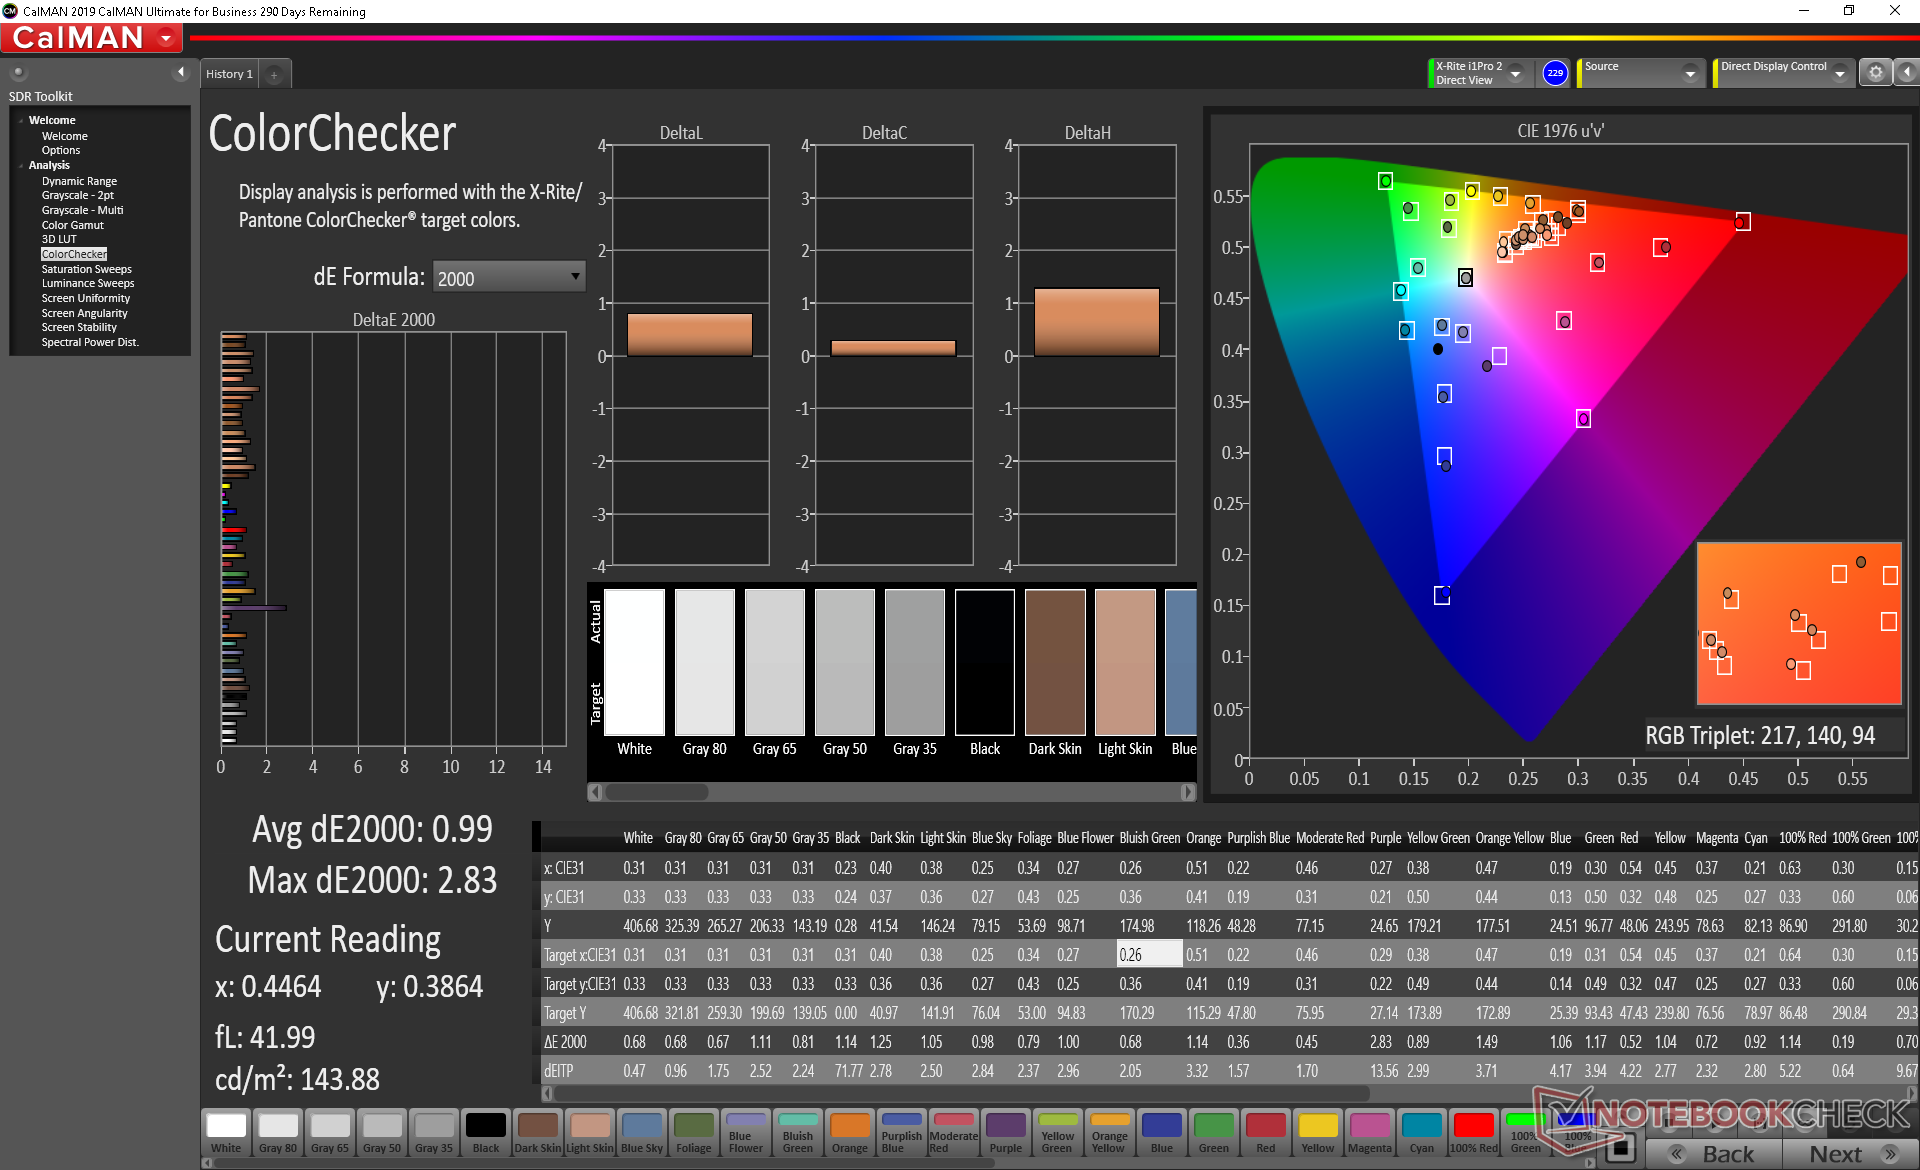
ΔE ColorChecker Calman: 0.94 | ∀{0.5-29.43 Ø4.72}
calibrated: 0.99
ΔE Greyscale Calman: 0.9 | ∀{0.09-98 Ø4.97}
98.7% sRGB (Argyll 1.6.3 3D)
62.3% AdobeRGB 1998 (Argyll 1.6.3 3D)
67.8% AdobeRGB 1998 (Argyll 3D)
98.6% sRGB (Argyll 3D)
65.7% Display P3 (Argyll 3D)
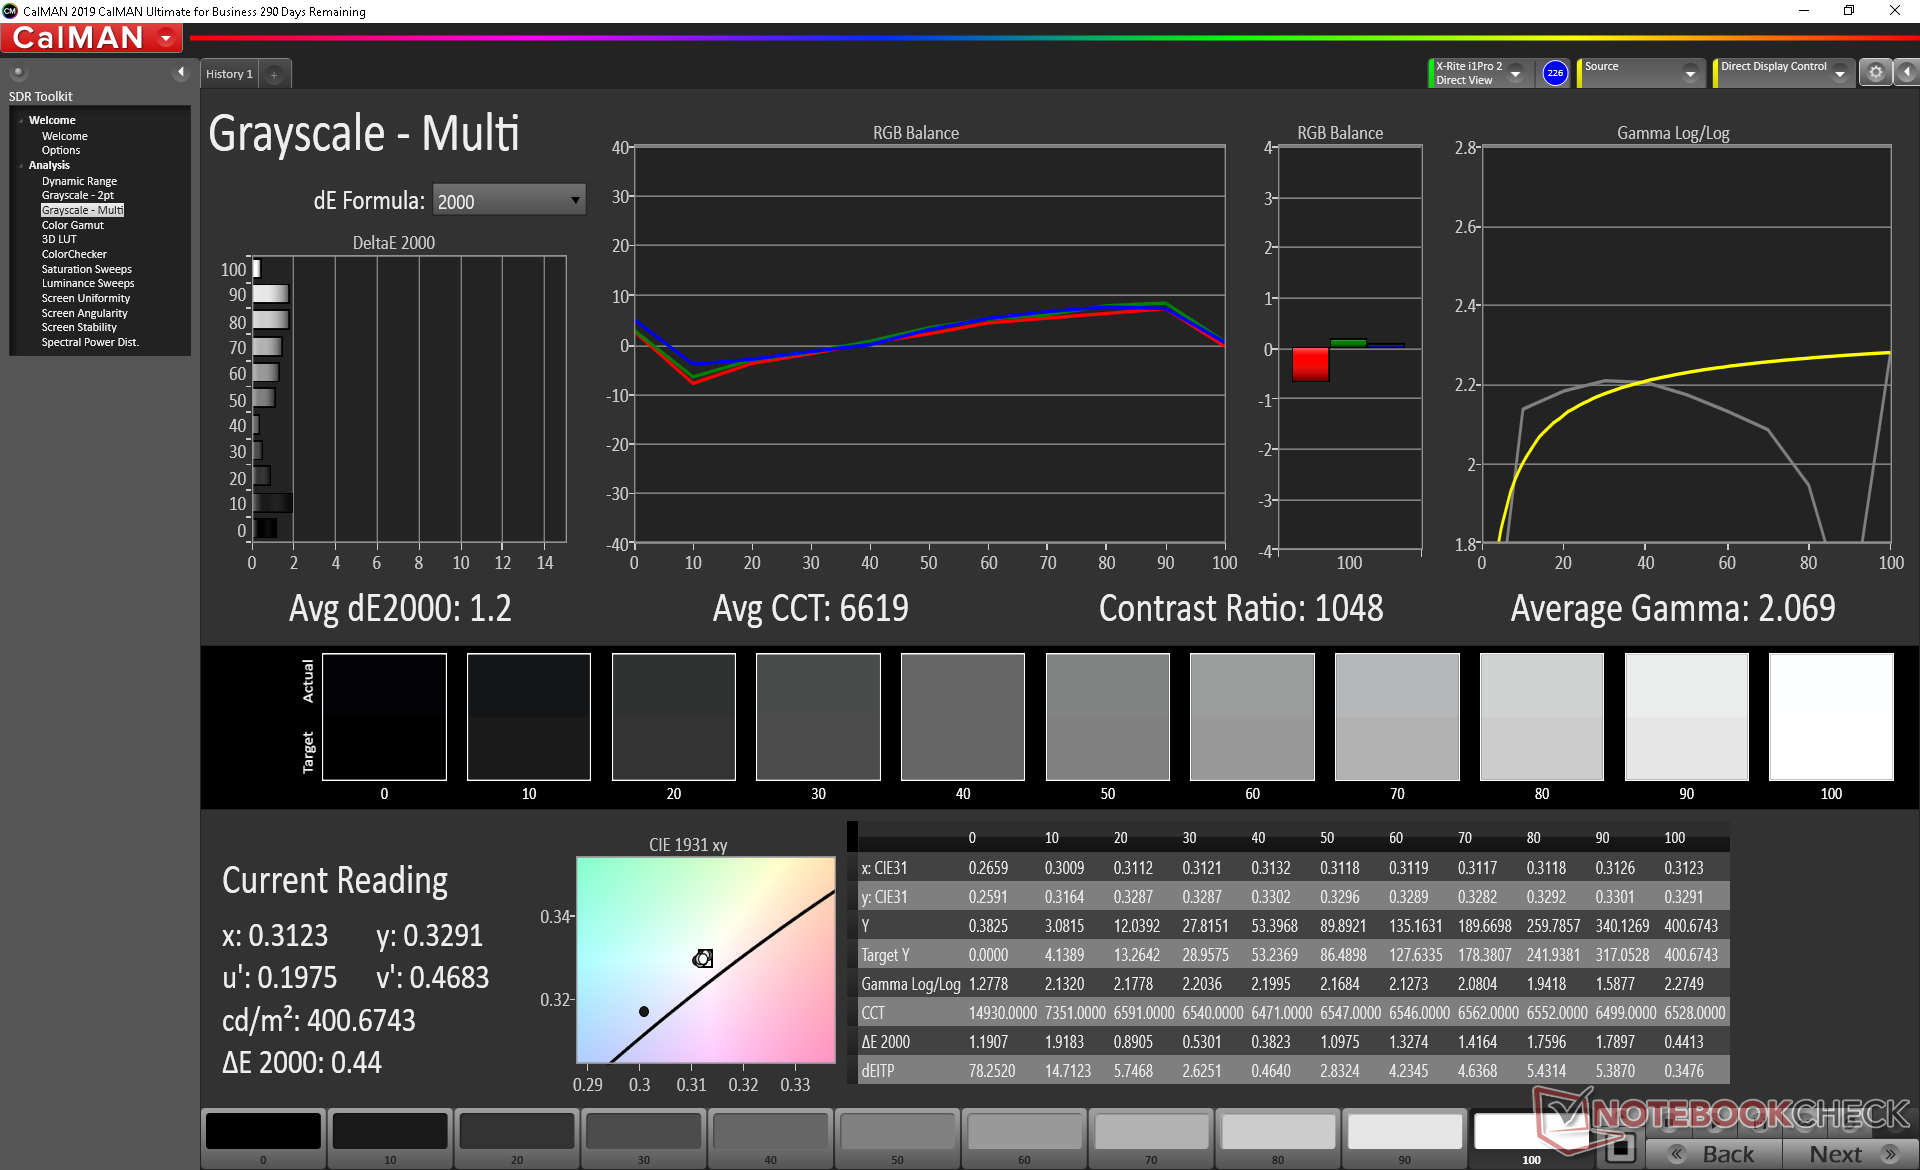
Gamma: 2.13
CCT: 6620 K
| Microsoft Surface Laptop 3 13 Core i5-1035G7 Sharp LQ135P1JX51, IPS, 13.5", 2256x1504 | Apple MacBook Pro 13 2019 2TB3 APPA03D, IPS, 13.3", 2560x1600 | Huawei Matebook X Pro i5 Tianma XM, IPS, 13.9", 3000x2000 | Microsoft Surface Laptop 2-LQN-00004 VVX14T092N00, IPS, 13.5", 2256x1504 | Dell XPS 13 7390 2-in-1 Core i7 Sharp LQ134N1, IPS, 13.4", 1920x1200 | Lenovo ThinkPad X1 Carbon 2019-20QE000VGE LP140QH2-SPD1, IPS, 14", 2560x1440 | |
|---|---|---|---|---|---|---|
| Display | 24% | -1% | 1% | 4% | 6% | |
| Display P3 Coverage (%) | 65.7 | 96.1 46% | 65.9 0% | 68 4% | 69.9 6% | 72.5 10% |
| sRGB Coverage (%) | 98.6 | 99.4 1% | 95.2 -3% | 94.7 -4% | 99.2 1% | 97.8 -1% |
| AdobeRGB 1998 Coverage (%) | 67.8 | 85.6 26% | 67.6 0% | 69.2 2% | 71.5 5% | 73.8 9% |
| Response Times | 15% | 35% | -15% | 25% | 43% | |
| Response Time Grey 50% / Grey 80% * (ms) | 59.2 ? | 50.4 ? 15% | 40.4 ? 32% | 69.2 ? -17% | 47.6 ? 20% | 33.6 ? 43% |
| Response Time Black / White * (ms) | 41.6 ? | 35.2 ? 15% | 25.6 ? 38% | 46.4 ? -12% | 29.2 ? 30% | 24 ? 42% |
| PWM Frequency (Hz) | 21740 ? | 116300 ? | 2500 ? | |||
| Screen | -3% | -113% | -67% | -28% | -113% | |
| Brightness middle (cd/m²) | 403.4 | 603 49% | 442.7 10% | 392 -3% | 549.8 36% | 338 -16% |
| Brightness (cd/m²) | 397 | 577 45% | 428 8% | 390 -2% | 520 31% | 315 -21% |
| Brightness Distribution (%) | 89 | 92 3% | 84 -6% | 89 0% | 86 -3% | 88 -1% |
| Black Level * (cd/m²) | 0.34 | 0.35 -3% | 0.31 9% | 0.24 29% | 0.39 -15% | 0.43 -26% |
| Contrast (:1) | 1186 | 1723 45% | 1428 20% | 1633 38% | 1410 19% | 786 -34% |
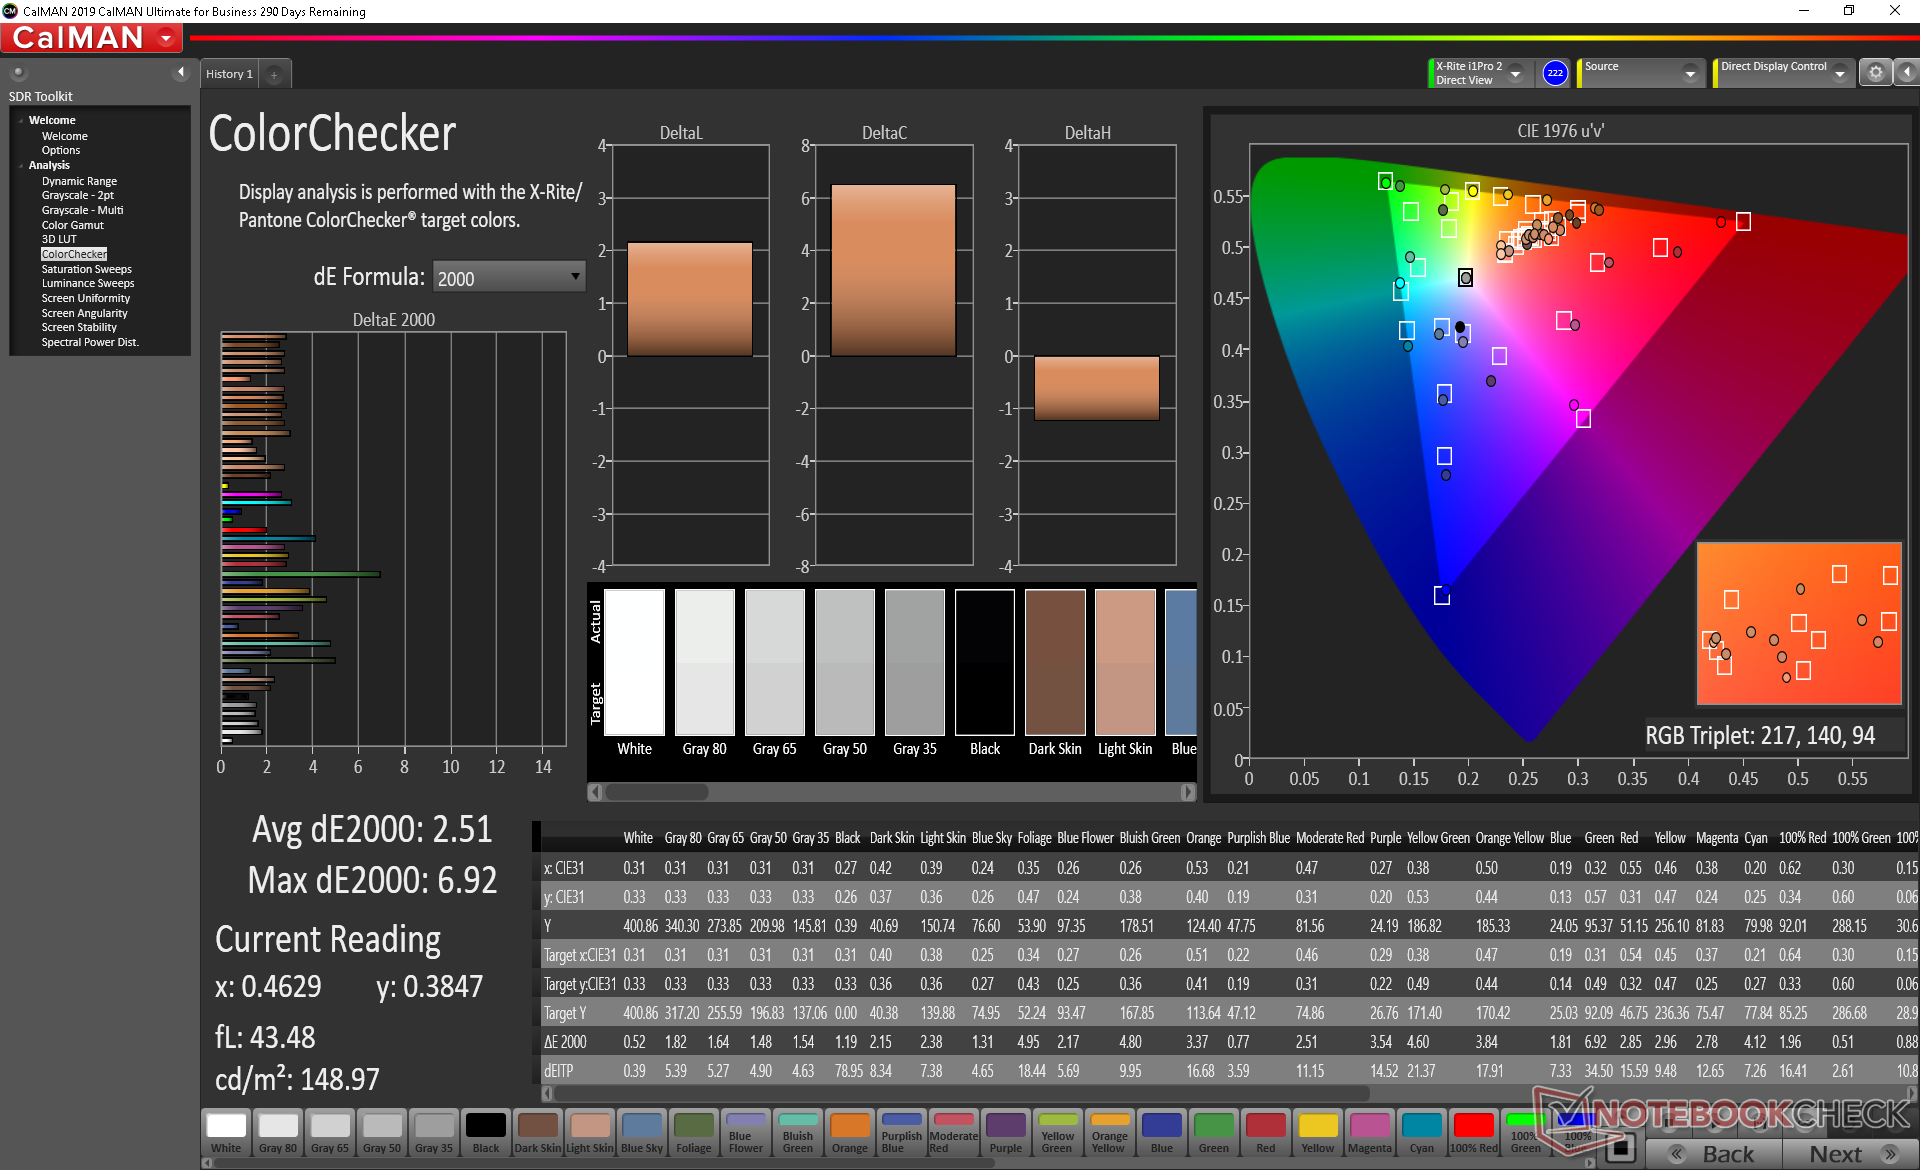
| Colorchecker dE 2000 * | 0.94 | 1.7 -81% | 2.24 -138% | 3.2 -240% | 2.12 -126% | 4 -326% |
| Colorchecker dE 2000 max. * | 2.92 | 3.1 -6% | 7.19 -146% | 6.3 -116% | 3.66 -25% | 7.9 -171% |
| Colorchecker dE 2000 calibrated * | 0.99 | 0.7 29% | 1.11 -12% | 1.4 -41% | 1.37 -38% | 1.7 -72% |
| Greyscale dE 2000 * | 0.9 | 2.1 -133% | 9.7 -978% | 4.5 -400% | 2.6 -189% | 6.2 -589% |
| Gamma | 2.13 103% | 2.18 101% | 1.42 155% | 2.2 100% | 2.3 96% | 2.13 103% |
| CCT | 6620 98% | 6843 95% | 6227 104% | 7556 86% | 6884 94% | 6787 96% |
| Color Space (Percent of AdobeRGB 1998) (%) | 62.3 | 76.7 23% | 61.6 -1% | 63.9 3% | 65.4 5% | 68.1 9% |
| Color Space (Percent of sRGB) (%) | 98.7 | 99.4 1% | 95 -4% | 95 -4% | 99.7 1% | 97.8 -1% |
| Toplam Ortalama (Program / Ayarlar) | 12% /
5% | -26% /
-73% | -27% /
-48% | 0% /
-15% | -21% /
-72% |
* ... daha küçük daha iyidir
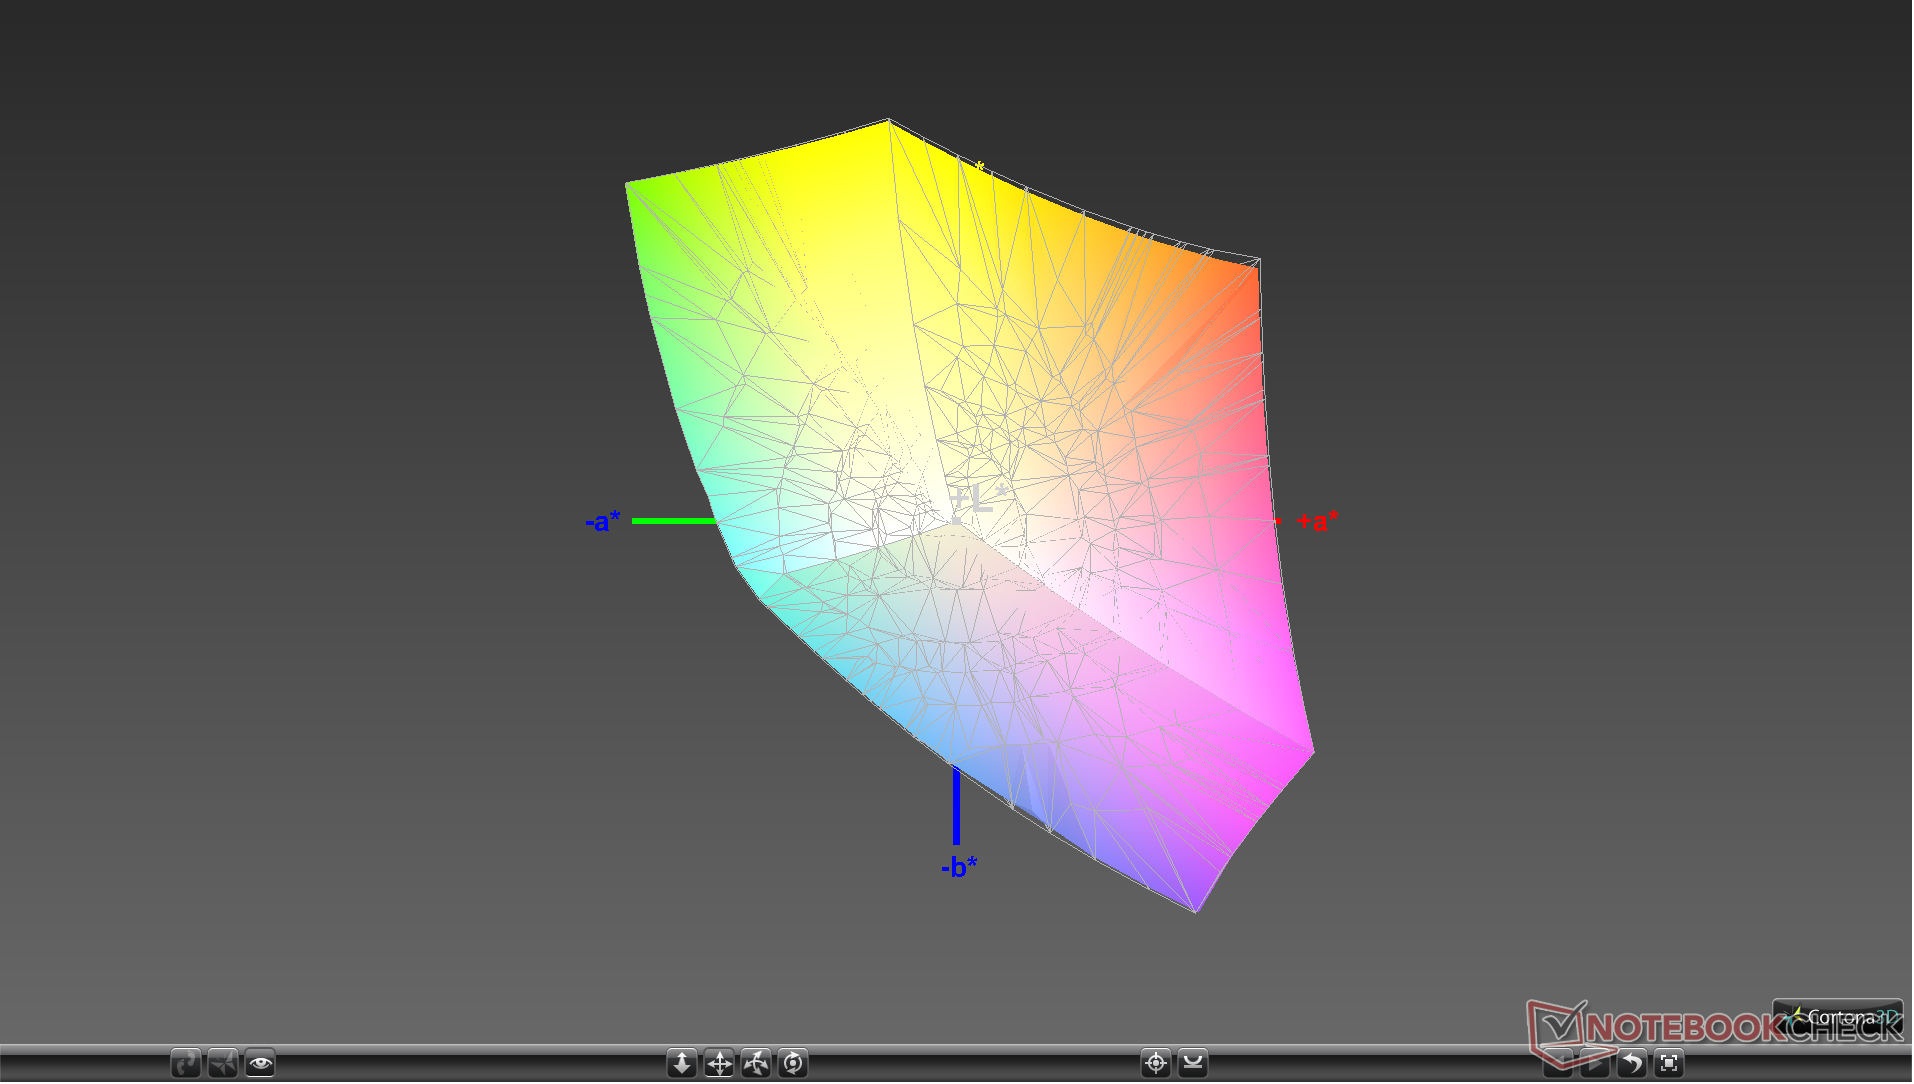
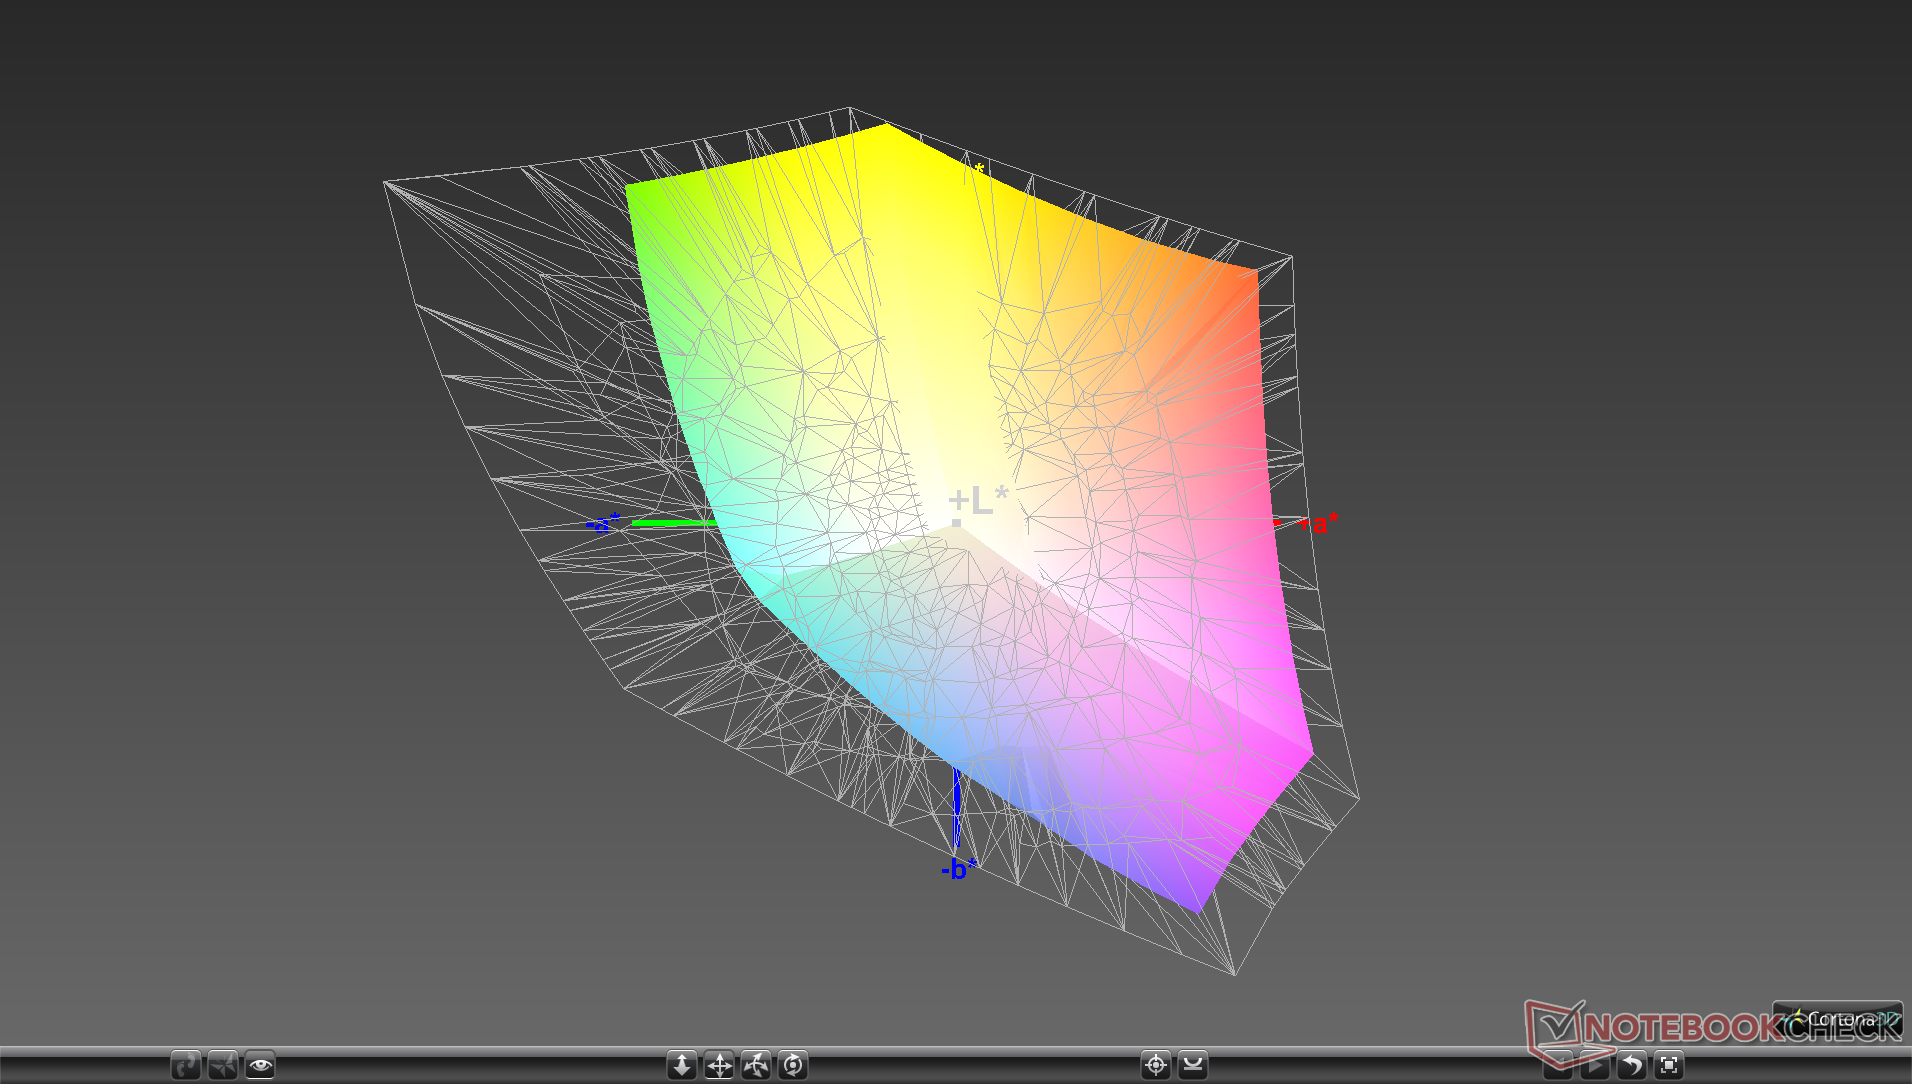
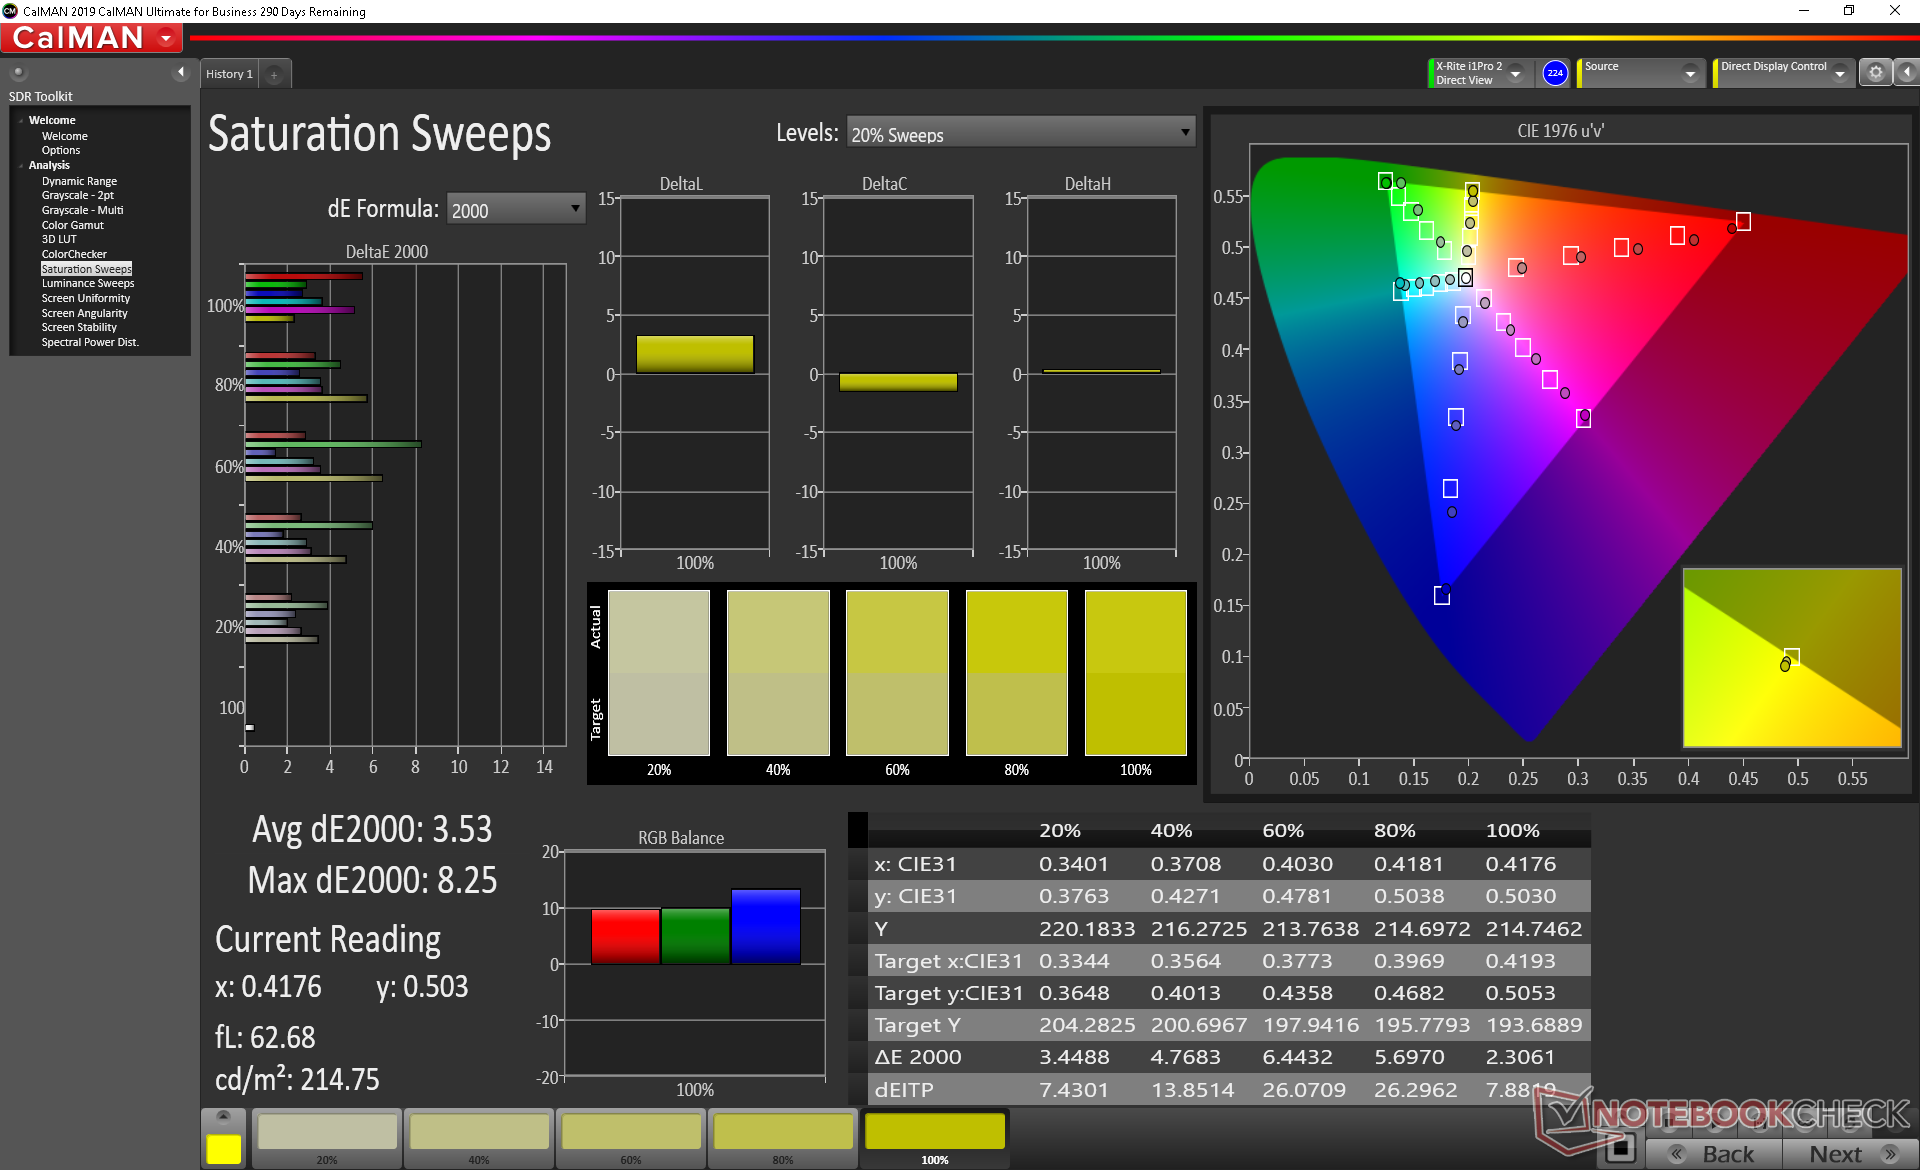
Renk alanı, Dell XPS 13 2'si 1 arada veya daha eski Surface Dizüstü Bilgisayar 2'den farklı olarak, sırasıyla yaklaşık yüzde 99 ve yüzde 62 oranında sRGB ve AdobeRGB'yi kapsıyor. MacBook Pro 13 veya Dell XPS 15 gibi OLED seçeneklerine sahip diğer dizüstü bilgisayarlar daha derin renkler sunabilir.
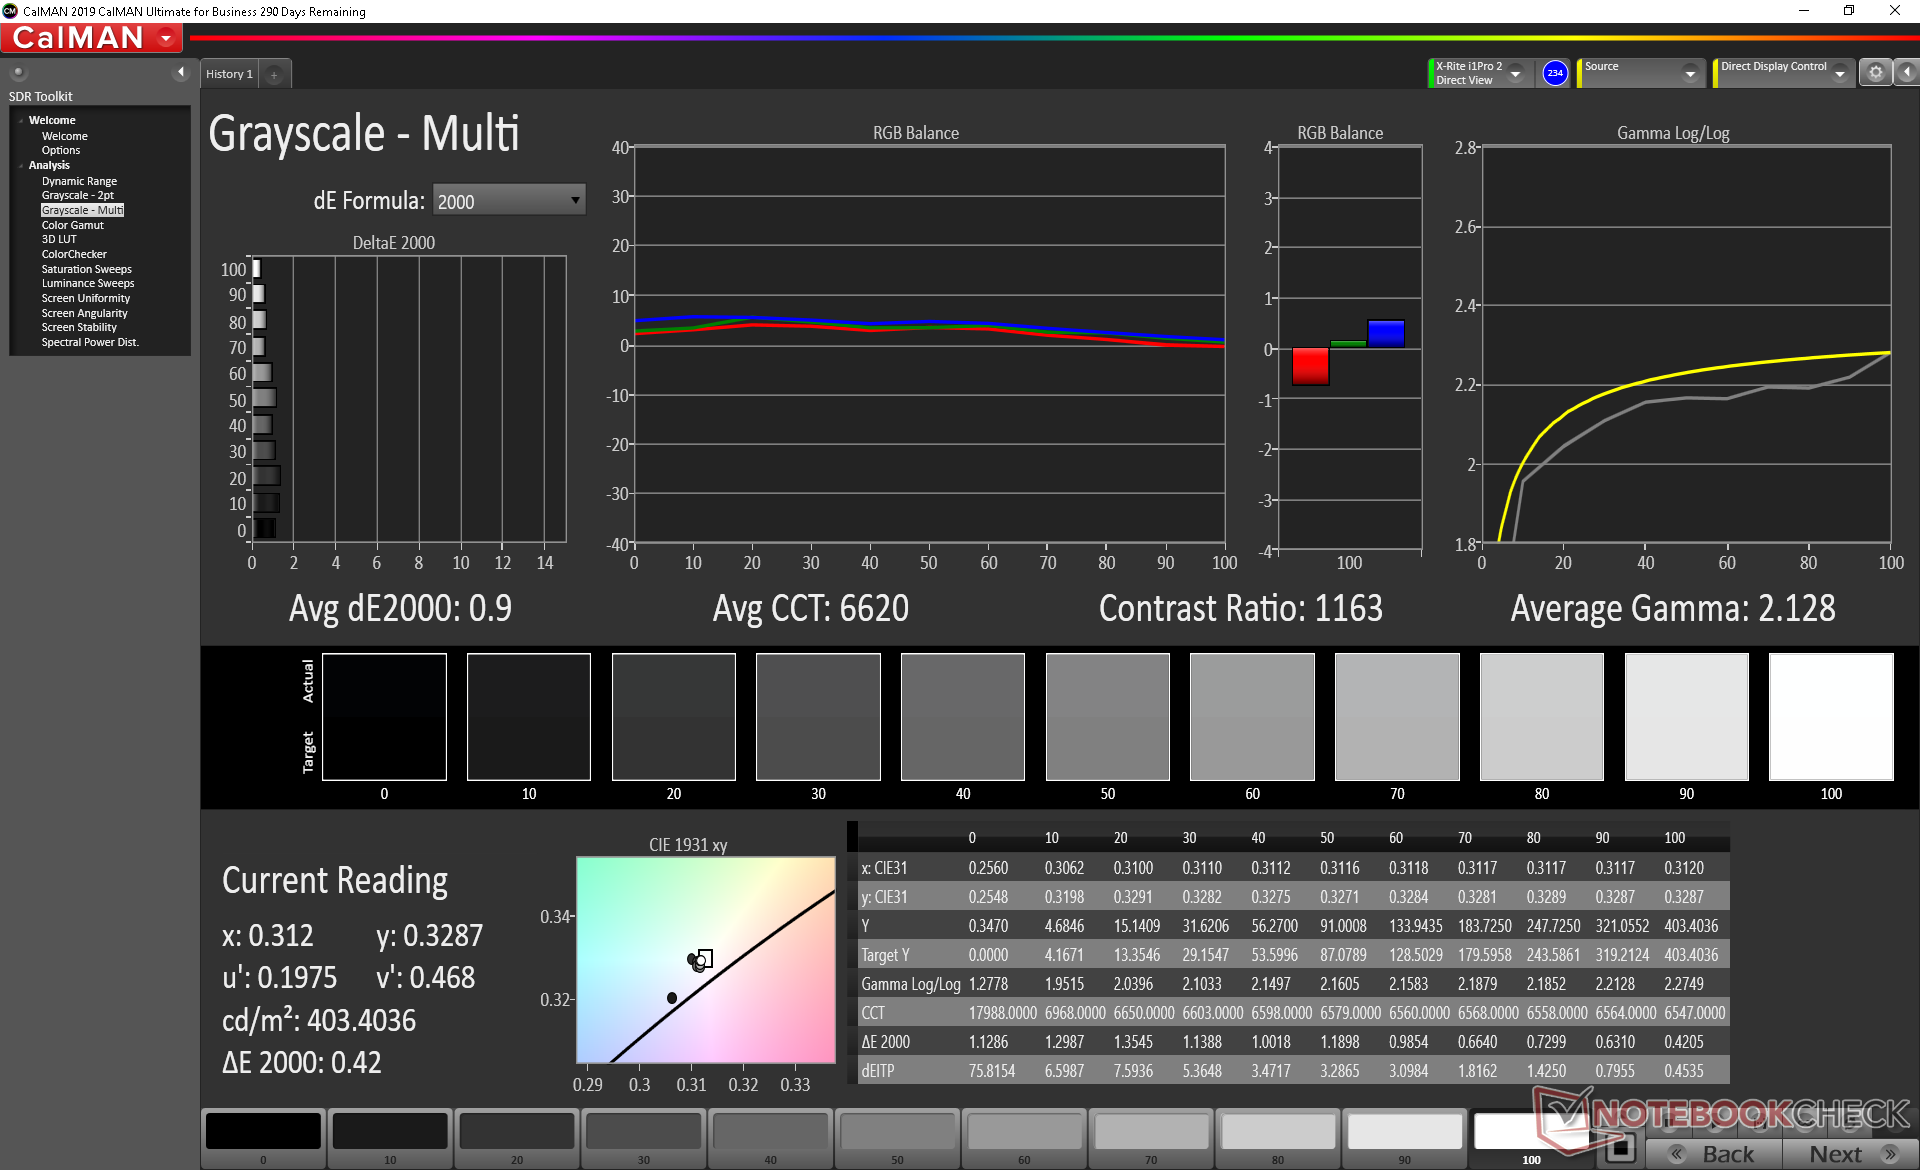
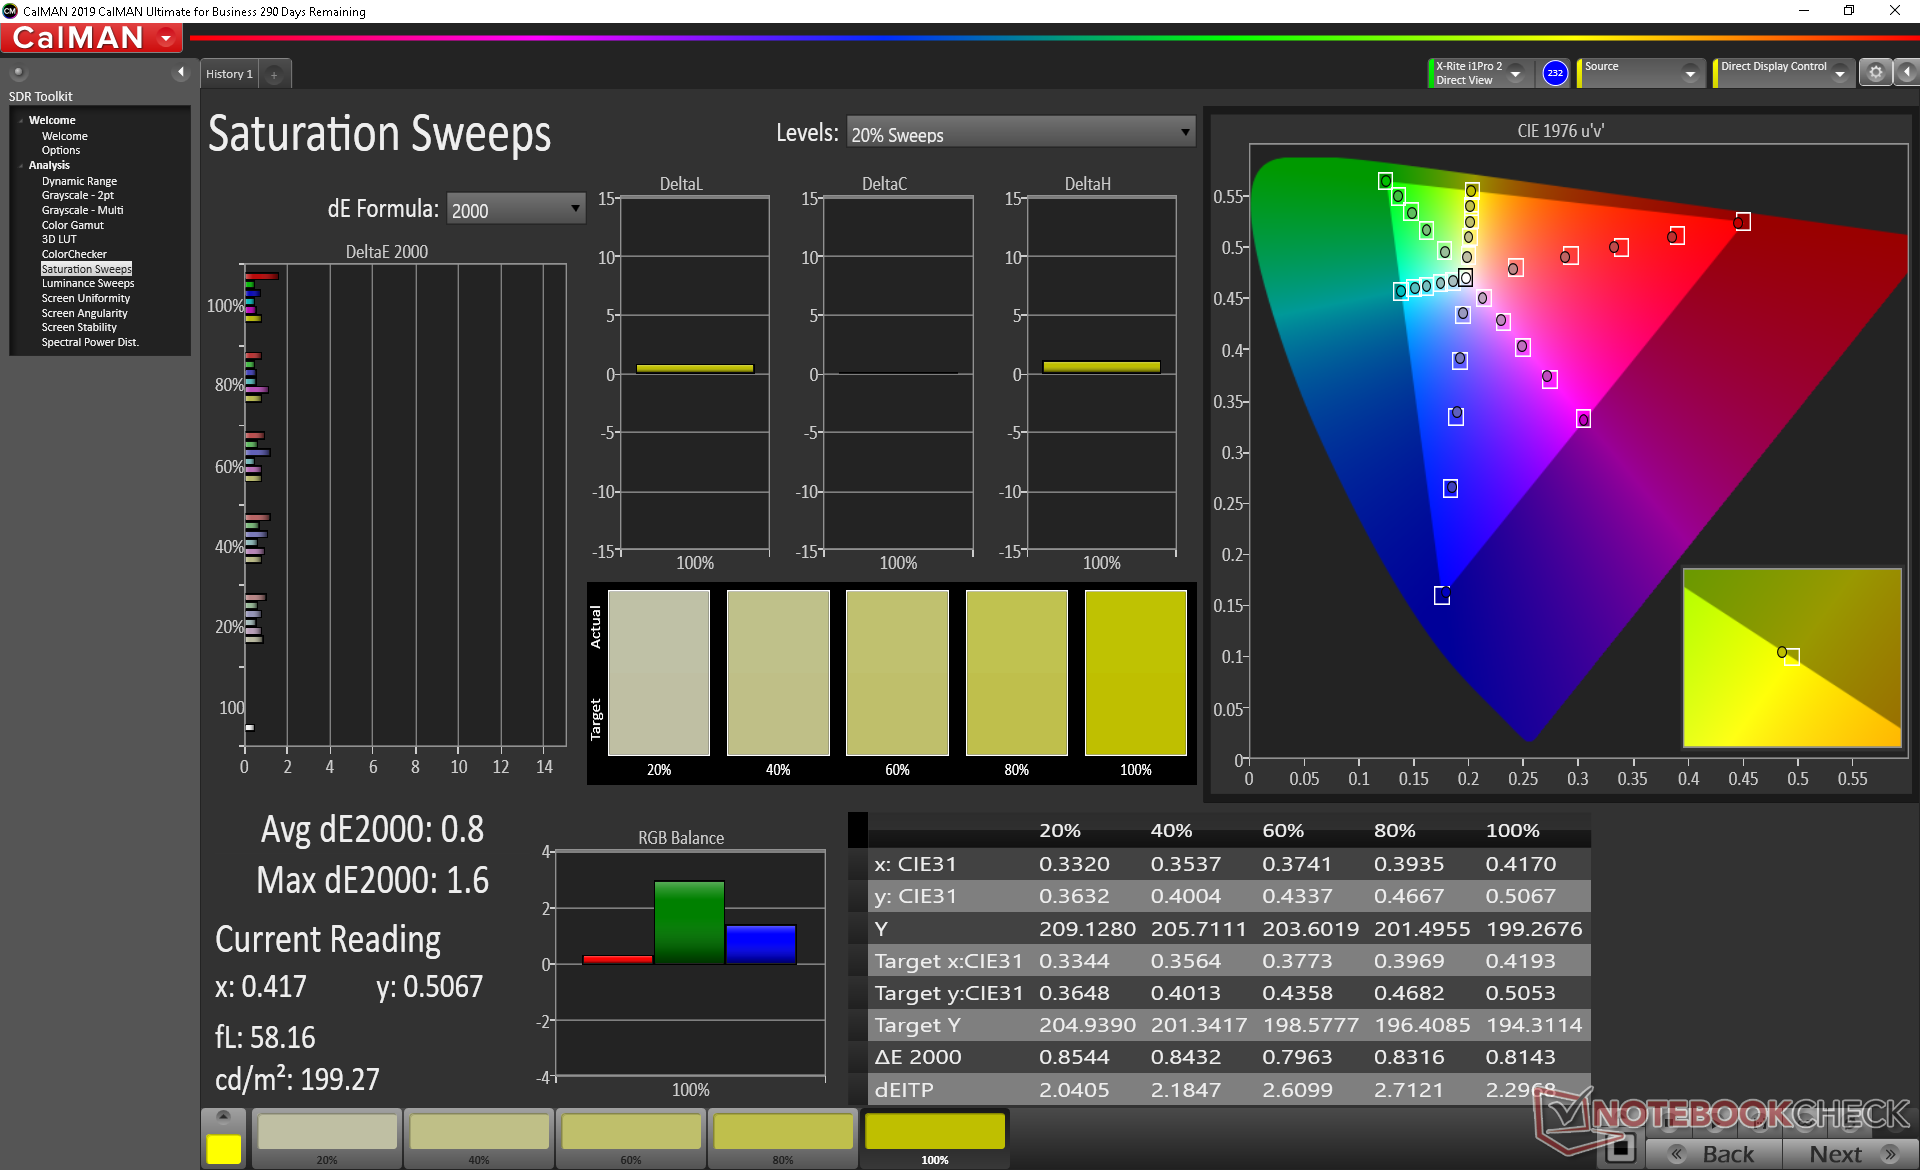
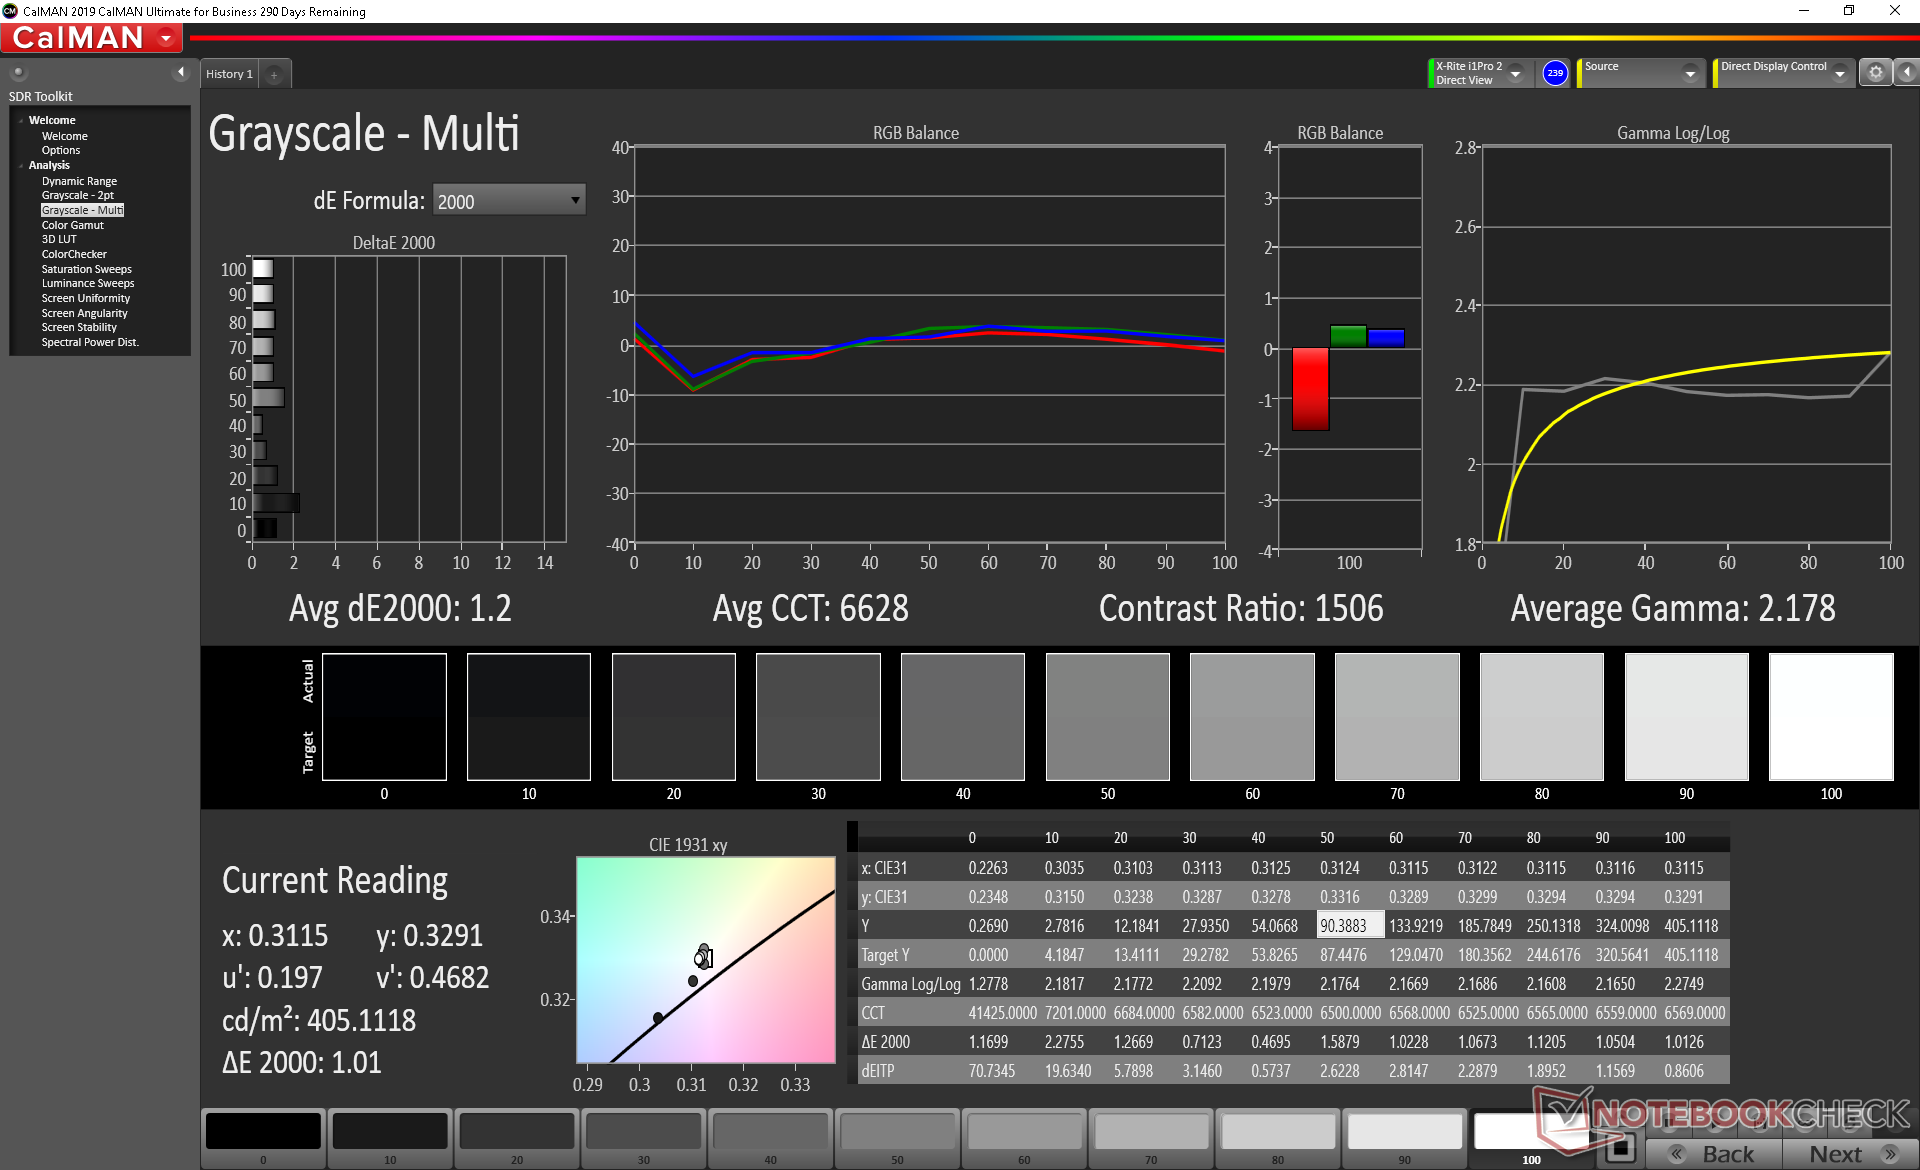
X-Rite kolorimetre ile yapılan diğer ölçümler, Surface Laptop 2'de keşfettiklerimizin aksine iyi kalibre edilmiş bir ekran ortaya koyuyor. Ortalama gri tonlama ve renk deltaE değerleri sırasıyla sadece 0,9 ve 0,8'de duruyor, bu nedenle son kullanıcı yok ekrandan en iyi şekilde yararlanmak için kalibrasyon gereklidir. Bu belki de ekran kalitesi açısından Surface Laptop 2'ye göre en büyük avantajdır. Paneli kendimiz daha da kalibre etmeye çalışmak önemli bir gelişme sağlamaz. 15 inç Surface Laptop 3'te olduğu gibi, 13.5 inç modelde standart sRGB'nin yanında "Geliştirilmiş" renk modu seçeneği bulunur. Bu mod, sRGB doğruluğu pahasına daha canlı video oynatımı ve görüntü izleme için renkleri doyuruyor gibi görünüyor. Mümkün olduğunda bunu bırakmanızı öneririz.

Yanıt Sürelerini Görüntüle
| ↔ Tepki Süresi Siyahtan Beyaza | ||
|---|---|---|
| 41.6 ms ... yükseliş ↗ ve sonbahar↘ birleşimi | ↗ 23.6 ms yükseliş | 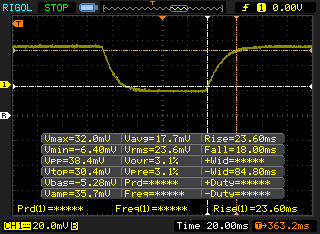 |
| ↘ 18 ms sonbahar | ||
| Ekran, testlerimizde yavaş yanıt oranları gösteriyor ve oyuncular için yetersiz olacaktır. Karşılaştırıldığında, test edilen tüm cihazlar 0.1 (minimum) ile 240 (maksimum) ms arasında değişir. » Tüm cihazların 98 %'si daha iyi. Bu, ölçülen yanıt süresinin test edilen tüm cihazların ortalamasından (19.8 ms) daha kötü olduğu anlamına gelir. | ||
| ↔ Tepki Süresi %50 Griden %80 Griye | ||
| 59.2 ms ... yükseliş ↗ ve sonbahar↘ birleşimi | ↗ 28.4 ms yükseliş | 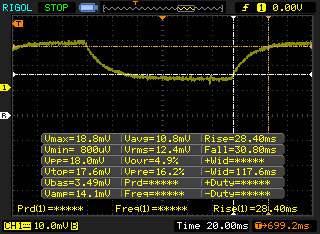 |
| ↘ 30.8 ms sonbahar | ||
| Ekran, testlerimizde yavaş yanıt oranları gösteriyor ve oyuncular için yetersiz olacaktır. Karşılaştırıldığında, test edilen tüm cihazlar 0.165 (minimum) ile 636 (maksimum) ms arasında değişir. » Tüm cihazların 95 %'si daha iyi. Bu, ölçülen yanıt süresinin test edilen tüm cihazların ortalamasından (31 ms) daha kötü olduğu anlamına gelir. | ||
Ekran Titremesi / PWM (Darbe Genişliği Modülasyonu)
| Ekran titriyor / PWM algılandı | 21740 Hz | ≤ 51 % parlaklık ayarı | 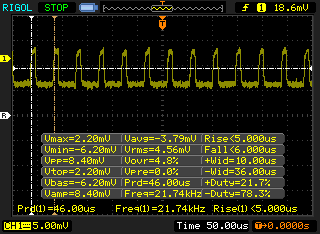 |
Ekran arka ışığı 21740 Hz'de titriyor (en kötü durum, örneğin PWM kullanılması) 51 % ve altındaki parlaklık ayarında titreme algılandı. Bu parlaklık ayarının üzerinde titreme veya PWM olmamalıdır. 21740 Hz frekansı oldukça yüksektir, bu nedenle PWM'ye duyarlı çoğu kullanıcı herhangi bir titremeyi fark etmemelidir. Karşılaştırıldığında: Test edilen tüm cihazların %52 %'si ekranı karartmak için PWM kullanmıyor. PWM tespit edilirse, ortalama 7765 (minimum: 5 - maksimum: 343500) Hz ölçüldü. | |||
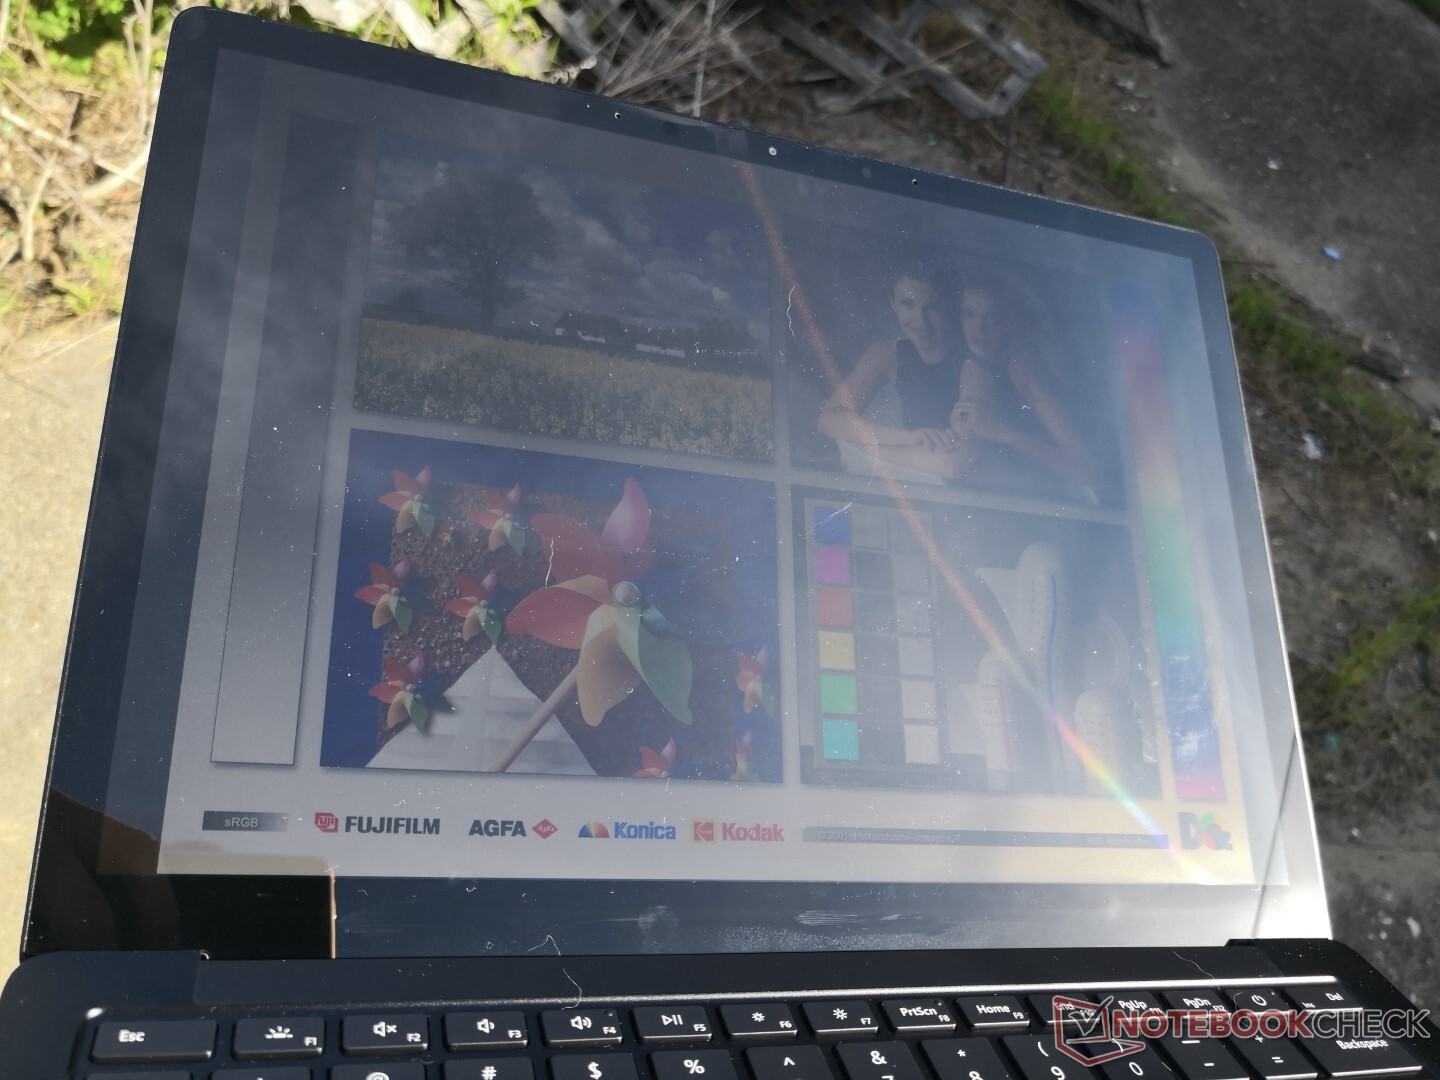
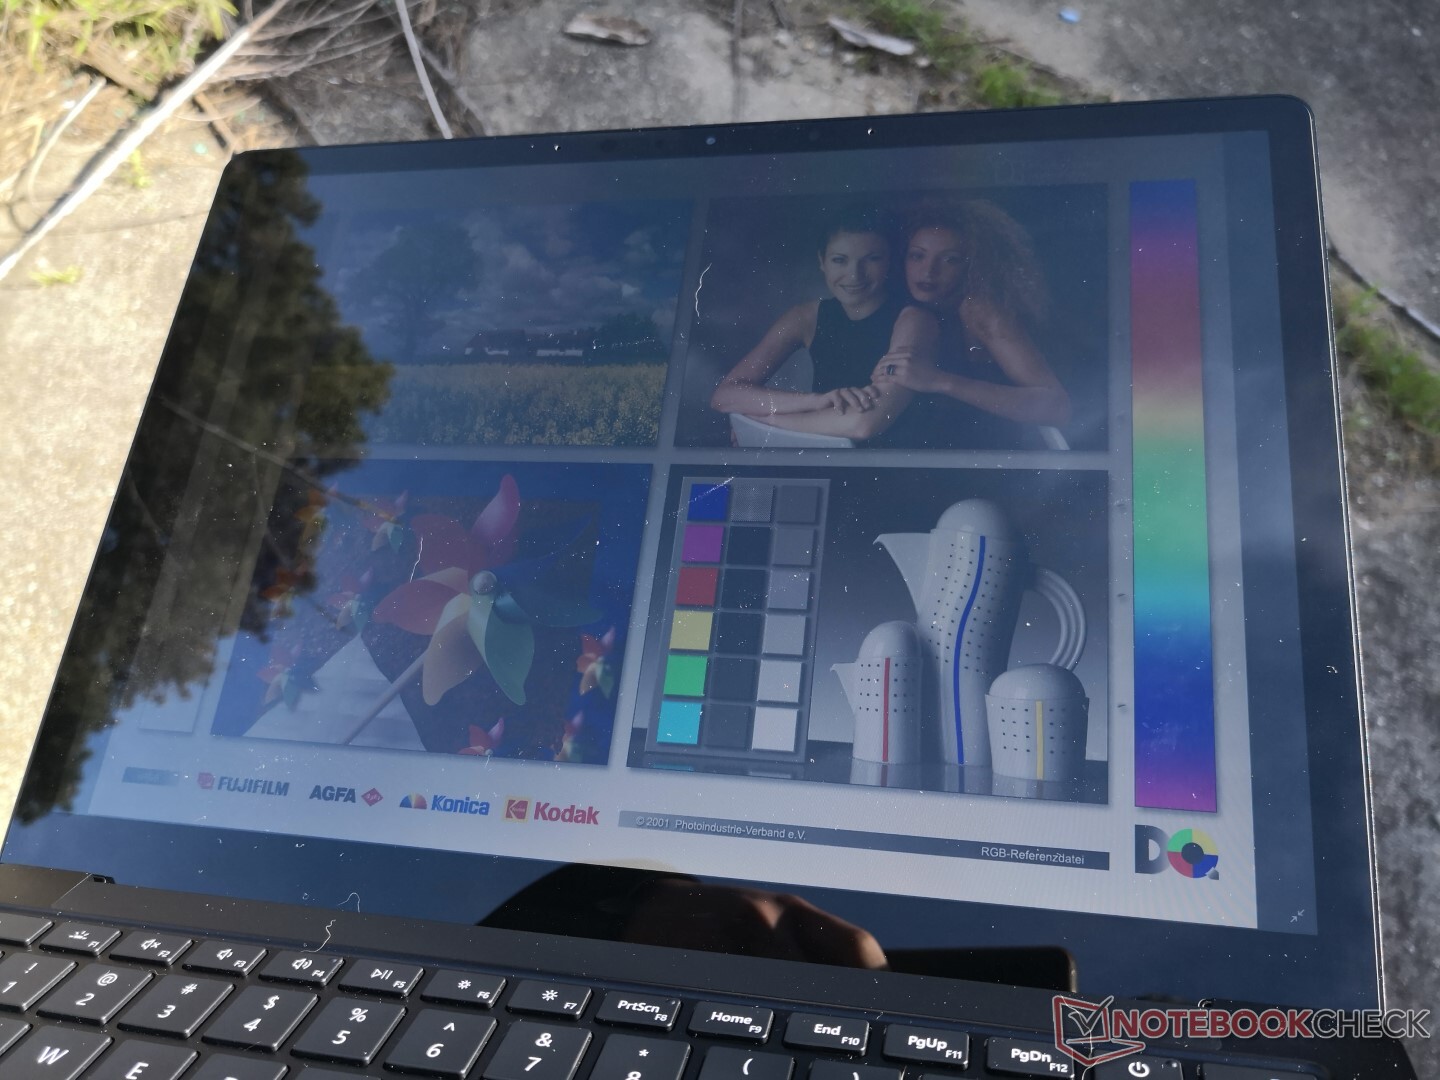
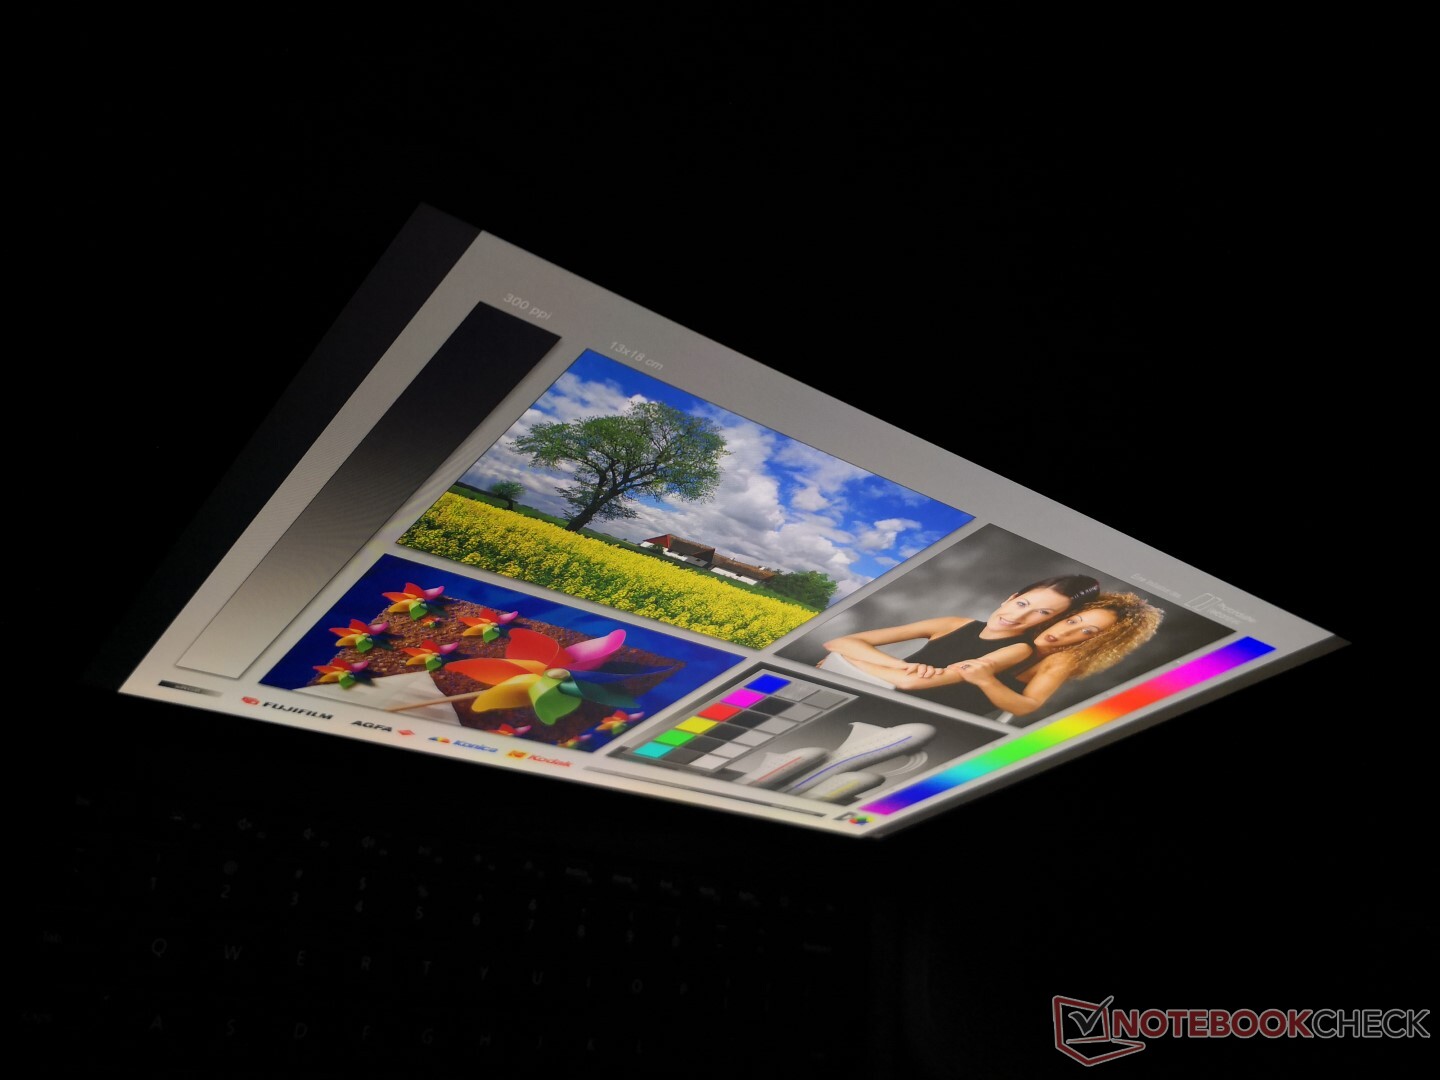
Dış mekan görünürlüğü, Surface Laptop 2'den farklı değildir, çünkü parlaklık ve kontrast gen-gen açısından nispeten sabit kalmıştır. Her ne kadar kötü olmasa da, hala hayal kırıklığı yaratıyor çünkü Microsoft bu bağlamda son model üzerinde hiçbir gelişme sunmuyor. Parlak panelden bir kez daha parlamayı bekleyin. Aşırı açılardan bakıldığında görüntüleme açıları, minimum kontrast ve renk bozulması ile mükemmeldir. İlginç bir şekilde, resim kalitesi diğer IPS panellerine kıyasla daha uzun süre daha kararlı görünüyor. Surface Laptop'un dönüştürülebilir olmaması çok kötü, çünkü bu ekran bir tablet olarak da mükemmel olurdu.
Verim
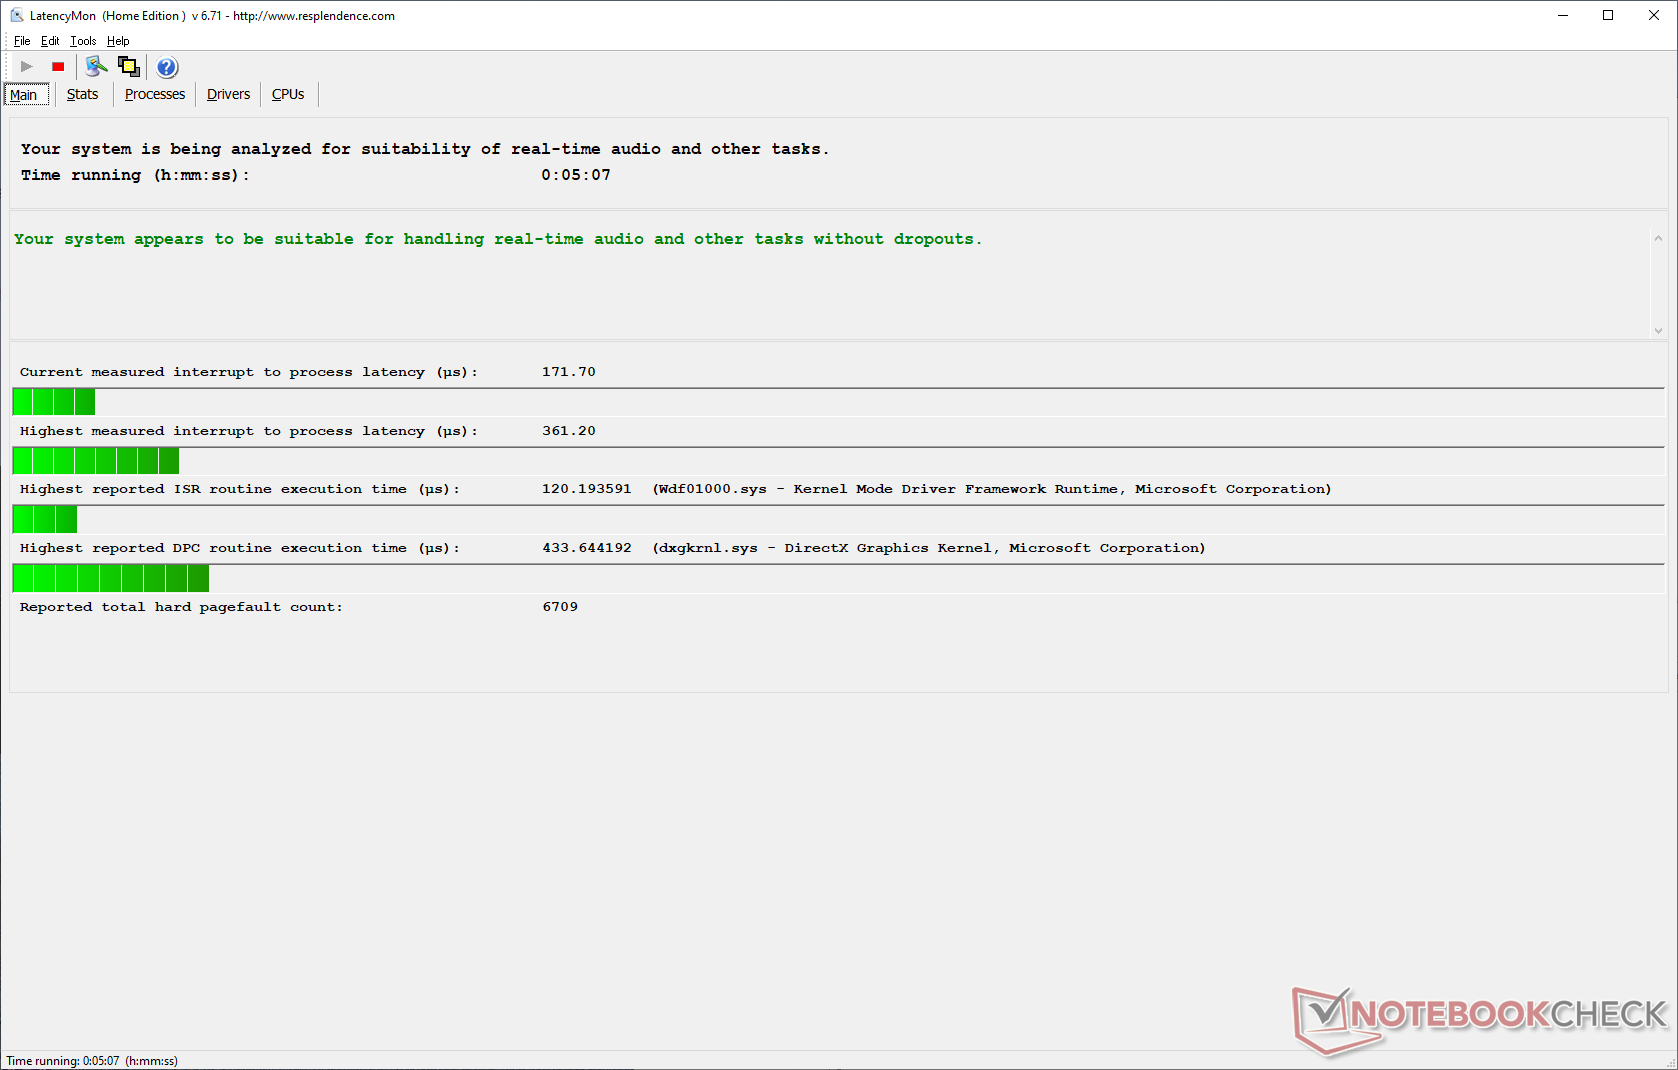
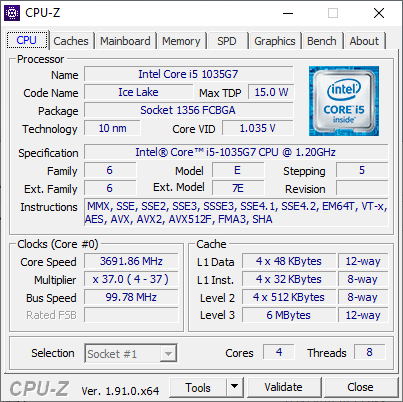
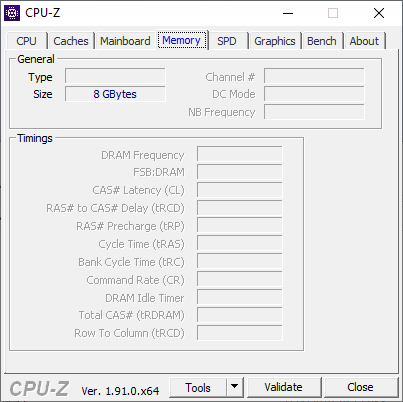
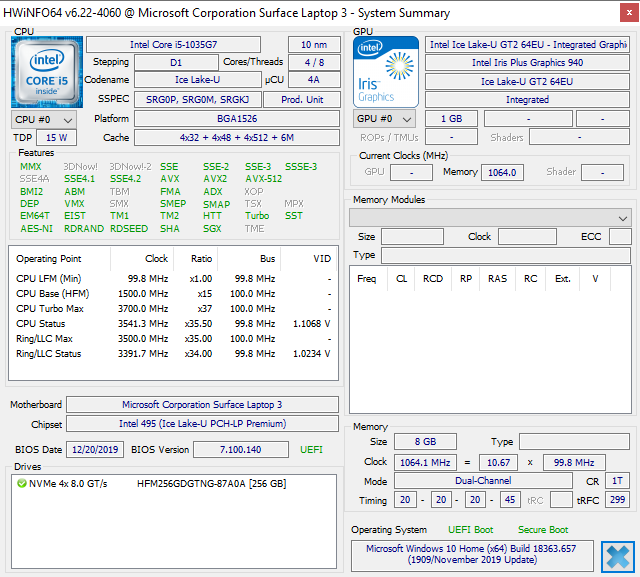
Şu anda tüm 13,5 inç Surface Laptop 3 SKU'ları Intel dört çekirdekli Core i5-1035G7 veya Core i7-1065G7 CPU ile geliyor. Microsoft'un daha hızlı 14 nm altıgen çekirdekli Comet Lake-U parçaları yerine 10 nm Buz Gölü parçalarını tercih ettiğini görmek ilginç, ancak Microsoft'un özellikle Buz Gölü Iris Plus GPU'nun daha hızlı grafik potansiyelini özellikle Surface Laptop, özel GeForce MX seçenekleri sunmuyorRAM, 8 GB veya 16 GB lehimli LPDDR4x ile sabitlenmiştir. LatencyMon, kablosuz etkinleştirilmiş olsa bile yinelenen DPC gecikme sorunu göstermez.
İşlemci
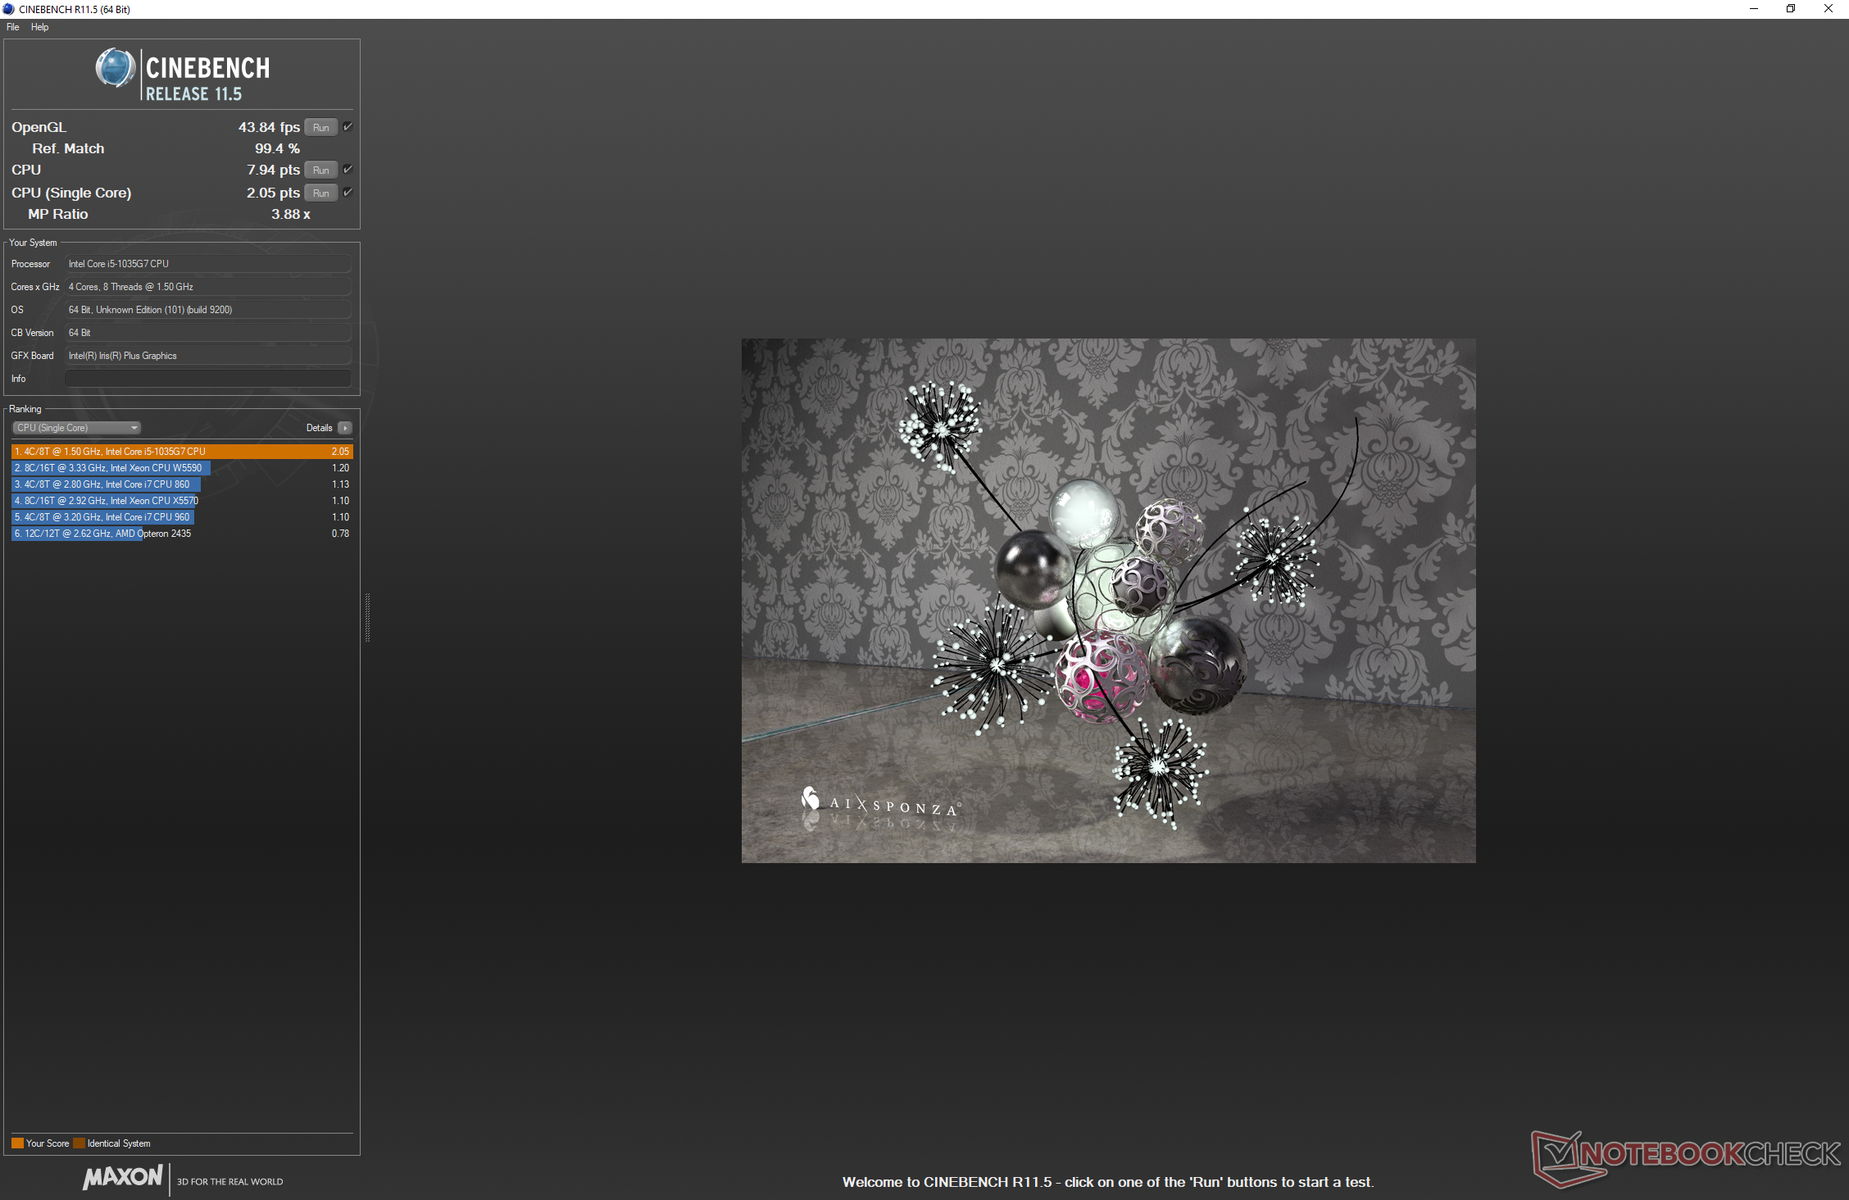
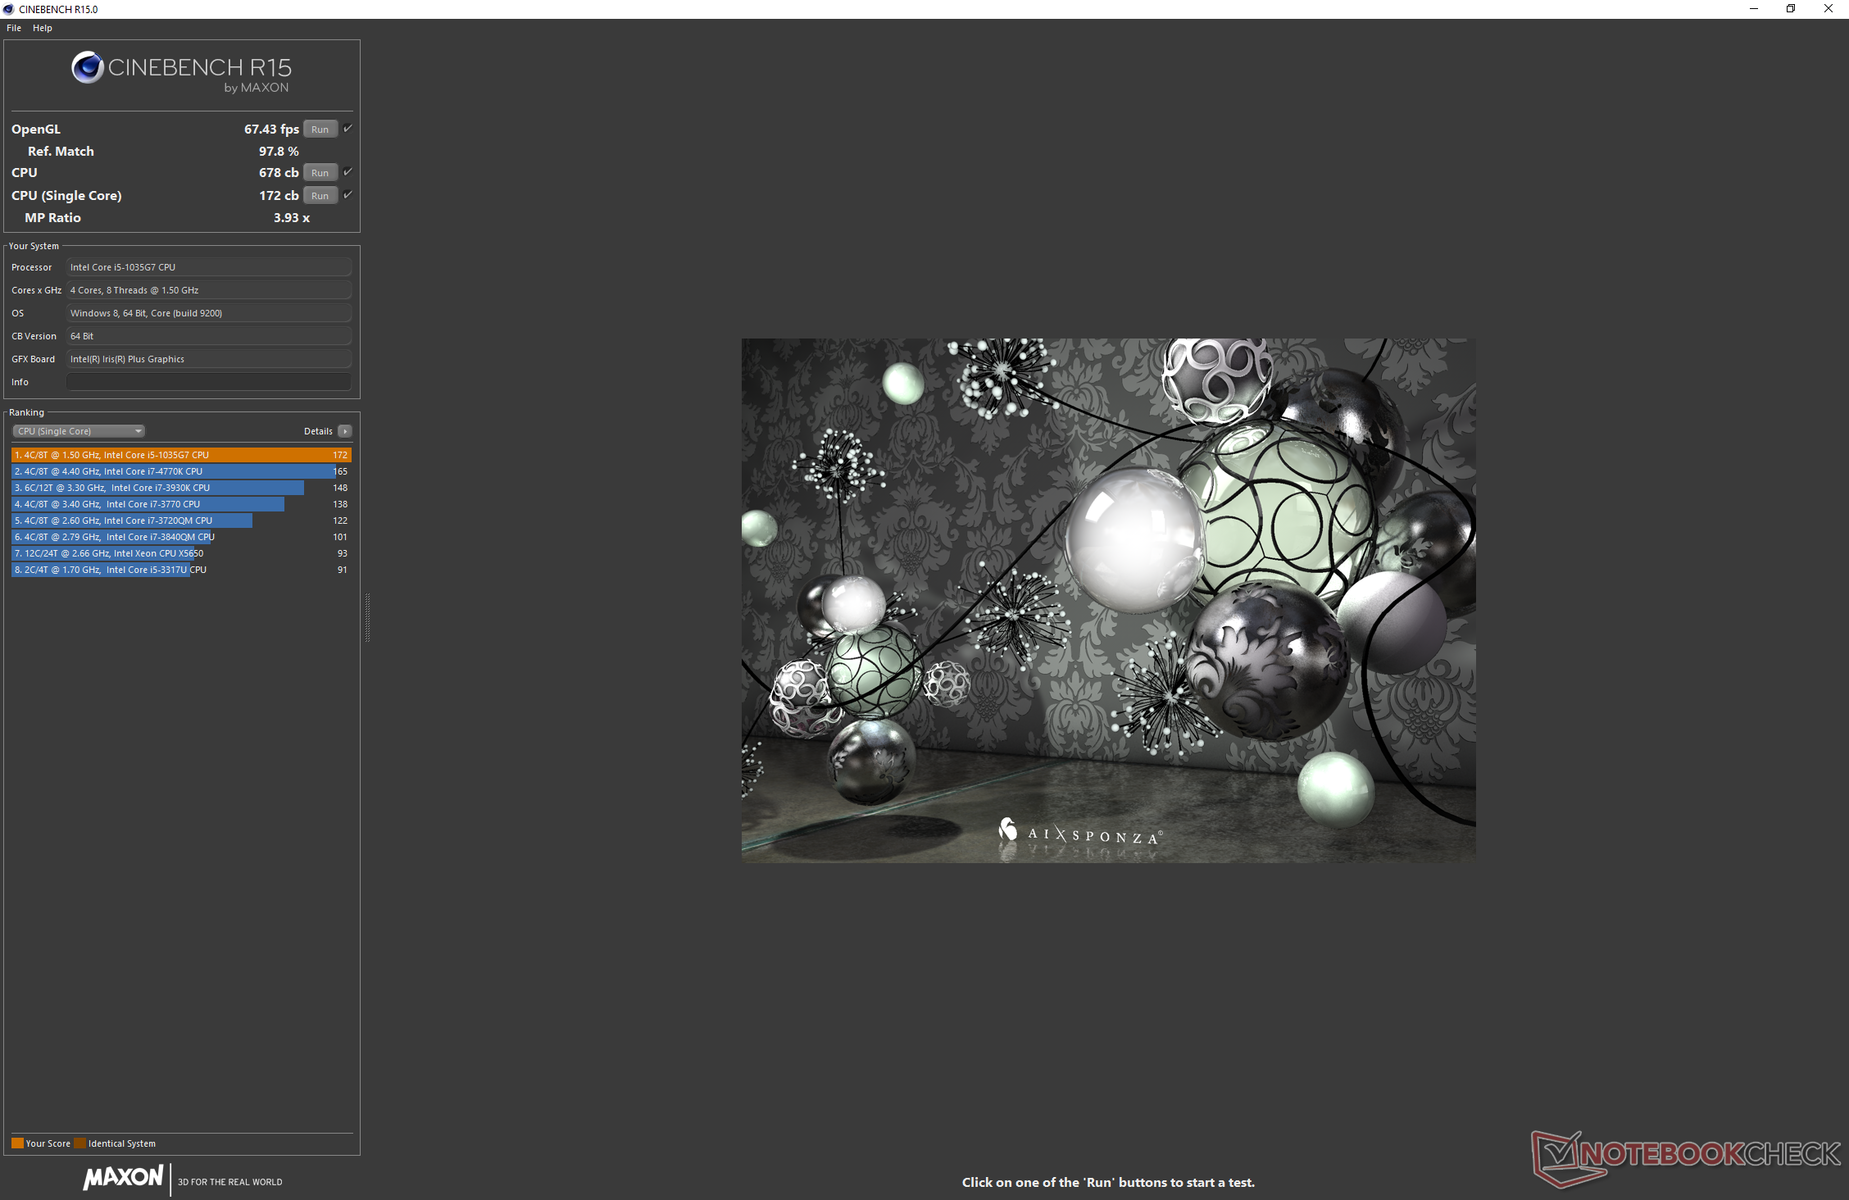
Her ikisi de neredeyse aynı temel saat hızına sahip olmasına rağmen (1.1 GHz ve 1.2 GHz) Surface Laptop'ta daha iyi Turbo Boost sürdürülebilirliği sayesinde CPU performansı, Surface Pro 7 tabletindeki Core i5-1035G4'ten daha hızlıdır. Örneğin CineBench R20, Surface Dizüstü Bilgisayar'da yüzde 16 daha yüksek. Yine de, Turbo Boost sürdürülebilirliği daha iyi olabilirdi. Aşağıda gösterildiği gibi bir döngüde CineBench R15 Multi-Thread çalıştırıldığında, yüzde 11'lik bir performans düşüşünü temsil etmek için ikinci döngüde 738 puanlık başlangıç puanı ~ 655 puana düşer. Bu, zaman içinde daha da yüzde 20'lik bir düşüş için ~ 592 puana düşer. Ham işlemci performansı, daha büyük 15 inçlik Yüzey Dizüstü Bilgisayarında Ryzen 5 3580U'dan daha hızlı olurken Comet Lake-U Core i5-10210U ile karşılaştırılabilir. Üst düzey Core i7-1065G7 yapılandırması, Core i5-1035G7'ye göre yaklaşık yüzde 10 daha hızlı CPU performansı sunar. Daha fazla teknik bilgi ve kıyaslama karşılaştırması için Core i5-1035G7'deki özel sayfamıza bakın.
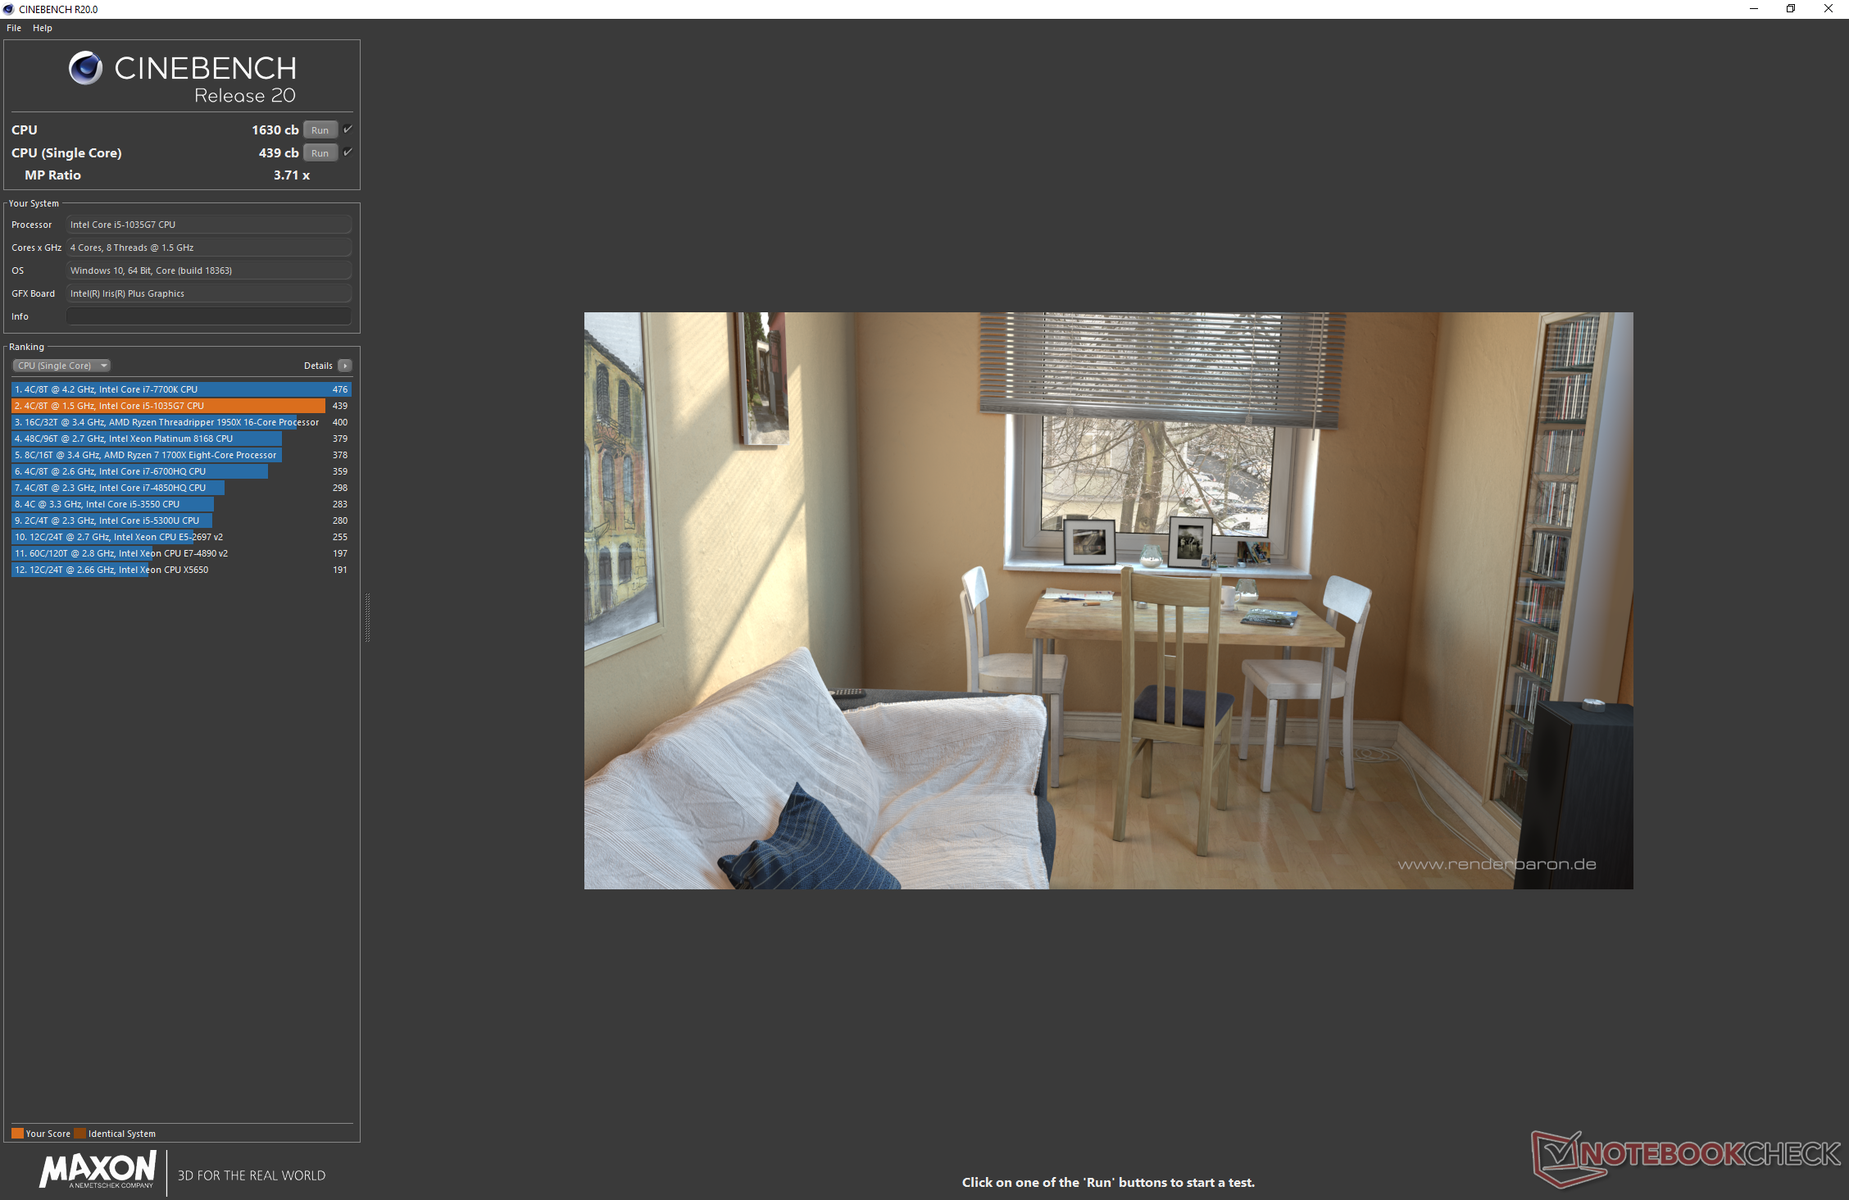
| Cinebench R20 | |
| CPU (Single Core) | |
| MSI Modern 15 A10RB | |
| MSI Prestige 15 A10SC | |
| Microsoft Surface Laptop 3 15 i7-1065G7 | |
| Microsoft Surface Pro 7 Core i5-1035G4 | |
| Microsoft Surface Laptop 3 13 Core i5-1035G7 | |
| MSI GF63 Thin 9SC | |
| Lenovo ThinkBook 15 | |
| Ortalama Intel Core i5-1035G7 (380 - 439, n=3) | |
| Dell XPS 13 7390 2-in-1 Core i3 | |
| Walmart Motile M142 | |
| Microsoft Surface Laptop 3 15 Ryzen 5 3580U | |
| CPU (Multi Core) | |
| MSI Prestige 15 A10SC | |
| MSI Modern 15 A10RB | |
| Microsoft Surface Laptop 3 15 i7-1065G7 | |
| MSI GF63 Thin 9SC | |
| Microsoft Surface Laptop 3 13 Core i5-1035G7 | |
| Lenovo ThinkBook 15 | |
| Microsoft Surface Laptop 3 15 Ryzen 5 3580U | |
| Microsoft Surface Pro 7 Core i5-1035G4 | |
| Walmart Motile M142 | |
| Ortalama Intel Core i5-1035G7 (1043 - 1630, n=3) | |
| Dell XPS 13 7390 2-in-1 Core i3 | |
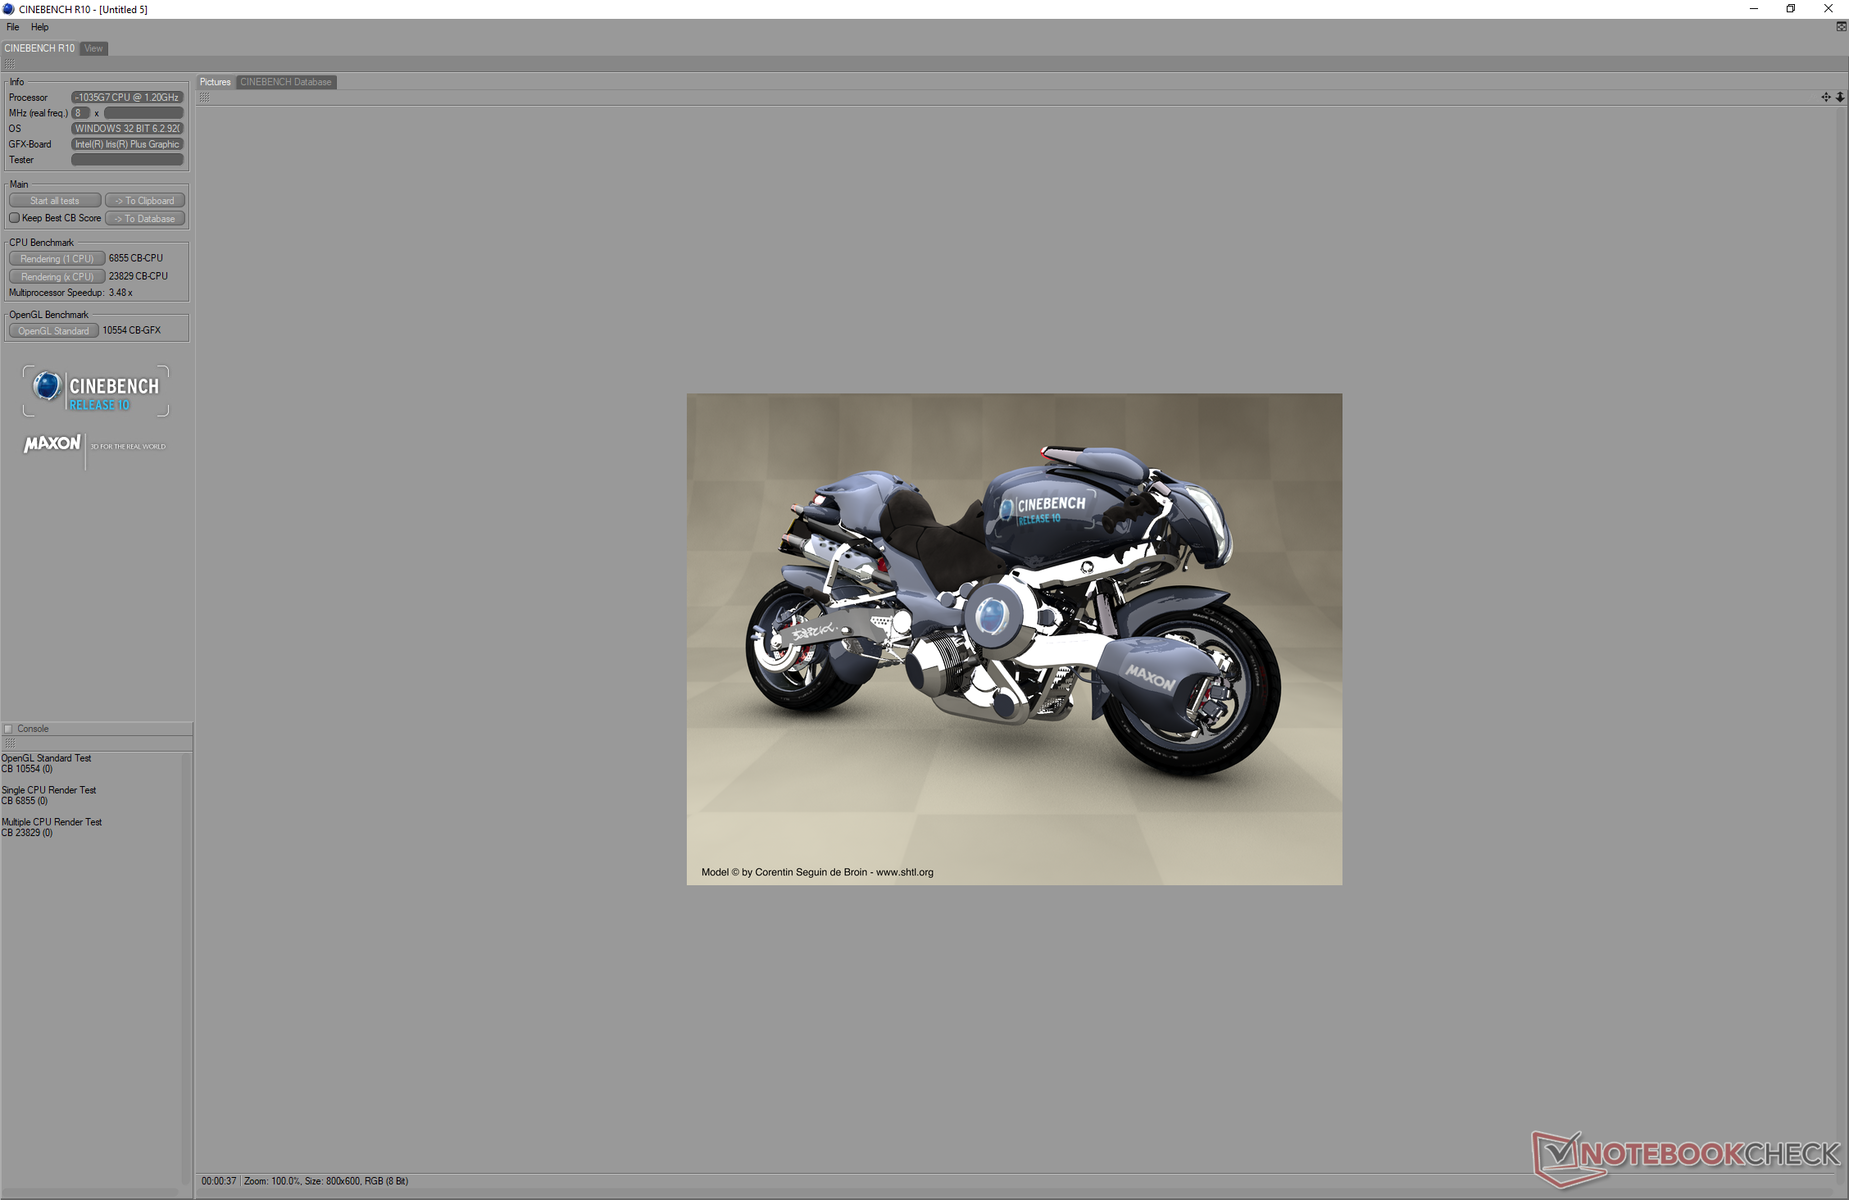
| Cinebench R10 | |
| Rendering Multiple CPUs 32Bit | |
| Microsoft Surface Laptop 3 13 Core i5-1035G7 | |
| Microsoft Surface Pro 7 Core i5-1035G4 | |
| Ortalama Intel Core i5-1035G7 (15373 - 23829, n=2) | |
| Microsoft Surface Laptop 3 15 Ryzen 5 3580U | |
| Dell XPS 13 7390 2-in-1 Core i3 | |
| Microsoft Surface Laptop i7 | |
| Microsoft Surface Go MHN-00003 | |
| Rendering Single 32Bit | |
| Microsoft Surface Laptop 3 13 Core i5-1035G7 | |
| Microsoft Surface Pro 7 Core i5-1035G4 | |
| Dell XPS 13 7390 2-in-1 Core i3 | |
| Ortalama Intel Core i5-1035G7 (6044 - 6855, n=2) | |
| Microsoft Surface Laptop i7 | |
| Microsoft Surface Laptop 3 15 Ryzen 5 3580U | |
| Microsoft Surface Go MHN-00003 | |
| wPrime 2.10 - 1024m | |
| Microsoft Surface Go MHN-00003 | |
| Dell XPS 13 7390 2-in-1 Core i3 | |
| Microsoft Surface Laptop i7 | |
| Microsoft Surface Pro 7 Core i5-1035G4 | |
| Microsoft Surface Laptop 3 15 Ryzen 5 3580U | |
| Microsoft Surface Laptop 3 13 Core i5-1035G7 | |
| Ortalama Intel Core i5-1035G7 (n=1) | |
* ... daha küçük daha iyidir
Sistem performansı
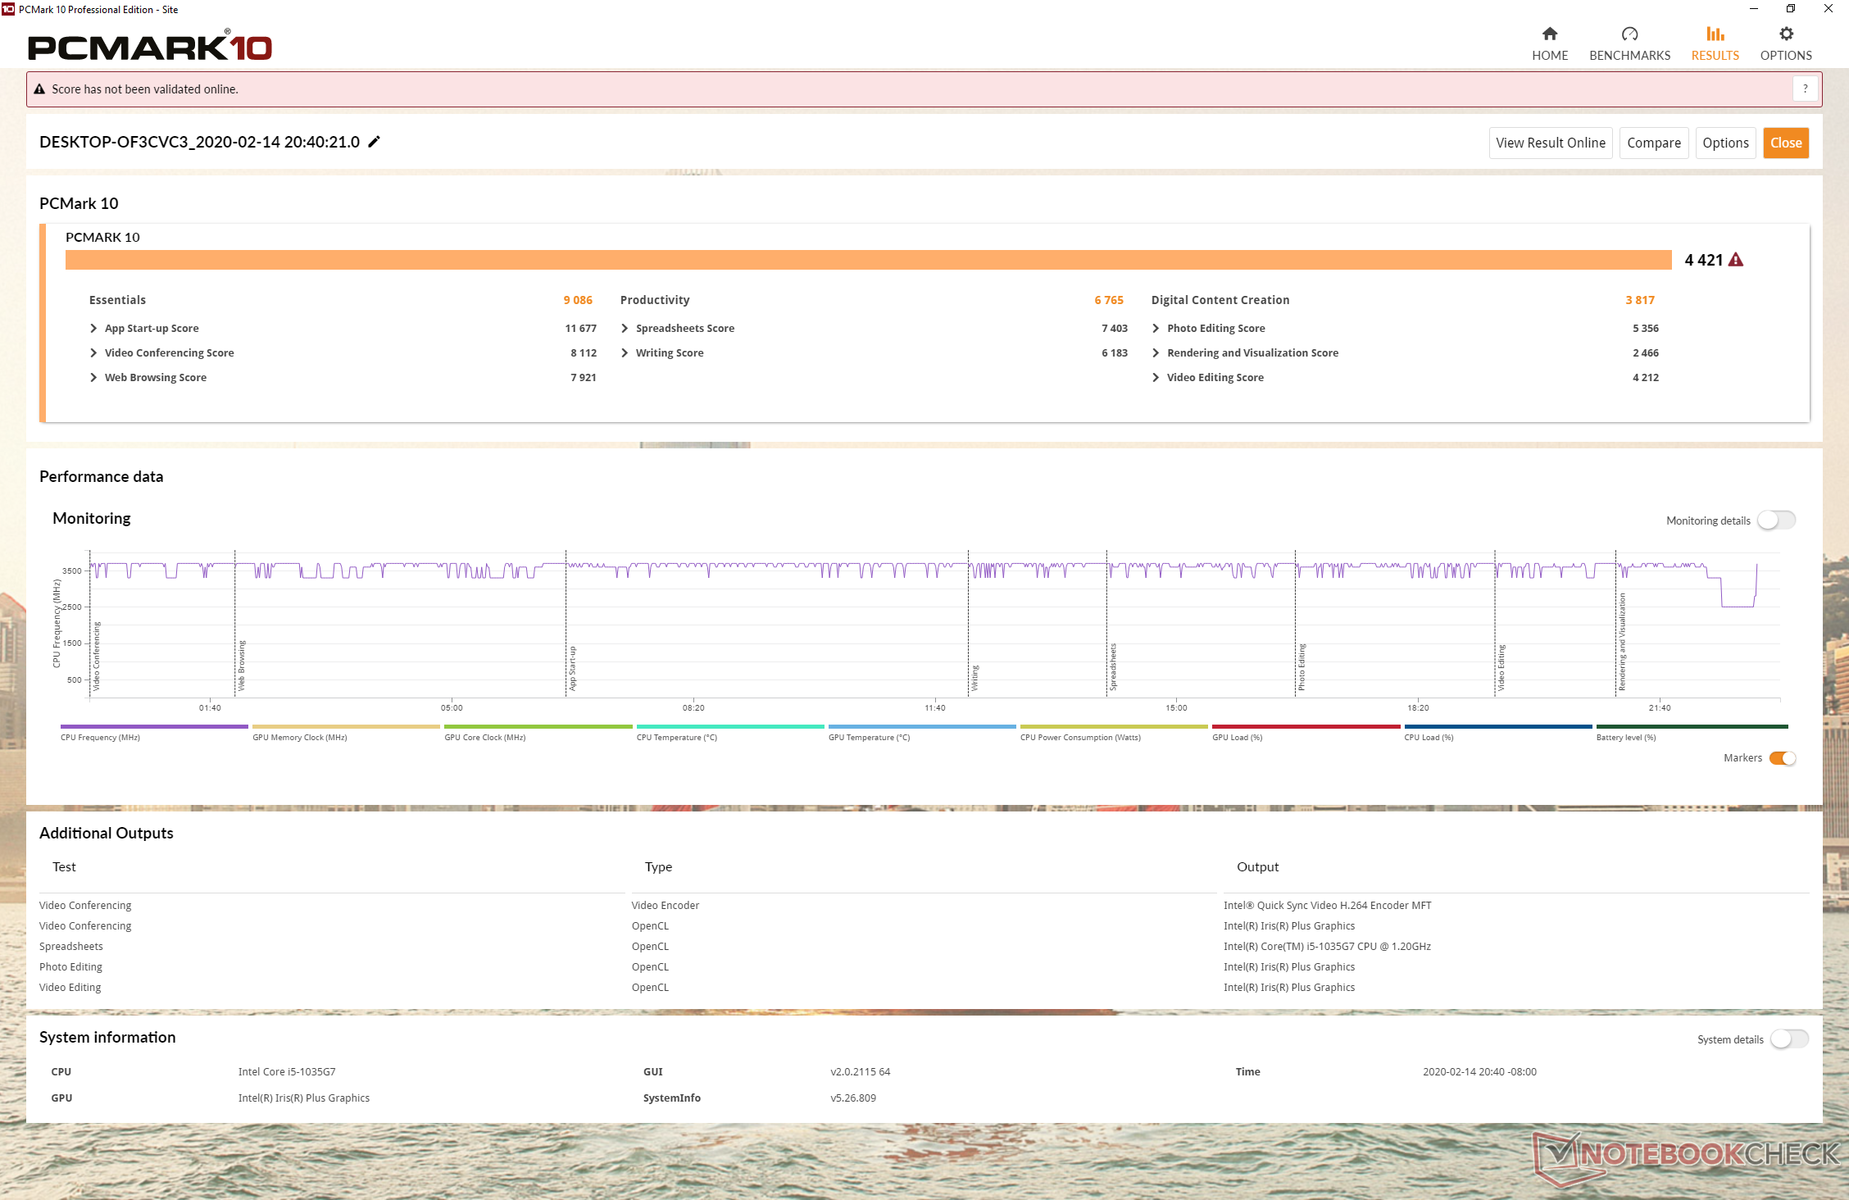
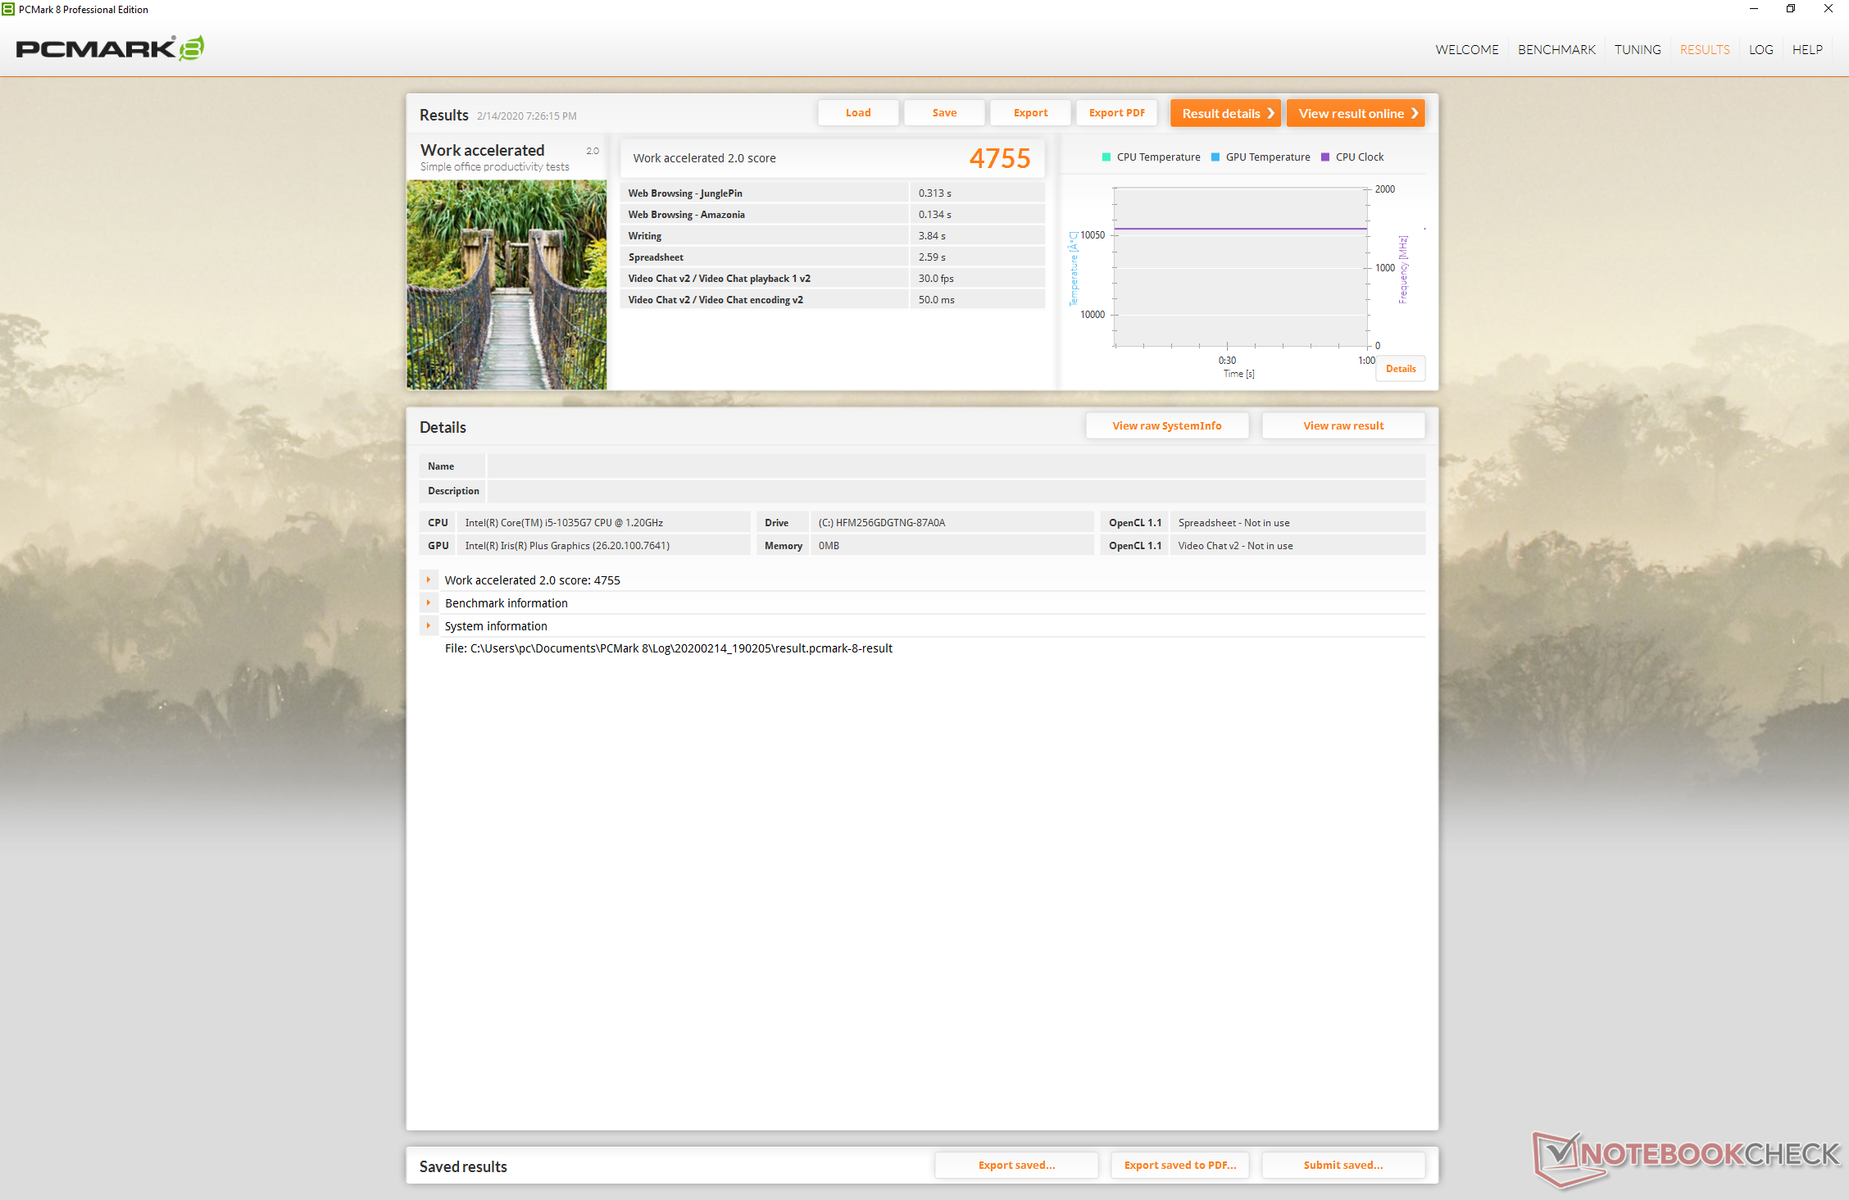
PCMark kriterleri, Core i7-1065G7 ile Dell XPS 13 2'si 1 arada ile Ryzen 5 3580U ile donatılmış en ucuz 15 inçlik Yüzey Dizüstü Bilgisayarı 3 SKU'su arasında sıkıca oturuyor. Temiz barebonlar Surface serisinde herhangi bir bloatware hissi veriyor ve eksikliği Lenovo, HP veya Dell'in Ultrabook'larına kıyasla kesin artılar. Test ünitesi ile zamanımız boyunca herhangi bir yazılım sorunu yaşamadık. Daha tipik Ultrabook'larla karşılaştırıldığında Surface cihazlarının şişmesiz deneyimini takdir ediyoruz.
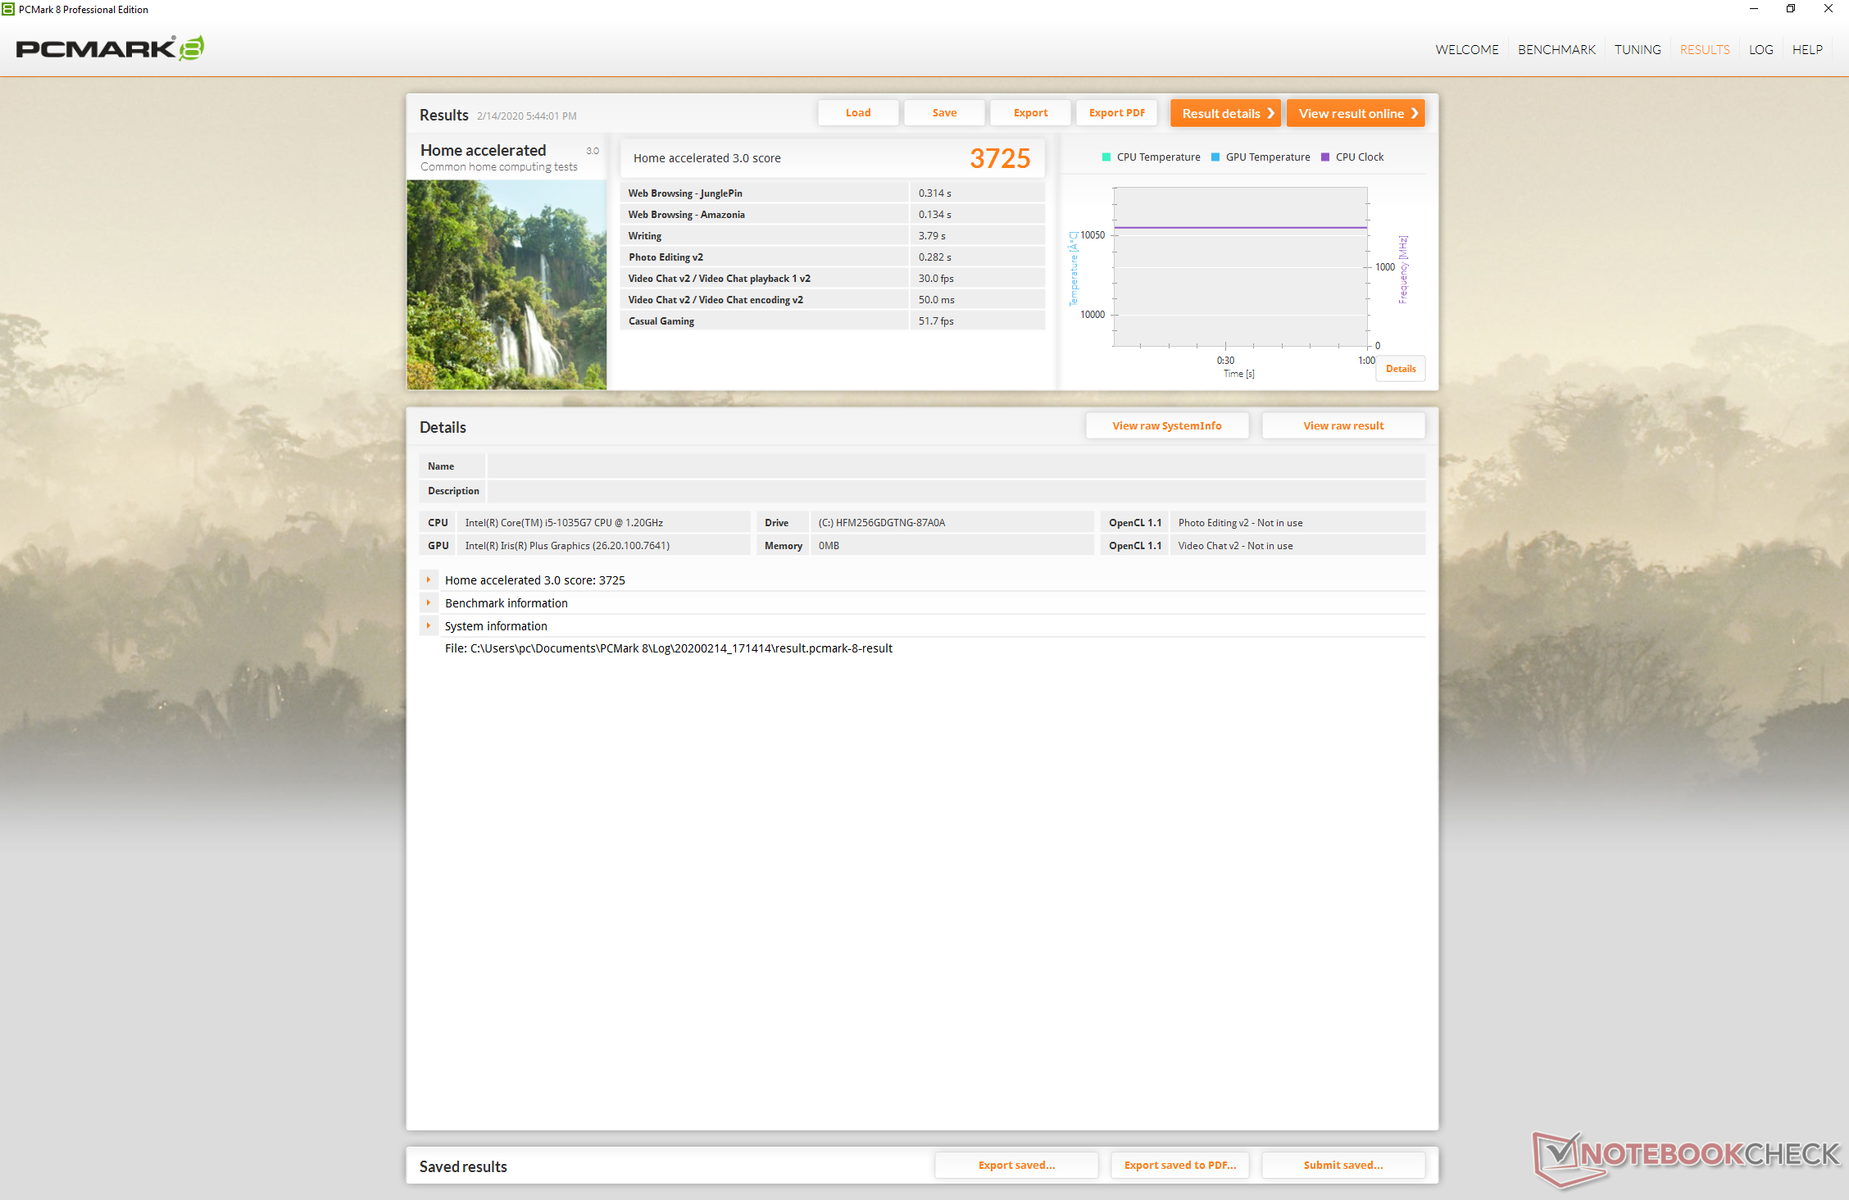
| PCMark 8 Home Score Accelerated v2 | 3725 puan | |
| PCMark 8 Work Score Accelerated v2 | 4755 puan | |
| PCMark 10 Score | 4421 puan | |
Yardım | ||
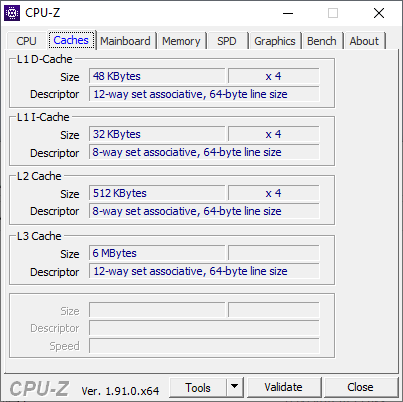
Depolama aygıtları
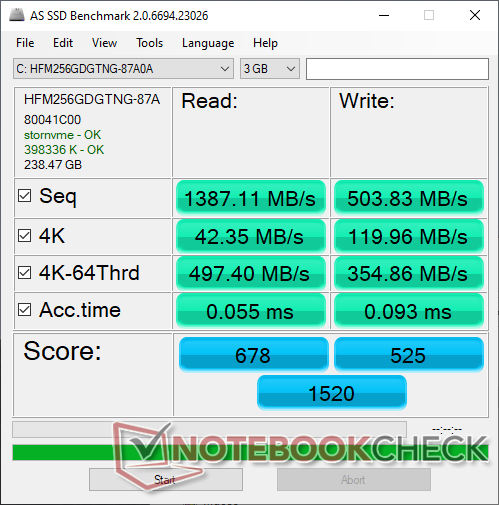
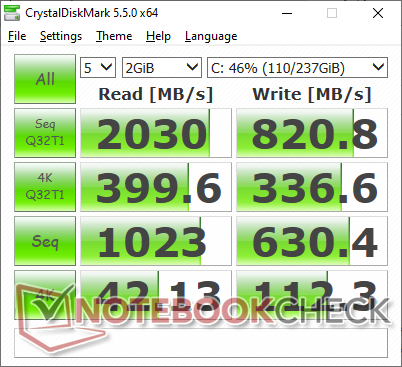
Microsoft, Surface Laptop 3 13.5 için en ucuz Surface Laptop 3 15'te bulunan 256 GB SK Hynix BC501 HFM256GDGTNG sürücüsünü tam olarak donattı. Bu nedenle, sürücü performansı esasen iki Surface Laptop 3 SKU'su ile aynıdır. SK Hynix BC501, daha pahalı Samsung PM981 serisindeki ~ 2500 MB / s ile karşılaştırıldığında sırasıyla yaklaşık 1400 MB / s ve 500 MB / s'lik nispeten yavaş sıralı okuma ve yazma hızlarıyla örneklendiği gibi bir bütçe NVMe sürücüsüdür. Daha pahalı Yüzey Dizüstü bilgisayarı yapılandırmaları bunun yerine daha hızlı Toshiba sürücülerle gelebilir, ancak satın almadan önce onaylamak zordur. Daha fazla karşılaştırma karşılaştırması için SSD ve HDD tablolarımıza bakın.
| Microsoft Surface Laptop 3 13 Core i5-1035G7 SK hynix BC501 HFM256GDGTNG | Apple MacBook Pro 13 2019 2TB3 Apple SSD AP0256 | Huawei Matebook X Pro i5 Samsung PM961 MZVLW256HEHP | Microsoft Surface Laptop 2-LQN-00004 SK Hynix BC501 NVMe 256 GB | Dell XPS 13 7390 2-in-1 Core i7 Toshiba BG4 KBG40ZPZ512G | |
|---|---|---|---|---|---|
| AS SSD | -33% | 44% | 3% | 8% | |
| Seq Read (MB/s) | 1387 | 974 -30% | 2416 74% | 826 -40% | 1801 30% |
| Seq Write (MB/s) | 504 | 1340 166% | 1170 132% | 555 10% | 1125 123% |
| 4K Read (MB/s) | 42.35 | 11.35 -73% | 48.33 14% | 33.39 -21% | 39.7 -6% |
| 4K Write (MB/s) | 120 | 15.95 -87% | 103.1 -14% | 95.3 -21% | 67 -44% |
| 4K-64 Read (MB/s) | 497.4 | 643 29% | 1039 109% | 447 -10% | 1253 152% |
| 4K-64 Write (MB/s) | 354.9 | 163 -54% | 399.6 13% | 370.4 4% | 209 -41% |
| Access Time Read * (ms) | 0.055 | 0.316 -475% | 0.058 -5% | 0.048 13% | 0.069 -25% |
| Access Time Write * (ms) | 0.093 | 0.258 -177% | 0.036 61% | 0.048 48% | 0.625 -572% |
| Score Read (Points) | 678 | 752 11% | 1329 96% | 563 -17% | 1472 117% |
| Score Write (Points) | 525 | 313 -40% | 620 18% | 521 -1% | 388 -26% |
| Score Total (Points) | 1520 | 1465 -4% | 2575 69% | 1369 -10% | 2583 70% |
| Copy ISO MB/s (MB/s) | 764 | 1404 84% | 739 -3% | 755 -1% | 1293 69% |
| Copy Program MB/s (MB/s) | 256.1 | 406.9 59% | 312.3 22% | 325.1 27% | 560 119% |
| Copy Game MB/s (MB/s) | 368.4 | 850 131% | 486.3 32% | 577 57% | 927 152% |
| CrystalDiskMark 5.2 / 6 | 16% | -11% | 36% | ||
| Write 4K (MB/s) | 112.3 | 116.5 4% | 87.3 -22% | 106.7 -5% | |
| Read 4K (MB/s) | 42.13 | 42.18 0% | 36.52 -13% | 49.94 19% | |
| Write Seq (MB/s) | 630 | 1079 71% | 716 14% | 1223 94% | |
| Read Seq (MB/s) | 1023 | 1030 1% | 1009 -1% | 1801 76% | |
| Write 4K Q32T1 (MB/s) | 336.6 | 225.7 -33% | 324.1 -4% | 325.3 -3% | |
| Read 4K Q32T1 (MB/s) | 399.6 | 302.9 -24% | 249 -38% | 551 38% | |
| Write Seq Q32T1 (MB/s) | 821 | 1174 43% | 811 -1% | 1224 49% | |
| Read Seq Q32T1 (MB/s) | 2030 | 3394 67% | 1631 -20% | 2350 16% | |
| Toplam Ortalama (Program / Ayarlar) | -33% /
-33% | 30% /
34% | -4% /
-2% | 22% /
18% |
* ... daha küçük daha iyidir

GPU Performansı
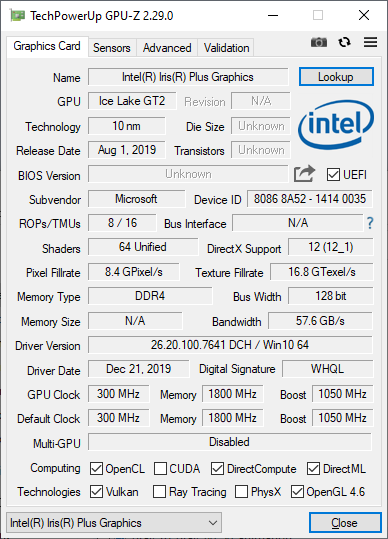
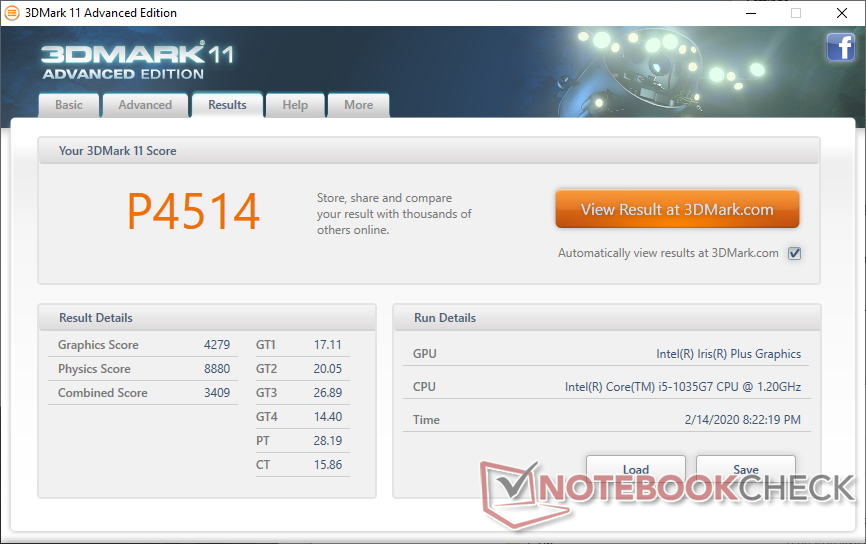
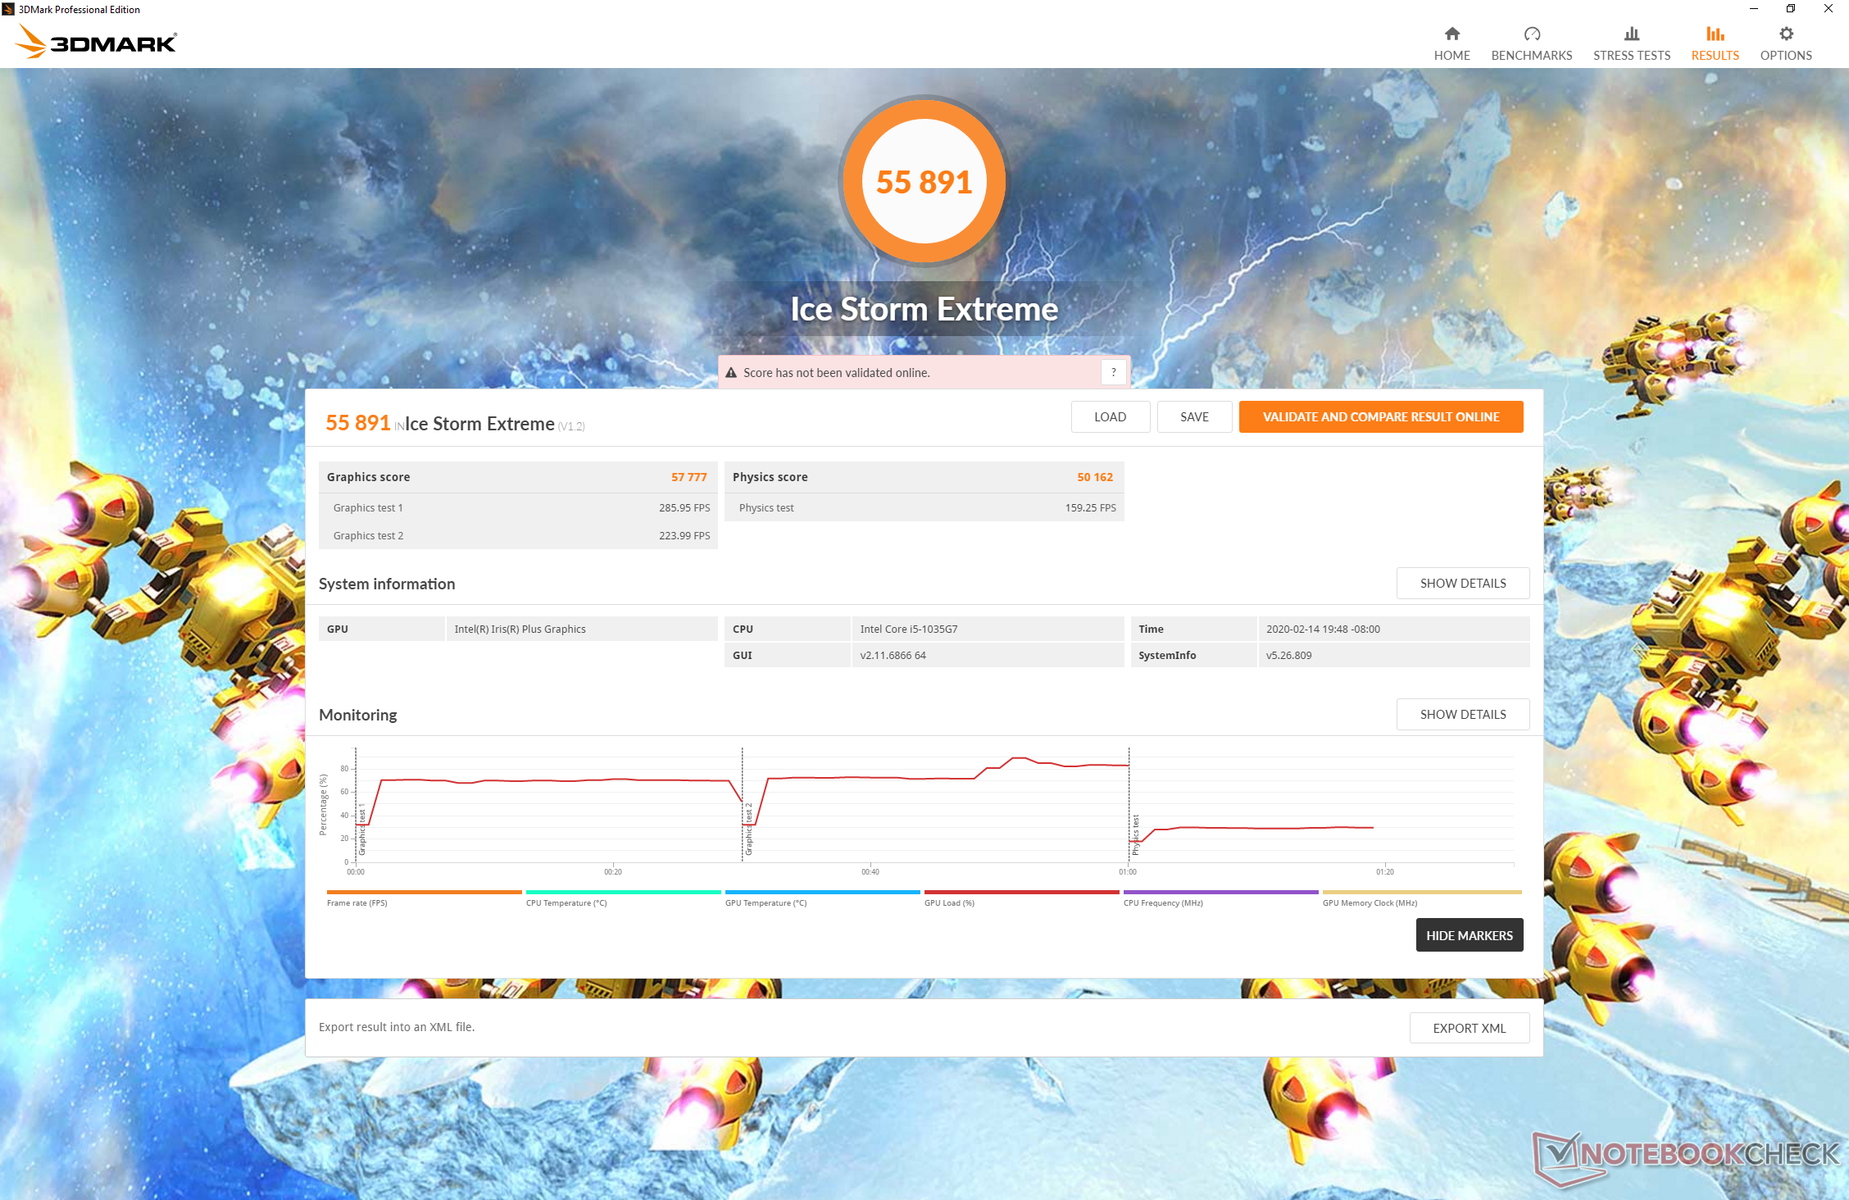
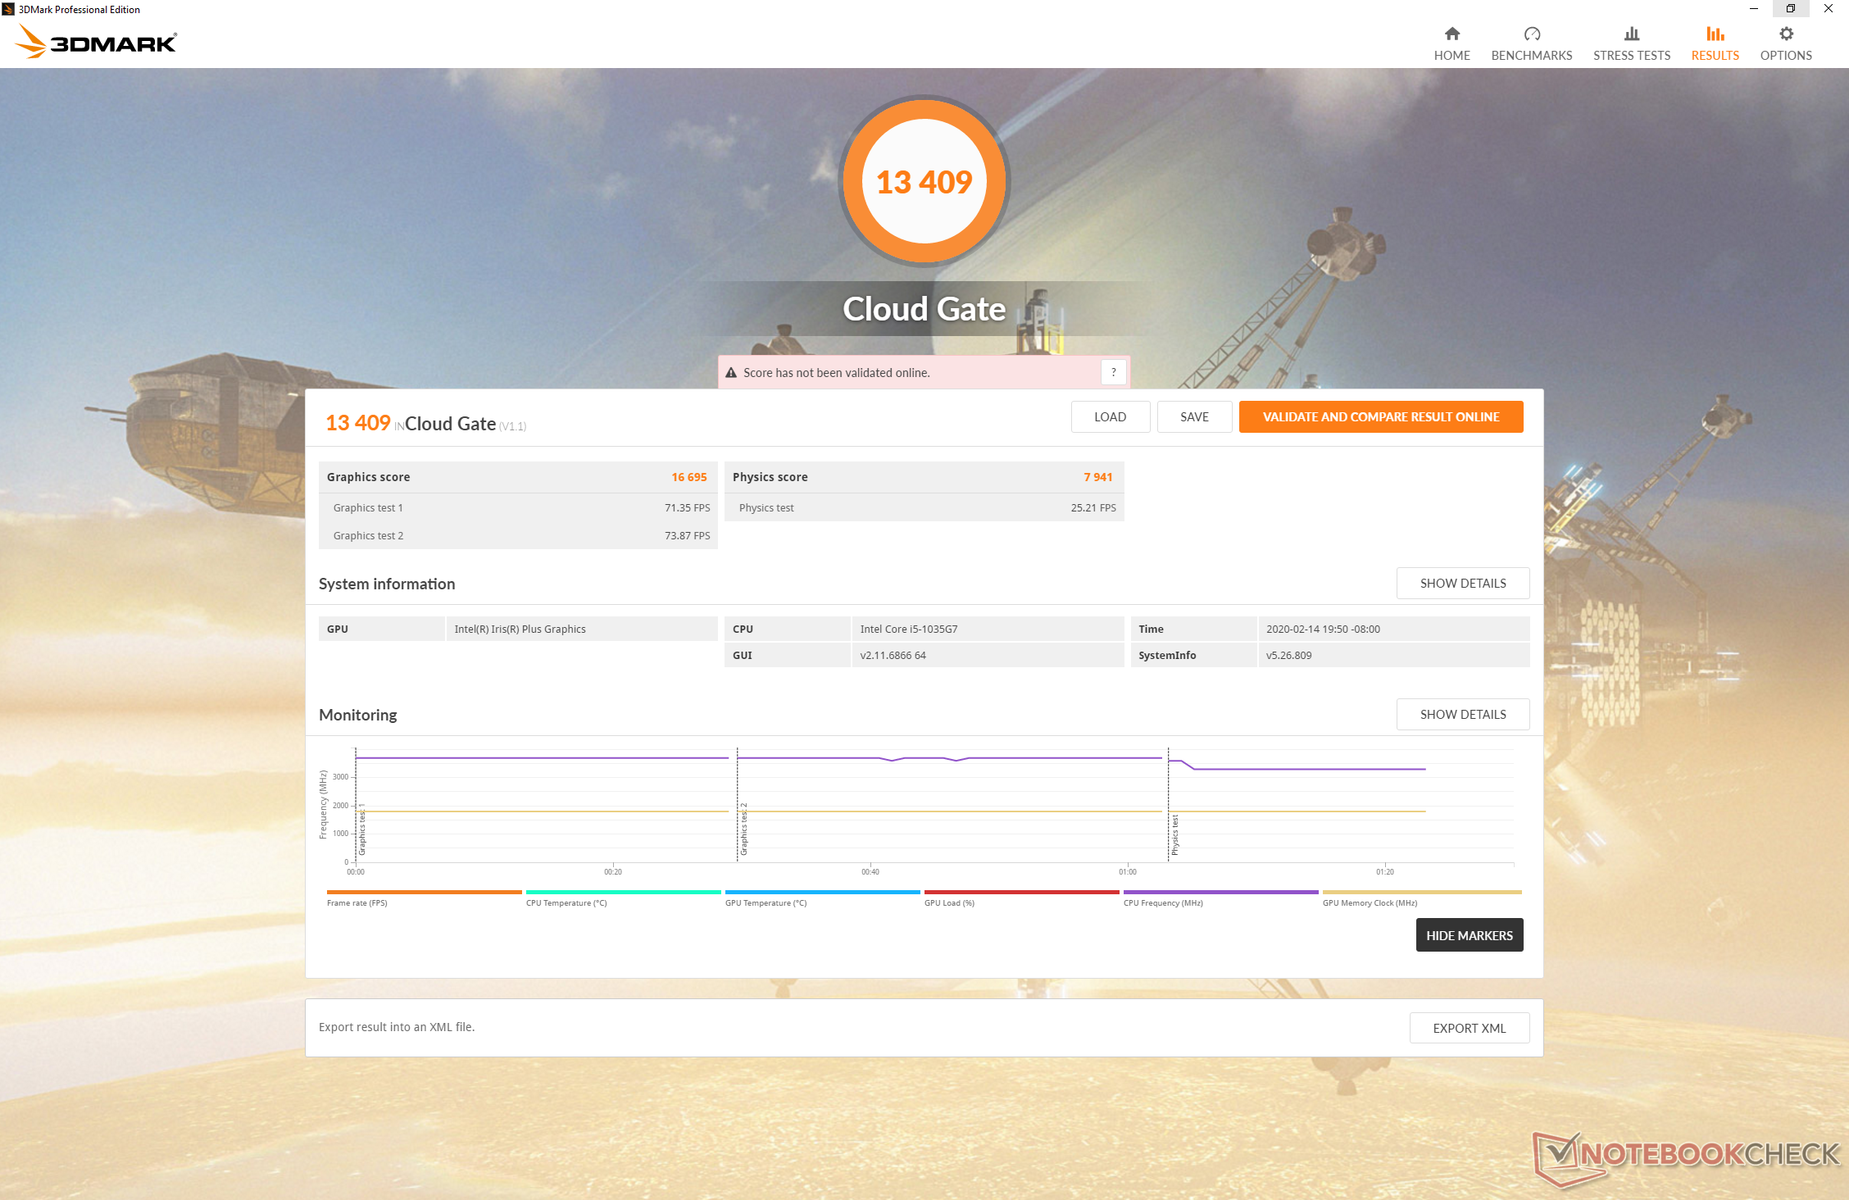
Core i5-1035G7, Core i7-1065G7 ile aynı entegre Iris Plus G7 GPU'ya sahip olabilir, ancak 3DMark karşılaştırma sonuçlarının söylediklerine rağmen gerçek dünya oyunlarındaki genel performans aralarında aynı değildir. Örneğin, Roket Ligi, şimdiye kadar test ettiğimiz neredeyse tüm Iris Plus G7 dizüstü bilgisayarlardan sürekli olarak daha düşük ortalama kare hızları döndürüyor. Bu arada, Witcher 3 ve Shadow of the Tomb Raider gibi daha zorlu oyunlar olmasını beklediğimiz yerde oynuyor. Bu karışık sonuçlar, Core i5-1035G7'nin düşük ayarlarla iddiasız oyunlarda çok yüksek kare hızlarını koruma konusunda sorunları olduğunu gösteriyor. Her ikisi de vurgulandığında, düşük TDP'nin çipin hem CPU hem de GPU bölümleri için bir darboğaz olduğundan şüpheleniyoruz.Ancak, yine de tüm ayarlar azaltılmış olsa da Borderlands 3 dahil olmak üzere çoğu modern oyunu sadece 720p'de oynamak mümkün. Daha fazla teknik bilgi ve kıyaslama karşılaştırması için Iris Plus G7 GPU'daki özel sayfamıza bakın.
| 3DMark 06 Standard Score | 15227 puan | |
| 3DMark Vantage P Result | 14442 puan | |
| 3DMark 11 Performance | 4514 puan | |
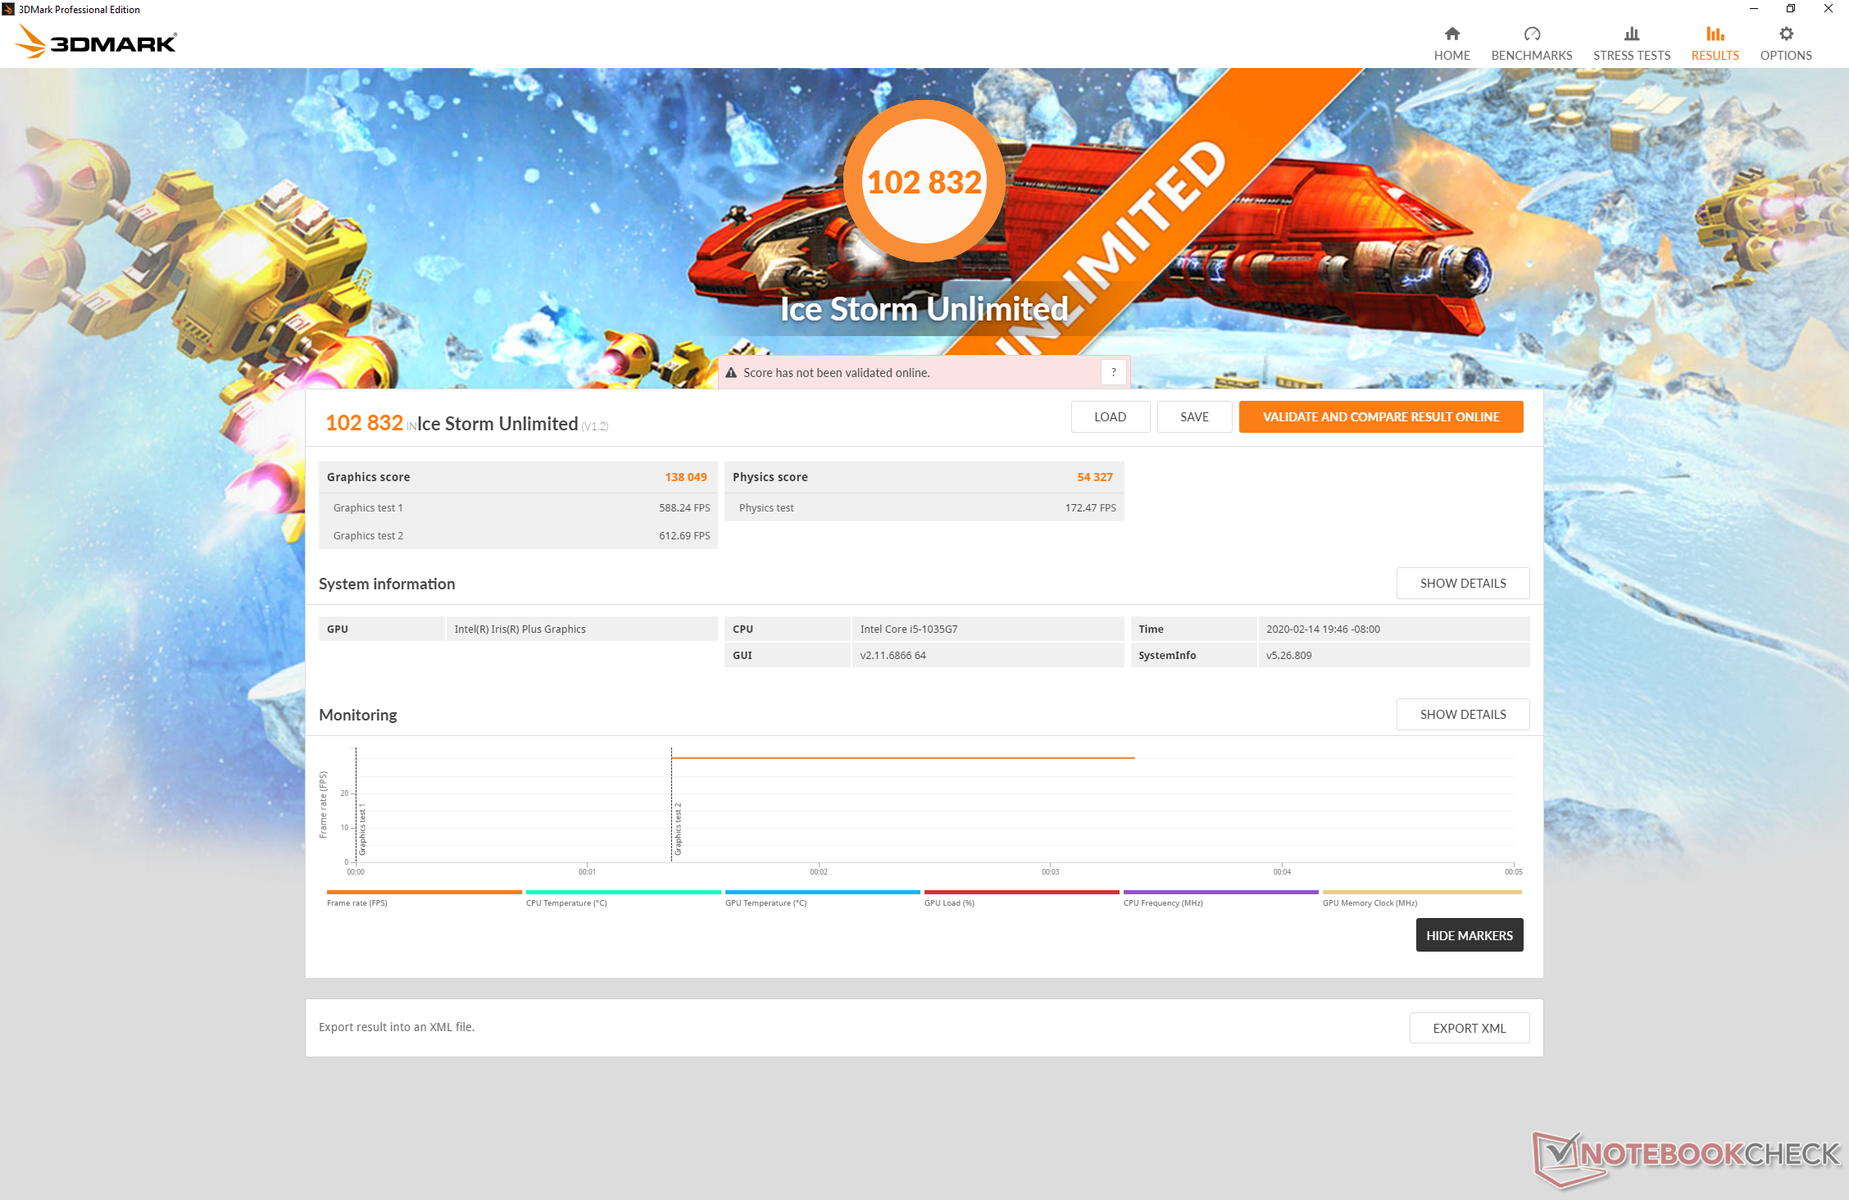
| 3DMark Ice Storm Standard Score | 66232 puan | |
| 3DMark Cloud Gate Standard Score | 13409 puan | |
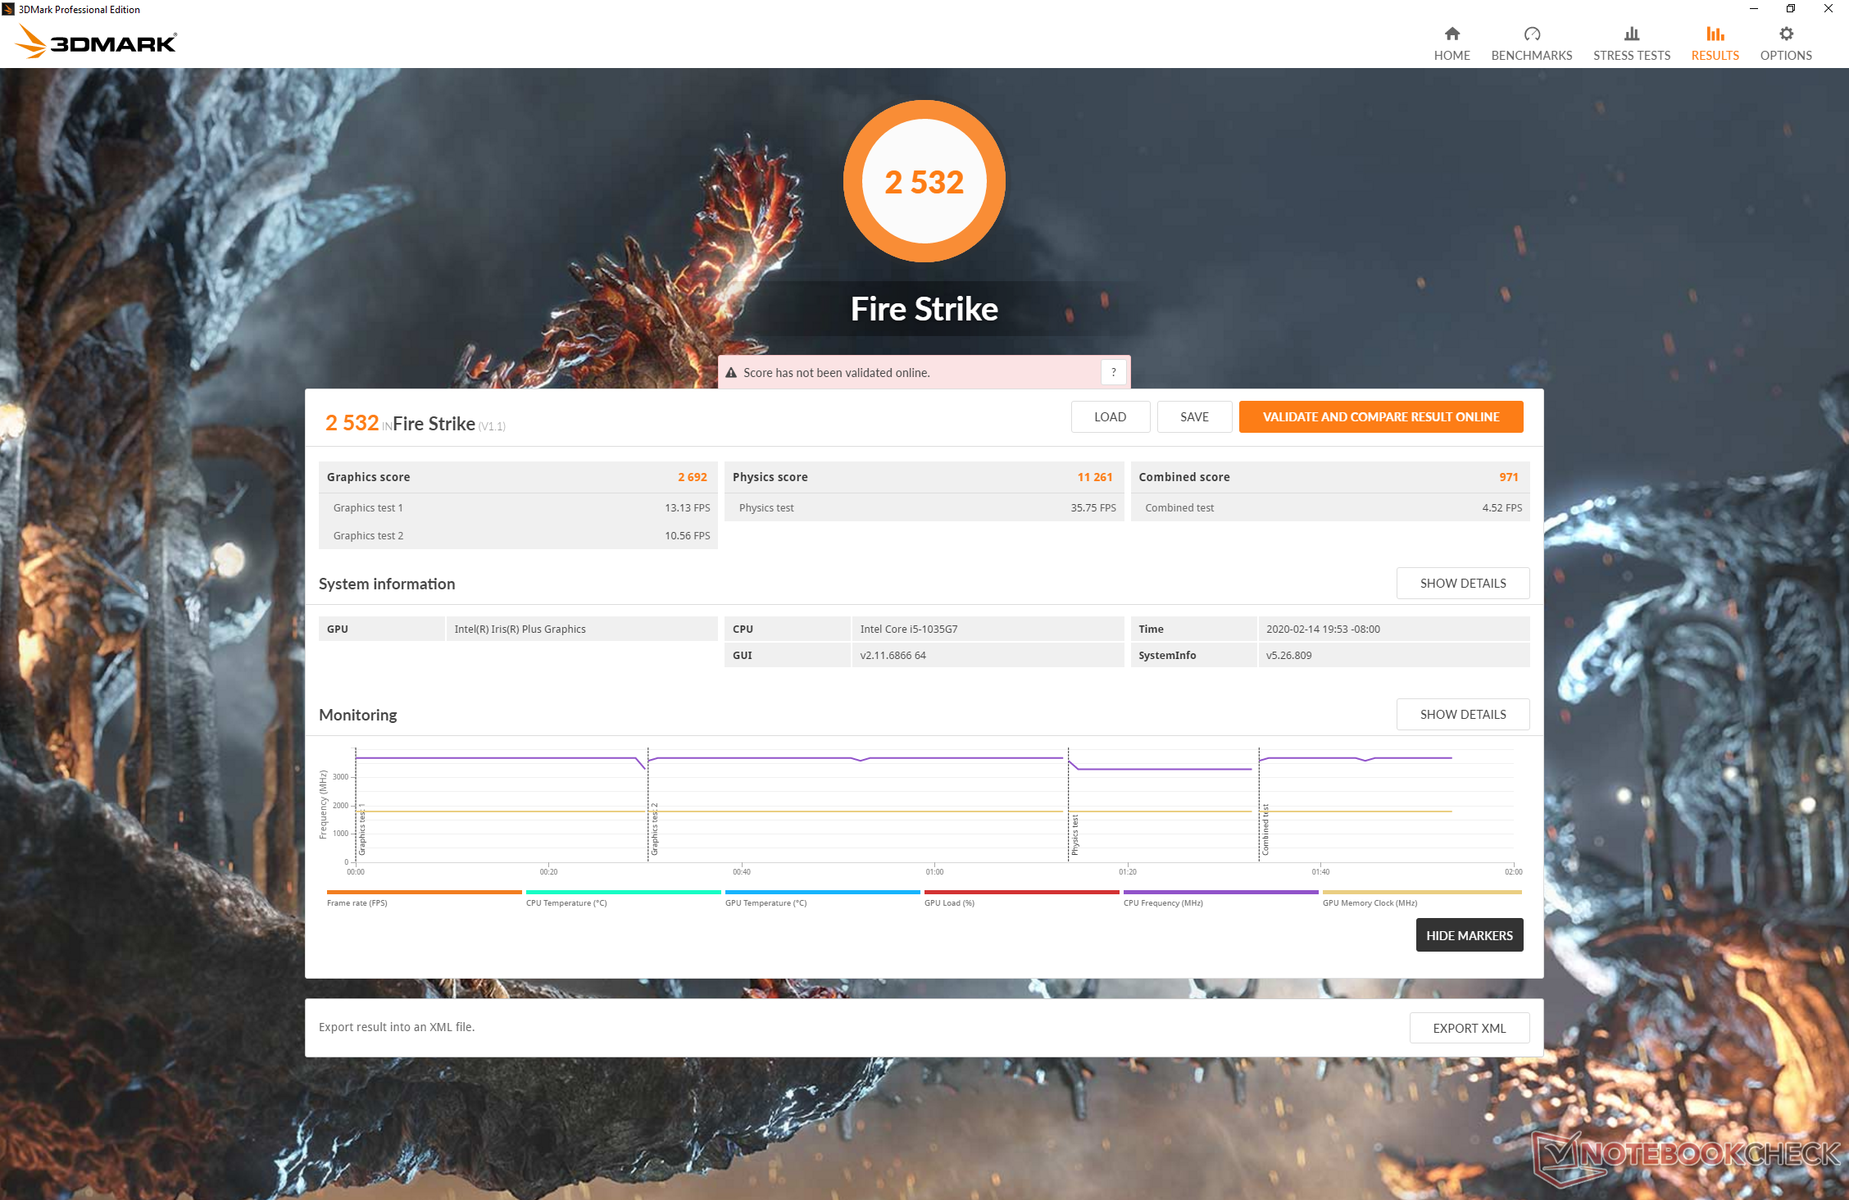
| 3DMark Fire Strike Score | 2532 puan | |
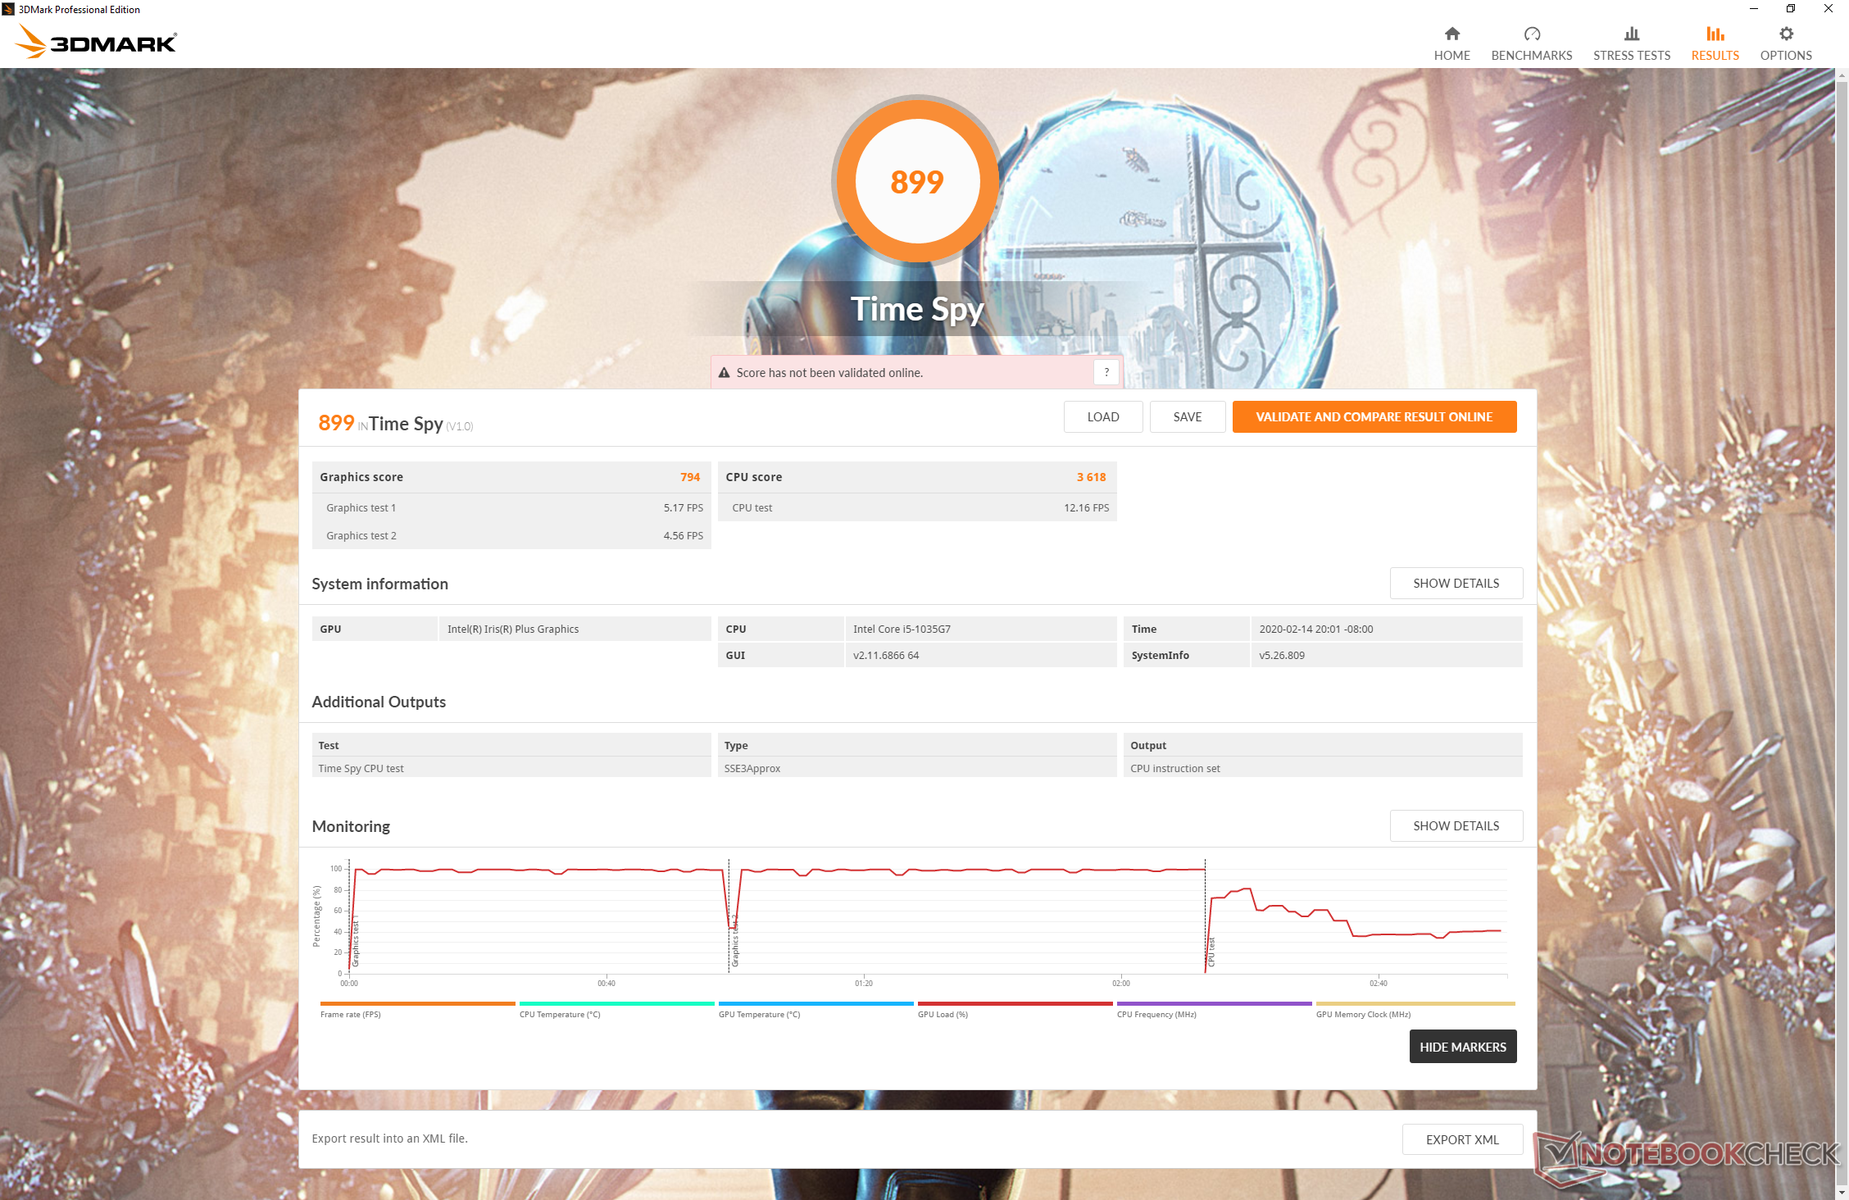
| 3DMark Time Spy Score | 899 puan | |
Yardım | ||
| The Witcher 3 | |
| 1024x768 Low Graphics & Postprocessing | |
| Huawei MateBook 13 i7 | |
| MSI Modern 15 A10RB | |
| Microsoft Surface Laptop 3 15 i7-1065G7 | |
| Dell Inspiron 15 5000 5585 | |
| Microsoft Surface Laptop 3 13 Core i5-1035G7 | |
| Acer Swift 3 SF314-41G-R491 | |
| Ortalama Intel Iris Plus Graphics G7 (Ice Lake 64 EU) (28.2 - 58, n=20) | |
| Microsoft Surface Laptop 3 15 Ryzen 5 3580U | |
| Acer Swift 5 SF514-54T-501U | |
| 1366x768 Medium Graphics & Postprocessing | |
| MSI Modern 15 A10RB | |
| Huawei MateBook 13 i7 | |
| Microsoft Surface Laptop 3 15 i7-1065G7 | |
| Ortalama Intel Iris Plus Graphics G7 (Ice Lake 64 EU) (20.8 - 36.8, n=18) | |
| Microsoft Surface Laptop 3 13 Core i5-1035G7 | |
| Acer Swift 3 SF314-41G-R491 | |
| Acer Swift 5 SF514-54T-501U | |
| Shadow of the Tomb Raider - 1280x720 Lowest Preset | |
| MSI Modern 15 A10RB | |
| Acer Swift 3 SF314-41G-R491 | |
| Dell Inspiron 15 5000 5585 | |
| Microsoft Surface Pro 7 | |
| Microsoft Surface Laptop 3 15 i7-1065G7 | |
| Microsoft Surface Laptop 3 15 Ryzen 5 3580U | |
| Ortalama Intel Iris Plus Graphics G7 (Ice Lake 64 EU) (15.6 - 33, n=13) | |
| Microsoft Surface Laptop 3 13 Core i5-1035G7 | |
| Overwatch | |
| 1280x720 Low (Render Scale 100 %) AA:FX AF:1x | |
| Acer Swift 3 SF314-41G-R491 | |
| Microsoft Surface Laptop 3 15 Ryzen 5 3580U | |
| Microsoft Surface Laptop 3 15 i7-1065G7 | |
| HP Envy x360 15-bq102ng | |
| Ortalama Intel Iris Plus Graphics G7 (Ice Lake 64 EU) (62.6 - 92.7, n=6) | |
| Microsoft Surface Laptop 3 13 Core i5-1035G7 | |
| 1920x1080 High (Render Scale 100 %) AA:SM AF:4x | |
| Acer Swift 3 SF314-41G-R491 | |
| Microsoft Surface Laptop 3 15 Ryzen 5 3580U | |
| Microsoft Surface Laptop 3 15 i7-1065G7 | |
| HP Envy x360 15-bq102ng | |
| Ortalama Intel Iris Plus Graphics G7 (Ice Lake 64 EU) (29.7 - 32.9, n=4) | |
| Microsoft Surface Laptop 3 13 Core i5-1035G7 | |
| düşük | orta | yüksek | ultra | |
|---|---|---|---|---|
| BioShock Infinite (2013) | 89.8 | 60.4 | 50.4 | 19.2 |
| The Witcher 3 (2015) | 49 | 31 | 17 | 8.8 |
| Overwatch (2016) | 62.6 | 44.1 | 30.5 | 19 |
| Rocket League (2017) | 79 | 45.6 | 31.4 | |
| Shadow of the Tomb Raider (2018) | 26 | |||
| Borderlands 3 (2019) | 30.1 |
Emissions
System Noise
Surface Laptop models are generally quiet machines for their category and this latest iteration is no different. Low processing loads like browsing or video streaming illicit no fan activity for a quiet experience. Even running the first benchmark scene of 3DMark 06, which would almost always kick start the fans on most other laptops, resulted in no fan noise from the Surface Laptop 3.
Running higher loads like Witcher 3 or Prime95 for extended periods will finally cause fan noise to climb steadily until a maximum of 40.4 dB(A). This is comparable to the MacBook Pro 13 while being louder than many other Windows Ultrabooks including the Lenovo ThinkPad X1 Carbon and HP EliteBook x360 1040.
We can notice slight electronic noise or coil whine when placing an ear near the keyboard keys on our test unit.
| Microsoft Surface Laptop 3 13 Core i5-1035G7 Iris Plus Graphics G7 (Ice Lake 64 EU), i5-1035G7, SK hynix BC501 HFM256GDGTNG | Apple MacBook Pro 13 2019 2TB3 Iris Plus Graphics 645, i5-8257U, Apple SSD AP0256 | Huawei Matebook X Pro i5 GeForce MX150, i5-8250U, Samsung PM961 MZVLW256HEHP | Microsoft Surface Laptop 2-LQN-00004 UHD Graphics 620, i5-8250U, SK Hynix BC501 NVMe 256 GB | Dell XPS 13 7390 2-in-1 Core i7 Iris Plus Graphics G7 (Ice Lake 64 EU), i7-1065G7, Toshiba BG4 KBG40ZPZ512G | Lenovo ThinkPad X1 Carbon 2019-20QE000VGE UHD Graphics 620, i7-8665U, WDC PC SN720 SDAQNTW-512G | |
|---|---|---|---|---|---|---|
| Noise | -4% | -6% | 2% | -3% | 1% | |
| kapalı / ortam * (dB) | 28.5 | 29.5 -4% | 27.9 2% | 28.7 -1% | 28.1 1% | 28.4 -0% |
| Idle Minimum * (dB) | 28.5 | 29.5 -4% | 27.9 2% | 28.7 -1% | 28.1 1% | 28.4 -0% |
| Idle Average * (dB) | 28.5 | 29.5 -4% | 27.9 2% | 28.7 -1% | 28.1 1% | 28.4 -0% |
| Idle Maximum * (dB) | 28.5 | 29.5 -4% | 27.9 2% | 28.7 -1% | 28.1 1% | 28.6 -0% |
| Load Average * (dB) | 28.5 | 31.1 -9% | 36.2 -27% | 30 -5% | 31.7 -11% | 31.5 -11% |
| Witcher 3 ultra * (dB) | 40.4 | 45 -11% | 43.4 -7% | |||
| Load Maximum * (dB) | 40.4 | 39.3 3% | 45.2 -12% | 32.9 19% | 43.4 -7% | 33.1 18% |
* ... daha küçük daha iyidir
Ses yüksekliği
| Boşta |
| 28.5 / 28.5 / 28.5 dB |
| Çalışırken |
| 28.5 / 40.4 dB |
 | ||
30 dB sessiz 40 dB(A) duyulabilirlik 50 dB(A) gürültülü |
||
min: | ||
Temperature
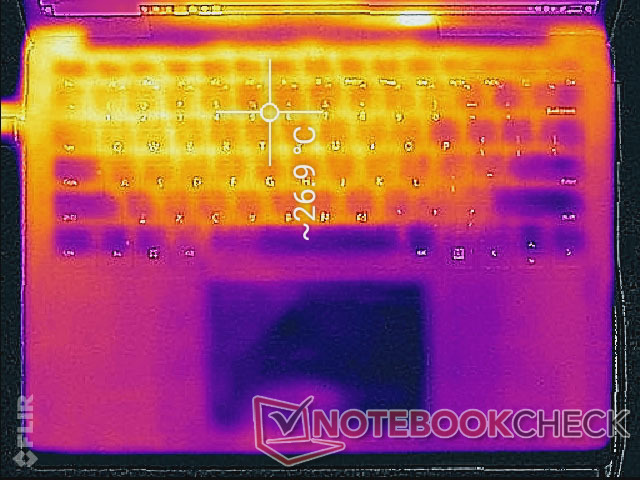
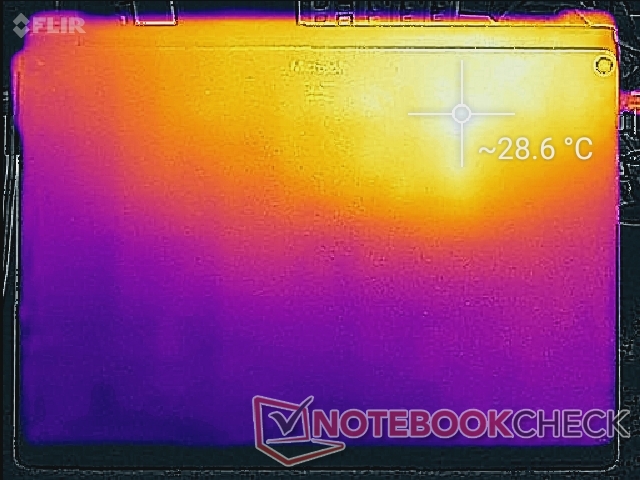
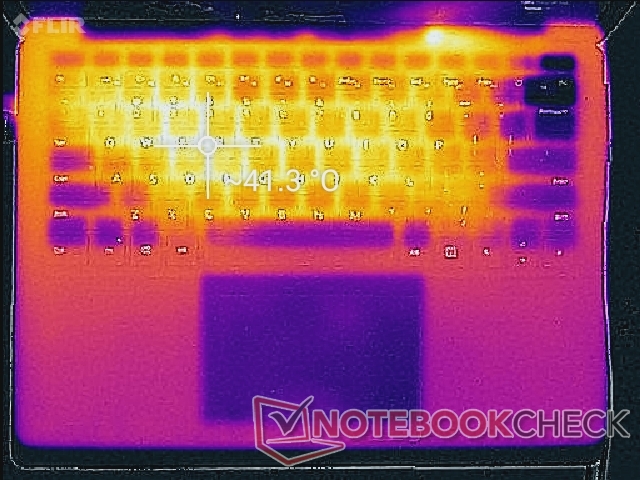
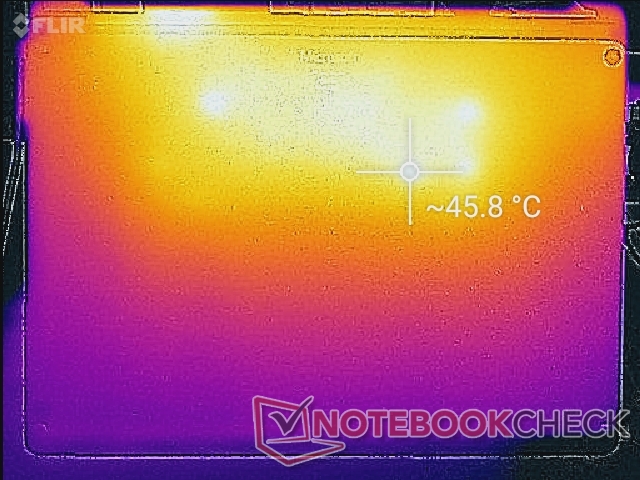
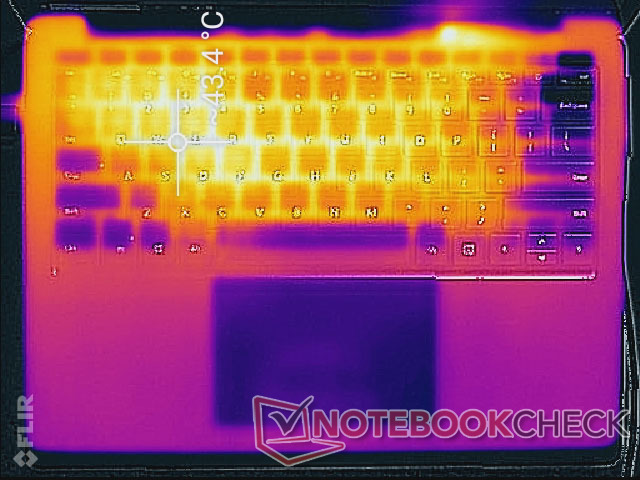
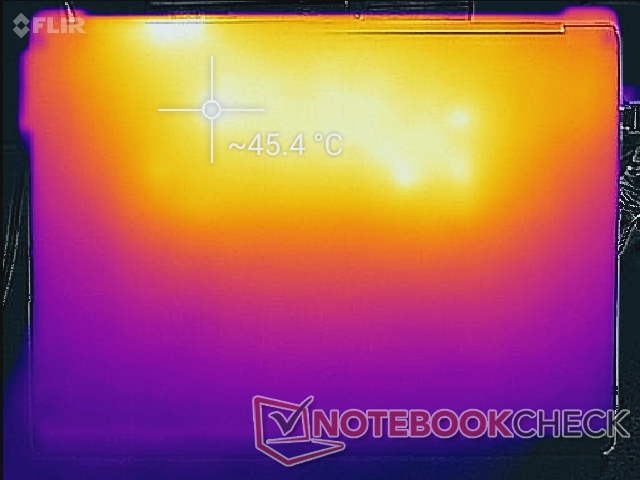
Are surface temperatures on the metal Surface Laptop 3 13.5 warmer than the surfaces of the Alcantara Surface Laptop 2? Yes. When idling, average surface temperature on the top and bottom of the metal Surface Laptop 3 is about 26 C to 27 C compared to 23 C on the Surface Laptop 2. When subjected to extreme processing loads, average surface temperatures on the metal Surface Laptop 3 are again warmer. The palm rests, for example, can become as warm as 35 C compared to only 29 C on the Surface Laptop 2. Cooler temperatures would be preferable especially since the hot spots on the keyboard keys and bottom panel are so large as shown by our temperature maps below. Microsoft's insistence on having as few ventilation grilles as possible is a likely culprit.
The Dell XPS 13 2-in-1 runs even warmer than our Surface at 46 C to 51 C when under similar heavy loads. It's even smaller and thinner than the Microsoft laptop, after all.
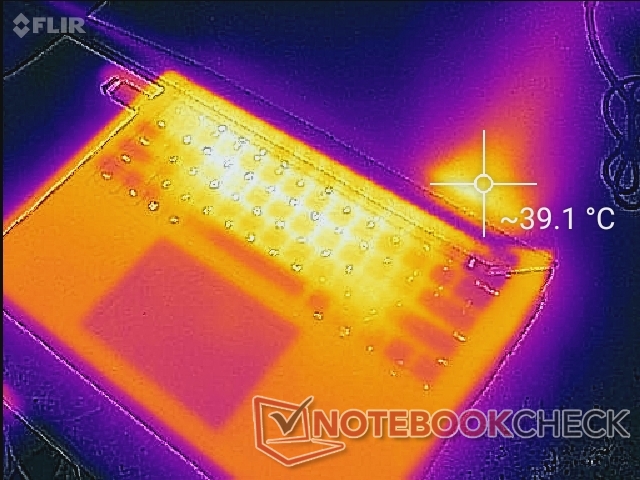
(±) Üst taraftaki maksimum sıcaklık, 34.3 °C / 94 F ortalamasına kıyasla 42.6 °C / 109 F'dir. , Office sınıfı için 21.2 ile 62.5 °C arasında değişir.
(-) Alt kısım, 36.8 °C / 98 F ortalamasına kıyasla maksimum 45.4 °C / 114 F'ye kadar ısınır
(+) Boşta kullanımda, üst tarafın ortalama sıcaklığı 25.5 °C / 78 F olup, cihazın 29.5 °C / 85 F.
(±) The Witcher 3 oynarken, üst tarafın ortalama sıcaklığı 34.8 °C / 95 F olup, cihazın 29.5 °C / 85 F.
(+) Avuç içi dayanakları ve dokunmatik yüzey maksimum (35.2 °C / 95.4 F) cilt sıcaklığına ulaşıyor ve bu nedenle sıcak değil.
(-) Benzer cihazların avuç içi dayanağı alanının ortalama sıcaklığı 27.5 °C / 81.5 F (-7.7 °C / -13.9 F) idi.
Stress Test
We stress the system with synthetic loads to identify for any potential throttling or stability issues. When running Prime95 to stress the CPU, core clock rates can be observed running at 3.3 GHz for about 20 seconds until hitting a core temperature of 82 C. Thereafter, clock rates and core temperature would drop to 2.4 GHz and 69 C, respectively. Core temperature slowly rises again until hitting 80 C where clock rates will then drop further to a stable 2.2 to 2.3 GHz range in order to maintain a final core temperature of 75 C.
Running Prime95 and FurMark simultaneously will throttle the CPU and GPU to 1.0 GHz and 650 MHz, respectively. When running Witcher 3, GPU clock rate and CPU temperature stabilize at 950 MHz and 71 C, respectively, compared to 1100 MHz and 79 C on the Dell XPS 13 2-in-1 with the faster Core i7-1065G7.
Performance will not be reduced if running on battery power. A 3DMark 11 run on batteries returns Physics and Graphics scores of 9031 and 4287 points, respectively, compared to 8880 and 4279 points when on mains.
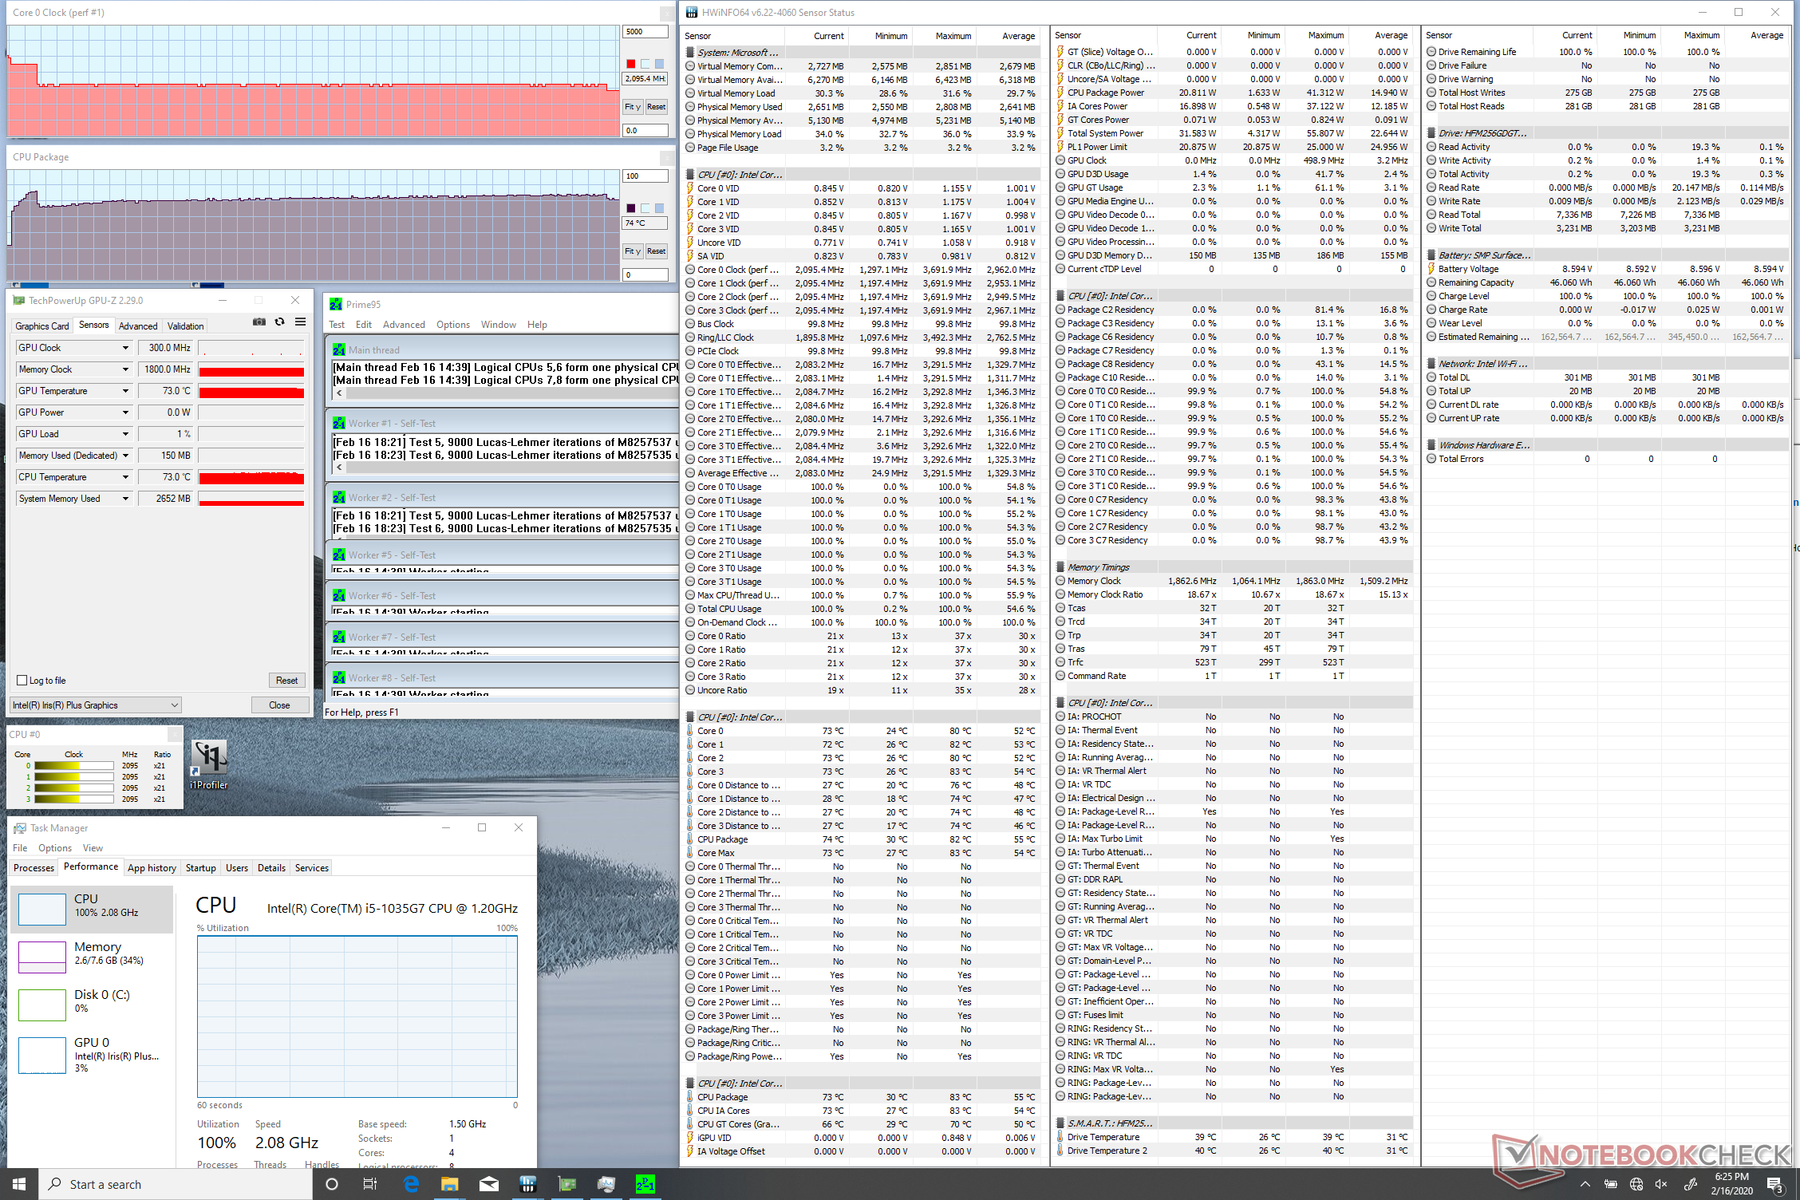
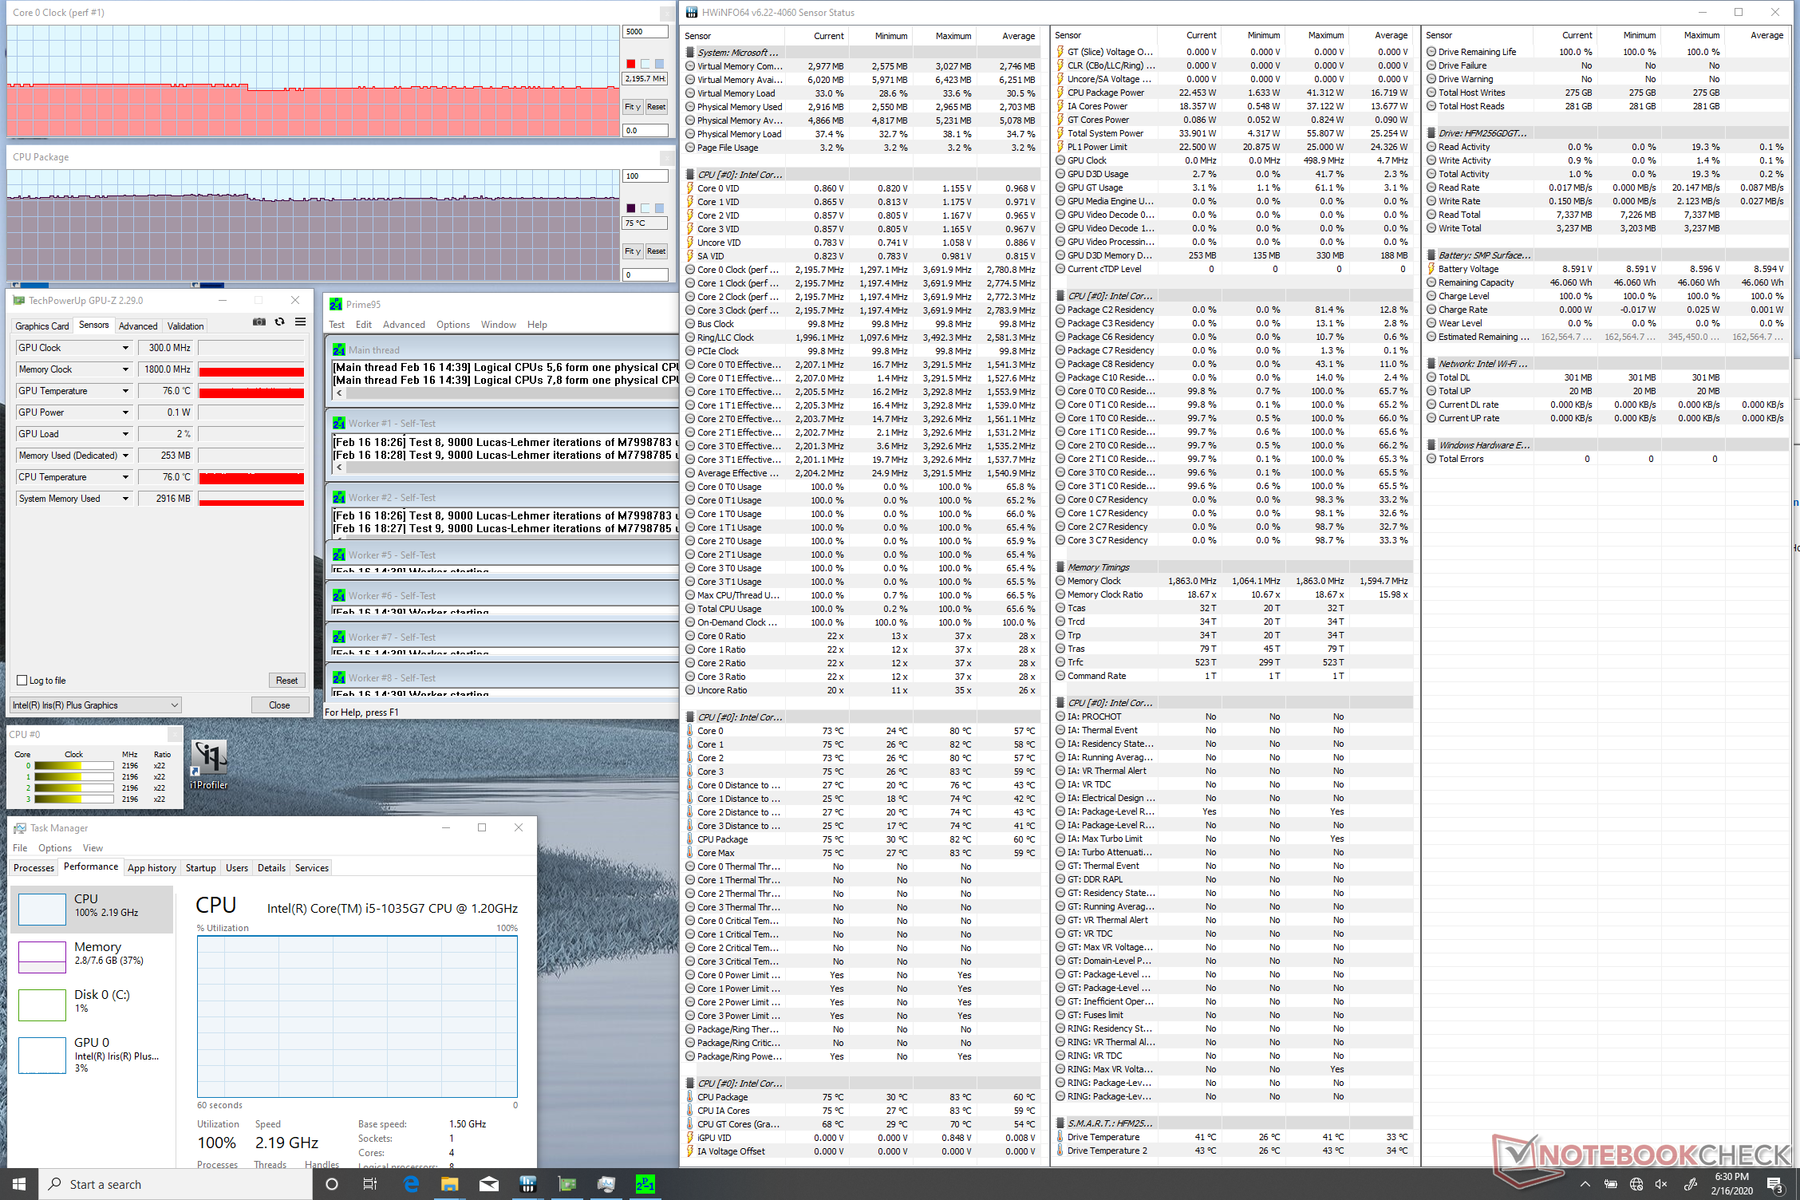
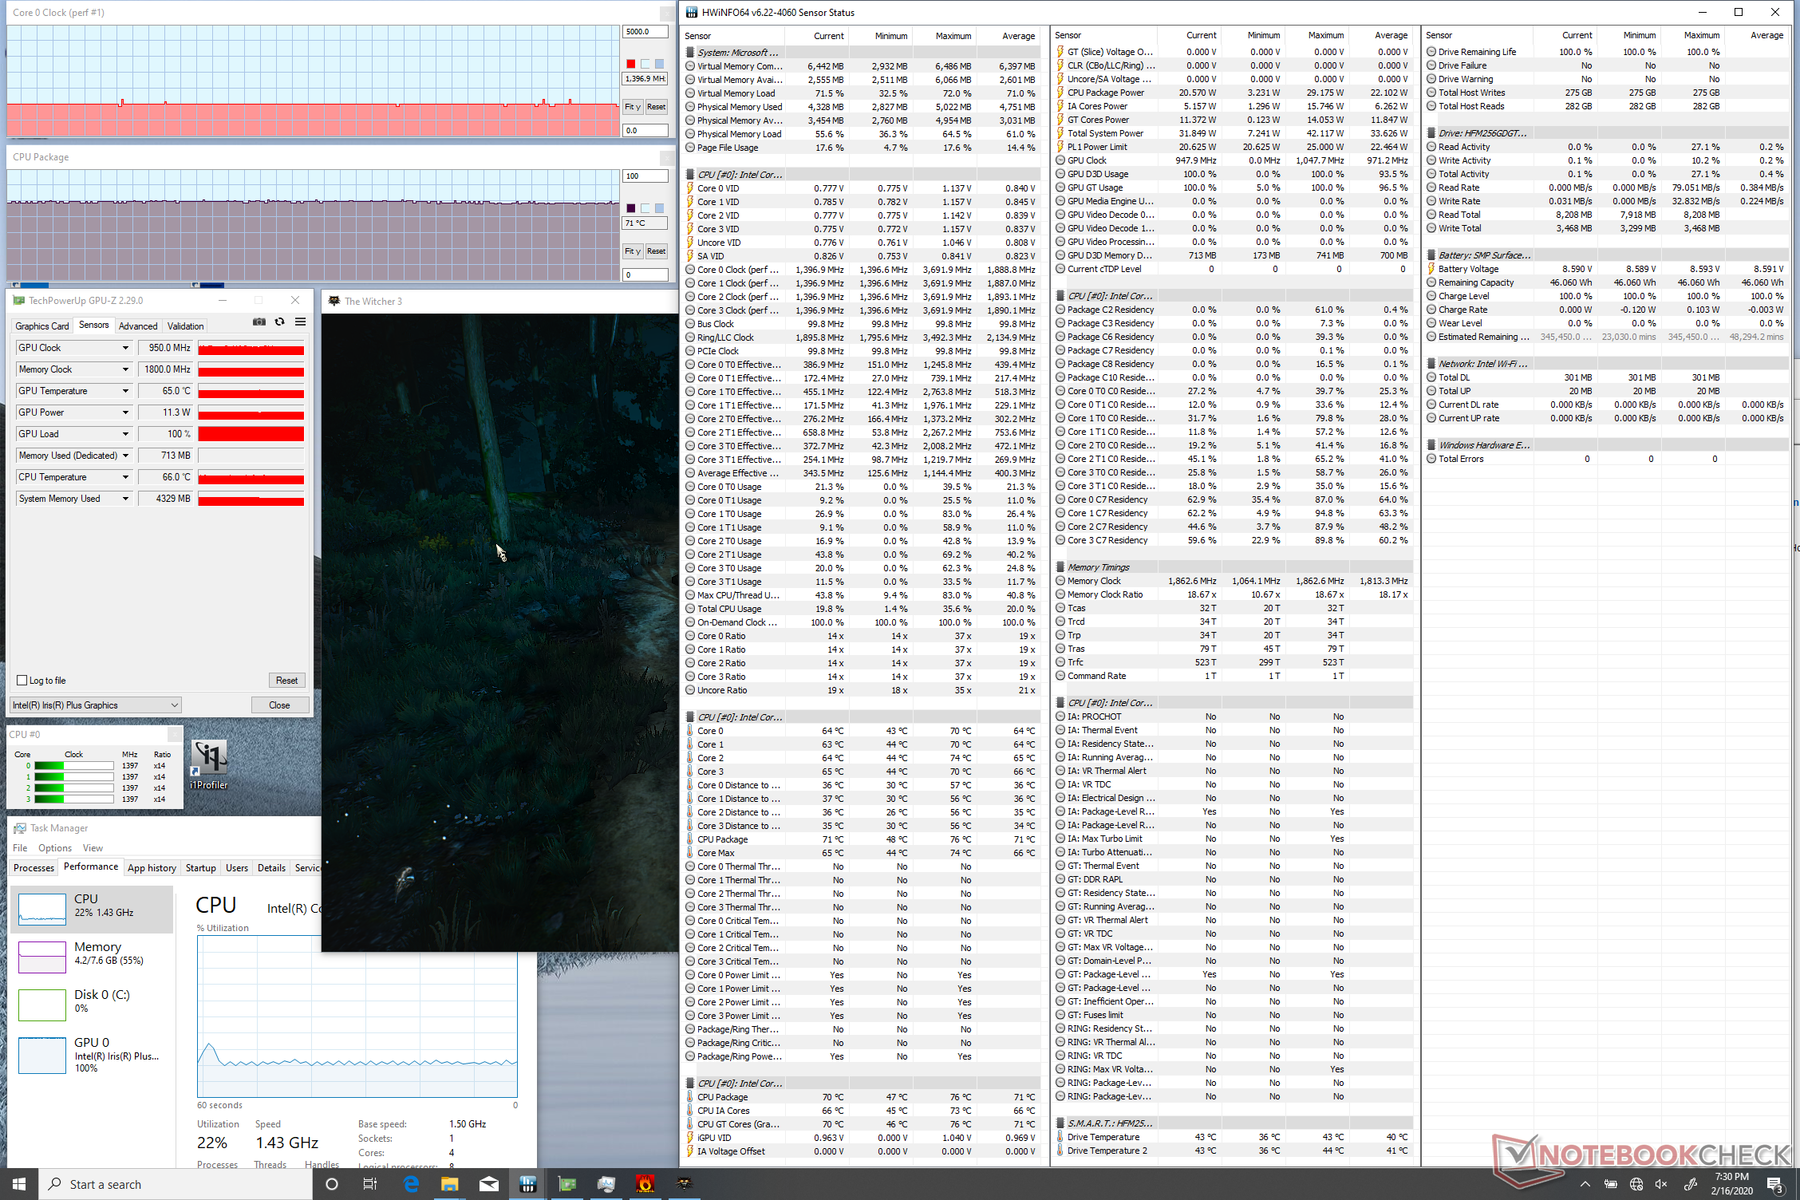
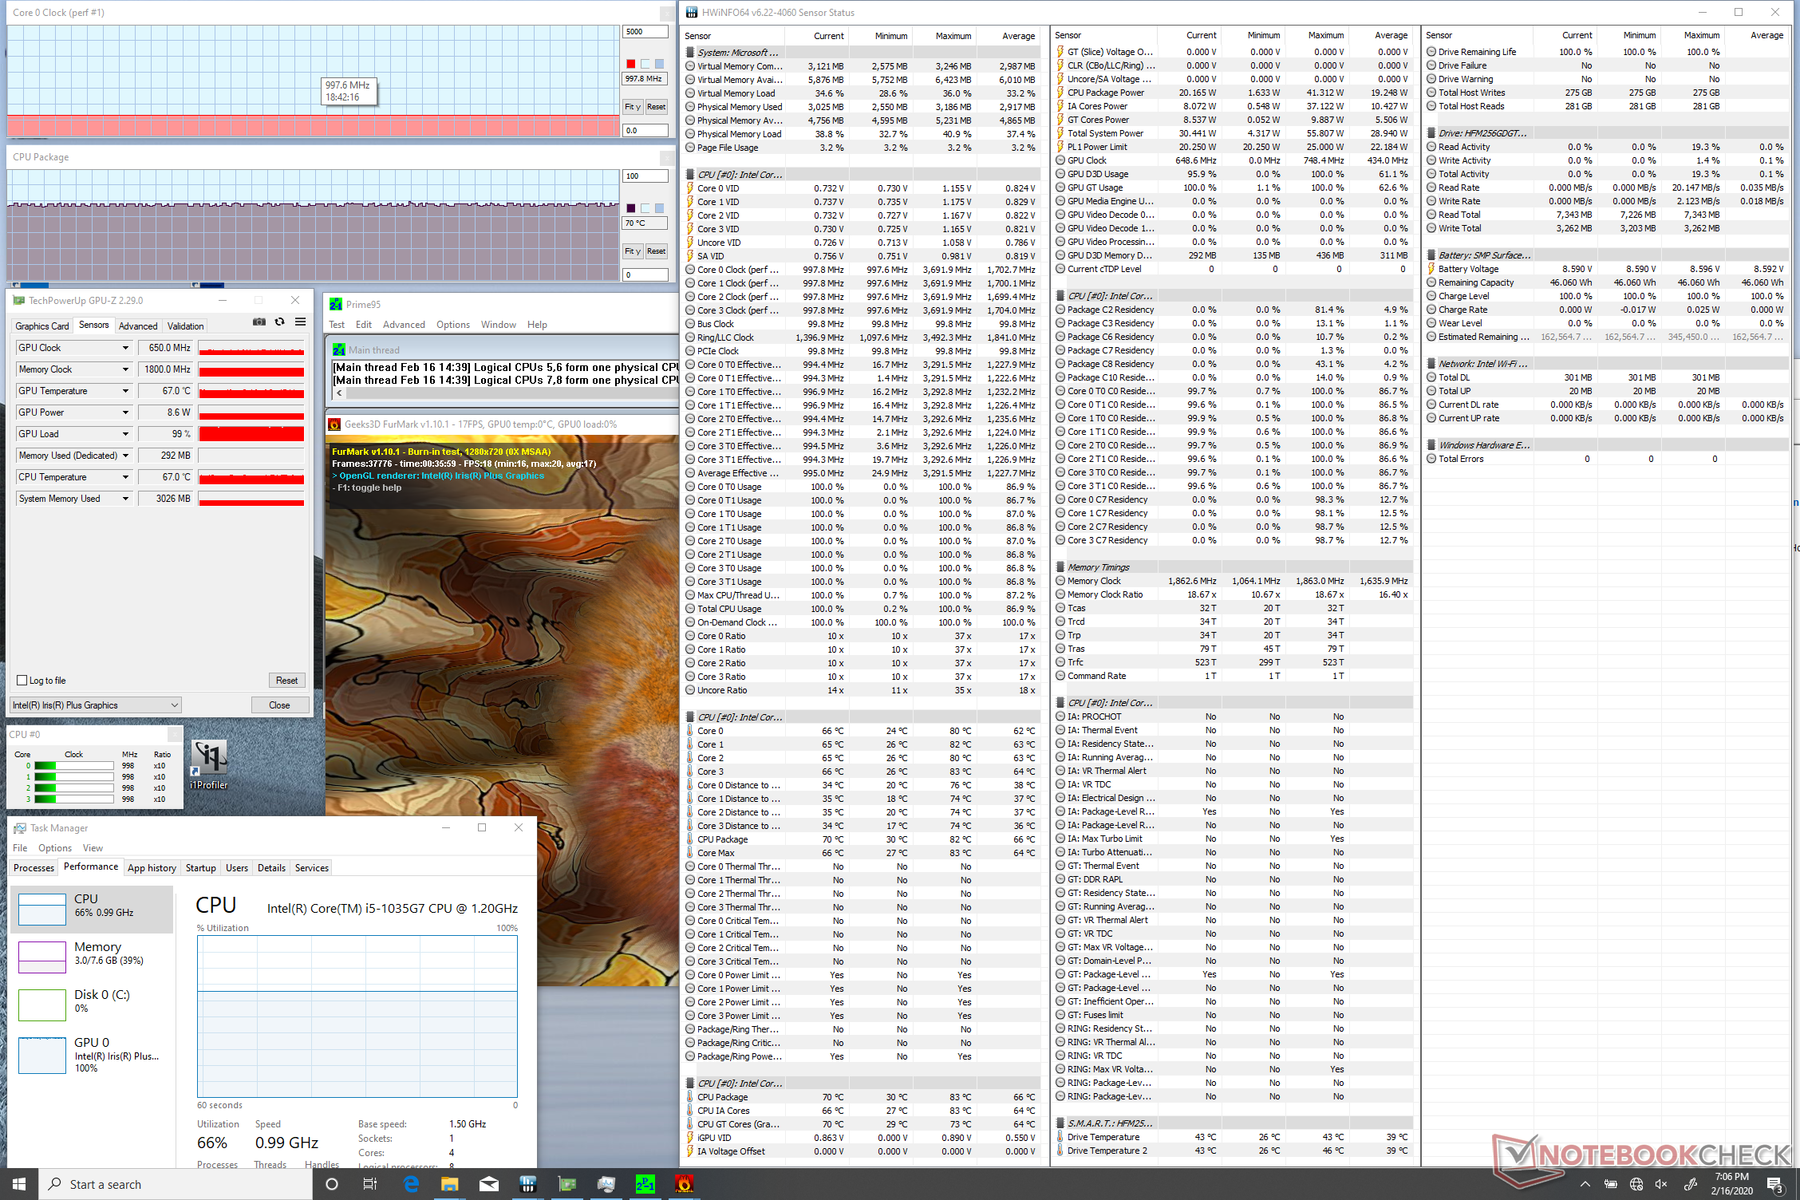
| CPU Clock (GHz) | GPU Clock (MHz) | Average CPU Temperature (°C) | Average GPU Temperature (°C) | |
| System Idle | -- | -- | 32 | 28 |
| Prime95 Stress | 2.2 - 2.3 | -- | 75 | -- |
| Prime95 + FurMark Stress | 1.0 | 650 | 70 | 67 |
| Witcher 3 Stress | 1.4 | 950 | 71 | 65 |
Speakers
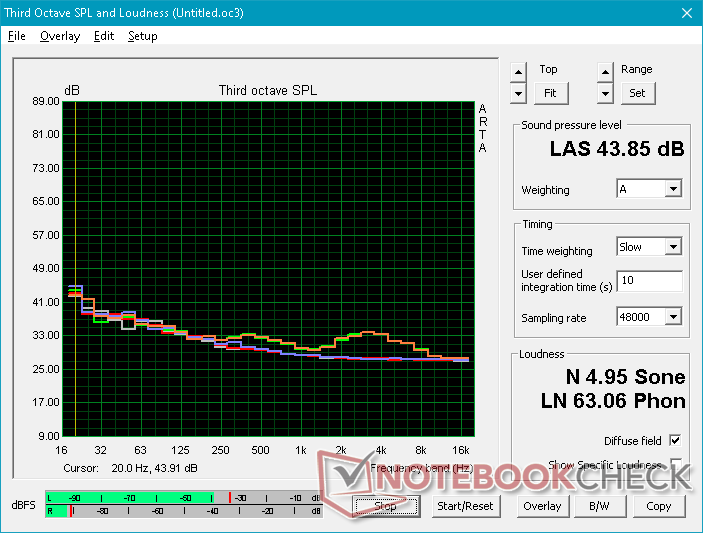
Audio quality is identical to the larger 15-inch Surface Laptop 3 as exemplified by their near-identical pink noise graphs below. Even their maximum volumes are about the same. Playback is relatively balanced and better than expected from a subnotebook with only slight vibrations on the palm rests at high volume settings.
")
")
Microsoft Surface Laptop 3 13 Core i5-1035G7 ses analizi
(±) | hoparlör ses yüksekliği ortalama ama iyi (79 dB)
Bas 100 - 315Hz
(+) | iyi bas - medyandan yalnızca 4.2% uzakta
(±) | Bas doğrusallığı ortalamadır (10.5% delta - önceki frekans)
Ortalar 400 - 2000 Hz
(+) | dengeli ortalar - medyandan yalnızca 3.6% uzakta
(±) | Ortaların doğrusallığı ortalamadır (7.1% delta - önceki frekans)
Yüksekler 2 - 16 kHz
(+) | dengeli yüksekler - medyandan yalnızca 1.8% uzakta
(+) | yüksekler doğrusaldır (6.5% deltadan önceki frekansa)
Toplam 100 - 16.000 Hz
(+) | genel ses doğrusaldır (11.4% ortancaya göre fark)
Aynı sınıfla karşılaştırıldığında
» Bu sınıftaki tüm test edilen cihazların %3%'si daha iyi, 2% benzer, 95% daha kötüydü
» En iyisinin deltası 7% idi, ortalama 21% idi, en kötüsü 53% idi
Test edilen tüm cihazlarla karşılaştırıldığında
» Test edilen tüm cihazların %7'si daha iyi, 2 benzer, % 91 daha kötüydü
» En iyisinin deltası 4% idi, ortalama 24% idi, en kötüsü 134% idi
Apple MacBook 12 (Early 2016) 1.1 GHz ses analizi
(+) | hoparlörler nispeten yüksek sesle çalabilir (83.6 dB)
Bas 100 - 315Hz
(±) | azaltılmış bas - ortalama olarak medyandan 11.3% daha düşük
(±) | Bas doğrusallığı ortalamadır (14.2% delta - önceki frekans)
Ortalar 400 - 2000 Hz
(+) | dengeli ortalar - medyandan yalnızca 2.4% uzakta
(+) | orta frekanslar doğrusaldır (5.5% deltadan önceki frekansa)
Yüksekler 2 - 16 kHz
(+) | dengeli yüksekler - medyandan yalnızca 2% uzakta
(+) | yüksekler doğrusaldır (4.5% deltadan önceki frekansa)
Toplam 100 - 16.000 Hz
(+) | genel ses doğrusaldır (10.2% ortancaya göre fark)
Aynı sınıfla karşılaştırıldığında
» Bu sınıftaki tüm test edilen cihazların %7%'si daha iyi, 2% benzer, 91% daha kötüydü
» En iyisinin deltası 5% idi, ortalama 18% idi, en kötüsü 53% idi
Test edilen tüm cihazlarla karşılaştırıldığında
» Test edilen tüm cihazların %5'si daha iyi, 1 benzer, % 94 daha kötüydü
» En iyisinin deltası 4% idi, ortalama 24% idi, en kötüsü 134% idi
Energy Management
Power Consumption
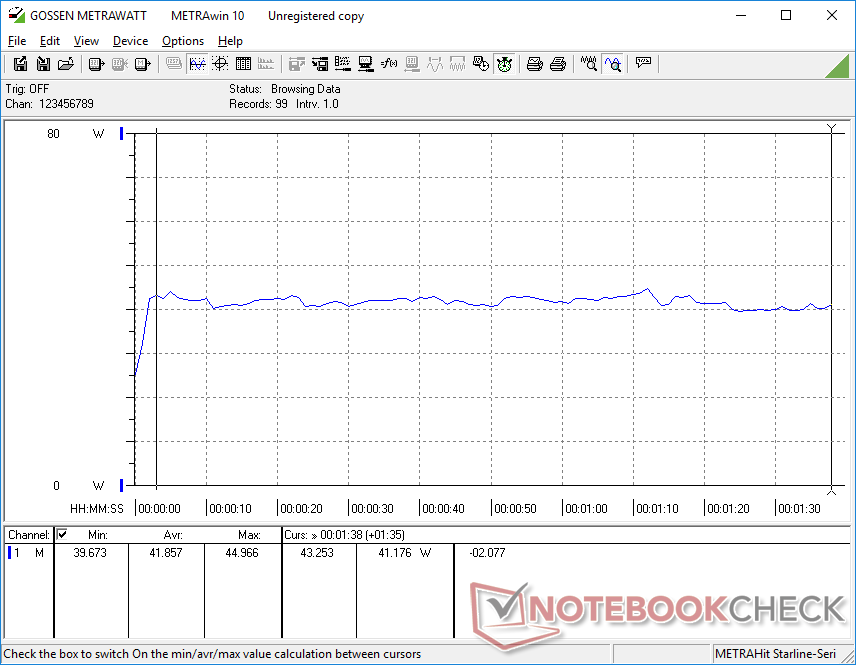
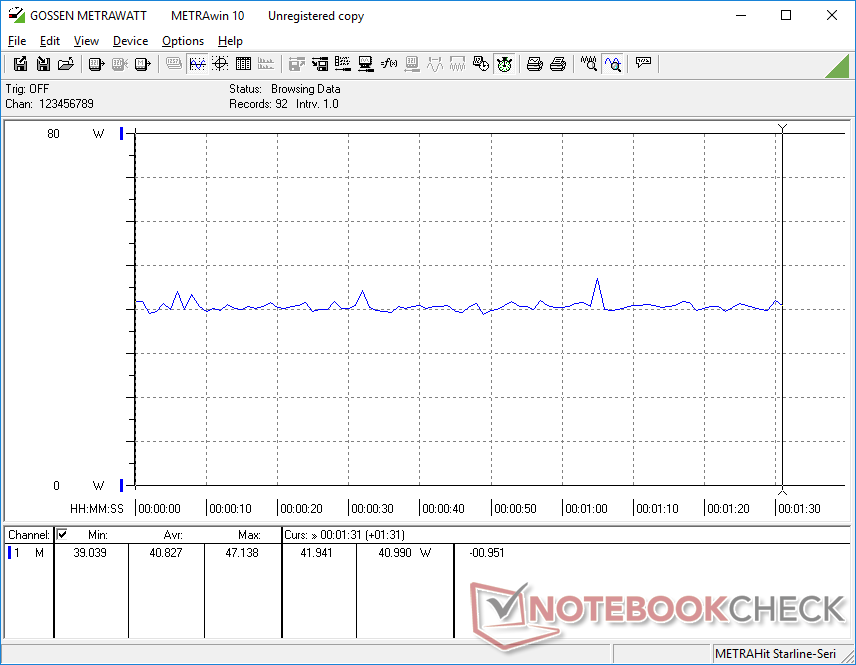
The system consumes about the same power as the Surface Laptop 3 15 Core i7 while being more power-hungry than the Surface Laptop 2. Idling on desktop consumes around 4 W when the brightness is set to minimum or almost 8 W when the brightness is set to maximum. Running 3DMark 06 averages 42 W to be nearly the same as the MacBook Pro 13 or Lenovo ThinkPad X1 Carbon while offering much faster GPU performance than both.
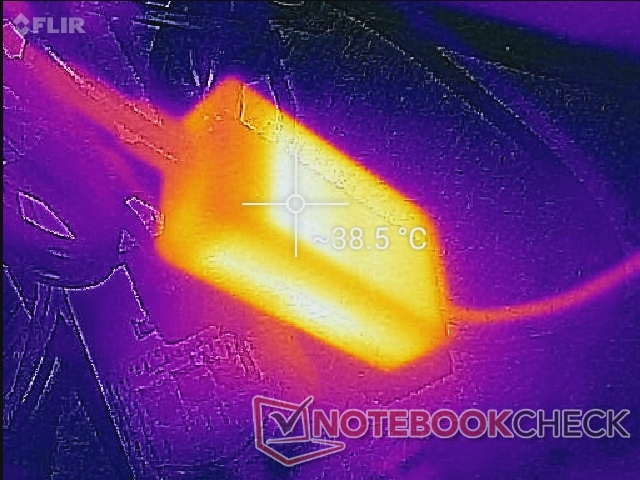
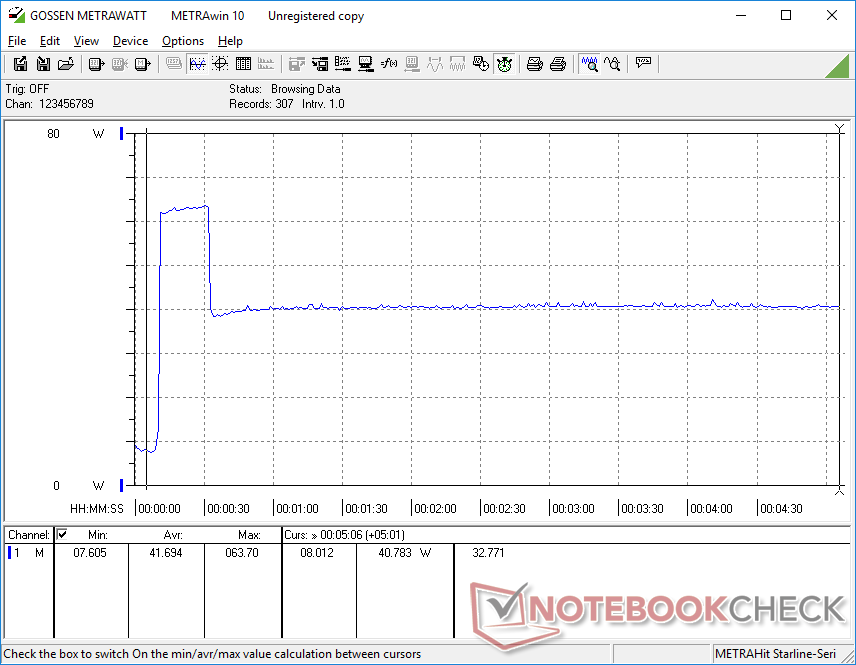
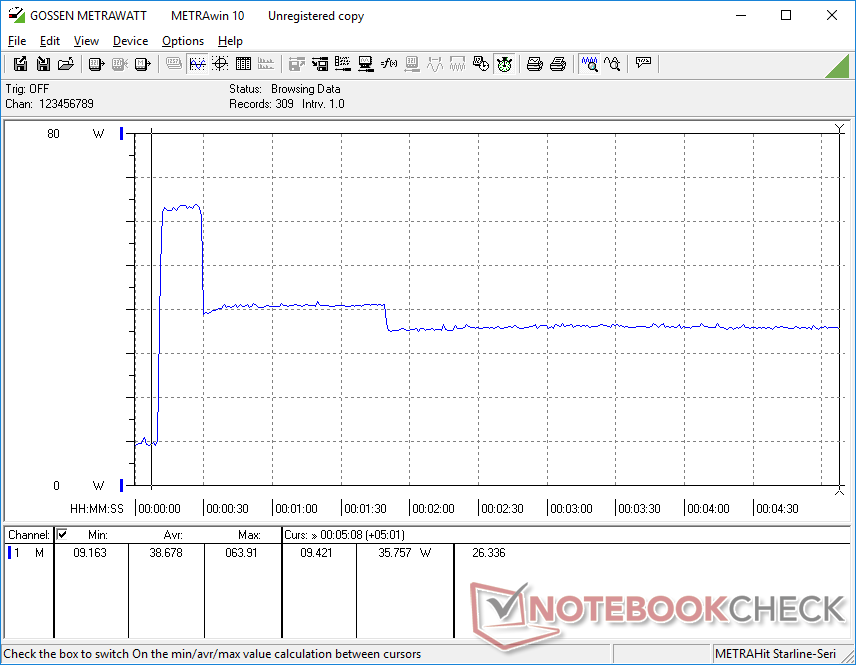
We're able to record a maximum consumption of 63.9 W from the small (~9 x 5 x 2.5 cm) 65 W AC adapter when running both Prime95 and FurMark simultaneously. However, this high of a consumption rate lasts for only about 20 seconds before falling and stabilizing at just 35.8 W instead due to thermal limits as shown by our graphs below.
| Kapalı / Bekleme modu | |
| Boşta | |
| Çalışırken |
|
Key:
min: | |
| Microsoft Surface Laptop 3 13 Core i5-1035G7 i5-1035G7, Iris Plus Graphics G7 (Ice Lake 64 EU), SK hynix BC501 HFM256GDGTNG, IPS, 2256x1504, 13.5" | Apple MacBook Pro 13 2019 2TB3 i5-8257U, Iris Plus Graphics 645, Apple SSD AP0256, IPS, 2560x1600, 13.3" | Huawei Matebook X Pro i5 i5-8250U, GeForce MX150, Samsung PM961 MZVLW256HEHP, IPS, 3000x2000, 13.9" | Microsoft Surface Laptop 2-LQN-00004 i5-8250U, UHD Graphics 620, SK Hynix BC501 NVMe 256 GB, IPS, 2256x1504, 13.5" | Dell XPS 13 7390 2-in-1 Core i7 i7-1065G7, Iris Plus Graphics G7 (Ice Lake 64 EU), Toshiba BG4 KBG40ZPZ512G, IPS, 1920x1200, 13.4" | Lenovo ThinkPad X1 Carbon 2019-20QE000VGE i7-8665U, UHD Graphics 620, WDC PC SN720 SDAQNTW-512G, IPS, 2560x1440, 14" | |
|---|---|---|---|---|---|---|
| Power Consumption | 12% | -12% | 16% | 16% | 6% | |
| Idle Minimum * (Watt) | 4.4 | 2.1 52% | 3.5 20% | 3 32% | 2.6 41% | 3 32% |
| Idle Average * (Watt) | 7.5 | 6.9 8% | 8.9 -19% | 6.8 9% | 5.3 29% | 6.3 16% |
| Idle Maximum * (Watt) | 7.8 | 7.8 -0% | 12.3 -58% | 8.76 -12% | 7 10% | 8.9 -14% |
| Load Average * (Watt) | 41.9 | 42 -0% | 54.2 -29% | 35.1 16% | 43.1 -3% | 40.8 3% |
| Witcher 3 ultra * (Watt) | 40.8 | 42.4 -4% | 43.1 -6% | |||
| Load Maximum * (Watt) | 63.9 | 64.5 -1% | 52.1 18% | 42.6 33% | 49 23% | 67.5 -6% |
* ... daha küçük daha iyidir
Battery Life
Internal battery capacity remains at 45 Wh to be the same as it was on the Surface Laptop 2. Runtimes aren't necessarily longer this time around at just over 8 hours of real-world WLAN use compared to 9 hours on the last gen model. If simply idling on desktop, however, the system can last for almost 35 hours not unlike what we discovered on the Ice Lake-powered 15-inch Surface Laptop 3. The MacBook Pro 13, Huawei MateBook X Pro, and Dell XPS 13 2-in-1 can all last for longer than the Surface Laptop 3 13.5 when under real-world browsing loads.
Recharging from empty to full capacity with the included Surface Connect adapter takes about 1.5 hours. Connecting our third party USB Type-C charger also works.
| Microsoft Surface Laptop 3 13 Core i5-1035G7 i5-1035G7, Iris Plus Graphics G7 (Ice Lake 64 EU), 45 Wh | Apple MacBook Pro 13 2019 2TB3 i5-8257U, Iris Plus Graphics 645, 58.2 Wh | Huawei Matebook X Pro i5 i5-8250U, GeForce MX150, 57.4 Wh | Microsoft Surface Laptop 2-LQN-00004 i5-8250U, UHD Graphics 620, 45 Wh | Dell XPS 13 7390 2-in-1 Core i7 i7-1065G7, Iris Plus Graphics G7 (Ice Lake 64 EU), 51 Wh | Lenovo ThinkPad X1 Carbon 2019-20QE000VGE i7-8665U, UHD Graphics 620, 51 Wh | |
|---|---|---|---|---|---|---|
| Pil Çalışma Süresi | 57% | -4% | -15% | 8% | -14% | |
| Reader / Idle (h) | 34.4 | 20.7 -40% | 20.8 -40% | |||
| WiFi v1.3 (h) | 8.3 | 13 57% | 9.3 12% | 9.1 10% | 9 8% | 8.2 -1% |
| Load (h) | 1.9 | 2.2 16% | 1.6 -16% | 1.4 -26% |
Artılar
Eksiler
Verdict
The Surface Laptop 3 is stuck between a generalist consumer Ultrabook and a professional laptop as it doesn't excel in any particular category. More well-known Ultrabooks like the Dell XPS 13 2-in-1, HP Spectre 13, or Huawei MateBook X Pro have brighter displays or faster dedicated GPUs than the Microsoft laptop while "proper" professional laptops like the Lenovo ThinkPad X1 Carbon or HP EliteBook x360 1040 are easier to service and have more integrated ports. The system feels barebones and even outdated as a result despite sporting the latest 10th gen Intel CPU.
On the other hand, what's here is excellent considering the $1000 price tag. The metal chassis is stronger than Alcantara, the glossy display is well-calibrated, audio quality is good for the size, and fan noise is minimal under most conditions. You might like the Surface Laptop 3 if you don't mind its laundry list of missing features commonly found on most other Windows Ultrabooks.
Perhaps it's time for Microsoft to fully refresh the three-year old chassis design and incorporate more compelling hardware features. The Huawei MateBook X Pro is an excellent alternative to the 13.5-inch Surface Laptop 3 as it offers better serviceability, a larger 3:2 screen size, GeForce MX graphics, and Thunderbolt 3 connectivity all in a smaller chassis.
Microsoft Surface Laptop 3 13 Core i5-1035G7
- 02/23/2020 v7 (old)
Allen Ngo
Price comparison
