Apple MacBook Pro 14 2023 M3 Max İncelemesi - 14 inç dizüstü bilgisayardaki en hızlı CPU
MacBook Pro 14'ün M3 SoC tabanlı yeni giriş seviyesi modelinden sonra (burada gözden geçirme), yeni üst düzey modeli inceliyoruz. Apple, MacBook Pro 14 için 16 CPU çekirdeğinin yanı sıra 40 GPU çekirdeğine sahip en hızlı M3 Max dahil olmak üzere her iki M3 Max sürümünü de sunuyor. M3 Max'in (özellikle CPU) aşırı performansını yeni MacBook Pro 14'te zaten görmüştük MacBook Pro 16ancak 14 inçlik küçük modelin soğutma çözümünün M3 Max'i de idare edip edemeyeceğini öğrenmek için sabırsızlanıyoruz.
| MBP 14 M3 | MBP 14 M3 Pro | MBP 14 M3 Pro | MBP 14 M3 Max | MBP 14 M3 Max | |
|---|---|---|---|---|---|
| CPU | Apple M3 8 çekirdekli CPU (4P & 4E) |
Apple M3 Pro 11 çekirdekli CPU (5P & 6E) |
Apple M3 Pro 12 çekirdekli (6P & 6 E) |
Apple M3 Max çekirdekli CPU (10P & 4E) |
Apple M3 Max 16 çekirdekli (12P & 4E) |
| GPU | 10-çekirdekli GPU | 14-çekirdekli GPU | 18-çekirdekli | 30-çekirdekli | 40-çekirdekli |
| RAM | 8 GB (16/24 GB) | 18 GB (36 GB) | 18 GB (36 GB) | 36 GB (96 GB) | 48 GB (64/128 GB) |
| SSD | 512 GB (1/2 TB) | 512 GB (1/2/4 TB) | 1 TB (2/4 TB) | 1 TB (2/4/8 TB) | 1 TB (2/4/8 TB) |
| Bellek Bant Genişliği | 100 GB/s | 150 GB/s | 150 GB/s | 300 GB/s | 400 GB/s |
| Bağlantı Noktaları | 2x USB-C 4.0 w/ Thunderbolt 3 HDMI, SD kart okuyucu |
3x USB-C 4.0 w/ Thunderbolt 4 HDMI, SD kart okuyucu |
3x USB-C 4.0 w/ Thunderbolt 4 HDMI, SD kart okuyucu |
3x USB-C 4.0 w/ Thunderbolt 4 HDMI, SD kart okuyucu |
3x USB-C 4.0 w/ Thunderbolt 4 HDMI, SD kart okuyucu |
| Fiyat | $1599'dan | $1999'dan | $2399'dan | $3199'dan | $3699'dan |
İnceleme birimimiz MacBook Pro 14, 64 GB RAM ve 2 TB SSD depolama alanıyla birlikte en hızlı M3 Max'i kullanıyor ve bu da fiyatı 4299 dolara çıkarıyor. Üst düzey multimedya dizüstü bilgisayarlara ek olarak, karşılaştırma grubumuz için iki oyun dizüstü bilgisayarı da kullandık. Her ikisi deAsus ROG Zephyrus G14yanı sıraRazer Blade 14çok iyi ekranlarla birlikte güçlü bileşenler sunar, bu nedenle içerik oluşturucular için de ilginç seçeneklerdir.
Karşılaştırmalı olarak olası rakipler
Derecelendirme | Tarih | Modeli | Ağırlık | Yükseklik | Boyut | Çözünürlük | Fiyat |
|---|---|---|---|---|---|---|---|
| 92.8 % v7 (old) | 11/2023 | Apple MacBook Pro 14 2023 M3 Max Apple M3 Max 16-Core, M3 Max 40-Core GPU | 1.6 kg | 15.5 mm | 14.20" | 3024x1964 | |
| 85.5 % v7 (old) | 10/2023 | Microsoft Surface Laptop Studio 2 RTX 4060 i7-13700H, GeForce RTX 4060 Laptop GPU | 2 kg | 22 mm | 14.40" | 2400x1600 | |
| 89.8 % v7 (old) | 11/2023 | Lenovo Yoga Pro 9-14IRP G8 i7-13705H, GeForce RTX 4050 Laptop GPU | 1.7 kg | 17.6 mm | 14.50" | 3072x1920 | |
| 89.3 % v7 (old) | 07/2023 | Asus Zenbook Pro 14 OLED UX6404VI i9-13900H, GeForce RTX 4070 Laptop GPU | 1.7 kg | 17.9 mm | 14.50" | 2880x1800 | |
| 87 % v7 (old) | 09/2023 | Asus ZenBook Pro 14 Duo UX8402VV-P1021W i9-13900H, GeForce RTX 4060 Laptop GPU | 1.8 kg | 21 mm | 14.50" | 2880x1800 | |
| 88.7 % v7 (old) | 07/2023 | Razer Blade 14 RTX 4070 R9 7940HS, GeForce RTX 4070 Laptop GPU | 1.8 kg | 17.99 mm | 14.00" | 2560x1600 | |
| 90 % v7 (old) | 04/2023 | Asus ROG Zephyrus G14 GA402XY R9 7940HS, GeForce RTX 4090 Laptop GPU | 1.7 kg | 20.5 mm | 14.00" | 2560x1600 |
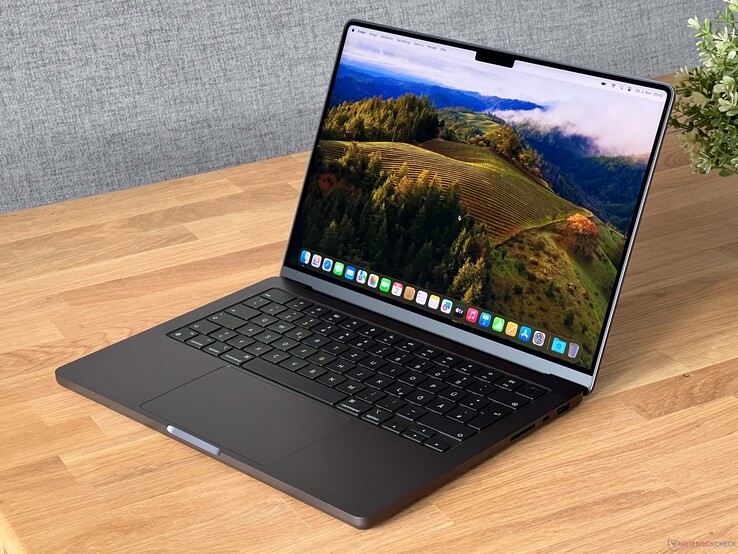
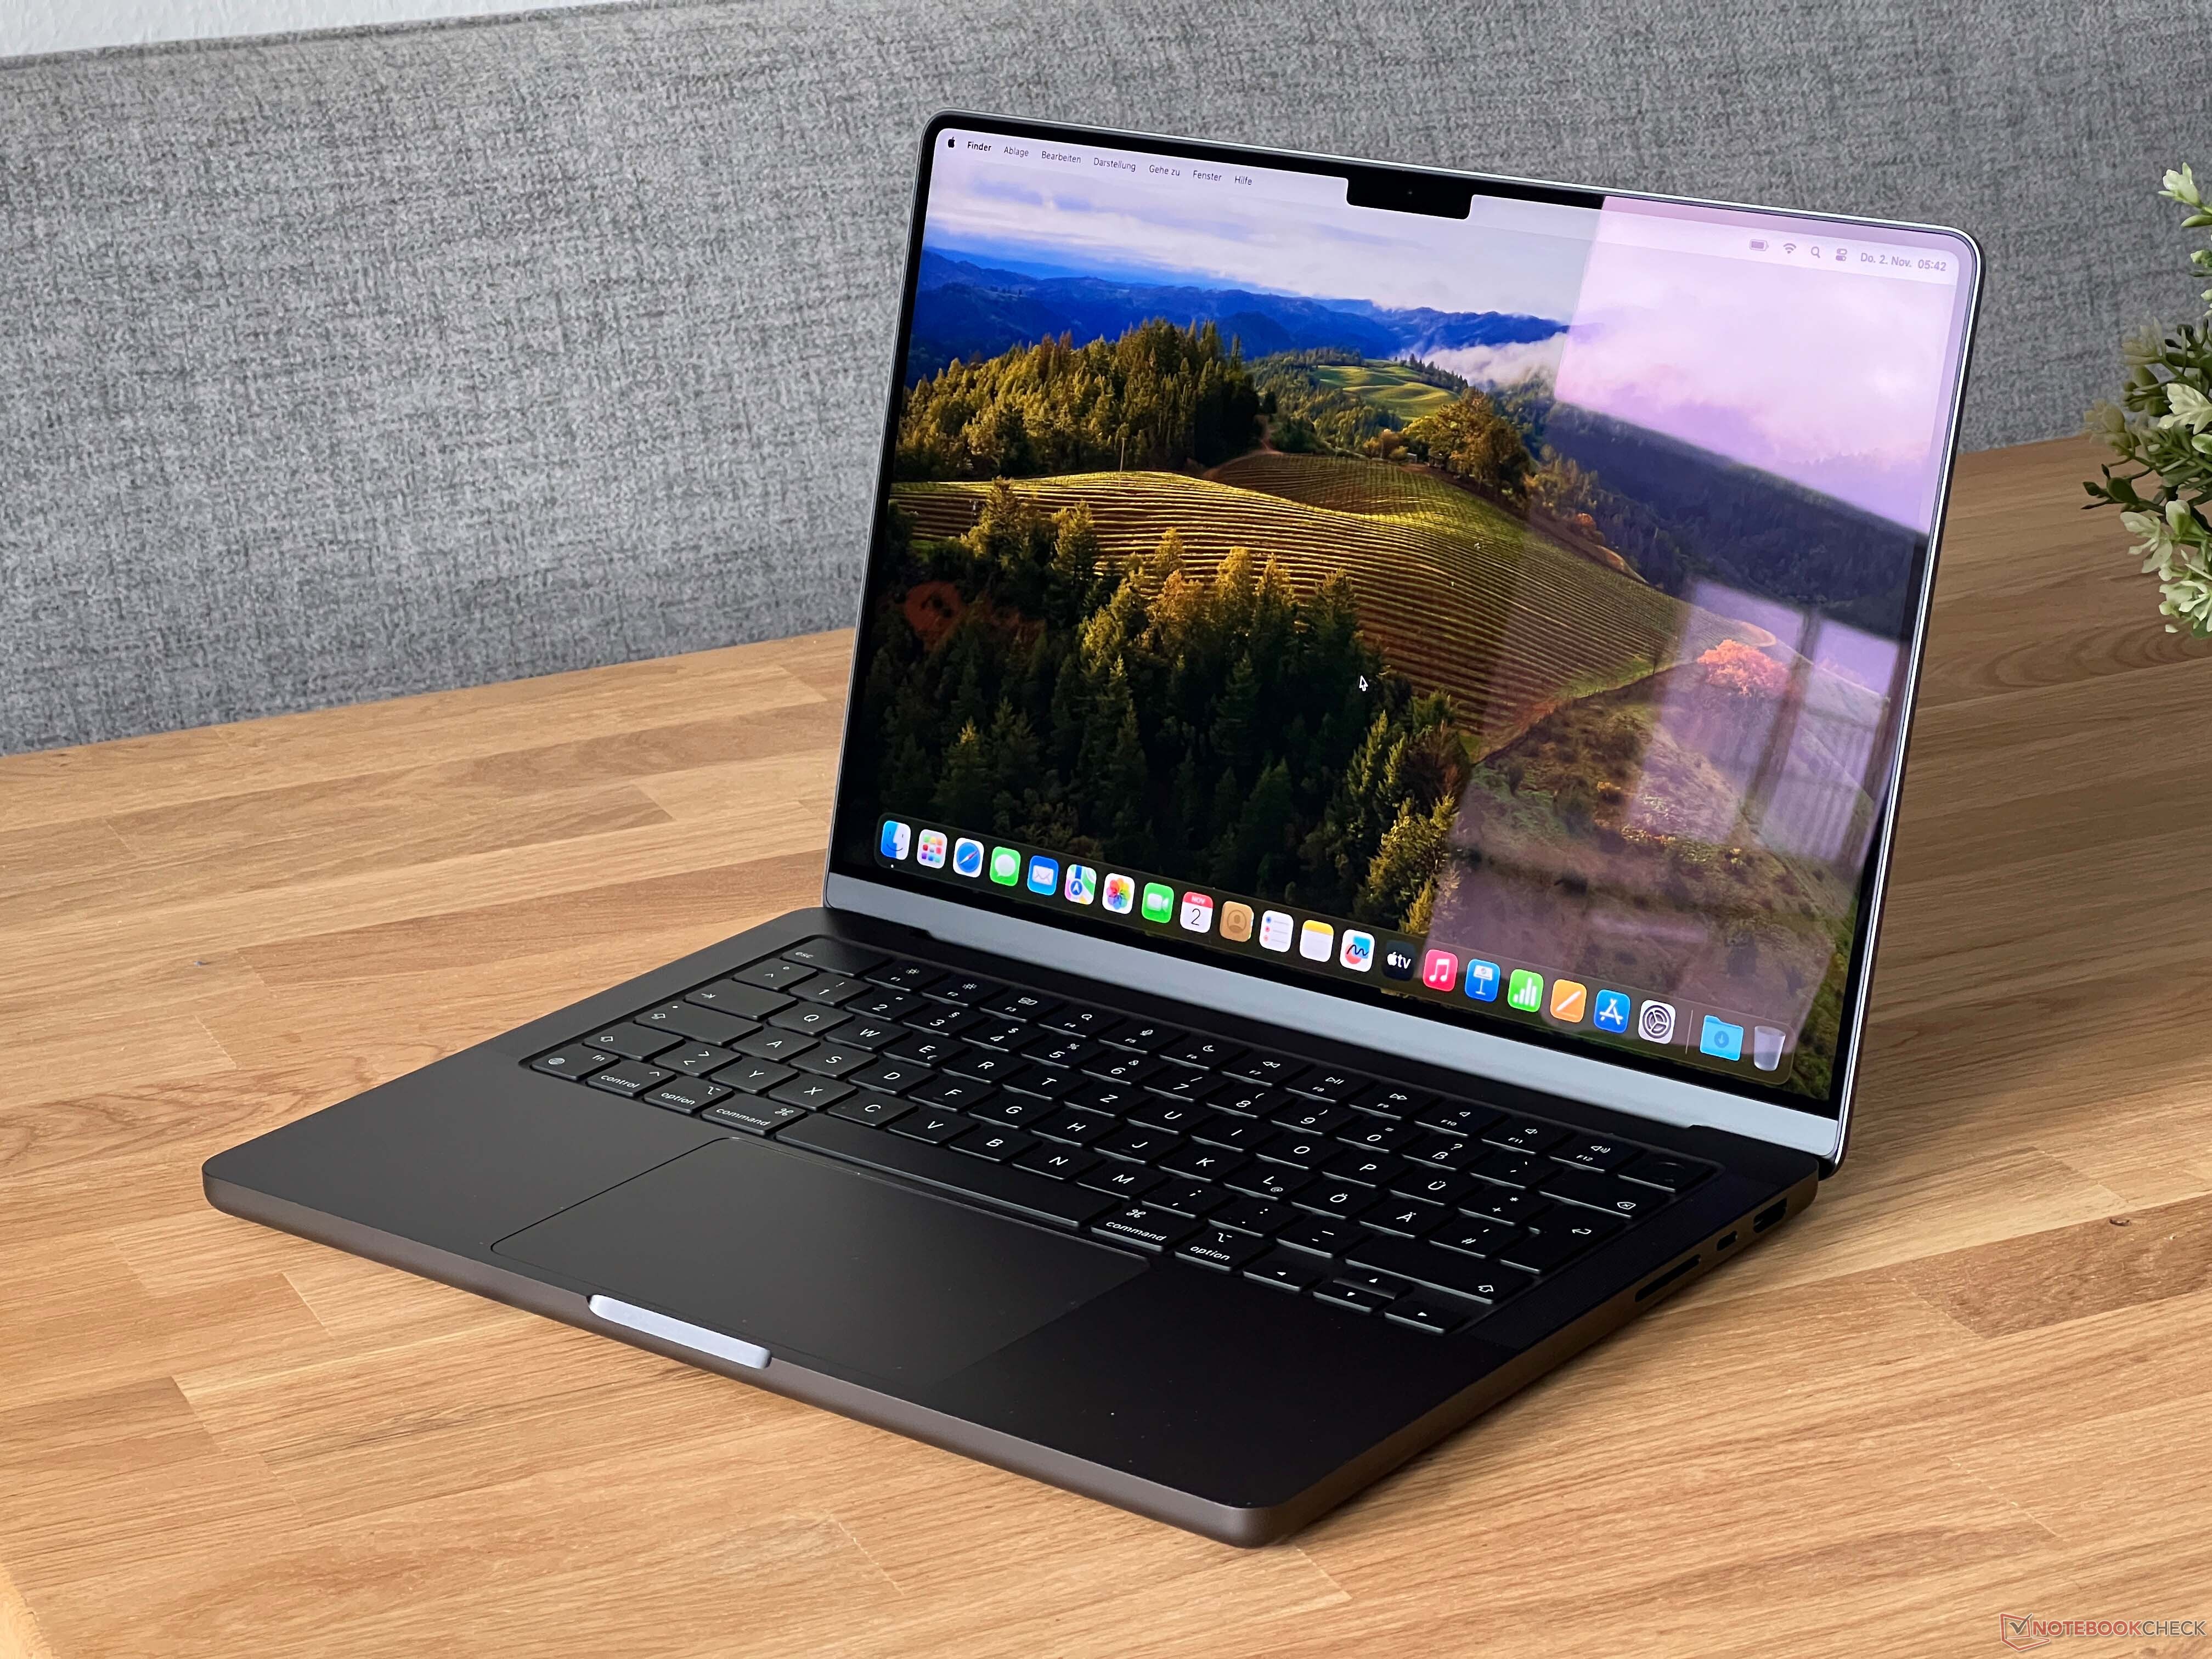
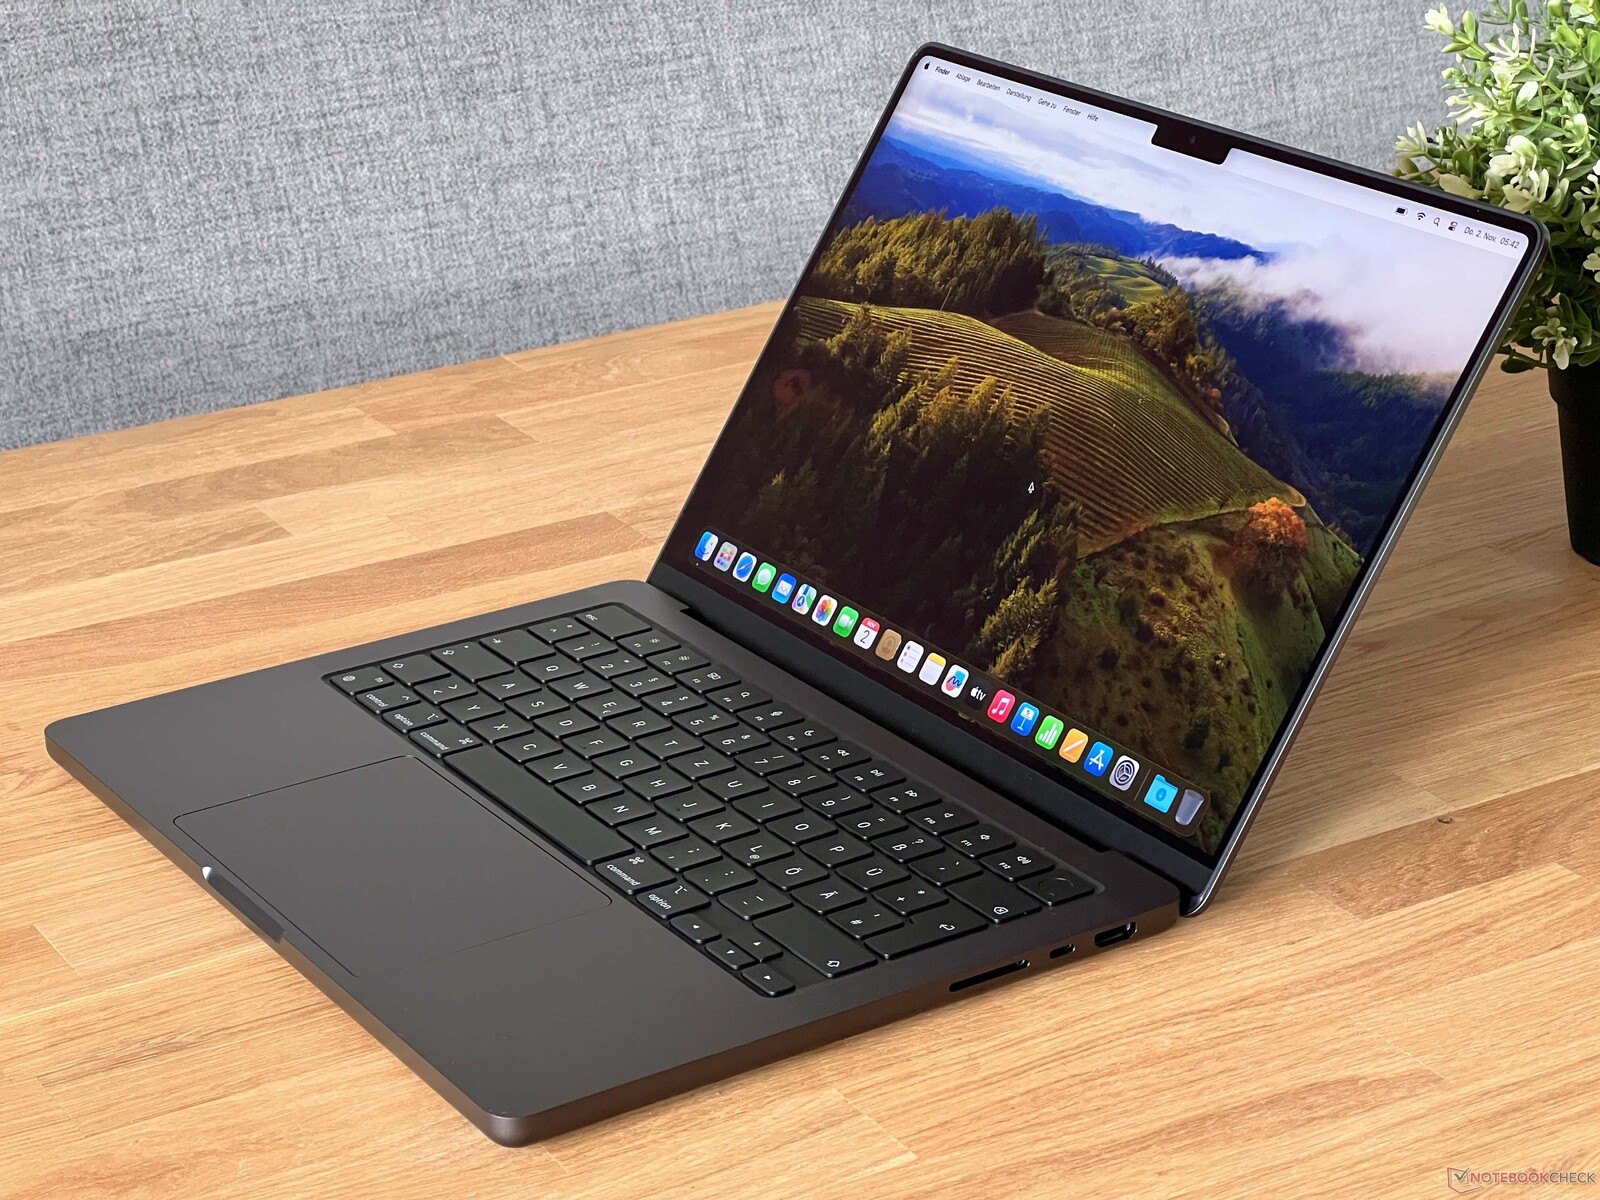
Kılıf - MBP 14 Gümüş veya Uzay Siyahı
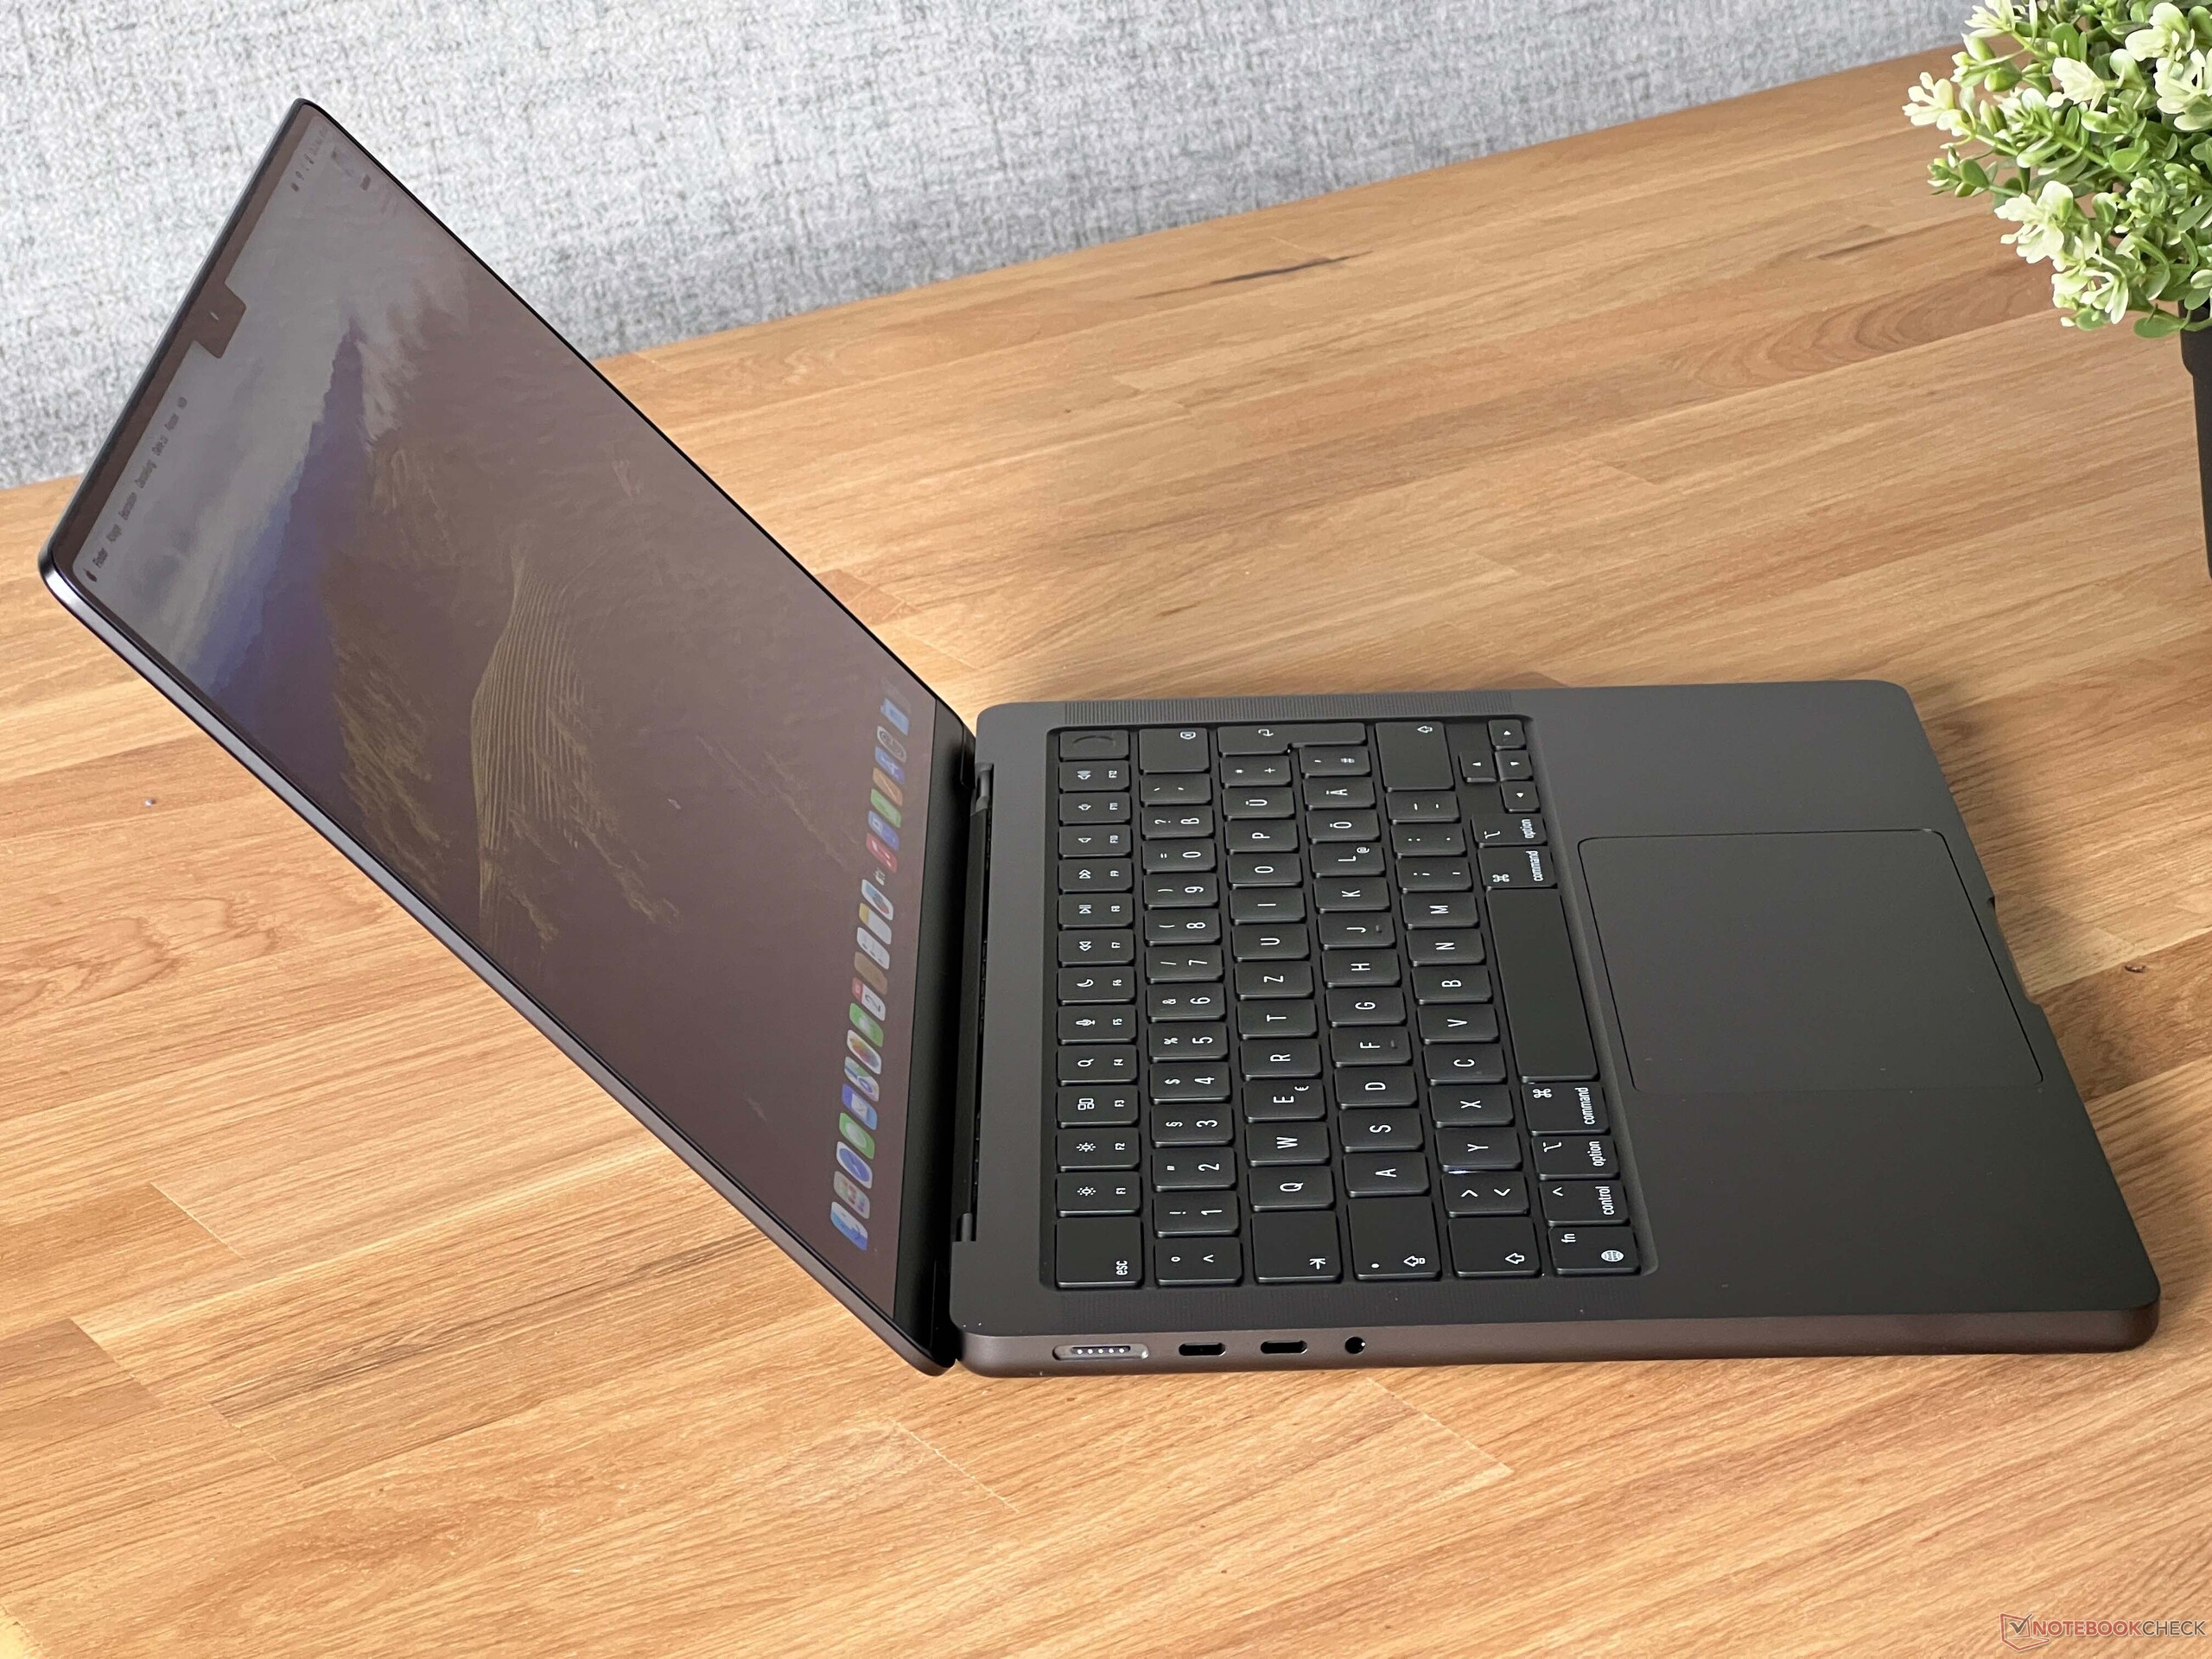
Apple önceki iki yılın tanıdık kasa tasarımını koruyor ve yeni giriş seviyesi model hala gümüş veya uzay grisi renklerinde mevcutken, müşteriler daha pahalı M3 Pro ve M3 Max SKU'larında gümüş ve yeni uzay siyahı versiyon arasında seçim yapabiliyor. İnceleme birimimiz yeni uzay siyahı modeldir, ancak gerçekten siyah değildir ve siyah klavye ile arasında her zaman gözle görülür bir fark vardır, daha çok gerçekten koyu bir gridir (ayrıca aydınlatma koşullarına bağlı olarak daha parlak veya daha koyu görünür). Daha küçük olsa daMacBook Airmidnight renginde saf bir parmak izi mıknatısıydı ve her zaman temizlemeniz gerekiyordu, yeni siyah model bu konuda daha iyi, ancak yine de gümüş modele kıyasla parmak izlerini daha hızlı göreceksiniz. Apple, eloksalın bir parçası olan ve bir kaplama olmayan kimyasal bir işlem kullanır. Kasanın kalitesi hala mükemmel ve alüminyum kasa birinci sınıf ve sağlam bir his veriyor. Ekran menteşeleri de iyi bir izlenim bırakıyor, sadece maksimum açılma açısı (135 derece) daha büyük olabilirdi.
Ana ünitenin sert ön kenarı sorun yaratabilir ve uzun süre kullandığınızda cildi kesebilir. Konik kenarları olmayan ana ünitenin tasarımı da oldukça hantal hissettiriyor, ancak bu öznel izlenim yanıltıcı ve 15,5 milimetre ile MBP 14 aslında eski MacBook Pro 13'ten (15,6 mm) biraz daha ince.
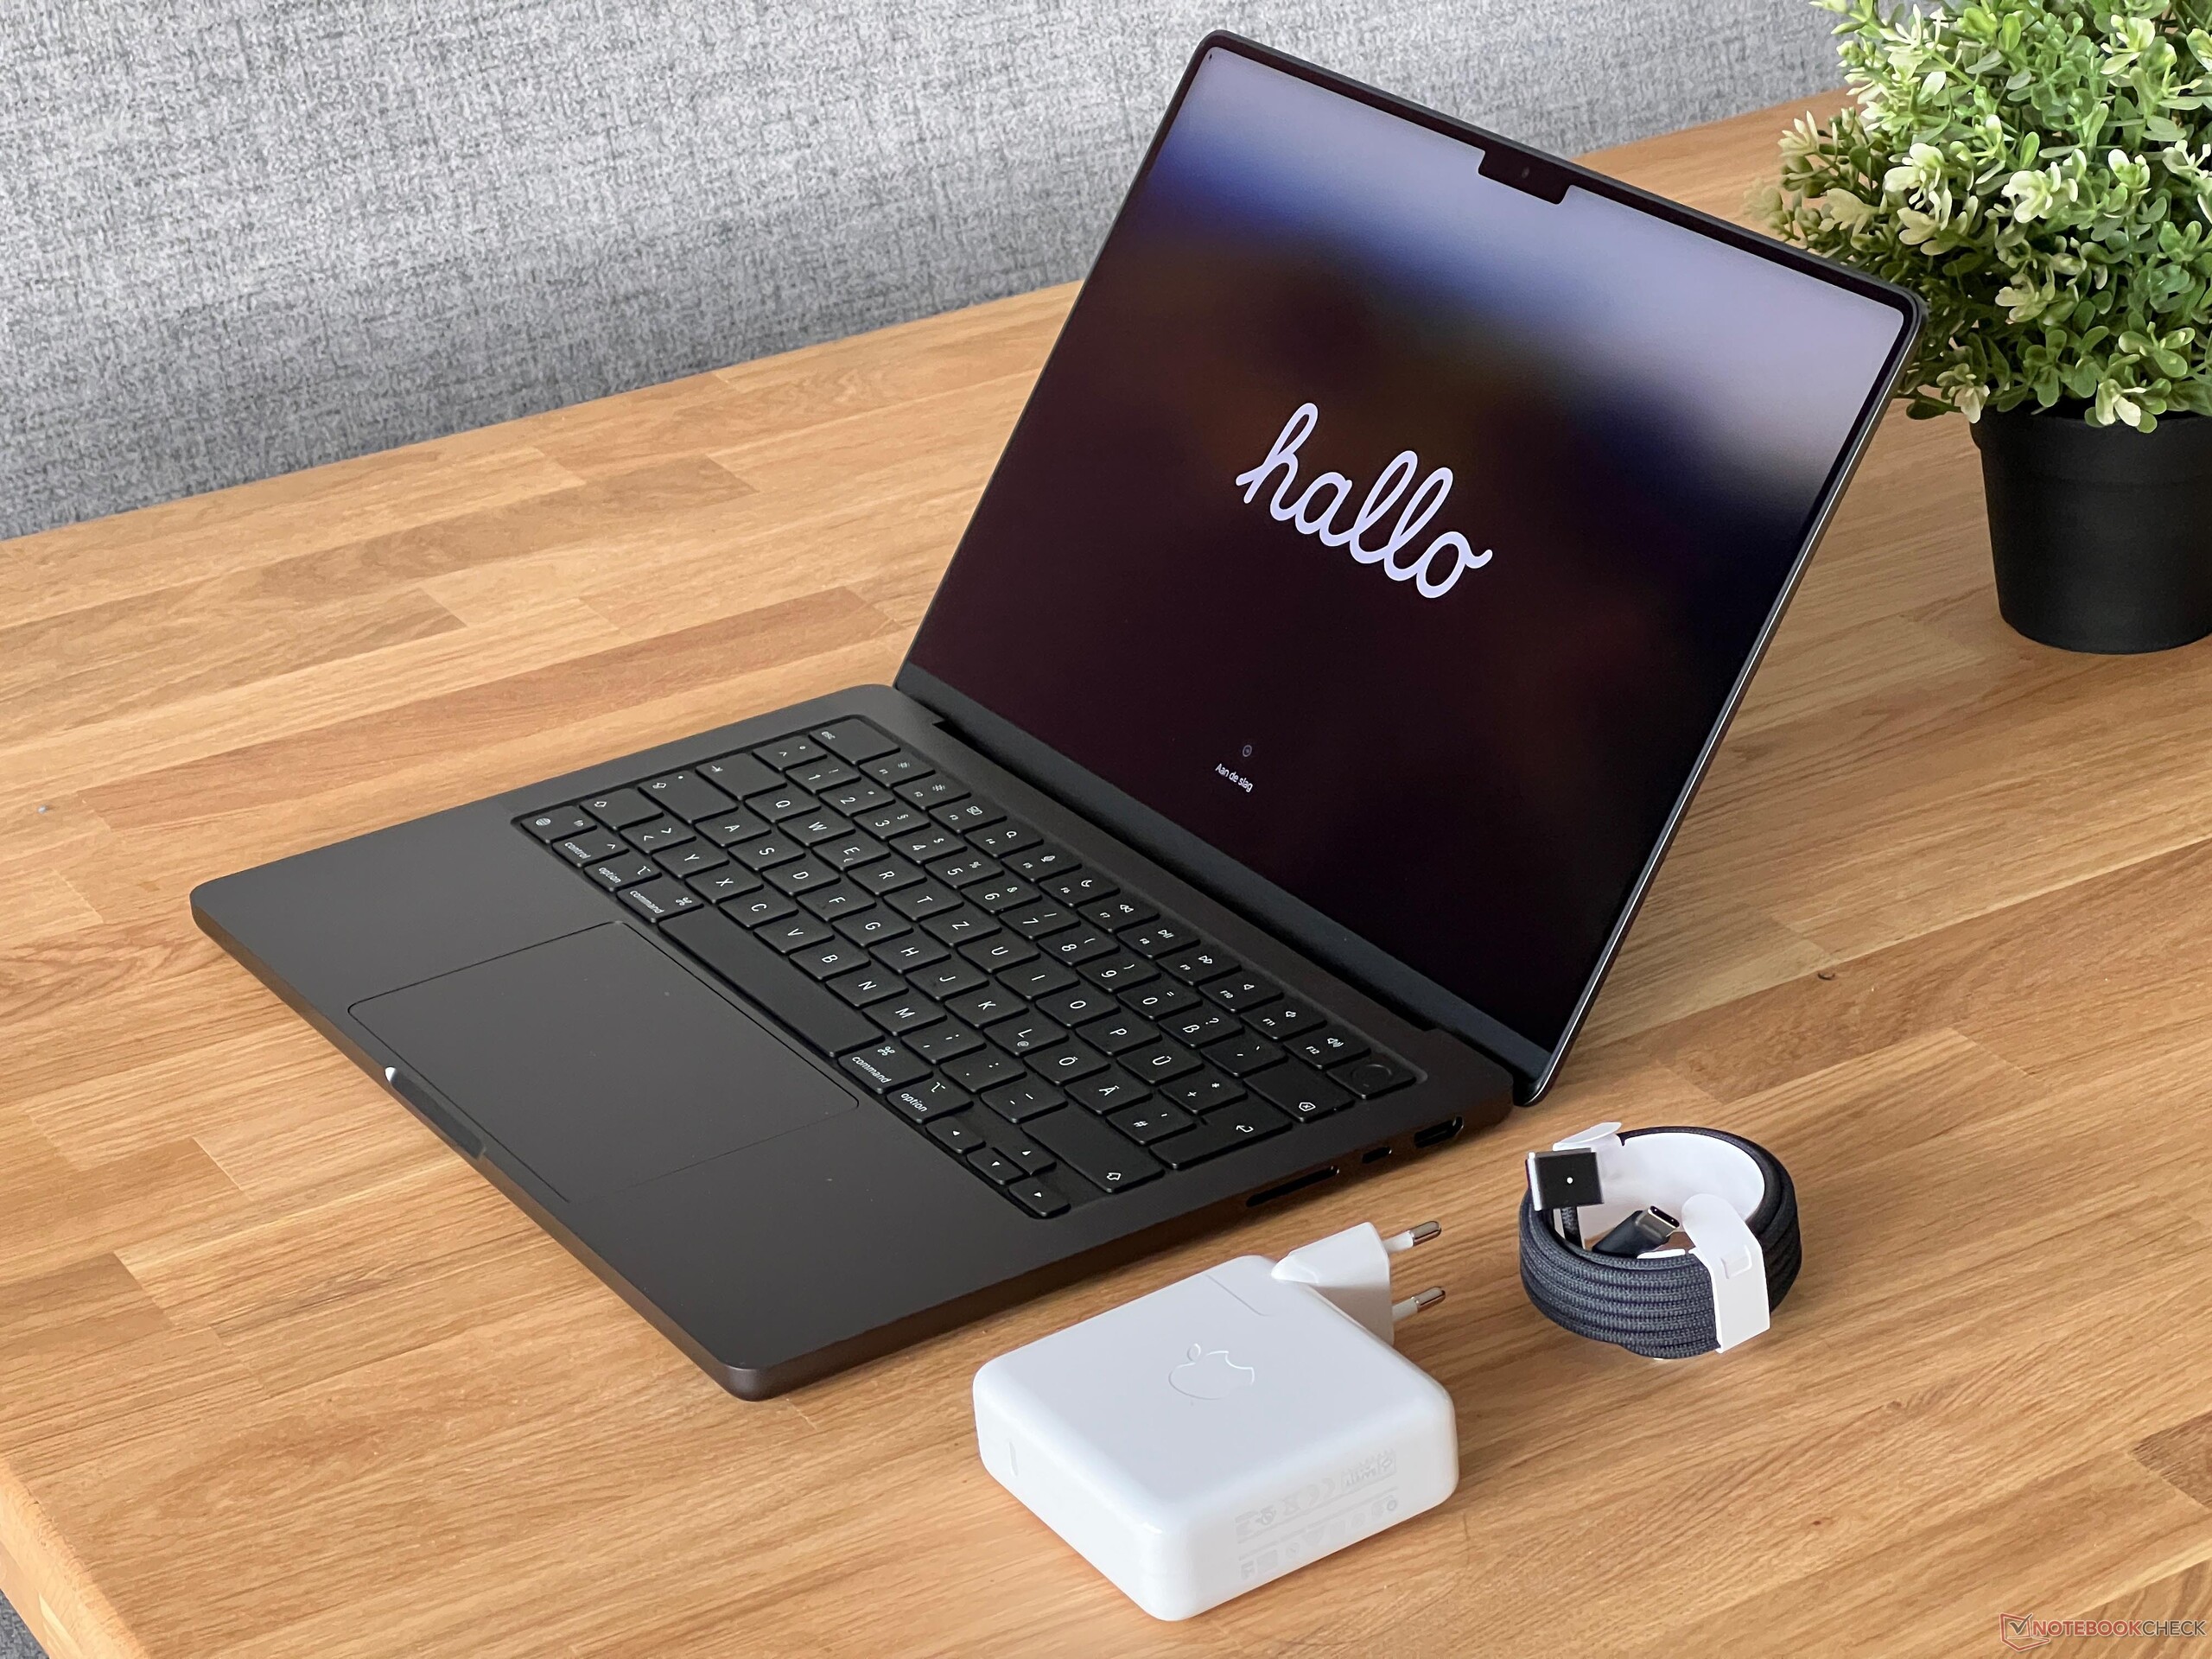
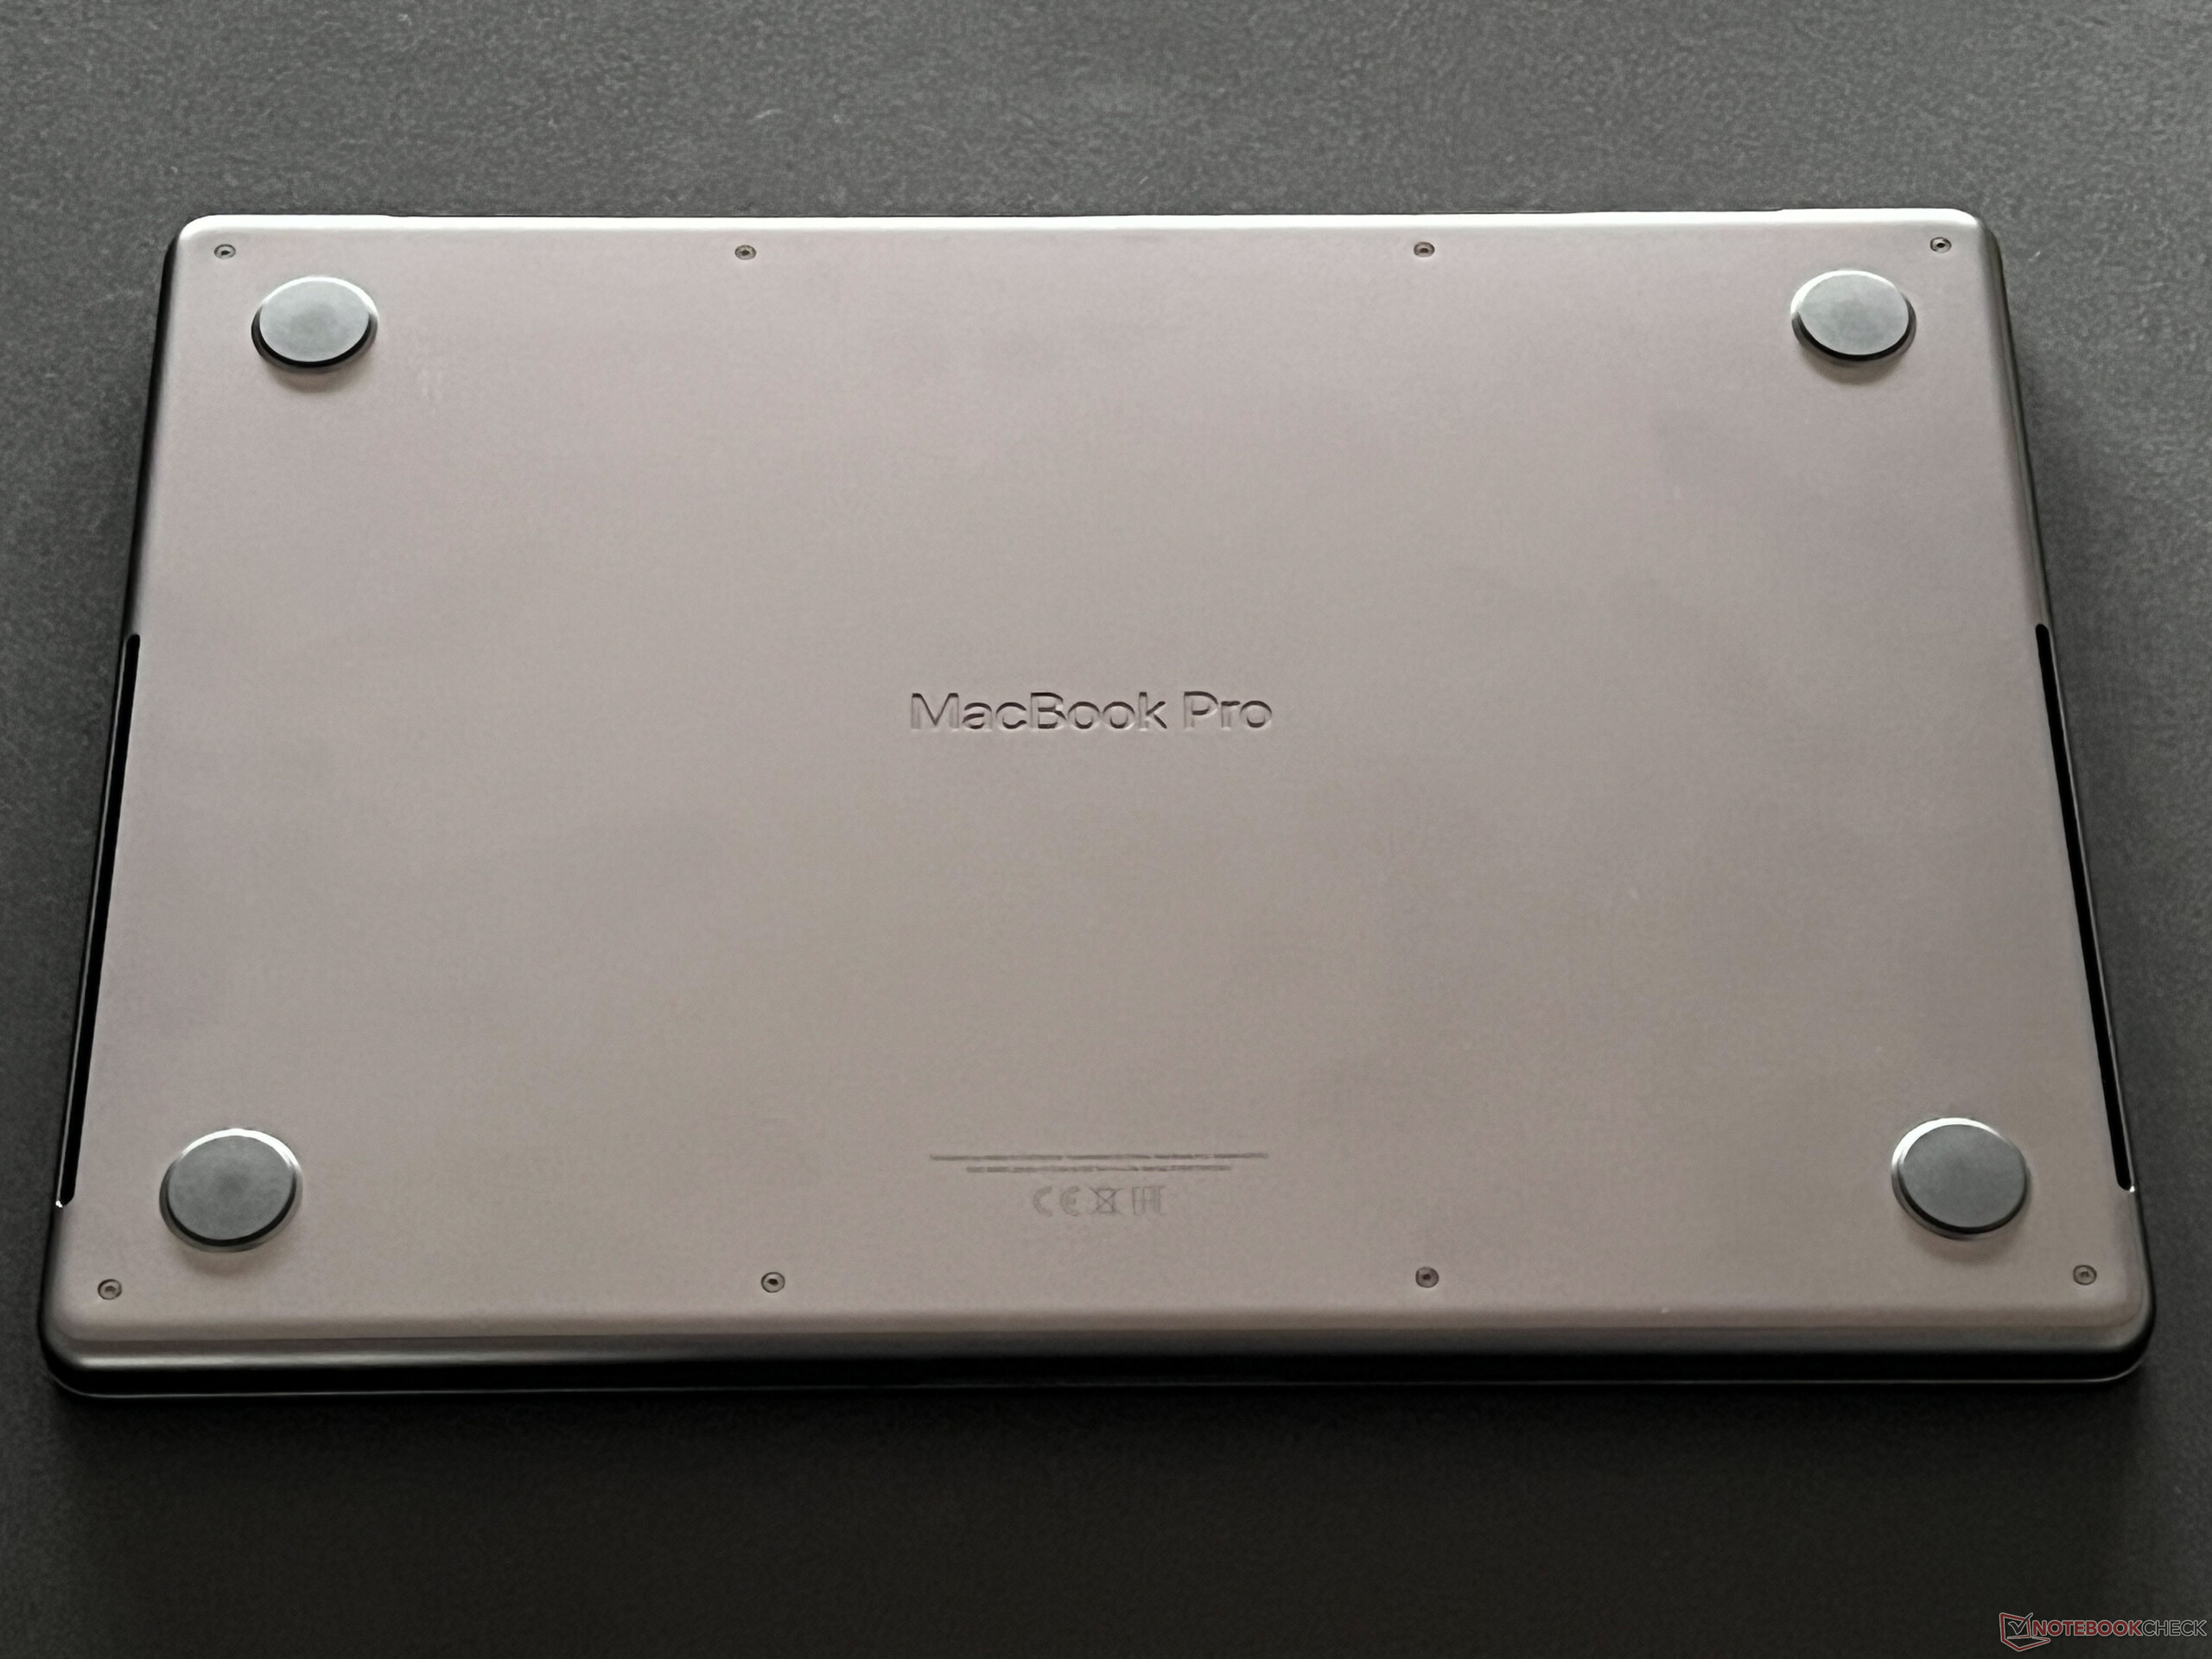
MBP 14'ün üst düzey modeli 1,611 kg ağırlığındadır, bu nedenle M3 SoC'li temel modelden (1,525 kg) biraz daha ağırdır, bu da esas olarak daha güçlü soğutma ünitesinin bir sonucudur. MBP 14 hala karşılaştırma grubumuzdaki en hafif ve en ince/en kompakt cihazdır. 96W güç adaptörü 366 gram ağırlığında (MagSafe kablosu dahil); MacBook'u USB-C üzerinden şarj etmek de mümkün.
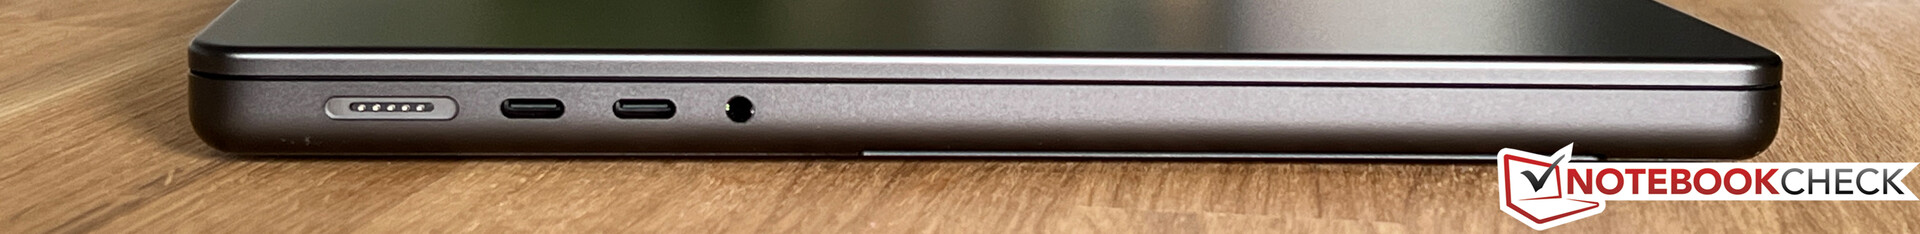
Bağlanabilirlik - Thunderbolt 4 ve HDMI 2.1
Bağlantı noktası durumu önceki modele kıyasla değişmedi ve Thunderbolt 4 dahil üç USB-C bağlantı noktasının yanı sıra modern bir HDMI 2.1 çıkışına sahip olmaya devam ediyorsunuz. M3 Max'li MBP 16 aynı anda dört adede kadar harici ekranı çalıştırabilir (Thunderbolt ile 3x 6K @60 Hz ve HDMI ile 1x 4K @ 144 Hz) ve HDMI ile maksimum çözünürlük 8K @60 Hz veya 4K @240 Hz'dir. MagSafe konnektörüne ek olarak, büyük MBP'yi USB-C üzerinden de şarj edebilirsiniz ve 65W güç adaptörüyle çalışır.
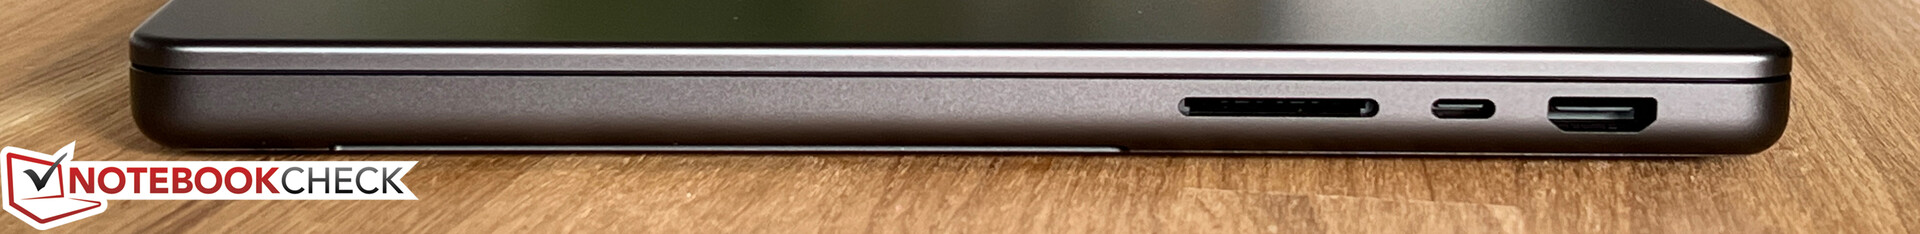
SD Kart Okuyucu
Sağ taraftaki SDXC kart okuyucu hala çok hızlı ve referans kartımızla (Angelbird AV Pro V60) 221 MB/s'ye kadar ve karttan görüntü dosyalarını kopyaladığımızda hala 156 MB/s'ye kadar tespit ettik ki bu da iyi bir sonuç. Takılan kartlar yaklaşık 1,5 cm çıkıntı yapıyor.
| SD Card Reader | |
| average JPG Copy Test (av. of 3 runs) | |
| Microsoft Surface Laptop Studio 2 RTX 4060 (Angelbird AV Pro V60) | |
| Apple MacBook Pro 14 2023 M3 Max (Angelbird AV Pro V60) | |
| Asus ROG Zephyrus G14 GA402XY (Angelibrid AV Pro V60) | |
| Sınıf ortalaması Multimedia (23 - 531, n=44, son 2 yıl) | |
| Asus Zenbook Pro 14 OLED UX6404VI (Angelbird AV Pro V60) | |
| Lenovo Yoga Pro 9-14IRP G8 (Angelbird AV Pro V60) | |
| Asus ZenBook Pro 14 Duo UX8402VV-P1021W (AV Pro SD microSD 128 GB V60) | |
| maximum AS SSD Seq Read Test (1GB) | |
| Asus ROG Zephyrus G14 GA402XY (Angelibrid AV Pro V60) | |
| Asus Zenbook Pro 14 OLED UX6404VI (Angelbird AV Pro V60) | |
| Apple MacBook Pro 14 2023 M3 Max (Angelbird AV Pro V60) | |
| Microsoft Surface Laptop Studio 2 RTX 4060 (Angelbird AV Pro V60) | |
| Sınıf ortalaması Multimedia (27.9 - 1455, n=43, son 2 yıl) | |
| Lenovo Yoga Pro 9-14IRP G8 (Angelbird AV Pro V60) | |
| Asus ZenBook Pro 14 Duo UX8402VV-P1021W (AV Pro SD microSD 128 GB V60) | |
İletişim
Apple hala Bluetooth 5.3 dahil geçen yılın Wi-Fi 6E modülünü kullanıyor ve Asus referans yönlendiricimizle birlikte istikrarlı aktarım hızları ile genel performans çok iyi. İnceleme süremiz boyunca büyük indirmelerde veya kötü sinyal alımında herhangi bir sorun yaşamadık. Apple henüz Wi-Fi 7 modülleri sunmuyor.
| Networking | |
| Apple MacBook Pro 14 2023 M3 Max | |
| iperf3 transmit AXE11000 | |
| iperf3 receive AXE11000 | |
| Microsoft Surface Laptop Studio 2 RTX 4060 | |
| iperf3 transmit AXE11000 | |
| iperf3 receive AXE11000 | |
| Lenovo Yoga Pro 9-14IRP G8 | |
| iperf3 transmit AXE11000 | |
| iperf3 receive AXE11000 | |
| Asus Zenbook Pro 14 OLED UX6404VI | |
| iperf3 transmit AXE11000 | |
| iperf3 receive AXE11000 | |
| Asus ZenBook Pro 14 Duo UX8402VV-P1021W | |
| iperf3 transmit AXE11000 | |
| iperf3 receive AXE11000 | |
| iperf3 transmit AXE11000 6GHz | |
| iperf3 receive AXE11000 6GHz | |
| Razer Blade 14 RTX 4070 | |
| iperf3 transmit AXE11000 | |
| iperf3 receive AXE11000 | |
| iperf3 transmit AXE11000 6GHz | |
| iperf3 receive AXE11000 6GHz | |
| Asus ROG Zephyrus G14 GA402XY | |
| iperf3 transmit AXE11000 | |
| iperf3 receive AXE11000 | |
Web kamerası
1080p web kamerasının görüntü kalitesi hala iyi ancak iPad'lerdeki ön kameralarla karşılaştırılamaz. Face ID veya Center Stage de hala mevcut değil.


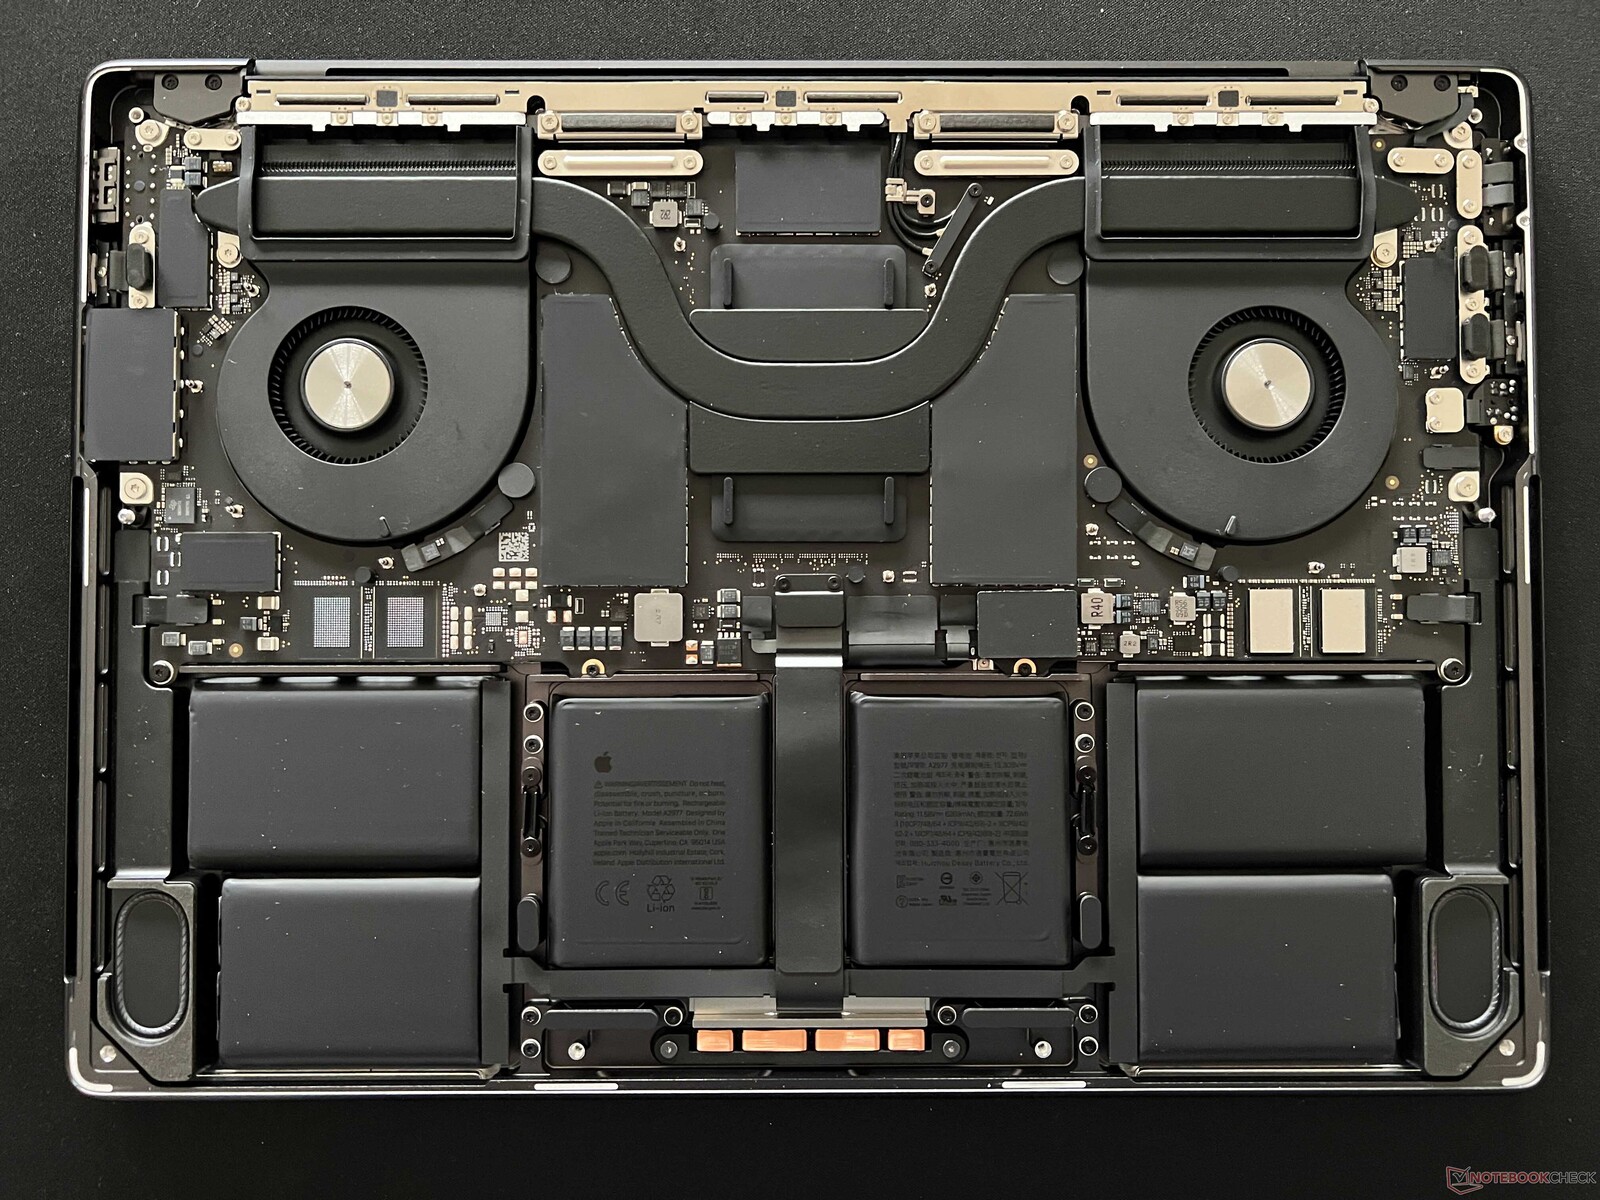
Bakım
Alt panel Pentalobe vidalarla (P5) ve arkadaki küçük metal kancalarla sabitlenmiştir, bu da tüm vidaları çıkardıktan sonra kapağı öne doğru itmeniz gerektiği anlamına gelir. Ayrıca yanların ortasında biraz güç gerektiren iki kelepçe vardır (bir vantuz öneririz). İçeri girdikten sonra yapılacak pek bir şey yok, sadece fan kullanıcı tarafından temizlenebilir. Diğer tüm bileşenler lehimlenmiştir ve herhangi bir bileşeni yükseltemezsiniz. Pil yapıştırılmıştır, ancak gerekirse değiştirilebilir (yeni yapışkan şeritler gerektirir).
Garanti
MacBook Pro için temel garanti bir yıldır. Üç yıllık bir garanti uzatması (Apple Care+) satın alabilirsiniz, bunun maliyeti 279 ABD dolarıdır. Buna kaza sonucu oluşan hasar masrafları da dahildir (her biri ekran hasarı veya harici muhafaza hasarı için 99 ABD doları veya diğer kaza sonucu oluşan hasarlar için 299 ABD doları servis ücretine tabidir). AppleCare+ için yıllık 99 ABD doları ödemek de mümkündür.
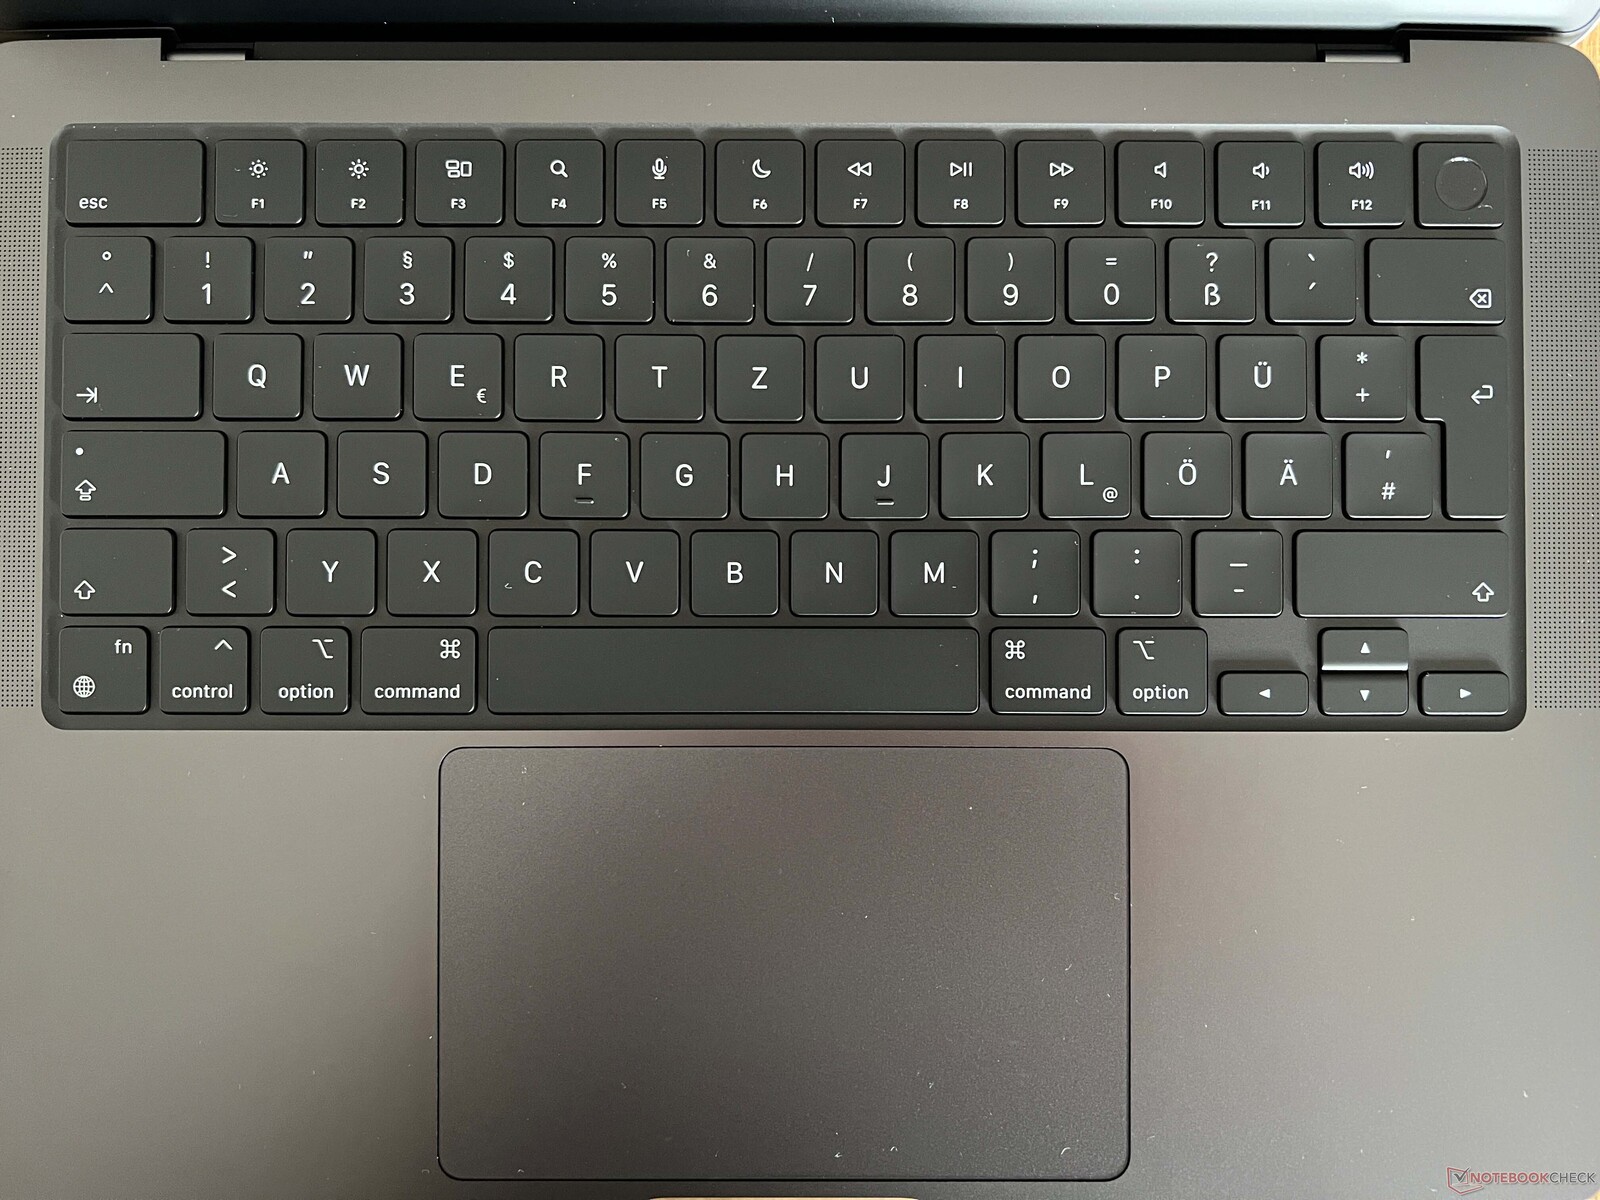
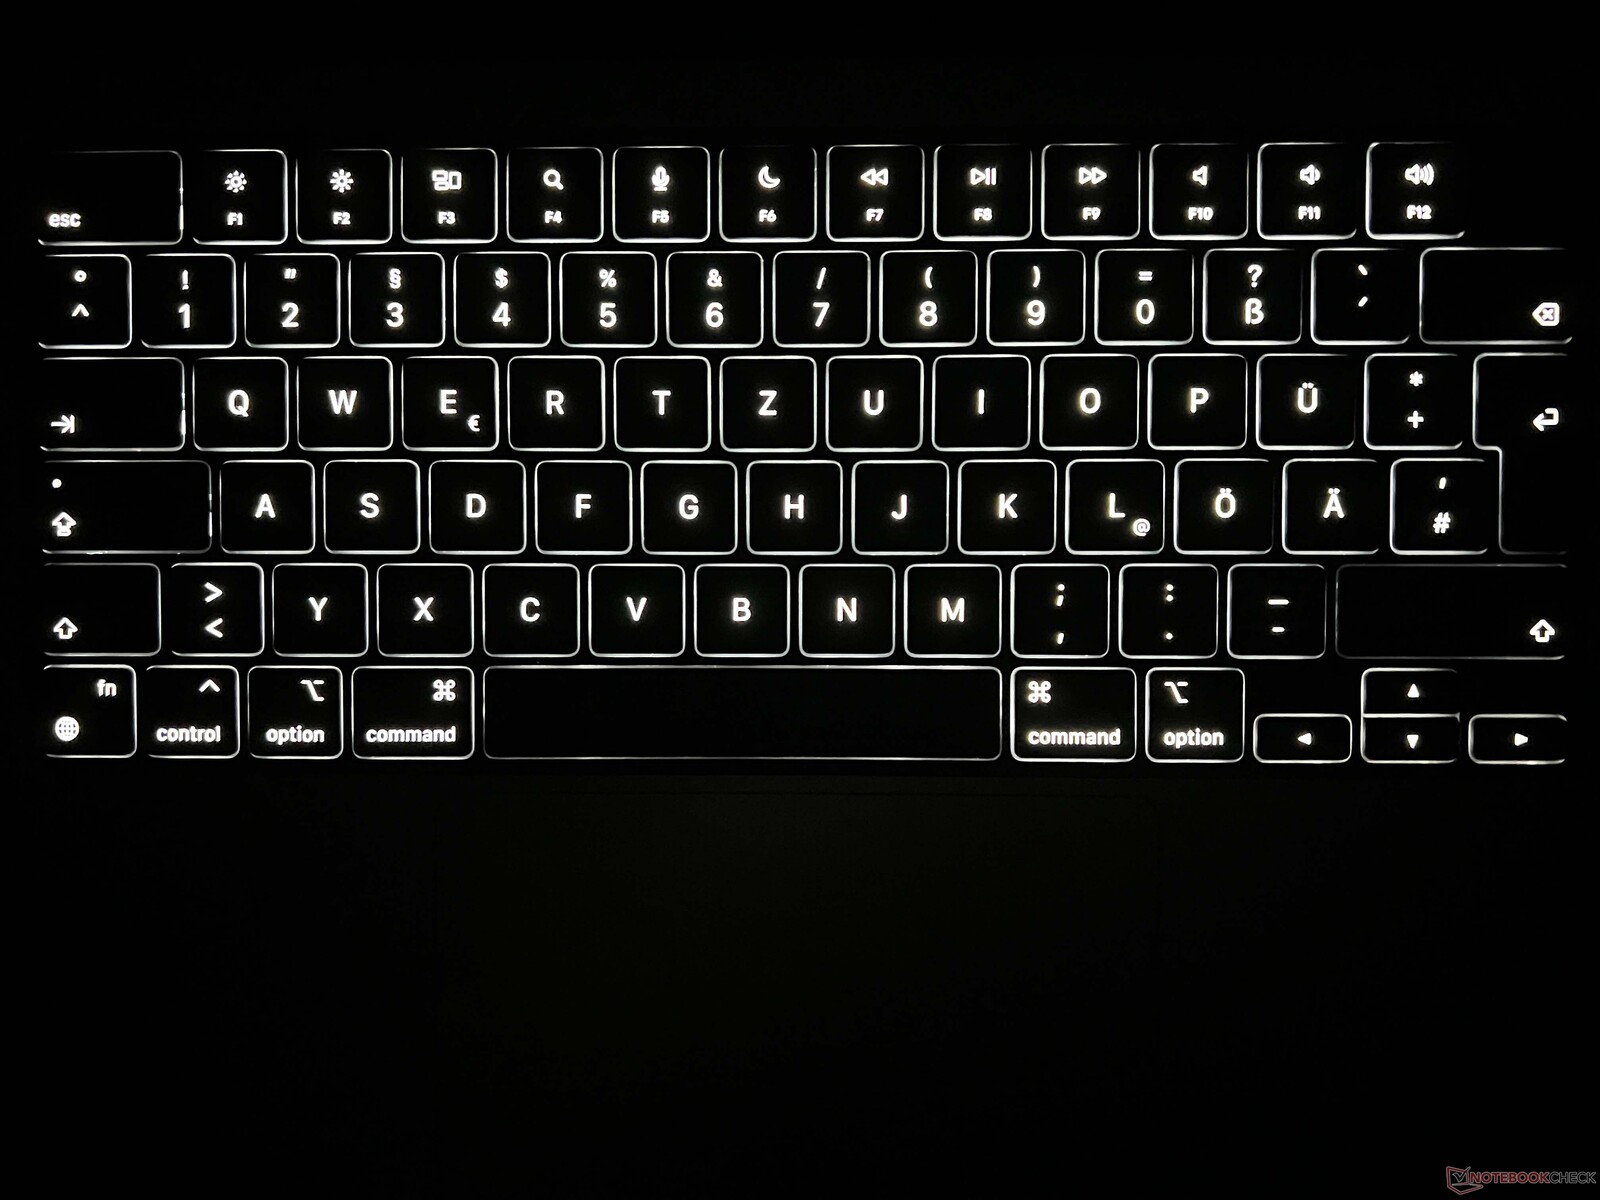
Giriş Aygıtları - Perfect TrackPad
Giriş aygıtları değişmedi ve siyah klavye, nispeten sığ hareket mesafesine rağmen hala rahat ve hassas bir yazma deneyimi sunuyor. En iyi iş dizüstü bilgisayarlarına kıyasla hala geliştirilebilecek yönleri var, ancak uzun süreler boyunca yazı yazmak sorun değil. Tuş vuruşları da biraz daha sessiz olabilir ve ok tuşları çok küçük. MacBook, bunca yıl sonra bile klavye aydınlatması açısından Windows dizüstü bilgisayarlardan daha üstün. Parlaklık çok hassas bir şekilde ayarlanabiliyor ve hem otomatik aktivasyon hem de ortam aydınlatmasına bağlı yoğunluk mükemmel çalışıyor.
İzleme dörtgeni yıllardır bir ölçüt olmuştur ve macOS ile uygulanması mükemmeldir. Hareketli parçalar olmadığı için dokunduğunuz her yerde tıklama deneyimi tamamen aynıdır. macOS ayrıca bol miktarda özelleştirme sunar.
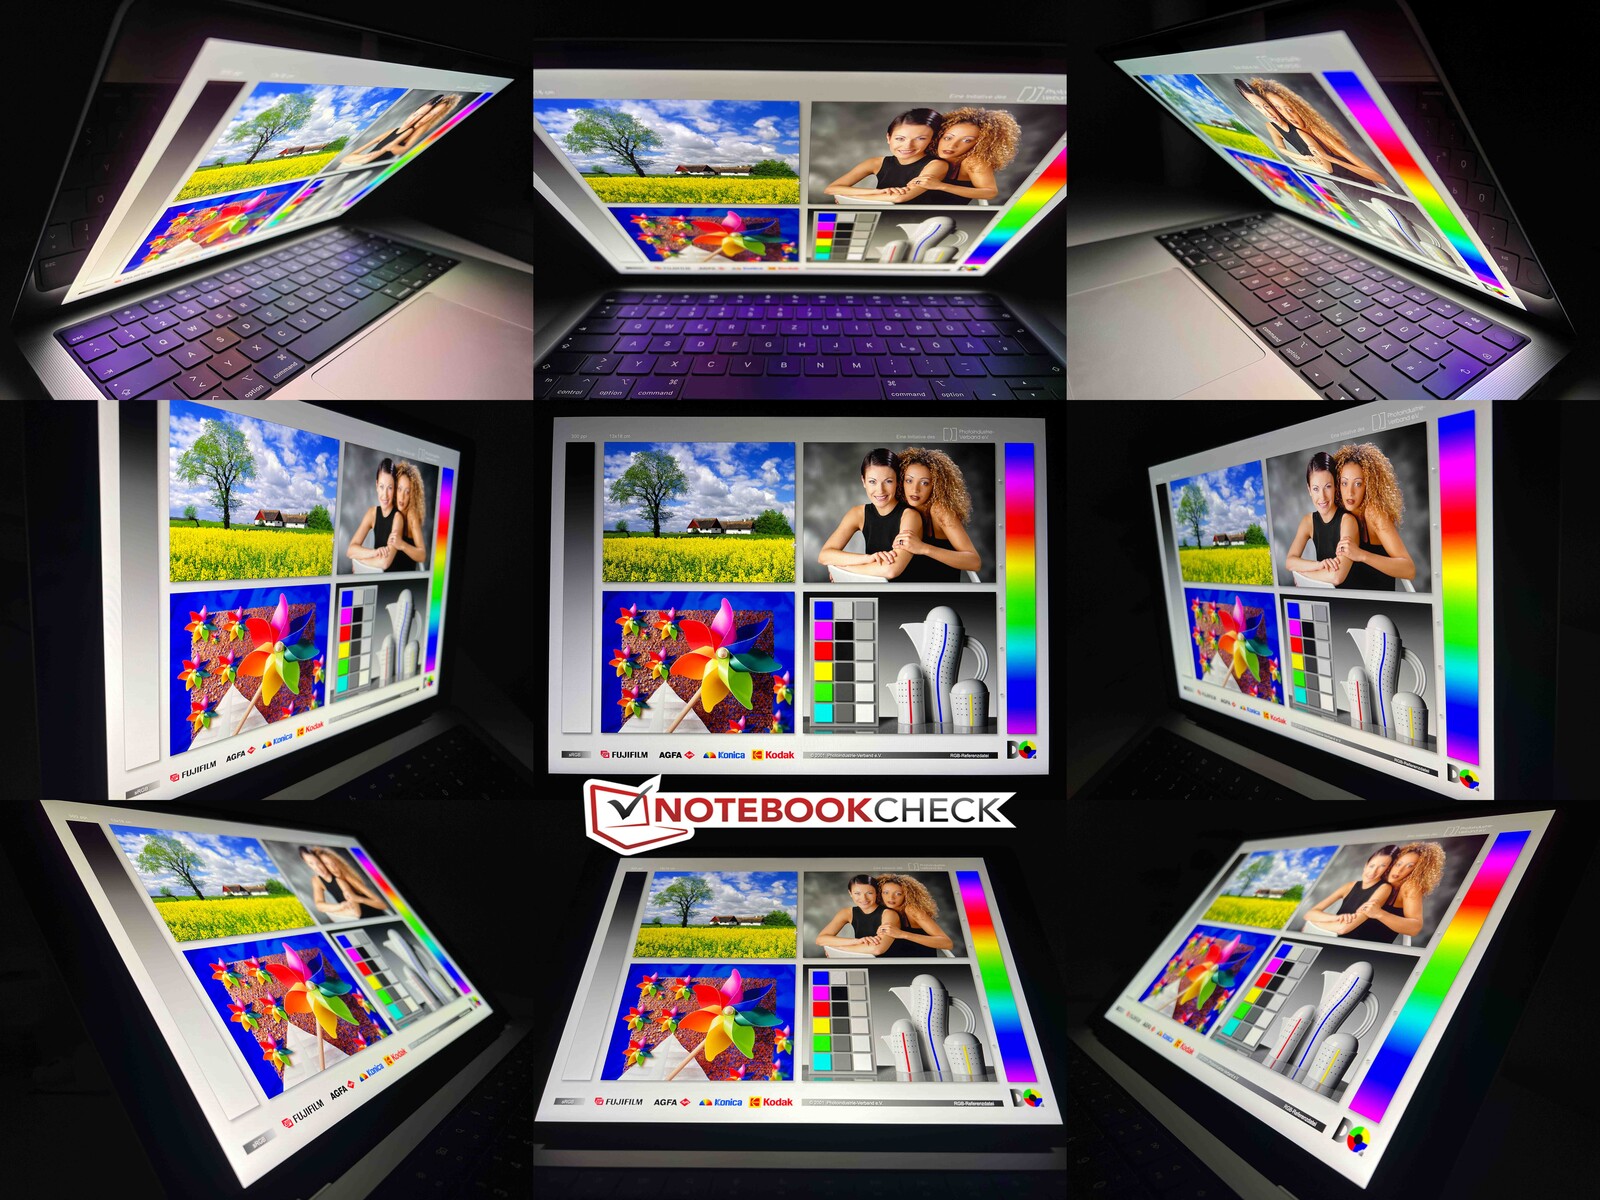
Ekran - Mini-LED şimdi daha yüksek SDR parlaklığı ile
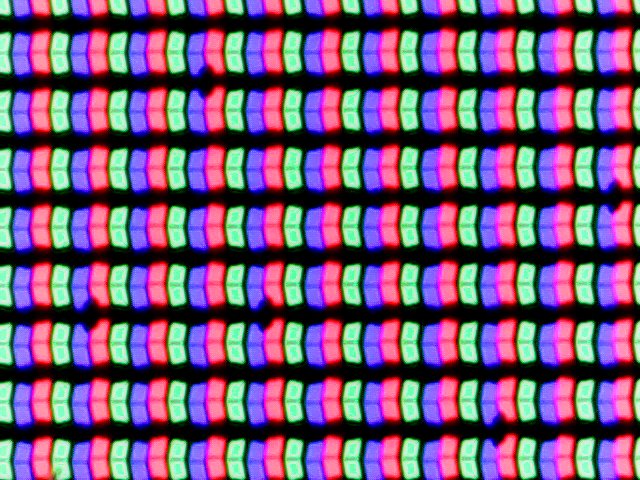
MacBook Pro 16'nın içindeki Mini-LED panelin temel özellikleri değişmedi. Ortadaki kamera çentiği hala çok iyi görünmüyor ancak 16:10 panelden herhangi bir yer kaplamıyor. Çentiğin yanındaki dikey alan (menü öğeleri için kullanılan) üste eklenmiş ve bu da 3456 x 2234 piksel çözünürlükle sonuçlanıyor. Bu da normal bir 16:10 panele kıyasla biraz daha fazla alana sahip olduğunuz anlamına geliyor. Öznel görüntü kalitesi hala mükemmel ve gerektiğinde sistem tarafından dinamik olarak uygulanan yüksek yenileme hızından (120 Hz) yararlanıyor. Siyah içerikler de saf siyahtır (OLED ekranlar gibi) ve bu da son derece yüksek bir kontrast oranı yaratır. Tek dezavantajı, parlak nesneler koyu arka planlarda göründüğünde bulutlanmadır. Bu özellikle logolar gösterildiğinde fark edilir ve bu sorunu açıkça provoke edebilirsiniz, ancak pratikte genellikle fark edilmez. Hem parlaklık hem de renk sıcaklığı (True Tone) ortam aydınlatmasına göre otomatik olarak ayarlanabiliyor ve bu da kusursuz çalışıyor. MacOS'ta da herhangi bir ölçeklendirme sorunu yok.
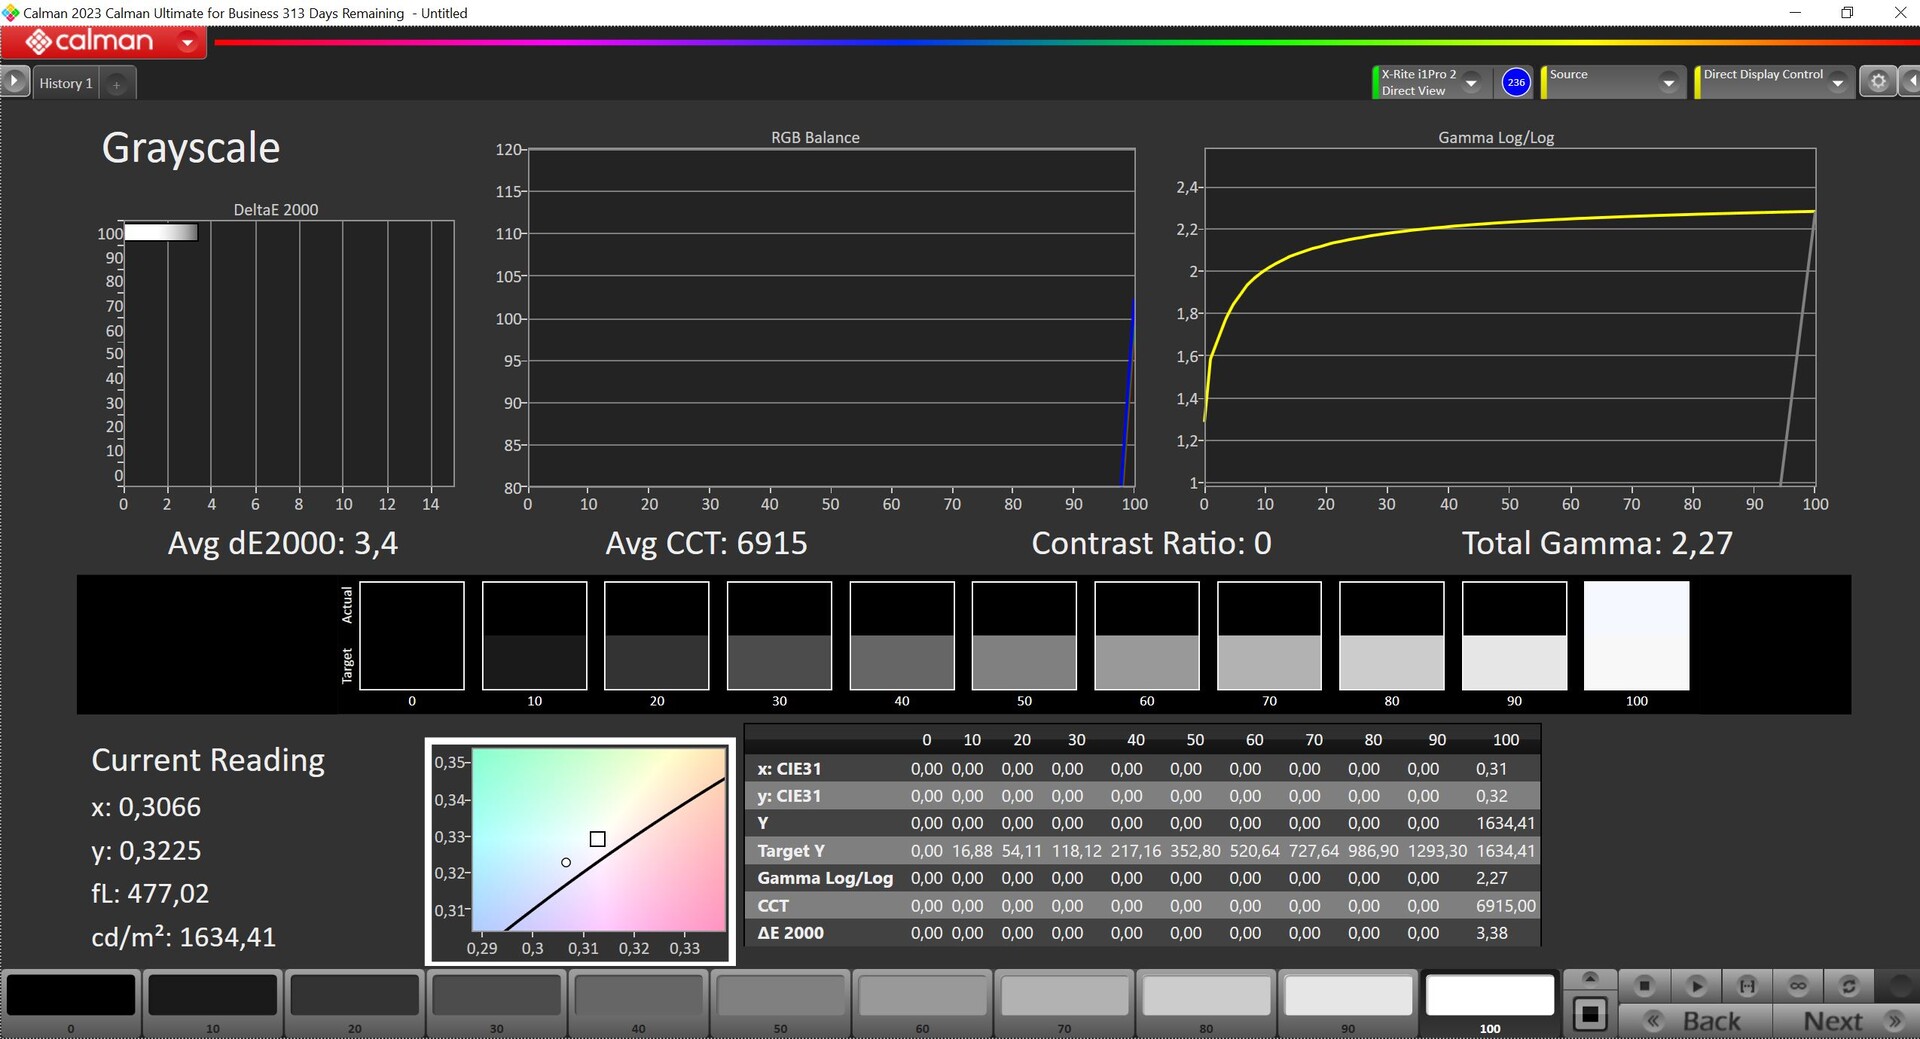
Apple maksimum SDR parlaklığını 500'den 600 nite yükseltti ve inceleme ünitemizde 610 nite kadar (ortalama ~600 nit) ölçüm yaptık. Mini-LED panellerin siyah değeri 0'dır ve bu da son derece yüksek bir kontrast oranıyla sonuçlanır. Maksimum HDR parlaklığı, görüntünün bazı kısımları için 1634 nite kadar ve tam ekran görüntüler için 1178 nite kadar çıkmaktadır. Mini-LED ekranı Lenovo Yoga Pro 9i 14 bazı açılardan üstündür (700 nitten fazla SDR parlaklığı, 1400 nit'e kadar HDR tam ekran) ve maksimum HDR parlaklığı açısından sadece biraz geride kalır. Apple, HDR içeriklerin işlenmesi söz konusu olduğunda hala büyük bir avantaja sahiptir, çünkü HDR içerikler gösterildiğinde ekran parlaklığı basitçe artırır. Öte yandan Windows kullanıcıları HDR modunu manuel olarak etkinleştirmek zorunda.
| |||||||||||||||||||||||||
Aydınlatma: 96 %
Batarya modunda parlaklık: 609 cd/m²
Kontrast: ∞:1 (Siyah: 0 cd/m²)
ΔE ColorChecker Calman: 1.7 | ∀{0.5-29.43 Ø4.72}
ΔE Greyscale Calman: 2.1 | ∀{0.09-98 Ø4.97}
99.2% Display P3 (Argyll 3D)
Gamma: 2.22
CCT: 6874 K
| Apple MacBook Pro 14 2023 M3 Max Mini-LED, 3024x1964, 14.2" | Microsoft Surface Laptop Studio 2 RTX 4060 LQ144P1JX01, IPS, 2400x1600, 14.4" | Lenovo Yoga Pro 9-14IRP G8 CSOT T3 MNE507HZ2-1, Mini-LED, 3072x1920, 14.5" | Asus Zenbook Pro 14 OLED UX6404VI SDC4190, OLED, 2880x1800, 14.5" | Asus ZenBook Pro 14 Duo UX8402VV-P1021W ATNA45AF04-0 , OLED, 2880x1800, 14.5" | Razer Blade 14 RTX 4070 AU Optronics B140QAN06.U, IPS, 2560x1600, 14" | Asus ROG Zephyrus G14 GA402XY B140QAN06.S, Mini-LED, 2560x1600, 14" | |
|---|---|---|---|---|---|---|---|
| Display | -33% | -7% | 0% | 1% | -2% | 0% | |
| Display P3 Coverage (%) | 99.2 | 66.7 -33% | 92 -7% | 99.6 0% | 99.91 1% | 97.3 -2% | 99.6 0% |
| sRGB Coverage (%) | 99 | 99.7 | 100 | 100 | 99.8 | 100 | |
| AdobeRGB 1998 Coverage (%) | 68.9 | 96.9 | 97.5 | 95.35 | 85.3 | 93.4 | |
| Response Times | 30% | 85% | 99% | 98% | 88% | 83% | |
| Response Time Grey 50% / Grey 80% * (ms) | 80.8 ? | 77.6 ? 4% | 12.7 ? 84% | 0.67 ? 99% | 2 ? 98% | 11.9 ? 85% | 17.2 ? 79% |
| Response Time Black / White * (ms) | 78.8 ? | 34.3 ? 56% | 11.4 ? 86% | 0.9 ? 99% | 2 ? 97% | 8 ? 90% | 9.9 ? 87% |
| PWM Frequency (Hz) | 14878 ? | 17600 ? | 6000 ? | 240 | 240 | 5430 | |
| Screen | 24% | -58% | 10% | -14% | -119% | 2% | |
| Brightness middle (cd/m²) | 610 | 511 -16% | 670 10% | 356 -42% | 340 -44% | 559.3 -8% | 535 -12% |
| Brightness (cd/m²) | 600 | 503 -16% | 680 13% | 358 -40% | 340 -43% | 560 -7% | 563 -6% |
| Brightness Distribution (%) | 96 | 89 -7% | 89 -7% | 99 3% | 99 3% | 88 -8% | 91 -5% |
| Black Level * (cd/m²) | 0.26 | 0.19 | 0.002 | 0.44 | |||
| Colorchecker dE 2000 * | 1.7 | 0.5 71% | 4 -135% | 0.8 53% | 1.76 -4% | 4.44 -161% | 1 41% |
| Colorchecker dE 2000 max. * | 2.3 | 1.1 52% | 4.5 -96% | 1.6 30% | 3.2 -39% | 9.3 -304% | 2.8 -22% |
| Greyscale dE 2000 * | 2.1 | 0.8 62% | 4.9 -133% | 0.9 57% | 1.16 45% | 6.8 -224% | 1.8 14% |
| Gamma | 2.22 99% | 2.19 100% | 2.22 99% | 2.19 100% | 2.43 91% | 2.3 96% | 2.24 98% |
| CCT | 6874 95% | 6650 98% | 5735 113% | 6590 99% | 6418 101% | 6242 104% | 6337 103% |
| Contrast (:1) | 1965 | 3526 | 170000 | 1271 | |||
| Colorchecker dE 2000 calibrated * | 1.3 | 1.62 | 0.39 | ||||
| Toplam Ortalama (Program / Ayarlar) | 7% /
19% | 7% /
-21% | 36% /
29% | 28% /
13% | -11% /
-60% | 28% /
20% |
* ... daha küçük daha iyidir
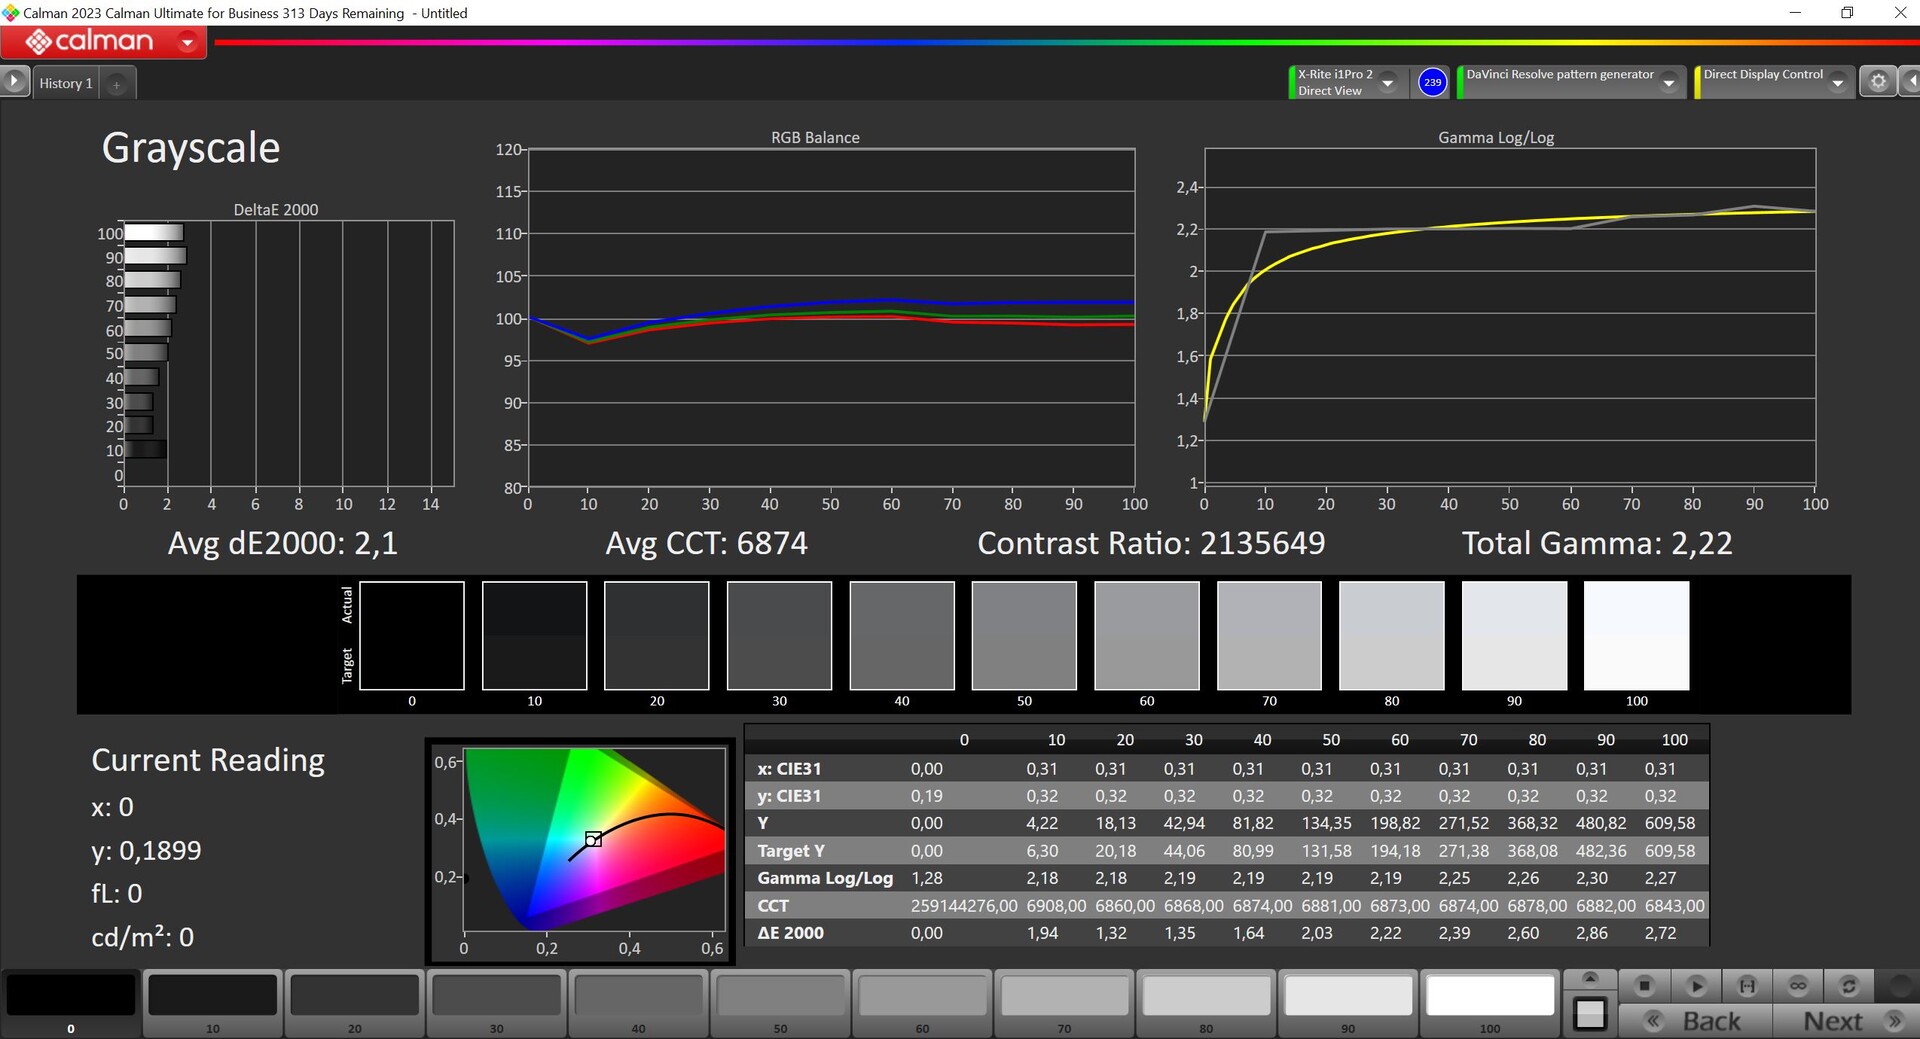
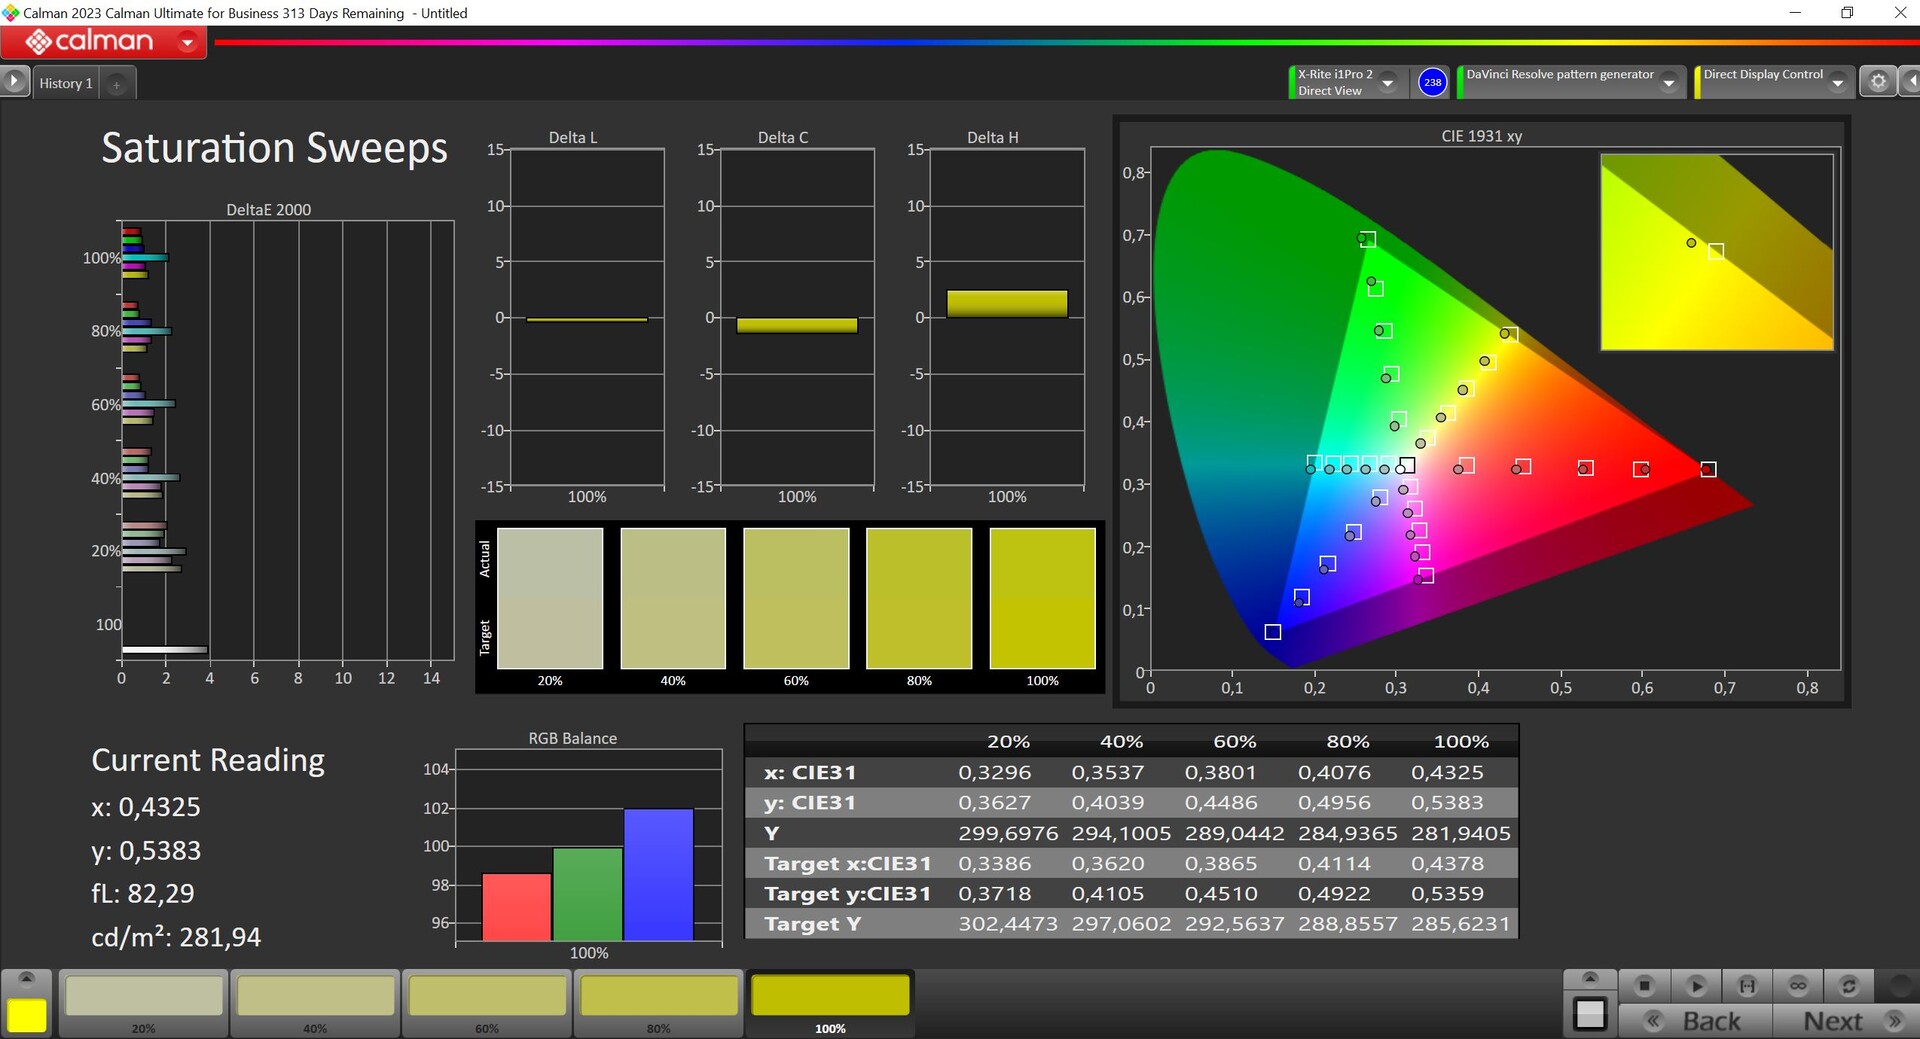
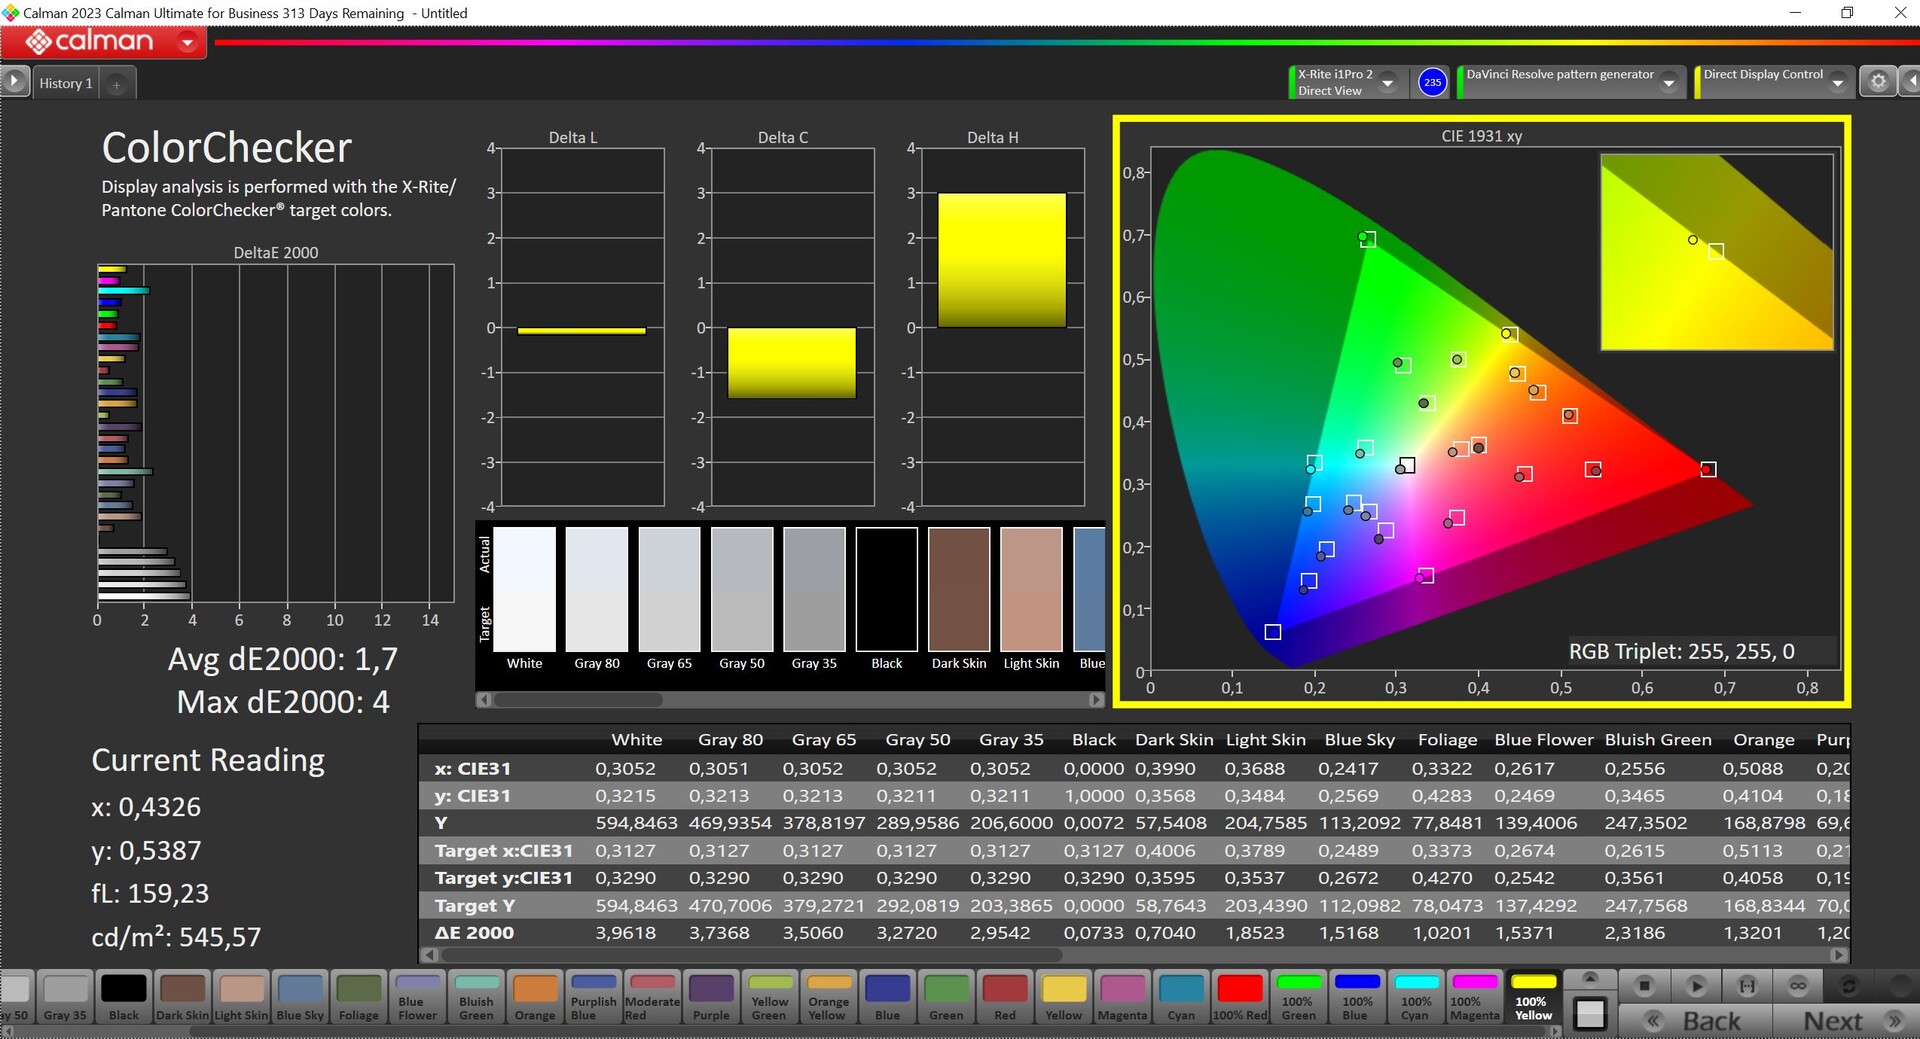
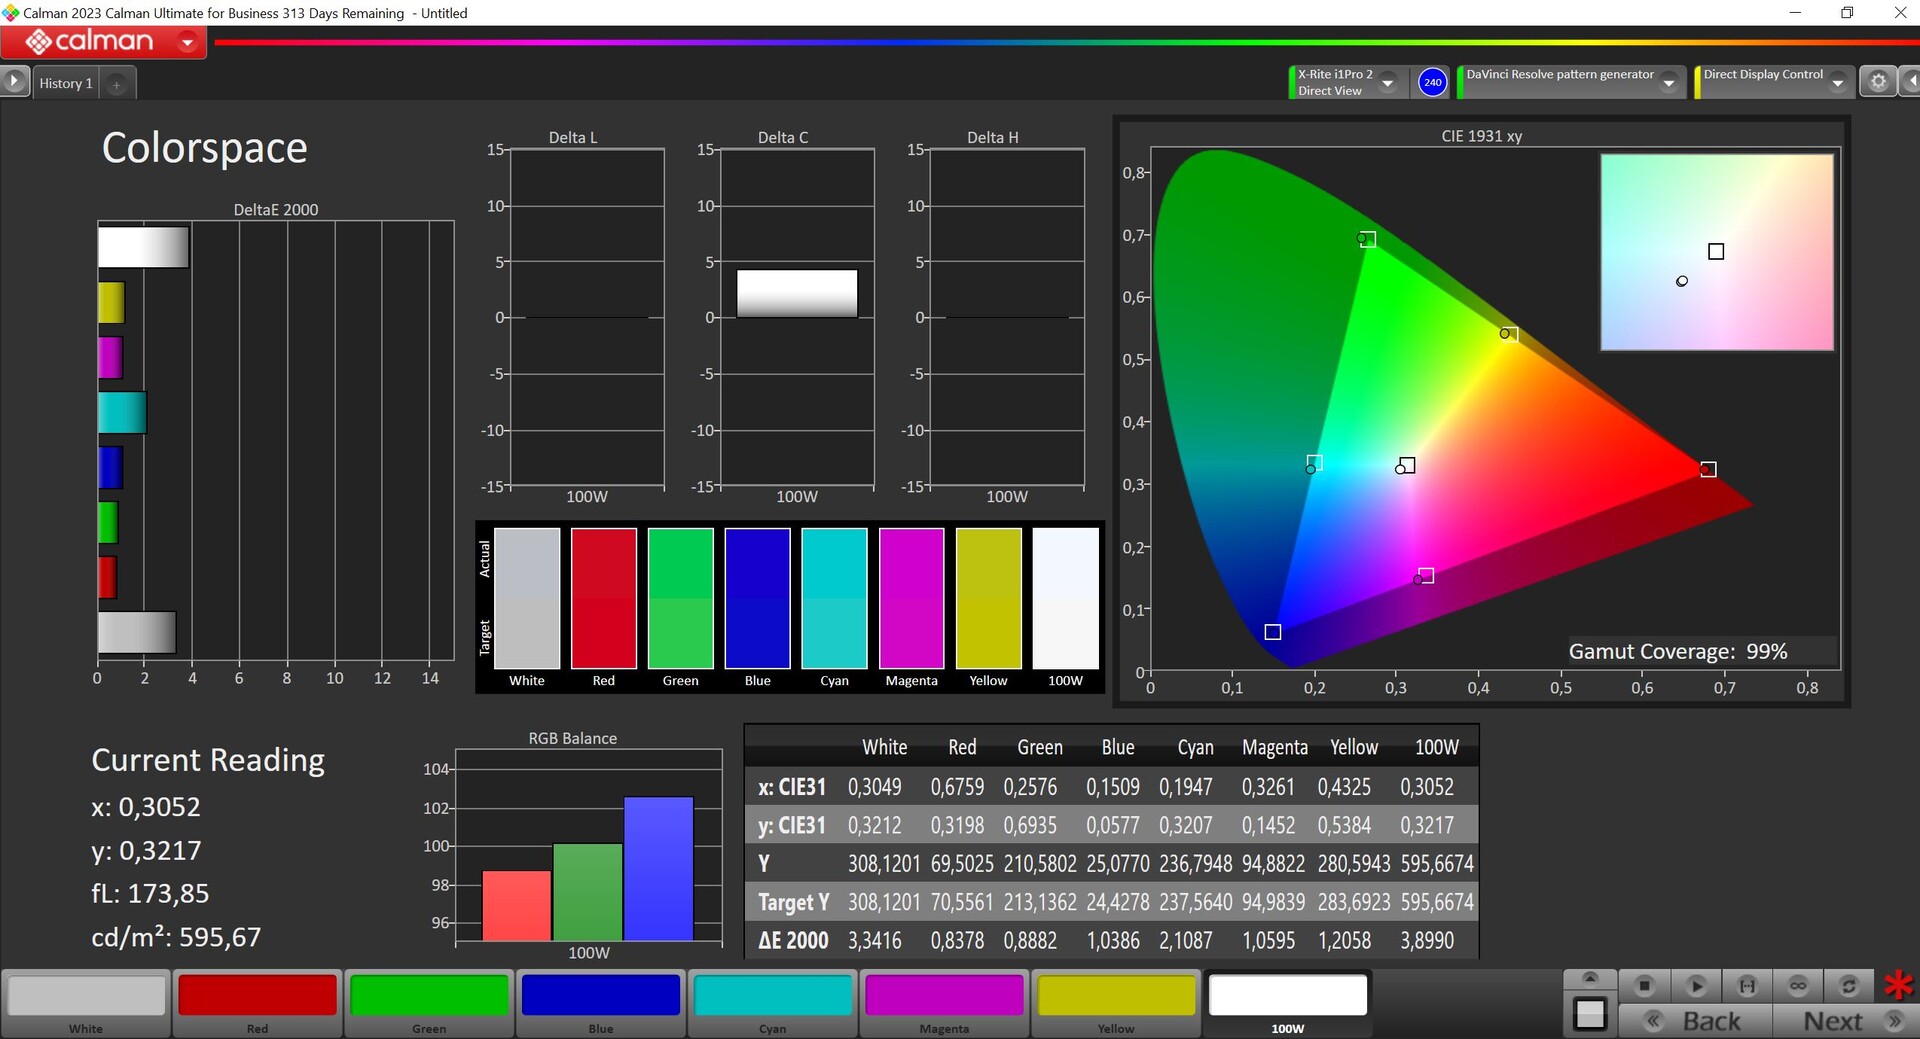
Ekranı profesyonel CalMAN yazılımı (X-Rite i1 Pro 2) ile analiz ettik ve görüntü kalitesi, temel M3 SoC'ye sahip giriş seviyesi MBP 14'e kıyasla daha iyi, çünkü ne renkler ne de gri tonlama, P3 referans renk alanına kıyasla 3'ten fazla DeltaE-2000 sapması göstermiyor. Ayrıca paneli kalibre ettik, ancak görüntü kalitesini daha fazla iyileştiremedik, bu nedenle bu noktada bir renk profili sunmuyoruz. MacBook, P3 referansını yüzde 99,2 oranında kapsıyor.
Yanıt Sürelerini Görüntüle
| ↔ Tepki Süresi Siyahtan Beyaza | ||
|---|---|---|
| 78.8 ms ... yükseliş ↗ ve sonbahar↘ birleşimi | ↗ 49.6 ms yükseliş | 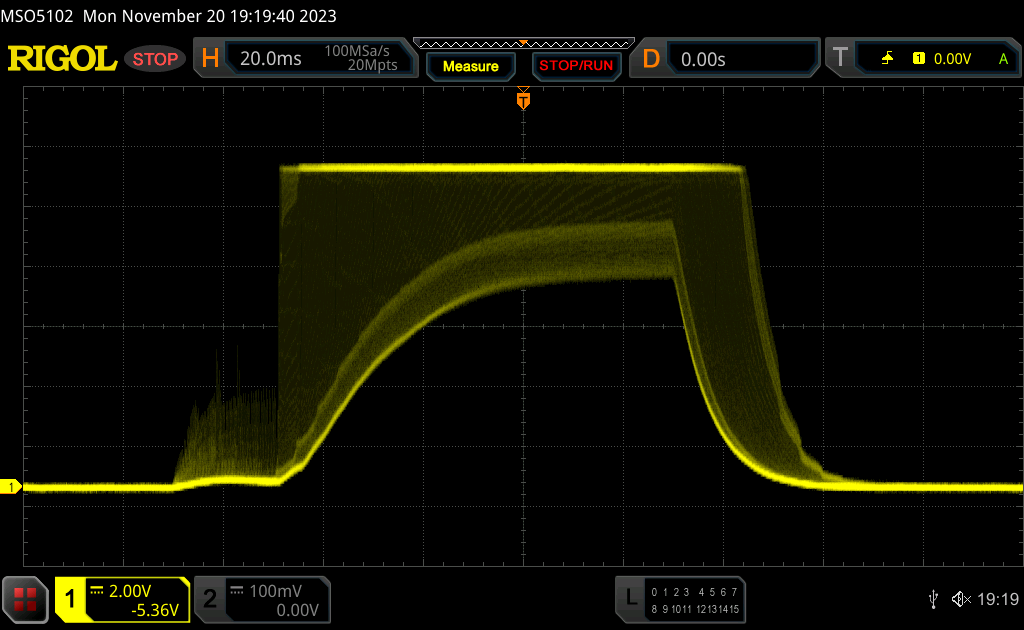 |
| ↘ 29.2 ms sonbahar | ||
| Ekran, testlerimizde yavaş yanıt oranları gösteriyor ve oyuncular için yetersiz olacaktır. Karşılaştırıldığında, test edilen tüm cihazlar 0.1 (minimum) ile 240 (maksimum) ms arasında değişir. » Tüm cihazların 100 %'si daha iyi. Bu, ölçülen yanıt süresinin test edilen tüm cihazların ortalamasından (19.8 ms) daha kötü olduğu anlamına gelir. | ||
| ↔ Tepki Süresi %50 Griden %80 Griye | ||
| 80.8 ms ... yükseliş ↗ ve sonbahar↘ birleşimi | ↗ 36.2 ms yükseliş | 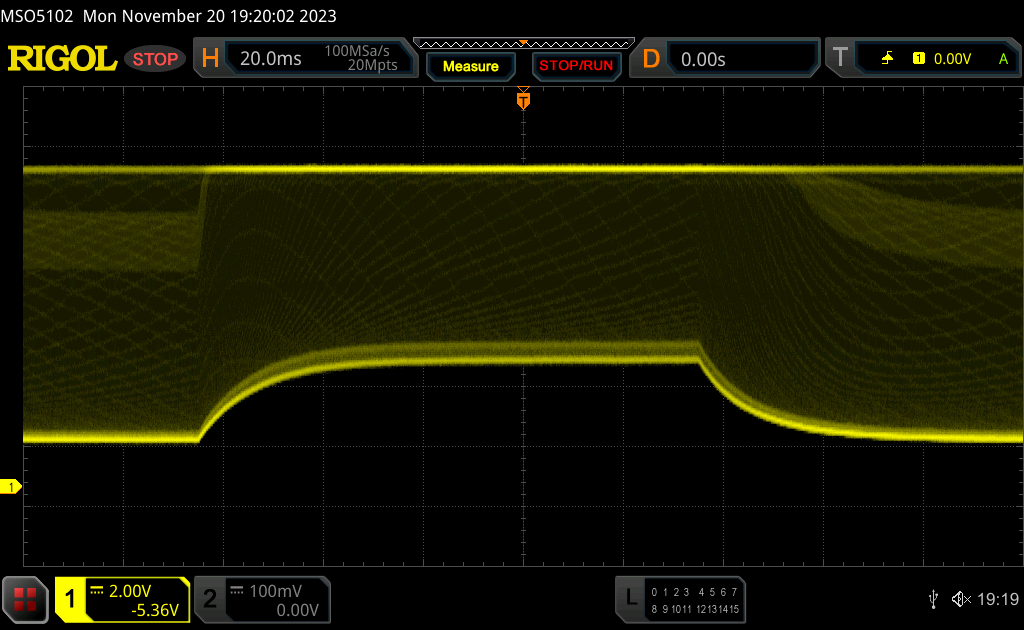 |
| ↘ 44.6 ms sonbahar | ||
| Ekran, testlerimizde yavaş yanıt oranları gösteriyor ve oyuncular için yetersiz olacaktır. Karşılaştırıldığında, test edilen tüm cihazlar 0.165 (minimum) ile 636 (maksimum) ms arasında değişir. » Tüm cihazların 99 %'si daha iyi. Bu, ölçülen yanıt süresinin test edilen tüm cihazların ortalamasından (31 ms) daha kötü olduğu anlamına gelir. | ||
Ekran Titremesi / PWM (Darbe Genişliği Modülasyonu)
| Ekran titriyor / PWM algılandı | 14878 Hz | ≤ 100 % parlaklık ayarı | 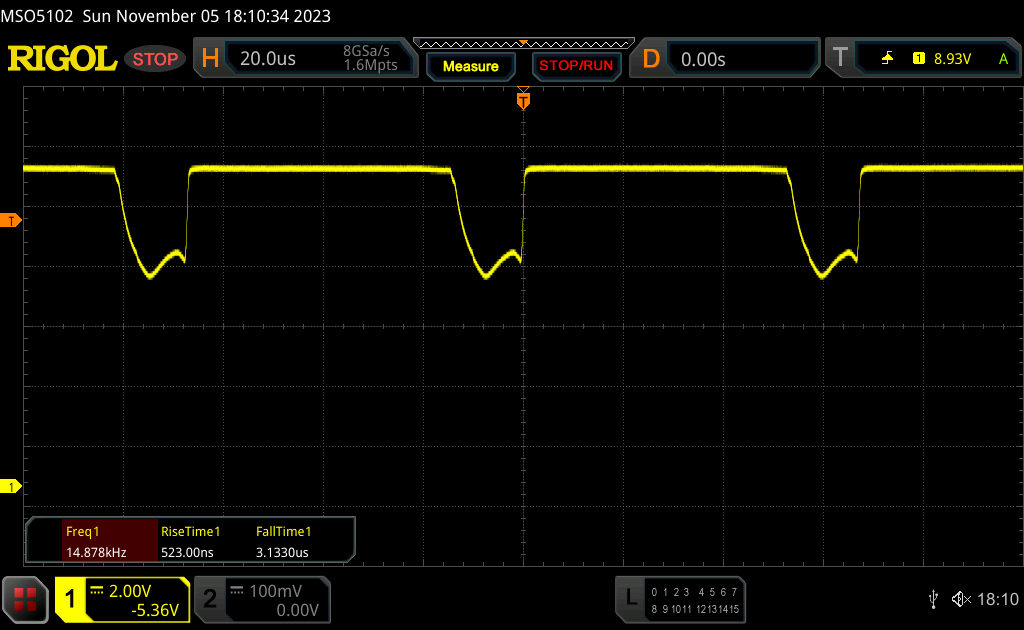 |
Ekran arka ışığı 14878 Hz'de titriyor (en kötü durum, örneğin PWM kullanılması) 100 % ve altındaki parlaklık ayarında titreme algılandı. Bu parlaklık ayarının üzerinde titreme veya PWM olmamalıdır. 14878 Hz frekansı oldukça yüksektir, bu nedenle PWM'ye duyarlı çoğu kullanıcı herhangi bir titremeyi fark etmemelidir. Karşılaştırıldığında: Test edilen tüm cihazların %52 %'si ekranı karartmak için PWM kullanmıyor. PWM tespit edilirse, ortalama 7769 (minimum: 5 - maksimum: 343500) Hz ölçüldü. | |||
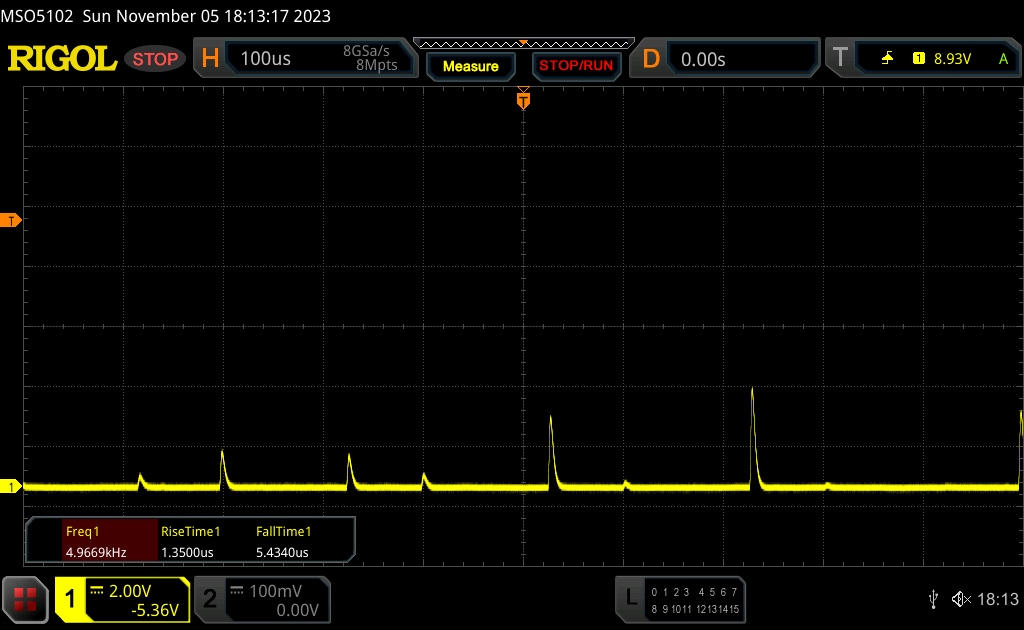
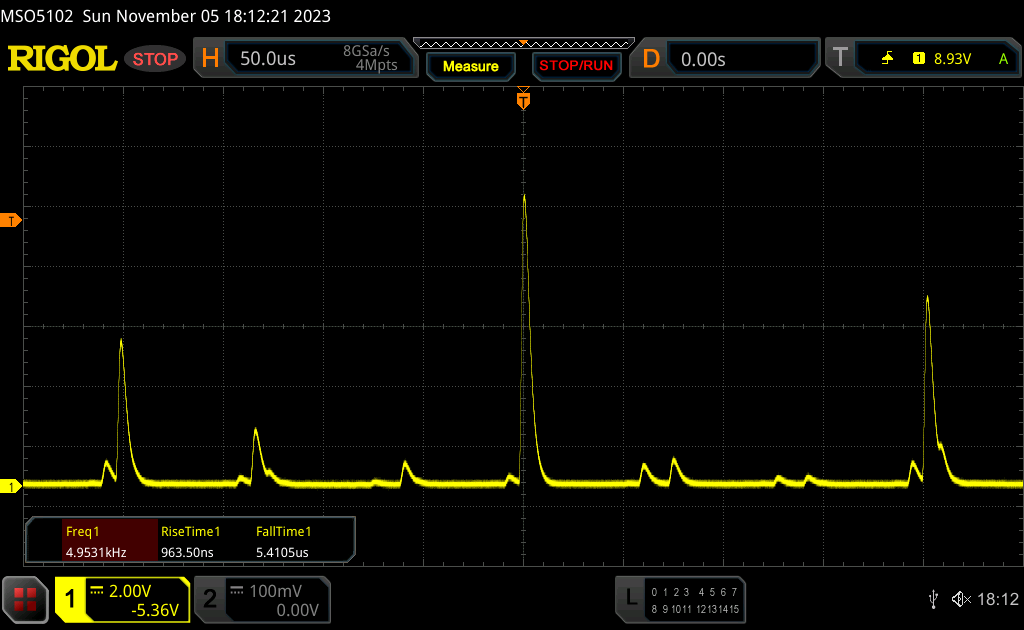
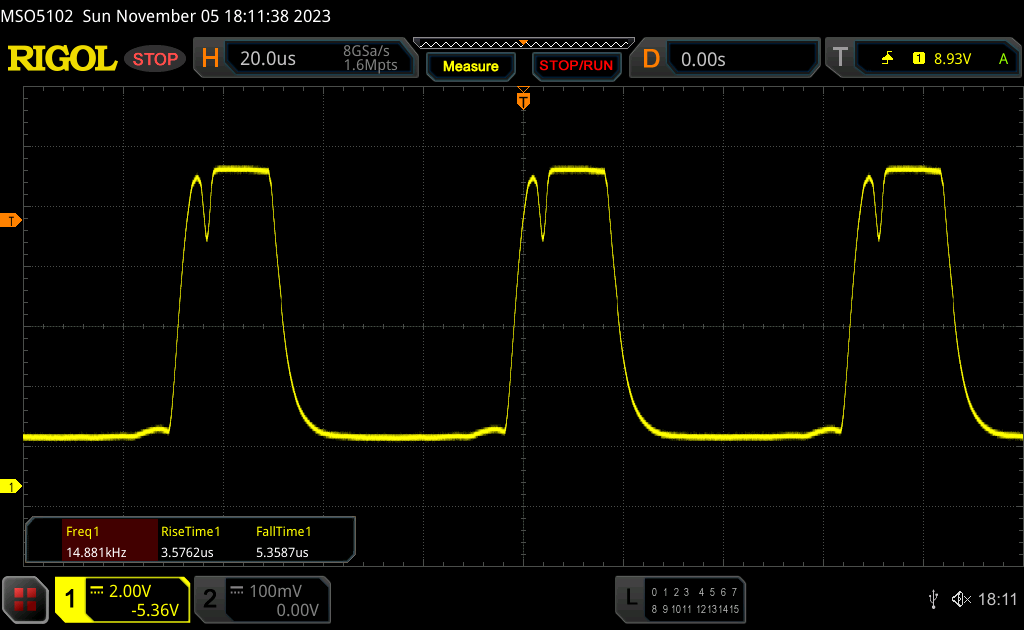
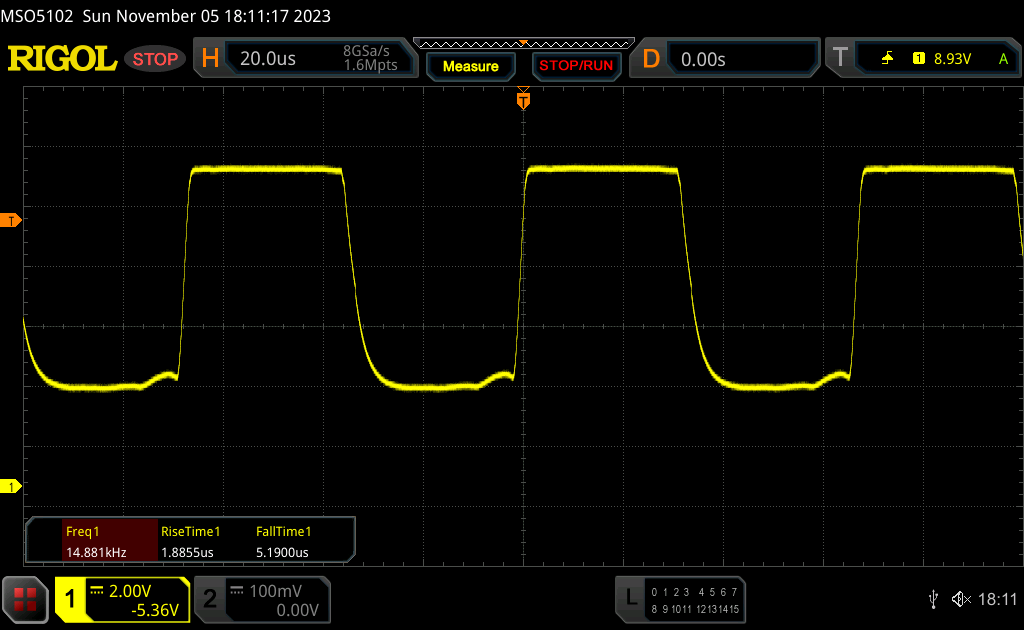
Önceki modelde olduğu gibi, yeni MacBook Pro 14'te de 15 kHz'de sabit bir titreme ölçebiliyoruz, ancak yüksek frekans nedeniyle herhangi bir sorun olmamalı. Sürekli titreme, doğru tepki sürelerini belirlemeyi zorlaştırıyor ve Mini-LED arka aydınlatmalı IPS panel için oldukça yavaş değerler belirliyoruz. Özel testlerde biraz gölgelenme görebilirsiniz, ancak günlük kullanımda genellikle görünmez ve 120 Hz'lik artan frekans kesinlikle yardımcı olur. Yine de, rakipleri gibi Yoga Pro 9i ya da Asus'un OLED modelleri bu konuda daha üstündür.
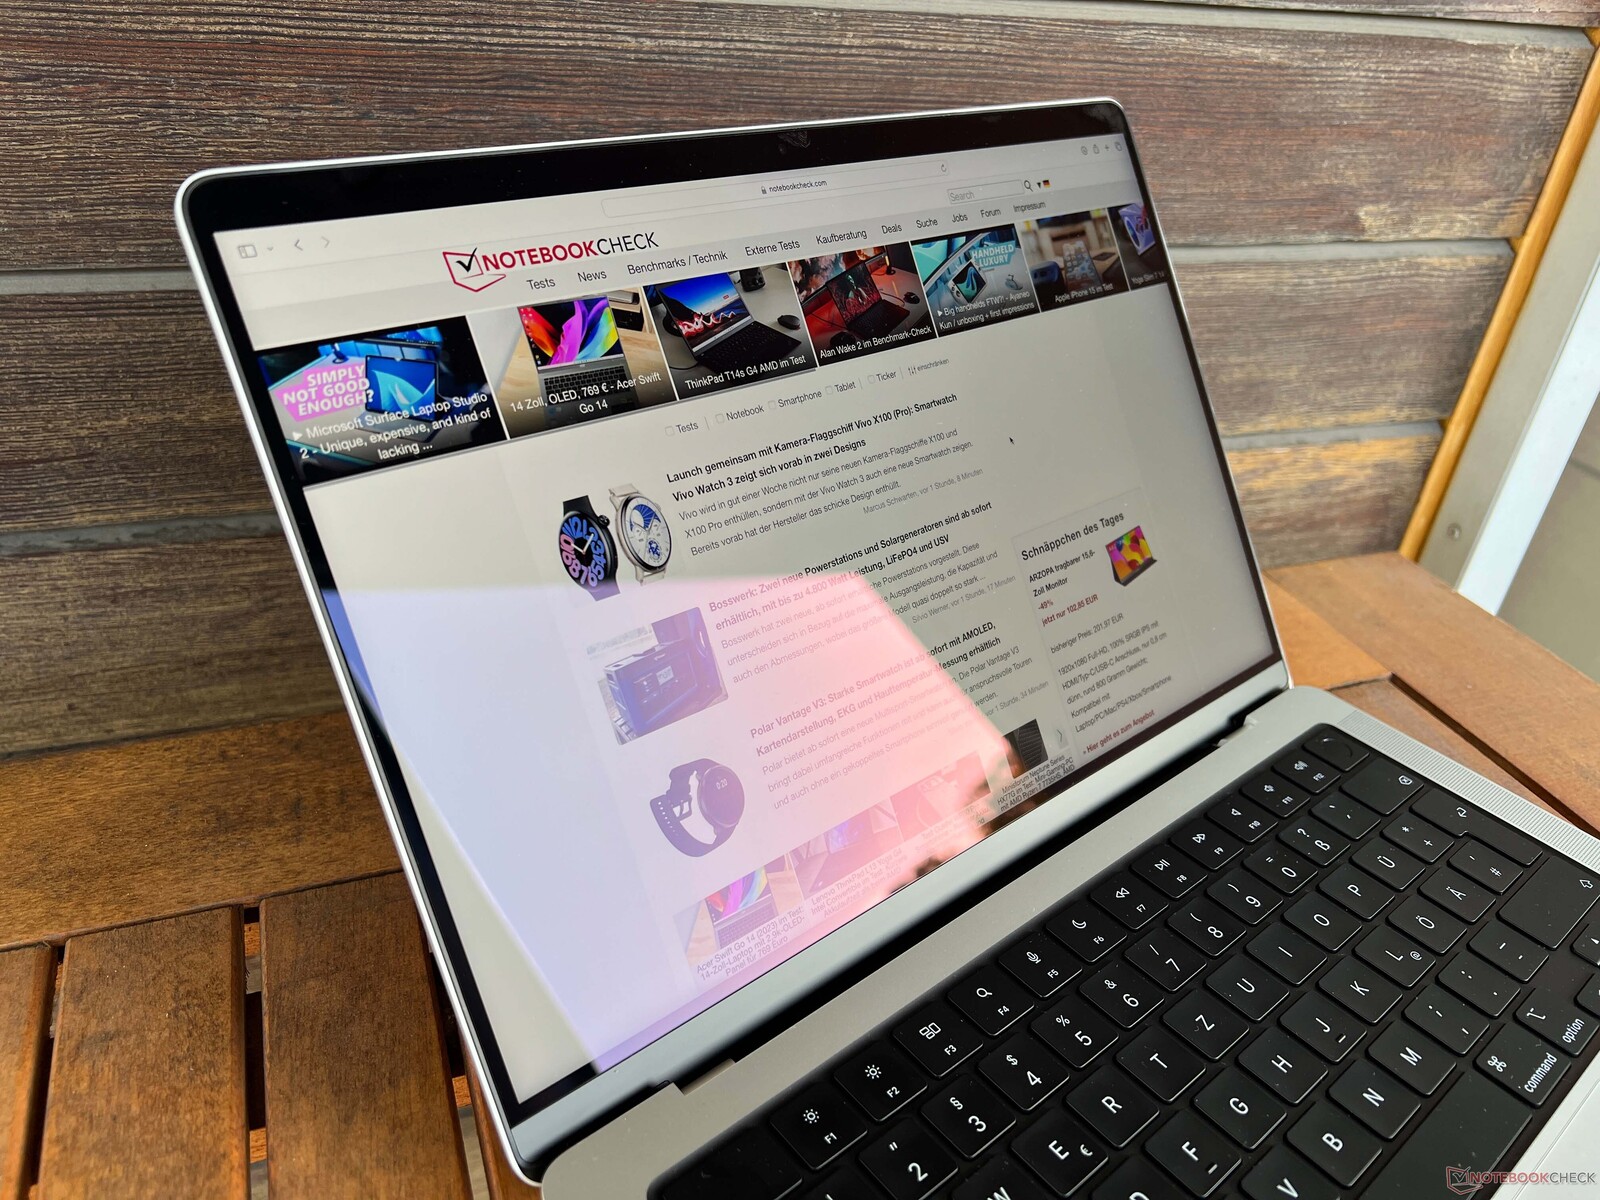
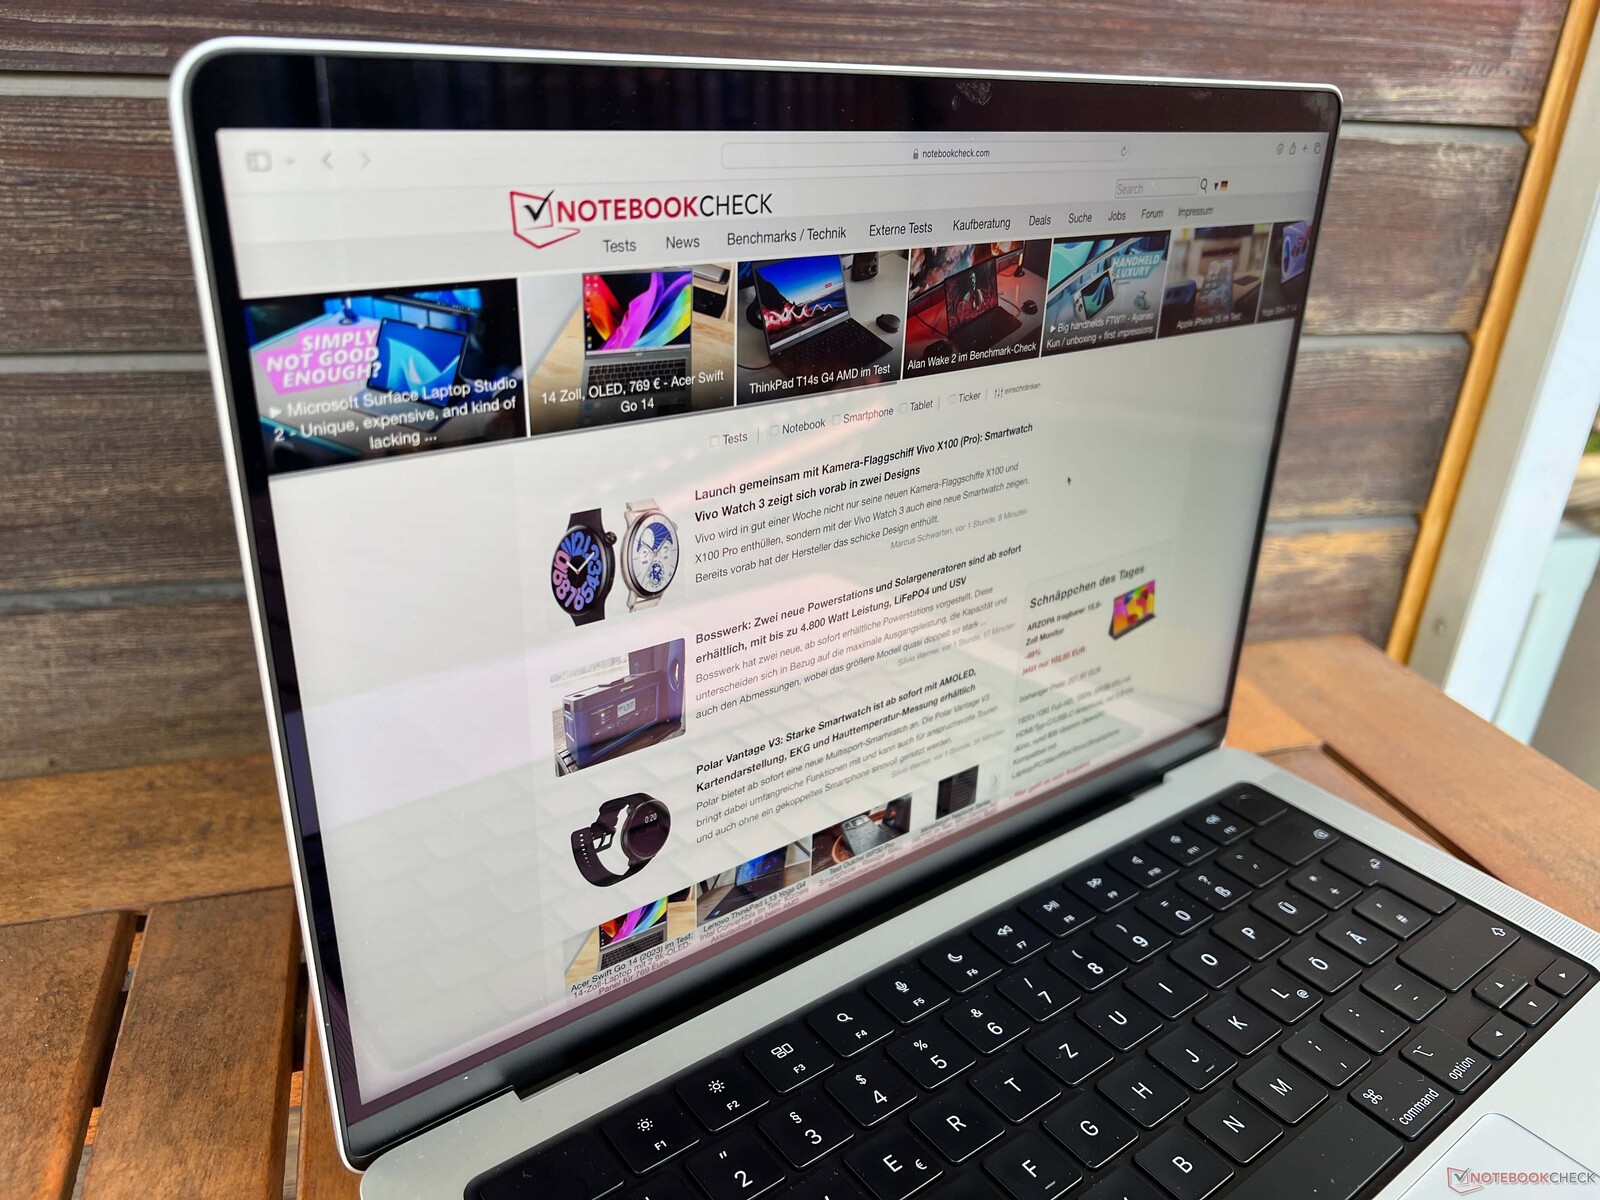
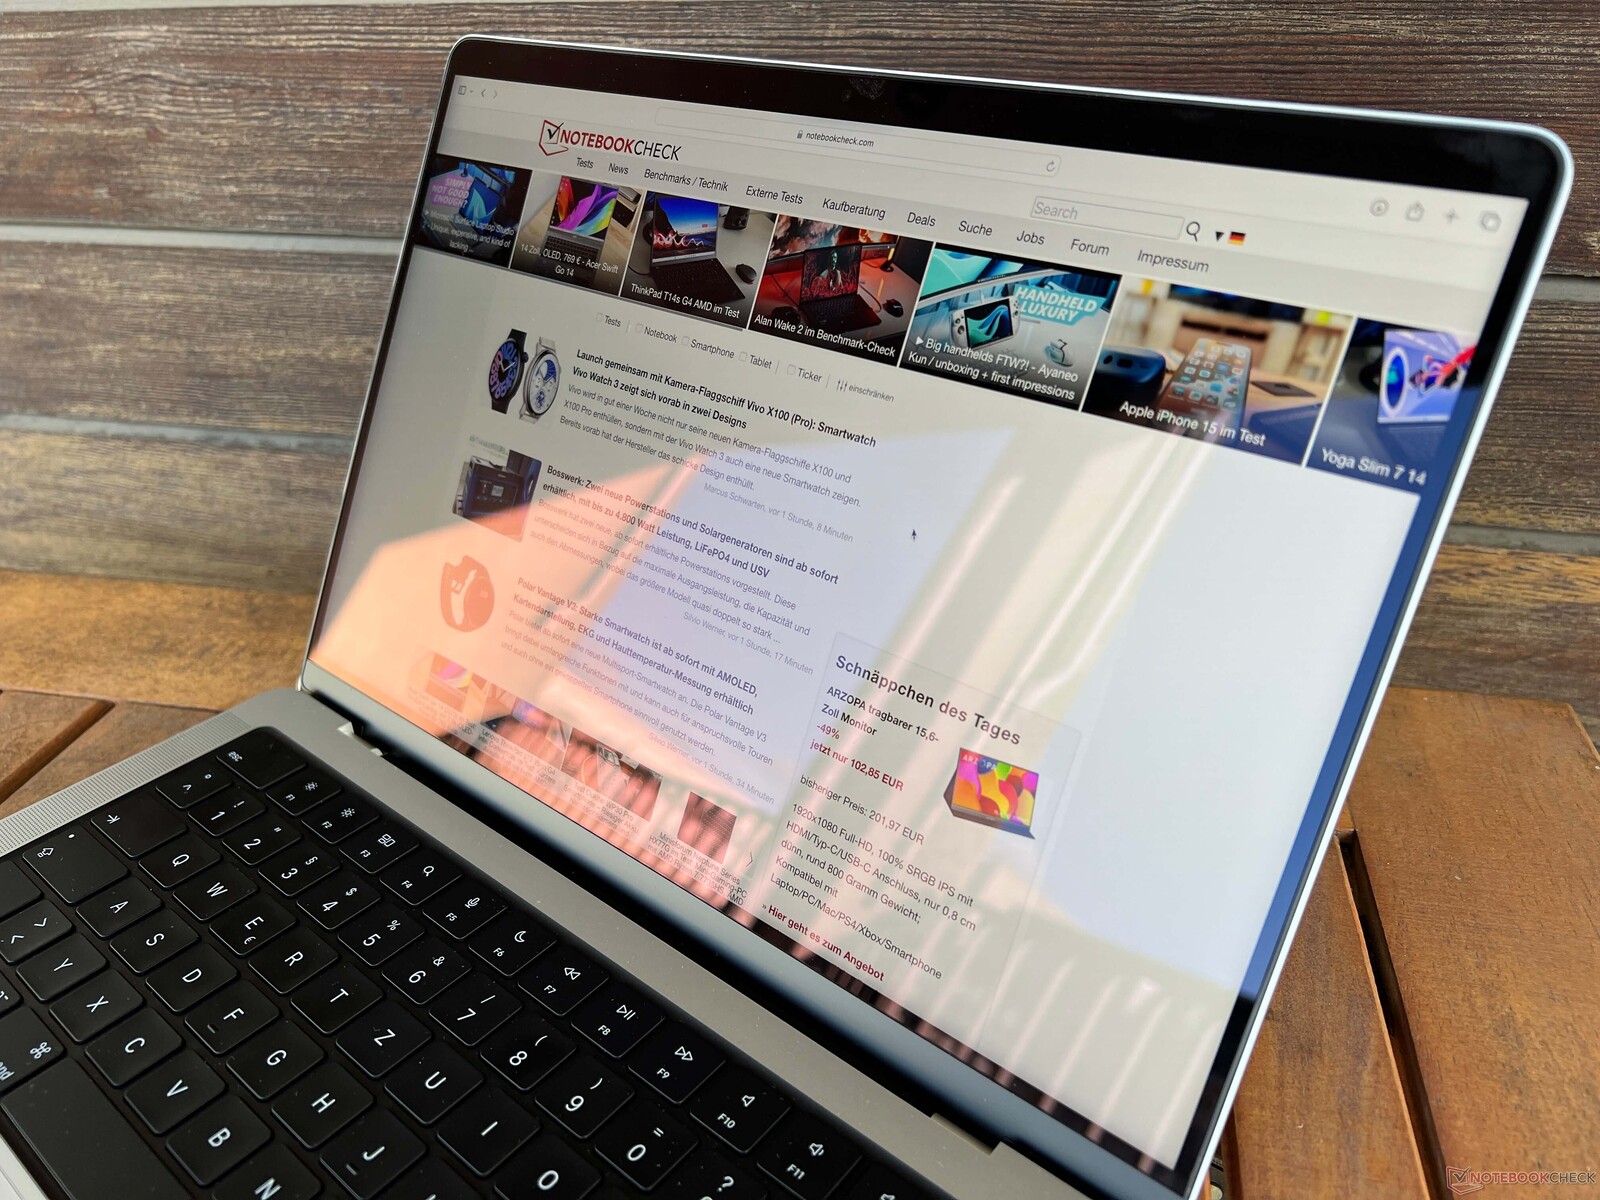
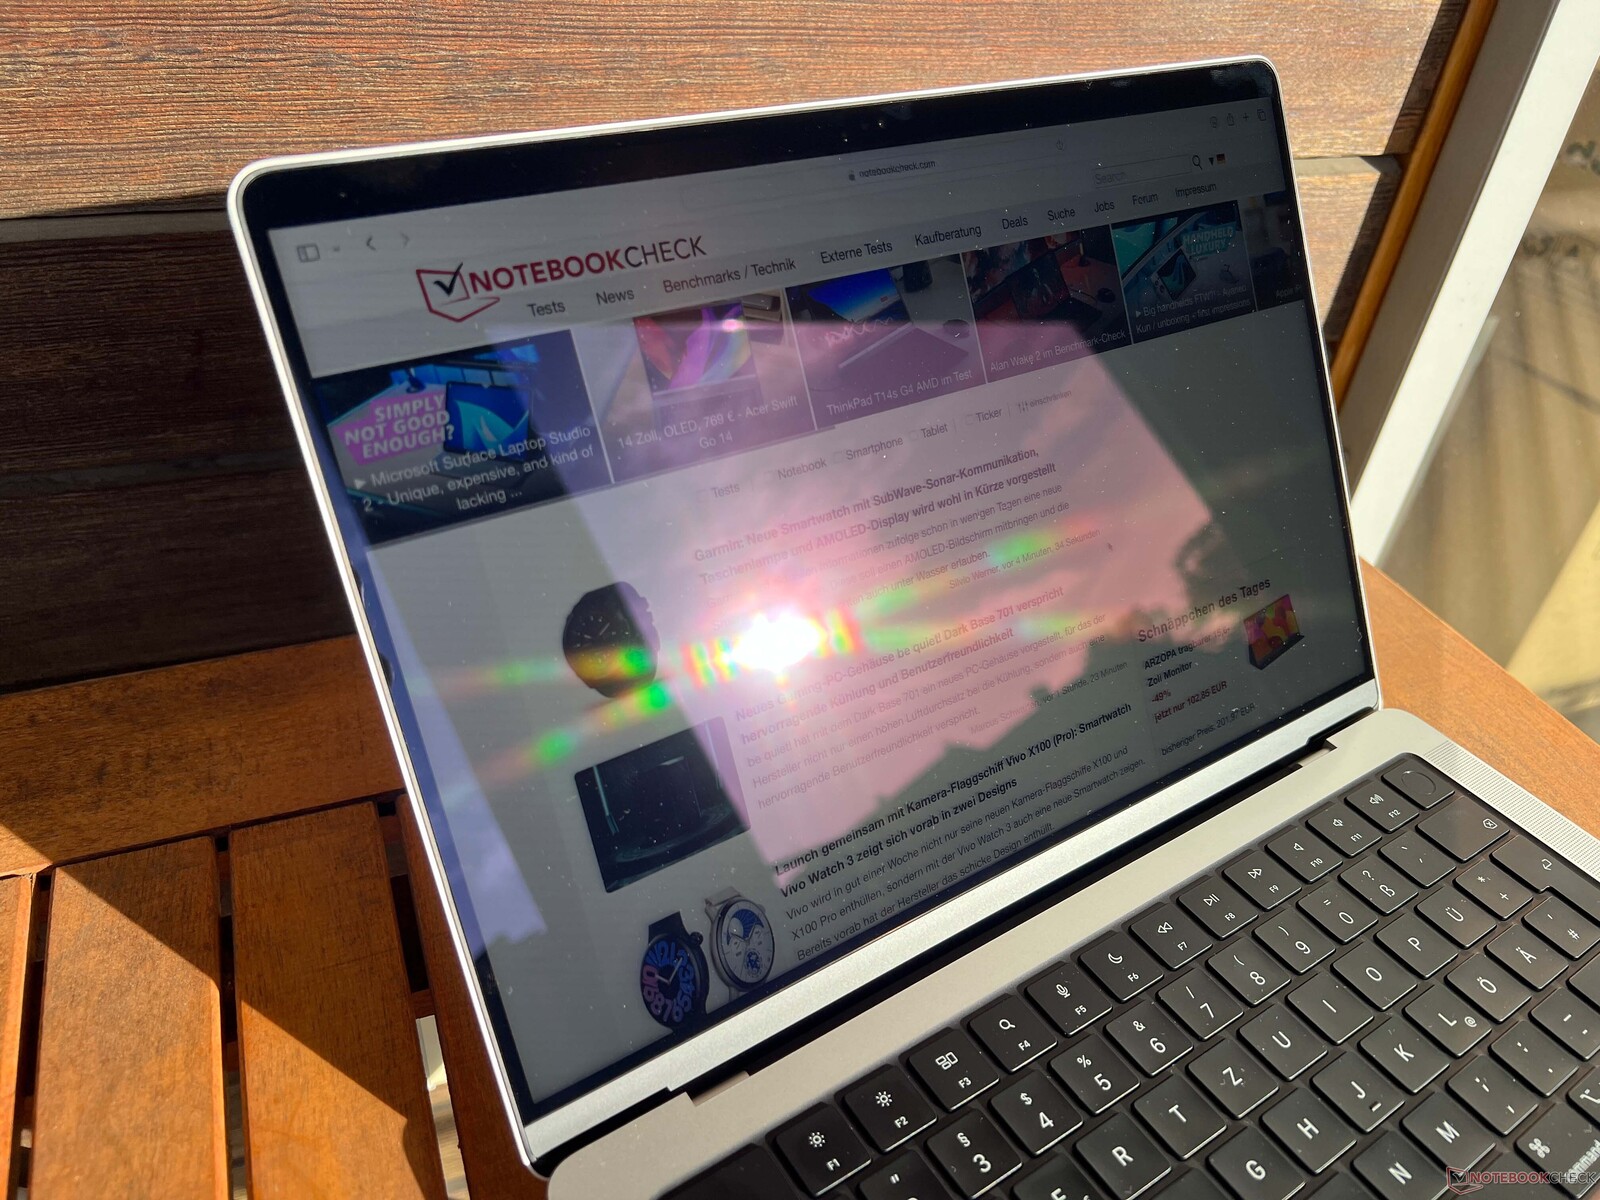
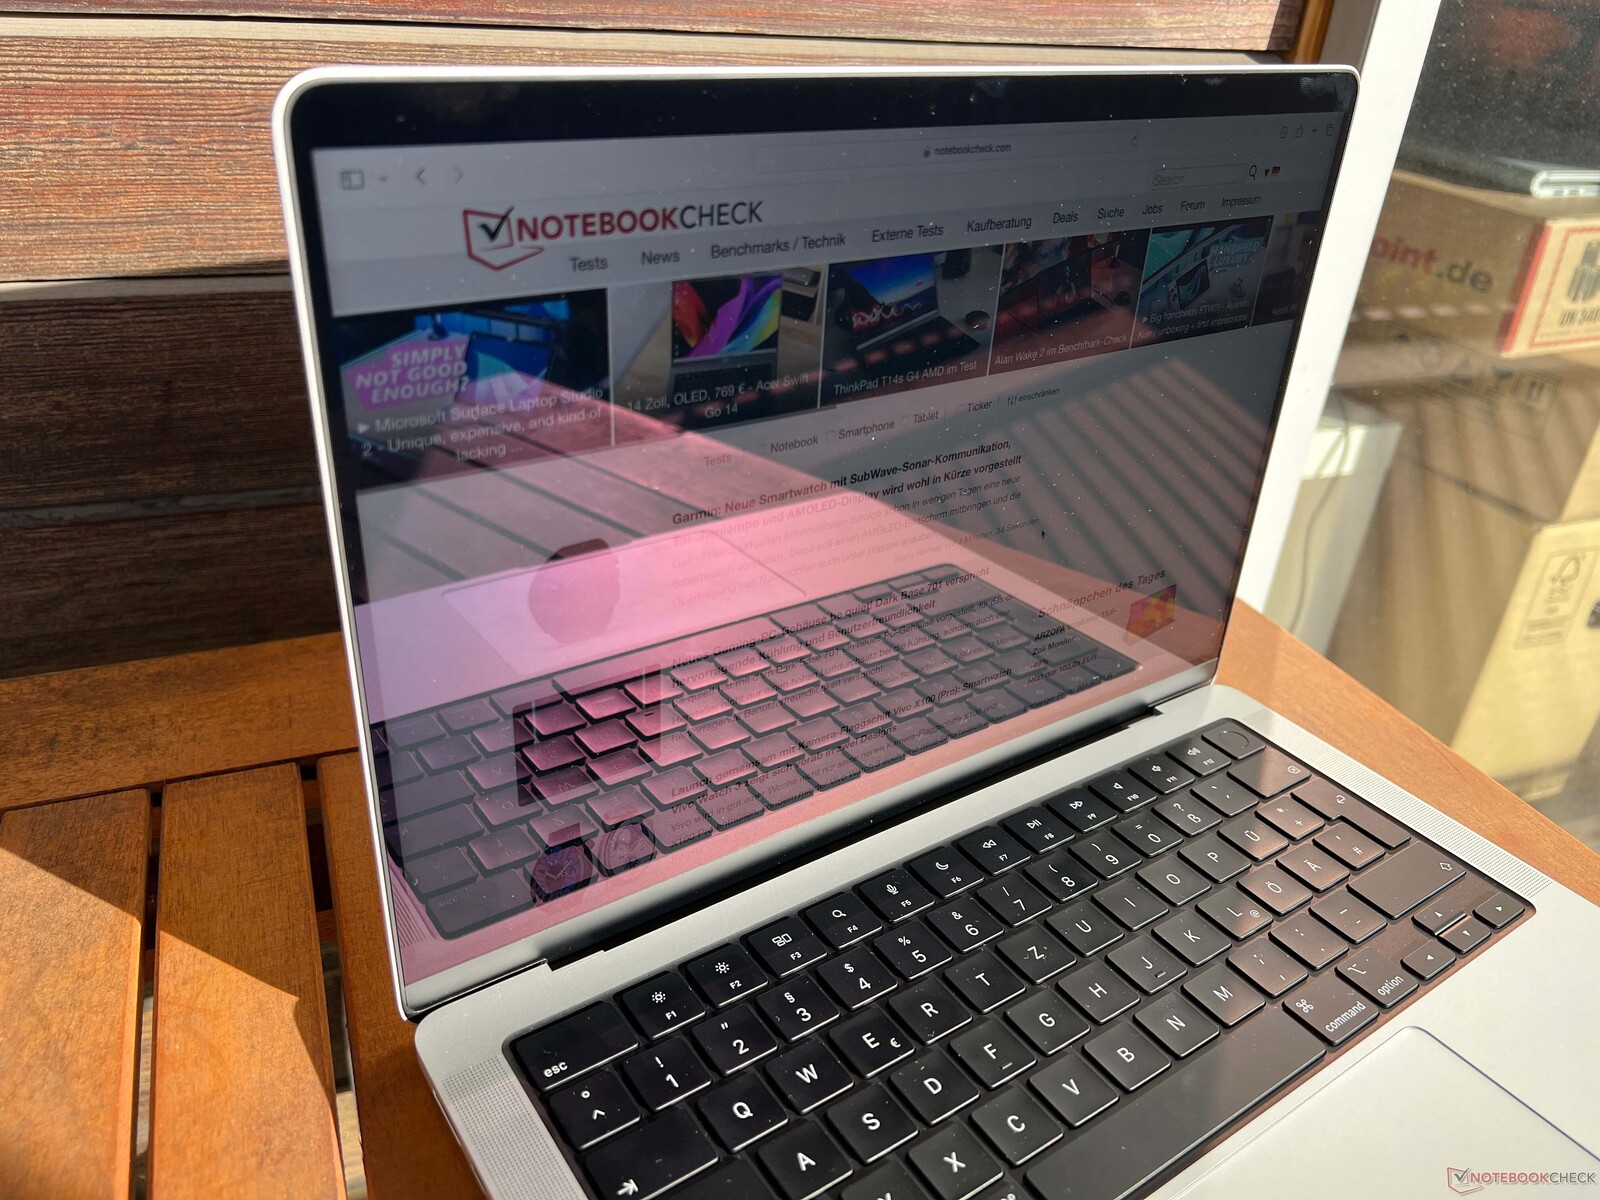
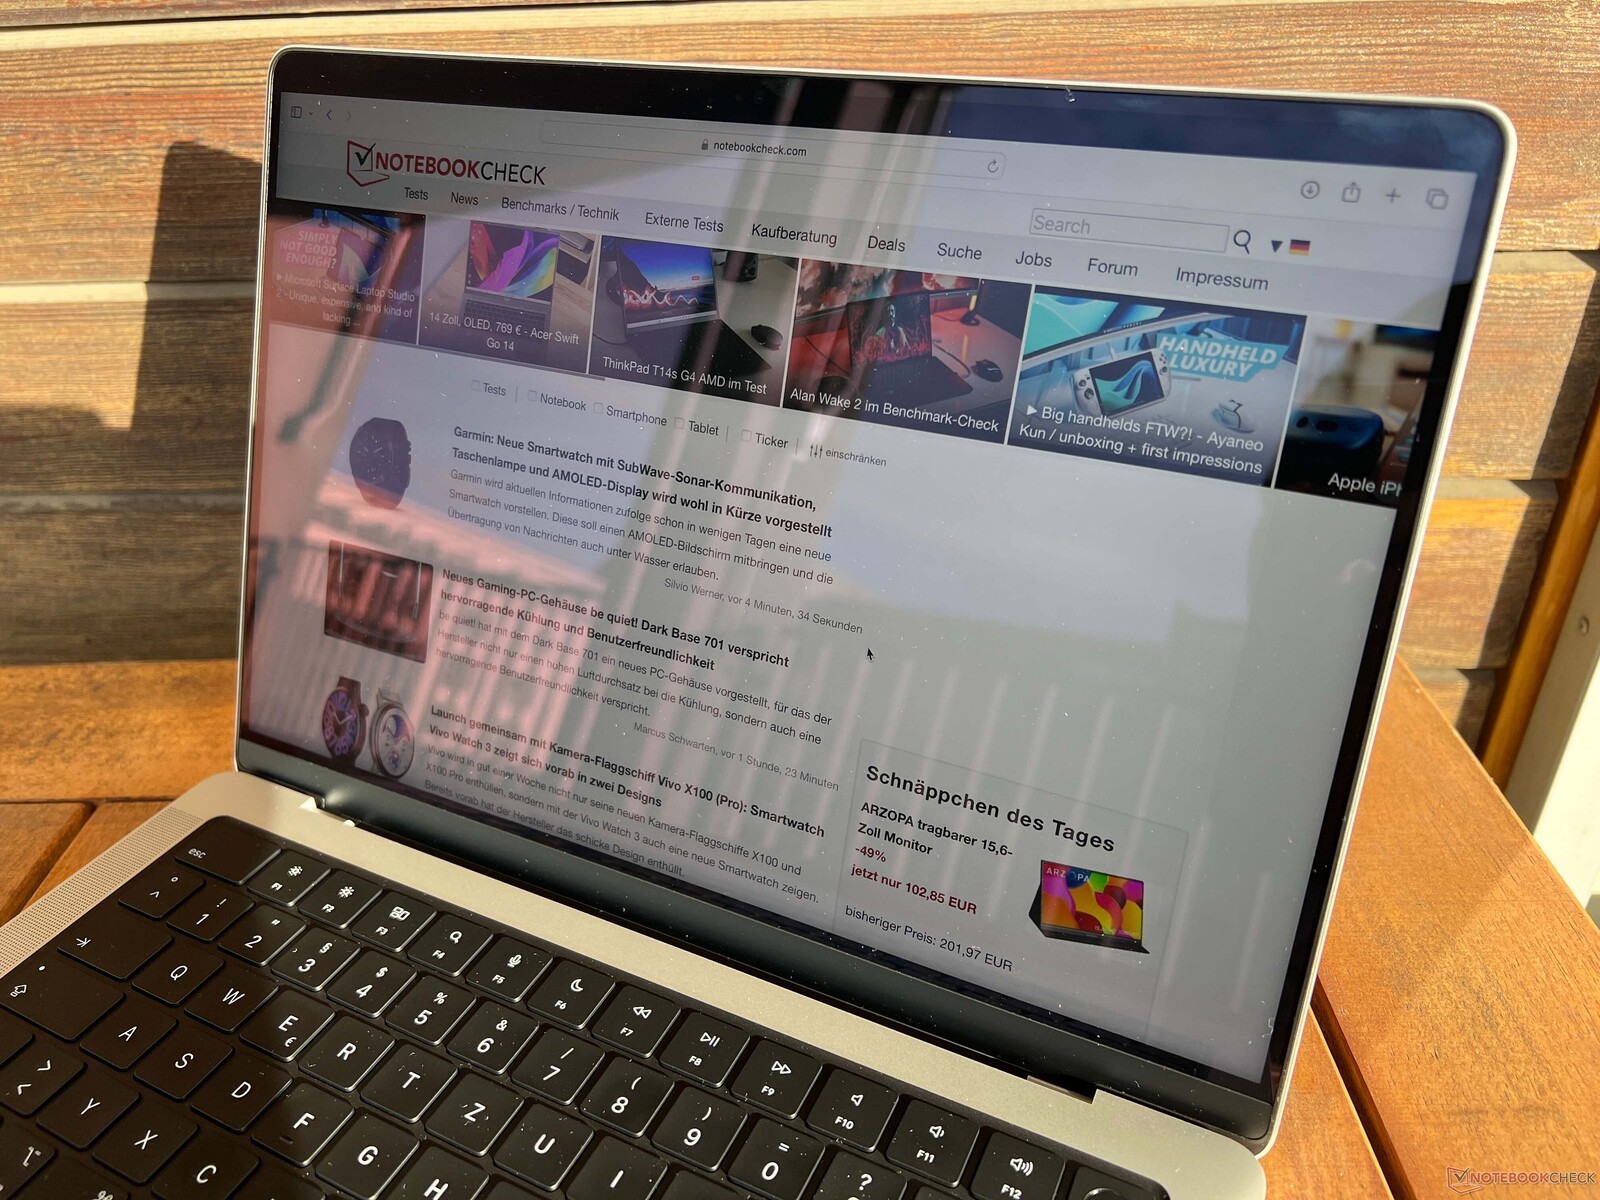
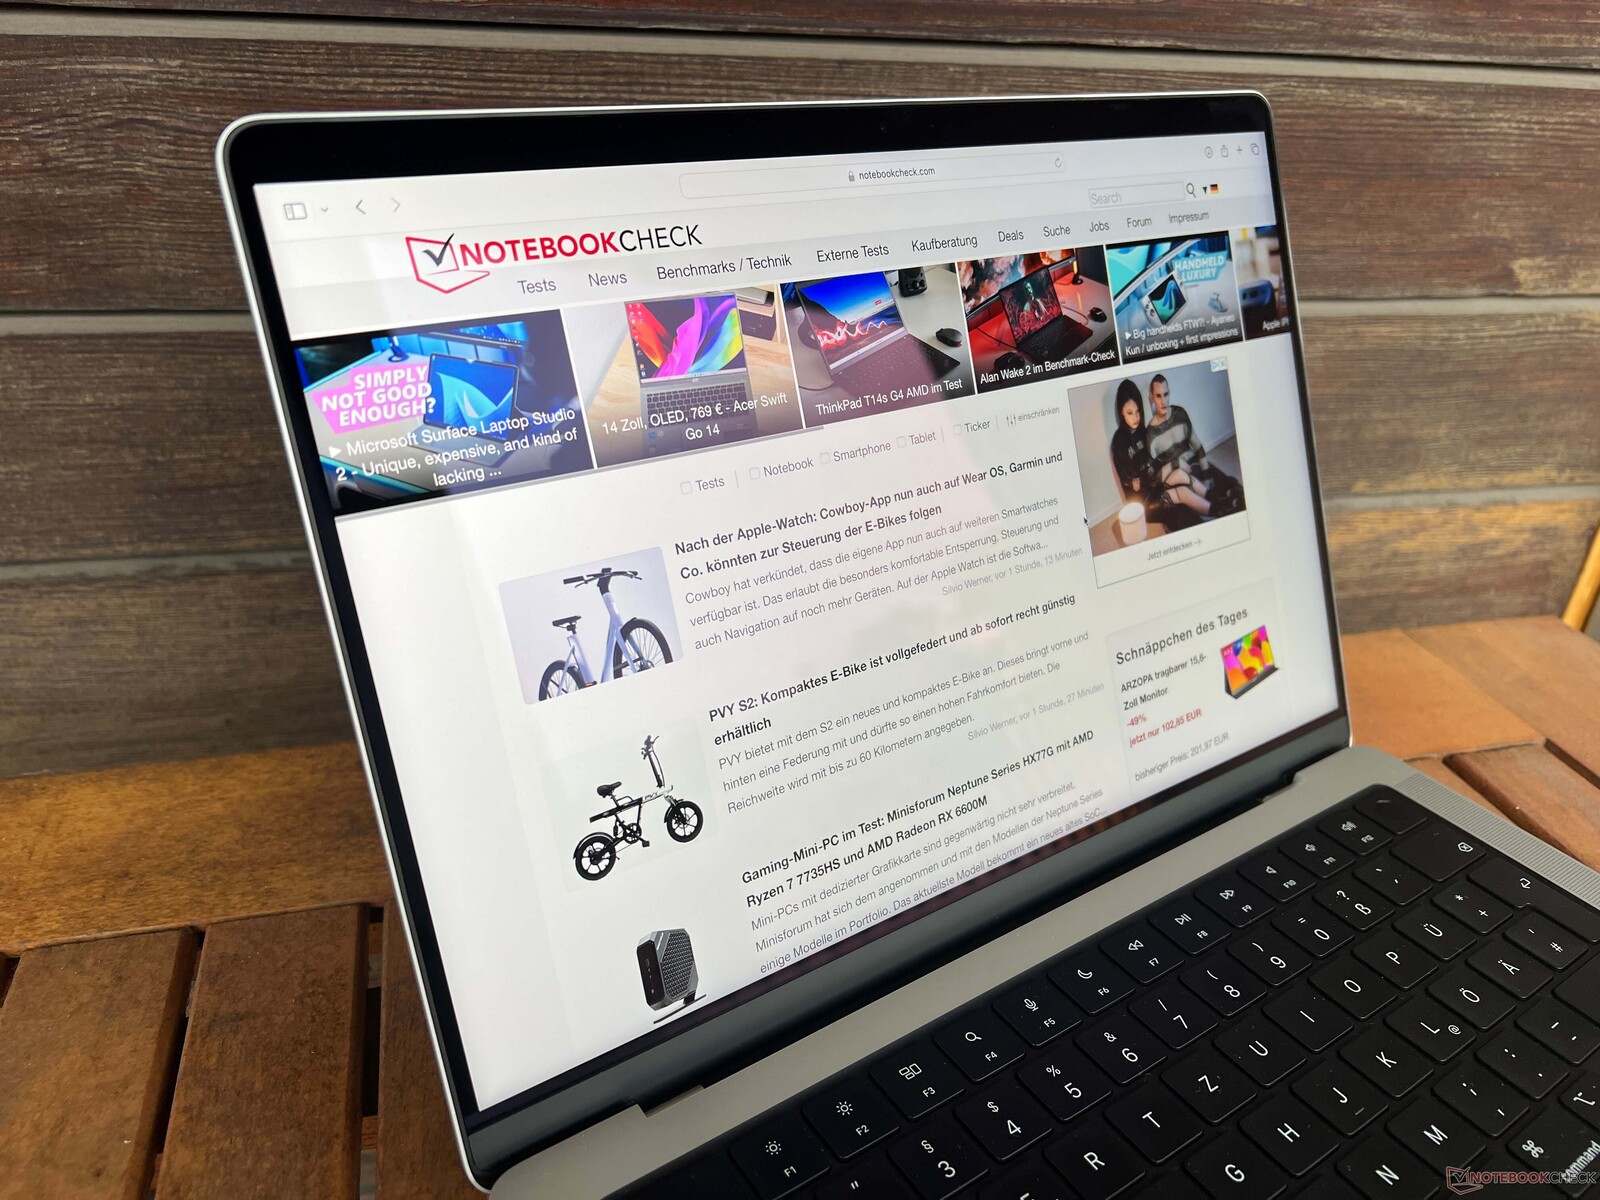
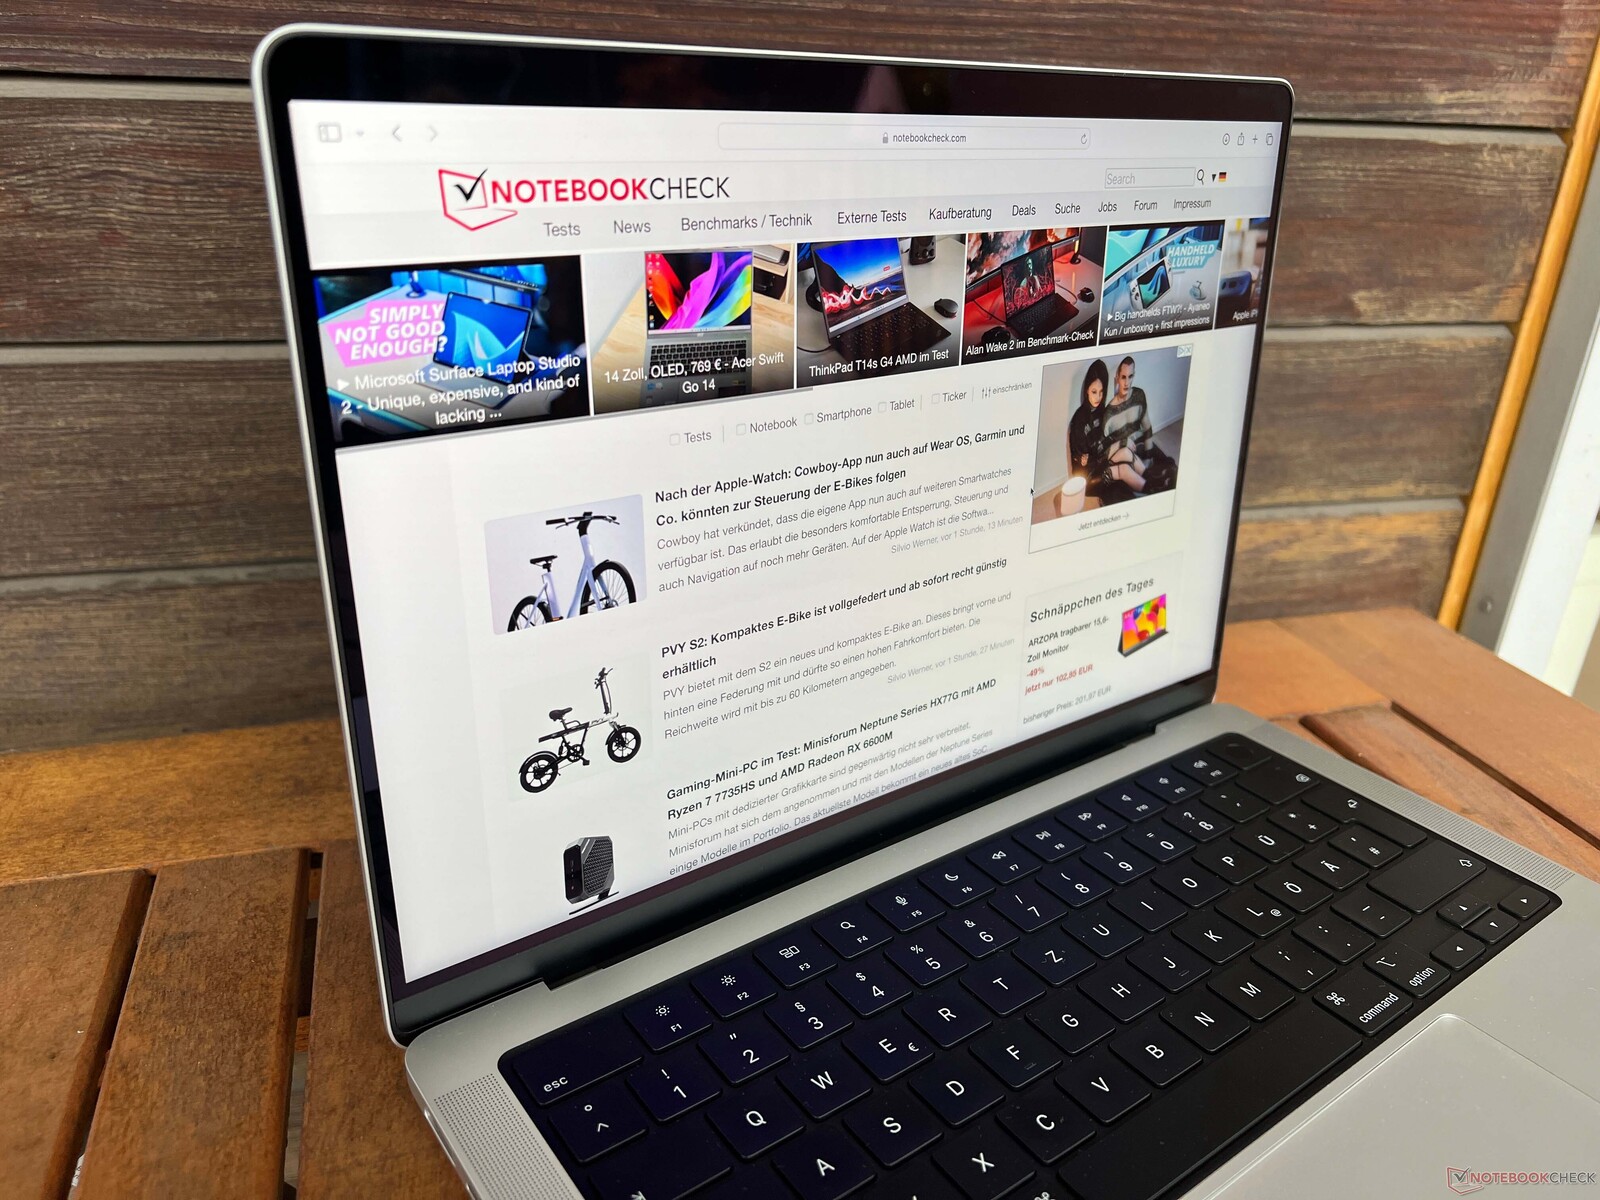
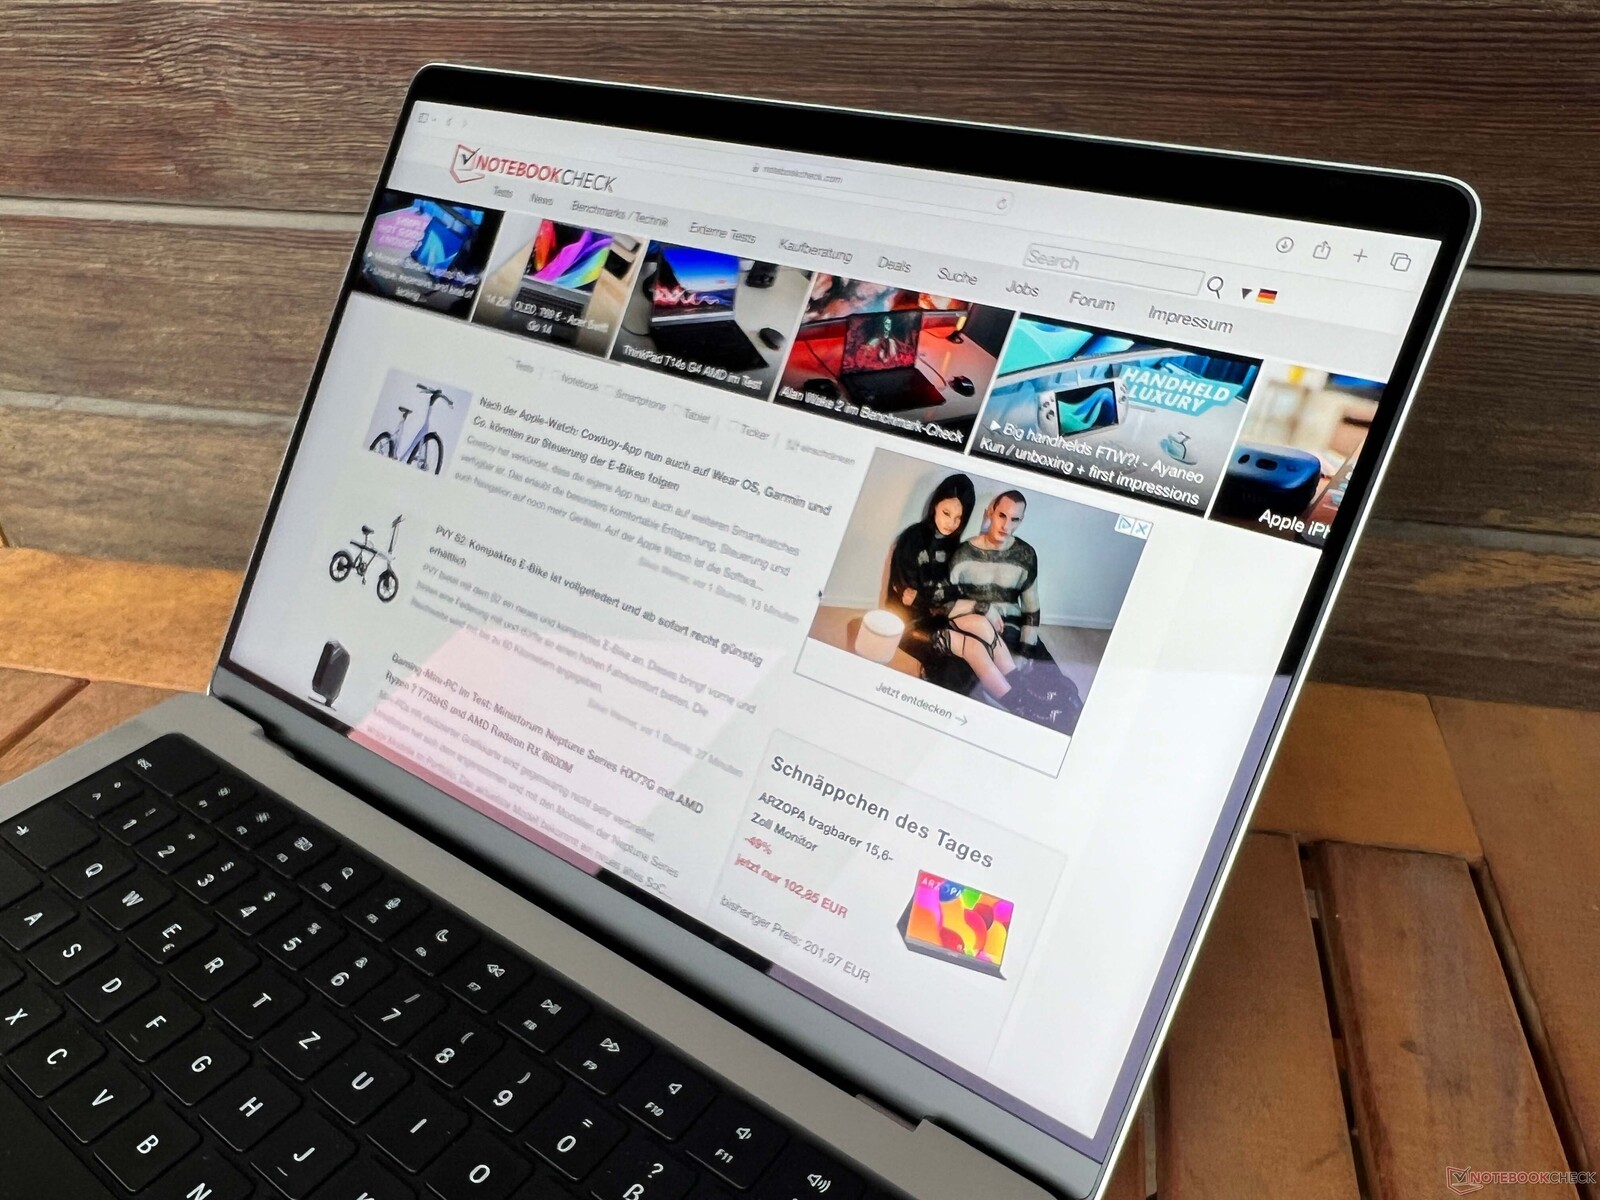
MacBook Pro 14 parlak bir ekran kullanıyor, ancak diğer birçok parlak panel kadar yansıtıcı değil. Parlaklığın yanı sıra kontrast oranının da yüksek değerlere sahip olması bu konuda yardımcı oluyor. Örnek görüntülerimiz (MacBook ProMacBook Pro 14 M3) doğrudan güneş ışığından kaçındığınız sürece MacBook'u güneşli günlerde dışarıda bile kullanabileceğinizi gösteriyor. Görüş açısı stabilitesi açısından herhangi bir sınırlama yoktur.
Performans - Turbo modlu M3 Max
Ayarları Gözden Geçir
M1 Max veya M2 Max ile daha büyük MacBook Pro 16 geçmişte zaten birden fazla performans modu sunuyordu(Düşük Performans, Otomatik, Yüksek Performans) ve M3 Max ile daha küçük MacBook Pro 14 de artık bu modlara sahip. Yüksek Performans modu esas olarak CPU ve GPU'yu aynı anda zorladığınızda (daha yüksek fan gürültüsü pahasına) fark edilir. Öte yandan saf CPU/GPU performansı aynıdır, bu nedenle aşağıdaki kıyaslamaları ve ölçümleri varsayılan Otomatik ayarıyla gerçekleştirdik.
İşlemci - 16 CPU çekirdekli M3 Max
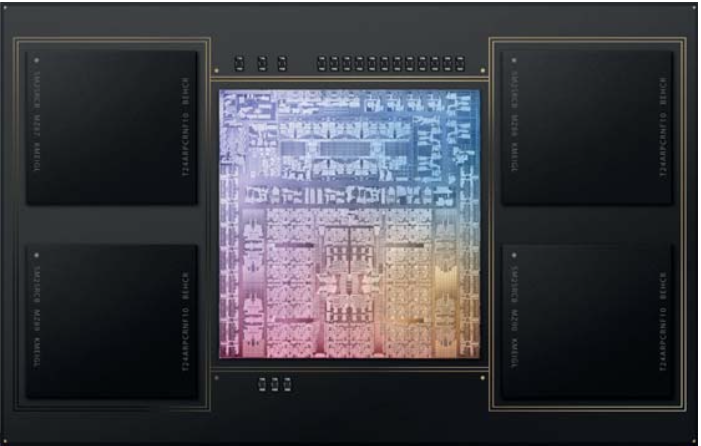
BuM3 Maksgelişmiş 3 nm sürecinde üretilmiştir ve üst düzey modelde dört ek performans çekirdeği (toplam 12) bulunmaktadır.M2 Maks. Dört verimlilik çekirdeğine ek olarak, CPU aynı anda 16 adede kadar iş parçacığı çalıştırabilir. Daha yüksek çekirdek sayısı aynı zamanda güç tüketiminde de önemli bir artışa neden oluyor çünkü M2 Max CPU kıyaslamalarında 36 Watt'a kadar tüketirken yeni M3 Max 56 Watt'a kadar tüketiyor.
Performans çekirdekleri 4,056 GHz'e kadar çıkabilir ve tüm çekirdekleri aynı anda kullandığınızda yaklaşık 3,6 GHz'e ulaşabilir. Dört verimlilik çekirdeği 2,567 GHz'e kadar ulaşır (tam yük altında 2,418 GHz) ve temel verimlilik çekirdeklerinden daha yavaştırM3 SoC. Performans eski M2 Max'e kıyasla önemli ölçüde daha iyi ve Cinebench R23 Multi testinde %63'lük bir avantaj görüyoruz. Bu, Apple 'un 14 inçlik rakipleri arasında kolayca zirveye yerleştiği anlamına geliyor ve Cinebench R23 Multi testinde eski M2 Max'e kıyasla %26'lık bir avantaj görüyoruz.Core i9-13900HiçindeAsus Zenbook Pro 14(120/90 Watt) ve %32 daha fazlaAMD Ryzen 9 7940HSiçindeAsus ROG Zephyrus G14(80 Watt). M3 Max'in avantajı yerel Geekbench Testlerinde daha da büyüktür. Yalnızca AMD ve Intel'in HX modelleri daha fazla CPU performansı sunuyor (çok daha yüksek TDP değerlerinde), ancak bunlar yalnızca 16 inç ve daha büyük dizüstü bilgisayarlarda mevcut.
Cinebench 2024: CPU Multi Core | CPU Single Core
Geekbench 5.5: Multi-Core | Single-Core
Geekbench 6.7: Multi-Core | Single-Core
Blender: v3.3 Classroom CPU
| Cinebench 2024 / CPU Multi Core | |
| Apple MacBook Pro 16 2023 M3 Max | |
| Ortalama Apple M3 Max 16-Core (1532 - 1612, n=2) | |
| Apple MacBook Pro 14 2023 M3 Max | |
| Sınıf ortalaması Multimedia (327 - 2437, n=82, son 2 yıl) | |
| Asus ROG Zephyrus G14 GA402XY | |
| Cinebench 2024 / CPU Single Core | |
| Apple MacBook Pro 14 2023 M3 Max | |
| Ortalama Apple M3 Max 16-Core (139 - 140, n=2) | |
| Apple MacBook Pro 16 2023 M3 Max | |
| Sınıf ortalaması Multimedia (72.5 - 201, n=63, son 2 yıl) | |
| Asus ROG Zephyrus G14 GA402XY | |
| Geekbench 6.7 / Multi-Core | |
| Apple MacBook Pro 14 2023 M3 Max | |
| Ortalama Apple M3 Max 16-Core (21243 - 21264, n=2) | |
| Apple MacBook Pro 16 2023 M3 Max | |
| Sınıf ortalaması Multimedia (4983 - 29415, n=76, son 2 yıl) | |
| Lenovo Yoga Pro 9-14IRP G8 | |
| Lenovo Yoga Pro 9-14IRP G8 | |
| Microsoft Surface Laptop Studio 2 RTX 4060 | |
| Asus ROG Zephyrus G14 GA402XY | |
| Geekbench 6.7 / Single-Core | |
| Apple MacBook Pro 14 2023 M3 Max | |
| Ortalama Apple M3 Max 16-Core (3096 - 3157, n=2) | |
| Apple MacBook Pro 16 2023 M3 Max | |
| Sınıf ortalaması Multimedia (1534 - 4335, n=75, son 2 yıl) | |
| Microsoft Surface Laptop Studio 2 RTX 4060 | |
| Lenovo Yoga Pro 9-14IRP G8 | |
| Lenovo Yoga Pro 9-14IRP G8 | |
| Asus ROG Zephyrus G14 GA402XY | |
| Blender / v3.3 Classroom CPU | |
| Sınıf ortalaması Multimedia (134.5 - 1042, n=67, son 2 yıl) | |
| Microsoft Surface Laptop Studio 2 RTX 4060 | |
| Lenovo Yoga Pro 9-14IRP G8 | |
| Apple MacBook Pro 14 2023 M2 Pro | |
| Asus ZenBook Pro 14 Duo UX8402VV-P1021W | |
| Apple MacBook Pro 16 2023 M2 Max | |
| Asus Zenbook Pro 14 OLED UX6404VI | |
| Razer Blade 14 RTX 4070 | |
| Asus ROG Zephyrus G14 GA402XY | |
| Apple MacBook Pro 14 2023 M3 Max | |
| Ortalama Apple M3 Max 16-Core (194 - 196, n=2) | |
| Apple MacBook Pro 16 2023 M3 Max | |
* ... daha küçük daha iyidir
Tek çekirdek performansı da gözle görülür şekilde daha iyi ve yeni M3 Max, Ryzen 9 7940HS'nin yanı sıra Cinebench R23'teki iki H45 Core i7 yongasından daha hızlı, ancak iki Core i9 modeli, artan Turbo frekansları sayesinde hala küçük bir avantaja sahip, ancak bu daha yüksek güç tüketimi pahasına geliyor. M3 Max, Geekbench testlerinde bir kez daha karşılaştırma alanının en üstünde yer alıyor.
Her zamanki gibi, işlemci performansı pil seviyesi %3'e düşene kadar pil gücünde azalmıyor. Daha fazla CPU kıyaslaması şurada listelenmiştir teknoloji̇ bölümümüz ayrıca verimlilik hakkında daha fazla bilgi için yakında yayınlanacak olan M3 Pro/M3 Max analiz makalemizi de tavsiye ediyoruz.
Cinebench R15 Multi döngümüzü de gerçekleştirdik, ancak bu kıyaslamanın taklit edildiğini ve bunun da performansı etkilediğini unutmamalısınız. Performans hala çok rekabetçi veCore i9-13900Hbir kez daha yenilmiştir. Bununla birlikte, döngümüz, düşüş %10'un altında çok küçük olsa da performansın tamamen istikrarlı olmadığını da göstermektedir. M3 Max'in güç tüketimi Otomatik modda 56 Watt'tan yaklaşık 41 Watt'a ve Yüksek Performans modunda yaklaşık 50 Watt'a düşecektir.
Cinebench R15 Multi Loop
Sistem Performansı
Öznel performans izleniminin mükemmel olması ve artan tek çekirdek performansının da yardımcı olması şaşırtıcı değildir. Adobe Premiere Pro veya DaVinci Resolve gibi karmaşık uygulamalar bile zorlanmıyor. Rosetta 2 aracılığıyla entegre emülasyon sayesinde, Intel Mac'ler için yapılmış uygulamaları da kullanabilirsiniz (örneğin henüz yerel bir sürüm yoksa). Bu da iyi çalışıyor, ancak zorlu uygulamalarda (Adobe gibi) gözle görülür bir performans düşüşü var.
Adobe Photoshop ve Premiere Pro için iki PugetBench testi ekledik, ancak lütfen kıyaslamaların yalnızca uygulamaların emüle edilmiş sürümleriyle çalıştığını unutmayın. Yine de MacBook Pro 14 M3 Max, MacBook Pro'yu kolayca geçebilir.ROG Zephyrus G14GeForce RTX 4090 Dizüstü Bilgisayar ile.
Blackmagic RAW Speed Test: 12:1 8K CPU | 12:1 8K Metal
Photoshop PugetBench: Overall Score | GPU Score | General Score | Filter Score
Premiere Pro PugetBench: Overall Score 0.98 | LongGOP 0.98 | Intraframe 0.98 | RAW 0.98 | GPU Effects 0.98
Jetstream 2: 2.0 Total
Speedometer 2.0: Result 2.0
WebXPRT 3: Overall
| CrossMark / Overall | |
| Apple MacBook Pro 16 2023 M3 Max | |
| Ortalama Apple M3 Max 16-Core, Apple M3 Max 40-Core GPU (2032 - 2051, n=2) | |
| Apple MacBook Pro 14 2023 M3 Max | |
| Asus Zenbook Pro 14 OLED UX6404VI | |
| Apple MacBook Pro 16 2023 M2 Max | |
| Asus ZenBook Pro 14 Duo UX8402VV-P1021W | |
| Lenovo Yoga Pro 9-14IRP G8 | |
| Sınıf ortalaması Multimedia (866 - 2728, n=67, son 2 yıl) | |
| Asus ROG Zephyrus G14 GA402XY | |
| Razer Blade 14 RTX 4070 | |
| Microsoft Surface Laptop Studio 2 RTX 4060 | |
| CrossMark / Productivity | |
| Apple MacBook Pro 14 2023 M3 Max | |
| Ortalama Apple M3 Max 16-Core, Apple M3 Max 40-Core GPU (1828 - 1832, n=2) | |
| Apple MacBook Pro 16 2023 M3 Max | |
| Asus Zenbook Pro 14 OLED UX6404VI | |
| Asus ZenBook Pro 14 Duo UX8402VV-P1021W | |
| Razer Blade 14 RTX 4070 | |
| Asus ROG Zephyrus G14 GA402XY | |
| Sınıf ortalaması Multimedia (931 - 2489, n=67, son 2 yıl) | |
| Lenovo Yoga Pro 9-14IRP G8 | |
| Apple MacBook Pro 16 2023 M2 Max | |
| Microsoft Surface Laptop Studio 2 RTX 4060 | |
| CrossMark / Creativity | |
| Apple MacBook Pro 16 2023 M3 Max | |
| Ortalama Apple M3 Max 16-Core, Apple M3 Max 40-Core GPU (2509 - 2564, n=2) | |
| Apple MacBook Pro 14 2023 M3 Max | |
| Apple MacBook Pro 16 2023 M2 Max | |
| Asus Zenbook Pro 14 OLED UX6404VI | |
| Lenovo Yoga Pro 9-14IRP G8 | |
| Sınıf ortalaması Multimedia (907 - 3465, n=67, son 2 yıl) | |
| Asus ZenBook Pro 14 Duo UX8402VV-P1021W | |
| Asus ROG Zephyrus G14 GA402XY | |
| Microsoft Surface Laptop Studio 2 RTX 4060 | |
| Razer Blade 14 RTX 4070 | |
| CrossMark / Responsiveness | |
| Asus Zenbook Pro 14 OLED UX6404VI | |
| Razer Blade 14 RTX 4070 | |
| Asus ZenBook Pro 14 Duo UX8402VV-P1021W | |
| Lenovo Yoga Pro 9-14IRP G8 | |
| Sınıf ortalaması Multimedia (605 - 2024, n=67, son 2 yıl) | |
| Apple MacBook Pro 16 2023 M3 Max | |
| Ortalama Apple M3 Max 16-Core, Apple M3 Max 40-Core GPU (1474 - 1486, n=2) | |
| Apple MacBook Pro 14 2023 M3 Max | |
| Asus ROG Zephyrus G14 GA402XY | |
| Apple MacBook Pro 16 2023 M2 Max | |
| Microsoft Surface Laptop Studio 2 RTX 4060 | |
| Blackmagic RAW Speed Test / 12:1 8K CPU | |
| Sınıf ortalaması Multimedia (44 - 102, n=7, son 2 yıl) | |
| Apple MacBook Pro 16 2023 M3 Max | |
| Apple MacBook Pro 14 2023 M3 Max | |
| Ortalama Apple M3 Max 16-Core, Apple M3 Max 40-Core GPU (68 - 68, n=2) | |
| Apple MacBook Pro 16 2023 M2 Max | |
| Blackmagic RAW Speed Test / 12:1 8K Metal | |
| Apple MacBook Pro 14 2023 M3 Max | |
| Ortalama Apple M3 Max 16-Core, Apple M3 Max 40-Core GPU (293 - 294, n=2) | |
| Apple MacBook Pro 16 2023 M3 Max | |
| Sınıf ortalaması Multimedia (78 - 430, n=7, son 2 yıl) | |
| Apple MacBook Pro 16 2023 M2 Max | |
| Photoshop PugetBench / Overall Score | |
| Apple MacBook Pro 14 2023 M3 Max | |
| Ortalama Apple M3 Max 16-Core, Apple M3 Max 40-Core GPU (1425 - 1442, n=2) | |
| Apple MacBook Pro 16 2023 M3 Max | |
| Asus ROG Zephyrus G14 GA402XY | |
| Apple MacBook Pro 16 2023 M2 Max | |
| Microsoft Surface Laptop Studio 2 RTX 4060 | |
| Photoshop PugetBench / GPU Score | |
| Apple MacBook Pro 14 2023 M3 Max | |
| Ortalama Apple M3 Max 16-Core, Apple M3 Max 40-Core GPU (145.1 - 146.8, n=2) | |
| Apple MacBook Pro 16 2023 M3 Max | |
| Apple MacBook Pro 16 2023 M2 Max | |
| Asus ROG Zephyrus G14 GA402XY | |
| Microsoft Surface Laptop Studio 2 RTX 4060 | |
| Photoshop PugetBench / General Score | |
| Apple MacBook Pro 14 2023 M3 Max | |
| Ortalama Apple M3 Max 16-Core, Apple M3 Max 40-Core GPU (162.6 - 165, n=2) | |
| Apple MacBook Pro 16 2023 M3 Max | |
| Asus ROG Zephyrus G14 GA402XY | |
| Microsoft Surface Laptop Studio 2 RTX 4060 | |
| Apple MacBook Pro 16 2023 M2 Max | |
| Photoshop PugetBench / Filter Score | |
| Apple MacBook Pro 14 2023 M3 Max | |
| Ortalama Apple M3 Max 16-Core, Apple M3 Max 40-Core GPU (122.4 - 123.3, n=2) | |
| Apple MacBook Pro 16 2023 M3 Max | |
| Apple MacBook Pro 16 2023 M2 Max | |
| Asus ROG Zephyrus G14 GA402XY | |
| Microsoft Surface Laptop Studio 2 RTX 4060 | |
| Premiere Pro PugetBench / Overall Score 0.98 | |
| Apple MacBook Pro 14 2023 M3 Max | |
| Ortalama Apple M3 Max 16-Core, Apple M3 Max 40-Core GPU (760 - 762, n=2) | |
| Apple MacBook Pro 16 2023 M3 Max | |
| Asus ROG Zephyrus G14 GA402XY | |
| Premiere Pro PugetBench / LongGOP 0.98 | |
| Apple MacBook Pro 16 2023 M3 Max | |
| Ortalama Apple M3 Max 16-Core, Apple M3 Max 40-Core GPU (84.2 - 85.4, n=2) | |
| Apple MacBook Pro 14 2023 M3 Max | |
| Asus ROG Zephyrus G14 GA402XY | |
| Premiere Pro PugetBench / Intraframe 0.98 | |
| Apple MacBook Pro 14 2023 M3 Max | |
| Ortalama Apple M3 Max 16-Core, Apple M3 Max 40-Core GPU (121.3 - 123.9, n=2) | |
| Apple MacBook Pro 16 2023 M3 Max | |
| Asus ROG Zephyrus G14 GA402XY | |
| Premiere Pro PugetBench / RAW 0.98 | |
| Apple MacBook Pro 16 2023 M3 Max | |
| Apple MacBook Pro 14 2023 M3 Max | |
| Ortalama Apple M3 Max 16-Core, Apple M3 Max 40-Core GPU (55.9 - 55.9, n=2) | |
| Asus ROG Zephyrus G14 GA402XY | |
| Premiere Pro PugetBench / GPU Effects 0.98 | |
| Asus ROG Zephyrus G14 GA402XY | |
| Apple MacBook Pro 14 2023 M3 Max | |
| Ortalama Apple M3 Max 16-Core, Apple M3 Max 40-Core GPU (57.6 - 57.9, n=2) | |
| Apple MacBook Pro 16 2023 M3 Max | |
| Jetstream 2 / 2.0 Total | |
| Sınıf ortalaması Multimedia (287 - 481, n=35, son 2 yıl) | |
| Microsoft Surface Laptop Studio 2 RTX 4060 | |
| Apple MacBook Pro 14 2023 M3 Max | |
| Ortalama Apple M3 Max 16-Core, Apple M3 Max 40-Core GPU (309 - 311, n=2) | |
| Apple MacBook Pro 16 2023 M3 Max | |
| Asus Zenbook Pro 14 OLED UX6404VI | |
| Lenovo Yoga Pro 9-14IRP G8 | |
| Razer Blade 14 RTX 4070 | |
| Apple MacBook Pro 16 2023 M2 Max | |
| Speedometer 2.0 / Result 2.0 | |
| Sınıf ortalaması Multimedia (337 - 946, n=34, son 2 yıl) | |
| Apple MacBook Pro 16 2023 M3 Max | |
| Ortalama Apple M3 Max 16-Core, Apple M3 Max 40-Core GPU (560 - 562, n=2) | |
| Apple MacBook Pro 14 2023 M3 Max | |
| Apple MacBook Pro 16 2023 M2 Max | |
| Asus Zenbook Pro 14 OLED UX6404VI | |
| Microsoft Surface Laptop Studio 2 RTX 4060 | |
| Lenovo Yoga Pro 9-14IRP G8 | |
| WebXPRT 3 / Overall | |
| Apple MacBook Pro 16 2023 M3 Max | |
| Ortalama Apple M3 Max 16-Core, Apple M3 Max 40-Core GPU (416 - 426, n=2) | |
| Apple MacBook Pro 14 2023 M3 Max | |
| Apple MacBook Pro 16 2023 M2 Max | |
| Sınıf ortalaması Multimedia (136.4 - 596, n=70, son 2 yıl) | |
| Asus Zenbook Pro 14 OLED UX6404VI | |
| Asus ROG Zephyrus G14 GA402XY | |
| Razer Blade 14 RTX 4070 | |
| Lenovo Yoga Pro 9-14IRP G8 | |
| Microsoft Surface Laptop Studio 2 RTX 4060 | |
Depolama Cihazları
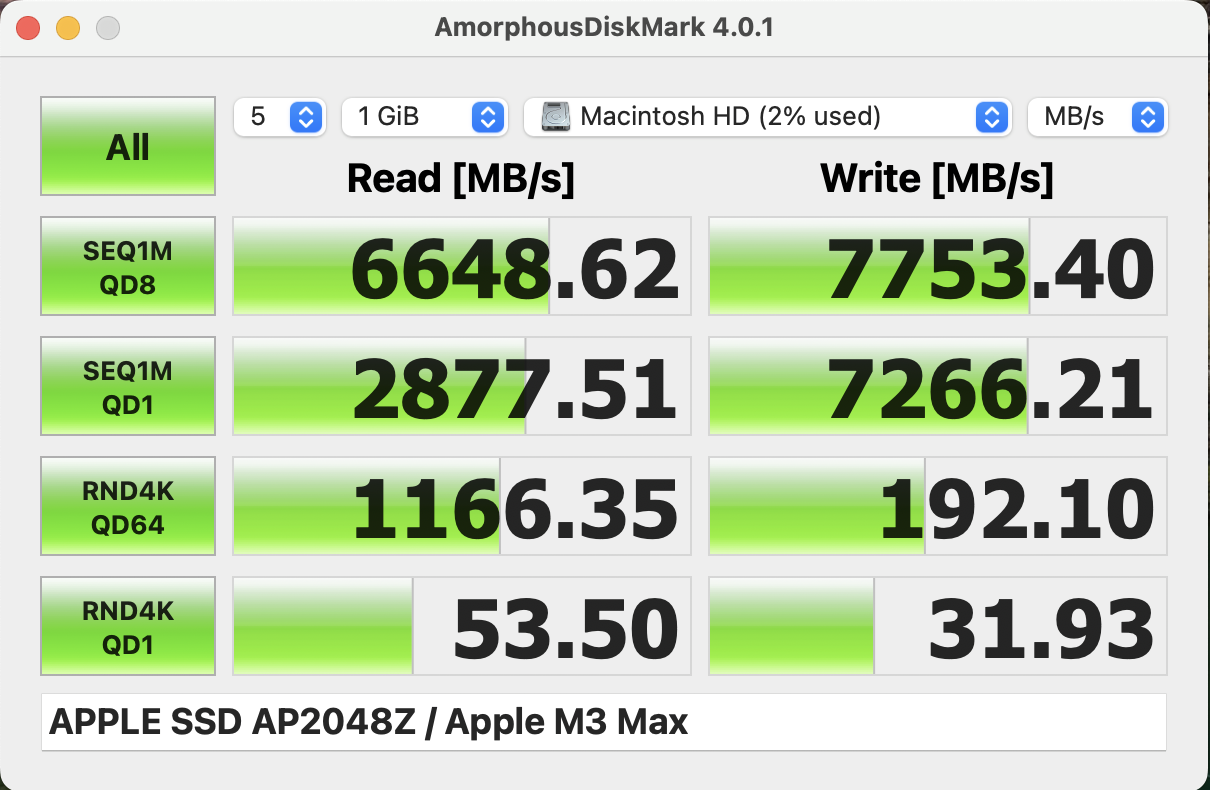
İnceleme birimimiz, bir önceki yazıda daha önce incelediğimiz 2 TB SSD (AP2048Z) ile donatılmıştır.MacBook Pro 14m2 Pro ile. Aktarım hızları çok iyi ve performans sorunu yok, ancak SSD kapasitesini yükseltemeyeceğinizi ve Apple adresinin yükseltmeler için yüksek fiyatlar talep ettiğini unutmayın. (400 dolar karşılığında 1 TB'tan 2 TB'a). Karşılaştırma için: 2 TB Samsung SSD 990 Pro (M.2-2280) yaklaşık 140 dolara satılmaktadır). Aslında temel M3 Pro SKU'sunu M3 Max'e yükselterek M3 max'i temel 512 GB SSD sürücü ile birleştirmek mümkündür. Daha fazla SSD karşılaştırması listelenmiştir burada.
| Blackmagic Disk Speed Test | |
| 5GB Read | |
| Apple MacBook Pro 16 2023 M3 Max | |
| Apple MacBook Pro 14 2023 M2 Pro | |
| Apple MacBook Pro 14 2023 M3 Max | |
| Apple MacBook Pro 16 2023 M3 Pro | |
| Apple MacBook Pro 14 2023 M2 Pro Entry | |
| Apple MacBook Pro 14 2023 M3 | |
| 5GB Write | |
| Apple MacBook Pro 16 2023 M3 Max | |
| Apple MacBook Pro 14 2023 M3 Max | |
| Apple MacBook Pro 14 2023 M2 Pro | |
| Apple MacBook Pro 16 2023 M3 Pro | |
| Apple MacBook Pro 14 2023 M2 Pro Entry | |
| Apple MacBook Pro 14 2023 M3 | |
GPU Performansı
Üst düzeyM3 Maksçip 40 çekirdekli bir GPU ile donatılmıştır, bu da önceki 38 çekirdekli birime kıyasla iki ek çekirdek olduğu anlamına gelir. Ayrıca çekirdek saatinin de daha yüksek olduğundan şüpheleniyoruz. Performans teste bağlı olarak %13-25 arasında daha yüksektir, ancak maksimum güç tüketimi 64 Watt'tan 60 Watt'a düşmüştür. GPU'nun en büyük avantajı, özellikle video düzenleme sırasında hala paylaşılan bellek. YouTube için inceleme videolarımızı DaVinci Resolve ile düzenliyoruz ve düzenleme sırasında zaman zaman RTX 4090'ın 16 GB VRAM sınırıyla karşılaşıyoruz. Bu, 8 GB VRAM'li daha küçük GPU'larda (14 inç segmentinde çok daha yaygın olan) daha da büyük bir sorun.
Mevcut Nvidia dizüstü bilgisayar GPU'larıyla karşılaştırıldığında M3 Max GPU, platformlar arası karşılaştırma ölçütü 3DMark WildLife Extreme Unlimited'da RTX 4070 Dizüstü Bilgisayarı açıkça geçebiliyor ve RTX 4090'dan yalnızca %9 daha yavaş.GeForce RTX 4090 Dizüstü Bilgisayar125 Watt ve M2 Max GPU'ya göre avantajı %25'tir. Ancak M3 Max, M2 Max'ın gerisinde kalıyor.RTX 4060 Dizüstü Bilgisayar..Surface Laptop Studio 2geekbench'in OpenCL testinde.
GPU performansı bu nedenle temelde daha büyük MacBook Pro 16 ile aynıdır, ancak performans bir kez daha Otomatik modda tamamen kararlı değildir. WildLife Extreme stres testi %93,7 ile sonuçlanıyor, yani yaklaşık %6'lık bir açık var. Yüksek Performans modunu kullandığınızda sonuç %98,2 ile daha iyi. Hızlı GeForce GPU'lar için geçerli olmayan pil üzerinde herhangi bir performans sınırlaması yoktur. Daha fazla GPU kıyaslaması listelenmiştir burada.
* ... daha küçük daha iyidir
Oyun Performansı
Mac'te oyun oynamak daha ilginç hale geliyor ve yeni macOS 14 (Sonoma) tam ekran modunda oynadığınızda bir Oyun modu da sunuyor. Emüle edilmiş oyunlara (Shadow of the Tomb Raider ve Total War: Three Kingdoms gibi) ek olarak, Windows oyunlarını oynamak için CrossOver'ı da kullanabilirsiniz. Başlığa bağlı olarak, bu iyi çalışıyor (GTA V, Far Cry 5 gibi), ancak bazen biraz deneme yapmanız gerekiyor ve her zaman tabana kıyasla beklenen farkları göremiyoruzApple M3-SoC. Bazen emülasyon donanımın tam performansını kullanamaz ve örneğin GTA V, ana yük CPU tarafından alınırken neredeyse hiç GPU yükü göstermez.
Apple'un silikonu için yerel oyunlar açıkça çok daha iyi çalışıyor ve buna Resident Evil Village, No Man's Sky veya Baldur's gate 3 gibi başlıklar da dahil. Yeni Apple M3 Max'in performansı gerçekten etkileyici ve tüm oyunlar QHD ve maksimum ayarlarda tamamen sorunsuz çalışıyor. Yine de MacBook gerçek bir oyun dizüstü bilgisayarı değil ve bu fiyat aralığındaki Windows rakipleri çok daha kötü bir oyun performansı sunuyor ve aralarından seçim yapabileceğiniz çok daha fazla oyun var.
| Total War Pharaoh | |
| 1920x1080 High Preset | |
| Ortalama Apple M3 Max 40-Core GPU (138 - 139, n=2) | |
| Apple MacBook Pro 14 2023 M3 Max | |
| Sınıf ortalaması Multimedia (30.8 - 99.3, n=12, son 2 yıl) | |
| 1920x1080 Ultra Preset | |
| Ortalama Apple M3 Max 40-Core GPU (97 - 121, n=2) | |
| Apple MacBook Pro 14 2023 M3 Max | |
| Sınıf ortalaması Multimedia (23.4 - 84.1, n=15, son 2 yıl) | |
| Total War: Three Kingdoms | |
| 1920x1080 Ultra (incl textures) | |
| Ortalama Apple M3 Max 40-Core GPU (80 - 84, n=2) | |
| Apple MacBook Pro 14 2023 M3 Max | |
| Apple MacBook Pro 16 2023 M2 Max | |
| Sınıf ortalaması Multimedia (49.6 - 55, n=2, son 2 yıl) | |
| 2560x1440 Ultra (incl textures) | |
| Ortalama Apple M3 Max 40-Core GPU (54 - 58, n=2) | |
| Apple MacBook Pro 14 2023 M3 Max | |
| Apple MacBook Pro 16 2023 M2 Max | |
| Sınıf ortalaması Multimedia (31.5 - 35.6, n=2, son 2 yıl) | |
| Baldur's Gate 3 | |
| 1920x1080 Ultra Preset AA:T | |
| Apple MacBook Pro 14 2023 M3 Max | |
| Ortalama Apple M3 Max 40-Core GPU (n=1) | |
| Sınıf ortalaması Multimedia (7.8 - 158.7, n=72, son 2 yıl) | |
| 2560x1440 Ultra Preset AA:T | |
| Sınıf ortalaması Multimedia (28.7 - 121, n=26, son 2 yıl) | |
| Apple MacBook Pro 14 2023 M3 Max | |
| Ortalama Apple M3 Max 40-Core GPU (n=1) | |
| düşük | orta | yüksek | ultra | QHD | |
|---|---|---|---|---|---|
| GTA V (2015) | 79 | 54 | 52 | ||
| The Witcher 3 (2015) | 92 | ||||
| Far Cry 5 (2018) | 53 | 51 | 49 | ||
| Shadow of the Tomb Raider (2018) | 145 | 135 | 118 | 86 | |
| Total War: Three Kingdoms (2019) | 170 | 109 | 80 | 54 | |
| Baldur's Gate 3 (2023) | 96 | 90 | 60 | ||
| Cyberpunk 2077 (2023) | 44.4 | 40.8 | 35.5 | ||
| Total War Pharaoh (2023) | 242 | 207 | 138 | 97 | 82 |
Emisyonlar - MBP 14'ün soğutması sınırda
Sistem Gürültüsü
Yeni giriş seviyesi MBP 14'ün aksine, M3 Pro ve M3 Max ile daha güçlü SKU'lar iki fanlı tanıdık soğutma çözümünü kullanmaya devam ediyor, ancak sistemin fark edilir derecede daha hızlı M3 Max çipleri tarafından zorlandığını fark ediyorsunuz. Basit iş yükleri genellikle herhangi bir fan aktivitesine neden olmaz ve fanlar oldukça geç devreye girer, bu da Apple cihazları için yaygındır. Fan hızı sorunsuz bir şekilde artıyor ve ilk aşamada 2500 rpm civarında ~26 dB(A) ile neredeyse duyulmuyor, ancak daha yüksek yükler Otomatik modda ~5100 rpm maksimum fan hızı ile sonuçlanıyor ve bu da 43,3 dB(A) ile sonuçlanıyor. Bu, Windows rakiplerine kıyasla hala iyi bir sonuçtur. Yüksek Performans modunu kullanırsanız, fanlar maksimum hızlarına 53,8 dB(A) ile ulaşacaktır. M3 Max'li daha büyük MBP 16'da olduğu gibi, bazı GPU kıyaslamalarımız sırasında bir miktar bobin vınlaması da fark ettik, ancak ~26 dB(A) ile çok sessizdi.
Ses yüksekliği
| Boşta |
| 24.8 / 24.8 / 24.8 dB |
| Çalışırken |
| 25.8 / 43.4 dB |
 | ||
30 dB sessiz 40 dB(A) duyulabilirlik 50 dB(A) gürültülü |
||
min: | ||
| Apple MacBook Pro 14 2023 M3 Max M3 Max 40-Core GPU, Apple M3 Max 16-Core, Apple SSD AP2048Z | Microsoft Surface Laptop Studio 2 RTX 4060 GeForce RTX 4060 Laptop GPU, i7-13700H, Kioxia XG8 KXG80ZNV1T02 | Lenovo Yoga Pro 9-14IRP G8 GeForce RTX 4050 Laptop GPU, i7-13705H, Samsung PM9A1 MZVL21T0HCLR | Asus Zenbook Pro 14 OLED UX6404VI GeForce RTX 4070 Laptop GPU, i9-13900H, Micron 3400 2TB MTFDKBA2T0TFH | Asus ZenBook Pro 14 Duo UX8402VV-P1021W GeForce RTX 4060 Laptop GPU, i9-13900H, Samsung PM9A1 MZVL22T0HBLB | Razer Blade 14 RTX 4070 GeForce RTX 4070 Laptop GPU, R9 7940HS, Samsung PM9A1 MZVL21T0HCLR | Asus ROG Zephyrus G14 GA402XY GeForce RTX 4090 Laptop GPU, R9 7940HS, Samsung PM9A1 MZVL21T0HCLR | |
|---|---|---|---|---|---|---|---|
| Noise | -18% | -18% | -7% | -35% | -7% | -21% | |
| kapalı / ortam * (dB) | 24.8 | 23.9 4% | 24.8 -0% | 23.3 6% | 25.2 -2% | 22.7 8% | 23.3 6% |
| Idle Minimum * (dB) | 24.8 | 23.9 4% | 24.8 -0% | 23.3 6% | 25.2 -2% | 23.4 6% | 23.6 5% |
| Idle Average * (dB) | 24.8 | 24.4 2% | 24.8 -0% | 23.3 6% | 25.2 -2% | 23.4 6% | 23.6 5% |
| Idle Maximum * (dB) | 24.8 | 26.9 -8% | 24.8 -0% | 23.3 6% | 32.5 -31% | 23.4 6% | 33 -33% |
| Load Average * (dB) | 25.8 | 48.5 -88% | 47.4 -84% | 39.3 -52% | 59.7 -131% | 33 -28% | 49.5 -92% |
| Witcher 3 ultra * (dB) | 43.4 | 51.8 -19% | 52.9 -22% | 48.8 -12% | 51.8 -19% | 52.2 -20% | |
| Load Maximum * (dB) | 43.4 | 51.8 -19% | 52.9 -22% | 48.8 -12% | 60.9 -40% | 55.6 -28% | 52.2 -20% |
* ... daha küçük daha iyidir
Sıcaklık
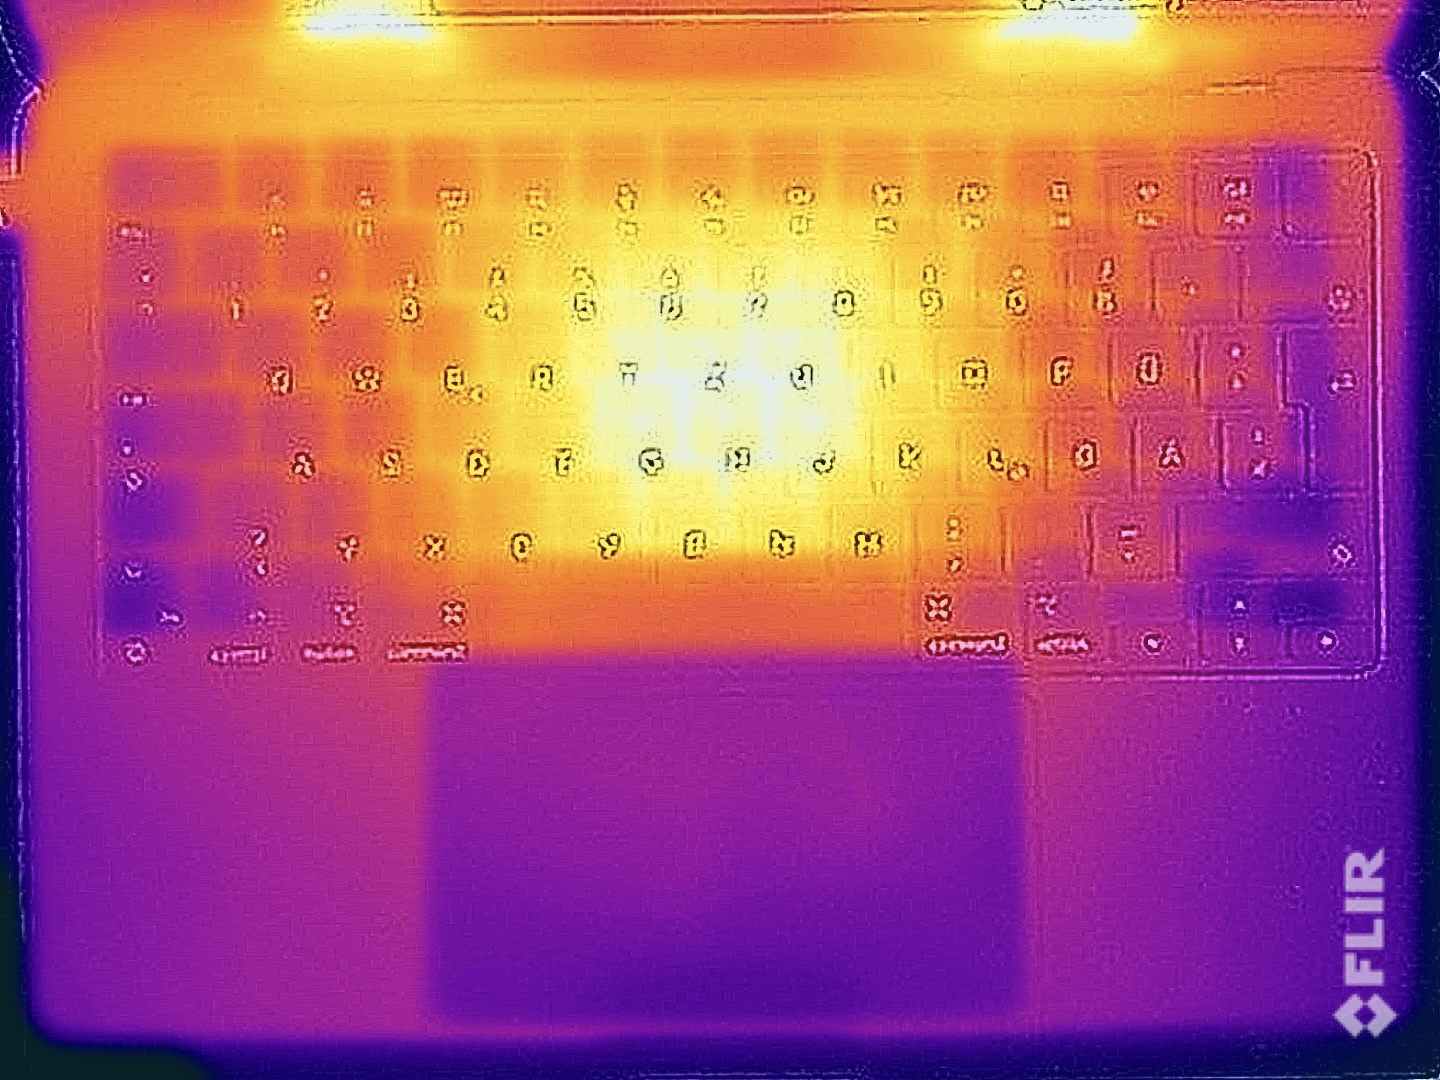
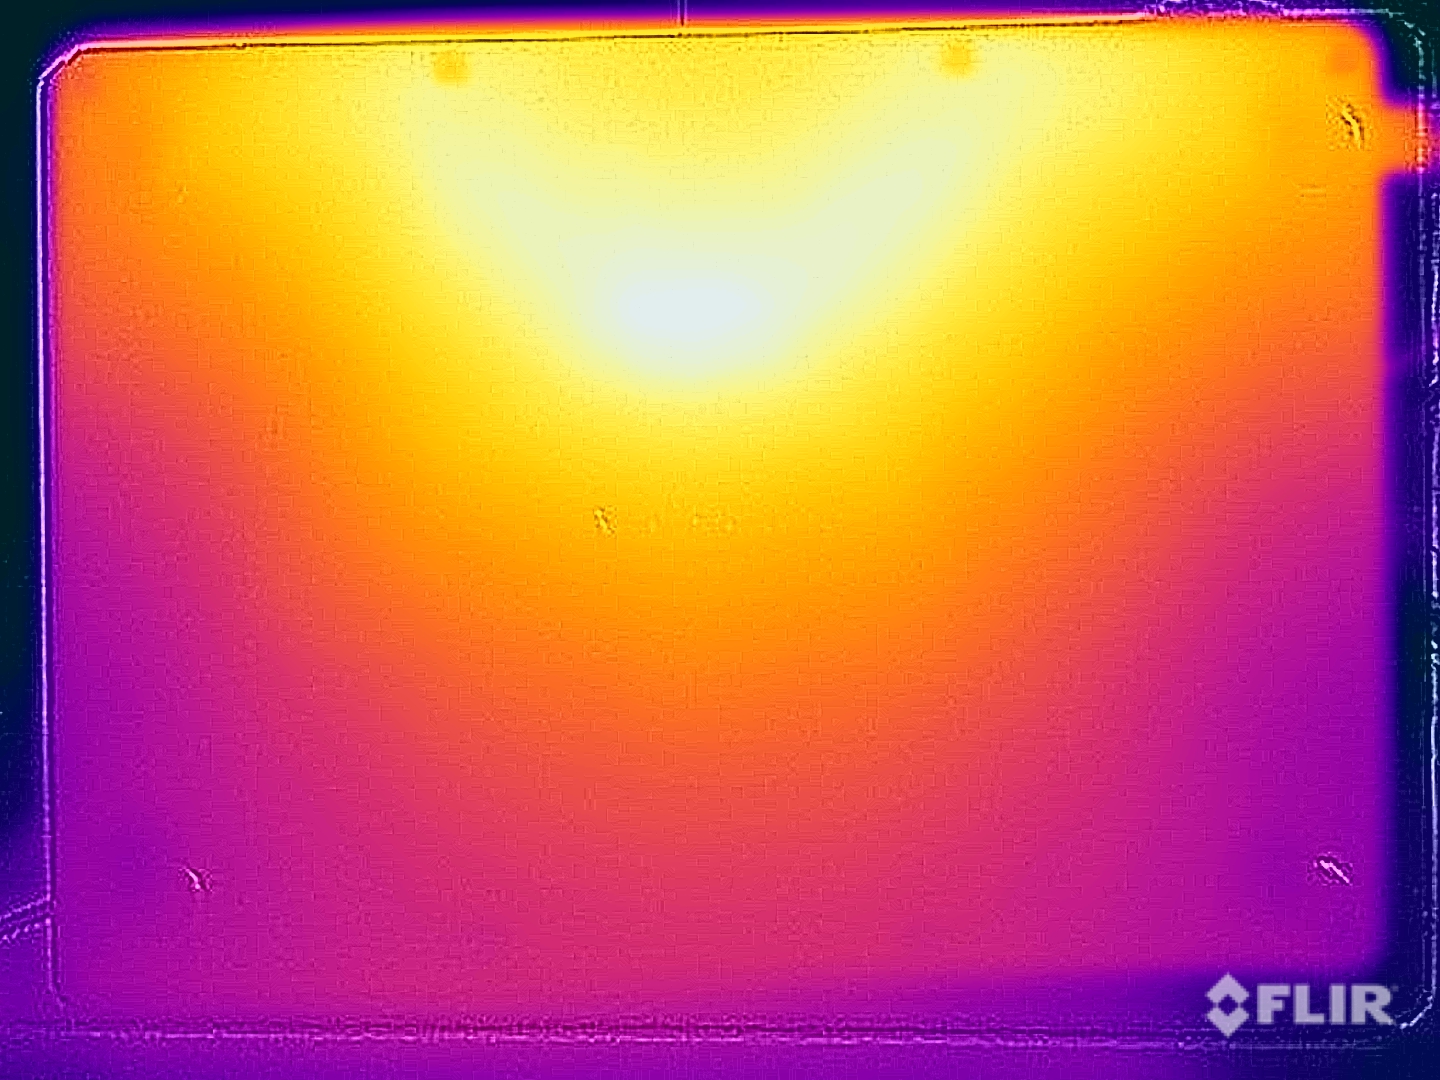
MacBook Pro 14'ün alüminyum kasası hafif iş yükleri sırasında hiç ısınmıyor, ancak yük altında bu durum değişiyor. MacBook'larda her zaman olduğu gibi, en yüksek yüzey sıcaklıklarını altta değil, ana ünitenin üst kısmında ölçüyoruz. Bu durum Windows makinelerde genellikle tam tersidir.
Alt panelin arka orta bölgesinde 42 °C'ye kadar sıcaklık tespit ettik, yani MBP 14'ü aşırı yük senaryolarında herhangi bir sınırlama olmadan kucağınıza koyabilirsiniz. Orta klavye alanı 46 °C'ye kadar ısınır, bu kesinlikle fark edilir ve yazma sırasında parmaklarınız ısınır. Güç adaptörü 50 °C'ye kadar ulaşır ki bu kritik bir değer değildir.
(-) Üst taraftaki maksimum sıcaklık, 36.8 °C / 98 F ortalamasına kıyasla 45.9 °C / 115 F'dir. , Multimedia sınıfı için 21 ile 71 °C arasında değişir.
(±) Alt kısım, 39.1 °C / 102 F ortalamasına kıyasla maksimum 42.1 °C / 108 F'ye kadar ısınır
(+) Boşta kullanımda, üst tarafın ortalama sıcaklığı 23.2 °C / 74 F olup, cihazın 31.3 °C / 88 F.
(±) The Witcher 3 oynarken, üst tarafın ortalama sıcaklığı 37.6 °C / 100 F olup, cihazın 31.3 °C / 88 F.
(+) Avuç içi dayanakları ve dokunmatik yüzey, maksimum 29.8 °C / 85.6 F ile cilt sıcaklığından daha soğuktur ve bu nedenle dokunulduğunda soğuktur.
(±) Benzer cihazların avuç içi dayanağı alanının ortalama sıcaklığı 28.7 °C / 83.7 F (-1.1 °C / -1.9 F) idi.
| Apple MacBook Pro 14 2023 M3 Max Apple M3 Max 16-Core, Apple M3 Max 40-Core GPU | Microsoft Surface Laptop Studio 2 RTX 4060 Intel Core i7-13700H, NVIDIA GeForce RTX 4060 Laptop GPU | Lenovo Yoga Pro 9-14IRP G8 Intel Core i7-13705H, NVIDIA GeForce RTX 4050 Laptop GPU | Asus Zenbook Pro 14 OLED UX6404VI Intel Core i9-13900H, NVIDIA GeForce RTX 4070 Laptop GPU | Asus ZenBook Pro 14 Duo UX8402VV-P1021W Intel Core i9-13900H, NVIDIA GeForce RTX 4060 Laptop GPU | Razer Blade 14 RTX 4070 AMD Ryzen 9 7940HS, NVIDIA GeForce RTX 4070 Laptop GPU | Asus ROG Zephyrus G14 GA402XY AMD Ryzen 9 7940HS, NVIDIA GeForce RTX 4090 Laptop GPU | |
|---|---|---|---|---|---|---|---|
| Heat | -4% | -16% | -14% | -16% | -15% | -10% | |
| Maximum Upper Side * (°C) | 45.9 | 40.4 12% | 41 11% | 40.6 12% | 37.1 19% | 37.4 19% | 47 -2% |
| Maximum Bottom * (°C) | 42.1 | 42.2 -0% | 56.7 -35% | 49.5 -18% | 49.4 -17% | 35.2 16% | 46.5 -10% |
| Idle Upper Side * (°C) | 23.4 | 26.6 -14% | 27.4 -17% | 28.2 -21% | 30 -28% | 33.2 -42% | 25.9 -11% |
| Idle Bottom * (°C) | 23.8 | 27 -13% | 29.1 -22% | 30.6 -29% | 32.4 -36% | 36.2 -52% | 28 -18% |
* ... daha küçük daha iyidir
Stres Testi
Kombine CPU/GPU yükü ile yapılan stres testi çok ilginç ve bir kez daha MacBook Pro 14'ün daha zayıf soğutmasını gösteriyor. Sistem GPU'yu destekliyor ve bu yük senaryosu için Yüksek Performans modunu önerebiliriz çünkü bu mod (daha fazla fan gürültüsü pahasına) gözle görülür bir performans avantajı sağlıyor ve neredeyse daha büyük MacBook Pro 16 ile aynı seviyede. M3 Max'in GPU çekirdekleri çok fazla ısı üretiyor gibi görünüyor, çünkü M3 Pro'lu MacBook Pro 16 (inceleme yakında yayınlanacak) stres testinde 50 Watt'tan fazla soğutabiliyor (CPU/GPU arasında eşit dağılım).
Konuşmacılar
MacBook Pro 14'ün altı modüllü hoparlör sistemi hala mükemmel ve genellikle harici hoparlörlere ihtiyaç duymuyorsunuz. Ancak, rekabet aradaki farkı kapattı ve hem Lenovo Yoga Pro 9i 14 yanı sıra Asus ROG Zephyrus G14 hemen hemen aynı seviyede.
Apple MacBook Pro 14 2023 M3 Max ses analizi
(+) | hoparlörler nispeten yüksek sesle çalabilir (85 dB)
Bas 100 - 315Hz
(+) | iyi bas - medyandan yalnızca 4.9% uzakta
(±) | Bas doğrusallığı ortalamadır (8.4% delta - önceki frekans)
Ortalar 400 - 2000 Hz
(+) | dengeli ortalar - medyandan yalnızca 1.2% uzakta
(+) | orta frekanslar doğrusaldır (2.8% deltadan önceki frekansa)
Yüksekler 2 - 16 kHz
(+) | dengeli yüksekler - medyandan yalnızca 2.6% uzakta
(+) | yüksekler doğrusaldır (2.6% deltadan önceki frekansa)
Toplam 100 - 16.000 Hz
(+) | genel ses doğrusaldır (5.6% ortancaya göre fark)
Aynı sınıfla karşılaştırıldığında
» Bu sınıftaki tüm test edilen cihazların %2%'si daha iyi, 1% benzer, 97% daha kötüydü
» En iyisinin deltası 5% idi, ortalama 17% idi, en kötüsü 45% idi
Test edilen tüm cihazlarla karşılaştırıldığında
» Test edilen tüm cihazların %0'si daha iyi, 0 benzer, % 100 daha kötüydü
» En iyisinin deltası 4% idi, ortalama 24% idi, en kötüsü 134% idi
Lenovo Yoga Pro 9-14IRP G8 ses analizi
(±) | hoparlör ses yüksekliği ortalama ama iyi (81.8 dB)
Bas 100 - 315Hz
(±) | azaltılmış bas - ortalama olarak medyandan 5.9% daha düşük
(±) | Bas doğrusallığı ortalamadır (7.8% delta - önceki frekans)
Ortalar 400 - 2000 Hz
(+) | dengeli ortalar - medyandan yalnızca 2.3% uzakta
(+) | orta frekanslar doğrusaldır (3.2% deltadan önceki frekansa)
Yüksekler 2 - 16 kHz
(+) | dengeli yüksekler - medyandan yalnızca 2.5% uzakta
(+) | yüksekler doğrusaldır (3.4% deltadan önceki frekansa)
Toplam 100 - 16.000 Hz
(+) | genel ses doğrusaldır (7.3% ortancaya göre fark)
Aynı sınıfla karşılaştırıldığında
» Bu sınıftaki tüm test edilen cihazların %6%'si daha iyi, 1% benzer, 94% daha kötüydü
» En iyisinin deltası 5% idi, ortalama 17% idi, en kötüsü 45% idi
Test edilen tüm cihazlarla karşılaştırıldığında
» Test edilen tüm cihazların %1'si daha iyi, 0 benzer, % 99 daha kötüydü
» En iyisinin deltası 4% idi, ortalama 24% idi, en kötüsü 134% idi
Asus ROG Zephyrus G14 GA402XY ses analizi
(±) | hoparlör ses yüksekliği ortalama ama iyi (80 dB)
Bas 100 - 315Hz
(±) | azaltılmış bas - ortalama olarak medyandan 8.8% daha düşük
(±) | Bas doğrusallığı ortalamadır (9.7% delta - önceki frekans)
Ortalar 400 - 2000 Hz
(+) | dengeli ortalar - medyandan yalnızca 3.3% uzakta
(+) | orta frekanslar doğrusaldır (5% deltadan önceki frekansa)
Yüksekler 2 - 16 kHz
(+) | dengeli yüksekler - medyandan yalnızca 2% uzakta
(+) | yüksekler doğrusaldır (4.3% deltadan önceki frekansa)
Toplam 100 - 16.000 Hz
(+) | genel ses doğrusaldır (10% ortancaya göre fark)
Aynı sınıfla karşılaştırıldığında
» Bu sınıftaki tüm test edilen cihazların %5%'si daha iyi, 2% benzer, 93% daha kötüydü
» En iyisinin deltası 6% idi, ortalama 18% idi, en kötüsü 132% idi
Test edilen tüm cihazlarla karşılaştırıldığında
» Test edilen tüm cihazların %4'si daha iyi, 1 benzer, % 94 daha kötüydü
» En iyisinin deltası 4% idi, ortalama 24% idi, en kötüsü 134% idi
Enerji Yönetimi - Daha Uzun Çalışma Süresi
Güç Tüketimi
MBP 14'ün M3 Max ile tüketim ölçümleri beklentilerimizi karşılıyor ve maksimum SDR parlaklığı artırılmış olmasına rağmen maksimum boşta tüketim önceki M2 Pro modeline kıyasla sadece biraz daha yüksek. Daha büyük MBP 16'nın incelemesinden sonra 96W güç adaptörünün M3 Max ile birlikte yetersiz kalabileceğini düşünmüştük, ancak durum böyle değil. Yüksek Performans modunu kullandığımızda bile pil bitmiyor ve 140W güç adaptörünü kullandığımızda bile maksimum tüketim 101 Watt. 96W güç adaptörü yük altında tüketimi karşılıyor, ancak aynı anda pili şarj etmek için boşluk yok.
| Kapalı / Bekleme modu | |
| Boşta | |
| Çalışırken |
|
Key:
min: | |
| Apple MacBook Pro 14 2023 M3 Max Apple M3 Max 16-Core, M3 Max 40-Core GPU, Apple SSD AP2048Z, Mini-LED, 3024x1964, 14.2" | Microsoft Surface Laptop Studio 2 RTX 4060 i7-13700H, GeForce RTX 4060 Laptop GPU, Kioxia XG8 KXG80ZNV1T02, IPS, 2400x1600, 14.4" | Lenovo Yoga Pro 9-14IRP G8 i7-13705H, GeForce RTX 4050 Laptop GPU, Samsung PM9A1 MZVL21T0HCLR, Mini-LED, 3072x1920, 14.5" | Asus Zenbook Pro 14 OLED UX6404VI i9-13900H, GeForce RTX 4070 Laptop GPU, Micron 3400 2TB MTFDKBA2T0TFH, OLED, 2880x1800, 14.5" | Asus ZenBook Pro 14 Duo UX8402VV-P1021W i9-13900H, GeForce RTX 4060 Laptop GPU, Samsung PM9A1 MZVL22T0HBLB, OLED, 2880x1800, 14.5" | Razer Blade 14 RTX 4070 R9 7940HS, GeForce RTX 4070 Laptop GPU, Samsung PM9A1 MZVL21T0HCLR, IPS, 2560x1600, 14" | Asus ROG Zephyrus G14 GA402XY R9 7940HS, GeForce RTX 4090 Laptop GPU, Samsung PM9A1 MZVL21T0HCLR, Mini-LED, 2560x1600, 14" | Apple MacBook Pro 14 2023 M2 Pro M2 Pro, M2 Pro 19-Core GPU, Apple SSD AP2048Z, Mini-LED, 3024x1964, 14.2" | Ortalama Apple M3 Max 40-Core GPU | Sınıf ortalaması Multimedia | |
|---|---|---|---|---|---|---|---|---|---|---|
| Power Consumption | 7% | -85% | -53% | -48% | -174% | -81% | 17% | -22% | -15% | |
| Idle Minimum * (Watt) | 2.6 | 3 -15% | 10.9 -319% | 7.5 -188% | 8.5 -227% | 19.5 -650% | 9.4 -262% | 2.4 8% | 3.9 ? -50% | 5.64 ? -117% |
| Idle Average * (Watt) | 11.8 | 7.1 40% | 17.7 -50% | 11.1 6% | 8.8 25% | 24.7 -109% | 14.2 -20% | 11.3 4% | 14.4 ? -22% | 10 ? 15% |
| Idle Maximum * (Watt) | 12.2 | 7.6 38% | 19.3 -58% | 11.6 5% | 16.5 -35% | 27 -121% | 14.5 -19% | 11.5 6% | 14.7 ? -20% | 12.2 ? -0% |
| Load Average * (Watt) | 99.9 | 73.1 27% | 93.3 7% | 91.9 8% | 102 -2% | 83.2 17% | 79 21% | 59.6 40% | 95.2 ? 5% | 64.8 ? 35% |
| Witcher 3 ultra * (Watt) | 92.5 | 113.9 -23% | 129.5 -40% | 132.2 -43% | 101.2 -9% | 165.8 -79% | 172 -86% | 55.9 40% | ||
| Load Maximum * (Watt) | 101.7 | 128.5 -26% | 150.2 -48% | 208 -105% | 140 -38% | 204.5 -101% | 220.8 -117% | 100 2% | 123.4 ? -21% | 111.7 ? -10% |
* ... daha küçük daha iyidir
Power Consumption Witcher 3 / Stress test
Power Consumption external screen
Pil Çalışma Süresi
Pil çalışma süresi 72,6 Wh pil ile mükemmel, sadece yük altında çalışma süresi bazı Windows rakiplerinden daha kötü. Ancak bu biraz yanıltıcı çünkü MacBook performansını düşürmezken (güç tasarrufu moduyla daha uzun sonuçlar alabilseniz bile), Windows rakipleri genellikle performansı önemli ölçüde düşürüyor.
150 nit (maksimum SDR parlaklığından eksi 7 büyük adım ve 3 küçük adım) değerindeki testlerimiz, bu performans sınıfında Windows rakiplerine göre büyük bir avantaj olduğunu gösteriyor ve M2 Pro'lu eski MacBook Pro 14 2023 bile yeniliyor. Video testi neredeyse 18 saat, Wi-Fi testi ise 15 saatten fazla sürüyor. Tam SDR parlaklıkta Wi-Fi çalışma süresi 06:21 saate düşüyor ve tam parlaklıkta bir HDR videonun oynatılması 05:20 saat mümkün oluyor.
Bataryanın 96W güç adaptörüyle tam olarak şarj edilmesi iki saatten biraz daha az sürüyor; 50 dakikadan biraz daha uzun bir süre sonra kapasitenin %80'i kullanılabilir hale geliyor.
| Apple MacBook Pro 14 2023 M3 Max Apple M3 Max 16-Core, M3 Max 40-Core GPU, 72.6 Wh | Microsoft Surface Laptop Studio 2 RTX 4060 i7-13700H, GeForce RTX 4060 Laptop GPU, 58 Wh | Lenovo Yoga Pro 9-14IRP G8 i7-13705H, GeForce RTX 4050 Laptop GPU, 75 Wh | Asus Zenbook Pro 14 OLED UX6404VI i9-13900H, GeForce RTX 4070 Laptop GPU, 76 Wh | Asus ZenBook Pro 14 Duo UX8402VV-P1021W i9-13900H, GeForce RTX 4060 Laptop GPU, 76 Wh | Razer Blade 14 RTX 4070 R9 7940HS, GeForce RTX 4070 Laptop GPU, 68 Wh | Asus ROG Zephyrus G14 GA402XY R9 7940HS, GeForce RTX 4090 Laptop GPU, 76 Wh | Apple MacBook Pro 14 2023 M2 Pro M2 Pro, M2 Pro 19-Core GPU, 70 Wh | Sınıf ortalaması Multimedia | |
|---|---|---|---|---|---|---|---|---|---|
| Pil Çalışma Süresi | 0% | -32% | -40% | 76% | -38% | -43% | -9% | 3% | |
| H.264 (h) | 18 | 11.3 -37% | 9.1 -49% | 8.5 -53% | 7.2 -60% | 15.3 -15% | 16.4 ? -9% | ||
| WiFi v1.3 (h) | 15.2 | 8.3 -45% | 8 -47% | 7.6 -50% | 9 -41% | 6.2 -59% | 7.5 -51% | 13.5 -11% | 12 ? -21% |
| Load (h) | 1.2 | 2.2 83% | 1.2 0% | 1 -17% | 3.5 192% | 1 -17% | 1 -17% | 1.2 0% | 1.675 ? 40% |
| Reader / Idle (h) | 8.6 | 25.2 ? |
Artılar
Eksiler
Karar - MacBook Pro 14 segmentindeki en iyi CPU performansına sahip
Daha büyük ölçekli incelememizMacBook Pro 16m3 Max, Apple 'un yeni M3 Max SoC'lerle CPU performansını büyük ölçüde artırabildiğini zaten göstermiştir. 12 performans çekirdeği ile çok çekirdekli performans, eski M2 Max'e kıyasla %60'tan fazla daha yüksek. Daha küçük olan MacBook Pro 14 de bu performansı sunuyor ve bu da onu çok çekirdekli performans açısından satın alabileceğiniz en hızlı 14 inç dizüstü bilgisayar yapıyor. Asus Zenbook Pro 14'teki Core i9-13900H bile (çok daha yüksek TDP değerlerine sahip) yaklaşık %20 oranında geride kalıyor. AMD'nin Ryzen 9 7940HS (80 Watt) gibi mevcut Zen4 CPU'larının da hiç şansı yok. Sadece Intel ve AMD'nin HX CPU'ları daha fazla performans sunuyor, ancak 16 inçten küçük dizüstü bilgisayarlarda mevcut değiller. Apple ayrıca tek çekirdek performansını yaklaşık %20 oranında artırmayı başardı ve önemli ölçüde daha düşük güç tüketimine rağmen en hızlı Intel yongalarının gerisinde kaldı.
M3 Max'in üst düzey versiyonuna sahip MacBook Pro 14, 16 inçlik kardeşine kıyasla soğutma performansıyla biraz sınırlıdır, çünkü ne CPU ne de GPU performansı sürekli iş yükleri altında tamamen kararlıdır. MBP 14 artık Yüksek Performans moduna da sahip (daha önce daha büyük MBP 16 için ayrılmıştı) ve bu yardımcı oluyor, ancak M3 Max'in maksimum performansını istiyorsanız, daha büyük MacBook Pro 16'yı almalısınız.
Yeni M3 Max, MacBook Pro 14'ü piyasadaki en hızlı 14 inç dizüstü bilgisayara dönüştürüyor ve çok çekirdekli CPU testlerinde Intel'in Core i9 CPU'larını bile geride bırakıyor, ancak ucuz değil.
Grafik performansı da yaklaşık %20 daha yüksek ve videoları düzenlemek istediğinizde birleşik bellek büyük bir avantaj. 14 inçlik dizüstü bilgisayarlar genellikle 8 GB VRAM'e sahip GPU'larla donatılmıştır veROG Zephyrus G14rTX 4090 Dizüstü Bilgisayar (16 GB RAM) ile bir istisnadır. MacBook'ta da oyun oynayabilirsiniz ve Baldur's Gate 3 veya Resident Evil Village gibi yerel oyunlar çok iyi çalışır, ancak MacBook hala hardcore oyun dizüstü bilgisayarı değildir ve Windows rekabetinin sadece bir avantajı vardır.
M3 Max ile MacBook Pro 14'ü kimler almalı? CPU performansındaki büyük artış sayesinde, M2 Max'ten ilginç bir yükseltme bile olabilir ve yeni MBP 14, CPU performansı açısından 14 inç segmentindeki açık ara en güçlü dizüstü bilgisayar ve pil gücünde bile azalma yok. Sadece AMD ve Intel'in HX CPU'ları daha hızlı, ancak bu kadar küçük bir dizüstü bilgisayarda mevcut değiller. Bununla birlikte, sürekli iş yükleri altında bile M3 Max'in maksimum performansını istiyorsanız, daha büyük olanını almalısınız.MacBook Pro 16.
Kapakta Apple olmadan harika bir multimedya dizüstü bilgisayar arıyorsanız, mükemmel bir Mini-LED ekrana ve iyi performans rakamlarına sahip çok daha uygun fiyatlı Lenovo Yoga Pro 9i 14'ü (2300 Euro) öneriyoruz, ancak pil çalışma süresi MacBook'a kıyasla daha kötü. BuAsus ROG Zephyrus G144000 Euro'ya Mini-LED ekran, AMD Zen4 CPU ve oyun için çok daha iyi olan GeForce RTX 4090 Dizüstü Bilgisayar da sunuyor.
Kesinlikle bireysel disiplinlerde avantajları olan alternatifler var ve MacBook Pro'nun kesinlikle dezavantajları var (özellikle Apple'un yüksek yükseltme fiyatları ile birlikte var olmayan bakım seçenekleri), ancak yine de daha iyi bir genel paket bulmak zor.
Fiyat ve Bulunabilirlik
Küçük M3 Max (14 çekirdekli CPU, 30 çekirdekli GPU) ile temel model MacBook Pro 14 Amazon'da $3195'a satılmaktadır. Üst düzey model Apple'un web sitesinde 3699 $'dan başlayan fiyatlarla yapılandırılabilir.
Apple MacBook Pro 14 2023 M3 Max
- 11/20/2023 v7 (old)
Andreas Osthoff
Şeffaflık
İncelenecek cihazların seçimi editör ekibimiz tarafından yapılır. Test örneği, bu incelemenin amacı doğrultusunda üretici veya perakendeci tarafından yazara ödünç olarak sağlanmıştır. Borç verenin bu inceleme üzerinde herhangi bir etkisi olmadığı gibi, üretici de yayınlanmadan önce bu incelemenin bir kopyasını almamıştır. Bu incelemeyi yayınlama zorunluluğu yoktu. Bağımsız bir medya şirketi olarak Notebookcheck, üreticilerin, perakendecilerin veya yayıncıların otoritesine tabi değildir.
Notebookcheck bu şekilde test yapıyor
Notebookcheck, tüm sonuçların karşılaştırılabilir olmasını sağlamak için her yıl yüzlerce dizüstü bilgisayarı ve akıllı telefonu standart prosedürler kullanarak bağımsız olarak inceliyor. Yaklaşık 20 yıldır test yöntemlerimizi sürekli olarak geliştirdik ve bu süreçte endüstri standartlarını belirledik. Test laboratuvarlarımızda deneyimli teknisyenler ve editörler tarafından yüksek kaliteli ölçüm ekipmanları kullanılmaktadır. Bu testler çok aşamalı bir doğrulama sürecini içerir. Karmaşık derecelendirme sistemimiz, nesnelliği koruyan yüzlerce sağlam temellere dayanan ölçüm ve kıyaslamaya dayanmaktadır.Price comparison

