Apple MacBook Pro 16 2021 M1 Max Dizüstü Bilgisayar İncelemesi: Throttle’sız Tam Performans
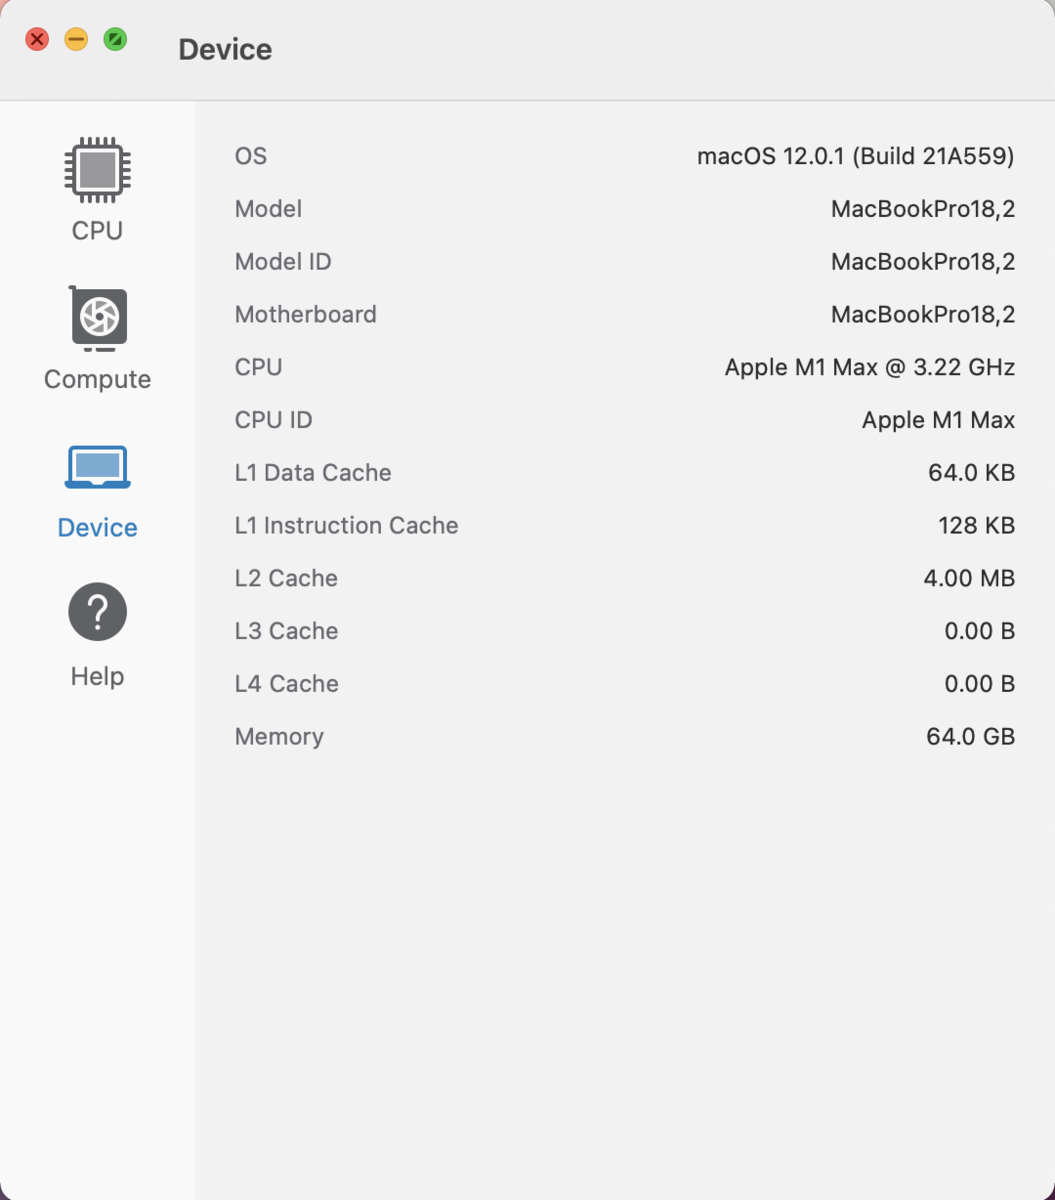
Apple'ın M1 Pro SoC'sine sahip giriş seviyesi MacBook Pro 16'yı zaten inceledik. Şimdi Cupertino'nun en güçlü birimi olan M1 Max SoC, 32 GPU çekirdeği ve 64 GB RAM ile MacBook Pro 16'ya daha yakından bakmanın zamanı geldi. 2 TB PCIe 4.0 SSD ile birlikte 4769 Euro perakende fiyatına sahip.
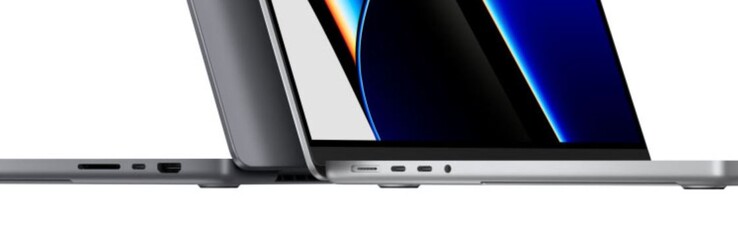
Bu yazıda, M1 Pro ile MBP 16 ile M1 Max arasındaki performans farkının yanı sıra sıcaklıklara ve fan davranışına olan etkilerine odaklanacağız. M1 Max'li ünitede ayrıca test edeceğimiz ek bir performans modu var. Kasa, bağlantı, giriş aygıtları, ekran ve hoparlörler gibi diğer tüm bölümler önceki inceleme birimiyle aynıdır, bu nedenle tüm ayrıntılar için lütfen kapsamlı incelememize bir göz atın:
Karşılaştırmada muhtemel rakipleri
Derece | Tarih | Model | Ağırlık | Yükseklik | Boyut | En iyi fiyat | Fiyat |
|---|---|---|---|---|---|---|---|
| 92.5 % v7 (old) | 01/2022 | Apple MacBook Pro 16 2021 M1 Max M1 Max, M1 Max 32-Core GPU | 2.2 kg | 16.8 mm | 16.20" | 3456x2234 | |
| 93.2 % v7 (old) | 12/2021 | Apple MacBook Pro 16 2021 M1 Pro M1 Pro, M1 Pro 16-Core GPU | 2.2 kg | 16.8 mm | 16.20" | 3456x2234 | |
| 89.8 % v7 (old) | 06/2022 | Lenovo ThinkPad P1 G4-20Y4S0KS00 i7-11850H, GeForce RTX 3070 Laptop GPU | 2 kg | 17.7 mm | 16.00" | 3840x2400 | |
| 87.8 % v7 (old) | 10/2021 | HP ZBook Studio 15 G8 i9-11950H, GeForce RTX 3070 Laptop GPU | 1.9 kg | 18 mm | 15.60" | 3840x2160 | |
| 88.9 % v7 (old) | 10/2021 | Razer Blade 15 Advanced (Mid 2021) i7-11800H, GeForce RTX 3080 Laptop GPU | 2 kg | 16.99 mm | 15.60" | 1920x1080 | |
| 87.9 % v7 (old) | 09/2021 | Dell XPS 17 9710 Core i7 RTX 3060 i7-11800H, GeForce RTX 3060 Laptop GPU | 2.5 kg | 19.5 mm | 17.00" | 3840x2400 |


Performans - 32 GPU Çekirdekli Apple M1 Max
İnceleme Ayarları
M1 Max işlemcili yeni MacBook Pro 16 2021, isteğe bağlı bir performans moduna sahiptir. Ancak, yalnızca fan hızını ve dolayısıyla yük altındaki yüzey sıcaklıklarını etkiler, ancak standart otomatik ayara göre performans farkı yoktur. Aşağıdaki tüm testleri ve ölçümleri varsayılan otomatik modda gerçekleştirdik. İsteğe bağlı güç tasarrufu modu, M1 Max'in paket gücünü 30W ile sınırlayacak, bu da sistemin stres altında bile sessiz kalacağı anlamına geliyor.
İşlemci
Apple M1 Max'in 10 çekirdekli CPU kısmı ( iki çekirdekli 1 verimlilik kümesi + her biri dört çekirdekli 2 performans kümesi) temelde M1 Pro ile aynıdır , bu yüzden burada kısa tutabiliriz. Hem sürekli iş yüklerinde hem de pil gücünde çok çekirdekli karşılaştırmalarda yaklaşık 29 Watt'lık (~34W paket gücü) bir maksimum tüketim belirledik. Bu tüketim değerleri M1 Pro ile karşılaştırıldığında biraz daha yüksek ancak buna ek GPU çekirdekli daha büyük çip, daha büyük önbellek ve daha fazla RAM neden oluyor. Kıyaslama sonuçlarımız, beklendiği gibi, küçük dalgalanmalar dışında M1 Pro ile neredeyse aynı.
Hem tek çekirdekli hem de çok çekirdekli sonuçlar rakiplerle karşılaştırılabilir, ancak hepsi 45W CPU'larla donatılmıştır ve çoğu zaman gerçekte çok daha fazla güç gerektirir. Ayrıca, hemen hemen her Windows rakibi, pil gücüyle ilgili CPU performansını düşürür.
Cinebench R15 Multi Loop
Cinebench R23: Multi Core | Single Core
Cinebench R20: CPU (Multi Core) | CPU (Single Core)
Cinebench R15: CPU Multi 64Bit | CPU Single 64Bit
Blender: v2.79 BMW27 CPU
Geekbench 5.5: Multi-Core | Single-Core
| CPU Performance rating | |
| Sınıf ortalaması Multimedia | |
| Lenovo ThinkPad P1 G4-20Y4S0KS00 | |
| HP ZBook Studio 15 G8 | |
| Apple MacBook Pro 16 2021 M1 Pro | |
| Ortalama Apple M1 Max | |
| Apple MacBook Pro 16 2021 M1 Max | |
| Razer Blade 15 Advanced (Mid 2021) -2! | |
| Dell XPS 17 9710 Core i7 RTX 3060 -2! | |
| Cinebench R23 / Multi Core | |
| Sınıf ortalaması Multimedia (4861 - 33362, n=79, son 2 yıl) | |
| Ortalama Apple M1 Max (12385 - 12396, n=3) | |
| Apple MacBook Pro 16 2021 M1 Max | |
| Apple MacBook Pro 16 2021 M1 Pro | |
| Razer Blade 15 Advanced (Mid 2021) | |
| HP ZBook Studio 15 G8 | |
| Lenovo ThinkPad P1 G4-20Y4S0KS00 | |
| Dell XPS 17 9710 Core i7 RTX 3060 | |
| Cinebench R23 / Single Core | |
| Sınıf ortalaması Multimedia (1128 - 2459, n=71, son 2 yıl) | |
| HP ZBook Studio 15 G8 | |
| Lenovo ThinkPad P1 G4-20Y4S0KS00 | |
| Apple MacBook Pro 16 2021 M1 Pro | |
| Ortalama Apple M1 Max (1530 - 1536, n=3) | |
| Apple MacBook Pro 16 2021 M1 Max | |
| Razer Blade 15 Advanced (Mid 2021) | |
| Dell XPS 17 9710 Core i7 RTX 3060 | |
| Cinebench R20 / CPU (Multi Core) | |
| Sınıf ortalaması Multimedia (1887 - 12912, n=62, son 2 yıl) | |
| Razer Blade 15 Advanced (Mid 2021) | |
| Lenovo ThinkPad P1 G4-20Y4S0KS00 | |
| HP ZBook Studio 15 G8 | |
| Dell XPS 17 9710 Core i7 RTX 3060 | |
| Ortalama Apple M1 Max (2735 - 2753, n=3) | |
| Apple MacBook Pro 16 2021 M1 Max | |
| Apple MacBook Pro 16 2021 M1 Pro | |
| Cinebench R20 / CPU (Single Core) | |
| Sınıf ortalaması Multimedia (425 - 853, n=62, son 2 yıl) | |
| HP ZBook Studio 15 G8 | |
| Lenovo ThinkPad P1 G4-20Y4S0KS00 | |
| Razer Blade 15 Advanced (Mid 2021) | |
| Dell XPS 17 9710 Core i7 RTX 3060 | |
| Apple MacBook Pro 16 2021 M1 Pro | |
| Ortalama Apple M1 Max (390 - 395, n=3) | |
| Apple MacBook Pro 16 2021 M1 Max | |
| Cinebench R15 / CPU Multi 64Bit | |
| Sınıf ortalaması Multimedia (856 - 5224, n=66, son 2 yıl) | |
| Lenovo ThinkPad P1 G4-20Y4S0KS00 | |
| Razer Blade 15 Advanced (Mid 2021) | |
| Dell XPS 17 9710 Core i7 RTX 3060 | |
| HP ZBook Studio 15 G8 | |
| Apple MacBook Pro 16 2021 M1 Max | |
| Ortalama Apple M1 Max (1689 - 1693, n=3) | |
| Apple MacBook Pro 16 2021 M1 Pro | |
| Cinebench R15 / CPU Single 64Bit | |
| Sınıf ortalaması Multimedia (184.8 - 326, n=64, son 2 yıl) | |
| HP ZBook Studio 15 G8 | |
| Lenovo ThinkPad P1 G4-20Y4S0KS00 | |
| Razer Blade 15 Advanced (Mid 2021) | |
| Dell XPS 17 9710 Core i7 RTX 3060 | |
| Apple MacBook Pro 16 2021 M1 Pro | |
| Ortalama Apple M1 Max (197 - 210, n=3) | |
| Apple MacBook Pro 16 2021 M1 Max | |
| Blender / v2.79 BMW27 CPU | |
| Dell XPS 17 9710 Core i7 RTX 3060 | |
| Razer Blade 15 Advanced (Mid 2021) | |
| Lenovo ThinkPad P1 G4-20Y4S0KS00 | |
| HP ZBook Studio 15 G8 | |
| Sınıf ortalaması Multimedia (100 - 557, n=63, son 2 yıl) | |
| Apple MacBook Pro 16 2021 M1 Max | |
| Ortalama Apple M1 Max (187 - 190, n=3) | |
| Apple MacBook Pro 16 2021 M1 Pro | |
| Geekbench 5.5 / Multi-Core | |
| Sınıf ortalaması Multimedia (4652 - 20422, n=60, son 2 yıl) | |
| Apple MacBook Pro 16 2021 M1 Max | |
| Ortalama Apple M1 Max (12563 - 12818, n=4) | |
| Apple MacBook Pro 16 2021 M1 Pro | |
| Lenovo ThinkPad P1 G4-20Y4S0KS00 | |
| HP ZBook Studio 15 G8 | |
| Geekbench 5.5 / Single-Core | |
| Sınıf ortalaması Multimedia (805 - 2974, n=60, son 2 yıl) | |
| Ortalama Apple M1 Max (1764 - 1798, n=4) | |
| Apple MacBook Pro 16 2021 M1 Max | |
| Apple MacBook Pro 16 2021 M1 Pro | |
| HP ZBook Studio 15 G8 | |
| Lenovo ThinkPad P1 G4-20Y4S0KS00 | |
* ... daha küçük daha iyidir
Sistem performansı
MacBook Pro 16 2021'in üst düzey SKU'sunun açıkça çok güçlü ve son derece duyarlı bir dizüstü bilgisayar olması şaşırtıcı değil. Günlük görevler sırasında veya yalnızca CPU'yu vurguladığınızda, M1 Pro ile giriş seviyesi birimde bir fark görmeyeceksiniz . Bu, iki cihazın çok benzer olduğu sistemler arası karşılaştırmalı değerlendirme CrossMark tarafından da desteklenir. BlackMagic RAW Hız Testi, daha büyük önbelleğin avantajını gösterir, çünkü CPU testi yüzde 7'lik küçük bir avantaj gösterir.
Ayrıca Adobe Photoshop ve Adobe Premiere Pro için iki PugetBench testi gerçekleştirdik. M1 Max, M1 Pro'dan belirgin şekilde daha iyi performans gösteriyor, ancak testler yalnızca uygulamaların Intel sürümleriyle uyumlu olduğundan, sonuçlar konusunda biraz dikkatli olmalısınız. Bunlar Rosetta 2 ile taklit edilir ve çalışır, ancak performans yerel sürümlere kıyasla belirgin şekilde daha kötüdür. Bunlar pratikte çok daha hızlı olacak ama tam performans avantajını belirleyemiyoruz.
CrossMark: Overall | Productivity | Creativity | Responsiveness
Photoshop PugetBench: Overall Score | GPU Score | General Score | Filter Score
Premiere Pro PugetBench: Overall Score 0.9 | Export 0.9 | Live Playback 0.9 | GPU 0.9
Jetstream 2: 2.0 Total
WebXPRT 3: Overall
Speedometer 2.0: Result 2.0
| Blackmagic RAW Speed Test / 12:1 8K Metal | |
| Sınıf ortalaması Multimedia (78 - 430, n=7, son 2 yıl) | |
| Apple MacBook Pro 16 2021 M1 Max | |
| Ortalama Apple M1 Max, Apple M1 Max 32-Core GPU (200 - 202, n=2) | |
| Apple MacBook Pro 16 2021 M1 Pro | |
| Apple MacBook Pro 14 2021 M1 Pro Entry | |
| Apple MacBook Pro 16 2019 i9 5500M | |
| Blackmagic RAW Speed Test / 12:1 8K CPU | |
| Sınıf ortalaması Multimedia (44 - 102, n=7, son 2 yıl) | |
| Apple MacBook Pro 16 2019 i9 5500M | |
| Ortalama Apple M1 Max, Apple M1 Max 32-Core GPU (29 - 30, n=2) | |
| Apple MacBook Pro 16 2021 M1 Max | |
| Apple MacBook Pro 16 2021 M1 Pro | |
| Apple MacBook Pro 14 2021 M1 Pro Entry | |
| CrossMark / Overall | |
| Sınıf ortalaması Multimedia (866 - 2728, n=65, son 2 yıl) | |
| Lenovo ThinkPad P1 G4-20Y4S0KS00 | |
| Ortalama Apple M1 Max, Apple M1 Max 32-Core GPU (1586 - 1621, n=2) | |
| Apple MacBook Pro 16 2021 M1 Max | |
| Apple MacBook Pro 16 2021 M1 Pro | |
| Apple MacBook Pro 14 2021 M1 Pro Entry | |
| Apple MacBook Air 2020 M1 Entry | |
| Apple MacBook Pro 16 2019 i9 5500M | |
| CrossMark / Productivity | |
| Sınıf ortalaması Multimedia (931 - 2489, n=65, son 2 yıl) | |
| Lenovo ThinkPad P1 G4-20Y4S0KS00 | |
| Ortalama Apple M1 Max, Apple M1 Max 32-Core GPU (1361 - 1385, n=2) | |
| Apple MacBook Pro 16 2021 M1 Max | |
| Apple MacBook Pro 16 2021 M1 Pro | |
| Apple MacBook Pro 14 2021 M1 Pro Entry | |
| Apple MacBook Air 2020 M1 Entry | |
| Apple MacBook Pro 16 2019 i9 5500M | |
| CrossMark / Creativity | |
| Sınıf ortalaması Multimedia (907 - 3465, n=65, son 2 yıl) | |
| Ortalama Apple M1 Max, Apple M1 Max 32-Core GPU (2102 - 2153, n=2) | |
| Apple MacBook Pro 16 2021 M1 Max | |
| Apple MacBook Pro 16 2021 M1 Pro | |
| Apple MacBook Pro 14 2021 M1 Pro Entry | |
| Lenovo ThinkPad P1 G4-20Y4S0KS00 | |
| Apple MacBook Air 2020 M1 Entry | |
| Apple MacBook Pro 16 2019 i9 5500M | |
| CrossMark / Responsiveness | |
| Sınıf ortalaması Multimedia (605 - 2024, n=65, son 2 yıl) | |
| Lenovo ThinkPad P1 G4-20Y4S0KS00 | |
| Ortalama Apple M1 Max, Apple M1 Max 32-Core GPU (1080 - 1107, n=2) | |
| Apple MacBook Pro 16 2021 M1 Max | |
| Apple MacBook Pro 16 2021 M1 Pro | |
| Apple MacBook Pro 14 2021 M1 Pro Entry | |
| Apple MacBook Air 2020 M1 Entry | |
| Apple MacBook Pro 16 2019 i9 5500M | |
| Photoshop PugetBench / Overall Score | |
| Lenovo ThinkPad P1 G4-20Y4S0KS00 | |
| Ortalama Apple M1 Max, Apple M1 Max 32-Core GPU (809 - 989, n=2) | |
| Apple MacBook Pro 16 2021 M1 Max | |
| Apple MacBook Pro 16 2021 M1 Pro | |
| Apple MacBook Pro 16 2019 i9 5500M | |
| Apple MacBook Pro 14 2021 M1 Pro Entry | |
| Apple MacBook Air 2020 M1 Entry | |
| Photoshop PugetBench / GPU Score | |
| Lenovo ThinkPad P1 G4-20Y4S0KS00 | |
| Ortalama Apple M1 Max, Apple M1 Max 32-Core GPU (98.5 - 108.1, n=2) | |
| Apple MacBook Pro 16 2021 M1 Max | |
| Apple MacBook Pro 16 2021 M1 Pro | |
| Apple MacBook Pro 14 2021 M1 Pro Entry | |
| Apple MacBook Pro 16 2019 i9 5500M | |
| Apple MacBook Air 2020 M1 Entry | |
| Photoshop PugetBench / General Score | |
| Ortalama Apple M1 Max, Apple M1 Max 32-Core GPU (86.5 - 97.2, n=2) | |
| Lenovo ThinkPad P1 G4-20Y4S0KS00 | |
| Apple MacBook Pro 16 2021 M1 Max | |
| Apple MacBook Pro 16 2021 M1 Pro | |
| Apple MacBook Pro 14 2021 M1 Pro Entry | |
| Apple MacBook Pro 16 2019 i9 5500M | |
| Apple MacBook Air 2020 M1 Entry | |
| Photoshop PugetBench / Filter Score | |
| Lenovo ThinkPad P1 G4-20Y4S0KS00 | |
| Ortalama Apple M1 Max, Apple M1 Max 32-Core GPU (75.2 - 100.6, n=2) | |
| Apple MacBook Pro 16 2021 M1 Max | |
| Apple MacBook Pro 16 2019 i9 5500M | |
| Apple MacBook Pro 16 2021 M1 Pro | |
| Apple MacBook Pro 14 2021 M1 Pro Entry | |
| Apple MacBook Air 2020 M1 Entry | |
| Premiere Pro PugetBench / Overall Score 0.9 | |
| Apple MacBook Pro 16 2021 M1 Max | |
| Ortalama Apple M1 Max, Apple M1 Max 32-Core GPU (862 - 1080, n=2) | |
| Apple MacBook Pro 14 2021 M1 Pro Entry | |
| Lenovo ThinkPad P1 G4-20Y4S0KS00 | |
| Apple MacBook Pro 16 2021 M1 Pro | |
| Apple MacBook Air 2020 M1 Entry | |
| Premiere Pro PugetBench / Export 0.9 | |
| Ortalama Apple M1 Max, Apple M1 Max 32-Core GPU (53.2 - 90.9, n=2) | |
| Lenovo ThinkPad P1 G4-20Y4S0KS00 | |
| Apple MacBook Pro 16 2021 M1 Max | |
| Apple MacBook Pro 16 2021 M1 Pro | |
| Apple MacBook Pro 14 2021 M1 Pro Entry | |
| Apple MacBook Air 2020 M1 Entry | |
| Premiere Pro PugetBench / Live Playback 0.9 | |
| Apple MacBook Pro 16 2021 M1 Max | |
| Apple MacBook Pro 14 2021 M1 Pro Entry | |
| Ortalama Apple M1 Max, Apple M1 Max 32-Core GPU (106 - 216, n=2) | |
| Apple MacBook Pro 16 2021 M1 Pro | |
| Lenovo ThinkPad P1 G4-20Y4S0KS00 | |
| Apple MacBook Air 2020 M1 Entry | |
| Premiere Pro PugetBench / GPU 0.9 | |
| Lenovo ThinkPad P1 G4-20Y4S0KS00 | |
| Ortalama Apple M1 Max, Apple M1 Max 32-Core GPU (54.8 - 55.8, n=2) | |
| Apple MacBook Pro 16 2021 M1 Max | |
| Apple MacBook Pro 16 2021 M1 Pro | |
| Apple MacBook Pro 14 2021 M1 Pro Entry | |
| Apple MacBook Air 2020 M1 Entry | |
| Jetstream 2 / 2.0 Total | |
| Sınıf ortalaması Multimedia (287 - 481, n=34, son 2 yıl) | |
| Ortalama Apple M1 Max, Apple M1 Max 32-Core GPU (215 - 215, n=2) | |
| Apple MacBook Pro 16 2021 M1 Max | |
| Apple MacBook Pro 16 2021 M1 Pro | |
| Apple MacBook Pro 14 2021 M1 Pro Entry | |
| HP ZBook Studio 15 G8 | |
| Apple MacBook Air 2020 M1 Entry | |
| Apple MacBook Air 2020 M1 Entry | |
| Dell XPS 17 9710 Core i7 RTX 3060 | |
| Razer Blade 15 Advanced (Mid 2021) | |
| Apple MacBook Pro 13 Late 2020 M1 Entry (8 / 256 GB) | |
| Speedometer 2.0 / Result 2.0 | |
| Sınıf ortalaması Multimedia (337 - 946, n=33, son 2 yıl) | |
| Ortalama Apple M1 Max, Apple M1 Max 32-Core GPU (272 - 349, n=2) | |
| Apple MacBook Pro 16 2021 M1 Pro | |
| Apple MacBook Pro 16 2021 M1 Max | |
| Apple MacBook Air 2020 M1 Entry | |
| Apple MacBook Air 2020 M1 Entry | |
| Apple MacBook Pro 14 2021 M1 Pro Entry | |
| Apple MacBook Pro 13 Late 2020 M1 Entry (8 / 256 GB) | |
Depolama aygıtları
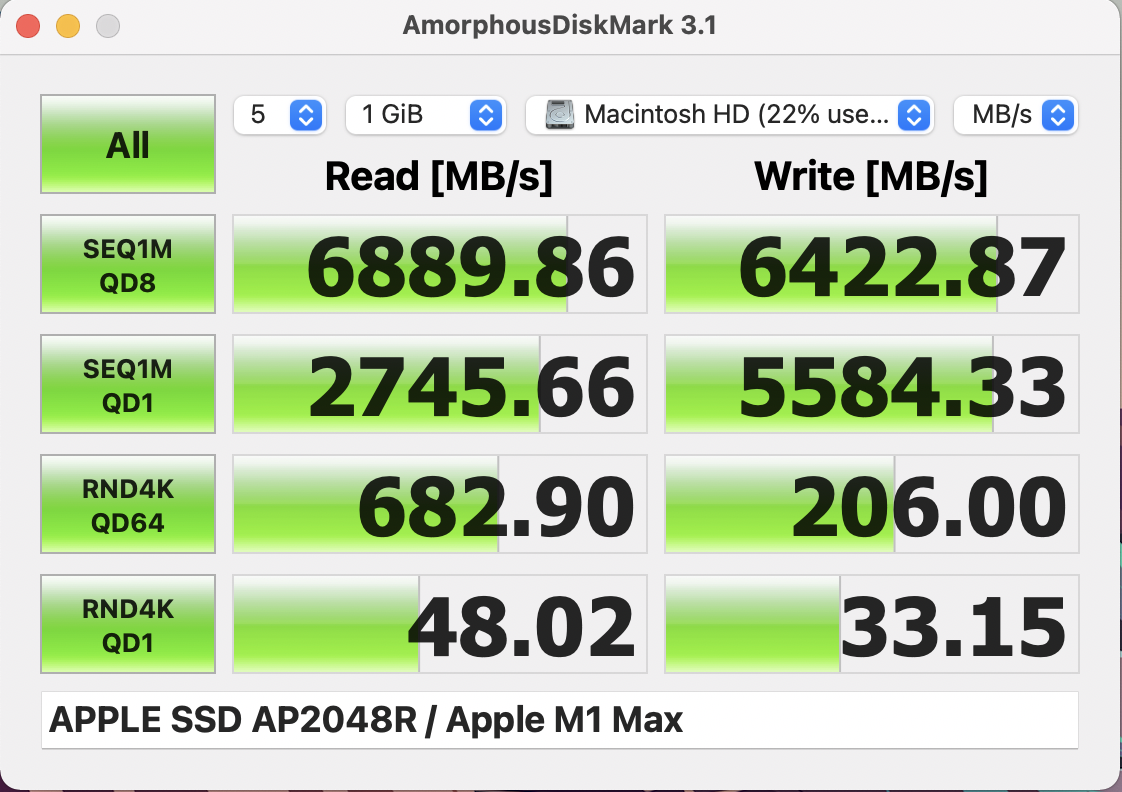
İnceleme birimimiz hızlı bir PCIe 4.0 SSD ve 2 TB depolama kapasitesi ile donatılmıştır. İlk kurulumdan sonra kendi dosyalarınız için 1,97 TB kullanabilirsiniz. Disk, kıyaslamalarda neredeyse 7 GB/sn'lik mükemmel aktarım hızlarını yönetir. MacBook Pro'yu 8 TB'a kadar SSD depolama alanıyla donatabilirsiniz, ancak Apple bunun için yüksek bir prim alır (2 TB SSD'ye kıyasla +2070 Euro). Teknik bölümümüzde daha fazla SSD kıyaslaması mevcuttur
Ekran Kartı Performansı - 32 GPU Çekirdeği
MacBook Pro 16 2021'in en hızlı M1 Max'e sahip üst düzey sürümü, dört GPU kümesi ve her biri sekiz çekirdek ile donatılmıştır. Benchmarklar sırasında GPU için maksimum 44W tüketimi belirleyebiliyoruz ve sonuçlar yüzde 60 ile 95 arasında bir avantajla 16 GPU çekirdeğine sahip M1 Pro'ya kıyasla çok daha iyi. MacBook'ta yerel olarak çalışan Wild Life Extreme Unlimited karşılaştırması, M1 Max gücün yarısına bile ihtiyaç duymasa da GeForce RTX 3070 ile karşılaştırılabilir performans rakamları gösteriyor. Grafik performansı da pil gücüyle tamamen sabittir.
MacBook Pro 16'da oyun oynayabilirsiniz, ancak mevcut oyunların sayısı büyük sınırlamadır. Şu anda yalnızca birkaç yerel başlık vardır ve bazıları taklit edilebilir. Oyun testlerimiz bir kez daha M1 Pro'ya göre yüzde 70-80 civarında bir avantaj gösteriyor ve Shadow of the Tomb Raider'daki performans, GeForce RTX 3060'ın hızlı sürümleriyle kabaca karşılaştırılabilir . Ancak, bir kez daha öykünülmüş bir başlık olması sorunu var.
CrossWare gibi uygulamalar, Witcher 3 veya GTA V gibi Windows başlıkları için destek ekler ve performans aslında fena değil. Örnek olarak aşağıdaki videoda GTA V benchmark dizisini yakaladık. Ultra ayarlarda (1920 x 1200 piksel) performansın çok iyi olduğunu açıkça görebilirsiniz, ancak belirgin takılmalar var. Oyunu yine de bu şekilde oynayabilirsiniz, ancak MacBook Pro 16, güçlü M1 Max ile bile bir oyun dizüstü bilgisayarı değildir.
| düşük | orta | yüksek | ultra | |
|---|---|---|---|---|
| Shadow of the Tomb Raider (2018) | 140 | 104 | 97 | 87 |
| Total War: Three Kingdoms (2019) | 201 | 127 | 80 | 59 |
| Borderlands 3 (2019) | 65.5 | 55.3 | 47.6 | 40.7 |
Sistem Gürültüsü
M1 Max işlemcili MacBook Pro 16, fanlar kapalı olduğundan ve başka elektronik sesler (bobin sesi gibi) olmadığından boşta çalışırken ve hafif iş yükleri sırasında sessizdir. Saf CPU yükü, neredeyse hiç duyulmayan en düşük fan hızına (1600 rpm) neden olur. Yalnızca 32 GPU çekirdeğini vurgulamaya başladığınızda daha yüksek ses çıkaracaktır.
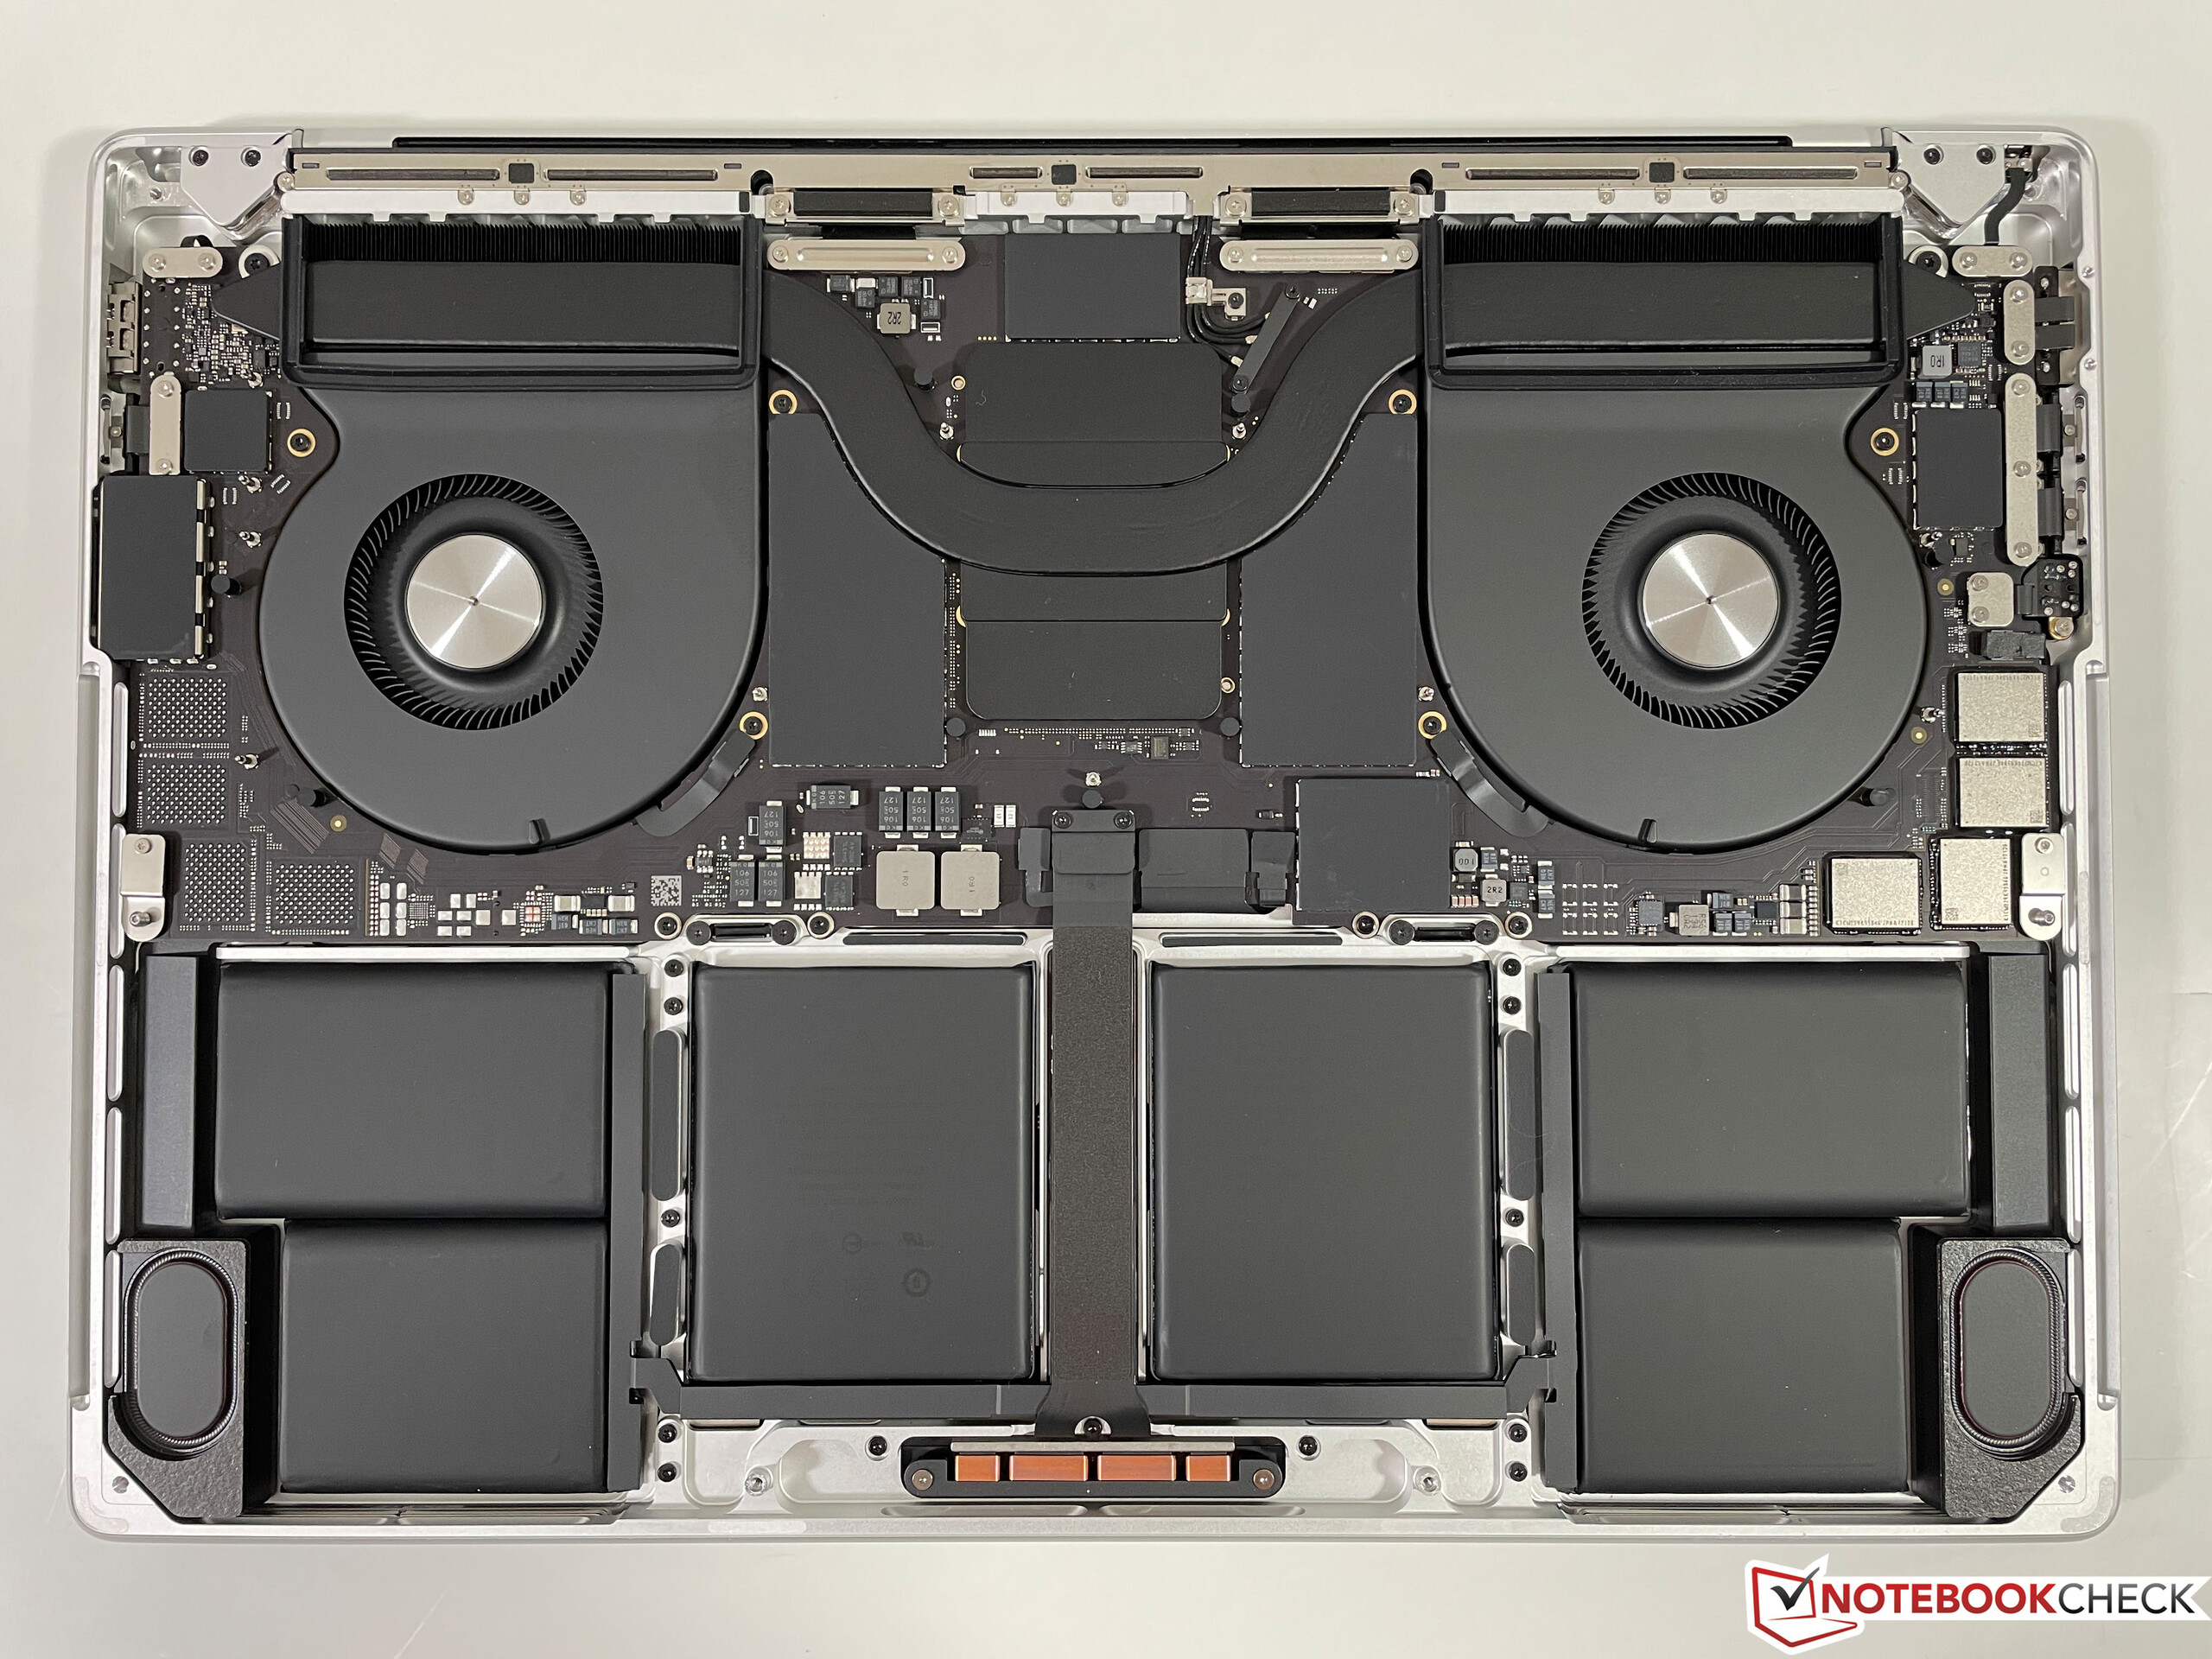
MacBook Pro 16 M1 Max'in fanları, M1 Pro ünitesine kıyasla daha yüksek bir maksimum hıza (sol tarafta 5348 rpm ve sağ tarafta 5776 rpm) ulaşabilir.(sırasıyla 4280 ve 4750 rpm). Ancak bu maksimum hızlar oldukça teorik çünkü maksimum hıza ulaşabileceğimiz tek bir senaryo vardı. Stres testini (CB R23 ve 3DMark Wildlife Extreme) normal modda başlatmak zorunda kaldık ve birkaç dakika sonra performans moduna geçtik. MBP 16 daha sonra fan hızını birkaç dakika için maksimum değere yükseltecek ve bu da yüksek 55.6 dB(A) ile sonuçlanacaktır. Bir süre sonra fanlar 4400 d/d (49.5 dB(A)'da düzleşecektir.Performans modunda stres testine başlarsanız fan hızı 4000 (47.3 dB(A)) ile 4900 dB(52 dB) arasında dalgalanacaktır. (A)) ortalama 4400 rpm (49.5 dB(A)) ile.Daha önce de söylediğimiz gibi performans avantajı olmadığı için performans modunu kullanmanın bir anlamı yok.
Enerji ayarlarını varsayılan otomatik modda bırakırsanız, stres testi yalnızca 3600 rpm ile sonuçlanır ve bu da 42,9 dB(A) ile sonuçlanır. Witcher 3 oyun testimiz sırasında, fan hızı ortalama 3200 rpm (39.5 dB(A)) ile biraz dalgalanacak. Ayrıca PugetBench karşılaştırmasında (Premiere Pro) 3600 rpm gözlemleyebiliriz, ancak bunun uygulamanın öykünülmüş versiyonu olduğunu unutmayın. Genel fan gürültüsü çok uygun bir üfürümdür ve yine de kulaklık olmadan çok rahat çalışabilirsiniz. Tüm bu sonuçlar, şebeke ve pil gücü için aynıdır.
İsteğe bağlı enerji tasarrufu modu, M1 Max'in paket gücünü 30W ile sınırlayacak ve bu da stres testi sırasında bile tamamen sessiz bir çalışma ile sonuçlanacaktır.
Ses yüksekliği
| Boşta |
| 24.2 / 24.2 / 24.2 dB |
| Çalışırken |
| 42.9 / 42.9 dB |
 | ||
30 dB sessiz 40 dB(A) duyulabilirlik 50 dB(A) gürültülü |
||
min: | ||
| Apple MacBook Pro 16 2021 M1 Max M1 Max 32-Core GPU, M1 Max, Apple SSD AP2048R | Apple MacBook Pro 16 2021 M1 Pro M1 Pro 16-Core GPU, M1 Pro, Apple SSD AP1024R | Lenovo ThinkPad P1 G4-20Y4S0KS00 GeForce RTX 3070 Laptop GPU, i7-11850H, Samsung PM9A1 MZVL21T0HCLR | HP ZBook Studio 15 G8 GeForce RTX 3070 Laptop GPU, i9-11950H, Samsung PM981a MZVLB2T0HALB | Razer Blade 15 Advanced (Mid 2021) GeForce RTX 3080 Laptop GPU, i7-11800H, SSSTC CA6-8D1024 | Dell XPS 17 9710 Core i7 RTX 3060 GeForce RTX 3060 Laptop GPU, i7-11800H, Micron 2300 1TB MTFDHBA1T0TDV | |
|---|---|---|---|---|---|---|
| Noise | 7% | -4% | -7% | -7% | -9% | |
| kapalı / ortam * (dB) | 24.2 | 24.7 -2% | 23.8 2% | 23.5 3% | 25.1 -4% | 25.5 -5% |
| Idle Minimum * (dB) | 24.2 | 24.7 -2% | 23.8 2% | 25.3 -5% | 25.3 -5% | 25.2 -4% |
| Idle Average * (dB) | 24.2 | 24.7 -2% | 23.8 2% | 25.3 -5% | 25.3 -5% | 25.2 -4% |
| Idle Maximum * (dB) | 24.2 | 24.7 -2% | 28.3 -17% | 25.3 -5% | 25.3 -5% | 25.2 -4% |
| Load Average * (dB) | 42.9 | 26.1 39% | 38.6 10% | 41.2 4% | 42 2% | 45.9 -7% |
| Witcher 3 ultra * (dB) | 39.5 | 47.4 -20% | 49.4 -25% | 45.6 -15% | 49 -24% | |
| Load Maximum * (dB) | 42.9 | 37.4 13% | 47.4 -10% | 49.4 -15% | 51.6 -20% | 50.4 -17% |
* ... daha küçük daha iyidir
Sıcaklıklar
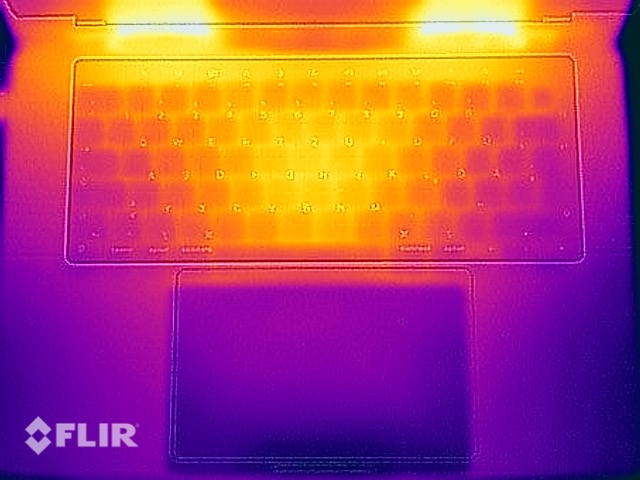
Yeni MacBook Pro 16'da herhangi bir sıcaklık sorunu yok, çünkü günlük işler sırasında daha sıcak yüzeyler neredeyse hiç fark etmeyeceksiniz ve üniteyi gerçekten zorladığınızda bile sıcaklıklar hiç de kritik değil.
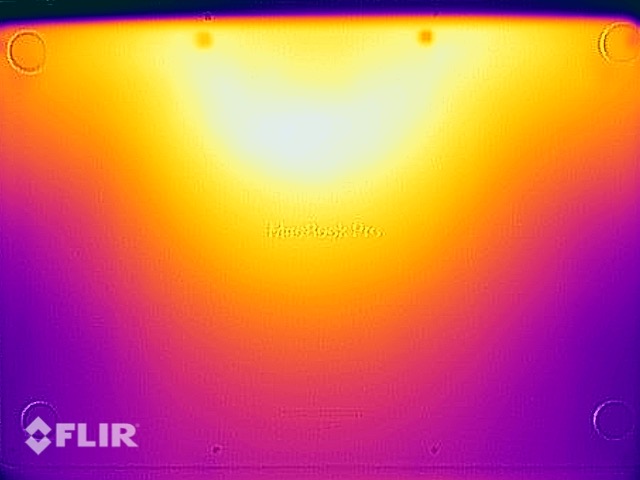
Standart prosedürümüzün (Cinebench R15 + FurMark) aksine, MacBook Pro'daki stres testi için iki yerel uygulama Cinebench R23 ve 3DMark Wildlife Extreme (her uygulama için stres testi) kullanıyoruz. Bu kombinasyon ile en yüksek tüketim rakamlarını almayı başardık. Güçlü Windows dizüstü bilgisayarların aksine, performans bir saatlik test boyunca kaya gibi sağlam ve yüzey sıcaklıkları hala çok düşük. Ana ünitenin üstünde ve altında sadece 42 °C ölçebiliyoruz. Kasa, Witcher 3 testi sırasında daha düşük fan hızları nedeniyle biraz daha ısınıyor, ancak fark neredeyse hiç fark edilmedi.
Ayrıca isteğe bağlı performans modu ile stres testi yaptık ve sıcaklıklara baktık. Daha önce belirtildiği gibi, performansı etkilemez, ancak daha yüksek fan hızları nedeniyle yüzey sıcaklıkları 39.9 °C'ye kadar daha da düşüktür. Sonuç olarak, bu sonuçlar performans seviyeleri ve fan gürültüsü göz önüne alındığında mükemmel. PSU sıcaklıkları bile 43 °C'ye kadar tamamen iyidir.
Harici bir ekran kullandığımızda fan hızı veya yüzey sıcaklıkları açısından bir fark göremiyoruz.
(±) Üst taraftaki maksimum sıcaklık, 36.8 °C / 98 F ortalamasına kıyasla 42.3 °C / 108 F'dir. , Multimedia sınıfı için 21 ile 71 °C arasında değişir.
(±) Alt kısım, 39.1 °C / 102 F ortalamasına kıyasla maksimum 41.7 °C / 107 F'ye kadar ısınır
(+) Boşta kullanımda, üst tarafın ortalama sıcaklığı 23.5 °C / 74 F olup, cihazın 31.3 °C / 88 F.
(±) The Witcher 3 oynarken, üst tarafın ortalama sıcaklığı 36.9 °C / 98 F olup, cihazın 31.3 °C / 88 F.
(+) Avuç içi dayanakları ve dokunmatik yüzey, maksimum 30.2 °C / 86.4 F ile cilt sıcaklığından daha soğuktur ve bu nedenle dokunulduğunda soğuktur.
(±) Benzer cihazların avuç içi dayanağı alanının ortalama sıcaklığı 28.7 °C / 83.7 F (-1.5 °C / -2.7 F) idi.
İsteğe bağlı Performans Modu ile yüzey sıcaklıkları stres testi:
(+) Üst taraftaki maksimum sıcaklık, 36.8 °C / 98 F ortalamasına kıyasla 39.9 °C / 104 F'dir. , Multimedia sınıfı için 21 ile 71 °C arasında değişir.
(+) Alt kısım, 39.1 °C / 102 F ortalamasına kıyasla maksimum 38.7 °C / 102 F'ye kadar ısınır
(+) Avuç içi dayanakları ve dokunmatik yüzey, maksimum 25.9 °C / 78.6 F ile cilt sıcaklığından daha soğuktur ve bu nedenle dokunulduğunda soğuktur.
(+) Benzer cihazların avuç içi dayanağı alanının ortalama sıcaklığı 28.7 °C / 83.7 F (+2.8 °C / 5.1 F) idi.
| Apple MacBook Pro 16 2021 M1 Max Apple M1 Max, Apple M1 Max 32-Core GPU | Apple MacBook Pro 16 2021 M1 Pro Apple M1 Pro, Apple M1 Pro 16-Core GPU | Lenovo ThinkPad P1 G4-20Y4S0KS00 Intel Core i7-11850H, NVIDIA GeForce RTX 3070 Laptop GPU | HP ZBook Studio 15 G8 Intel Core i9-11950H, NVIDIA GeForce RTX 3070 Laptop GPU | Razer Blade 15 Advanced (Mid 2021) Intel Core i7-11800H, NVIDIA GeForce RTX 3080 Laptop GPU | Dell XPS 17 9710 Core i7 RTX 3060 Intel Core i7-11800H, NVIDIA GeForce RTX 3060 Laptop GPU | |
|---|---|---|---|---|---|---|
| Heat | 2% | -23% | -21% | -38% | -28% | |
| Maximum Upper Side * (°C) | 42.3 | 41 3% | 51 -21% | 49 -16% | 51 -21% | 50.2 -19% |
| Maximum Bottom * (°C) | 41.7 | 39 6% | 53.5 -28% | 54.2 -30% | 52 -25% | 38.4 8% |
| Idle Upper Side * (°C) | 23.9 | 24 -0% | 28.8 -21% | 26.2 -10% | 35.2 -47% | 37.6 -57% |
| Idle Bottom * (°C) | 23.9 | 24 -0% | 29.3 -23% | 30.2 -26% | 37.8 -58% | 34.2 -43% |
* ... daha küçük daha iyidir
Enerji Yönetimi - M1 Max daha fazla güç tüketiyor
Güç tüketimi
M1 Max'li MacBook Pro 16 , ek GPU çekirdekleri, daha büyük önbellek ve daha fazla RAM'in bir sonucu olarak M1 Pro'ya sahip birime kıyasla biraz daha yüksek boşta tüketime sahiptir . Ayrıca, HDR videoların oynatılması sırasında panel tam HDR parlaklığına ulaştığında 30W'a kadar en yüksek tüketimi ölçmeyi başardık.
Yaklaşık 90W'lık (daha doğrusu 86W) bir maksimum paket gücü görebiliyoruz, ancak kıyaslama dizilerindeki değişikliklerden dolayı dalgalanmalar var. Bu davranışı, stres testimiz sırasında tüketimin 90 ile 135 Watt arasında dalgalandığı aşağıdaki çizelgede çok iyi görebilirsiniz. Ortalama 115 Watt tüketim ile tekrar tekrar daha yüksek rakamlara ulaşacaktır. Oyun (Steam/CrossWare aracılığıyla Witcher 3 ile test edilmiştir) 100 Watt'tan (~61W paket gücü) daha fazla sabit bir tüketim ile sonuçlanır. 140W güç adaptörü, tam stres altında zirveleri kapatmak için yeterlidir.
| Kapalı / Bekleme modu | |
| Boşta | |
| Çalışırken |
|
Key:
min: | |
| Apple MacBook Pro 16 2021 M1 Max M1 Max, M1 Max 32-Core GPU, 99.6 Wh | Apple MacBook Pro 16 2021 M1 Pro M1 Pro, M1 Pro 16-Core GPU, 99.6 Wh | Lenovo ThinkPad P1 G4-20Y4S0KS00 i7-11850H, GeForce RTX 3070 Laptop GPU, 90 Wh | HP ZBook Studio 15 G8 i9-11950H, GeForce RTX 3070 Laptop GPU, 83 Wh | Razer Blade 15 Advanced (Mid 2021) i7-11800H, GeForce RTX 3080 Laptop GPU, 80 Wh | Dell XPS 17 9710 Core i7 RTX 3060 i7-11800H, GeForce RTX 3060 Laptop GPU, 97 Wh | Sınıf ortalaması Multimedia | |
|---|---|---|---|---|---|---|---|
| Power Consumption | 20% | -28% | -48% | -96% | -13% | 22% | |
| Idle Minimum * (Watt) | 5.4 | 5 7% | 8.1 -50% | 11 -104% | 19.5 -261% | 7.5 -39% | 5.65 ? -5% |
| Idle Average * (Watt) | 16.4 | 15.1 8% | 20.2 -23% | 18.8 -15% | 23.3 -42% | 15.7 4% | 10 ? 39% |
| Idle Maximum * (Watt) | 16.7 | 15.5 7% | 21.9 -31% | 31.7 -90% | 40.1 -140% | 23.1 -38% | 12.3 ? 26% |
| Load Average * (Watt) | 94 | 54 43% | 88.2 6% | 105.2 -12% | 98.9 -5% | 87.2 7% | 65.1 ? 31% |
| Witcher 3 ultra * (Watt) | 104 | 149 -43% | 148 -42% | 174 -67% | 116 -12% | ||
| Load Maximum * (Watt) | 135 | 90 33% | 170.6 -26% | 171.8 -27% | 214 -59% | 131.6 3% | 112.5 ? 17% |
* ... daha küçük daha iyidir
Witcher 3 enerji tüketimi / Stress test
Batarya Çalışma Süresi
Biraz daha yüksek tüketim değerlerinin de pil çalışma süreleri üzerinde etkisi var ve MBP 16 M1 Max için sonuçlar M1 Pro ünitesine. 150 nit'teki Wi-Fi testi (maksimum SDR parlaklığının %50'sinden biraz fazlası), yaklaşık 15 saati ve dolayısıyla M1 Pro ünitesinden 2 saat daha azını belirler. Bu sonuç, 500 nit'lik maksimum SDR parlaklığını kullandığımızda 7 saatten biraz fazlaya düşüyor. Pencerede veya tam ekran modunda Safari arasında hiçbir fark yoktur.
150 nit'te standart h.264 test videomuz 17 saat çalışır ve bu nedenle M1 Pro'lu MBP 16'ya kıyasla yalnızca 30 dakika daha kısadır. YouTube'da bir 4K HDR videonun maksimum parlaklıkta video oynatımı sırasında pil kullanım süresini de kontrol ettik ve bu da 4:37 saatlik bir çalışma süresiyle sonuçlandı. HDR videolarla ilgili sorun raporları olduğundan ve YouTube şu anda yeni MacBook Pro modelinde (ayrıca 14 inç) HDR videolar sunmadığı için bu artık mümkün değil.
Hem CPU'yu hem de GPU'yu vurguladığınızda bile performans pil gücüyle sınırlı değildir. Bu, stres testi sırasında ortalama 115 W'lık bir tüketim düşünüldüğünde şaşırtıcıdır ve sonuç olarak, bu senaryoda 99,6 Wh pil çok uzun sürmez. 63 dakikanın sonucu ancak, pil seviyeleri kalan kapasite %5'e ulaştığında, performans büyük ölçüde 13W paket gücüne düştüğü için mümkün olur, ki bu sadece 50 dakika sonra gerçekleşir.
| Apple MacBook Pro 16 2021 M1 Max M1 Max, M1 Max 32-Core GPU, 99.6 Wh | Apple MacBook Pro 16 2021 M1 Pro M1 Pro, M1 Pro 16-Core GPU, 99.6 Wh | Lenovo ThinkPad P1 G4-20Y4S0KS00 i7-11850H, GeForce RTX 3070 Laptop GPU, 90 Wh | HP ZBook Studio 15 G8 i9-11950H, GeForce RTX 3070 Laptop GPU, 83 Wh | Razer Blade 15 Advanced (Mid 2021) i7-11800H, GeForce RTX 3080 Laptop GPU, 80 Wh | Dell XPS 17 9710 Core i7 RTX 3060 i7-11800H, GeForce RTX 3060 Laptop GPU, 97 Wh | Sınıf ortalaması Multimedia | |
|---|---|---|---|---|---|---|---|
| Pil Çalışma Süresi | 8% | -34% | 3% | -60% | 44% | 9% | |
| H.264 (h) | 17 | 17.5 3% | 7.2 -58% | 16.2 ? -5% | |||
| WiFi v1.3 (h) | 14.9 | 16.9 13% | 7 -53% | 6.2 -58% | 5.9 -60% | 7.6 -49% | 12 ? -19% |
| Load (h) | 1.1 | 1.2 9% | 1.8 64% | 2.6 136% | 1.669 ? 52% | ||
| Reader / Idle (h) | 12.9 | 17.7 | 25.2 ? |
Artılar
Eksiler
Son Görüş - M1 Max, performansı ve serin çalışabilmesi ile ikna edici
32 GPU çekirdeği içeren M1 Max işlemcinin en hızlı sürümüne sahip MacBook Pro 16 2021, yalnızca performansıyla değil, özellikle düşük sıcaklıkları ve nispeten sessiz fanları ile ikna ediyor. Güçlü soğutma çözümü ve verimli çip tasarımı, burada kesinlikle karşılığını veriyor, çünkü sıcaklıklar maksimum yük altında bile tamamen kritik değil. Hatta bu performans aralığında şimdiye kadar duyulmamış maksimum pil gücü performansını kullanabilirsiniz. İsteğe bağlı performans modu ise biraz daha yüksek fanlar ve daha düşük yüzey sıcaklıkları sağlar, ancak bunun gerçekten gerekli olduğunu düşünmüyoruz.
M1 Max ve M1 Pro'nun performansı, CPU açısından hemen hemen aynıdır ve büyük fark, GPU çekirdeklerinin sayısıdır. Ek güce gerçekten ihtiyacınız olup olmadığı, kullanım senaryonuza bağlıdır. Çok sayıda video düzenlerseniz veya daha fazla harici ekran kullanmayı planlıyorsanız, M1 Max gitmeniz gereken yoldur. Ancak yalnızca üst düzey bir multimedya dizüstü bilgisayar arıyorsanız, MacBook Pro 16'nın M1 Pro ile temel modelini öneririz.
Yeni MacBook Pro 16 2021'in üst düzey modeli, yalnızca M1 Max SoC'nin artan grafik performansıyla değil, aynı zamanda mükemmel emisyon sonuçlarıyla da ikna ediyor.
Aksi takdirde, MBP 16 temel modelinin derinlemesine incelememizde tartıştığımız aynı artıları ve eksileri elde edersiniz. Harika Mini-LED ekran ve mükemmel hoparlörler sayesinde, örneğin bağlantı konusunda hala iyileştirmeler yapılmasına rağmen şikayet edilecek pek bir şey yok. MacBook Pro da her kullanıcıya uygun olmayacaktır. Her şey için tek bir cihaz istiyorsanız ve ayrıca bazı oyunlar oynamayı seviyorsanız, ThinkPad X1 Extreme G4, Razer Blade 15, veya Dell XPS 17 (XPS 15 mevcut değil gibi güçlü bir Windows dizüstü bilgisayar kullanmak zorunda kalacaksınız. benzer şekilde güçlü bir GPU ile). Bu, yalnızca MacBook için mevcut olmayan bir yazılıma güveniyorsanız da geçerlidir.
Fiyat ve Stok Durumu
Yeni MacBook Pro 16'nın bulunabilirliği şu anda sınırlıdır. En iyi seçenek, 2 TB SDD'li test ünitemizi 4299 $ karşılığında alabileceğiniz Apple'ın perakende mağazalarından birinden teslim almaktır.
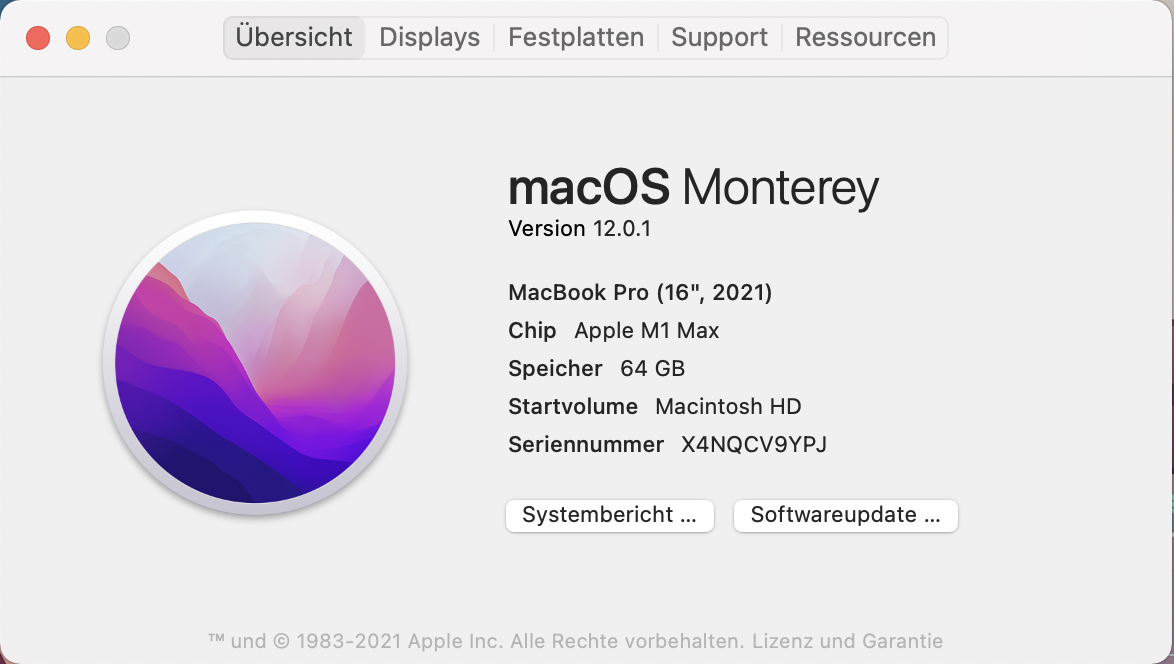
Apple MacBook Pro 16 2021 M1 Max
- 11/24/2021 v7 (old)
Andreas Osthoff
Price comparison

