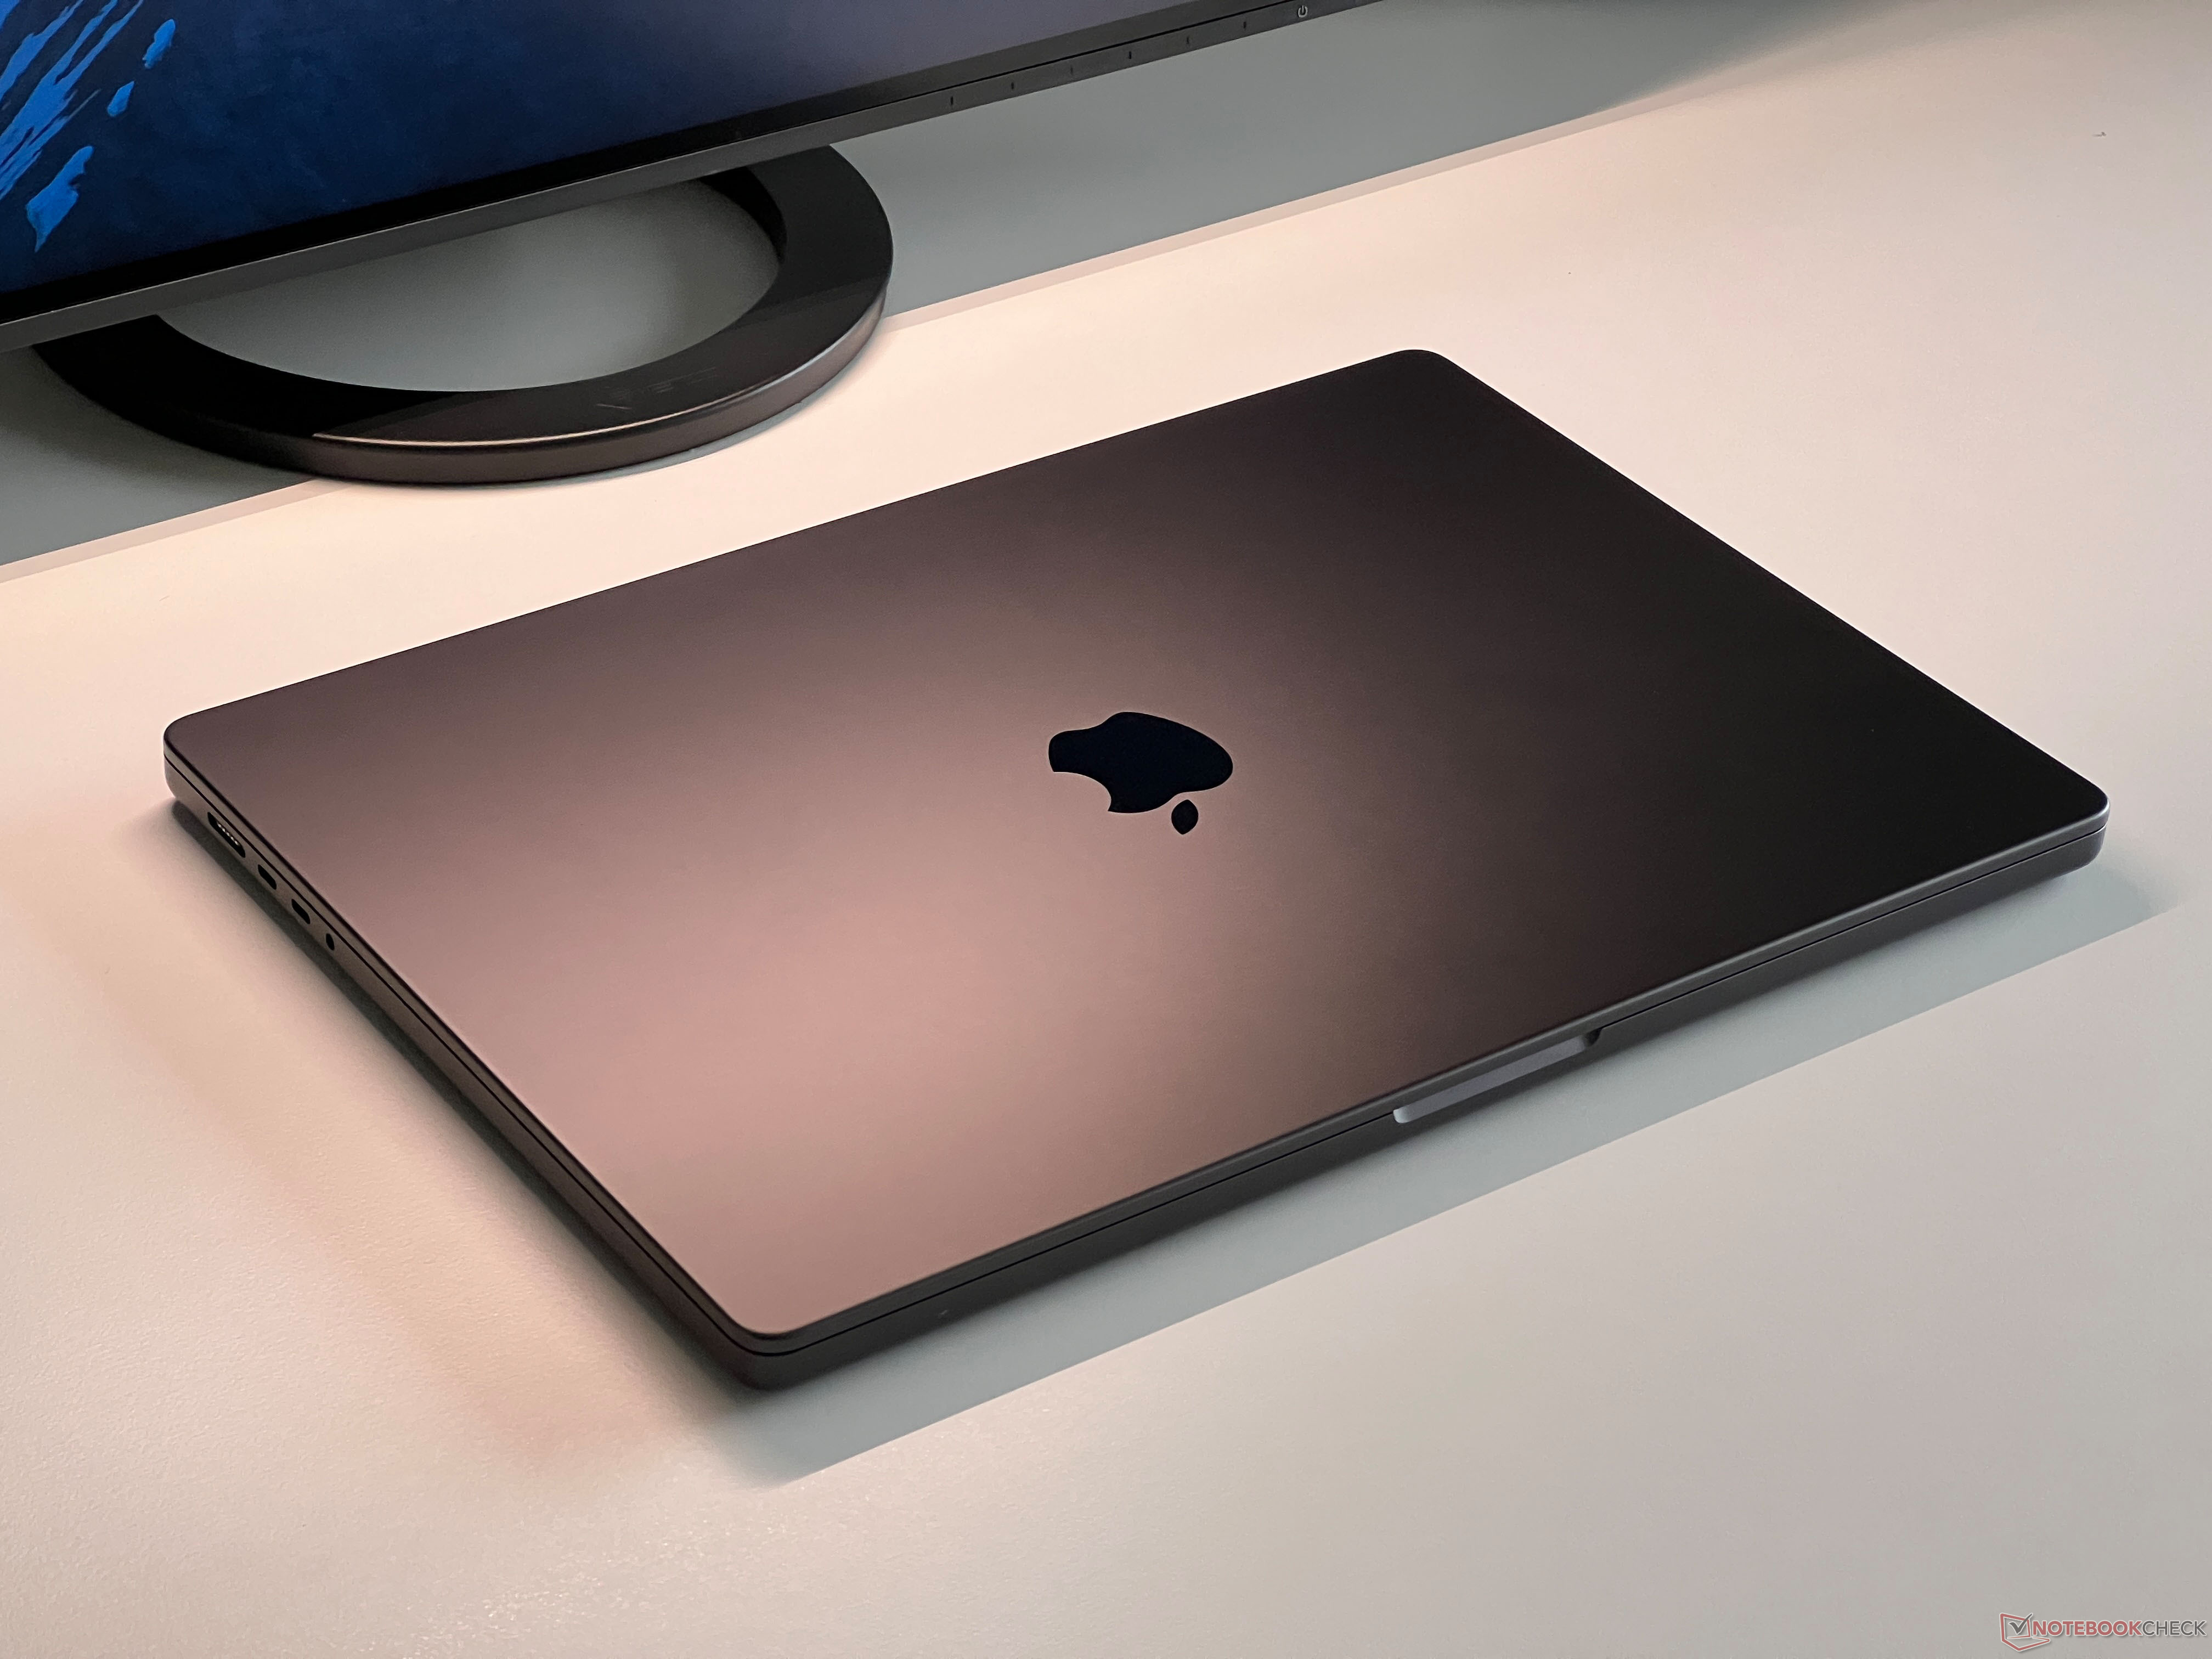
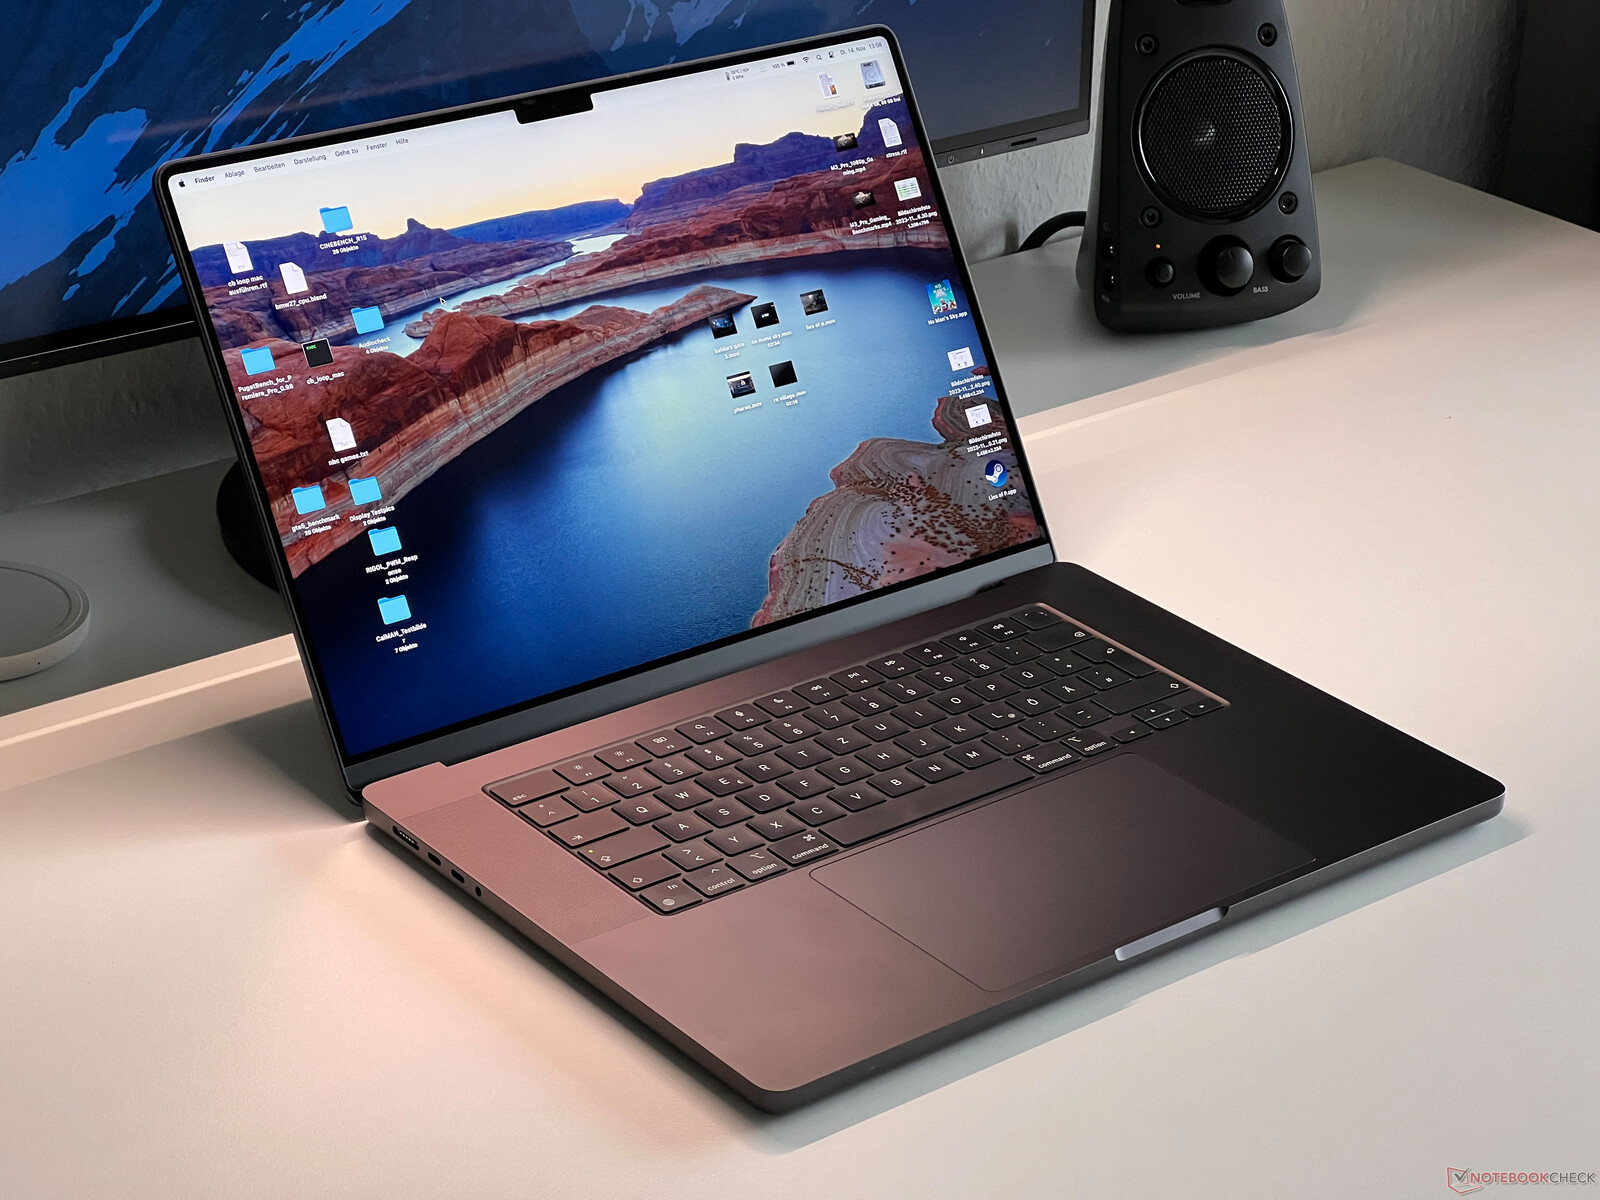
Apple MacBook Pro 16 2023 M3 Pro incelemesi - Performanstan önce verimlilik
Yeni üst düzey versiyonunu zaten test ettik MacBook Pro 16 2023m3 Max ile, ancak 2.999 Euro (~ 3.272 $) MSRP'ye sahip M3 Pro SoC'li temel model çoğu kullanıcı için çok daha ilginç olabilir. Daha fazla performansın zararı olmasa da, her kullanıcının yeni M3 Max'in aşırı performansına (hem CPU hem de GPU) ihtiyacı yoktur. Daha küçük olanın aksine MacBook Pro 14mBP 16 sadece M3 Pro'nun en hızlı versiyonu ile birlikte geliyor. Yüksek fiyatına rağmen, temel model hala yetersiz 512 GB SSD'sini koruyor.
| MBP 16 M3 Pro | MBP 16 M3 Max | MBP 16 M3 Max | |
|---|---|---|---|
| CPU | Apple M3 Pro 12 CPU çekirdeği (6P & 6E) |
Apple M3 Max 14 CPU çekirdeği (10P & 4E) |
Apple M3 Max 16 CPU çekirdeği (12P & 4E) |
| GPU | 18 GPU çekirdeği | 30 GPU çekirdeği | 40 GPU çekirdeği |
| RAM | 18 GB (36 GB) | 36 GB (96 GB) | 48 GB (64/128 GB) |
| SSD | 512 GB (1/2/4 TB) | 1 TB (2/4/8 TB) | 1 TB (2/4/8 TB) |
| Depolama Bant Genişliği | 150 GB/s | 300 GB/s | 400 GB/s |
| Bağlantılar | Thunderbolt 4 ile 3x USB-C 4.0 HDMI, SD kart okuyucu |
Thunderbolt 4 ile 3x USB-C 4.0 HDMI, SD kart okuyucu |
Thunderbolt 4 ile 3x USB-C 4.0 HDMI, SD kart okuyucu |
| Fiyat | 2,999 Euro'dan (~3,272$) | 4,249 Euro'dan (~4,635$) | 4,849 Euro'dan (~5,290$) |
Karşılaştırma cihazlarımız arasında elbette MacBook Pro 16'nın M1 ve M2 çipli önceki modellerinin yanı sıra Dell XPS 15, Lenovo Yoga Pro 9i 16, Asus Vivobook Pro 16, Schenker Vision 16 ve Samsung Galaxy Book3 Ultra 16 gibi bazı yüksek kaliteli Windows multimedya dizüstü bilgisayarlar da yer alıyor.
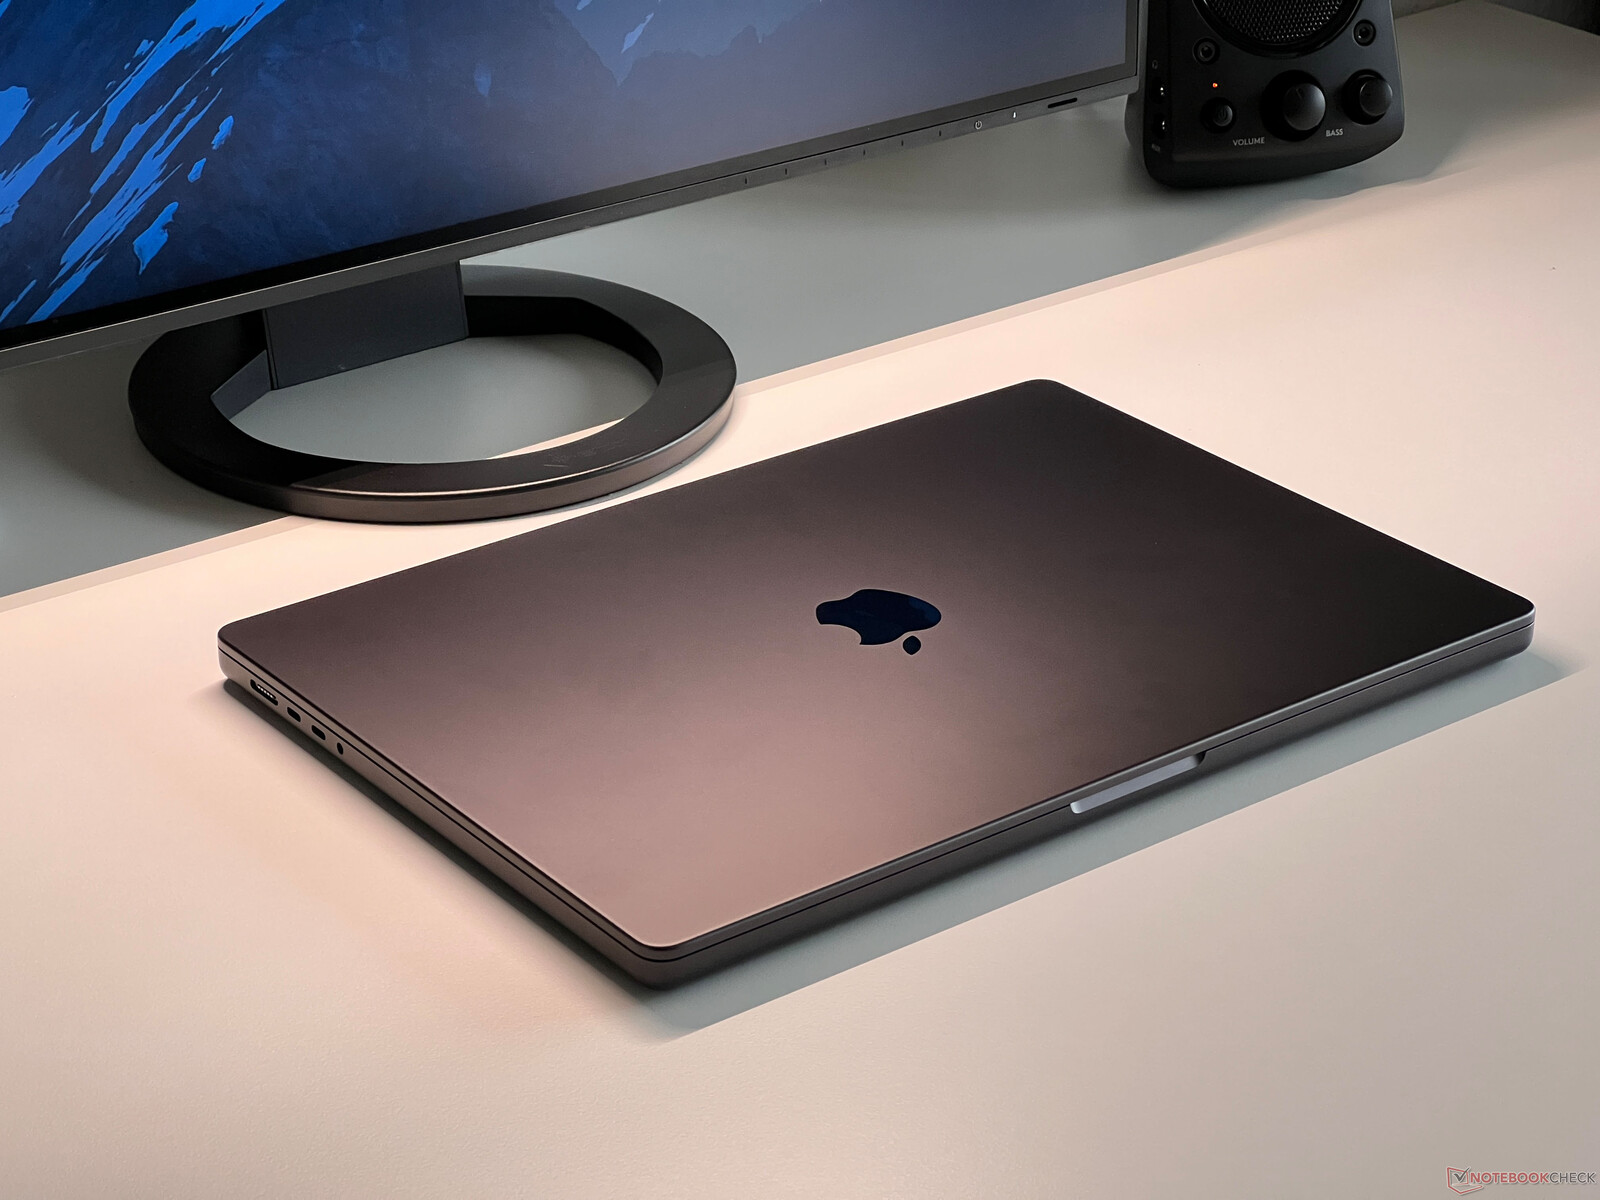
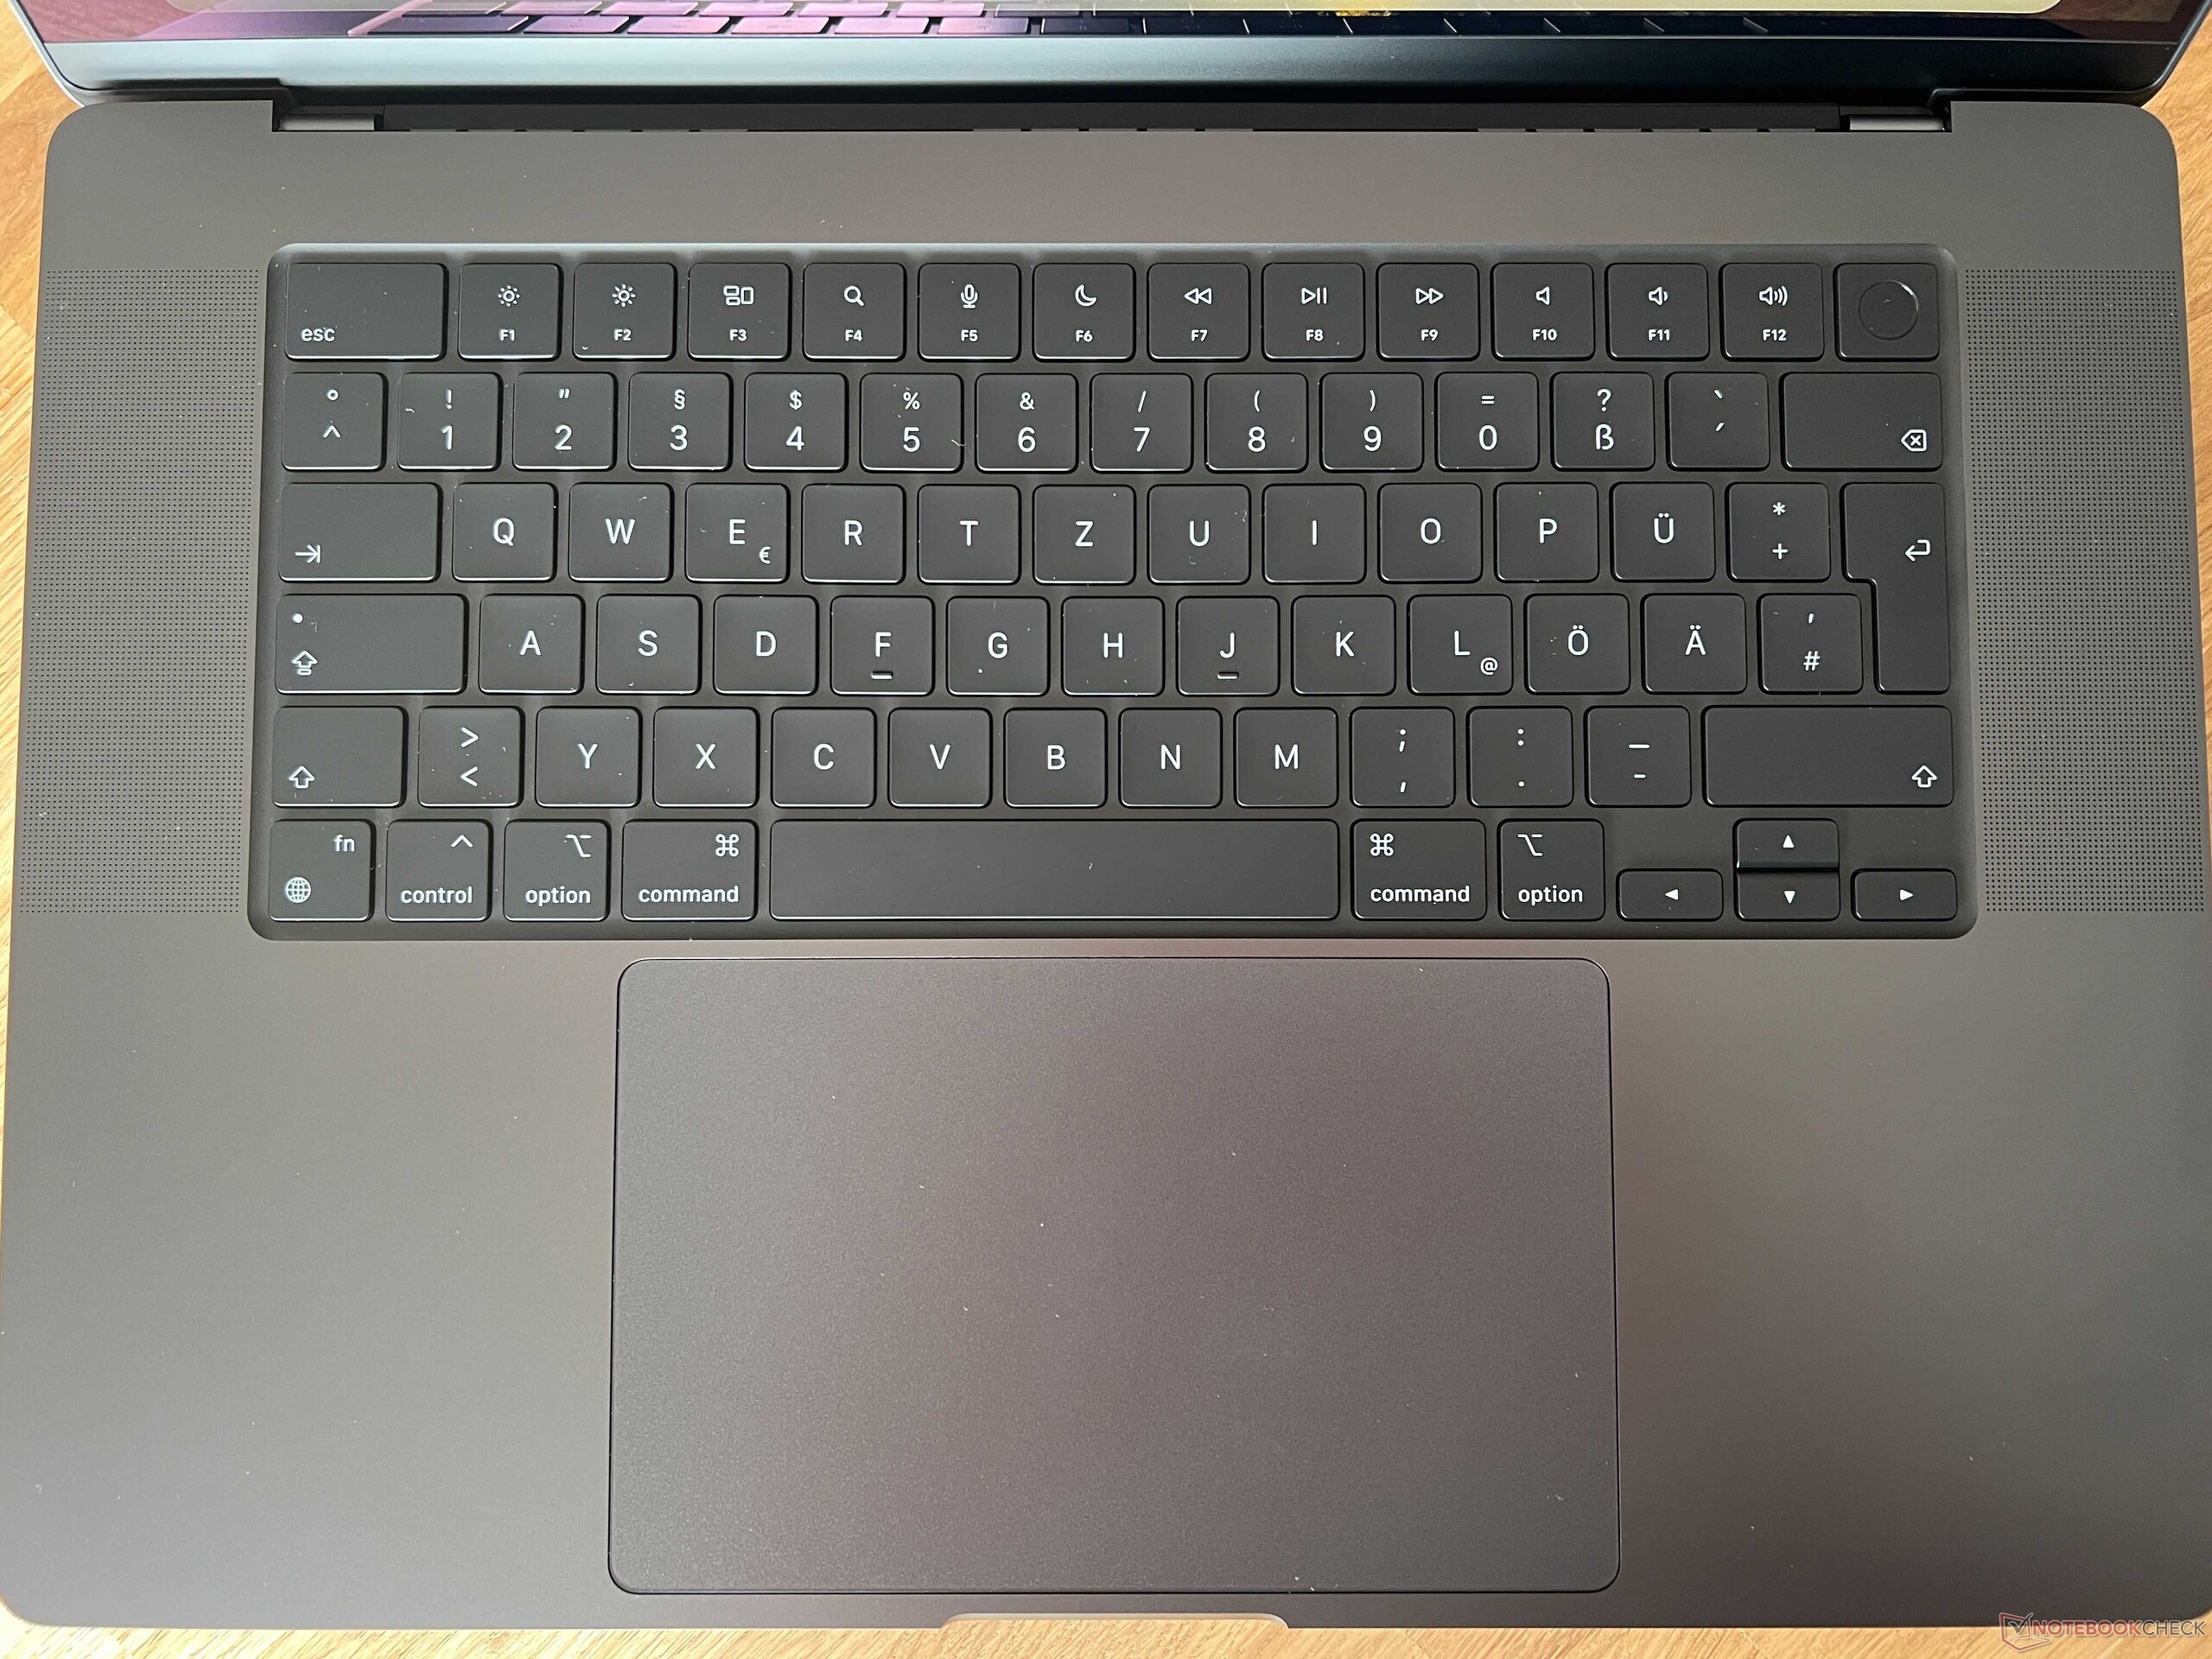
M3 Pro modellerinin birçok özelliği daha önce test ettiğimiz MBP 16 M3 Max modellerinden farklı olmadığından, bu testte performans ve emisyonlara odaklanacağız. Kasa, donanım, giriş aygıtları, ekran ve hoparlörlerle ilgili tüm bilgileri M3 Max versiyonuyla ilgili kapsamlı testimizde bulabilirsiniz:
Karşılaştırmalı olarak olası rakipler
Derecelendirme | Tarih | Modeli | Ağırlık | Yükseklik | Boyut | Çözünürlük | Fiyat |
|---|---|---|---|---|---|---|---|
| 93.7 % v7 (old) | 11/2023 | Apple MacBook Pro 16 2023 M3 Pro Apple M3 Pro 12-Core, M3 Pro 18-Core GPU | 2.1 kg | 16.9 mm | 16.20" | 3456x2234 | |
| 87.6 % v7 (old) | 11/2023 | Asus VivoBook Pro 16 K6602VU i9-13900H, GeForce RTX 4050 Laptop GPU | 1.9 kg | 19 mm | 16.00" | 3200x2000 | |
| 88 % v7 (old) | 09/2023 | Lenovo Slim Pro 9i 16IRP8 i9-13905H, GeForce RTX 4050 Laptop GPU | 2.2 kg | 18.2 mm | 16.00" | 3200x2000 | |
| 88.6 % v7 (old) | 11/2023 | Schenker VISION 16 Pro (M23) i7-13700H, GeForce RTX 4070 Laptop GPU | 1.6 kg | 17.1 mm | 16.00" | 2560x1600 | |
| 89.4 % v7 (old) | 04/2023 | Samsung Galaxy Book3 Ultra 16 i7-13700H, GeForce RTX 4050 Laptop GPU | 1.8 kg | 16.5 mm | 16.00" | 2880x1800 | |
| 90.3 % v7 (old) | 06/2023 | Dell XPS 15 9530 RTX 4070 i7-13700H, GeForce RTX 4070 Laptop GPU | 1.9 kg | 18 mm | 15.60" | 3456x2160 |
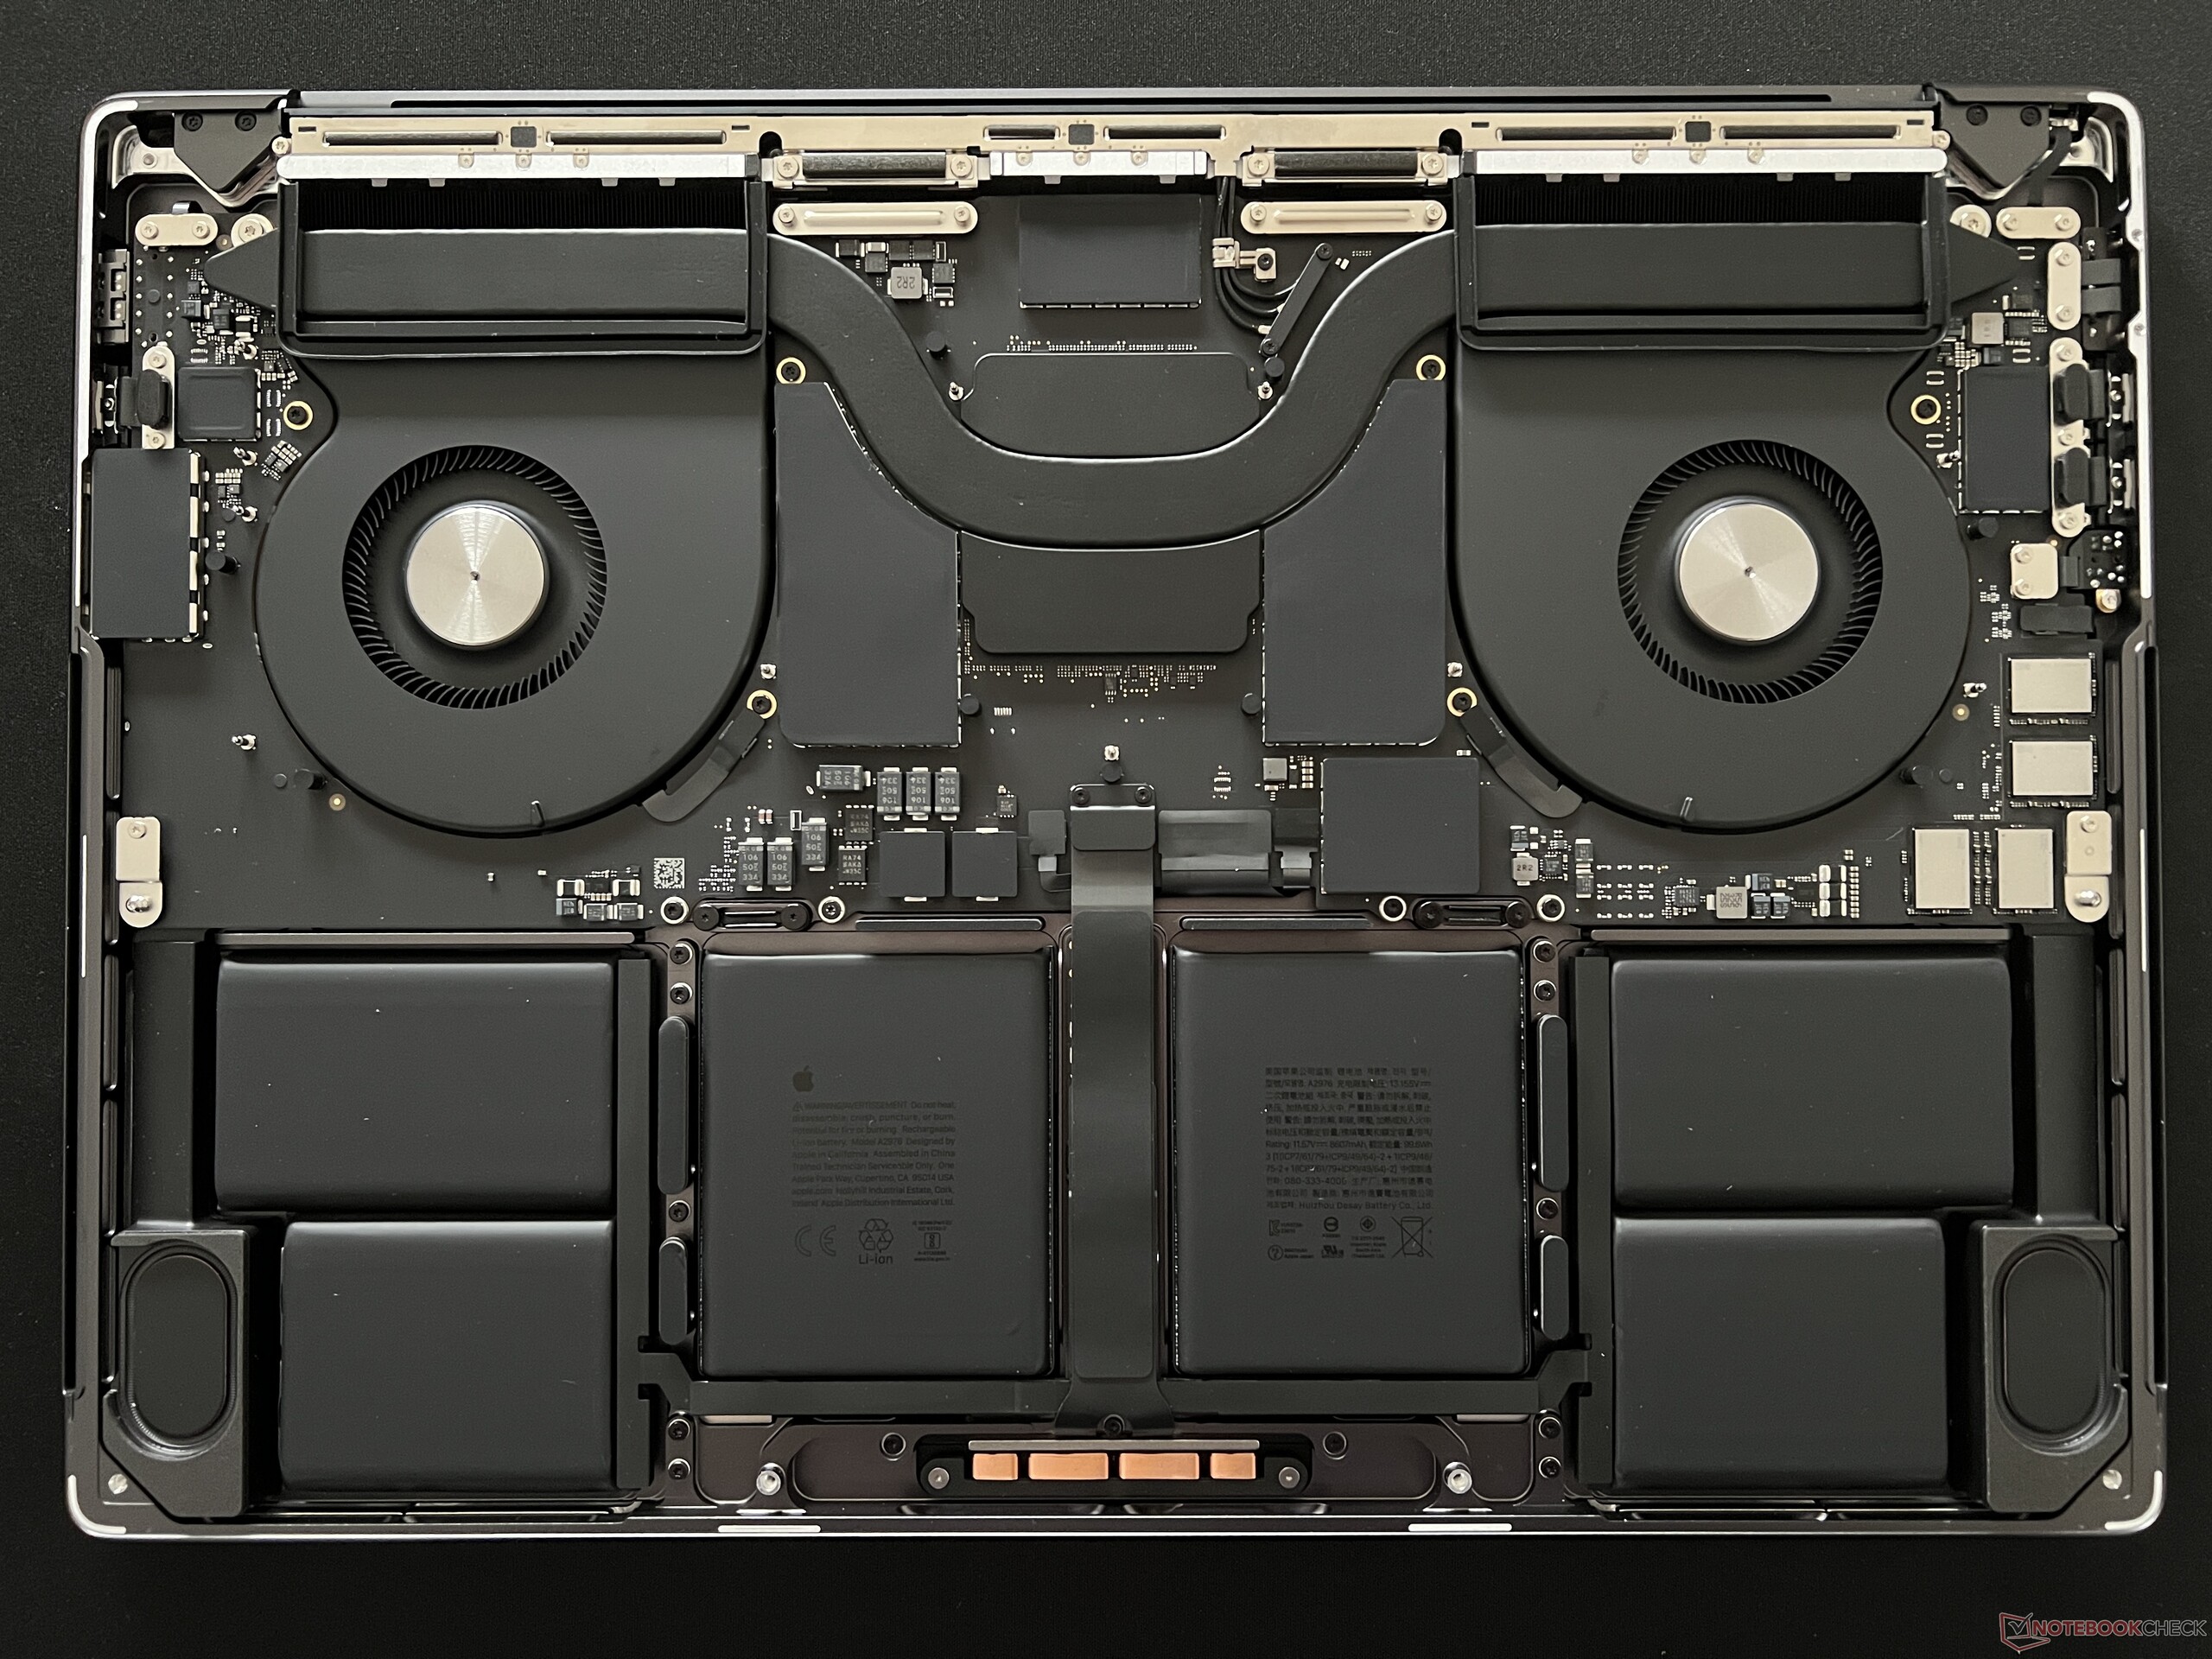
M3 Max özellikli MacBook Pro 16'dan farkları
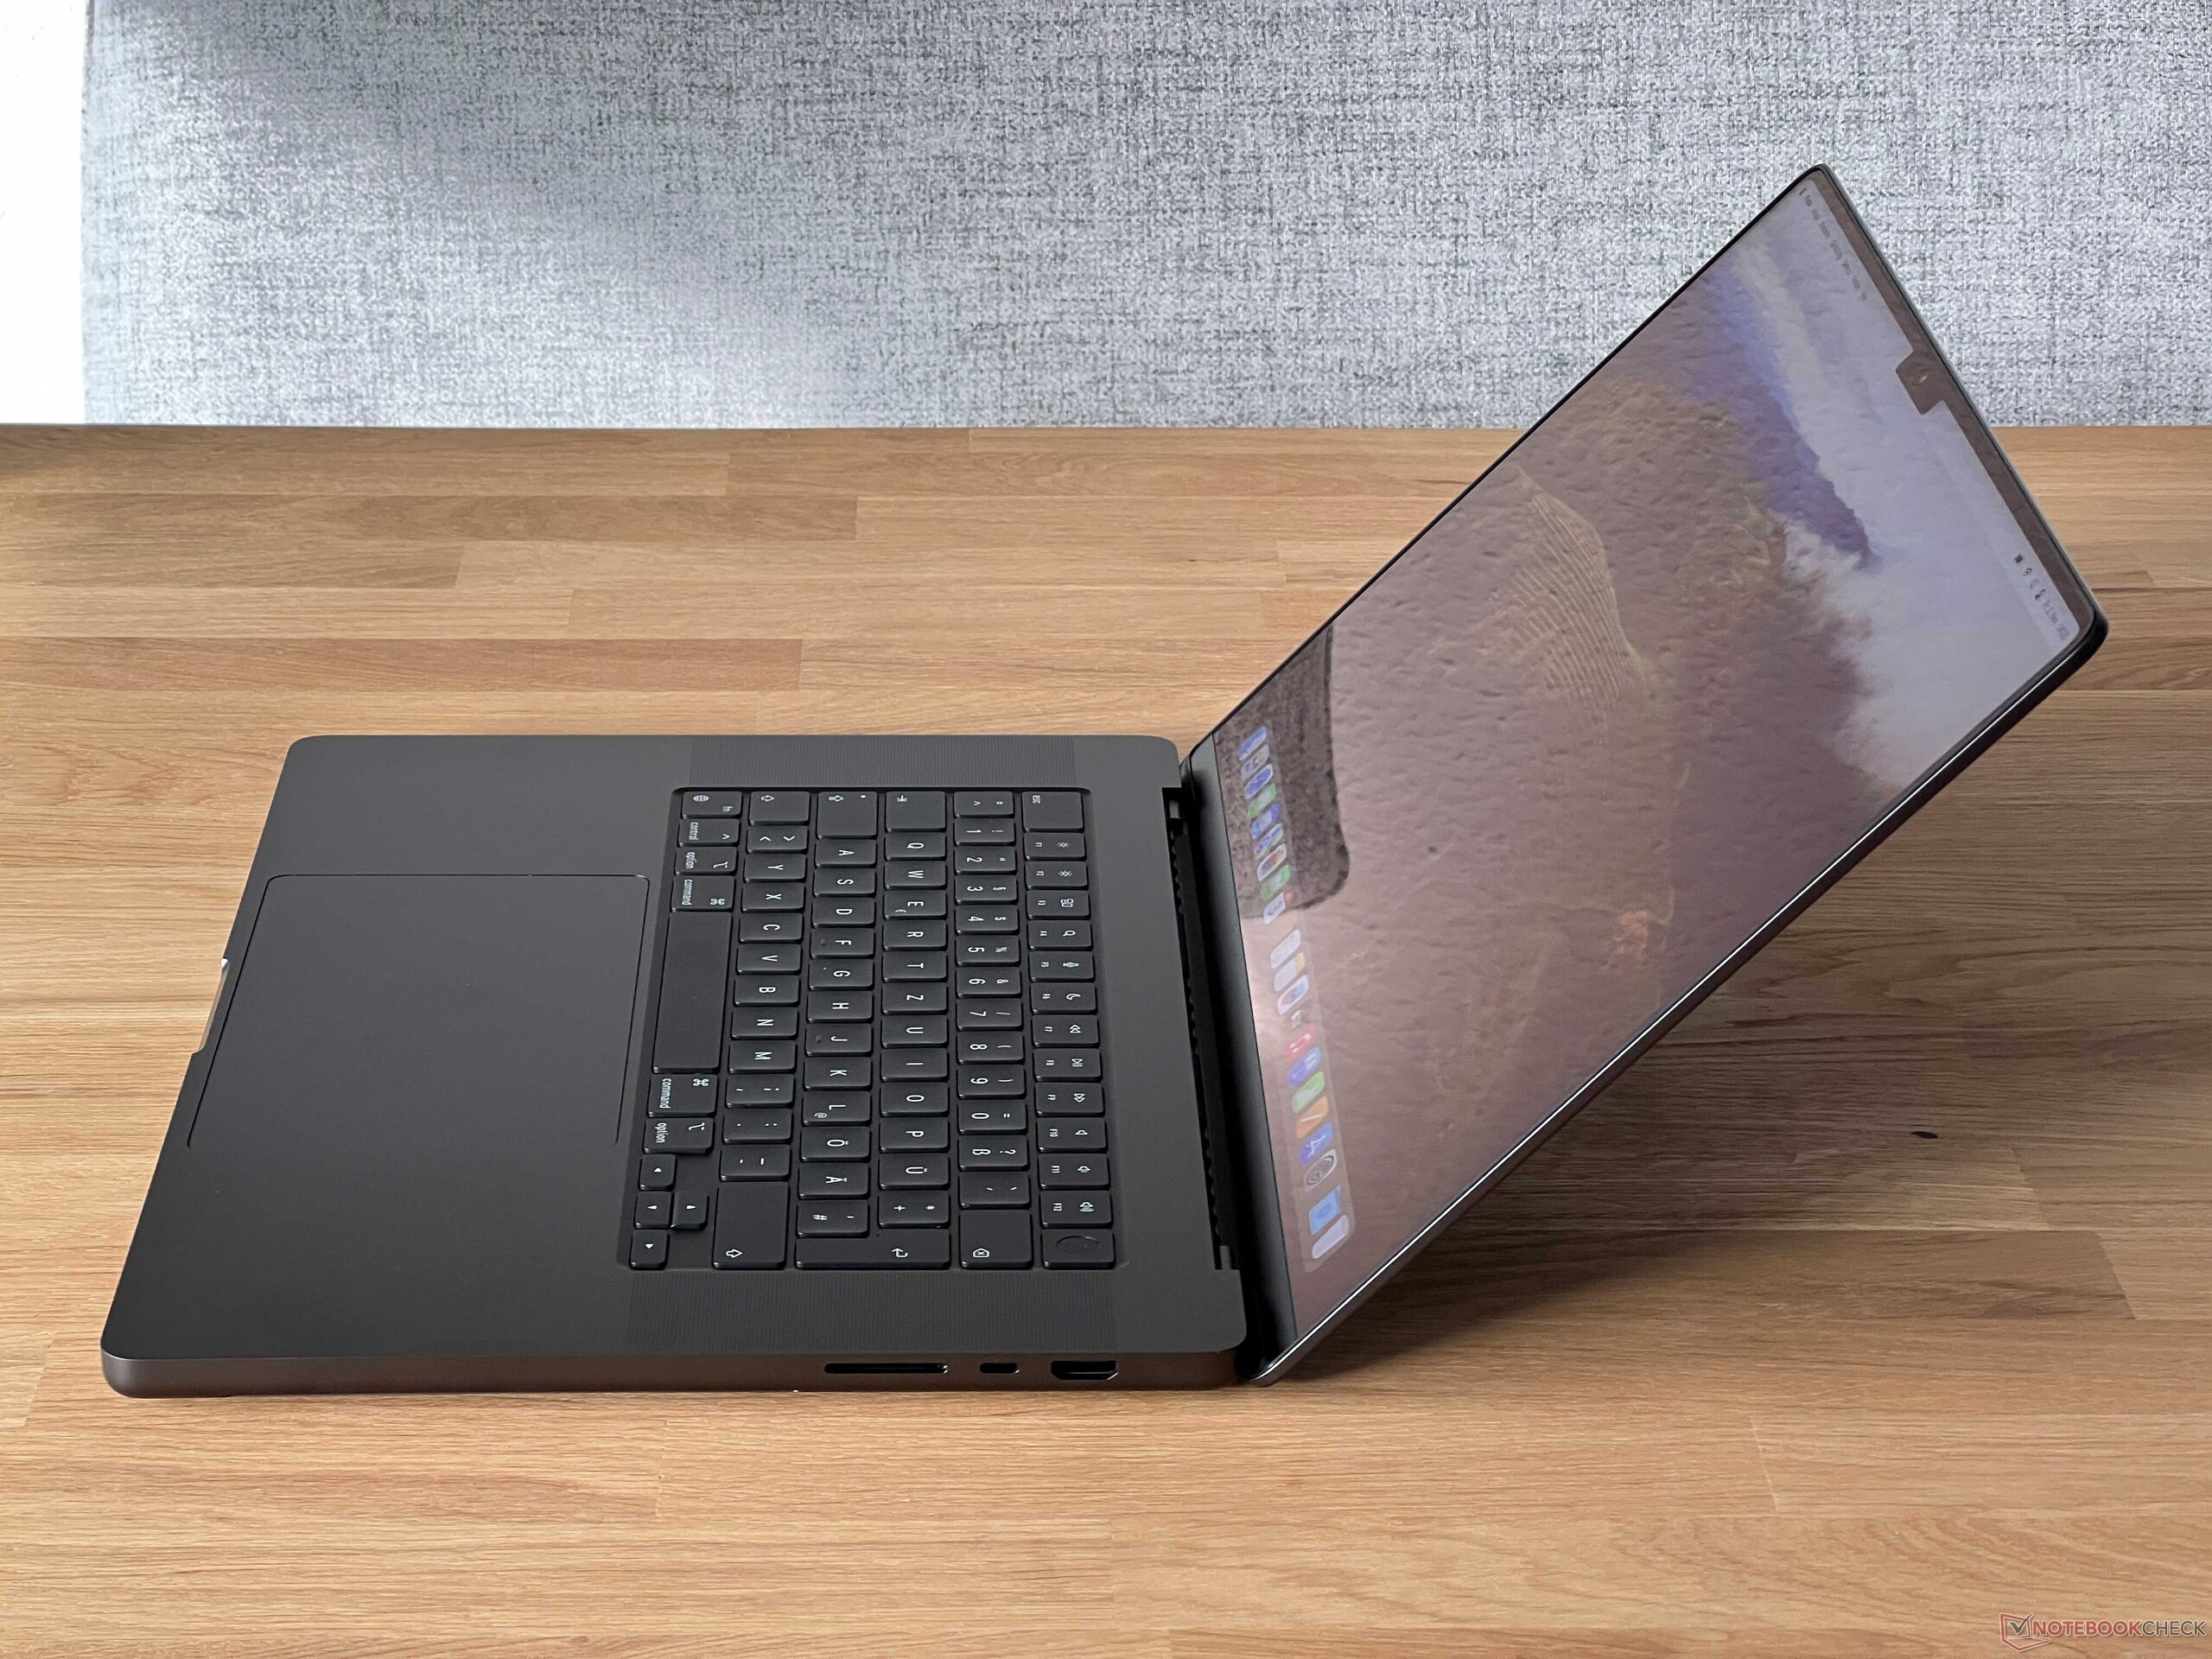
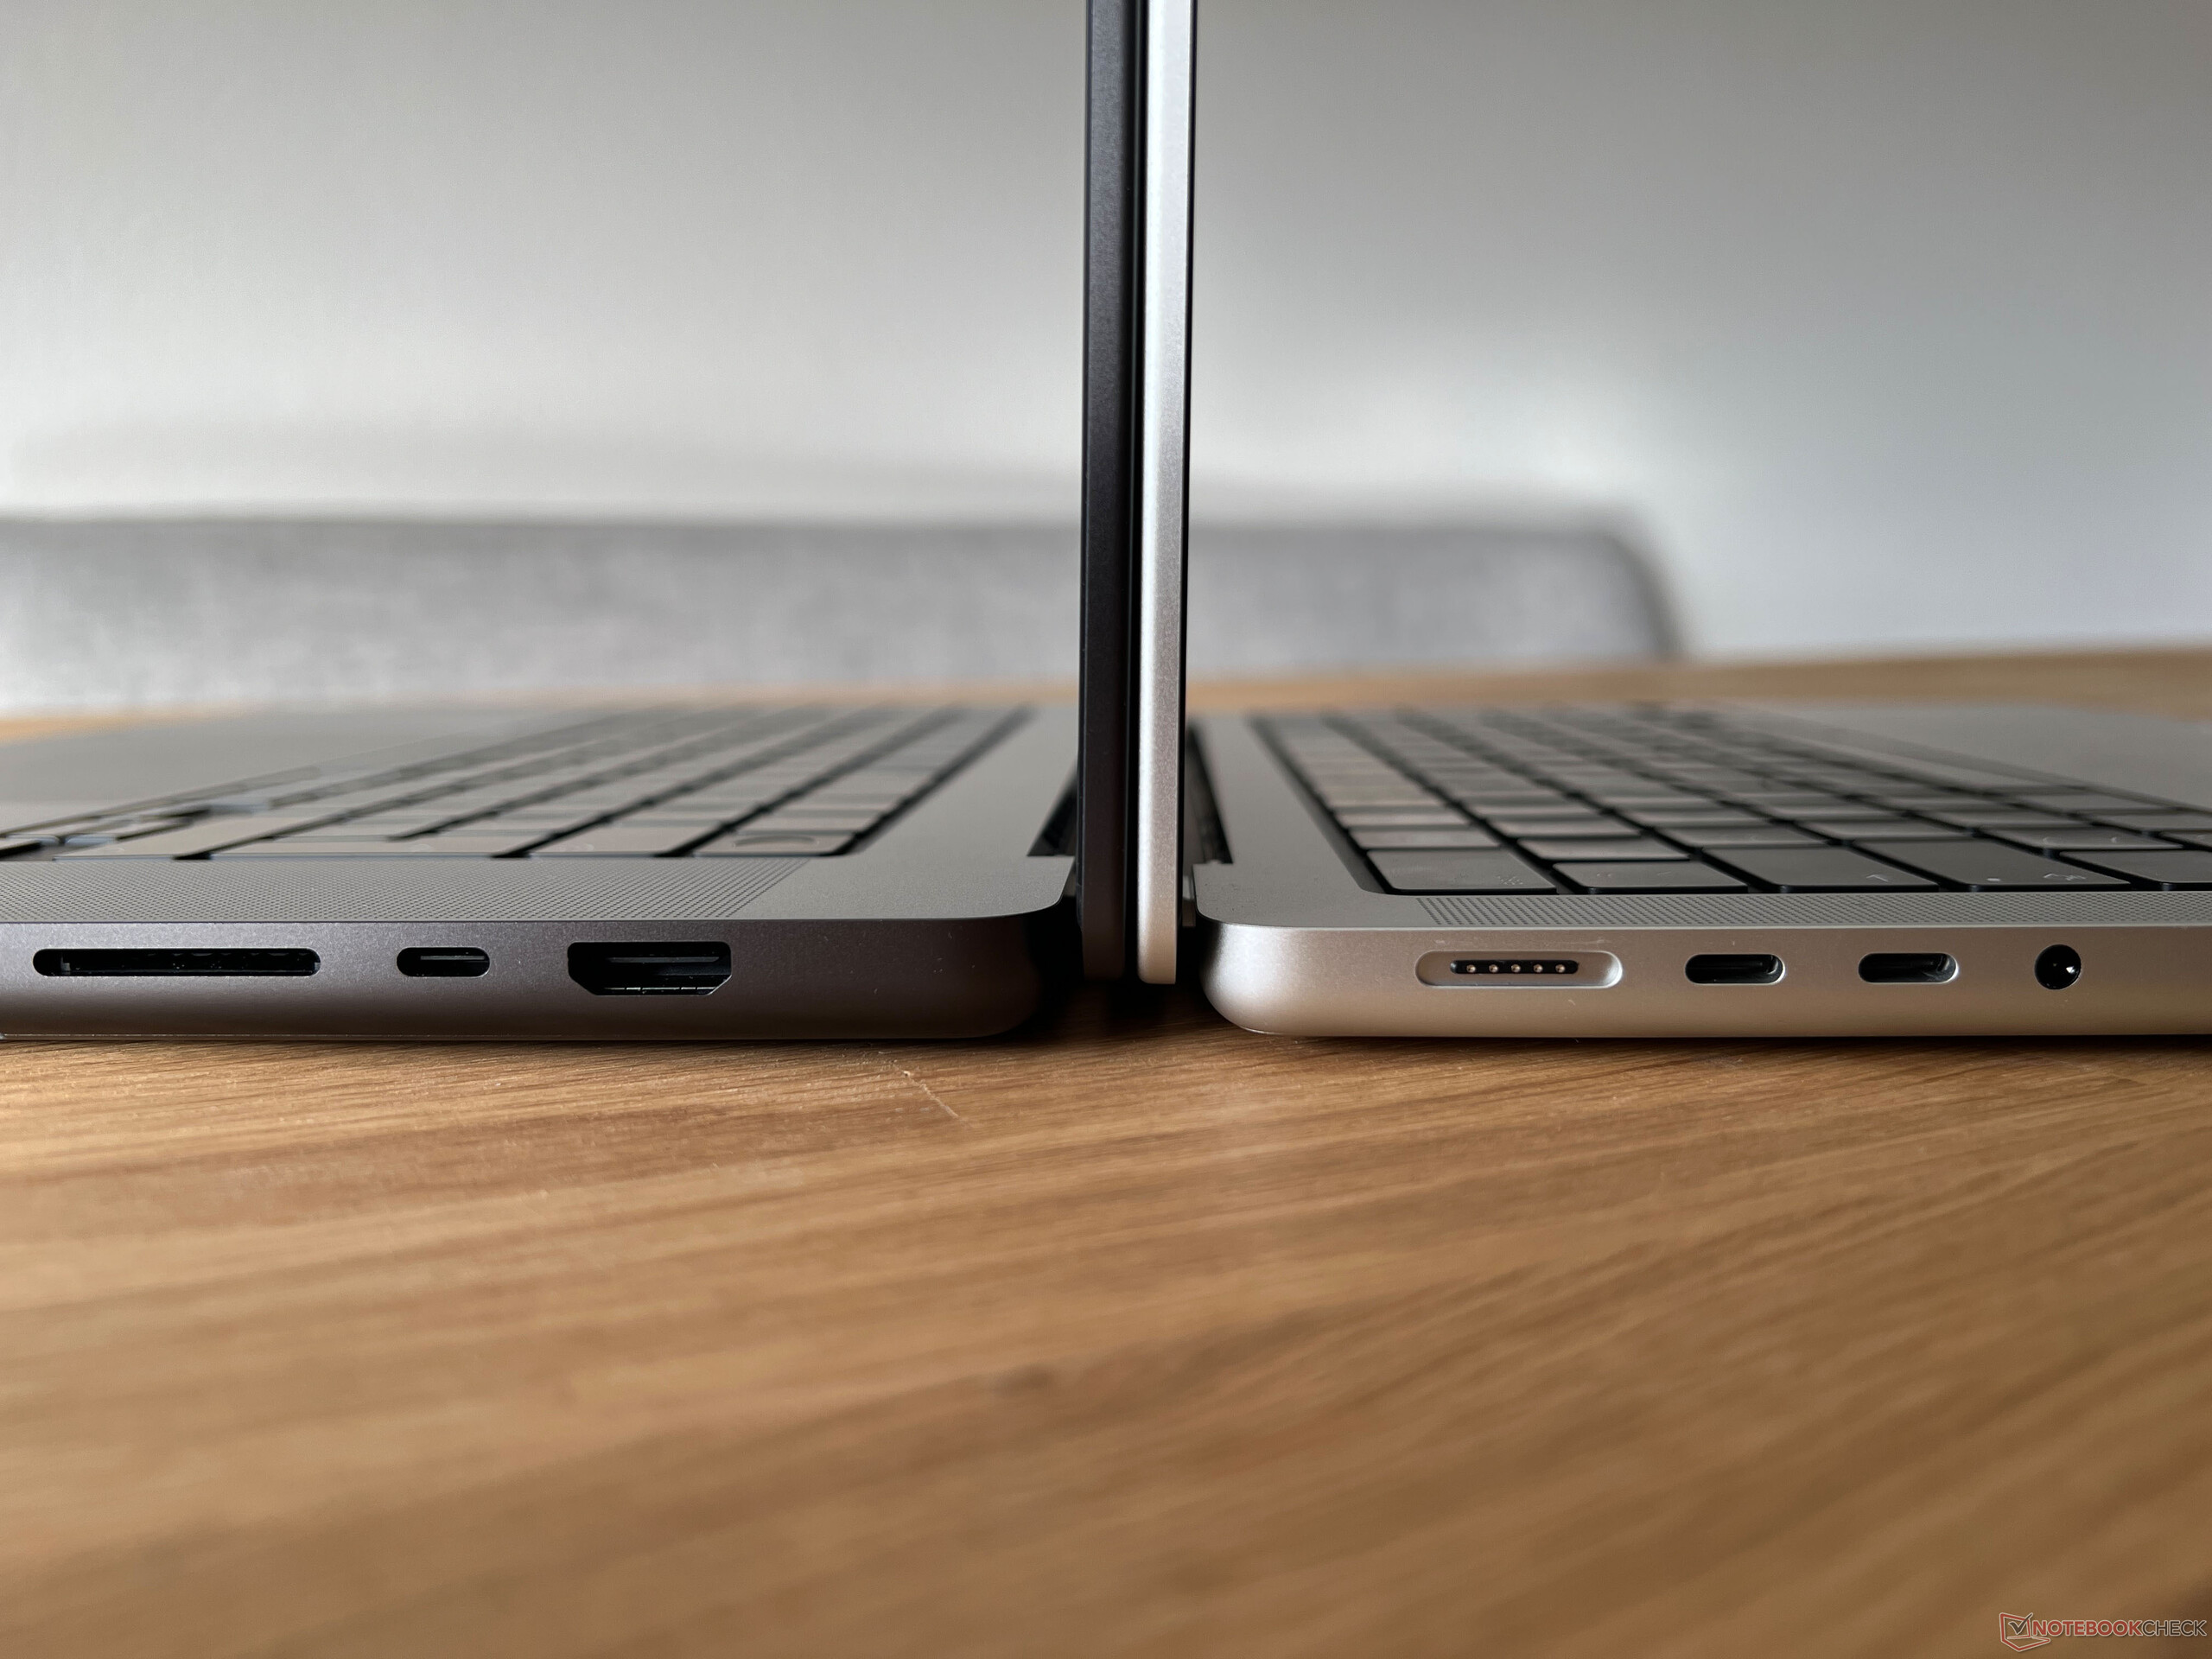
M3 Pro ve M3 Max konfigürasyonları arasında kasa ve bağlantılar açısından halihazırda sahip olduğumuz hiçbir fark yoktur ayrıntılı olarak test edilmiştir. Dahili yapı da video bağlantıları dışında tamamen aynıdır. M3 Max ile MBP 16 aynı anda en fazla dört harici ekranı kontrol edebilirken, M3 Pro yalnızca iki harici ekranı idare edebilir (maksimum çözünürlükleri M3 Max ile aynıdır).
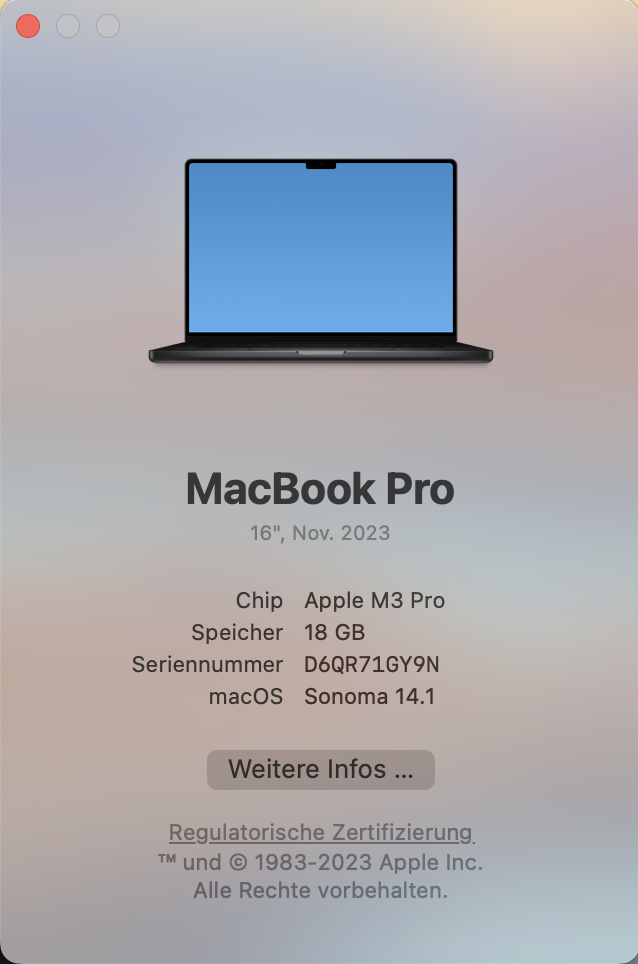
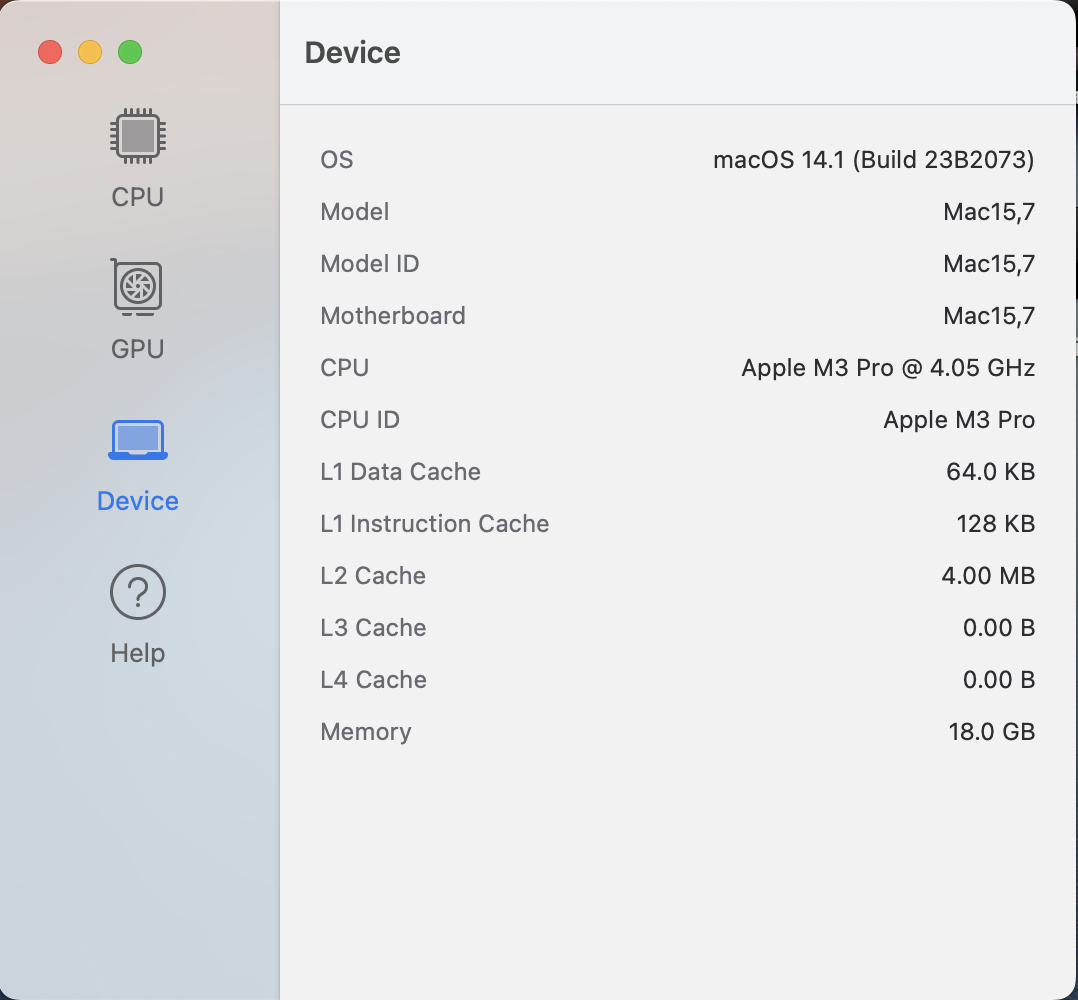
Performans - 18 GB RAM ile Apple M3 Pro
İşlemci - 6 Performans çekirdeği
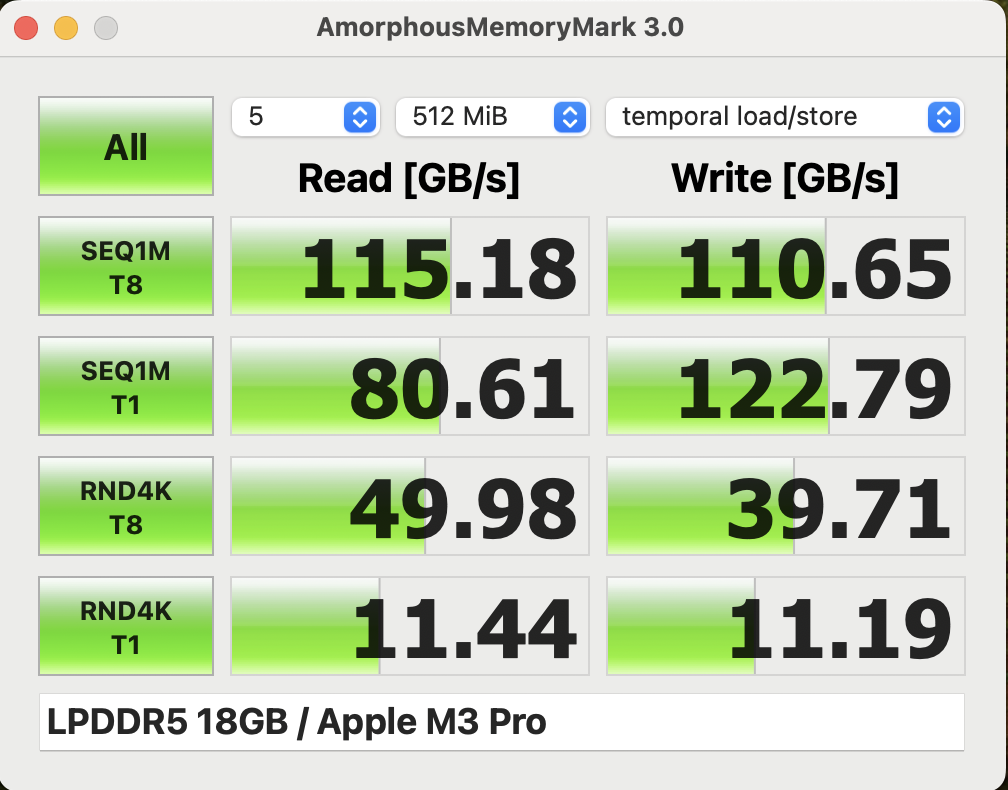
Yeni M3 Pro SoC'nin iki versiyonu mevcut olsa da, büyük MacBook Pro 16 yalnızca daha hızlı versiyonla geliyor. Selefi gibi, işlemci toplam on iki CPU çekirdeği sunuyor, ancak çekirdek yapılandırması değişti. Süre M2 Prosekiz Performans ve dört Verimlilik çekirdeği kullanırken, şimdi altı Performans ve altı Verimlilik çekirdeği kullanmaktadır. Eski M2 çipleriyle (Pro/Max) karşılaştırıldığında, M3 Pro/Max'teki CPU kümeleri artık dört çekirdek yerine altı çekirdek kullanmaktadır. Çekirdekler diğer M3 CPU'larla aynı özelliklere sahiptir; Performans çekirdekleri 4,056 GHz'e, Verimlilik çekirdekleri ise 2,748 GHz'e kadar çıkabilmektedir ki pratikte de durum böyledir. Depolama arayüzünün hızı 256 bitten 192 bite düşürülmüştür, bu da maksimum depolama bant genişliğinin 200 GB/s yerine artık yalnızca 150 GB/s olmasıyla sonuçlanmaktadır.
Tabii ki, ilk ilginç karşılaştırma eski M2 Protestlerimizde maksimum ~34 watt güç tüketimi gösterdi. Yerel testlerdeki çok çekirdekli performans yalnızca birkaç yüzde puanı daha yüksektir (%2 ile %6 arasında), bu da pratikte neredeyse aynı olmasını sağlar. Ancak aynı zamanda, Apple güç tüketimini de azaltmayı başardı ve şu anda sadece 26-27 watt. Mevcut Intel işlemcilerle karşılaştırıldığında M3 Pro, Intel'in en iyi işlemcileri seviyesinde performans gösteriyor Core i7-13700H içindeSamsung Galaxy Book 3 Ultra veya Dell XPS 15 9530çok çekirdekli testlerde, her ikisi de önemli ölçüde daha fazla güç tüketmesine rağmen.
Cinebench 2024: CPU Multi Core | CPU Single Core
Geekbench 5.5: Multi-Core | Single-Core
Geekbench 6.7: Multi-Core | Single-Core
Blender: v3.3 Classroom CPU
| Cinebench R23 / Multi Core | |
| Apple MacBook Pro 16 2023 M3 Max | |
| Lenovo Slim Pro 9i 16IRP8 | |
| Sınıf ortalaması Multimedia (4861 - 33362, n=74, son 2 yıl) | |
| Dell XPS 15 9530 RTX 4070 | |
| Samsung Galaxy Book3 Ultra 16 | |
| Apple MacBook Pro 16 2023 M3 Pro | |
| Ortalama Apple M3 Pro 12-Core (n=1) | |
| Asus VivoBook Pro 16 K6602VU | |
| Apple MacBook Pro 14 2023 M2 Pro | |
| Apple MacBook Pro 14 2023 M2 Pro | |
| Schenker VISION 16 Pro (M23) | |
| Apple MacBook Pro 16 2021 M1 Pro | |
| Cinebench R23 / Single Core | |
| Lenovo Slim Pro 9i 16IRP8 | |
| Apple MacBook Pro 16 2023 M3 Pro | |
| Ortalama Apple M3 Pro 12-Core (n=1) | |
| Apple MacBook Pro 16 2023 M3 Max | |
| Sınıf ortalaması Multimedia (1128 - 2459, n=66, son 2 yıl) | |
| Schenker VISION 16 Pro (M23) | |
| Dell XPS 15 9530 RTX 4070 | |
| Asus VivoBook Pro 16 K6602VU | |
| Samsung Galaxy Book3 Ultra 16 | |
| Apple MacBook Pro 14 2023 M2 Pro | |
| Apple MacBook Pro 14 2023 M2 Pro | |
| Apple MacBook Pro 16 2021 M1 Pro | |
| Cinebench 2024 / CPU Multi Core | |
| Apple MacBook Pro 16 2023 M3 Max | |
| Sınıf ortalaması Multimedia (327 - 2437, n=73, son 2 yıl) | |
| Apple MacBook Pro 16 2023 M3 Pro | |
| Ortalama Apple M3 Pro 12-Core (n=1) | |
| Apple MacBook Pro 14 2023 M2 Pro | |
| Apple MacBook Pro 16 2021 M1 Pro | |
| Cinebench 2024 / CPU Single Core | |
| Apple MacBook Pro 16 2023 M3 Pro | |
| Ortalama Apple M3 Pro 12-Core (n=1) | |
| Apple MacBook Pro 16 2023 M3 Max | |
| Sınıf ortalaması Multimedia (72.5 - 201, n=58, son 2 yıl) | |
| Apple MacBook Pro 14 2023 M2 Pro | |
| Apple MacBook Pro 16 2021 M1 Pro | |
| Geekbench 5.5 / Multi-Core | |
| Apple MacBook Pro 16 2023 M3 Max | |
| Apple MacBook Pro 16 2023 M3 Pro | |
| Ortalama Apple M3 Pro 12-Core (n=1) | |
| Apple MacBook Pro 14 2023 M2 Pro | |
| Lenovo Slim Pro 9i 16IRP8 | |
| Apple MacBook Pro 14 2023 M2 Pro | |
| Dell XPS 15 9530 RTX 4070 | |
| Sınıf ortalaması Multimedia (4652 - 20422, n=56, son 2 yıl) | |
| Apple MacBook Pro 16 2021 M1 Pro | |
| Schenker VISION 16 Pro (M23) | |
| Samsung Galaxy Book3 Ultra 16 | |
| Asus VivoBook Pro 16 K6602VU | |
| Geekbench 5.5 / Single-Core | |
| Apple MacBook Pro 16 2023 M3 Max | |
| Apple MacBook Pro 16 2023 M3 Pro | |
| Ortalama Apple M3 Pro 12-Core (n=1) | |
| Sınıf ortalaması Multimedia (805 - 2974, n=56, son 2 yıl) | |
| Lenovo Slim Pro 9i 16IRP8 | |
| Apple MacBook Pro 14 2023 M2 Pro | |
| Apple MacBook Pro 14 2023 M2 Pro | |
| Dell XPS 15 9530 RTX 4070 | |
| Schenker VISION 16 Pro (M23) | |
| Apple MacBook Pro 16 2021 M1 Pro | |
| Asus VivoBook Pro 16 K6602VU | |
| Samsung Galaxy Book3 Ultra 16 | |
| Geekbench 6.7 / Multi-Core | |
| Apple MacBook Pro 16 2023 M3 Max | |
| Apple MacBook Pro 16 2023 M3 Pro | |
| Ortalama Apple M3 Pro 12-Core (n=1) | |
| Sınıf ortalaması Multimedia (4983 - 29415, n=69, son 2 yıl) | |
| Apple MacBook Pro 14 2023 M2 Pro | |
| Apple MacBook Pro 16 2021 M1 Pro | |
| Asus VivoBook Pro 16 K6602VU | |
| Geekbench 6.7 / Single-Core | |
| Apple MacBook Pro 16 2023 M3 Pro | |
| Ortalama Apple M3 Pro 12-Core (n=1) | |
| Apple MacBook Pro 16 2023 M3 Max | |
| Sınıf ortalaması Multimedia (1534 - 4335, n=68, son 2 yıl) | |
| Apple MacBook Pro 14 2023 M2 Pro | |
| Asus VivoBook Pro 16 K6602VU | |
| Apple MacBook Pro 16 2021 M1 Pro | |
| Blender / v3.3 Classroom CPU | |
| Sınıf ortalaması Multimedia (134.5 - 1042, n=62, son 2 yıl) | |
| Schenker VISION 16 Pro (M23) | |
| Samsung Galaxy Book3 Ultra 16 | |
| Dell XPS 15 9530 RTX 4070 | |
| Asus VivoBook Pro 16 K6602VU | |
| Apple MacBook Pro 14 2023 M2 Pro | |
| Apple MacBook Pro 16 2023 M3 Pro | |
| Ortalama Apple M3 Pro 12-Core (n=1) | |
| Lenovo Slim Pro 9i 16IRP8 | |
| Apple MacBook Pro 16 2023 M3 Max | |
* ... daha küçük daha iyidir
Ancak tek çekirdekli testlerde yeni M3 Pro (tıpkı normal M3 Pro gibi) M3 & M3 Maks) bizi tamamen ikna edebiliyor ve ~5,6 watt'lık benzer bir CPU tüketimine rağmen eski M2 nesline kıyasla %20'lik bir performans avantajı görüyoruz. Bununla birlikte, Apple çipi sadece zar zor Core i9-13905Hkarşılaştırma alanımızda, ancak aynı zamanda tek çekirdekli yük altında önemli ölçüde daha fazla güç tüketiyor. Kısa süre içinde yayınlanacak olan M3 Pro/M3 Max analizimizde verimliliğin daha yakından bir analizini sunacağız.
Her zamanki gibi, CPU performansı pil kullanımında tamamen sabit kalmaktadır. Her zamanki Cinebench R15 Multi döngümüzü de çalıştırdık, ancak burada emülasyon nedeniyle performansın biraz düştüğünü not etmelisiniz. Ayrıca eskisine kıyasla hafif bir avantaj görüyoruz M2 Proburada ve döngü, CPU performansının sabit yük altında bile tamamen sabit kaldığını çok net bir şekilde göstermektedir. Ek CPU kıyaslamalarını bulabilirsiniz burada.
Cinebench R15 Multi Constant Load Test
Sistem Performansı
M1, M2 veya M3 fark etmeksizin Apple M SoC'ye sahip her Macbook Pro, son derece yüksek bir öznel performans izlenimi sunuyor ve yeni Macbook Pro'nun artırılmış tek çekirdek performansı M3 Probu izlenimi daha da destekliyor. Karmaşık olanlar da dahil olmak üzere tüm uygulamalar hızlı bir şekilde başlıyor ve yerel uygulamalar son derece iyi çalışıyor. Platformlar arasında yapılan CrossMark testinde MBP 16 M3 Pro sadece daha hızlı olan MBP 16 M3 Makswindows rakipleri ise geride kalıyor. Temel olarak, en küçük MacBook Pro 16 bile video ve fotoğraf işleme için mükemmel bir şekilde uygundur.
Intel Mac'ler için programlar Rosetta 2 sayesinde taklit edilebilir ve bu da iyi çalışır. Ancak performans açısından bazı maliyetleri de beraberinde getiriyor, bu da özellikle daha karmaşık uygulamalarda fark ediliyor. Adobe Photoshop ve Premiere Pro için iki PugetBench testi yaptık ve sonuçlar hala çok saygındı.
Blackmagic RAW Speed Test: 12:1 8K Metal | 12:1 8K CPU
Photoshop PugetBench: Overall Score | GPU Score | General Score | Filter Score
Premiere Pro PugetBench: Overall Score 0.98 | LongGOP 0.98 | Intraframe 0.98 | RAW 0.98 | GPU Effects 0.98
Jetstream 2: 2.0 Total
Speedometer 2.0: Result 2.0
WebXPRT 3: Overall
| CrossMark / Overall | |
| Apple MacBook Pro 16 2023 M3 Max | |
| Asus Zenbook Pro 16X UX7602BZ-MY005W | |
| Apple MacBook Pro 16 2023 M3 Pro | |
| Ortalama Apple M3 Pro 12-Core, Apple M3 Pro 18-Core GPU (n=1) | |
| Schenker VISION 16 Pro (M23) | |
| Dell XPS 15 9530 RTX 4070 | |
| Sınıf ortalaması Multimedia (866 - 2728, n=60, son 2 yıl) | |
| Asus ROG Zephyrus G14 GA402XY | |
| Apple MacBook Pro 14 2023 M2 Pro | |
| Lenovo Slim Pro 9i 16IRP8 | |
| Asus VivoBook Pro 16 K6602VU | |
| Samsung Galaxy Book3 Ultra 16 | |
| Apple MacBook Pro 16 2021 M1 Pro | |
| CrossMark / Productivity | |
| Asus Zenbook Pro 16X UX7602BZ-MY005W | |
| Apple MacBook Pro 16 2023 M3 Max | |
| Schenker VISION 16 Pro (M23) | |
| Apple MacBook Pro 16 2023 M3 Pro | |
| Ortalama Apple M3 Pro 12-Core, Apple M3 Pro 18-Core GPU (n=1) | |
| Sınıf ortalaması Multimedia (931 - 2489, n=60, son 2 yıl) | |
| Asus ROG Zephyrus G14 GA402XY | |
| Dell XPS 15 9530 RTX 4070 | |
| Asus VivoBook Pro 16 K6602VU | |
| Lenovo Slim Pro 9i 16IRP8 | |
| Apple MacBook Pro 14 2023 M2 Pro | |
| Samsung Galaxy Book3 Ultra 16 | |
| Apple MacBook Pro 16 2021 M1 Pro | |
| CrossMark / Creativity | |
| Apple MacBook Pro 16 2023 M3 Max | |
| Apple MacBook Pro 16 2023 M3 Pro | |
| Ortalama Apple M3 Pro 12-Core, Apple M3 Pro 18-Core GPU (n=1) | |
| Apple MacBook Pro 14 2023 M2 Pro | |
| Asus Zenbook Pro 16X UX7602BZ-MY005W | |
| Sınıf ortalaması Multimedia (907 - 3465, n=60, son 2 yıl) | |
| Dell XPS 15 9530 RTX 4070 | |
| Asus ROG Zephyrus G14 GA402XY | |
| Lenovo Slim Pro 9i 16IRP8 | |
| Apple MacBook Pro 16 2021 M1 Pro | |
| Schenker VISION 16 Pro (M23) | |
| Asus VivoBook Pro 16 K6602VU | |
| Samsung Galaxy Book3 Ultra 16 | |
| CrossMark / Responsiveness | |
| Schenker VISION 16 Pro (M23) | |
| Dell XPS 15 9530 RTX 4070 | |
| Asus Zenbook Pro 16X UX7602BZ-MY005W | |
| Asus VivoBook Pro 16 K6602VU | |
| Sınıf ortalaması Multimedia (605 - 2024, n=60, son 2 yıl) | |
| Samsung Galaxy Book3 Ultra 16 | |
| Apple MacBook Pro 16 2023 M3 Max | |
| Apple MacBook Pro 16 2023 M3 Pro | |
| Ortalama Apple M3 Pro 12-Core, Apple M3 Pro 18-Core GPU (n=1) | |
| Asus ROG Zephyrus G14 GA402XY | |
| Lenovo Slim Pro 9i 16IRP8 | |
| Apple MacBook Pro 14 2023 M2 Pro | |
| Apple MacBook Pro 16 2021 M1 Pro | |
| Blackmagic RAW Speed Test / 12:1 8K Metal | |
| Apple MacBook Pro 16 2023 M3 Max | |
| Sınıf ortalaması Multimedia (78 - 430, n=7, son 2 yıl) | |
| Apple MacBook Pro 14 2023 M2 Pro | |
| Apple MacBook Pro 16 2021 M1 Pro | |
| Apple MacBook Pro 16 2023 M3 Pro | |
| Ortalama Apple M3 Pro 12-Core, Apple M3 Pro 18-Core GPU (n=1) | |
| Blackmagic RAW Speed Test / 12:1 8K CPU | |
| Sınıf ortalaması Multimedia (44 - 102, n=7, son 2 yıl) | |
| Apple MacBook Pro 16 2023 M3 Max | |
| Apple MacBook Pro 14 2023 M2 Pro | |
| Apple MacBook Pro 16 2023 M3 Pro | |
| Ortalama Apple M3 Pro 12-Core, Apple M3 Pro 18-Core GPU (n=1) | |
| Apple MacBook Pro 16 2021 M1 Pro | |
| Photoshop PugetBench / Overall Score | |
| Apple MacBook Pro 16 2023 M3 Max | |
| Asus ROG Zephyrus G14 GA402XY | |
| Asus Zenbook Pro 16X UX7602BZ-MY005W | |
| Apple MacBook Pro 16 2023 M3 Pro | |
| Ortalama Apple M3 Pro 12-Core, Apple M3 Pro 18-Core GPU (n=1) | |
| Apple MacBook Pro 14 2023 M2 Pro | |
| Apple MacBook Pro 16 2021 M1 Pro | |
| Photoshop PugetBench / GPU Score | |
| Apple MacBook Pro 16 2023 M3 Max | |
| Apple MacBook Pro 16 2023 M3 Pro | |
| Ortalama Apple M3 Pro 12-Core, Apple M3 Pro 18-Core GPU (n=1) | |
| Asus ROG Zephyrus G14 GA402XY | |
| Apple MacBook Pro 14 2023 M2 Pro | |
| Asus Zenbook Pro 16X UX7602BZ-MY005W | |
| Apple MacBook Pro 16 2021 M1 Pro | |
| Photoshop PugetBench / General Score | |
| Apple MacBook Pro 16 2023 M3 Max | |
| Asus ROG Zephyrus G14 GA402XY | |
| Asus Zenbook Pro 16X UX7602BZ-MY005W | |
| Apple MacBook Pro 16 2023 M3 Pro | |
| Ortalama Apple M3 Pro 12-Core, Apple M3 Pro 18-Core GPU (n=1) | |
| Apple MacBook Pro 14 2023 M2 Pro | |
| Apple MacBook Pro 16 2021 M1 Pro | |
| Photoshop PugetBench / Filter Score | |
| Apple MacBook Pro 16 2023 M3 Max | |
| Apple MacBook Pro 16 2023 M3 Pro | |
| Ortalama Apple M3 Pro 12-Core, Apple M3 Pro 18-Core GPU (n=1) | |
| Asus ROG Zephyrus G14 GA402XY | |
| Apple MacBook Pro 14 2023 M2 Pro | |
| Asus Zenbook Pro 16X UX7602BZ-MY005W | |
| Apple MacBook Pro 16 2021 M1 Pro | |
| Premiere Pro PugetBench / Overall Score 0.98 | |
| Asus Zenbook Pro 16X UX7602BZ-MY005W | |
| Apple MacBook Pro 16 2023 M3 Max | |
| Asus ROG Zephyrus G14 GA402XY | |
| Apple MacBook Pro 16 2023 M3 Pro | |
| Ortalama Apple M3 Pro 12-Core, Apple M3 Pro 18-Core GPU (n=1) | |
| Apple MacBook Pro 16 2021 M1 Pro | |
| Premiere Pro PugetBench / LongGOP 0.98 | |
| Asus Zenbook Pro 16X UX7602BZ-MY005W | |
| Apple MacBook Pro 16 2023 M3 Max | |
| Asus ROG Zephyrus G14 GA402XY | |
| Apple MacBook Pro 16 2023 M3 Pro | |
| Ortalama Apple M3 Pro 12-Core, Apple M3 Pro 18-Core GPU (n=1) | |
| Apple MacBook Pro 16 2021 M1 Pro | |
| Premiere Pro PugetBench / Intraframe 0.98 | |
| Apple MacBook Pro 16 2023 M3 Max | |
| Asus Zenbook Pro 16X UX7602BZ-MY005W | |
| Apple MacBook Pro 16 2023 M3 Pro | |
| Ortalama Apple M3 Pro 12-Core, Apple M3 Pro 18-Core GPU (n=1) | |
| Apple MacBook Pro 16 2021 M1 Pro | |
| Asus ROG Zephyrus G14 GA402XY | |
| Premiere Pro PugetBench / RAW 0.98 | |
| Asus Zenbook Pro 16X UX7602BZ-MY005W | |
| Apple MacBook Pro 16 2023 M3 Max | |
| Asus ROG Zephyrus G14 GA402XY | |
| Apple MacBook Pro 16 2023 M3 Pro | |
| Ortalama Apple M3 Pro 12-Core, Apple M3 Pro 18-Core GPU (n=1) | |
| Apple MacBook Pro 16 2021 M1 Pro | |
| Premiere Pro PugetBench / GPU Effects 0.98 | |
| Asus Zenbook Pro 16X UX7602BZ-MY005W | |
| Asus ROG Zephyrus G14 GA402XY | |
| Apple MacBook Pro 16 2023 M3 Max | |
| Apple MacBook Pro 16 2021 M1 Pro | |
| Apple MacBook Pro 16 2023 M3 Pro | |
| Ortalama Apple M3 Pro 12-Core, Apple M3 Pro 18-Core GPU (n=1) | |
| Jetstream 2 / 2.0 Total | |
| Sınıf ortalaması Multimedia (287 - 481, n=31, son 2 yıl) | |
| Lenovo Slim Pro 9i 16IRP8 | |
| Apple MacBook Pro 16 2023 M3 Max | |
| Apple MacBook Pro 16 2023 M3 Pro | |
| Ortalama Apple M3 Pro 12-Core, Apple M3 Pro 18-Core GPU (n=1) | |
| Schenker VISION 16 Pro (M23) | |
| Dell XPS 15 9530 RTX 4070 | |
| Samsung Galaxy Book3 Ultra 16 | |
| Apple MacBook Pro 14 2023 M2 Pro | |
| Apple MacBook Pro 16 2021 M1 Pro | |
| Speedometer 2.0 / Result 2.0 | |
| Sınıf ortalaması Multimedia (337 - 946, n=30, son 2 yıl) | |
| Apple MacBook Pro 16 2023 M3 Max | |
| Apple MacBook Pro 16 2023 M3 Pro | |
| Ortalama Apple M3 Pro 12-Core, Apple M3 Pro 18-Core GPU (n=1) | |
| Apple MacBook Pro 14 2023 M2 Pro | |
| Schenker VISION 16 Pro (M23) | |
| Samsung Galaxy Book3 Ultra 16 | |
| Apple MacBook Pro 16 2021 M1 Pro | |
| WebXPRT 3 / Overall | |
| Apple MacBook Pro 16 2023 M3 Pro | |
| Ortalama Apple M3 Pro 12-Core, Apple M3 Pro 18-Core GPU (n=1) | |
| Apple MacBook Pro 16 2023 M3 Max | |
| Apple MacBook Pro 14 2023 M2 Pro | |
| Apple MacBook Pro 16 2021 M1 Pro | |
| Sınıf ortalaması Multimedia (136.4 - 596, n=63, son 2 yıl) | |
| Lenovo Slim Pro 9i 16IRP8 | |
| Dell XPS 15 9530 RTX 4070 | |
| Asus ROG Zephyrus G14 GA402XY | |
| Schenker VISION 16 Pro (M23) | |
| Samsung Galaxy Book3 Ultra 16 | |
Depolama Çözümü
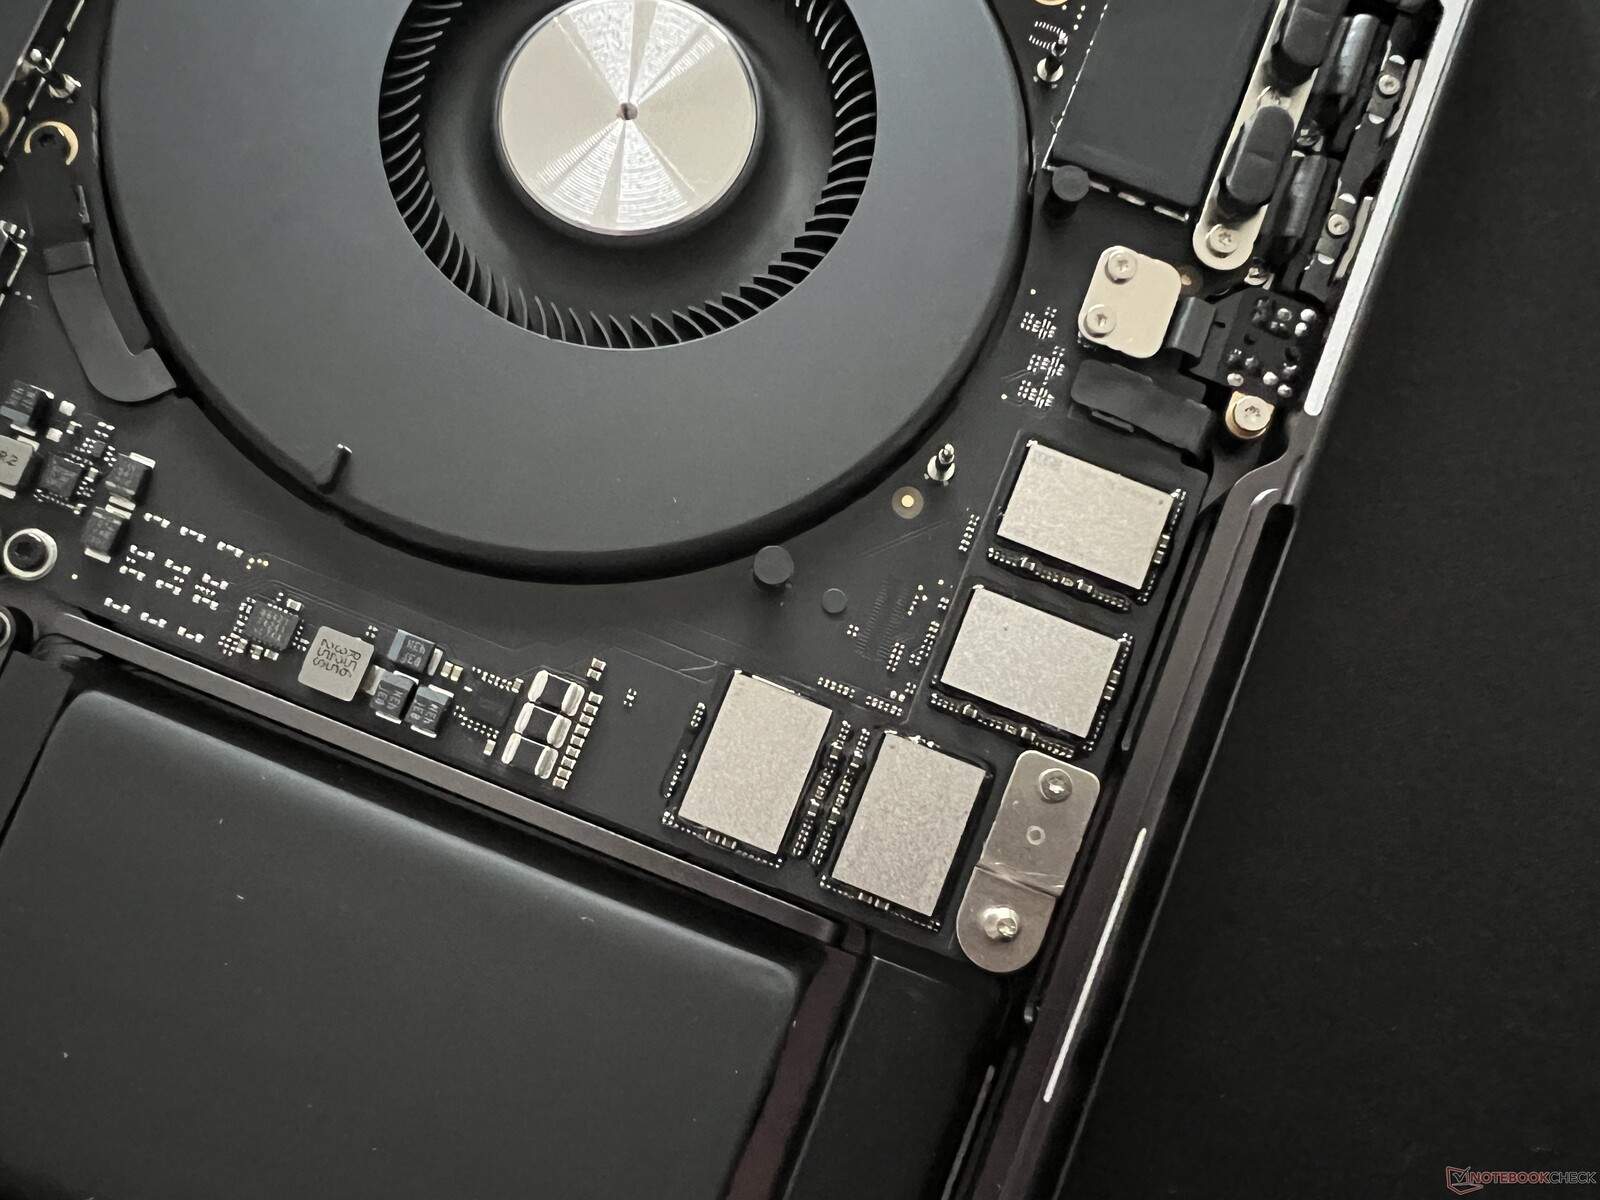
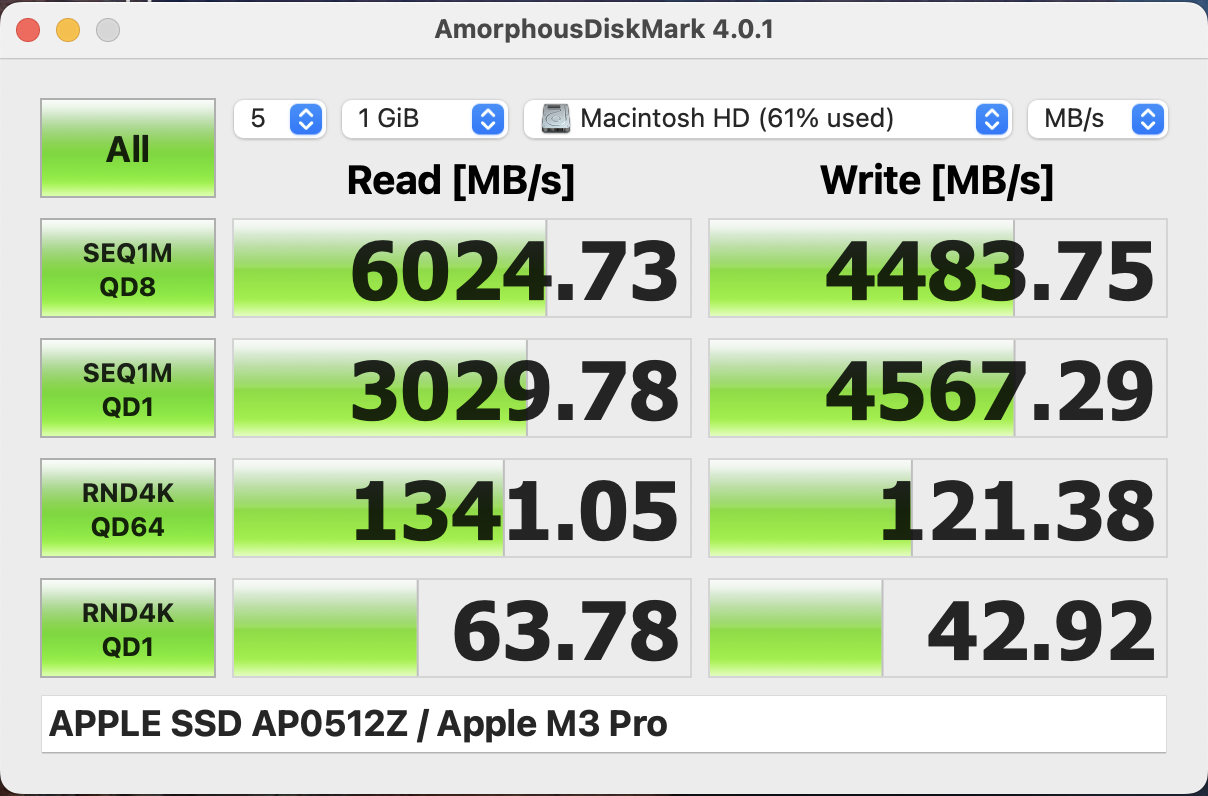
MacBook Pro 16'nın temel sürümü 512 GB SSD (AP0512Z) ile gelmeye devam ediyor. Eski M2 Pro ile MacBook Pro 14eskisine göre daha az NAND yongası kullanıyordu ve bu da aktarım hızlarını olumsuz etkiliyordu. Bu nedenle, 512 GB SSD'li yeni MacBook Pro 14 M3 Pro için de geçerli olan dört NAND çipini tekrar gördüğümüzde çok şaşırdık. Aktarım hızları şimdi tekrar arttı ve veri okurken maksimum neredeyse 6 GB/s ve veri yazarken ~4,5 GB/s görüyoruz. SSD'deki 512 GB'ın 466 GB'ı ilk çalıştırmadan sonra kullanıcı tarafından kullanılabilir durumda kalıyor. Listelenen diğer SSD kıyaslamalarını şurada bulabilirsiniz tekni̇k bölümümüz.
Grafik Kartı
İşlemciye benzer şekilde, ekran kartlarındaki çekirdek sayısı da değişti. Ekran kartlarının en üst modeli M2 Pro hala 19 GPU çekirdeği sunuyordum3 Pro'da artık 18 GPU çekirdeği bulunmaktadır. Saat hızını okuyamasak da burada da bir artış olduğunu varsayıyoruz. Çoğu kıyaslamada, 19 GPU çekirdekli M2 Pro'ya kıyasla hafif bir performans artışı görüyoruz (Geekbench 6.2 hariç). Bununla birlikte, güç tüketimi de 25 watt'tan 28 watt'a biraz artmıştır. Yani işlemcinin aksine, grafik kartı daha verimli hale gelmedi ve performans açısından da bir duraklama var ki bu biraz üzücü.
WildLife Extreme Unlimited testinde, M3 Pro GPU, M3 Pro'nun önünde yer alıyor RTX 4050 Dizüstü Bilgisayar (65 watt), ancak biraz geride RTX 4060 Dizüstü Bilgisayar (80 watt). Ancak OpenCL testlerinde M3 Pro GPU, özel GeForce rakiplerinin önemli ölçüde gerisinde kalıyor.
Grafik performansı hem sabit yük altında hem de pille çalışırken her zaman sabit kalmaktadır ki bu çoğu GeForce GPU'da görülen bir durum değildir. Ek GPU kıyaslamalarını bulabilirsiniz burada.
* ... daha küçük daha iyidir
Oyun Performansı
MacBook kullanarak oyun oynamanın birkaç yolu olduğunu diğer incelemelerde zaten belirtmiştik. Emüle edilmiş oyunlar ve CrossOver gibi ek yazılımlar kullanmanın yanı sıra, bu noktada başka seçenekleriniz de var ( GTA V veya Cyberpunk 2077 gibi), ancak her zaman donanımın tam potansiyelini kullanamayacaksınız ve elbette burada da optimizasyon yok.
Yerel oyunlar elbette en iyi şekilde çalışacaktır ve bu noktada Baldur's Gate 3 veya No Man's Sky gibi birkaç AAA oyun da bunlara dahildir. Bu oyunlar MacBook Pro'da da çok iyi çalışıyor ve genellikle en yüksek ayarları da kullanabiliyorsunuz. Bununla birlikte, Windows bilgisayarlarla karşılaştırıldığında, oyun performansı hala bir bilgisayarınkinin önemli ölçüde altında kalıyor GeForce RTX 4050 Dizüstü Bilgisayar. MacBook'ta ara sıra oyun oynamak isteyen ve sınırlı seçeneklerden memnun olanlar hayal kırıklığına uğramayacaklar, ancak bunun gerçek bir oyun dizüstü bilgisayarı olmadığını da anlamalısınız. Aşağıdaki videoda, 1080p çözünürlükte en yüksek ayarlarda birkaç yerel oyunu test ettik.
| düşük | orta | yüksek | ultra | QHD | |
|---|---|---|---|---|---|
| GTA V (2015) | 90 | 79 | 52 | 49 | |
| The Witcher 3 (2015) | 43 | ||||
| Shadow of the Tomb Raider (2018) | 71 | 65 | 57 | 37 | |
| Total War: Three Kingdoms (2019) | 87 | 56 | 41 | 25 | |
| Star Wars Jedi Survivor (2023) | 30 | 26 | 17 | ||
| Baldur's Gate 3 (2023) | 53 | 43 | |||
| Cyberpunk 2077 (2023) | 53 | 42.6 | 35 | 30.8 | |
| Total War Pharaoh (2023) | 212 | 140 | 77 | 58 | 42 |
Emisyonlar - Neredeyse her zaman sessiz
Gürültü Seviyeleri
MacBook Pro 16'nın iki fanı genellikle düşük ve orta yükler altında tamamen fark edilmez. 25,1 dB(A) üreten 1.400 rpm'lik ilk fan seviyesi bile yalnızca kulağınızı doğrudan dizüstü bilgisayarın yanına yerleştirirseniz duyulabilir. Verimli M3 Pro çip sayesinde bu seviyede oyun oynamak bile mümkün. Doğal oyun sırasında belirlediğimiz maksimum değer 1.900 rpm civarındaydı ve bu da sadece yaklaşık 26,2 dB(A)'ya karşılık geliyordu. 20 dakikalık sabit yükten sonra, 3DMark WildLife Extreme stres testi yalnızca ~1.900 rpm'ye yol açtı ve Cinebench R23 Multi ile 30 dakika sonra 31.1 dB(A) ile maksimum 2.400 rpm oldu.
Sadece birleşik CPU/GPU yükü ile yapılan stres testinde fanlar testin ilk dakikalarında 4.400 rpm'ye ulaşmış ve bu da 50,4 dB(A) gibi yüksek bir sese yol açmıştır. Bunun nedeni fan davranışında yatmaktadır, çünkü çipin önce çok ısınmasına (100 °C'den fazla, 212 °F) izin verildikten sonra fanların bunu düzeltmeye çalışması gerekir. Stres testinin devamı sırasında fan hızı 3.600 ila 3.800 rpm'de dengeleniyor. Pratikte bu, MBP 16 M3 Pro'yu, aşağıdaki Stres Testi bölümünde açıklayacağımız M3 Max'li MBP 16'dan (Otomatik modda) biraz daha gürültülü hale getirir.
Tam yük altındaki stres testi sırasında, MacBook neredeyse rakiplerinin gürültü seviyesinde, sadece Samsung Galaxy Book3 Ultradaha sessiz kalıyor, ancak bunun nedeni birleşik yük altında önemli ölçüde azalan performansı (CPU: 17 watt, GPU: 12 watt). Diğer tüm yük senaryolarında MBP 16 önemli ölçüde daha sessiz kalıyor. MBP 16'nın aksine M3 Max modellerim3 Pro ile MacBook'ta herhangi bir bobin vınlaması veya diğer elektronik sesler fark etmedik.
Ses yüksekliği
| Boşta |
| 24.4 / 24.4 / 24.4 dB |
| Çalışırken |
| 26.9 / 50.4 dB |
 | ||
30 dB sessiz 40 dB(A) duyulabilirlik 50 dB(A) gürültülü |
||
min: | ||
| Apple MacBook Pro 16 2023 M3 Pro M3 Pro 18-Core GPU, Apple M3 Pro 12-Core, Apple SSD AP0512Z | Asus VivoBook Pro 16 K6602VU GeForce RTX 4050 Laptop GPU, i9-13900H, Micron 2400 MTFDKBA1T0QFM | Lenovo Slim Pro 9i 16IRP8 GeForce RTX 4050 Laptop GPU, i9-13905H, Samsung PM9A1 MZVL21T0HCLR | Schenker VISION 16 Pro (M23) GeForce RTX 4070 Laptop GPU, i7-13700H, Samsung 990 Pro 1 TB | Samsung Galaxy Book3 Ultra 16 GeForce RTX 4050 Laptop GPU, i7-13700H, Samsung PM9A1 MZVL2512HCJQ | Dell XPS 15 9530 RTX 4070 GeForce RTX 4070 Laptop GPU, i7-13700H, SK hynix PC801 HFS001TEJ9X101N | |
|---|---|---|---|---|---|---|
| Noise | -27% | -16% | -34% | -17% | -5% | |
| kapalı / ortam * (dB) | 24.4 | 20.96 14% | 22.7 7% | 25.9 -6% | 25 -2% | 23.1 5% |
| Idle Minimum * (dB) | 24.4 | 25.28 -4% | 22.7 7% | 25.9 -6% | 26 -7% | 23.1 5% |
| Idle Average * (dB) | 24.4 | 25.28 -4% | 22.7 7% | 25.9 -6% | 27 -11% | 23.1 5% |
| Idle Maximum * (dB) | 24.4 | 25.28 -4% | 27.5 -13% | 32 -31% | 28 -15% | 24.2 1% |
| Load Average * (dB) | 26.9 | 51.88 -93% | 28.9 -7% | 47.2 -75% | 40 -49% | 27.1 -1% |
| Witcher 3 ultra * (dB) | 25.1 | 49 -95% | 52.6 -110% | 53.1 -112% | 39 -55% | 40.1 -60% |
| Load Maximum * (dB) | 50.4 | 51.8 -3% | 52.5 -4% | 53.1 -5% | 41 19% | 44.6 12% |
* ... daha küçük daha iyidir
Sıcaklıklar
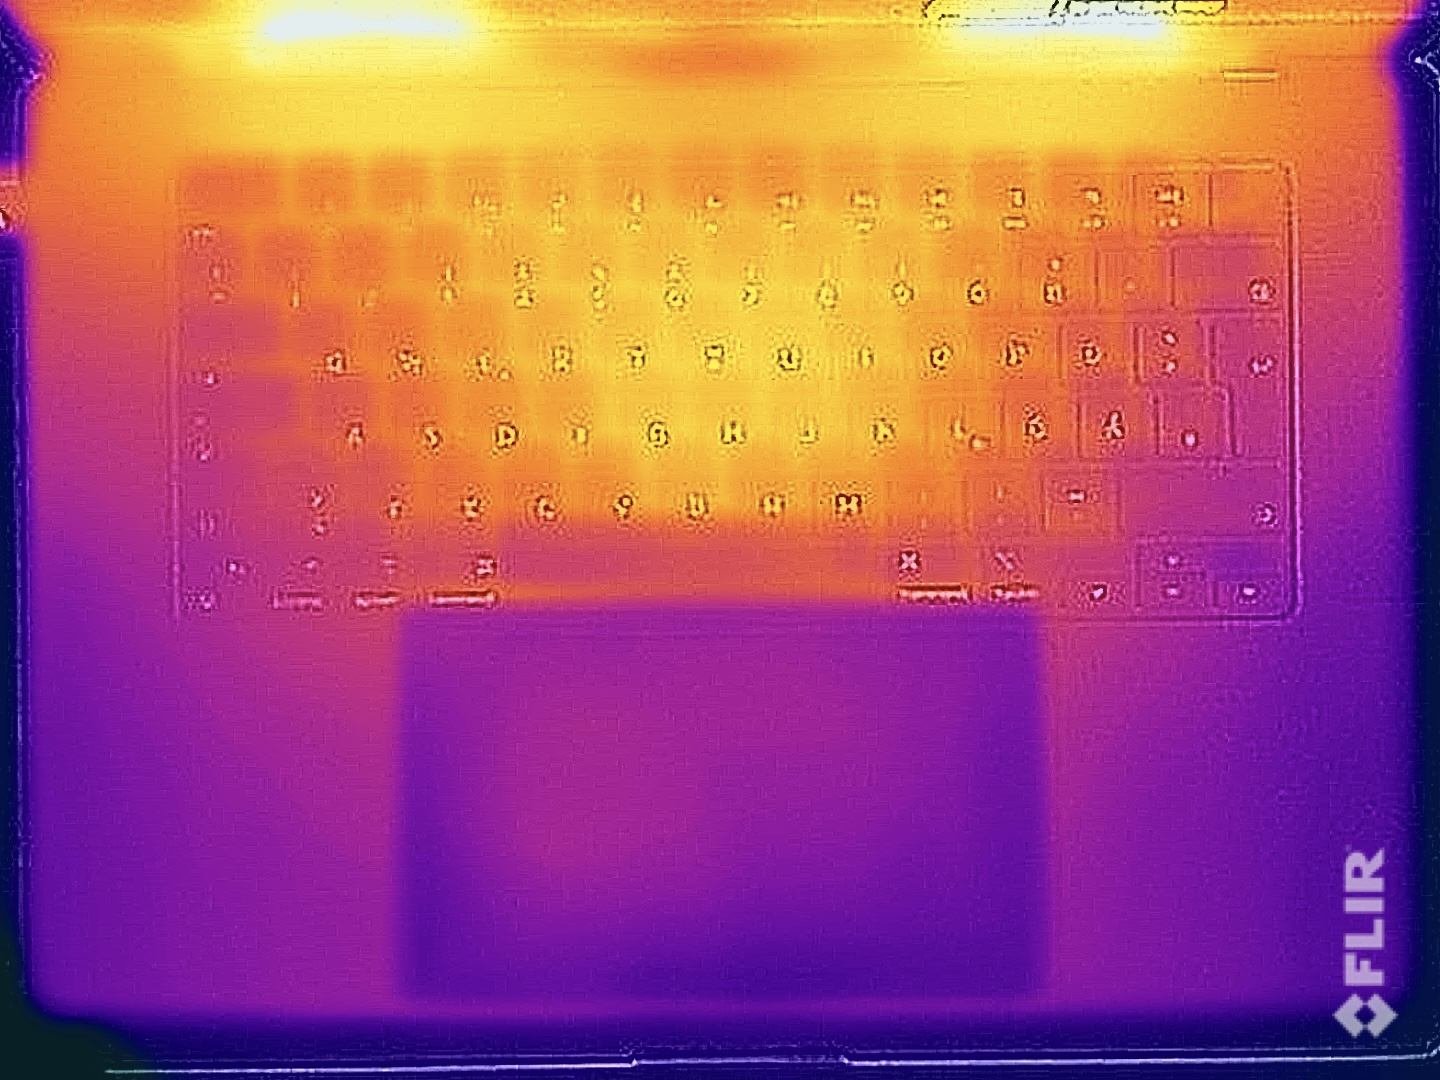
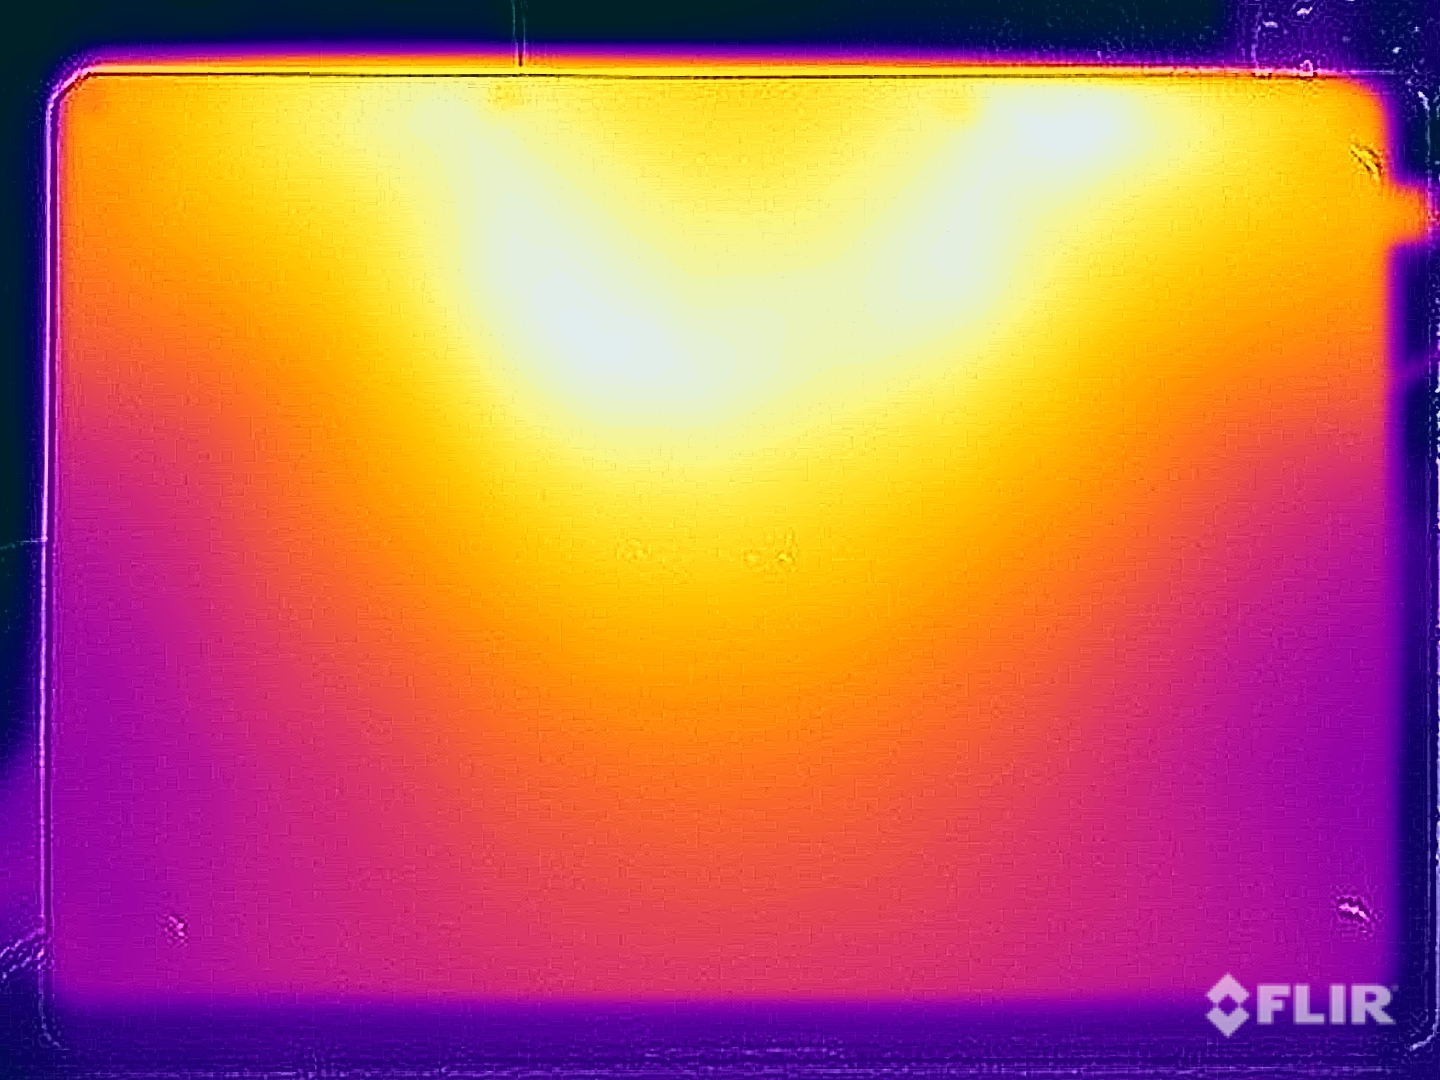
Yüksek sıcaklıklarla ilgili sorunlar M3 Pro ile MacBook Pro 16'ya yabancı kalıyor. Daha az zorlu görevlerde kasa hiç ısınmıyor. Stres testi sırasında, artan fan aktivitesi nedeniyle yüzey sıcaklıkları en sıcak noktalarda ancak 37 ila 38 °C'ye (99-100 °F) ulaştı. En kötü senaryo, fanlar genellikle 1.400 ila 1.900 rpm'de çalışırken oyun oynamakla temsil edilir, ancak burada bile maksimum 42 ° C (108 ° F) kesinlikle endişelenmek için bir neden vermez. 140 Watt'lık şarj cihazı maksimum 45 °C (113 °F) sıcaklığa ulaşır.
(+) Üst taraftaki maksimum sıcaklık, 36.8 °C / 98 F ortalamasına kıyasla 38.1 °C / 101 F'dir. , Multimedia sınıfı için 21 ile 71 °C arasında değişir.
(+) Alt kısım, 39.1 °C / 102 F ortalamasına kıyasla maksimum 37 °C / 99 F'ye kadar ısınır
(+) Boşta kullanımda, üst tarafın ortalama sıcaklığı 24 °C / 75 F olup, cihazın 31.3 °C / 88 F.
(±) The Witcher 3 oynarken, üst tarafın ortalama sıcaklığı 37.6 °C / 100 F olup, cihazın 31.3 °C / 88 F.
(+) Avuç içi dayanakları ve dokunmatik yüzey maksimum (33.8 °C / 92.8 F) cilt sıcaklığına ulaşıyor ve bu nedenle sıcak değil.
(-) Benzer cihazların avuç içi dayanağı alanının ortalama sıcaklığı 28.7 °C / 83.7 F (-5.1 °C / -9.1 F) idi.
| Apple MacBook Pro 16 2023 M3 Pro Apple M3 Pro 12-Core, Apple M3 Pro 18-Core GPU | Asus VivoBook Pro 16 K6602VU Intel Core i9-13900H, NVIDIA GeForce RTX 4050 Laptop GPU | Lenovo Slim Pro 9i 16IRP8 Intel Core i9-13905H, NVIDIA GeForce RTX 4050 Laptop GPU | Schenker VISION 16 Pro (M23) Intel Core i7-13700H, NVIDIA GeForce RTX 4070 Laptop GPU | Samsung Galaxy Book3 Ultra 16 Intel Core i7-13700H, NVIDIA GeForce RTX 4050 Laptop GPU | Dell XPS 15 9530 RTX 4070 Intel Core i7-13700H, NVIDIA GeForce RTX 4070 Laptop GPU | |
|---|---|---|---|---|---|---|
| Heat | -42% | -18% | -22% | -7% | -28% | |
| Maximum Upper Side * (°C) | 38.1 | 42.6 -12% | 37.8 1% | 46.7 -23% | 41 -8% | 45.6 -20% |
| Maximum Bottom * (°C) | 37 | 48.4 -31% | 44.8 -21% | 54.1 -46% | 44 -19% | 42 -14% |
| Idle Upper Side * (°C) | 24.2 | 39.4 -63% | 30.6 -26% | 26.5 -10% | 23 5% | 34.4 -42% |
| Idle Bottom * (°C) | 24.6 | 39.8 -62% | 31 -26% | 26.8 -9% | 26 -6% | 33.2 -35% |
* ... daha küçük daha iyidir
Stres Testi
Birleştirilmiş CPU/GPU yükü ile yapılan stres testi çok ilginçtir, çünkü m3 Max ile model. Stres testinde bile M3 Pro, işlemci ve grafik kartının tam performansını tüm süre boyunca sunabiliyor. Genel olarak, güç tüketimi yaklaşık 55 watt'tır. Bu çok ilginç, çünkü M3 Max'te GPU'ya açıkça öncelik verilmişti ve yalnızca toplamda yaklaşık 48 watt'lık bir sınıra kadar serin tutulabiliyordu. M3 Max'in daha hızlı GPU'sunun daha fazla ısı üreterek soğutmadan daha fazla talepte bulunduğundan şüpheleniyoruz.
Güç Yönetimi - Muazzam dayanıklılık
Güç Tüketimi
Güç tüketimi ölçümlerinde herhangi bir sürpriz yok ve cihaz minimum parlaklıkta çok verimli. Yüksek çözünürlük ve 600 cd/m²'den fazla artırılmış SDR parlaklığı göz önüne alındığında, boşta çalışma sırasında neredeyse 17 watt'lık maksimum tüketim bile tamamen normaldir. Stres testi sırasında yük altında, maksimum neredeyse 103 watt ölçüyoruz, bu nedenle birlikte verilen 140 Watt'lık şarj cihazı tamamen yeterli ve yük altında bile pili şarj etmeye devam edebilmek için yeterli rezerv sunuyor.
| Kapalı / Bekleme modu | |
| Boşta | |
| Çalışırken |
|
Key:
min: | |
| Apple MacBook Pro 16 2023 M3 Pro Apple M3 Pro 12-Core, M3 Pro 18-Core GPU, Apple SSD AP0512Z, Mini-LED, 3456x2234, 16.2" | Asus VivoBook Pro 16 K6602VU i9-13900H, GeForce RTX 4050 Laptop GPU, Micron 2400 MTFDKBA1T0QFM, OLED, 3200x2000, 16" | Lenovo Slim Pro 9i 16IRP8 i9-13905H, GeForce RTX 4050 Laptop GPU, Samsung PM9A1 MZVL21T0HCLR, Mini-LED, 3200x2000, 16" | Schenker VISION 16 Pro (M23) i7-13700H, GeForce RTX 4070 Laptop GPU, Samsung 990 Pro 1 TB, IPS, 2560x1600, 16" | Samsung Galaxy Book3 Ultra 16 i7-13700H, GeForce RTX 4050 Laptop GPU, Samsung PM9A1 MZVL2512HCJQ, AMOLED, 2880x1800, 16" | Dell XPS 15 9530 RTX 4070 i7-13700H, GeForce RTX 4070 Laptop GPU, SK hynix PC801 HFS001TEJ9X101N, OLED, 3456x2160, 15.6" | Ortalama Apple M3 Pro 18-Core GPU | Sınıf ortalaması Multimedia | |
|---|---|---|---|---|---|---|---|---|
| Power Consumption | -101% | -121% | -54% | 13% | -91% | 0% | 4% | |
| Idle Minimum * (Watt) | 4.5 | 21.06 -368% | 16 -256% | 8.6 -91% | 3 33% | 20 -344% | 4.5 ? -0% | 5.66 ? -26% |
| Idle Average * (Watt) | 16.5 | 24.27 -47% | 30 -82% | 12 27% | 5 70% | 20.7 -25% | 16.5 ? -0% | 10.2 ? 38% |
| Idle Maximum * (Watt) | 16.7 | 25.12 -50% | 30.4 -82% | 12.4 26% | 11 34% | 22.4 -34% | 16.7 ? -0% | 12.5 ? 25% |
| Load Average * (Watt) | 60.4 | 52.4 13% | 78.9 -31% | 80 -32% | 72 -19% | 77.1 -28% | 60.4 ? -0% | 65.2 ? -8% |
| Witcher 3 ultra * (Watt) | 52.1 | 110.2 -112% | 155.3 -198% | 147.7 -183% | 69.7 -34% | 95.4 -83% | ||
| Load Maximum * (Watt) | 102.9 | 146 -42% | 180.4 -75% | 173.1 -68% | 108 -5% | 133.4 -30% | 102.9 ? -0% | 113.5 ? -10% |
* ... daha küçük daha iyidir
Power Consumption The Witcher 3 / Stress Test
Power Consumption With External Monitor
Pil Ömrü
99,6 Wh ile Apple çok büyük bir pil kullanmaya devam ediyor ve artan verimlilik de büyük MacBook Pro 16 için son derece uzun bir pil ömrü sağlıyor. Maksimum yük altında (CPU ve GPU yükü, maksimum parlaklık), pili en uç durumda 83 dakika gibi kısa bir sürede boşaltabilirsiniz, ancak aynı zamanda tam performans elde edebilirsiniz (pil minimum %3 kapasiteye ulaşana kadar).
Öte yandan, parlaklığı 150 cd/m²'ye düşürürsek, M3 Pro'lu MBP 16, video testimizde 24 saatten fazla ve WLAN testimizde 20 saat gibi son derece uzun bir pil ömrüne ulaşabilir. Rakipler bu sonuçların yanına bile yaklaşamıyor ve M3 Pro'lu MBP 16 da M3 Pro'lu MBP 16'dan daha fazla dayanıklılığa sahip M3 Maksimum yapılandırma. WLAN testini maksimum SDR parlaklığında çalıştırdığımızda, çalışma süresi yaklaşık 7,5 saate düşüyor, bu da yüksek çözünürlüklü ve 600 cd/m² parlaklığa sahip 16,2 inçlik devasa bir ekran için iyi bir sonucu temsil ediyor.
Cihaz açıkken tamamen şarj olması ancak 1,5 saat sürüyor ve 50 dakika sonra kapasitenin %80'i kullanılabilir hale geliyor.
| Apple MacBook Pro 16 2023 M3 Pro Apple M3 Pro 12-Core, M3 Pro 18-Core GPU, 99.6 Wh | Asus VivoBook Pro 16 K6602VU i9-13900H, GeForce RTX 4050 Laptop GPU, 96 Wh | Lenovo Slim Pro 9i 16IRP8 i9-13905H, GeForce RTX 4050 Laptop GPU, 75 Wh | Schenker VISION 16 Pro (M23) i7-13700H, GeForce RTX 4070 Laptop GPU, 80 Wh | Samsung Galaxy Book3 Ultra 16 i7-13700H, GeForce RTX 4050 Laptop GPU, 76 Wh | Dell XPS 15 9530 RTX 4070 i7-13700H, GeForce RTX 4070 Laptop GPU, 86 Wh | Apple MacBook Pro 16 2023 M3 Max Apple M3 Max 16-Core, M3 Max 40-Core GPU, 99.6 Wh | Sınıf ortalaması Multimedia | |
|---|---|---|---|---|---|---|---|---|
| Pil Çalışma Süresi | -55% | -67% | -45% | -23% | -27% | -16% | -17% | |
| H.264 (h) | 24.7 | 9.8 -60% | 7.8 -68% | 13.4 -46% | 20.4 -17% | 17.1 ? -31% | ||
| WiFi v1.3 (h) | 20.1 | 10.1 -50% | 6.6 -67% | 7.8 -61% | 9.6 -52% | 8 -60% | 16.7 -17% | 12.2 ? -39% |
| Load (h) | 1.4 | 1.3 -7% | 1.8 29% | 1.5 7% | 1.2 -14% | 1.664 ? 19% |
Artılar
Eksiler
Karar: MacBook Pro 16 mükemmel ama pahalı bir multimedya dizüstü bilgisayar
Yeni M3 Pro SoC ile Apple, M3 Max yongalarından farklı bir yol izliyor, çünkü hem çok çekirdekli performans hem de GPU performansı M2 Pro'ya kıyasla neredeyse aynı kalıyor. Bunun yerine, tek çekirdek performansı önemli ölçüde artmış ve M3 Pro genel olarak daha verimli hale gelmiştir. Pratikte bu daha da iyi bir pil ömrüne yol açıyor ve 150 cd/m² parlaklıkta yaptığımız testte, WLAN testinde 20 saatten fazla (ve hatta 24 saat video oynatma) mümkün, bu da yüksek çözünürlüklü mini LED panelli 16 inçlik büyük bir dizüstü bilgisayar için son derece iyi değerler. Windows rakipleri genellikle 10 saat sınırına bile ulaşamıyor. Buna ek olarak, Apple maksimum SDR parlaklığını 500'den 600 cd/m²'ye yükseltti ve panel çok iyi bir görüntü kalitesi sunmaya devam ediyor. Tepki süreleri çok yavaş olsa da, bu durum günlük kullanımda neredeyse hiç fark edilmiyor ve neredeyse hiç görünür gölgelenme yok - 120 Hz'lik yüksek frekans da burada yardımcı oluyor.
Daha verimli M3 Pro ve önemli ölçüde artırılmış tek çekirdek performansı sayesinde MacBook Pro 16 daha da iyi hale geldi ve piyasadaki en iyi genel pakete sahip multimedya dizüstü bilgisayar olmaya devam etti.
Bununla birlikte, yeni M3 Pro hala biraz yavan bir tat bıraktı, çünkü daha fazla Verimlilik ancak daha az Performans çekirdeğine sahip yeni çekirdek yapılandırması, burada performansın kasıtlı olarak sınırlandırıldığı izlenimini bırakıyor. Ancak yeni küme yapılandırması nedeniyle burada çok fazla alternatif yok. Aynı zamanda, performansın hem pil kullanımında hem de CPU ve GPU'nun eşzamanlı yükü altında tamamen sabit kaldığını da onaylamamız gerekiyor. Bu durum ne yeni M3 Max modelleri ne de Windows rakipleri için geçerli. Ek bir eleştiri noktası da 3.000 Euro'luk (~3.273$) bir dizüstü bilgisayarın 512 GB'lık yetersiz bir SSD ile gelmeye devam etmesi.
MacBook Pro 16'dan M2 Pro'ya ve hatta M1 Pro'ya yükseltme yapmak pek mantıklı değil, ancak hala Intel işlemcili bir MacBook Pro 16 kullanıyorsanız veya ilk kez bir MacBook Pro satın alıyorsanız yeni MBP 16 M3 Pro ideal bir seçim.
Bu fiyat sınıfındaki Windows rakipleriyle karşılaştırıldığında, özellikle grafik kartlarında ve dizüstü bilgisayarınızı oyun oynamak için de kullanmak istiyorsanız, bunların genellikle daha fazla performans sunduğunu açıkça söylemeliyiz. Baldur's Gate 3, Lies of P veya No Man's Sky gibi yerel oyunlar MacBook'ta sorunsuz çalışır, ancak performans Windows rakiplerinden daha düşüktür ve daha fazla verimlilik de bu konuda pek yardımcı olmaz. Öte yandan, multimedya alanında daha iyi bir genel paket bulmak zor olacaktır, çünkü yüksek kaliteli işçilik, harika bir mini LED ekran, düşük emisyon (günlük kullanımda fanları neredeyse hiç duymazsınız), mükemmel hoparlörler ve muazzam bir pil ömrünün daha iyi bir kombinasyonu yoktur. Bir yerde bazı ödünler vermek zorundasınız ve Windows dizüstü bilgisayarlarda bu genellikle fanlar veya pil ömrü ile ilgili bir durumdur. Ancak Apple aynı zamanda bu genel paket için size ödeme yaptırıyor ve mevcut olmayan bakım seçenekleriyle birlikte büyük yükseltme fiyatları çok açık bir şekilde büyük bir dezavantaj.
Fiyat ve Bulunabilirlik
M3 Pro'lu MacBook Pro 16'nın temel modeli şu anda adresinden 2.499 $'dan başlayan fiyatlarla temin edilebilir Apple doğrudan veya Amazon gibi çevrimiçi mağazalardan 2.299 $ 'dan başlayan fiyatlarla satın alabilirsiniz.
Apple MacBook Pro 16 2023 M3 Pro
- 11/24/2023 v7 (old)
Andreas Osthoff
Şeffaflık
İncelenecek cihazların seçimi editör ekibimiz tarafından yapılır. Test örneği, bu incelemenin amacı doğrultusunda üretici veya perakendeci tarafından yazara ödünç olarak sağlanmıştır. Borç verenin bu inceleme üzerinde herhangi bir etkisi olmadığı gibi, üretici de yayınlanmadan önce bu incelemenin bir kopyasını almamıştır. Bu incelemeyi yayınlama zorunluluğu yoktu. Bağımsız bir medya şirketi olarak Notebookcheck, üreticilerin, perakendecilerin veya yayıncıların otoritesine tabi değildir.
Notebookcheck bu şekilde test yapıyor
Notebookcheck, tüm sonuçların karşılaştırılabilir olmasını sağlamak için her yıl yüzlerce dizüstü bilgisayarı ve akıllı telefonu standart prosedürler kullanarak bağımsız olarak inceliyor. Yaklaşık 20 yıldır test yöntemlerimizi sürekli olarak geliştirdik ve bu süreçte endüstri standartlarını belirledik. Test laboratuvarlarımızda deneyimli teknisyenler ve editörler tarafından yüksek kaliteli ölçüm ekipmanları kullanılmaktadır. Bu testler çok aşamalı bir doğrulama sürecini içerir. Karmaşık derecelendirme sistemimiz, nesnelliği koruyan yüzlerce sağlam temellere dayanan ölçüm ve kıyaslamaya dayanmaktadır.Price comparison

