Core i9 ve RTX 3060’lı Intel NUC 11 Beast Canyon İncelemede

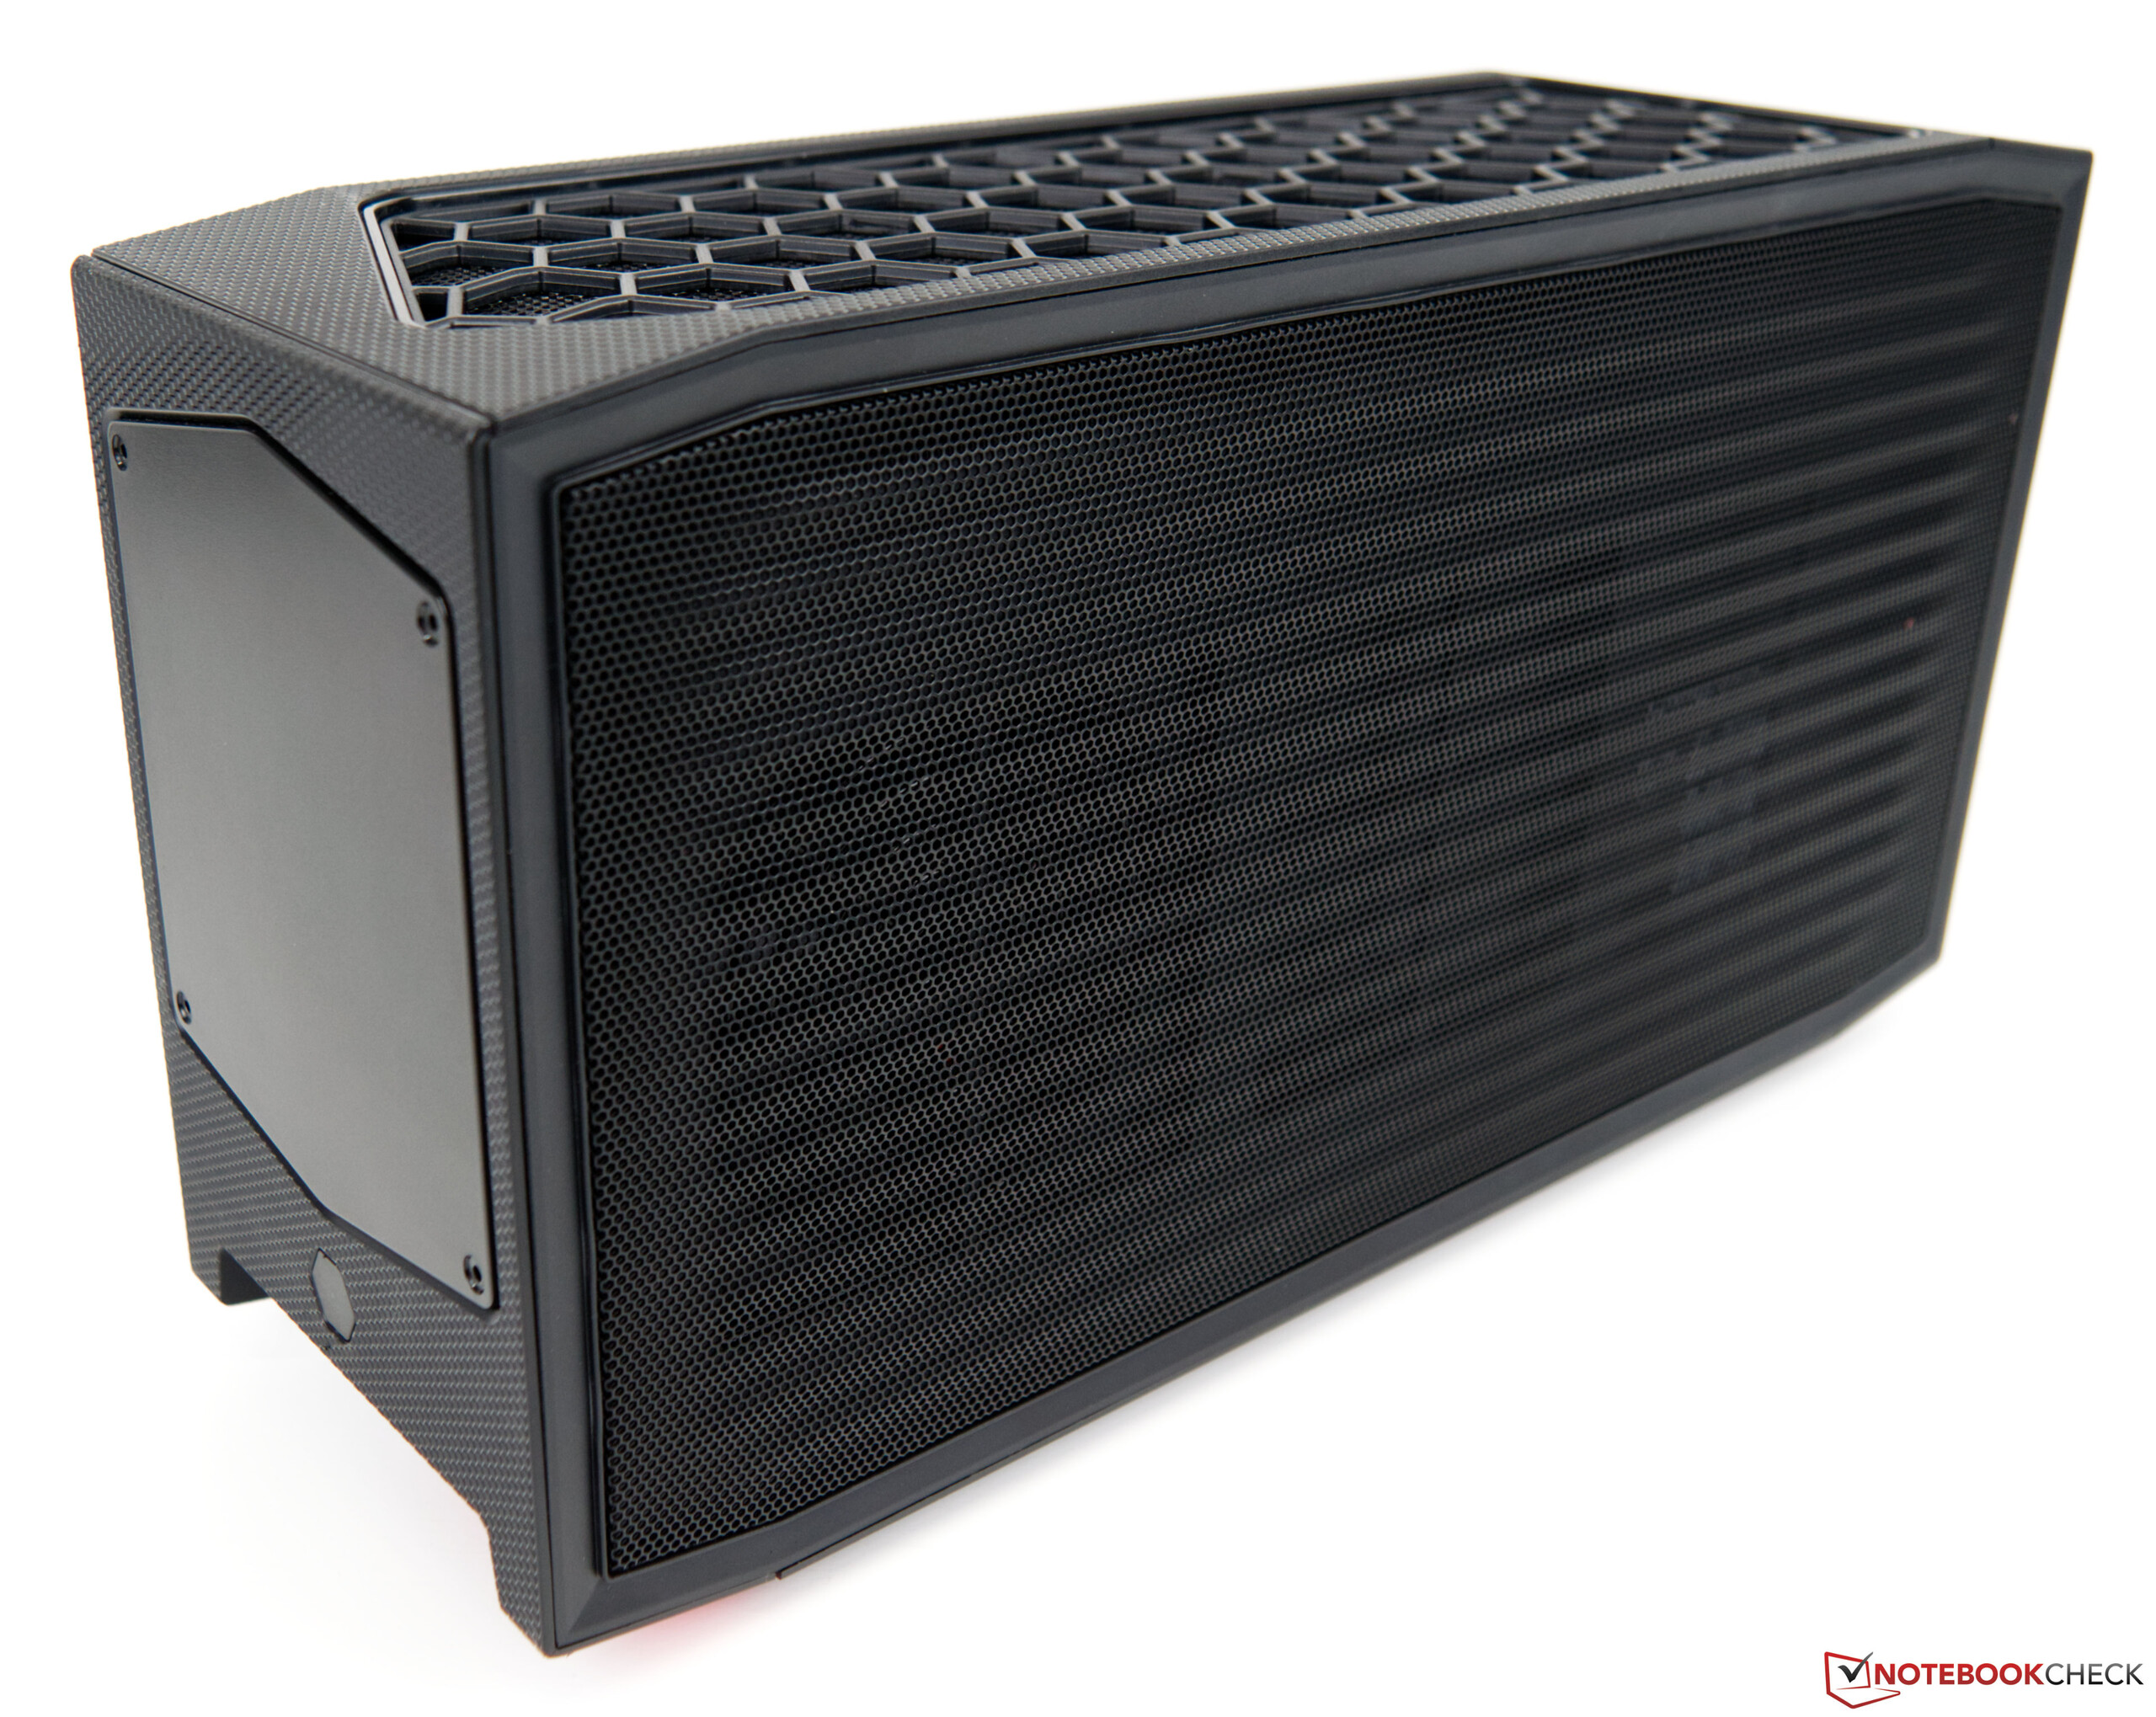
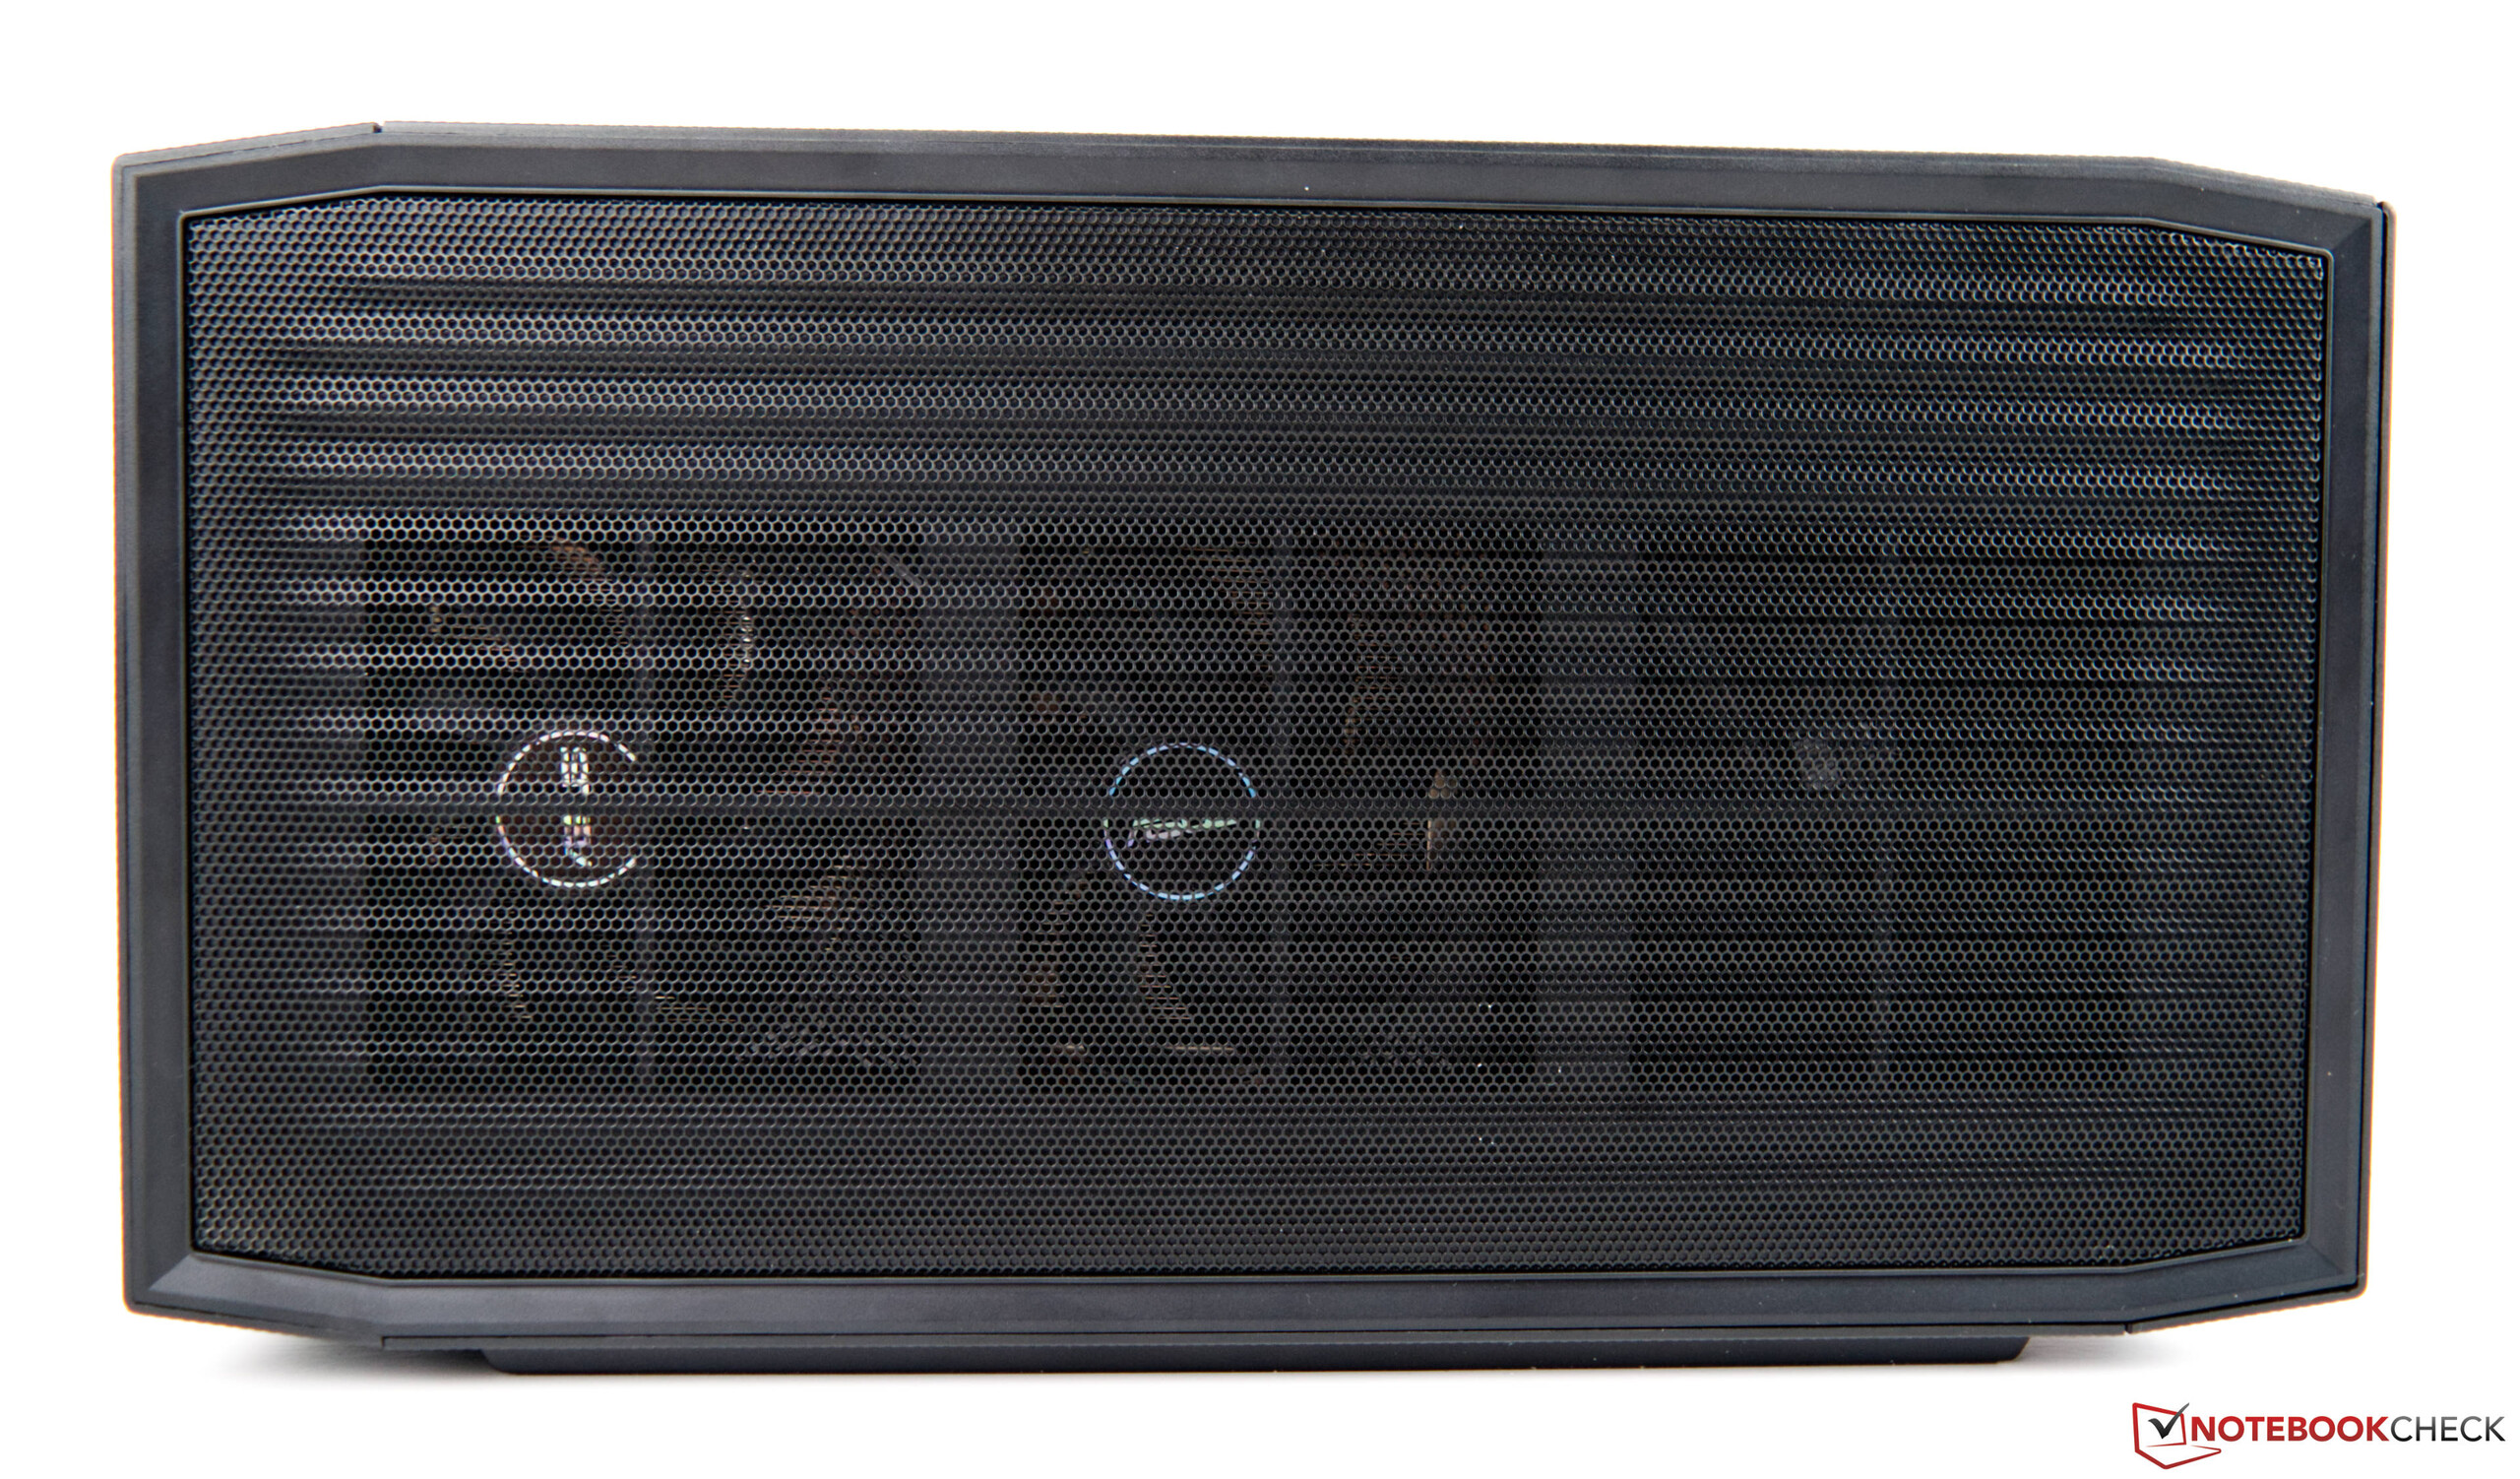
Intel, ağırlıklı olarak NUC markası altında kompakt ofis sistemleri sunar. Yine de, Intel'den kendi adlarına NUC taşıyan oyun sistemleri de var. Örneğin geçen yıl Intel Ghost Canyon NUC'ın performansından çok etkilendik . Bu yıl Intel, biraz farklı bir yaklaşım benimseyerek özel olarak geliştirilmiş bilgi işlem öğesi olan Beast Canyon NUC'ye dayanan başka bir oyun sistemini tanıttı.
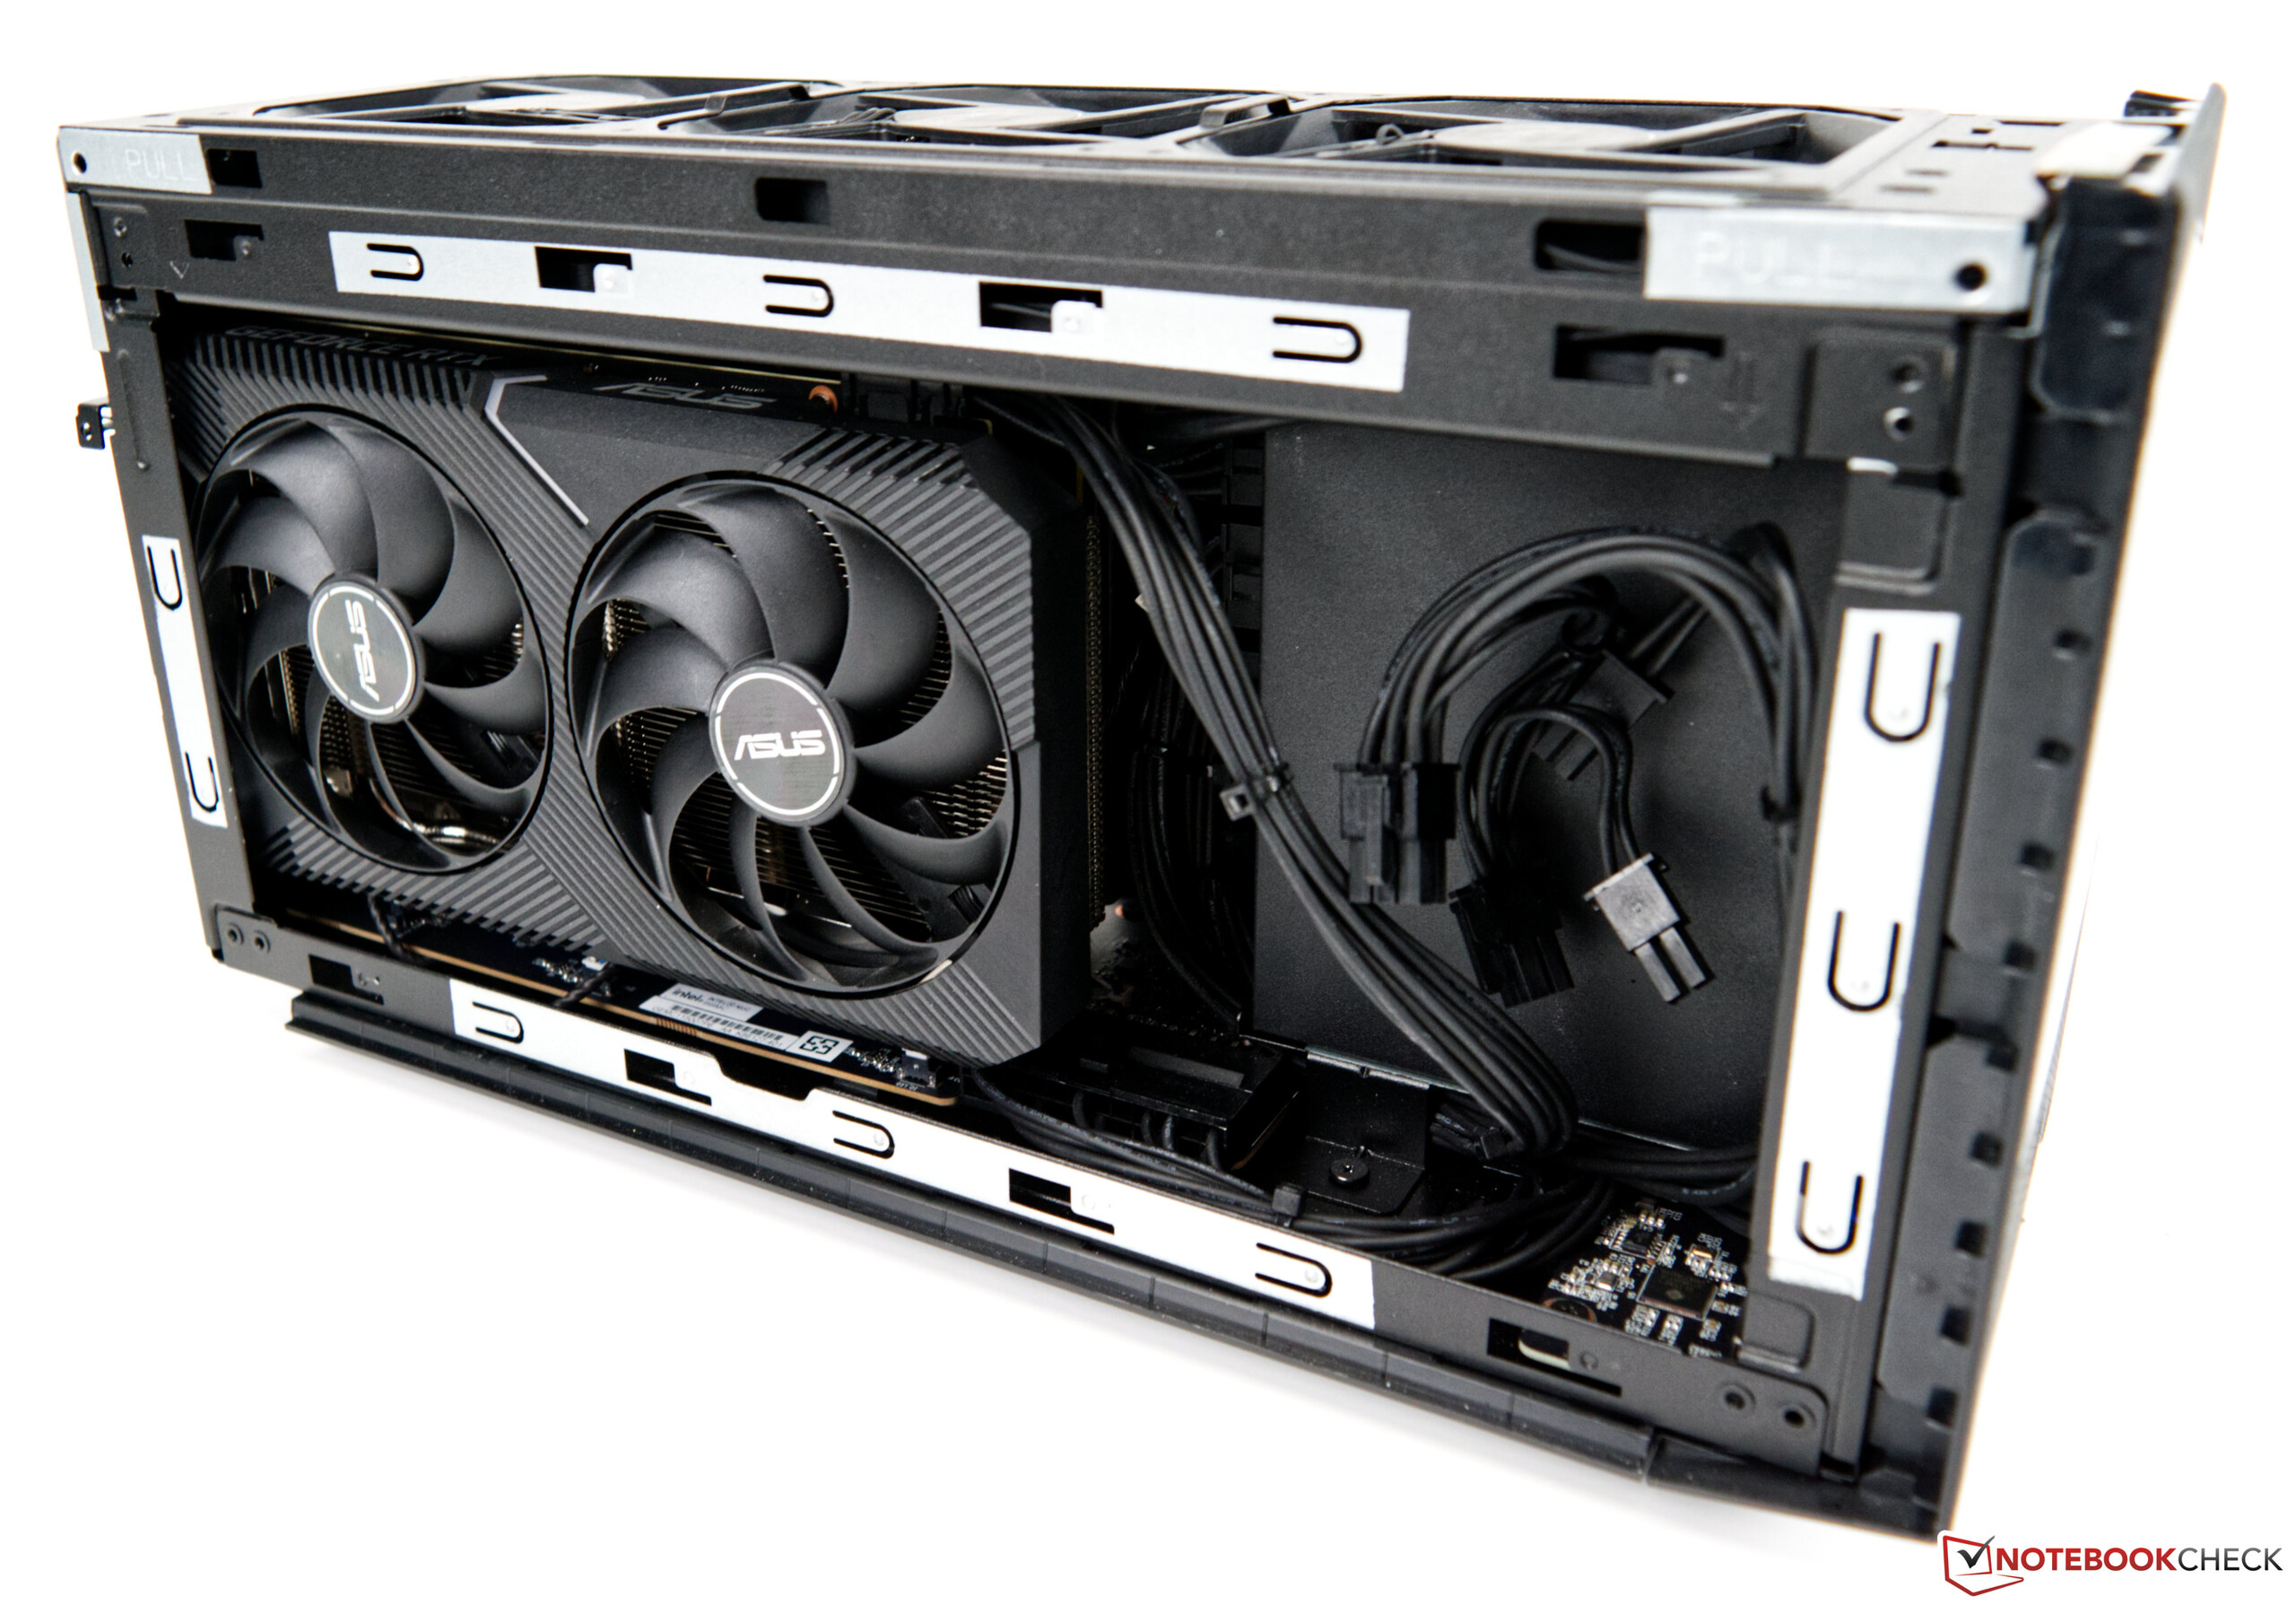
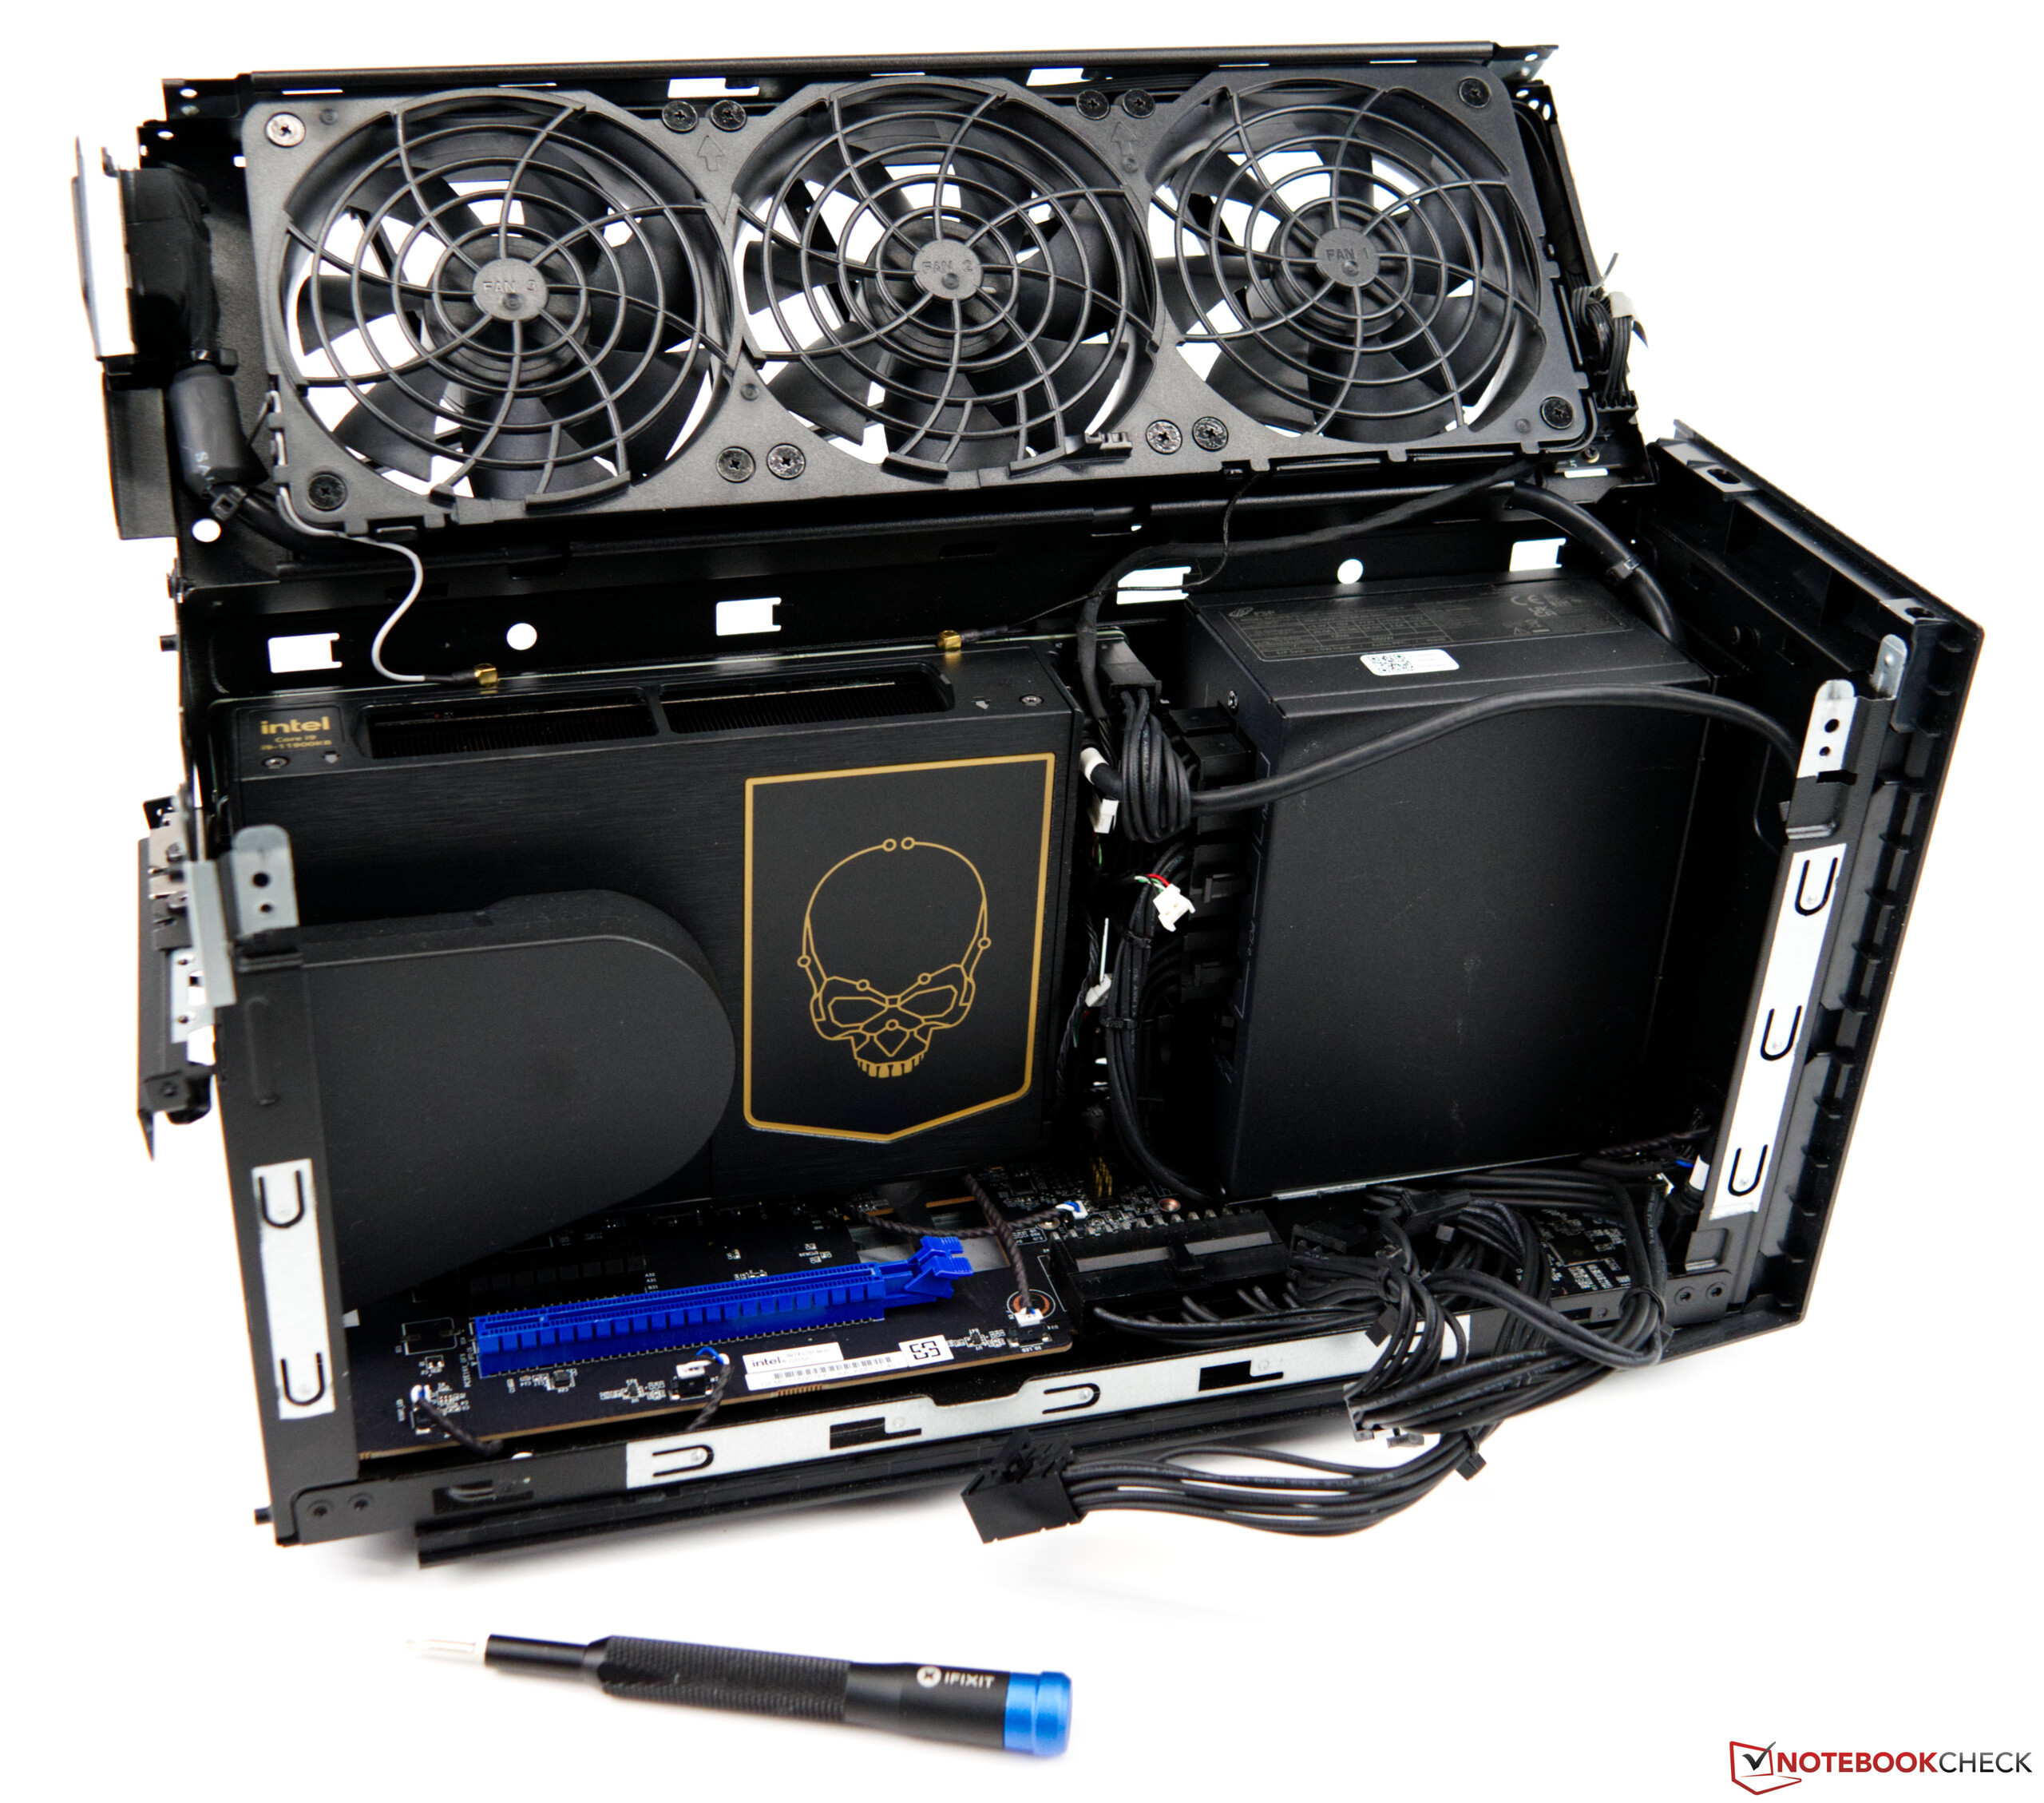
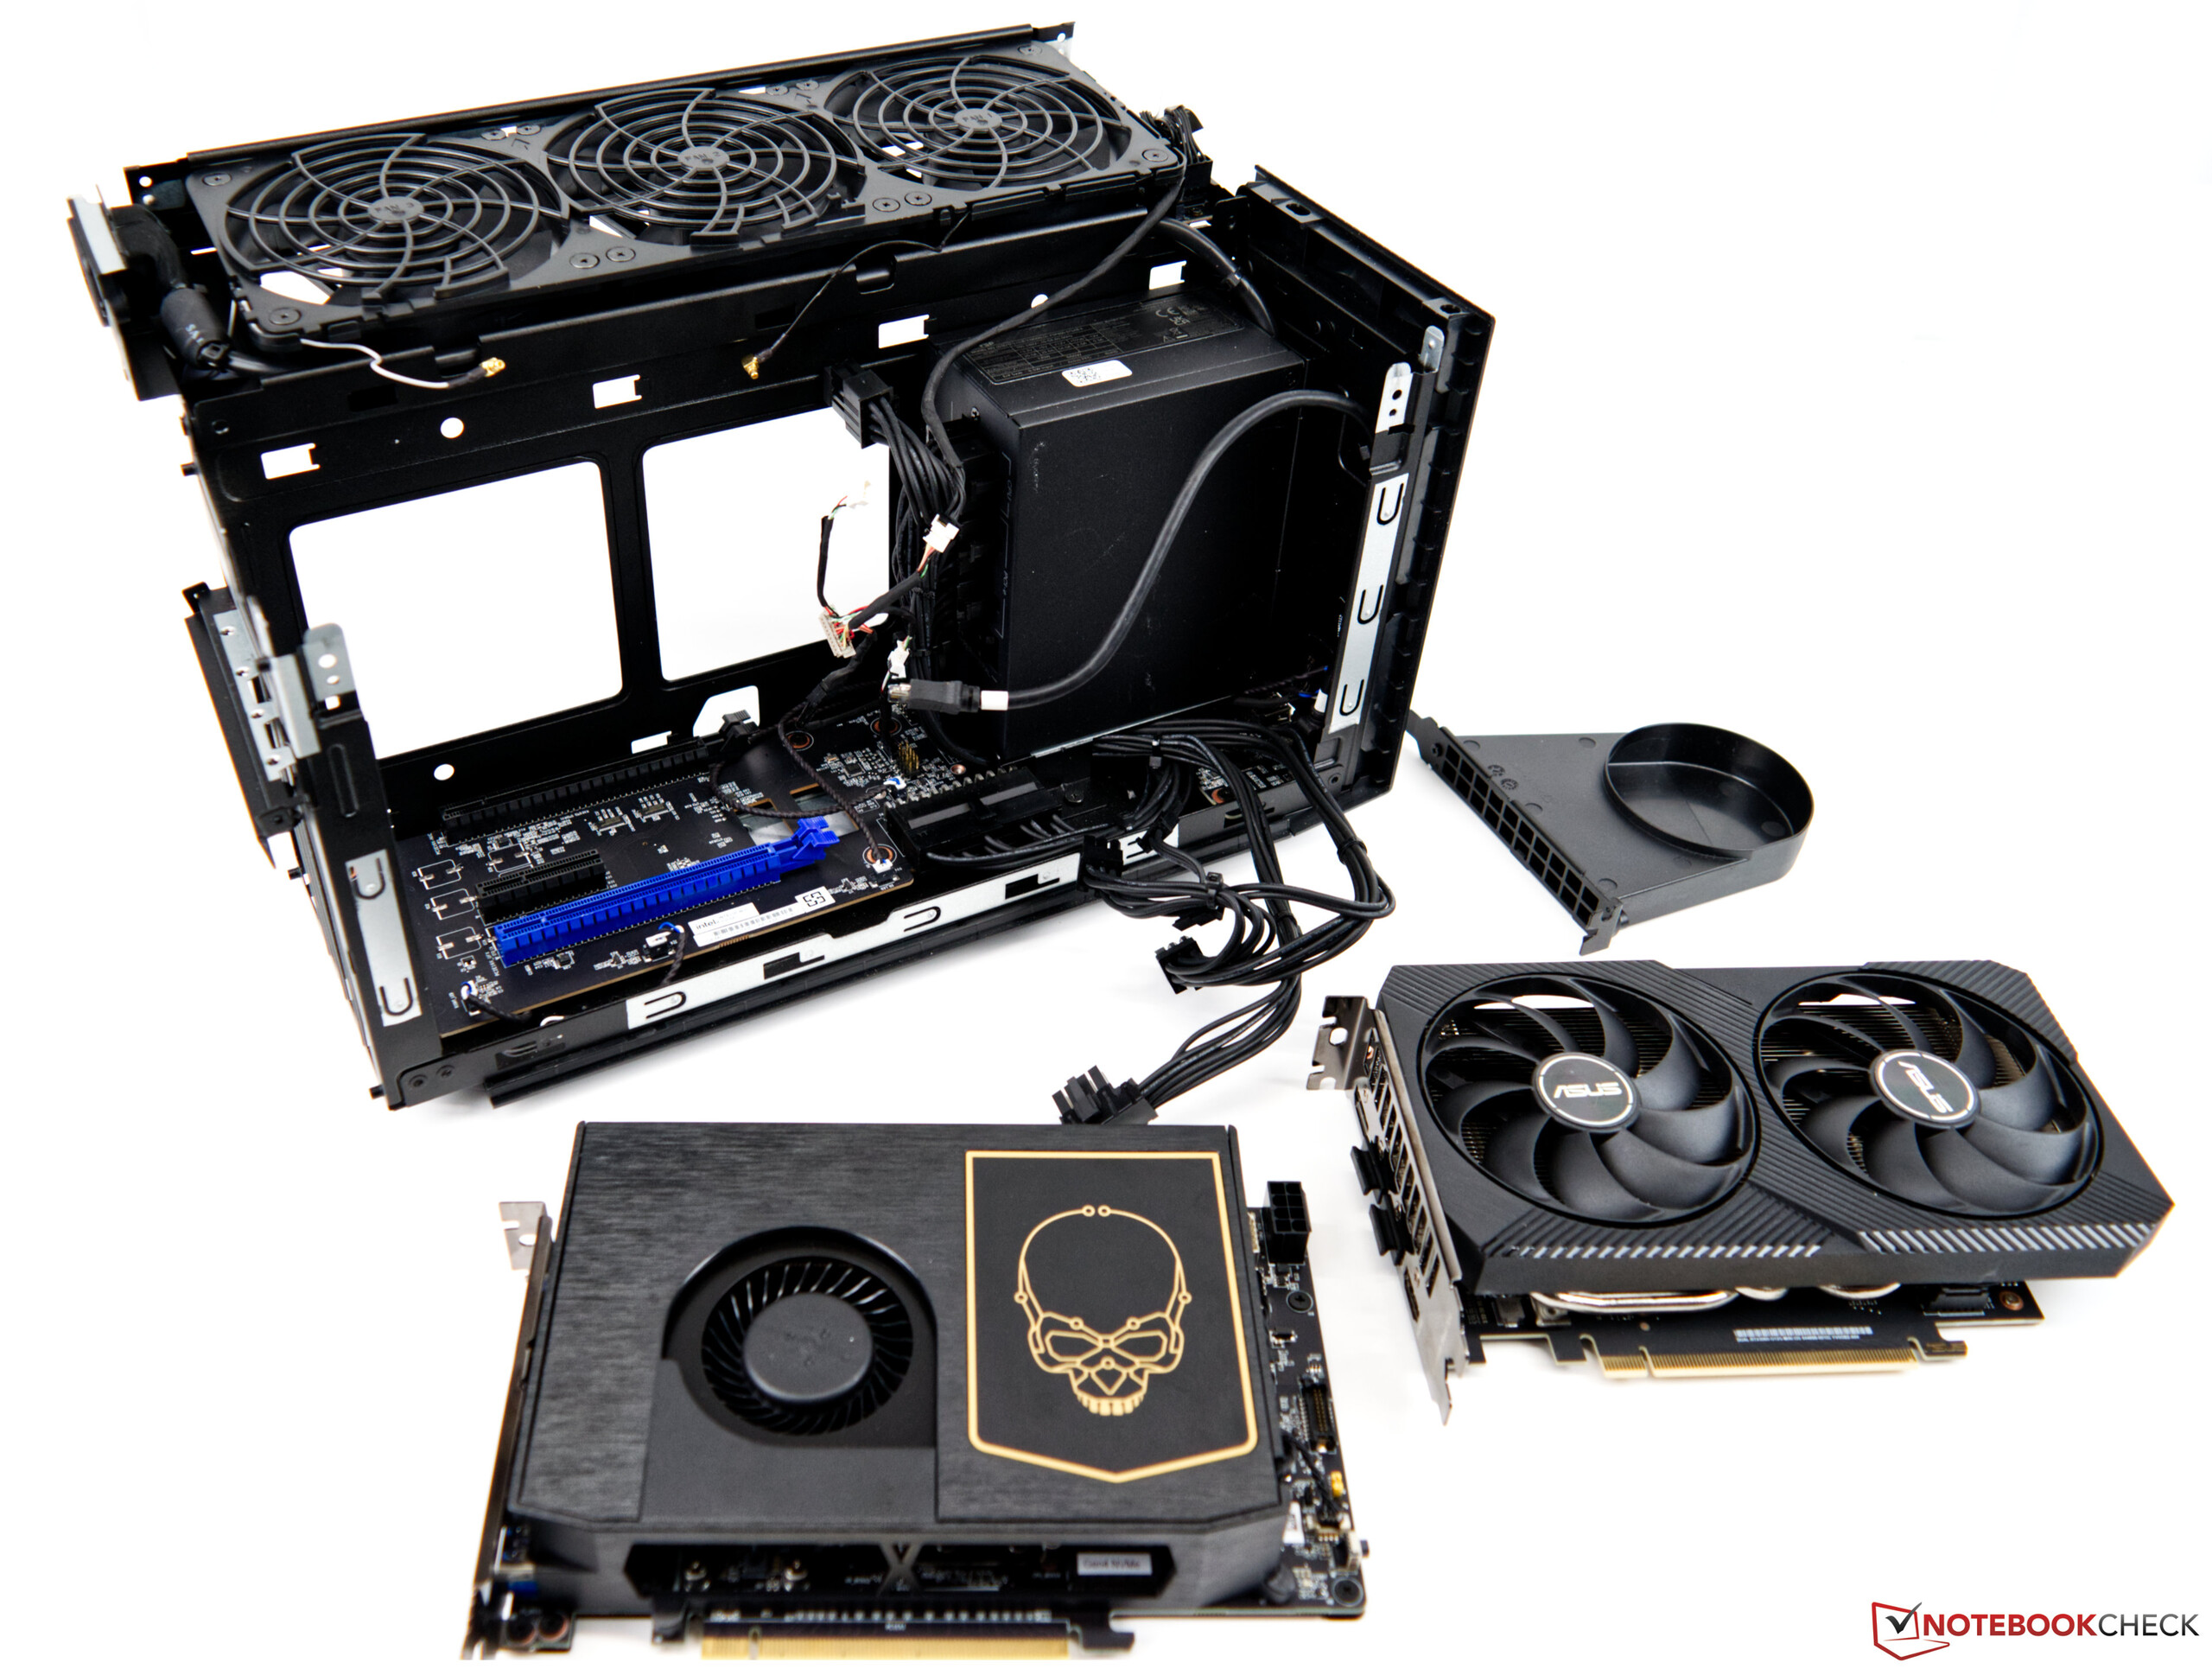
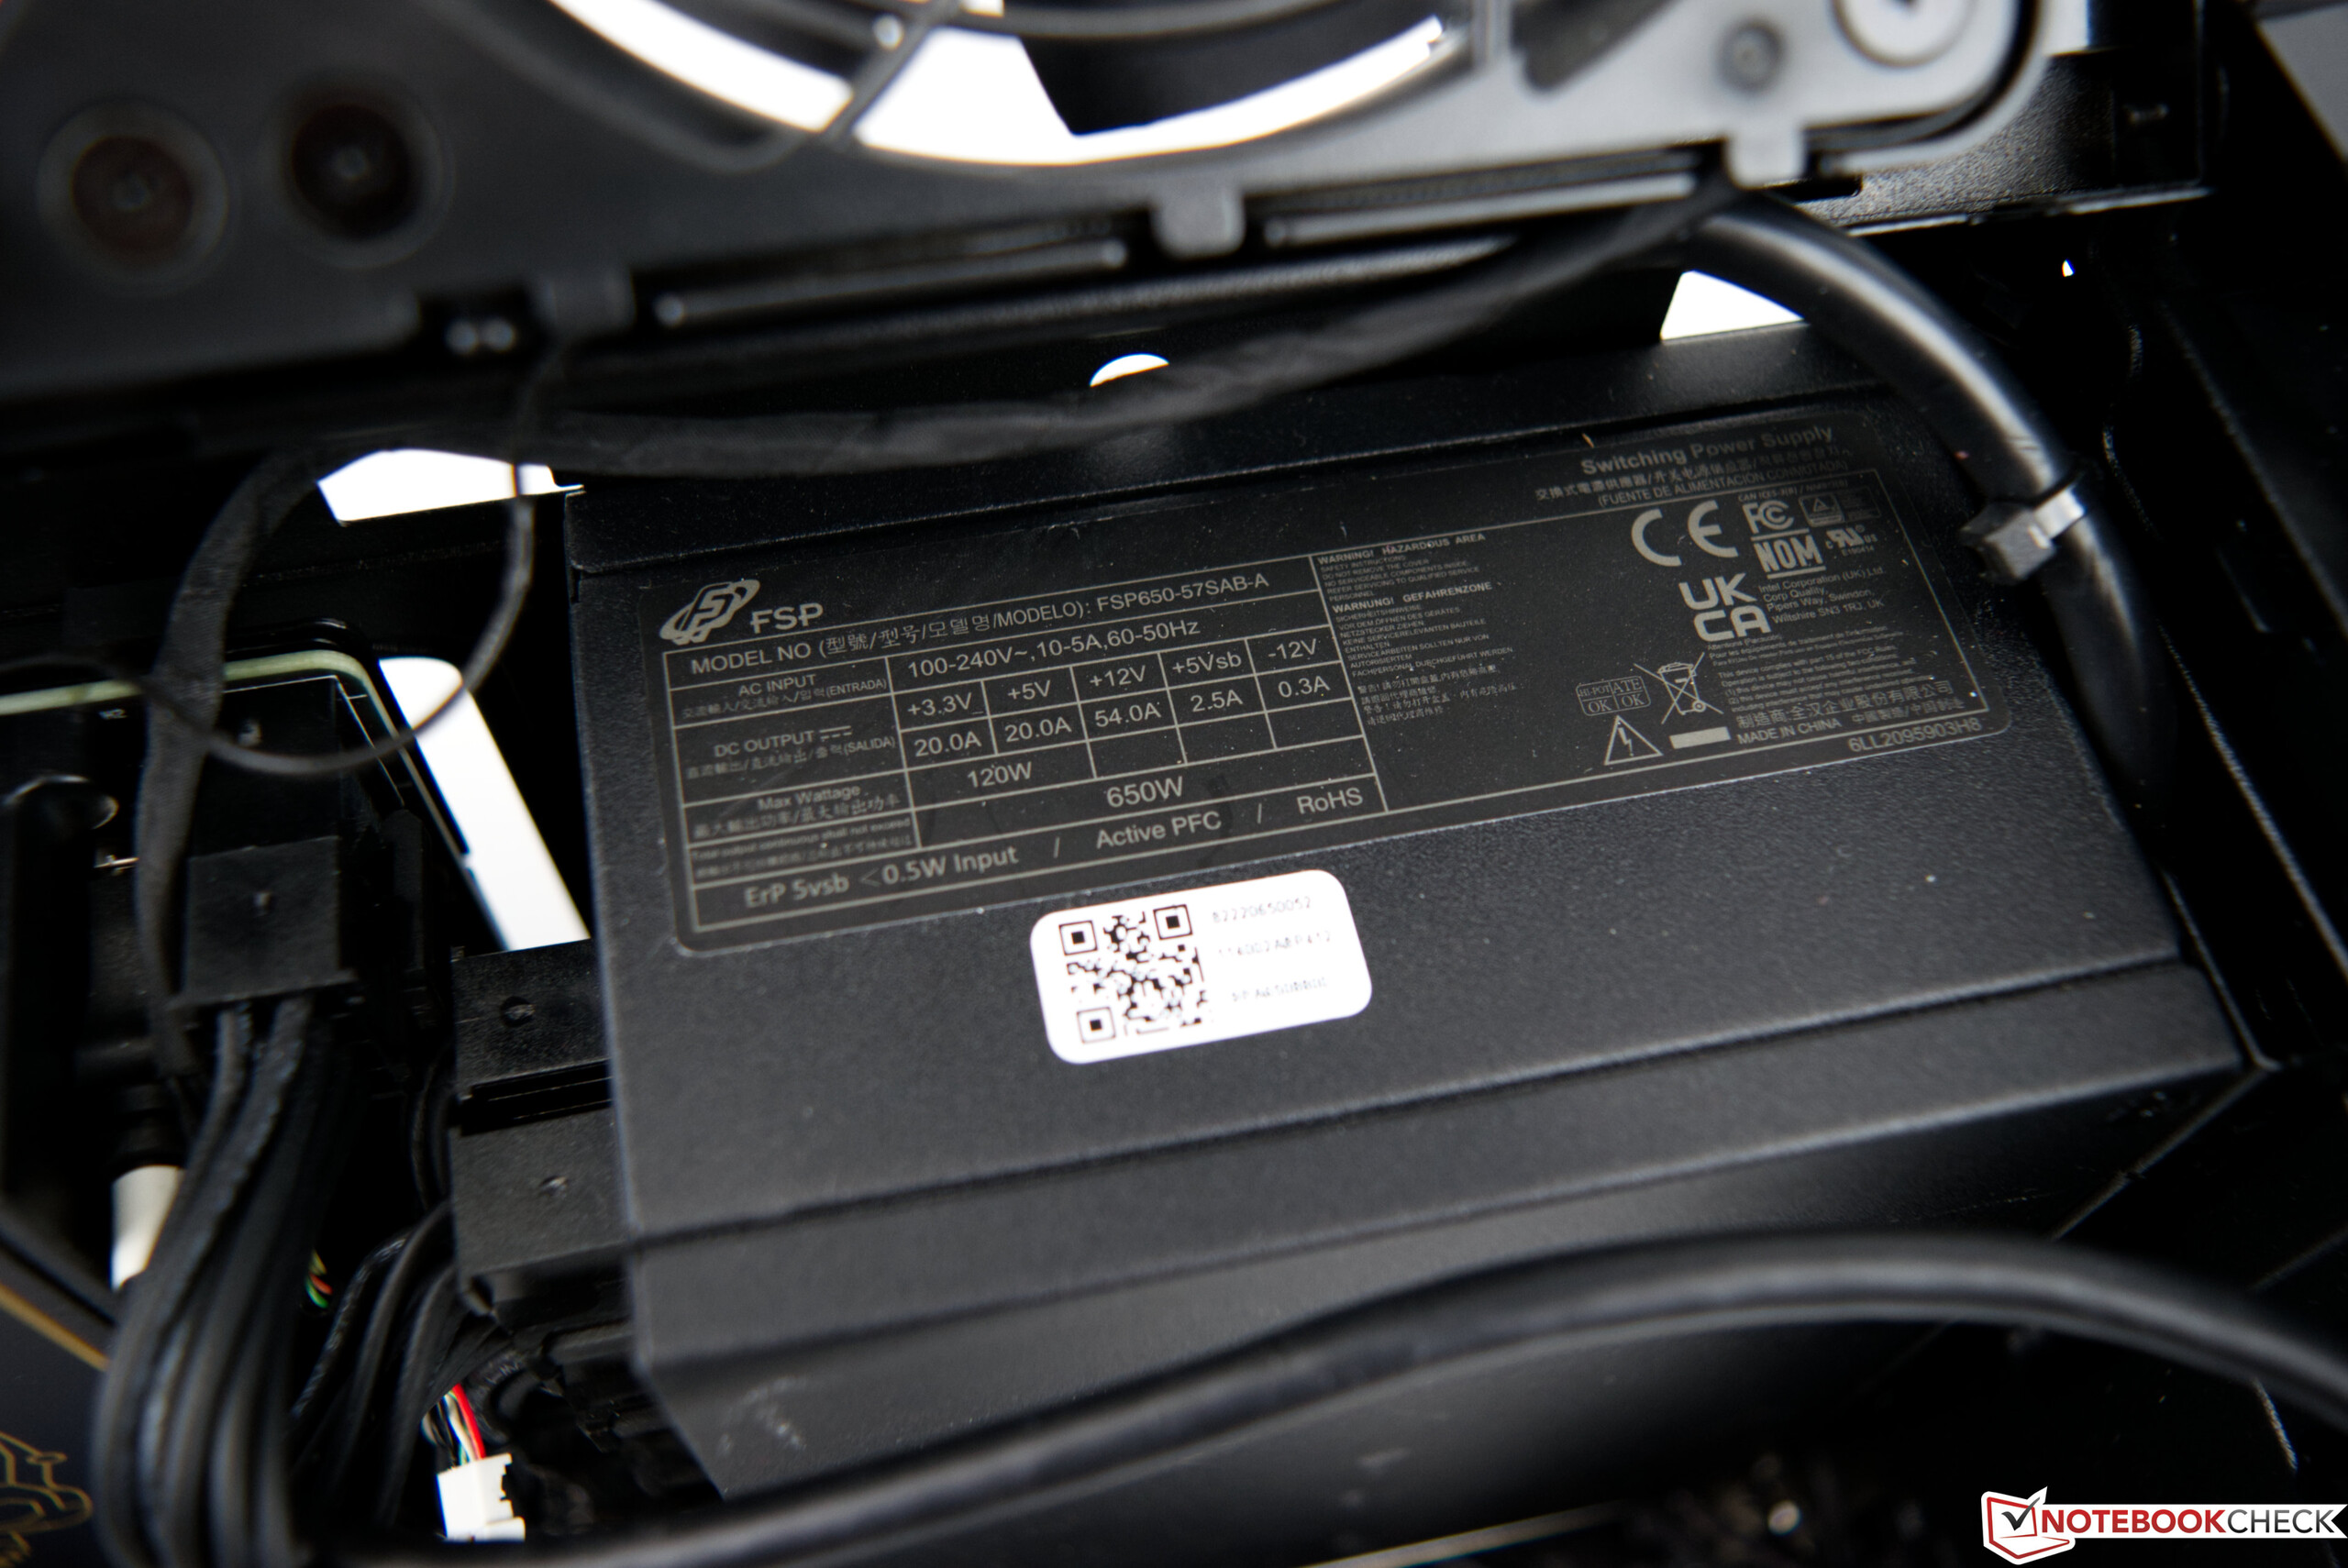
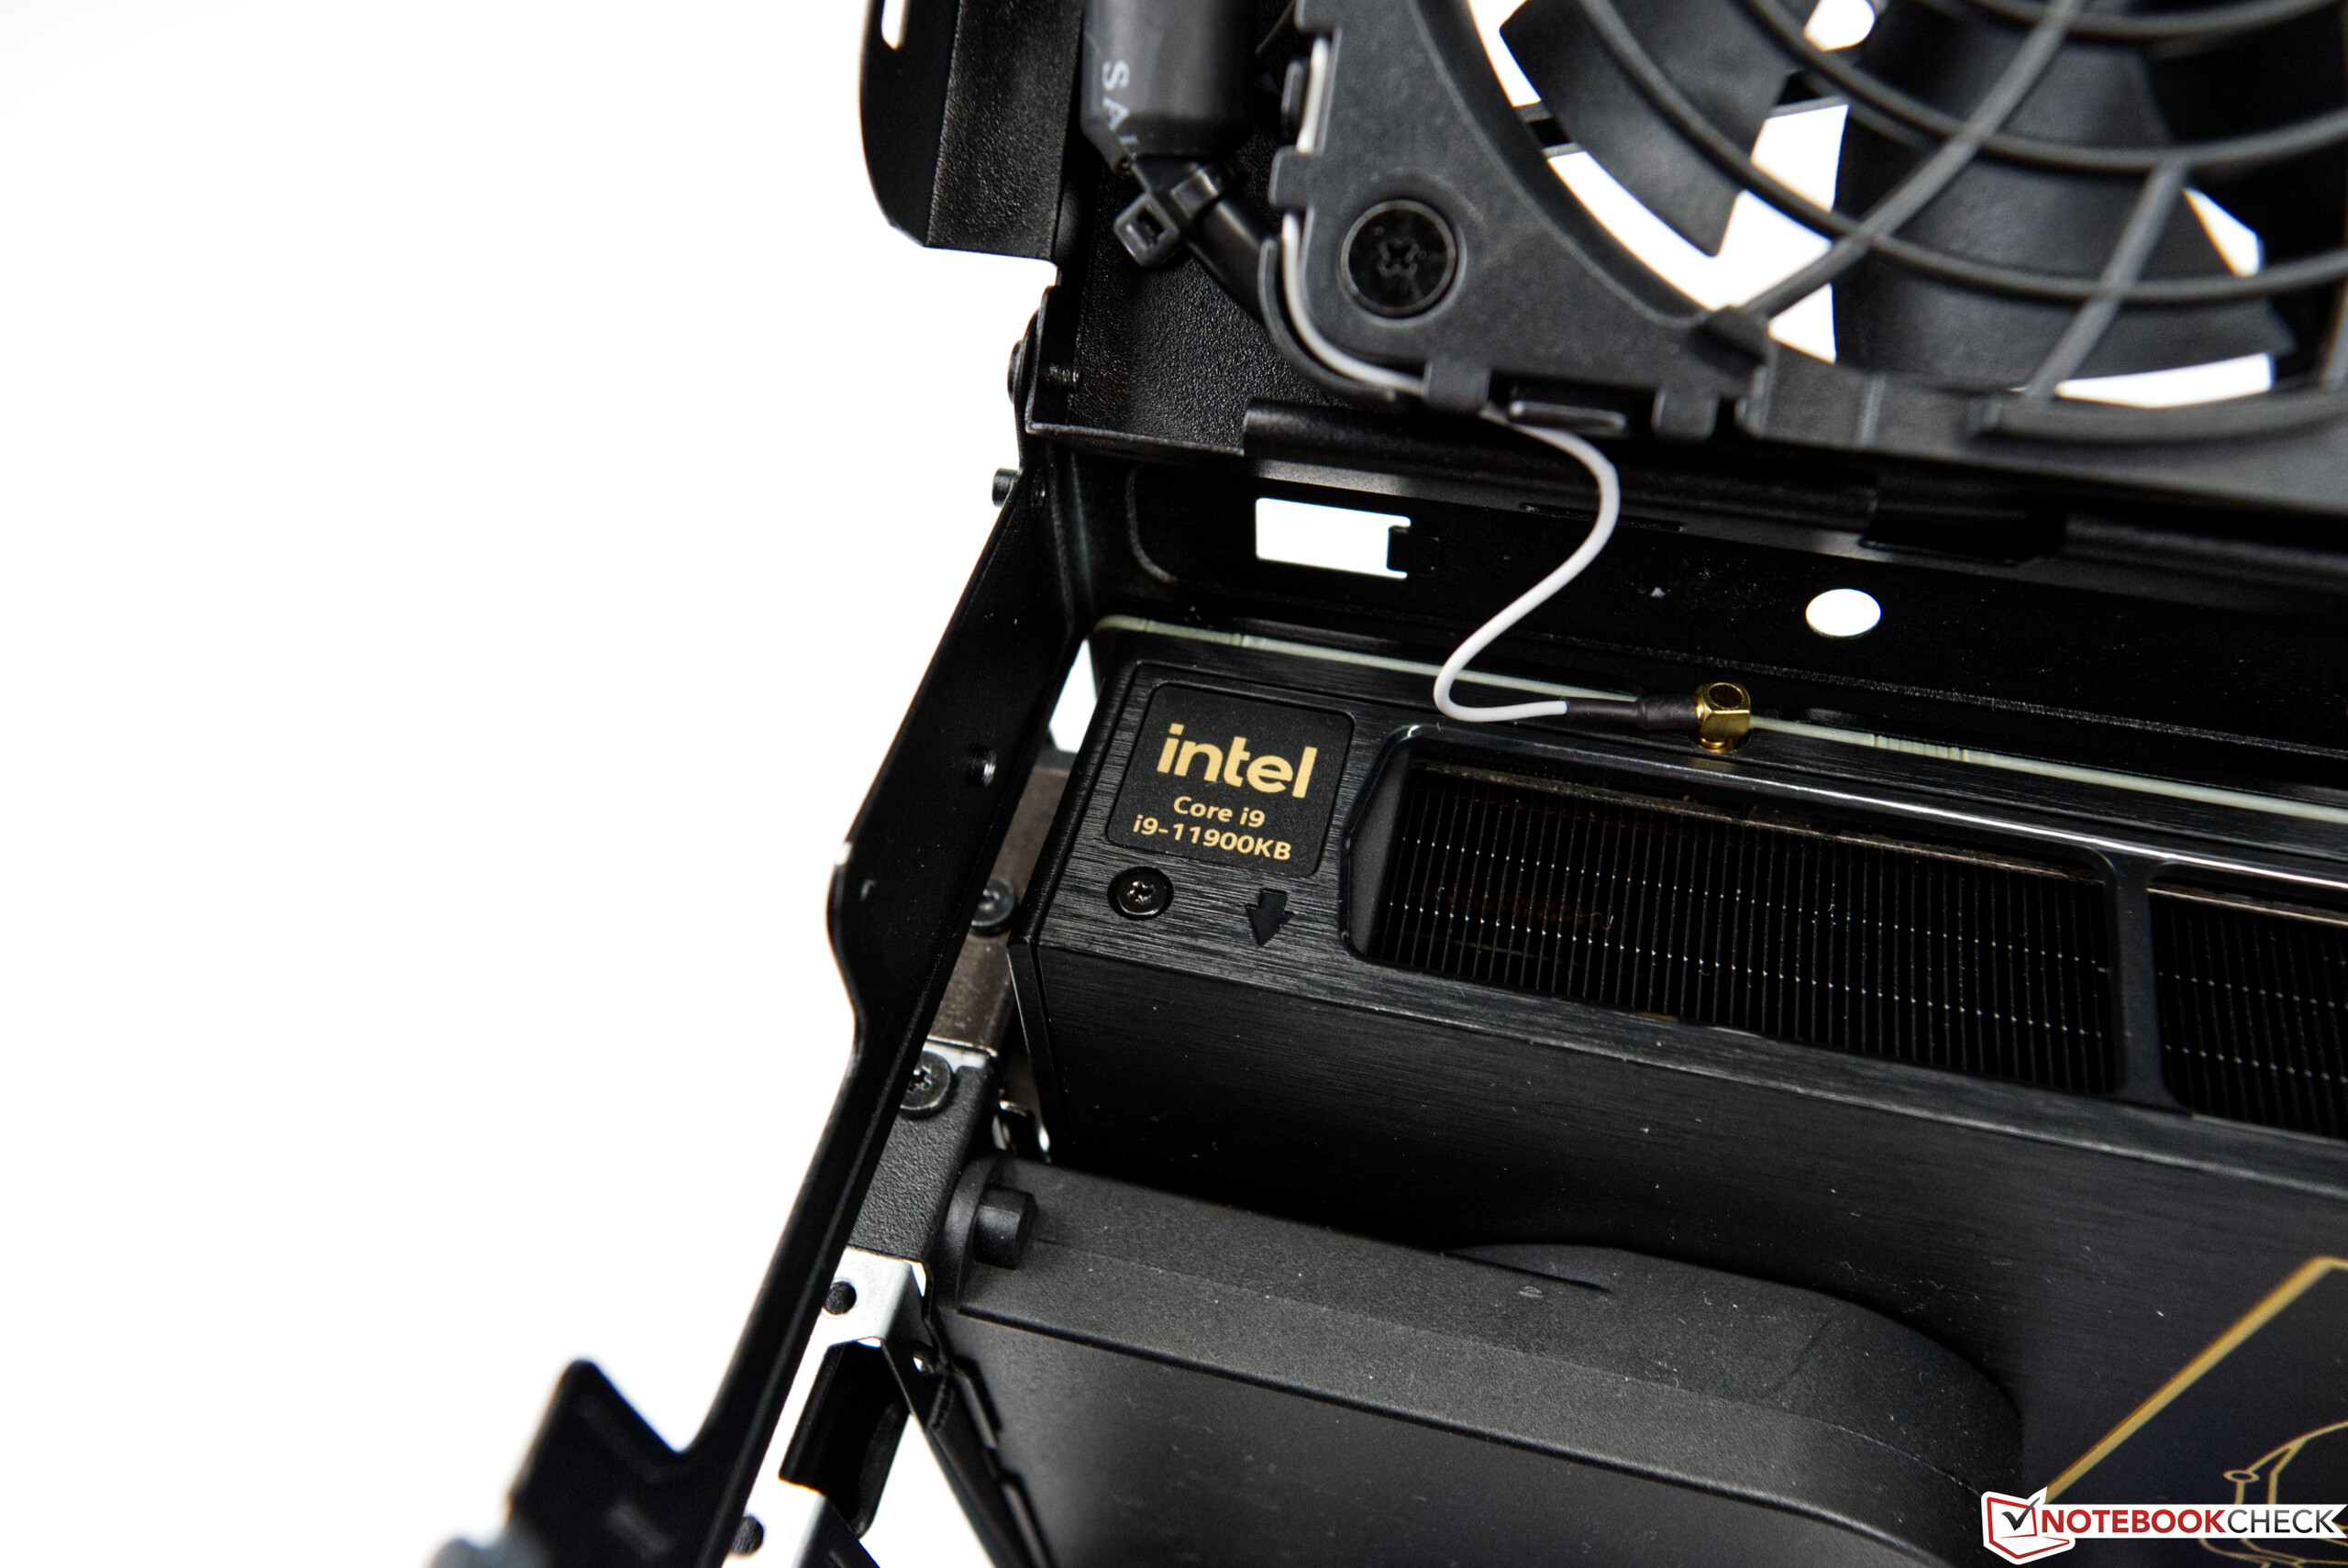
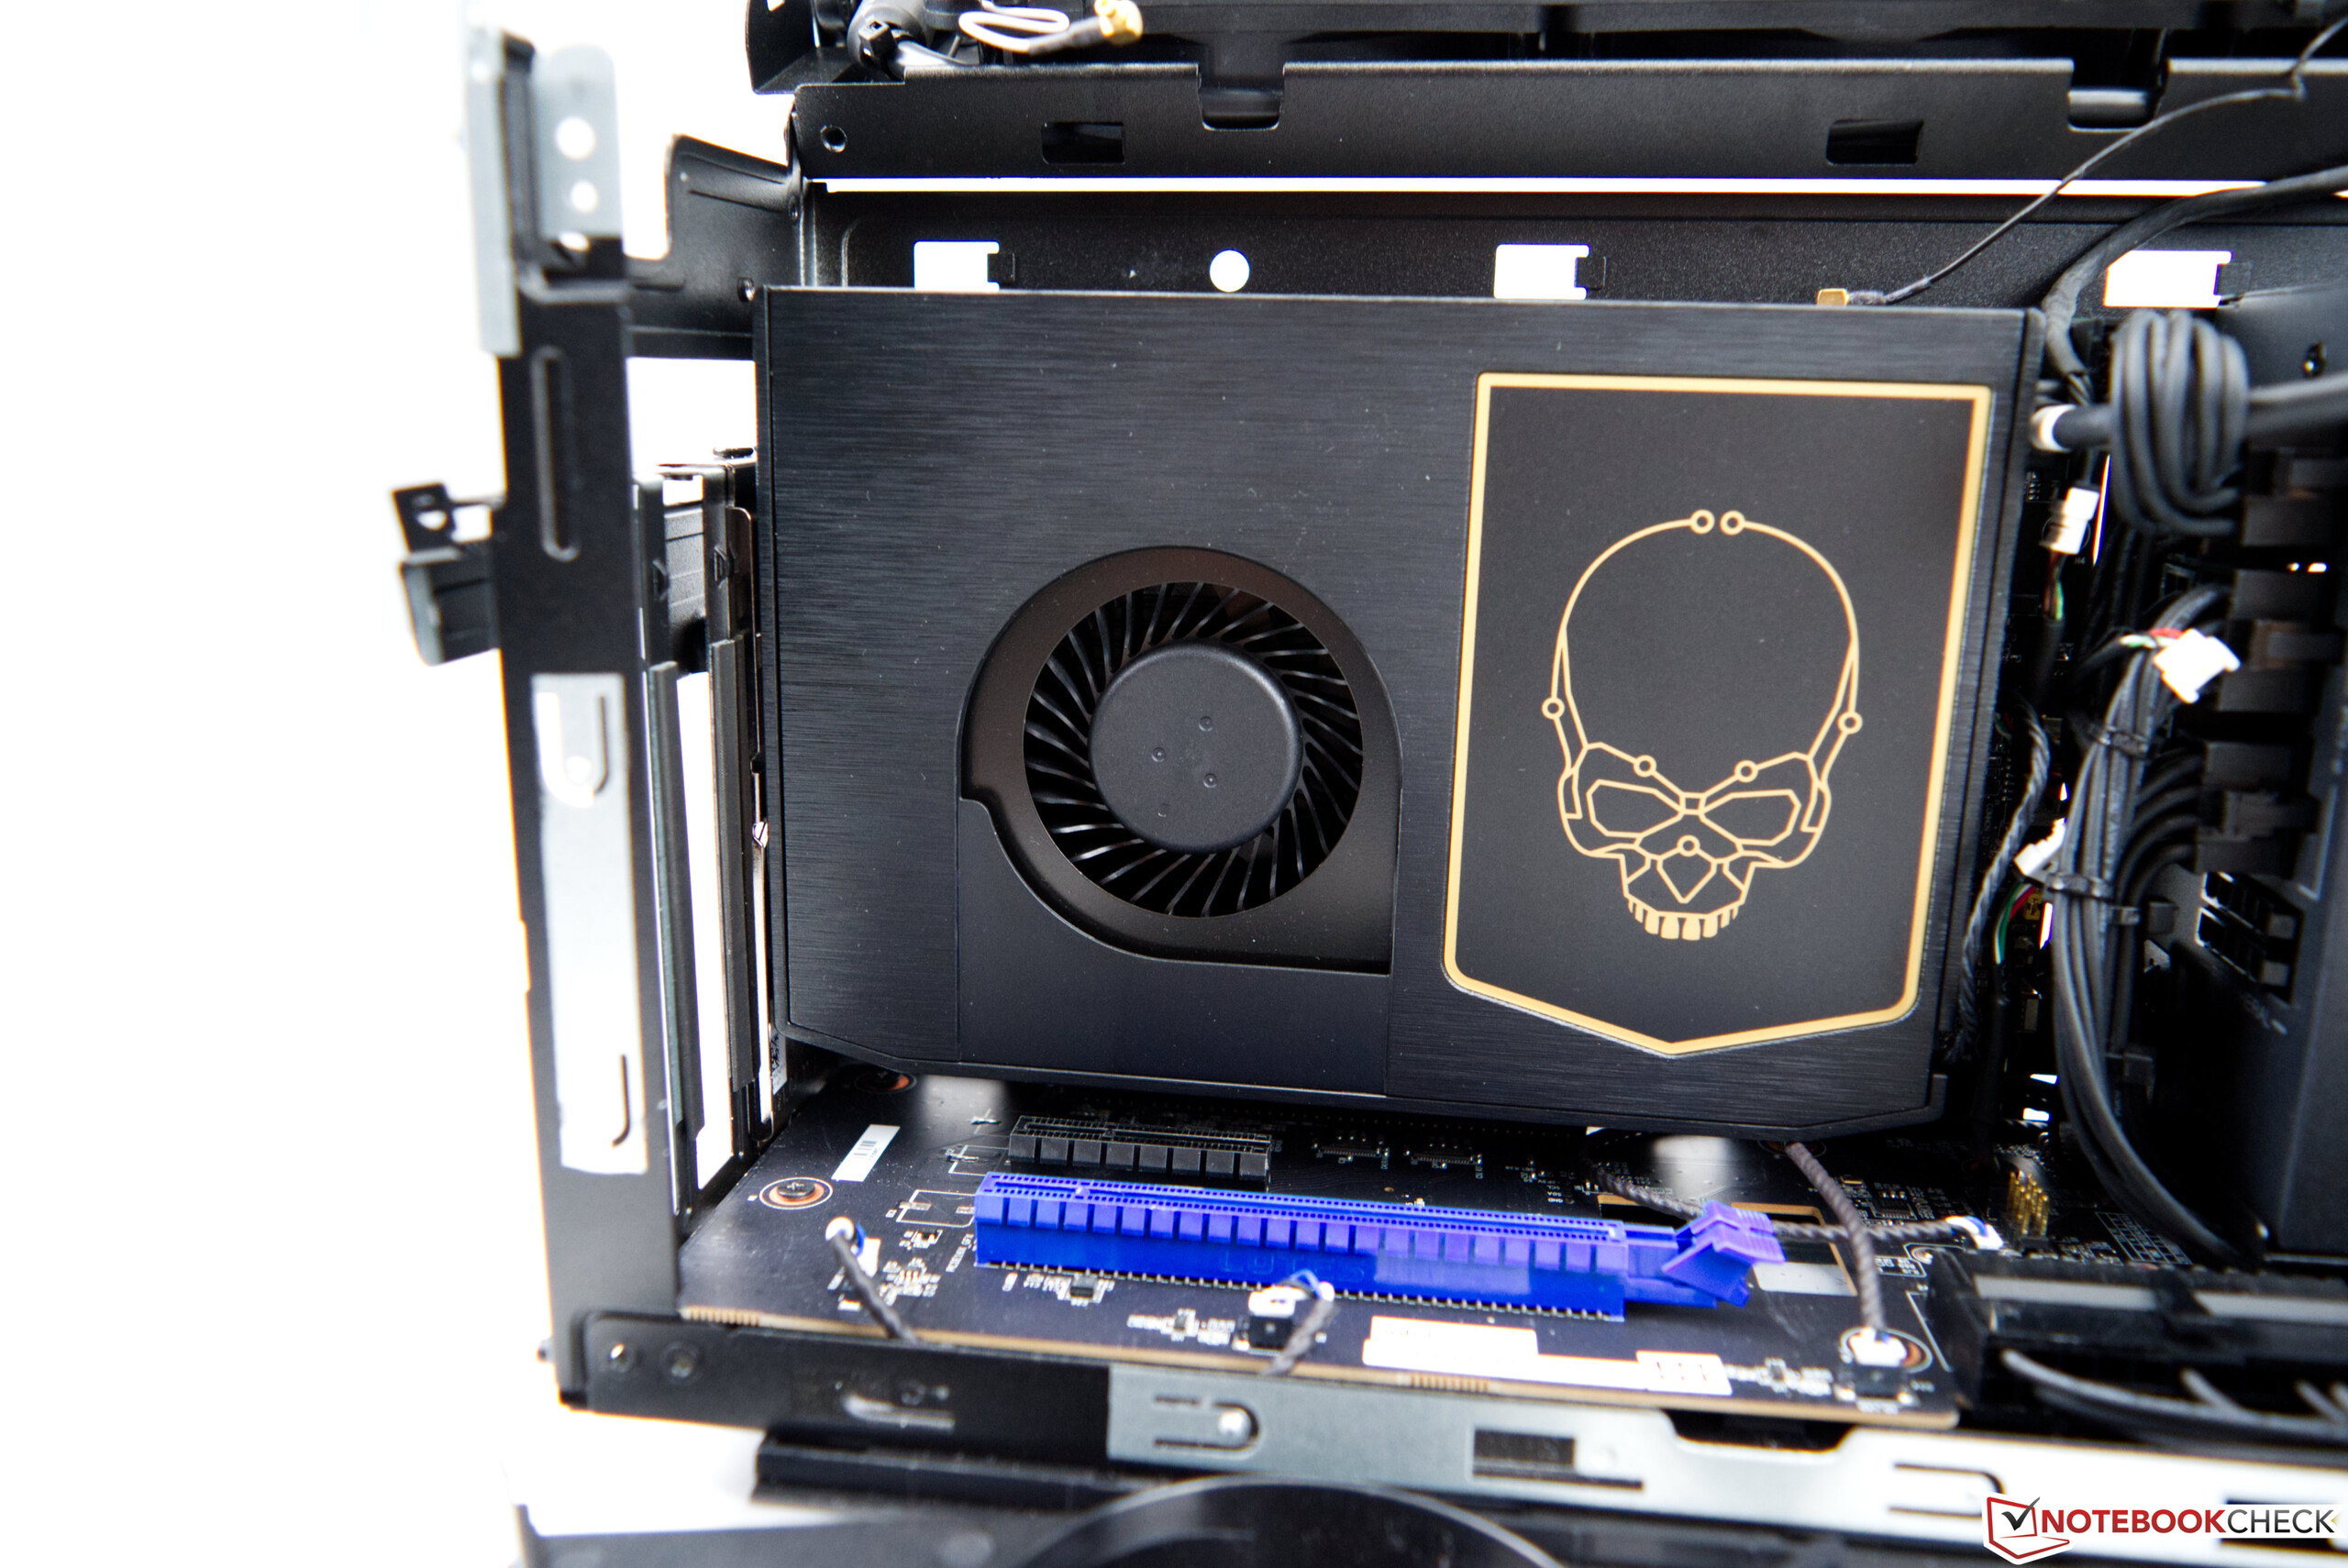
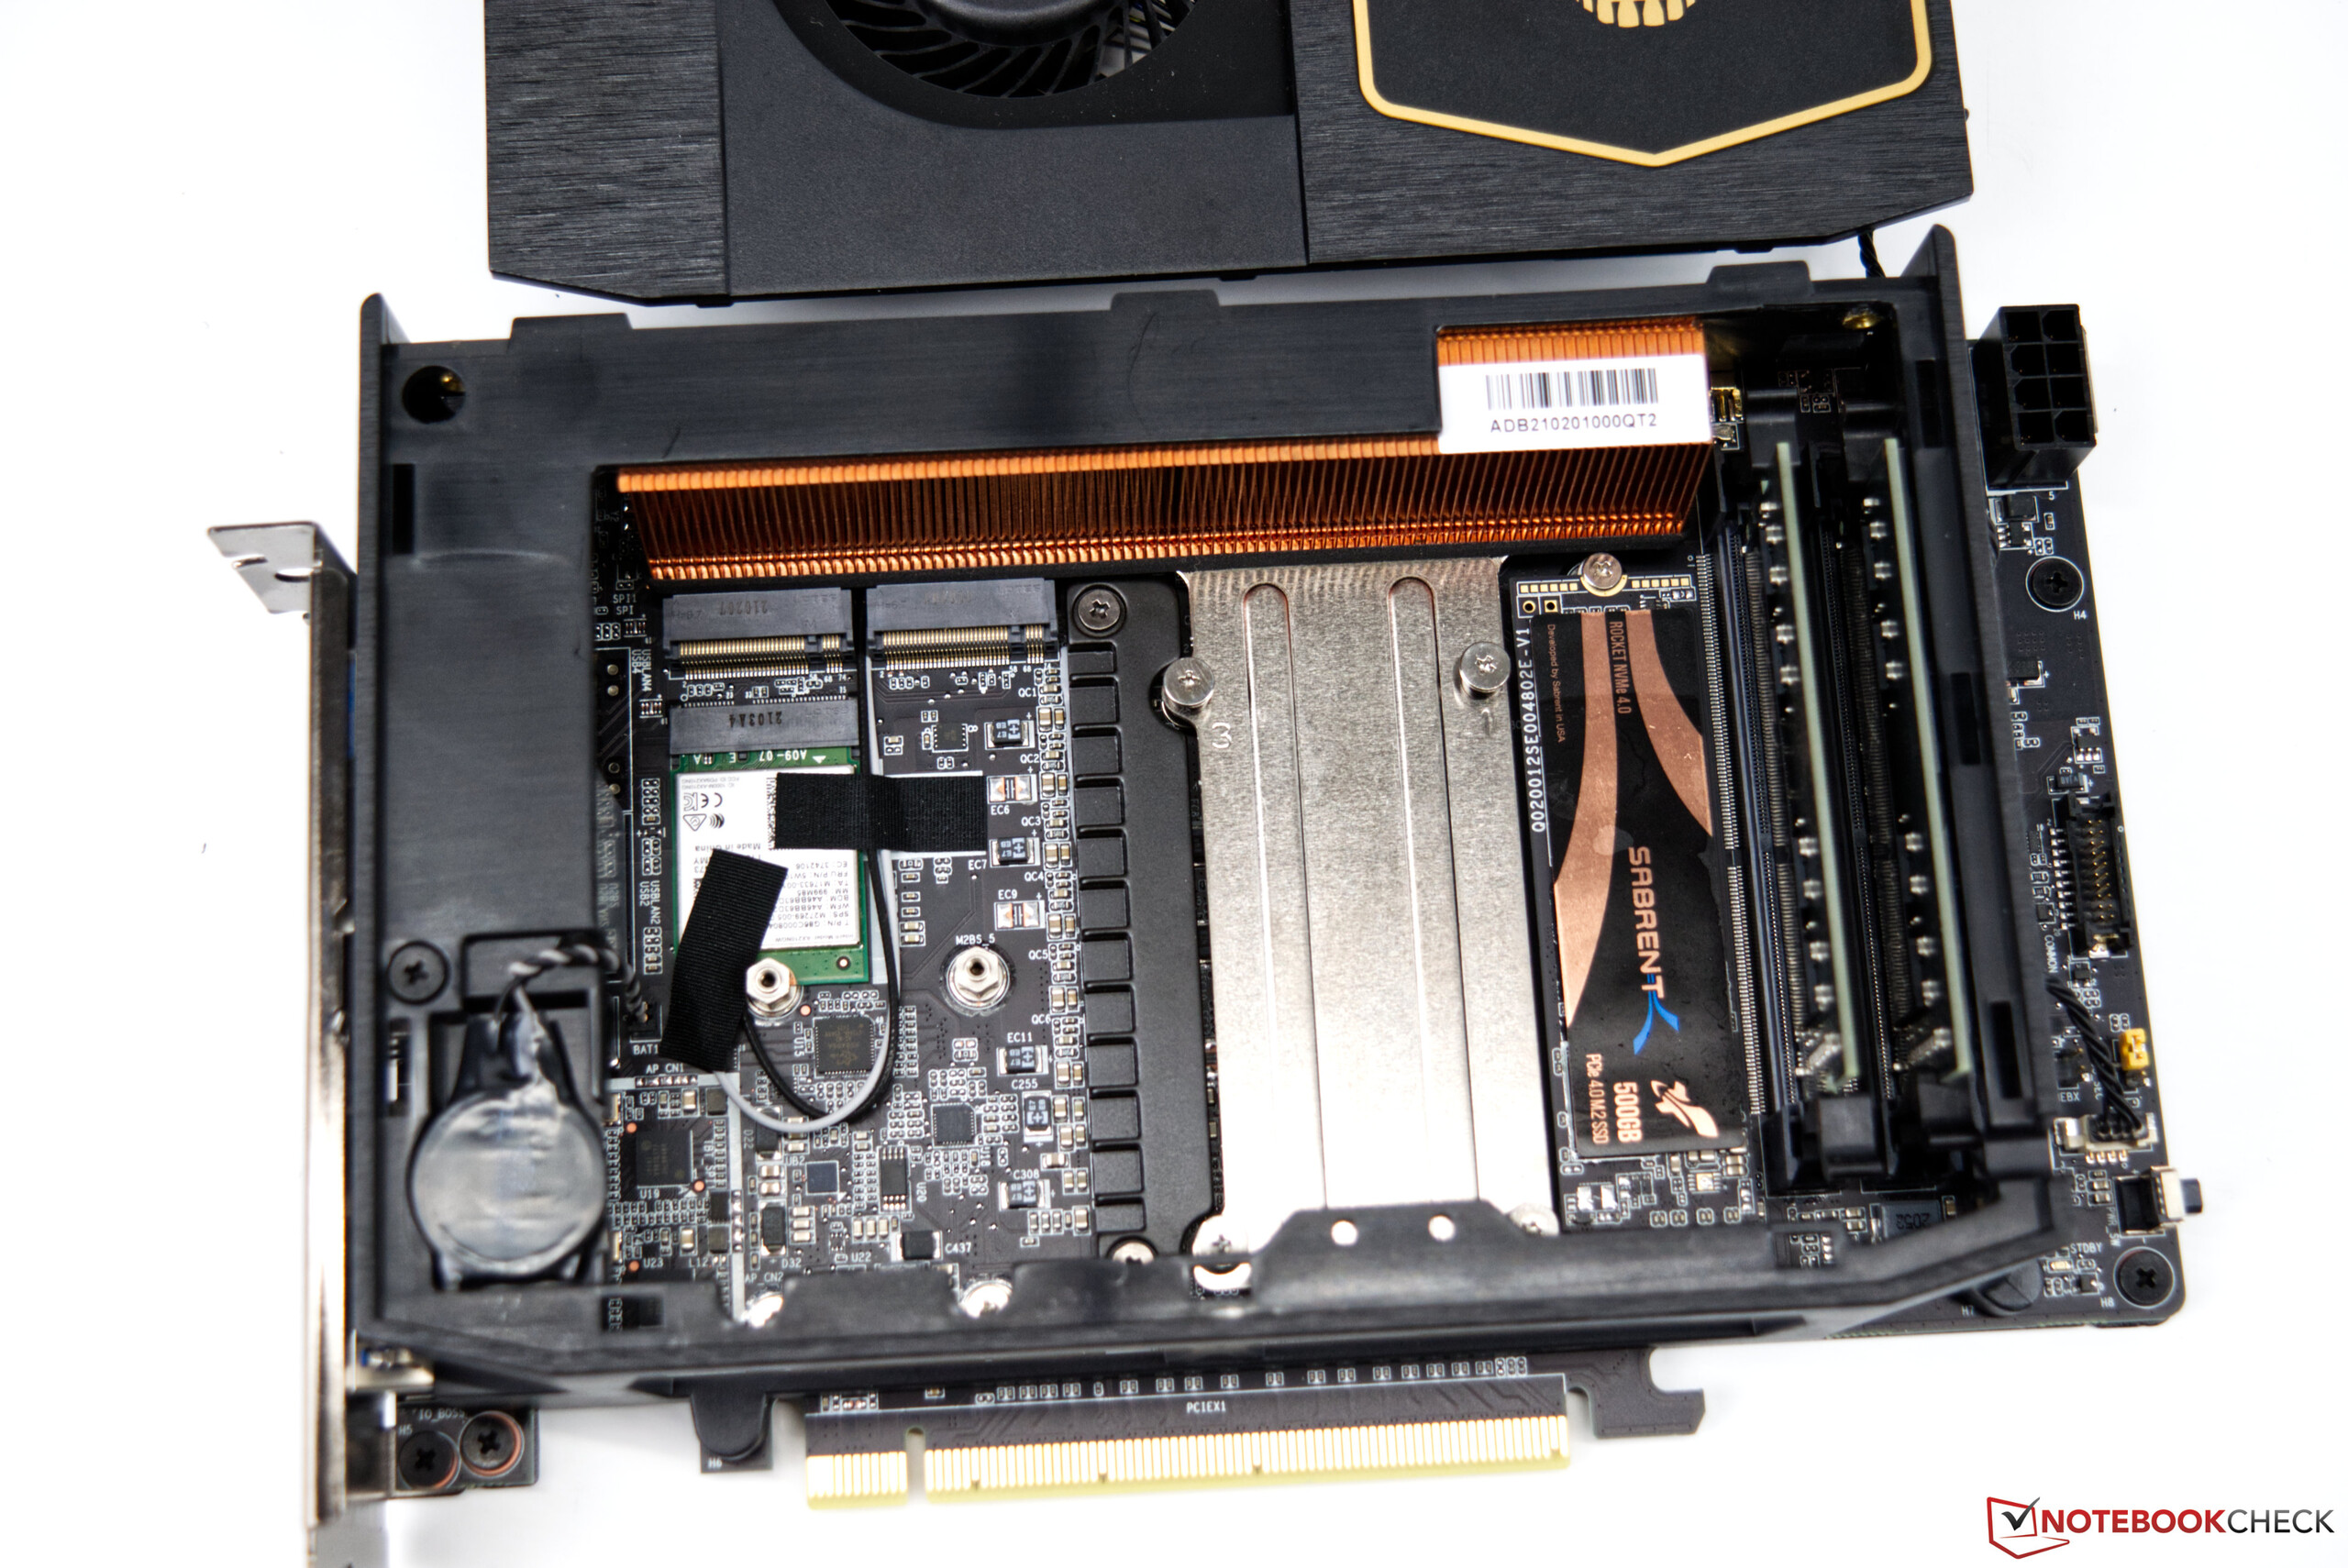
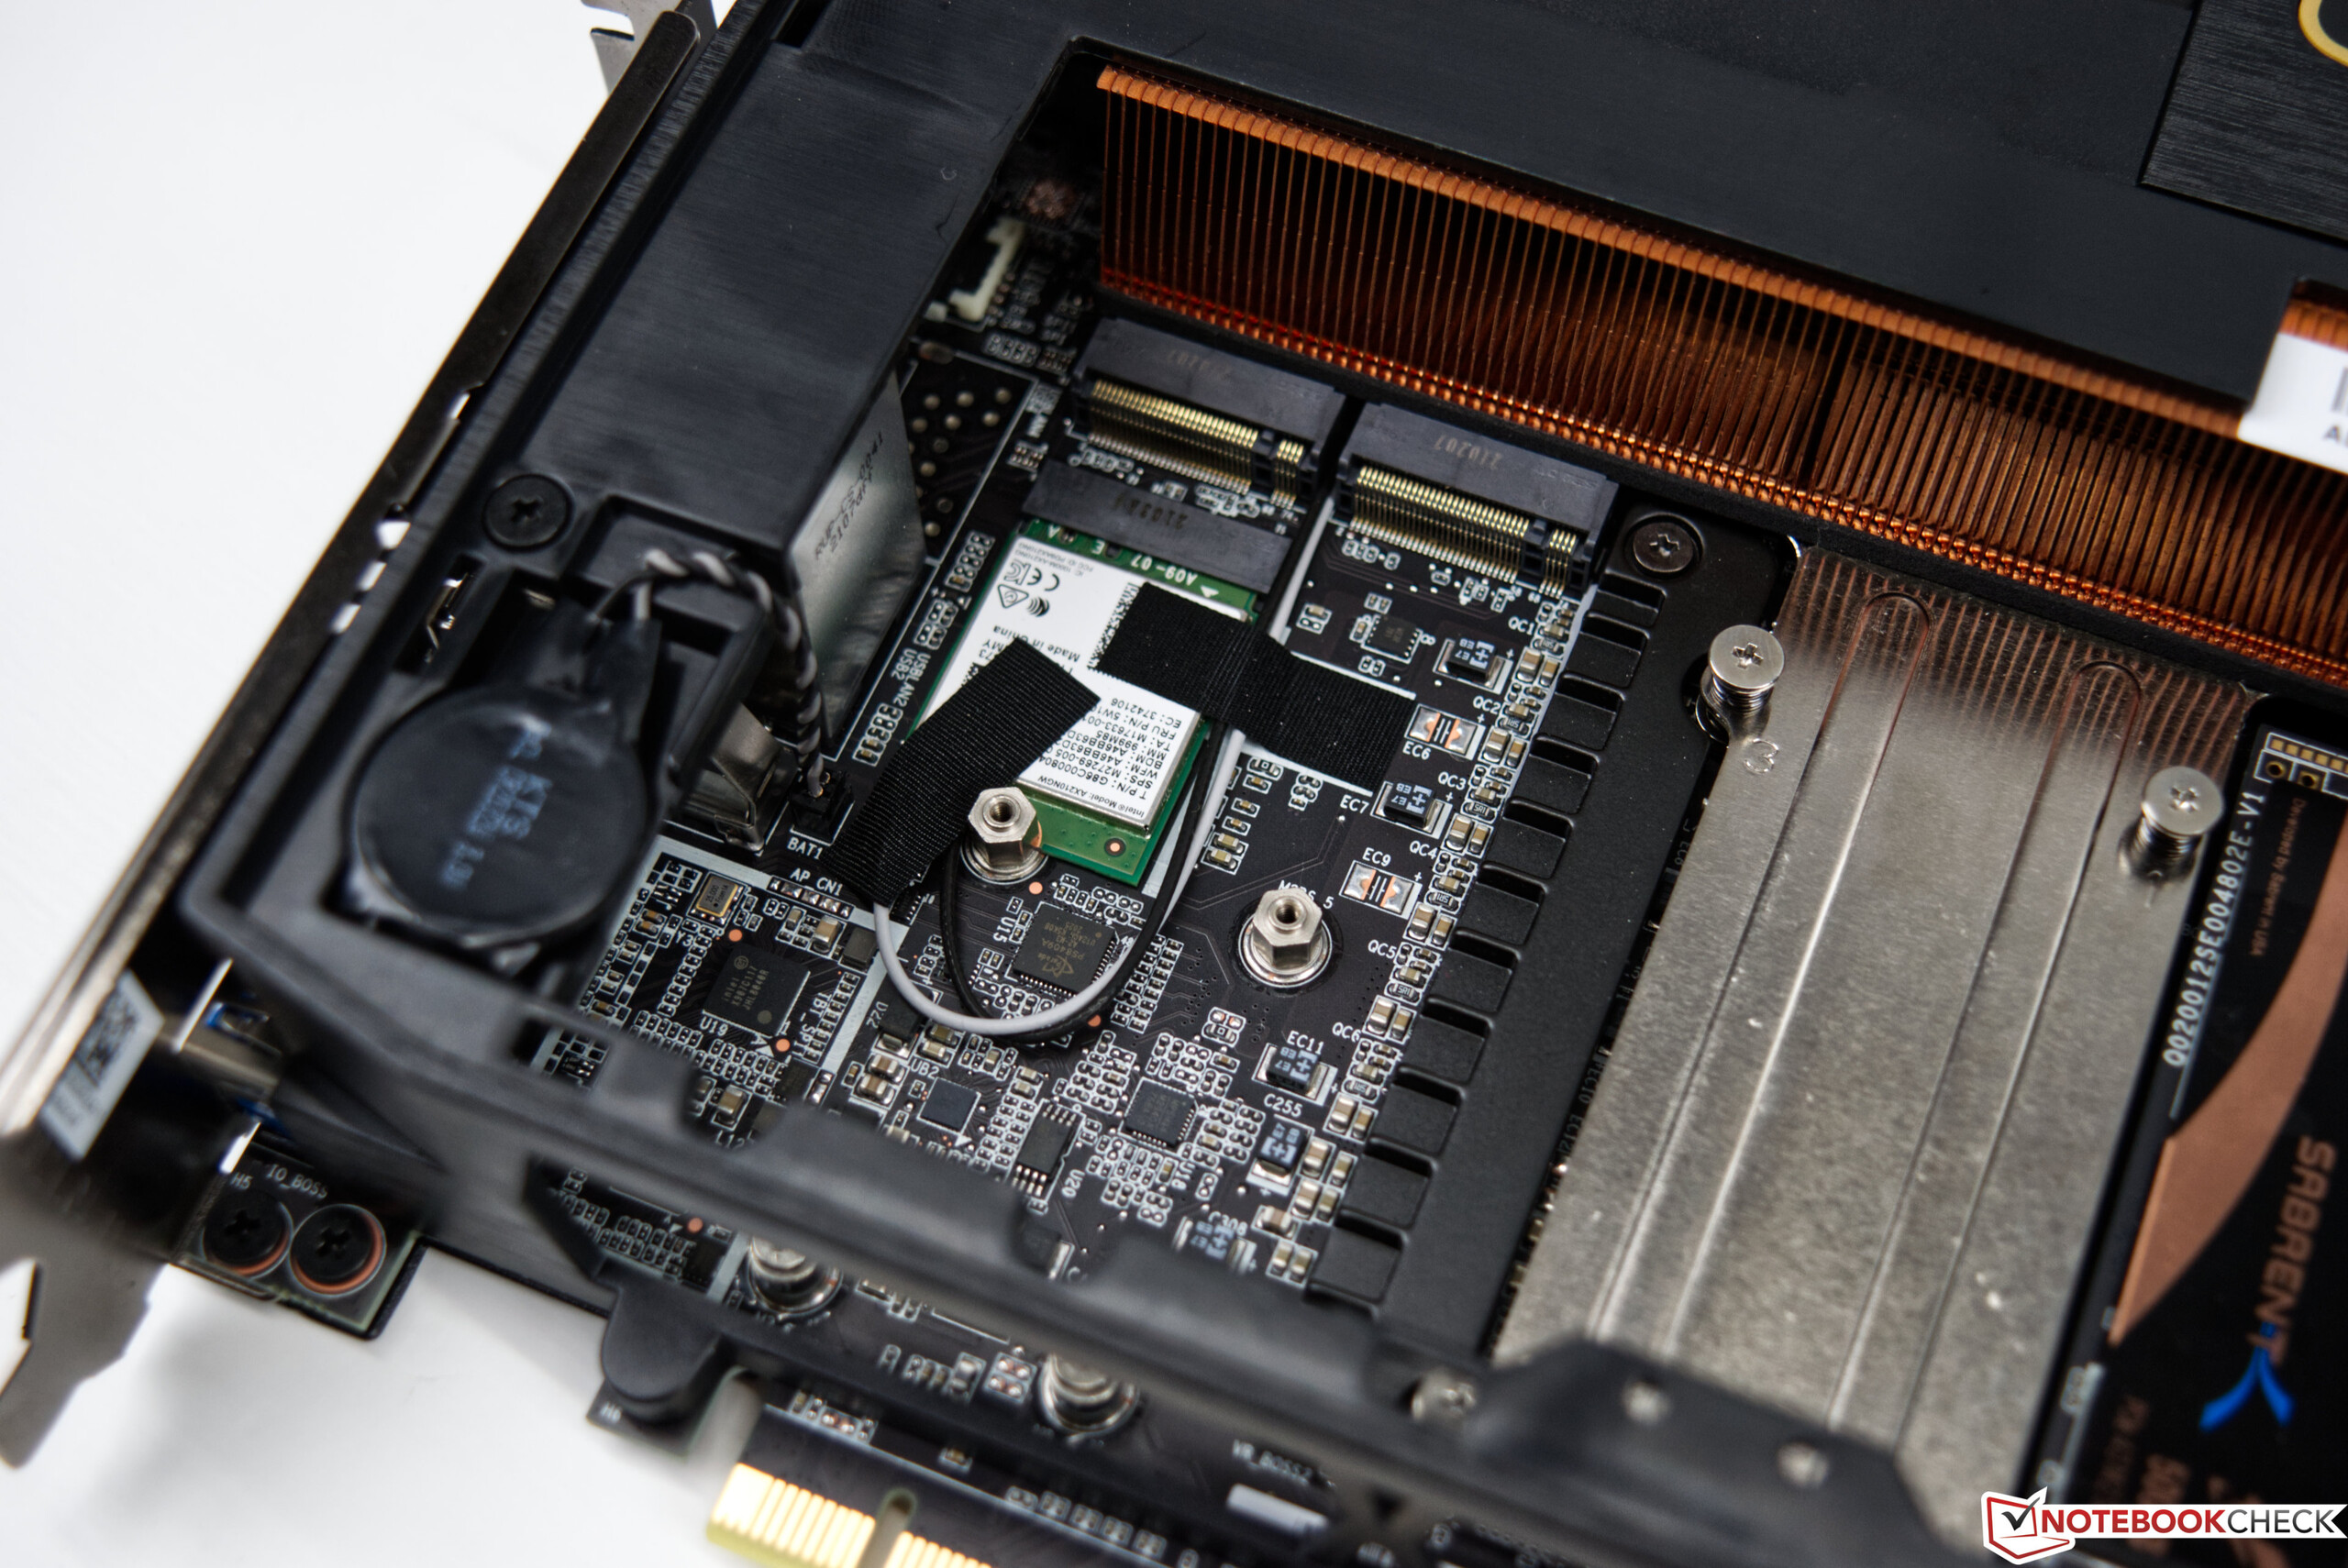
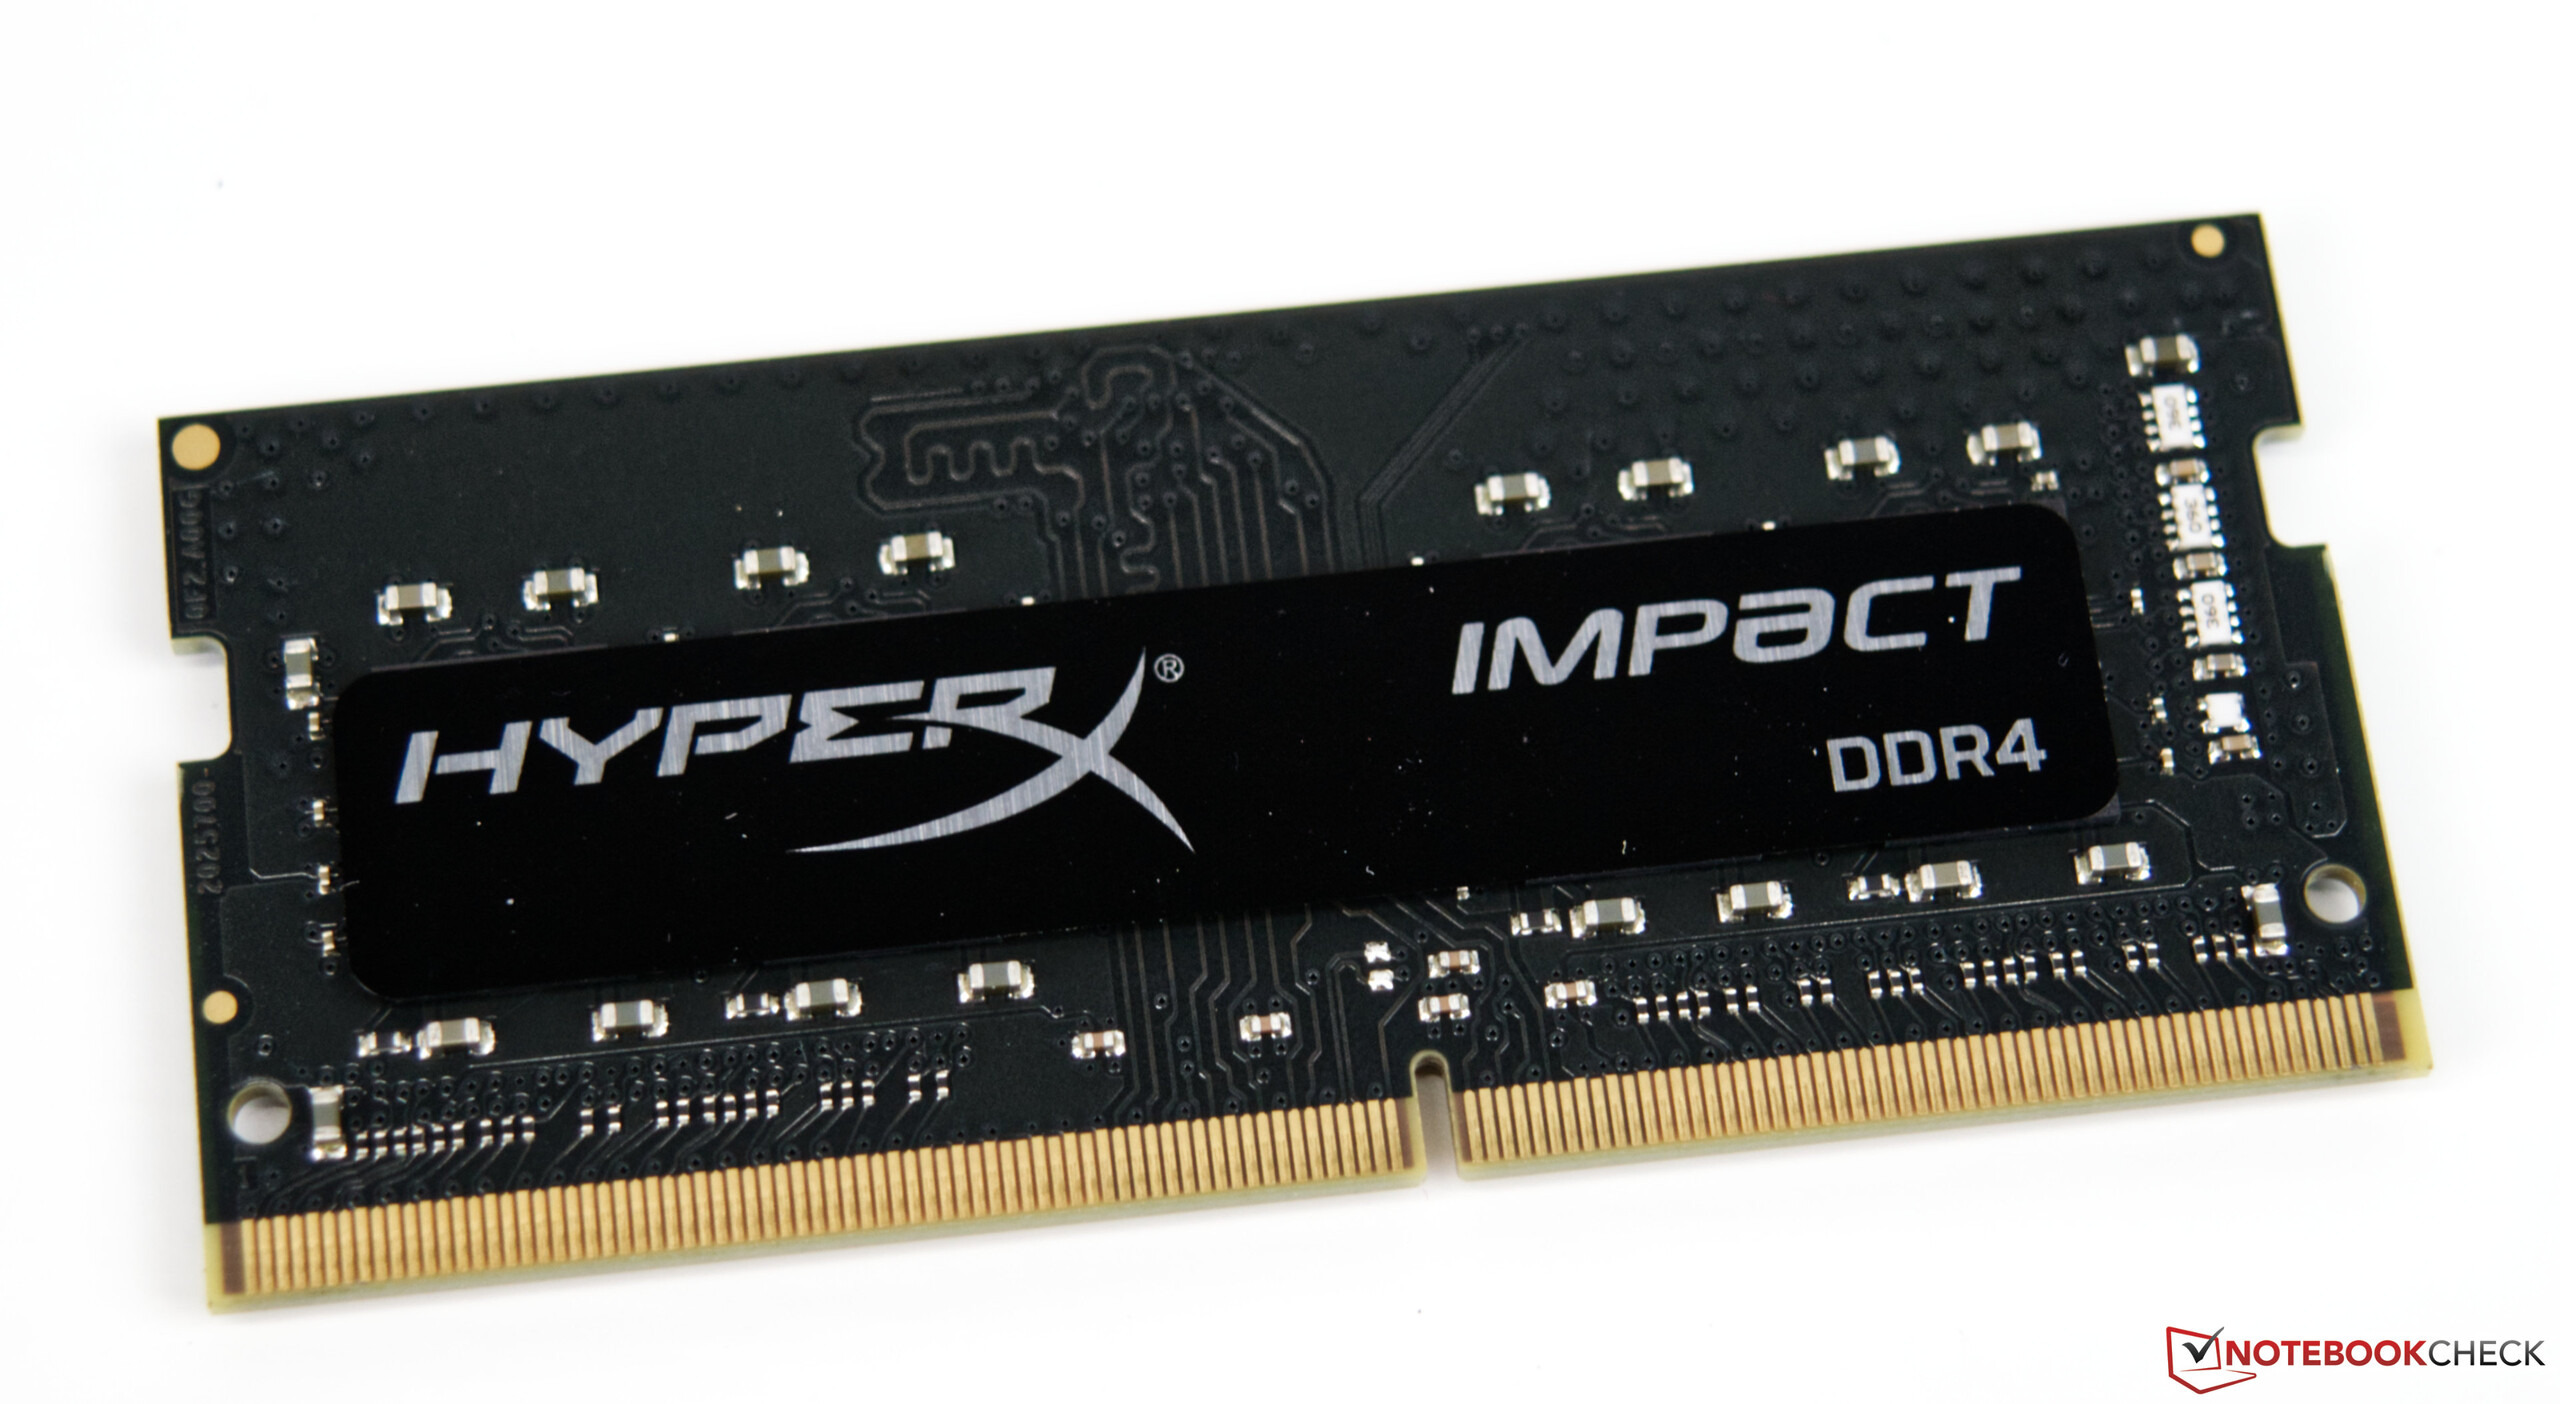
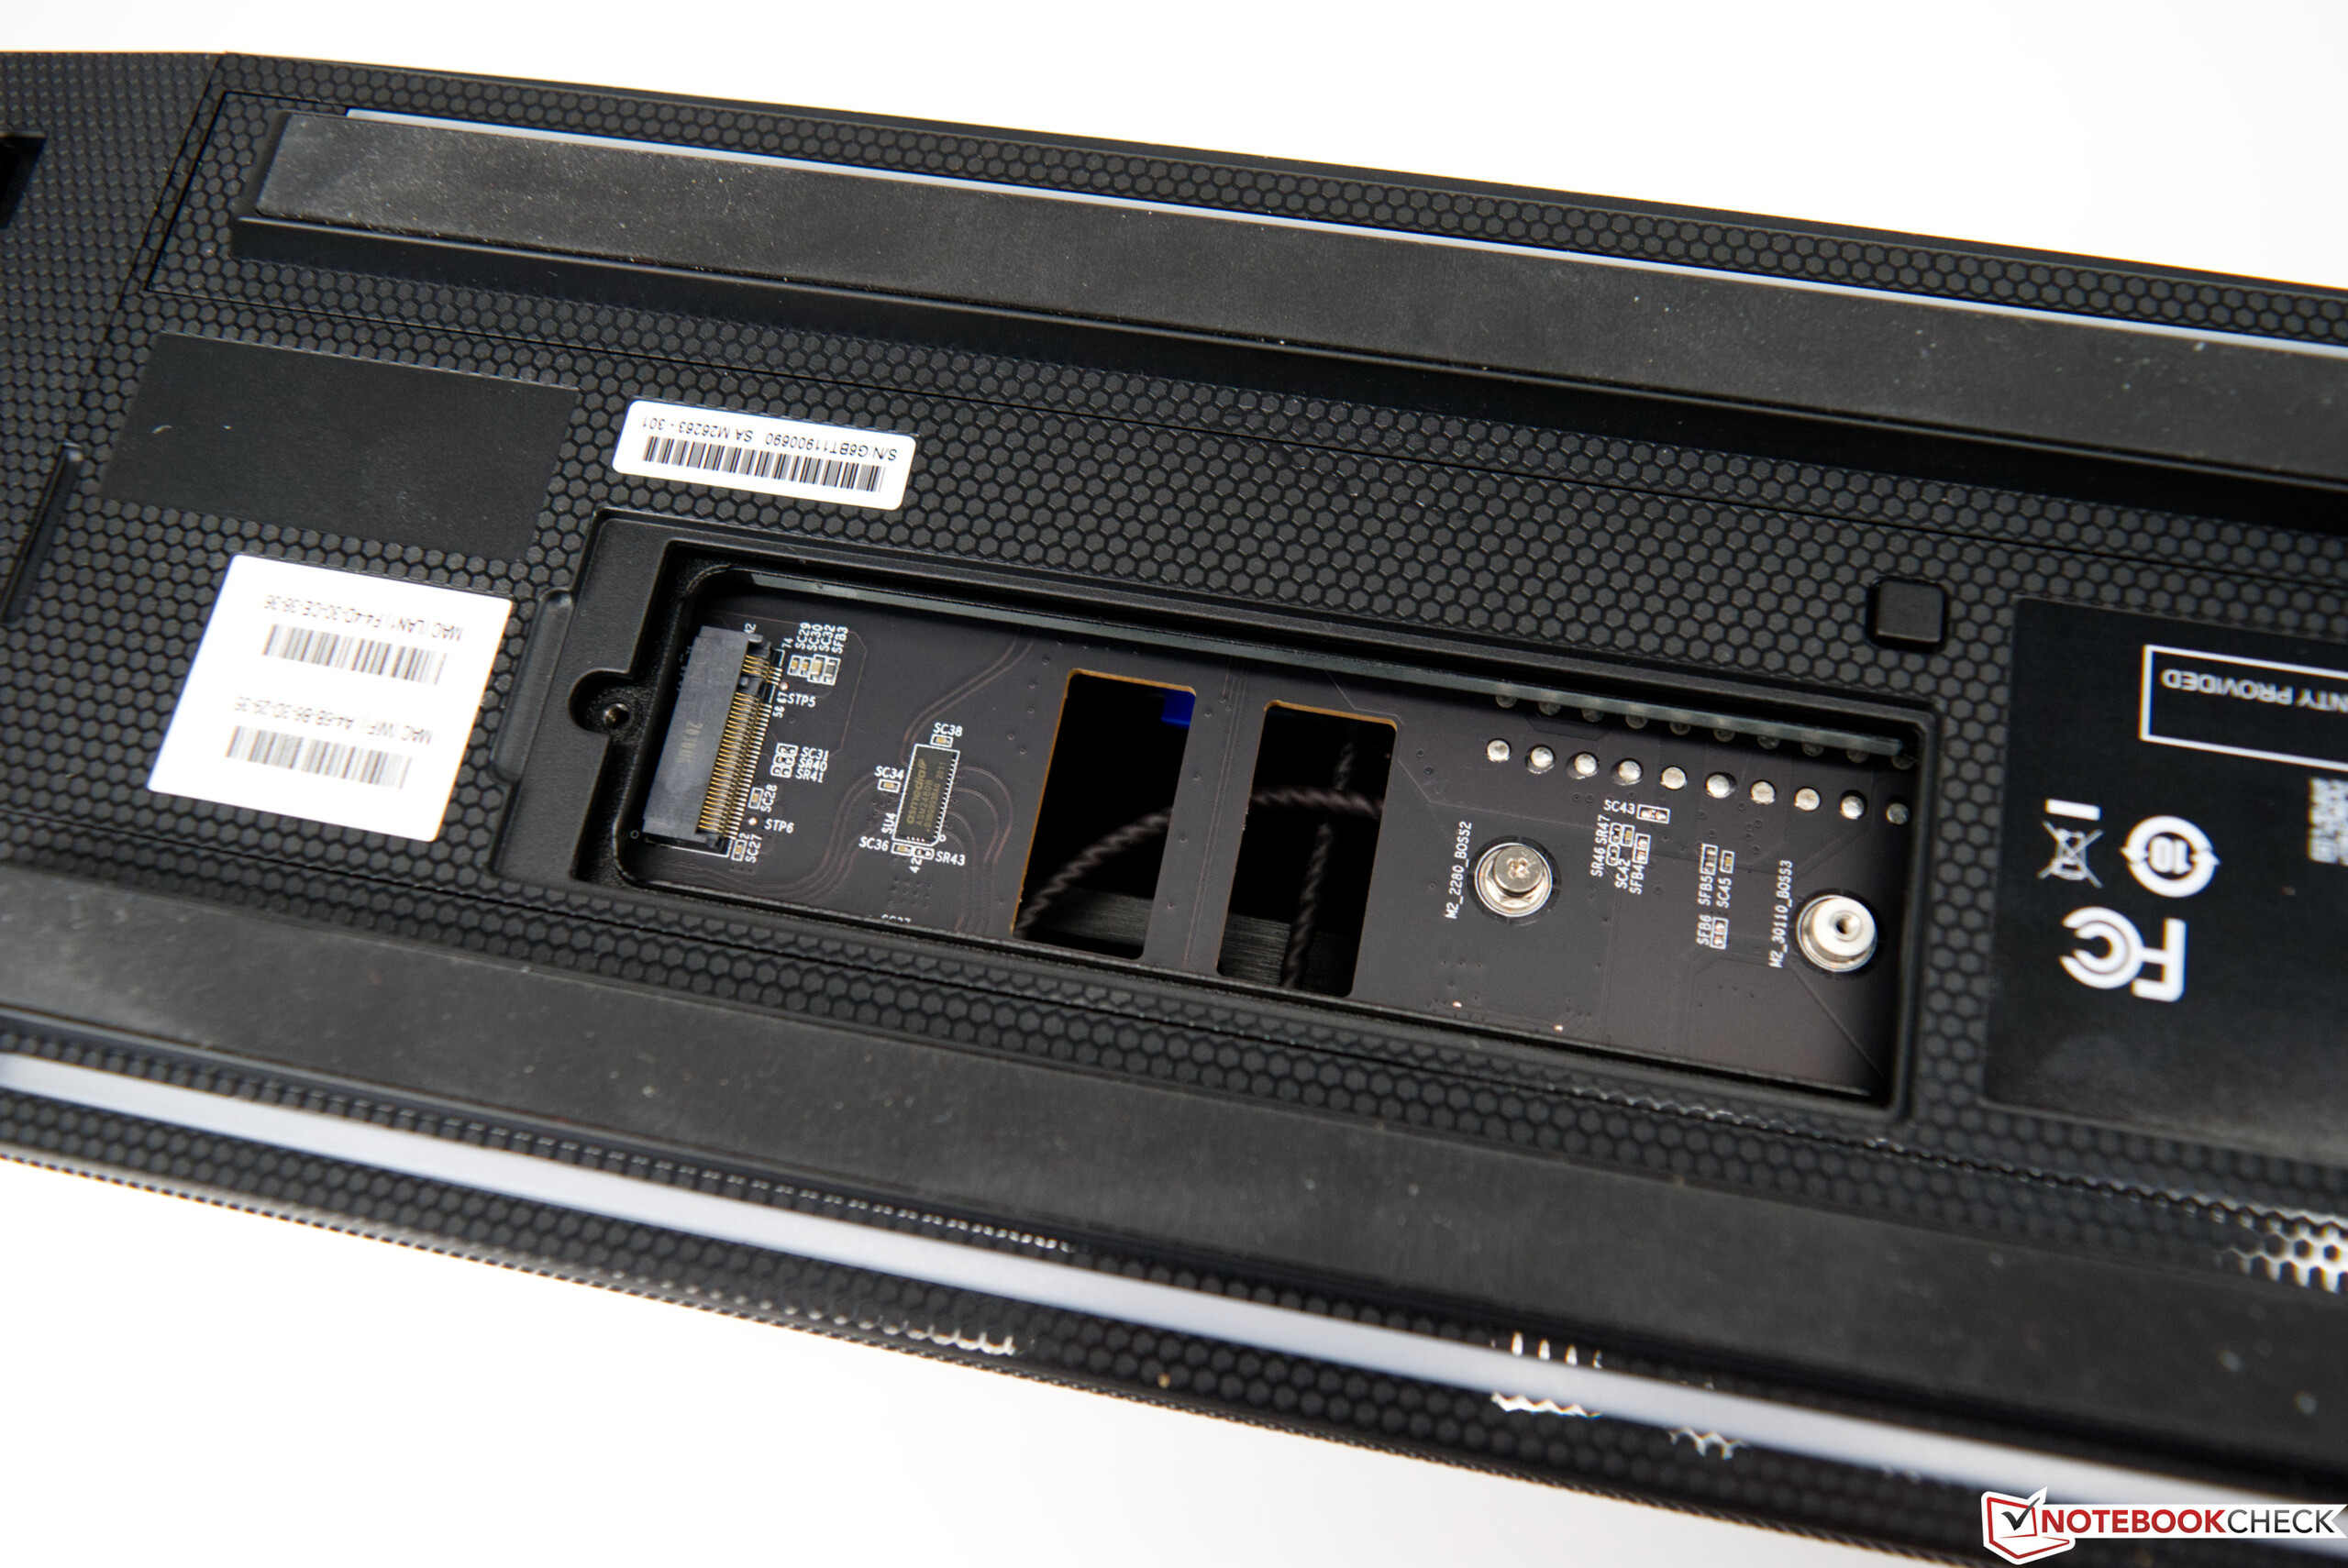
Görsel açıdan, iki sistem büyük ölçüde farklılık gösterir, ancak kaba iç yerleşim yalnızca bileşenlerin yerleşiminde değişiklik gösterir. Güç kaynağı hala kasada saklanmış durumda ve bu sefer SFX form faktörünü kullanıyor, bu da bir arıza durumunda değiştirmeyi kolaylaştırıyor. Yeni bilgi işlem öğesi hala bir PCI Express yuvasında bir eklenti kartı olarak saklanıyor ve Intel Core i9-11900KB'yi içeriyor - 8 çekirdekli ve 16 iş parçacıklı çok hızlı bir SoC. Ayrıca, NUC 11 Extreme bilgi işlem öğesi, iki SO-DIMM modülü için alan sunar ve WLAN modülüne ek olarak üç adede kadar M.2 SSD2 depolar.
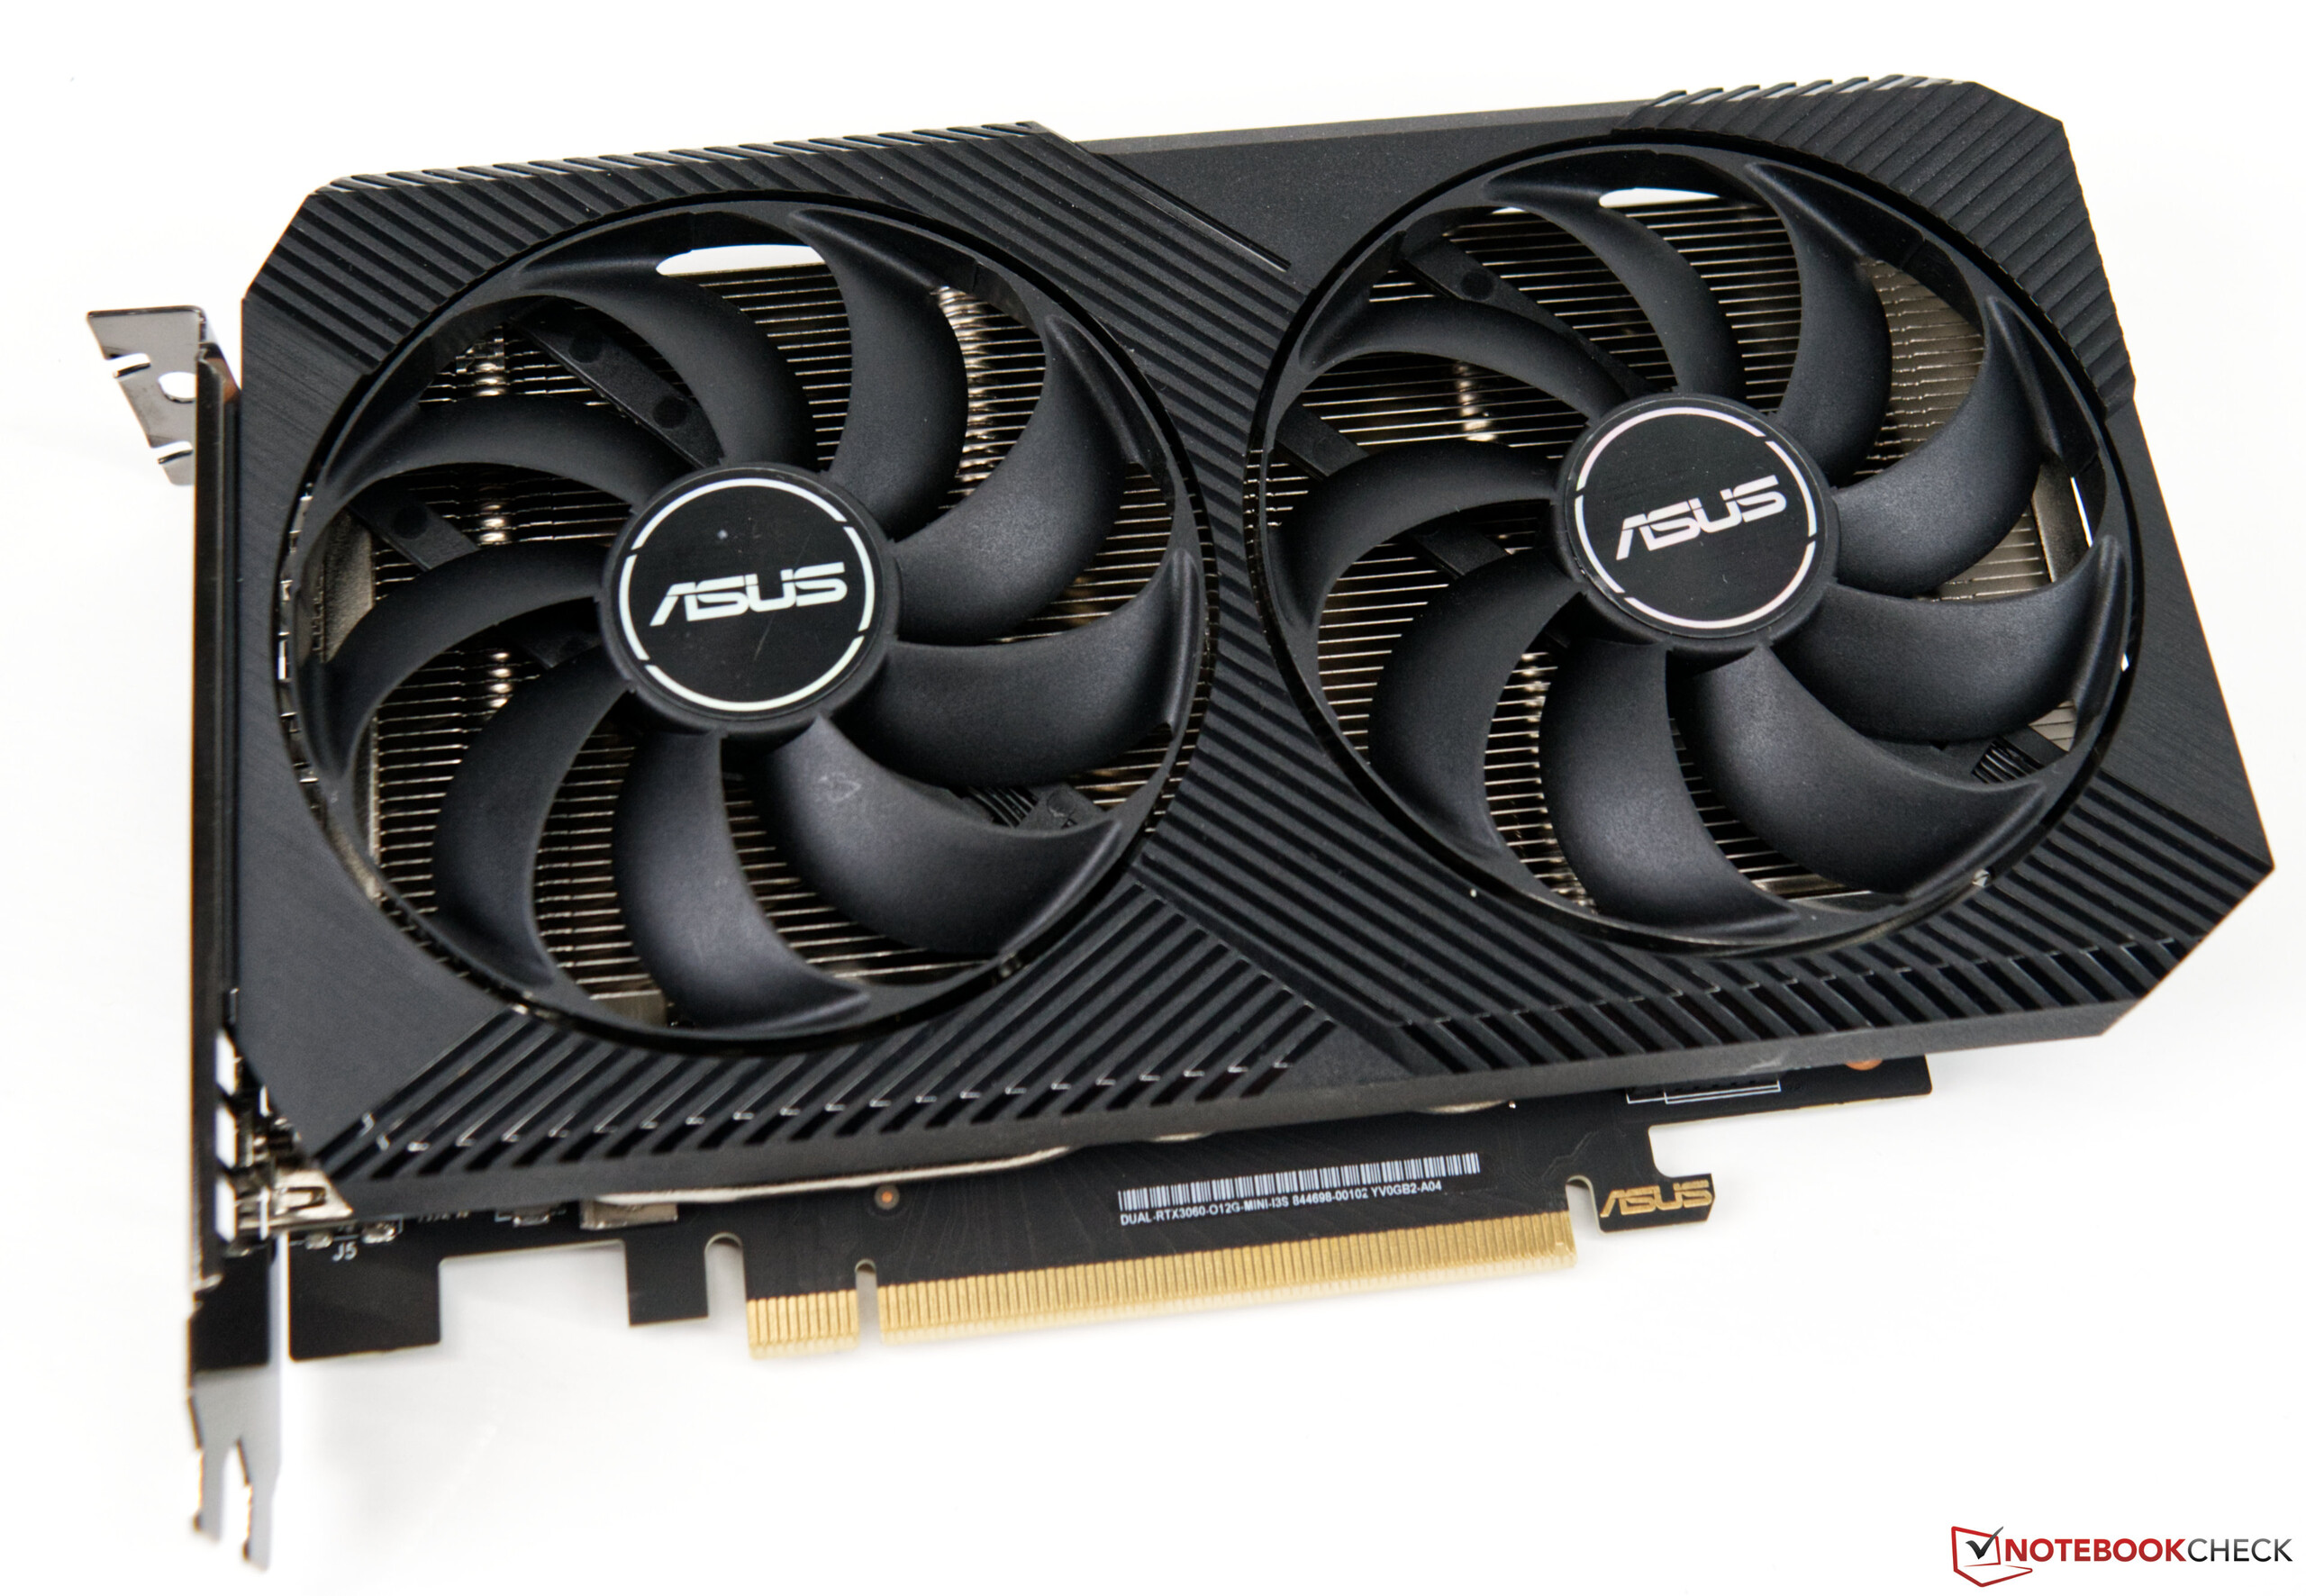
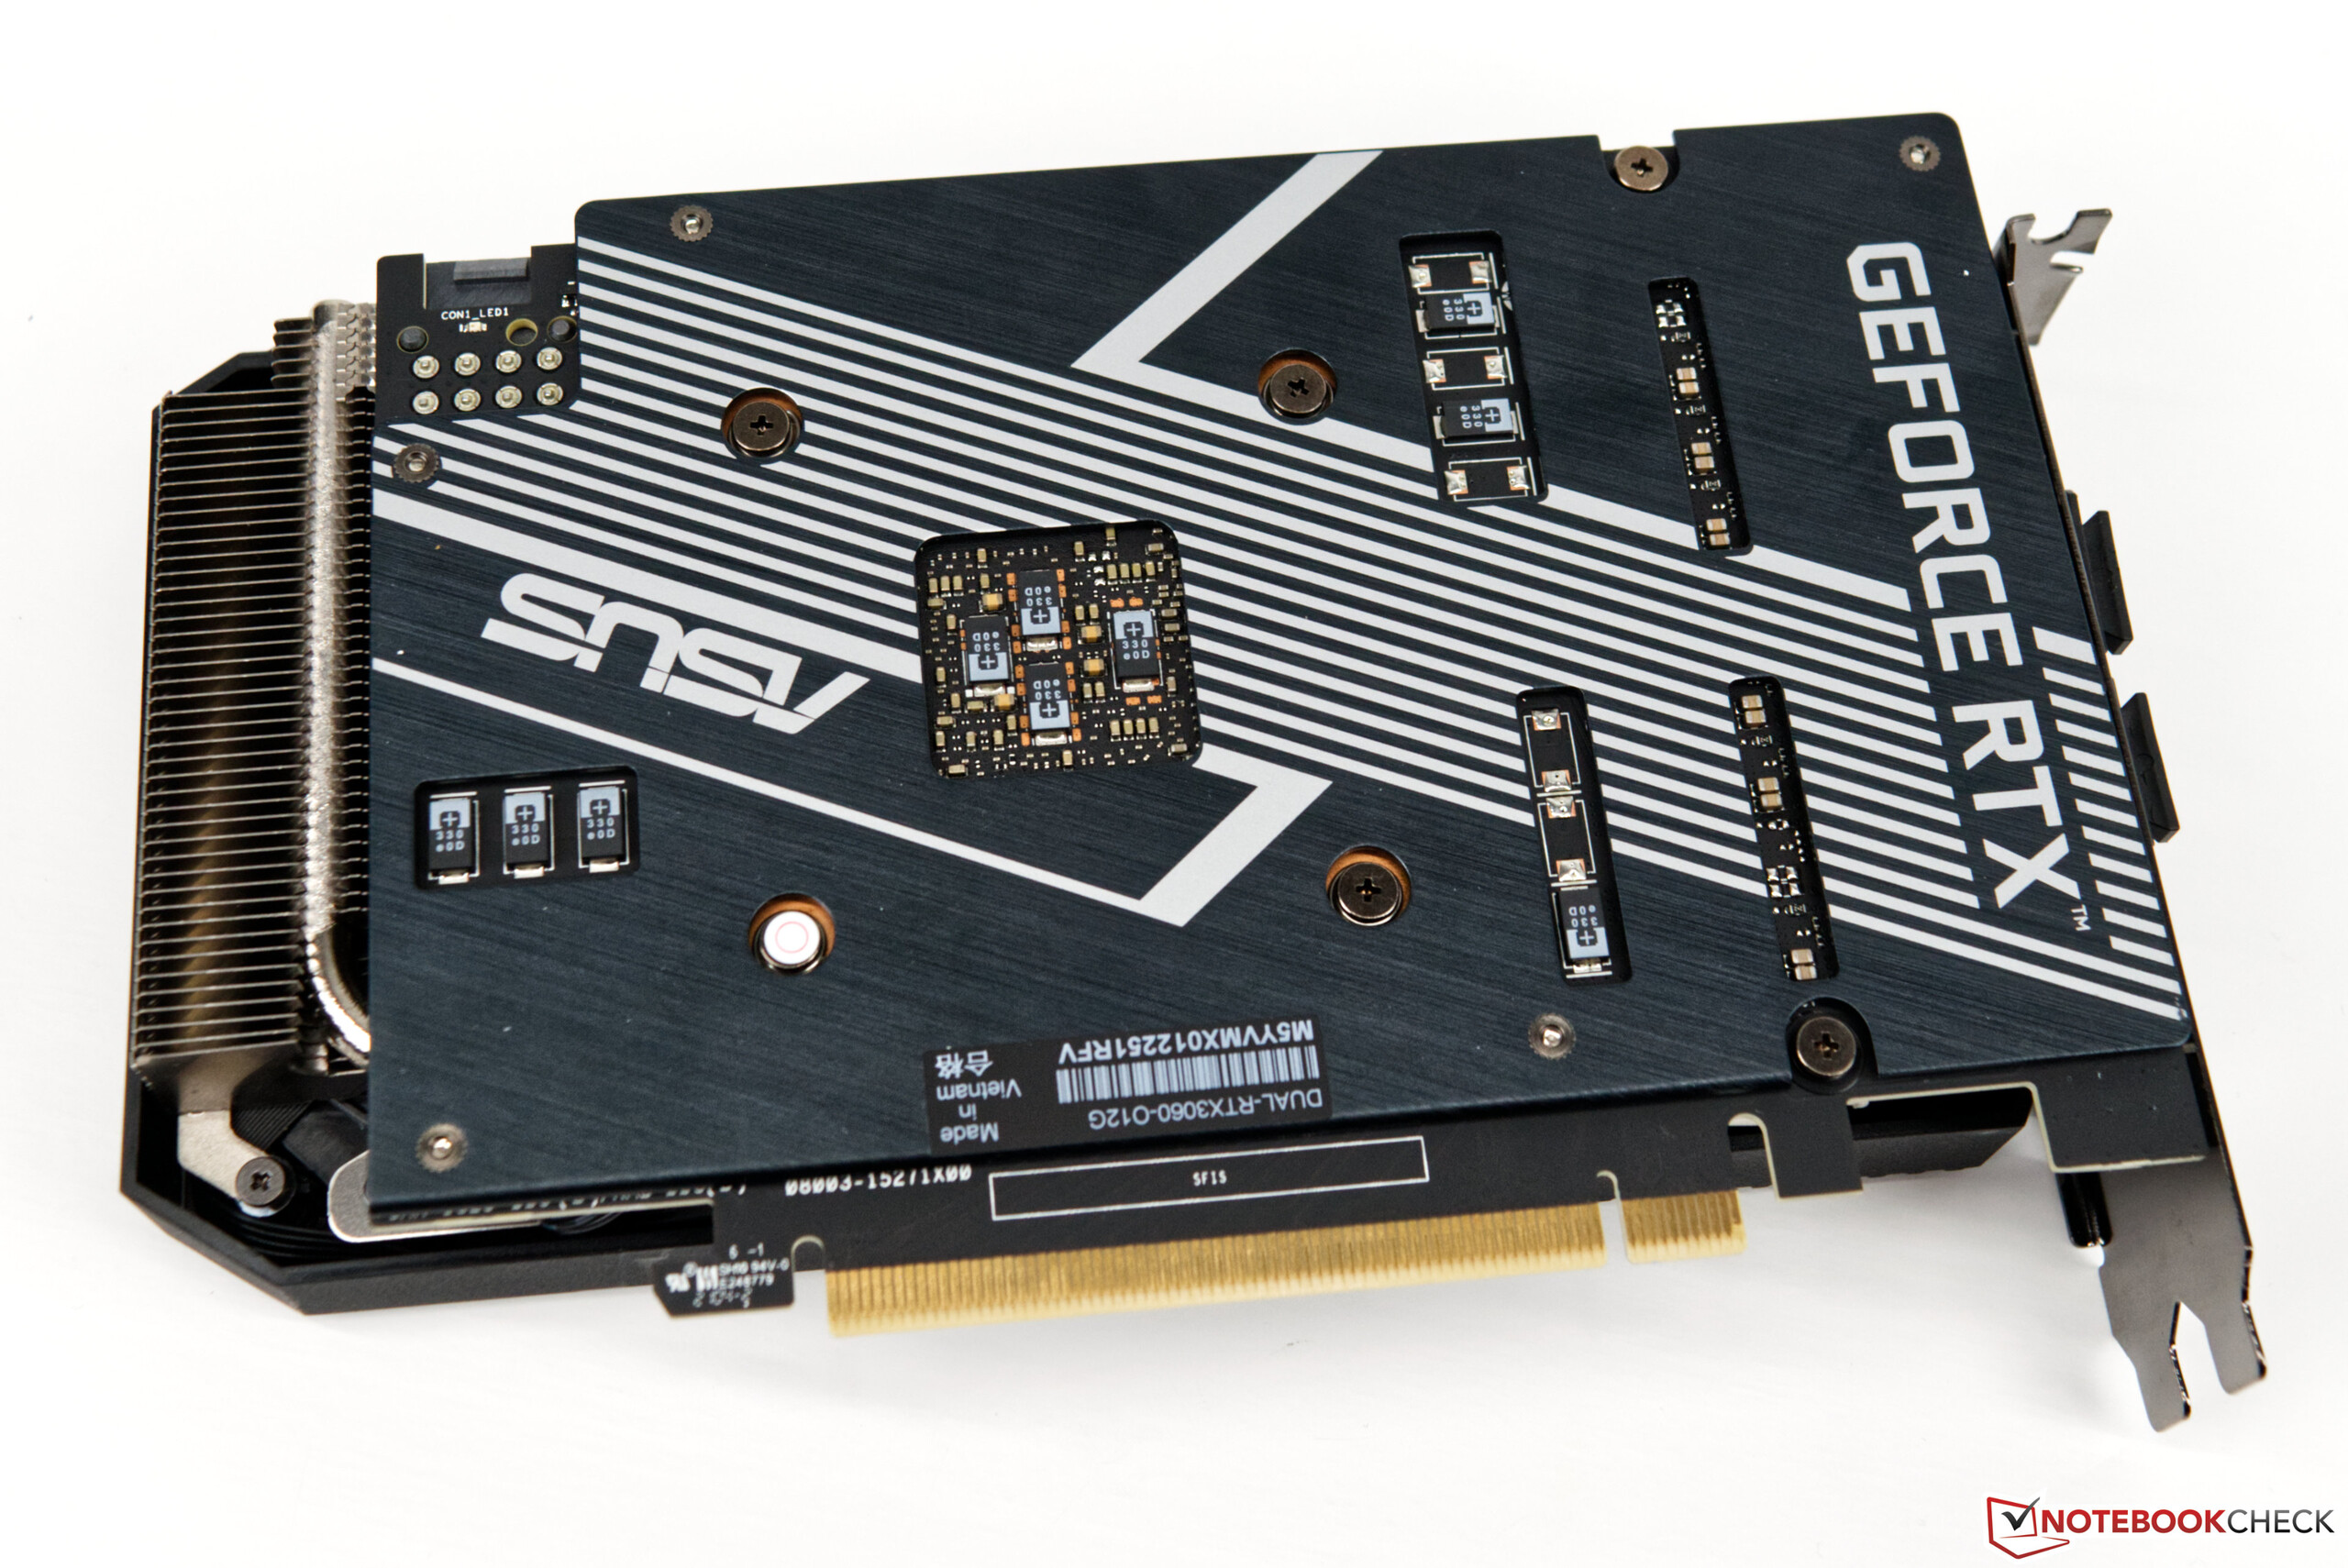
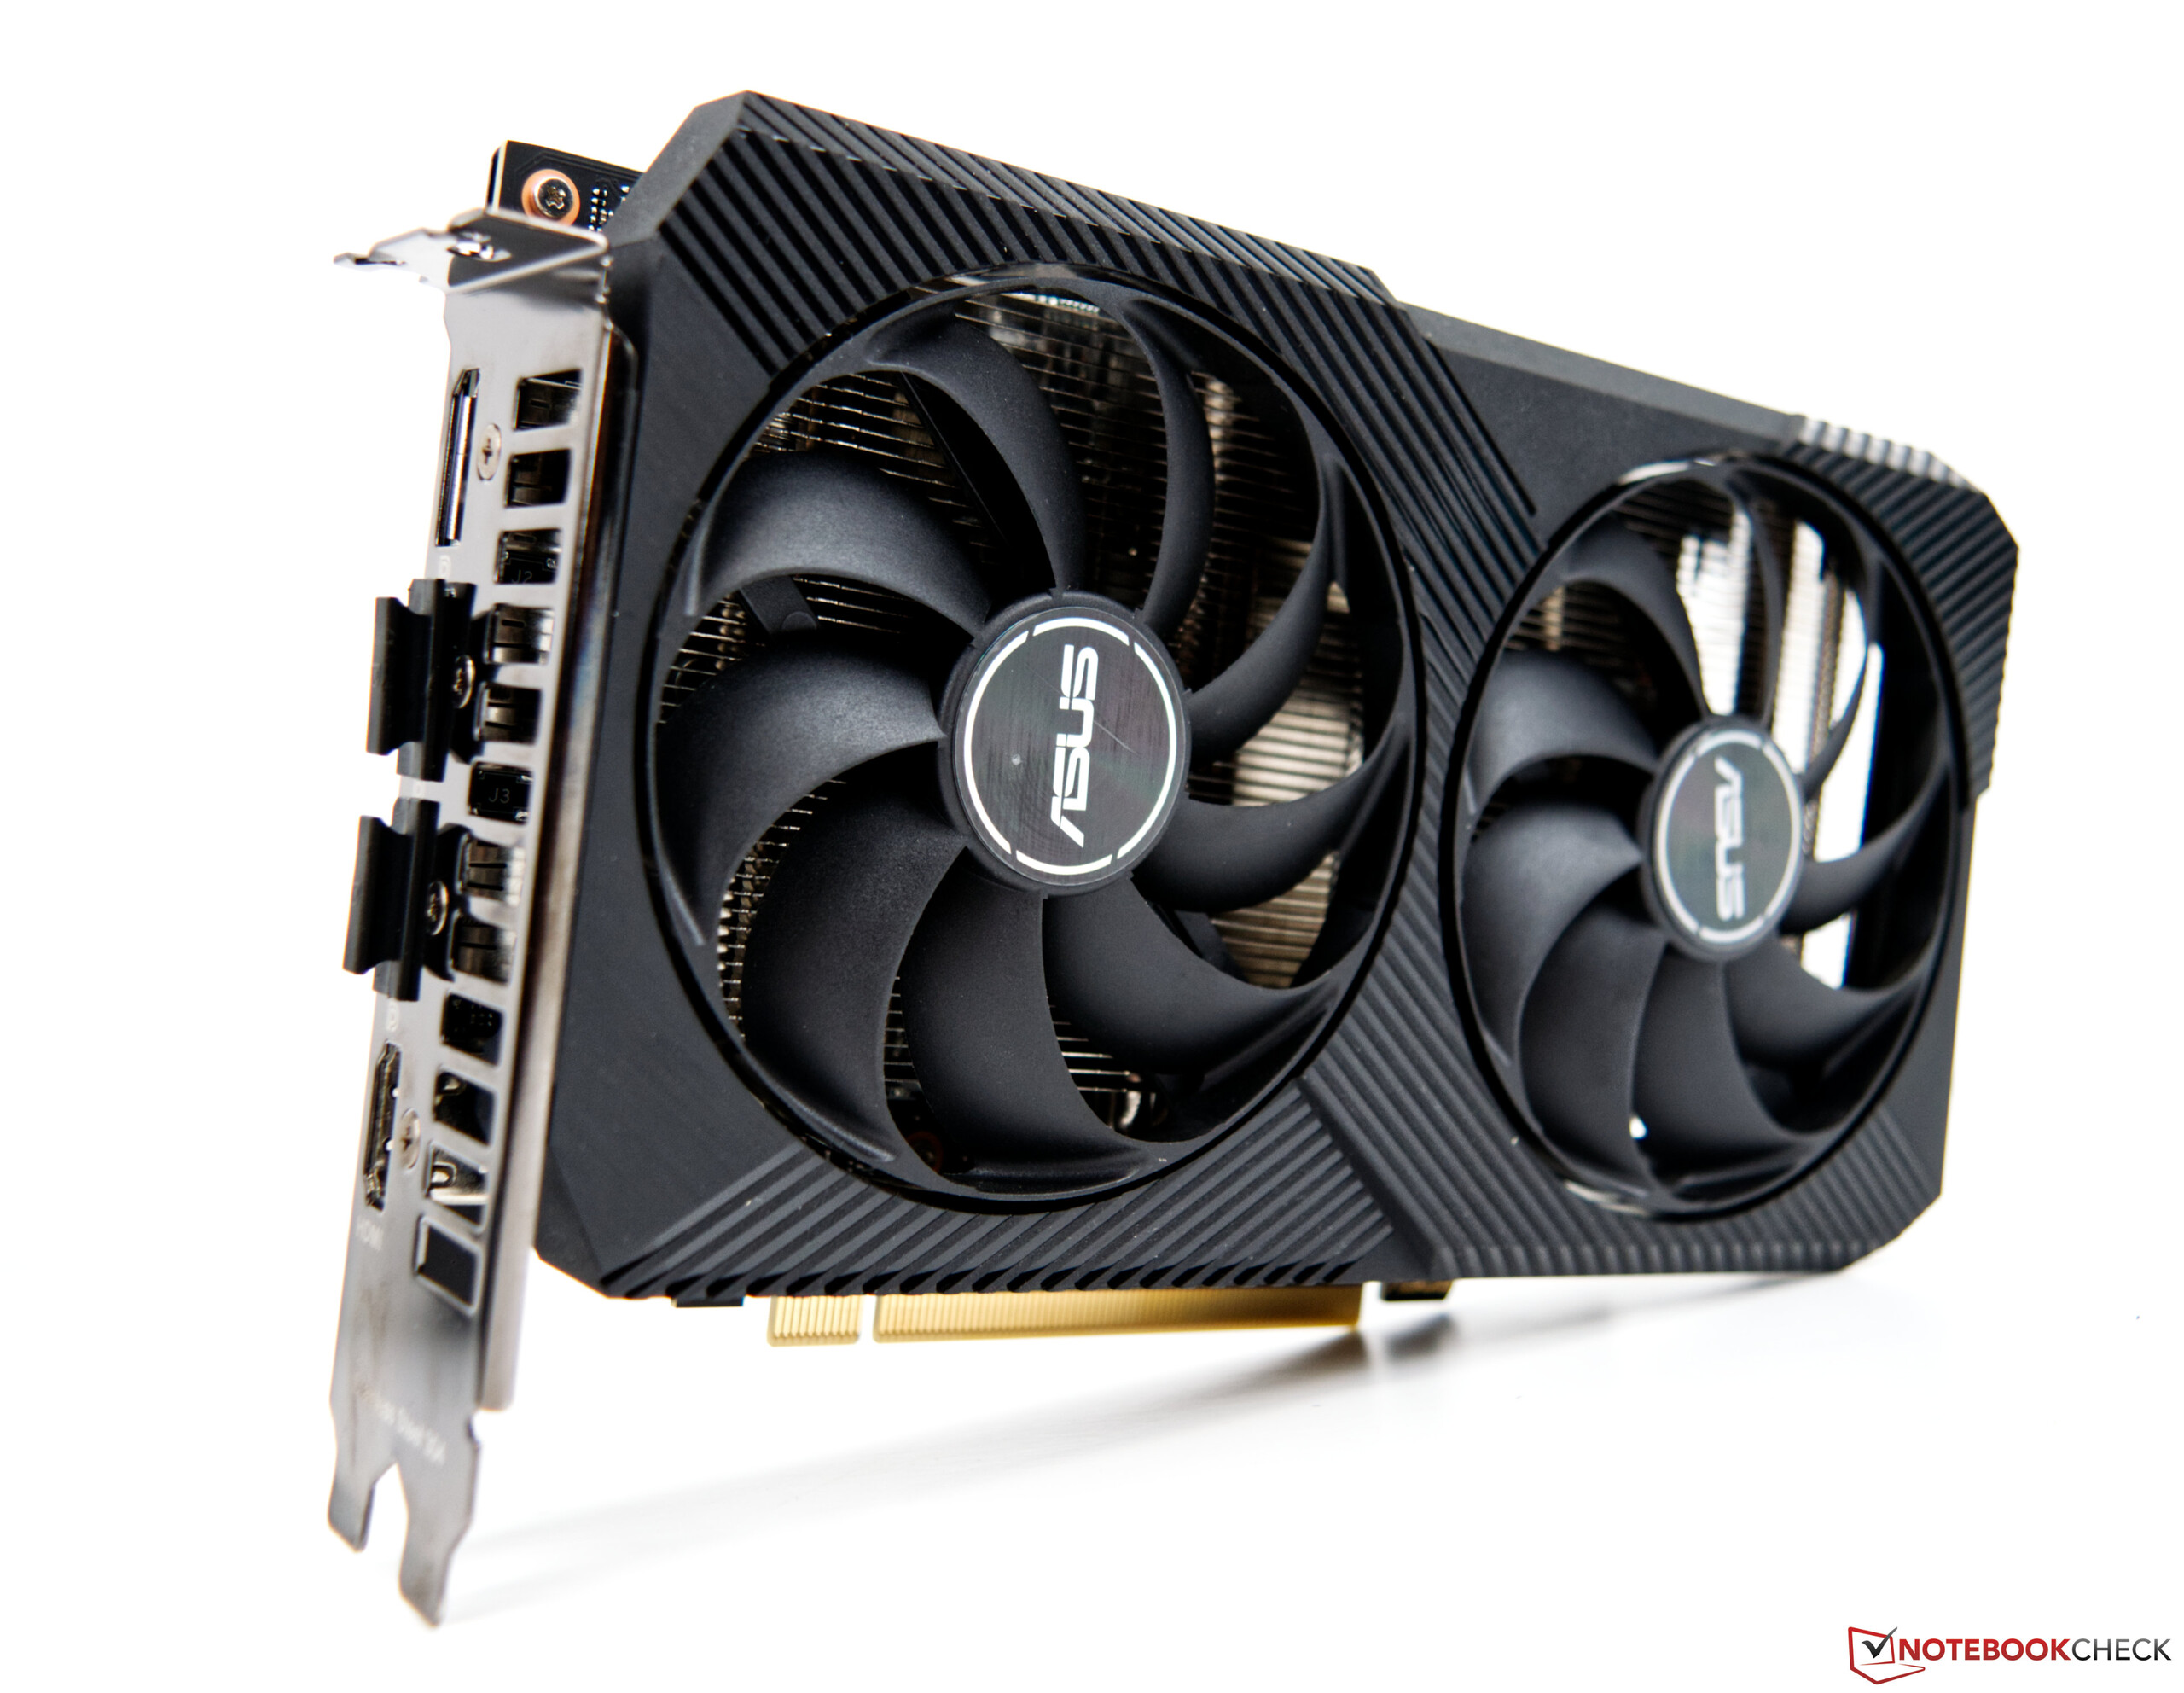
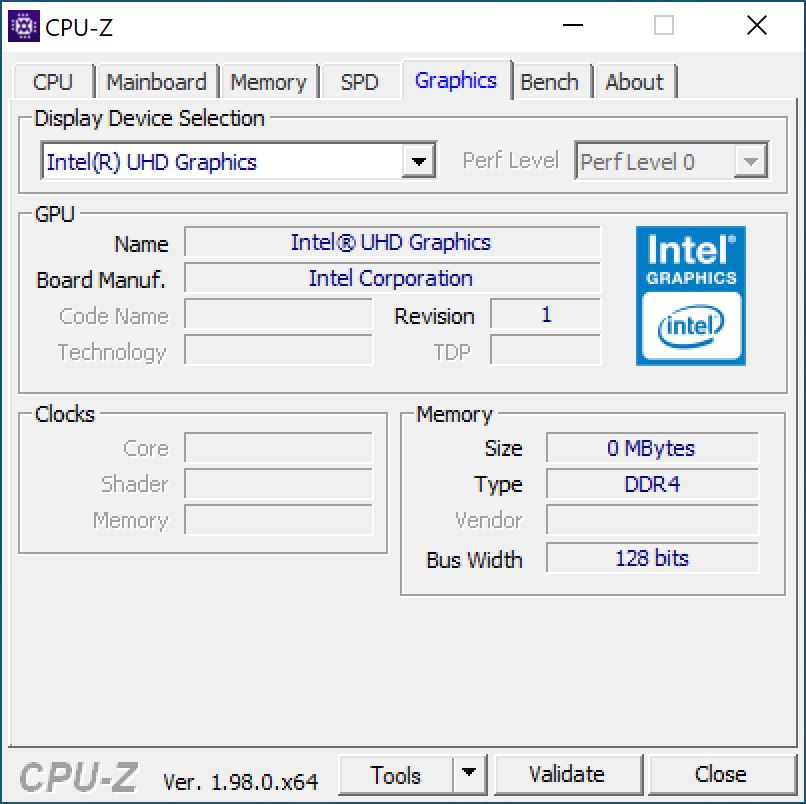
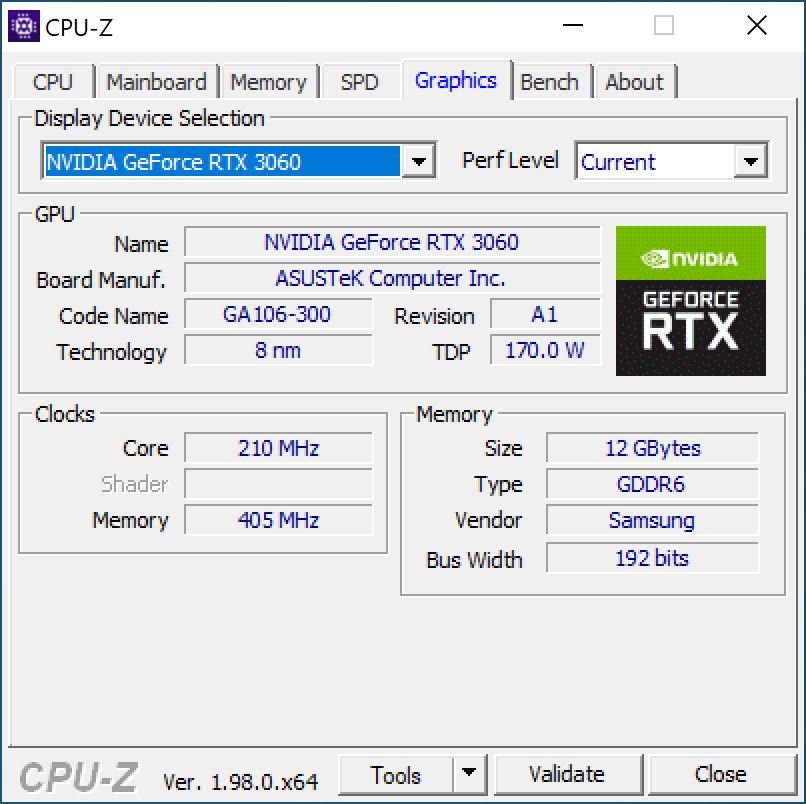
SoC, yalnızca sınırlı ölçüde oyun oynamak için uygun olan kendi entegre ekran kartına sahiptir. Bunun yerine, Beast Canyon'da kurulu Nvidia GeForce RTX 3060, hızlı SoC ile birlikte iyi bir oyun performansı sağlıyor.
Beast Canyon'un fiyatlandırması açıkçası anlaşılır değil. Intel'in kendisi, burada incelediğimiz Core i9 modeli için 1.200 ABD Dolarının hemen altında bir MSRP'den alıntı yapıyor. Core i7 modelinin (Intel Core i9-11700B) fiyatı yaklaşık 1.000 ABD Doları. Unutulmamalıdır ki bunlar barebone sistem fiyatlarıdır, yani RAM, SSD ve ekran kartı için ek maliyetler demektir. Test sistemimizi temel alan kaba bir tahmin, maliyetlerin 2.000 ABD Dolarının üzerinde olduğunu gösterir. Grafik kartlarının mevcut durumu, ek maliyetler için en büyük etkendir. Asus'tan kurulu GeForce RTX 3060'ın fiyatı şu anda ~1.000 ABD Doları. Daha ucuz bir alternatif seçerseniz veya kendinize uygun bir model seçerseniz, maliyetler biraz düşebilir.
Ancak Intel NUC 11 Extreme Kit'i özel ekran kartı ile kullanmak isteyenlerin kartın boyutlarına dikkat etmesi gerekiyor. Soğutma ünitesi ikiden fazla PCIe yuvasını almamalıdır. Grafik kartının uzunluğu maksimum 12 inç ile sınırlıdır.


Intel NUC 11 Extreme compute element (bilgi işlem öğesi) hakkında ayrıntılı bilgiler
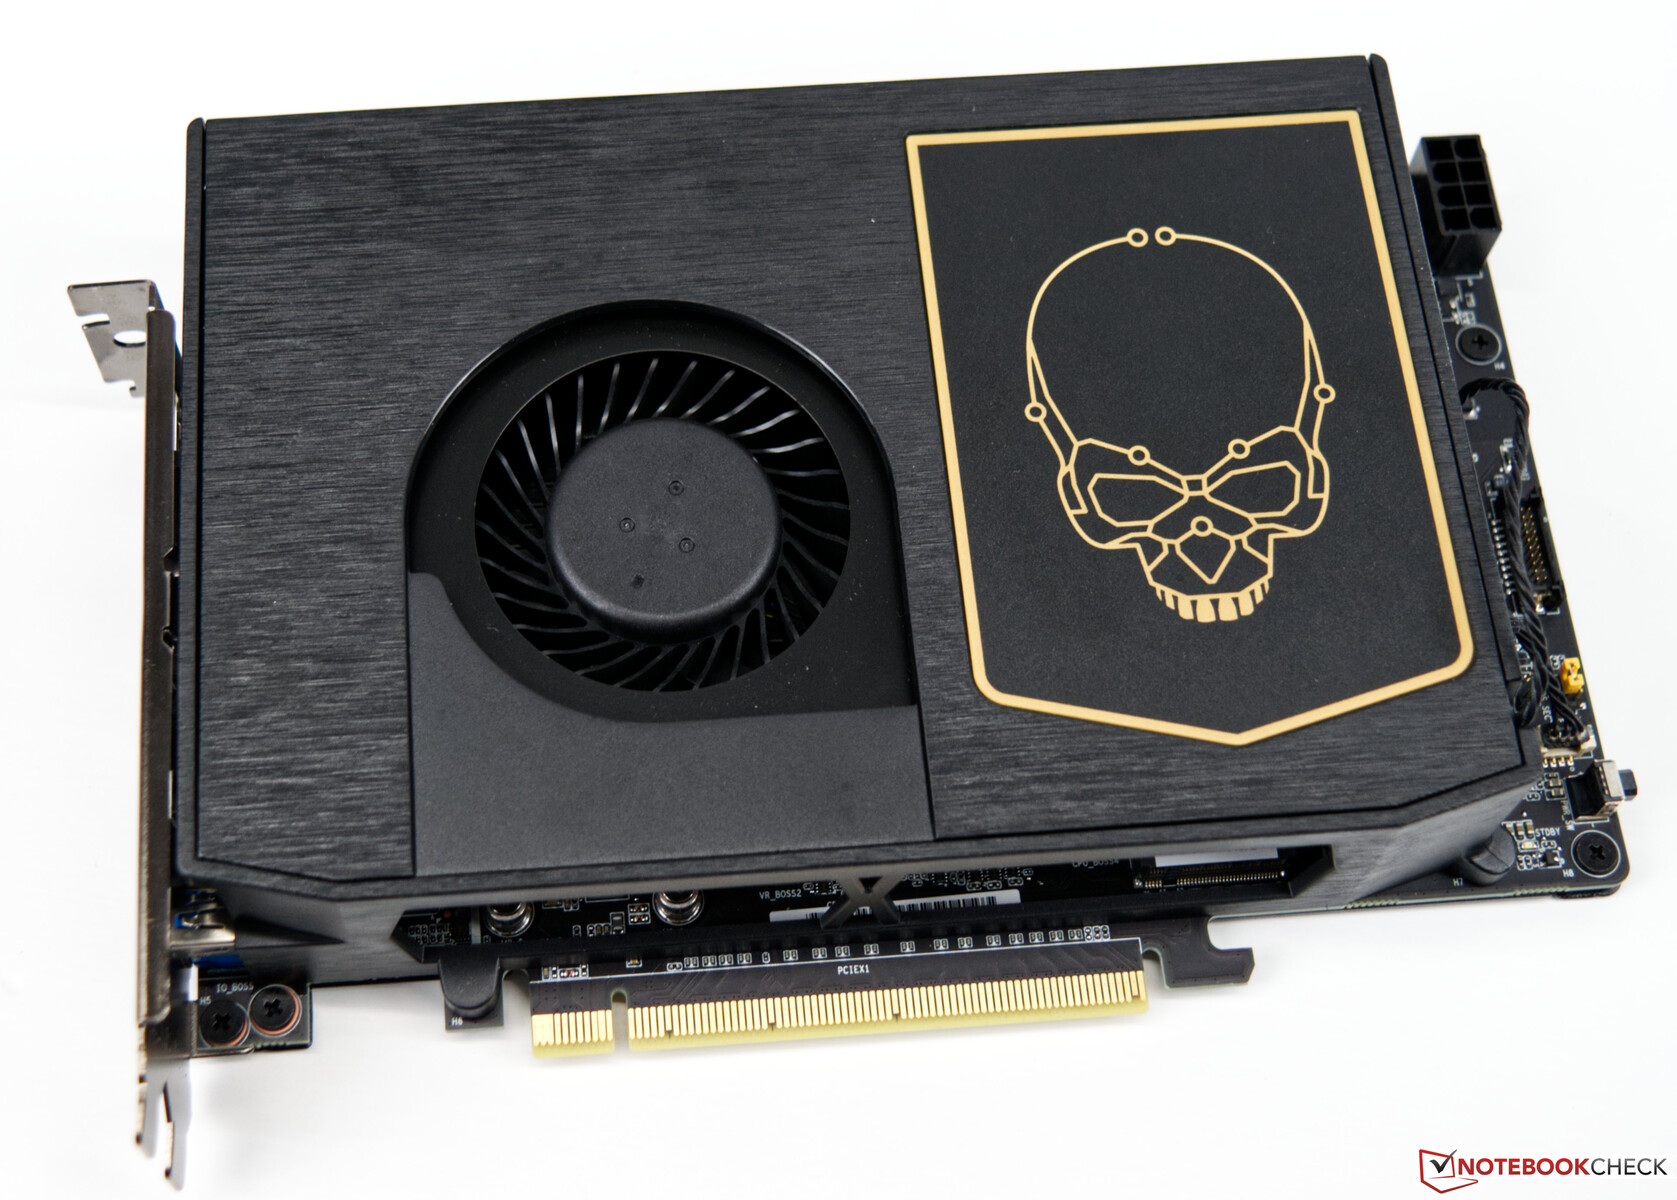
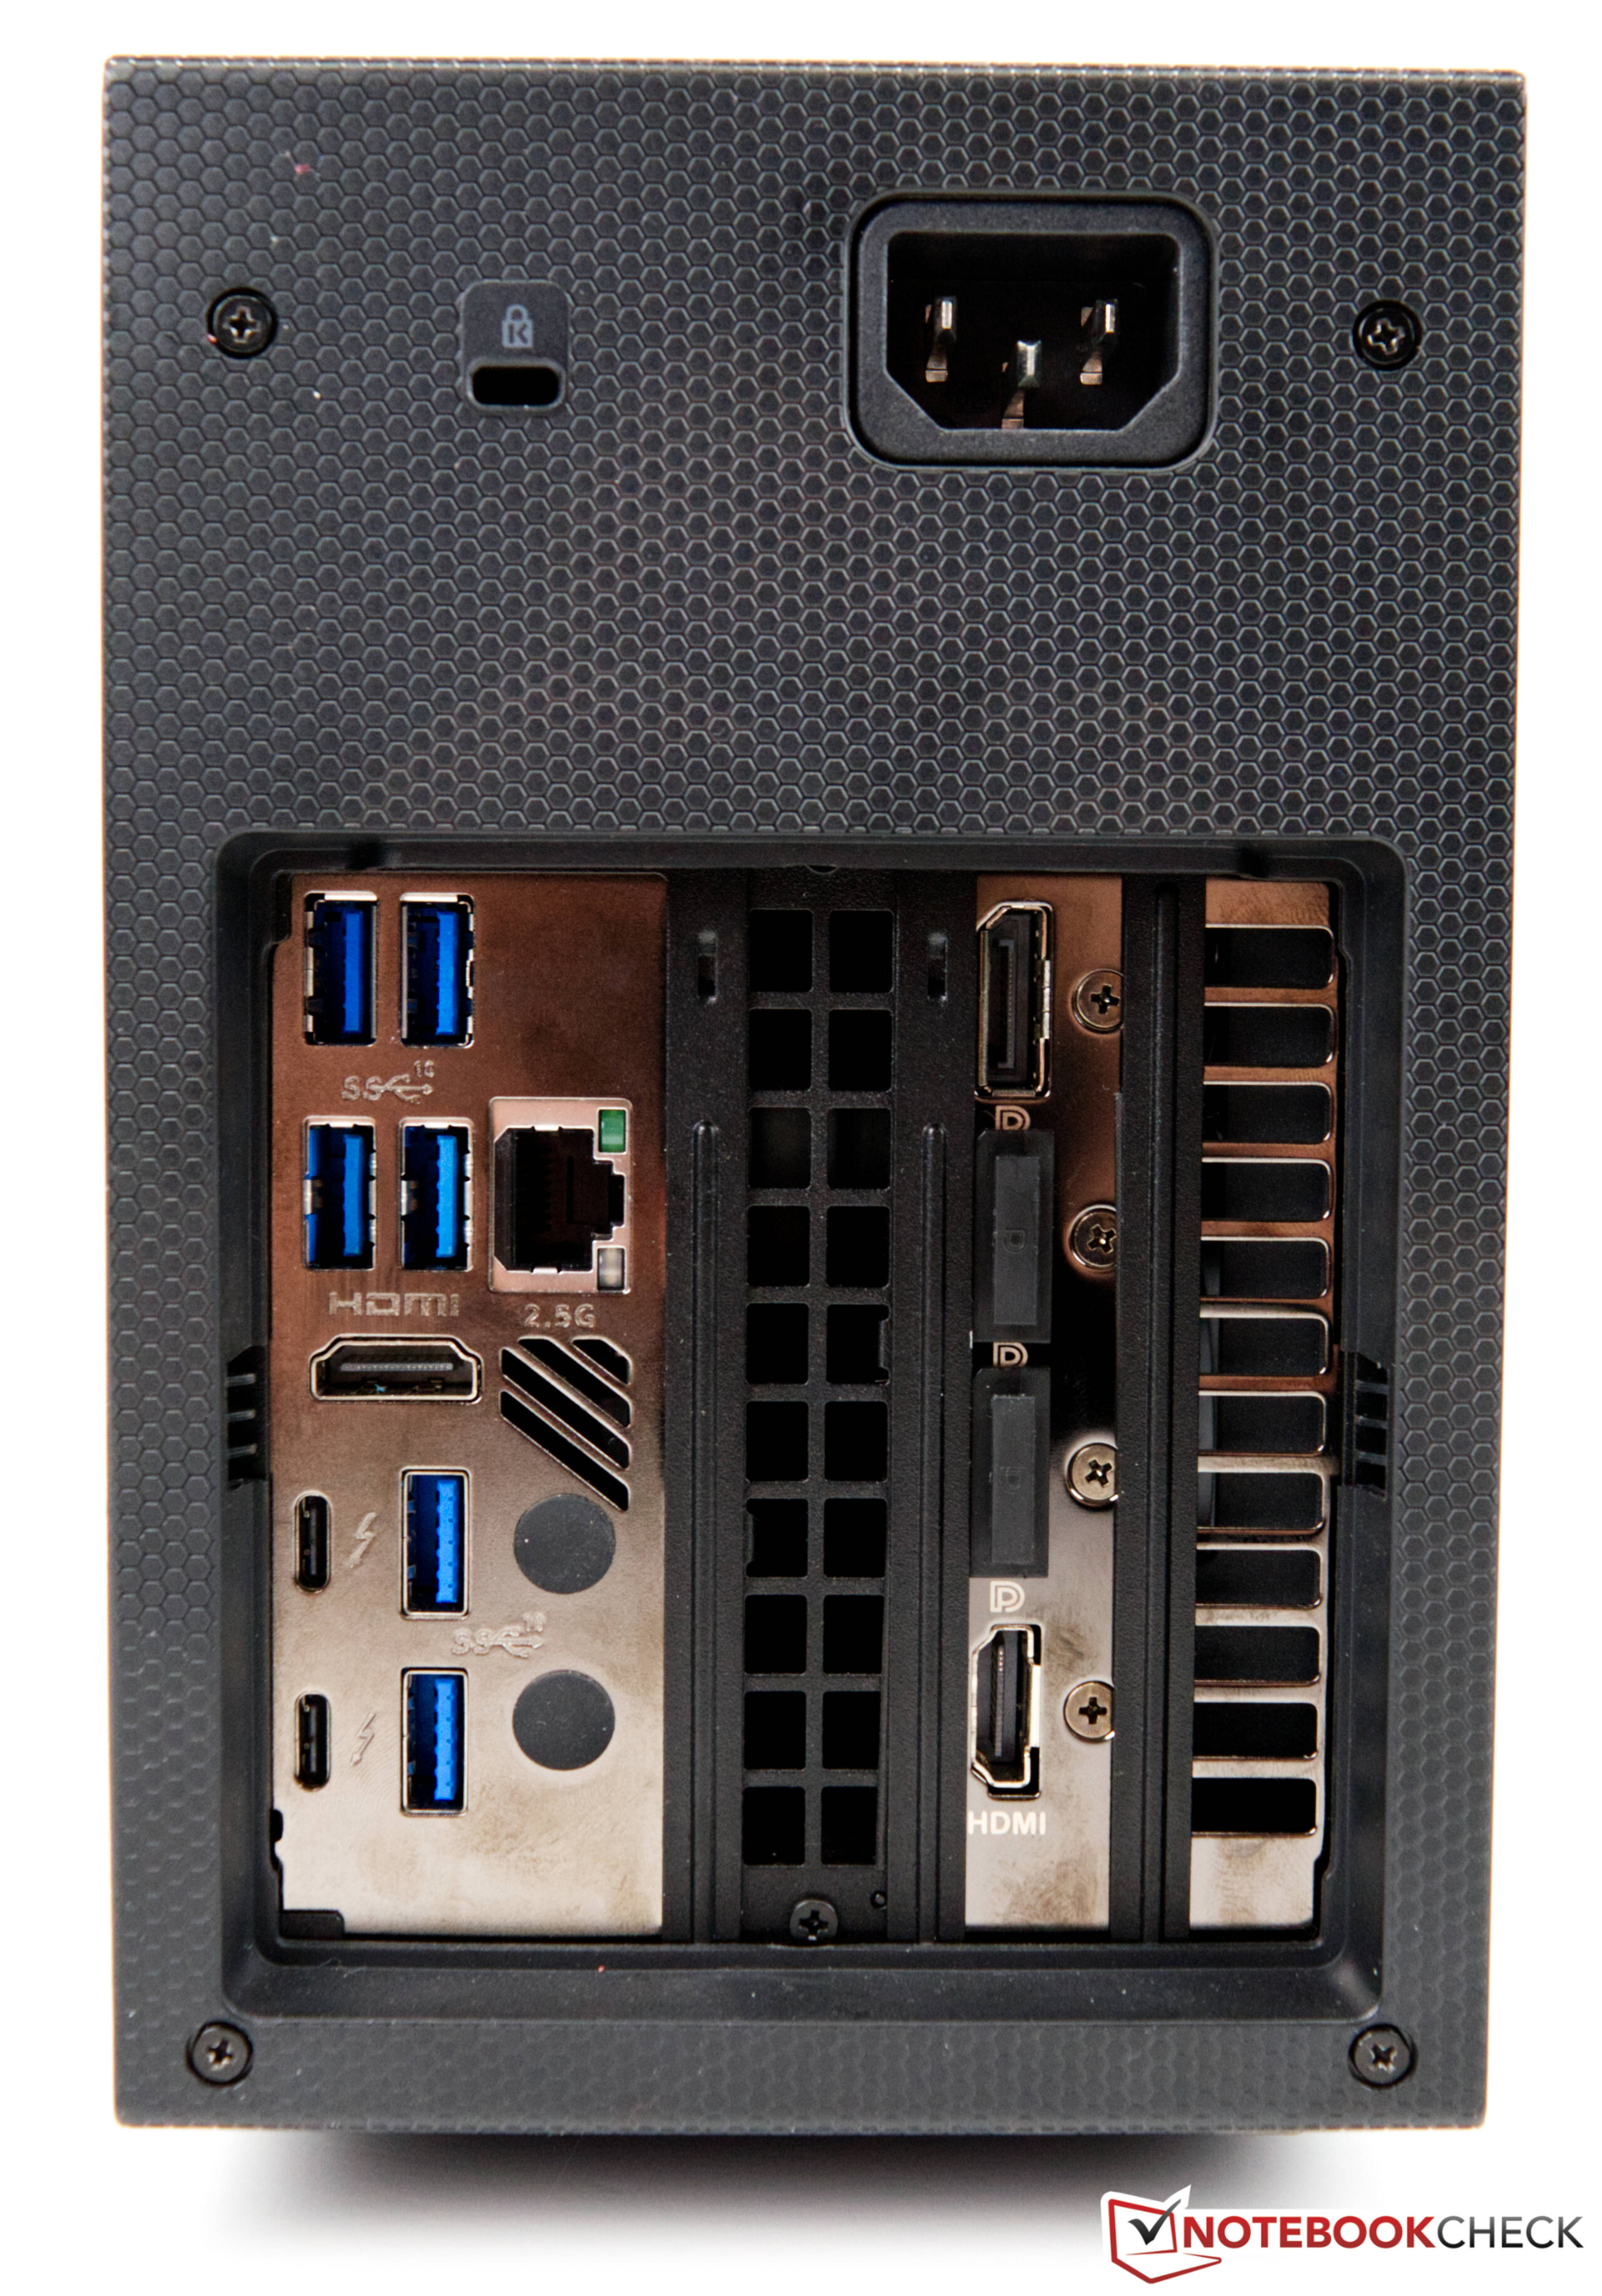
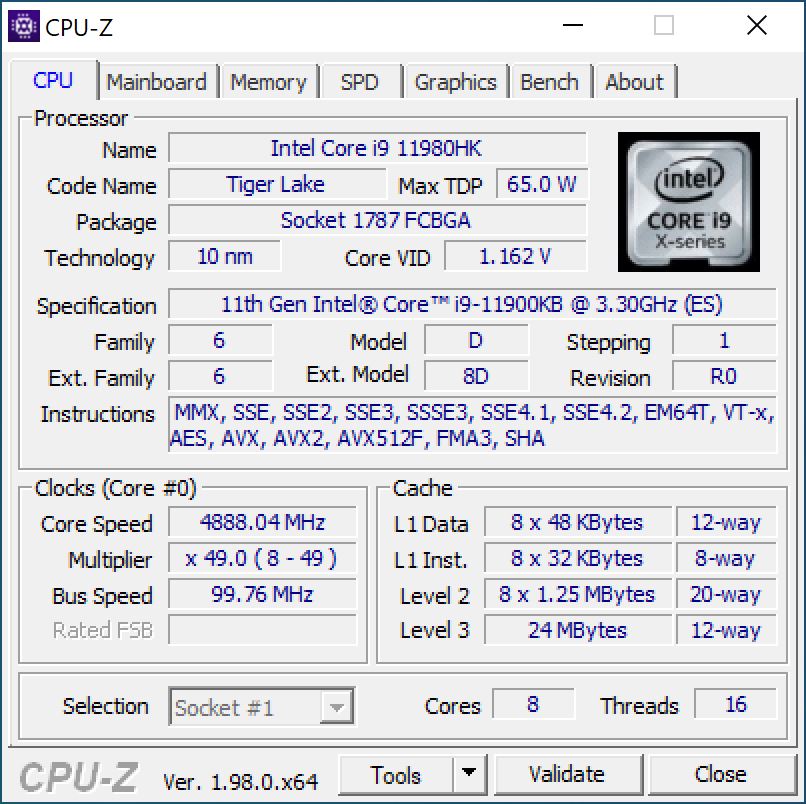
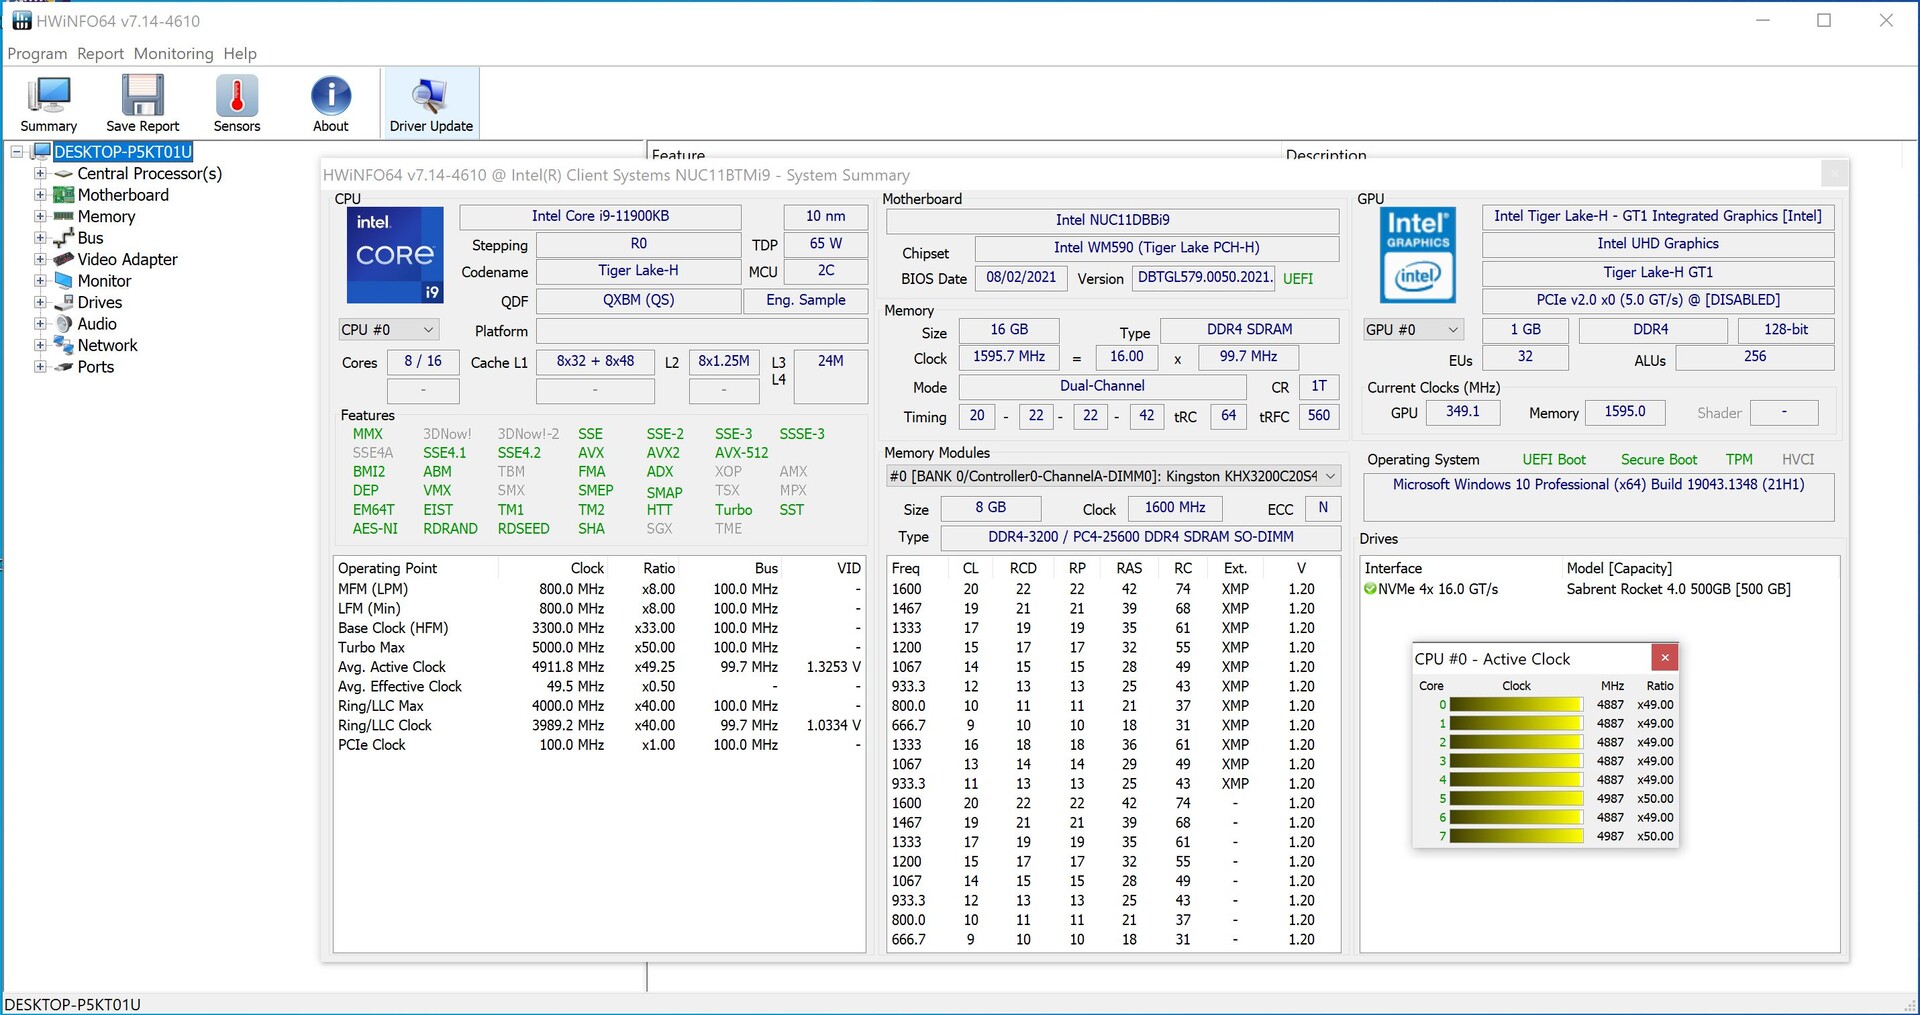
Intel NUC 11 Extreme, Tiger Lake serisini temel alan 16 iş parçacığına sahip 8 çekirdekli bir SoC olan Intel Core i9-11900KB'yi sunar. SoC'nin kökleri mobil form faktörlerindedir ve düşük güç tüketimi nedeniyle küçük ve kompakt sistemler için iyi bir seçenektir. Ayrıca, tüm harici arayüzler, sistemdeki bir PCI Express eklenti kartı şeklinde olan Bilgi İşlem Öğesi’nin üzerindedir. Önemli olan her şey halihazırda yerinde, ve hiçbir şey yapmanız gerekmiyor.
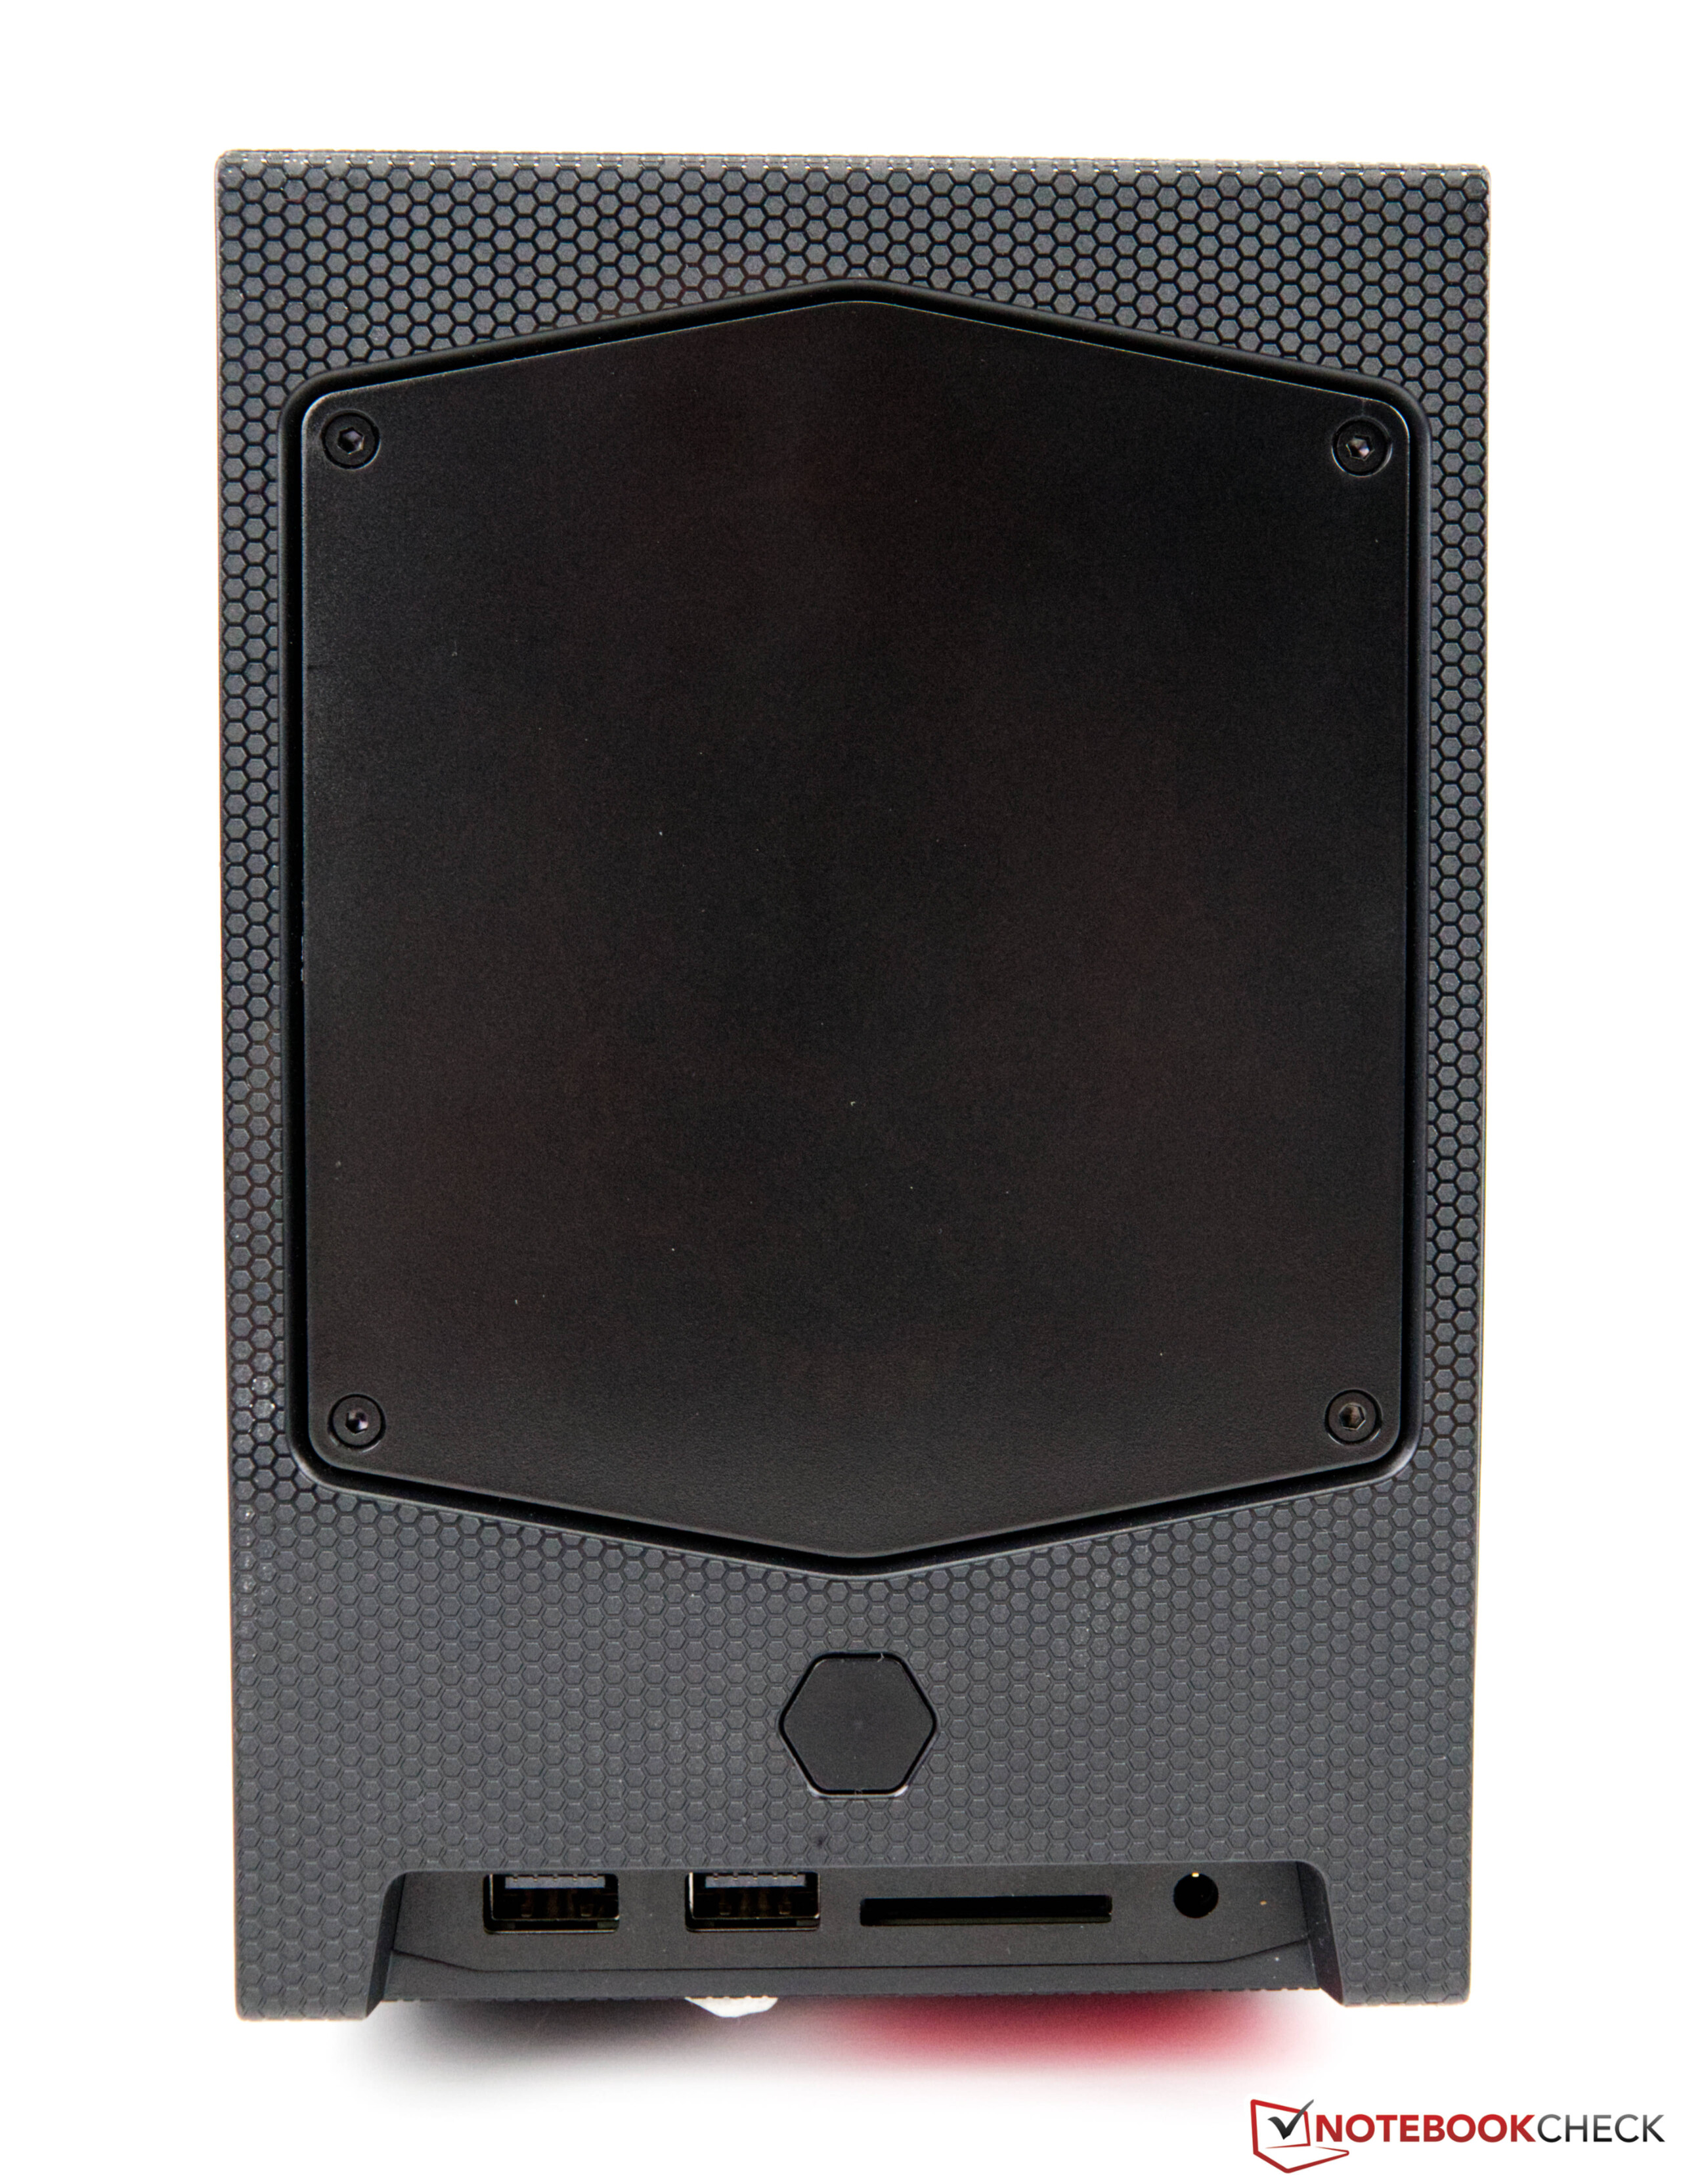
Arkada 6x USB 3.1 Gen2 Type-A ve Thunderbolt 4 dahil olmak üzere iki USB-C bağlantı noktası vardır. HDMI veya USB-C aracılığıyla aynı anda üç adede kadar ekran çalıştırılabilir ve sistemi bilgisayara bağlamanın iki farklı yolu vardır. ağ — WiFi 6E veya 2.5 Gbit LAN. Her biri maksimum 32 GB olan iki SO-DIMM RAM modülü, hesaplama öğesinin kendisine takılabilir. Ayrıca, üç M.2 SSD için yer vardır.
İşlemci karşılaştırmaları
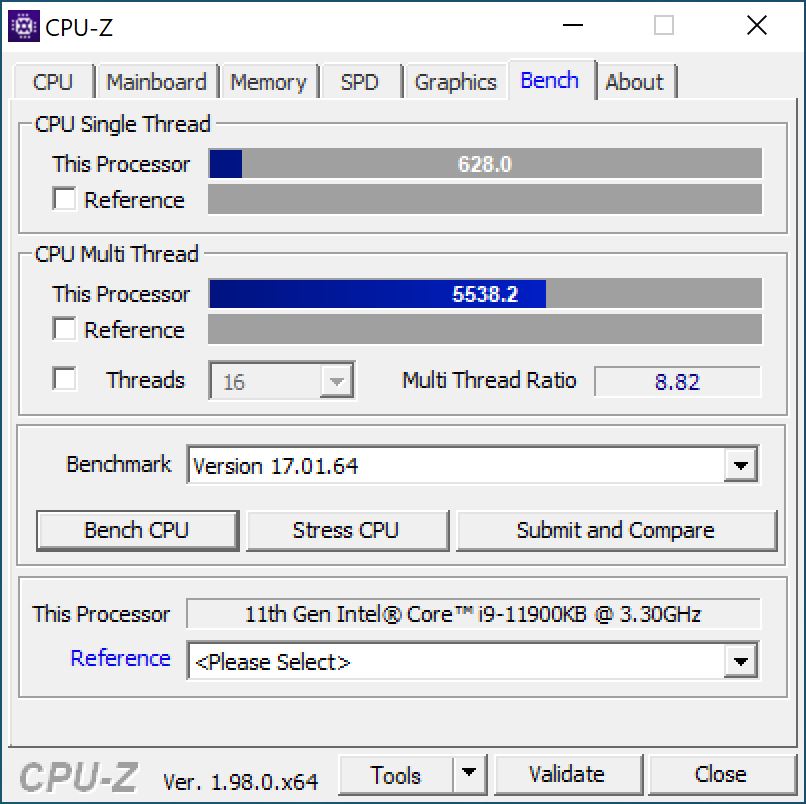
Intel Core i9-11900KB, dizüstü bilgisayardan masaüstüne giden yolu bulan bir SoC'dir . Intel, SoC'yi Hesaplama Öğesine kurar ve 65 W'lık düşük güç tüketiminden yararlanır. Ancak, maksimum CPU paketi gücü kısa bir süre için 90 W ile sınırlıdır.
Testte, SoC sağlam performans gösteriyor ve Intel Core i5-11600K'ya biraz benzer bir performans sergiliyor. Intel Core i9-11900KB, iki ek bilgi işlem birimi sayesinde çok iş parçacıklı uygulamalarda Core i5-11600K'dan üstündür. İki 8 çekirdekli CPU'yu karşılaştırırsak, test örneğimiz Intel Core i9-11900K ile karşılaştırıldığında yenilgiyi kabul etmelidir . Yine de, bu CPU'ların enerji tüketimine baktığınızda boşluk yönetilebilir.
Daha fazla karşılaştırma ve kıyaslama için sizi CPU karşılaştırma tablosuna yönlendiriyoruz.
| Performance rating - Percent | |
| AMD Ryzen 7 5800X, NVIDIA Titan RTX | |
| AMD Ryzen 9 3950X, NVIDIA Titan RTX | |
| Intel Core i9-11900K, NVIDIA Titan RTX | |
| Intel Core i9-10900K, NVIDIA Titan RTX | |
| Intel Core i9-11900KB, NVIDIA GeForce RTX 3060 | |
| Intel Core i5-11600K, NVIDIA Titan RTX | |
| AMD Ryzen 7 3800XT, NVIDIA Titan RTX | |
| Intel Core i9-9980HK, NVIDIA GeForce RTX 2070 (Desktop) | |
| Intel Core i5-10600K, NVIDIA Titan RTX | |
| Cinebench R15 | |
| CPU Single 64Bit | |
| AMD Ryzen 7 5800X, NVIDIA Titan RTX | |
| Intel Core i9-11900K, NVIDIA Titan RTX | |
| Intel Core i9-11900KB, NVIDIA GeForce RTX 3060 | |
| Intel Core i5-11600K, NVIDIA Titan RTX | |
| Intel Core i9-10900K, NVIDIA Titan RTX | |
| AMD Ryzen 7 3800XT, NVIDIA Titan RTX | |
| Intel Core i9-9980HK, NVIDIA GeForce RTX 2070 (Desktop) | |
| AMD Ryzen 9 3950X, NVIDIA Titan RTX | |
| Intel Core i5-10600K, NVIDIA Titan RTX | |
| CPU Multi 64Bit | |
| AMD Ryzen 9 3950X, NVIDIA Titan RTX | |
| Intel Core i9-10900K, NVIDIA Titan RTX | |
| AMD Ryzen 7 5800X, NVIDIA Titan RTX | |
| Intel Core i9-11900K, NVIDIA Titan RTX | |
| AMD Ryzen 7 3800XT, NVIDIA Titan RTX | |
| Intel Core i9-11900KB, NVIDIA GeForce RTX 3060 | |
| Intel Core i5-11600K, NVIDIA Titan RTX | |
| Intel Core i9-9980HK, NVIDIA GeForce RTX 2070 (Desktop) | |
| Intel Core i5-10600K, NVIDIA Titan RTX | |
| Cinebench R20 | |
| CPU (Single Core) | |
| Intel Core i9-11900K, NVIDIA Titan RTX | |
| Intel Core i9-11900KB, NVIDIA GeForce RTX 3060 | |
| AMD Ryzen 7 5800X, NVIDIA Titan RTX | |
| Intel Core i5-11600K, NVIDIA Titan RTX | |
| AMD Ryzen 7 3800XT, NVIDIA Titan RTX | |
| Intel Core i9-10900K, NVIDIA Titan RTX | |
| AMD Ryzen 9 3950X, NVIDIA Titan RTX | |
| Intel Core i9-9980HK, NVIDIA GeForce RTX 2070 (Desktop) | |
| Intel Core i5-10600K, NVIDIA Titan RTX | |
| CPU (Multi Core) | |
| AMD Ryzen 9 3950X, NVIDIA Titan RTX | |
| Intel Core i9-10900K, NVIDIA Titan RTX | |
| AMD Ryzen 7 5800X, NVIDIA Titan RTX | |
| Intel Core i9-11900K, NVIDIA Titan RTX | |
| AMD Ryzen 7 3800XT, NVIDIA Titan RTX | |
| Intel Core i9-11900KB, NVIDIA GeForce RTX 3060 | |
| Intel Core i5-11600K, NVIDIA Titan RTX | |
| Intel Core i5-10600K, NVIDIA Titan RTX | |
| Intel Core i9-9980HK, NVIDIA GeForce RTX 2070 (Desktop) | |
| Cinebench R11.5 | |
| CPU Single 64Bit | |
| Intel Core i9-11900K, NVIDIA Titan RTX | |
| AMD Ryzen 7 5800X, NVIDIA Titan RTX | |
| Intel Core i5-11600K, NVIDIA Titan RTX | |
| Intel Core i9-11900KB, NVIDIA GeForce RTX 3060 | |
| Intel Core i9-10900K, NVIDIA Titan RTX | |
| Intel Core i9-9980HK, NVIDIA GeForce RTX 2070 (Desktop) | |
| AMD Ryzen 9 3950X, NVIDIA Titan RTX | |
| AMD Ryzen 7 3800XT, NVIDIA Titan RTX | |
| Intel Core i5-10600K, NVIDIA Titan RTX | |
| CPU Multi 64Bit | |
| AMD Ryzen 9 3950X, NVIDIA Titan RTX | |
| AMD Ryzen 7 5800X, NVIDIA Titan RTX | |
| Intel Core i9-10900K, NVIDIA Titan RTX | |
| Intel Core i9-11900K, NVIDIA Titan RTX | |
| AMD Ryzen 7 3800XT, NVIDIA Titan RTX | |
| Intel Core i9-11900KB, NVIDIA GeForce RTX 3060 | |
| Intel Core i5-11600K, NVIDIA Titan RTX | |
| Intel Core i9-9980HK, NVIDIA GeForce RTX 2070 (Desktop) | |
| Intel Core i5-10600K, NVIDIA Titan RTX | |
| Cinebench R10 | |
| Rendering Single CPUs 64Bit | |
| Intel Core i9-11900K, NVIDIA Titan RTX | |
| AMD Ryzen 7 5800X, NVIDIA Titan RTX | |
| Intel Core i5-11600K, NVIDIA Titan RTX | |
| Intel Core i9-11900KB, NVIDIA GeForce RTX 3060 | |
| Intel Core i9-10900K, NVIDIA Titan RTX | |
| AMD Ryzen 9 3950X, NVIDIA Titan RTX | |
| AMD Ryzen 7 3800XT, NVIDIA Titan RTX | |
| Intel Core i9-9980HK, NVIDIA GeForce RTX 2070 (Desktop) | |
| Intel Core i5-10600K, NVIDIA Titan RTX | |
| Rendering Multiple CPUs 64Bit | |
| AMD Ryzen 9 3950X, NVIDIA Titan RTX | |
| AMD Ryzen 7 5800X, NVIDIA Titan RTX | |
| Intel Core i9-11900K, NVIDIA Titan RTX | |
| Intel Core i9-10900K, NVIDIA Titan RTX | |
| AMD Ryzen 7 3800XT, NVIDIA Titan RTX | |
| Intel Core i9-11900KB, NVIDIA GeForce RTX 3060 | |
| Intel Core i5-11600K, NVIDIA Titan RTX | |
| Intel Core i9-9980HK, NVIDIA GeForce RTX 2070 (Desktop) | |
| Intel Core i5-10600K, NVIDIA Titan RTX | |
| Blender - v2.79 BMW27 CPU | |
| Intel Core i9-9980HK, NVIDIA GeForce RTX 2070 (Desktop) | |
| Intel Core i5-10600K, NVIDIA Titan RTX | |
| Intel Core i5-11600K, NVIDIA Titan RTX | |
| Intel Core i9-11900KB, NVIDIA GeForce RTX 3060 | |
| AMD Ryzen 7 3800XT, NVIDIA Titan RTX | |
| AMD Ryzen 7 5800X, NVIDIA Titan RTX | |
| Intel Core i9-11900K, NVIDIA Titan RTX | |
| Intel Core i9-10900K, NVIDIA Titan RTX | |
| AMD Ryzen 9 3950X, NVIDIA Titan RTX | |
| wPrime 2.10 | |
| 32m | |
| Intel Core i5-11600K, NVIDIA Titan RTX | |
| Intel Core i5-10600K, NVIDIA Titan RTX | |
| AMD Ryzen 9 3950X, NVIDIA Titan RTX | |
| Intel Core i9-11900K, NVIDIA Titan RTX | |
| Intel Core i9-9980HK, NVIDIA GeForce RTX 2070 (Desktop) | |
| AMD Ryzen 7 3800XT, NVIDIA Titan RTX | |
| Intel Core i9-10900K, NVIDIA Titan RTX | |
| Intel Core i9-11900KB, NVIDIA GeForce RTX 3060 | |
| AMD Ryzen 7 5800X, NVIDIA Titan RTX | |
| 1024m | |
| Intel Core i9-9980HK, NVIDIA GeForce RTX 2070 (Desktop) | |
| Intel Core i5-10600K, NVIDIA Titan RTX | |
| Intel Core i5-11600K, NVIDIA Titan RTX | |
| Intel Core i9-11900KB, NVIDIA GeForce RTX 3060 | |
| AMD Ryzen 7 5800X, NVIDIA Titan RTX | |
| AMD Ryzen 7 3800XT, NVIDIA Titan RTX | |
| Intel Core i9-11900K, NVIDIA Titan RTX | |
| Intel Core i9-10900K, NVIDIA Titan RTX | |
| AMD Ryzen 9 3950X, NVIDIA Titan RTX | |
| X264 HD Benchmark 4.0 | |
| Pass 1 | |
| AMD Ryzen 7 5800X, NVIDIA Titan RTX | |
| Intel Core i9-11900K, NVIDIA Titan RTX | |
| Intel Core i5-11600K, NVIDIA Titan RTX | |
| Intel Core i9-10900K, NVIDIA Titan RTX | |
| Intel Core i9-11900KB, NVIDIA GeForce RTX 3060 | |
| AMD Ryzen 7 3800XT, NVIDIA Titan RTX | |
| AMD Ryzen 9 3950X, NVIDIA Titan RTX | |
| Intel Core i5-10600K, NVIDIA Titan RTX | |
| Intel Core i9-9980HK, NVIDIA GeForce RTX 2070 (Desktop) | |
| Pass 2 | |
| AMD Ryzen 9 3950X, NVIDIA Titan RTX | |
| AMD Ryzen 7 5800X, NVIDIA Titan RTX | |
| Intel Core i9-10900K, NVIDIA Titan RTX | |
| Intel Core i9-11900K, NVIDIA Titan RTX | |
| AMD Ryzen 7 3800XT, NVIDIA Titan RTX | |
| Intel Core i9-11900KB, NVIDIA GeForce RTX 3060 | |
| Intel Core i5-11600K, NVIDIA Titan RTX | |
| Intel Core i9-9980HK, NVIDIA GeForce RTX 2070 (Desktop) | |
| Intel Core i5-10600K, NVIDIA Titan RTX | |
| WinRAR - Result | |
| AMD Ryzen 7 5800X, NVIDIA Titan RTX | |
| Intel Core i9-10900K, NVIDIA Titan RTX | |
| Intel Core i9-11900KB, NVIDIA GeForce RTX 3060 | |
| Intel Core i9-11900K, NVIDIA Titan RTX | |
| Intel Core i5-11600K, NVIDIA Titan RTX | |
| AMD Ryzen 7 3800XT, NVIDIA Titan RTX | |
| AMD Ryzen 9 3950X, NVIDIA Titan RTX | |
| Intel Core i9-9980HK, NVIDIA GeForce RTX 2070 (Desktop) | |
| Intel Core i5-10600K, NVIDIA Titan RTX | |
| TrueCrypt | |
| AES Mean 100MB | |
| AMD Ryzen 7 5800X, NVIDIA Titan RTX | |
| Intel Core i9-10900K, NVIDIA Titan RTX | |
| Intel Core i9-11900K, NVIDIA Titan RTX | |
| Intel Core i9-11900KB, NVIDIA GeForce RTX 3060 | |
| AMD Ryzen 7 3800XT, NVIDIA Titan RTX | |
| AMD Ryzen 9 3950X, NVIDIA Titan RTX | |
| Intel Core i9-9980HK, NVIDIA GeForce RTX 2070 (Desktop) | |
| Intel Core i5-11600K, NVIDIA Titan RTX | |
| Intel Core i5-10600K, NVIDIA Titan RTX | |
| Twofish Mean 100MB | |
| AMD Ryzen 9 3950X, NVIDIA Titan RTX | |
| Intel Core i9-10900K, NVIDIA Titan RTX | |
| AMD Ryzen 7 3800XT, NVIDIA Titan RTX | |
| AMD Ryzen 7 5800X, NVIDIA Titan RTX | |
| Intel Core i9-11900K, NVIDIA Titan RTX | |
| Intel Core i9-9980HK, NVIDIA GeForce RTX 2070 (Desktop) | |
| Intel Core i9-11900KB, NVIDIA GeForce RTX 3060 | |
| Intel Core i5-11600K, NVIDIA Titan RTX | |
| Intel Core i5-10600K, NVIDIA Titan RTX | |
| Serpent Mean 100MB | |
| AMD Ryzen 9 3950X, NVIDIA Titan RTX | |
| Intel Core i9-10900K, NVIDIA Titan RTX | |
| AMD Ryzen 7 5800X, NVIDIA Titan RTX | |
| AMD Ryzen 7 3800XT, NVIDIA Titan RTX | |
| Intel Core i9-11900K, NVIDIA Titan RTX | |
| Intel Core i9-11900KB, NVIDIA GeForce RTX 3060 | |
| Intel Core i9-9980HK, NVIDIA GeForce RTX 2070 (Desktop) | |
| Intel Core i5-11600K, NVIDIA Titan RTX | |
| Intel Core i5-10600K, NVIDIA Titan RTX | |
| Geekbench 5.5 | |
| Multi-Core | |
| AMD Ryzen 9 3950X, NVIDIA Titan RTX | |
| Intel Core i9-10900K, NVIDIA Titan RTX | |
| AMD Ryzen 7 5800X, NVIDIA Titan RTX | |
| Intel Core i9-11900K, NVIDIA Titan RTX | |
| AMD Ryzen 7 3800XT, NVIDIA Titan RTX | |
| Intel Core i9-11900KB, NVIDIA GeForce RTX 3060 | |
| Intel Core i5-11600K, NVIDIA Titan RTX | |
| Intel Core i9-9980HK, NVIDIA GeForce RTX 2070 (Desktop) | |
| Intel Core i5-10600K, NVIDIA Titan RTX | |
| Single-Core | |
| Intel Core i9-11900K, NVIDIA Titan RTX | |
| Intel Core i5-11600K, NVIDIA Titan RTX | |
| AMD Ryzen 7 5800X, NVIDIA Titan RTX | |
| Intel Core i9-11900KB, NVIDIA GeForce RTX 3060 | |
| Intel Core i9-10900K, NVIDIA Titan RTX | |
| Intel Core i9-9980HK, NVIDIA GeForce RTX 2070 (Desktop) | |
| AMD Ryzen 7 3800XT, NVIDIA Titan RTX | |
| AMD Ryzen 9 3950X, NVIDIA Titan RTX | |
| Intel Core i5-10600K, NVIDIA Titan RTX | |
| Geekbench 5.0 | |
| 5.0 Multi-Core | |
| AMD Ryzen 9 3950X, NVIDIA Titan RTX | |
| Intel Core i9-10900K, NVIDIA Titan RTX | |
| AMD Ryzen 7 5800X, NVIDIA Titan RTX | |
| Intel Core i9-11900K, NVIDIA Titan RTX | |
| AMD Ryzen 7 3800XT, NVIDIA Titan RTX | |
| Intel Core i9-11900KB, NVIDIA GeForce RTX 3060 | |
| Intel Core i5-11600K, NVIDIA Titan RTX | |
| Intel Core i9-9980HK, NVIDIA GeForce RTX 2070 (Desktop) | |
| Intel Core i5-10600K, NVIDIA Titan RTX | |
| 5.0 Single-Core | |
| Intel Core i9-11900K, NVIDIA Titan RTX | |
| Intel Core i5-11600K, NVIDIA Titan RTX | |
| AMD Ryzen 7 5800X, NVIDIA Titan RTX | |
| Intel Core i9-11900KB, NVIDIA GeForce RTX 3060 | |
| Intel Core i9-10900K, NVIDIA Titan RTX | |
| AMD Ryzen 7 3800XT, NVIDIA Titan RTX | |
| Intel Core i9-9980HK, NVIDIA GeForce RTX 2070 (Desktop) | |
| AMD Ryzen 9 3950X, NVIDIA Titan RTX | |
| Intel Core i5-10600K, NVIDIA Titan RTX | |
| Geekbench 4.4 | |
| 64 Bit Single-Core Score | |
| Intel Core i9-11900K, NVIDIA Titan RTX | |
| Intel Core i5-11600K, NVIDIA Titan RTX | |
| AMD Ryzen 7 5800X, NVIDIA Titan RTX | |
| Intel Core i9-11900KB, NVIDIA GeForce RTX 3060 | |
| Intel Core i9-10900K, NVIDIA Titan RTX | |
| Intel Core i9-9980HK, NVIDIA GeForce RTX 2070 (Desktop) | |
| AMD Ryzen 7 3800XT, NVIDIA Titan RTX | |
| Intel Core i5-10600K, NVIDIA Titan RTX | |
| AMD Ryzen 9 3950X, NVIDIA Titan RTX | |
| 64 Bit Multi-Core Score | |
| AMD Ryzen 9 3950X, NVIDIA Titan RTX | |
| AMD Ryzen 7 5800X, NVIDIA Titan RTX | |
| Intel Core i9-10900K, NVIDIA Titan RTX | |
| Intel Core i9-11900K, NVIDIA Titan RTX | |
| Intel Core i9-11900KB, NVIDIA GeForce RTX 3060 | |
| AMD Ryzen 7 3800XT, NVIDIA Titan RTX | |
| Intel Core i5-11600K, NVIDIA Titan RTX | |
| Intel Core i9-9980HK, NVIDIA GeForce RTX 2070 (Desktop) | |
| Intel Core i5-10600K, NVIDIA Titan RTX | |
| 3DMark 11 - 1280x720 Performance Physics | |
| AMD Ryzen 7 5800X, NVIDIA Titan RTX | |
| Intel Core i9-10900K, NVIDIA Titan RTX | |
| Intel Core i9-11900K, NVIDIA Titan RTX | |
| AMD Ryzen 9 3950X, NVIDIA Titan RTX | |
| AMD Ryzen 7 3800XT, NVIDIA Titan RTX | |
| Intel Core i9-11900KB, NVIDIA GeForce RTX 3060 | |
| Intel Core i5-11600K, NVIDIA Titan RTX | |
| Intel Core i9-9980HK, NVIDIA GeForce RTX 2070 (Desktop) | |
| Intel Core i5-10600K, NVIDIA Titan RTX | |
| 7-Zip 18.03 | |
| 7z b 4 | |
| AMD Ryzen 9 3950X, NVIDIA Titan RTX | |
| AMD Ryzen 7 5800X, NVIDIA Titan RTX | |
| Intel Core i9-10900K, NVIDIA Titan RTX | |
| Intel Core i9-11900K, NVIDIA Titan RTX | |
| AMD Ryzen 7 3800XT, NVIDIA Titan RTX | |
| Intel Core i9-11900KB, NVIDIA GeForce RTX 3060 | |
| Intel Core i5-11600K, NVIDIA Titan RTX | |
| Intel Core i9-9980HK, NVIDIA GeForce RTX 2070 (Desktop) | |
| Intel Core i5-10600K, NVIDIA Titan RTX | |
| 7z b 4 -mmt1 | |
| AMD Ryzen 7 5800X, NVIDIA Titan RTX | |
| Intel Core i9-11900K, NVIDIA Titan RTX | |
| Intel Core i5-11600K, NVIDIA Titan RTX | |
| Intel Core i9-11900KB, NVIDIA GeForce RTX 3060 | |
| Intel Core i9-10900K, NVIDIA Titan RTX | |
| Intel Core i9-9980HK, NVIDIA GeForce RTX 2070 (Desktop) | |
| AMD Ryzen 7 3800XT, NVIDIA Titan RTX | |
| AMD Ryzen 9 3950X, NVIDIA Titan RTX | |
| Intel Core i5-10600K, NVIDIA Titan RTX | |
| HWBOT x265 Benchmark v2.2 - 4k Preset | |
| Intel Core i9-10900K, NVIDIA Titan RTX | |
| AMD Ryzen 7 5800X, NVIDIA Titan RTX | |
| Intel Core i9-11900K, NVIDIA Titan RTX | |
| AMD Ryzen 7 3800XT, NVIDIA Titan RTX | |
| AMD Ryzen 9 3950X, NVIDIA Titan RTX | |
| Intel Core i5-11600K, NVIDIA Titan RTX | |
| Intel Core i9-11900KB, NVIDIA GeForce RTX 3060 | |
| Intel Core i5-10600K, NVIDIA Titan RTX | |
| Intel Core i9-9980HK, NVIDIA GeForce RTX 2070 (Desktop) | |
| R Benchmark 2.5 - Overall mean | |
| Intel Core i5-10600K, NVIDIA Titan RTX | |
| Intel Core i9-9980HK, NVIDIA GeForce RTX 2070 (Desktop) | |
| Intel Core i9-11900KB, NVIDIA GeForce RTX 3060 | |
| Intel Core i9-10900K, NVIDIA Titan RTX | |
| AMD Ryzen 9 3950X, NVIDIA Titan RTX | |
| AMD Ryzen 7 3800XT, NVIDIA Titan RTX | |
| Intel Core i5-11600K, NVIDIA Titan RTX | |
| Intel Core i9-11900K, NVIDIA Titan RTX | |
| AMD Ryzen 7 5800X, NVIDIA Titan RTX | |
| LibreOffice - 20 Documents To PDF | |
| Intel Core i9-10900K, NVIDIA Titan RTX | |
| Intel Core i9-11900K, NVIDIA Titan RTX | |
| AMD Ryzen 9 3950X, NVIDIA Titan RTX | |
| Intel Core i5-10600K, NVIDIA Titan RTX | |
| Intel Core i9-9980HK, NVIDIA GeForce RTX 2070 (Desktop) | |
| Intel Core i9-11900KB, NVIDIA GeForce RTX 3060 | |
| AMD Ryzen 7 3800XT, NVIDIA Titan RTX | |
| AMD Ryzen 7 5800X, NVIDIA Titan RTX | |
| Intel Core i5-11600K, NVIDIA Titan RTX | |
| WebXPRT 3 - Overall | |
| AMD Ryzen 7 5800X, NVIDIA Titan RTX | |
| Intel Core i5-11600K, NVIDIA Titan RTX | |
| Intel Core i9-11900KB, NVIDIA GeForce RTX 3060 | |
| Intel Core i9-10900K, NVIDIA Titan RTX | |
| AMD Ryzen 7 3800XT, NVIDIA Titan RTX | |
| AMD Ryzen 9 3950X, NVIDIA Titan RTX | |
| Intel Core i5-10600K, NVIDIA Titan RTX | |
| Intel Core i9-9980HK, NVIDIA GeForce RTX 2070 (Desktop) | |
| Intel Core i9-11900K, NVIDIA Titan RTX | |
| Mozilla Kraken 1.1 - Total | |
| Intel Core i5-10600K, NVIDIA Titan RTX | |
| Intel Core i9-9980HK, NVIDIA GeForce RTX 2070 (Desktop) | |
| Intel Core i9-10900K, NVIDIA Titan RTX | |
| AMD Ryzen 9 3950X, NVIDIA Titan RTX | |
| AMD Ryzen 7 3800XT, NVIDIA Titan RTX | |
| Intel Core i9-11900KB, NVIDIA GeForce RTX 3060 | |
| Intel Core i5-11600K, NVIDIA Titan RTX | |
| AMD Ryzen 7 5800X, NVIDIA Titan RTX | |
| Intel Core i9-11900K, NVIDIA Titan RTX | |
| 3DMark | |
| 3840x2160 Fire Strike Ultra Physics | |
| AMD Ryzen 9 3950X, NVIDIA Titan RTX | |
| AMD Ryzen 7 5800X, NVIDIA Titan RTX | |
| Intel Core i9-10900K, NVIDIA Titan RTX | |
| Intel Core i9-11900K, NVIDIA Titan RTX | |
| AMD Ryzen 7 3800XT, NVIDIA Titan RTX | |
| Intel Core i9-11900KB, NVIDIA GeForce RTX 3060 | |
| Intel Core i5-11600K, NVIDIA Titan RTX | |
| Intel Core i9-9980HK, NVIDIA GeForce RTX 2070 (Desktop) | |
| Intel Core i5-10600K, NVIDIA Titan RTX | |
| 1920x1080 Fire Strike Physics | |
| AMD Ryzen 9 3950X, NVIDIA Titan RTX | |
| AMD Ryzen 7 5800X, NVIDIA Titan RTX | |
| Intel Core i9-10900K, NVIDIA Titan RTX | |
| Intel Core i9-11900K, NVIDIA Titan RTX | |
| AMD Ryzen 7 3800XT, NVIDIA Titan RTX | |
| Intel Core i9-11900KB, NVIDIA GeForce RTX 3060 | |
| Intel Core i5-11600K, NVIDIA Titan RTX | |
| Intel Core i9-9980HK, NVIDIA GeForce RTX 2070 (Desktop) | |
| Intel Core i5-10600K, NVIDIA Titan RTX | |
| 2560x1440 Time Spy CPU | |
| Intel Core i9-10900K, NVIDIA Titan RTX | |
| Intel Core i9-11900K, NVIDIA Titan RTX | |
| AMD Ryzen 9 3950X, NVIDIA Titan RTX | |
| AMD Ryzen 7 5800X, NVIDIA Titan RTX | |
| AMD Ryzen 7 3800XT, NVIDIA Titan RTX | |
| Intel Core i9-11900KB, NVIDIA GeForce RTX 3060 | |
| Intel Core i5-11600K, NVIDIA Titan RTX | |
| Intel Core i9-9980HK, NVIDIA GeForce RTX 2070 (Desktop) | |
| Intel Core i5-10600K, NVIDIA Titan RTX | |
* ... daha küçük daha iyidir
Cinebench R15 çoklu döngüde Intel NUC 11 Extreme Kiti
Cinebench R15 çoklu döngü ile yapılan ilk yük testi istikrarlı performans gösteriyor. 1.800 puanla Intel Core i9-11900KB, performans düşüşü olmadan tutarlı bir şekilde yüksek performans sunar. Bununla birlikte, ilk iki çalıştırmadan sonra hafif bir performans düşüşü fark edilebilir.
Uygulama performansı
Uygulama karşılaştırmalarında, test örneğimiz Ghost Canyon NUC'nin yalnızca çok az ilerisindedir. Genel olarak, yeni donanım iyi bir performans kazancı sağlayamaz. Ancak öznel olarak hem Ghost Canyon NUC hem de Beast Canyon NUC'nin günlük kullanımda oldukça hızlı olduğunu söyleyebiliriz. Uzun bekleme süreleri sadece büyük oyunları indirirken yaşanıyordu, ancak bu internet sağlayıcısının bant genişliği kısıtlamalarından kaynaklanıyor. Aşağıdaki PCMark 10 sonuçlarında da görülebileceği gibi, test örneğimiz mevcut test sistemlerine karşı da oldukça başarılıdır.
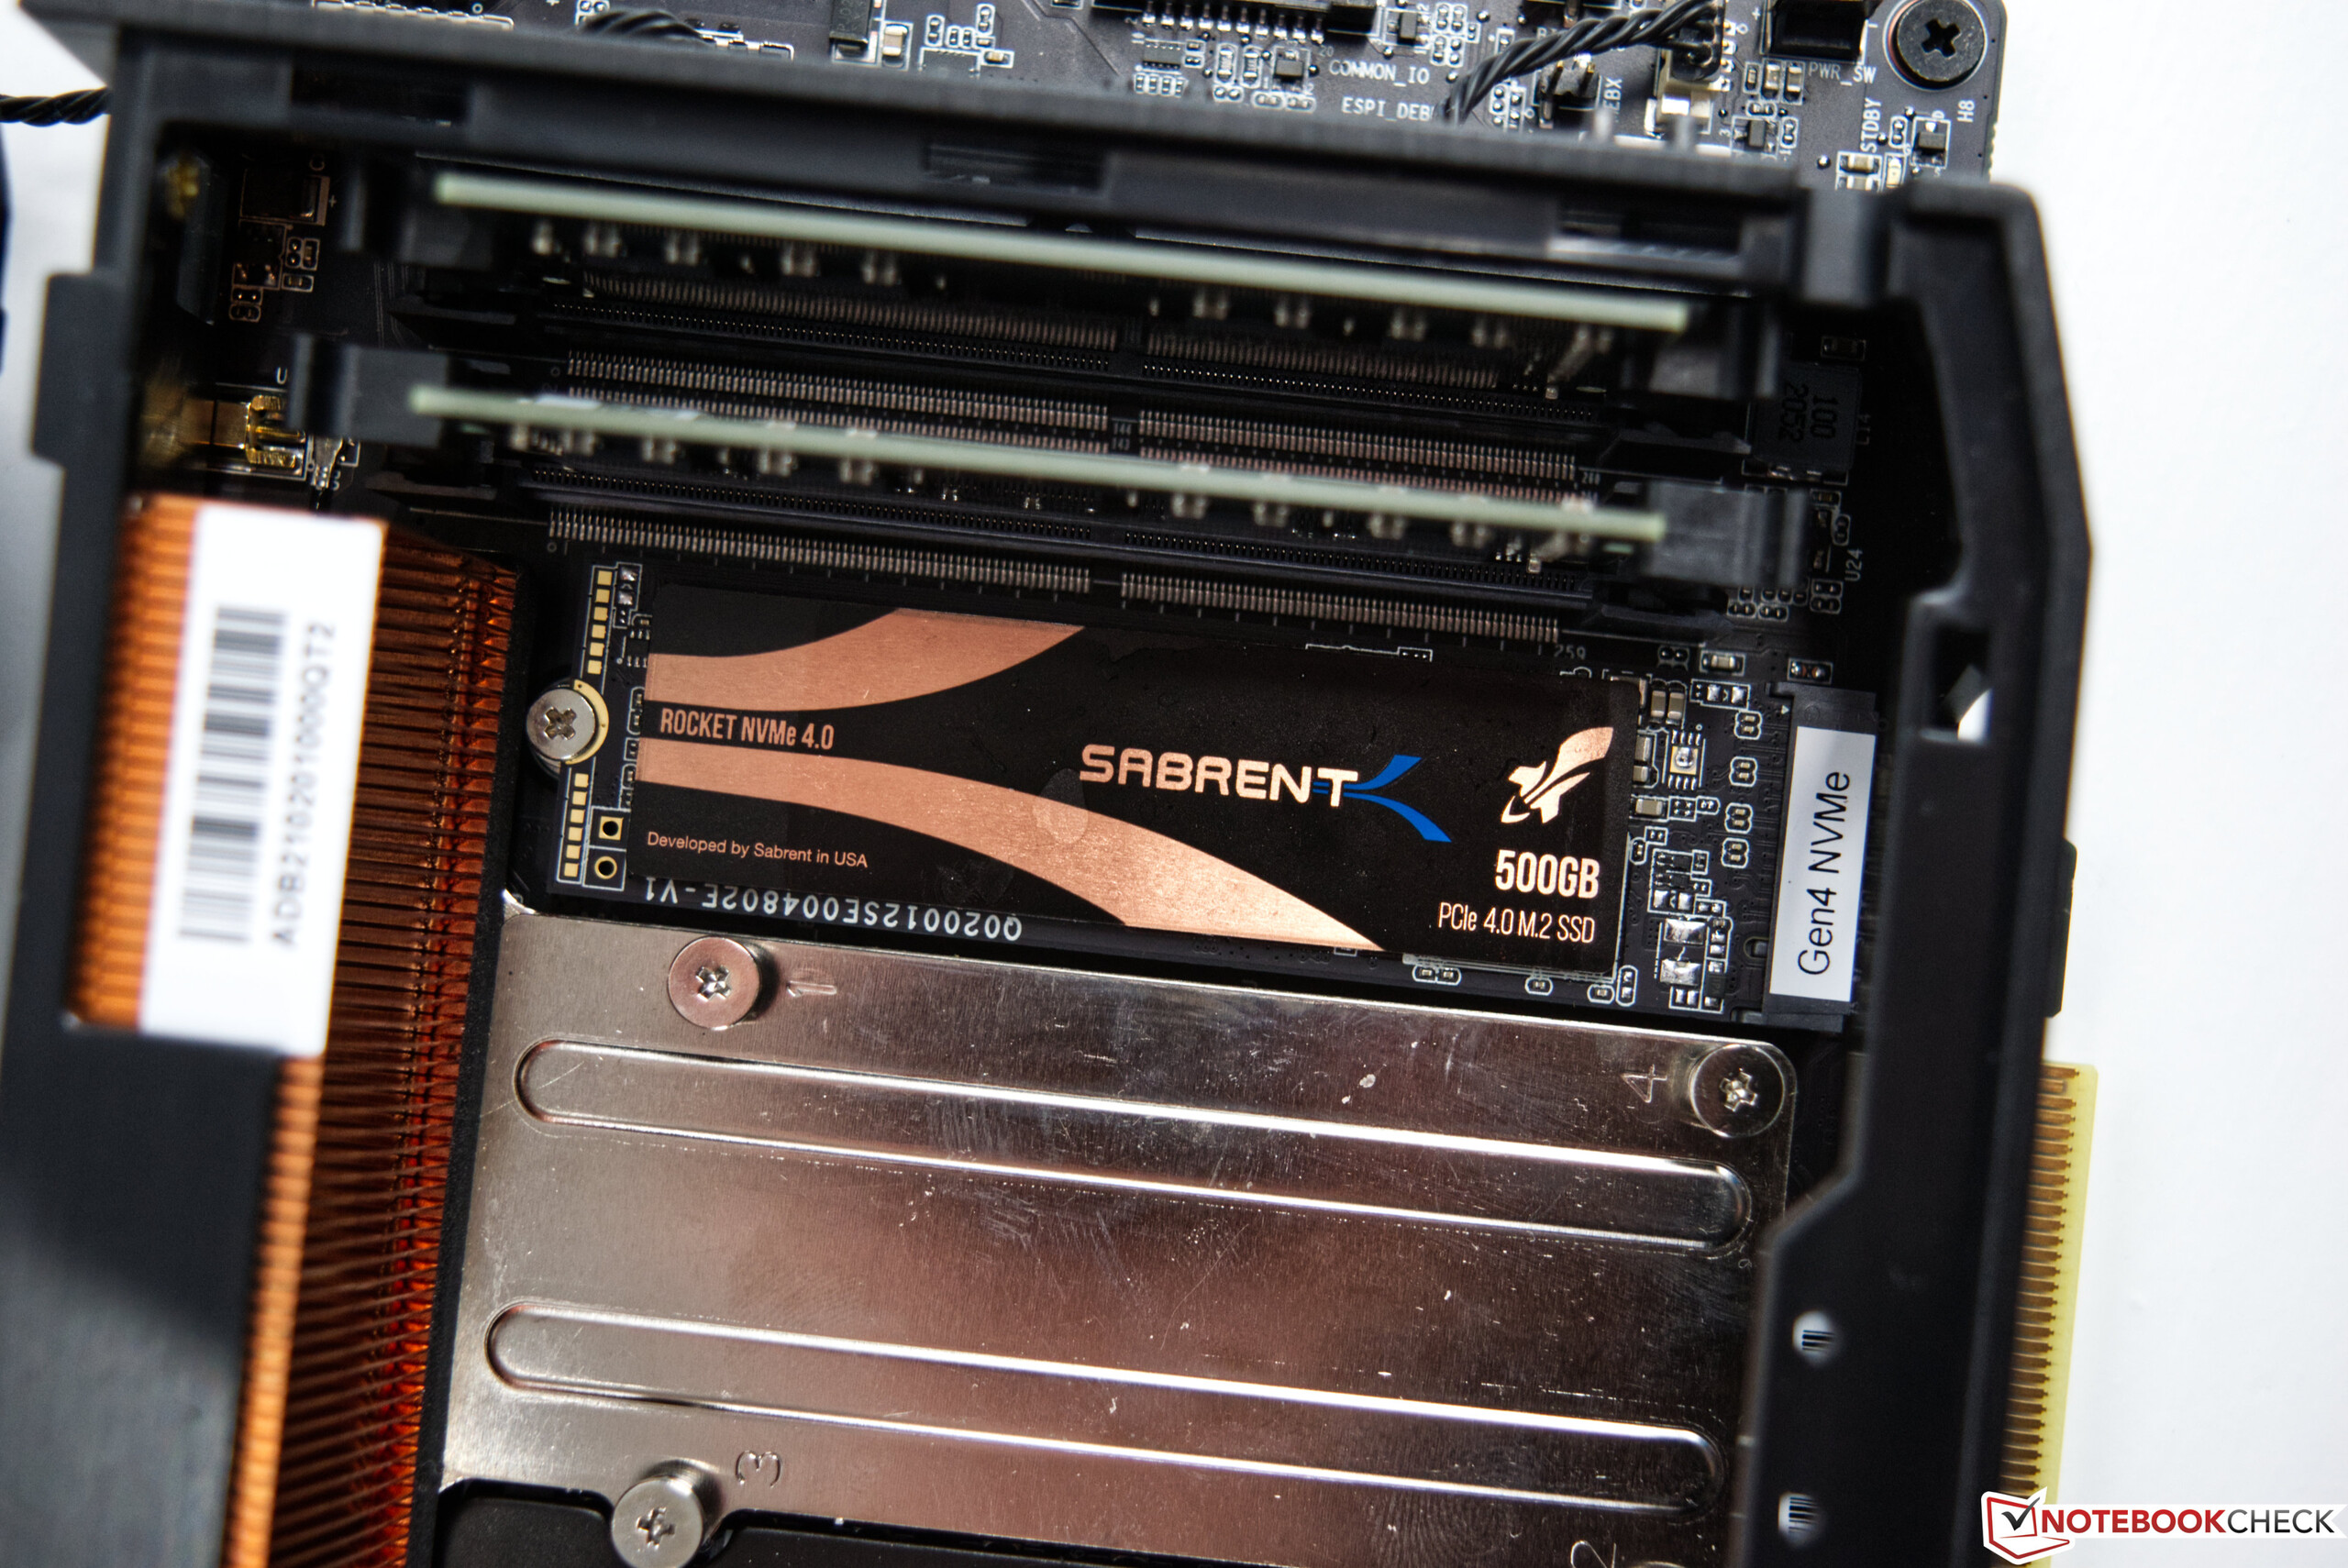
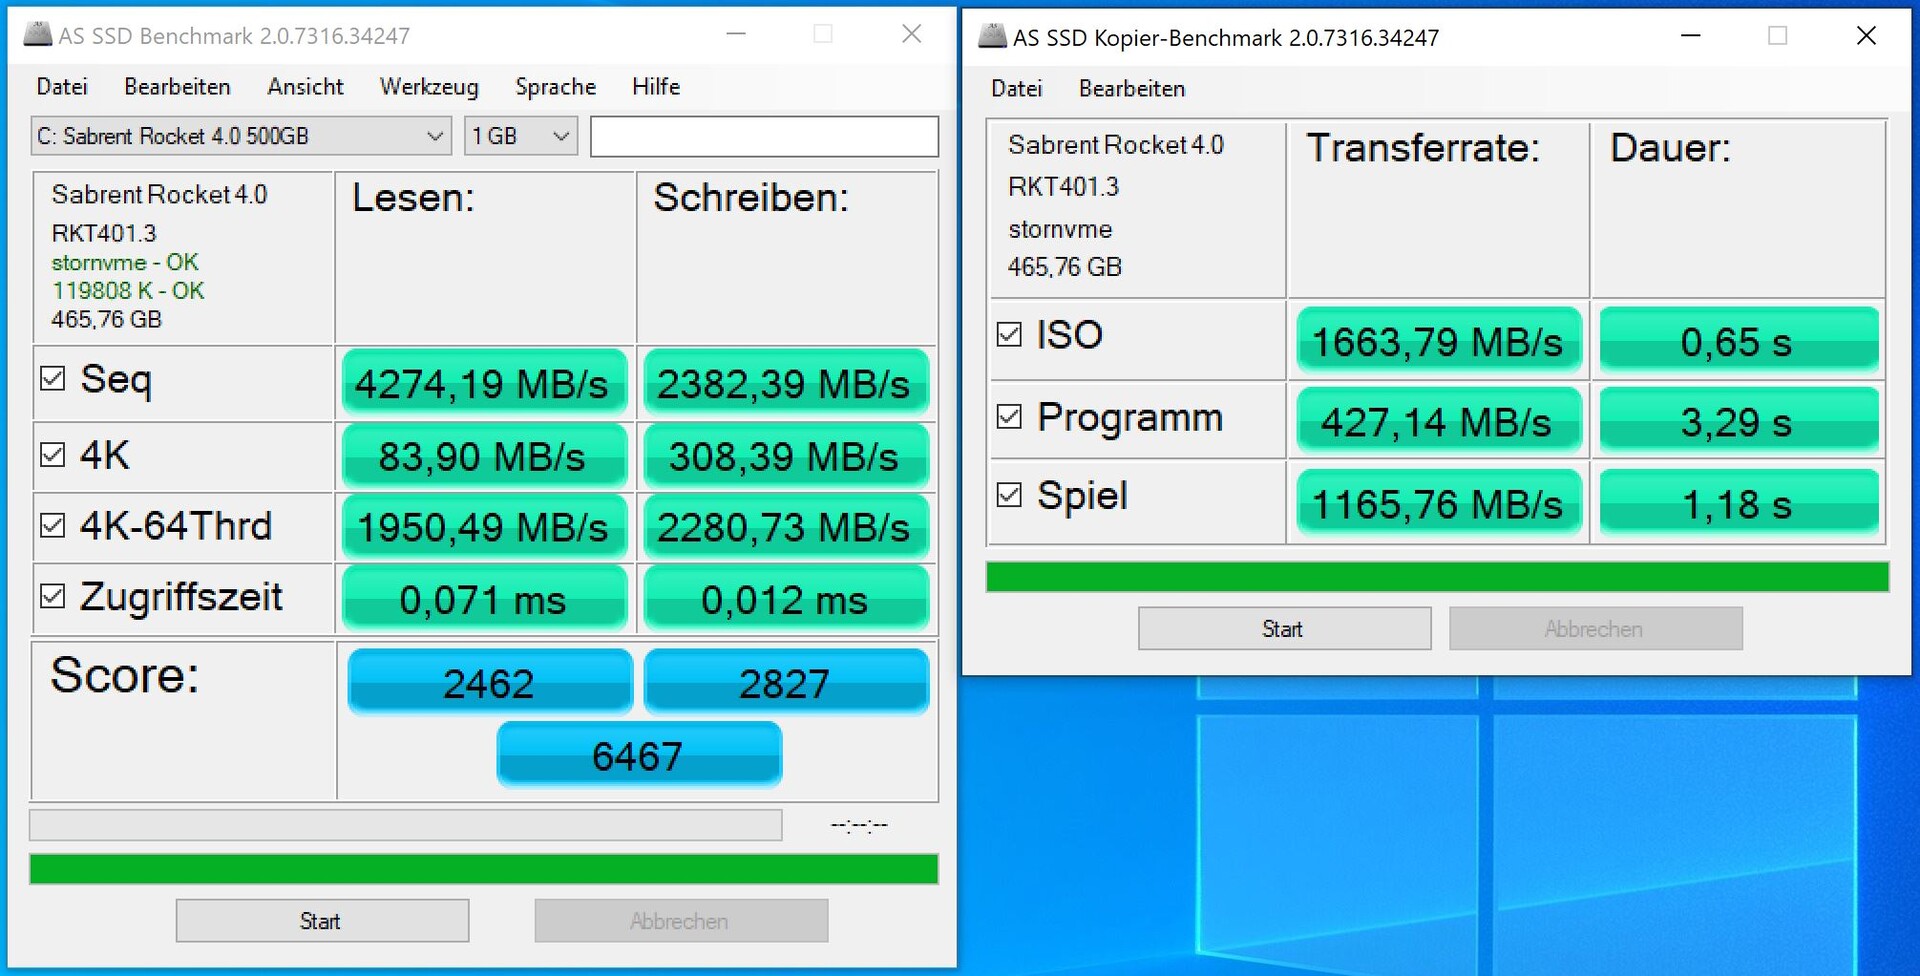
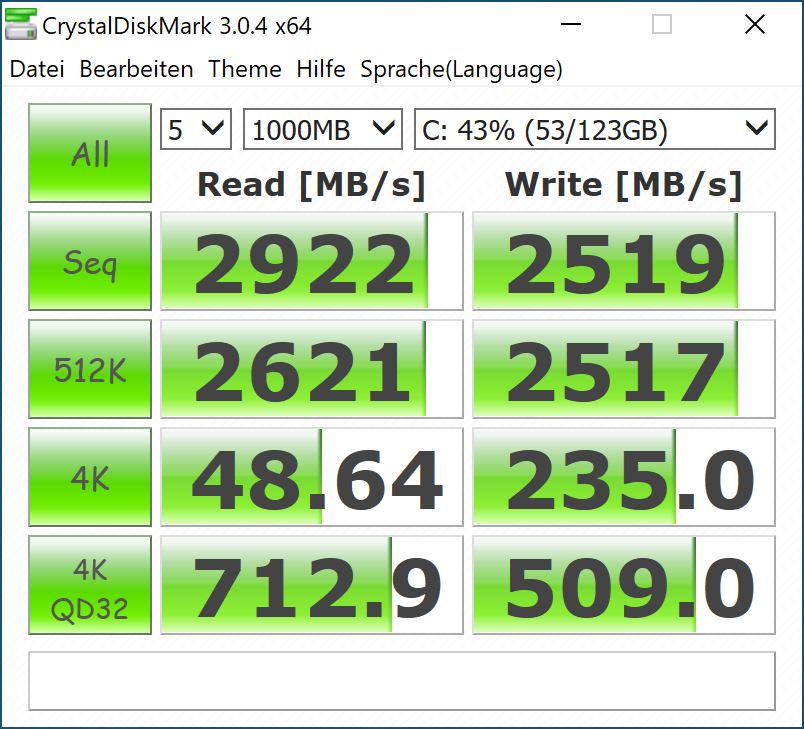
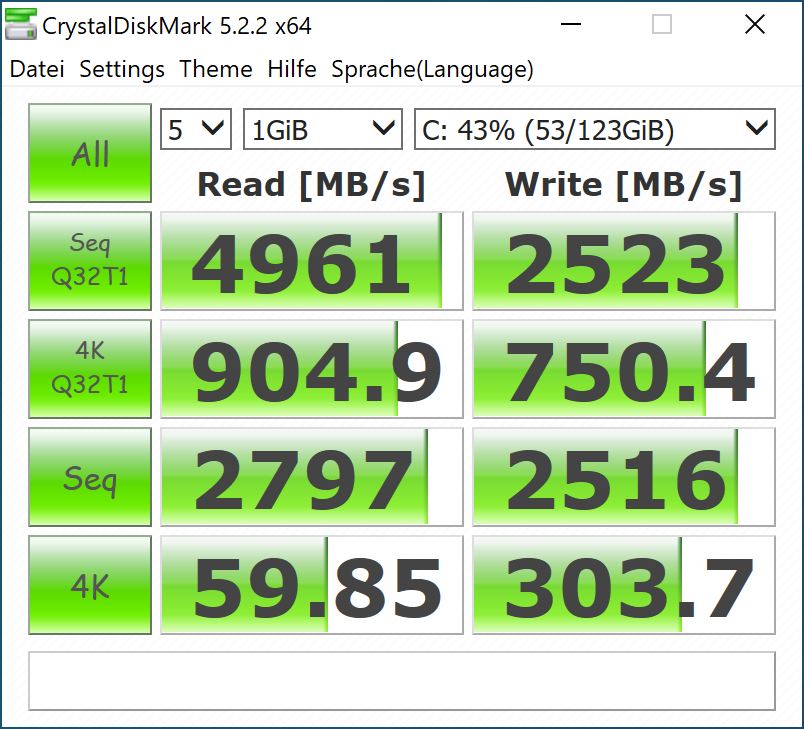
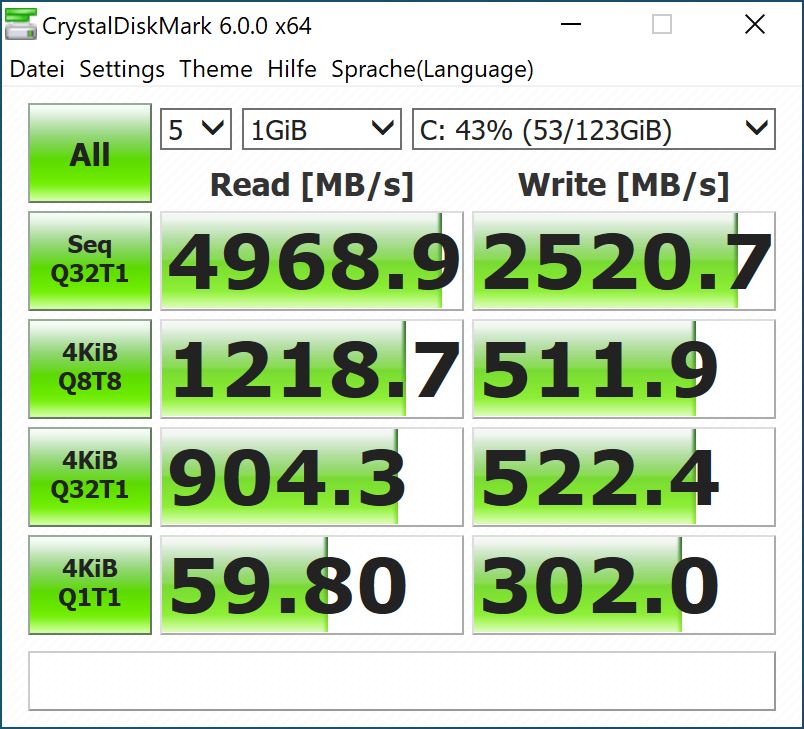
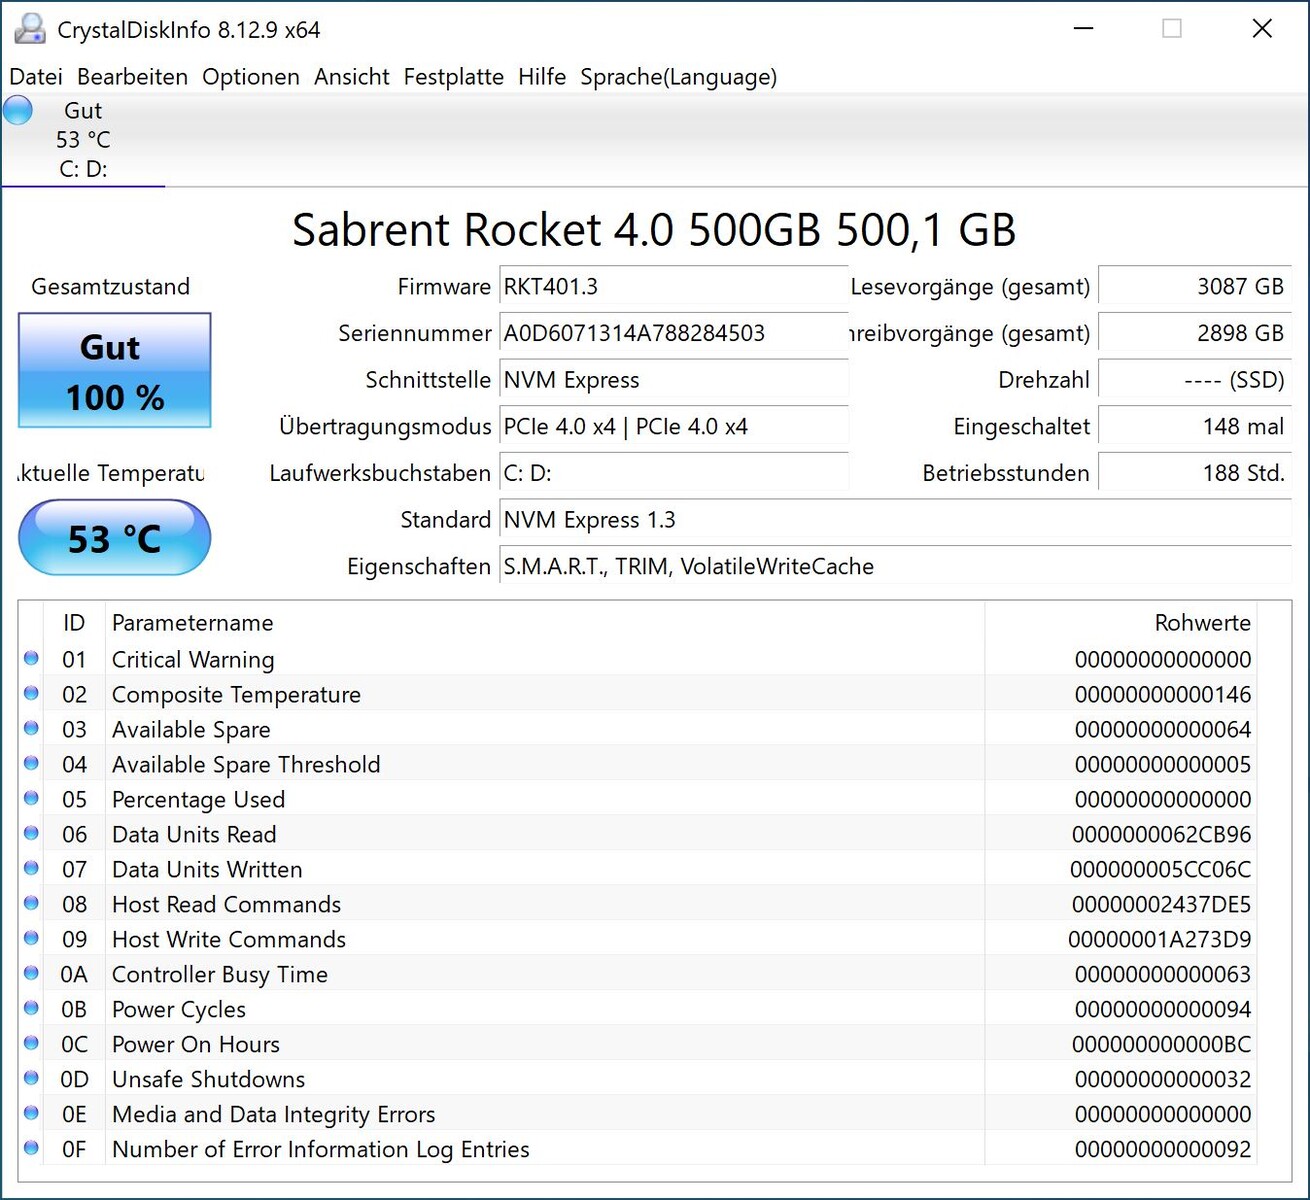
Intel, test örneğini, testte çok iyi performans gösteren 500 GB SSD ile donattı. Yapı nedeniyle, yalnızca SSD'leri Beast Canyon NUC'ye kurmak mümkündür. Hesaplama Elemanı üç M.2-2280 yuvasına sahiptir ve alt taraftaki kasaya başka bir modül takılabilir.
| Performance rating - Percent | |
| Intel Core i9-11900K, Intel Core i9-11900K | |
| Intel Core i5-11600K, Intel Core i5-11600K | |
| Intel Core i9-10900K, Intel Core i9-10900K | |
| Intel Core i5-10600K, Intel Core i5-10600K | |
| AMD Ryzen 9 3950X, AMD Ryzen 9 3950X | |
| Corsair One i160, Intel Core i9-9900K | |
| Intel Beast Canyon NUC, Intel Core i9-11900KB | |
| Intel Ghost Canyon NUC (RTX 2070), Intel Core i9-9980HK | |
| PCMark 10 - Score | |
| AMD Ryzen 9 3950X, AMD Ryzen 9 3950X | |
| Intel Core i9-11900K, Intel Core i9-11900K | |
| Intel Core i5-11600K, Intel Core i5-11600K | |
| Intel Core i9-10900K, Intel Core i9-10900K | |
| Corsair One i160, Intel Core i9-9900K | |
| Intel Beast Canyon NUC, Intel Core i9-11900KB | |
| Intel Core i5-10600K, Intel Core i5-10600K | |
| Intel Ghost Canyon NUC (RTX 2070), Intel Core i9-9980HK | |
| SPECviewperf 12 | |
| 1900x1060 Solidworks (sw-03) | |
| Intel Core i9-11900K, Intel Core i9-11900K | |
| Intel Core i9-10900K, Intel Core i9-10900K | |
| Intel Core i5-11600K, Intel Core i5-11600K | |
| Intel Core i5-10600K, Intel Core i5-10600K | |
| AMD Ryzen 9 3950X, AMD Ryzen 9 3950X | |
| Corsair One i160, Intel Core i9-9900K | |
| Intel Beast Canyon NUC, Intel Core i9-11900KB | |
| Intel Ghost Canyon NUC (RTX 2070), Intel Core i9-9980HK | |
| 1900x1060 Siemens NX (snx-02) | |
| Intel Core i9-10900K, Intel Core i9-10900K | |
| Intel Core i5-10600K, Intel Core i5-10600K | |
| AMD Ryzen 9 3950X, AMD Ryzen 9 3950X | |
| Intel Core i5-11600K, Intel Core i5-11600K | |
| Intel Core i9-11900K, Intel Core i9-11900K | |
| Corsair One i160, Intel Core i9-9900K | |
| Intel Ghost Canyon NUC (RTX 2070), Intel Core i9-9980HK | |
| Intel Beast Canyon NUC, Intel Core i9-11900KB | |
| 1900x1060 Showcase (showcase-01) | |
| Intel Core i9-11900K, Intel Core i9-11900K | |
| Intel Core i5-11600K, Intel Core i5-11600K | |
| Intel Core i5-10600K, Intel Core i5-10600K | |
| Intel Core i9-10900K, Intel Core i9-10900K | |
| AMD Ryzen 9 3950X, AMD Ryzen 9 3950X | |
| Corsair One i160, Intel Core i9-9900K | |
| Intel Ghost Canyon NUC (RTX 2070), Intel Core i9-9980HK | |
| Intel Beast Canyon NUC, Intel Core i9-11900KB | |
| 1900x1060 Medical (medical-01) | |
| Intel Core i5-10600K, Intel Core i5-10600K | |
| Intel Core i9-10900K, Intel Core i9-10900K | |
| Intel Core i5-11600K, Intel Core i5-11600K | |
| AMD Ryzen 9 3950X, AMD Ryzen 9 3950X | |
| Intel Core i9-11900K, Intel Core i9-11900K | |
| Corsair One i160, Intel Core i9-9900K | |
| Intel Beast Canyon NUC, Intel Core i9-11900KB | |
| Intel Ghost Canyon NUC (RTX 2070), Intel Core i9-9980HK | |
| 1900x1060 Maya (maya-04) | |
| Intel Core i9-11900K, Intel Core i9-11900K | |
| Intel Beast Canyon NUC, Intel Core i9-11900KB | |
| Corsair One i160, Intel Core i9-9900K | |
| Intel Core i9-10900K, Intel Core i9-10900K | |
| Intel Core i5-11600K, Intel Core i5-11600K | |
| AMD Ryzen 9 3950X, AMD Ryzen 9 3950X | |
| Intel Ghost Canyon NUC (RTX 2070), Intel Core i9-9980HK | |
| Intel Core i5-10600K, Intel Core i5-10600K | |
| 1900x1060 Energy (energy-01) | |
| Intel Core i5-10600K, Intel Core i5-10600K | |
| Intel Core i9-10900K, Intel Core i9-10900K | |
| Intel Core i5-11600K, Intel Core i5-11600K | |
| Intel Core i9-11900K, Intel Core i9-11900K | |
| AMD Ryzen 9 3950X, AMD Ryzen 9 3950X | |
| Corsair One i160, Intel Core i9-9900K | |
| Intel Ghost Canyon NUC (RTX 2070), Intel Core i9-9980HK | |
| Intel Beast Canyon NUC, Intel Core i9-11900KB | |
| 1900x1060 Creo (creo-01) | |
| Intel Core i9-11900K, Intel Core i9-11900K | |
| Intel Core i5-11600K, Intel Core i5-11600K | |
| Intel Core i9-10900K, Intel Core i9-10900K | |
| Intel Core i5-10600K, Intel Core i5-10600K | |
| AMD Ryzen 9 3950X, AMD Ryzen 9 3950X | |
| Corsair One i160, Intel Core i9-9900K | |
| Intel Ghost Canyon NUC (RTX 2070), Intel Core i9-9980HK | |
| Intel Beast Canyon NUC, Intel Core i9-11900KB | |
| 1900x1060 Catia (catia-04) | |
| Intel Core i9-11900K, Intel Core i9-11900K | |
| Intel Core i5-11600K, Intel Core i5-11600K | |
| Intel Core i9-10900K, Intel Core i9-10900K | |
| AMD Ryzen 9 3950X, AMD Ryzen 9 3950X | |
| Intel Core i5-10600K, Intel Core i5-10600K | |
| Corsair One i160, Intel Core i9-9900K | |
| Intel Ghost Canyon NUC (RTX 2070), Intel Core i9-9980HK | |
| Intel Beast Canyon NUC, Intel Core i9-11900KB | |
| 1900x1060 3ds Max (3dsmax-05) | |
| Intel Core i9-10900K, Intel Core i9-10900K | |
| Intel Core i5-10600K, Intel Core i5-10600K | |
| Intel Core i9-11900K, Intel Core i9-11900K | |
| Intel Core i5-11600K, Intel Core i5-11600K | |
| AMD Ryzen 9 3950X, AMD Ryzen 9 3950X | |
| Corsair One i160, Intel Core i9-9900K | |
| Intel Beast Canyon NUC, Intel Core i9-11900KB | |
| Intel Ghost Canyon NUC (RTX 2070), Intel Core i9-9980HK | |
| SPECviewperf 13 | |
| Solidworks (sw-04) | |
| Intel Core i9-11900K, Intel Core i9-11900K | |
| Intel Core i5-11600K, Intel Core i5-11600K | |
| Intel Core i9-10900K, Intel Core i9-10900K | |
| Intel Core i5-10600K, Intel Core i5-10600K | |
| AMD Ryzen 9 3950X, AMD Ryzen 9 3950X | |
| Corsair One i160, Intel Core i9-9900K | |
| Intel Beast Canyon NUC, Intel Core i9-11900KB | |
| Intel Ghost Canyon NUC (RTX 2070), Intel Core i9-9980HK | |
| Siemens NX (snx-03) | |
| Intel Core i9-10900K, Intel Core i9-10900K | |
| Intel Core i5-10600K, Intel Core i5-10600K | |
| AMD Ryzen 9 3950X, AMD Ryzen 9 3950X | |
| Intel Core i5-11600K, Intel Core i5-11600K | |
| Intel Core i9-11900K, Intel Core i9-11900K | |
| Corsair One i160, Intel Core i9-9900K | |
| Intel Ghost Canyon NUC (RTX 2070), Intel Core i9-9980HK | |
| Intel Beast Canyon NUC, Intel Core i9-11900KB | |
| Showcase (showcase-02) | |
| Intel Core i5-10600K, Intel Core i5-10600K | |
| Intel Core i9-10900K, Intel Core i9-10900K | |
| Intel Core i9-11900K, Intel Core i9-11900K | |
| Intel Core i5-11600K, Intel Core i5-11600K | |
| AMD Ryzen 9 3950X, AMD Ryzen 9 3950X | |
| Corsair One i160, Intel Core i9-9900K | |
| Intel Ghost Canyon NUC (RTX 2070), Intel Core i9-9980HK | |
| Intel Beast Canyon NUC, Intel Core i9-11900KB | |
| Medical (medical-02) | |
| AMD Ryzen 9 3950X, AMD Ryzen 9 3950X | |
| Intel Core i9-11900K, Intel Core i9-11900K | |
| Intel Core i5-11600K, Intel Core i5-11600K | |
| Intel Core i5-10600K, Intel Core i5-10600K | |
| Intel Core i9-10900K, Intel Core i9-10900K | |
| Corsair One i160, Intel Core i9-9900K | |
| Intel Ghost Canyon NUC (RTX 2070), Intel Core i9-9980HK | |
| Intel Beast Canyon NUC, Intel Core i9-11900KB | |
| Maya (maya-05) | |
| Intel Core i9-11900K, Intel Core i9-11900K | |
| Intel Core i5-11600K, Intel Core i5-11600K | |
| Intel Core i9-10900K, Intel Core i9-10900K | |
| Corsair One i160, Intel Core i9-9900K | |
| AMD Ryzen 9 3950X, AMD Ryzen 9 3950X | |
| Intel Core i5-10600K, Intel Core i5-10600K | |
| Intel Ghost Canyon NUC (RTX 2070), Intel Core i9-9980HK | |
| Intel Beast Canyon NUC, Intel Core i9-11900KB | |
| Energy (energy-02) | |
| Intel Core i5-11600K, Intel Core i5-11600K | |
| Intel Core i9-11900K, Intel Core i9-11900K | |
| Intel Core i5-10600K, Intel Core i5-10600K | |
| Intel Core i9-10900K, Intel Core i9-10900K | |
| AMD Ryzen 9 3950X, AMD Ryzen 9 3950X | |
| Corsair One i160, Intel Core i9-9900K | |
| Intel Ghost Canyon NUC (RTX 2070), Intel Core i9-9980HK | |
| Intel Beast Canyon NUC, Intel Core i9-11900KB | |
| Creo (creo-02) | |
| Intel Core i9-11900K, Intel Core i9-11900K | |
| Intel Core i5-11600K, Intel Core i5-11600K | |
| Intel Core i9-10900K, Intel Core i9-10900K | |
| Intel Core i5-10600K, Intel Core i5-10600K | |
| AMD Ryzen 9 3950X, AMD Ryzen 9 3950X | |
| Corsair One i160, Intel Core i9-9900K | |
| Intel Ghost Canyon NUC (RTX 2070), Intel Core i9-9980HK | |
| Intel Beast Canyon NUC, Intel Core i9-11900KB | |
| Catia (catia-05) | |
| Intel Core i9-11900K, Intel Core i9-11900K | |
| Intel Core i5-11600K, Intel Core i5-11600K | |
| Intel Core i9-10900K, Intel Core i9-10900K | |
| AMD Ryzen 9 3950X, AMD Ryzen 9 3950X | |
| Intel Core i5-10600K, Intel Core i5-10600K | |
| Corsair One i160, Intel Core i9-9900K | |
| Intel Ghost Canyon NUC (RTX 2070), Intel Core i9-9980HK | |
| Intel Beast Canyon NUC, Intel Core i9-11900KB | |
| 3ds Max (3dsmax-06) | |
| Intel Core i5-10600K, Intel Core i5-10600K | |
| Intel Core i9-10900K, Intel Core i9-10900K | |
| Intel Core i5-11600K, Intel Core i5-11600K | |
| Intel Core i9-11900K, Intel Core i9-11900K | |
| AMD Ryzen 9 3950X, AMD Ryzen 9 3950X | |
| Corsair One i160, Intel Core i9-9900K | |
| Intel Beast Canyon NUC, Intel Core i9-11900KB | |
| Intel Ghost Canyon NUC (RTX 2070), Intel Core i9-9980HK | |
3D performans ve oyun performansı
İyi bir oyun performansı için test sistemimiz Asus'tan Nvidia GeForce RTX 3060 ile donatılmıştır. Beast Canyon NUC, özel bir grafik kartı olmadan satıldığından, kullanıcılar neyi yüklemek istediklerine kendileri karar verebilir. Intel Core i9-11900KB'nin entegre ekran kartı oyun oynamak için önerilmez. Buraya kurulan GeForce RTX 3060, 1080p ve 1440p oyun için çoğunlukla yeterli olan sağlam bir performans sunar. Yine de, sürekli olarak akıcı 4K oyun oynamak için pek yeterli değil. Bununla birlikte, eski başlıklar yüksek çözünürlüklerde sorunsuz bir şekilde oluşturulabilir.
Daha fazla karşılaştırma ve kıyaslama için Ekran kartı karşılaştırma tablomuza bakın.
Beast Canyon NUC'a farklı bir ekran kartı takmak istiyorsanız ekran kartının boyutlarına önceden dikkat etmelisiniz. Grafik kartı iki yuvadan fazla soğutma tasarımına sahip olmamalı ve maksimum 12 inç uzunluğa sahip olmalıdır.
| Performance rating - Percent | |
| Zotac Magnus One (ECM73070C) | |
| Inno3D GeForce RTX 3060 Twin X2 | |
| Intel Beast Canyon NUC -2! | |
| Intel Ghost Canyon NUC (RTX 2070) | |
| Borderlands 3 | |
| 1280x720 Very Low Overall Quality (DX11) | |
| Inno3D GeForce RTX 3060 Twin X2 | |
| Intel Beast Canyon NUC | |
| Intel Ghost Canyon NUC (RTX 2070) | |
| Zotac Magnus One (ECM73070C) | |
| 1920x1080 Badass Overall Quality (DX11) | |
| Intel Beast Canyon NUC | |
| Zotac Magnus One (ECM73070C) | |
| Inno3D GeForce RTX 3060 Twin X2 | |
| Intel Ghost Canyon NUC (RTX 2070) | |
| Metro Exodus | |
| 1280x720 Low Quality AF:4x | |
| Inno3D GeForce RTX 3060 Twin X2 | |
| Intel Beast Canyon NUC | |
| Intel Ghost Canyon NUC (RTX 2070) | |
| Zotac Magnus One (ECM73070C) | |
| 1920x1080 Ultra Quality AF:16x | |
| Zotac Magnus One (ECM73070C) | |
| Intel Ghost Canyon NUC (RTX 2070) | |
| Intel Beast Canyon NUC | |
| Inno3D GeForce RTX 3060 Twin X2 | |
| Far Cry New Dawn | |
| 1280x720 Low Preset | |
| Inno3D GeForce RTX 3060 Twin X2 | |
| Intel Beast Canyon NUC | |
| Intel Ghost Canyon NUC (RTX 2070) | |
| Zotac Magnus One (ECM73070C) | |
| 1920x1080 Ultra Preset | |
| Inno3D GeForce RTX 3060 Twin X2 | |
| Intel Beast Canyon NUC | |
| Zotac Magnus One (ECM73070C) | |
| Intel Ghost Canyon NUC (RTX 2070) | |
| Far Cry 5 | |
| 1280x720 Low Preset AA:T | |
| Inno3D GeForce RTX 3060 Twin X2 | |
| Intel Beast Canyon NUC | |
| Zotac Magnus One (ECM73070C) | |
| Intel Ghost Canyon NUC (RTX 2070) | |
| 1920x1080 Ultra Preset AA:T | |
| Inno3D GeForce RTX 3060 Twin X2 | |
| Intel Beast Canyon NUC | |
| Zotac Magnus One (ECM73070C) | |
| Intel Ghost Canyon NUC (RTX 2070) | |
| X-Plane 11.11 | |
| 1280x720 low (fps_test=1) | |
| Inno3D GeForce RTX 3060 Twin X2 | |
| Intel Beast Canyon NUC | |
| Intel Ghost Canyon NUC (RTX 2070) | |
| Zotac Magnus One (ECM73070C) | |
| 1920x1080 high (fps_test=3) | |
| Inno3D GeForce RTX 3060 Twin X2 | |
| Intel Beast Canyon NUC | |
| Intel Ghost Canyon NUC (RTX 2070) | |
| Zotac Magnus One (ECM73070C) | |
| Final Fantasy XV Benchmark | |
| 1280x720 Lite Quality | |
| Inno3D GeForce RTX 3060 Twin X2 | |
| Intel Beast Canyon NUC | |
| Intel Ghost Canyon NUC (RTX 2070) | |
| Zotac Magnus One (ECM73070C) | |
| 1920x1080 High Quality | |
| Zotac Magnus One (ECM73070C) | |
| Intel Ghost Canyon NUC (RTX 2070) | |
| Inno3D GeForce RTX 3060 Twin X2 | |
| Intel Beast Canyon NUC | |
| Dota 2 Reborn | |
| 1280x720 min (0/3) fastest | |
| Inno3D GeForce RTX 3060 Twin X2 | |
| Intel Beast Canyon NUC | |
| Zotac Magnus One (ECM73070C) | |
| Intel Ghost Canyon NUC (RTX 2070) | |
| 1920x1080 ultra (3/3) best looking | |
| Inno3D GeForce RTX 3060 Twin X2 | |
| Intel Beast Canyon NUC | |
| Intel Ghost Canyon NUC (RTX 2070) | |
| Zotac Magnus One (ECM73070C) | |
| The Witcher 3 | |
| 1024x768 Low Graphics & Postprocessing | |
| Inno3D GeForce RTX 3060 Twin X2 | |
| Zotac Magnus One (ECM73070C) | |
| Intel Ghost Canyon NUC (RTX 2070) | |
| 1920x1080 Ultra Graphics & Postprocessing (HBAO+) | |
| Zotac Magnus One (ECM73070C) | |
| Intel Ghost Canyon NUC (RTX 2070) | |
| Inno3D GeForce RTX 3060 Twin X2 | |
| 3DMark | |
| Fire Strike Extreme Graphics | |
| Zotac Magnus One (ECM73070C) | |
| Inno3D GeForce RTX 3060 Twin X2 | |
| Intel Beast Canyon NUC | |
| Intel Ghost Canyon NUC (RTX 2070) | |
| 1920x1080 Fire Strike Graphics | |
| Zotac Magnus One (ECM73070C) | |
| Inno3D GeForce RTX 3060 Twin X2 | |
| Intel Beast Canyon NUC | |
| Intel Ghost Canyon NUC (RTX 2070) | |
| 2560x1440 Time Spy Graphics | |
| Zotac Magnus One (ECM73070C) | |
| Intel Ghost Canyon NUC (RTX 2070) | |
| Inno3D GeForce RTX 3060 Twin X2 | |
| Intel Beast Canyon NUC | |
| düşük | orta | yüksek | ultra | QHD DLSS | QHD | 4K DLSS | 4K | |
|---|---|---|---|---|---|---|---|---|
| GTA V (2015) | 186 | 181 | 177 | 104 | 81.4 | 82.3 | ||
| Dota 2 Reborn (2015) | 178.3 | 161.7 | 155.6 | 147.1 | 116.1 | |||
| Final Fantasy XV Benchmark (2018) | 196 | 123 | 88.6 | 64.8 | 38 | |||
| X-Plane 11.11 (2018) | 151 | 133 | 105 | 88.5 | ||||
| Far Cry 5 (2018) | 170 | 140 | 131 | 122 | 94 | 49 | ||
| Strange Brigade (2018) | 491 | 230 | 180 | 154 | 116 | 66.8 | ||
| Far Cry New Dawn (2019) | 144 | 120 | 115 | 102 | 88 | 50 | ||
| Metro Exodus (2019) | 198 | 105 | 77.4 | 59.8 | 48.6 | 31.3 | ||
| Borderlands 3 (2019) | 156 | 152 | 133 | 100 | 70.2 | 36.8 | ||
| F1 2020 (2020) | 355 | 259 | 208 | 142 | 106 | 60.2 | ||
| F1 2021 (2021) | 419 | 261 | 206 | 96.9 | 72 | 40.9 | ||
| Far Cry 6 (2021) | 136 | 116 | 103 | 90.8 | 68.8 | 38.8 | ||
| Baldur's Gate 3 (2023) | 131 | 100 | 86.7 | 86 | 59 | 30.8 | ||
| Kingdom Come Deliverance 2 (2025) | 81.7 | 66.5 | 46.8 | |||||
| F1 25 (2025) | 209 | 174.7 | 131.4 | 11.5 | 12 | 6.63 | 5.61 | 3.08 |
| Borderlands 4 (2025) | 42.5 | 34.6 | 26.8 | 19.6 |
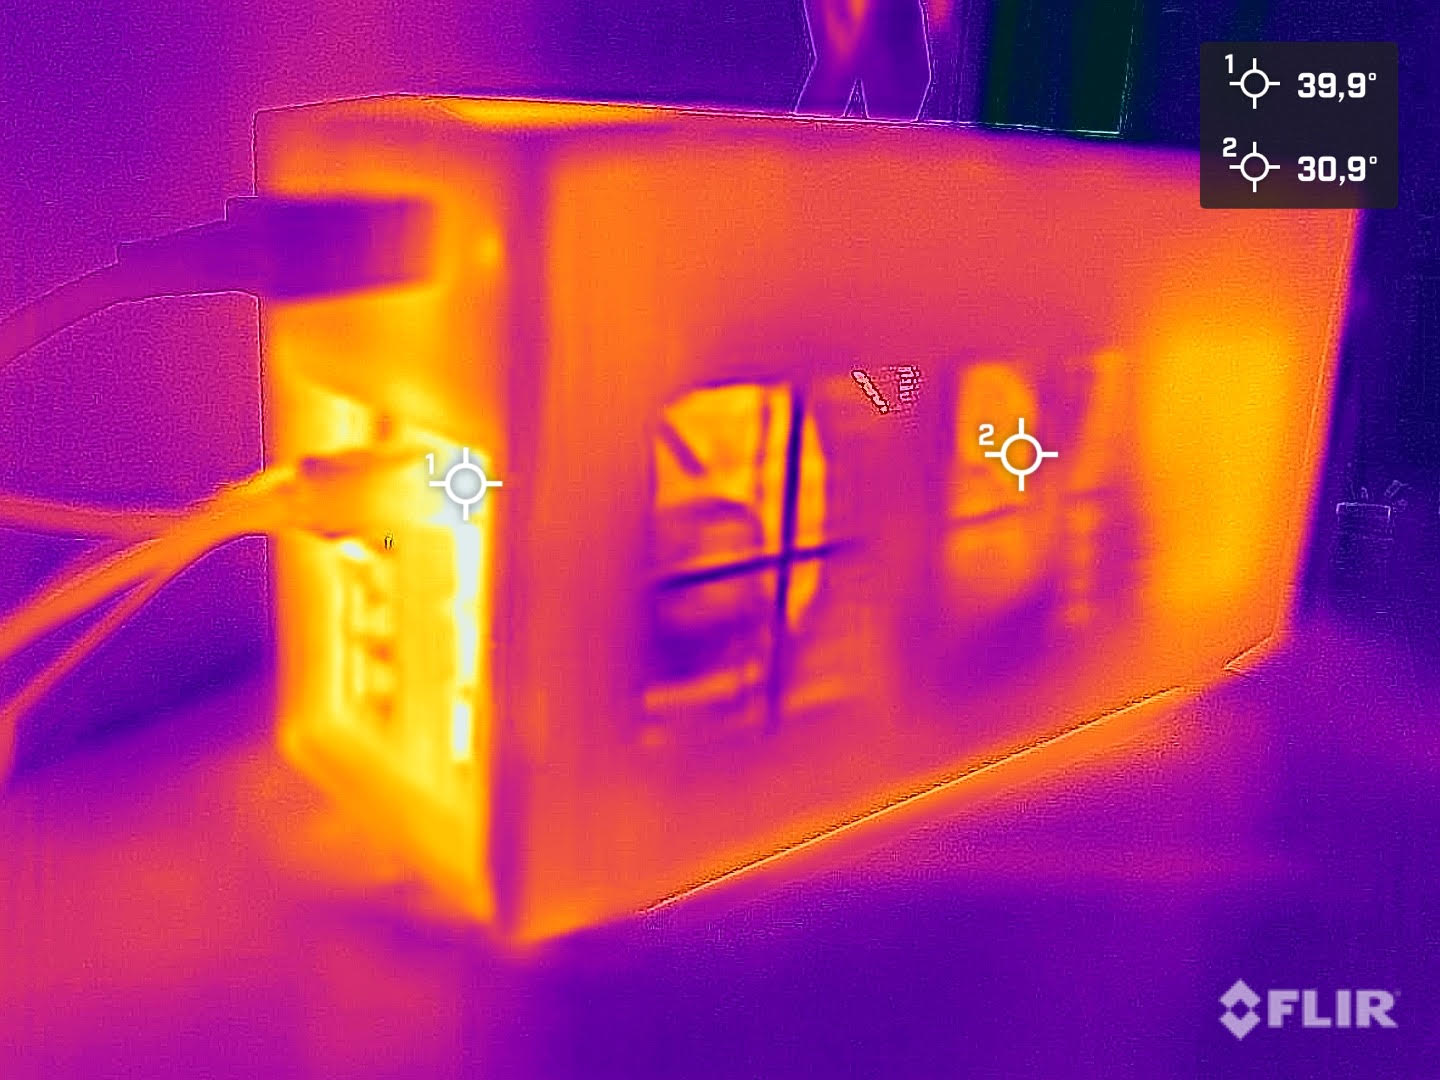
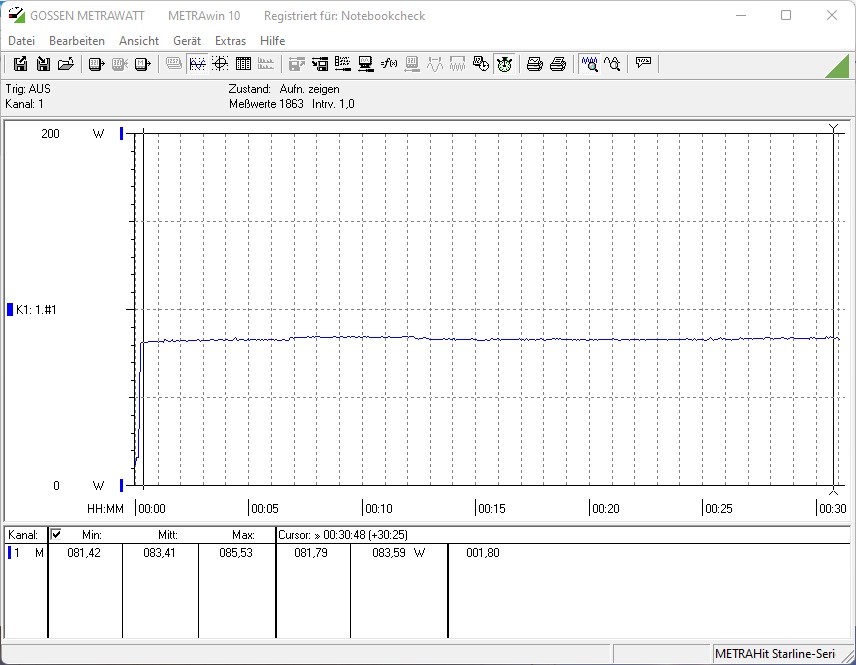
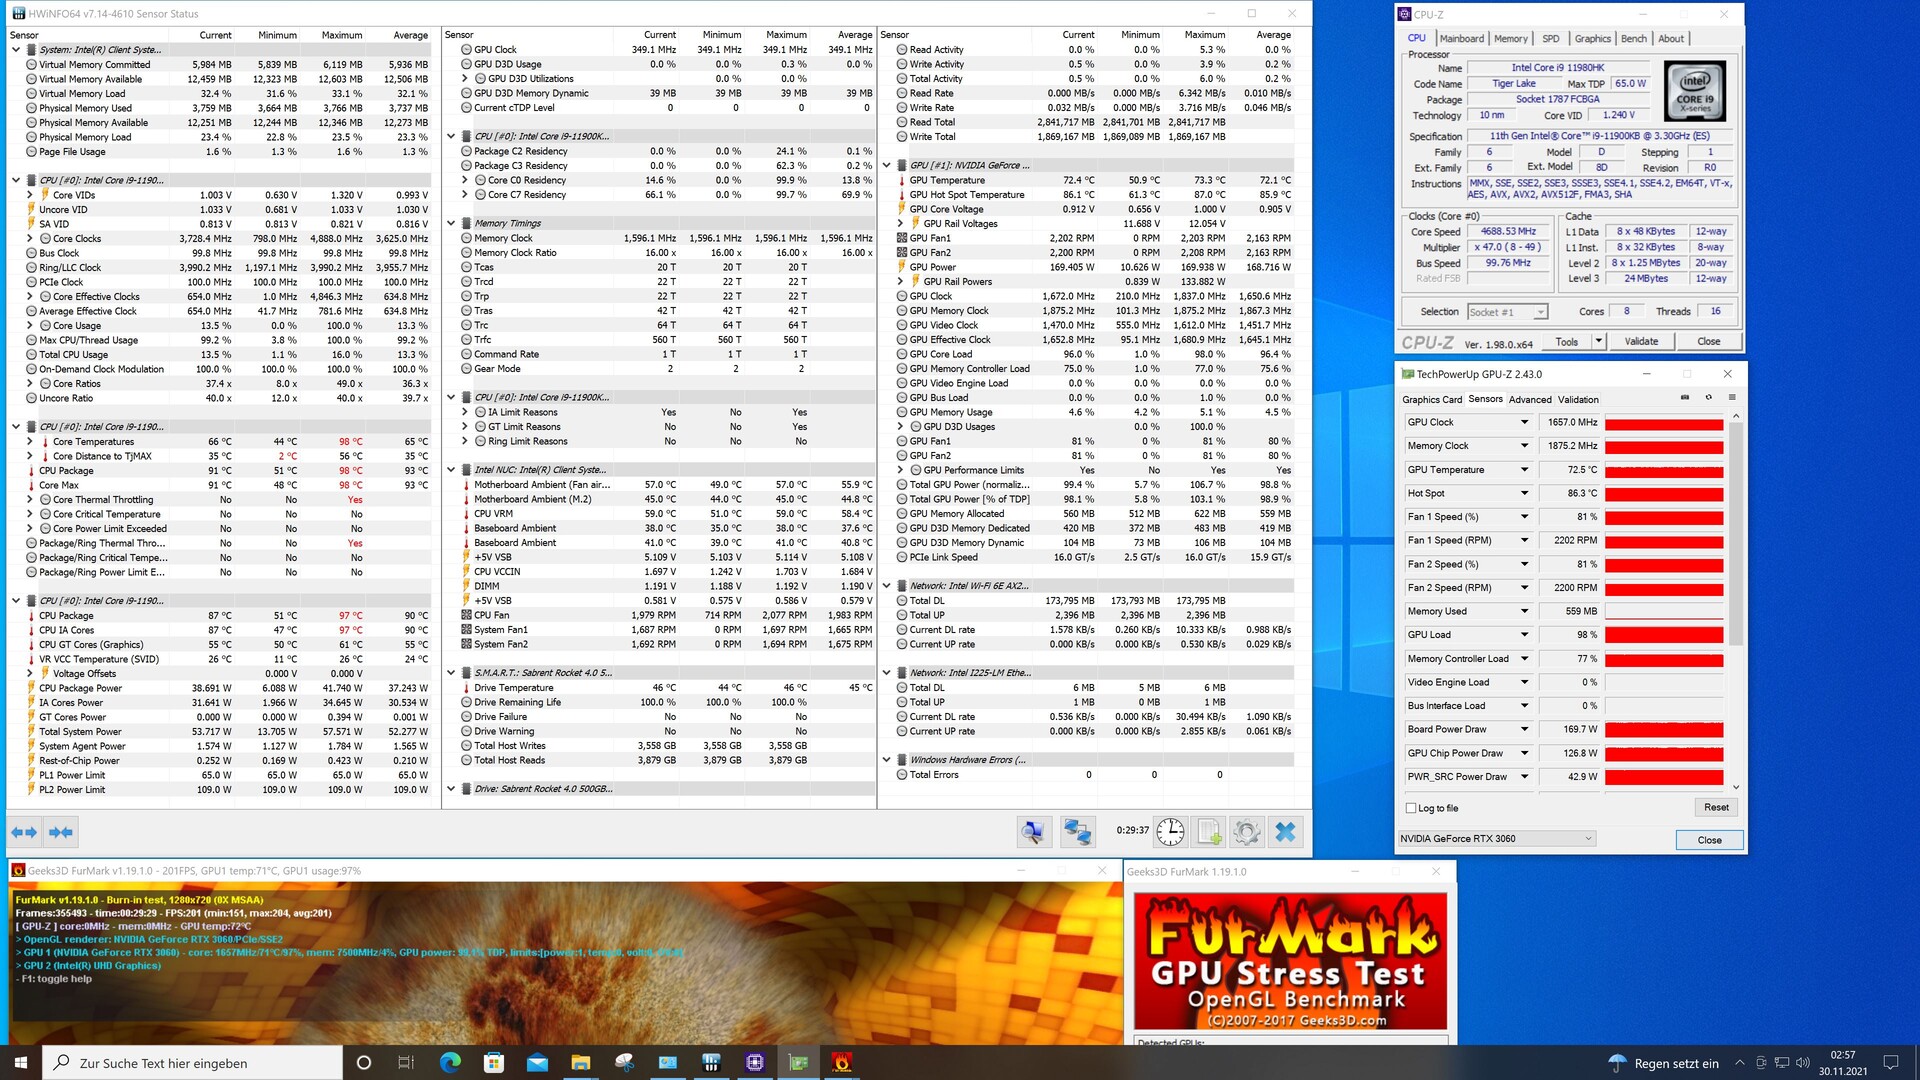
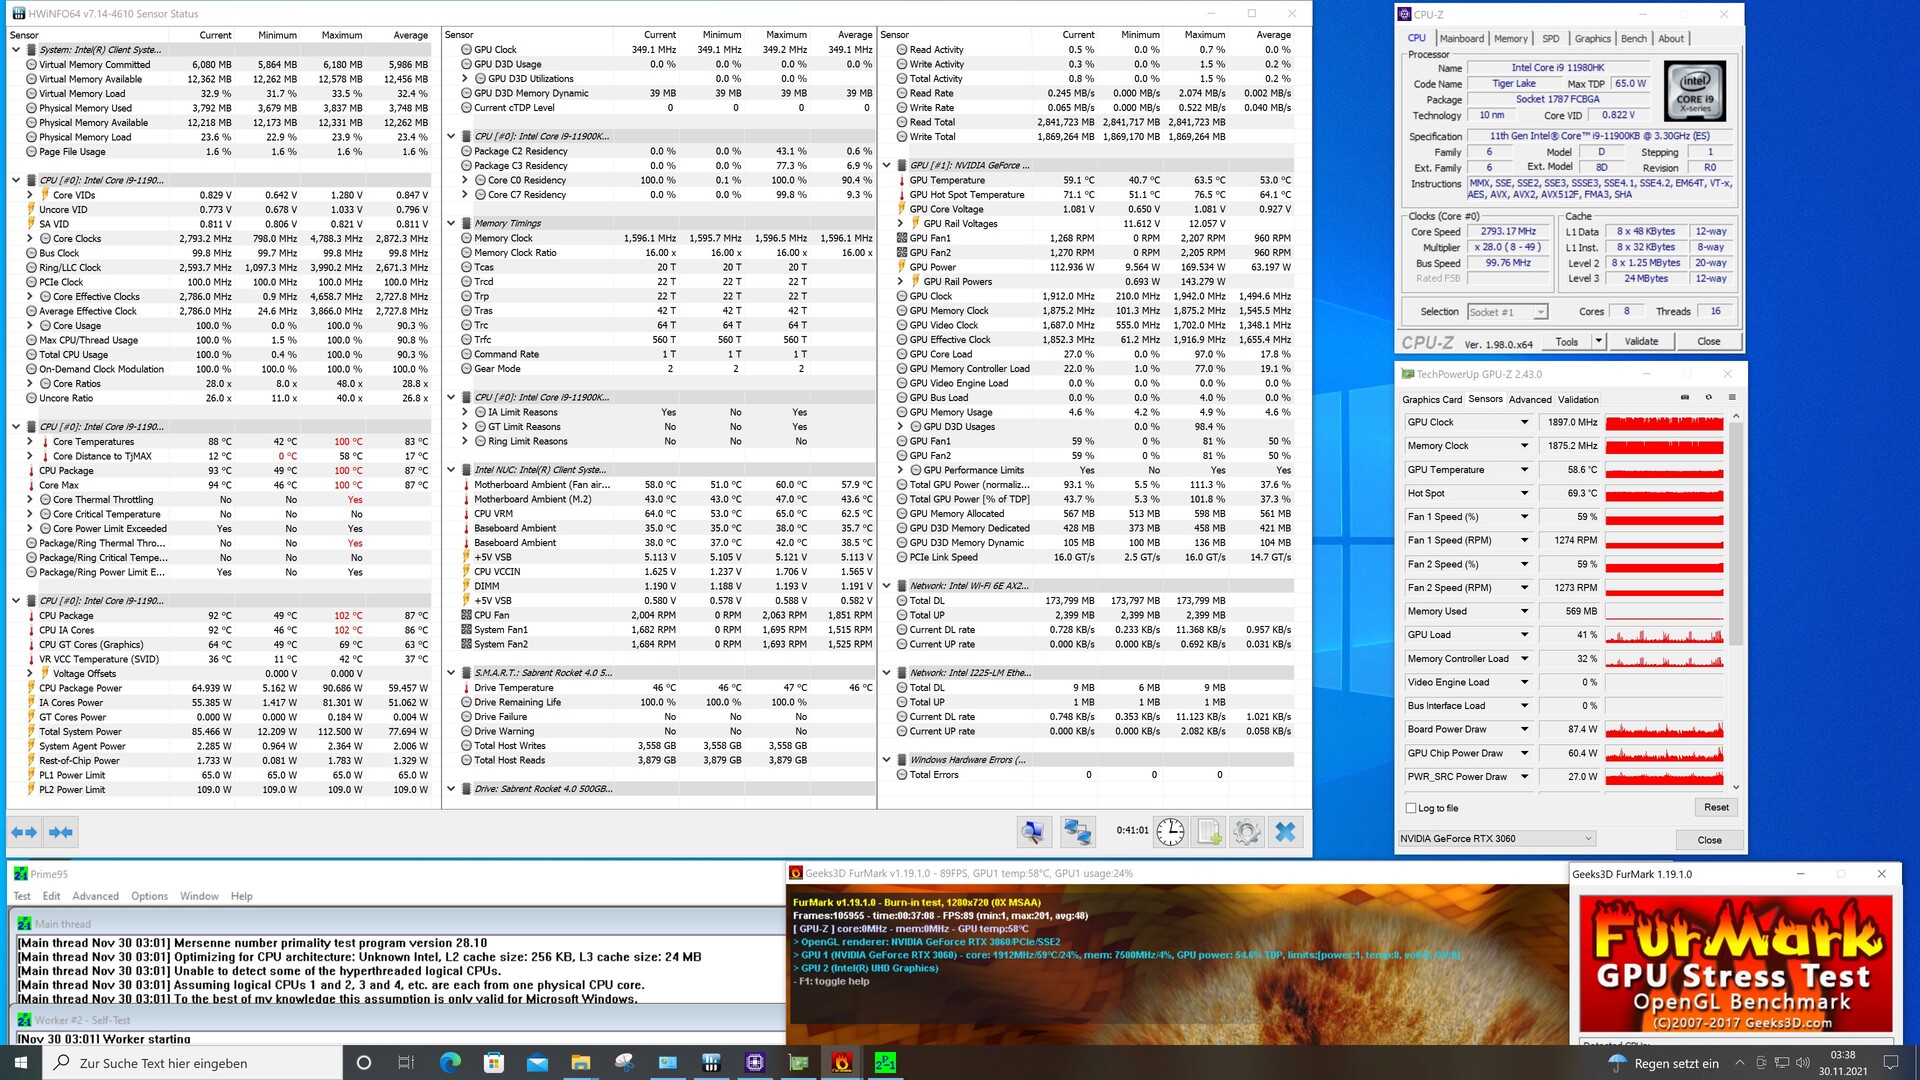
Intel NUC 11 Beast Canyon'un enerji tüketimi ve ısı gelişimi
Intel NUC 11 Extreme'in düşük enerji tüketimi çok keyif verici. Tutumlu SoC nedeniyle, Cinebench R15 Multi testinde yük altındaki sistem için yalnızca 124 W not aldık. Intel Core i5-10600K tabanlı bir masaüstü sistemi ortalama 172,5 W'a ihtiyaç duyar. Intel Core i9-10900K ile test sistemi de ~100 W tüketir.
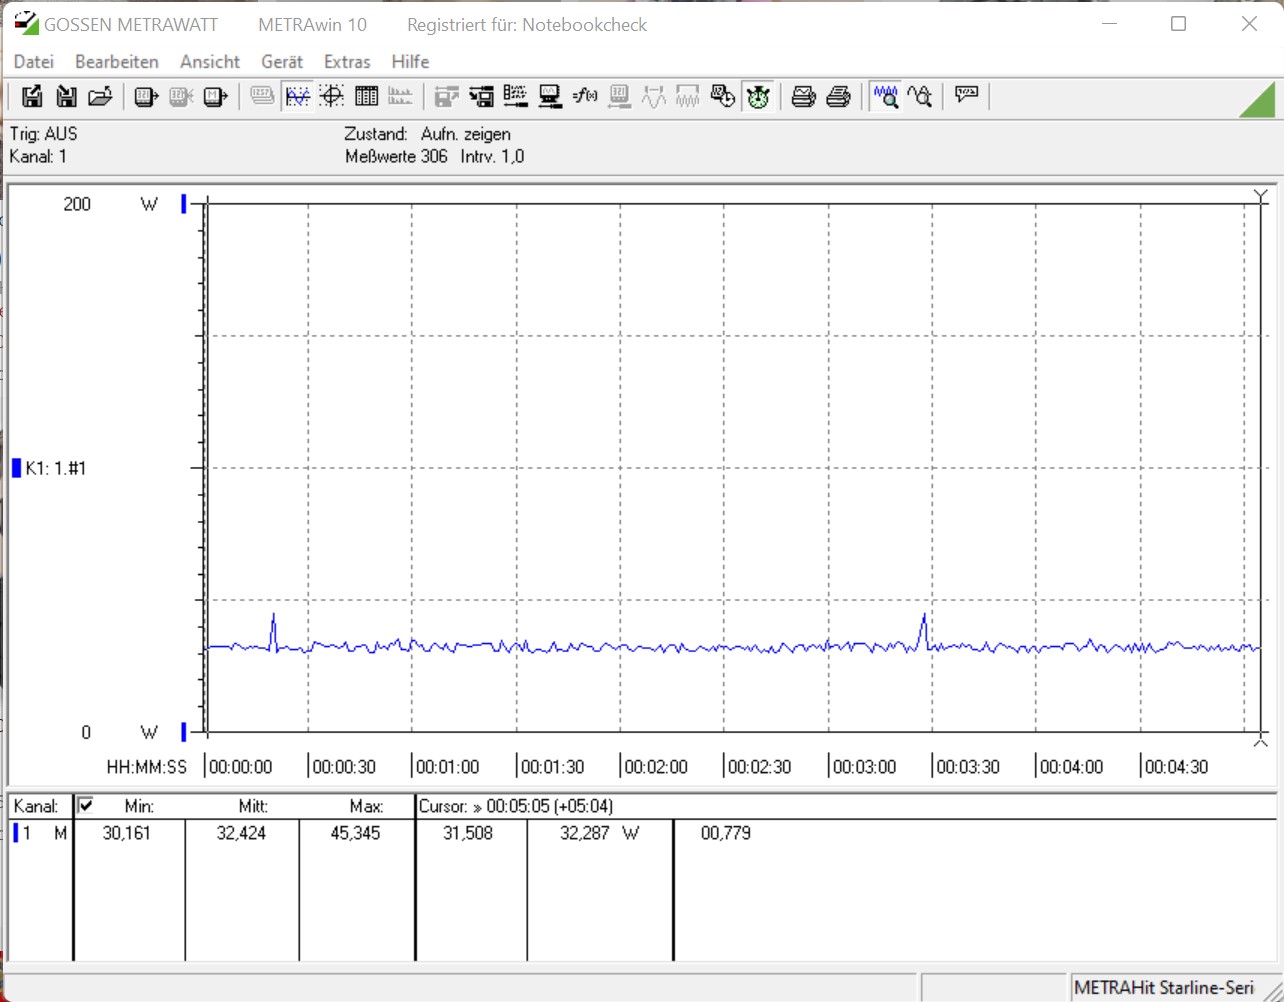
Stres testinde Intel Core i9-11900KB, Intel Core i9-9980HK ile karşılaştırıldığında güç tüketimi söz konusu olduğunda biraz daha aç kalıyor . Bununla birlikte, yalnızca yüzde üçlük ek talep yönetilebilir ve sonuçta 113 W ile oldukça iyi.
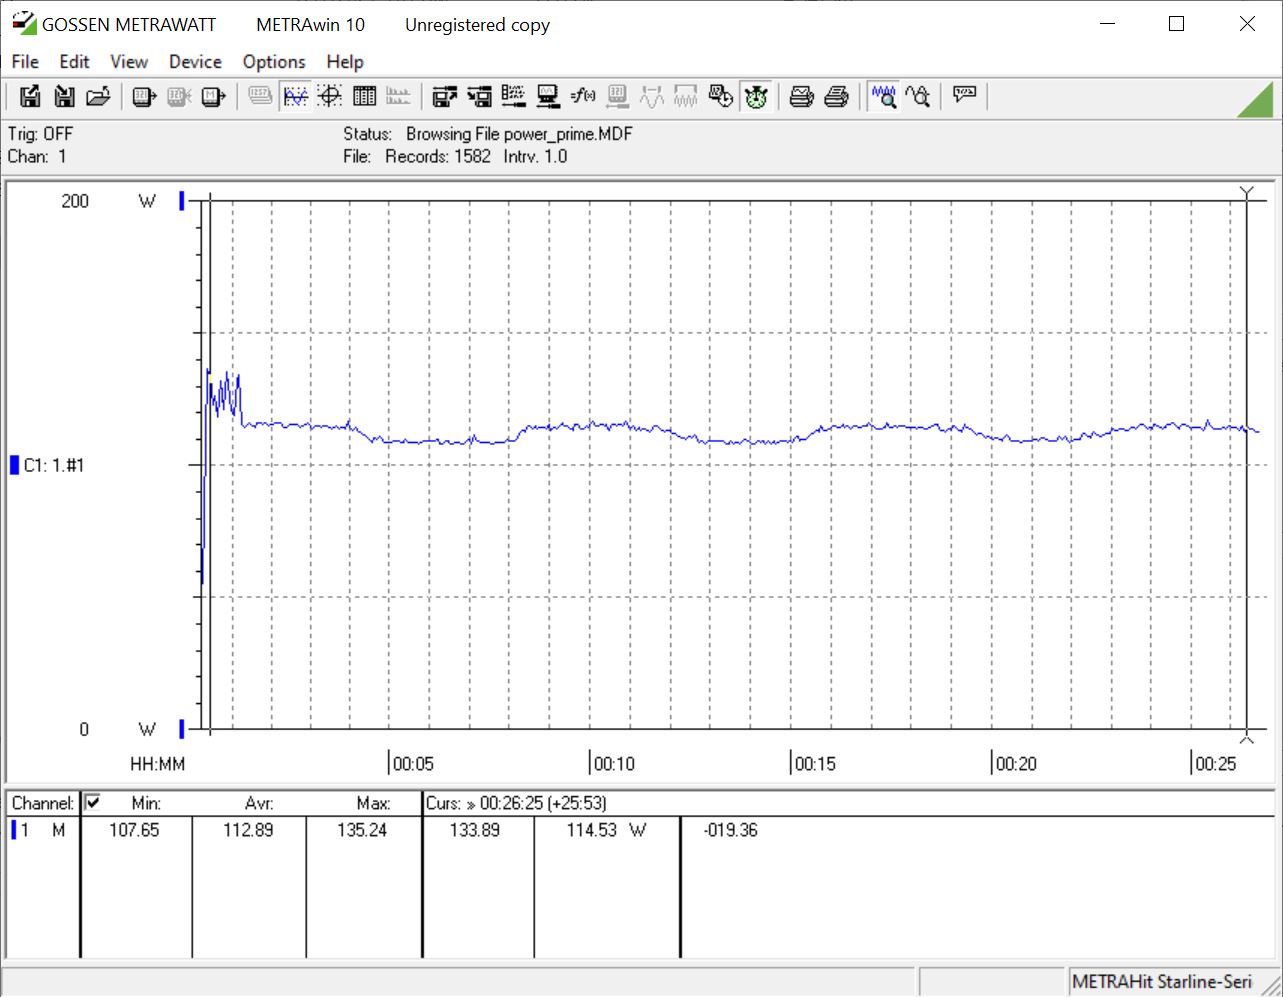
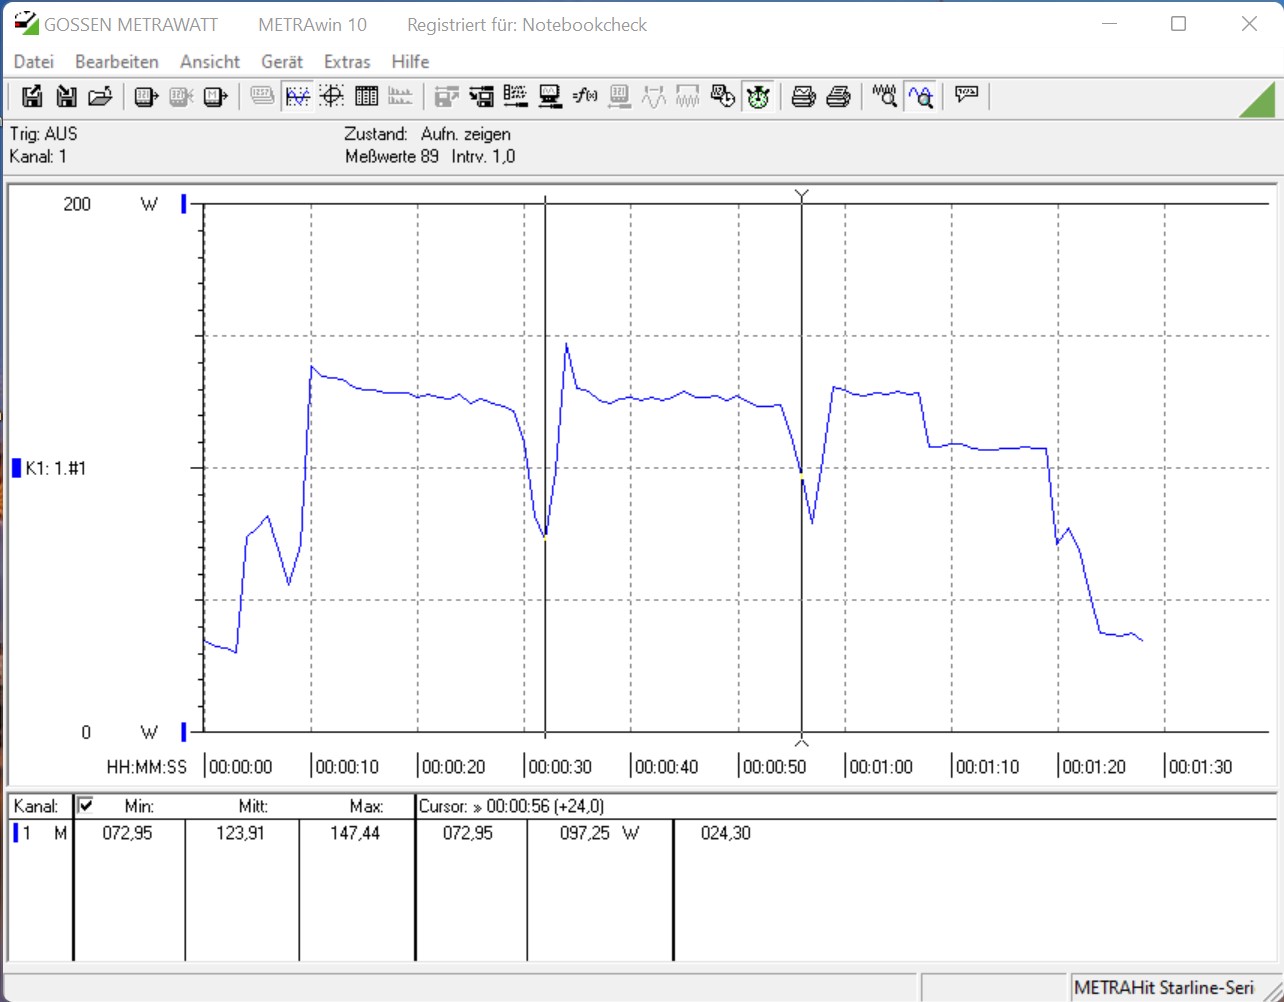
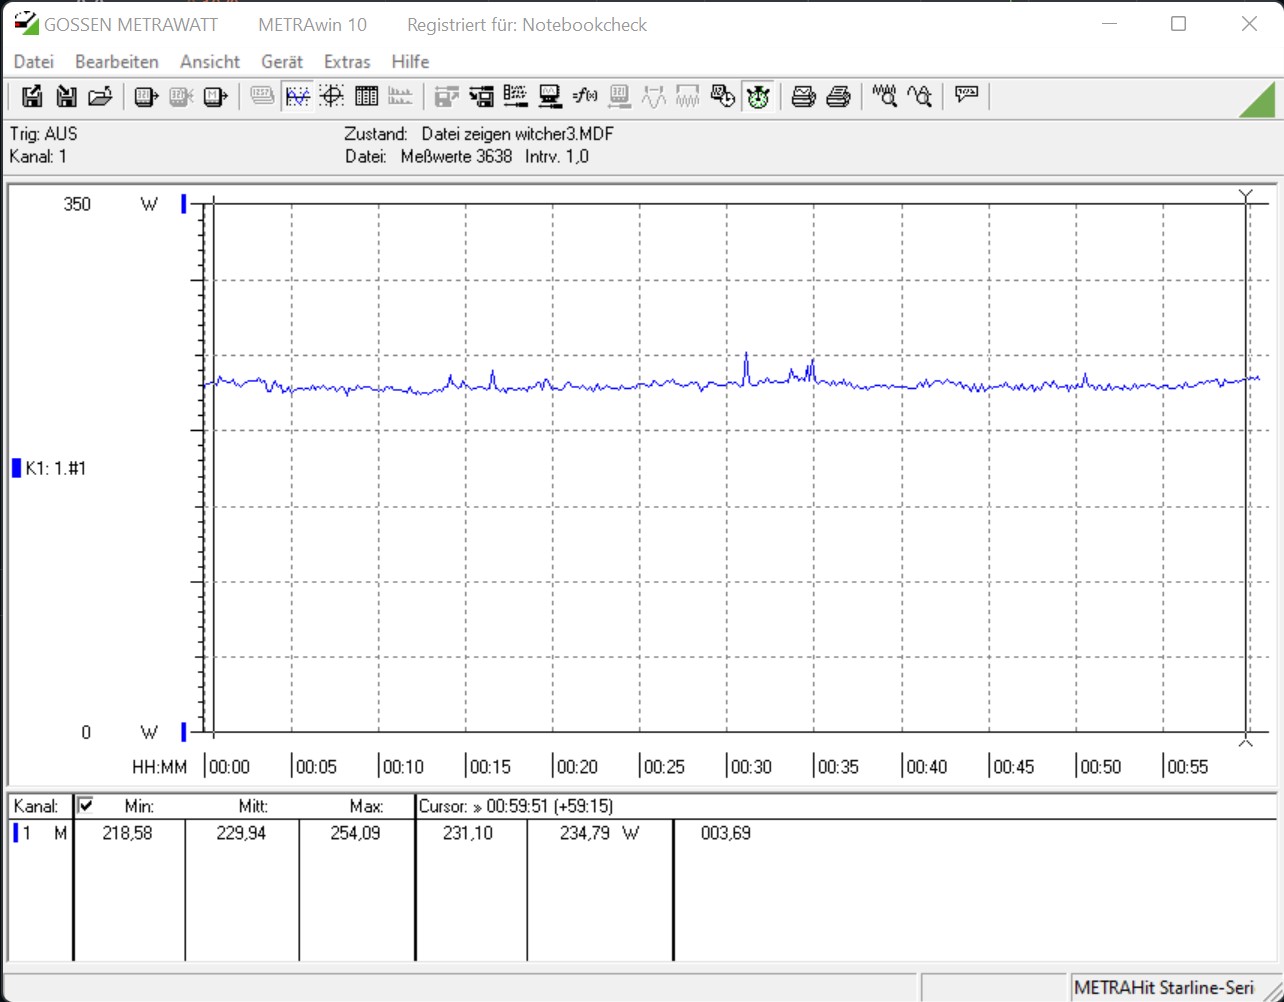
Oyun oynarken, takılan grafik kartı sistemin enerji gereksinimlerini büyük ölçüde belirler. 170 W ile GeForce RTX 3060'ın TDP'si GeForce RTX 2070 Super (215 W) oldukça düşük olmasına rağmen, Beast Canyon NUC Ghost Canyon NUC ile karşılaştırıldığında dar bir farkla kazanıyor.
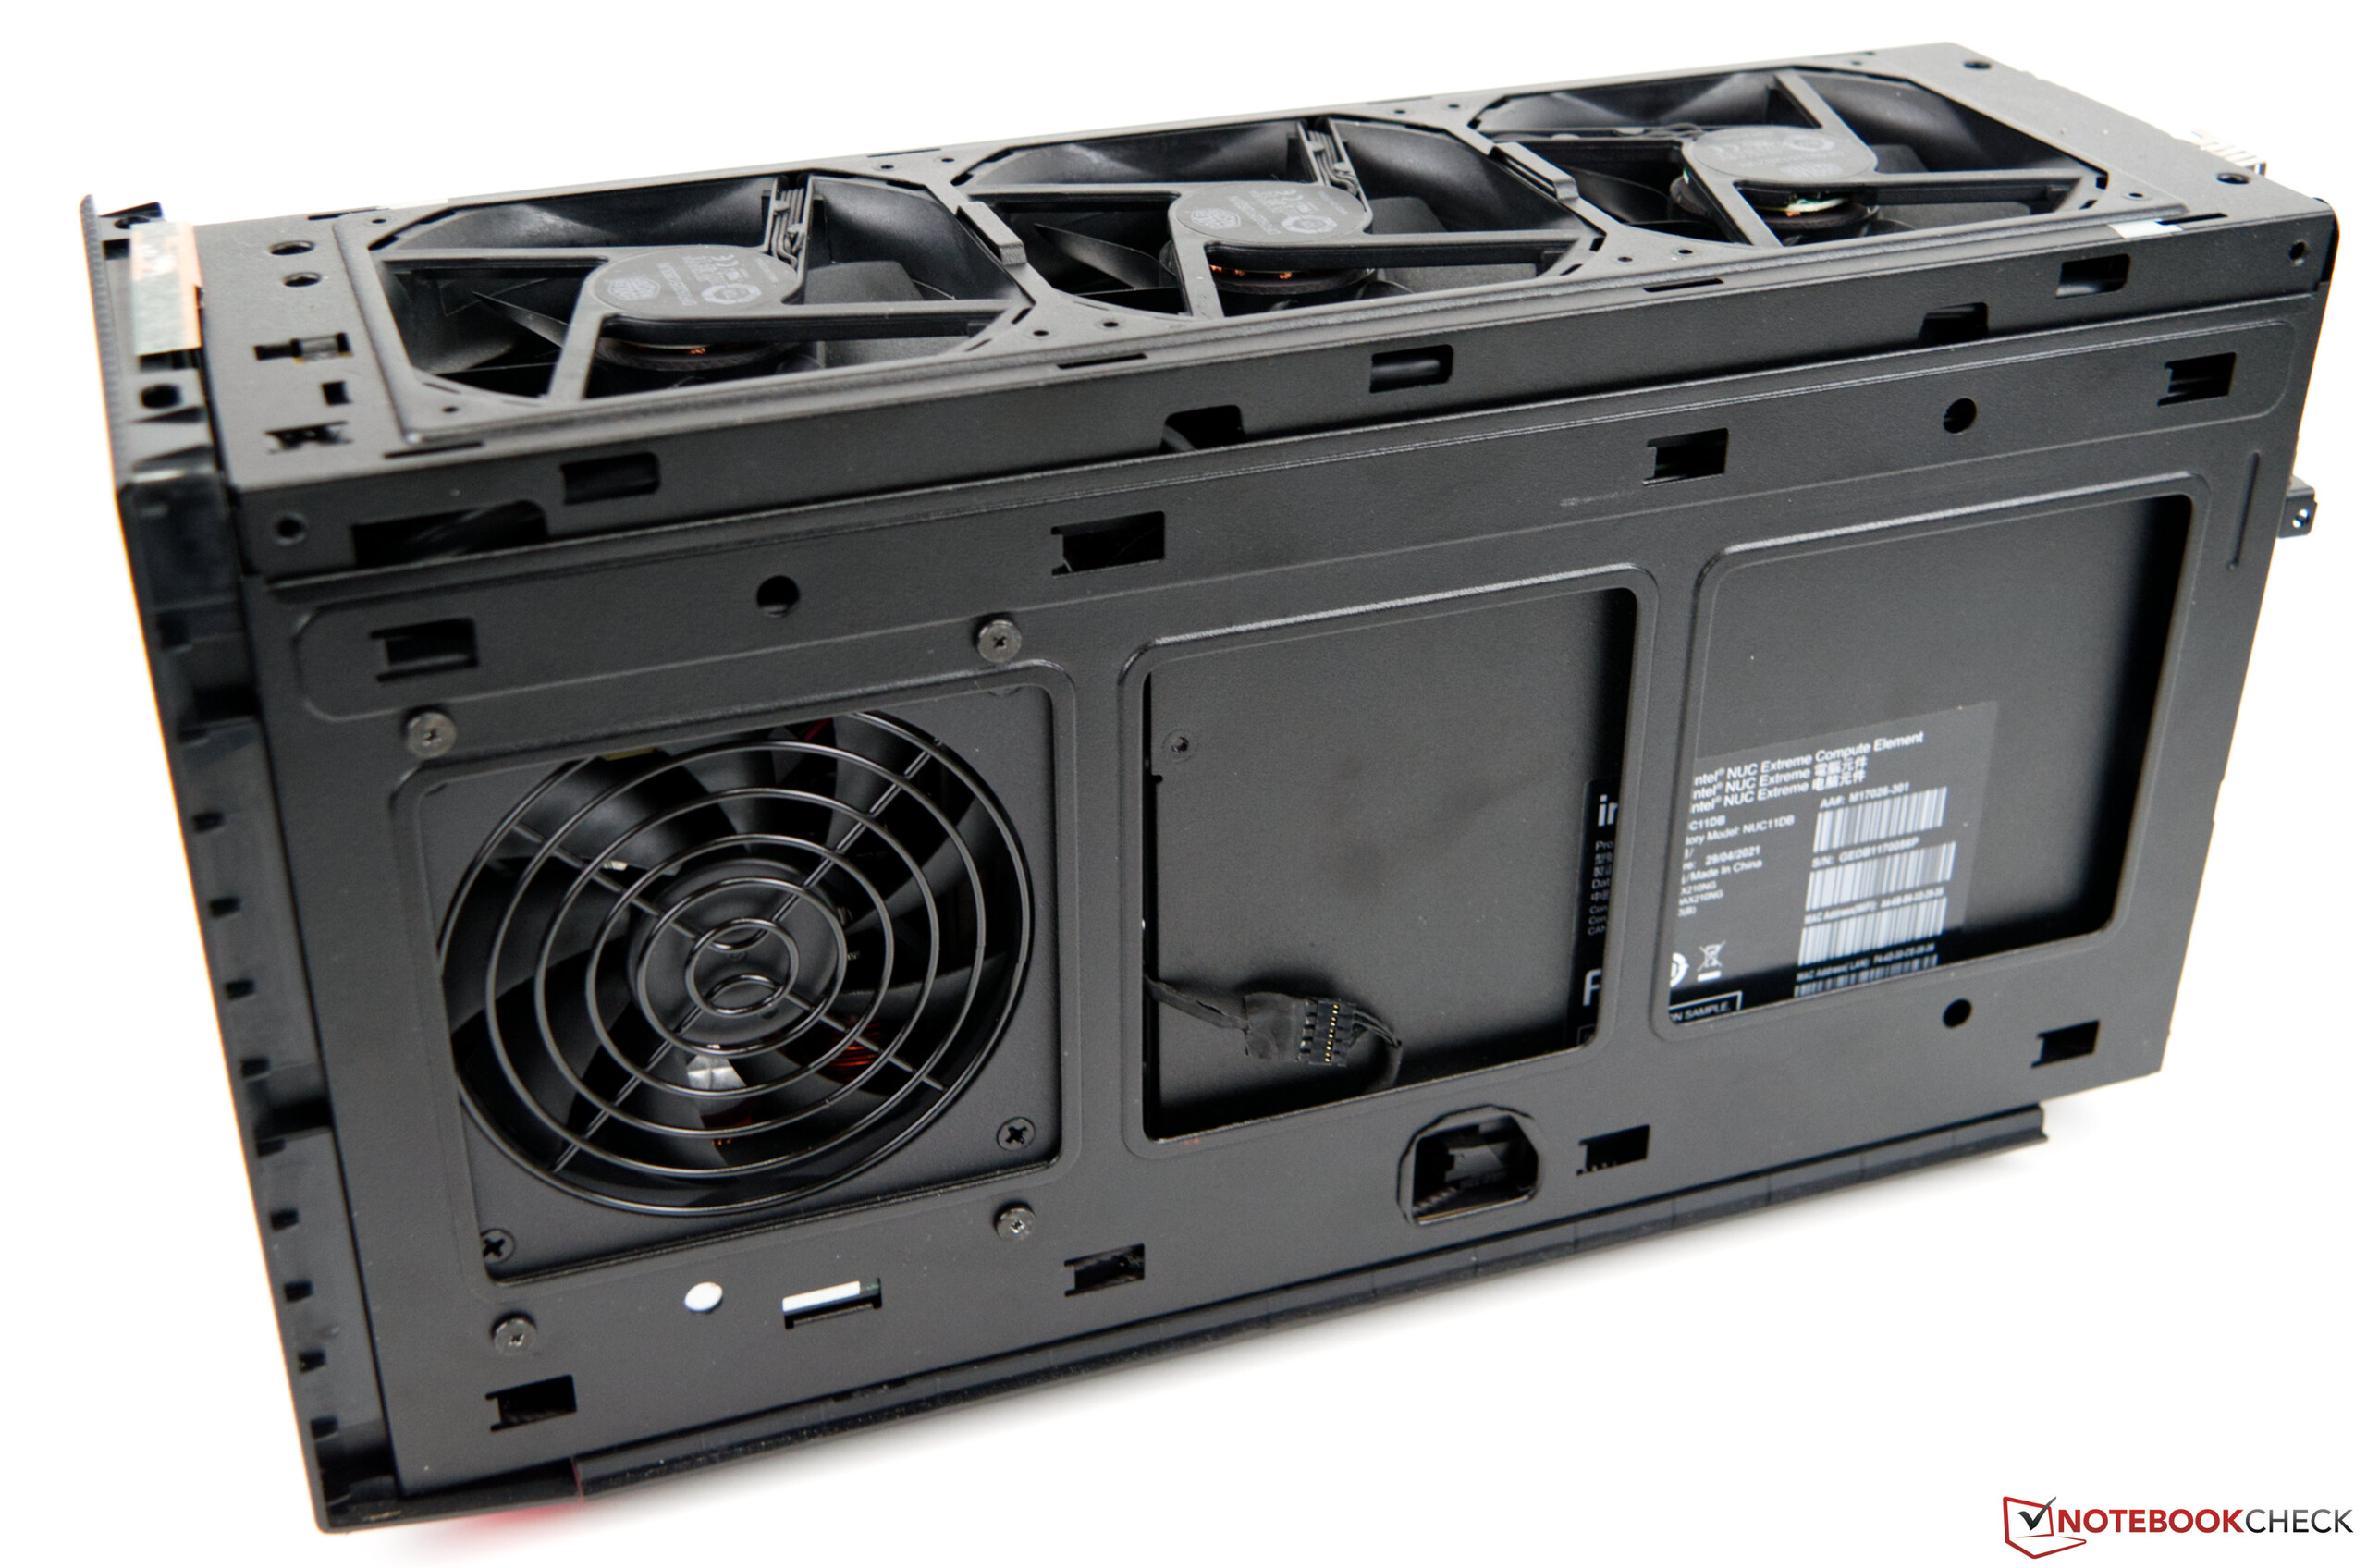
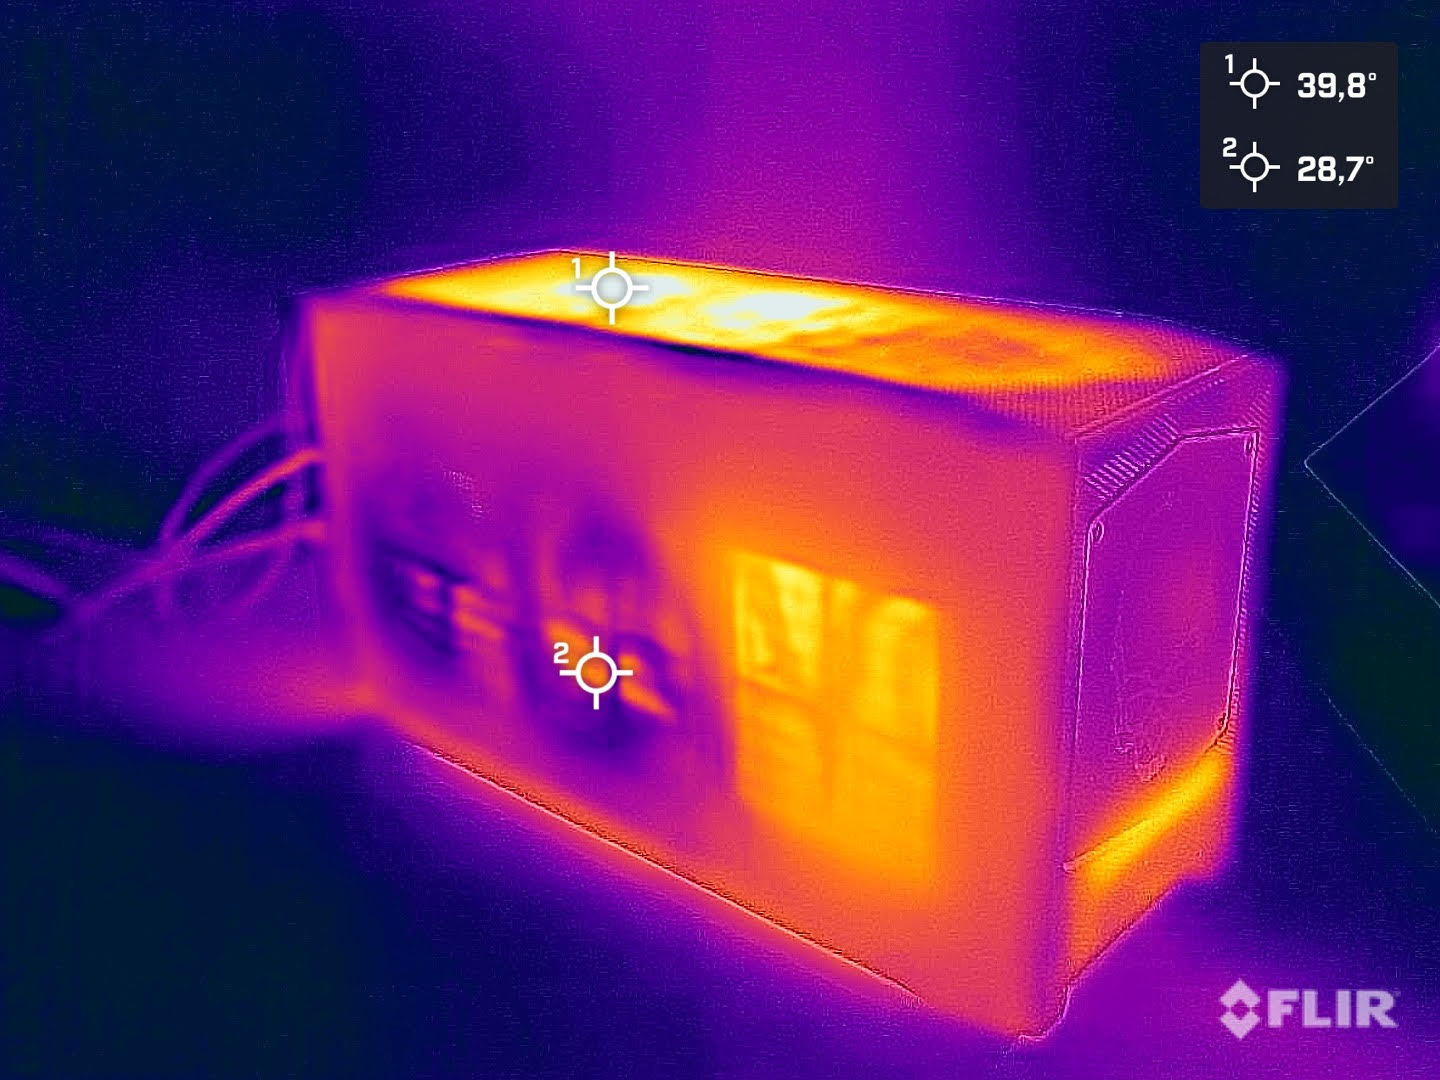
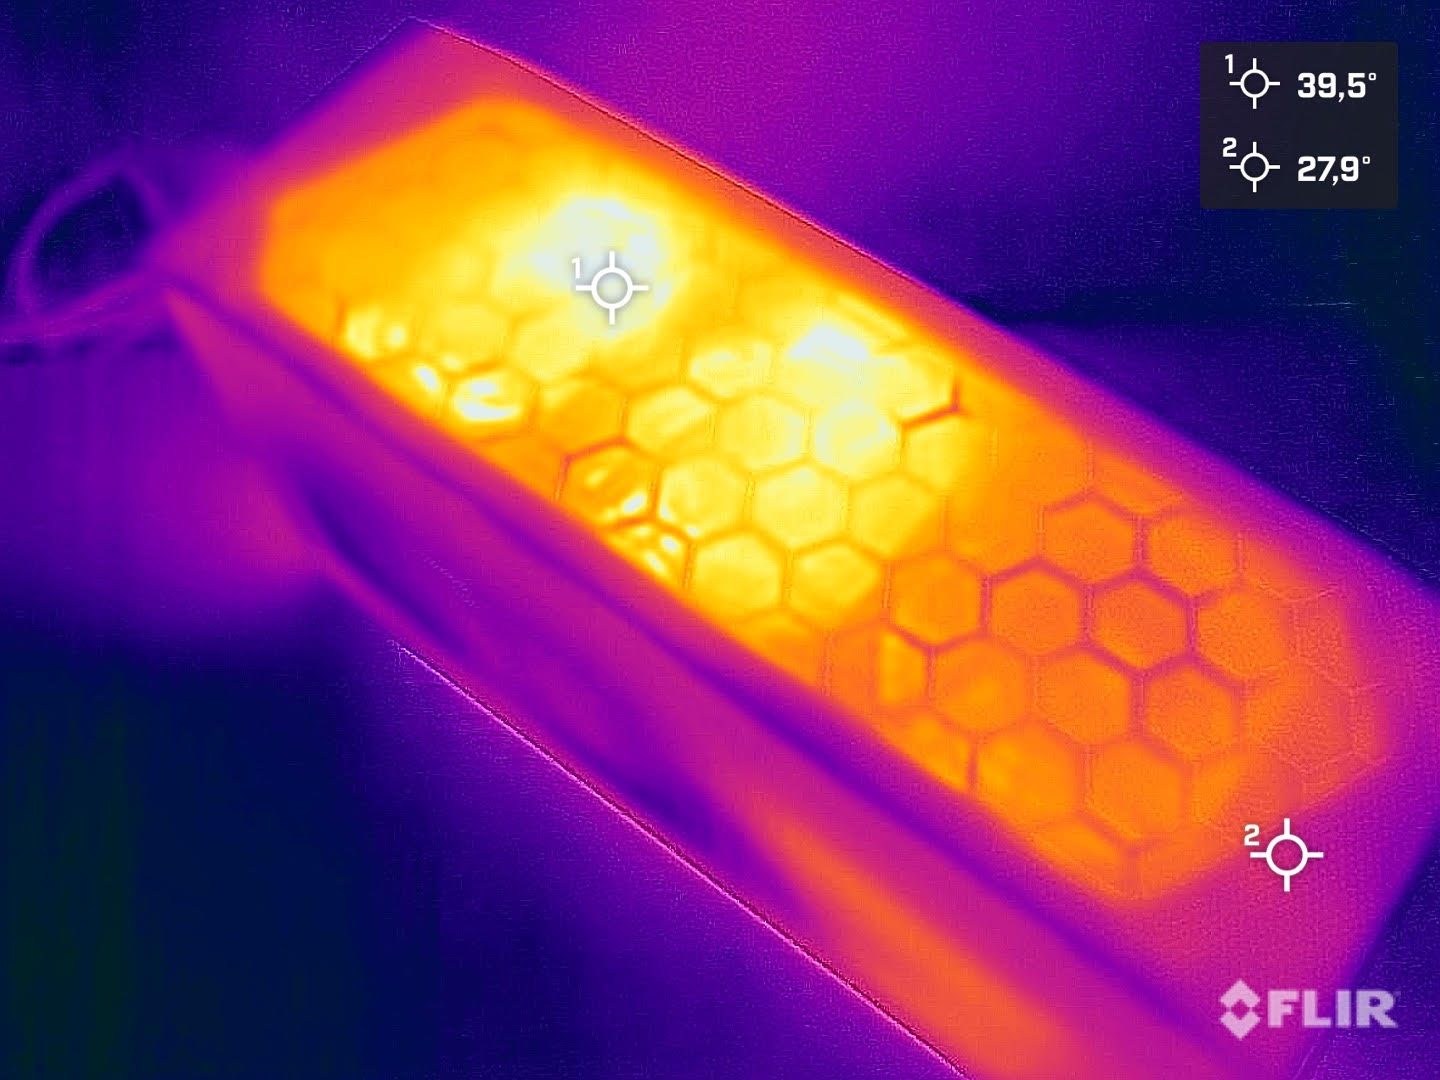
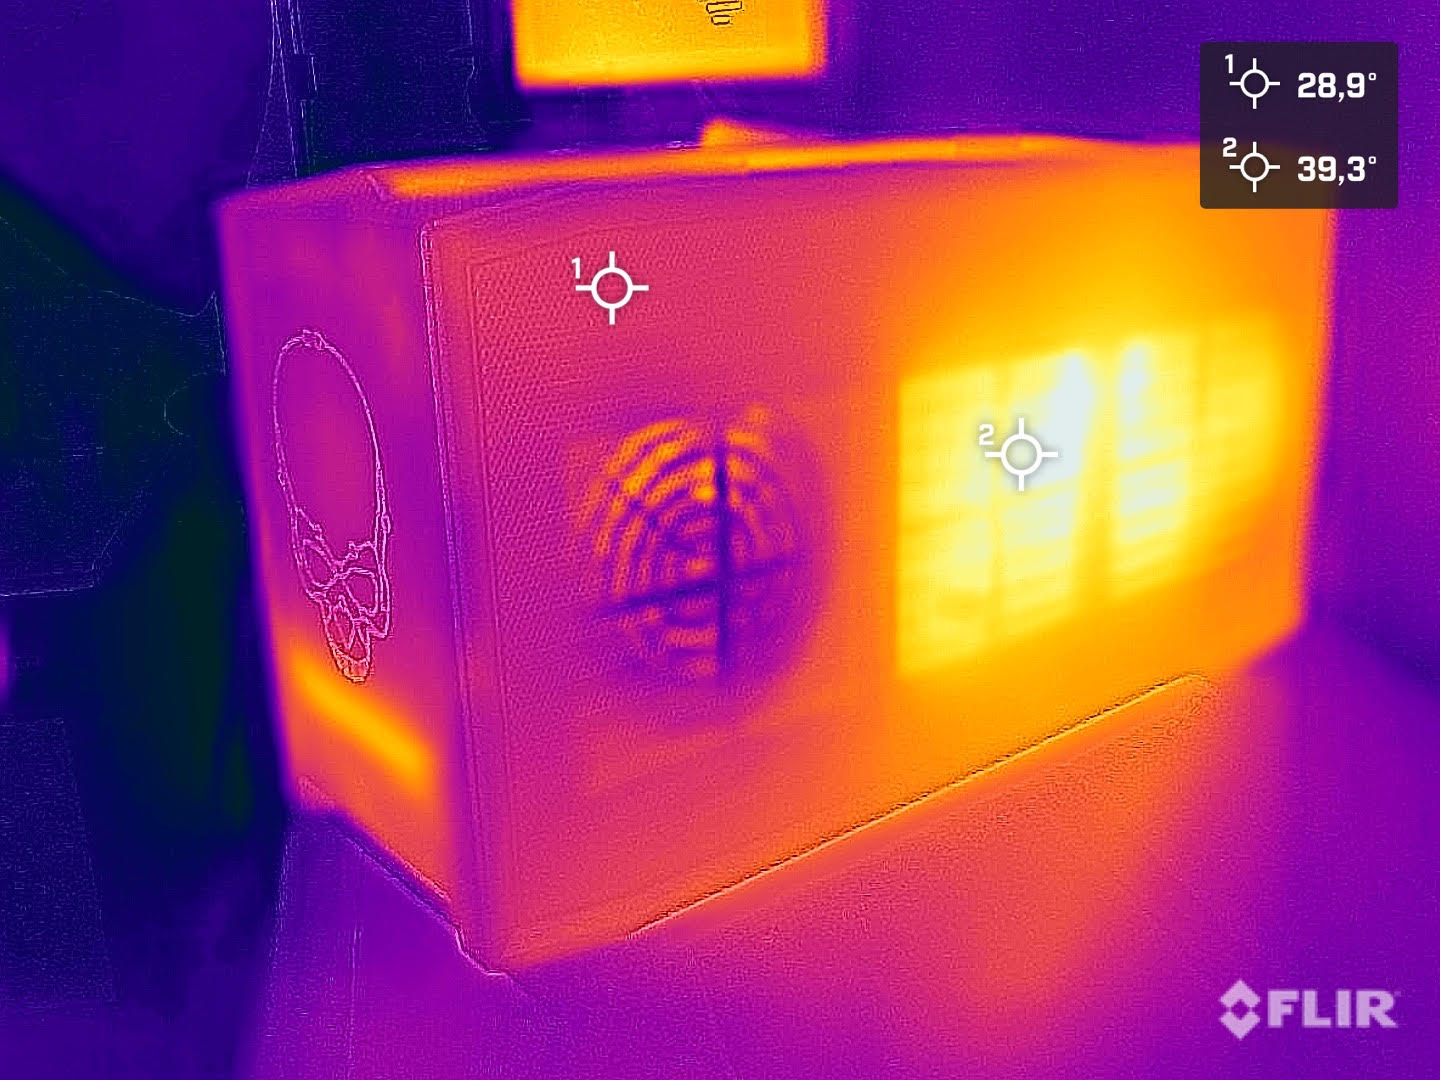
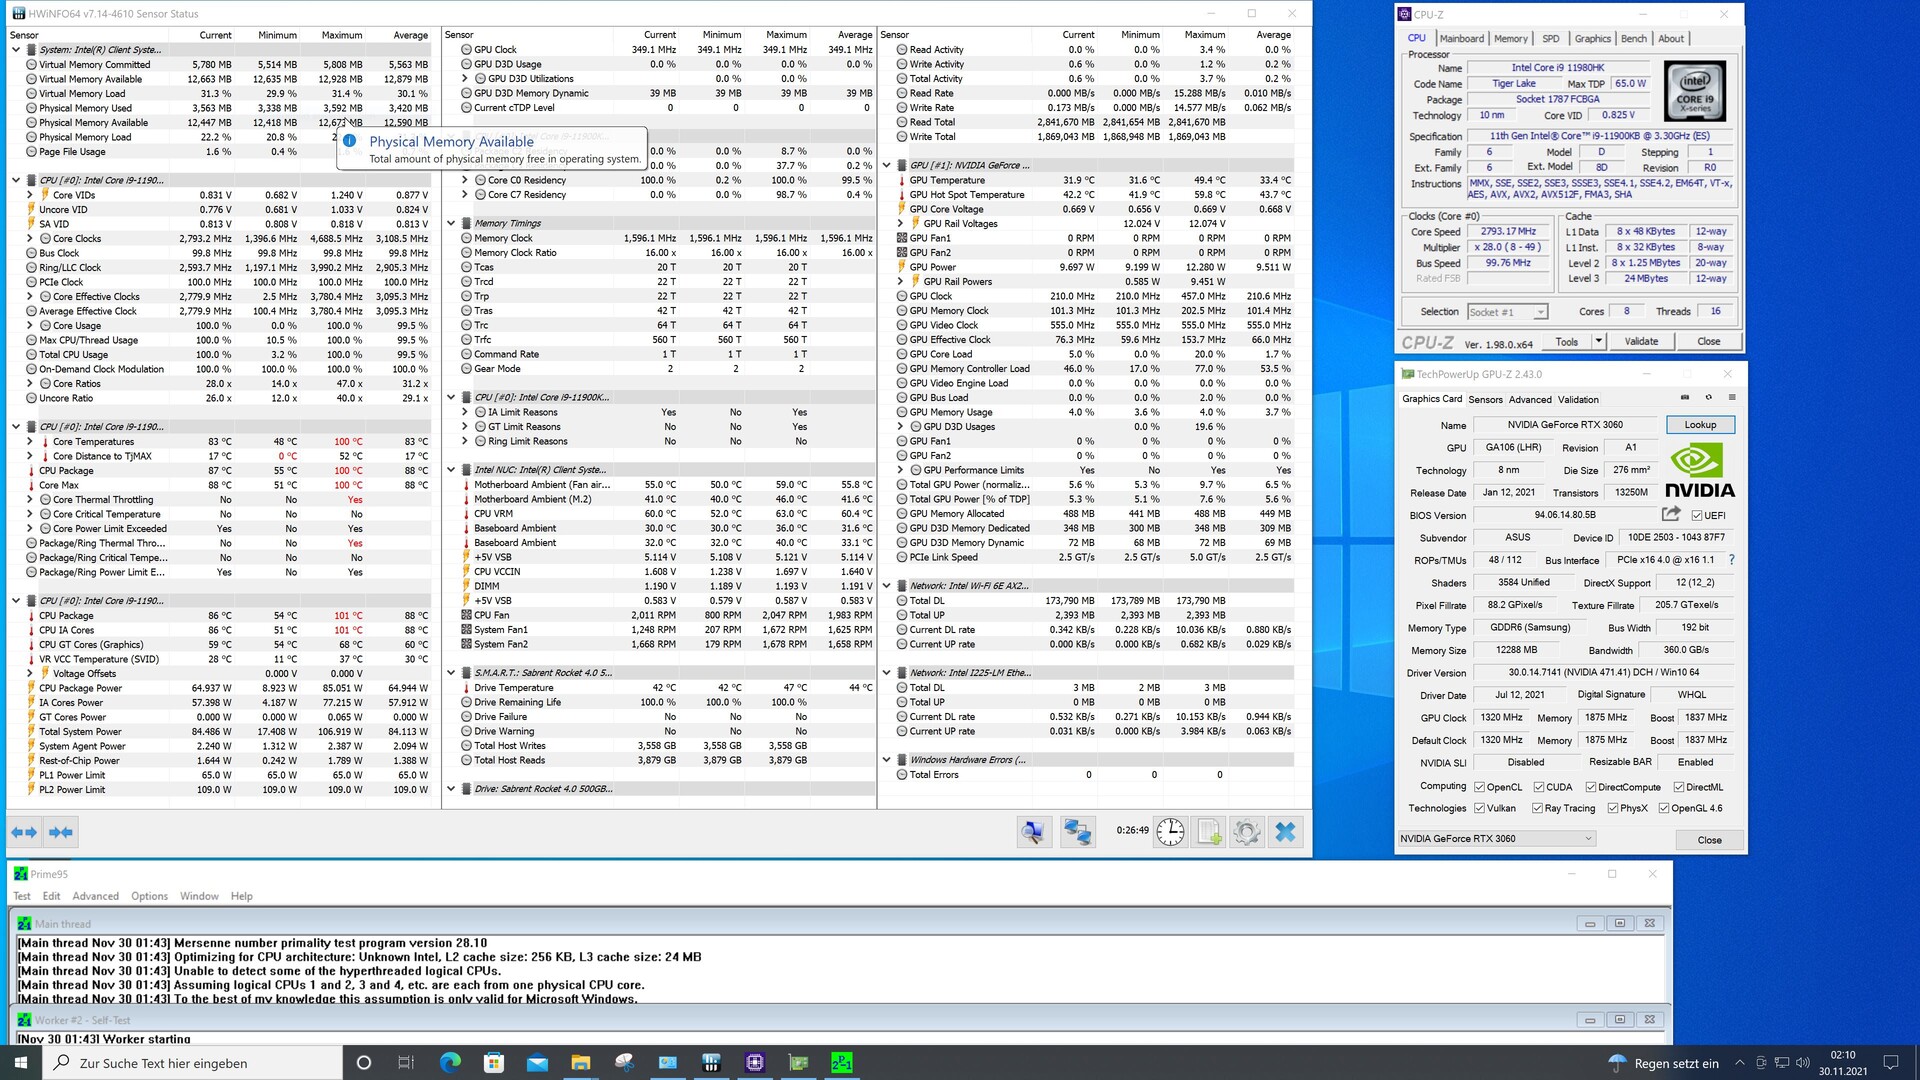
Intel'in Intel Core i9-11900KB'nin performansını aşırı derecede düzenlemediği, performans istendiği anda sıcaklık okumalarından görülebilir. 100 °C işaretine çok fazla sorun olmadan ulaşılabilir. Ancak bu, performans testinde açıkça düşen bir performansla ilişkilendirilemez. Hesaplama Elemanı'nın soğutulması, kasanın üst kısmındaki üç ek kasa fanı tarafından desteklenen küçük bir fan ile sağlanır. Kompakt tasarımın doğal olarak bileşenlerin sıcaklıklarında payı vardır. Buna göre, sistemdeki özel grafik kartına da bağlıdır. Yalnızca entegre ekran kartını kullanmak ve özel bir grafik bağdaştırıcısı olmadan yapmak istiyorsanız, SoC'den biraz daha yüksek performans bekleyebilirsiniz. Ancak ciddi bir performans artışı beklenmemelidir.
Kompakt tasarımın yine de büyük bir dezavantajı var ve bu da gürültü seviyeleri. Intel NUC 11 Extreme Kit - Beast Canyon net bir şekilde duyulabilir ve 36 dB(A) ile sistem rölantideyken bile gerçekten sessiz değildir. Bu nedenle, oyun sırasında 50,5 dB(A) ölçebilmemiz şaşırtıcı değil. Gürültü seviyelerini cihazdan 15 cm (~6 inç) uzaklıkta belirledik. Intel NUC 11 Extreme Kit - Beast Canyon'u doğrudan yanınıza yerleştirmediğiniz sürece arka plan gürültüsünü biraz daha az fark edeceksiniz.
| Power Consumption | |
| 1920x1080 The Witcher 3 ultra (external Monitor) | |
| AMD Ryzen 9 3950X (Idle: 95 W) | |
| Intel Core i9-10900K (Idle: 52.3 W) | |
| Intel Core i5-10600K (Idle: 52.2 W) | |
| Corsair One i160 (Idle: 51.5 W) | |
| Intel Ghost Canyon NUC (RTX 2070) (Idle: 33.1 W) | |
| Intel Beast Canyon NUC (Idle: 32 W) | |
| Prime95 V2810 Stress (external Monitor) | |
| Intel Core i9-10900K (Idle: 52.3 W) | |
| Intel Core i5-10600K (Idle: 52.2 W) | |
| AMD Ryzen 9 3950X (Idle: 95 W) | |
| Intel Beast Canyon NUC (Idle: 34 W) | |
| Intel Ghost Canyon NUC (RTX 2070) (Idle: 33.1 W) | |
| Cinebench R15 Multi (external Monitor) | |
| Intel Core i9-10900K (Idle: 52.3 W) | |
| AMD Ryzen 9 3950X (Idle: 95 W) | |
| Intel Core i5-10600K (Idle: 52.2 W) | |
| Intel Beast Canyon NUC (Idle: 32 W) | |
| Temperatures - CPU Temperature Prime95 | |
| Intel Core i9-10900K | |
| AMD Ryzen 9 3950X | |
| Intel Core i5-10600K | |
* ... daha küçük daha iyidir
Artılar
Eksiler
Son Görüş - Kompakt, Modern ve Hızlı
Intel NUC 11 Extreme Kit - Beast Canyon, küçük bir kasada çok iyi performans sunar. Intel Core i9-11900KB tabanlı yeni Hesaplama Elemanı ile dizüstü bilgisayar segmentinden gelen ekonomik bir SoC var. 8 çekirdek ve 16 iş parçacığı, yüksek IPC sayesinde oyunlarda ve üretkenlikte çok iyi performans sağlar. Ancak, 1,200 ABD Doları tutarındaki minimum fiyat iyi bir pazarlık değildir. Bunun üzerine özel bir grafik kartı, çalışan bellek, yığın depolama ve işletim sisteminin eklenmesi gerekir, böylece hızla 2.000 ABD dolarının kuzeyine ulaşırsınız. Karşılaştırılabilir masaüstü sistemleri şu anda benzer şekilde pahalıdır, bu nedenle Intel NUC 11 Extreme Kit - Beast Canyon'u satın almayı kesinlikle düşünebilirsiniz.
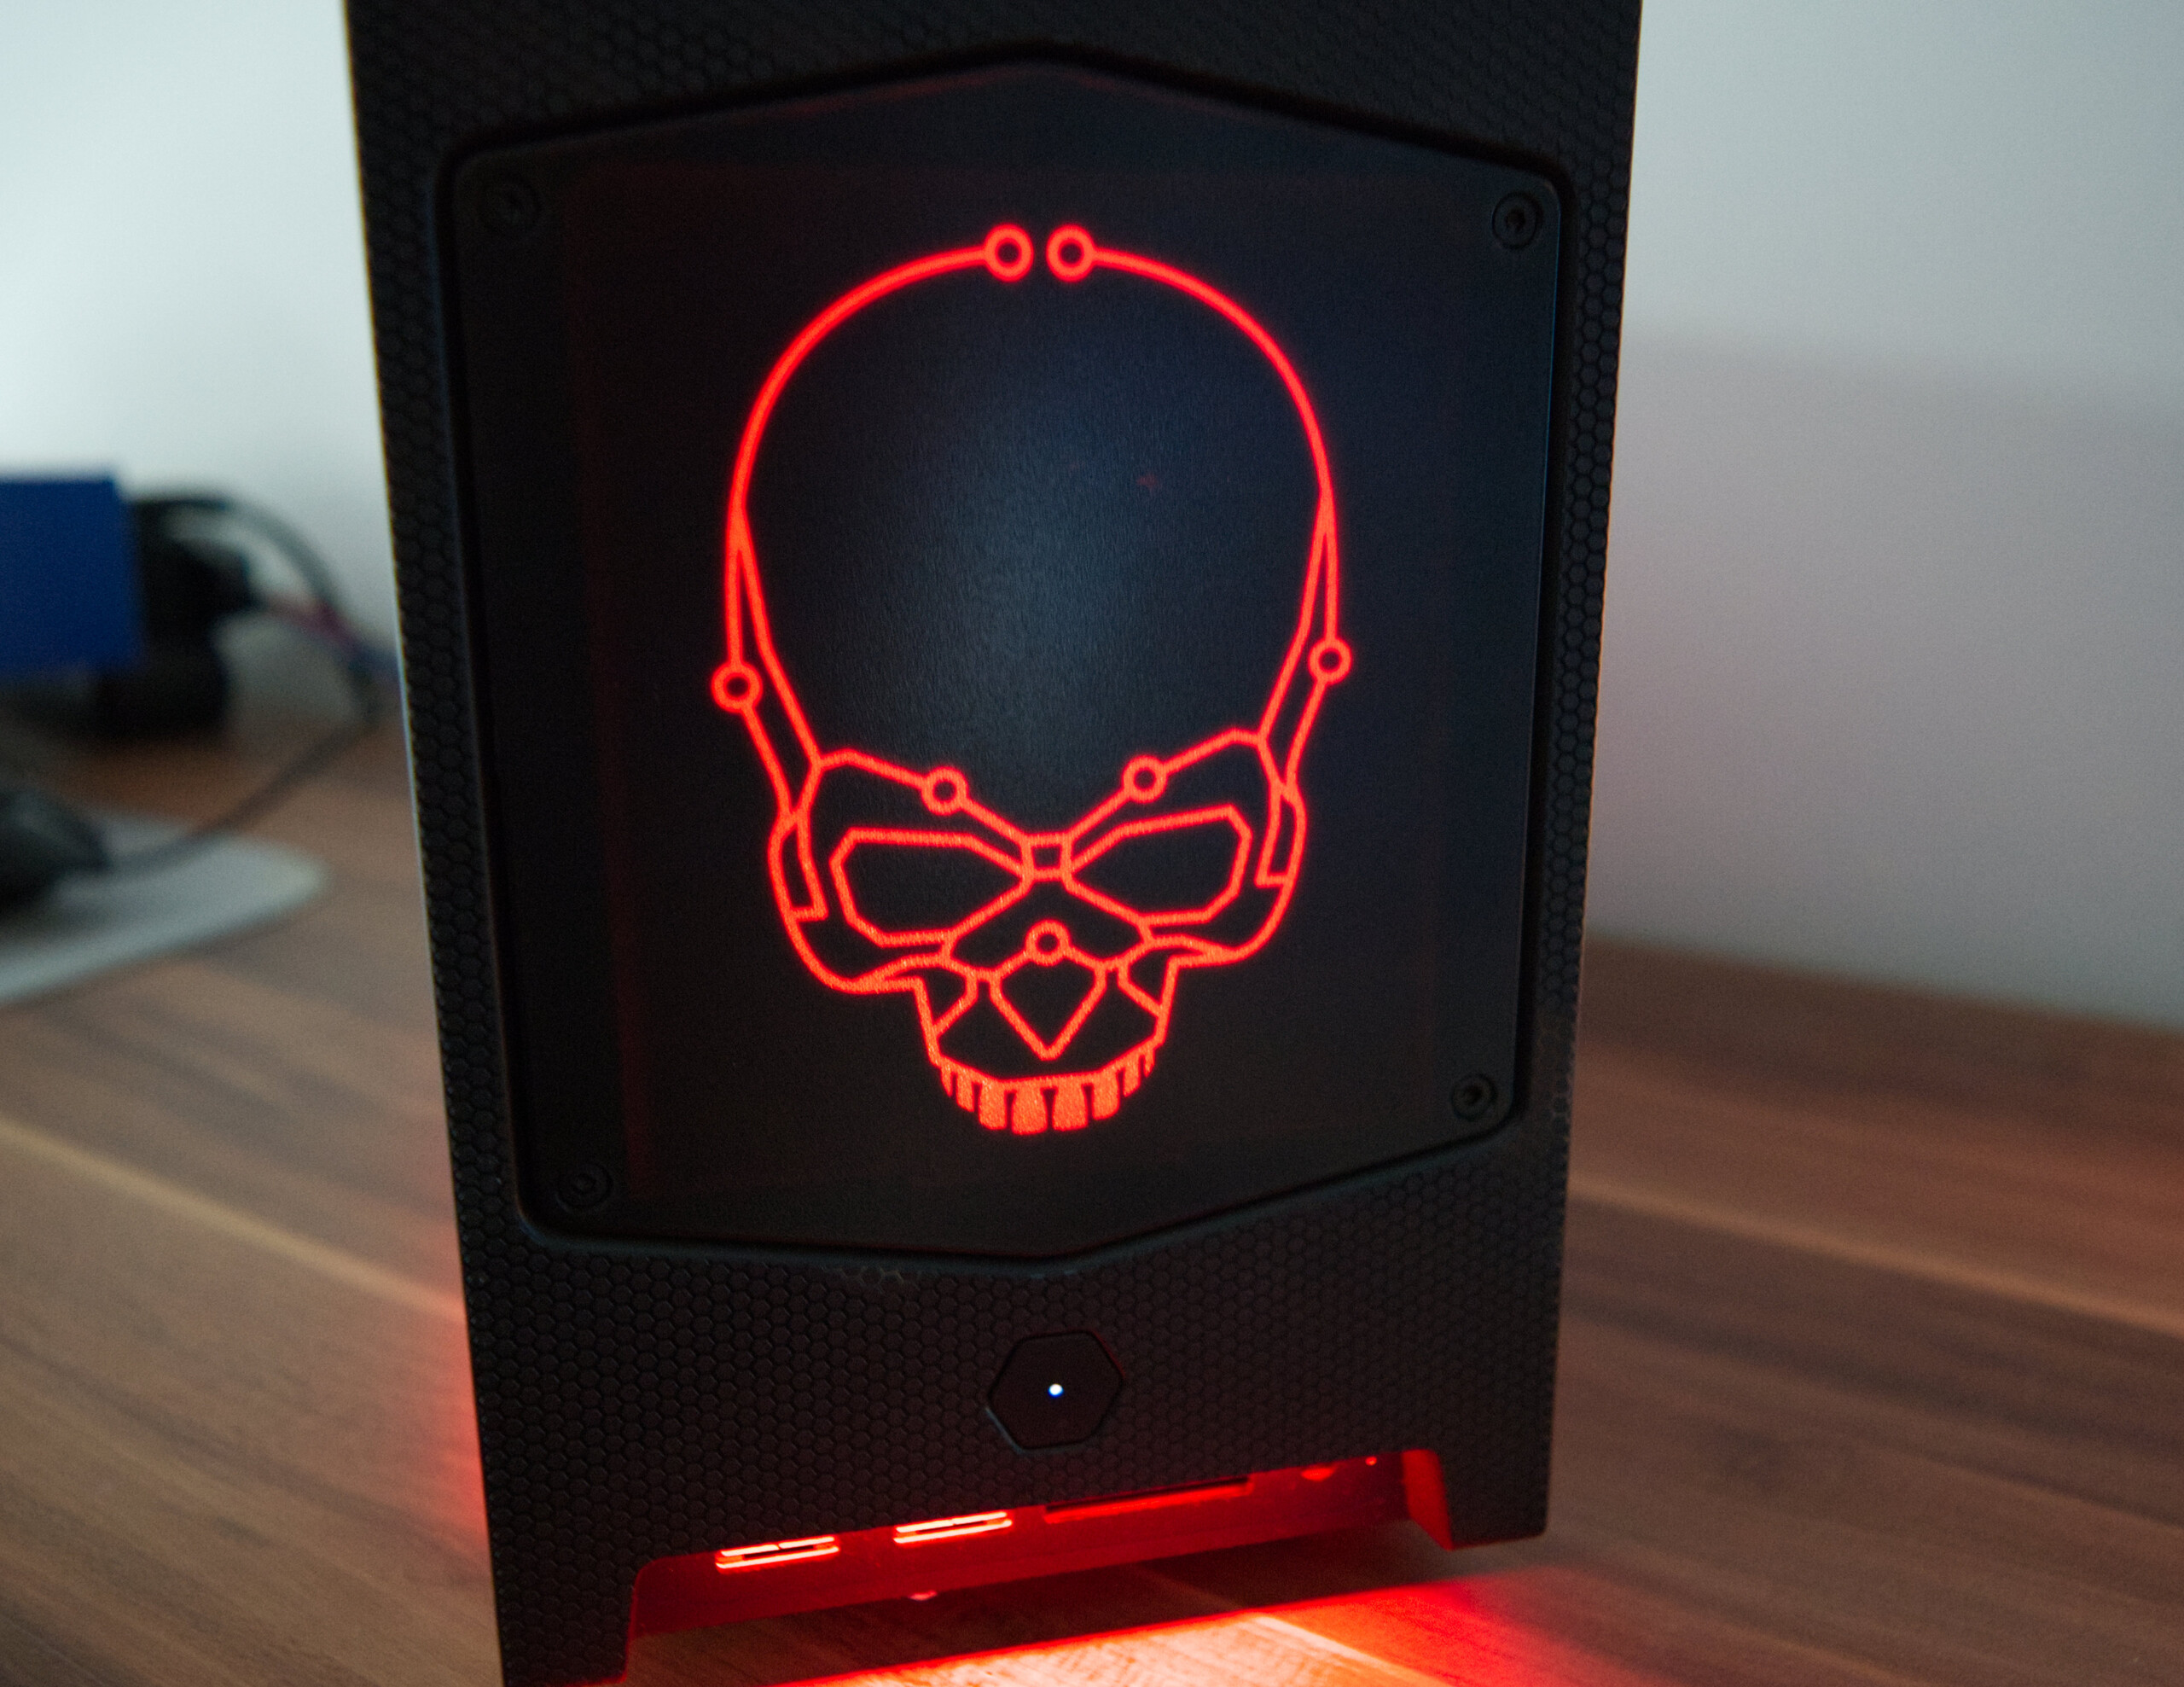
En büyük dezavantajı, muhtemelen yük altında açıkça duyulabilen yüksek gürültü seviyeleridir. Sistemin dezavantajlarıyla yaşayabiliyor ve en büyük ekran kartını takmak istemiyorsanız Intel NUC 11 Extreme Kit - Beast Canyon ile nadirlik değeri olan kompakt bir sisteme sahip olacaksınız. Kılıf ayrı olarak mevcut değildir ve optik vurgulu göz alıcıdır.
Intel, Intel NUC 11 Extreme Kit - Beast Canyon ile kompakt cihazlarının performansını daha da ileri taşıyor.
Arayüzlerin seçimi ve sayısı çok iyi. İki Thunderbolt 4 bağlantı noktasıyla, geleceğe yönelik en hızlı ve en modern standarda bile sahiptir. Ayrıca çevre birimlerini bağlamak için birçok USB bağlantı noktası vardır ve hatta UHS-II standardına sahip hızlı bir SD kart okuyucu da mevcuttur. Yalnızca ikinci bir Ethernet bağlantı noktasının olmaması eleştirilebilir, ancak bu yüksek düzeyde şikâyetçi olacaktır.
Intel NUC 11 Extreme Kit - Beast Canyon'un alternatifi, muhtemelen aynı maliyete sahip olacak bir sistemi kendiniz monte etmek olacaktır. Zotac Magnus One, çok kompakt oyun bilgisayarları söz konusu olduğunda da iyi bir seçenek.
