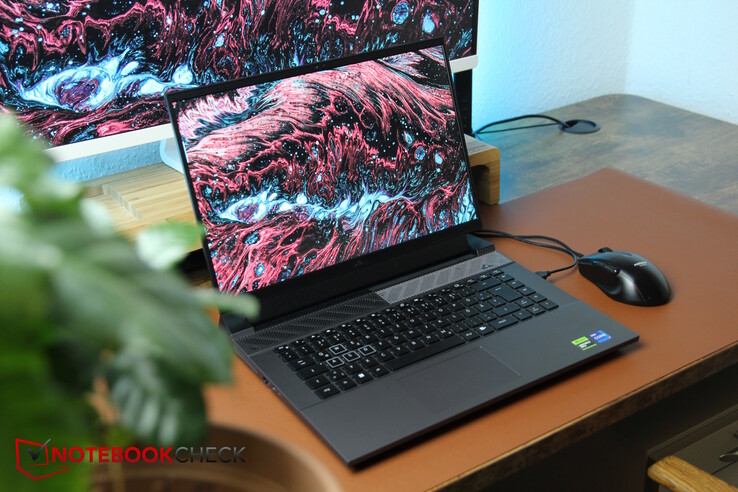
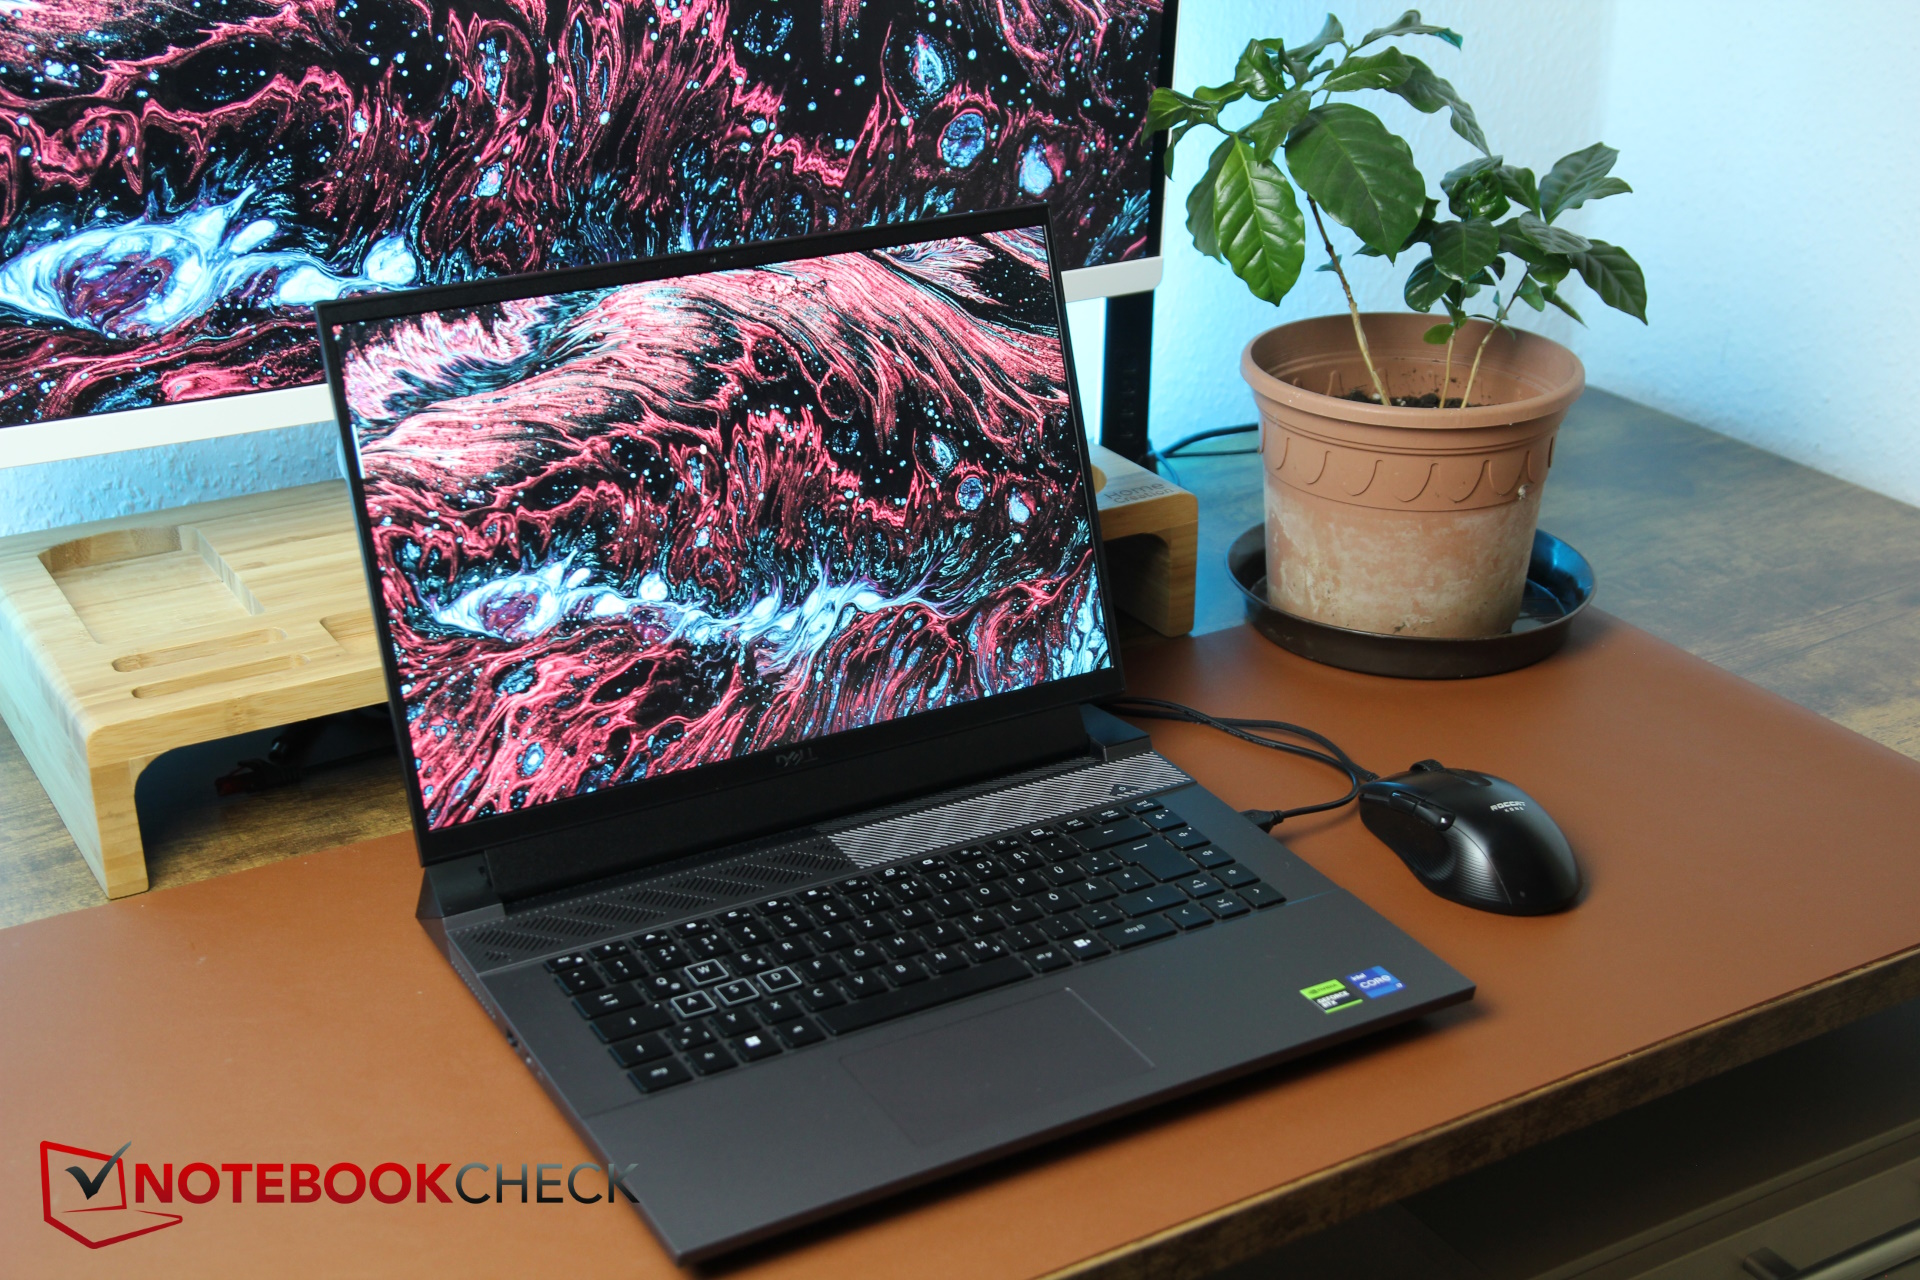
Dell G16 (2024) dizüstü bilgisayar incelemesi: Aynı üreticiden uygun fiyatlı bir Alienware alternatifi mi?
2022'nin sonunda, Dell'in bütçe-orta seviye oyun dizüstü bilgisayarları olan nispeten yeni G serisinin 16 inçlik modeline en son (ve tesadüfen ilk kez) bir göz attık. O zamanlar Dell G16 intel Gen-12 CPU ile donatılmıştı ve RTX 3060. 2024 modelinde üretici Intel Gen 13'e geçiş yapıyor ve RTX 4060 (başka GPU seçenekleri de mevcuttur). Ekran, bir seçenek olarak biraz daha güçlü bir varyant aldı.
Dell'in dizüstü bilgisayarın nispeten kalın kasasını daha da inceltmeyi başarıp başaramadığına da bakacağız. Dahası, G16 elbette aşağıdaki gibi diğer bütçe ve orta sınıf oyuncularla rekabet etmek zorunda MSI Raider GE68 HX 13VF, the Lenovo Legion Slim 5 16APH8 ve Lenovo LOQ 16-Ayrıca, doğal olarak onu bir önceki modelle ve biraz daha pahalı olan Alienware m16 R1.
Karşılaştırmalı olarak olası rakipler
Derecelendirme | Tarih | Modeli | Ağırlık | Yükseklik | Boyut | Çözünürlük | Fiyat |
|---|---|---|---|---|---|---|---|
| 85.5 % v7 (old) | 02/2024 | Dell G16, i7-13650HX, RTX 4060 i7-13650HX, GeForce RTX 4060 Laptop GPU | 2.8 kg | 25.65 mm | 16.00" | 2560x1600 | |
| 86.1 % v7 (old) | 01/2023 | Dell G16 7620 i7-12700H, GeForce RTX 3060 Laptop GPU | 2.6 kg | 26.9 mm | 16.00" | 2560x1600 | |
| 86.9 % v7 (old) | 10/2023 | MSI Raider GE68HX 13VF i9-13950HX, GeForce RTX 4060 Laptop GPU | 2.7 kg | 27.9 mm | 16.00" | 1900x1200 | |
| 87.7 % v7 (old) | 09/2023 | Lenovo Legion Slim 5 16APH8 R7 7840HS, GeForce RTX 4060 Laptop GPU | 2.4 kg | 25.2 mm | 16.00" | 2560x1600 | |
| 88.3 % v7 (old) | 07/2023 | Alienware m16 R1 Intel i7-13700HX, GeForce RTX 4060 Laptop GPU | 3 kg | 25.4 mm | 16.00" | 2560x1600 | |
| 87.3 % v7 (old) | 09/2023 | Lenovo LOQ 16IRH8 i7-13620H, GeForce RTX 4060 Laptop GPU | 2.7 kg | 25.9 mm | 16.00" | 2560x1600 |
Kasa - Alüminyum kapak ve geri kalanı gri plastik
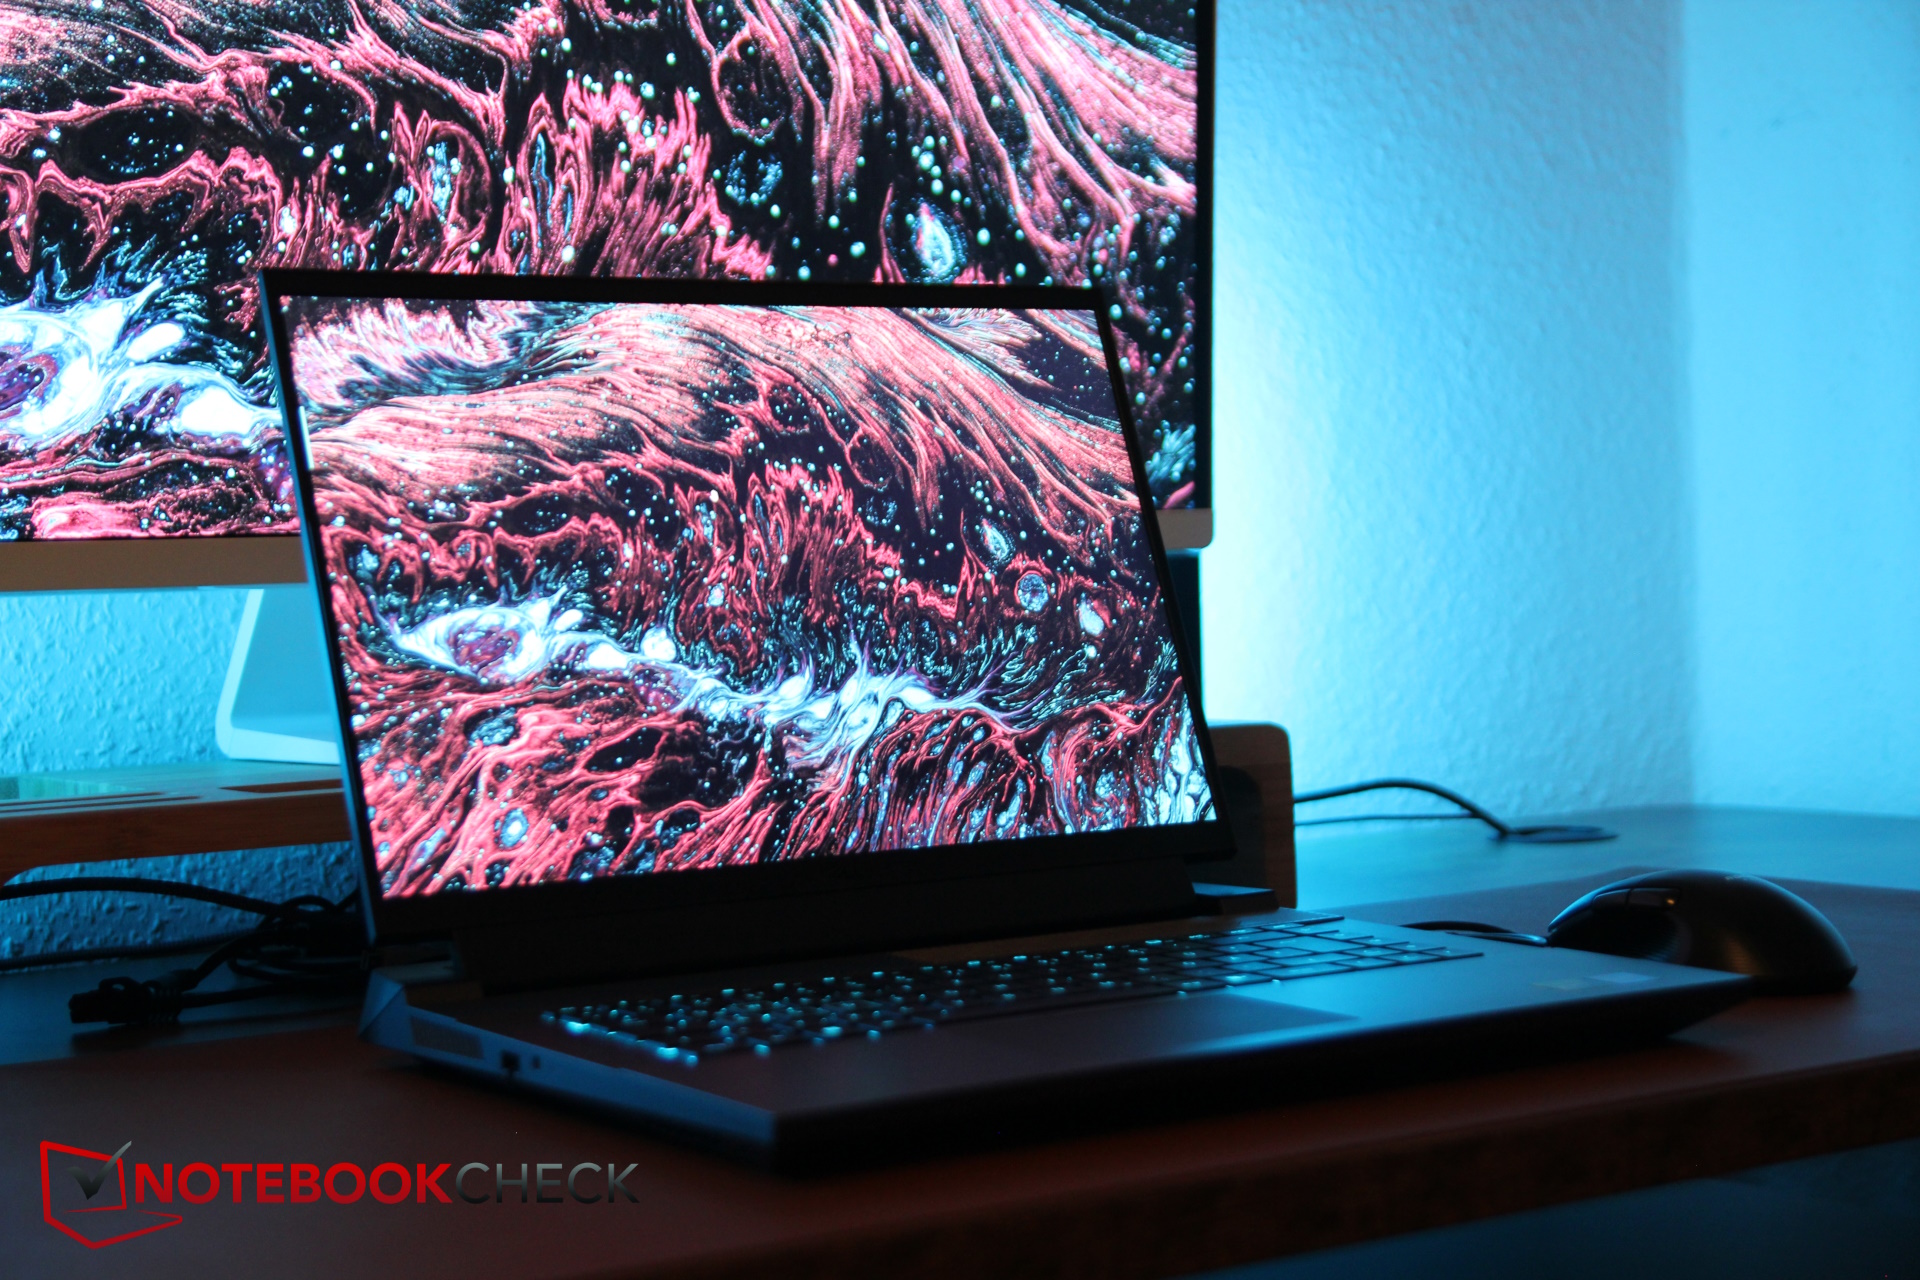
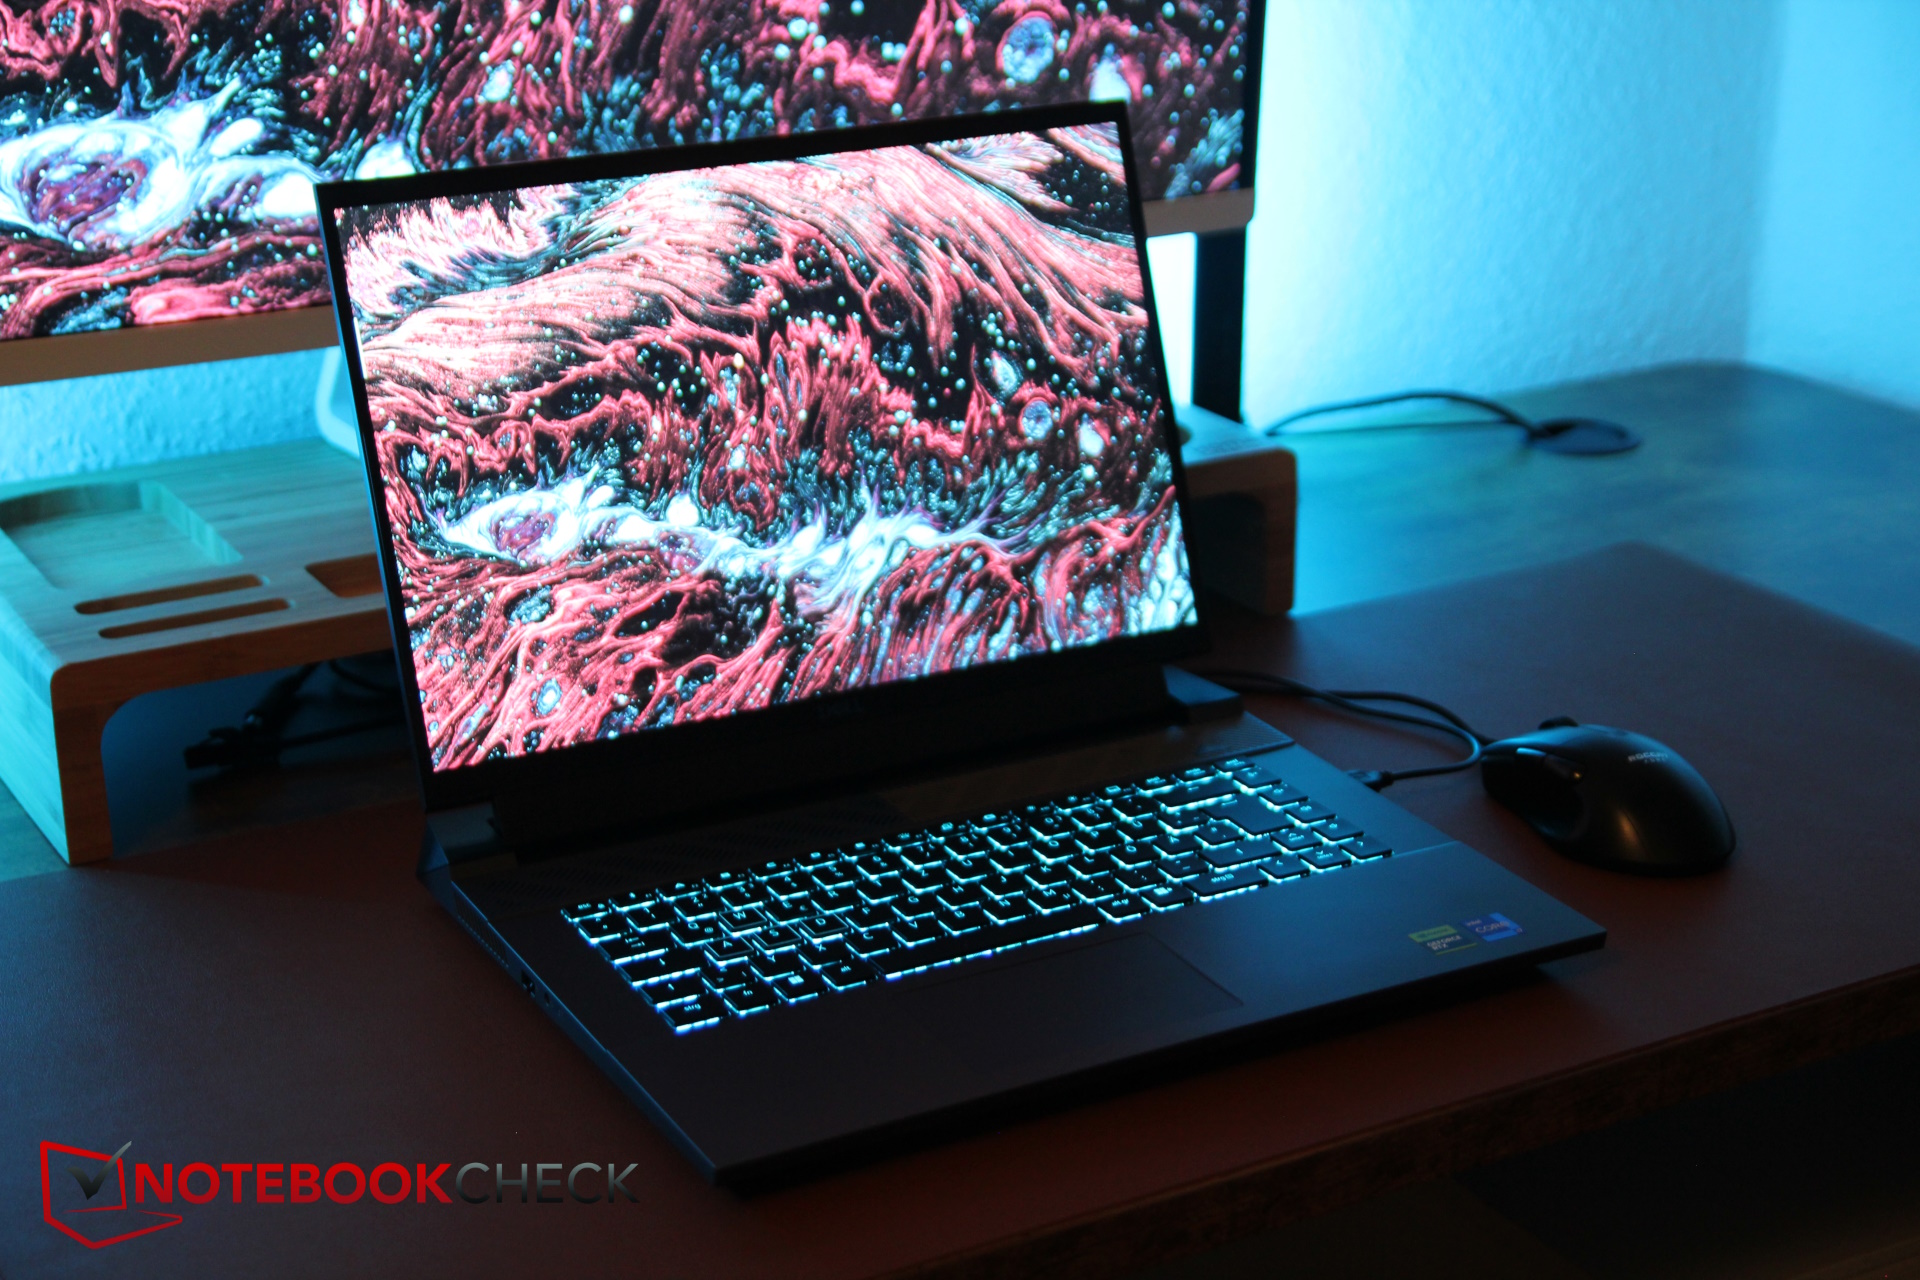
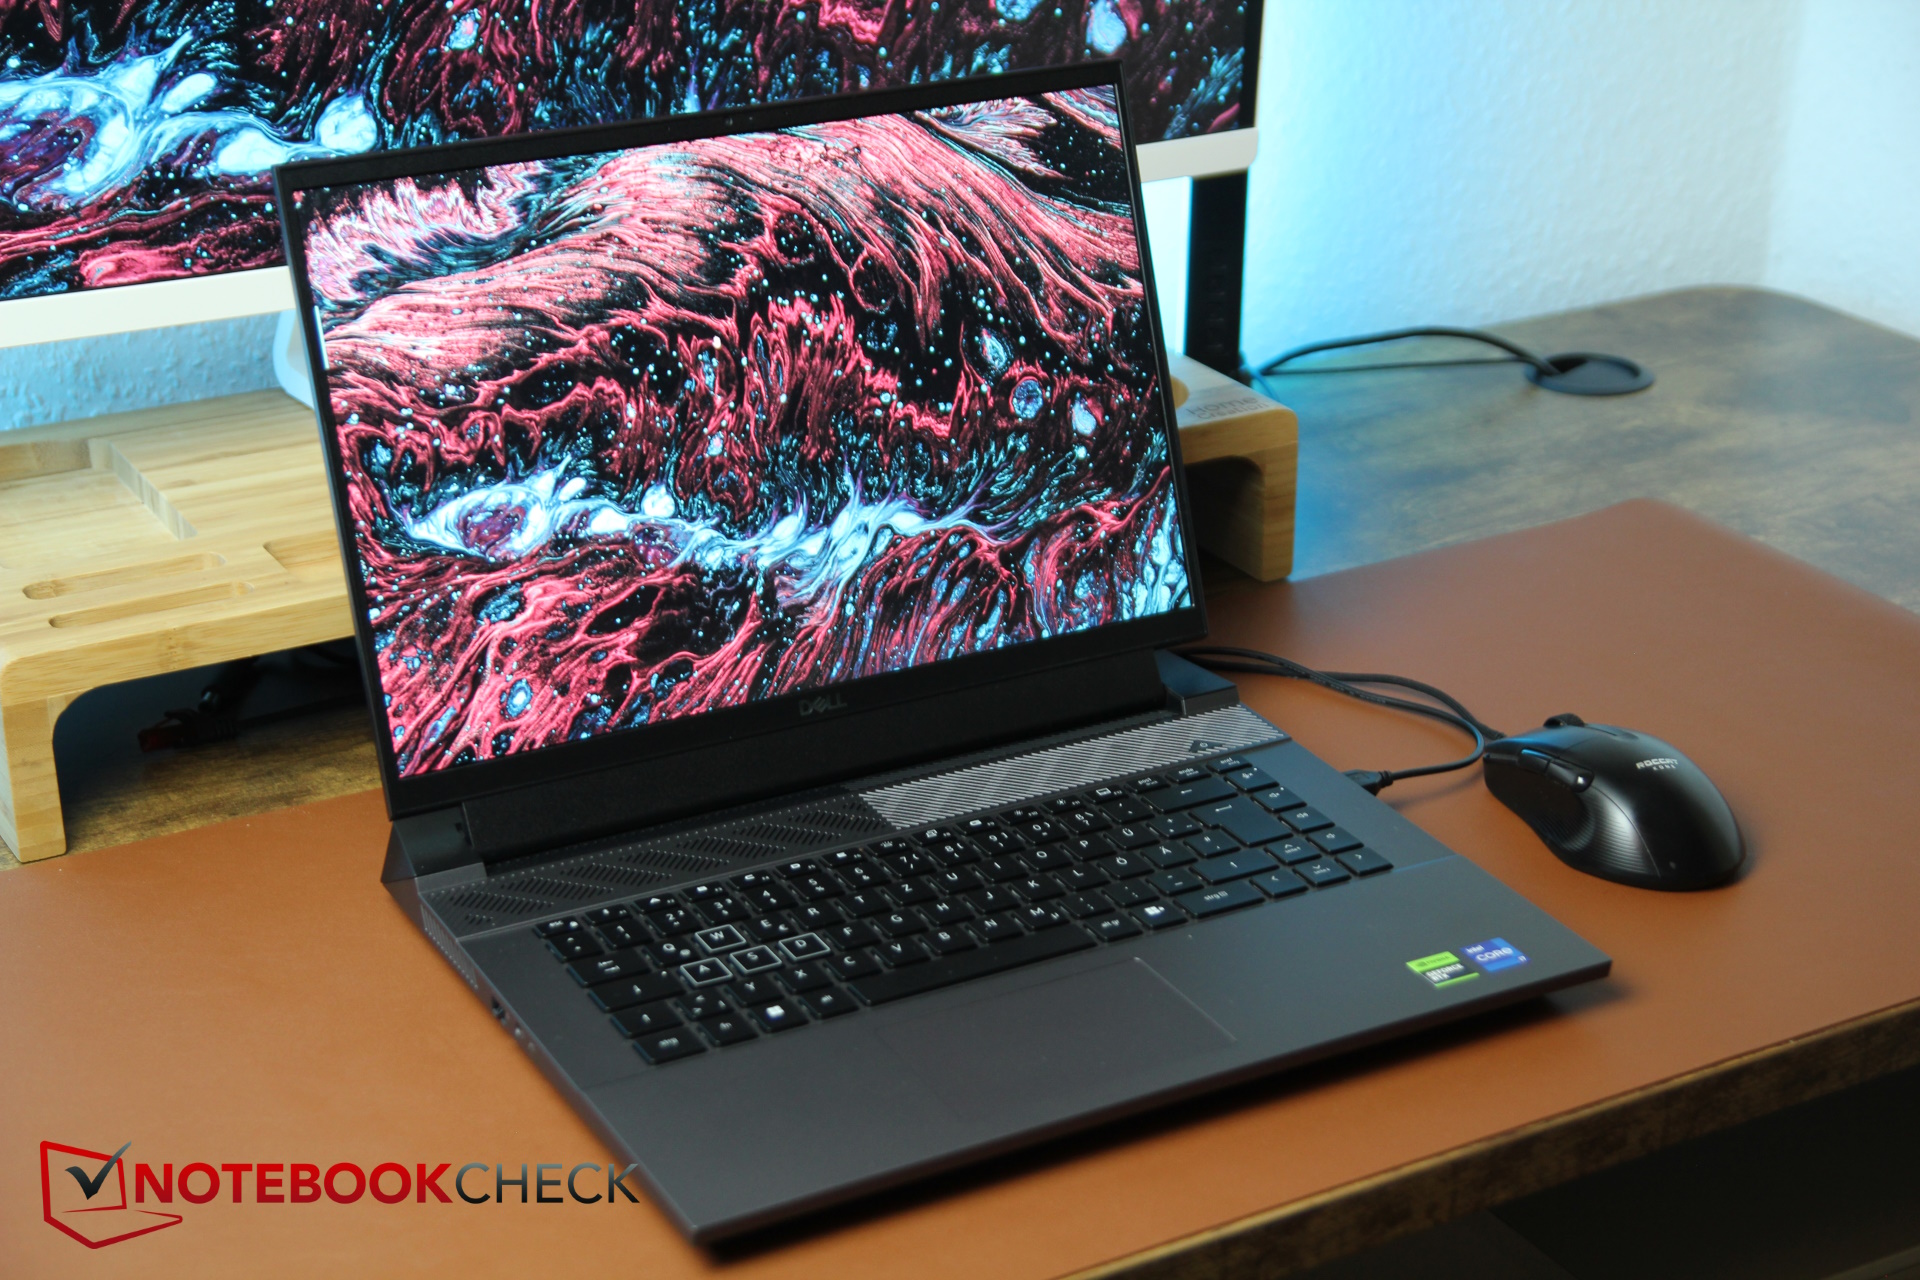
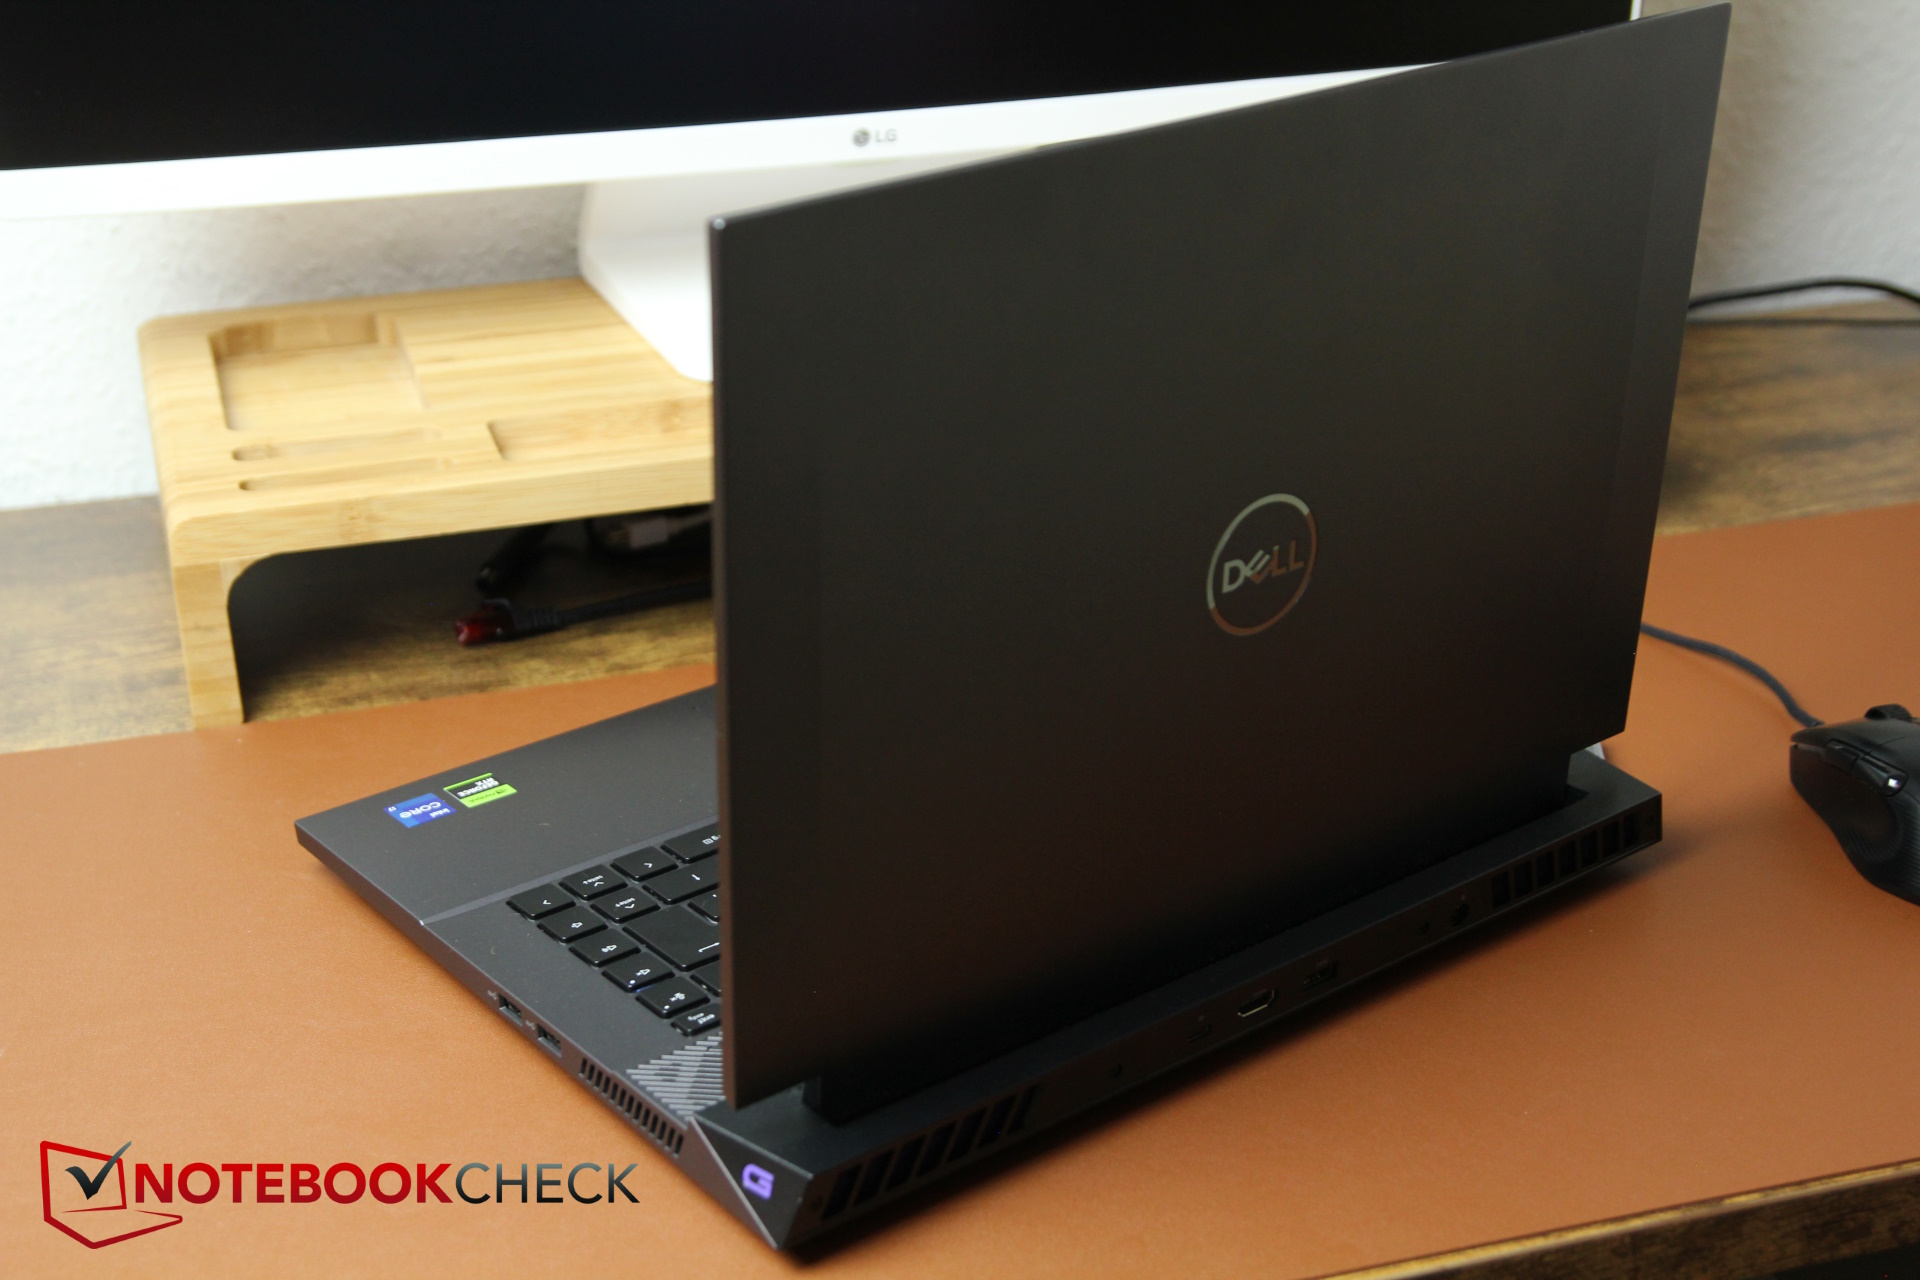
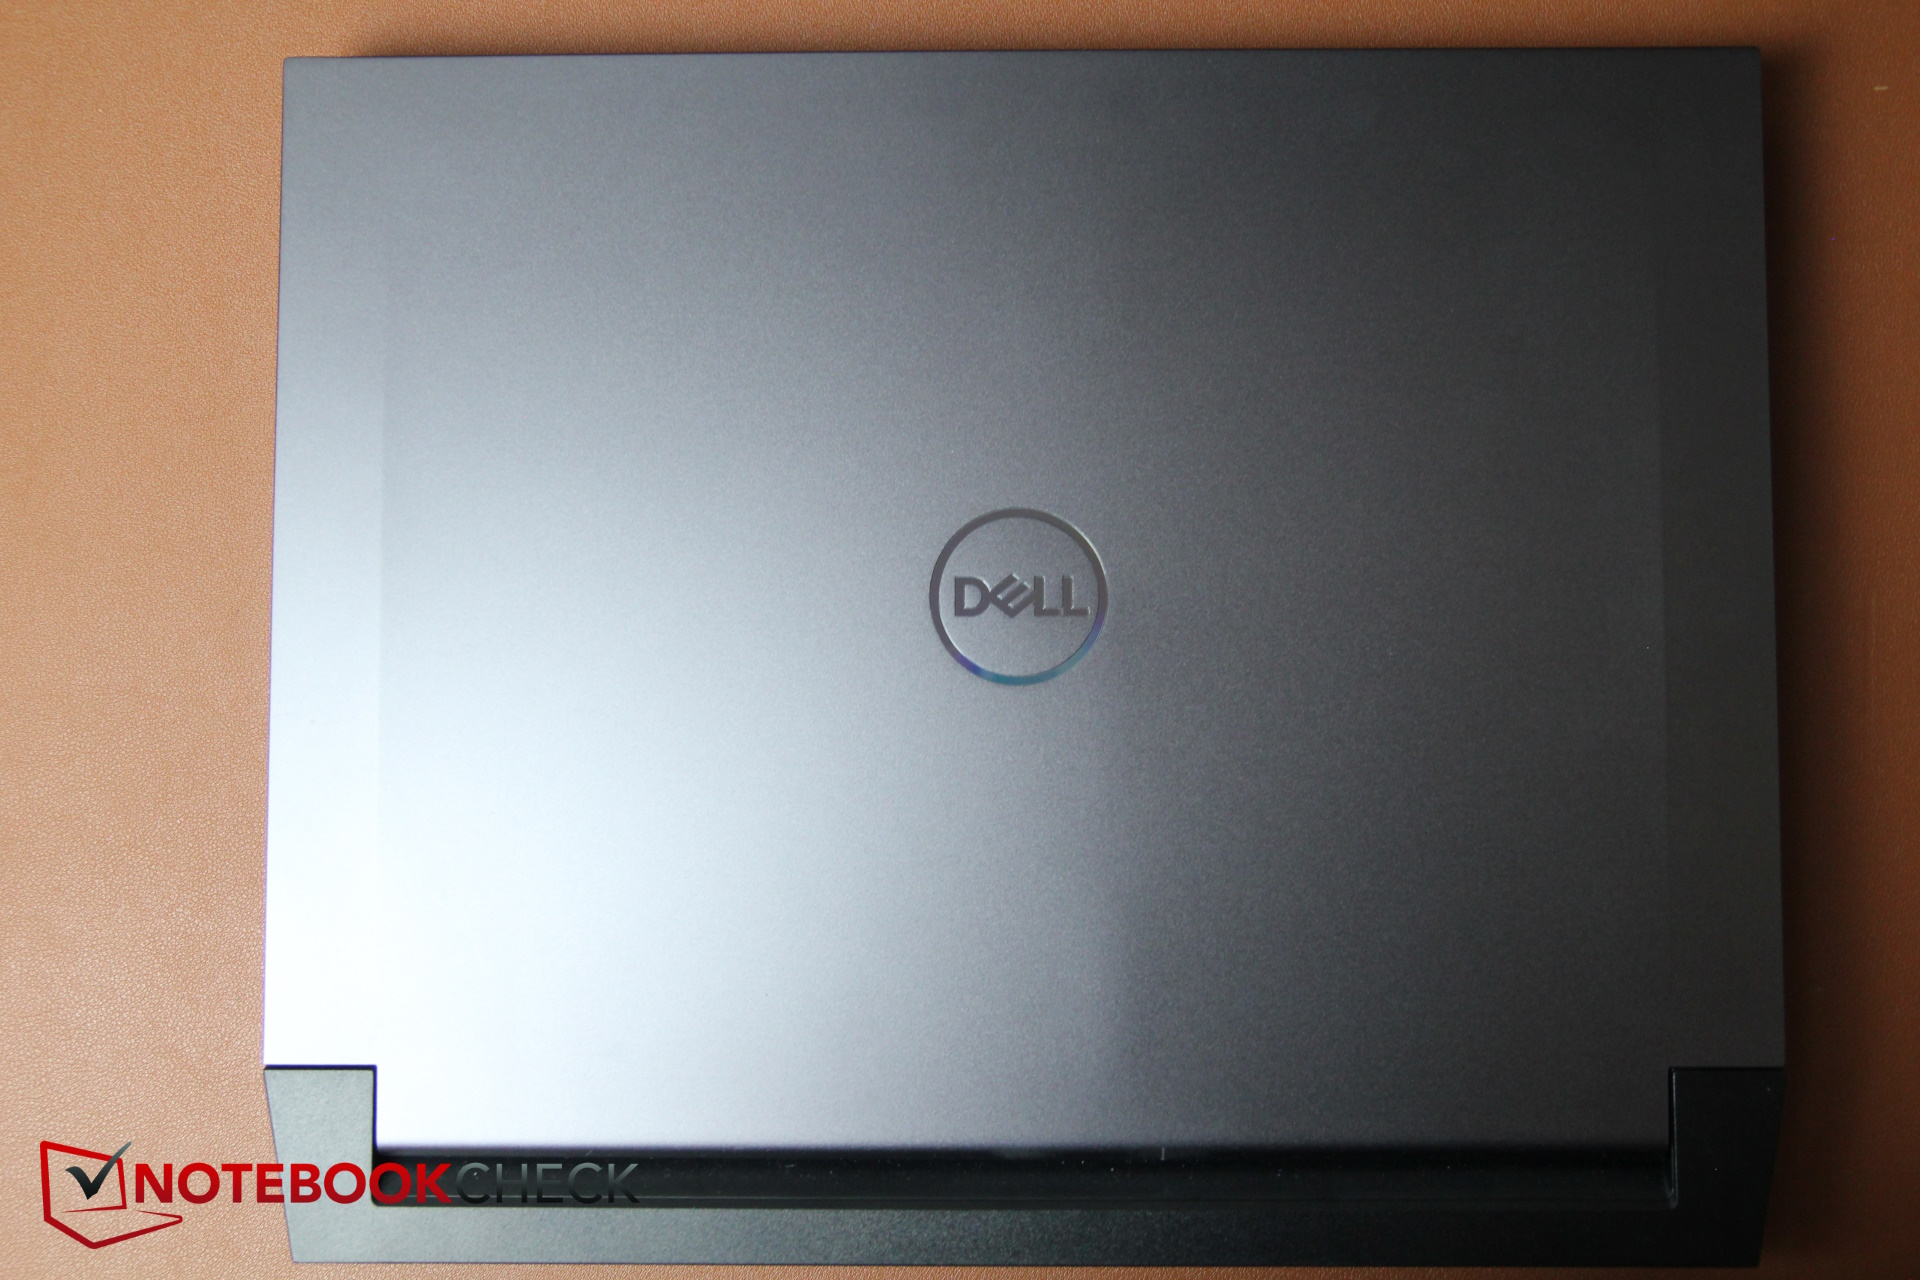
Dizüstü bilgisayarın önceki modelden farklı olan kasası çoğunlukla gri plastikten yapılmış, sadece kapakta alüminyum kullanılmış ve bu da iyi bir stabilite sağlıyor. Ana ünite de sağlam ve zorlukla bükülebiliyor. Uzun menteşe ekranı iyi bir şekilde yerinde tutuyor, ancak açıp kapatırken bazı hafif sürtünme sesleri ve gıcırtılar fark ettik. Umarım bu durum cihazın uzun ömürlülüğünü etkilemez. Yapısı iyi ancak daha pahalı Dell ve Alienware modelleri kadar yüksek kaliteli hissettirmiyor.
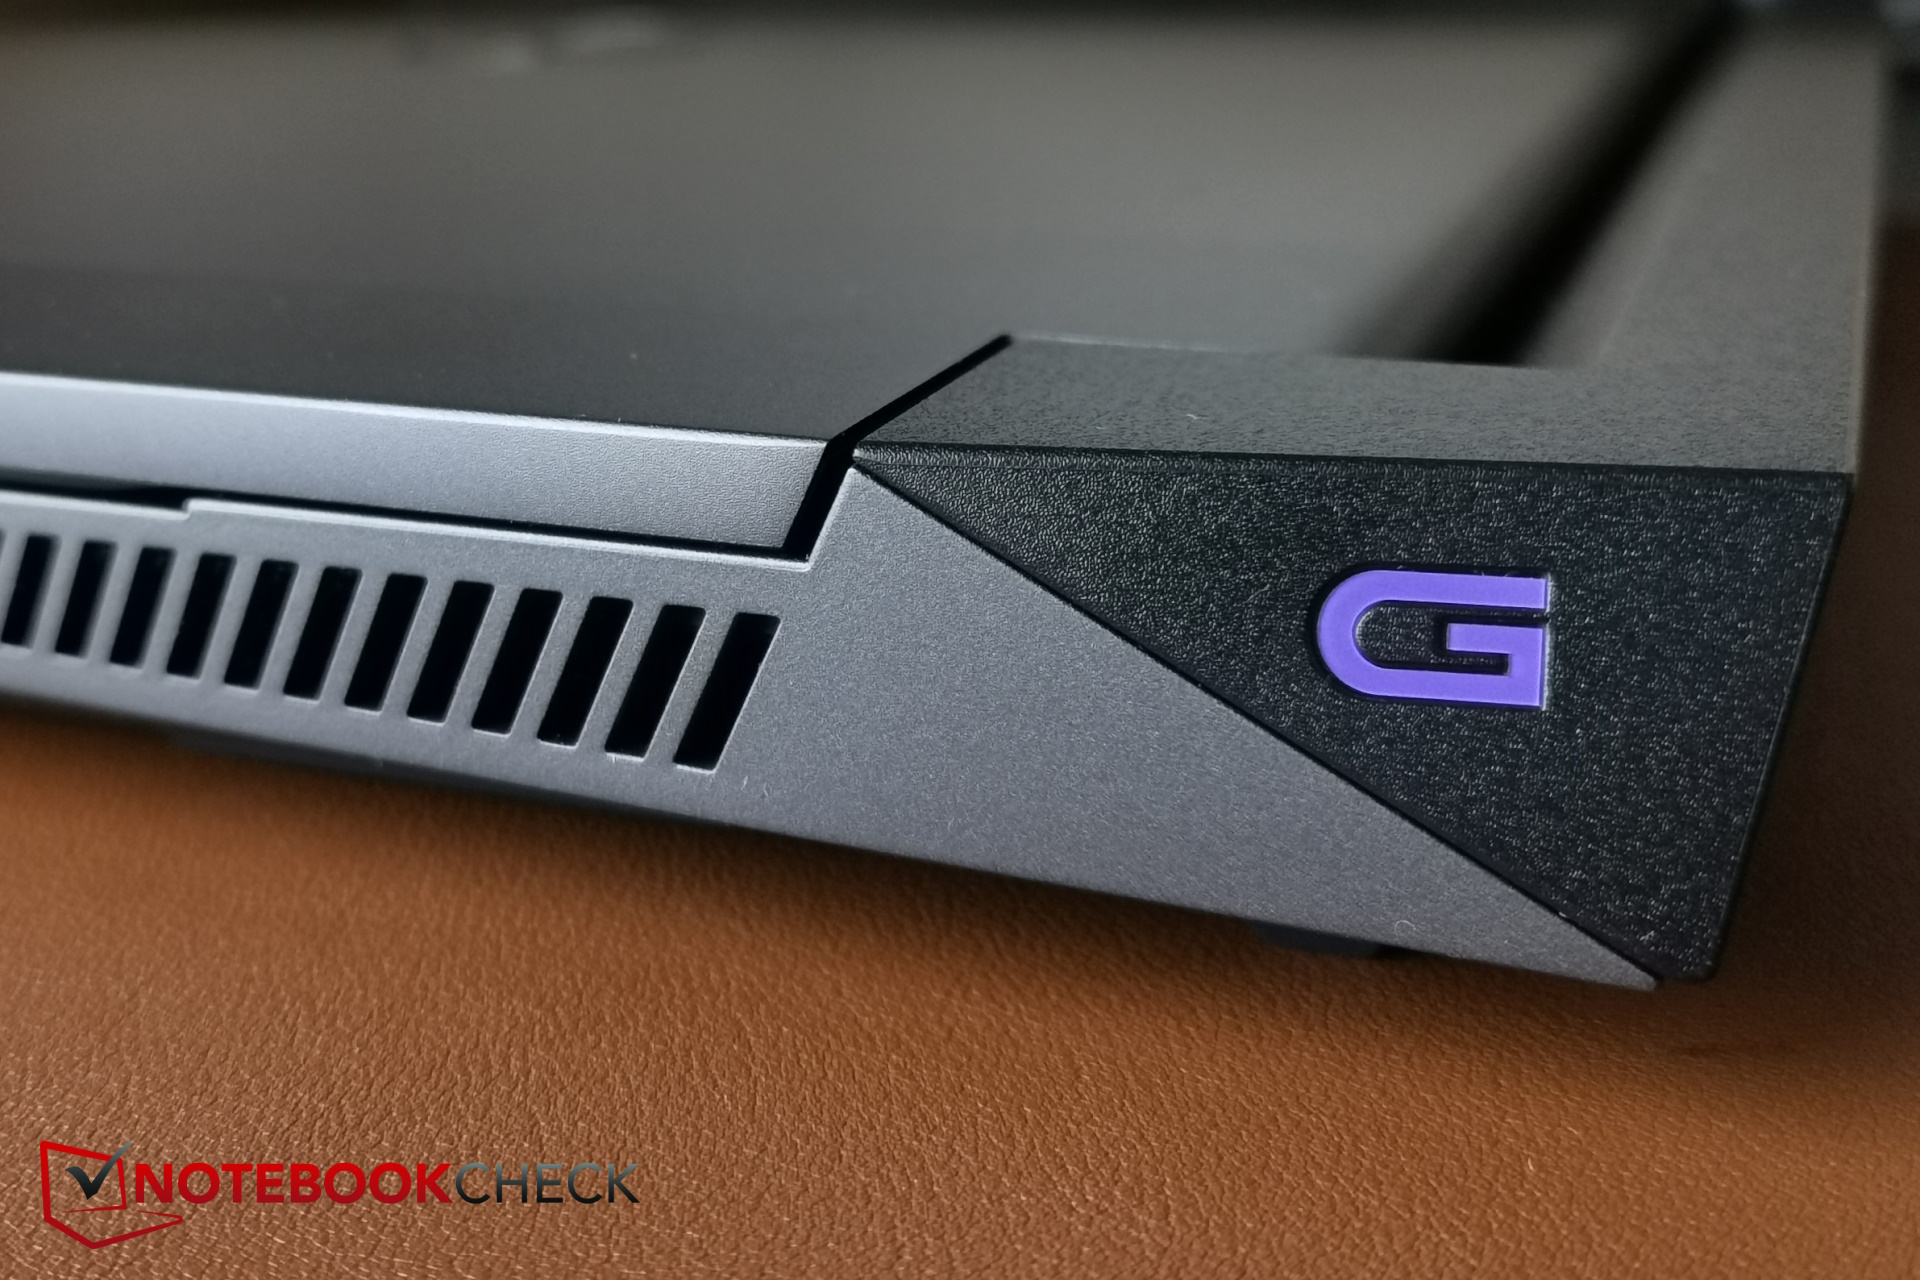
Dell logosu dizüstü bilgisayarın üst kısmında göze çarpıyor ve bunun dışında herhangi bir ek renk vurgusu bulunmuyor. Bununla birlikte, bariz oyuncu da çok şık görünmüyor, bunun başlıca nedeni soğutma ünitesinin arkaya doğru çıkıntı yapması. Genel olarak, G16 çok zarif görünmüyor ama oldukça hantal ve ağır.
Daha pahalı Alienware m16 R1 aslında bizim G16'dan biraz daha geniş ve benzer kalınlıkta. Bu MSI Raider GE68HX biraz daha kalınken, diğer ölçümleri neredeyse aynıdır. Hatta Lenovo Legion Slim 5 g16 oldukça kalın görünmesine rağmen çok daha ince değildir, ancak ilki biraz daha küçüktür.
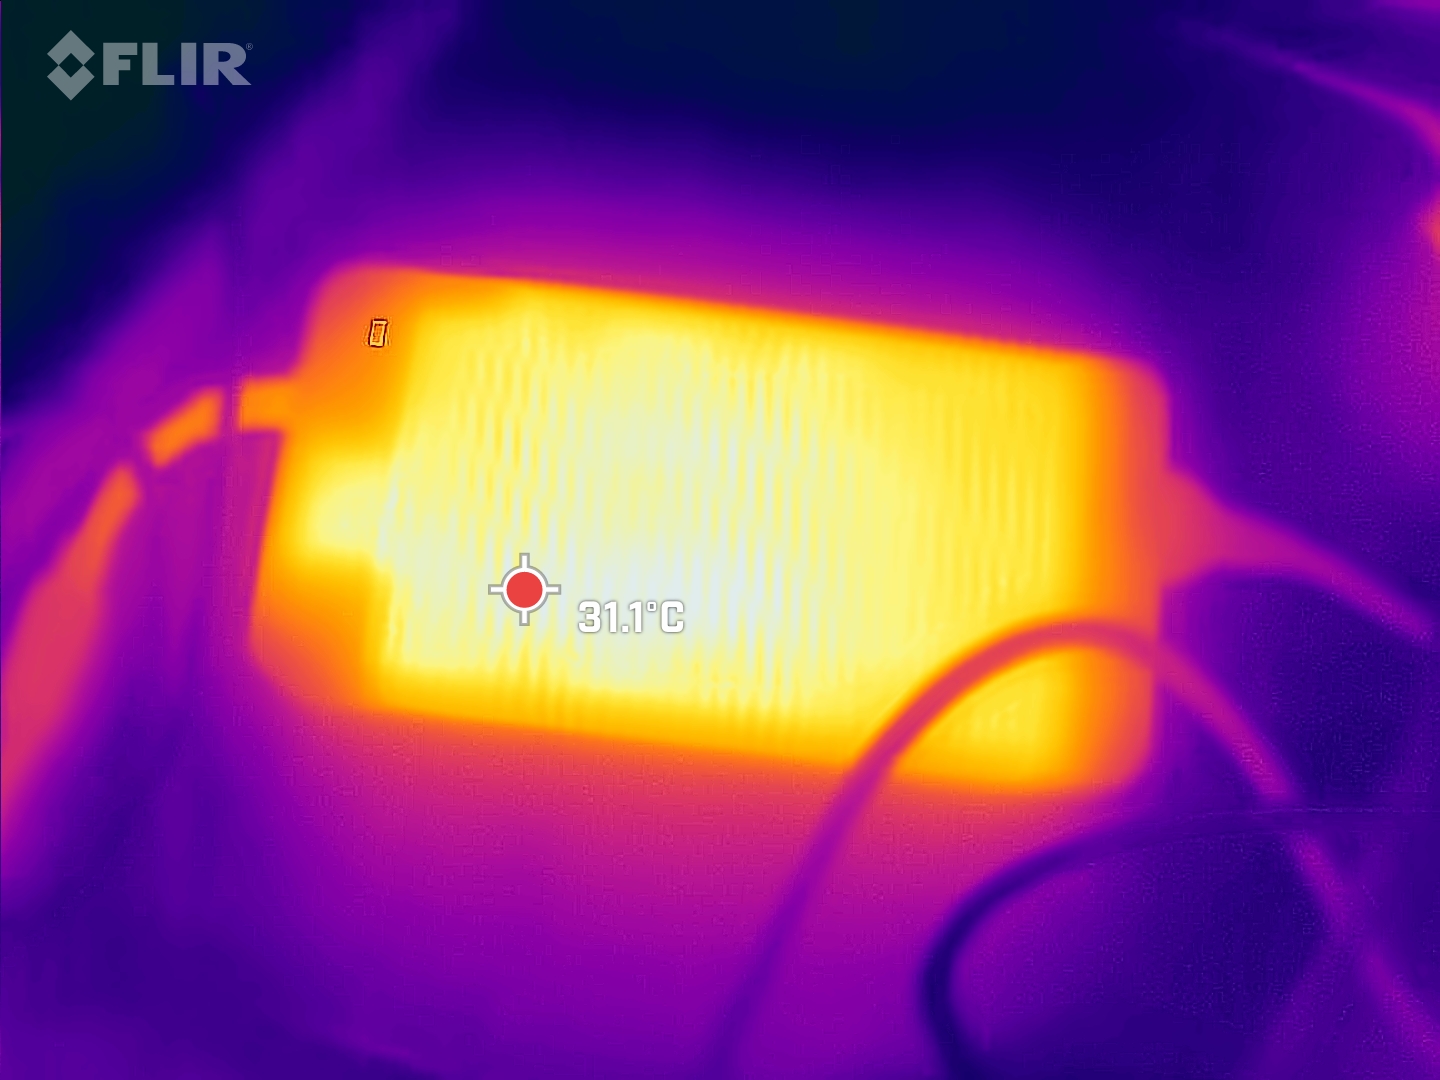
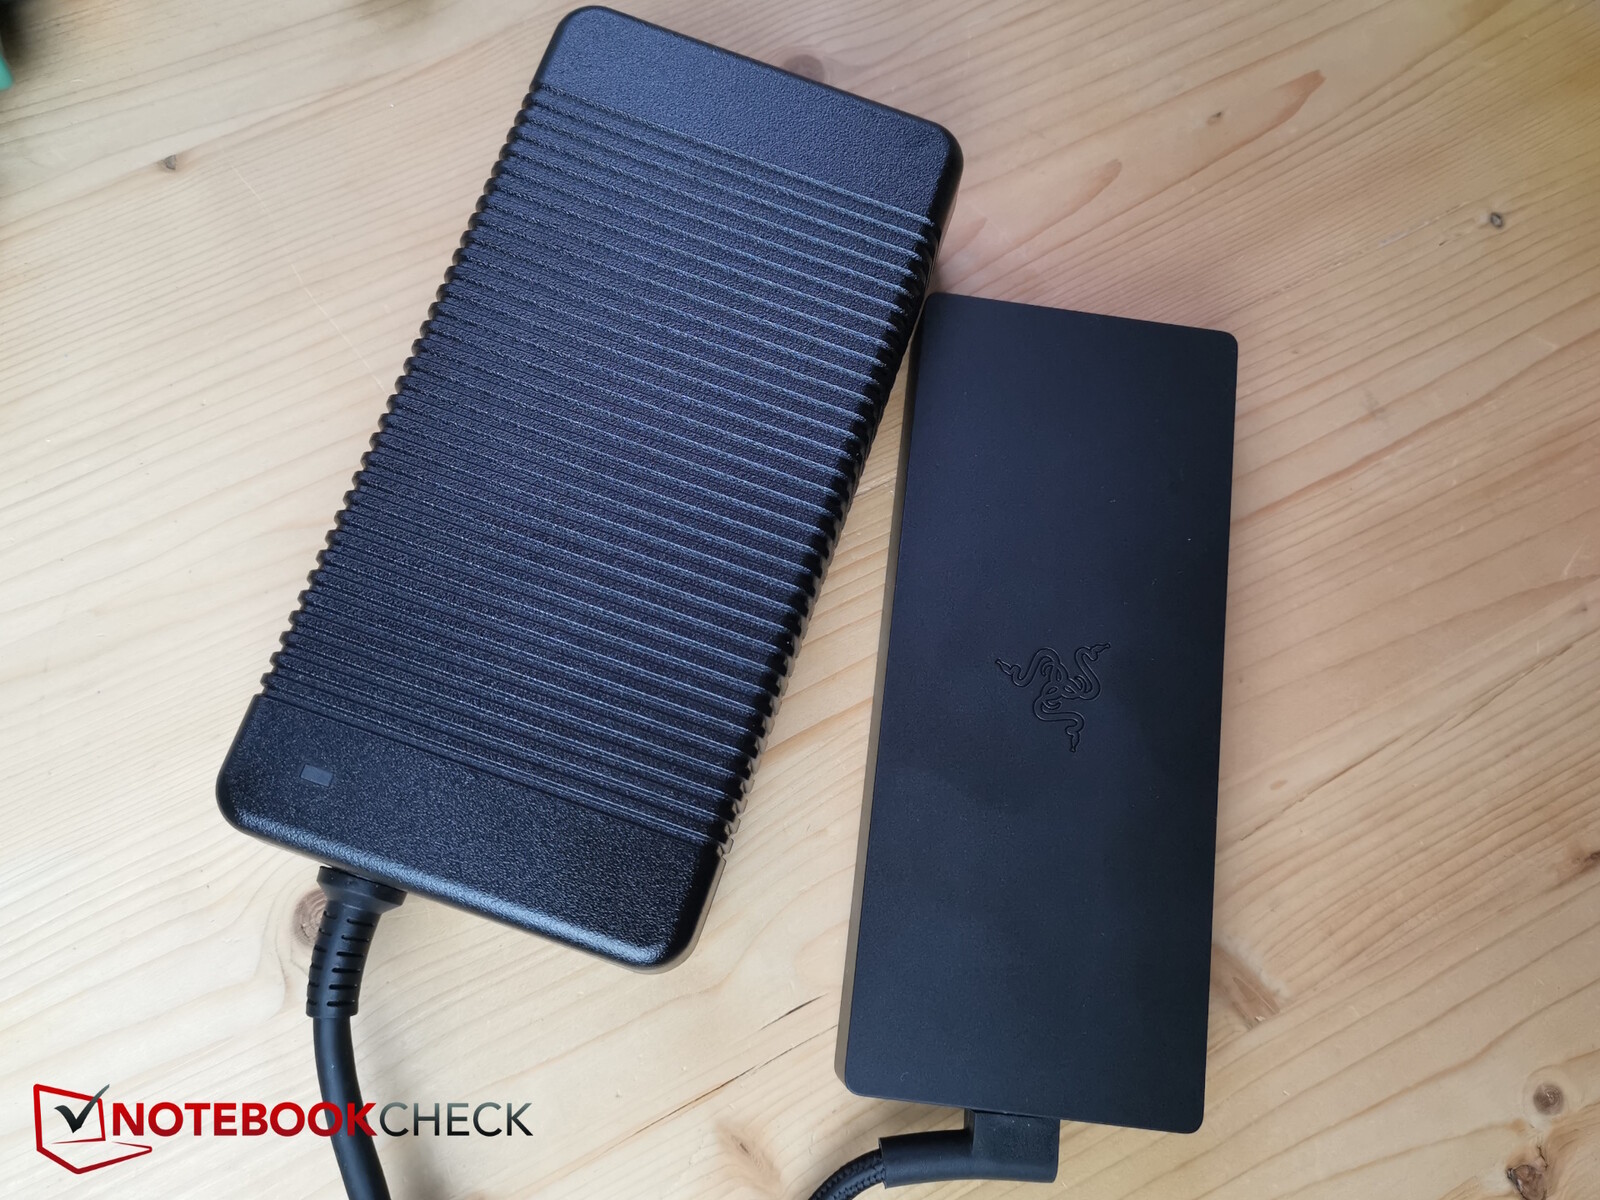
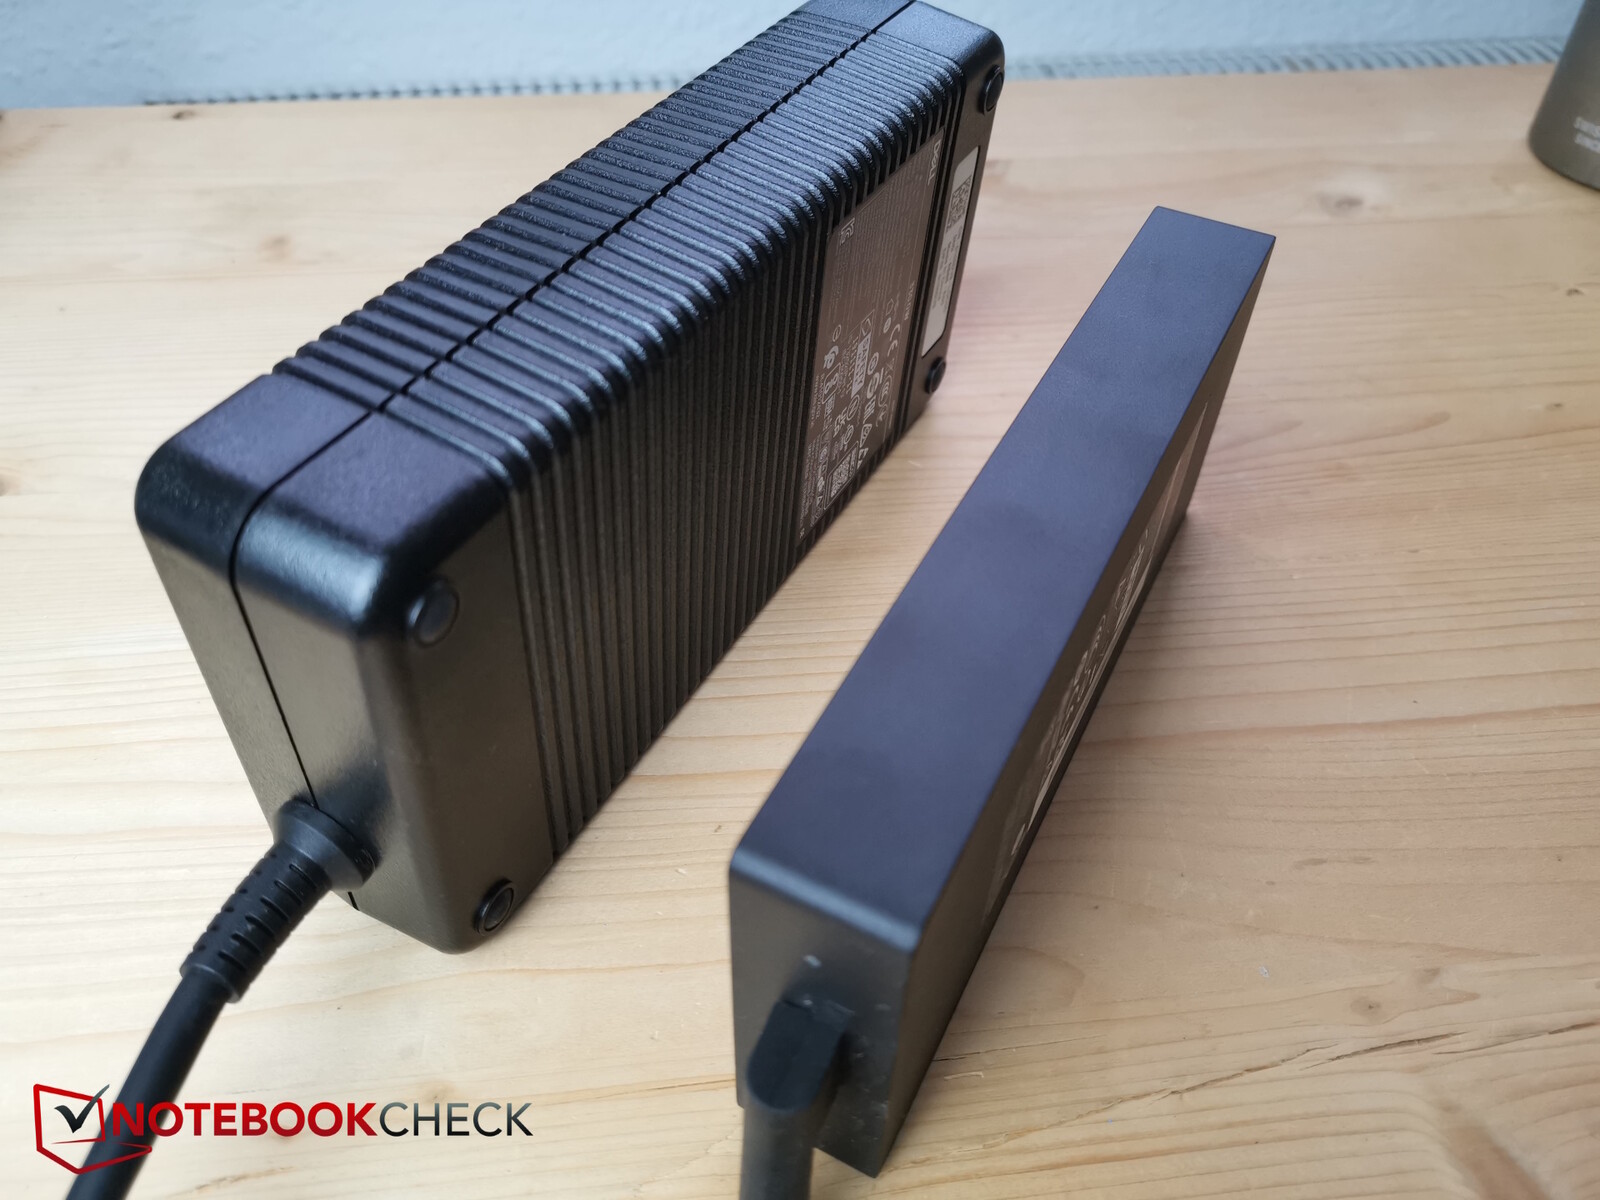
Selefiyle karşılaştırıldığında, bu model aslında biraz daha incelmiş ancak aynı zamanda derinliği artmıştır. Ayrıca daha ağır (+ 200 g), yani G16 artık aynı üreticinin Alienware'inden sonra RTX 4060'a sahip ikinci en ağır 16 inçlik oyuncu. Buna ek olarak Dell, RTX 4060 versiyonunu 330 watt'lık devasa ve ağır bir güç kaynağıyla birlikte sunuyor - bu bile tek başına 1,5 kg'ın üzerinde bir ağırlığa sahip.
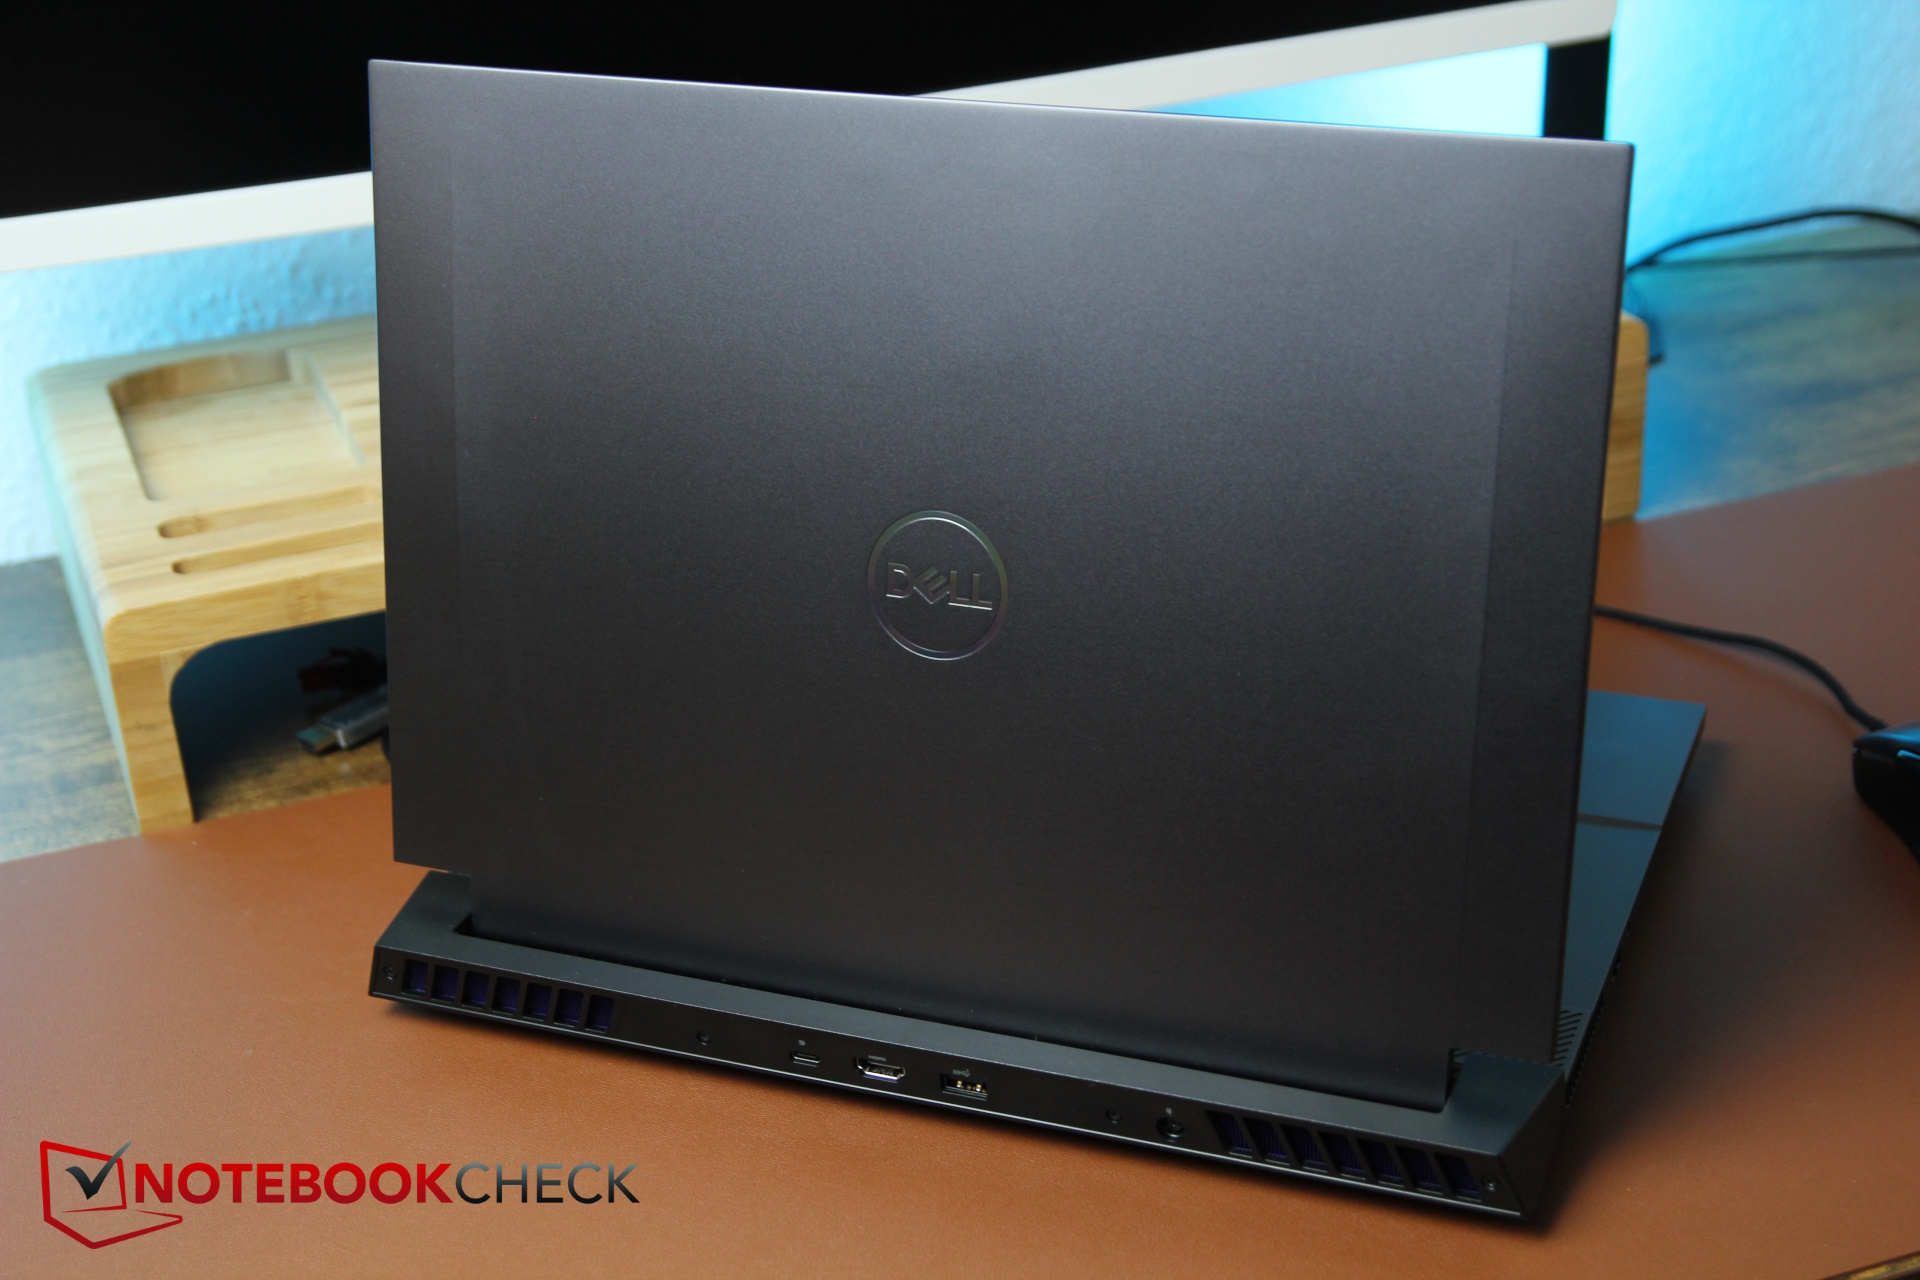
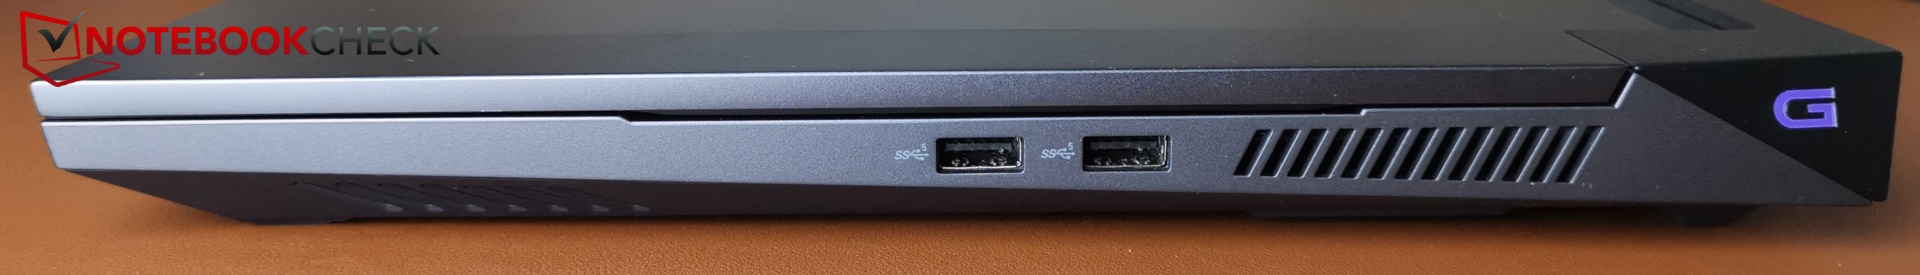
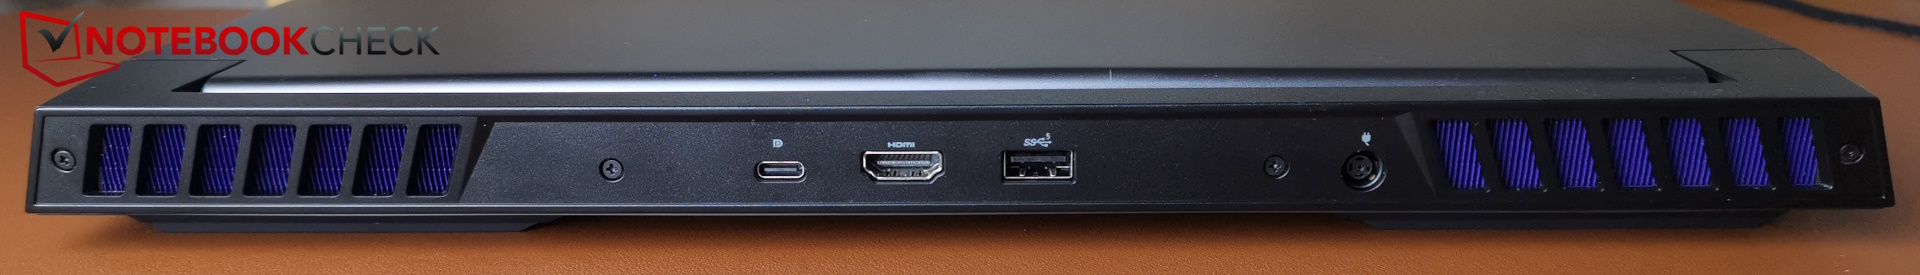
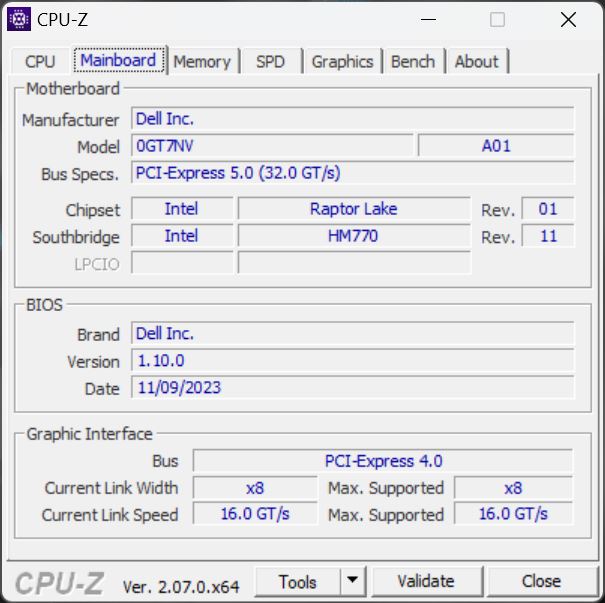
Bağlanabilirlik - Thunderbolt tüm G16 modellerinde yok
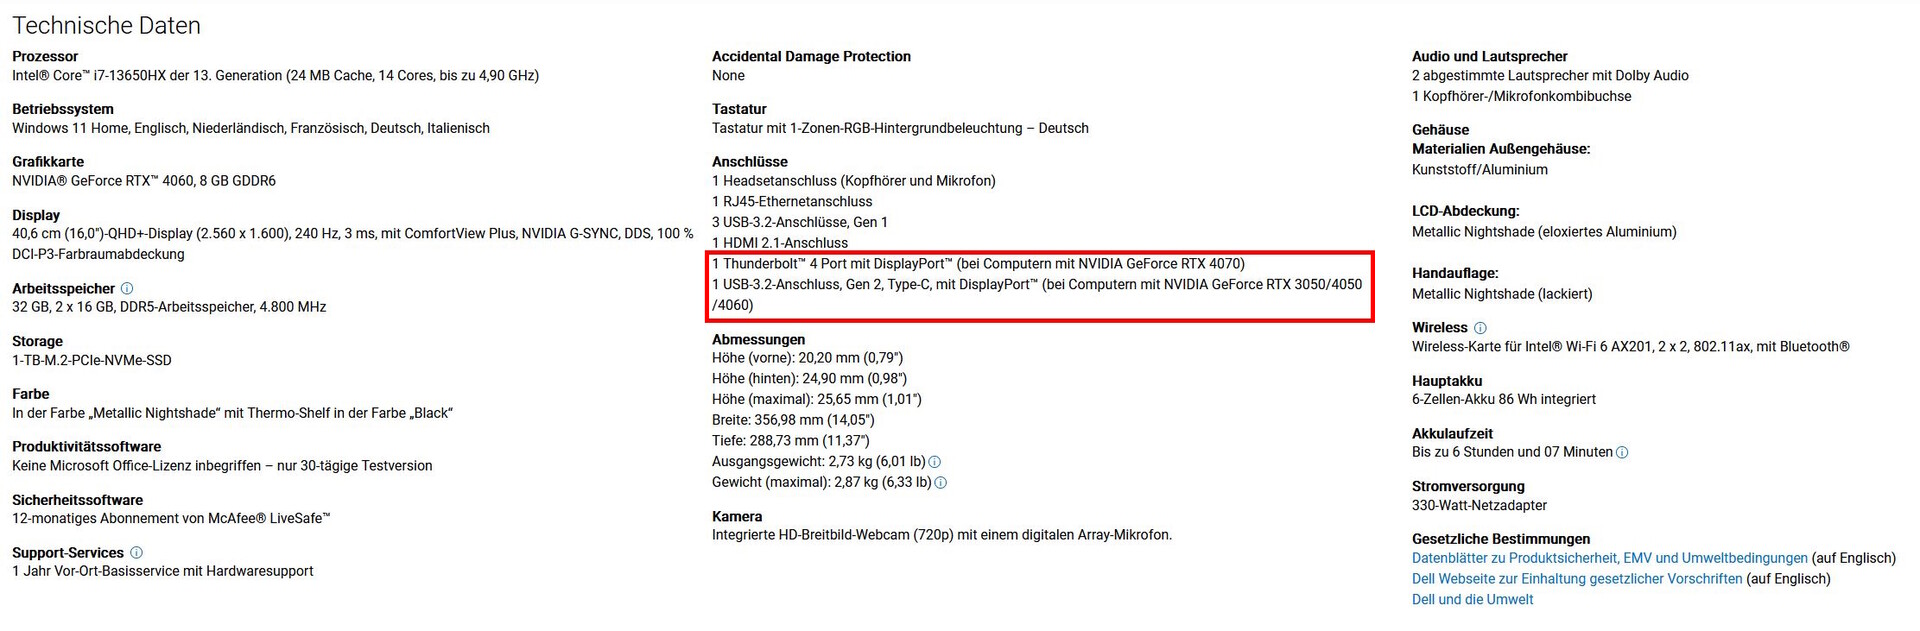
Dizüstü bilgisayarın bağlantı noktası düzeni bir istisna dışında aynı kalmıştır: Arka tarafta bağlantılar biraz karıştırılmış. HDMI bağlantı noktası önceki modelde çok fazla alana sahipken, şimdi USB-A bağlantı noktası ile USB-C bağlantı noktası arasında yer alıyor - ilki daha büyük fişlerle kullanıldığında bazı alan sorunlarına yol açabilir. Dell'in bu kararı oldukça tartışmalı.
Dikkat: Elektrik fişi çok sağlam oturmuyor ve dizüstü bilgisayar hareket ettirildiğinde oldukça kolay bir şekilde kayıyor. Ağır güç kaynağı da bu soruna katkıda bulunuyor.
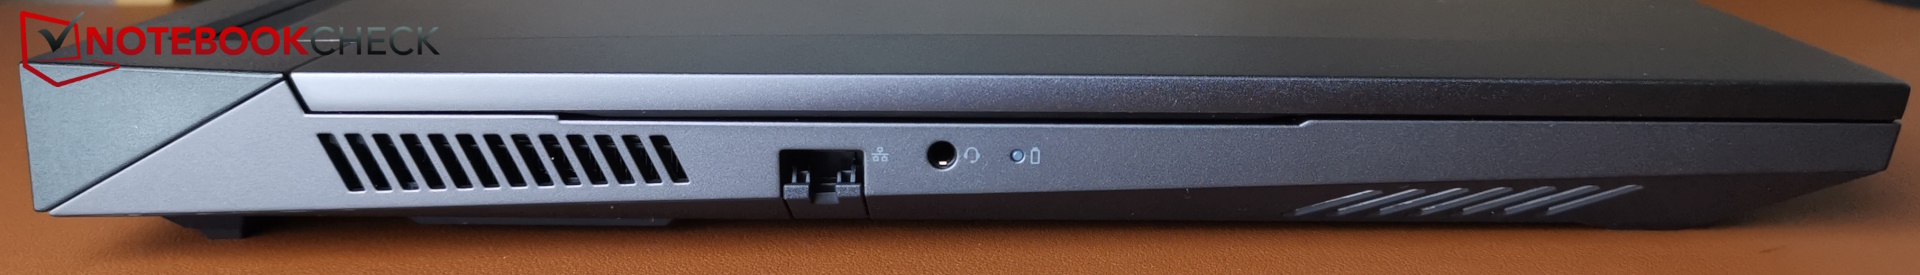
Cihazın selefinde yer alan Thunderbolt (4) desteği de bir o kadar şüpheli. Şimdi, görünüşe göre yüklü grafik kartına bağlı. Dell'e göre Thunderbolt, RTX 4060'a kadar olan modellerde desteklenmezken, RTX 4070 ve üstü modellerde destekleniyor. Bu alışılmadık bir durum ve daha küçük konfigürasyonları satın alan müşteriler için sinir bozucu. Bağlantı noktası PowerDelivery'yi desteklemiyor.
İletişim
Intel AX201 WiFi modülü WiFi 6'yı destekliyor ancak henüz WiFi 6E'yi desteklemiyor.
5-GHz bandındaki aktarım hızları olağanüstü iken 210 Mb/sn'lik 2.4-GHz hızları hayal kırıklığı yaratıyor.
Web kamerası
En son 720p web kamerası Dell'in nerede tasarruf yaptığını gösteriyor. Birçok rakibinde Full-HD ya da daha iyi bir kamera bulunuyor. Renk sapmaları ve görüntü netliği konusunda da daha iyi modeller var.


Güvenlik
G16, ne parmak izi sensörüne ne de Kensington kilidine sahip olduğu için herhangi bir fiziksel güvenlik işlevine sahip değildir. TPM elbette işlemciye entegre edilmiştir.
Aksesuarlar ve garanti
Ambalaj herhangi bir ekstra içermiyor. Dell bu cihaza yerinde temel servis ve donanım desteği ile birlikte 12 aylık standart bir garanti veriyor ve özel koşullar aşağıdaki ekran görüntüsünde görülebilir.

Bakım
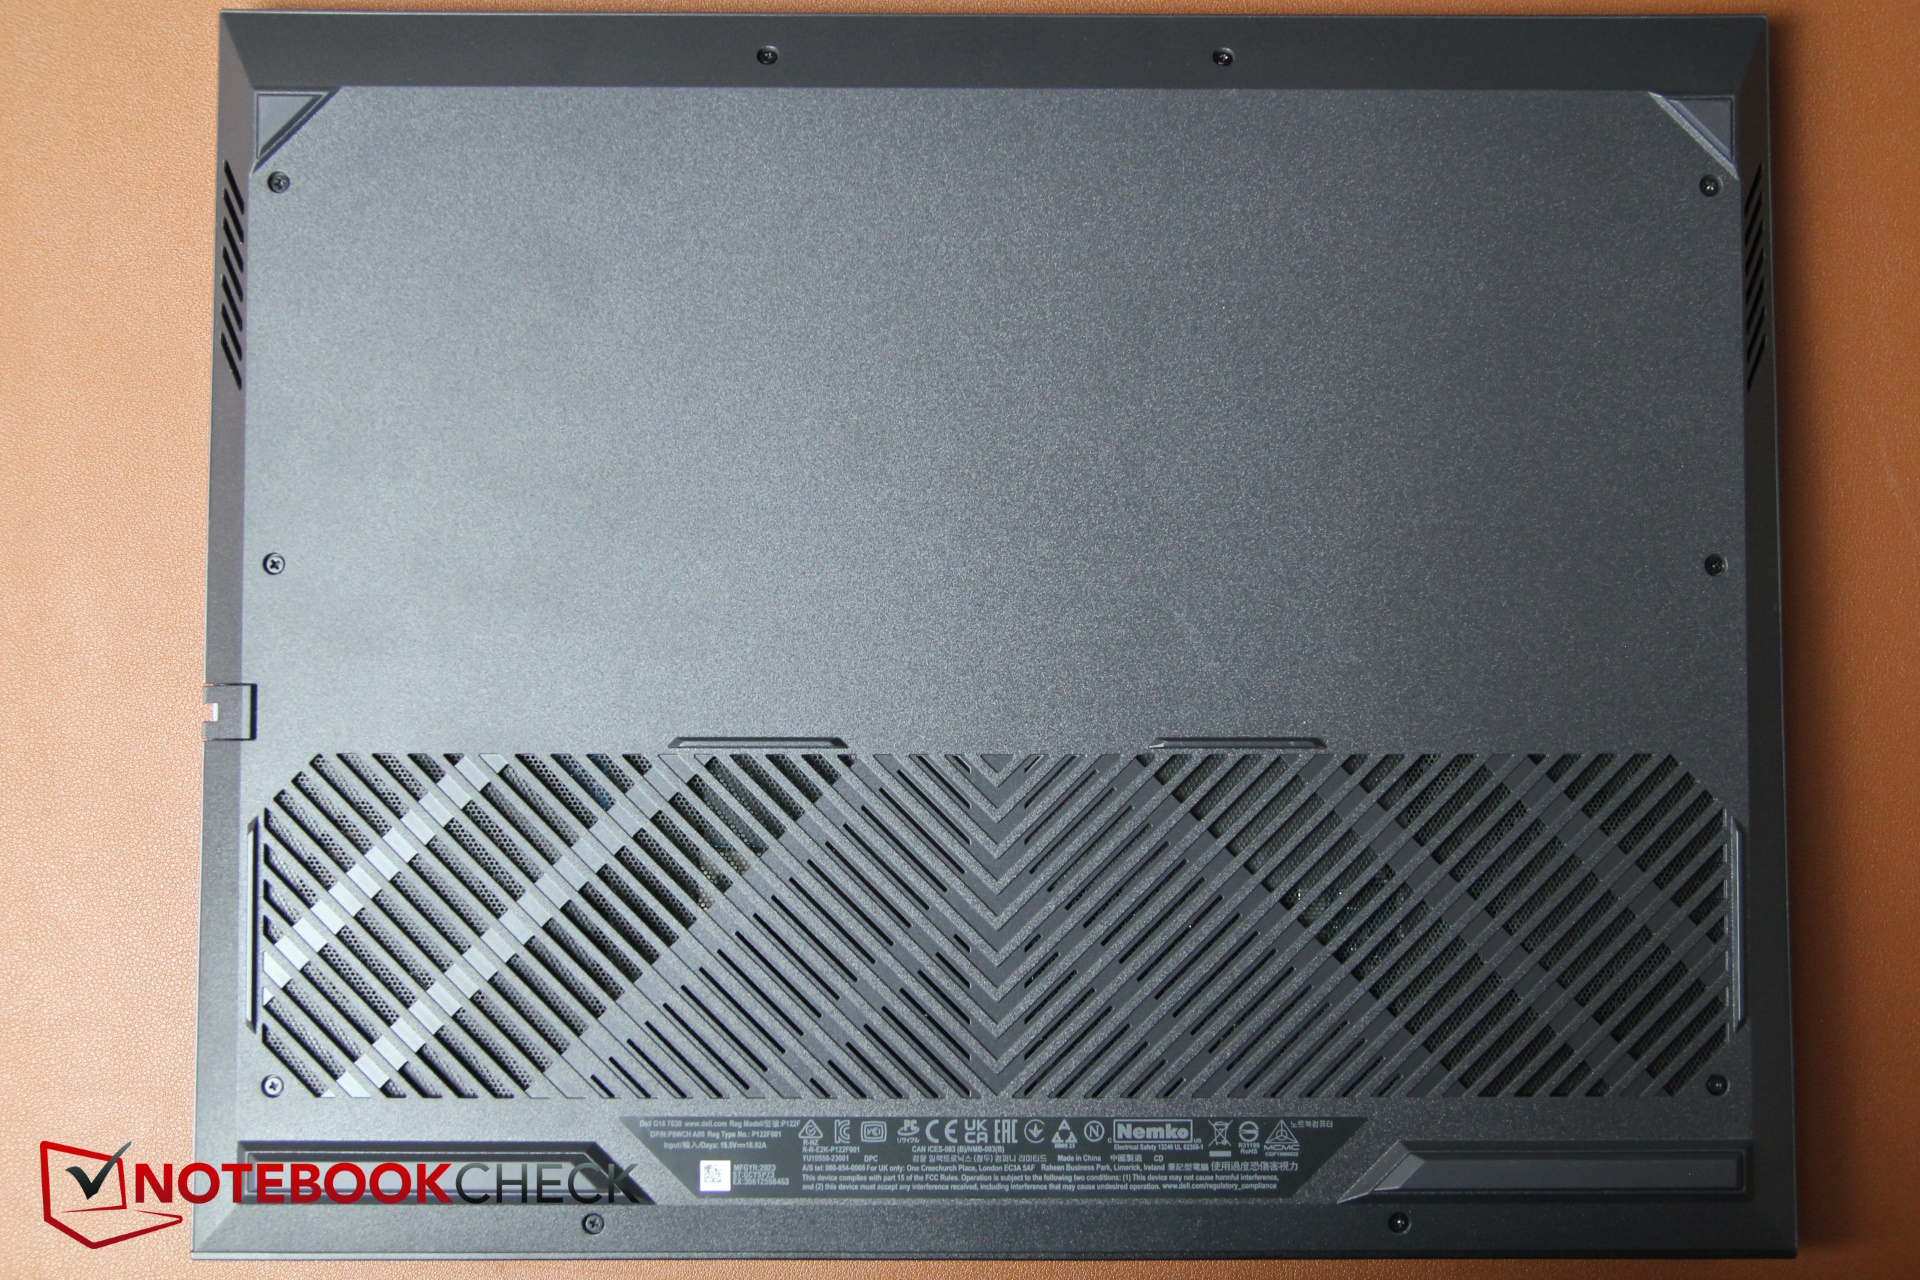
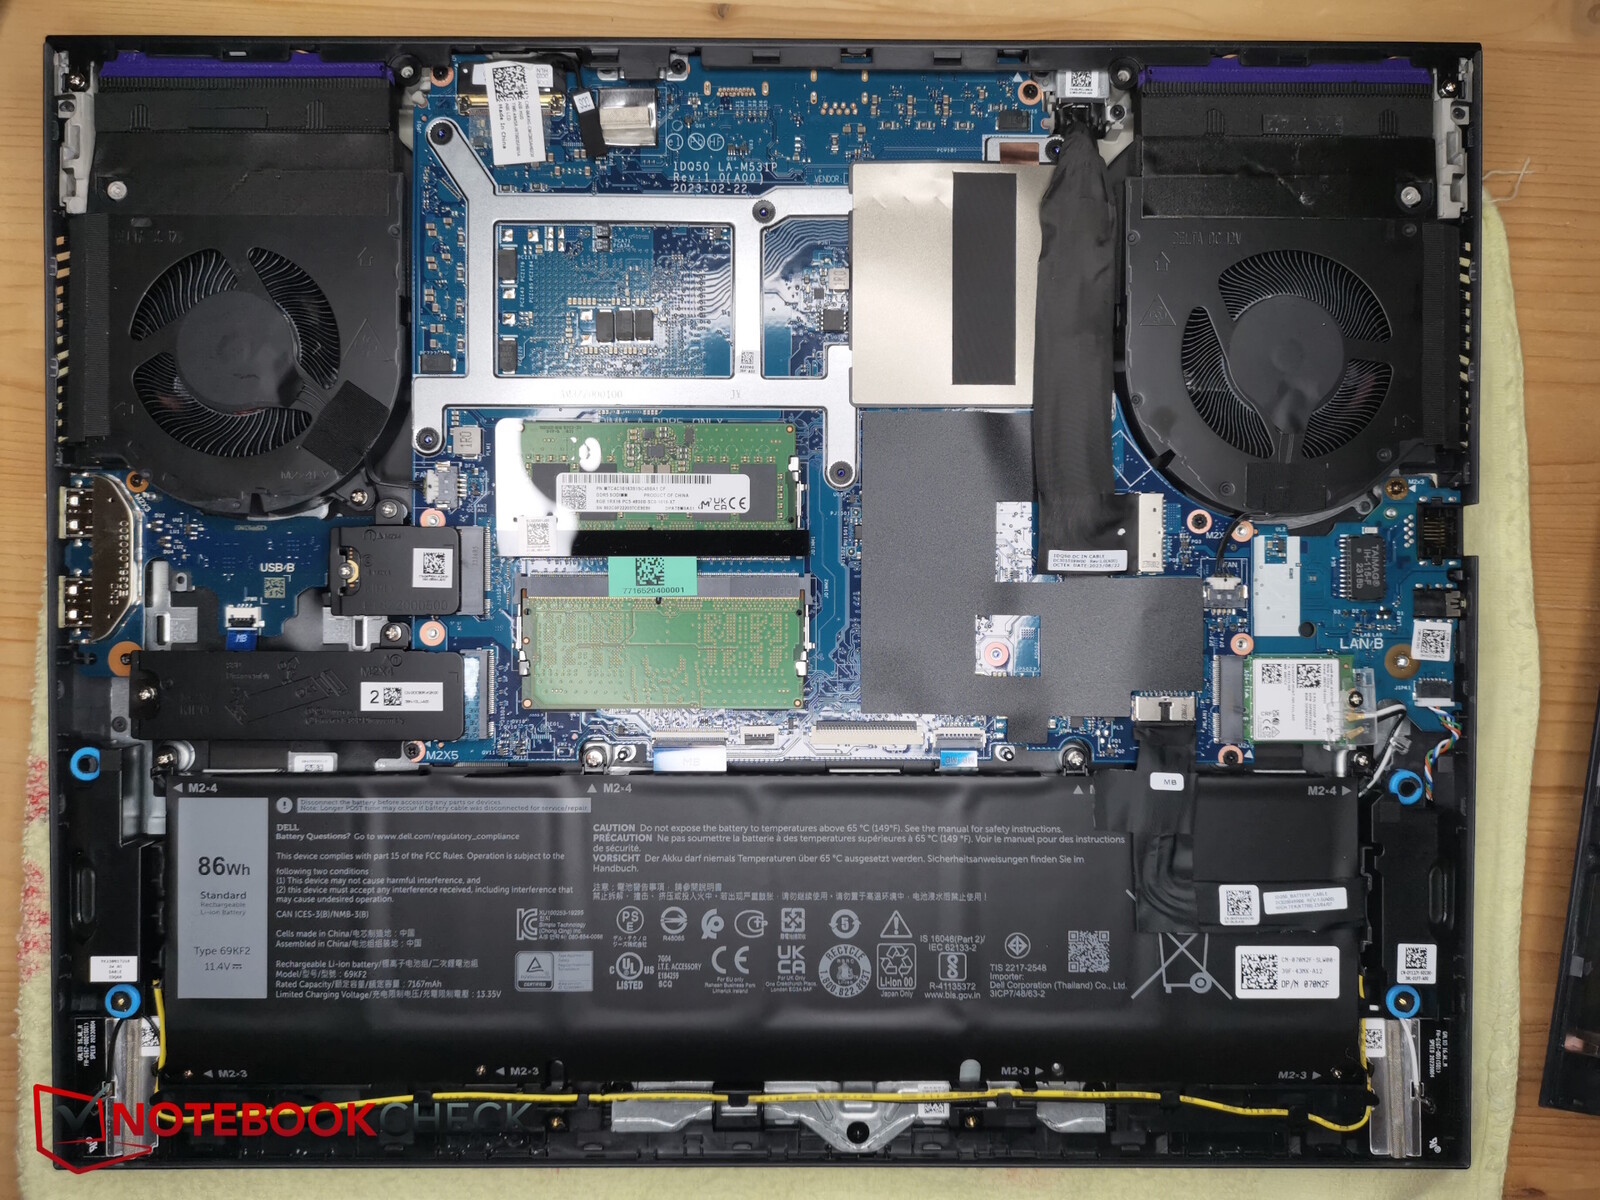
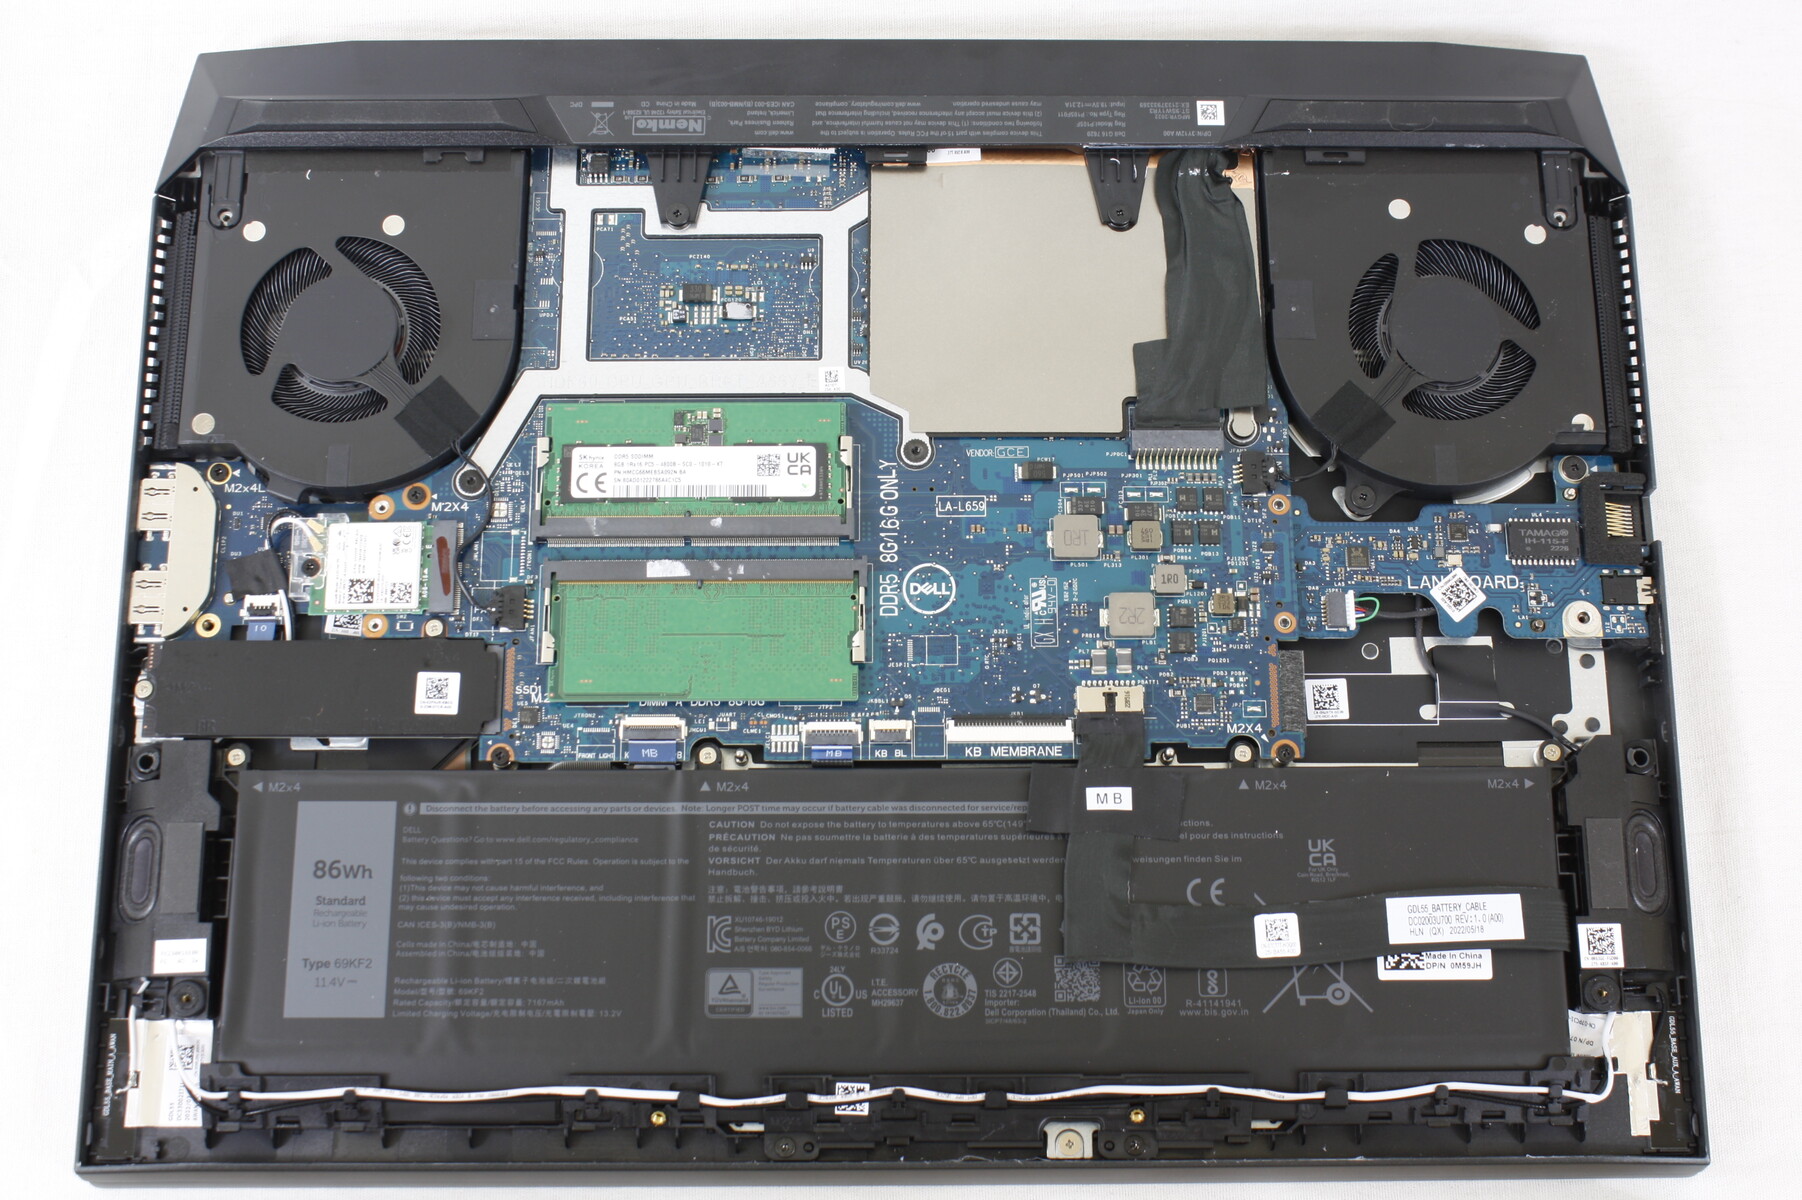
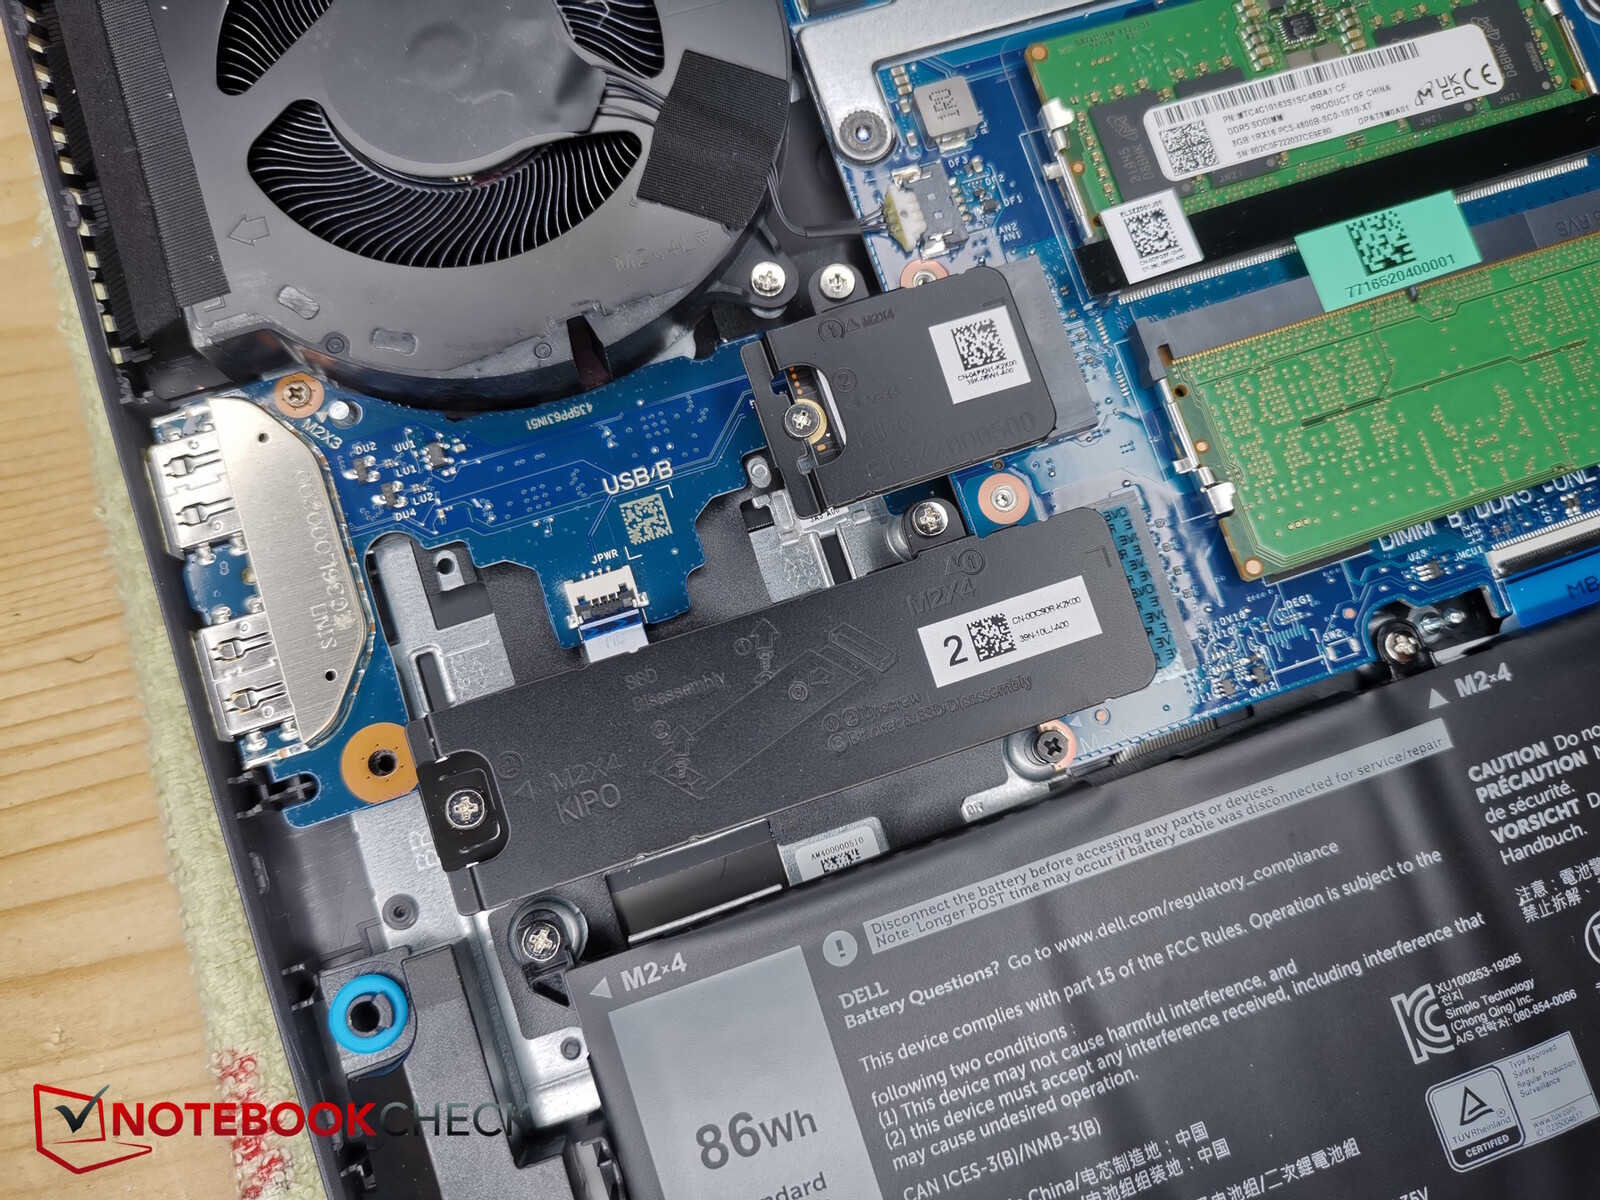
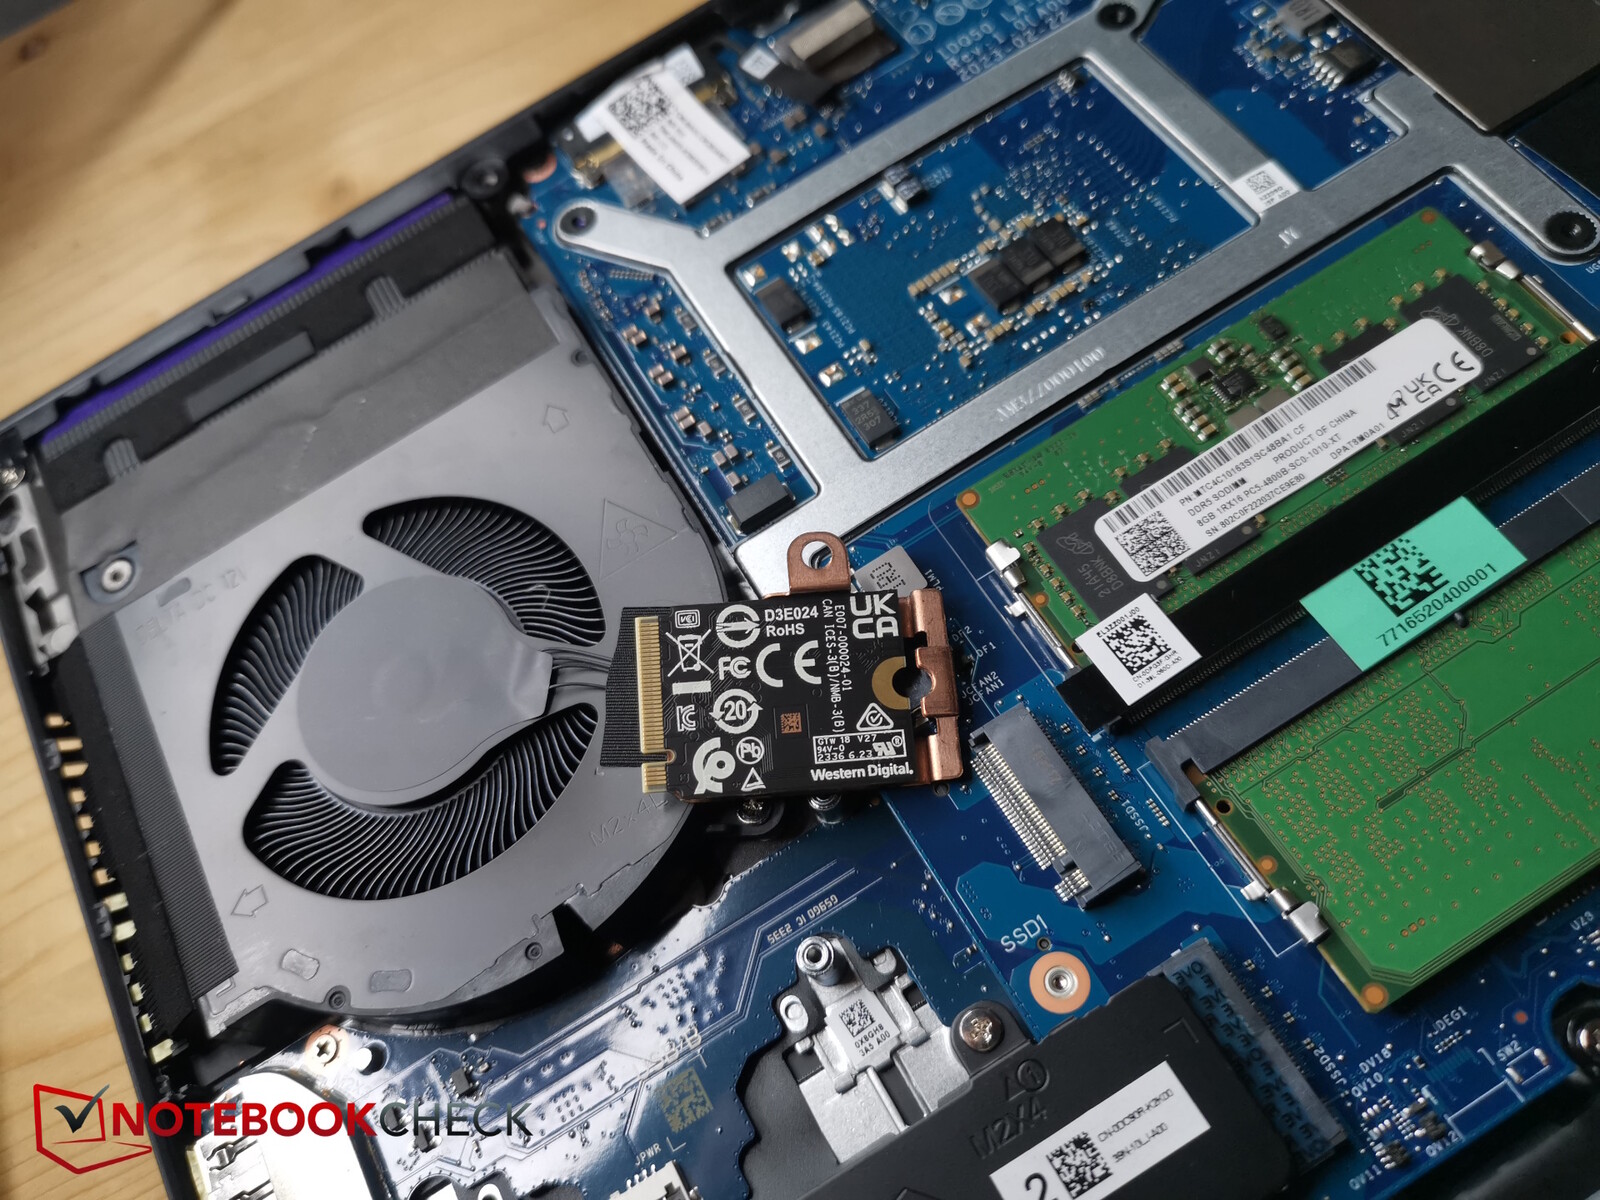
10 adet çapraz başlı vida alt plakayı yerinde tutar. Dördü diğerlerinden daha uzundur, ancak deliklerinden düşmezler, bu nedenle karışmaları konusunda herhangi bir endişe yoktur. Vidaları çıkarırsanız, kasanın alt kısmı neredeyse kendiliğinden ayrılır, bu nedenle herhangi bir ek alete ihtiyacınız olmaz.
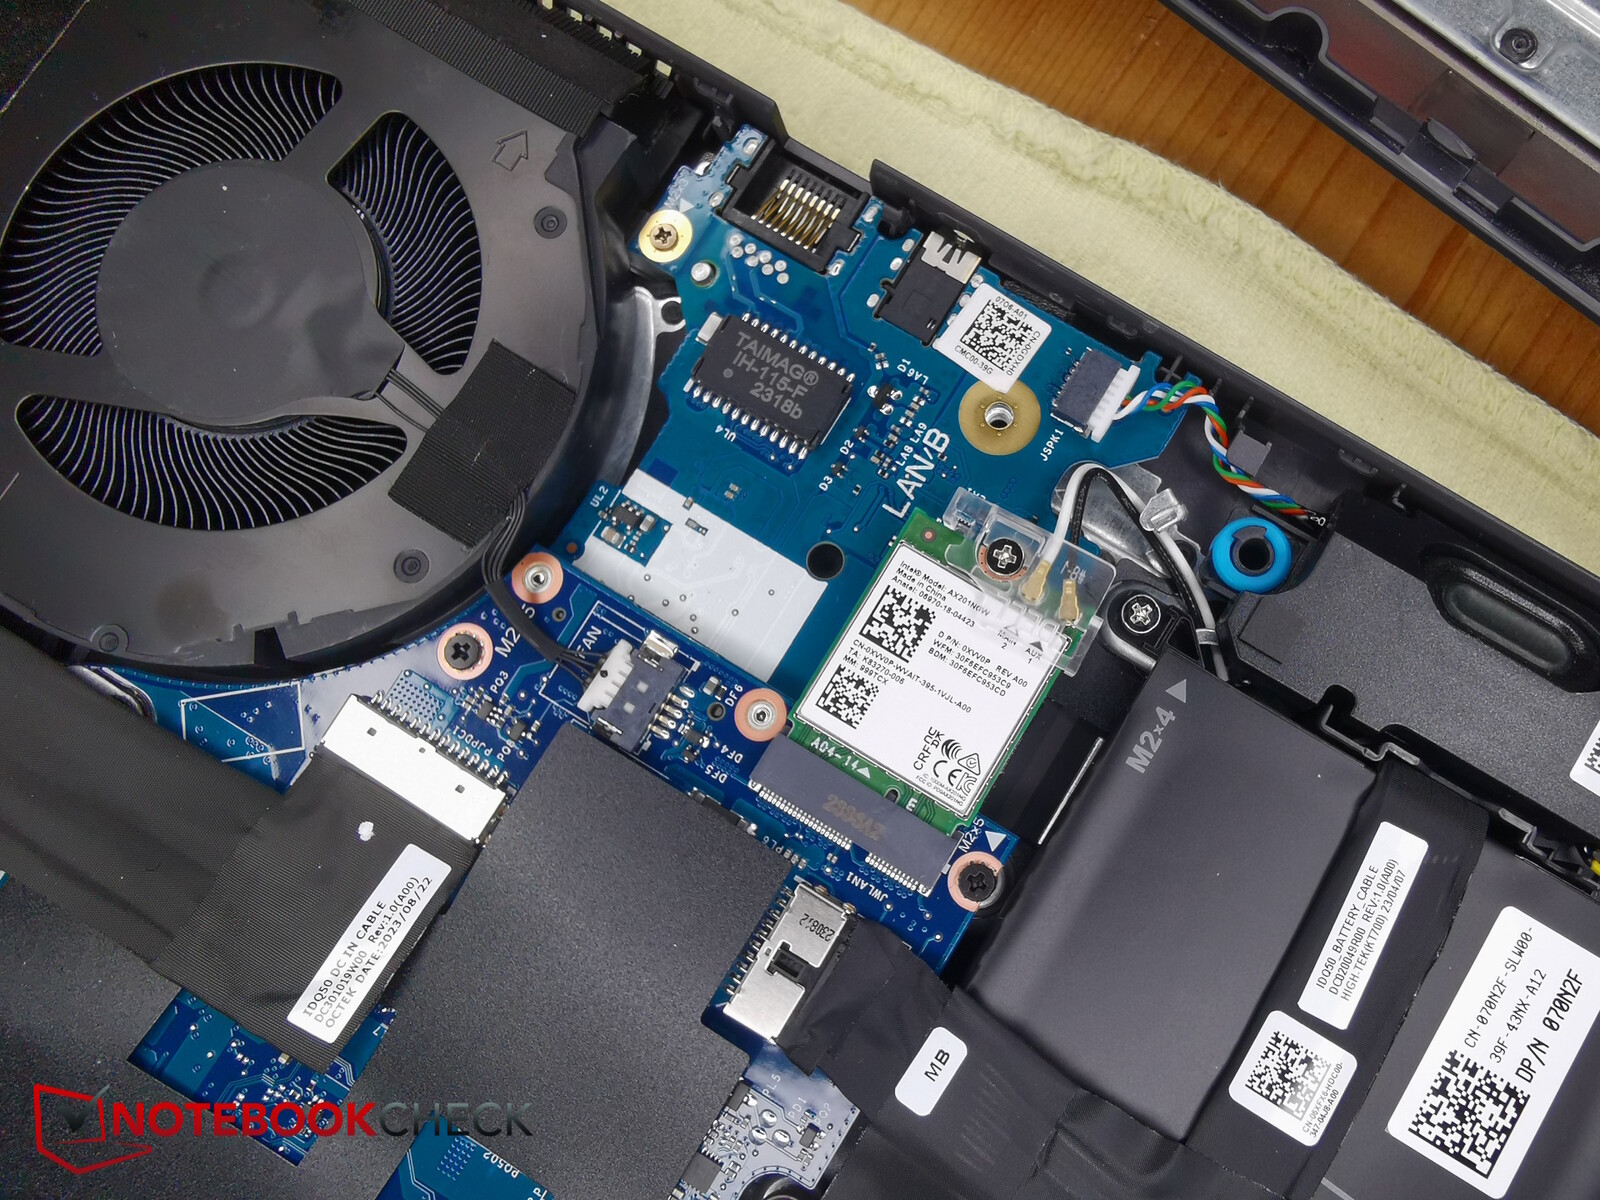
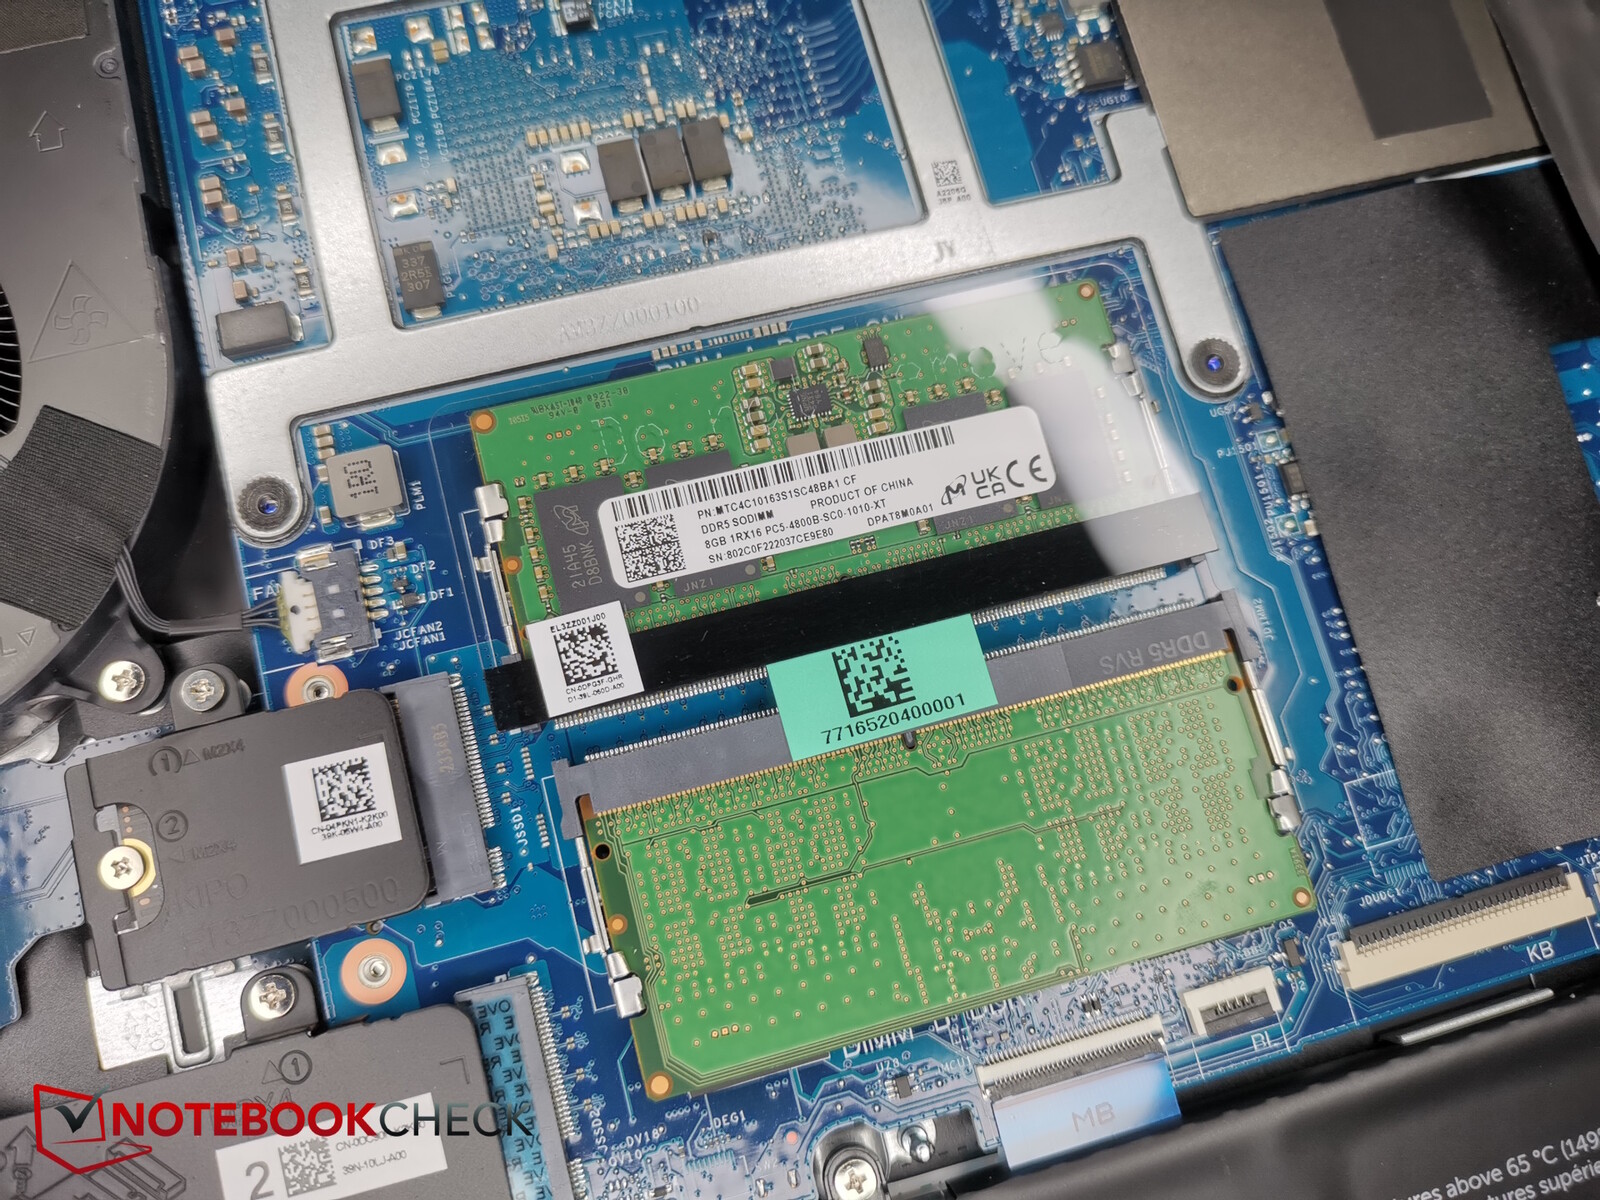
İç kısımda, çoğu oyun rakibinde görülebileceği gibi göze çarpan bakır ısı boruları yok. Fanlara, her iki RAM yuvasına, WiFi modülüne, bataryaya ve her iki M.2-SSD yuvasına erişebilirsiniz, bunlardan yalnızca daha küçük formatlı 2230 olanı doludur.
Giriş cihazları - 5 yapılandırılabilir özel tuş
Klavye
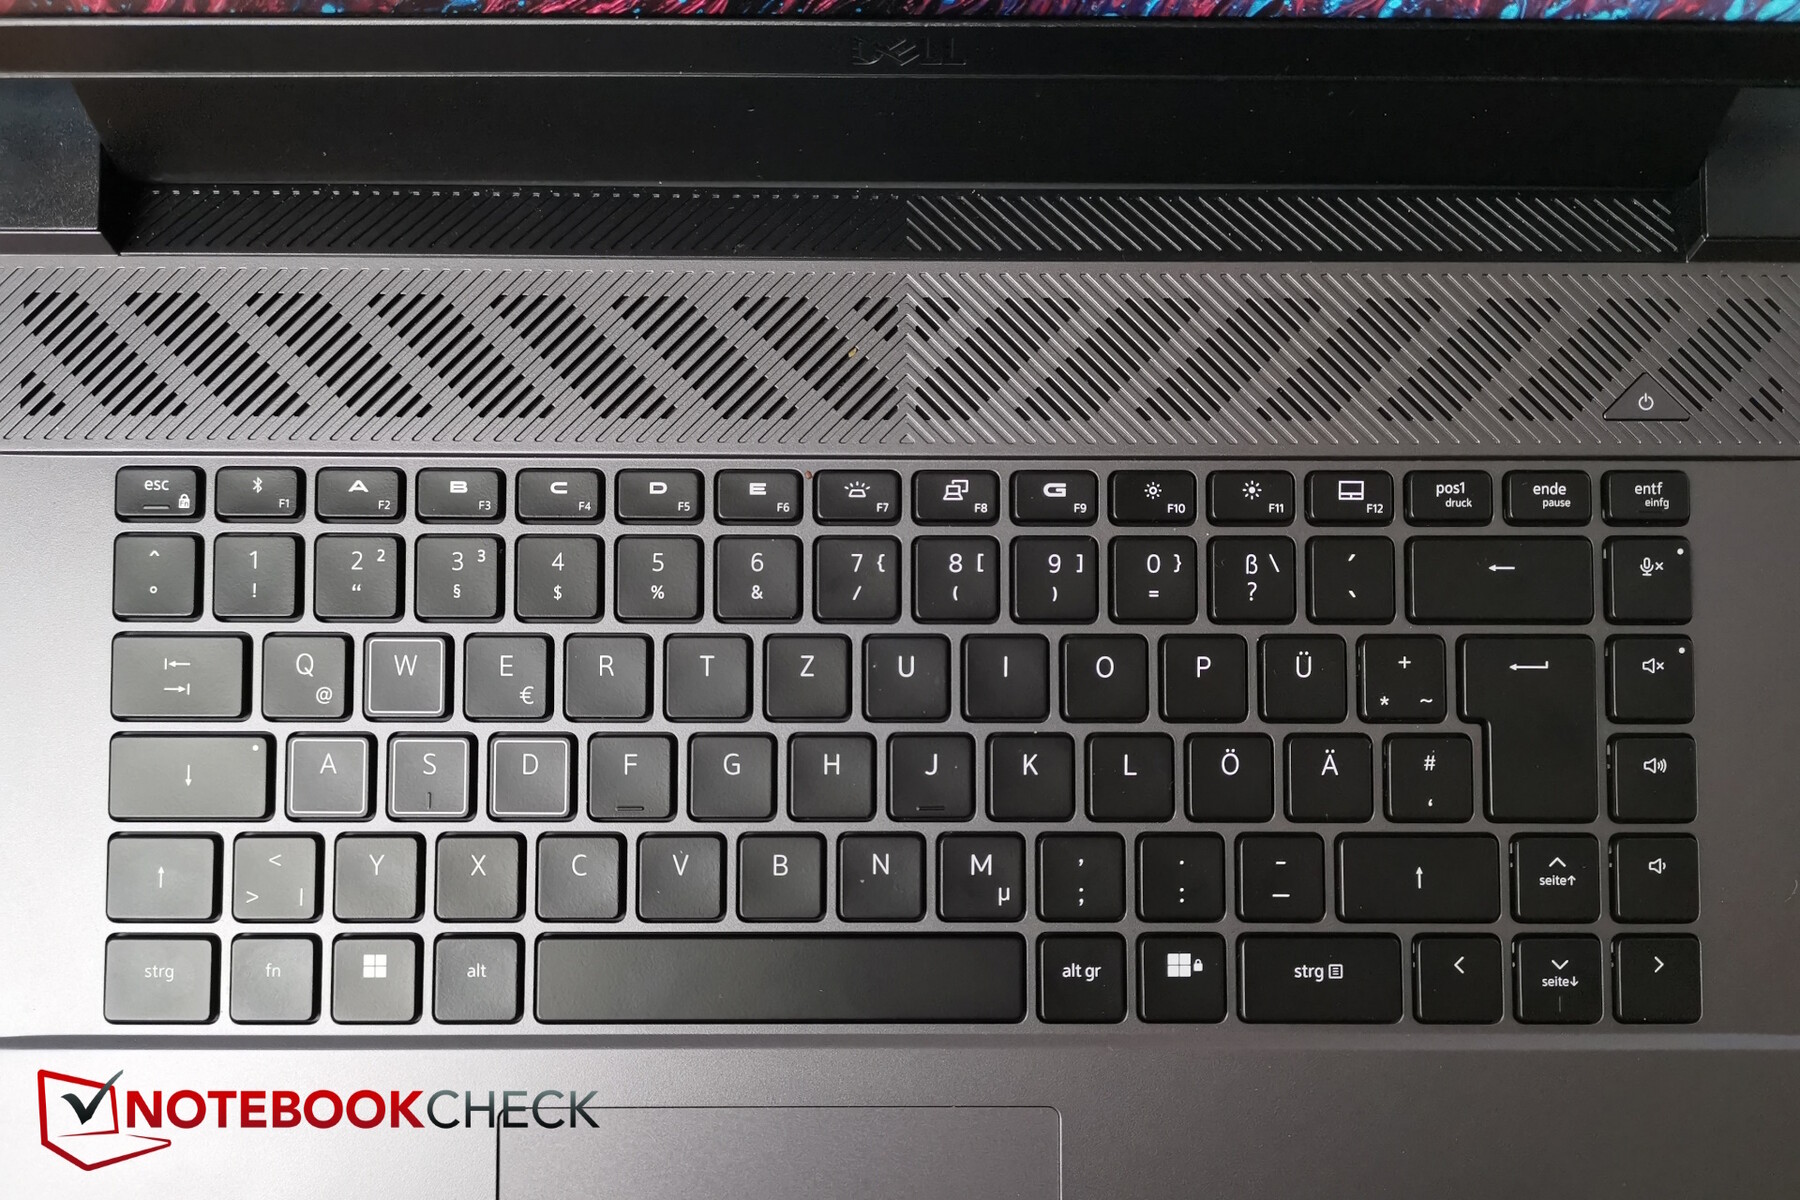
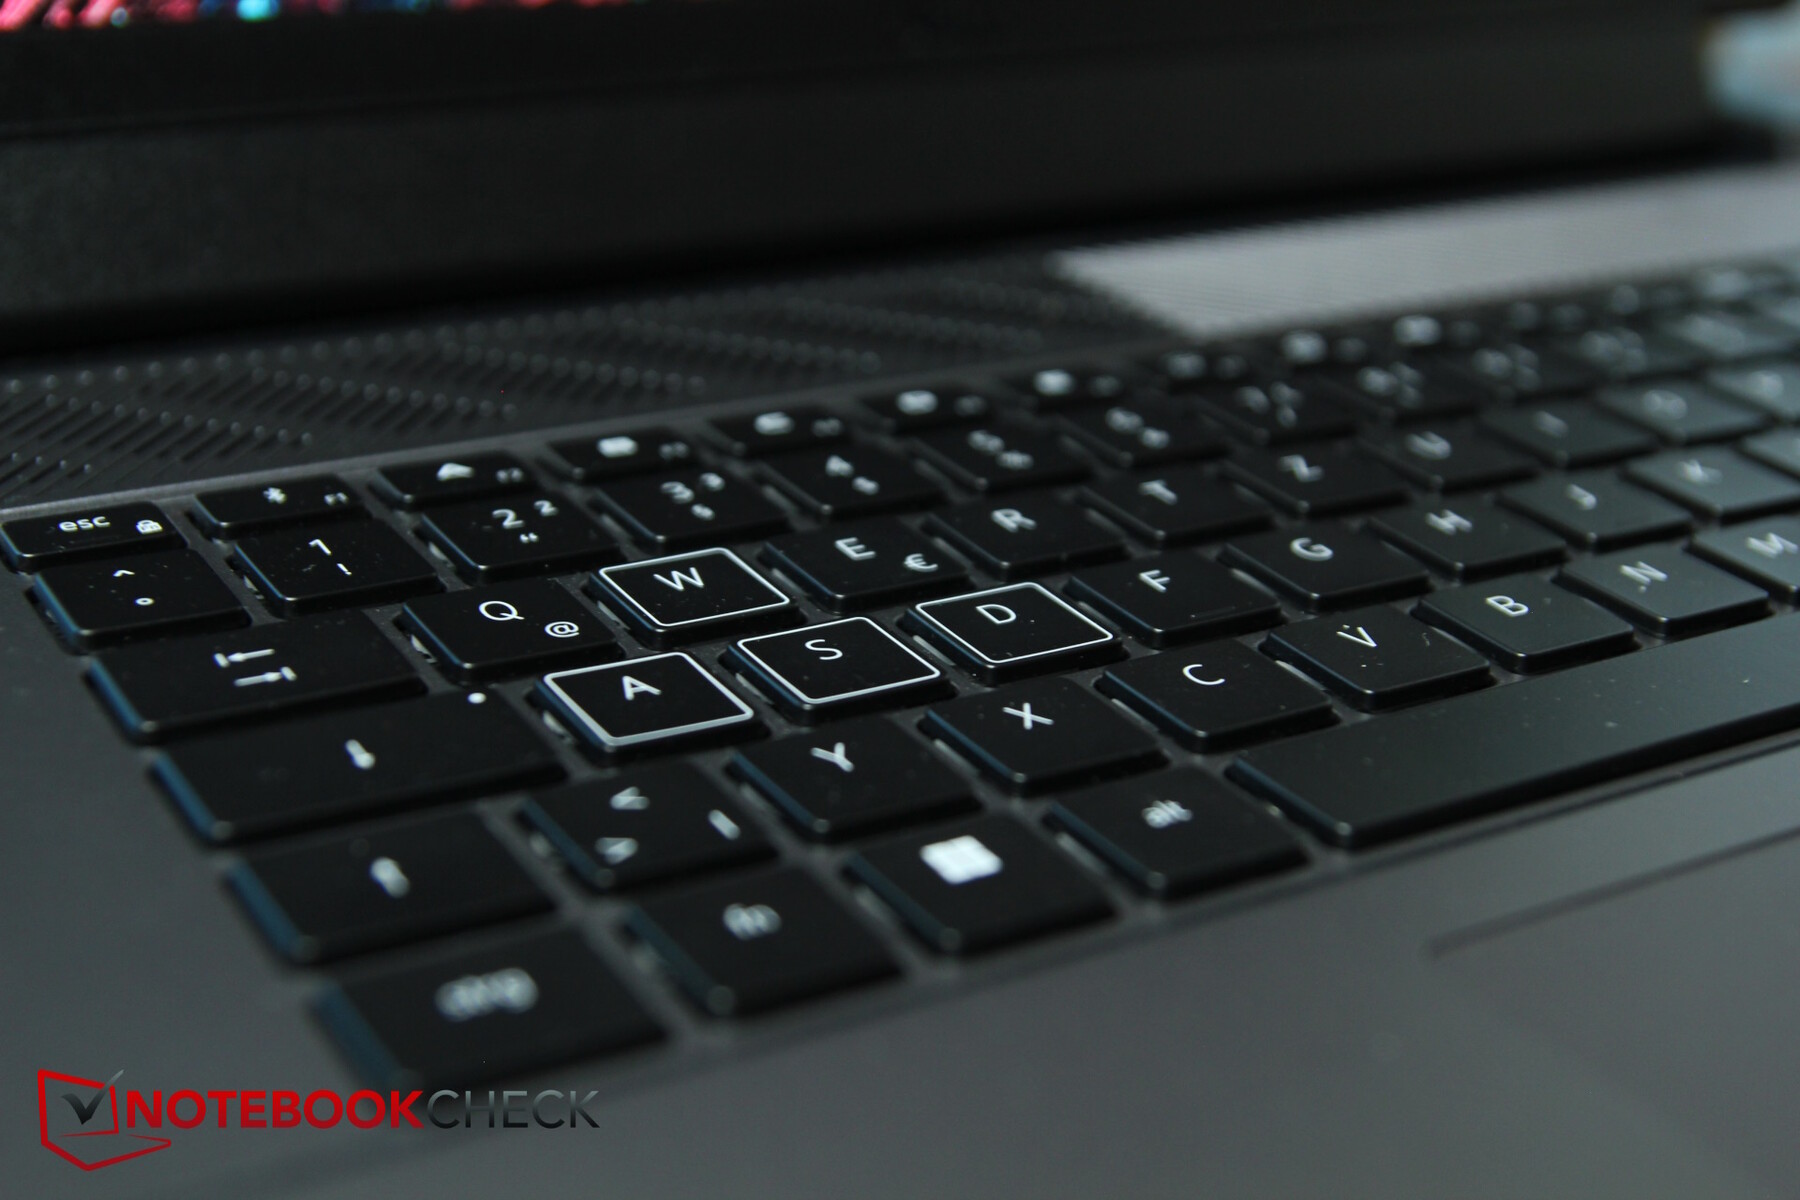
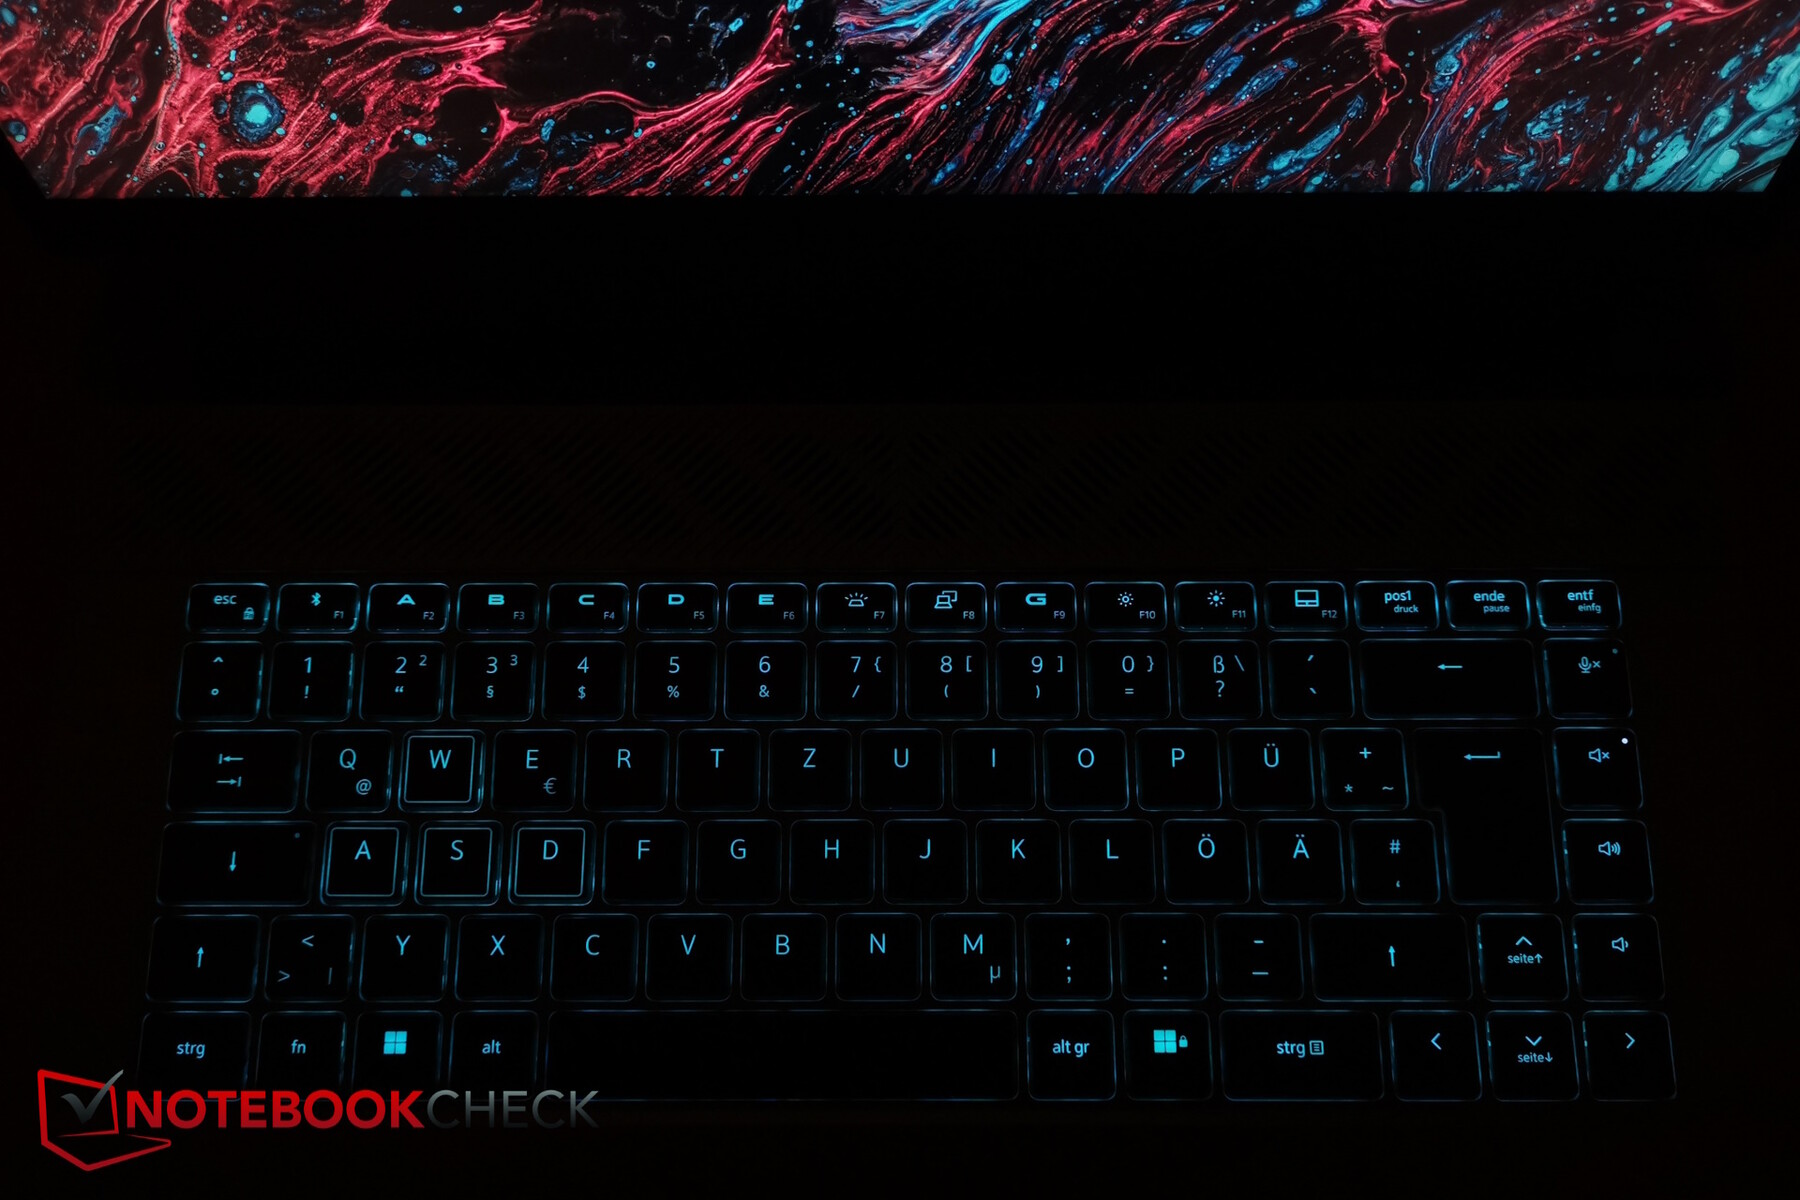
G16'da sayı tuş takımı bulunmuyor ancak bu, tüm tuşların yeterli alana sahip olduğu anlamına geliyor - buna normal boyuttaki ok tuşları da dahil. Sağ tarafta birkaç özel tuş (ses seviyesi, mikrofon sesini kapatma düğmesi) var. Normal tuşlar yaklaşık 1,6 x 1,6 cm boyutlarındadır ve F tuşları bunun yarısı yüksekliğindedir. WASD tuşları beyaz bir dış çizgiye sahiptir.
Bazı özel tuşlar sağ tarafta yer aldığından, F2 ila F6 manuel olarak, örneğin makrolarla yapılandırılabilir.
Tuşların yüksekliği çok yüksek değil, ancak geri bildirimleri iyi ve üzerlerinde rahat ve hızlı bir şekilde yazabilirsiniz. Ortaya çıkan sesler çok ılımlı. Test cihazımızdaki sol ok tuşu, diğer (ok) tuşlardan biraz farklı ses çıkarıyor - sanki içinde bir şey yankılanıyormuş gibi hafifçe çukur. Bu, umarız sadece bizim cihazımızı etkileyen bir üretim hatası olabilir.
Klavye iki yoğunluk seviyesine sahip bir arka plan aydınlatmasına sahip. Sadece bir bölgesi var, ancak Komuta Merkezi üzerinden bir dizi RGB efekti seçebilirsiniz (yağmur damlası, titreşimli vb.).

Dokunmatik yüzey
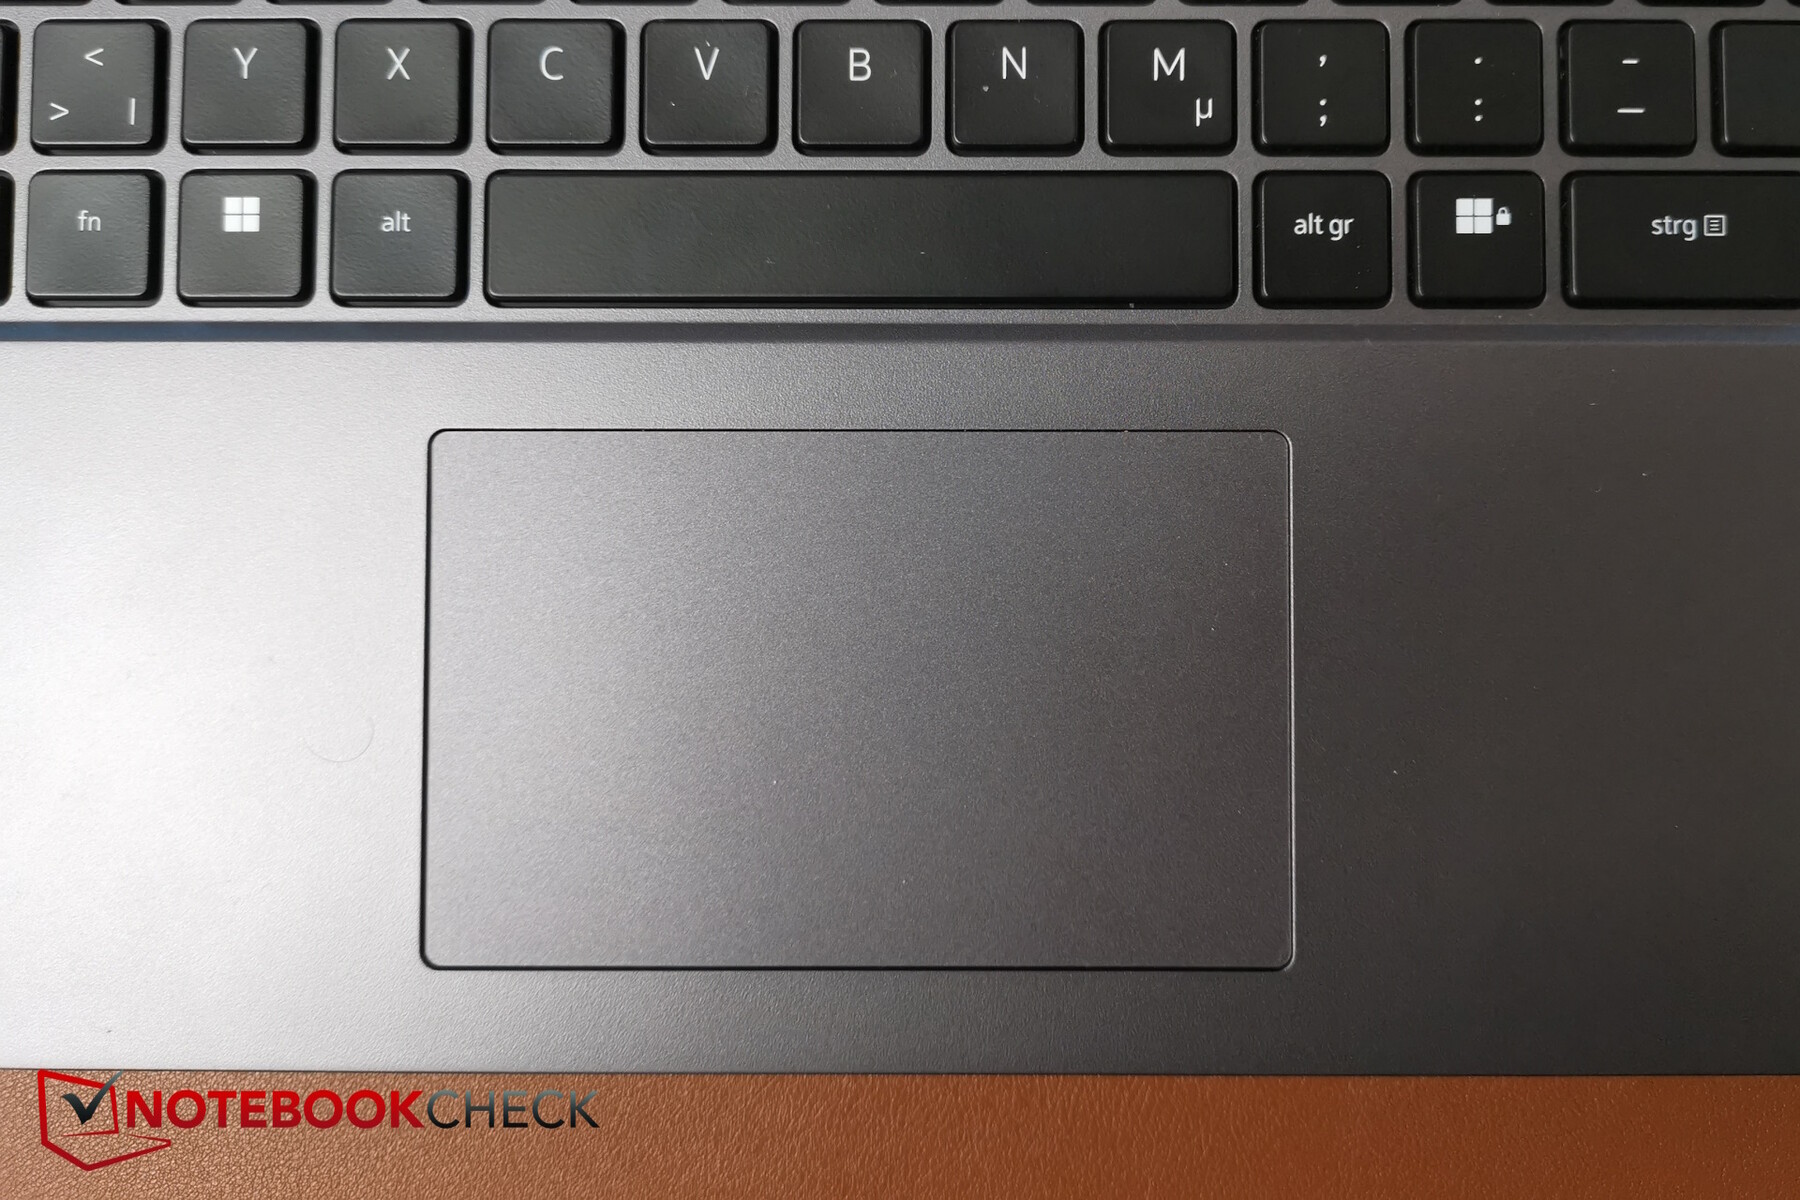
Dokunmatik yüzey biraz küçük (yaklaşık 10,5 x 6,5 cm) ancak çoğu oyuncu muhtemelen bir fare kullanacaktır, Dell bunu varsayabilir. Yüzeyi güzel ve pürüzsüz ancak çok yavaş hareketler sırasında veya parmaklarınız nemliyse biraz yapışabilir.
Entegre düğmeler güvenilir bir şekilde tetiklenir - tıklama sesi düğmelerinkinden biraz daha yüksektir, ancak hiçbir şekilde rahatsız edici değildir.
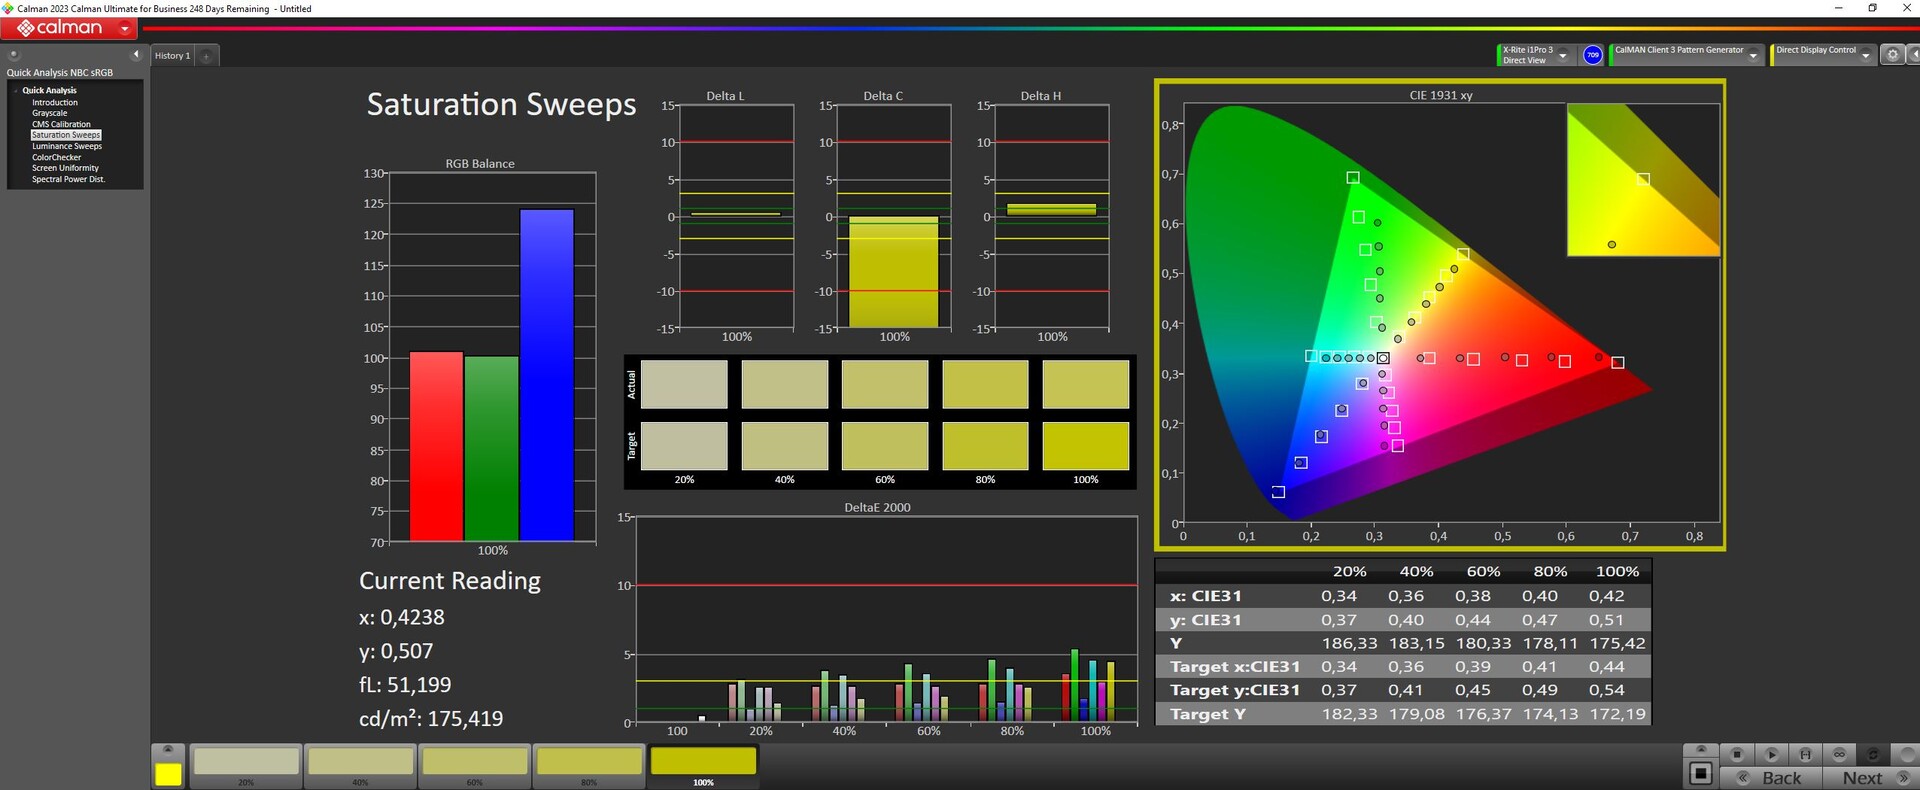
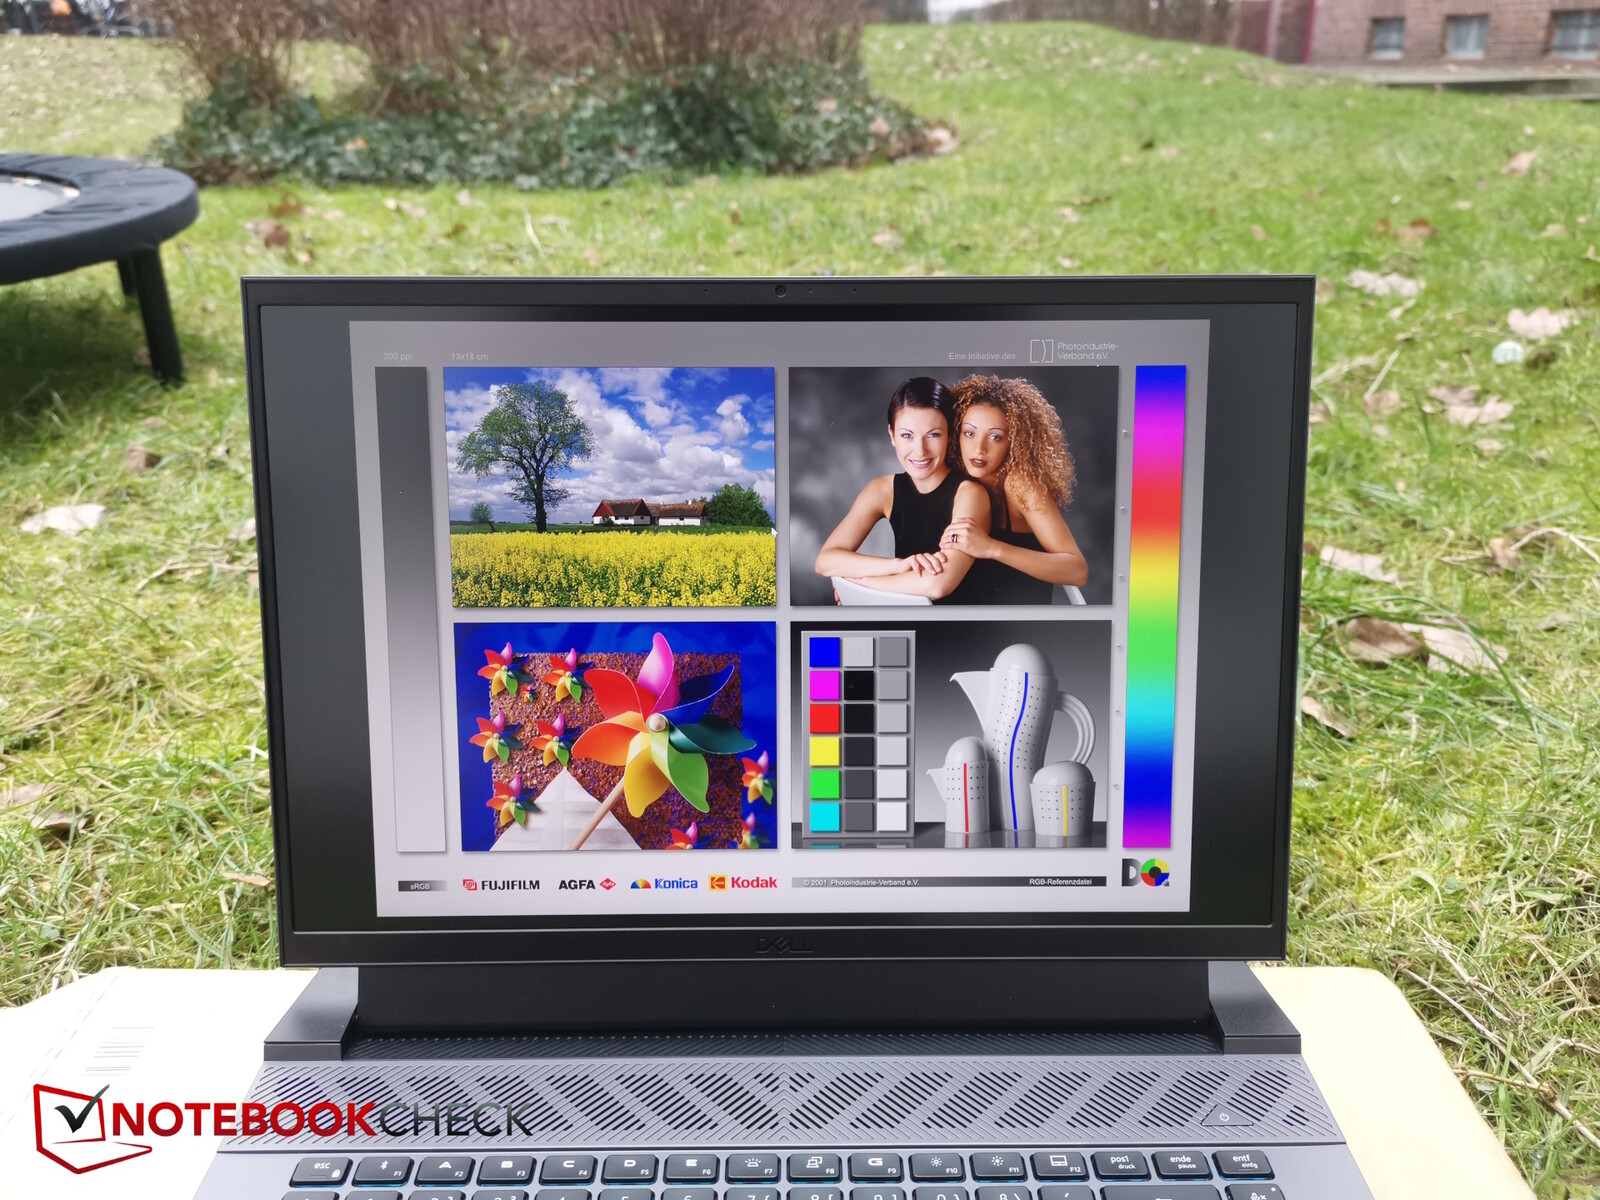
Ekran - DCI-P3 mü yoksa sonuçta sadece sRGB mi?
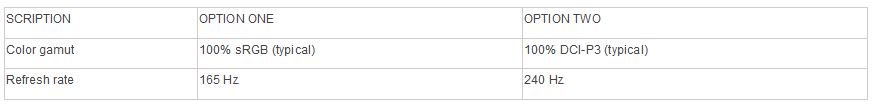
Aynı çözünürlüğe sahip olmasına rağmen Dell, BOE'den Chi Mei'ye geçiş yapmıştır. Mat IPS ekran 2.560 x 1.600 piksel çözünürlüğe sahiptir. Ancak dikkatli olun: Web sitesi şu anda G16 için yalnızca bir ekran sunsa da - yani 240 Hz yenileme hızı, 3 ms, NVIDIA G-SYNC ve %100 DCI-P3 kapsama alanına sahip QHD+ ekran (2.560 x 1.600) - test örneğimiz aynı çözünürlüğe sahip ancak "yalnızca" 165 Hz yenileme hızına ve daha da önemlisi DCI-P3 değil yalnızca sRGB kapsama alanına sahip bir panelle donatılmıştır! Cihazın kılavuzuna bir göz atmanız gerekiyor her iki varyantı da keşfetmek için.
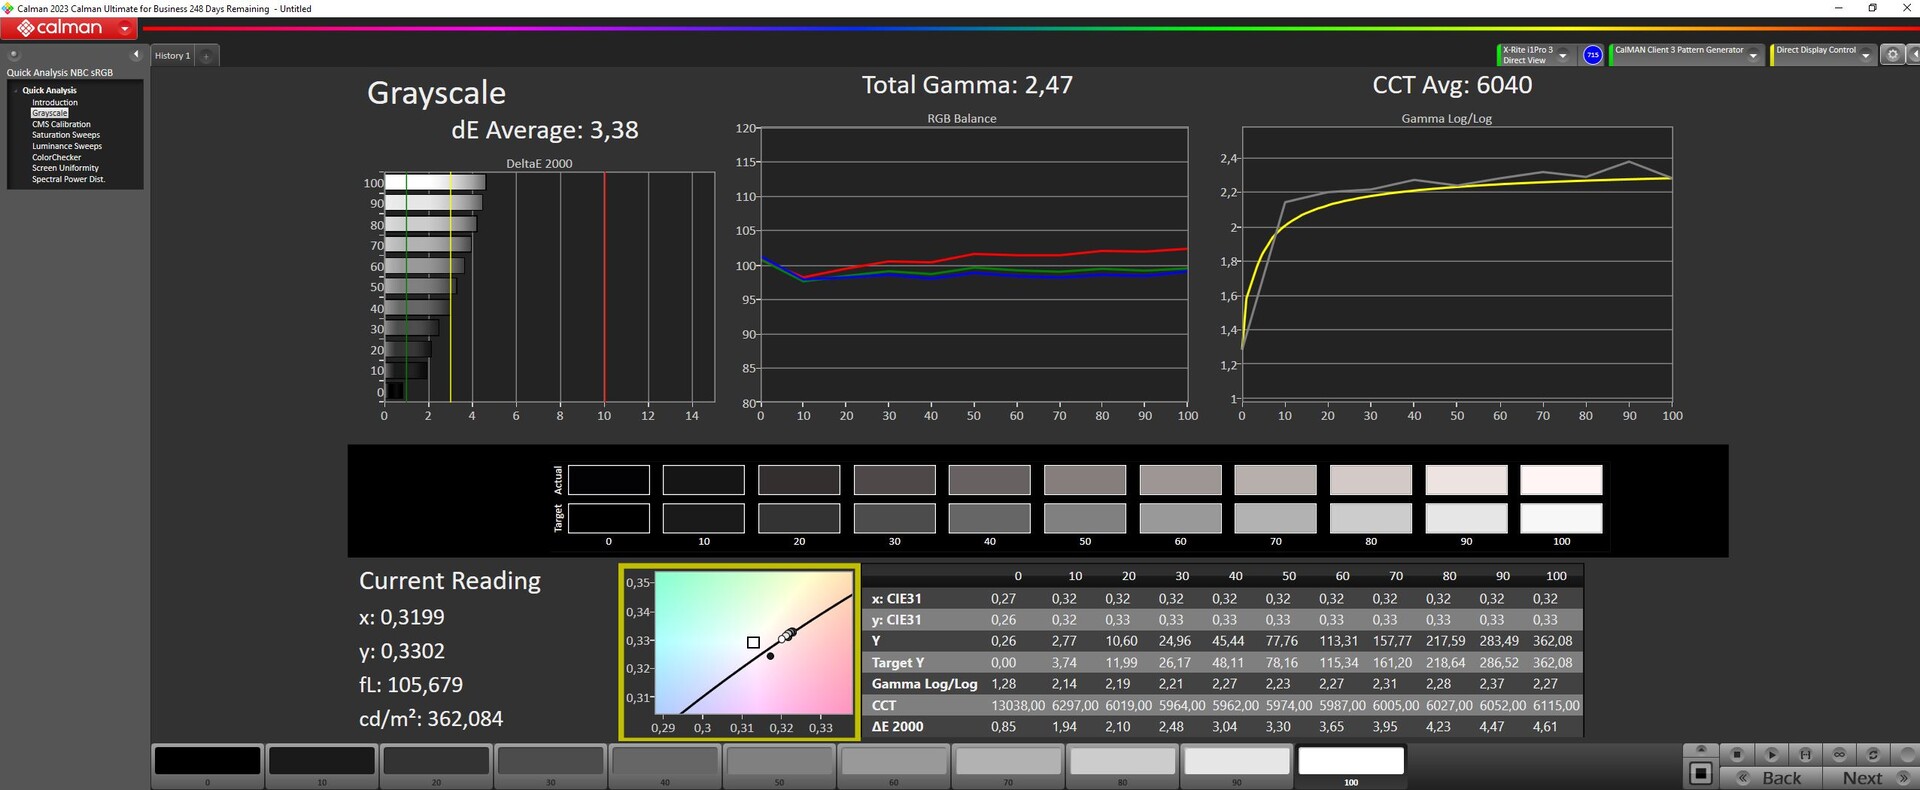
89'luk iyi bir aydınlatma ile ortalama 344 nit parlaklık ölçtük. Bununla birlikte, karanlık sahneleri tasvir ederken, neredeyse her kenar boyunca bazı ince arka ışık kanamaları fark ettik.
Aynı parlaklığa sahip olmasına rağmen ekran, kontrastına da fayda sağlayan gelişmiş bir siyah değeri gösteriyor. Sonuç olarak, bu oldukça iyi bir sRGB ekran ve tepki süreleri de yeterince hızlı.
| |||||||||||||||||||||||||
Aydınlatma: 89 %
Batarya modunda parlaklık: 369 cd/m²
Kontrast: 1419:1 (Siyah: 0.26 cd/m²)
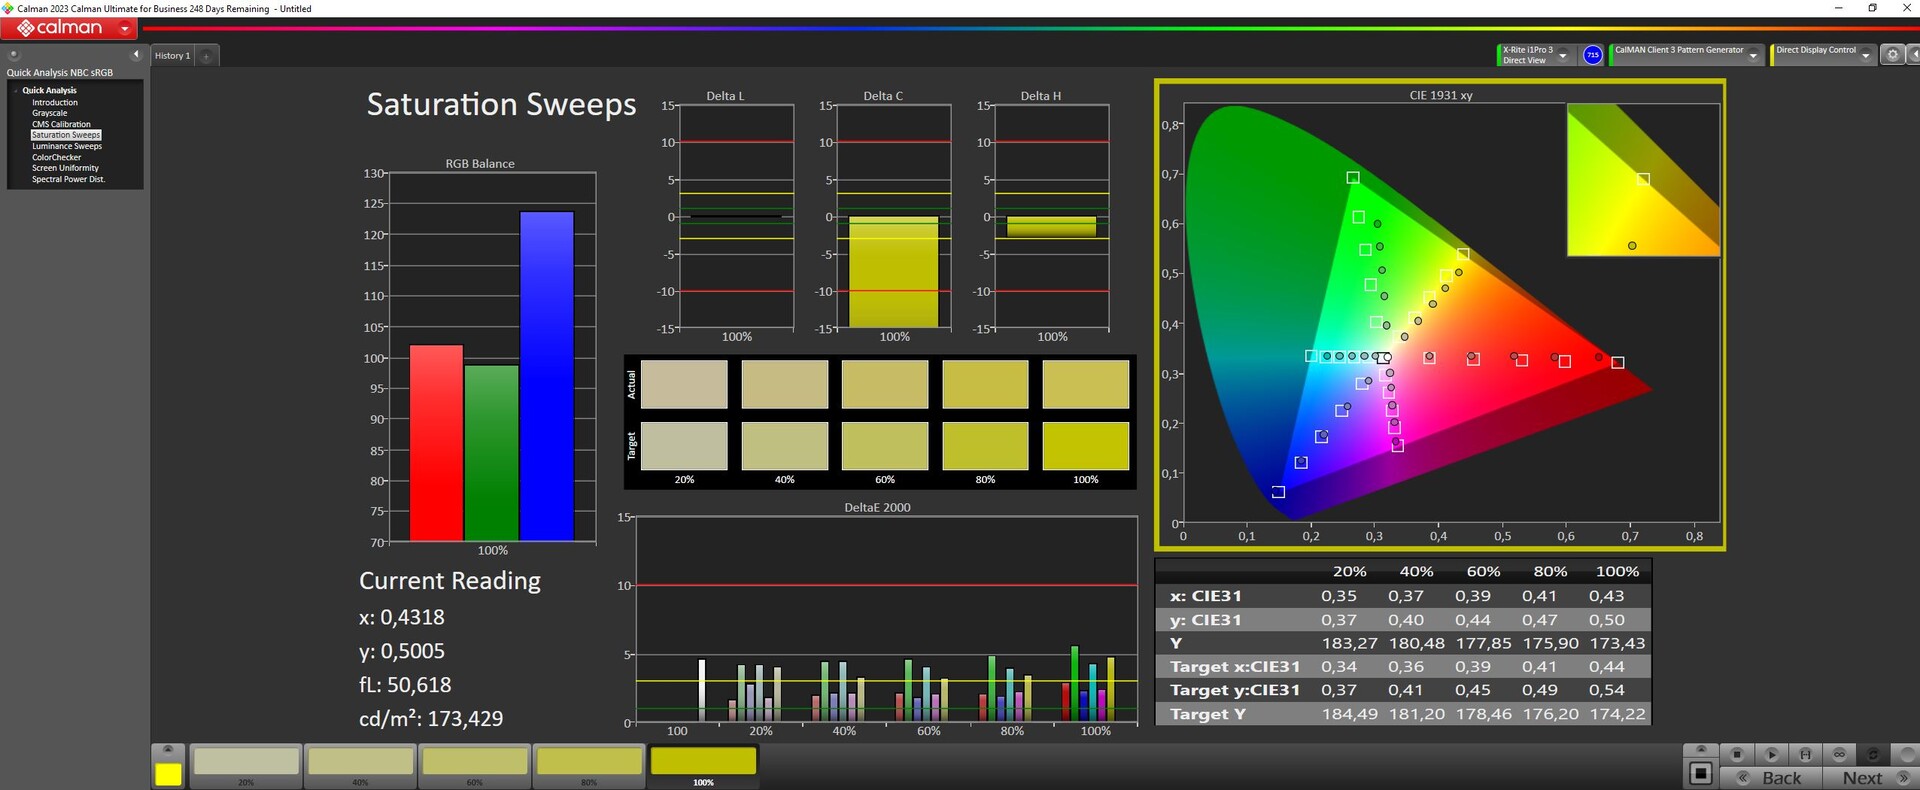
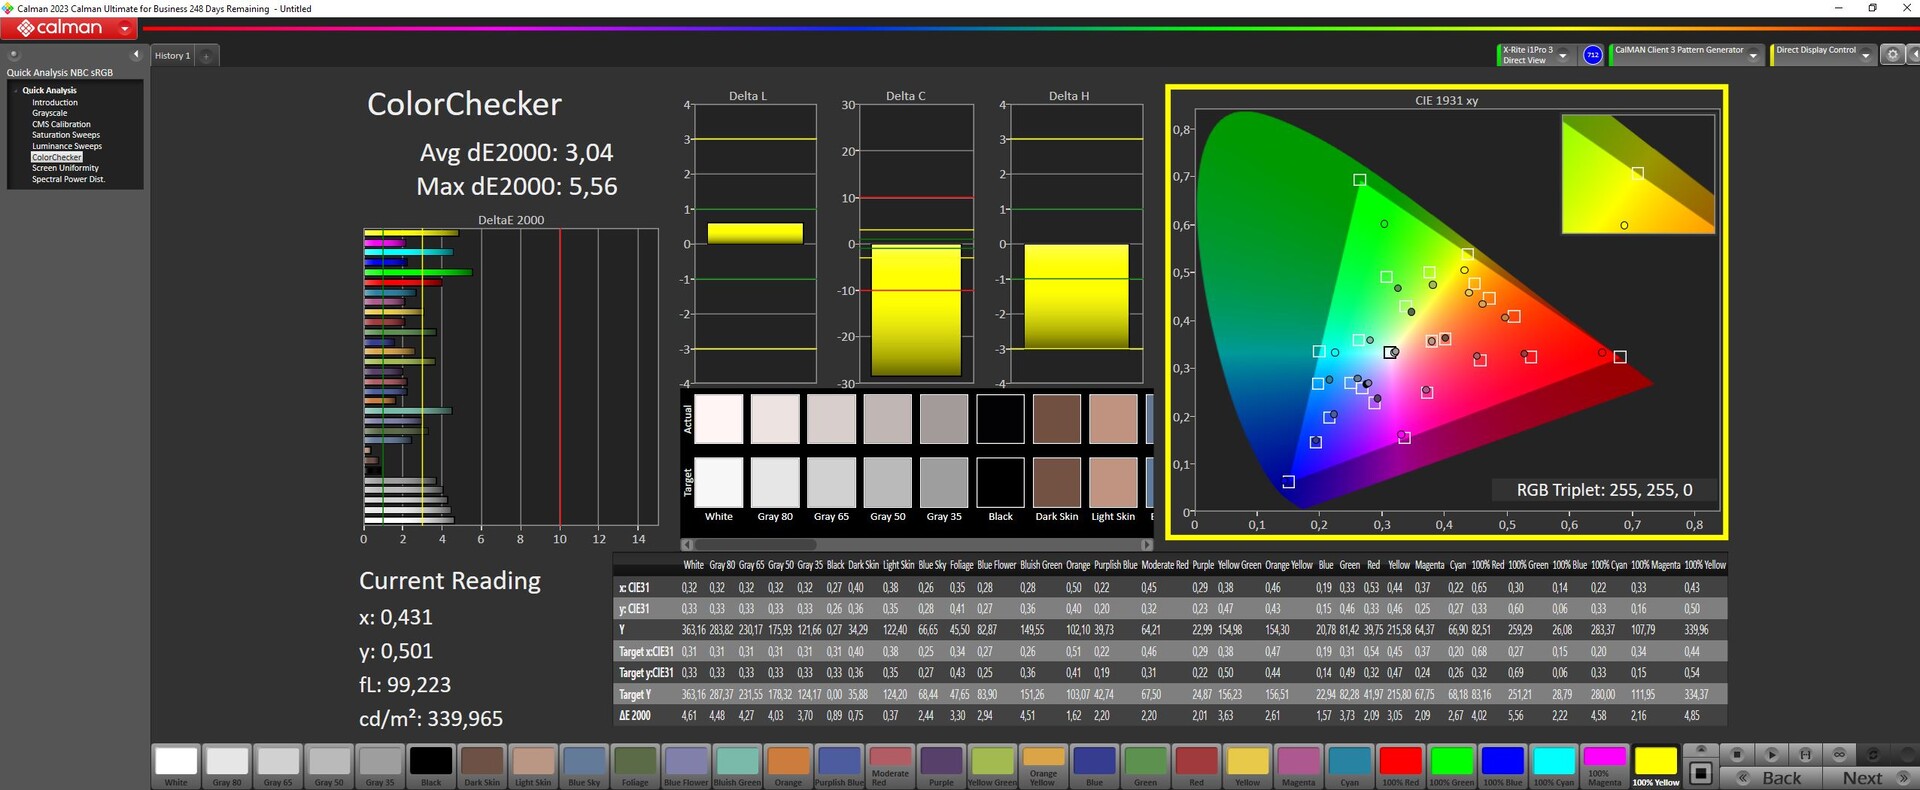
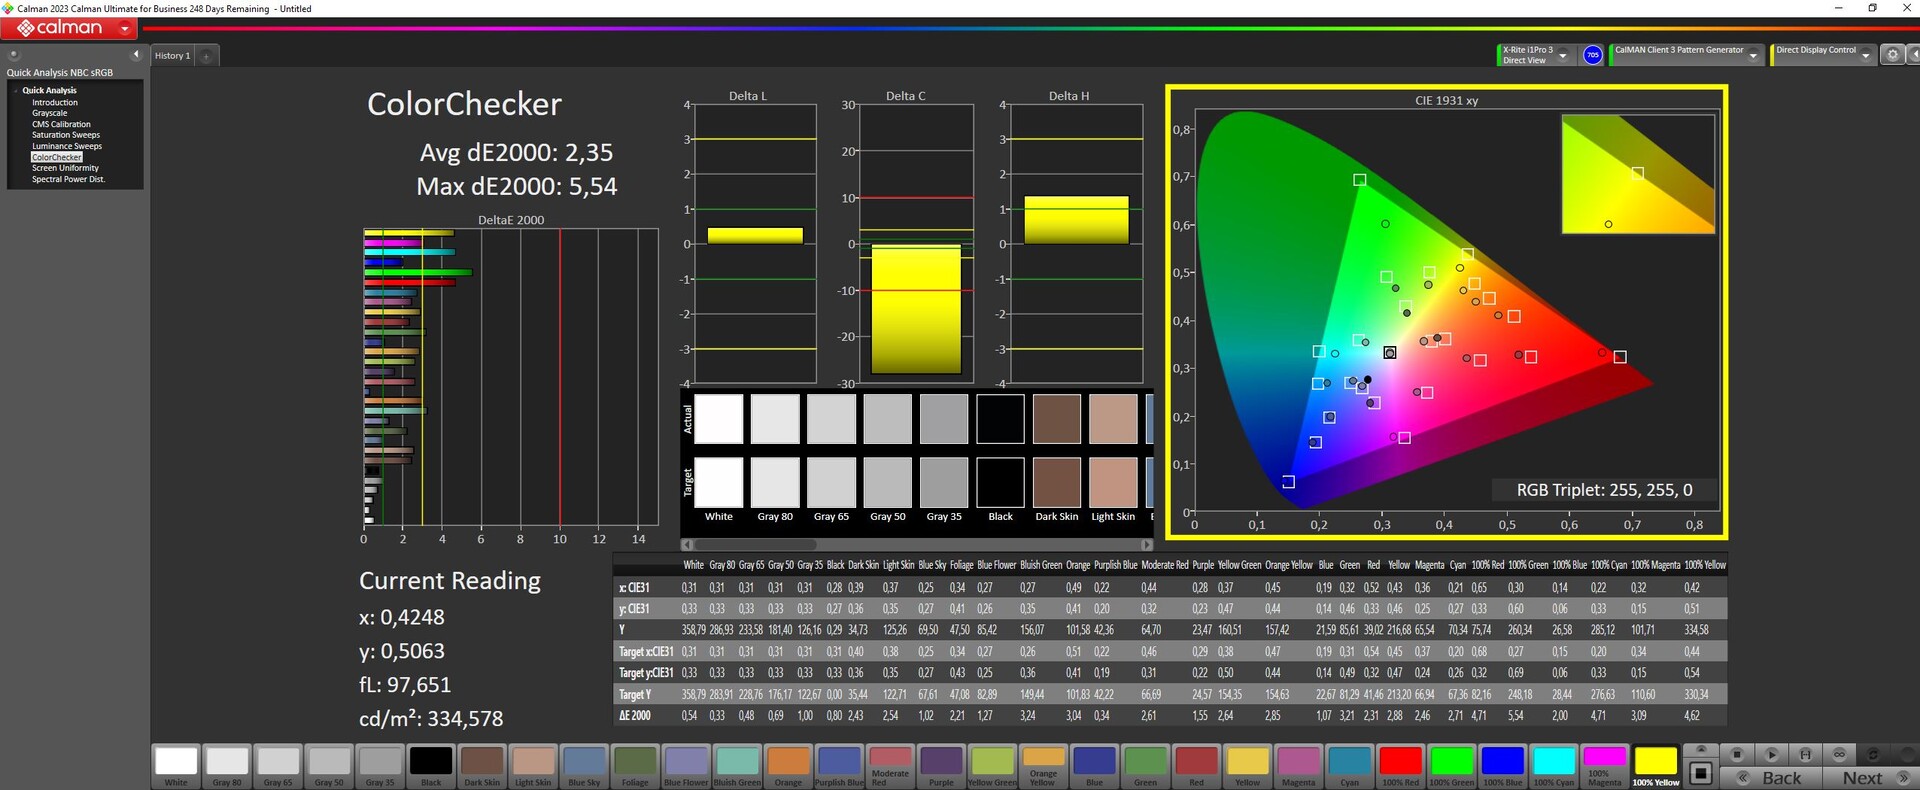
ΔE ColorChecker Calman: 3.04 | ∀{0.5-29.43 Ø4.71}
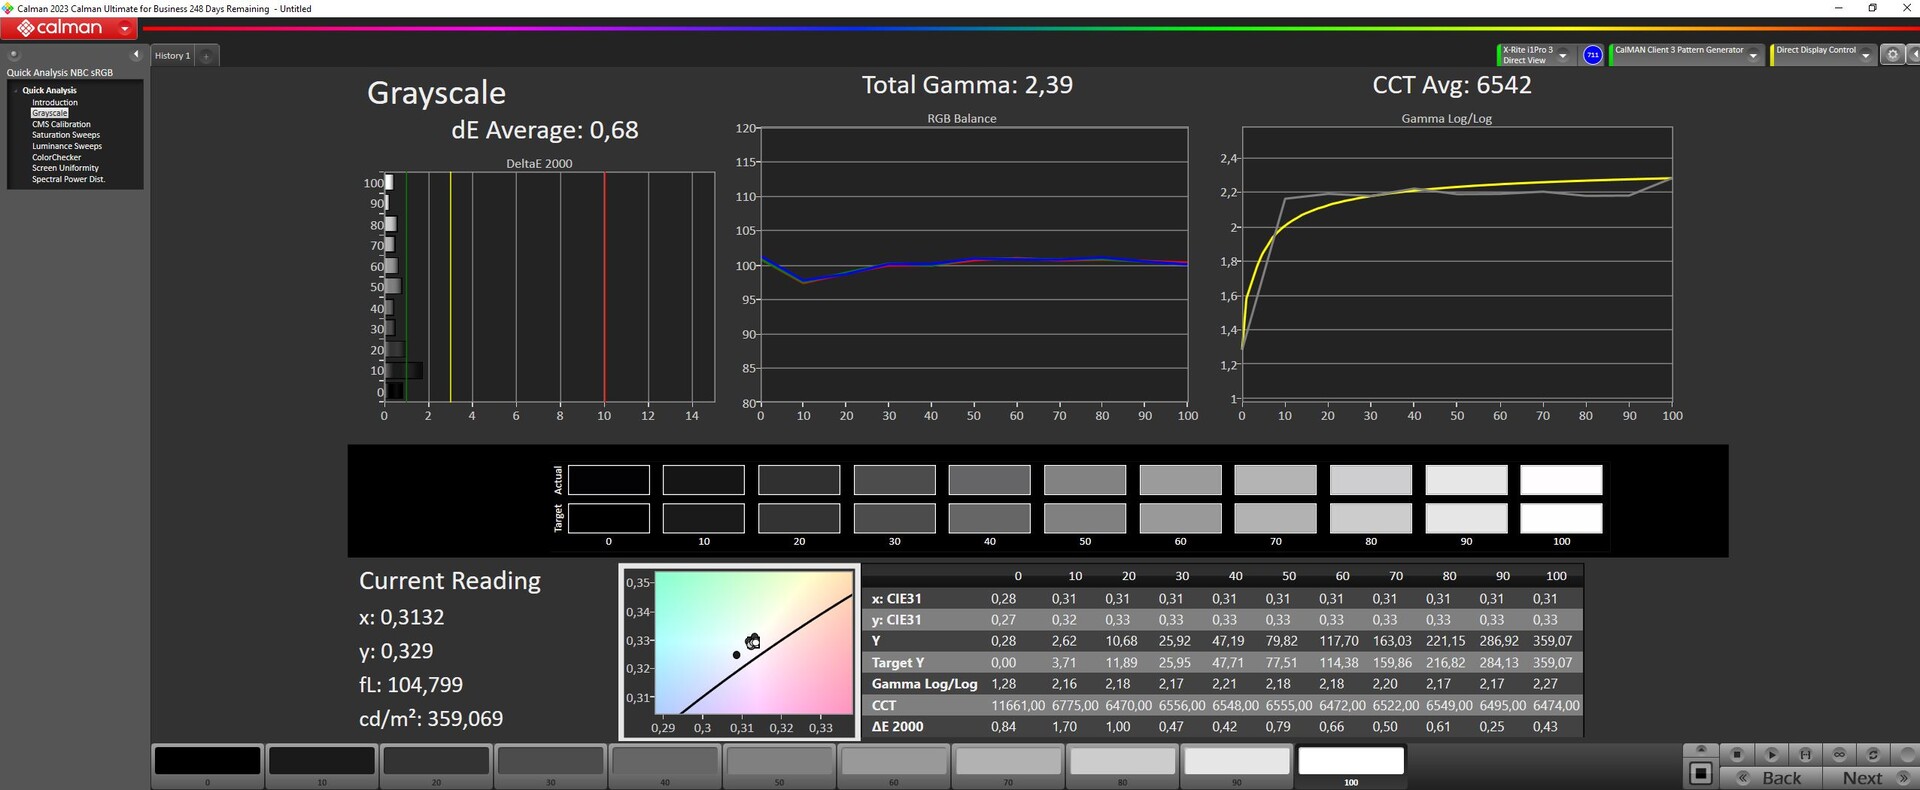
calibrated: 2.35
ΔE Greyscale Calman: 3.38 | ∀{0.09-98 Ø4.96}
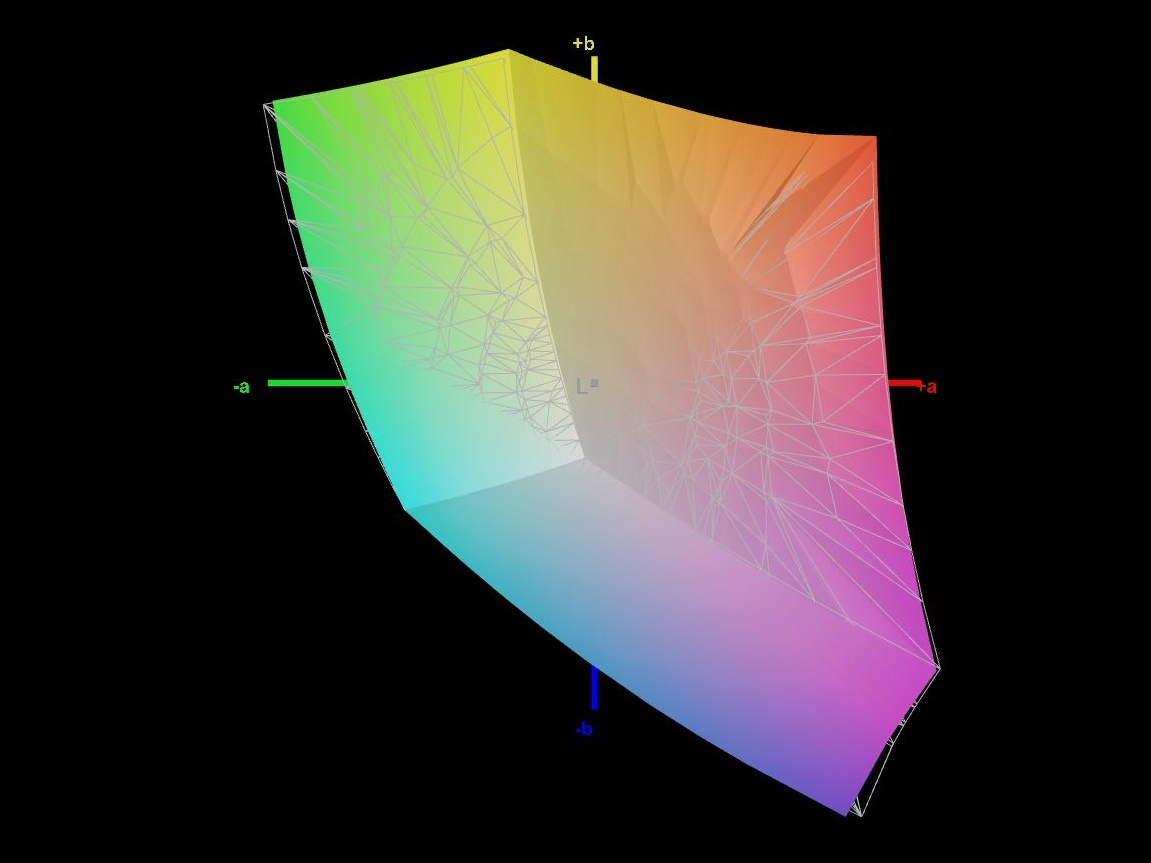
69.3% AdobeRGB 1998 (Argyll 3D)
98.5% sRGB (Argyll 3D)
67.5% Display P3 (Argyll 3D)
Gamma: 2.47
CCT: 6040 K
| Dell G16, i7-13650HX, RTX 4060 Chi Mei CMN161D (160GME), IPS, 2560x1600, 16" | Dell G16 7620 BOE NE16QDM, IPS, 2560x1600, 16" | MSI Raider GE68HX 13VF Chi Mei N160JME-GTK, IPS, 1900x1200, 16" | Lenovo Legion Slim 5 16APH8 BOE NJ NE160QDM-NYC, IPS, 2560x1600, 16" | Alienware m16 R1 Intel BOE NE16NYB, IPS, 2560x1600, 16" | Lenovo LOQ 16IRH8 AUOC1A5 (B160QAN03.L), IPS, 2560x1600, 16" | |
|---|---|---|---|---|---|---|
| Display | 1% | -38% | 2% | 0% | 3% | |
| Display P3 Coverage (%) | 67.5 | 68.3 1% | 41.6 -38% | 69.3 3% | 67.7 0% | 70.5 4% |
| sRGB Coverage (%) | 98.5 | 98 -1% | 62.2 -37% | 100 2% | 97.2 -1% | 98.9 0% |
| AdobeRGB 1998 Coverage (%) | 69.3 | 70.5 2% | 43 -38% | 70 1% | 70 1% | 72.6 5% |
| Response Times | -7% | -131% | -8% | 39% | 17% | |
| Response Time Grey 50% / Grey 80% * (ms) | 7.6 ? | 8.6 ? -13% | 17.3 ? -128% | 10.7 ? -41% | 4 ? 47% | 7.2 ? 5% |
| Response Time Black / White * (ms) | 10.4 ? | 10.4 ? -0% | 24.2 ? -133% | 7.8 ? 25% | 7.3 ? 30% | 7.4 ? 29% |
| PWM Frequency (Hz) | ||||||
| Screen | 7% | -37% | 15% | 4% | 13% | |
| Brightness middle (cd/m²) | 369 | 369.4 0% | 300.9 -18% | 371.6 1% | 306 -17% | 407 10% |
| Brightness (cd/m²) | 344 | 348 1% | 302 -12% | 343 0% | 302 -12% | 369 7% |
| Brightness Distribution (%) | 89 | 83 -7% | 93 4% | 84 -6% | 89 0% | 85 -4% |
| Black Level * (cd/m²) | 0.26 | 0.32 -23% | 0.31 -19% | 0.44 -69% | 0.3 -15% | 0.45 -73% |
| Contrast (:1) | 1419 | 1154 -19% | 971 -32% | 845 -40% | 1020 -28% | 904 -36% |
| Colorchecker dE 2000 * | 3.04 | 1.78 41% | 4.6 -51% | 1.52 50% | 2.57 15% | 1.43 53% |
| Colorchecker dE 2000 max. * | 5.56 | 4.41 21% | 17.6 -217% | 2.68 52% | 4.26 23% | 3.58 36% |
| Colorchecker dE 2000 calibrated * | 2.35 | 1.22 48% | 2.04 13% | 0.33 86% | 0.85 64% | 1.07 54% |
| Greyscale dE 2000 * | 3.38 | 3.2 5% | 3.3 2% | 1.2 64% | 3.3 2% | 1.13 67% |
| Gamma | 2.47 89% | 2.2 100% | 2.09 105% | 2.1 105% | 1.997 110% | 2.5 88% |
| CCT | 6040 108% | 6750 96% | 7151 91% | 6503 100% | 6895 94% | 6526 100% |
| Toplam Ortalama (Program / Ayarlar) | 0% /
4% | -69% /
-50% | 3% /
9% | 14% /
8% | 11% /
11% |
* ... daha küçük daha iyidir
DisplayP3 ve AdobeRGB kapsamını yaklaşık %70 olarak ölçtük, sRGB ise neredeyse tamamen kapsanıyor. Eski ekran da benzer değerler elde etti; web sitesinde sunulan versiyonun DCI-P3'ün %100'ünü kapsadığı söyleniyor.

Kutudan çıkar çıkmaz, ekran en iyi şekilde kalibre edilmemiştir. X-Rite ölçüm cihazı ve Calman yazılımı kullanarak yaptığımız kalibrasyon, gri tonlama sapmalarını tamamen iyileştirirken, renkleri aynı derecede iyileştirmedi.
Yanıt Sürelerini Görüntüle
| ↔ Tepki Süresi Siyahtan Beyaza | ||
|---|---|---|
| 10.4 ms ... yükseliş ↗ ve sonbahar↘ birleşimi | ↗ 5.8 ms yükseliş | 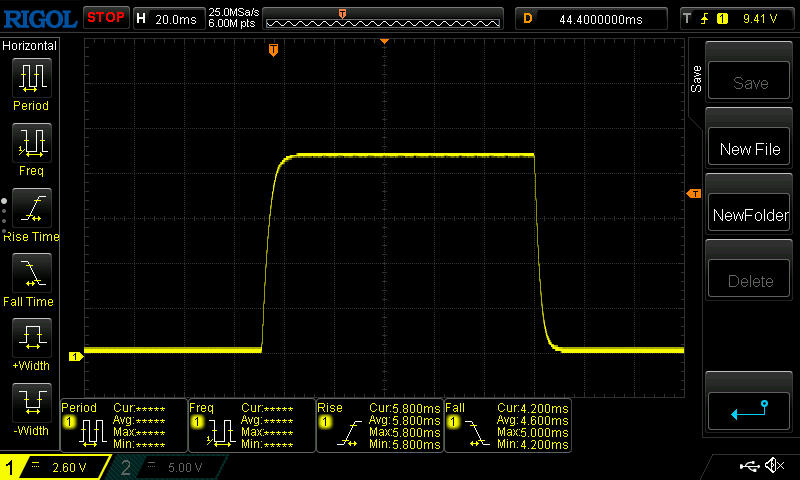 |
| ↘ 4.6 ms sonbahar | ||
| Ekran, testlerimizde iyi yanıt oranları gösteriyor ancak rekabetçi oyuncular için çok yavaş olabilir. Karşılaştırıldığında, test edilen tüm cihazlar 0.1 (minimum) ile 240 (maksimum) ms arasında değişir. » Tüm cihazların 28 %'si daha iyi. Bu, ölçülen yanıt süresinin test edilen tüm cihazların ortalamasından (19.8 ms) daha iyi olduğu anlamına gelir. | ||
| ↔ Tepki Süresi %50 Griden %80 Griye | ||
| 7.6 ms ... yükseliş ↗ ve sonbahar↘ birleşimi | ↗ 3.8 ms yükseliş | 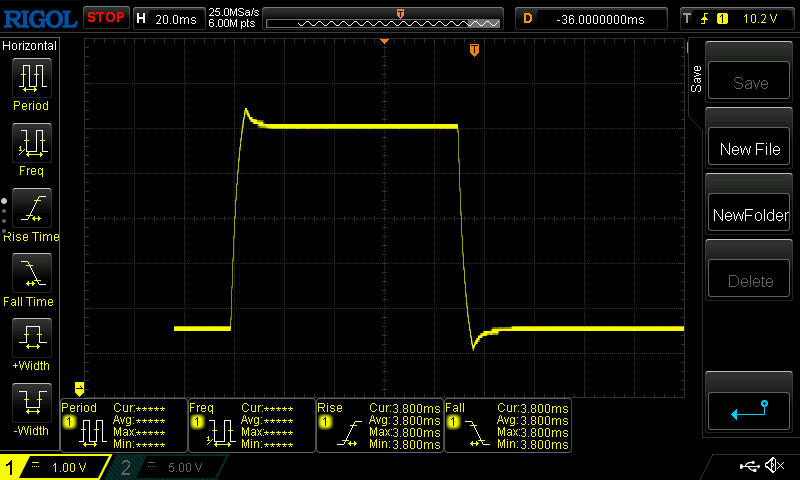 |
| ↘ 3.8 ms sonbahar | ||
| Ekran, testlerimizde çok hızlı yanıt oranları gösteriyor ve hızlı oyun oynamaya çok uygun olmalı. Karşılaştırıldığında, test edilen tüm cihazlar 0.165 (minimum) ile 636 (maksimum) ms arasında değişir. » Tüm cihazların 20 %'si daha iyi. Bu, ölçülen yanıt süresinin test edilen tüm cihazların ortalamasından (31 ms) daha iyi olduğu anlamına gelir. | ||
Ekran Titremesi / PWM (Darbe Genişliği Modülasyonu)
| Ekran titriyor / PWM algılanmadı | 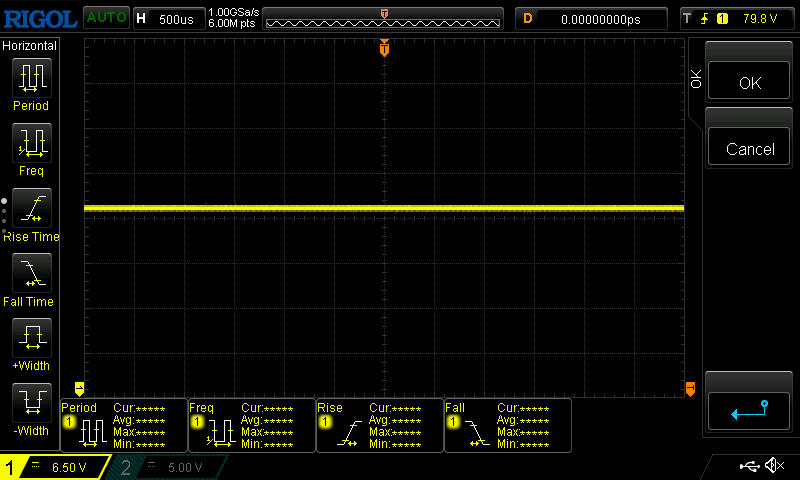 | ||
Karşılaştırıldığında: Test edilen tüm cihazların %52 %'si ekranı karartmak için PWM kullanmıyor. PWM tespit edilirse, ortalama 7757 (minimum: 5 - maksimum: 343500) Hz ölçüldü. | |||
Ekran dışarıda -en azından gölgeli ortamlarda- kullanılabilecek kadar parlak, ayrıca mat yüzeyi büyük yansımaları ortadan kaldırıyor.

Performans - G16 tam da beklendiği gibi
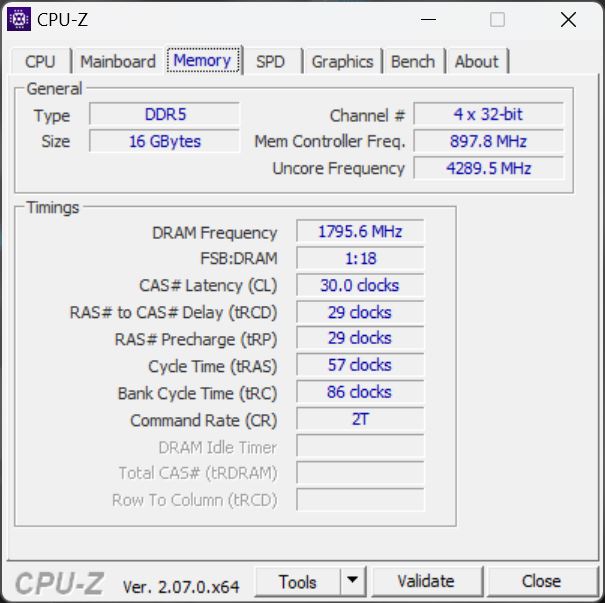
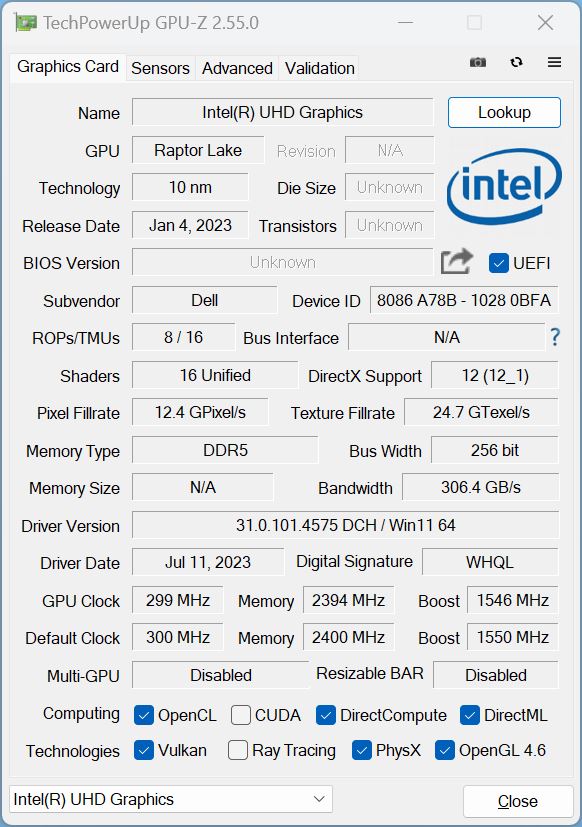
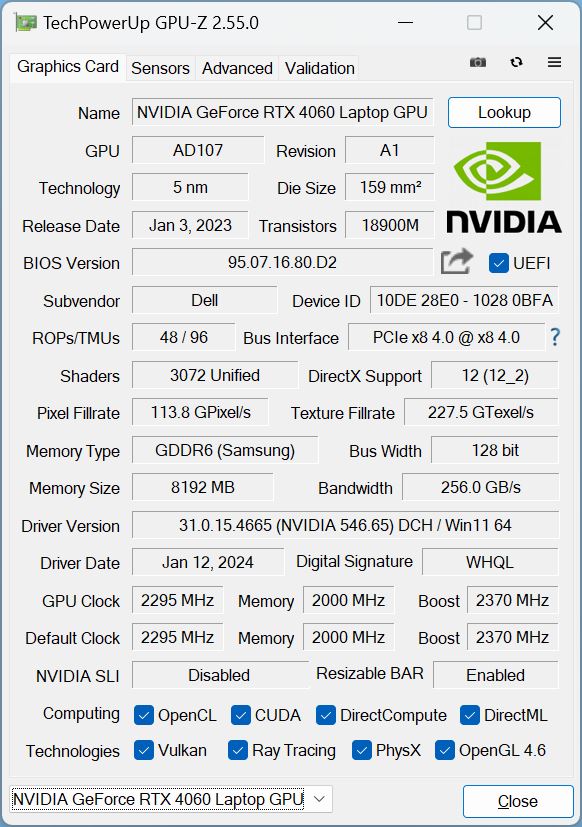
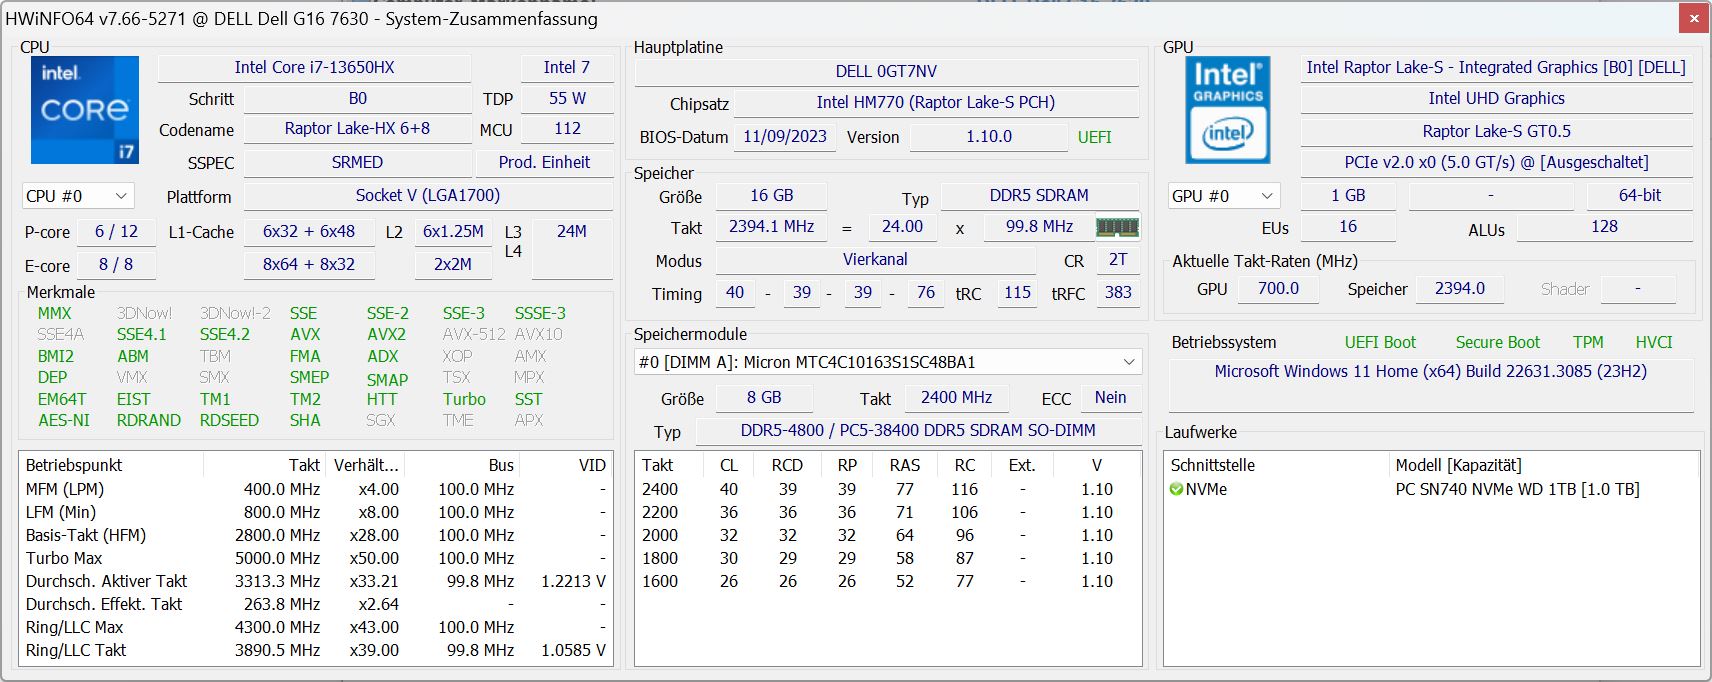
Dell G16 tipik bir bütçe-orta sınıf oyun dizüstü bilgisayarıdır. İşlemcisi Intel Core i7-13650HX ve buna ek olarak bir RTX 4060 140 watt, 16 GB RAM ve 1 TB NVMe SSD. Sonuç olarak, güncel oyunların çoğu Full HD olarak oynanabilir. İyi sayılabilecek 16:10 ekran, dizüstü bilgisayarın donanım yapılandırmasını tamamlıyor.
Test koşulları
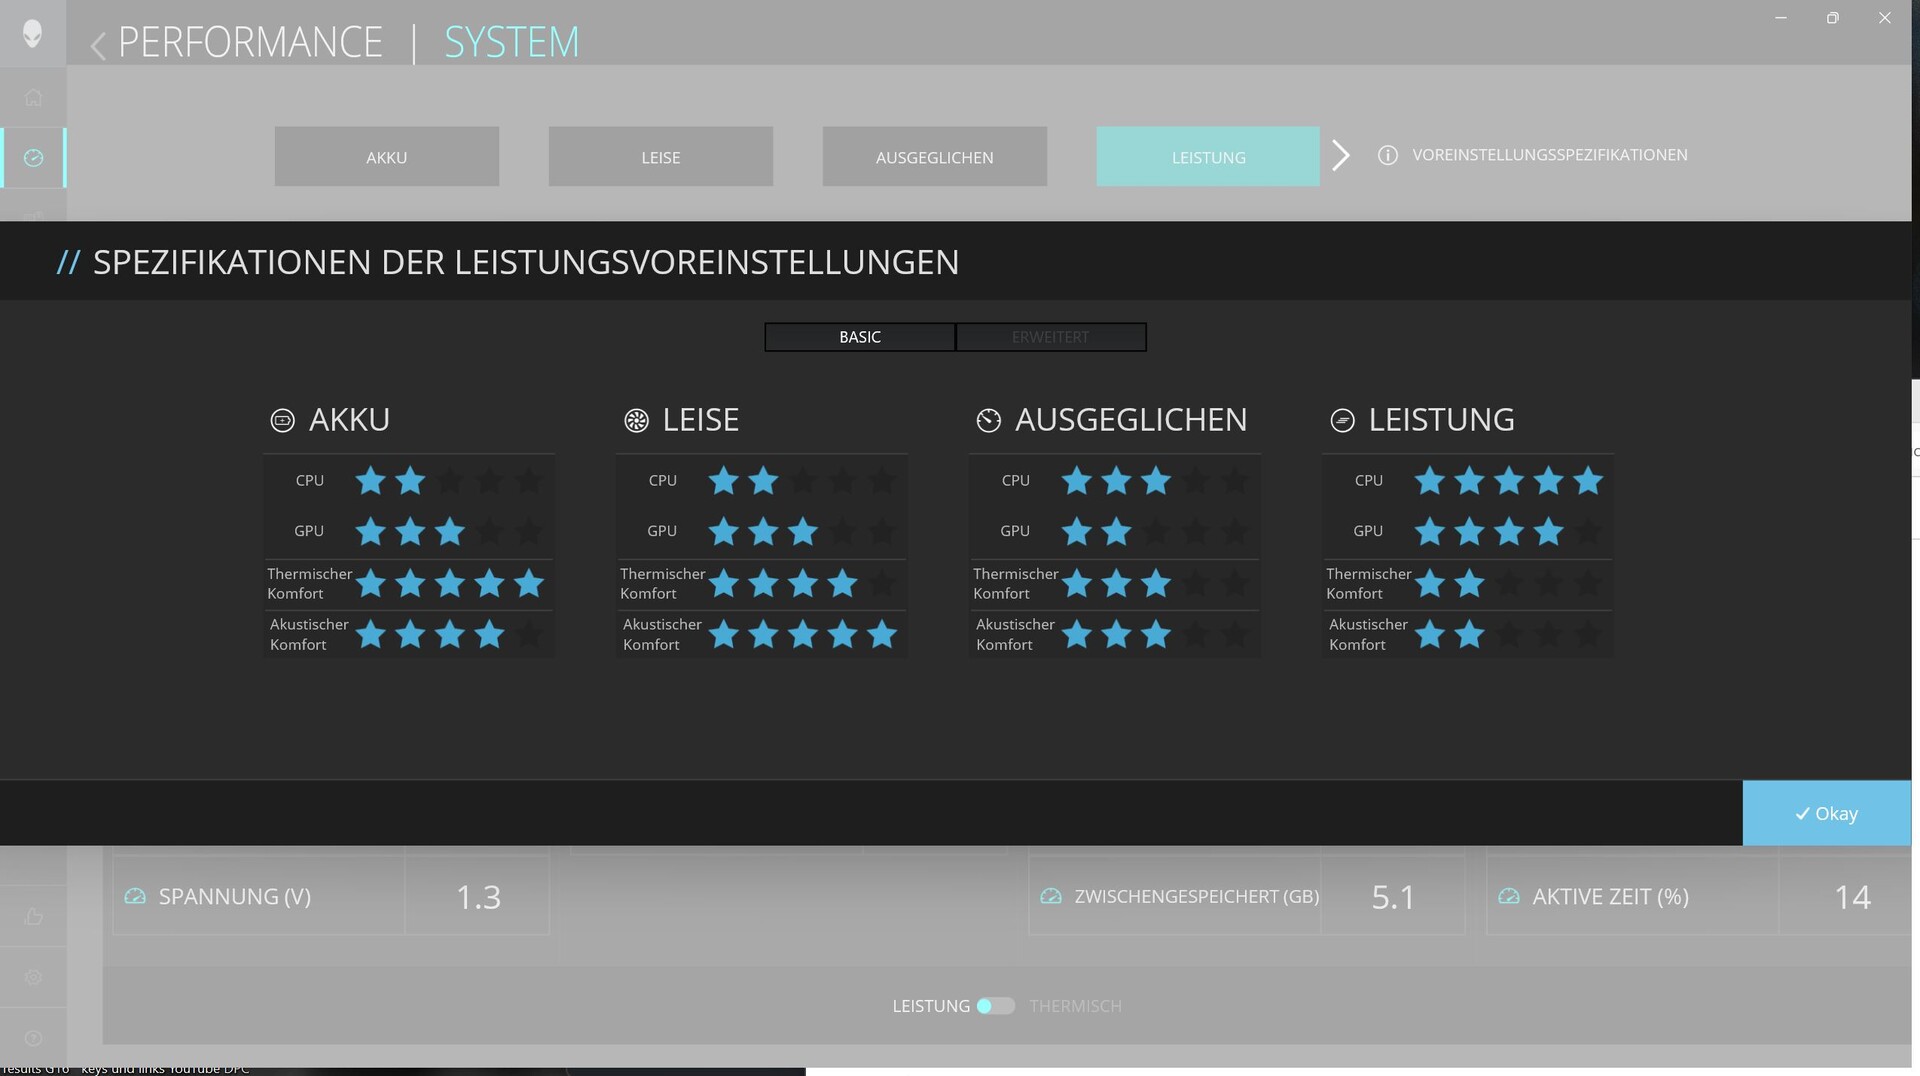
Dell, G16'ya en az iki uygulamayı (bkz. McAffee) önceden yüklemiştir. Biri, oyuncu olmayan modellerinde de önceden yüklenmiş olarak gelen My Dell, diğeri ise Alienware modellerinde bulunan Alienware Command Center. My Dell servis, güncellemeler vb. içerirken, Komuta Merkezi farklı performans modları(pil, sessiz, dengeli, performans, manuel), tuş aydınlatması ve diğer seçenekleri ayarlamanıza olanak tanır.
Uzun yıllardır geliştirilmesine rağmen, Komuta Merkezi hala tam olarak geliştirilmemiştir. Örneğin, pencere düzgün bir şekilde büyütülemiyor; masaüstünü hala altta görebilirsiniz.
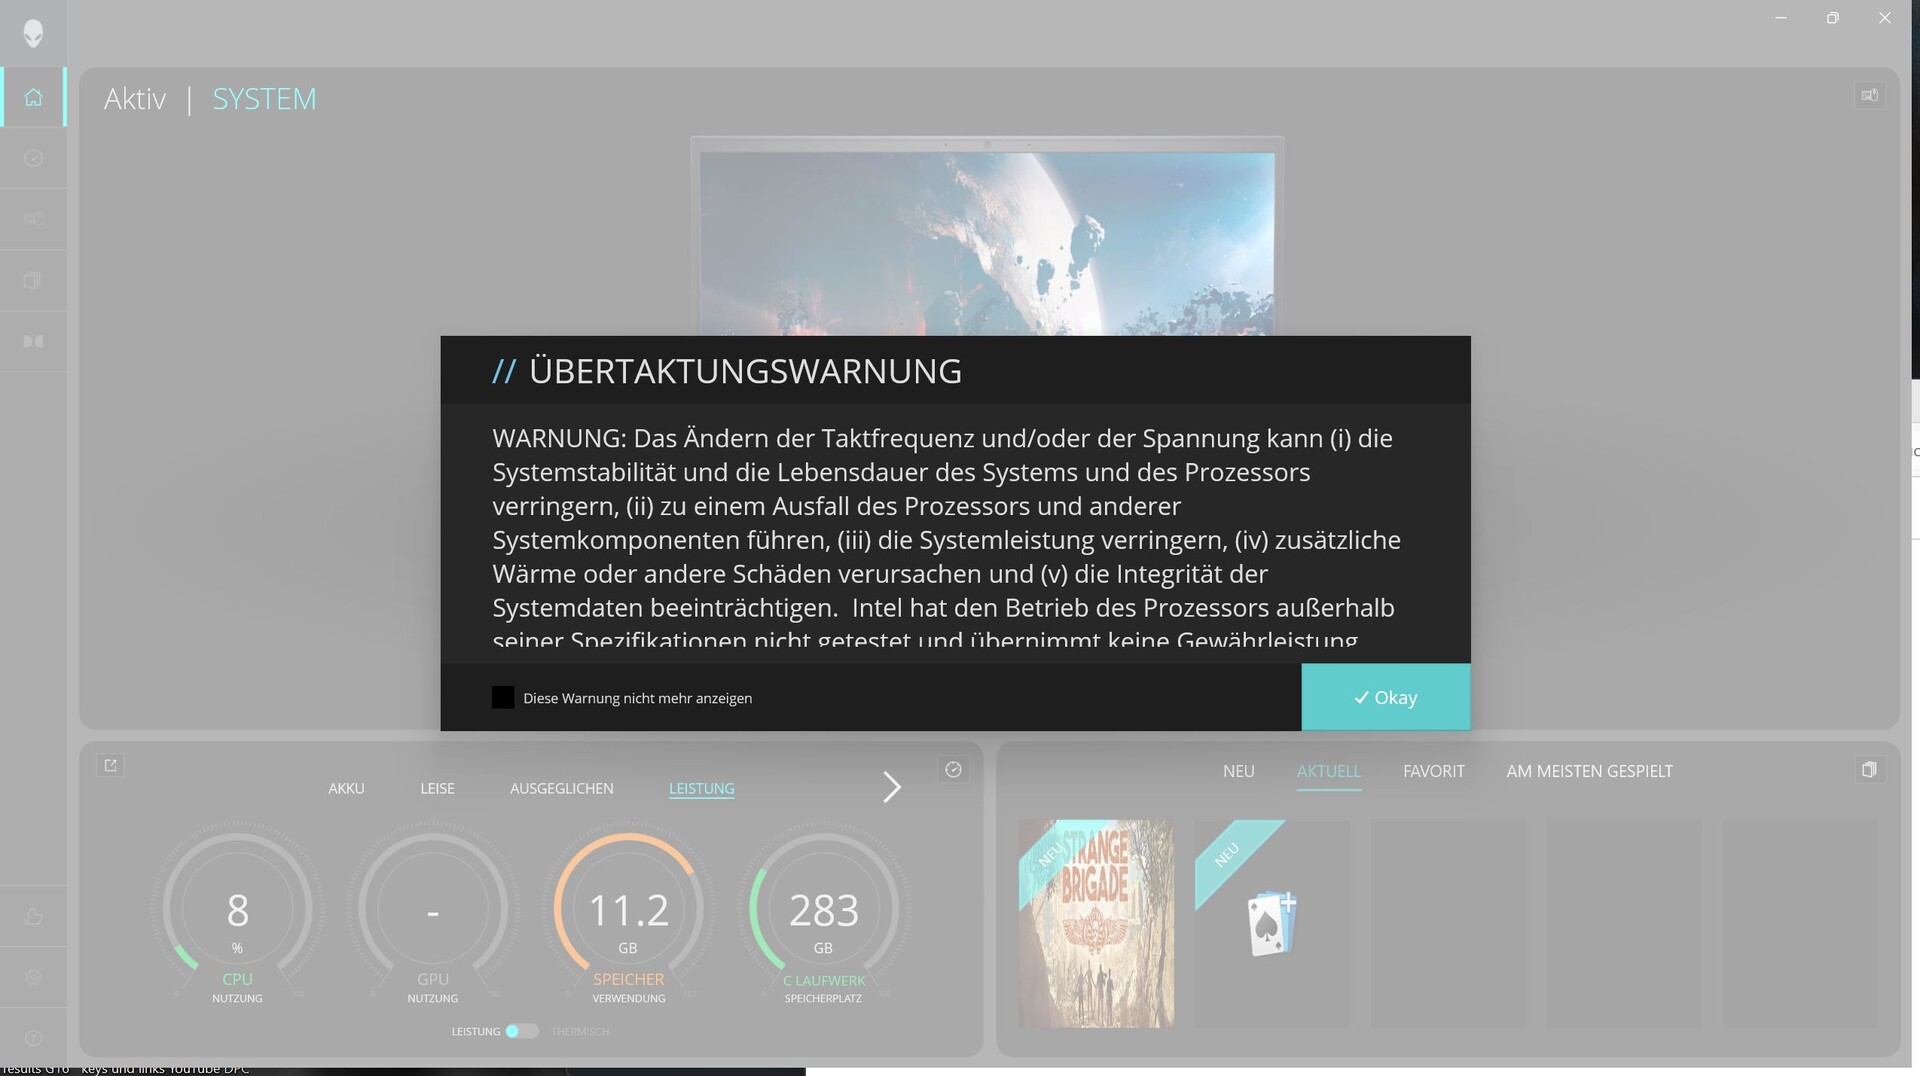
Muhtemelen bir başka hata da performans moduna geçer geçmez bir uyarı almamız. Bu çok rahatsız edici bir durum çünkü donanımın önerilen özelliklerin dışında çalıştırılması durumunda garantinin geçersiz kılınabileceğini gösteriyor. Bununla birlikte, uyarının Dell tarafından belirtilen performans moduna değil, manuel moda atıfta bulunduğundan şüpheleniyoruz - çok kafa karıştırıcı!
Ancak can sıkıcı olan, McAffee'nin yalnızca önceden yüklenmiş olması değil, aynı zamanda Dell'in bize düzenli olarak bu hizmeti kullanmamızı isteyen bir mesaj göndermesi (biz kaldırdık) ve bu mesajın en geç her gün geri gelmeye devam etmesi.
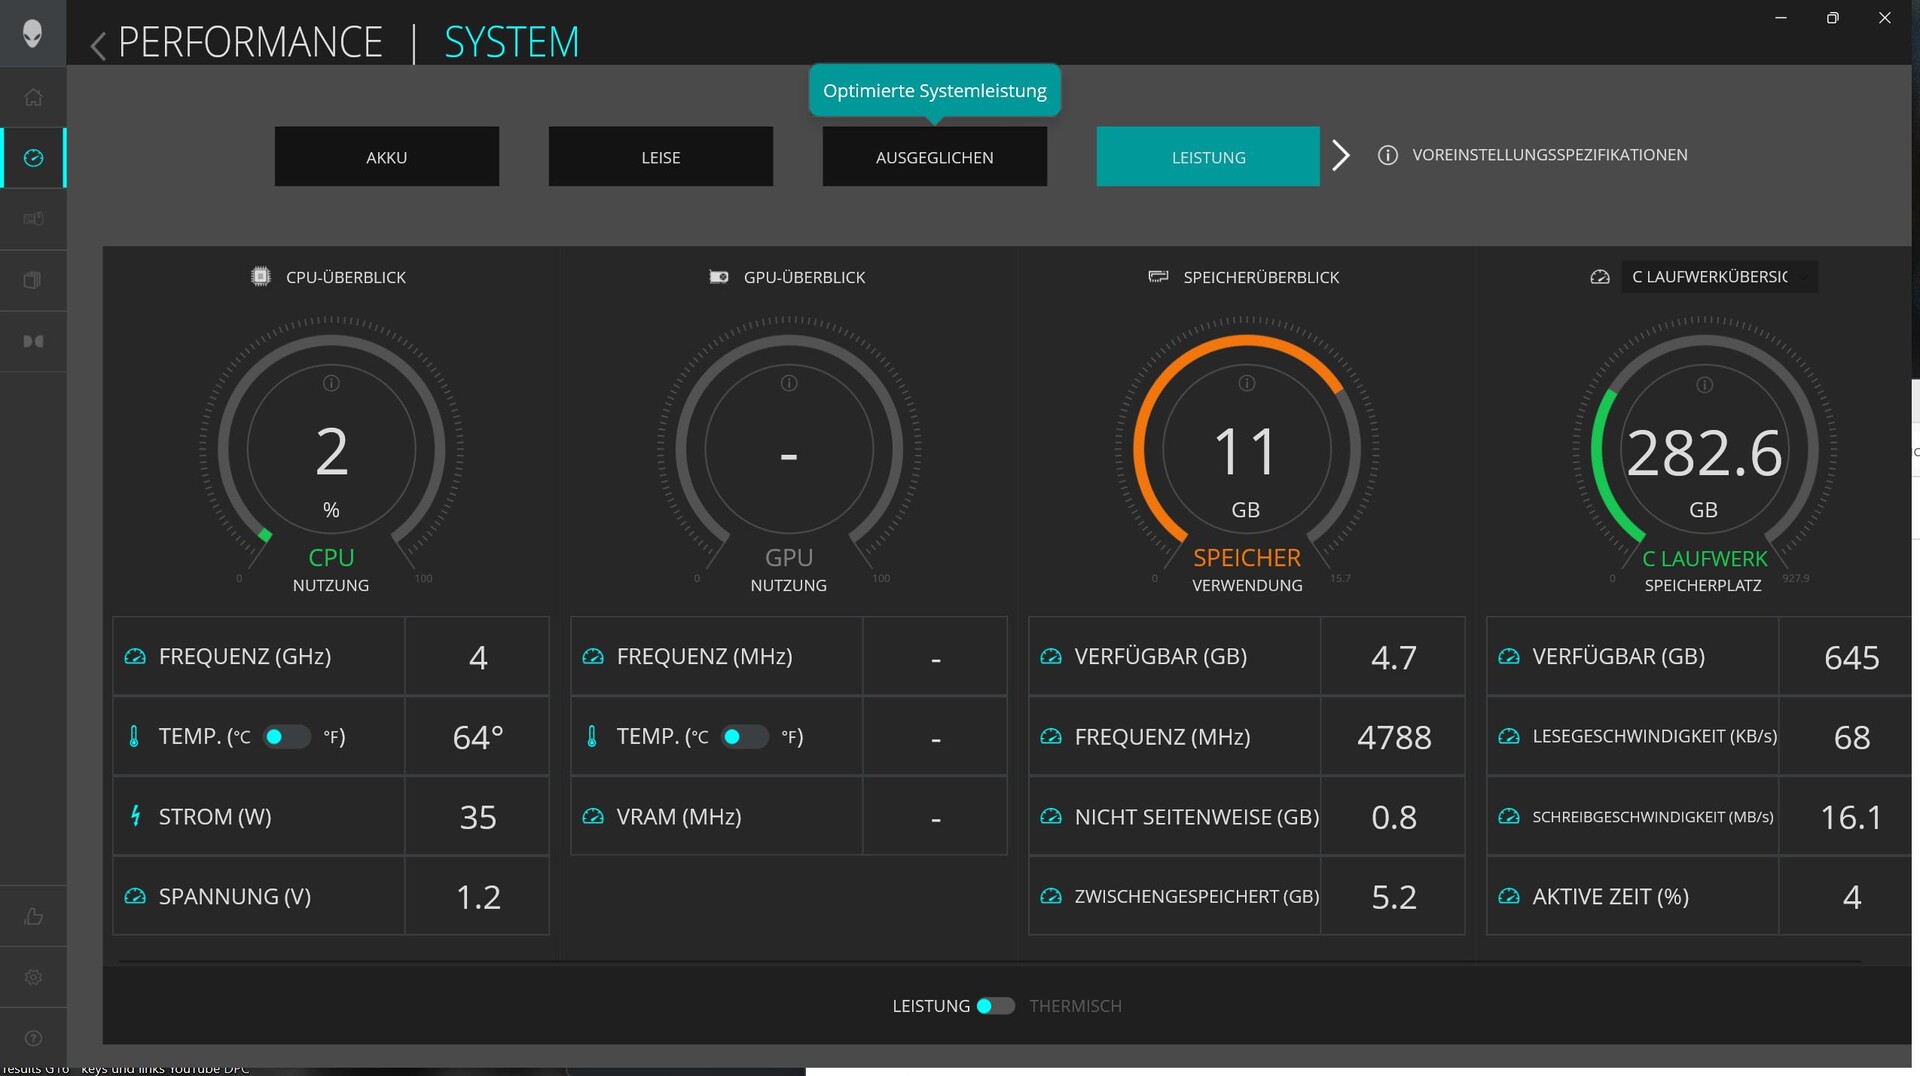

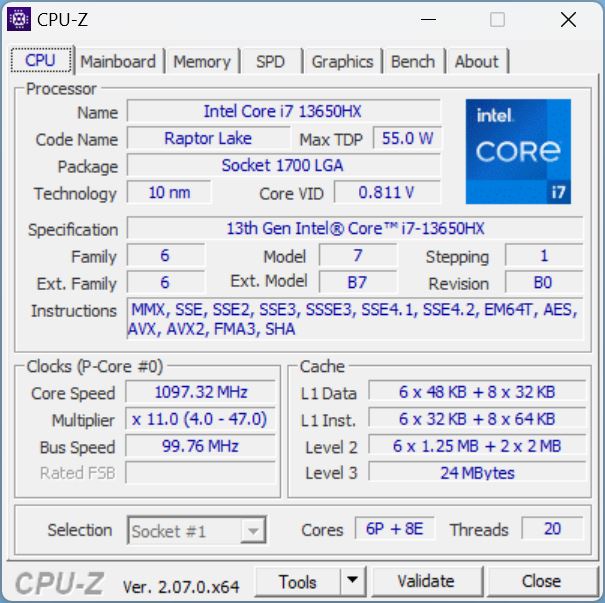
İşlemci
Dell dizüstü bilgisayar bir Raptor-Lake CPU, Intel Core i7-13650HX barındırıyor 14 çekirdekli (6 P, 8 E) ve 20 iş parçacıklı. P çekirdekleri ayrı ayrı 4,9 GHz'e kadar çıkabilirken verimlilik çekirdeklerinin temel saat hızı 1,9 GHz'dir. Yalnızca daha güçlü olanı alabilirsiniz i9-13900HX ile birlikte RTX 4070bu da biraz daha pahalıya mal oluyor.
Cinebench-R15 döngüsü sırasında G16, ilk birkaç çalıştırmadan sonra herhangi bir performans kaybı yaşamadan sürekli olarak yüksek performans seviyelerinde çalıştı.
Tüm CPU kıyaslamalarımızda, i7-13650HX beklenen düzeyde ve G16'dan yaklaşık %15 ila 19 daha hızlı performans gösterdi i7-12700H cihazın önceki modelinde.
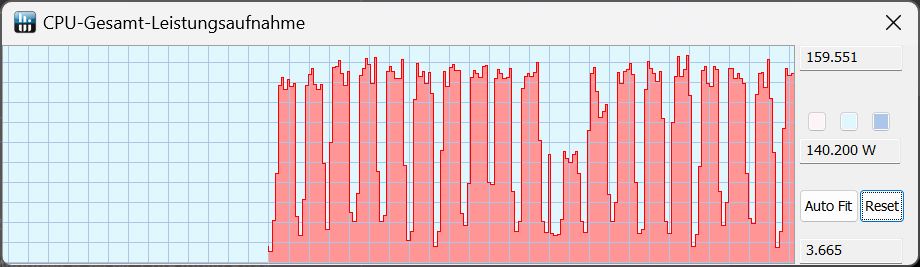
Performans, dengeli ve sessiz modlarını kullanan dizüstü bilgisayar, bir Cinebench çalışmasının başlangıcında 159 watt güç tüketimi değerlerine ulaştı ve tek bir kez ölçüldüğünde tüm modlar kullanılarak aynı skorla sonuçlandı. İlerleyen süreçte, bu TDP yalnızca performans modunda sabit kaldı. Diğer tüm modlarda, TDP ikinci çalıştırmadan itibaren yaklaşık 50 watt'a düştü.
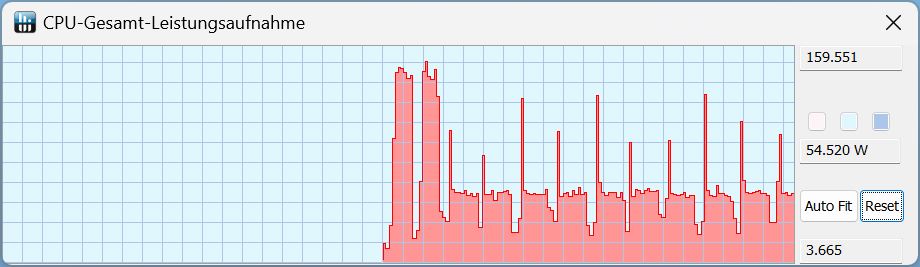
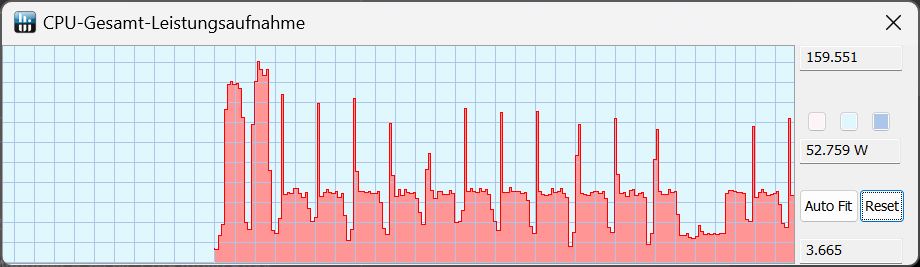
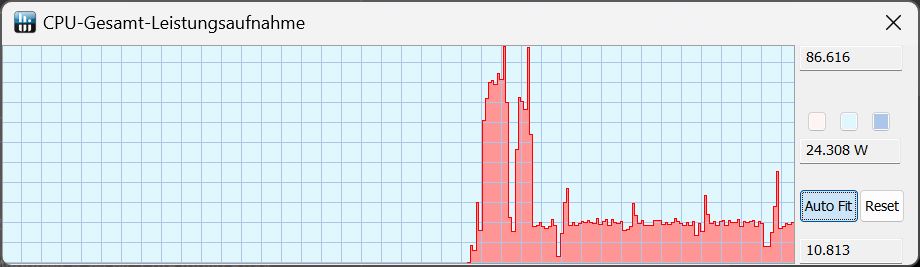
Dizüstü bilgisayarın güç bağlantısını keserseniz, sistem otomatik olarak pil moduna geçer. Cinebench R15 Multi sırasında yalnızca 86 watt'lık bir çıkış TDP'si elde etti ve ilk çalıştırmadan sonra TDP sadece 24 watt'a düştü.
Cinebench R15 Multi continuous test
Cinebench R23: Multi Core | Single Core
Cinebench R20: CPU (Multi Core) | CPU (Single Core)
Cinebench R15: CPU Multi 64Bit | CPU Single 64Bit
Blender: v2.79 BMW27 CPU
7-Zip 18.03: 7z b 4 | 7z b 4 -mmt1
Geekbench 6.7: Multi-Core | Single-Core
Geekbench 5.5: Multi-Core | Single-Core
HWBOT x265 Benchmark v2.2: 4k Preset
LibreOffice : 20 Documents To PDF
R Benchmark 2.5: Overall mean
| CPU Performance rating | |
| MSI Raider GE68HX 13VF | |
| Sınıf ortalaması Gaming | |
| Alienware m16 R1 Intel | |
| Ortalama Intel Core i7-13650HX | |
| Dell G16, i7-13650HX, RTX 4060 | |
| Lenovo Legion Slim 5 16APH8 -2! | |
| Lenovo LOQ 16IRH8 | |
| Dell G16 7620 -2! | |
| Cinebench R23 / Multi Core | |
| MSI Raider GE68HX 13VF | |
| Sınıf ortalaması Gaming (10488 - 42661, n=107, son 2 yıl) | |
| Alienware m16 R1 Intel | |
| Dell G16, i7-13650HX, RTX 4060 | |
| Ortalama Intel Core i7-13650HX (18744 - 21006, n=6) | |
| Dell G16 7620 | |
| Lenovo Legion Slim 5 16APH8 | |
| Lenovo LOQ 16IRH8 | |
| Cinebench R23 / Single Core | |
| MSI Raider GE68HX 13VF | |
| Sınıf ortalaması Gaming (1166 - 2415, n=107, son 2 yıl) | |
| Alienware m16 R1 Intel | |
| Dell G16, i7-13650HX, RTX 4060 | |
| Lenovo LOQ 16IRH8 | |
| Ortalama Intel Core i7-13650HX (1693 - 1903, n=6) | |
| Lenovo Legion Slim 5 16APH8 | |
| Dell G16 7620 | |
| Cinebench R20 / CPU (Multi Core) | |
| MSI Raider GE68HX 13VF | |
| Sınıf ortalaması Gaming (4029 - 16433, n=106, son 2 yıl) | |
| Alienware m16 R1 Intel | |
| Dell G16, i7-13650HX, RTX 4060 | |
| Ortalama Intel Core i7-13650HX (7197 - 8021, n=5) | |
| Lenovo Legion Slim 5 16APH8 | |
| Dell G16 7620 | |
| Lenovo LOQ 16IRH8 | |
| Cinebench R20 / CPU (Single Core) | |
| MSI Raider GE68HX 13VF | |
| Sınıf ortalaması Gaming (442 - 913, n=106, son 2 yıl) | |
| Alienware m16 R1 Intel | |
| Dell G16, i7-13650HX, RTX 4060 | |
| Ortalama Intel Core i7-13650HX (700 - 728, n=5) | |
| Lenovo LOQ 16IRH8 | |
| Lenovo Legion Slim 5 16APH8 | |
| Dell G16 7620 | |
| Cinebench R15 / CPU Multi 64Bit | |
| MSI Raider GE68HX 13VF | |
| Sınıf ortalaması Gaming (1578 - 6330, n=105, son 2 yıl) | |
| Alienware m16 R1 Intel | |
| Ortalama Intel Core i7-13650HX (2864 - 3147, n=5) | |
| Dell G16, i7-13650HX, RTX 4060 | |
| Lenovo Legion Slim 5 16APH8 | |
| Dell G16 7620 | |
| Lenovo LOQ 16IRH8 | |
| Cinebench R15 / CPU Single 64Bit | |
| MSI Raider GE68HX 13VF | |
| Sınıf ortalaması Gaming (188.8 - 350, n=106, son 2 yıl) | |
| Lenovo Legion Slim 5 16APH8 | |
| Alienware m16 R1 Intel | |
| Dell G16, i7-13650HX, RTX 4060 | |
| Ortalama Intel Core i7-13650HX (256 - 275, n=5) | |
| Lenovo LOQ 16IRH8 | |
| Dell G16 7620 | |
| Blender / v2.79 BMW27 CPU | |
| Lenovo LOQ 16IRH8 | |
| Lenovo Legion Slim 5 16APH8 | |
| Dell G16 7620 | |
| Ortalama Intel Core i7-13650HX (158 - 226, n=5) | |
| Dell G16, i7-13650HX, RTX 4060 | |
| Alienware m16 R1 Intel | |
| Sınıf ortalaması Gaming (79 - 330, n=104, son 2 yıl) | |
| MSI Raider GE68HX 13VF | |
| 7-Zip 18.03 / 7z b 4 | |
| MSI Raider GE68HX 13VF | |
| Sınıf ortalaması Gaming (33491 - 148086, n=105, son 2 yıl) | |
| Alienware m16 R1 Intel | |
| Ortalama Intel Core i7-13650HX (73927 - 80057, n=5) | |
| Dell G16, i7-13650HX, RTX 4060 | |
| Lenovo Legion Slim 5 16APH8 | |
| Dell G16 7620 | |
| Lenovo LOQ 16IRH8 | |
| 7-Zip 18.03 / 7z b 4 -mmt1 | |
| MSI Raider GE68HX 13VF | |
| Lenovo Legion Slim 5 16APH8 | |
| Sınıf ortalaması Gaming (4199 - 7436, n=105, son 2 yıl) | |
| Alienware m16 R1 Intel | |
| Ortalama Intel Core i7-13650HX (5828 - 6125, n=5) | |
| Dell G16, i7-13650HX, RTX 4060 | |
| Lenovo LOQ 16IRH8 | |
| Dell G16 7620 | |
| Geekbench 6.7 / Multi-Core | |
| MSI Raider GE68HX 13VF | |
| Sınıf ortalaması Gaming (6625 - 22850, n=106, son 2 yıl) | |
| Alienware m16 R1 Intel | |
| Ortalama Intel Core i7-13650HX (13554 - 14378, n=3) | |
| Dell G16, i7-13650HX, RTX 4060 | |
| Lenovo LOQ 16IRH8 | |
| Geekbench 6.7 / Single-Core | |
| MSI Raider GE68HX 13VF | |
| Sınıf ortalaması Gaming (1490 - 3259, n=106, son 2 yıl) | |
| Alienware m16 R1 Intel | |
| Lenovo LOQ 16IRH8 | |
| Dell G16, i7-13650HX, RTX 4060 | |
| Ortalama Intel Core i7-13650HX (2505 - 2595, n=3) | |
| Geekbench 5.5 / Multi-Core | |
| MSI Raider GE68HX 13VF | |
| Sınıf ortalaması Gaming (6460 - 28263, n=105, son 2 yıl) | |
| Alienware m16 R1 Intel | |
| Ortalama Intel Core i7-13650HX (12509 - 14778, n=5) | |
| Dell G16, i7-13650HX, RTX 4060 | |
| Lenovo LOQ 16IRH8 | |
| Dell G16 7620 | |
| Lenovo Legion Slim 5 16APH8 | |
| Geekbench 5.5 / Single-Core | |
| Sınıf ortalaması Gaming (986 - 2474, n=105, son 2 yıl) | |
| MSI Raider GE68HX 13VF | |
| Lenovo Legion Slim 5 16APH8 | |
| Dell G16, i7-13650HX, RTX 4060 | |
| Alienware m16 R1 Intel | |
| Ortalama Intel Core i7-13650HX (1810 - 1866, n=5) | |
| Lenovo LOQ 16IRH8 | |
| Dell G16 7620 | |
| HWBOT x265 Benchmark v2.2 / 4k Preset | |
| MSI Raider GE68HX 13VF | |
| Sınıf ortalaması Gaming (11.5 - 44.4, n=105, son 2 yıl) | |
| Alienware m16 R1 Intel | |
| Lenovo Legion Slim 5 16APH8 | |
| Ortalama Intel Core i7-13650HX (18.9 - 23.6, n=5) | |
| Dell G16, i7-13650HX, RTX 4060 | |
| Dell G16 7620 | |
| Lenovo LOQ 16IRH8 | |
| LibreOffice / 20 Documents To PDF | |
| Dell G16 7620 | |
| Dell G16, i7-13650HX, RTX 4060 | |
| Sınıf ortalaması Gaming (33.2 - 88.8, n=105, son 2 yıl) | |
| Ortalama Intel Core i7-13650HX (38.9 - 58.8, n=5) | |
| Lenovo LOQ 16IRH8 | |
| Alienware m16 R1 Intel | |
| Lenovo Legion Slim 5 16APH8 | |
| MSI Raider GE68HX 13VF | |
| R Benchmark 2.5 / Overall mean | |
| Dell G16 7620 | |
| Lenovo LOQ 16IRH8 | |
| Alienware m16 R1 Intel | |
| Lenovo Legion Slim 5 16APH8 | |
| Ortalama Intel Core i7-13650HX (0.4217 - 0.4461, n=6) | |
| Sınıf ortalaması Gaming (0.3439 - 0.759, n=106, son 2 yıl) | |
| Dell G16, i7-13650HX, RTX 4060 | |
| Dell G16, i7-13650HX, RTX 4060 | |
| MSI Raider GE68HX 13VF | |
* ... daha küçük daha iyidir
AIDA64: FP32 Ray-Trace | FPU Julia | CPU SHA3 | CPU Queen | FPU SinJulia | FPU Mandel | CPU AES | CPU ZLib | FP64 Ray-Trace | CPU PhotoWorxx
| Performance rating | |
| MSI Raider GE68HX 13VF | |
| Sınıf ortalaması Gaming | |
| Lenovo Legion Slim 5 16APH8 | |
| Alienware m16 R1 Intel | |
| Dell G16, i7-13650HX, RTX 4060 | |
| Ortalama Intel Core i7-13650HX | |
| Dell G16 7620 | |
| Lenovo LOQ 16IRH8 | |
| AIDA64 / FP32 Ray-Trace | |
| Sınıf ortalaması Gaming (10227 - 85542, n=105, son 2 yıl) | |
| Lenovo Legion Slim 5 16APH8 | |
| MSI Raider GE68HX 13VF | |
| Alienware m16 R1 Intel | |
| Dell G16, i7-13650HX, RTX 4060 | |
| Ortalama Intel Core i7-13650HX (13404 - 20012, n=5) | |
| Dell G16 7620 | |
| Lenovo LOQ 16IRH8 | |
| AIDA64 / FPU Julia | |
| Sınıf ortalaması Gaming (51376 - 238426, n=105, son 2 yıl) | |
| MSI Raider GE68HX 13VF | |
| Lenovo Legion Slim 5 16APH8 | |
| Alienware m16 R1 Intel | |
| Dell G16, i7-13650HX, RTX 4060 | |
| Ortalama Intel Core i7-13650HX (68241 - 97317, n=5) | |
| Dell G16 7620 | |
| Lenovo LOQ 16IRH8 | |
| AIDA64 / CPU SHA3 | |
| MSI Raider GE68HX 13VF | |
| Sınıf ortalaması Gaming (2180 - 10115, n=105, son 2 yıl) | |
| Lenovo Legion Slim 5 16APH8 | |
| Alienware m16 R1 Intel | |
| Dell G16, i7-13650HX, RTX 4060 | |
| Ortalama Intel Core i7-13650HX (3127 - 4487, n=5) | |
| Dell G16 7620 | |
| Lenovo LOQ 16IRH8 | |
| AIDA64 / CPU Queen | |
| MSI Raider GE68HX 13VF | |
| Lenovo Legion Slim 5 16APH8 | |
| Sınıf ortalaması Gaming (49785 - 173351, n=90, son 2 yıl) | |
| Alienware m16 R1 Intel | |
| Ortalama Intel Core i7-13650HX (108627 - 110589, n=5) | |
| Dell G16, i7-13650HX, RTX 4060 | |
| Dell G16 7620 | |
| Lenovo LOQ 16IRH8 | |
| AIDA64 / FPU SinJulia | |
| MSI Raider GE68HX 13VF | |
| Lenovo Legion Slim 5 16APH8 | |
| Sınıf ortalaması Gaming (4424 - 33636, n=105, son 2 yıl) | |
| Alienware m16 R1 Intel | |
| Dell G16, i7-13650HX, RTX 4060 | |
| Ortalama Intel Core i7-13650HX (9134 - 10887, n=5) | |
| Dell G16 7620 | |
| Lenovo LOQ 16IRH8 | |
| AIDA64 / FPU Mandel | |
| Sınıf ortalaması Gaming (25115 - 128721, n=105, son 2 yıl) | |
| MSI Raider GE68HX 13VF | |
| Lenovo Legion Slim 5 16APH8 | |
| Alienware m16 R1 Intel | |
| Dell G16, i7-13650HX, RTX 4060 | |
| Ortalama Intel Core i7-13650HX (33391 - 48323, n=5) | |
| Dell G16 7620 | |
| Lenovo LOQ 16IRH8 | |
| AIDA64 / CPU AES | |
| Alienware m16 R1 Intel | |
| MSI Raider GE68HX 13VF | |
| Sınıf ortalaması Gaming (39258 - 247074, n=105, son 2 yıl) | |
| Dell G16, i7-13650HX, RTX 4060 | |
| Ortalama Intel Core i7-13650HX (64436 - 85343, n=5) | |
| Dell G16 7620 | |
| Lenovo Legion Slim 5 16APH8 | |
| Lenovo LOQ 16IRH8 | |
| AIDA64 / CPU ZLib | |
| MSI Raider GE68HX 13VF | |
| Sınıf ortalaması Gaming (574 - 2531, n=105, son 2 yıl) | |
| Alienware m16 R1 Intel | |
| Dell G16, i7-13650HX, RTX 4060 | |
| Ortalama Intel Core i7-13650HX (1136 - 1285, n=5) | |
| Lenovo Legion Slim 5 16APH8 | |
| Dell G16 7620 | |
| Lenovo LOQ 16IRH8 | |
| AIDA64 / FP64 Ray-Trace | |
| Sınıf ortalaması Gaming (5509 - 45446, n=105, son 2 yıl) | |
| Lenovo Legion Slim 5 16APH8 | |
| MSI Raider GE68HX 13VF | |
| Alienware m16 R1 Intel | |
| Dell G16, i7-13650HX, RTX 4060 | |
| Ortalama Intel Core i7-13650HX (7270 - 10900, n=5) | |
| Dell G16 7620 | |
| Lenovo LOQ 16IRH8 | |
| AIDA64 / CPU PhotoWorxx | |
| MSI Raider GE68HX 13VF | |
| Sınıf ortalaması Gaming (12271 - 89891, n=105, son 2 yıl) | |
| Ortalama Intel Core i7-13650HX (36170 - 43289, n=5) | |
| Dell G16, i7-13650HX, RTX 4060 | |
| Alienware m16 R1 Intel | |
| Dell G16 7620 | |
| Lenovo LOQ 16IRH8 | |
| Lenovo Legion Slim 5 16APH8 | |
Sistem performansı
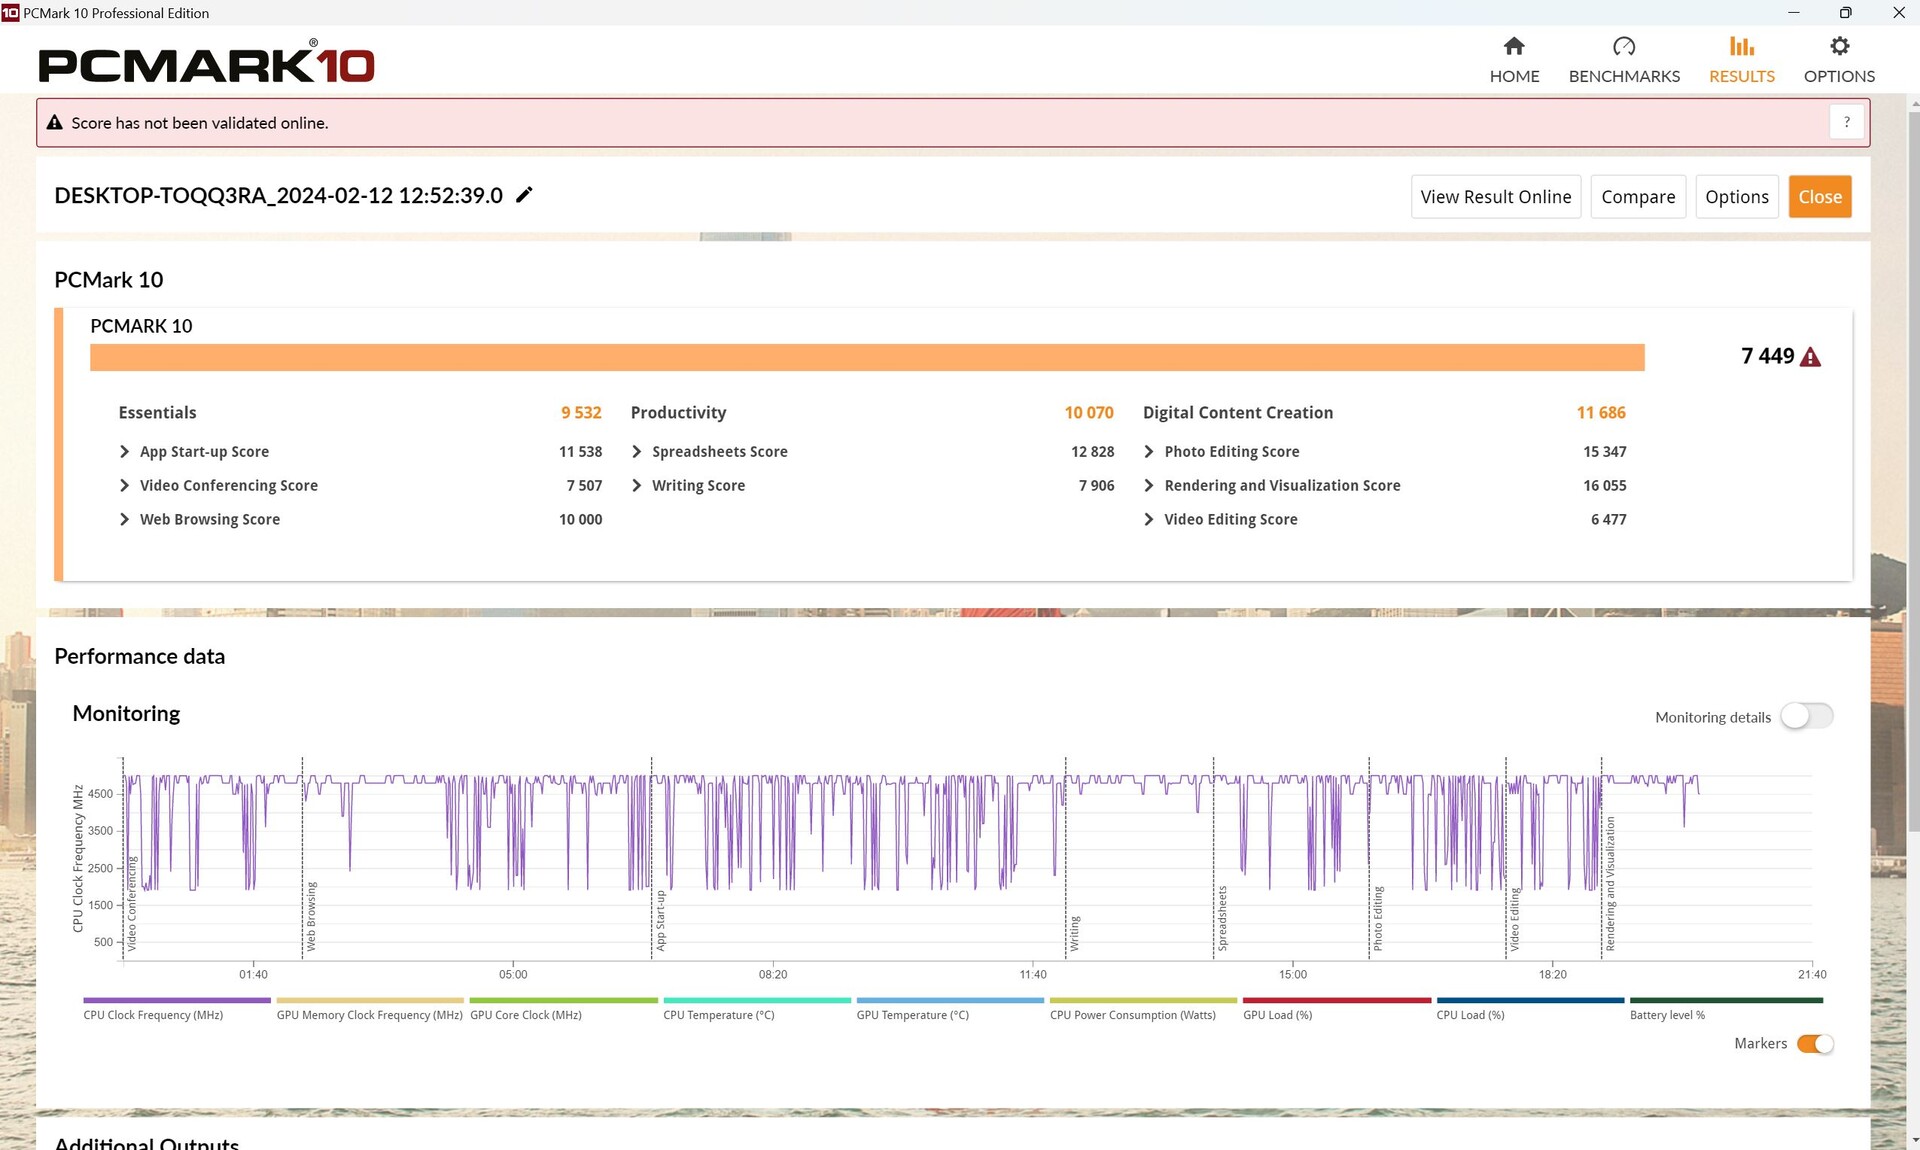
G16, PCMark 10 sırasında genel olarak iyi performans gösterdi, ancak Essentials alt testinde bazı zayıflıklar gösterdi. Aynı şey CrossMark'ın Verimlilik testi için de söylenebilir. Tüm testler boyunca, test modelimiz veritabanımızdaki aynı CPU/GPU yapılandırmasına sahip tüm dizüstü bilgisayarların biraz üzerine çıkmayı başardı, bu nedenle bu aykırı değerler çok önemli değil.
CrossMark: Overall | Productivity | Creativity | Responsiveness
WebXPRT 3: Overall
WebXPRT 4: Overall
Mozilla Kraken 1.1: Total
| PCMark 10 / Score | |
| Sınıf ortalaması Gaming (5828 - 12414, n=93, son 2 yıl) | |
| MSI Raider GE68HX 13VF | |
| Lenovo Legion Slim 5 16APH8 | |
| Dell G16, i7-13650HX, RTX 4060 | |
| Ortalama Intel Core i7-13650HX, NVIDIA GeForce RTX 4060 Laptop GPU (6984 - 7613, n=3) | |
| Alienware m16 R1 Intel | |
| Dell G16 7620 | |
| Lenovo LOQ 16IRH8 | |
| PCMark 10 / Essentials | |
| MSI Raider GE68HX 13VF | |
| Lenovo Legion Slim 5 16APH8 | |
| Alienware m16 R1 Intel | |
| Sınıf ortalaması Gaming (8810 - 11935, n=97, son 2 yıl) | |
| Ortalama Intel Core i7-13650HX, NVIDIA GeForce RTX 4060 Laptop GPU (9532 - 11151, n=3) | |
| Dell G16 7620 | |
| Lenovo LOQ 16IRH8 | |
| Dell G16, i7-13650HX, RTX 4060 | |
| PCMark 10 / Productivity | |
| Sınıf ortalaması Gaming (6845 - 25323, n=95, son 2 yıl) | |
| Lenovo Legion Slim 5 16APH8 | |
| Ortalama Intel Core i7-13650HX, NVIDIA GeForce RTX 4060 Laptop GPU (9961 - 10204, n=3) | |
| Dell G16, i7-13650HX, RTX 4060 | |
| MSI Raider GE68HX 13VF | |
| Alienware m16 R1 Intel | |
| Dell G16 7620 | |
| Lenovo LOQ 16IRH8 | |
| PCMark 10 / Digital Content Creation | |
| Sınıf ortalaması Gaming (7602 - 19954, n=95, son 2 yıl) | |
| MSI Raider GE68HX 13VF | |
| Lenovo Legion Slim 5 16APH8 | |
| Dell G16, i7-13650HX, RTX 4060 | |
| Dell G16 7620 | |
| Ortalama Intel Core i7-13650HX, NVIDIA GeForce RTX 4060 Laptop GPU (8323 - 11686, n=3) | |
| Alienware m16 R1 Intel | |
| Lenovo LOQ 16IRH8 | |
| CrossMark / Overall | |
| Alienware m16 R1 Intel | |
| Sınıf ortalaması Gaming (1366 - 2409, n=94, son 2 yıl) | |
| MSI Raider GE68HX 13VF | |
| Lenovo LOQ 16IRH8 | |
| Ortalama Intel Core i7-13650HX, NVIDIA GeForce RTX 4060 Laptop GPU (1839 - 1951, n=3) | |
| Dell G16, i7-13650HX, RTX 4060 | |
| Lenovo Legion Slim 5 16APH8 | |
| Dell G16 7620 | |
| CrossMark / Productivity | |
| Alienware m16 R1 Intel | |
| Lenovo LOQ 16IRH8 | |
| Sınıf ortalaması Gaming (1386 - 2254, n=94, son 2 yıl) | |
| MSI Raider GE68HX 13VF | |
| Ortalama Intel Core i7-13650HX, NVIDIA GeForce RTX 4060 Laptop GPU (1730 - 1864, n=3) | |
| Lenovo Legion Slim 5 16APH8 | |
| Dell G16, i7-13650HX, RTX 4060 | |
| Dell G16 7620 | |
| CrossMark / Creativity | |
| MSI Raider GE68HX 13VF | |
| Sınıf ortalaması Gaming (1343 - 2786, n=94, son 2 yıl) | |
| Alienware m16 R1 Intel | |
| Ortalama Intel Core i7-13650HX, NVIDIA GeForce RTX 4060 Laptop GPU (2020 - 2063, n=3) | |
| Lenovo LOQ 16IRH8 | |
| Dell G16, i7-13650HX, RTX 4060 | |
| Lenovo Legion Slim 5 16APH8 | |
| Dell G16 7620 | |
| CrossMark / Responsiveness | |
| Alienware m16 R1 Intel | |
| Lenovo LOQ 16IRH8 | |
| Ortalama Intel Core i7-13650HX, NVIDIA GeForce RTX 4060 Laptop GPU (1544 - 1907, n=3) | |
| Sınıf ortalaması Gaming (1226 - 2334, n=94, son 2 yıl) | |
| Dell G16, i7-13650HX, RTX 4060 | |
| MSI Raider GE68HX 13VF | |
| Dell G16 7620 | |
| Lenovo Legion Slim 5 16APH8 | |
| WebXPRT 3 / Overall | |
| MSI Raider GE68HX 13VF | |
| Lenovo Legion Slim 5 16APH8 | |
| Lenovo LOQ 16IRH8 | |
| Lenovo LOQ 16IRH8 | |
| Sınıf ortalaması Gaming (220 - 532, n=98, son 2 yıl) | |
| Alienware m16 R1 Intel | |
| Ortalama Intel Core i7-13650HX, NVIDIA GeForce RTX 4060 Laptop GPU (268 - 302, n=3) | |
| Dell G16 7620 | |
| Dell G16, i7-13650HX, RTX 4060 | |
| WebXPRT 4 / Overall | |
| MSI Raider GE68HX 13VF | |
| Sınıf ortalaması Gaming (165 - 354, n=98, son 2 yıl) | |
| Alienware m16 R1 Intel | |
| Ortalama Intel Core i7-13650HX, NVIDIA GeForce RTX 4060 Laptop GPU (260 - 276, n=2) | |
| Lenovo Legion Slim 5 16APH8 | |
| Dell G16 7620 | |
| Mozilla Kraken 1.1 / Total | |
| Dell G16 7620 | |
| Ortalama Intel Core i7-13650HX, NVIDIA GeForce RTX 4060 Laptop GPU (507 - 511, n=3) | |
| Lenovo LOQ 16IRH8 | |
| Lenovo LOQ 16IRH8 | |
| Dell G16, i7-13650HX, RTX 4060 | |
| Alienware m16 R1 Intel | |
| Lenovo Legion Slim 5 16APH8 | |
| Sınıf ortalaması Gaming (391 - 590, n=100, son 2 yıl) | |
| MSI Raider GE68HX 13VF | |
* ... daha küçük daha iyidir
| PCMark 10 Score | 7449 puan | |
Yardım | ||
| AIDA64 / Memory Copy | |
| MSI Raider GE68HX 13VF | |
| Sınıf ortalaması Gaming (21750 - 129946, n=105, son 2 yıl) | |
| Lenovo Legion Slim 5 16APH8 | |
| Ortalama Intel Core i7-13650HX (59266 - 66372, n=5) | |
| Dell G16, i7-13650HX, RTX 4060 | |
| Alienware m16 R1 Intel | |
| Dell G16 7620 | |
| Lenovo LOQ 16IRH8 | |
| AIDA64 / Memory Read | |
| MSI Raider GE68HX 13VF | |
| Sınıf ortalaması Gaming (22956 - 118858, n=105, son 2 yıl) | |
| Ortalama Intel Core i7-13650HX (67305 - 71022, n=5) | |
| Alienware m16 R1 Intel | |
| Dell G16, i7-13650HX, RTX 4060 | |
| Dell G16 7620 | |
| Lenovo LOQ 16IRH8 | |
| Lenovo Legion Slim 5 16APH8 | |
| AIDA64 / Memory Write | |
| Lenovo Legion Slim 5 16APH8 | |
| MSI Raider GE68HX 13VF | |
| Sınıf ortalaması Gaming (22297 - 135096, n=105, son 2 yıl) | |
| Ortalama Intel Core i7-13650HX (58028 - 68225, n=5) | |
| Alienware m16 R1 Intel | |
| Dell G16, i7-13650HX, RTX 4060 | |
| Dell G16 7620 | |
| Lenovo LOQ 16IRH8 | |
| AIDA64 / Memory Latency | |
| Lenovo LOQ 16IRH8 | |
| Sınıf ortalaması Gaming (75.3 - 259, n=105, son 2 yıl) | |
| Dell G16 7620 | |
| Lenovo Legion Slim 5 16APH8 | |
| Dell G16, i7-13650HX, RTX 4060 | |
| Ortalama Intel Core i7-13650HX (83.7 - 90.8, n=5) | |
| Alienware m16 R1 Intel | |
| MSI Raider GE68HX 13VF | |
* ... daha küçük daha iyidir
DPC gecikme süresi
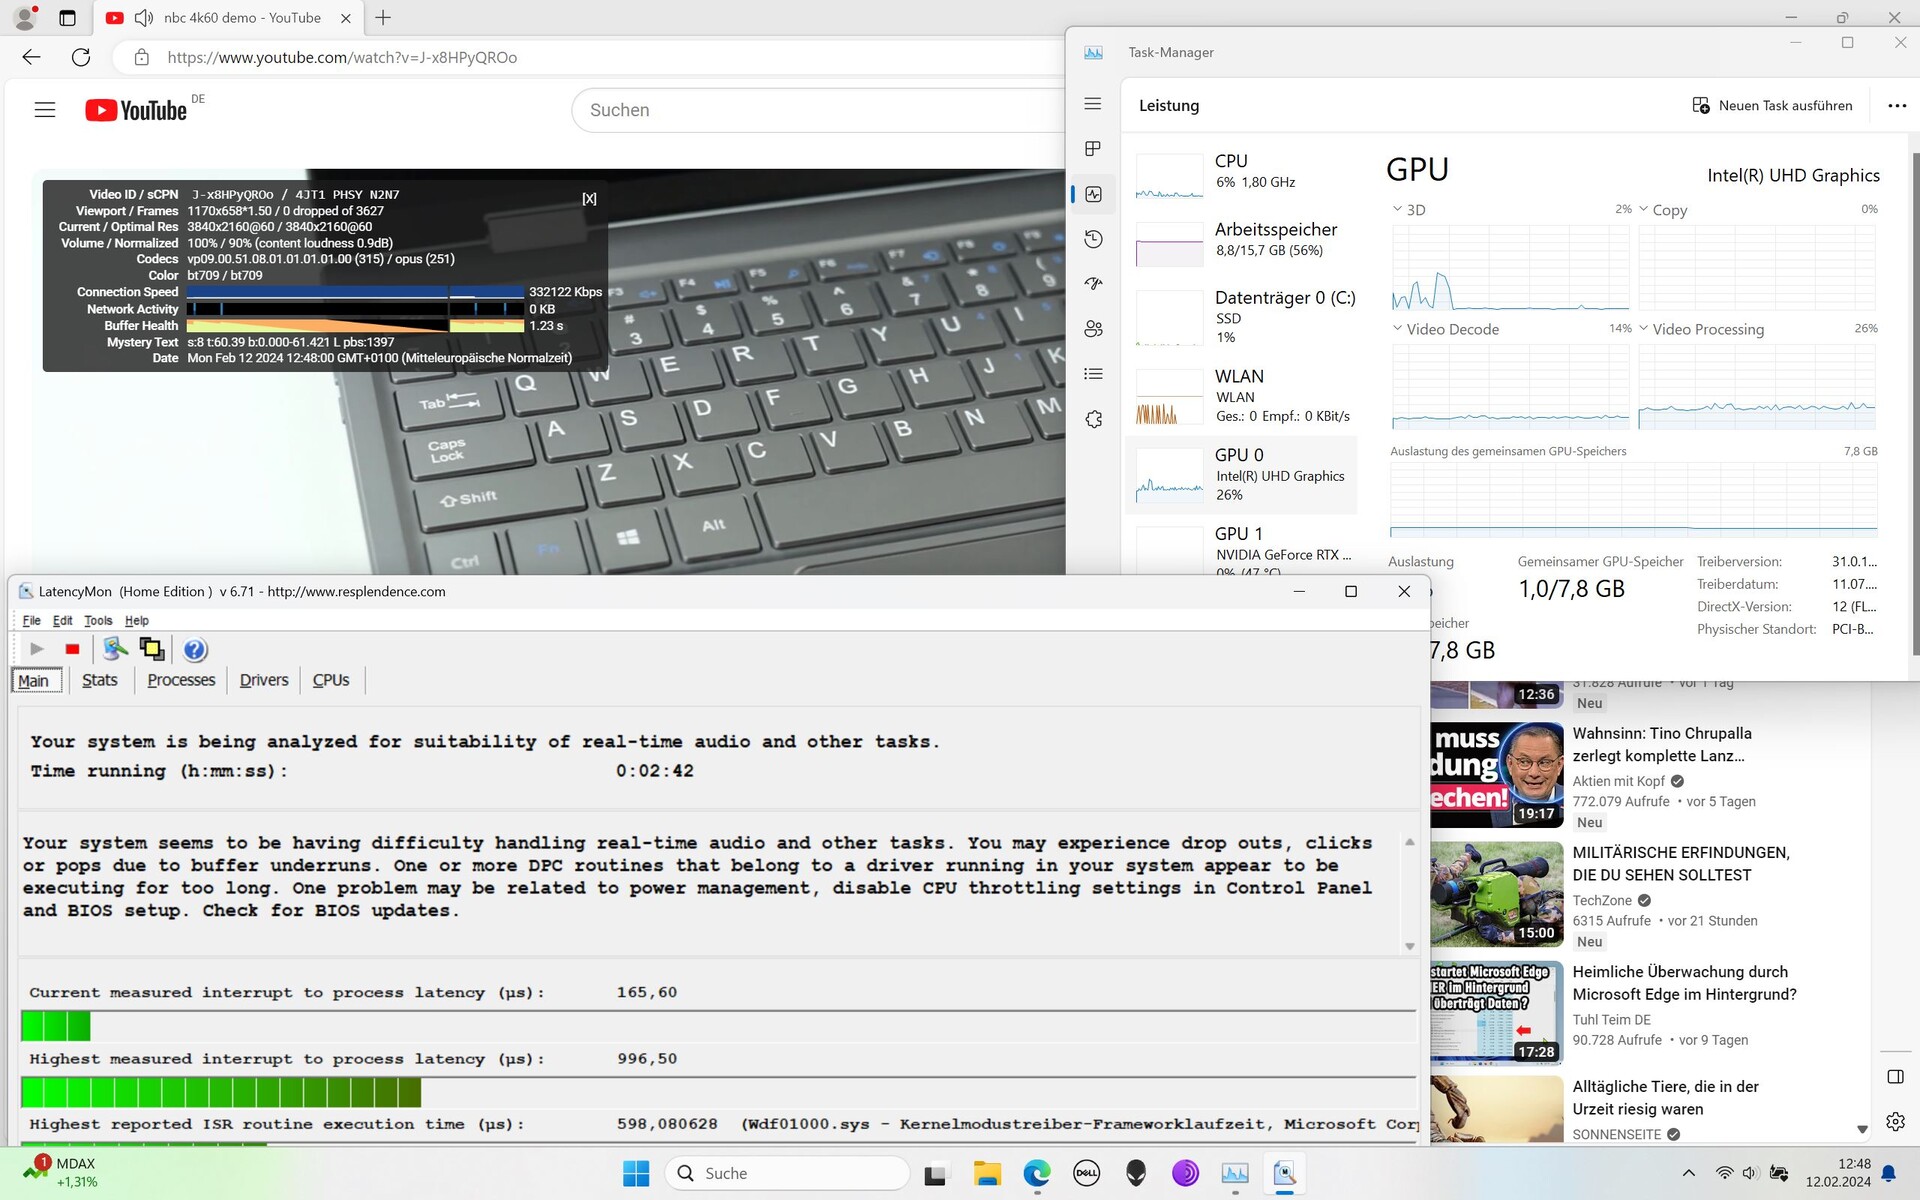
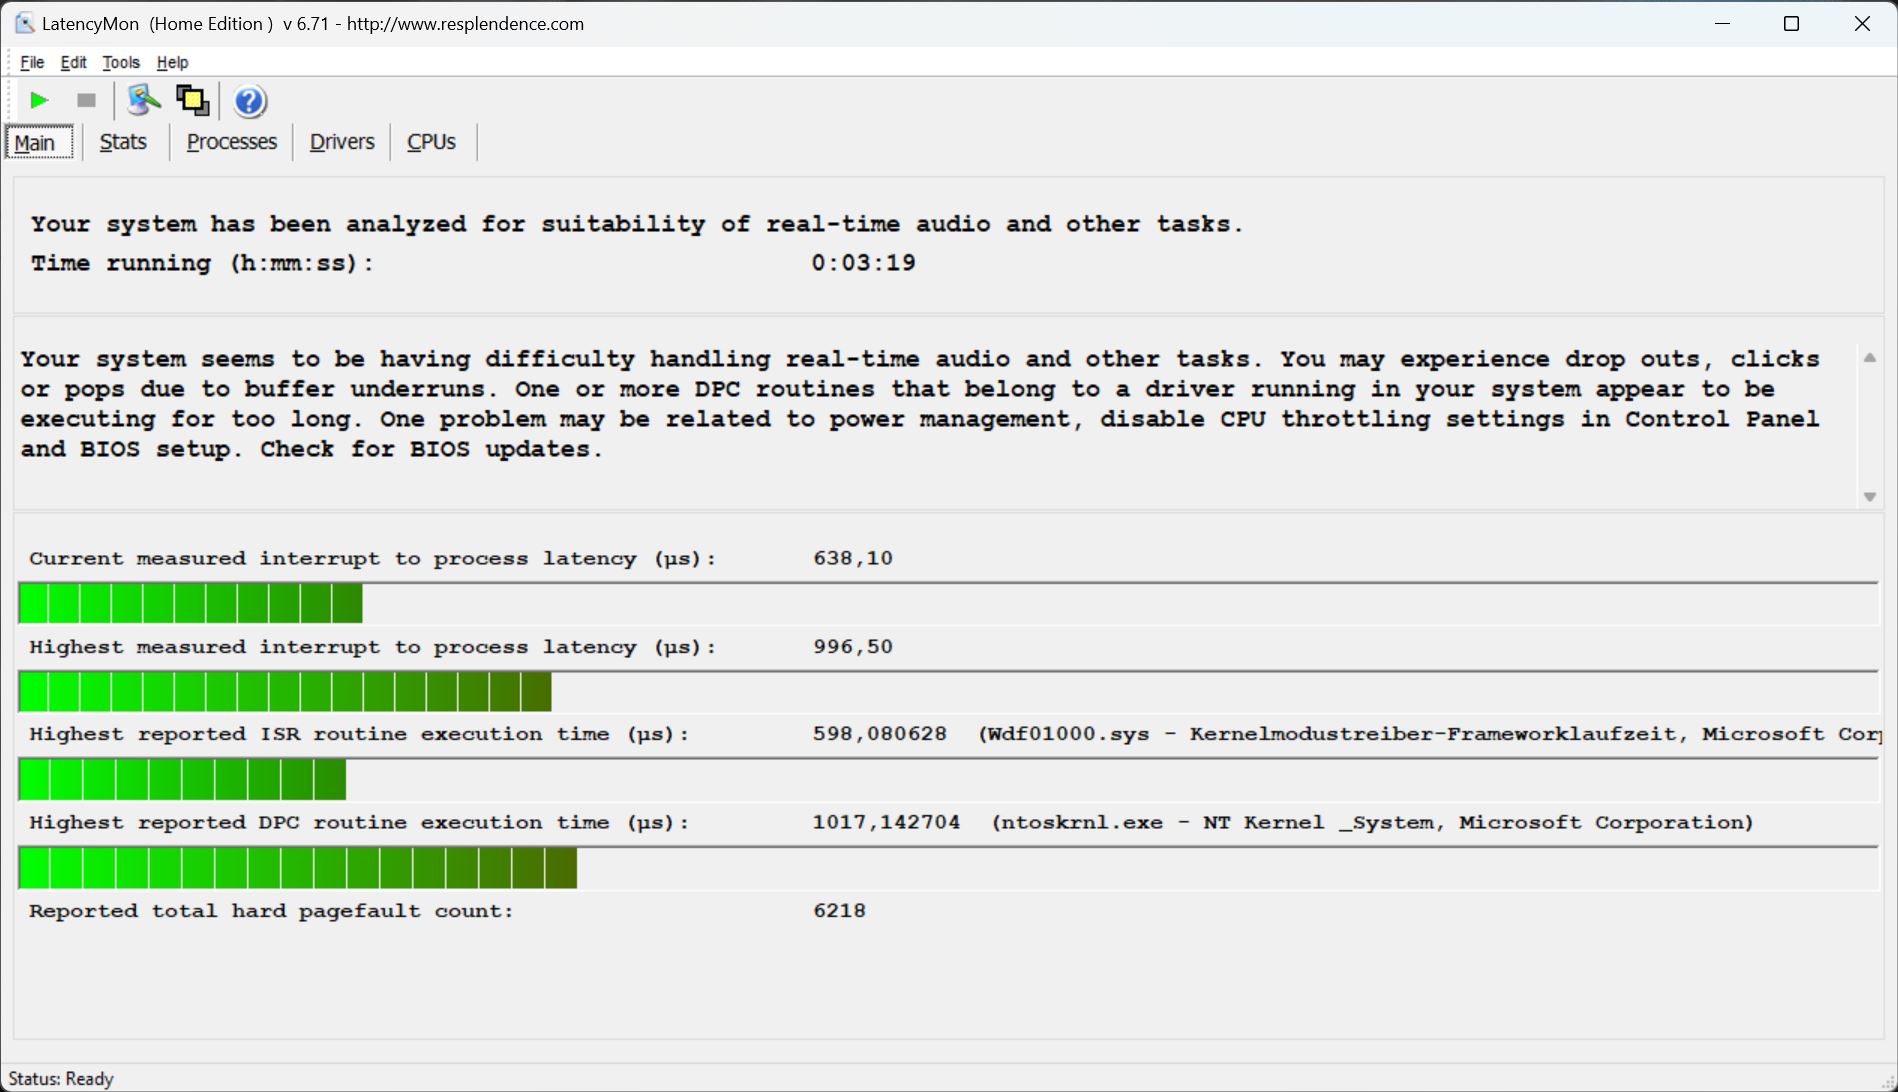
Web sitemizi açarken, dizüstü bilgisayar bazı hafif gecikmeler gösterdi, ancak LatencyMon yazılımı bunları kritik olarak işaretlemedi. Birden fazla sekme açıldığında da bu durum değişmedi. 4K/60 fps YouTube videomuzu oynatırken gecikme süreleri çok az arttı ve ölçüm aracımızın bazı sorunlara işaret etmesine neden oldu. Ancak karşılaştırıldığında, bu gecikmeler oldukça düşük ve test videosu herhangi bir kare düşmesi olmadan oynatıldı.
| DPC Latencies / LatencyMon - interrupt to process latency (max), Web, Youtube, Prime95 | |
| Alienware m16 R1 Intel | |
| MSI Raider GE68HX 13VF | |
| Lenovo LOQ 16IRH8 | |
| Lenovo Legion Slim 5 16APH8 | |
| Dell G16, i7-13650HX, RTX 4060 | |
| Dell G16 7620 | |
* ... daha küçük daha iyidir
Depolama cihazları
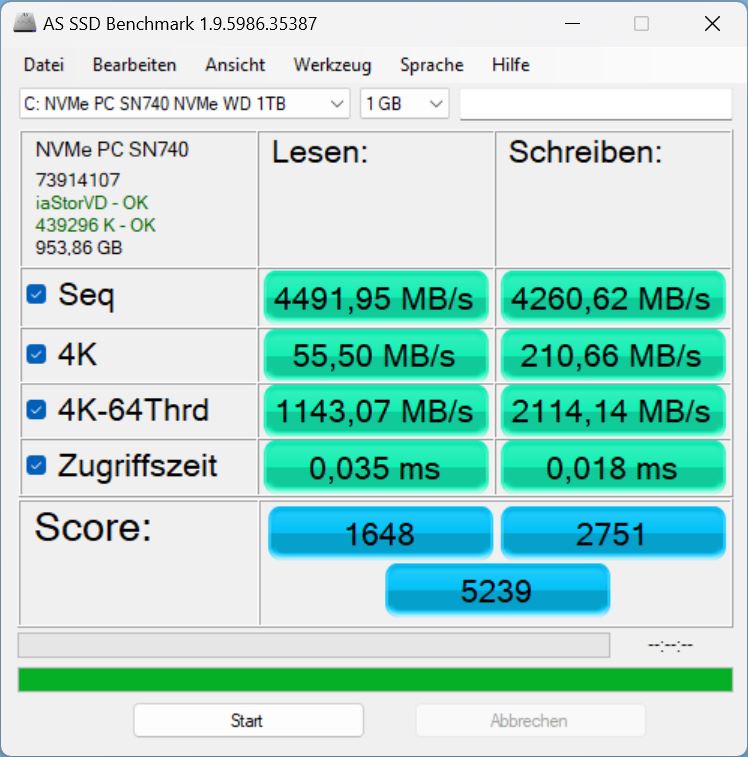
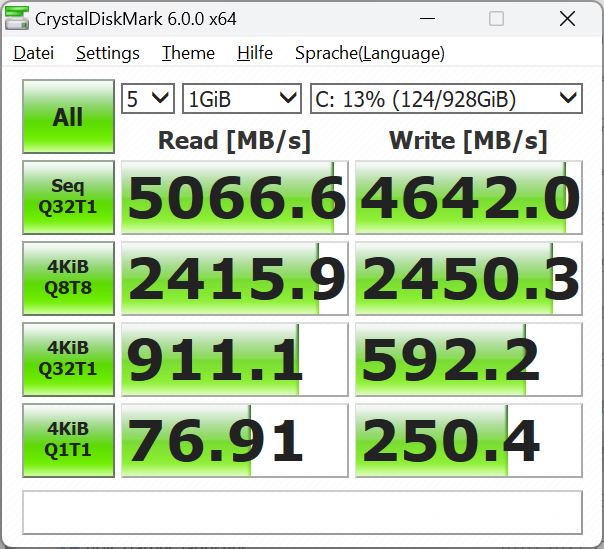
Dell, Western Digital'den küçük M.2 2230 form faktörüne sahip bir SN740 kurdu. İkinci, daha büyük bir M.2-2280 yuvası da boş. PCIe-4-NVMe bizim 142 pozisyonumuzu işgal ediyor SSD en iyiler listesi. Çıkış performansı aslında MSI Raider ya da Lenovo LOQ 16'daki SSD'lerden daha iyidir. Ancak bunların ve diğer rakiplerin aksine, G16'daki depolama ortamı çok kısa bir süre sonra termal olarak yavaşlar.
Bu durumda aktarım hızları yarıdan fazla düşüyor. Bu arada, selefinde daha hızlı bir model vardı - her ne kadar o da yavaşlama sorunlarından etkilenmiş olsa da. Ancak bunlar çok daha sonra başladı.


* ... daha küçük daha iyidir
Reading continuous performance: DiskSpd Read Loop, Queue Depth 8
Grafik kartı
Dell, G16'ya bir RTX 4060 140 watt'ta. Whisper Mode, Max-Q, Dynamic Boost ve hatta Advanced Optimus destekleniyor. Bununla birlikte, grafik değiştirme işlemi her 3D uygulama sırasında (başlatma ve kapatma) birkaç saniye sürdüğünden ve bu sırada ekran donduğundan, ikincisi oldukça düzenli olarak can sıkıcı hale geliyor.
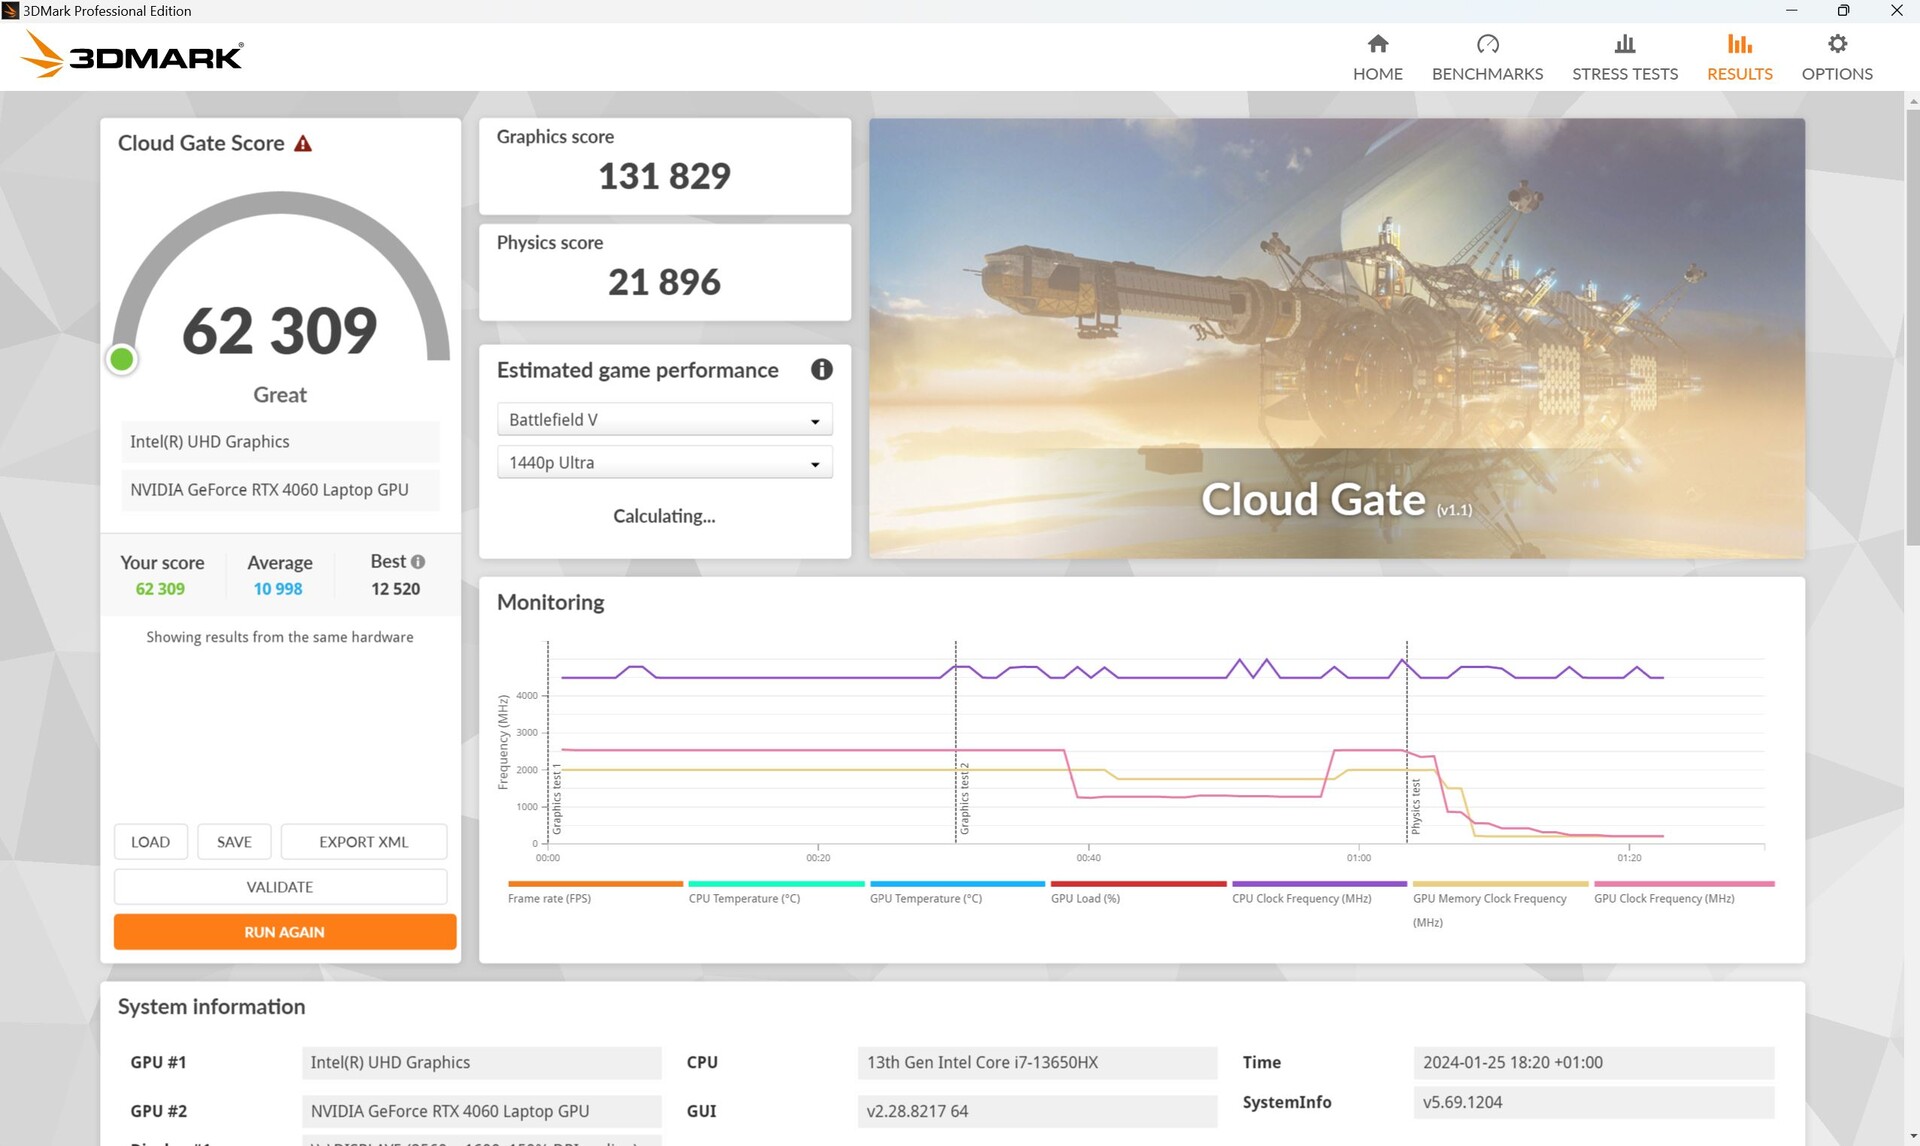
Yine de, sentetik 3DMarks sırasındaki performansı biraz daha iyi olmasa da beklediğimiz gibiydi. Dizüstü bilgisayarın selefine göre liderliği RTX 3060 ve i7-12700H yaklaşık %22'dir.
Güç bağlantısı kesildiğinde, 3D performansı beklenenden daha az düştü. Başka bir Fire Strike çalışmasında, yaklaşık %20'lik bir düşüş ölçtük.
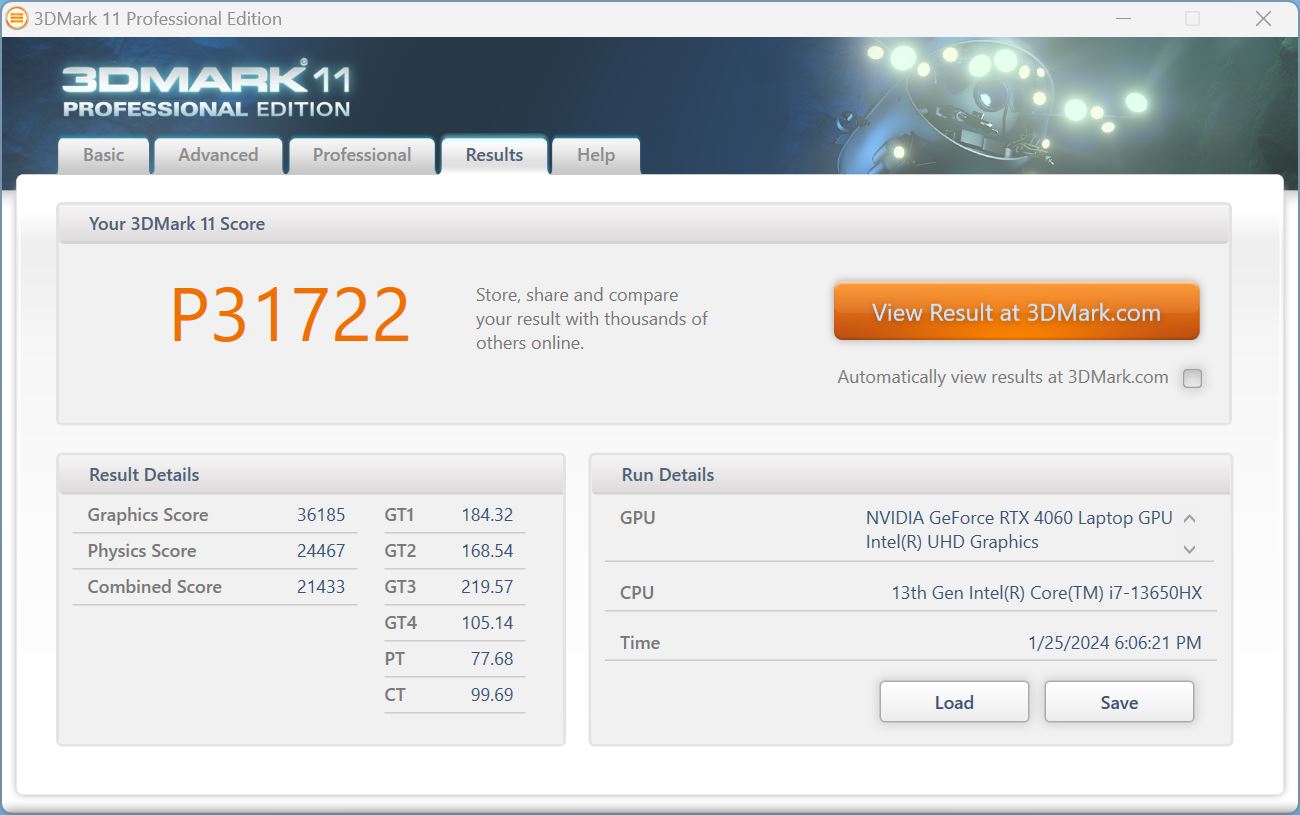
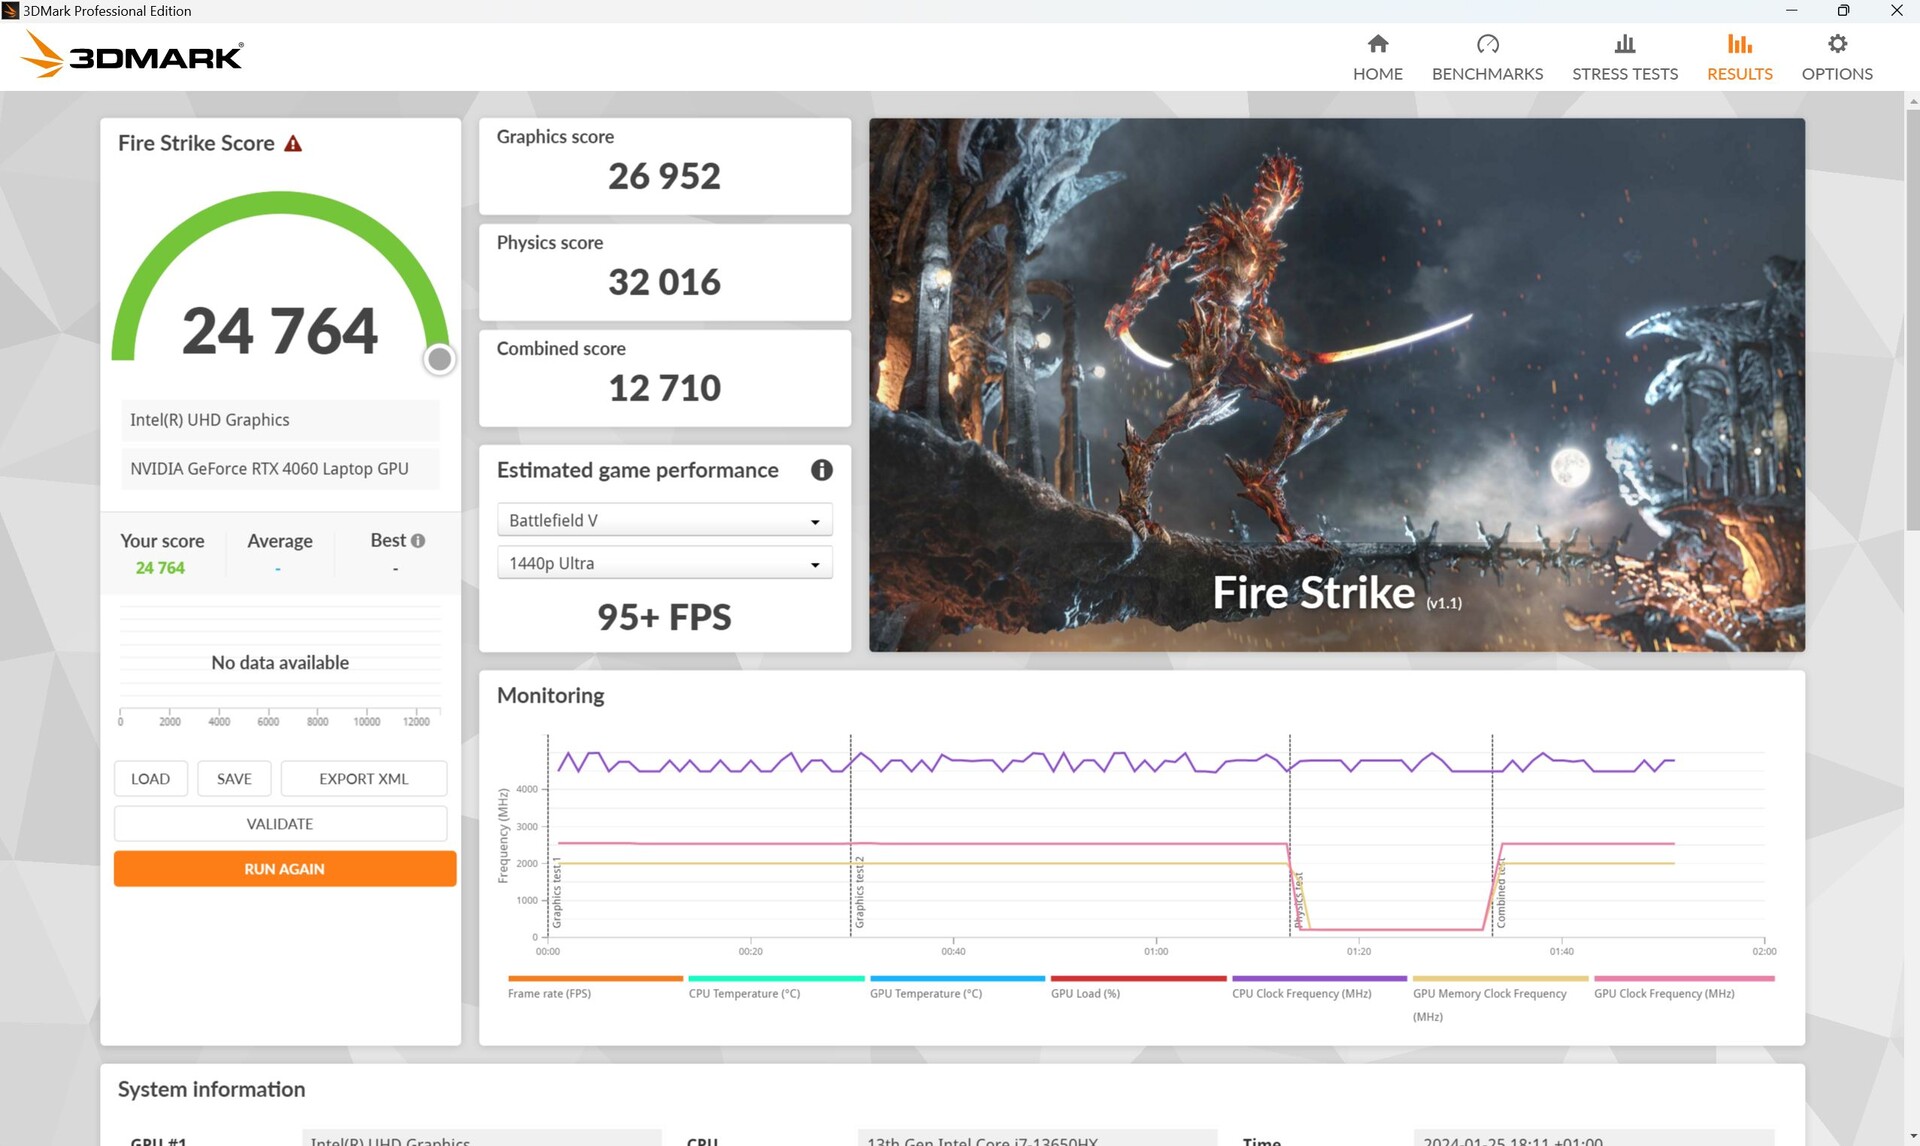
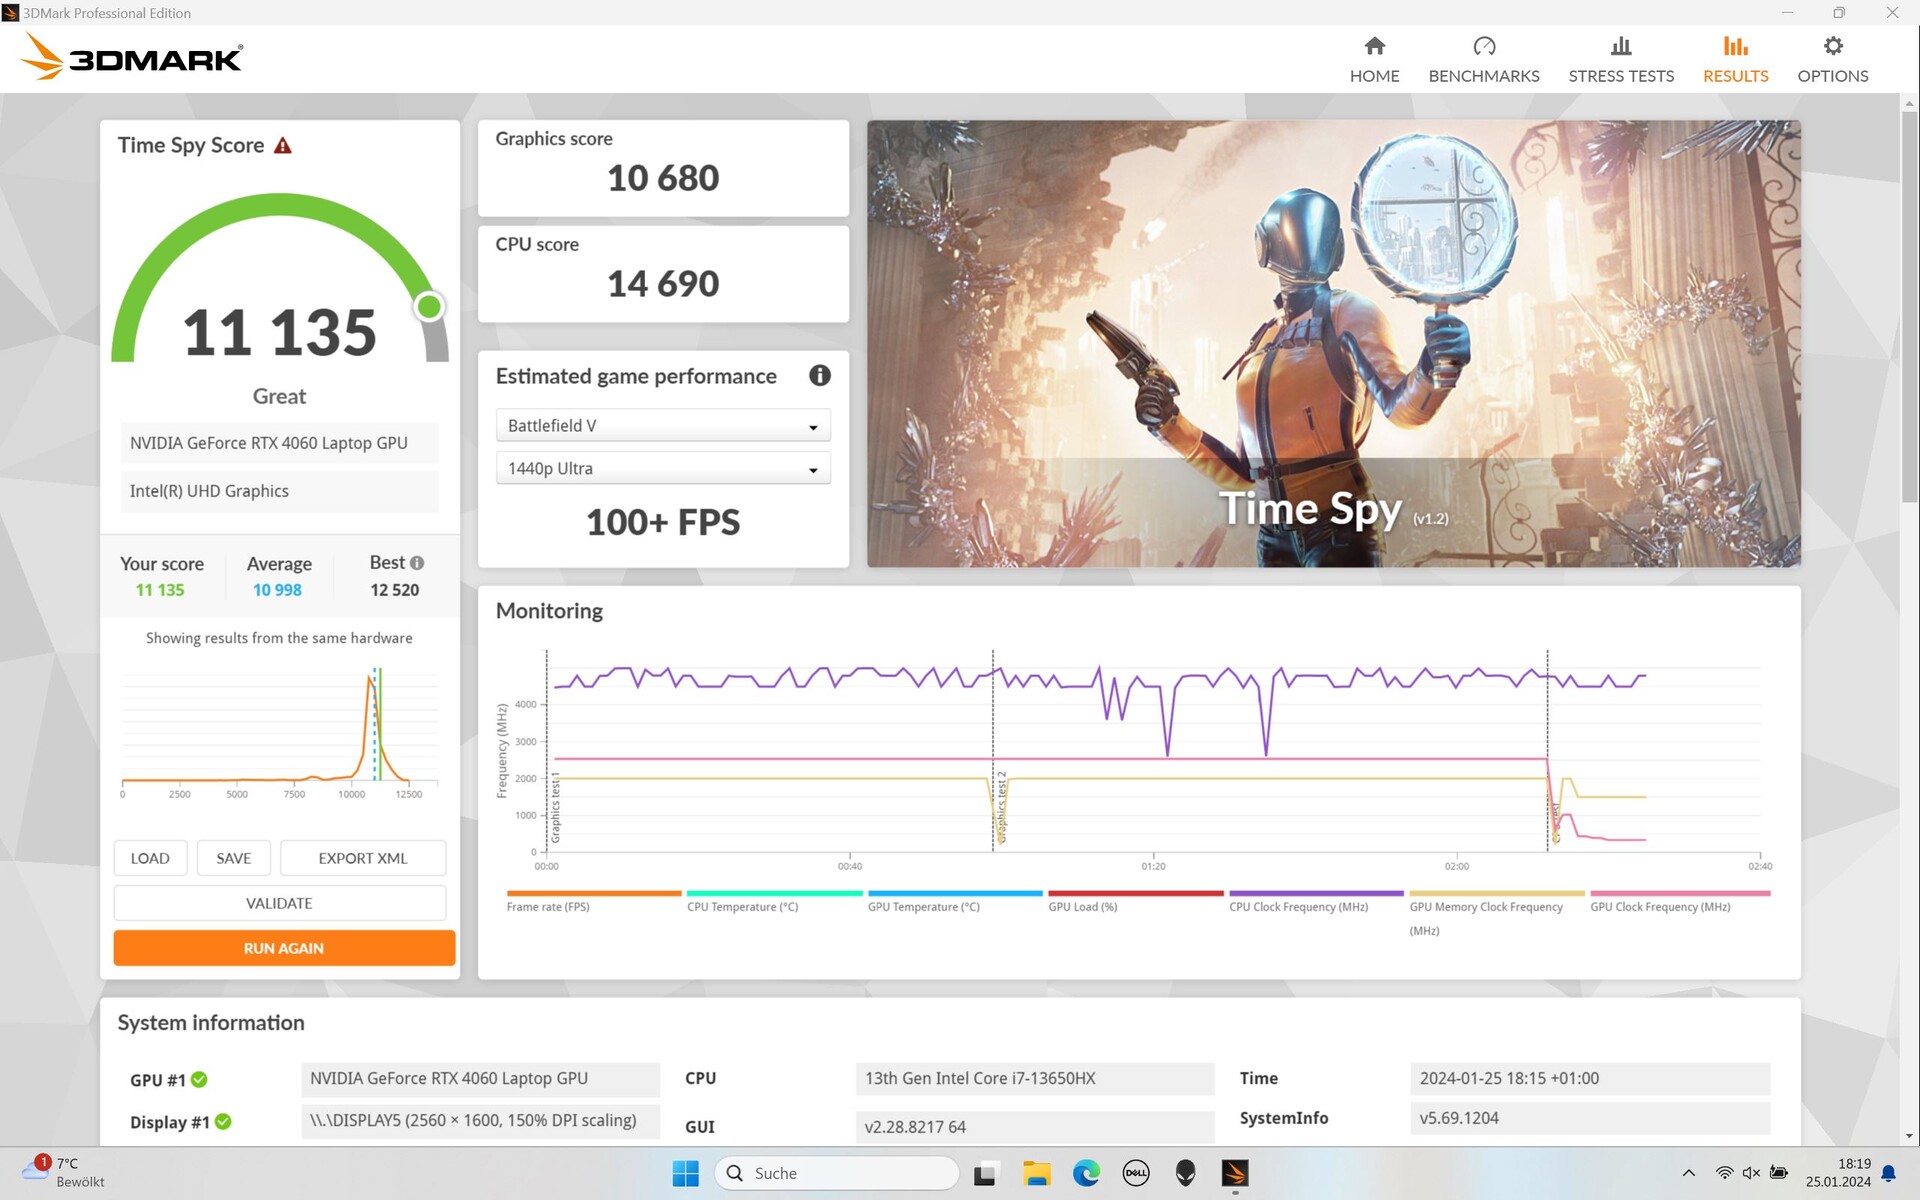
| 3DMark 11 Performance | 31722 puan | |
| 3DMark Cloud Gate Standard Score | 62309 puan | |
| 3DMark Fire Strike Score | 24764 puan | |
| 3DMark Time Spy Score | 11135 puan | |
Yardım | ||
* ... daha küçük daha iyidir
Oyun performansı
Kontrol paneli aracılığıyla oyun kıyaslamalarımız için yalnızca Nvidia-GPU modunu açtığımızda, belirli ayarların (ör. Witcher 3 Full HD Ultra, Strange Brigade QHD) Optimus veya otomatik moda göre önemli ölçüde daha düşük kare hızlarıyla sonuçlandığını fark ettik. Bu oldukça sıra dışı ve biraz hayal kırıklığına yol açabilir.
Aksi takdirde, dizüstü bilgisayarın oyun performansı hakkında şikayet edemeyiz. Karşılaştırma yapacak olursak, G16'mız MSI Raider bir i9-13950HX ve bir RTX 4060ama Alienware ve Lenovo LOQ hemen arkasından geliyor.
Sonuç olarak, mevcut tüm oyunlar Ultra ayarlar kullanılarak FHD'de 60 fps'nin üzerinde oynanabiliyor. Doğal 1.600p çözünürlüğü kullandığınızda, genellikle 60 fps'nin üzerinde bir değer elde edemezsiniz, ancak oyunlar yine de 40 fps'nin üzerinde sorunsuz çalışır.
| Performance rating - Percent | |
| Sınıf ortalaması Gaming | |
| MSI Raider GE68HX 13VF -1! | |
| Dell G16, i7-13650HX, RTX 4060 | |
| Lenovo LOQ 16IRH8 | |
| Alienware m16 R1 Intel -1! | |
| Dell G16 7620 | |
| Lenovo Legion Slim 5 16APH8 | |
| The Witcher 3 - 1920x1080 Ultra Graphics & Postprocessing (HBAO+) | |
| Sınıf ortalaması Gaming (104.7 - 240, n=6, son 2 yıl) | |
| Dell G16, i7-13650HX, RTX 4060 | |
| Alienware m16 R1 Intel | |
| Lenovo LOQ 16IRH8 | |
| MSI Raider GE68HX 13VF | |
| Lenovo Legion Slim 5 16APH8 | |
| Dell G16 7620 | |
| GTA V - 1920x1080 Highest AA:4xMSAA + FX AF:16x | |
| Sınıf ortalaması Gaming (48.3 - 186.9, n=94, son 2 yıl) | |
| Dell G16, i7-13650HX, RTX 4060 | |
| Lenovo LOQ 16IRH8 | |
| Dell G16 7620 | |
| Lenovo Legion Slim 5 16APH8 | |
| Final Fantasy XV Benchmark - 1920x1080 High Quality | |
| Sınıf ortalaması Gaming (41 - 215, n=95, son 2 yıl) | |
| Alienware m16 R1 Intel | |
| Dell G16, i7-13650HX, RTX 4060 | |
| MSI Raider GE68HX 13VF | |
| Lenovo LOQ 16IRH8 | |
| Lenovo Legion Slim 5 16APH8 | |
| Dell G16 7620 | |
| Strange Brigade - 1920x1080 ultra AA:ultra AF:16 | |
| Sınıf ortalaması Gaming (76.3 - 458, n=87, son 2 yıl) | |
| Dell G16, i7-13650HX, RTX 4060 | |
| MSI Raider GE68HX 13VF | |
| Alienware m16 R1 Intel | |
| Lenovo LOQ 16IRH8 | |
| Lenovo Legion Slim 5 16APH8 | |
| Dell G16 7620 | |
| Dota 2 Reborn - 1920x1080 ultra (3/3) best looking | |
| MSI Raider GE68HX 13VF | |
| Sınıf ortalaması Gaming (84.8 - 248, n=107, son 2 yıl) | |
| Alienware m16 R1 Intel | |
| Lenovo LOQ 16IRH8 | |
| Dell G16, i7-13650HX, RTX 4060 | |
| Dell G16 7620 | |
| Lenovo Legion Slim 5 16APH8 | |
| X-Plane 11.11 - 1920x1080 high (fps_test=3) | |
| MSI Raider GE68HX 13VF | |
| Alienware m16 R1 Intel | |
| Dell G16, i7-13650HX, RTX 4060 | |
| Lenovo LOQ 16IRH8 | |
| Dell G16 7620 | |
| Sınıf ortalaması Gaming (55.5 - 143.5, n=109, son 2 yıl) | |
| Lenovo Legion Slim 5 16APH8 | |
Witcher 3 Ultra ' da, G16'mız en iyi performansını sergiledi ve rakiplerinin kare hızlarını hafiften (Alienware) önemli ölçüde (Legion Slim 5, GPU otomatik) aştı.
Aşağıdaki tabloda Witcher 3 (FHD Ultra) fps değerlerinin yanı sıra üç performans moduna bağlı olarak gürültü emisyonu ve tüketim ölçümlerimiz listelenmektedir.
| Performans modu/değeri | fps başlangıç | fps ortalama | gürültü emisyonları | tüketim |
|---|---|---|---|---|
| Performans | 108 | 105,6 | 47,89 dB | 185 watt |
| Dengeli | 100 | 97,6 | 39 - 43 dB | 178 watt |
| Sessiz | 99 | 97,6 | 35,52 dB | 168 watt |
Witcher 3 FPS diagram
| düşük | orta | yüksek | ultra | QHD | 4K | |
|---|---|---|---|---|---|---|
| GTA V (2015) | 185.8 | 183.2 | 176.2 | 117.4 | 50.8 | |
| The Witcher 3 (2015) | 340.4 | 193.1 | 110 | 108 | 42.4 | |
| Dota 2 Reborn (2015) | 177 | 168.7 | 160.8 | 149 | 126.2 | |
| Final Fantasy XV Benchmark (2018) | 219 | 150.1 | 103.7 | 75.9 | ||
| X-Plane 11.11 (2018) | 160.4 | 144.6 | 114.9 | 119.6 | ||
| Far Cry 5 (2018) | 176 | 148 | 141 | 135 | 105 | |
| Strange Brigade (2018) | 478 | 291 | 228 | 194.9 | 129 | |
| Cyberpunk 2077 (2023) | 131.1 | 75.6 | 69.8 | 45.6 |
Emisyonlar - Oyun oynarken bile oldukça sessiz
Gürültü emisyonları
Boş modda, performans hariç tüm modlar kullanılırken fanlar kapalıdır. Ortalama yük senaryomuz olan 3DMark06'da, dizüstü bilgisayar boş modda olduğu gibi aynı gürültü emisyonlarına sahiptir(performans modu, yaklaşık 28 dB), bu nedenle fanlar daha hızlı dönmez.
Oyun oynarken ve tam yük altındayken bile Dell G16, 50 dB'nin çok altında rakiplerinden belirgin şekilde daha sessiz kalıyor, bu da büyük soğutma sisteminin işe yaradığı yer gibi görünüyor.
Ses yüksekliği
| Boşta |
| 23 / 23 / 27.96 dB |
| Çalışırken |
| 27.96 / 47.89 dB |
 | ||
30 dB sessiz 40 dB(A) duyulabilirlik 50 dB(A) gürültülü |
||
min: | ||
| Dell G16, i7-13650HX, RTX 4060 GeForce RTX 4060 Laptop GPU, i7-13650HX, WD PC SN740 SDDPNQD-1T00 | Dell G16 7620 GeForce RTX 3060 Laptop GPU, i7-12700H, WDC PC SN810 512GB | MSI Raider GE68HX 13VF GeForce RTX 4060 Laptop GPU, i9-13950HX, Samsung PM9B1 1024GB MZVL41T0HBLB | Lenovo Legion Slim 5 16APH8 GeForce RTX 4060 Laptop GPU, R7 7840HS, SK hynix PC801 HFS512GEJ9X115N | Alienware m16 R1 Intel GeForce RTX 4060 Laptop GPU, i7-13700HX, Kioxia KXG70ZNV512G | Lenovo LOQ 16IRH8 GeForce RTX 4060 Laptop GPU, i7-13620H, Solidigm SSDPFINW512GZL | |
|---|---|---|---|---|---|---|
| Noise | -10% | -26% | -6% | -19% | -16% | |
| kapalı / ortam * (dB) | 23 | 23.2 -1% | 23.3 -1% | 22.9 -0% | 25 -9% | 23 -0% |
| Idle Minimum * (dB) | 23 | 28.3 -23% | 25 -9% | 23.1 -0% | 25 -9% | 23 -0% |
| Idle Average * (dB) | 23 | 28.8 -25% | 31.3 -36% | 23.1 -0% | 26 -13% | 23 -0% |
| Idle Maximum * (dB) | 27.96 | 28.9 -3% | 37.5 -34% | 27.7 1% | 27 3% | 27.66 1% |
| Load Average * (dB) | 27.96 | 32.4 -16% | 44 -57% | 33.3 -19% | 52 -86% | 53.62 -92% |
| Witcher 3 ultra * (dB) | 47.89 | 48.3 -1% | 57 -19% | 54 -13% | 51 -6% | 53.5 -12% |
| Load Maximum * (dB) | 47.89 | 48.1 -0% | 60.1 -25% | 54 -13% | 53 -11% | 53.5 -12% |
* ... daha küçük daha iyidir
Sıcaklık
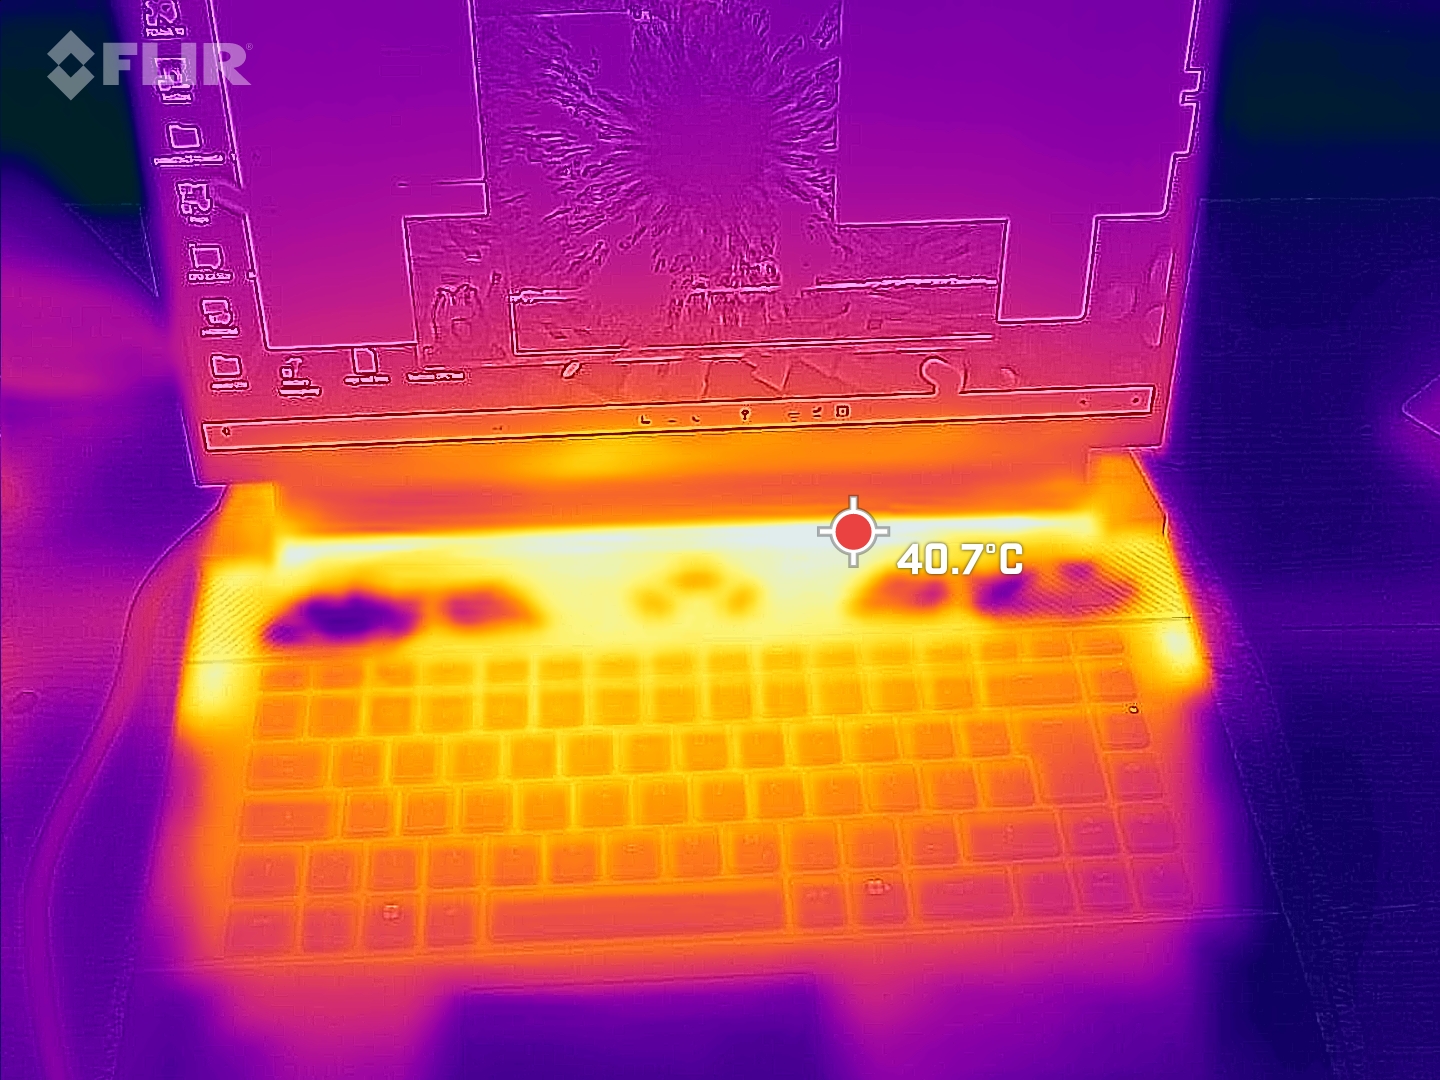
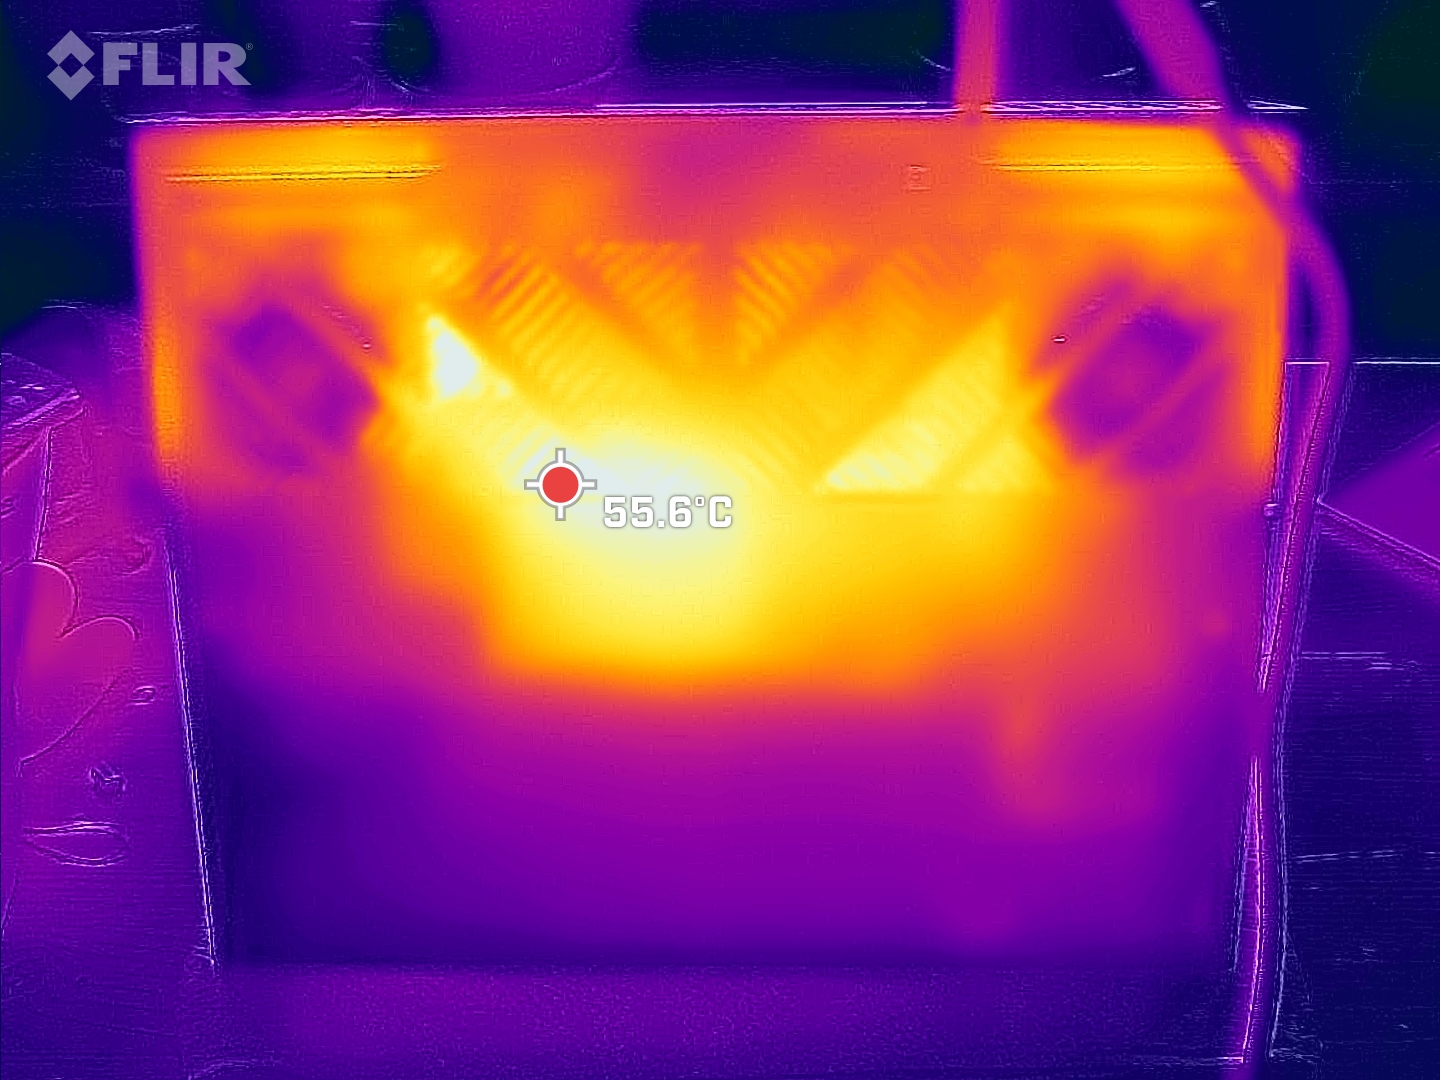
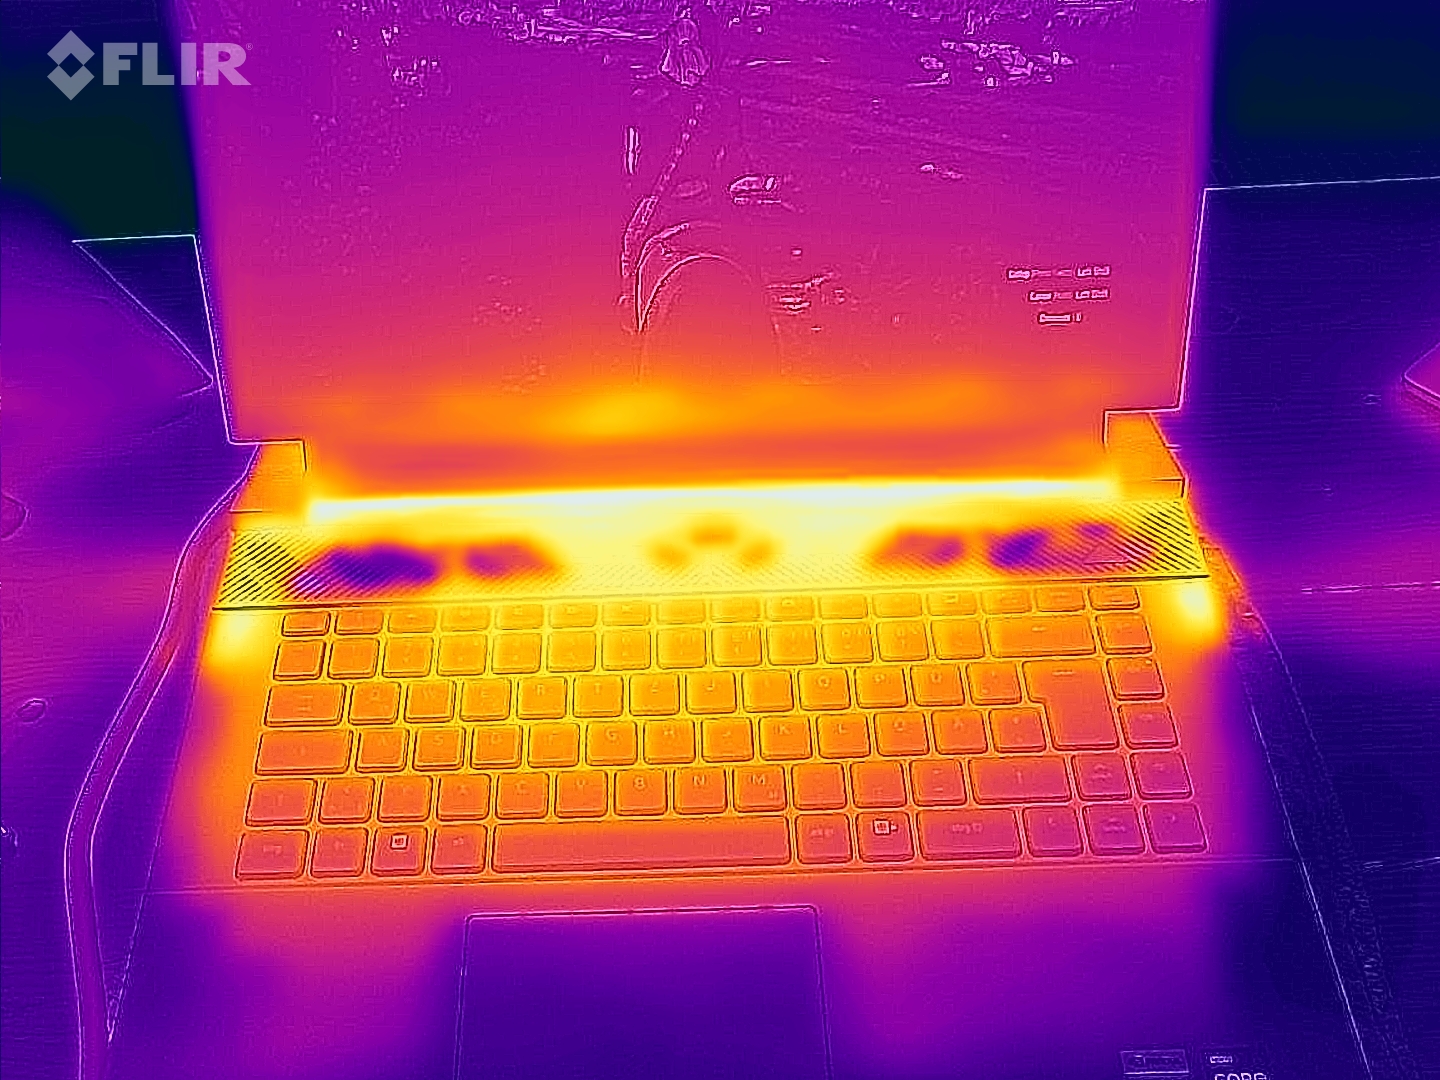
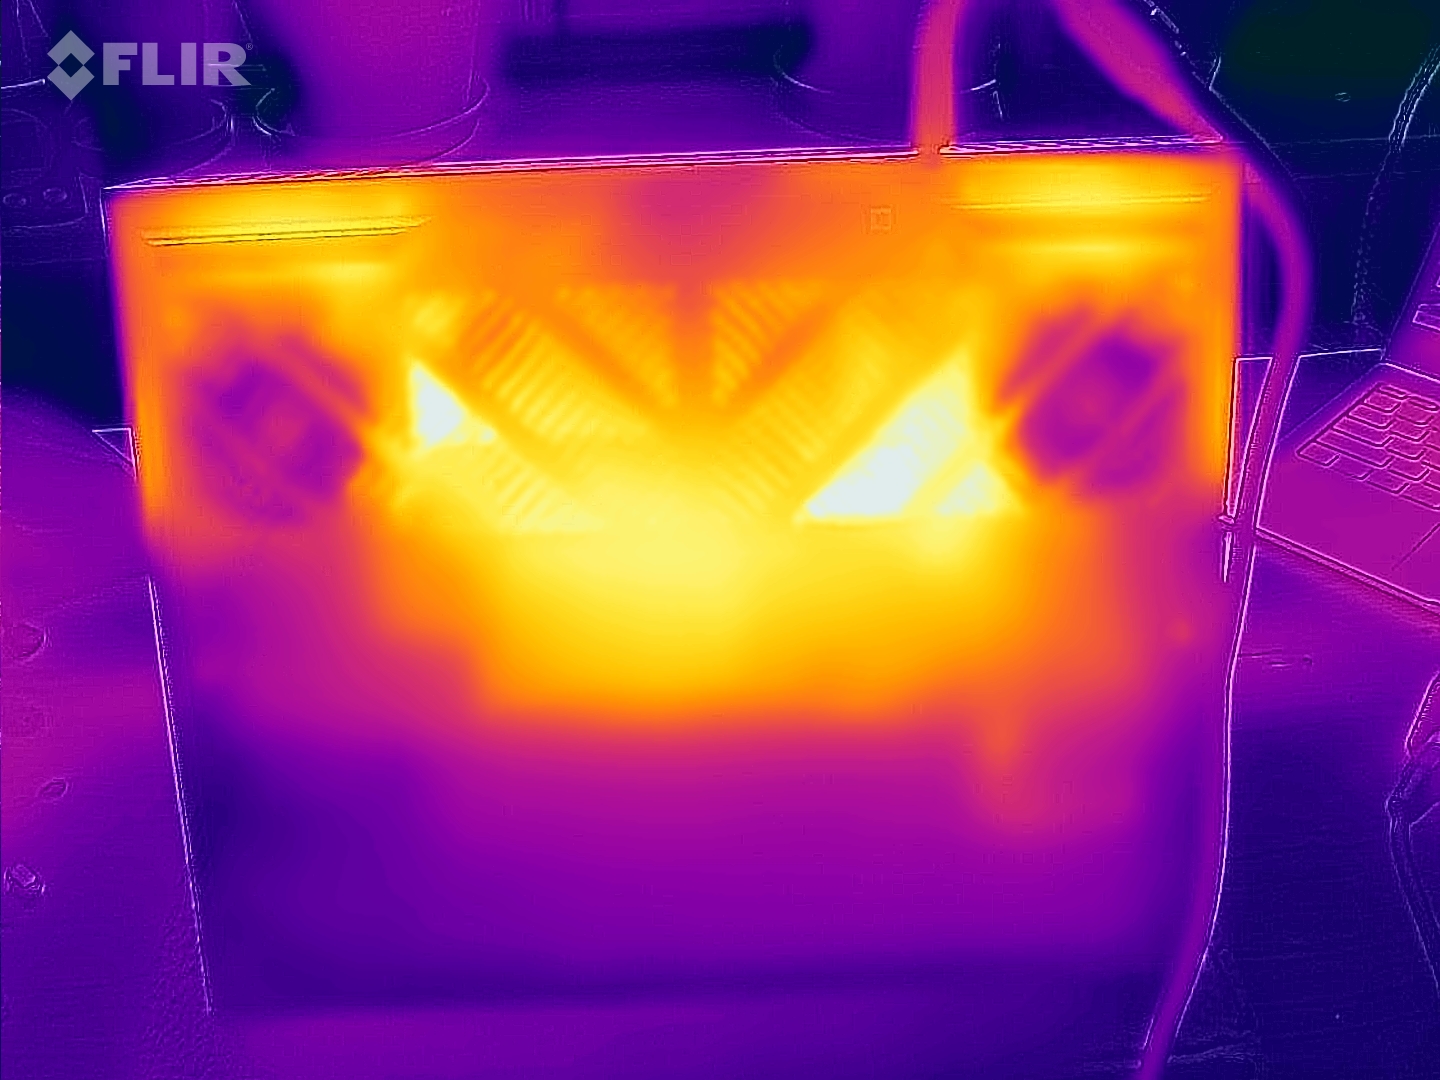
Bununla birlikte, cihazın nispeten düşük gürültü emisyonları da bazı küçük dezavantajlara sahiptir. G16'nın yüzeyi rakiplerine göre daha fazla ısınma eğilimindedir. Maksimum yük altında alt tarafta 58 °C'ye varan sıcak noktalar ölçtük! Sadece Lenovo LOQ 16 ve G16'nın selefi benzer şekilde ısınırken, diğer karşılaştırma cihazları 50 °C'nin hemen altında kalıyor. En azından avuç içi dayanakları her zaman serin ve WASD tuşlarını çevreleyen alan da kabul edilebilir bir aralıkta kalıyor.
(-) Üst taraftaki maksimum sıcaklık, 40.4 °C / 105 F ortalamasına kıyasla 49 °C / 120 F'dir. , Gaming sınıfı için 21.2 ile 68.8 °C arasında değişir.
(-) Alt kısım, 43.2 °C / 110 F ortalamasına kıyasla maksimum 58 °C / 136 F'ye kadar ısınır
(+) Boşta kullanımda, üst tarafın ortalama sıcaklığı 30 °C / 86 F olup, cihazın 33.9 °C / 93 F.
(±) The Witcher 3 oynarken, üst tarafın ortalama sıcaklığı 34.4 °C / 94 F olup, cihazın 33.9 °C / 93 F.
(+) Avuç içi dayanakları ve dokunmatik yüzey, maksimum 25 °C / 77 F ile cilt sıcaklığından daha soğuktur ve bu nedenle dokunulduğunda soğuktur.
(+) Benzer cihazların avuç içi dayanağı alanının ortalama sıcaklığı 28.8 °C / 83.8 F (+3.8 °C / 6.8 F) idi.
| Dell G16, i7-13650HX, RTX 4060 Intel Core i7-13650HX, NVIDIA GeForce RTX 4060 Laptop GPU | Dell G16 7620 Intel Core i7-12700H, NVIDIA GeForce RTX 3060 Laptop GPU | MSI Raider GE68HX 13VF Intel Core i9-13950HX, NVIDIA GeForce RTX 4060 Laptop GPU | Lenovo Legion Slim 5 16APH8 AMD Ryzen 7 7840HS, NVIDIA GeForce RTX 4060 Laptop GPU | Alienware m16 R1 Intel Intel Core i7-13700HX, NVIDIA GeForce RTX 4060 Laptop GPU | Lenovo LOQ 16IRH8 Intel Core i7-13620H, NVIDIA GeForce RTX 4060 Laptop GPU | |
|---|---|---|---|---|---|---|
| Heat | 19% | 16% | 23% | -2% | 10% | |
| Maximum Upper Side * (°C) | 49 | 47.6 3% | 41.4 16% | 40.6 17% | 49 -0% | 48 2% |
| Maximum Bottom * (°C) | 58 | 54 7% | 45.4 22% | 42 28% | 48 17% | 59 -2% |
| Idle Upper Side * (°C) | 35 | 23 34% | 29.8 15% | 27.8 21% | 40 -14% | 28 20% |
| Idle Bottom * (°C) | 35 | 24.6 30% | 31.4 10% | 26.6 24% | 39 -11% | 28 20% |
* ... daha küçük daha iyidir
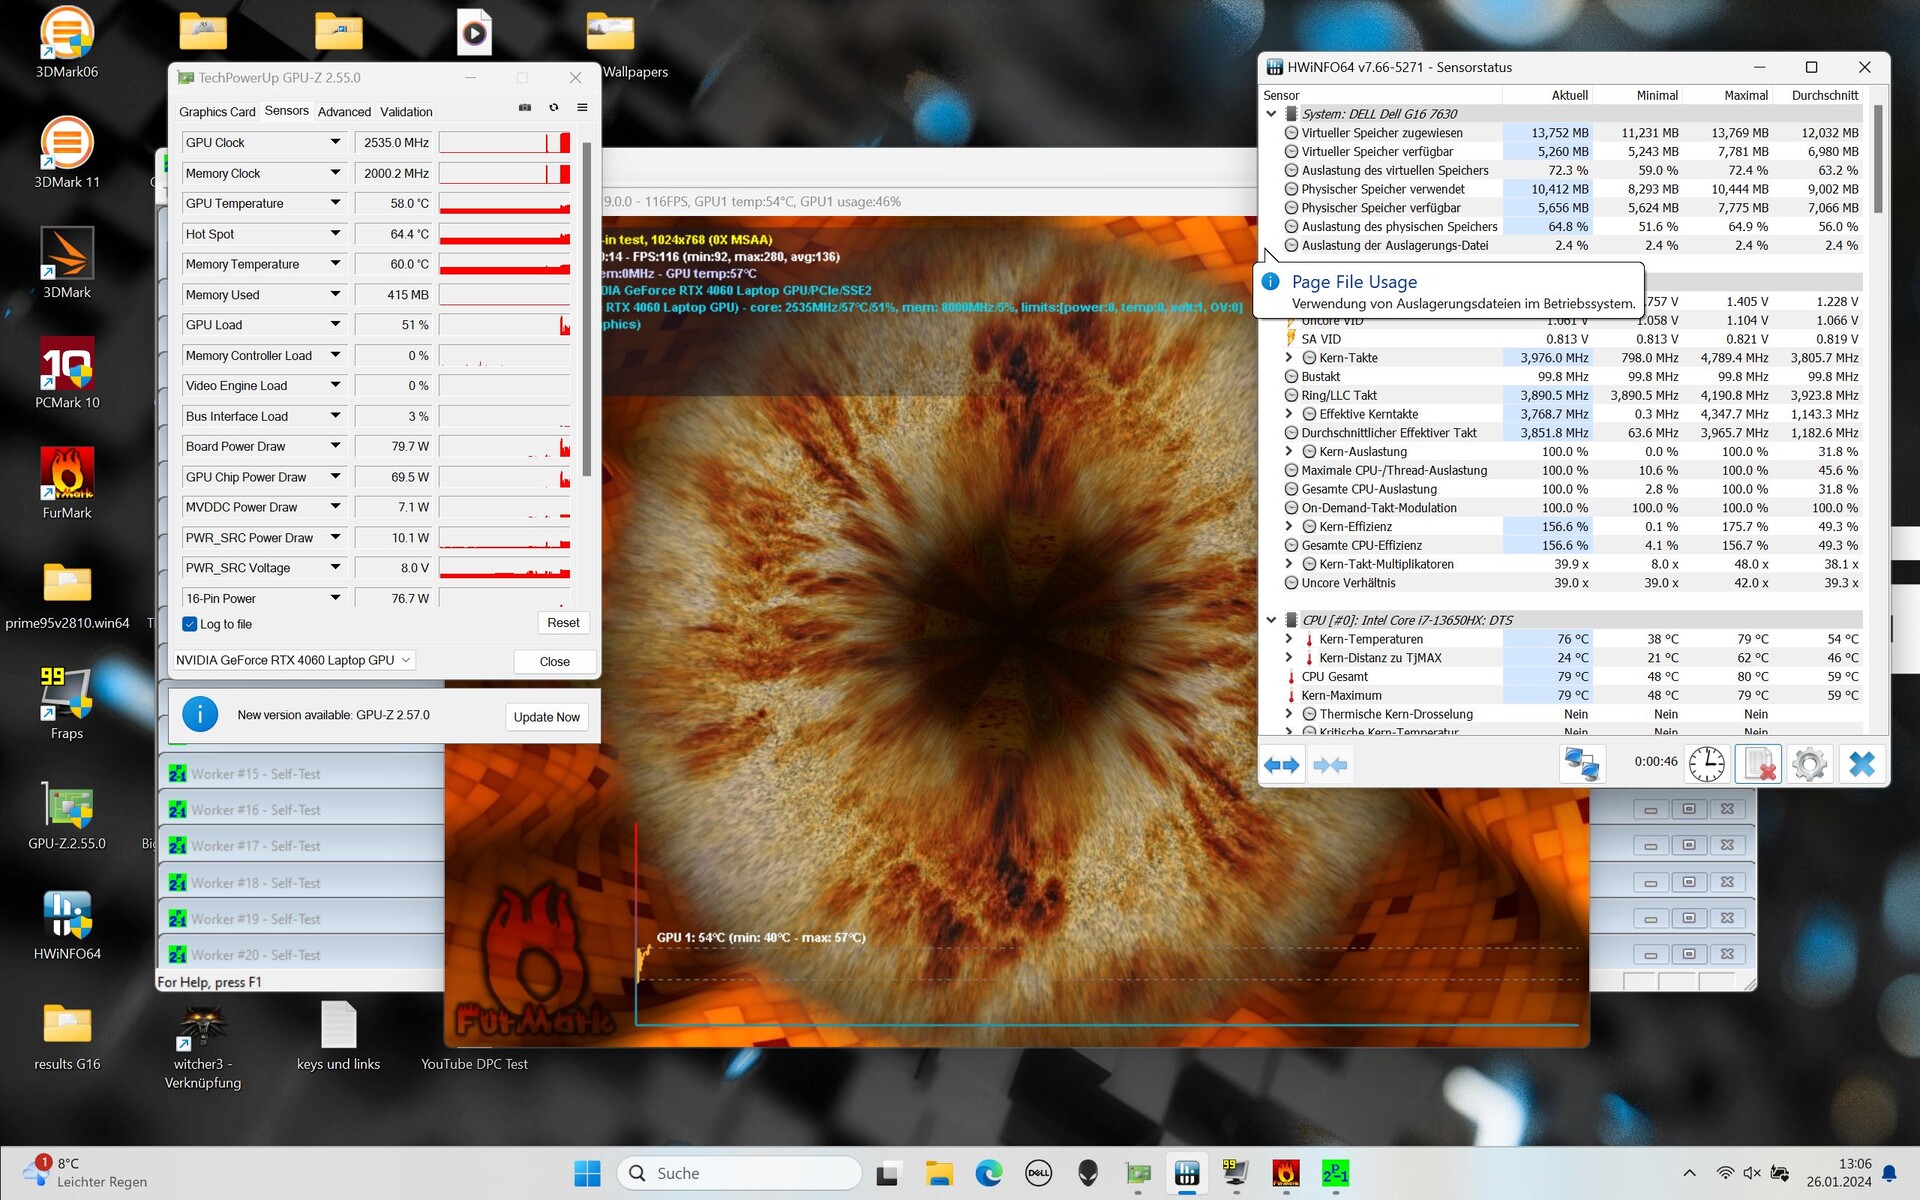
Stres testi
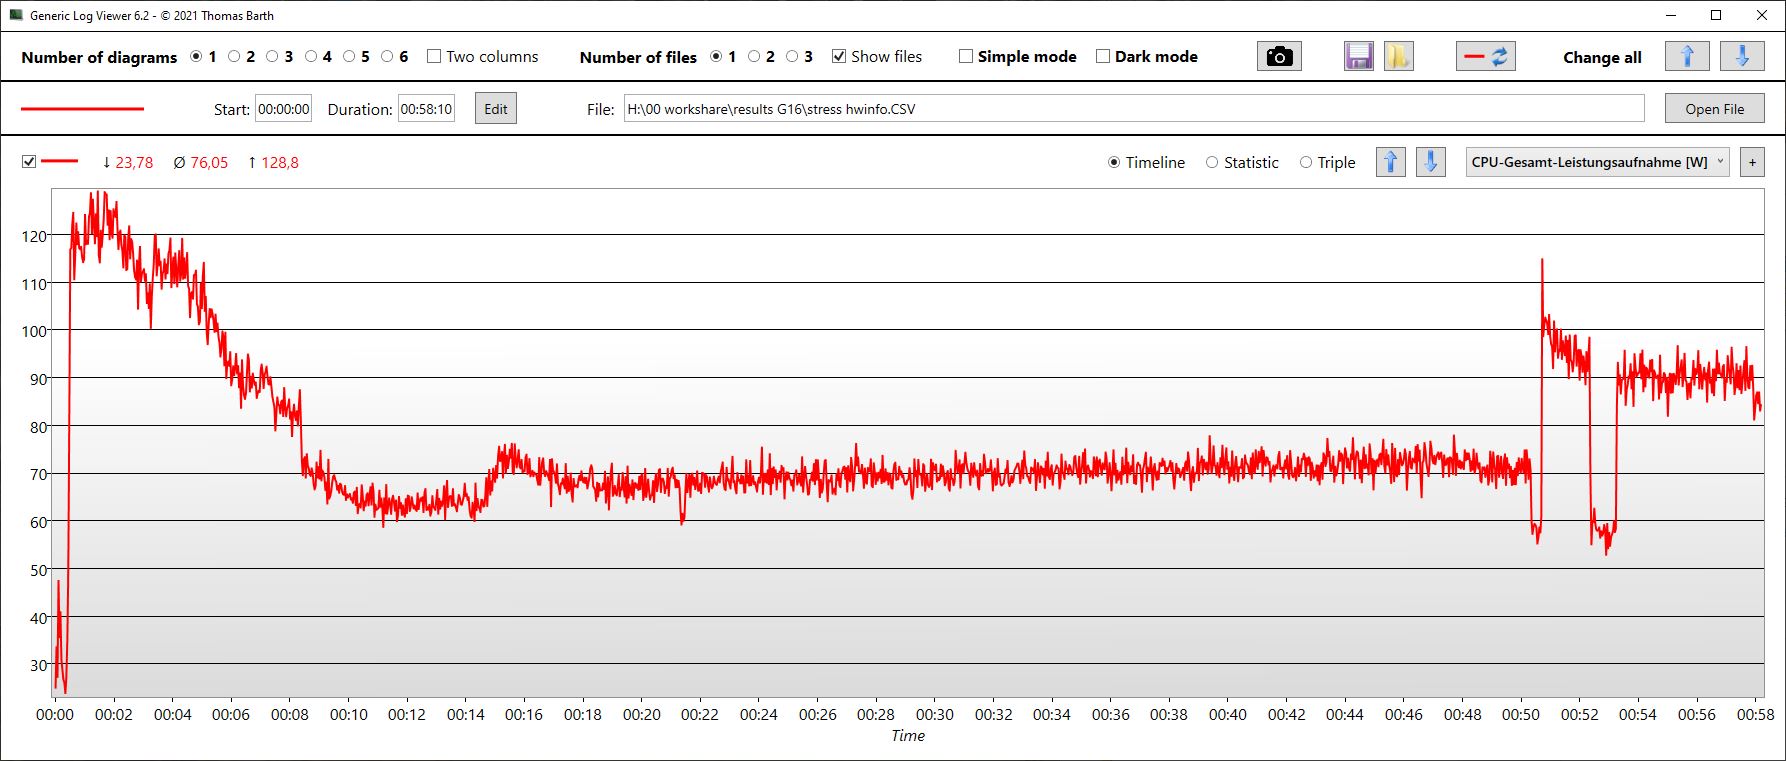
Stres testi sırasında çekirdekler kısa süreliğine 4,1 GHz'e kadar hızlandı. Ne yazık ki bu durum CPU'nun 100 °C'ye kadar ısınmasına neden olmuş, bunun üzerine cihazın güç tüketimi orijinal 128 watt'tan düşerek yaklaşık 70 watt'ta sabitlenmiştir. CPU saat hızı yaklaşık 2,9 GHz'de ve sıcaklıklar yaklaşık 85 °C'de sabitlendi.
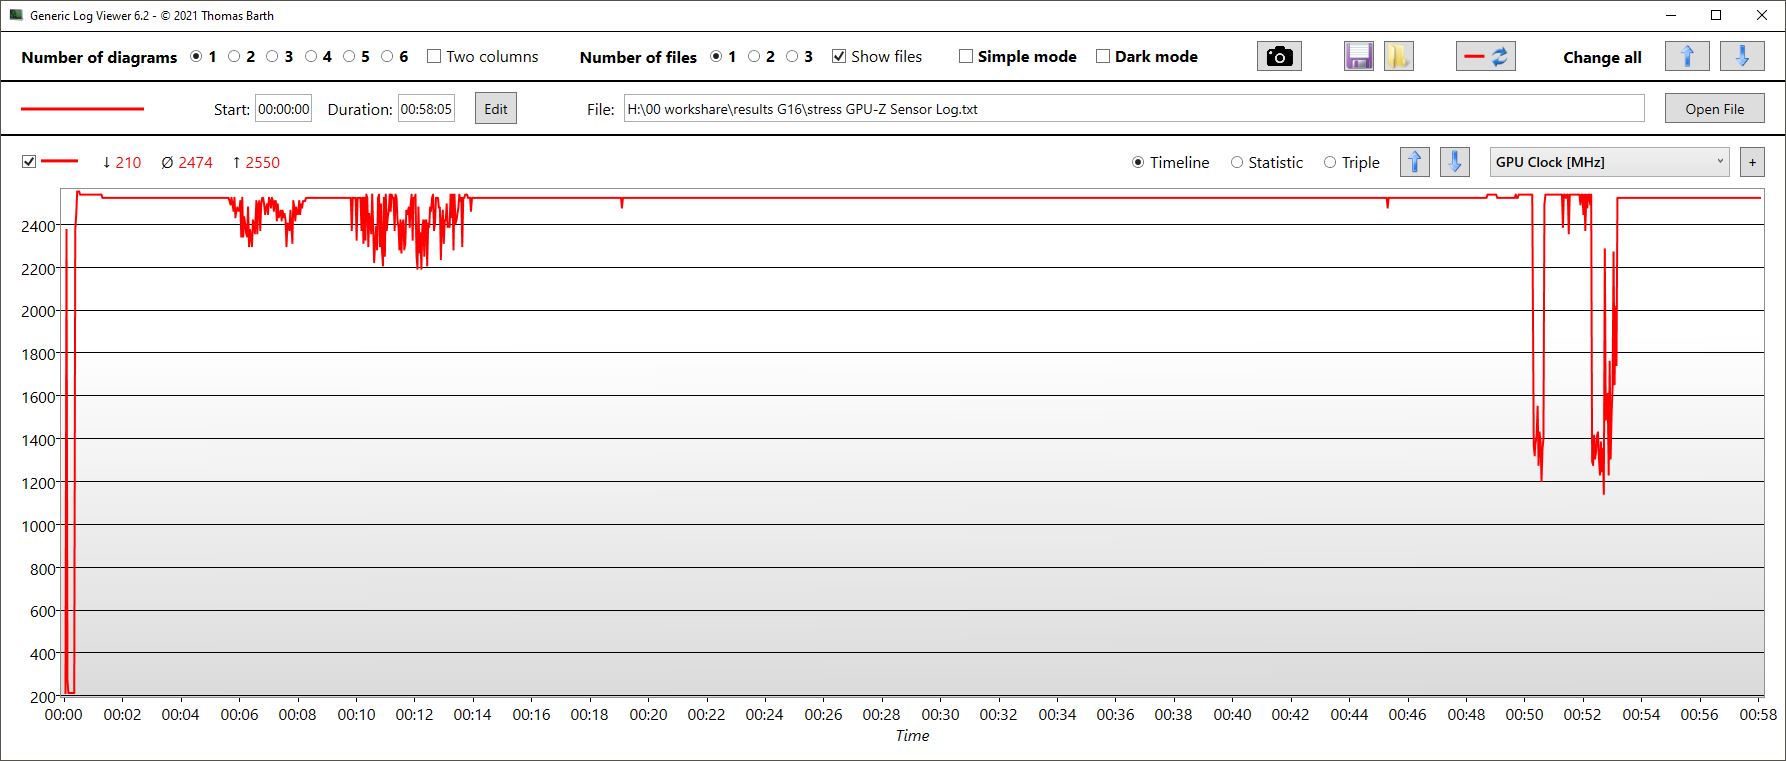
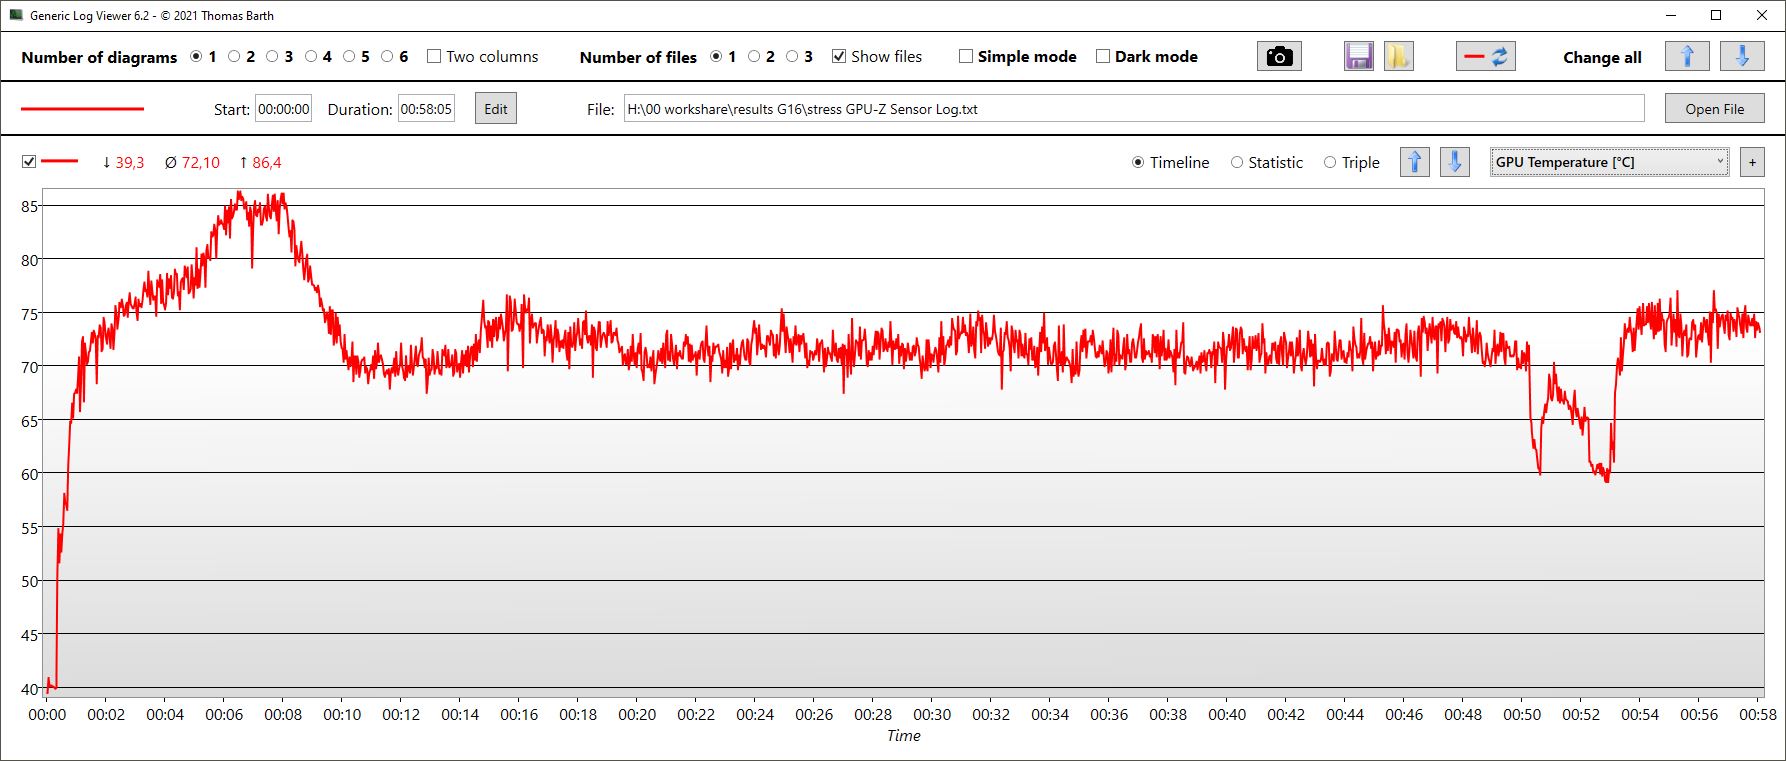
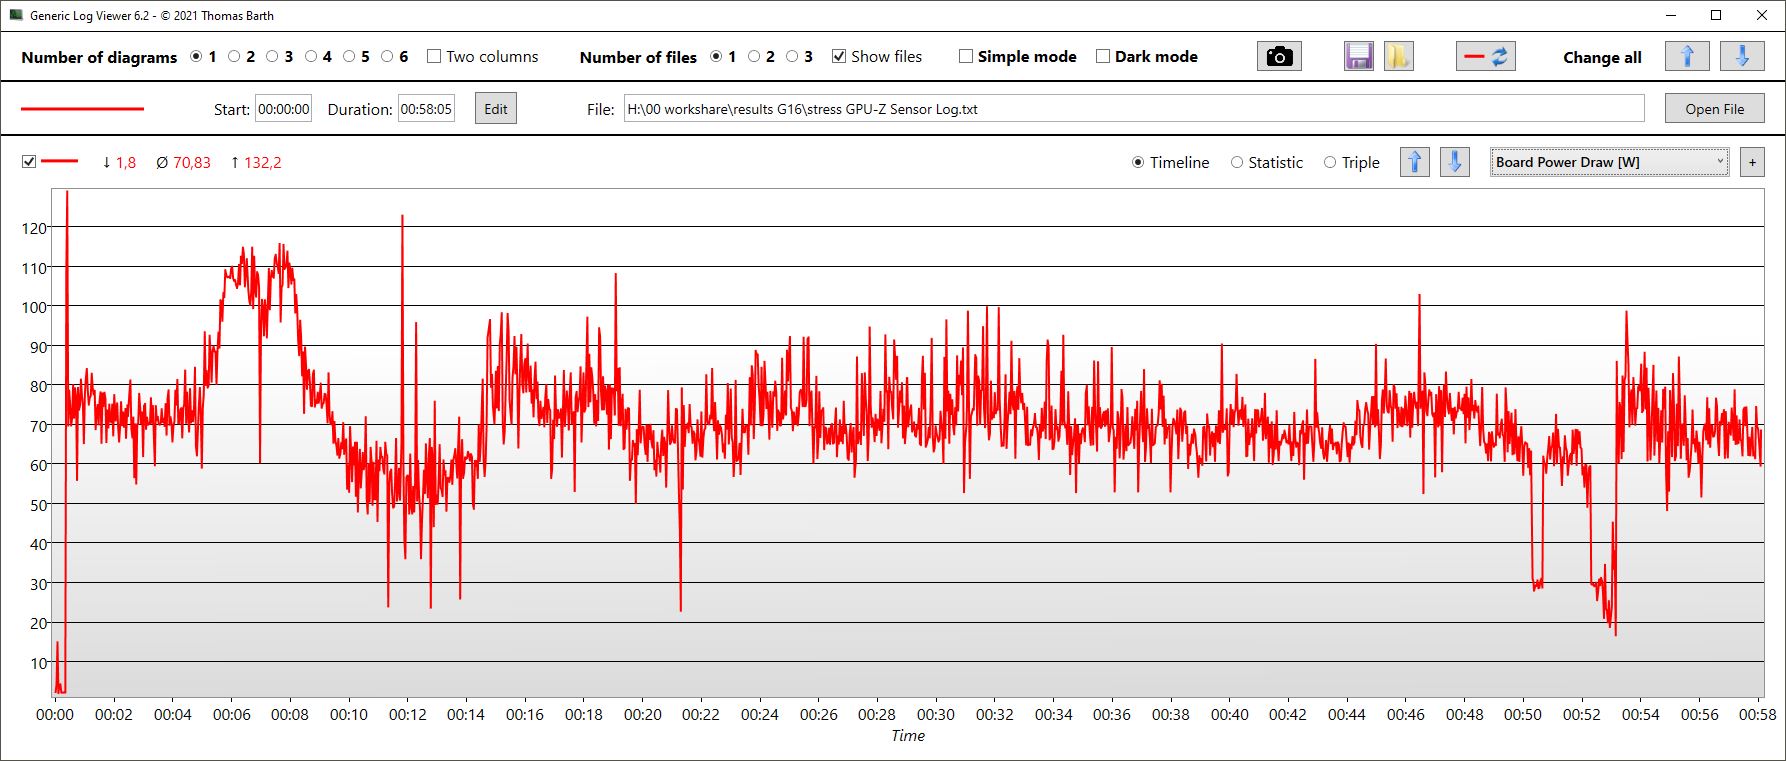
Buna karşılık, GPU saat hızları tüm çalışma süresi boyunca 2,4 ila 2,5 GHz civarında oldukça sabit kaldı. Aynı durum bellek saati (2 GHz) için de geçerlidir. Çip sıcaklığı yaklaşık 72 °C'de dengelendi ve ortalama güç tüketimi 71 watt oldu.
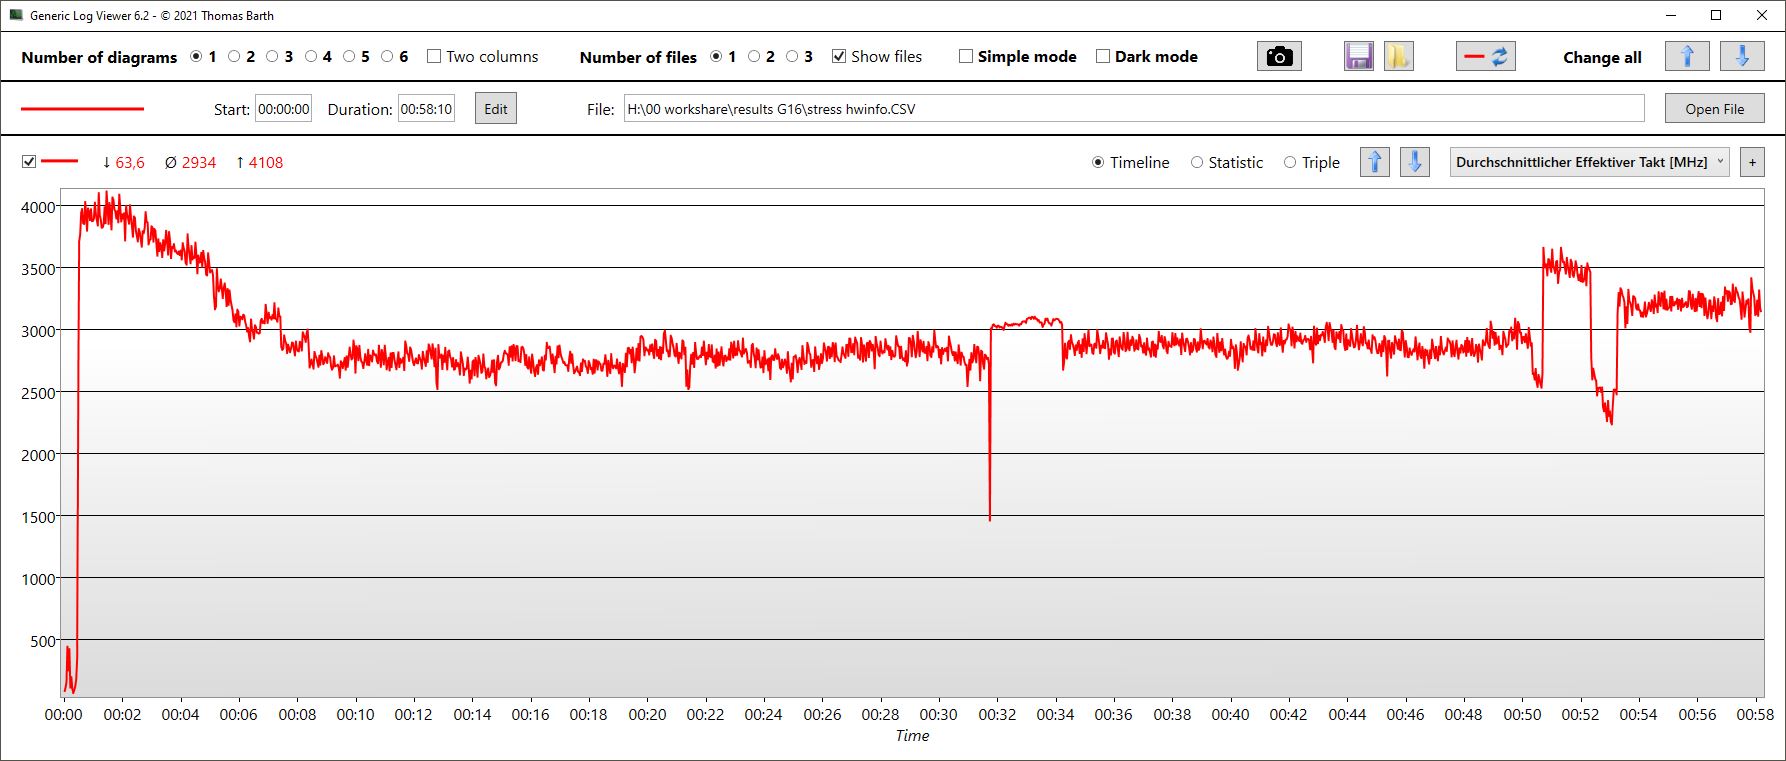
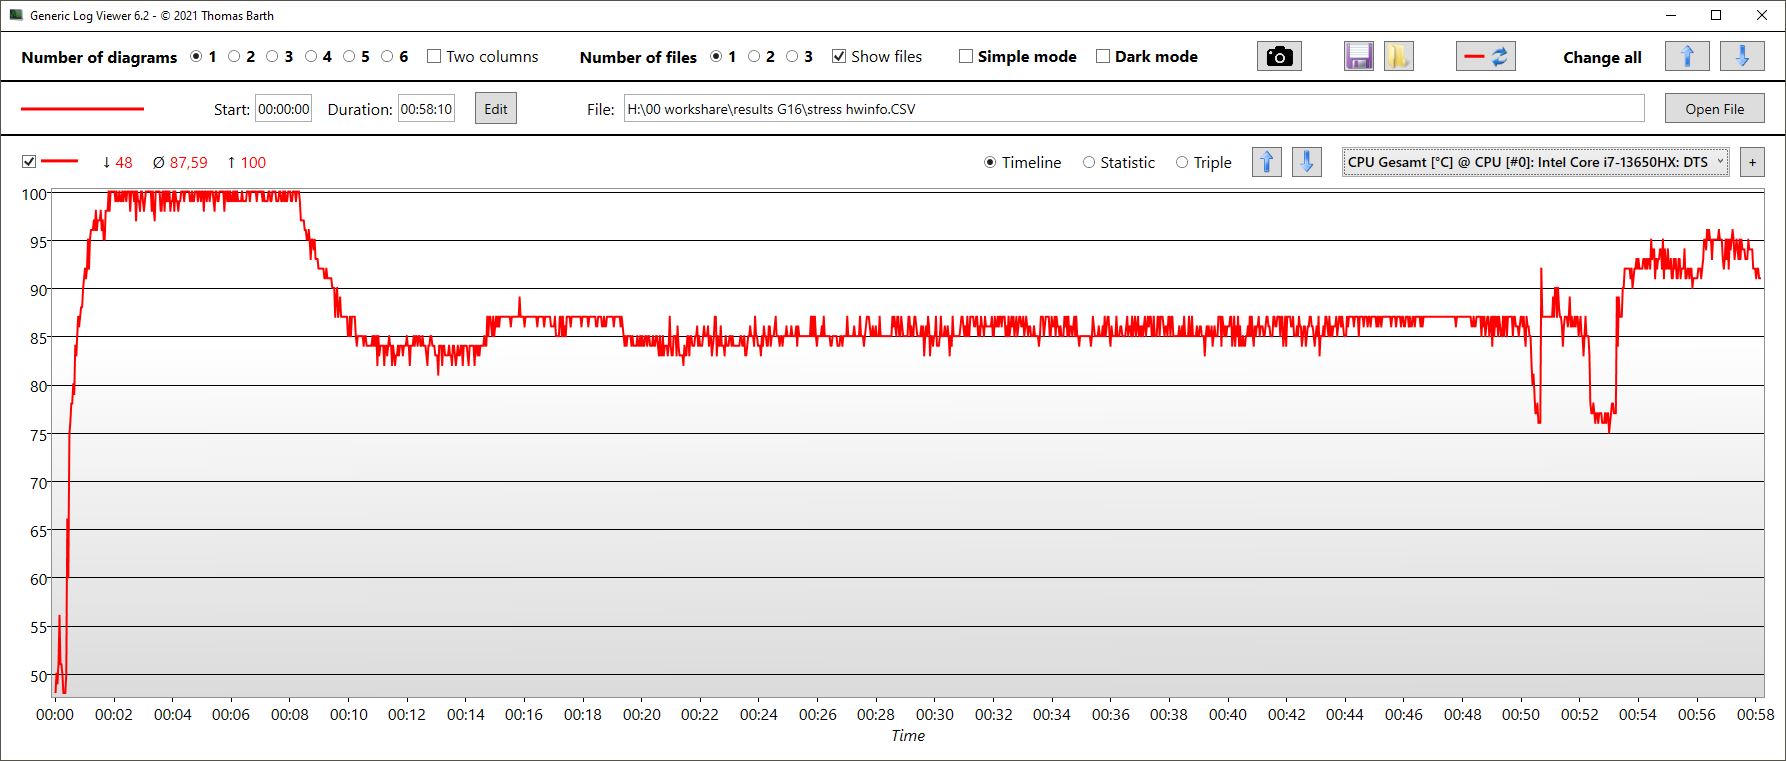
| CPU Saati (GHz) | GPU Saati (MHz) | Ortalama CPU Sıcaklığı (°C) | Ortalama GPU Sıcaklığı (°C) | |
| Prime95 + FurMark Stres | 2.9 | 2,490 | 85 | 72 |
| Witcher 3 Stres | 0,538 | 2.500 | 81 | 73 |
Konuşmacılar
Dizüstü bilgisayarın stereo hoparlörleri en iyisi değil: Neredeyse hiç bas yok, çok sessiz olma eğilimindeler ve hatta orta ve yüksek sesler çok dengeli veya doğrusal değil. Analog ses bağlantısı olarak sadece 3,5 mm kulaklık bağlantısı mevcut.
Dell G16, i7-13650HX, RTX 4060 ses analizi
(±) | hoparlör ses yüksekliği ortalama ama iyi (80.55 dB)
Bas 100 - 315Hz
(-) | neredeyse hiç bas yok - ortalama olarak medyandan 25.1% daha düşük
(-) | bas doğrusal değildir (18.9% delta ile önceki frekans)
Ortalar 400 - 2000 Hz
(±) | daha yüksek ortalar - ortalama olarak medyandan 8% daha yüksek
(+) | orta frekanslar doğrusaldır (5.9% deltadan önceki frekansa)
Yüksekler 2 - 16 kHz
(+) | dengeli yüksekler - medyandan yalnızca 3.5% uzakta
(±) | Yükseklerin doğrusallığı ortalamadır (8.6% delta - önceki frekans)
Toplam 100 - 16.000 Hz
(±) | Genel sesin doğrusallığı ortalamadır (23.4% ortancaya göre fark)
Aynı sınıfla karşılaştırıldığında
» Bu sınıftaki tüm test edilen cihazların %85%'si daha iyi, 5% benzer, 11% daha kötüydü
» En iyisinin deltası 6% idi, ortalama 18% idi, en kötüsü 132% idi
Test edilen tüm cihazlarla karşılaştırıldığında
» Test edilen tüm cihazların %70'si daha iyi, 6 benzer, % 24 daha kötüydü
» En iyisinin deltası 4% idi, ortalama 23% idi, en kötüsü 134% idi
Apple MacBook Pro 16 2021 M1 Pro ses analizi
(+) | hoparlörler nispeten yüksek sesle çalabilir (84.7 dB)
Bas 100 - 315Hz
(+) | iyi bas - medyandan yalnızca 3.8% uzakta
(+) | bas doğrusaldır (5.2% delta ile önceki frekans)
Ortalar 400 - 2000 Hz
(+) | dengeli ortalar - medyandan yalnızca 1.3% uzakta
(+) | orta frekanslar doğrusaldır (2.1% deltadan önceki frekansa)
Yüksekler 2 - 16 kHz
(+) | dengeli yüksekler - medyandan yalnızca 1.9% uzakta
(+) | yüksekler doğrusaldır (2.7% deltadan önceki frekansa)
Toplam 100 - 16.000 Hz
(+) | genel ses doğrusaldır (4.6% ortancaya göre fark)
Aynı sınıfla karşılaştırıldığında
» Bu sınıftaki tüm test edilen cihazların %0%'si daha iyi, 0% benzer, 100% daha kötüydü
» En iyisinin deltası 5% idi, ortalama 17% idi, en kötüsü 45% idi
Test edilen tüm cihazlarla karşılaştırıldığında
» Test edilen tüm cihazların %0'si daha iyi, 0 benzer, % 100 daha kötüydü
» En iyisinin deltası 4% idi, ortalama 23% idi, en kötüsü 134% idi
Güç yönetimi - Dell G16 sınıf ortalamasında sonuçlar elde ediyor
Güç tüketimi
Performansıyla kıyaslandığında G16'nın tüketimi gayet iyi. Genel olarak, cihaz daha da verimli hale geldi. Artık özellikle boştayken selefinden daha az tüketiyor. Oyun oynarken ise sadece %5 daha fazla tüketiyor ve aynı anda yaklaşık %14 performans artışı sağlıyor.
Oyun oynarken, benzer şekilde hızlı Alienware ve MSI Raider neredeyse aynı miktarda, yani The Witcher 3 oynarken ortalama 185 watt tüketiyor. Kısa vadeli maksimum tüketimi 255 watt.
Bunu akılda tutarak, Dell'in RTX 4060'lı G16'ya 330 watt'lık devasa, hantal ve ağır bir güç kaynağı dahil etmesi çok şaşırtıcı. Bu, takılan donanım için tamamen aşırı büyük. Muhtemelen Dell, i9-13900HX ve RTX 4070 için de donanımlı olması için aynı güç kaynağını tüm konfigürasyonlarla birlikte gönderiyor. Daha küçük, daha hafif bir güç kaynağı ünitesi bu modeli satın alan müşteriler için daha uygun olurdu.
| Kapalı / Bekleme modu | |
| Boşta | |
| Çalışırken |
|
Key:
min: | |
| Dell G16, i7-13650HX, RTX 4060 i7-13650HX, GeForce RTX 4060 Laptop GPU, WD PC SN740 SDDPNQD-1T00, IPS, 2560x1600, 16" | Dell G16 7620 i7-12700H, GeForce RTX 3060 Laptop GPU, WDC PC SN810 512GB, IPS, 2560x1600, 16" | MSI Raider GE68HX 13VF i9-13950HX, GeForce RTX 4060 Laptop GPU, Samsung PM9B1 1024GB MZVL41T0HBLB, IPS, 1900x1200, 16" | Lenovo Legion Slim 5 16APH8 R7 7840HS, GeForce RTX 4060 Laptop GPU, SK hynix PC801 HFS512GEJ9X115N, IPS, 2560x1600, 16" | Alienware m16 R1 Intel i7-13700HX, GeForce RTX 4060 Laptop GPU, Kioxia KXG70ZNV512G, IPS, 2560x1600, 16" | Lenovo LOQ 16IRH8 i7-13620H, GeForce RTX 4060 Laptop GPU, Solidigm SSDPFINW512GZL, IPS, 2560x1600, 16" | Ortalama NVIDIA GeForce RTX 4060 Laptop GPU | Sınıf ortalaması Gaming | |
|---|---|---|---|---|---|---|---|---|
| Power Consumption | -21% | -32% | 9% | -9% | -12% | -1% | -19% | |
| Idle Minimum * (Watt) | 11 | 14.4 -31% | 15.8 -44% | 9.4 15% | 10 9% | 17.2 -56% | 11.5 ? -5% | 13 ? -18% |
| Idle Average * (Watt) | 14.8 | 17.8 -20% | 19.4 -31% | 15.5 -5% | 14 5% | 19.3 -30% | 16 ? -8% | 18.7 ? -26% |
| Idle Maximum * (Watt) | 16.8 | 31.5 -88% | 27.3 -63% | 24.4 -45% | 21 -25% | 21.2 -26% | 20.3 ? -21% | 24.3 ? -45% |
| Load Average * (Watt) | 103.7 | 101.2 2% | 114.7 -11% | 74.1 29% | 119 -15% | 90 13% | 92.9 ? 10% | 110.2 ? -6% |
| Witcher 3 ultra * (Watt) | 185 | 176.9 4% | 185.5 -0% | 112.9 39% | 186.7 -1% | 168 9% | ||
| Load Maximum * (Watt) | 255 | 242.9 5% | 364.2 -43% | 206.5 19% | 323 -27% | 211 17% | 210 ? 18% | 258 ? -1% |
* ... daha küçük daha iyidir
Power consumption Witcher 3 / stress test
Power consumption with external monitor
Çalışma Zamanları
Dell dizüstü bilgisayara 86 Wh'lik bir pil yerleştirmiştir. Rakipleri de benzer donanıma sahip. Bu, G16'nın internette gezinirken veya video izlerken yaklaşık 5,5 saat (maksimum parlaklık) ila neredeyse 6,5 saat (150 nit) çalışma süreleri elde etmesi için yeterlidir. Bu, Dell oyuncusunu sınıf ortalaması hakkında yapar.
| Dell G16, i7-13650HX, RTX 4060 i7-13650HX, GeForce RTX 4060 Laptop GPU, 86 Wh | Dell G16 7620 i7-12700H, GeForce RTX 3060 Laptop GPU, 84 Wh | MSI Raider GE68HX 13VF i9-13950HX, GeForce RTX 4060 Laptop GPU, 99.9 Wh | Lenovo Legion Slim 5 16APH8 R7 7840HS, GeForce RTX 4060 Laptop GPU, 80 Wh | Alienware m16 R1 Intel i7-13700HX, GeForce RTX 4060 Laptop GPU, 86 Wh | Lenovo LOQ 16IRH8 i7-13620H, GeForce RTX 4060 Laptop GPU, 80 Wh | Sınıf ortalaması Gaming | |
|---|---|---|---|---|---|---|---|
| Pil Çalışma Süresi | -34% | 23% | 3% | -20% | 5% | 20% | |
| H.264 (h) | 6.4 | 5.6 -13% | 6.4 0% | 8.32 ? 30% | |||
| WiFi v1.3 (h) | 6.3 | 5 -21% | 6.8 8% | 7.1 13% | 4.8 -24% | 6.3 0% | 7.11 ? 13% |
| Load (h) | 1.3 | 0.7 -46% | 1.8 38% | 1.2 -8% | 1 -23% | 1.5 15% | 1.502 ? 16% |
| Reader / Idle (h) | 7.1 | 8.8 | 11.7 | 6.4 | 8.16 ? |
Artılar
Eksiler
Karar - Bazı küçük sorunlarla birlikte uygun fiyatlı Alienware alternatifi
Dell G16 7630, Dell'in Alienware serisinden biraz daha şık ve daha uygun fiyatlı görünüyor. Performansı hala iyi ve çok olumlu bir yönü de oyun oynarken birçok rakibine kıyasla ne kadar sessiz kaldığı.
Dell, özellikle web kamerası ve yapısı söz konusu olduğunda, bütçesi kısıtlı müşteriler için büyük olasılıkla katlanılabilir, ancak yine de zaman zaman can sıkıcı olan bazı tasarruflar yaptı: Örnekler arasında dizüstü bilgisayarın güç bağlantısının cihaz hareket ettiğinde yavaş yavaş kayması, hantal ve ağır güç kaynağı veya yalnızca i9-13900HX ve bir RTX 4070 thunderbolt'u destekler. Test örneğimiz bir i7-13650H ve bir RTX 4060öte yandan, kılavuzda yalnızca renk alanları ve yenileme hızları açısından farklılık gösteren iki farklı ekran türü de müşteriler için şeffaflıktan yoksundur.
Dell G16 7630, iyi performans ve sessiz çalışmadan yararlanan oldukça büyük ve ağır bir orta sınıf oyun dizüstü bilgisayarıdır. Bağlanabilirlik ve yapı söz konusu olduğunda, Dell daha cömert davranabilirdi.
Daha şık ve daha verimli şeylerden hoşlanıyorsanız, o zaman biraz daha zayıf olana bir göz atmaya değer olabilir Dell Inspiron 16 Plus 7630. Başka bir alternatif de şu olabilir Lenovo Legion Slim 5 ve eğer bütçeniz bu kadar kısıtlı değilse Legion Pro 5 16.
Fiyat ve bulunabilirlik
Dell G16 7630 şu anda Amazon'da 1.401,84 ABD dolarına satılmaktadır. Bu versiyon Intel Core i9-13900HX, RTX 4070, 16 GB RAM ve 1 TB SSD ile birlikte geliyor.
Dell G16, i7-13650HX, RTX 4060
- 02/13/2024 v7 (old)
Christian Hintze
Şeffaflık
İncelenecek cihazların seçimi editör ekibimiz tarafından yapılır. Test örneği, bu incelemenin amacı doğrultusunda üretici veya perakendeci tarafından yazara ödünç olarak sağlanmıştır. Borç verenin bu inceleme üzerinde herhangi bir etkisi olmadığı gibi, üretici de yayınlanmadan önce bu incelemenin bir kopyasını almamıştır. Bu incelemeyi yayınlama zorunluluğu yoktu. Bağımsız bir medya şirketi olarak Notebookcheck, üreticilerin, perakendecilerin veya yayıncıların otoritesine tabi değildir.
Notebookcheck bu şekilde test yapıyor
Notebookcheck, tüm sonuçların karşılaştırılabilir olmasını sağlamak için her yıl yüzlerce dizüstü bilgisayarı ve akıllı telefonu standart prosedürler kullanarak bağımsız olarak inceliyor. Yaklaşık 20 yıldır test yöntemlerimizi sürekli olarak geliştirdik ve bu süreçte endüstri standartlarını belirledik. Test laboratuvarlarımızda deneyimli teknisyenler ve editörler tarafından yüksek kaliteli ölçüm ekipmanları kullanılmaktadır. Bu testler çok aşamalı bir doğrulama sürecini içerir. Karmaşık derecelendirme sistemimiz, nesnelliği koruyan yüzlerce sağlam temellere dayanan ölçüm ve kıyaslamaya dayanmaktadır.Price comparison

