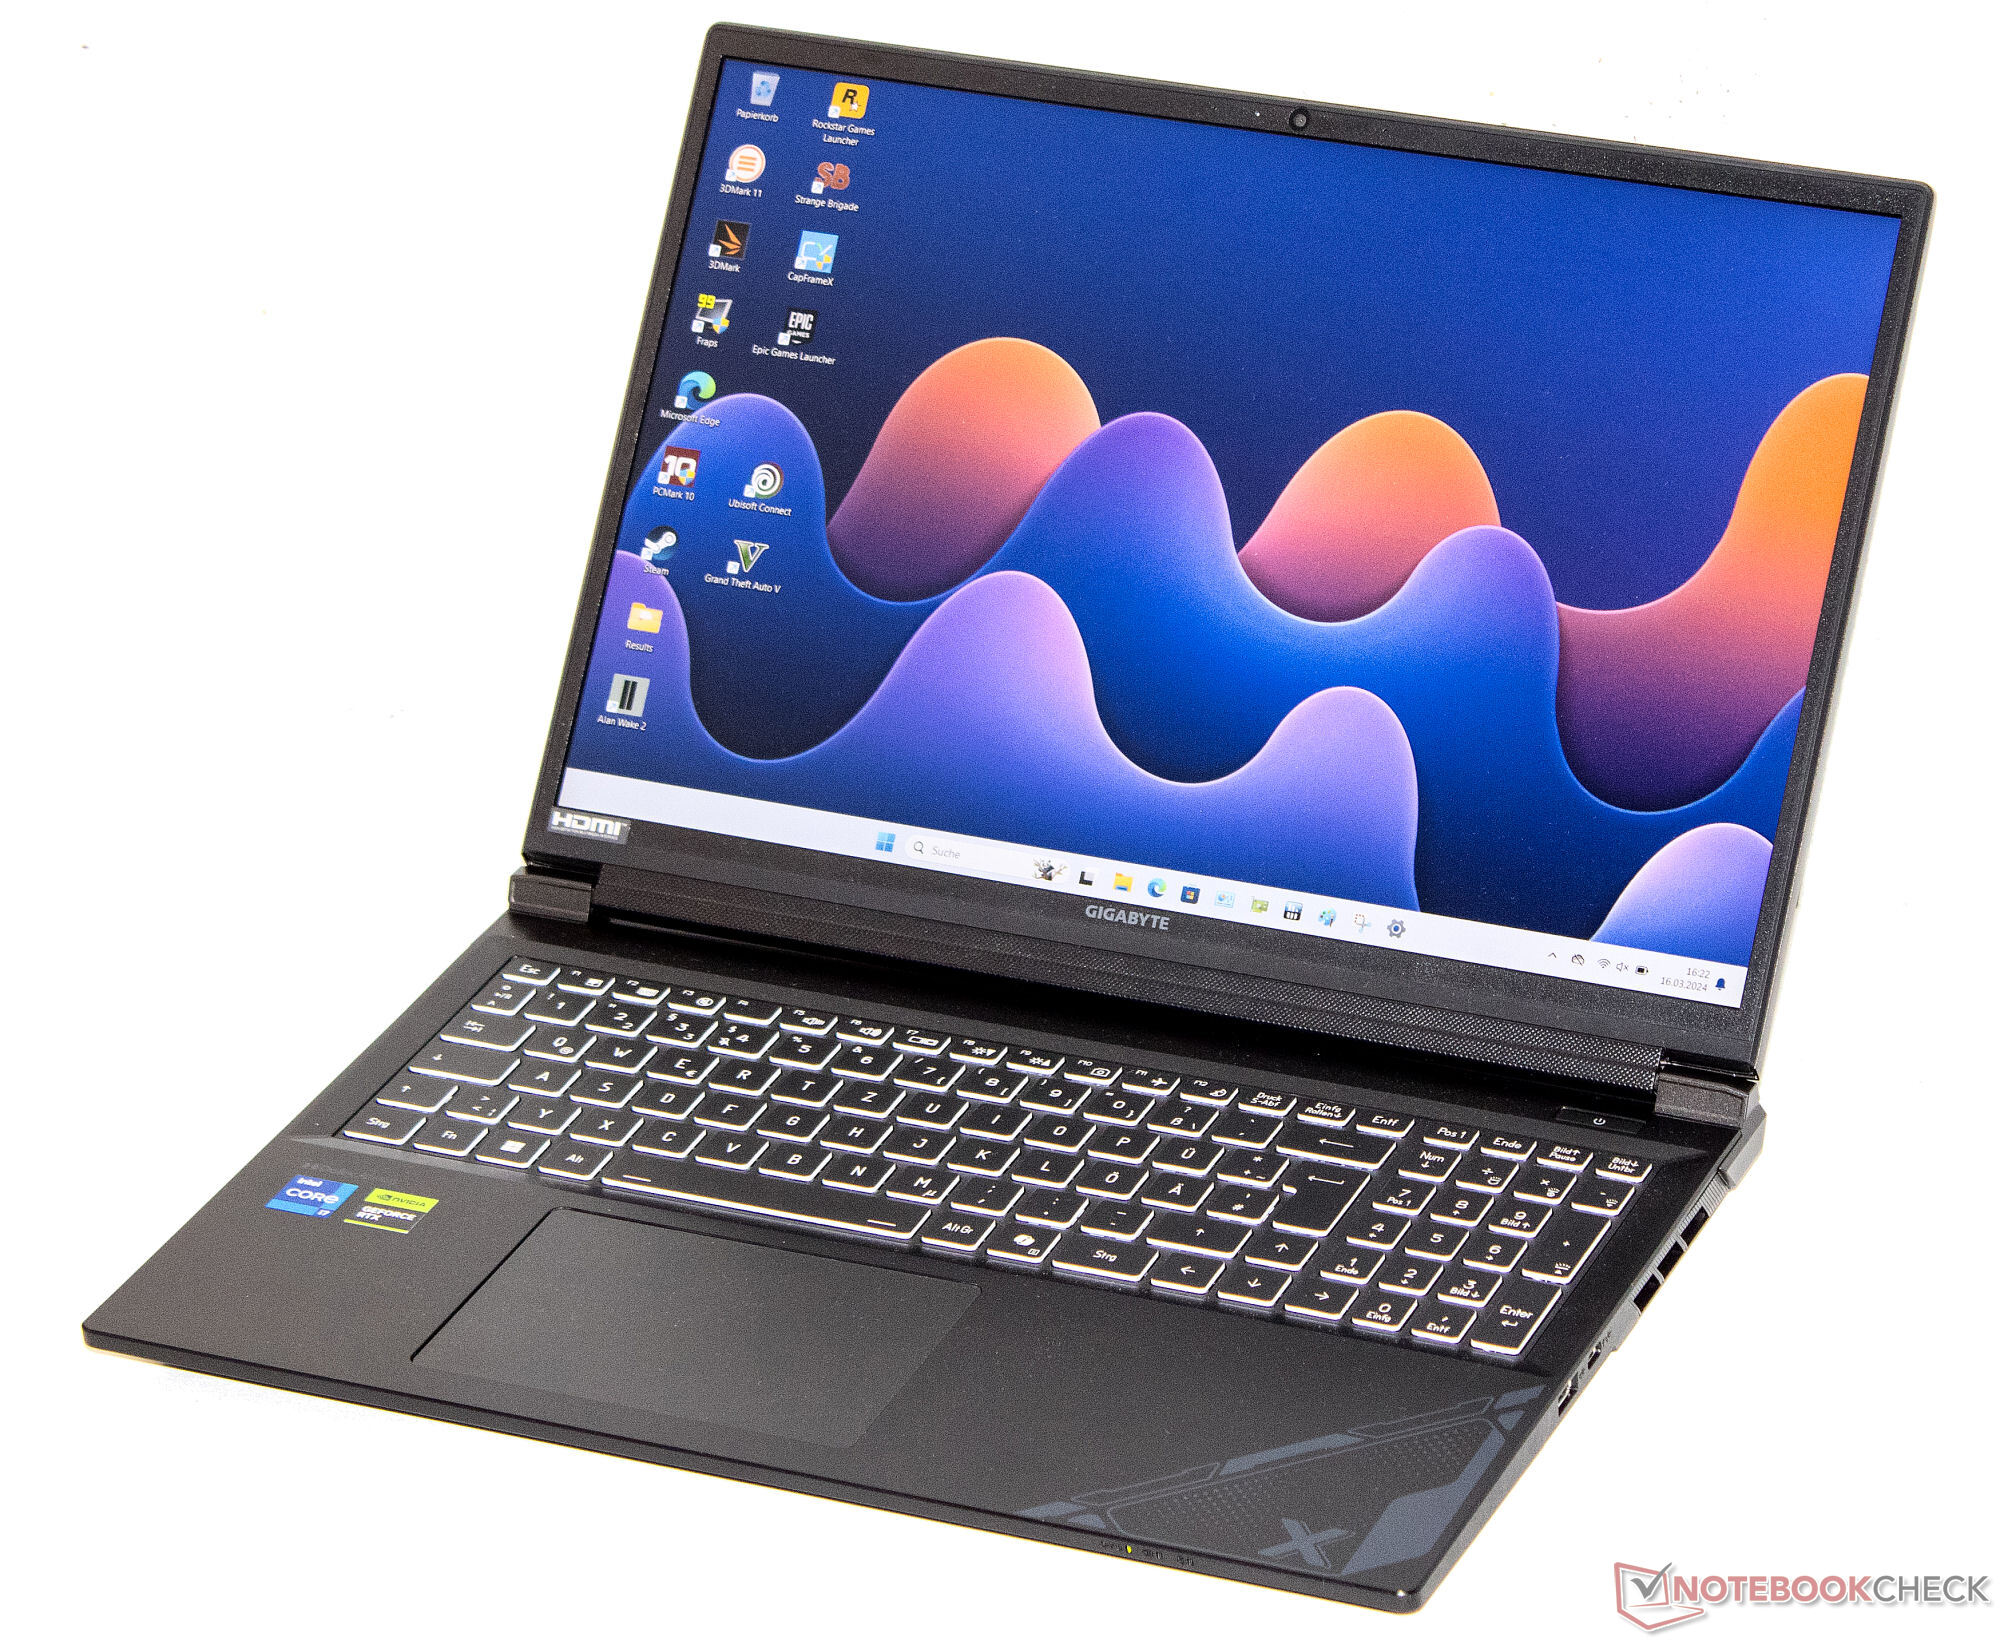
Gigabyte G6X 9KG (2024) incelemesi: RTX 4060 ile uygun fiyatlı oyun dizüstü bilgisayarı

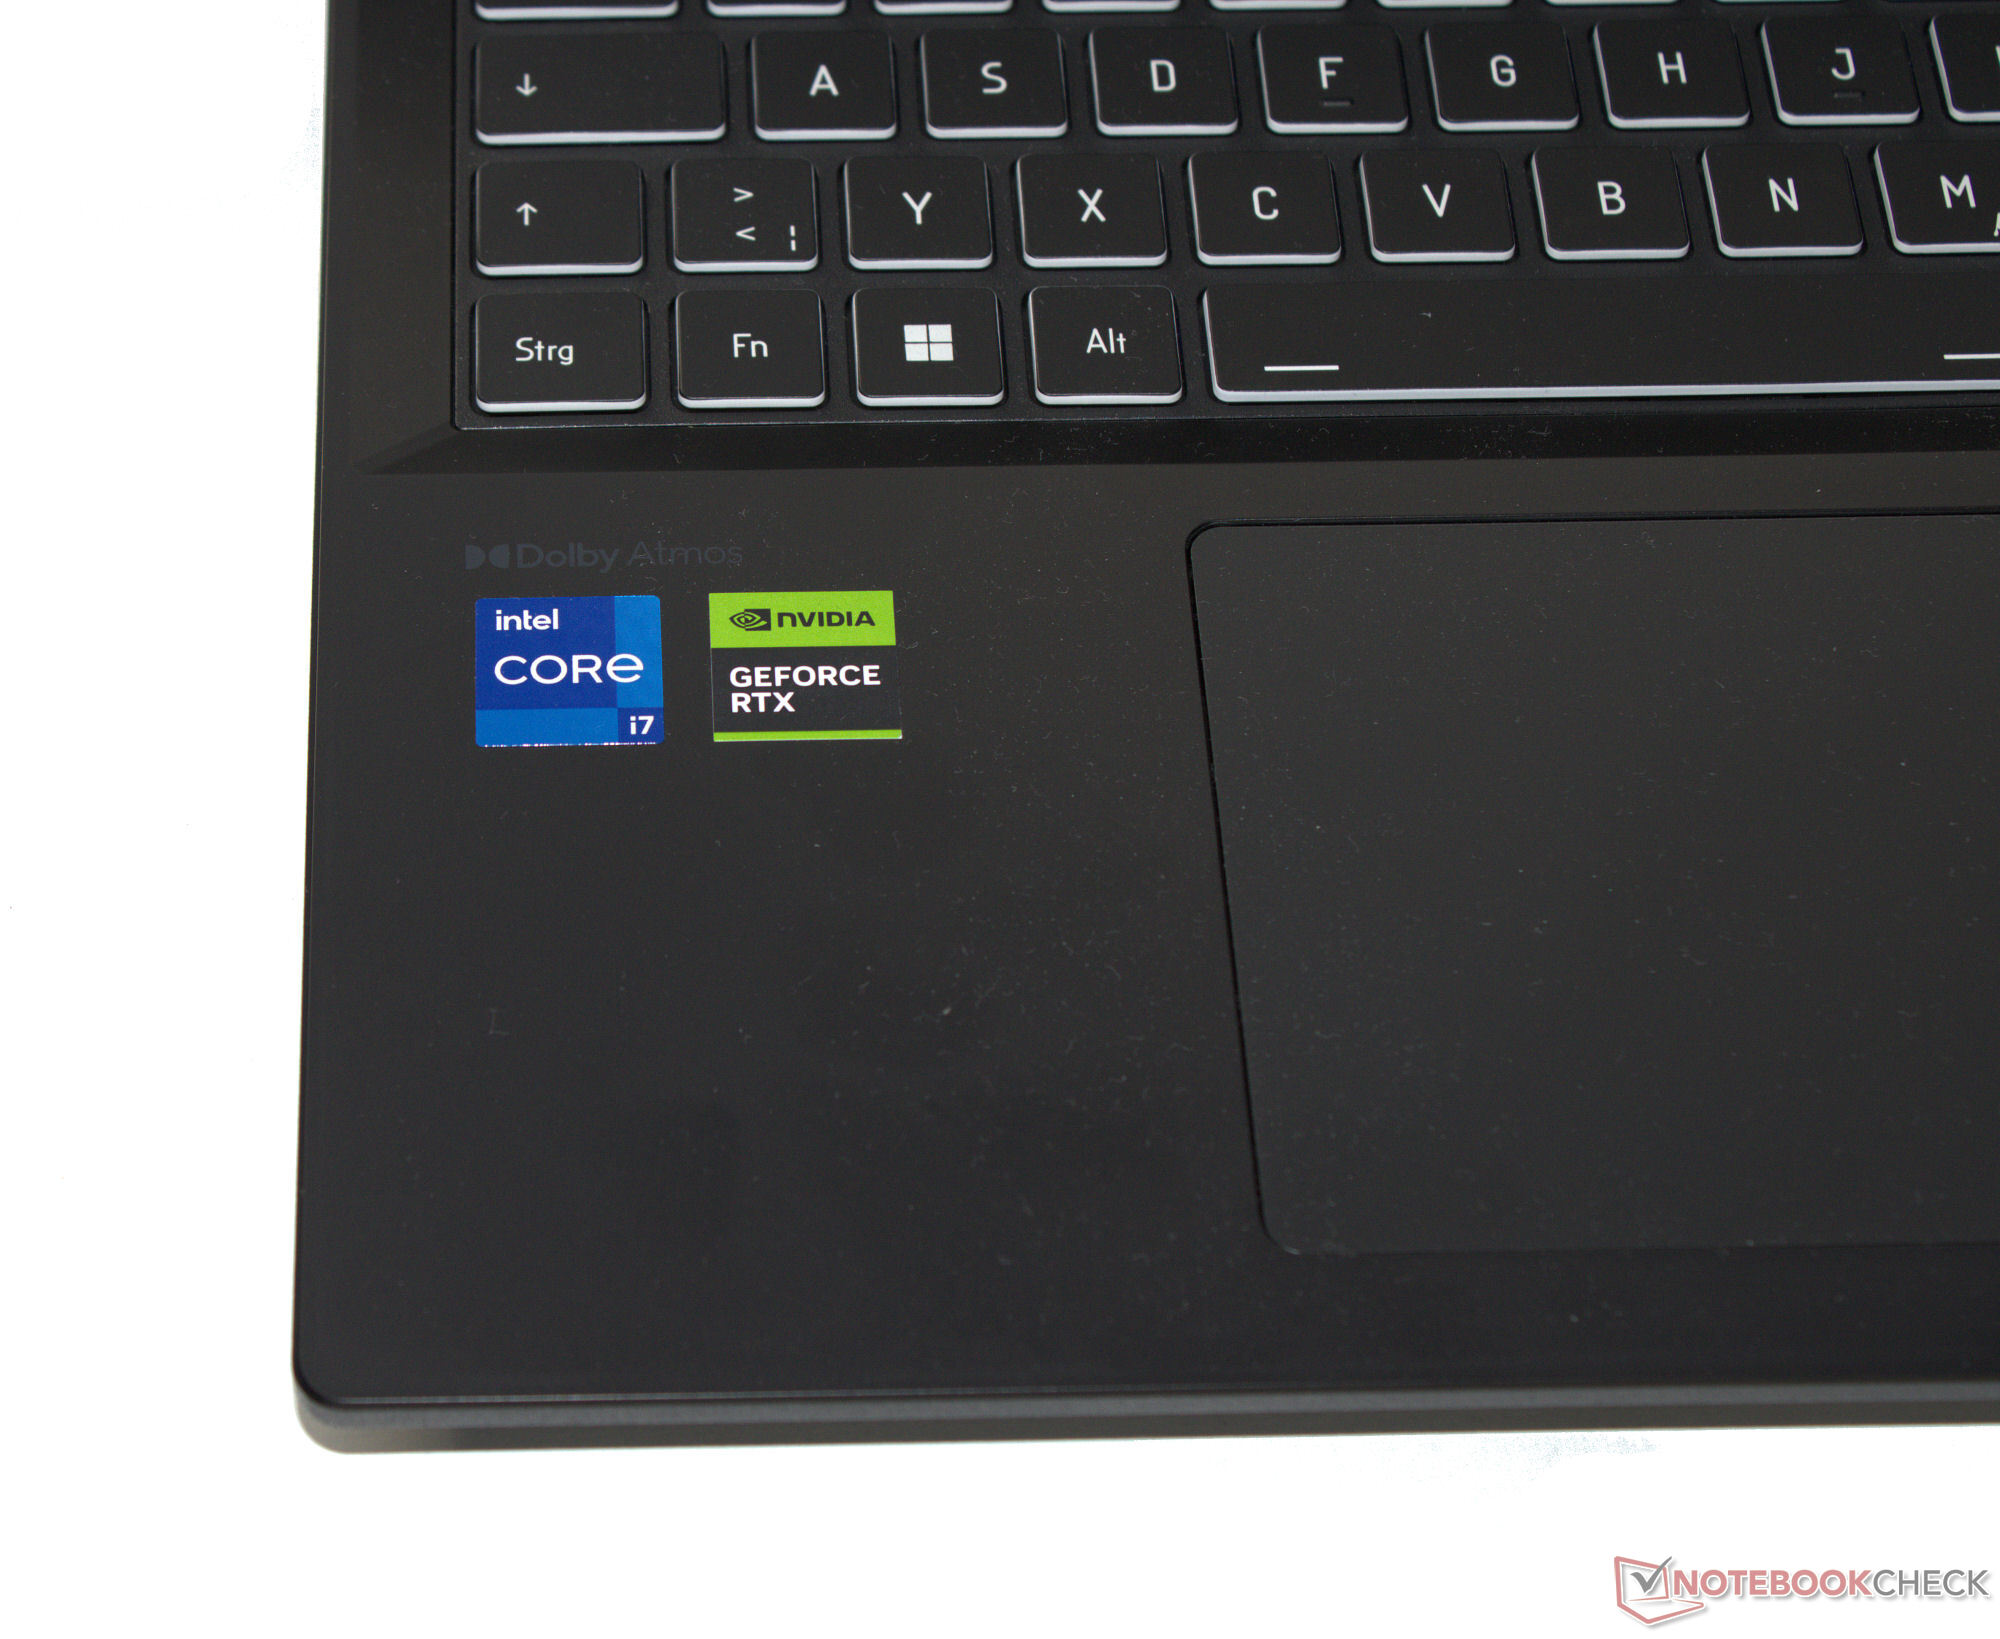
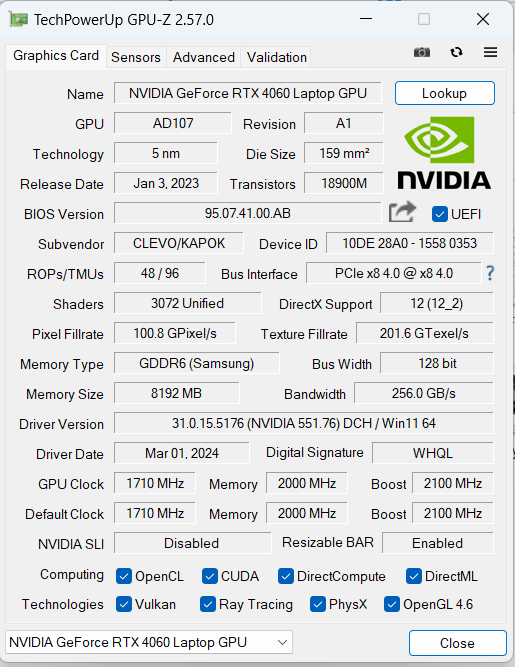
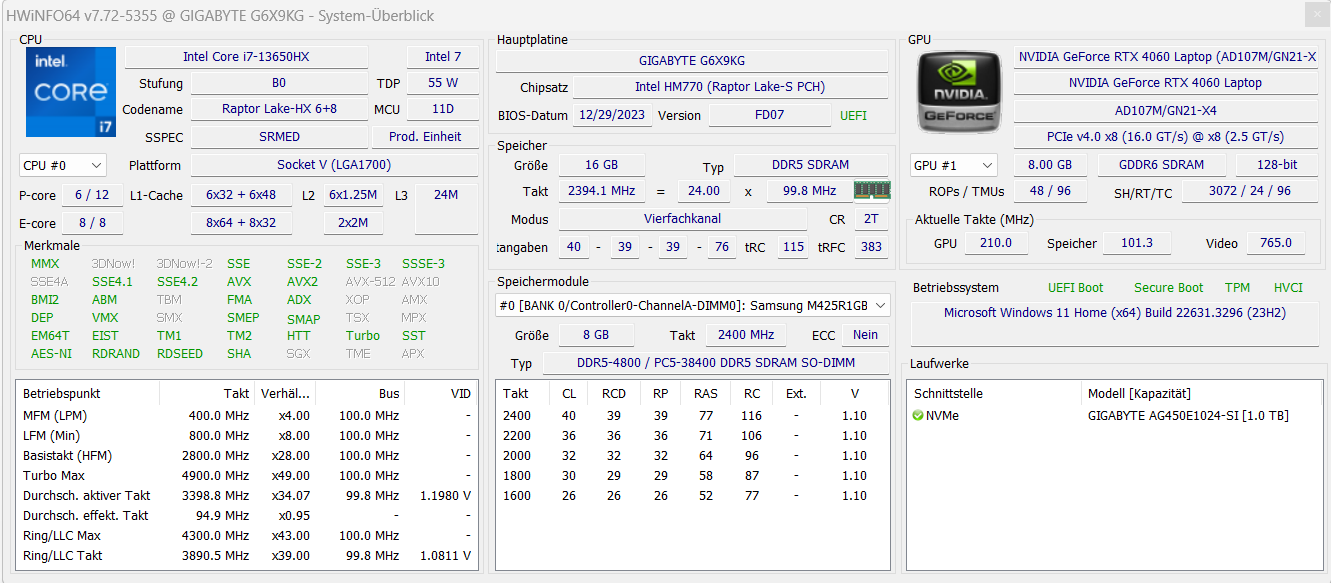
Gigabyte G6X 9KG, 1.350 €'nun biraz altındaki fiyatıyla uygun fiyatlı oyun dizüstü bilgisayarları arasında yer alıyor. Dizüstü bilgisayar gücünü Intel Core i7-13650HX Raptor Lake-HX CPU ve bir Nvidia GeForce RTX 4060 Ada Lovelace Dizüstü Bilgisayar GPU.
Yarışma, aşağıdaki gibi dizüstü bilgisayarları içeriyor Dell G16, Lenovo Legion 5 16IRX G9, MSI Raider GE68HX 13VFve Asus TUF Gaming A16 FA617XS.
Karşılaştırmalı olarak olası rakipler
Derecelendirme | Tarih | Modeli | Ağırlık | Yükseklik | Boyut | Çözünürlük | Fiyat |
|---|---|---|---|---|---|---|---|
| 83.2 % v7 (old) | 03/2024 | Gigabyte G6X 9KG (2024) i7-13650HX, GeForce RTX 4060 Laptop GPU | 2.6 kg | 25.1 mm | 16.00" | 1920x1200 | |
| 85.5 % v7 (old) | 02/2024 | Dell G16, i7-13650HX, RTX 4060 i7-13650HX, GeForce RTX 4060 Laptop GPU | 2.8 kg | 25.65 mm | 16.00" | 2560x1600 | |
| 89.1 % v7 (old) | 02/2024 | Lenovo Legion 5 16IRX G9 i7-14650HX, GeForce RTX 4060 Laptop GPU | 2.4 kg | 25.2 mm | 16.00" | 2560x1600 | |
| 86.9 % v7 (old) | 10/2023 | MSI Raider GE68HX 13VF i9-13950HX, GeForce RTX 4060 Laptop GPU | 2.7 kg | 27.9 mm | 16.00" | 1900x1200 | |
| 86.9 % v7 (old) | 06/2023 | Asus TUF Gaming A16 FA617XS R9 7940HS, Radeon RX 7600S | 2.2 kg | 22.1 mm | 16.00" | 1920x1200 |
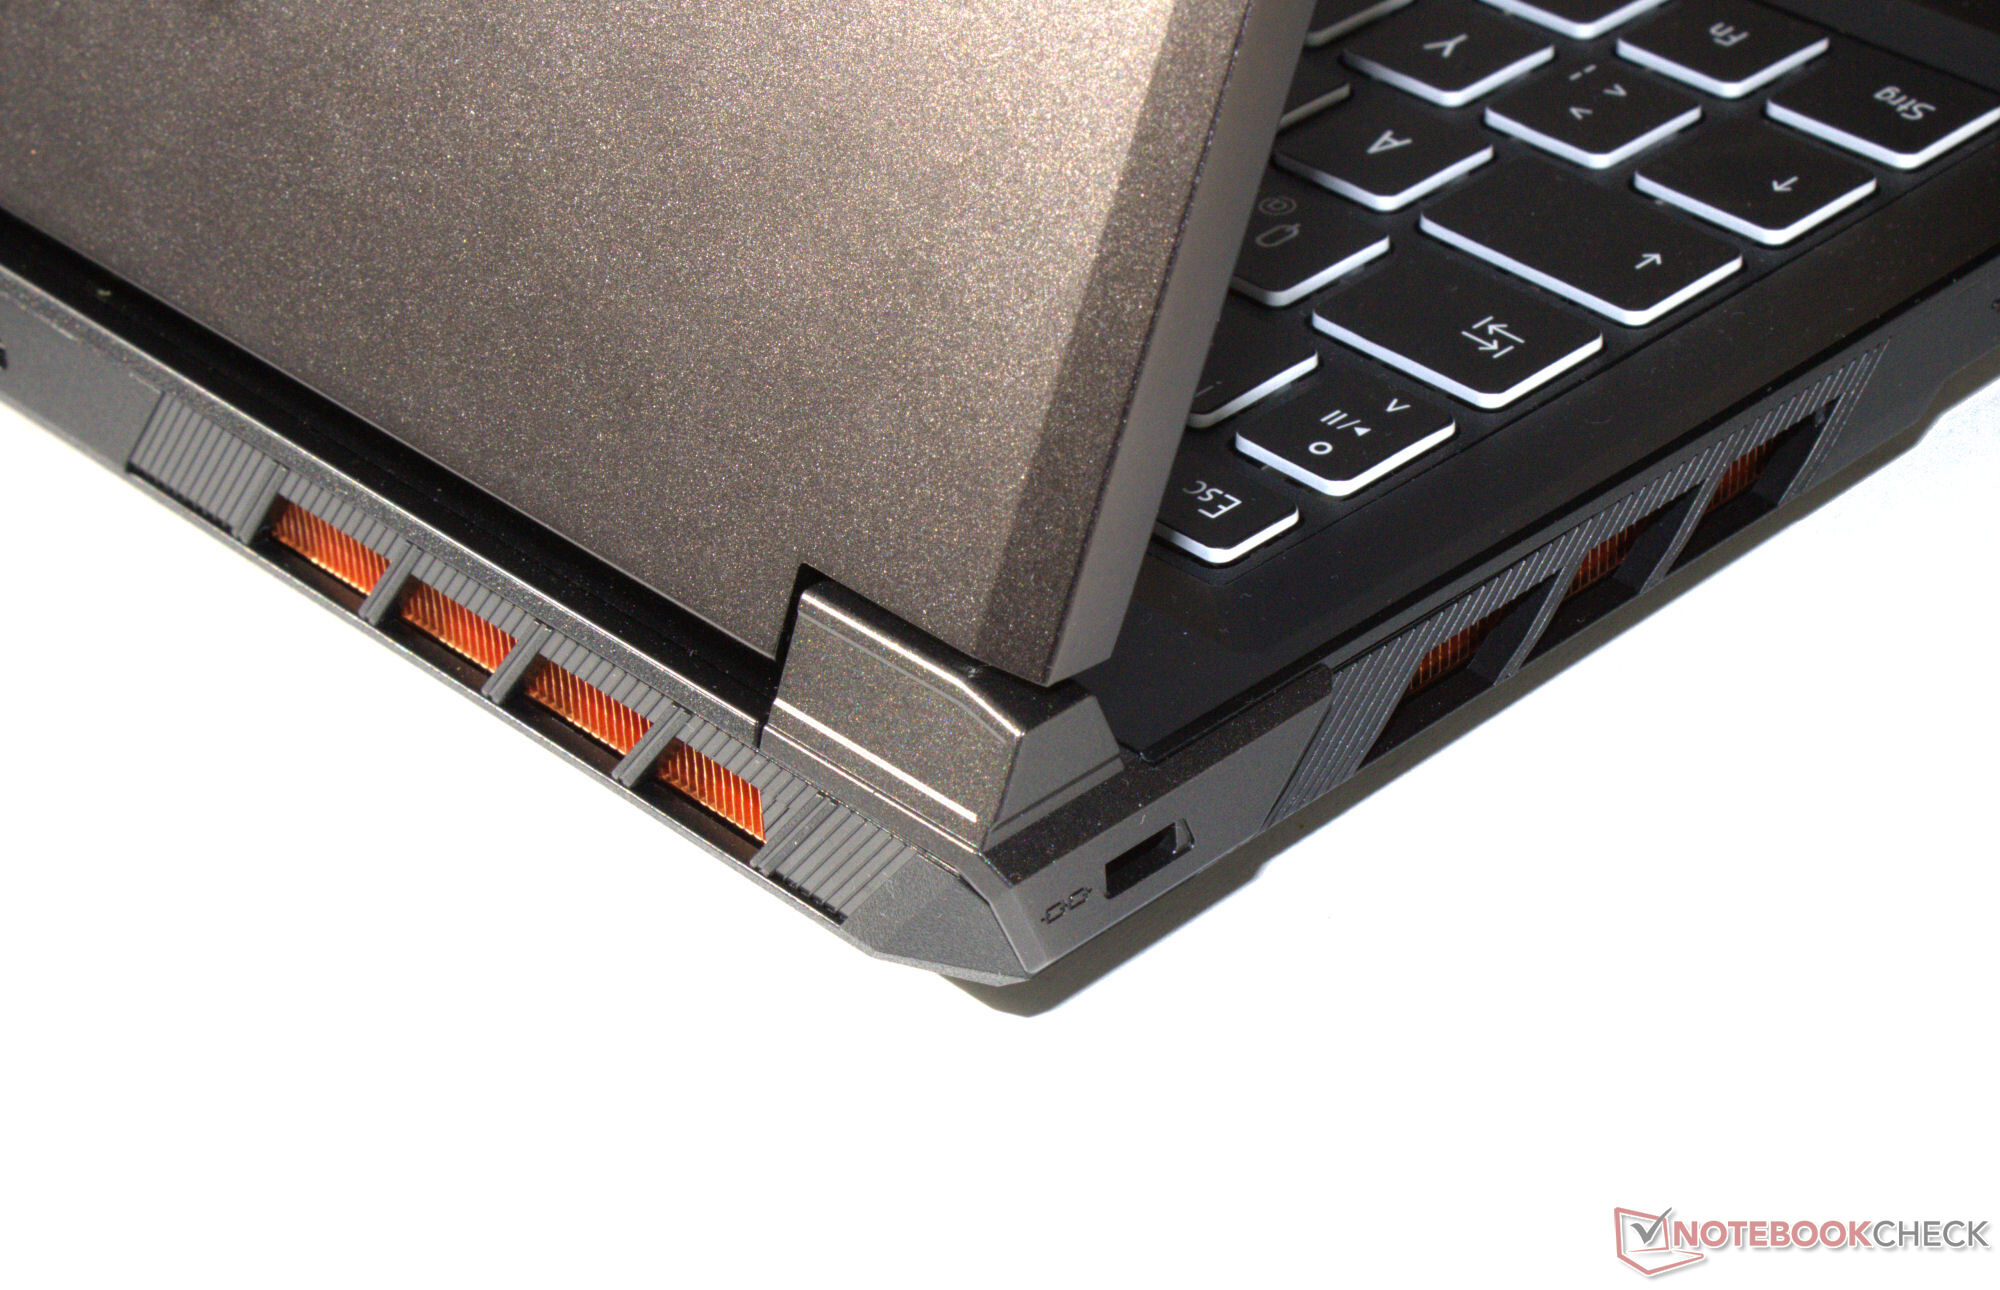
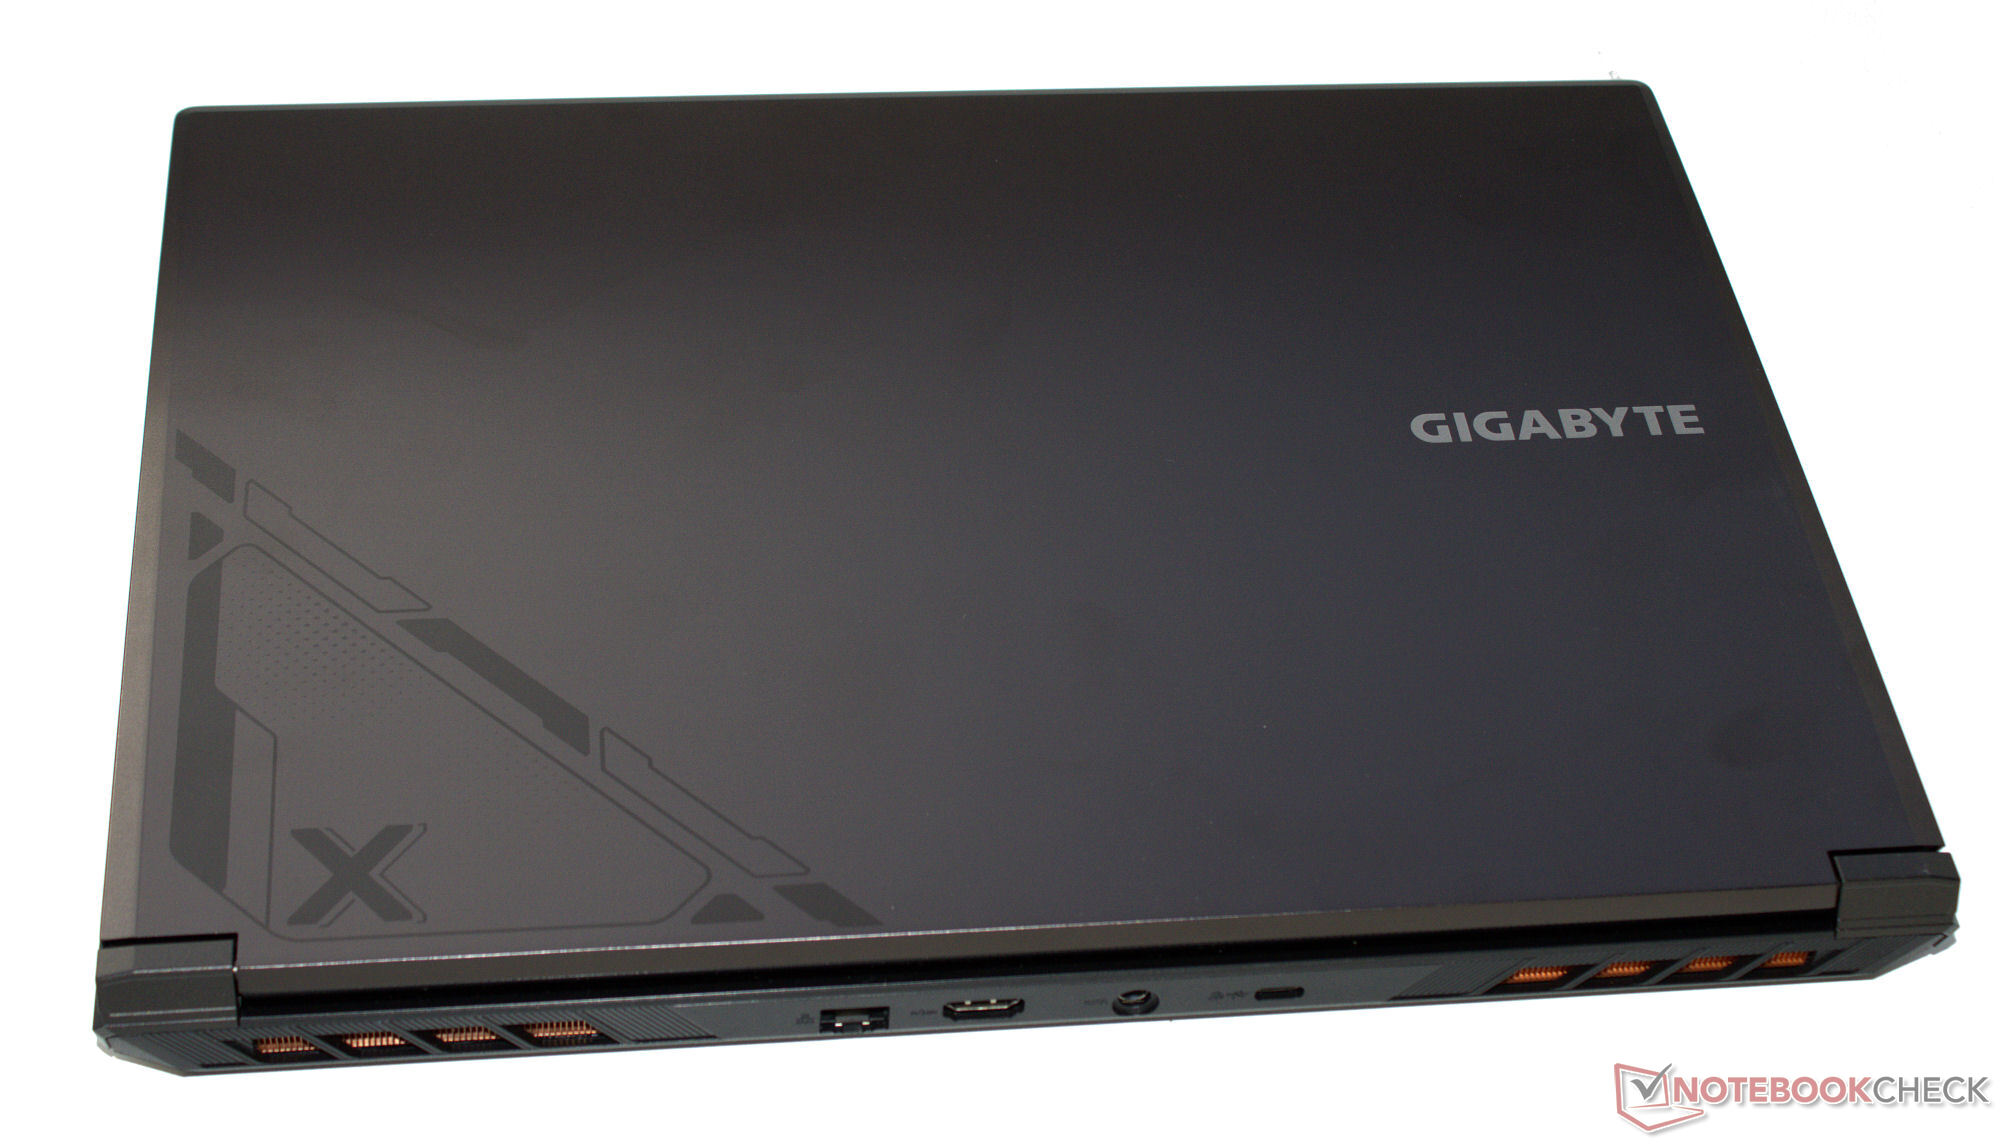
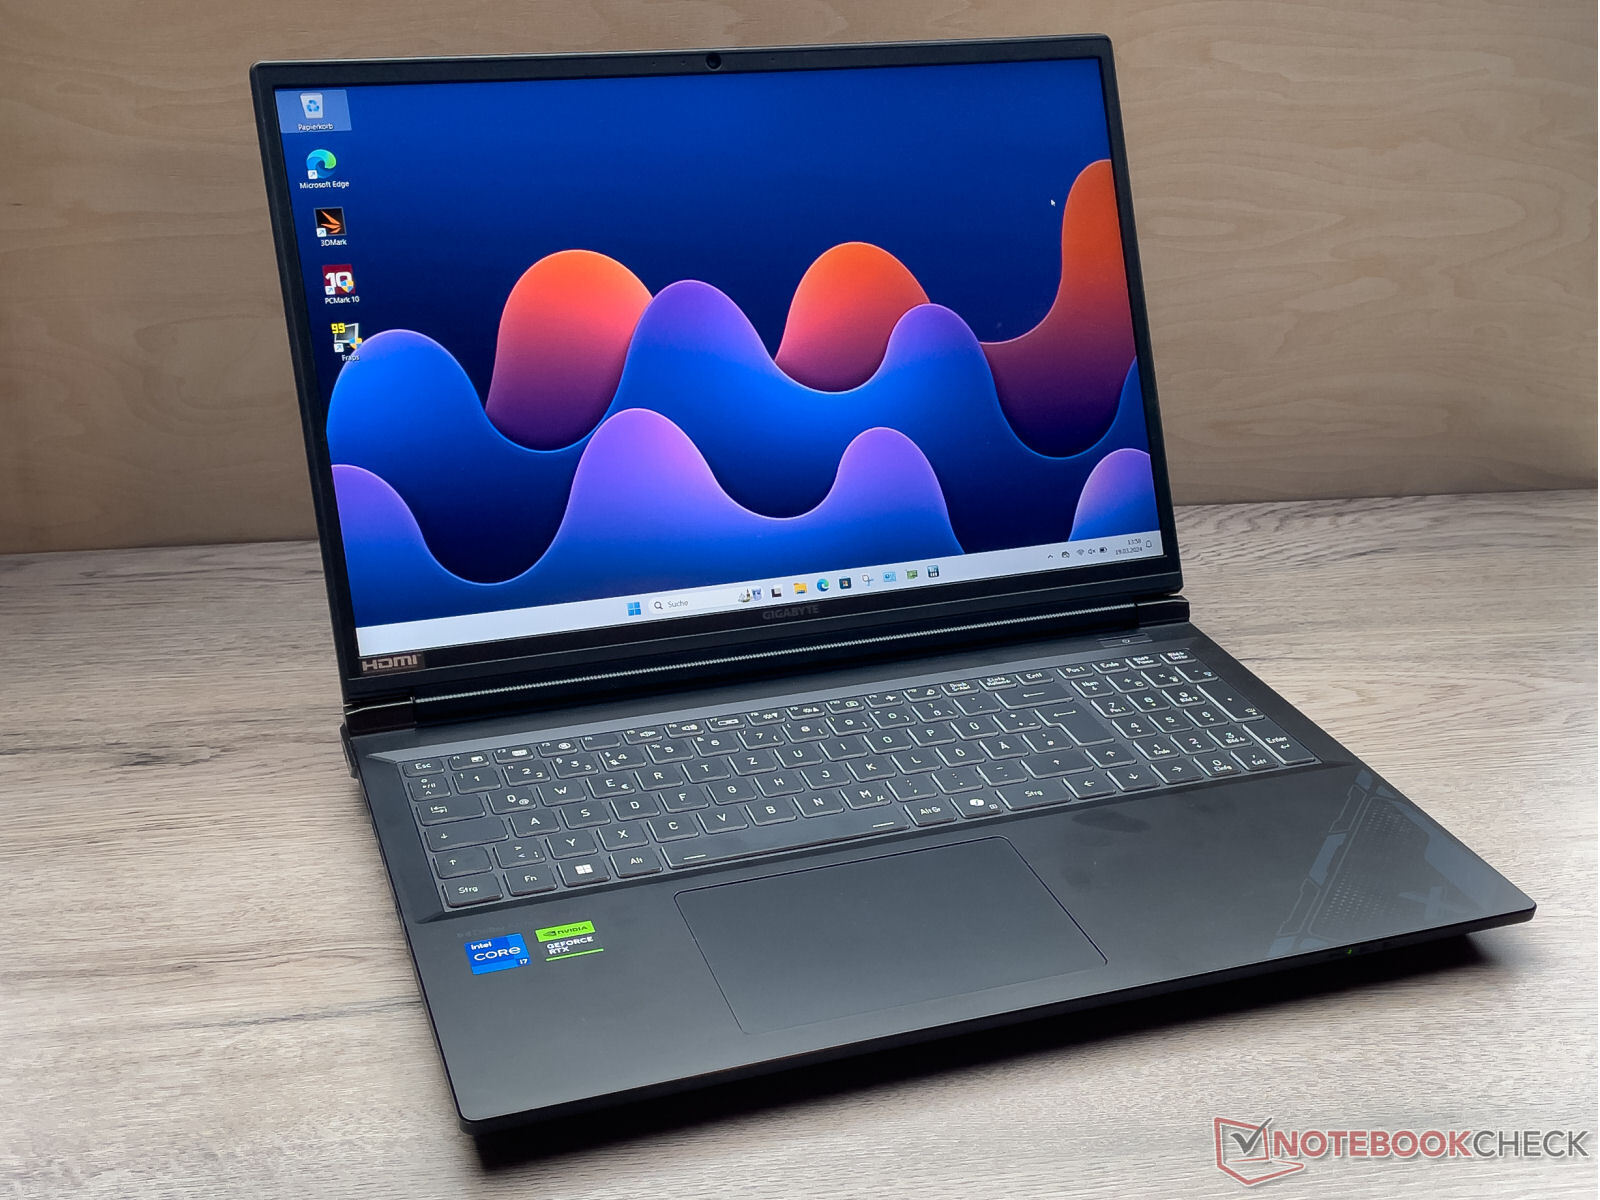
Kasa ve özellikler: G6X Thunderbolt 4'ten yoksundur
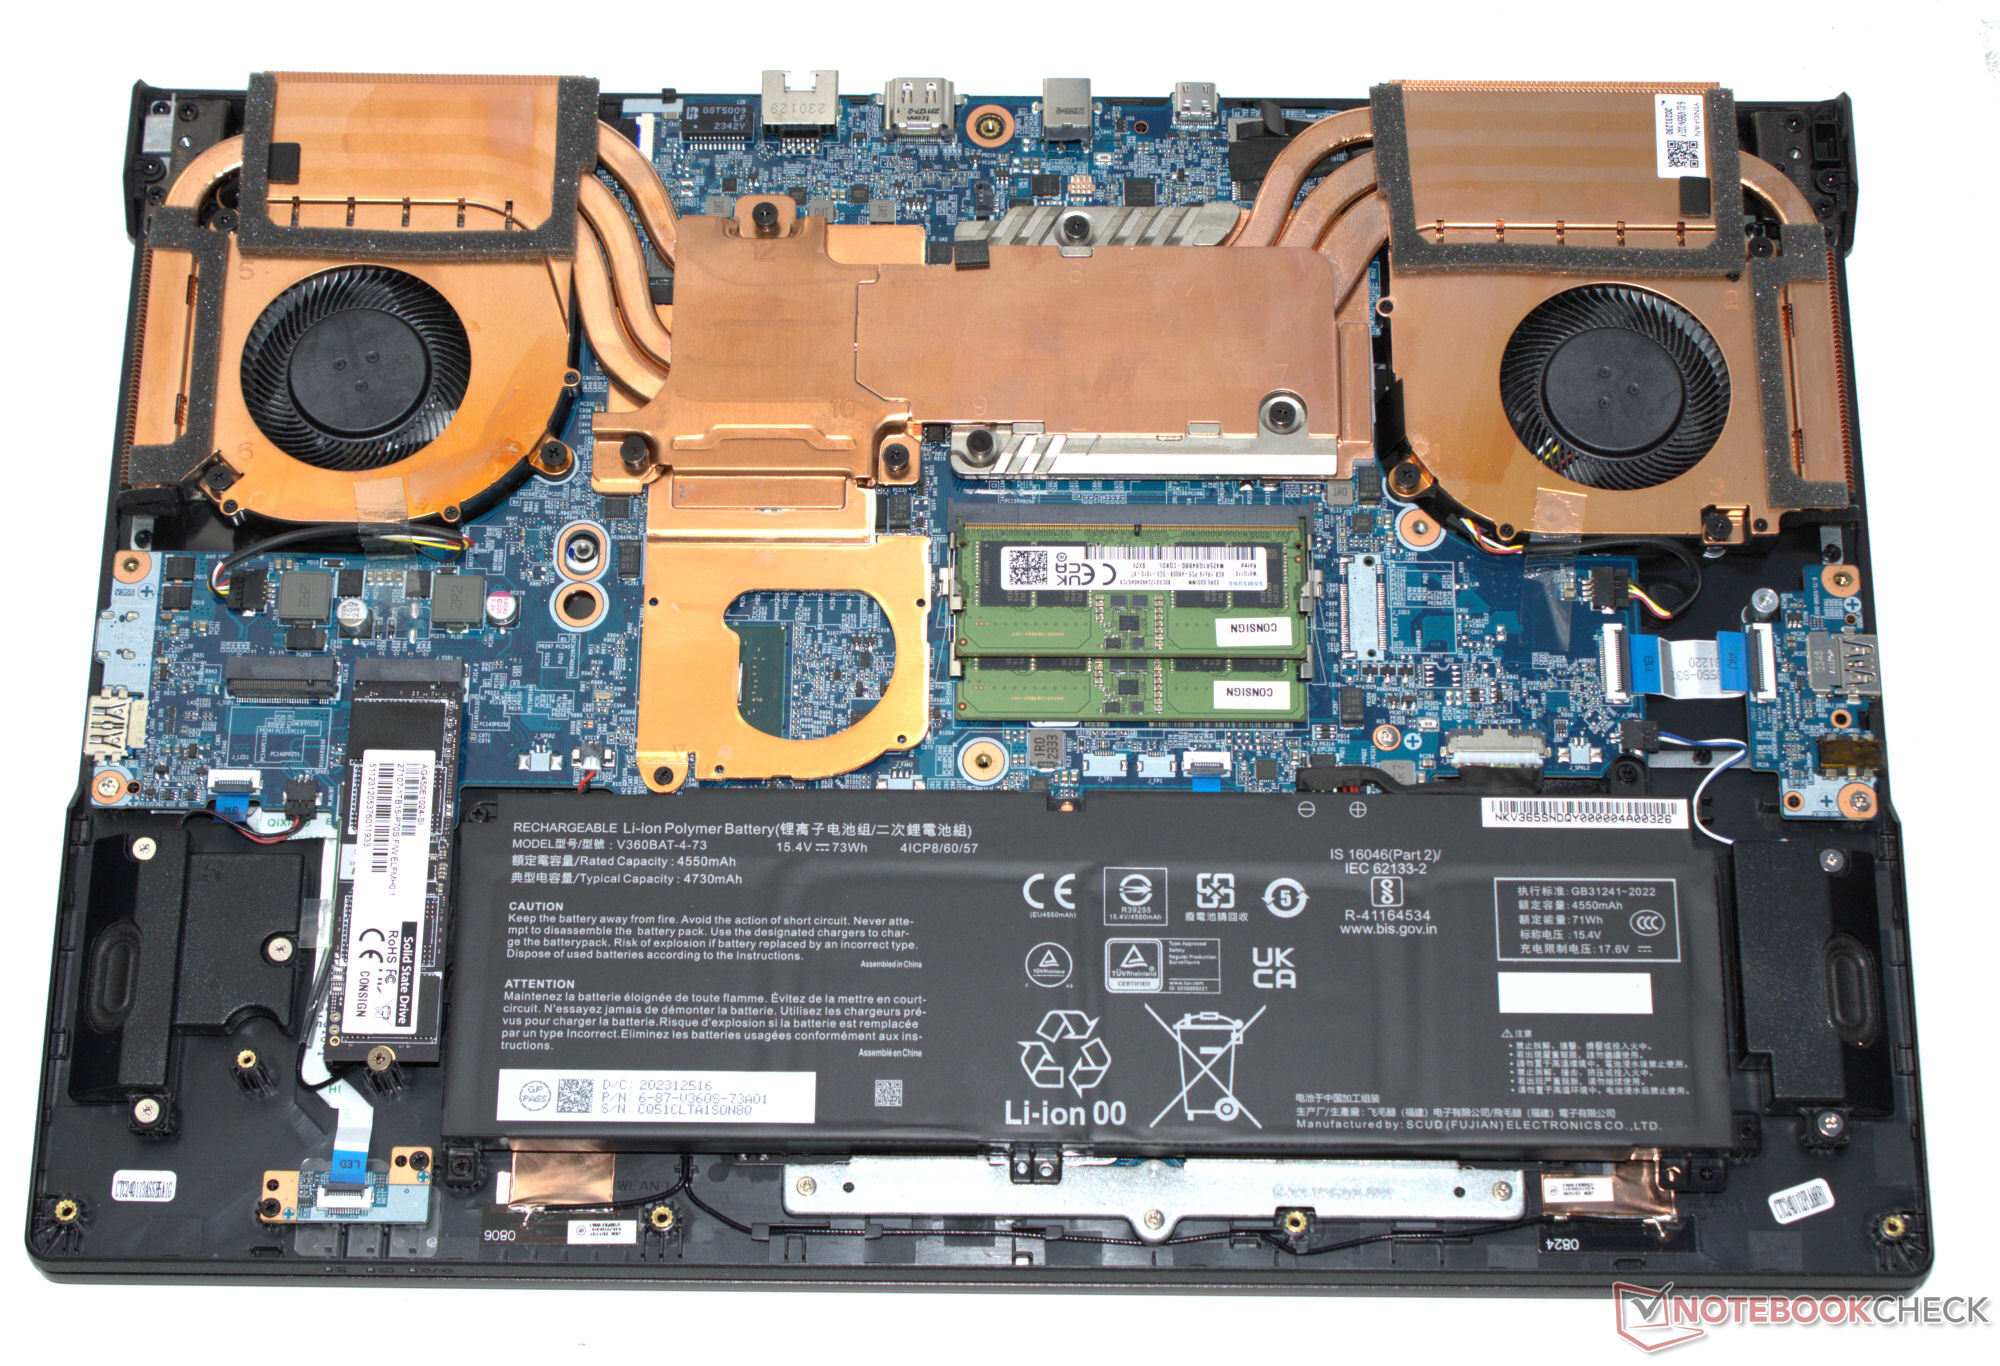
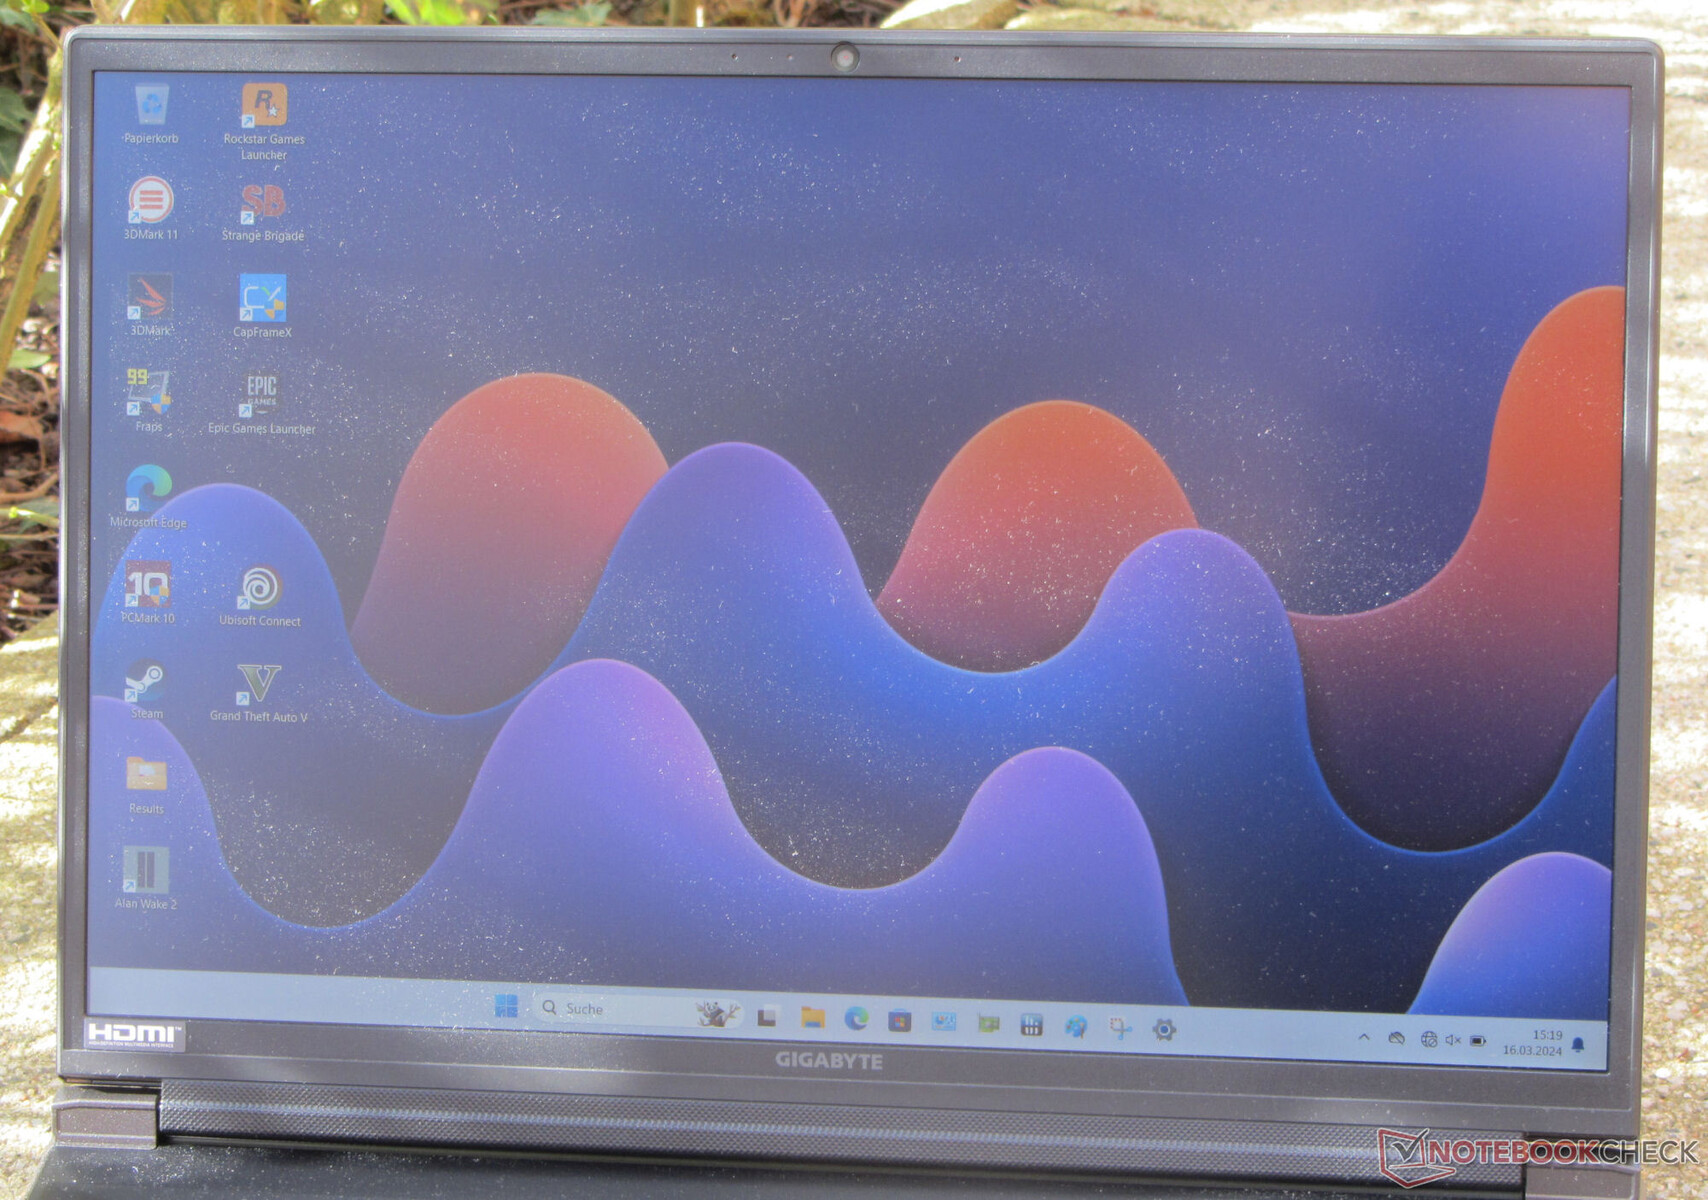
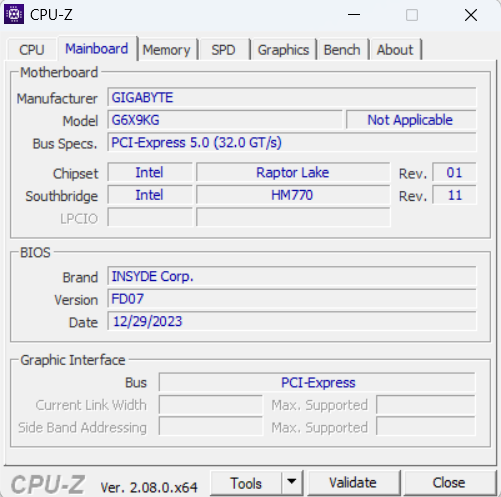
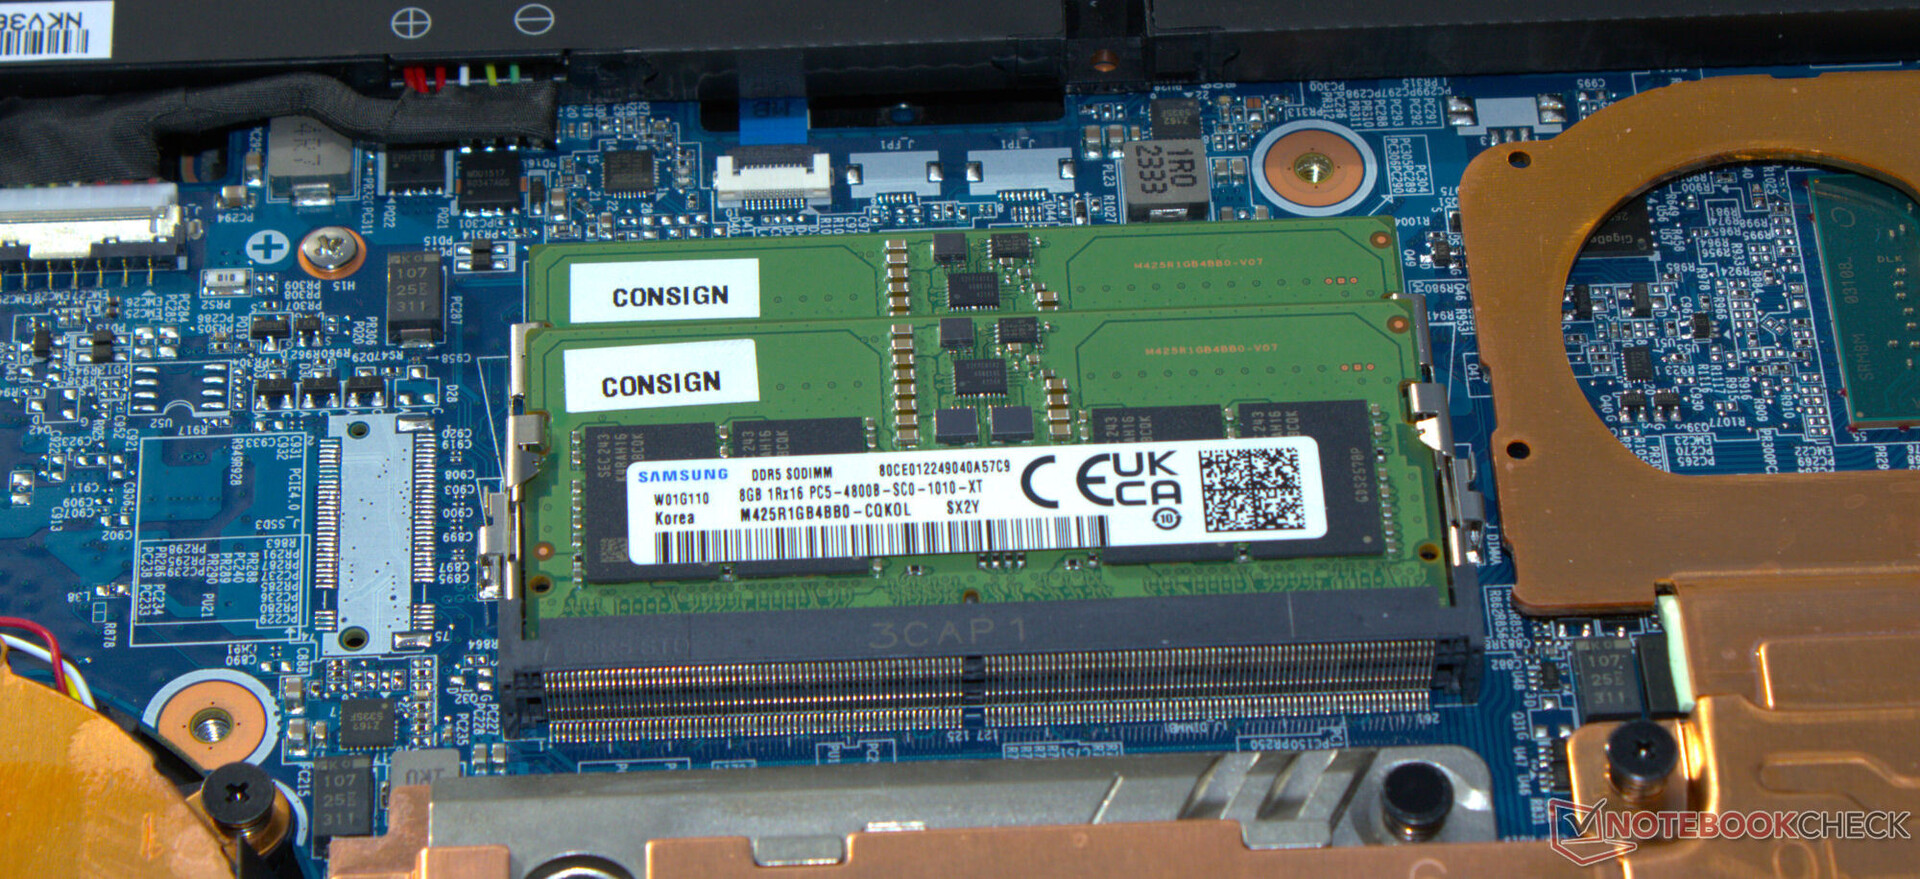
G6X'in mat gri ("Gunmetal Grey") şasisinin ana ünitesi plastikten yapılırken, kapağın arkasında alüminyum kullanılmış. Göze çarpan bir işçilik kusuru yok; sağlamlık ve sertlik iyi görünüyor. Batarya ve diğer dahili bileşenlere ana kabuk çıkarıldıktan sonra erişilebiliyor.
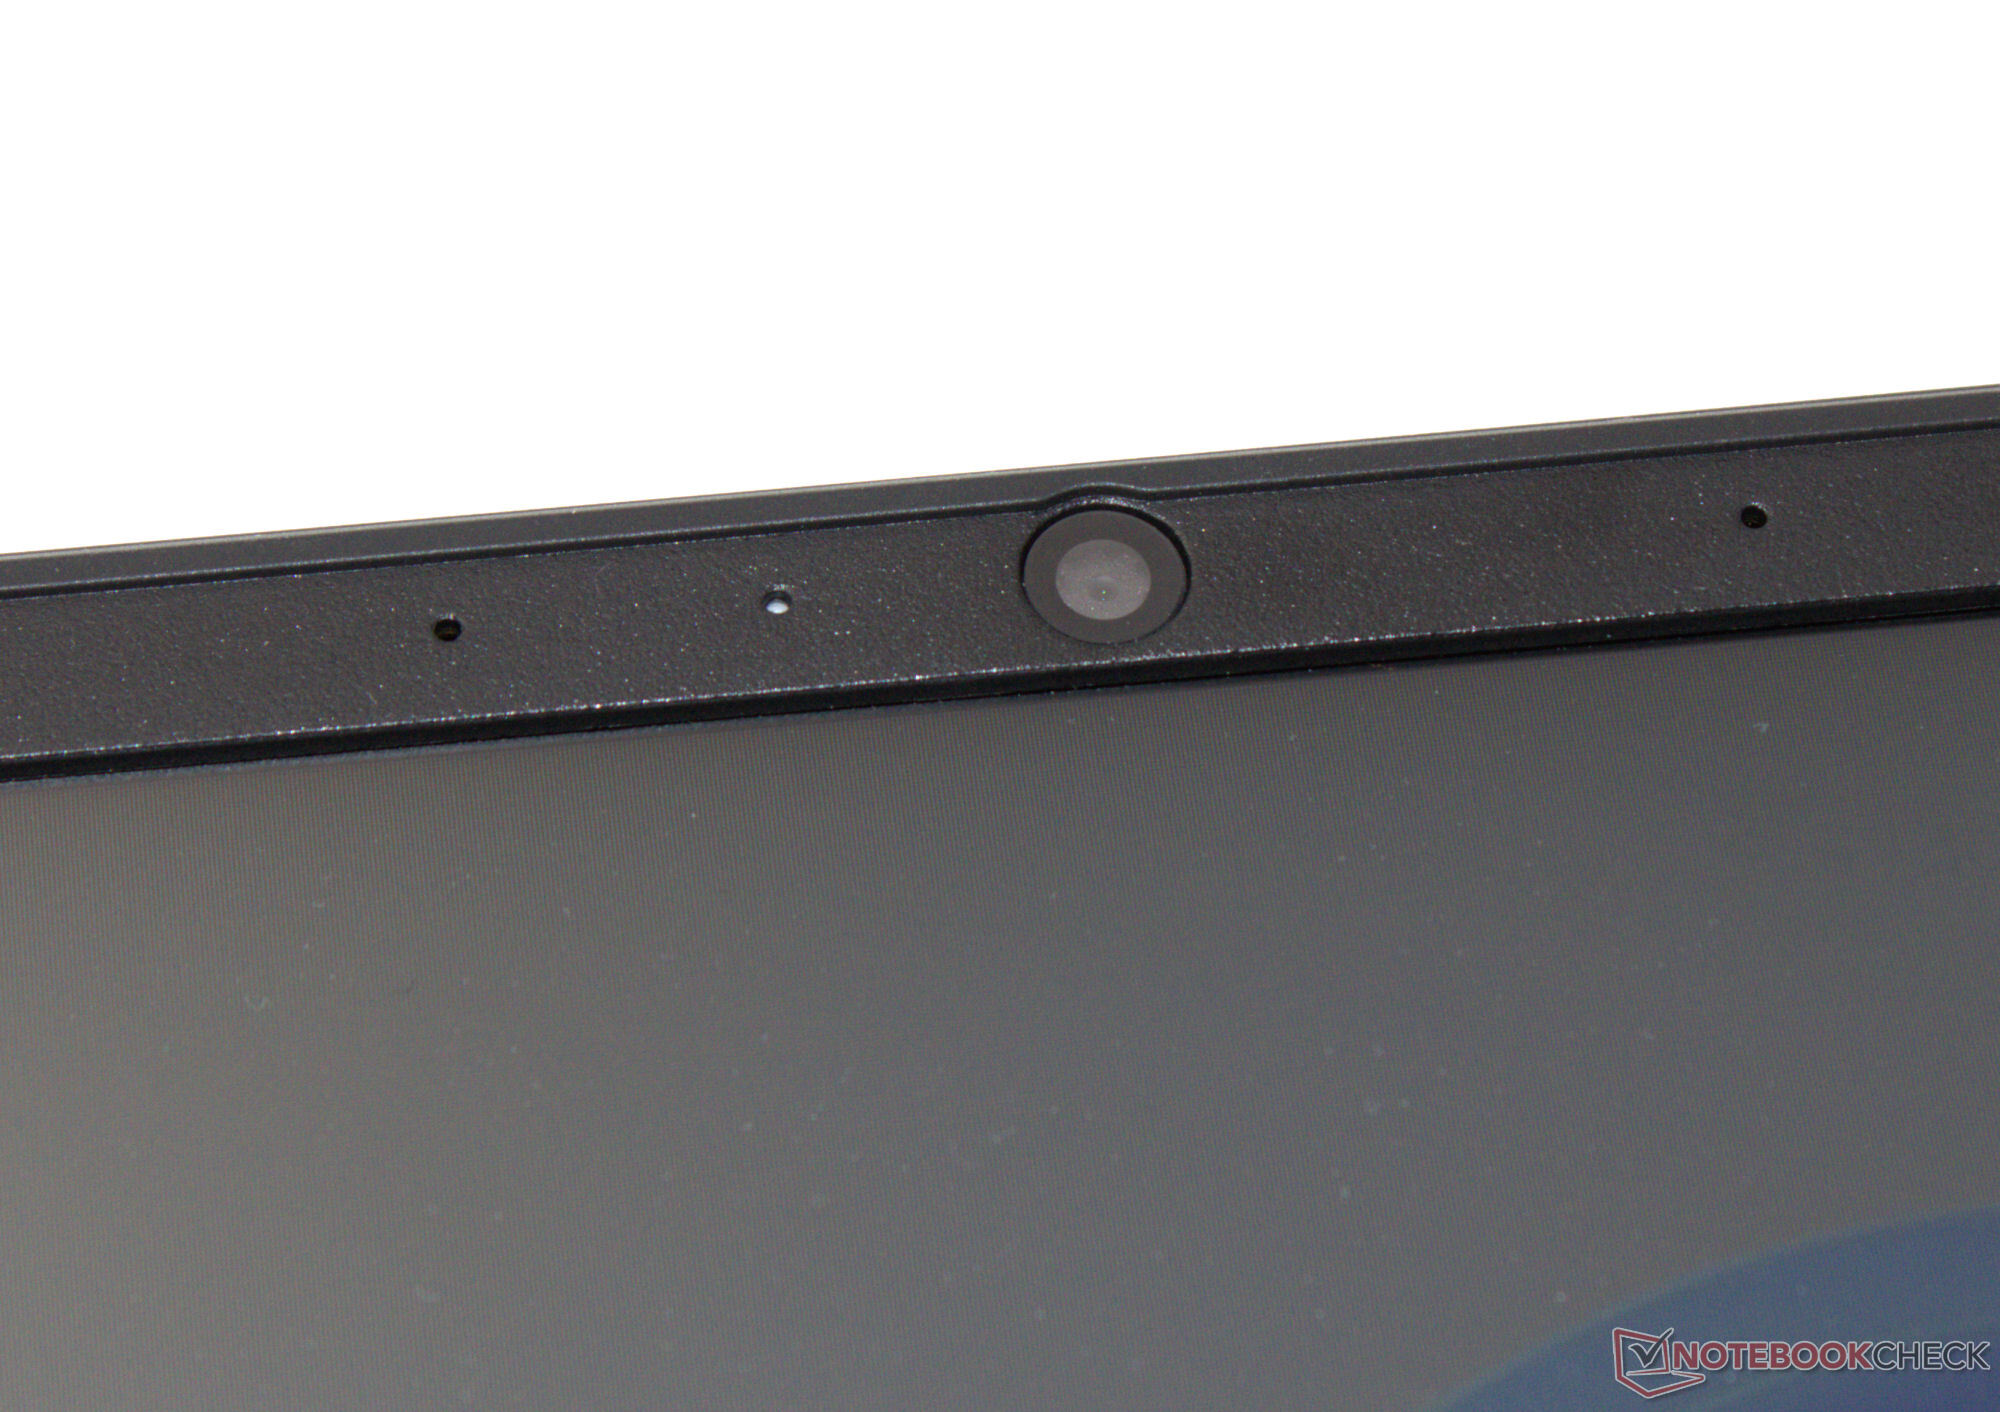
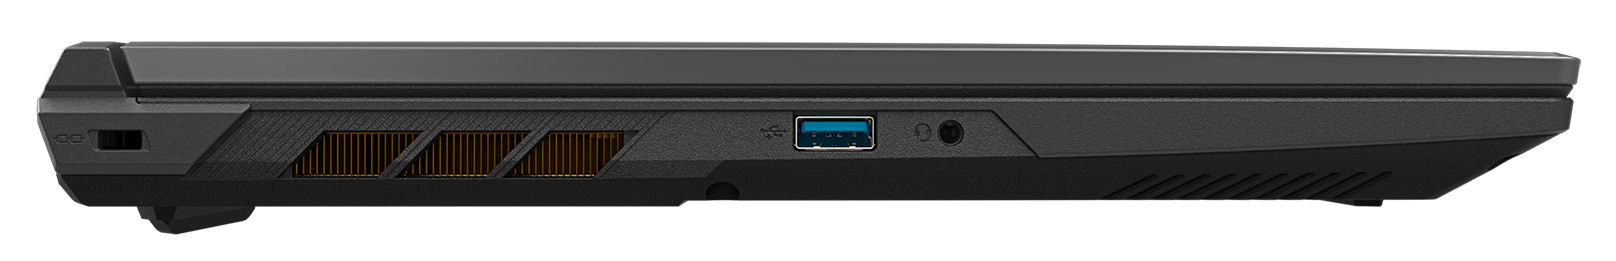
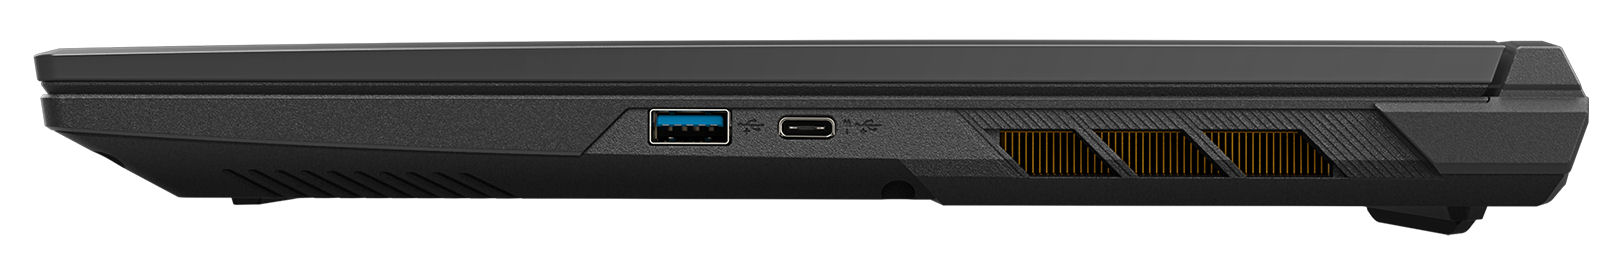
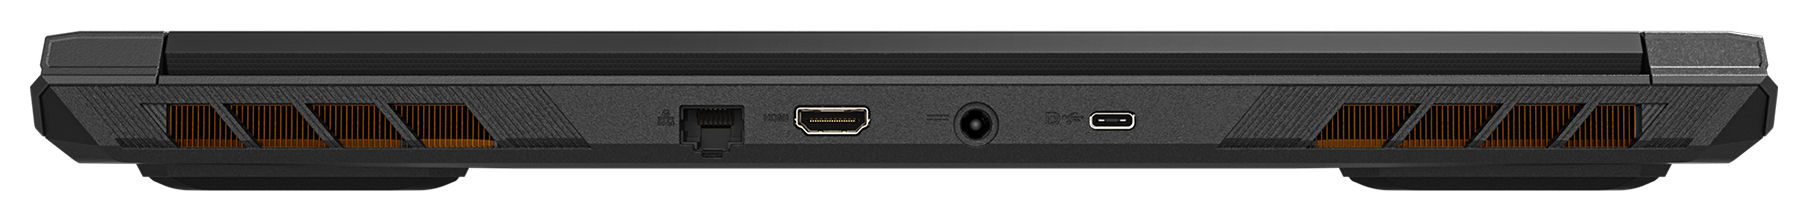
Gigabyte G6X 9KG'de birer adet USB 3.2 Gen 1 ve 1x USB 3.2 Gen 2 Tip-A bağlantı noktası ve ayrı ayrı Güç Dağıtımı ve DisplayPort çıkışı sunan iki adet USB 3.2 Gen 2 Tip-C bağlantı noktası bulunur. Sonuç olarak, G6X iki video çıkışına sahiptir (1x HDMI, 1x DP). Bellek kartı okuyucusu yoktur. 1280 x 720 0,9 MP web kamerası standart özellikler sunar.
Yakın çevrede hiçbir Wi-Fi cihazının bulunmadığı ve dizüstü bilgisayar ile sunucu bilgisayar arasında 1 m gibi kısa bir mesafenin olduğu optimum test koşullarında mükemmel Wi-Fi veri çıkışı elde ettik. Dizüstü bilgisayar Intel AX211 Wi-Fi 6E yongası kullanıyor. Kablolu bağlantılar bir Realtek RTL8168/8111 denetleyici tarafından gerçekleştirilmektedir.

 GeForce RTX 4060 Laptop GPU, i7-13650HX, Gigabyte AG450E1024-SI")
 GeForce RTX 4060 Laptop GPU, i7-13650HX, Gigabyte AG450E1024-SI")
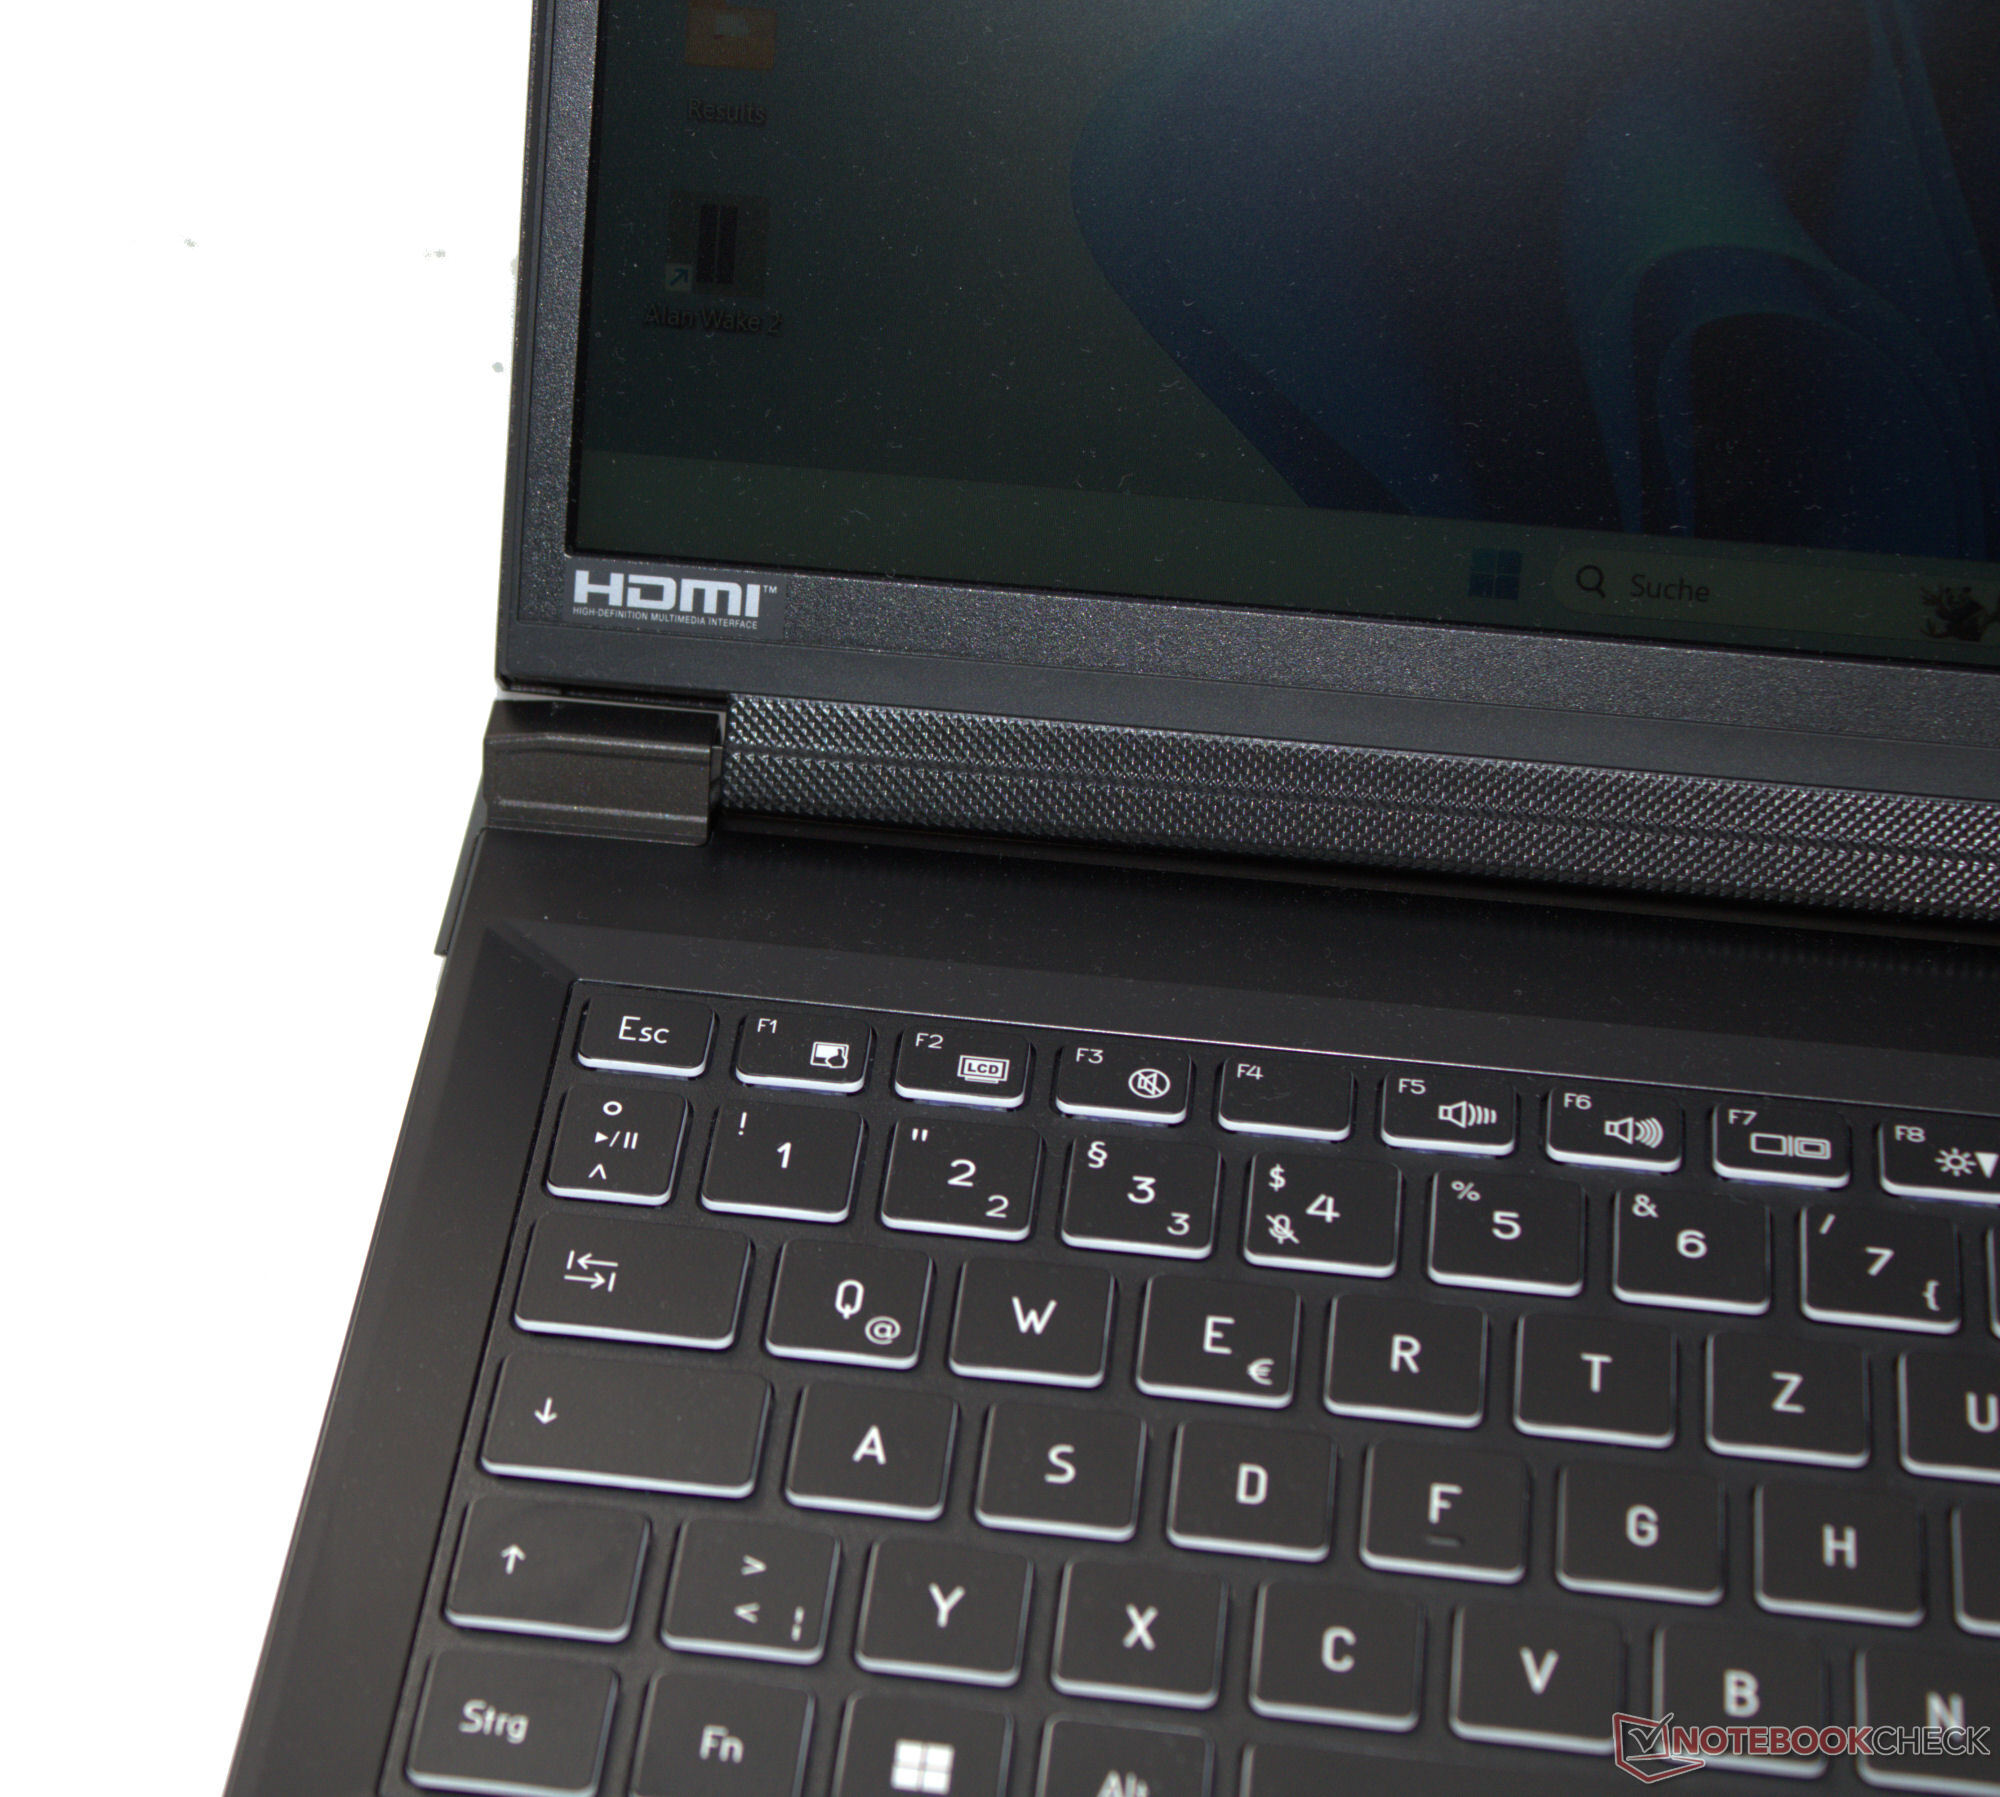
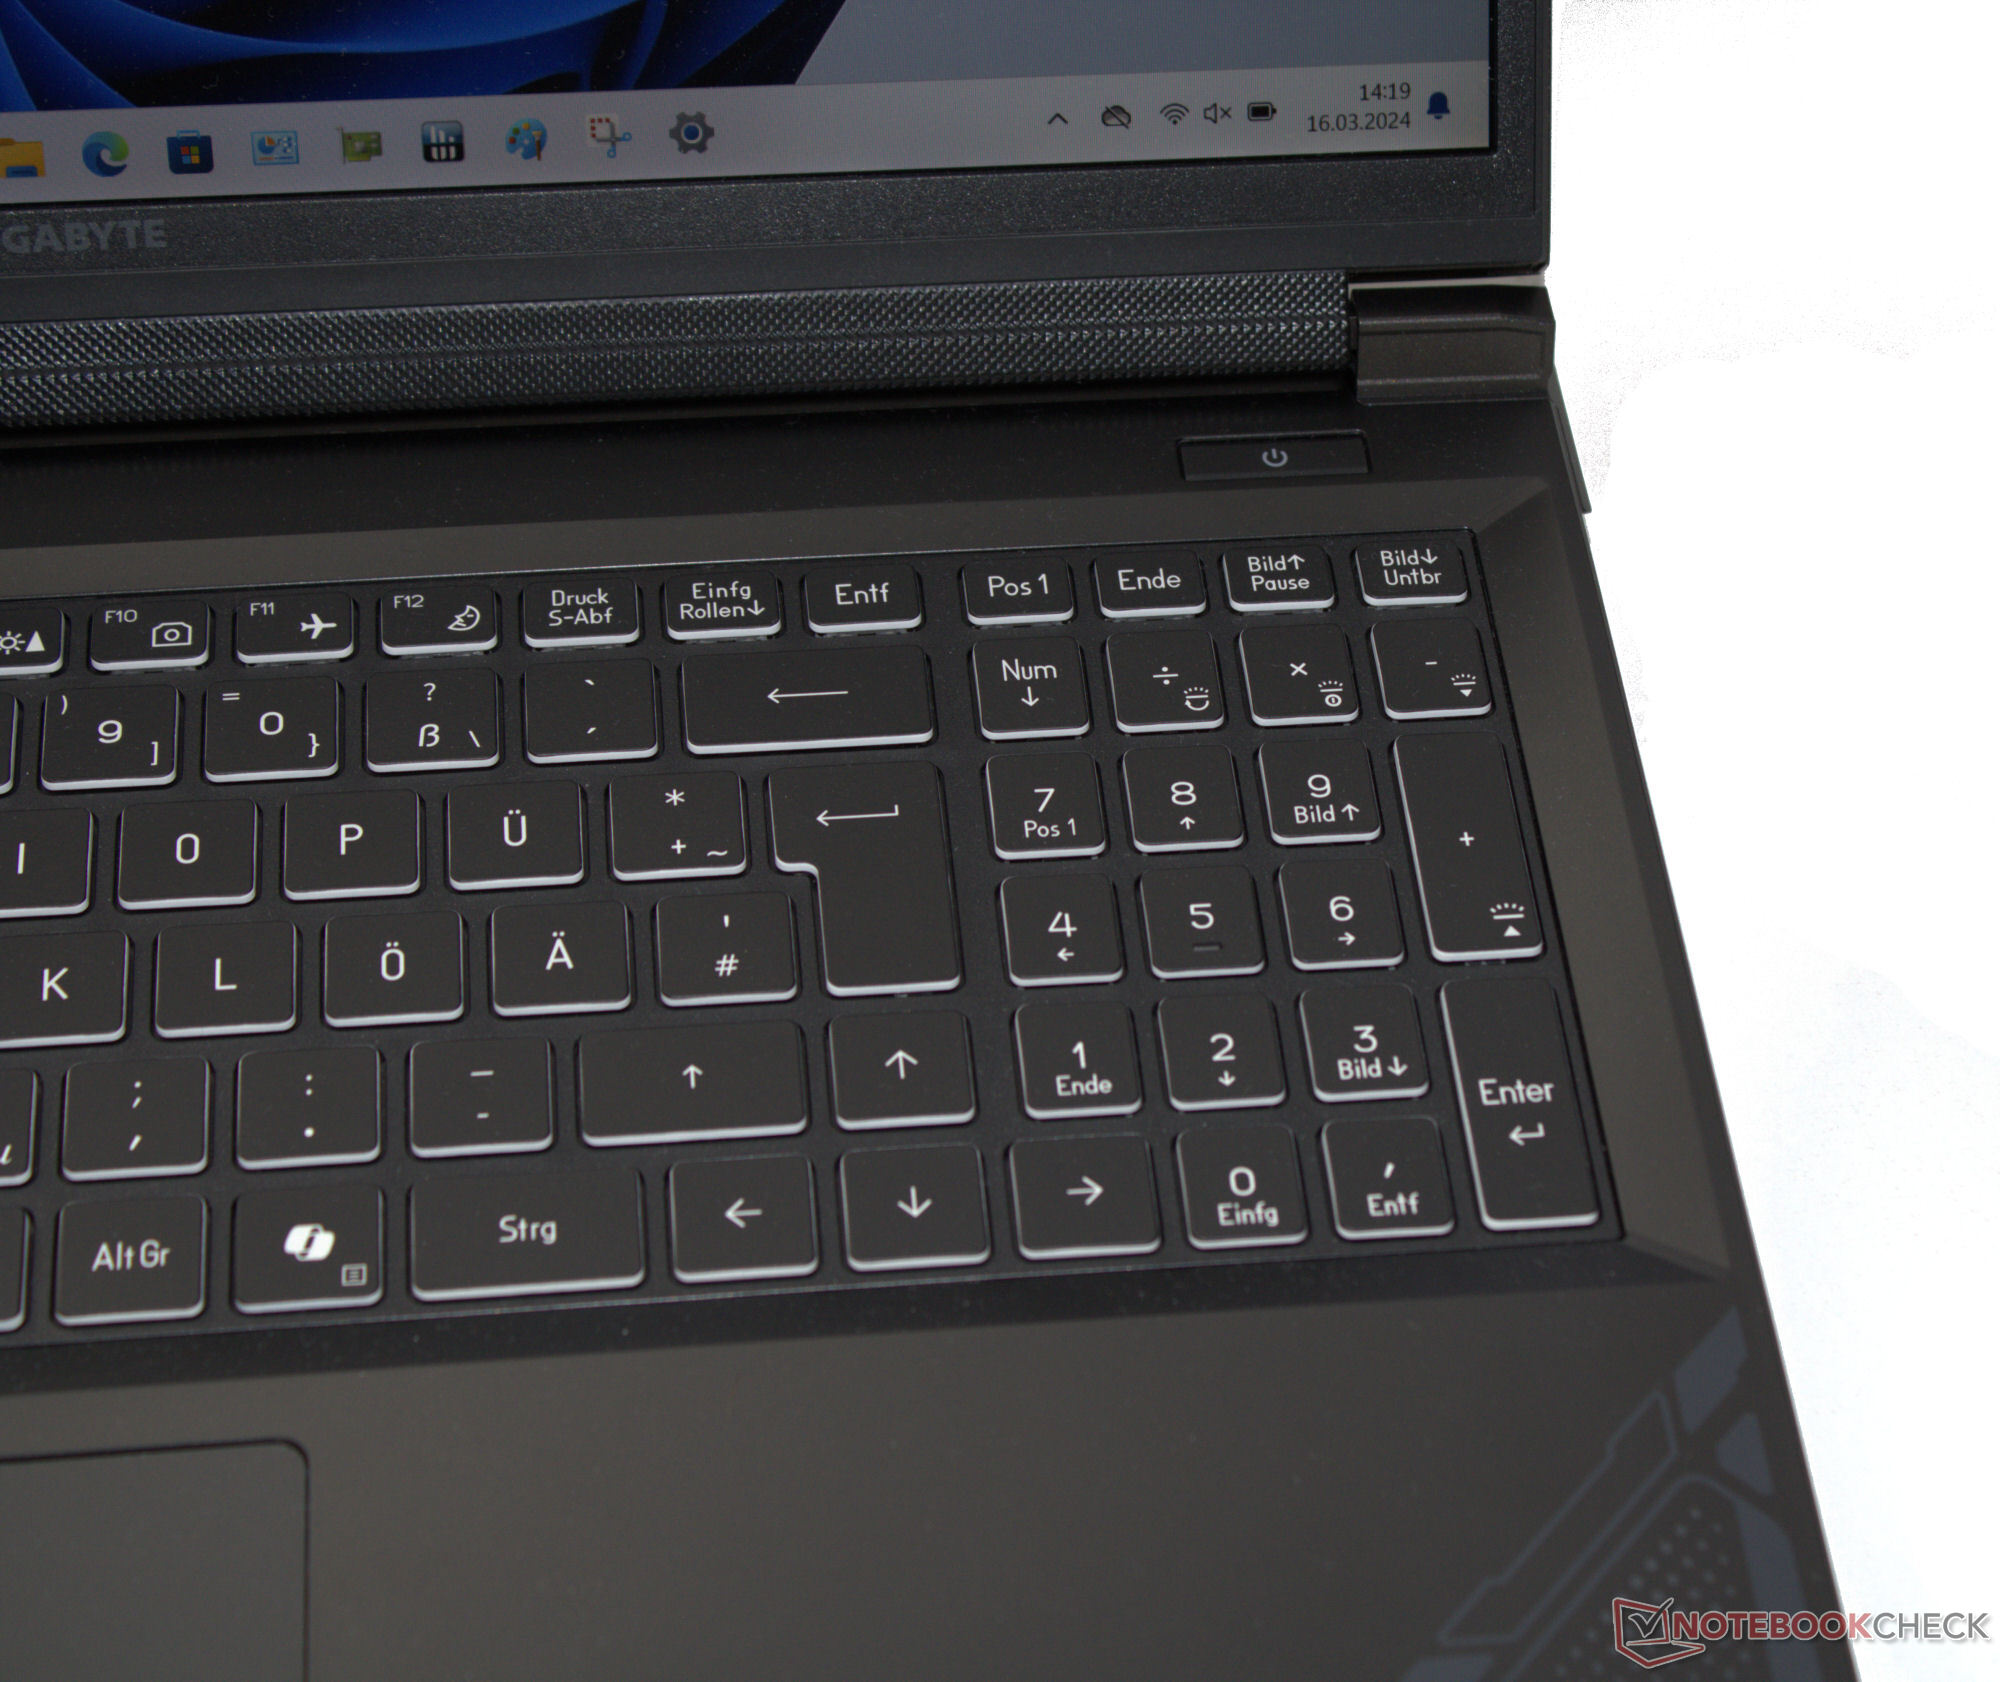
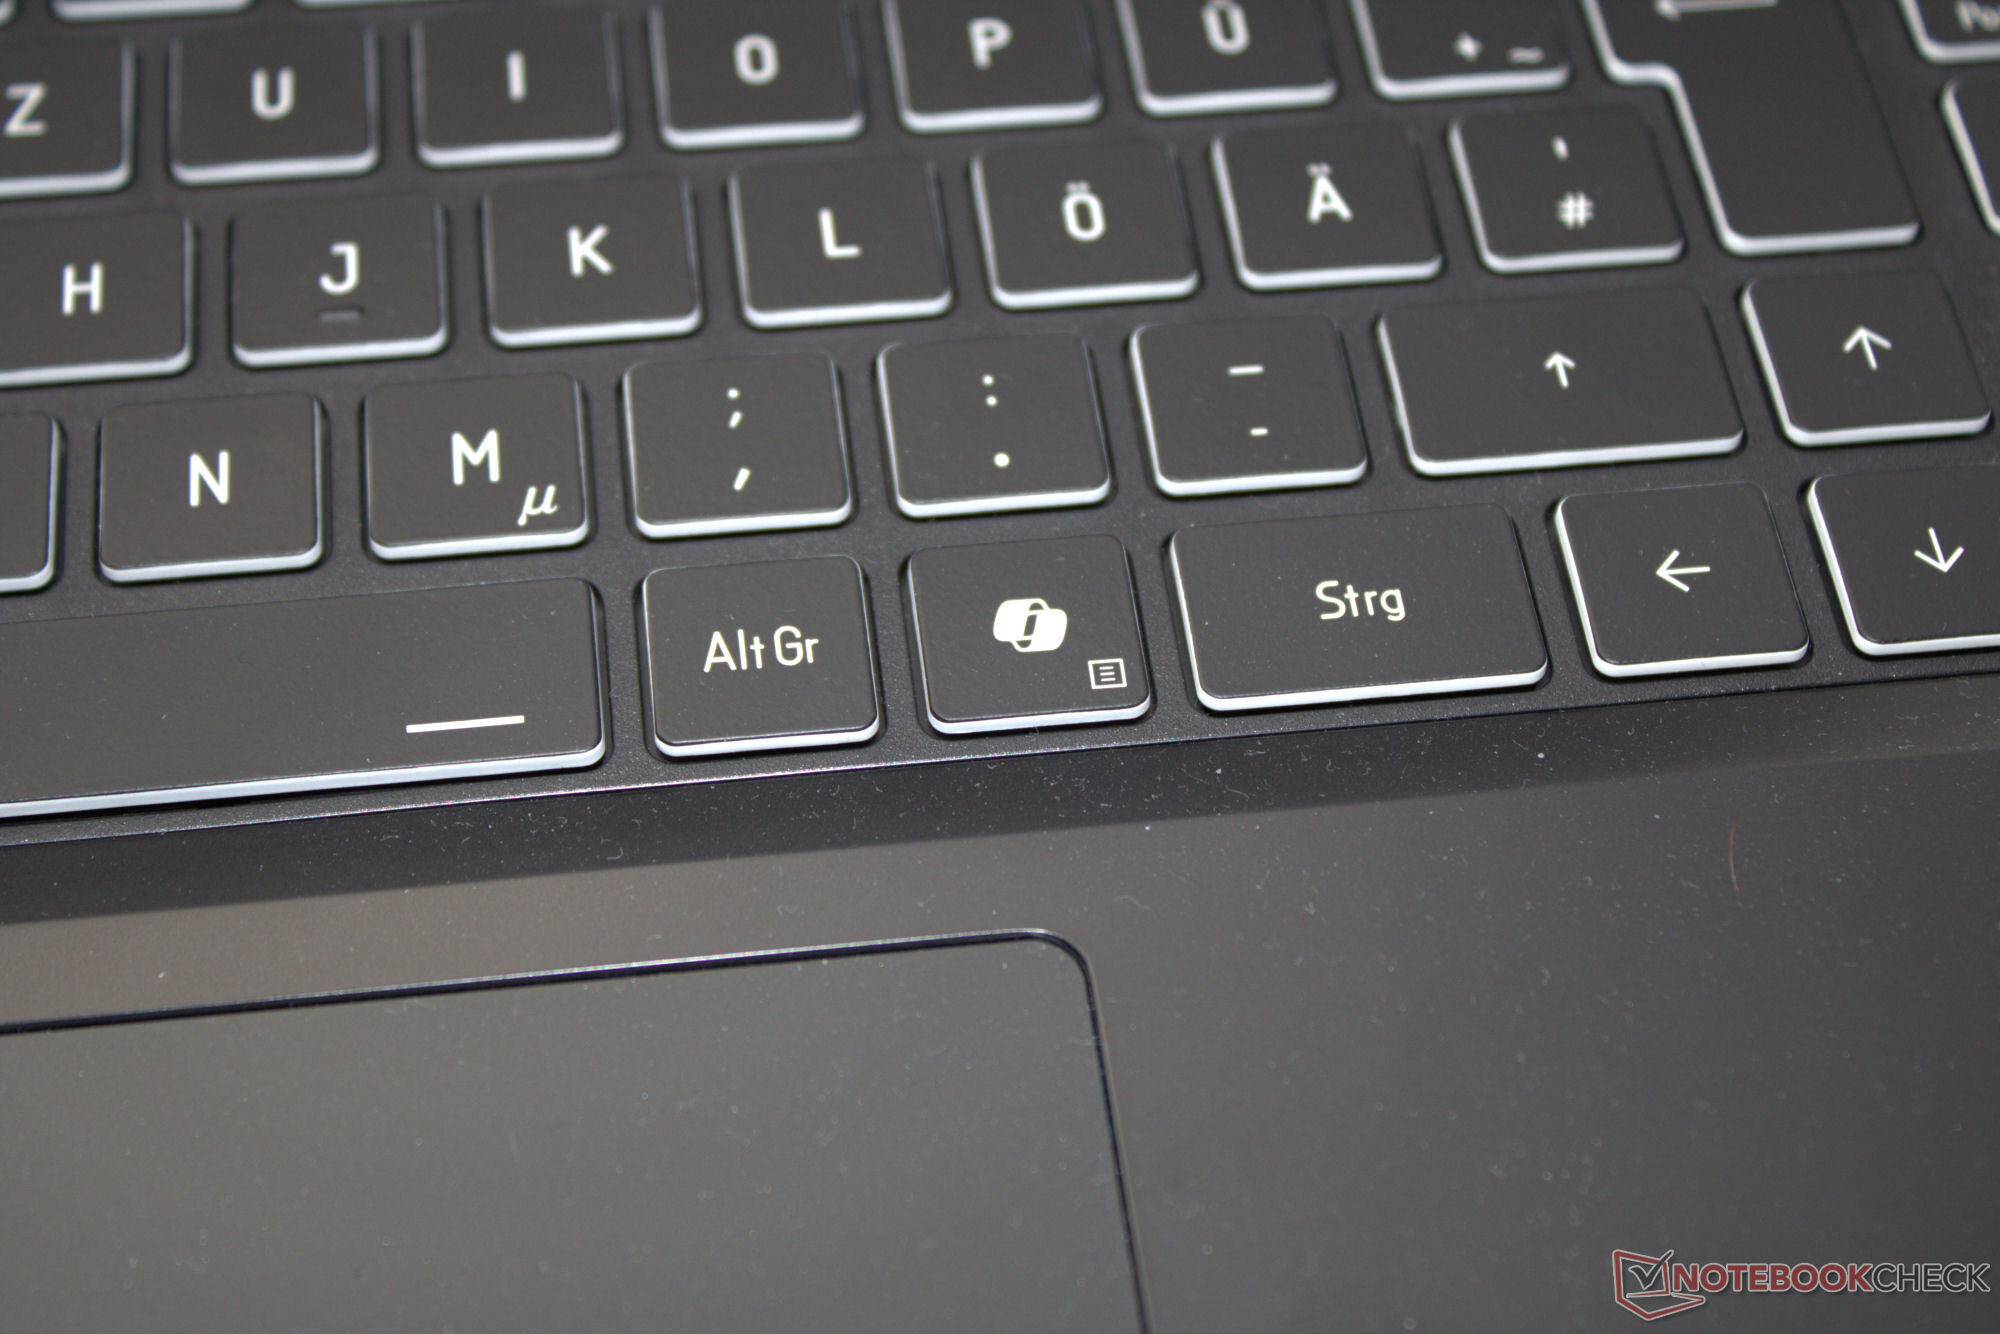
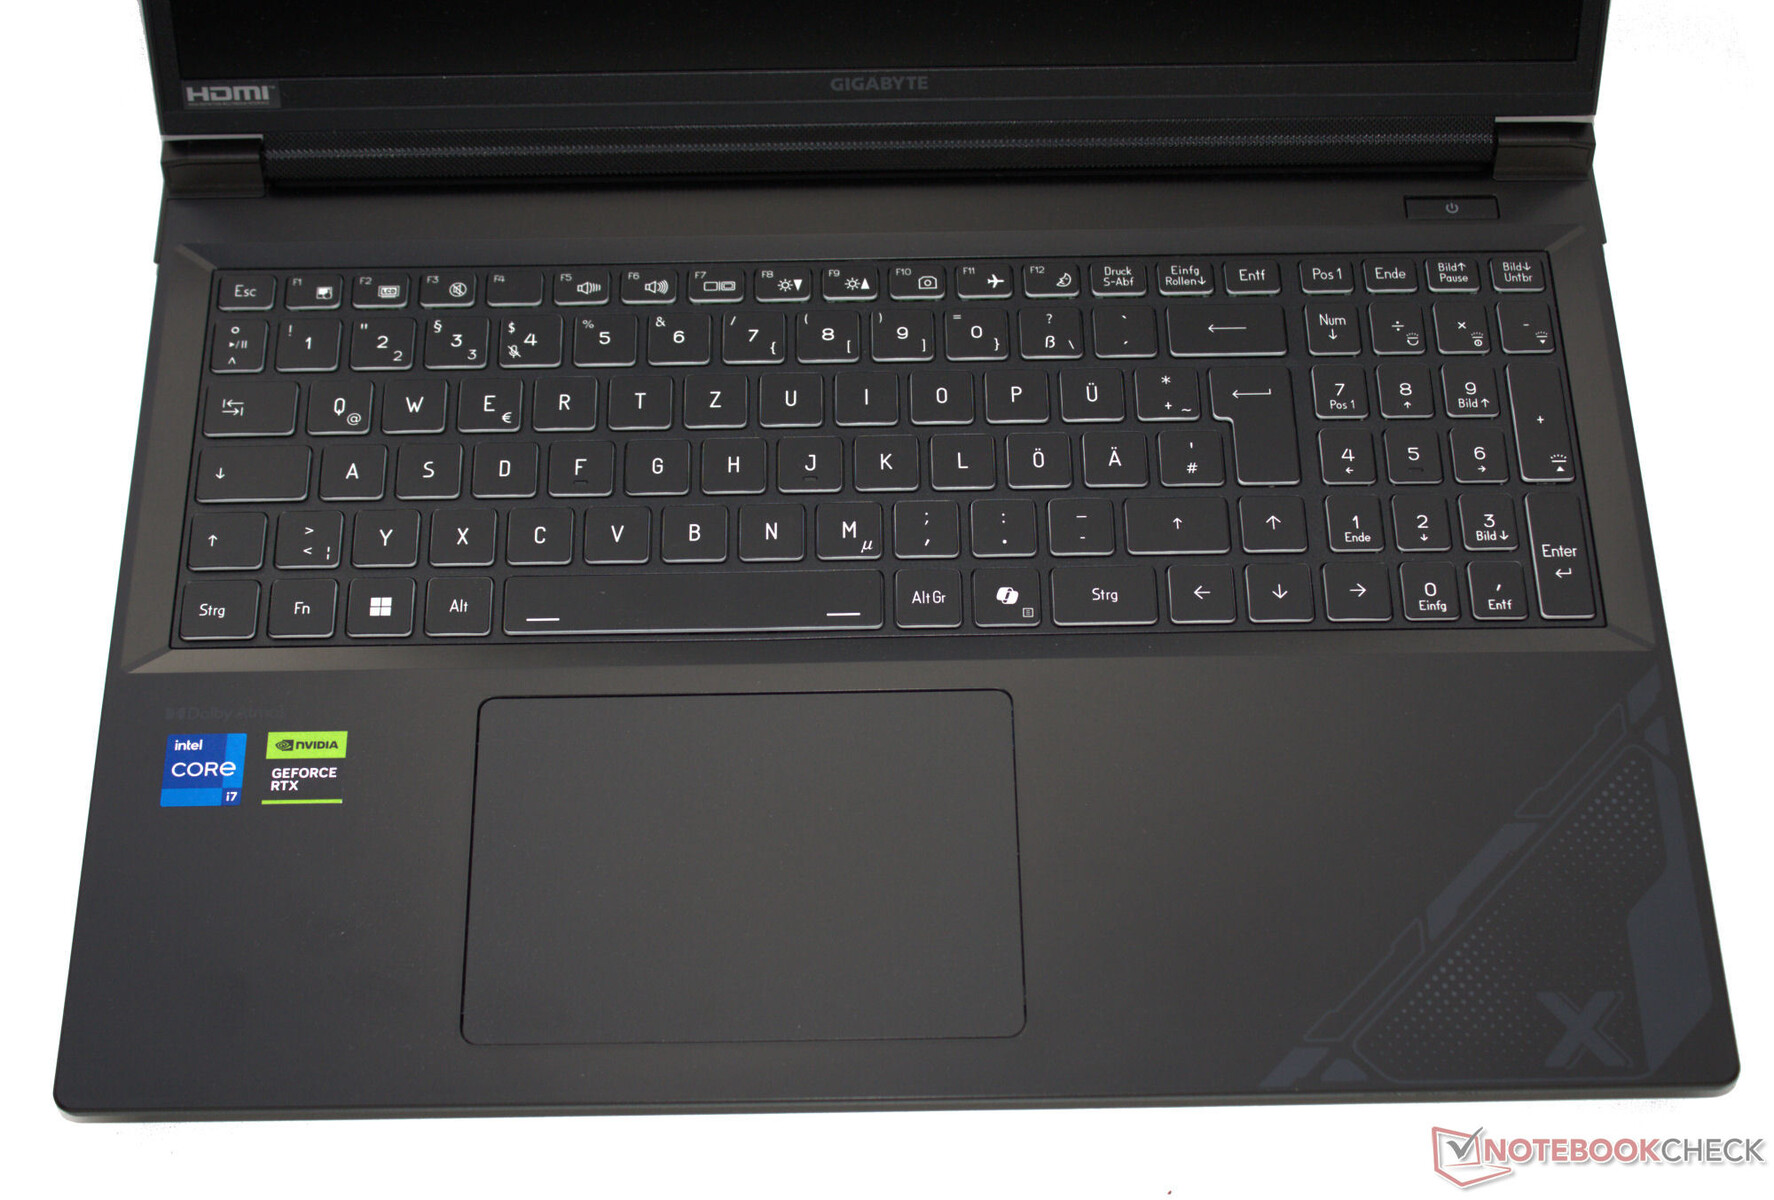
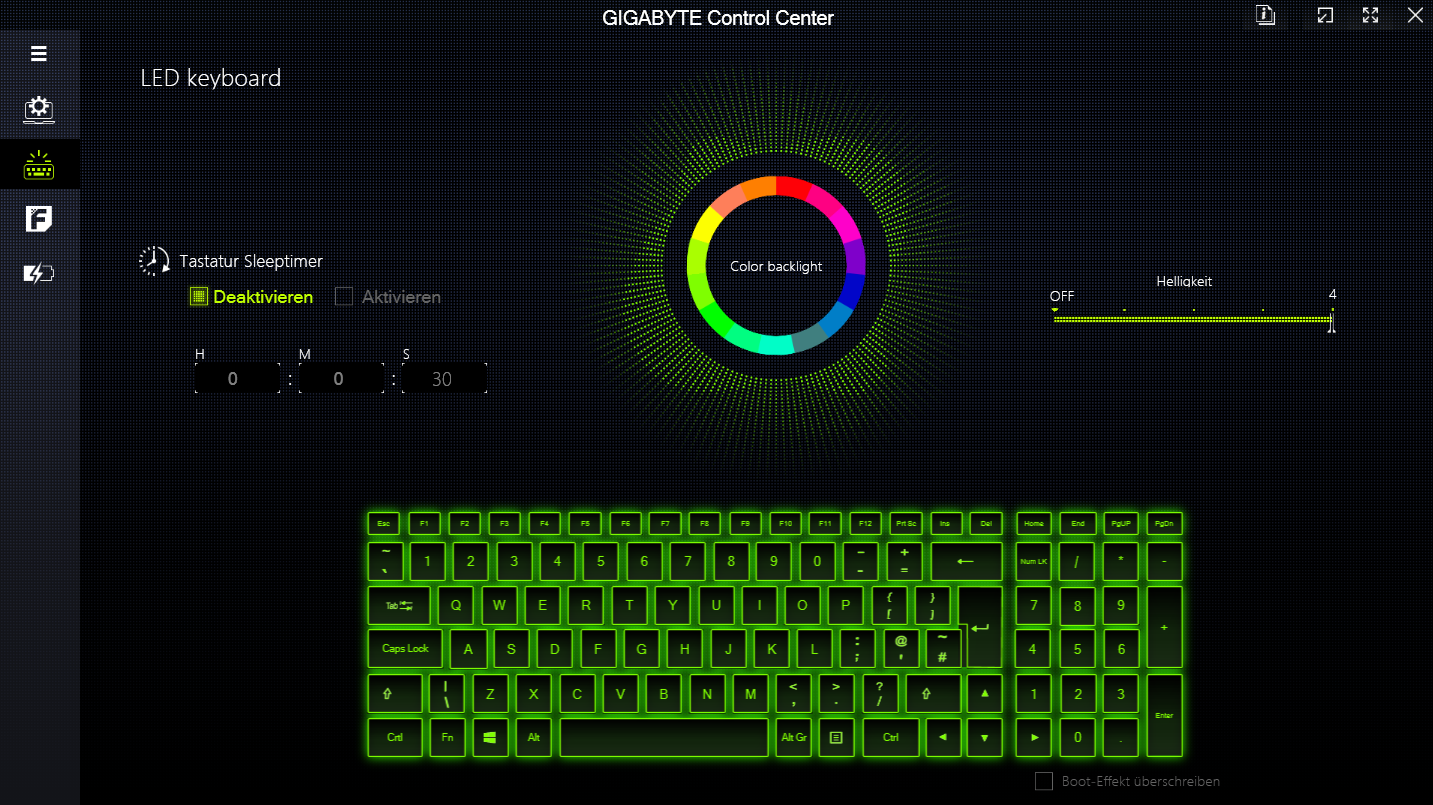
Giriş aygıtları: Günlük kullanım için uygun arkadan aydınlatmalı klavye
G6X, numpad, RGB aydınlatma ve günlük yazma ihtiyaçları için uygun düz, pürüzsüz tuşlara sahip bir chiclet klavyeye sahiptir. Klavye yazarken hafifçe eğilir, ancak bu bir anlaşma kırıcı değildir.
Tuş direnci net bir his veriyor. Ok tuşlarının tam boyutlu olması iyi bir özellik.
Kısa stroklu ve net basınç noktalı çoklu dokunmatik touchpad (12,1 cm x 8,5 cm) fare yerine kullanılabiliyor.
Ekran: PWM olmadan FHD+ 165 Hz
1920 x 1200 çözünürlüğe sahip duyarlı 165 Hz 16:10 panel, hiçbir parlaklık ayarında PWM titremesi göstermez.
Mat 16 inç ekranın parlaklığı ve kontrastı, reklamı yapılan ilgili hedefleri karşılıyor (> 300 cd/m² ve 1.000:1). Gigabyte, G6X için başka ekran seçenekleri sunmuyor.
| |||||||||||||||||||||||||
Aydınlatma: 81 %
Batarya modunda parlaklık: 353 cd/m²
Kontrast: 1681:1 (Siyah: 0.21 cd/m²)
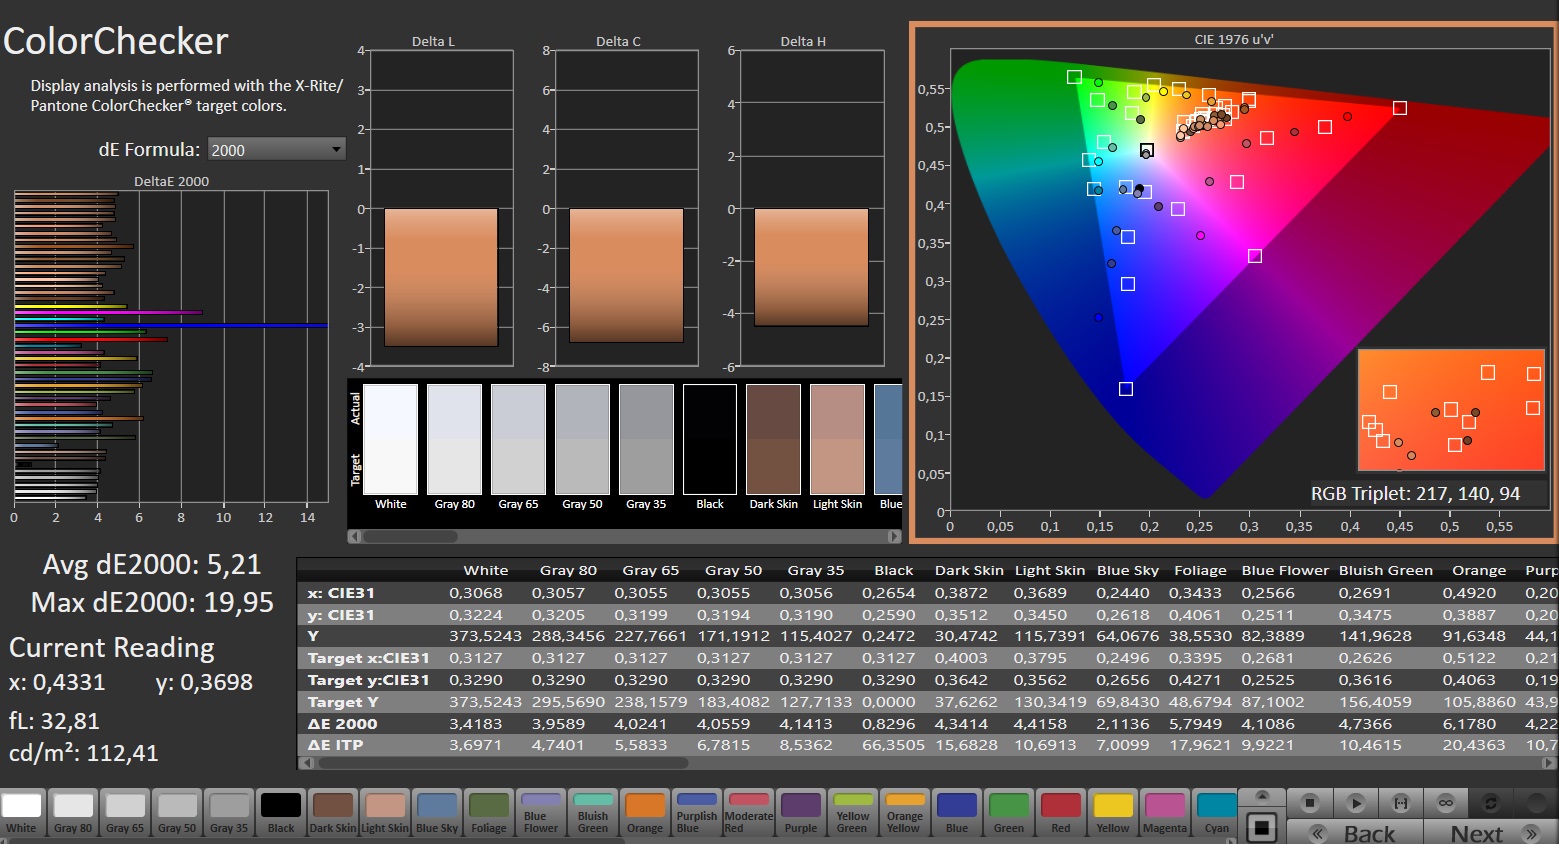
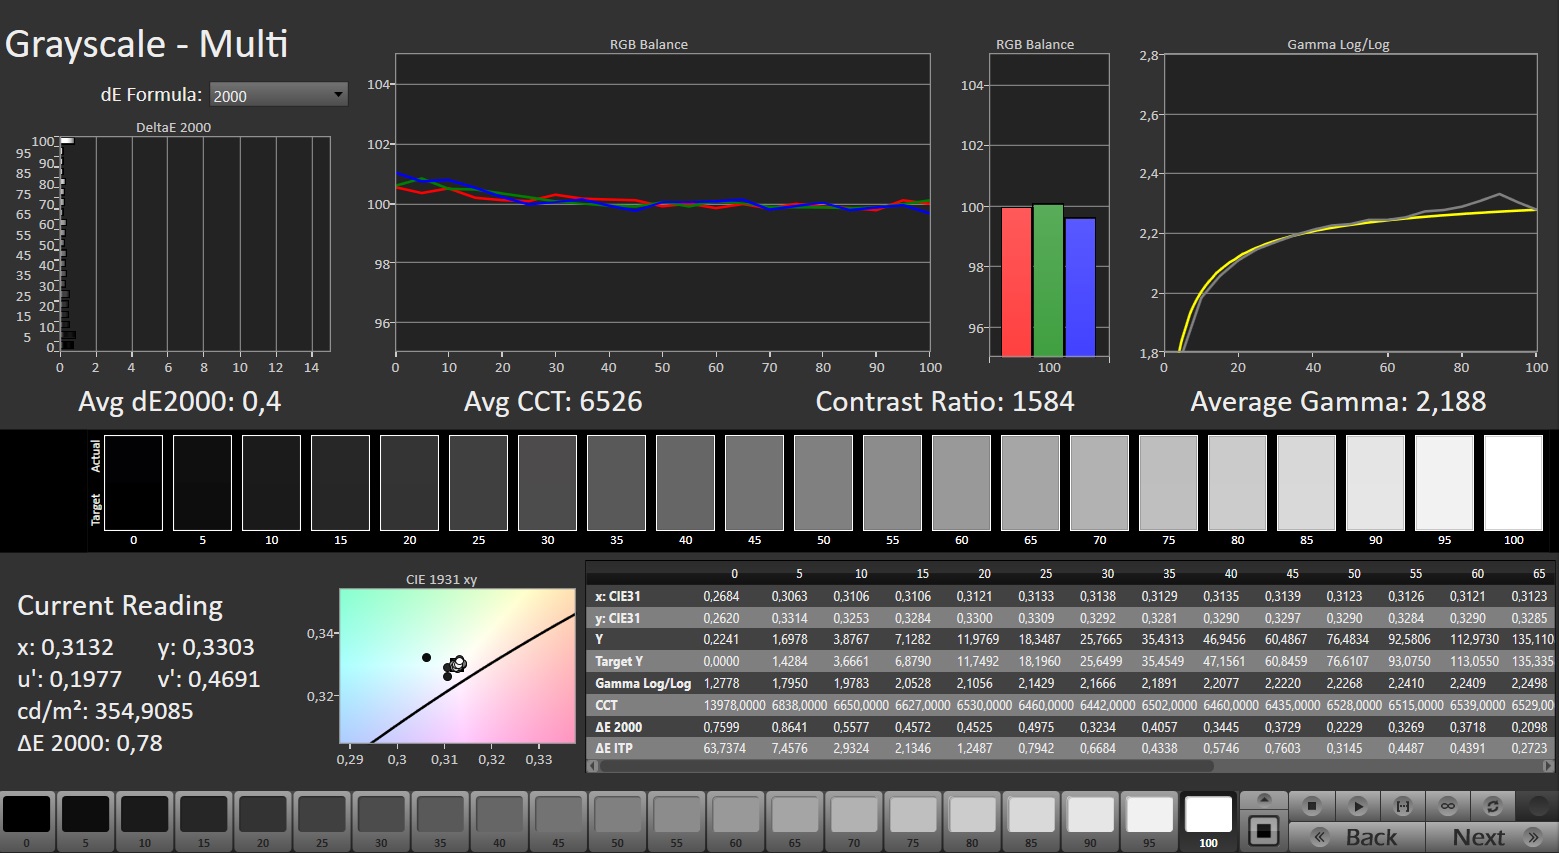
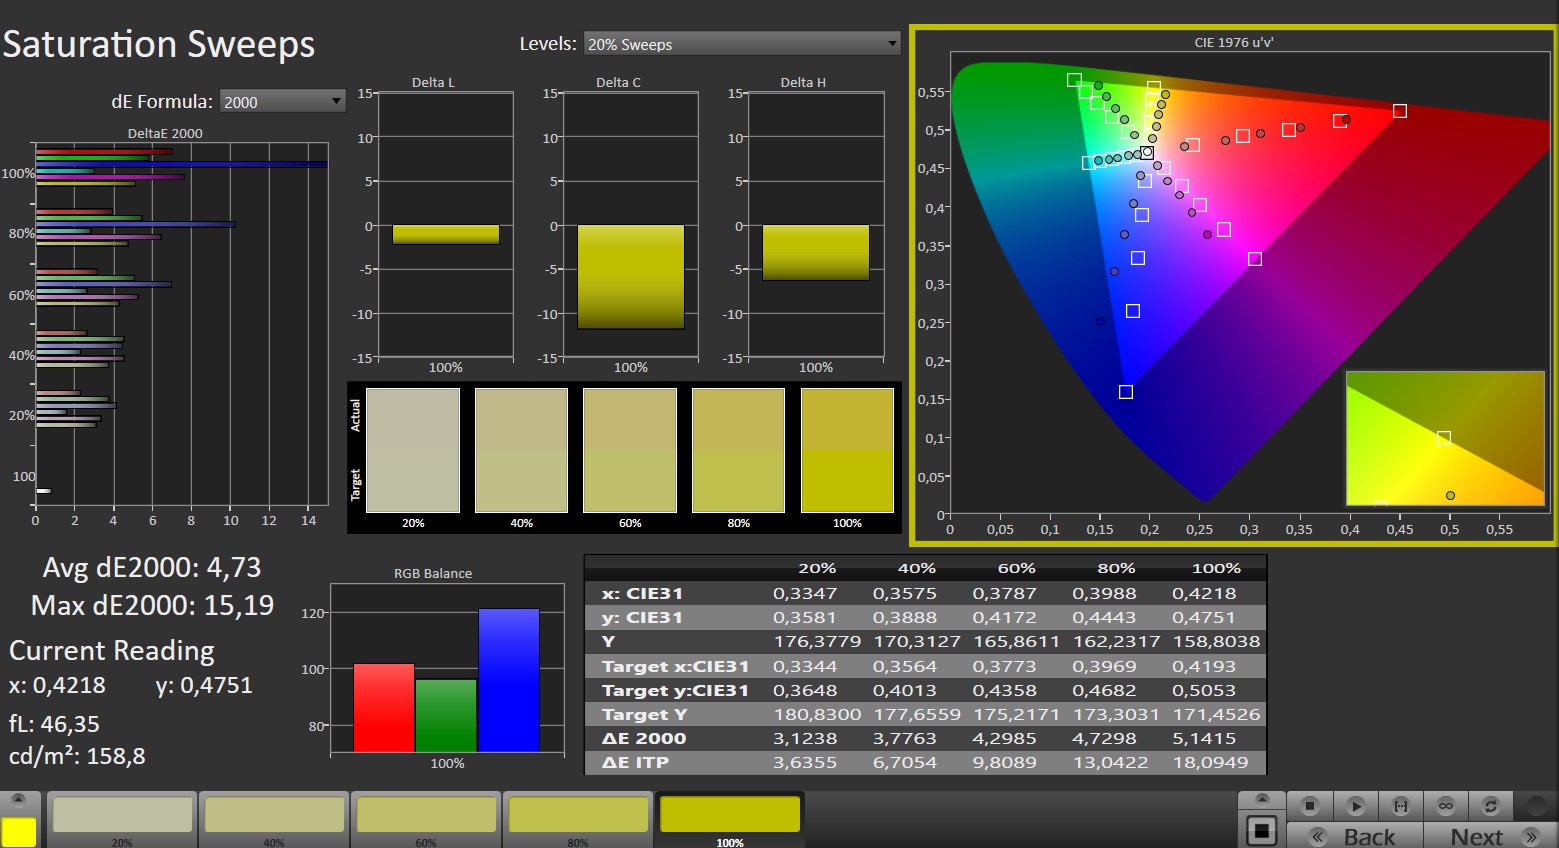
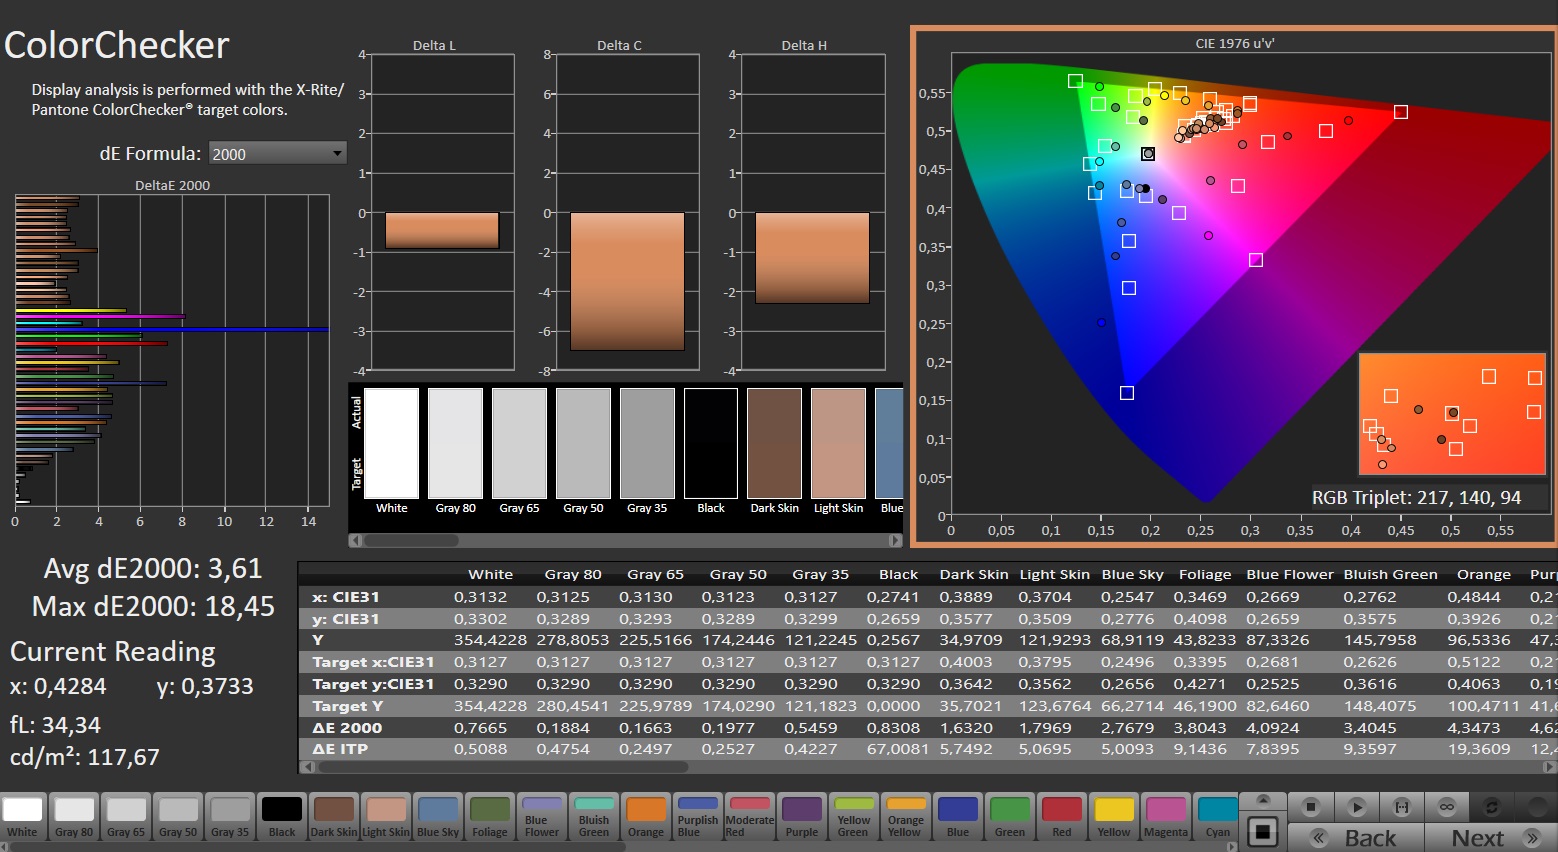
ΔE ColorChecker Calman: 5.21 | ∀{0.5-29.43 Ø4.73}
calibrated: 3.61
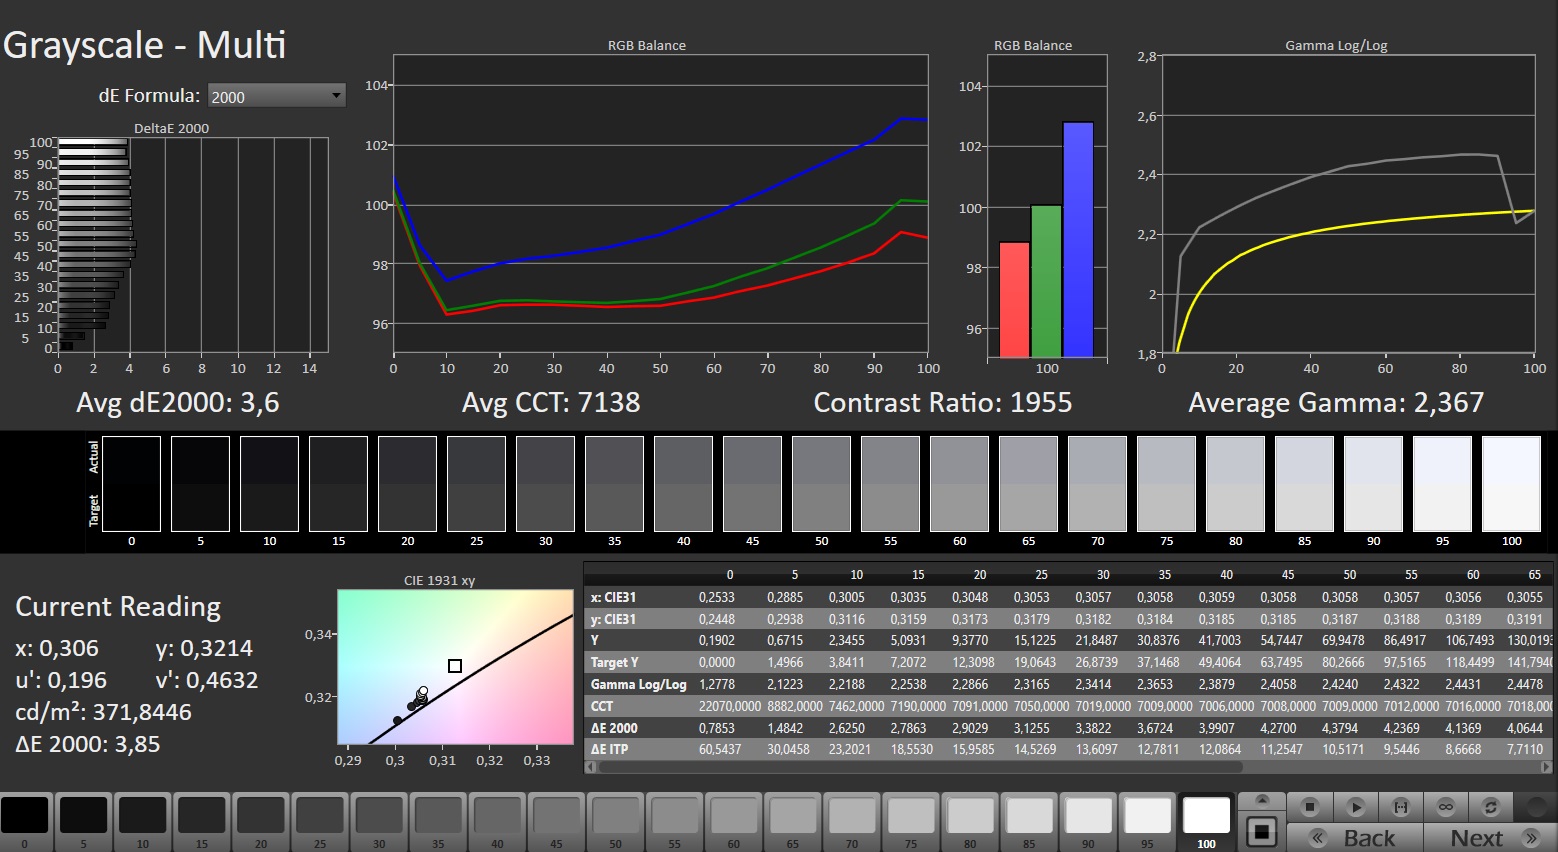
ΔE Greyscale Calman: 3.6 | ∀{0.09-98 Ø4.97}
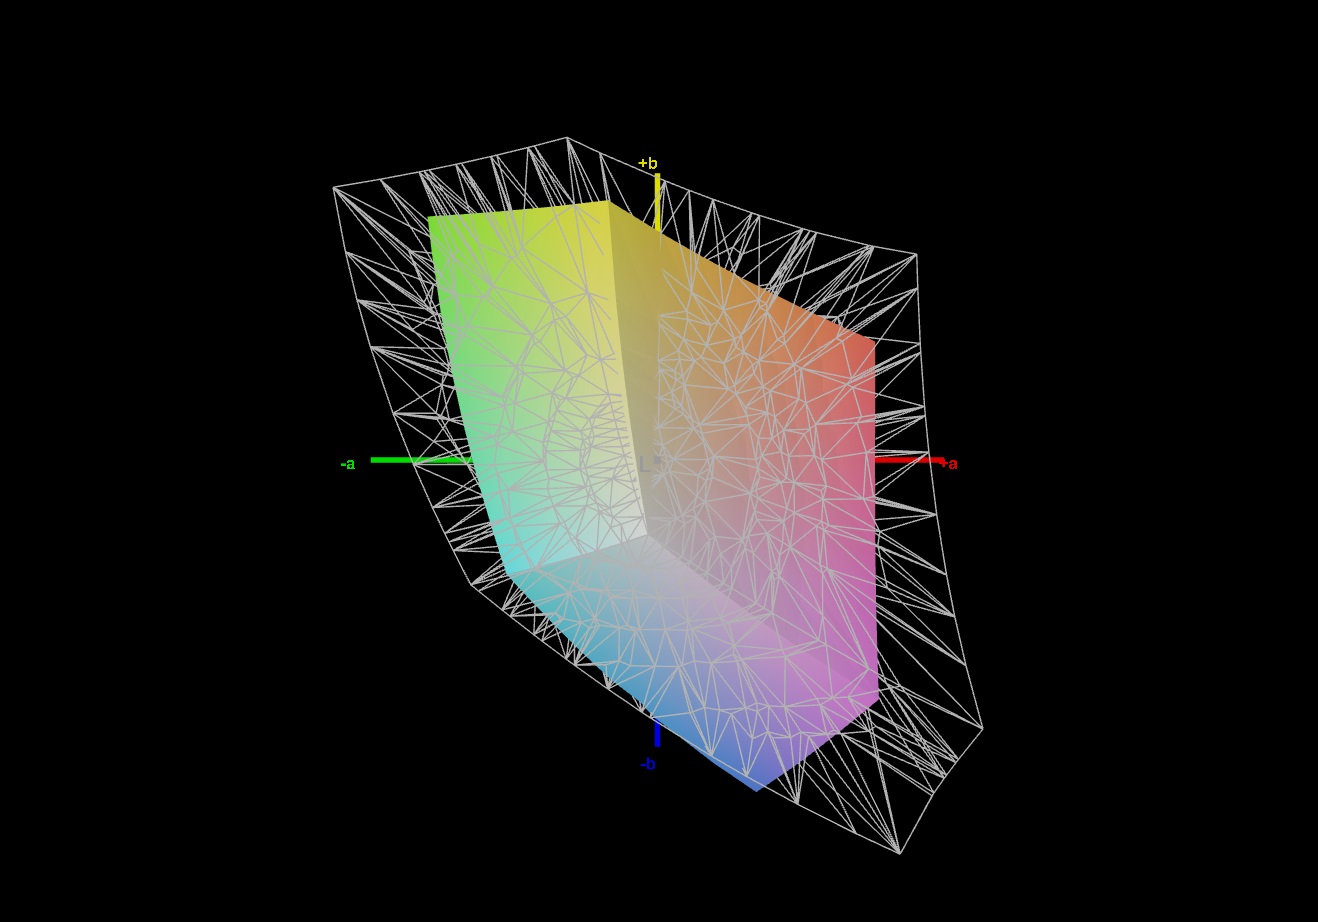
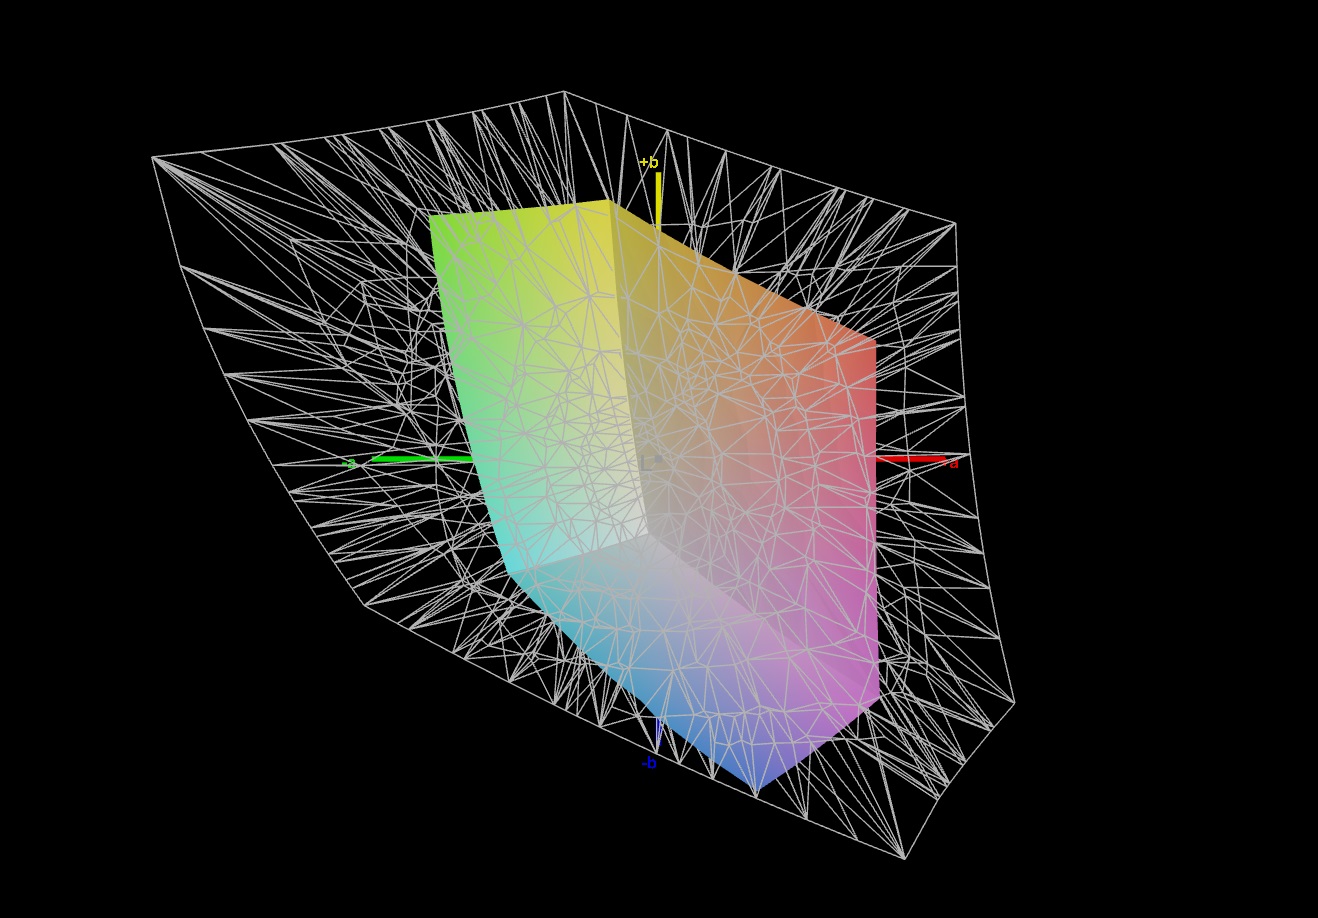
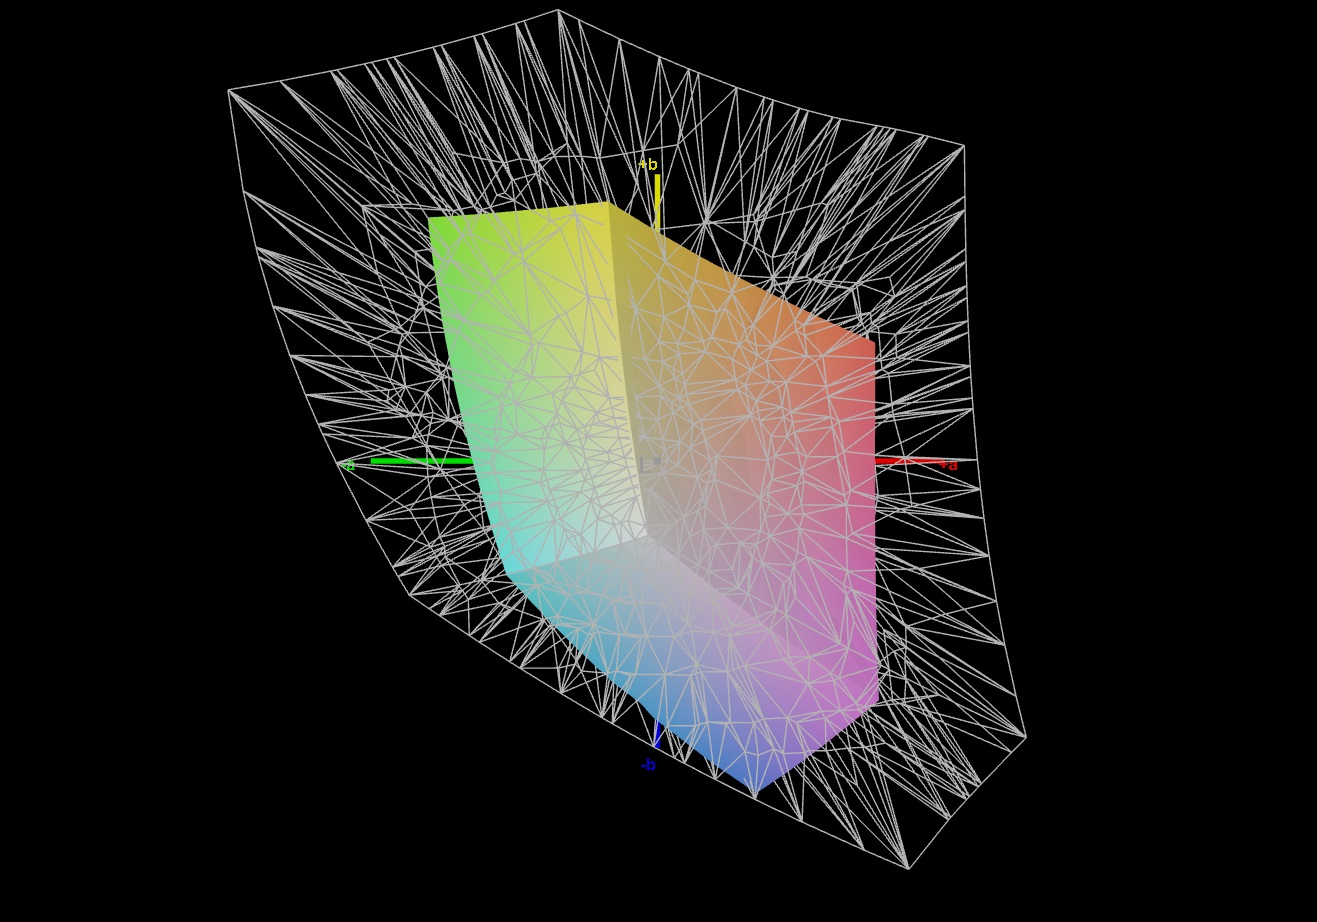
43.3% AdobeRGB 1998 (Argyll 3D)
62.4% sRGB (Argyll 3D)
41.8% Display P3 (Argyll 3D)
Gamma: 2.367
CCT: 7138 K
| Gigabyte G6X 9KG (2024) BOE NE160WUM-NX6, IPS, 1920x1200, 16" | Dell G16, i7-13650HX, RTX 4060 Chi Mei CMN161D (160GME), IPS, 2560x1600, 16" | Lenovo Legion 5 16IRX G9 NE160QDM-NZ3, IPS, 2560x1600, 16" | MSI Raider GE68HX 13VF Chi Mei N160JME-GTK, IPS, 1900x1200, 16" | Asus TUF Gaming A16 FA617XS BOE NE160WUM-NX2, IPS, 1920x1200, 16" | |
|---|---|---|---|---|---|
| Display | 60% | 68% | -0% | 62% | |
| Display P3 Coverage (%) | 41.8 | 67.5 61% | 72.4 73% | 41.6 0% | 69.3 66% |
| sRGB Coverage (%) | 62.4 | 98.5 58% | 100 60% | 62.2 0% | 97.3 56% |
| AdobeRGB 1998 Coverage (%) | 43.3 | 69.3 60% | 74.1 71% | 43 -1% | 70.7 63% |
| Response Times | 67% | 65% | 23% | 58% | |
| Response Time Grey 50% / Grey 80% * (ms) | 40.5 ? | 7.6 ? 81% | 12.5 ? 69% | 17.3 ? 57% | 15.6 ? 61% |
| Response Time Black / White * (ms) | 21.6 ? | 10.4 ? 52% | 8.7 ? 60% | 24.2 ? -12% | 10 ? 54% |
| PWM Frequency (Hz) | |||||
| Screen | 15% | 39% | -2% | 25% | |
| Brightness middle (cd/m²) | 353 | 369 5% | 526 49% | 300.9 -15% | 301 -15% |
| Brightness (cd/m²) | 318 | 344 8% | 500 57% | 302 -5% | 294 -8% |
| Brightness Distribution (%) | 81 | 89 10% | 87 7% | 93 15% | 94 16% |
| Black Level * (cd/m²) | 0.21 | 0.26 -24% | 0.33 -57% | 0.31 -48% | 0.21 -0% |
| Contrast (:1) | 1681 | 1419 -16% | 1594 -5% | 971 -42% | 1433 -15% |
| Colorchecker dE 2000 * | 5.21 | 3.04 42% | 1.2 77% | 4.6 12% | 1.79 66% |
| Colorchecker dE 2000 max. * | 19.95 | 5.56 72% | 2.1 89% | 17.6 12% | 3.48 83% |
| Colorchecker dE 2000 calibrated * | 3.61 | 2.35 35% | 1 72% | 2.04 43% | 1.2 67% |
| Greyscale dE 2000 * | 3.6 | 3.38 6% | 1.3 64% | 3.3 8% | 2.5 31% |
| Gamma | 2.367 93% | 2.47 89% | 2.23 99% | 2.09 105% | 2.265 97% |
| CCT | 7138 91% | 6040 108% | 6391 102% | 7151 91% | 6157 106% |
| Toplam Ortalama (Program / Ayarlar) | 47% /
32% | 57% /
49% | 7% /
2% | 48% /
38% |
* ... daha küçük daha iyidir
Ekran, eski çalışmalarda vasat bir renk üretimi gösterir: Yaklaşık 5,2 sapma ile deltaE 2000 hedefi olan <3 karşılanmıyor. Kalibrasyon, sapmayı 3,6'ya düşürür ve daha dengeli gri tonları sağlar.
Panel AdobeRGB, sRGB ve DCI-P3 renk alanlarını tam olarak üretemez. Bu açıdan G6X'in rakipleri daha iyi ekranlar sunuyor.

Yanıt Sürelerini Görüntüle
| ↔ Tepki Süresi Siyahtan Beyaza | ||
|---|---|---|
| 21.6 ms ... yükseliş ↗ ve sonbahar↘ birleşimi | ↗ 11.1 ms yükseliş | 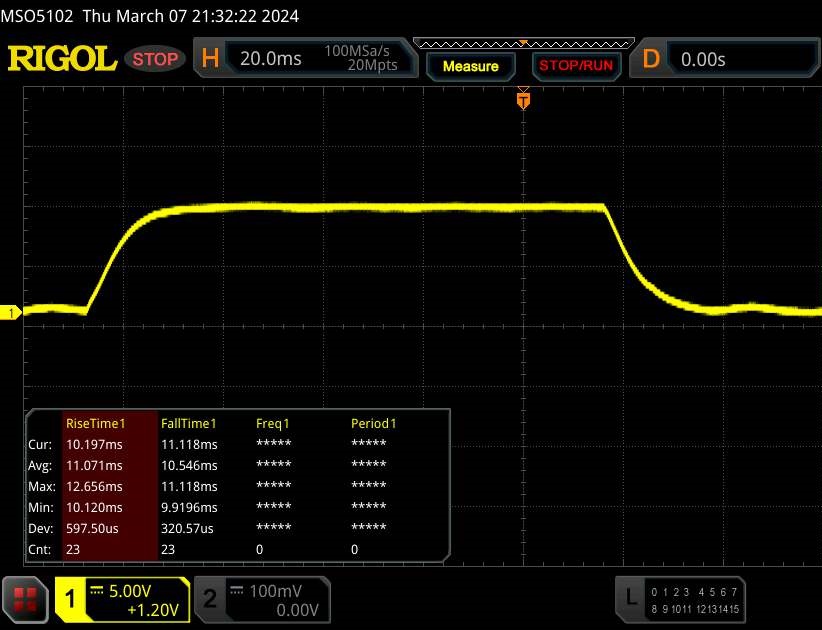 |
| ↘ 10.5 ms sonbahar | ||
| Ekran, testlerimizde iyi yanıt oranları gösteriyor ancak rekabetçi oyuncular için çok yavaş olabilir. Karşılaştırıldığında, test edilen tüm cihazlar 0.1 (minimum) ile 240 (maksimum) ms arasında değişir. » Tüm cihazların 48 %'si daha iyi. Bu, ölçülen yanıt süresinin test edilen tüm cihazların ortalamasına benzer olduğu anlamına gelir (19.9 ms). | ||
| ↔ Tepki Süresi %50 Griden %80 Griye | ||
| 40.5 ms ... yükseliş ↗ ve sonbahar↘ birleşimi | ↗ 19 ms yükseliş | 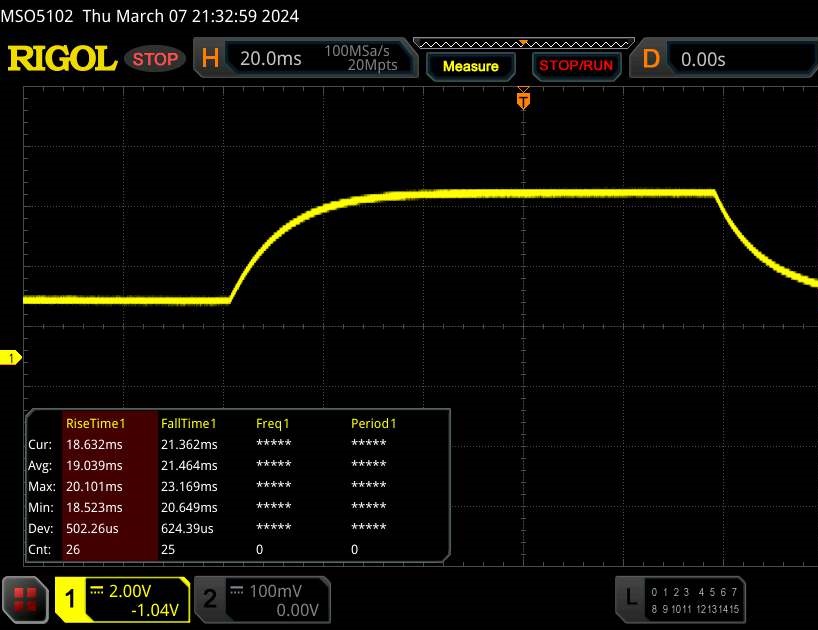 |
| ↘ 21.5 ms sonbahar | ||
| Ekran, testlerimizde yavaş yanıt oranları gösteriyor ve oyuncular için yetersiz olacaktır. Karşılaştırıldığında, test edilen tüm cihazlar 0.165 (minimum) ile 636 (maksimum) ms arasında değişir. » Tüm cihazların 64 %'si daha iyi. Bu, ölçülen yanıt süresinin test edilen tüm cihazların ortalamasından (31.1 ms) daha kötü olduğu anlamına gelir. | ||
Ekran Titremesi / PWM (Darbe Genişliği Modülasyonu)
| Ekran titriyor / PWM algılanmadı |  | ||
Karşılaştırıldığında: Test edilen tüm cihazların %52 %'si ekranı karartmak için PWM kullanmıyor. PWM tespit edilirse, ortalama 7784 (minimum: 5 - maksimum: 343500) Hz ölçüldü. | |||
IPS panel, aşırı konumlardan okunabilen nispeten sabit görüntüleme açıları sunar. Güneş çok parlak değilse ekranı açık havada kullanmak mümkündür.
Performans: Raptor Lake ve Ada Lovelace 16-incher'a güç veriyor
Gigabyte, G6X 9KG ile orta sınıf bir oyun dizüstü bilgisayarı sunuyor. Raptor Lake-HX ve Ada Lovelace gerekli bilgi işlem gücünü sağlıyor.
Test koşulları
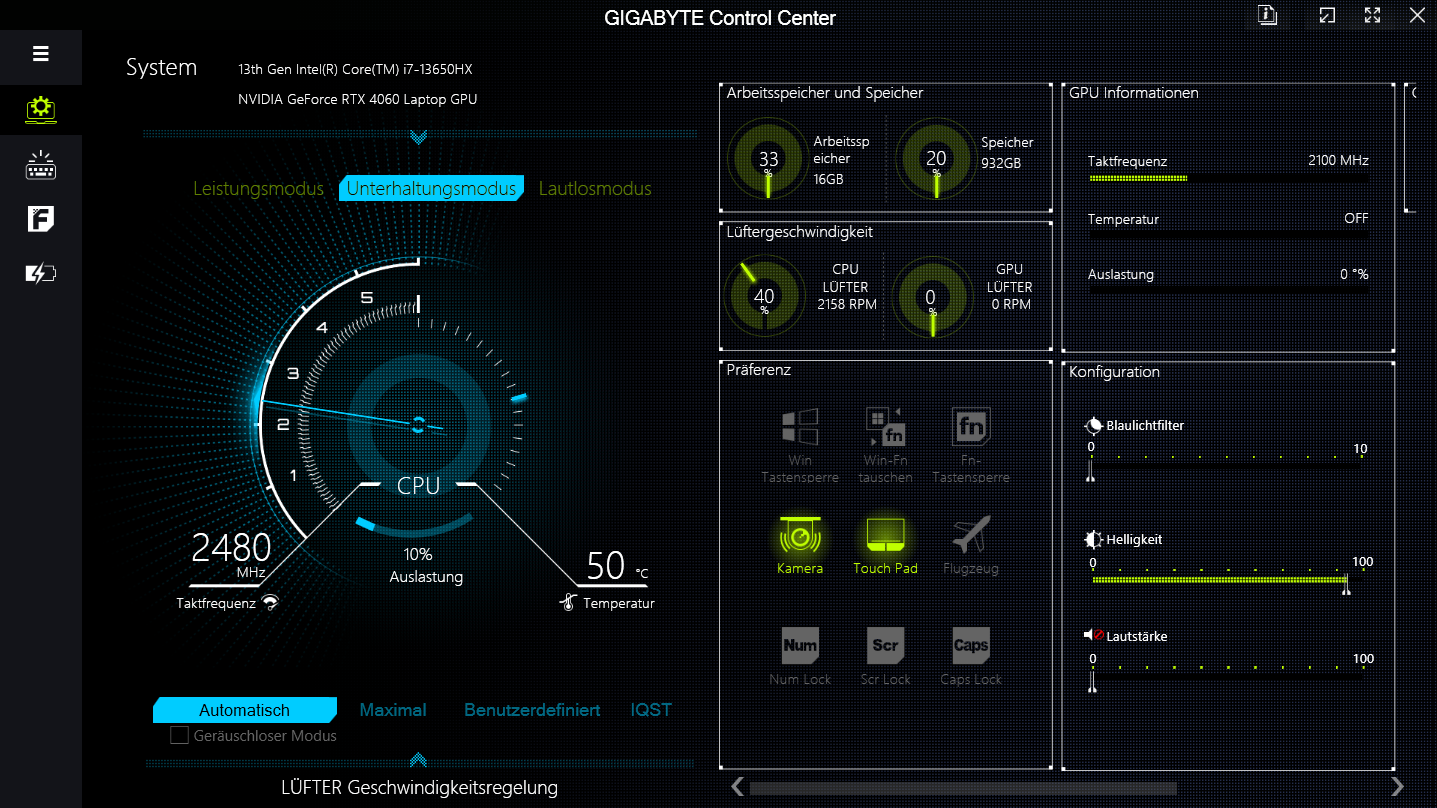
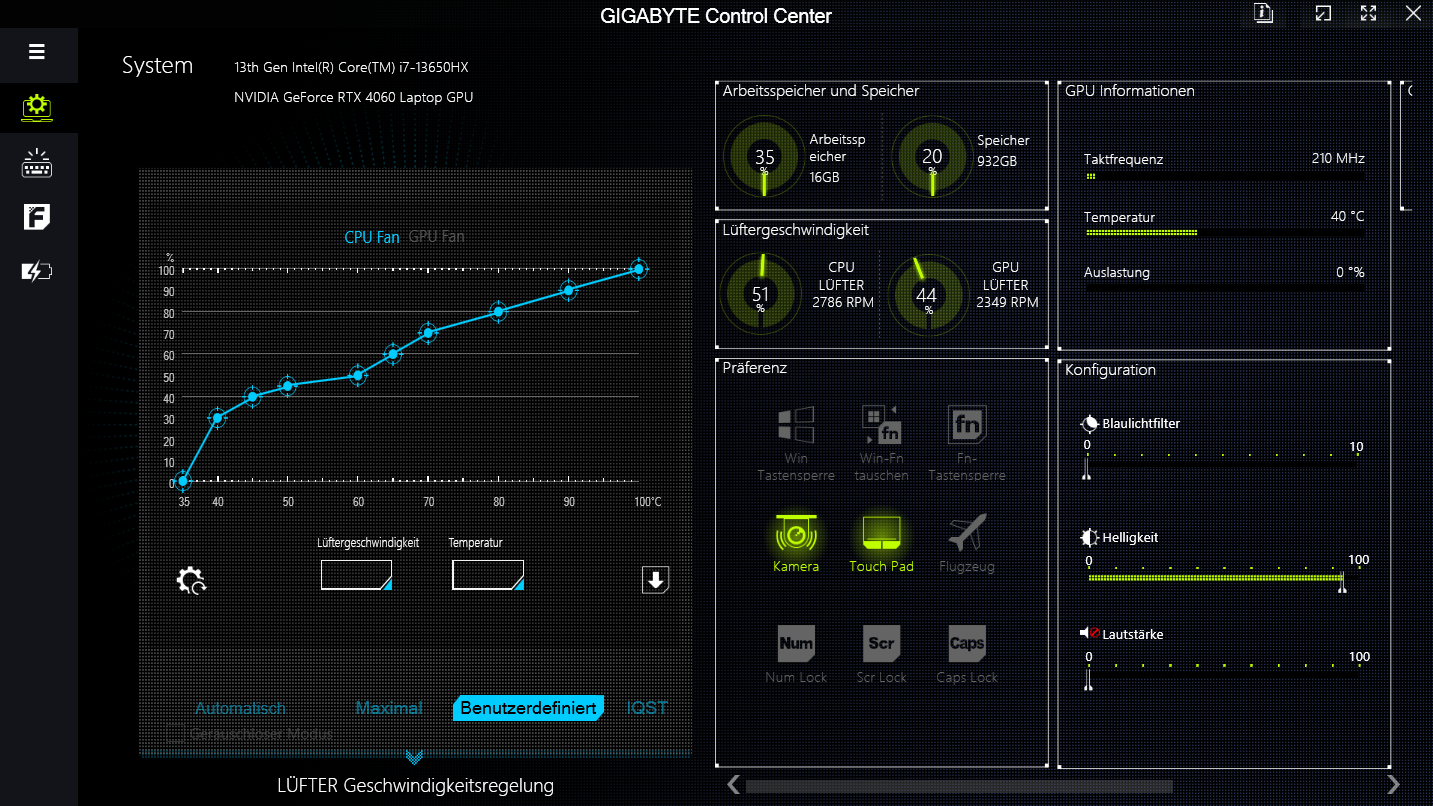
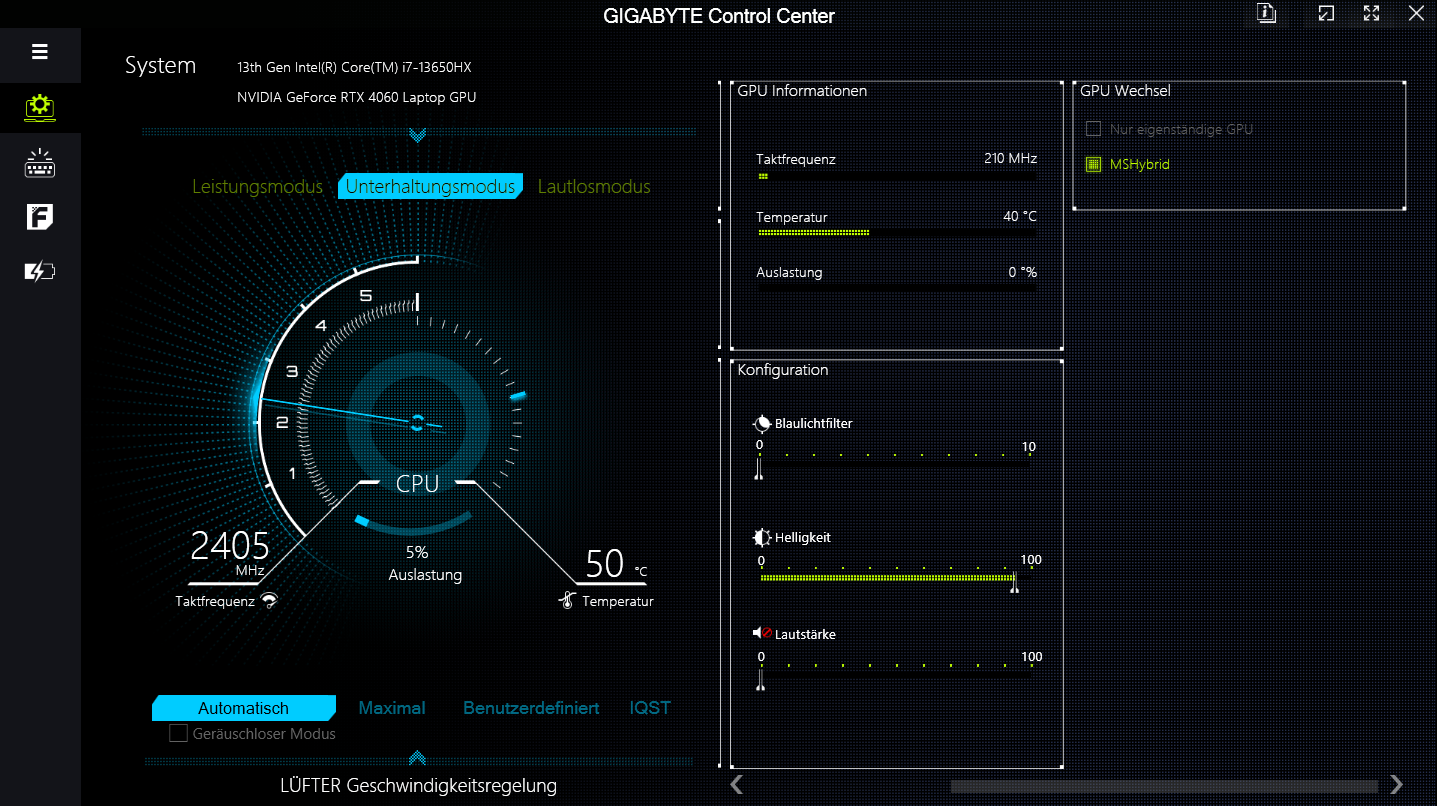
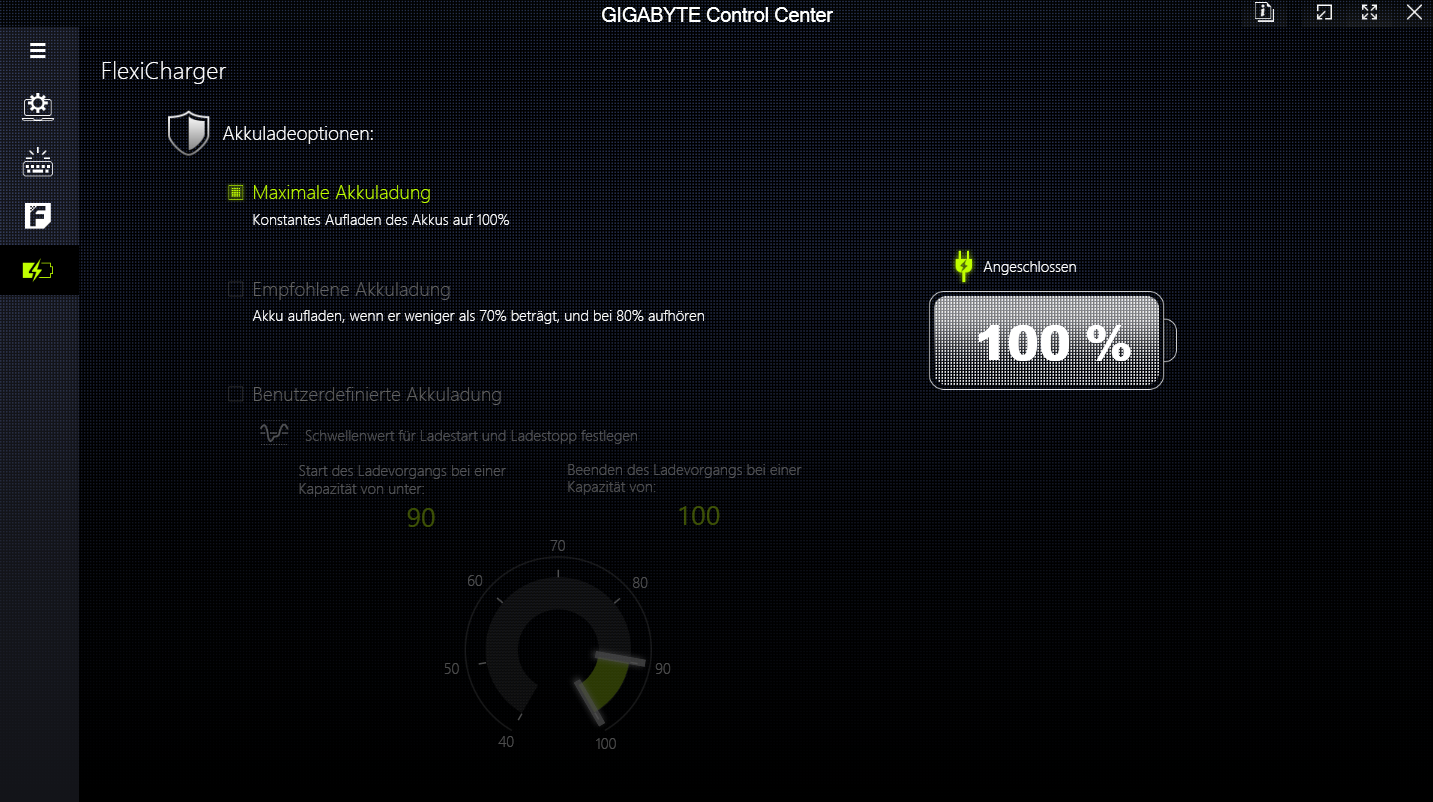
G6X, Kontrol Merkezi uygulaması aracılığıyla aralarında geçiş yapılabilen, üreticiye özel üç performans modu (aşağıdaki tabloya bakın) sunmaktadır. "Eğlence modu" kıyaslamalar için kullanılırken, "Sessiz mod" pil testleri için kullanılmıştır. Her iki mod da otomatik fan kontrolü sunuyor.
| Performans modu | Eğlence modu | Sessiz mod (= dGPU kapalı) | |
|---|---|---|---|
| Güç Sınırı 1 (HWInfo) | 135 W | 55 W | 25 W |
| Güç Sınırı 2 (HWInfo) | 155 W | 115 W | 30 W |
| Gürültü (The Witcher 3 1080p Ultra) | 55 dB(A) | 51 dB(A) | 33 dB(A) |
| Performans (The Witcher 3 1080p Ultra) | ~102 fps | ~100 fps | 4 fps |
İşlemci
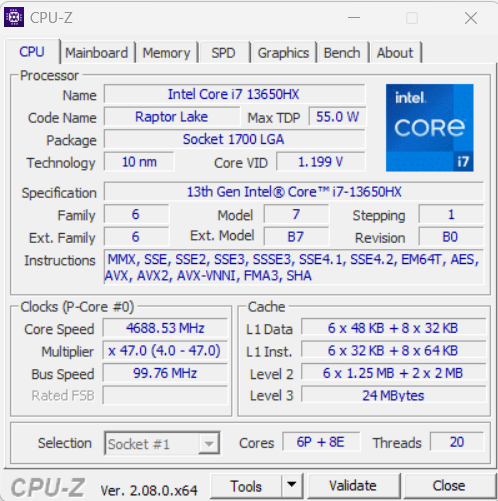
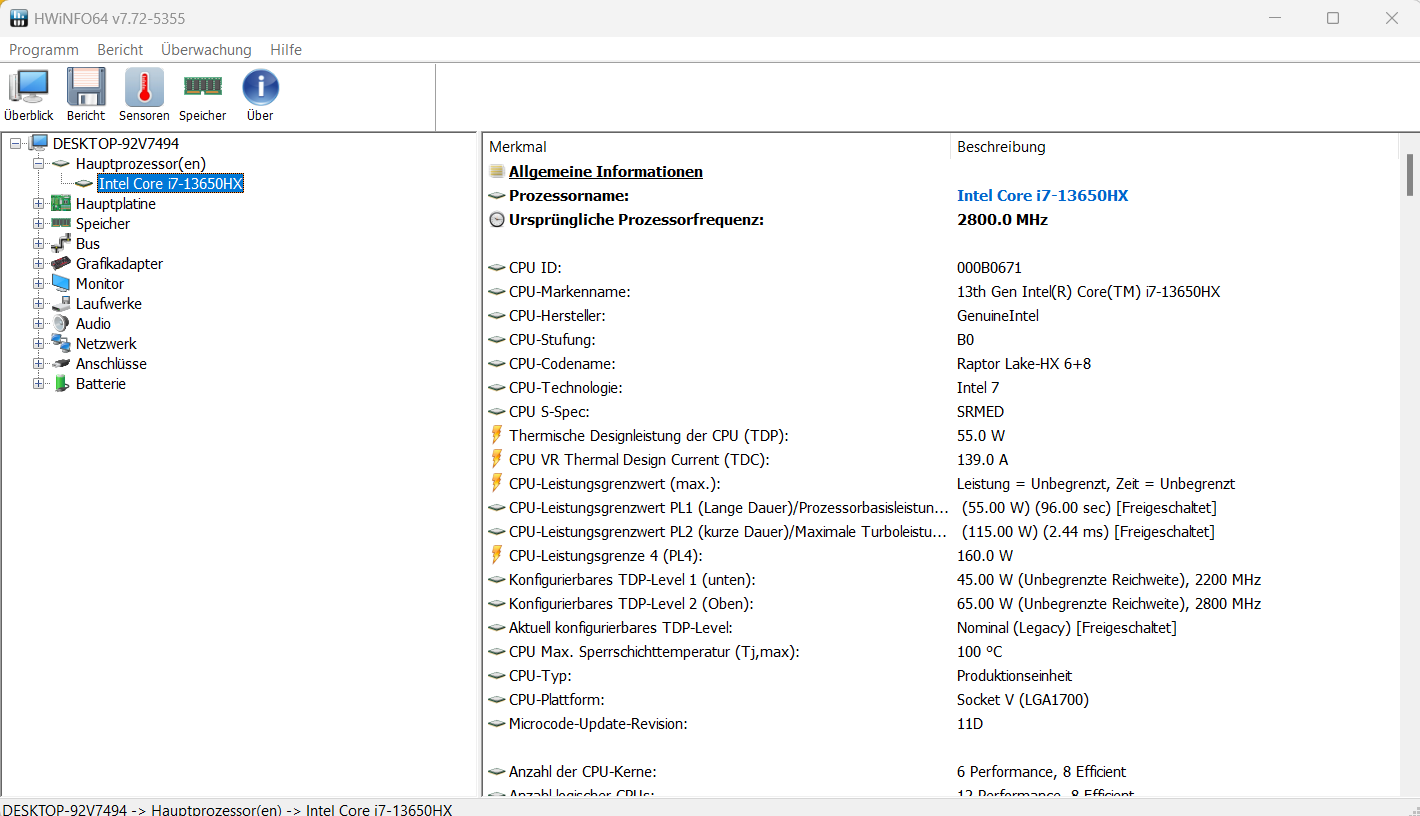
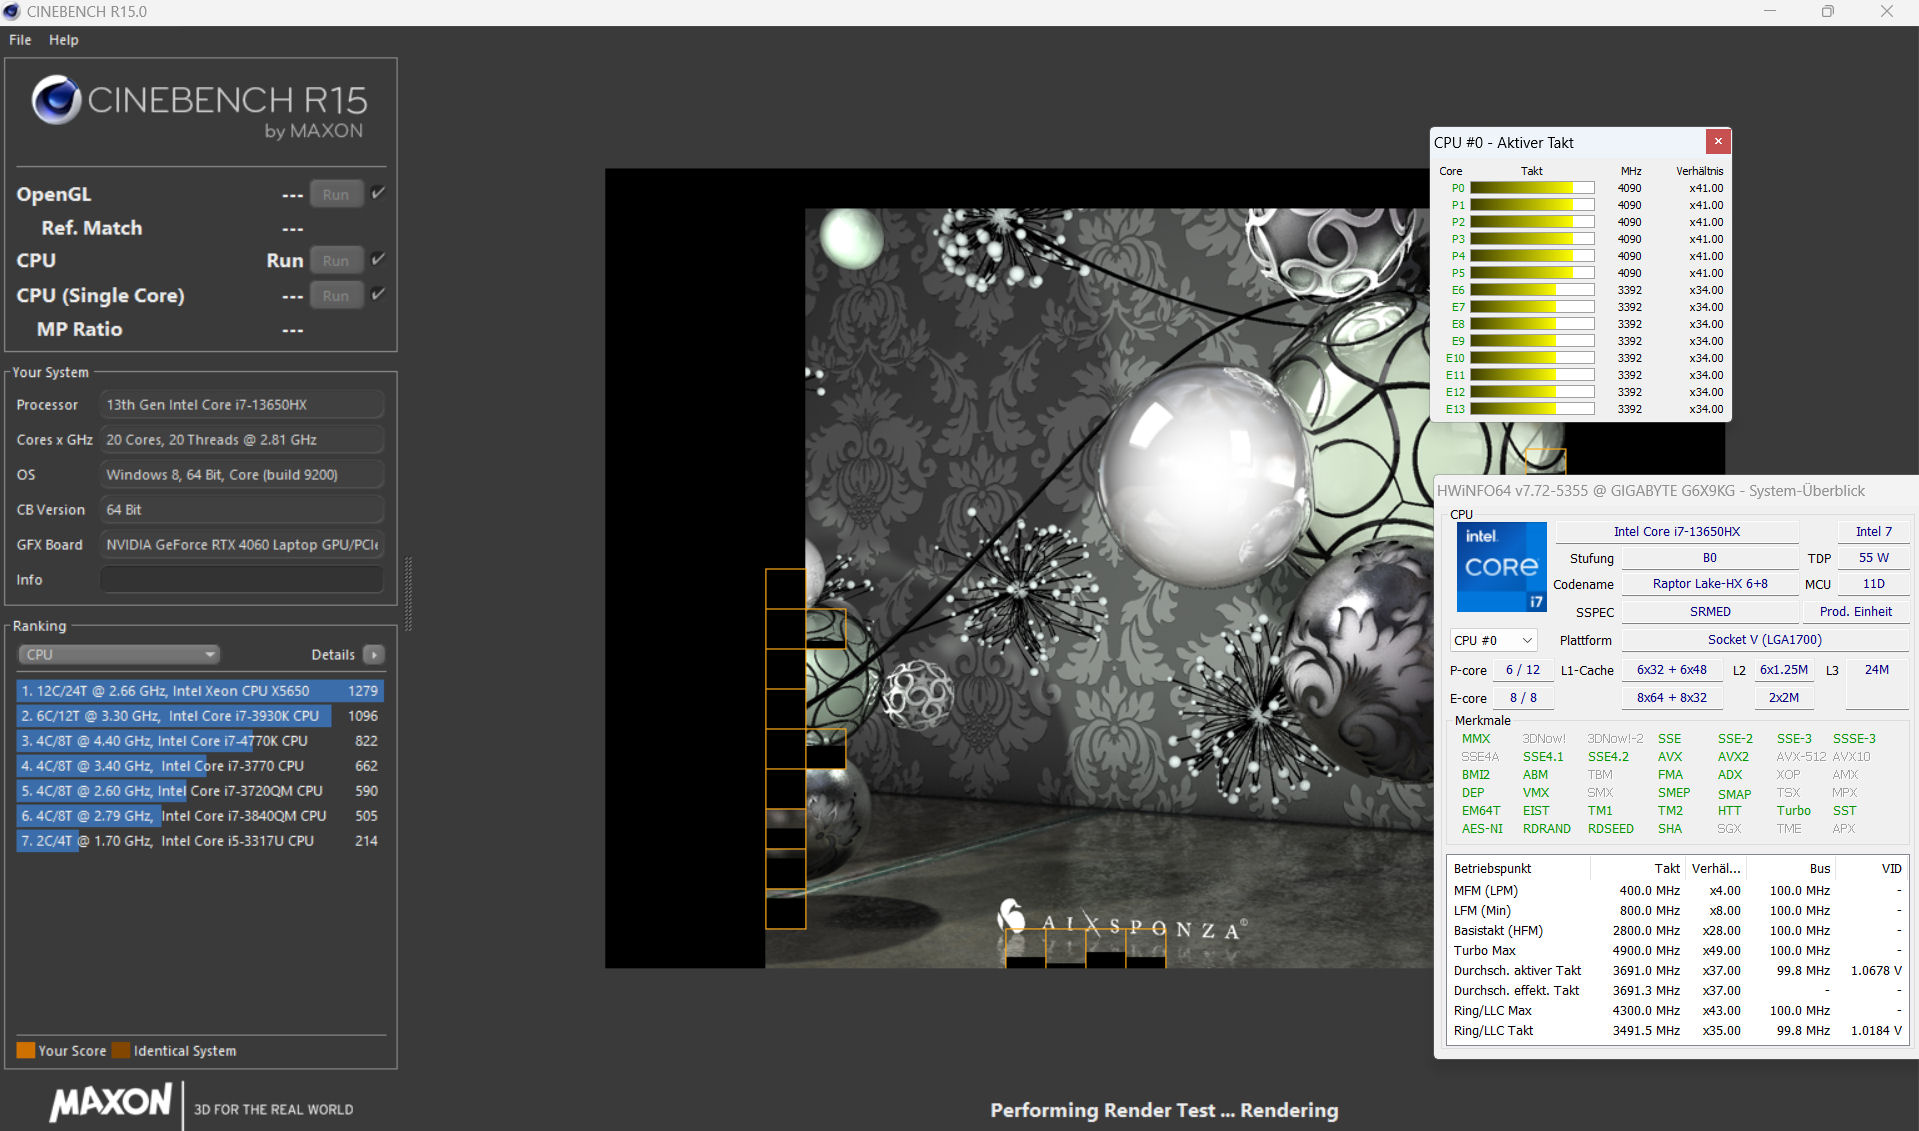
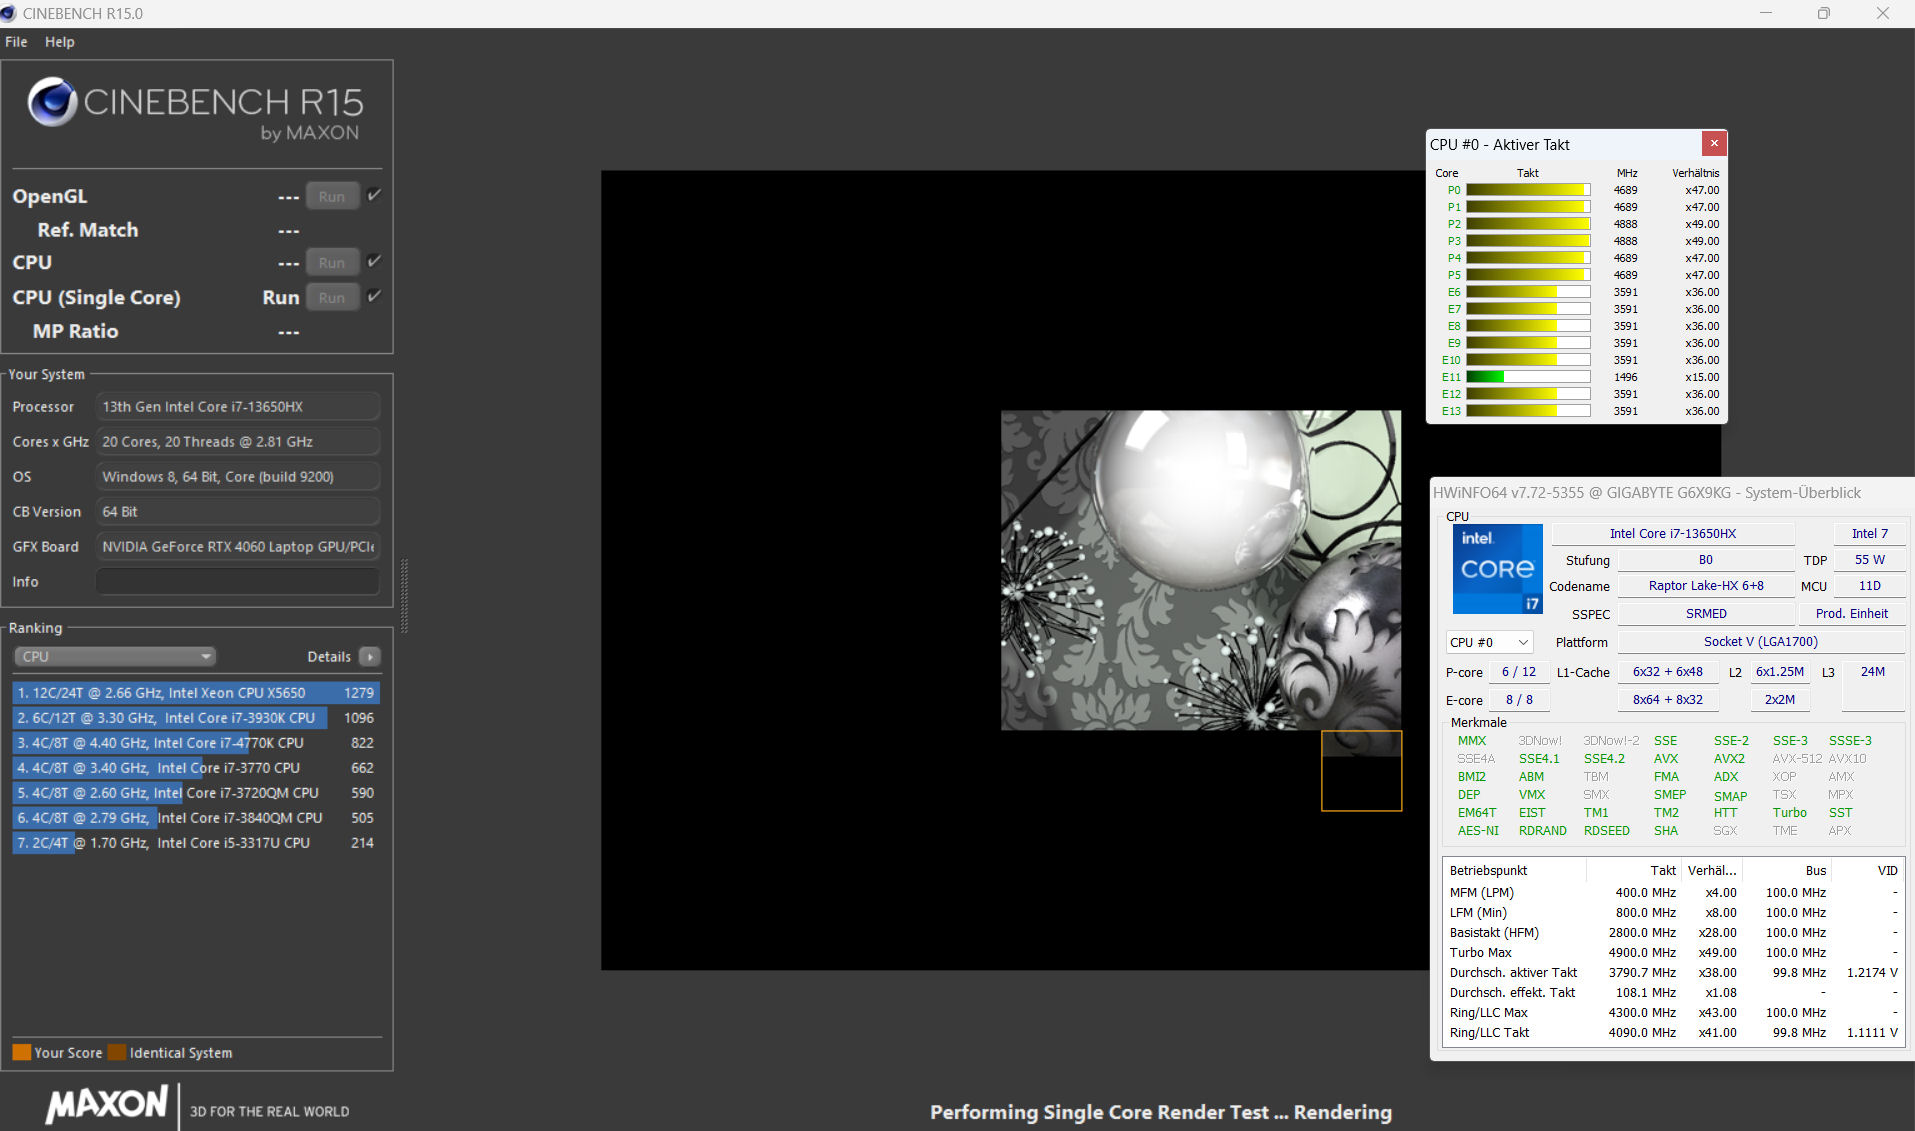
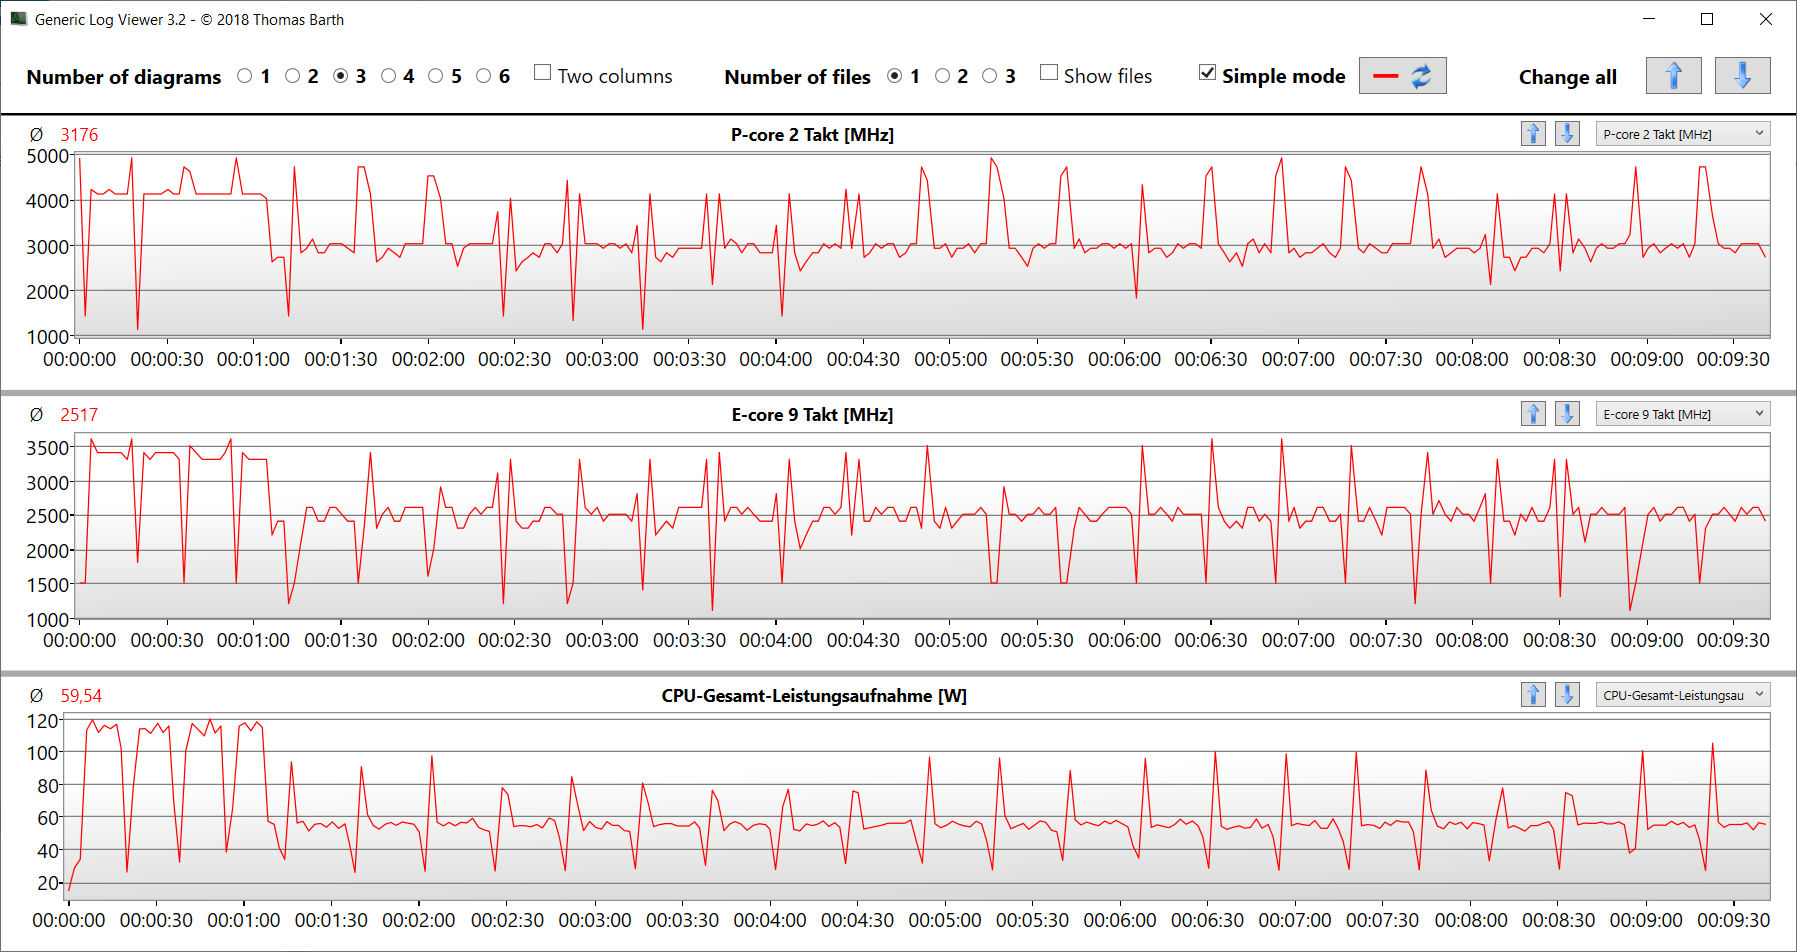
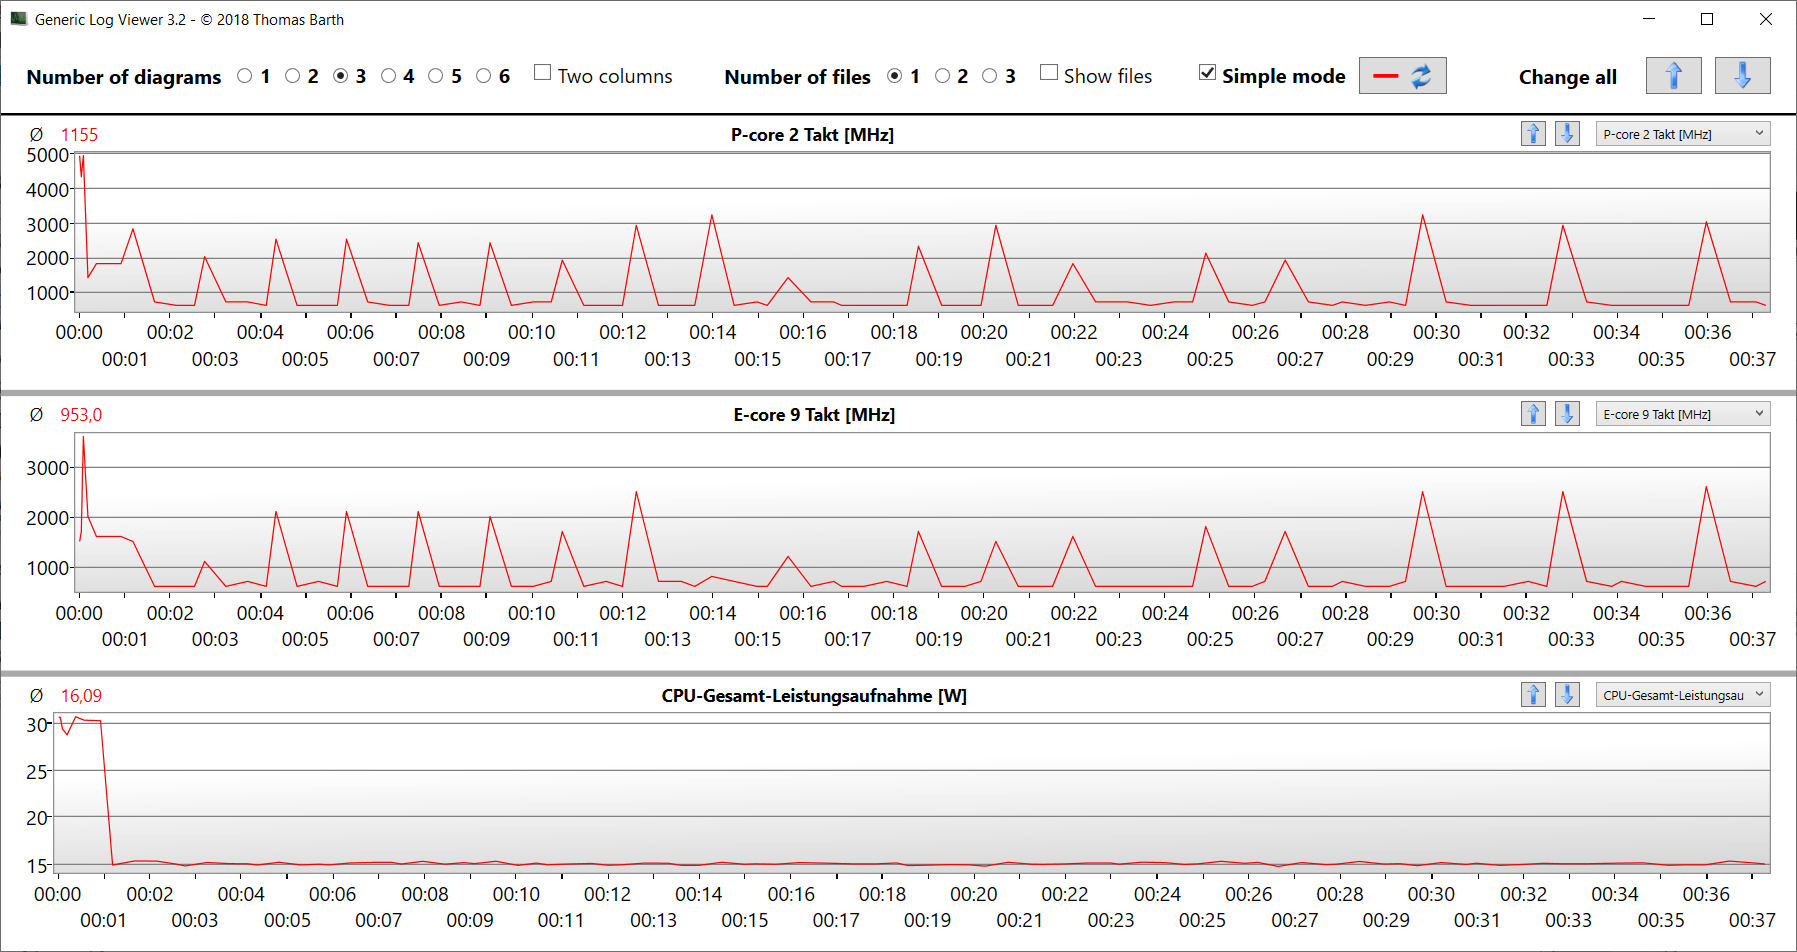
14 CPU çekirdeği Core i7-13650HX (6P+8E) 4,9 GHz (P) ve 3,6 GHz (E) maksimum saat hızlarına ulaşır. Sürekli çoklu iş parçacığı yükü (Cinebench R15 çok çekirdekli döngü) saat hızının dördüncüden beşinci çalıştırmaya kadar düşmesine neden olur. Bundan sonra, oldukça sabit bir seviye korunur. Performans modu sürekli olarak daha yüksek değerler sağlar.
Kıyaslama değerleri CPU ortalamasının biraz altındadır, ancak Performans modu küçük kazanımlarla sonuçlanır. Pil modunda, Cinebench R15'teki daha alakalı tek iş parçacığı performansı, çok iş parçacığı performansından (1.225 puan) daha az düşüyor (168 puan).
Cinebench R15 Multi-core loop test
| LibreOffice - 20 Documents To PDF | |
| Dell G16, i7-13650HX, RTX 4060 (6.3.4.2) | |
| Sınıf ortalaması Gaming (19 - 88.8, n=108, son 2 yıl) | |
| Ortalama Intel Core i7-13650HX (38.9 - 58.8, n=5) | |
| Lenovo Legion 5 16IRX G9 (6.3.4.2) | |
| Asus TUF Gaming A16 FA617XS | |
| Gigabyte G6X 9KG (2024) (6.3.4.2) | |
| MSI Raider GE68HX 13VF | |
* ... daha küçük daha iyidir
AIDA64: FP32 Ray-Trace | FPU Julia | CPU SHA3 | CPU Queen | FPU SinJulia | FPU Mandel | CPU AES | CPU ZLib | FP64 Ray-Trace | CPU PhotoWorxx
| Performance rating | |
| MSI Raider GE68HX 13VF | |
| Sınıf ortalaması Gaming | |
| Asus TUF Gaming A16 FA617XS | |
| Lenovo Legion 5 16IRX G9 | |
| Dell G16, i7-13650HX, RTX 4060 | |
| Ortalama Intel Core i7-13650HX | |
| Gigabyte G6X 9KG (2024) | |
| AIDA64 / FP32 Ray-Trace | |
| Sınıf ortalaması Gaming (10227 - 85542, n=107, son 2 yıl) | |
| Asus TUF Gaming A16 FA617XS (v6.75.6100) | |
| MSI Raider GE68HX 13VF (v6.85.6300) | |
| Lenovo Legion 5 16IRX G9 (v6.92.6600) | |
| Dell G16, i7-13650HX, RTX 4060 (v6.92.6600) | |
| Ortalama Intel Core i7-13650HX (13404 - 20012, n=5) | |
| Gigabyte G6X 9KG (2024) (v6.92.6600) | |
| AIDA64 / FPU Julia | |
| MSI Raider GE68HX 13VF (v6.85.6300) | |
| Sınıf ortalaması Gaming (51376 - 238426, n=107, son 2 yıl) | |
| Asus TUF Gaming A16 FA617XS (v6.75.6100) | |
| Lenovo Legion 5 16IRX G9 (v6.92.6600) | |
| Dell G16, i7-13650HX, RTX 4060 (v6.92.6600) | |
| Ortalama Intel Core i7-13650HX (68241 - 97317, n=5) | |
| Gigabyte G6X 9KG (2024) (v6.92.6600) | |
| AIDA64 / CPU SHA3 | |
| MSI Raider GE68HX 13VF (v6.85.6300) | |
| Sınıf ortalaması Gaming (2180 - 9817, n=107, son 2 yıl) | |
| Asus TUF Gaming A16 FA617XS (v6.75.6100) | |
| Dell G16, i7-13650HX, RTX 4060 (v6.92.6600) | |
| Lenovo Legion 5 16IRX G9 (v6.92.6600) | |
| Ortalama Intel Core i7-13650HX (3127 - 4487, n=5) | |
| Gigabyte G6X 9KG (2024) (v6.92.6600) | |
| AIDA64 / CPU Queen | |
| MSI Raider GE68HX 13VF (v6.85.6300) | |
| Asus TUF Gaming A16 FA617XS (v6.75.6100) | |
| Sınıf ortalaması Gaming (49785 - 173351, n=98, son 2 yıl) | |
| Gigabyte G6X 9KG (2024) (v6.92.6600) | |
| Ortalama Intel Core i7-13650HX (108627 - 110589, n=5) | |
| Dell G16, i7-13650HX, RTX 4060 (v6.92.6600) | |
| Lenovo Legion 5 16IRX G9 (v6.92.6600) | |
| AIDA64 / FPU SinJulia | |
| MSI Raider GE68HX 13VF (v6.85.6300) | |
| Asus TUF Gaming A16 FA617XS (v6.75.6100) | |
| Sınıf ortalaması Gaming (4424 - 33636, n=107, son 2 yıl) | |
| Lenovo Legion 5 16IRX G9 (v6.92.6600) | |
| Dell G16, i7-13650HX, RTX 4060 (v6.92.6600) | |
| Ortalama Intel Core i7-13650HX (9134 - 10887, n=5) | |
| Gigabyte G6X 9KG (2024) (v6.92.6600) | |
| AIDA64 / FPU Mandel | |
| Sınıf ortalaması Gaming (25115 - 128721, n=107, son 2 yıl) | |
| MSI Raider GE68HX 13VF (v6.85.6300) | |
| Asus TUF Gaming A16 FA617XS (v6.75.6100) | |
| Lenovo Legion 5 16IRX G9 (v6.92.6600) | |
| Dell G16, i7-13650HX, RTX 4060 (v6.92.6600) | |
| Ortalama Intel Core i7-13650HX (33391 - 48323, n=5) | |
| Gigabyte G6X 9KG (2024) (v6.92.6600) | |
| AIDA64 / CPU AES | |
| MSI Raider GE68HX 13VF (v6.85.6300) | |
| Sınıf ortalaması Gaming (39258 - 247074, n=107, son 2 yıl) | |
| Lenovo Legion 5 16IRX G9 (v6.92.6600) | |
| Asus TUF Gaming A16 FA617XS (v6.75.6100) | |
| Dell G16, i7-13650HX, RTX 4060 (v6.92.6600) | |
| Ortalama Intel Core i7-13650HX (64436 - 85343, n=5) | |
| Gigabyte G6X 9KG (2024) (v6.92.6600) | |
| AIDA64 / CPU ZLib | |
| MSI Raider GE68HX 13VF (v6.85.6300) | |
| Sınıf ortalaması Gaming (574 - 2531, n=107, son 2 yıl) | |
| Lenovo Legion 5 16IRX G9 (v6.92.6600) | |
| Dell G16, i7-13650HX, RTX 4060 (v6.92.6600) | |
| Ortalama Intel Core i7-13650HX (1136 - 1285, n=5) | |
| Gigabyte G6X 9KG (2024) (v6.92.6600) | |
| Asus TUF Gaming A16 FA617XS (v6.75.6100) | |
| AIDA64 / FP64 Ray-Trace | |
| Sınıf ortalaması Gaming (5509 - 45446, n=107, son 2 yıl) | |
| Asus TUF Gaming A16 FA617XS (v6.75.6100) | |
| MSI Raider GE68HX 13VF (v6.85.6300) | |
| Dell G16, i7-13650HX, RTX 4060 (v6.92.6600) | |
| Lenovo Legion 5 16IRX G9 (v6.92.6600) | |
| Ortalama Intel Core i7-13650HX (7270 - 10900, n=5) | |
| Gigabyte G6X 9KG (2024) (v6.92.6600) | |
| AIDA64 / CPU PhotoWorxx | |
| MSI Raider GE68HX 13VF (v6.85.6300) | |
| Sınıf ortalaması Gaming (12271 - 89891, n=107, son 2 yıl) | |
| Ortalama Intel Core i7-13650HX (36170 - 43289, n=5) | |
| Gigabyte G6X 9KG (2024) (v6.92.6600) | |
| Dell G16, i7-13650HX, RTX 4060 (v6.92.6600) | |
| Lenovo Legion 5 16IRX G9 (v6.92.6600) | |
| Asus TUF Gaming A16 FA617XS (v6.75.6100) | |
Sistem performansı
Gigabyte G6X sorunsuz çalışıyor ve işlem gücünden yoksun değil. Dizüstü bilgisayar oyun, akış ve render işlemlerini sorunsuz bir şekilde gerçekleştiriyor.
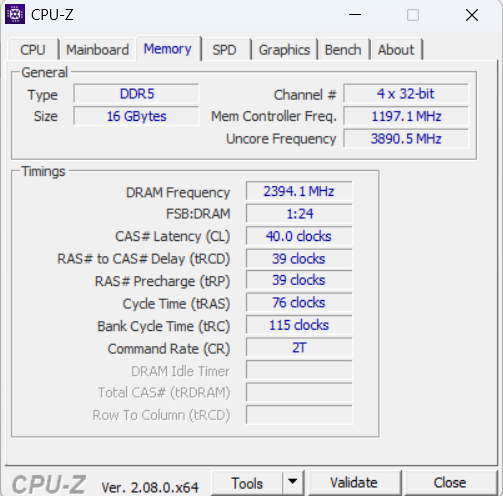
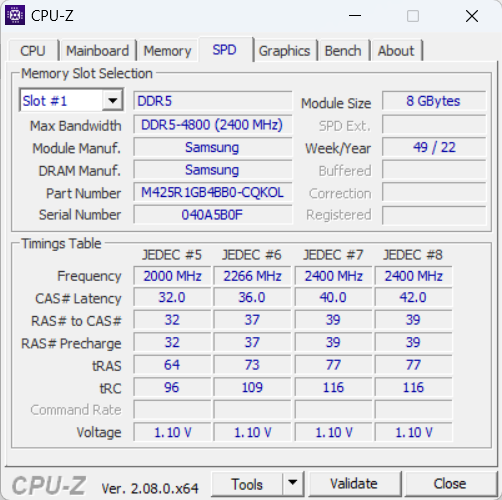
RAM'in aktarım hızları DDR5-4800 RAM için normal seviyede.
CrossMark: Overall | Productivity | Creativity | Responsiveness
WebXPRT 3: Overall
WebXPRT 4: Overall
Mozilla Kraken 1.1: Total
| PCMark 10 / Score | |
| Sınıf ortalaması Gaming (5828 - 11574, n=94, son 2 yıl) | |
| MSI Raider GE68HX 13VF | |
| Asus TUF Gaming A16 FA617XS | |
| Lenovo Legion 5 16IRX G9 | |
| Gigabyte G6X 9KG (2024) | |
| Dell G16, i7-13650HX, RTX 4060 | |
| Ortalama Intel Core i7-13650HX, NVIDIA GeForce RTX 4060 Laptop GPU (6984 - 7613, n=3) | |
| PCMark 10 / Essentials | |
| MSI Raider GE68HX 13VF | |
| Asus TUF Gaming A16 FA617XS | |
| Lenovo Legion 5 16IRX G9 | |
| Sınıf ortalaması Gaming (8810 - 12600, n=98, son 2 yıl) | |
| Ortalama Intel Core i7-13650HX, NVIDIA GeForce RTX 4060 Laptop GPU (9532 - 11151, n=3) | |
| Gigabyte G6X 9KG (2024) | |
| Dell G16, i7-13650HX, RTX 4060 | |
| PCMark 10 / Productivity | |
| Sınıf ortalaması Gaming (6845 - 18766, n=96, son 2 yıl) | |
| Asus TUF Gaming A16 FA617XS | |
| Gigabyte G6X 9KG (2024) | |
| Ortalama Intel Core i7-13650HX, NVIDIA GeForce RTX 4060 Laptop GPU (9961 - 10204, n=3) | |
| Dell G16, i7-13650HX, RTX 4060 | |
| MSI Raider GE68HX 13VF | |
| Lenovo Legion 5 16IRX G9 | |
| PCMark 10 / Digital Content Creation | |
| Sınıf ortalaması Gaming (7602 - 19657, n=96, son 2 yıl) | |
| MSI Raider GE68HX 13VF | |
| Lenovo Legion 5 16IRX G9 | |
| Asus TUF Gaming A16 FA617XS | |
| Dell G16, i7-13650HX, RTX 4060 | |
| Gigabyte G6X 9KG (2024) | |
| Ortalama Intel Core i7-13650HX, NVIDIA GeForce RTX 4060 Laptop GPU (8323 - 11686, n=3) | |
| CrossMark / Overall | |
| Lenovo Legion 5 16IRX G9 | |
| Sınıf ortalaması Gaming (1366 - 2409, n=96, son 2 yıl) | |
| MSI Raider GE68HX 13VF | |
| Gigabyte G6X 9KG (2024) | |
| Ortalama Intel Core i7-13650HX, NVIDIA GeForce RTX 4060 Laptop GPU (1839 - 1951, n=3) | |
| Dell G16, i7-13650HX, RTX 4060 | |
| Asus TUF Gaming A16 FA617XS | |
| CrossMark / Productivity | |
| Lenovo Legion 5 16IRX G9 | |
| Gigabyte G6X 9KG (2024) | |
| Sınıf ortalaması Gaming (1386 - 2254, n=96, son 2 yıl) | |
| MSI Raider GE68HX 13VF | |
| Ortalama Intel Core i7-13650HX, NVIDIA GeForce RTX 4060 Laptop GPU (1730 - 1864, n=3) | |
| Dell G16, i7-13650HX, RTX 4060 | |
| Asus TUF Gaming A16 FA617XS | |
| CrossMark / Creativity | |
| Lenovo Legion 5 16IRX G9 | |
| MSI Raider GE68HX 13VF | |
| Sınıf ortalaması Gaming (1343 - 2729, n=96, son 2 yıl) | |
| Gigabyte G6X 9KG (2024) | |
| Ortalama Intel Core i7-13650HX, NVIDIA GeForce RTX 4060 Laptop GPU (2020 - 2063, n=3) | |
| Dell G16, i7-13650HX, RTX 4060 | |
| Asus TUF Gaming A16 FA617XS | |
| CrossMark / Responsiveness | |
| Gigabyte G6X 9KG (2024) | |
| Lenovo Legion 5 16IRX G9 | |
| Ortalama Intel Core i7-13650HX, NVIDIA GeForce RTX 4060 Laptop GPU (1544 - 1907, n=3) | |
| Sınıf ortalaması Gaming (1226 - 2334, n=96, son 2 yıl) | |
| Dell G16, i7-13650HX, RTX 4060 | |
| MSI Raider GE68HX 13VF | |
| Asus TUF Gaming A16 FA617XS | |
| WebXPRT 3 / Overall | |
| MSI Raider GE68HX 13VF | |
| Sınıf ortalaması Gaming (242 - 532, n=99, son 2 yıl) | |
| Lenovo Legion 5 16IRX G9 | |
| Gigabyte G6X 9KG (2024) | |
| Ortalama Intel Core i7-13650HX, NVIDIA GeForce RTX 4060 Laptop GPU (268 - 302, n=3) | |
| Dell G16, i7-13650HX, RTX 4060 | |
| WebXPRT 4 / Overall | |
| MSI Raider GE68HX 13VF | |
| Sınıf ortalaması Gaming (176.4 - 354, n=99, son 2 yıl) | |
| Lenovo Legion 5 16IRX G9 | |
| Ortalama Intel Core i7-13650HX, NVIDIA GeForce RTX 4060 Laptop GPU (260 - 276, n=2) | |
| Asus TUF Gaming A16 FA617XS | |
| Gigabyte G6X 9KG (2024) | |
| Mozilla Kraken 1.1 / Total | |
| Gigabyte G6X 9KG (2024) | |
| Ortalama Intel Core i7-13650HX, NVIDIA GeForce RTX 4060 Laptop GPU (507 - 511, n=3) | |
| Dell G16, i7-13650HX, RTX 4060 | |
| Asus TUF Gaming A16 FA617XS | |
| Lenovo Legion 5 16IRX G9 | |
| Sınıf ortalaması Gaming (391 - 590, n=104, son 2 yıl) | |
| MSI Raider GE68HX 13VF | |
* ... daha küçük daha iyidir
| PCMark 10 Score | 7613 puan | |
Yardım | ||
| AIDA64 / Memory Copy | |
| MSI Raider GE68HX 13VF | |
| Sınıf ortalaması Gaming (21750 - 129946, n=107, son 2 yıl) | |
| Ortalama Intel Core i7-13650HX (59266 - 66372, n=5) | |
| Gigabyte G6X 9KG (2024) | |
| Lenovo Legion 5 16IRX G9 | |
| Asus TUF Gaming A16 FA617XS | |
| Dell G16, i7-13650HX, RTX 4060 | |
| AIDA64 / Memory Read | |
| MSI Raider GE68HX 13VF | |
| Sınıf ortalaması Gaming (22956 - 118858, n=107, son 2 yıl) | |
| Lenovo Legion 5 16IRX G9 | |
| Ortalama Intel Core i7-13650HX (67305 - 71022, n=5) | |
| Gigabyte G6X 9KG (2024) | |
| Dell G16, i7-13650HX, RTX 4060 | |
| Asus TUF Gaming A16 FA617XS | |
| AIDA64 / Memory Write | |
| MSI Raider GE68HX 13VF | |
| Sınıf ortalaması Gaming (22297 - 135096, n=107, son 2 yıl) | |
| Asus TUF Gaming A16 FA617XS | |
| Ortalama Intel Core i7-13650HX (58028 - 68225, n=5) | |
| Gigabyte G6X 9KG (2024) | |
| Dell G16, i7-13650HX, RTX 4060 | |
| Lenovo Legion 5 16IRX G9 | |
| AIDA64 / Memory Latency | |
| Sınıf ortalaması Gaming (75.3 - 259, n=107, son 2 yıl) | |
| Dell G16, i7-13650HX, RTX 4060 | |
| Asus TUF Gaming A16 FA617XS | |
| Gigabyte G6X 9KG (2024) | |
| Lenovo Legion 5 16IRX G9 | |
| Ortalama Intel Core i7-13650HX (83.7 - 90.8, n=5) | |
| MSI Raider GE68HX 13VF | |
* ... daha küçük daha iyidir
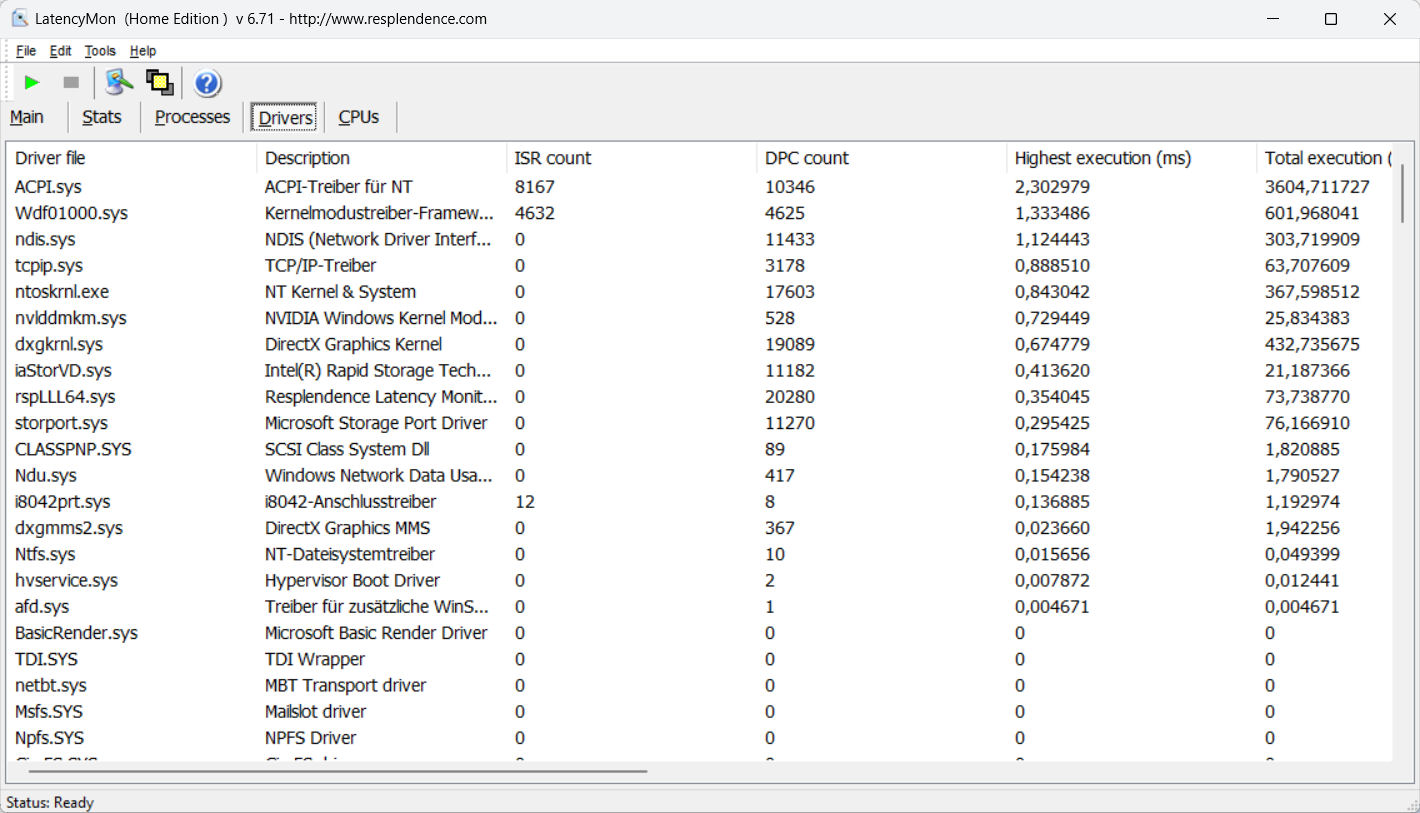
DPC gecikme süresi
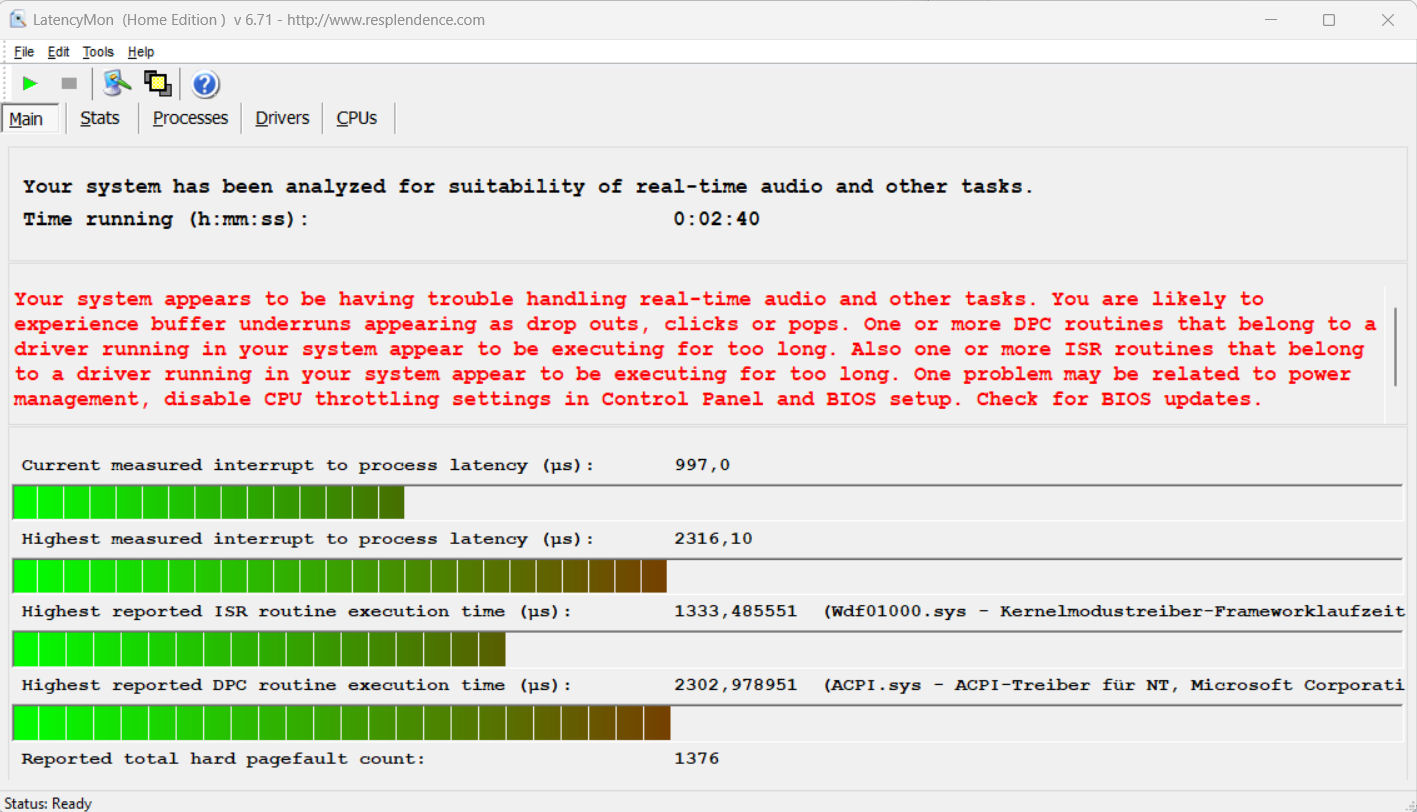
Standartlaştırılmış LatencyMon testi (web'de gezinme, 4k video oynatma, Prime95 High-Load) anormallikler ortaya çıkardı. Sistem gerçek zamanlı video ve ses düzenleme için uygun görünmüyor. Gelecekteki yazılım güncellemeleri iyileştirmelere ve hatta kötüleşmelere yol açabilir.
| DPC Latencies / LatencyMon - interrupt to process latency (max), Web, Youtube, Prime95 | |
| MSI Raider GE68HX 13VF | |
| Gigabyte G6X 9KG (2024) | |
| Lenovo Legion 5 16IRX G9 | |
| Asus TUF Gaming A16 FA617XS | |
| Dell G16, i7-13650HX, RTX 4060 | |
* ... daha küçük daha iyidir
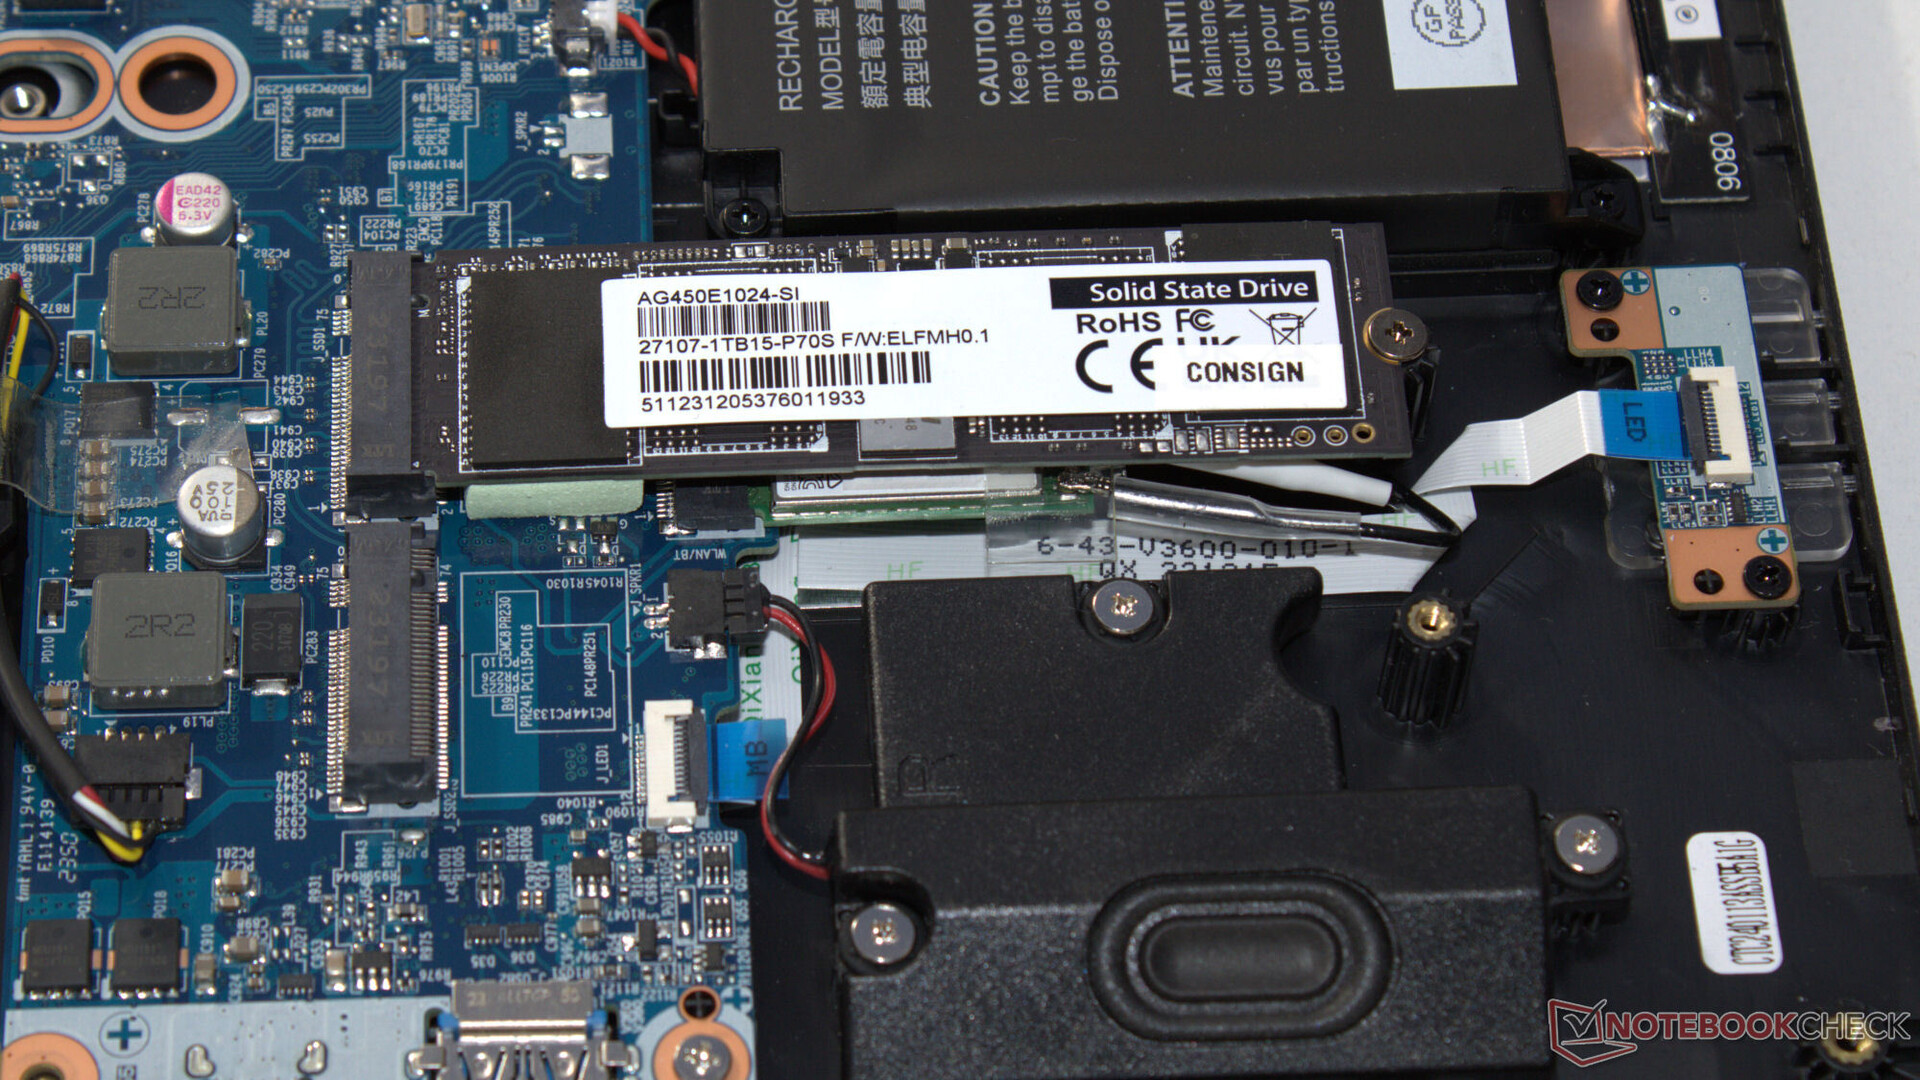
Yığın depolama
G6X, toplam iki adet M.2 2280 PCIe Gen 4 SSD'yi barındırabilir. RAID desteklenmemektedir. Test cihazımızdaki 1 TB Gigabyte SSD, çok iyi veri hızları sunmaktadır.
Herhangi bir termal daralma sorunu gözlemlemedik ki bu iyi bir şey.

* ... daha küçük daha iyidir
Disk Throttling: DiskSpd Read Loop, Queue Depth 8
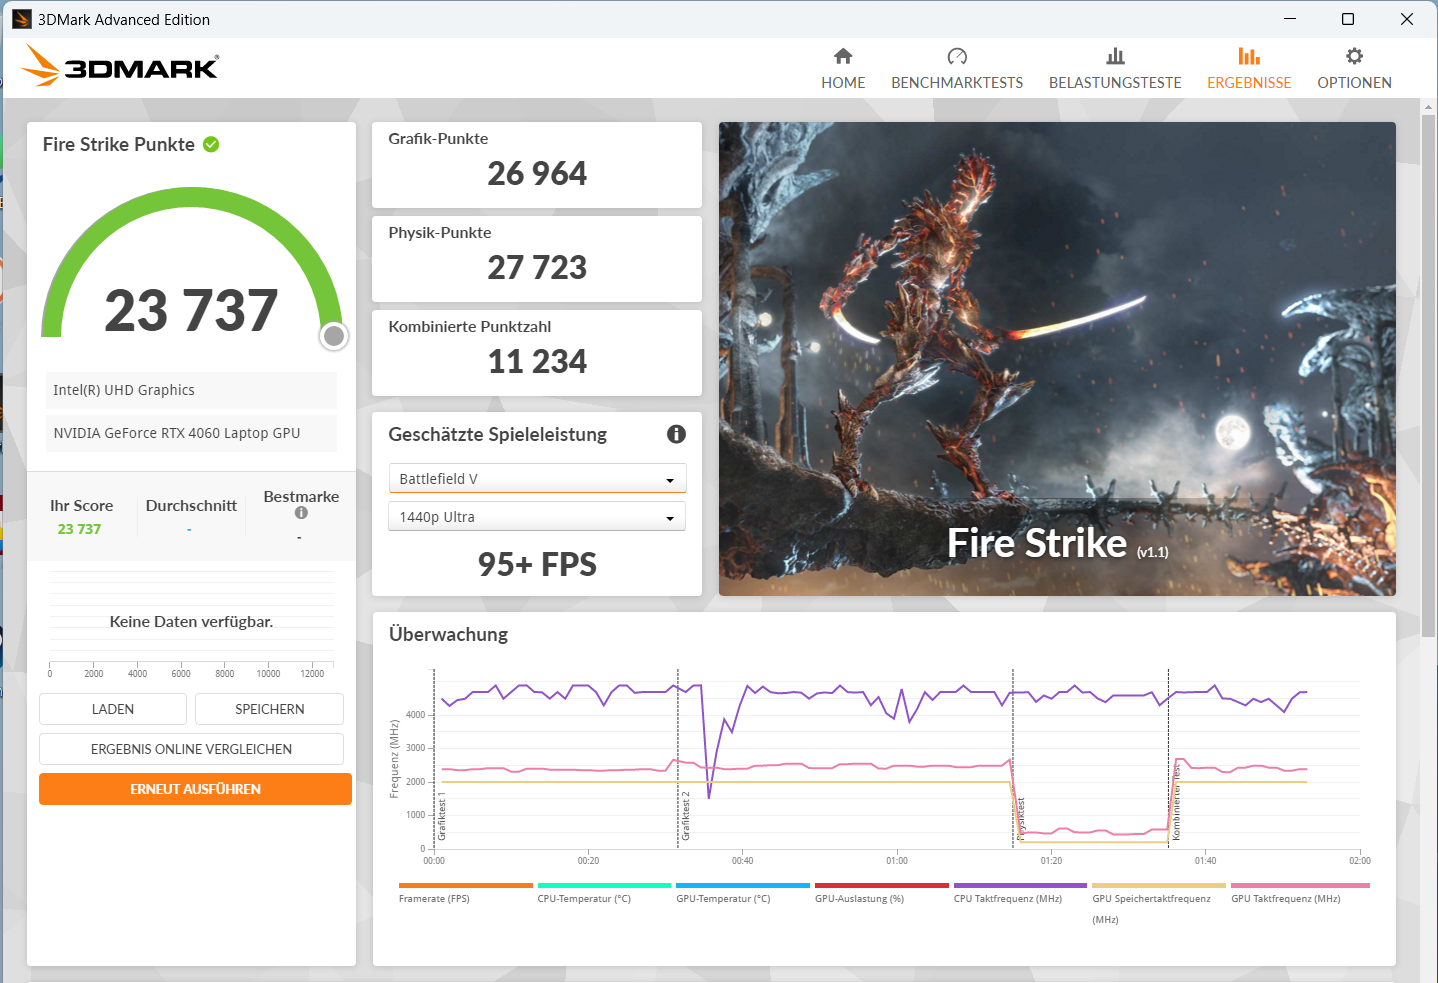
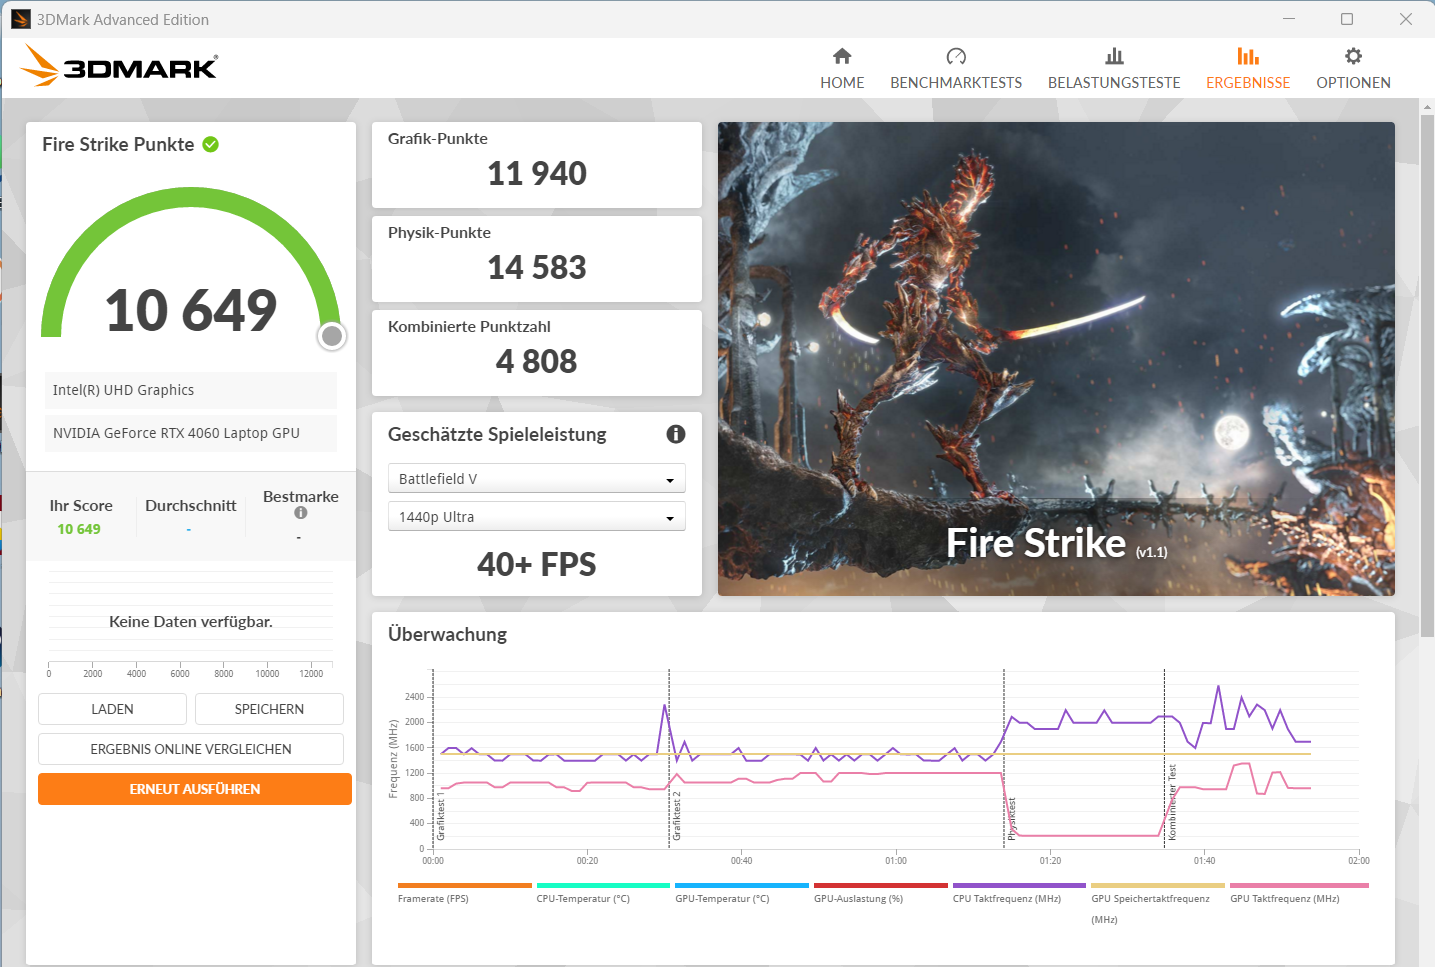
Grafik kartı
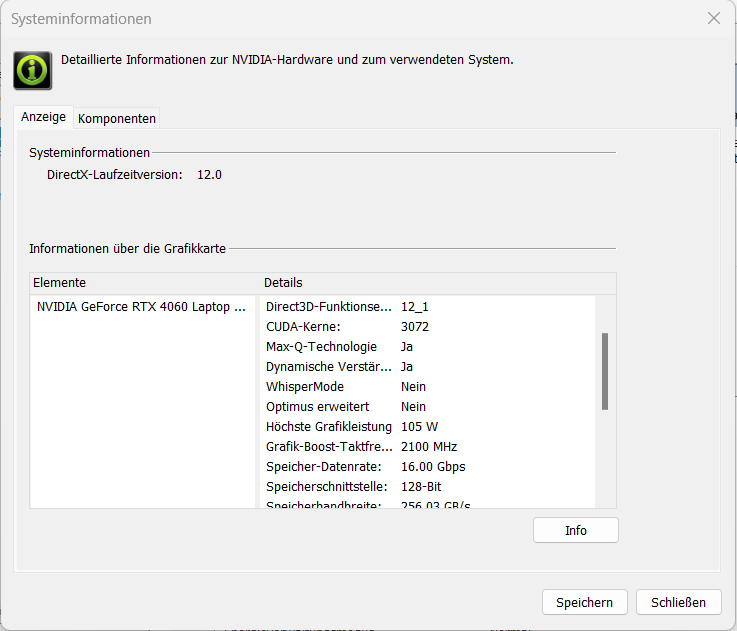
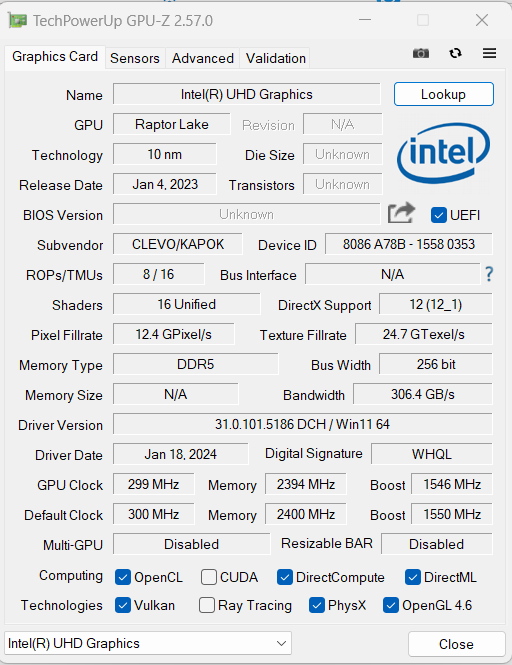
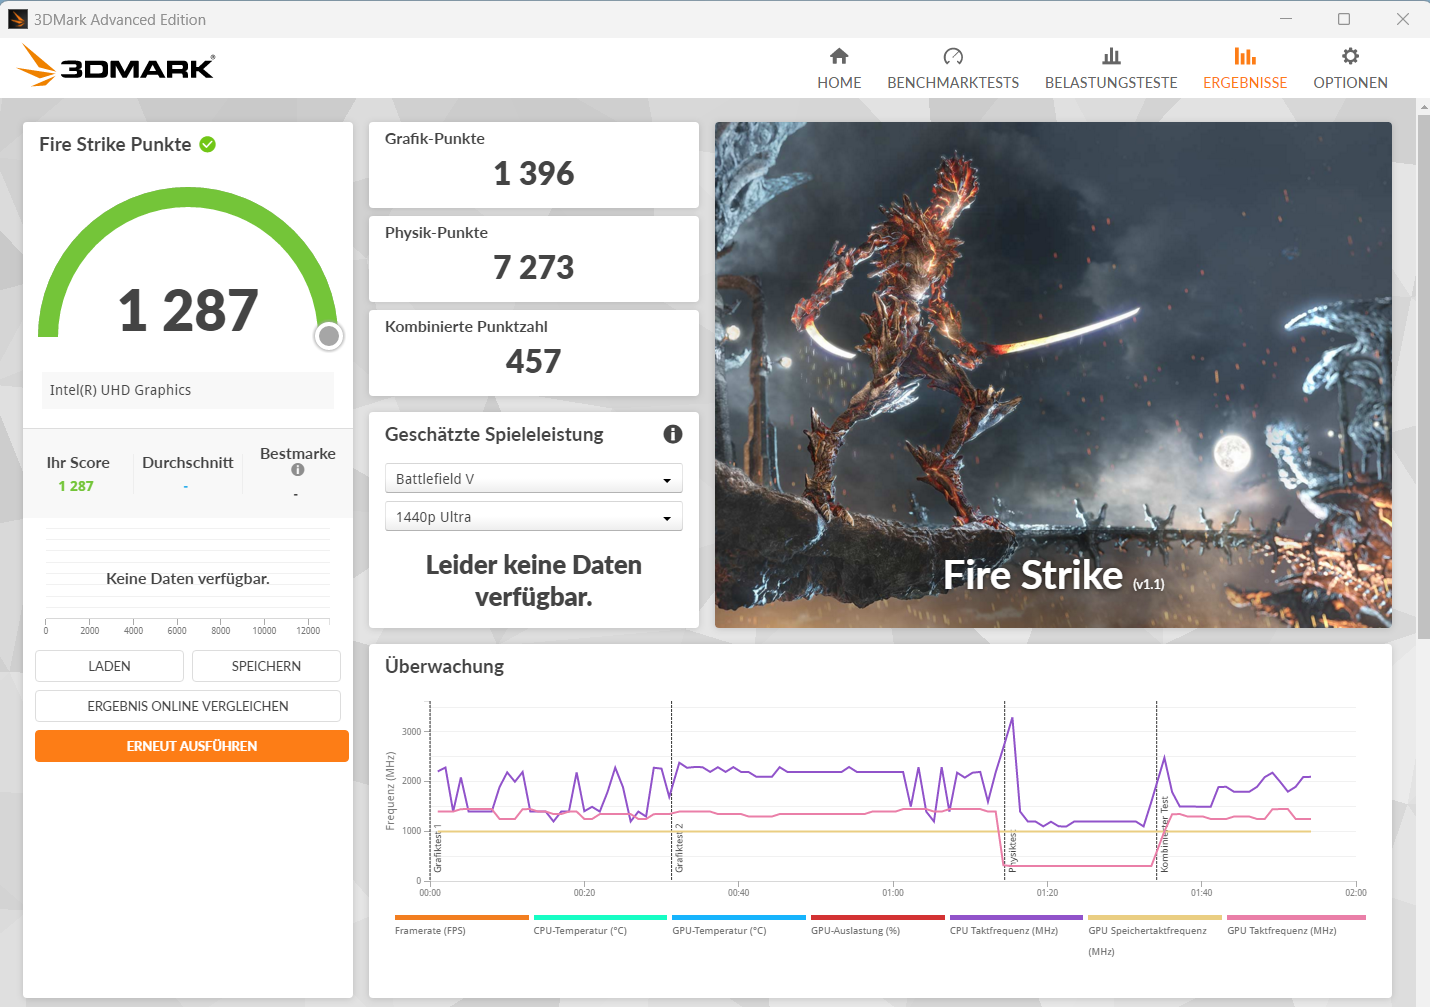
Gigabyte 105 W gücünde bir GeForce RTX 4060 Dizüstü Bilgisayar GPU'su (3.424 gölgelendirici, 128 bit veri yolu, 8 GB GDDR6) G6X 9KG'de. RTX 4060, Nvidia'nın mevcut GPU serisinden orta seviye bir modeldir.
Benchmark değerleri ve kare hızları RTX 4060 ortalamasının üzerinde. Performans modu en iyi ihtimalle küçük bir artı sağlıyor. Gelişmiş Optimus desteklenmediği için dGPU ve Optimus modları arasında geçiş yapmak yeniden başlatma gerektiriyor.
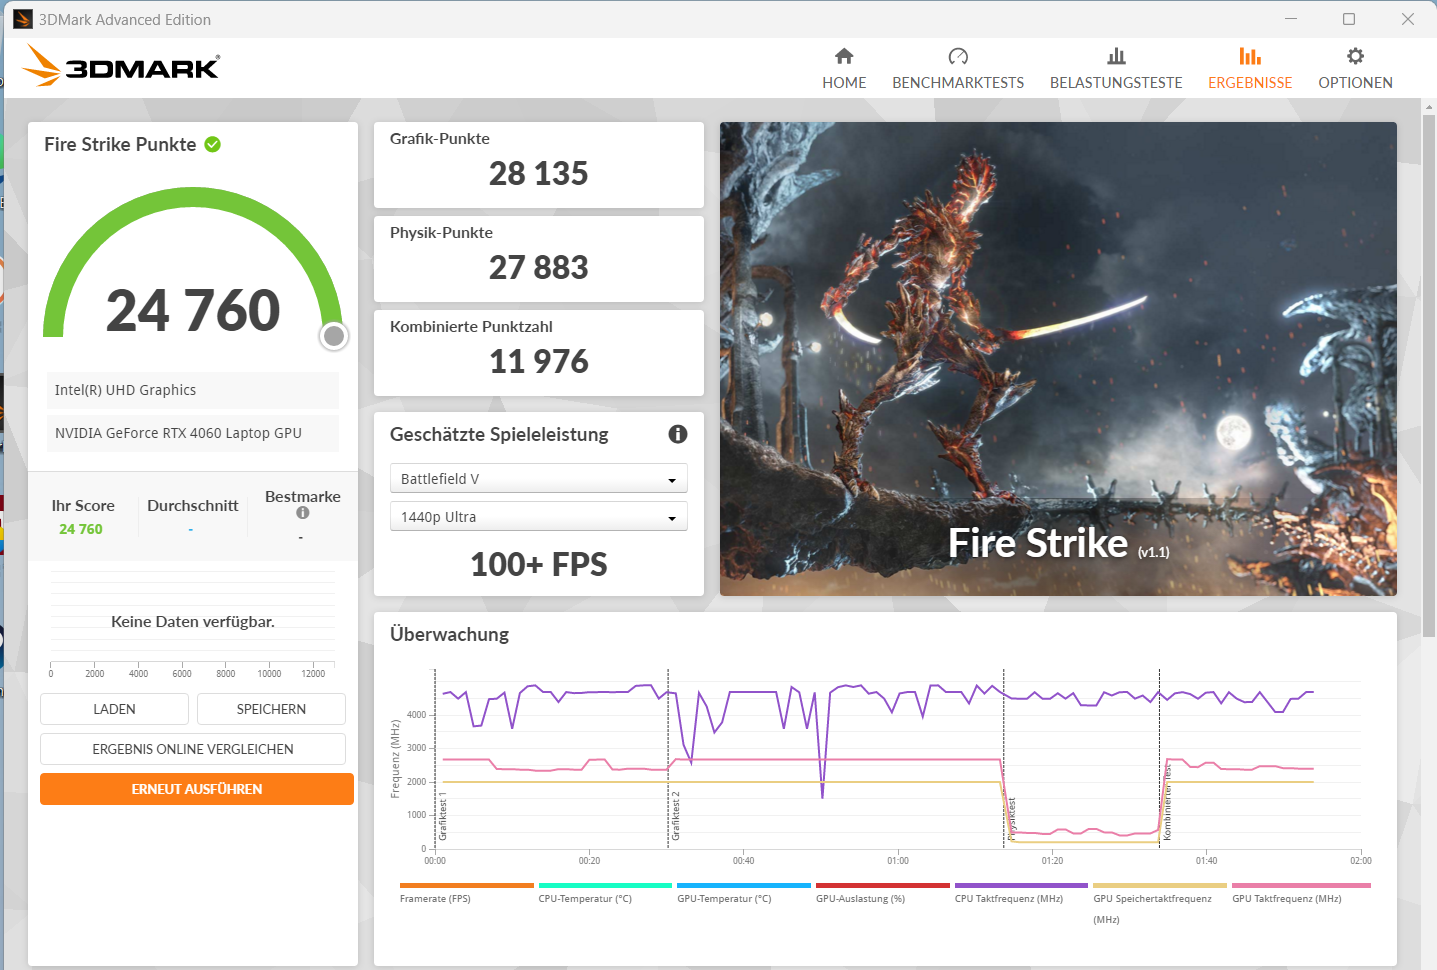
| 3DMark 11 Performance | 30293 puan | |
| 3DMark Fire Strike Score | 23737 puan | |
| 3DMark Time Spy Score | 10260 puan | |
Yardım | ||
* ... daha küçük daha iyidir
| The Witcher 3 - 1920x1080 Ultra Graphics & Postprocessing (HBAO+) | |
| Sınıf ortalaması Gaming (95 - 240, n=8, son 2 yıl) | |
| Dell G16, i7-13650HX, RTX 4060 | |
| MSI Raider GE68HX 13VF | |
| Ortalama NVIDIA GeForce RTX 4060 Laptop GPU (77 - 159.7, n=42) | |
| Gigabyte G6X 9KG (2024) | |
| Asus TUF Gaming A16 FA617XS (neu) | |
| Lenovo Legion 5 16IRX G9 | |
| Final Fantasy XV Benchmark - 1920x1080 High Quality | |
| Sınıf ortalaması Gaming (41 - 215, n=101, son 2 yıl) | |
| Lenovo Legion 5 16IRX G9 (1.3) | |
| Dell G16, i7-13650HX, RTX 4060 (1.3) | |
| MSI Raider GE68HX 13VF (1.3) | |
| Gigabyte G6X 9KG (2024) (1.3) | |
| Ortalama NVIDIA GeForce RTX 4060 Laptop GPU (75.1 - 109.8, n=51) | |
| Asus TUF Gaming A16 FA617XS (1.3) | |
| Strange Brigade - 1920x1080 ultra AA:ultra AF:16 | |
| Sınıf ortalaması Gaming (76.3 - 456, n=91, son 2 yıl) | |
| Lenovo Legion 5 16IRX G9 | |
| Dell G16, i7-13650HX, RTX 4060 (1.47.22.14 D3D12) | |
| MSI Raider GE68HX 13VF (1.47.22.14 D3D12) | |
| Gigabyte G6X 9KG (2024) (1.47.22.14 D3D12) | |
| Ortalama NVIDIA GeForce RTX 4060 Laptop GPU (135.3 - 210, n=50) | |
| Asus TUF Gaming A16 FA617XS (1.47.22.14 D3D12) | |
| Cyberpunk 2077 | |
| 1920x1080 Ultra Preset (FSR off) | |
| Sınıf ortalaması Gaming (17.7 - 169.9, n=118, son 2 yıl) | |
| Lenovo Legion 5 16IRX G9 | |
| Ortalama NVIDIA GeForce RTX 4060 Laptop GPU (56.4 - 93.1, n=31) | |
| Dell G16, i7-13650HX, RTX 4060 | |
| Gigabyte G6X 9KG (2024) | |
| 1920x1080 Ray Tracing Ultra Preset (DLSS off) | |
| Sınıf ortalaması Gaming (19.1 - 84.9, n=41, son 2 yıl) | |
| Ortalama NVIDIA GeForce RTX 4060 Laptop GPU (23.6 - 37.4, n=21) | |
| Gigabyte G6X 9KG (2024) | |
| 1920x1080 Ultra Preset (FSR2 on) | |
| Sınıf ortalaması Gaming (58 - 173.1, n=7, son 2 yıl) | |
| Gigabyte G6X 9KG (2024) | |
| Ortalama NVIDIA GeForce RTX 4060 Laptop GPU (68.5 - 92.4, n=4) | |
| Skull & Bones - 1920x1080 Ultra High Preset AA:T | |
| Gigabyte G6X 9KG (2024) | |
| Ortalama NVIDIA GeForce RTX 4060 Laptop GPU (65 - 73, n=5) | |
| Last Epoch - 1920x1080 Ultra Preset AA:T | |
| Gigabyte G6X 9KG (2024) | |
| Ortalama NVIDIA GeForce RTX 4060 Laptop GPU (120.4 - 122.8, n=2) | |
| Sınıf ortalaması Gaming (n=1son 2 yıl) | |
| Helldivers 2 - 1920x1080 Ultra Preset | |
| Sınıf ortalaması Gaming (18.4 - 153.8, n=5, son 2 yıl) | |
| Gigabyte G6X 9KG (2024) | |
| Ortalama NVIDIA GeForce RTX 4060 Laptop GPU (82.3 - 85.6, n=2) | |
| Ready or Not - 1920x1080 Epic Preset | |
| Ortalama NVIDIA GeForce RTX 4060 Laptop GPU (131.5 - 133.7, n=2) | |
| Gigabyte G6X 9KG (2024) | |
The Witcher 3 FPS chart
| düşük | orta | yüksek | ultra | |
|---|---|---|---|---|
| GTA V (2015) | 183.6 | 180.4 | 174.6 | 115.2 |
| The Witcher 3 (2015) | 400.9 | 306.6 | 186.5 | 100 |
| Dota 2 Reborn (2015) | 183.7 | 164.4 | 157.6 | 142.4 |
| Final Fantasy XV Benchmark (2018) | 186.5 | 139.3 | 101.5 | |
| X-Plane 11.11 (2018) | 155.1 | 132.7 | 107.1 | |
| Strange Brigade (2018) | 473 | 263 | 209 | 182.2 |
| Cyberpunk 2077 (2023) | 118.3 | 94.8 | 81.1 | 69.7 |
| Ready or Not (2023) | 218 | 152.4 | 147.6 | 131.5 |
| Helldivers 2 (2024) | 123.9 | 97.6 | 88.5 | 85.6 |
| Skull & Bones (2024) | 125 | 111 | 97 | 73 |
| Last Epoch (2024) | 195.5 | 184.6 | 164.1 | 122.8 |
Emisyonlar ve enerji: G6X iyi çalışma süreleri sunar
Gürültü emisyonları
Ses basıncı seviyesi (SPL) tam yük altında 54 dB(A)'ya kadar yükselir (Eğlence modu). Performans modunda SPL daha yüksek olabilir. Sessiz mod ile önemli ölçüde daha sessiz bir çalışma elde edilebilir.
Ancak, dGPU bu şekilde çalışmadığı için bu durum belirgin bir performans kaybına neden olur. Genel olarak, Eğlence modu günlük kullanım için önerilir. Tam yükün ötesinde, gürültü gelişimi orta düzeyde kalır.
Ses yüksekliği
| Boşta |
| 30 / 32 / 35 dB |
| Çalışırken |
| 51 / 54 dB |
 | ||
30 dB sessiz 40 dB(A) duyulabilirlik 50 dB(A) gürültülü |
||
min: | ||
| Gigabyte G6X 9KG (2024) i7-13650HX, GeForce RTX 4060 Laptop GPU | Dell G16, i7-13650HX, RTX 4060 i7-13650HX, GeForce RTX 4060 Laptop GPU | Lenovo Legion 5 16IRX G9 i7-14650HX, GeForce RTX 4060 Laptop GPU | MSI Raider GE68HX 13VF i9-13950HX, GeForce RTX 4060 Laptop GPU | Asus TUF Gaming A16 FA617XS R9 7940HS, Radeon RX 7600S | |
|---|---|---|---|---|---|
| Noise | 21% | 7% | 2% | 11% | |
| kapalı / ortam * (dB) | 26 | 23 12% | 24 8% | 23.3 10% | 25 4% |
| Idle Minimum * (dB) | 30 | 23 23% | 24 20% | 25 17% | 25 17% |
| Idle Average * (dB) | 32 | 23 28% | 28.8 10% | 31.3 2% | 26 19% |
| Idle Maximum * (dB) | 35 | 27.96 20% | 32 9% | 37.5 -7% | 28 20% |
| Load Average * (dB) | 51 | 27.96 45% | 45.5 11% | 44 14% | 43 16% |
| Witcher 3 ultra * (dB) | 51 | 47.89 6% | 53.1 -4% | 57 -12% | 51 -0% |
| Load Maximum * (dB) | 54 | 47.89 11% | 55.7 -3% | 60.1 -11% | 53 2% |
* ... daha küçük daha iyidir
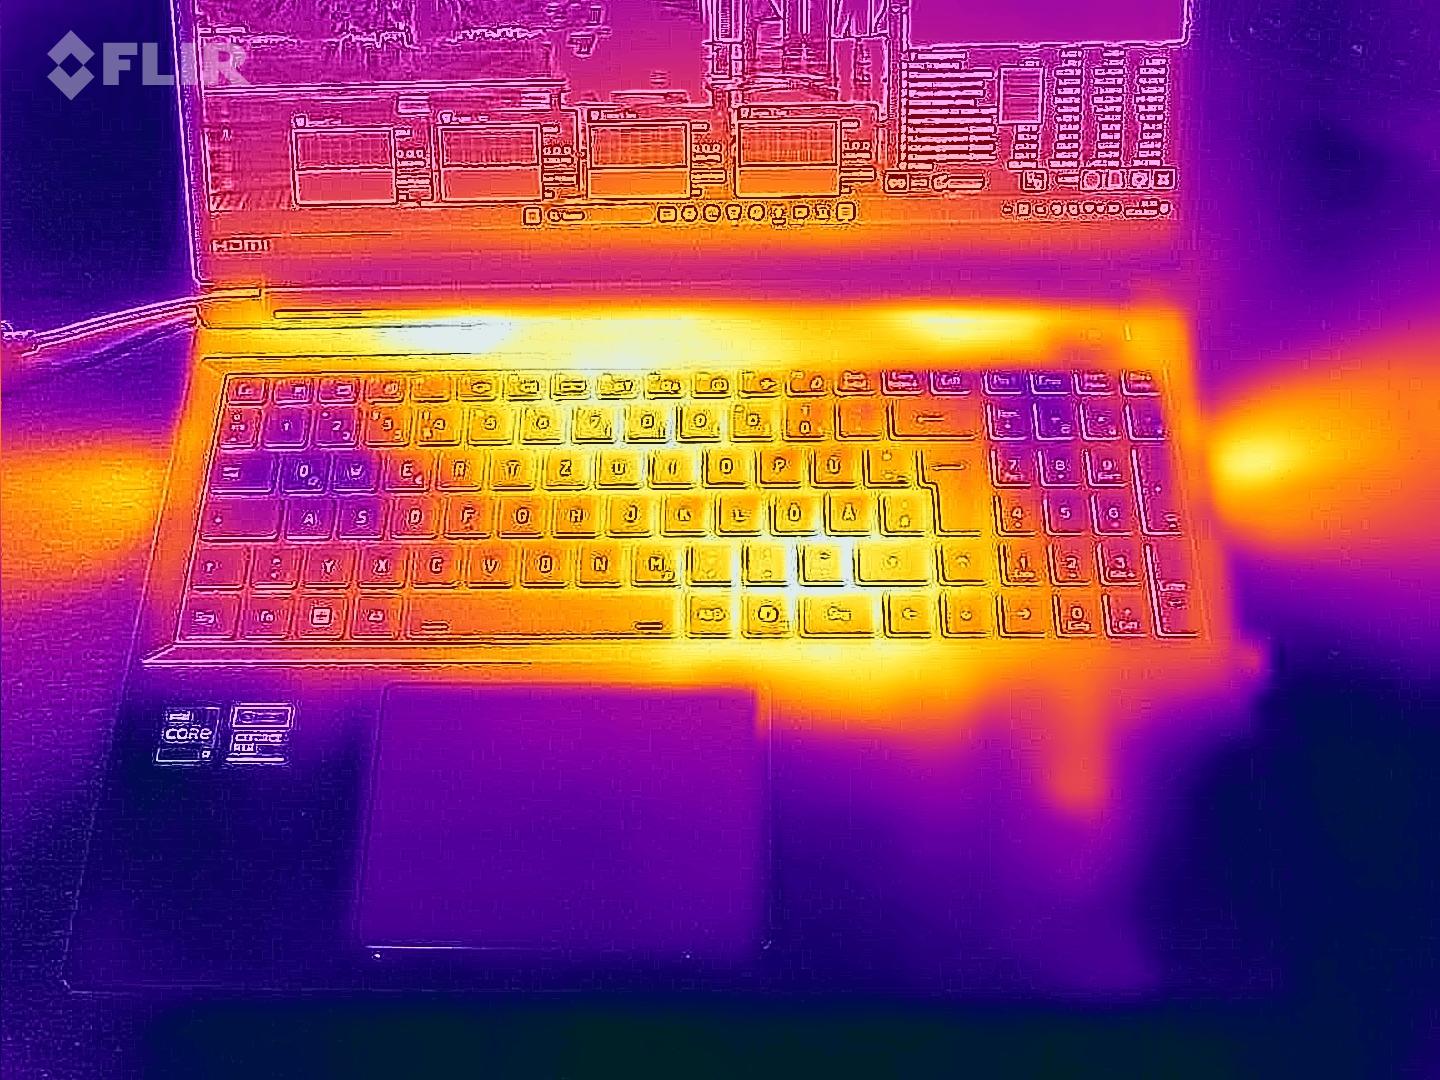
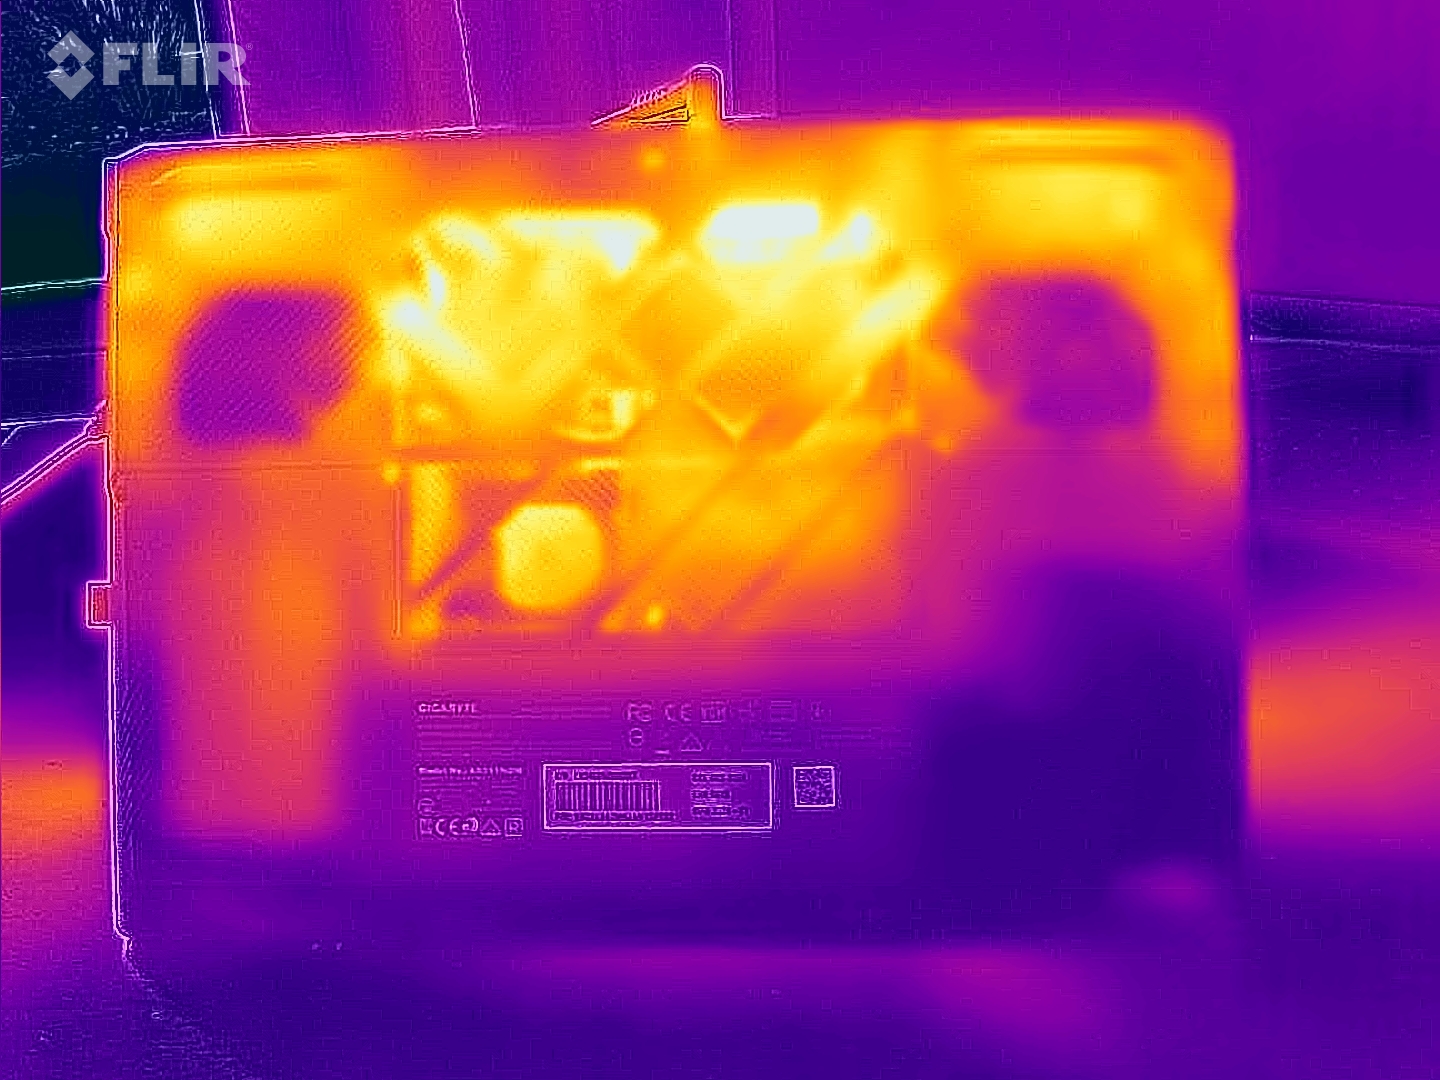
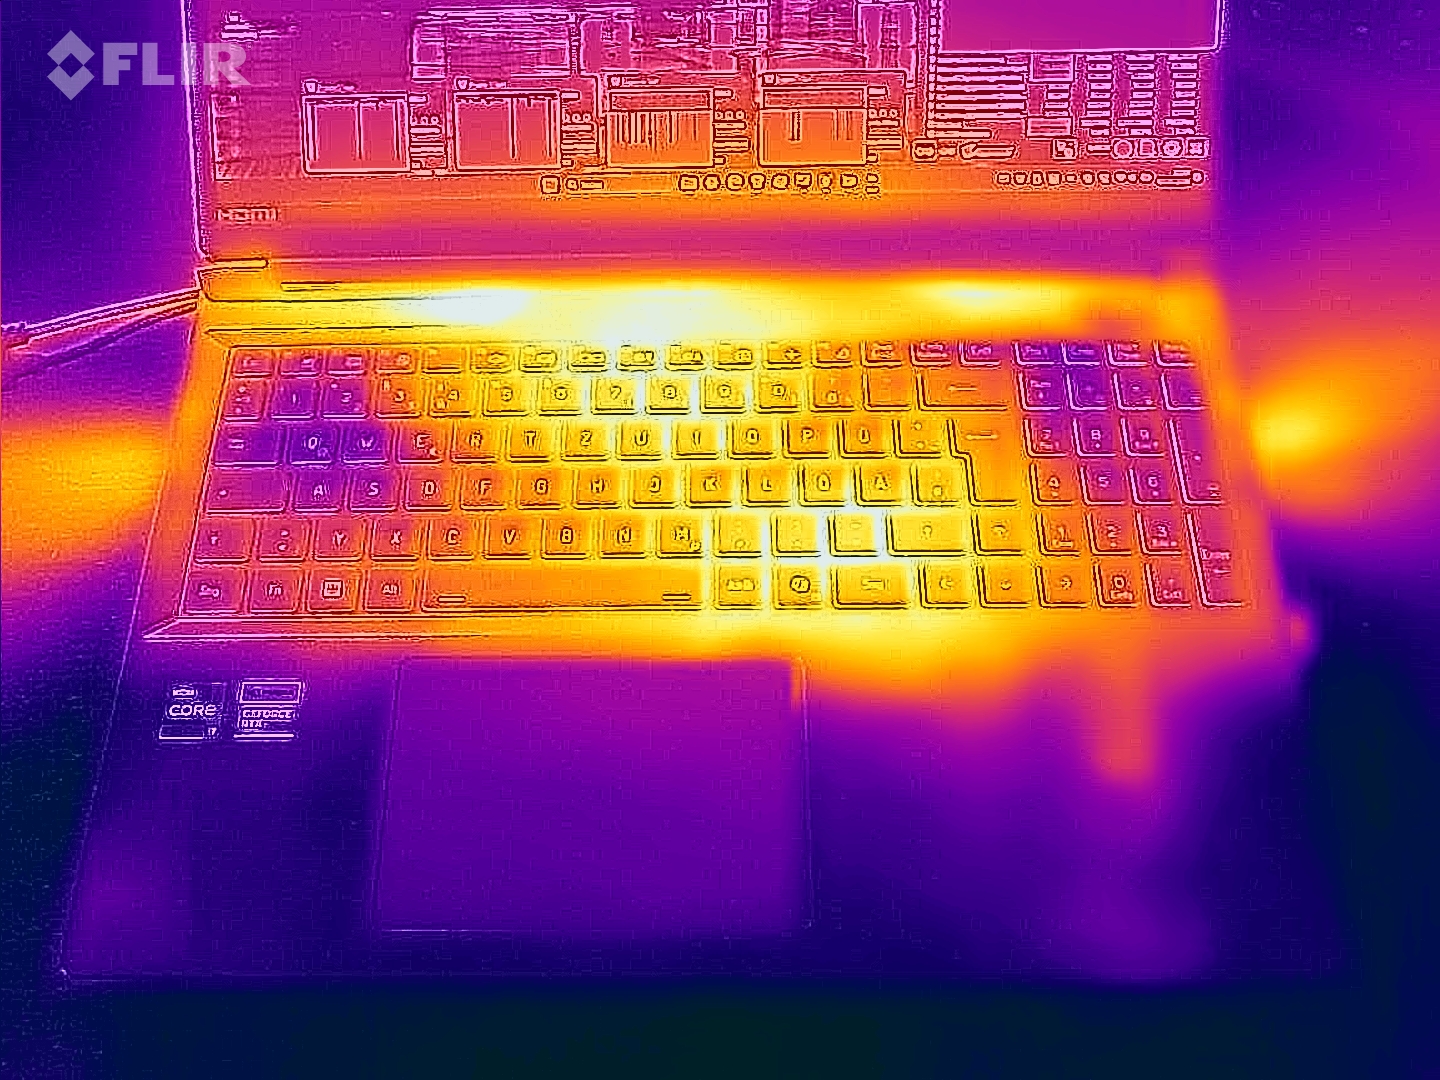
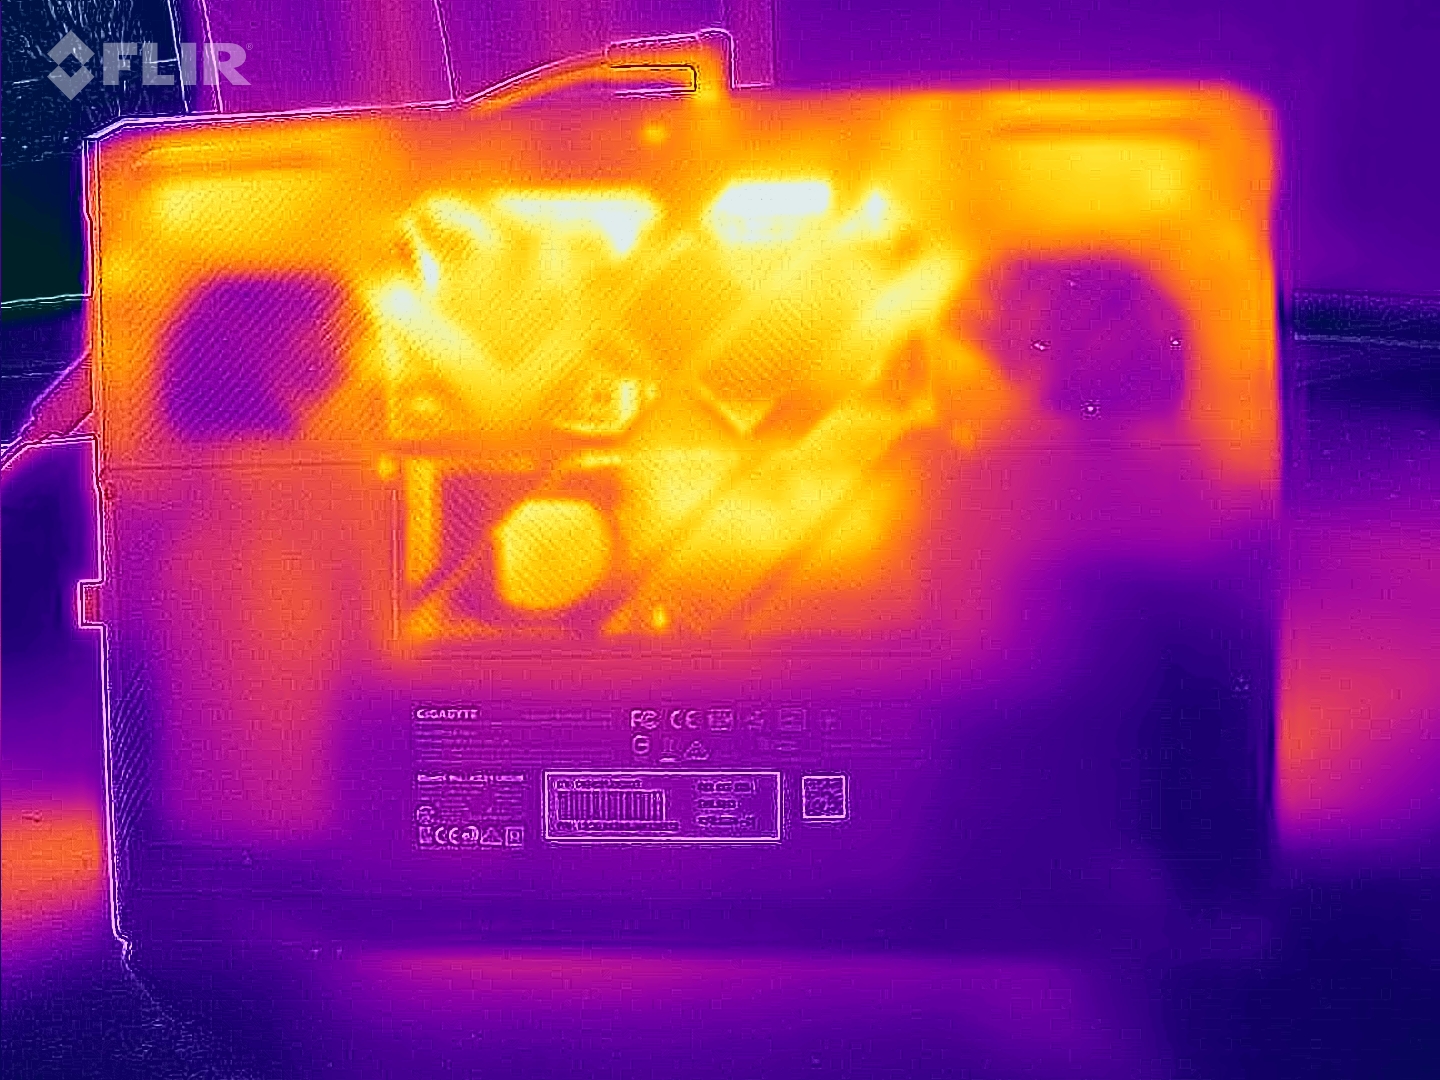
Sıcaklık
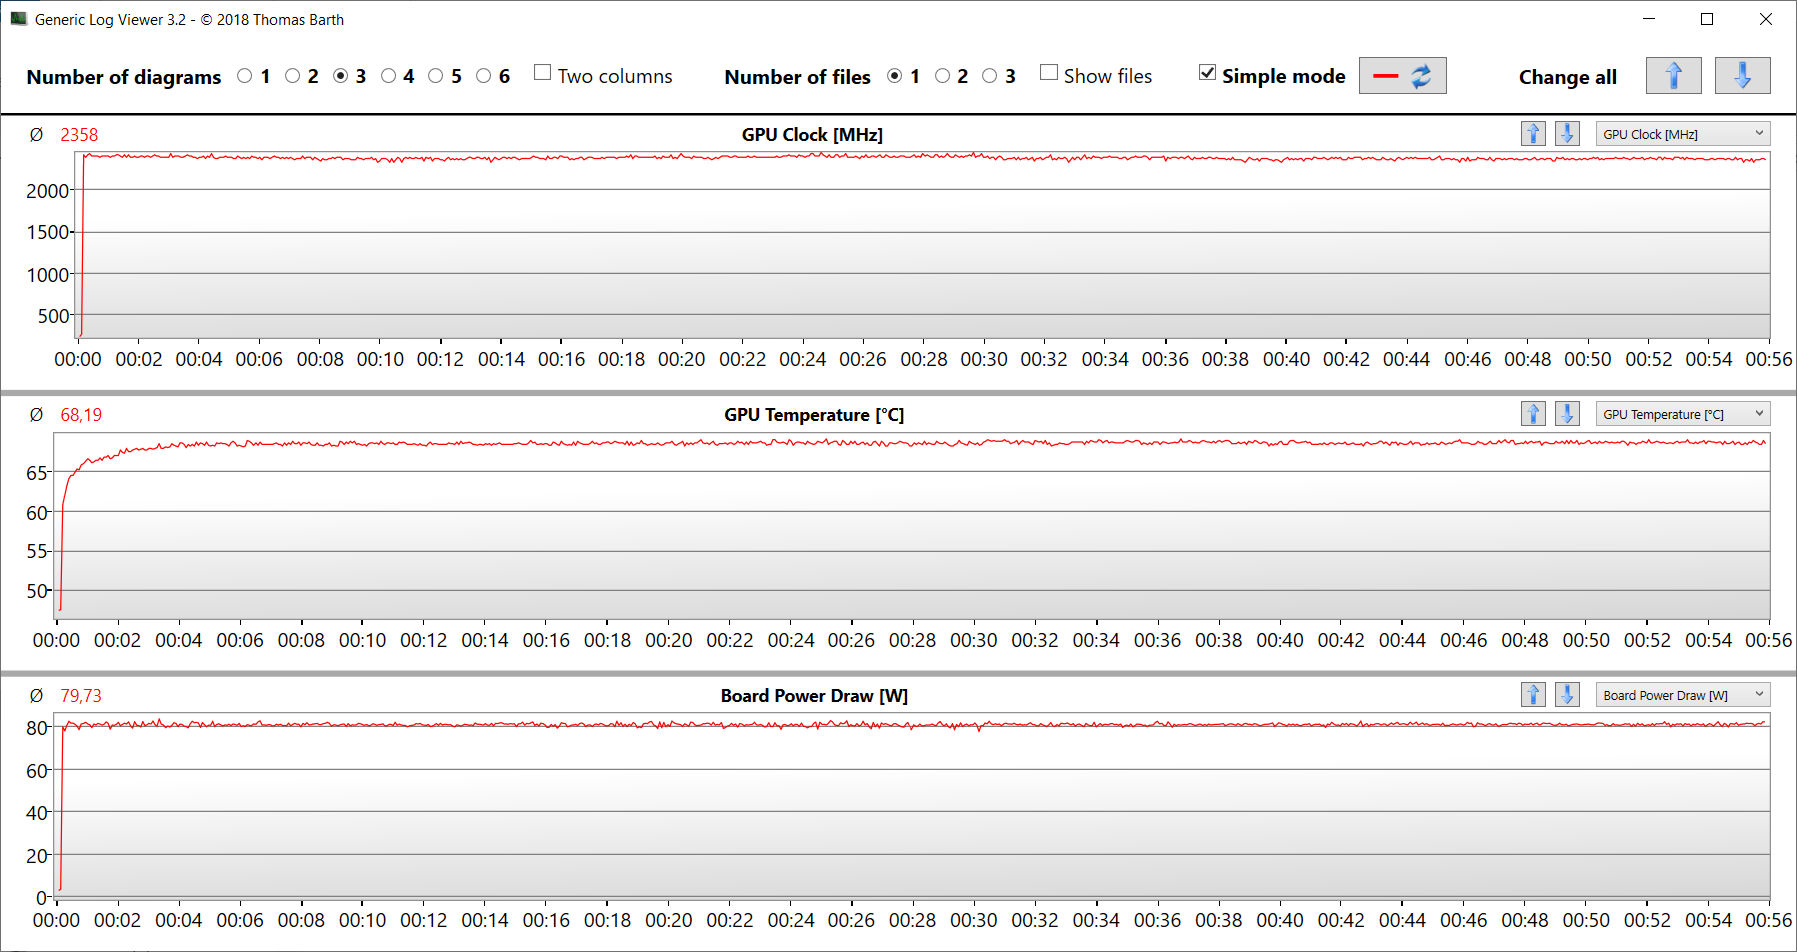
Stres testi ve Witcher 3 testleri dizüstü bilgisayarın en iyi ihtimalle orta derecede ısınmasını sağlar. Alt 40 °C aralığındaki değerlere zaman zaman ulaşılmaktadır. Günlük kullanımda (Office, internette gezinme) değerler yeşil aralıkta kalır.
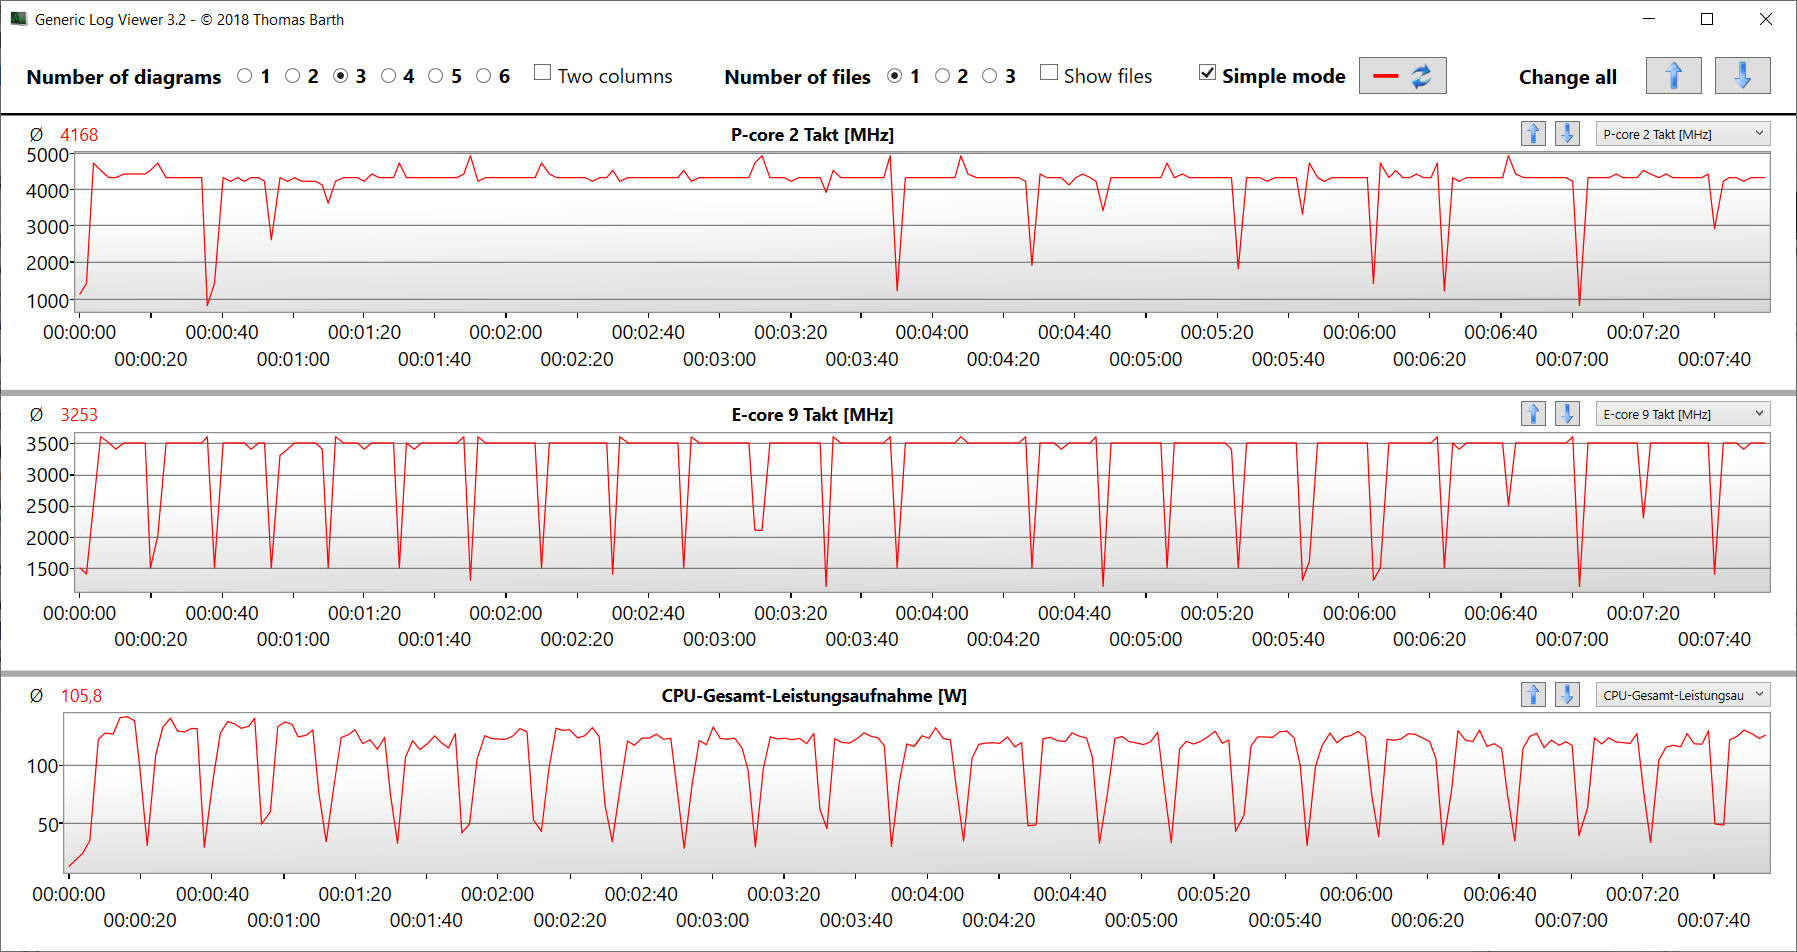
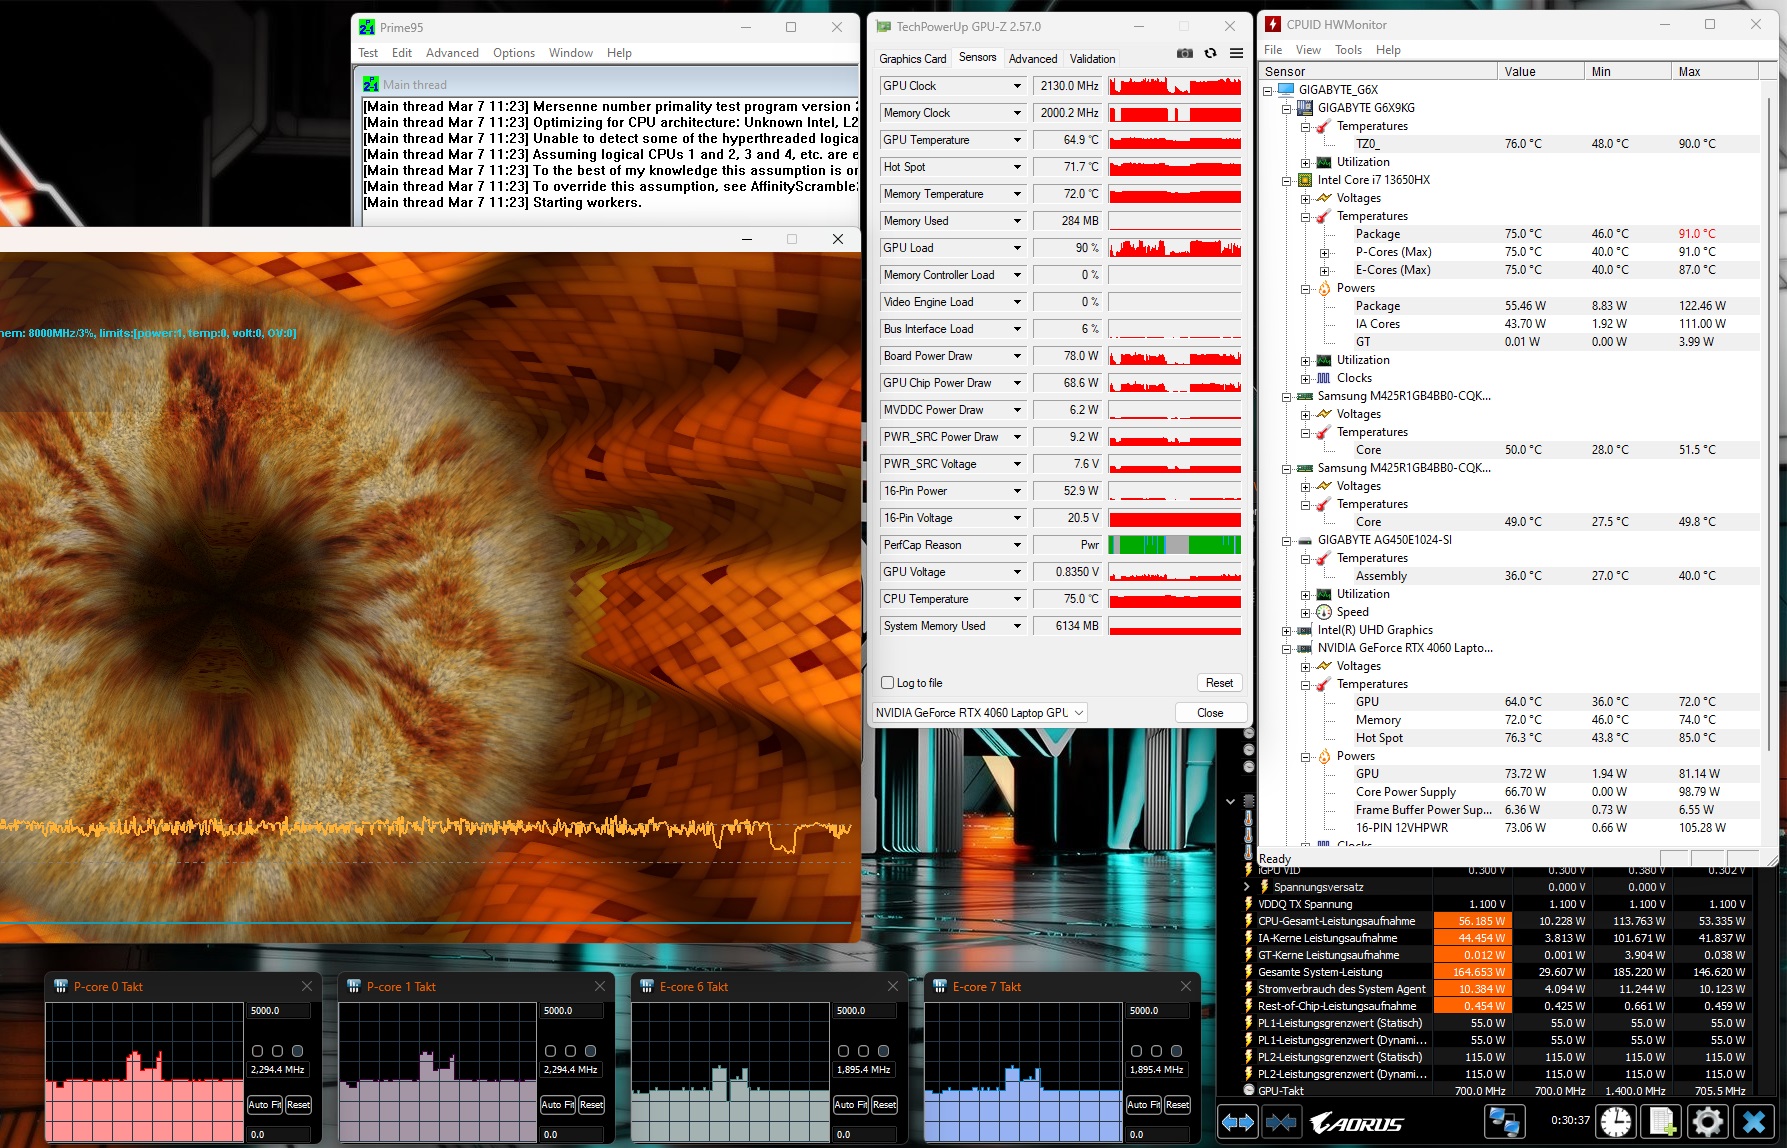
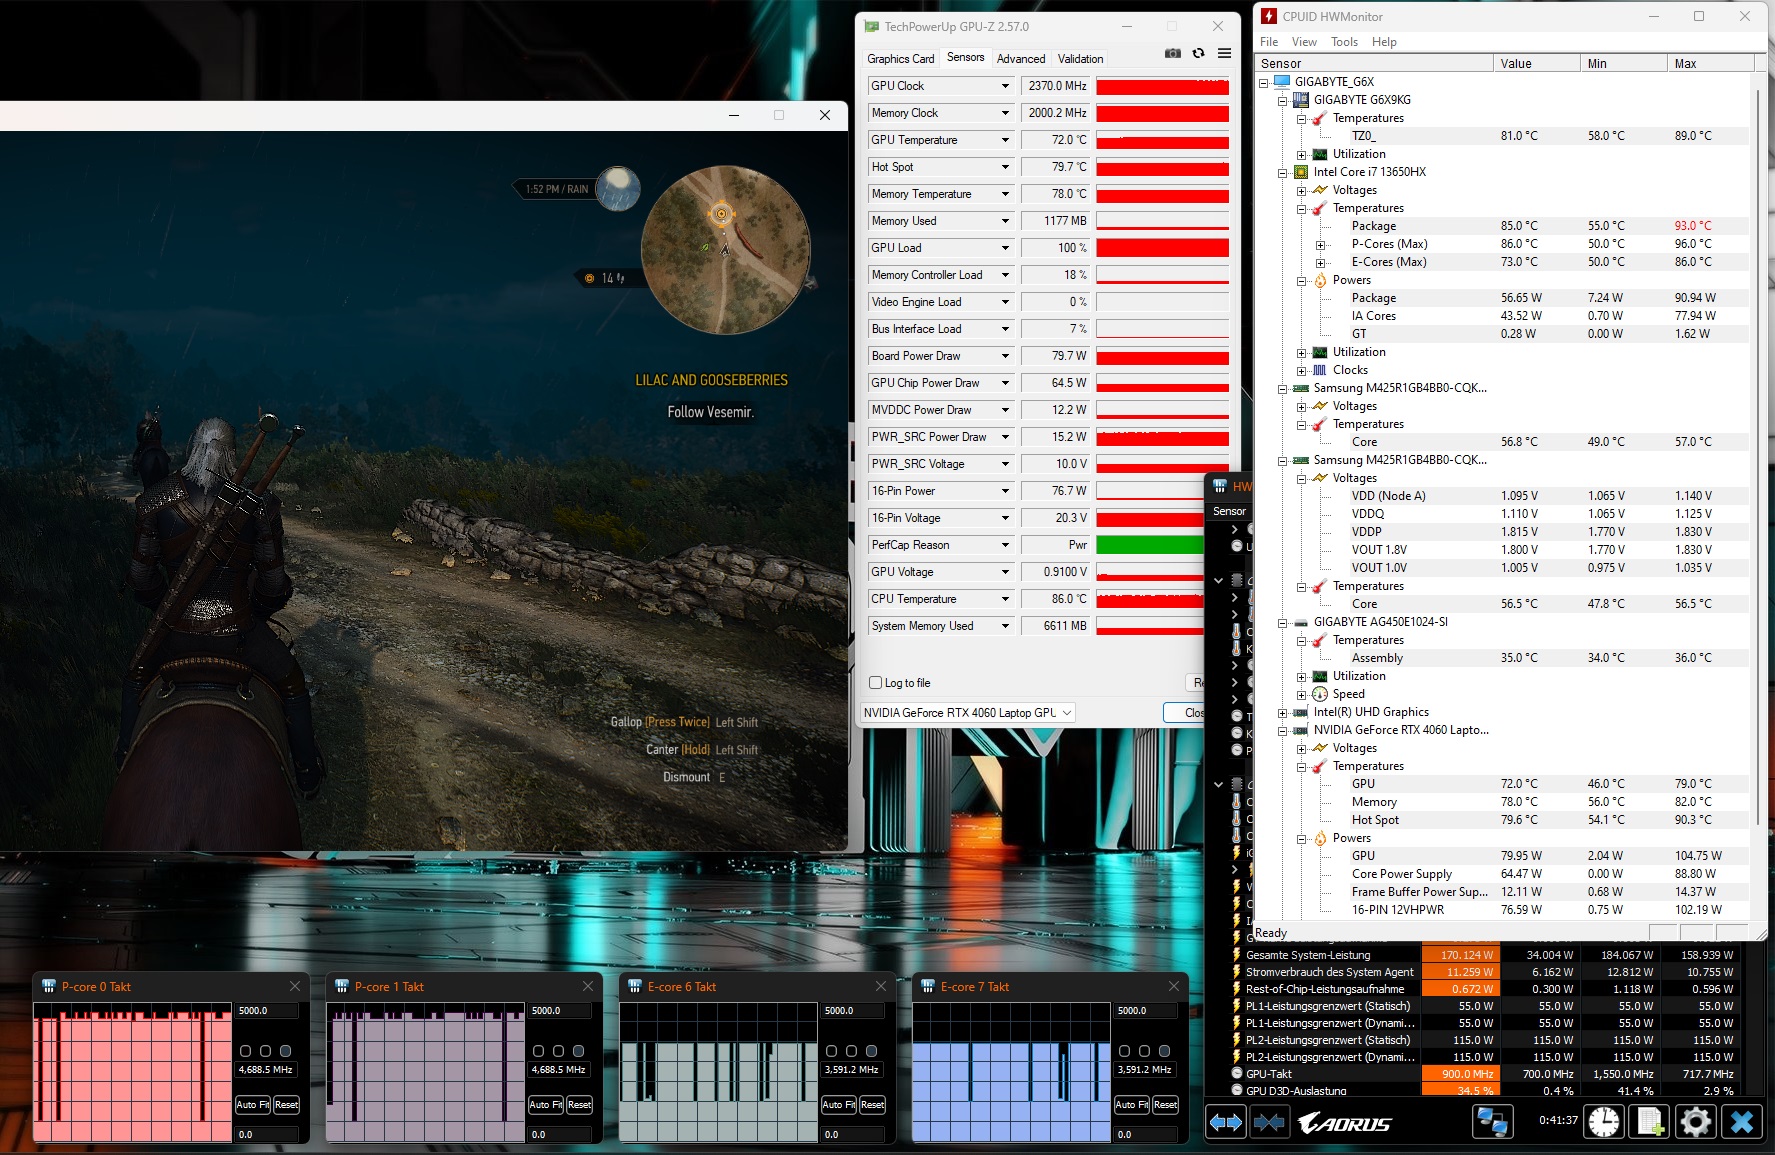
Aşırı stres testi senaryosu (sürekli çalışmada Prime95 ve FurMark) tam yük altında sistem kararlılığını kontrol eder. G6X'in CPU'su başlangıçta tam güçte çalışır, ancak saat hızını hızla temel saat seviyesine düşürür. GPU saat hızı 2,3 GHz-2,6 GHz'den 1,9-2,1 GHz'e düşer.
(±) Üst taraftaki maksimum sıcaklık, 40.4 °C / 105 F ortalamasına kıyasla 41 °C / 106 F'dir. , Gaming sınıfı için 21.2 ile 68.8 °C arasında değişir.
(±) Alt kısım, 43.2 °C / 110 F ortalamasına kıyasla maksimum 43 °C / 109 F'ye kadar ısınır
(+) Boşta kullanımda, üst tarafın ortalama sıcaklığı 29.6 °C / 85 F olup, cihazın 33.9 °C / 93 F.
(±) The Witcher 3 oynarken, üst tarafın ortalama sıcaklığı 34.9 °C / 95 F olup, cihazın 33.9 °C / 93 F.
(+) Avuç içi dayanakları ve dokunmatik yüzey, maksimum 28 °C / 82.4 F ile cilt sıcaklığından daha soğuktur ve bu nedenle dokunulduğunda soğuktur.
(±) Benzer cihazların avuç içi dayanağı alanının ortalama sıcaklığı 28.8 °C / 83.8 F (+0.8 °C / 1.4 F) idi.
| Gigabyte G6X 9KG (2024) i7-13650HX, GeForce RTX 4060 Laptop GPU | Dell G16, i7-13650HX, RTX 4060 i7-13650HX, GeForce RTX 4060 Laptop GPU | Lenovo Legion 5 16IRX G9 i7-14650HX, GeForce RTX 4060 Laptop GPU | MSI Raider GE68HX 13VF i9-13950HX, GeForce RTX 4060 Laptop GPU | Asus TUF Gaming A16 FA617XS R9 7940HS, Radeon RX 7600S | |
|---|---|---|---|---|---|
| Heat | -15% | 2% | 4% | -4% | |
| Maximum Upper Side * (°C) | 41 | 49 -20% | 40.4 1% | 41.4 -1% | 53 -29% |
| Maximum Bottom * (°C) | 43 | 58 -35% | 43.8 -2% | 45.4 -6% | 48 -12% |
| Idle Upper Side * (°C) | 32 | 35 -9% | 30.3 5% | 29.8 7% | 30 6% |
| Idle Bottom * (°C) | 37 | 35 5% | 35.3 5% | 31.4 15% | 30 19% |
* ... daha küçük daha iyidir
Hoparlör
Stereo hoparlörler genel olarak iyi bir ses üretir. Bununla birlikte, bas eksikliği vardır.
Gigabyte G6X 9KG (2024) ses analizi
(+) | hoparlörler nispeten yüksek sesle çalabilir (82 dB)
Bas 100 - 315Hz
(-) | neredeyse hiç bas yok - ortalama olarak medyandan 24.9% daha düşük
(±) | Bas doğrusallığı ortalamadır (13.7% delta - önceki frekans)
Ortalar 400 - 2000 Hz
(+) | dengeli ortalar - medyandan yalnızca 4.1% uzakta
(+) | orta frekanslar doğrusaldır (5.4% deltadan önceki frekansa)
Yüksekler 2 - 16 kHz
(+) | dengeli yüksekler - medyandan yalnızca 2.2% uzakta
(±) | Yükseklerin doğrusallığı ortalamadır (7.4% delta - önceki frekans)
Toplam 100 - 16.000 Hz
(±) | Genel sesin doğrusallığı ortalamadır (17.2% ortancaya göre fark)
Aynı sınıfla karşılaştırıldığında
» Bu sınıftaki tüm test edilen cihazların %46%'si daha iyi, 11% benzer, 42% daha kötüydü
» En iyisinin deltası 6% idi, ortalama 18% idi, en kötüsü 132% idi
Test edilen tüm cihazlarla karşılaştırıldığında
» Test edilen tüm cihazların %32'si daha iyi, 8 benzer, % 60 daha kötüydü
» En iyisinin deltası 4% idi, ortalama 24% idi, en kötüsü 134% idi
Dell G16, i7-13650HX, RTX 4060 ses analizi
(±) | hoparlör ses yüksekliği ortalama ama iyi (80.55 dB)
Bas 100 - 315Hz
(-) | neredeyse hiç bas yok - ortalama olarak medyandan 25.1% daha düşük
(-) | bas doğrusal değildir (18.9% delta ile önceki frekans)
Ortalar 400 - 2000 Hz
(±) | daha yüksek ortalar - ortalama olarak medyandan 8% daha yüksek
(+) | orta frekanslar doğrusaldır (5.9% deltadan önceki frekansa)
Yüksekler 2 - 16 kHz
(+) | dengeli yüksekler - medyandan yalnızca 3.5% uzakta
(±) | Yükseklerin doğrusallığı ortalamadır (8.6% delta - önceki frekans)
Toplam 100 - 16.000 Hz
(±) | Genel sesin doğrusallığı ortalamadır (23.4% ortancaya göre fark)
Aynı sınıfla karşılaştırıldığında
» Bu sınıftaki tüm test edilen cihazların %85%'si daha iyi, 5% benzer, 11% daha kötüydü
» En iyisinin deltası 6% idi, ortalama 18% idi, en kötüsü 132% idi
Test edilen tüm cihazlarla karşılaştırıldığında
» Test edilen tüm cihazların %70'si daha iyi, 6 benzer, % 24 daha kötüydü
» En iyisinin deltası 4% idi, ortalama 24% idi, en kötüsü 134% idi
Enerji tüketimi
Güç tüketimi, kurulu donanım için normal düzeydedir. Witcher 3 testi sabit bir enerji tüketiminde çalıştırılırken, stres testi sırasında talep hafifçe dalgalanır.
Güç kaynağının güç çıkışı birkaç dakika boyunca nominal gücün (180 W) üzerindedir ancak daha sonra nominal güç seviyesine düşürülür.
| Kapalı / Bekleme modu | |
| Boşta | |
| Çalışırken |
|
Key:
min: | |
Energieaufnahme Witcher 3 / Stresstest
Power consumption: External monitor
Pil ömrü
Gigabyte G6X, pratik WLAN testinde (bir komut dosyası kullanarak web sitelerine erişirken yükün haritalanması) 7:54 saatlik bir çalışma süresi elde etti; bu iyi bir değer ve karşılaştırmadaki en iyi ikinci çalışma süresi.
Artılar
Eksiler
Karar: Çok yönlü genel paket
Gigabyte G6X 9KG, yüksek ila maksimum ayarlarda FHD oyun için tasarlanmıştır, ancak Core i7-13650HX ve GeForce RTX 4060 yapılandırma, video düzenleme ve işleme gibi diğer alanlarda da hizmet verebilmelidir. Hızlı 1 TB PCIe Gen 4 SSD, kısa yükleme süreleri sağlar.
Gigabyte, G6X 9KG (2024) ile tutarlı bir orta sınıf oyun dizüstü bilgisayarı sunuyor."
Dizüstü bilgisayar yük altında fazla ısınmıyor ancak çok fazla gürültü üretebiliyor. Sessiz güç profili buna karşı koyabilir, ancak bu dGPU'nun kapatılmasına neden olur. Bu nedenle, 8 saatin biraz altındaki iyi Wi-Fi çalışma süresi sürpriz değildir.
G6X, herhangi bir modern Thunderbolt veya USB4 bağlantı noktasına sahip değildir. Güç Dağıtımını destekleyen USB Type-C'lerden biriyle, tescilli güç kaynağı ünitesi normal işler için evde kalabilir. İki USB 3.2 Gen 2 Type-C bağlantı noktası da mevcut iş istasyonu kurulumlarına kolay entegrasyon sağlıyor.
Mat 16 inç WUXGA 165 Hz IPS ekran genel olarak iyi bir izlenim bırakıyor ancak yetersiz renk alanı kapsamı sunuyor.
Alternatif olarak Lenovo Legion 5 16IRX G9 düşünülebilir. Daha fazla GPU performansı ve daha iyi renk alanı kapsamına sahip daha parlak bir ekran sunar.
Fiyat ve bulunabilirlik
ABD'de Gigabyte G6X 9KG (2024) Amazon'dan yaklaşık 1.350 dolara temin edilebilir.
Gigabyte G6X 9KG (2024)
- 03/22/2024 v7 (old)
Sascha Mölck
Şeffaflık
İncelenecek cihazların seçimi editör ekibimiz tarafından yapılır. Test örneği, bu incelemenin amacı doğrultusunda üretici veya perakendeci tarafından yazara ödünç olarak sağlanmıştır. Borç verenin bu inceleme üzerinde herhangi bir etkisi olmadığı gibi, üretici de yayınlanmadan önce bu incelemenin bir kopyasını almamıştır. Bu incelemeyi yayınlama zorunluluğu yoktu. Bağımsız bir medya şirketi olarak Notebookcheck, üreticilerin, perakendecilerin veya yayıncıların otoritesine tabi değildir.
Notebookcheck bu şekilde test yapıyor
Notebookcheck, tüm sonuçların karşılaştırılabilir olmasını sağlamak için her yıl yüzlerce dizüstü bilgisayarı ve akıllı telefonu standart prosedürler kullanarak bağımsız olarak inceliyor. Yaklaşık 20 yıldır test yöntemlerimizi sürekli olarak geliştirdik ve bu süreçte endüstri standartlarını belirledik. Test laboratuvarlarımızda deneyimli teknisyenler ve editörler tarafından yüksek kaliteli ölçüm ekipmanları kullanılmaktadır. Bu testler çok aşamalı bir doğrulama sürecini içerir. Karmaşık derecelendirme sistemimiz, nesnelliği koruyan yüzlerce sağlam temellere dayanan ölçüm ve kıyaslamaya dayanmaktadır.Price comparison
