HP Pavilion Plus 16 İncelemesi: RTX 4050'den faydalanabilecek premium multimedya dizüstü bilgisayar
 incelemede")
HP, Envy serisine daha uygun fiyatlı bir alternatif olarak geçtiğimiz günlerde iki yeni Pavilion Plus modelini tanıttı. Daha önce Pavilion Plus 14'ü her iki modelde de incelemiştik Intel Raptor Lake ve AMD Zen 4 varyantlar. Şimdi, daha büyük olan Pavilion Plus 16'ya bir göz atıyoruz.
Pavilion Plus 16, Pavilion Plus 14'ün "IMAX Enhanced" OLED panelinden vazgeçiyor, bunun yerine H serisi işlemci ve isteğe bağlı Nvidia grafikler sunuyor.
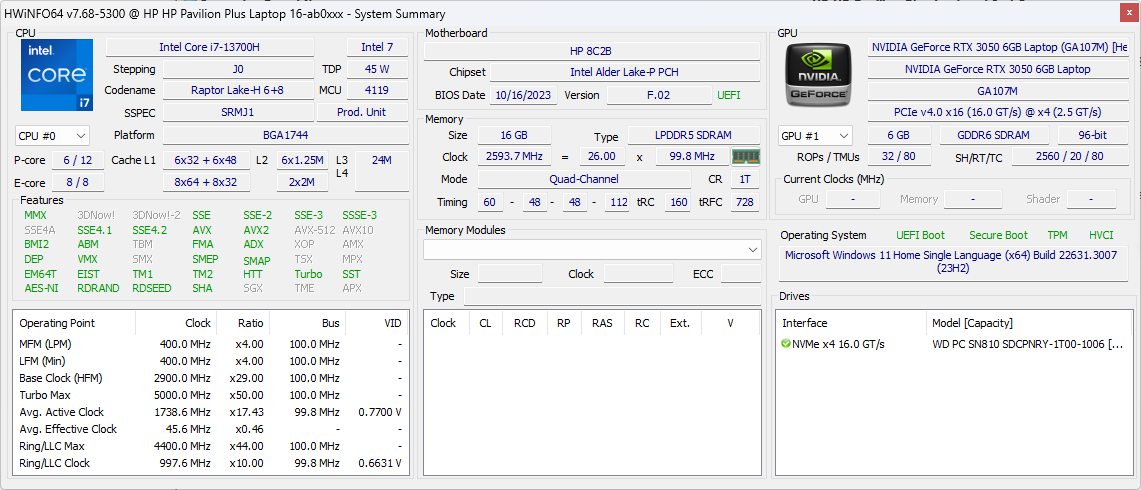
Pavilion Plus 16 ünitemiz bir Intel Core i7-13700H işlemci ile birlikte 16 GB RAM, 1 TB SSD ve 16 inç 2560 x 1600 120 Hz IPS ekrana sahip. Pavilion Plus 16, aşağıdaki özelliklere sahip bir avuç dizüstü bilgisayar arasında yer alıyor Nvidia GeForce RTX 3050 6 GB Dizüstü Bilgisayar GPU'su. Bu yapılandırma, resmi HP Hindistan mağazasında size ₹1,24,999 (1,350 ABD Doları) geri ödeyecektir.
Karşılaştırmalı olarak olası rakipler
Derecelendirme | Tarih | Modeli | Ağırlık | Yükseklik | Boyut | Çözünürlük | Fiyat |
|---|---|---|---|---|---|---|---|
| 88.7 % v7 (old) | 02/2024 | HP Pavilion Plus 16-ab0456tx i7-13700H, GeForce RTX 3050 6GB Laptop GPU | 1.9 kg | 19.9 mm | 16.00" | 2560x1600 | |
| 88.2 % v7 (old) | 01/2024 | Schenker Vision 14 M23 RTX 3050 i7-13700H, GeForce RTX 3050 6GB Laptop GPU | 1.3 kg | 16.6 mm | 14.00" | 2880x1800 | |
| 87.1 % v7 (old) | 09/2023 | Dell Inspiron 16 Plus 7630 i7-13700H, GeForce RTX 4060 Laptop GPU | 2.2 kg | 19.95 mm | 16.00" | 2560x1600 | |
| 85.6 % v7 (old) | Asus VivoBook 14X K3405 i5-13500H, GeForce RTX 3050 4GB Laptop GPU | 1.4 kg | 18.9 mm | 14.00" | 2880x1800 | ||
| 89.2 % v7 (old) | 06/2023 | Lenovo Slim Pro 7 14ARP8 R7 7735HS, GeForce RTX 3050 6GB Laptop GPU | 1.6 kg | 15.6 mm | 14.50" | 2560x1600 | |
| 87.6 % v7 (old) | 11/2023 | Asus VivoBook Pro 16 K6602VU i9-13900H, GeForce RTX 4050 Laptop GPU | 1.9 kg | 19 mm | 16.00" | 3200x2000 | |
| 89.4 % v7 (old) | 04/2023 | Samsung Galaxy Book3 Ultra 16 i7-13700H, GeForce RTX 4050 Laptop GPU | 1.8 kg | 16.5 mm | 16.00" | 2880x1800 |
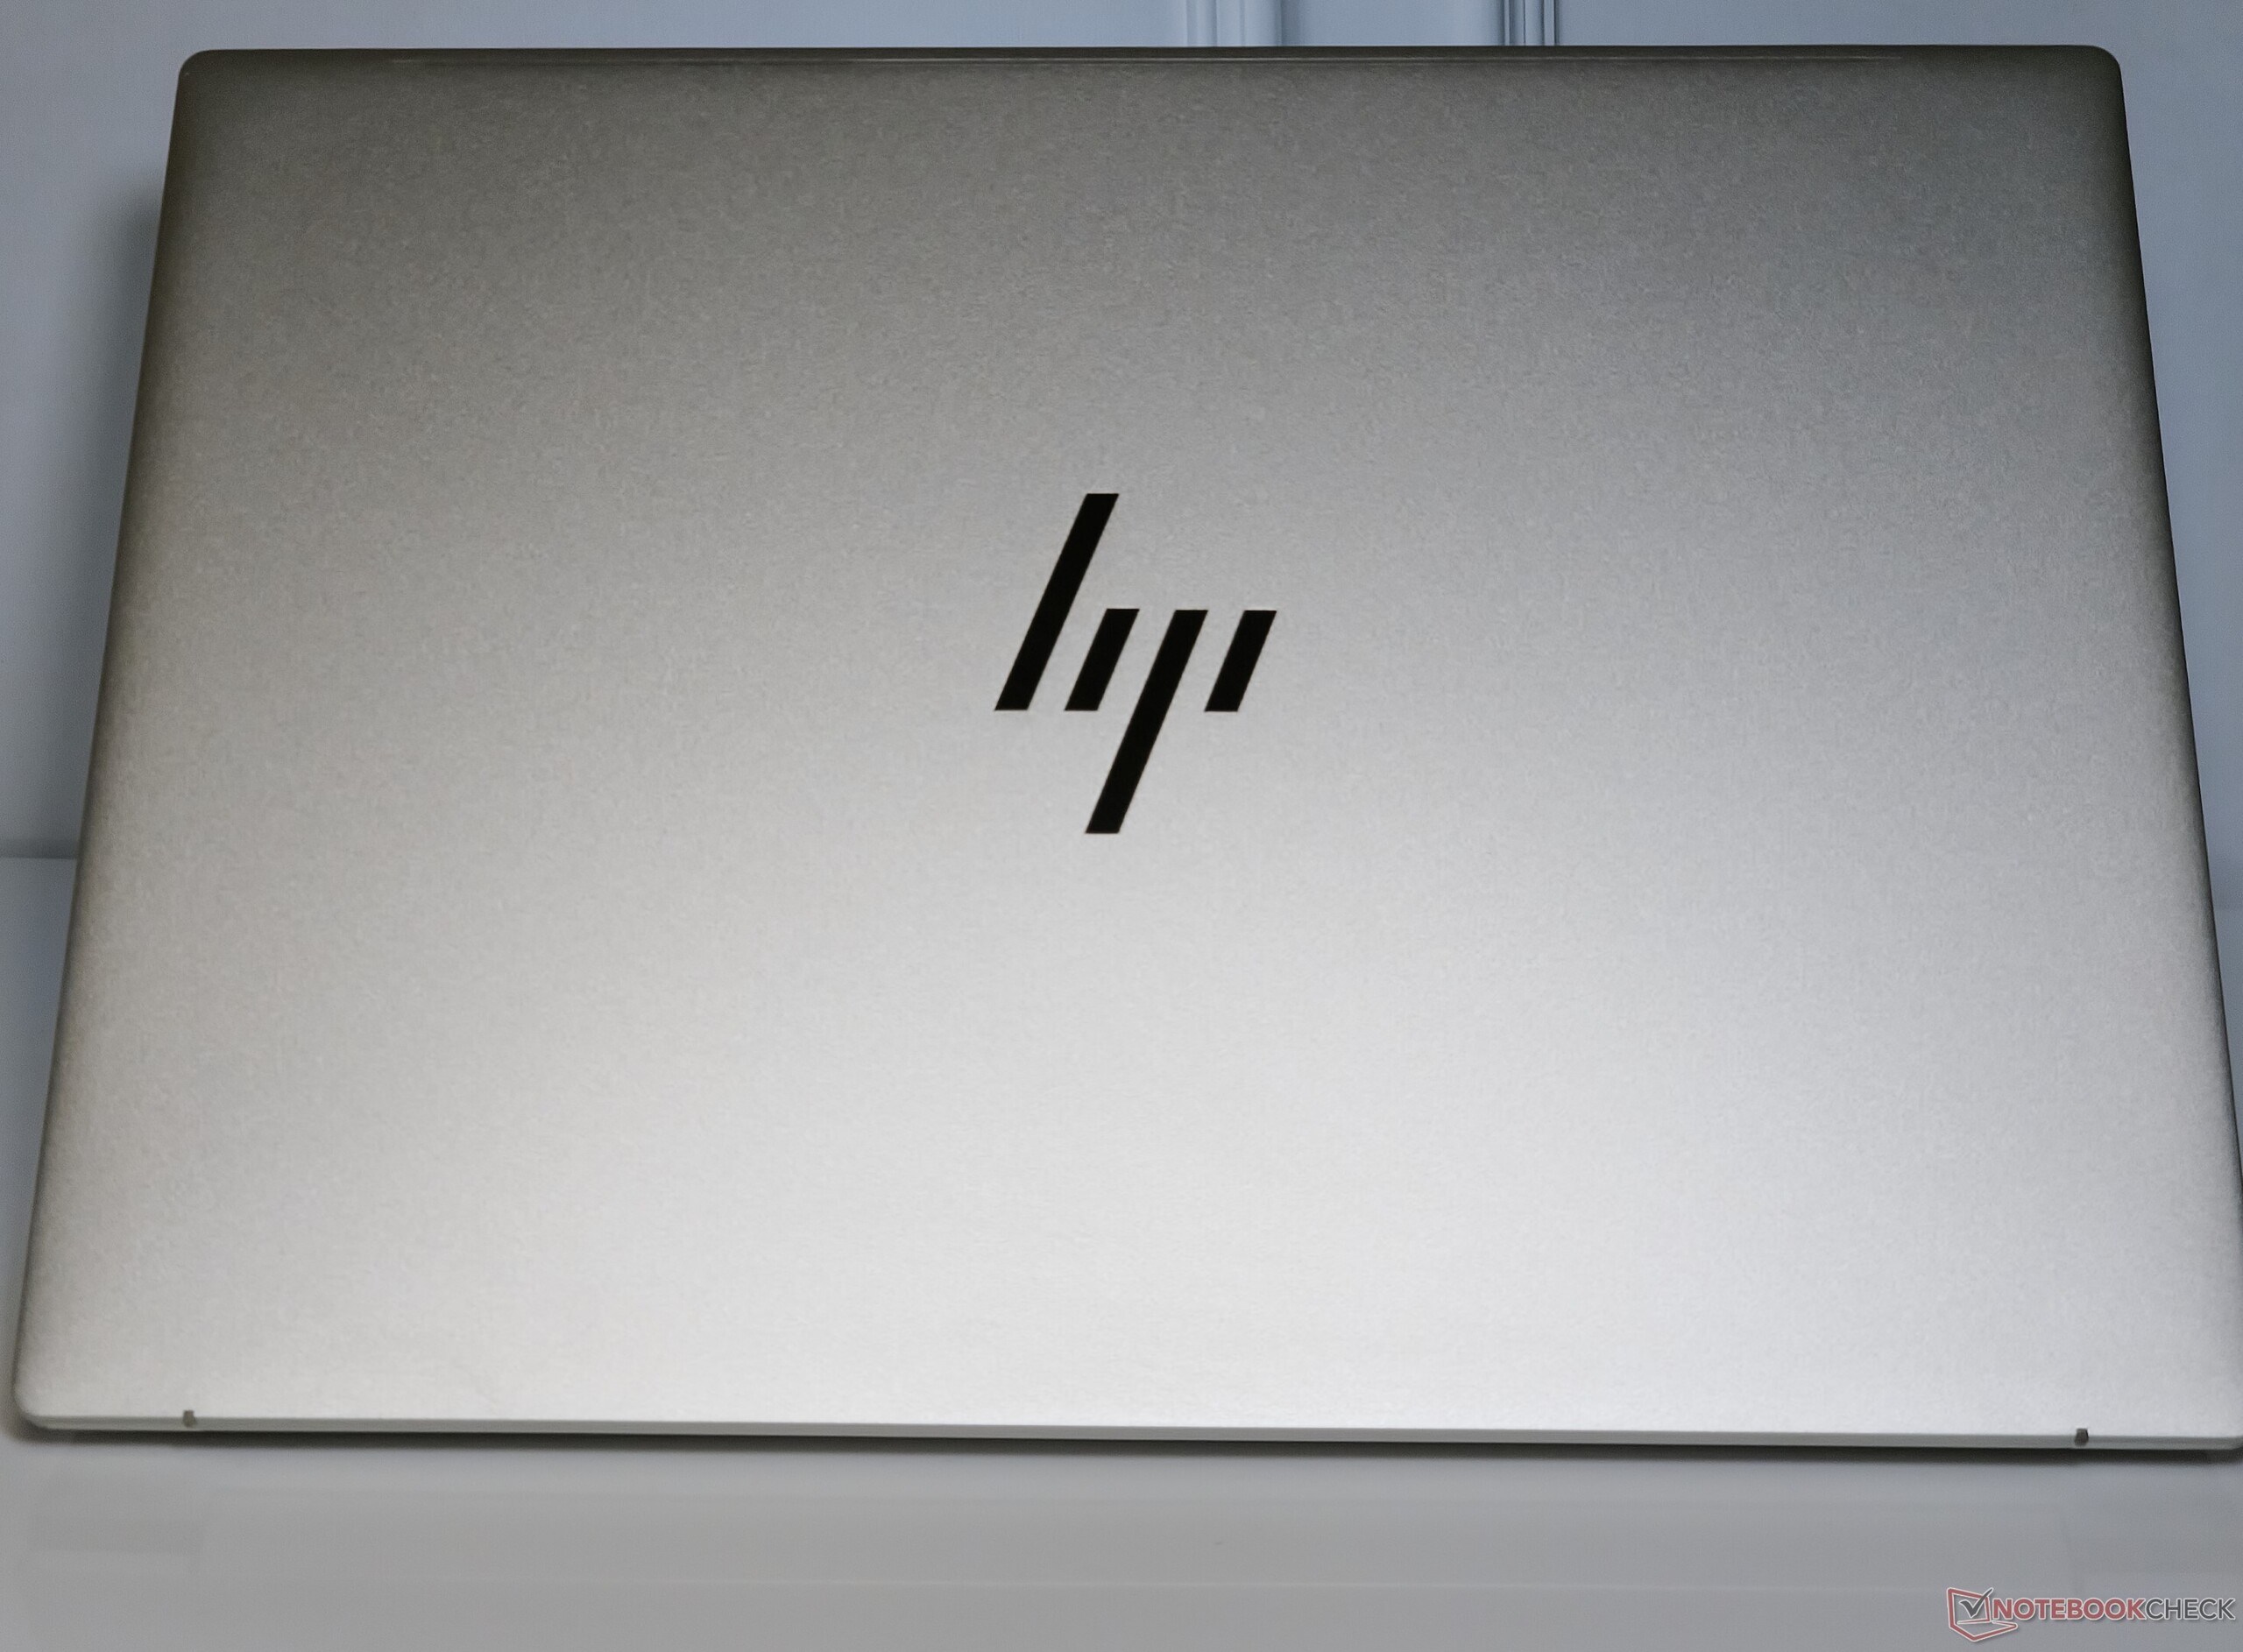
Şasi: Sağlam, tamamen metal yapı
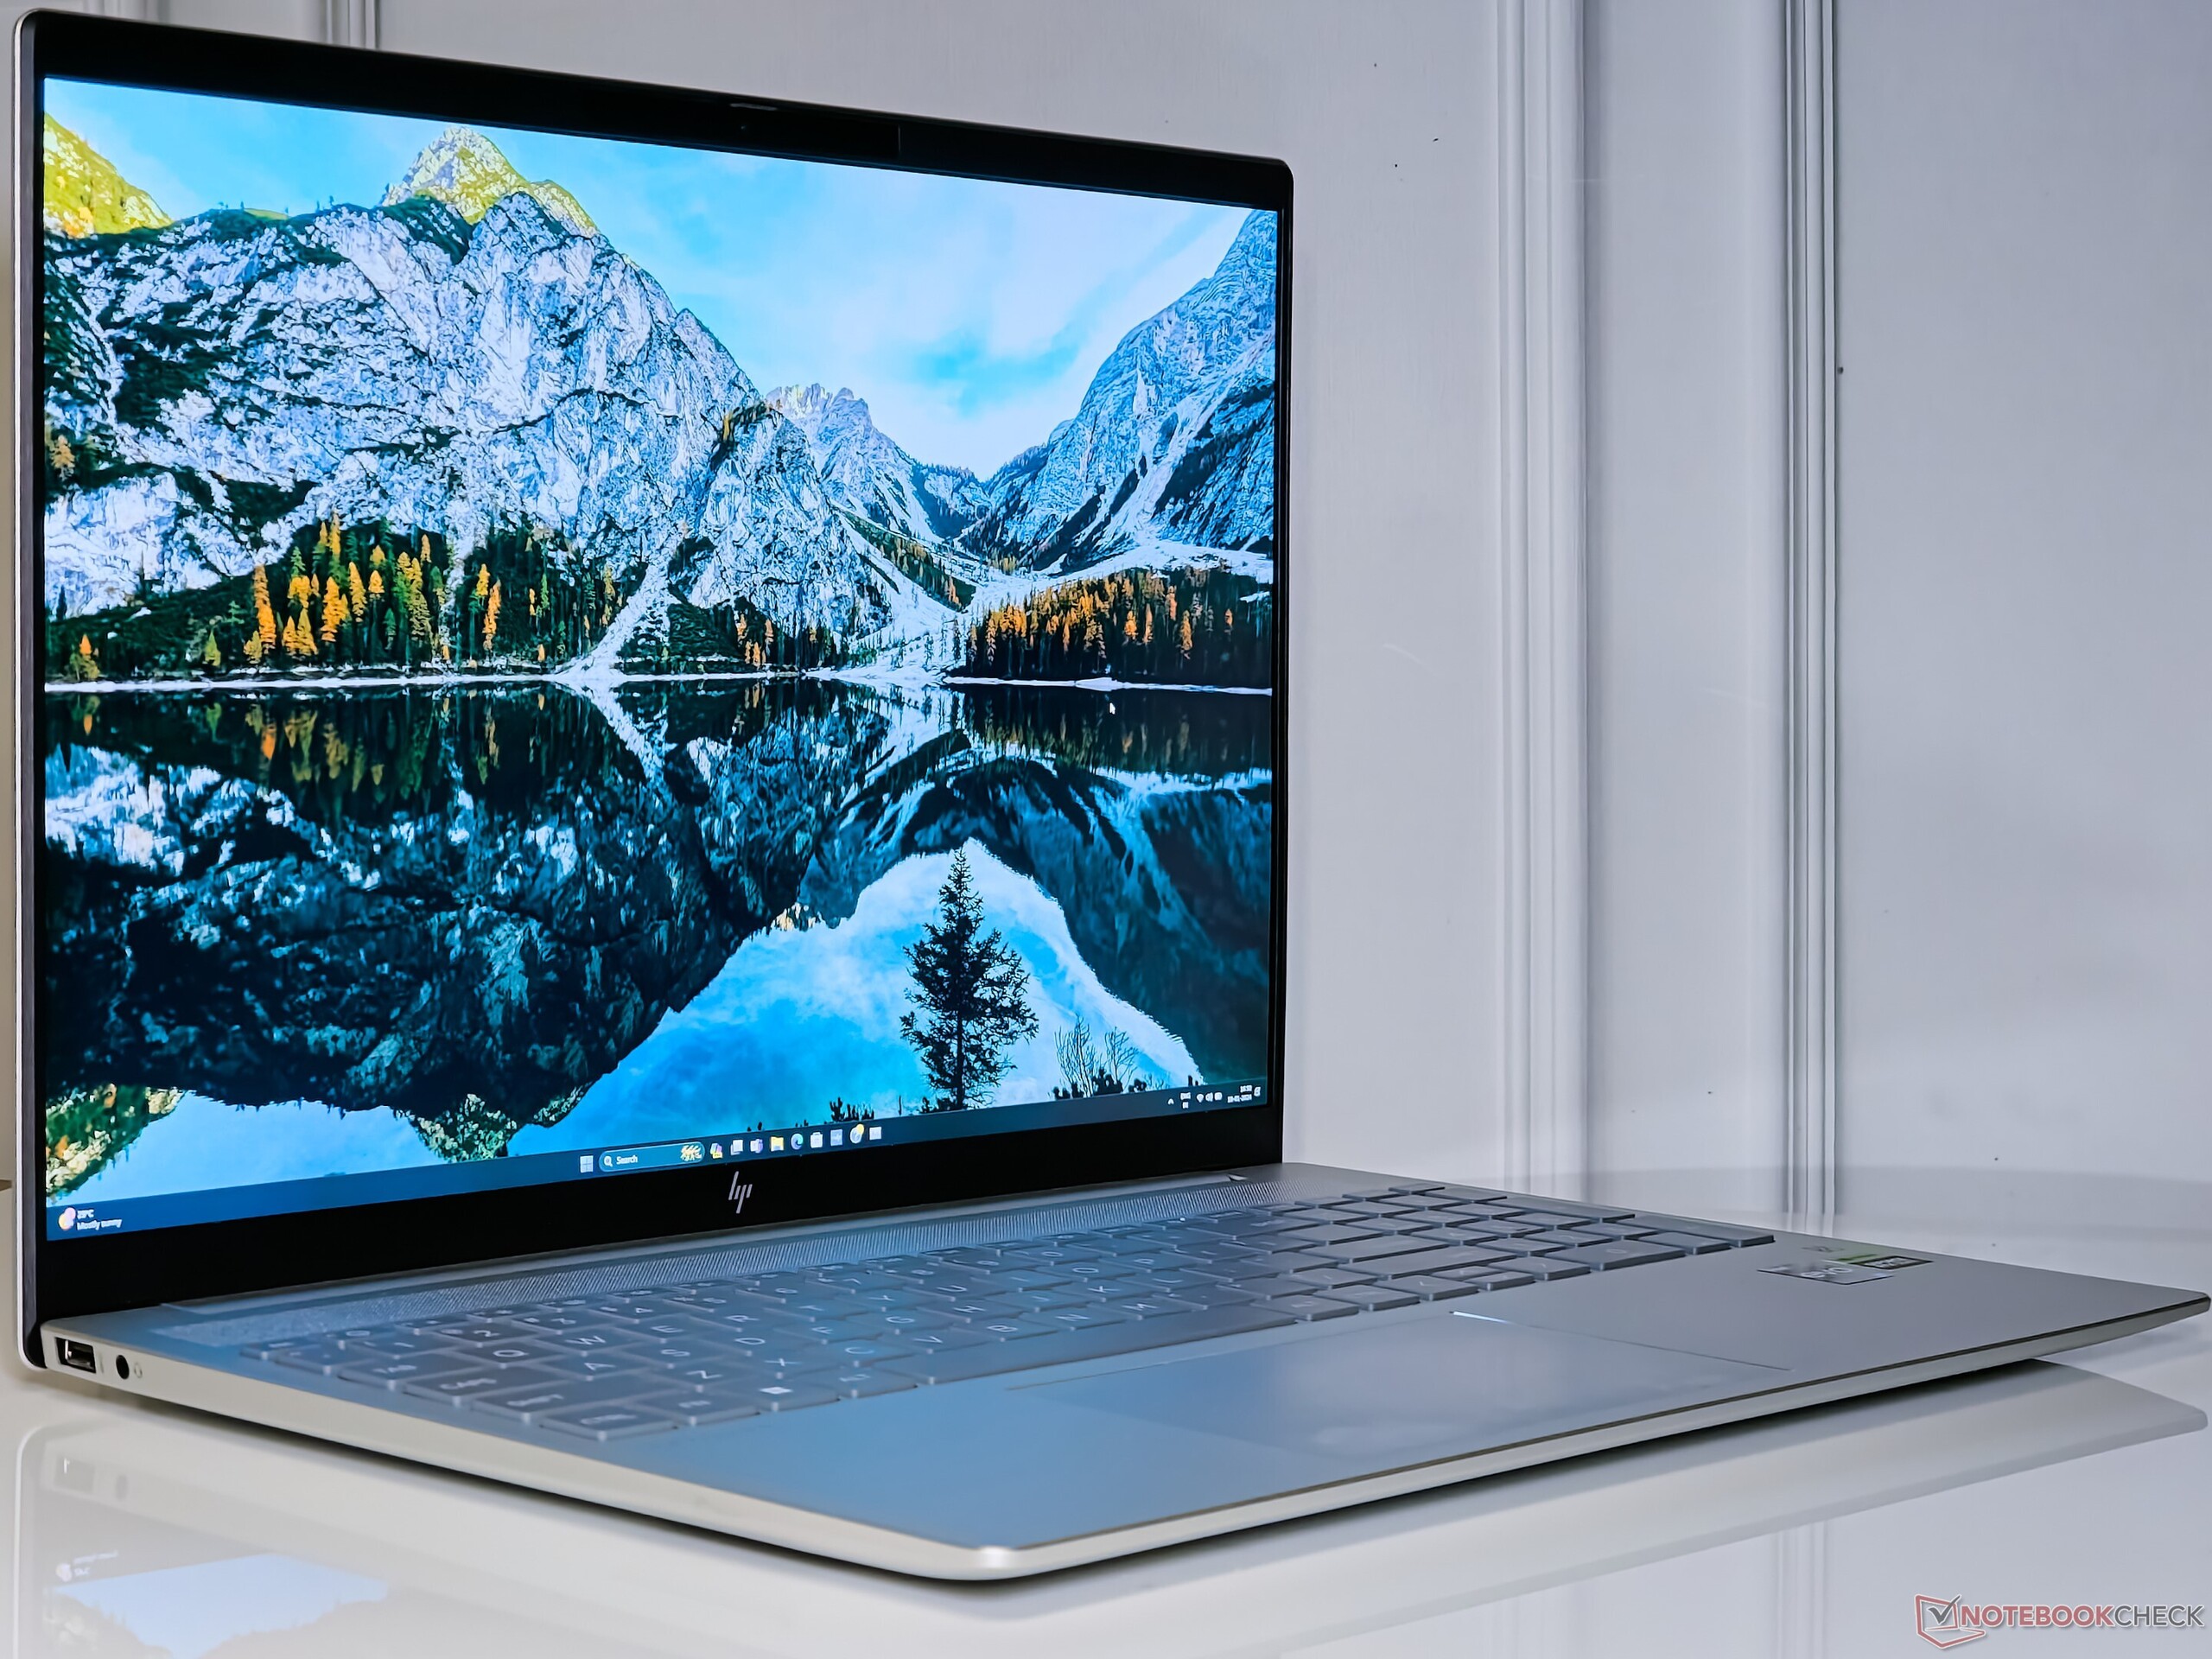
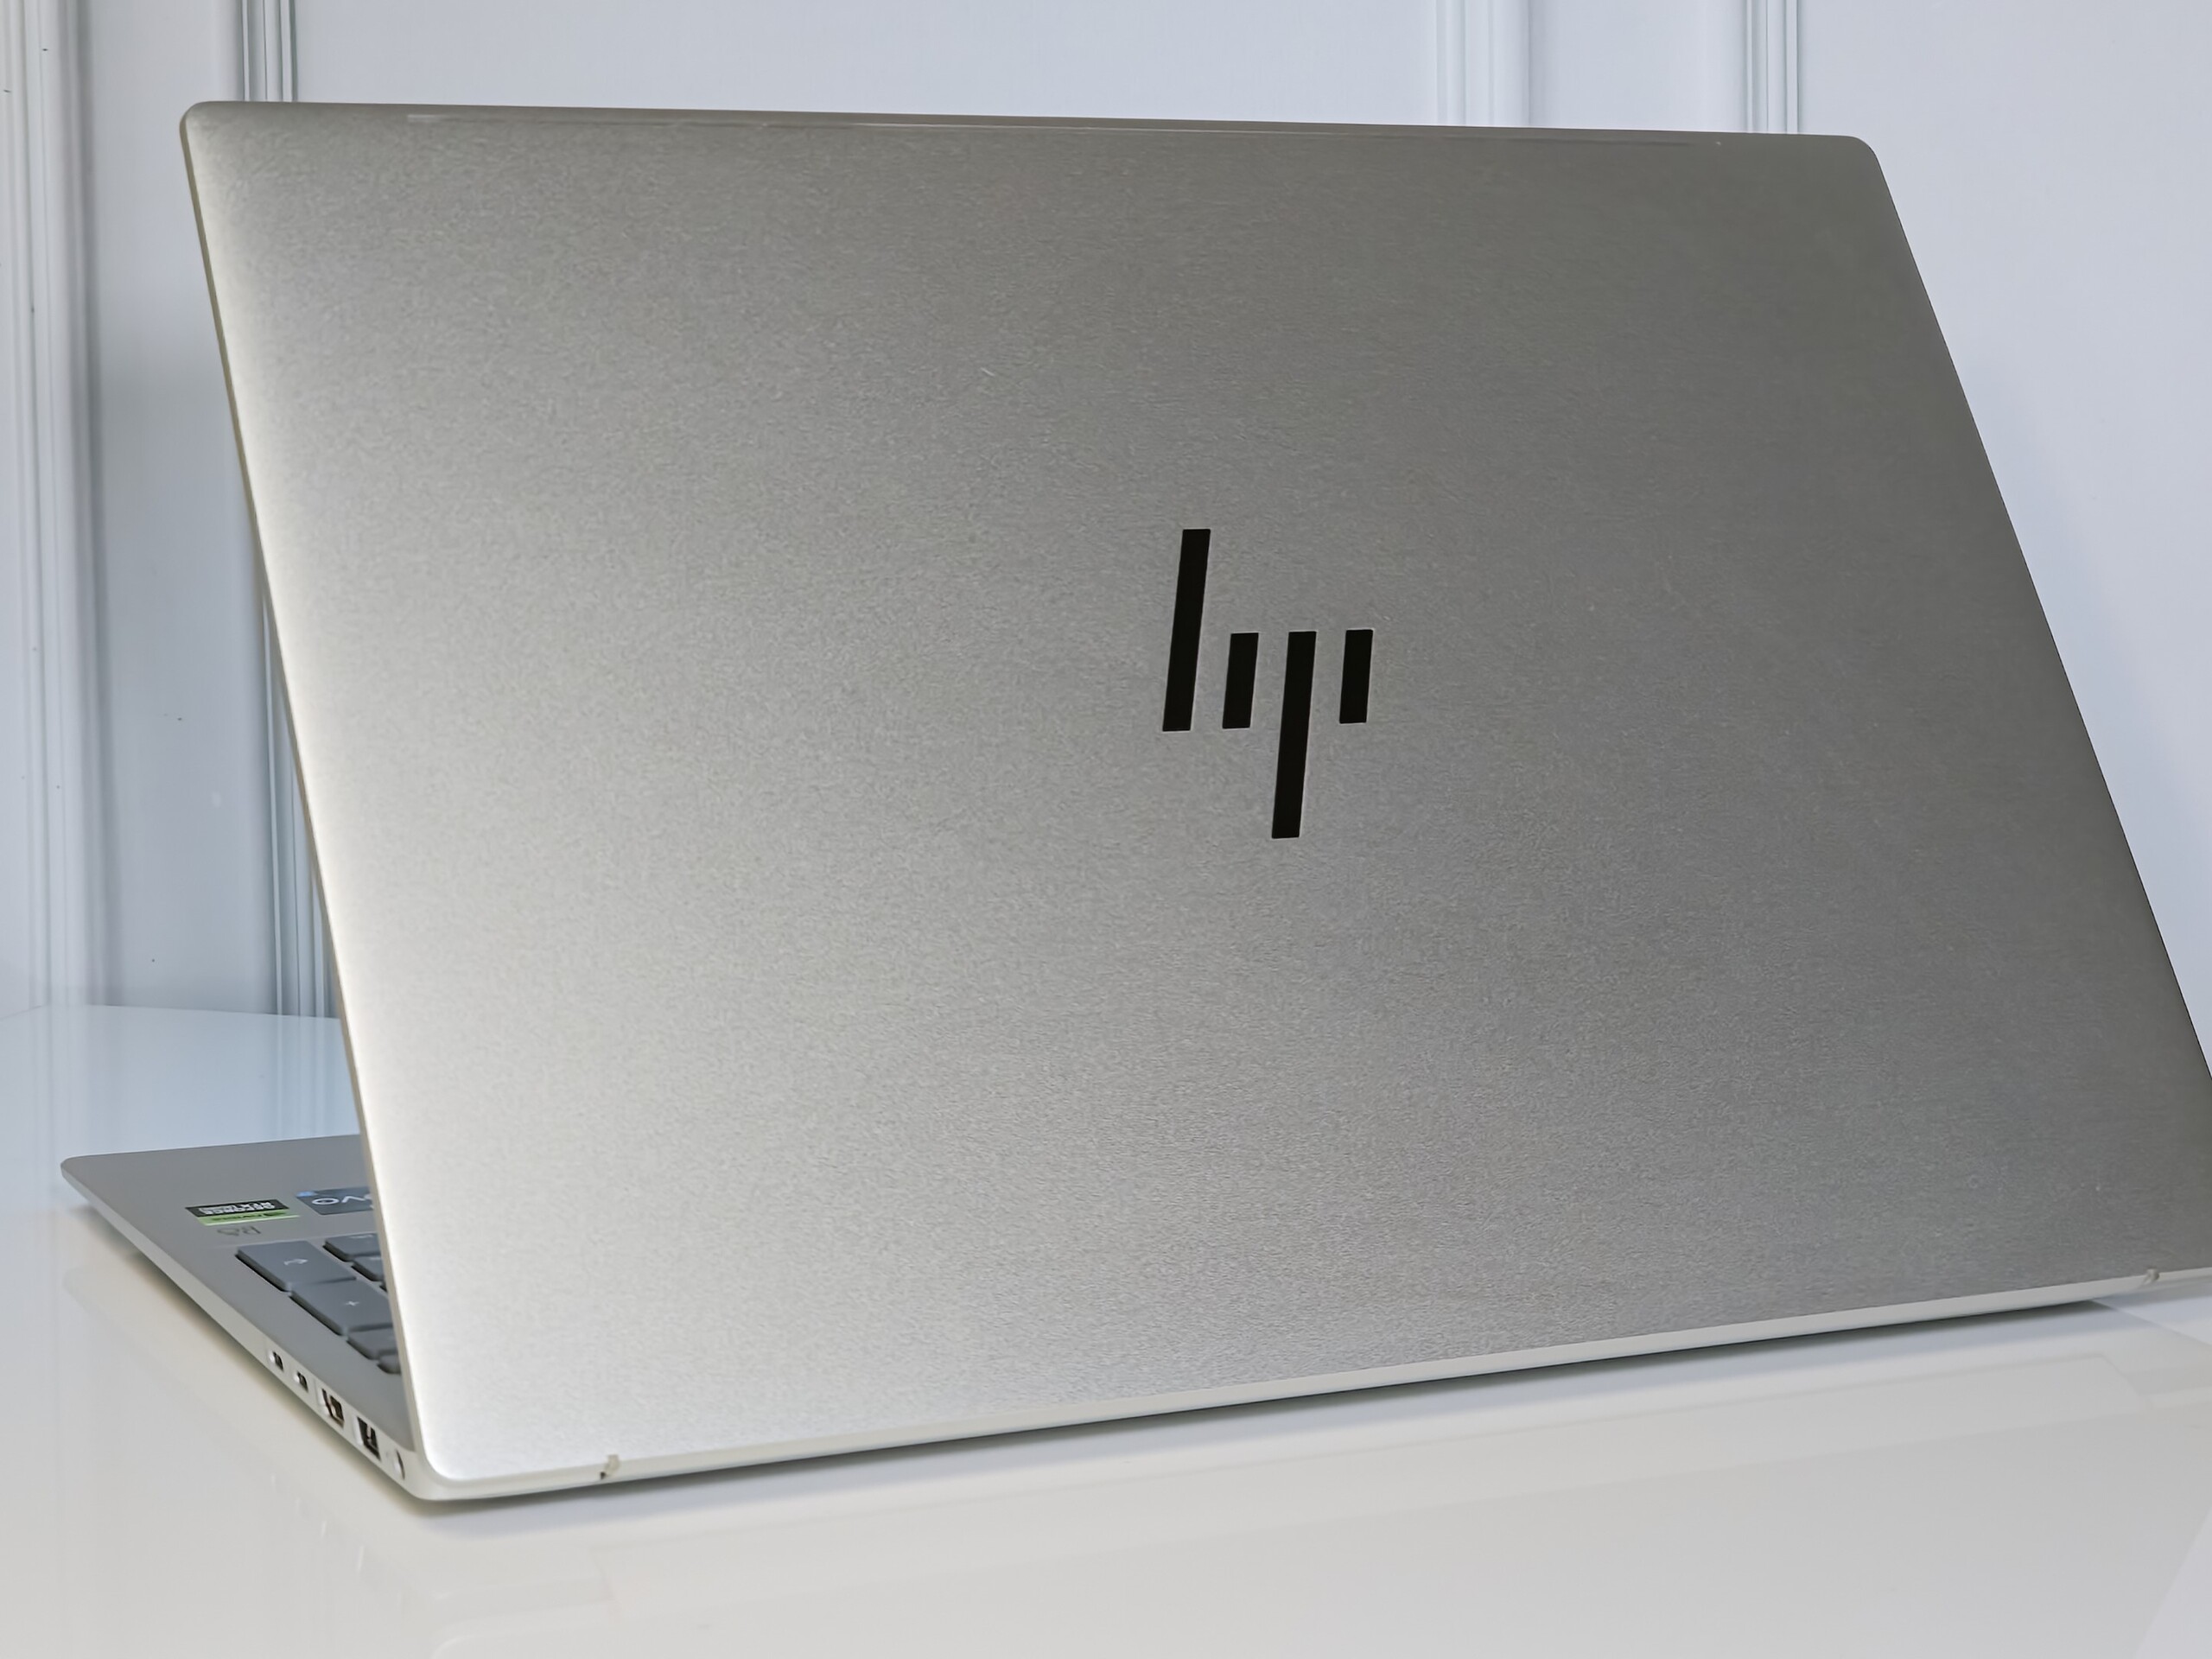
Pavilion Plus 14'e benzer şekilde, Pavilion Plus 16 da A, C ve D kapakları için Doğal Gümüş metalik bir yapıya sahipken, kapak alüminyumdan yapılmıştır.
Genel yapı kalitesi şikayet için çok az yer bırakıyor. Kapakta veya klavye bölümünde herhangi bir esneme fark etmedik.
HP %89,74'lük bir ekran-gövde oranının reklamını yapıyor, ancak ölçülen değer %83'e geliyor. 1,9 kg ağırlığındaki dizüstü bilgisayar, modadaki diğer 16 inç multimedya dizüstü bilgisayarlara benzer bir ağırlığa sahip.
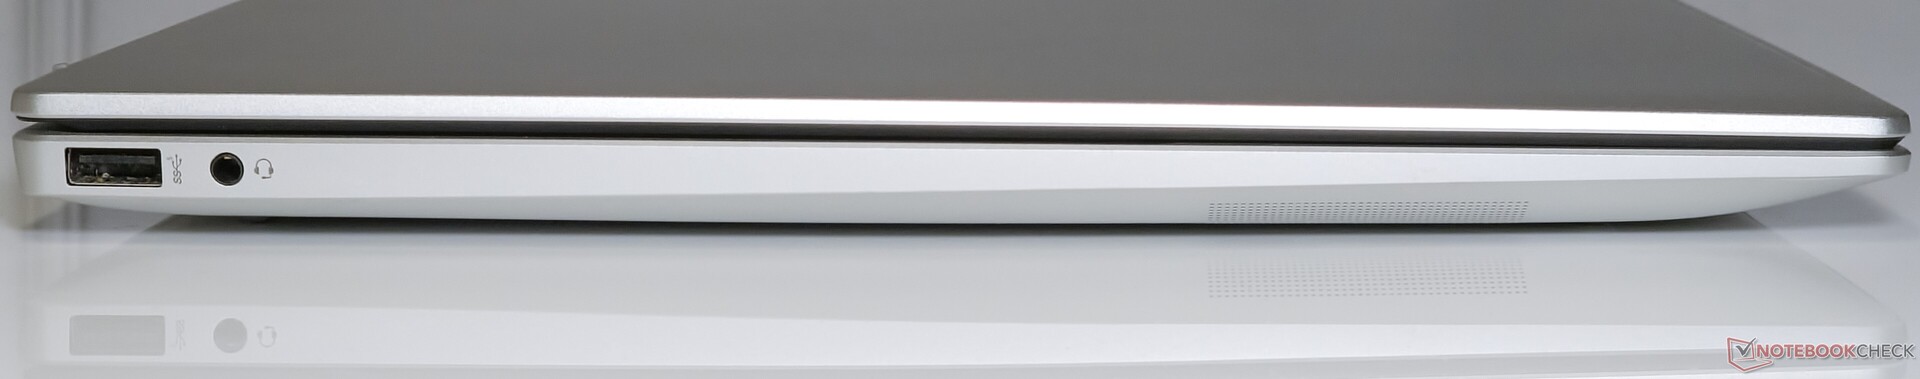
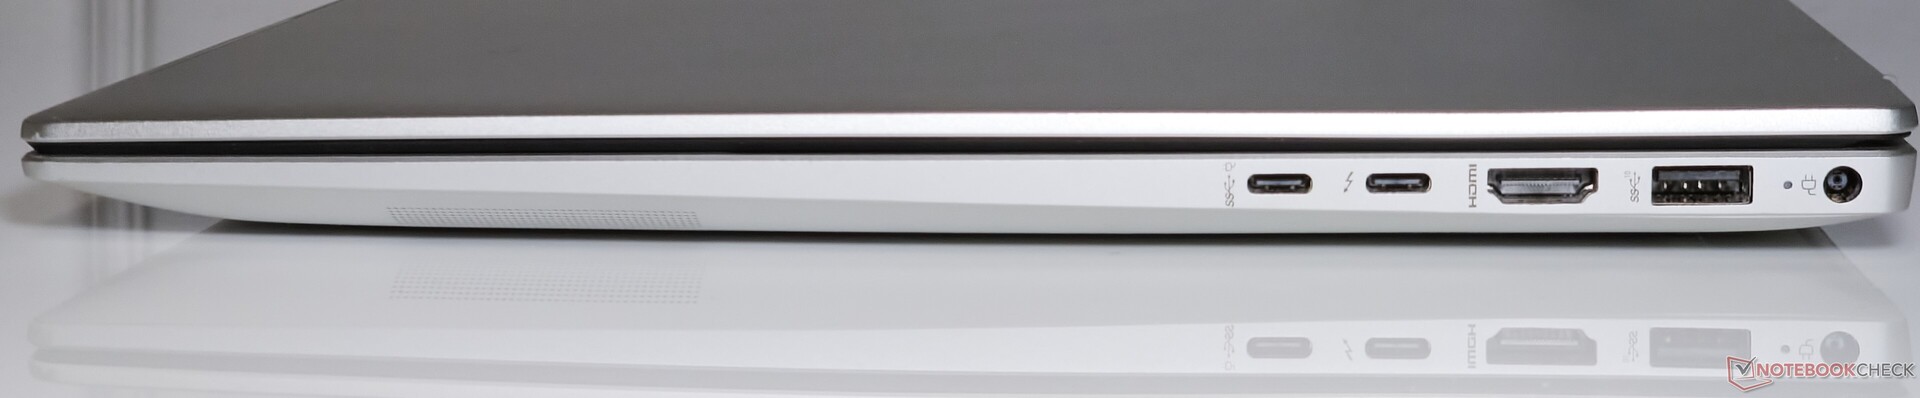
Bağlanabilirlik: Tutarlı WLAN çıkışı
Pavilion Plus 16, Thunderbolt 4 dahil olmak üzere USB Tip-A ve USB Tip-C bağlantı noktalarını içeren iyi bir bağlantı noktası seçimi sunar.
Bağlantı noktası yerleşimi iyi ve bitişik çevre birimi bağlantısını engellemiyor, ancak Type-C bağlantı noktalarından biri daha eşit bir dağılım için sol tarafta olabilirdi.
İletişim
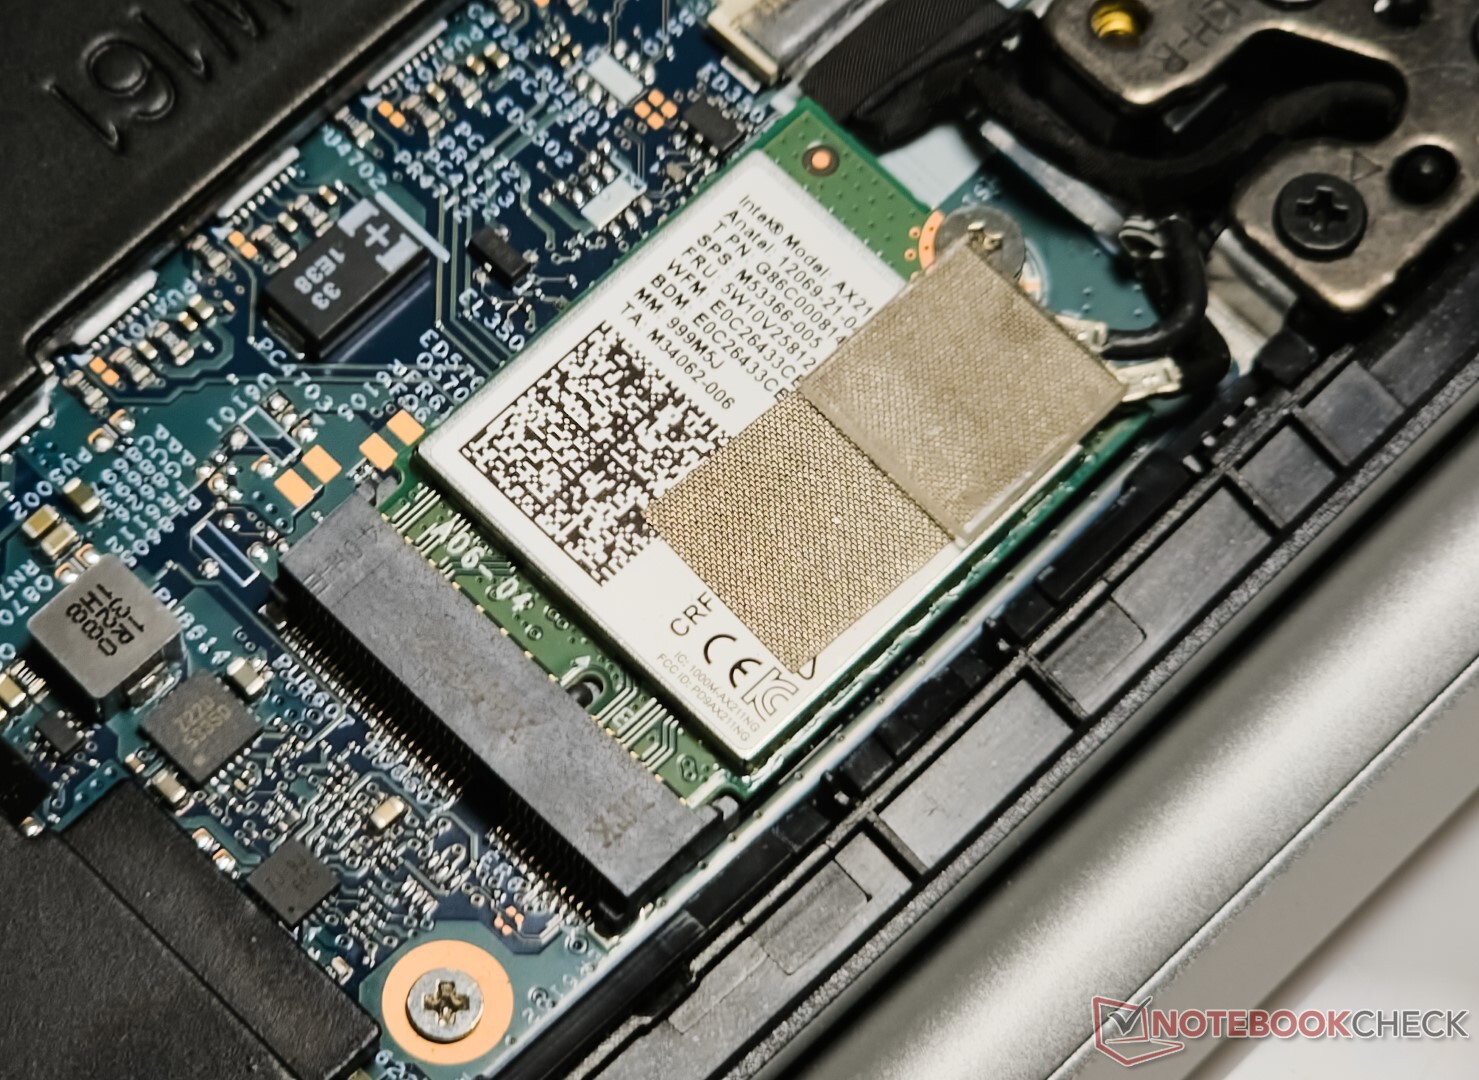
Pavilion Plus 16'nın iPerf3 performansı 5 GHz bandında gözlemlediğimizden biraz daha yavaş Asus VivoBook Pro 16 aynı Intel Wi-Fi 6E AX211 WLAN kartı ile.
Pavilion, 6 GHz'de VivoBook Pro 16'ya karşı bu eksikliği telafi ediyor ancak çok fazla değil.
iPerf3'ün hem 5 GHz hem de 6 GHz bantlarındaki performansı, 5 GHz ve 6 GHz bantlarında gördüğümüzün aksine herhangi bir aksaklık olmadan oldukça tutarlıdır Lenovo Slim Pro 7 mediaTek Wi-Fi 6E MT7922 çip ile.
| Networking / iperf3 transmit AXE11000 | |
| Asus VivoBook 14X K3405 | |
| HP Pavilion Plus 16-ab0456tx | |
| Asus VivoBook Pro 16 K6602VU | |
| Samsung Galaxy Book3 Ultra 16 | |
| Sınıf ortalaması Multimedia (606 - 1978, n=61, son 2 yıl) | |
| Lenovo Slim Pro 7 14ARP8 | |
| Dell Inspiron 16 Plus 7630 | |
| Ortalama Intel Wi-Fi 6E AX211 (64 - 1921, n=276) | |
| Networking / iperf3 receive AXE11000 | |
| Asus VivoBook 14X K3405 | |
| Asus VivoBook Pro 16 K6602VU | |
| HP Pavilion Plus 16-ab0456tx | |
| Samsung Galaxy Book3 Ultra 16 | |
| Lenovo Slim Pro 7 14ARP8 | |
| Ortalama Intel Wi-Fi 6E AX211 (582 - 1890, n=276) | |
| Sınıf ortalaması Multimedia (682 - 1818, n=61, son 2 yıl) | |
| Dell Inspiron 16 Plus 7630 | |
| Networking / iperf3 transmit AXE11000 6GHz | |
| HP Pavilion Plus 16-ab0456tx | |
| Dell Inspiron 16 Plus 7630 | |
| Sınıf ortalaması Multimedia (869 - 2373, n=25, son 2 yıl) | |
| Asus VivoBook 14X K3405 | |
| Asus VivoBook Pro 16 K6602VU | |
| Ortalama Intel Wi-Fi 6E AX211 (385 - 1851, n=226) | |
| Networking / iperf3 receive AXE11000 6GHz | |
| HP Pavilion Plus 16-ab0456tx | |
| Sınıf ortalaması Multimedia (1212 - 2361, n=25, son 2 yıl) | |
| Asus VivoBook Pro 16 K6602VU | |
| Asus VivoBook 14X K3405 | |
| Ortalama Intel Wi-Fi 6E AX211 (700 - 1857, n=226) | |
| Dell Inspiron 16 Plus 7630 | |
Web kamerası
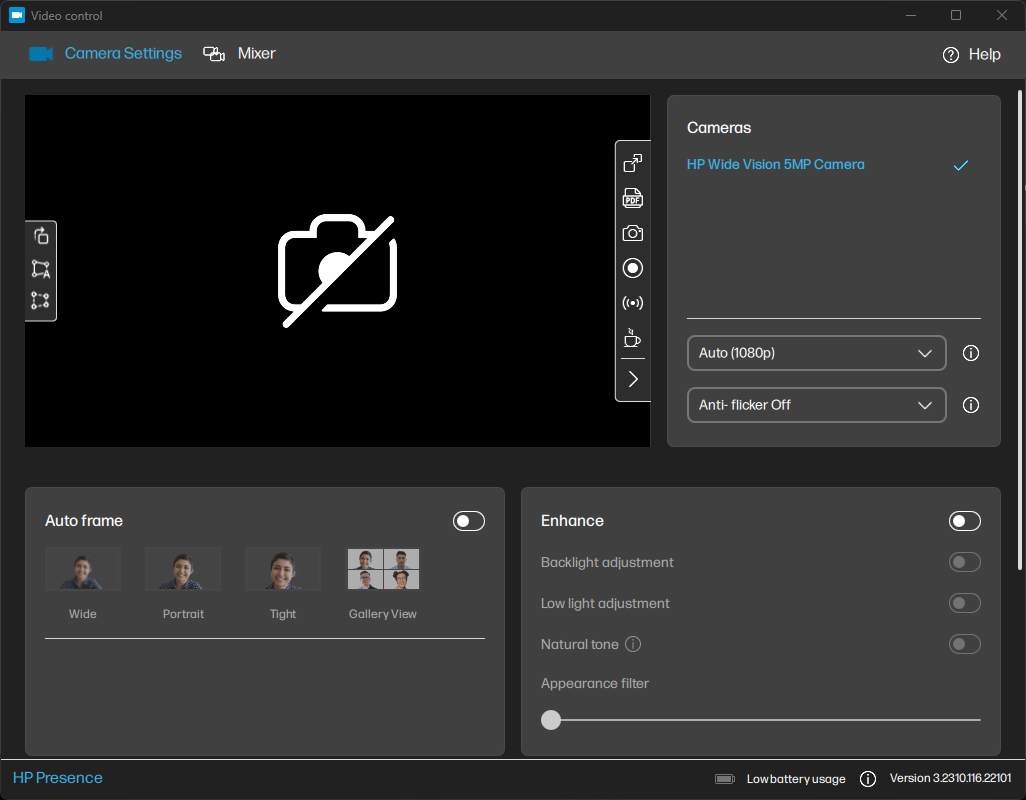
5 MP web kamerası, video konferans için oldukça kullanışlı olan iyi görüntüler üretir. Ayrıntılar bir dizüstü bilgisayar web kamerası için oldukça iyi korunuyor, ancak kamera düşük ışıkta zorlanabiliyor.
HP, nesnenin etrafındaki ekranı aydınlatan HP Gelişmiş Aydınlatma ve ek çerçeveleme ve görüntü ayarlama seçenekleri sunan bir Video Kontrol uygulaması gibi bazı şık yardımcı programlar sağlar.


Güvenlik
HP, Pavilion Plus 16 için Windows Hello uyumlu bir IR kamera ve web kamerası için bir gizlilik deklanşörü sağlıyor. IR kamera, cihazla geçirdiğimiz süre boyunca oldukça hızlı bir performans sergiledi.
Ayrıca, Windows 11'in güvenlik gereksinimlerini karşılamak için bir TPM 2.0 modülü mevcut.
Aksesuarlar ve Garanti
Kutuda 135 W güç adaptörü ve olağan evraklar dışında ek bir aksesuar bulunmuyor.
HP, Hindistan'da Pavilion Plus 16 için bir yıllık garanti sunuyor. Alıcılar uygun HP Bakım Paketlerini satın alarak bu garantiyi üç yıla kadar uzatabilirler.
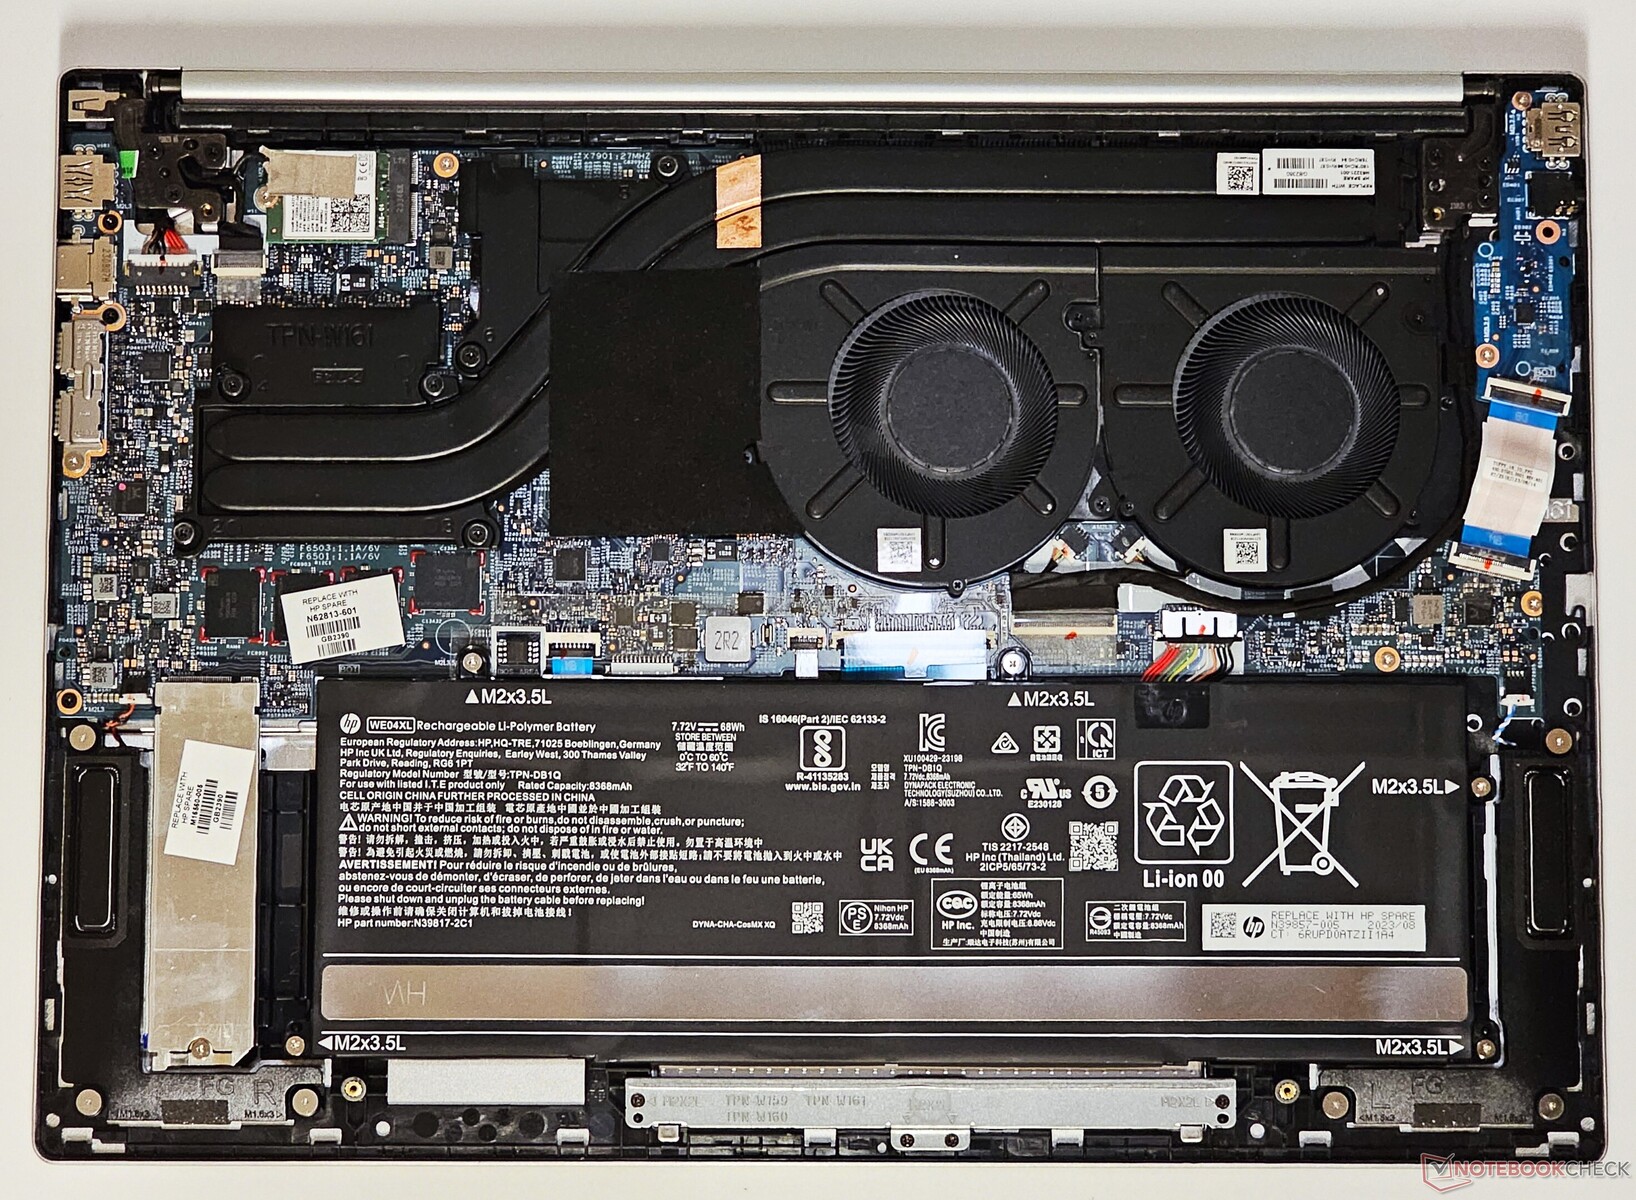
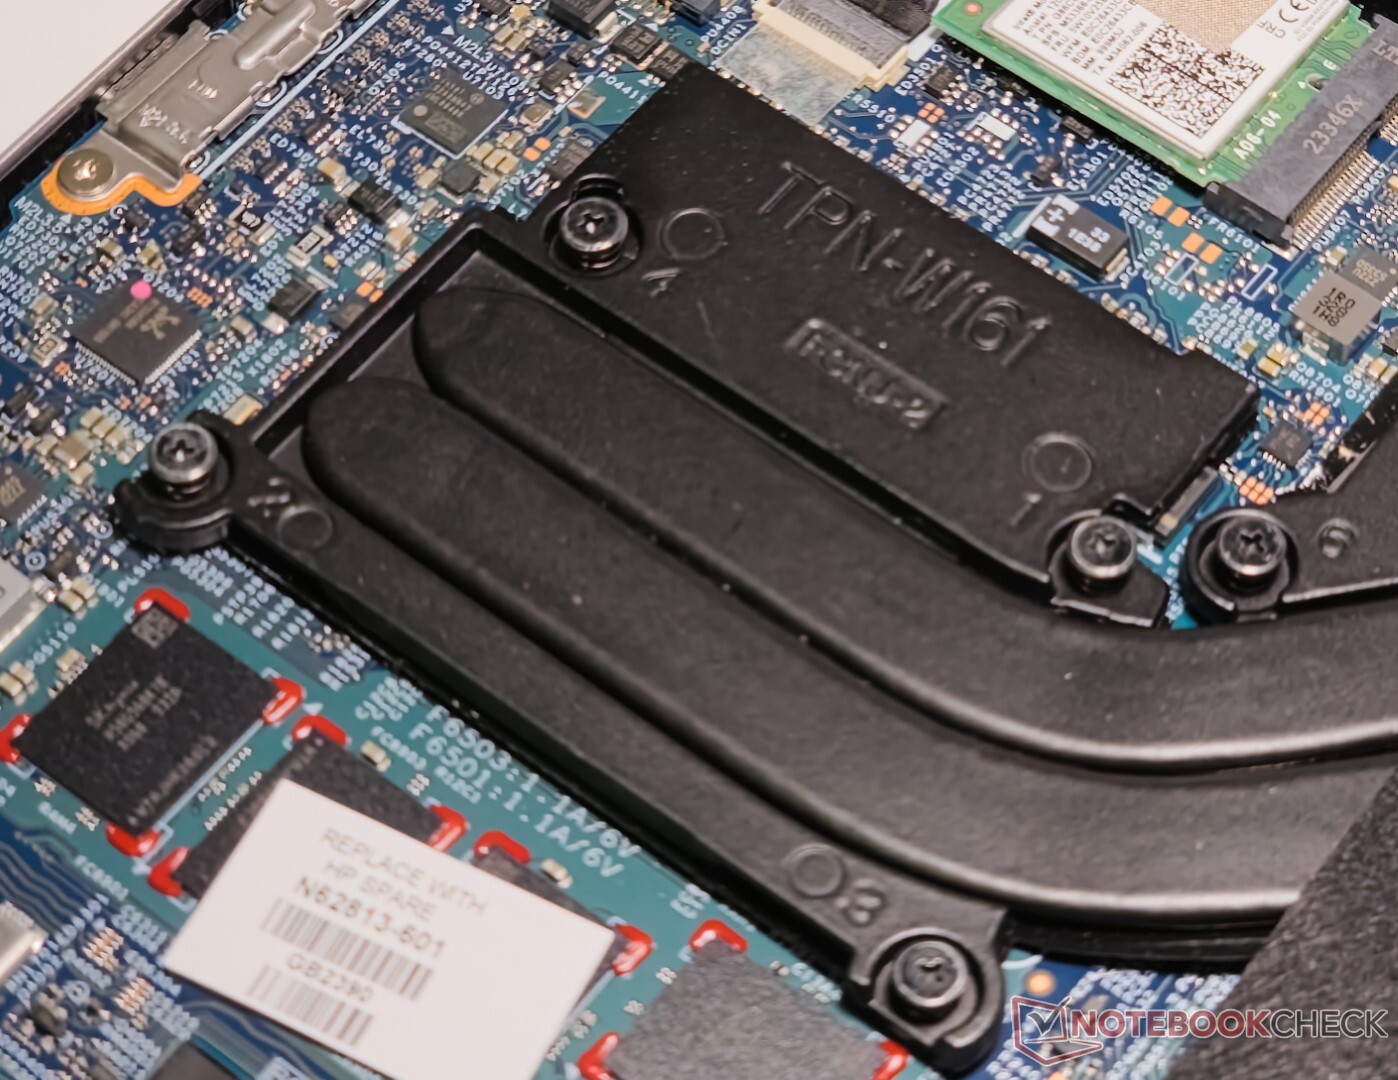
Bakım
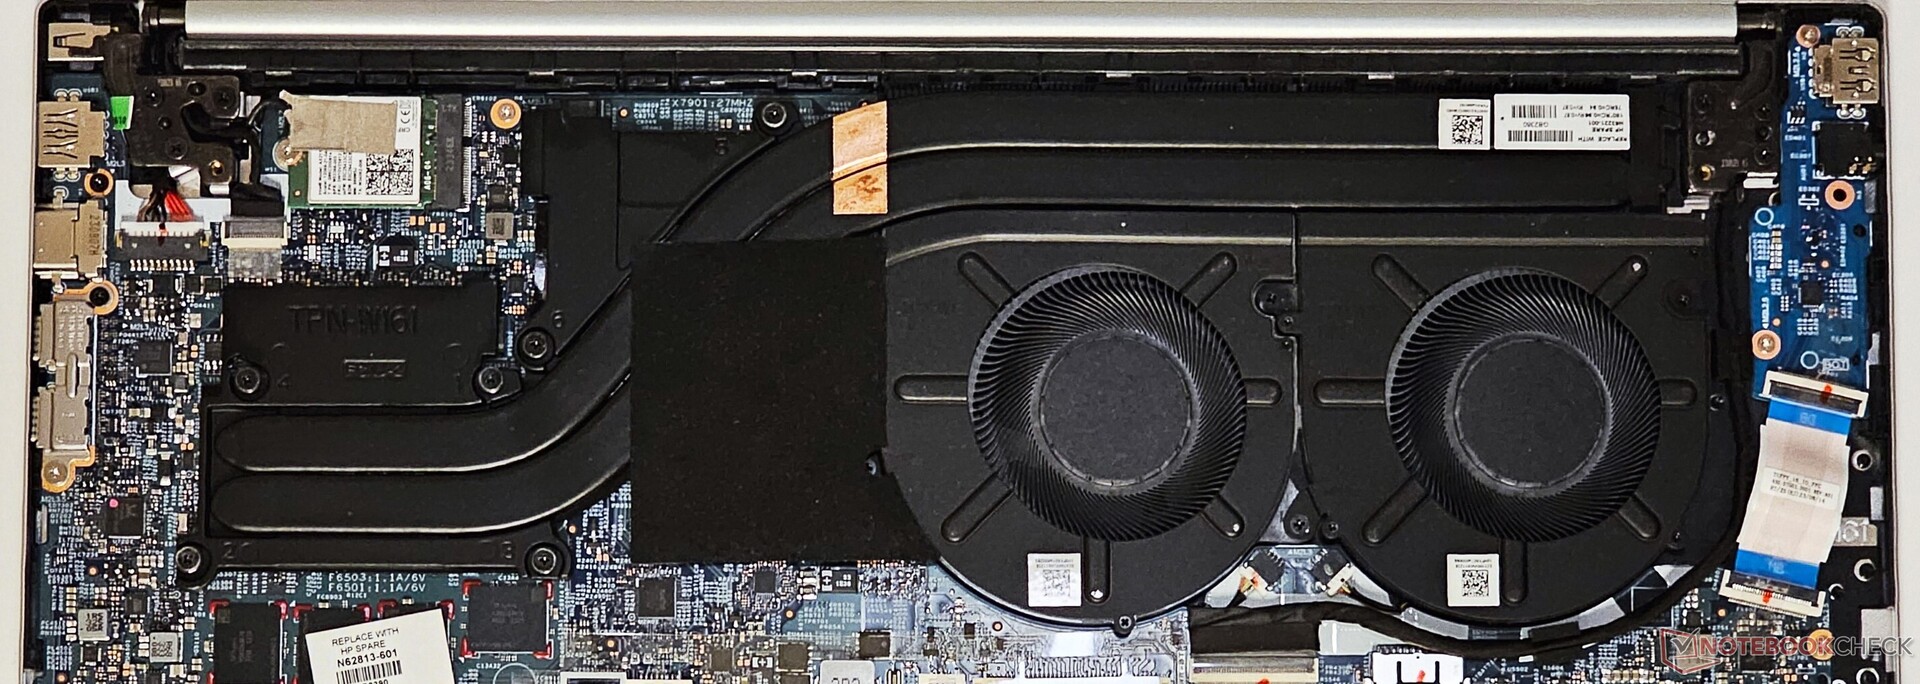
Dört PH0 vidası çıkarıldıktan sonra alt panel açılabilir. Bellek lehimli olarak gelir, ancak WLAN kartı, NVMe SSD ve pil takımı gerektiğinde değiştirilebilir.
Giriş Aygıtları: İyi dokunsallığa sahip tam boyutlu numpad
Klavye
Pavilion Plus 16'nın klavyesi iyi bir yazma deneyimi sunuyor. Gri tuş başlıkları Doğal Gümüş kasa rengiyle iyi bir kontrast sunuyor. Numpad geniş ve Excel'de sayıları hesaplamak için kullanışlı. Ancak Num Lock göstergesi bulunmuyor.
Güç düğmesi Delete tuşunun hemen yanında yer alıyor, bu da ilk kez kullanacakların kafasını karıştırabilir. Üst ve alt ok tuşları da sıkışık hissettiriyor. Üç kademeli beyaz arka ışık, düşük ışıkta okunabilirliğe yardımcı olur.
Dokunmatik yüzey
12,5 cm x 8 cm boyutlarındaki dokunmatik yüzey geniş bir his veriyor ve iyi bir geri bildirimle pürüzsüz bir kayma deneyimi sunuyor. Ancak, hareket mesafesi o kadar derin değil.
Dokunmatik yüzeyin tamamı sol fare düğmesi olarak işlev görür. Dokunmatik yüzeyin ortasına ve tabanına doğru yapılan tıklamalar, üst kısımdakilere göre daha duyarlıdır.
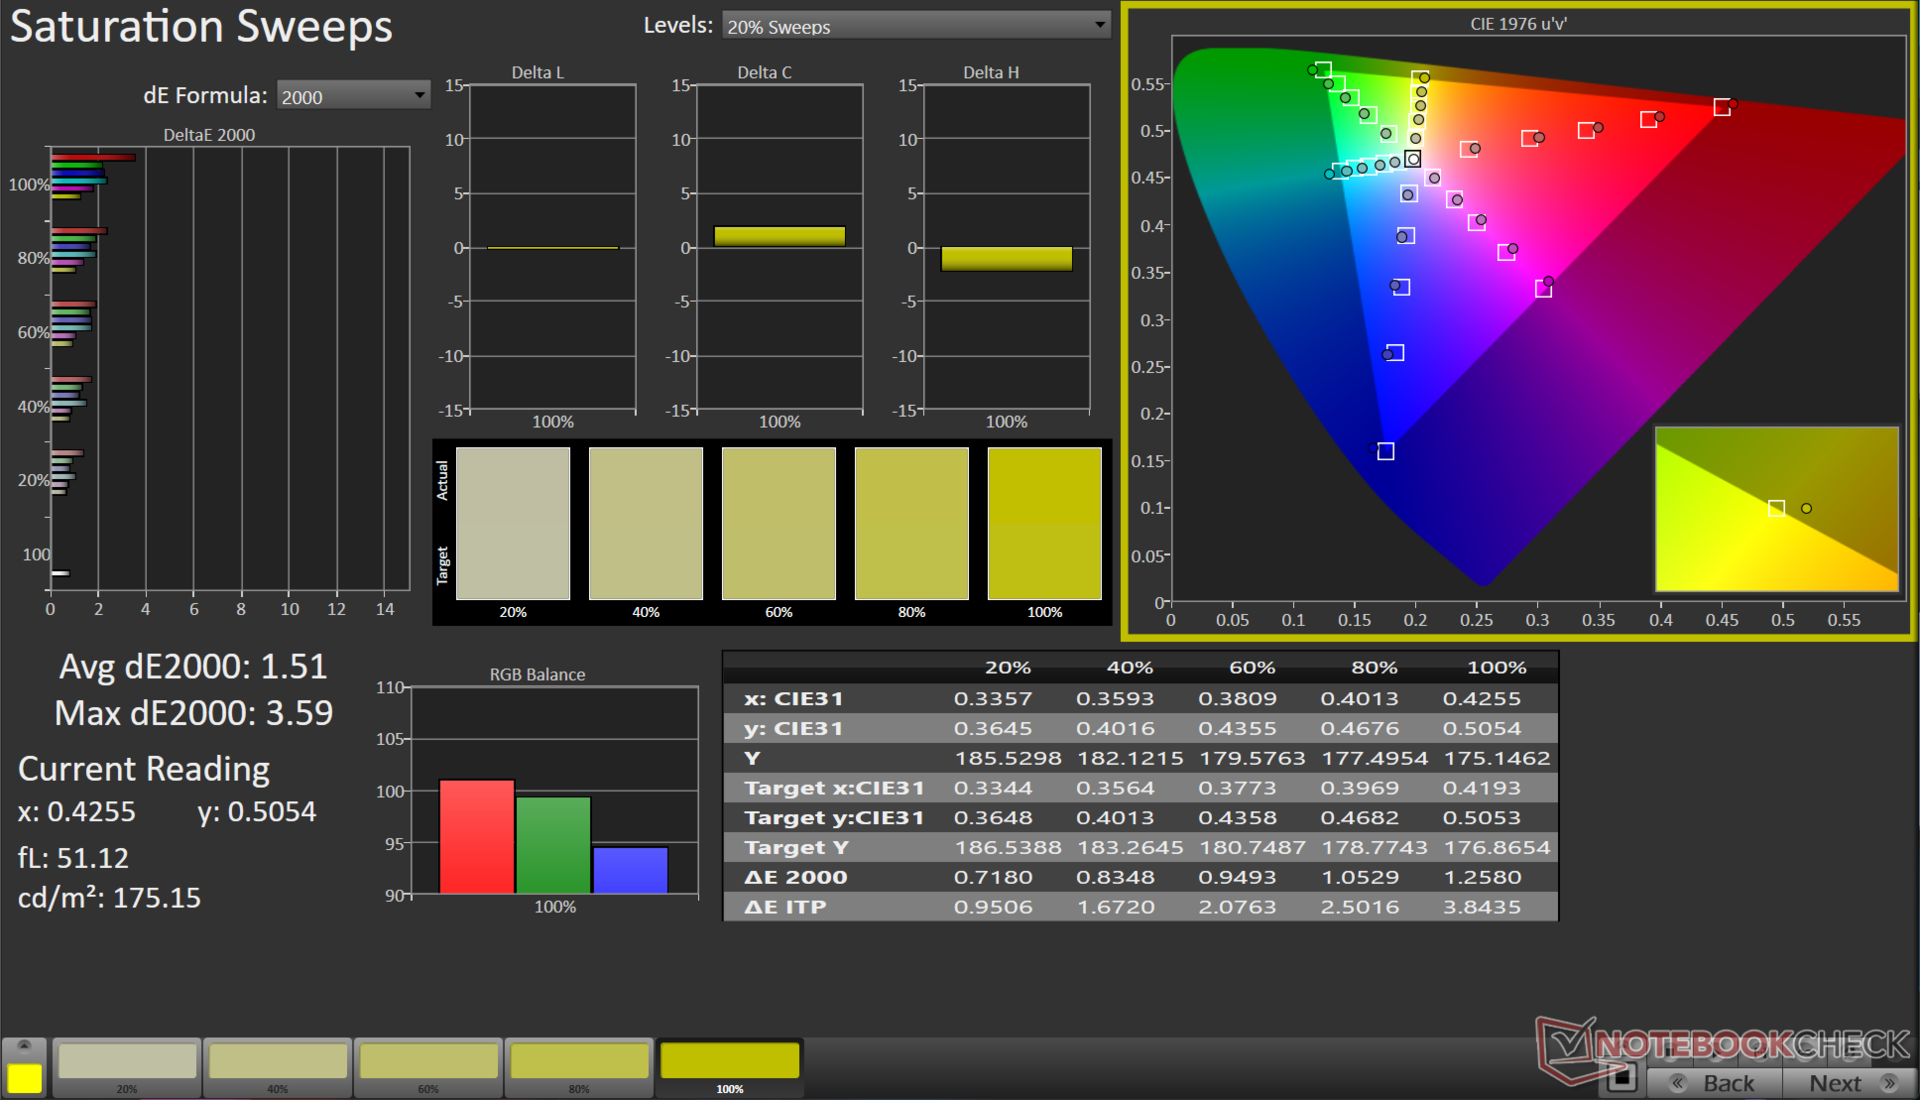
Ekran: 120 Hz WQXGA panel, iyi bir renk profiline sahip ve PWM yok
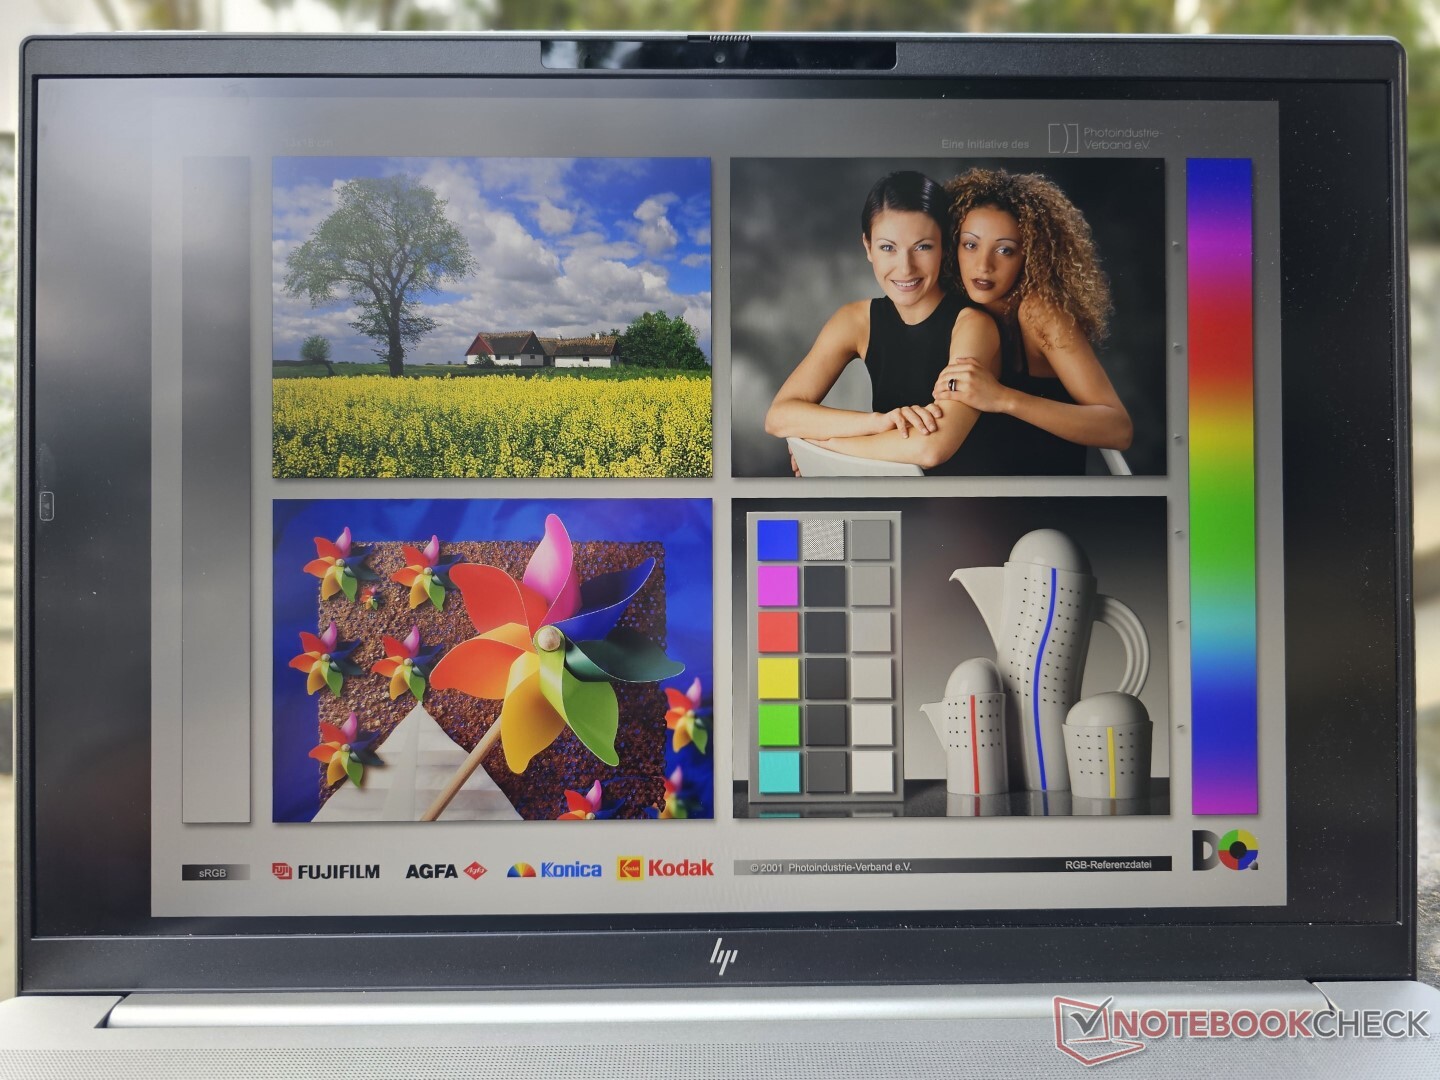
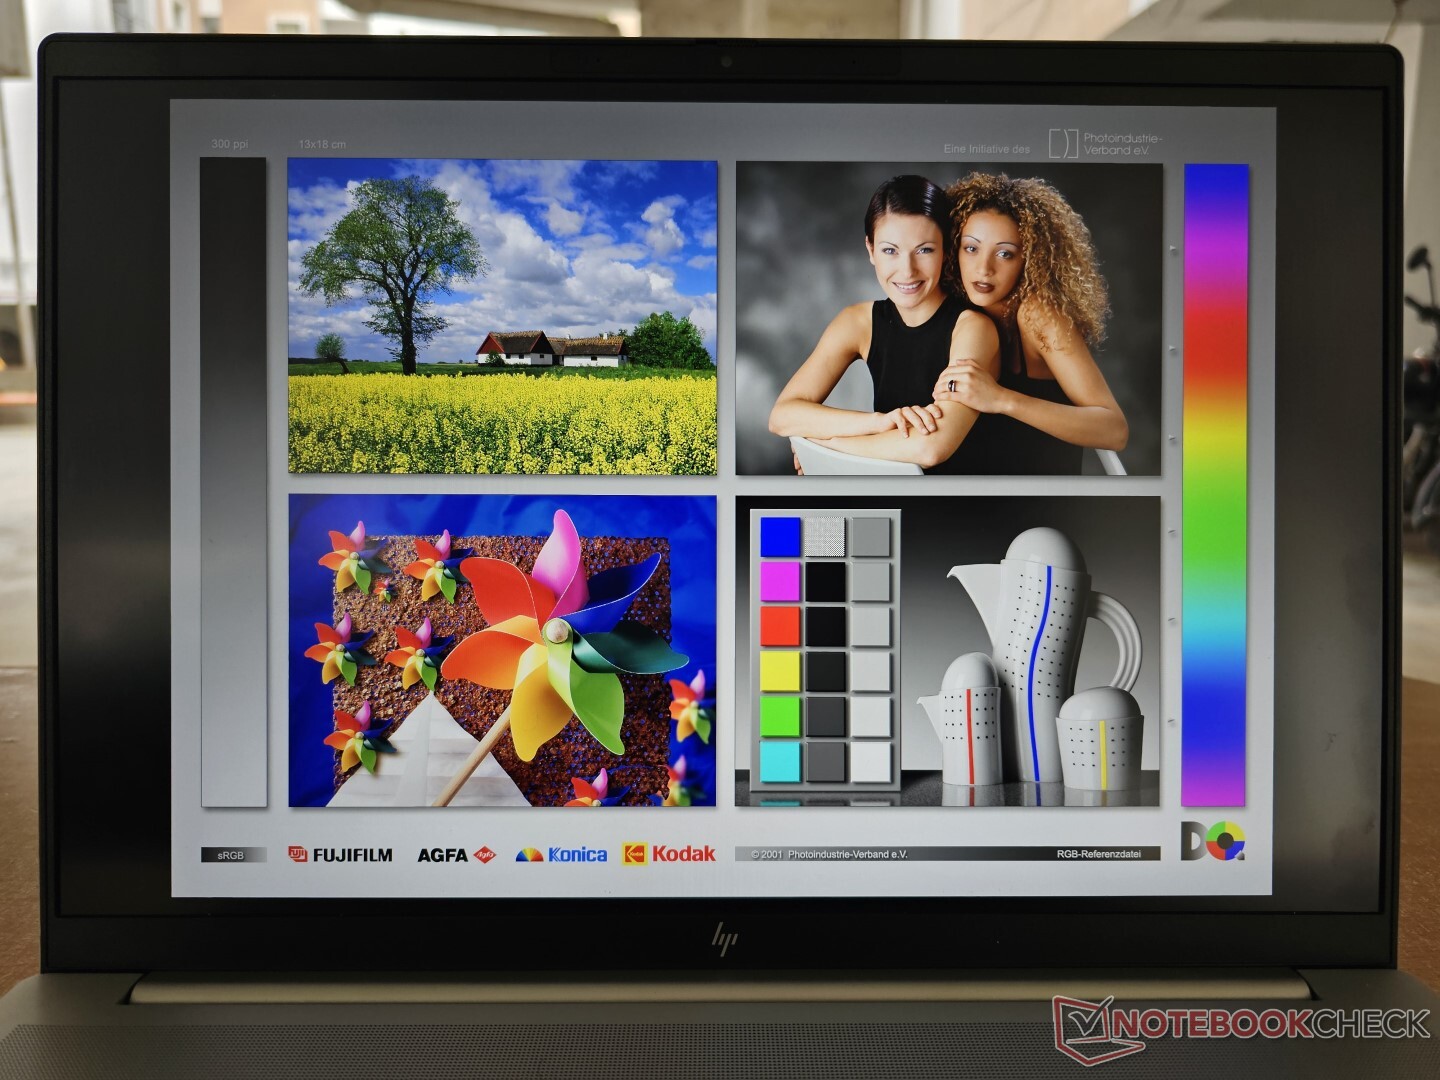
Pavilion Plus 16, 120 Hz yenileme hızına ve 400 nit nominal parlaklığa sahip 16 inç 16:10 2560 x 1600 WQXGA IPS panel ile birlikte geliyor.
Ortalama 394 nit ve iyi bir %90 dağılım ile 415 nit maksimum parlaklık ölçtük. Bir IPS panel olan ekran, arka ışık akmasından etkilenmiyor - bu, uzun pozlama altında alt köşelerde fark edilebilir.
Öznel olarak, Pavilion Plus 16 hem iş hem de eğlence için uygun olması gereken iyi bir görüntüleme deneyimi sunuyor.
| |||||||||||||||||||||||||
Aydınlatma: 90 %
Batarya modunda parlaklık: 401 cd/m²
Kontrast: 1185:1 (Siyah: 0.34 cd/m²)
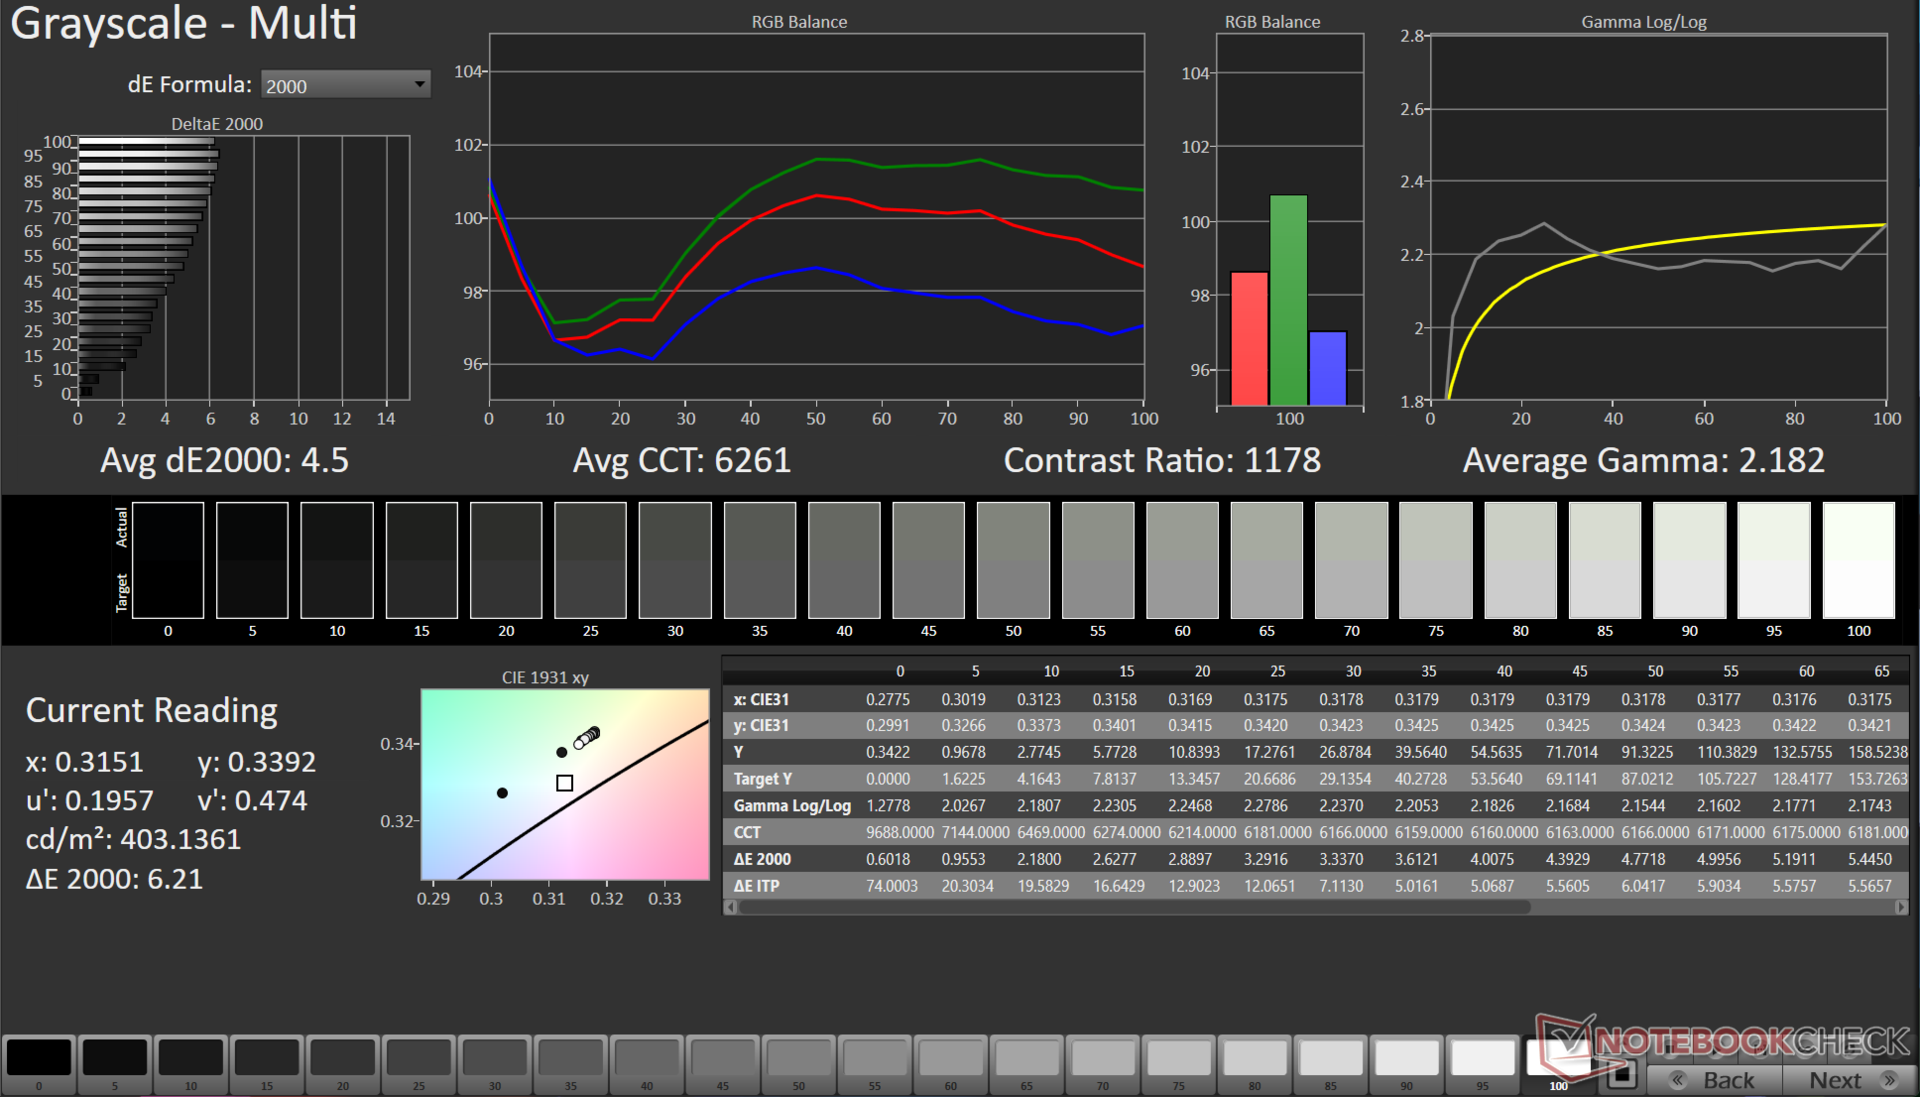
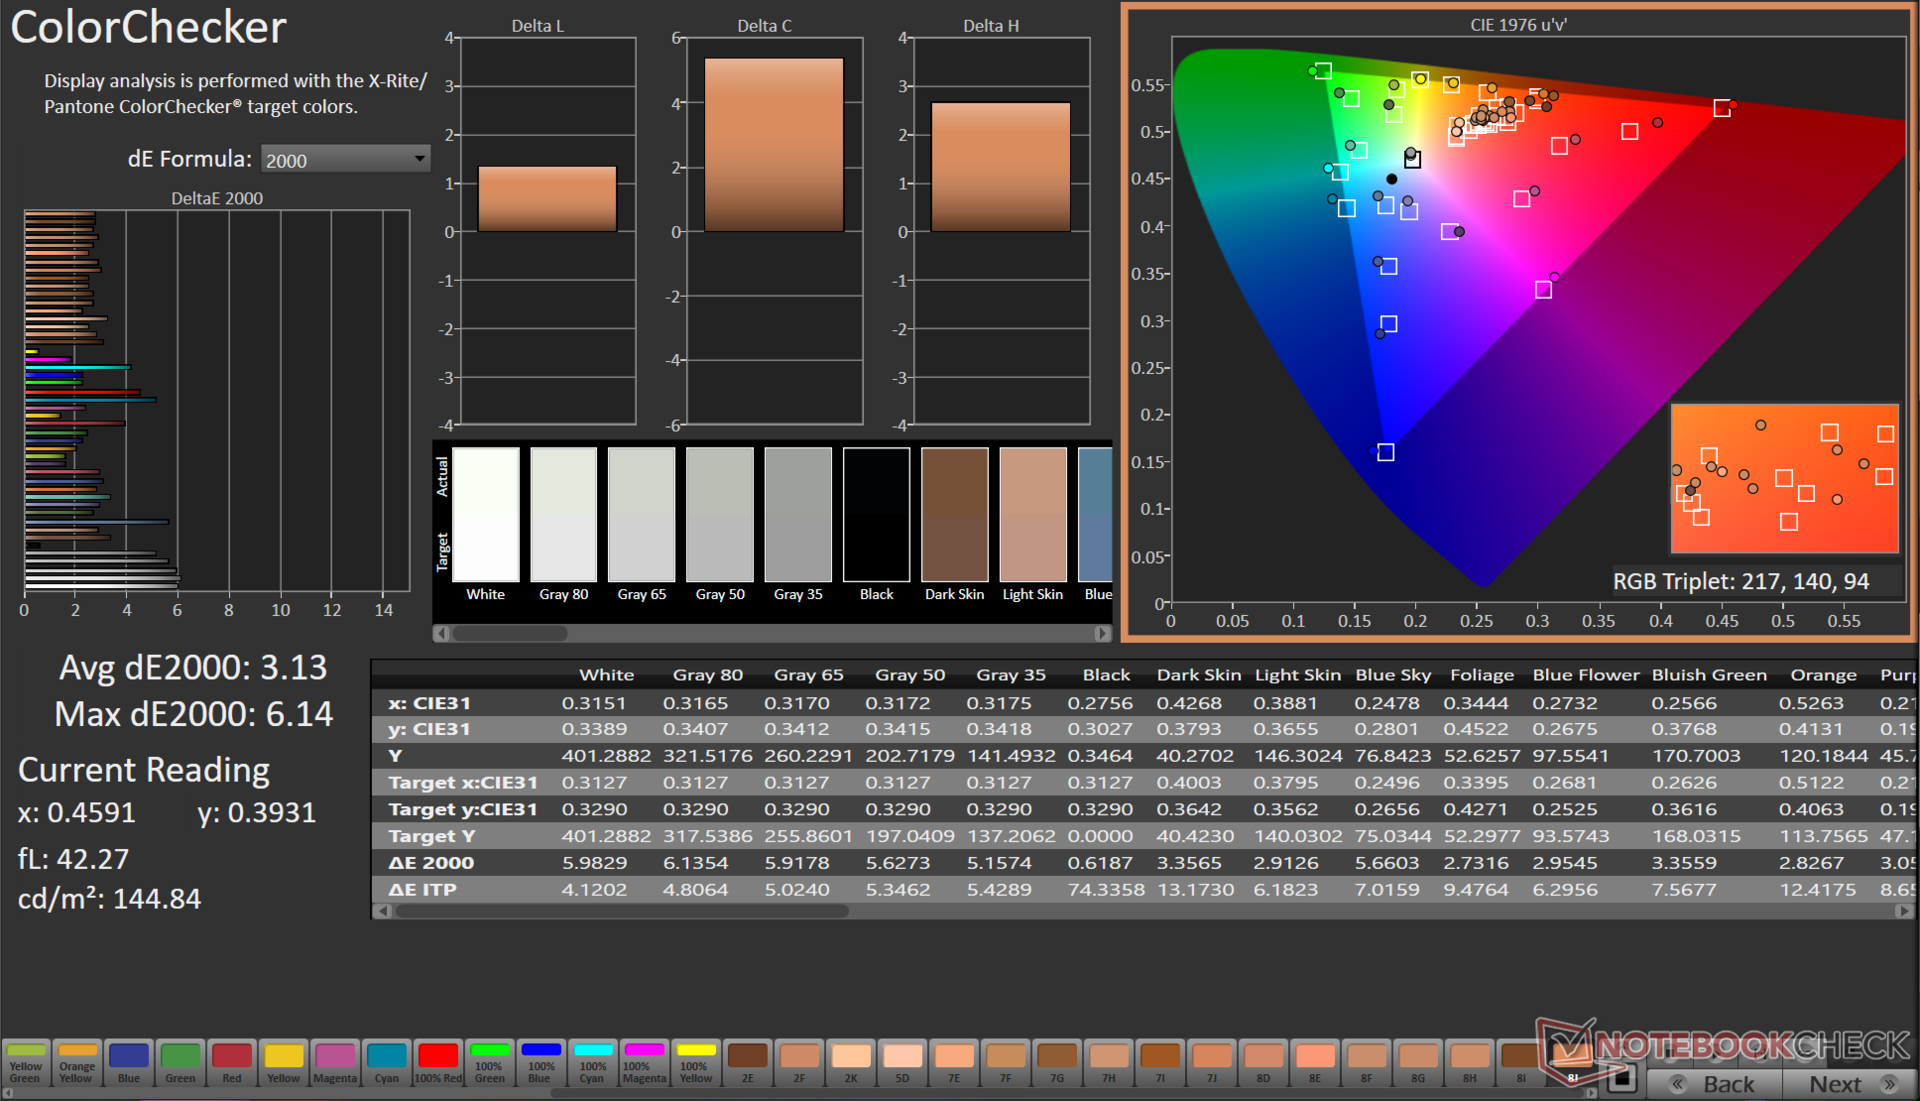
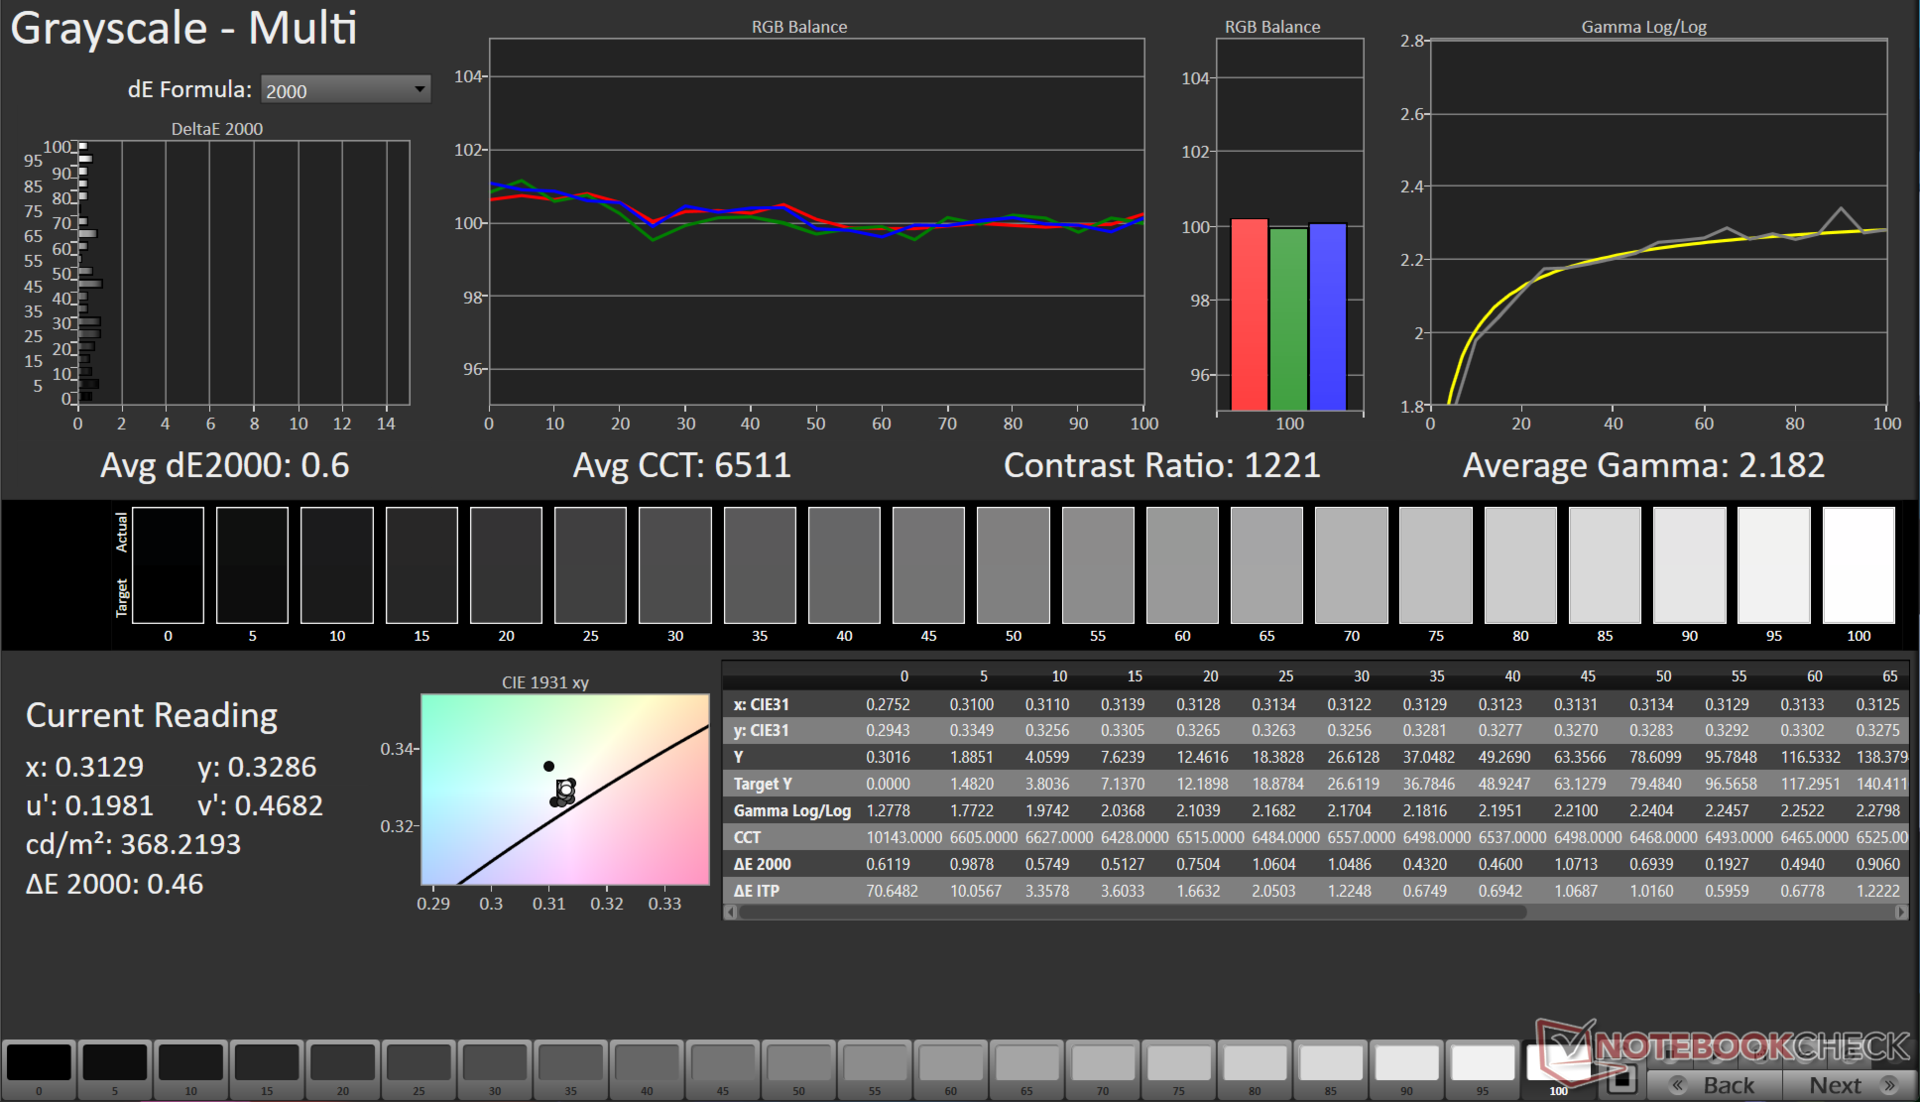
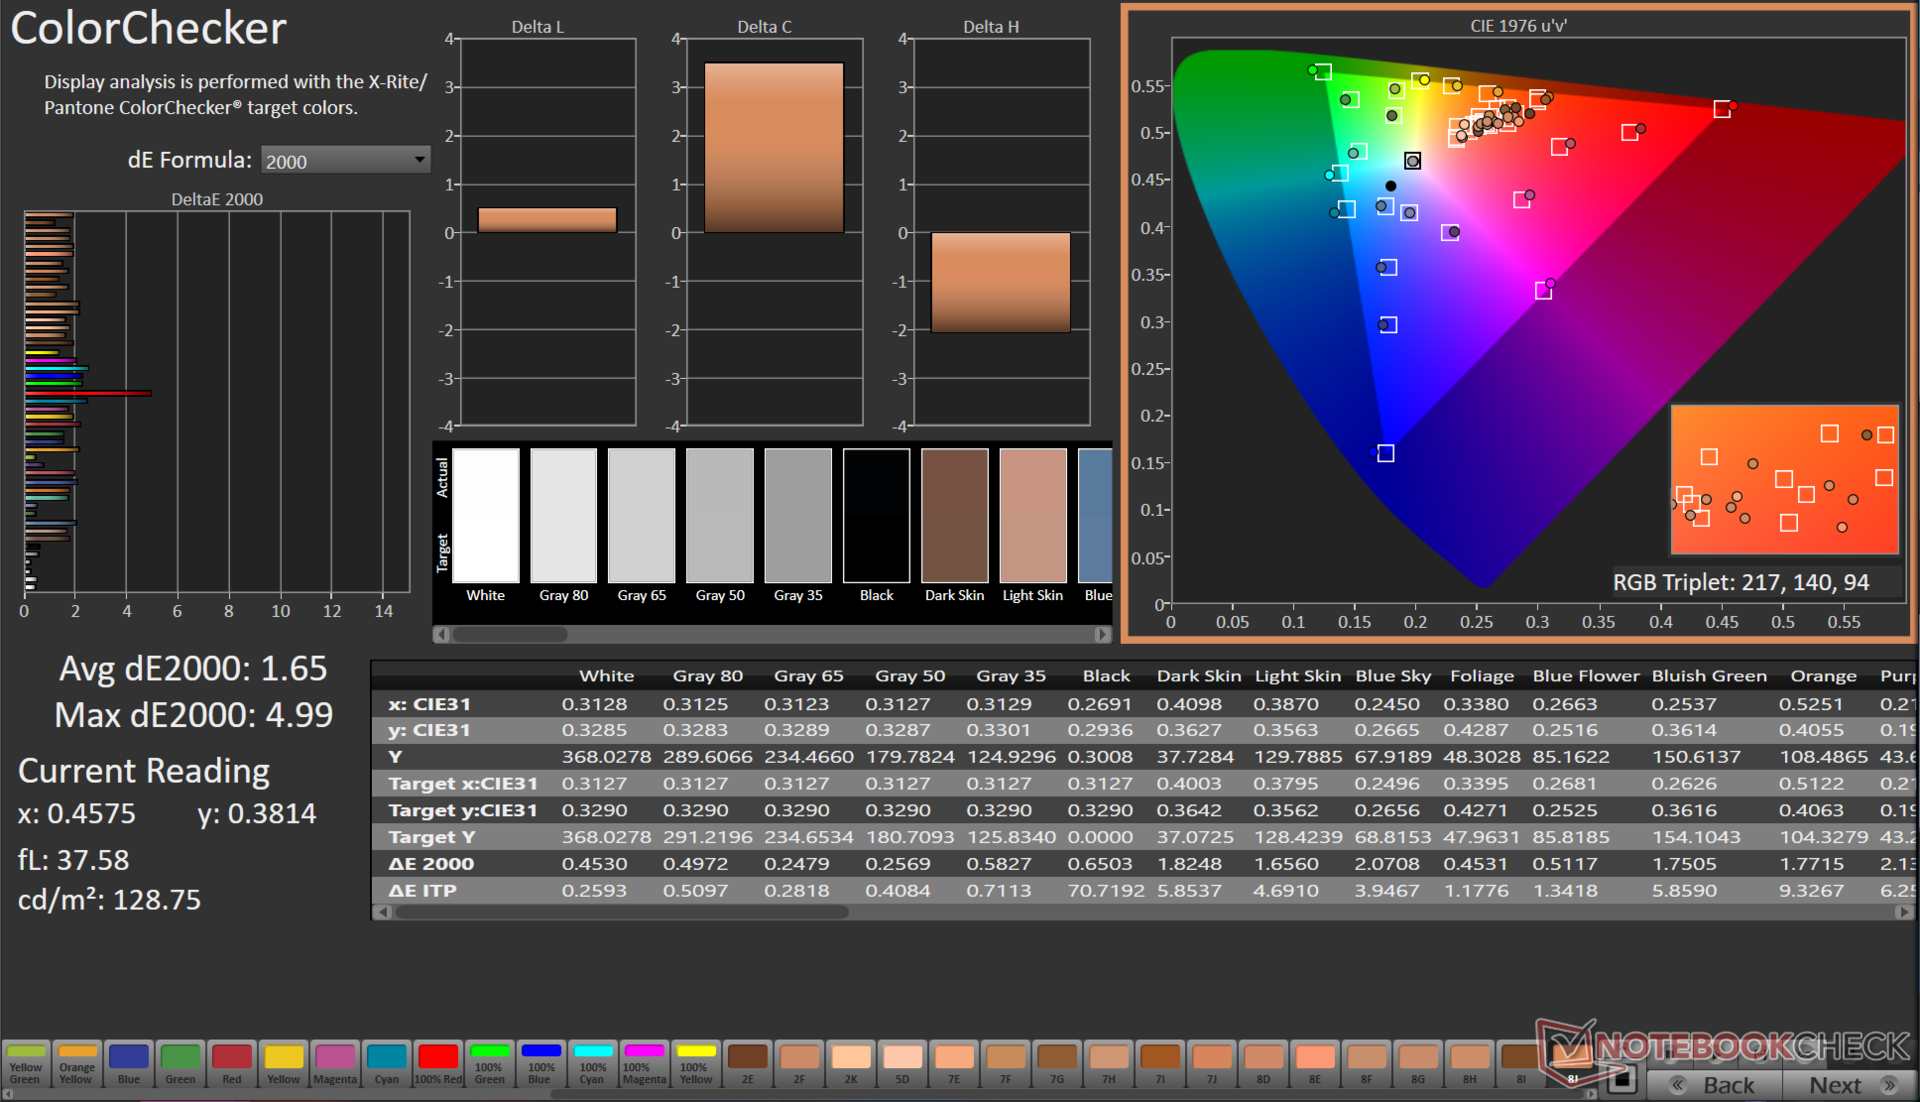
ΔE ColorChecker Calman: 3.13 | ∀{0.5-29.43 Ø4.72}
calibrated: 1.65
ΔE Greyscale Calman: 4.5 | ∀{0.09-98 Ø4.97}
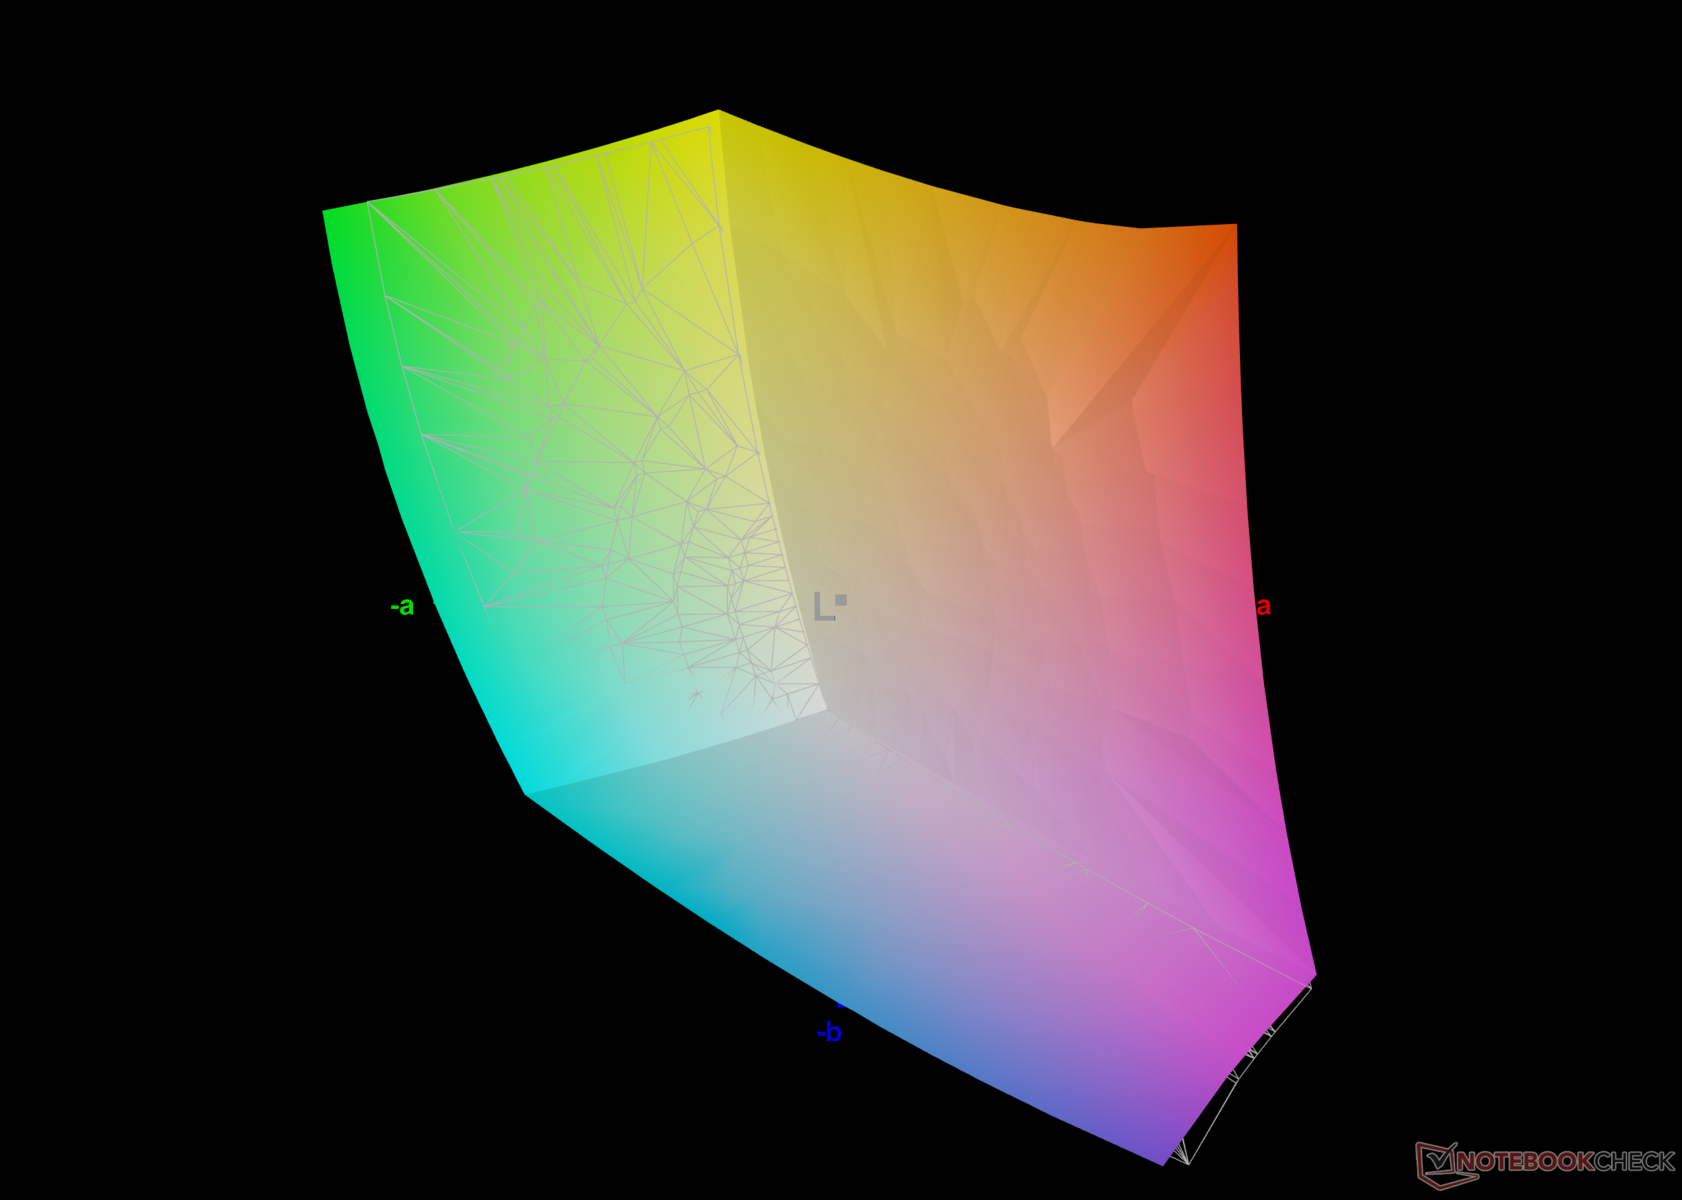
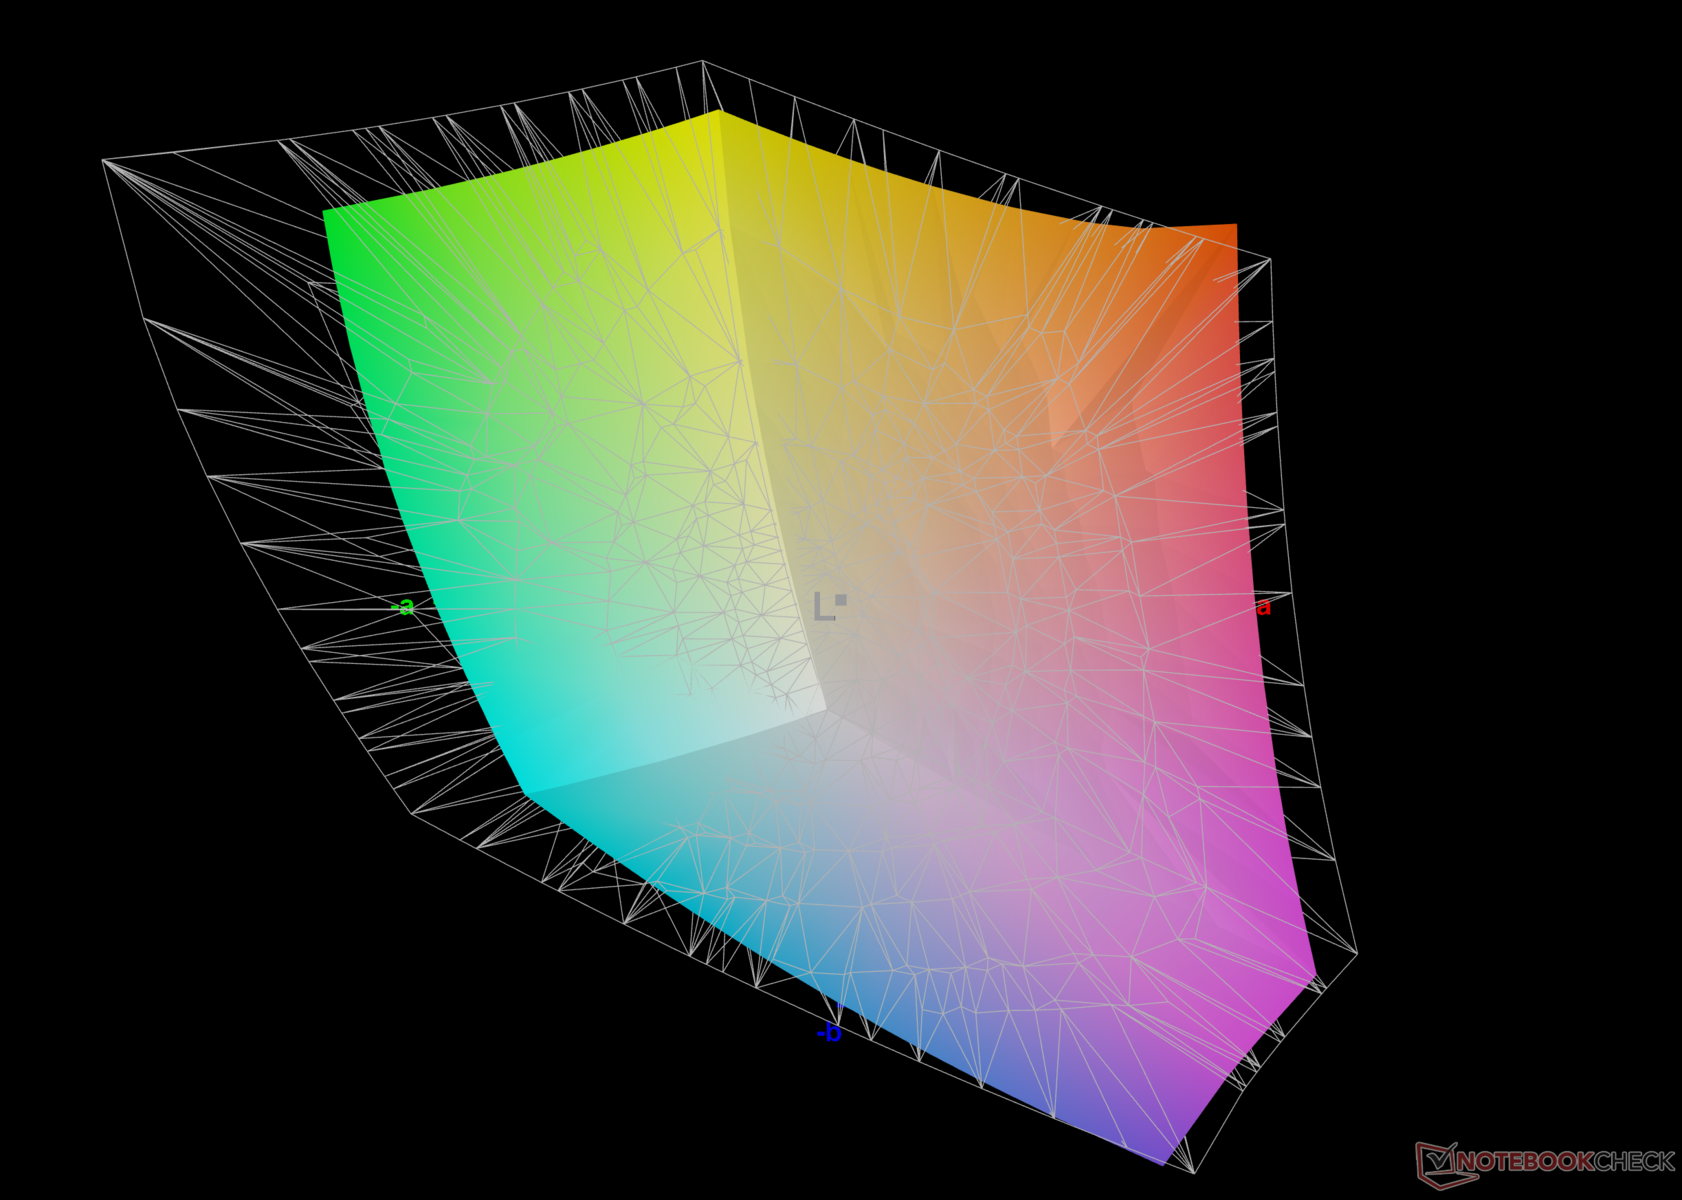
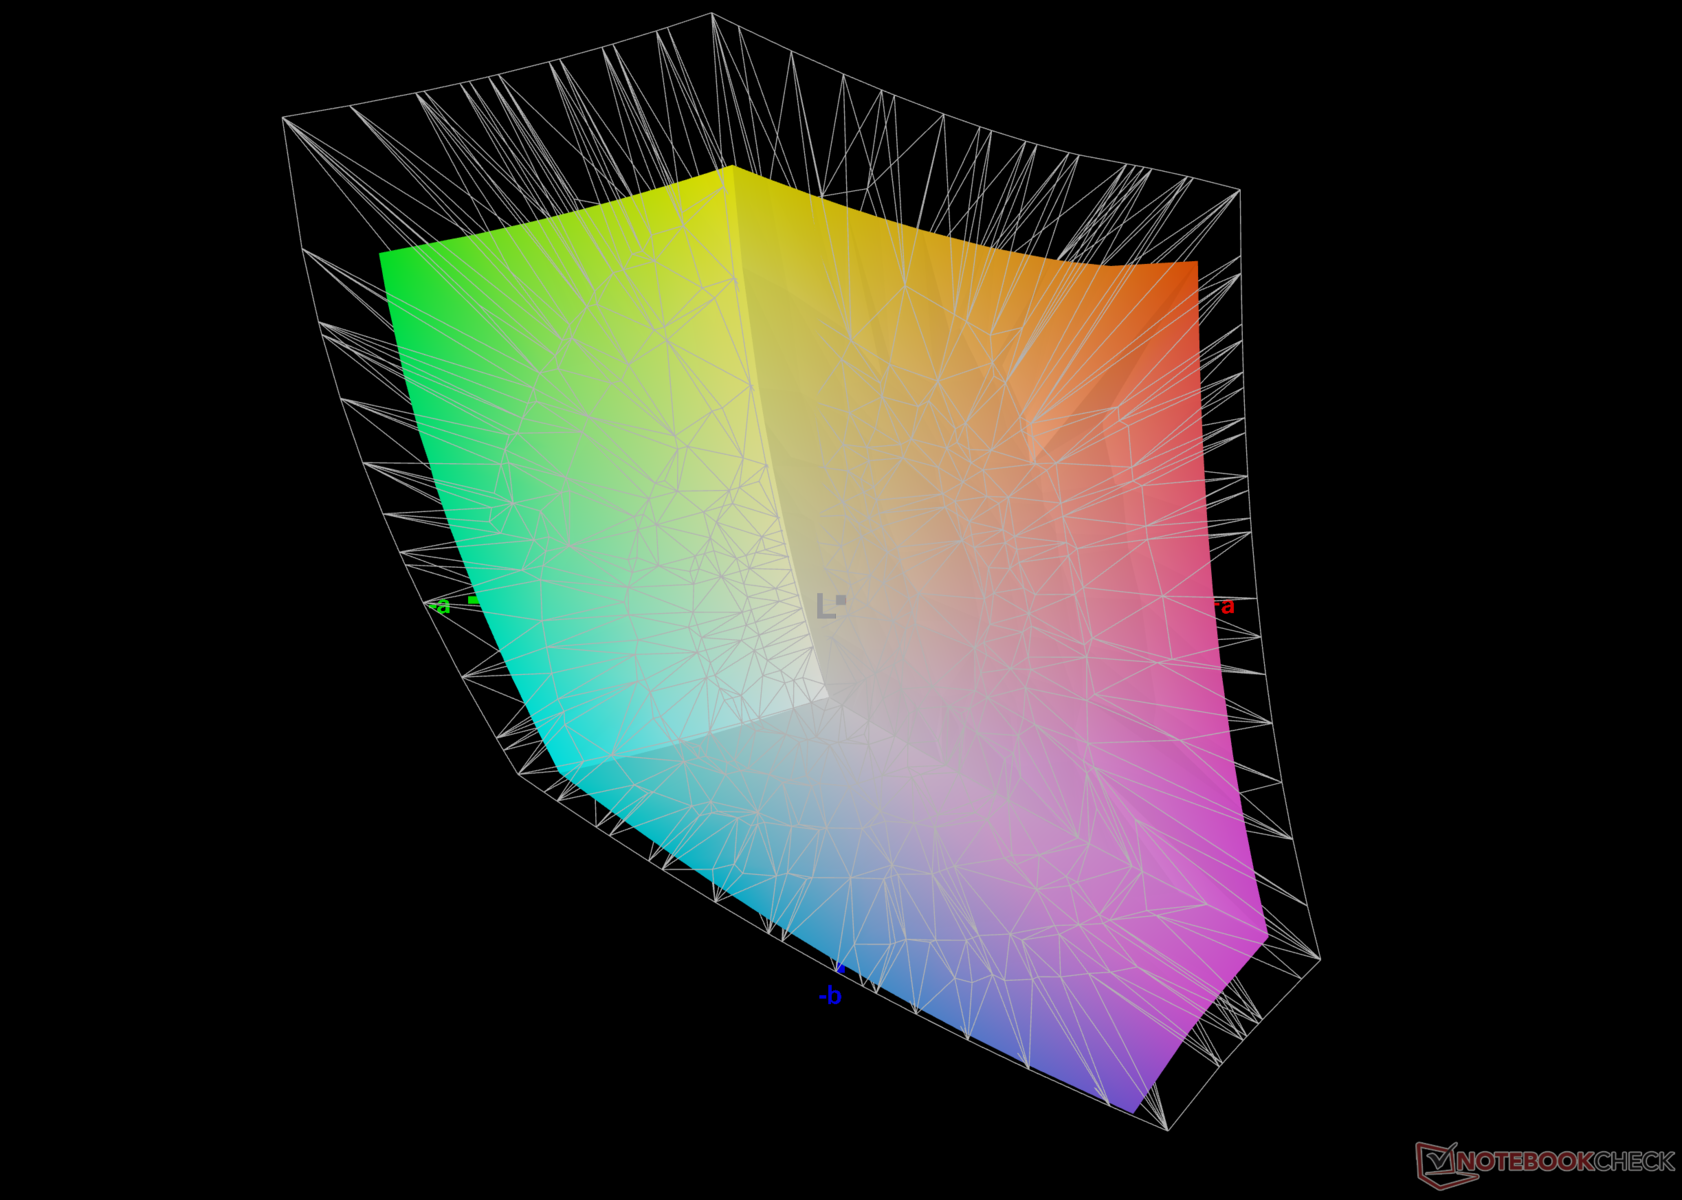
76.5% AdobeRGB 1998 (Argyll 3D)
99% sRGB (Argyll 3D)
74.6% Display P3 (Argyll 3D)
Gamma: 2.18
CCT: 6261 K
| HP Pavilion Plus 16-ab0456tx AU Optronics AUOFDA4, IPS, 2560x1600, 16" | Schenker Vision 14 2023 CSOT T3 MNE007ZA1-3, IPS, 2880x1800, 14" | Dell Inspiron 16 Plus 7630 LG Philips 160WQ2, IPS, 2560x1600, 16" | Asus VivoBook 14X K3405 Samsung ATNA40YK07-1, , 2880x1800, 14" | Lenovo Slim Pro 7 14ARP8 LEN89C1, IPS, 2560x1600, 14.5" | Asus VivoBook Pro 16 K6602VU Samsung ATNA60BX01-1, OLED, 3200x2000, 16" | Samsung Galaxy Book3 Ultra 16 Samsung ATNA60CL03-0, AMOLED, 2880x1800, 16" | |
|---|---|---|---|---|---|---|---|
| Display | 0% | -3% | 20% | -2% | 20% | 20% | |
| Display P3 Coverage (%) | 74.6 | 74.7 0% | 70.1 -6% | 99.9 34% | 72.9 -2% | 98.7 32% | 99.9 34% |
| sRGB Coverage (%) | 99 | 99.6 1% | 99.6 1% | 100 1% | 98.2 -1% | 99.7 1% | 100 1% |
| AdobeRGB 1998 Coverage (%) | 76.5 | 75.8 -1% | 72.3 -5% | 96.5 26% | 74.6 -2% | 96.5 26% | 96.3 26% |
| Response Times | -193% | -274% | -14% | -220% | -3% | 93% | |
| Response Time Grey 50% / Grey 80% * (ms) | 9.06 ? | 32.2 ? -255% | 35 ? -286% | 1.15 ? 87% | 31.8 ? -251% | 0.68 ? 92% | 0.49 ? 95% |
| Response Time Black / White * (ms) | 6.7 ? | 15.4 ? -130% | 24.2 ? -261% | 14.4 ? -115% | 19.3 ? -188% | 13.2 ? -97% | 0.65 ? 90% |
| PWM Frequency (Hz) | 90.02 ? | 240 ? | 240 ? | ||||
| Screen | 21% | 1% | 5% | 3% | -10% | 135% | |
| Brightness middle (cd/m²) | 403 | 402 0% | 299.4 -26% | 369 -8% | 344.7 -14% | 353 -12% | 400 -1% |
| Brightness (cd/m²) | 394 | 371 -6% | 290 -26% | 364 -8% | 334 -15% | 354 -10% | 399 1% |
| Brightness Distribution (%) | 90 | 86 -4% | 92 2% | 85 -6% | 92 2% | 98 9% | 93 3% |
| Black Level * (cd/m²) | 0.34 | 0.27 21% | 0.21 38% | 0.31 9% | 0.03 91% | ||
| Contrast (:1) | 1185 | 1489 26% | 1426 20% | 1112 -6% | 13333 1025% | ||
| Colorchecker dE 2000 * | 3.13 | 1.8 42% | 4.25 -36% | 2.85 9% | 3.01 4% | 4.23 -35% | 2.3 27% |
| Colorchecker dE 2000 max. * | 6.14 | 3.6 41% | 6.71 -9% | 4.22 31% | 6.3 -3% | 7.13 -16% | 4.15 32% |
| Colorchecker dE 2000 calibrated * | 1.65 | 1.5 9% | 0.52 68% | 2.18 -32% | 0.83 50% | 2.42 -47% | 1.66 -1% |
| Greyscale dE 2000 * | 4.5 | 1.8 60% | 5.5 -22% | 2.2 51% | 4.6 -2% | 2.5 44% | 2.7 40% |
| Gamma | 2.18 101% | 2.27 97% | 2.35 94% | 2.15 102% | 2.28 96% | 2.4 92% | 2.266 97% |
| CCT | 6261 104% | 6695 97% | 6368 102% | 6518 100% | 6420 101% | 6642 98% | 7047 92% |
| Toplam Ortalama (Program / Ayarlar) | -57% /
-14% | -92% /
-39% | 4% /
6% | -73% /
-30% | 2% /
-1% | 83% /
105% |
* ... daha küçük daha iyidir
Panel, sRGB renk alanının %99'unu kapsarken iyi bir Adobe RGB ve Display P3 reprodüksiyonu sunar. Bu da Pavilion Plus 16'yı genel multimedya tüketimi ve özellikle web içeriği için temel düzenleme iş akışları için uygun hale getiriyor.
X-Rite i1Basic Pro 3 spektrofotometre ve Portrait Displays'in Calman Ultimate yazılımını kullanarak, ortalama Gri Tonlama ve ColorChecker Delta E 2000 değerlerini sırasıyla 4,5'ten 0,6'ya ve 3,13'ten 1,65'e yükseltmeyi başardık.
Kalibre edilmiş dosyamızı yukarıdaki bağlantıdan indirebilirsiniz.
Yanıt Sürelerini Görüntüle
| ↔ Tepki Süresi Siyahtan Beyaza | ||
|---|---|---|
| 6.7 ms ... yükseliş ↗ ve sonbahar↘ birleşimi | ↗ 3.6 ms yükseliş | 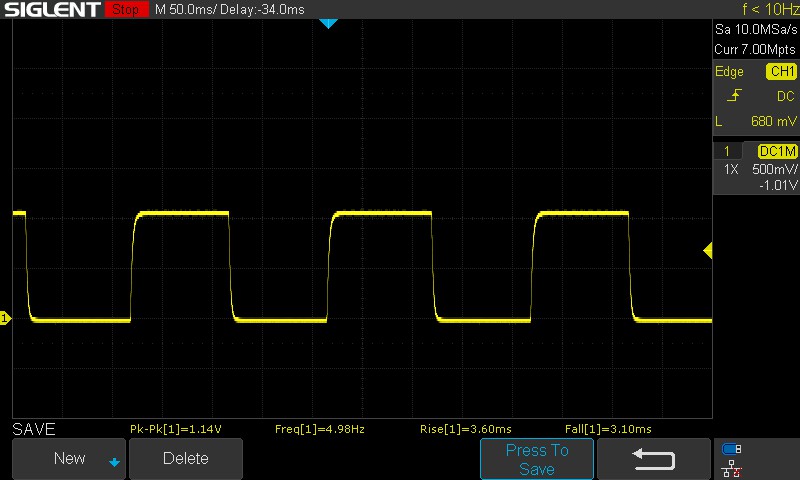 |
| ↘ 3.1 ms sonbahar | ||
| Ekran, testlerimizde çok hızlı yanıt oranları gösteriyor ve hızlı oyun oynamaya çok uygun olmalı. Karşılaştırıldığında, test edilen tüm cihazlar 0.1 (minimum) ile 240 (maksimum) ms arasında değişir. » Tüm cihazların 21 %'si daha iyi. Bu, ölçülen yanıt süresinin test edilen tüm cihazların ortalamasından (19.8 ms) daha iyi olduğu anlamına gelir. | ||
| ↔ Tepki Süresi %50 Griden %80 Griye | ||
| 9.06 ms ... yükseliş ↗ ve sonbahar↘ birleşimi | ↗ 4.27 ms yükseliş | 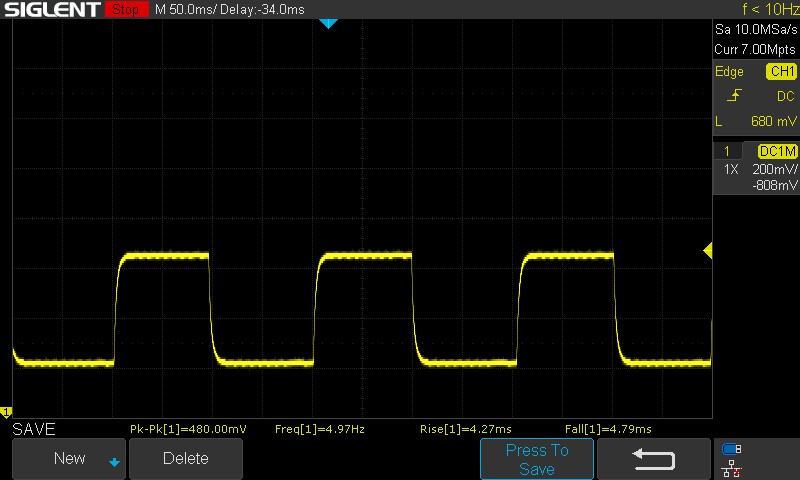 |
| ↘ 4.79 ms sonbahar | ||
| Ekran, testlerimizde hızlı yanıt oranları gösteriyor ve oyun oynamaya uygun olmalı. Karşılaştırıldığında, test edilen tüm cihazlar 0.165 (minimum) ile 636 (maksimum) ms arasında değişir. » Tüm cihazların 23 %'si daha iyi. Bu, ölçülen yanıt süresinin test edilen tüm cihazların ortalamasından (31 ms) daha iyi olduğu anlamına gelir. | ||
Ekran Titremesi / PWM (Darbe Genişliği Modülasyonu)
| Ekran titriyor / PWM algılanmadı | ≤ 100 % parlaklık ayarı | 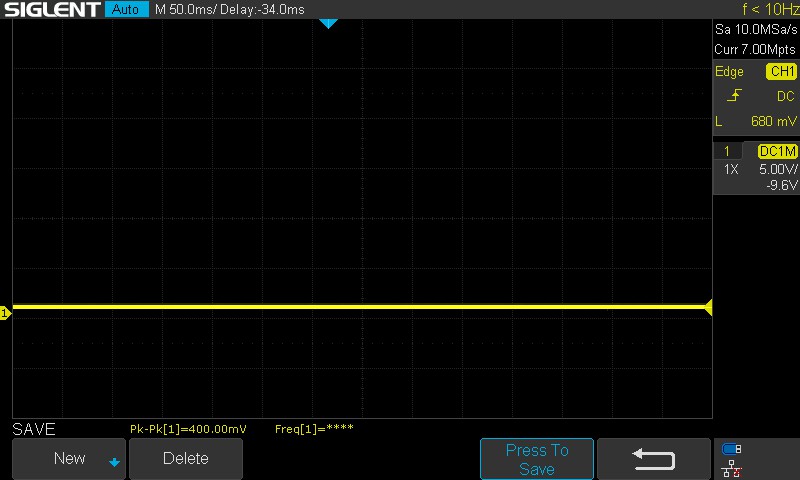 | |
Karşılaştırıldığında: Test edilen tüm cihazların %52 %'si ekranı karartmak için PWM kullanmıyor. PWM tespit edilirse, ortalama 7772 (minimum: 5 - maksimum: 343500) Hz ölçüldü. | |||
Tepki süreleri, Pavilion Plus 16'nın oyun tutkunlarını hedeflemediği düşünüldüğünde gayet iyi. Test edilen tüm parlaklık seviyelerinde PWM gözlemlemedik, bu da iyi bir şey.
Daha fazla bilgi için "PWM neden bu kadar baş ağrısı" makalemize göz atın. PWM Sıralaması tablomuz incelenen cihazlar arasında ölçülen PWM'ye genel bir bakış sağlar.
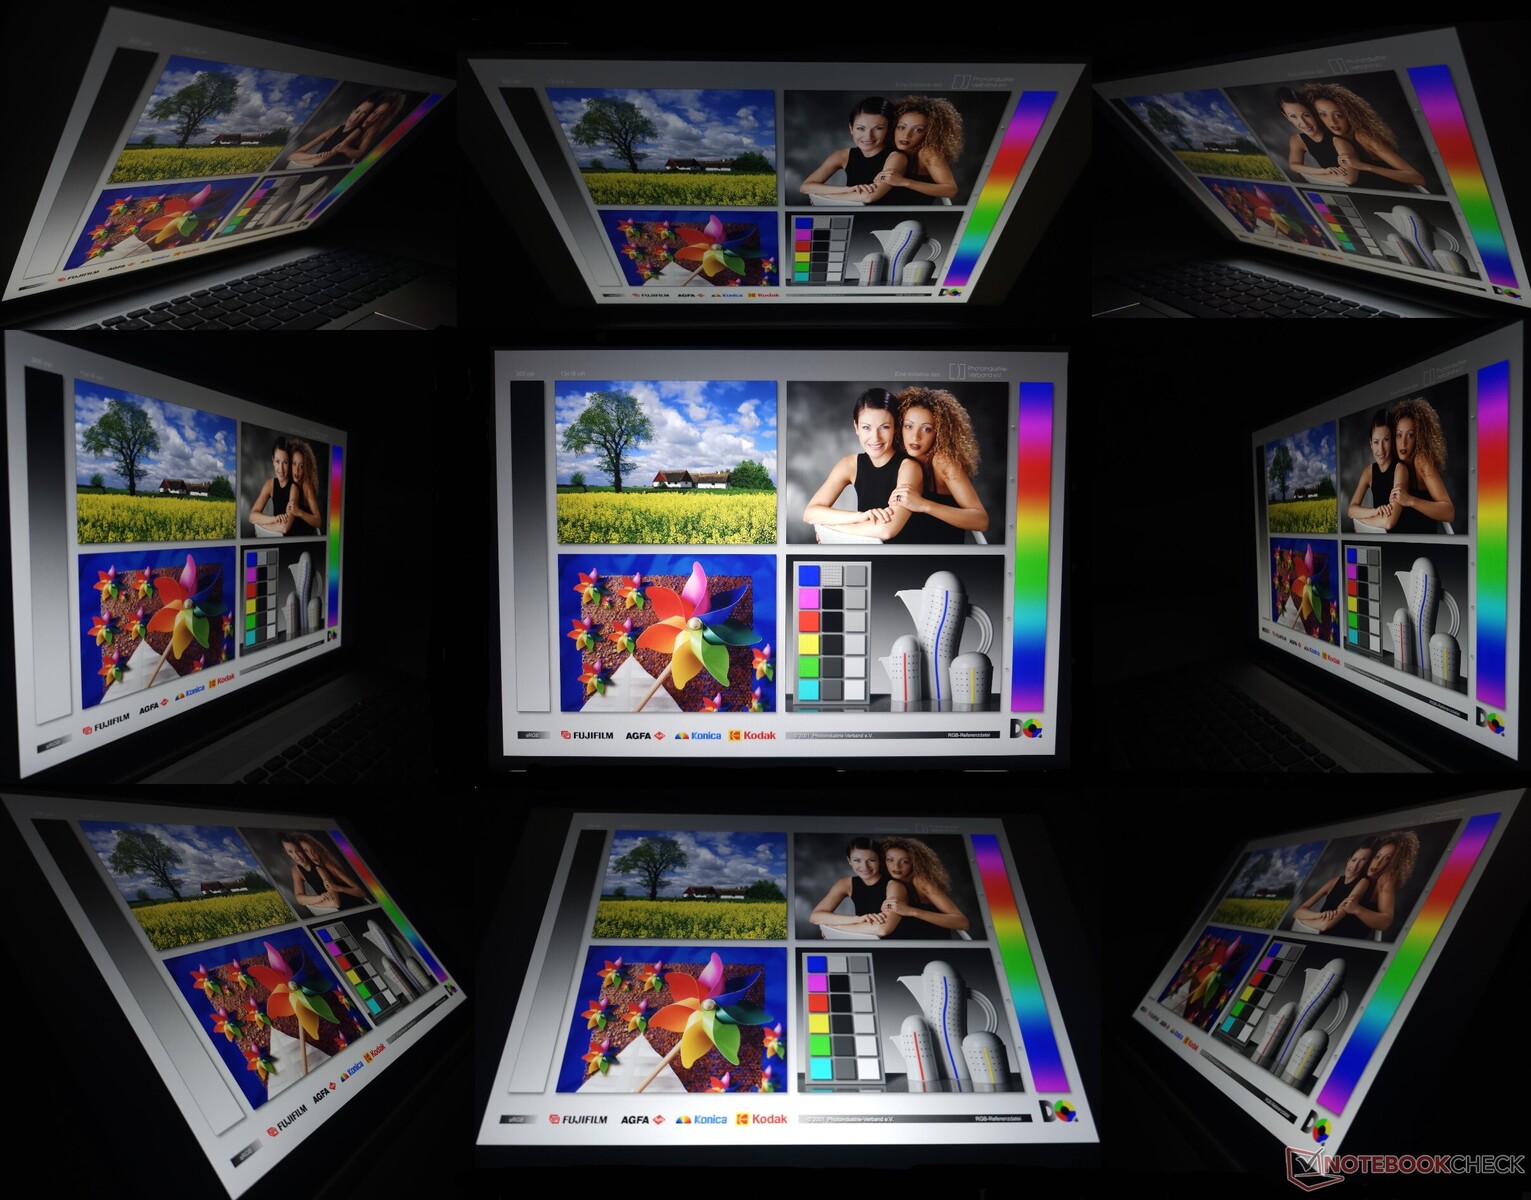
Dış mekanda görüntüleme, ekrana doğrudan güneş ışığı düşmediği sürece maksimum parlaklıkta genellikle iyidir. Görüntüleme açıları sabittir, ancak uç noktalarda parlaklık ve renk bilgisi kaybı gözlemledik.
Performans: Core i7-13700H düşük PL2 ile kısıtlı
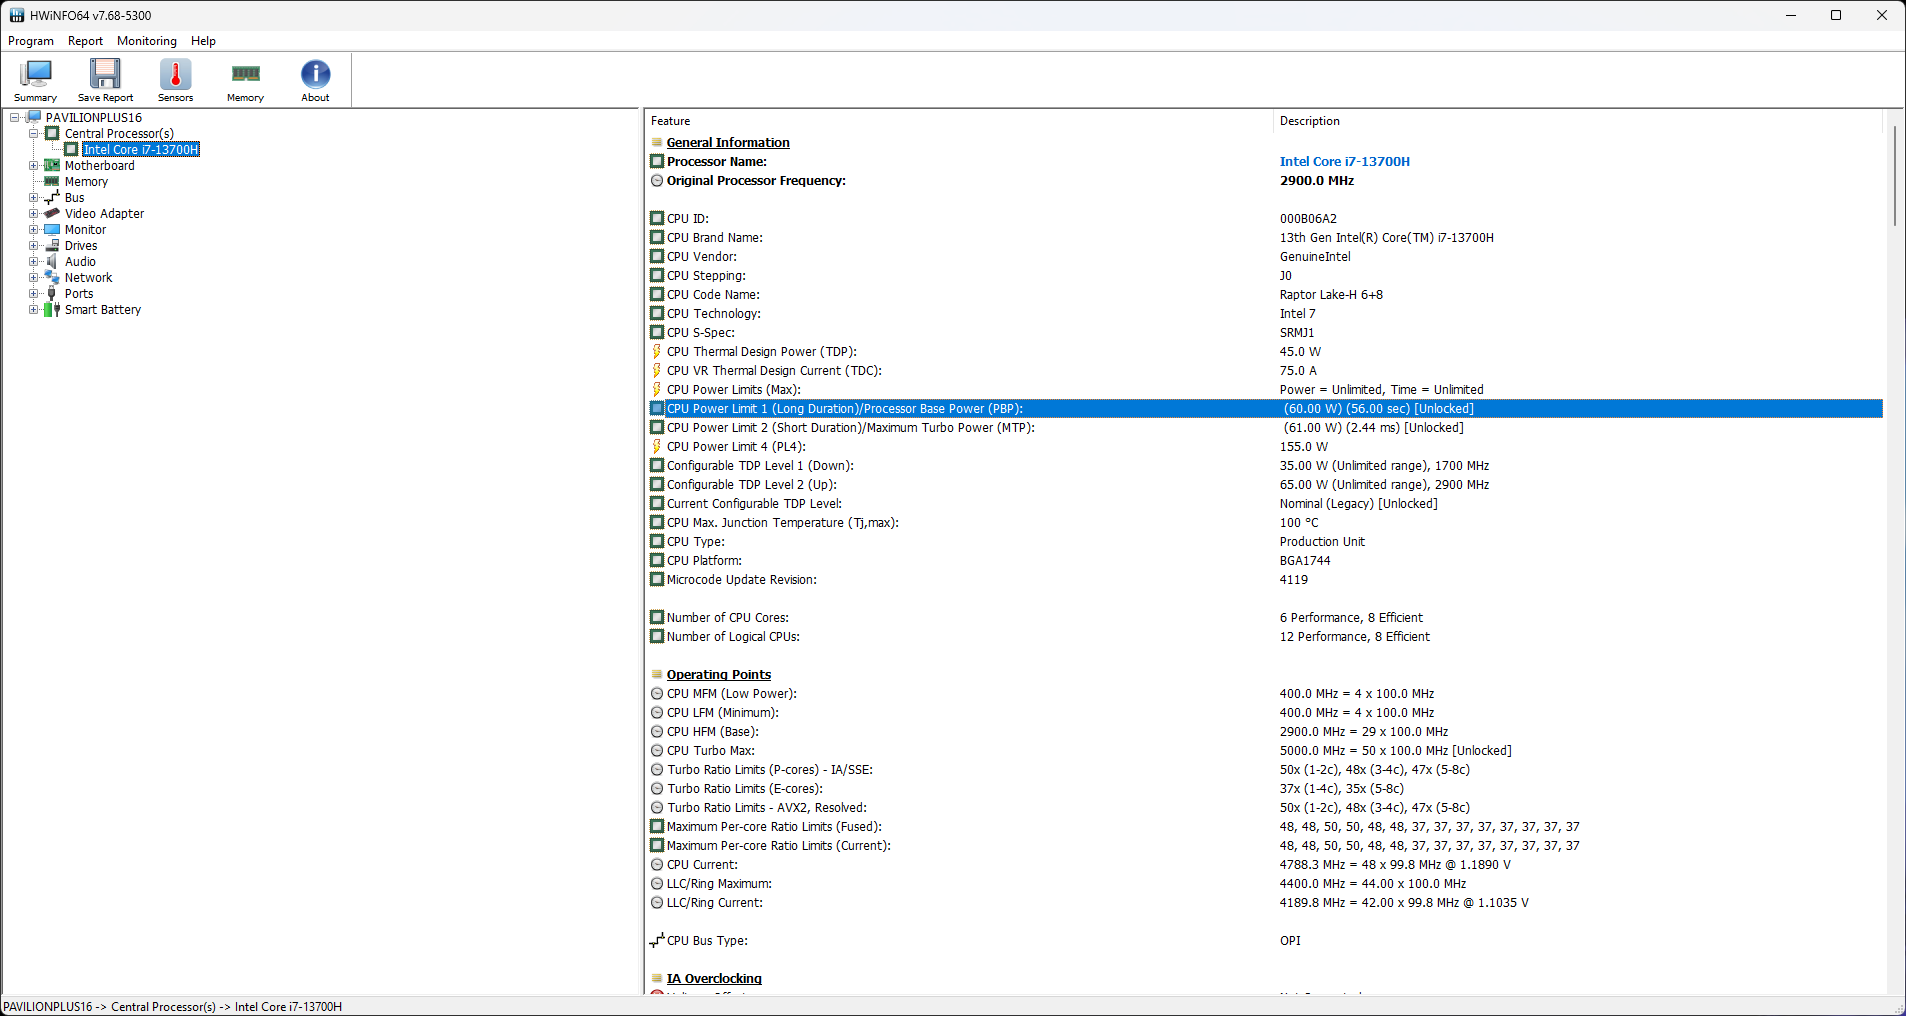
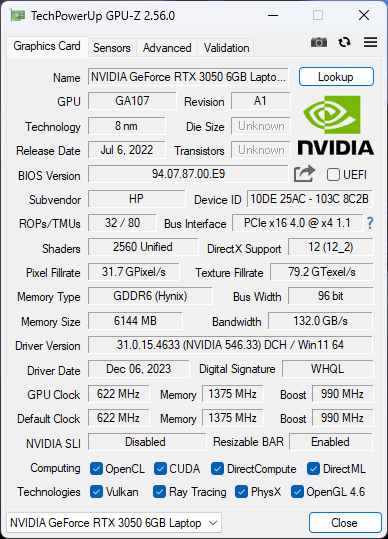
Bölgeye bağlı olarak HP, Pavilion Plus 16 inç Core i5-13500H ve Core i7-13700H modellerinin yanı sıra isteğe bağlı RTX 3050 6 GB grafikler.
Test Koşulları
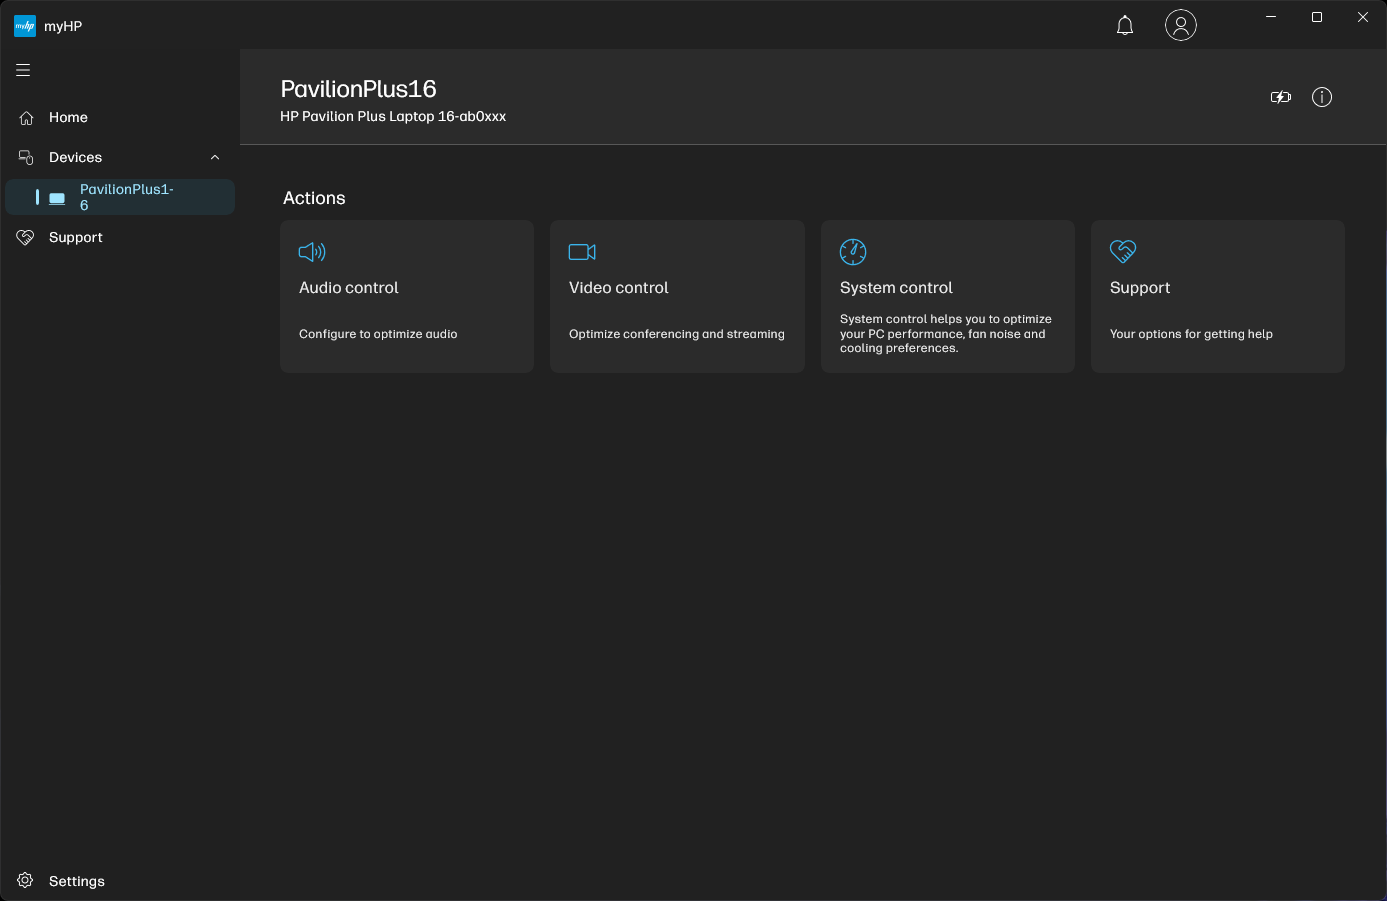
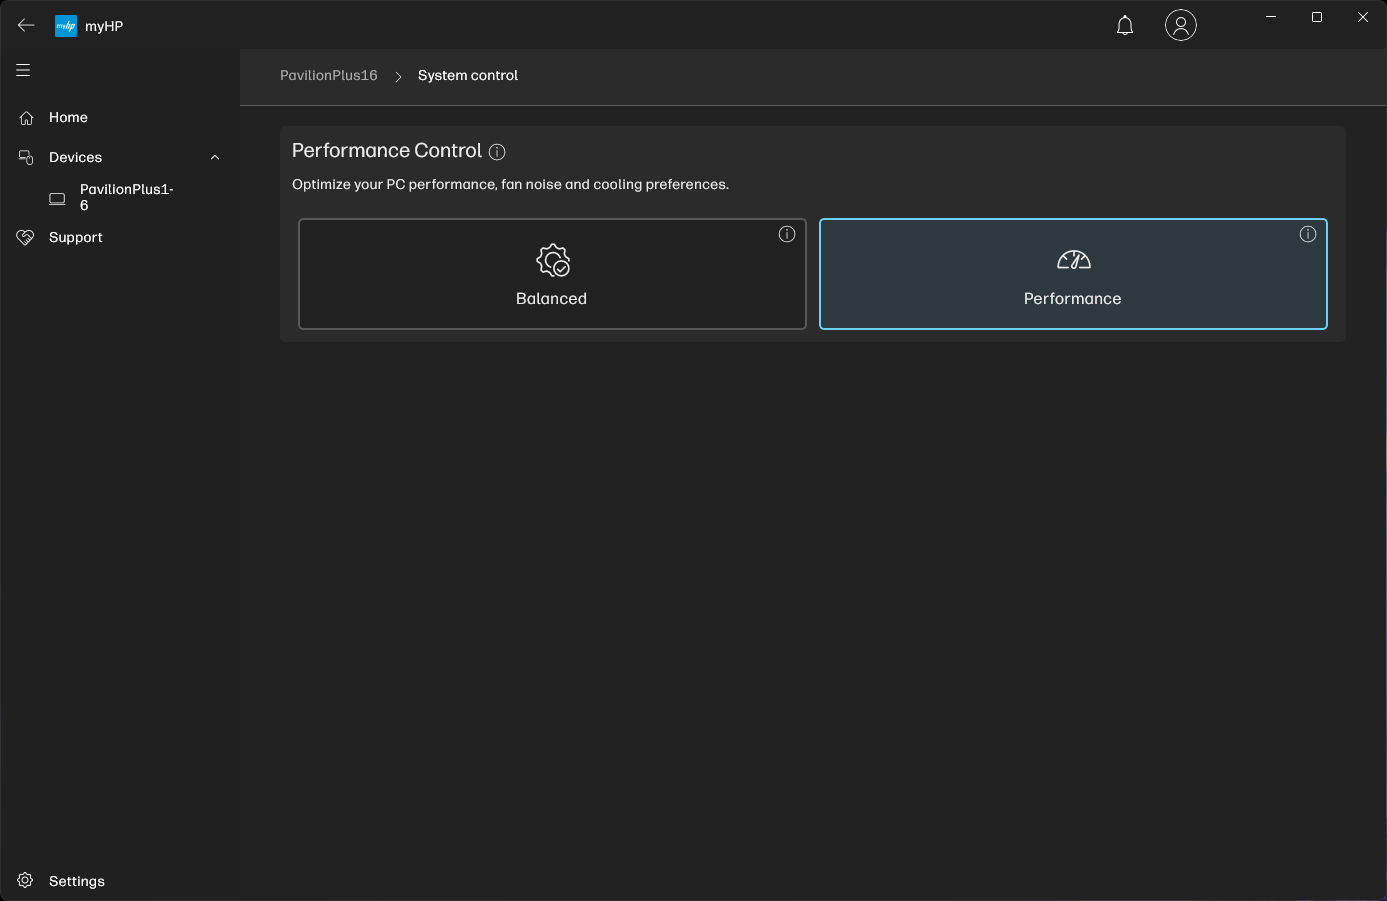
MyHP uygulaması, kullanıcıların iki çalışma modu arasında seçim yapmasına olanak tanır: Dengeli ve Performans. Dengeli mod, Performans modunda 60 W'a kadar çıkan 50 W PL1 kullanır. Bu modların her ikisinde de PL2 61 W ile sınırlandırılmıştır.
RTX 3050 6 GB GPU, varsayılan olarak MSHybrid / Optimus modunda çalışır ve MUX geçişi mümkün değildir.
Tüm kıyaslamalar için Performans modunu kullandık. PL1/PL2 pil gücüyle 35 W / 35 W'a düşüyor.
İşlemci
Pavilion Plus 16'nın Core i7-13700H'si düşük PL2 değeri nedeniyle zorlanıyor. Bu durum özellikle çok çekirdekli karşılaştırmalarda ortaya çıkıyor ve Core i7-13700H'nin Dell Inspiron 16 Plus 7630 89 W PL2 Core i7-13700H'ye sahip.
Bununla birlikte, Pavilion Plus 16'nın soğutması, Cinebench R15 çok çekirdekli döngü testimiz sırasında iyi sürdürülen bir performans sağlamada çok etkili görünüyor.
Pavilion Plus 16 çoğu CPU tek çekirdekli listesinin başında yer alıyor, ancak Schenker Vision 14 M23 bu testlerde onun hemen arkasındadır.
Cinebench R15 Multi Loop
Cinebench R23: Multi Core | Single Core
Cinebench R20: CPU (Multi Core) | CPU (Single Core)
Cinebench R15: CPU Multi 64Bit | CPU Single 64Bit
Blender: v2.79 BMW27 CPU
7-Zip 18.03: 7z b 4 | 7z b 4 -mmt1
Geekbench 6.7: Multi-Core | Single-Core
Geekbench 5.5: Multi-Core | Single-Core
HWBOT x265 Benchmark v2.2: 4k Preset
LibreOffice : 20 Documents To PDF
R Benchmark 2.5: Overall mean
| CPU Performance rating | |
| Sınıf ortalaması Multimedia | |
| Dell Inspiron 16 Plus 7630 | |
| Ortalama Intel Core i7-13700H | |
| HP Pavilion Plus 16-ab0456tx | |
| Asus VivoBook Pro 16 K6602VU | |
| Samsung Galaxy Book3 Ultra 16 -2! | |
| Schenker Vision 14 M23 RTX 3050 | |
| Asus VivoBook 14X K3405 -2! | |
| Lenovo Slim Pro 7 14ARP8 -2! | |
| Cinebench R23 / Multi Core | |
| Sınıf ortalaması Multimedia (4861 - 33362, n=81, son 2 yıl) | |
| Dell Inspiron 16 Plus 7630 | |
| Samsung Galaxy Book3 Ultra 16 | |
| Ortalama Intel Core i7-13700H (5890 - 20034, n=29) | |
| Asus VivoBook Pro 16 K6602VU | |
| Asus VivoBook 14X K3405 | |
| Schenker Vision 14 M23 RTX 3050 | |
| Lenovo Slim Pro 7 14ARP8 | |
| HP Pavilion Plus 16-ab0456tx | |
| Cinebench R23 / Single Core | |
| Sınıf ortalaması Multimedia (1128 - 2459, n=73, son 2 yıl) | |
| HP Pavilion Plus 16-ab0456tx | |
| Schenker Vision 14 M23 RTX 3050 | |
| Dell Inspiron 16 Plus 7630 | |
| Ortalama Intel Core i7-13700H (1323 - 1914, n=29) | |
| Asus VivoBook Pro 16 K6602VU | |
| Asus VivoBook 14X K3405 | |
| Samsung Galaxy Book3 Ultra 16 | |
| Lenovo Slim Pro 7 14ARP8 | |
| Cinebench R20 / CPU (Multi Core) | |
| Sınıf ortalaması Multimedia (1887 - 12912, n=64, son 2 yıl) | |
| Dell Inspiron 16 Plus 7630 | |
| Samsung Galaxy Book3 Ultra 16 | |
| Ortalama Intel Core i7-13700H (2322 - 7674, n=29) | |
| HP Pavilion Plus 16-ab0456tx | |
| Asus VivoBook Pro 16 K6602VU | |
| Asus VivoBook 14X K3405 | |
| Schenker Vision 14 M23 RTX 3050 | |
| Lenovo Slim Pro 7 14ARP8 | |
| Cinebench R20 / CPU (Single Core) | |
| HP Pavilion Plus 16-ab0456tx | |
| Schenker Vision 14 M23 RTX 3050 | |
| Dell Inspiron 16 Plus 7630 | |
| Sınıf ortalaması Multimedia (425 - 853, n=64, son 2 yıl) | |
| Ortalama Intel Core i7-13700H (508 - 741, n=29) | |
| Asus VivoBook Pro 16 K6602VU | |
| Asus VivoBook 14X K3405 | |
| Samsung Galaxy Book3 Ultra 16 | |
| Lenovo Slim Pro 7 14ARP8 | |
| Cinebench R15 / CPU Multi 64Bit | |
| Sınıf ortalaması Multimedia (856 - 5224, n=68, son 2 yıl) | |
| Samsung Galaxy Book3 Ultra 16 | |
| Asus VivoBook Pro 16 K6602VU | |
| Dell Inspiron 16 Plus 7630 | |
| Ortalama Intel Core i7-13700H (905 - 2982, n=29) | |
| Asus VivoBook 14X K3405 | |
| HP Pavilion Plus 16-ab0456tx | |
| Lenovo Slim Pro 7 14ARP8 | |
| Schenker Vision 14 M23 RTX 3050 | |
| Cinebench R15 / CPU Single 64Bit | |
| Sınıf ortalaması Multimedia (184.8 - 326, n=66, son 2 yıl) | |
| HP Pavilion Plus 16-ab0456tx | |
| Schenker Vision 14 M23 RTX 3050 | |
| Dell Inspiron 16 Plus 7630 | |
| Ortalama Intel Core i7-13700H (213 - 278, n=29) | |
| Asus VivoBook Pro 16 K6602VU | |
| Asus VivoBook 14X K3405 | |
| Samsung Galaxy Book3 Ultra 16 | |
| Lenovo Slim Pro 7 14ARP8 | |
| Blender / v2.79 BMW27 CPU | |
| Schenker Vision 14 M23 RTX 3050 | |
| Sınıf ortalaması Multimedia (100 - 557, n=65, son 2 yıl) | |
| Lenovo Slim Pro 7 14ARP8 | |
| Asus VivoBook 14X K3405 | |
| Ortalama Intel Core i7-13700H (169 - 555, n=29) | |
| Samsung Galaxy Book3 Ultra 16 | |
| Dell Inspiron 16 Plus 7630 | |
| HP Pavilion Plus 16-ab0456tx | |
| Asus VivoBook Pro 16 K6602VU | |
| 7-Zip 18.03 / 7z b 4 | |
| Asus VivoBook Pro 16 K6602VU | |
| HP Pavilion Plus 16-ab0456tx | |
| Samsung Galaxy Book3 Ultra 16 | |
| Ortalama Intel Core i7-13700H (27322 - 76344, n=29) | |
| Dell Inspiron 16 Plus 7630 | |
| Sınıf ortalaması Multimedia (26062 - 130368, n=62, son 2 yıl) | |
| Lenovo Slim Pro 7 14ARP8 | |
| Schenker Vision 14 M23 RTX 3050 | |
| Asus VivoBook 14X K3405 | |
| 7-Zip 18.03 / 7z b 4 -mmt1 | |
| Schenker Vision 14 M23 RTX 3050 | |
| HP Pavilion Plus 16-ab0456tx | |
| Sınıf ortalaması Multimedia (3666 - 7545, n=63, son 2 yıl) | |
| Ortalama Intel Core i7-13700H (4825 - 6238, n=29) | |
| Asus VivoBook Pro 16 K6602VU | |
| Dell Inspiron 16 Plus 7630 | |
| Asus VivoBook 14X K3405 | |
| Samsung Galaxy Book3 Ultra 16 | |
| Lenovo Slim Pro 7 14ARP8 | |
| Geekbench 6.7 / Multi-Core | |
| Sınıf ortalaması Multimedia (4983 - 29415, n=76, son 2 yıl) | |
| Dell Inspiron 16 Plus 7630 | |
| HP Pavilion Plus 16-ab0456tx | |
| Schenker Vision 14 M23 RTX 3050 | |
| Ortalama Intel Core i7-13700H (8415 - 13832, n=13) | |
| Asus VivoBook Pro 16 K6602VU | |
| Geekbench 6.7 / Single-Core | |
| Sınıf ortalaması Multimedia (1534 - 4335, n=75, son 2 yıl) | |
| Schenker Vision 14 M23 RTX 3050 | |
| Dell Inspiron 16 Plus 7630 | |
| HP Pavilion Plus 16-ab0456tx | |
| Ortalama Intel Core i7-13700H (2316 - 2639, n=13) | |
| Asus VivoBook Pro 16 K6602VU | |
| Geekbench 5.5 / Multi-Core | |
| Sınıf ortalaması Multimedia (4652 - 20422, n=62, son 2 yıl) | |
| Dell Inspiron 16 Plus 7630 | |
| Ortalama Intel Core i7-13700H (6165 - 14215, n=29) | |
| Samsung Galaxy Book3 Ultra 16 | |
| HP Pavilion Plus 16-ab0456tx | |
| Schenker Vision 14 M23 RTX 3050 | |
| Asus VivoBook Pro 16 K6602VU | |
| Asus VivoBook 14X K3405 | |
| Lenovo Slim Pro 7 14ARP8 | |
| Geekbench 5.5 / Single-Core | |
| Sınıf ortalaması Multimedia (805 - 2974, n=62, son 2 yıl) | |
| Dell Inspiron 16 Plus 7630 | |
| Schenker Vision 14 M23 RTX 3050 | |
| HP Pavilion Plus 16-ab0456tx | |
| Ortalama Intel Core i7-13700H (1362 - 1919, n=29) | |
| Asus VivoBook Pro 16 K6602VU | |
| Samsung Galaxy Book3 Ultra 16 | |
| Asus VivoBook 14X K3405 | |
| Lenovo Slim Pro 7 14ARP8 | |
| HWBOT x265 Benchmark v2.2 / 4k Preset | |
| Sınıf ortalaması Multimedia (5.26 - 36.1, n=63, son 2 yıl) | |
| Samsung Galaxy Book3 Ultra 16 | |
| Asus VivoBook Pro 16 K6602VU | |
| Ortalama Intel Core i7-13700H (6.72 - 21.2, n=29) | |
| HP Pavilion Plus 16-ab0456tx | |
| Lenovo Slim Pro 7 14ARP8 | |
| Dell Inspiron 16 Plus 7630 | |
| Asus VivoBook 14X K3405 | |
| Schenker Vision 14 M23 RTX 3050 | |
| LibreOffice / 20 Documents To PDF | |
| HP Pavilion Plus 16-ab0456tx | |
| Lenovo Slim Pro 7 14ARP8 | |
| Schenker Vision 14 M23 RTX 3050 | |
| Asus VivoBook Pro 16 K6602VU | |
| Sınıf ortalaması Multimedia (23.9 - 146.7, n=64, son 2 yıl) | |
| Samsung Galaxy Book3 Ultra 16 | |
| Ortalama Intel Core i7-13700H (31.3 - 62.4, n=29) | |
| Asus VivoBook 14X K3405 | |
| Dell Inspiron 16 Plus 7630 | |
| R Benchmark 2.5 / Overall mean | |
| Lenovo Slim Pro 7 14ARP8 | |
| Asus VivoBook 14X K3405 | |
| Samsung Galaxy Book3 Ultra 16 | |
| Asus VivoBook Pro 16 K6602VU | |
| Ortalama Intel Core i7-13700H (0.4308 - 0.607, n=29) | |
| Sınıf ortalaması Multimedia (0.3604 - 0.947, n=63, son 2 yıl) | |
| Schenker Vision 14 M23 RTX 3050 | |
| HP Pavilion Plus 16-ab0456tx | |
| Dell Inspiron 16 Plus 7630 | |
* ... daha küçük daha iyidir
AIDA64: FP32 Ray-Trace | FPU Julia | CPU SHA3 | CPU Queen | FPU SinJulia | FPU Mandel | CPU AES | CPU ZLib | FP64 Ray-Trace | CPU PhotoWorxx
| Performance rating | |
| Sınıf ortalaması Multimedia | |
| Asus VivoBook Pro 16 K6602VU | |
| Lenovo Slim Pro 7 14ARP8 | |
| HP Pavilion Plus 16-ab0456tx | |
| Samsung Galaxy Book3 Ultra 16 | |
| Ortalama Intel Core i7-13700H | |
| Dell Inspiron 16 Plus 7630 | |
| Asus VivoBook 14X K3405 | |
| Schenker Vision 14 M23 RTX 3050 | |
| AIDA64 / FP32 Ray-Trace | |
| Sınıf ortalaması Multimedia (2214 - 50388, n=60, son 2 yıl) | |
| Lenovo Slim Pro 7 14ARP8 | |
| HP Pavilion Plus 16-ab0456tx | |
| Samsung Galaxy Book3 Ultra 16 | |
| Ortalama Intel Core i7-13700H (4986 - 18908, n=29) | |
| Dell Inspiron 16 Plus 7630 | |
| Asus VivoBook Pro 16 K6602VU | |
| Asus VivoBook 14X K3405 | |
| Schenker Vision 14 M23 RTX 3050 | |
| AIDA64 / FPU Julia | |
| Lenovo Slim Pro 7 14ARP8 | |
| Sınıf ortalaması Multimedia (12867 - 201874, n=61, son 2 yıl) | |
| HP Pavilion Plus 16-ab0456tx | |
| Asus VivoBook Pro 16 K6602VU | |
| Ortalama Intel Core i7-13700H (25360 - 92359, n=29) | |
| Samsung Galaxy Book3 Ultra 16 | |
| Dell Inspiron 16 Plus 7630 | |
| Asus VivoBook 14X K3405 | |
| Schenker Vision 14 M23 RTX 3050 | |
| AIDA64 / CPU SHA3 | |
| Sınıf ortalaması Multimedia (626 - 8623, n=61, son 2 yıl) | |
| Asus VivoBook 14X K3405 | |
| HP Pavilion Plus 16-ab0456tx | |
| Asus VivoBook Pro 16 K6602VU | |
| Samsung Galaxy Book3 Ultra 16 | |
| Ortalama Intel Core i7-13700H (1339 - 4224, n=29) | |
| Lenovo Slim Pro 7 14ARP8 | |
| Dell Inspiron 16 Plus 7630 | |
| Schenker Vision 14 M23 RTX 3050 | |
| AIDA64 / CPU Queen | |
| Dell Inspiron 16 Plus 7630 | |
| Samsung Galaxy Book3 Ultra 16 | |
| HP Pavilion Plus 16-ab0456tx | |
| Ortalama Intel Core i7-13700H (59324 - 107159, n=29) | |
| Asus VivoBook Pro 16 K6602VU | |
| Lenovo Slim Pro 7 14ARP8 | |
| Schenker Vision 14 M23 RTX 3050 | |
| Asus VivoBook 14X K3405 | |
| Sınıf ortalaması Multimedia (13483 - 181505, n=48, son 2 yıl) | |
| AIDA64 / FPU SinJulia | |
| Lenovo Slim Pro 7 14ARP8 | |
| HP Pavilion Plus 16-ab0456tx | |
| Samsung Galaxy Book3 Ultra 16 | |
| Sınıf ortalaması Multimedia (886 - 28794, n=61, son 2 yıl) | |
| Dell Inspiron 16 Plus 7630 | |
| Asus VivoBook Pro 16 K6602VU | |
| Ortalama Intel Core i7-13700H (4800 - 11050, n=29) | |
| Schenker Vision 14 M23 RTX 3050 | |
| Asus VivoBook 14X K3405 | |
| AIDA64 / FPU Mandel | |
| Lenovo Slim Pro 7 14ARP8 | |
| Sınıf ortalaması Multimedia (6395 - 105740, n=60, son 2 yıl) | |
| HP Pavilion Plus 16-ab0456tx | |
| Samsung Galaxy Book3 Ultra 16 | |
| Ortalama Intel Core i7-13700H (12321 - 45118, n=29) | |
| Asus VivoBook Pro 16 K6602VU | |
| Dell Inspiron 16 Plus 7630 | |
| Asus VivoBook 14X K3405 | |
| Schenker Vision 14 M23 RTX 3050 | |
| AIDA64 / CPU AES | |
| Asus VivoBook Pro 16 K6602VU | |
| Asus VivoBook 14X K3405 | |
| Ortalama Intel Core i7-13700H (28769 - 151254, n=29) | |
| HP Pavilion Plus 16-ab0456tx | |
| Samsung Galaxy Book3 Ultra 16 | |
| Sınıf ortalaması Multimedia (8171 - 126790, n=61, son 2 yıl) | |
| Dell Inspiron 16 Plus 7630 | |
| Schenker Vision 14 M23 RTX 3050 | |
| Lenovo Slim Pro 7 14ARP8 | |
| AIDA64 / CPU ZLib | |
| Samsung Galaxy Book3 Ultra 16 | |
| Sınıf ortalaması Multimedia (143.8 - 2022, n=61, son 2 yıl) | |
| HP Pavilion Plus 16-ab0456tx | |
| Asus VivoBook Pro 16 K6602VU | |
| Ortalama Intel Core i7-13700H (389 - 1215, n=29) | |
| Asus VivoBook 14X K3405 | |
| Dell Inspiron 16 Plus 7630 | |
| Schenker Vision 14 M23 RTX 3050 | |
| Lenovo Slim Pro 7 14ARP8 | |
| AIDA64 / FP64 Ray-Trace | |
| Sınıf ortalaması Multimedia (1014 - 26875, n=61, son 2 yıl) | |
| HP Pavilion Plus 16-ab0456tx | |
| Lenovo Slim Pro 7 14ARP8 | |
| Samsung Galaxy Book3 Ultra 16 | |
| Asus VivoBook Pro 16 K6602VU | |
| Ortalama Intel Core i7-13700H (2540 - 10135, n=29) | |
| Dell Inspiron 16 Plus 7630 | |
| Asus VivoBook 14X K3405 | |
| Schenker Vision 14 M23 RTX 3050 | |
| AIDA64 / CPU PhotoWorxx | |
| Sınıf ortalaması Multimedia (8187 - 88154, n=61, son 2 yıl) | |
| Samsung Galaxy Book3 Ultra 16 | |
| Schenker Vision 14 M23 RTX 3050 | |
| HP Pavilion Plus 16-ab0456tx | |
| Ortalama Intel Core i7-13700H (12872 - 52727, n=29) | |
| Asus VivoBook Pro 16 K6602VU | |
| Dell Inspiron 16 Plus 7630 | |
| Lenovo Slim Pro 7 14ARP8 | |
| Asus VivoBook 14X K3405 | |
Bize özel olanlara göz atın Intel Core i7-13700H sayfasında daha fazla performans karşılaştırması bulabilirsiniz.
Sistem Performansı
Pavilion Plus 16, VivoBook Pro 16'yı bir şekilde geçmeyi başarıyor Core i9-13900H ve RTX 4050 combo'ya karşı üstünlük sağlarken, PCMark 10'da %6'lık bir farkla ikincisine yeniliyor.
Bunun dışında, sistem günlük üretkenlik ve web tarama görevleri için oldukça duyarlı hissettiriyor.
CrossMark: Overall | Productivity | Creativity | Responsiveness
AIDA64: Memory Copy | Memory Read | Memory Write | Memory Latency
WebXPRT 3: Overall
WebXPRT 4: Overall
Mozilla Kraken 1.1: Total
| PCMark 10 / Score | |
| Sınıf ortalaması Multimedia (4325 - 10386, n=58, son 2 yıl) | |
| Dell Inspiron 16 Plus 7630 | |
| Asus VivoBook Pro 16 K6602VU | |
| Samsung Galaxy Book3 Ultra 16 | |
| Asus VivoBook 14X K3405 | |
| HP Pavilion Plus 16-ab0456tx | |
| Ortalama Intel Core i7-13700H, NVIDIA GeForce RTX 3050 6GB Laptop GPU (6290 - 6597, n=2) | |
| Lenovo Slim Pro 7 14ARP8 | |
| Schenker Vision 14 M23 RTX 3050 | |
| PCMark 10 / Essentials | |
| Dell Inspiron 16 Plus 7630 | |
| Samsung Galaxy Book3 Ultra 16 | |
| Sınıf ortalaması Multimedia (8025 - 11664, n=57, son 2 yıl) | |
| Asus VivoBook Pro 16 K6602VU | |
| Asus VivoBook 14X K3405 | |
| HP Pavilion Plus 16-ab0456tx | |
| Ortalama Intel Core i7-13700H, NVIDIA GeForce RTX 3050 6GB Laptop GPU (9943 - 10112, n=2) | |
| Lenovo Slim Pro 7 14ARP8 | |
| Schenker Vision 14 M23 RTX 3050 | |
| PCMark 10 / Productivity | |
| Sınıf ortalaması Multimedia (7323 - 18233, n=57, son 2 yıl) | |
| Dell Inspiron 16 Plus 7630 | |
| Asus VivoBook 14X K3405 | |
| Schenker Vision 14 M23 RTX 3050 | |
| Ortalama Intel Core i7-13700H, NVIDIA GeForce RTX 3050 6GB Laptop GPU (8803 - 8950, n=2) | |
| HP Pavilion Plus 16-ab0456tx | |
| Asus VivoBook Pro 16 K6602VU | |
| Samsung Galaxy Book3 Ultra 16 | |
| Lenovo Slim Pro 7 14ARP8 | |
| PCMark 10 / Digital Content Creation | |
| Dell Inspiron 16 Plus 7630 | |
| Asus VivoBook Pro 16 K6602VU | |
| Sınıf ortalaması Multimedia (3651 - 16240, n=57, son 2 yıl) | |
| Samsung Galaxy Book3 Ultra 16 | |
| Lenovo Slim Pro 7 14ARP8 | |
| HP Pavilion Plus 16-ab0456tx | |
| Asus VivoBook 14X K3405 | |
| Ortalama Intel Core i7-13700H, NVIDIA GeForce RTX 3050 6GB Laptop GPU (7590 - 8752, n=2) | |
| Schenker Vision 14 M23 RTX 3050 | |
| CrossMark / Overall | |
| Sınıf ortalaması Multimedia (866 - 2728, n=67, son 2 yıl) | |
| Dell Inspiron 16 Plus 7630 | |
| HP Pavilion Plus 16-ab0456tx | |
| Asus VivoBook Pro 16 K6602VU | |
| Asus VivoBook 14X K3405 | |
| Ortalama Intel Core i7-13700H, NVIDIA GeForce RTX 3050 6GB Laptop GPU (1504 - 1752, n=2) | |
| Samsung Galaxy Book3 Ultra 16 | |
| Schenker Vision 14 M23 RTX 3050 | |
| Lenovo Slim Pro 7 14ARP8 | |
| CrossMark / Productivity | |
| Dell Inspiron 16 Plus 7630 | |
| Sınıf ortalaması Multimedia (931 - 2489, n=67, son 2 yıl) | |
| Asus VivoBook Pro 16 K6602VU | |
| HP Pavilion Plus 16-ab0456tx | |
| Asus VivoBook 14X K3405 | |
| Ortalama Intel Core i7-13700H, NVIDIA GeForce RTX 3050 6GB Laptop GPU (1417 - 1657, n=2) | |
| Samsung Galaxy Book3 Ultra 16 | |
| Schenker Vision 14 M23 RTX 3050 | |
| Lenovo Slim Pro 7 14ARP8 | |
| CrossMark / Creativity | |
| Sınıf ortalaması Multimedia (907 - 3465, n=67, son 2 yıl) | |
| Dell Inspiron 16 Plus 7630 | |
| HP Pavilion Plus 16-ab0456tx | |
| Asus VivoBook Pro 16 K6602VU | |
| Ortalama Intel Core i7-13700H, NVIDIA GeForce RTX 3050 6GB Laptop GPU (1711 - 1970, n=2) | |
| Schenker Vision 14 M23 RTX 3050 | |
| Asus VivoBook 14X K3405 | |
| Samsung Galaxy Book3 Ultra 16 | |
| Lenovo Slim Pro 7 14ARP8 | |
| CrossMark / Responsiveness | |
| Dell Inspiron 16 Plus 7630 | |
| Asus VivoBook Pro 16 K6602VU | |
| Sınıf ortalaması Multimedia (605 - 2024, n=67, son 2 yıl) | |
| Samsung Galaxy Book3 Ultra 16 | |
| Asus VivoBook 14X K3405 | |
| HP Pavilion Plus 16-ab0456tx | |
| Ortalama Intel Core i7-13700H, NVIDIA GeForce RTX 3050 6GB Laptop GPU (1220 - 1458, n=2) | |
| Schenker Vision 14 M23 RTX 3050 | |
| Lenovo Slim Pro 7 14ARP8 | |
| AIDA64 / Memory Copy | |
| Sınıf ortalaması Multimedia (11299 - 132135, n=61, son 2 yıl) | |
| Samsung Galaxy Book3 Ultra 16 | |
| Schenker Vision 14 M23 RTX 3050 | |
| Ortalama Intel Core i7-13700H, NVIDIA GeForce RTX 3050 6GB Laptop GPU (64356 - 65837, n=2) | |
| HP Pavilion Plus 16-ab0456tx | |
| Dell Inspiron 16 Plus 7630 | |
| Asus VivoBook Pro 16 K6602VU | |
| Lenovo Slim Pro 7 14ARP8 | |
| Asus VivoBook 14X K3405 | |
| AIDA64 / Memory Read | |
| Sınıf ortalaması Multimedia (11624 - 174586, n=61, son 2 yıl) | |
| Schenker Vision 14 M23 RTX 3050 | |
| Samsung Galaxy Book3 Ultra 16 | |
| Ortalama Intel Core i7-13700H, NVIDIA GeForce RTX 3050 6GB Laptop GPU (65825 - 70861, n=2) | |
| Dell Inspiron 16 Plus 7630 | |
| Asus VivoBook Pro 16 K6602VU | |
| HP Pavilion Plus 16-ab0456tx | |
| Lenovo Slim Pro 7 14ARP8 | |
| Asus VivoBook 14X K3405 | |
| AIDA64 / Memory Write | |
| Samsung Galaxy Book3 Ultra 16 | |
| Sınıf ortalaması Multimedia (11755 - 134998, n=61, son 2 yıl) | |
| HP Pavilion Plus 16-ab0456tx | |
| Ortalama Intel Core i7-13700H, NVIDIA GeForce RTX 3050 6GB Laptop GPU (68174 - 76930, n=2) | |
| Schenker Vision 14 M23 RTX 3050 | |
| Asus VivoBook Pro 16 K6602VU | |
| Dell Inspiron 16 Plus 7630 | |
| Lenovo Slim Pro 7 14ARP8 | |
| Asus VivoBook 14X K3405 | |
| AIDA64 / Memory Latency | |
| Sınıf ortalaması Multimedia (7 - 535, n=60, son 2 yıl) | |
| Lenovo Slim Pro 7 14ARP8 | |
| Samsung Galaxy Book3 Ultra 16 | |
| Dell Inspiron 16 Plus 7630 | |
| Asus VivoBook Pro 16 K6602VU | |
| HP Pavilion Plus 16-ab0456tx | |
| Asus VivoBook 14X K3405 | |
| Ortalama Intel Core i7-13700H, NVIDIA GeForce RTX 3050 6GB Laptop GPU (85.7 - 89.7, n=2) | |
| Schenker Vision 14 M23 RTX 3050 | |
| WebXPRT 3 / Overall | |
| Sınıf ortalaması Multimedia (136.4 - 596, n=70, son 2 yıl) | |
| Dell Inspiron 16 Plus 7630 | |
| Schenker Vision 14 M23 RTX 3050 | |
| Ortalama Intel Core i7-13700H, NVIDIA GeForce RTX 3050 6GB Laptop GPU (286 - 300, n=2) | |
| HP Pavilion Plus 16-ab0456tx | |
| Asus VivoBook 14X K3405 | |
| Lenovo Slim Pro 7 14ARP8 | |
| Samsung Galaxy Book3 Ultra 16 | |
| WebXPRT 4 / Overall | |
| Schenker Vision 14 M23 RTX 3050 | |
| Ortalama Intel Core i7-13700H, NVIDIA GeForce RTX 3050 6GB Laptop GPU (273 - 325, n=2) | |
| Sınıf ortalaması Multimedia (167.3 - 402, n=71, son 2 yıl) | |
| Dell Inspiron 16 Plus 7630 | |
| HP Pavilion Plus 16-ab0456tx | |
| Asus VivoBook 14X K3405 | |
| Asus VivoBook Pro 16 K6602VU | |
| Samsung Galaxy Book3 Ultra 16 | |
| Lenovo Slim Pro 7 14ARP8 | |
| Mozilla Kraken 1.1 / Total | |
| Lenovo Slim Pro 7 14ARP8 | |
| Samsung Galaxy Book3 Ultra 16 | |
| Asus VivoBook 14X K3405 | |
| Asus VivoBook Pro 16 K6602VU | |
| Dell Inspiron 16 Plus 7630 | |
| Schenker Vision 14 M23 RTX 3050 | |
| Ortalama Intel Core i7-13700H, NVIDIA GeForce RTX 3050 6GB Laptop GPU (490 - 496, n=2) | |
| HP Pavilion Plus 16-ab0456tx | |
| Sınıf ortalaması Multimedia (228 - 835, n=73, son 2 yıl) | |
* ... daha küçük daha iyidir
| PCMark 8 Home Score Accelerated v2 | 5525 puan | |
| PCMark 8 Work Score Accelerated v2 | 5653 puan | |
| PCMark 10 Score | 6597 puan | |
Yardım | ||
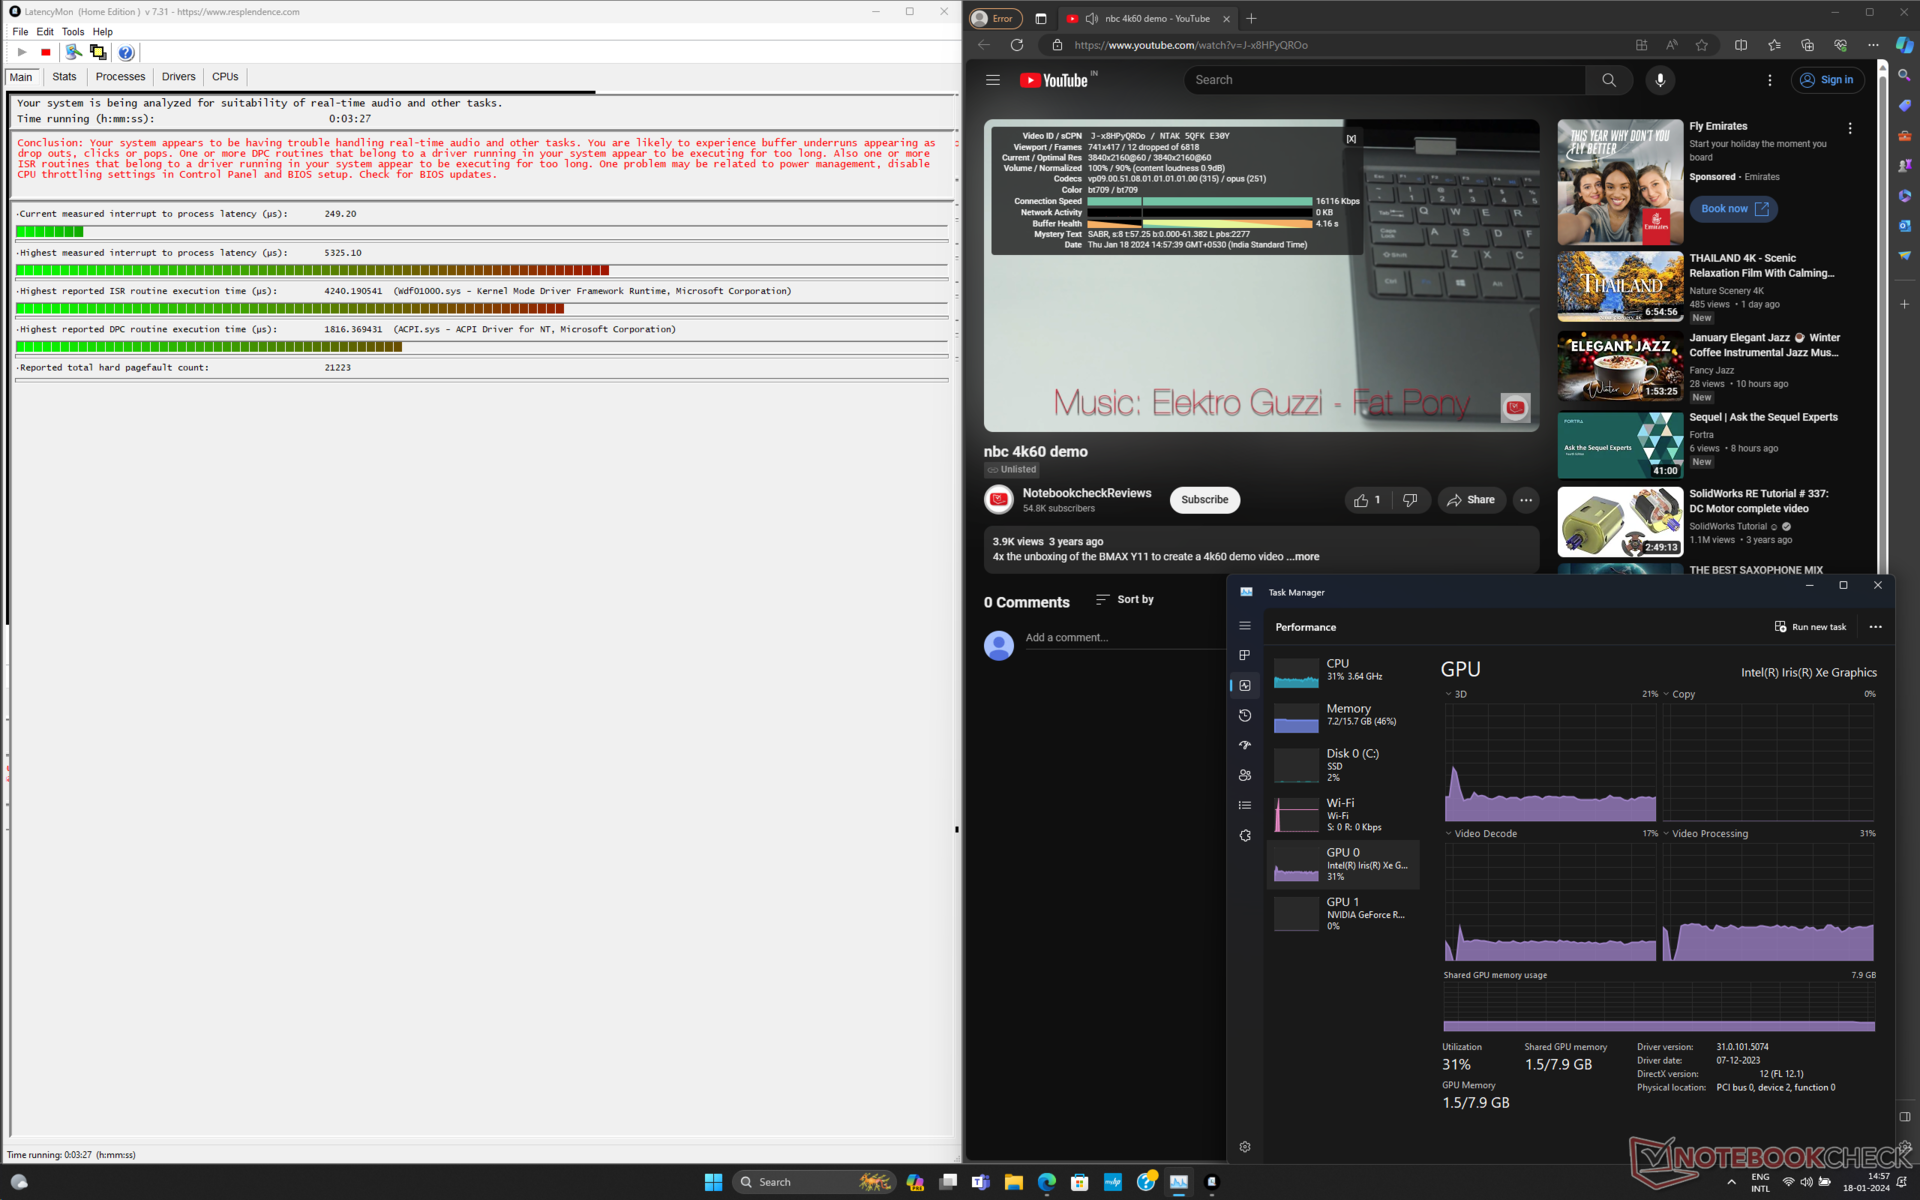
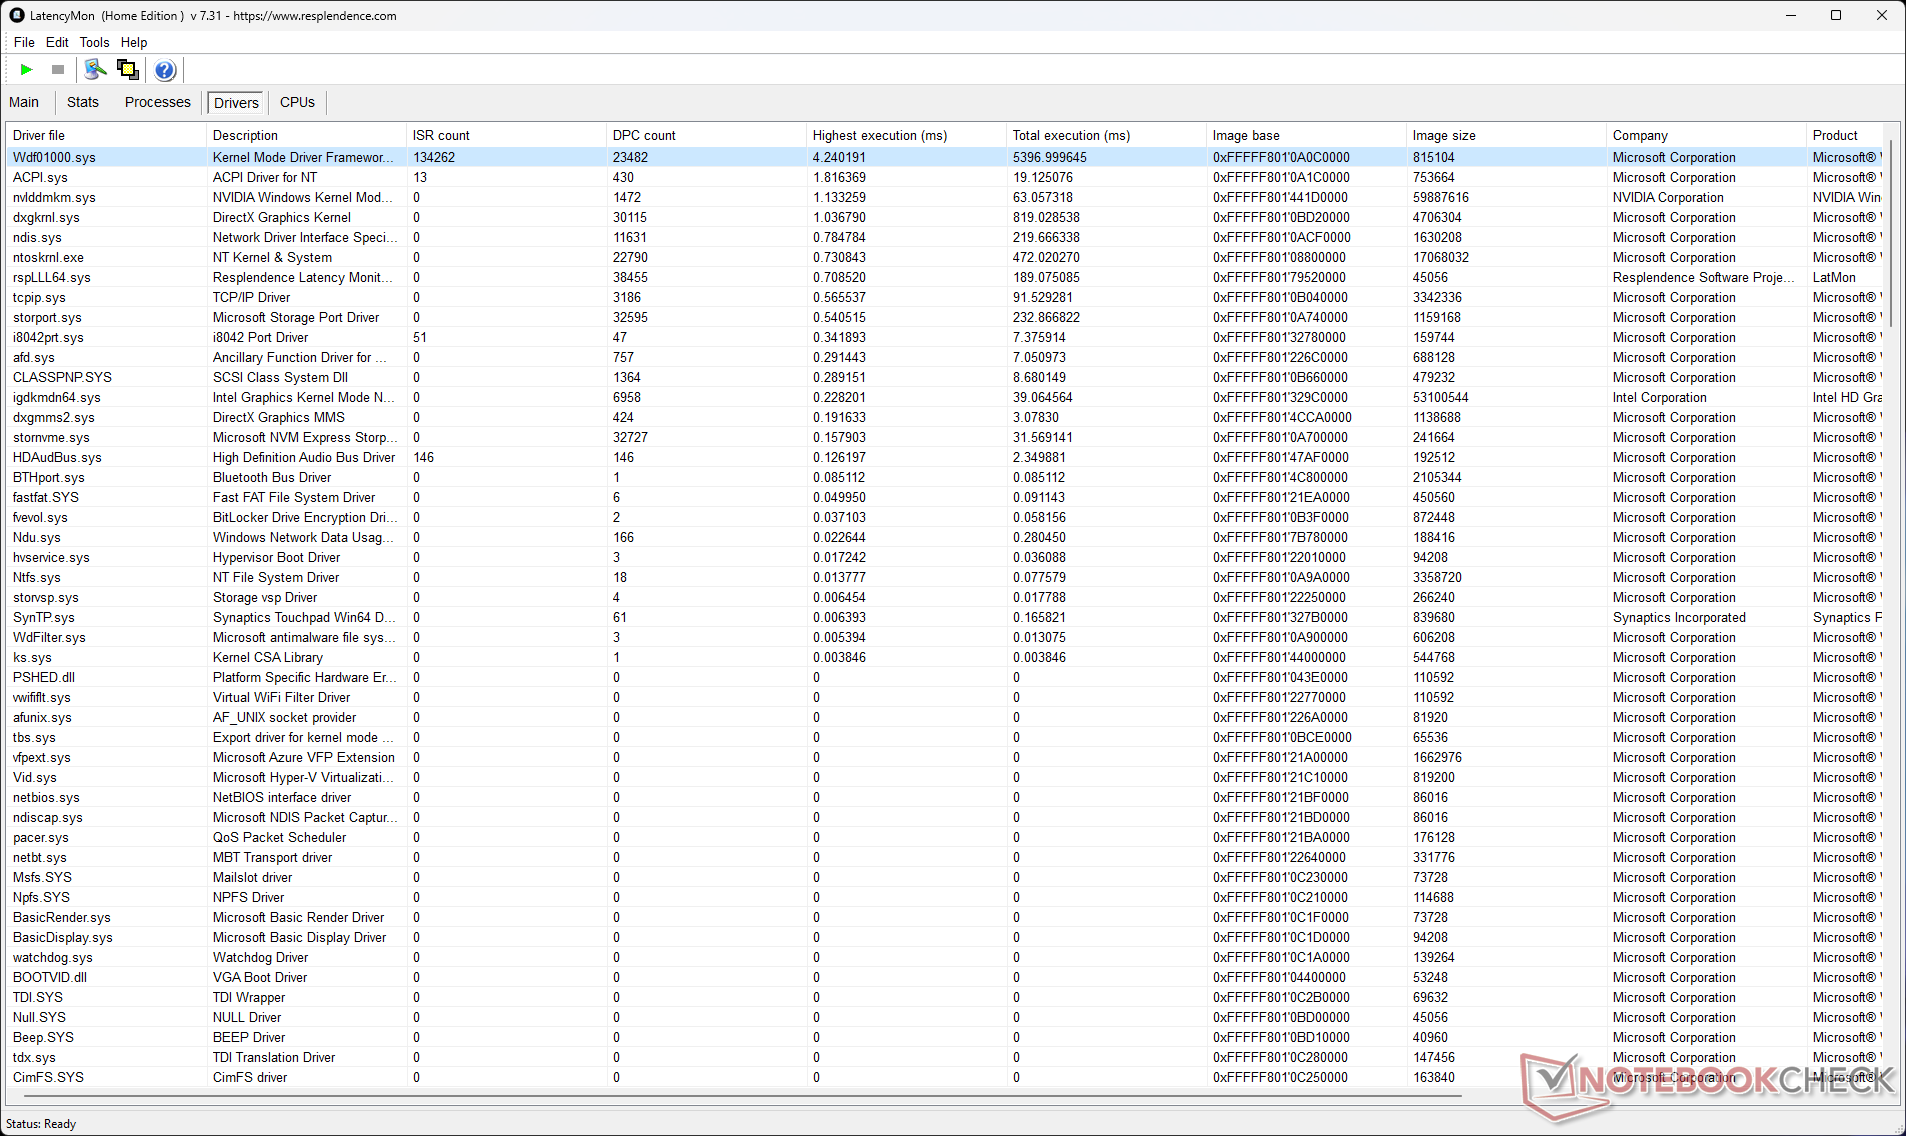
DPC Gecikme Süresi
Pavilion Plus 16'nın ölçülen 5325,1 μs'lik kesme-işlem gecikmesi daha yüksektir ve bu da gerçek zamanlı ses ve video iş akışlarıyla ilgilenenler için bir endişe kaynağı olabilir.
| DPC Latencies / LatencyMon - interrupt to process latency (max), Web, Youtube, Prime95 | |
| HP Pavilion Plus 16-ab0456tx | |
| Samsung Galaxy Book3 Ultra 16 | |
| Asus VivoBook Pro 16 K6602VU | |
| Schenker Vision 14 M23 RTX 3050 | |
| Lenovo Slim Pro 7 14ARP8 | |
| Asus VivoBook 14X K3405 | |
| Dell Inspiron 16 Plus 7630 | |
* ... daha küçük daha iyidir
Bizim DPC Gecikme Sıralaması sayfası, incelenen cihazlar arasında daha fazla gecikme karşılaştırması sunar.
Depolama Cihazları
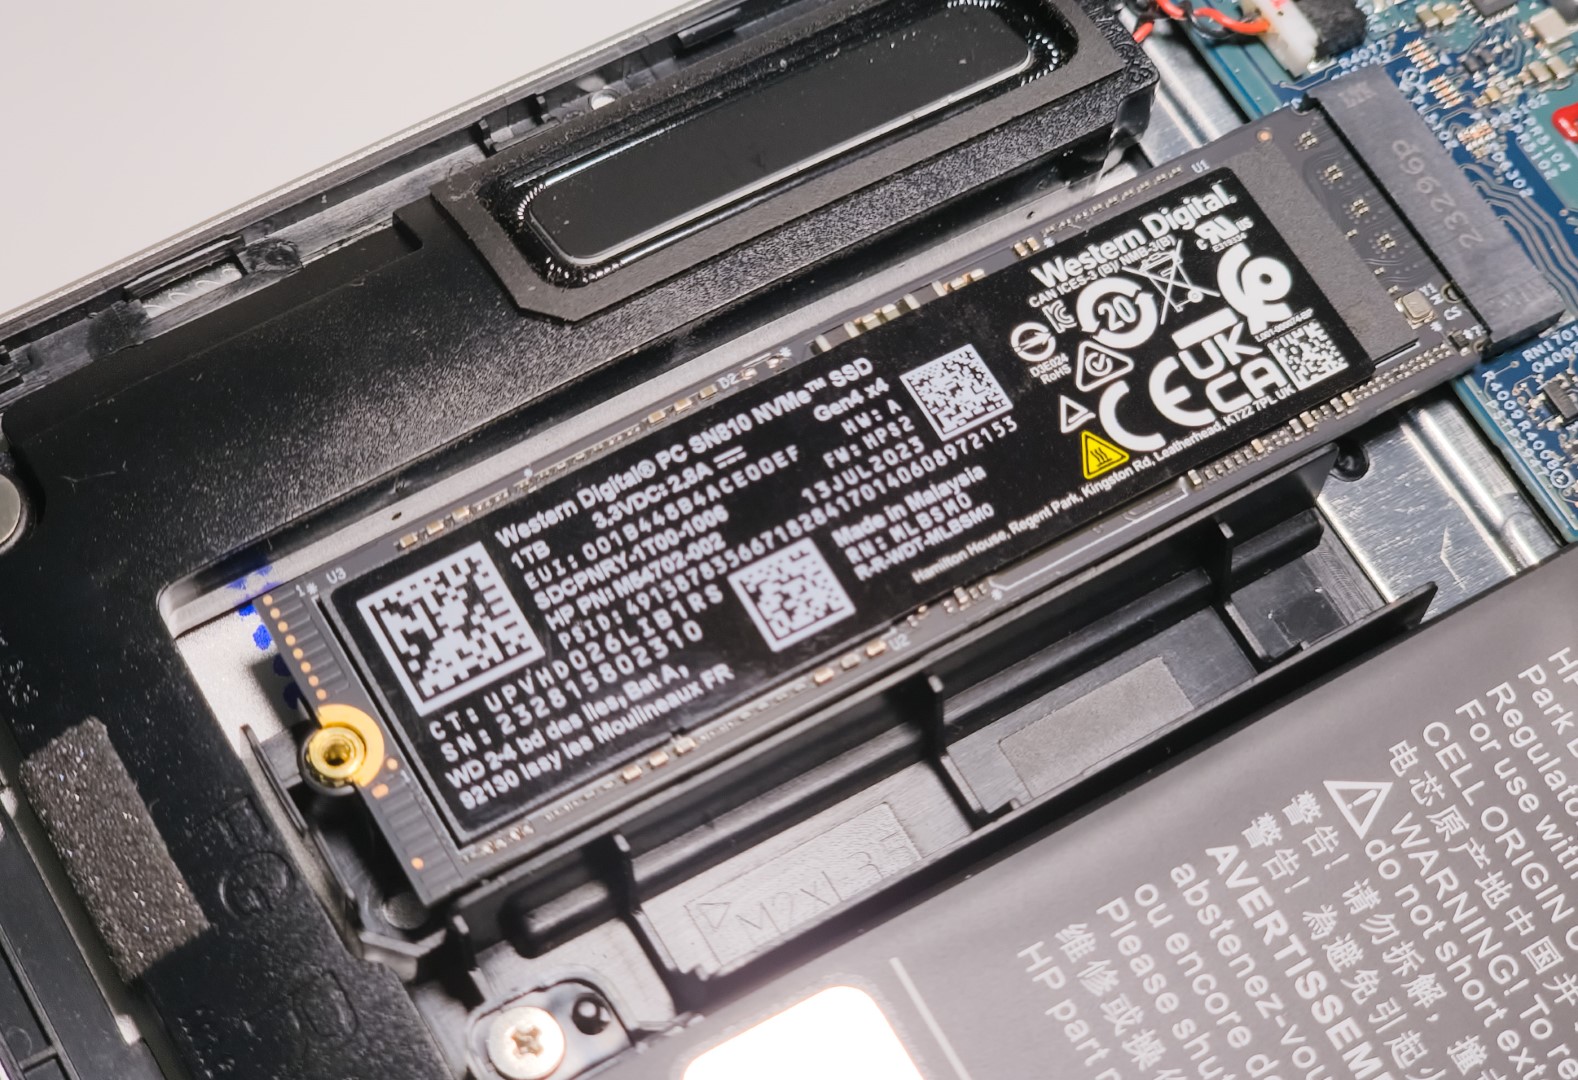
Western Digital PC SN810 1 TB NVMe sürücü Pavilion Plus 16 ünitemize takılı olarak geliyor. Kümülatif sürücü performansı, Schenker Vision 14 M23'teki Samsung 990 Pro'dan yaklaşık %10 daha yavaş ve Schenker Vision 14 M23'teki Samsung PM9A1'den yaklaşık %16 daha yavaş Samsung Galaxy Book3 Ultra 16.
Düşük 4K okuma/yazma performansı bu performans açığına katkıda bulunmaktadır.
Ne yazık ki kasaya yalnızca bir SSD takılabiliyor. Ayrıca 2,5 inç sürücüler de eklenemiyor.

| Drive Performance rating - Percent | |
| Samsung Galaxy Book3 Ultra 16 | |
| Schenker Vision 14 M23 RTX 3050 | |
| Ortalama WDC PC SN810 1TB | |
| HP Pavilion Plus 16-ab0456tx | |
| Sınıf ortalaması Multimedia | |
| Dell Inspiron 16 Plus 7630 | |
| Lenovo Slim Pro 7 14ARP8 | |
| Asus VivoBook 14X K3405 | |
| Asus VivoBook Pro 16 K6602VU | |
* ... daha küçük daha iyidir
Disk Daraltma: DiskSpd Okuma Döngüsü, Kuyruk Derinliği 8
HP, SSD için bir termal kapak sağlamasına rağmen, 8 kuyruk derinliğinde DiskSpd okuma döngüsü testimiz sırasında sürücünün 25. döngüden sonra yavaşlamasını önlemek için yeterli değildir.
Daha fazla depolama kıyaslamasını şurada bulabilirsiniz SSD karşılaştırma sayfası.
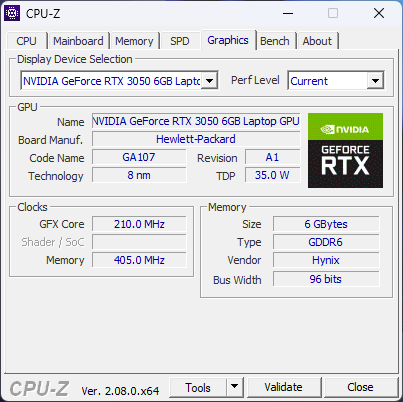
GPU Performansı
Pavilion Plus 16, Lenovo Slim Pro 7 ve Schenker Vision 14 M23 dışında yeni RTX 3050 6 GB Dizüstü Bilgisayar GPU'suna sahip test ettiğimiz diğer tek dizüstü bilgisayar.
HP dizüstü bilgisayardaki RTX 3050 6 GB, 60 W TGP olarak derecelendirilirken, Schenker ve Lenovo sırasıyla 50 W ve 63 W uygulamalarına sahiptir.
Buna göre, Slim 7 Pro kümülatif 3DMark performansında Pavilion Plus 16'ya göre hafif bir üstünlüğe sahipken, Vision 14 M23 HP'yi %5 oranında geride bırakıyor.
| 3DMark Performance rating - Percent | |
| Dell Inspiron 16 Plus 7630 -1! | |
| Asus VivoBook Pro 16 K6602VU | |
| Samsung Galaxy Book3 Ultra 16 | |
| Sınıf ortalaması Multimedia | |
| Lenovo Slim Pro 7 14ARP8 -1! | |
| HP Pavilion Plus 16-ab0456tx -1! | |
| Schenker Vision 14 M23 RTX 3050 -1! | |
| Ortalama NVIDIA GeForce RTX 3050 4GB Laptop GPU | |
| Asus VivoBook 14X K3405 | |
| 3DMark 11 Performance | 17282 puan | |
| 3DMark Ice Storm Standard Score | 82182 puan | |
| 3DMark Cloud Gate Standard Score | 43015 puan | |
| 3DMark Fire Strike Score | 10890 puan | |
| 3DMark Fire Strike Extreme Score | 5641 puan | |
Yardım | ||
| Blender / v3.3 Classroom OPTIX/RTX | |
| Asus VivoBook 14X K3405 | |
| Schenker Vision 14 M23 RTX 3050 | |
| Ortalama NVIDIA GeForce RTX 3050 4GB Laptop GPU (53 - 99, n=12) | |
| Lenovo Slim Pro 7 14ARP8 | |
| HP Pavilion Plus 16-ab0456tx | |
| Sınıf ortalaması Multimedia (12 - 105, n=24, son 2 yıl) | |
| Samsung Galaxy Book3 Ultra 16 | |
| Asus VivoBook Pro 16 K6602VU | |
| Dell Inspiron 16 Plus 7630 | |
| Blender / v3.3 Classroom CUDA | |
| Asus VivoBook 14X K3405 | |
| Asus VivoBook 14X K3405 | |
| Ortalama NVIDIA GeForce RTX 3050 4GB Laptop GPU (97 - 152, n=13) | |
| Schenker Vision 14 M23 RTX 3050 | |
| Lenovo Slim Pro 7 14ARP8 | |
| HP Pavilion Plus 16-ab0456tx | |
| Samsung Galaxy Book3 Ultra 16 | |
| Sınıf ortalaması Multimedia (20 - 186, n=24, son 2 yıl) | |
| Asus VivoBook Pro 16 K6602VU | |
| Dell Inspiron 16 Plus 7630 | |
| Blender / v3.3 Classroom CPU | |
| Ortalama NVIDIA GeForce RTX 3050 4GB Laptop GPU (388 - 937, n=11) | |
| Schenker Vision 14 M23 RTX 3050 | |
| Asus VivoBook 14X K3405 | |
| Lenovo Slim Pro 7 14ARP8 | |
| Dell Inspiron 16 Plus 7630 | |
| Sınıf ortalaması Multimedia (134.5 - 1042, n=67, son 2 yıl) | |
| Samsung Galaxy Book3 Ultra 16 | |
| HP Pavilion Plus 16-ab0456tx | |
| Asus VivoBook Pro 16 K6602VU | |
* ... daha küçük daha iyidir
Oyun Performansı
RTX 3050 6 GB ile 1080p oyunlarda, RTX 3050 6 GB'a kıyasla yaklaşık %10'luk bir kümülatif fayda görüyoruz RTX 3050 4 GB ortalama.
Pavilion Plus 16'nın RTX 3050'si, kümülatif 1080p oyun performansında Slim Pro 7 ve Vision 14 M23'e göre iyi kazanımlar gösterirken, VivoBook Pro 16'daki 65 W RTX 4050 Dizüstü Bilgisayar GPU'sunun %25 gerisinde kalıyor.
İlginç bir şekilde, Pavilion Plus 16 genel oyunlarda RTX 4050'ye sahip Galaxy Book3 Ultra 16'yı da geride bırakabiliyor, ancak bunun nedeni Dota 2 Reborn ve X-Plane 11'deki kötü performansı.
RTX 3050 6 GB, eski oyunları 1080p Ultra'da sorunsuz bir şekilde oynatabilir, ancak modern AAA oyunları 1080p Yüksek ayarların üzerinde herhangi bir şeyle mücadele eder.
| Performance rating - Percent | |
| Dell Inspiron 16 Plus 7630 -1! | |
| Asus VivoBook Pro 16 K6602VU | |
| HP Pavilion Plus 16-ab0456tx | |
| Samsung Galaxy Book3 Ultra 16 | |
| Lenovo Slim Pro 7 14ARP8 -1! | |
| Ortalama NVIDIA GeForce RTX 3050 4GB Laptop GPU | |
| Schenker Vision 14 M23 RTX 3050 | |
| Sınıf ortalaması Multimedia | |
| Asus VivoBook 14X K3405 | |
| The Witcher 3 - 1920x1080 Ultra Graphics & Postprocessing (HBAO+) | |
| Dell Inspiron 16 Plus 7630 | |
| Asus VivoBook Pro 16 K6602VU | |
| Samsung Galaxy Book3 Ultra 16 | |
| Lenovo Slim Pro 7 14ARP8 | |
| HP Pavilion Plus 16-ab0456tx | |
| Sınıf ortalaması Multimedia (11 - 121, n=13, son 2 yıl) | |
| Ortalama NVIDIA GeForce RTX 3050 4GB Laptop GPU (31.5 - 55.8, n=21) | |
| Schenker Vision 14 M23 RTX 3050 | |
| Asus VivoBook 14X K3405 | |
| GTA V - 1920x1080 Highest AA:4xMSAA + FX AF:16x | |
| Asus VivoBook Pro 16 K6602VU | |
| Samsung Galaxy Book3 Ultra 16 | |
| Lenovo Slim Pro 7 14ARP8 | |
| HP Pavilion Plus 16-ab0456tx | |
| Ortalama NVIDIA GeForce RTX 3050 4GB Laptop GPU (48 - 72.5, n=21) | |
| Sınıf ortalaması Multimedia (7.92 - 141.6, n=63, son 2 yıl) | |
| Schenker Vision 14 M23 RTX 3050 | |
| Asus VivoBook 14X K3405 | |
| Final Fantasy XV Benchmark - 1920x1080 High Quality | |
| Dell Inspiron 16 Plus 7630 | |
| Asus VivoBook Pro 16 K6602VU | |
| Samsung Galaxy Book3 Ultra 16 | |
| Sınıf ortalaması Multimedia (7.61 - 144.4, n=66, son 2 yıl) | |
| HP Pavilion Plus 16-ab0456tx | |
| Lenovo Slim Pro 7 14ARP8 | |
| Ortalama NVIDIA GeForce RTX 3050 4GB Laptop GPU (35.9 - 53.5, n=21) | |
| Schenker Vision 14 M23 RTX 3050 | |
| Asus VivoBook 14X K3405 | |
| Strange Brigade - 1920x1080 ultra AA:ultra AF:16 | |
| Dell Inspiron 16 Plus 7630 | |
| Asus VivoBook Pro 16 K6602VU | |
| Samsung Galaxy Book3 Ultra 16 | |
| Sınıf ortalaması Multimedia (13.3 - 303, n=66, son 2 yıl) | |
| HP Pavilion Plus 16-ab0456tx | |
| Ortalama NVIDIA GeForce RTX 3050 4GB Laptop GPU (57.9 - 95.1, n=21) | |
| Schenker Vision 14 M23 RTX 3050 | |
| Asus VivoBook 14X K3405 | |
| Dota 2 Reborn - 1920x1080 ultra (3/3) best looking | |
| Dell Inspiron 16 Plus 7630 | |
| Asus VivoBook Pro 16 K6602VU | |
| HP Pavilion Plus 16-ab0456tx | |
| Asus VivoBook 14X K3405 | |
| Ortalama NVIDIA GeForce RTX 3050 4GB Laptop GPU (82.8 - 147.7, n=22) | |
| Schenker Vision 14 M23 RTX 3050 | |
| Lenovo Slim Pro 7 14ARP8 | |
| Sınıf ortalaması Multimedia (29 - 179.9, n=68, son 2 yıl) | |
| Samsung Galaxy Book3 Ultra 16 | |
| X-Plane 11.11 - 1920x1080 high (fps_test=3) | |
| Dell Inspiron 16 Plus 7630 | |
| Asus VivoBook Pro 16 K6602VU | |
| HP Pavilion Plus 16-ab0456tx | |
| Schenker Vision 14 M23 RTX 3050 | |
| Samsung Galaxy Book3 Ultra 16 | |
| Asus VivoBook 14X K3405 | |
| Ortalama NVIDIA GeForce RTX 3050 4GB Laptop GPU (51.6 - 103.1, n=22) | |
| Lenovo Slim Pro 7 14ARP8 | |
| Sınıf ortalaması Multimedia (16.9 - 141.1, n=62, son 2 yıl) | |
Witcher 3 FPS Tablosu
The Witcher 3 ile 1080p Ultra'da yaptığımız stres testi sırasında hissedilebilir bir yavaşlama gözlemlemedik, bu da verimli soğutmaya işaret ediyor.
| düşük | orta | yüksek | ultra | QHD | |
|---|---|---|---|---|---|
| GTA V (2015) | 177.9 | 172 | 123.3 | 62.7 | 42.7 |
| The Witcher 3 (2015) | 244 | 159.1 | 91.4 | 50.1 | 37 |
| Dota 2 Reborn (2015) | 155.2 | 131 | 124.2 | 116.9 | |
| Final Fantasy XV Benchmark (2018) | 128.2 | 70.9 | 52 | 37.4 | |
| X-Plane 11.11 (2018) | 140.6 | 117 | 97.3 | ||
| Far Cry 5 (2018) | 89 | 82 | 76 | 52 | |
| Strange Brigade (2018) | 256 | 112.8 | 91.9 | 80.5 | 57.1 |
| F1 22 (2022) | 150.2 | 145.3 | 109.5 | 34 | 20.1 |
| F1 23 (2023) | 150.1 | 141.2 | 97.5 | 26 | 14.3 |
| Cyberpunk 2077 (2023) | 67.6 | 52.1 | 43.2 | 36.9 | 21.3 |
| Assassin's Creed Mirage (2023) | 70 | 63 | 55 | 41 | 31 |
| Avatar Frontiers of Pandora (2023) | 39.5 | 36.3 | 31.5 | 23.4 | 15.1 |
Özel olarak hazırladığımız Nvidia GeForce RTX 3050 6 GB Dizüstü Bilgisayar GPU'su sayfasından daha fazla bilgi edinebilirsiniz.
Emisyonlar: Tolere edilebilir fan gürültüsü ancak yük altında yüksek yüzey sıcaklıkları
Sistem Gürültüsü
Maksimum yük altında Performans modunda 42,1 dB(A) ses basınç seviyesi (SPL) ölçtük. HP'nin fan gürültüsünün Dengeli modda 35 db(A) ve Performans modunda 45 dB(A) altında kalması için sınırlar belirlediği görülüyor.
Ses yüksekliği
| Boşta |
| 22.22 / 22.22 / 22.22 dB |
| Çalışırken |
| 42.03 / 42.1 dB |
 | ||
30 dB sessiz 40 dB(A) duyulabilirlik 50 dB(A) gürültülü |
||
min: | ||
| Performans Modu | Rölanti dB(A) | Yük ortalama dB(A) | Yük maksimum dB(A) | Witcher 3 1080p Ultra dB(A) |
|---|---|---|---|---|
| Dengeli | 22.22 | 33.81 | 34.08 | 34.41 / 48 fps |
| Performans | 22.22 | 42.03 | 42.1 | 42.1 / 50 fps |
| HP Pavilion Plus 16-ab0456tx i7-13700H, GeForce RTX 3050 6GB Laptop GPU | Schenker Vision 14 M23 RTX 3050 i7-13700H, GeForce RTX 3050 6GB Laptop GPU | Dell Inspiron 16 Plus 7630 i7-13700H, GeForce RTX 4060 Laptop GPU | Asus VivoBook 14X K3405 i5-13500H, GeForce RTX 3050 4GB Laptop GPU | Lenovo Slim Pro 7 14ARP8 R7 7735HS, GeForce RTX 3050 6GB Laptop GPU | Asus VivoBook Pro 16 K6602VU i9-13900H, GeForce RTX 4050 Laptop GPU | Samsung Galaxy Book3 Ultra 16 i7-13700H, GeForce RTX 4050 Laptop GPU | |
|---|---|---|---|---|---|---|---|
| Noise | -10% | -7% | -10% | -4% | -14% | -9% | |
| kapalı / ortam * (dB) | 22.22 | 23.5 -6% | 23.2 -4% | 21.46 3% | 22.7 -2% | 20.96 6% | 25 -13% |
| Idle Minimum * (dB) | 22.22 | 23.5 -6% | 23.2 -4% | 22.08 1% | 22.8 -3% | 25.28 -14% | 26 -17% |
| Idle Average * (dB) | 22.22 | 23.5 -6% | 23.2 -4% | 22.08 1% | 22.8 -3% | 25.28 -14% | 27 -22% |
| Idle Maximum * (dB) | 22.22 | 26 -17% | 23.2 -4% | 22.08 1% | 22.8 -3% | 25.28 -14% | 28 -26% |
| Load Average * (dB) | 42.03 | 43.6 -4% | 35.1 16% | 52.98 -26% | 43.8 -4% | 51.88 -23% | 40 5% |
| Witcher 3 ultra * (dB) | 42.1 | 48.7 -16% | 52.5 -25% | 52.7 -25% | 43.8 -4% | 49 -16% | 39 7% |
| Load Maximum * (dB) | 42.1 | 49.1 -17% | 52.5 -25% | 52.67 -25% | 47.1 -12% | 51.8 -23% | 41 3% |
* ... daha küçük daha iyidir
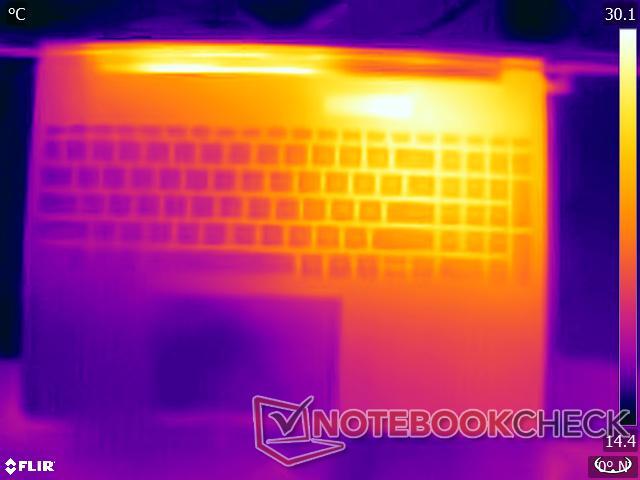
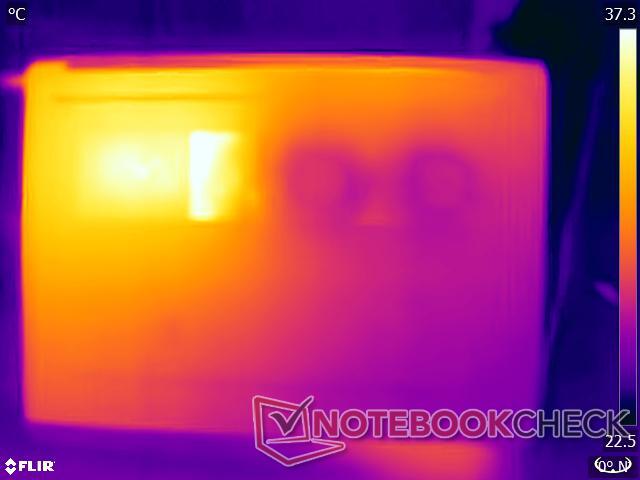
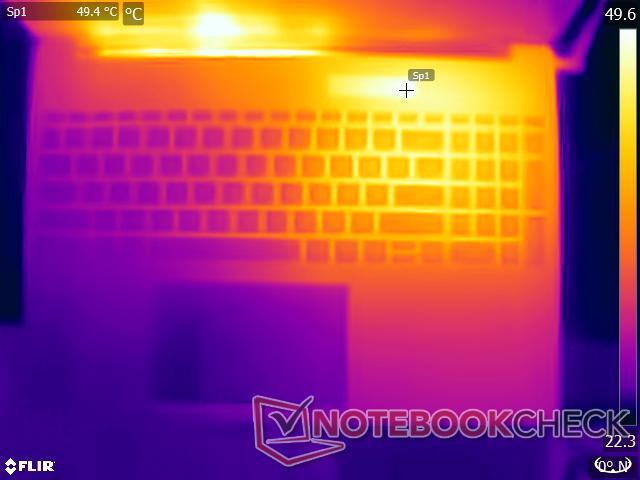
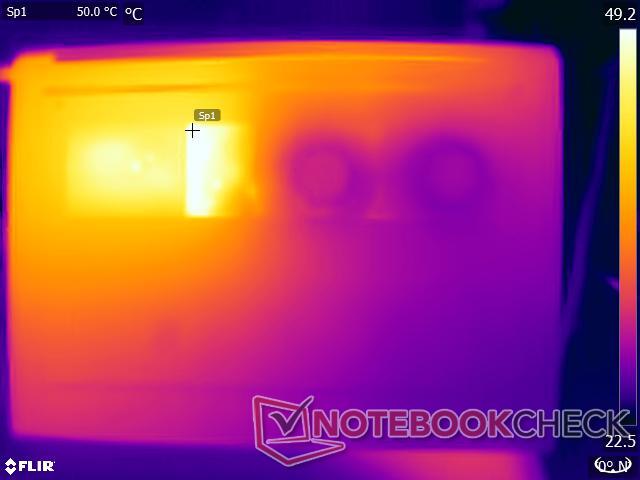
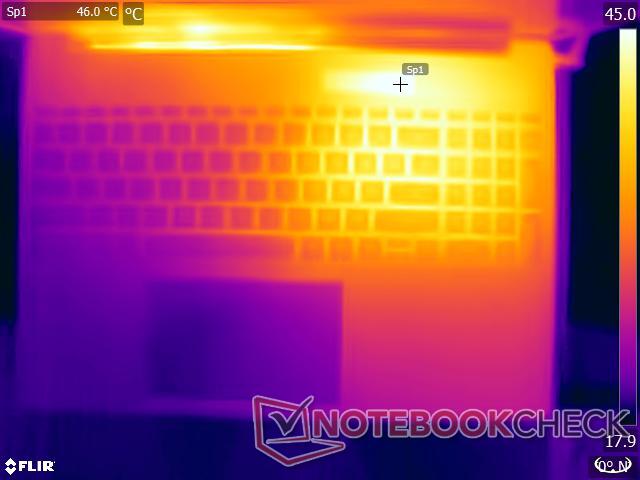
Sıcaklık
Pavilion Plus 16, CPU ve GPU'yu soğutmak için çift fanlı çift ısı borulu bir sistem kullanmaktadır. Stres testlerimiz sırasında, bu kurulum üstte 49,6°C ve altta 45,8°C'ye ulaşan yüzey sıcaklıkları ile sınırları zorladı.
Cihaz hafif görevler için kucakta rahatça kullanılabilse de, ağır iş yükü altında rahatsız edici olabilir.
(-) Üst taraftaki maksimum sıcaklık, 36.8 °C / 98 F ortalamasına kıyasla 49.6 °C / 121 F'dir. , Multimedia sınıfı için 21 ile 71 °C arasında değişir.
(-) Alt kısım, 39.1 °C / 102 F ortalamasına kıyasla maksimum 45.8 °C / 114 F'ye kadar ısınır
(±) Boşta kullanımda, üst tarafın ortalama sıcaklığı 32.3 °C / 90 F olup, cihazın 31.3 °C / 88 F.
(-) The Witcher 3 oynarken, üst tarafın ortalama sıcaklığı 39.7 °C / 103 F olup, cihazın 31.3 °C / 88 F.
(+) Avuç içi dayanakları ve dokunmatik yüzey maksimum (35 °C / 95 F) cilt sıcaklığına ulaşıyor ve bu nedenle sıcak değil.
(-) Benzer cihazların avuç içi dayanağı alanının ortalama sıcaklığı 28.7 °C / 83.7 F (-6.3 °C / -11.3 F) idi.
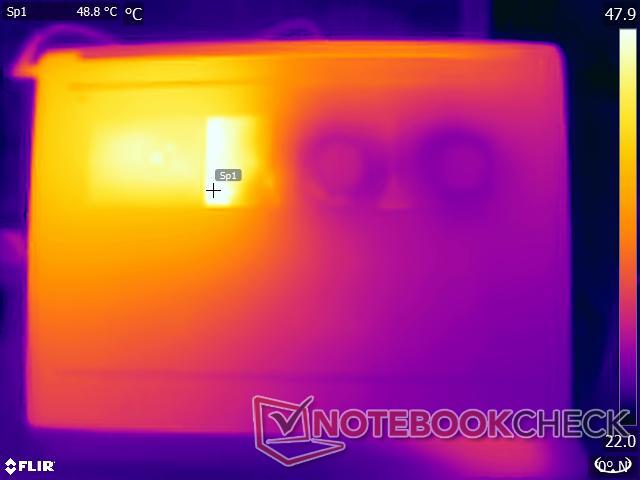
| HP Pavilion Plus 16-ab0456tx Intel Core i7-13700H, NVIDIA GeForce RTX 3050 6GB Laptop GPU | Schenker Vision 14 M23 RTX 3050 Intel Core i7-13700H, NVIDIA GeForce RTX 3050 6GB Laptop GPU | Dell Inspiron 16 Plus 7630 Intel Core i7-13700H, NVIDIA GeForce RTX 4060 Laptop GPU | Asus VivoBook 14X K3405 Intel Core i5-13500H, NVIDIA GeForce RTX 3050 4GB Laptop GPU | Lenovo Slim Pro 7 14ARP8 AMD Ryzen 7 7735HS, NVIDIA GeForce RTX 3050 6GB Laptop GPU | Asus VivoBook Pro 16 K6602VU Intel Core i9-13900H, NVIDIA GeForce RTX 4050 Laptop GPU | Samsung Galaxy Book3 Ultra 16 Intel Core i7-13700H, NVIDIA GeForce RTX 4050 Laptop GPU | |
|---|---|---|---|---|---|---|---|
| Heat | 10% | 6% | -2% | 19% | -1% | 22% | |
| Maximum Upper Side * (°C) | 49.6 | 48.5 2% | 47.8 4% | 49.2 1% | 42.2 15% | 42.6 14% | 41 17% |
| Maximum Bottom * (°C) | 45.8 | 52.8 -15% | 42.2 8% | 54 -18% | 49 -7% | 48.4 -6% | 44 4% |
| Idle Upper Side * (°C) | 39.2 | 27.6 30% | 35.2 10% | 33.6 14% | 24.4 38% | 39.4 -1% | 23 41% |
| Idle Bottom * (°C) | 35.4 | 27 24% | 35 1% | 37.6 -6% | 25.2 29% | 39.8 -12% | 26 27% |
* ... daha küçük daha iyidir
Stres Testi
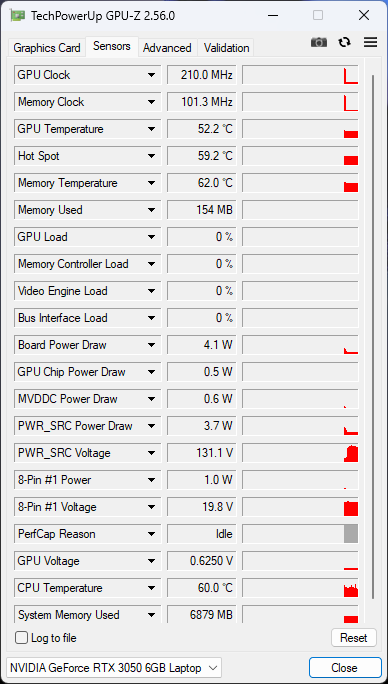
Prime95 yerinde büyük FFT stresi sırasında, Pavilion Plus 16'nın Core i7-13700H'si ortalama 53 W paket gücü tüketirken ortalama 2,2 GHz hızında çalışmaktadır.
FurMark eklendiğinde Core i7-13700H ve RTX 3050 güç için rekabet ederek hem CPU hem de GPU için aralıklı saat artış ve düşüşlerine neden oluyor.
Ortalama olarak Core i7-13700H sadece 1,96 GHz'e kadar çıkabilirken RTX 3050 910 MHz'e çıkabiliyor ve sırasıyla 41 W ve 39 W ortalama güç tüketiyor.
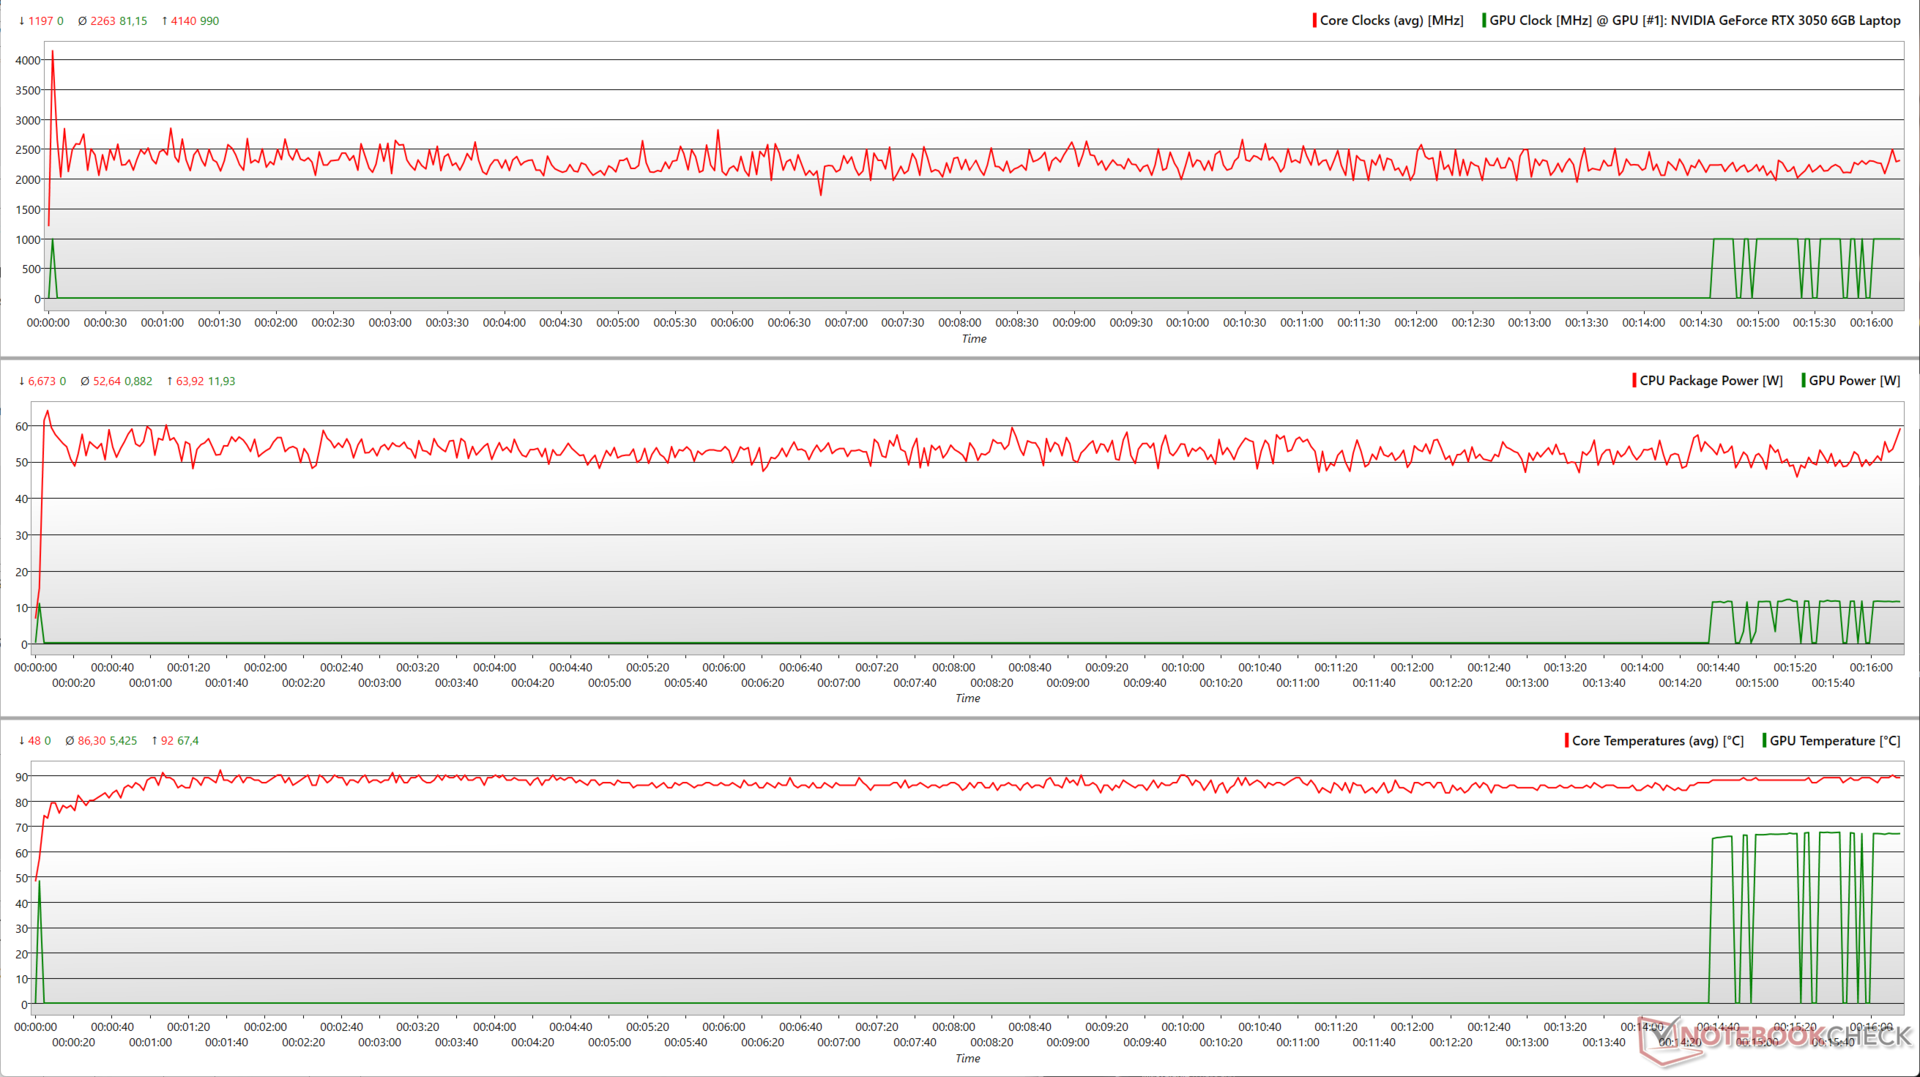
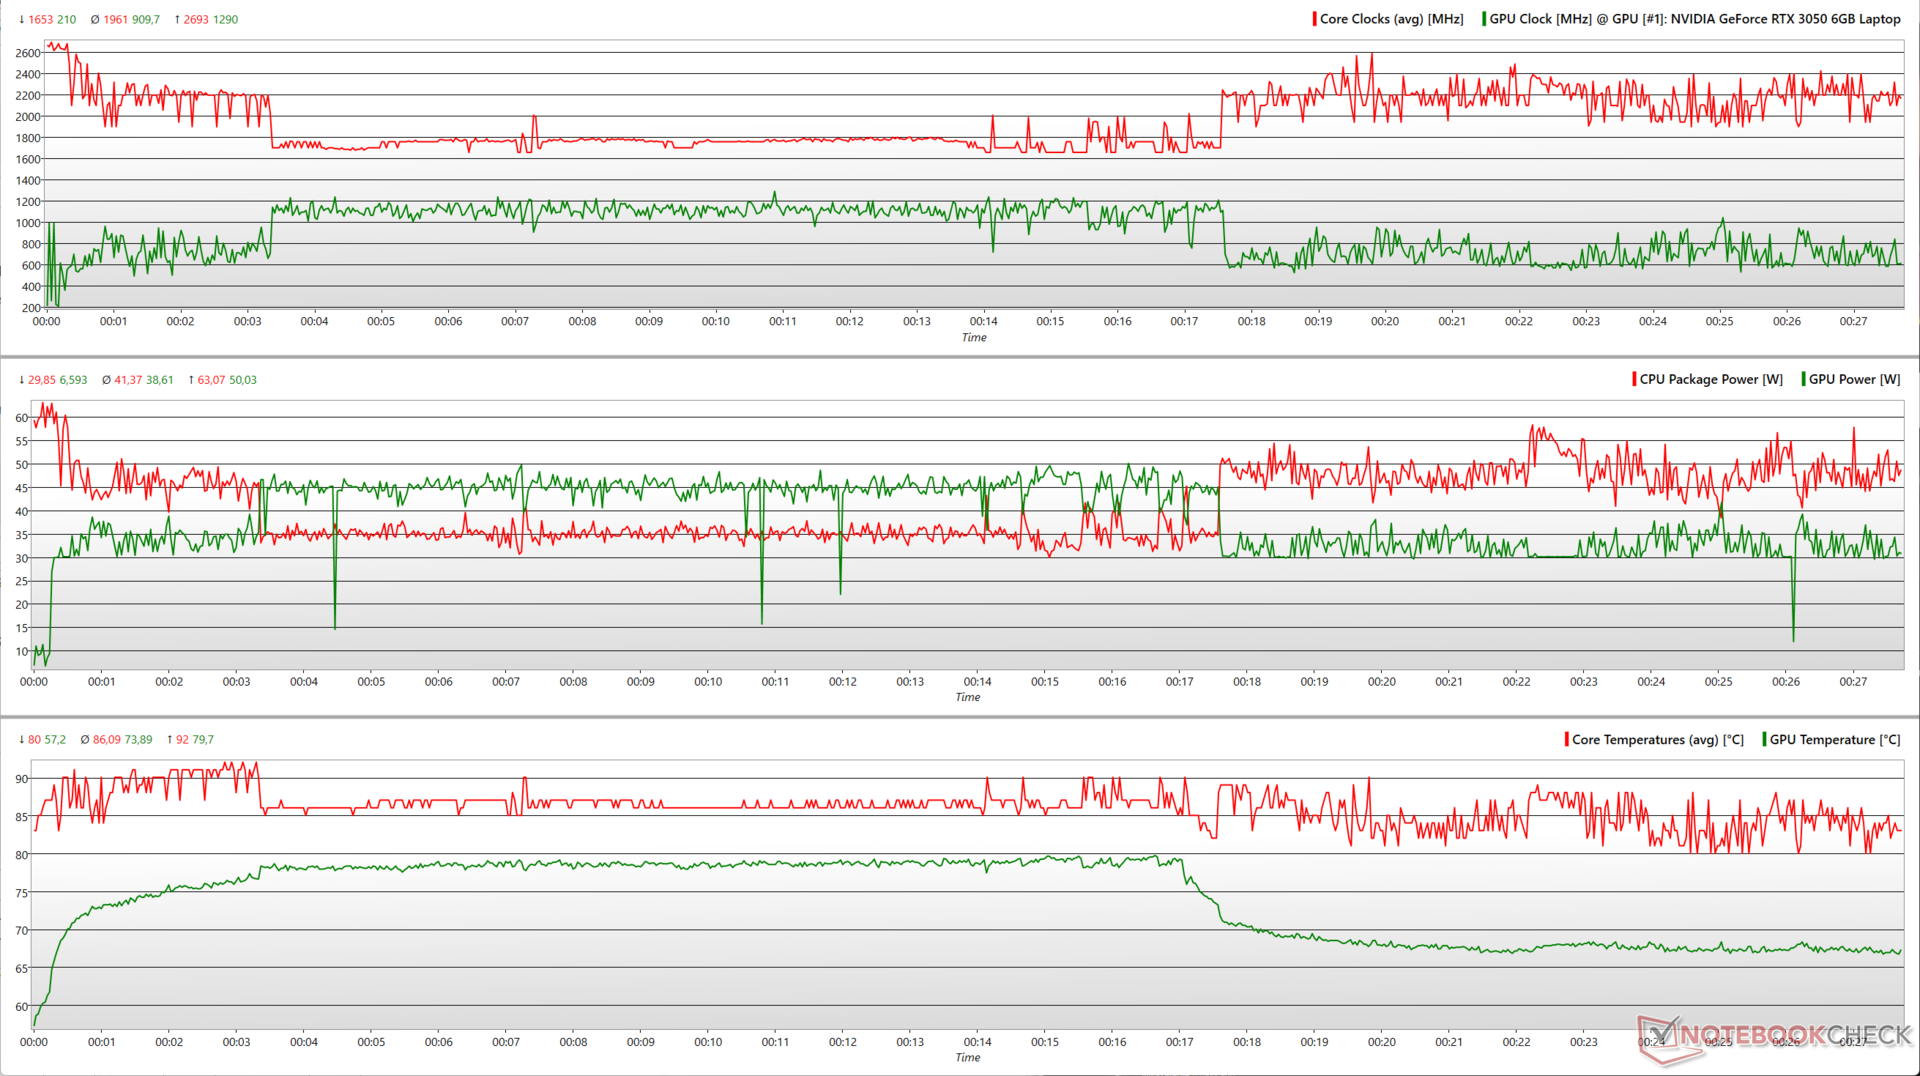
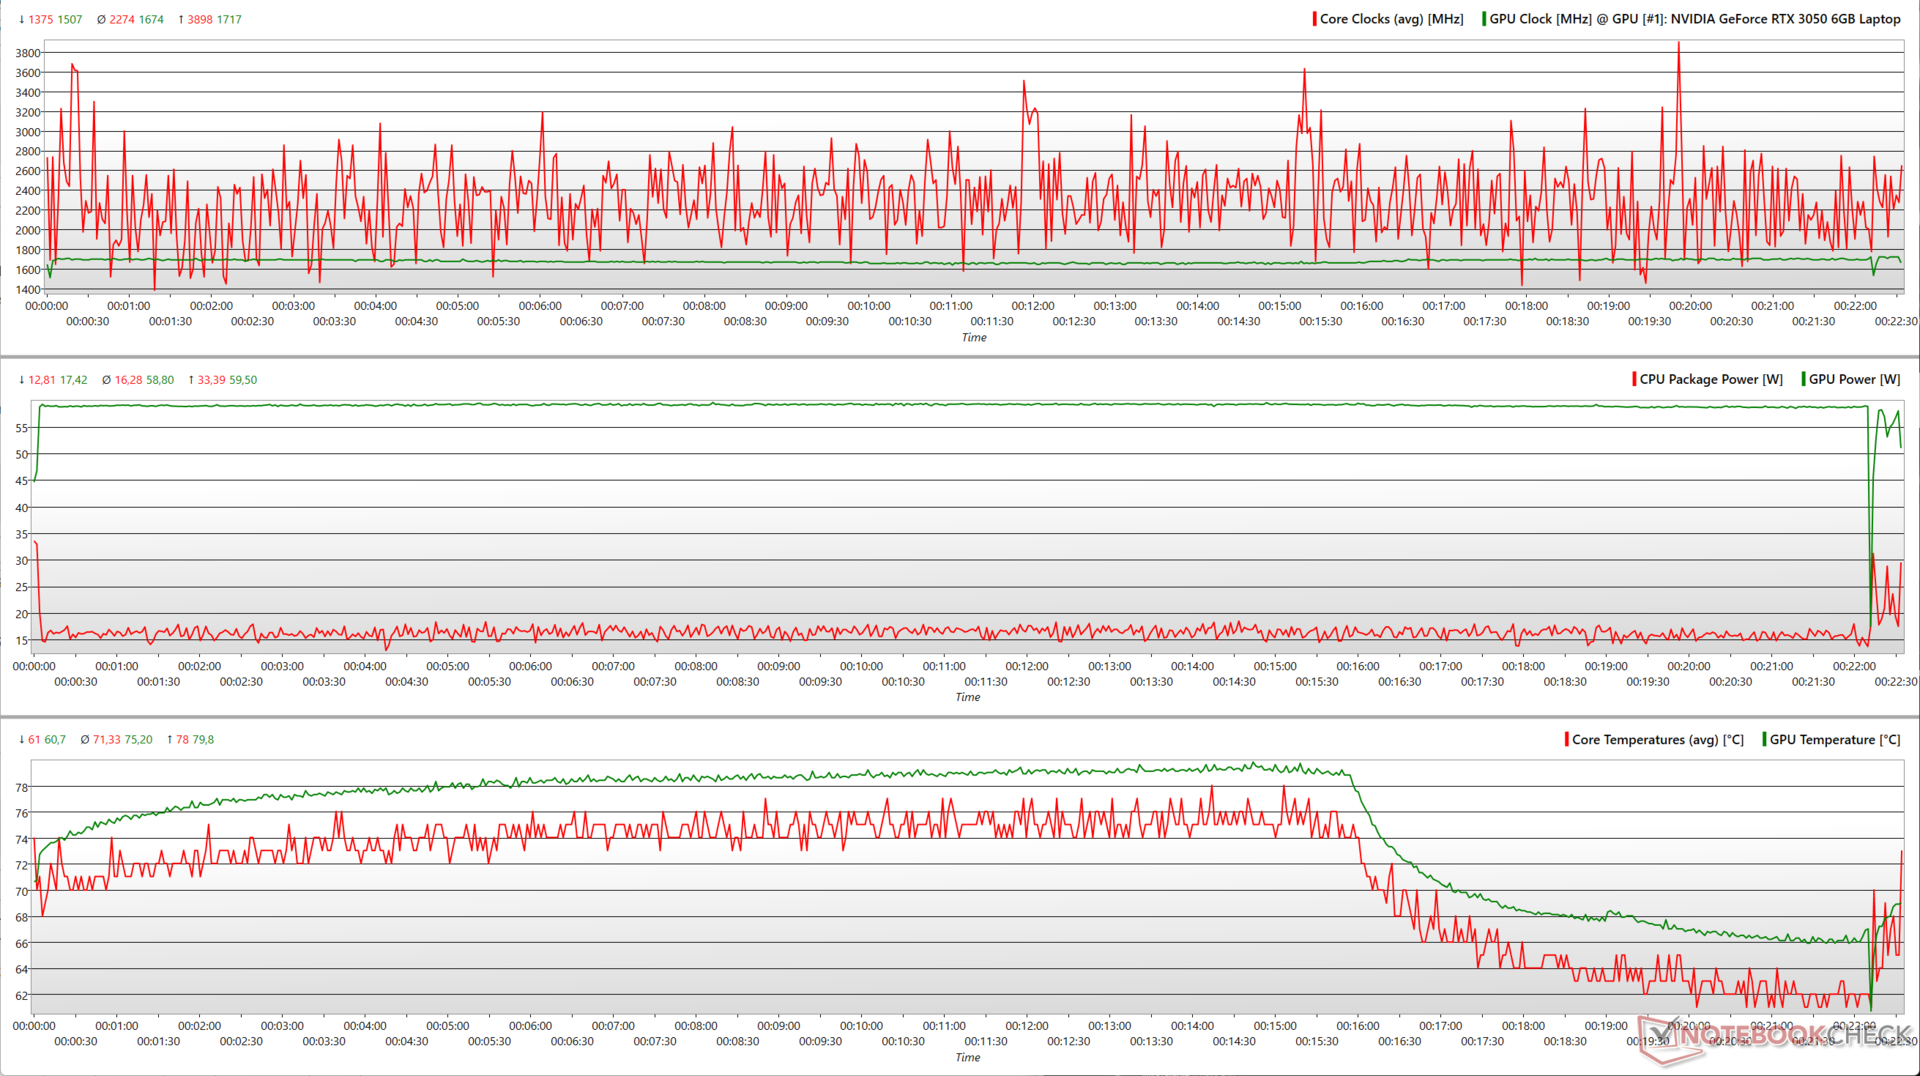
1080p Ultra'da The Witcher 3 ile işler çok daha tahmin edilebilir hale geliyor. RTX 3050 artık neredeyse 60 W'a yakın maksimum TGP'sini tutarlı bir şekilde kullanabiliyor.
İlginç bir şekilde, CPU/GPU saatleri ve gücü nispeten değişmeden kalsa bile çekirdek sıcaklıkları bir süre sonra düşmeye başlıyor.
| Stres Testi | CPU Saati (GHz) | GPU Saati (MHz) | Ortalama CPU Sıcaklığı (°C) | Ortalama GPU Sıcaklığı (°C) |
| Sistem Boşta | 3.74 | - | 52 | 31.1 |
| Prime95 | 2.1 | - | 86 | 67.4 |
| Prime95 + FurMark | 1.93 | 735 | 86 | 73.5 |
| Witcher 3 1080p Ultra | 2.2 | 1,717 | 71 | 74.2 |
Konuşmacılar
Pavilion Plus 16, ortalama büyüklükteki odaların çoğunda yeterli olabilecek 74,2 dB(A) çıkışa sahip bir çift stereo hoparlörle birlikte gelir. Baslar algılanabilir ancak çok belirgin değil. Bununla birlikte, orta ve yüksek sesler nispeten iyi tanımlanmıştır.
Bununla birlikte, kullanıcılar harici hoparlörler veya Bluetooth 5.3 ile daha iyi ses elde edebilirler.
HP Pavilion Plus 16-ab0456tx ses analizi
(±) | hoparlör ses yüksekliği ortalama ama iyi (74.2 dB)
Bas 100 - 315Hz
(±) | azaltılmış bas - ortalama olarak medyandan 14.7% daha düşük
(±) | Bas doğrusallığı ortalamadır (7.8% delta - önceki frekans)
Ortalar 400 - 2000 Hz
(+) | dengeli ortalar - medyandan yalnızca 3.4% uzakta
(+) | orta frekanslar doğrusaldır (4.2% deltadan önceki frekansa)
Yüksekler 2 - 16 kHz
(+) | dengeli yüksekler - medyandan yalnızca 4.6% uzakta
(+) | yüksekler doğrusaldır (4.8% deltadan önceki frekansa)
Toplam 100 - 16.000 Hz
(±) | Genel sesin doğrusallığı ortalamadır (16.7% ortancaya göre fark)
Aynı sınıfla karşılaştırıldığında
» Bu sınıftaki tüm test edilen cihazların %44%'si daha iyi, 8% benzer, 48% daha kötüydü
» En iyisinin deltası 5% idi, ortalama 17% idi, en kötüsü 45% idi
Test edilen tüm cihazlarla karşılaştırıldığında
» Test edilen tüm cihazların %29'si daha iyi, 7 benzer, % 64 daha kötüydü
» En iyisinin deltası 4% idi, ortalama 24% idi, en kötüsü 134% idi
Apple MacBook Pro 16 2021 M1 Pro ses analizi
(+) | hoparlörler nispeten yüksek sesle çalabilir (84.7 dB)
Bas 100 - 315Hz
(+) | iyi bas - medyandan yalnızca 3.8% uzakta
(+) | bas doğrusaldır (5.2% delta ile önceki frekans)
Ortalar 400 - 2000 Hz
(+) | dengeli ortalar - medyandan yalnızca 1.3% uzakta
(+) | orta frekanslar doğrusaldır (2.1% deltadan önceki frekansa)
Yüksekler 2 - 16 kHz
(+) | dengeli yüksekler - medyandan yalnızca 1.9% uzakta
(+) | yüksekler doğrusaldır (2.7% deltadan önceki frekansa)
Toplam 100 - 16.000 Hz
(+) | genel ses doğrusaldır (4.6% ortancaya göre fark)
Aynı sınıfla karşılaştırıldığında
» Bu sınıftaki tüm test edilen cihazların %0%'si daha iyi, 0% benzer, 100% daha kötüydü
» En iyisinin deltası 5% idi, ortalama 17% idi, en kötüsü 45% idi
Test edilen tüm cihazlarla karşılaştırıldığında
» Test edilen tüm cihazların %0'si daha iyi, 0 benzer, % 100 daha kötüydü
» En iyisinin deltası 4% idi, ortalama 24% idi, en kötüsü 134% idi
Enerji Yönetimi: Ekonomik güç çekimleri ve iyi pil ömrü
Güç Tüketimi
Pavilion Plus 16, genel olarak verilen donanım için nispeten daha az güç tüketir. Schenker Vision 14 M23 ve Lenovo Slim Pro 7 ortalama yükte daha tutumlu iken Witcher 3, Pavilion Plus 16 maksimum yük altında daha ekonomiktir.
Birlikte verilen 135 W güç adaptörü, dizüstü bilgisayarı stres altında çalıştırmak için fazlasıyla yeterli.
| Kapalı / Bekleme modu | |
| Boşta | |
| Çalışırken |
|
Key:
min: | |
| HP Pavilion Plus 16-ab0456tx i7-13700H, GeForce RTX 3050 6GB Laptop GPU, IPS, 2560x1600, 16" | Schenker Vision 14 M23 RTX 3050 i7-13700H, GeForce RTX 3050 6GB Laptop GPU, IPS, 2880x1800, 14" | Dell Inspiron 16 Plus 7630 i7-13700H, GeForce RTX 4060 Laptop GPU, IPS, 2560x1600, 16" | Asus VivoBook 14X K3405 i5-13500H, GeForce RTX 3050 4GB Laptop GPU, , 2880x1800, 14" | Lenovo Slim Pro 7 14ARP8 R7 7735HS, GeForce RTX 3050 6GB Laptop GPU, IPS, 2560x1600, 14.5" | Asus VivoBook Pro 16 K6602VU i9-13900H, GeForce RTX 4050 Laptop GPU, OLED, 3200x2000, 16" | Samsung Galaxy Book3 Ultra 16 i7-13700H, GeForce RTX 4050 Laptop GPU, AMOLED, 2880x1800, 16" | Ortalama NVIDIA GeForce RTX 3050 6GB Laptop GPU | Sınıf ortalaması Multimedia | |
|---|---|---|---|---|---|---|---|---|---|
| Power Consumption | -2% | -100% | 6% | -30% | -141% | 20% | -8% | -12% | |
| Idle Minimum * (Watt) | 3.3 | 5.2 -58% | 15.6 -373% | 4.96 -50% | 7.6 -130% | 21.06 -538% | 3 9% | 4.55 ? -38% | 5.64 ? -71% |
| Idle Average * (Watt) | 7.3 | 7.8 -7% | 17.7 -142% | 7.54 -3% | 12.2 -67% | 24.27 -232% | 5 32% | 8.63 ? -18% | 10 ? -37% |
| Idle Maximum * (Watt) | 14.24 | 9 37% | 20.6 -45% | 9.31 35% | 12.8 10% | 25.12 -76% | 11 23% | 11.7 ? 18% | 12.2 ? 14% |
| Load Average * (Watt) | 91.7 | 78.6 14% | 87.4 5% | 83.4 9% | 76.5 17% | 52.4 43% | 72 21% | 86.6 ? 6% | 64.8 ? 29% |
| Witcher 3 ultra * (Watt) | 96.2 | 86.8 10% | 121.7 -27% | 73.3 24% | 89.5 7% | 110.2 -15% | 69.7 28% | ||
| Load Maximum * (Watt) | 115.8 | 121.2 -5% | 138 -19% | 91.74 21% | 135.7 -17% | 146 -26% | 108 7% | 127.6 ? -10% | 111.7 ? 4% |
* ... daha küçük daha iyidir
Power Consumption: The Witcher 3 / Stress test
Power Consumption: External monitor
Pil Ömrü
Güçlü ancak düşük güçlü dahili parçalar iyi pil ömrüne yardımcı olur. Pavilion Plus 16'nın 68 WHr pili 150 nit parlaklıkta yaklaşık 10,5 saat web'de gezinme ve 12 saat 1080p video oynatma gibi etkileyici çalışma sürelerine ulaşabiliyor.
| HP Pavilion Plus 16-ab0456tx i7-13700H, GeForce RTX 3050 6GB Laptop GPU, 68 Wh | Schenker Vision 14 M23 RTX 3050 i7-13700H, GeForce RTX 3050 6GB Laptop GPU, 99 Wh | Dell Inspiron 16 Plus 7630 i7-13700H, GeForce RTX 4060 Laptop GPU, 86 Wh | Asus VivoBook 14X K3405 i5-13500H, GeForce RTX 3050 4GB Laptop GPU, 63 Wh | Lenovo Slim Pro 7 14ARP8 R7 7735HS, GeForce RTX 3050 6GB Laptop GPU, 73 Wh | Asus VivoBook Pro 16 K6602VU i9-13900H, GeForce RTX 4050 Laptop GPU, 96 Wh | Samsung Galaxy Book3 Ultra 16 i7-13700H, GeForce RTX 4050 Laptop GPU, 76 Wh | Sınıf ortalaması Multimedia | |
|---|---|---|---|---|---|---|---|---|
| Pil Çalışma Süresi | 16% | -10% | -18% | 1% | -11% | 2% | 26% | |
| H.264 (h) | 12 | 10.4 -13% | 9.8 -18% | 13.4 12% | 16.4 ? 37% | |||
| WiFi v1.3 (h) | 10.4 | 12.1 16% | 9.4 -10% | 8.1 -22% | 10.5 1% | 10.1 -3% | 9.6 -8% | 12 ? 15% |
| Reader / Idle (h) | 17.6 | 18.2 | 25.2 ? | |||||
| Load (h) | 1.4 | 1.1 | 1.8 | 1.675 ? | ||||
| Witcher 3 ultra (h) | 1.3 |
Artılar
Eksiler
Karar: Ödünler nedeniyle engellenen büyük potansiyel
HP Pavilion Plus 16, iş ve eğlence için modern bir multimedya dizüstü bilgisayardan beklenebilecek çoğu kutuyu işaretler. Pavilion Plus 16, gereksiz esnemeler olmadan birinci sınıf bir his veren tamamen metal bir yapıya ve temel unsurları kapsayan bir bağlantı noktası seçimine sahiptir.
2560 x 1600 120 Hz panel, HDR veya kapsamlı Adobe RGB ve Display P3 kapsamına sahip değildir Pavilion Artı 14'in 2.8K OLED paneli. Bununla birlikte, iyi tepki süreleri ve PWM titremesi olmadan temel özellikleri doğru bir şekilde yerine getiriyor.
HP Pavilion Plus 16, çok yönlü bir multimedya ve üretkenlik dizüstü bilgisayarıdır, ancak istenen fiyat en azından bir RTX 4050 ile ideal bir şekilde paketlenebilirdi."
Performans sınırlamaları, rakipleriyle karşılaştırmaya başladığınızda ortaya çıkıyor. 60 W PL2, çoklu çekirdekte Pavilion Plus 16 için özellikle dezavantajlı olduğunu kanıtlıyor Dell Inspiron 16 Plus 7630 ve hatta Samsung Galaxy Book3 Ultra 16daha yüksek watt değerine sahip Core i7-13700H.
HP, çipin potansiyelini en üst düzeye çıkarmak için ek bir güç profilinde 80 W PL2 veya daha fazlasına kolayca izin verebilirdi. Ancak, soğutma alt sistemi mevcut konfigürasyonla yük altında zaten zorlanmış görünüyor.
Nvidia GeForce RTX 3050 6 GB, performans ve güç verimliliği açısından Ada neslinin gerisinde kalıyor. 1080p oyunlarda RTX 3050 4 GB'a göre gözle görülür bir artış görülse de sentetik testlerde pek bir artış görülmüyor.
HP'nin sitesindeki fiyatı 1.350 ABD doları olan Pavilion Plus 16, 60 W RTX 4060 ve daha iyi performanslı Core i7-13700H sunan Inspiron 16 Plus 7630'dan 100 ABD doları daha pahalı. Bununla birlikte, Pavilion Plus 16, Hindistan pazarında Inspiron 16 Plus 7630'dan daha ucuza satılmaktadır.
Bu Asus VivoBook Pro 16 3.2K OLED ekran, Core i9-13900H ve RTX 4060'a kadar, plastik ve ek 300 ABD doları prim sizi engellemediği sürece, tomurcuklanan yaratıcılar için mükemmel bir alternatiftir.
Fiyat ve Bulunabilirlik
Test edilen HP Pavilion Plus 16-ab0456tx resmi HP Hindistan adresinden temin edilebilir web sitesinden 1,24,999 ₹ karşılığında satın alınabilir. Dizüstü bilgisayar ayrıca HP ABD sitesinde 1.350 ABD Doları karşılığında yapılandırılabilir.
Amazon Hindistan Pavilion Plus 16'yı RTX 3050 dGPU olmadan ₹1,25,900'e sunuyor.
HP Pavilion Plus 16-ab0456tx
- 02/07/2024 v7 (old)
Vaidyanathan Subramaniam
Şeffaflık
İncelenecek cihazların seçimi editör ekibimiz tarafından yapılır. Test örneği, bu incelemenin amacı doğrultusunda üretici veya perakendeci tarafından yazara ödünç olarak sağlanmıştır. Borç verenin bu inceleme üzerinde herhangi bir etkisi olmadığı gibi, üretici de yayınlanmadan önce bu incelemenin bir kopyasını almamıştır. Bu incelemeyi yayınlama zorunluluğu yoktu. Bağımsız bir medya şirketi olarak Notebookcheck, üreticilerin, perakendecilerin veya yayıncıların otoritesine tabi değildir.
Notebookcheck bu şekilde test yapıyor
Notebookcheck, tüm sonuçların karşılaştırılabilir olmasını sağlamak için her yıl yüzlerce dizüstü bilgisayarı ve akıllı telefonu standart prosedürler kullanarak bağımsız olarak inceliyor. Yaklaşık 20 yıldır test yöntemlerimizi sürekli olarak geliştirdik ve bu süreçte endüstri standartlarını belirledik. Test laboratuvarlarımızda deneyimli teknisyenler ve editörler tarafından yüksek kaliteli ölçüm ekipmanları kullanılmaktadır. Bu testler çok aşamalı bir doğrulama sürecini içerir. Karmaşık derecelendirme sistemimiz, nesnelliği koruyan yüzlerce sağlam temellere dayanan ölçüm ve kıyaslamaya dayanmaktadır.Price comparison

