İncelenen Acer Predator Helios 300 PH315-53: Ekstra performansa sahip hızlı oyun makinesi

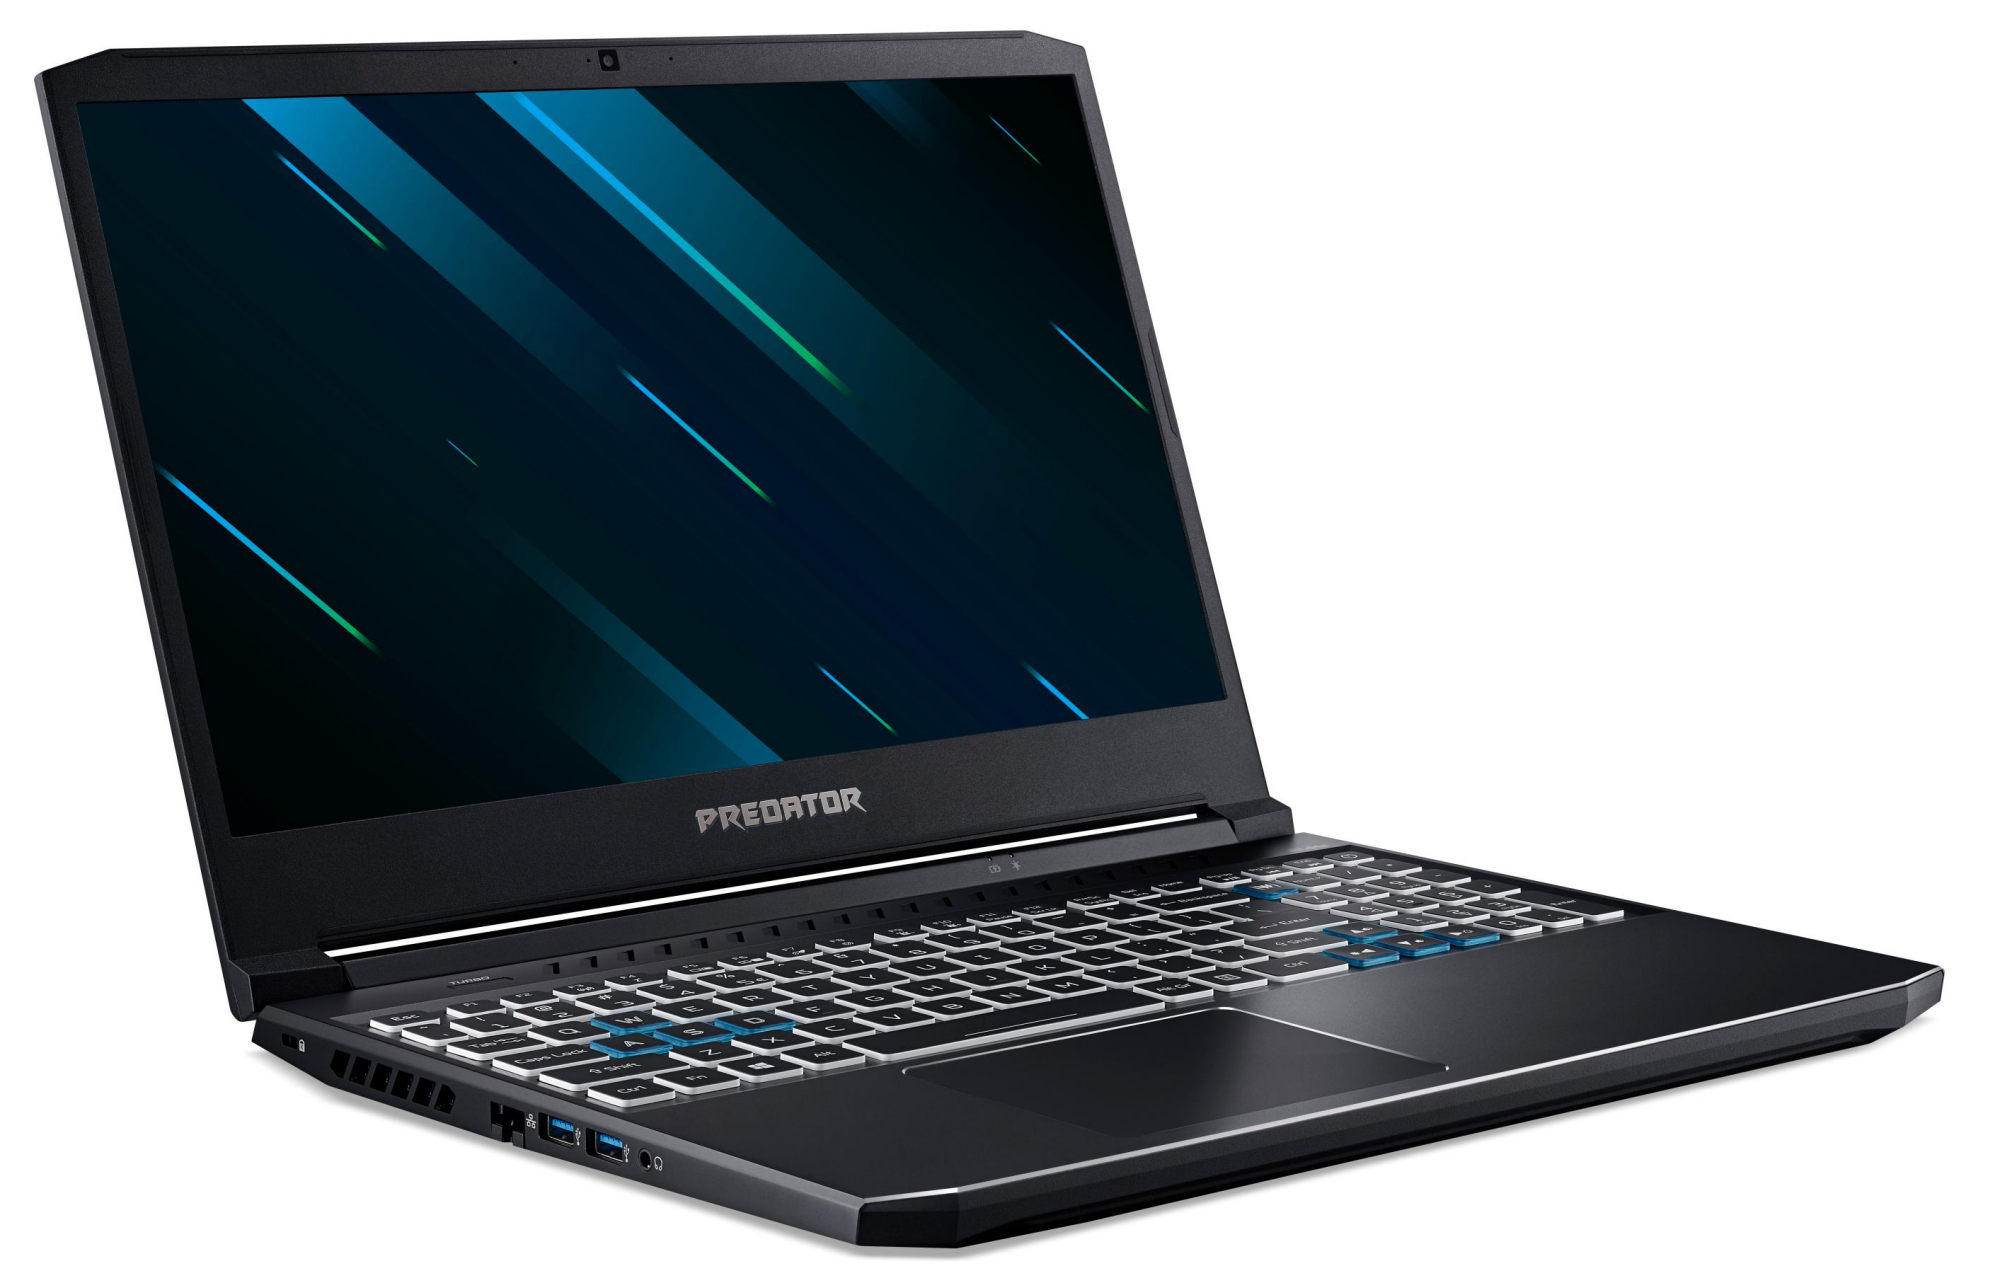
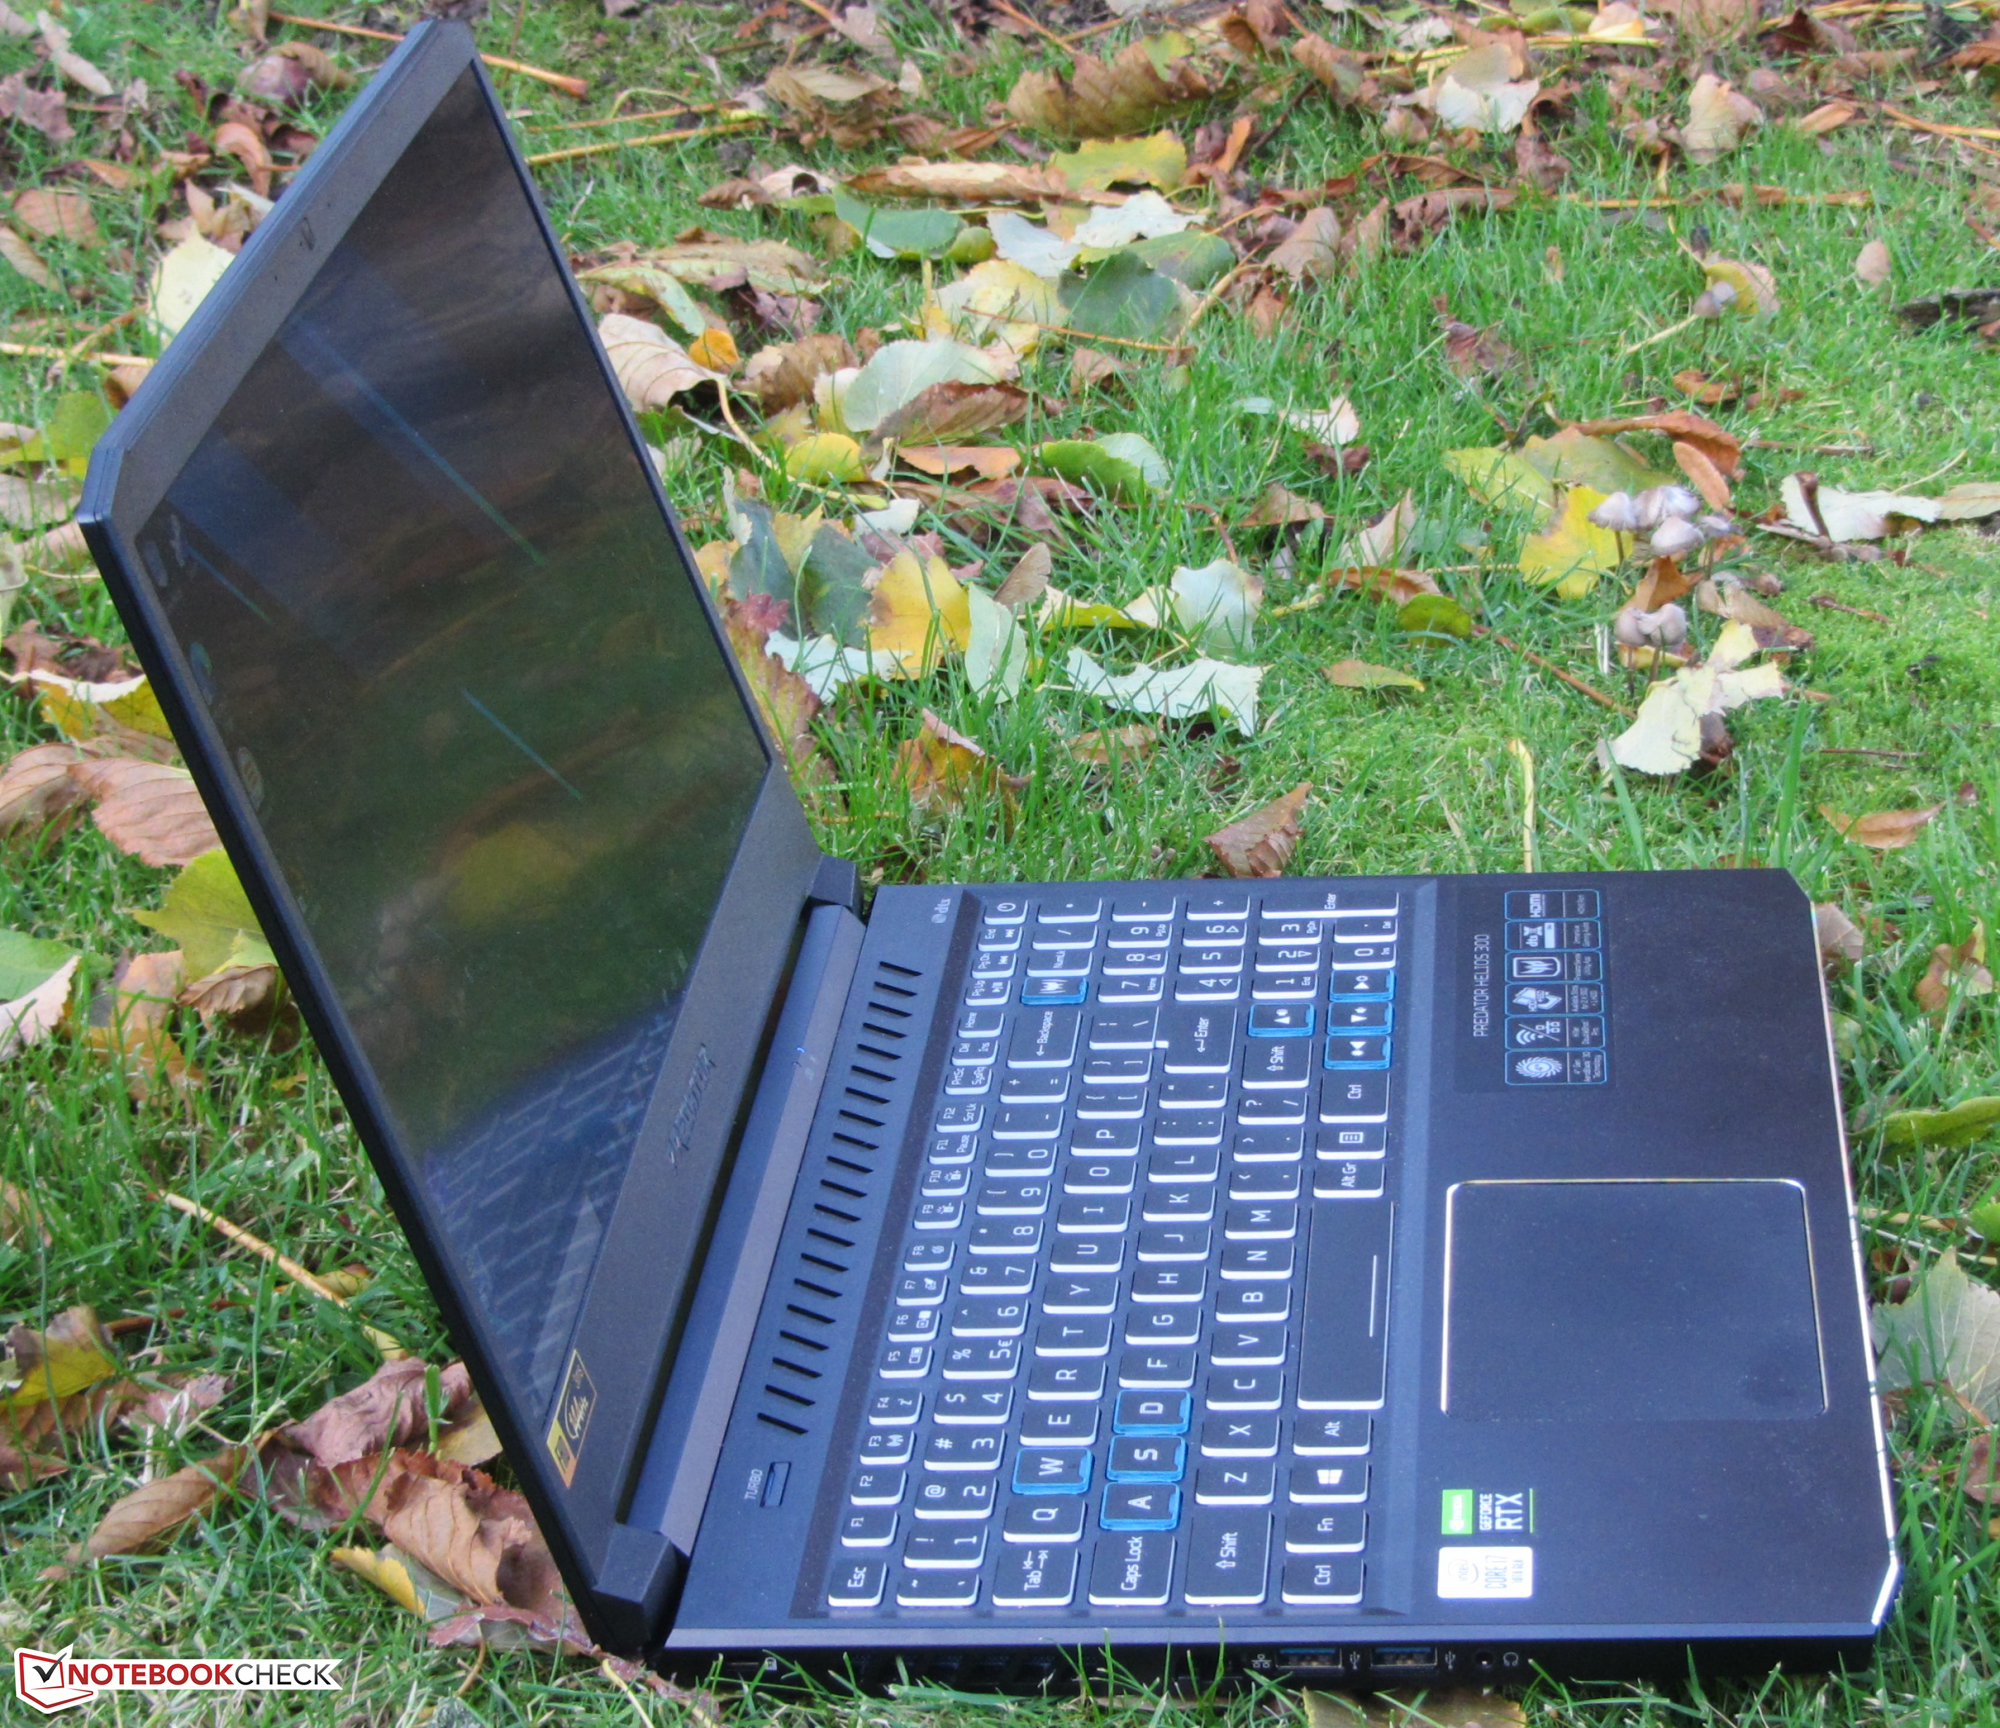
Predator Helios, 15,6 inçlik bir oyun dizüstü bilgisayarıdır. Cihaz, Core i7-10750H işlemci ve GeForce RTX 2060 GPU tarafından desteklenmektedir. Rakipler arasında Dell G5 15 SE, Aorus 5 KB, Schenker XMG Core 15 ve Asus TUF A15 FA506IV gibi cihazlar yer alıyor. Predator, yapım açısından büyük ölçüde selefi ile aynı olduğundan, davaya daha fazla girmeyeceğiz , bağlantı, giriş cihazları, ekran ve hoparlörler - farklılıklar olmadığı sürece. İlgili bilgiler Acer Predator Helios 300 PH315-52'nin incelemesinde bulunabilir.
Derecelendirme | Tarih | Modeli | Ağırlık | Yükseklik | Boyut | Çözünürlük | Fiyat |
|---|---|---|---|---|---|---|---|
| 82.9 % v7 (old) | 12/2020 | Acer Predator Helios 300 PH315-53-77N5 i7-10750H, GeForce RTX 2060 Mobile | 2.5 kg | 22.9 mm | 15.60" | 1920x1080 | |
| 83.7 % v7 (old) | 06/2020 | Dell G5 15 SE 5505 P89F R7 4800H, Radeon RX 5600M | 2.4 kg | 21.6 mm | 15.60" | 1920x1080 | |
| 83.7 % v7 (old) | Aorus 5 KB i7-10750H, GeForce RTX 2060 Mobile | 2.1 kg | 28 mm | 15.60" | 1920x1080 | ||
| 82.1 % v7 (old) | Schenker XMG Core 15 GK5NR0O R7 4800H, GeForce RTX 2060 Mobile | 2 kg | 19.9 mm | 15.60" | 1920x1080 | ||
| 82.7 % v7 (old) | Asus TUF Gaming A15 FA506IV-HN172 R7 4800H, GeForce RTX 2060 Mobile | 2.2 kg | 24.9 mm | 15.60" | 1920x1080 |
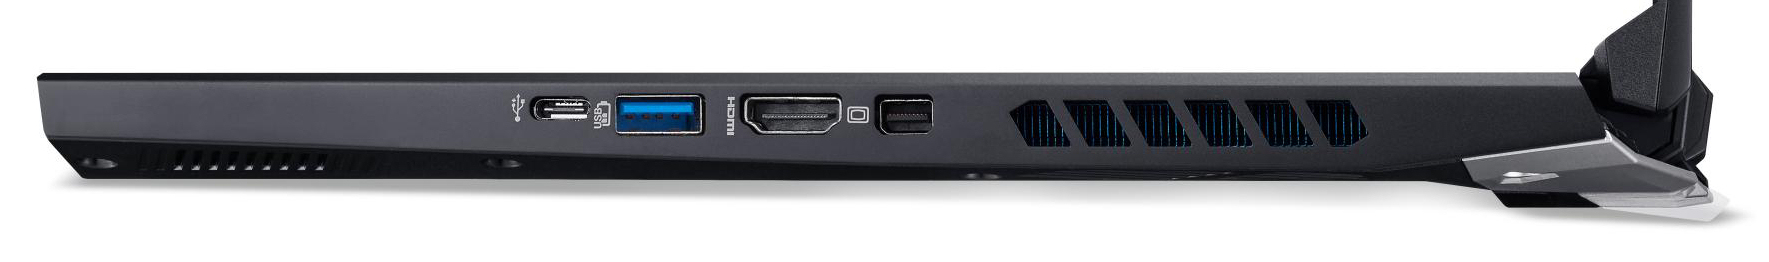
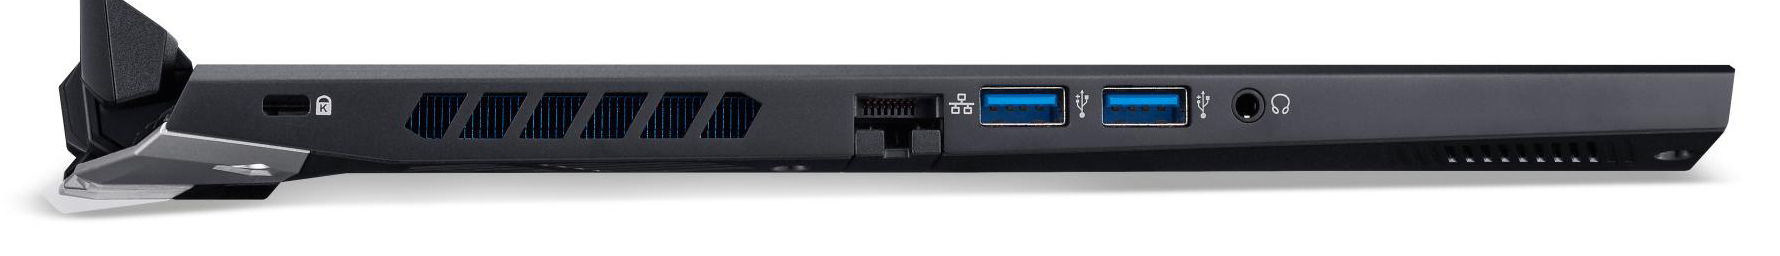
Durum ve bağlantı - Önceki modele göre küçük değişiklikler
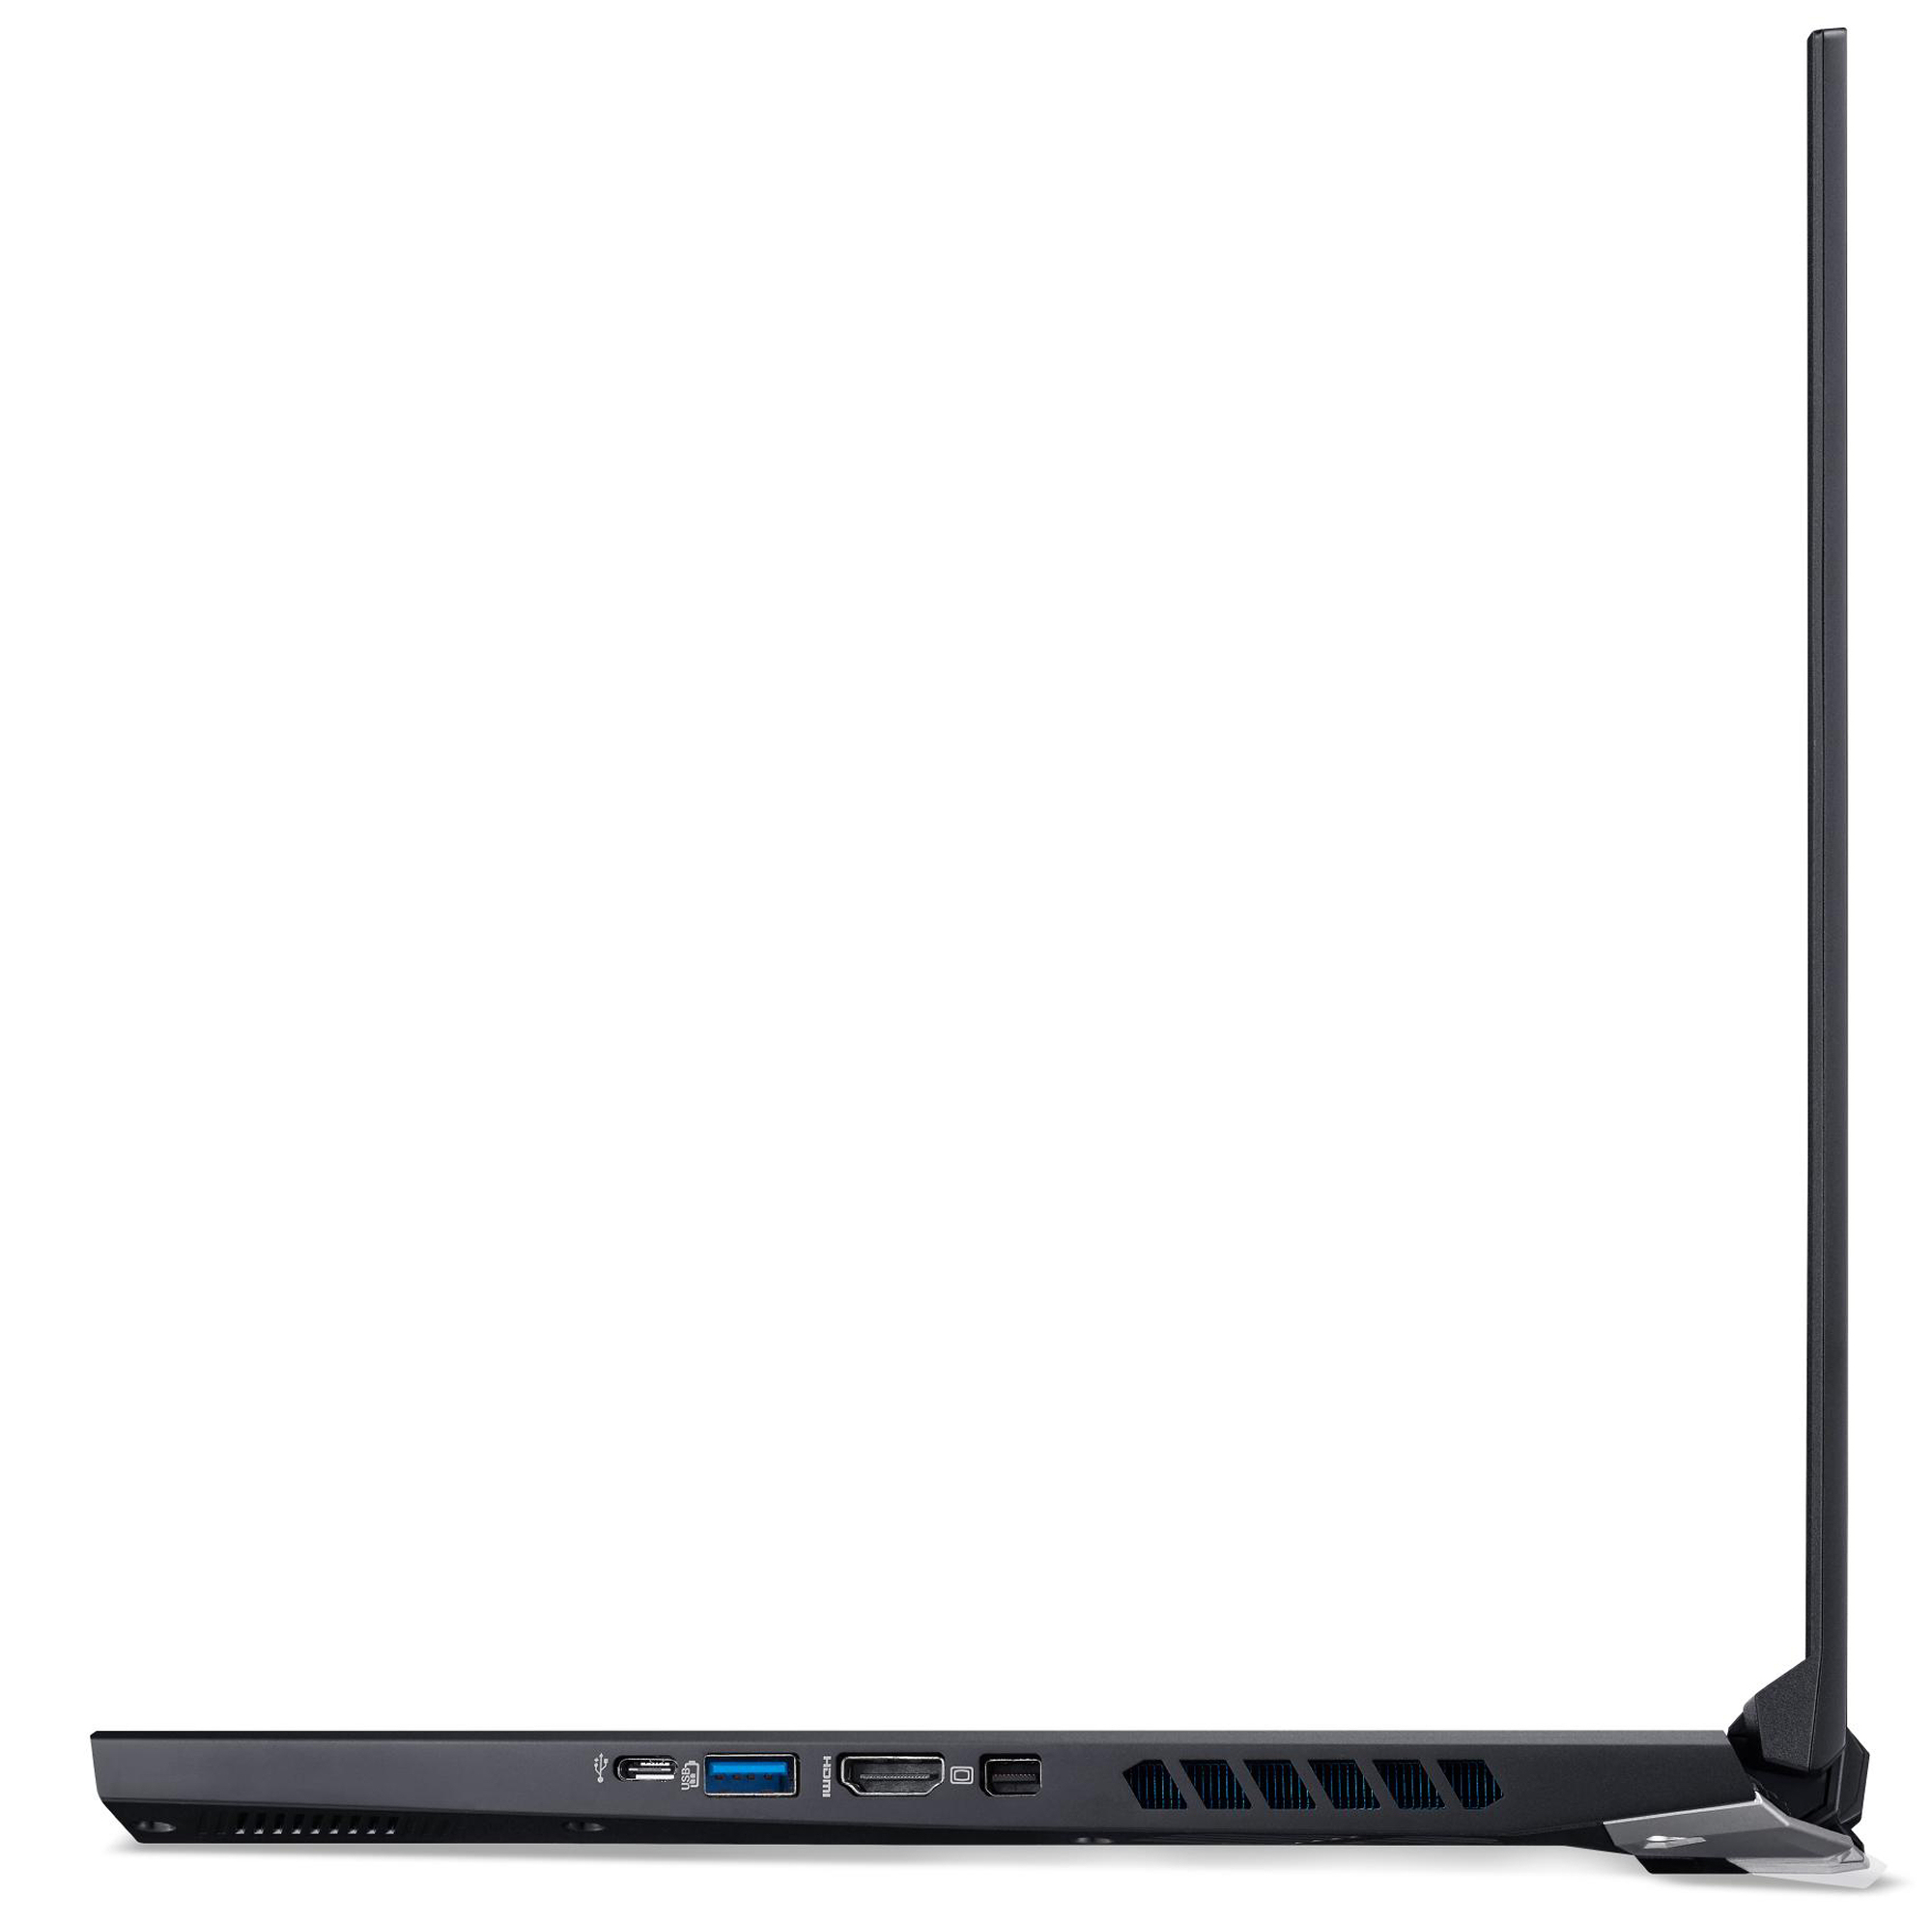
İlk bakışta, kasa önceki modele benziyor. Ancak farklılıklar var. Örneğin, güç kaynağı konektörü sol tarafın ortasından arka tarafın ortasına taşınmıştır. HDMI çıkışı ve Mini DisplayPort yer değiştirdi. Ayrıca klavyenin üzerinde ek havalandırma açıklıkları oluşturulmuştur. Dahası, mevcut model biraz ağırlık kazandı. Bağlantı noktaları açısından da yeni bir ekleme var: USB Type-C 3.2 Gen 1 bağlantı noktası yerine, mevcut Predator modelinde bir USB Type-C 3.2 Gen 2 bağlantı noktası var.


| Networking | |
| iperf3 transmit AX12 | |
| Acer Predator Helios 300 PH315-53-77N5 | |
| Dell G5 15 SE 5505 P89F | |
| Aorus 5 KB | |
| Ortalama Killer Wi-Fi 6 AX1650i 160MHz Wireless Network Adapter (201NGW) (758 - 1514, n=10) | |
| Schenker XMG Core 15 GK5NR0O | |
| MSI Bravo 15 A4DCR | |
| Asus TUF Gaming A15 FA506IV-HN172 | |
| HP Pavilion Gaming 15-ec1177ng | |
| Acer Predator Helios 300 PH315-52-79TY | |
| iperf3 receive AX12 | |
| Schenker XMG Core 15 GK5NR0O | |
| Dell G5 15 SE 5505 P89F | |
| Acer Predator Helios 300 PH315-53-77N5 | |
| Aorus 5 KB | |
| MSI Bravo 15 A4DCR | |
| Ortalama Killer Wi-Fi 6 AX1650i 160MHz Wireless Network Adapter (201NGW) (887 - 1670, n=10) | |
| Acer Predator Helios 300 PH315-52-79TY | |
| HP Pavilion Gaming 15-ec1177ng | |
| Asus TUF Gaming A15 FA506IV-HN172 | |


")
")


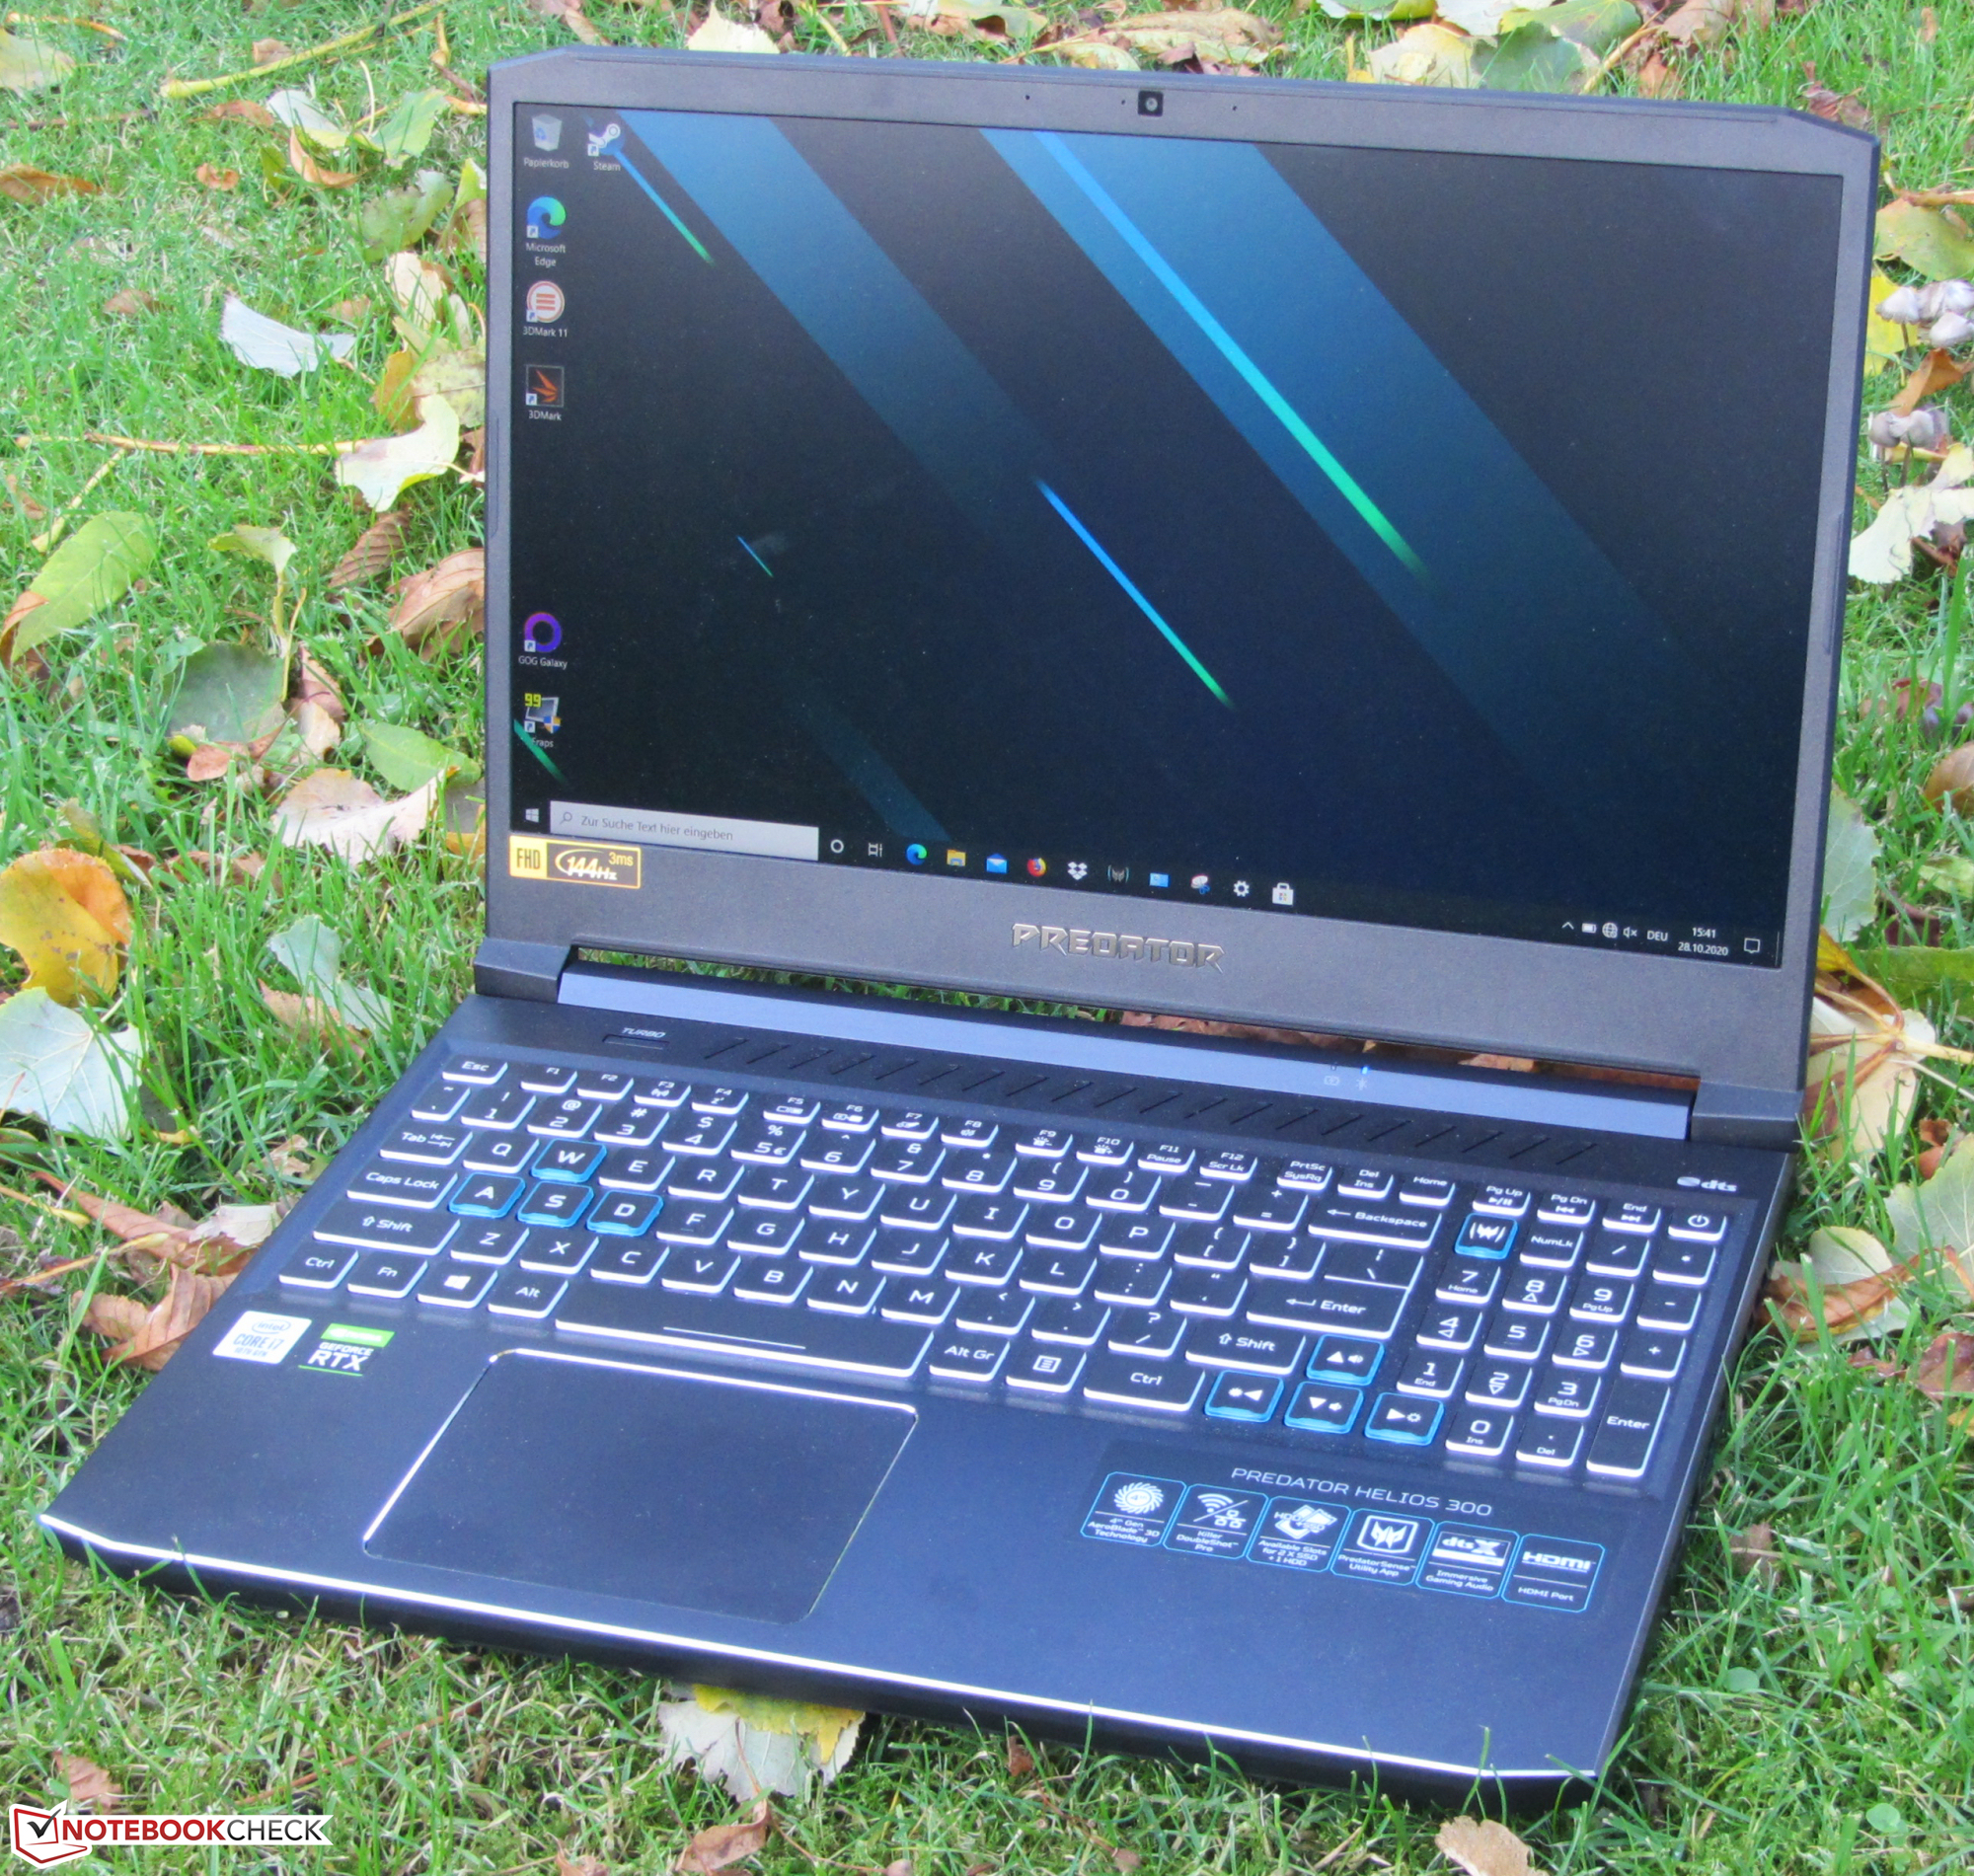
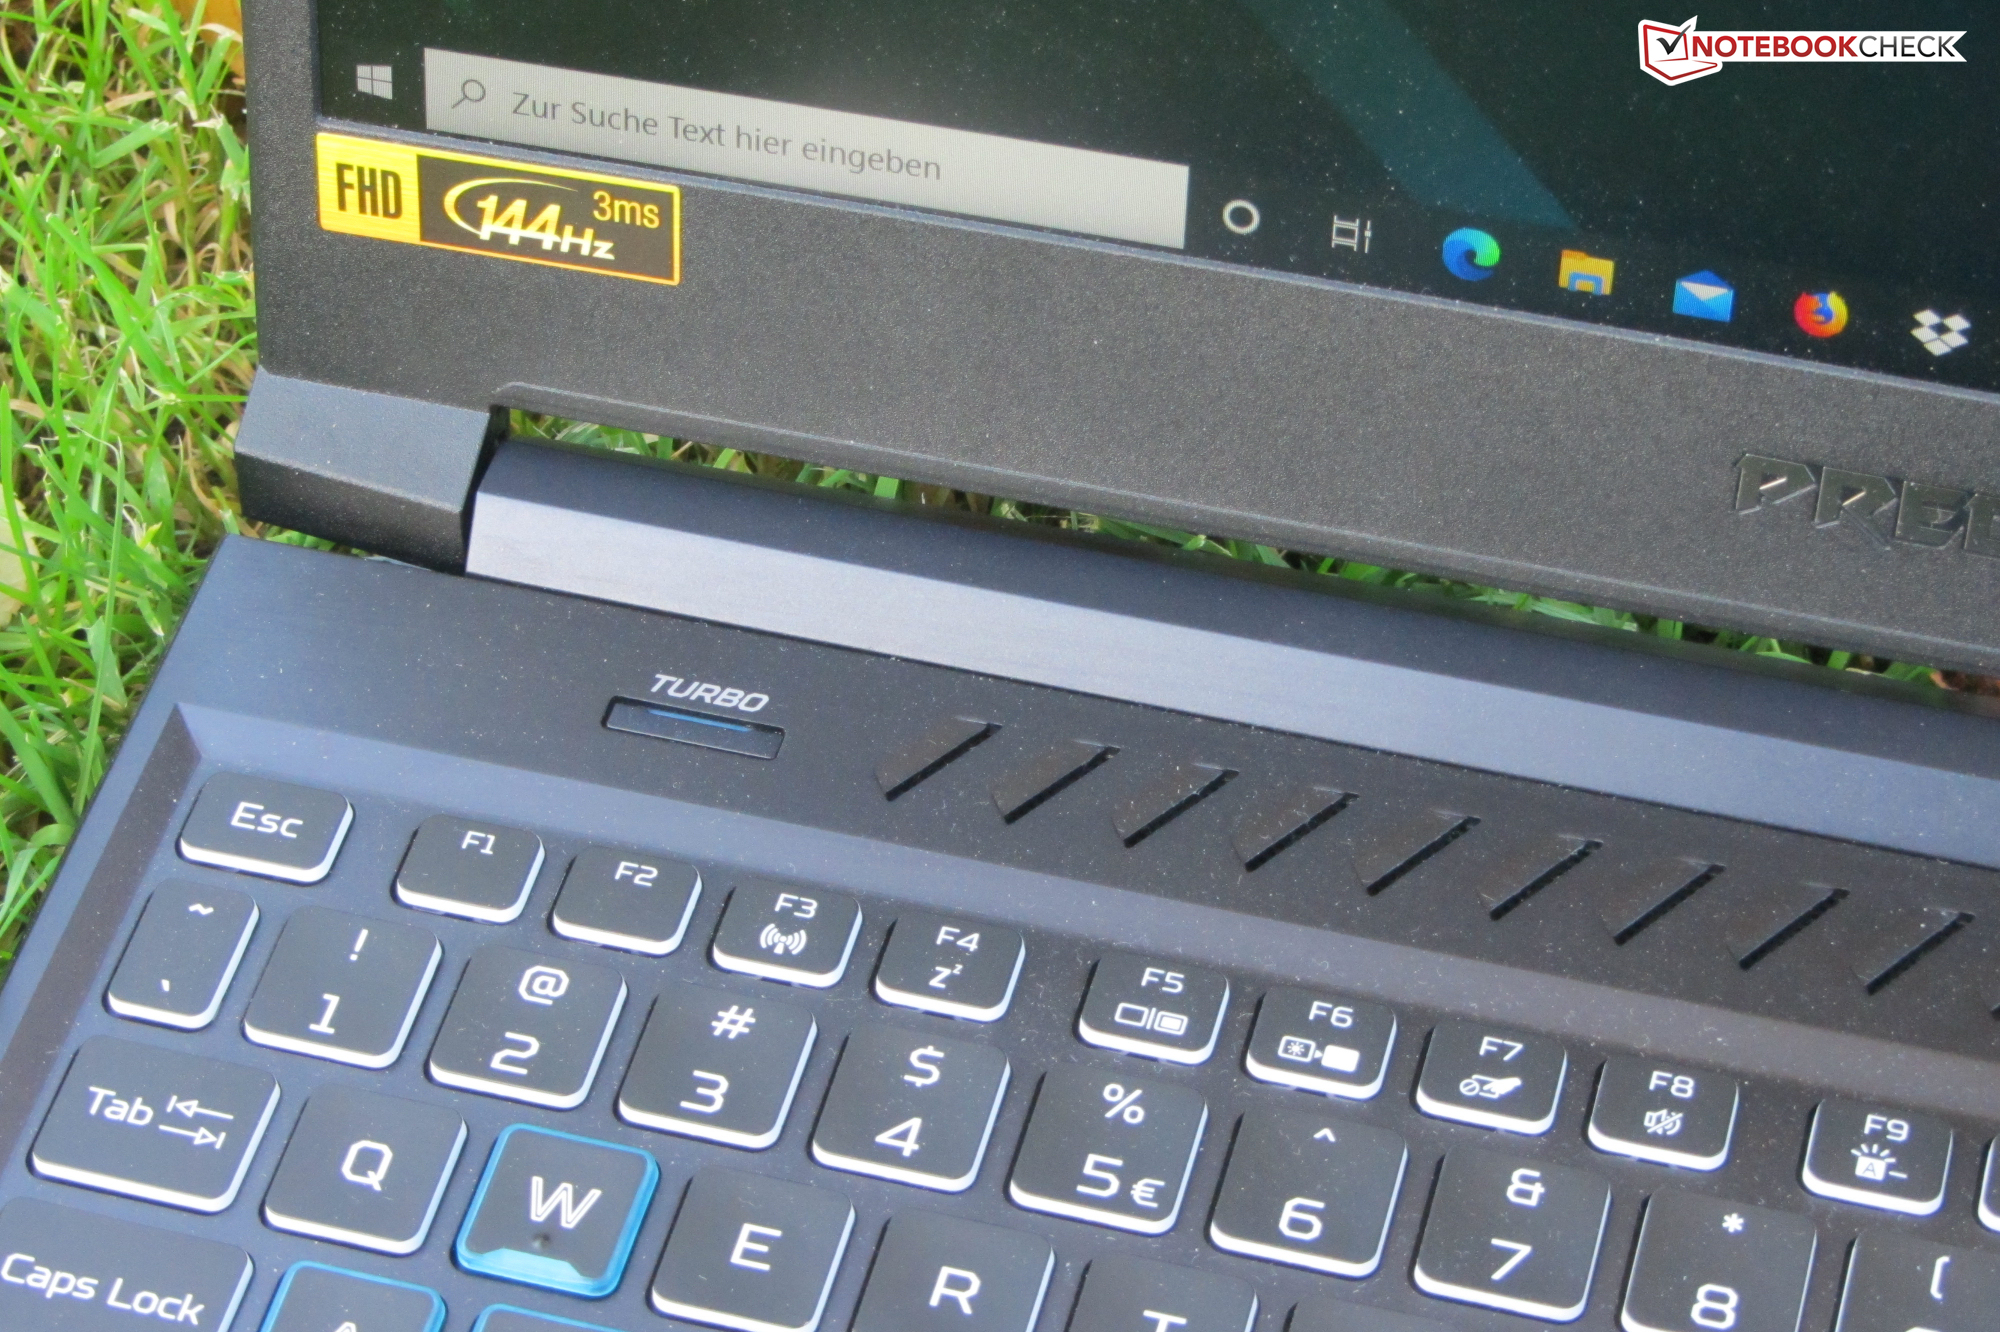
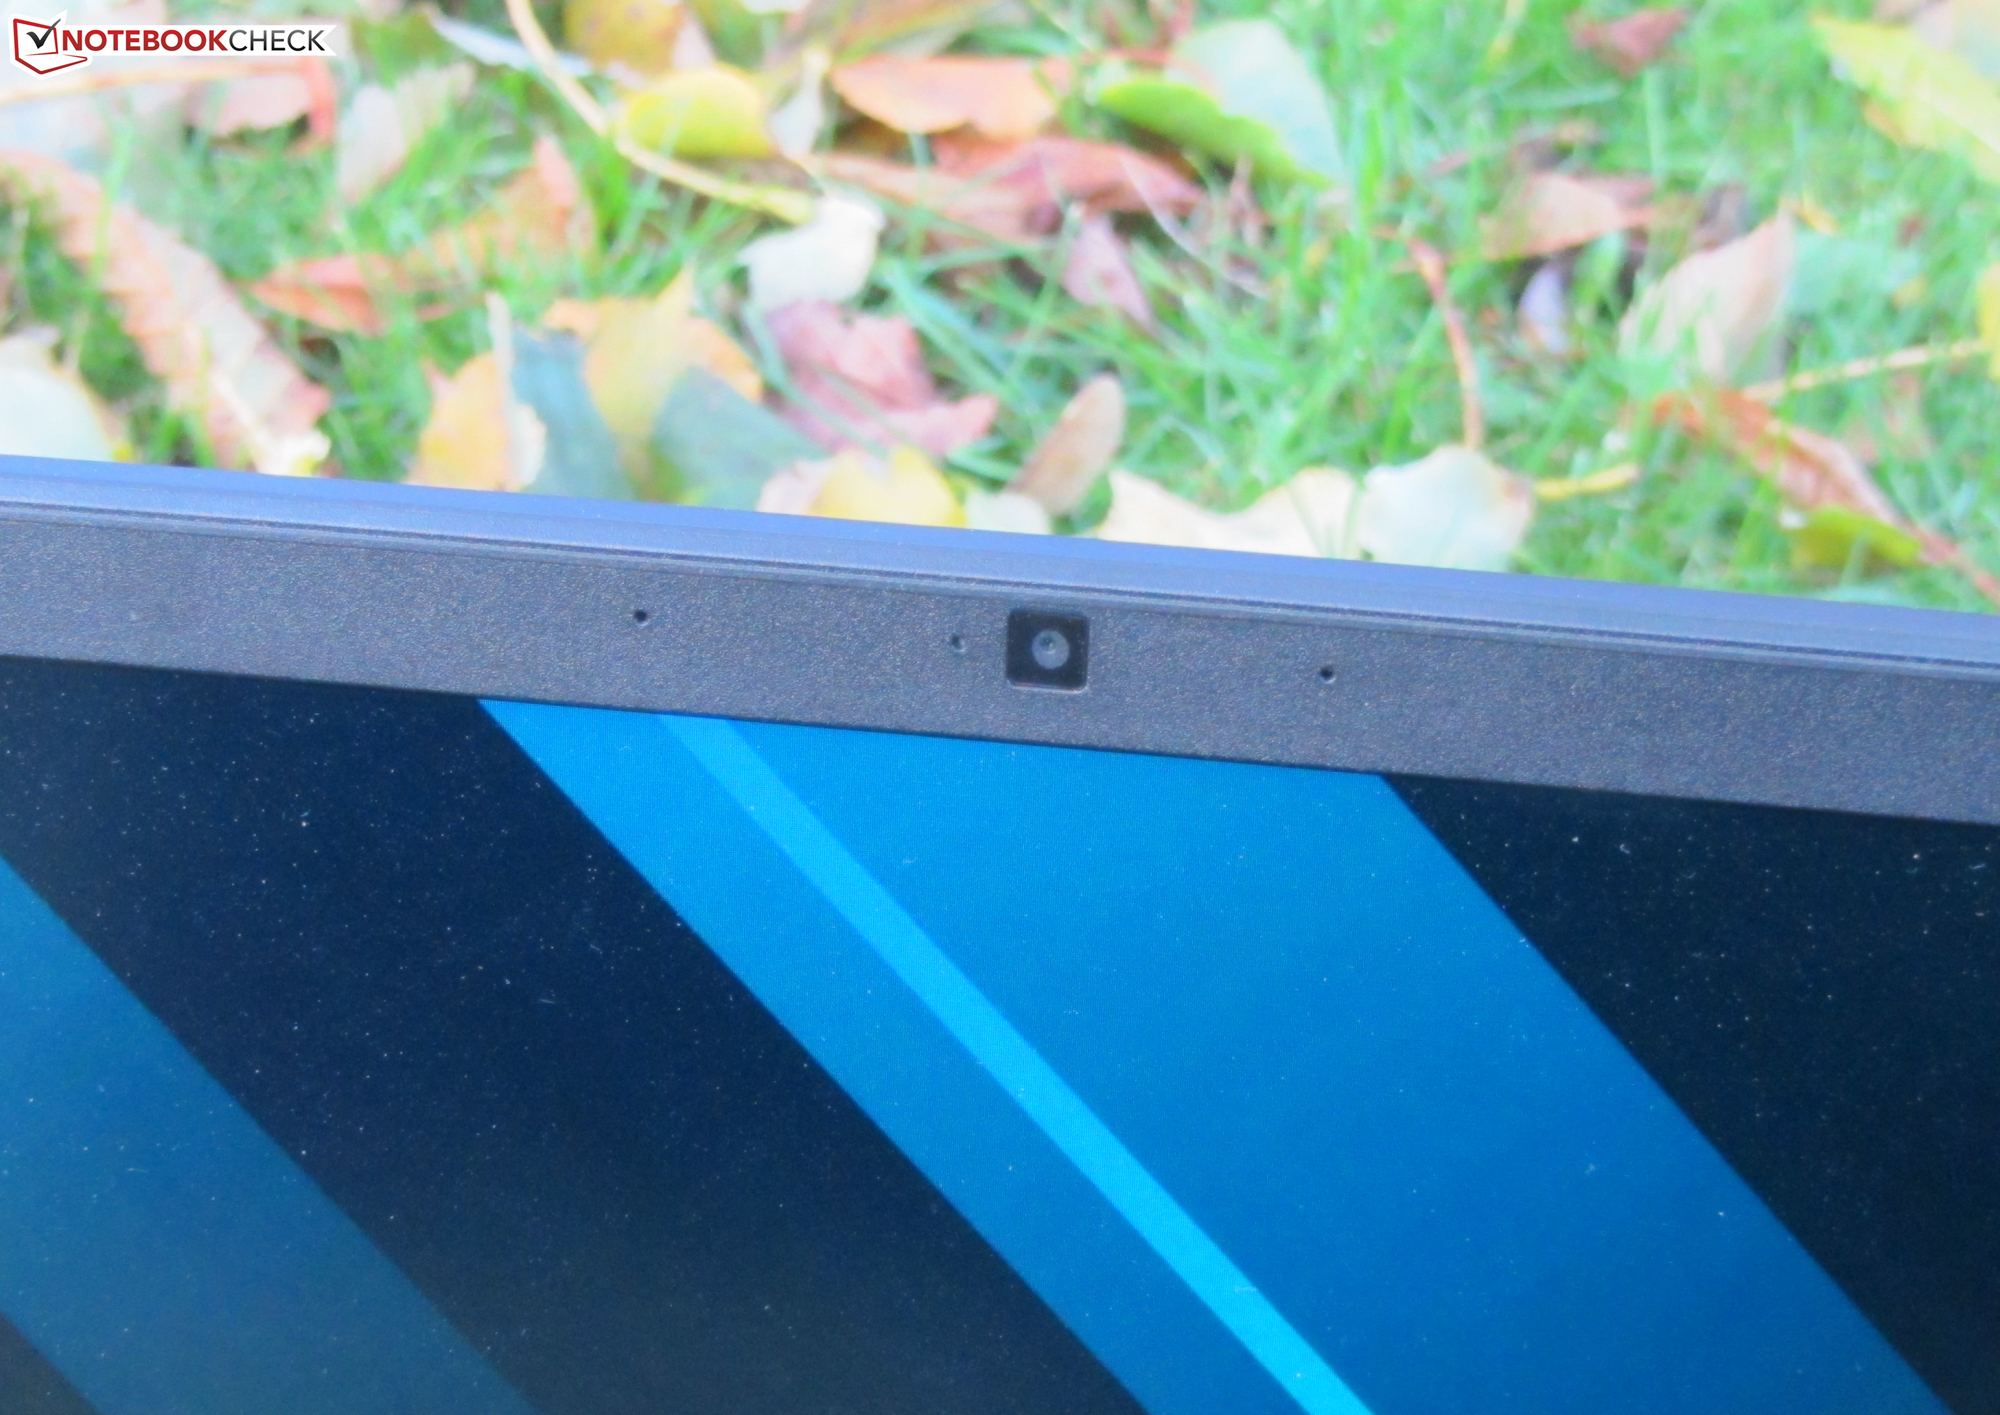
Ekran - 144 Hz IPS

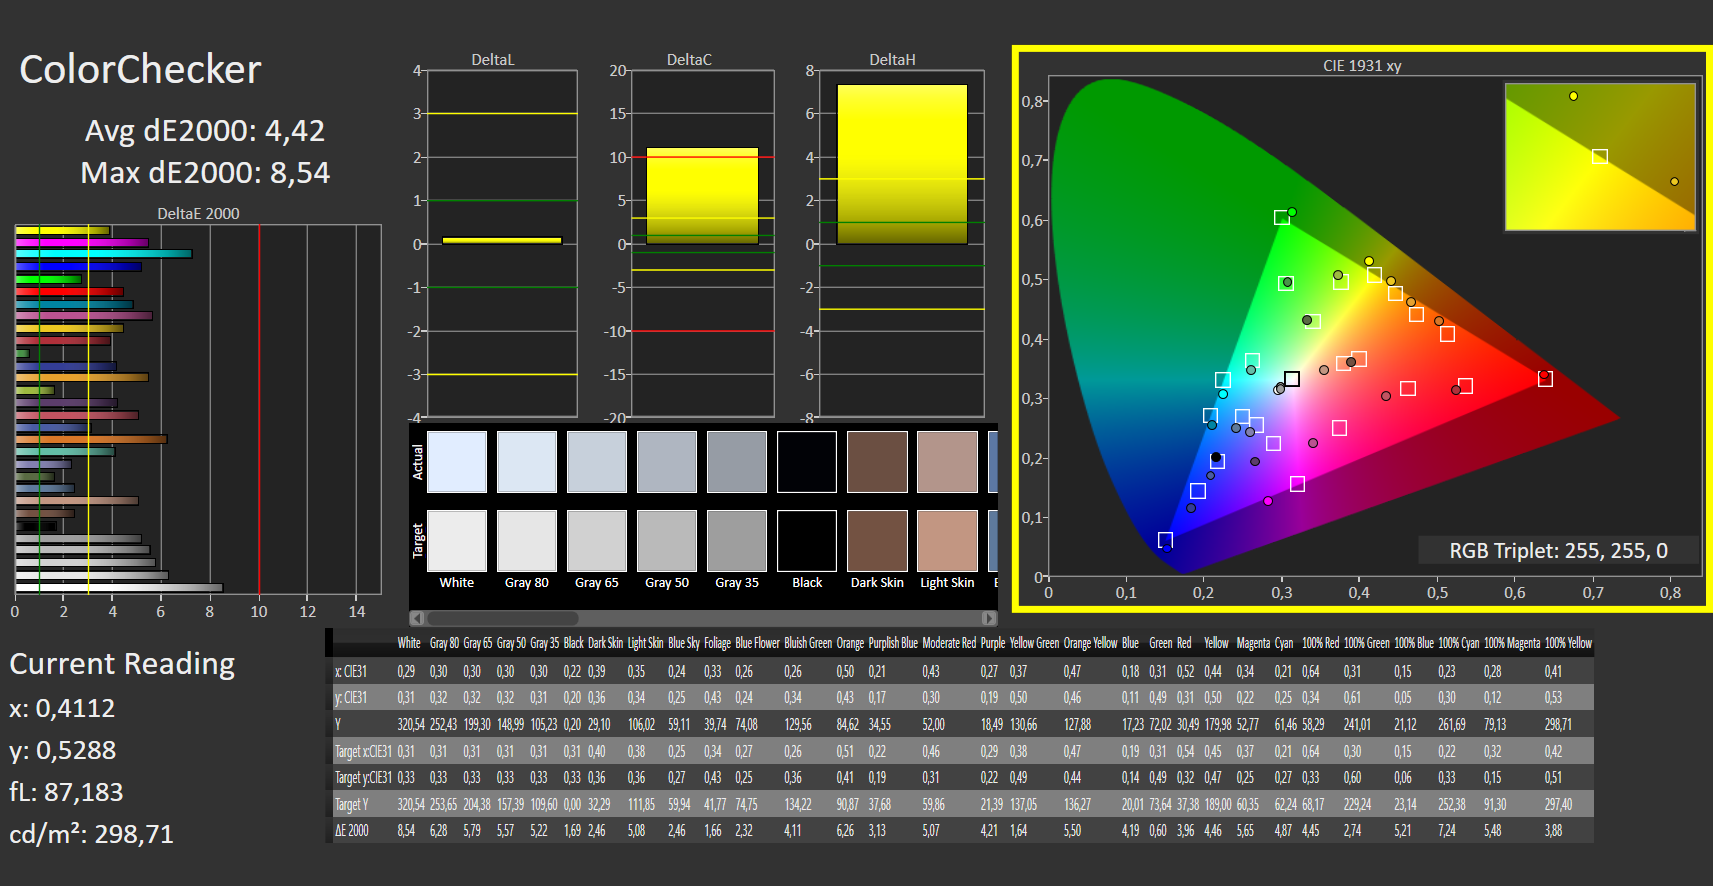
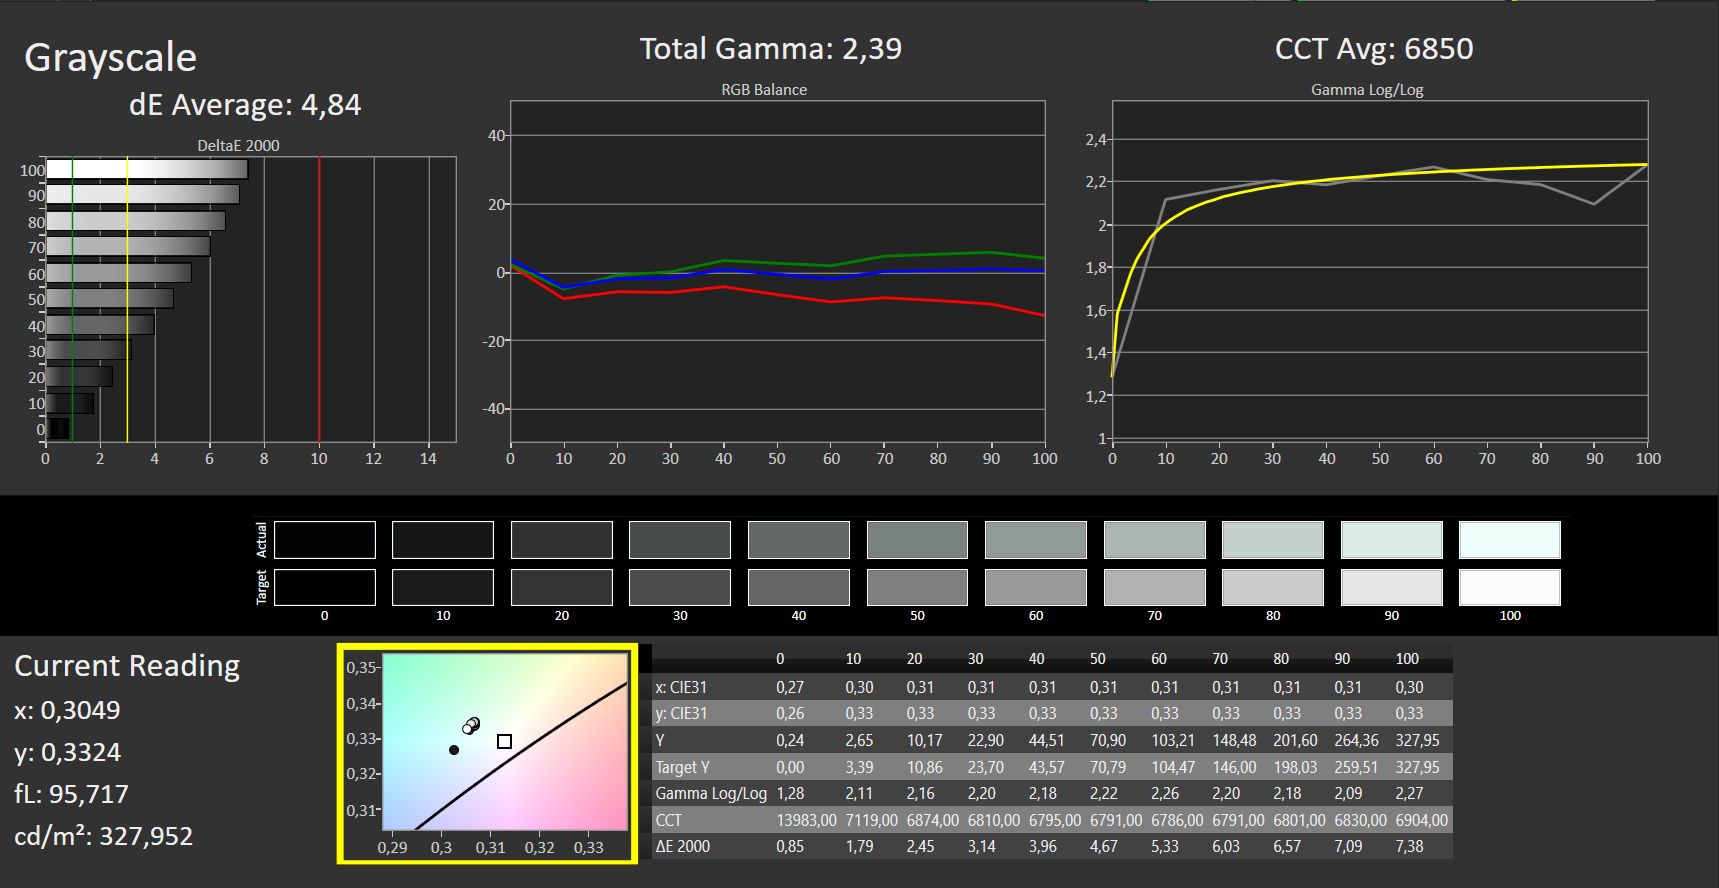
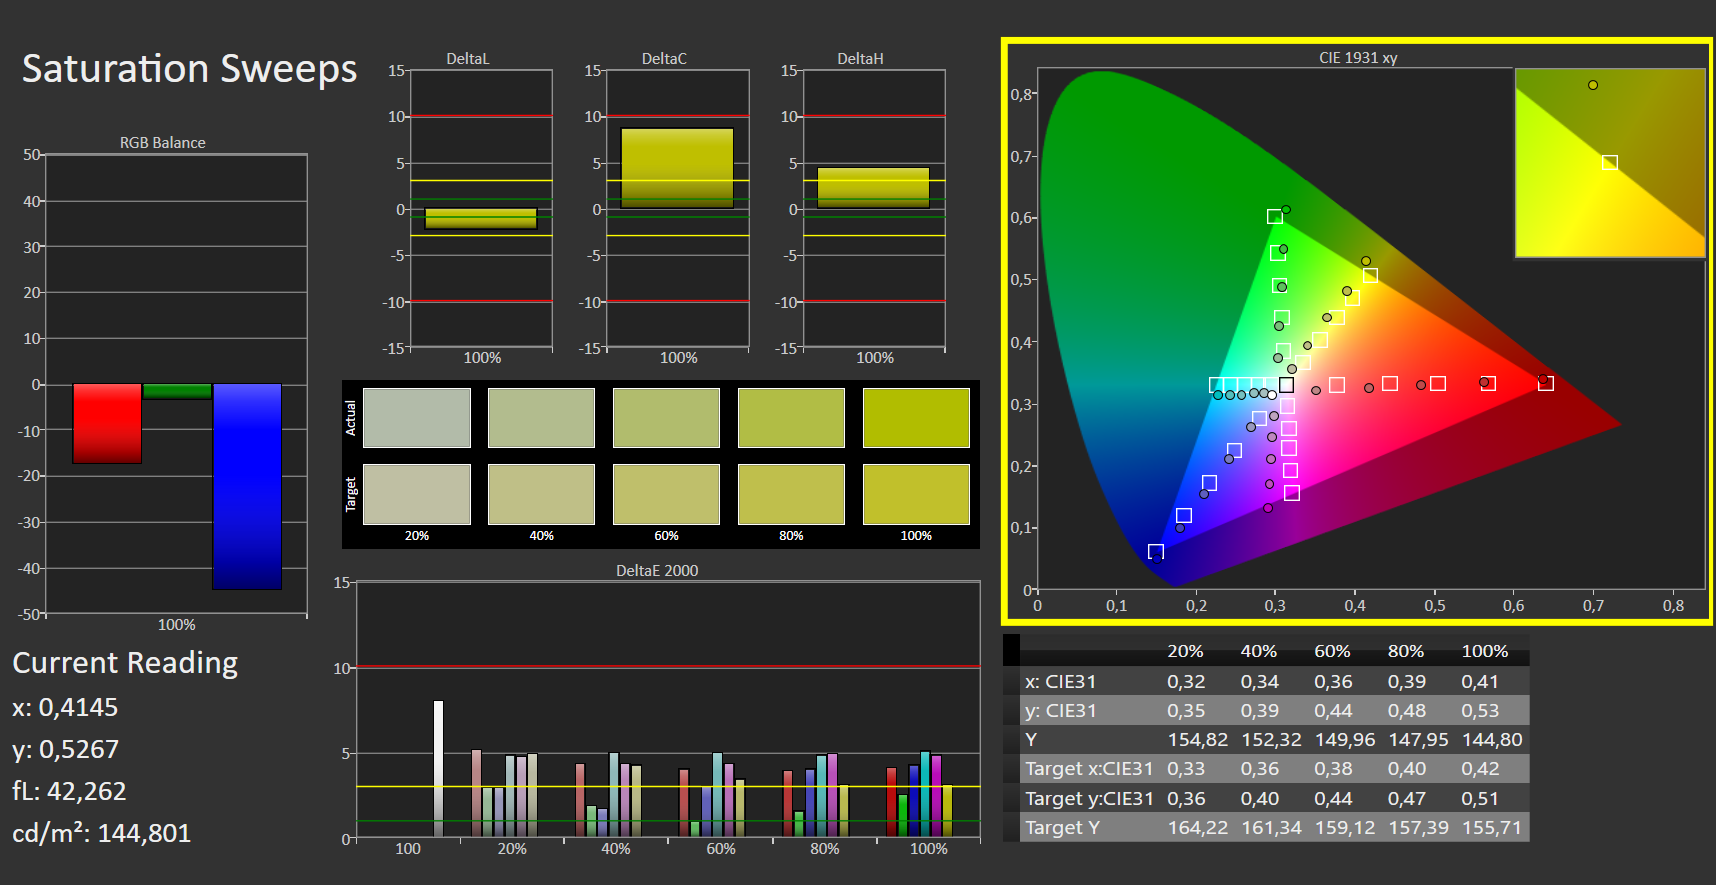
Mat, görüş açısı sabit 15,6 inçlik ekranın (Full HD, IPS) kontrastı (1,450: 1) iyi olsa da, parlaklık (294,3 cd / m²) hemen hemen kabul edilebilir. 300 cd / m²'nin üzerindeki değerlerin iyi olduğunu düşünüyoruz. Kullanılan 144 Hz panel, hızlı yanıt süreleri ve uygun renk üretimi sunar. Olumlu: Herhangi bir PWM titreşimi tespit edemedik. Bu, önceki modelde kullanılan panelin aynısı. Yine de ölçülen değerler biraz farklıdır. Bu normal bir durumdur. İki özdeş ekran asla% 100 tutarlı olmayacaktır.
| |||||||||||||||||||||||||
Aydınlatma: 83 %
Batarya modunda parlaklık: 254 cd/m²
Kontrast: 1450:1 (Siyah: 0.22 cd/m²)
ΔE ColorChecker Calman: 4.42 | ∀{0.5-29.43 Ø4.71}
ΔE Greyscale Calman: 4.84 | ∀{0.09-98 Ø4.96}
92% sRGB (Argyll 1.6.3 3D)
60% AdobeRGB 1998 (Argyll 1.6.3 3D)
66.3% AdobeRGB 1998 (Argyll 3D)
92.3% sRGB (Argyll 3D)
65.2% Display P3 (Argyll 3D)
Gamma: 2.39
CCT: 6850 K
| Acer Predator Helios 300 PH315-53-77N5 AU Optronics B156HAN08.2, IPS, 1920x1080, 15.6" | Acer Predator Helios 300 PH315-52-79TY AUO, B156HAN08.2, IPS, 1920x1080, 15.6" | Dell G5 15 SE 5505 P89F BOE NV156FH, WVA, 1920x1080, 15.6" | Aorus 5 KB LG Philips LP156WFG-SPB2 (LGD05E8), IPS, 1920x1080, 15.6" | Schenker XMG Core 15 GK5NR0O LM156LF-1F02, IPS, 1920x1080, 15.6" | Asus TUF Gaming A15 FA506IV-HN172 LM156LF-2F01, IPS, 1920x1080, 15.6" | |
|---|---|---|---|---|---|---|
| Display | -1% | -3% | -1% | 3% | -39% | |
| Display P3 Coverage (%) | 65.2 | 64.1 -2% | 63 -3% | 63.4 -3% | 67.2 3% | 38.92 -40% |
| sRGB Coverage (%) | 92.3 | 93 1% | 90.1 -2% | 92.8 1% | 95.9 4% | 58.5 -37% |
| AdobeRGB 1998 Coverage (%) | 66.3 | 65.7 -1% | 64.1 -3% | 64.8 -2% | 68.5 3% | 40.22 -39% |
| Response Times | 15% | -9% | 7% | 29% | -109% | |
| Response Time Grey 50% / Grey 80% * (ms) | 17 ? | 15 ? 12% | 20.4 ? -20% | 14.4 ? 15% | 9.6 ? 44% | 34 ? -100% |
| Response Time Black / White * (ms) | 11 ? | 9 ? 18% | 10.8 ? 2% | 11.2 ? -2% | 9.6 ? 13% | 24 ? -118% |
| PWM Frequency (Hz) | 198.4 ? | |||||
| Screen | -2% | 0% | 10% | -13% | -17% | |
| Brightness middle (cd/m²) | 319 | 325 2% | 292 -8% | 318 0% | 312 -2% | 280 -12% |
| Brightness (cd/m²) | 294 | 310 5% | 290 -1% | 298 1% | 290 -1% | 254 -14% |
| Brightness Distribution (%) | 83 | 82 -1% | 77 -7% | 87 5% | 87 5% | 88 6% |
| Black Level * (cd/m²) | 0.22 | 0.255 -16% | 0.27 -23% | 0.3 -36% | 0.2 9% | 0.15 32% |
| Contrast (:1) | 1450 | 1275 -12% | 1081 -25% | 1060 -27% | 1560 8% | 1867 29% |
| Colorchecker dE 2000 * | 4.42 | 4.28 3% | 3.99 10% | 2.49 44% | 4.84 -10% | 5.89 -33% |
| Colorchecker dE 2000 max. * | 8.54 | 8.42 1% | 6.11 28% | 5.06 41% | 13.85 -62% | 19 -122% |
| Greyscale dE 2000 * | 4.84 | 5.01 -4% | 3.3 32% | 1.6 67% | 9 -86% | 4.08 16% |
| Gamma | 2.39 92% | 2.6 85% | 2.25 98% | 2.211 100% | 2.105 105% | 2.33 94% |
| CCT | 6850 95% | 7678 85% | 7047 92% | 6714 97% | 8099 80% | 7303 89% |
| Color Space (Percent of AdobeRGB 1998) (%) | 60 | 60 0% | 58.1 -3% | 65 8% | 68 13% | 37 -38% |
| Color Space (Percent of sRGB) (%) | 92 | 93 1% | 89.7 -2% | 89 -3% | 92 0% | 58 -37% |
| Colorchecker dE 2000 calibrated * | 1.45 | 3.02 | 1.53 | 1.77 | 4.79 | |
| Toplam Ortalama (Program / Ayarlar) | 4% /
0% | -4% /
-2% | 5% /
7% | 6% /
-4% | -55% /
-34% |
* ... daha küçük daha iyidir
Yanıt Sürelerini Görüntüle
| ↔ Tepki Süresi Siyahtan Beyaza | ||
|---|---|---|
| 11 ms ... yükseliş ↗ ve sonbahar↘ birleşimi | ↗ 6 ms yükseliş | 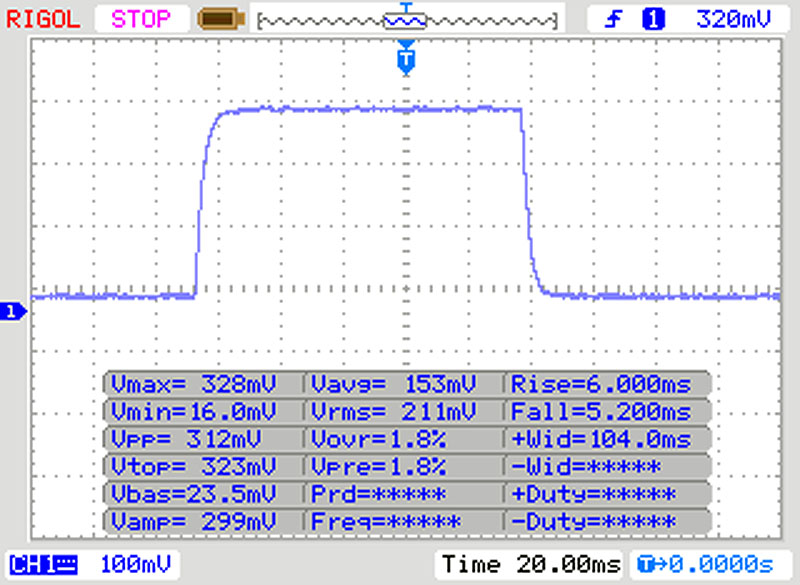 |
| ↘ 5 ms sonbahar | ||
| Ekran, testlerimizde iyi yanıt oranları gösteriyor ancak rekabetçi oyuncular için çok yavaş olabilir. Karşılaştırıldığında, test edilen tüm cihazlar 0.1 (minimum) ile 240 (maksimum) ms arasında değişir. » Tüm cihazların 30 %'si daha iyi. Bu, ölçülen yanıt süresinin test edilen tüm cihazların ortalamasından (19.8 ms) daha iyi olduğu anlamına gelir. | ||
| ↔ Tepki Süresi %50 Griden %80 Griye | ||
| 17 ms ... yükseliş ↗ ve sonbahar↘ birleşimi | ↗ 9 ms yükseliş | 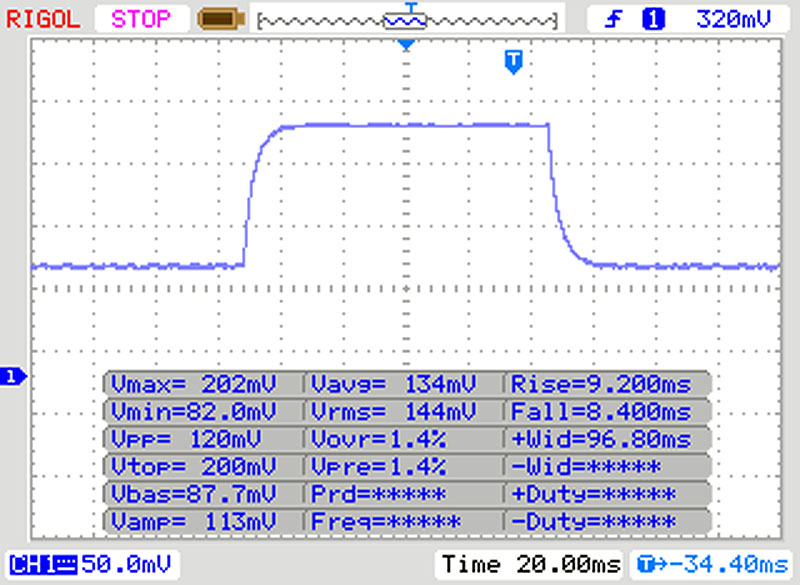 |
| ↘ 8 ms sonbahar | ||
| Ekran, testlerimizde iyi yanıt oranları gösteriyor ancak rekabetçi oyuncular için çok yavaş olabilir. Karşılaştırıldığında, test edilen tüm cihazlar 0.165 (minimum) ile 636 (maksimum) ms arasında değişir. » Tüm cihazların 31 %'si daha iyi. Bu, ölçülen yanıt süresinin test edilen tüm cihazların ortalamasından (31 ms) daha iyi olduğu anlamına gelir. | ||
Ekran Titremesi / PWM (Darbe Genişliği Modülasyonu)
| Ekran titriyor / PWM algılanmadı |  | ||
Karşılaştırıldığında: Test edilen tüm cihazların %52 %'si ekranı karartmak için PWM kullanmıyor. PWM tespit edilirse, ortalama 7757 (minimum: 5 - maksimum: 343500) Hz ölçüldü. | |||
Performans - Otomatik GPU hız aşırtmalı Predator
Predator Helios 300 ile Acer, her modern oyunu ekrana sorunsuz bir şekilde getiren 15.6 inçlik bir dizüstü oyun bilgisayarına sahip. Test cihazımızın fiyatı yaklaşık 1.500 ila 1.600 Euro (~ 1.744 $ ve ~ 1.860 $) arasında olmalıdır. Diğer konfigürasyon çeşitleri mevcuttur. Fiyatlar 1.020 Euro'dan (~ 1.186 $) başlıyor.
Test koşulları
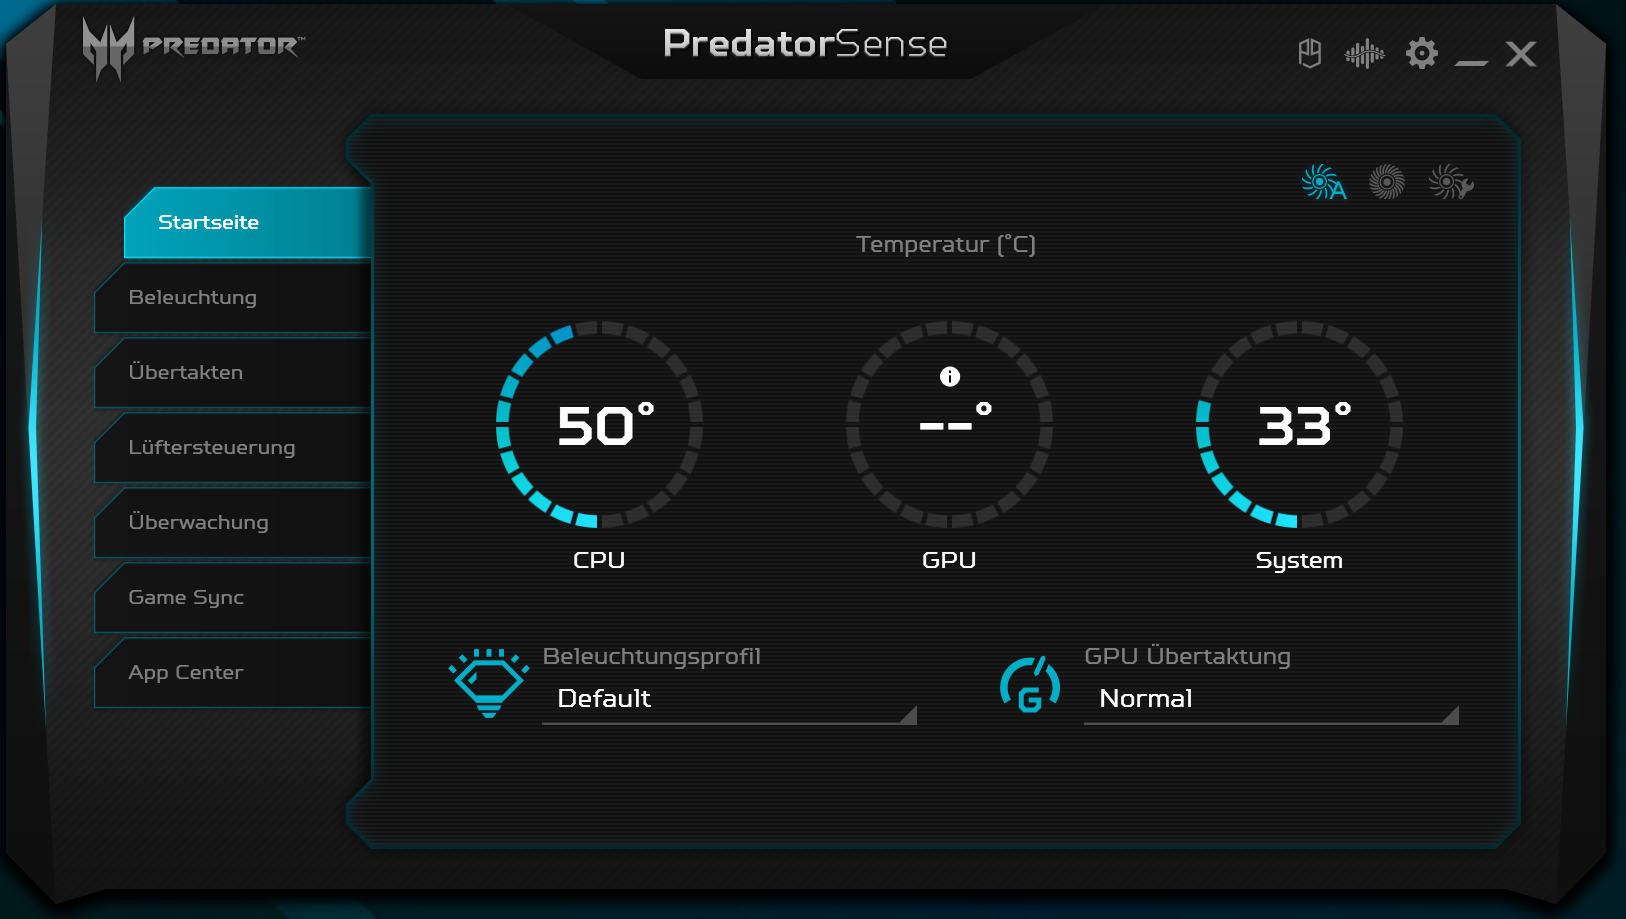
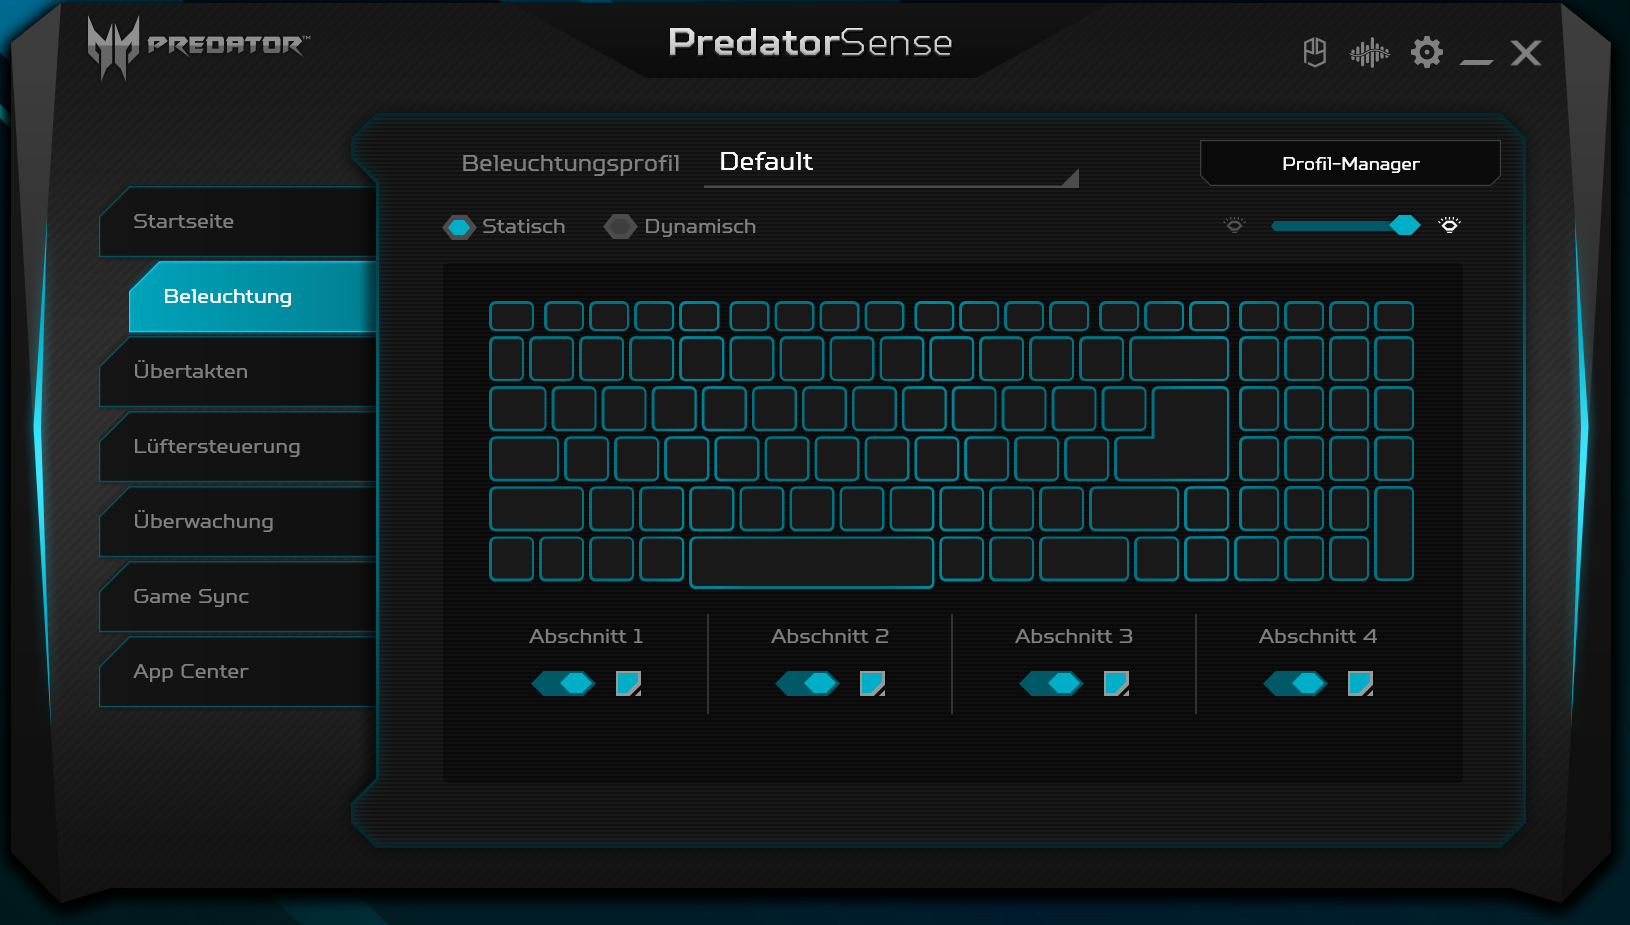
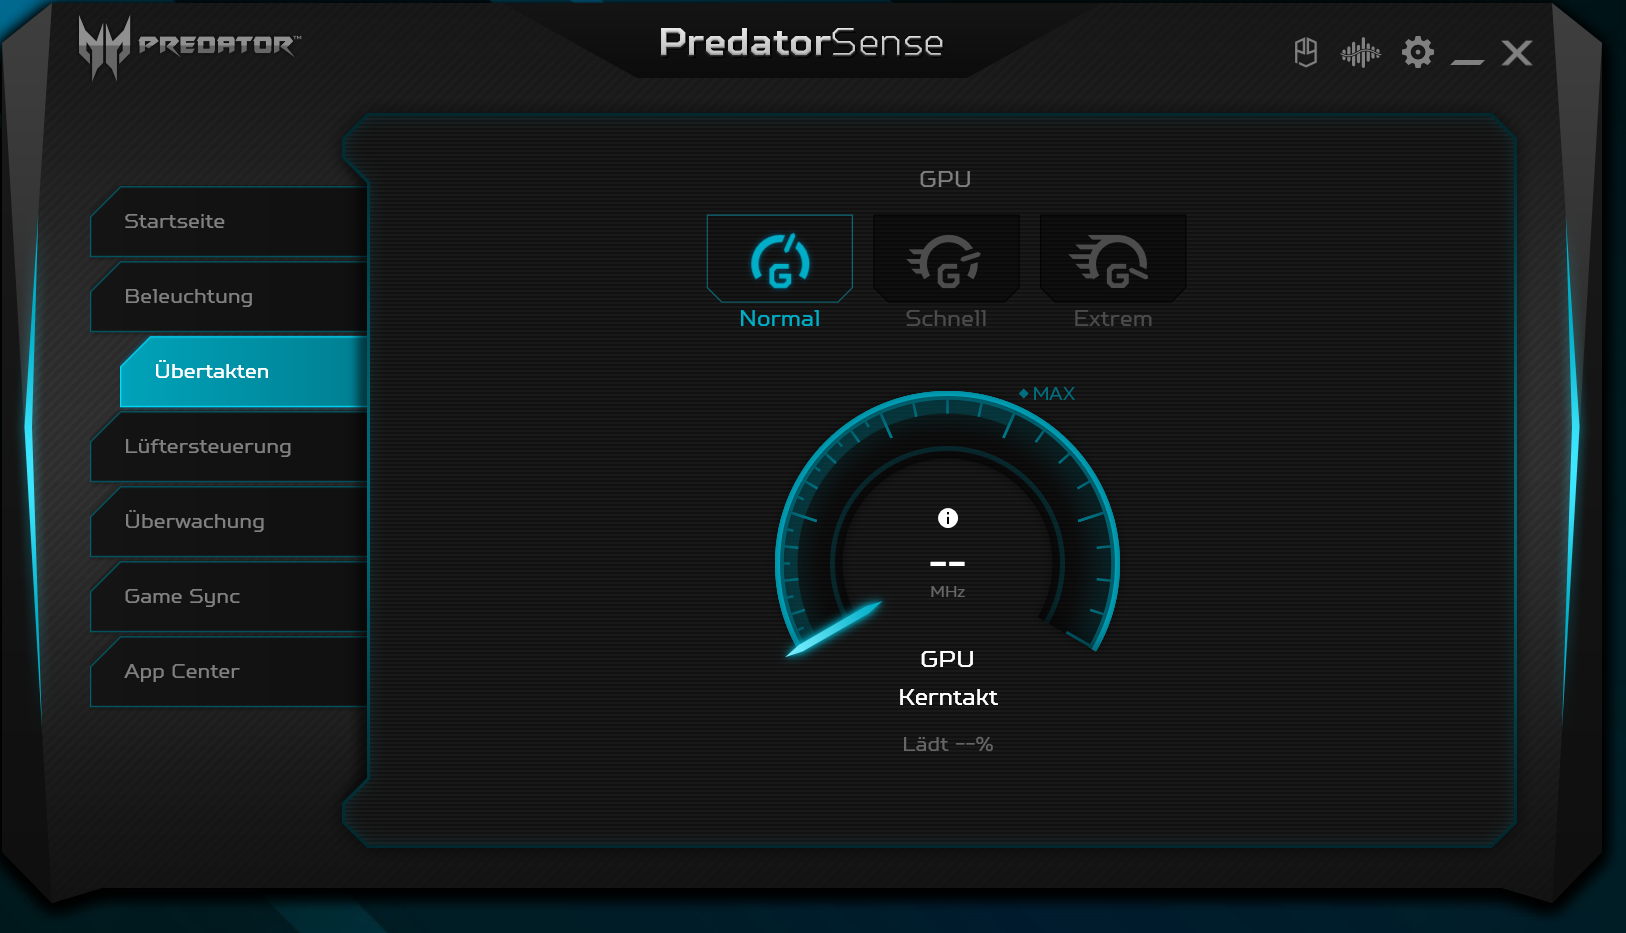
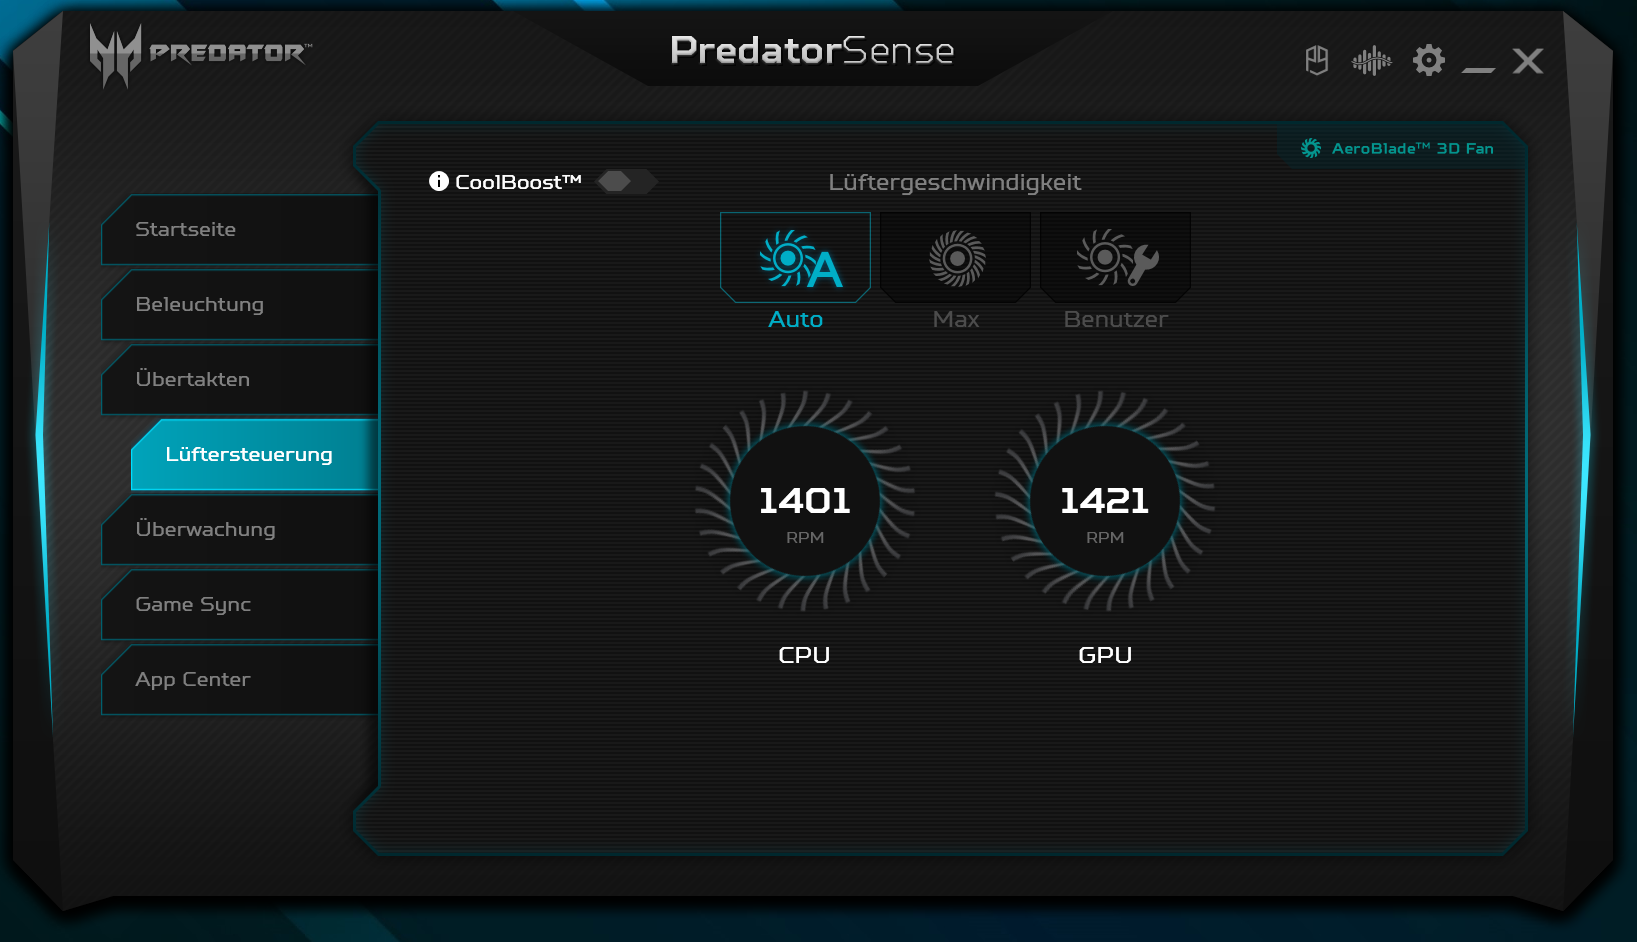
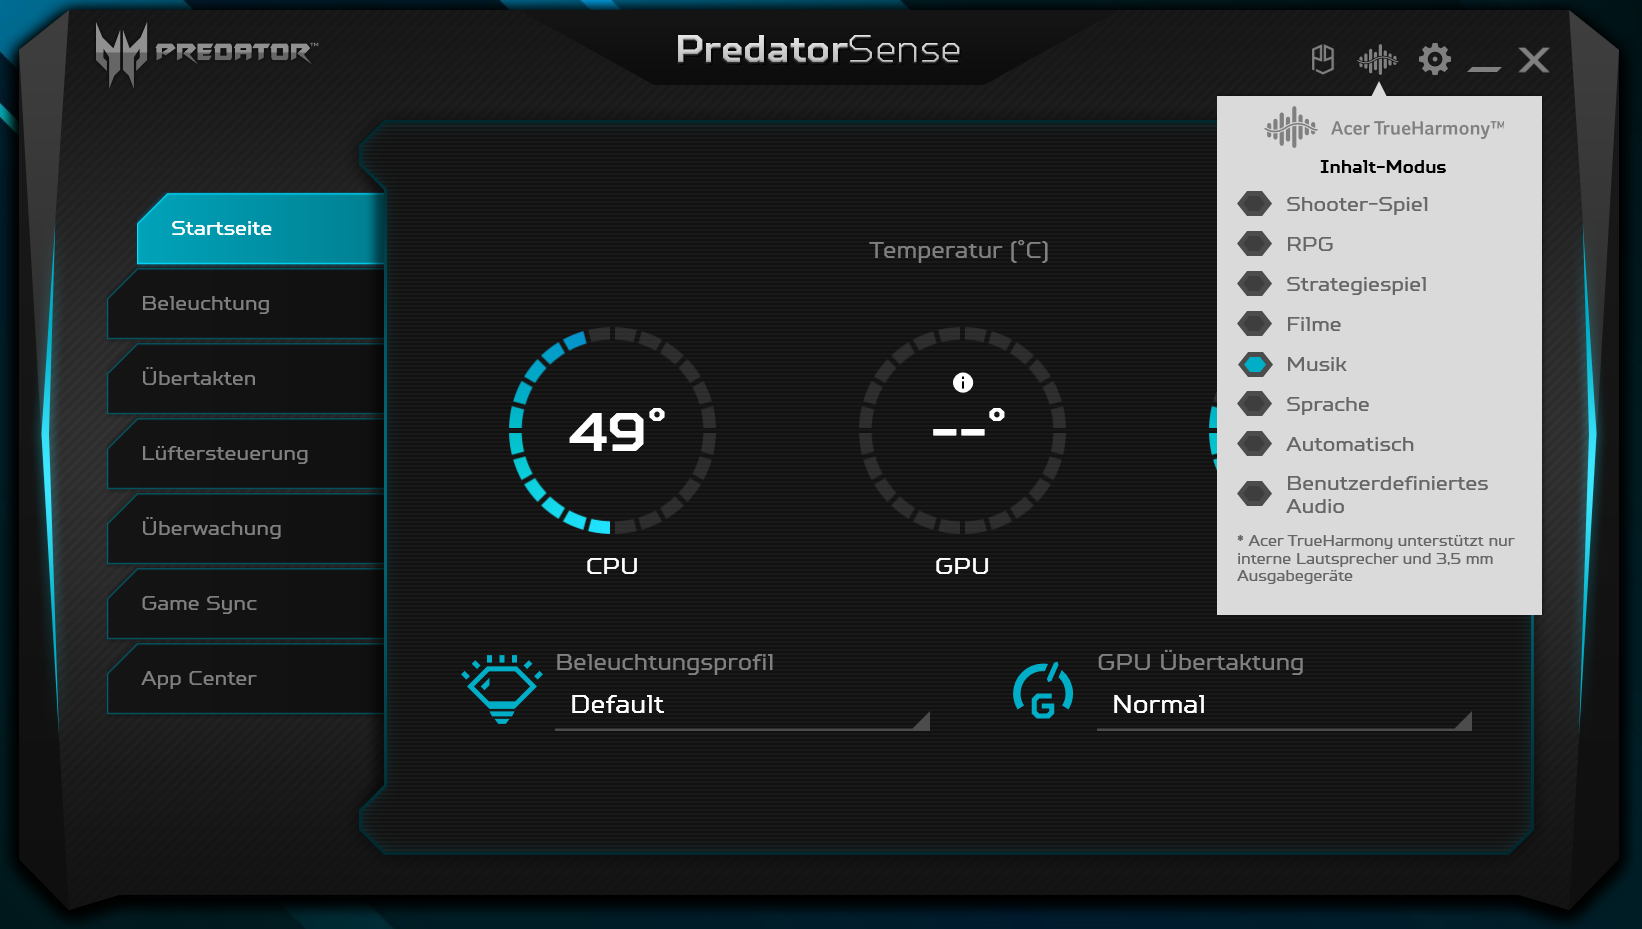
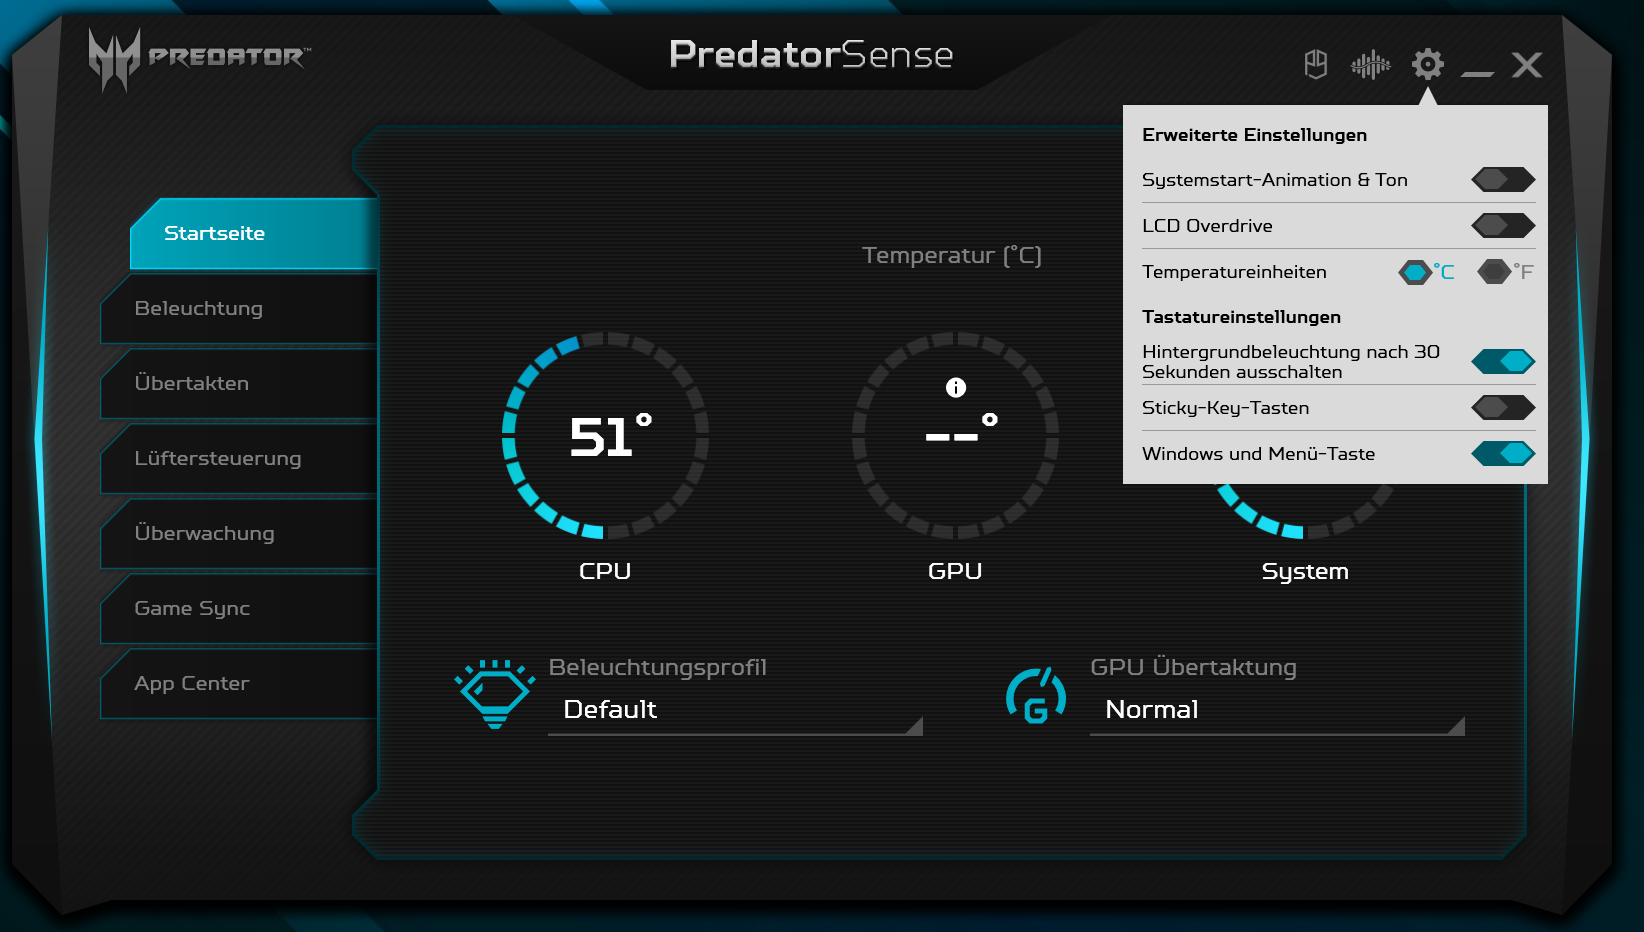
Önceden yüklenmiş Predator Sense yazılımı, fan kontrol ayarına ve otomatik GPU hız aşırtmaya olanak tanır. GPU profilleri "Normal", "Hızlı" ve "Aşırı" mevcuttur. Testimizi otomatik fan kontrollü ve "Normal" GPU profili altında gerçekleştirdik. Bazı testler ayrıca "Extreme" profili altında çalıştırıldı.Acer klavyenin üzerine bir "Turbo" tuşu yerleştirdi. Bu düğmeye basılırsa, fanlar sürekli olarak tam güçte çalışır ve "Extreme" GPU profili etkinleştirilir.
İşlemci
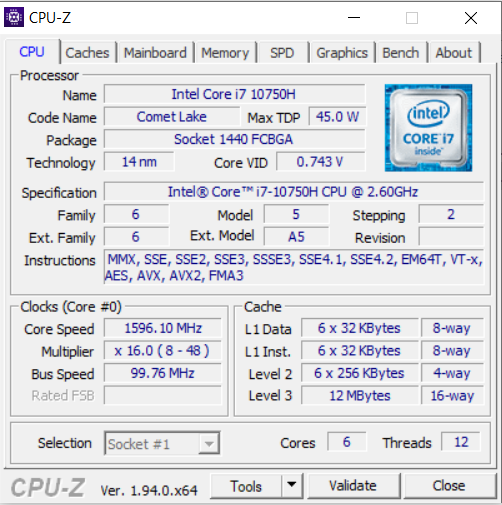
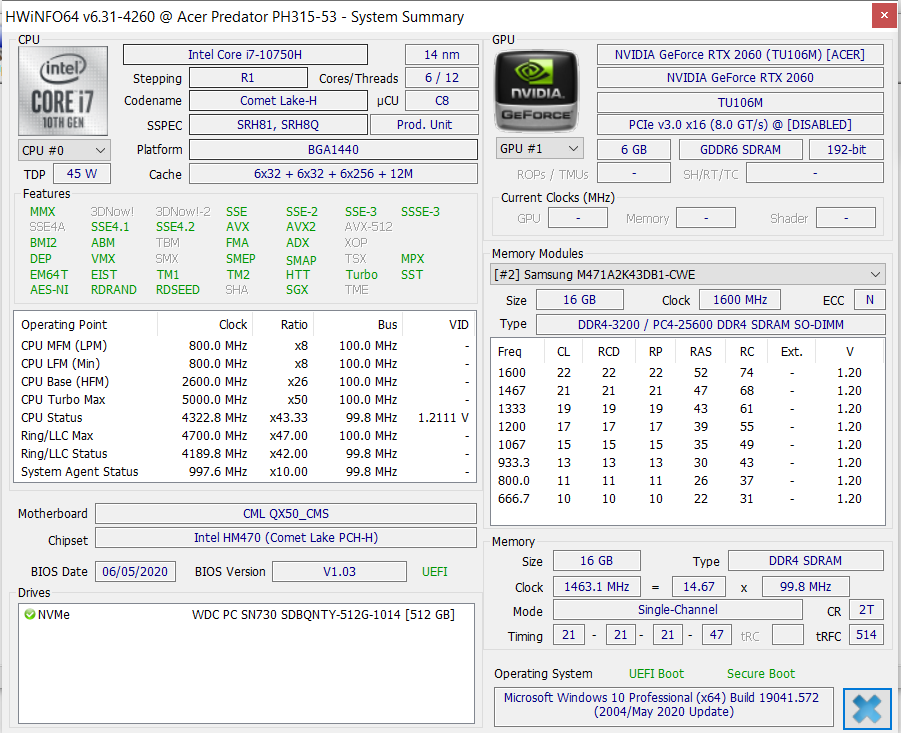
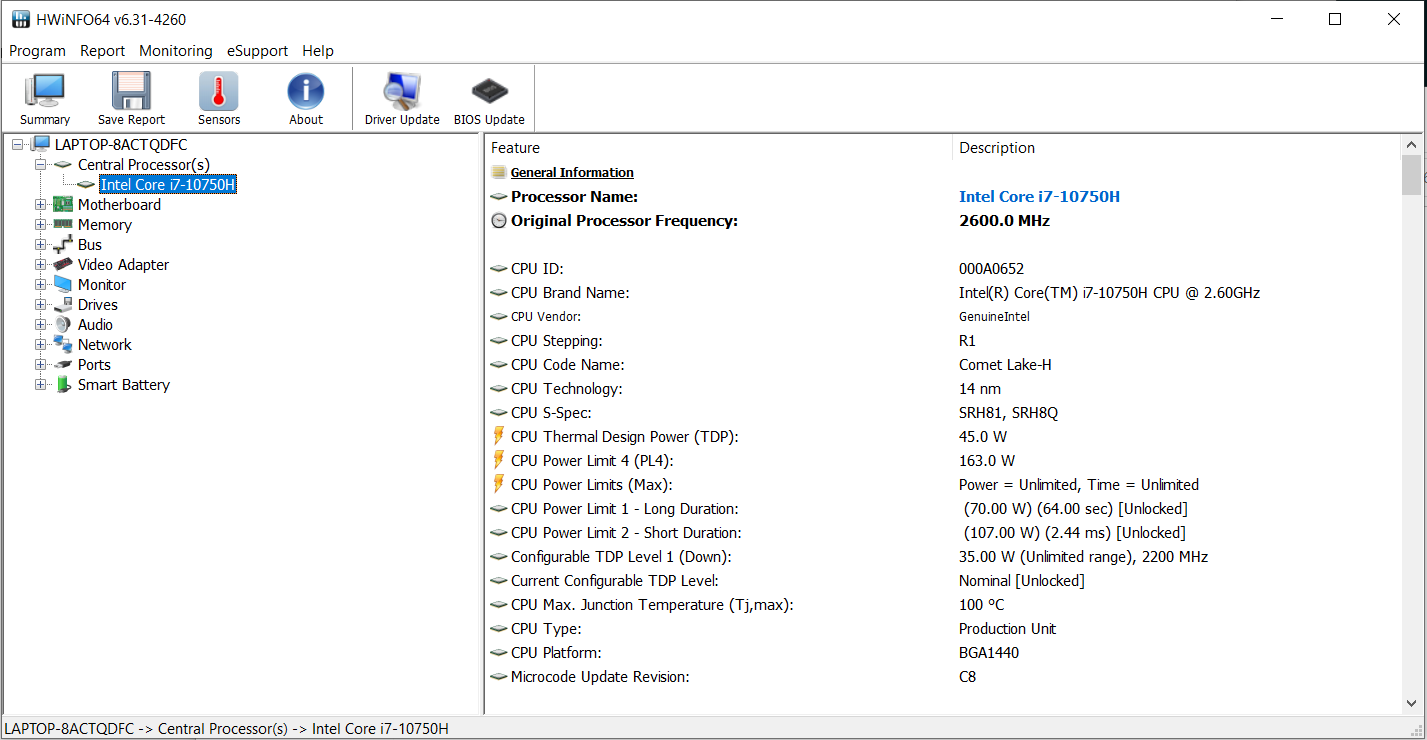
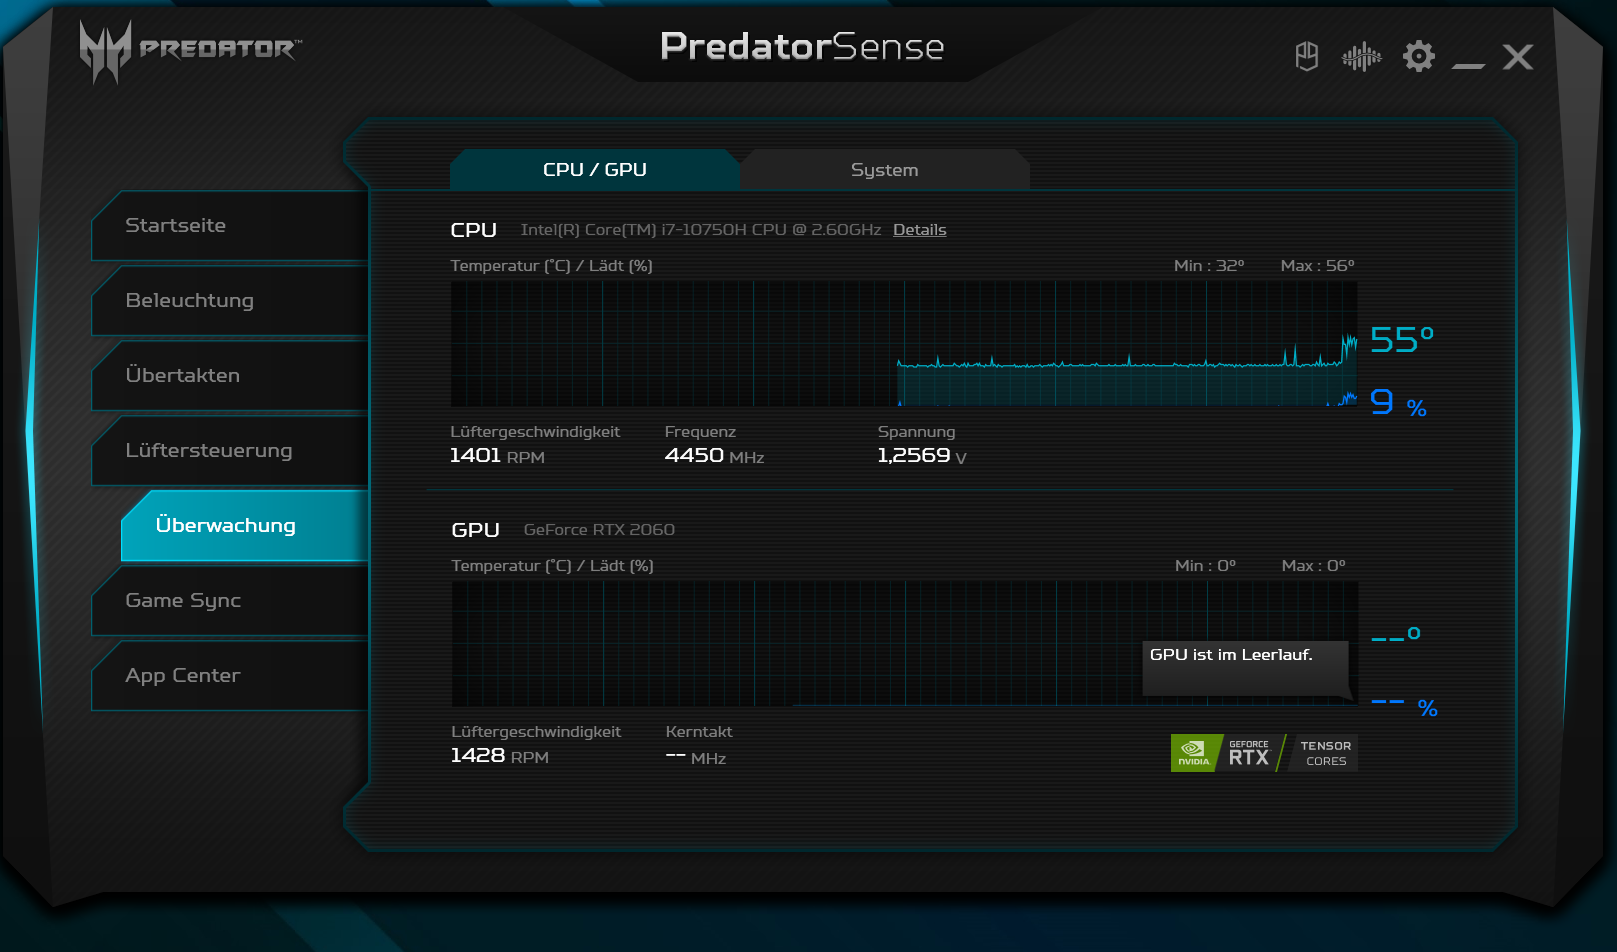
Core i7-10750H altı çekirdekli işlemci (Comet Lake) 2,6 GHz temel hızda çalışır. Saat hızı, Turbo aracılığıyla 4,3 GHz (altı çekirdek) veya 5 GHz (bir çekirdek) değerine yükseltilebilir. Hyper-Threading (çekirdek başına iki iş parçacığı) desteklenir. İşlemci, sırasıyla 4,2 GHz (çok iş parçacıklı) ve 4,2 ila 5 GHz (tek iş parçacıklı) Cinebench R15 karşılaştırmasının CPU testleriyle çalışır. Pil gücünde, saat hızları sırasıyla 2,4 ila 2,6 GHz (çoklu iş parçacıklı) ve 2,4 ila 3,2 GHz'dir (tek iş parçacıklı).
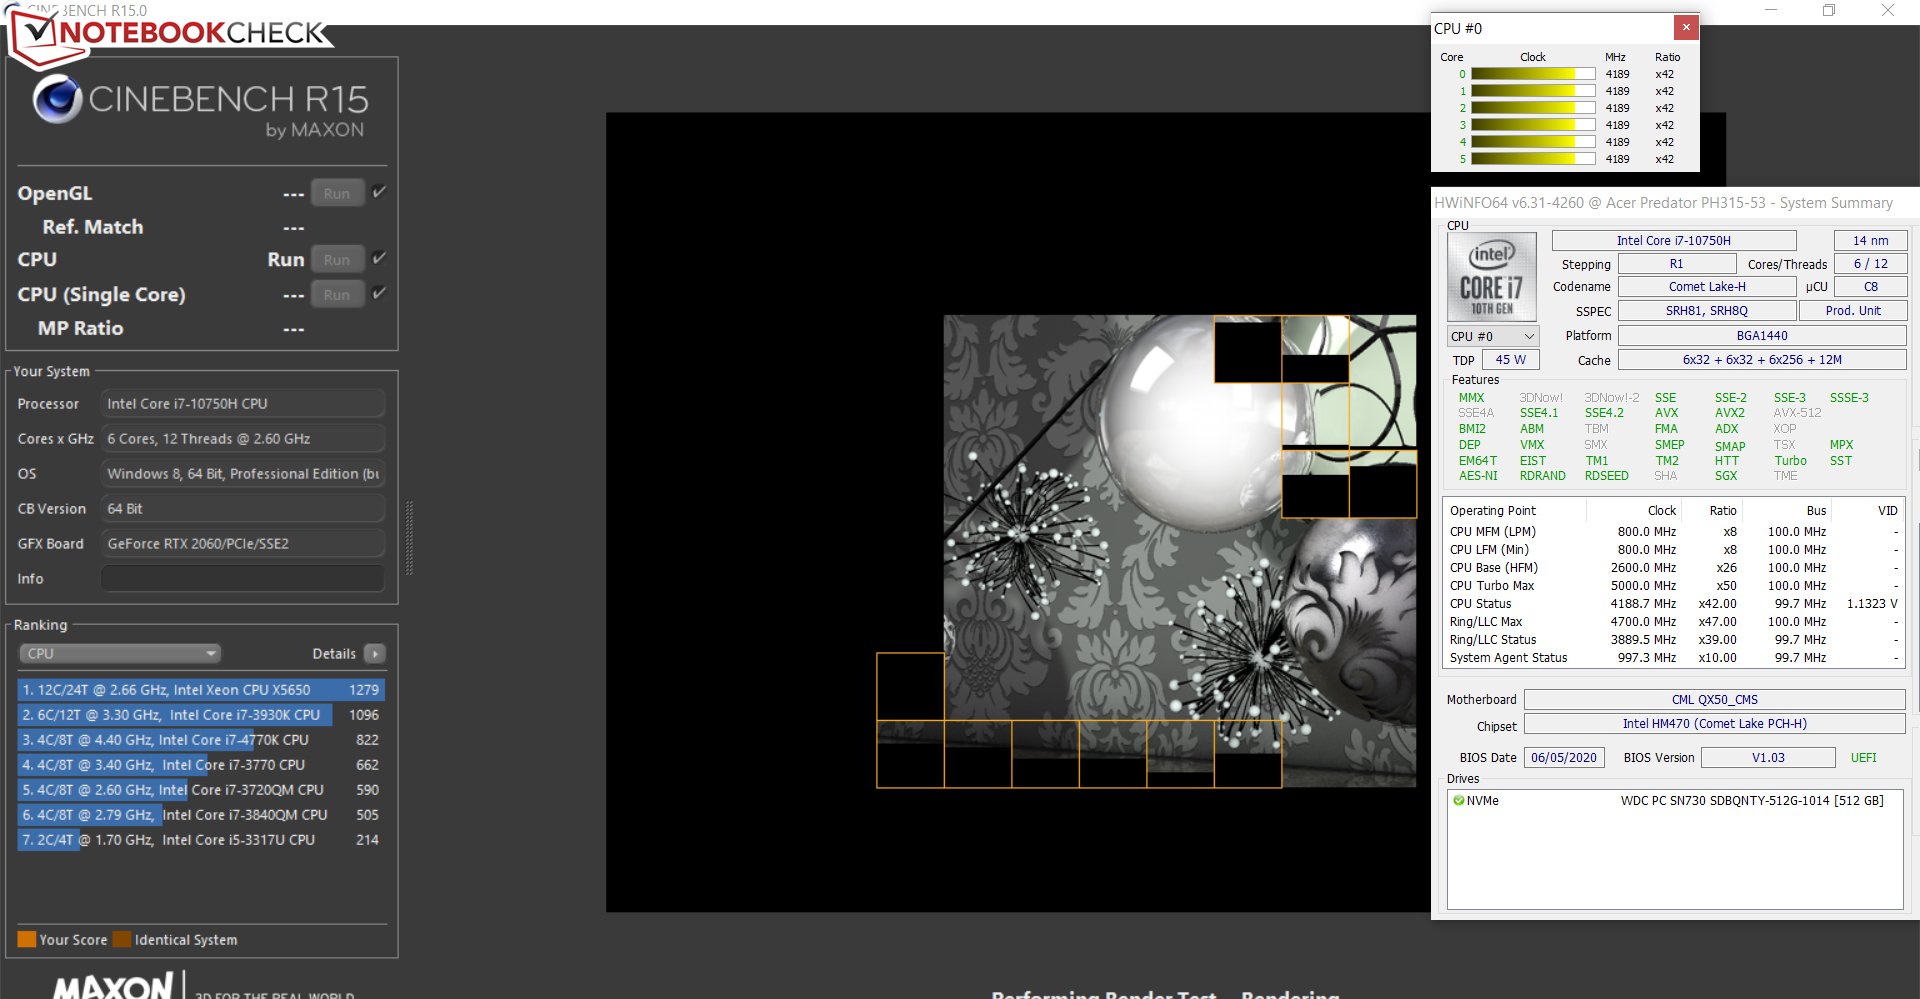

Cinebench R15 benchmark'ın multithread testini en az 30 dakika sürekli bir döngüde çalıştırarak CPU Turbo'nun takılıyken tutarlı bir şekilde kullanılıp kullanılmadığını doğrularız. Turbo büyük ölçüde kullanılmaktadır.

| Cinebench R15 | |
| CPU Single 64Bit | |
| Sınıf ortalaması Gaming (188.8 - 350, n=106, son 2 yıl) | |
| Aorus 5 KB | |
| Ortalama Intel Core i7-10750H (184 - 213, n=45) | |
| Acer Predator Helios 300 PH315-53-77N5 | |
| Acer Predator Helios 300 PH315-52-79TY | |
| Dell G5 15 SE 5505 P89F | |
| HP Pavilion Gaming 15-ec1177ng | |
| Schenker XMG Core 15 GK5NR0O | |
| Asus TUF Gaming A15 FA506IV-HN172 | |
| MSI Bravo 15 A4DCR | |
| CPU Multi 64Bit | |
| Sınıf ortalaması Gaming (1578 - 6330, n=105, son 2 yıl) | |
| Dell G5 15 SE 5505 P89F | |
| Schenker XMG Core 15 GK5NR0O | |
| HP Pavilion Gaming 15-ec1177ng | |
| Asus TUF Gaming A15 FA506IV-HN172 | |
| MSI Bravo 15 A4DCR | |
| Acer Predator Helios 300 PH315-53-77N5 | |
| Ortalama Intel Core i7-10750H (804 - 1418, n=50) | |
| Aorus 5 KB | |
| Acer Predator Helios 300 PH315-52-79TY | |
| Blender - v2.79 BMW27 CPU | |
| Acer Predator Helios 300 PH315-52-79TY | |
| Ortalama Intel Core i7-10750H (322 - 587, n=43) | |
| Aorus 5 KB | |
| Acer Predator Helios 300 PH315-53-77N5 | |
| MSI Bravo 15 A4DCR | |
| Dell G5 15 SE 5505 P89F | |
| Asus TUF Gaming A15 FA506IV-HN172 | |
| HP Pavilion Gaming 15-ec1177ng | |
| Schenker XMG Core 15 GK5NR0O | |
| Sınıf ortalaması Gaming (79 - 330, n=104, son 2 yıl) | |
| 7-Zip 18.03 | |
| 7z b 4 -mmt1 | |
| Sınıf ortalaması Gaming (4199 - 7436, n=105, son 2 yıl) | |
| Aorus 5 KB | |
| Acer Predator Helios 300 PH315-53-77N5 | |
| Ortalama Intel Core i7-10750H (4504 - 5470, n=43) | |
| HP Pavilion Gaming 15-ec1177ng | |
| Acer Predator Helios 300 PH315-52-79TY | |
| Asus TUF Gaming A15 FA506IV-HN172 | |
| Dell G5 15 SE 5505 P89F | |
| Schenker XMG Core 15 GK5NR0O | |
| MSI Bravo 15 A4DCR | |
| 7z b 4 | |
| Sınıf ortalaması Gaming (33491 - 148086, n=105, son 2 yıl) | |
| HP Pavilion Gaming 15-ec1177ng | |
| Dell G5 15 SE 5505 P89F | |
| Schenker XMG Core 15 GK5NR0O | |
| MSI Bravo 15 A4DCR | |
| Asus TUF Gaming A15 FA506IV-HN172 | |
| Acer Predator Helios 300 PH315-53-77N5 | |
| Aorus 5 KB | |
| Ortalama Intel Core i7-10750H (26040 - 37345, n=43) | |
| Acer Predator Helios 300 PH315-52-79TY | |
| Cinebench R20 | |
| CPU (Single Core) | |
| Sınıf ortalaması Gaming (442 - 913, n=106, son 2 yıl) | |
| HP Pavilion Gaming 15-ec1177ng | |
| Asus TUF Gaming A15 FA506IV-HN172 | |
| Dell G5 15 SE 5505 P89F | |
| Acer Predator Helios 300 PH315-53-77N5 | |
| MSI Bravo 15 A4DCR | |
| Aorus 5 KB | |
| Schenker XMG Core 15 GK5NR0O | |
| Ortalama Intel Core i7-10750H (431 - 504, n=43) | |
| Acer Predator Helios 300 PH315-52-79TY | |
| CPU (Multi Core) | |
| Sınıf ortalaması Gaming (4029 - 16433, n=106, son 2 yıl) | |
| Schenker XMG Core 15 GK5NR0O | |
| Dell G5 15 SE 5505 P89F | |
| HP Pavilion Gaming 15-ec1177ng | |
| Asus TUF Gaming A15 FA506IV-HN172 | |
| MSI Bravo 15 A4DCR | |
| Acer Predator Helios 300 PH315-53-77N5 | |
| Aorus 5 KB | |
| Ortalama Intel Core i7-10750H (1749 - 3325, n=43) | |
| Acer Predator Helios 300 PH315-52-79TY | |
| Geekbench 5.5 | |
| Single-Core | |
| Sınıf ortalaması Gaming (986 - 2474, n=105, son 2 yıl) | |
| Aorus 5 KB | |
| Ortalama Intel Core i7-10750H (1114 - 1333, n=43) | |
| Acer Predator Helios 300 PH315-53-77N5 | |
| HP Pavilion Gaming 15-ec1177ng | |
| Schenker XMG Core 15 GK5NR0O | |
| Asus TUF Gaming A15 FA506IV-HN172 | |
| Dell G5 15 SE 5505 P89F | |
| MSI Bravo 15 A4DCR | |
| Multi-Core | |
| Sınıf ortalaması Gaming (6460 - 28263, n=105, son 2 yıl) | |
| HP Pavilion Gaming 15-ec1177ng | |
| Dell G5 15 SE 5505 P89F | |
| MSI Bravo 15 A4DCR | |
| Schenker XMG Core 15 GK5NR0O | |
| Aorus 5 KB | |
| Ortalama Intel Core i7-10750H (4443 - 6674, n=43) | |
| Asus TUF Gaming A15 FA506IV-HN172 | |
| Acer Predator Helios 300 PH315-53-77N5 | |
| HWBOT x265 Benchmark v2.2 - 4k Preset | |
| Sınıf ortalaması Gaming (11.5 - 44.4, n=105, son 2 yıl) | |
| HP Pavilion Gaming 15-ec1177ng | |
| Dell G5 15 SE 5505 P89F | |
| Schenker XMG Core 15 GK5NR0O | |
| MSI Bravo 15 A4DCR | |
| Asus TUF Gaming A15 FA506IV-HN172 | |
| Acer Predator Helios 300 PH315-53-77N5 | |
| Ortalama Intel Core i7-10750H (5.54 - 11.6, n=43) | |
| Aorus 5 KB | |
| Acer Predator Helios 300 PH315-52-79TY | |
| LibreOffice - 20 Documents To PDF | |
| MSI Bravo 15 A4DCR | |
| Dell G5 15 SE 5505 P89F | |
| HP Pavilion Gaming 15-ec1177ng | |
| Schenker XMG Core 15 GK5NR0O | |
| Acer Predator Helios 300 PH315-53-77N5 | |
| Ortalama Intel Core i7-10750H (43.1 - 99.2, n=43) | |
| Sınıf ortalaması Gaming (33.2 - 88.8, n=105, son 2 yıl) | |
| Aorus 5 KB | |
| Asus TUF Gaming A15 FA506IV-HN172 | |
| R Benchmark 2.5 - Overall mean | |
| Ortalama Intel Core i7-10750H (0.578 - 0.708, n=42) | |
| Asus TUF Gaming A15 FA506IV-HN172 | |
| Aorus 5 KB | |
| Acer Predator Helios 300 PH315-53-77N5 | |
| MSI Bravo 15 A4DCR | |
| Schenker XMG Core 15 GK5NR0O | |
| Dell G5 15 SE 5505 P89F | |
| HP Pavilion Gaming 15-ec1177ng | |
| Sınıf ortalaması Gaming (0.3439 - 0.759, n=106, son 2 yıl) | |
* ... daha küçük daha iyidir
Sistem performansı
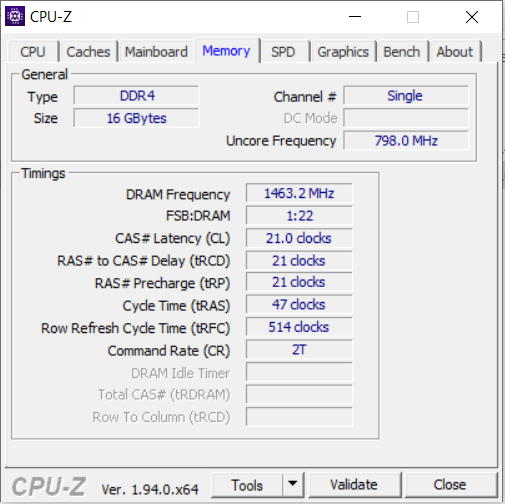
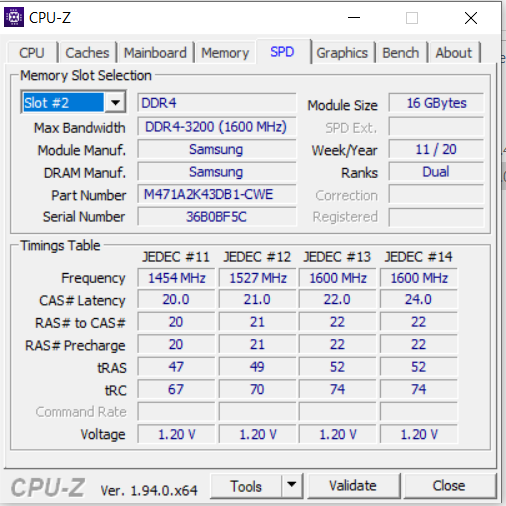
Sistem hızlı ve sorunsuzdur. PCMark sonuçları iyidir. Dizüstü bilgisayar, önümüzdeki yıllar için oyun, video düzenleme ve görüntü işleme gibi performans gerektiren uygulamalar için yeterli bilgi işlem gücü sunuyor. Çift kanallı mod etkinleştirilerek performansta hafif bir artış sağlanabilir. Bu amaçla, dizüstü bilgisayarın ikinci bir bellek modülüyle donatılması gerekiyordu.

| PCMark 8 Home Score Accelerated v2 | 4160 puan | |
| PCMark 8 Creative Score Accelerated v2 | 5899 puan | |
| PCMark 8 Work Score Accelerated v2 | 5405 puan | |
| PCMark 10 Score | 5921 puan | |
Yardım | ||
| PCMark 8 | |
| Home Score Accelerated v2 | |
| Sınıf ortalaması Gaming (n=1son 2 yıl) | |
| Schenker XMG Core 15 GK5NR0O | |
| Dell G5 15 SE 5505 P89F | |
| HP Pavilion Gaming 15-ec1177ng | |
| Asus TUF Gaming A15 FA506IV-HN172 | |
| Acer Predator Helios 300 PH315-52-79TY | |
| Ortalama Intel Core i7-10750H, NVIDIA GeForce RTX 2060 Mobile (3836 - 4539, n=6) | |
| Acer Predator Helios 300 PH315-53-77N5 | |
| Work Score Accelerated v2 | |
| Schenker XMG Core 15 GK5NR0O | |
| Asus TUF Gaming A15 FA506IV-HN172 | |
| Ortalama Intel Core i7-10750H, NVIDIA GeForce RTX 2060 Mobile (5405 - 5928, n=6) | |
| HP Pavilion Gaming 15-ec1177ng | |
| Acer Predator Helios 300 PH315-52-79TY | |
| Acer Predator Helios 300 PH315-53-77N5 | |
| Dell G5 15 SE 5505 P89F | |
| Sınıf ortalaması Gaming (n=1son 2 yıl) | |
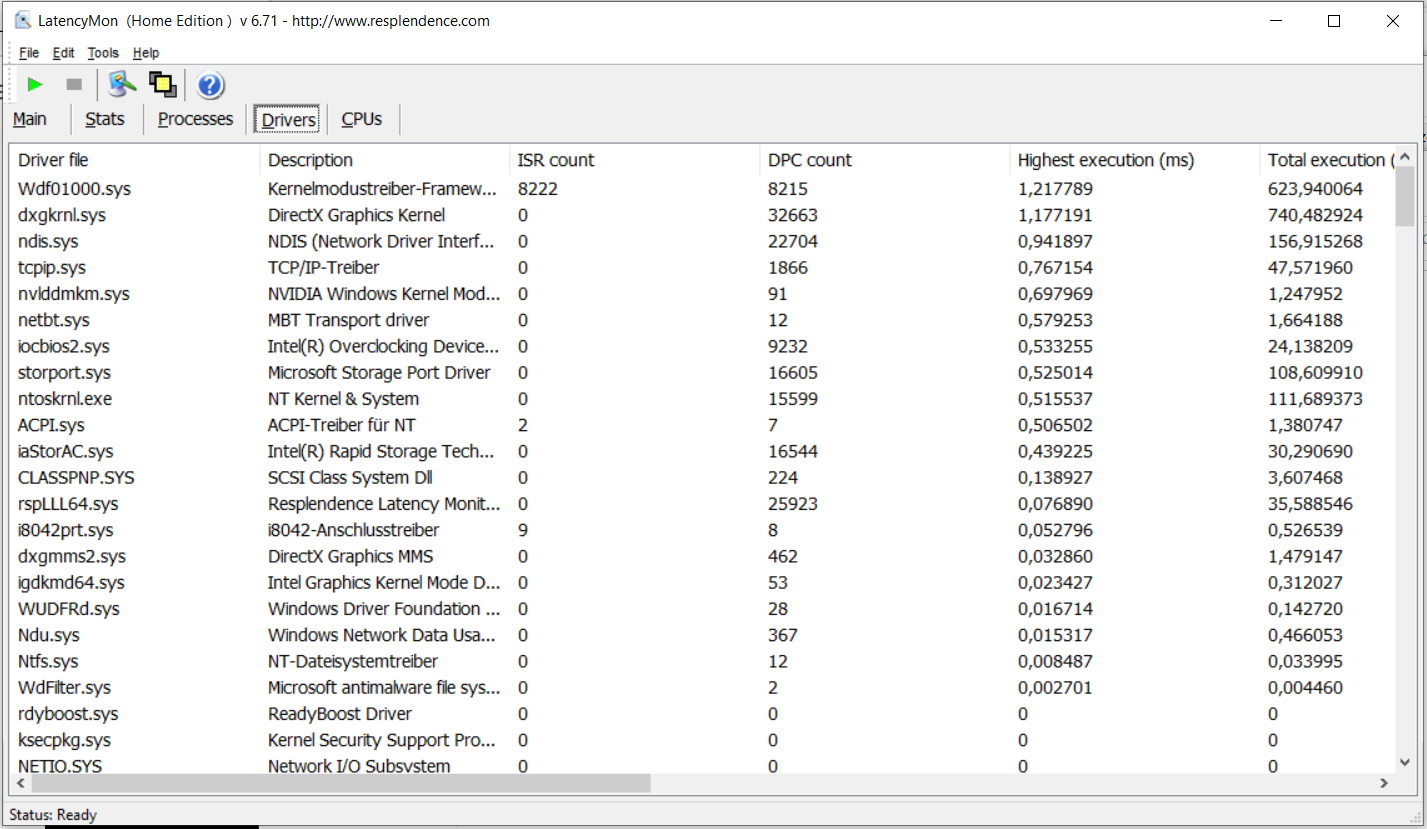
DPC gecikmeleri
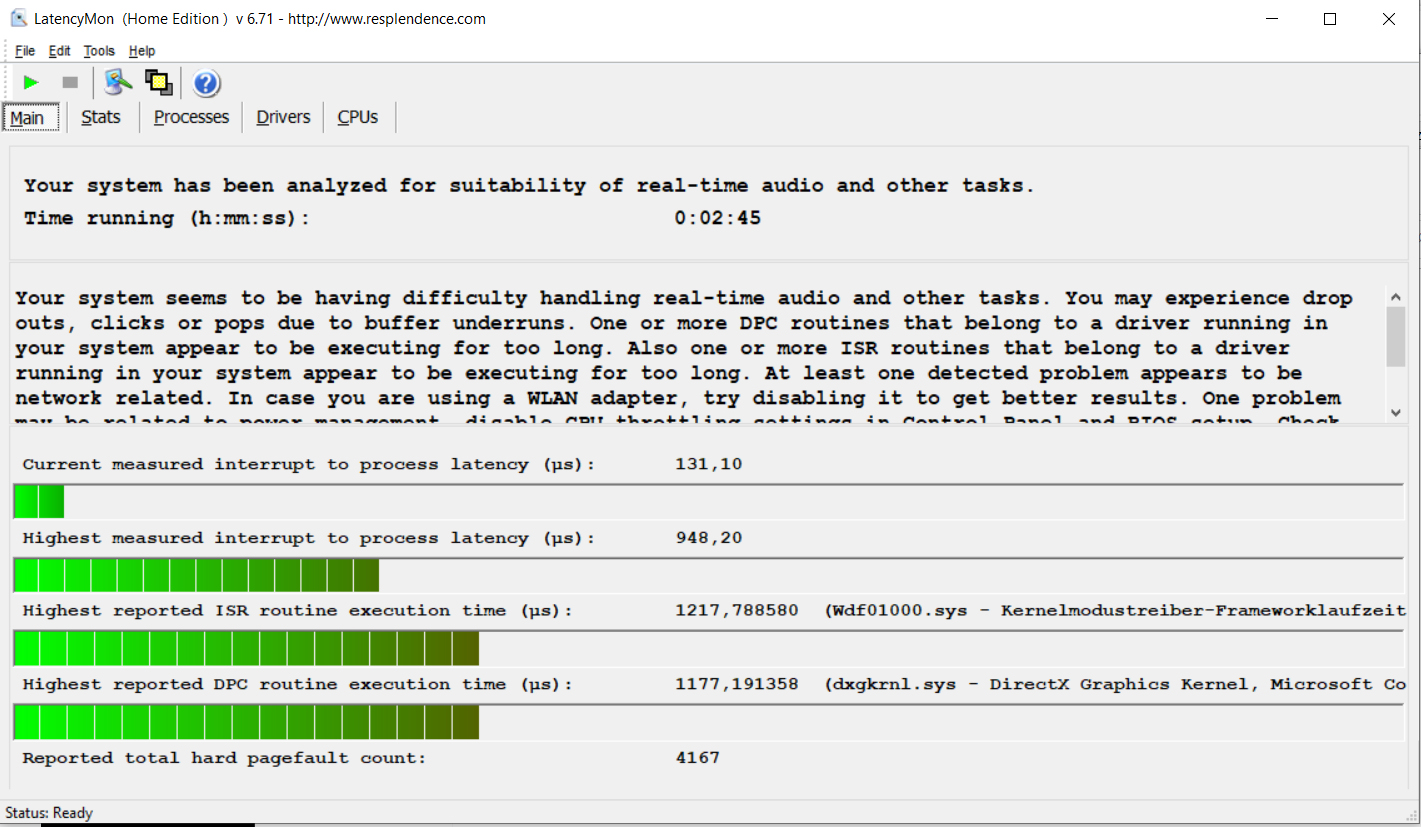
Standartlaştırılmış gecikmeli monitör testimizde (web sörfü, 4K video oynatma, yüksek yüklü Prime95), DPC gecikmeleriyle ilgili sorunları gözlemleyebildik. Sistem, gerçek zamanlı video ve ses düzenleme için uygun görünmüyor.
| DPC Latencies / LatencyMon - interrupt to process latency (max), Web, Youtube, Prime95 | |
| Dell G5 15 SE 5505 P89F | |
| Schenker XMG Core 15 GK5NR0O | |
| MSI Bravo 15 A4DCR | |
| Aorus 5 KB | |
| Acer Predator Helios 300 PH315-53-77N5 | |
| Asus TUF Gaming A15 FA506IV-HN172 | |
| HP Pavilion Gaming 15-ec1177ng | |
* ... daha küçük daha iyidir
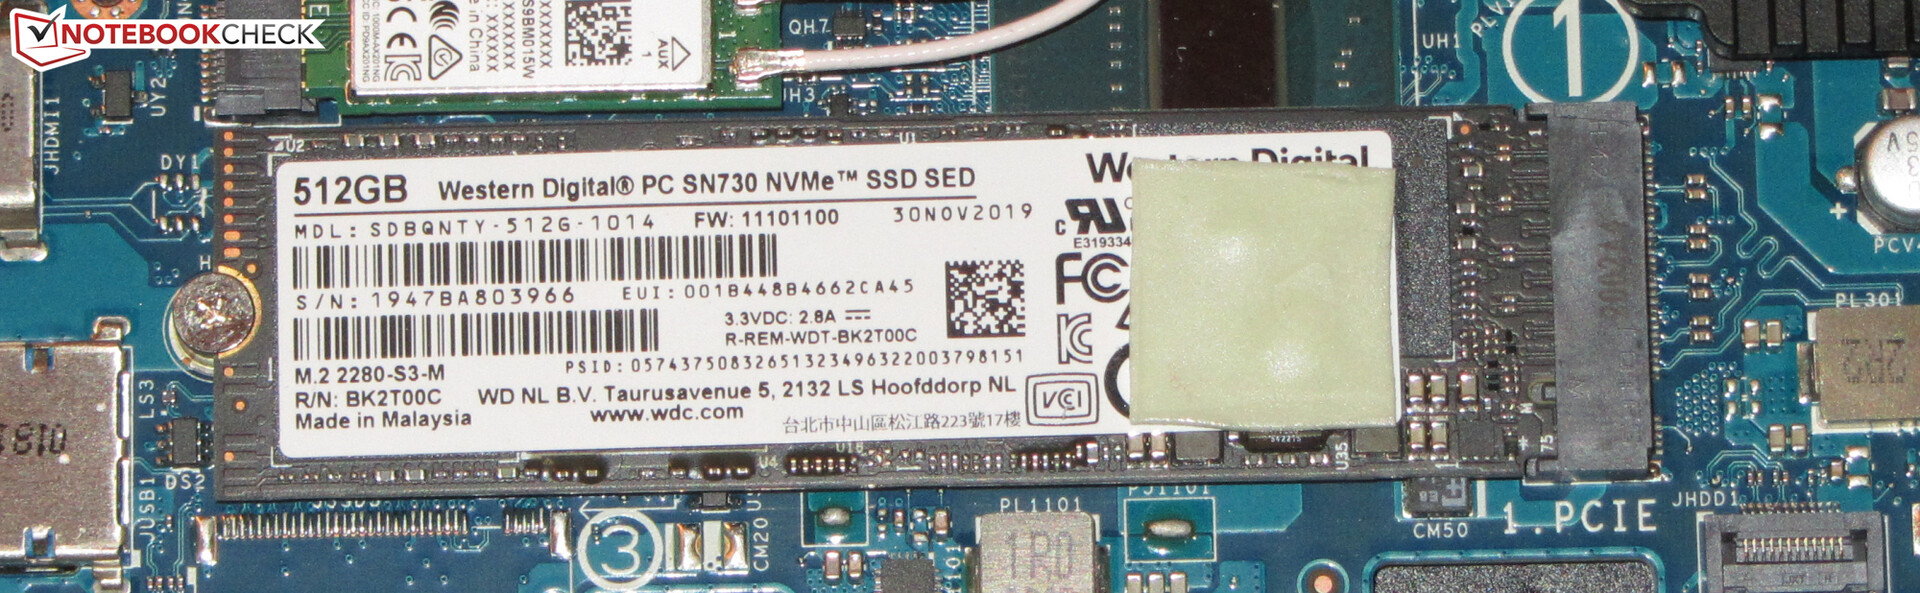
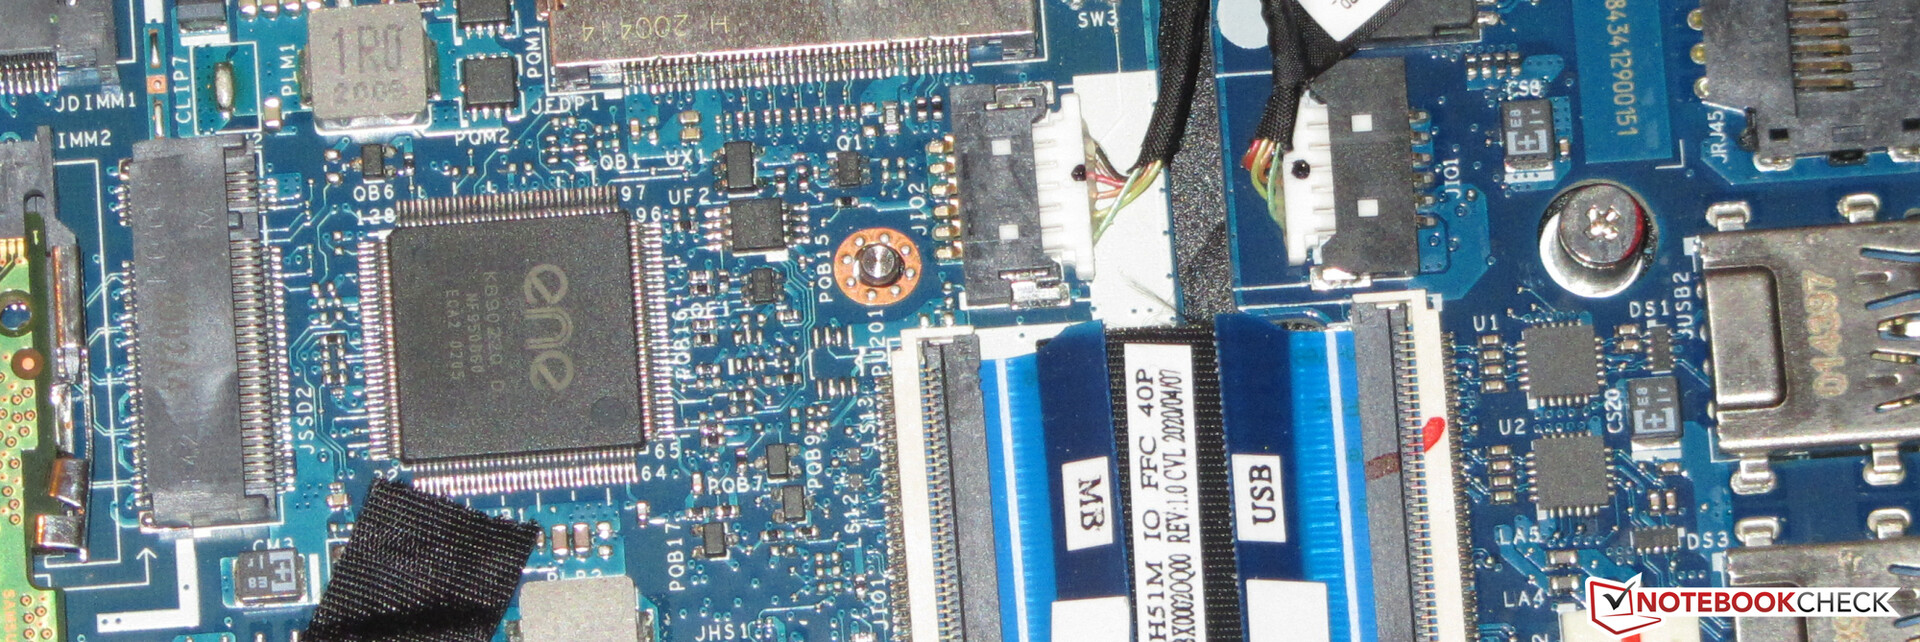
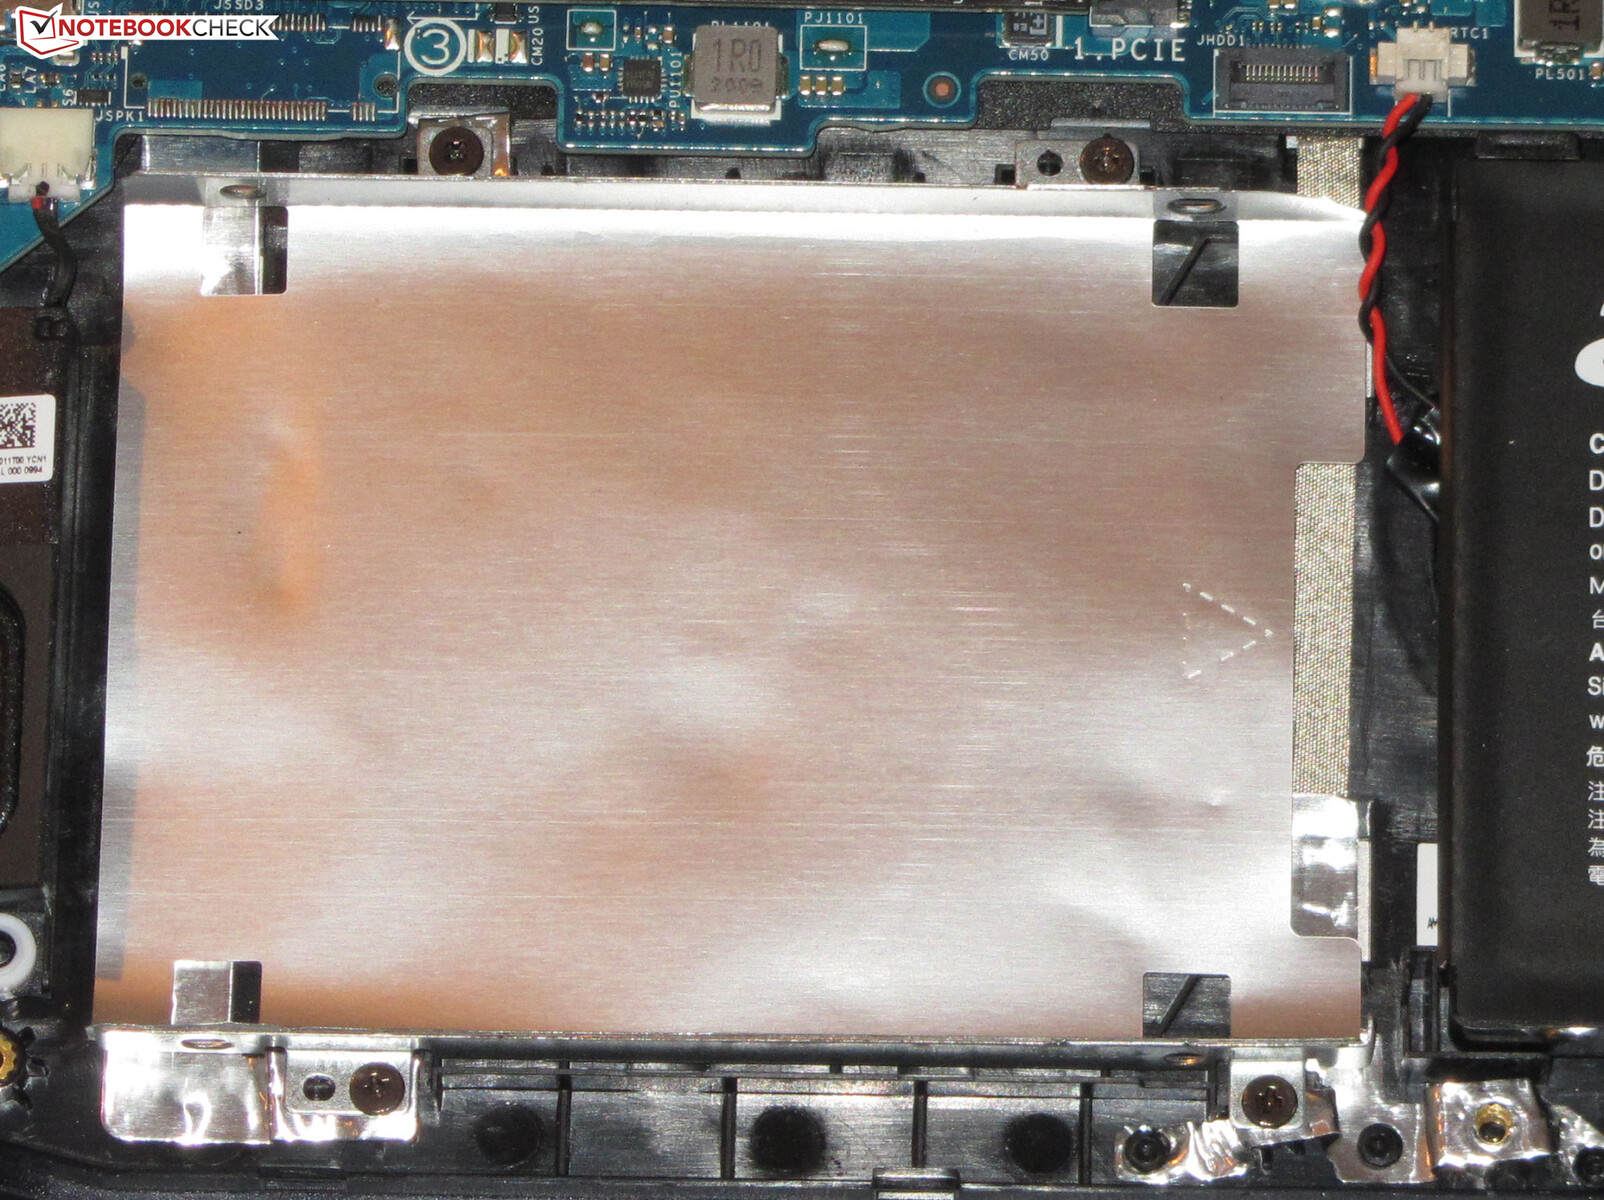
Depolama
Dizüstü bilgisayar, gerekirse bir RAID 0 dizisi oluşturabilen M.2 2280 biçiminde iki NVMe SSD barındırabilir. Test cihazımız yalnızca 512 GB depolama alanı sağlayan bir NVMe SSD ile donatılmıştır. Transfer oranları iyi. Ayrıca, Predator'da hala 2,5 inçlik bir depolama ortamı için yer var. Test cihazımız bu tür bir sürücü ile yükseltilemez çünkü gerekli SATA yuvası dahil değildir.

| Acer Predator Helios 300 PH315-53-77N5 WDC PC SN730 SDBQNTY-512GB | Acer Predator Helios 300 PH315-52-79TY WDC PC SN720 SDAPNTW-512G | Dell G5 15 SE 5505 P89F Samsung PM991 MZ9LQ512HALU | Aorus 5 KB ADATA XPG SX8200 Pro (ASX8200PNP-512GT) | Schenker XMG Core 15 GK5NR0O Samsung SSD 970 EVO Plus 500GB | Asus TUF Gaming A15 FA506IV-HN172 Kingston OM8PCP3512F-AB | Ortalama WDC PC SN730 SDBQNTY-512GB | |
|---|---|---|---|---|---|---|---|
| CrystalDiskMark 5.2 / 6 | -7% | -17% | 11% | 29% | -13% | -2% | |
| Write 4K (MB/s) | 137.5 | 108.7 -21% | 142.1 3% | 162.1 18% | 233 69% | 219.8 60% | 140.9 ? 2% |
| Read 4K (MB/s) | 48.24 | 44.91 -7% | 46.43 -4% | 60.7 26% | 54.5 13% | 50.2 4% | 45.6 ? -5% |
| Write Seq (MB/s) | 2644 | 2424 -8% | 1108 -58% | 2366 -11% | 3050 15% | 979 -63% | 2066 ? -22% |
| Read Seq (MB/s) | 1718 | 1617 -6% | 1622 -6% | 2633 53% | 3042 77% | 1990 16% | 2014 ? 17% |
| Write 4K Q32T1 (MB/s) | 416.6 | 356.9 -14% | 467 12% | 428.2 3% | 520 25% | 516 24% | 472 ? 13% |
| Read 4K Q32T1 (MB/s) | 525 | 557 6% | 525 0% | 582 11% | 546 4% | 298.3 -43% | 453 ? -14% |
| Write Seq Q32T1 (MB/s) | 2705 | 2542 -6% | 1203 -56% | 2480 -8% | 3241 20% | 982 -64% | 2433 ? -10% |
| Read Seq Q32T1 (MB/s) | 3213 | 3218 0% | 2288 -29% | 3121 -3% | 3538 10% | 1907 -41% | 3237 ? 1% |
| Write 4K Q8T8 (MB/s) | 1138 | 981 | |||||
| Read 4K Q8T8 (MB/s) | 1346 | 300.9 | |||||
| AS SSD | 4% | -29% | 0% | 32% | -23% | 3% | |
| Seq Read (MB/s) | 2753 | 2841 3% | 1386 -50% | 2795 2% | 2836 3% | 1682 -39% | 2506 ? -9% |
| Seq Write (MB/s) | 2495 | 2009 -19% | 1234 -51% | 2172 -13% | 2452 -2% | 904 -64% | 1655 ? -34% |
| 4K Read (MB/s) | 38.64 | 39.34 2% | 41.32 7% | 53.3 38% | 60.4 56% | 60.2 56% | 42.2 ? 9% |
| 4K Write (MB/s) | 88.8 | 102.8 16% | 128 44% | 121.3 37% | 190.5 115% | 164.8 86% | 127.5 ? 44% |
| 4K-64 Read (MB/s) | 952 | 1257 32% | 854 -10% | 714 -25% | 1283 35% | 472.5 -50% | 1061 ? 11% |
| 4K-64 Write (MB/s) | 1568 | 1522 -3% | 721 -54% | 1376 -12% | 2298 47% | 845 -46% | 1480 ? -6% |
| Access Time Read * (ms) | 0.086 | 0.098 | 0.049 | 0.034 | 0.087 | 0.1012 ? | |
| Access Time Write * (ms) | 0.044 | 0.036 18% | 0.095 -116% | 0.036 18% | 0.02 55% | 0.02 55% | 0.03833 ? 13% |
| Score Read (Points) | 1266 | 1581 25% | 1034 -18% | 1046 -17% | 1627 29% | 701 -45% | 1354 ? 7% |
| Score Write (Points) | 1906 | 1825 -4% | 973 -49% | 1714 -10% | 2734 43% | 1101 -42% | 1772 ? -7% |
| Score Total (Points) | 3811 | 4175 10% | 2536 -33% | 3279 -14% | 5184 36% | 2143 -44% | 3781 ? -1% |
| Copy ISO MB/s (MB/s) | 2037 | 1446 -29% | 1284 -37% | 2039 0% | 675 -67% | 1903 ? -7% | |
| Copy Program MB/s (MB/s) | 475.6 | 473.4 0% | 401.9 -15% | 438 -8% | 248.4 -48% | 533 ? 12% | |
| Copy Game MB/s (MB/s) | 1018 | 971 -5% | 1013 0% | 1137 12% | 535 -47% | 1074 ? 6% | |
| Toplam Ortalama (Program / Ayarlar) | -2% /
-0% | -23% /
-25% | 6% /
5% | 31% /
31% | -18% /
-19% | 1% /
1% |
* ... daha küçük daha iyidir
Continuous load read: DiskSpd Read Loop, Queue Depth 8
Grafik kartı
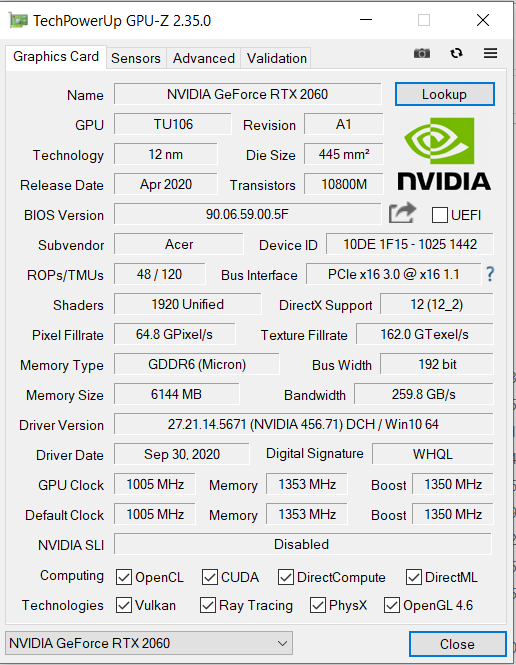
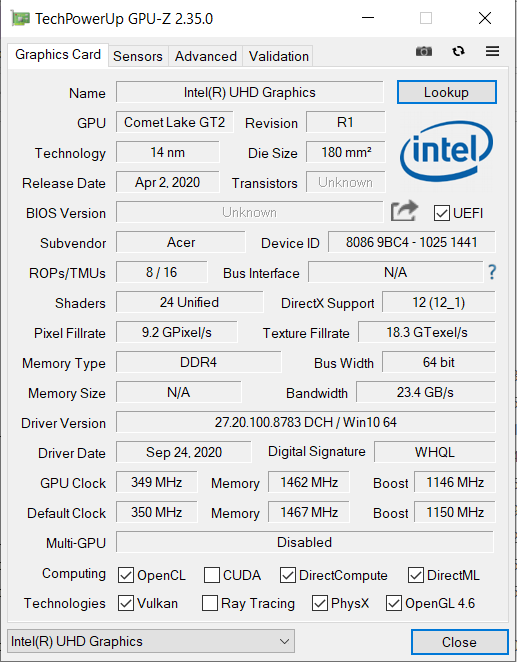
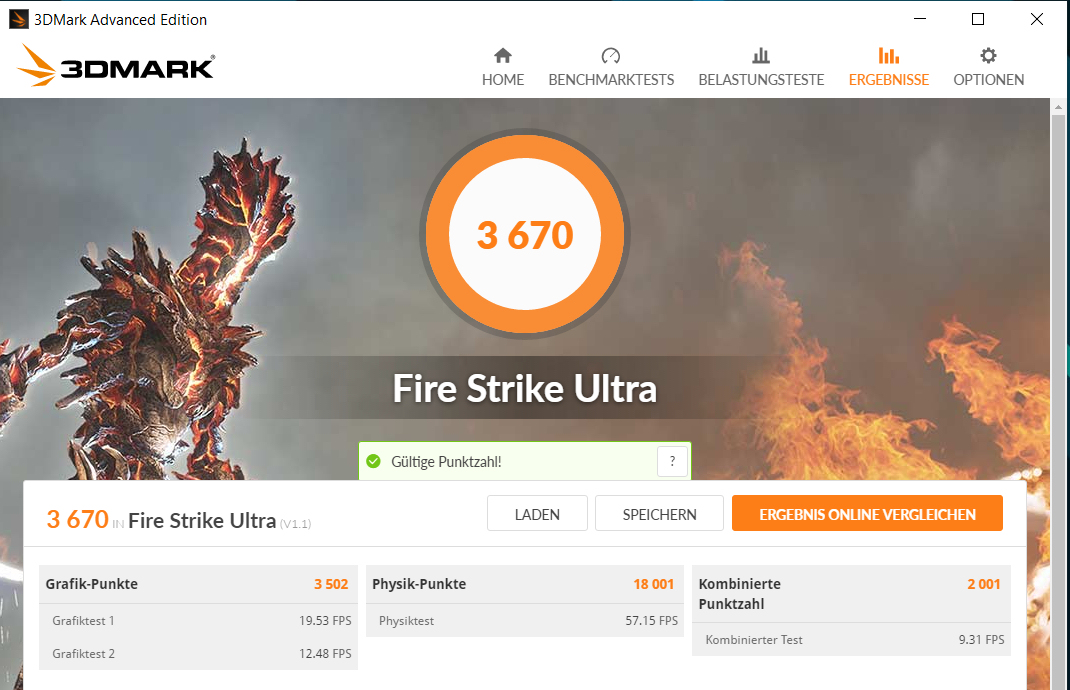
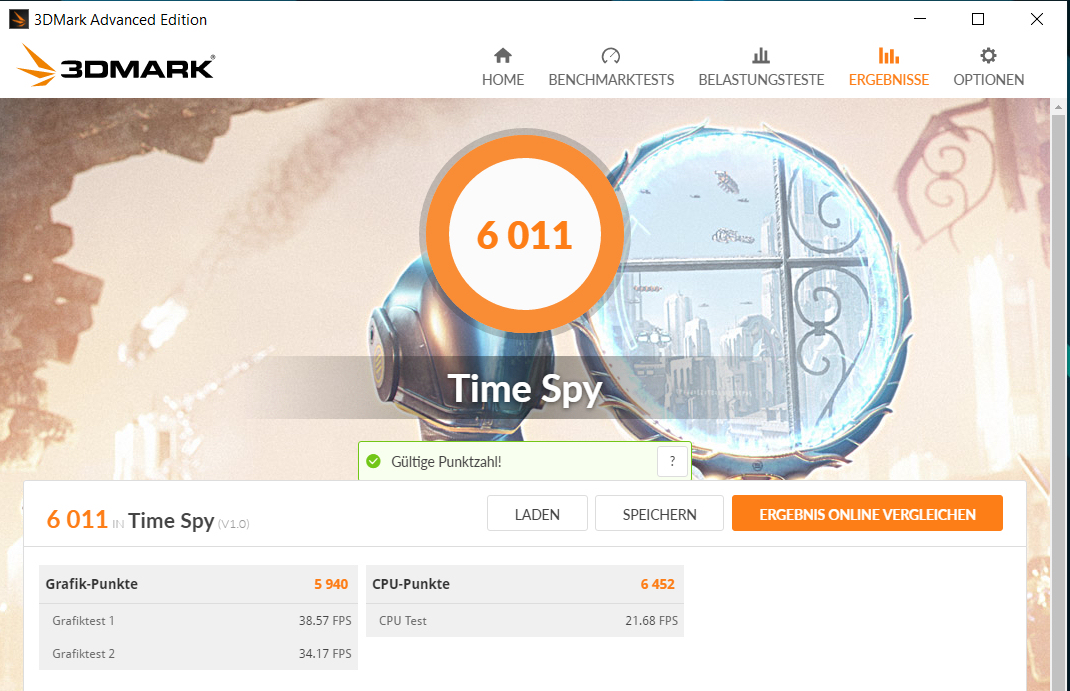
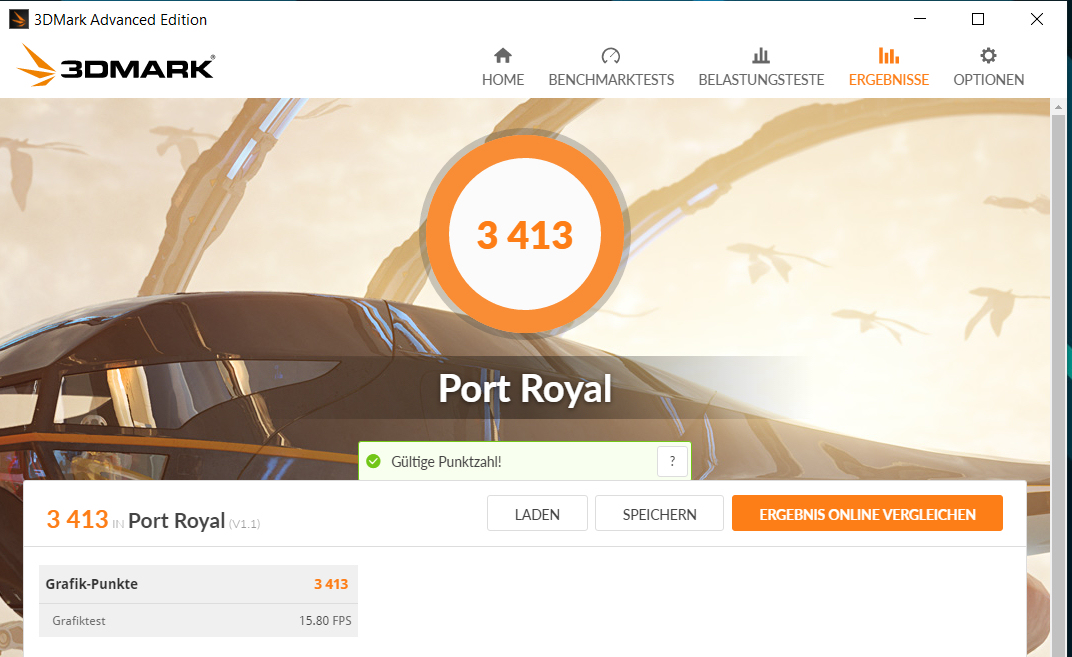
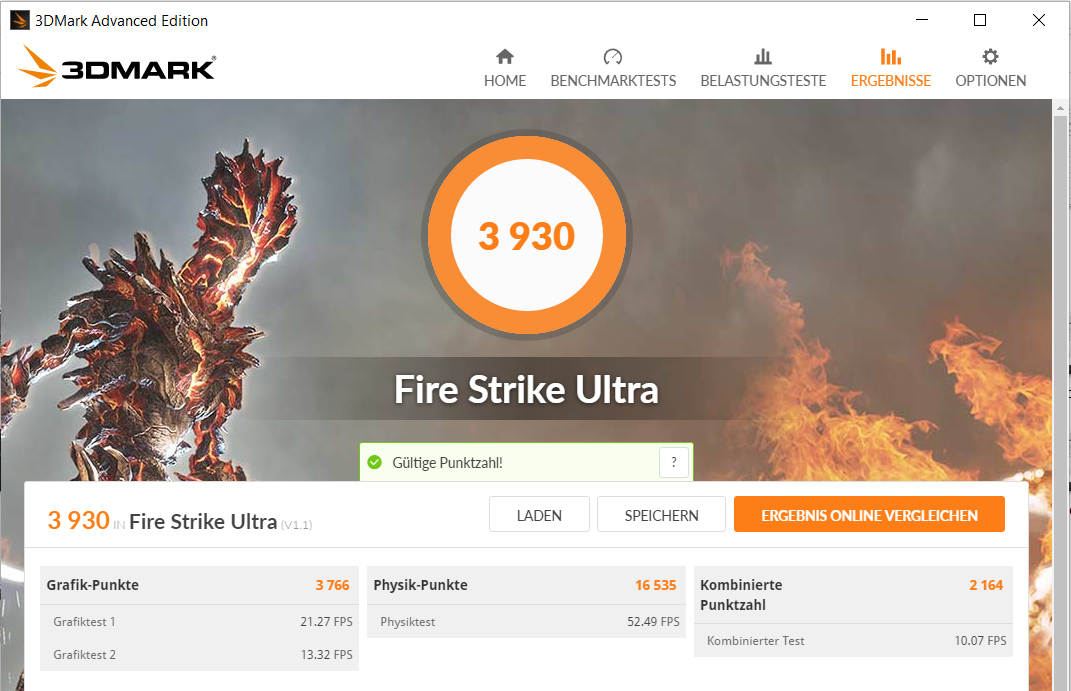
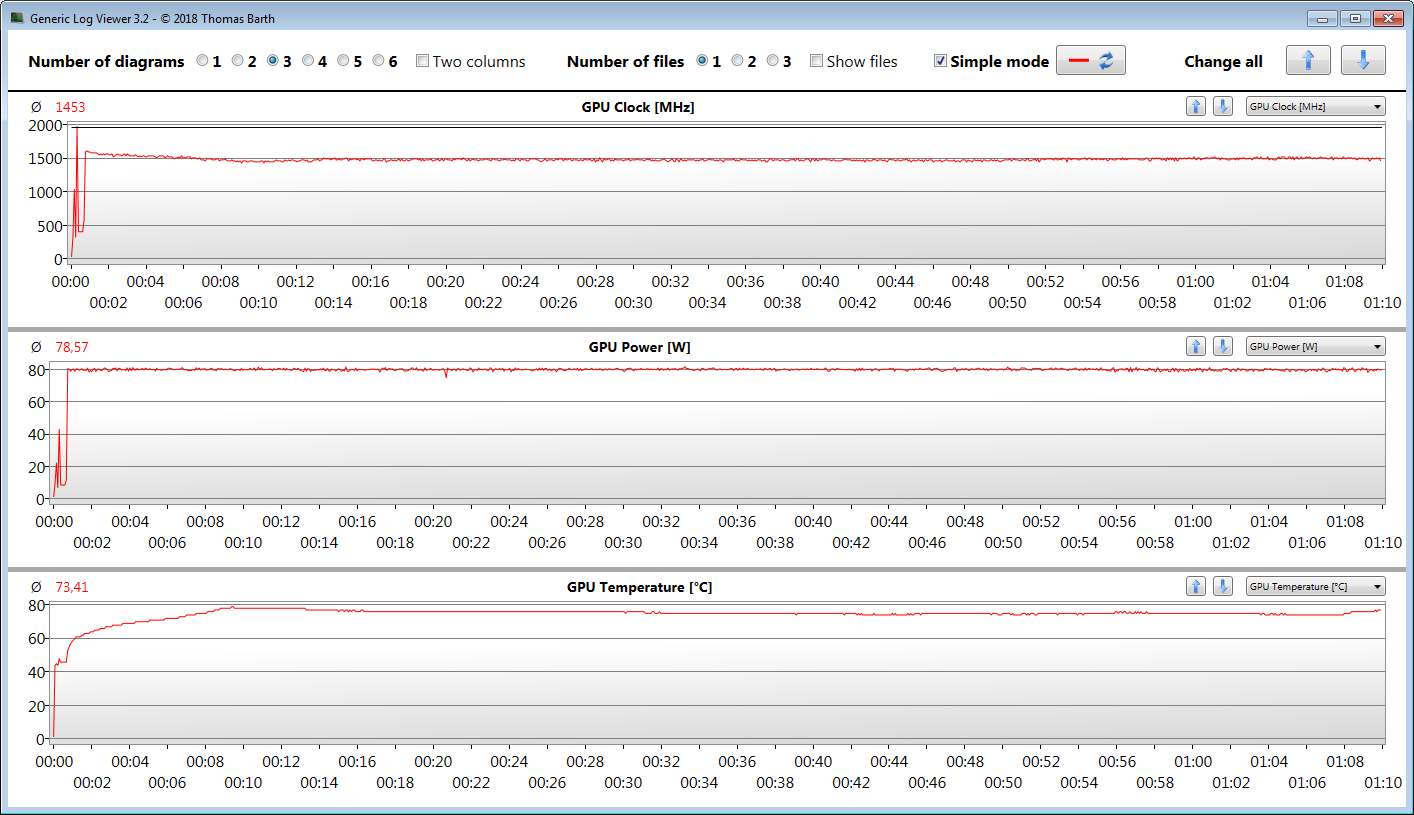
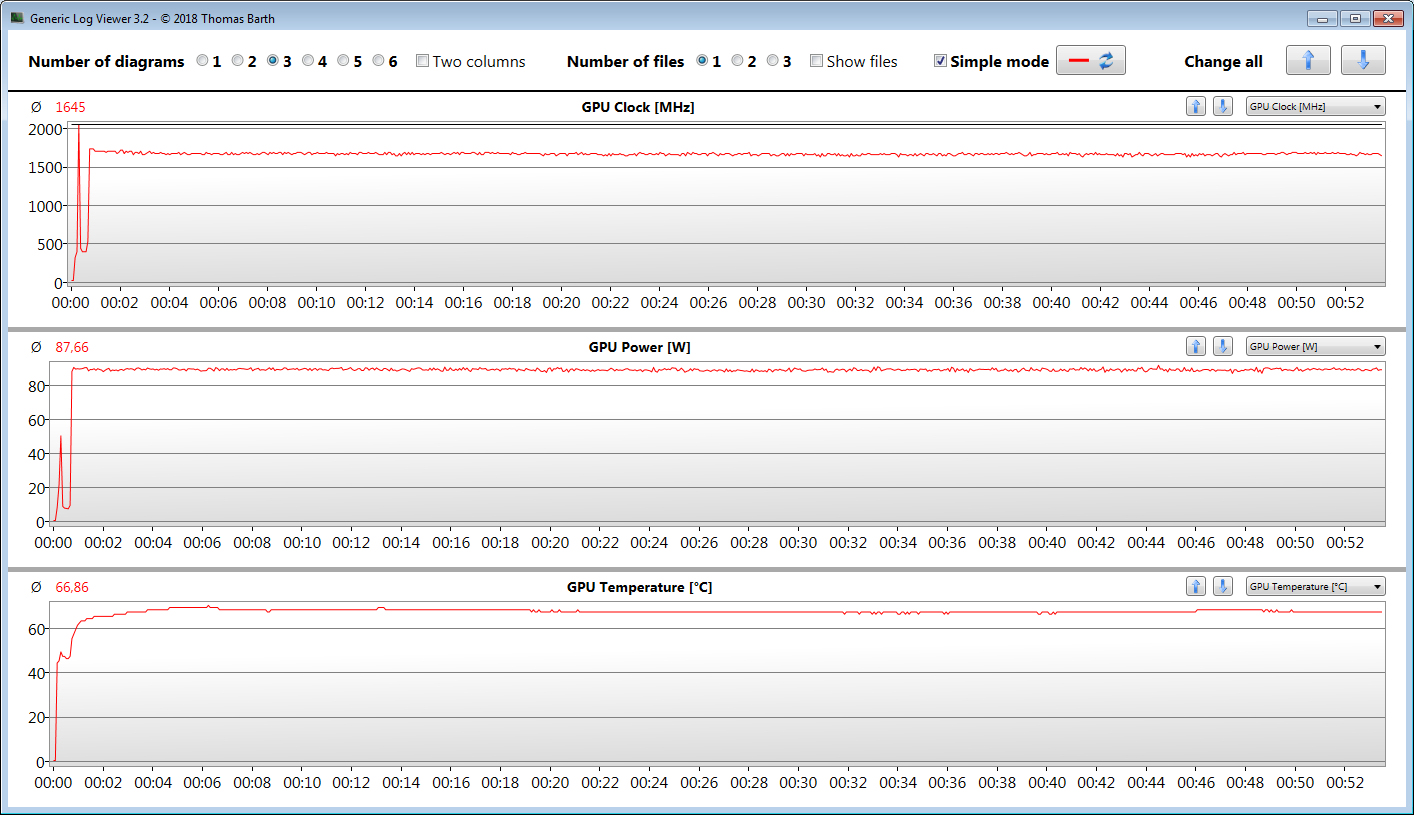
GeForce RTX 2060 grafik çekirdeği, GPU üst sınıfında giriş seviyesi bir modeldir. Hızlı GDDR6 grafik belleğine (6,144 MB) erişebilir. 3DMark kıyaslamalarındaki sonuçlar RTX 2060 GPU için normal seviyededir. Dahası, "Extreme" Predator Sense GPU profili, performansta yalnızca küçük bir artış sağlar. İşlemciye entegre olan UHD Graphics 630 yongası etkindir ve dizüstü bilgisayar, Nvidia'nın Optimus grafik değiştirme çözümüyle çalışır. Nvidia, bu DirectX 12 GPU için 1.005 MHz (temel) ile 1.350 MHz (güçlendirme) arasında bir saat aralığı belirler. GPU belirli bir sıcaklığa ve / veya enerji eşiğine ulaşmazsa daha yüksek hızlar mümkündür. Maksimum 2.032 MHz'dir. The Witcher 3 testimiz, sırasıyla ortalama 1.453 MHz ve 1.645 MHz (GPU profili: Extreme) hızlarında yürütülmektedir.

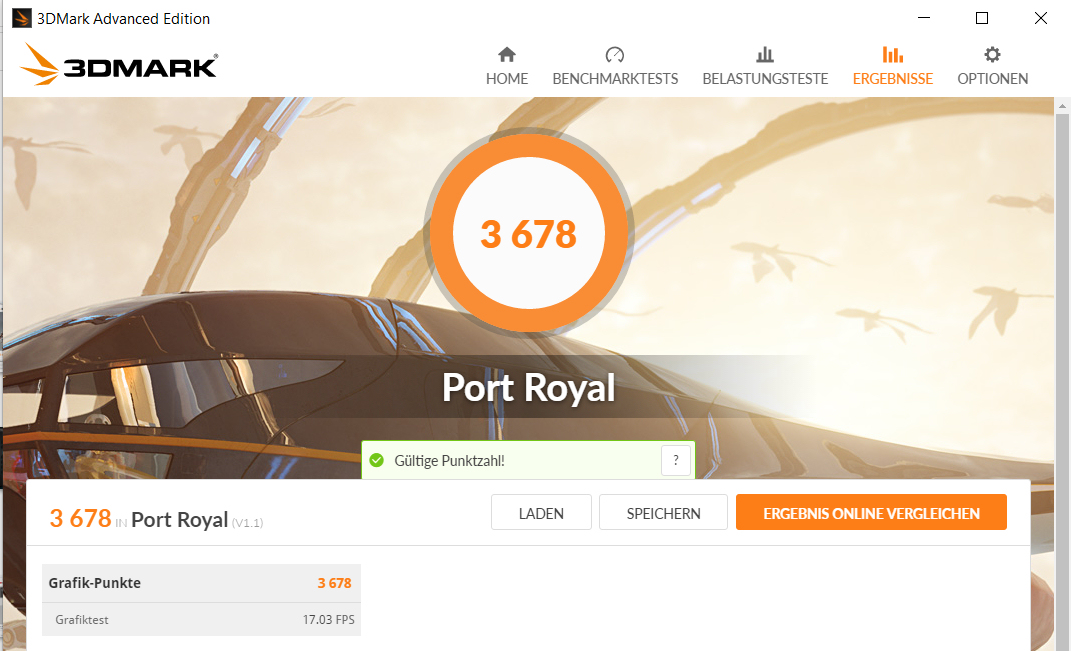
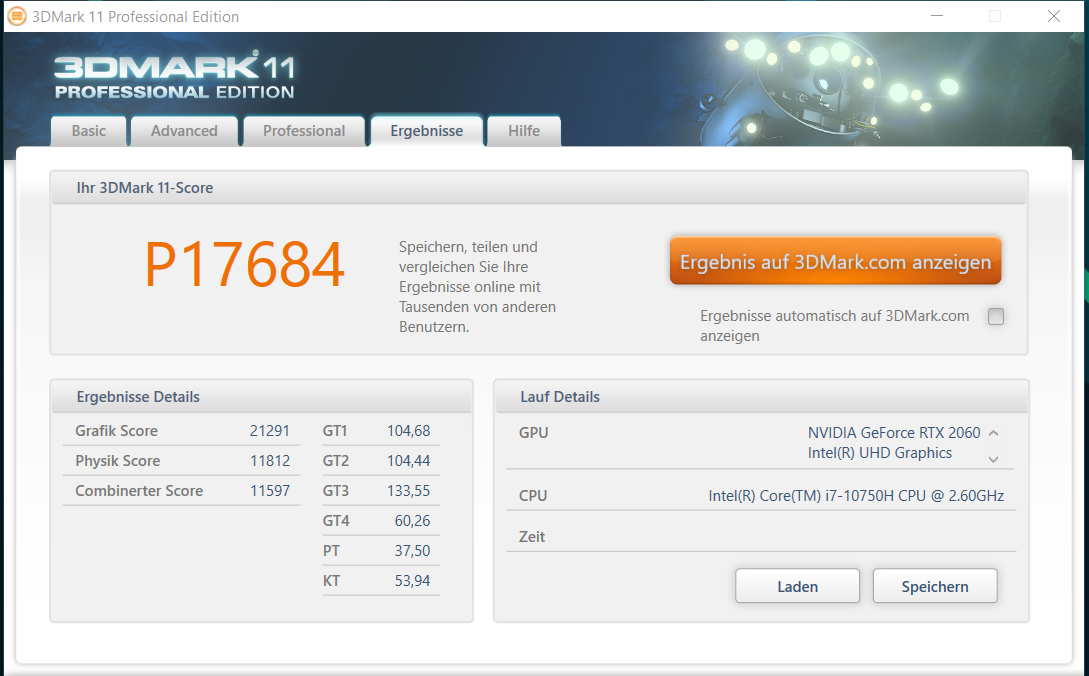
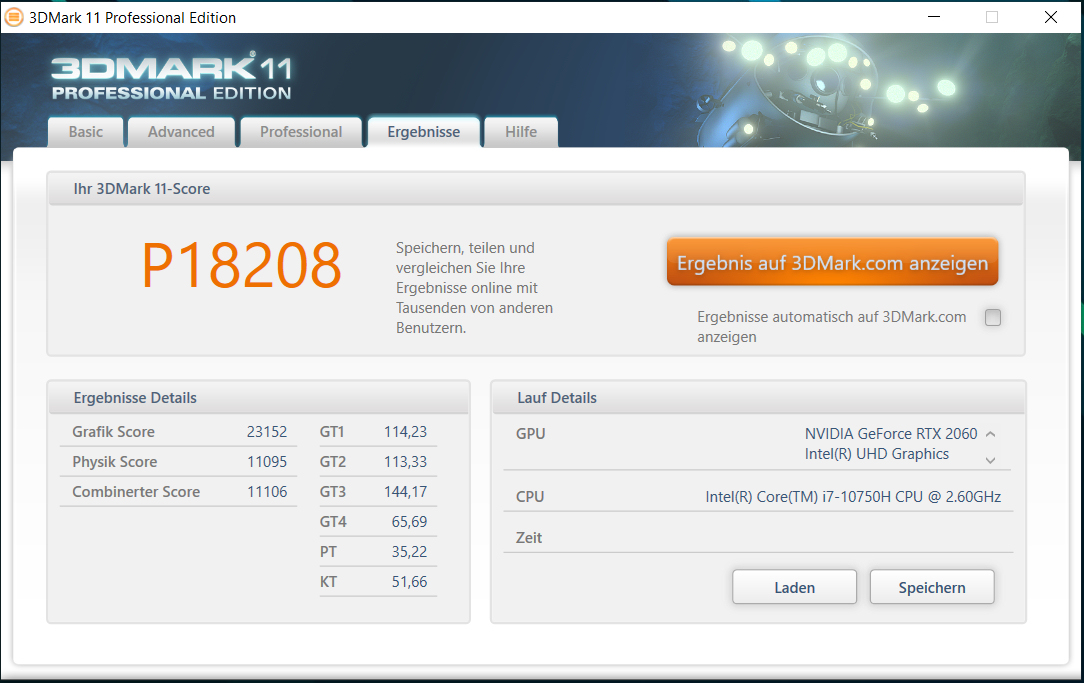
| 3DMark 11 Performance | 17684 puan | |
| 3DMark Cloud Gate Standard Score | 36435 puan | |
| 3DMark Fire Strike Score | 14732 puan | |
| 3DMark Time Spy Score | 6011 puan | |
Yardım | ||
| 3DMark 11 - 1280x720 Performance GPU | |
| Sınıf ortalaması Gaming (21841 - 80022, n=104, son 2 yıl) | |
| Dell G5 15 SE 5505 P89F | |
| Acer Predator Helios 300 PH315-53-77N5 (Extrem) | |
| Aorus 5 KB | |
| Schenker XMG Core 15 GK5NR0O | |
| Asus TUF Gaming A15 FA506IV-HN172 | |
| Ortalama NVIDIA GeForce RTX 2060 Mobile (19143 - 24662, n=40) | |
| Acer Predator Helios 300 PH315-53-77N5 | |
| Acer Predator Helios 300 PH315-52-79TY | |
| HP Pavilion Gaming 15-ec1177ng | |
| MSI Bravo 15 A4DCR | |
Oyun performansı
Yerleşik CPU-GPU kombinasyonu, en yeni oyunları sorunsuz bir şekilde ekrana getirebilir. Full HD çözünürlük ve yüksek ila maksimum kalite ayarları genellikle seçilebilir. Daha yüksek çözünürlükler (bunun için uygun bir monitörün takılması gerekir), kalite seviyesinin düşürülmesini gerektirir. "Extreme" GPU profili, kare hızlarında yalnızca küçük bir artış üretir (karşılaştırma şemasına bakın). Tek kanallı bellek, bazı oyunların düşük ayarlarda karşılaştırılabilir şekilde donatılmış dizüstü bilgisayarlara göre önemli ölçüde daha düşük kare hızları elde etmesinden sorumludur. İkinci bir bellek modülü (= çift kanallı mod etkin) iyileştirmeler sağlayacaktır.
| The Witcher 3 | |
| 1920x1080 Ultra Graphics & Postprocessing (HBAO+) | |
| Sınıf ortalaması Gaming (104.7 - 240, n=7, son 2 yıl) | |
| Acer Predator Helios 300 PH315-53-77N5 (Extrem) | |
| Acer Predator Helios 300 PH317-54-75G8 | |
| Dell G5 15 SE 5505 P89F | |
| Acer Predator Helios 300 PH315-53-77N5 | |
| Aorus 7 KB | |
| Ortalama NVIDIA GeForce RTX 2060 Mobile (50.6 - 74, n=40) | |
| Asus TUF Gaming A15 FA506IV-HN172 | |
| Schenker XMG Core 15 GK5NR0O | |
| Aorus 5 KB | |
| Acer Predator Helios 300 PH315-52-79TY | |
| HP Pavilion Gaming 15-ec1177ng | |
| MSI Bravo 15 A4DCR | |
| 1024x768 Low Graphics & Postprocessing | |
| Sınıf ortalaması Gaming (447 - 686, n=2, son 2 yıl) | |
| Acer Predator Helios 300 PH317-54-75G8 | |
| Aorus 7 KB | |
| Dell G5 15 SE 5505 P89F | |
| HP Pavilion Gaming 15-ec1177ng | |
| Ortalama NVIDIA GeForce RTX 2060 Mobile (188.7 - 295, n=27) | |
| Acer Predator Helios 300 PH315-53-77N5 | |
| Schenker XMG Core 15 GK5NR0O | |
| Acer Predator Helios 300 PH315-52-79TY | |
| Asus TUF Gaming A15 FA506IV-HN172 | |
| MSI Bravo 15 A4DCR | |
| Shadow of the Tomb Raider | |
| 1920x1080 Highest Preset AA:T | |
| Sınıf ortalaması Gaming (96 - 116, n=2, son 2 yıl) | |
| Acer Predator Helios 300 PH317-54-75G8 | |
| Aorus 7 KB | |
| Acer Predator Helios 300 PH315-53-77N5 (Extrem) | |
| Ortalama NVIDIA GeForce RTX 2060 Mobile (54 - 86, n=22) | |
| Acer Predator Helios 300 PH315-53-77N5 | |
| Dell G5 15 SE 5505 P89F | |
| MSI Bravo 15 A4DCR | |
| 1280x720 Lowest Preset | |
| Dell G5 15 SE 5505 P89F | |
| Aorus 7 KB | |
| Ortalama NVIDIA GeForce RTX 2060 Mobile (88 - 133, n=19) | |
| Acer Predator Helios 300 PH317-54-75G8 | |
| MSI Bravo 15 A4DCR | |
| Acer Predator Helios 300 PH315-53-77N5 | |
| Serious Sam 4 - 1920x1080 Ultra (DX12) AA:2xMS | |
| Acer Predator Helios 300 PH315-53-77N5 (Extrem) | |
| Acer Predator Helios 300 PH317-54-75G8 | |
| Aorus 7 KB | |
| Ortalama NVIDIA GeForce RTX 2060 Mobile (50.3 - 63.3, n=6) | |
| Acer Predator Helios 300 PH315-53-77N5 | |
| Horizon Zero Dawn - 1920x1080 Ultimate Quality | |
| Acer Predator Helios 300 PH317-54-75G8 | |
| Acer Predator Helios 300 PH315-53-77N5 (Extrem) | |
| Ortalama NVIDIA GeForce RTX 2060 Mobile (54 - 67, n=6) | |
| Acer Predator Helios 300 PH315-53-77N5 | |
| Aorus 7 KB | |
| HP Pavilion Gaming 15-ec1177ng | |
| Mafia Definitive Edition - 1920x1080 High Preset | |
| Aorus 7 KB | |
| Ortalama NVIDIA GeForce RTX 2060 Mobile (60.2 - 76.1, n=4) | |
| Acer Predator Helios 300 PH317-54-75G8 | |
| Acer Predator Helios 300 PH315-53-77N5 | |
| Star Wars Squadrons - 1920x1080 Ultra Preset | |
| Ortalama NVIDIA GeForce RTX 2060 Mobile (156.2 - 181, n=3) | |
| Acer Predator Helios 300 PH317-54-75G8 | |
| Acer Predator Helios 300 PH315-53-77N5 | |
Kare hızlarının uzun bir süre boyunca büyük ölçüde sabit kalıp kalmadığını doğrulamak için The Witcher 3 oyununun Full HD çözünürlükte ve maksimum kalite ayarlarında yaklaşık 60 dakika çalışmasına izin verdik. Karakter taşınmaz. Kare hızlarında bir düşüş bulunamadı.
| düşük | orta | yüksek | ultra | |
|---|---|---|---|---|
| BioShock Infinite (2013) | 307.3 | 270.5 | 249.6 | 130.9 |
| The Witcher 3 (2015) | 226.4 | 172.4 | 110.7 | 64.8 |
| Shadow of the Tomb Raider (2018) | 88 | 80 | 76 | 71 |
| Doom Eternal (2020) | 171 | 126.9 | 117.9 | 114 |
| Gears Tactics (2020) | 201.6 | 128.5 | 93.4 | 66.5 |
| Horizon Zero Dawn (2020) | 106 | 72 | 67 | 57 |
| Serious Sam 4 (2020) | 113 | 75.7 | 69.9 | 56.6 |
| Mafia Definitive Edition (2020) | 94.3 | 62.5 | 60.2 | |
| Star Wars Squadrons (2020) | 262.1 | 184.5 | 172.8 | 156.2 |
Emisyonlar - Helios 300 yük altında gürültülü hale geliyor
Gürültü emisyonları
Fanlar boşta kullanımda fazla gürültü yapmaz. Ya hareketsiz duruyorlar ya da çok düşük hızlarda çalışıyorlar. Her şey yük altında. Bu şekilde, sırasıyla 56 dB (A) (stres testi) ve 53.1 dB (A) (The Witcher 3 testimiz) olan maksimum ses basıncı seviyelerini kaydediyoruz.
Ses yüksekliği
| Boşta |
| 25.2 / 25.2 / 25.2 dB |
| Çalışırken |
| 43.5 / 56 dB |
 | ||
30 dB sessiz 40 dB(A) duyulabilirlik 50 dB(A) gürültülü |
||
min: | ||
| Acer Predator Helios 300 PH315-53-77N5 i7-10750H, GeForce RTX 2060 Mobile | Acer Predator Helios 300 PH315-52-79TY i7-9750H, GeForce GTX 1660 Ti Mobile | Dell G5 15 SE 5505 P89F R7 4800H, Radeon RX 5600M | Aorus 5 KB i7-10750H, GeForce RTX 2060 Mobile | Schenker XMG Core 15 GK5NR0O R7 4800H, GeForce RTX 2060 Mobile | Asus TUF Gaming A15 FA506IV-HN172 R7 4800H, GeForce RTX 2060 Mobile | Ortalama NVIDIA GeForce RTX 2060 Mobile | Sınıf ortalaması Gaming | |
|---|---|---|---|---|---|---|---|---|
| Noise | -8% | 1% | -11% | -4% | -7% | -12% | -4% | |
| kapalı / ortam * (dB) | 25.2 | 30.2 -20% | 28 -11% | 25 1% | 25 1% | 30.2 -20% | 27.9 ? -11% | 24.1 ? 4% |
| Idle Minimum * (dB) | 25.2 | 31 -23% | 28 -11% | 26 -3% | 26 -3% | 30.2 -20% | 29 ? -15% | 26 ? -3% |
| Idle Average * (dB) | 25.2 | 31 -23% | 28 -11% | 30 -19% | 30 -19% | 30.2 -20% | 30 ? -19% | 27.4 ? -9% |
| Idle Maximum * (dB) | 25.2 | 31 -23% | 28 -11% | 34 -35% | 32 -27% | 30.2 -20% | 33 ? -31% | 30.1 ? -19% |
| Load Average * (dB) | 43.5 | 41.5 5% | 28 36% | 53 -22% | 46 -6% | 40 8% | 44 ? -1% | 43.6 ? -0% |
| Witcher 3 ultra * (dB) | 53.1 | 46.7 12% | 50.6 5% | 51 4% | 48 10% | 49 8% | ||
| Load Maximum * (dB) | 56 | 46.9 16% | 50.6 10% | 56 -0% | 48 14% | 49 12% | 51.6 ? 8% | 54.2 ? 3% |
* ... daha küçük daha iyidir
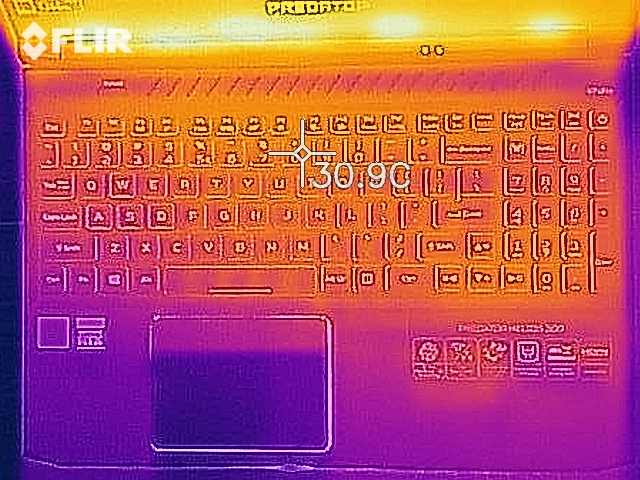
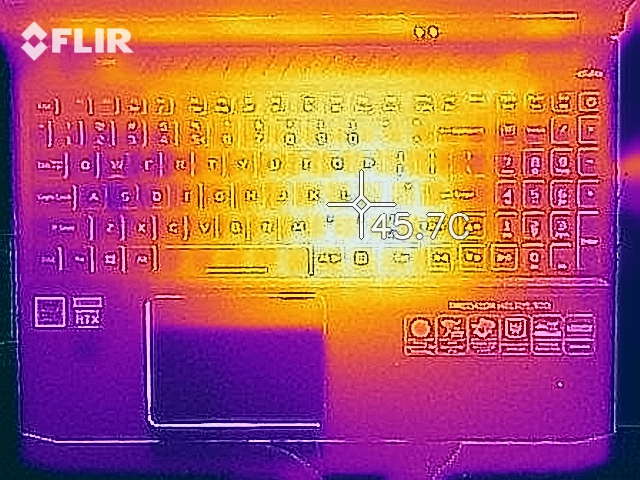
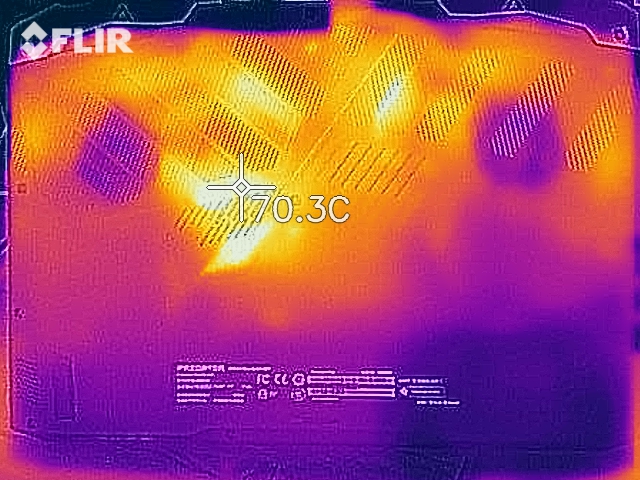
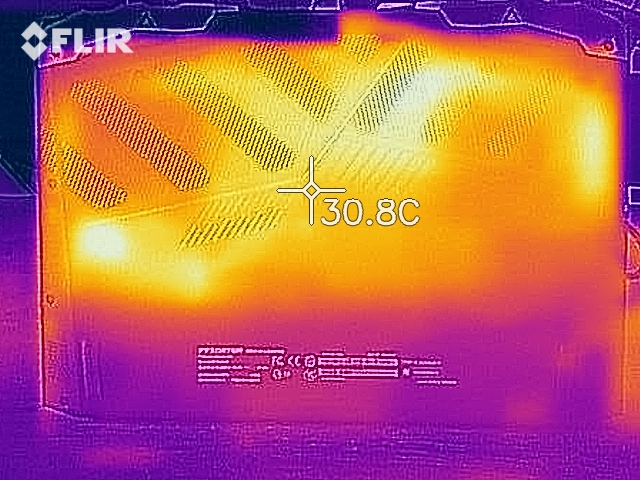
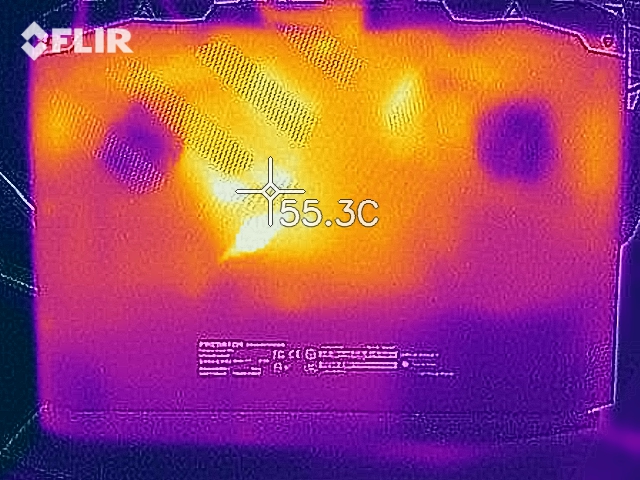
Sıcaklık
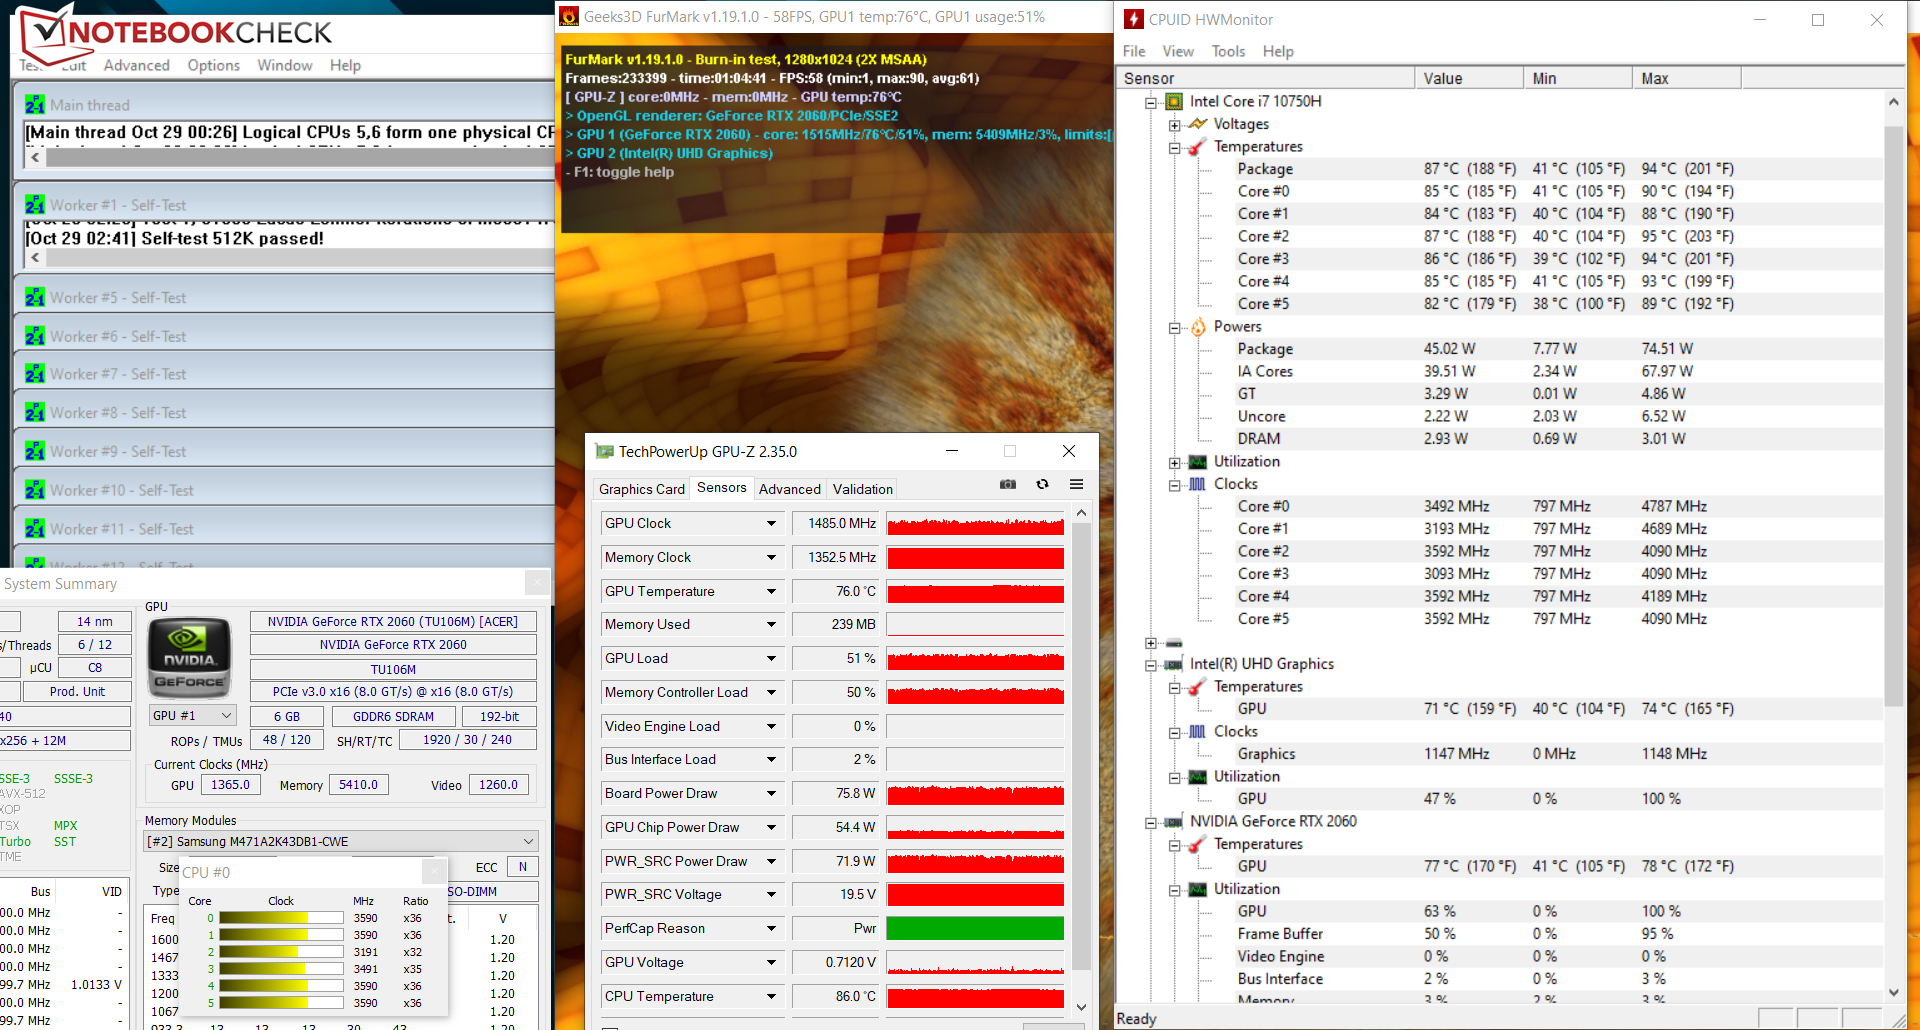
Stres testi (Prime95 ve FurMark en az bir saat çalıştırılır) CPU ve GPU tarafından sırasıyla 3 ila 3,5 GHz ve 1,2 ila 1,4 GHz'de çalıştırılır. Pil gücünde, saat hızları 800 MHz (CPU) ve 1,380 MHz'dir (GPU). Stres testi aşırı bir senaryoyu temsil ediyor. Bu test ile sistemin tam yük altında bile stabil olup olmadığını kontrol ediyoruz.
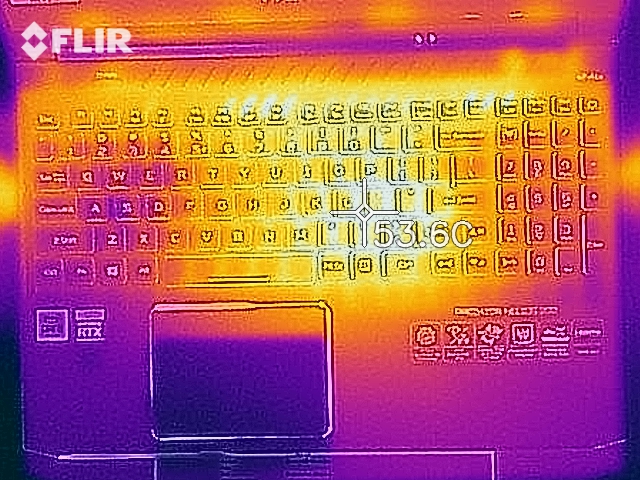
Stres testi sırasında, bazı ölçüm noktalarında sıcaklıkları 40- ° C (~ 104 ° F) aralığında kaydederiz. The Witcher 3 testimizi gerçekleştirirken ısı gelişimi önemli ölçüde daha düşüktür. Günlük kullanımda değerler yeşil aralıktadır.
(±) Üst taraftaki maksimum sıcaklık, 40.4 °C / 105 F ortalamasına kıyasla 44.1 °C / 111 F'dir. , Gaming sınıfı için 21.2 ile 68.8 °C arasında değişir.
(-) Alt kısım, 43.2 °C / 110 F ortalamasına kıyasla maksimum 48 °C / 118 F'ye kadar ısınır
(+) Boşta kullanımda, üst tarafın ortalama sıcaklığı 24.1 °C / 75 F olup, cihazın 33.9 °C / 93 F.
(±) The Witcher 3 oynarken, üst tarafın ortalama sıcaklığı 33.9 °C / 93 F olup, cihazın 33.9 °C / 93 F.
(+) Avuç içi dayanakları ve dokunmatik yüzey, maksimum 31.9 °C / 89.4 F ile cilt sıcaklığından daha soğuktur ve bu nedenle dokunulduğunda soğuktur.
(-) Benzer cihazların avuç içi dayanağı alanının ortalama sıcaklığı 28.8 °C / 83.8 F (-3.1 °C / -5.6 F) idi.
| Acer Predator Helios 300 PH315-53-77N5 i7-10750H, GeForce RTX 2060 Mobile | Acer Predator Helios 300 PH315-52-79TY i7-9750H, GeForce GTX 1660 Ti Mobile | Dell G5 15 SE 5505 P89F R7 4800H, Radeon RX 5600M | Aorus 5 KB i7-10750H, GeForce RTX 2060 Mobile | Schenker XMG Core 15 GK5NR0O R7 4800H, GeForce RTX 2060 Mobile | Asus TUF Gaming A15 FA506IV-HN172 R7 4800H, GeForce RTX 2060 Mobile | Ortalama NVIDIA GeForce RTX 2060 Mobile | Sınıf ortalaması Gaming | |
|---|---|---|---|---|---|---|---|---|
| Heat | -3% | -18% | -19% | -22% | -4% | -17% | -15% | |
| Maximum Upper Side * (°C) | 44.1 | 52 -18% | 53 -20% | 50 -13% | 51 -16% | 42.9 3% | 47.2 ? -7% | 45.2 ? -2% |
| Maximum Bottom * (°C) | 48 | 46.3 4% | 57.6 -20% | 49 -2% | 64 -33% | 49.9 -4% | 52.7 ? -10% | 48.1 ? -0% |
| Idle Upper Side * (°C) | 25.2 | 24.8 2% | 27.4 -9% | 35 -39% | 29 -15% | 27.8 -10% | 31 ? -23% | 31 ? -23% |
| Idle Bottom * (°C) | 25.7 | 25.4 1% | 31 -21% | 31 -21% | 32 -25% | 27 -5% | 32.9 ? -28% | 34.2 ? -33% |
* ... daha küçük daha iyidir
Hoparlörler
Stereo hoparlörler, cihazın alt kısmının ön kısmında bulunur. Bas içermeyen iyi bir ses üretirler. Daha iyi bir ses deneyimi için kulaklık veya harici hoparlörler kullanılmalıdır.
Acer Predator Helios 300 PH315-53-77N5 ses analizi
(±) | hoparlör ses yüksekliği ortalama ama iyi (74.4 dB)
Bas 100 - 315Hz
(-) | neredeyse hiç bas yok - ortalama olarak medyandan 20.9% daha düşük
(±) | Bas doğrusallığı ortalamadır (10.1% delta - önceki frekans)
Ortalar 400 - 2000 Hz
(±) | daha yüksek ortalar - ortalama olarak medyandan 5.7% daha yüksek
(±) | Ortaların doğrusallığı ortalamadır (10.3% delta - önceki frekans)
Yüksekler 2 - 16 kHz
(+) | dengeli yüksekler - medyandan yalnızca 1.3% uzakta
(+) | yüksekler doğrusaldır (4.7% deltadan önceki frekansa)
Toplam 100 - 16.000 Hz
(±) | Genel sesin doğrusallığı ortalamadır (18.2% ortancaya göre fark)
Aynı sınıfla karşılaştırıldığında
» Bu sınıftaki tüm test edilen cihazların %57%'si daha iyi, 8% benzer, 35% daha kötüydü
» En iyisinin deltası 6% idi, ortalama 18% idi, en kötüsü 132% idi
Test edilen tüm cihazlarla karşılaştırıldığında
» Test edilen tüm cihazların %39'si daha iyi, 8 benzer, % 53 daha kötüydü
» En iyisinin deltası 4% idi, ortalama 23% idi, en kötüsü 134% idi
Enerji yönetimi - PH315'in pil ömrü kabul edilebilir
Enerji tüketimi
Boşta kullanımda, maksimum 19,8 watt güç tüketimi kaydediyoruz. Stres testi ve The Witcher 3 testimiz, talebin sırasıyla 177 watt ve 127 watt'a çıkmasına izin verdi. Güç adaptörünün çıkışı 230 watt'tır.
| Kapalı / Bekleme modu | |
| Boşta | |
| Çalışırken |
|
Key:
min: | |
| Acer Predator Helios 300 PH315-53-77N5 i7-10750H, GeForce RTX 2060 Mobile | Acer Predator Helios 300 PH315-52-79TY i7-9750H, GeForce GTX 1660 Ti Mobile | Dell G5 15 SE 5505 P89F R7 4800H, Radeon RX 5600M | Aorus 5 KB i7-10750H, GeForce RTX 2060 Mobile | Schenker XMG Core 15 GK5NR0O R7 4800H, GeForce RTX 2060 Mobile | Asus TUF Gaming A15 FA506IV-HN172 R7 4800H, GeForce RTX 2060 Mobile | Ortalama NVIDIA GeForce RTX 2060 Mobile | Sınıf ortalaması Gaming | |
|---|---|---|---|---|---|---|---|---|
| Power Consumption | -115% | -10% | -38% | -54% | -7% | -71% | -93% | |
| Idle Minimum * (Watt) | 2.9 | 17.2 -493% | 6.5 -124% | 8 -176% | 12 -314% | 5.4 -86% | 11.5 ? -297% | 13 ? -348% |
| Idle Average * (Watt) | 13.2 | 22.6 -71% | 10.6 20% | 12 9% | 14 -6% | 10 24% | 16.5 ? -25% | 19 ? -44% |
| Idle Maximum * (Watt) | 19.8 | 25.5 -29% | 11 44% | 21 -6% | 20 -1% | 10.5 47% | 23.7 ? -20% | 24.6 ? -24% |
| Load Average * (Watt) | 105 | 88 16% | 84.1 20% | 128 -22% | 103 2% | 135 -29% | 107.5 ? -2% | 110.7 ? -5% |
| Witcher 3 ultra * (Watt) | 127 | 152.9 -20% | 138 -9% | 125 2% | 144 -13% | |||
| Load Maximum * (Watt) | 177 | 177 -0% | 180.4 -2% | 217 -23% | 193 -9% | 147 17% | 199.7 ? -13% | 259 ? -46% |
* ... daha küçük daha iyidir
Pil ömrü
Acer dizüstü bilgisayar, WLAN testimizde (web sitelerine komut dosyası kullanarak erişim) ve video testimizde (kısa film Big Buck Bunny (H.264 kodlama, Full HD) çalışırken sırasıyla 4:40 saat ve 5:38 saatlik çalışma sürelerine ulaşır. bir döngü). Her iki test sırasında da enerji tasarrufu işlevleri devre dışı bırakılır ve ekran parlaklığı yaklaşık 150 cd / m²'ye ayarlanır. Video testini gerçekleştirmek için kablosuz modüller de kapatılır.
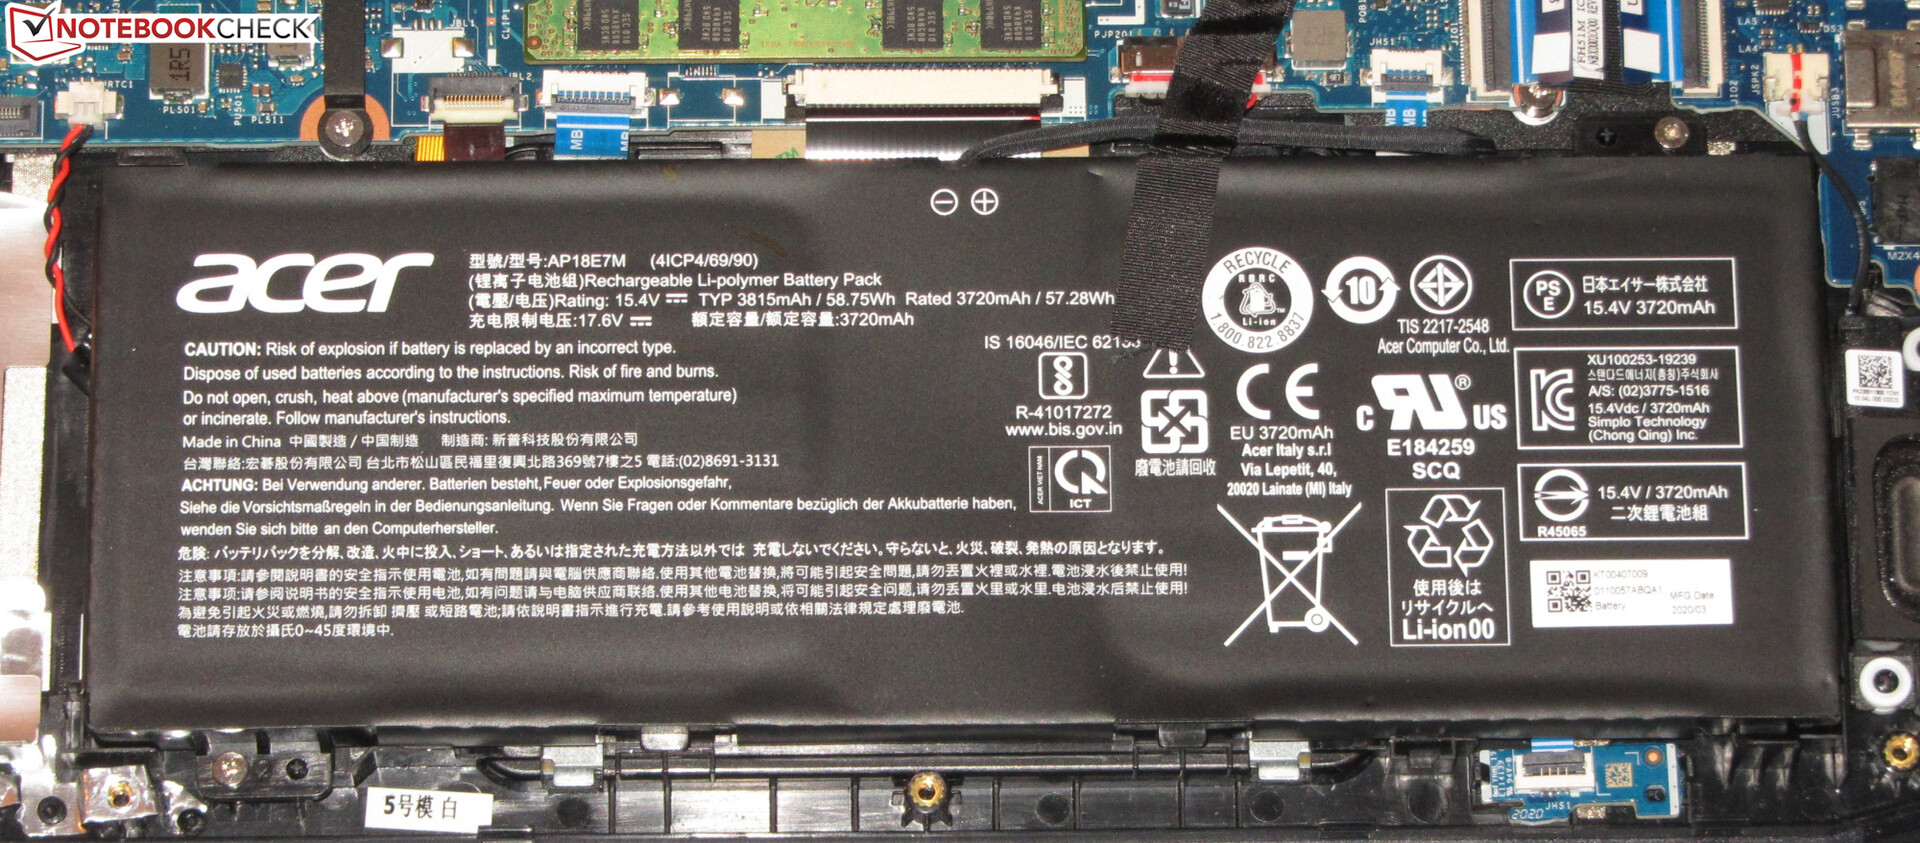
| Acer Predator Helios 300 PH315-53-77N5 i7-10750H, GeForce RTX 2060 Mobile, 58.7 Wh | Acer Predator Helios 300 PH315-52-79TY i7-9750H, GeForce GTX 1660 Ti Mobile, 58.75 Wh | Dell G5 15 SE 5505 P89F R7 4800H, Radeon RX 5600M, 51 Wh | Aorus 5 KB i7-10750H, GeForce RTX 2060 Mobile, 48.96 Wh | Schenker XMG Core 15 GK5NR0O R7 4800H, GeForce RTX 2060 Mobile, 62 Wh | Asus TUF Gaming A15 FA506IV-HN172 R7 4800H, GeForce RTX 2060 Mobile, 48 Wh | Sınıf ortalaması Gaming | |
|---|---|---|---|---|---|---|---|
| Pil Çalışma Süresi | -38% | 8% | -18% | -1% | 7% | 16% | |
| Reader / Idle (h) | 10.4 | 5 -52% | 11.2 8% | 9 -13% | 7.8 -25% | 9.8 -6% | 8.27 ? -20% |
| H.264 (h) | 5.6 | 3.4 -39% | 6.2 11% | 5.4 -4% | 8.32 ? 49% | ||
| WiFi v1.3 (h) | 4.7 | 3.5 -26% | 6.2 32% | 4.8 2% | 5.9 26% | 6.2 32% | 7.11 ? 51% |
| Load (h) | 1.8 | 1.2 -33% | 1.5 -17% | 1 -44% | 1.5 -17% | 1.9 6% | 1.502 ? -17% |
Artılar
Eksiler
Karar
Acer'ın dizüstü oyun bilgisayarı, Core i7-10750H işlemci ve GeForce RTX 2060 grafik çekirdeği sayesinde en yeni oyunları sorunsuz bir şekilde ekrana getiriyor. Full HD çözünürlük ve yüksek ila maksimum kalite ayarları genellikle burada kullanılabilir. GPU performansı gerekirse artırılabilir. Acer Predator Helios 300 PH315-53, büyük ölçüde çok yönlü bir oyun dizüstü bilgisayarıdır ve biraz hareket alanı sunar. Donanım 16 GB RAM (1x 16 GB, tek kanal modu) ile desteklenir . Çift kanal modunu etkinleştirmek için dizüstü bilgisayar ikinci bir bellek modülüyle yükseltilebilir ve yükseltilmelidir. Bu, performansta hafif bir artışa neden olur. Depolama alanı kapasitesi (512 GB, NVMe SSD) bir oyun dizüstü bilgisayarı için çok büyük değildir. İkinci bir NVMe SSD takılabilir. Predator ayrıca RAID 0'ı da destekler. Ekran (Full HD, IPS, 144 Hz) sabit görüş açıları, mat bir yüzey, iyi kontrast, hızlı tepki süreleri ve uygun renk üretimi sunar. Yine de maksimum parlaklık daha yüksek olmalıdır. Klavyenin (arkadan aydınlatmalı) günlük kullanım için uygun olduğu kanıtlanmıştır. Pil ömrü kabul edilebilir. Dahası, Helios'ta Thunderbolt 3 bağlantı noktası yok. Yalnızca bir USB Type-C 3.2 Gen 2 bağlantı noktası vardır ve ne DisplayPort'u ne de Power Delivery'yi desteklemez. Predator prensipte iyi bir izlenim bıraktı. Bununla birlikte, bellek ve depolama söz konusu olduğunda, konfigürasyon varyantımız en iyi şekilde donatılmamıştır. İkinci bir bellek modülü veya ikinci bir NVMe SSD için takip maliyetleri olabilir. Predator ile temelde ilgileniyorsanız, daha donanımlı bir versiyon satın almanızı öneririz.
Acer Predator Helios 300 PH315-53-77N5
- 10/30/2020 v7 (old)
Sascha Mölck
Price comparison

