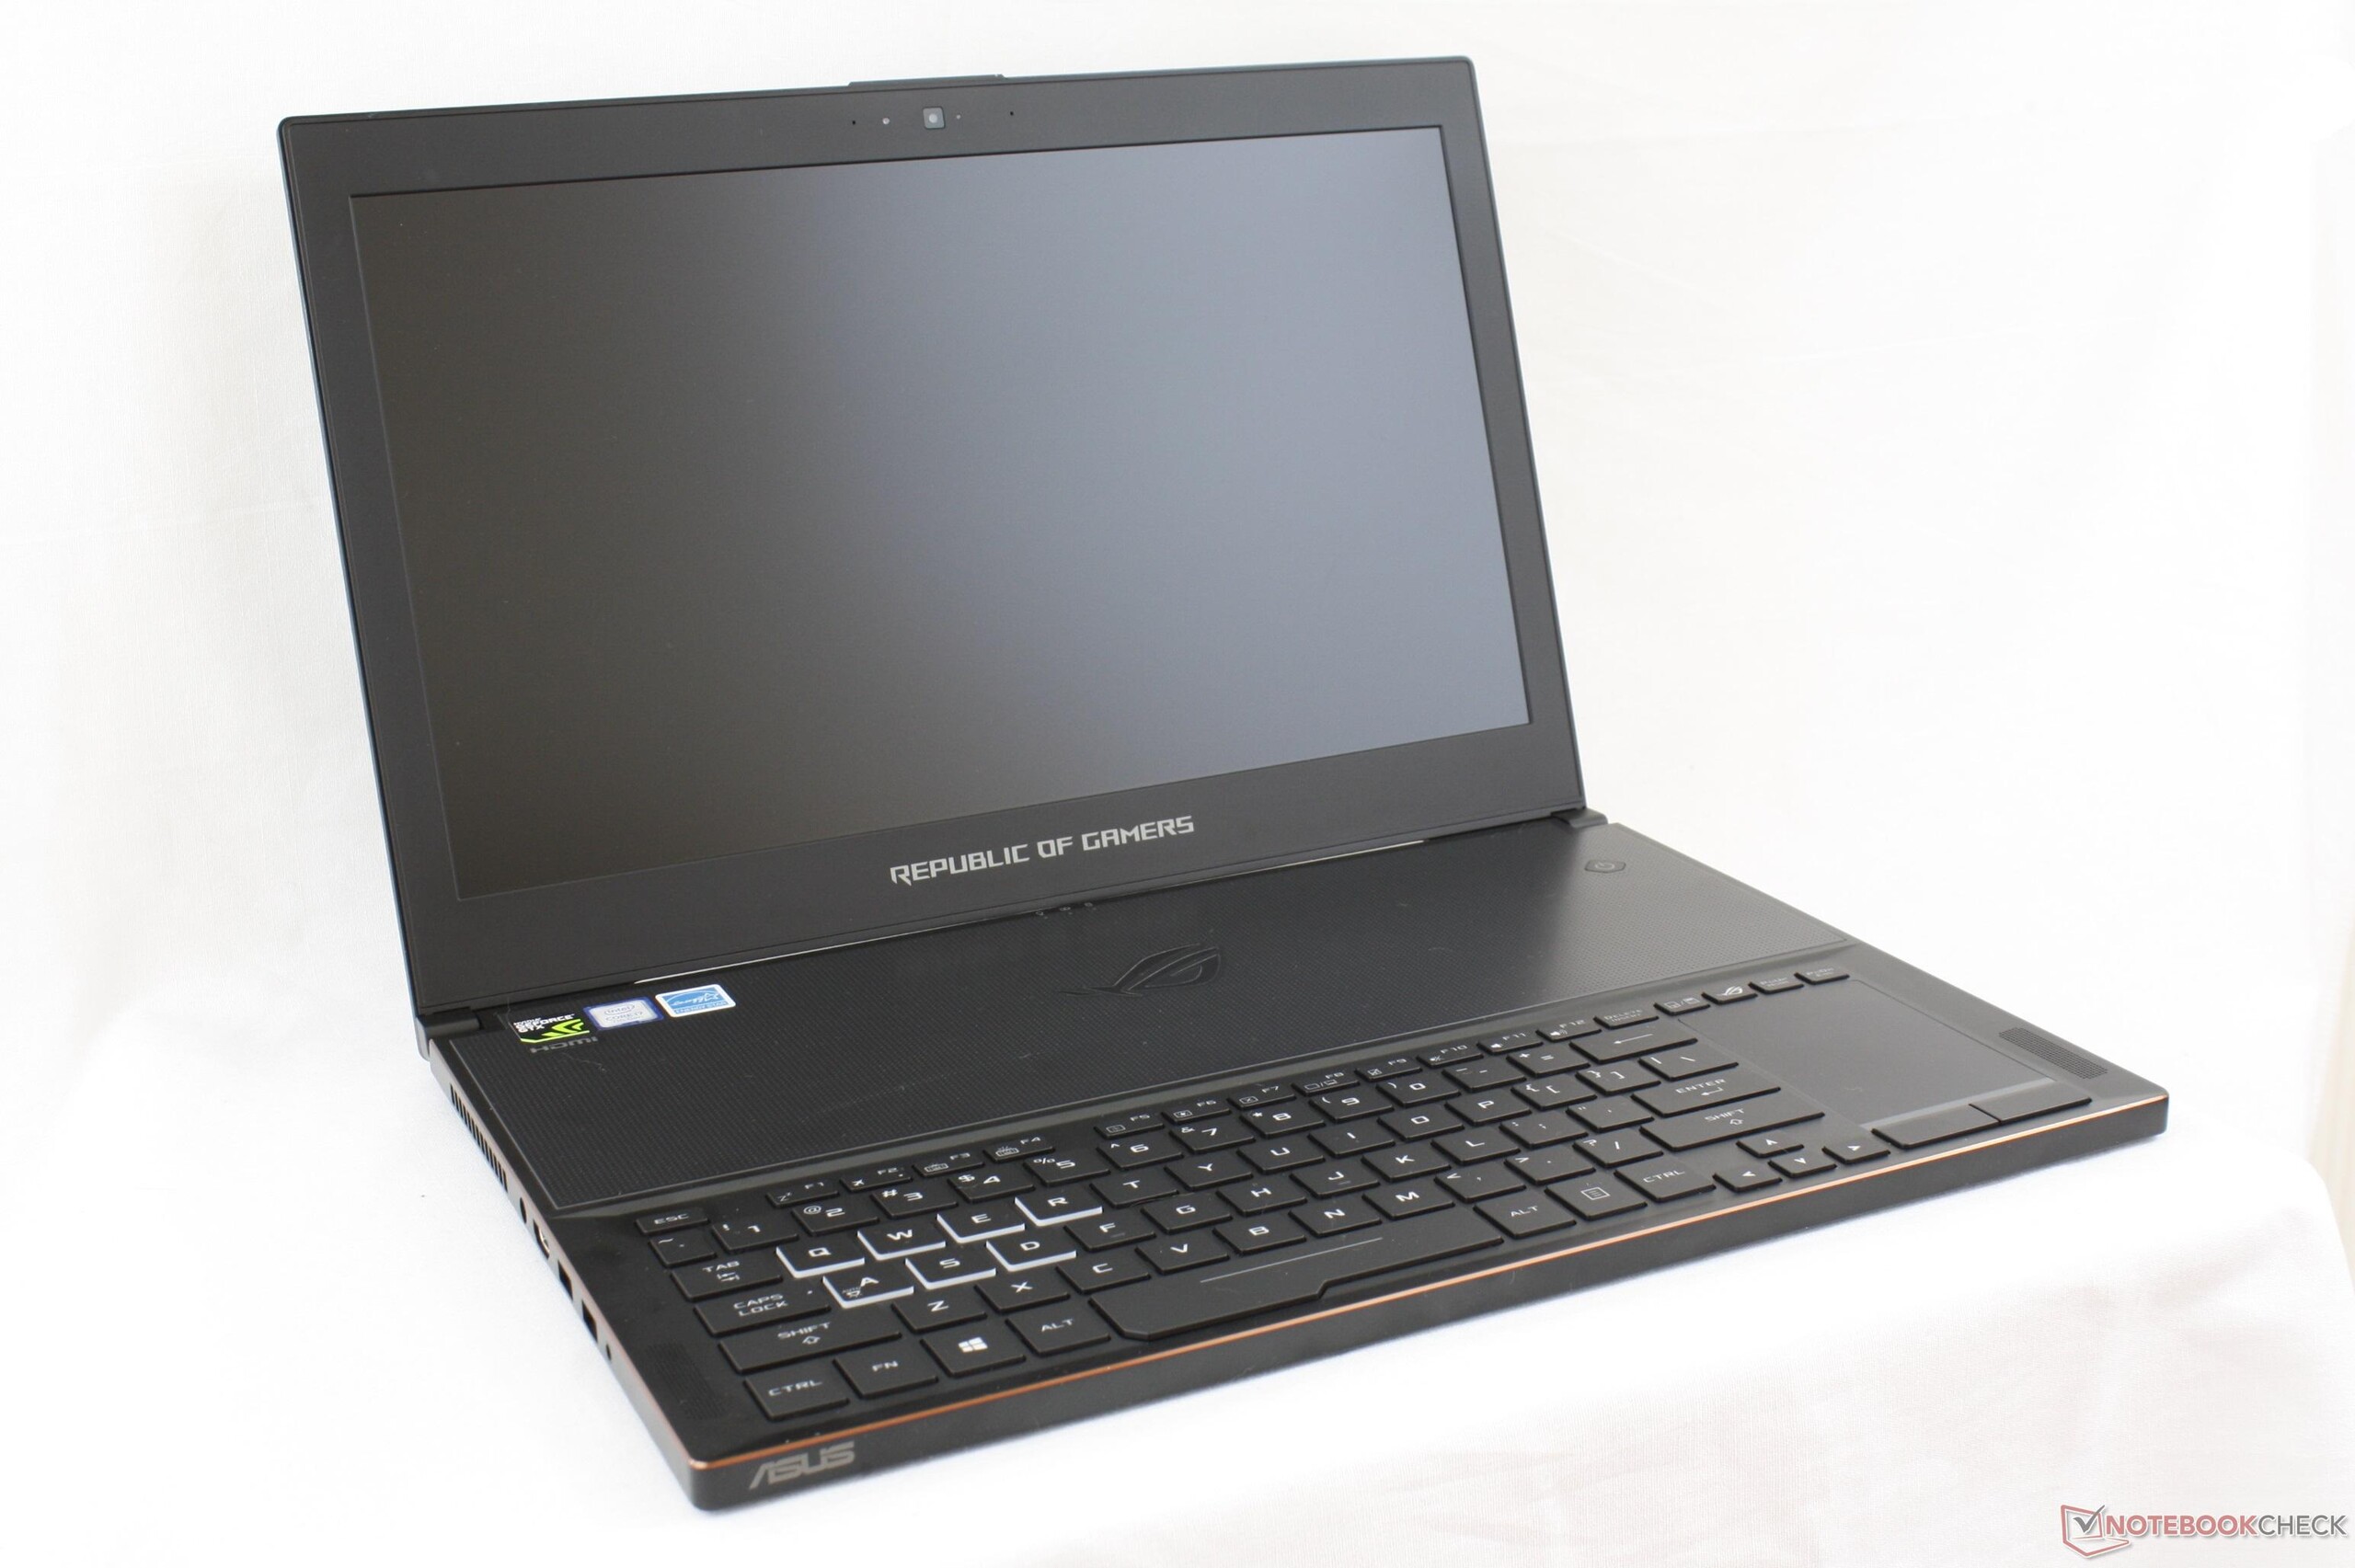
Kısa inceleme: Asus Zephyrus GX501VS (i7-7700HQ, GTX 1070 Max-Q) Laptop
| Networking | |
| iperf3 transmit AX12 | |
| Asus Zephyrus GX501VS | |
| EVGA SC15 | |
| Gigabyte P56XT | |
| iperf3 receive AX12 | |
| Gigabyte P56XT | |
| EVGA SC15 | |
| Asus Zephyrus GX501VS | |
| |||||||||||||||||||||||||
Aydınlatma: 86 %
Batarya modunda parlaklık: 307.1 cd/m²
Kontrast: 877:1 (Siyah: 0.35 cd/m²)
ΔE ColorChecker Calman: 3.4 | ∀{0.5-29.43 Ø4.73}
ΔE Greyscale Calman: 1.4 | ∀{0.09-98 Ø4.97}
85% sRGB (Argyll 1.6.3 3D)
55.6% AdobeRGB 1998 (Argyll 1.6.3 3D)
62.4% AdobeRGB 1998 (Argyll 3D)
85.6% sRGB (Argyll 3D)
62.1% Display P3 (Argyll 3D)
Gamma: 2.19
CCT: 6558 K
| Asus Zephyrus GX501VS ID: AUO42ED, Name: AU Optronics B156HAN04.2, IPS, 15.6", 1920x1080 | Asus Zephyrus GX501 AUO B156HAN04.2 (AUO42ED), IPS, 15.6", 1920x1080 | Gigabyte P56XT LG Philips LP156WF6 (LGD046F), IPS, 15.6", 1920x1080 | Aorus X5 v6 IPS, 15.6", 2880x1620 | EVGA SC15 ID: AUO42ED, Name: AU Optronics B156HAN04.2, , 15.6", 1920x1080 | |
|---|---|---|---|---|---|
| Display | 6% | 1% | 1% | 2% | |
| Display P3 Coverage (%) | 62.1 | 64.8 4% | 64.8 4% | 62.5 1% | 62.3 0% |
| sRGB Coverage (%) | 85.6 | 91.8 7% | 84.6 -1% | 86.2 1% | 89.6 5% |
| AdobeRGB 1998 Coverage (%) | 62.4 | 65.9 6% | 61.8 -1% | 62.5 0% | 63.6 2% |
| Response Times | -4% | -1% | -8% | -18% | |
| Response Time Grey 50% / Grey 80% * (ms) | 33.2 ? | 40.4 ? -22% | 37.2 ? -12% | 34 ? -2% | 41.6 ? -25% |
| Response Time Black / White * (ms) | 28 ? | 24 ? 14% | 24.8 ? 11% | 32 ? -14% | 30.8 ? -10% |
| PWM Frequency (Hz) | 20000 ? | 198.4 | |||
| Screen | -35% | -44% | -28% | -16% | |
| Brightness middle (cd/m²) | 307.1 | 328 7% | 301 -2% | 280.4 -9% | 281.5 -8% |
| Brightness (cd/m²) | 309 | 305 -1% | 280 -9% | 271 -12% | 253 -18% |
| Brightness Distribution (%) | 86 | 83 -3% | 87 1% | 83 -3% | 73 -15% |
| Black Level * (cd/m²) | 0.35 | 0.25 29% | 0.32 9% | 0.249 29% | 0.27 23% |
| Contrast (:1) | 877 | 1312 50% | 941 7% | 1126 28% | 1043 19% |
| Colorchecker dE 2000 * | 3.4 | 6.02 -77% | 6.21 -83% | 4.94 -45% | 3.9 -15% |
| Colorchecker dE 2000 max. * | 8.2 | 10.14 -24% | 10.78 -31% | 8.13 1% | 7.1 13% |
| Greyscale dE 2000 * | 1.4 | 6.32 -351% | 6.08 -334% | 5.13 -266% | 3.8 -171% |
| Gamma | 2.19 100% | 2.28 96% | 2.31 95% | 2.26 97% | 2.27 97% |
| CCT | 6558 99% | 8194 79% | 7375 88% | 7433 87% | 7322 89% |
| Color Space (Percent of AdobeRGB 1998) (%) | 55.6 | 60 8% | 55 -1% | 55.9 1% | 57.8 4% |
| Color Space (Percent of sRGB) (%) | 85 | 92 8% | 84 -1% | 85.9 1% | 89.3 5% |
| Toplam Ortalama (Program / Ayarlar) | -11% /
-23% | -15% /
-30% | -12% /
-19% | -11% /
-13% |
* ... daha küçük daha iyidir
Yanıt Sürelerini Görüntüle
| ↔ Tepki Süresi Siyahtan Beyaza | ||
|---|---|---|
| 28 ms ... yükseliş ↗ ve sonbahar↘ birleşimi | ↗ 15.6 ms yükseliş | 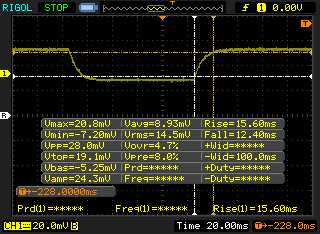 |
| ↘ 12.4 ms sonbahar | ||
| Ekran, testlerimizde nispeten yavaş yanıt oranları gösteriyor ve oyuncular için çok yavaş olabilir. Karşılaştırıldığında, test edilen tüm cihazlar 0.1 (minimum) ile 240 (maksimum) ms arasında değişir. » Tüm cihazların 71 %'si daha iyi. Bu, ölçülen yanıt süresinin test edilen tüm cihazların ortalamasından (19.9 ms) daha kötü olduğu anlamına gelir. | ||
| ↔ Tepki Süresi %50 Griden %80 Griye | ||
| 33.2 ms ... yükseliş ↗ ve sonbahar↘ birleşimi | ↗ 18.4 ms yükseliş | 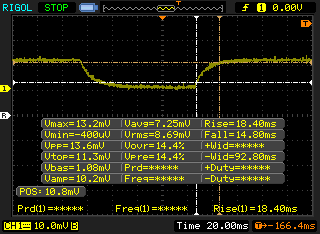 |
| ↘ 14.8 ms sonbahar | ||
| Ekran, testlerimizde yavaş yanıt oranları gösteriyor ve oyuncular için yetersiz olacaktır. Karşılaştırıldığında, test edilen tüm cihazlar 0.165 (minimum) ile 636 (maksimum) ms arasında değişir. » Tüm cihazların 46 %'si daha iyi. Bu, ölçülen yanıt süresinin test edilen tüm cihazların ortalamasına benzer olduğu anlamına gelir (31.1 ms). | ||
| Cinebench R15 | |
| CPU Single 64Bit | |
| Eurocom Tornado F5 | |
| Eurocom Sky X7E2 | |
| Asus Zephyrus GX501 | |
| Eurocom Sky MX5 R3 | |
| Asus Zephyrus GX501VS | |
| MSI GP62-2QEi781FD | |
| Asus GL702VM-GC102D | |
| Toshiba Satellite S70-B-106 | |
| CPU Multi 64Bit | |
| Eurocom Tornado F5 | |
| Eurocom Sky X7E2 | |
| Eurocom Sky MX5 R3 | |
| Asus Zephyrus GX501 | |
| Asus Zephyrus GX501VS | |
| MSI GP62-2QEi781FD | |
| Asus GL702VM-GC102D | |
| Toshiba Satellite S70-B-106 | |
| Cinebench R11.5 | |
| CPU Single 64Bit | |
| Eurocom Tornado F5 | |
| Eurocom Sky MX5 R3 | |
| Asus Zephyrus GX501 | |
| Asus Zephyrus GX501VS | |
| Eurocom Sky X7E2 | |
| MSI GP62-2QEi781FD | |
| Asus GL702VM-GC102D | |
| Toshiba Satellite S70-B-106 | |
| CPU Multi 64Bit | |
| Eurocom Tornado F5 | |
| Eurocom Sky X7E2 | |
| Eurocom Sky MX5 R3 | |
| Asus Zephyrus GX501 | |
| Asus Zephyrus GX501VS | |
| MSI GP62-2QEi781FD | |
| Asus GL702VM-GC102D | |
| Toshiba Satellite S70-B-106 | |
| Cinebench R10 | |
| Rendering Multiple CPUs 32Bit | |
| Eurocom Tornado F5 | |
| Eurocom Sky X7E2 | |
| Eurocom Sky MX5 R3 | |
| Asus Zephyrus GX501 | |
| Asus Zephyrus GX501VS | |
| Asus GL702VM-GC102D | |
| MSI GP62-2QEi781FD | |
| Rendering Single 32Bit | |
| Eurocom Tornado F5 | |
| Eurocom Sky X7E2 | |
| Eurocom Sky MX5 R3 | |
| Asus Zephyrus GX501 | |
| Asus Zephyrus GX501VS | |
| MSI GP62-2QEi781FD | |
| Asus GL702VM-GC102D | |
| wPrime 2.10 - 1024m | |
| Eurocom Sky MX5 R3 | |
| Asus Zephyrus GX501VS | |
| MSI GP62-2QEi781FD | |
| Eurocom Sky X7E2 | |
| Eurocom Tornado F5 | |
* ... daha küçük daha iyidir
| PCMark 8 | |
| Home Score Accelerated v2 | |
| EVGA SC15 | |
| Asus Zephyrus GX501 | |
| Asus Zephyrus GX501VS | |
| Aorus X5 v6 | |
| Work Score Accelerated v2 | |
| EVGA SC15 | |
| Asus Zephyrus GX501VS | |
| Asus Zephyrus GX501 | |
| Aorus X5 v6 | |
| Creative Score Accelerated v2 | |
| Aorus X5 v6 | |
| Asus Zephyrus GX501VS | |
| EVGA SC15 | |
| PCMark 8 Home Score Accelerated v2 | 5009 puan | |
| PCMark 8 Creative Score Accelerated v2 | 7653 puan | |
| PCMark 8 Work Score Accelerated v2 | 5358 puan | |
| PCMark 10 Score | 4333 puan | |
Yardım | ||
| Asus Zephyrus GX501VS Samsung SM961 MZVPW256HEGL | MSI GT62VR 7RE-223 Samsung SSD PM871a MZNLN256HMHQ | Eurocom Tornado F5 Samsung SSD 960 Pro 512 GB m.2 | Aorus X5 v6 Samsung SM951 MZVPV256 m.2 | EVGA SC15 Toshiba NVMe THNSN5256GPU7 | |
|---|---|---|---|---|---|
| AS SSD | -63% | 22% | -76% | -20% | |
| Copy Game MB/s (MB/s) | 719 | 377.8 -47% | 1310 82% | 1073 49% | 977 36% |
| Copy Program MB/s (MB/s) | 383.3 | 199 -48% | 635 66% | 351.5 -8% | 442.3 15% |
| Copy ISO MB/s (MB/s) | 1795 | 354.7 -80% | 1614 -10% | 351.1 -80% | 1071 -40% |
| Score Total (Points) | 3995 | 1019 -74% | 3943 -1% | 1630 -59% | 2474 -38% |
| Score Write (Points) | 1293 | 304 -76% | 1689 31% | 514 -60% | 896 -31% |
| Score Read (Points) | 1818 | 472 -74% | 1512 -17% | 756 -58% | 1081 -41% |
| Access Time Write * (ms) | 0.032 | 0.037 -16% | 0.024 25% | 0.025 22% | 0.035 -9% |
| Access Time Read * (ms) | 0.047 | 0.1 -113% | 0.03 36% | 0.367 -681% | 0.054 -15% |
| 4K-64 Write (MB/s) | 1035 | 171.6 -83% | 1334 29% | 272.5 -74% | 706 -32% |
| 4K-64 Read (MB/s) | 1527 | 383.4 -75% | 1179 -23% | 521 -66% | 822 -46% |
| 4K Write (MB/s) | 117.3 | 104 -11% | 150.5 28% | 131.3 12% | 95.5 -19% |
| 4K Read (MB/s) | 50.2 | 37.2 -26% | 51 2% | 44.6 -11% | 39.13 -22% |
| Seq Write (MB/s) | 1409 | 288.2 -80% | 2046 45% | 1099 -22% | 943 -33% |
| Seq Read (MB/s) | 2412 | 510 -79% | 2819 17% | 1904 -21% | 2203 -9% |
* ... daha küçük daha iyidir

| 3DMark | |
| 1920x1080 Fire Strike Graphics | |
| Nvidia GeForce GTX 1080 Ti Founders Edition | |
| Eurocom Tornado F5 Killer Edition | |
| Asus Zephyrus GX501 | |
| Aorus X7 v7 | |
| Asus Zephyrus GX501VS | |
| Nvidia GeForce GTX 1060 Founders Edition 6 GB | |
| EVGA SC15 | |
| HP Omen 15-ce002ng | |
| Asus Strix GL502VY-DS71 | |
| MSI GP62 7REX-1045US | |
| 3840x2160 Fire Strike Ultra Graphics | |
| Nvidia GeForce GTX 1080 Ti Founders Edition | |
| Eurocom Tornado F5 Killer Edition | |
| Aorus X7 v7 | |
| Asus Zephyrus GX501 | |
| Asus Zephyrus GX501VS | |
| Nvidia GeForce GTX 1060 Founders Edition 6 GB | |
| EVGA SC15 | |
| Asus Strix GL502VY-DS71 | |
| MSI GP62 7REX-1045US | |
| Fire Strike Extreme Graphics | |
| Eurocom Tornado F5 Killer Edition | |
| Aorus X7 v7 | |
| Asus Zephyrus GX501VS | |
| EVGA SC15 | |
| Asus Strix GL502VY-DS71 | |
| MSI GP62 7REX-1045US | |
| 3DMark 11 | |
| 1280x720 Performance GPU | |
| Nvidia GeForce GTX 1080 Ti Founders Edition | |
| Eurocom Tornado F5 Killer Edition | |
| Asus Zephyrus GX501 | |
| Aorus X7 v7 | |
| Asus Zephyrus GX501VS | |
| Nvidia GeForce GTX 1060 Founders Edition 6 GB | |
| EVGA SC15 | |
| HP Omen 15-ce002ng | |
| Asus Strix GL502VY-DS71 | |
| MSI GP62 7REX-1045US | |
| 1280x720 Performance Combined | |
| Nvidia GeForce GTX 1080 Ti Founders Edition | |
| Nvidia GeForce GTX 1060 Founders Edition 6 GB | |
| Aorus X7 v7 | |
| Asus Zephyrus GX501VS | |
| Asus Zephyrus GX501 | |
| EVGA SC15 | |
| HP Omen 15-ce002ng | |
| Eurocom Tornado F5 Killer Edition | |
| Asus Strix GL502VY-DS71 | |
| MSI GP62 7REX-1045US | |
| 3DMark 11 Performance | 15479 puan | |
| 3DMark Ice Storm Standard Score | 140612 puan | |
| 3DMark Cloud Gate Standard Score | 27890 puan | |
| 3DMark Fire Strike Score | 13136 puan | |
| 3DMark Fire Strike Extreme Score | 6993 puan | |
Yardım | ||
| The Witcher 3 - 1920x1080 Ultra Graphics & Postprocessing (HBAO+) | |
| MSI GT75VR 7RF-012 Titan Pro | |
| Asus Zephyrus GX501 | |
| Aorus X7 v7 | |
| Asus Zephyrus GX501VS | |
| MSI GS43VR 7RE-069US | |
| HP Omen 15-ce002ng | |
| HP Omen 17-w206ng | |
| Gigabyte Sabre 15G | |
| düşük | orta | yüksek | ultra | |
|---|---|---|---|---|
| Guild Wars 2 (2012) | 70 | |||
| BioShock Infinite (2013) | 131.6 | |||
| Metro: Last Light (2013) | 108.4 | |||
| Thief (2014) | 98.8 | |||
| The Witcher 3 (2015) | 96 | 51 | ||
| Batman: Arkham Knight (2015) | 111 | 79 | ||
| Metal Gear Solid V (2015) | 60 | |||
| Fallout 4 (2015) | 95.3 | |||
| Rise of the Tomb Raider (2016) | 85.9 | |||
| Ashes of the Singularity (2016) | 74.2 | 72.8 | ||
| Overwatch (2016) | 81.3 | |||
| Mafia 3 (2016) | 56 | |||
| Prey (2017) | 140.8 | |||
| Dirt 4 (2017) | 82.7 |
Ses yüksekliği
| Boşta |
| 28.5 / 28.5 / 30.1 dB |
| Çalışırken |
| 35.2 / 48.8 dB |
 | ||
30 dB sessiz 40 dB(A) duyulabilirlik 50 dB(A) gürültülü |
||
min: | ||
| Asus Zephyrus GX501VS GeForce GTX 1070 Max-Q, i7-7700HQ, Samsung SM961 MZVPW256HEGL | Asus Zephyrus GX501 GeForce GTX 1080 Max-Q, i7-7700HQ, Samsung SSD SM961 1TB M.2 MZVKW1T0HMLH | Gigabyte P56XT GeForce GTX 1070 Mobile, i7-7700HQ, LiteOn CX2-8B256 | MSI GT62VR 7RE-223 GeForce GTX 1070 Mobile, i7-7700HQ, Samsung SSD PM871a MZNLN256HMHQ | EVGA SC15 GeForce GTX 1060 Mobile, i7-7700HQ, Toshiba NVMe THNSN5256GPU7 | MSI GS63VR 7RF-228US GeForce GTX 1060 Mobile, i7-7700HQ, Samsung SM961 MZVKW512HMJP m.2 PCI-e | |
|---|---|---|---|---|---|---|
| Noise | -8% | -15% | -13% | -5% | -9% | |
| kapalı / ortam * (dB) | 28.5 | 31 -9% | 30 -5% | 30 -5% | 28 2% | 28.8 -1% |
| Idle Minimum * (dB) | 28.5 | 32 -12% | 34 -19% | 34 -19% | 31.9 -12% | 33.1 -16% |
| Idle Average * (dB) | 28.5 | 33 -16% | 35 -23% | 35 -23% | 32 -12% | 33.1 -16% |
| Idle Maximum * (dB) | 30.1 | 34 -13% | 39 -30% | 36 -20% | 32 -6% | 34 -13% |
| Load Average * (dB) | 35.2 | 39 -11% | 39 -11% | 40 -14% | 36.5 -4% | 37.2 -6% |
| Witcher 3 ultra * (dB) | 41.7 | 42 -1% | 48 -15% | 40.3 3% | 46.1 -11% | |
| Load Maximum * (dB) | 48.8 | 46 6% | 49 -0% | 46 6% | 53.4 -9% | 47.1 3% |
* ... daha küçük daha iyidir
(-) Üst taraftaki maksimum sıcaklık, 40.4 °C / 105 F ortalamasına kıyasla 54.4 °C / 130 F'dir. , Gaming sınıfı için 21.2 ile 68.8 °C arasında değişir.
(±) Alt kısım, 43.2 °C / 110 F ortalamasına kıyasla maksimum 41.2 °C / 106 F'ye kadar ısınır
(+) Boşta kullanımda, üst tarafın ortalama sıcaklığı 27.2 °C / 81 F olup, cihazın 33.9 °C / 93 F.
(-) The Witcher 3 oynarken, üst tarafın ortalama sıcaklığı 41.5 °C / 107 F olup, cihazın 33.9 °C / 93 F.
(±) Avuç içi dayanakları ve dokunmatik yüzey maksimum 39 °C / 102.2 F ile dokunulamayacak kadar ısınabilir.
(-) Benzer cihazların avuç içi dayanağı alanının ortalama sıcaklığı 28.8 °C / 83.8 F (-10.2 °C / -18.4 F) idi.
Asus Zephyrus GX501VS ses analizi
(-) | hoparlörler çok yüksek ses çıkarmıyor (71.4 dB)
Bas 100 - 315Hz
(-) | neredeyse hiç bas yok - ortalama olarak medyandan 18.8% daha düşük
(±) | Bas doğrusallığı ortalamadır (11.3% delta - önceki frekans)
Ortalar 400 - 2000 Hz
(+) | dengeli ortalar - medyandan yalnızca 1.2% uzakta
(+) | orta frekanslar doğrusaldır (6.3% deltadan önceki frekansa)
Yüksekler 2 - 16 kHz
(±) | daha yüksek en yüksekler - ortalama olarak medyandan 6.5% daha yüksek
(+) | yüksekler doğrusaldır (6.3% deltadan önceki frekansa)
Toplam 100 - 16.000 Hz
(±) | Genel sesin doğrusallığı ortalamadır (23.4% ortancaya göre fark)
Aynı sınıfla karşılaştırıldığında
» Bu sınıftaki tüm test edilen cihazların %85%'si daha iyi, 5% benzer, 11% daha kötüydü
» En iyisinin deltası 6% idi, ortalama 18% idi, en kötüsü 132% idi
Test edilen tüm cihazlarla karşılaştırıldığında
» Test edilen tüm cihazların %70'si daha iyi, 6 benzer, % 24 daha kötüydü
» En iyisinin deltası 4% idi, ortalama 24% idi, en kötüsü 134% idi
Apple MacBook 12 (Early 2016) 1.1 GHz ses analizi
(+) | hoparlörler nispeten yüksek sesle çalabilir (83.6 dB)
Bas 100 - 315Hz
(±) | azaltılmış bas - ortalama olarak medyandan 11.3% daha düşük
(±) | Bas doğrusallığı ortalamadır (14.2% delta - önceki frekans)
Ortalar 400 - 2000 Hz
(+) | dengeli ortalar - medyandan yalnızca 2.4% uzakta
(+) | orta frekanslar doğrusaldır (5.5% deltadan önceki frekansa)
Yüksekler 2 - 16 kHz
(+) | dengeli yüksekler - medyandan yalnızca 2% uzakta
(+) | yüksekler doğrusaldır (4.5% deltadan önceki frekansa)
Toplam 100 - 16.000 Hz
(+) | genel ses doğrusaldır (10.2% ortancaya göre fark)
Aynı sınıfla karşılaştırıldığında
» Bu sınıftaki tüm test edilen cihazların %7%'si daha iyi, 2% benzer, 91% daha kötüydü
» En iyisinin deltası 5% idi, ortalama 18% idi, en kötüsü 53% idi
Test edilen tüm cihazlarla karşılaştırıldığında
» Test edilen tüm cihazların %5'si daha iyi, 1 benzer, % 94 daha kötüydü
» En iyisinin deltası 4% idi, ortalama 24% idi, en kötüsü 134% idi
| Kapalı / Bekleme modu | |
| Boşta | |
| Çalışırken |
|
Key:
min: | |
| Asus Zephyrus GX501VS i7-7700HQ, GeForce GTX 1070 Max-Q, Samsung SM961 MZVPW256HEGL, IPS, 1920x1080, 15.6" | Gigabyte P56XT i7-7700HQ, GeForce GTX 1070 Mobile, LiteOn CX2-8B256, IPS, 1920x1080, 15.6" | EVGA SC15 i7-7700HQ, GeForce GTX 1060 Mobile, Toshiba NVMe THNSN5256GPU7, , 1920x1080, 15.6" | Asus Zephyrus GX501 i7-7700HQ, GeForce GTX 1080 Max-Q, Samsung SSD SM961 1TB M.2 MZVKW1T0HMLH, IPS, 1920x1080, 15.6" | MSI GT75VR 7RF-012 Titan Pro i7-7820HK, GeForce GTX 1080 Mobile, 2x Samsung SM961 MZVPW256HEGL NVMe (RAID 0), TN LED, 1920x1080, 17.3" | |
|---|---|---|---|---|---|
| Power Consumption | -1% | -13% | -14% | -88% | |
| Idle Minimum * (Watt) | 19.1 | 13 32% | 25.8 -35% | 18 6% | 34 -78% |
| Idle Average * (Watt) | 20.8 | 17 18% | 26.6 -28% | 23 -11% | 41 -97% |
| Idle Maximum * (Watt) | 21.8 | 22 -1% | 26.7 -22% | 31 -42% | 50 -129% |
| Load Average * (Watt) | 73.7 | 85 -15% | 80.3 -9% | 79 -7% | 106 -44% |
| Witcher 3 ultra * (Watt) | 130.2 | 154 -18% | 121.2 7% | 148 -14% | 257 -97% |
| Load Maximum * (Watt) | 173.1 | 208 -20% | 159.3 8% | 196 -13% | 320 -85% |
* ... daha küçük daha iyidir
| Asus Zephyrus GX501VS i7-7700HQ, GeForce GTX 1070 Max-Q, 50 Wh | MSI GT62VR 7RE-223 i7-7700HQ, GeForce GTX 1070 Mobile, 75 Wh | Gigabyte P56XT i7-7700HQ, GeForce GTX 1070 Mobile, 91.2 Wh | Aorus X5 v6 6820HK, GeForce GTX 1070 Mobile, 94.24 Wh | EVGA SC15 i7-7700HQ, GeForce GTX 1060 Mobile, 62 Wh | Asus Zephyrus GX501 i7-7700HQ, GeForce GTX 1080 Max-Q, 50 Wh | |
|---|---|---|---|---|---|---|
| Pil Çalışma Süresi | 77% | 152% | 48% | 28% | -14% | |
| Reader / Idle (h) | 3.8 | 6.3 66% | 9.5 150% | 4.2 11% | 3.7 -3% | 3.1 -18% |
| WiFi v1.3 (h) | 2.5 | 4.1 64% | 6.4 156% | 3 20% | 2.8 12% | 2.2 -12% |
| Load (h) | 0.8 | 1.6 100% | 2 150% | 1.7 113% | 1.4 75% | 0.7 -13% |
Artılar
Eksiler

GX501VS, GX501VI modeline göre 500$ daha ucuz. %15lik performans kaybına takılmayacak oyuncular bu konfigrasyonu teric edebilir. Özellikle 120 FPS veya 4K UHD ile oyun oynamak ilgi çekici gelmiyorsa GTX 1070 Max-Q 1080p oyunculuk için oldukça yeterli. En yakın Max-Q kullanmayan rakibine kıyasla GX501 etkileyici şekilde hızlı ve sessiz.
Performans dışında da her iki Max-Q modelinde benzerlikler söz konusu. GTX 1070 modeli 10 derece daha az ısınıyor olmasına rağmen fan sesi aynı. İşlemci performansı yüksek sıcaklığa rağmen üst sınıfta yer alıyor. Klavye ise bir oyun cihazı için ortalamanın altında.
Asus'un daha makul fiyatlı GX501VS modeli piyasadaki diğer ultra-ince modellere göre daha sessiz. Zephyrus boyutunda bir cihaz isteyen kullanıcılar bu modellerin bir benzerini daha bulamayabilir. Ancak elbette normal 15 inçlik standart oyun cihazları GTX 1070 grafik kartı ile daha iyi performans verecektir.
Asus Zephyrus GX501VS
- 08/25/2017 v6 (old)
Allen Ngo
Price comparison
