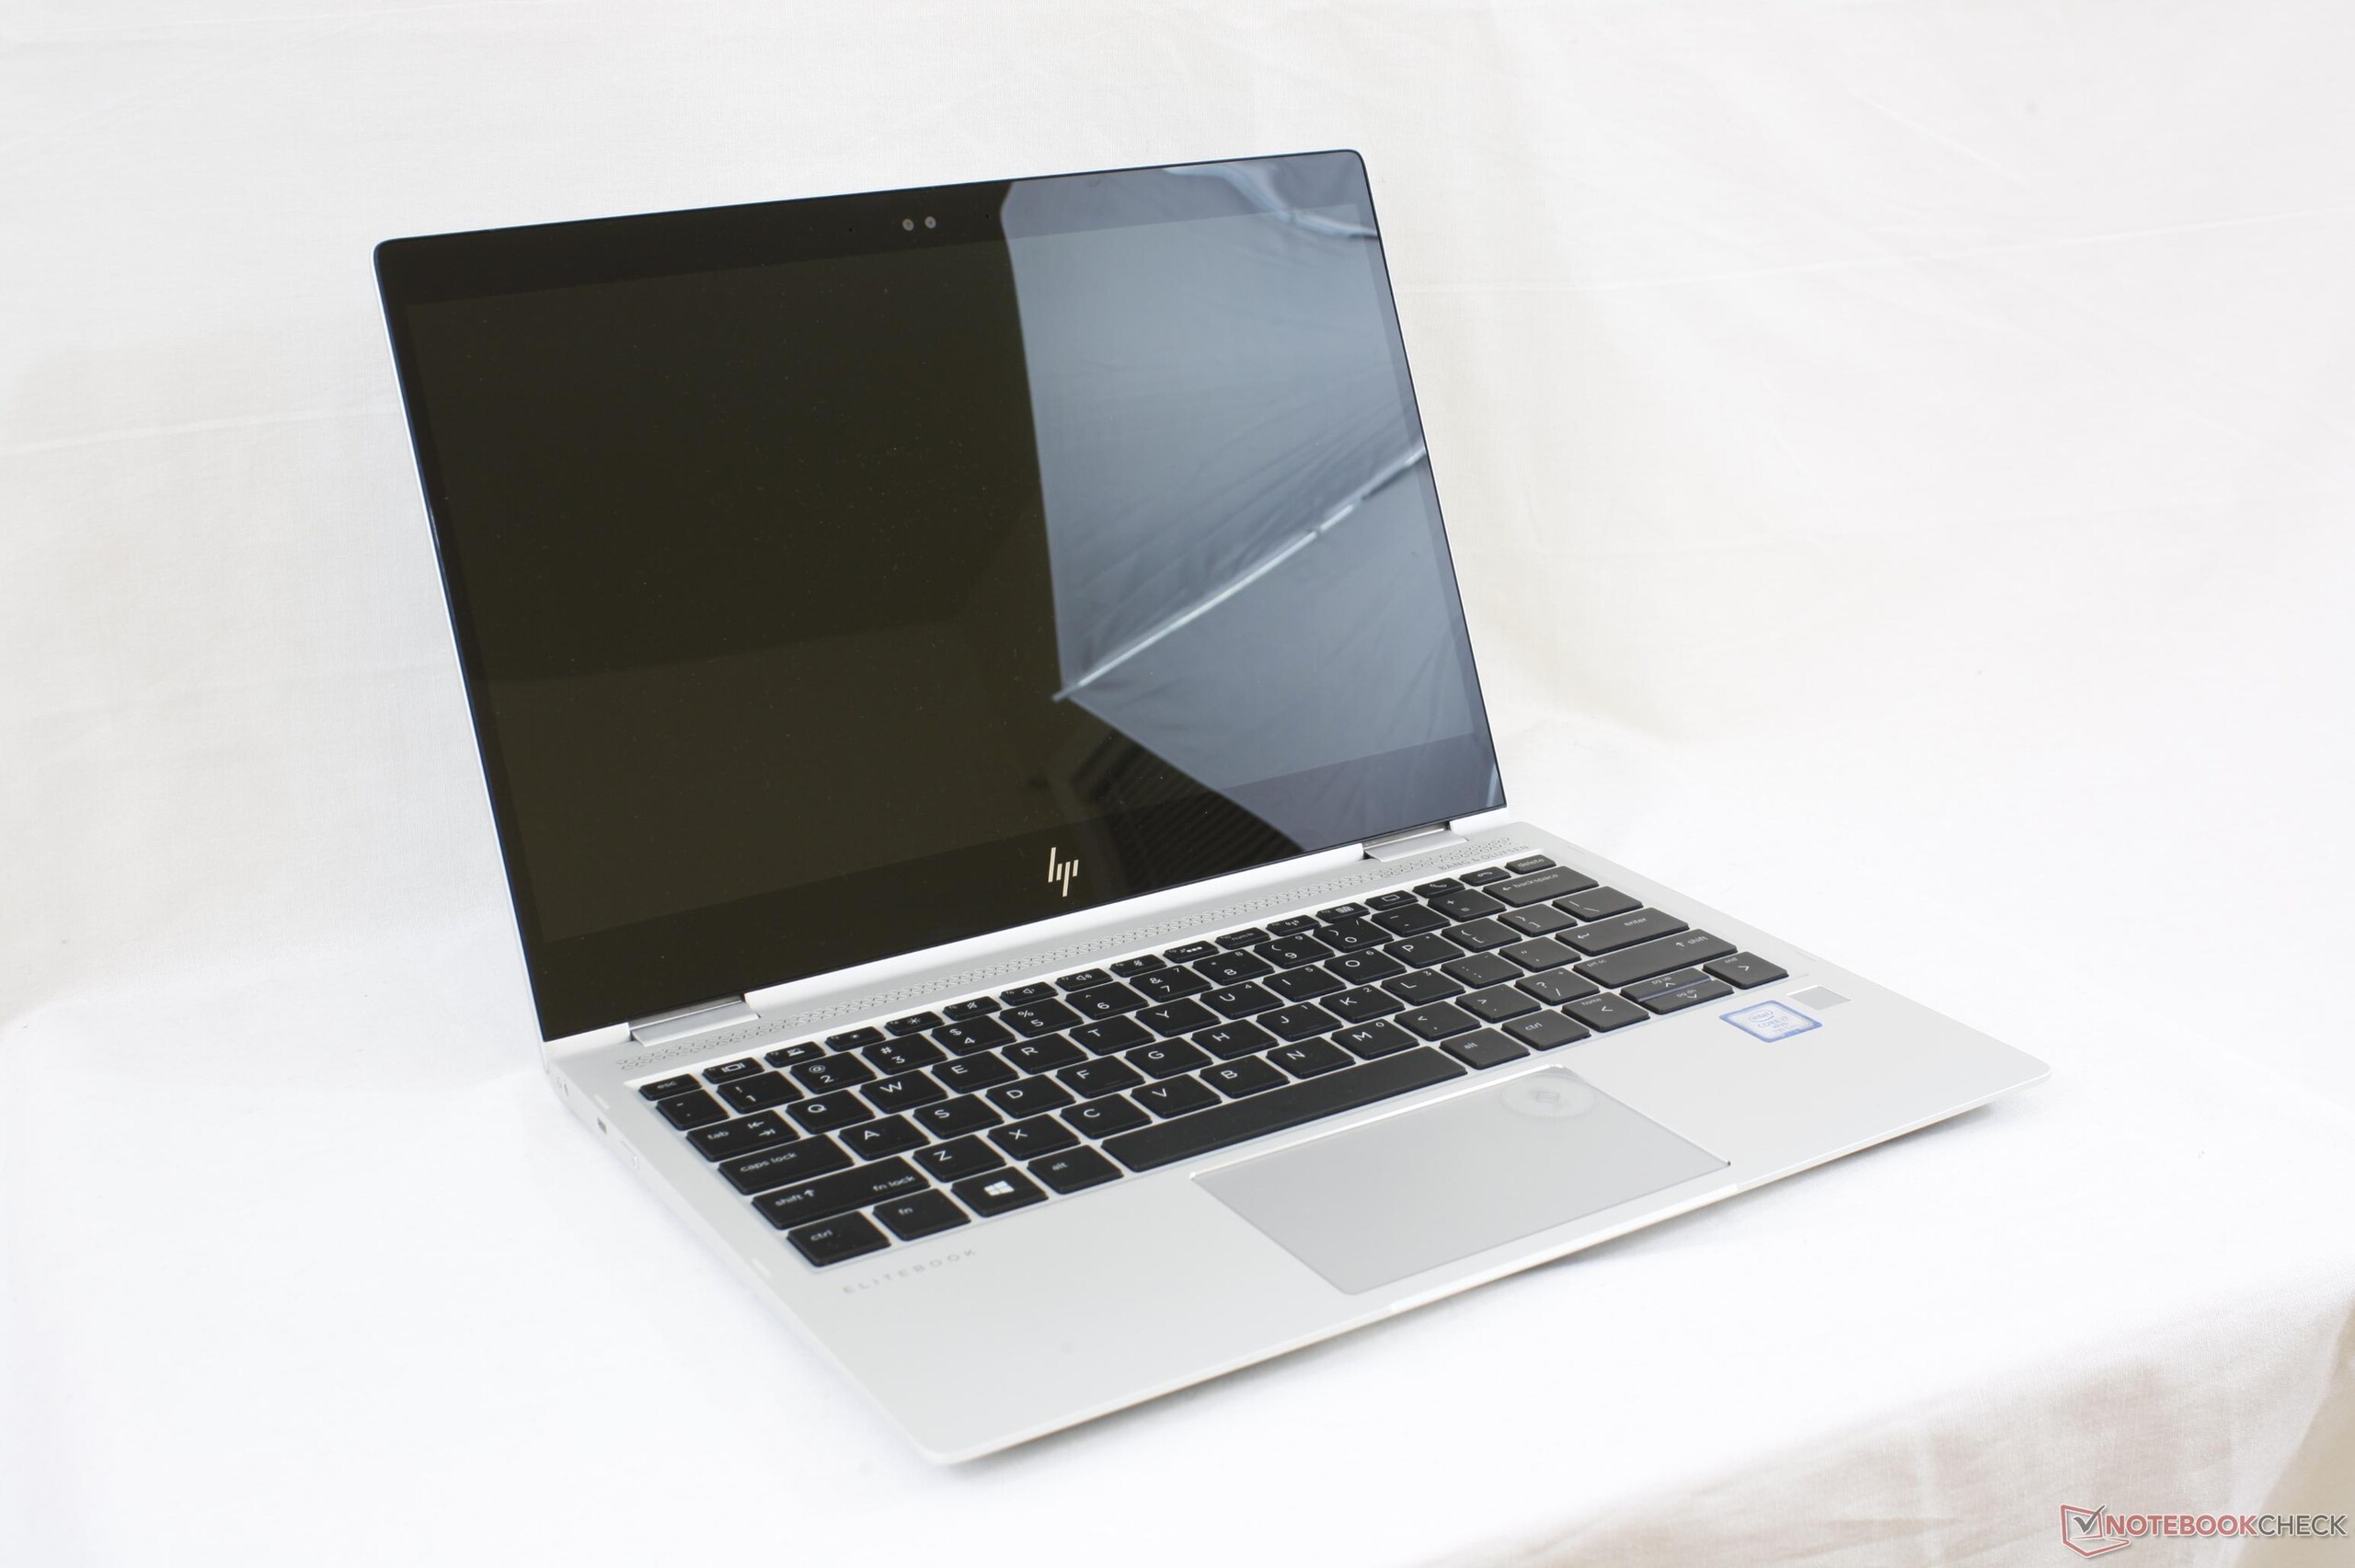
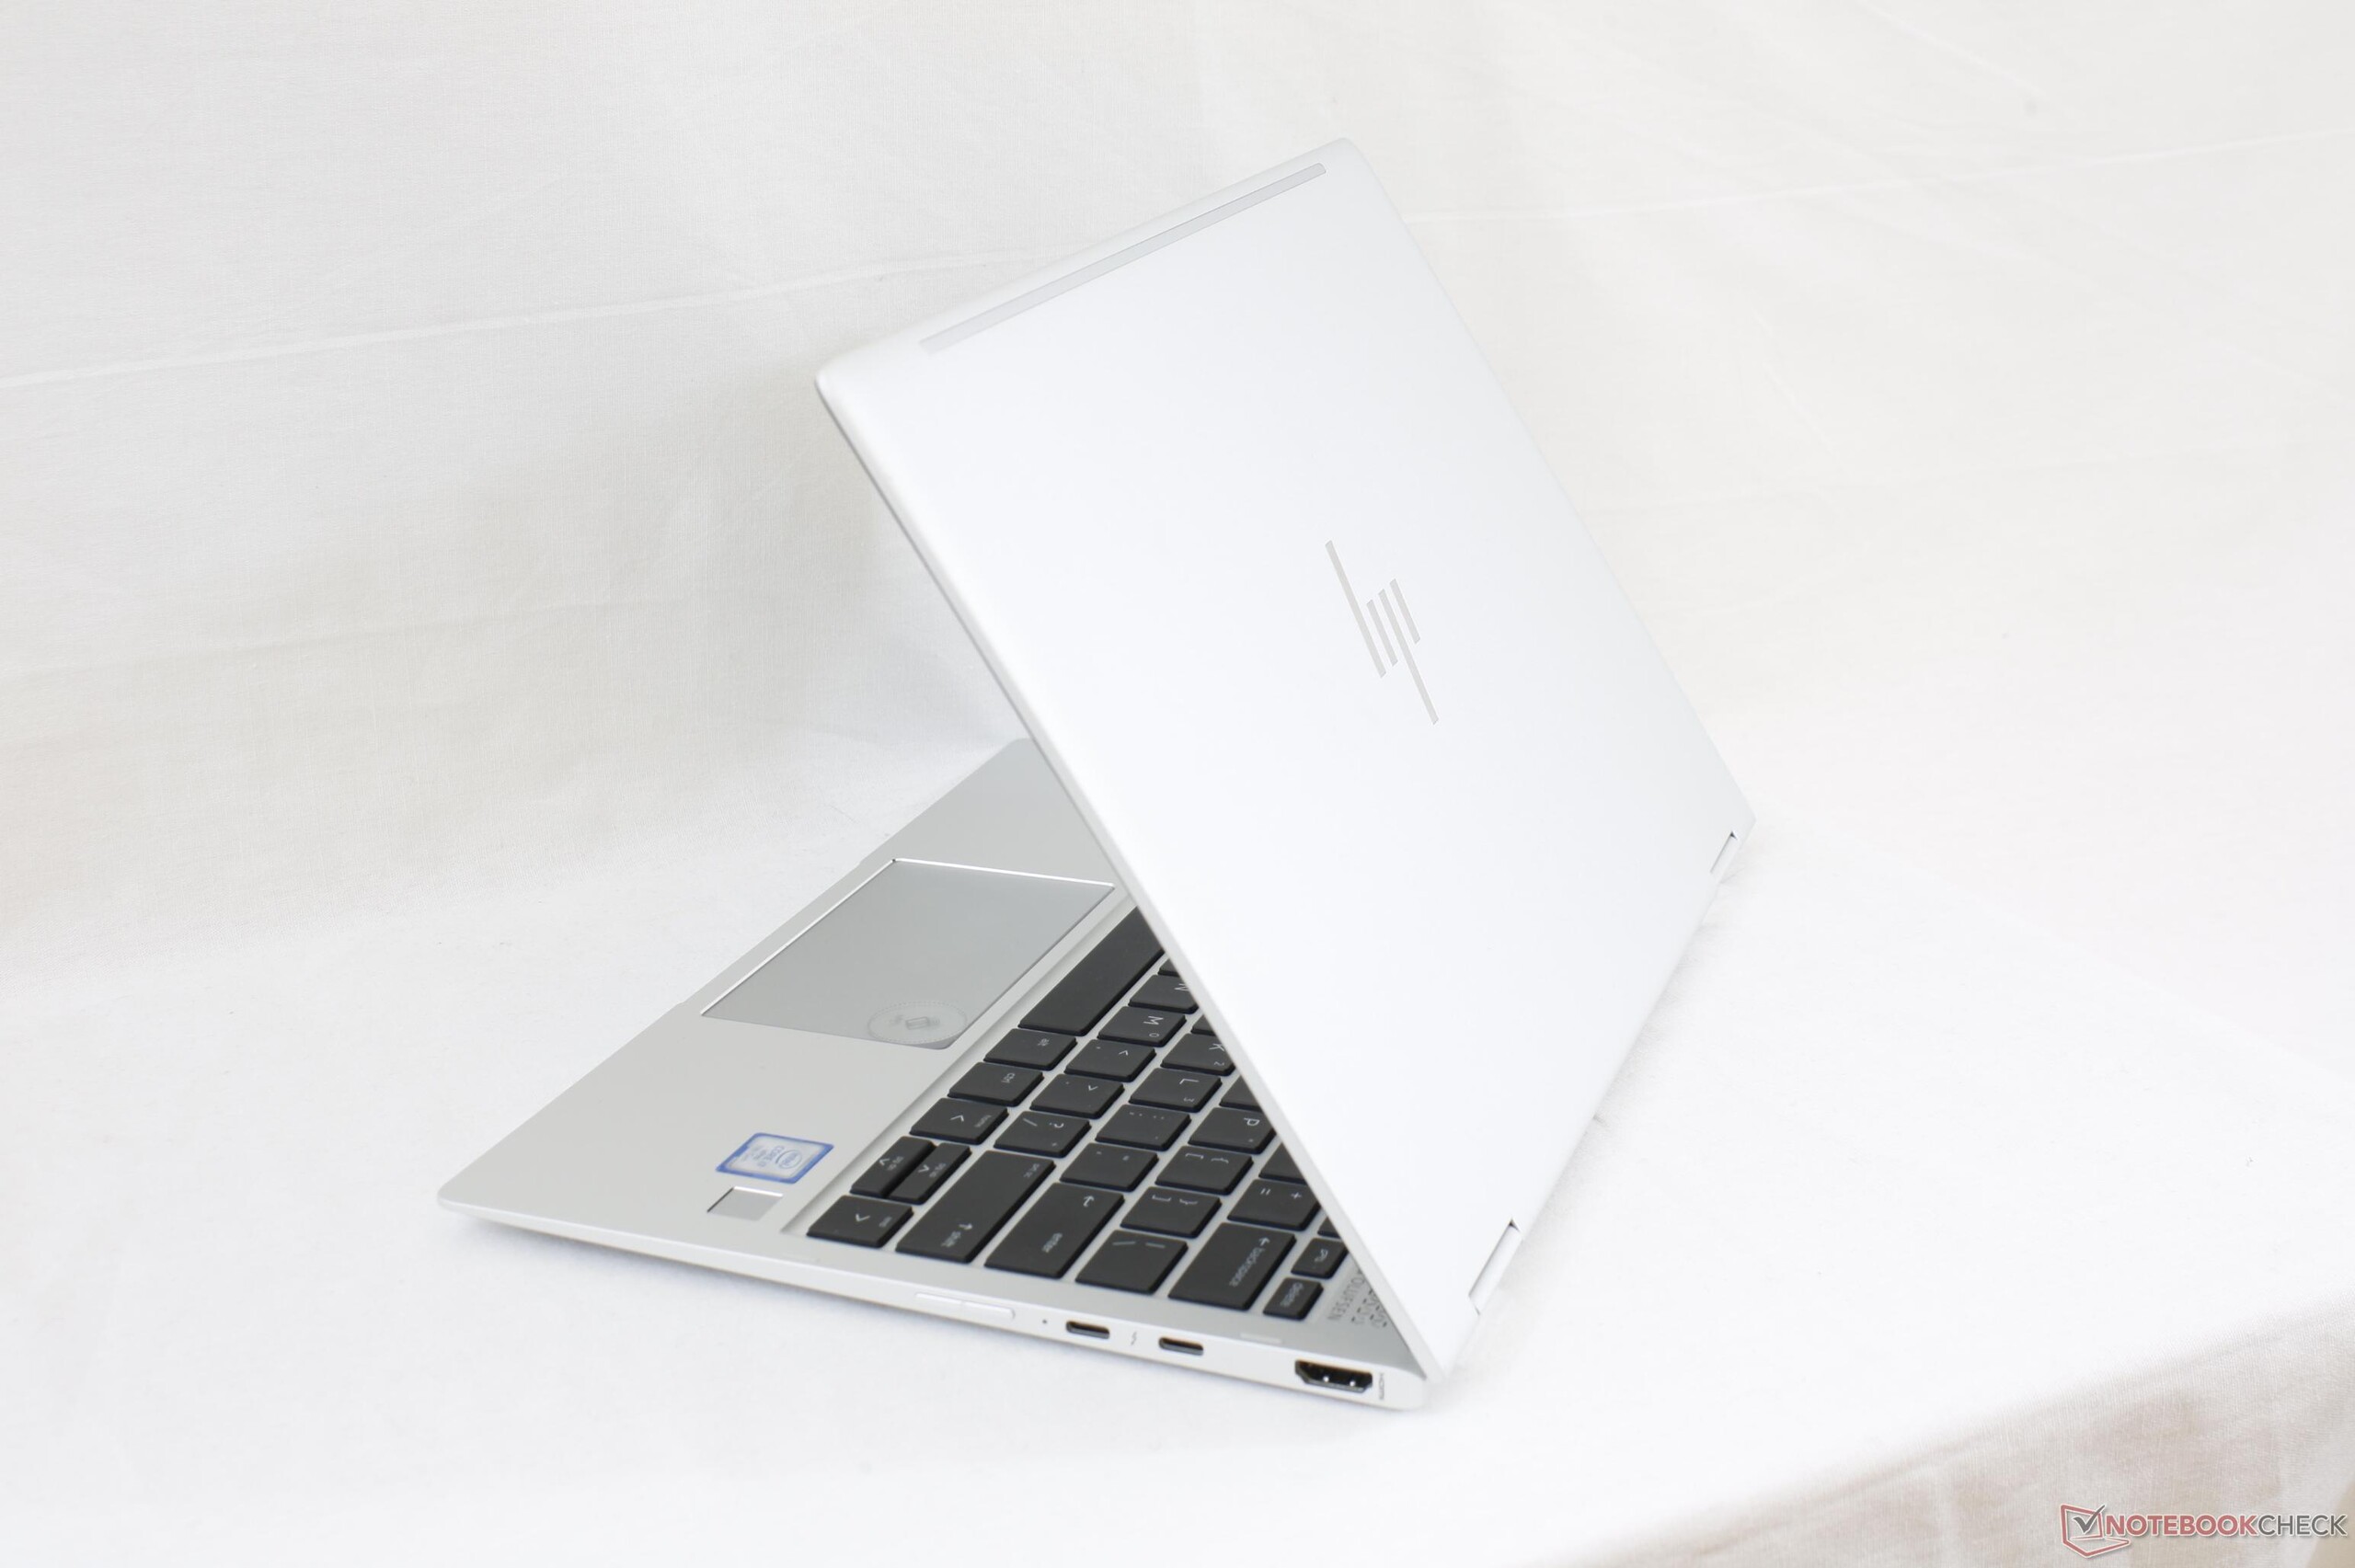
Kısa inceleme:HP EliteBook x360 1020 G2 (i7-7600U, FHD Sure View) dönüştürülebilir model


| SD Card Reader | |
| maximum SDCardreader Maximum Transfer Rate | |
| average SDCardreader Average Transfer Rate |
| Networking | |
| iperf3 transmit AX12 | |
| Microsoft Surface Pro (2017) i5 | |
| Dell XPS 13 i5-8250U | |
| HP EliteBook x360 1020 G2 | |
| iperf3 receive AX12 | |
| HP EliteBook x360 1020 G2 | |
| Microsoft Surface Pro (2017) i5 | |
| Dell XPS 13 i5-8250U | |
| |||||||||||||||||||||||||
Aydınlatma: 85 %
Batarya modunda parlaklık: 677.4 cd/m²
Kontrast: 880:1 (Siyah: 0.77 cd/m²)
ΔE ColorChecker Calman: 2.24 | ∀{0.5-29.43 Ø4.73}
ΔE Greyscale Calman: 2.2 | ∀{0.09-98 Ø4.97}
89.6% sRGB (Argyll 1.6.3 3D)
57% AdobeRGB 1998 (Argyll 1.6.3 3D)
62.2% AdobeRGB 1998 (Argyll 3D)
89.5% sRGB (Argyll 3D)
61.1% Display P3 (Argyll 3D)
Gamma: 2.1
CCT: 6821 K
| HP EliteBook x360 1020 G2 ID: IVO04E8, Name: M125NVF6 R0, IPS, 12.5", 1920x1080 | HP EliteBook Folio G1 V1C37EA AUO226D, IPS, 12.5", 1920x1080 | Dell XPS 13 i5-8250U ID: Sharp SHP144A, Name: LQ133Z1, IGZO IPS, 13.3", 3200x1800 | Microsoft Surface Pro (2017) i5 LG Display LP123WQ112604, IPS, 12.3", 2736x1824 | Dell Latitude 5280 TN LED, 12.5", 1366x768 | Razer Blade Stealth UHD i7-6500U IPS IGZO, 12.5", 3840x2160 | |
|---|---|---|---|---|---|---|
| Display | -27% | 4% | 11% | -35% | 35% | |
| Display P3 Coverage (%) | 61.1 | 44.45 -27% | 63.9 5% | 67.6 11% | 39.34 -36% | 83.7 37% |
| sRGB Coverage (%) | 89.5 | 65.2 -27% | 91.7 2% | 99 11% | 59.2 -34% | 99.2 11% |
| AdobeRGB 1998 Coverage (%) | 62.2 | 45.96 -26% | 65.7 6% | 69.1 11% | 40.67 -35% | 97.2 56% |
| Response Times | 11% | 5% | -13% | -3% | -60% | |
| Response Time Grey 50% / Grey 80% * (ms) | 34.4 ? | 32 ? 7% | 29 ? 16% | 42 ? -22% | 42 ? -22% | 63.2 ? -84% |
| Response Time Black / White * (ms) | 28 ? | 24 ? 14% | 30 ? -7% | 29 ? -4% | 23.2 ? 17% | 38 ? -36% |
| PWM Frequency (Hz) | 1623 ? | 19500 ? | 21000 | |||
| Screen | -32% | -33% | 2% | -138% | -2% | |
| Brightness middle (cd/m²) | 677.4 | 289 -57% | 361 -47% | 417 -38% | 251.8 -63% | 415 -39% |
| Brightness (cd/m²) | 673 | 298 -56% | 303 -55% | 401 -40% | 246 -63% | 399 -41% |
| Brightness Distribution (%) | 85 | 87 2% | 72 -15% | 88 4% | 90 6% | 93 9% |
| Black Level * (cd/m²) | 0.77 | 0.27 65% | 0.33 57% | 0.29 62% | 0.75 3% | 0.309 60% |
| Contrast (:1) | 880 | 1070 22% | 1094 24% | 1438 63% | 336 -62% | 1343 53% |
| Colorchecker dE 2000 * | 2.24 | 4.82 -115% | 5.26 -135% | 3.63 -62% | 11.3 -404% | 3.78 -69% |
| Colorchecker dE 2000 max. * | 7.09 | 10.73 -51% | 7.79 -10% | 6.74 5% | 23.1 -226% | 7.2 -2% |
| Greyscale dE 2000 * | 2.2 | 3.84 -75% | 5.69 -159% | 2.18 1% | 13.2 -500% | 3.38 -54% |
| Gamma | 2.1 105% | 2.41 91% | 1.63 135% | 3.09 71% | 2.05 107% | 2.23 99% |
| CCT | 6821 95% | 6492 100% | 6499 100% | 6767 96% | 14912 44% | 7329 89% |
| Color Space (Percent of AdobeRGB 1998) (%) | 57 | 42.03 -26% | 59 4% | 63 11% | 37.6 -34% | 85.1 49% |
| Color Space (Percent of sRGB) (%) | 89.6 | 64.8 -28% | 92 3% | 99 10% | 59.2 -34% | 99.3 11% |
| Toplam Ortalama (Program / Ayarlar) | -16% /
-25% | -8% /
-21% | 0% /
2% | -59% /
-99% | -9% /
-3% |
* ... daha küçük daha iyidir
Yanıt Sürelerini Görüntüle
| ↔ Tepki Süresi Siyahtan Beyaza | ||
|---|---|---|
| 28 ms ... yükseliş ↗ ve sonbahar↘ birleşimi | ↗ 15.6 ms yükseliş | 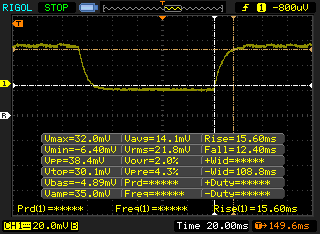 |
| ↘ 12.4 ms sonbahar | ||
| Ekran, testlerimizde nispeten yavaş yanıt oranları gösteriyor ve oyuncular için çok yavaş olabilir. Karşılaştırıldığında, test edilen tüm cihazlar 0.1 (minimum) ile 240 (maksimum) ms arasında değişir. » Tüm cihazların 71 %'si daha iyi. Bu, ölçülen yanıt süresinin test edilen tüm cihazların ortalamasından (19.9 ms) daha kötü olduğu anlamına gelir. | ||
| ↔ Tepki Süresi %50 Griden %80 Griye | ||
| 34.4 ms ... yükseliş ↗ ve sonbahar↘ birleşimi | ↗ 18 ms yükseliş | 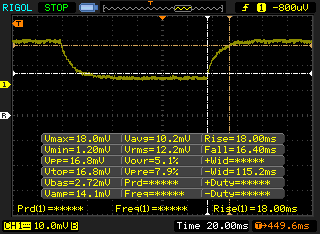 |
| ↘ 16.4 ms sonbahar | ||
| Ekran, testlerimizde yavaş yanıt oranları gösteriyor ve oyuncular için yetersiz olacaktır. Karşılaştırıldığında, test edilen tüm cihazlar 0.165 (minimum) ile 636 (maksimum) ms arasında değişir. » Tüm cihazların 48 %'si daha iyi. Bu, ölçülen yanıt süresinin test edilen tüm cihazların ortalamasından (31.1 ms) daha kötü olduğu anlamına gelir. | ||
Ekran Titremesi / PWM (Darbe Genişliği Modülasyonu)
| Ekran titriyor / PWM algılandı | 1623 Hz | ≤ 99 % parlaklık ayarı | 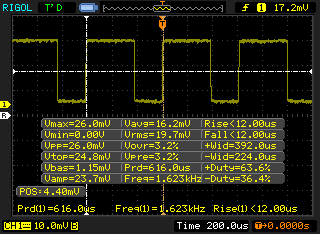 |
Ekran arka ışığı 1623 Hz'de titriyor (en kötü durum, örneğin PWM kullanılması) 99 % ve altındaki parlaklık ayarında titreme algılandı. Bu parlaklık ayarının üzerinde titreme veya PWM olmamalıdır. 1623 Hz frekansı oldukça yüksektir, bu nedenle PWM'ye duyarlı çoğu kullanıcı herhangi bir titremeyi fark etmemelidir. Karşılaştırıldığında: Test edilen tüm cihazların %52 %'si ekranı karartmak için PWM kullanmıyor. PWM tespit edilirse, ortalama 7798 (minimum: 5 - maksimum: 343500) Hz ölçüldü. | |||
* ... daha küçük daha iyidir
| PCMark 8 Home Score Accelerated v2 | 3684 puan | |
| PCMark 8 Creative Score Accelerated v2 | 4931 puan | |
| PCMark 8 Work Score Accelerated v2 | 4880 puan | |
| PCMark 10 Score | 3683 puan | |
Yardım | ||
| HP EliteBook x360 1020 G2 Samsung PM961 NVMe MZVLW512HMJP | HP EliteBook Folio G1 V1C37EA Samsung SM951 MZVPV256 m.2 | Dell Latitude 5280 N014L528012QG45 Samsung SSD PM871 MZNLN512HMJP | Microsoft Surface Pro (2017) i7 Samsung PM971 KUS040202M | Dell XPS 13 9360 FHD i5 Toshiba NVMe THNSN5256GPUK | |
|---|---|---|---|---|---|
| AS SSD | -24% | -31% | -239% | -36% | |
| Copy Game MB/s (MB/s) | 905 | 582 -36% | 582 -36% | 390 -57% | |
| Copy Program MB/s (MB/s) | 323.7 | 295 -9% | 386 19% | 188 -42% | |
| Copy ISO MB/s (MB/s) | 1435 | 754 -47% | 1036 -28% | 283.3 -80% | |
| Score Total (Points) | 3738 | 2195 -41% | 1202 -68% | 1774 -53% | 1607 -57% |
| Score Write (Points) | 1122 | 491 -56% | 474 -58% | 52 -95% | 327 -71% |
| Score Read (Points) | 1757 | 1147 -35% | 472 -73% | 1164 -34% | 870 -50% |
| Access Time Write * (ms) | 0.26 | 0.297 -14% | 0.035 87% | 7.6 -2823% | 0.035 87% |
| Access Time Read * (ms) | 0.39 | 0.049 87% | 0.05 87% | 0.04 90% | 0.055 86% |
| 4K-64 Write (MB/s) | 878 | 304 -65% | 330.8 -62% | 34 -96% | 197.7 -77% |
| 4K-64 Read (MB/s) | 1506 | 938 -38% | 378 -75% | 1015 -33% | 723 -52% |
| 4K Write (MB/s) | 141.1 | 80.9 -43% | 95.8 -32% | 0.2 -100% | 92 -35% |
| 4K Read (MB/s) | 54.4 | 35.58 -35% | 43 -21% | 41 -25% | 29.52 -46% |
| Seq Write (MB/s) | 1032 | 1061 3% | 472.8 -54% | 171 -83% | 372.8 -64% |
| Seq Read (MB/s) | 1964 | 1731 -12% | 512 -74% | 1070 -46% | 1179 -40% |
* ... daha küçük daha iyidir

| 3DMark 11 | |
| 1280x720 Performance GPU | |
| HP Envy x360 15m-bq121dx | |
| Acer Aspire V3-372-57CW | |
| Microsoft Surface Pro (2017) i7 | |
| Dell XPS 13 9360 FHD i7 Iris | |
| HP EliteBook x360 1020 G2 | |
| Dell Latitude 13 7380 | |
| Lenovo Miix 520-12IKB 81CG | |
| HP EliteBook Folio G1 V1C37EA | |
| Fujitsu Lifebook E746 | |
| Eve-Tech Eve V i5 | |
| 1280x720 Performance Combined | |
| HP Envy x360 15m-bq121dx | |
| Acer Aspire V3-372-57CW | |
| Microsoft Surface Pro (2017) i7 | |
| Dell XPS 13 9360 FHD i7 Iris | |
| HP EliteBook x360 1020 G2 | |
| Lenovo Miix 520-12IKB 81CG | |
| Dell Latitude 13 7380 | |
| Fujitsu Lifebook E746 | |
| Eve-Tech Eve V i5 | |
| HP EliteBook Folio G1 V1C37EA | |
| 3DMark | |
| 1280x720 Cloud Gate Standard Graphics | |
| HP Envy x360 15m-bq121dx | |
| Acer Aspire V3-372-57CW | |
| Microsoft Surface Pro (2017) i7 | |
| Dell XPS 13 9360 FHD i7 Iris | |
| HP EliteBook x360 1020 G2 | |
| Lenovo Miix 520-12IKB 81CG | |
| Dell Latitude 13 7380 | |
| HP EliteBook Folio G1 V1C37EA | |
| Fujitsu Lifebook E746 | |
| Eve-Tech Eve V i5 | |
| 1920x1080 Fire Strike Graphics | |
| HP Envy x360 15m-bq121dx | |
| Acer Aspire V3-372-57CW | |
| Microsoft Surface Pro (2017) i7 | |
| Dell XPS 13 9360 FHD i7 Iris | |
| HP EliteBook x360 1020 G2 | |
| Lenovo Miix 520-12IKB 81CG | |
| Dell Latitude 13 7380 | |
| Eve-Tech Eve V i5 | |
| HP EliteBook Folio G1 V1C37EA | |
| Fujitsu Lifebook E746 | |
| 1920x1080 Ice Storm Extreme Graphics | |
| Acer Aspire V3-372-57CW | |
| HP EliteBook x360 1020 G2 | |
| Lenovo Miix 520-12IKB 81CG | |
| Dell Latitude 13 7380 | |
| 3DMark 11 Performance | 1842 puan | |
| 3DMark Ice Storm Standard Score | 70030 puan | |
| 3DMark Cloud Gate Standard Score | 7131 puan | |
| 3DMark Fire Strike Score | 980 puan | |
| 3DMark Fire Strike Extreme Score | 446 puan | |
Yardım | ||
| düşük | orta | yüksek | ultra | |
|---|---|---|---|---|
| BioShock Infinite (2013) | 58.7 | 31.9 | 25.9 | 8.1 |
| Rise of the Tomb Raider (2016) | 19.8 |
Ses yüksekliği
| Boşta |
| 28.3 / 28.3 / 29.3 dB |
| Çalışırken |
| 32.2 / 34.5 dB |
 | ||
30 dB sessiz 40 dB(A) duyulabilirlik 50 dB(A) gürültülü |
||
min: | ||
| HP EliteBook x360 1020 G2 HD Graphics 620, i7-7600U, Samsung PM961 NVMe MZVLW512HMJP | Dell Latitude 5280 N014L528012QG45 HD Graphics 620, i5-7200U, Samsung SSD PM871 MZNLN512HMJP | Microsoft Surface Pro (2017) i7 Iris Plus Graphics 640, i7-7660U, Samsung PM971 KUS040202M | Dell XPS 13 i5-8250U UHD Graphics 620, i5-8250U, Toshiba XG5 KXG50ZNV256G | HP Elite x2 1012 G2-1LV76EA HD Graphics 620, i5-7200U, Samsung PM961 MZVLW256HEHP | |
|---|---|---|---|---|---|
| Noise | -9% | -3% | -7% | -0% | |
| kapalı / ortam * (dB) | 28.3 | 29.6 -5% | 30.4 -7% | 29.5 -4% | |
| Idle Minimum * (dB) | 28.3 | 30 -6% | 29.6 -5% | 30.4 -7% | 29.5 -4% |
| Idle Average * (dB) | 28.3 | 30.5 -8% | 29.6 -5% | 30.4 -7% | 29.5 -4% |
| Idle Maximum * (dB) | 29.3 | 31.1 -6% | 29.6 -1% | 30.4 -4% | 29.5 -1% |
| Load Average * (dB) | 32.2 | 35.9 -11% | 33.4 -4% | 38.3 -19% | 30.6 5% |
| Load Maximum * (dB) | 34.5 | 39.5 -14% | 34.1 1% | 33.6 3% | 32.5 6% |
| Witcher 3 ultra * (dB) | 33.4 |
* ... daha küçük daha iyidir
(±) Üst taraftaki maksimum sıcaklık, 35.9 °C / 97 F ortalamasına kıyasla 42.6 °C / 109 F'dir. , Subnotebook sınıfı için 21.4 ile 59 °C arasında değişir.
(-) Alt kısım, 39.2 °C / 103 F ortalamasına kıyasla maksimum 46.2 °C / 115 F'ye kadar ısınır
(+) Boşta kullanımda, üst tarafın ortalama sıcaklığı 23.2 °C / 74 F olup, cihazın 30.8 °C / 87 F.
(+) Avuç içi dayanakları ve dokunmatik yüzey, maksimum 26 °C / 78.8 F ile cilt sıcaklığından daha soğuktur ve bu nedenle dokunulduğunda soğuktur.
(+) Benzer cihazların avuç içi dayanağı alanının ortalama sıcaklığı 28.2 °C / 82.8 F (+2.2 °C / 4 F) idi.
HP EliteBook x360 1020 G2 ses analizi
(±) | hoparlör ses yüksekliği ortalama ama iyi (78.1 dB)
Bas 100 - 315Hz
(±) | azaltılmış bas - ortalama olarak medyandan 11.9% daha düşük
(±) | Bas doğrusallığı ortalamadır (13.4% delta - önceki frekans)
Ortalar 400 - 2000 Hz
(+) | dengeli ortalar - medyandan yalnızca 3% uzakta
(+) | orta frekanslar doğrusaldır (6.5% deltadan önceki frekansa)
Yüksekler 2 - 16 kHz
(+) | dengeli yüksekler - medyandan yalnızca 4.1% uzakta
(+) | yüksekler doğrusaldır (5% deltadan önceki frekansa)
Toplam 100 - 16.000 Hz
(+) | genel ses doğrusaldır (13% ortancaya göre fark)
Aynı sınıfla karşılaştırıldığında
» Bu sınıftaki tüm test edilen cihazların %20%'si daha iyi, 4% benzer, 76% daha kötüydü
» En iyisinin deltası 5% idi, ortalama 18% idi, en kötüsü 53% idi
Test edilen tüm cihazlarla karşılaştırıldığında
» Test edilen tüm cihazların %13'si daha iyi, 2 benzer, % 85 daha kötüydü
» En iyisinin deltası 4% idi, ortalama 24% idi, en kötüsü 134% idi
Apple MacBook 12 (Early 2016) 1.1 GHz ses analizi
(+) | hoparlörler nispeten yüksek sesle çalabilir (83.6 dB)
Bas 100 - 315Hz
(±) | azaltılmış bas - ortalama olarak medyandan 11.3% daha düşük
(±) | Bas doğrusallığı ortalamadır (14.2% delta - önceki frekans)
Ortalar 400 - 2000 Hz
(+) | dengeli ortalar - medyandan yalnızca 2.4% uzakta
(+) | orta frekanslar doğrusaldır (5.5% deltadan önceki frekansa)
Yüksekler 2 - 16 kHz
(+) | dengeli yüksekler - medyandan yalnızca 2% uzakta
(+) | yüksekler doğrusaldır (4.5% deltadan önceki frekansa)
Toplam 100 - 16.000 Hz
(+) | genel ses doğrusaldır (10.2% ortancaya göre fark)
Aynı sınıfla karşılaştırıldığında
» Bu sınıftaki tüm test edilen cihazların %7%'si daha iyi, 2% benzer, 91% daha kötüydü
» En iyisinin deltası 5% idi, ortalama 18% idi, en kötüsü 53% idi
Test edilen tüm cihazlarla karşılaştırıldığında
» Test edilen tüm cihazların %5'si daha iyi, 1 benzer, % 94 daha kötüydü
» En iyisinin deltası 4% idi, ortalama 24% idi, en kötüsü 134% idi
| Kapalı / Bekleme modu | |
| Boşta | |
| Çalışırken |
|
Key:
min: | |
| HP EliteBook x360 1020 G2 i7-7600U, HD Graphics 620, Samsung PM961 NVMe MZVLW512HMJP, IPS, 1920x1080, 12.5" | HP EliteBook Folio G1 V1C37EA 6Y54, HD Graphics 515, Samsung SM951 MZVPV256 m.2, IPS, 1920x1080, 12.5" | Dell Latitude 5280 N014L528012QG45 i5-7200U, HD Graphics 620, Samsung SSD PM871 MZNLN512HMJP, , 1366x768, 12.5" | Microsoft Surface Pro (2017) i7 i7-7660U, Iris Plus Graphics 640, Samsung PM971 KUS040202M, IPS, 2736x1824, 12.3" | Dell XPS 13 i5-8250U i5-8250U, UHD Graphics 620, Toshiba XG5 KXG50ZNV256G, IGZO IPS, 3200x1800, 13.3" | Razer Blade Stealth QHD i7-8550U i5-8550U, UHD Graphics 620, Samsung PM961 NVMe MZVLW512HMJP, , 3200x1800, 13.3" | |
|---|---|---|---|---|---|---|
| Power Consumption | 19% | 24% | -15% | -3% | -5% | |
| Idle Minimum * (Watt) | 3.4 | 4.3 -26% | 2 41% | 4.2 -24% | 3.6 -6% | 5.6 -65% |
| Idle Average * (Watt) | 7.5 | 6 20% | 5.9 21% | 10.1 -35% | 7.9 -5% | 7.5 -0% |
| Idle Maximum * (Watt) | 11.1 | 6.4 42% | 8.5 23% | 14 -26% | 8.5 23% | 8.4 24% |
| Load Average * (Watt) | 37.6 | 22.7 40% | 30.4 19% | 37.4 1% | 43 -14% | 33.7 10% |
| Load Maximum * (Watt) | 37.6 | 31.2 17% | 31.1 17% | 34 10% | 43 -14% | 34.6 8% |
| Witcher 3 ultra * (Watt) | 38.1 | 31 |
* ... daha küçük daha iyidir
| HP EliteBook x360 1020 G2 i7-7600U, HD Graphics 620, 49 Wh | HP EliteBook Folio 1020 G1 5Y51, HD Graphics 5300, 36 Wh | Microsoft Surface Pro (2017) i7 i7-7660U, Iris Plus Graphics 640, 45 Wh | Dell XPS 13 i5-8250U i5-8250U, UHD Graphics 620, 60 Wh | HP EliteBook Folio G1 V1C37EA 6Y54, HD Graphics 515, 38 Wh | Dell Latitude 5280 i5-7200U, HD Graphics 620, 51 Wh | |
|---|---|---|---|---|---|---|
| Pil Çalışma Süresi | 0% | -3% | 35% | -13% | 18% | |
| Reader / Idle (h) | 12.8 | 11 -14% | 18.2 42% | 8.8 -31% | 18.5 45% | |
| WiFi v1.3 (h) | 7.5 | 6.9 -8% | 8.2 9% | 11.5 53% | 5.9 -21% | 7.8 4% |
| Load (h) | 2.2 | 2.7 23% | 1.9 -14% | 2.4 9% | 2.5 14% | 2.3 5% |
| Witcher 3 ultra (h) | 1.9 |
Artılar
Eksiler
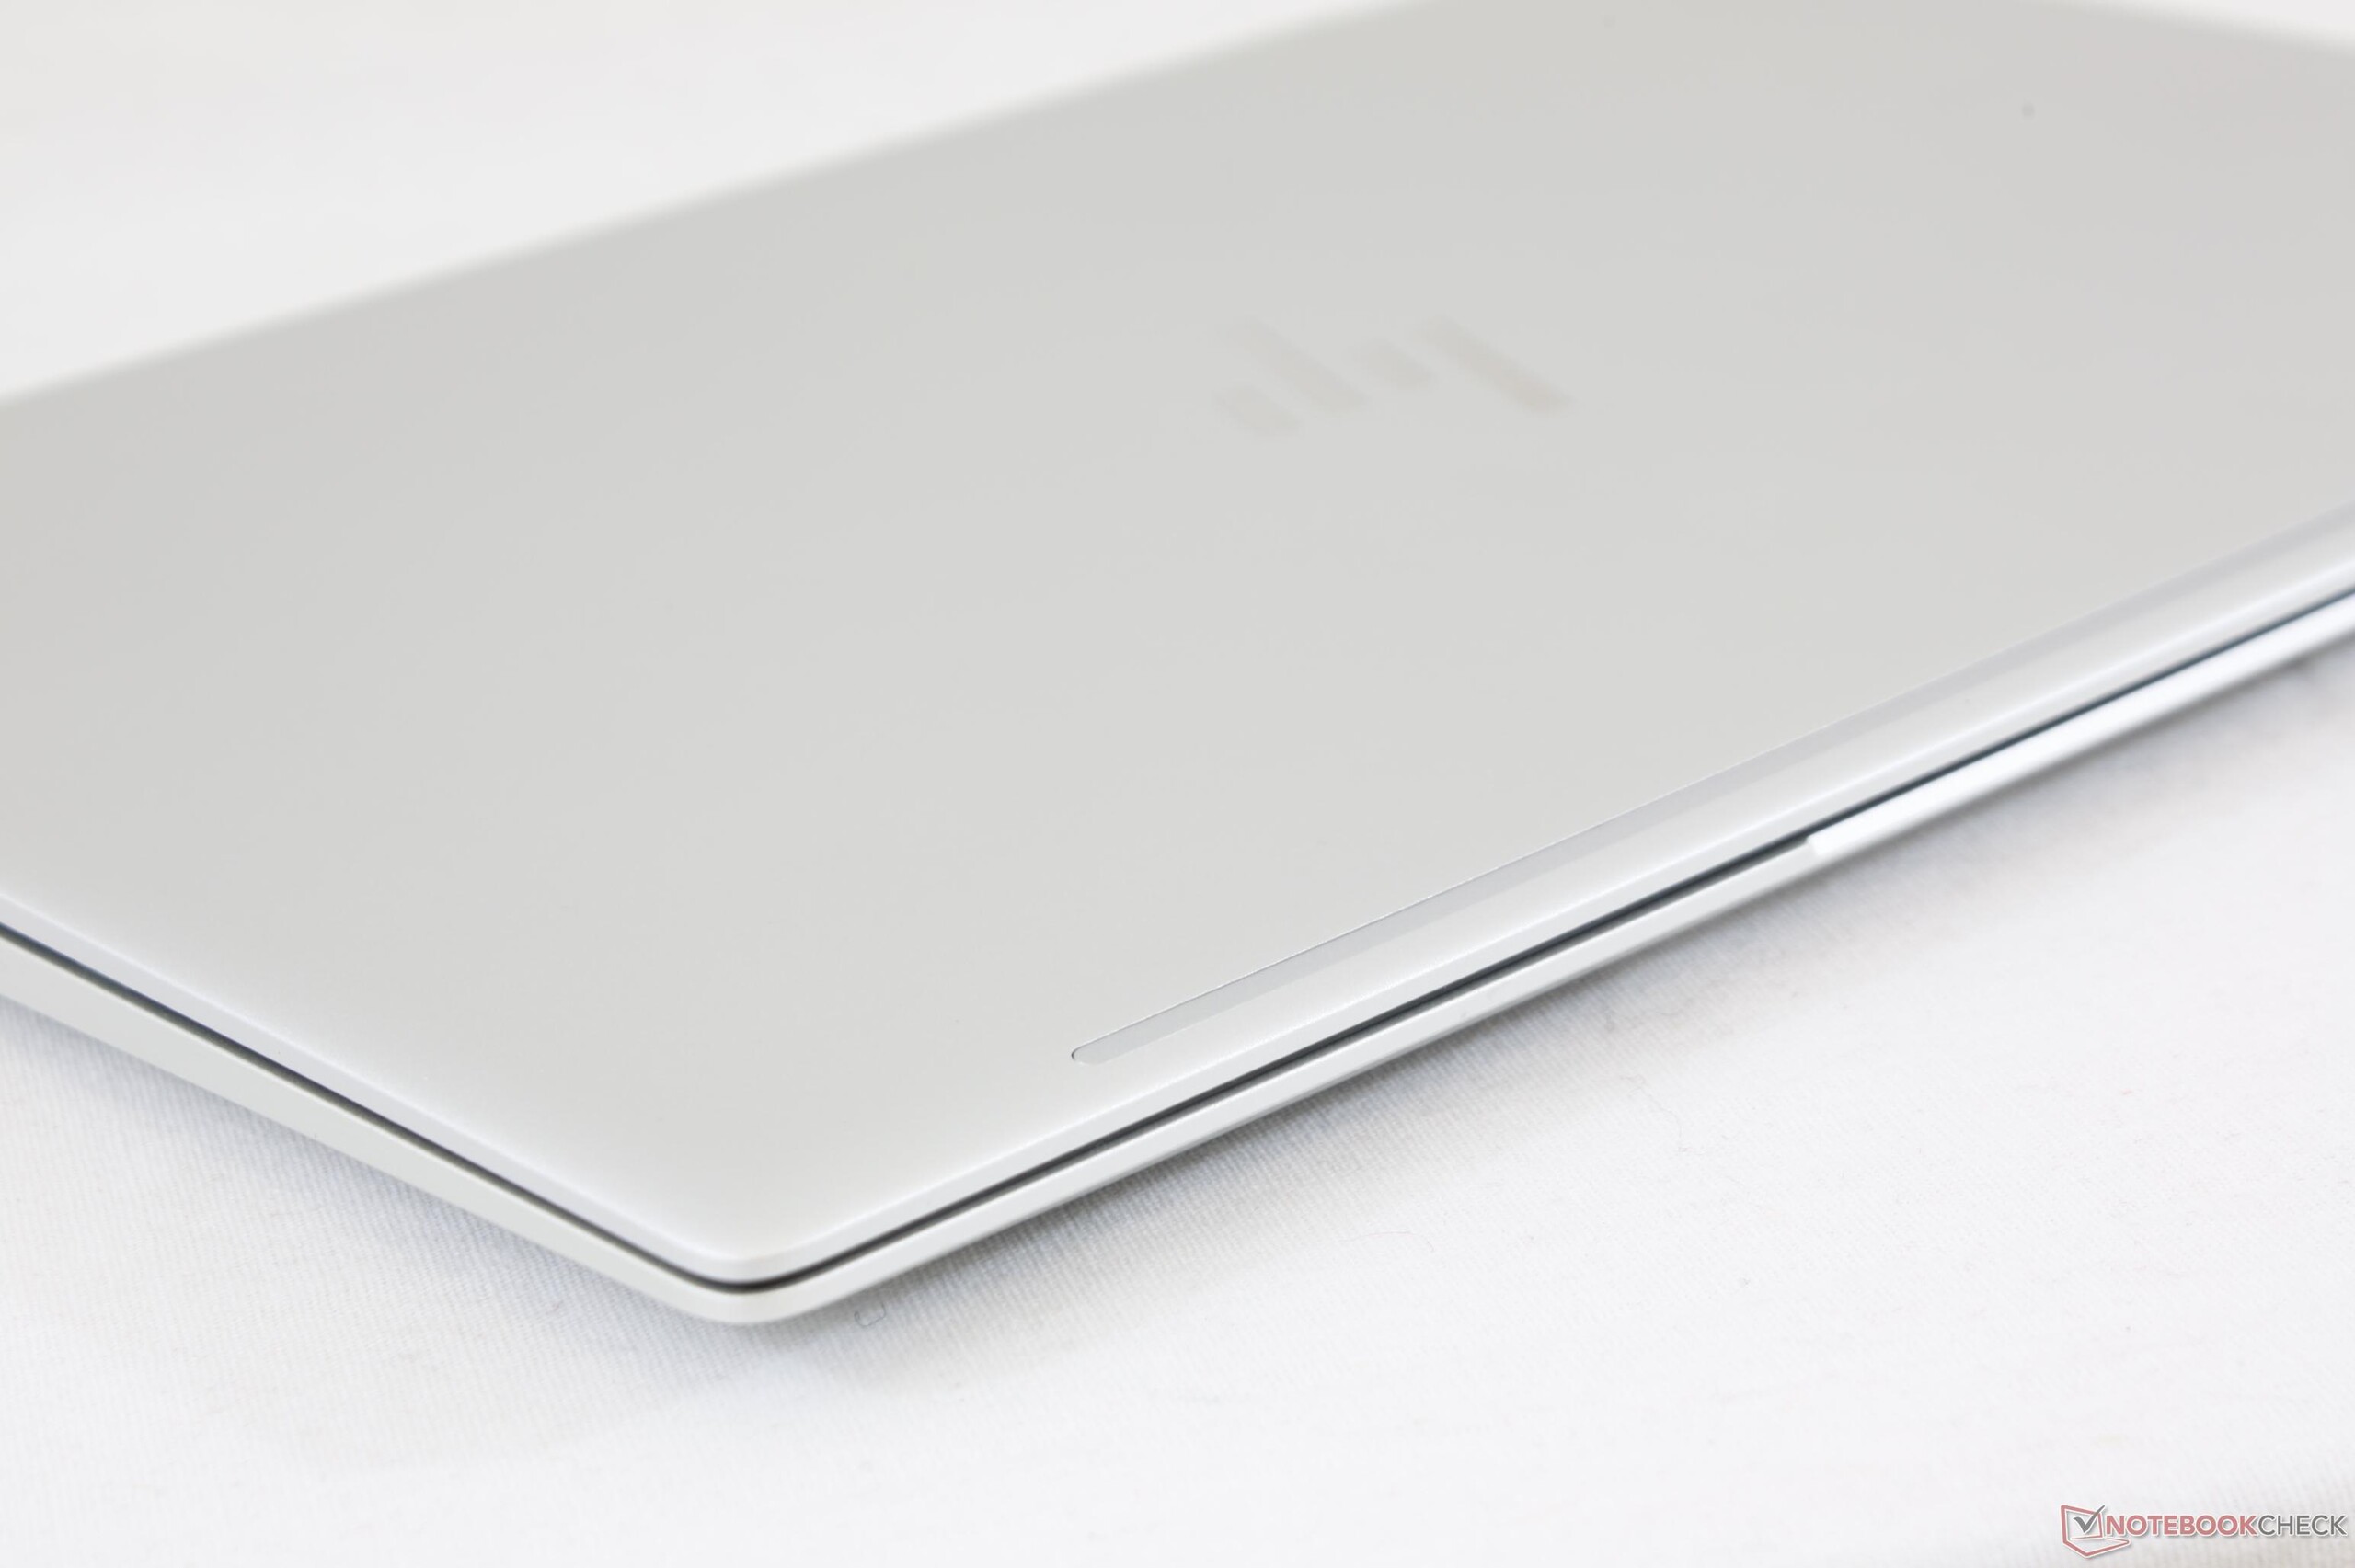
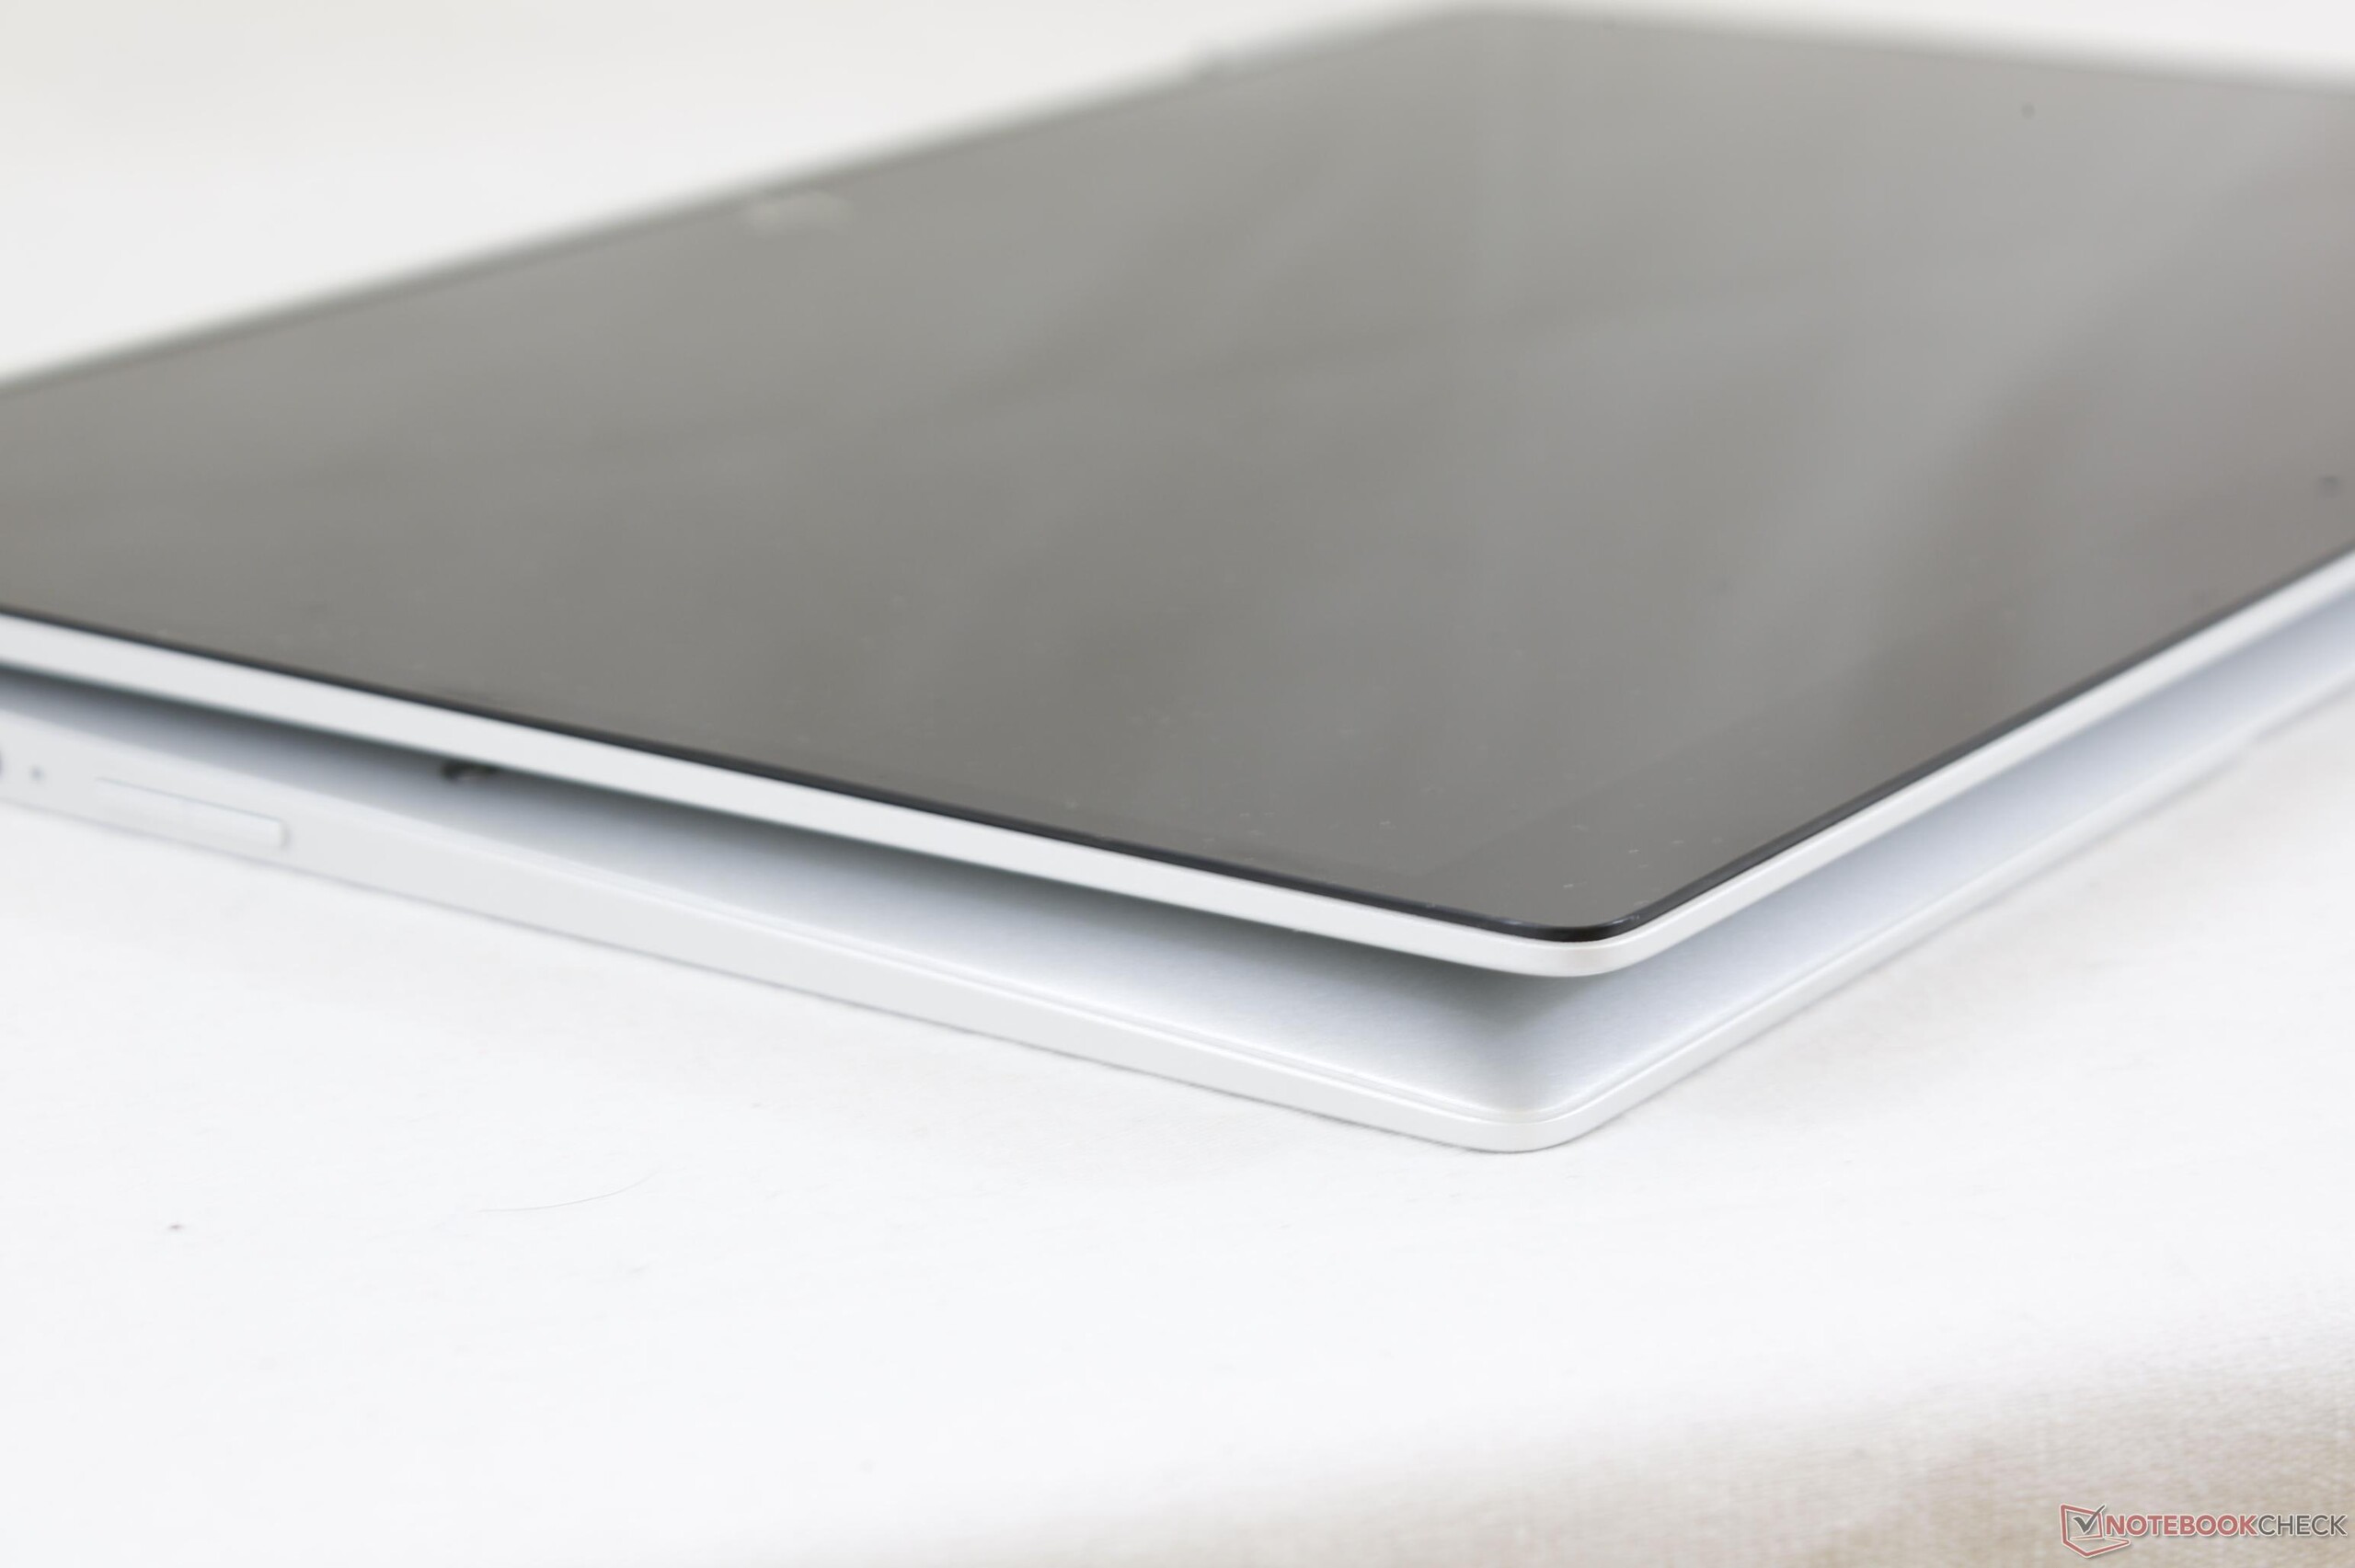
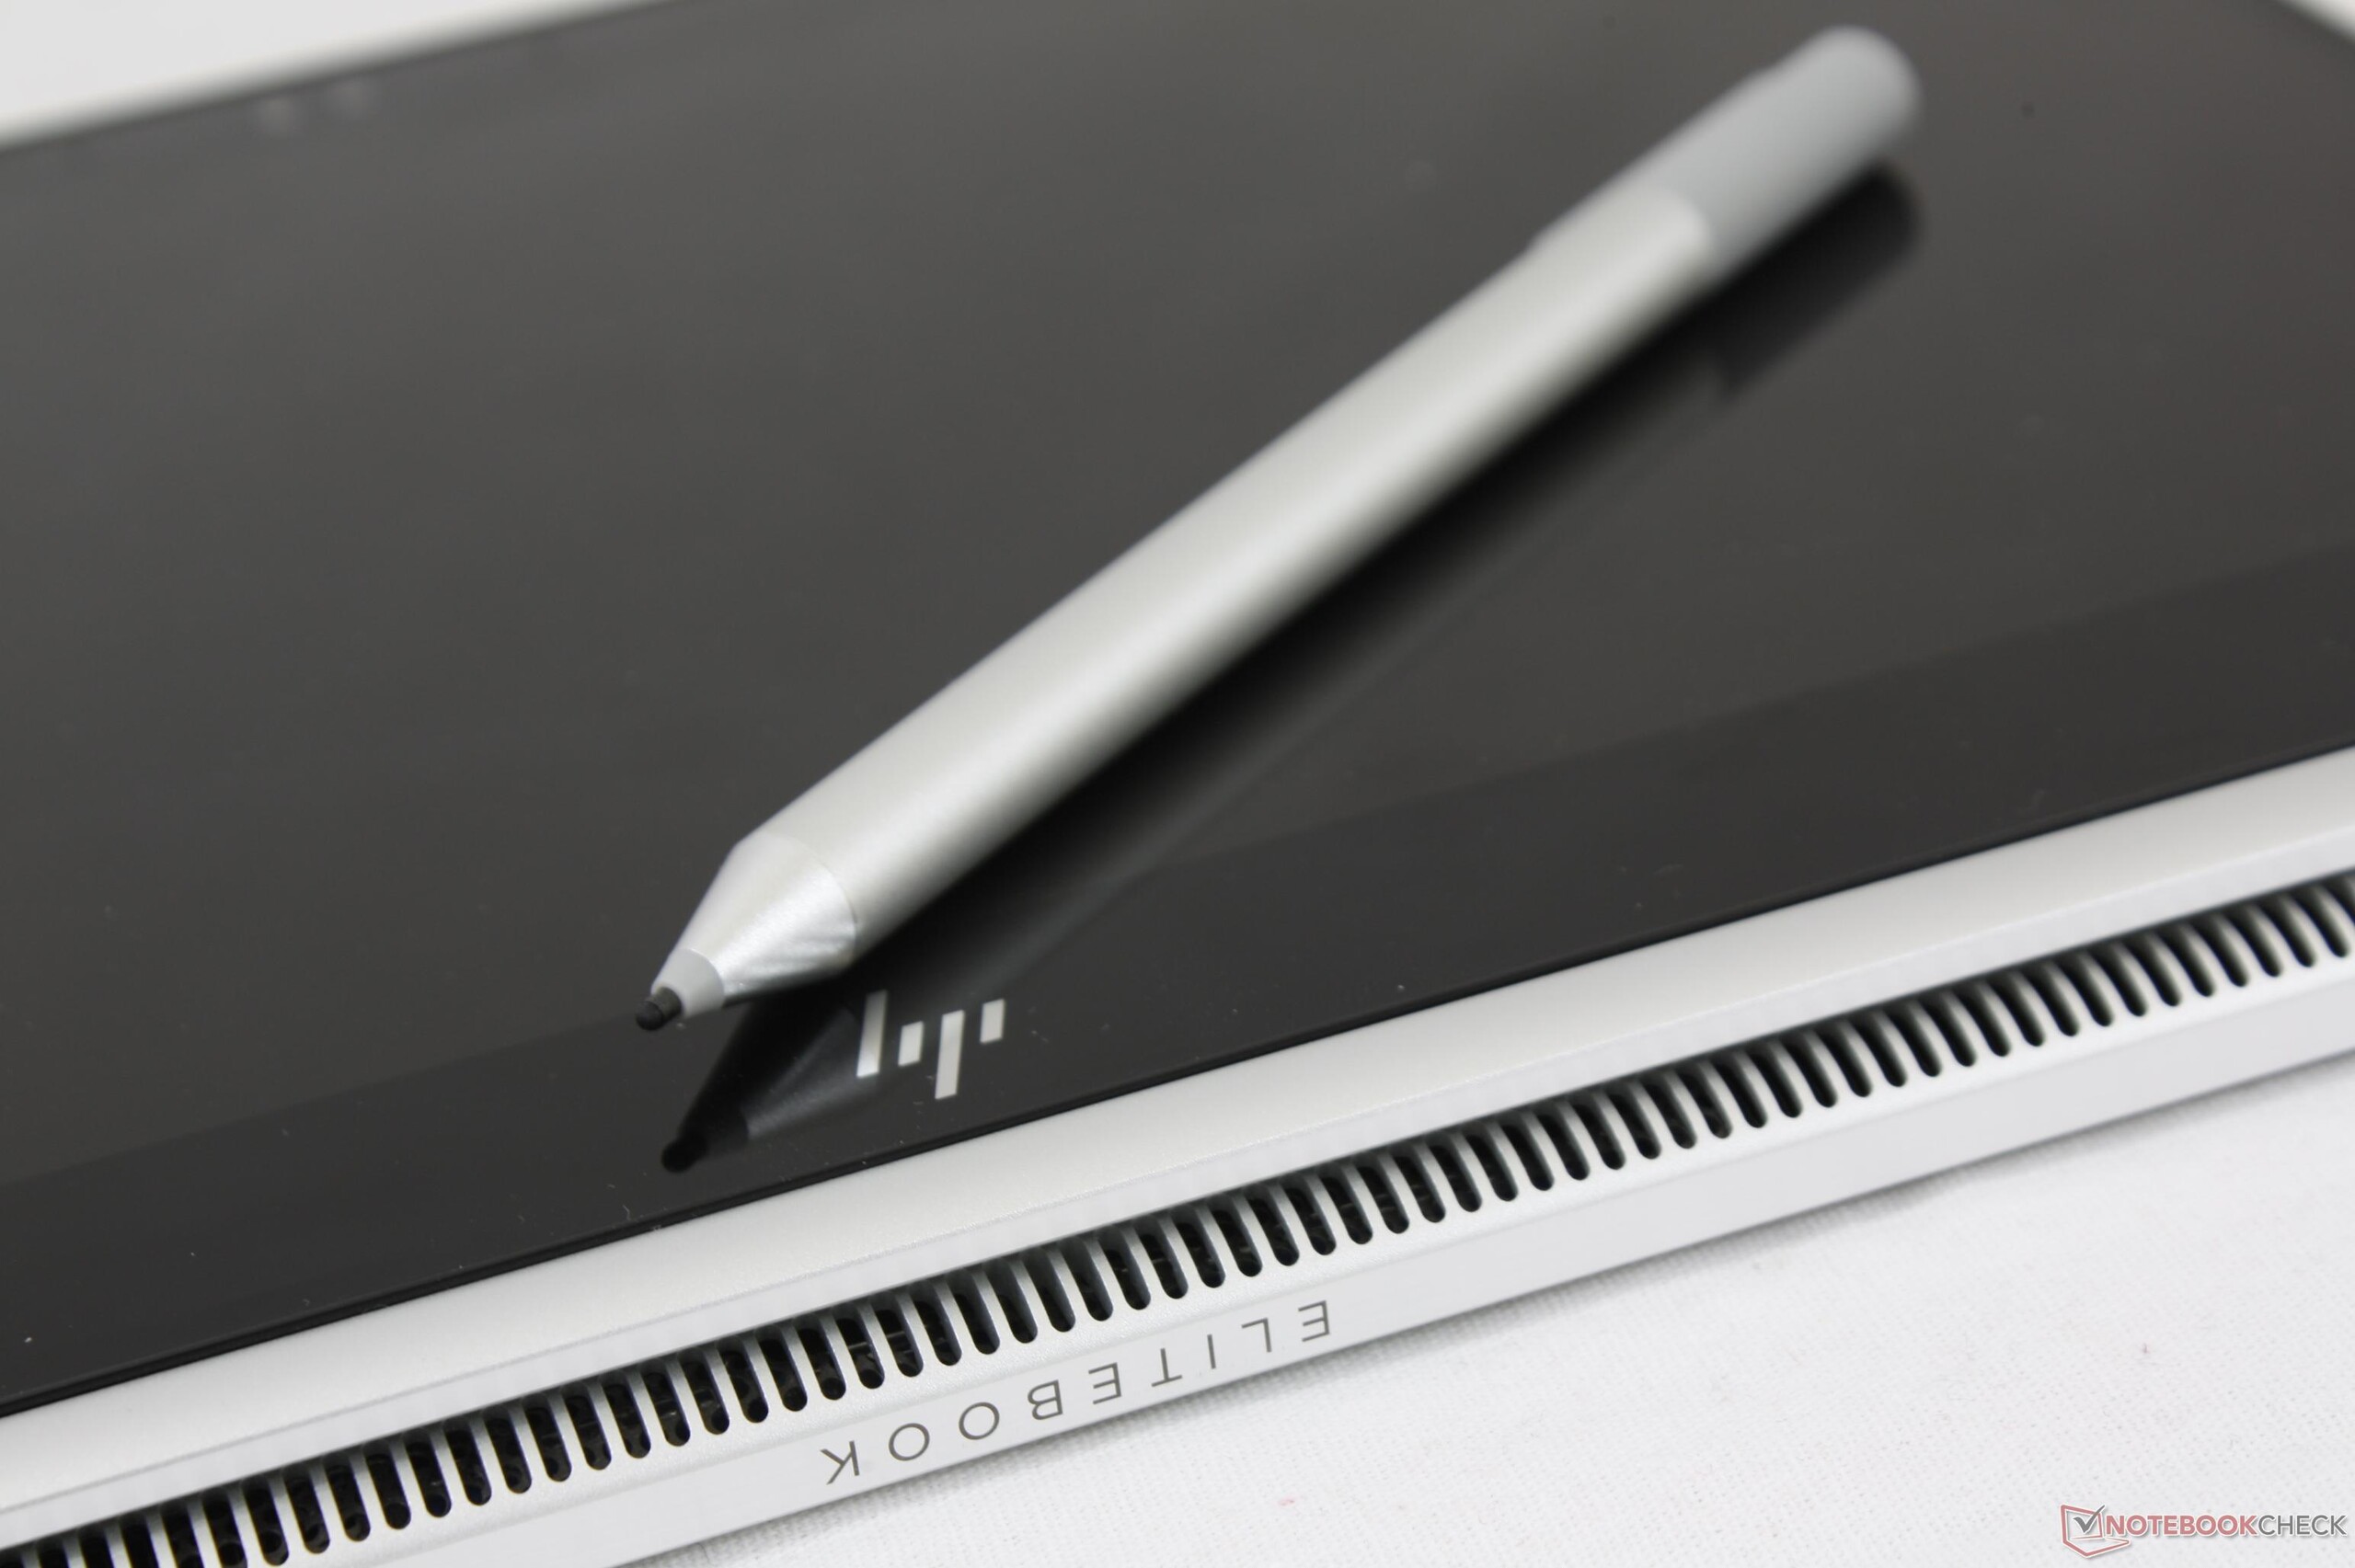
EliteBook X360 1020 G2 hakkında beğenilecek çok şey var. Güçlü Spectre tabanlı dönüştürülebilir tasarım felsefesi, harika parlaklığa sahip ekranı, kullanımı kolay tablet modu bunlardan sadece birkaçı. Ses kalitesi ve klavyesi tatmin edici. HP'nin güvenlik özelliklerini es geçmeyişi de takdir edilecek türden. Bunu 4K UHD ve FHD 120 Hz Sure View ekran seçenekleri ile birleştirince 1020 G2 iş segmentince kolayca türünün tek örneği diyebileceğimiz bir dönüştürülebilir model haline geliyor.
Elbette her ne kadar türünün tek örneği diye nitelesek de, 1020 G2 mükemmel olmaktan uzak. Avantaj ve dezavantajlar listesinde bu gariplikleri sıraladık, satın alma kararınızı verirken bunlara bakmakta fayda var.
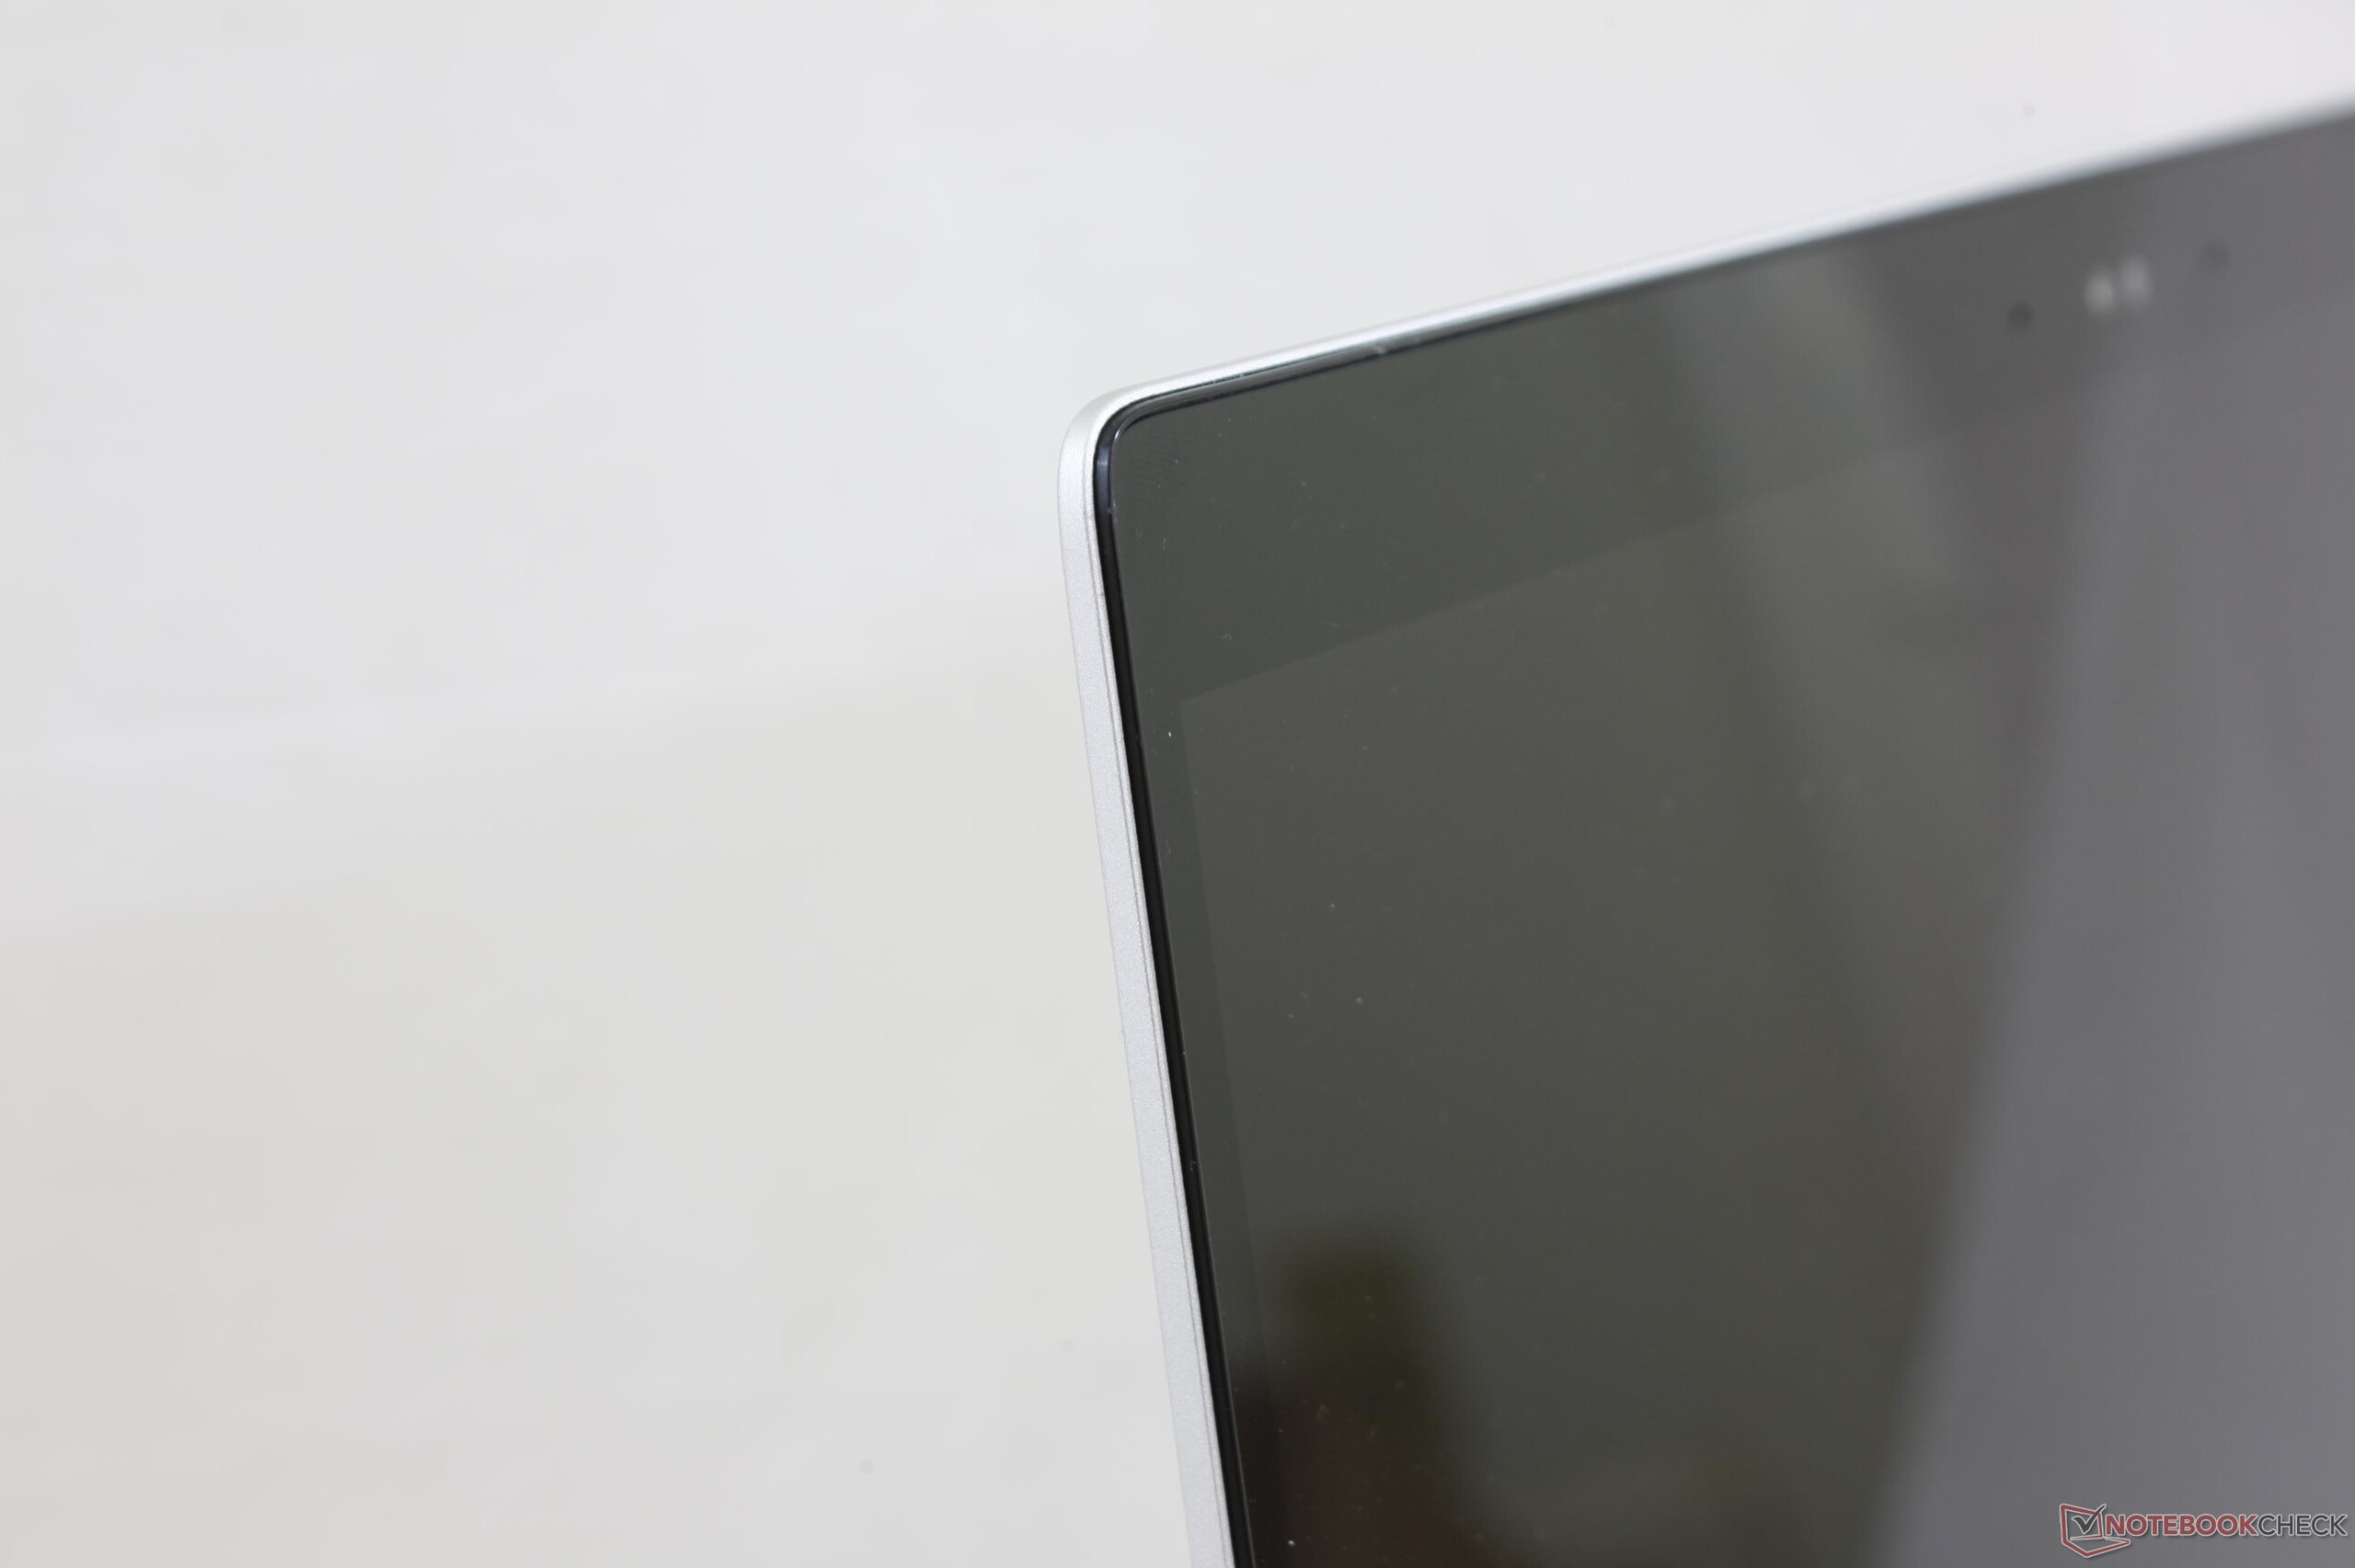
Daha derin bir seviyede ise ekranın bazı aksaklıkları olduğunu görüyoruz. Öncelikle böylesi bir cihaz için ışık kaybının çok yüksek olduğunu söylemeliyiz. PWM tüm parlaklık seviyelerinde devreye girdiğinden ekran parlaklığına karşı hassaslığı olan kullanıcıları rahatsız edebilir. Çok parlak arka aydınlatma diğer cihazlara kıyasla bu cihaz için bir diğer sorun olabilir. Son olarak ekranın yansıtmalı olmasından kaynaklı direk önünde oturulmadığında parlaklığın düştüğünü belirtmek gerek. Bunun Sure View ekrana yönelik bir özellik olup olmadığından emin değiliz, Sure View kullanmayan modellere bakıp emin olmaya çalışacağız.
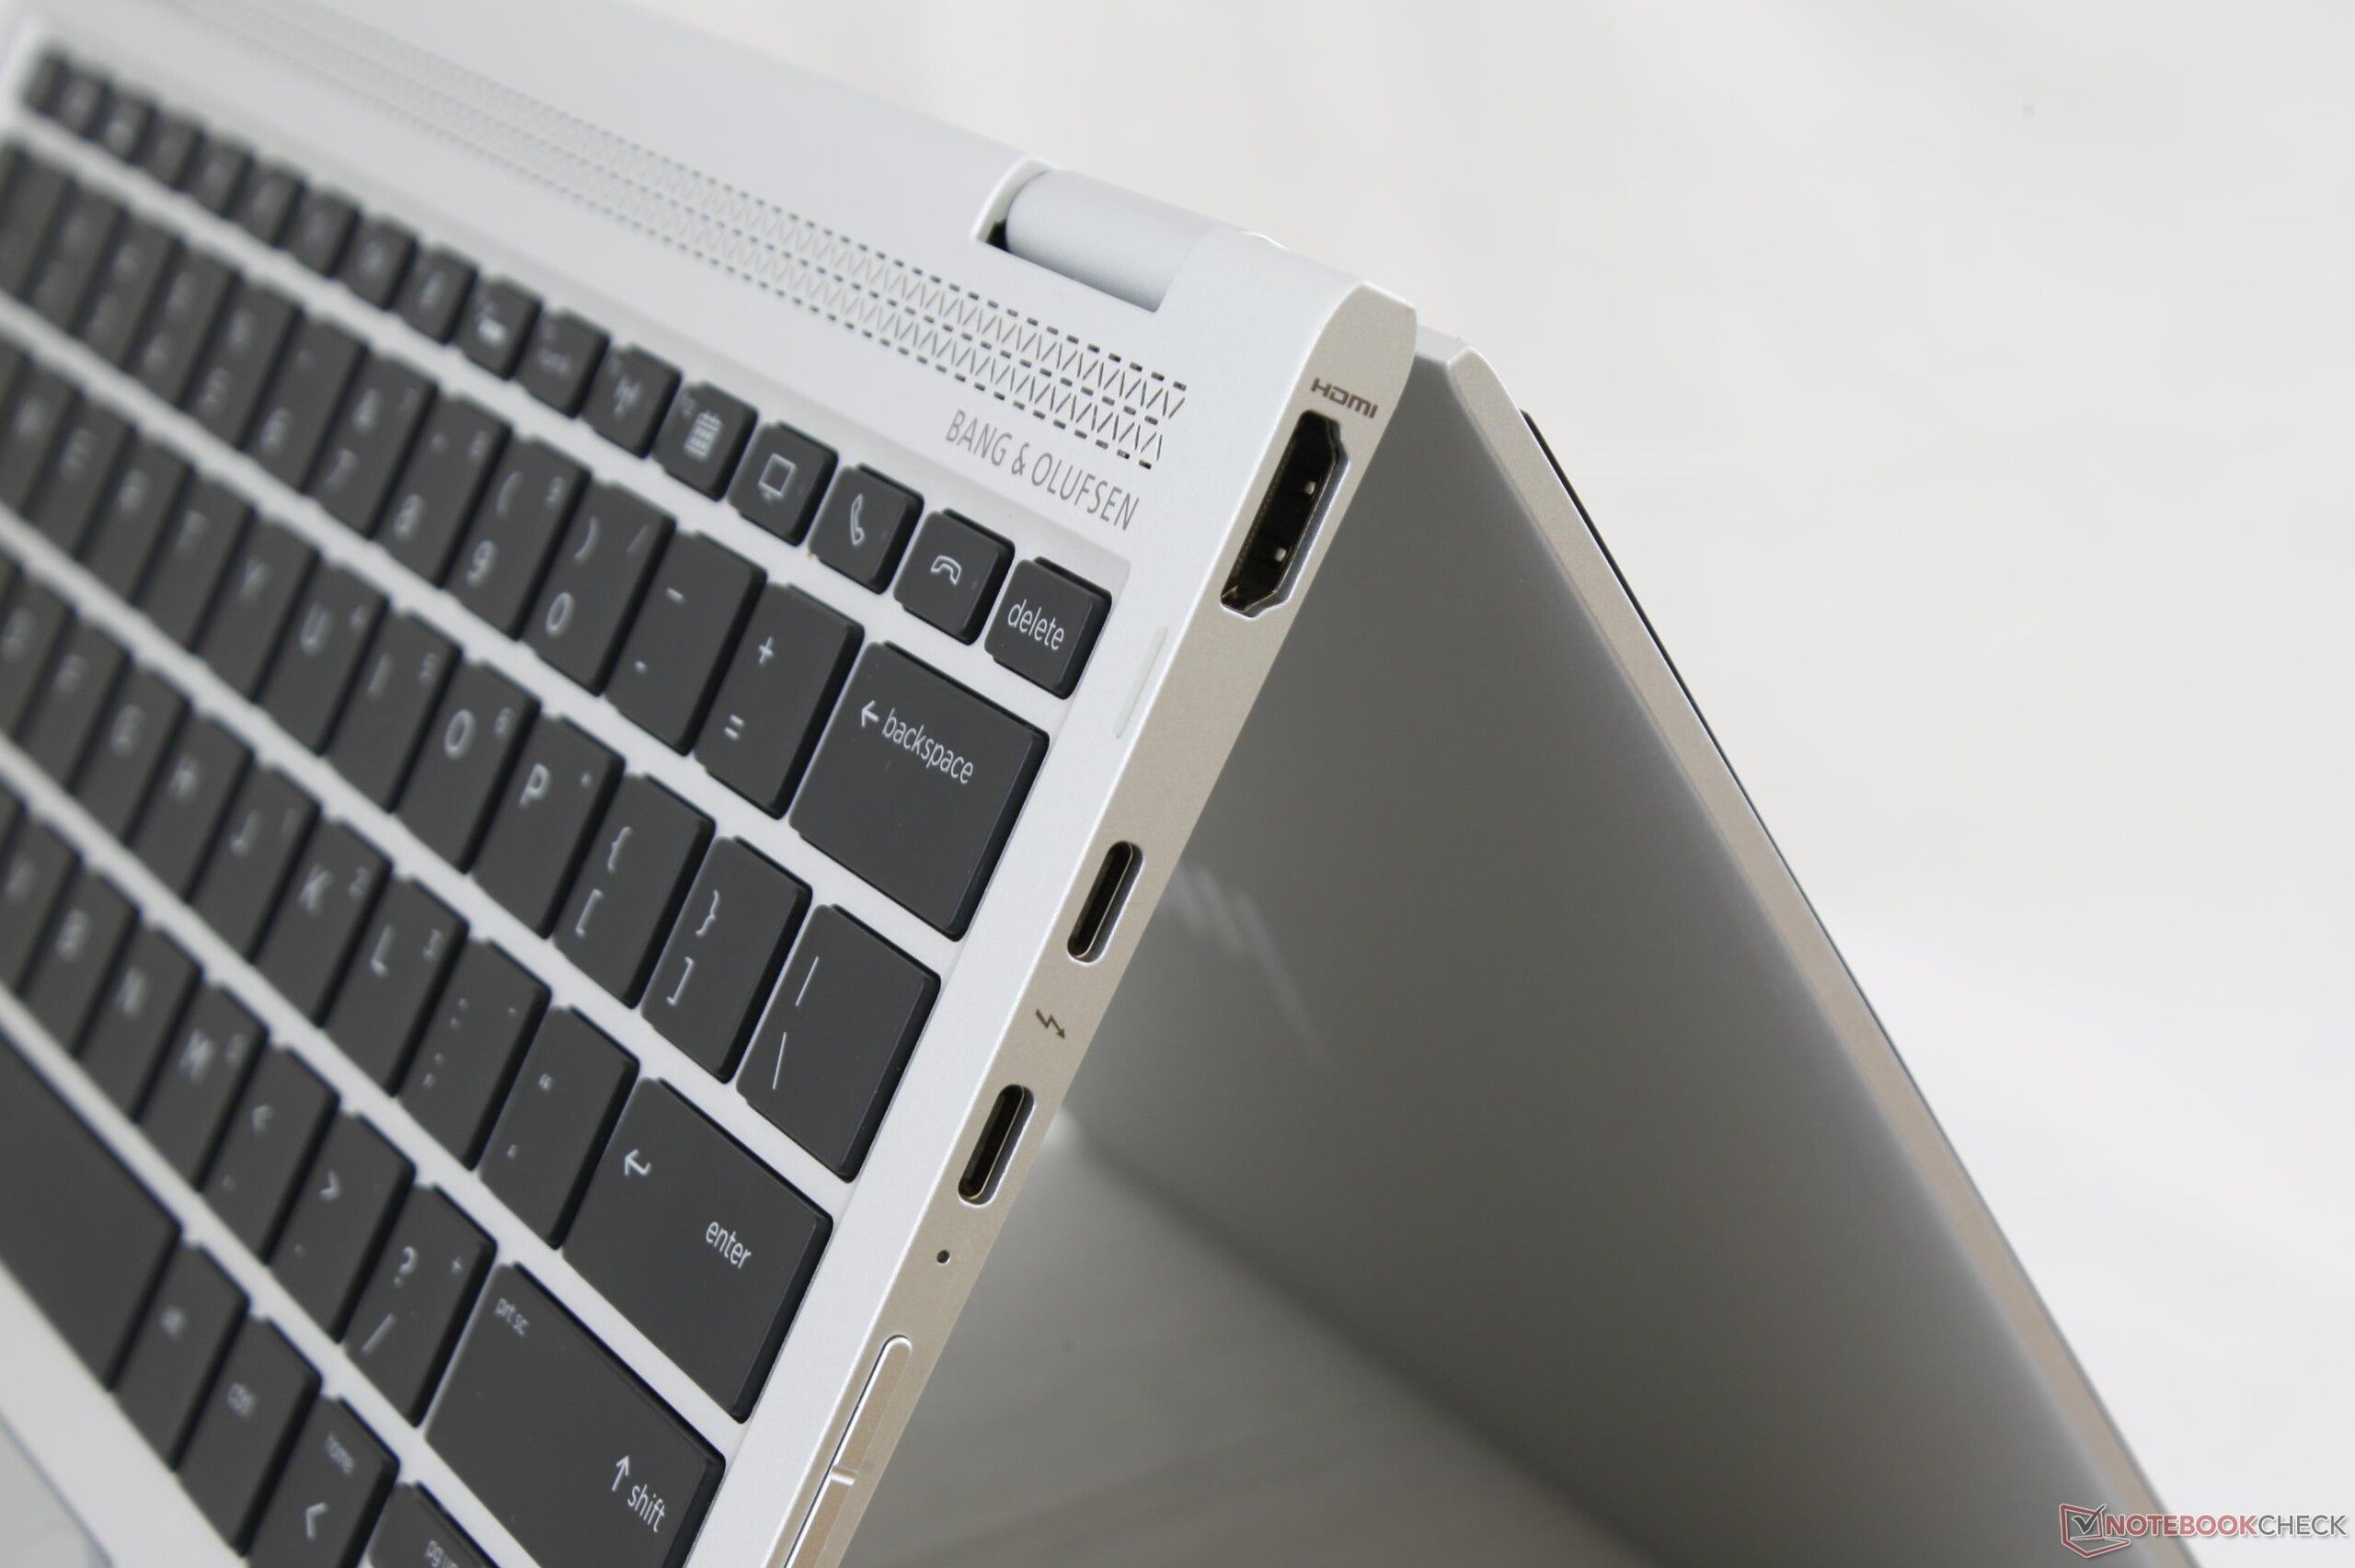
EliteBook x360 1020 G2 modelinin gelecek nesillerinde görmek isteyeceklerimiz listesi kısa. USB Type-A, MicroSD, 4G LTE, 4K UHD 120Hz, mat dokunmatik ekran ve Kaby Lake-R veya Iris Pro serinin Surface Pro, MacBook 12, XPS 13 9365 ve Latitude 7280 gibi modellerle rekabetini ileri taşıyacaktır. PWM sorunlarını çözmek ve daha geniş fan kullanmak da yüksek fan sesi ve parlaklığa karşı duyarlı kullanıcıların olası sorunlarını engelleyebilir. Yine de dış mekan kullanımı, güvenlik ve ses kalitesi yönünden şu anda dönüştürülebilir modeller kategorisinde en iyi cihaz bu.
EliteBook x360 1020 G2 kendi boyutunda diğer iş cihazlarındada bulunmayan ekran özelliklerine sahip. Bazı bakış açılarında parlaklığın yansıtmalı ekrandan ötürü garip davranışları olabiliyor. Ancak aparat taşımaya alışkın kullanıcılar tablet modundan ve bu çok parlak ekrandan fazlasıyla faydalanacaktır.
HP EliteBook x360 1020 G2
- 12/21/2017 v6 (old)
Allen Ngo
Price comparison
