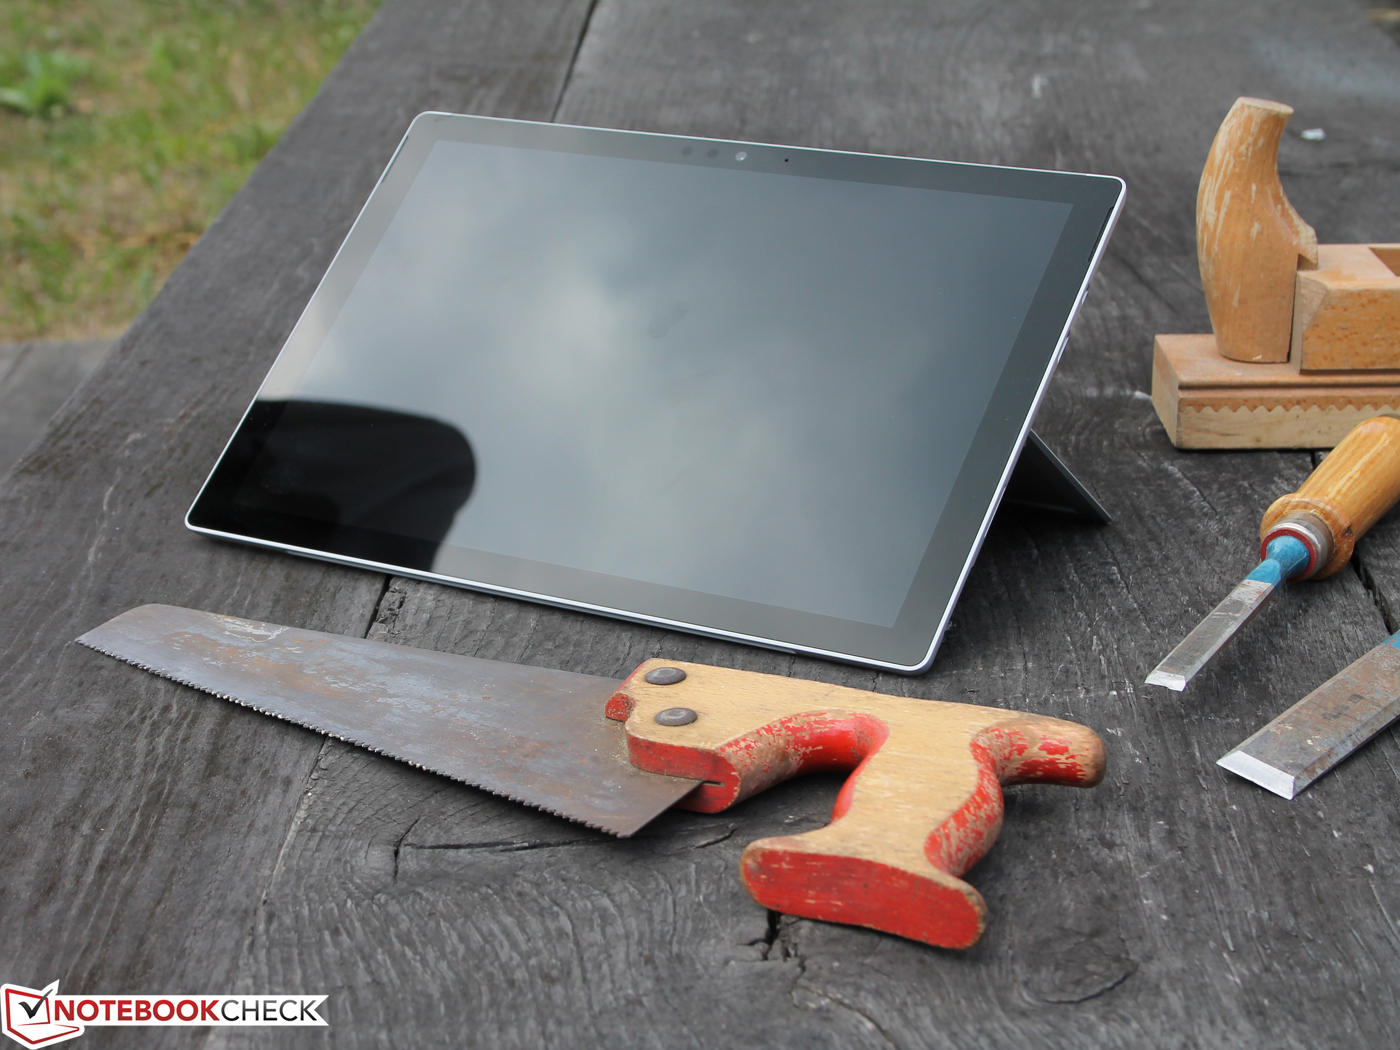
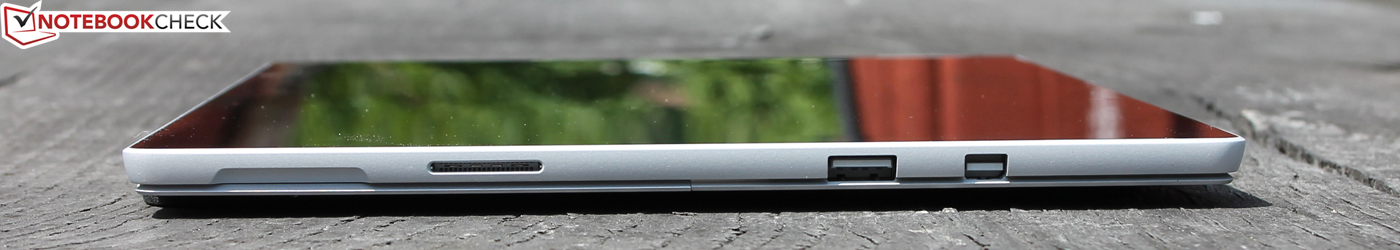
Kısa inceleme: Microsoft Surface Pro 2017 (i5-7300U, 256 GB) dönüştürülebilir model
| Networking | |
| iperf3 transmit AX12 | |
| Asus Transformer 3 Pro T303UA-GN050T | |
| Lenovo Ideapad Miix 720-12IKB | |
| Microsoft Surface Pro (2017) i5 | |
| Microsoft Surface Pro 4, Core i5, 128GB (Klaus I211) | |
| Dell Latitude 12 5285 2-in-1 | |
| Lenovo ThinkPad X1 Tablet Gen 2 | |
| iperf3 receive AX12 | |
| Lenovo ThinkPad X1 Tablet Gen 2 | |
| Microsoft Surface Pro (2017) i5 | |
| Asus Transformer 3 Pro T303UA-GN050T | |
| Lenovo Ideapad Miix 720-12IKB | |
| Microsoft Surface Pro 4, Core i5, 128GB (Klaus I211) | |
| Dell Latitude 12 5285 2-in-1 | |
| |||||||||||||||||||||||||
Aydınlatma: 88 %
Batarya modunda parlaklık: 417 cd/m²
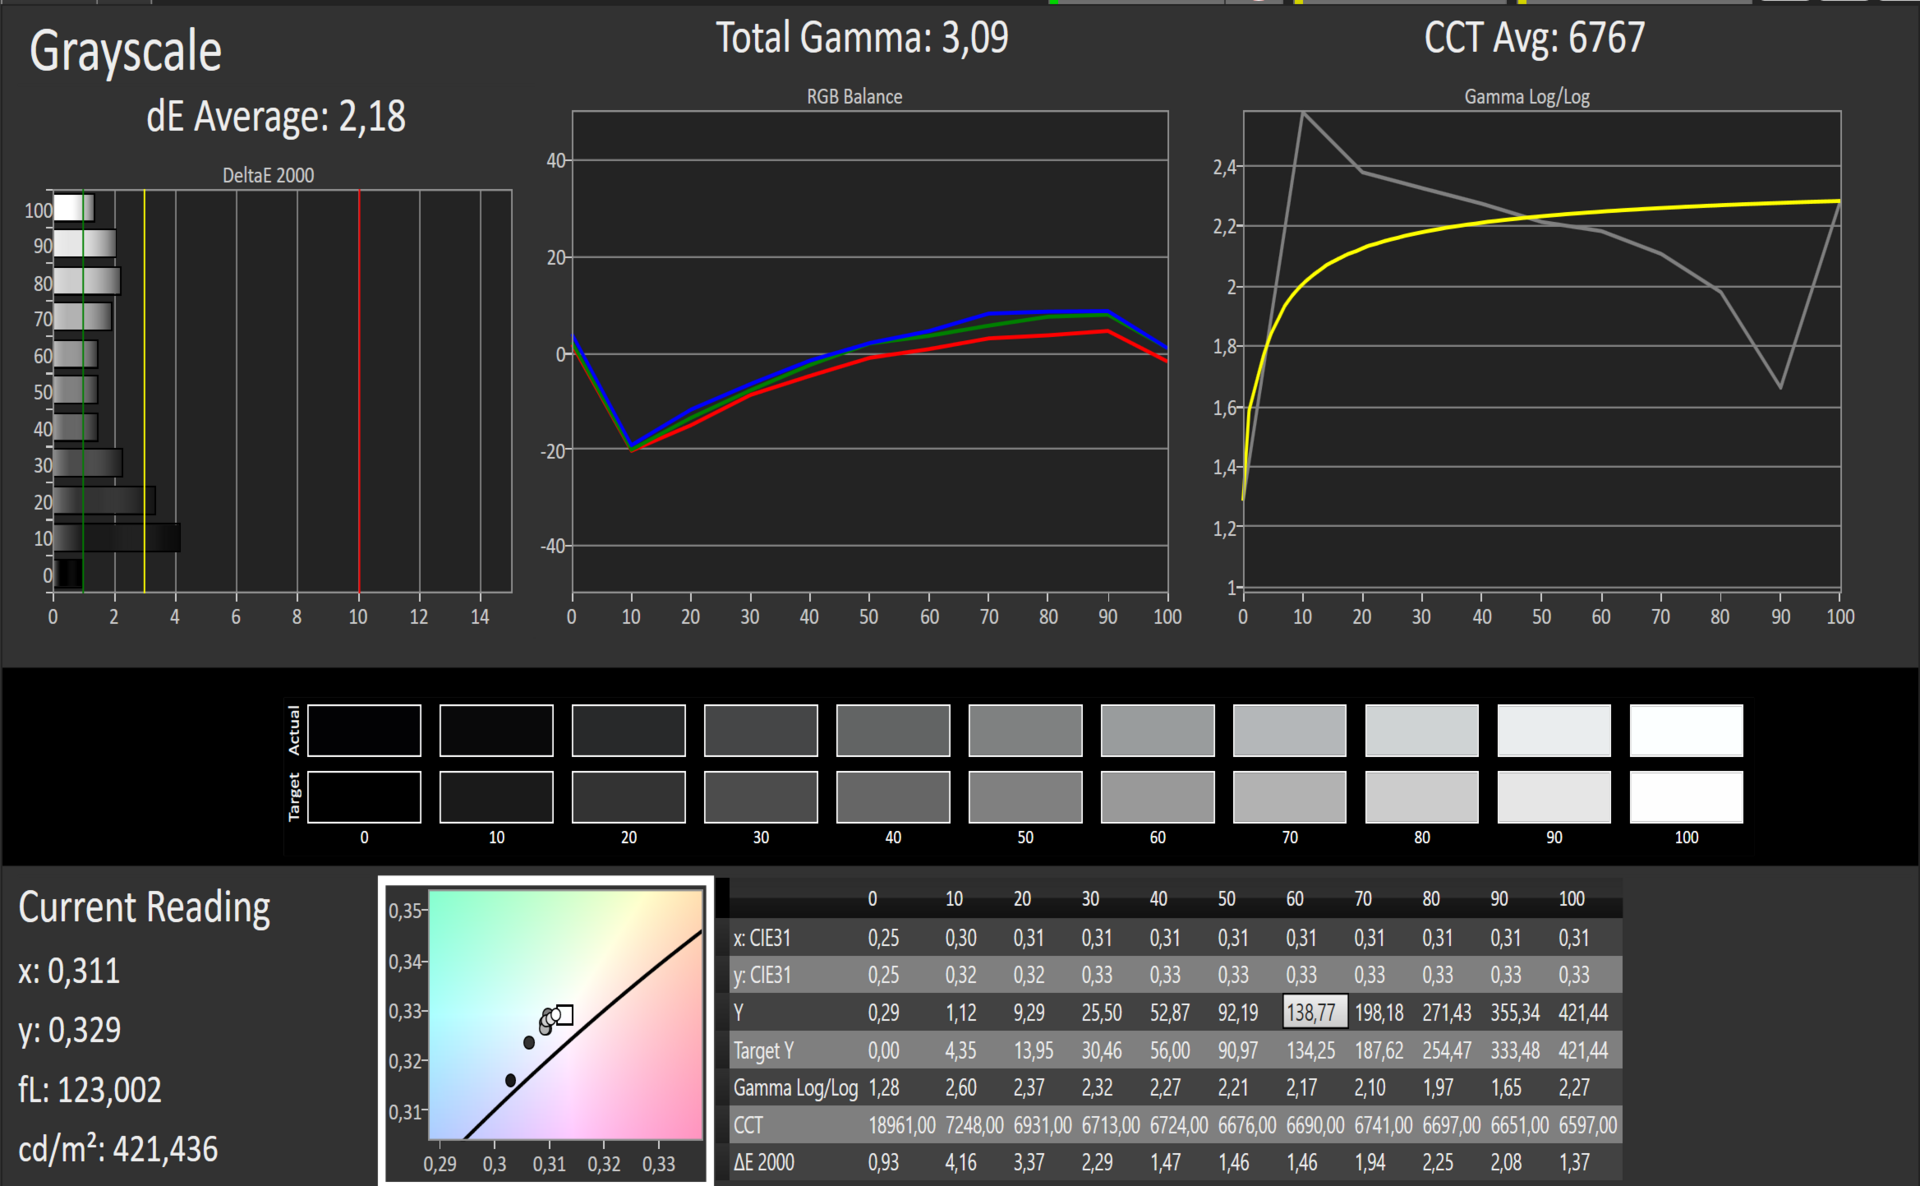
Kontrast: 1438:1 (Siyah: 0.29 cd/m²)
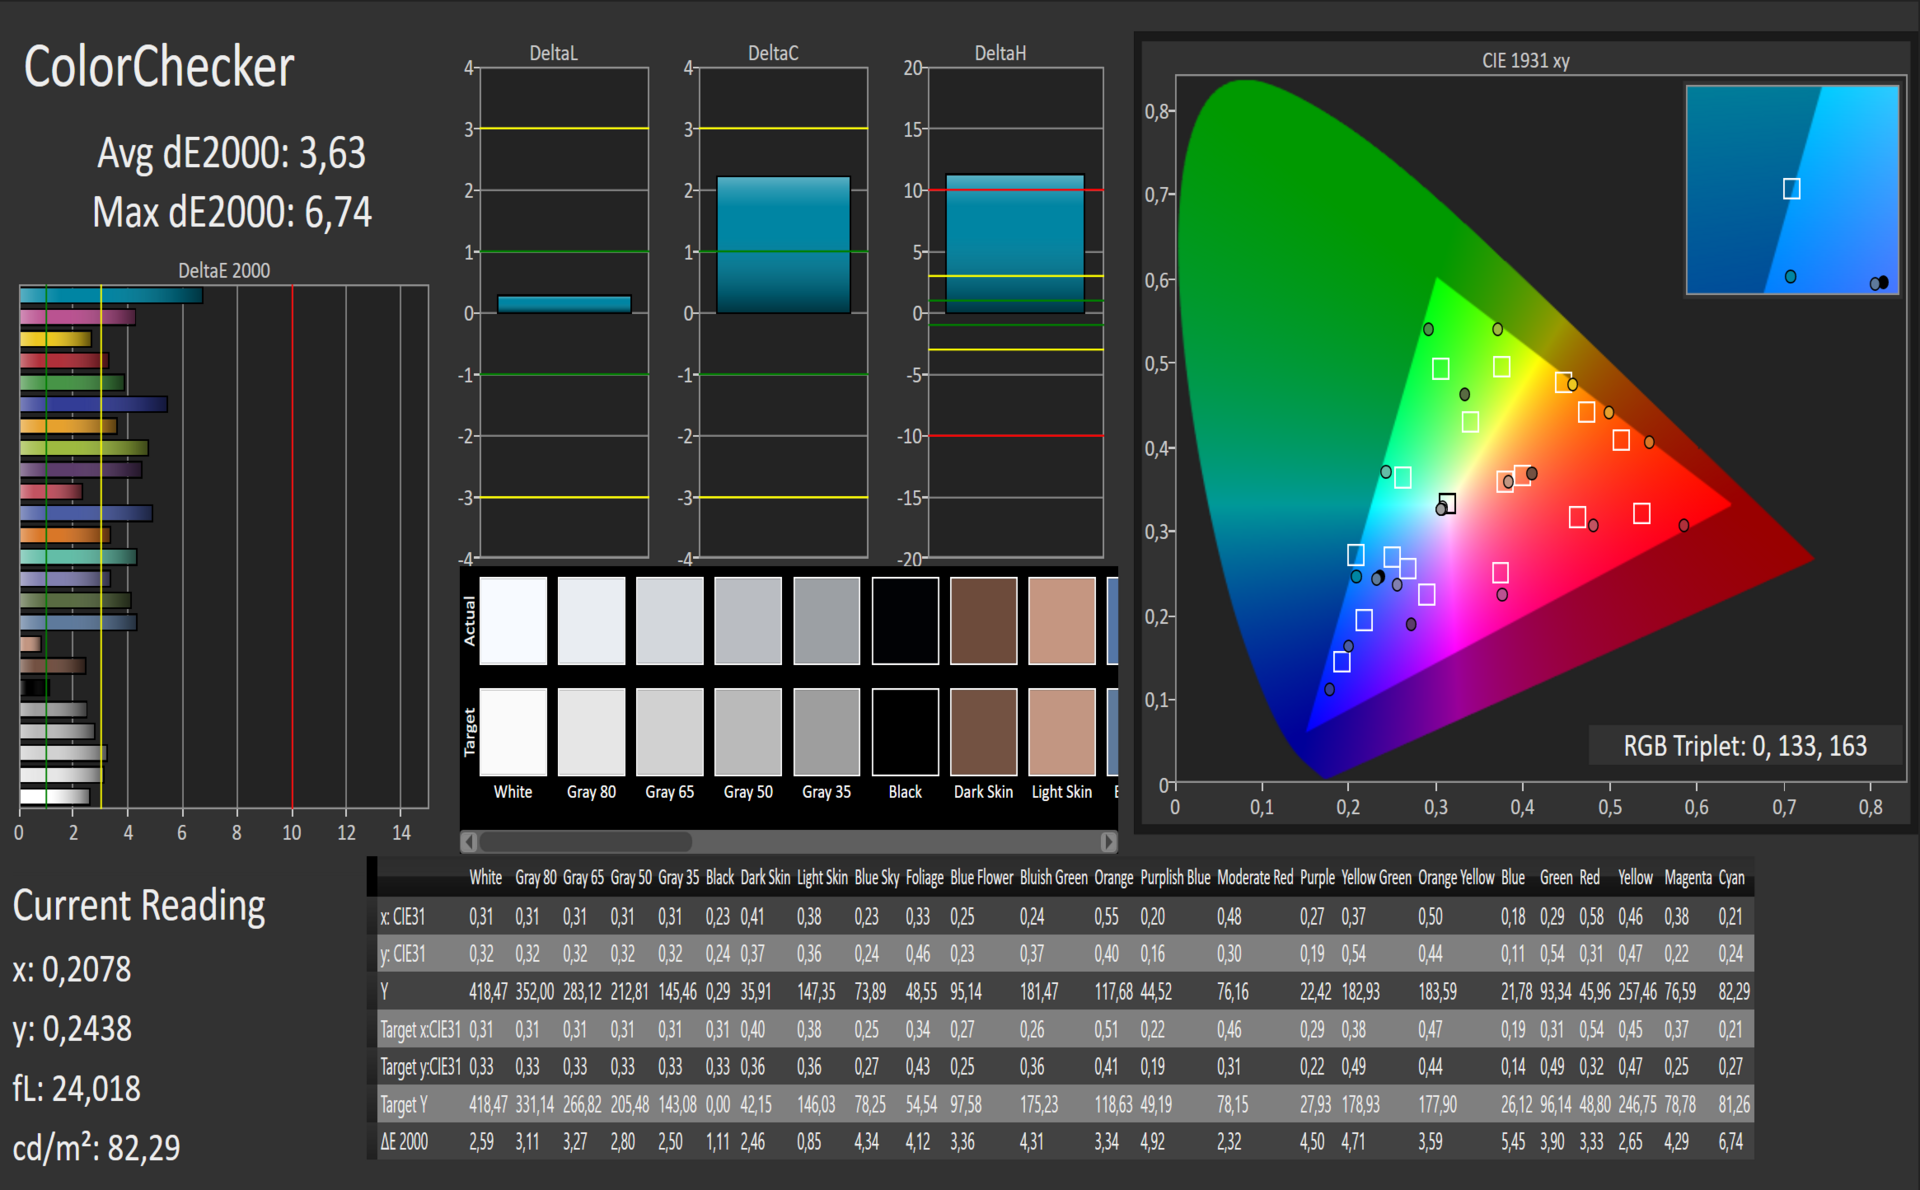
ΔE ColorChecker Calman: 3.63 | ∀{0.5-29.43 Ø4.73}
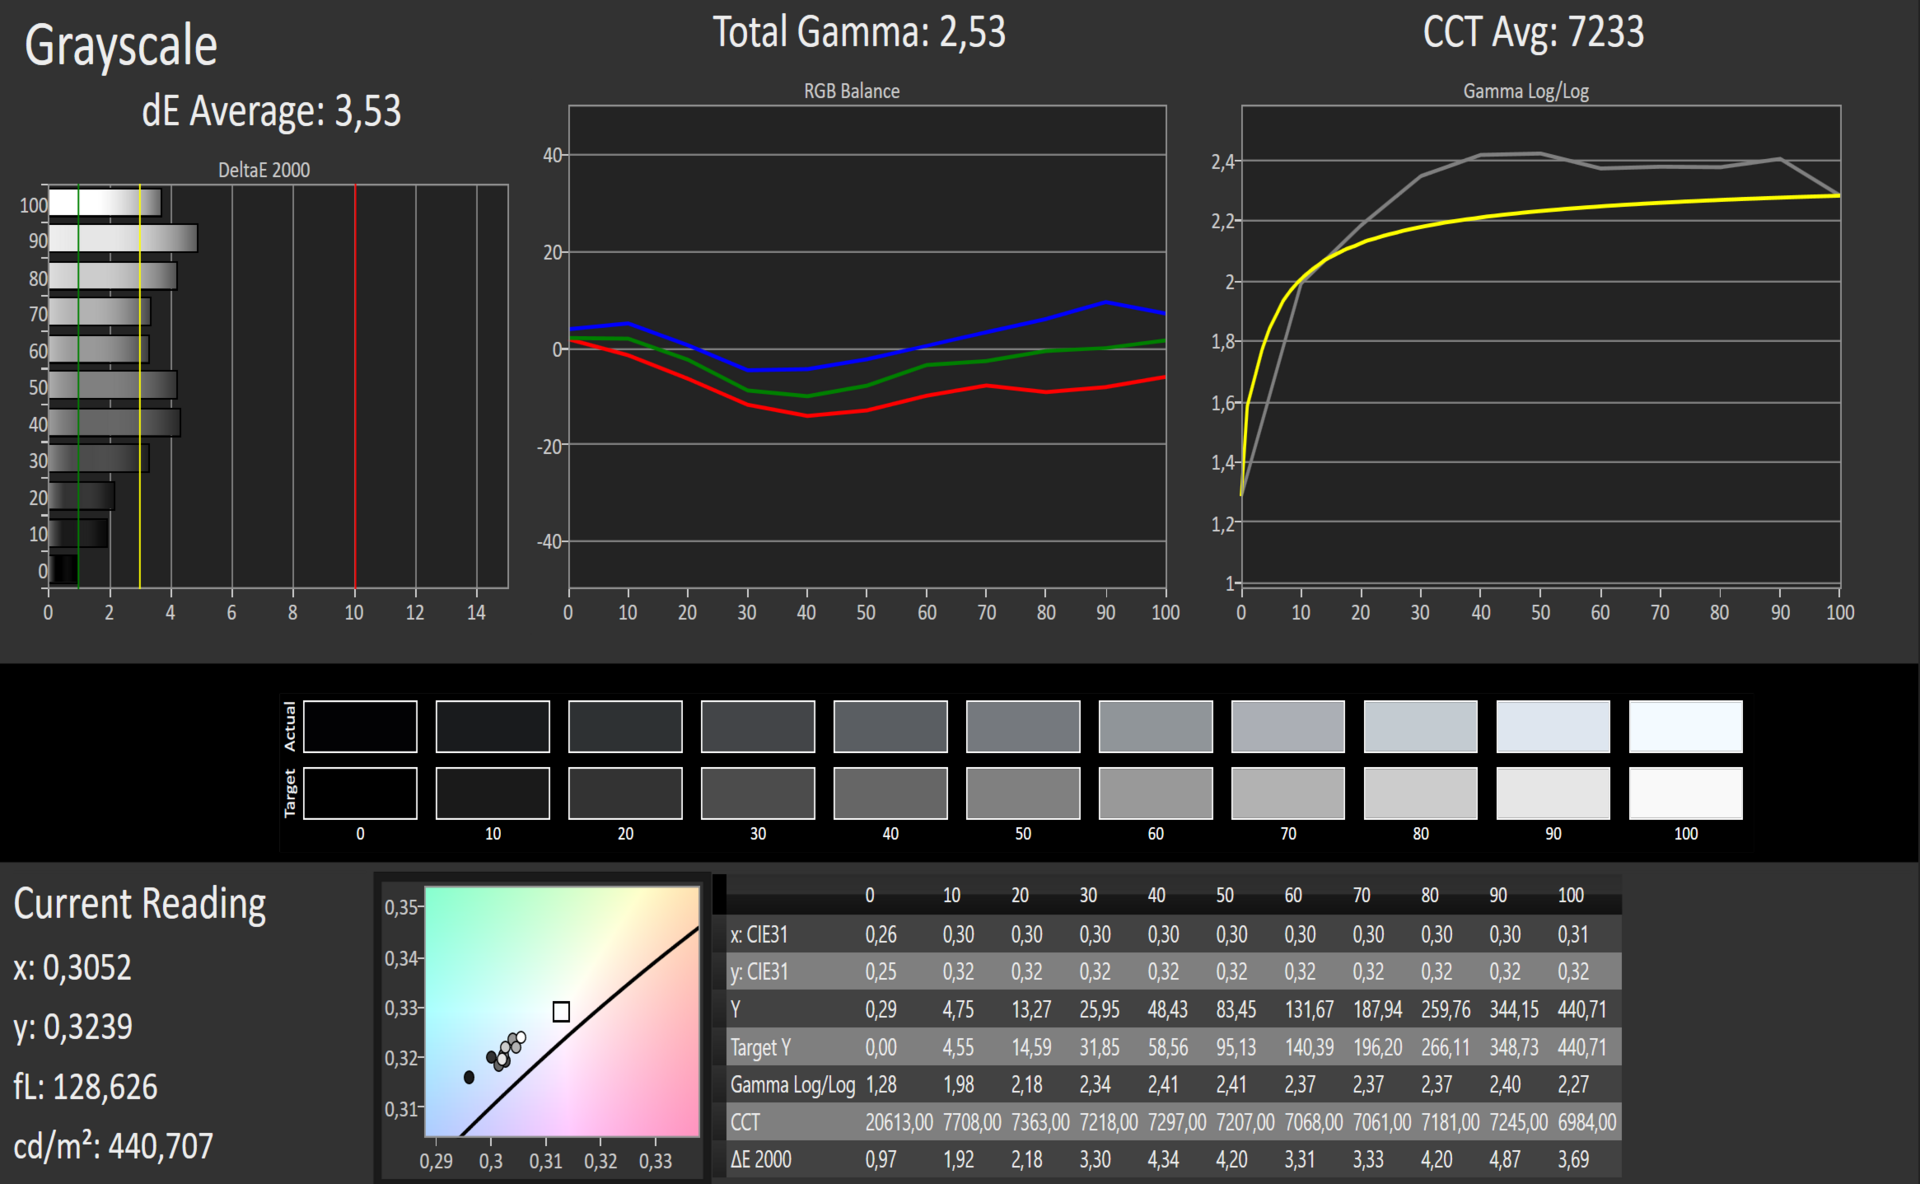
ΔE Greyscale Calman: 2.18 | ∀{0.09-98 Ø4.97}
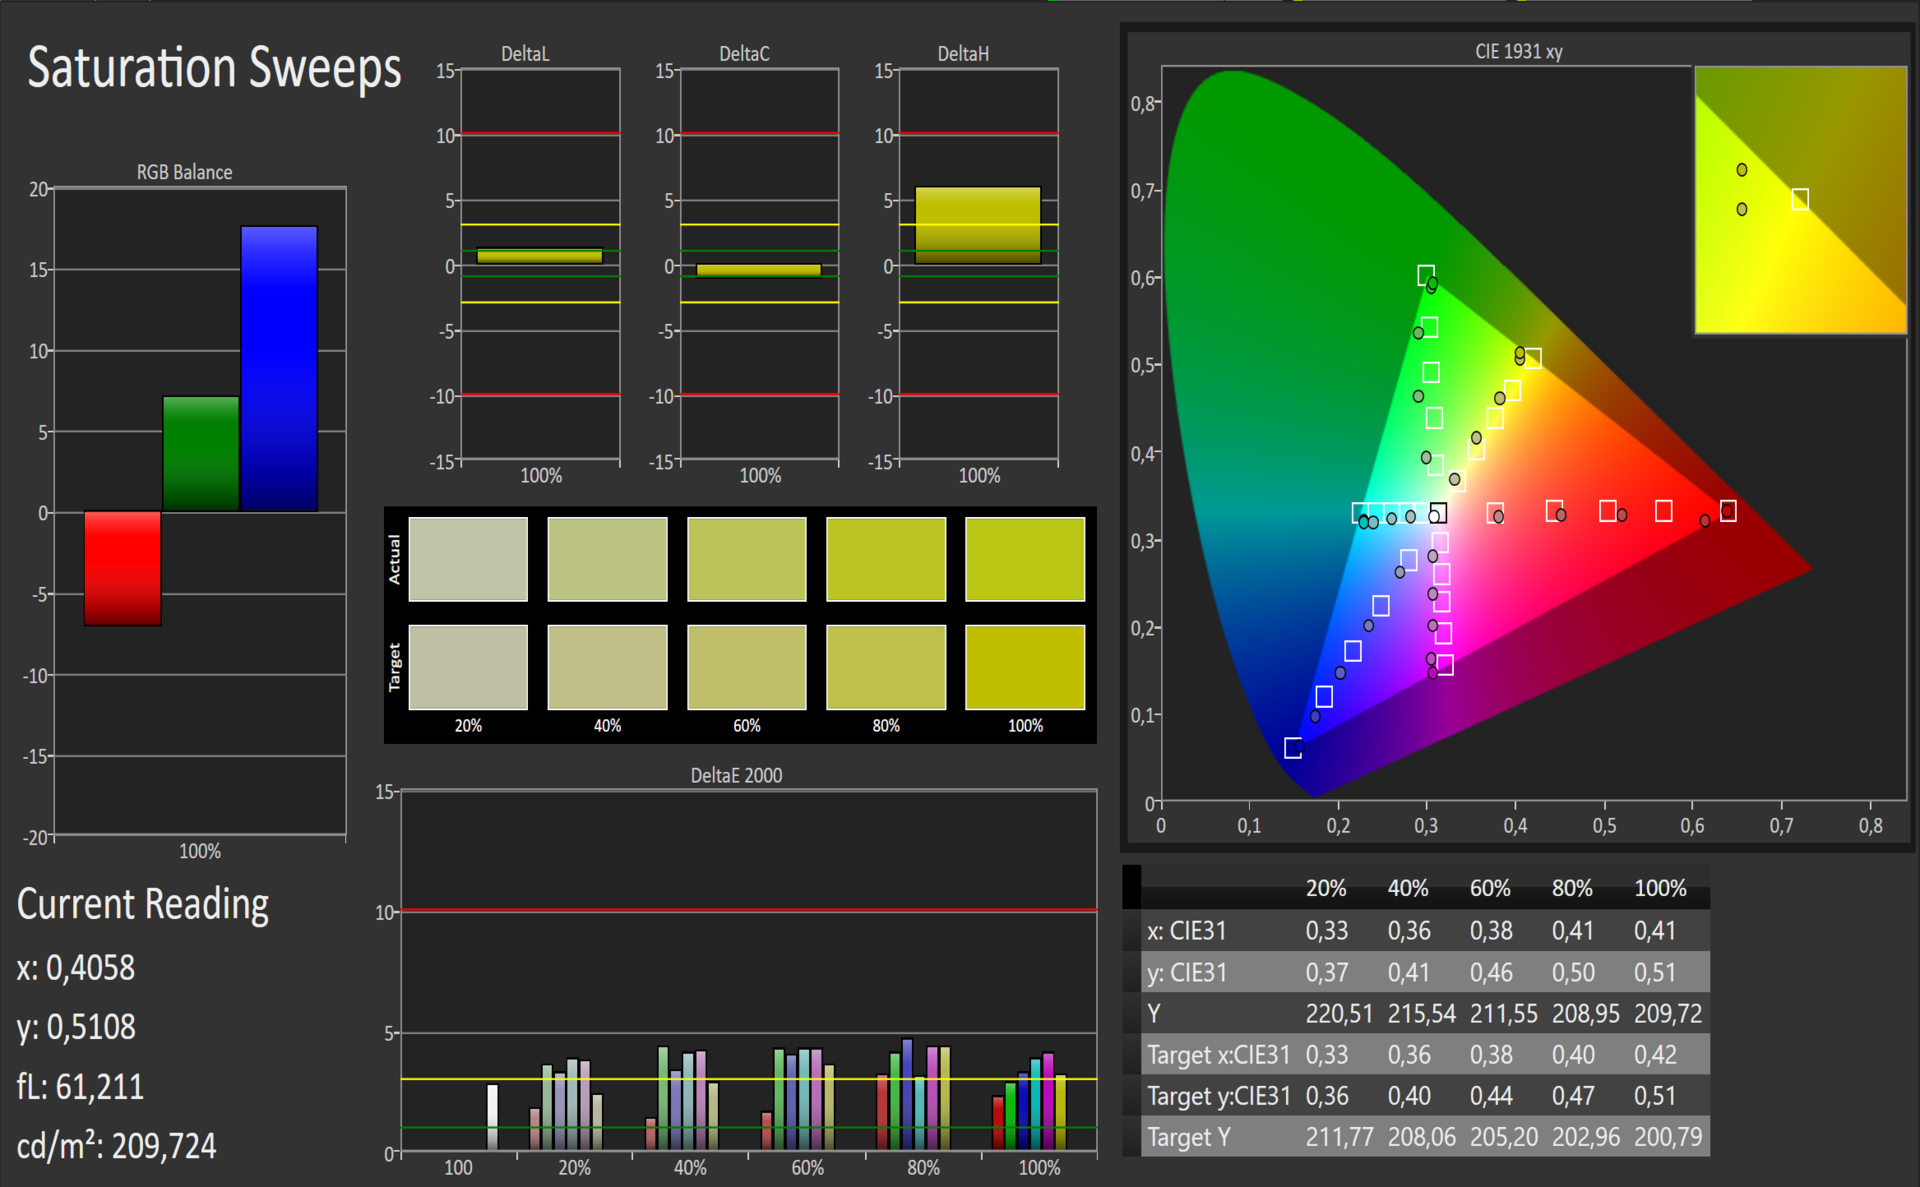
99% sRGB (Argyll 1.6.3 3D)
63% AdobeRGB 1998 (Argyll 1.6.3 3D)
69.1% AdobeRGB 1998 (Argyll 3D)
99% sRGB (Argyll 3D)
67.6% Display P3 (Argyll 3D)
Gamma: 3.09
CCT: 6767 K
| Microsoft Surface Pro (2017) i5 LG Display LP123WQ112604, , 2736x1824, 12.3" | Microsoft Surface Pro 4, Core i5, 128GB Samsung 123YL01-001 ID: SDC3853, , 2736x1824, 12.3" | Lenovo Ideapad Miix 720-12IKB AUO B120YAN01 / AUO106F, , 2880x1920, 12" | Lenovo ThinkPad X1 Tablet Gen 2 LSN120QL01L01, , 2160x1440, 12" | Asus Transformer 3 Pro T303UA-GN050T BOE BOE06AC (NV126A1M-N51), , 2880x1920, 12.6" | Toshiba Portege Z20t-C-121 Toshiba TOS508F, , 1920x1080, 12.5" | Dell Latitude 12 5285 2-in-1 BOE06DC, , 1920x1280, 12.3" | HP Elite x2 1012 G1 LG Philips, , 1920x1280, 12.1" | |
|---|---|---|---|---|---|---|---|---|
| Display | -3% | -5% | 13% | -36% | -6% | -23% | ||
| Display P3 Coverage (%) | 67.6 | 65 -4% | 65.2 -4% | 81.8 21% | 42.51 -37% | 62.8 -7% | 53.8 -20% | |
| sRGB Coverage (%) | 99 | 96.5 -3% | 91 -8% | 98.3 -1% | 63.7 -36% | 94 -5% | 73.7 -26% | |
| AdobeRGB 1998 Coverage (%) | 69.1 | 67 -3% | 66.1 -4% | 82.2 19% | 43.95 -36% | 64.7 -6% | 53.8 -22% | |
| Response Times | -9% | 5% | 27% | 15% | -35% | -4% | 21% | |
| Response Time Grey 50% / Grey 80% * (ms) | 42 ? | 46 ? -10% | 45 ? -7% | 28.4 ? 32% | 30 ? 29% | 61 ? -45% | 42.4 ? -1% | 33.2 ? 21% |
| Response Time Black / White * (ms) | 29 ? | 31.2 ? -8% | 24 ? 17% | 22.8 ? 21% | 29 ? -0% | 36 ? -24% | 30.8 ? -6% | 22.8 ? 21% |
| PWM Frequency (Hz) | 21000 | 50 ? | 221.2 ? | 200 ? | 210.1 ? | |||
| Screen | -13% | -33% | -35% | -23% | -82% | -20% | -48% | |
| Brightness middle (cd/m²) | 417 | 413 -1% | 406 -3% | 388.1 -7% | 316 -24% | 354 -15% | 523.2 25% | 322 -23% |
| Brightness (cd/m²) | 401 | 396 -1% | 396 -1% | 344 -14% | 307 -23% | 330 -18% | 522 30% | 319 -20% |
| Brightness Distribution (%) | 88 | 87 -1% | 88 0% | 78 -11% | 91 3% | 86 -2% | 88 0% | 97 10% |
| Black Level * (cd/m²) | 0.29 | 0.36 -24% | 0.3 -3% | 0.39 -34% | 0.29 -0% | 0.63 -117% | 0.42 -45% | 0.42 -45% |
| Contrast (:1) | 1438 | 1147 -20% | 1353 -6% | 995 -31% | 1090 -24% | 562 -61% | 1246 -13% | 767 -47% |
| Colorchecker dE 2000 * | 3.63 | 3.09 15% | 5.28 -45% | 4.6 -27% | 3.91 -8% | 8.28 -128% | 4 -10% | 6.02 -66% |
| Colorchecker dE 2000 max. * | 6.74 | 9.83 -46% | 9.1 -35% | 7.9 -17% | 12.71 -89% | 8.6 -28% | 10.06 -49% | |
| Greyscale dE 2000 * | 2.18 | 3.92 -80% | 6.71 -208% | 6.1 -180% | 5.37 -146% | 9.15 -320% | 5.5 -152% | 6.29 -189% |
| Gamma | 3.09 71% | 2.3 96% | 2.29 96% | 2.07 106% | 2.36 93% | 2.73 81% | 2.16 102% | 2.4 92% |
| CCT | 6767 96% | 7333 89% | 6532 100% | 7104 91% | 7812 83% | 5953 109% | 7546 86% | 7712 84% |
| Color Space (Percent of AdobeRGB 1998) (%) | 63 | 61 -3% | 59 -6% | 59 -6% | 72 14% | 40 -37% | 64.86 3% | 47.8 -24% |
| Color Space (Percent of sRGB) (%) | 99 | 97 -2% | 91 -8% | 91 -8% | 98 -1% | 63 -36% | 93.97 -5% | 73.2 -26% |
| Toplam Ortalama (Program / Ayarlar) | -8% /
-10% | -11% /
-22% | -4% /
-25% | 2% /
-11% | -51% /
-67% | -10% /
-15% | -17% /
-34% |
* ... daha küçük daha iyidir

Yanıt Sürelerini Görüntüle
| ↔ Tepki Süresi Siyahtan Beyaza | ||
|---|---|---|
| 29 ms ... yükseliş ↗ ve sonbahar↘ birleşimi | ↗ 18 ms yükseliş | 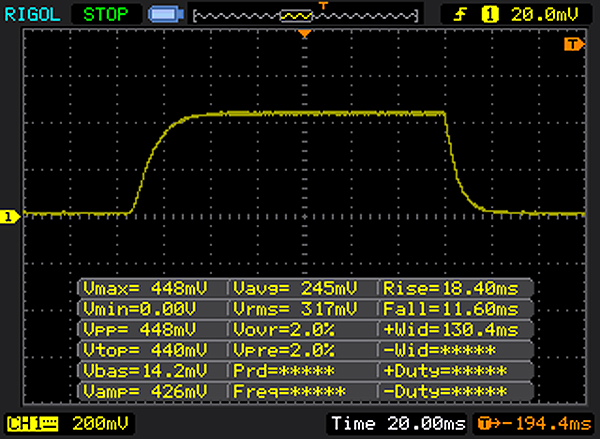 |
| ↘ 11 ms sonbahar | ||
| Ekran, testlerimizde nispeten yavaş yanıt oranları gösteriyor ve oyuncular için çok yavaş olabilir. Karşılaştırıldığında, test edilen tüm cihazlar 0.1 (minimum) ile 240 (maksimum) ms arasında değişir. » Tüm cihazların 77 %'si daha iyi. Bu, ölçülen yanıt süresinin test edilen tüm cihazların ortalamasından (19.9 ms) daha kötü olduğu anlamına gelir. | ||
| ↔ Tepki Süresi %50 Griden %80 Griye | ||
| 42 ms ... yükseliş ↗ ve sonbahar↘ birleşimi | ↗ 20 ms yükseliş | 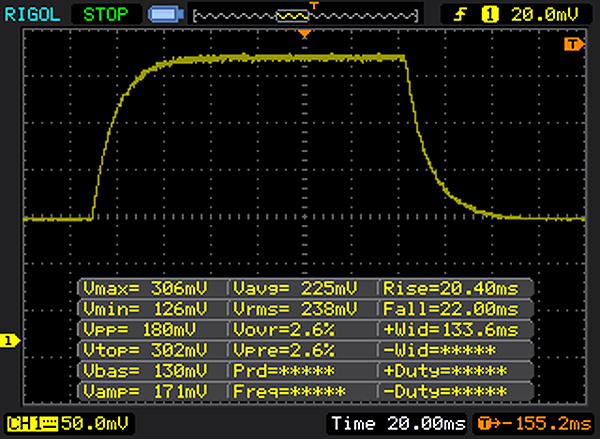 |
| ↘ 22 ms sonbahar | ||
| Ekran, testlerimizde yavaş yanıt oranları gösteriyor ve oyuncular için yetersiz olacaktır. Karşılaştırıldığında, test edilen tüm cihazlar 0.165 (minimum) ile 636 (maksimum) ms arasında değişir. » Tüm cihazların 67 %'si daha iyi. Bu, ölçülen yanıt süresinin test edilen tüm cihazların ortalamasından (31.1 ms) daha kötü olduğu anlamına gelir. | ||
Ekran Titremesi / PWM (Darbe Genişliği Modülasyonu)
| Ekran titriyor / PWM algılandı | 21000 Hz | 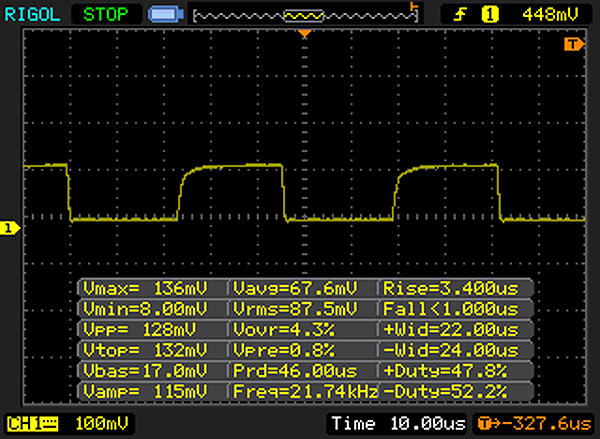 | |
Ekran arka ışığı 21000 Hz'de titriyor (en kötü durum, örneğin PWM kullanılması) . 21000 Hz frekansı oldukça yüksektir, bu nedenle PWM'ye duyarlı çoğu kullanıcı herhangi bir titremeyi fark etmemelidir. Karşılaştırıldığında: Test edilen tüm cihazların %52 %'si ekranı karartmak için PWM kullanmıyor. PWM tespit edilirse, ortalama 7791 (minimum: 5 - maksimum: 343500) Hz ölçüldü. | |||
| PCMark 8 Home Score Accelerated v2 | 2936 puan | |
| PCMark 8 Work Score Accelerated v2 | 3983 puan | |
| PCMark 10 Score | 2957 puan | |
Yardım | ||
| Microsoft Surface Pro (2017) i5 Samsung PM971 KUS030202M | Microsoft Surface Pro 4, Core i5, 128GB Samsung MZFLV128 NVMe | Lenovo Ideapad Miix 720-12IKB Samsung SSD PM961 1TB M.2 PCIe 3.0 x4 NVMe (MZVLW1T0) | Lenovo ThinkPad X1 Tablet Gen 2 Samsung PM961 MZVLW256HEHP | Asus Transformer 3 Pro T303UA-GN050T SK Hynix Canvas SC300 512GB M.2 (HFS512G39MND) | Toshiba Portege Z20t-C-121 Samsung SSD PM871 MZNLN512HCJH | Dell Latitude 12 5285 2-in-1 Samsung PM961 MZVLW256HEHP | HP Elite x2 1012 G1 Liteon L8H-256V2G | |
|---|---|---|---|---|---|---|---|---|
| CrystalDiskMark 3.0 | -33% | 135% | 54% | -33% | -10% | 19% | -25% | |
| Read Seq (MB/s) | 723 | 666 -8% | 2408 233% | 1739 141% | 398.9 -45% | 505 -30% | 1294 79% | 501 -31% |
| Write Seq (MB/s) | 853 | 154.2 -82% | 1702 100% | 1259 48% | 402 -53% | 501 -41% | 865 1% | 297.2 -65% |
| Read 512 (MB/s) | 225 | 266.3 18% | 1301 478% | 698 210% | 303.1 35% | 412.6 83% | 406 80% | 351.7 56% |
| Write 512 (MB/s) | 445 | 154.2 -65% | 1288 189% | 869 95% | 320.3 -28% | 422.4 -5% | 589 32% | 295.7 -34% |
| Read 4k (MB/s) | 46 | 28.51 -38% | 53.6 17% | 52.3 14% | 26.11 -43% | 32.87 -29% | 31.75 -31% | 28.31 -38% |
| Write 4k (MB/s) | 125 | 101.5 -19% | 162.2 30% | 120 -4% | 57.7 -54% | 89.7 -28% | 72.2 -42% | 90.3 -28% |
| Read 4k QD32 (MB/s) | 423 | 368.3 -13% | 504 19% | 247.9 -41% | 245.8 -42% | 352.4 -17% | 493.3 17% | 285 -33% |
| Write 4k QD32 (MB/s) | 373 | 153.6 -59% | 420.8 13% | 259 -31% | 253.8 -32% | 316.9 -15% | 434.5 16% | 268.4 -28% |

| 3DMark | |
| 1280x720 Cloud Gate Standard Graphics | |
| Dell Latitude 12 5285 2-in-1 | |
| Microsoft Surface Pro 4, Core i5, 128GB | |
| Acer Aspire Switch Alpha 12 SA5-271-56HM | |
| Lenovo Ideapad Miix 720-12IKB | |
| Microsoft Surface Pro (2017) i5 | |
| HP Elite x2 1012 G1 | |
| Lenovo ThinkPad X1 Tablet Gen 2 | |
| Asus Transformer 3 Pro T303UA-GN050T | |
| 1920x1080 Fire Strike Graphics | |
| Dell Latitude 12 5285 2-in-1 | |
| Microsoft Surface Pro 4, Core i5, 128GB | |
| Microsoft Surface Pro (2017) i5 | |
| HP Elite x2 1012 G1 | |
| Asus Transformer 3 Pro T303UA-GN050T | |
| Lenovo ThinkPad X1 Tablet Gen 2 | |
| 3DMark Cloud Gate Standard Score | 5420 puan | |
| 3DMark Fire Strike Score | 805 puan | |
Yardım | ||
| The Witcher 3 - 1024x768 Low Graphics & Postprocessing | |
| HP Elite x2 1012 G1 | |
| Microsoft Surface Pro (2017) i5 | |
| Rise of the Tomb Raider - 1024x768 Lowest Preset | |
| Asus Transformer 3 Pro T303UA-GN050T | |
| Acer Aspire Switch Alpha 12 SA5-271-56HM | |
| Lenovo Ideapad Miix 720-12IKB | |
| Microsoft Surface Pro (2017) i5 | |
| Samsung Galaxy Tab Pro S W700N | |
| BioShock Infinite - 1366x768 Medium Preset | |
| Dell Latitude 12 5285 2-in-1 | |
| Microsoft Surface Pro (2017) i5 | |
| Microsoft Surface Pro 4, Core i5, 128GB | |
| Lenovo Ideapad Miix 720-12IKB | |
| Acer Aspire Switch Alpha 12 SA5-271-56HM | |
| Asus Transformer 3 Pro T303UA-GN050T | |
| HP Elite x2 1012 G1 | |
| Lenovo ThinkPad X1 Tablet Gen 2 | |
| Toshiba Portege Z20t-C-121 | |
| Thief - 1024x768 Very Low Preset | |
| Lenovo Ideapad Miix 720-12IKB | |
| Microsoft Surface Pro (2017) i5 | |
| düşük | orta | yüksek | ultra | |
|---|---|---|---|---|
| BioShock Infinite (2013) | 42.9 | 32.15 | 28.3 | |
| Thief (2014) | 21.3 | 13.8 | 11.4 | |
| The Witcher 3 (2015) | 9.5 | 7 | ||
| Rise of the Tomb Raider (2016) | 14.7 | 9.7 |
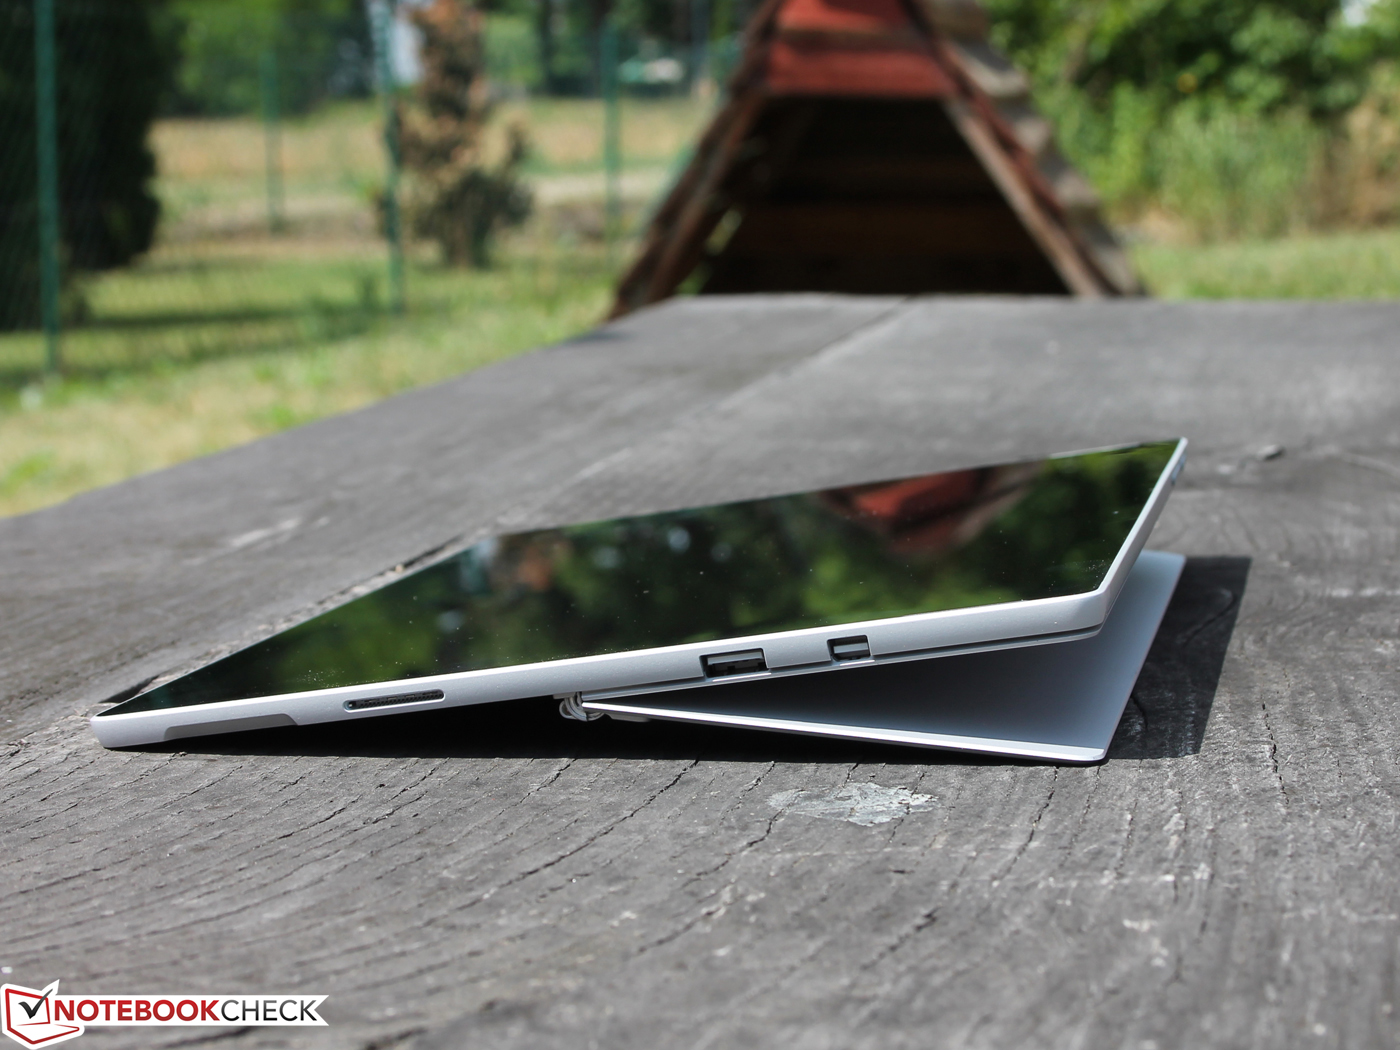
(+) Üst taraftaki maksimum sıcaklık, 35.4 °C / 96 F ortalamasına kıyasla 39.2 °C / 103 F'dir. , Convertible sınıfı için 19.6 ile 60 °C arasında değişir.
(±) Alt kısım, 36.9 °C / 98 F ortalamasına kıyasla maksimum 40.3 °C / 105 F'ye kadar ısınır
(±) Boşta kullanımda, üst tarafın ortalama sıcaklığı 32.2 °C / 90 F olup, cihazın 30.3 °C / 87 F.
(±) Avuç içi dayanakları ve dokunmatik yüzey maksimum 39.2 °C / 102.6 F ile dokunulamayacak kadar ısınabilir.
(-) Benzer cihazların avuç içi dayanağı alanının ortalama sıcaklığı 28 °C / 82.4 F (-11.2 °C / -20.2 F) idi.
Microsoft Surface Pro (2017) i5 ses analizi
(-) | hoparlörler çok yüksek ses çıkarmıyor (68 dB)
Bas 100 - 315Hz
(±) | azaltılmış bas - ortalama olarak medyandan 9.7% daha düşük
(±) | Bas doğrusallığı ortalamadır (7% delta - önceki frekans)
Ortalar 400 - 2000 Hz
(+) | dengeli ortalar - medyandan yalnızca 4.6% uzakta
(+) | orta frekanslar doğrusaldır (6.3% deltadan önceki frekansa)
Yüksekler 2 - 16 kHz
(+) | dengeli yüksekler - medyandan yalnızca 2.1% uzakta
(+) | yüksekler doğrusaldır (5.2% deltadan önceki frekansa)
Toplam 100 - 16.000 Hz
(±) | Genel sesin doğrusallığı ortalamadır (18.2% ortancaya göre fark)
Aynı sınıfla karşılaştırıldığında
» Bu sınıftaki tüm test edilen cihazların %40%'si daha iyi, 7% benzer, 53% daha kötüydü
» En iyisinin deltası 6% idi, ortalama 20% idi, en kötüsü 57% idi
Test edilen tüm cihazlarla karşılaştırıldığında
» Test edilen tüm cihazların %39'si daha iyi, 8 benzer, % 53 daha kötüydü
» En iyisinin deltası 4% idi, ortalama 24% idi, en kötüsü 134% idi
Lenovo Ideapad Miix 720-12IKB ses analizi
(-) | hoparlörler çok yüksek ses çıkarmıyor (64 dB)
Bas 100 - 315Hz
(±) | azaltılmış bas - ortalama olarak medyandan 9.9% daha düşük
(-) | bas doğrusal değildir (16.2% delta ile önceki frekans)
Ortalar 400 - 2000 Hz
(±) | daha yüksek ortalar - ortalama olarak medyandan 7.3% daha yüksek
(±) | Ortaların doğrusallığı ortalamadır (13.3% delta - önceki frekans)
Yüksekler 2 - 16 kHz
(+) | dengeli yüksekler - medyandan yalnızca 3.3% uzakta
(±) | Yükseklerin doğrusallığı ortalamadır (12.2% delta - önceki frekans)
Toplam 100 - 16.000 Hz
(±) | Genel sesin doğrusallığı ortalamadır (25.1% ortancaya göre fark)
Aynı sınıfla karşılaştırıldığında
» Bu sınıftaki tüm test edilen cihazların %76%'si daha iyi, 7% benzer, 17% daha kötüydü
» En iyisinin deltası 6% idi, ortalama 20% idi, en kötüsü 57% idi
Test edilen tüm cihazlarla karşılaştırıldığında
» Test edilen tüm cihazların %77'si daha iyi, 5 benzer, % 18 daha kötüydü
» En iyisinin deltası 4% idi, ortalama 24% idi, en kötüsü 134% idi
| Kapalı / Bekleme modu | |
| Boşta | |
| Çalışırken |
|
Key:
min: | |
| Microsoft Surface Pro (2017) i5 i5-7300U, HD Graphics 620, Samsung PM971 KUS030202M, IPS, 2736x1824, 12.3" | Microsoft Surface Pro 4, Core i5, 128GB 6300U, HD Graphics 520, Samsung MZFLV128 NVMe, IPS, 2736x1824, 12.3" | Lenovo Ideapad Miix 720-12IKB i7-7500U, HD Graphics 620, Samsung SSD PM961 1TB M.2 PCIe 3.0 x4 NVMe (MZVLW1T0), IPS, 2880x1920, 12" | Lenovo ThinkPad X1 Tablet Gen 2 i5-7Y54, HD Graphics 615, Samsung PM961 MZVLW256HEHP, IPS, 2160x1440, 12" | Asus Transformer 3 Pro T303UA-GN050T 6500U, HD Graphics 520, SK Hynix Canvas SC300 512GB M.2 (HFS512G39MND), IPS, 2880x1920, 12.6" | Toshiba Portege Z20t-C-121 6Y75, HD Graphics 515, Samsung SSD PM871 MZNLN512HCJH, IPS, 1920x1080, 12.5" | Dell Latitude 12 5285 2-in-1 i7-7600U, HD Graphics 620, Samsung PM961 MZVLW256HEHP, IPS, 1920x1280, 12.3" | HP Elite x2 1012 G1 6Y54, HD Graphics 515, Liteon L8H-256V2G, IPS, 1920x1280, 12.1" | Acer Aspire Switch Alpha 12 SA5-271-56HM 6200U, HD Graphics 520, Kingston RBU-SNS8152S3256GG2, IPS, 2160x1440, 12" | |
|---|---|---|---|---|---|---|---|---|---|
| Power Consumption | -4% | -5% | 7% | -39% | 12% | -6% | -2% | -33% | |
| Idle Minimum * (Watt) | 3.6 | 4.4 -22% | 3.5 3% | 5 -39% | 6.7 -86% | 4.3 -19% | 2.85 21% | 3.7 -3% | 7.3 -103% |
| Idle Average * (Watt) | 8.1 | 9 -11% | 7.2 11% | 6.3 22% | 10.3 -27% | 6.1 25% | 6.76 17% | 6.8 16% | 10 -23% |
| Idle Maximum * (Watt) | 8.7 | 10.7 -23% | 7.9 9% | 7.8 10% | 13.5 -55% | 8.9 -2% | 6.91 21% | 7.6 13% | 10.15 -17% |
| Load Average * (Watt) | 25.5 | 19.6 23% | 29.6 -16% | 19.5 24% | 26 -2% | 16.3 36% | 32.88 -29% | 22.5 12% | 25.2 1% |
| Load Maximum * (Watt) | 23.5 | 19.9 15% | 30.8 -31% | 19.6 17% | 28.8 -23% | 18.6 21% | 37.41 -59% | 34.5 -47% | 29.3 -25% |
* ... daha küçük daha iyidir
| Microsoft Surface Pro (2017) i5 i5-7300U, HD Graphics 620, 45 Wh | Microsoft Surface Pro 4, Core i5, 128GB 6300U, HD Graphics 520, 38 Wh | Lenovo Ideapad Miix 720-12IKB i7-7500U, HD Graphics 620, 41 Wh | Lenovo ThinkPad X1 Tablet Gen 2 i5-7Y54, HD Graphics 615, 37 Wh | Asus Transformer 3 Pro T303UA-GN050T 6500U, HD Graphics 520, 39 Wh | Toshiba Portege Z20t-C-121 6Y75, HD Graphics 515, 72 Wh | Dell Latitude 12 5285 2-in-1 i7-7600U, HD Graphics 620, 42 Wh | HP Elite x2 1012 G1 6Y54, HD Graphics 515, 37 Wh | Acer Aspire Switch Alpha 12 SA5-271-56HM 6200U, HD Graphics 520, 37 Wh | HP Spectre x2 12-a001ng 6Y30, HD Graphics 515, 43 Wh | Samsung Galaxy Tab Pro S W700N 6Y30, HD Graphics 515, 39.5 Wh | |
|---|---|---|---|---|---|---|---|---|---|---|---|
| Pil Çalışma Süresi | -30% | -39% | -33% | -56% | 8% | -23% | -31% | -42% | -30% | -12% | |
| Reader / Idle (h) | 17.6 | 15 -15% | 11.9 -32% | 11 -37% | 7.1 -60% | 17.9 2% | 12.2 -31% | 10.7 -39% | 11.4 -35% | 18.5 5% | |
| WiFi v1.3 (h) | 12.4 | 7.1 -43% | 5.8 -53% | 7.4 -40% | 3.7 -70% | 13.4 8% | 8.1 -35% | 7.4 -40% | 5.4 -56% | 6.1 -51% | 8.8 -29% |
| Load (h) | 2.8 | 1.9 -32% | 1.9 -32% | 2.2 -21% | 1.7 -39% | 1.8 -36% | 2.2 -21% | 1.9 -32% | 2.7 -4% | ||
| H.264 (h) | 3.4 | 7.2 | 7.8 | 8.6 |
Artılar
Eksiler
Eski Surface Pro 4 ile yeni Surface Pro 2017 modelleri arasındaki en büyük fark batarya kullanım süreleri olacak. 12 saatten fazlasına karşın 7 saatlik kullanım büyük bir avantaj.
Fansız Core i5-7300U kısa süreler için performansının zirvesini verebiliyor. Ancak süre uzadıkça takılmalar kendisini gösteriyor. Daha güçlü bir cihaz isteyen kullanıcılar ise Dell Latitude 12 5285 modelini inceleyebilirler. Her ne kadar onlar da bu takılmalardan müzdarip olsa da, Surface Pro 2017 kadar kötü değil.
Bu da cihazın en öne çıkan fansız kullanım avantajının arka planda kalmasına sebep oluyor. Performans için çok kötü diyemeyiz ama sürekli değil. Ek olarak Microsoft'un söz ettiği %50 performans kazanımını da teyit edemedik. Ayrıca USB-C ve Thunderbolt 3 gibi geleceğe dönük özellikler yok.
Pozitif olarak ise Windows Hello destekli kameralar, çok iyi mikrofon, parlak ekran sayılabilir. Bunların hepsi için 1299 dolarlık ücret beklentisi ise bizce pahalı.
Alternatifler
Aşağıda sıraladığımız tabletler ise alternatif olarak aklımıza geliyor ve Surface Pro 2017 kadar takılma sorunları yok, ayrıca daha ucuzlar.
- Dell Latitude 12 5285 2-in-1 (1275 Euro/~$1458, 88%)
- Lenovo IdeaPad Miix 720-12IKB 1 (1145 Euro/~$1309, 85%)
- Asus Transformer 3 Pro T303UA (1100 Euro/~$1258, 86%)
Microsoft Surface Pro (2017) i5
- 06/26/2017 v6 (old)
Sebastian Jentsch
Price comparison
