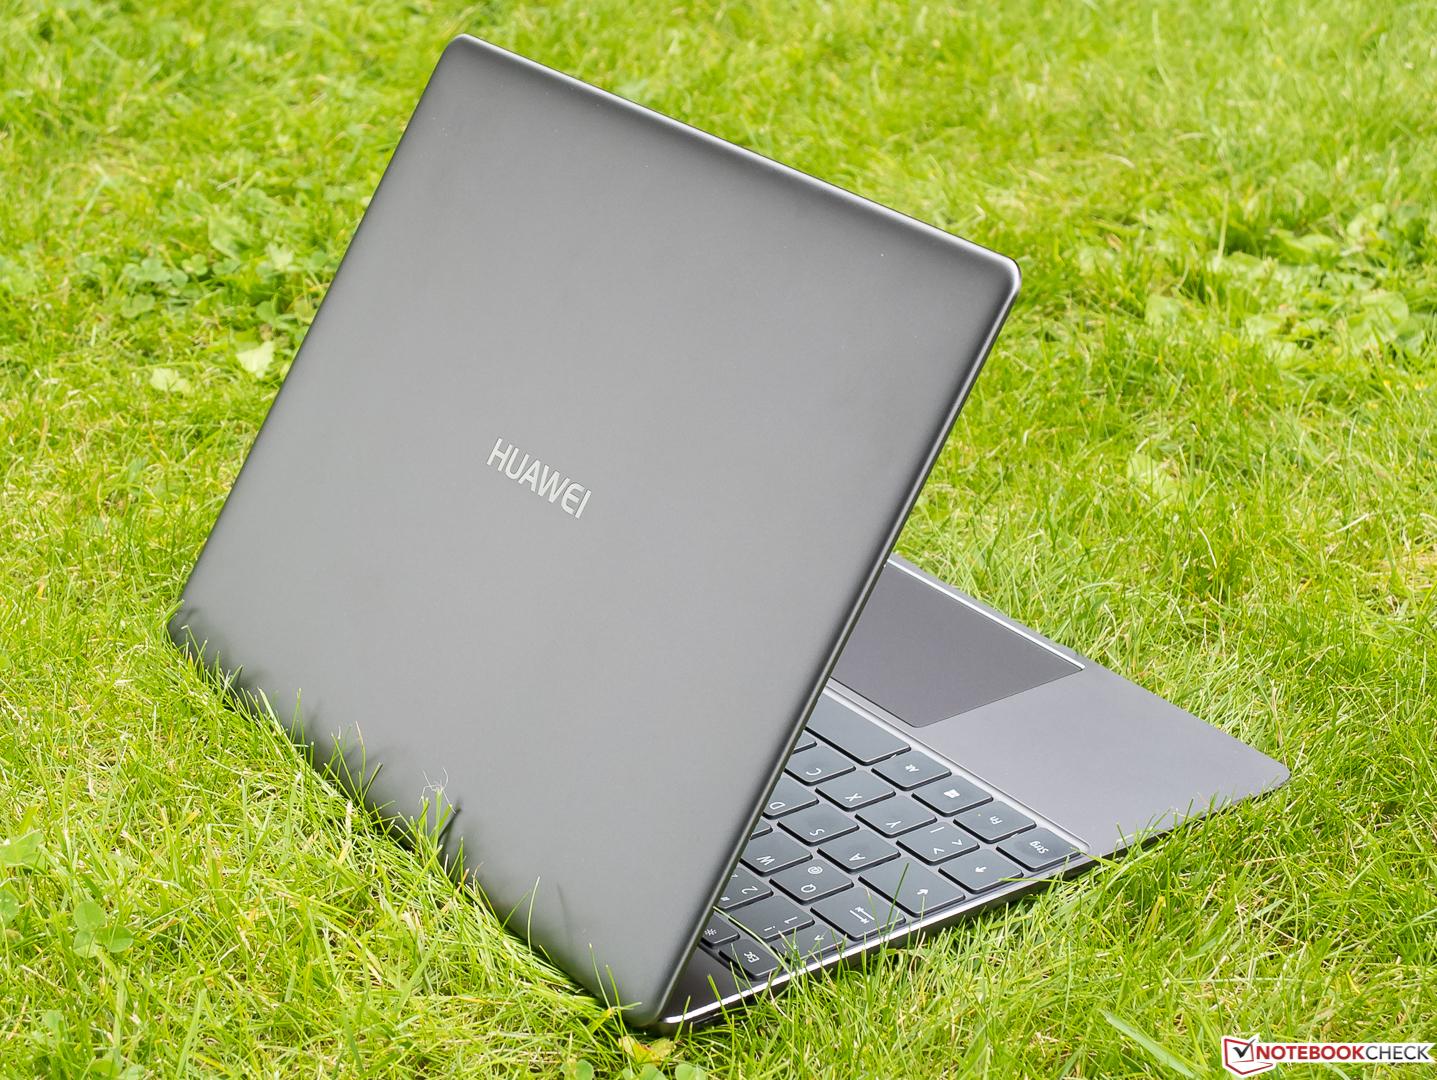
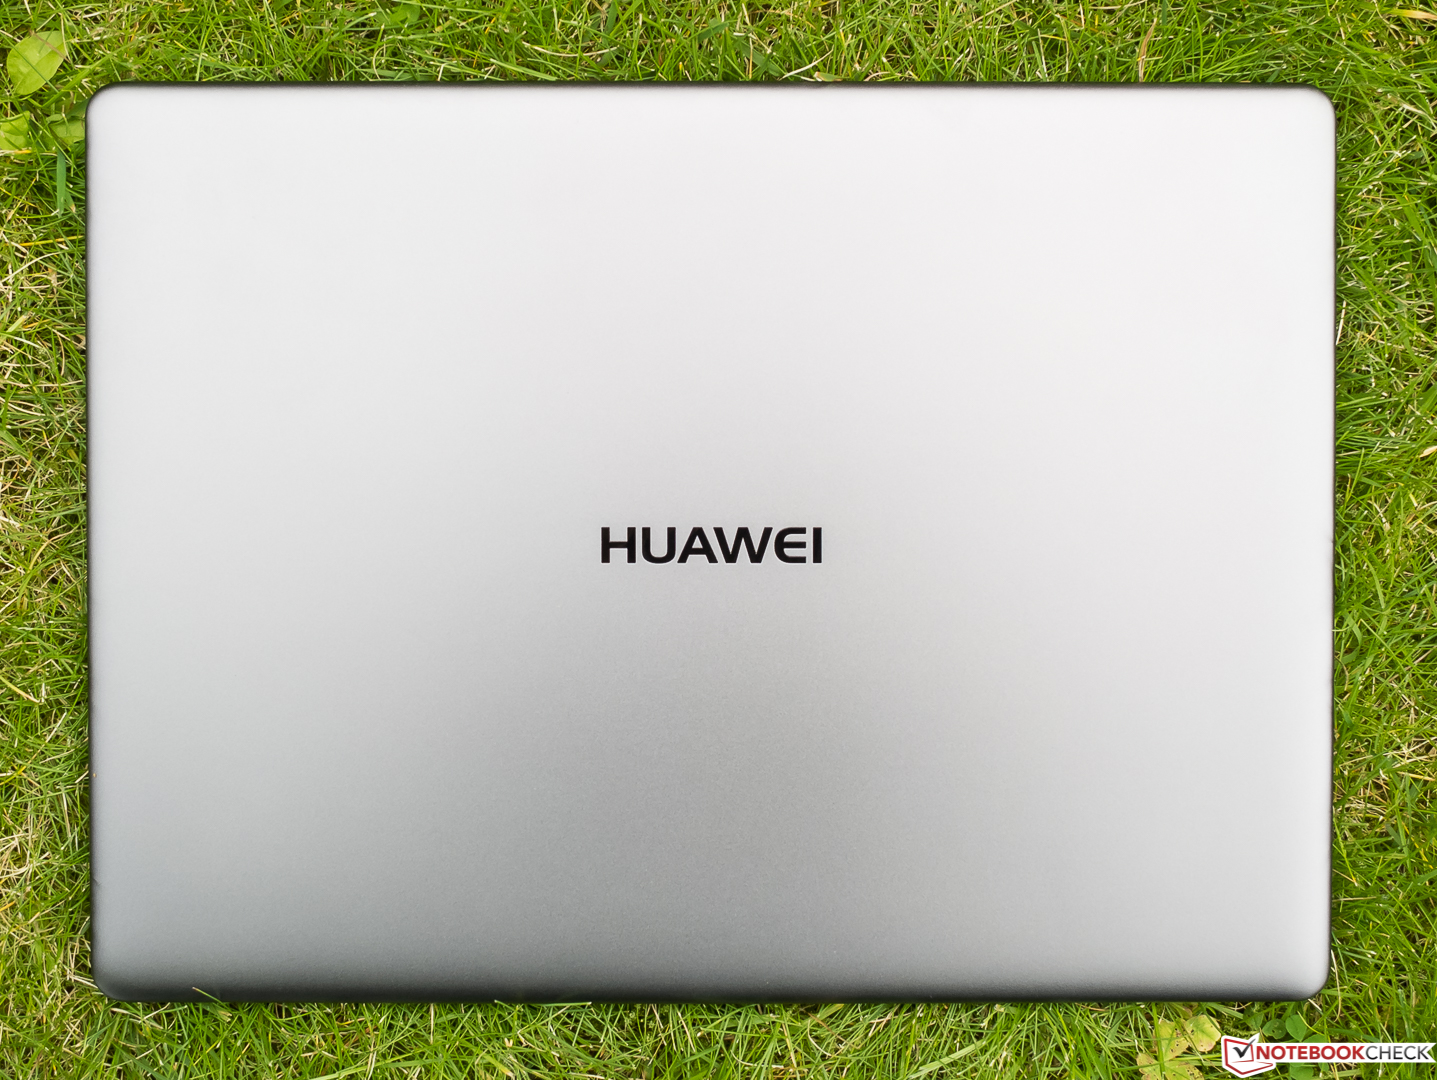
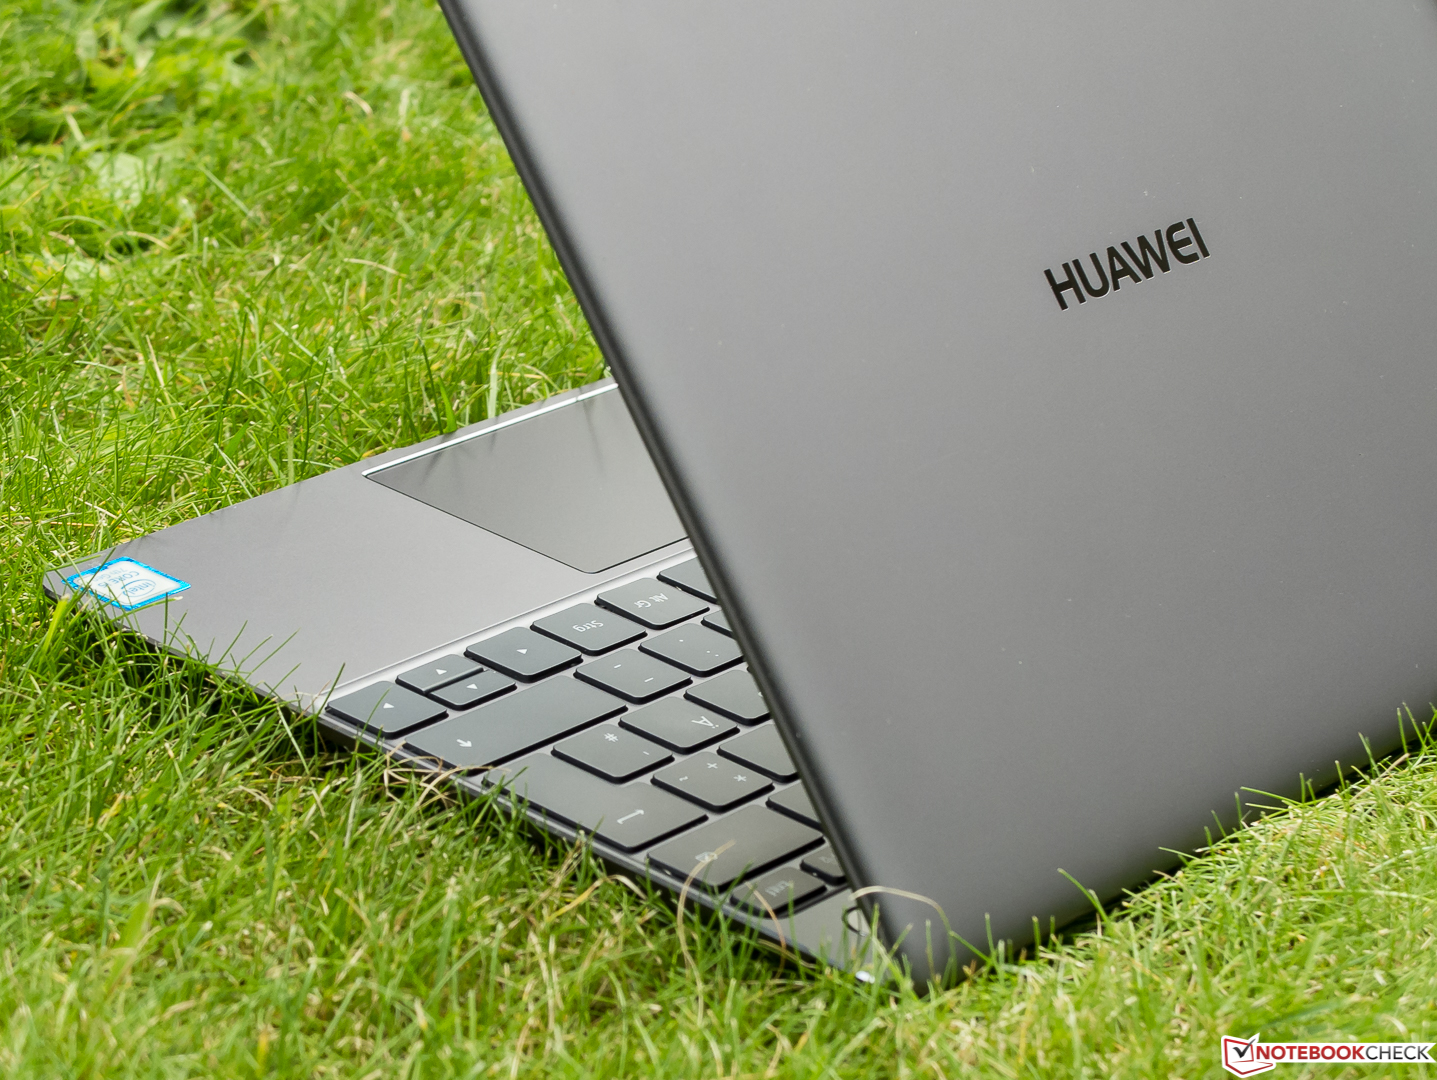
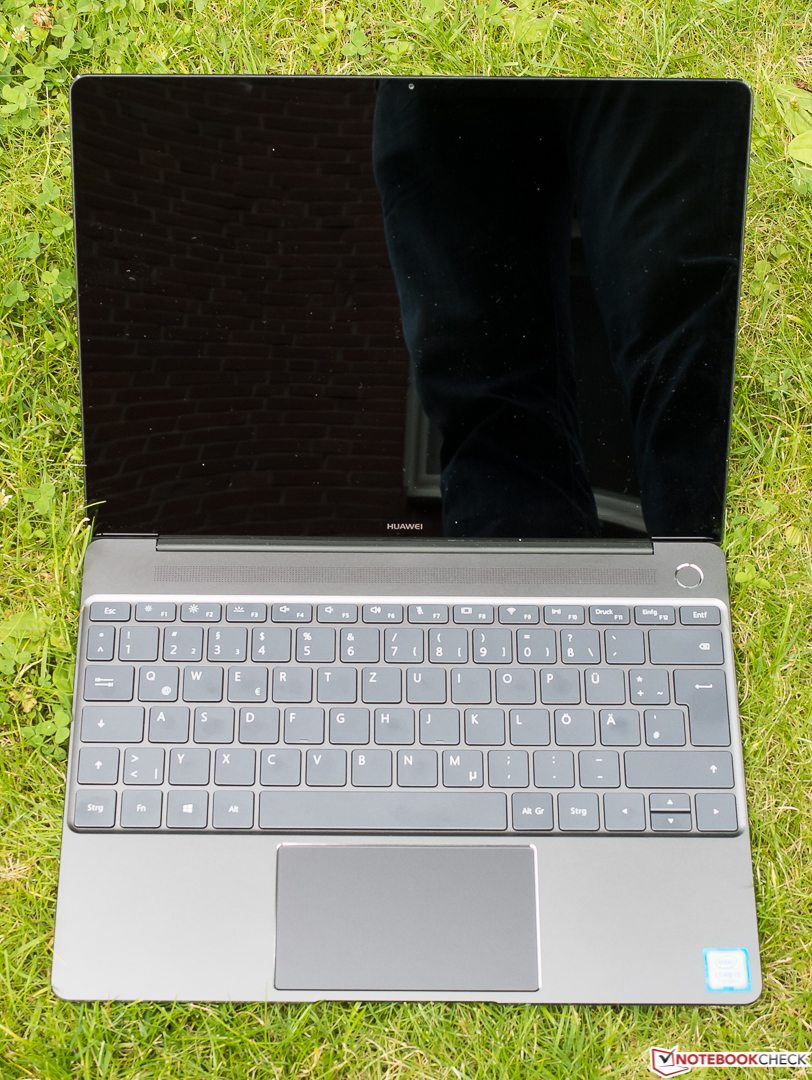
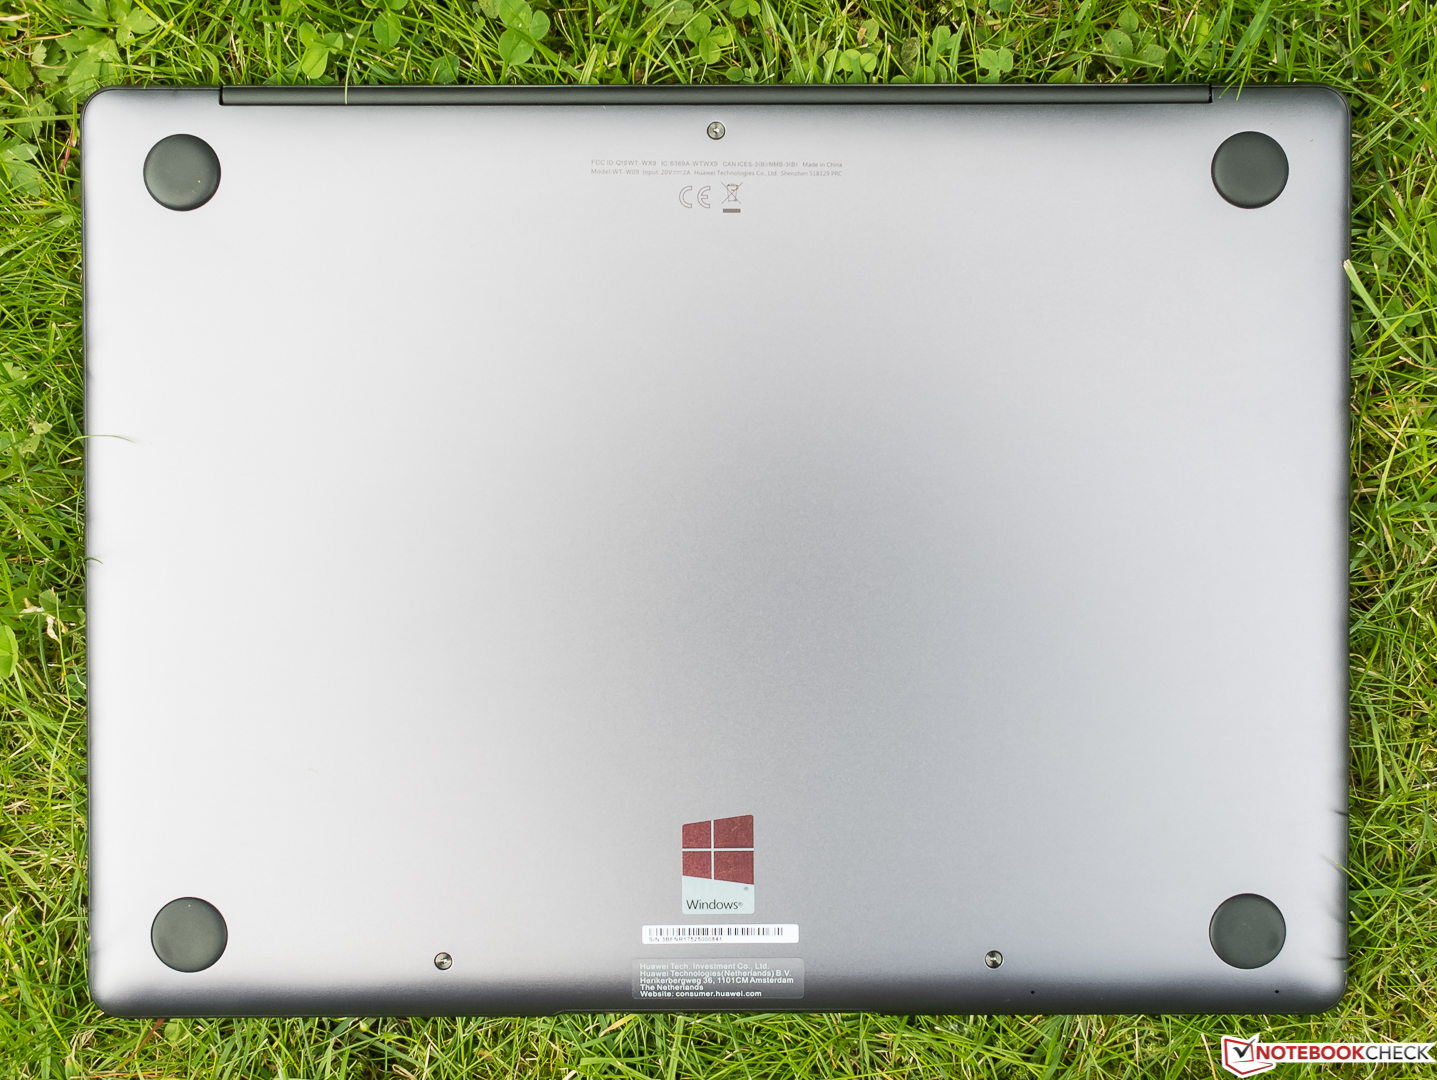
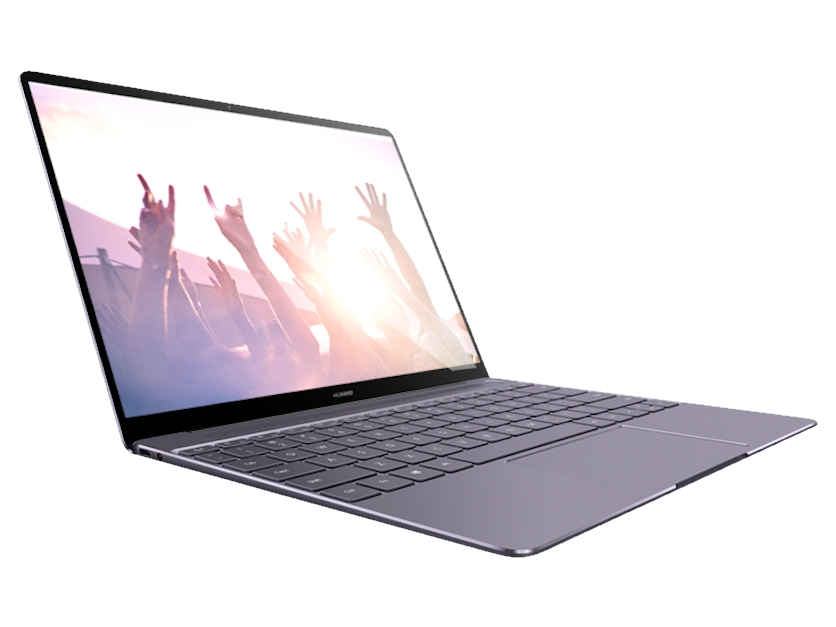
Kısa inceleme: Huawei MateBook X (i5-7200U, 256 GB) Subnotebook


| Networking | |
| iperf3 transmit AX12 | |
| Huawei MateBook X | |
| Microsoft Surface Pro (2017) i5 | |
| Lenovo IdeaPad 710S Plus-13IKB | |
| Dell XPS 13 9360 FHD i5 | |
| iperf3 receive AX12 | |
| Lenovo IdeaPad 710S Plus-13IKB | |
| Microsoft Surface Pro (2017) i5 | |
| Dell XPS 13 9360 FHD i5 | |
| Huawei MateBook X | |
| |||||||||||||||||||||||||
Aydınlatma: 88 %
Batarya modunda parlaklık: 408 cd/m²
Kontrast: 907:1 (Siyah: 0.45 cd/m²)
ΔE ColorChecker Calman: 1.55 | ∀{0.5-29.43 Ø4.71}
ΔE Greyscale Calman: 1.91 | ∀{0.09-98 Ø4.96}
96% sRGB (Argyll 1.6.3 3D)
61% AdobeRGB 1998 (Argyll 1.6.3 3D)
66.8% AdobeRGB 1998 (Argyll 3D)
96.2% sRGB (Argyll 3D)
65.8% Display P3 (Argyll 3D)
Gamma: 2.34
CCT: 6491 K
| Huawei MateBook X Chi Mei CMN8201 / P130ZDZ-EF1, , 2160x1440, 13.3" | HP EliteBook 1030 G1-X2F03EA Sharp SHP1465, , 3200x1800, 13.3" | Dell XPS 13 9360 FHD i5 Sharp SHP1449 LQ133M1, , 1920x1080, 13.3" | Lenovo IdeaPad 710S Plus-13IKB LG Philips LP133WF4-SPB1 (LGD04EF), , 1920x1080, 13.3" | Microsoft Surface Pro (2017) i5 LG Display LP123WQ112604, , 2736x1824, 12.3" | |
|---|---|---|---|---|---|
| Display | 1% | -25% | -8% | 3% | |
| Display P3 Coverage (%) | 65.8 | 67.6 3% | 48.94 -26% | 65.3 -1% | 67.6 3% |
| sRGB Coverage (%) | 96.2 | 94.7 -2% | 73.3 -24% | 82.9 -14% | 99 3% |
| AdobeRGB 1998 Coverage (%) | 66.8 | 69 3% | 50.5 -24% | 60.6 -9% | 69.1 3% |
| Response Times | -18% | -19% | -29% | -24% | |
| Response Time Grey 50% / Grey 80% * (ms) | 33 ? | 42.4 ? -28% | 32.8 ? 1% | 45 ? -36% | 42 ? -27% |
| Response Time Black / White * (ms) | 24 ? | 25.6 ? -7% | 33.2 ? -38% | 29 ? -21% | 29 ? -21% |
| PWM Frequency (Hz) | 21000 | ||||
| Screen | -40% | -86% | -60% | -25% | |
| Brightness middle (cd/m²) | 408 | 401 -2% | 351.2 -14% | 343 -16% | 417 2% |
| Brightness (cd/m²) | 395 | 369 -7% | 325 -18% | 306 -23% | 401 2% |
| Brightness Distribution (%) | 88 | 85 -3% | 89 1% | 81 -8% | 88 0% |
| Black Level * (cd/m²) | 0.45 | 0.35 22% | 0.195 57% | 0.3 33% | 0.29 36% |
| Contrast (:1) | 907 | 1146 26% | 1801 99% | 1143 26% | 1438 59% |
| Colorchecker dE 2000 * | 1.55 | 3.5 -126% | 7.4 -377% | 4.73 -205% | 3.63 -134% |
| Colorchecker dE 2000 max. * | 2.19 | 6.33 -189% | 9.08 -315% | 9.05 -313% | 6.74 -208% |
| Greyscale dE 2000 * | 1.91 | 4.13 -116% | 6.71 -251% | 3.29 -72% | 2.18 -14% |
| Gamma | 2.34 94% | 2.28 96% | 2.74 80% | 2.36 93% | 3.09 71% |
| CCT | 6491 100% | 6508 100% | 7222 90% | 6437 101% | 6767 96% |
| Color Space (Percent of AdobeRGB 1998) (%) | 61 | 61.56 1% | 50.48 -17% | 54 -11% | 63 3% |
| Color Space (Percent of sRGB) (%) | 96 | 94.64 -1% | 73.31 -24% | 83 -14% | 99 3% |
| Toplam Ortalama (Program / Ayarlar) | -19% /
-28% | -43% /
-65% | -32% /
-46% | -15% /
-19% |
* ... daha küçük daha iyidir
Yanıt Sürelerini Görüntüle
| ↔ Tepki Süresi Siyahtan Beyaza | ||
|---|---|---|
| 24 ms ... yükseliş ↗ ve sonbahar↘ birleşimi | ↗ 12 ms yükseliş | 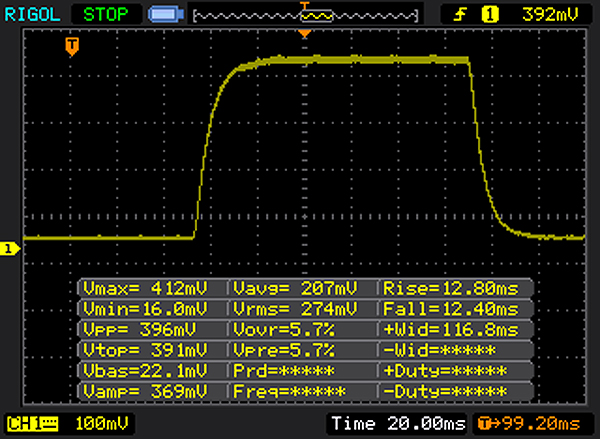 |
| ↘ 12 ms sonbahar | ||
| Ekran, testlerimizde iyi yanıt oranları gösteriyor ancak rekabetçi oyuncular için çok yavaş olabilir. Karşılaştırıldığında, test edilen tüm cihazlar 0.1 (minimum) ile 240 (maksimum) ms arasında değişir. » Tüm cihazların 54 %'si daha iyi. Bu, ölçülen yanıt süresinin test edilen tüm cihazların ortalamasından (19.8 ms) daha kötü olduğu anlamına gelir. | ||
| ↔ Tepki Süresi %50 Griden %80 Griye | ||
| 33 ms ... yükseliş ↗ ve sonbahar↘ birleşimi | ↗ 15 ms yükseliş | 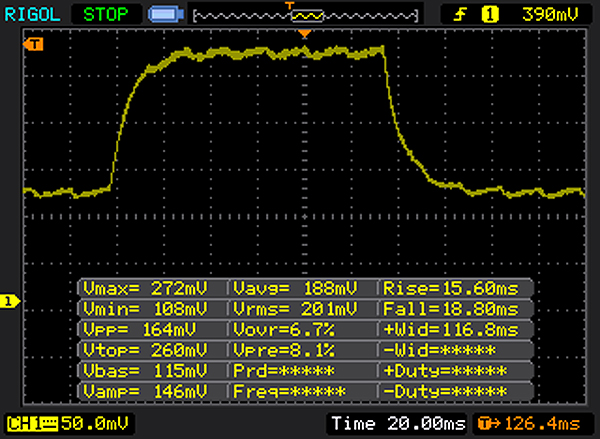 |
| ↘ 18 ms sonbahar | ||
| Ekran, testlerimizde yavaş yanıt oranları gösteriyor ve oyuncular için yetersiz olacaktır. Karşılaştırıldığında, test edilen tüm cihazlar 0.165 (minimum) ile 636 (maksimum) ms arasında değişir. » Tüm cihazların 45 %'si daha iyi. Bu, ölçülen yanıt süresinin test edilen tüm cihazların ortalamasına benzer olduğu anlamına gelir (31 ms). | ||
Ekran Titremesi / PWM (Darbe Genişliği Modülasyonu)
| Ekran titriyor / PWM algılanmadı | ||
Karşılaştırıldığında: Test edilen tüm cihazların %52 %'si ekranı karartmak için PWM kullanmıyor. PWM tespit edilirse, ortalama 7757 (minimum: 5 - maksimum: 343500) Hz ölçüldü. | ||
| PCMark 8 Home Score Accelerated v2 | 3507 puan | |
| PCMark 8 Work Score Accelerated v2 | 4276 puan | |
Yardım | ||
| Huawei MateBook X LITEON CB1-SD256 | HP EliteBook 1030 G1-X2F03EA Sandisk X300 SD7SN6S-512G-1006 | Dell XPS 13 9360 FHD i5 Toshiba NVMe THNSN5256GPUK | Lenovo IdeaPad 710S Plus-13IKB Samsung PM961 NVMe MZVLW512HMJP | Microsoft Surface Pro (2017) i5 Samsung PM971 KUS030202M | |
|---|---|---|---|---|---|
| CrystalDiskMark 3.0 | -21% | 41% | 117% | 30% | |
| Read Seq (MB/s) | 741 | 387.5 -48% | 1233 66% | 1577 113% | 723 -2% |
| Write Seq (MB/s) | 461.2 | 348.7 -24% | 733 59% | 1472 219% | 853 85% |
| Read 512 (MB/s) | 504 | 239.9 -52% | 1036 106% | 1165 131% | 225 -55% |
| Write 512 (MB/s) | 310.3 | 335.3 8% | 439.9 42% | 1244 301% | 445 43% |
| Read 4k (MB/s) | 29.48 | 30.34 3% | 29.31 -1% | 54.8 86% | 46 56% |
| Write 4k (MB/s) | 68.1 | 75.9 11% | 116.9 72% | 121.5 78% | 125 84% |
| Read 4k QD32 (MB/s) | 498.9 | 311.3 -38% | 479.2 -4% | 407.5 -18% | 423 -15% |
| Write 4k QD32 (MB/s) | 257.5 | 192.8 -25% | 218.3 -15% | 321.4 25% | 373 45% |

| 3DMark 11 - 1280x720 Performance GPU | |
| Lenovo IdeaPad 710S Plus-13IKB | |
| Dell XPS 13 9360 FHD i5 | |
| Huawei MateBook X | |
| HP EliteBook 1030 G1-X2F03EA | |
| 3DMark | |
| 1280x720 Cloud Gate Standard Graphics | |
| Lenovo IdeaPad 710S Plus-13IKB | |
| Dell XPS 13 9360 FHD i5 | |
| Huawei MateBook X | |
| Microsoft Surface Pro (2017) i5 | |
| HP EliteBook 1030 G1-X2F03EA | |
| 1920x1080 Fire Strike Graphics | |
| Lenovo IdeaPad 710S Plus-13IKB | |
| Dell XPS 13 9360 FHD i5 | |
| HP EliteBook 1030 G1-X2F03EA | |
| Microsoft Surface Pro (2017) i5 | |
| Huawei MateBook X | |
| 3DMark 11 Performance | 1667 puan | |
| 3DMark Ice Storm Standard Score | 54224 puan | |
| 3DMark Cloud Gate Standard Score | 5691 puan | |
| 3DMark Fire Strike Score | 785 puan | |
Yardım | ||
| düşük | orta | yüksek | ultra | |
|---|---|---|---|---|
| Battlefield 1 (2016) | 11.7 | |||
| Farming Simulator 17 (2016) | 61.2 | 40.8 | 14 | |
| For Honor (2017) | 20.2 |
(±) Üst taraftaki maksimum sıcaklık, 35.9 °C / 97 F ortalamasına kıyasla 40.4 °C / 105 F'dir. , Subnotebook sınıfı için 21.4 ile 59 °C arasında değişir.
(±) Alt kısım, 39.2 °C / 103 F ortalamasına kıyasla maksimum 41.2 °C / 106 F'ye kadar ısınır
(+) Boşta kullanımda, üst tarafın ortalama sıcaklığı 25.3 °C / 78 F olup, cihazın 30.8 °C / 87 F.
(+) Avuç içi dayanakları ve dokunmatik yüzey maksimum (32.8 °C / 91 F) cilt sıcaklığına ulaşıyor ve bu nedenle sıcak değil.
(-) Benzer cihazların avuç içi dayanağı alanının ortalama sıcaklığı 28.2 °C / 82.8 F (-4.6 °C / -8.2 F) idi.
Huawei MateBook X ses analizi
(-) | hoparlörler çok yüksek ses çıkarmıyor (66 dB)
Bas 100 - 315Hz
(±) | azaltılmış bas - ortalama olarak medyandan 8.3% daha düşük
(±) | Bas doğrusallığı ortalamadır (7.6% delta - önceki frekans)
Ortalar 400 - 2000 Hz
(+) | dengeli ortalar - medyandan yalnızca 3.3% uzakta
(+) | orta frekanslar doğrusaldır (6.2% deltadan önceki frekansa)
Yüksekler 2 - 16 kHz
(+) | dengeli yüksekler - medyandan yalnızca 2.6% uzakta
(+) | yüksekler doğrusaldır (6.6% deltadan önceki frekansa)
Toplam 100 - 16.000 Hz
(+) | genel ses doğrusaldır (14.7% ortancaya göre fark)
Aynı sınıfla karşılaştırıldığında
» Bu sınıftaki tüm test edilen cihazların %31%'si daha iyi, 5% benzer, 64% daha kötüydü
» En iyisinin deltası 5% idi, ortalama 18% idi, en kötüsü 53% idi
Test edilen tüm cihazlarla karşılaştırıldığında
» Test edilen tüm cihazların %19'si daha iyi, 4 benzer, % 77 daha kötüydü
» En iyisinin deltası 4% idi, ortalama 23% idi, en kötüsü 134% idi
HP EliteBook 1030 G1-X2F03EA ses analizi
(+) | hoparlörler nispeten yüksek sesle çalabilir (83.3 dB)
Bas 100 - 315Hz
(-) | neredeyse hiç bas yok - ortalama olarak medyandan 22.7% daha düşük
(±) | Bas doğrusallığı ortalamadır (11.2% delta - önceki frekans)
Ortalar 400 - 2000 Hz
(+) | dengeli ortalar - medyandan yalnızca 4.1% uzakta
(±) | Ortaların doğrusallığı ortalamadır (7.5% delta - önceki frekans)
Yüksekler 2 - 16 kHz
(+) | dengeli yüksekler - medyandan yalnızca 2.2% uzakta
(+) | yüksekler doğrusaldır (5.2% deltadan önceki frekansa)
Toplam 100 - 16.000 Hz
(±) | Genel sesin doğrusallığı ortalamadır (19.8% ortancaya göre fark)
Aynı sınıfla karşılaştırıldığında
» Bu sınıftaki tüm test edilen cihazların %63%'si daha iyi, 7% benzer, 31% daha kötüydü
» En iyisinin deltası 5% idi, ortalama 18% idi, en kötüsü 53% idi
Test edilen tüm cihazlarla karşılaştırıldığında
» Test edilen tüm cihazların %51'si daha iyi, 7 benzer, % 42 daha kötüydü
» En iyisinin deltası 4% idi, ortalama 23% idi, en kötüsü 134% idi
Dell XPS 13 9360 FHD i5 ses analizi
(-) | hoparlörler çok yüksek ses çıkarmıyor (70.3 dB)
Bas 100 - 315Hz
(±) | azaltılmış bas - ortalama olarak medyandan 6.9% daha düşük
(±) | Bas doğrusallığı ortalamadır (10.5% delta - önceki frekans)
Ortalar 400 - 2000 Hz
(+) | dengeli ortalar - medyandan yalnızca 3.7% uzakta
(+) | orta frekanslar doğrusaldır (4% deltadan önceki frekansa)
Yüksekler 2 - 16 kHz
(+) | dengeli yüksekler - medyandan yalnızca 2% uzakta
(±) | Yükseklerin doğrusallığı ortalamadır (10.3% delta - önceki frekans)
Toplam 100 - 16.000 Hz
(±) | Genel sesin doğrusallığı ortalamadır (18.3% ortancaya göre fark)
Aynı sınıfla karşılaştırıldığında
» Bu sınıftaki tüm test edilen cihazların %53%'si daha iyi, 7% benzer, 40% daha kötüydü
» En iyisinin deltası 5% idi, ortalama 18% idi, en kötüsü 53% idi
Test edilen tüm cihazlarla karşılaştırıldığında
» Test edilen tüm cihazların %40'si daha iyi, 8 benzer, % 52 daha kötüydü
» En iyisinin deltası 4% idi, ortalama 23% idi, en kötüsü 134% idi
Lenovo IdeaPad 710S Plus-13IKB ses analizi
(±) | hoparlör ses yüksekliği ortalama ama iyi (73 dB)
Bas 100 - 315Hz
(-) | neredeyse hiç bas yok - ortalama olarak medyandan 21.4% daha düşük
(±) | Bas doğrusallığı ortalamadır (12.2% delta - önceki frekans)
Ortalar 400 - 2000 Hz
(±) | daha yüksek ortalar - ortalama olarak medyandan 6.7% daha yüksek
(±) | Ortaların doğrusallığı ortalamadır (10.6% delta - önceki frekans)
Yüksekler 2 - 16 kHz
(+) | dengeli yüksekler - medyandan yalnızca 2.2% uzakta
(+) | yüksekler doğrusaldır (6.9% deltadan önceki frekansa)
Toplam 100 - 16.000 Hz
(±) | Genel sesin doğrusallığı ortalamadır (24.4% ortancaya göre fark)
Aynı sınıfla karşılaştırıldığında
» Bu sınıftaki tüm test edilen cihazların %82%'si daha iyi, 4% benzer, 13% daha kötüydü
» En iyisinin deltası 5% idi, ortalama 18% idi, en kötüsü 53% idi
Test edilen tüm cihazlarla karşılaştırıldığında
» Test edilen tüm cihazların %74'si daha iyi, 6 benzer, % 20 daha kötüydü
» En iyisinin deltası 4% idi, ortalama 23% idi, en kötüsü 134% idi
Microsoft Surface Pro (2017) i5 ses analizi
(-) | hoparlörler çok yüksek ses çıkarmıyor (68 dB)
Bas 100 - 315Hz
(±) | azaltılmış bas - ortalama olarak medyandan 9.7% daha düşük
(±) | Bas doğrusallığı ortalamadır (7% delta - önceki frekans)
Ortalar 400 - 2000 Hz
(+) | dengeli ortalar - medyandan yalnızca 4.6% uzakta
(+) | orta frekanslar doğrusaldır (6.3% deltadan önceki frekansa)
Yüksekler 2 - 16 kHz
(+) | dengeli yüksekler - medyandan yalnızca 2.1% uzakta
(+) | yüksekler doğrusaldır (5.2% deltadan önceki frekansa)
Toplam 100 - 16.000 Hz
(±) | Genel sesin doğrusallığı ortalamadır (18.2% ortancaya göre fark)
Aynı sınıfla karşılaştırıldığında
» Bu sınıftaki tüm test edilen cihazların %40%'si daha iyi, 7% benzer, 53% daha kötüydü
» En iyisinin deltası 6% idi, ortalama 20% idi, en kötüsü 57% idi
Test edilen tüm cihazlarla karşılaştırıldığında
» Test edilen tüm cihazların %39'si daha iyi, 8 benzer, % 53 daha kötüydü
» En iyisinin deltası 4% idi, ortalama 23% idi, en kötüsü 134% idi
| Kapalı / Bekleme modu | |
| Boşta | |
| Çalışırken |
|
Key:
min: | |
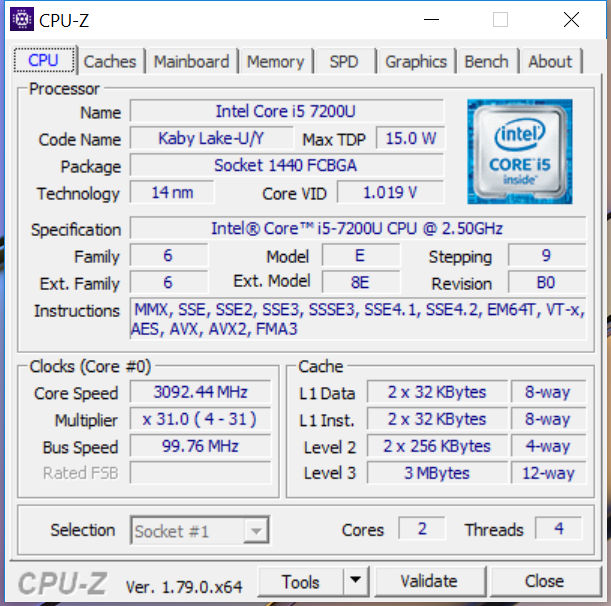
| Huawei MateBook X i5-7200U, HD Graphics 620, LITEON CB1-SD256, , 2160x1440, 13.3" | HP EliteBook 1030 G1-X2F03EA 6Y75, HD Graphics 515, Sandisk X300 SD7SN6S-512G-1006, IPS, 3200x1800, 13.3" | Dell XPS 13 9360 FHD i5 i5-7200U, HD Graphics 620, Toshiba NVMe THNSN5256GPUK, IPS, 1920x1080, 13.3" | Lenovo IdeaPad 710S Plus-13IKB i7-7500U, GeForce 940MX, Samsung PM961 NVMe MZVLW512HMJP, IPS, 1920x1080, 13.3" | Microsoft Surface Pro (2017) i5 i5-7300U, HD Graphics 620, Samsung PM971 KUS030202M, IPS, 2736x1824, 12.3" | |
|---|---|---|---|---|---|
| Power Consumption | 20% | 38% | 10% | 28% | |
| Idle Minimum * (Watt) | 4.6 | 4 13% | 4.1 11% | 3.6 22% | 3.6 22% |
| Idle Average * (Watt) | 11 | 8 27% | 4.2 62% | 7.4 33% | 8.1 26% |
| Idle Maximum * (Watt) | 12 | 8.6 28% | 5.1 57% | 8.7 27% | 8.7 27% |
| Load Average * (Watt) | 39.5 | 26.5 33% | 22.1 44% | 43 -9% | 25.5 35% |
| Load Maximum * (Watt) | 34.6 | 34.8 -1% | 29.4 15% | 42 -21% | 23.5 32% |
* ... daha küçük daha iyidir
| Huawei MateBook X i5-7200U, HD Graphics 620, 40 Wh | HP EliteBook 1030 G1-X2F03EA 6Y75, HD Graphics 515, 40 Wh | Dell XPS 13 9360 FHD i5 i5-7200U, HD Graphics 620, 60 Wh | Lenovo IdeaPad 710S Plus-13IKB i7-7500U, GeForce 940MX, 46 Wh | Microsoft Surface Pro (2017) i5 i5-7300U, HD Graphics 620, 45 Wh | |
|---|---|---|---|---|---|
| Pil Çalışma Süresi | 0% | 84% | -17% | 77% | |
| Reader / Idle (h) | 8.5 | 10.3 21% | 21.6 154% | 7.8 -8% | 17.6 107% |
| WiFi v1.3 (h) | 5.6 | 5.1 -9% | 11.3 102% | 5.6 0% | 12.4 121% |
| Load (h) | 2.7 | 2.4 -11% | 2.6 -4% | 1.5 -44% | 2.8 4% |
| H.264 (h) | 6.3 |
Artılar
Eksiler
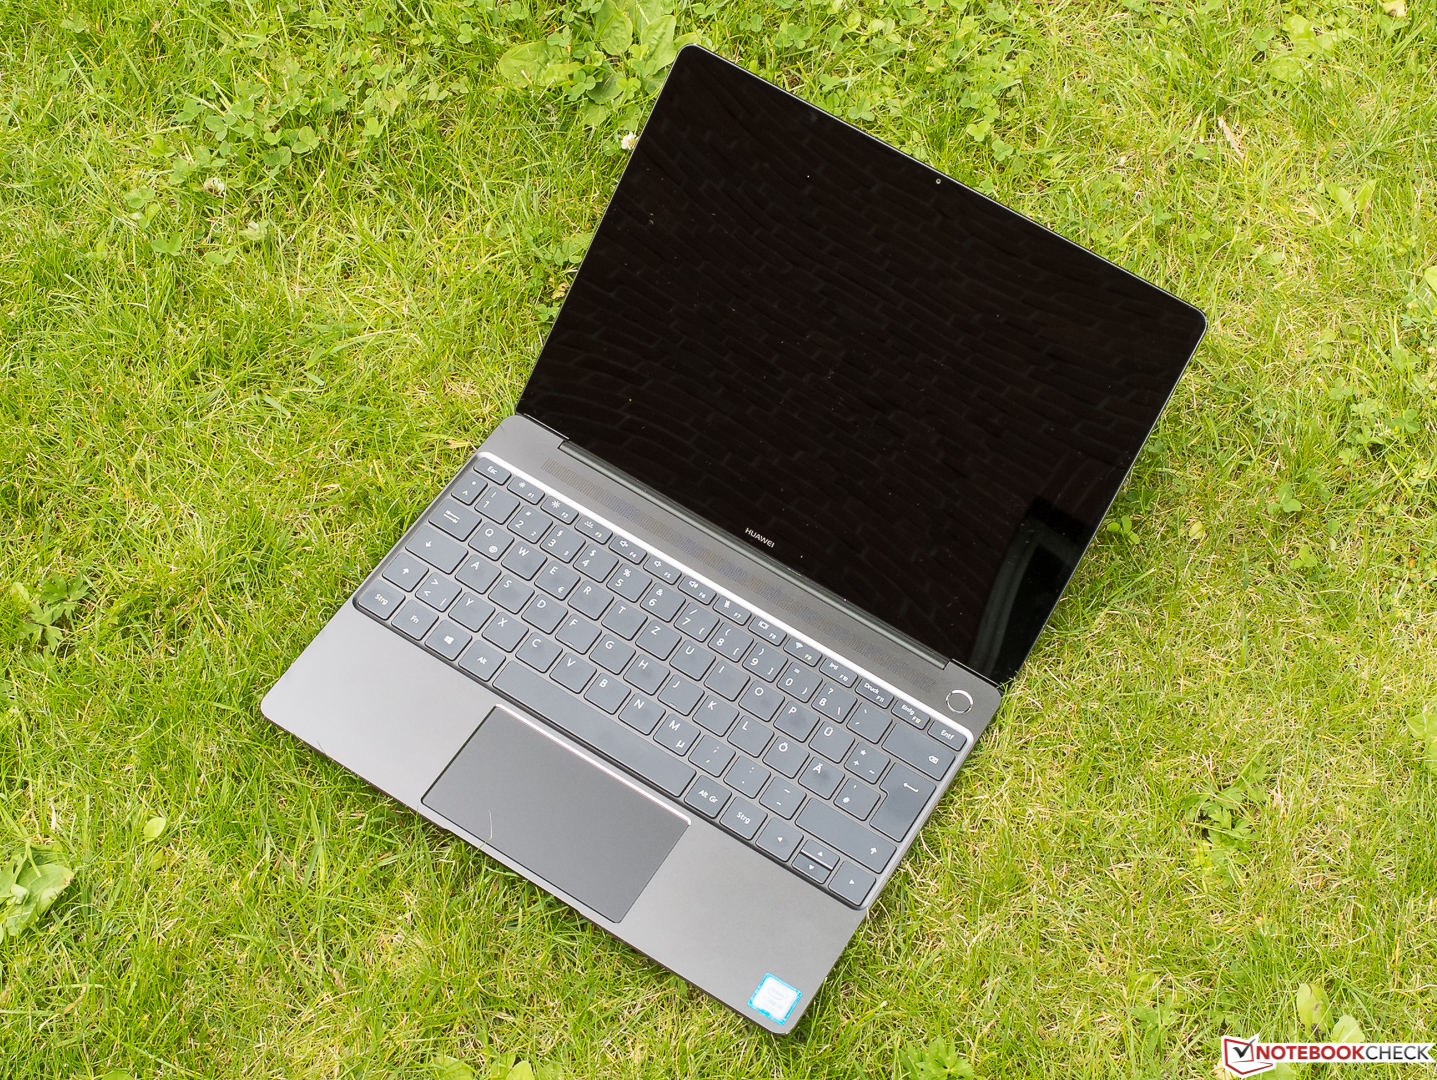
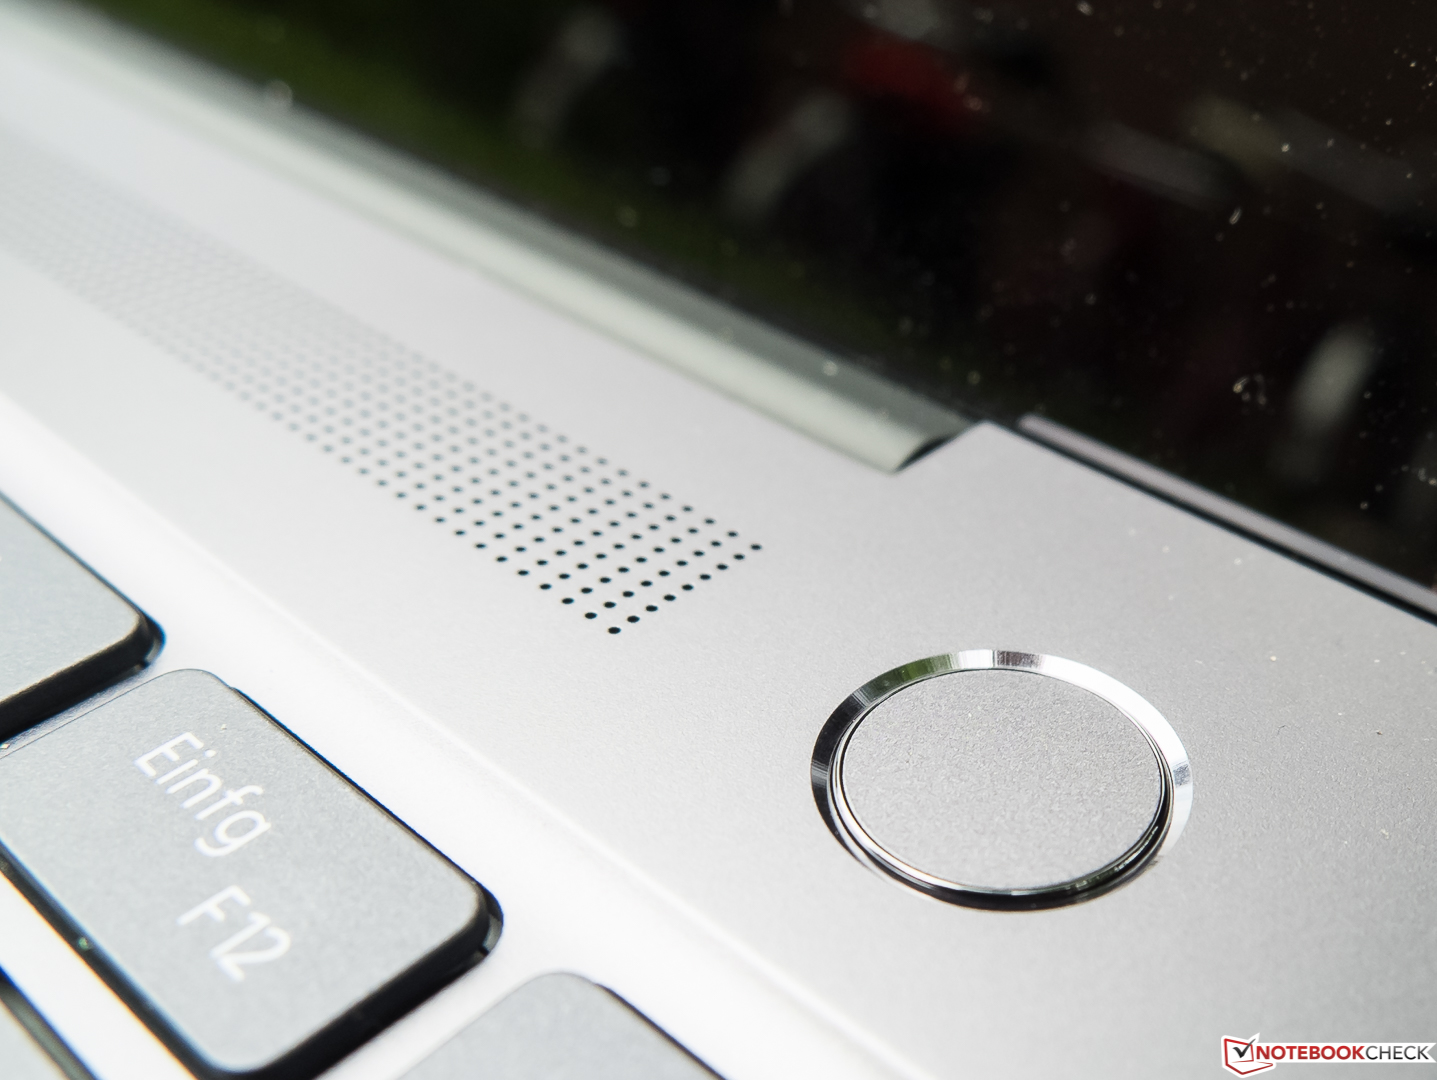
Şahsi kanaatinimiz Huawei'nin notebook pazarına girişinin başarılı olduğu yönünde. İyi düşünülmüş MateBook X, 3:2 formatı ile oldukça küçük, sağlam, iyi görünüşlü ve yeni MEPCM pasif soğutma sistemi ile geliyor. Mevcut güvenlik özellikleri ise parmak izi okuyucu ve TPM 2.0 ile sınırlı.
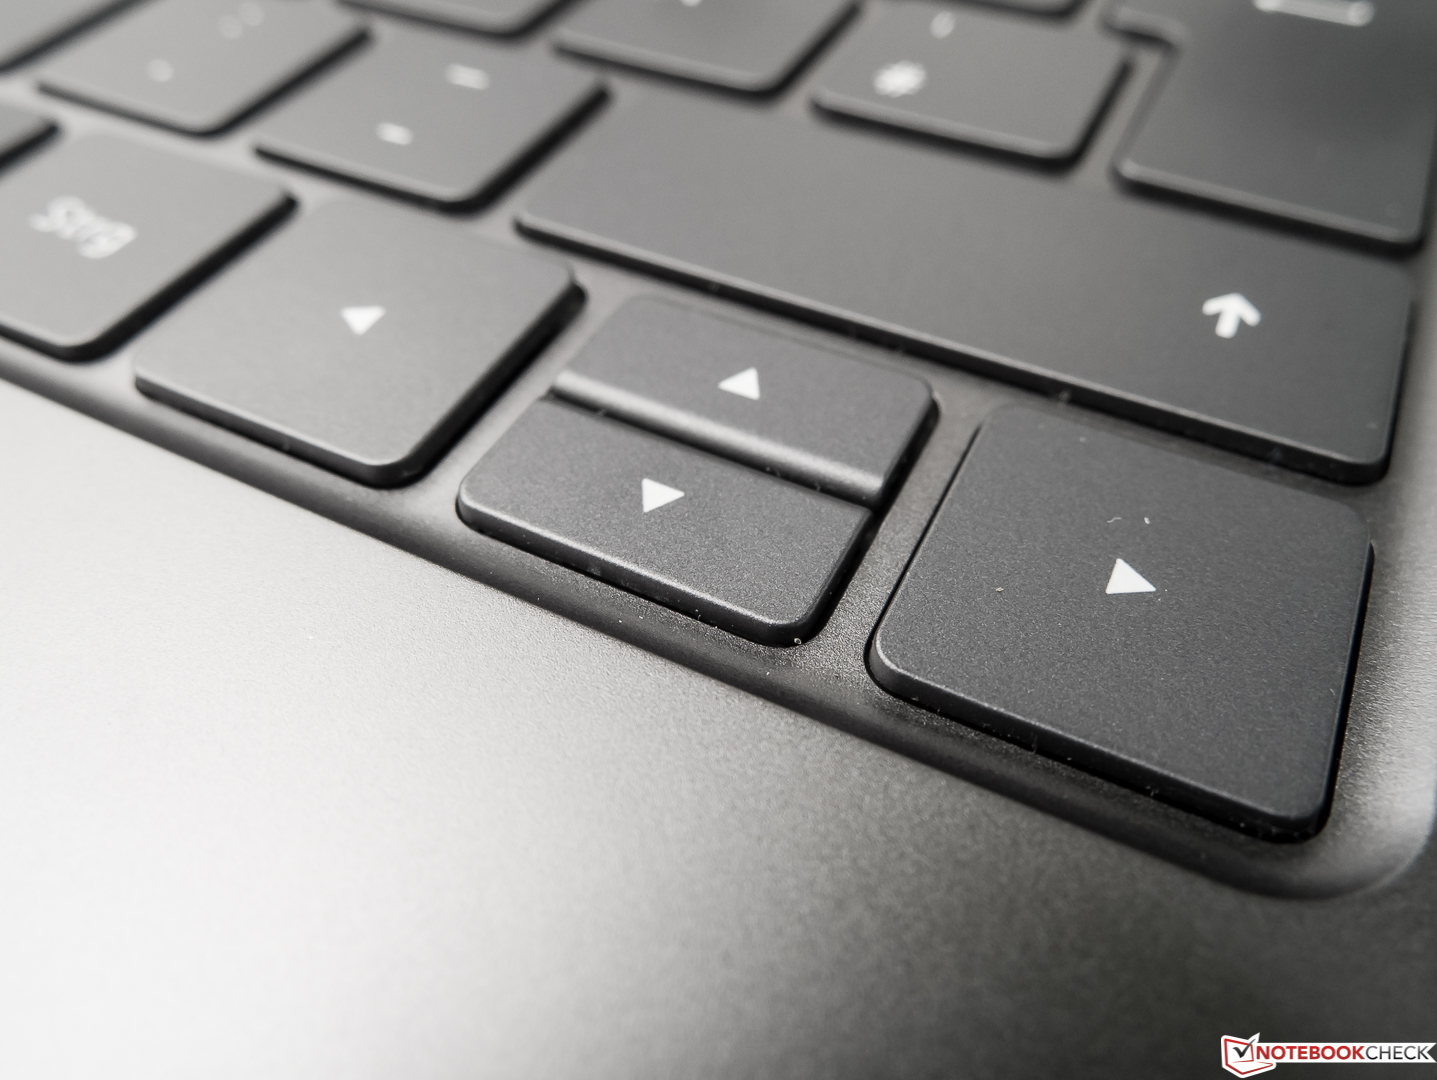
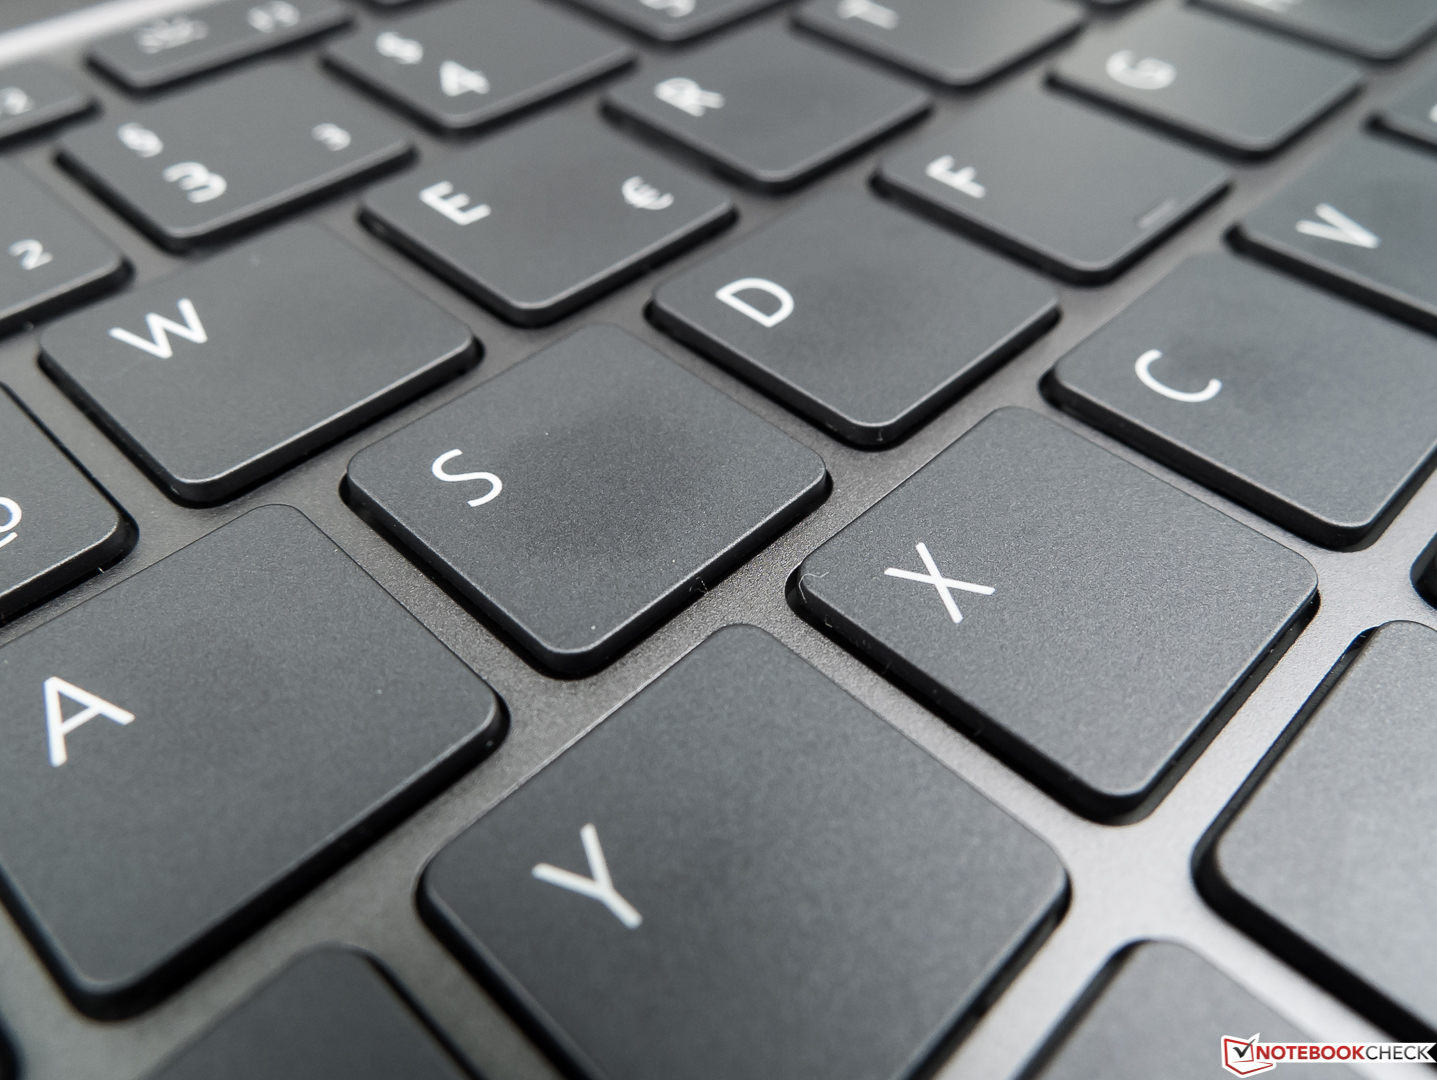
Klavyeye alışmanız kolay olacaktır. Bunun dışında yüksek güç tüketimi ve bataryanın hayal kırıklığı yaratması kısmı bir BIOS güncellemesi ile iyileştirilebilir ve Huawei'nin bunu kesinlikle iyileştirmesi gerekli.
Cihazın bağlantı olanaklarının kısıtlılığı ise dahili adaptörü kullanmaya sizi mecbur bırakıyor. Belki kasanın tasarımından ötürü bu şekilde bir çözüm üretilmiştir. Gerçekten iyi iş çıkaran ekranın tek zayıflığı ise biraz yüksek sayılabilecek siyahlık değeri ve elbette yansıtmalı yüzeyi.
Eğer Huawei yüksek güç tüketimi ve düşük batarya ömrünü biraz olsun iyileştirebilirse daha iyi bir sonuca imza atabilir. Ama şu anki puanlaması bile gayet iyi.
Huawei MateBook X
- 07/26/2017 v6 (old)
Sven Kloevekorn