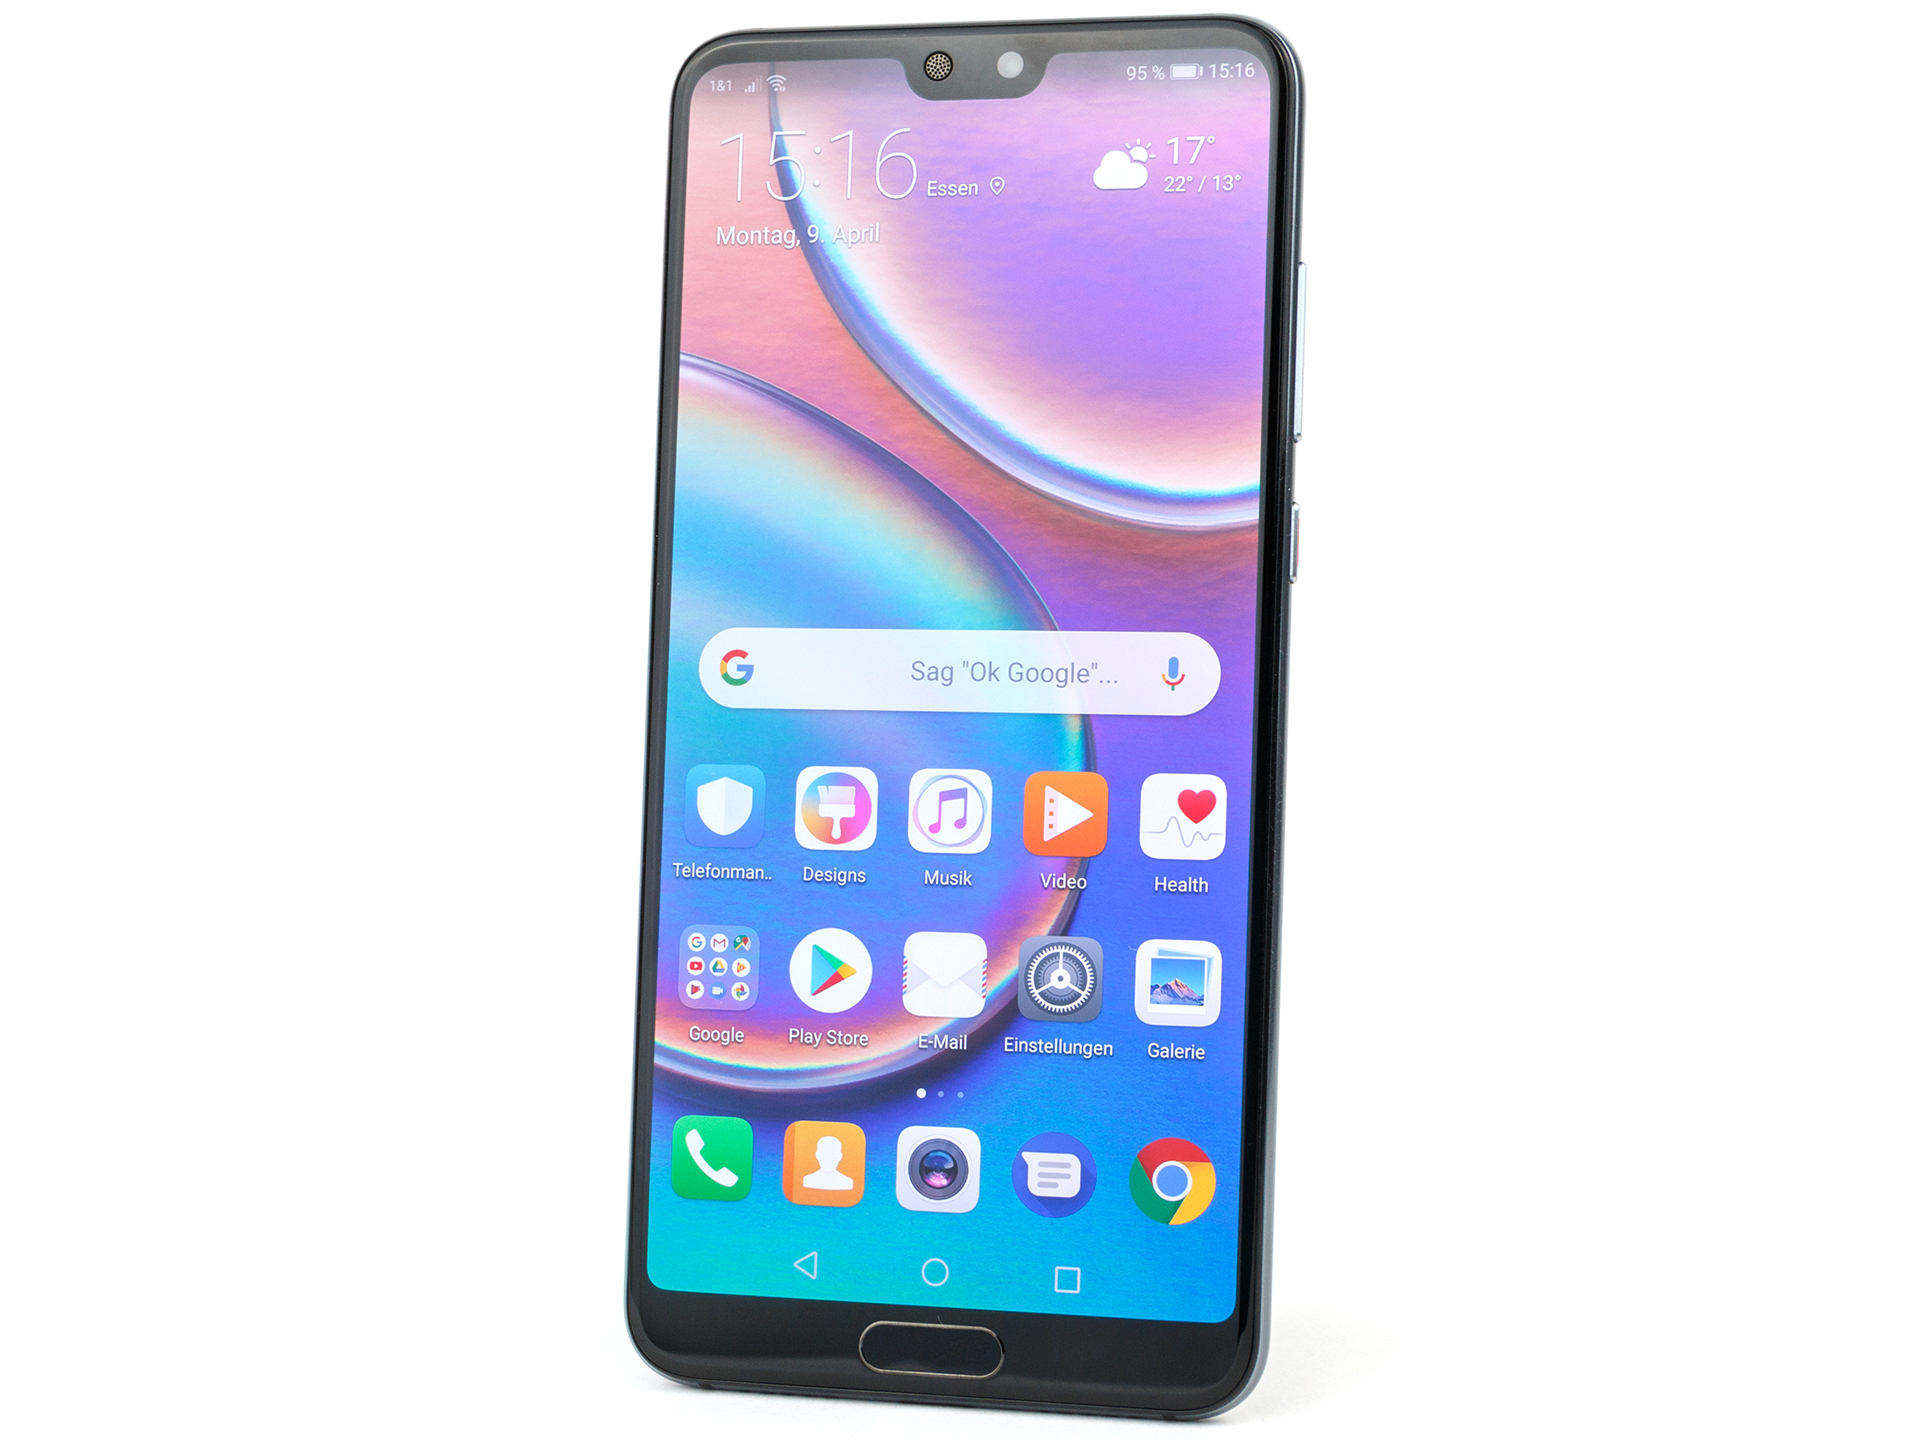
Kısa inceleme: Huawei P20 Pro


| |||||||||||||||||||||||||
Aydınlatma: 95 %
Batarya modunda parlaklık: 569 cd/m²
Kontrast: ∞:1 (Siyah: 0 cd/m²)
ΔE ColorChecker Calman: 1.3 | ∀{0.5-29.43 Ø4.73}
ΔE Greyscale Calman: 1.6 | ∀{0.09-98 Ø4.97}
Gamma: 2.31
CCT: 6401 K
| Huawei P20 Pro OLED, 2240x1080, 6.1" | Huawei P10 Plus LTPS, 2560x1440, 5.5" | Apple iPhone X Super AMOLED, 2436x1125, 5.8" | Samsung Galaxy S9 Plus Super AMOLED, 2960x1440, 6.2" | Google Pixel 2 XL P-OLED, 2880x1440, 6" | LG V30 OLED, 2880x1440, 6" | OnePlus 5T AMOLED, 2160x1080, 6" | HTC U11 Plus Super LCD 6, 2880x1440, 6" | |
|---|---|---|---|---|---|---|---|---|
| Screen | -38% | -4% | -38% | -64% | -136% | -39% | -55% | |
| Brightness middle (cd/m²) | 569 | 568 0% | 600 5% | 565 -1% | 415 -27% | 432 -24% | 425 -25% | 361 -37% |
| Brightness (cd/m²) | 578 | 562 -3% | 606 5% | 571 -1% | 420 -27% | 428 -26% | 423 -27% | 356 -38% |
| Brightness Distribution (%) | 95 | 92 -3% | 94 -1% | 96 1% | 87 -8% | 87 -8% | 92 -3% | 90 -5% |
| Black Level * (cd/m²) | 0.43 | 0.21 | ||||||
| Colorchecker dE 2000 * | 1.3 | 2.4 -85% | 1.2 8% | 2.3 -77% | 2.7 -108% | 4.18 -222% | 2.1 -62% | 2.5 -92% |
| Colorchecker dE 2000 max. * | 2.1 | 3.8 -81% | 3 -43% | 4.8 -129% | 4.3 -105% | 8.53 -306% | 3.4 -62% | 5.3 -152% |
| Greyscale dE 2000 * | 1.6 | 2.5 -56% | 1.6 -0% | 1.9 -19% | 3.3 -106% | 5.3 -231% | 2.5 -56% | 1.7 -6% |
| Gamma | 2.31 95% | 2.37 93% | 2.23 99% | 2.16 102% | 2.36 93% | 2.33 94% | 2.32 95% | 2.21 100% |
| CCT | 6401 102% | 6779 96% | 6707 97% | 6332 103% | 6787 96% | 7487 87% | 6455 101% | 6580 99% |
| Contrast (:1) | 1321 | 1719 |
* ... daha küçük daha iyidir
Ekran Titremesi / PWM (Darbe Genişliği Modülasyonu)
| Ekran titriyor / PWM algılandı | 238.1 Hz | 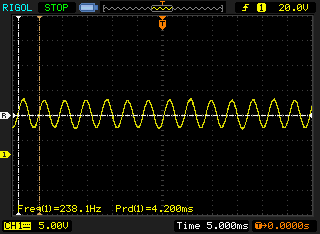 | |
Ekran arka ışığı 238.1 Hz'de titriyor (en kötü durum, örneğin PWM kullanılması) . 238.1 Hz frekansı nispeten düşüktür, bu nedenle hassas kullanıcılar belirtilen parlaklık ayarında ve altında muhtemelen titremeyi fark edecek ve göz yorgunluğu yaşayacaktır. Karşılaştırıldığında: Test edilen tüm cihazların %52 %'si ekranı karartmak için PWM kullanmıyor. PWM tespit edilirse, ortalama 7801 (minimum: 5 - maksimum: 343500) Hz ölçüldü. | |||
Yanıt Sürelerini Görüntüle
| ↔ Tepki Süresi Siyahtan Beyaza | ||
|---|---|---|
| 4 ms ... yükseliş ↗ ve sonbahar↘ birleşimi | ↗ 2 ms yükseliş | 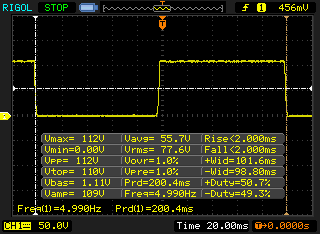 |
| ↘ 2 ms sonbahar | ||
| Ekran, testlerimizde çok hızlı yanıt oranları gösteriyor ve hızlı oyun oynamaya çok uygun olmalı. Karşılaştırıldığında, test edilen tüm cihazlar 0.1 (minimum) ile 240 (maksimum) ms arasında değişir. » Tüm cihazların 16 %'si daha iyi. Bu, ölçülen yanıt süresinin test edilen tüm cihazların ortalamasından (19.9 ms) daha iyi olduğu anlamına gelir. | ||
| ↔ Tepki Süresi %50 Griden %80 Griye | ||
| 4 ms ... yükseliş ↗ ve sonbahar↘ birleşimi | ↗ 2 ms yükseliş | 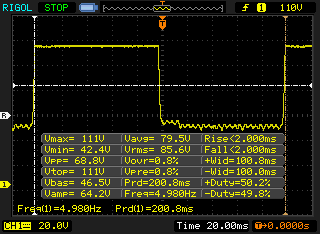 |
| ↘ 2 ms sonbahar | ||
| Ekran, testlerimizde çok hızlı yanıt oranları gösteriyor ve hızlı oyun oynamaya çok uygun olmalı. Karşılaştırıldığında, test edilen tüm cihazlar 0.165 (minimum) ile 636 (maksimum) ms arasında değişir. » Tüm cihazların 15 %'si daha iyi. Bu, ölçülen yanıt süresinin test edilen tüm cihazların ortalamasından (31.1 ms) daha iyi olduğu anlamına gelir. | ||
| Lightmark - 1920x1080 1080p (değere göre sırala) | |
| Huawei P20 Pro | |
| Huawei Mate 10 Pro | |
| Samsung Galaxy S9 Plus | |
| HTC U11 Plus | |
| Google Pixel 2 XL | |
| Ortalama HiSilicon Kirin 970 (21.5 - 25.9, n=2) | |
| Basemark ES 3.1 / Metal - offscreen Overall Score (değere göre sırala) | |
| Huawei P20 Pro | |
| Huawei Mate 10 Pro | |
| Samsung Galaxy S9 Plus | |
| Apple iPhone X | |
| HTC U11 Plus | |
| Google Pixel 2 XL | |
| Ortalama HiSilicon Kirin 970 (788 - 887, n=2) | |
| Sınıf ortalaması Smartphone (544 - 7731, n=24, son 2 yıl) | |
| JetStream 1.1 - 1.1 Total | |
| Apple iPhone X (IOS 11.1.1) | |
| Samsung Galaxy S9 Plus (Samsung Browser 7.0) | |
| OnePlus 5T (Chrome 63) | |
| HTC U11 Plus (Chrome 63) | |
| Google Pixel 2 XL (Chrome 62) | |
| Huawei P10 Plus | |
| Huawei P20 Pro (Chrome 65) | |
| Huawei Mate 10 Pro (Chrome 61) | |
| LG V30 (Chrome 62) | |
| Ortalama HiSilicon Kirin 970 (33.1 - 58.6, n=8) | |
| Octane V2 - Total Score | |
| Sınıf ortalaması Smartphone (2800 - 126661, n=160, son 2 yıl) | |
| Apple iPhone X (IOS 11.1.2) | |
| Samsung Galaxy S9 Plus (Samsung Browser 7.0) | |
| OnePlus 5T (Chrome 63) | |
| Huawei P20 Pro (Chrome 65) | |
| HTC U11 Plus (Chrome 63) | |
| Google Pixel 2 XL (Chrome 62) | |
| LG V30 (Chrome 62) | |
| Huawei Mate 10 Pro (Chrome 61) | |
| Huawei P10 Plus (Chrome 58.0.3029.83) | |
| Ortalama HiSilicon Kirin 970 (6692 - 11838, n=8) | |
| Mozilla Kraken 1.1 - Total | |
| Ortalama HiSilicon Kirin 970 (3591 - 6221, n=8) | |
| Huawei P20 Pro (Chrome 65) | |
| LG V30 (Chrome 62) | |
| Huawei Mate 10 Pro (Chrome 61) | |
| Google Pixel 2 XL (Chrome 62) | |
| HTC U11 Plus (Chrome 63) | |
| Huawei P10 Plus (Chrome 58.0.3029.83) | |
| OnePlus 5T (Chrome 63) | |
| Samsung Galaxy S9 Plus (Samsung Browser 7.0) | |
| Sınıf ortalaması Smartphone (257 - 28190, n=138, son 2 yıl) | |
| Apple iPhone X (IOS 11.1.2) | |
| WebXPRT 2015 - Overall | |
| Apple iPhone X (Safari Mobile 11.0) | |
| Google Pixel 2 XL (Chrome 62) | |
| Huawei P20 Pro (Chrome 65) | |
| OnePlus 5T (Chrome 63) | |
| HTC U11 Plus (Chrome 63) | |
| Ortalama HiSilicon Kirin 970 (119 - 187, n=8) | |
| Samsung Galaxy S9 Plus (Samsung Browser 7.0) | |
| Huawei Mate 10 Pro (Chrome 61) | |
| Huawei P10 Plus | |
| LG V30 (Chrome 62) | |
* ... daha küçük daha iyidir
| Huawei P20 Pro | Huawei P10 Plus | Samsung Galaxy S9 Plus | OnePlus 5T | Google Pixel 2 XL | LG V30 | Ortalama 128 GB UFS 2.1 Flash | Sınıf ortalaması Smartphone | |
|---|---|---|---|---|---|---|---|---|
| AndroBench 3-5 | -2% | -24% | -26% | -20% | -41% | 9% | 324% | |
| Sequential Read 256KB (MB/s) | 832 | 733 -12% | 819 -2% | 699 -16% | 760 -9% | 669 -20% | 762 ? -8% | 2258 ? 171% |
| Sequential Write 256KB (MB/s) | 196.7 | 182.6 -7% | 204.9 4% | 203.4 3% | 195.3 -1% | 193.2 -2% | 300 ? 53% | 1938 ? 885% |
| Random Read 4KB (MB/s) | 144.3 | 173.1 20% | 129.7 -10% | 138.1 -4% | 170.6 18% | 78.2 -46% | 154.7 ? 7% | 310 ? 115% |
| Random Write 4KB (MB/s) | 160.5 | 149.8 -7% | 22.74 -86% | 20 -88% | 17.84 -89% | 10.21 -94% | 131.1 ? -18% | 363 ? 126% |
| Real Racing 3 | |||
| Ayarlar | Değer | ||
| high | 51 fps | ||
| World of Tanks Blitz | |||
| Ayarlar | Değer | ||
| high, 0xAA, 0xAF | 60 fps | ||
| Shadow Fight 3 | |||
| Ayarlar | Değer | ||
| minimal | 60 fps | ||
(+) Üst taraftaki maksimum sıcaklık, 35.3 °C / 96 F ortalamasına kıyasla 35.6 °C / 96 F'dir. , Smartphone sınıfı için 21.9 ile 247 °C arasında değişir.
(+) Alt kısım, 34 °C / 93 F ortalamasına kıyasla maksimum 34.3 °C / 94 F'ye kadar ısınır
(+) Boşta kullanımda, üst tarafın ortalama sıcaklığı 29.6 °C / 85 F olup, cihazın 32.9 °C / 91 F.
Huawei P20 Pro ses analizi
(+) | hoparlörler nispeten yüksek sesle çalabilir (84.9 dB)
Bas 100 - 315Hz
(-) | neredeyse hiç bas yok - ortalama olarak medyandan 21% daha düşük
(±) | Bas doğrusallığı ortalamadır (9.5% delta - önceki frekans)
Ortalar 400 - 2000 Hz
(±) | daha yüksek ortalar - ortalama olarak medyandan 5% daha yüksek
(±) | Ortaların doğrusallığı ortalamadır (7.2% delta - önceki frekans)
Yüksekler 2 - 16 kHz
(±) | daha yüksek en yüksekler - ortalama olarak medyandan 5.6% daha yüksek
(+) | yüksekler doğrusaldır (4.5% deltadan önceki frekansa)
Toplam 100 - 16.000 Hz
(±) | Genel sesin doğrusallığı ortalamadır (20.1% ortancaya göre fark)
Aynı sınıfla karşılaştırıldığında
» Bu sınıftaki tüm test edilen cihazların %33%'si daha iyi, 9% benzer, 58% daha kötüydü
» En iyisinin deltası 11% idi, ortalama 34% idi, en kötüsü 134% idi
Test edilen tüm cihazlarla karşılaştırıldığında
» Test edilen tüm cihazların %52'si daha iyi, 8 benzer, % 40 daha kötüydü
» En iyisinin deltası 4% idi, ortalama 24% idi, en kötüsü 134% idi
Samsung Galaxy S9 Plus ses analizi
(+) | hoparlörler nispeten yüksek sesle çalabilir (85.6 dB)
Bas 100 - 315Hz
(-) | neredeyse hiç bas yok - ortalama olarak medyandan 22.8% daha düşük
(±) | Bas doğrusallığı ortalamadır (12.2% delta - önceki frekans)
Ortalar 400 - 2000 Hz
(+) | dengeli ortalar - medyandan yalnızca 3.2% uzakta
(+) | orta frekanslar doğrusaldır (3.2% deltadan önceki frekansa)
Yüksekler 2 - 16 kHz
(+) | dengeli yüksekler - medyandan yalnızca 4.4% uzakta
(+) | yüksekler doğrusaldır (4.8% deltadan önceki frekansa)
Toplam 100 - 16.000 Hz
(±) | Genel sesin doğrusallığı ortalamadır (17.3% ortancaya göre fark)
Aynı sınıfla karşılaştırıldığında
» Bu sınıftaki tüm test edilen cihazların %12%'si daha iyi, 8% benzer, 80% daha kötüydü
» En iyisinin deltası 11% idi, ortalama 34% idi, en kötüsü 134% idi
Test edilen tüm cihazlarla karşılaştırıldığında
» Test edilen tüm cihazların %32'si daha iyi, 8 benzer, % 59 daha kötüydü
» En iyisinin deltası 4% idi, ortalama 24% idi, en kötüsü 134% idi
Apple iPhone X ses analizi
(+) | hoparlörler nispeten yüksek sesle çalabilir (85.3 dB)
Bas 100 - 315Hz
(±) | azaltılmış bas - ortalama olarak medyandan 14.9% daha düşük
(±) | Bas doğrusallığı ortalamadır (9.4% delta - önceki frekans)
Ortalar 400 - 2000 Hz
(+) | dengeli ortalar - medyandan yalnızca 3.4% uzakta
(+) | orta frekanslar doğrusaldır (5.1% deltadan önceki frekansa)
Yüksekler 2 - 16 kHz
(±) | daha yüksek en yüksekler - ortalama olarak medyandan 7.3% daha yüksek
(+) | yüksekler doğrusaldır (4.6% deltadan önceki frekansa)
Toplam 100 - 16.000 Hz
(±) | Genel sesin doğrusallığı ortalamadır (19% ortancaya göre fark)
Aynı sınıfla karşılaştırıldığında
» Bu sınıftaki tüm test edilen cihazların %24%'si daha iyi, 9% benzer, 66% daha kötüydü
» En iyisinin deltası 11% idi, ortalama 34% idi, en kötüsü 134% idi
Test edilen tüm cihazlarla karşılaştırıldığında
» Test edilen tüm cihazların %45'si daha iyi, 7 benzer, % 48 daha kötüydü
» En iyisinin deltası 4% idi, ortalama 24% idi, en kötüsü 134% idi
| Kapalı / Bekleme modu | |
| Boşta | |
| Çalışırken |
|
Key:
min: | |
| Huawei P20 Pro 4000 mAh | Huawei P10 Plus 3750 mAh | Samsung Galaxy S9 Plus 3500 mAh | Apple iPhone X 2716 mAh | HTC U11 Plus 3930 mAh | Google Pixel 2 XL 3520 mAh | LG V30 3300 mAh | Ortalama HiSilicon Kirin 970 | Sınıf ortalaması Smartphone | |
|---|---|---|---|---|---|---|---|---|---|
| Power Consumption | -132% | -21% | -66% | -55% | -74% | -44% | -88% | -106% | |
| Idle Minimum * (Watt) | 0.84 | 1.03 -23% | 0.68 19% | 1.03 -23% | 0.51 39% | 1.28 -52% | 0.72 14% | 0.978 ? -16% | 0.872 ? -4% |
| Idle Average * (Watt) | 1.54 | 2.61 -69% | 0.95 38% | 2.4 -56% | 1.62 -5% | 1.87 -21% | 1.37 11% | 2.12 ? -38% | 1.461 ? 5% |
| Idle Maximum * (Watt) | 1.57 | 2.83 -80% | 1.09 31% | 2.6 -66% | 1.87 -19% | 1.89 -20% | 1.41 10% | 2.51 ? -60% | 1.647 ? -5% |
| Load Average * (Watt) | 2.47 | 7.03 -185% | 4.58 -85% | 2.96 -20% | 3.92 -59% | 3.73 -51% | 3.46 -40% | 5.01 ? -103% | 6.78 ? -174% |
| Load Maximum * (Watt) | 2.49 | 10.08 -305% | 5.16 -107% | 6.6 -165% | 8.27 -232% | 8.08 -224% | 7.83 -214% | 8.1 ? -225% | 11.3 ? -354% |
* ... daha küçük daha iyidir
| Huawei P20 Pro 4000 mAh | Huawei P10 Plus 3750 mAh | Samsung Galaxy S9 Plus 3500 mAh | HTC U11 Plus 3930 mAh | Apple iPhone X 2716 mAh | Google Pixel 2 XL 3520 mAh | LG V30 3300 mAh | OnePlus 5T 3300 mAh | Huawei Mate 10 Pro 4000 mAh | |
|---|---|---|---|---|---|---|---|---|---|
| Pil Çalışma Süresi | -14% | -25% | -16% | -29% | -13% | -1% | -7% | 11% | |
| Reader / Idle (h) | 28.8 | 27.6 -4% | 22.4 -22% | 27.1 -6% | 21.5 -25% | 28.4 -1% | 31.9 11% | 29.2 1% | 29.1 1% |
| H.264 (h) | 13.1 | 12.6 -4% | 11.2 -15% | 10.2 -22% | 10.6 -19% | 11.2 -15% | 13.7 5% | 13.3 2% | 15.5 18% |
| WiFi v1.3 (h) | 12.4 | 12.7 2% | 8.7 -30% | 10.1 -19% | 9.4 -24% | 9.7 -22% | 12.9 4% | 12 -3% | 13.6 10% |
| Load (h) | 5.8 | 2.9 -50% | 4 -31% | 4.9 -16% | 3 -48% | 5 -14% | 4.5 -22% | 4.3 -26% | 6.6 14% |
Artılar
Eksiler
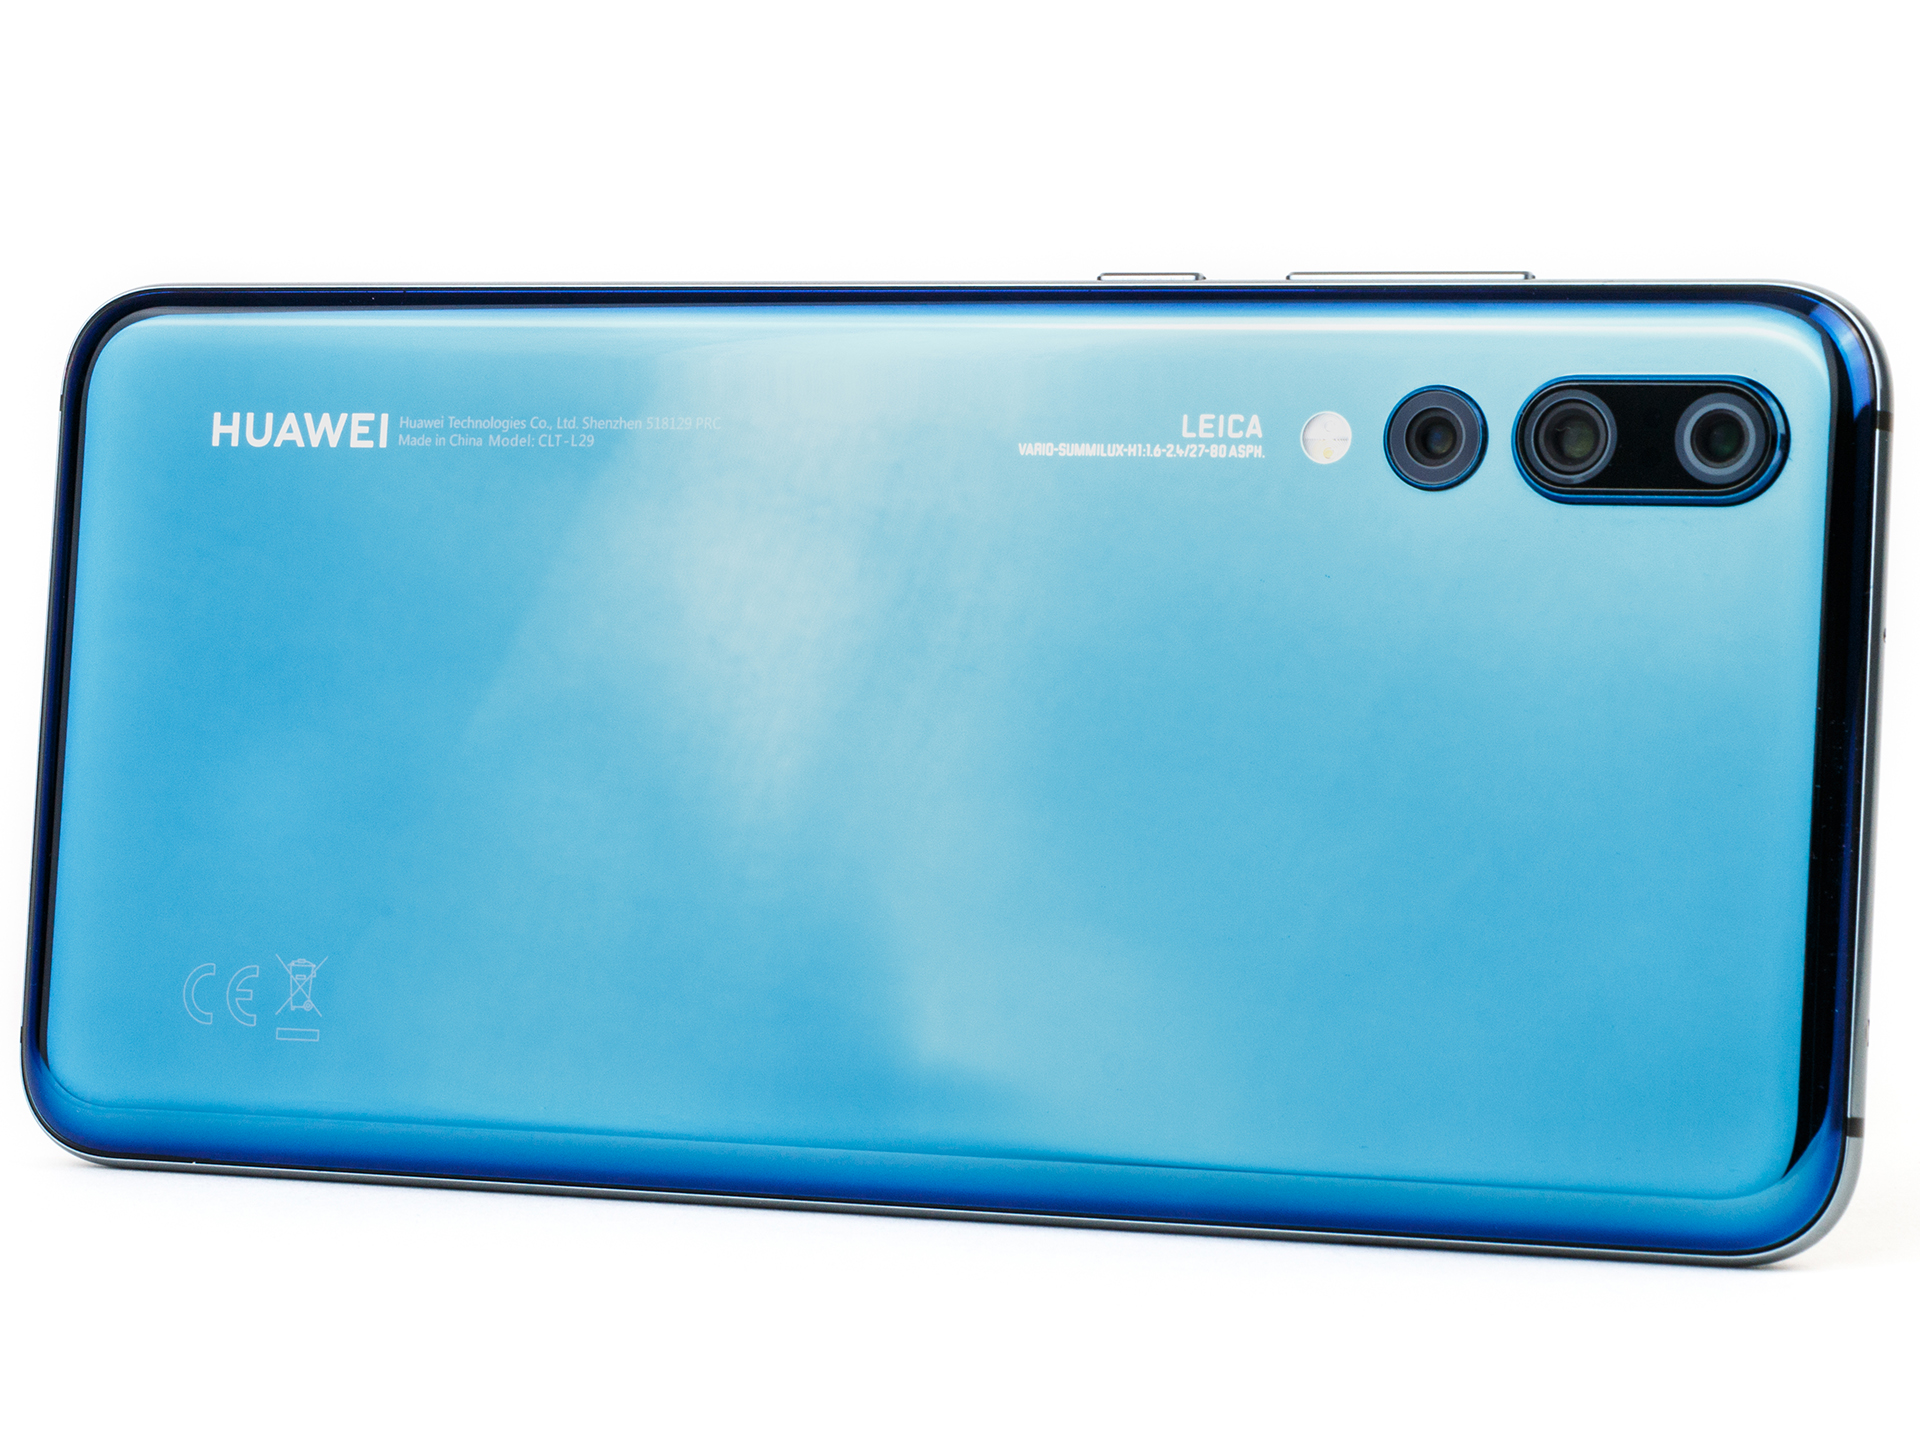
Huawei P20 Pro harika bir akıllı telefon. Temel olarak Mate 10 Pro alınıp, bazı şeylerin daha iyi yapıldığını söylemek mümkün. Mate 10 Pro estetik olarak hoş bir tasarıma, daha iyi arama kalitesine ve daha uzun batarya ömrüne şu sıralar daha ucuz bir fiyata sahip diyebiliriz. P20 Pro ise 3lü Leica kamerası ile tüm rekabeti yerle bir ediyor.
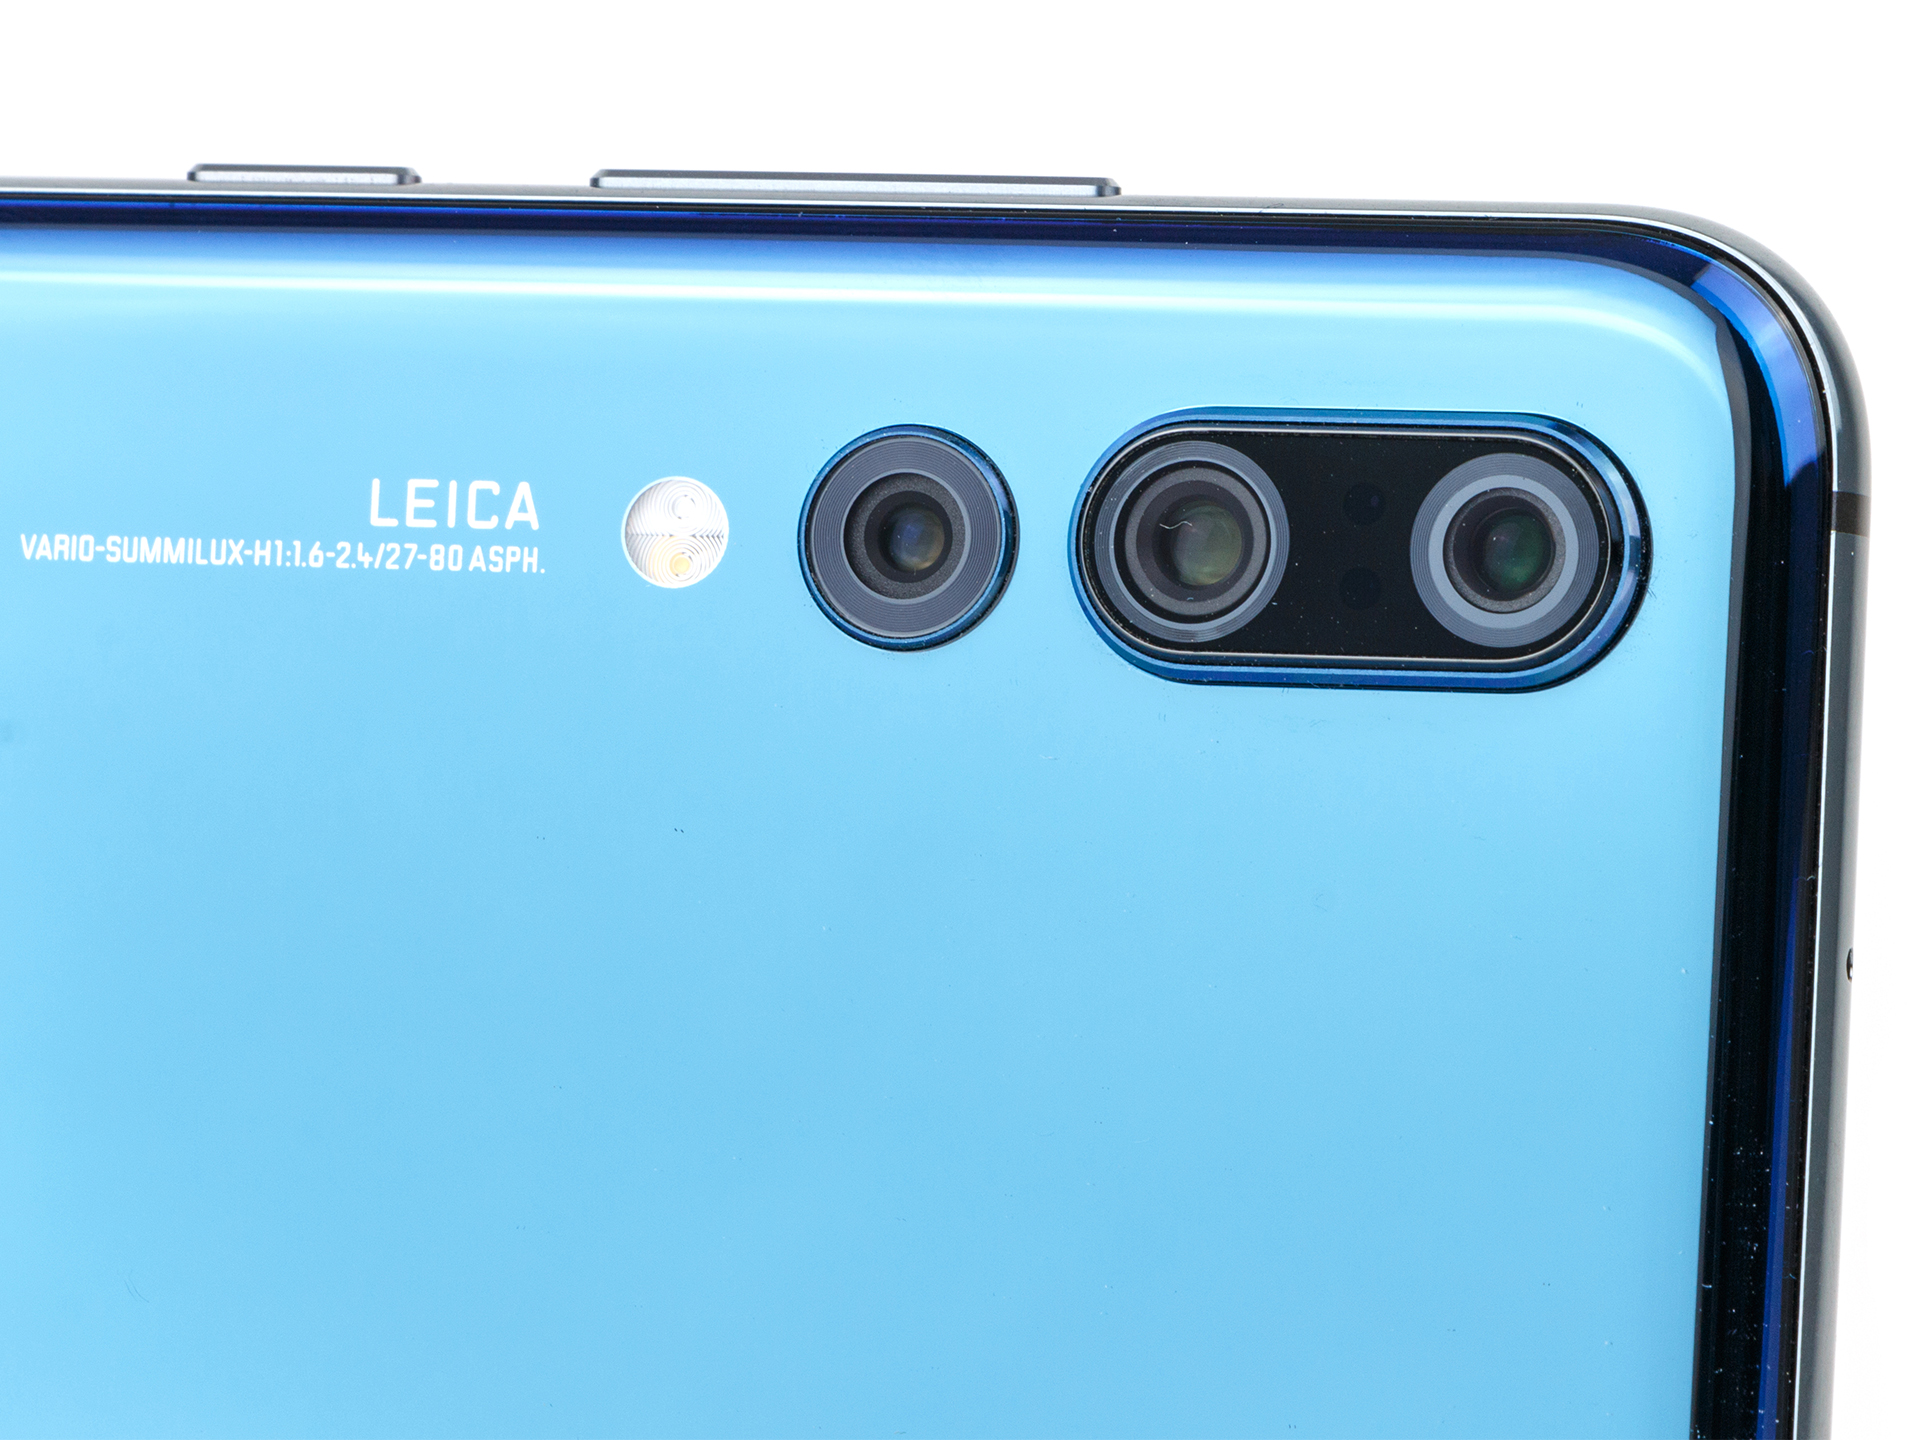
Üçlü Leica kamerası ile P20 Pro diğer tüm rakiplerin kameralarının kıyaslanacağı yeni standardı belirliyor.
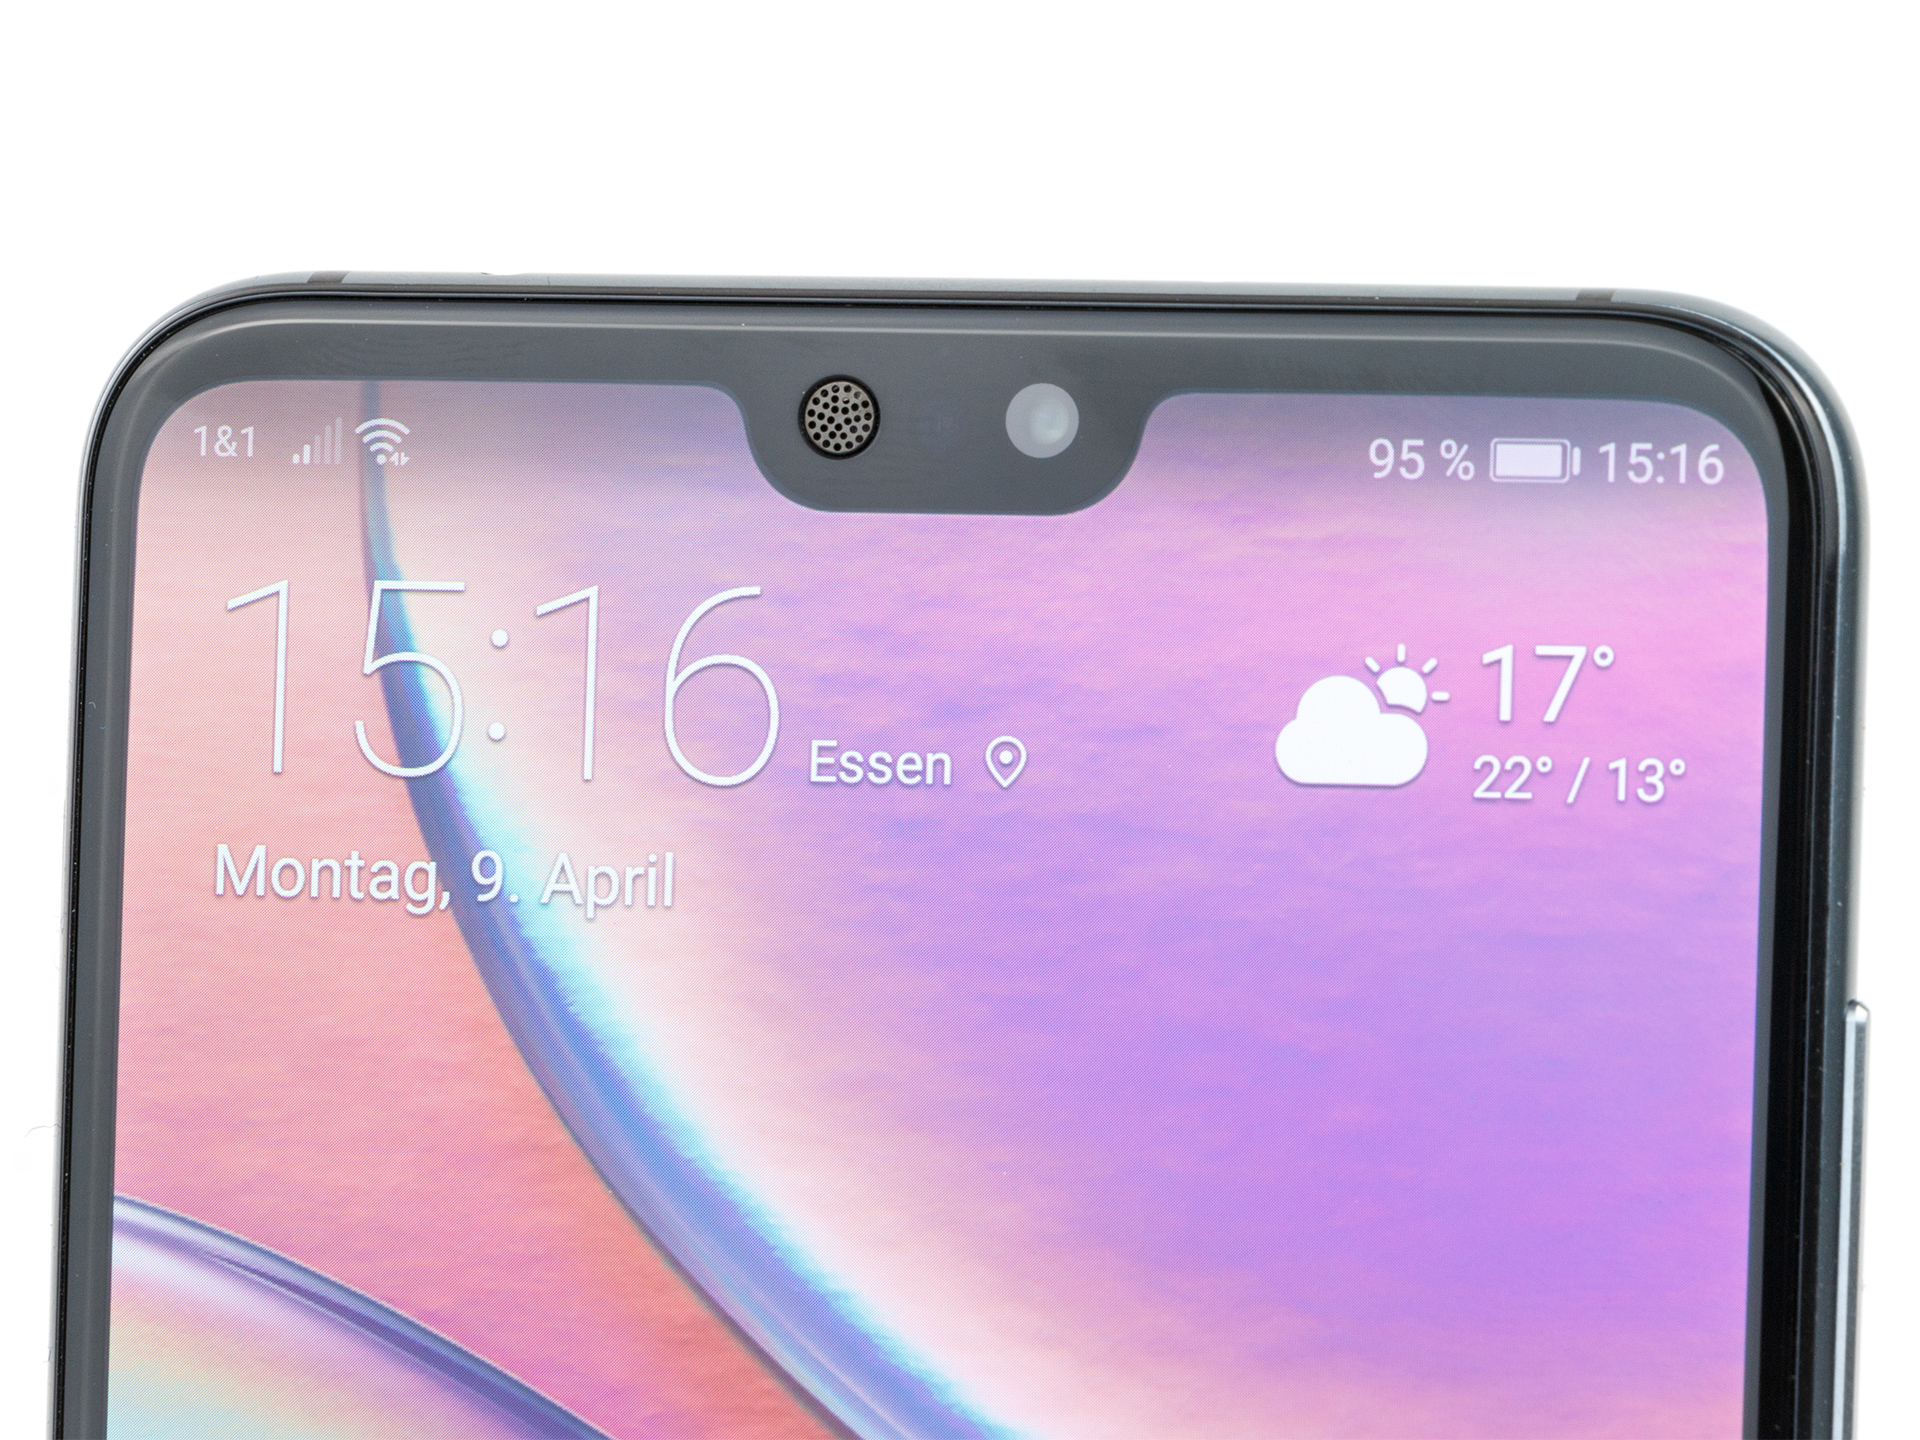
Cihazın donanımı da takdire şayan. Kirin 970 gibi hızlı bir sistem çipi, yeterince depolama alanı, MIMO WiFi, IP67 sertifikası, güçlü LTE performansı. 4000 mAh batarya ve etkileyici ekran. Tabi kulaklık çıkışının olmayışı, depolama alanının arttırılamaması, 1440p ekranın olmaması gibi dezavantajları da mevcut.
Tüm bunlara karşın Leica kameraları ile P20 Pro sadece uygun koşullarda değil düşük ışık gibi ortamlarda bile harika resimler çekmenize olanak sağlıyor. Video kaydı belki daha iyi olabilirdi, mesela 60 fps de Ultra HD video kaydı mümkün değil. Ama genel olarak P20 Pro tüm akıllı telefonlar arasında en iyi kameraya sahip.
Yazının orjinali için tıklayın.
Huawei P20 Pro
- 04/19/2018 v6 (old)
Daniel Schmidt
Price comparison
