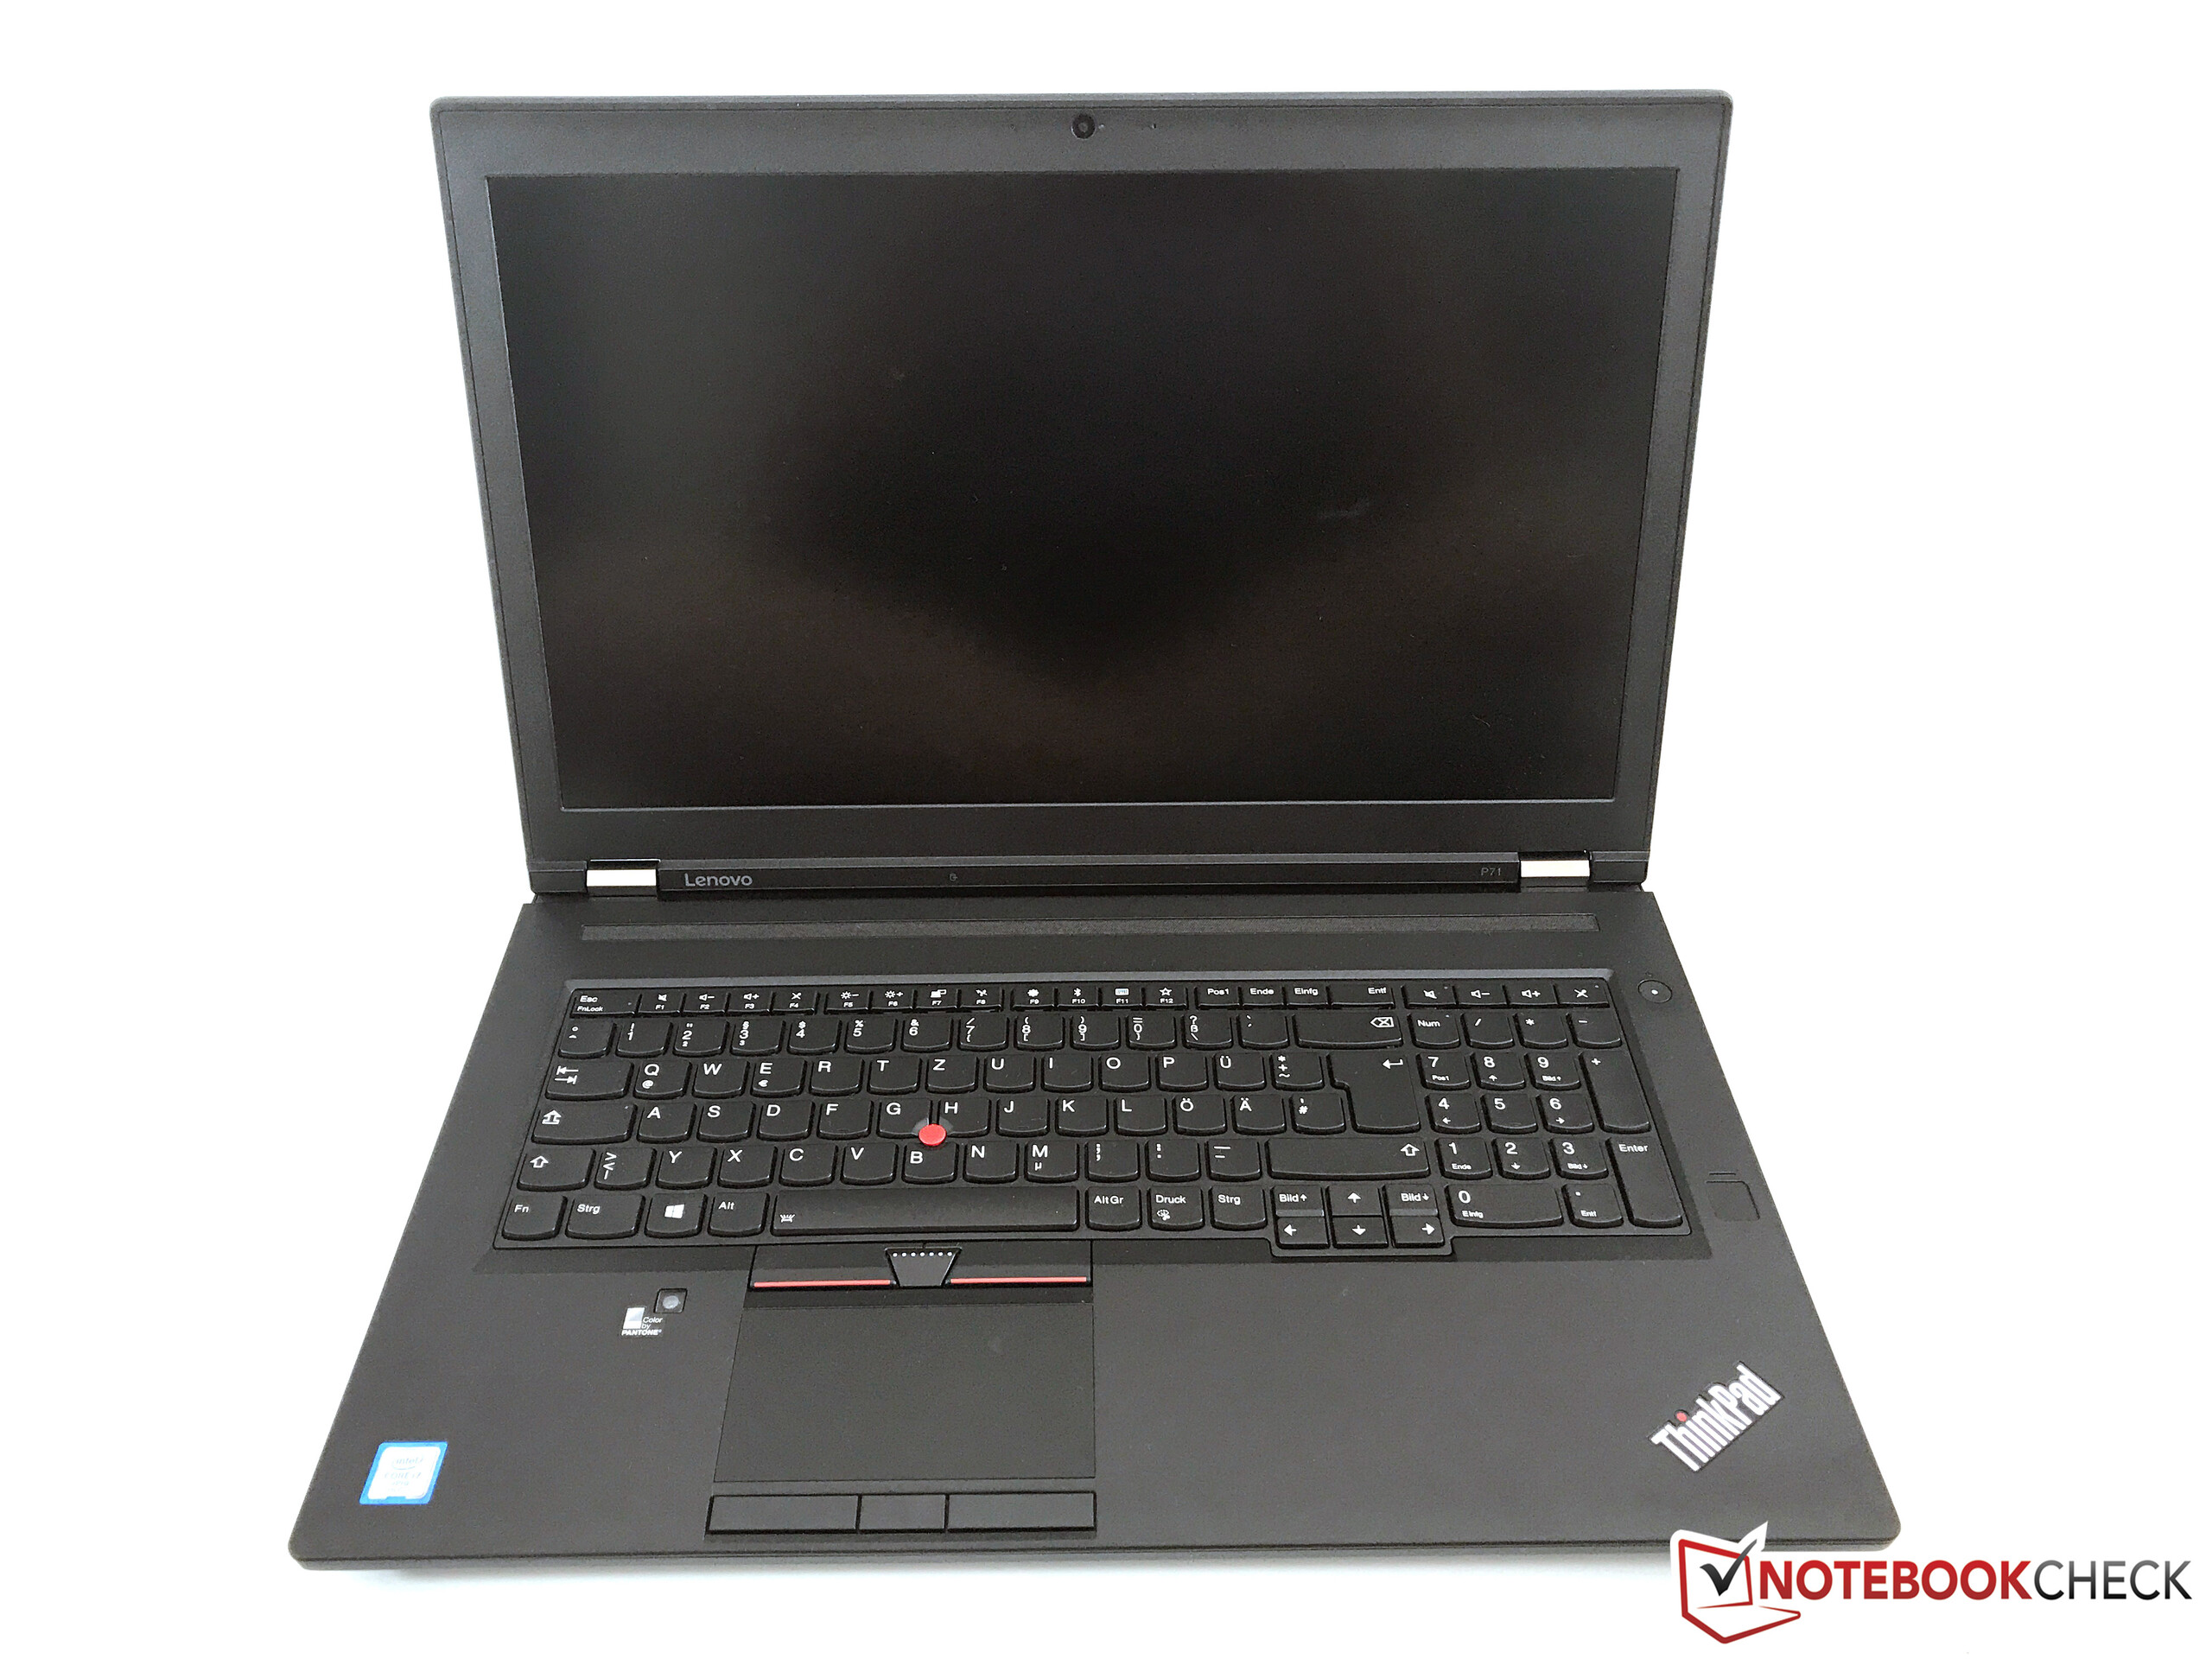
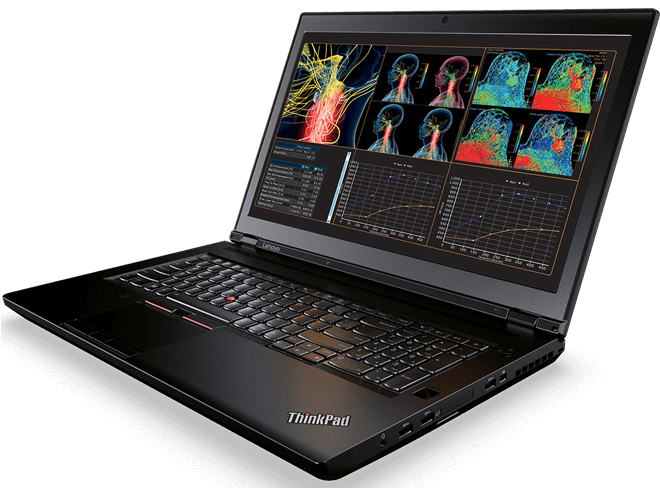
Kısa inceleme: Lenovo ThinkPad P71 (i7, P3000, 4K) çalışma istasyonu
| SD Card Reader | |
| average JPG Copy Test (av. of 3 runs) | |
| HP ZBook 17 G4-Y3J82AV | |
| Lenovo ThinkPad P71-20HK0004GE | |
| Fujitsu Celsius H970 | |
| MSI WE72 7RJ | |
| maximum AS SSD Seq Read Test (1GB) | |
| Lenovo ThinkPad P71-20HK0004GE | |
| HP ZBook 17 G4-Y3J82AV | |
| Fujitsu Celsius H970 | |
| MSI WE72 7RJ | |
| Networking | |
| iperf3 transmit AX12 | |
| HP ZBook 17 G4-Y3J82AV | |
| Dell Precision 7720 | |
| Lenovo ThinkPad P71-20HK0004GE | |
| Fujitsu Celsius H970 | |
| MSI WE72 7RJ | |
| iperf3 receive AX12 | |
| Fujitsu Celsius H970 | |
| Lenovo ThinkPad P71-20HK0004GE | |
| HP ZBook 17 G4-Y3J82AV | |
| Dell Precision 7720 | |
| MSI WE72 7RJ | |
| |||||||||||||||||||||||||
Aydınlatma: 83 %
Batarya modunda parlaklık: 363 cd/m²
Kontrast: 1155:1 (Siyah: 0.31 cd/m²)
ΔE ColorChecker Calman: 2.1 | ∀{0.5-29.43 Ø4.73}
ΔE Greyscale Calman: 2 | ∀{0.09-98 Ø4.97}
99.97% sRGB (Argyll 1.6.3 3D)
77% AdobeRGB 1998 (Argyll 1.6.3 3D)
Gamma: 2.16
CCT: 6216 K
| Lenovo ThinkPad P71-20HK0004GE LEN4123, VVX17P051J00, , 3840x2160, 17.3" | Lenovo ThinkPad P70-20ER000XUS Panasonic VVX17P051J00 / LEN4123, , 3840x2160, 17.3" | MSI WE72 7RJ LP173WF4-SPF1, , 1920x1080, 17.3" | Fujitsu Celsius H970 LP173WF4-SPF3, , 1920x1080, 17.3" | HP ZBook 17 G4-Y3J82AV Sharp SHP144C, , 3840x2160, 17.3" | Dell Precision 7720 SHP1446 (LQ173D1), , 3840x2160, 17.3" | |
|---|---|---|---|---|---|---|
| Display | ||||||
| Display P3 Coverage (%) | 67.4 | 66.8 | 88 | 87.6 | ||
| sRGB Coverage (%) | 85.3 | 84.6 | 100 | 100 | ||
| AdobeRGB 1998 Coverage (%) | 62.4 | 61.8 | 99.6 | 99.2 | ||
| Response Times | -3% | -15% | 2% | -56% | -77% | |
| Response Time Grey 50% / Grey 80% * (ms) | 39.2 ? | 34.8 ? 11% | 45.2 ? -15% | 32 ? 18% | 56.8 ? -45% | 60 ? -53% |
| Response Time Black / White * (ms) | 23.2 ? | 26.8 ? -16% | 26.4 ? -14% | 26.4 ? -14% | 38.4 ? -66% | 46.4 ? -100% |
| PWM Frequency (Hz) | 1412 ? | 219.3 ? | 1020 ? | 1020 ? | ||
| Screen | -26% | -73% | -66% | 10% | -21% | |
| Brightness middle (cd/m²) | 358 | 332 -7% | 302 -16% | 368 3% | 391 9% | 464 30% |
| Brightness (cd/m²) | 338 | 317 -6% | 306 -9% | 360 7% | 360 7% | 441 30% |
| Brightness Distribution (%) | 83 | 86 4% | 93 12% | 91 10% | 87 5% | 89 7% |
| Black Level * (cd/m²) | 0.31 | 0.397 -28% | 0.31 -0% | 0.3 3% | 0.35 -13% | 0.45 -45% |
| Contrast (:1) | 1155 | 836 -28% | 974 -16% | 1227 6% | 1117 -3% | 1031 -11% |
| Colorchecker dE 2000 * | 2.1 | 3.15 -50% | 6.2 -195% | 6.4 -205% | 1.3 38% | 3.2 -52% |
| Colorchecker dE 2000 max. * | 3.6 | 5.55 -54% | 10.6 -194% | 10.1 -181% | 2.5 31% | 6.1 -69% |
| Greyscale dE 2000 * | 2 | 3.72 -86% | 7.3 -265% | 7.2 -260% | 1.8 10% | 4.2 -110% |
| Gamma | 2.16 102% | 1.86 118% | 2.08 106% | 2.02 109% | 2.11 104% | 2.01 109% |
| CCT | 6216 105% | 6103 107% | 7020 93% | 6882 94% | 6461 101% | 6736 96% |
| Color Space (Percent of AdobeRGB 1998) (%) | 77 | 74.3 -4% | 56 -27% | 55.5 -28% | 87.9 14% | 88.1 14% |
| Color Space (Percent of sRGB) (%) | 99.97 | 100 0% | 85.2 -15% | 84.4 -16% | 100 0% | 100 0% |
| Toplam Ortalama (Program / Ayarlar) | -15% /
-22% | -44% /
-63% | -32% /
-55% | -23% /
-1% | -49% /
-30% |
* ... daha küçük daha iyidir
Yanıt Sürelerini Görüntüle
| ↔ Tepki Süresi Siyahtan Beyaza | ||
|---|---|---|
| 23.2 ms ... yükseliş ↗ ve sonbahar↘ birleşimi | ↗ 11.6 ms yükseliş | 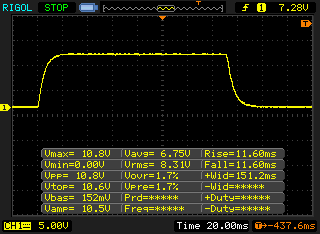 |
| ↘ 11.6 ms sonbahar | ||
| Ekran, testlerimizde iyi yanıt oranları gösteriyor ancak rekabetçi oyuncular için çok yavaş olabilir. Karşılaştırıldığında, test edilen tüm cihazlar 0.1 (minimum) ile 240 (maksimum) ms arasında değişir. » Tüm cihazların 53 %'si daha iyi. Bu, ölçülen yanıt süresinin test edilen tüm cihazların ortalamasından (19.9 ms) daha kötü olduğu anlamına gelir. | ||
| ↔ Tepki Süresi %50 Griden %80 Griye | ||
| 39.2 ms ... yükseliş ↗ ve sonbahar↘ birleşimi | ↗ 20.4 ms yükseliş | 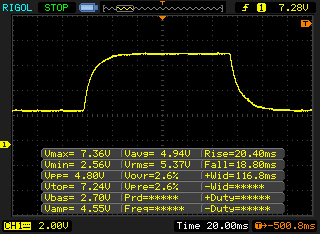 |
| ↘ 18.8 ms sonbahar | ||
| Ekran, testlerimizde yavaş yanıt oranları gösteriyor ve oyuncular için yetersiz olacaktır. Karşılaştırıldığında, test edilen tüm cihazlar 0.165 (minimum) ile 636 (maksimum) ms arasında değişir. » Tüm cihazların 60 %'si daha iyi. Bu, ölçülen yanıt süresinin test edilen tüm cihazların ortalamasından (31.1 ms) daha kötü olduğu anlamına gelir. | ||
Ekran Titremesi / PWM (Darbe Genişliği Modülasyonu)
| Ekran titriyor / PWM algılandı | 1412 Hz | ≤ 90 % parlaklık ayarı | 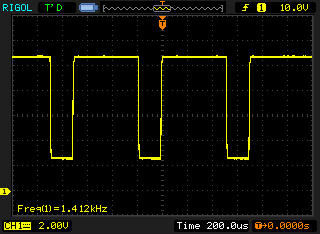 |
Ekran arka ışığı 1412 Hz'de titriyor (en kötü durum, örneğin PWM kullanılması) 90 % ve altındaki parlaklık ayarında titreme algılandı. Bu parlaklık ayarının üzerinde titreme veya PWM olmamalıdır. 1412 Hz frekansı oldukça yüksektir, bu nedenle PWM'ye duyarlı çoğu kullanıcı herhangi bir titremeyi fark etmemelidir. Karşılaştırıldığında: Test edilen tüm cihazların %52 %'si ekranı karartmak için PWM kullanmıyor. PWM tespit edilirse, ortalama 7791 (minimum: 5 - maksimum: 343500) Hz ölçüldü. | |||
| Cinebench R15 | |
| CPU Single 64Bit | |
| Dell Precision 7720 | |
| HP ZBook 17 G4-Y3J82AV | |
| Lenovo ThinkPad P51 20HH0016GE | |
| Fujitsu Celsius H970 | |
| HP ZBook Studio G4-Y6K17EA | |
| Lenovo ThinkPad P71-20HK0004GE | |
| MSI WE72 7RJ | |
| CPU Multi 64Bit | |
| Dell Precision 7720 | |
| HP ZBook 17 G4-Y3J82AV | |
| Lenovo ThinkPad P51 20HH0016GE | |
| Lenovo ThinkPad P71-20HK0004GE | |
| MSI WE72 7RJ | |
| HP ZBook Studio G4-Y6K17EA | |
| Fujitsu Celsius H970 | |
| PCMark 8 | |
| Creative Score Accelerated v2 | |
| HP ZBook 17 G4-Y3J82AV | |
| Fujitsu Celsius H970 | |
| Lenovo ThinkPad P71-20HK0004GE | |
| Dell Precision 7720 | |
| Home Score Accelerated v2 | |
| HP ZBook 17 G4-Y3J82AV | |
| MSI WE72 7RJ | |
| Dell Precision 7720 | |
| Lenovo ThinkPad P71-20HK0004GE | |
| PCMark 8 Home Score Accelerated v2 | 3578 puan | |
| PCMark 8 Creative Score Accelerated v2 | 6402 puan | |
Yardım | ||
| Lenovo ThinkPad P71-20HK0004GE Samsung PM961 NVMe MZVLW512HMJP | MSI WE72 7RJ Samsung SM961 MZVPW256 m.2 PCI-e | Fujitsu Celsius H970 Samsung SM961 MZVKW512HMJP m.2 PCI-e | HP ZBook 17 G4-Y3J82AV Samsung SSD SM961 1TB M.2 MZVKW1T0HMLH | Dell Precision 7720 Toshiba NVMe THNSN5512GPU7 | |
|---|---|---|---|---|---|
| CrystalDiskMark 3.0 | -5% | -17% | -8% | -7% | |
| Read Seq (MB/s) | 1628 | 1492 -8% | 1821 12% | 1767 9% | 1532 -6% |
| Write Seq (MB/s) | 1512 | 1512 0% | 1622 7% | 1662 10% | 1187 -21% |
| Read 512 (MB/s) | 880 | 312.6 -64% | 395.5 -55% | 406.7 -54% | 1227 39% |
| Write 512 (MB/s) | 1197 | 1483 24% | 1258 5% | 1197 0% | 1287 8% |
| Read 4k (MB/s) | 61.2 | 59.9 -2% | 42.86 -30% | 54.9 -10% | 45.33 -26% |
| Write 4k (MB/s) | 177 | 184.2 4% | 87.4 -51% | 159.3 -10% | 145 -18% |
| Read 4k QD32 (MB/s) | 667 | 681 2% | 590 -12% | 660 -1% | 590 -12% |
| Write 4k QD32 (MB/s) | 574 | 590 3% | 522 -9% | 549 -4% | 467 -19% |

| 3DMark 11 - 1280x720 Performance GPU | |
| HP ZBook 17 G4-Y3J82AV | |
| Dell Precision 7720 | |
| Fujitsu Celsius H970 | |
| MSI GF72VR 7RF | |
| Lenovo ThinkPad P71-20HK0004GE | |
| Lenovo ThinkPad P70-20ER000XUS | |
| Lenovo Legion Y520-15IKBN 80WK0042GE | |
| Dell Precision 7710 | |
| HP ZBook 17 G3 TZV66eA | |
| MSI WE72 7RJ | |
| 3DMark - 1920x1080 Fire Strike Graphics | |
| Dell Precision 7720 | |
| HP ZBook 17 G4-Y3J82AV | |
| Fujitsu Celsius H970 | |
| MSI GF72VR 7RF | |
| Lenovo ThinkPad P71-20HK0004GE | |
| Lenovo Legion Y520-15IKBN 80WK0042GE | |
| Lenovo ThinkPad P70-20ER000XUS | |
| Dell Precision 7710 | |
| HP ZBook 17 G3 TZV66eA | |
| MSI WE72 7RJ | |
| Unigine Heaven 4.0 | |
| Extreme Preset OpenGL | |
| Dell Precision 7720 | |
| HP ZBook 17 G4-Y3J82AV | |
| Lenovo ThinkPad P71-20HK0004GE | |
| MSI WE72 7RJ | |
| Extreme Preset DX11 | |
| Dell Precision 7720 | |
| HP ZBook 17 G4-Y3J82AV | |
| Lenovo ThinkPad P71-20HK0004GE | |
| MSI WE72 7RJ | |
| Unigine Valley 1.0 | |
| 1920x1080 Extreme HD DirectX AA:x8 | |
| HP ZBook 17 G4-Y3J82AV | |
| Dell Precision 7720 | |
| Lenovo ThinkPad P71-20HK0004GE | |
| HP ZBook 17 G3 TZV66eA | |
| Dell Precision 7710 | |
| MSI WE72 7RJ | |
| 1920x1080 Extreme HD Preset OpenGL AA:x8 | |
| HP ZBook 17 G4-Y3J82AV | |
| Dell Precision 7720 | |
| Lenovo ThinkPad P71-20HK0004GE | |
| HP ZBook 17 G3 TZV66eA | |
| Dell Precision 7710 | |
| MSI WE72 7RJ | |
| SiSoft Sandra 2016 | |
| Image Processing | |
| Dell Precision 7720 | |
| HP ZBook 17 G4-Y3J82AV | |
| Dell Precision 7710 | |
| Lenovo ThinkPad P71-20HK0004GE | |
| HP ZBook 17 G3 TZV66eA | |
| GP Cryptography (Higher Security AES256+SHA2-512) | |
| HP ZBook 17 G4-Y3J82AV | |
| Dell Precision 7720 | |
| Lenovo ThinkPad P71-20HK0004GE | |
| HP ZBook 17 G3 TZV66eA | |
| Dell Precision 7710 | |
| GP Financial Analysis (FP High/Double Precision) | |
| Dell Precision 7720 | |
| HP ZBook 17 G4-Y3J82AV | |
| Dell Precision 7710 | |
| Lenovo ThinkPad P71-20HK0004GE | |
| HP ZBook 17 G3 TZV66eA | |
| 3DMark 06 1024x768 Score | 29440 puan | |
| 3DMark Vantage P Result | 33390 puan | |
| 3DMark 11 Performance | 10738 puan | |
| 3DMark Cloud Gate Standard Score | 24854 puan | |
| 3DMark Fire Strike Score | 8003 puan | |
| 3DMark Fire Strike Extreme Score | 4175 puan | |
| 3DMark Time Spy Score | 2999 puan | |
Yardım | ||
| düşük | orta | yüksek | ultra | 4K | |
|---|---|---|---|---|---|
| BioShock Infinite (2013) | 231.9 | 203.7 | 184.7 | 89.8 | |
| Dirt Rally (2015) | 233.9 | 129.8 | 80.7 | 71.6 | 61.8 |
| The Witcher 3 (2015) | 167.2 | 103.6 | 59.1 | 31.2 | 21.8 |
| Star Wars Battlefront (2015) | 180.9 | 156.4 | 82.5 | 70.3 | 27.4 |
| Rainbow Six Siege (2015) | 278.2 | 189.5 | 107.3 | 78.8 | 34.9 |
| Rise of the Tomb Raider (2016) | 176.4 | 107 | 59.4 | 50.3 | 21 |
| Deus Ex Mankind Divided (2016) | 103.7 | 77.6 | 43.3 | 22.9 | 14.5 |
| Battlefield 1 (2016) | 165.8 | 139.5 | 68.7 | 60.6 | 25.1 |
| Titanfall 2 (2016) | 143.8 | 136.8 | 66.3 | 53.9 | 21.1 |
| Call of Duty Infinite Warfare (2016) | 120.8 | 114.2 | 79.9 | 68.7 | 30.9 |
| For Honor (2017) | 199.7 | 87.1 | 81.6 | 57.3 | 24.8 |
| Ghost Recon Wildlands (2017) | 107.7 | 53.7 | 48.4 | 26 | 19.5 |
| Warhammer 40.000: Dawn of War III (2017) | 84 | 41.2 | 28.7 | 25.4 | 9.6 |
Ses yüksekliği
| Boşta |
| 29.2 / 29.2 / 32.2 dB |
| Çalışırken |
| 34.7 / 39.1 dB |
 | ||
30 dB sessiz 40 dB(A) duyulabilirlik 50 dB(A) gürültülü |
||
min: | ||
| Lenovo ThinkPad P71-20HK0004GE Quadro P3000, i7-7820HQ, Samsung PM961 NVMe MZVLW512HMJP | MSI WE72 7RJ Quadro M2200, i7-7700HQ, Samsung SM961 MZVPW256 m.2 PCI-e | Fujitsu Celsius H970 Quadro P4000, E3-1535M v6, Samsung SM961 MZVKW512HMJP m.2 PCI-e | HP ZBook 17 G4-Y3J82AV Quadro P5000, E3-1535M v6, Samsung SSD SM961 1TB M.2 MZVKW1T0HMLH | Dell Precision 7720 Quadro P5000, E3-1535M v6, Toshiba NVMe THNSN5512GPU7 | |
|---|---|---|---|---|---|
| Noise | -16% | -13% | -9% | -3% | |
| kapalı / ortam * (dB) | 29.2 | 29.3 -0% | 30.2 -3% | 29.6 -1% | 29.5 -1% |
| Idle Minimum * (dB) | 29.2 | 36.3 -24% | 30.2 -3% | 29.6 -1% | 29.5 -1% |
| Idle Average * (dB) | 29.2 | 36.3 -24% | 32.8 -12% | 31.7 -9% | 29.5 -1% |
| Idle Maximum * (dB) | 32.2 | 36.6 -14% | 32.8 -2% | 34.4 -7% | 29.5 8% |
| Load Average * (dB) | 34.7 | 40.4 -16% | 47.3 -36% | 41.3 -19% | 35 -1% |
| Load Maximum * (dB) | 39.1 | 46.6 -19% | 47.3 -21% | 45.6 -17% | 47.8 -22% |
| Witcher 3 ultra * (dB) | 45.6 | 41 |
* ... daha küçük daha iyidir
(±) Üst taraftaki maksimum sıcaklık, 38.2 °C / 101 F ortalamasına kıyasla 44 °C / 111 F'dir. , Workstation sınıfı için 22.2 ile 69.8 °C arasında değişir.
(±) Alt kısım, 41.1 °C / 106 F ortalamasına kıyasla maksimum 43.9 °C / 111 F'ye kadar ısınır
(+) Boşta kullanımda, üst tarafın ortalama sıcaklığı 27.1 °C / 81 F olup, cihazın 32 °C / 90 F.
(+) Avuç içi dayanakları ve dokunmatik yüzey, maksimum 30 °C / 86 F ile cilt sıcaklığından daha soğuktur ve bu nedenle dokunulduğunda soğuktur.
(-) Benzer cihazların avuç içi dayanağı alanının ortalama sıcaklığı 27.8 °C / 82 F (-2.2 °C / -4 F) idi.
Lenovo ThinkPad P71-20HK0004GE ses analizi
(-) | hoparlörler çok yüksek ses çıkarmıyor (70.9 dB)
Bas 100 - 315Hz
(±) | azaltılmış bas - ortalama olarak medyandan 12.4% daha düşük
(±) | Bas doğrusallığı ortalamadır (10.5% delta - önceki frekans)
Ortalar 400 - 2000 Hz
(±) | daha yüksek ortalar - ortalama olarak medyandan 5.9% daha yüksek
(+) | orta frekanslar doğrusaldır (6.4% deltadan önceki frekansa)
Yüksekler 2 - 16 kHz
(±) | azaltılmış yüksekler - ortalama olarak medyandan 5% daha düşük
(±) | Yükseklerin doğrusallığı ortalamadır (13.6% delta - önceki frekans)
Toplam 100 - 16.000 Hz
(±) | Genel sesin doğrusallığı ortalamadır (26.6% ortancaya göre fark)
Aynı sınıfla karşılaştırıldığında
» Bu sınıftaki tüm test edilen cihazların %90%'si daha iyi, 4% benzer, 6% daha kötüydü
» En iyisinin deltası 7% idi, ortalama 17% idi, en kötüsü 35% idi
Test edilen tüm cihazlarla karşılaştırıldığında
» Test edilen tüm cihazların %82'si daha iyi, 3 benzer, % 15 daha kötüydü
» En iyisinin deltası 4% idi, ortalama 24% idi, en kötüsü 134% idi
Fujitsu Celsius H970 ses analizi
(±) | hoparlör ses yüksekliği ortalama ama iyi (73.8 dB)
Bas 100 - 315Hz
(-) | neredeyse hiç bas yok - ortalama olarak medyandan 26.7% daha düşük
(+) | bas doğrusaldır (5.1% delta ile önceki frekans)
Ortalar 400 - 2000 Hz
(±) | azaltılmış orta sesler - ortalama olarak medyandan 5.4% daha düşük
(±) | Ortaların doğrusallığı ortalamadır (8.3% delta - önceki frekans)
Yüksekler 2 - 16 kHz
(+) | dengeli yüksekler - medyandan yalnızca 4.1% uzakta
(+) | yüksekler doğrusaldır (6.2% deltadan önceki frekansa)
Toplam 100 - 16.000 Hz
(±) | Genel sesin doğrusallığı ortalamadır (29.1% ortancaya göre fark)
Aynı sınıfla karşılaştırıldığında
» Bu sınıftaki tüm test edilen cihazların %96%'si daha iyi, 1% benzer, 3% daha kötüydü
» En iyisinin deltası 7% idi, ortalama 17% idi, en kötüsü 35% idi
Test edilen tüm cihazlarla karşılaştırıldığında
» Test edilen tüm cihazların %87'si daha iyi, 2 benzer, % 11 daha kötüydü
» En iyisinin deltası 4% idi, ortalama 24% idi, en kötüsü 134% idi
| Kapalı / Bekleme modu | |
| Boşta | |
| Çalışırken |
|
Key:
min: | |
| Lenovo ThinkPad P71-20HK0004GE i7-7820HQ, Quadro P3000, Samsung PM961 NVMe MZVLW512HMJP, IPS, 3840x2160, 17.3" | Lenovo ThinkPad P70 6820HQ, Quadro M3000M, Samsung SSD PM871 MZNLN512HCJH, IPS, 3840x2160, 17.3" | HP ZBook 17 G4-Y3J82AV E3-1535M v6, Quadro P5000, Samsung SSD SM961 1TB M.2 MZVKW1T0HMLH, IPS, 3840x2160, 17.3" | Dell Precision 7720 E3-1535M v6, Quadro P5000, Toshiba NVMe THNSN5512GPU7, IGZO, 3840x2160, 17.3" | MSI WE72 7RJ i7-7700HQ, Quadro M2200, Samsung SM961 MZVPW256 m.2 PCI-e, IPS, 1920x1080, 17.3" | Fujitsu Celsius H970 E3-1535M v6, Quadro P4000, Samsung SM961 MZVKW512HMJP m.2 PCI-e, IPS LED, 1920x1080, 17.3" | |
|---|---|---|---|---|---|---|
| Power Consumption | -16% | -27% | -22% | -24% | -5% | |
| Idle Minimum * (Watt) | 7.44 | 12.1 -63% | 12.9 -73% | 9.6 -29% | 15 -102% | 10.7 -44% |
| Idle Average * (Watt) | 18 | 19.7 -9% | 19.6 -9% | 20.5 -14% | 20.1 -12% | 15.8 12% |
| Idle Maximum * (Watt) | 21.8 | 20.5 6% | 23.6 -8% | 22.9 -5% | 23.8 -9% | 17.8 18% |
| Load Average * (Watt) | 77.1 | 94.3 -22% | 92.8 -20% | 96.8 -26% | 85.6 -11% | 92 -19% |
| Load Maximum * (Watt) | 150.5 | 139.6 7% | 190 -26% | 202.1 -34% | 128 15% | 137 9% |
| Witcher 3 ultra * (Watt) | 148.5 |
* ... daha küçük daha iyidir
| Lenovo ThinkPad P71-20HK0004GE i7-7820HQ, Quadro P3000, 96 Wh | Lenovo ThinkPad P70 6820HQ, Quadro M3000M, 96 Wh | HP ZBook 17 G4-Y3J82AV E3-1535M v6, Quadro P5000, 95 Wh | Dell Precision 7720 E3-1535M v6, Quadro P5000, 91 Wh | MSI WE72 7RJ i7-7700HQ, Quadro M2200, 51 Wh | Fujitsu Celsius H970 E3-1535M v6, Quadro P4000, 96 Wh | |
|---|---|---|---|---|---|---|
| Pil Çalışma Süresi | -15% | -17% | -7% | -55% | 22% | |
| Reader / Idle (h) | 14.5 | 7.7 -47% | 7.8 -46% | 11.4 -21% | 4.5 -69% | 16.7 15% |
| H.264 (h) | 8.6 | 7.5 -13% | 5.3 -38% | 6.8 -21% | 3 -65% | 9.6 12% |
| WiFi v1.3 (h) | 6 | 6 0% | 4.9 -18% | 6.3 5% | 3 -50% | 9 50% |
| Load (h) | 1.1 | 1.1 0% | 1.5 36% | 1.2 9% | 0.7 -36% | 1.2 9% |
Artılar
Eksiler
Eğer bozuk değilse, düzeltme. Lenovo'nun ThinkPad P71 için yaklaşımı bu olabilir. Önceki P70 modeli uzun bir süredir ortalıktaydı ve büyük sorunları yoktu.
Bu yıl bazı noktaların iyileştirilmiş olduğunu görüyoruz. 4K ekran konusunda bir değişiklik olmasa da renk kalibrasyonu daha iyi. Halen sağlam bir kasa, harika arayüzler ve iyi bir soğutma çözümü geliyor.
Bu da bizi bileşen bazındaki değişikliklere getiriyor. Yeni Kaby Lake işlemci eski Skylake modeline kıyasla ufak bir güncelleme. Ancak Quadro P3000 grafik kartı eski Quadro M3000M modeline göre daha hızlı ve daha verimli. Fanlar genellikle sessiz ve sıcaklık kritik seviyelere çıkmıyor. Daha güçlü bir grafik kartı kullanıldığında bu durum elbette değişebilir.
ThinkPad P71 modelinin ana özelliği yeni grafik kartı jenerasyonu. İyi soğutma çözümü, çok iyi ekranı ve harika arayüzleri sayesinde piyasadaki en iyi mobil çalışma istasyonlarından birine sahip oluyorsunuz.
Bu yıl çok büyük sorunlar bulamadık. Webcam nihayet bir güncelleme geçirmiş, böylesine büyük bir cihazda daha iyi hoparlörler beklerdik. Arada sırada da olsa işlemci sesi duymak biraz rahatsız edici, üstelik yoğun kullanımda bile fanlar pasif duruma geçebiliyorken.
Lenovo ThinkPad P71-20HK0004GE
- 10/22/2019 v7 (old)
Andreas Osthoff
Price comparison
