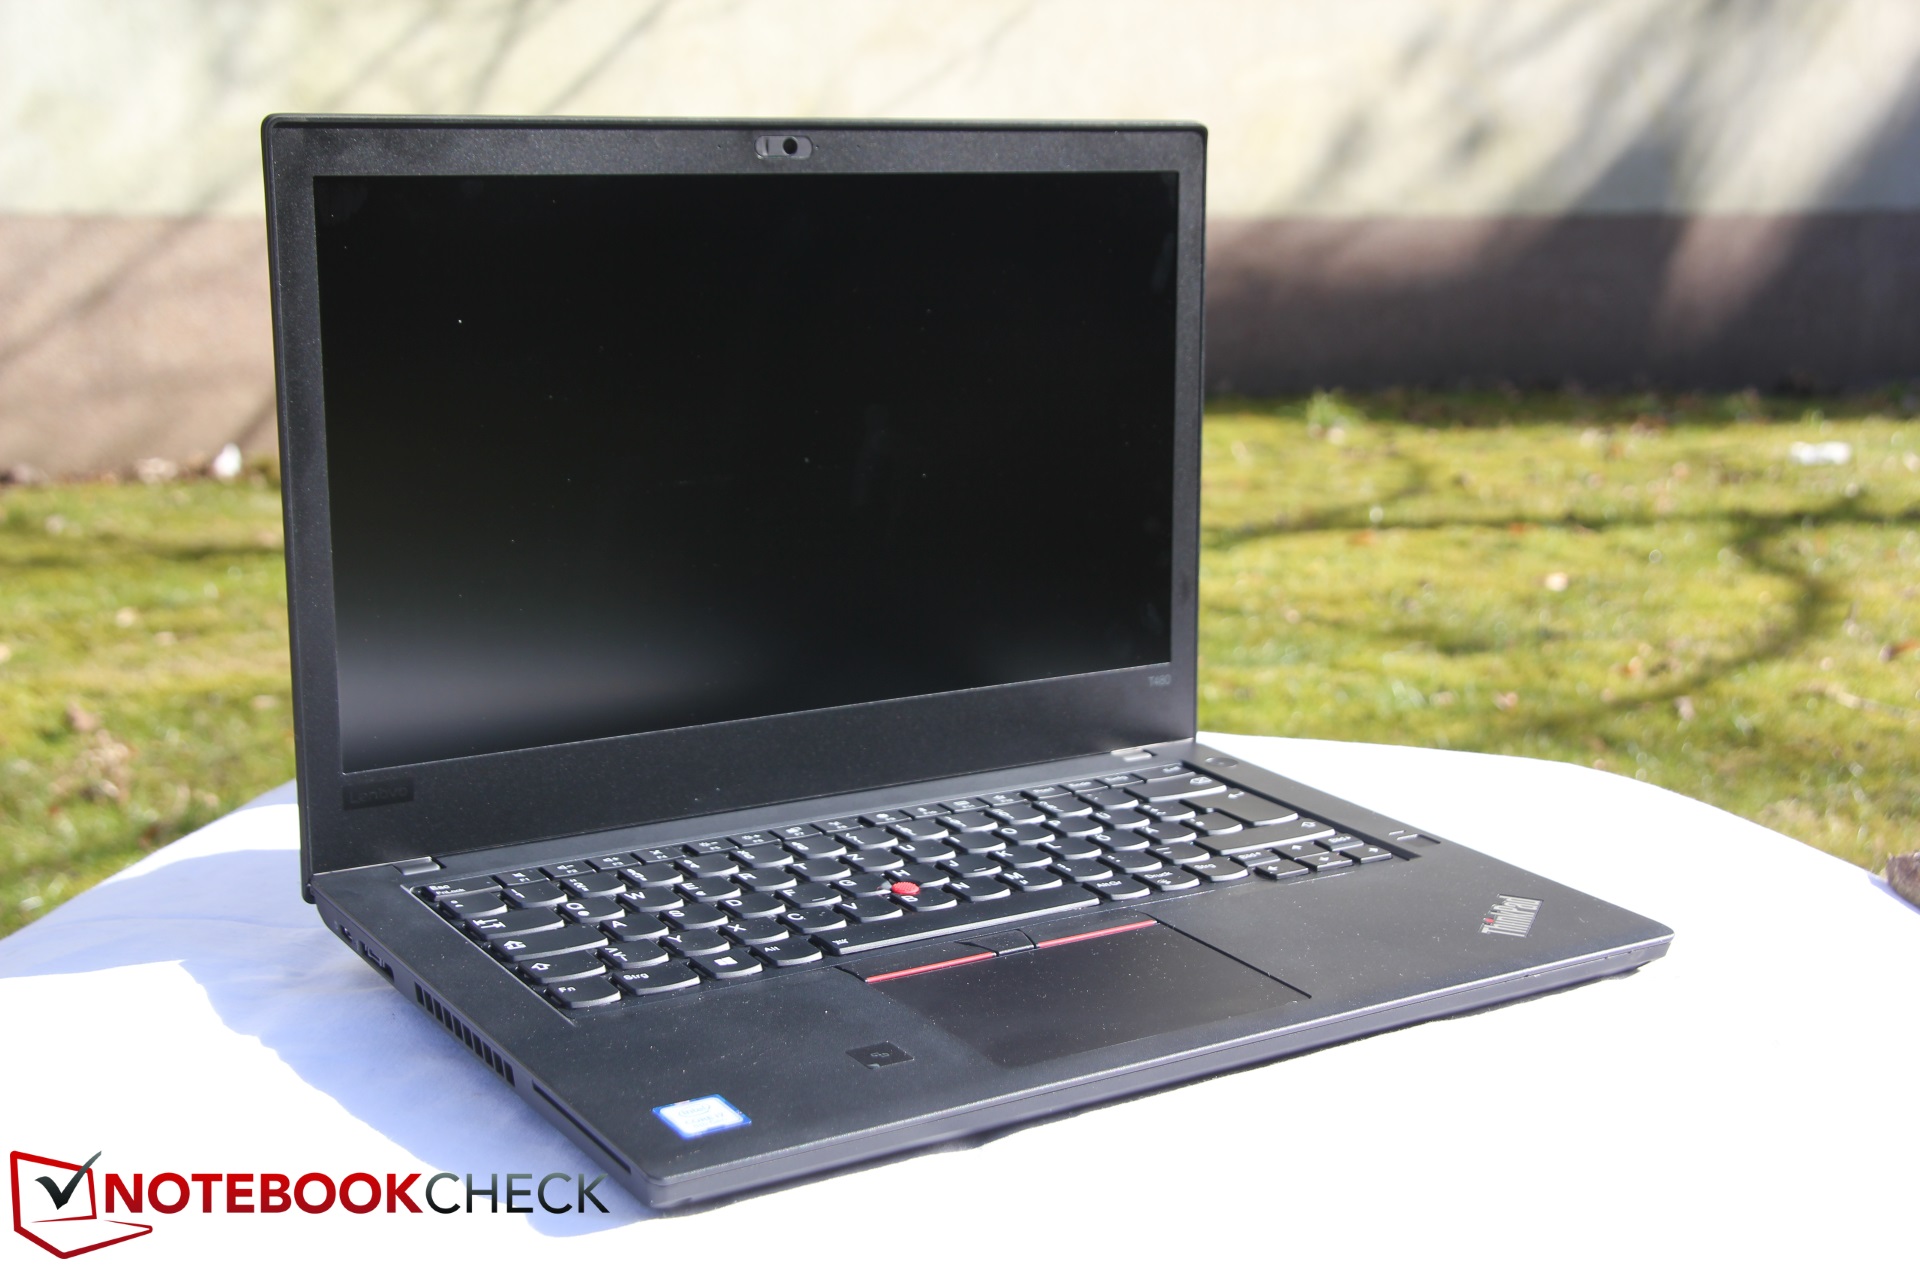
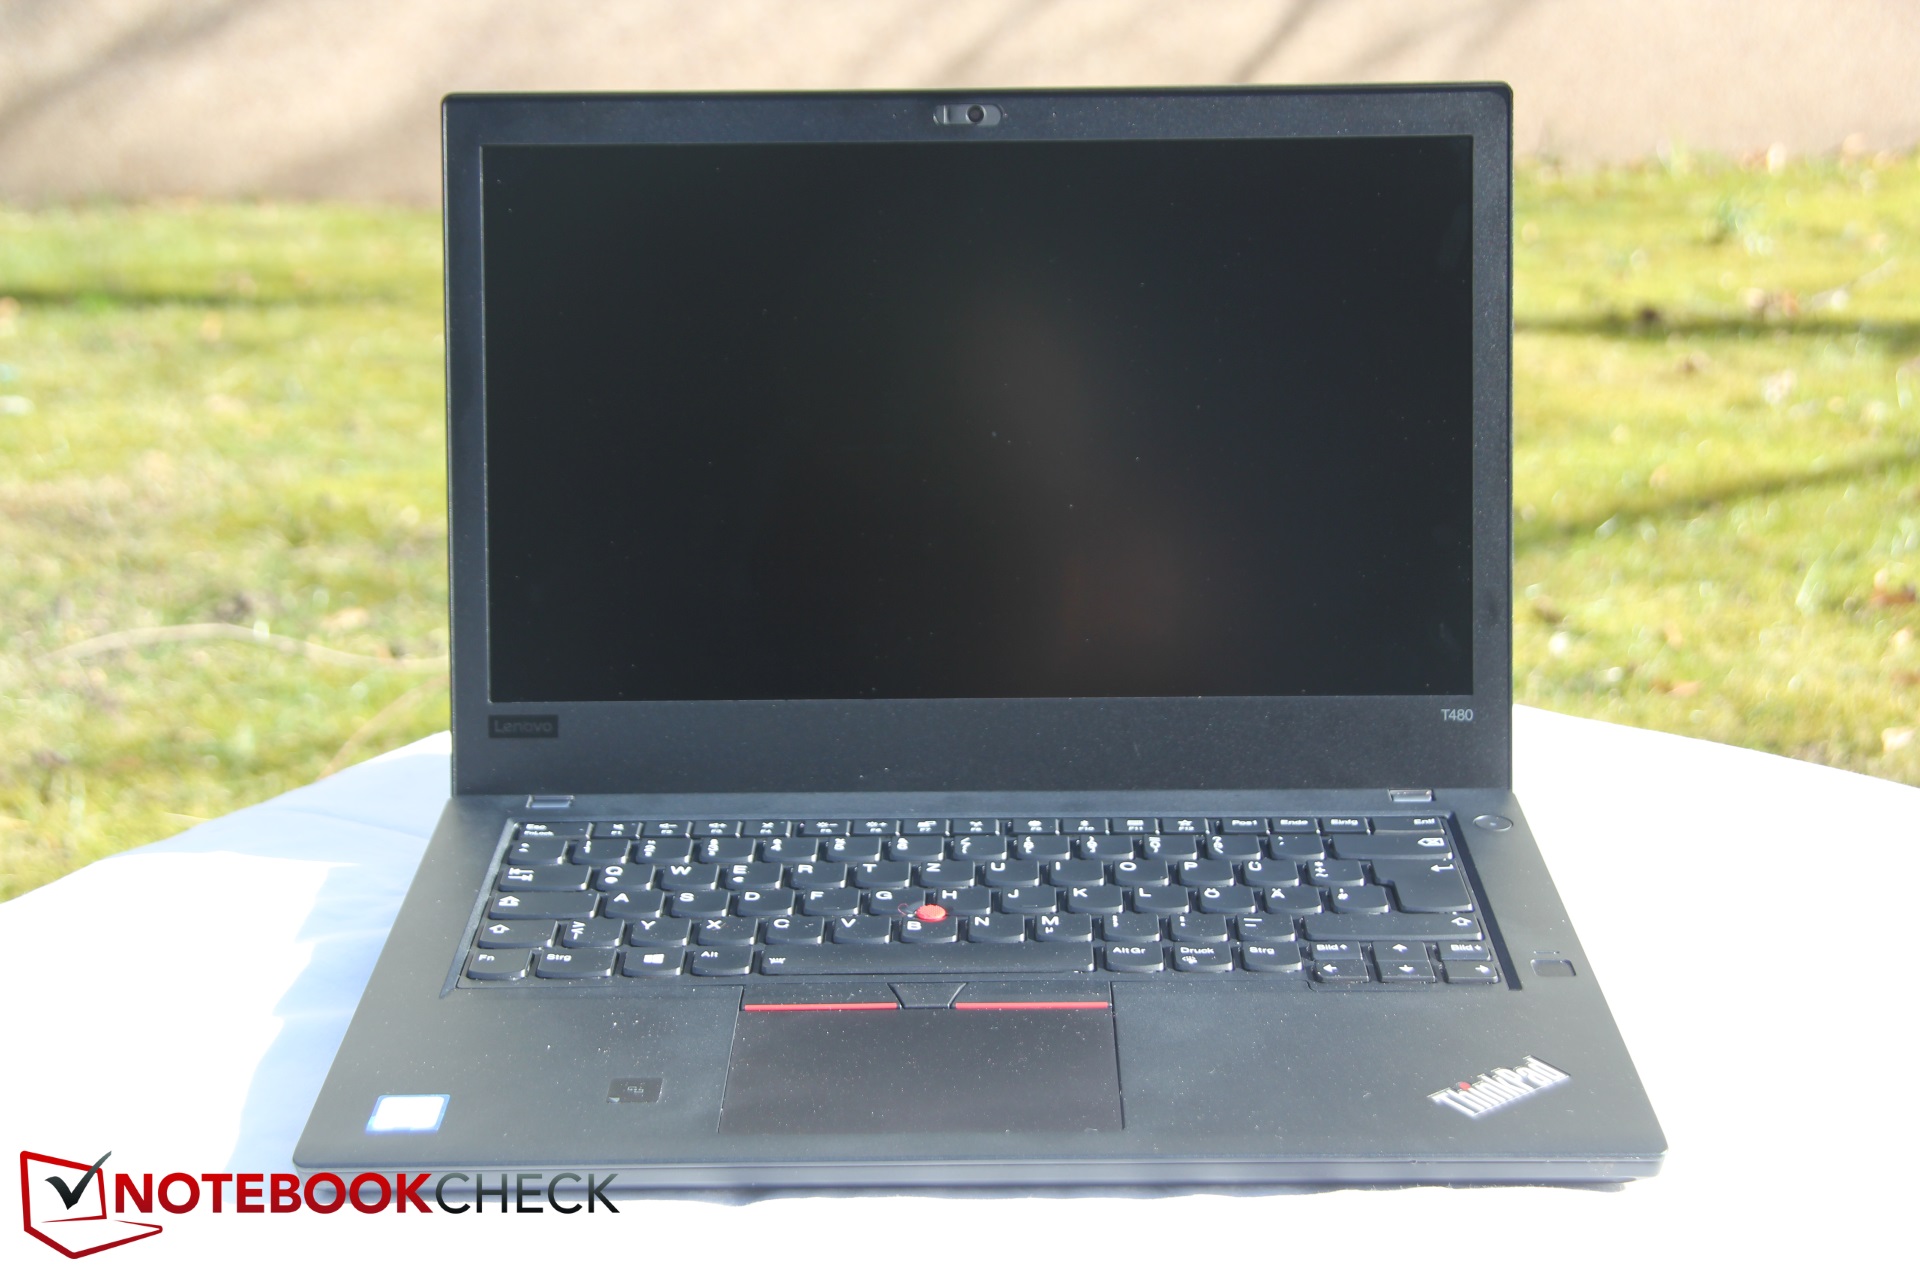
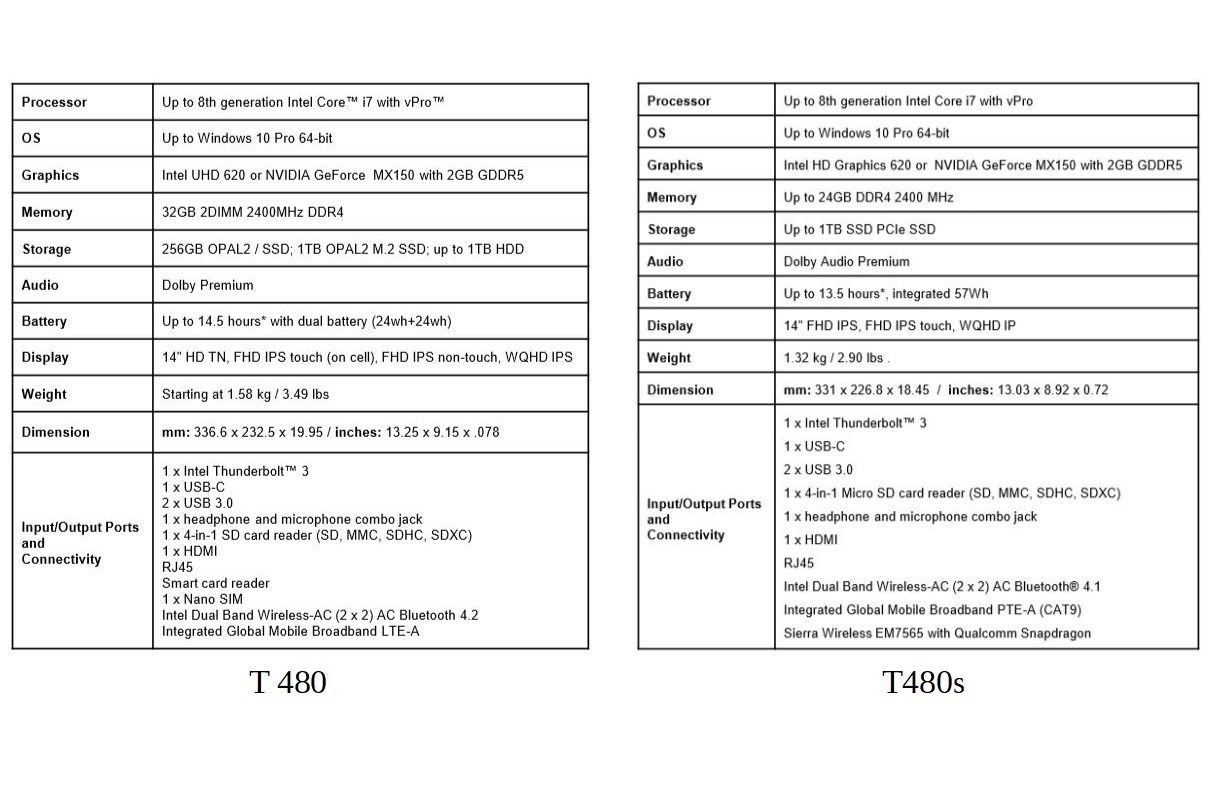
Kısa inceleme: Lenovo ThinkPad T480 (i7-8550U, MX150, FHD) Laptop
| SD Card Reader | |
| average JPG Copy Test (av. of 3 runs) | |
| Dell Latitude 5490-TD70X (Toshiba Exceria Pro SDXC 64 GB UHS-II) | |
| Lenovo ThinkPad T480-20L6S01V00 (Toshiba Exceria Pro SDXC 64 GB UHS-II) | |
| Lenovo ThinkPad T470-20HD002HGE (Toshiba Exceria Pro SDXC 64 GB UHS-II) | |
| Lenovo ThinkPad T480s-20L8S02E00 (Toshiba Exceria Pro SDXC 64 GB UHS-II) | |
| HP EliteBook 840 G4-Z2V49ET ABD (Toshiba Exceria Pro SDXC 64 GB UHS-II) | |
| Fujitsu LifeBook U747 (Toshiba Exceria Pro SDXC 64 GB UHS-II) | |
| Sınıf ortalaması Office (19.8 - 198.5, n=22, son 2 yıl) | |
| maximum AS SSD Seq Read Test (1GB) | |
| Dell Latitude 5490-TD70X (Toshiba Exceria Pro SDXC 64 GB UHS-II) | |
| Lenovo ThinkPad T470-20HD002HGE (Toshiba Exceria Pro SDXC 64 GB UHS-II) | |
| Lenovo ThinkPad T480s-20L8S02E00 (Toshiba Exceria Pro SDXC 64 GB UHS-II) | |
| Lenovo ThinkPad T480-20L6S01V00 (Toshiba Exceria Pro SDXC 64 GB UHS-II) | |
| HP EliteBook 840 G4-Z2V49ET ABD (Toshiba Exceria Pro SDXC 64 GB UHS-II) | |
| Fujitsu LifeBook U747 (Toshiba Exceria Pro SDXC 64 GB UHS-II) | |
| Sınıf ortalaması Office (27.4 - 249, n=21, son 2 yıl) | |
| Networking | |
| iperf3 transmit AX12 | |
| Lenovo ThinkPad T480-20L6S01V00 | |
| Lenovo ThinkPad T480s-20L8S02E00 | |
| Lenovo ThinkPad T470-20HD002HGE | |
| Dell Latitude 5490-TD70X | |
| HP EliteBook 840 G4-Z2V49ET ABD (jseb) | |
| Fujitsu LifeBook U747 | |
| iperf3 receive AX12 | |
| Lenovo ThinkPad T470-20HD002HGE | |
| Fujitsu LifeBook U747 | |
| Lenovo ThinkPad T480-20L6S01V00 | |
| Lenovo ThinkPad T480s-20L8S02E00 | |
| Dell Latitude 5490-TD70X | |
| HP EliteBook 840 G4-Z2V49ET ABD (jseb) | |
| |||||||||||||||||||||||||
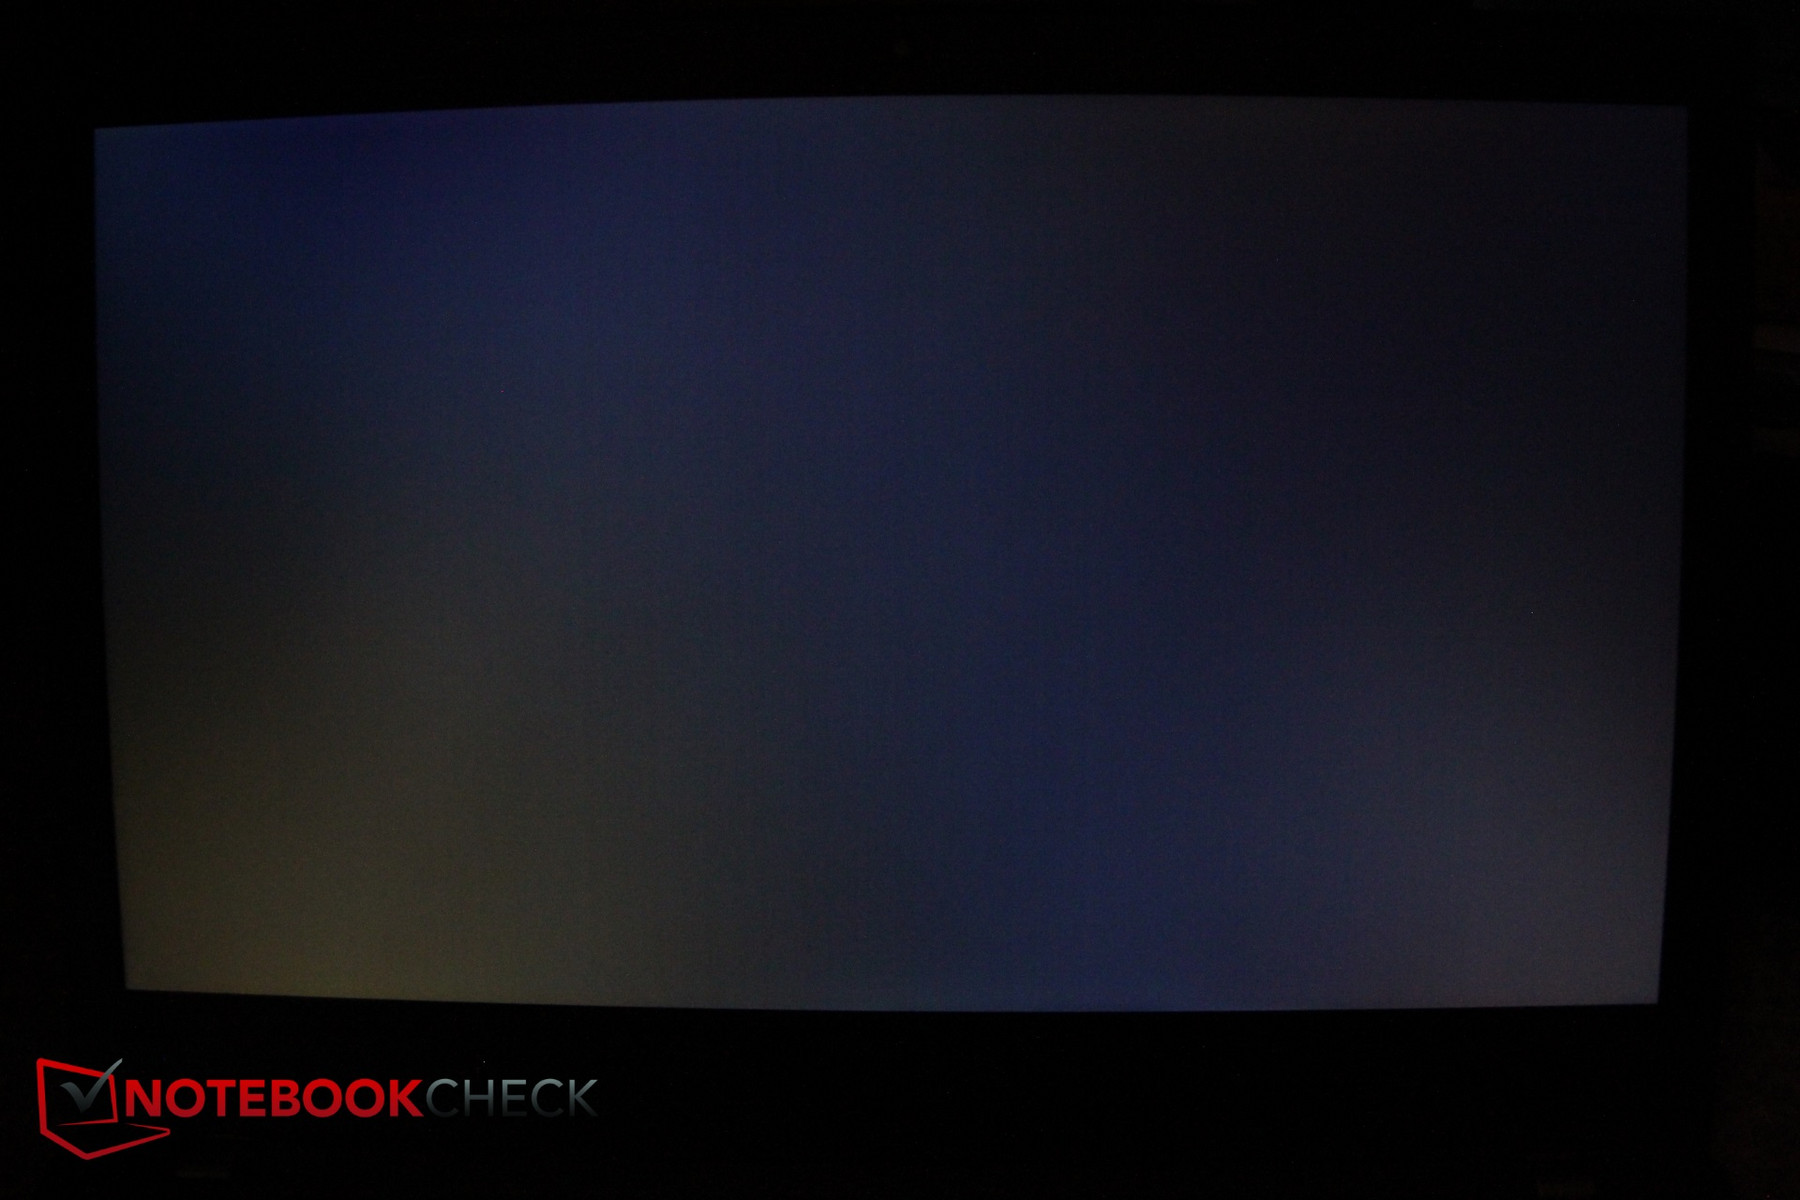
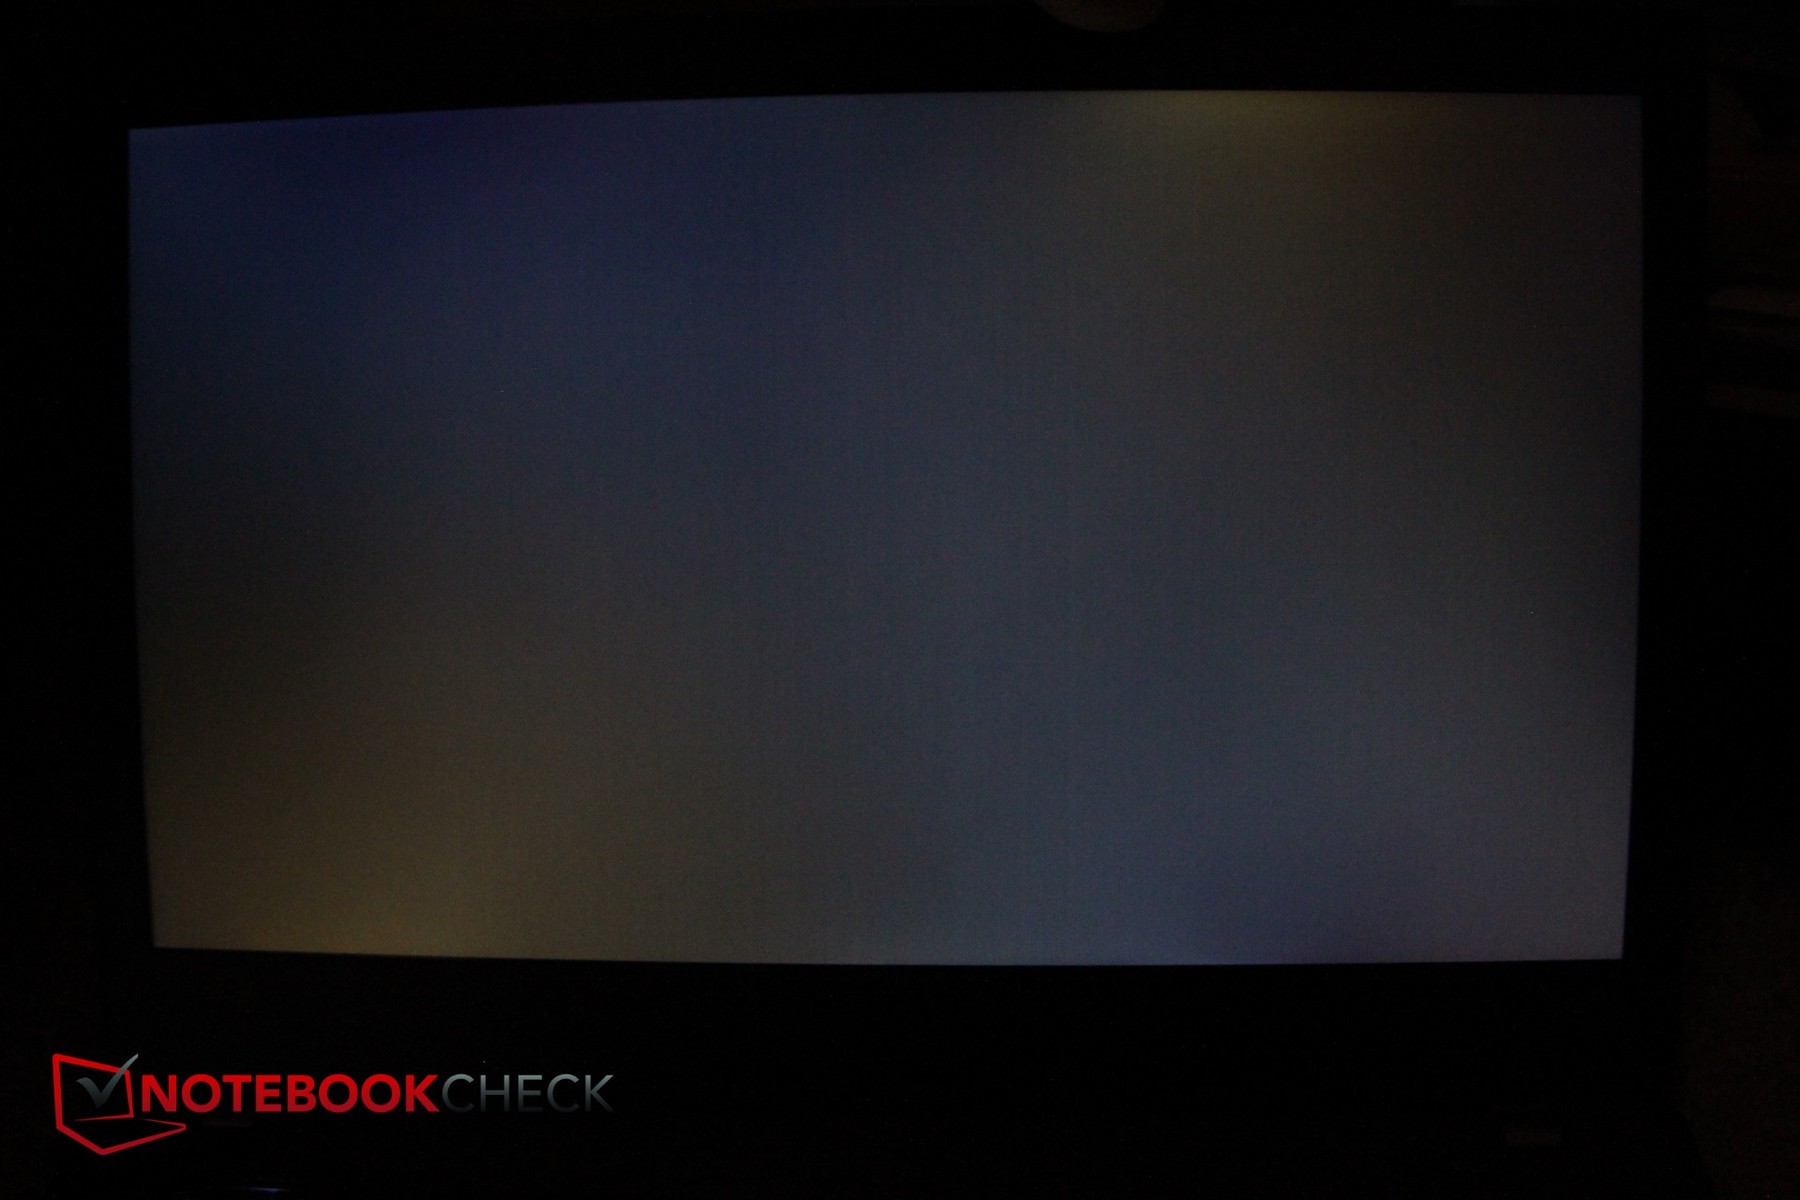
Aydınlatma: 90 %
Batarya modunda parlaklık: 311 cd/m²
Kontrast: 1228:1 (Siyah: 0.25 cd/m²)
ΔE ColorChecker Calman: 5.7 | ∀{0.5-29.43 Ø4.71}
calibrated: 4.7
ΔE Greyscale Calman: 3.7 | ∀{0.09-98 Ø4.96}
58.7% sRGB (Argyll 1.6.3 3D)
37.4% AdobeRGB 1998 (Argyll 1.6.3 3D)
40.56% AdobeRGB 1998 (Argyll 3D)
58.8% sRGB (Argyll 3D)
39.24% Display P3 (Argyll 3D)
Gamma: 2.11
CCT: 7353 K
| Lenovo ThinkPad T480-20L6S01V00 Lenovo LP140WF6-SPB7, , 1920x1080, 14" | Lenovo ThinkPad T470-20HD002HGE N140HCA-EAB, , 1920x1080, 14" | Lenovo ThinkPad T480s-20L8S02E00 LP140QH2-SPB1, , 2560x1440, 14" | Dell Latitude 5490-TD70X AU Optronics AUO263D, , 1920x1080, 14" | HP EliteBook 840 G4-Z2V49ET ABD AUO123D, , 1920x1080, 14" | Fujitsu LifeBook U747 LG LP140WF3, , 1920x1080, 14" | |
|---|---|---|---|---|---|---|
| Display | 6% | 75% | -8% | 40% | 55% | |
| Display P3 Coverage (%) | 39.24 | 41.6 6% | 71.4 82% | 36.28 -8% | 55.8 42% | 66.1 68% |
| sRGB Coverage (%) | 58.8 | 61.9 5% | 96.6 64% | 54.6 -7% | 80.7 37% | 84.8 44% |
| AdobeRGB 1998 Coverage (%) | 40.56 | 43.06 6% | 72.1 78% | 37.48 -8% | 57.7 42% | 62 53% |
| Response Times | -27% | -7% | -29% | -2% | 3% | |
| Response Time Grey 50% / Grey 80% * (ms) | 35.6 ? | 41.6 ? -17% | 36 ? -1% | 46.9 ? -32% | 39 ? -10% | 36 ? -1% |
| Response Time Black / White * (ms) | 24.8 ? | 34 ? -37% | 28 ? -13% | 31.2 ? -26% | 23 ? 7% | 23.2 ? 6% |
| PWM Frequency (Hz) | ||||||
| Screen | -6% | 22% | -2% | -44% | 10% | |
| Brightness middle (cd/m²) | 307 | 306 0% | 311 1% | 227 -26% | 346 13% | 291 -5% |
| Brightness (cd/m²) | 295 | 287 -3% | 302 2% | 211 -28% | 317 7% | 296 0% |
| Brightness Distribution (%) | 90 | 88 -2% | 91 1% | 88 -2% | 86 -4% | 84 -7% |
| Black Level * (cd/m²) | 0.25 | 0.3 -20% | 0.36 -44% | 0.19 24% | 0.86 -244% | 0.32 -28% |
| Contrast (:1) | 1228 | 1020 -17% | 864 -30% | 1195 -3% | 402 -67% | 909 -26% |
| Colorchecker dE 2000 * | 5.7 | 6.2 -9% | 3 47% | 5.6 2% | 8.64 -52% | 4.3 25% |
| Colorchecker dE 2000 max. * | 21.3 | 13.6 36% | 6.1 71% | 22.4 -5% | 13.58 36% | 7.5 65% |
| Colorchecker dE 2000 calibrated * | 4.7 | 1.7 64% | ||||
| Greyscale dE 2000 * | 3.7 | 5.8 -57% | 4 -8% | 2.4 35% | 11.24 -204% | 4.3 -16% |
| Gamma | 2.11 104% | 2.04 108% | 2.17 101% | 2.44 90% | 2.62 84% | 2.31 95% |
| CCT | 7353 88% | 6277 104% | 6961 93% | 6506 100% | 12530 52% | 6529 100% |
| Color Space (Percent of AdobeRGB 1998) (%) | 37.4 | 39.62 6% | 66.7 78% | 34.5 -8% | 52 39% | 55.46 48% |
| Color Space (Percent of sRGB) (%) | 58.7 | 61.44 5% | 96.7 65% | 54.4 -7% | 80 36% | 84.77 44% |
| Toplam Ortalama (Program / Ayarlar) | -9% /
-7% | 30% /
29% | -13% /
-7% | -2% /
-21% | 23% /
18% |
* ... daha küçük daha iyidir
Yanıt Sürelerini Görüntüle
| ↔ Tepki Süresi Siyahtan Beyaza | ||
|---|---|---|
| 24.8 ms ... yükseliş ↗ ve sonbahar↘ birleşimi | ↗ 13.2 ms yükseliş | 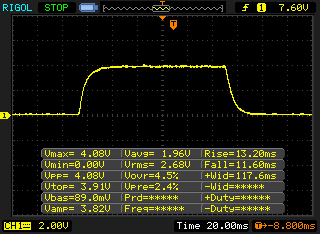 |
| ↘ 11.6 ms sonbahar | ||
| Ekran, testlerimizde iyi yanıt oranları gösteriyor ancak rekabetçi oyuncular için çok yavaş olabilir. Karşılaştırıldığında, test edilen tüm cihazlar 0.1 (minimum) ile 240 (maksimum) ms arasında değişir. » Tüm cihazların 58 %'si daha iyi. Bu, ölçülen yanıt süresinin test edilen tüm cihazların ortalamasından (19.8 ms) daha kötü olduğu anlamına gelir. | ||
| ↔ Tepki Süresi %50 Griden %80 Griye | ||
| 35.6 ms ... yükseliş ↗ ve sonbahar↘ birleşimi | ↗ 17.6 ms yükseliş | 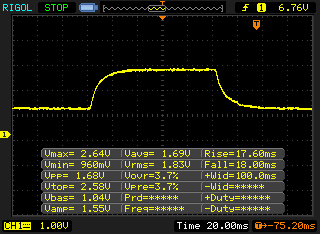 |
| ↘ 18 ms sonbahar | ||
| Ekran, testlerimizde yavaş yanıt oranları gösteriyor ve oyuncular için yetersiz olacaktır. Karşılaştırıldığında, test edilen tüm cihazlar 0.165 (minimum) ile 636 (maksimum) ms arasında değişir. » Tüm cihazların 50 %'si daha iyi. Bu, ölçülen yanıt süresinin test edilen tüm cihazların ortalamasından (31 ms) daha kötü olduğu anlamına gelir. | ||
Ekran Titremesi / PWM (Darbe Genişliği Modülasyonu)
| Ekran titriyor / PWM algılanmadı | 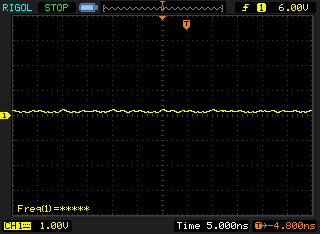 | ||
Karşılaştırıldığında: Test edilen tüm cihazların %52 %'si ekranı karartmak için PWM kullanmıyor. PWM tespit edilirse, ortalama 7757 (minimum: 5 - maksimum: 343500) Hz ölçüldü. | |||
| PCMark 8 Home Score Accelerated v2 | 3675 puan | |
| PCMark 8 Work Score Accelerated v2 | 5025 puan | |
| PCMark 10 Score | 3686 puan | |
Yardım | ||
| Lenovo ThinkPad T480-20L6S01V00 Samsung SSD PM981 MZVLB512HAJQ | Lenovo ThinkPad T470-20HD002HGE Samsung PM961 NVMe MZVLW512HMJP | Lenovo ThinkPad T480s-20L8S02E00 Samsung SSD PM981 MZVLB512HAJQ | Dell Latitude 5490-TD70X Toshiba KSG60ZMV512G | HP EliteBook 840 G4-Z2V49ET ABD Samsung PM961 MZVLW256HEHP | Fujitsu LifeBook U747 Samsung MZYTY256HDHP | Ortalama Samsung SSD PM981 MZVLB512HAJQ | |
|---|---|---|---|---|---|---|---|
| CrystalDiskMark 3.0 | 29% | 118% | -32% | 46% | -30% | 71% | |
| Read Seq (MB/s) | 922 | 1155 25% | 2588 181% | 465.1 -50% | 1819 97% | 504 -45% | 2002 ? 117% |
| Write Seq (MB/s) | 928 | 1076 16% | 1858 100% | 425 -54% | 1263 36% | 497.8 -46% | 1656 ? 78% |
| Read 512 (MB/s) | 561 | 811 45% | 1799 221% | 410.1 -27% | 922 64% | 396.7 -29% | 1213 ? 116% |
| Write 512 (MB/s) | 567 | 862 52% | 1863 229% | 360.7 -36% | 804 42% | 283.4 -50% | 1641 ? 189% |
| Read 4k (MB/s) | 64.4 | 55.5 -14% | 62.7 -3% | 27.34 -58% | 61.4 -5% | 35.73 -45% | 61.4 ? -5% |
| Write 4k (MB/s) | 108 | 134.6 25% | 146.8 36% | 89 -18% | 157.1 45% | 87.8 -19% | 131.3 ? 22% |
| Read 4k QD32 (MB/s) | 383.4 | 496.2 29% | 446.6 16% | 295.6 -23% | 513 34% | 399.1 4% | 407 ? 6% |
| Write 4k QD32 (MB/s) | 271.4 | 425.4 57% | 706 160% | 300.2 11% | 410.2 51% | 249.7 -8% | 402 ? 48% |

| 3DMark 11 - 1280x720 Performance GPU | |
| Sınıf ortalaması Office (2551 - 18313, n=72, son 2 yıl) | |
| Lenovo ThinkPad T480-20L6S01V00 | |
| Ortalama NVIDIA GeForce MX150 (2796 - 4905, n=47) | |
| Lenovo ThinkPad T480s-20L8S02E00 | |
| Lenovo ThinkPad T470p-20J7S00000 | |
| Dell Latitude 5490-TD70X | |
| Lenovo ThinkPad T470-20HD002HGE | |
| 3DMark | |
| 1280x720 Cloud Gate Standard Graphics | |
| Sınıf ortalaması Office (11640 - 118515, n=38, son 2 yıl) | |
| Lenovo ThinkPad T480-20L6S01V00 | |
| Ortalama NVIDIA GeForce MX150 (16227 - 22183, n=43) | |
| Lenovo ThinkPad T480s-20L8S02E00 | |
| Lenovo ThinkPad T470p-20J7S00000 | |
| Dell Latitude 5490-TD70X | |
| Lenovo ThinkPad T470-20HD002HGE | |
| 1920x1080 Fire Strike Graphics | |
| Sınıf ortalaması Office (736 - 21871, n=75, son 2 yıl) | |
| Lenovo ThinkPad T480-20L6S01V00 | |
| Ortalama NVIDIA GeForce MX150 (2323 - 3739, n=44) | |
| Lenovo ThinkPad T480s-20L8S02E00 | |
| Lenovo ThinkPad T470p-20J7S00000 | |
| Dell Latitude 5490-TD70X | |
| Lenovo ThinkPad T470-20HD002HGE | |
| 3DMark 11 Performance | 4236 puan | |
| 3DMark Cloud Gate Standard Score | 9981 puan | |
| 3DMark Fire Strike Score | 3218 puan | |
Yardım | ||
| The Witcher 3 | |
| 1024x768 Low Graphics & Postprocessing | |
| Sınıf ortalaması Office (32.2 - 135, n=3, son 2 yıl) | |
| Lenovo ThinkPad T480-20L6S01V00 | |
| Ortalama NVIDIA GeForce MX150 (42.6 - 72, n=24) | |
| Lenovo ThinkPad T480s-20L8S02E00 | |
| Lenovo ThinkPad T470p-20J7S00000 | |
| Dell Latitude 5490-TD70X | |
| Lenovo ThinkPad T470-20HD002HGE | |
| HP EliteBook 840 G4-Z2V49ET ABD | |
| 1366x768 Medium Graphics & Postprocessing | |
| Sınıf ortalaması Office (44.7 - 90.4, n=3, son 2 yıl) | |
| Ortalama NVIDIA GeForce MX150 (24.4 - 43.2, n=26) | |
| Lenovo ThinkPad T480-20L6S01V00 | |
| Lenovo ThinkPad T480s-20L8S02E00 | |
| Lenovo ThinkPad T470p-20J7S00000 | |
| Dell Latitude 5490-TD70X | |
| 1920x1080 High Graphics & Postprocessing (Nvidia HairWorks Off) | |
| Sınıf ortalaması Office (23.7 - 53.4, n=3, son 2 yıl) | |
| Lenovo ThinkPad T480-20L6S01V00 | |
| Ortalama NVIDIA GeForce MX150 (13.3 - 23.8, n=25) | |
| Lenovo ThinkPad T480s-20L8S02E00 | |
| Lenovo ThinkPad T470p-20J7S00000 | |
| Rise of the Tomb Raider | |
| 1024x768 Lowest Preset | |
| Lenovo ThinkPad T480-20L6S01V00 | |
| Ortalama NVIDIA GeForce MX150 (41.6 - 86, n=28) | |
| Lenovo ThinkPad T480s-20L8S02E00 | |
| Lenovo ThinkPad T470p-20J7S00000 | |
| Dell Latitude 5490-TD70X | |
| Lenovo ThinkPad T470-20HD002HGE | |
| Fujitsu LifeBook U747 | |
| 1366x768 Medium Preset AF:2x | |
| Ortalama NVIDIA GeForce MX150 (28.2 - 60, n=29) | |
| Lenovo ThinkPad T480-20L6S01V00 | |
| Lenovo ThinkPad T480s-20L8S02E00 | |
| Lenovo ThinkPad T470p-20J7S00000 | |
| Lenovo ThinkPad T470-20HD002HGE | |
| Dell Latitude 5490-TD70X | |
| 1920x1080 High Preset AA:FX AF:4x | |
| Lenovo ThinkPad T480-20L6S01V00 | |
| Ortalama NVIDIA GeForce MX150 (14.8 - 27, n=28) | |
| Lenovo ThinkPad T470p-20J7S00000 | |
| Lenovo ThinkPad T480s-20L8S02E00 | |
| Dell Latitude 5490-TD70X | |
| Doom | |
| 1280x720 Low Preset | |
| Lenovo ThinkPad T480-20L6S01V00 | |
| Ortalama NVIDIA GeForce MX150 (58.8 - 68.6, n=4) | |
| Lenovo ThinkPad T480s-20L8S02E00 | |
| 1366x768 Medium Preset | |
| Lenovo ThinkPad T480-20L6S01V00 | |
| Lenovo ThinkPad T480s-20L8S02E00 | |
| Ortalama NVIDIA GeForce MX150 (24.5 - 61.4, n=5) | |
| 1920x1080 Medium Preset | |
| Ortalama NVIDIA GeForce MX150 (n=1) | |
| Lenovo ThinkPad T480-20L6S01V00 | |
| düşük | orta | yüksek | ultra | |
|---|---|---|---|---|
| The Witcher 3 (2015) | 59 | 34 | 20 | 11 |
| Rise of the Tomb Raider (2016) | 70.5 | 37.5 | 21.8 | 18.6 |
| Doom (2016) | 65.9 | 56.6 | 26.08 | 24.14 |
Ses yüksekliği
| Boşta |
| 29 / 29 / 29 dB |
| Çalışırken |
| 35.6 / 35.6 dB |
 | ||
30 dB sessiz 40 dB(A) duyulabilirlik 50 dB(A) gürültülü |
||
min: | ||
| Lenovo ThinkPad T480-20L6S01V00 GeForce MX150, i5-8550U, Samsung SSD PM981 MZVLB512HAJQ | Lenovo ThinkPad T470-20HD002HGE HD Graphics 620, i5-7200U, Samsung PM961 NVMe MZVLW512HMJP | Lenovo ThinkPad T480s-20L8S02E00 GeForce MX150, i5-8550U, Samsung SSD PM981 MZVLB512HAJQ | Dell Latitude 5490-TD70X UHD Graphics 620, i5-8350U, Toshiba KSG60ZMV512G | HP EliteBook 840 G4-Z2V49ET ABD HD Graphics 620, i5-7200U, Samsung PM961 MZVLW256HEHP | Fujitsu LifeBook U747 HD Graphics 620, i5-7200U, Samsung MZYTY256HDHP | |
|---|---|---|---|---|---|---|
| Noise | 4% | -2% | -3% | -3% | 5% | |
| kapalı / ortam * (dB) | 29 | 28 3% | 29 -0% | 28.8 1% | 31 -7% | 28.2 3% |
| Idle Minimum * (dB) | 29 | 28 3% | 29 -0% | 28.8 1% | 31 -7% | 28.2 3% |
| Idle Average * (dB) | 29 | 28 3% | 29 -0% | 28.8 1% | 31 -7% | 28.2 3% |
| Idle Maximum * (dB) | 29 | 29.4 -1% | 29 -0% | 30.9 -7% | 31 -7% | 28.2 3% |
| Load Average * (dB) | 35.6 | 31.4 12% | 36.5 -3% | 35.6 -0% | 33.5 6% | 31.2 12% |
| Witcher 3 ultra * (dB) | 32.5 | 32.8 -1% | ||||
| Load Maximum * (dB) | 35.6 | 34.6 3% | 38.2 -7% | 41.4 -16% | 33.7 5% | 33 7% |
* ... daha küçük daha iyidir
(±) Üst taraftaki maksimum sıcaklık, 34.3 °C / 94 F ortalamasına kıyasla 41.2 °C / 106 F'dir. , Office sınıfı için 21.2 ile 62.5 °C arasında değişir.
(-) Alt kısım, 36.8 °C / 98 F ortalamasına kıyasla maksimum 49.9 °C / 122 F'ye kadar ısınır
(+) Boşta kullanımda, üst tarafın ortalama sıcaklığı 23.4 °C / 74 F olup, cihazın 29.5 °C / 85 F.
(-) The Witcher 3 oynarken, üst tarafın ortalama sıcaklığı 38.3 °C / 101 F olup, cihazın 29.5 °C / 85 F.
(±) Avuç içi dayanakları ve dokunmatik yüzey maksimum 36.4 °C / 97.5 F ile dokunulamayacak kadar ısınabilir.
(-) Benzer cihazların avuç içi dayanağı alanının ortalama sıcaklığı 27.5 °C / 81.5 F (-8.9 °C / -16 F) idi.
| Lenovo ThinkPad T480-20L6S01V00 GeForce MX150, i5-8550U, Samsung SSD PM981 MZVLB512HAJQ | Lenovo ThinkPad T470-20HD002HGE HD Graphics 620, i5-7200U, Samsung PM961 NVMe MZVLW512HMJP | Lenovo ThinkPad T480s-20L8S02E00 GeForce MX150, i5-8550U, Samsung SSD PM981 MZVLB512HAJQ | Dell Latitude 5490-TD70X UHD Graphics 620, i5-8350U, Toshiba KSG60ZMV512G | HP EliteBook 840 G4-Z2V49ET ABD HD Graphics 620, i5-7200U, Samsung PM961 MZVLW256HEHP | Fujitsu LifeBook U747 HD Graphics 620, i5-7200U, Samsung MZYTY256HDHP | |
|---|---|---|---|---|---|---|
| Heat | 4% | -2% | 3% | 4% | 5% | |
| Maximum Upper Side * (°C) | 41.2 | 37.2 10% | 49.2 -19% | 38.3 7% | 37 10% | 42.6 -3% |
| Maximum Bottom * (°C) | 49.9 | 45.1 10% | 48.2 3% | 44.7 10% | 39.4 21% | 34.4 31% |
| Idle Upper Side * (°C) | 24.1 | 24.4 -1% | 23.2 4% | 23.7 2% | 25.9 -7% | 25.1 -4% |
| Idle Bottom * (°C) | 23.9 | 25 -5% | 23 4% | 25.4 -6% | 25.6 -7% | 24.6 -3% |
* ... daha küçük daha iyidir
Lenovo ThinkPad T480-20L6S01V00 ses analizi
(±) | hoparlör ses yüksekliği ortalama ama iyi (74.6 dB)
Bas 100 - 315Hz
(-) | neredeyse hiç bas yok - ortalama olarak medyandan 22.6% daha düşük
(±) | Bas doğrusallığı ortalamadır (11.6% delta - önceki frekans)
Ortalar 400 - 2000 Hz
(+) | dengeli ortalar - medyandan yalnızca 3.1% uzakta
(±) | Ortaların doğrusallığı ortalamadır (8% delta - önceki frekans)
Yüksekler 2 - 16 kHz
(+) | dengeli yüksekler - medyandan yalnızca 4.1% uzakta
(±) | Yükseklerin doğrusallığı ortalamadır (8.1% delta - önceki frekans)
Toplam 100 - 16.000 Hz
(±) | Genel sesin doğrusallığı ortalamadır (23.4% ortancaya göre fark)
Aynı sınıfla karşılaştırıldığında
» Bu sınıftaki tüm test edilen cihazların %66%'si daha iyi, 8% benzer, 26% daha kötüydü
» En iyisinin deltası 7% idi, ortalama 21% idi, en kötüsü 53% idi
Test edilen tüm cihazlarla karşılaştırıldığında
» Test edilen tüm cihazların %70'si daha iyi, 6 benzer, % 24 daha kötüydü
» En iyisinin deltası 4% idi, ortalama 23% idi, en kötüsü 134% idi
Lenovo ThinkPad T480s-20L8S02E00 ses analizi
(±) | hoparlör ses yüksekliği ortalama ama iyi (78.9 dB)
Bas 100 - 315Hz
(-) | neredeyse hiç bas yok - ortalama olarak medyandan 19.4% daha düşük
(±) | Bas doğrusallığı ortalamadır (12.1% delta - önceki frekans)
Ortalar 400 - 2000 Hz
(±) | daha yüksek ortalar - ortalama olarak medyandan 6.5% daha yüksek
(±) | Ortaların doğrusallığı ortalamadır (9.6% delta - önceki frekans)
Yüksekler 2 - 16 kHz
(+) | dengeli yüksekler - medyandan yalnızca 3.5% uzakta
(±) | Yükseklerin doğrusallığı ortalamadır (7.6% delta - önceki frekans)
Toplam 100 - 16.000 Hz
(±) | Genel sesin doğrusallığı ortalamadır (22.1% ortancaya göre fark)
Aynı sınıfla karşılaştırıldığında
» Bu sınıftaki tüm test edilen cihazların %58%'si daha iyi, 8% benzer, 34% daha kötüydü
» En iyisinin deltası 7% idi, ortalama 21% idi, en kötüsü 53% idi
Test edilen tüm cihazlarla karşılaştırıldığında
» Test edilen tüm cihazların %64'si daha iyi, 6 benzer, % 30 daha kötüydü
» En iyisinin deltası 4% idi, ortalama 23% idi, en kötüsü 134% idi
| Kapalı / Bekleme modu | |
| Boşta | |
| Çalışırken |
|
Key:
min: | |
| Lenovo ThinkPad T480-20L6S01V00 i5-8550U, GeForce MX150, Samsung SSD PM981 MZVLB512HAJQ, IPS, 1920x1080, 14" | Lenovo ThinkPad T470-20HD002HGE i5-7200U, HD Graphics 620, Samsung PM961 NVMe MZVLW512HMJP, IPS, 1920x1080, 14" | Lenovo ThinkPad T480s-20L8S02E00 i5-8550U, GeForce MX150, Samsung SSD PM981 MZVLB512HAJQ, IPS LED, 2560x1440, 14" | Dell Latitude 5490-TD70X i5-8350U, UHD Graphics 620, Toshiba KSG60ZMV512G, IPS, 1920x1080, 14" | HP EliteBook 840 G4-Z2V49ET ABD i5-7200U, HD Graphics 620, Samsung PM961 MZVLW256HEHP, TN, 1920x1080, 14" | Fujitsu LifeBook U747 i5-7200U, HD Graphics 620, Samsung MZYTY256HDHP, IPS LED, 1920x1080, 14" | |
|---|---|---|---|---|---|---|
| Power Consumption | 31% | 5% | 19% | 32% | 18% | |
| Idle Minimum * (Watt) | 3.6 | 3.21 11% | 3.4 6% | 3.3 8% | 2.9 19% | 4.11 -14% |
| Idle Average * (Watt) | 7.1 | 6.15 13% | 7.5 -6% | 5.54 22% | 5.6 21% | 7.87 -11% |
| Idle Maximum * (Watt) | 9.5 | 6.82 28% | 10.8 -14% | 6.59 31% | 8.15 14% | 8.74 8% |
| Load Average * (Watt) | 63.9 | 28.5 55% | 55.4 13% | 42.4 34% | 30.6 52% | 30.2 53% |
| Witcher 3 ultra * (Watt) | 53.9 | 34 37% | ||||
| Load Maximum * (Watt) | 67.3 | 34.5 49% | 70.3 -4% | 67.6 -0% | 31 54% | 32.4 52% |
* ... daha küçük daha iyidir
| Lenovo ThinkPad T480-20L6S01V00 i5-8550U, GeForce MX150, 72 Wh | Lenovo ThinkPad T470-20HD002HGE i5-7200U, HD Graphics 620, 48 Wh | Lenovo ThinkPad T480s-20L8S02E00 i5-8550U, GeForce MX150, 57 Wh | Dell Latitude 5490-TD70X i5-8350U, UHD Graphics 620, 68 Wh | HP EliteBook 840 G4-Z2V49ET ABD i5-7200U, HD Graphics 620, 51 Wh | Fujitsu LifeBook U747 i5-7200U, HD Graphics 620, 50 Wh | Sınıf ortalaması Office | |
|---|---|---|---|---|---|---|---|
| Pil Çalışma Süresi | -27% | -29% | -2% | -13% | -37% | 0% | |
| Reader / Idle (h) | 27.9 | 22.8 -18% | 25.9 -7% | 19.3 -31% | 13 -53% | 24.5 ? -12% | |
| H.264 (h) | 10.6 | 10.4 -2% | 9.2 -13% | 13.2 25% | 9.9 -7% | 8.2 -23% | 15.5 ? 46% |
| WiFi v1.3 (h) | 13.2 | 7.3 -45% | 8.8 -33% | 15 14% | 9.5 -28% | 7.2 -45% | 13.2 ? 0% |
| Load (h) | 2.7 | 1.8 -33% | 1.3 -52% | 1.6 -41% | 3.1 15% | 2 -26% | 1.808 ? -33% |
Artılar
Eksiler
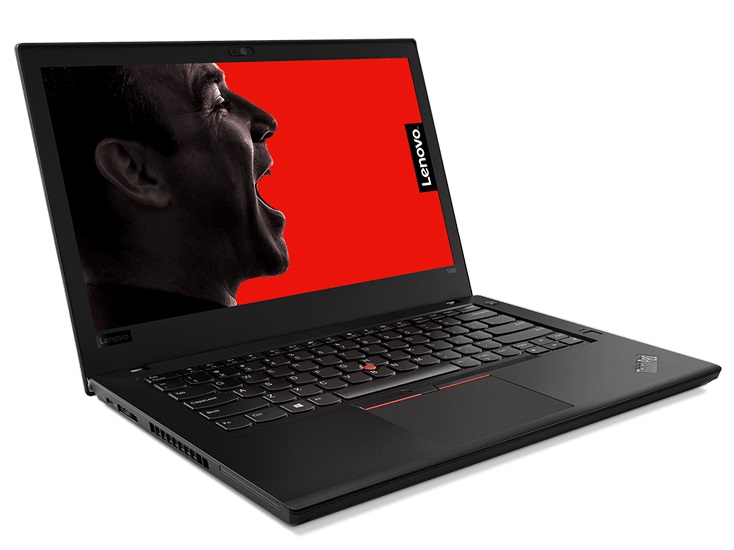
Lenovo ThinkPad T480 çoğu şeyi doğru yapıyor ve büyük sorunları yok.
Ekran baskıya oldukça duyarlı, SSD burada eleştirinin ana noktası. Çünkü sistemin genel yavaşlığının sebebi SSD bağlantı hızı. Yoğun kullanımda performans takılmalarının çok net bir açıklaması yok. En azından bu sorunlar BIOS güncellemesi ile giderilebiliyor.
Eğer yüksek kalite standartlarınız varsa ve güvenlik özellikleri de arıyorsanız, ThinkPad T480 doğru bir tercih. Donanımı, harici grafik kartı ile tüm senaryolarda ihtiyacınızı giderecek bir cihaz. Ayrıca sadece ofis işiniz için değil, diğer tüm multimedia cihazlarınız için de yerinde bir tercih olacağını belirtmek gerekli.
Lenovo ThinkPad T480-20L6S01V00
- 03/27/2018 v6 (old)
Christian Hintze