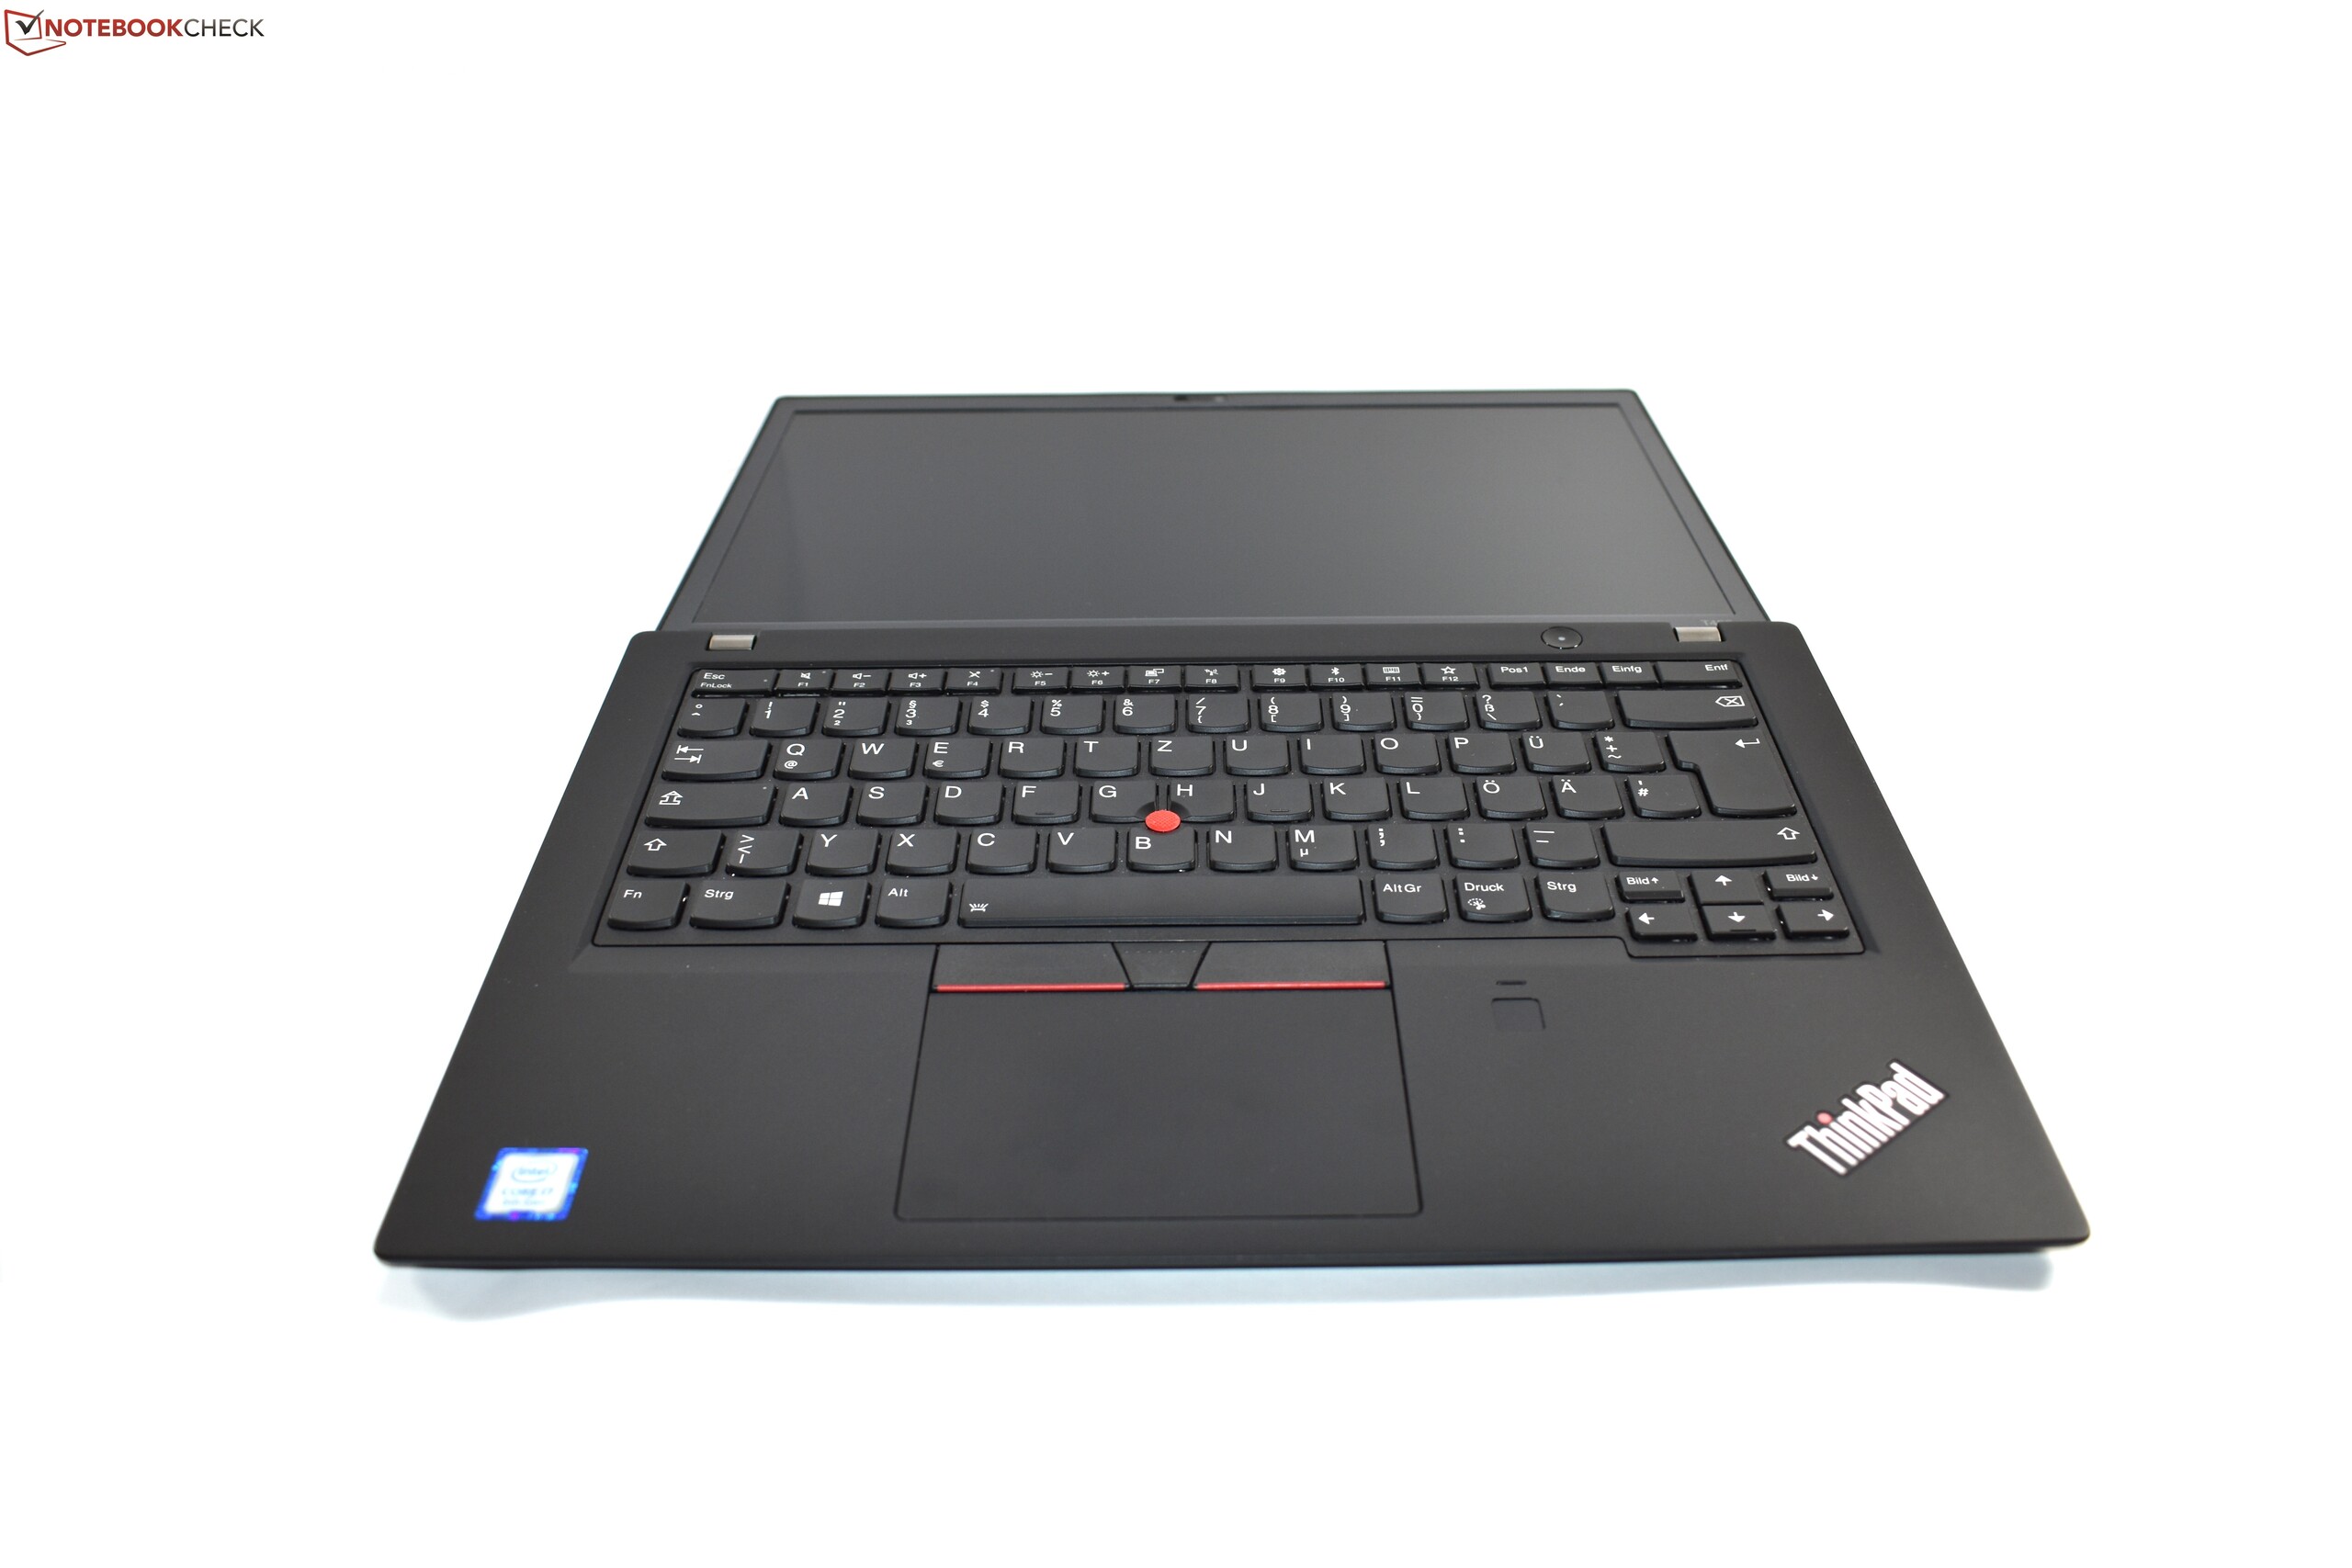
Kısa inceleme: Lenovo ThinkPad T480s (i7-8550U, MX150 Max-Q) Laptop

| SD Card Reader | |
| average JPG Copy Test (av. of 3 runs) | |
| Lenovo ThinkPad X1 Carbon 2018-20KGS03900 (Toshiba Exceria Pro M501) | |
| Lenovo ThinkPad T470s-20HGS00V00 (Toshiba Exceria Pro SDXC 64 GB UHS-II) | |
| Dell Latitude 7480 (Toshiba (Exceria Pro SDXC UHS-II 64 GB) | |
| Lenovo ThinkPad T480s-20L8S02E00 (Toshiba Exceria Pro SDXC 64 GB UHS-II) | |
| Sınıf ortalaması Office (19.8 - 198.5, n=22, son 2 yıl) | |
| maximum AS SSD Seq Read Test (1GB) | |
| Lenovo ThinkPad X1 Carbon 2018-20KGS03900 (Toshiba Exceria Pro M501) | |
| Dell Latitude 7480 (Toshiba (Exceria Pro SDXC UHS-II 64 GB) | |
| Lenovo ThinkPad T470s-20HGS00V00 (Toshiba Exceria Pro SDXC 64 GB UHS-II) | |
| Lenovo ThinkPad T480s-20L8S02E00 (Toshiba Exceria Pro SDXC 64 GB UHS-II) | |
| Sınıf ortalaması Office (27.4 - 249, n=21, son 2 yıl) | |
| |||||||||||||||||||||||||
Aydınlatma: 91 %
Batarya modunda parlaklık: 313 cd/m²
Kontrast: 864:1 (Siyah: 0.36 cd/m²)
ΔE ColorChecker Calman: 3 | ∀{0.5-29.43 Ø4.71}
calibrated: 1.7
ΔE Greyscale Calman: 4 | ∀{0.09-98 Ø4.96}
96.7% sRGB (Argyll 1.6.3 3D)
66.7% AdobeRGB 1998 (Argyll 1.6.3 3D)
72.1% AdobeRGB 1998 (Argyll 3D)
96.6% sRGB (Argyll 3D)
71.4% Display P3 (Argyll 3D)
Gamma: 2.17
CCT: 6961 K
| Lenovo ThinkPad T480s-20L8S02E00 LP140QH2-SPB1, , 2560x1440, 14" | Lenovo ThinkPad T480s-20L8S02D00 LP140QH2-SPB1, , 2560x1440, 14" | Lenovo ThinkPad T470s-20HGS00V00 B140QAN01.5, , 2560x1440, 14" | Lenovo ThinkPad X1 Carbon 2018-20KGS03900 B140QAN02.0, , 2560x1440, 14" | HP EliteBook 840 G4-Z2V22ES ABD AUO133D, , 1920x1080, 14" | Dell Latitude 7480 LG Philips LGD0557, , 1920x1080, 14" | |
|---|---|---|---|---|---|---|
| Display | 2% | -3% | 22% | -5% | -7% | |
| Display P3 Coverage (%) | 71.4 | 72.8 2% | 69 -3% | 87.7 23% | 67.5 -5% | 65.4 -8% |
| sRGB Coverage (%) | 96.6 | 97.9 1% | 95.1 -2% | 100 4% | 92.5 -4% | 92.3 -4% |
| AdobeRGB 1998 Coverage (%) | 72.1 | 74.1 3% | 69.6 -3% | 99.9 39% | 67.7 -6% | 65.8 -9% |
| Response Times | -4% | -16% | -44% | 12% | -12% | |
| Response Time Grey 50% / Grey 80% * (ms) | 36 ? | 38.4 ? -7% | 46.4 ? -29% | 59.2 ? -64% | 33.6 ? 7% | 40.8 ? -13% |
| Response Time Black / White * (ms) | 28 ? | 28.4 ? -1% | 28.8 ? -3% | 34.4 ? -23% | 23.2 ? 17% | 31.2 ? -11% |
| PWM Frequency (Hz) | ||||||
| Screen | -7% | -25% | 38% | -5% | 6% | |
| Brightness middle (cd/m²) | 311 | 352 13% | 327 5% | 578 86% | 289 -7% | 344 11% |
| Brightness (cd/m²) | 302 | 343 14% | 311 3% | 533 76% | 274 -9% | 321 6% |
| Brightness Distribution (%) | 91 | 91 0% | 88 -3% | 84 -8% | 82 -10% | 85 -7% |
| Black Level * (cd/m²) | 0.36 | 0.46 -28% | 0.25 31% | 0.38 -6% | 0.17 53% | 0.32 11% |
| Contrast (:1) | 864 | 765 -11% | 1308 51% | 1521 76% | 1700 97% | 1075 24% |
| Colorchecker dE 2000 * | 3 | 3.3 -10% | 6.1 -103% | 1.9 37% | 4.7 -57% | 2.6 13% |
| Colorchecker dE 2000 max. * | 6.1 | 7.3 -20% | 12.2 -100% | 3.8 38% | 8.6 -41% | 7.8 -28% |
| Colorchecker dE 2000 calibrated * | 1.7 | 0.8 53% | ||||
| Greyscale dE 2000 * | 4 | 5.3 -33% | 8.8 -120% | 3 25% | 6.4 -60% | 2.6 35% |
| Gamma | 2.17 101% | 2.22 99% | 2.18 101% | 2.14 103% | 2.22 99% | 2.28 96% |
| CCT | 6961 93% | 6452 101% | 6172 105% | 6377 102% | 6454 101% | 7050 92% |
| Color Space (Percent of AdobeRGB 1998) (%) | 66.7 | 68.4 3% | 61.56 -8% | 88.8 33% | 60.3 -10% | 65.82 -1% |
| Color Space (Percent of sRGB) (%) | 96.7 | 98 1% | 94.88 -2% | 100 3% | 92.3 -5% | 92.27 -5% |
| Toplam Ortalama (Program / Ayarlar) | -3% /
-5% | -15% /
-19% | 5% /
25% | 1% /
-3% | -4% /
1% |
* ... daha küçük daha iyidir
Yanıt Sürelerini Görüntüle
| ↔ Tepki Süresi Siyahtan Beyaza | ||
|---|---|---|
| 28 ms ... yükseliş ↗ ve sonbahar↘ birleşimi | ↗ 15.6 ms yükseliş | 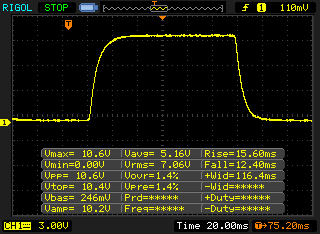 |
| ↘ 12.4 ms sonbahar | ||
| Ekran, testlerimizde nispeten yavaş yanıt oranları gösteriyor ve oyuncular için çok yavaş olabilir. Karşılaştırıldığında, test edilen tüm cihazlar 0.1 (minimum) ile 240 (maksimum) ms arasında değişir. » Tüm cihazların 71 %'si daha iyi. Bu, ölçülen yanıt süresinin test edilen tüm cihazların ortalamasından (19.8 ms) daha kötü olduğu anlamına gelir. | ||
| ↔ Tepki Süresi %50 Griden %80 Griye | ||
| 36 ms ... yükseliş ↗ ve sonbahar↘ birleşimi | ↗ 17.6 ms yükseliş | 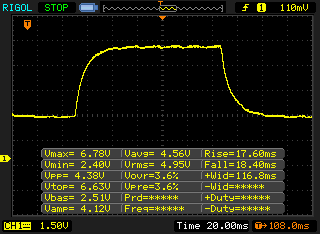 |
| ↘ 18.4 ms sonbahar | ||
| Ekran, testlerimizde yavaş yanıt oranları gösteriyor ve oyuncular için yetersiz olacaktır. Karşılaştırıldığında, test edilen tüm cihazlar 0.165 (minimum) ile 636 (maksimum) ms arasında değişir. » Tüm cihazların 51 %'si daha iyi. Bu, ölçülen yanıt süresinin test edilen tüm cihazların ortalamasından (31 ms) daha kötü olduğu anlamına gelir. | ||
Ekran Titremesi / PWM (Darbe Genişliği Modülasyonu)
| Ekran titriyor / PWM algılanmadı | 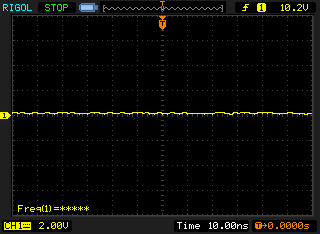 | ||
Karşılaştırıldığında: Test edilen tüm cihazların %52 %'si ekranı karartmak için PWM kullanmıyor. PWM tespit edilirse, ortalama 7757 (minimum: 5 - maksimum: 343500) Hz ölçüldü. | |||
| PCMark 8 Home Score Accelerated v2 | 3540 puan | |
| PCMark 8 Work Score Accelerated v2 | 4909 puan | |
| PCMark 10 Score | 3960 puan | |
Yardım | ||
| Lenovo ThinkPad T480s-20L8S02E00 Samsung SSD PM981 MZVLB512HAJQ | Lenovo ThinkPad T470s-20HGS00V00 Samsung SSD PM961 1TB M.2 PCIe 3.0 x4 NVMe (MZVLW1T0) | Lenovo ThinkPad X1 Carbon 2018-20KGS03900 Samsung SSD PM981 MZVLB512HAJQ | Dell Latitude 7480 Intel SSDSCKKF256H6 | Ortalama Samsung SSD PM981 MZVLB512HAJQ | |
|---|---|---|---|---|---|
| CrystalDiskMark 3.0 | -16% | -25% | -64% | -18% | |
| Read Seq (MB/s) | 2588 | 1760 -32% | 2327 -10% | 486.5 -81% | 2002 ? -23% |
| Write Seq (MB/s) | 1858 | 1666 -10% | 1808 -3% | 418.6 -77% | 1656 ? -11% |
| Read 512 (MB/s) | 1799 | 832 -54% | 419.3 -77% | 354.3 -80% | 1213 ? -33% |
| Write 512 (MB/s) | 1863 | 1064 -43% | 1272 -32% | 306.8 -84% | 1641 ? -12% |
| Read 4k (MB/s) | 62.7 | 53.2 -15% | 60.6 -3% | 29.25 -53% | 61.4 ? -2% |
| Write 4k (MB/s) | 146.8 | 167.4 14% | 132.9 -9% | 90.5 -38% | 131.3 ? -11% |
| Read 4k QD32 (MB/s) | 446.6 | 630 41% | 340.7 -24% | 280.2 -37% | 407 ? -9% |
| Write 4k QD32 (MB/s) | 706 | 533 -25% | 439.7 -38% | 252.8 -64% | 402 ? -43% |

| 3DMark 06 Standard Score | 12796 puan | |
| 3DMark Vantage P Result | 7839 puan | |
| 3DMark 11 Performance | 3922 puan | |
| 3DMark Ice Storm Standard Score | 65886 puan | |
| 3DMark Cloud Gate Standard Score | 12049 puan | |
| 3DMark Fire Strike Score | 2584 puan | |
Yardım | ||
| düşük | orta | yüksek | ultra | |
|---|---|---|---|---|
| BioShock Infinite (2013) | 158.3 | 87 | 77 | 28.89 |
| The Witcher 3 (2015) | 53 | 31.47 | 17.06 | |
| Star Wars Battlefront (2015) | 78.4 | 53.8 | 24.5 | 21.4 |
| Rise of the Tomb Raider (2016) | 54.6 | 32.6 | 16.5 | |
| Doom (2016) | 60.5 | 49.6 | 17.1 | |
| Civilization 6 (2016) | 75.5 | 42.87 | 19.47 | |
| Warhammer 40.000: Dawn of War III (2017) | 62.5 | 23.7 | ||
| FIFA 18 (2017) | 133.9 | 83.6 | 78.1 | 73 |
| Call of Duty WWII (2017) | 87.9 | 54.6 | 24.5 | |
| Star Wars Battlefront 2 (2017) | 59.3 | 26.4 | 22.5 | 14.6 |
Ses yüksekliği
| Boşta |
| 29 / 29 / 29 dB |
| Çalışırken |
| 36.5 / 38.2 dB |
 | ||
30 dB sessiz 40 dB(A) duyulabilirlik 50 dB(A) gürültülü |
||
min: | ||
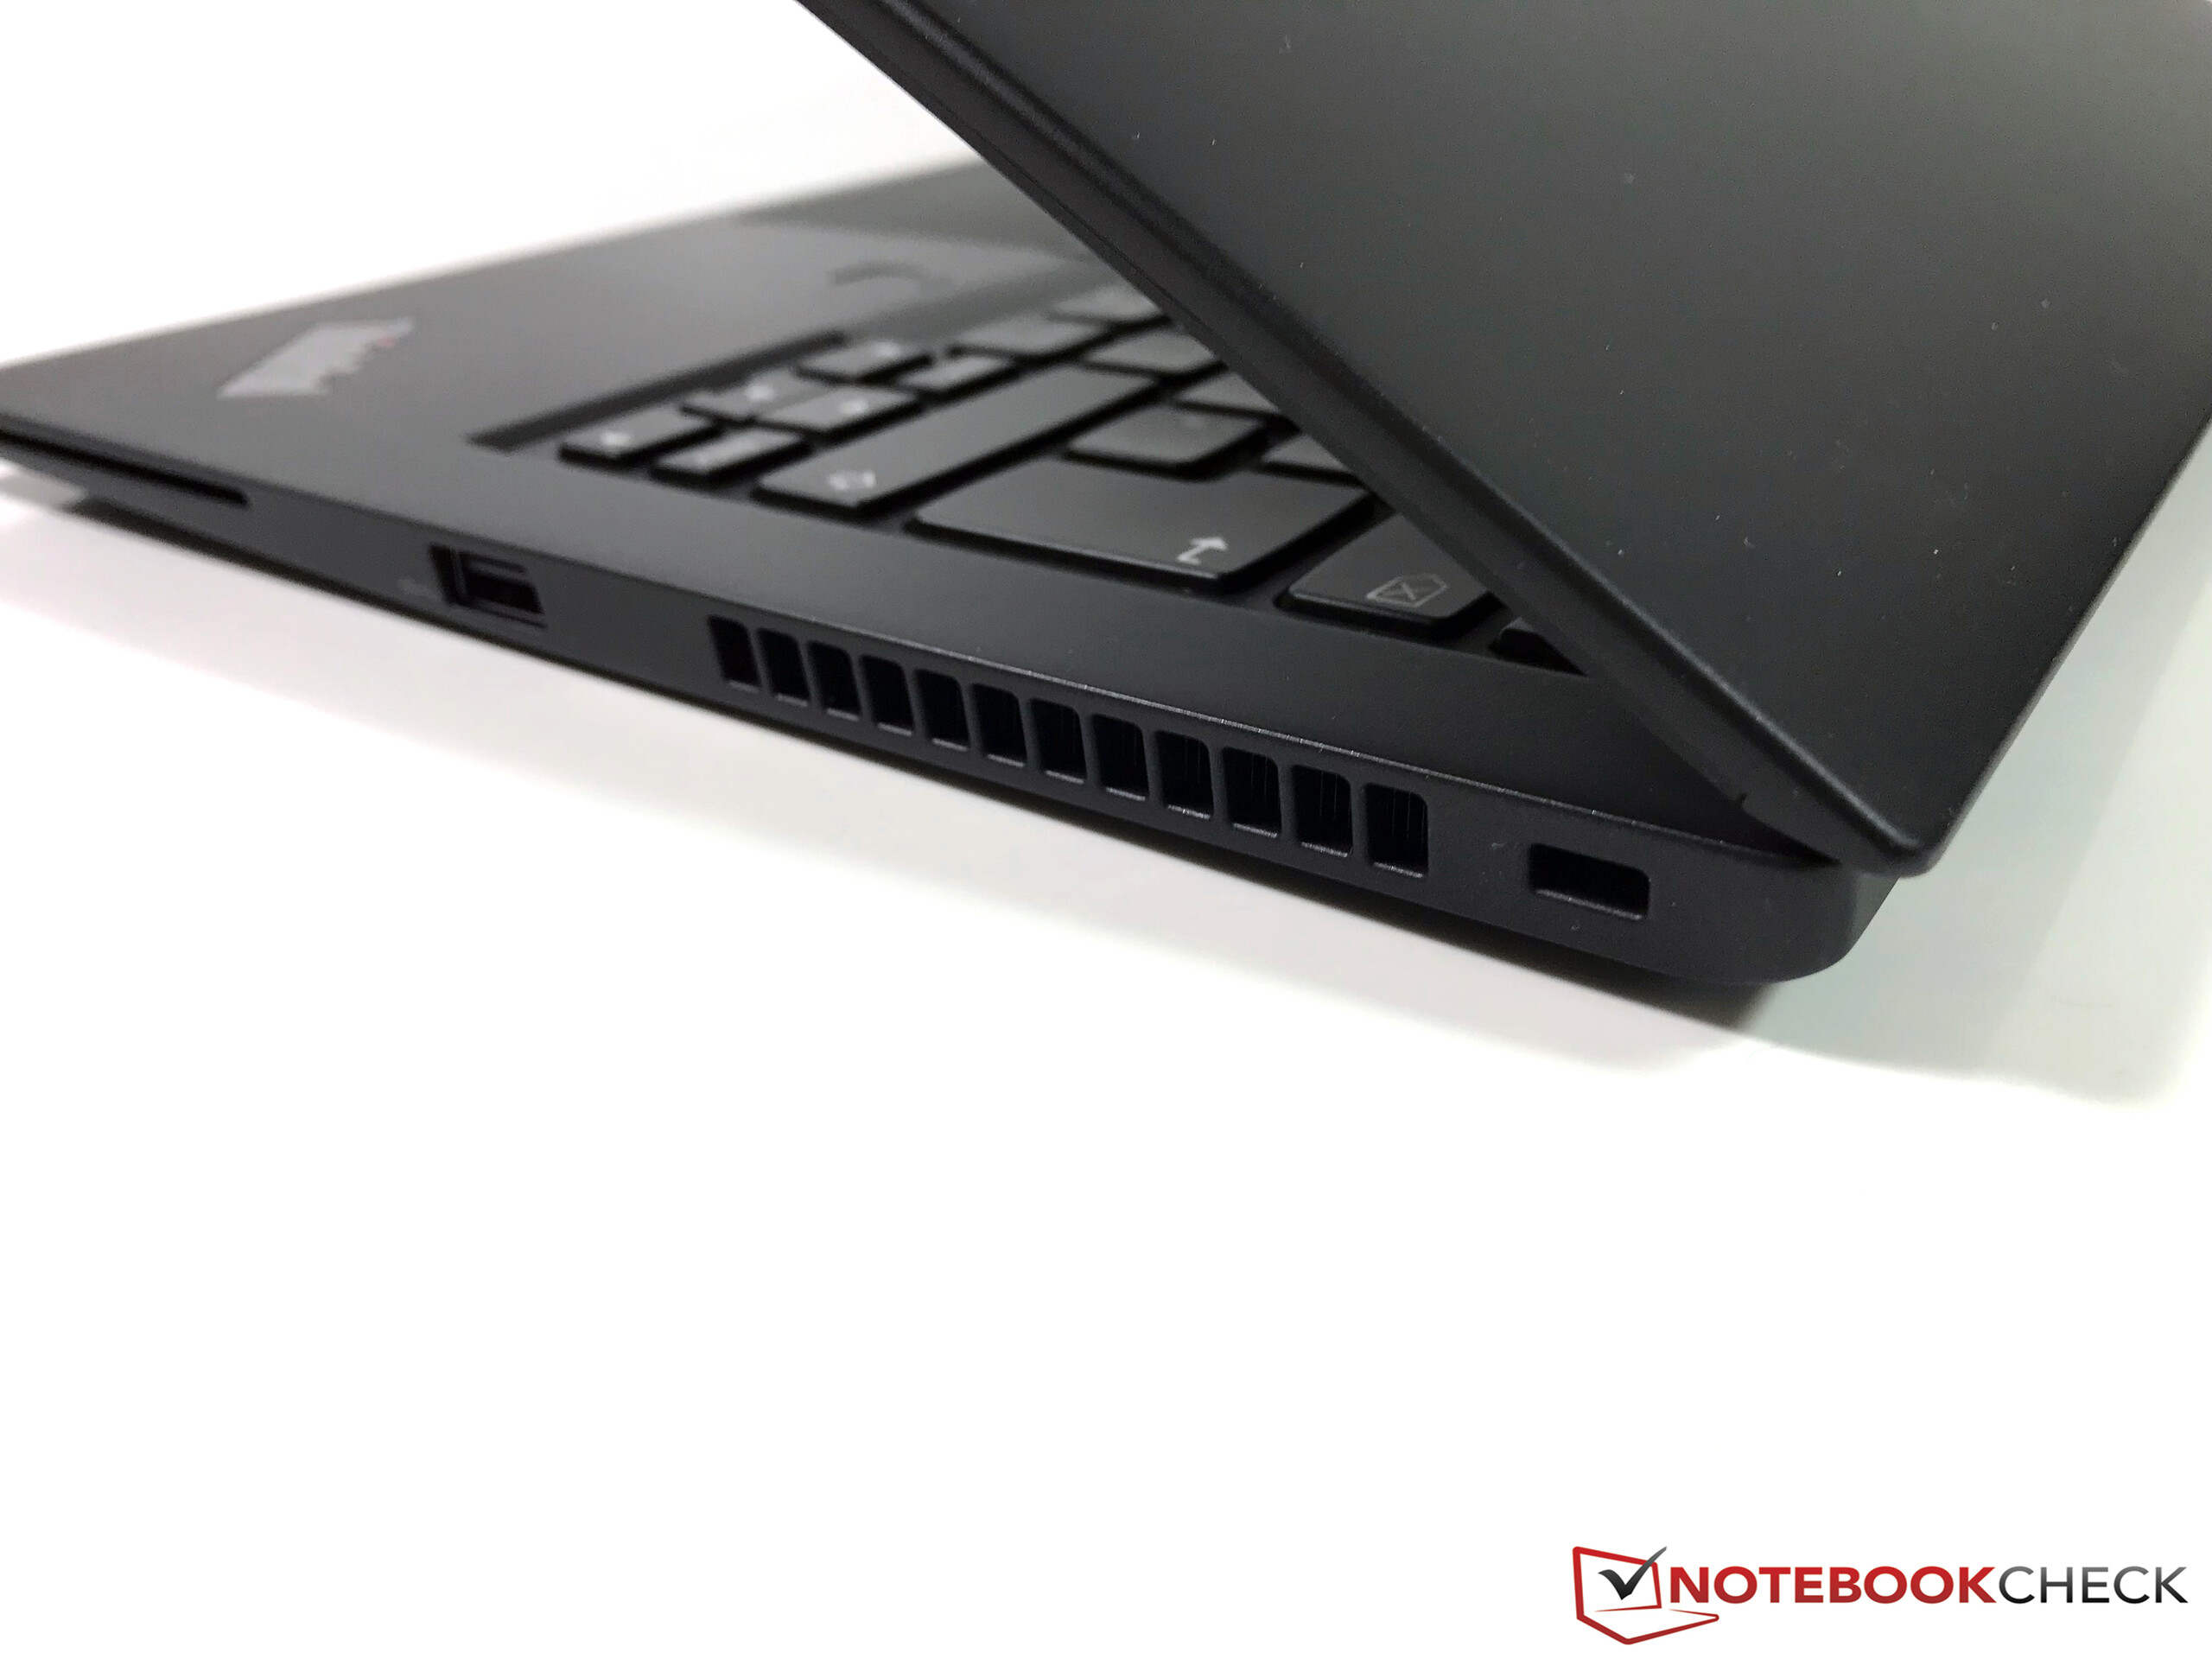
(-) Üst taraftaki maksimum sıcaklık, 34.3 °C / 94 F ortalamasına kıyasla 49.2 °C / 121 F'dir. , Office sınıfı için 21.2 ile 62.5 °C arasında değişir.
(-) Alt kısım, 36.8 °C / 98 F ortalamasına kıyasla maksimum 48.2 °C / 119 F'ye kadar ısınır
(+) Boşta kullanımda, üst tarafın ortalama sıcaklığı 22.6 °C / 73 F olup, cihazın 29.5 °C / 85 F.
(±) The Witcher 3 oynarken, üst tarafın ortalama sıcaklığı 36.9 °C / 98 F olup, cihazın 29.5 °C / 85 F.
(+) Avuç içi dayanakları ve dokunmatik yüzey maksimum (35.2 °C / 95.4 F) cilt sıcaklığına ulaşıyor ve bu nedenle sıcak değil.
(-) Benzer cihazların avuç içi dayanağı alanının ortalama sıcaklığı 27.5 °C / 81.5 F (-7.7 °C / -13.9 F) idi.
Lenovo ThinkPad T480s-20L8S02E00 ses analizi
(±) | hoparlör ses yüksekliği ortalama ama iyi (78.9 dB)
Bas 100 - 315Hz
(-) | neredeyse hiç bas yok - ortalama olarak medyandan 19.4% daha düşük
(±) | Bas doğrusallığı ortalamadır (12.1% delta - önceki frekans)
Ortalar 400 - 2000 Hz
(±) | daha yüksek ortalar - ortalama olarak medyandan 6.5% daha yüksek
(±) | Ortaların doğrusallığı ortalamadır (9.6% delta - önceki frekans)
Yüksekler 2 - 16 kHz
(+) | dengeli yüksekler - medyandan yalnızca 3.5% uzakta
(±) | Yükseklerin doğrusallığı ortalamadır (7.6% delta - önceki frekans)
Toplam 100 - 16.000 Hz
(±) | Genel sesin doğrusallığı ortalamadır (22.1% ortancaya göre fark)
Aynı sınıfla karşılaştırıldığında
» Bu sınıftaki tüm test edilen cihazların %58%'si daha iyi, 8% benzer, 34% daha kötüydü
» En iyisinin deltası 7% idi, ortalama 21% idi, en kötüsü 53% idi
Test edilen tüm cihazlarla karşılaştırıldığında
» Test edilen tüm cihazların %64'si daha iyi, 6 benzer, % 30 daha kötüydü
» En iyisinin deltası 4% idi, ortalama 23% idi, en kötüsü 134% idi
Dell Latitude 7480 ses analizi
(±) | hoparlör ses yüksekliği ortalama ama iyi (75 dB)
Bas 100 - 315Hz
(±) | azaltılmış bas - ortalama olarak medyandan 11.9% daha düşük
(±) | Bas doğrusallığı ortalamadır (10.6% delta - önceki frekans)
Ortalar 400 - 2000 Hz
(+) | dengeli ortalar - medyandan yalnızca 3.8% uzakta
(±) | Ortaların doğrusallığı ortalamadır (7.8% delta - önceki frekans)
Yüksekler 2 - 16 kHz
(±) | daha yüksek en yüksekler - ortalama olarak medyandan 6.6% daha yüksek
(+) | yüksekler doğrusaldır (6.3% deltadan önceki frekansa)
Toplam 100 - 16.000 Hz
(±) | Genel sesin doğrusallığı ortalamadır (23.2% ortancaya göre fark)
Aynı sınıfla karşılaştırıldığında
» Bu sınıftaki tüm test edilen cihazların %65%'si daha iyi, 8% benzer, 27% daha kötüydü
» En iyisinin deltası 7% idi, ortalama 21% idi, en kötüsü 53% idi
Test edilen tüm cihazlarla karşılaştırıldığında
» Test edilen tüm cihazların %70'si daha iyi, 5 benzer, % 25 daha kötüydü
» En iyisinin deltası 4% idi, ortalama 23% idi, en kötüsü 134% idi
Lenovo ThinkPad X1 Carbon 2018-20KGS03900 ses analizi
(+) | hoparlörler nispeten yüksek sesle çalabilir (83.6 dB)
Bas 100 - 315Hz
(-) | neredeyse hiç bas yok - ortalama olarak medyandan 25.9% daha düşük
(±) | Bas doğrusallığı ortalamadır (9.8% delta - önceki frekans)
Ortalar 400 - 2000 Hz
(+) | dengeli ortalar - medyandan yalnızca 3.8% uzakta
(±) | Ortaların doğrusallığı ortalamadır (9% delta - önceki frekans)
Yüksekler 2 - 16 kHz
(+) | dengeli yüksekler - medyandan yalnızca 2.1% uzakta
(+) | yüksekler doğrusaldır (4% deltadan önceki frekansa)
Toplam 100 - 16.000 Hz
(±) | Genel sesin doğrusallığı ortalamadır (18.7% ortancaya göre fark)
Aynı sınıfla karşılaştırıldığında
» Bu sınıftaki tüm test edilen cihazların %35%'si daha iyi, 6% benzer, 59% daha kötüydü
» En iyisinin deltası 7% idi, ortalama 21% idi, en kötüsü 53% idi
Test edilen tüm cihazlarla karşılaştırıldığında
» Test edilen tüm cihazların %43'si daha iyi, 8 benzer, % 49 daha kötüydü
» En iyisinin deltası 4% idi, ortalama 23% idi, en kötüsü 134% idi
| Kapalı / Bekleme modu | |
| Boşta | |
| Çalışırken |
|
Key:
min: | |
| Lenovo ThinkPad T480s-20L8S02E00 i5-8550U, GeForce MX150, Samsung SSD PM981 MZVLB512HAJQ, IPS LED, 2560x1440, 14" | Lenovo ThinkPad T480s-20L8S02D00 i5-8250U, UHD Graphics 620, Samsung SSD PM981 MZVLB512HAJQ, IPS, 2560x1440, 14" | Lenovo ThinkPad T470s-20HGS00V00 i7-7600U, HD Graphics 620, Samsung SSD PM961 1TB M.2 PCIe 3.0 x4 NVMe (MZVLW1T0), IPS, 2560x1440, 14" | Lenovo ThinkPad X1 Carbon 2018-20KGS03900 i5-8550U, UHD Graphics 620, Samsung SSD PM981 MZVLB512HAJQ, IPS, 2560x1440, 14" | Dell Latitude 7480 i7-7600U, HD Graphics 620, Intel SSDSCKKF256H6, IPS, 1920x1080, 14" | |
|---|---|---|---|---|---|
| Power Consumption | 8% | 4% | -0% | 26% | |
| Idle Minimum * (Watt) | 3.4 | 3.1 9% | 4.64 -36% | 3.8 -12% | 4.32 -27% |
| Idle Average * (Watt) | 7.5 | 6.8 9% | 8.93 -19% | 8.9 -19% | 6.27 16% |
| Idle Maximum * (Watt) | 10.8 | 10.1 6% | 9.12 16% | 11.9 -10% | 6.35 41% |
| Load Average * (Watt) | 55.4 | 48.4 13% | 42.2 24% | 47.5 14% | 29.82 46% |
| Witcher 3 ultra * (Watt) | 34 | ||||
| Load Maximum * (Watt) | 70.3 | 67.1 5% | 47.3 33% | 52.5 25% | 30.64 56% |
* ... daha küçük daha iyidir
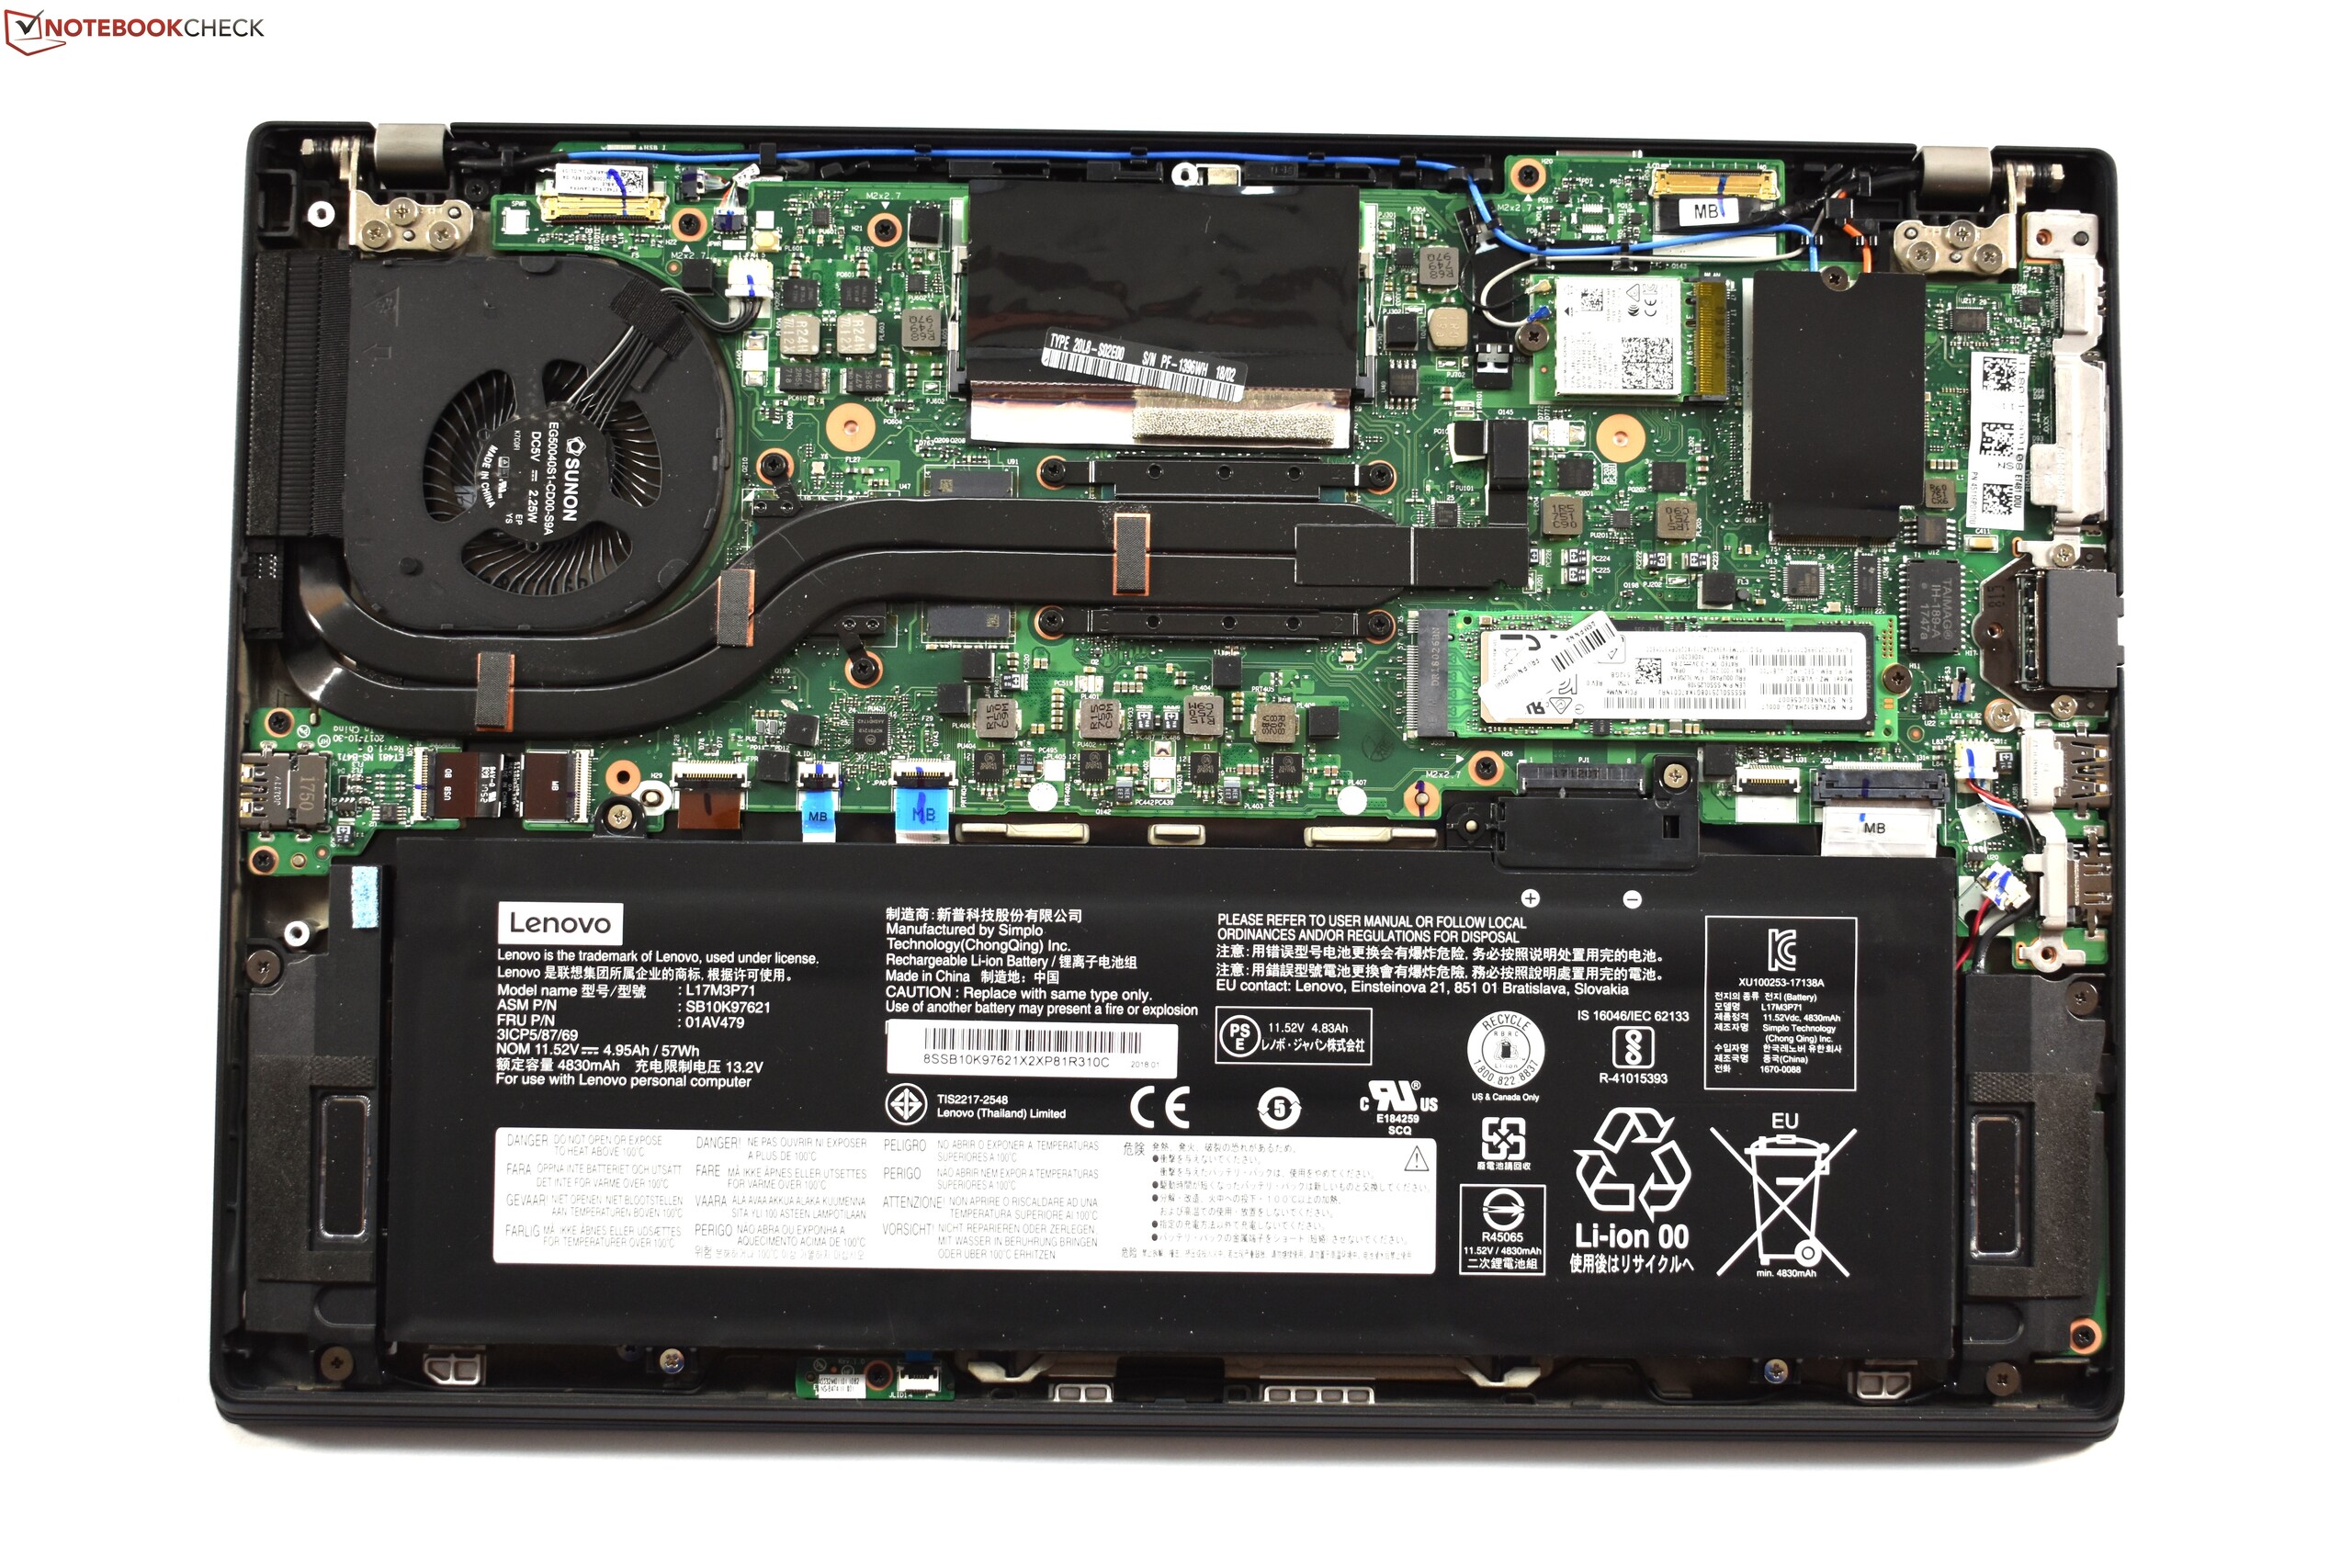
| Lenovo ThinkPad T480s-20L8S02E00 i5-8550U, GeForce MX150, 57 Wh | Lenovo ThinkPad T480s-20L8S02D00 i5-8250U, UHD Graphics 620, 57 Wh | Lenovo ThinkPad T470s-20HGS00V00 i7-7600U, HD Graphics 620, 51 Wh | Lenovo ThinkPad X1 Carbon 2018-20KGS03900 i5-8550U, UHD Graphics 620, 57 Wh | HP EliteBook 840 G4-Z2V22ES ABD i5-7200U, HD Graphics 620, 51 Wh | Dell Latitude 7480 i7-7600U, HD Graphics 620, 60 Wh | Sınıf ortalaması Office | |
|---|---|---|---|---|---|---|---|
| Pil Çalışma Süresi | 31% | -14% | 9% | 9% | 60% | 41% | |
| Reader / Idle (h) | 22.8 | 13.1 -43% | 22.1 -3% | 27.7 21% | 24.5 ? 7% | ||
| H.264 (h) | 9.2 | 12 30% | 7.6 -17% | 9.4 2% | 15.5 ? 68% | ||
| WiFi v1.3 (h) | 8.8 | 9 2% | 7 -20% | 8.7 -1% | 9.6 9% | 12 36% | 13.2 ? 50% |
| Load (h) | 1.3 | 2.1 62% | 1.6 23% | 1.8 38% | 2.9 123% | 1.808 ? 39% |
Artılar
Eksiler
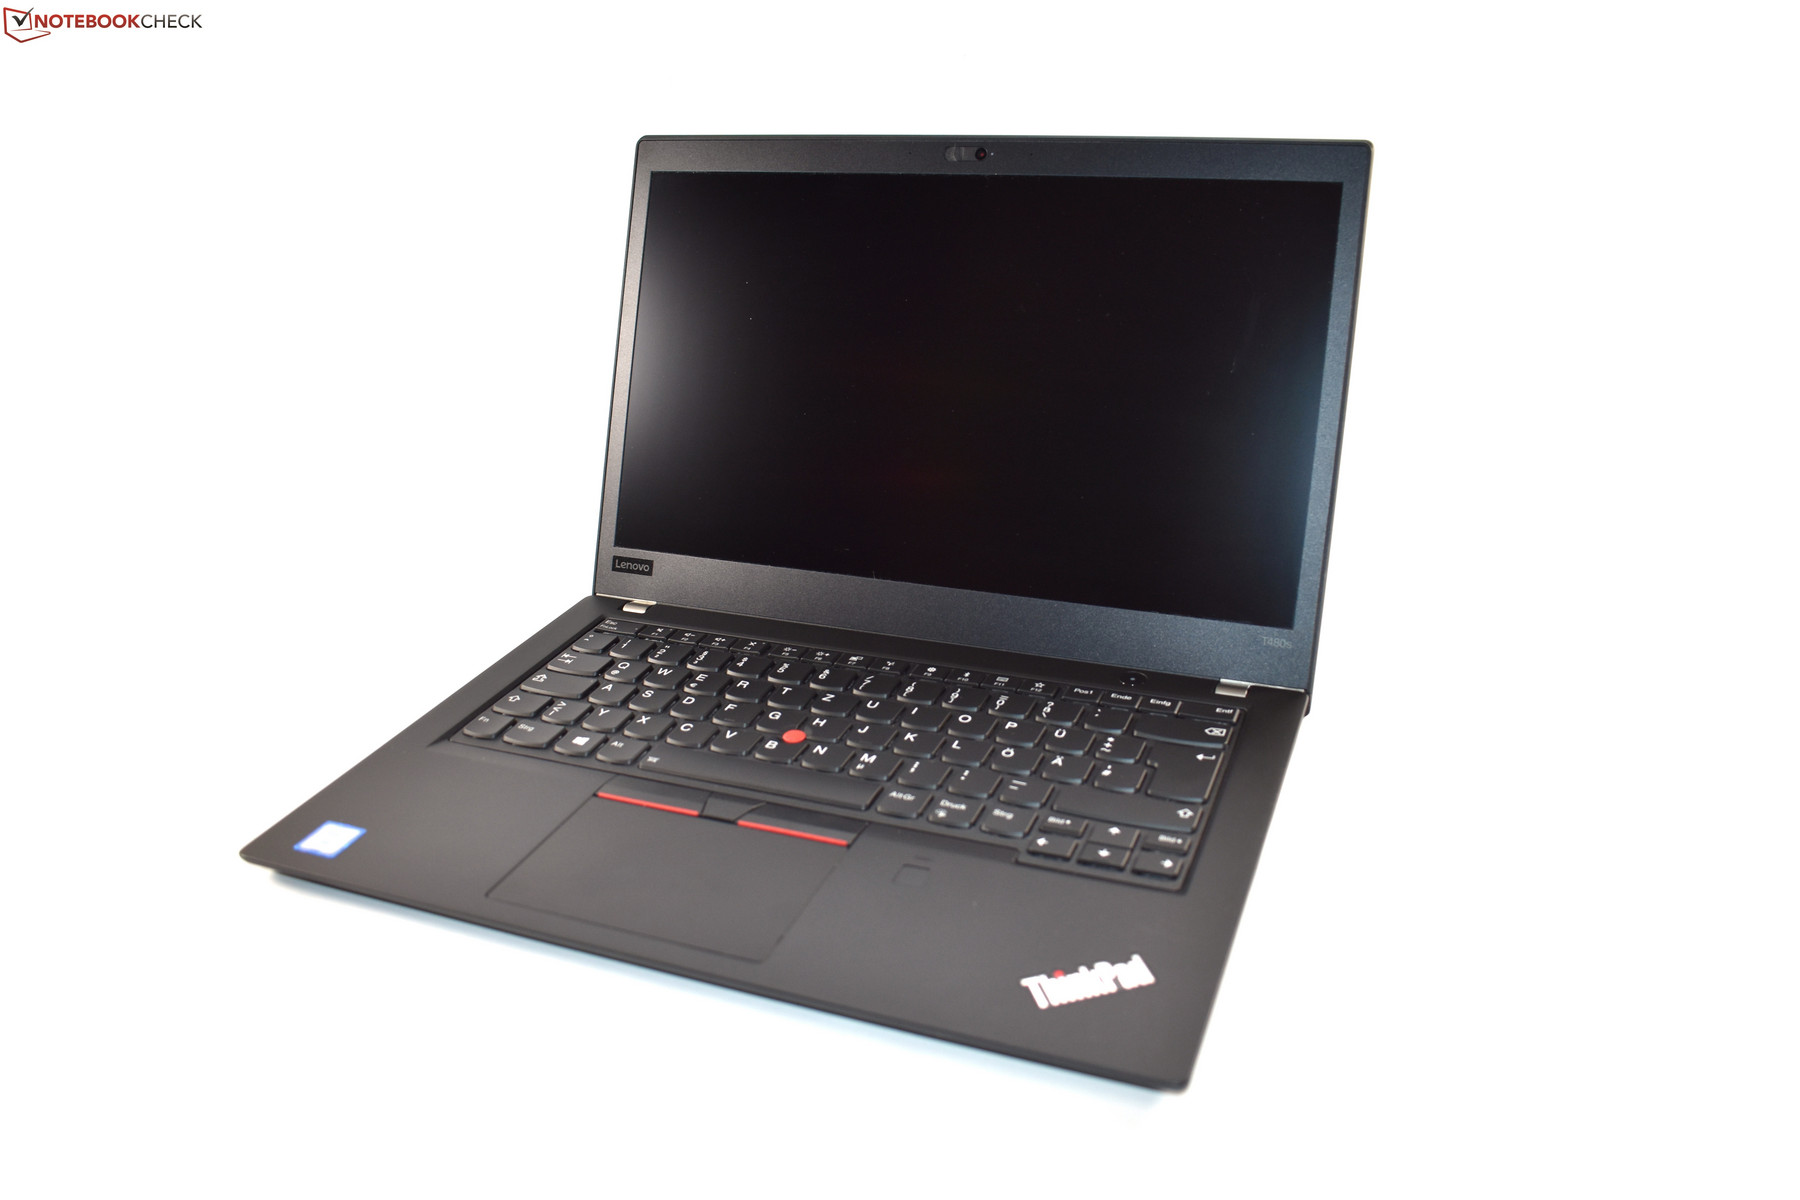
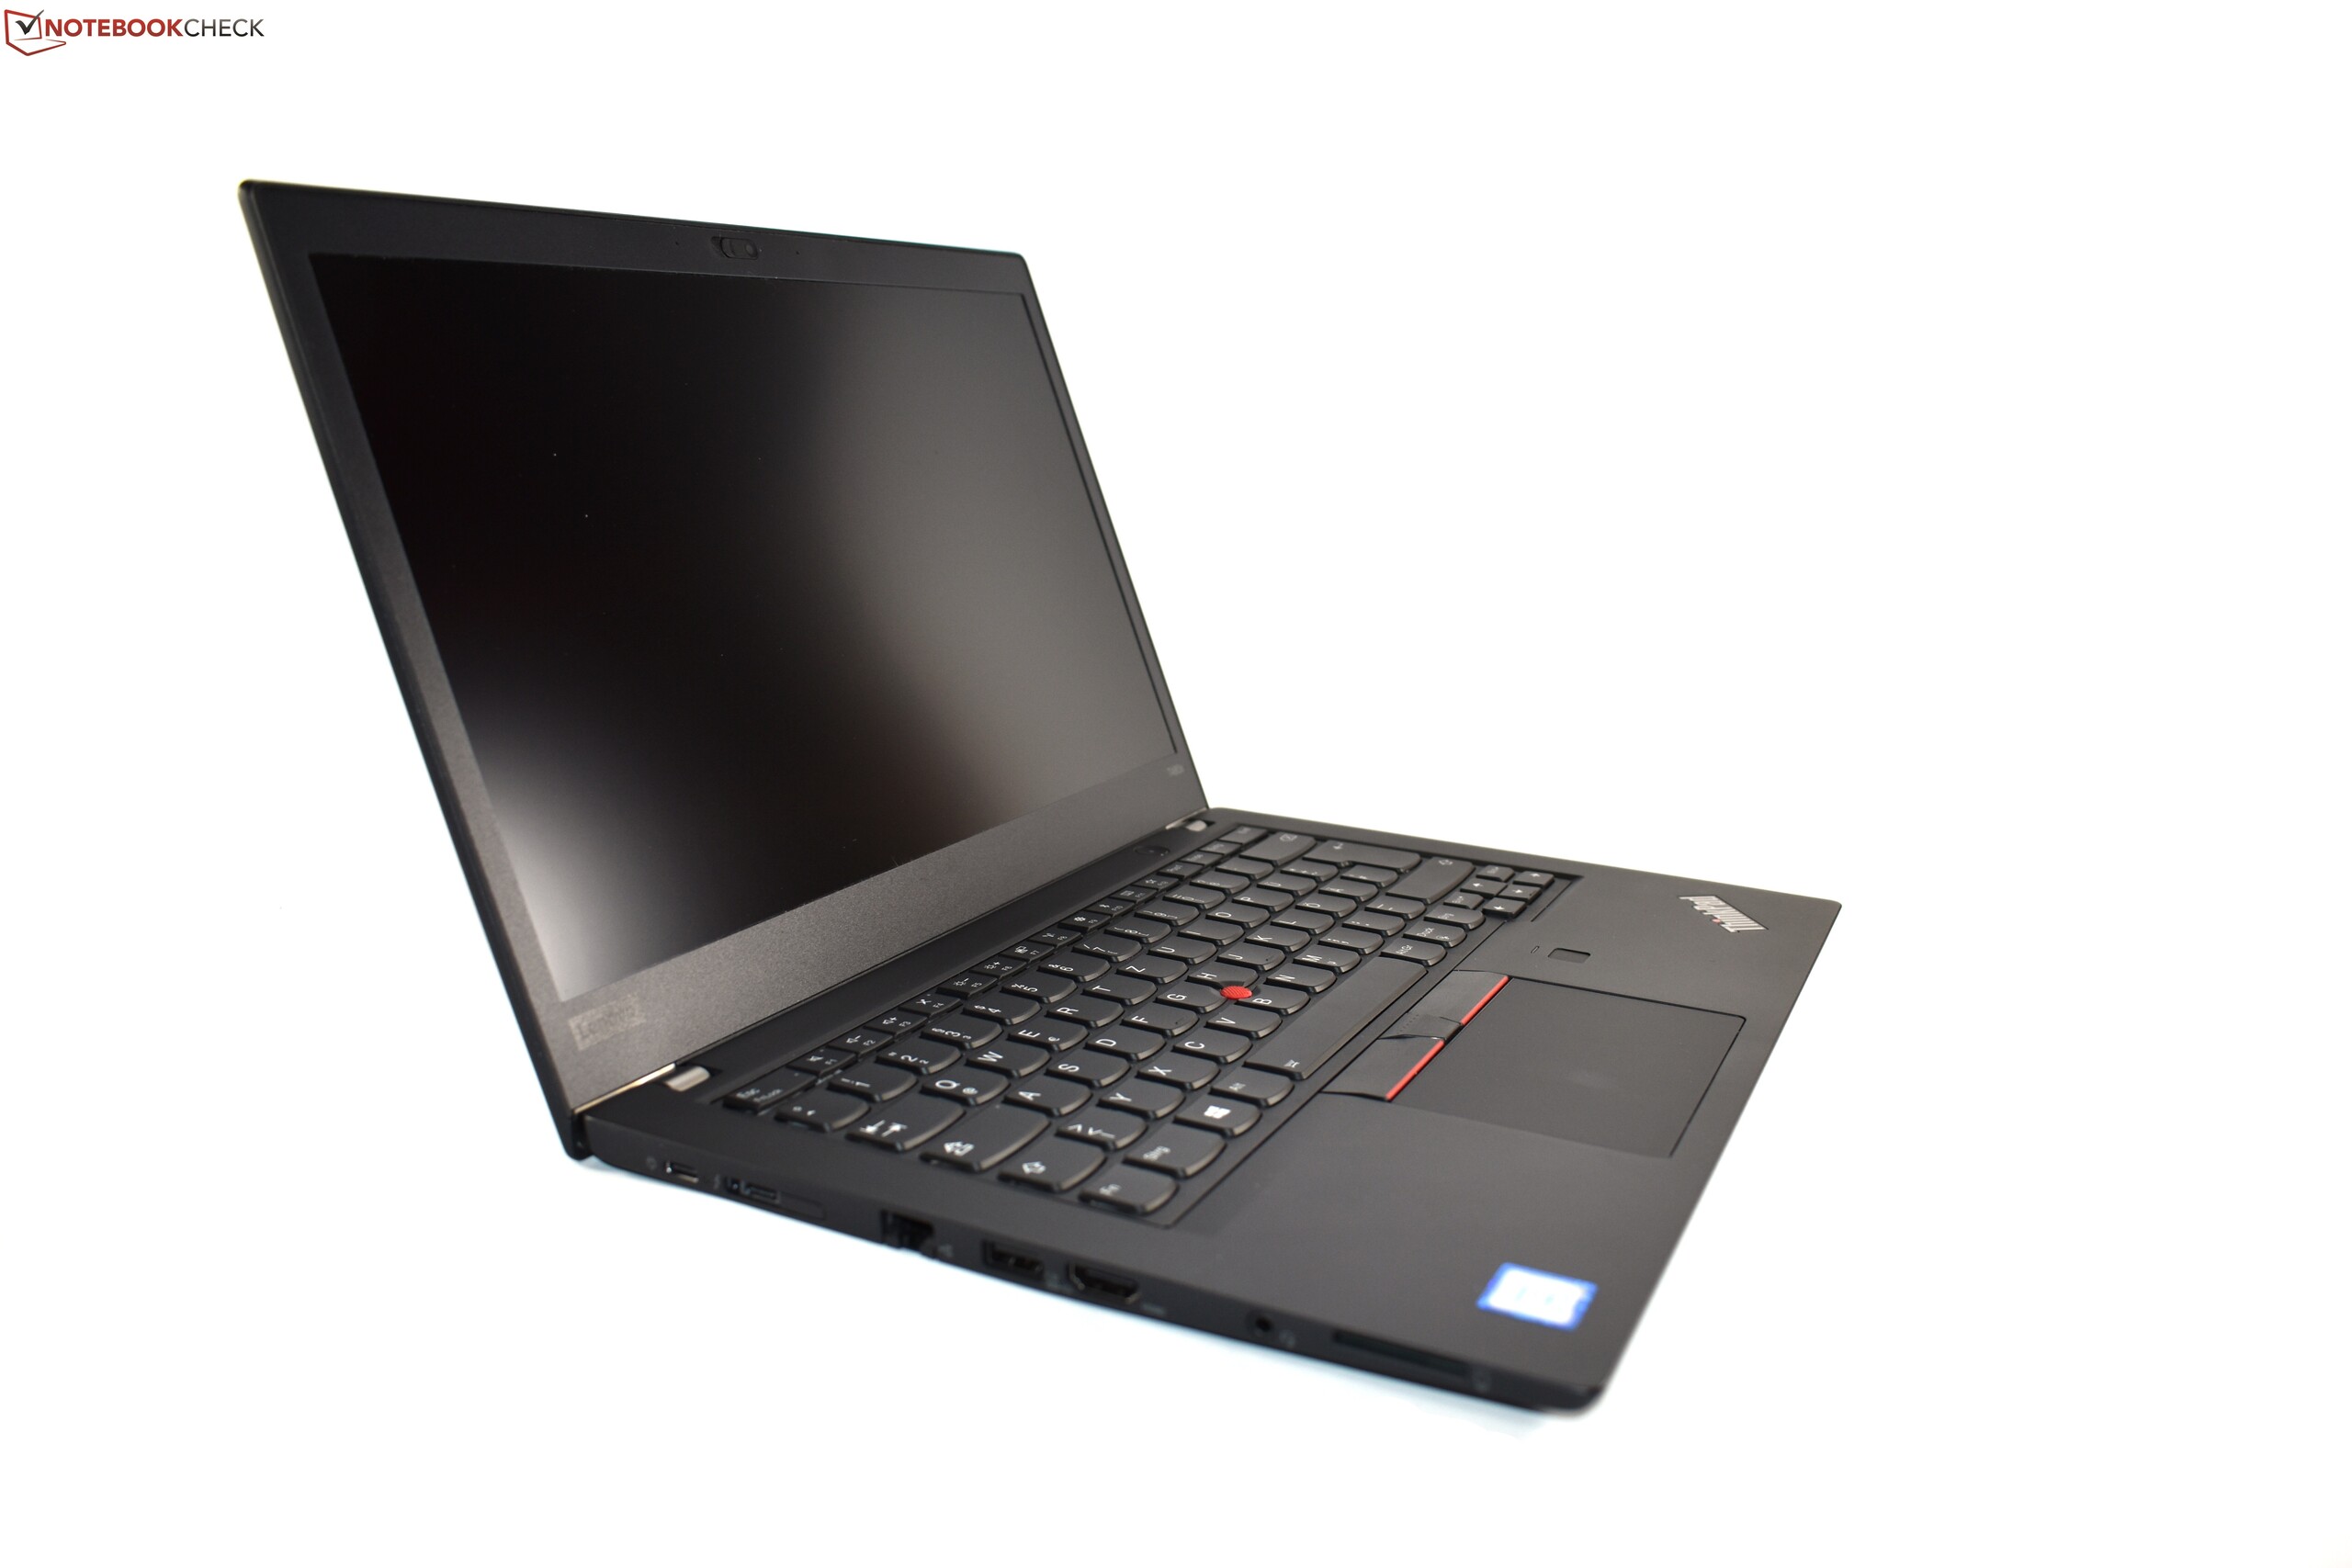
T480s oldukça dengeli ve üst sınıf bir iş cihazı. Harici Nvidia GeForce MX150 ekran kartı ile daha fazla kullanım alanı bulduğu söylenebilir.
İşlemci performansı i7 ile oldukça iyi ancak testlerimiz gösteriyorki soğutma sisteminin sınırlarına ulaşıldığında performans da sınırlarına ulaşıyor. Bu da aslında i7 mi i5 mi sorusunu gündeme getiriyor. ThinkPad X280 daha küçük bir model olmasına karşın benzer şekilde işlemci performans yönetiminde sorun yaşıyor, en azından BIOS güncellemesi ile bu sorunun düzeldiğini söyleyebiliriz. Yüzey sıcaklığı yüksek, hoparlörler zayıf.
Lenovo, T480s ile tüm kutucukları işaretlemeye çok yakın. Pozitifleri negatiflerinin fazlasıyla önünde. Bu yüzden MX150 ile T480s modelini öneriyoruz.
Asıl rakipler Dell Latitude 7490, HP 840 G5 ve daha pahalı ThinkPad X1 Carbon 2018. Bunu söylemekle beraber T480s modelinin rekabetten kaçmaya ihtiyacı yok. Lenovo bu modeli ile harika bir bileşimi ortaya çıkarmayı başarmış.
Lenovo ThinkPad T480s-20L8S02E00
- 03/19/2018 v6 (old)
Benjamin Herzig