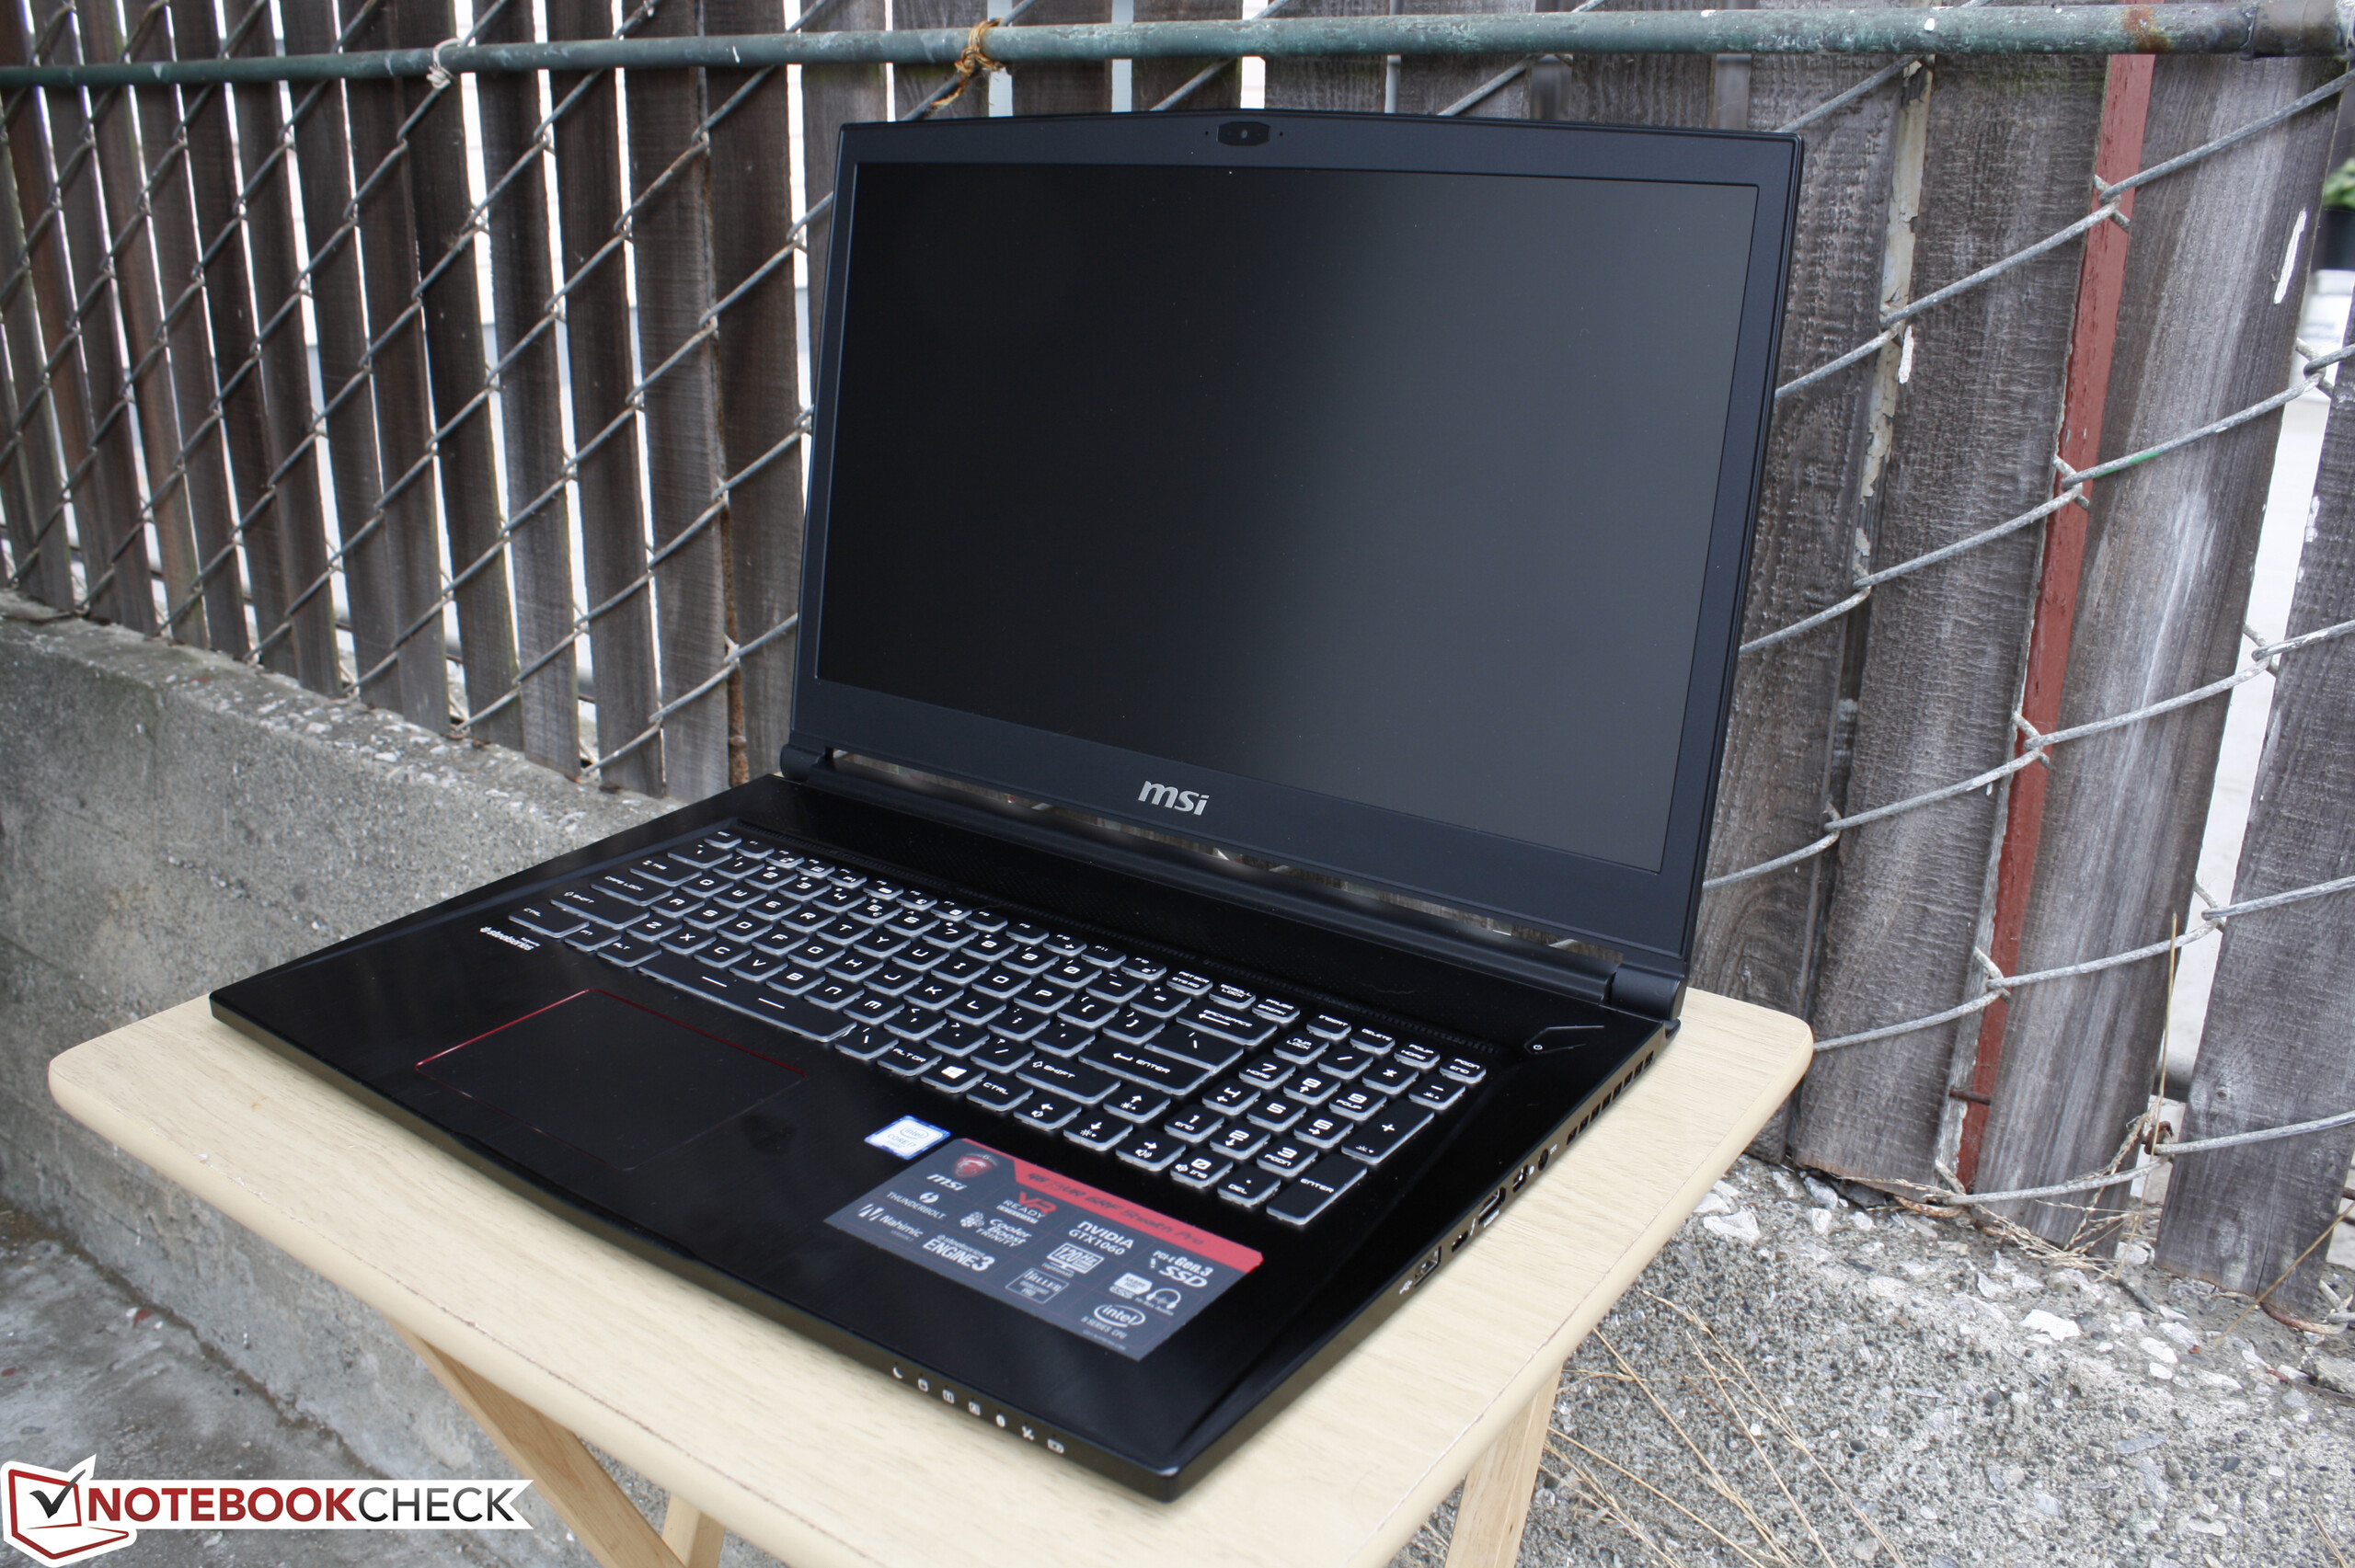
Kısa inceleme: MSI GS73VR 6RF Notebook


| SD Card Reader | |
| average JPG Copy Test (av. of 3 runs) | |
| MSI GT72VR 6RE-015US | |
| Dell XPS 13 2016 9350 (FHD, i7-6560U) | |
| Alienware 17 R3 (A17-9935) | |
| MSI GS73VR 6RF | |
| maximum AS SSD Seq Read Test (1GB) | |
| Dell XPS 13 2016 9350 (FHD, i7-6560U) | |
| MSI GT72VR 6RE-015US | |
| Alienware 17 R3 (A17-9935) | |
| MSI GS73VR 6RF | |
| Networking | |
| iperf Server (receive) TCP 1 m | |
| Dell XPS 13 2016 9350 (FHD, i7-6560U) | |
| MSI GS73VR 6RF | |
| iperf Client (transmit) TCP 1 m | |
| MSI GS73VR 6RF | |
| Dell XPS 13 2016 9350 (FHD, i7-6560U) | |
| |||||||||||||||||||||||||
Aydınlatma: 86 %
Batarya modunda parlaklık: 337.2 cd/m²
Kontrast: 1095:1 (Siyah: 0.308 cd/m²)
ΔE ColorChecker Calman: 2.96 | ∀{0.5-29.43 Ø4.71}
ΔE Greyscale Calman: 2.57 | ∀{0.09-98 Ø4.96}
100% sRGB (Argyll 1.6.3 3D)
74.3% AdobeRGB 1998 (Argyll 1.6.3 3D)
83.6% AdobeRGB 1998 (Argyll 3D)
99.9% sRGB (Argyll 3D)
90% Display P3 (Argyll 3D)
Gamma: 2.25
CCT: 7114 K
| MSI GS73VR 6RF TN LED, 17.3", 1920x1080 | Aorus X7 Pro v5 LG Philips LP173WF4-SPD1 (LGD046C), IPS, 17.3", 1920x1080 | MSI GS70-6QE16H21 Chi Mei N173HGE-E11 (CMN1735), TN LED, 17.3", 1920x1080 | Asus G752VS-XB78K LG Philips LP173WF4-SPF3 (LGD04E8), IPS, 17.3", 1920x1080 | Alienware 17 R3 (A17-9935) CV69H_173WF4 (LGD0459), IPS, 17.3", 1920x1080 | |
|---|---|---|---|---|---|
| Display | -24% | -16% | -22% | -23% | |
| Display P3 Coverage (%) | 90 | 66 -27% | 67 -26% | 66.9 -26% | 66.9 -26% |
| sRGB Coverage (%) | 99.9 | 83.4 -17% | 97.3 -3% | 85.2 -15% | 83.9 -16% |
| AdobeRGB 1998 Coverage (%) | 83.6 | 61 -27% | 67.6 -19% | 62.3 -25% | 61.4 -27% |
| Response Times | -77% | -83% | -79% | ||
| Response Time Grey 50% / Grey 80% * (ms) | 28 ? | 35 ? -25% | 38 ? -36% | 33 ? -18% | |
| Response Time Black / White * (ms) | 9.6 ? | 22 ? -129% | 22 ? -129% | 23 ? -140% | |
| PWM Frequency (Hz) | |||||
| Screen | -19% | -12% | -13% | -29% | |
| Brightness middle (cd/m²) | 337.2 | 271 -20% | 172 -49% | 328 -3% | 360 7% |
| Brightness (cd/m²) | 315 | 257 -18% | 161 -49% | 317 1% | 336 7% |
| Brightness Distribution (%) | 86 | 91 6% | 85 -1% | 88 2% | 90 5% |
| Black Level * (cd/m²) | 0.308 | 0.23 25% | 0.26 16% | 0.3 3% | 0.44 -43% |
| Contrast (:1) | 1095 | 1178 8% | 662 -40% | 1093 0% | 818 -25% |
| Colorchecker dE 2000 * | 2.96 | 4.14 -40% | 2.06 30% | 3.74 -26% | 4.76 -61% |
| Colorchecker dE 2000 max. * | 5.45 | 8.11 -49% | 8.97 -65% | 10.8 -98% | |
| Greyscale dE 2000 * | 2.57 | 4 -56% | 2.42 6% | 2.67 -4% | 3.69 -44% |
| Gamma | 2.25 98% | 2.43 91% | 2.45 90% | 2.41 91% | 2.24 98% |
| CCT | 7114 91% | 6558 99% | 6855 95% | 6861 95% | 6091 107% |
| Color Space (Percent of AdobeRGB 1998) (%) | 74.3 | 55 -26% | 62 -17% | 56 -25% | 55 -26% |
| Color Space (Percent of sRGB) (%) | 100 | 83 -17% | 97 -3% | 85 -15% | 84 -16% |
| Toplam Ortalama (Program / Ayarlar) | -40% /
-27% | -14% /
-13% | -39% /
-24% | -44% /
-35% |
* ... daha küçük daha iyidir
Yanıt Sürelerini Görüntüle
| ↔ Tepki Süresi Siyahtan Beyaza | ||
|---|---|---|
| 9.6 ms ... yükseliş ↗ ve sonbahar↘ birleşimi | ↗ 5.2 ms yükseliş | 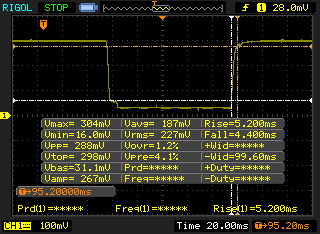 |
| ↘ 4.4 ms sonbahar | ||
| Ekran, testlerimizde hızlı yanıt oranları gösteriyor ve oyun oynamaya uygun olmalı. Karşılaştırıldığında, test edilen tüm cihazlar 0.1 (minimum) ile 240 (maksimum) ms arasında değişir. » Tüm cihazların 26 %'si daha iyi. Bu, ölçülen yanıt süresinin test edilen tüm cihazların ortalamasından (19.8 ms) daha iyi olduğu anlamına gelir. | ||
| ↔ Tepki Süresi %50 Griden %80 Griye | ||
| 28 ms ... yükseliş ↗ ve sonbahar↘ birleşimi | ↗ 13.2 ms yükseliş | 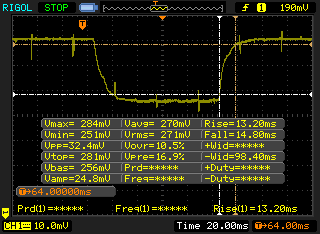 |
| ↘ 14.8 ms sonbahar | ||
| Ekran, testlerimizde nispeten yavaş yanıt oranları gösteriyor ve oyuncular için çok yavaş olabilir. Karşılaştırıldığında, test edilen tüm cihazlar 0.165 (minimum) ile 636 (maksimum) ms arasında değişir. » Tüm cihazların 38 %'si daha iyi. Bu, ölçülen yanıt süresinin test edilen tüm cihazların ortalamasına benzer olduğu anlamına gelir (30.9 ms). | ||
Ekran Titremesi / PWM (Darbe Genişliği Modülasyonu)
| Ekran titriyor / PWM algılanmadı | 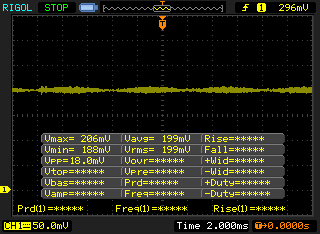 | ||
Karşılaştırıldığında: Test edilen tüm cihazların %52 %'si ekranı karartmak için PWM kullanmıyor. PWM tespit edilirse, ortalama 7741 (minimum: 5 - maksimum: 343500) Hz ölçüldü. | |||
| Cinebench R15 | |
| CPU Single 64Bit | |
| Eurocom Sky DLX7 | |
| MSI PX60 QD-034US | |
| Lenovo ThinkPad P40 Yoga 20GQ-000EUS | |
| MSI GS73VR 6RF | |
| Toshiba Satellite S70-B-106 | |
| CPU Multi 64Bit | |
| Eurocom Sky DLX7 | |
| MSI PX60 QD-034US | |
| MSI GS73VR 6RF | |
| Toshiba Satellite S70-B-106 | |
| Lenovo ThinkPad P40 Yoga 20GQ-000EUS | |
| Cinebench R11.5 | |
| CPU Single 64Bit | |
| Eurocom Sky DLX7 | |
| MSI PX60 QD-034US | |
| MSI GS73VR 6RF | |
| Toshiba Satellite S70-B-106 | |
| Lenovo ThinkPad P40 Yoga 20GQ-000EUS | |
| CPU Multi 64Bit | |
| Eurocom Sky DLX7 | |
| MSI PX60 QD-034US | |
| MSI GS73VR 6RF | |
| Toshiba Satellite S70-B-106 | |
| Lenovo ThinkPad P40 Yoga 20GQ-000EUS | |
| Cinebench R10 | |
| Rendering Multiple CPUs 32Bit | |
| Eurocom Sky DLX7 | |
| MSI PX60 QD-034US | |
| MSI GS73VR 6RF | |
| Lenovo ThinkPad P40 Yoga 20GQ-000EUS | |
| Rendering Single 32Bit | |
| Eurocom Sky DLX7 | |
| MSI PX60 QD-034US | |
| Lenovo ThinkPad P40 Yoga 20GQ-000EUS | |
| MSI GS73VR 6RF | |
| wPrime 2.10 - 1024m | |
| Lenovo ThinkPad P40 Yoga 20GQ-000EUS | |
| MSI GS73VR 6RF | |
| MSI PX60 QD-034US | |
| Eurocom Sky DLX7 | |
| Super Pi Mod 1.5 XS 32M - 32M | |
| MSI GS73VR 6RF | |
| Lenovo ThinkPad P40 Yoga 20GQ-000EUS | |
| MSI PX60 QD-034US | |
| Eurocom Sky DLX7 | |
* ... daha küçük daha iyidir
| PCMark 8 | |
| Home Score Accelerated v2 | |
| Asus G752VY-RH71 | |
| MSI GS73VR 6RF | |
| MSI GS70-6QE16H21 | |
| Razer Blade Pro 17 inch 2015 | |
| Aorus X5S v5 | |
| Work Score Accelerated v2 | |
| Asus G752VY-RH71 | |
| MSI GS70-6QE16H21 | |
| MSI GS73VR 6RF | |
| Razer Blade Pro 17 inch 2015 | |
| Aorus X5S v5 | |
| Creative Score Accelerated v2 | |
| Asus G752VY-RH71 | |
| MSI GS73VR 6RF | |
| MSI GS70-6QE16H21 | |
| Aorus X5S v5 | |
| Razer Blade Pro 17 inch 2015 | |
| PCMark 8 Home Score Accelerated v2 | 4012 puan | |
| PCMark 8 Creative Score Accelerated v2 | 5062 puan | |
| PCMark 8 Work Score Accelerated v2 | 4774 puan | |
Yardım | ||
| MSI GS73VR 6RF SanDisk SD8SN8U1T001122 | Aorus X5S v5 Samsung SM951 MZVPV256 m.2 | MSI GT72S-6QEG16SR421BW Toshiba NVMe THNSN5256GPU7 | Asus G752VY-RH71 Samsung SSD 950 Pro 512GB m.2 NVMe | Razer Blade Pro 17 inch 2015 Samsung PM851 Series MZMTE256HMHP | |
|---|---|---|---|---|---|
| CrystalDiskMark 3.0 | 263% | 256% | 298% | 62% | |
| Read Seq (MB/s) | 334.3 | 1748 423% | 1602 379% | 2007 500% | 527 58% |
| Write Seq (MB/s) | 319 | 1272 299% | 1062 233% | 1536 382% | 265.9 -17% |
| Read 512 (MB/s) | 242.3 | 993 310% | 1110 358% | 1022 322% | 445.9 84% |
| Write 512 (MB/s) | 254.4 | 1263 396% | 1095 330% | 1510 494% | 265.9 5% |
| Read 4k (MB/s) | 20.3 | 51.9 156% | 44.74 120% | 51.6 154% | 36.83 81% |
| Write 4k (MB/s) | 42.51 | 146.5 245% | 162.3 282% | 150.2 253% | 116 173% |
| Read 4k QD32 (MB/s) | 251.6 | 628 150% | 682 171% | 576 129% | 389 55% |
| Write 4k QD32 (MB/s) | 167.1 | 370.4 122% | 459.5 175% | 413.7 148% | 266.5 59% |

| 3DMark | |
| 1920x1080 Fire Strike Graphics | |
| Asus G752VS-XB78K | |
| Aorus X7 Pro v5 | |
| Asus G701VO-CS74K | |
| MSI GS73VR 6RF | |
| Aorus X5S v5 | |
| HP Pavilion 15 UHD T9Y85AV | |
| Fire Strike Extreme Graphics | |
| Asus G752VS-XB78K | |
| Asus G701VO-CS74K | |
| MSI GS73VR 6RF | |
| Aorus X5S v5 | |
| HP Pavilion 15 UHD T9Y85AV | |
| 3840x2160 Fire Strike Ultra Graphics | |
| Asus G752VS-XB78K | |
| Asus G701VO-CS74K | |
| MSI GS73VR 6RF | |
| Aorus X5S v5 | |
| HP Pavilion 15 UHD T9Y85AV | |
| 3DMark 11 | |
| 1280x720 Performance GPU | |
| Asus G752VS-XB78K | |
| Aorus X7 Pro v5 | |
| Asus G701VO-CS74K | |
| MSI GS73VR 6RF | |
| Aorus X5S v5 | |
| HP Pavilion 15 UHD T9Y85AV | |
| 1280x720 Performance Combined | |
| Asus G752VS-XB78K | |
| Asus G701VO-CS74K | |
| Aorus X7 Pro v5 | |
| MSI GS73VR 6RF | |
| Aorus X5S v5 | |
| HP Pavilion 15 UHD T9Y85AV | |
| 3DMark 11 Performance | 12423 puan | |
| 3DMark Ice Storm Standard Score | 88271 puan | |
| 3DMark Cloud Gate Standard Score | 22781 puan | |
| 3DMark Fire Strike Score | 9609 puan | |
| 3DMark Fire Strike Extreme Score | 5062 puan | |
Yardım | ||
| Batman: Arkham Knight - 1920x1080 High / On AA:SM AF:16x | |
| Asus G752VS-XB78K | |
| Asus G701VO-CS74K | |
| MSI GS73VR 6RF | |
| Aorus X5S v5 | |
| HP Pavilion 15 UHD T9Y85AV | |
| BioShock Infinite - 1920x1080 Ultra Preset, DX11 (DDOF) | |
| Asus G752VS-XB78K | |
| Asus G701VO-CS74K | |
| MSI GS73VR 6RF | |
| Aorus X5S v5 | |
| Aorus X3 Plus v5 | |
| HP Pavilion 15 UHD T9Y85AV | |
| Metro: Last Light - 1920x1080 Very High (DX11) AF:16x | |
| Asus G701VO-CS74K | |
| MSI GS73VR 6RF | |
| Aorus X5S v5 | |
| Aorus X3 Plus v5 | |
| HP Pavilion 15 UHD T9Y85AV | |
| Thief - 1920x1080 Very High Preset AA:FXAA & High SS AF:8x | |
| Asus G752VS-XB78K | |
| Asus G701VO-CS74K | |
| MSI GS73VR 6RF | |
| Aorus X5S v5 | |
| Aorus X3 Plus v5 | |
| HP Pavilion 15 UHD T9Y85AV | |
| Metal Gear Solid V - 1920x1080 Extra High / On | |
| Aorus X5S v5 | |
| Asus G701VO-CS74K | |
| MSI GS73VR 6RF | |
| Aorus X3 Plus v5 | |
| HP Pavilion 15 UHD T9Y85AV | |
| Fallout 4 - 1920x1080 Ultra Preset AA:T AF:16x | |
| Asus G701VO-CS74K | |
| MSI GS73VR 6RF | |
| Aorus X5S v5 | |
| Aorus X3 Plus v5 | |
| HP Pavilion 15 UHD T9Y85AV | |
| Rise of the Tomb Raider - 1920x1080 Very High Preset AA:FX AF:16x | |
| Asus G752VS-XB78K | |
| MSI GS73VR 6RF | |
| Asus G701VO-CS74K | |
| Aorus X5S v5 | |
| HP Pavilion 15 UHD T9Y85AV | |
| Doom - 1920x1080 Ultra Preset AA:SM | |
| Asus G701VO-CS74K | |
| MSI GS73VR 6RF | |
| Overwatch - 1920x1080 Epic (Render Scale 100 %) AA:SM AF:16x | |
| Asus G701VO-CS74K | |
| MSI GS73VR 6RF | |
| HP Pavilion 15 UHD T9Y85AV | |
| düşük | orta | yüksek | ultra | |
|---|---|---|---|---|
| Guild Wars 2 (2012) | 51.4 | |||
| BioShock Infinite (2013) | 156.9 | 100 | ||
| Metro: Last Light (2013) | 116 | 77.4 | ||
| Thief (2014) | 77.5 | 65.7 | ||
| Batman: Arkham Knight (2015) | 78 | 57 | ||
| Metal Gear Solid V (2015) | 60 | |||
| Fallout 4 (2015) | 57.1 | |||
| Rise of the Tomb Raider (2016) | 72.4 | 61.4 | ||
| Doom (2016) | 84.1 | 76.3 | ||
| Overwatch (2016) | 102.1 |
Ses yüksekliği
| Boşta |
| 31.9 / 32 / 34 dB |
| Çalışırken |
| 47 / 49.4 dB |
 | ||
30 dB sessiz 40 dB(A) duyulabilirlik 50 dB(A) gürültülü |
||
min: | ||
| MSI GS73VR 6RF GeForce GTX 1060 Mobile, 6700HQ, SanDisk SD8SN8U1T001122 | Aorus X7 Pro v5 GeForce GTX 970M SLI, 6820HK, Samsung SM951 MZVPV512 m.2 PCI-e | MSI GT72S 6QF GeForce GTX 980 (Laptop), 6820HK, 2x Micron M600 MTFDDAV128MBF NVMe (RAID 0) | MSI GS70 6QE-036XPL GeForce GTX 970M, 6700HQ, Toshiba HG6 THNSNJ128G8NU | Razer Blade Pro 17 inch 2015 GeForce GTX 960M, 4720HQ, Samsung PM851 Series MZMTE256HMHP | |
|---|---|---|---|---|---|
| Noise | -5% | -1% | -6% | 7% | |
| kapalı / ortam * (dB) | 28.4 | 30 -6% | |||
| Idle Minimum * (dB) | 31.9 | 34 -7% | 33.1 -4% | 32.5 -2% | 30.6 4% |
| Idle Average * (dB) | 32 | 35 -9% | 33.3 -4% | 34.2 -7% | 30.7 4% |
| Idle Maximum * (dB) | 34 | 39 -15% | 37 -9% | 36.1 -6% | 32.6 4% |
| Load Average * (dB) | 47 | 39 17% | 39 17% | 50.3 -7% | 38.8 17% |
| Load Maximum * (dB) | 49.4 | 54 -9% | 52.2 -6% | 54.5 -10% | 46.2 6% |
* ... daha küçük daha iyidir
(-) Üst taraftaki maksimum sıcaklık, 40.4 °C / 105 F ortalamasına kıyasla 50.8 °C / 123 F'dir. , Gaming sınıfı için 21.2 ile 68.8 °C arasında değişir.
(-) Alt kısım, 43.2 °C / 110 F ortalamasına kıyasla maksimum 60 °C / 140 F'ye kadar ısınır
(+) Boşta kullanımda, üst tarafın ortalama sıcaklığı 26.4 °C / 80 F olup, cihazın 33.9 °C / 93 F.
(+) Avuç içi dayanakları ve dokunmatik yüzey maksimum (34.4 °C / 93.9 F) cilt sıcaklığına ulaşıyor ve bu nedenle sıcak değil.
(-) Benzer cihazların avuç içi dayanağı alanının ortalama sıcaklığı 28.8 °C / 83.8 F (-5.6 °C / -10.1 F) idi.
MSI GS73VR 6RF ses analizi
(-) | hoparlörler çok yüksek ses çıkarmıyor (68.5 dB)
Bas 100 - 315Hz
(-) | neredeyse hiç bas yok - ortalama olarak medyandan 20.4% daha düşük
(±) | Bas doğrusallığı ortalamadır (11.4% delta - önceki frekans)
Ortalar 400 - 2000 Hz
(+) | dengeli ortalar - medyandan yalnızca 3% uzakta
(±) | Ortaların doğrusallığı ortalamadır (8.2% delta - önceki frekans)
Yüksekler 2 - 16 kHz
(+) | dengeli yüksekler - medyandan yalnızca 4% uzakta
(+) | yüksekler doğrusaldır (5.9% deltadan önceki frekansa)
Toplam 100 - 16.000 Hz
(±) | Genel sesin doğrusallığı ortalamadır (21% ortancaya göre fark)
Aynı sınıfla karşılaştırıldığında
» Bu sınıftaki tüm test edilen cihazların %76%'si daha iyi, 4% benzer, 20% daha kötüydü
» En iyisinin deltası 6% idi, ortalama 18% idi, en kötüsü 132% idi
Test edilen tüm cihazlarla karşılaştırıldığında
» Test edilen tüm cihazların %58'si daha iyi, 7 benzer, % 35 daha kötüydü
» En iyisinin deltası 4% idi, ortalama 23% idi, en kötüsü 134% idi
Apple MacBook 12 (Early 2016) 1.1 GHz ses analizi
(+) | hoparlörler nispeten yüksek sesle çalabilir (83.6 dB)
Bas 100 - 315Hz
(±) | azaltılmış bas - ortalama olarak medyandan 11.3% daha düşük
(±) | Bas doğrusallığı ortalamadır (14.2% delta - önceki frekans)
Ortalar 400 - 2000 Hz
(+) | dengeli ortalar - medyandan yalnızca 2.4% uzakta
(+) | orta frekanslar doğrusaldır (5.5% deltadan önceki frekansa)
Yüksekler 2 - 16 kHz
(+) | dengeli yüksekler - medyandan yalnızca 2% uzakta
(+) | yüksekler doğrusaldır (4.5% deltadan önceki frekansa)
Toplam 100 - 16.000 Hz
(+) | genel ses doğrusaldır (10.2% ortancaya göre fark)
Aynı sınıfla karşılaştırıldığında
» Bu sınıftaki tüm test edilen cihazların %7%'si daha iyi, 2% benzer, 90% daha kötüydü
» En iyisinin deltası 5% idi, ortalama 18% idi, en kötüsü 53% idi
Test edilen tüm cihazlarla karşılaştırıldığında
» Test edilen tüm cihazların %5'si daha iyi, 1 benzer, % 94 daha kötüydü
» En iyisinin deltası 4% idi, ortalama 23% idi, en kötüsü 134% idi
Schenker F516 Flex ses analizi
(-) | hoparlörler çok yüksek ses çıkarmıyor (69 dB)
Analysis not possible as minimum curve is missing or too high
| Kapalı / Bekleme modu | |
| Boşta | |
| Çalışırken |
|
Key:
min: | |
| MSI GS73VR 6RF 6700HQ, GeForce GTX 1060 Mobile, SanDisk SD8SN8U1T001122, TN LED, 1920x1080, 17.3" | Asus Strix GL502VY-DS71 6700HQ, GeForce GTX 980M, SanDisk SD8SN8U1T001122, IPS, 1920x1080, 15.6" | Asus G701VO-CS74K 6820HK, GeForce GTX 980 (Laptop), 2x Samsung SM951 MZVPV512HDGL (RAID 0), IPS, 1920x1080, 17.3" | MSI GS70 6QE-036XPL 6700HQ, GeForce GTX 970M, Toshiba HG6 THNSNJ128G8NU, , 1920x1080, 17.3" | MSI GT72VR 6RE-015US 6700HQ, GeForce GTX 1070 Mobile, SanDisk SD8SNAT256G1122, IPS, 1920x1080, 17.3" | |
|---|---|---|---|---|---|
| Power Consumption | 10% | -13% | 12% | -6% | |
| Idle Minimum * (Watt) | 22.6 | 20.6 9% | 28.2 -25% | 14.1 38% | 22.3 1% |
| Idle Average * (Watt) | 32.7 | 22.1 32% | 32 2% | 22.6 31% | 27.3 17% |
| Idle Maximum * (Watt) | 32.8 | 22.5 31% | 32.6 1% | 30.5 7% | 30 9% |
| Load Average * (Watt) | 114.7 | 130.6 -14% | 162.2 -41% | 143.1 -25% | 152.2 -33% |
| Load Maximum * (Watt) | 167.9 | 177.2 -6% | 173.5 -3% | 150 11% | 204.2 -22% |
* ... daha küçük daha iyidir
| MSI GS73VR 6RF 6700HQ, GeForce GTX 1060 Mobile, 65 Wh | Asus Strix GL502VY-DS71 6700HQ, GeForce GTX 980M, 64 Wh | Asus G701VO-CS74K 6820HK, GeForce GTX 980 (Laptop), 93 Wh | MSI GS70-6QE16H21 6700HQ, GeForce GTX 970M, 56 Wh | MSI GT72VR 6RE-015US 6700HQ, GeForce GTX 1070 Mobile, 83 Wh | |
|---|---|---|---|---|---|
| Pil Çalışma Süresi | -6% | -1% | -16% | 7% | |
| Reader / Idle (h) | 5.9 | 4.6 -22% | 4 -32% | 4 -32% | 5.4 -8% |
| WiFi v1.3 (h) | 3.6 | 3.1 -14% | 3.4 -6% | 3 -17% | 3.7 3% |
| Load (h) | 1.1 | 1.3 18% | 1.5 36% | 1.1 0% | 1.4 27% |
Artılar
Eksiler

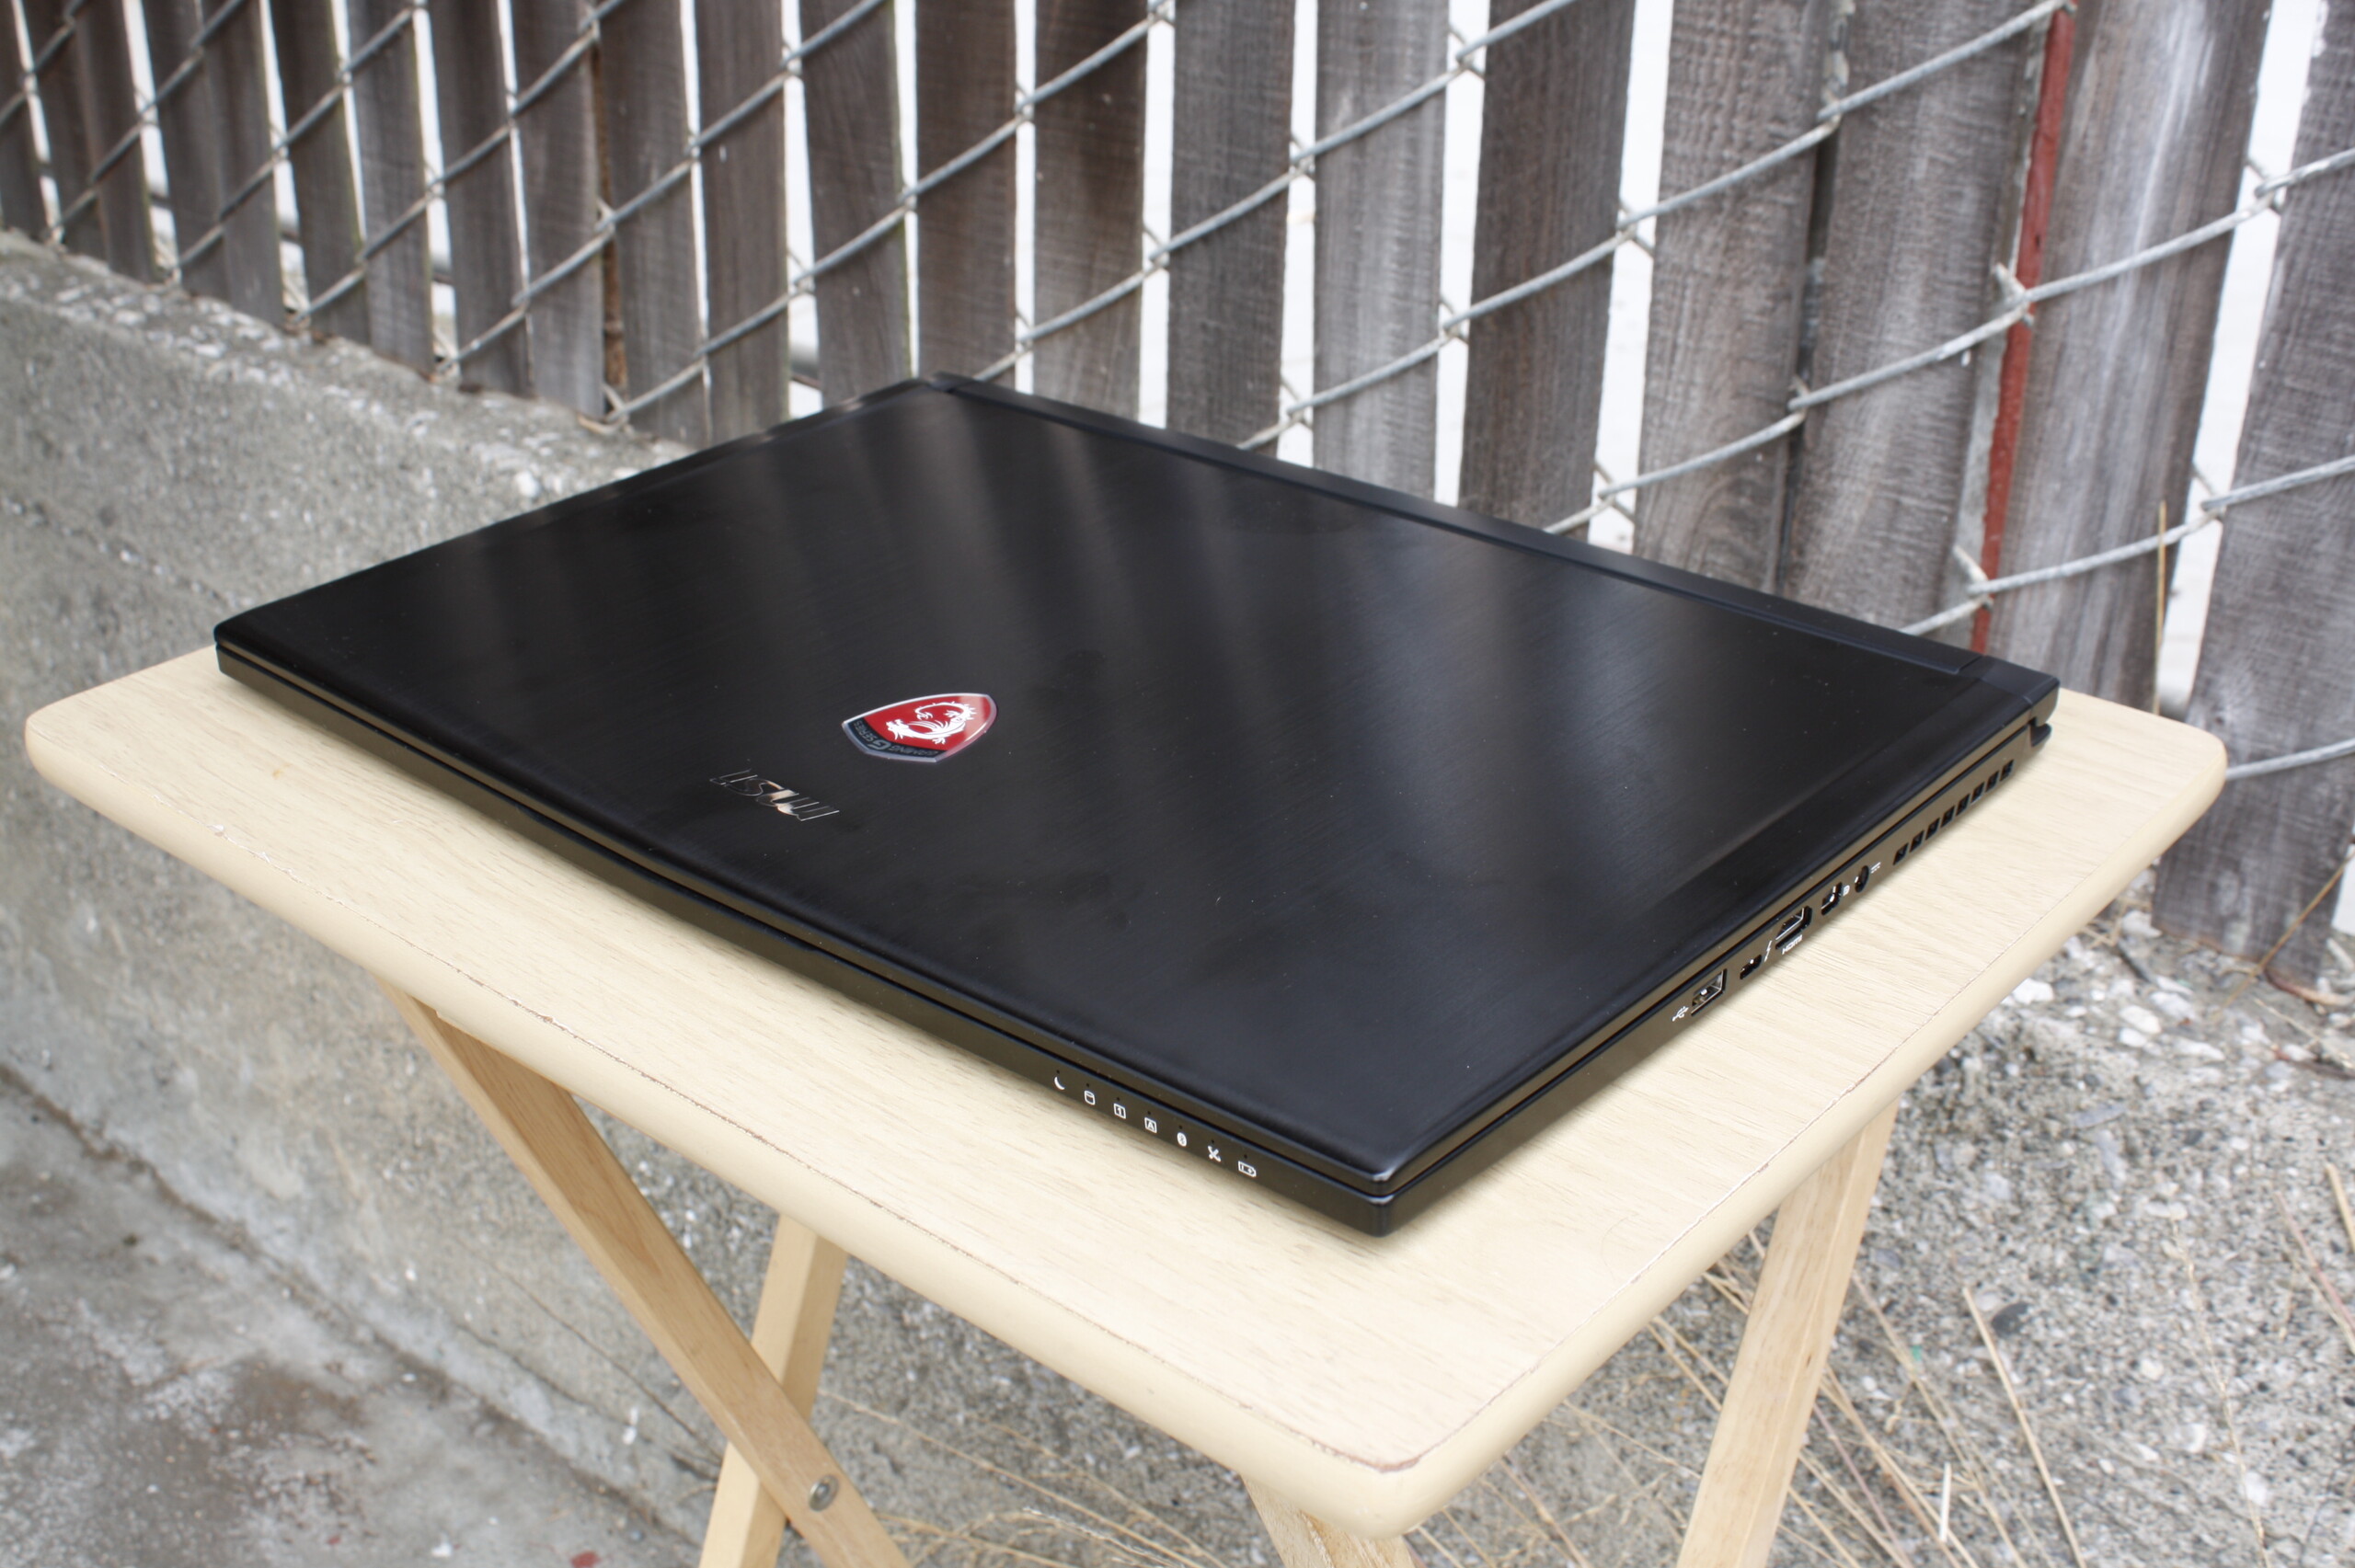
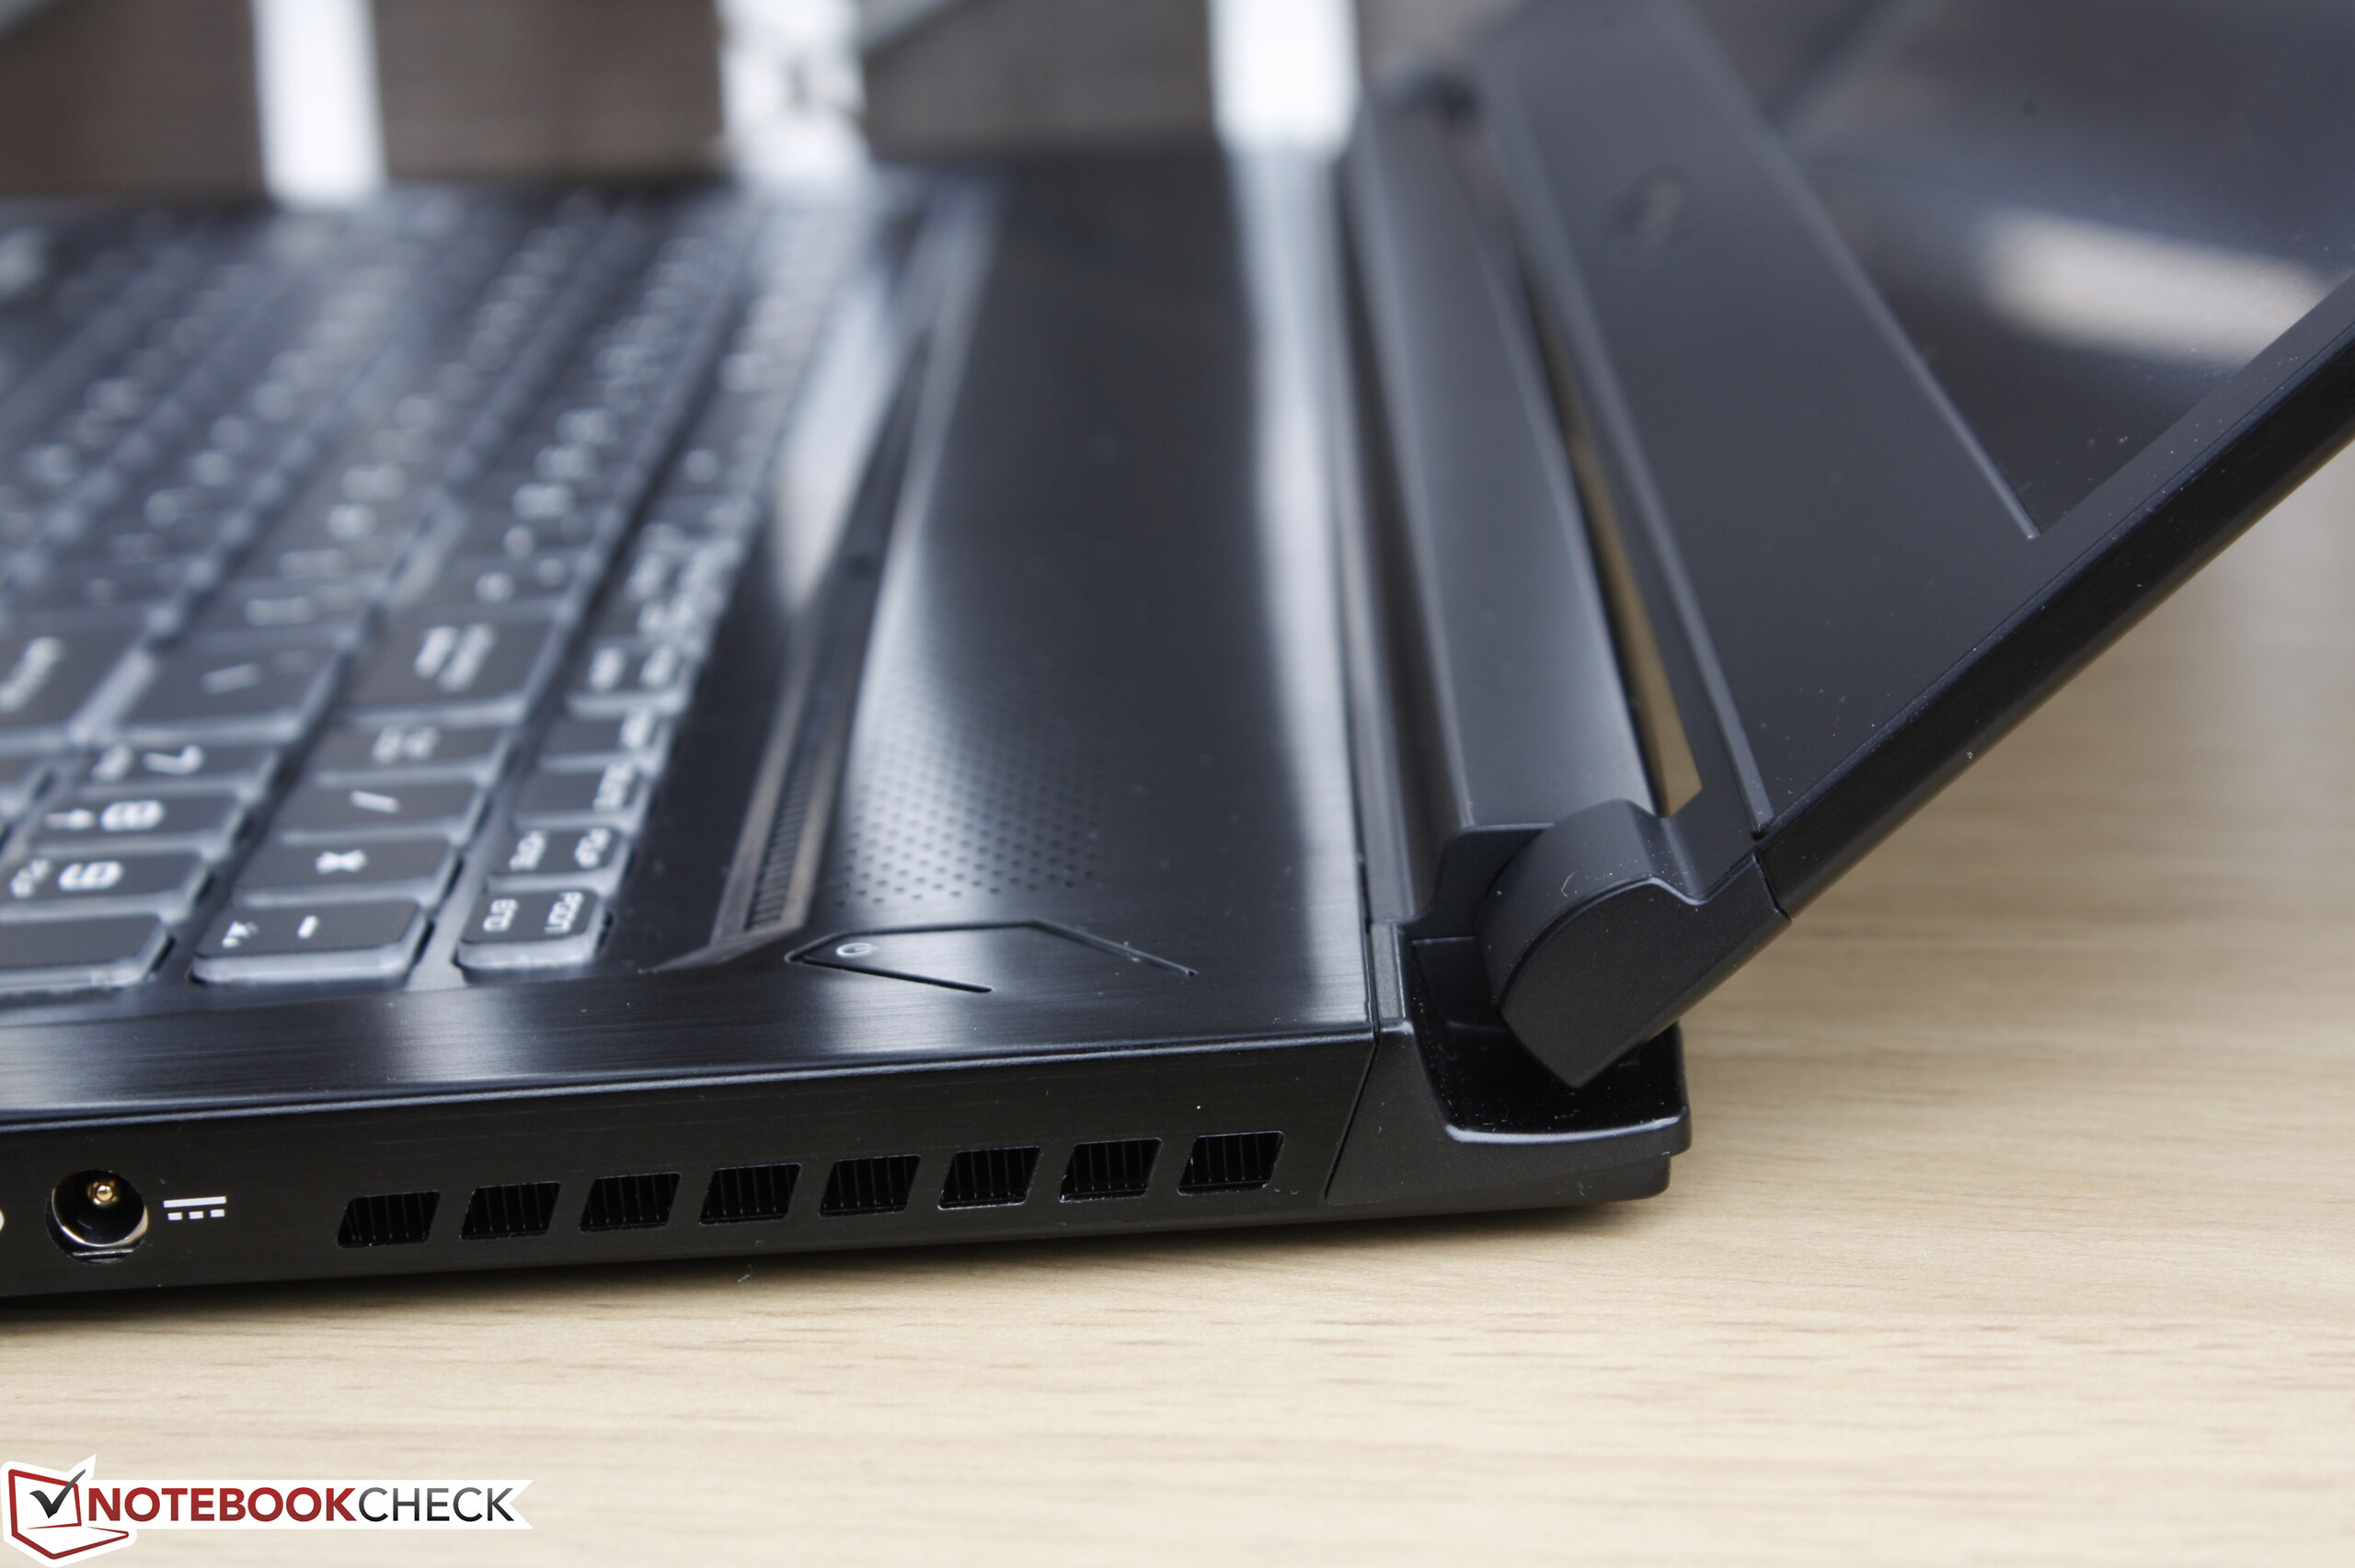
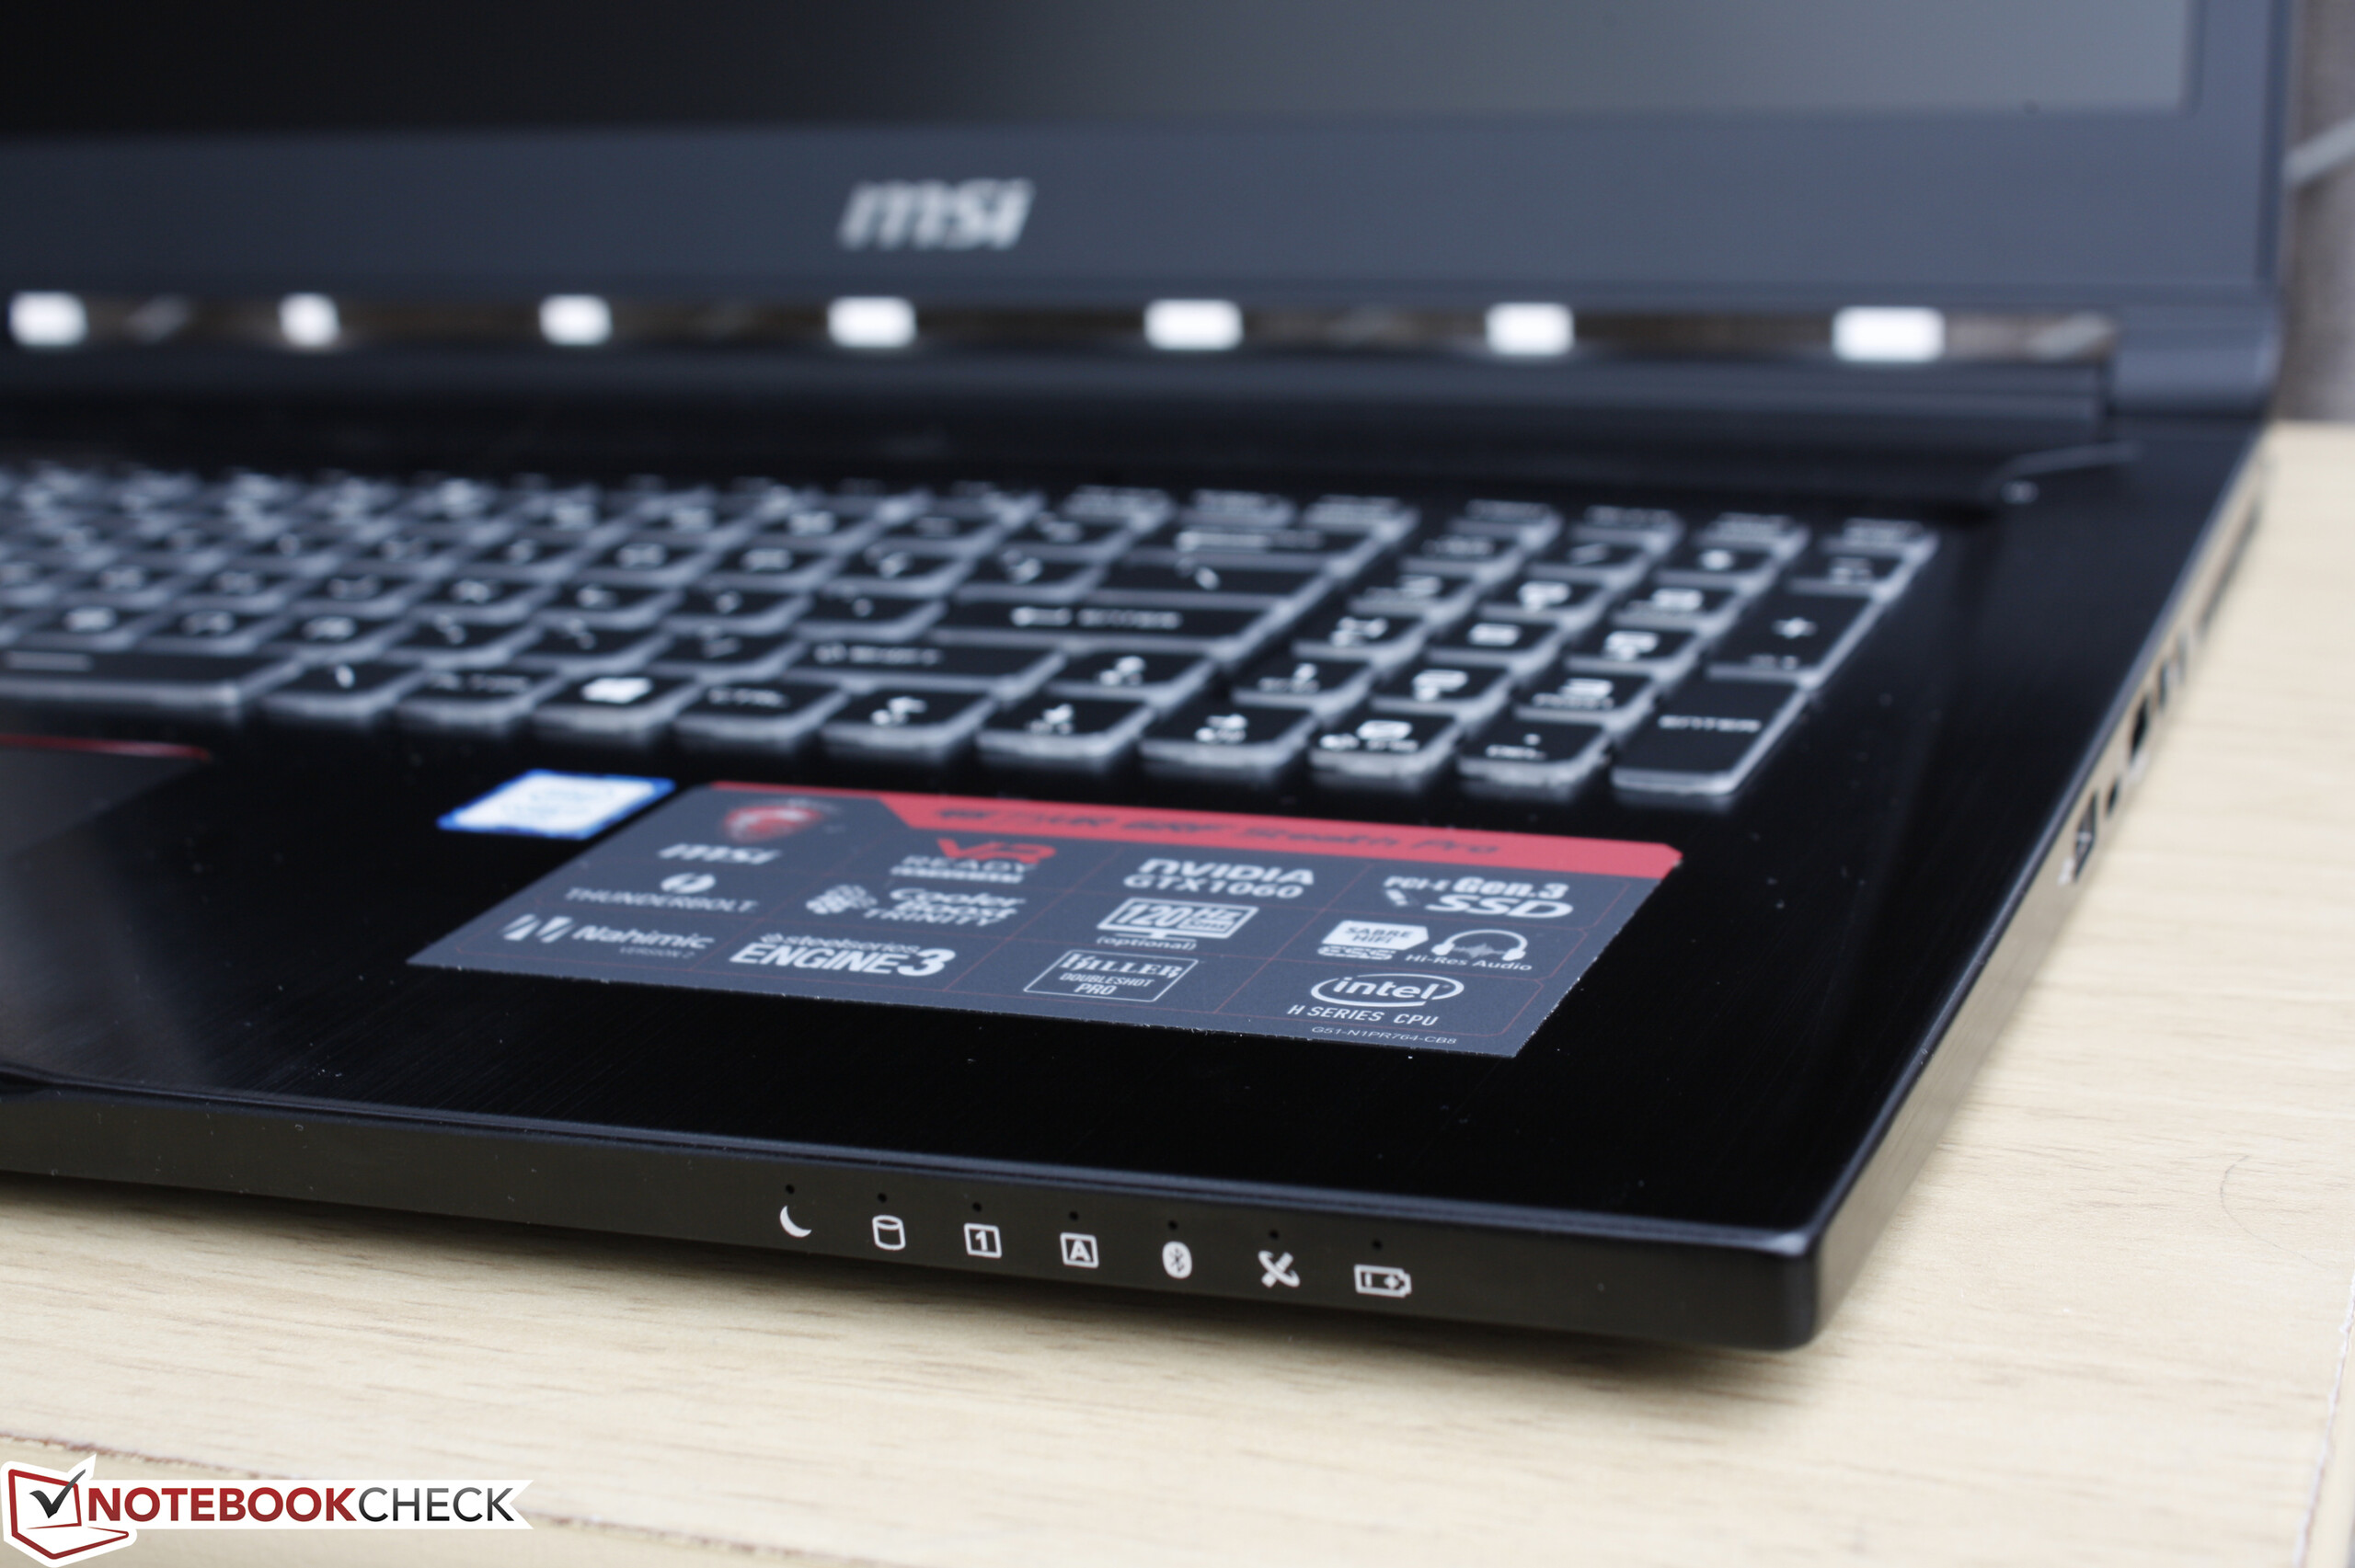
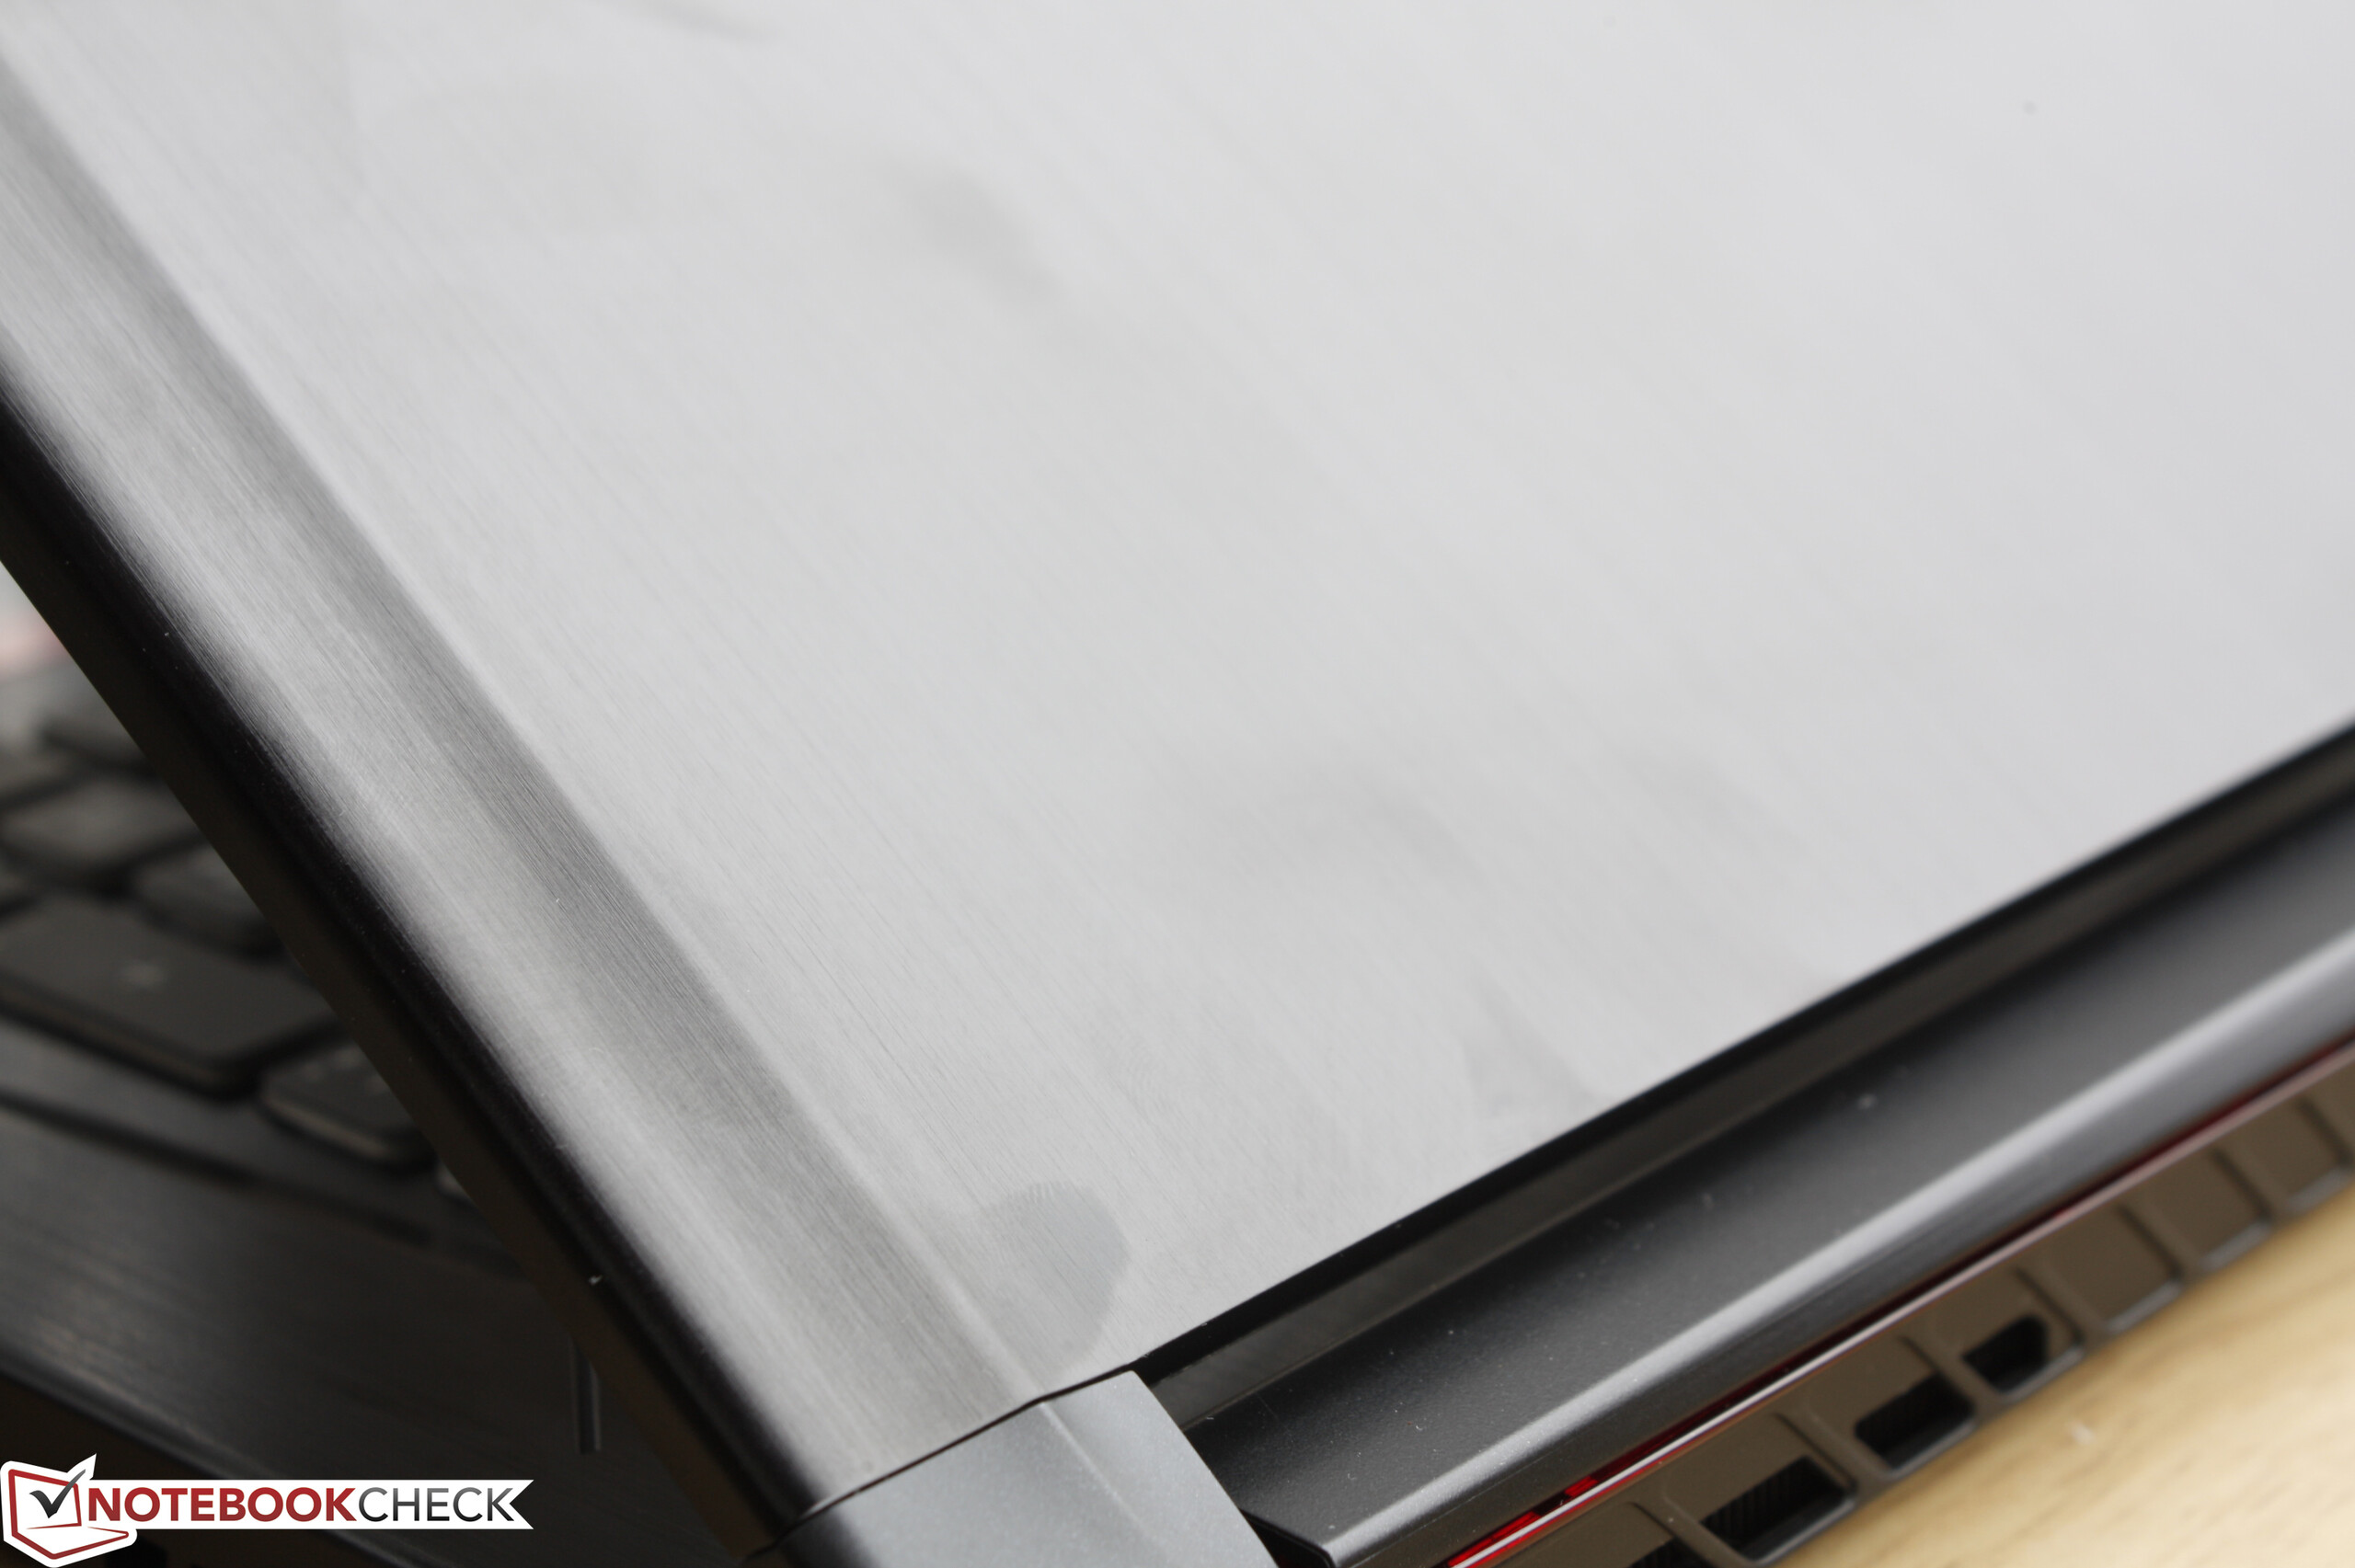
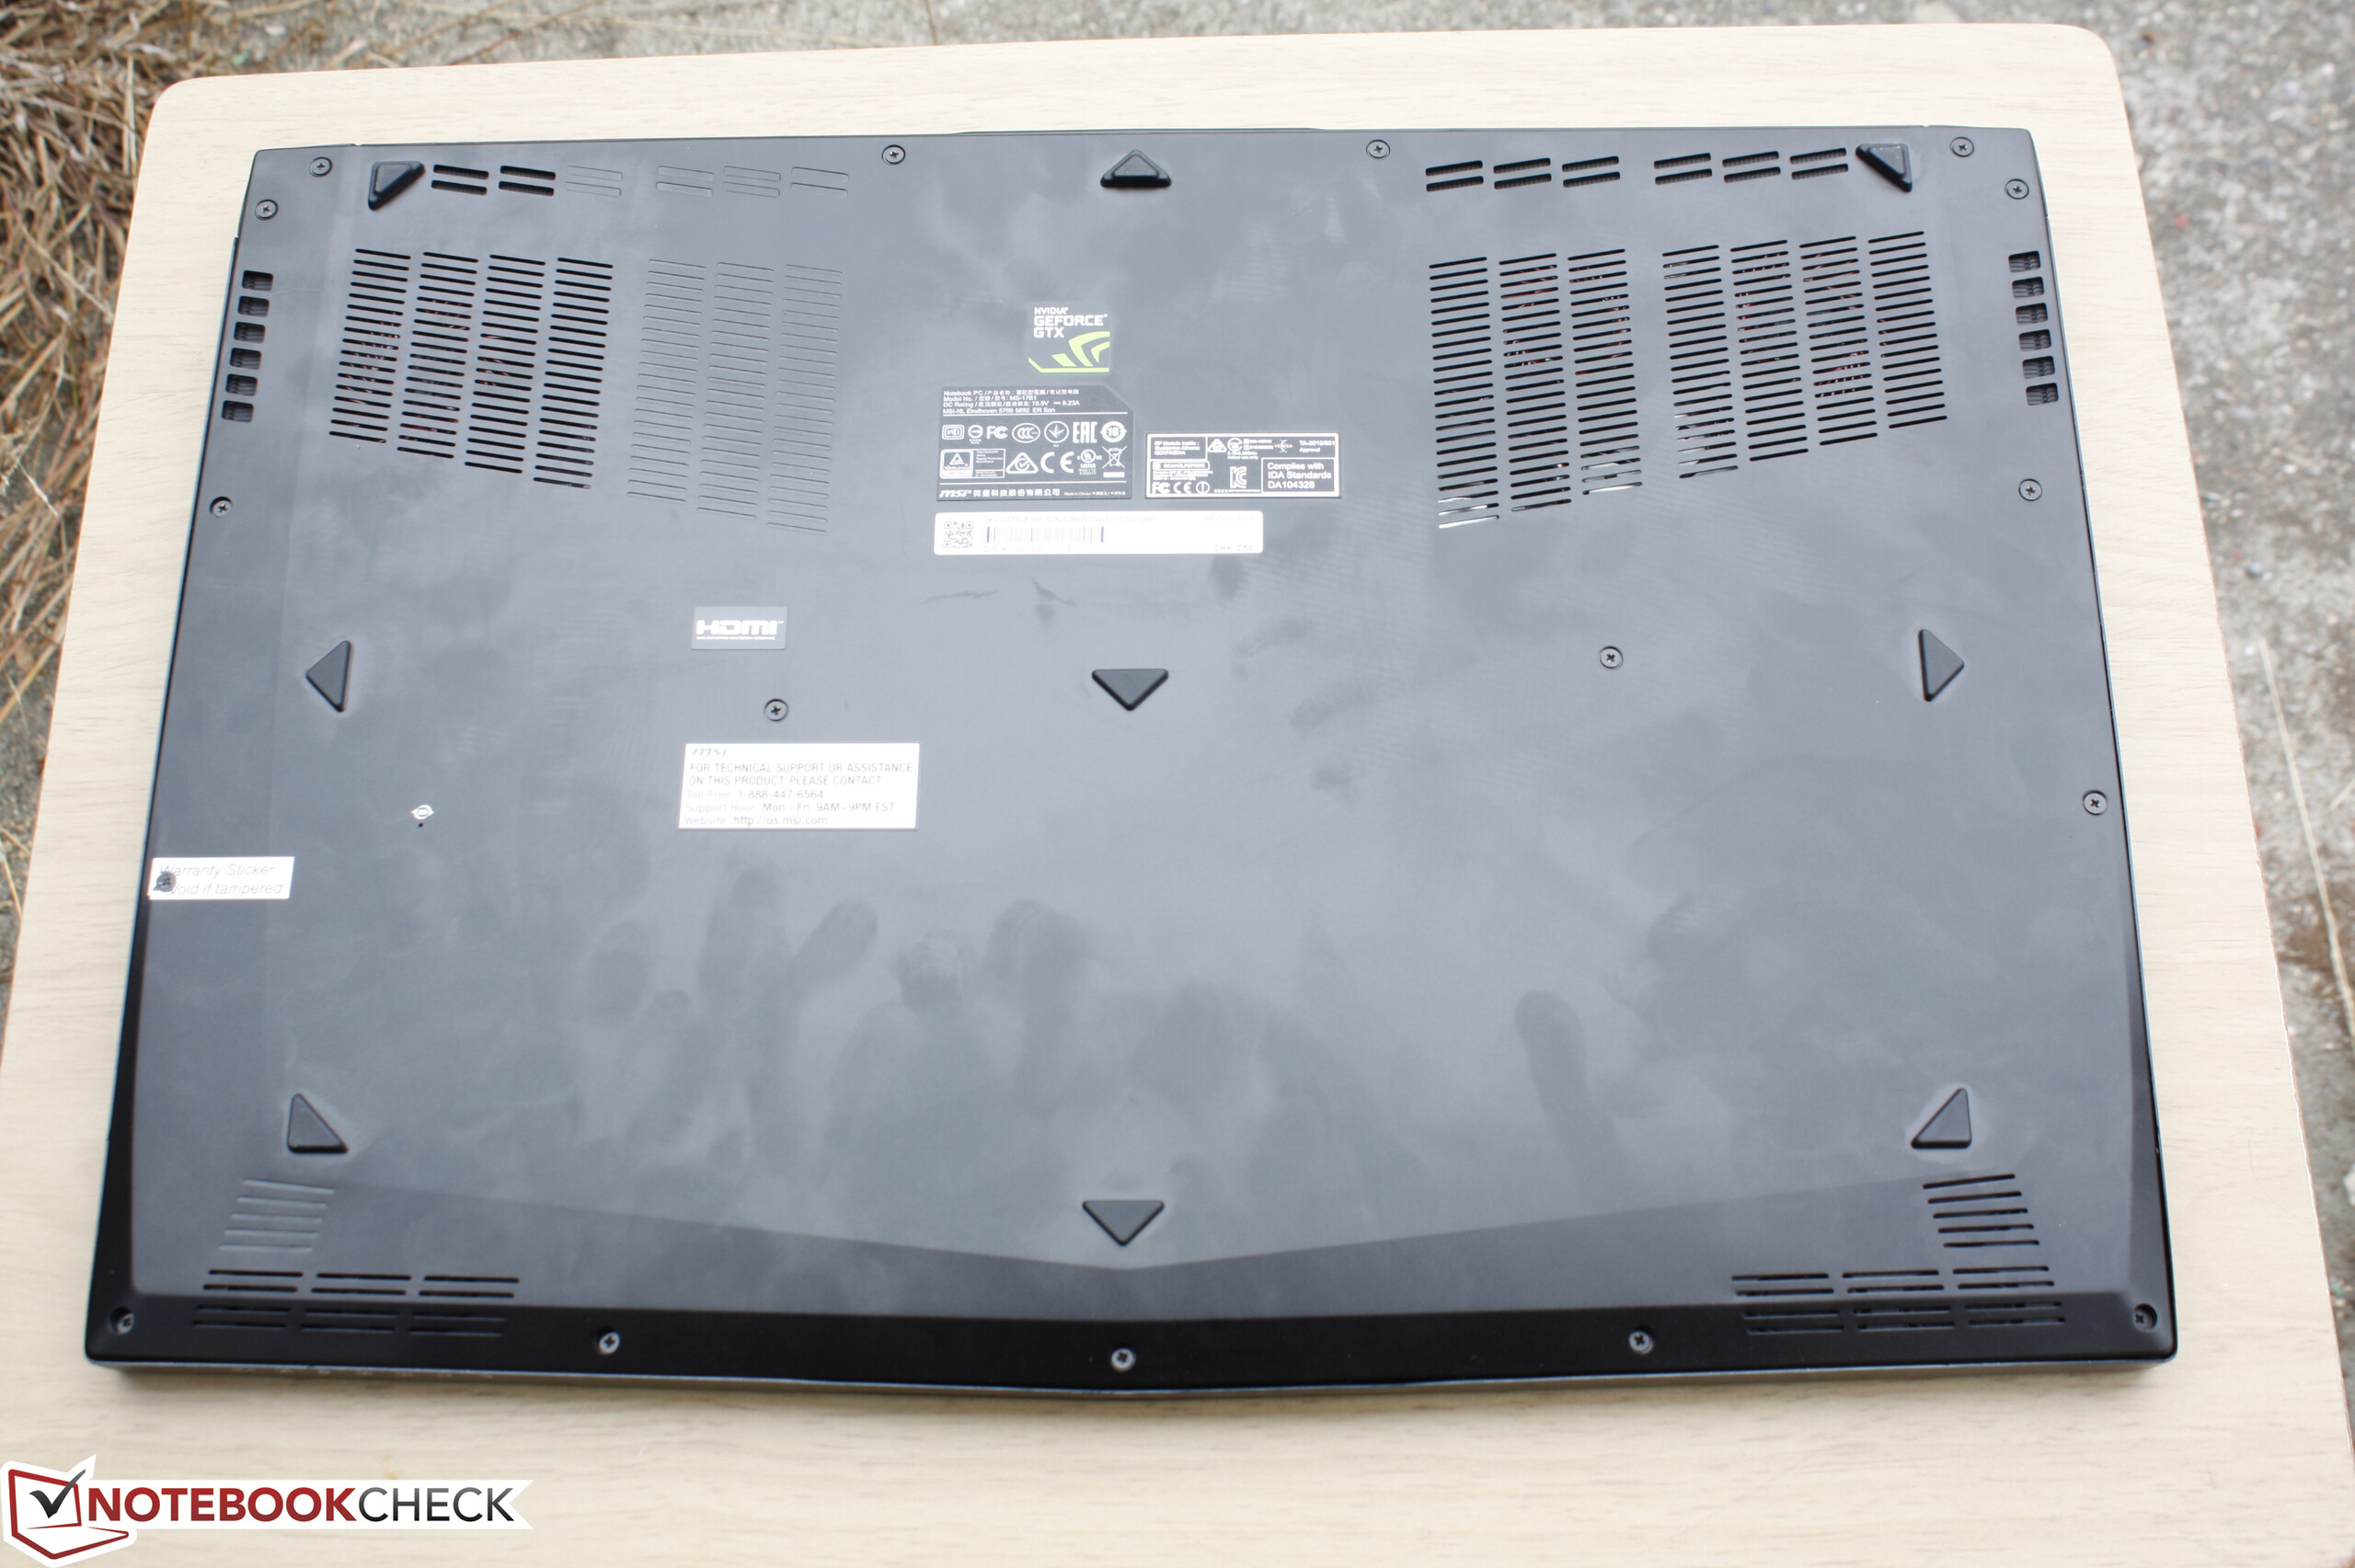
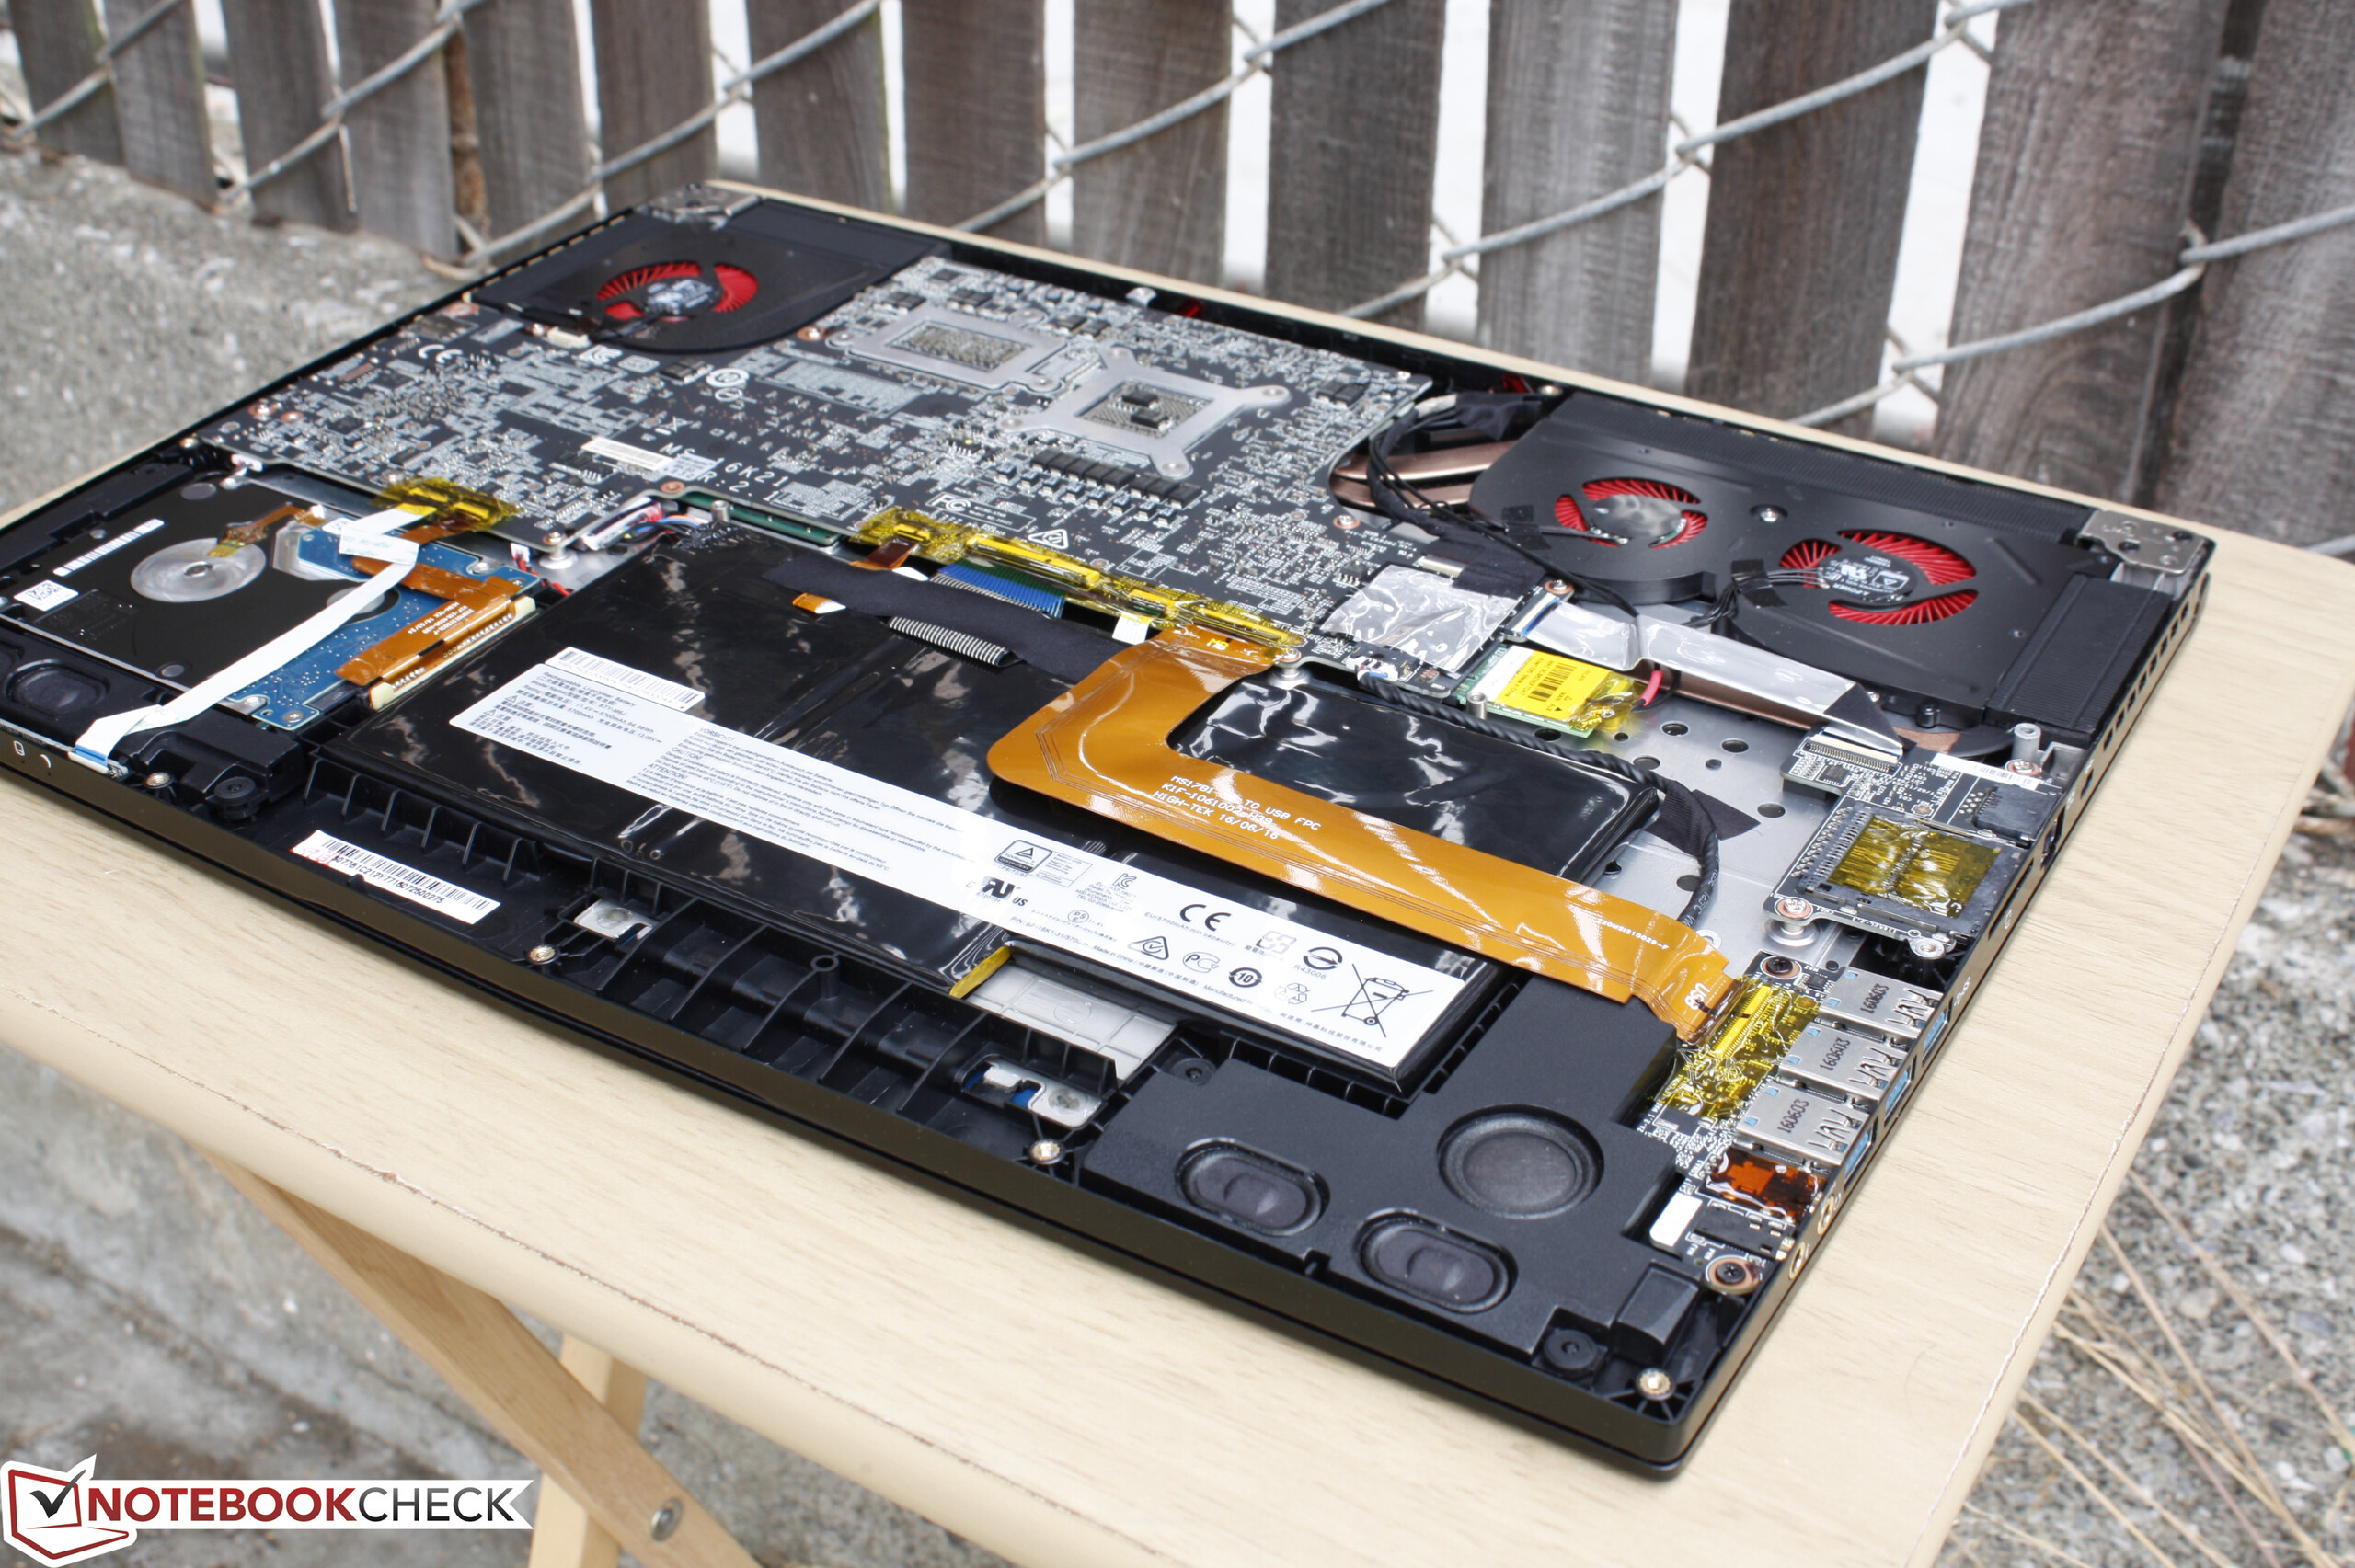
GS73VR, GS Stealth serisinin ihtiyaç duyduğu büyük yenileme olabilir. GS70 2013 yılında piyasaya sürüldüğünden beri neredeyse hiç değişmedi ve büyük sorunlarının üzerine dolayısıyla hiç gidilmedi. GS73VR nihayet daha ince, yapım kalitesi daha iyi, daha sessiz ve daha güçlü. Pascal, GTX 1060 grafik kartının GTX 980M modeline göre daha ince kasalarda kullanılabilmesi ile etkilemeye devam ediyor.
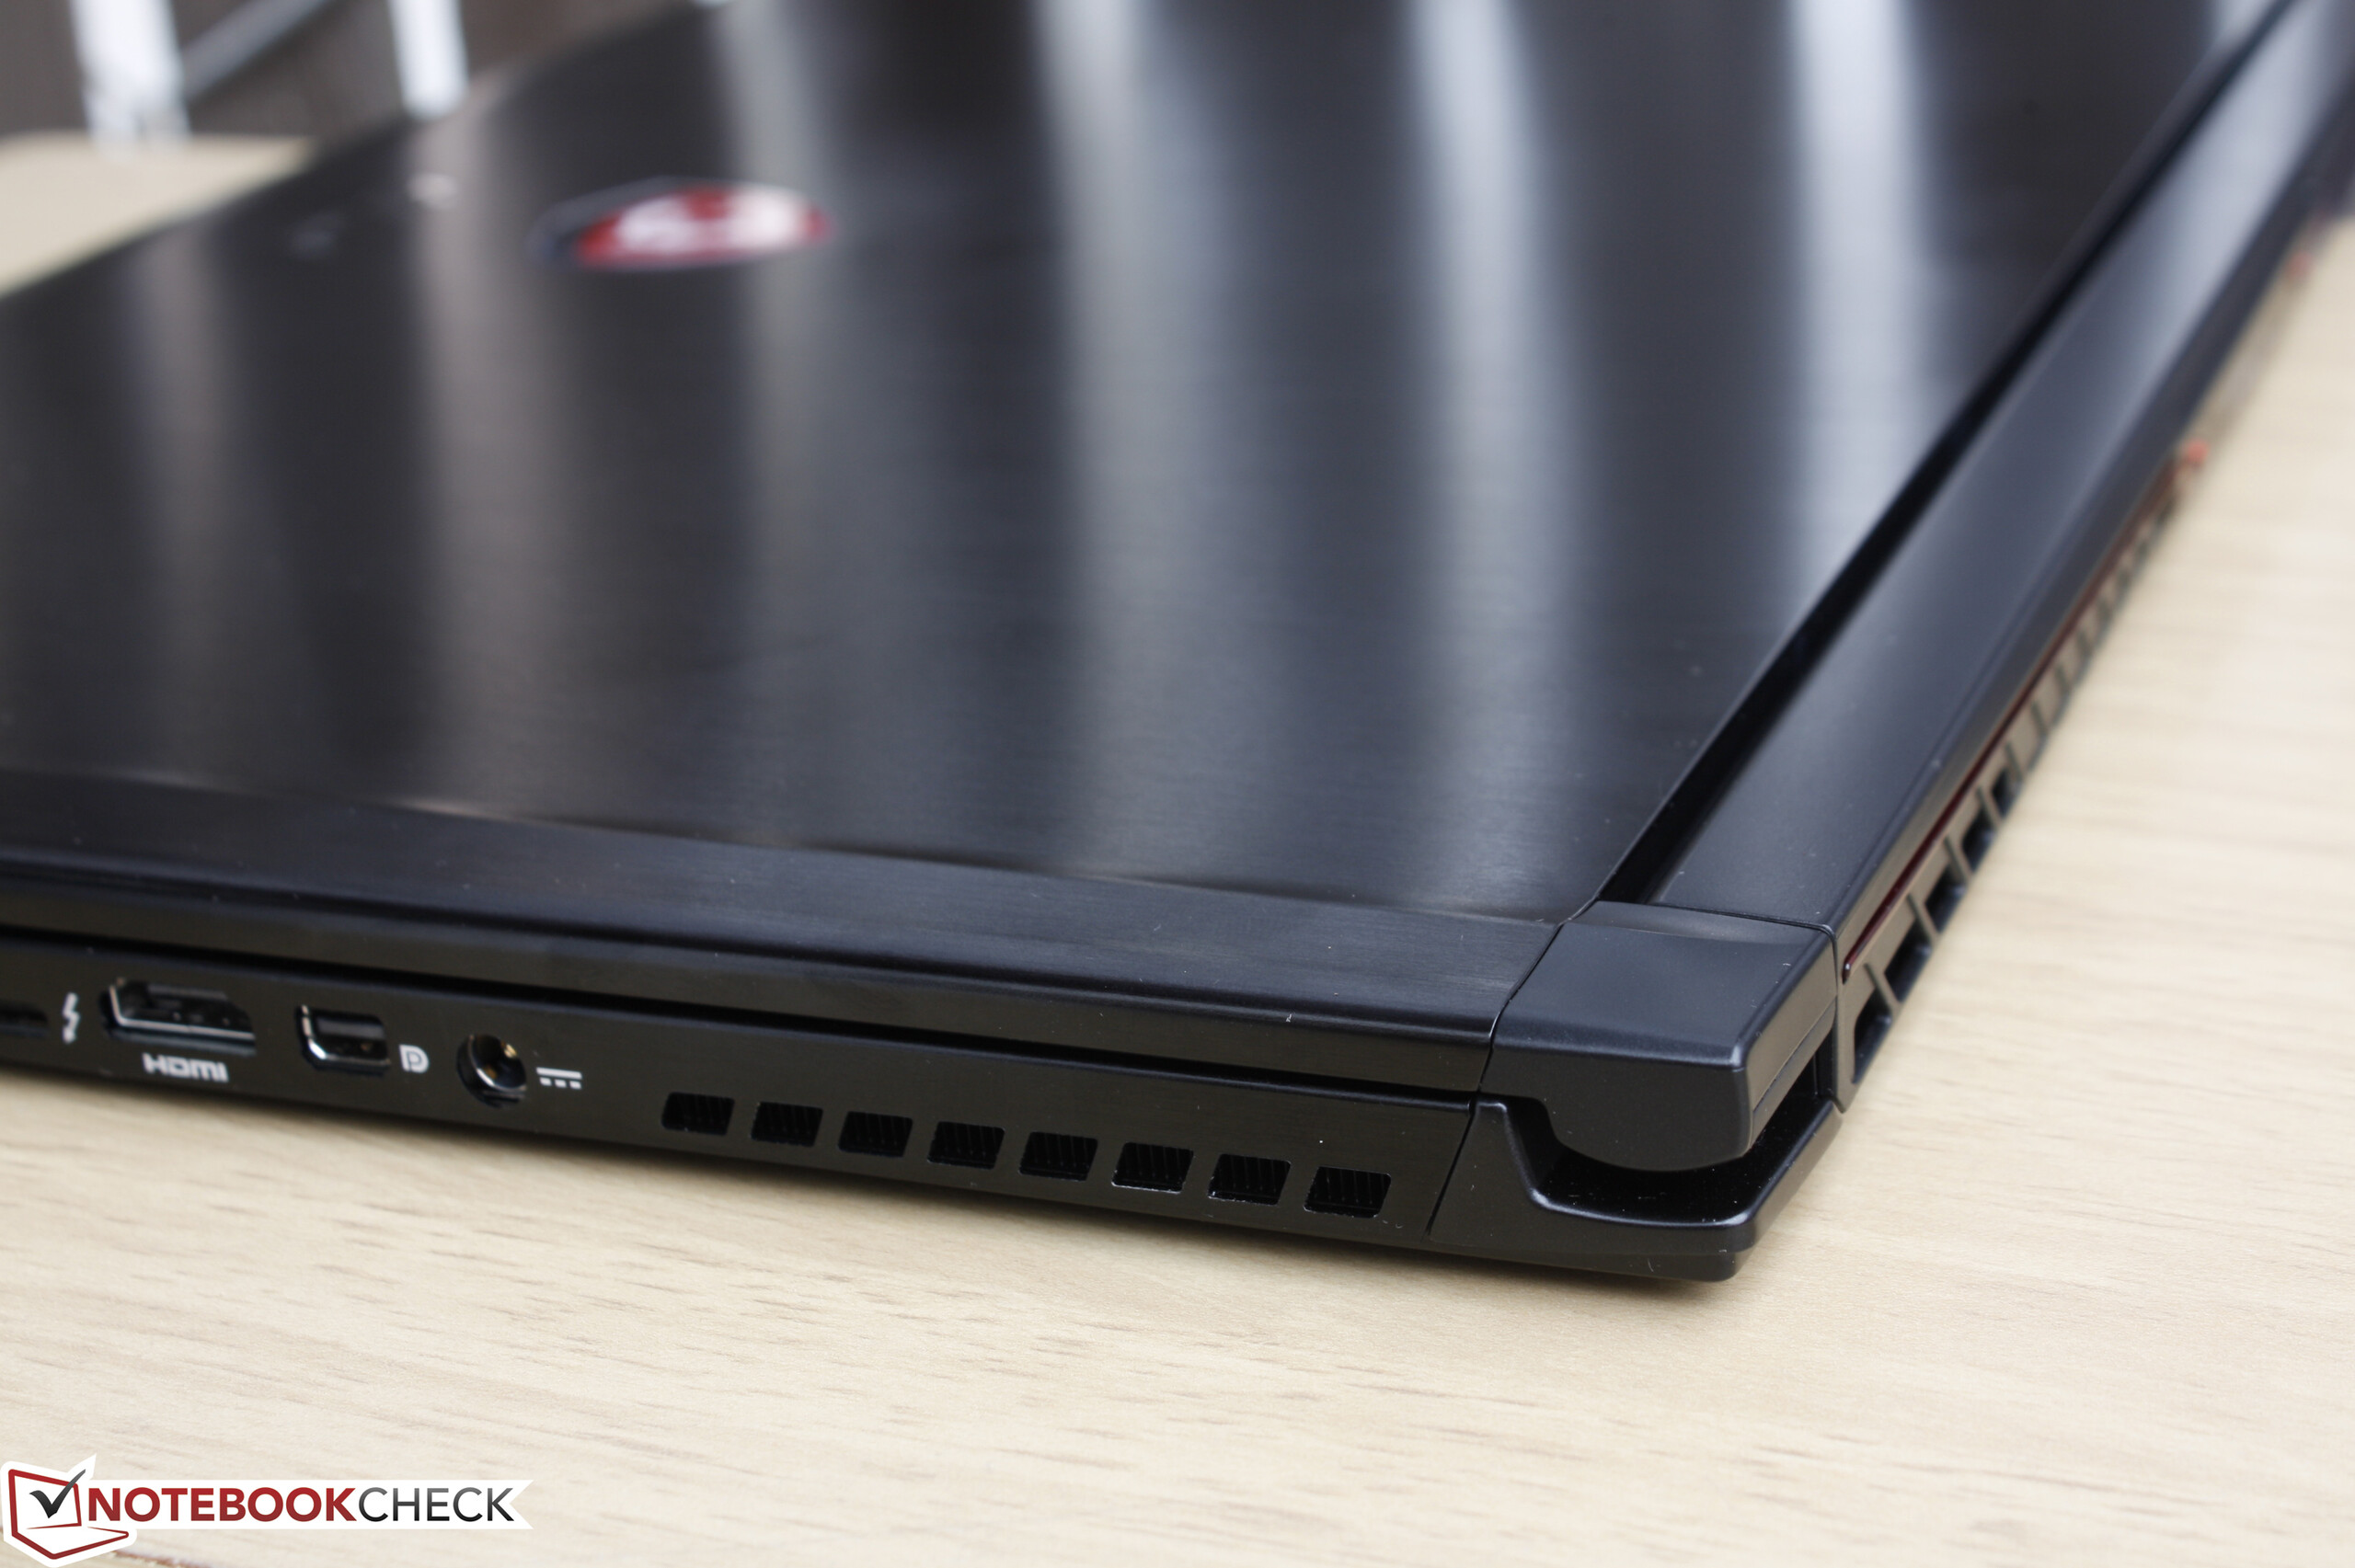
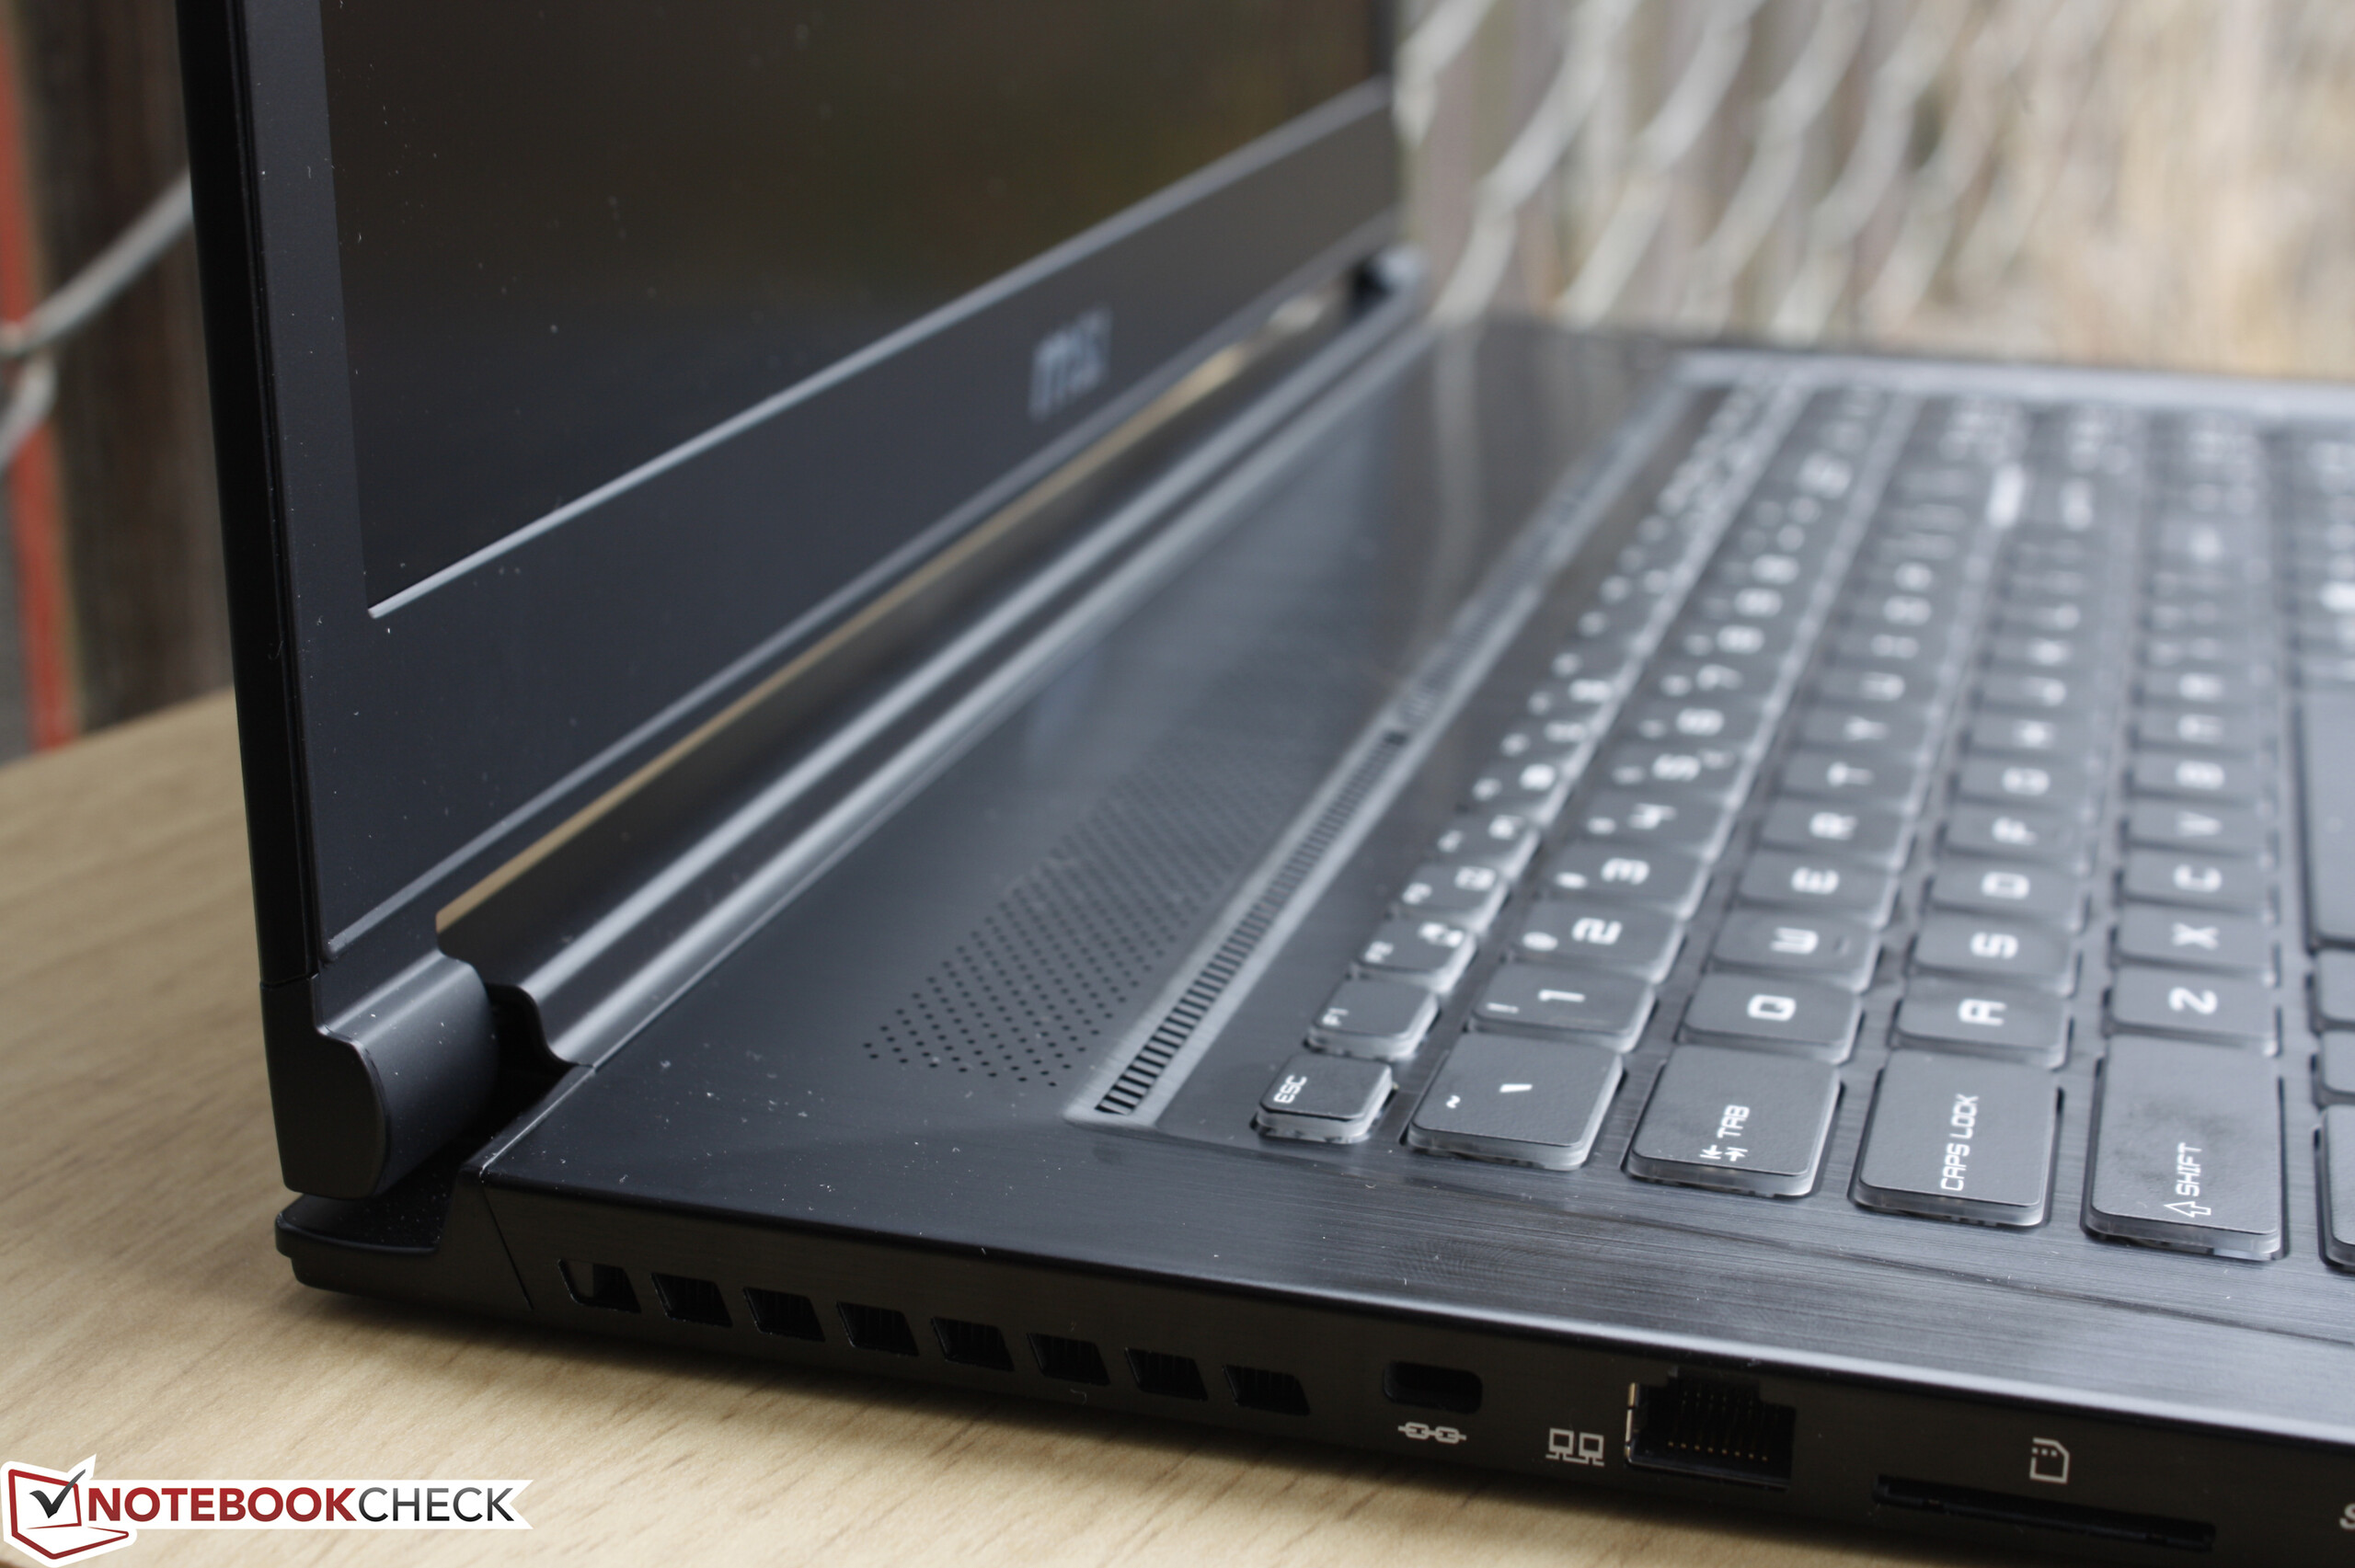
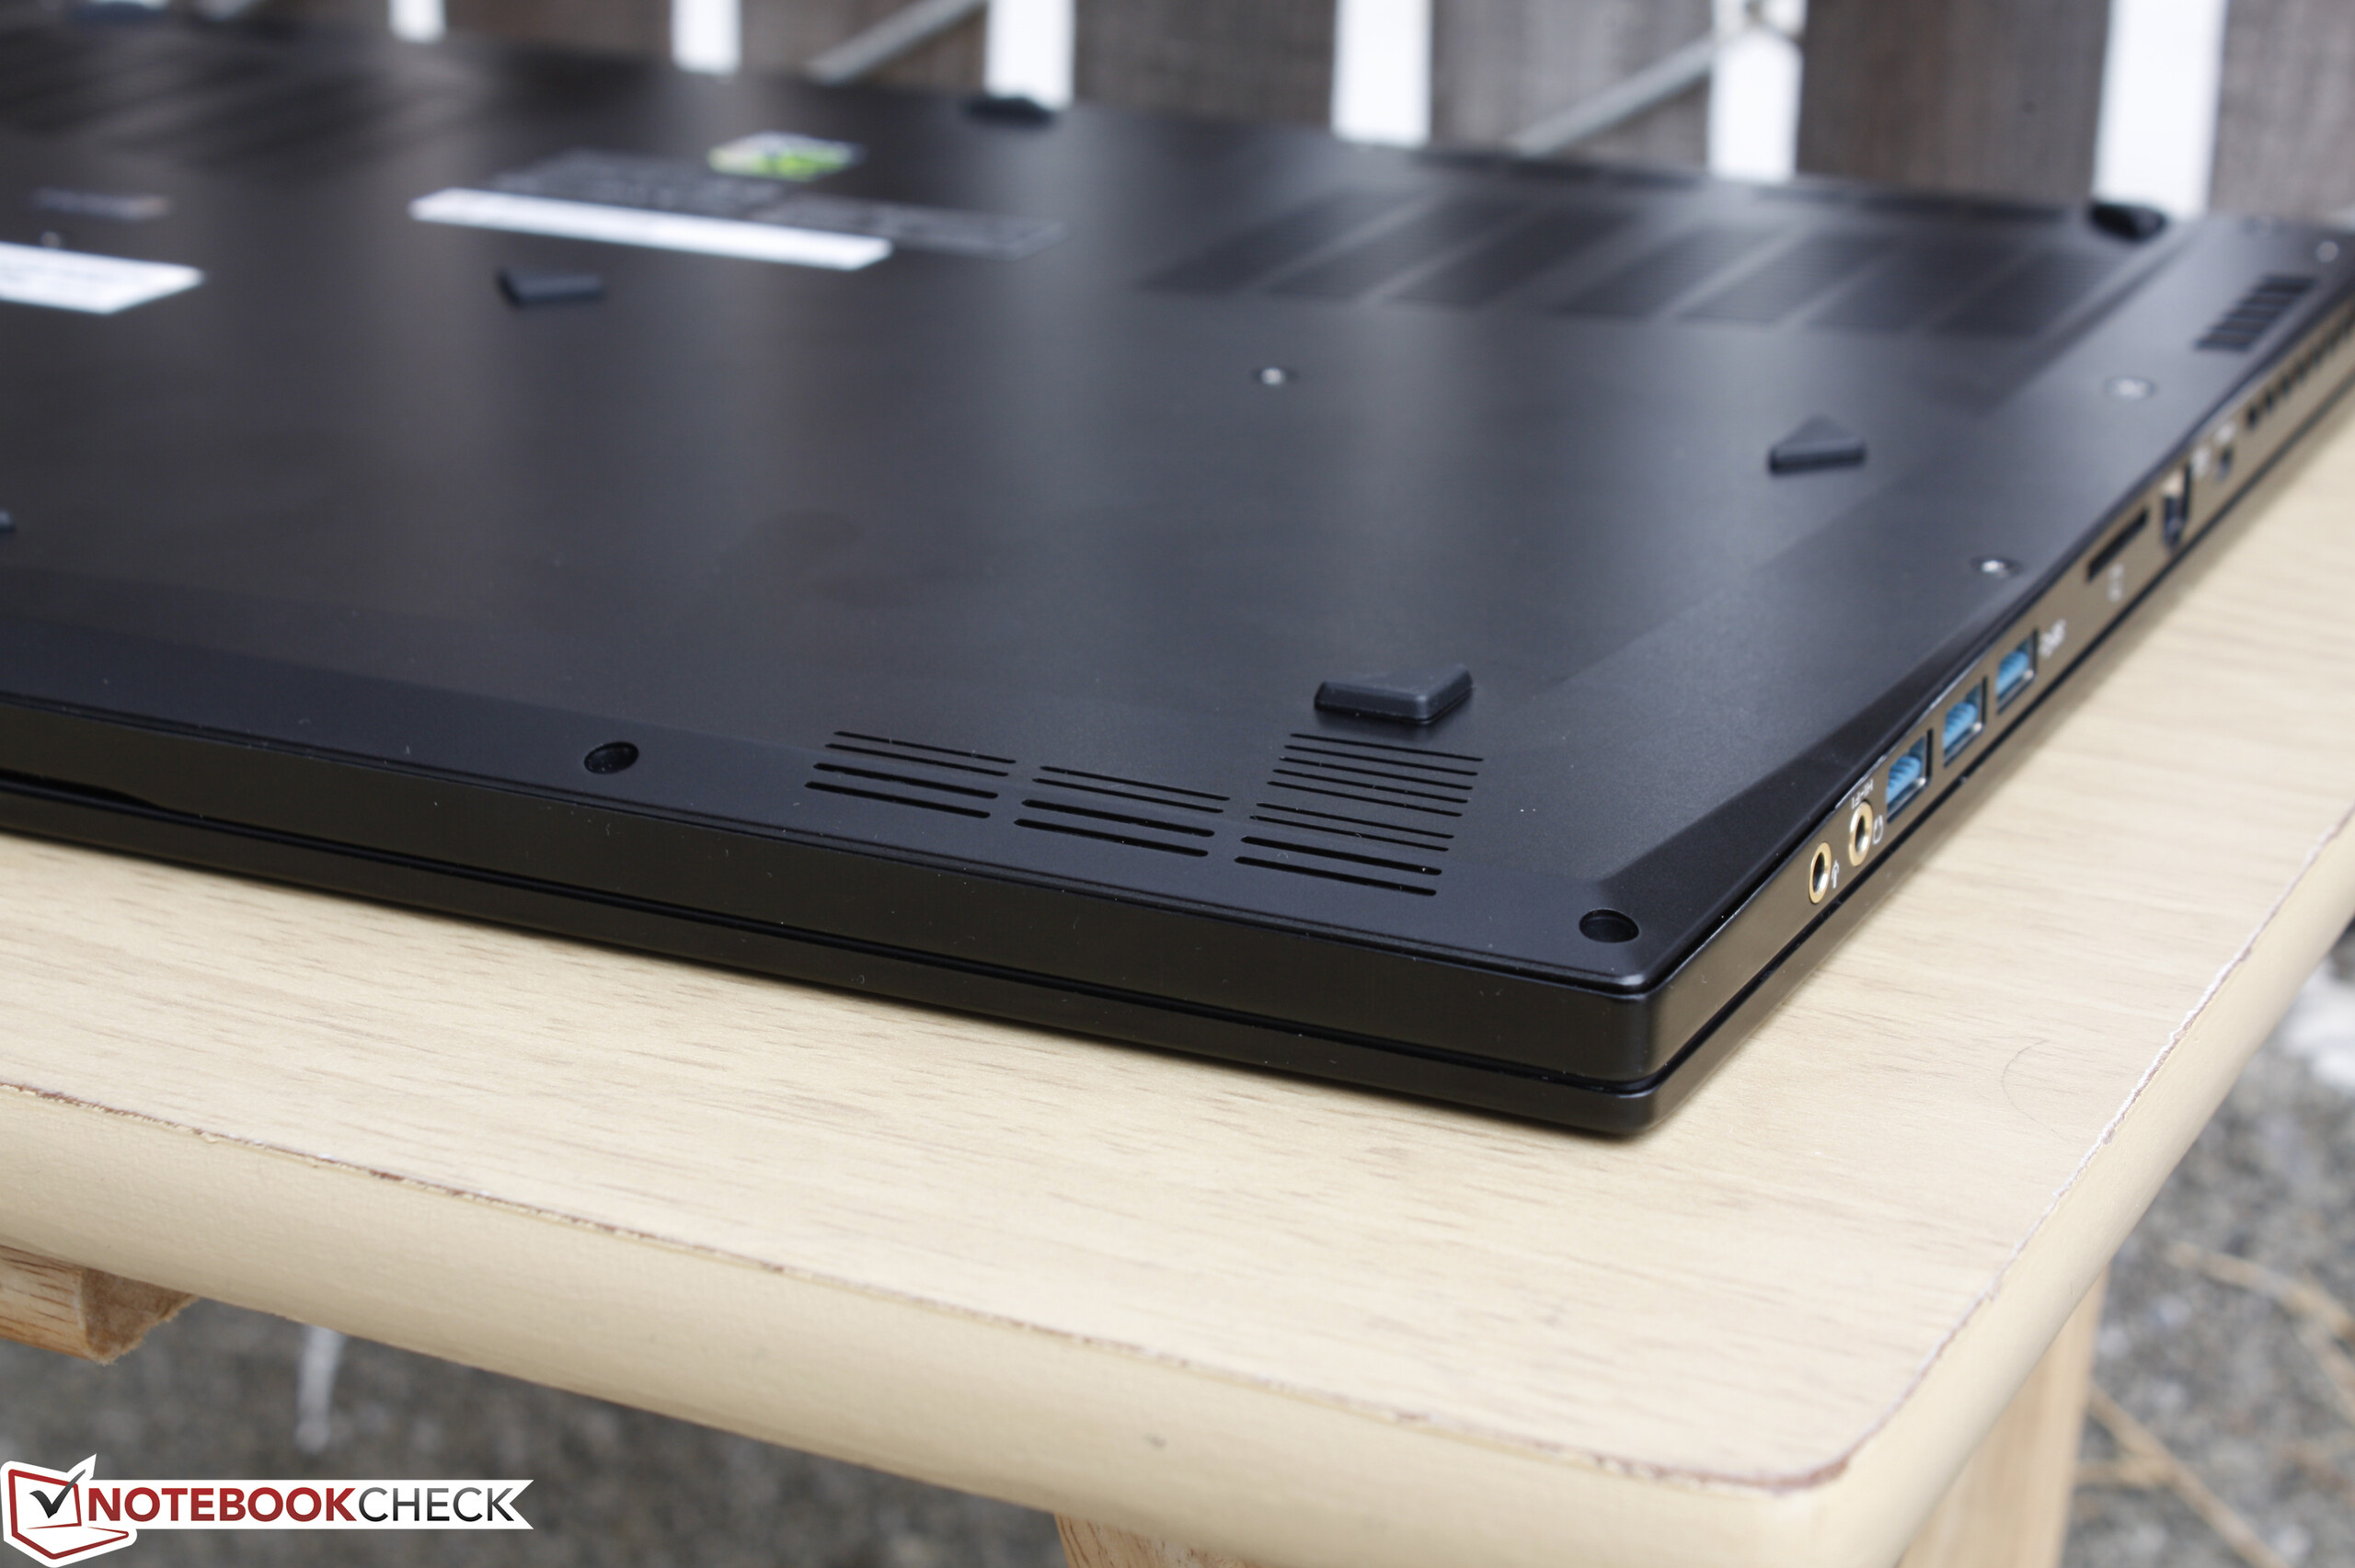
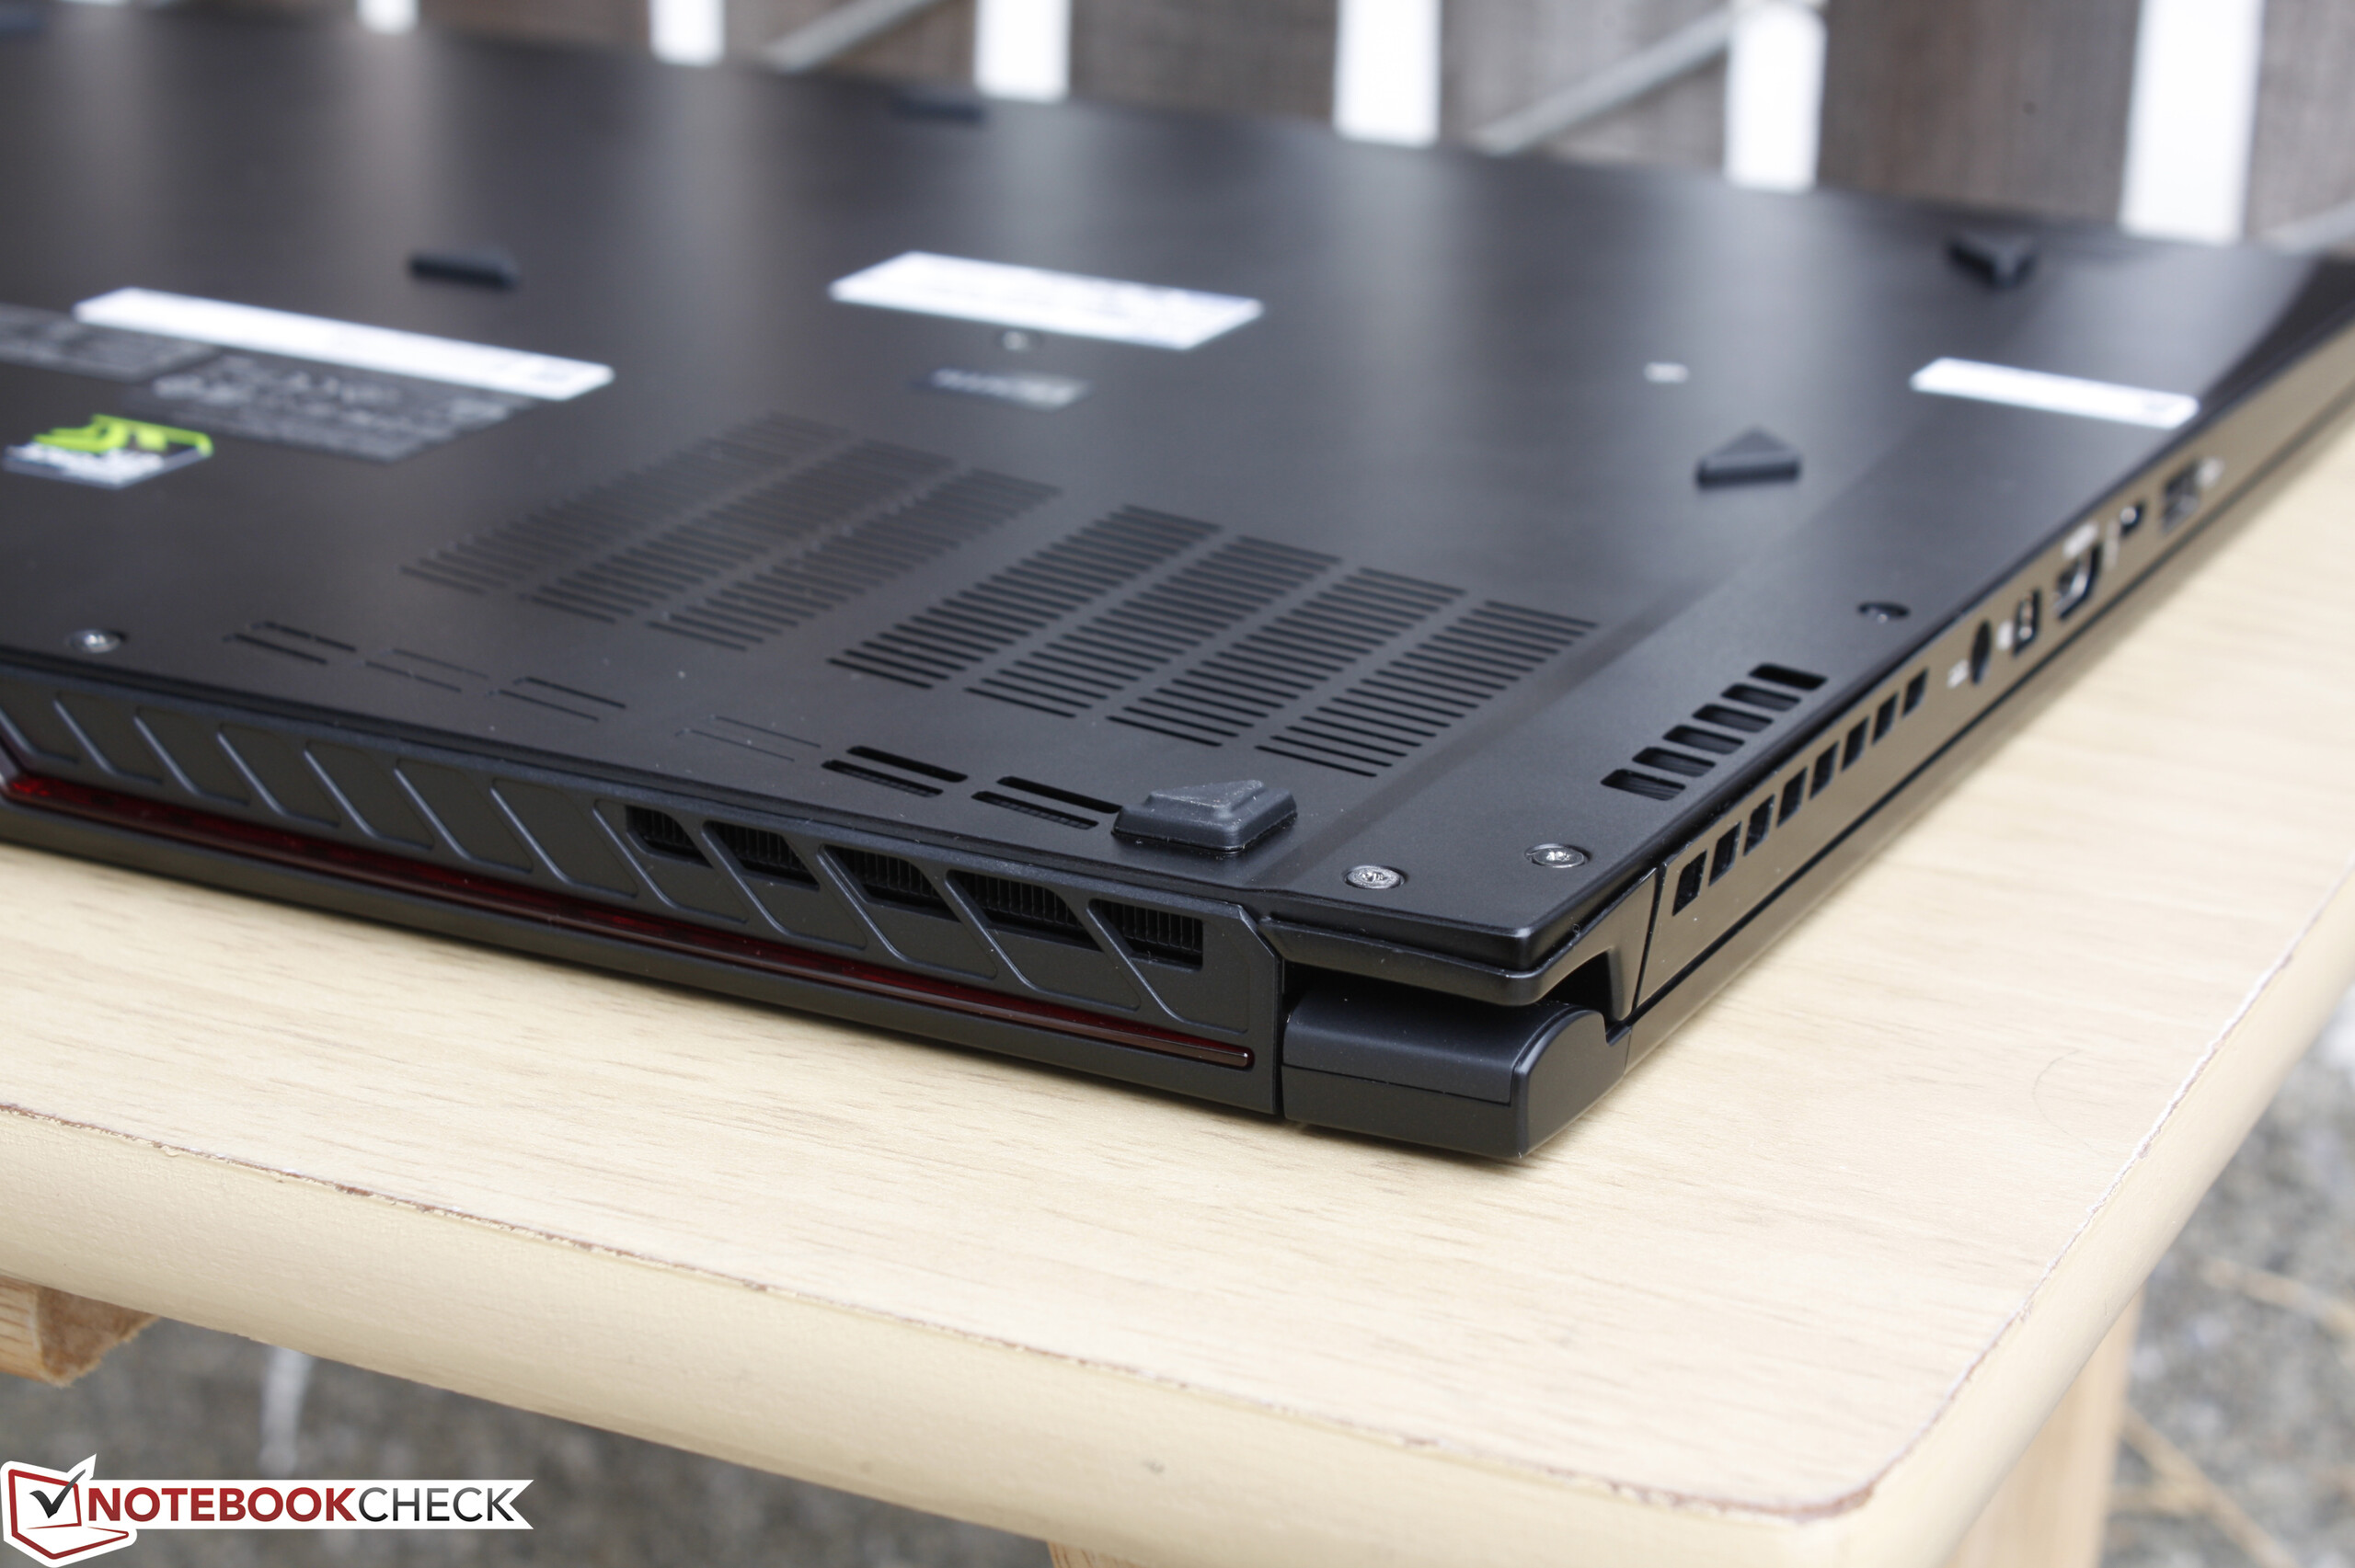
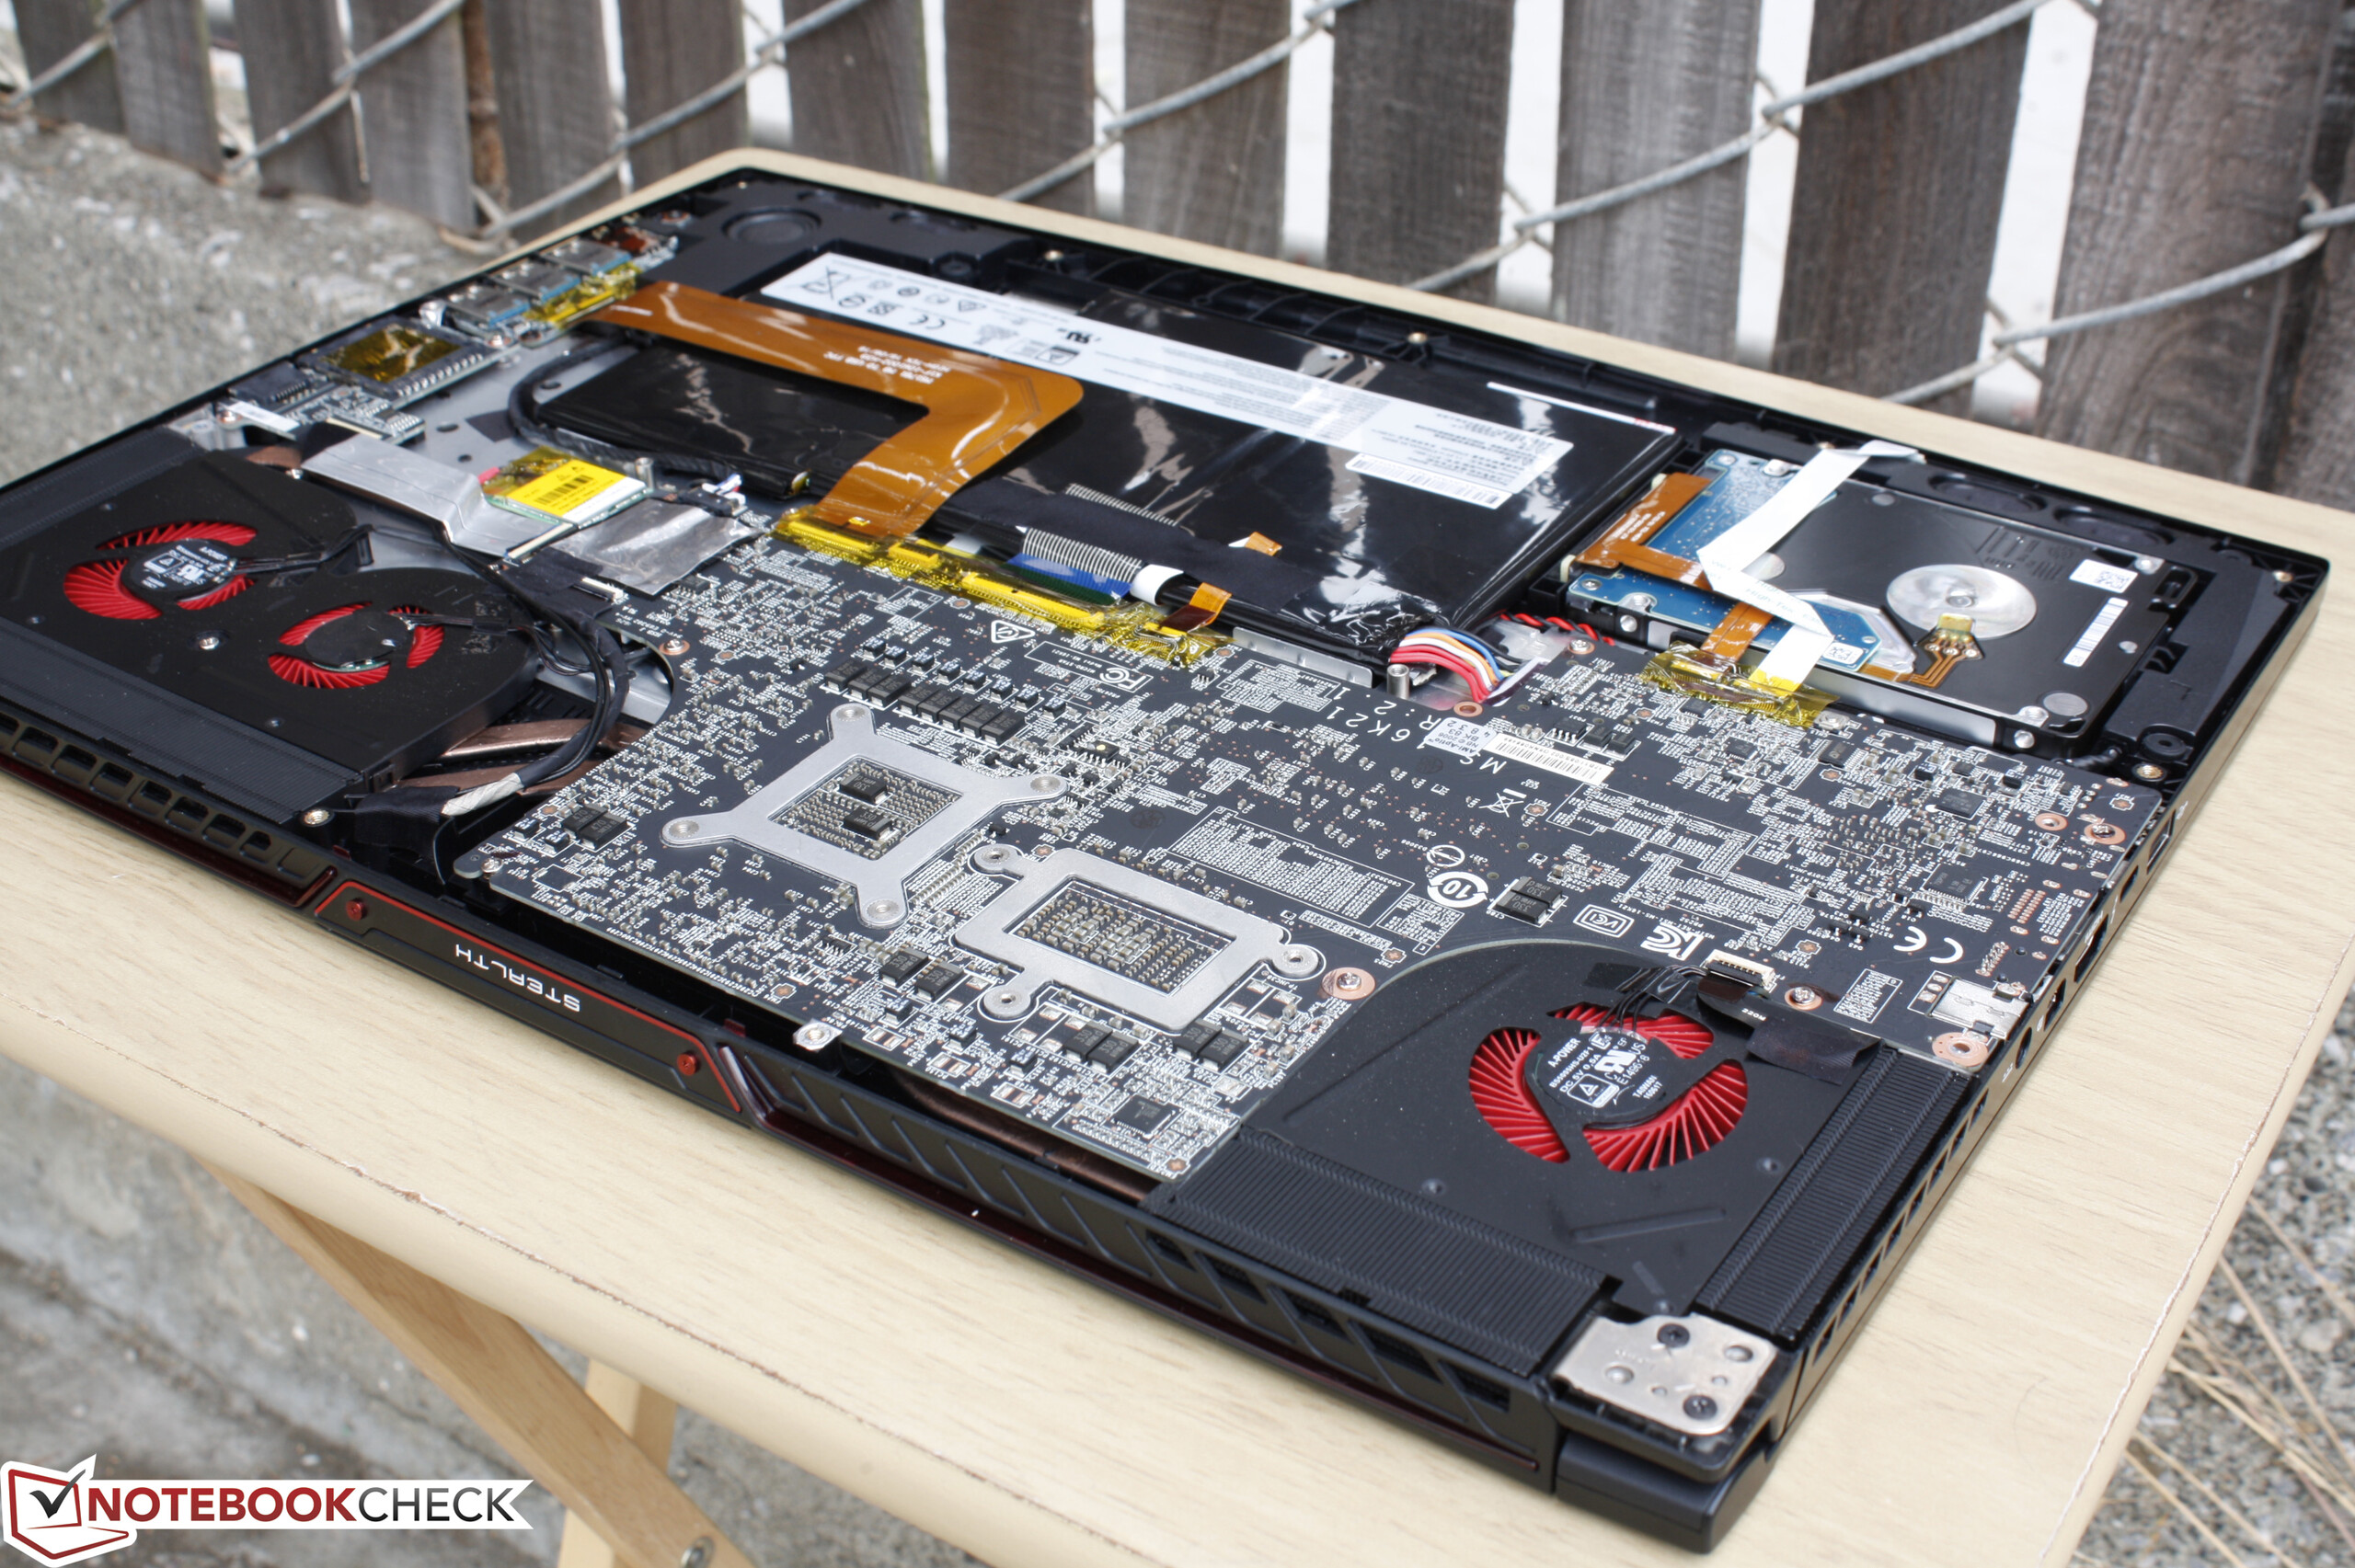
Bu serideki modeller için performans bir sorun değil, ama asıl dezavantajı fanların çıkardığı yüksek ses ve kısa batarya ömrü. Daha sessiz evet ama çok yüksek sesten biraz daha iyisi tatmin edici değil. Batarya kullanımındaki iyileştirme de çok göze batmıyor. Portların birbirine çok yakın oluşu da kullanım açısından sıkıntı yaratabilir. M.2 SSD ve SODIMM slotlarına ise erişim yok. Ayrıca alt kapağın açılmasıyla garantinin bozulması şaka gibi. Yavaş SDXC kart okuyucu bir diğer dezavantaj. Bazı harici Macro tuşlar veya G-Sync ile 4K seçeneği sistemi daha oyunculara yönelik hale getirebilirdi.
Sistem yeni Pascal işlemciler ile ileriye yönelik bir hale gelmiş. Daha kalın kasalı Maxwell modellerine göre tercih edilebilir. Fan sesi ve kısıtlı bakım imkanları ise daha büyük cihazları almak konusunda karar verme noktası olacaktır.
Yazının orjinali için tıklayın.
MSI GS73VR 6RF
- 09/13/2016 v5.1 (old)
Allen Ngo
Price comparison
