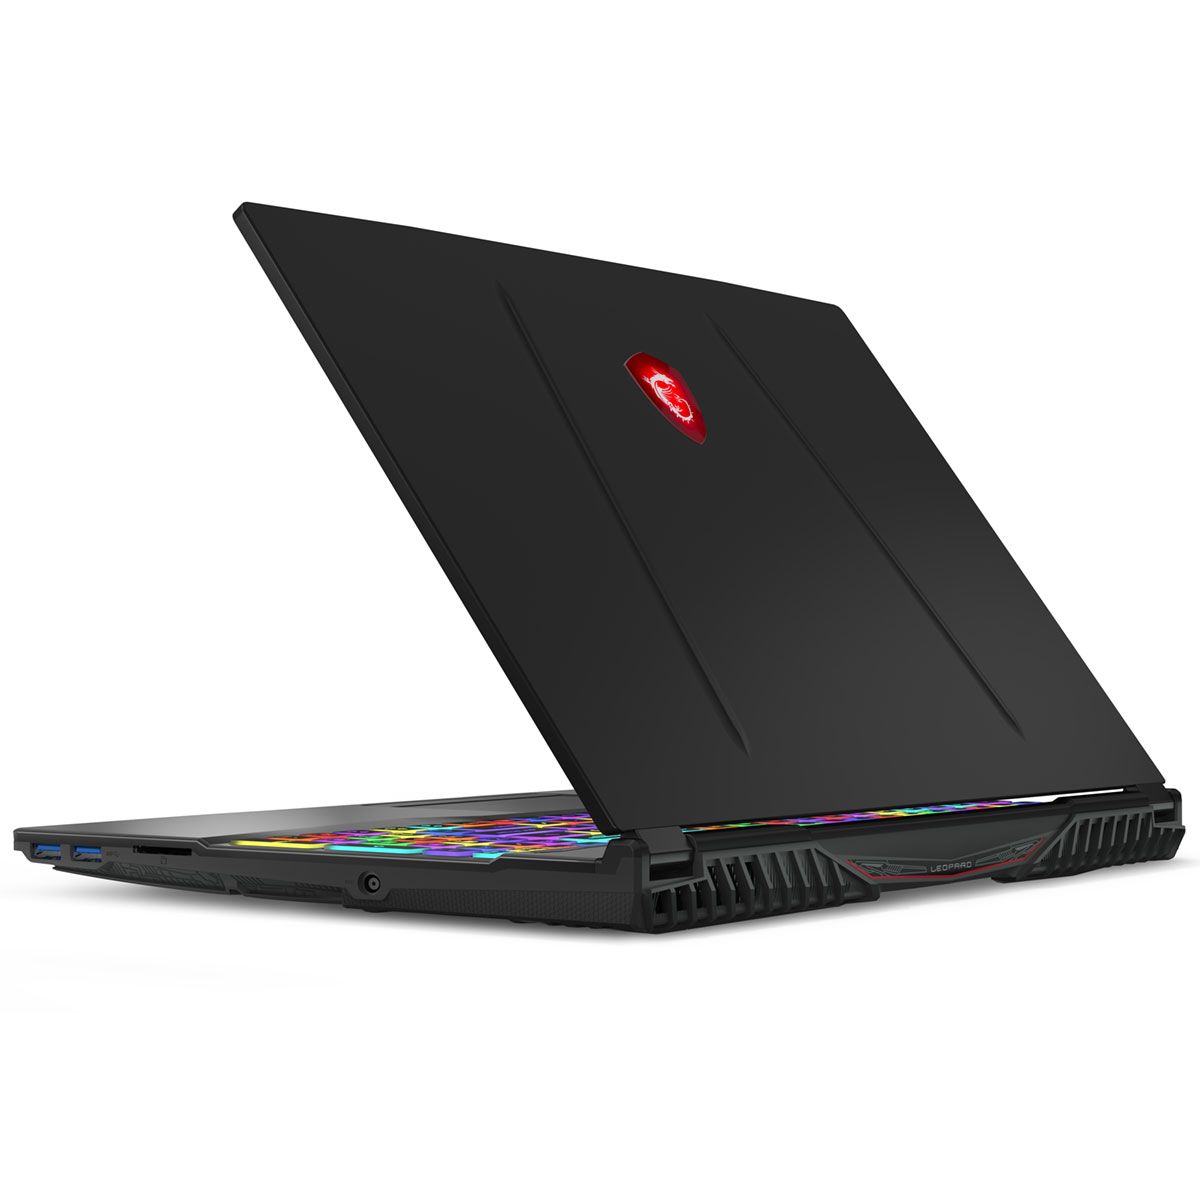
MSI GP65 10SFK Laptop incelemesi: 10. jenerasyon Intel Core i7 iz bırakıyor
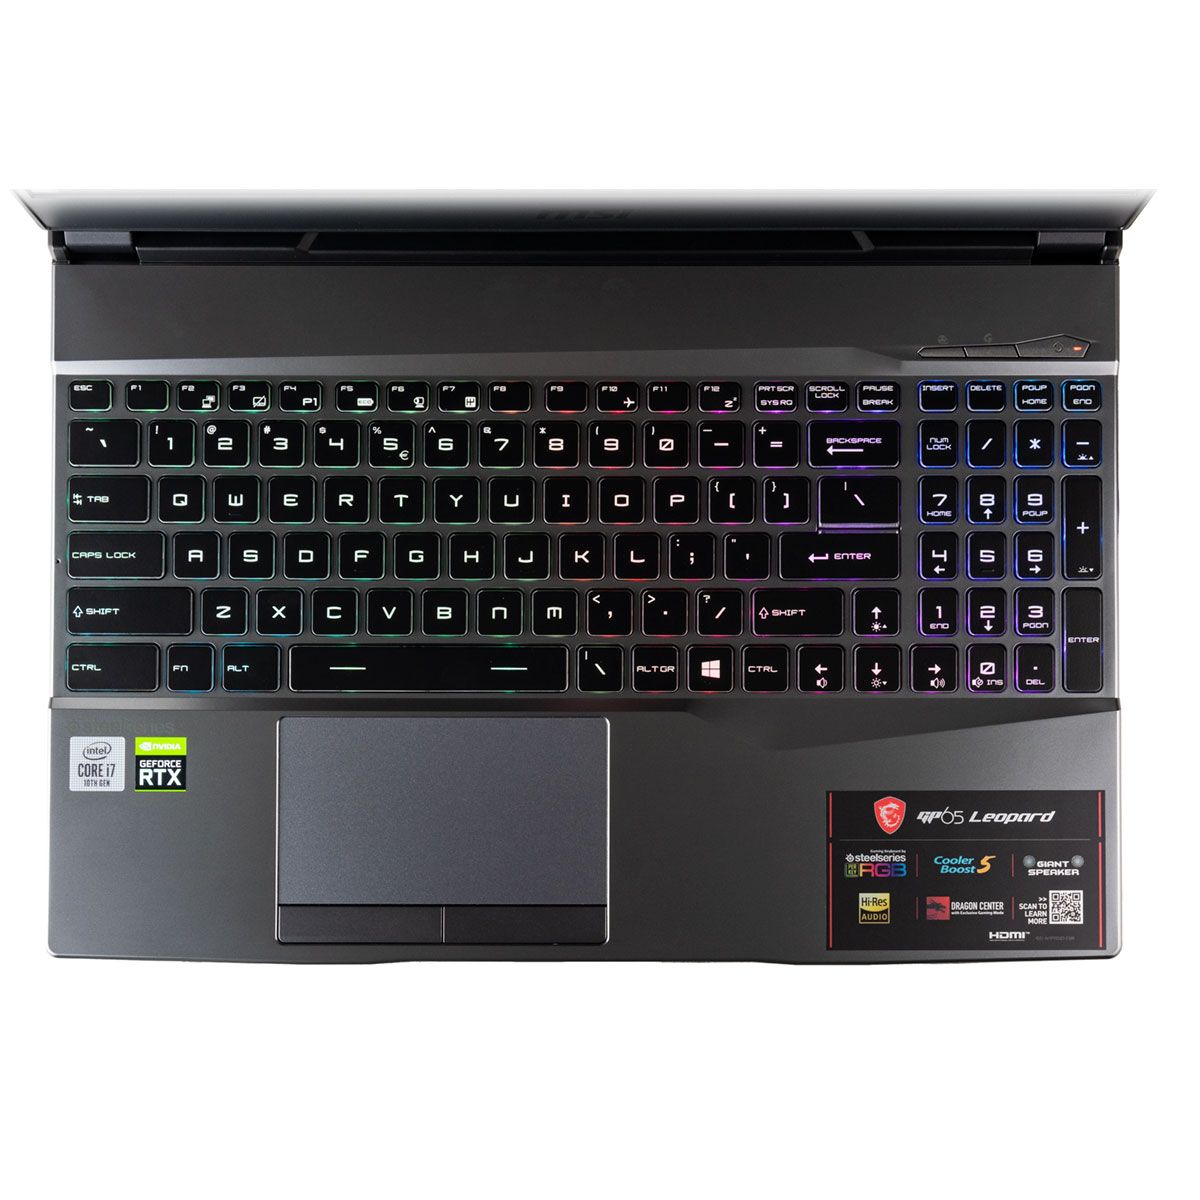
MSI, bu ayın başlarında Intel 10. nesil Comet Lake-H işlemcileriyle ilk oyun dizüstü bilgisayarlarını duyurdu. Yenilenmiş MSI GF75 10SCXR'yi ve yepyeni MSI GS66 10SFS'yi o zamandan bu yana yakın gelecekte daha fazlası ile test ettik. Bugün sahip olduğumuz son model, geçen yıl GP65 9SE'nin yerini alacak GP65 10SFK. Ancak CPU, GPU ve ekran panelindeki farklılıkların yanı sıra, kasa yıldan yıla aynı kalıyor. Yorumlarımızın çoğu burada da geçerli olduğundan GP65 9SE'deki mevcut incelememize göz atmanızı öneririz. GP65, Asus TUF FX505, HP Omen 15, Aorus 15 ve diğer orta sınıf 15.6 inçlik oyun dizüstü bilgisayarlarıyla doğrudan rekabet ediyor Lenovo Legion Y540. Core i7-10750H CPU, GeForce RTX 2070 GPU ve 144 Hz FHD ekran ile özel konfigürasyonumuz yaklaşık 1500 $ USD karşılığında çevrimiçi olarak bulunabilir.Daha fazla MSI incelemesi: MSI GS66MSI GF75MSI Prestij 14MSI Alpha 15MSI Modern 15
Derecelendirme | Tarih | Modeli | Ağırlık | Yükseklik | Boyut | Çözünürlük | Fiyat |
|---|---|---|---|---|---|---|---|
| 83.2 % v7 (old) | 05/2020 | MSI GP65 10SFK-047US i7-10750H, GeForce RTX 2070 Mobile | 2.3 kg | 27.5 mm | 15.60" | 1920x1080 | |
| 82.1 % v7 (old) | Asus Strix Scar III G531GW-AZ062T i7-9750H, GeForce RTX 2070 Mobile | 2.4 kg | 25 mm | 15.60" | 1920x1080 | ||
| 80.4 % v6 (old) | 08/2019 | Asus TUF FX505DT-EB73 R7 3750H, GeForce GTX 1650 Mobile | 2.2 kg | 26.8 mm | 15.60" | 1920x1080 | |
| 86.2 % v6 (old) | 09/2019 | HP Omen 15-dc1303ng i7-8750H, GeForce RTX 2070 Max-Q | 2.4 kg | 25 mm | 15.60" | 1920x1080 | |
| 85.5 % v6 (old) | 08/2019 | Aorus 15-SA i7-9750H, GeForce GTX 1660 Ti Mobile | 2.1 kg | 24.4 mm | 15.60" | 1920x1080 |
Durum
SD Kart Okuyucu
| SD Card Reader | |
| average JPG Copy Test (av. of 3 runs) | |
| HP Omen 15-dc1303ng (Toshiba Exceria Pro SDXC 64 GB UHS-II) | |
| MSI GP65 10SFK-047US (Toshiba Exceria Pro SDXC 64 GB UHS-II) | |
| MSI GP65 Leopard 9SE-225US | |
| MSI GP62 7REX-1045US (Toshiba Exceria Pro SDXC 64 GB UHS-II) | |
| maximum AS SSD Seq Read Test (1GB) | |
| HP Omen 15-dc1303ng (Toshiba Exceria Pro SDXC 64 GB UHS-II) | |
| MSI GP65 10SFK-047US (Toshiba Exceria Pro SDXC 64 GB UHS-II) | |
| MSI GP65 Leopard 9SE-225US | |
| MSI GP62 7REX-1045US (Toshiba Exceria Pro SDXC 64 GB UHS-II) | |
İletişim
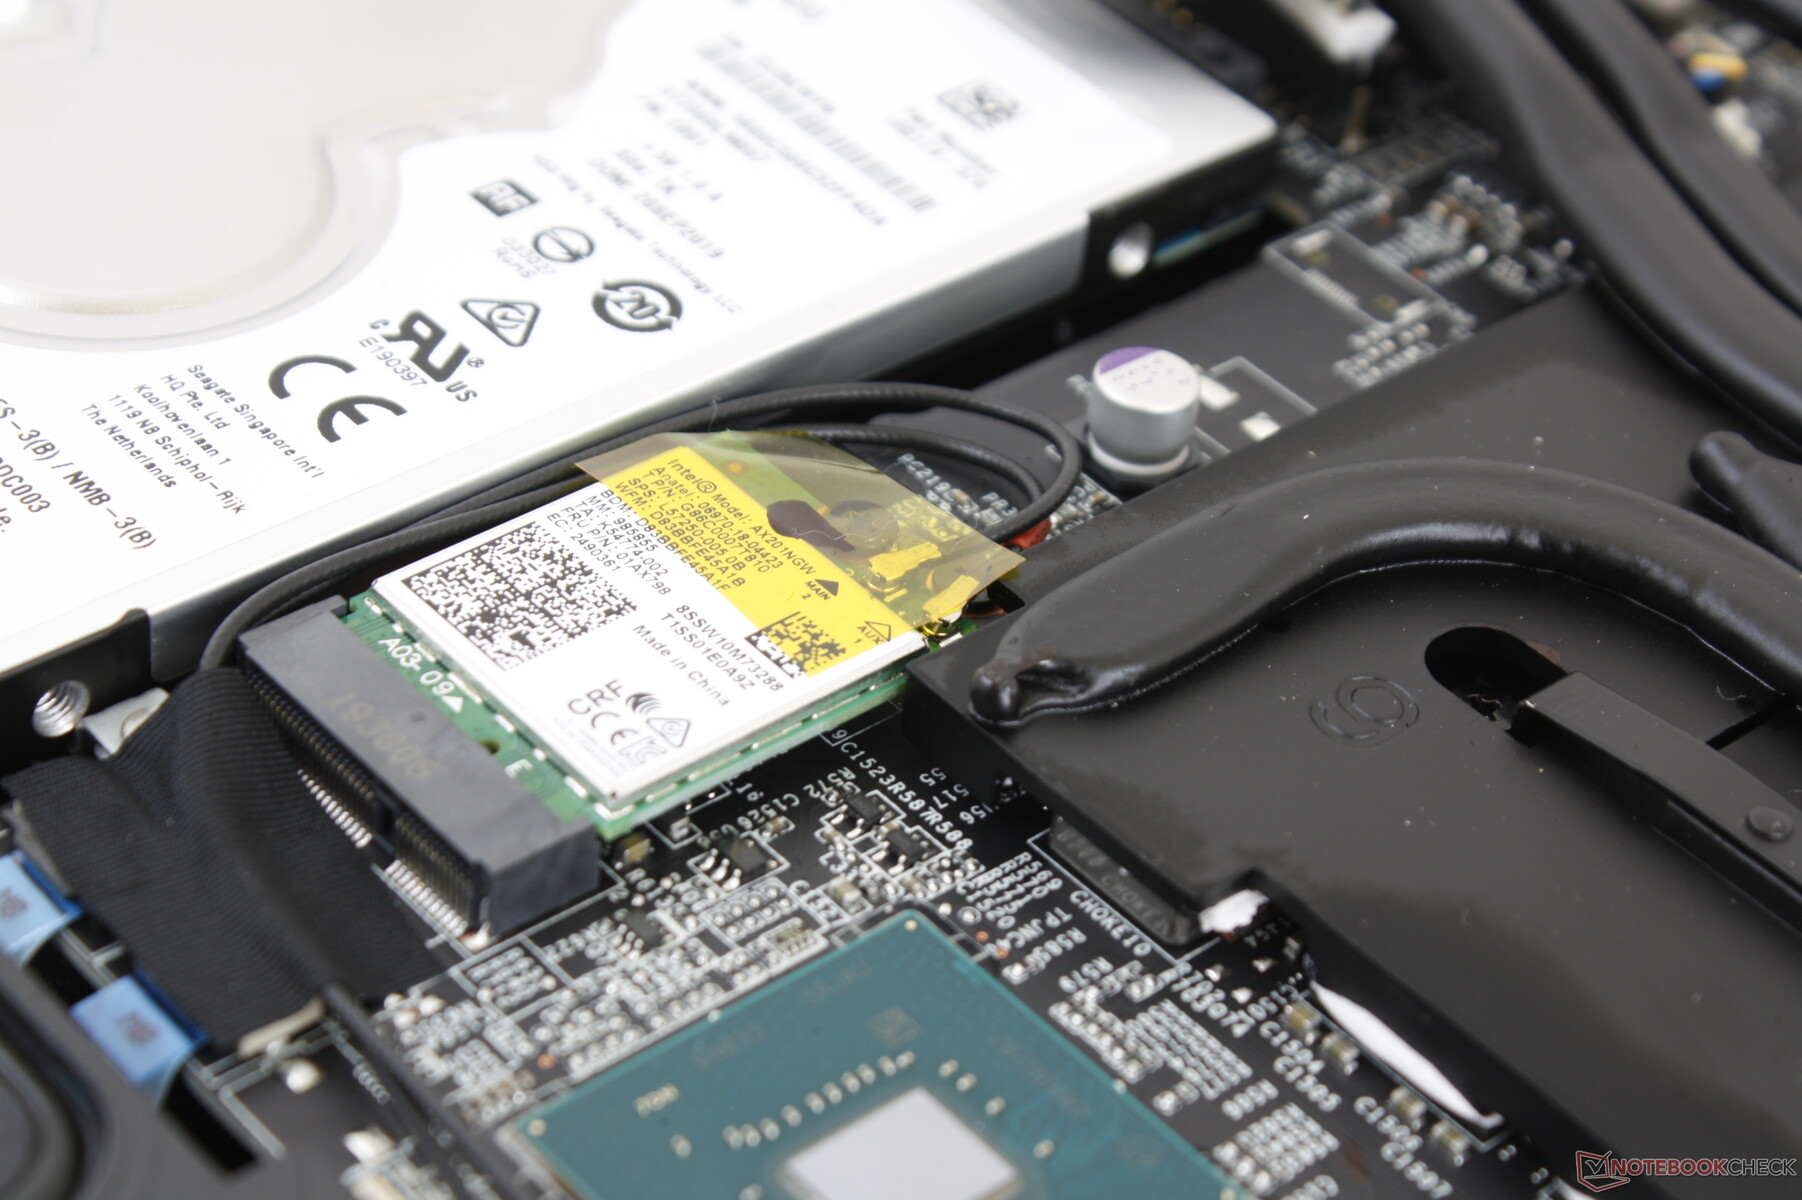
Intel AX201 artık 802.11ax veya Wi-Fi 6 bağlantısı için standart olarak sunulurken, geçen yılki model Wi-Fi 5 ile geldi. Netgear RAX200 test yönlendiricimize bağlandığında hiçbir sorunla karşılaşmadık.
Web kamerası


Bakım
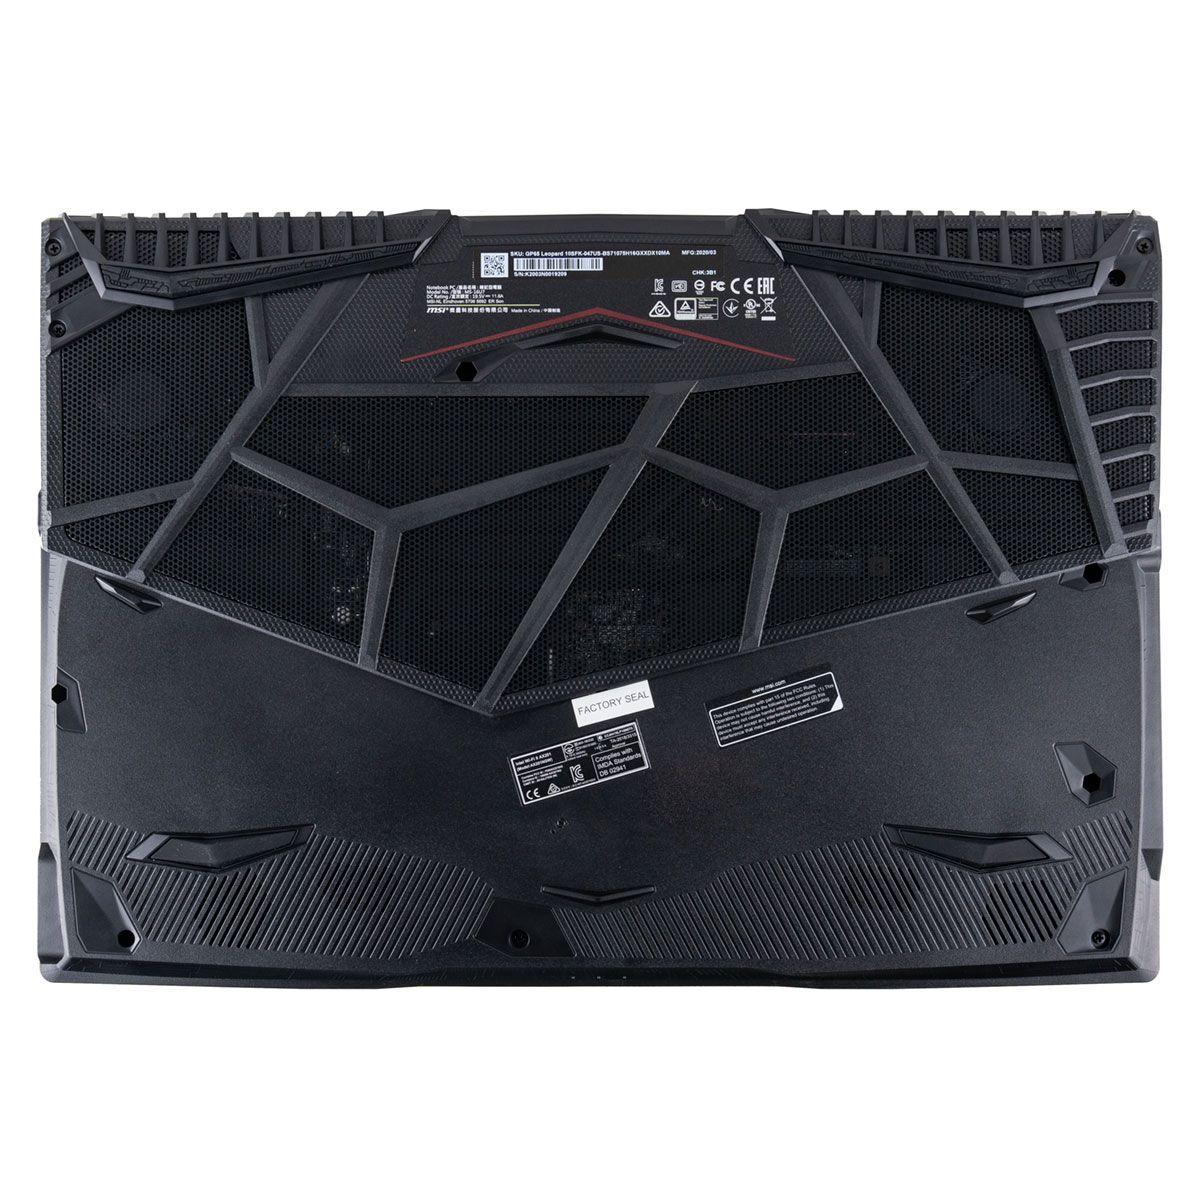
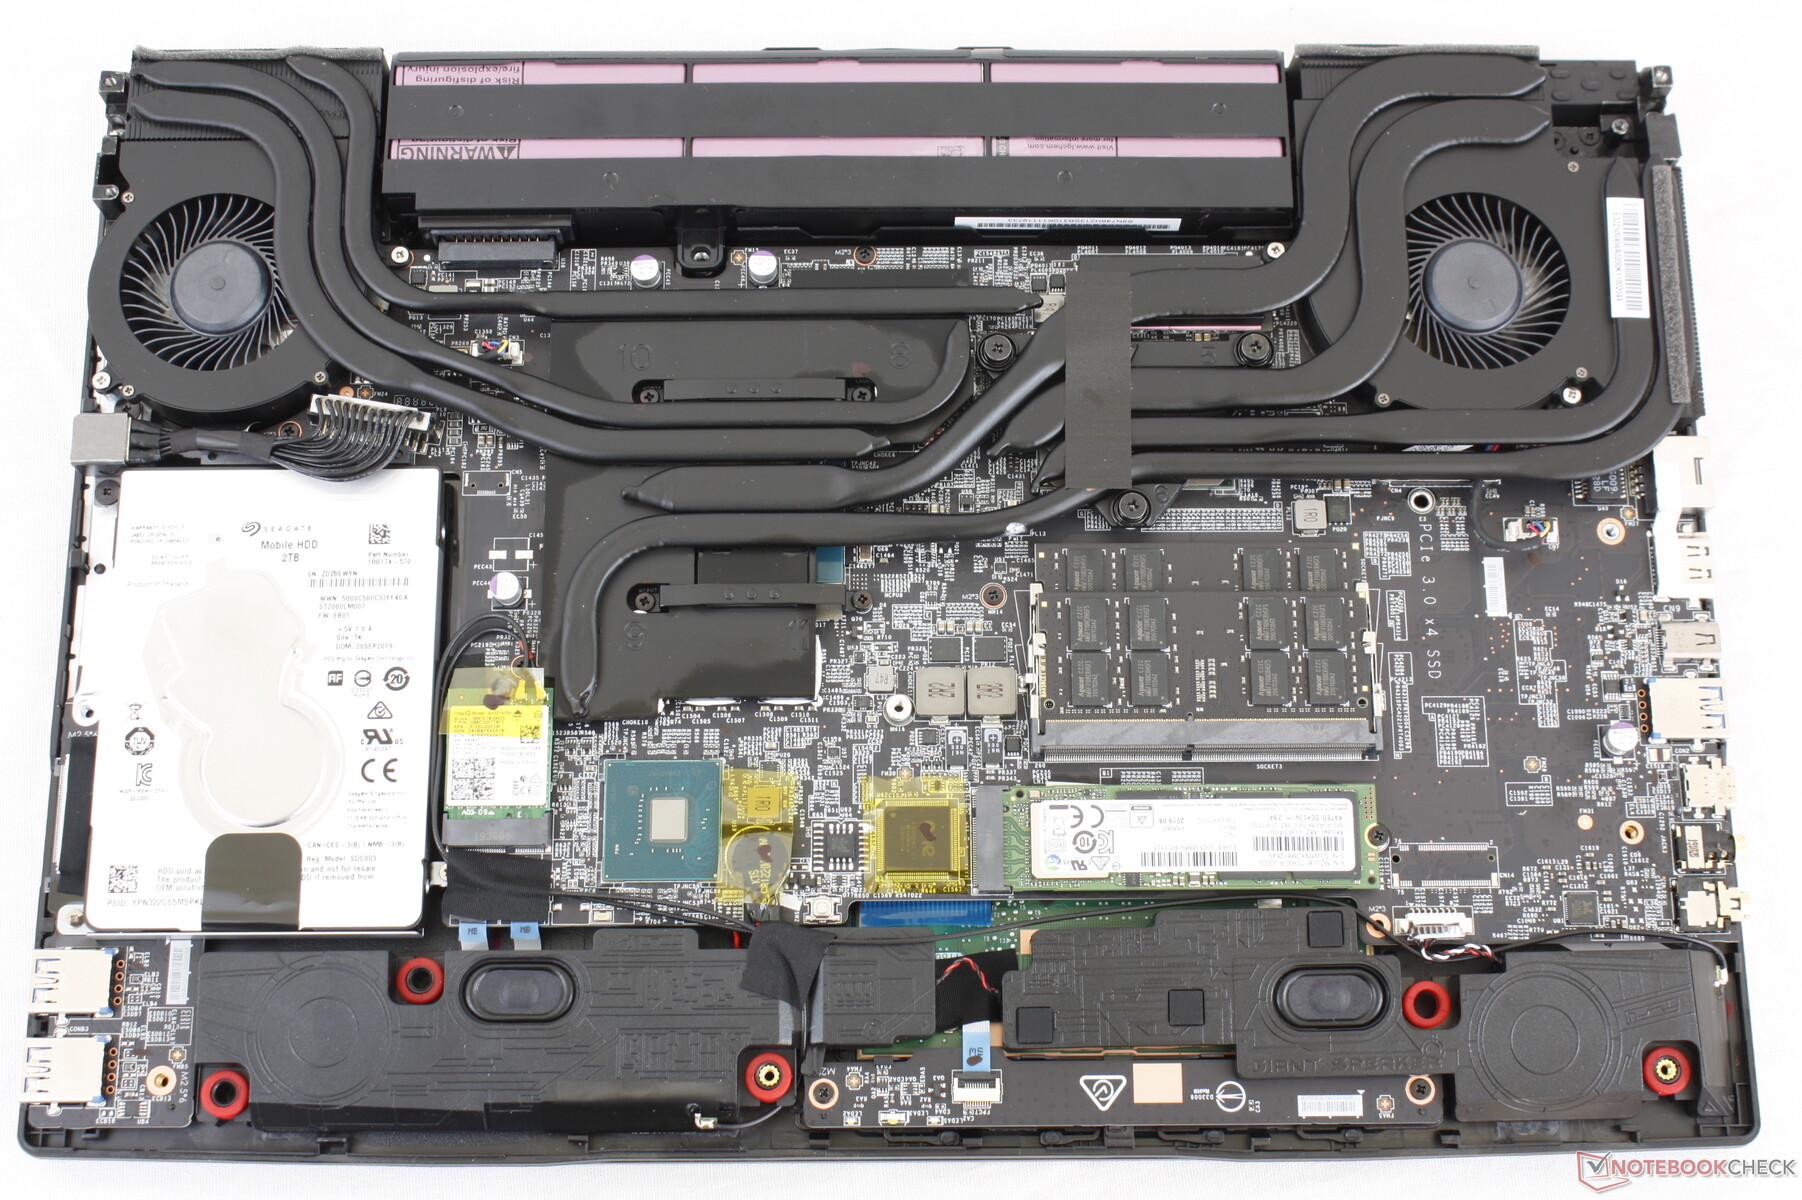
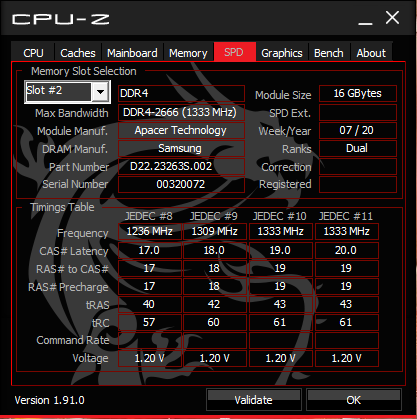
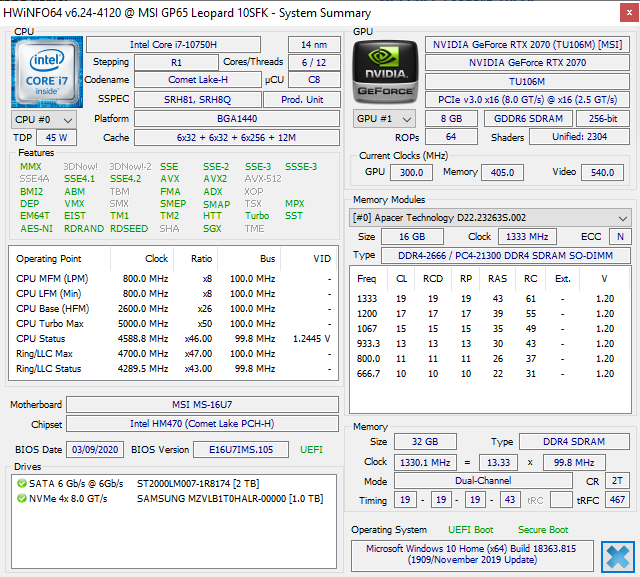
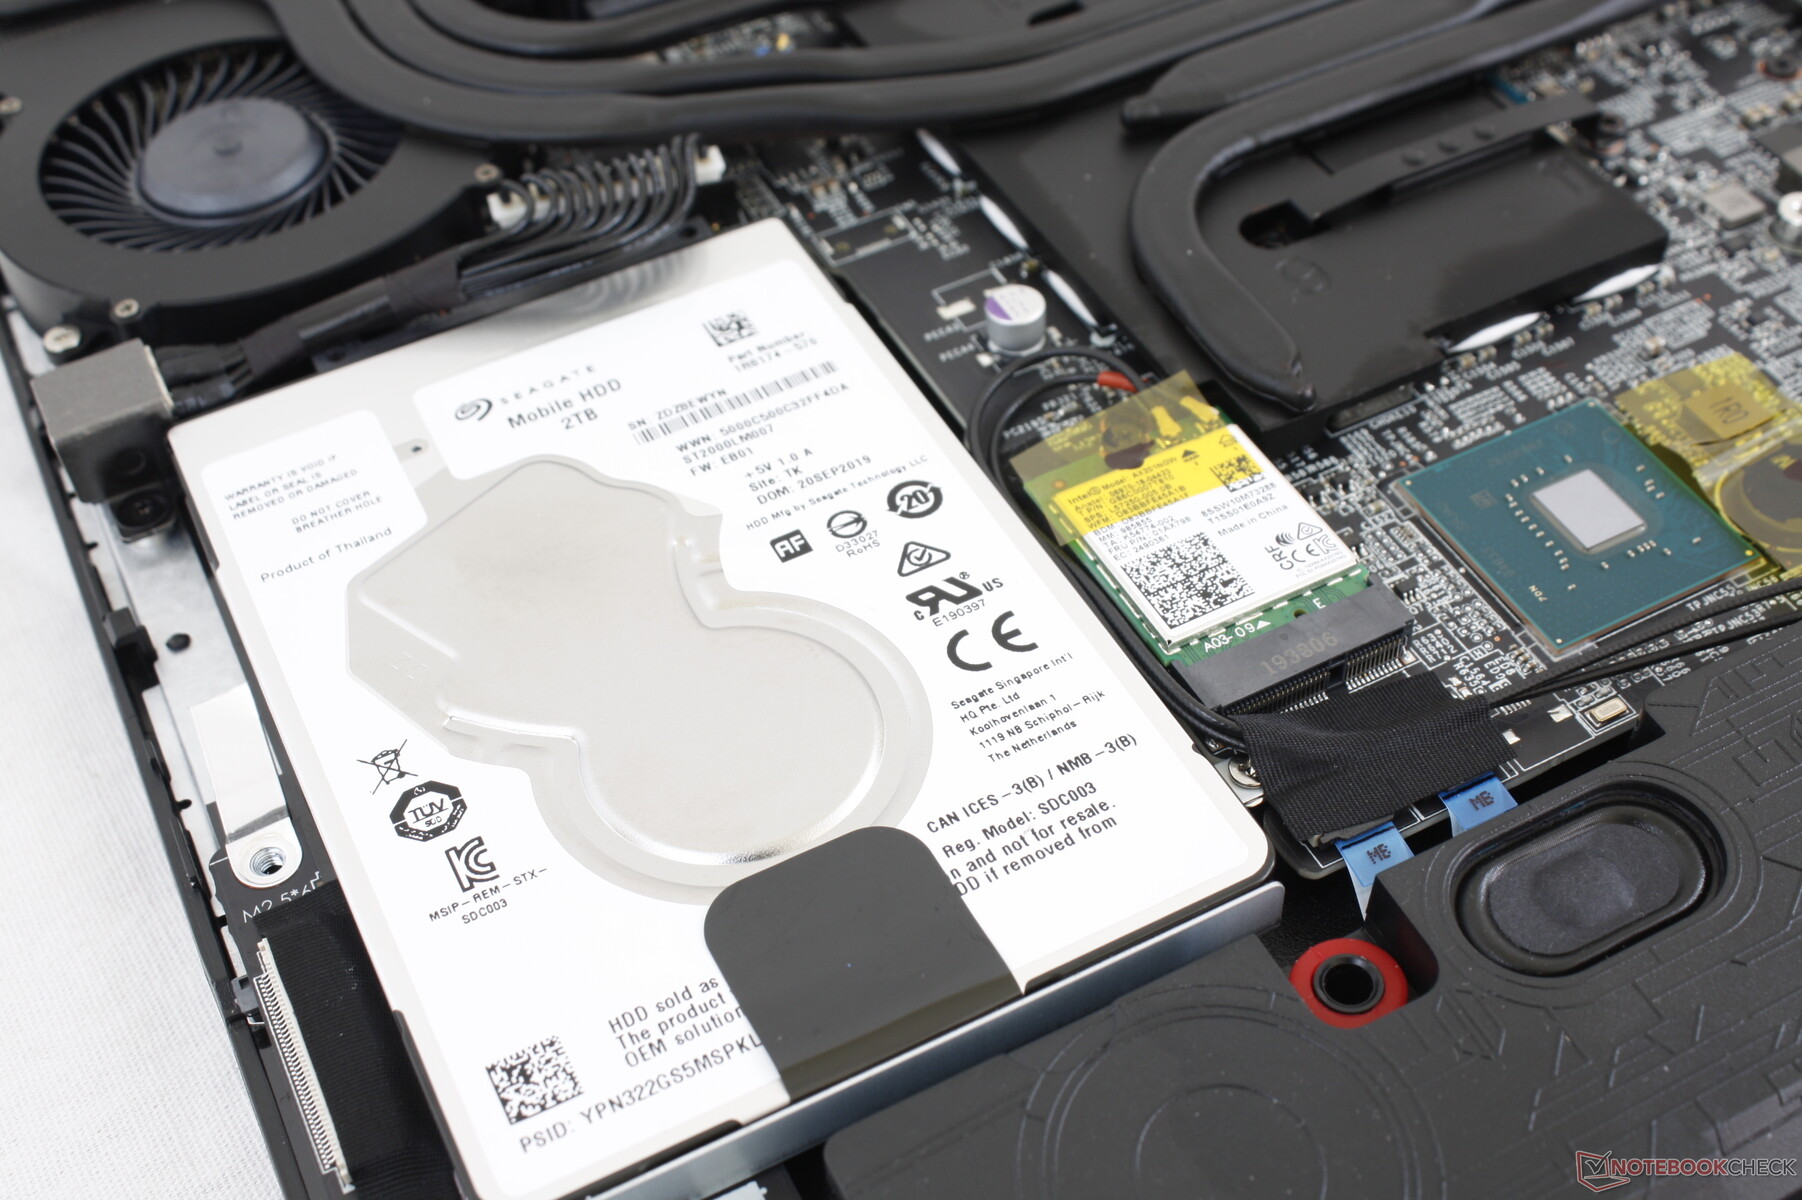
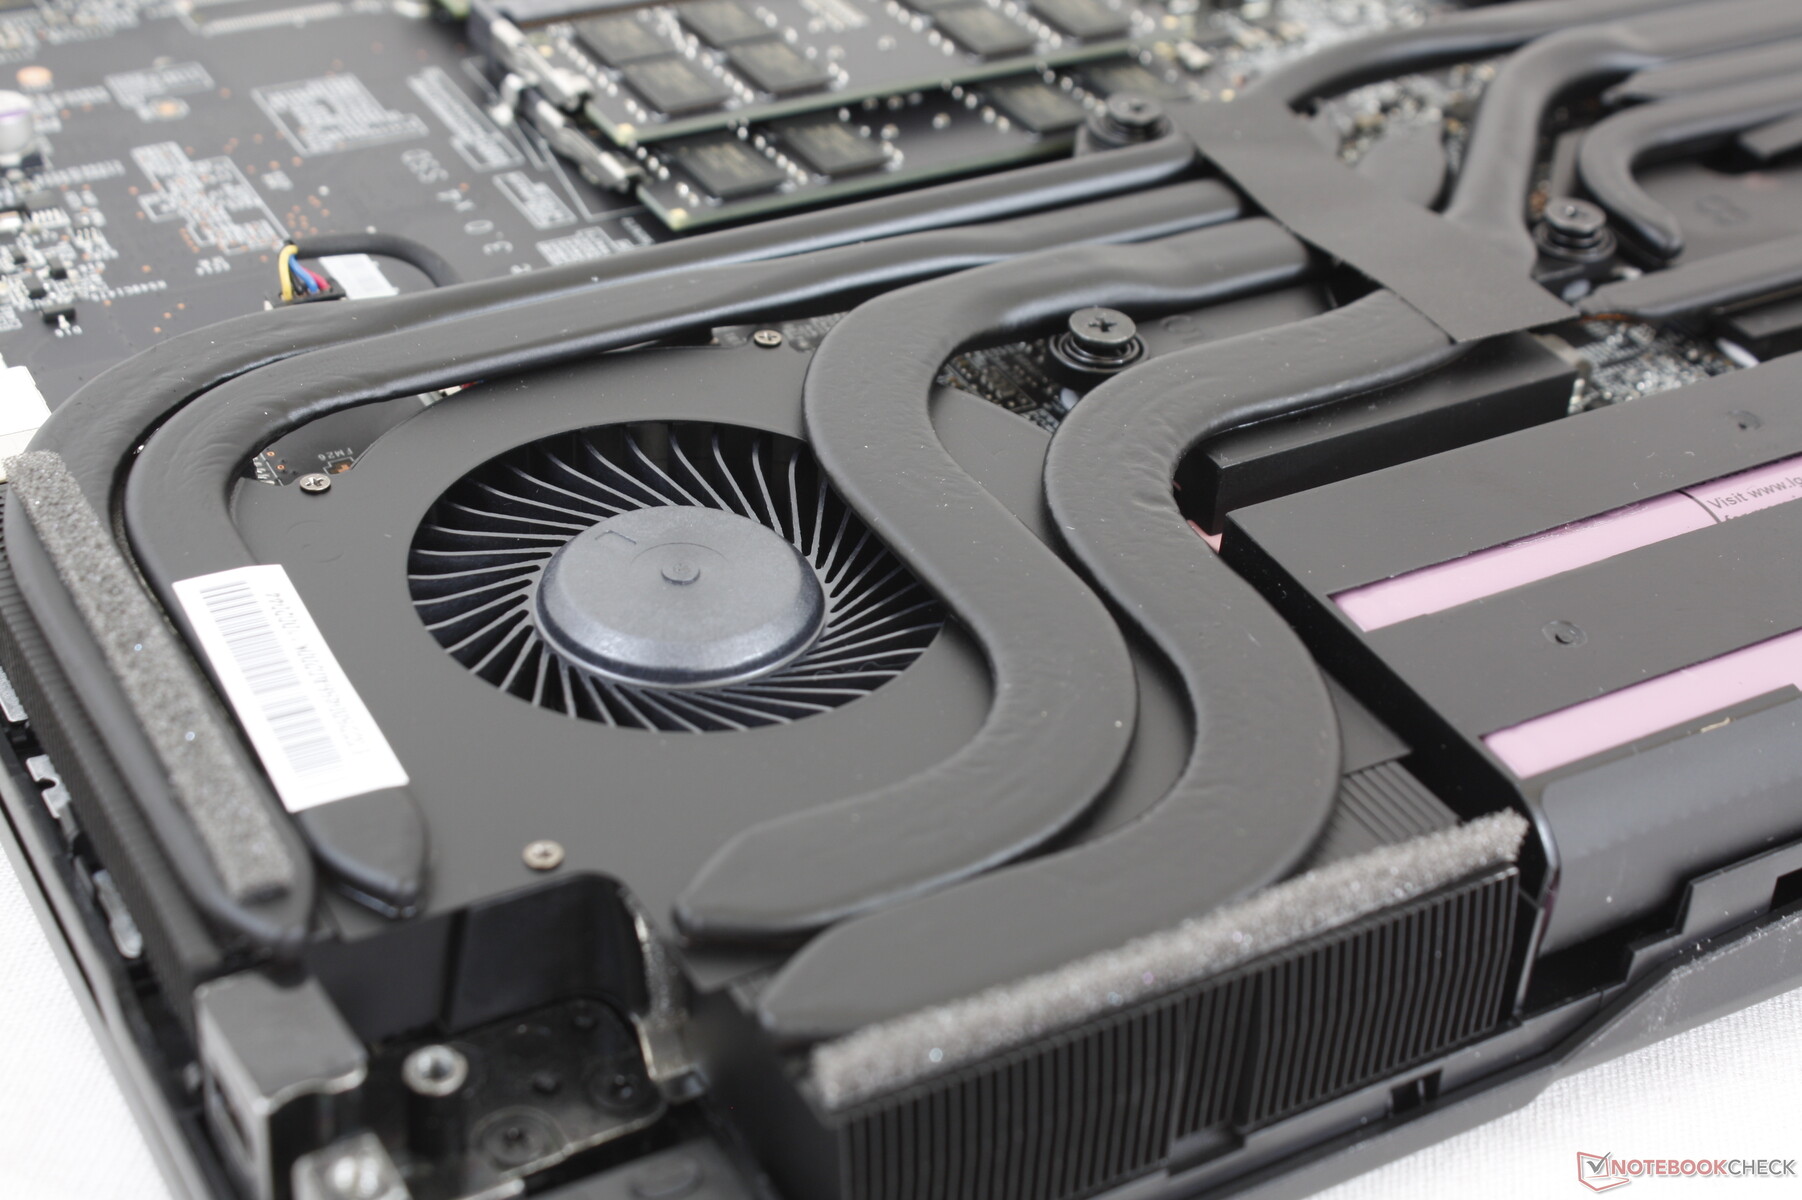
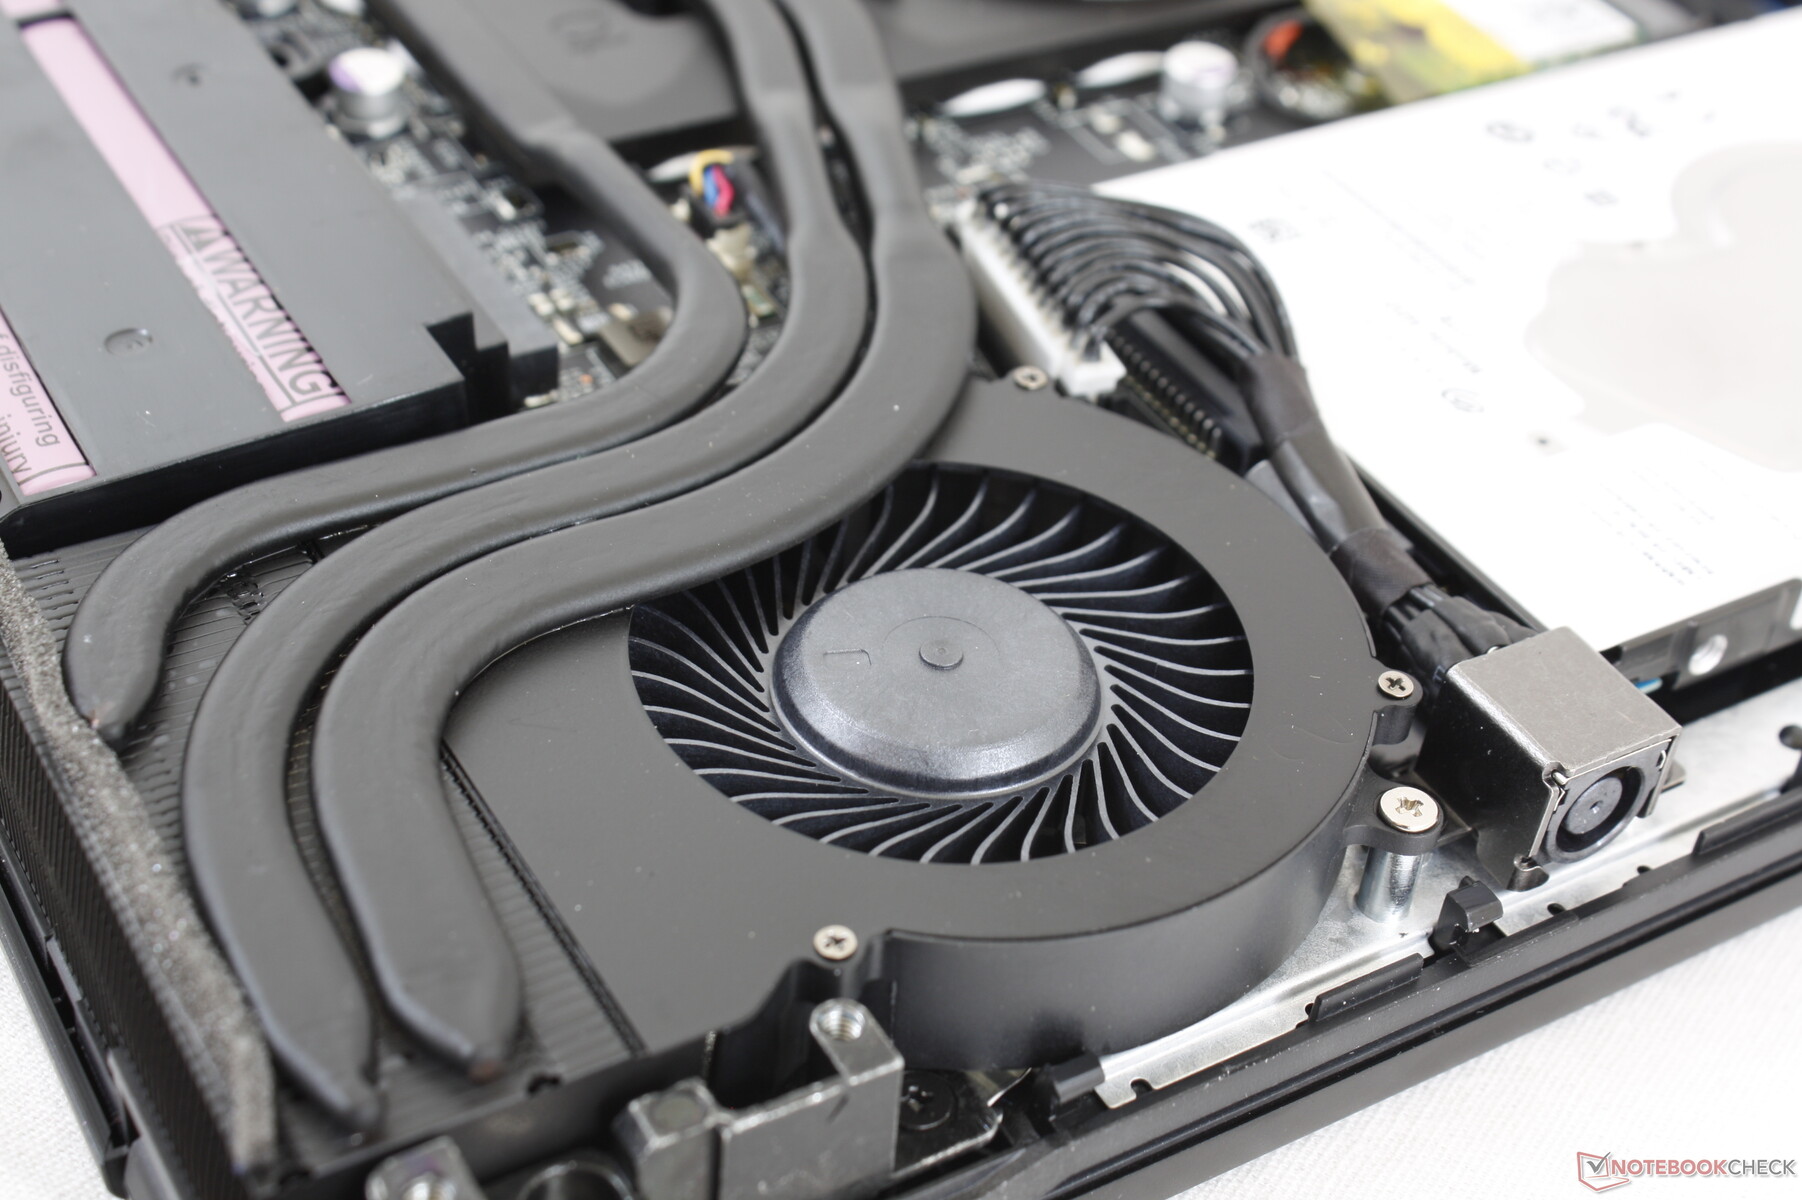
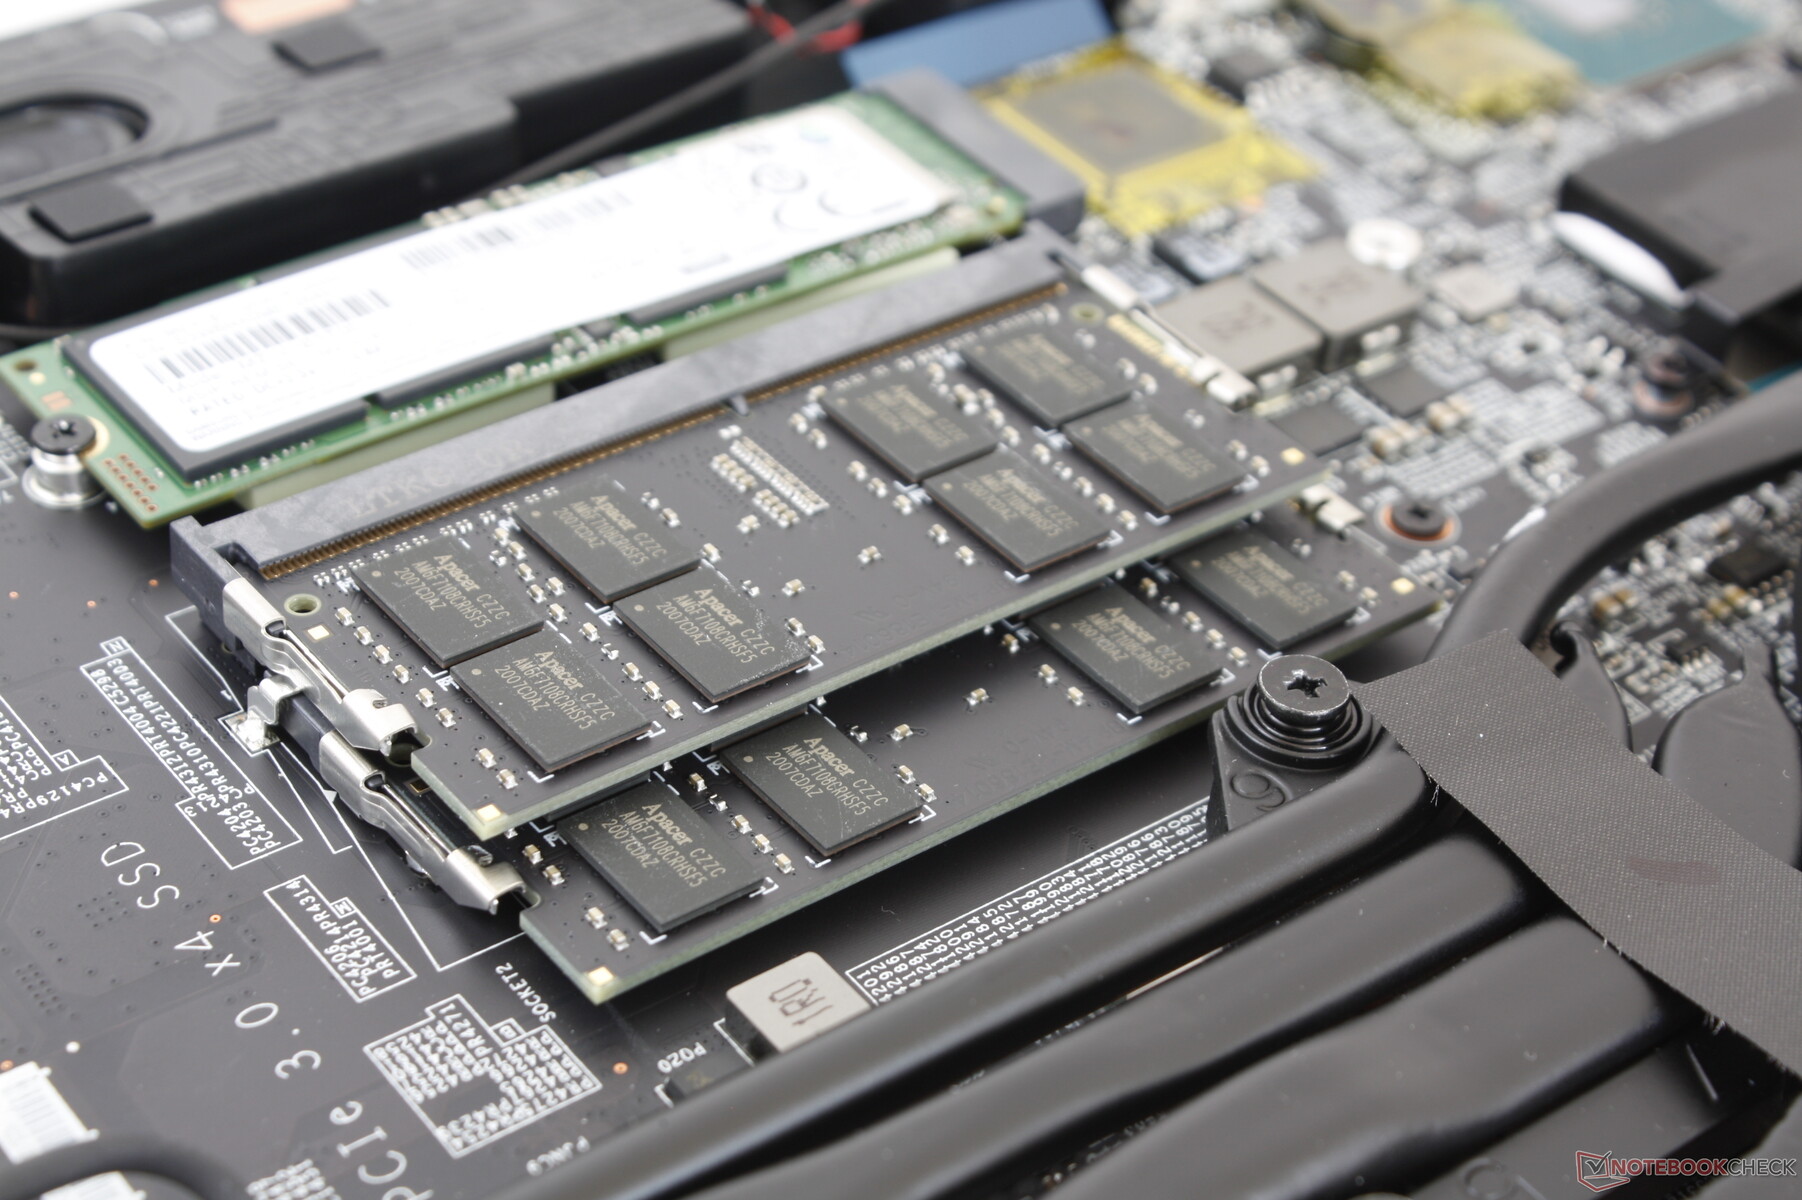
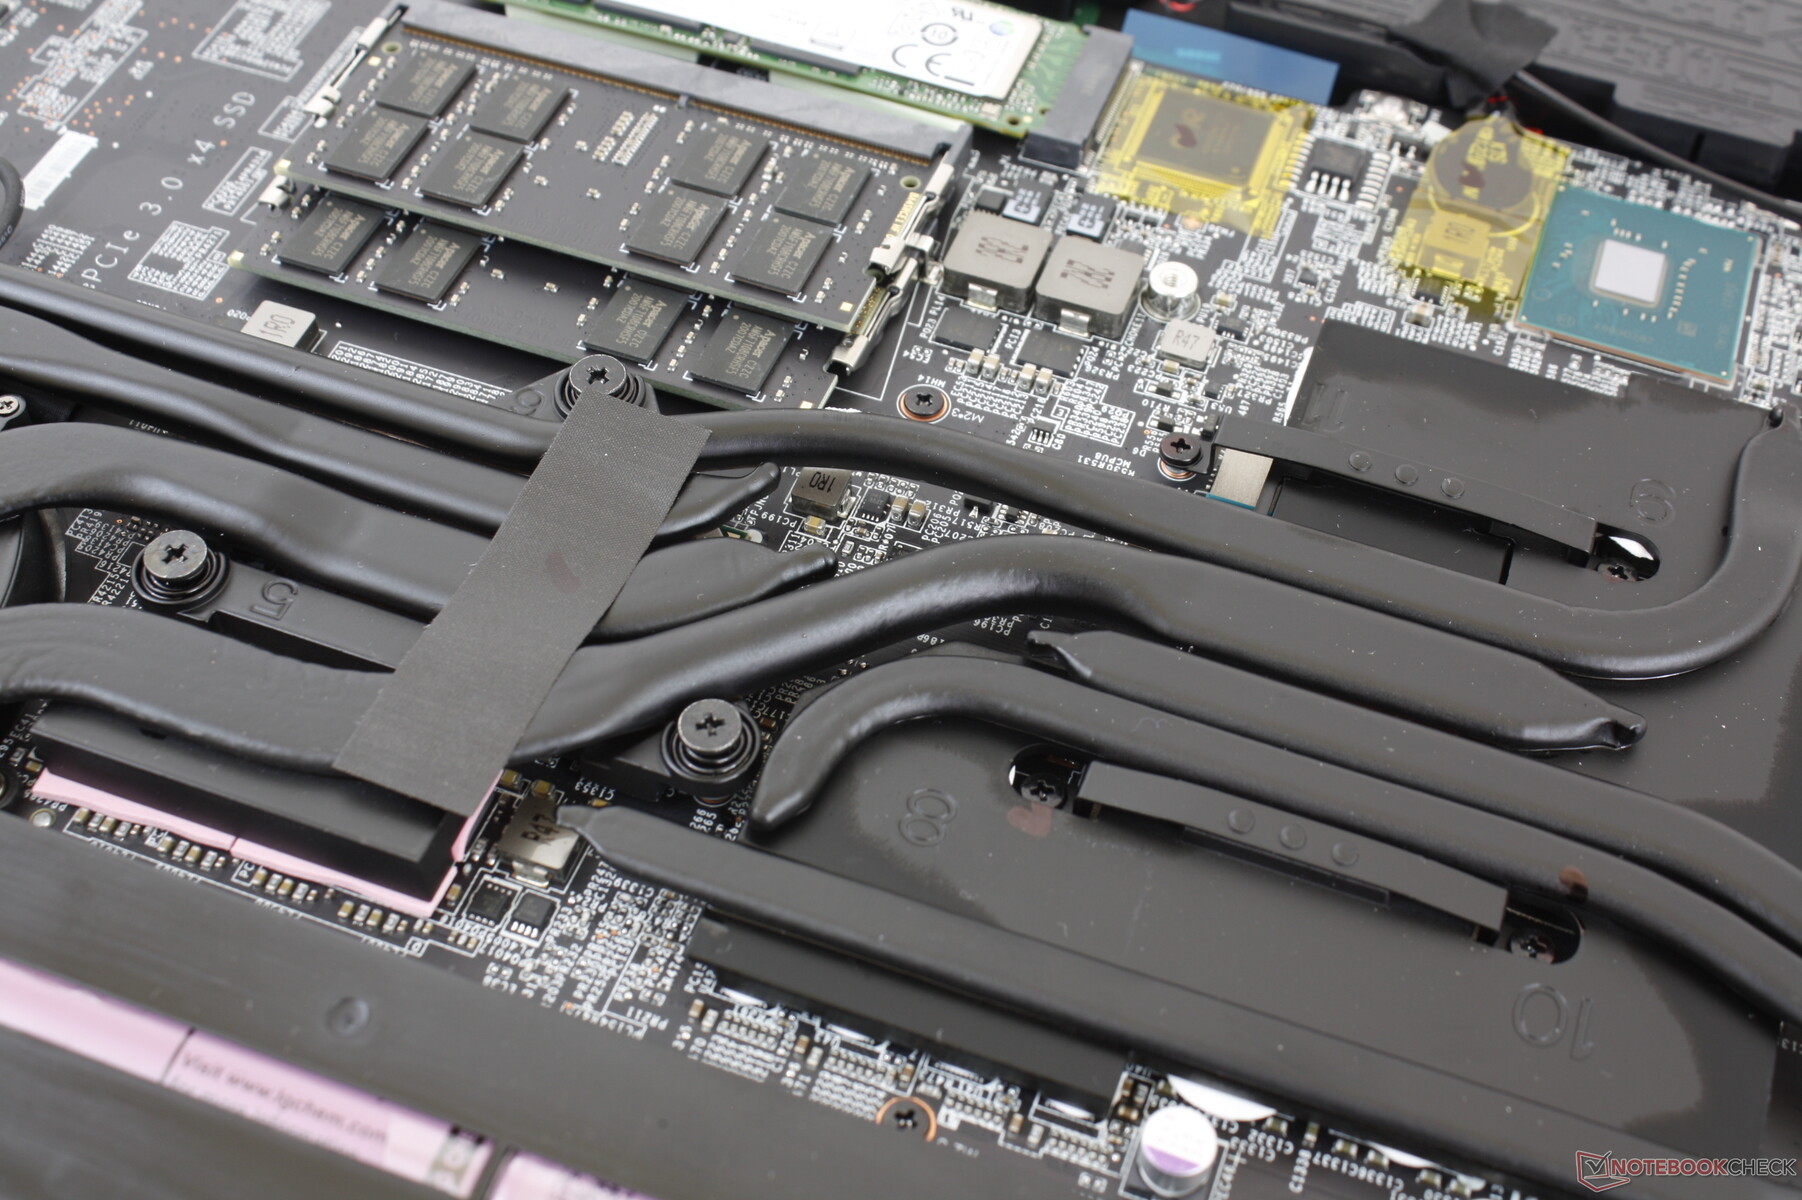
Alt panel, garanti mühür etiketi altında olan bir tane dahil olmak üzere birkaç Philips vida ile sabitlenmiştir. Kenarların ve köşelerin etrafındaki mandallar titiz ve ayrılması zor olduğundan panelin çıkarılması zor olabilir. İçeri girdikten sonra kullanıcılar iki depolama bölmesine ve iki SODIMM yuvasına erişebilir. SODIMM yuvalarına bitişik ikinci M.2 2280 yuvasının GP65 serisinde çıkarıldığını unutmayın.
Aksesuarlar ve Garanti
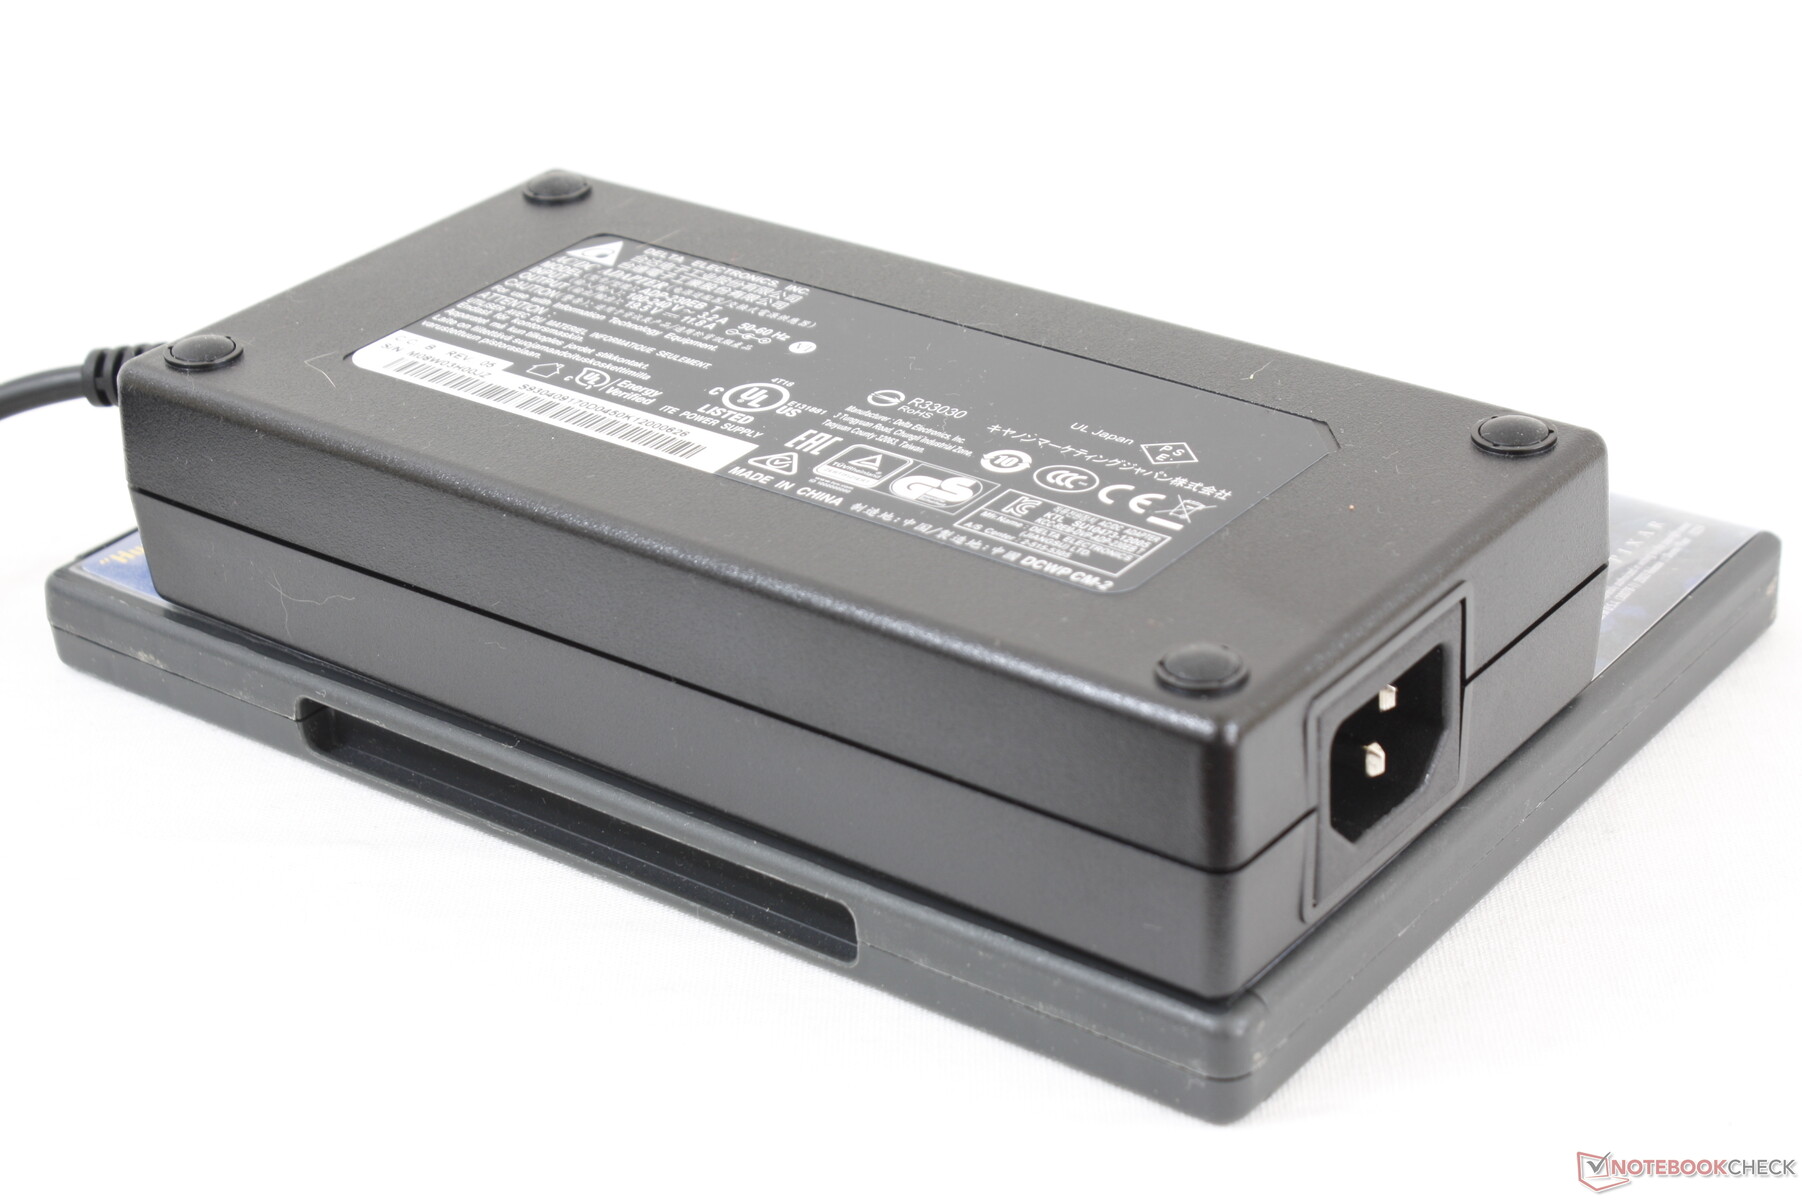
Kutuda normal evrak ve AC adaptör dışında ekstra yoktur. Standart bir yıllık sınırlı garanti, CUKUSA'dan satın alınmışsa mevcut ek koruma için geçerlidir.
Görüntüle
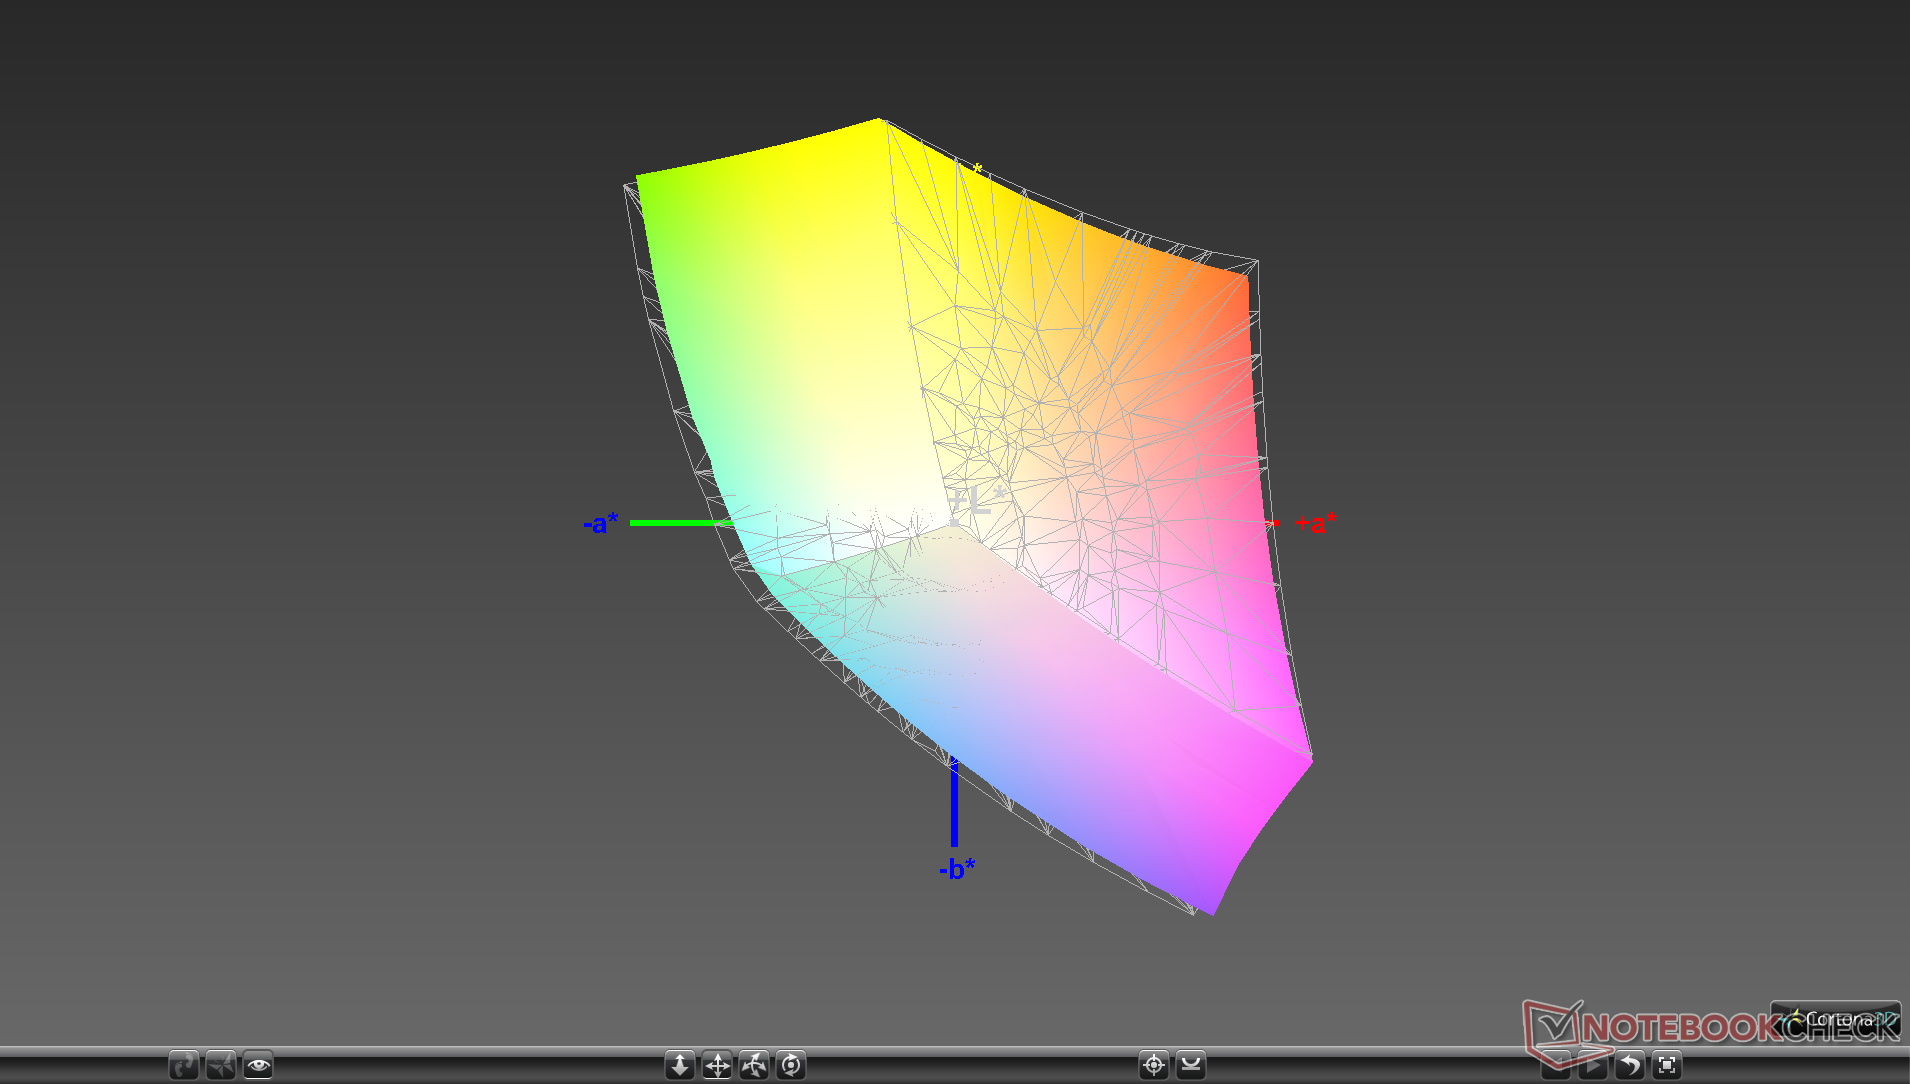
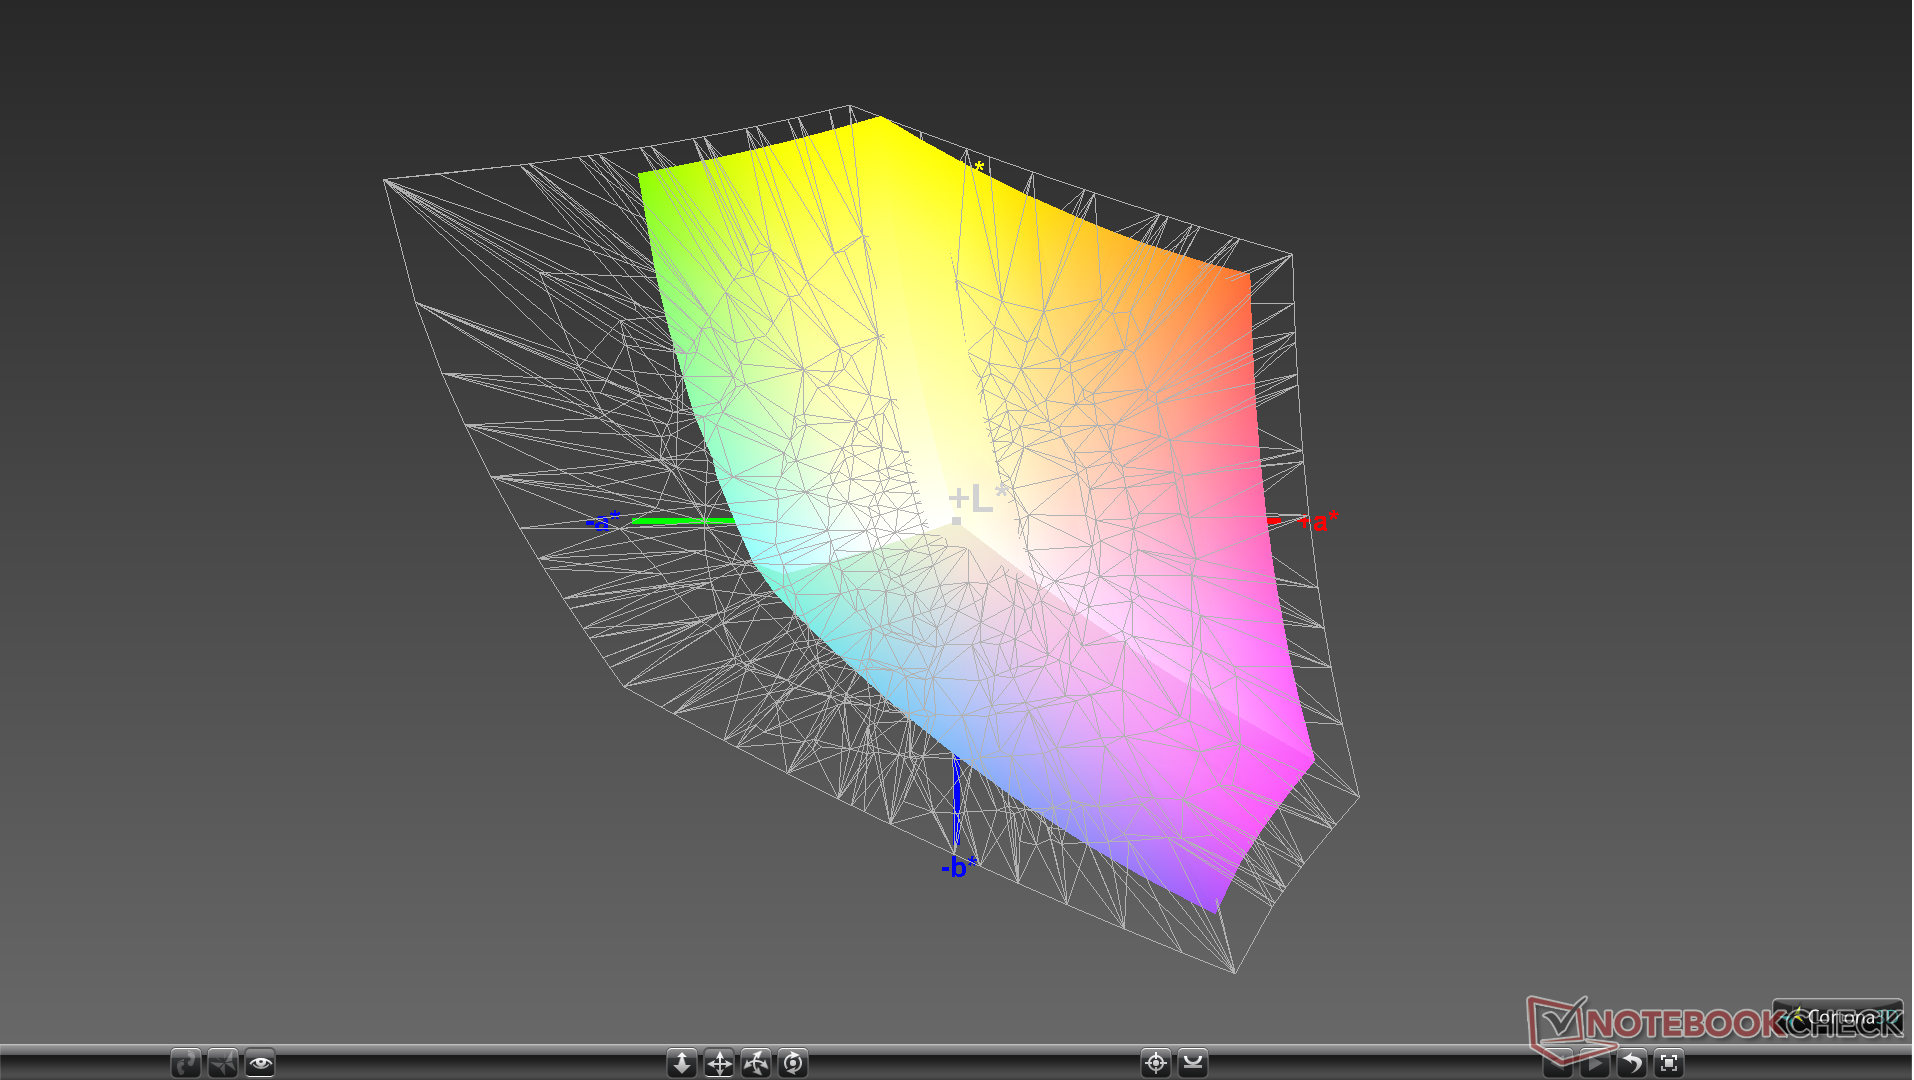
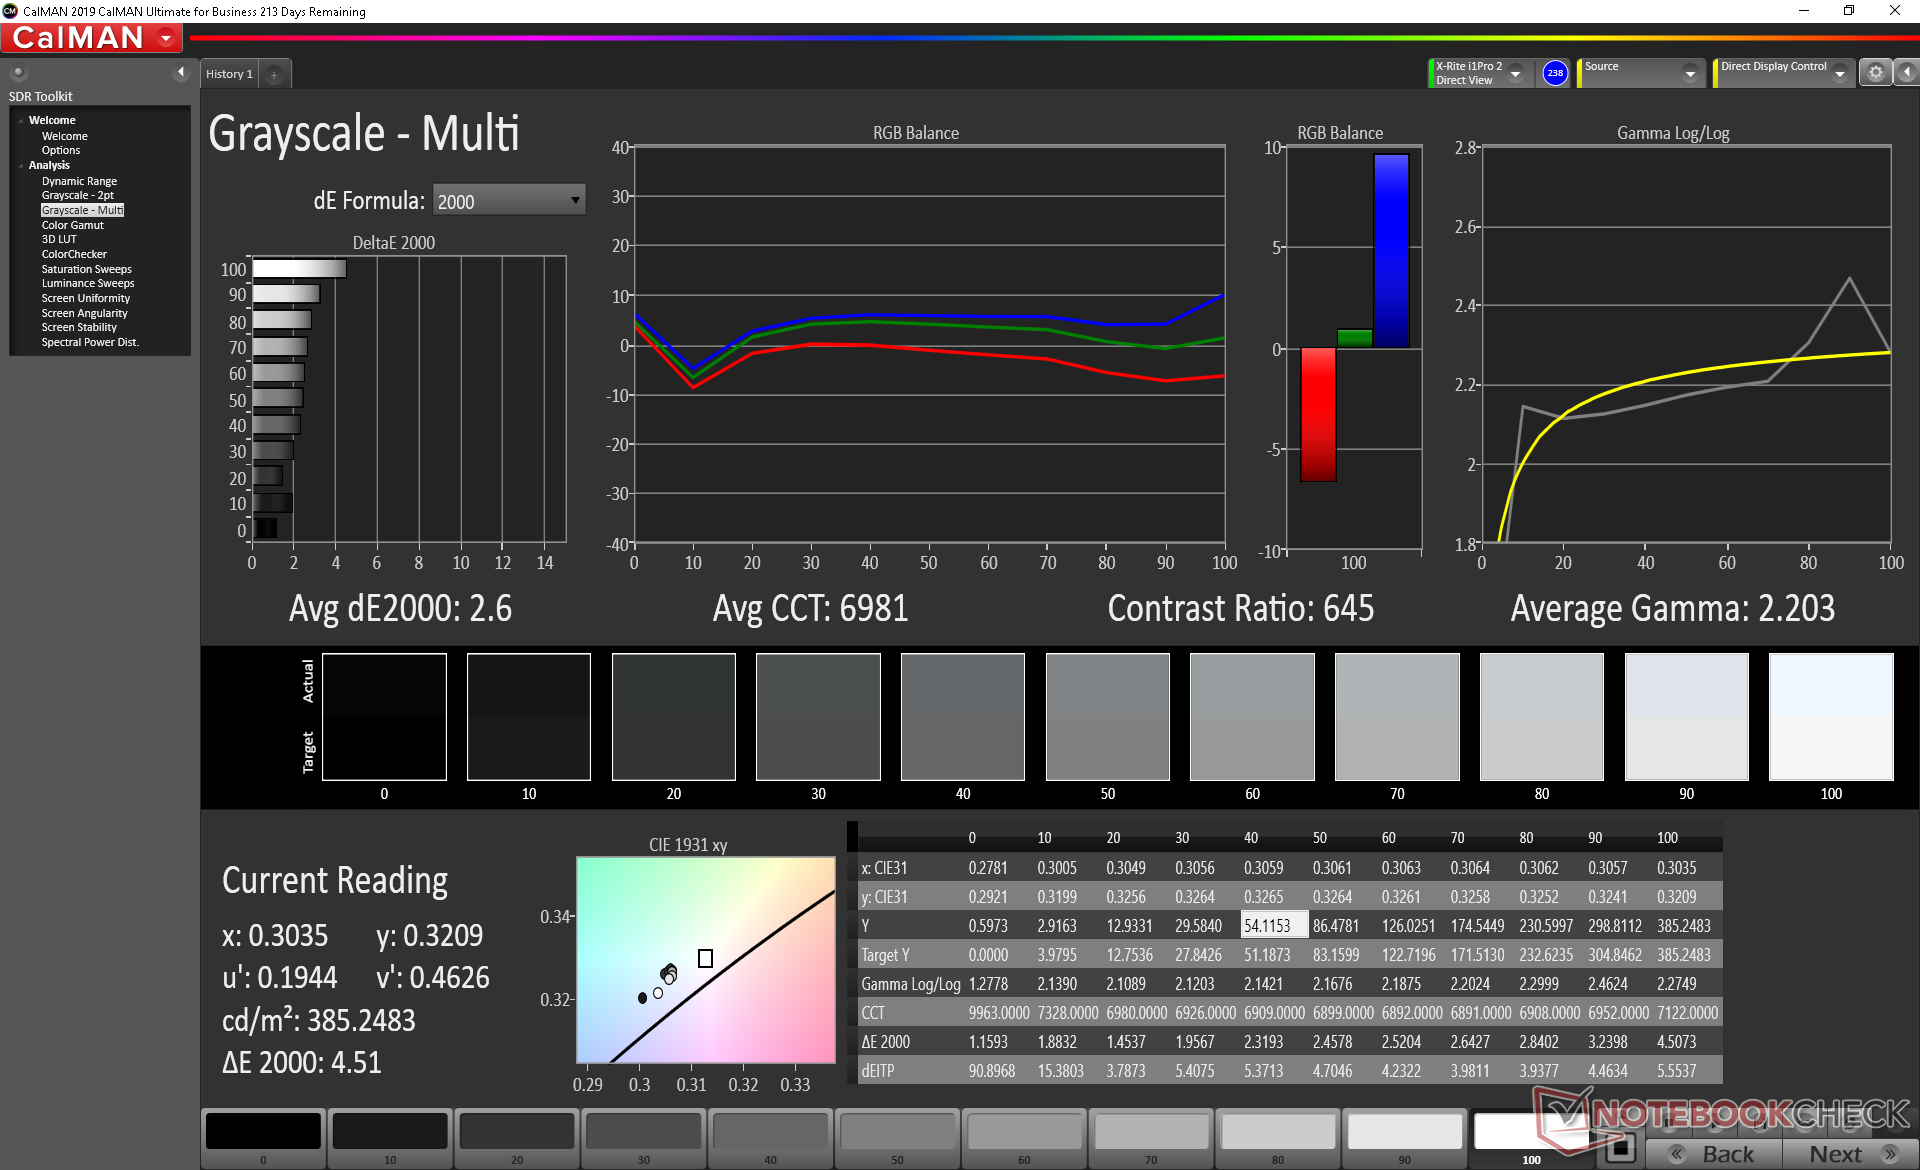
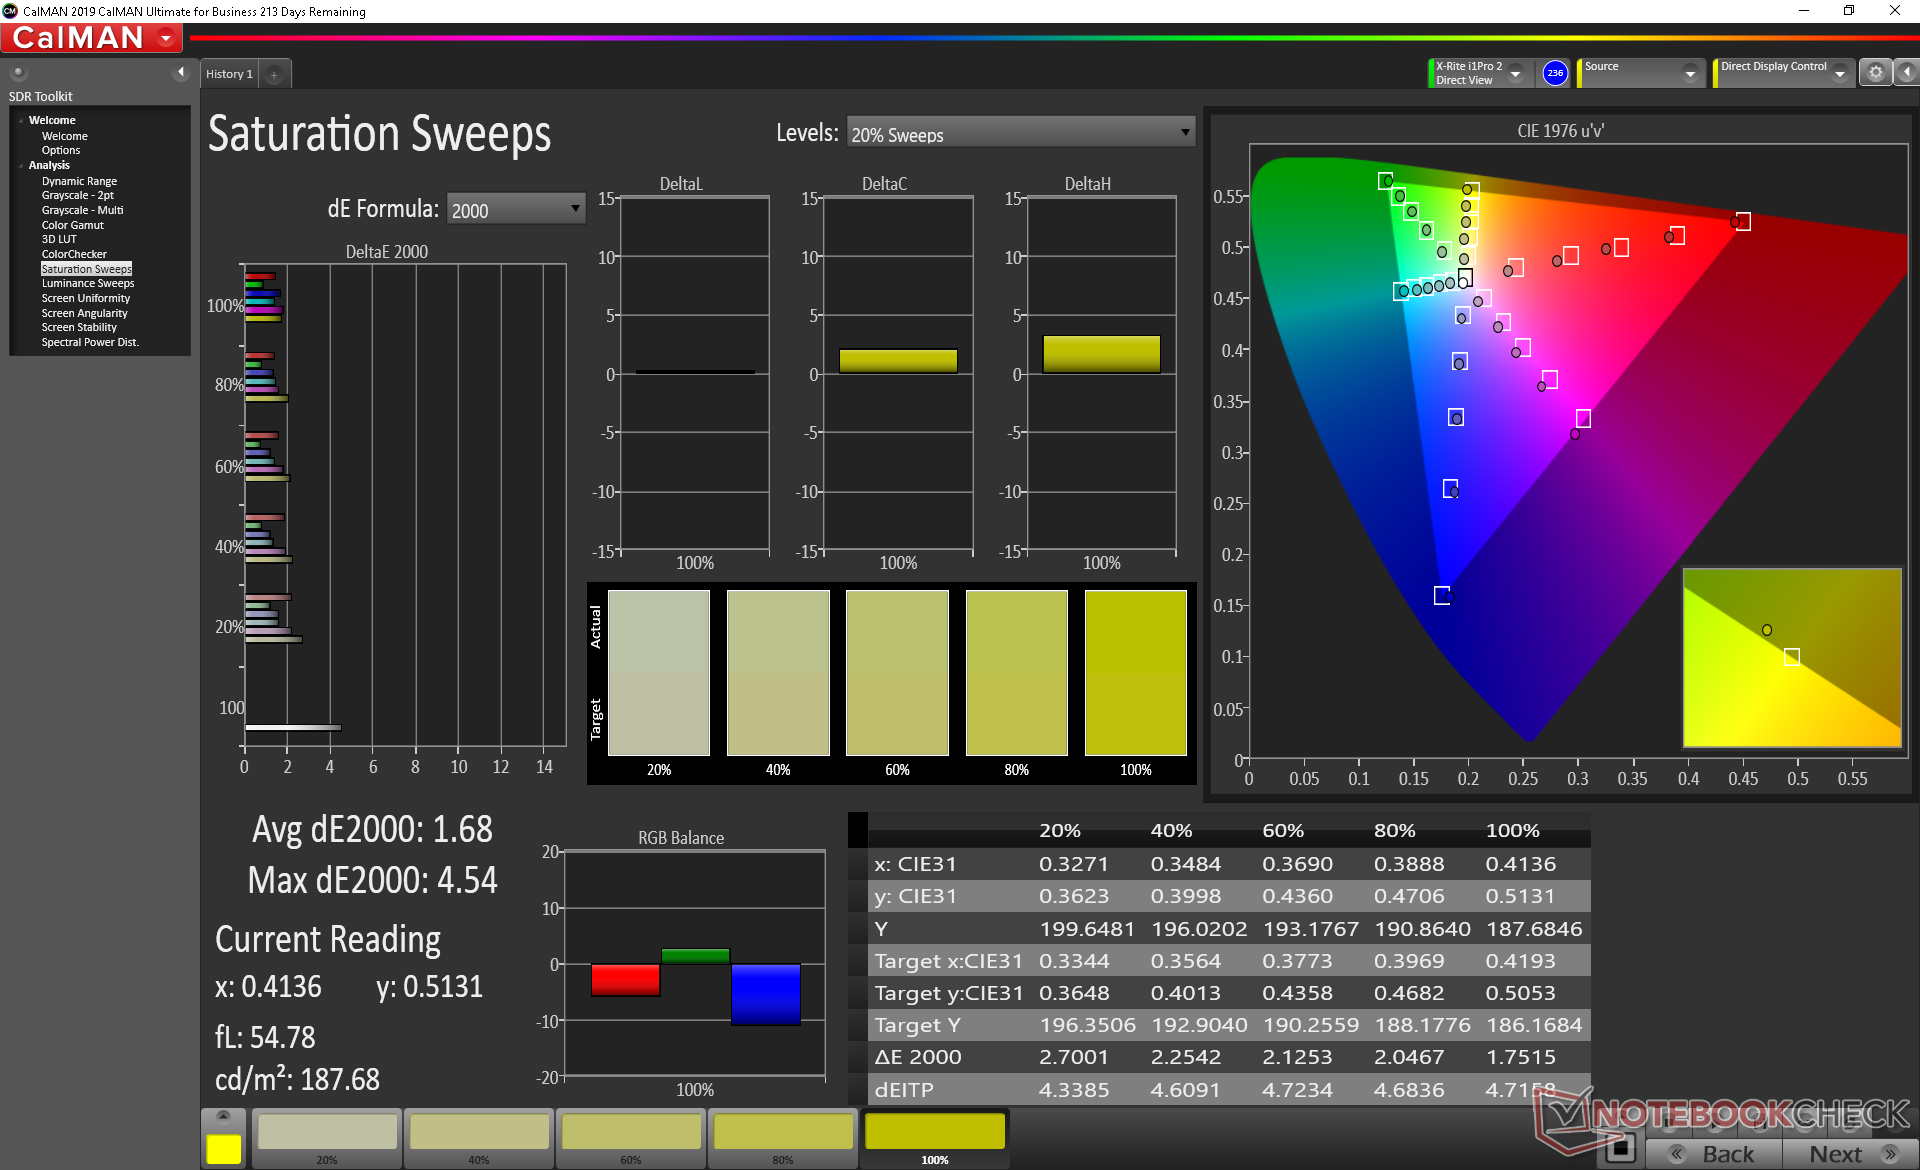
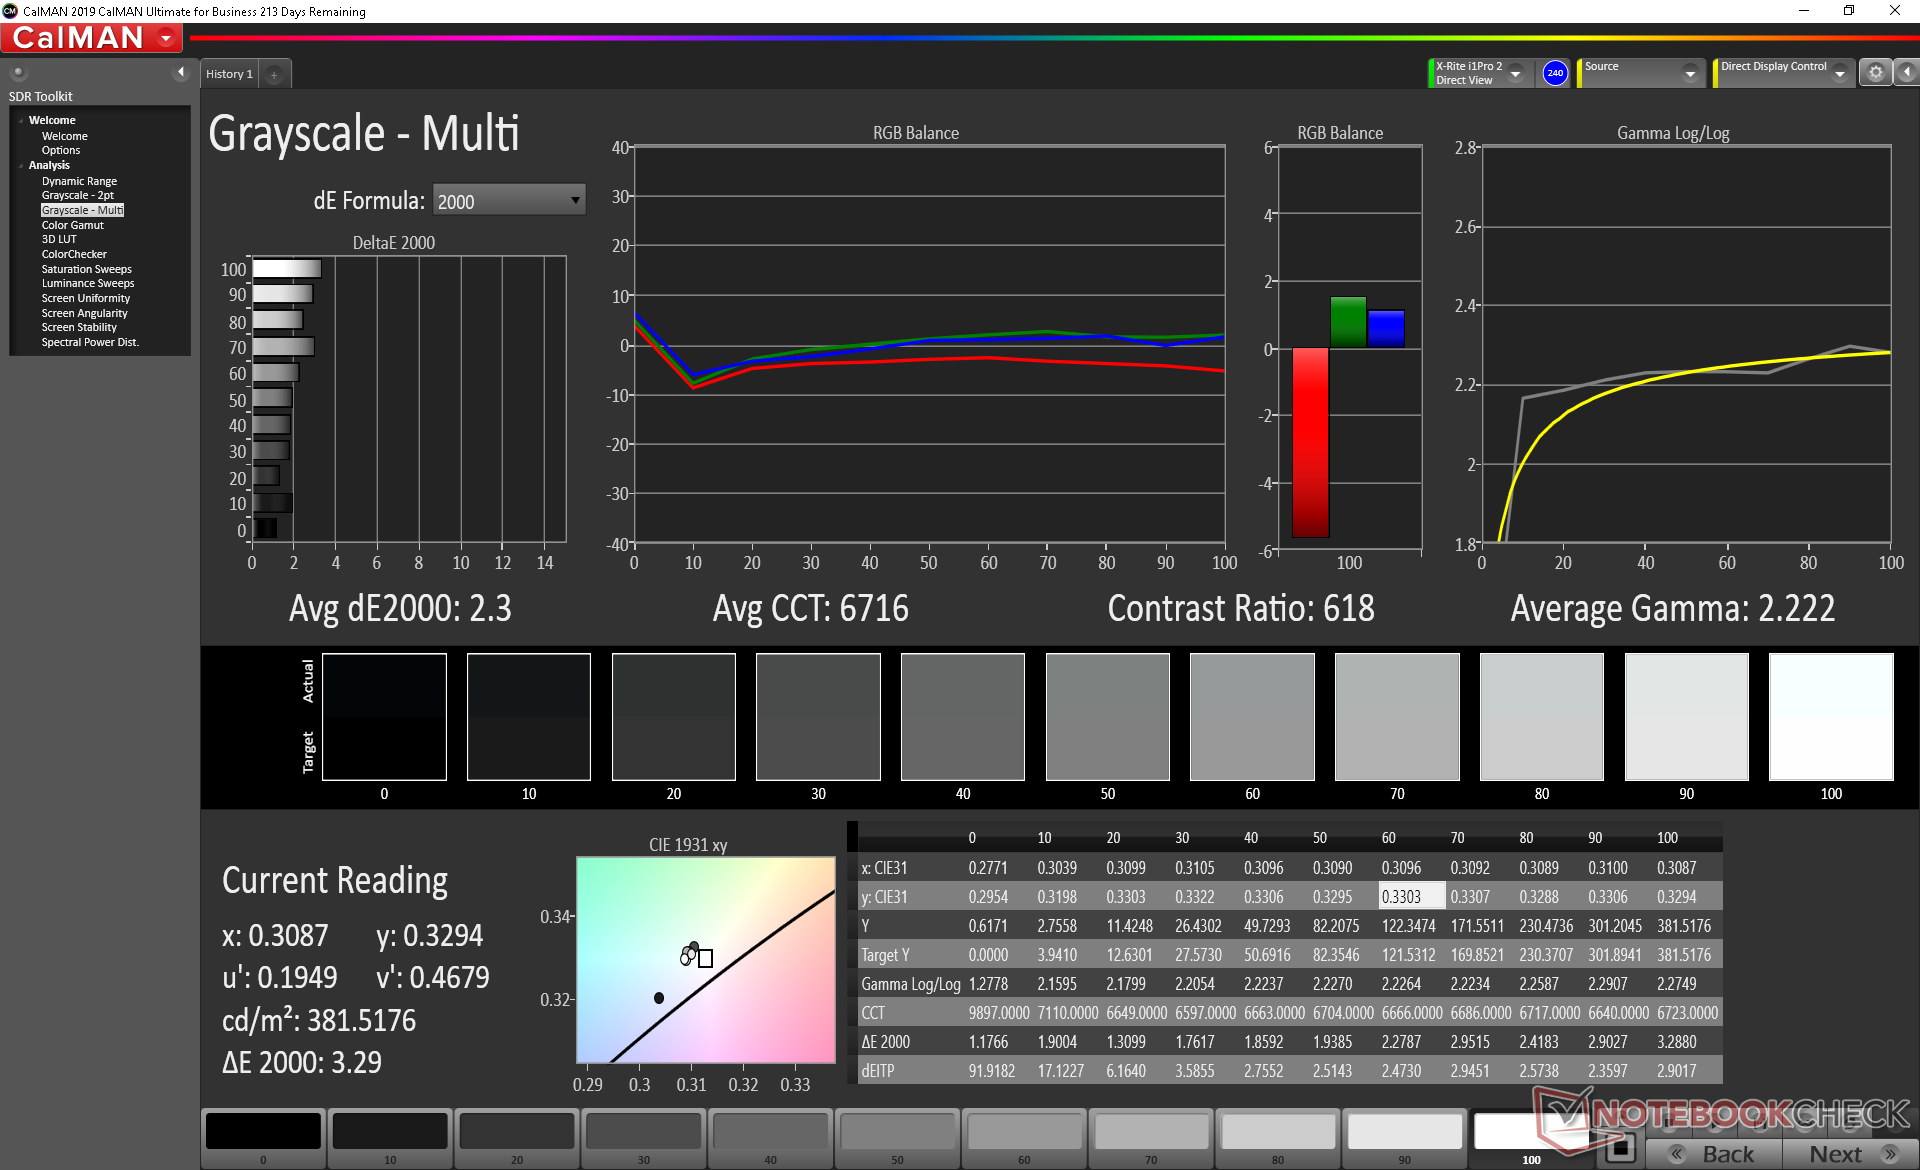
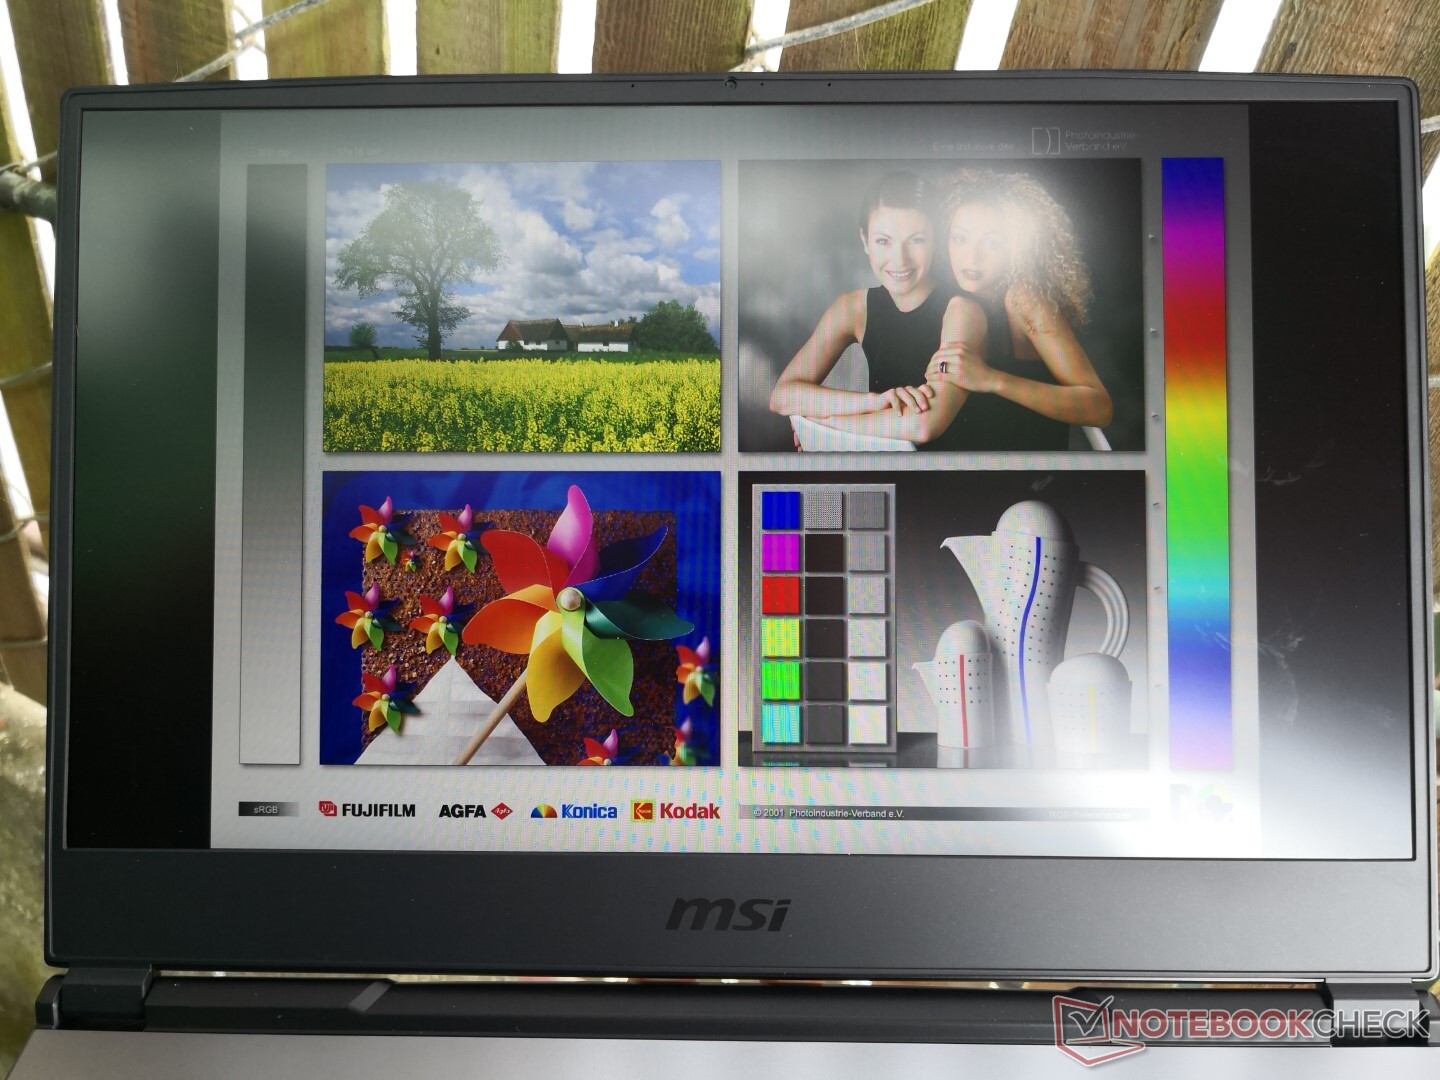
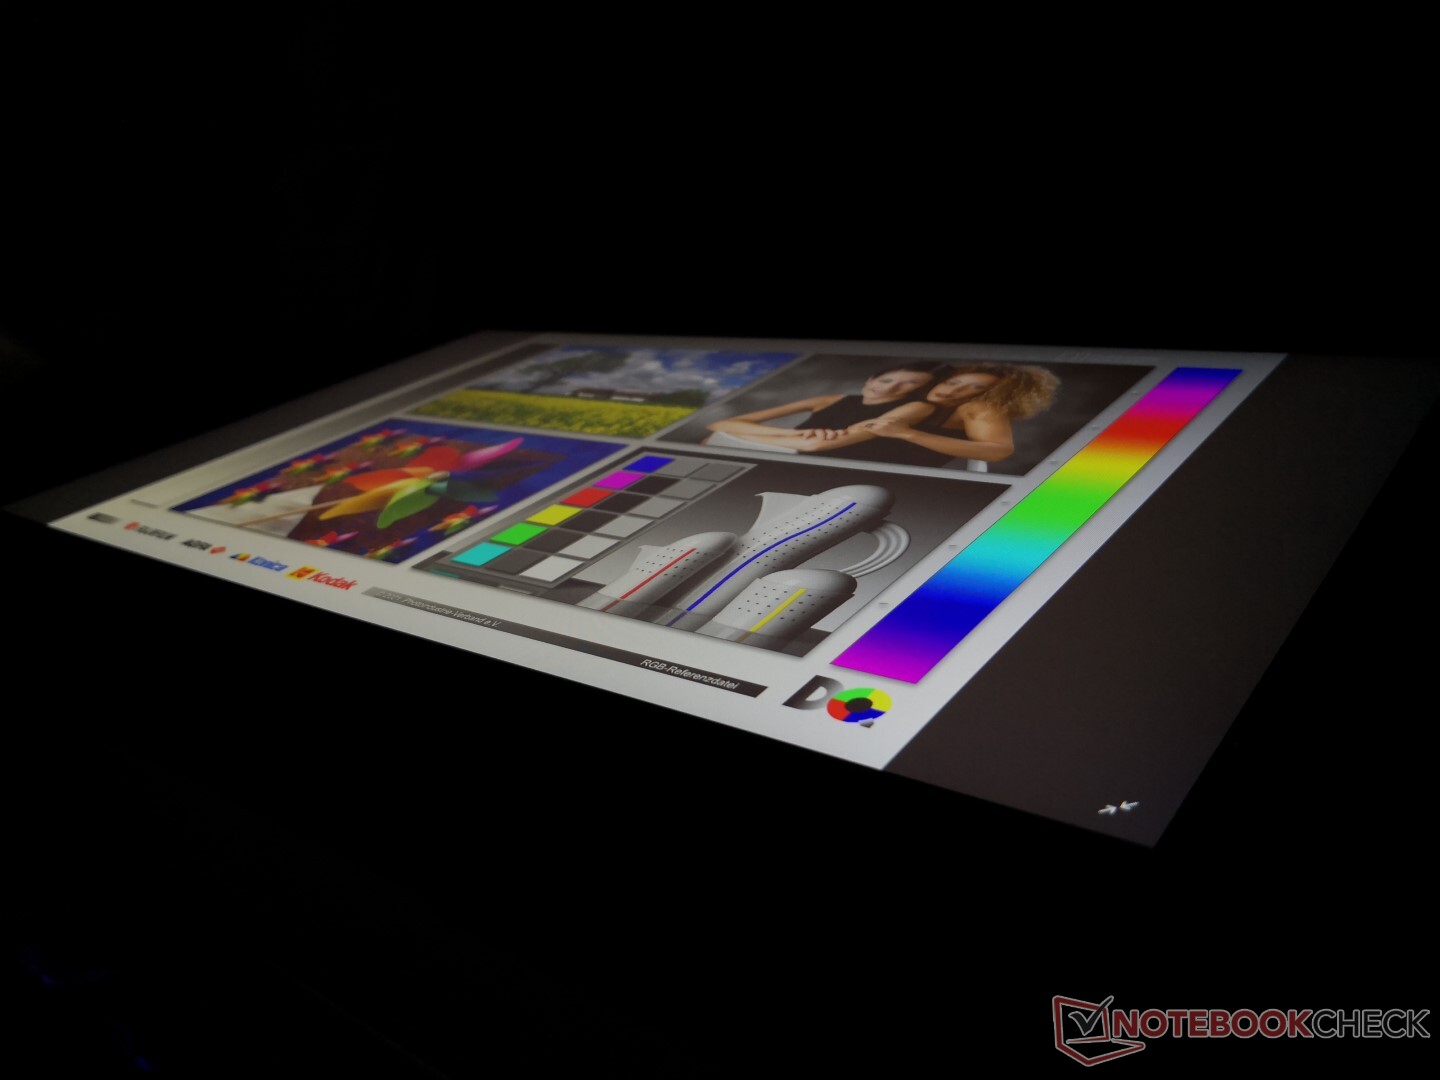
MSI'mızdaki LG Philips LP156WFG-SPB3 IPS paneli, veritabanımızda ilk kez yer alıyor. Benzer bir LP156WFG-SPB2 paneli, Aorus 15'te doğal 144 Hz yenileme hızı, hızlı siyah-beyaz ve gri-gri tepki süreleri ve nispeten geniş renk alanı dahil olmak üzere neredeyse aynı özelliklere sahip olabilir. MSI'mızdaki panel özellikle 390 nit kategorisinde ortalamasından daha parlak. Buna karşılık, Asus Strix Scar III veya Dell Alienware m15 gibi diğer oyun dizüstü bilgisayarları 300 nit'de zirveye ulaşma eğilimindedir. Panele olan ana dezavantaj ortalama kontrast oranı yaklaşık 600: 1 iken GS65'teki gibi daha pahalı oyun dizüstü bilgisayarlarındaki paneller 1000: 1'e daha yakındır.
| |||||||||||||||||||||||||
Aydınlatma: 87 %
Batarya modunda parlaklık: 384.9 cd/m²
Kontrast: 574:1 (Siyah: 0.67 cd/m²)
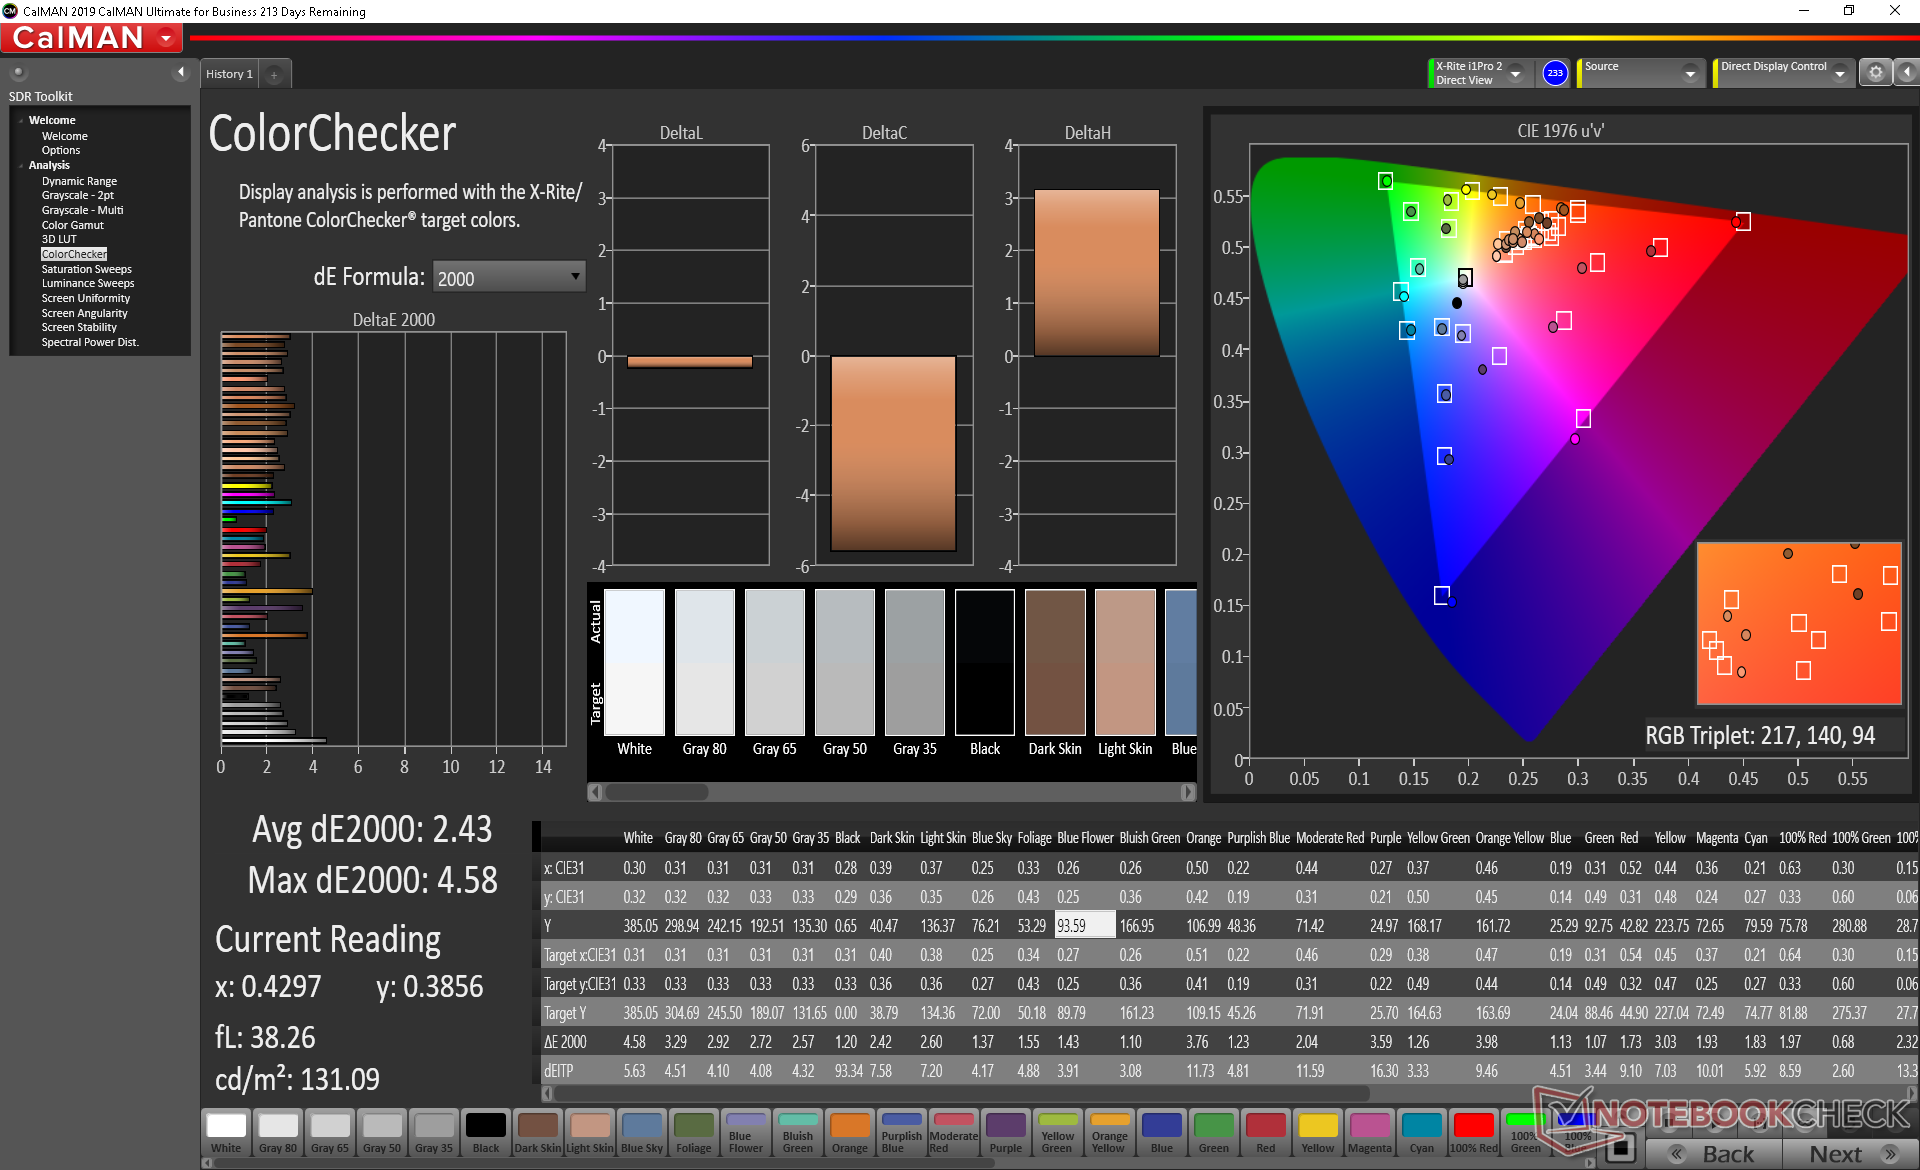
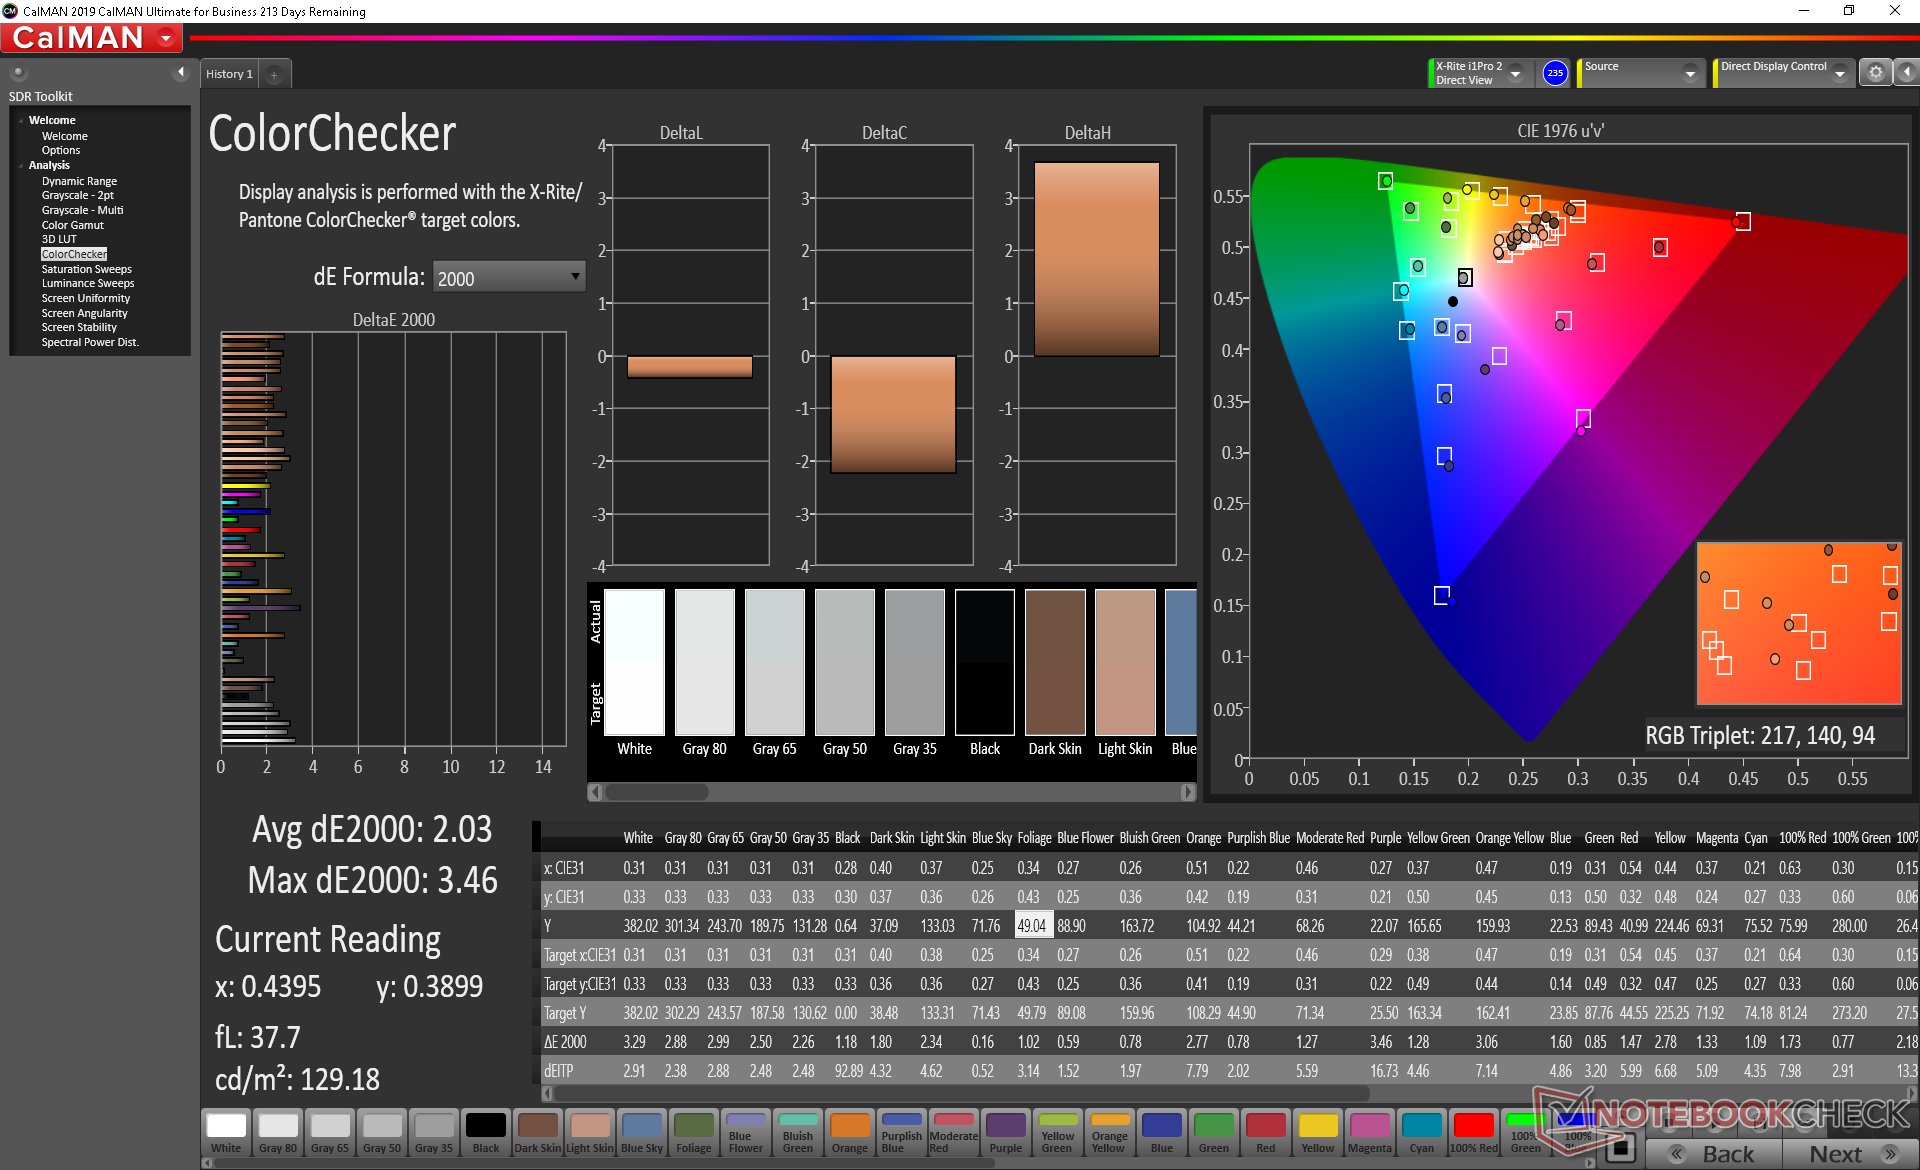
ΔE ColorChecker Calman: 2.43 | ∀{0.5-29.43 Ø4.72}
calibrated: 2.03
ΔE Greyscale Calman: 2.6 | ∀{0.09-98 Ø4.97}
93.9% sRGB (Argyll 1.6.3 3D)
59.7% AdobeRGB 1998 (Argyll 1.6.3 3D)
65.1% AdobeRGB 1998 (Argyll 3D)
94.4% sRGB (Argyll 3D)
63.5% Display P3 (Argyll 3D)
Gamma: 2.2
CCT: 6981 K
| MSI GP65 10SFK-047US LG Philips LP156WFG-SPB3, IPS, 15.6", 1920x1080 | MSI GP65 Leopard 9SE-225US LG Philips LGD0625, IPS, 15.6", 1920x1080 | Asus Strix Scar III G531GW-AZ062T Sharp LQ156M1JW09 (SHP14D3), IPS, 15.6", 1920x1080 | Asus TUF FX505DT-EB73 Panda LM156LF-GL, IPS, 15.6", 1920x1080 | HP Omen 15-dc1303ng LG Philips LGD05C0, IPS, 15.6", 1920x1080 | MSI GP62 7REX-1045US CMN N156HGE-EAL, TN LED, 15.6", 1920x1080 | |
|---|---|---|---|---|---|---|
| Display | 2% | 4% | -37% | -0% | 23% | |
| Display P3 Coverage (%) | 63.5 | 64.8 2% | 66.2 4% | 39.56 -38% | 63.8 0% | 85.8 35% |
| sRGB Coverage (%) | 94.4 | 96.2 2% | 97.1 3% | 59.5 -37% | 93.4 -1% | 100 6% |
| AdobeRGB 1998 Coverage (%) | 65.1 | 66.3 2% | 67.6 4% | 40.91 -37% | 65 0% | 84.2 29% |
| Response Times | 11% | -10% | -161% | -14% | -174% | |
| Response Time Grey 50% / Grey 80% * (ms) | 10.4 ? | 9.6 ? 8% | 15 ? -44% | 30.4 ? -192% | 14 ? -35% | 34.4 ? -231% |
| Response Time Black / White * (ms) | 12 ? | 10.4 ? 13% | 9 ? 25% | 27.6 ? -130% | 11 ? 8% | 26 ? -117% |
| PWM Frequency (Hz) | 250 ? | 200 ? | ||||
| Screen | 15% | -16% | -61% | 2% | -104% | |
| Brightness middle (cd/m²) | 384.9 | 348.3 -10% | 309 -20% | 286.2 -26% | 316 -18% | 265.7 -31% |
| Brightness (cd/m²) | 358 | 327 -9% | 284 -21% | 267 -25% | 295 -18% | 243 -32% |
| Brightness Distribution (%) | 87 | 85 -2% | 88 1% | 84 -3% | 84 -3% | 87 0% |
| Black Level * (cd/m²) | 0.67 | 0.4 40% | 0.42 37% | 0.33 51% | 0.42 37% | 0.63 6% |
| Contrast (:1) | 574 | 871 52% | 736 28% | 867 51% | 752 31% | 422 -26% |
| Colorchecker dE 2000 * | 2.43 | 1.6 34% | 3.99 -64% | 5.45 -124% | 2.7 -11% | 9.6 -295% |
| Colorchecker dE 2000 max. * | 4.58 | 5.07 -11% | 8.3 -81% | 18.08 -295% | 5.65 -23% | 18.5 -304% |
| Colorchecker dE 2000 calibrated * | 2.03 | 1 51% | 1.12 45% | 4.47 -120% | 1.58 22% | |
| Greyscale dE 2000 * | 2.6 | 2.3 12% | 5.43 -109% | 5.3 -104% | 2.35 10% | 12.7 -388% |
| Gamma | 2.2 100% | 2.203 100% | 2.57 86% | 2.1 105% | 2.41 91% | 2.01 109% |
| CCT | 6981 93% | 6707 97% | 7767 84% | 7679 85% | 6904 94% | 13654 48% |
| Color Space (Percent of AdobeRGB 1998) (%) | 59.7 | 61 2% | 63 6% | 37.6 -37% | 60 1% | 76 27% |
| Color Space (Percent of sRGB) (%) | 93.9 | 96 2% | 97 3% | 59.1 -37% | 93 -1% | 100 6% |
| Toplam Ortalama (Program / Ayarlar) | 9% /
12% | -7% /
-11% | -86% /
-69% | -4% /
-0% | -85% /
-88% |
* ... daha küçük daha iyidir
Renk alanı, eski GP62 TN panelinde bulunan renk alanından daha küçük olmak üzere, sRGB'nin yaklaşık yüzde 94'ünü ve AdobeRGB'nin yüzde 60'ını kaplar. Bununla birlikte, yeni panelin üstün tepki süreleri, yenileme hızı, görüş açıları ve genel kalitesi, renk açığını telafi etmekten çok daha fazlasıdır.
X-Rite kolorimetresi ile yapılan ölçümler kutudan iyi kalibre edilmiş bir ekranı ortaya çıkarır. Ekranı kendimiz daha da kalibre etmek, son kullanıcıların ekrandan en iyi şekilde yararlanmak için başka bir şey yapmaları gerekmediği anlamına gelir.

Yanıt Sürelerini Görüntüle
| ↔ Tepki Süresi Siyahtan Beyaza | ||
|---|---|---|
| 12 ms ... yükseliş ↗ ve sonbahar↘ birleşimi | ↗ 6.8 ms yükseliş | 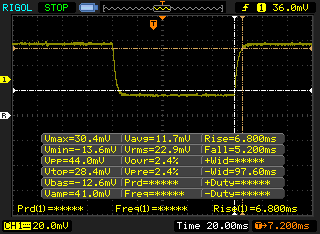 |
| ↘ 5.2 ms sonbahar | ||
| Ekran, testlerimizde iyi yanıt oranları gösteriyor ancak rekabetçi oyuncular için çok yavaş olabilir. Karşılaştırıldığında, test edilen tüm cihazlar 0.1 (minimum) ile 240 (maksimum) ms arasında değişir. » Tüm cihazların 32 %'si daha iyi. Bu, ölçülen yanıt süresinin test edilen tüm cihazların ortalamasından (19.8 ms) daha iyi olduğu anlamına gelir. | ||
| ↔ Tepki Süresi %50 Griden %80 Griye | ||
| 10.4 ms ... yükseliş ↗ ve sonbahar↘ birleşimi | ↗ 6.4 ms yükseliş | 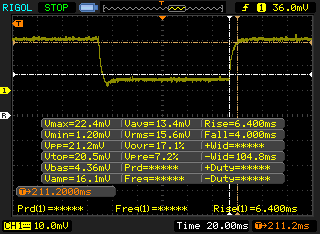 |
| ↘ 4 ms sonbahar | ||
| Ekran, testlerimizde iyi yanıt oranları gösteriyor ancak rekabetçi oyuncular için çok yavaş olabilir. Karşılaştırıldığında, test edilen tüm cihazlar 0.165 (minimum) ile 636 (maksimum) ms arasında değişir. » Tüm cihazların 24 %'si daha iyi. Bu, ölçülen yanıt süresinin test edilen tüm cihazların ortalamasından (31 ms) daha iyi olduğu anlamına gelir. | ||
Ekran Titremesi / PWM (Darbe Genişliği Modülasyonu)
| Ekran titriyor / PWM algılanmadı | 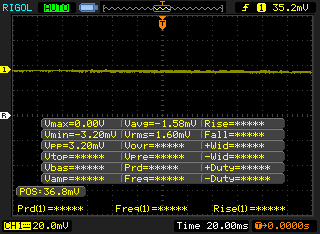 | ||
Karşılaştırıldığında: Test edilen tüm cihazların %52 %'si ekranı karartmak için PWM kullanmıyor. PWM tespit edilirse, ortalama 7750 (minimum: 5 - maksimum: 343500) Hz ölçüldü. | |||
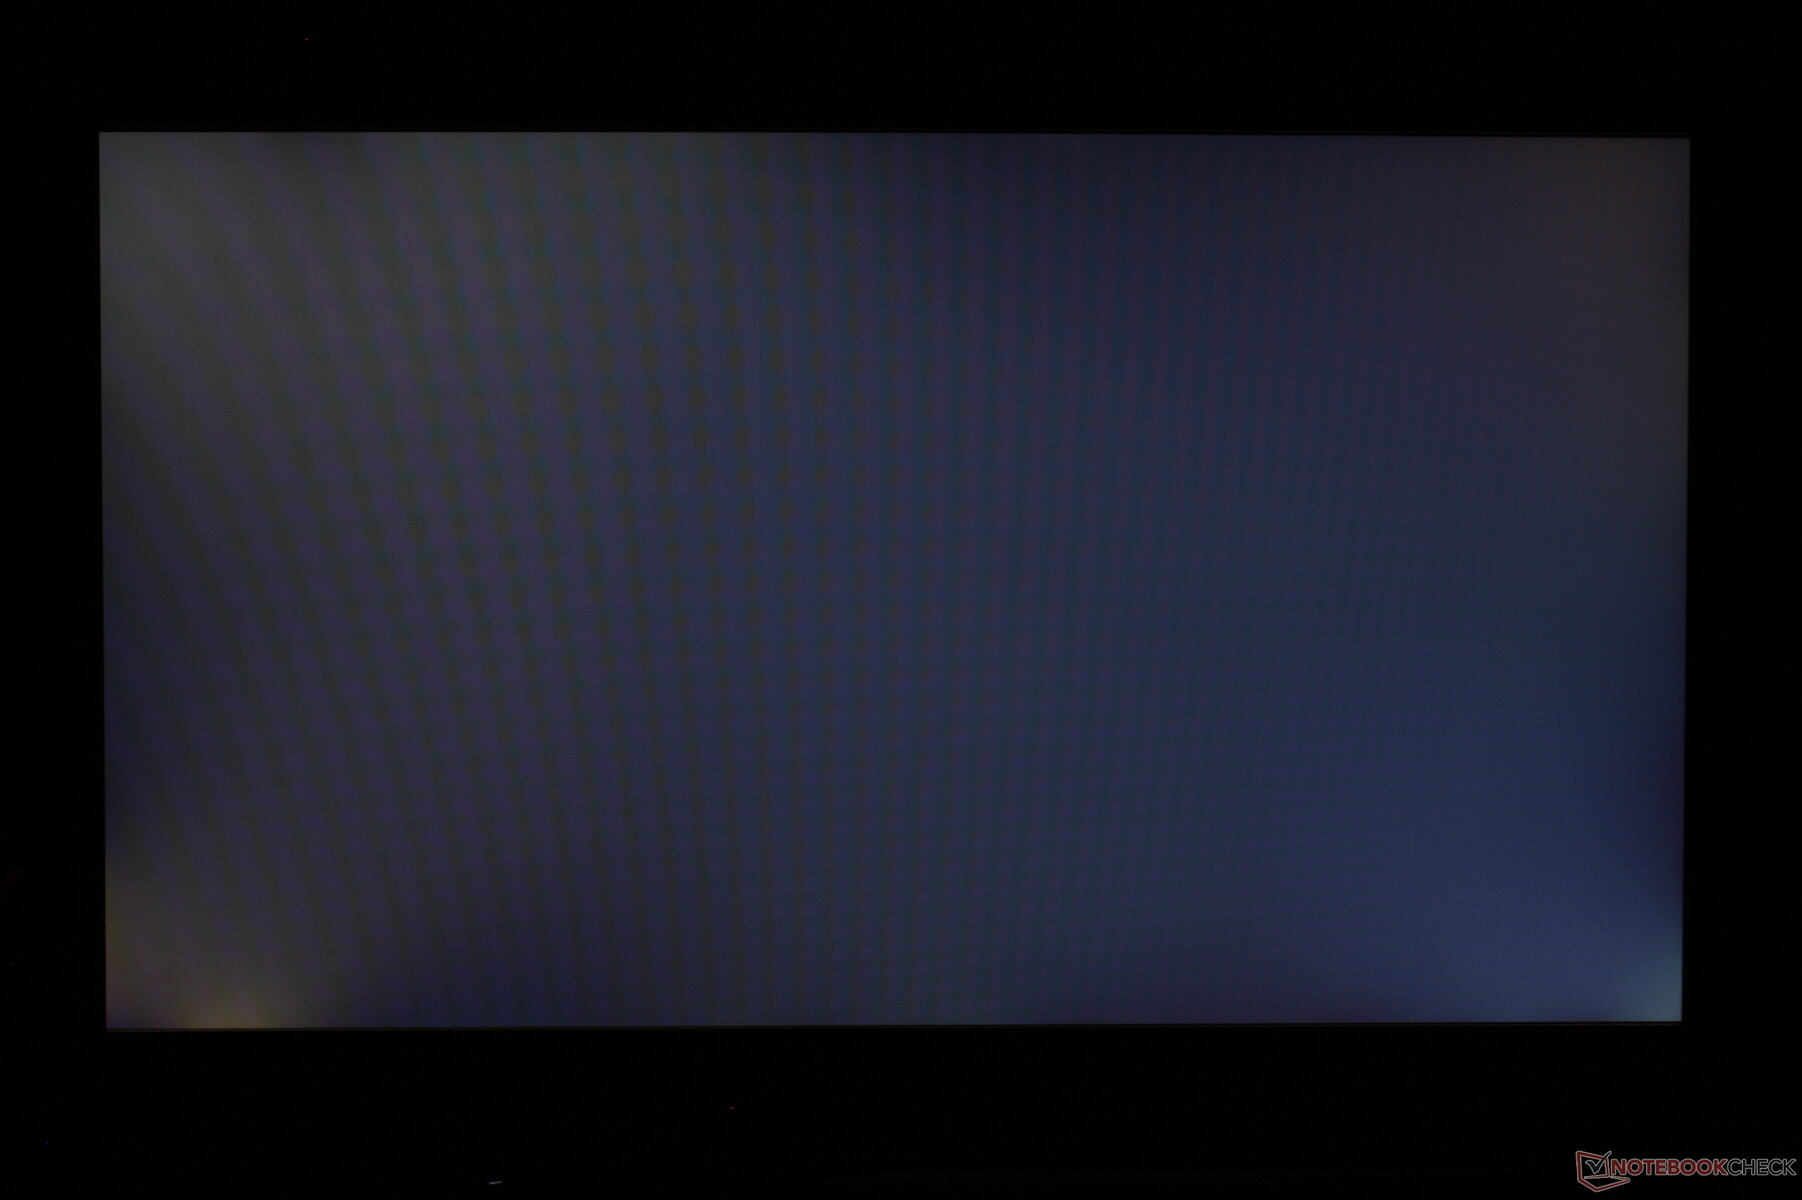
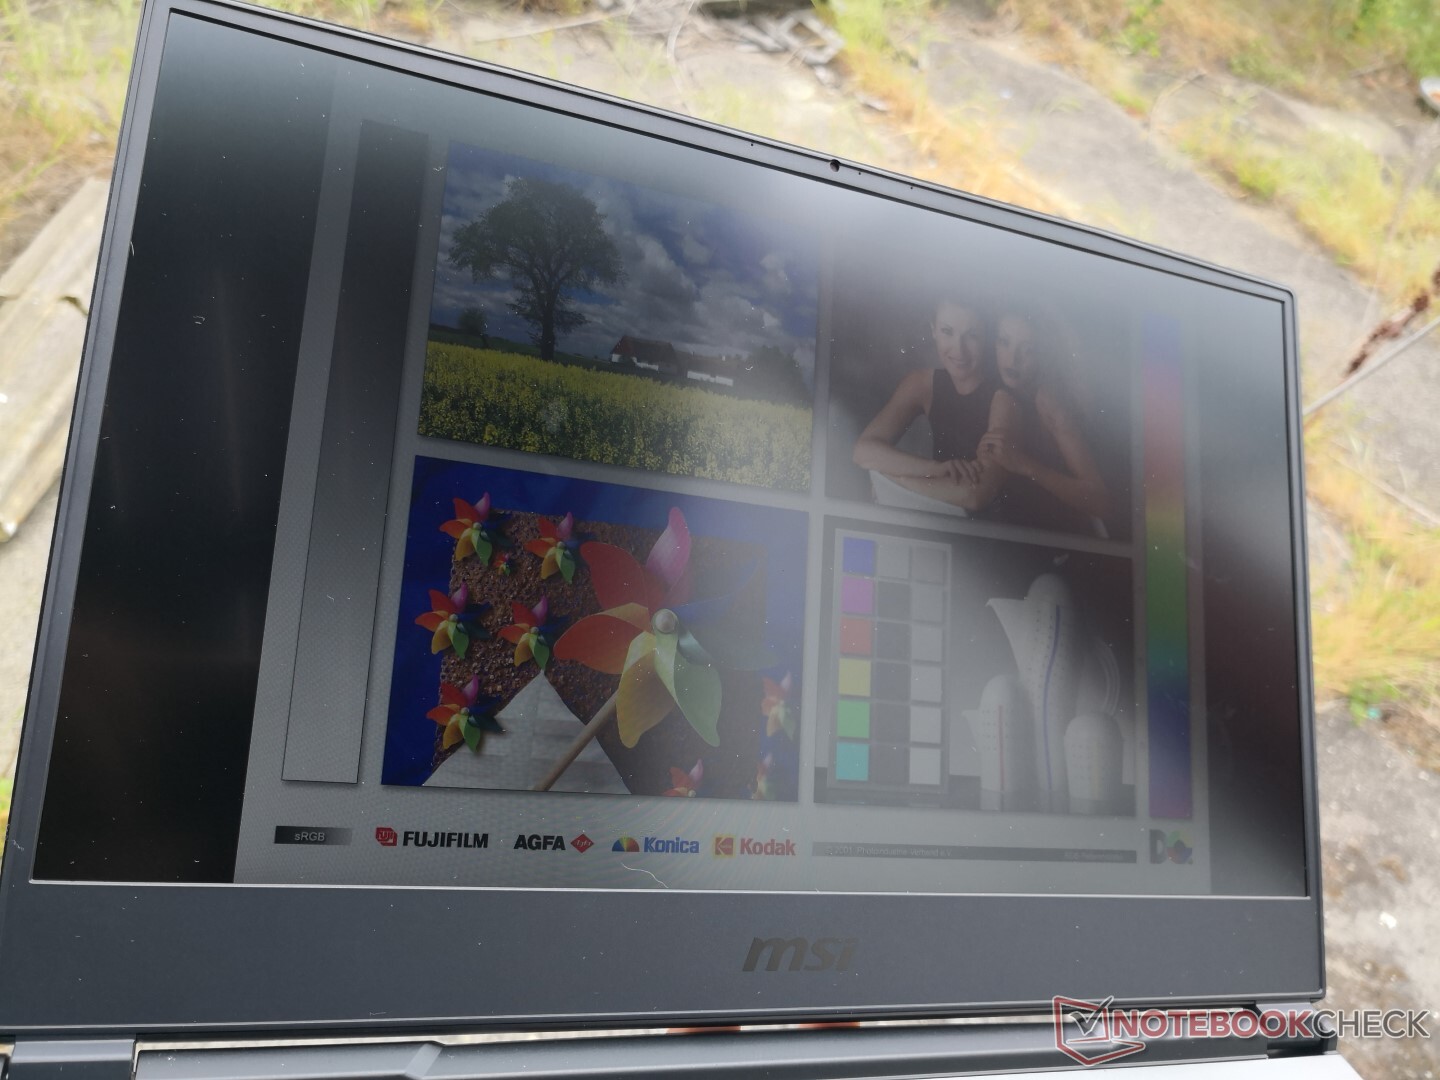
Oyun dizüstü bilgisayarları sık sık dışarıda kullanılmak üzere tasarlanmadığından, dış mekan görünürlüğü kategori için hala ortalamadır. Çoğu Ultrabook, parlamayı ve yıkanmış renkleri daha iyi hafifletmek için daha parlak ekranlara sahiptir.
Verim
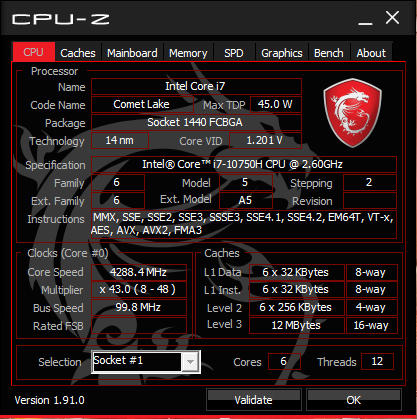
İşlemci
Ham CPU performansı ortalama Core i7-9750H dizüstü bilgisayardan yaklaşık yüzde 5 ila 15 daha hızlıdır. Eski bir Core i7-8750H dizüstü bilgisayardan yükseltme yapan kullanıcılar yaklaşık yüzde 11 ila 27 oranında daha önemli kazanımlar görecek. Nispeten küçük gen-gen kazançları beklenmedik değildir, çünkü Comet Lake-H, Coffee Lake-H ile aynı 14 nm silikonu paylaşmaktadır. CineBench R15 Multi-Thread'ı bir döngüde çalıştırmak, zaman içinde sadece yüzde 4'lük bir performans düşüşüyle sonuçlanır. Daha fazla teknik ayrıntı ve karşılaştırma karşılaştırması için Core i7-10750H'deki özel sayfamıza bakın. Hexa çekirdekli Core i7-10750H, Gigabyte Aero 15'te bulunan sekiz çekirdekli Core i7-10875H'ye sadece bir adım uzaklıktadır.
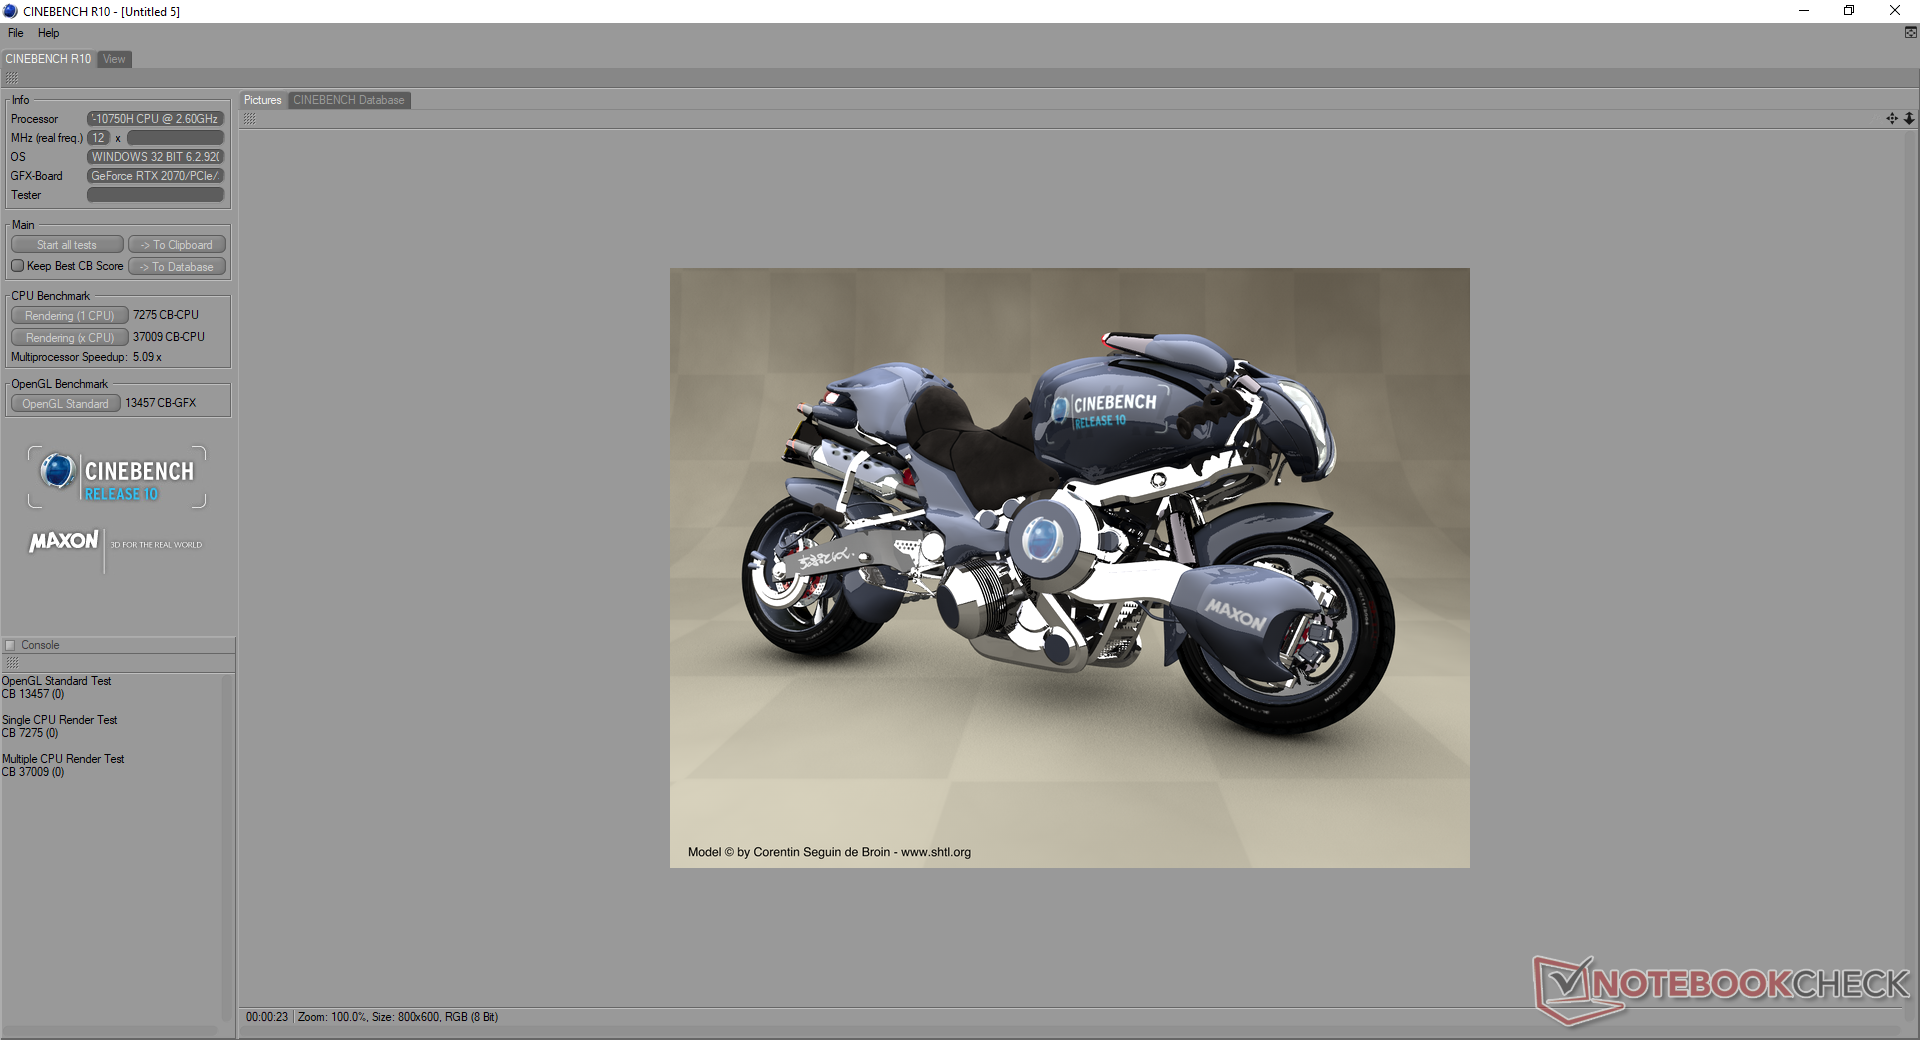
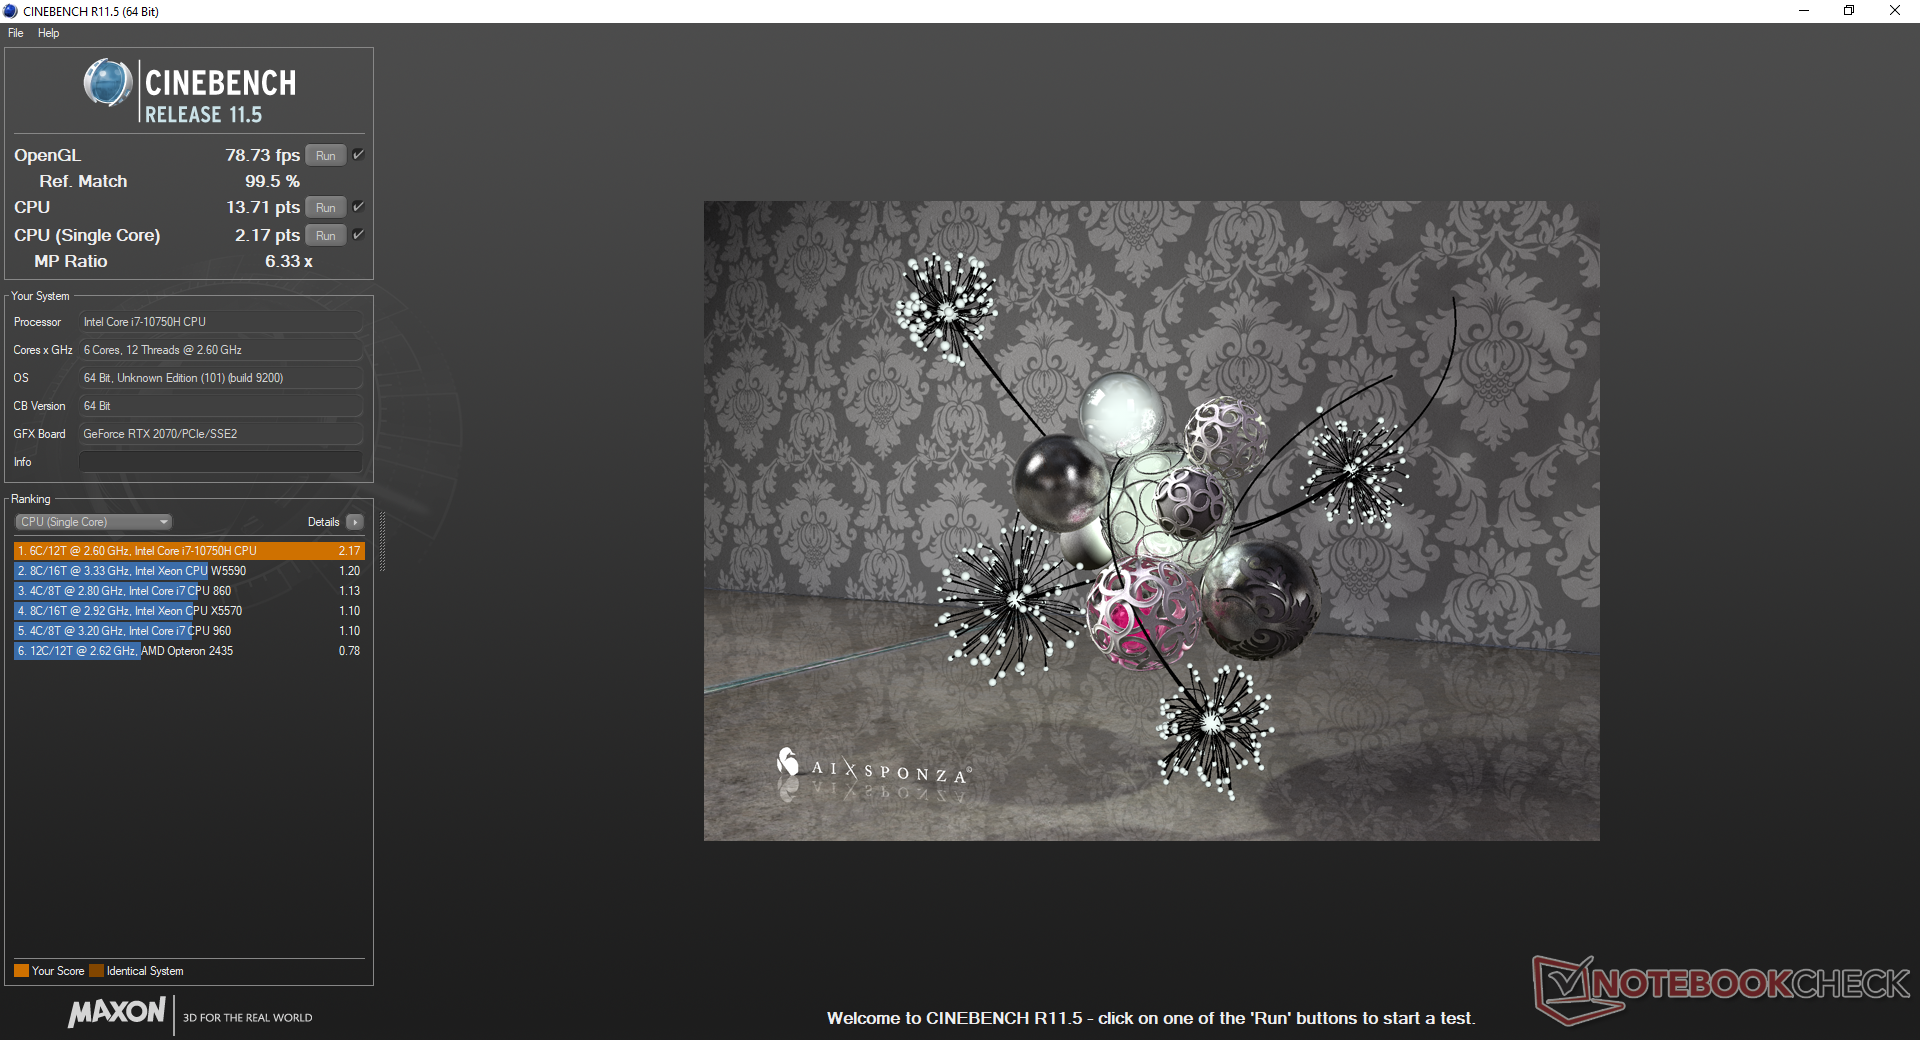
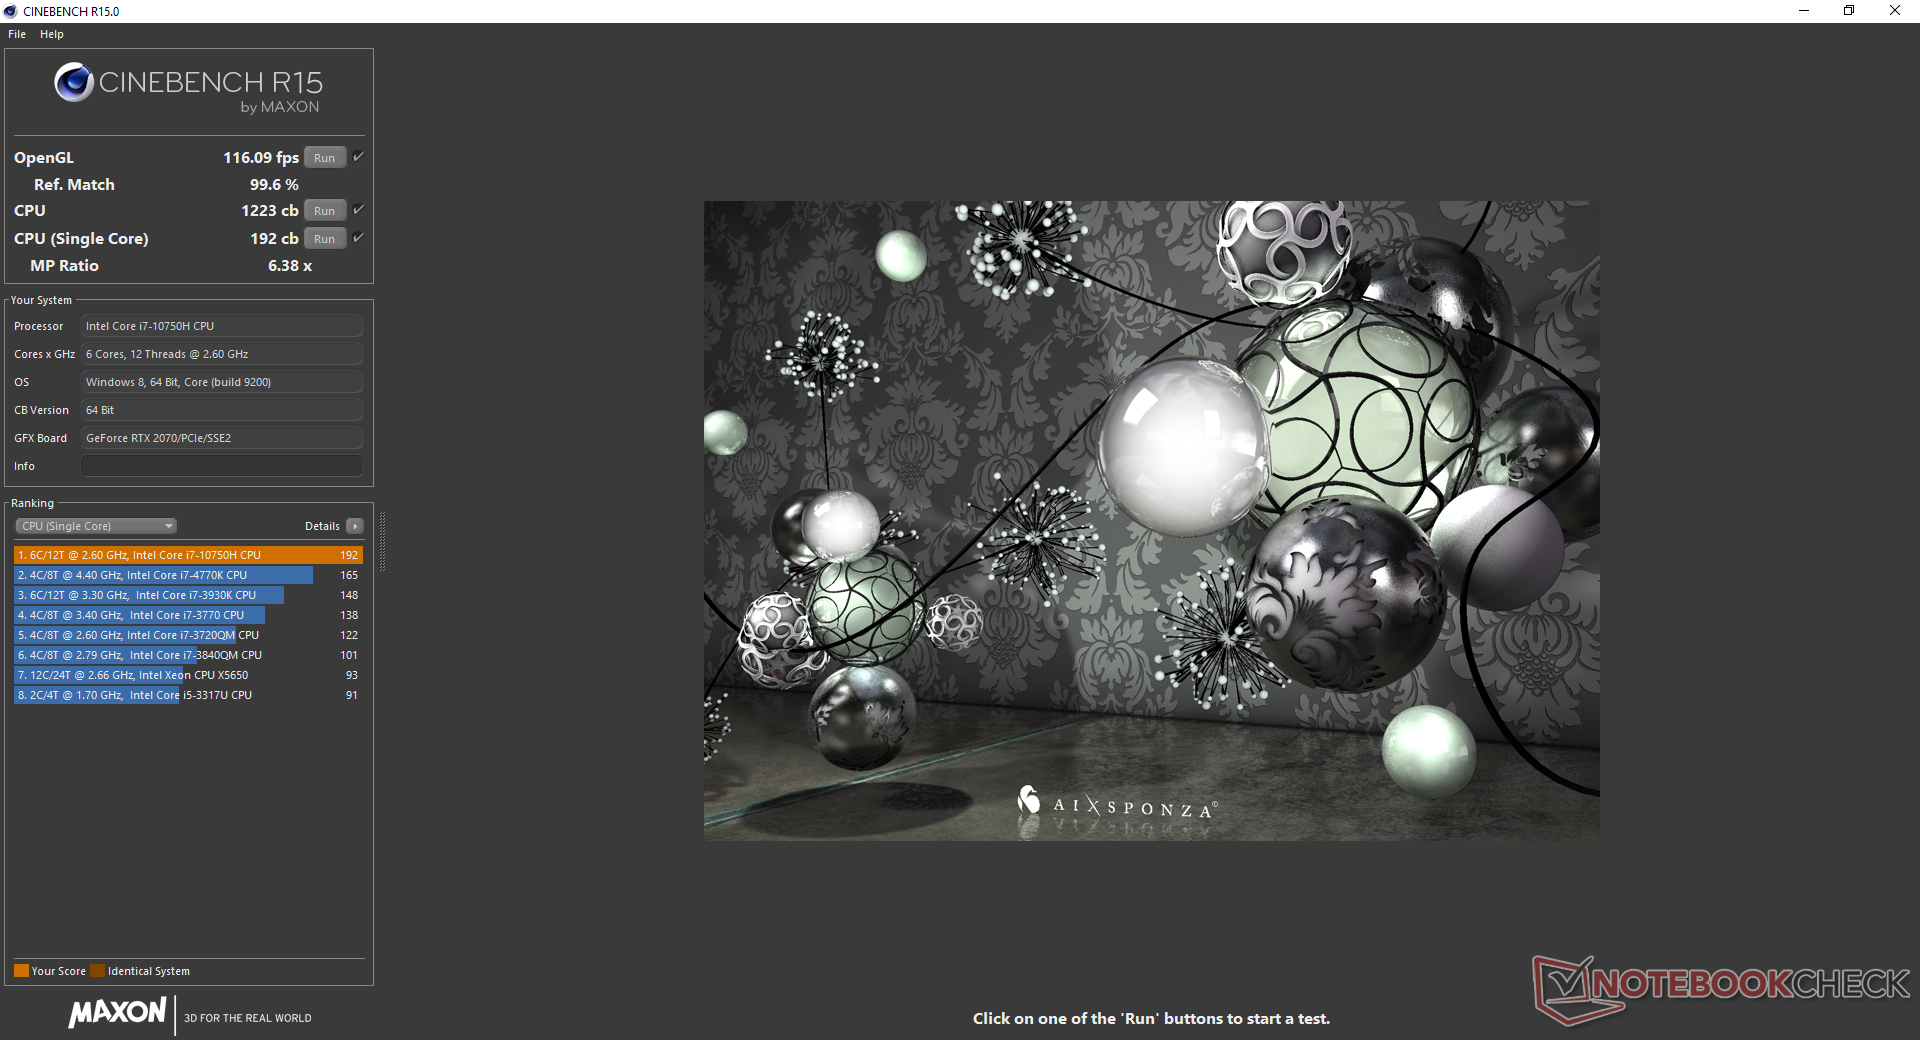
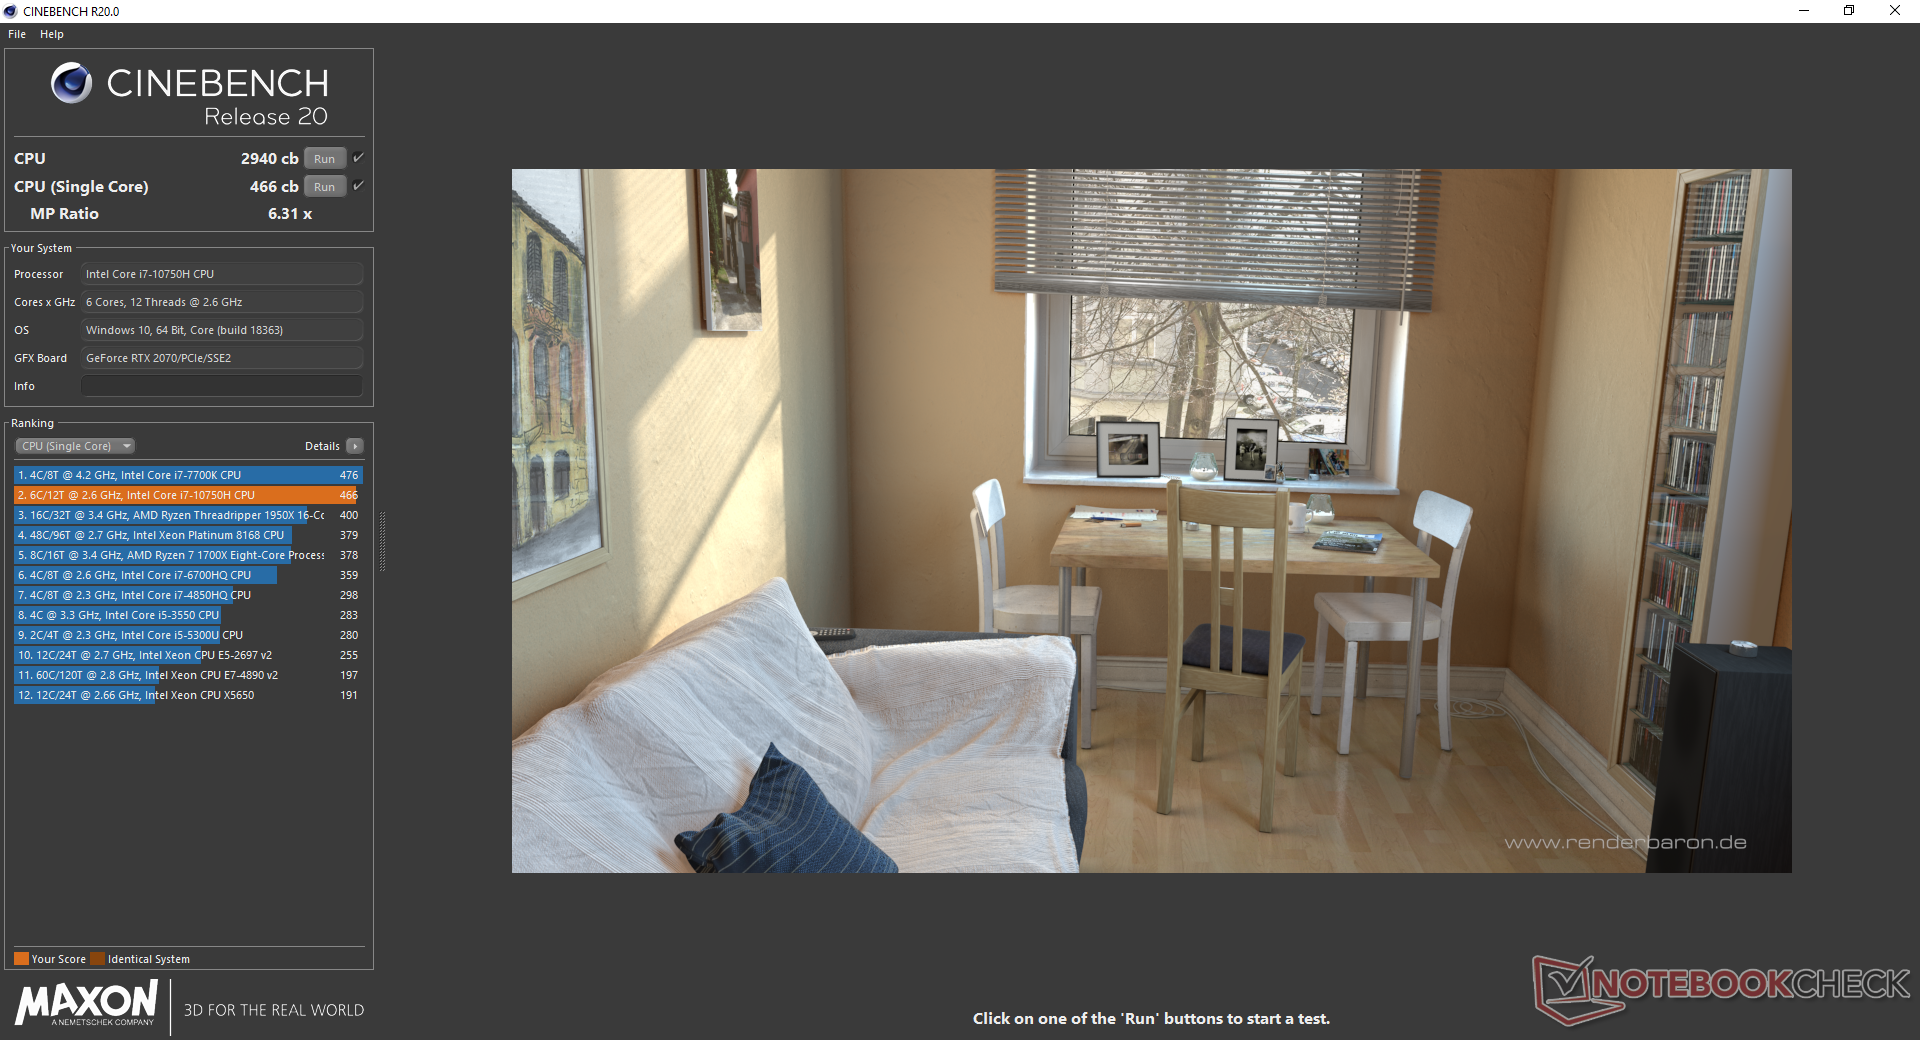
Cinebench R15: CPU Single 64Bit | CPU Multi 64Bit
Blender: v2.79 BMW27 CPU
7-Zip 18.03: 7z b 4 -mmt1 | 7z b 4
Geekbench 5.5: Single-Core | Multi-Core
HWBOT x265 Benchmark v2.2: 4k Preset
LibreOffice : 20 Documents To PDF
R Benchmark 2.5: Overall mean
| Cinebench R20 / CPU (Multi Core) | |
| Asus Zephyrus G14 GA401IV | |
| Eurocom Nightsky RX15 | |
| AMD Ryzen 1800X - Asus Crosshair VI Hero | |
| MSI GE65 Raider 9SF-049US | |
| Gigabyte Aero 17 HDR XB | |
| MSI GP65 10SFK-047US | |
| Ortalama Intel Core i7-9750H (2017 - 3133, n=55) | |
| Schenker Key 16 | |
| MSI GF75 Thin 10SCXR | |
| MSI GF63 Thin 9SC | |
| MSI Alpha 15 A3DDK-034 | |
| Cinebench R20 / CPU (Single Core) | |
| Gigabyte Aero 17 HDR XB | |
| Asus Zephyrus G14 GA401IV | |
| Eurocom Nightsky RX15 | |
| MSI GE65 Raider 9SF-049US | |
| MSI GP65 10SFK-047US | |
| Ortalama Intel Core i7-9750H (416 - 486, n=55) | |
| MSI GF75 Thin 10SCXR | |
| MSI GF63 Thin 9SC | |
| Schenker Key 16 | |
| AMD Ryzen 1800X - Asus Crosshair VI Hero | |
| MSI Alpha 15 A3DDK-034 | |
| Cinebench R15 / CPU Single 64Bit | |
| Gigabyte Aero 17 HDR XB | |
| Eurocom Nightsky RX15 | |
| MSI GE65 Raider 9SF-049US | |
| MSI GP65 Leopard 9SE-225US | |
| Asus Zephyrus G14 GA401IV | |
| MSI GP65 10SFK-047US | |
| Ortalama Intel Core i7-9750H (170 - 194, n=82) | |
| MSI GF75 Thin 10SCXR | |
| MSI GF63 Thin 9SC | |
| Schenker Key 16 | |
| AMD Ryzen 1800X - Asus Crosshair VI Hero | |
| MSI Alpha 15 A3DDK-034 | |
| Cinebench R15 / CPU Multi 64Bit | |
| Asus Zephyrus G14 GA401IV | |
| Eurocom Nightsky RX15 | |
| Gigabyte Aero 17 HDR XB | |
| MSI GE65 Raider 9SF-049US | |
| AMD Ryzen 1800X - Asus Crosshair VI Hero | |
| MSI GP65 10SFK-047US | |
| MSI GP65 Leopard 9SE-225US | |
| Ortalama Intel Core i7-9750H (952 - 1306, n=85) | |
| Schenker Key 16 | |
| MSI GF75 Thin 10SCXR | |
| MSI GF63 Thin 9SC | |
| MSI Alpha 15 A3DDK-034 | |
| Blender / v2.79 BMW27 CPU | |
| MSI GF75 Thin 10SCXR | |
| Eurocom Nightsky RX15 | |
| Ortalama Intel Core i7-9750H (342 - 495, n=21) | |
| MSI GP65 10SFK-047US | |
| Gigabyte Aero 17 HDR XB | |
| Asus Zephyrus G14 GA401IV | |
| AMD Ryzen 1800X - Asus Crosshair VI Hero | |
| 7-Zip 18.03 / 7z b 4 -mmt1 | |
| Gigabyte Aero 17 HDR XB | |
| Eurocom Nightsky RX15 | |
| MSI GP65 10SFK-047US | |
| Ortalama Intel Core i7-9750H (4580 - 5090, n=21) | |
| MSI GF75 Thin 10SCXR | |
| Asus Zephyrus G14 GA401IV | |
| 7-Zip 18.03 / 7z b 4 | |
| Asus Zephyrus G14 GA401IV | |
| Gigabyte Aero 17 HDR XB | |
| Eurocom Nightsky RX15 | |
| MSI GP65 10SFK-047US | |
| Ortalama Intel Core i7-9750H (28512 - 35174, n=21) | |
| MSI GF75 Thin 10SCXR | |
| Geekbench 5.5 / Single-Core | |
| Gigabyte Aero 17 HDR XB | |
| Asus Zephyrus G14 GA401IV | |
| MSI GP65 10SFK-047US | |
| Ortalama Intel Core i7-9750H (1117 - 1251, n=13) | |
| MSI GF75 Thin 10SCXR | |
| MSI Alpha 15 A3DDK-034 | |
| Geekbench 5.5 / Multi-Core | |
| Asus Zephyrus G14 GA401IV | |
| Gigabyte Aero 17 HDR XB | |
| MSI GP65 10SFK-047US | |
| Ortalama Intel Core i7-9750H (4859 - 6262, n=13) | |
| MSI GF75 Thin 10SCXR | |
| MSI Alpha 15 A3DDK-034 | |
| HWBOT x265 Benchmark v2.2 / 4k Preset | |
| Eurocom Nightsky RX15 | |
| Asus Zephyrus G14 GA401IV | |
| Gigabyte Aero 17 HDR XB | |
| MSI GP65 10SFK-047US | |
| Ortalama Intel Core i7-9750H (7.1 - 10.7, n=21) | |
| MSI GF75 Thin 10SCXR | |
| LibreOffice / 20 Documents To PDF | |
| MSI GP65 10SFK-047US | |
| Gigabyte Aero 17 HDR XB | |
| Ortalama Intel Core i7-9750H (54.5 - 64.7, n=9) | |
| MSI GF75 Thin 10SCXR | |
| R Benchmark 2.5 / Overall mean | |
| MSI GF75 Thin 10SCXR | |
| Ortalama Intel Core i7-9750H (0.608 - 0.695, n=14) | |
| MSI GP65 10SFK-047US | |
| Gigabyte Aero 17 HDR XB | |
* ... daha küçük daha iyidir
Sistem performansı
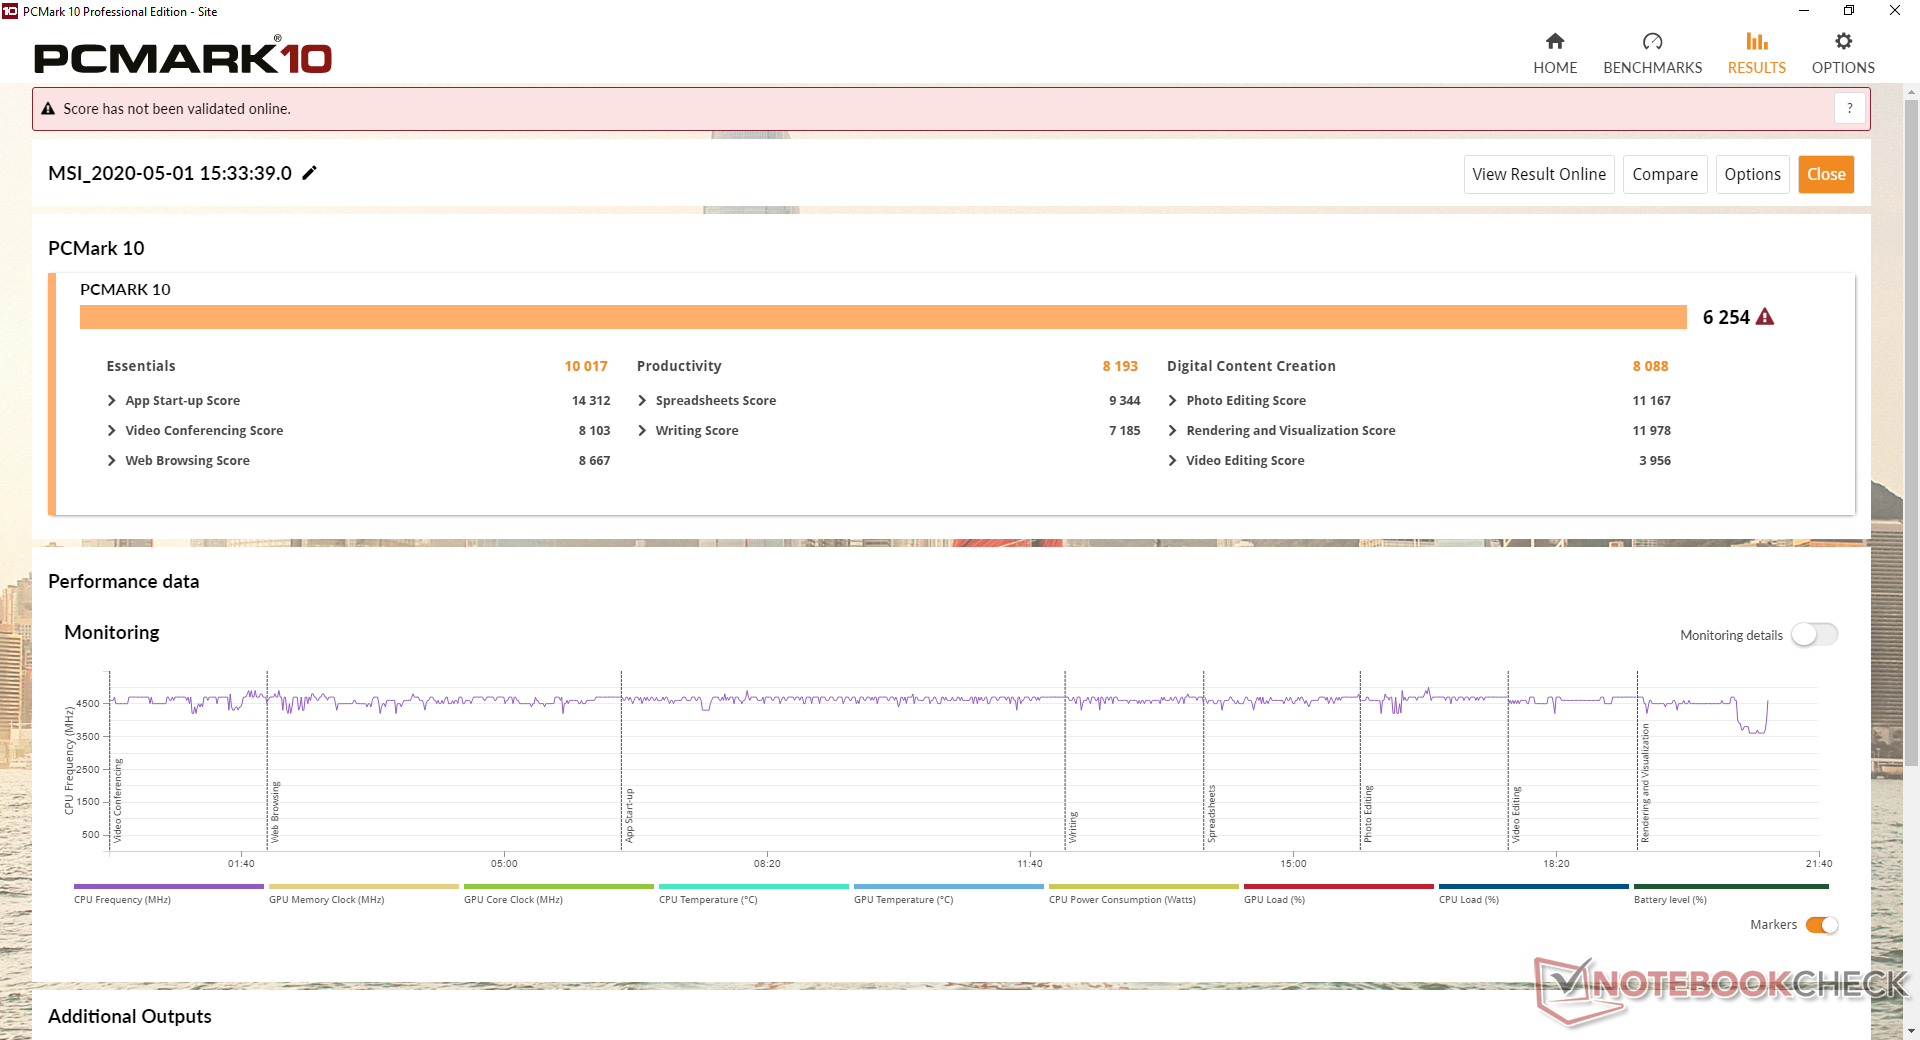
Farklılıklar küçük olmasına rağmen, PCMark kriterleri sürekli olarak 2019 GP65'ten daha yüksektir. GP62 gibi çok daha eski Core i5-7300HQ veya i7-7700HQ oyun dizüstü bilgisayarlarından yükseltme yapan kullanıcılar daha önemli kazanımlar görecek.
| PCMark 10 | |
| Score | |
| MSI GP65 10SFK-047US | |
| MSI GP65 Leopard 9SE-225US | |
| Aorus 15-SA | |
| Asus Strix Scar III G531GW-AZ062T | |
| HP Omen 15-dc1303ng | |
| Asus TUF FX505DT-EB73 | |
| MSI GP62 7REX-1045US | |
| Essentials | |
| MSI GP65 10SFK-047US | |
| HP Omen 15-dc1303ng | |
| MSI GP65 Leopard 9SE-225US | |
| Aorus 15-SA | |
| Asus Strix Scar III G531GW-AZ062T | |
| Asus TUF FX505DT-EB73 | |
| MSI GP62 7REX-1045US | |
| Productivity | |
| MSI GP65 10SFK-047US | |
| MSI GP65 Leopard 9SE-225US | |
| Asus Strix Scar III G531GW-AZ062T | |
| HP Omen 15-dc1303ng | |
| Aorus 15-SA | |
| MSI GP62 7REX-1045US | |
| Asus TUF FX505DT-EB73 | |
| Digital Content Creation | |
| MSI GP65 10SFK-047US | |
| Aorus 15-SA | |
| Asus Strix Scar III G531GW-AZ062T | |
| MSI GP65 Leopard 9SE-225US | |
| HP Omen 15-dc1303ng | |
| Asus TUF FX505DT-EB73 | |
| MSI GP62 7REX-1045US | |
| PCMark 8 | |
| Home Score Accelerated v2 | |
| Aorus 15-SA | |
| HP Omen 15-dc1303ng | |
| Asus Strix Scar III G531GW-AZ062T | |
| MSI GP65 10SFK-047US | |
| MSI GP65 Leopard 9SE-225US | |
| MSI GP62 7REX-1045US | |
| Asus TUF FX505DT-EB73 | |
| Work Score Accelerated v2 | |
| Aorus 15-SA | |
| MSI GP65 10SFK-047US | |
| HP Omen 15-dc1303ng | |
| MSI GP65 Leopard 9SE-225US | |
| Asus Strix Scar III G531GW-AZ062T | |
| MSI GP62 7REX-1045US | |
| Asus TUF FX505DT-EB73 | |
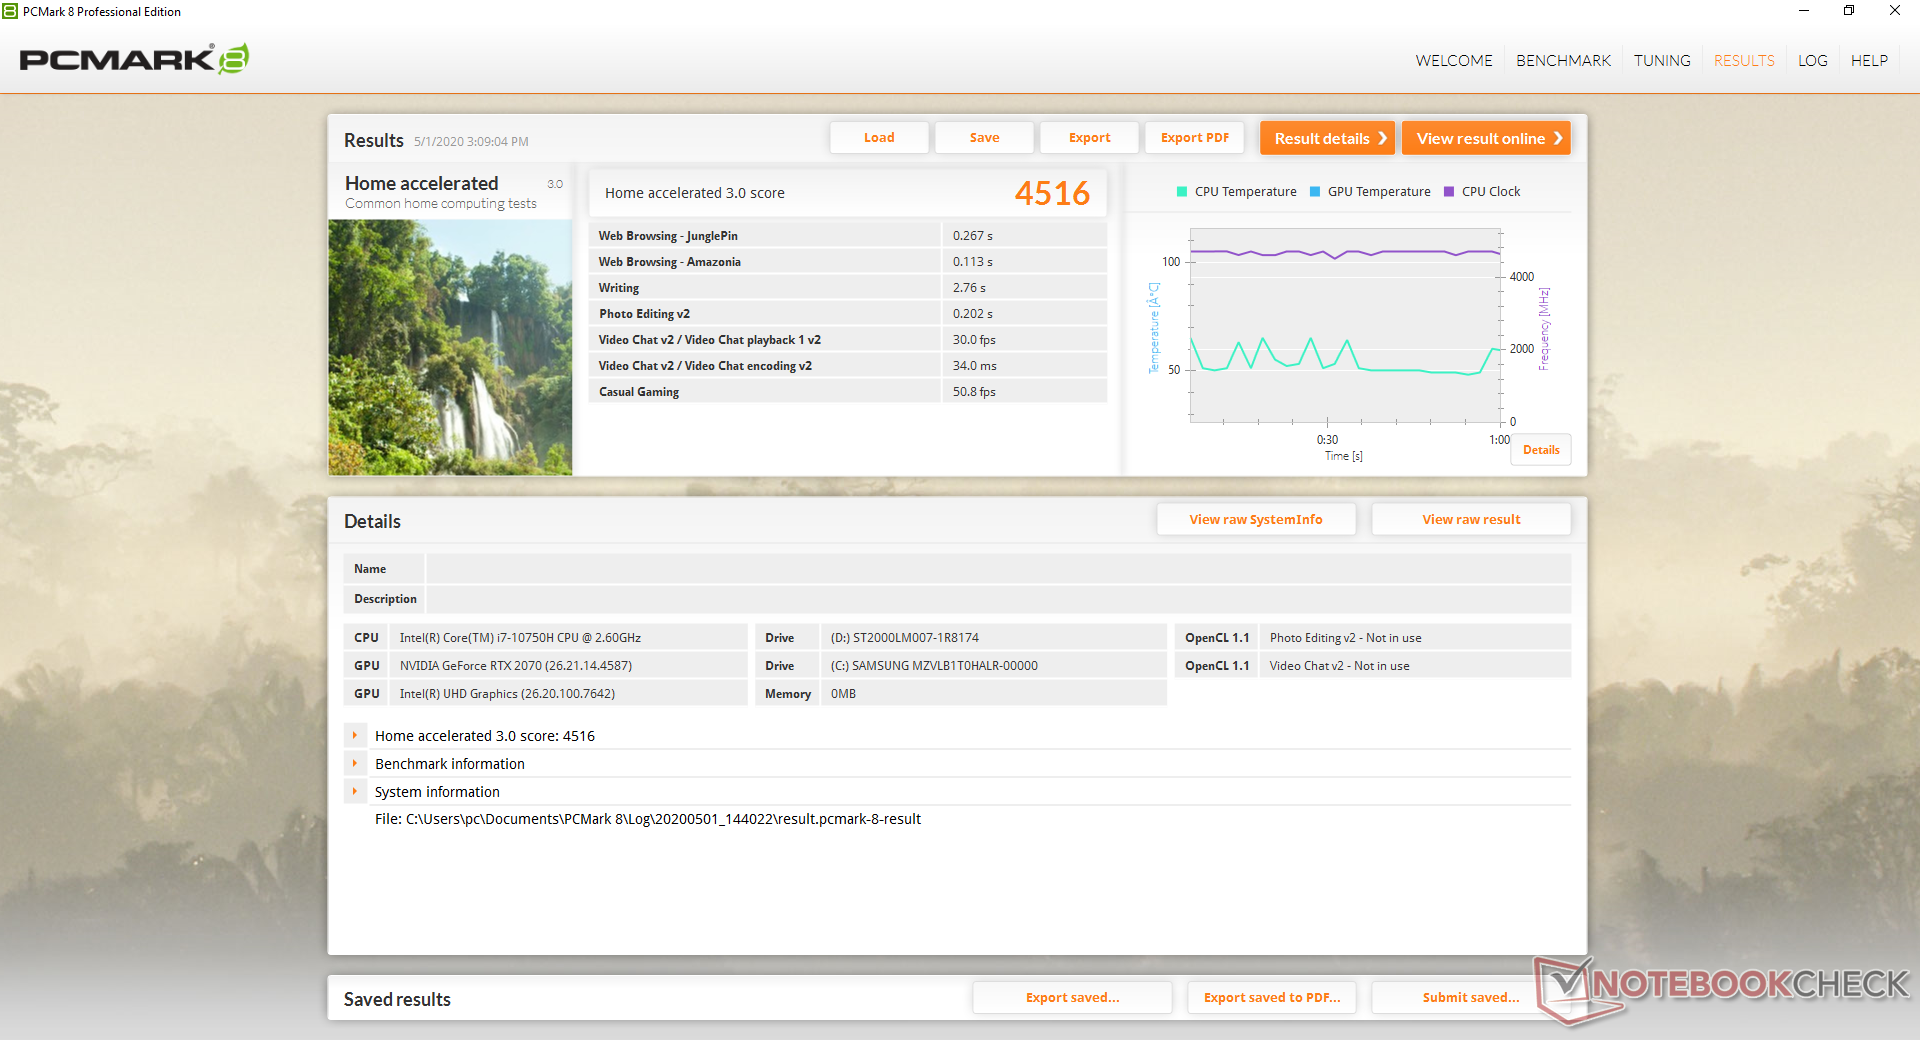
| PCMark 8 Home Score Accelerated v2 | 4516 puan | |
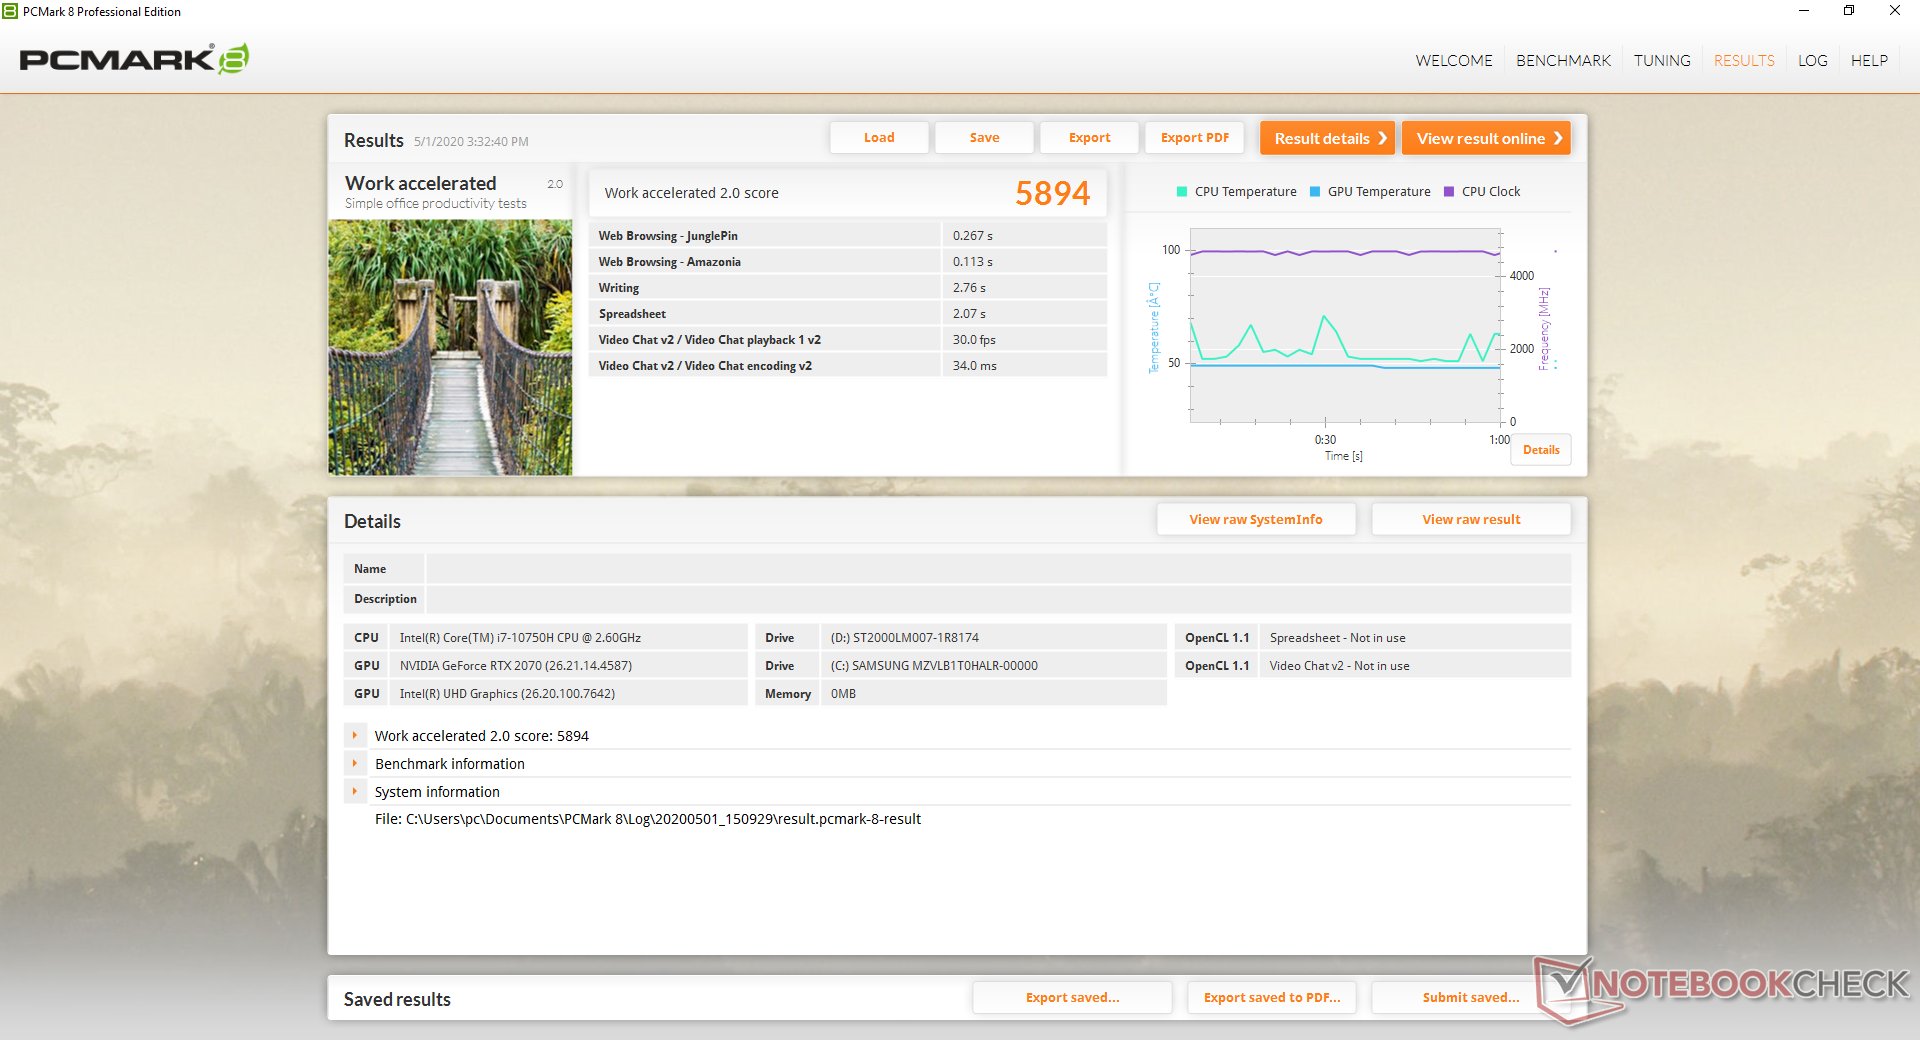
| PCMark 8 Work Score Accelerated v2 | 5894 puan | |
| PCMark 10 Score | 6254 puan | |
Yardım | ||
DPC Gecikmesi
LatencyMon, birden çok tarayıcı sekmesi açarken DPC gecikme sorunlarını gösterir. Neyse ki, 4K video oynatımı, atlanan kareler olmadan pürüzsüz.
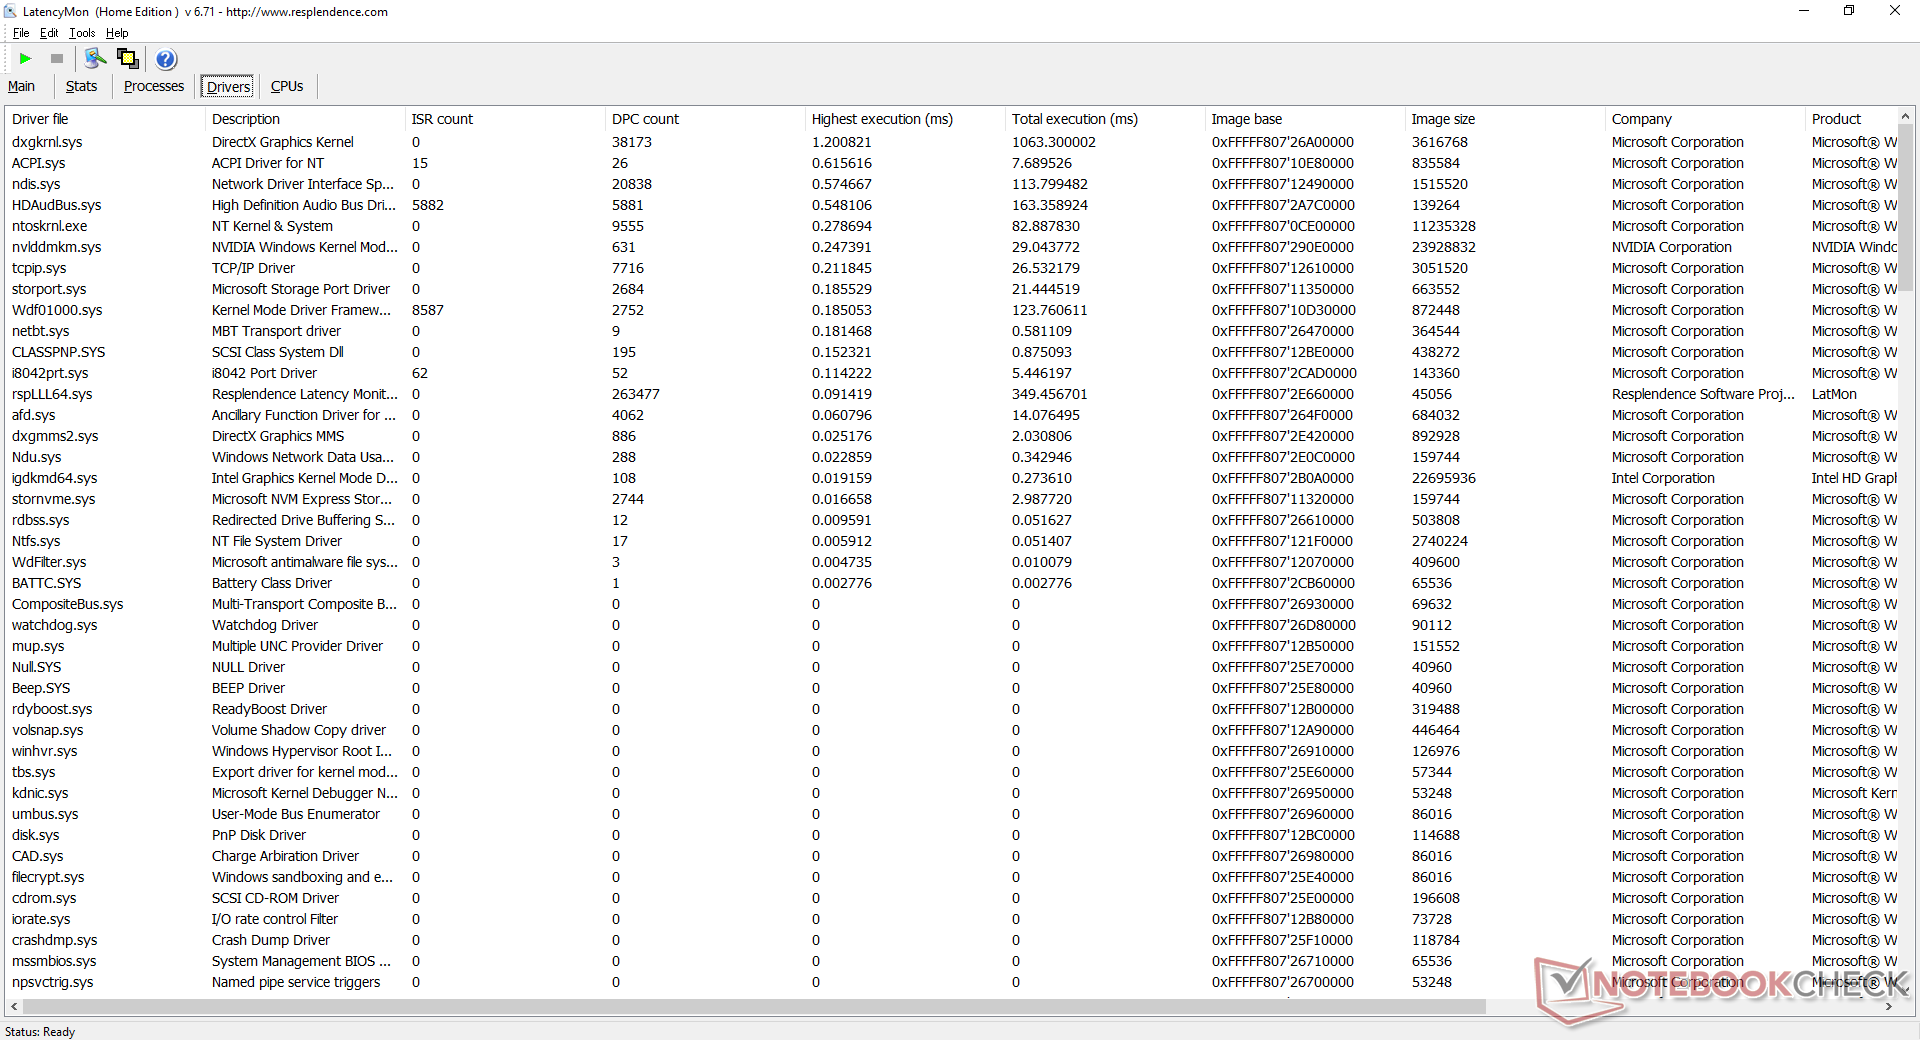
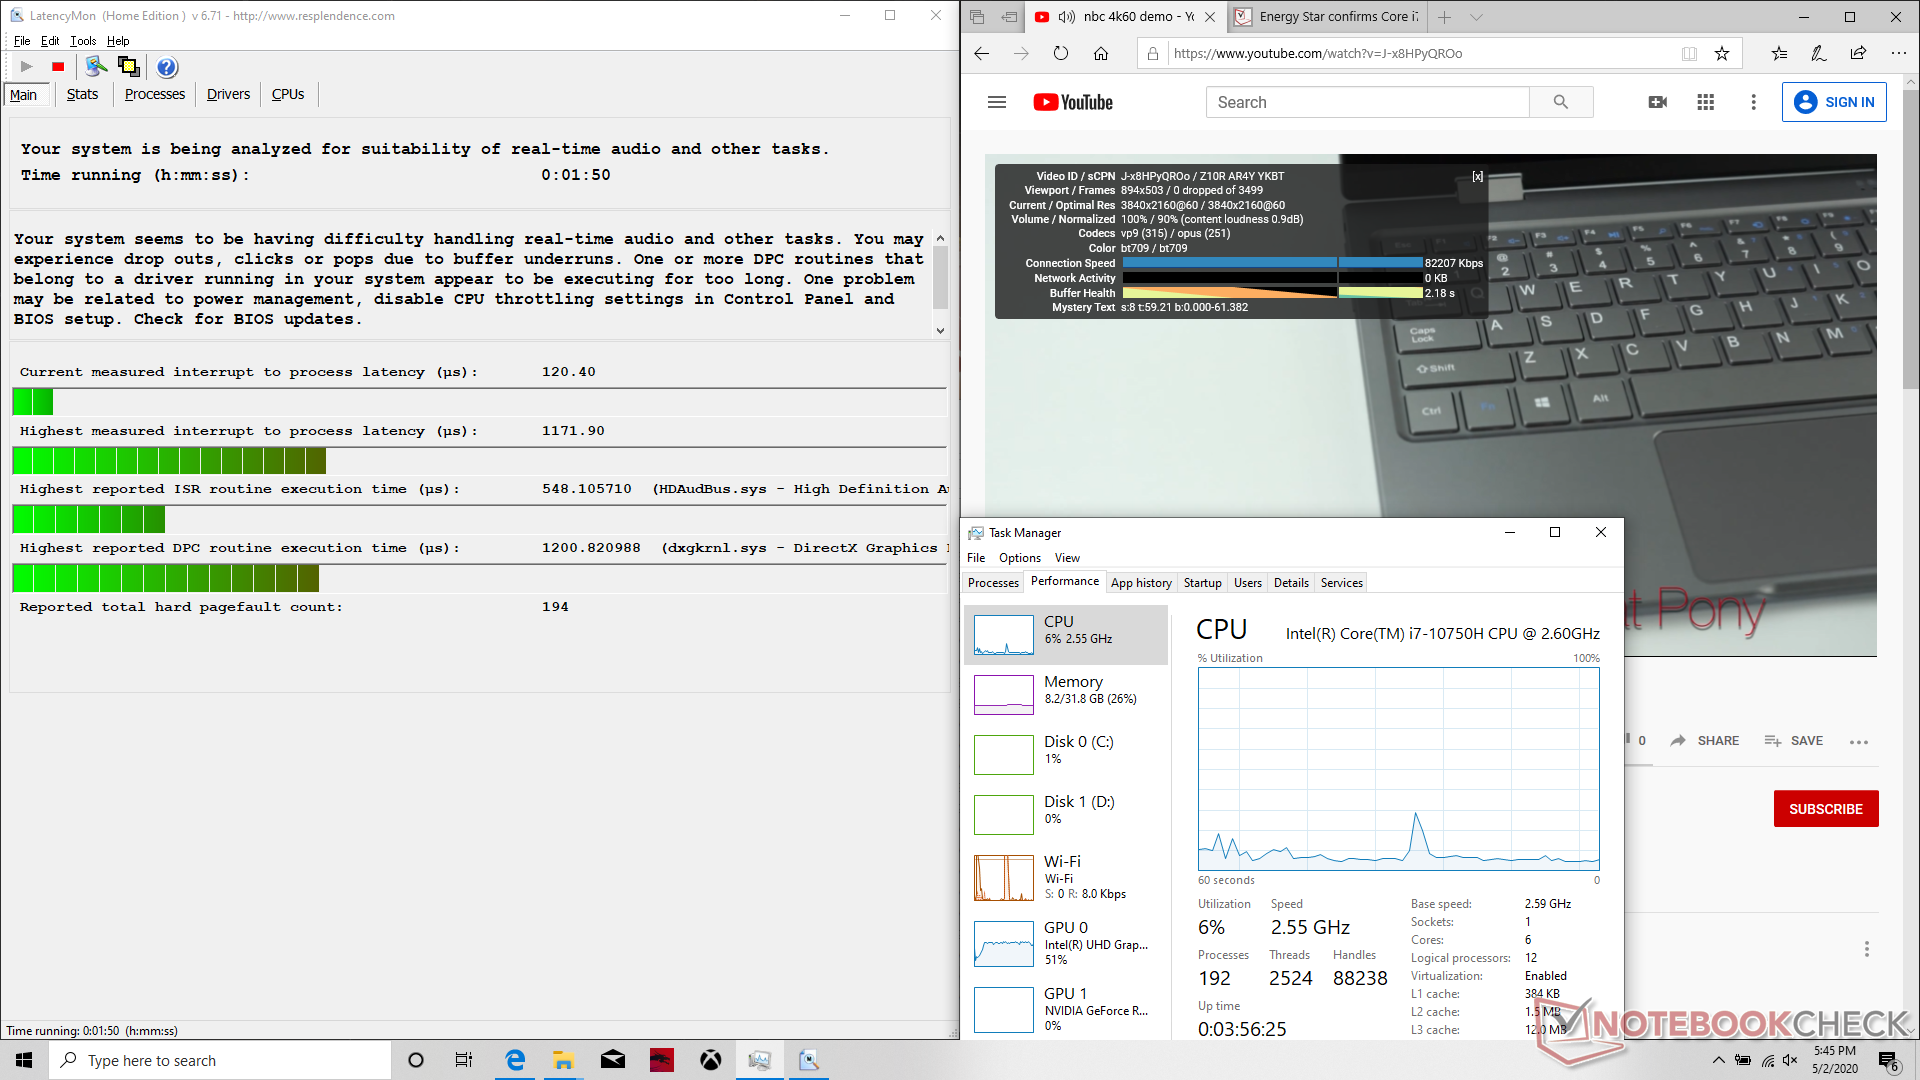
| DPC Latencies / LatencyMon - interrupt to process latency (max), Web, Youtube, Prime95 | |
| MSI GP65 10SFK-047US | |
* ... daha küçük daha iyidir
Depolama aygıtları
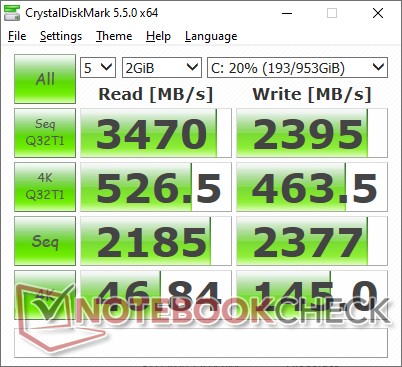
Test birimimiz 1 TB Samsung SSD PM981 ve ikincil 2 TB Seagate ST2000LM007 HDD ile birlikte gelir. Sürücü sadece 5400 RPM, ancak hızlı NVMe SSD bunu telafi etmekten daha fazlası. Samsung PM981, Ultrabook'larda ve diğer oyun dizüstü bilgisayarlarında yaygın olarak bulunan Intel 660p serisinden veya Toshiba XG3 serisinden daha hızlıdır. Daha fazla karşılaştırma karşılaştırması için SSD ve HDD tablolarımıza bakın.
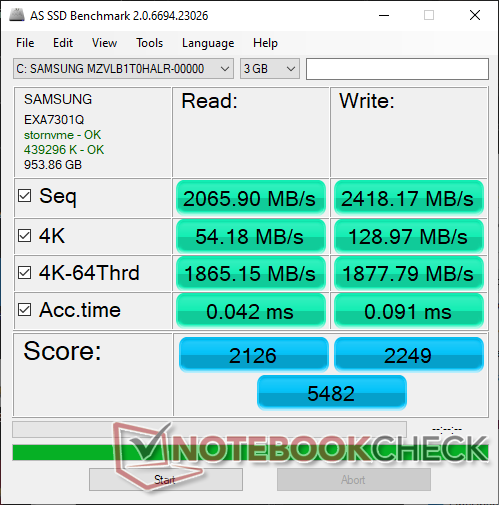
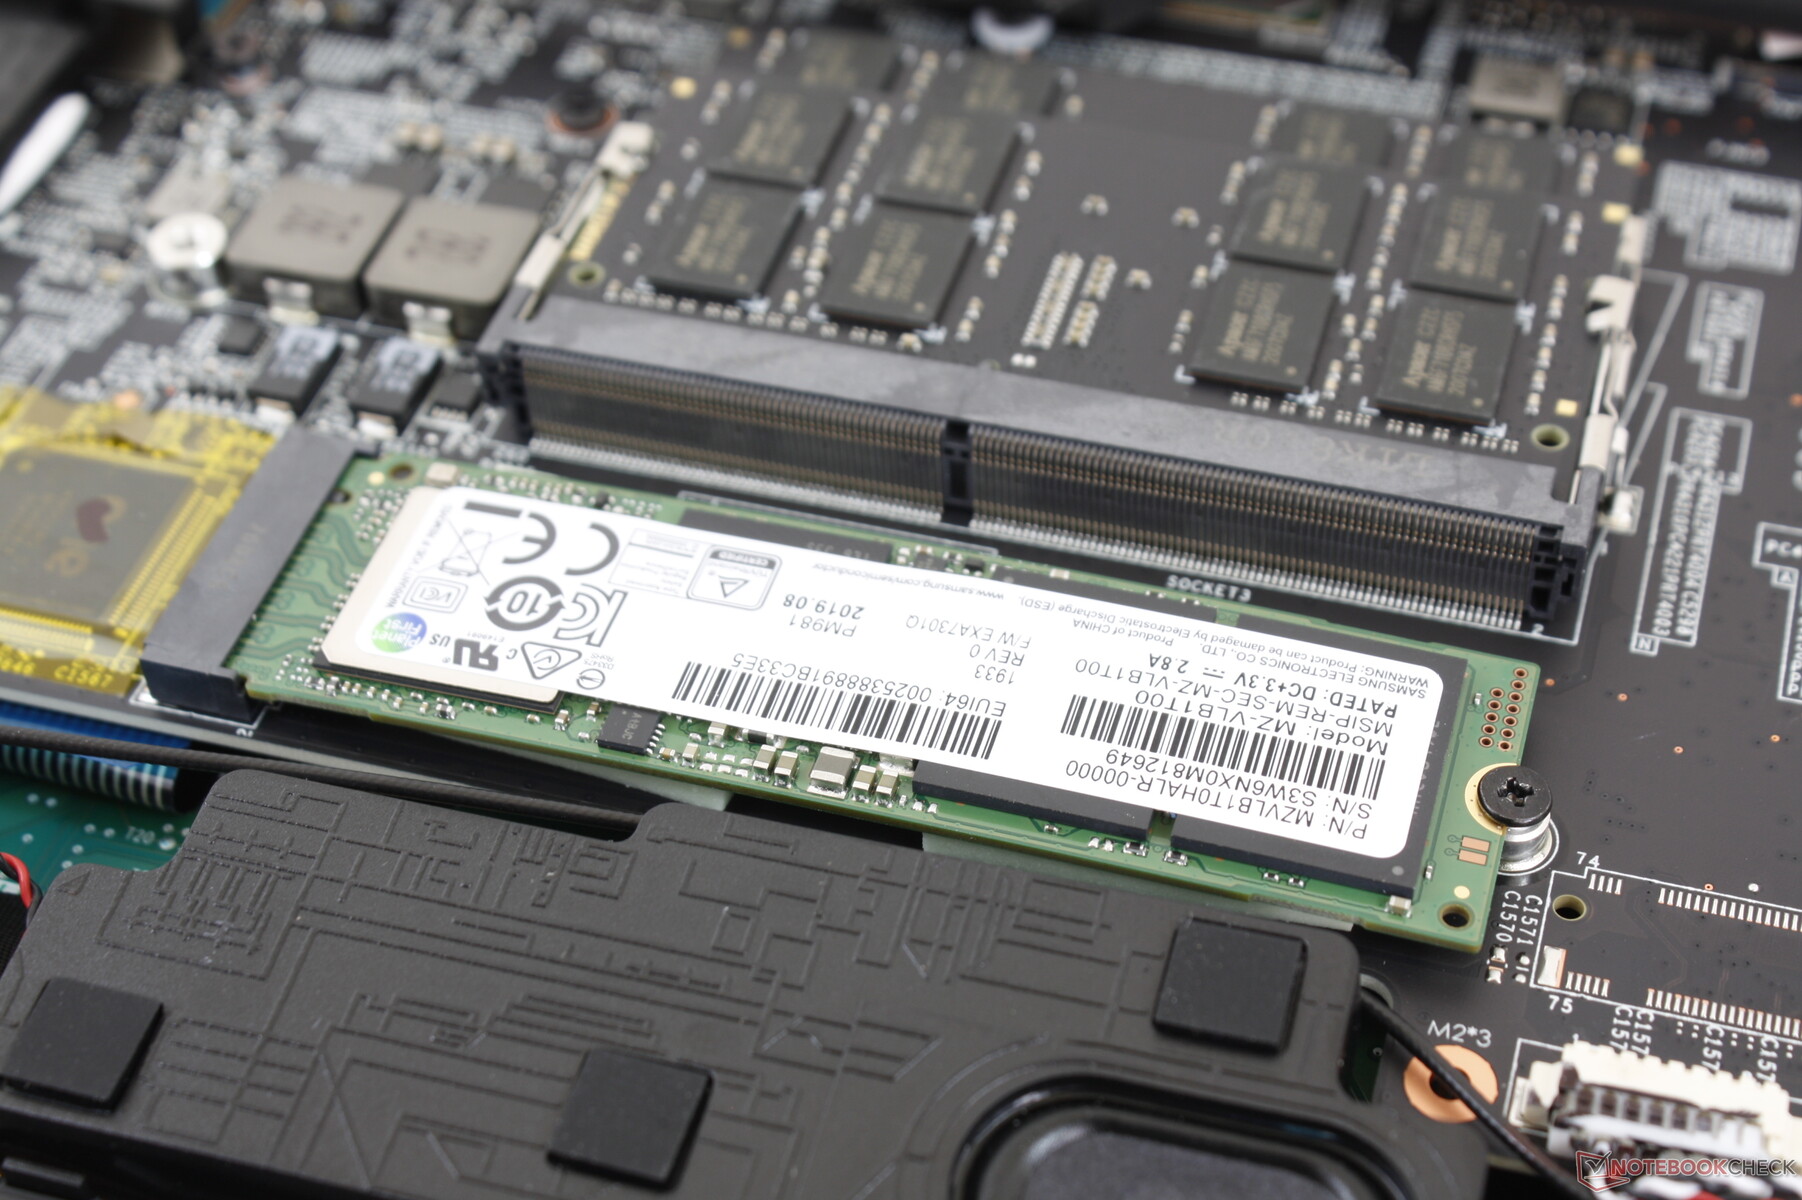
| MSI GP65 10SFK-047US Samsung SSD PM981 MZVLB1T0HALR | Asus Strix Scar III G531GW-AZ062T Intel SSD 660p SSDPEKNW512G8 | Asus TUF FX505DT-EB73 Intel SSD 660p SSDPEKNW512G8 | HP Omen 15-dc1303ng Samsung SSD PM981 MZVLB256HAHQ | MSI GP62 7REX-1045US Toshiba NVMe THNSN5128GP | MSI GP65 Leopard 9SE-225US Toshiba KBG30ZMT512G | |
|---|---|---|---|---|---|---|
| AS SSD | -79% | -46% | -19% | -49% | -94% | |
| Seq Read (MB/s) | 2066 | 1163 -44% | 1019 -51% | 2485 20% | 1848 -11% | 1307 -37% |
| Seq Write (MB/s) | 2418 | 919 -62% | 889 -63% | 1575 -35% | 601 -75% | 730 -70% |
| 4K Read (MB/s) | 54.2 | 48.88 -10% | 48.22 -11% | 53.4 -1% | 35.84 -34% | 27.58 -49% |
| 4K Write (MB/s) | 129 | 90.1 -30% | 115.5 -10% | 113.5 -12% | 112 -13% | 80.3 -38% |
| 4K-64 Read (MB/s) | 1865 | 323.8 -83% | 321.5 -83% | 725 -61% | 628 -66% | 878 -53% |
| 4K-64 Write (MB/s) | 1878 | 403.8 -78% | 787 -58% | 1371 -27% | 428.2 -77% | 246.8 -87% |
| Access Time Read * (ms) | 0.042 | 0.24 -471% | 0.065 -55% | 0.059 -40% | 0.079 -88% | 0.231 -450% |
| Access Time Write * (ms) | 0.091 | 0.046 49% | 0.047 48% | 0.032 65% | 0.034 63% | 0.223 -145% |
| Score Read (Points) | 2126 | 489 -77% | 472 -78% | 1027 -52% | 849 -60% | 1036 -51% |
| Score Write (Points) | 2249 | 586 -74% | 992 -56% | 1642 -27% | 600 -73% | 400 -82% |
| Score Total (Points) | 5482 | 1332 -76% | 1717 -69% | 3163 -42% | 1829 -67% | 1940 -65% |
| Copy ISO MB/s (MB/s) | 2927 | 1269 -57% | 942 -68% | 1128 -61% | 993 -66% | |
| Copy Program MB/s (MB/s) | 728 | 452.8 -38% | 444.5 -39% | 326.3 -55% | 309.5 -57% | |
| Copy Game MB/s (MB/s) | 1614 | 755 -53% | 867 -46% | 442.8 -73% | 582 -64% | |
| CrystalDiskMark 5.2 / 6 | -34% | -33% | -27% | -25% | -33% | |
| Write 4K (MB/s) | 145 | 133.3 -8% | 137.5 -5% | 50.2 -65% | 158.4 9% | 99.3 -32% |
| Read 4K (MB/s) | 46.84 | 55.3 18% | 57 22% | 35.32 -25% | 45.04 -4% | 46.96 0% |
| Write Seq (MB/s) | 2377 | 980 -59% | 984 -59% | 991 -58% | 622 -74% | |
| Read Seq (MB/s) | 2185 | 1406 -36% | 1564 -28% | 1526 -30% | 1592 -27% | |
| Write 4K Q32T1 (MB/s) | 463.5 | 286.3 -38% | 237.4 -49% | 445.1 -4% | 434.2 -6% | 240.1 -48% |
| Read 4K Q32T1 (MB/s) | 527 | 331.5 -37% | 340.7 -35% | 526 0% | 590 12% | 581 10% |
| Write Seq Q32T1 (MB/s) | 2395 | 976 -59% | 959 -60% | 1647 -31% | 630 -74% | 686 -71% |
| Read Seq Q32T1 (MB/s) | 3470 | 1520 -56% | 1732 -50% | 3427 -1% | 2108 -39% | 1581 -54% |
| Write 4K Q8T8 (MB/s) | 748 | 268.1 | ||||
| Read 4K Q8T8 (MB/s) | 344.6 | 977 | ||||
| Toplam Ortalama (Program / Ayarlar) | -57% /
-63% | -40% /
-41% | -23% /
-22% | -37% /
-41% | -64% /
-75% |
* ... daha küçük daha iyidir

GPU Performansı
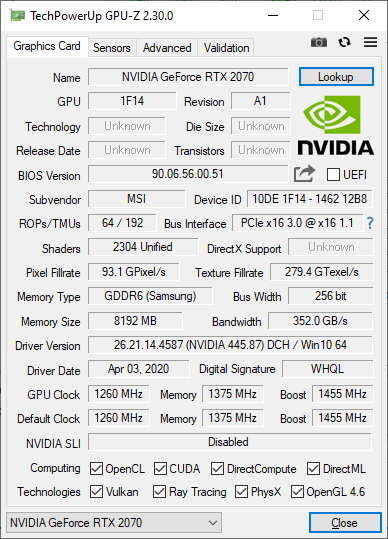
MSI'mızdaki GeForce RTX 2070 cep telefonu, GeForce RTX 2070 Max-Q'dan yüzde 10 ila 14 daha hızlı veya masaüstü GeForce RTX 2070'den yüzde 22 daha yavaş olmasını beklediğimiz yerde performans gösteriyor. hem yeni işlemci hem de 32 GB DDR4-2666 RAM'in geniş olması nedeniyle sadece birkaç yüzde puan. Witcher 3'e bir saat boyunca sabitlemek, pürüzsüz bir oyun performansı için beklenmedik düşüşler olmadan sabit kare hızlarını gösterir. Daha fazla teknik bilgi ve kıyaslama karşılaştırması için GeForce RTX 2070 mobile.

| 3DMark 11 | |
| 1280x720 Performance GPU | |
| MSI RTX 2080 Ti Gaming X Trio | |
| Eurocom Sky X4C i9-9900KS | |
| Zotac GeForce RTX 2070 AMP Extreme | |
| Acer Predator Triton 500 PT515-52-70N3 | |
| MSI GP65 10SFK-047US | |
| Ortalama NVIDIA GeForce RTX 2070 Mobile (23335 - 27298, n=21) | |
| Dell G7 17 7790 | |
| MSI GP65 Leopard 9SE-225US | |
| Aorus 15-SA | |
| MSI Alpha 15 A3DDK-034 | |
| HP Omen 15-dc1303ng | |
| Asus TUF FX505DT-EB73 | |
| MSI GP62 7REX-1045US | |
| 1280x720 Performance Combined | |
| Eurocom Sky X4C i9-9900KS | |
| MSI RTX 2080 Ti Gaming X Trio | |
| Zotac GeForce RTX 2070 AMP Extreme | |
| MSI GP65 10SFK-047US | |
| MSI GP65 Leopard 9SE-225US | |
| Acer Predator Triton 500 PT515-52-70N3 | |
| Ortalama NVIDIA GeForce RTX 2070 Mobile (8716 - 16364, n=21) | |
| Aorus 15-SA | |
| HP Omen 15-dc1303ng | |
| Dell G7 17 7790 | |
| MSI Alpha 15 A3DDK-034 | |
| MSI GP62 7REX-1045US | |
| Asus TUF FX505DT-EB73 | |
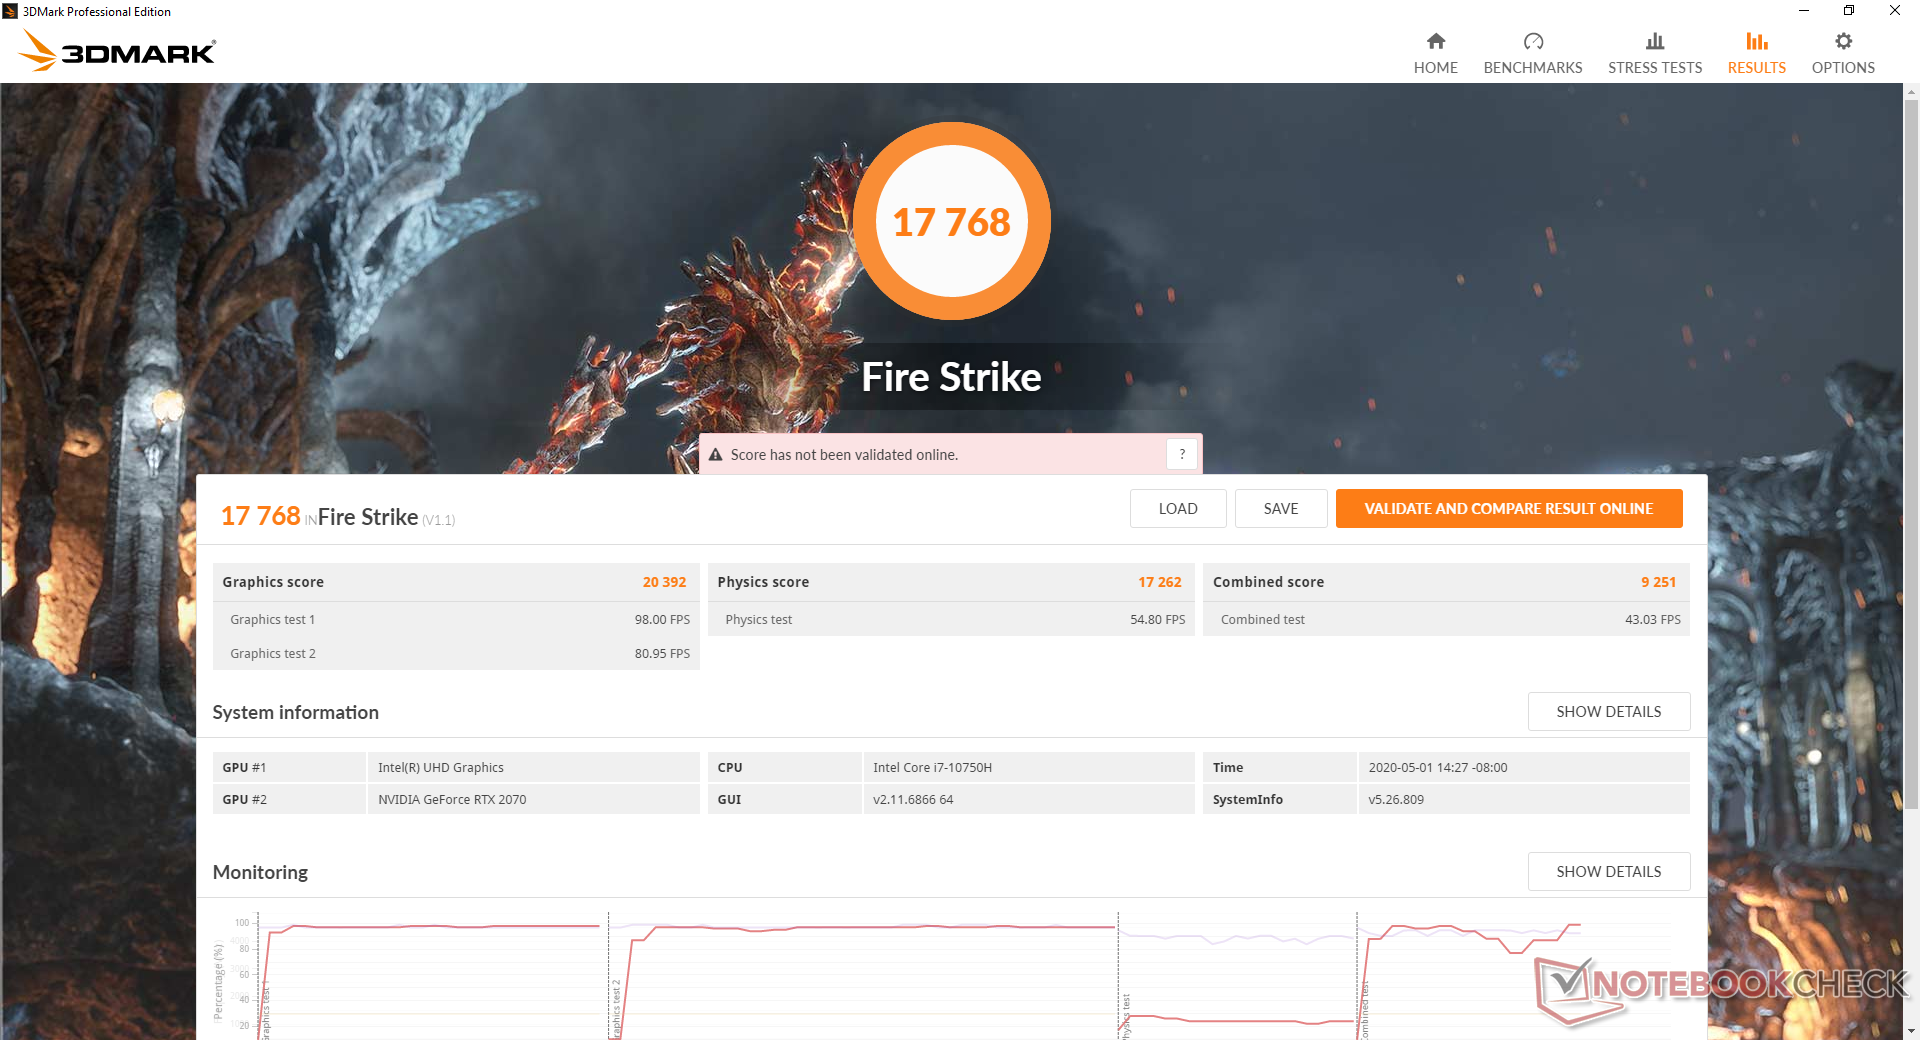
| 3DMark 06 Standard Score | 39513 puan | |
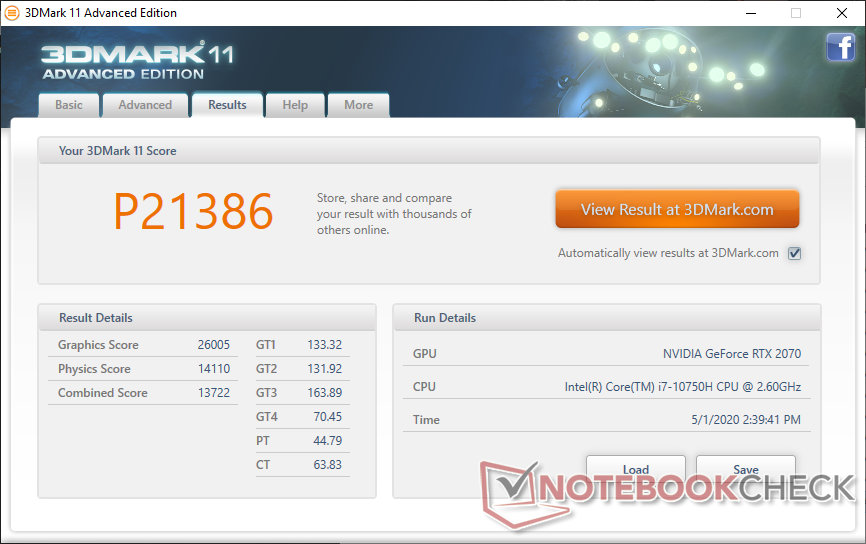
| 3DMark 11 Performance | 21386 puan | |
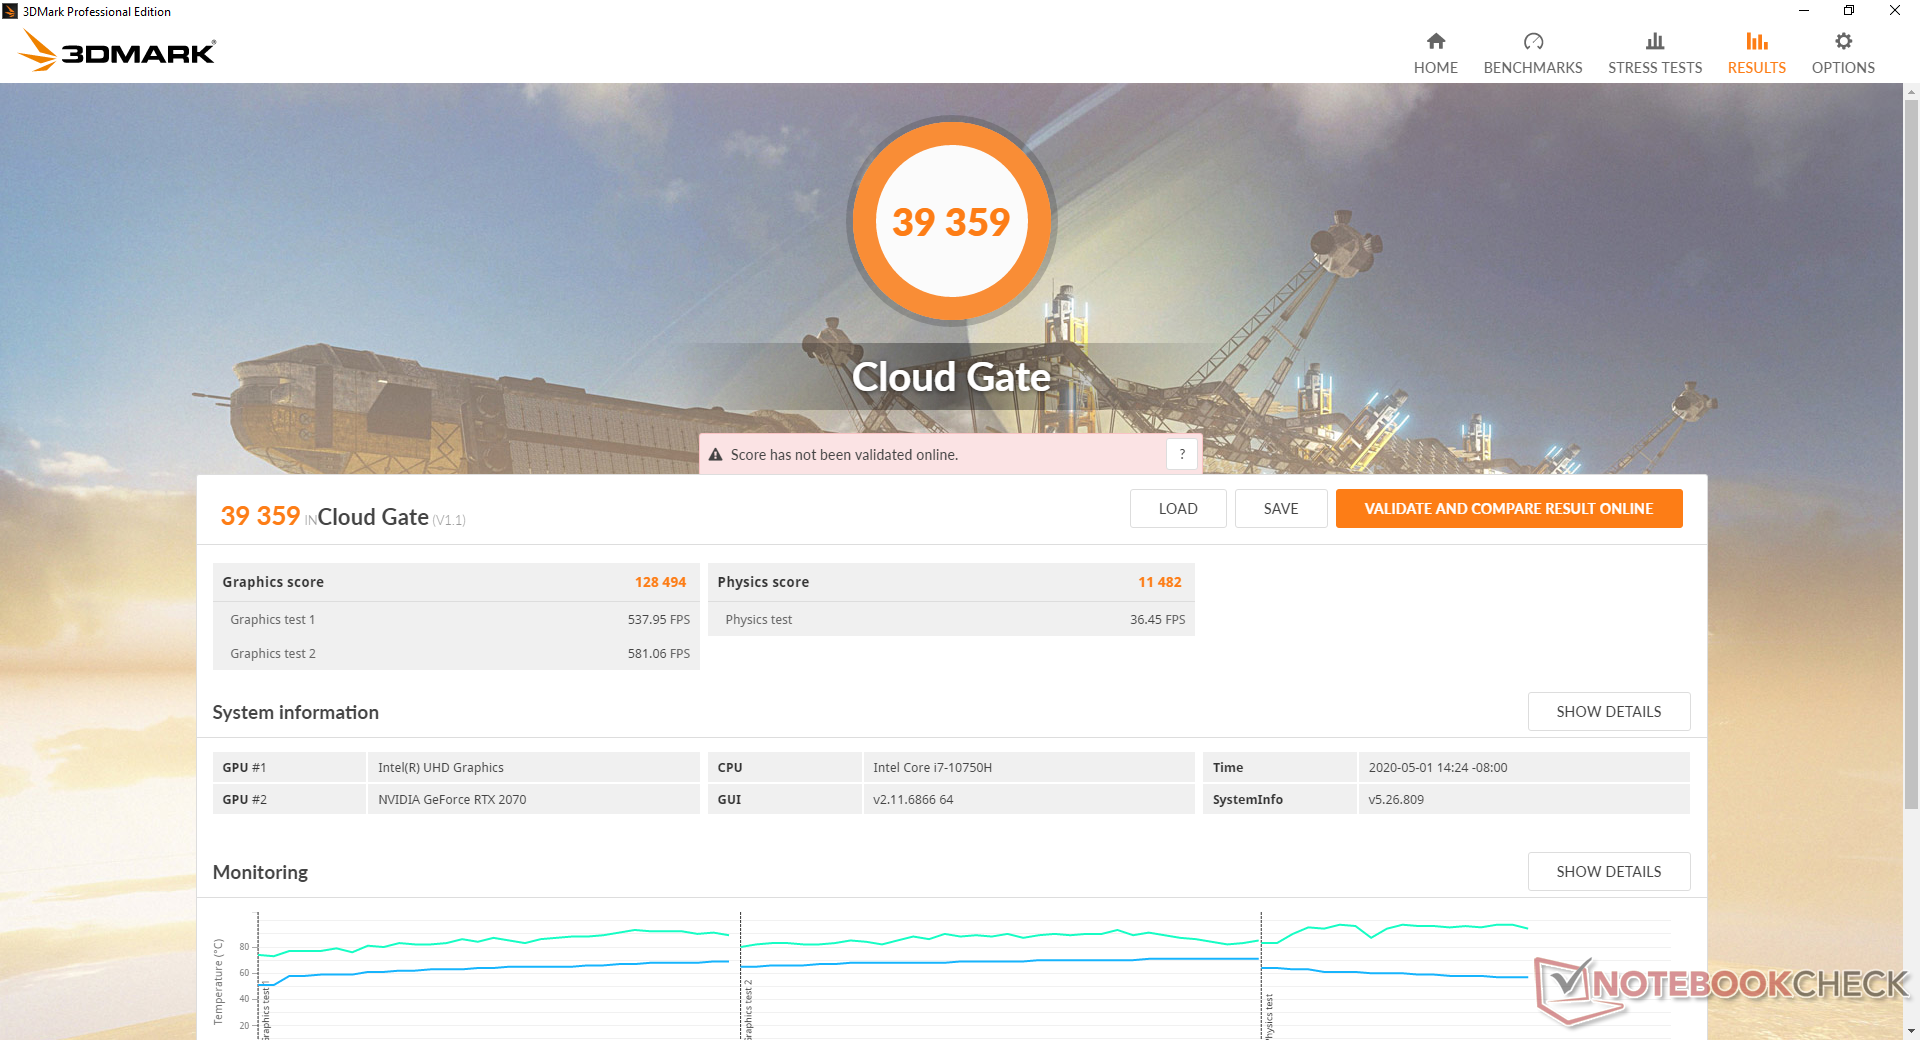
| 3DMark Cloud Gate Standard Score | 39359 puan | |
| 3DMark Fire Strike Score | 17768 puan | |
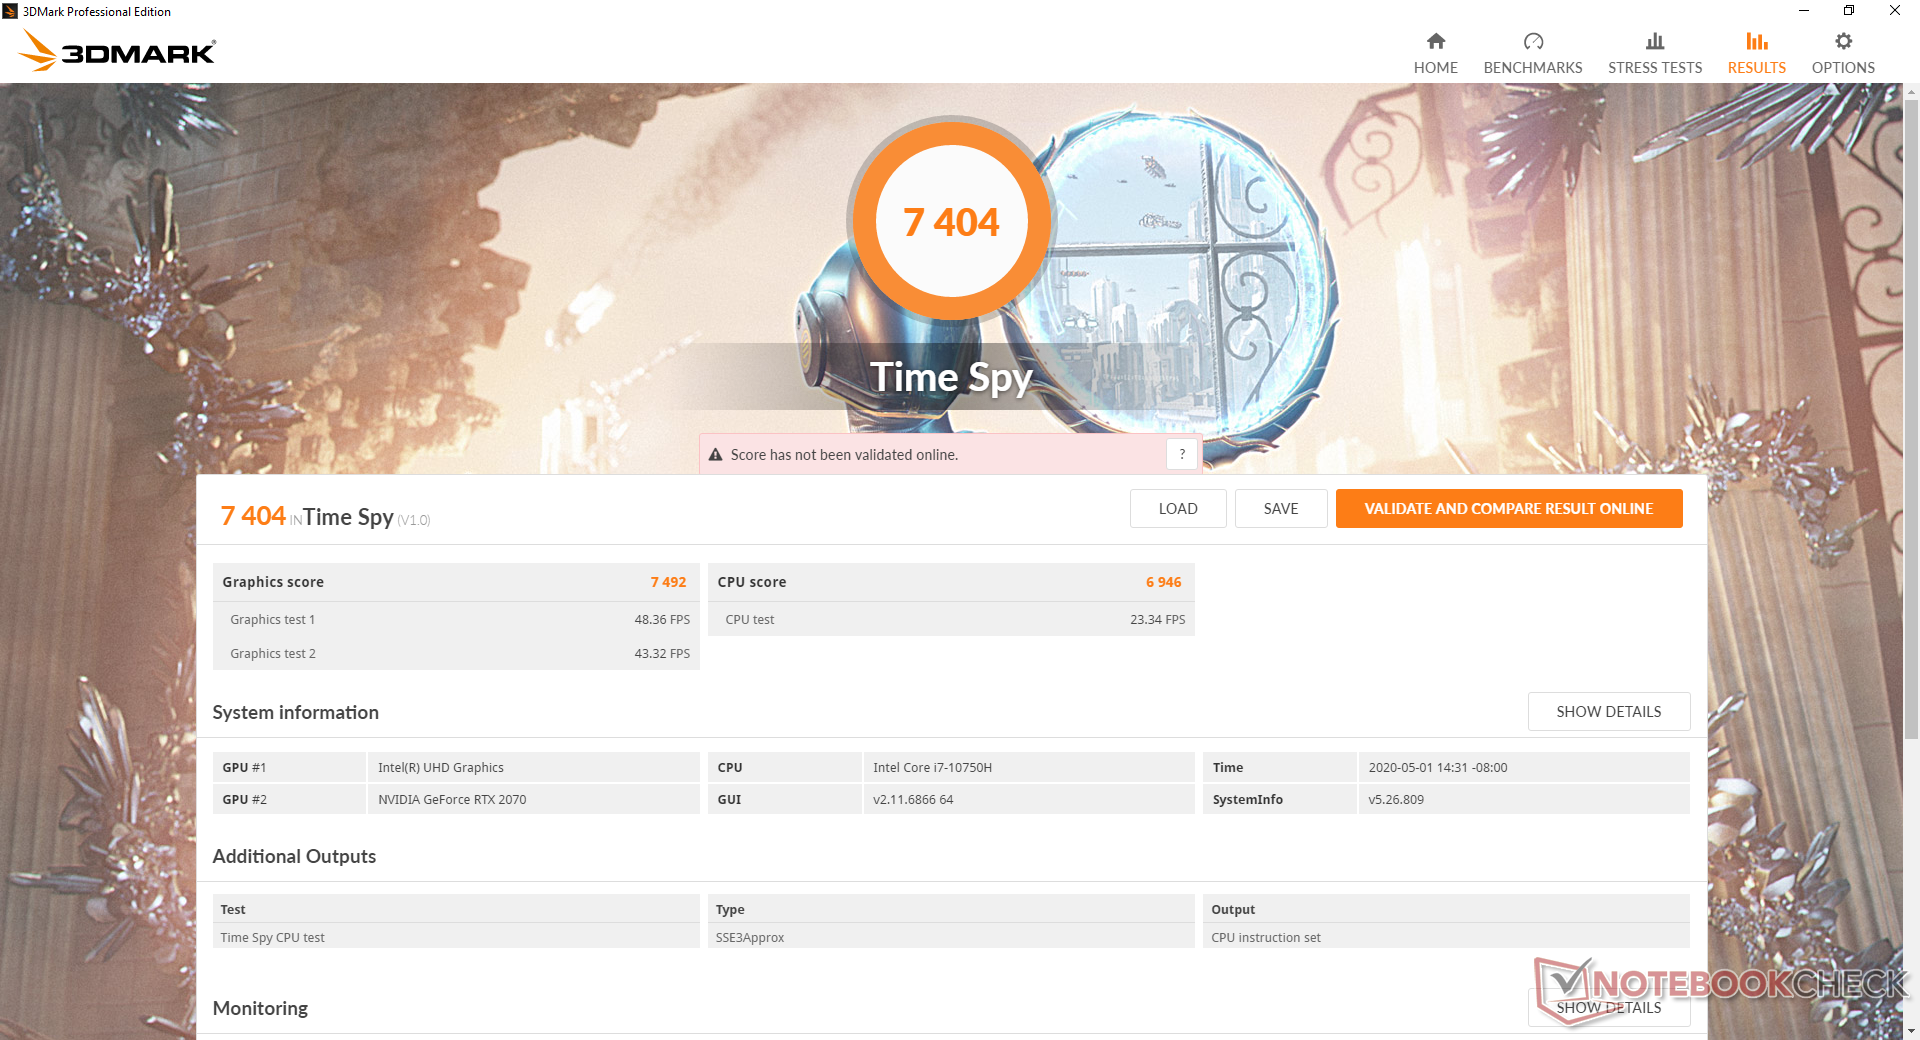
| 3DMark Time Spy Score | 7404 puan | |
Yardım | ||
| Shadow of the Tomb Raider | |
| 1280x720 Lowest Preset | |
| Eurocom Sky X4C i9-9900KS | |
| MSI GF65 9SD | |
| MSI GP65 10SFK-047US | |
| Walmart EVOO Gaming 17 | |
| MSI RTX 2080 Gaming X Trio | |
| Ortalama NVIDIA GeForce RTX 2070 Mobile (91.3 - 160, n=9) | |
| Asus G752VS | |
| Alienware 17 R4 | |
| 1920x1080 Medium Preset | |
| Eurocom Sky X4C i9-9900KS | |
| MSI RTX 2080 Gaming X Trio | |
| MSI GP65 10SFK-047US | |
| Ortalama NVIDIA GeForce RTX 2070 Mobile (86 - 114, n=10) | |
| Walmart EVOO Gaming 17 | |
| Asus G752VS | |
| Alienware 17 R4 | |
| MSI GF65 9SD | |
| 1920x1080 Highest Preset AA:T | |
| Eurocom Sky X4C i9-9900KS | |
| MSI RTX 2080 Gaming X Trio | |
| MSI GP65 10SFK-047US | |
| Ortalama NVIDIA GeForce RTX 2070 Mobile (74.2 - 97, n=11) | |
| Walmart EVOO Gaming 17 | |
| Alienware 17 R4 | |
| Asus G752VS | |
| MSI GF65 9SD | |
| The Witcher 3 | |
| 1024x768 Low Graphics & Postprocessing | |
| Eurocom Sky X4C i9-9900KS | |
| MSI GP65 10SFK-047US | |
| MSI RTX 2080 Gaming X Trio | |
| Walmart EVOO Gaming 17 | |
| Ortalama NVIDIA GeForce RTX 2070 Mobile (193.9 - 357, n=12) | |
| MSI GF65 9SD | |
| 1366x768 Medium Graphics & Postprocessing | |
| Eurocom Sky X4C i9-9900KS | |
| MSI RTX 2080 Gaming X Trio | |
| MSI GP65 10SFK-047US | |
| Ortalama NVIDIA GeForce RTX 2070 Mobile (154 - 250, n=12) | |
| Walmart EVOO Gaming 17 | |
| MSI GF65 9SD | |
| 1920x1080 High Graphics & Postprocessing (Nvidia HairWorks Off) | |
| MSI RTX 2080 Gaming X Trio | |
| Eurocom Sky X4C i9-9900KS | |
| MSI GP65 10SFK-047US | |
| Ortalama NVIDIA GeForce RTX 2070 Mobile (115.7 - 160.8, n=17) | |
| Walmart EVOO Gaming 17 | |
| MSI GF65 9SD | |
| 1920x1080 Ultra Graphics & Postprocessing (HBAO+) | |
| MSI RTX 2080 Gaming X Trio | |
| Eurocom Sky X4C i9-9900KS | |
| MSI GP65 10SFK-047US | |
| Ortalama NVIDIA GeForce RTX 2070 Mobile (64 - 82.1, n=21) | |
| Walmart EVOO Gaming 17 | |
| MSI GF65 9SD | |
| düşük | orta | yüksek | ultra | |
|---|---|---|---|---|
| BioShock Infinite (2013) | 352 | 316 | 288.9 | 164.6 |
| The Witcher 3 (2015) | 326.4 | 244.5 | 160.8 | 82.1 |
| Dota 2 Reborn (2015) | 152 | 139 | 128 | 120 |
| X-Plane 11.11 (2018) | 102 | 91.7 | 77.5 | |
| Shadow of the Tomb Raider (2018) | 135 | 107 | 102 | 93 |
Emisyonları
Sistem Gürültüsü
Fanlar, 29,3 dB (A) bir arka plana karşı minimum 31,9 dB (A) fan gürültüsü ayarı ne olursa olsun her zaman etkindir. Sessiz bir odada duyulacak, ancak ofis alanlarında esasen fark edilmeyecek. 3DMark 06'nın ilk kıyaslama sahnesini çalıştırırken, fan gürültüsü 90 saniyelik karşılaştırmanın sonuna doğru 47 dB (A) 'ya ulaşana kadar sürekli artacaktır. Sonuçlar, yavaş RTX 2060 GPU ile geçen yılki GP65'te kaydettiğimizden çok daha yüksek. Neyse ki, sadece web'e göz atmak veya video akışı yapmak için fan gürültüsü sadece 33,5 dB (A) 'da sabit kalır. Witcher 3'ü çalıştırırken, fan gürültüsü benzer koşullar altında çoğu oyun dizüstü bilgisayarından daha yüksek olacak şekilde neredeyse 54 dB (A)' da stabilize olur. Cooler Boost etkinleştirilirse, ekran üzerindeki yük ne olursa olsun fan gürültüsü neredeyse 57 dB (A) 'ya atlayacaktır. Test ünitemizden elektronik gürültü gelmediğini fark edebiliriz, ancak sabit fan gürültüsü yine de boğulurdu.
| MSI GP65 10SFK-047US GeForce RTX 2070 Mobile, i7-10750H, Samsung SSD PM981 MZVLB1T0HALR | Asus Strix Scar III G531GW-AZ062T GeForce RTX 2070 Mobile, i7-9750H, Intel SSD 660p SSDPEKNW512G8 | Asus TUF FX505DT-EB73 GeForce GTX 1650 Mobile, R7 3750H, Intel SSD 660p SSDPEKNW512G8 | HP Omen 15-dc1303ng GeForce RTX 2070 Max-Q, i7-8750H, Samsung SSD PM981 MZVLB256HAHQ | MSI GP62 7REX-1045US GeForce GTX 1050 Ti Mobile, i7-7700HQ, Toshiba NVMe THNSN5128GP | MSI GP65 Leopard 9SE-225US GeForce RTX 2060 Mobile, i7-9750H, Toshiba KBG30ZMT512G | |
|---|---|---|---|---|---|---|
| Noise | 5% | 10% | 3% | 7% | 12% | |
| kapalı / ortam * (dB) | 29.3 | 30 -2% | 28.2 4% | 30.5 -4% | 28 4% | 28.2 4% |
| Idle Minimum * (dB) | 31.9 | 30.6 4% | 28.2 12% | 32.8 -3% | 32.2 -1% | 29.5 8% |
| Idle Average * (dB) | 31.9 | 30.6 4% | 28.2 12% | 32.8 -3% | 32.2 -1% | 29.6 7% |
| Idle Maximum * (dB) | 33.5 | 37.7 -13% | 31.4 6% | 32.8 2% | 32.2 4% | 29.6 12% |
| Load Average * (dB) | 47 | 36.5 22% | 39.8 15% | 42.5 10% | 40.9 13% | 33 30% |
| Witcher 3 ultra * (dB) | 53.8 | 52.1 3% | 47 13% | 45.4 16% | 47.2 12% | |
| Load Maximum * (dB) | 56.7 | 48.1 15% | 50.2 11% | 47.5 16% | 48.6 14% | 52 8% |
* ... daha küçük daha iyidir
Ses yüksekliği
| Boşta |
| 31.9 / 31.9 / 33.5 dB |
| Çalışırken |
| 47 / 56.7 dB |
 | ||
30 dB sessiz 40 dB(A) duyulabilirlik 50 dB(A) gürültülü |
||
min: | ||
Sıcaklık
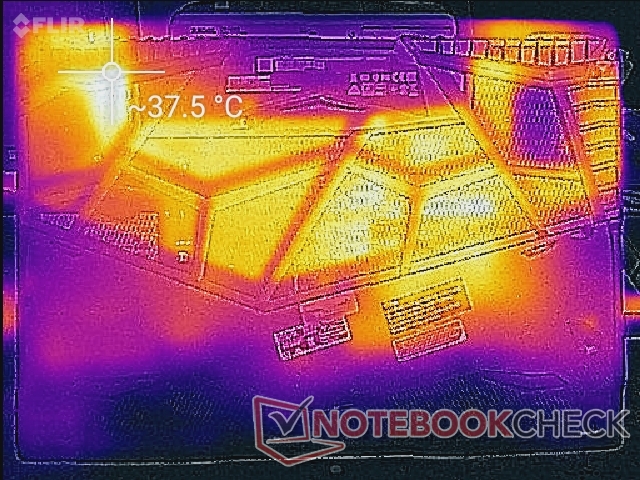
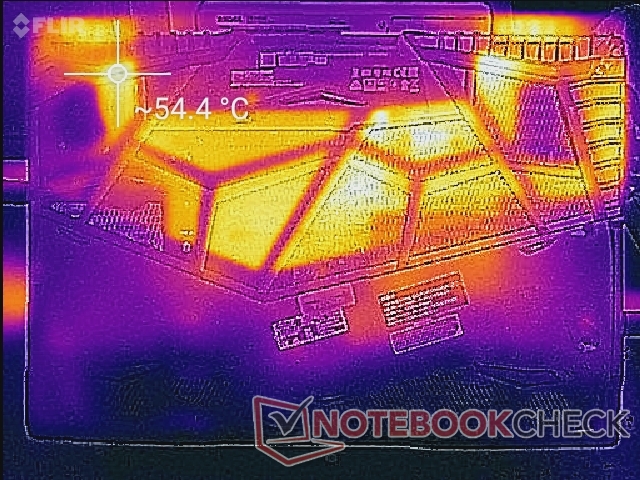
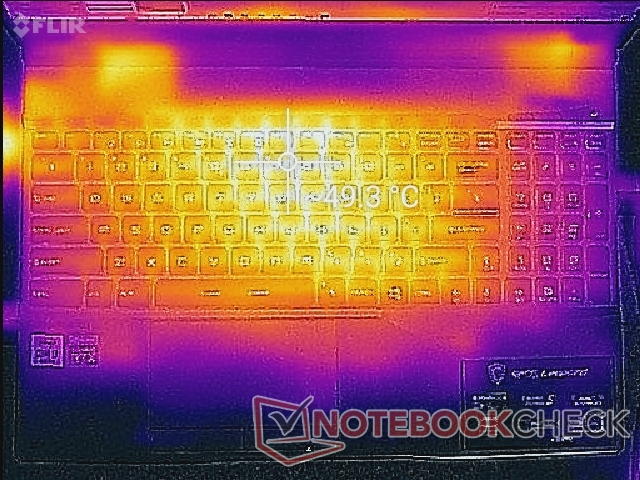
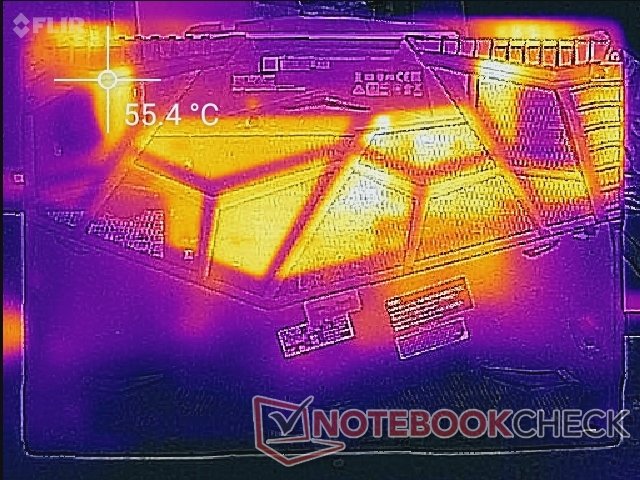
Bu daha yeni SKU daha güçlü GeForce RTX 2070 GPU ile birlikte gelmesine rağmen, yüzey sıcaklıkları geçen yıl GP65'te ölçtüğümüzle neredeyse aynı. Örneğin oyun, klavye merkezinin yaklaşık 46 C ila 49 C arasında stabilize olmasına neden oluyor. MSI'yi, Zephyrus G14 veya G15 gibi diğer oyun dizüstü bilgisayarlarının aksine alt panelde çok büyük havalandırma ızgaraları içerdiği için alkışlıyoruz.
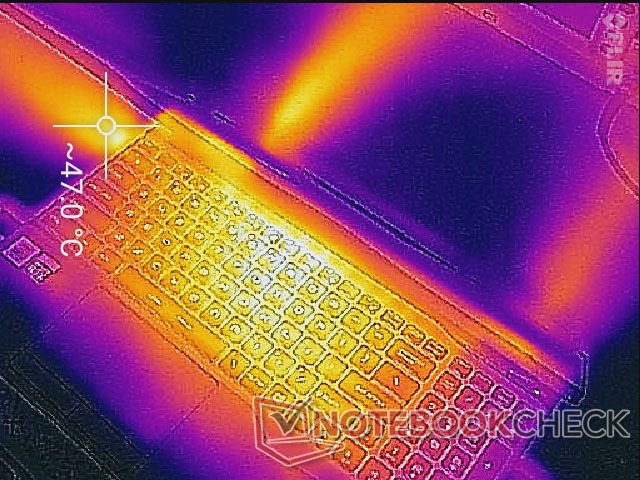
(-) Üst taraftaki maksimum sıcaklık, 40.4 °C / 105 F ortalamasına kıyasla 49.4 °C / 121 F'dir. , Gaming sınıfı için 21.2 ile 68.8 °C arasında değişir.
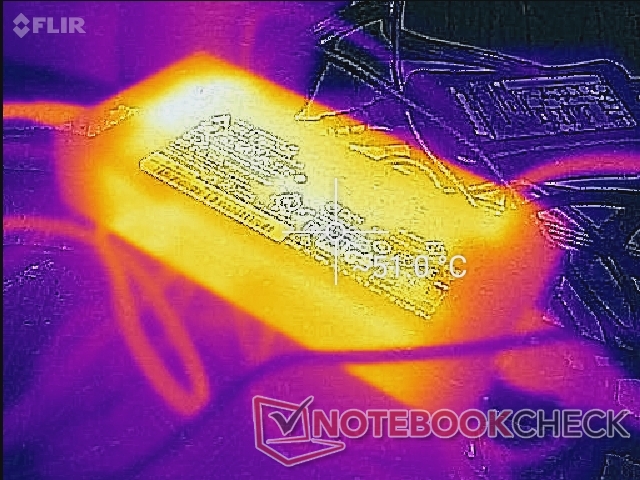
(-) Alt kısım, 43.2 °C / 110 F ortalamasına kıyasla maksimum 57.2 °C / 135 F'ye kadar ısınır
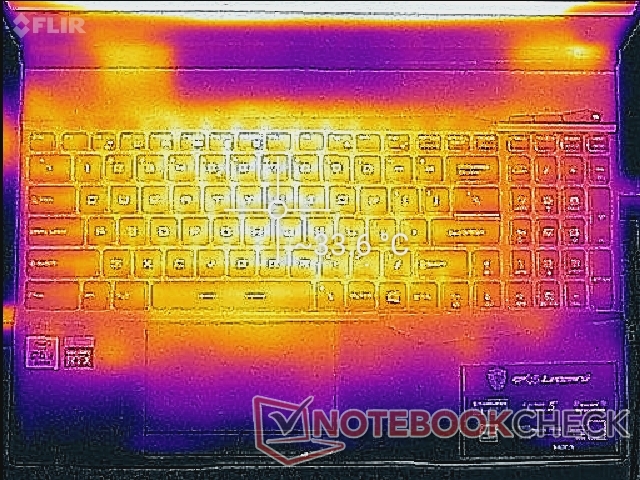
(+) Boşta kullanımda, üst tarafın ortalama sıcaklığı 30.6 °C / 87 F olup, cihazın 33.9 °C / 93 F.
(±) The Witcher 3 oynarken, üst tarafın ortalama sıcaklığı 34.3 °C / 94 F olup, cihazın 33.9 °C / 93 F.
(+) Avuç içi dayanakları ve dokunmatik yüzey, maksimum 30.8 °C / 87.4 F ile cilt sıcaklığından daha soğuktur ve bu nedenle dokunulduğunda soğuktur.
(±) Benzer cihazların avuç içi dayanağı alanının ortalama sıcaklığı 28.8 °C / 83.8 F (-2 °C / -3.6 F) idi.
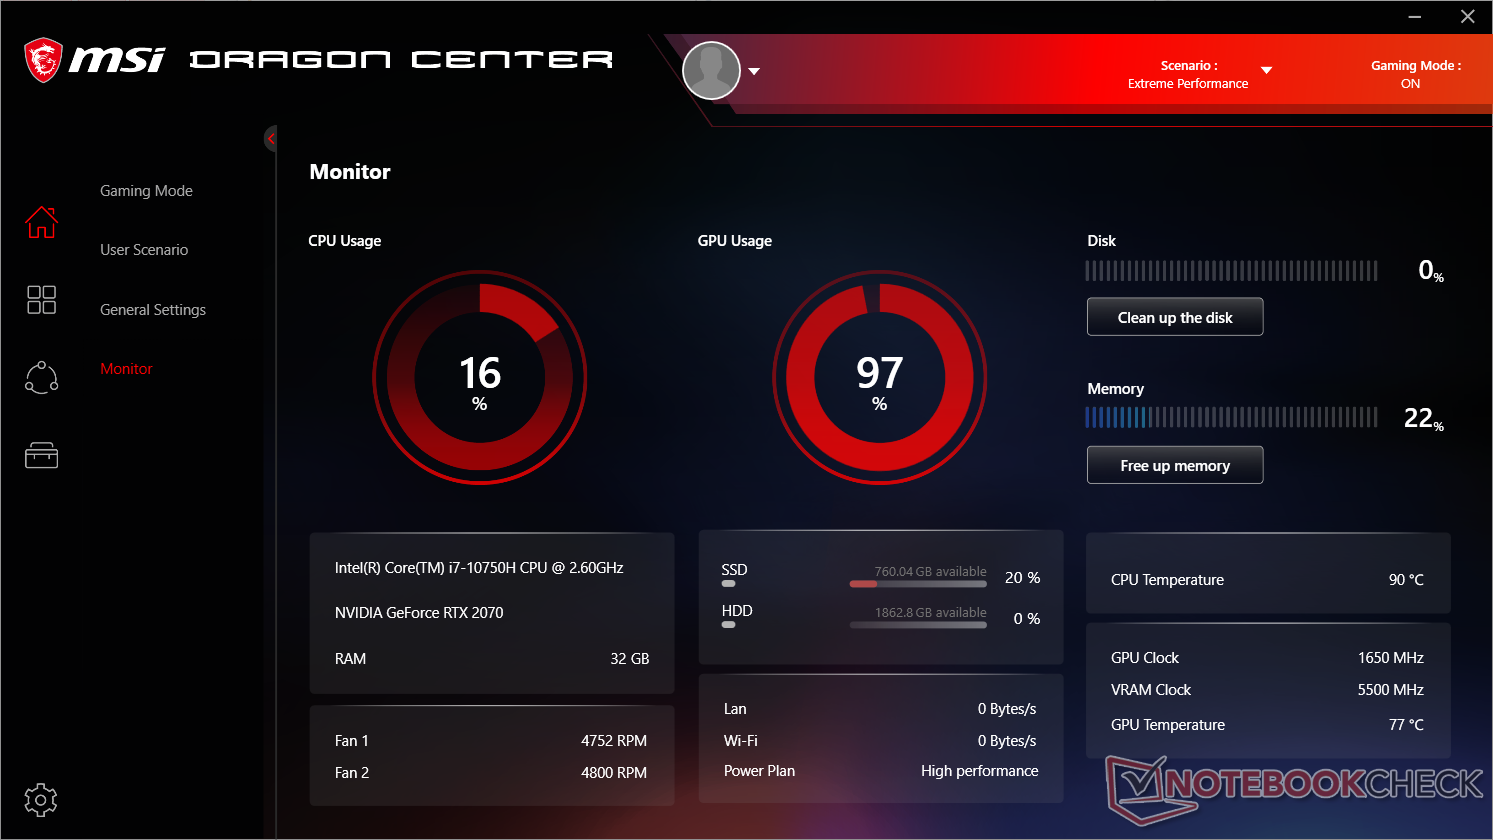
Stres testi
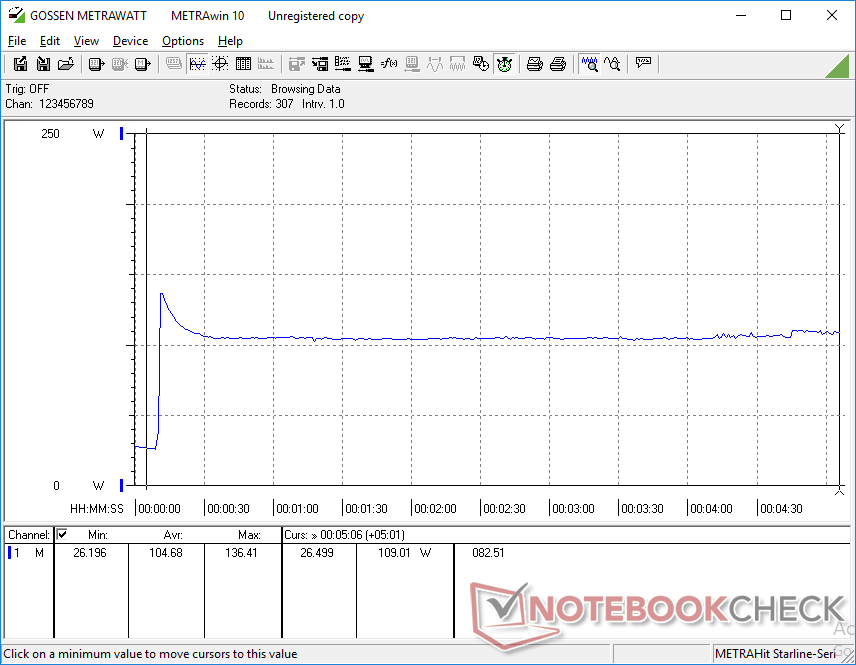
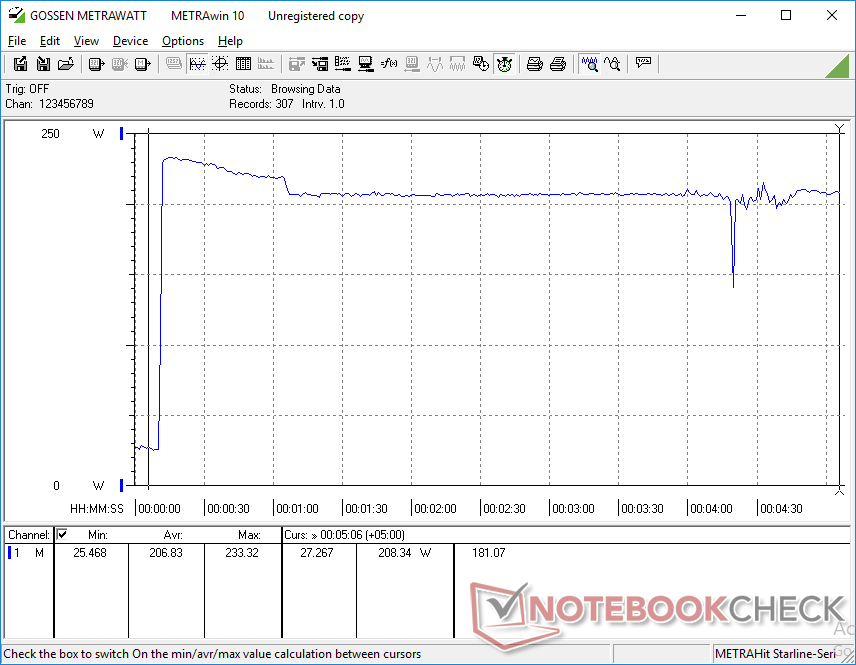
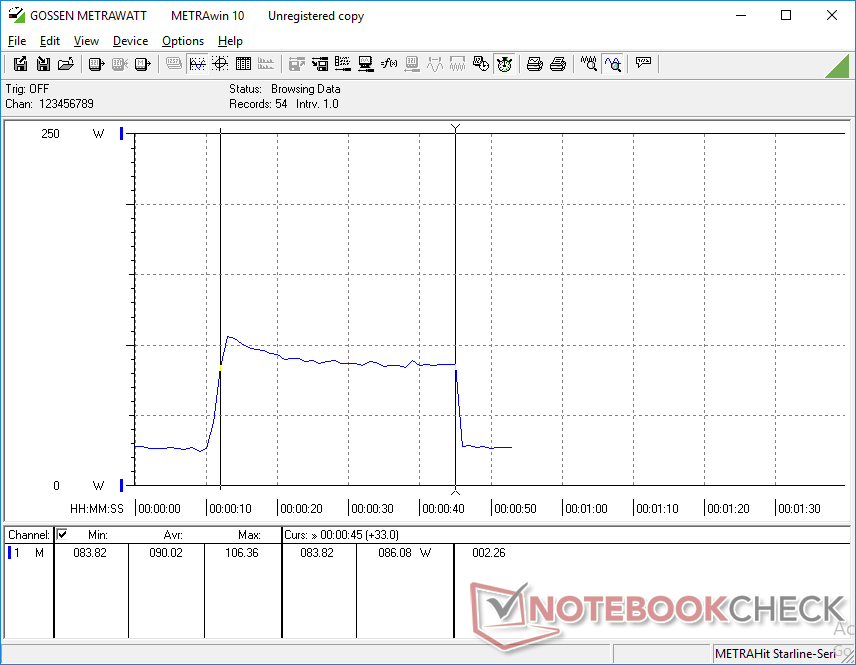
Herhangi bir olası azaltma veya kararlılık sorununu belirlemek için sistemi sentetik yüklerle vurgularız. Prime95'i çalıştırırken, CPU sabit bir 3,7 GHz'e düşmeden önce ilk birkaç saniye boyunca 4,2 GHz'e yükselir. Çekirdek sıcaklığı da çok sıcak 95 ° C'de stabilize olur. Hem Prime95 hem de FurMark'ı aynı anda çalıştırırsanız, CPU aynı C 95 ° C çekirdek sıcaklığını korurken 3.1 GHz'e daha da düşecektir. Temel sıcaklıkların sadece birkaç derece düşmesine neden olurken, saat hızlarını aşağıdaki ekran görüntülerinde gösterilenle aynı tutar. Running Witcher 3, gerçek dünya oyun yüklerini daha iyi temsil eder. Buna rağmen, GPU 79 C'de biraz daha serinken CPU hala yüksek bir 96 C'de stabilize olur. Buna karşılık, MSI GS65'teki eski Core i7-9750H benzer koşullar altında olduğunda daha makul bir 81 C'de stabilize olur. .Pillerin çalıştırılması performansı etkileyecektir. Pil gücüyle ilgili bir 3DMark Yangın Saldırısı, sırasıyla 11586 ve 5328 puanlık Fizik ve Grafik puanlarını döndürür. şebeke modundayken 15923 ve 18962 puanlara kıyasla.
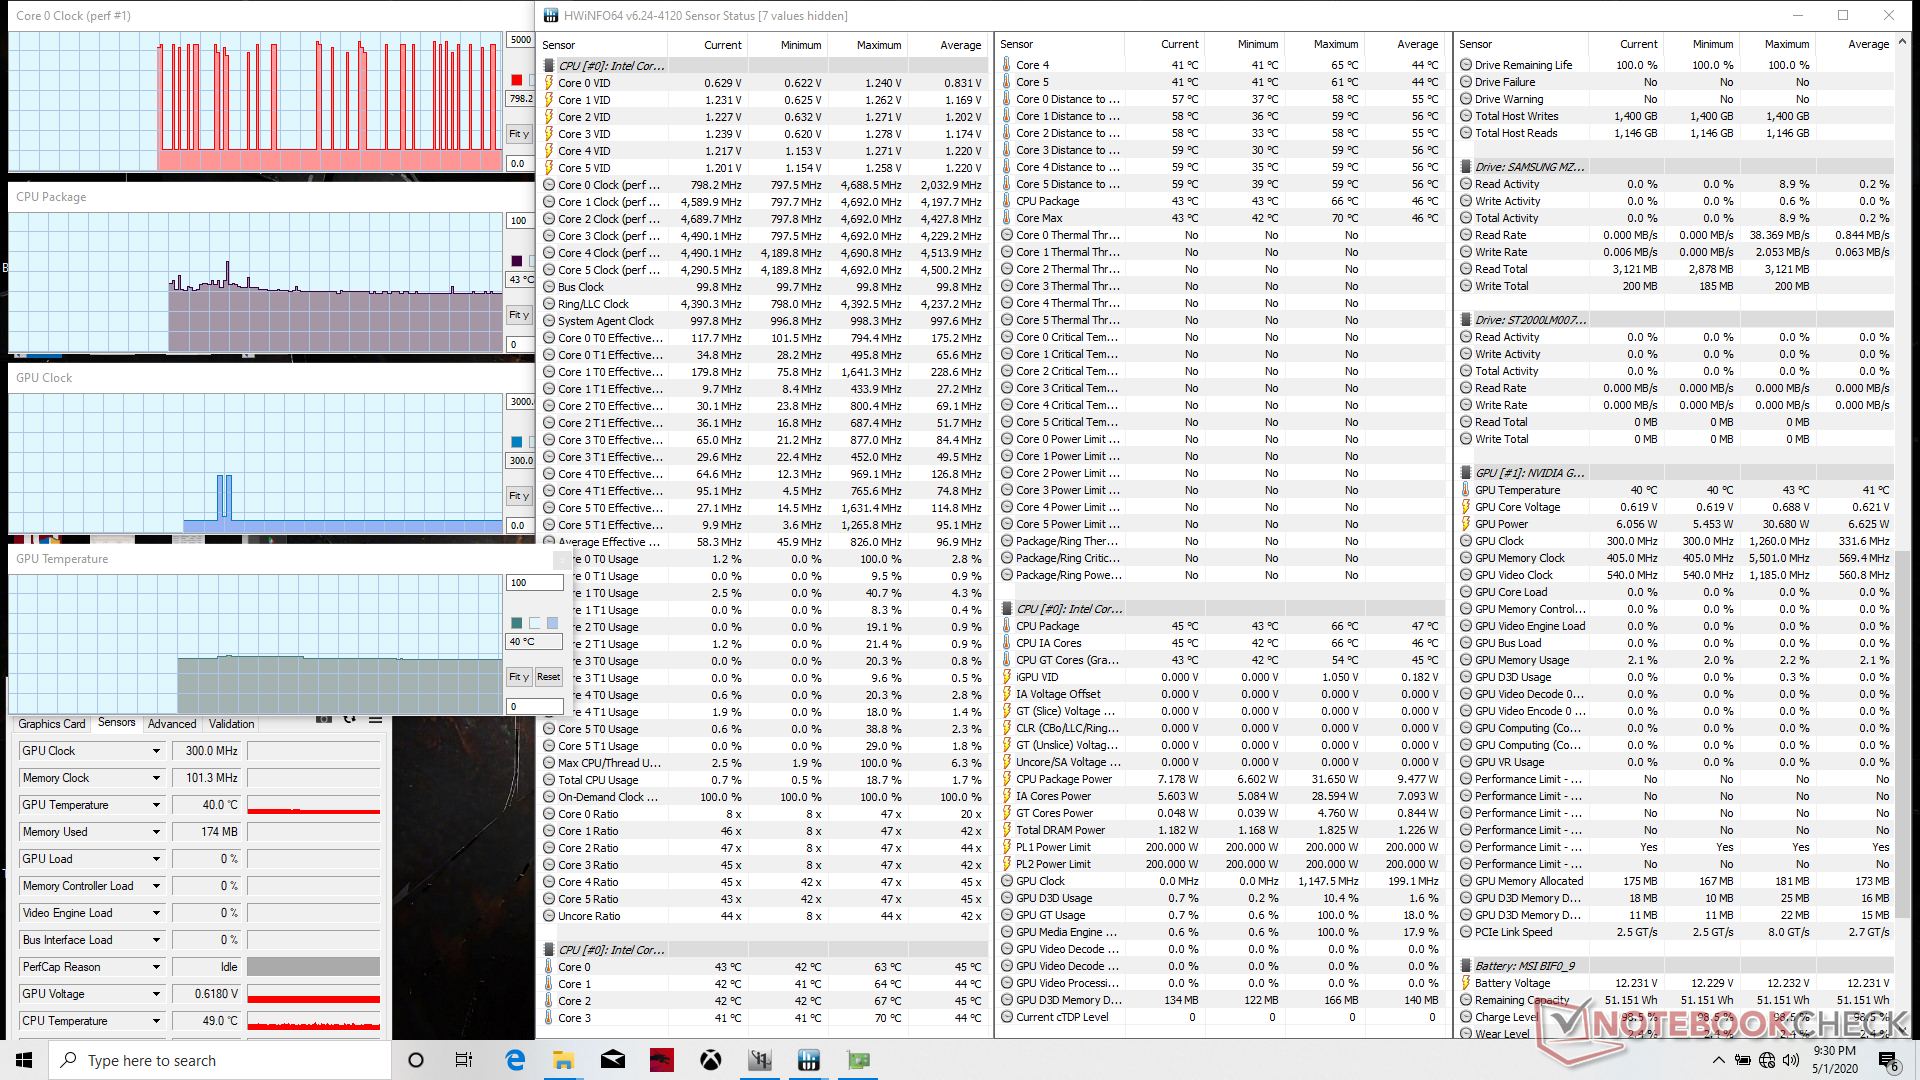
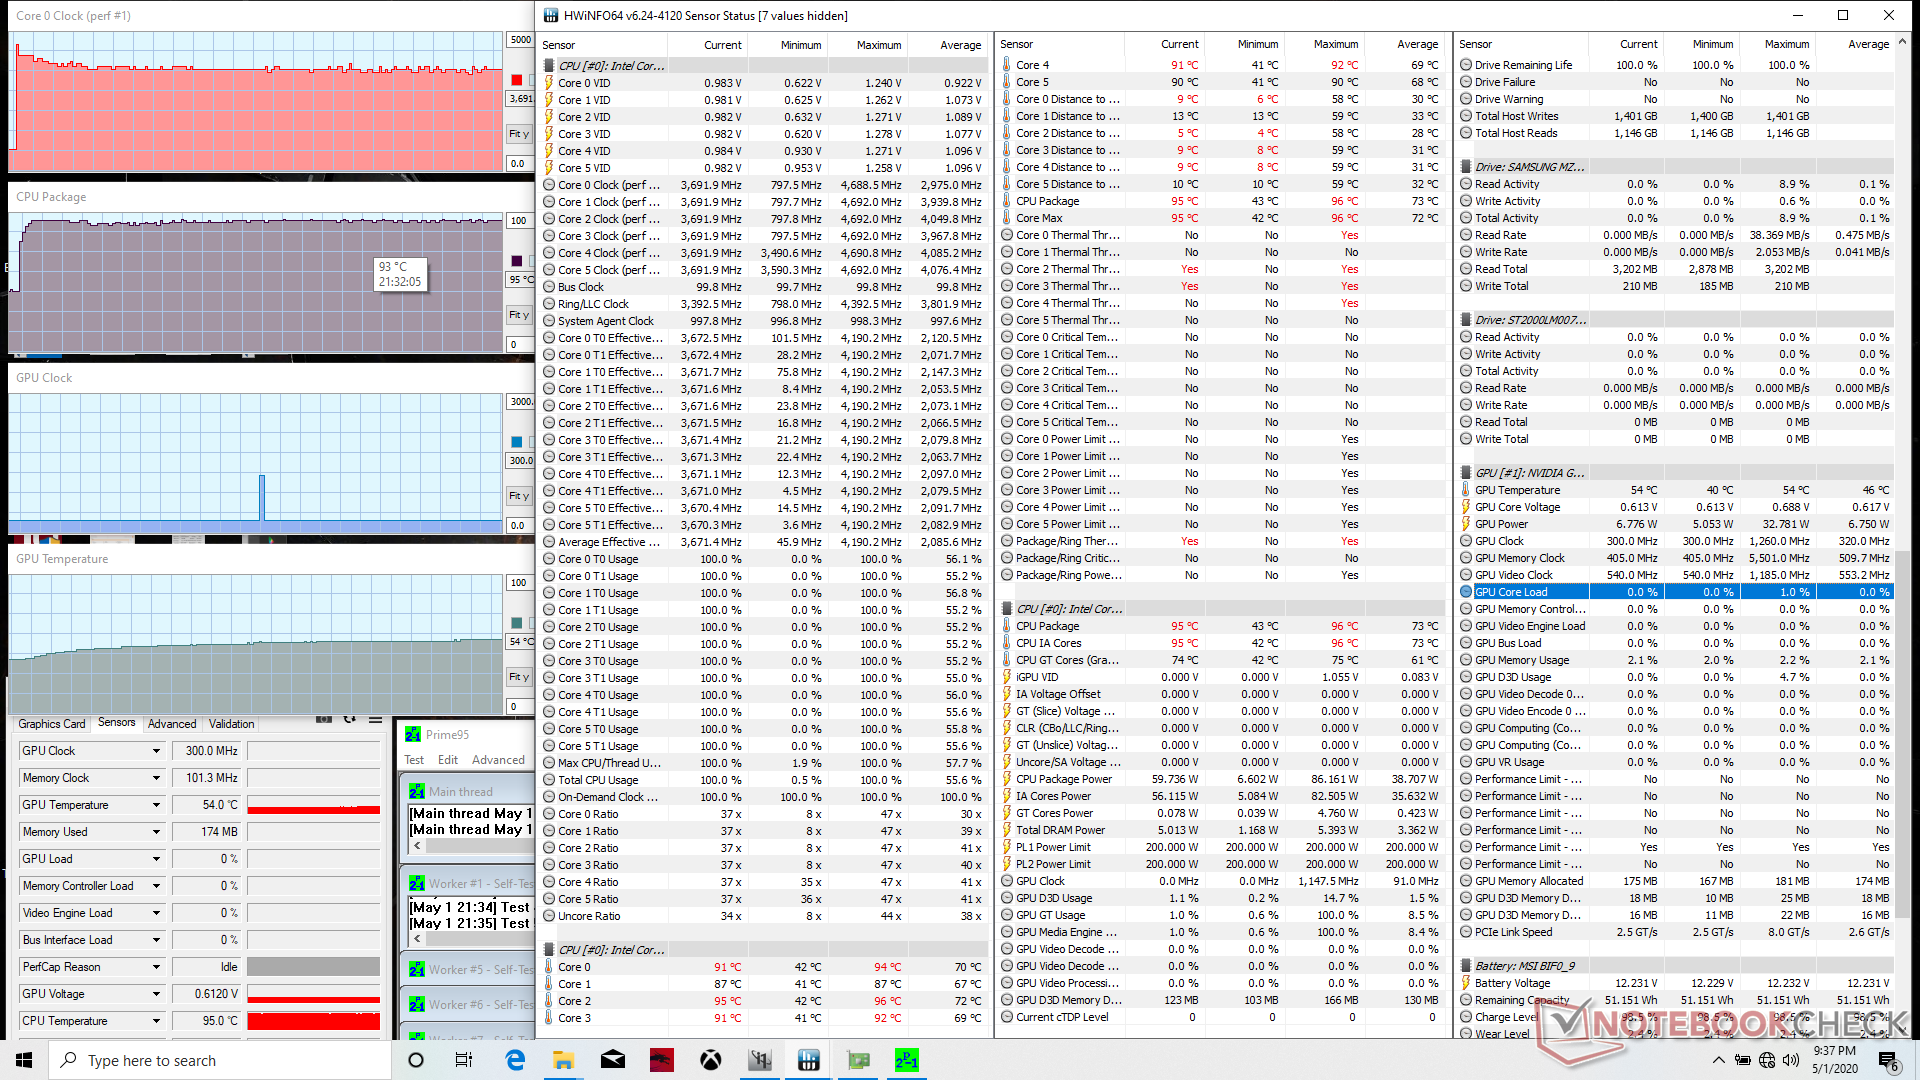
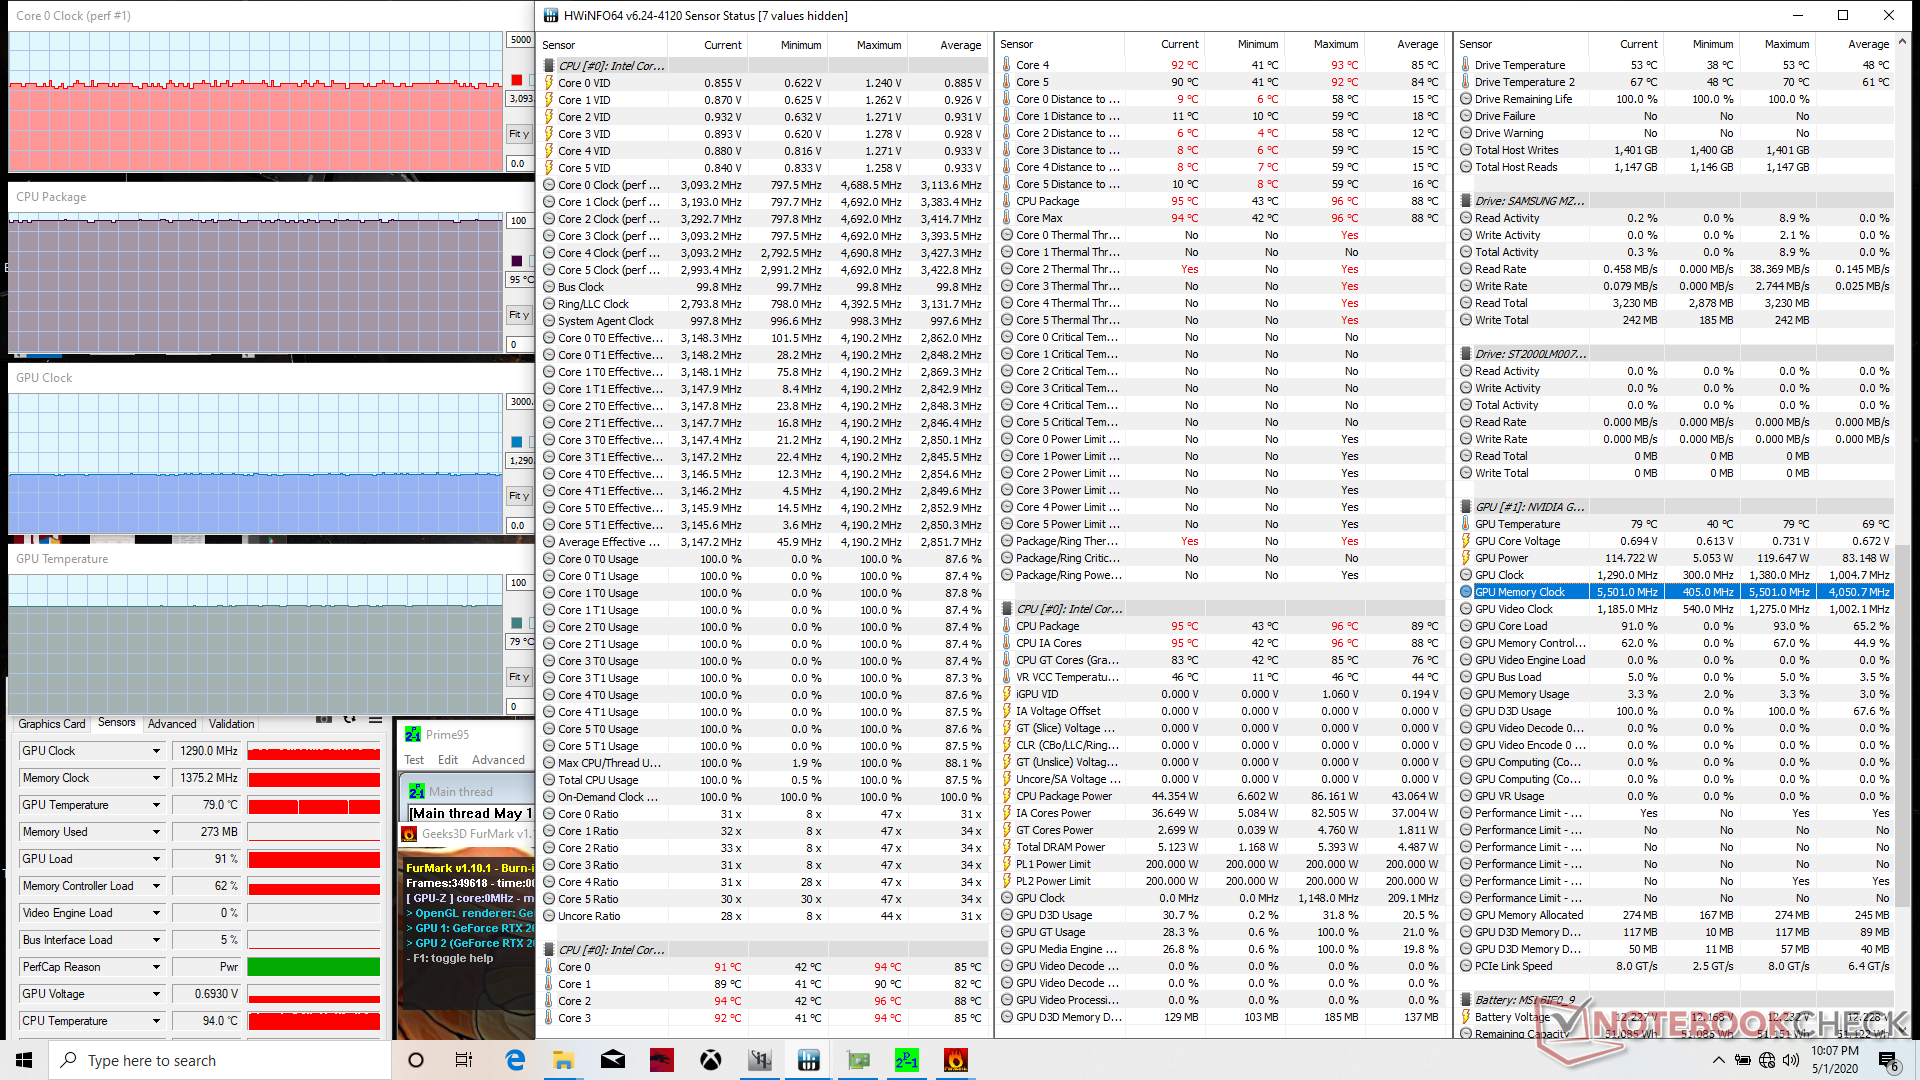
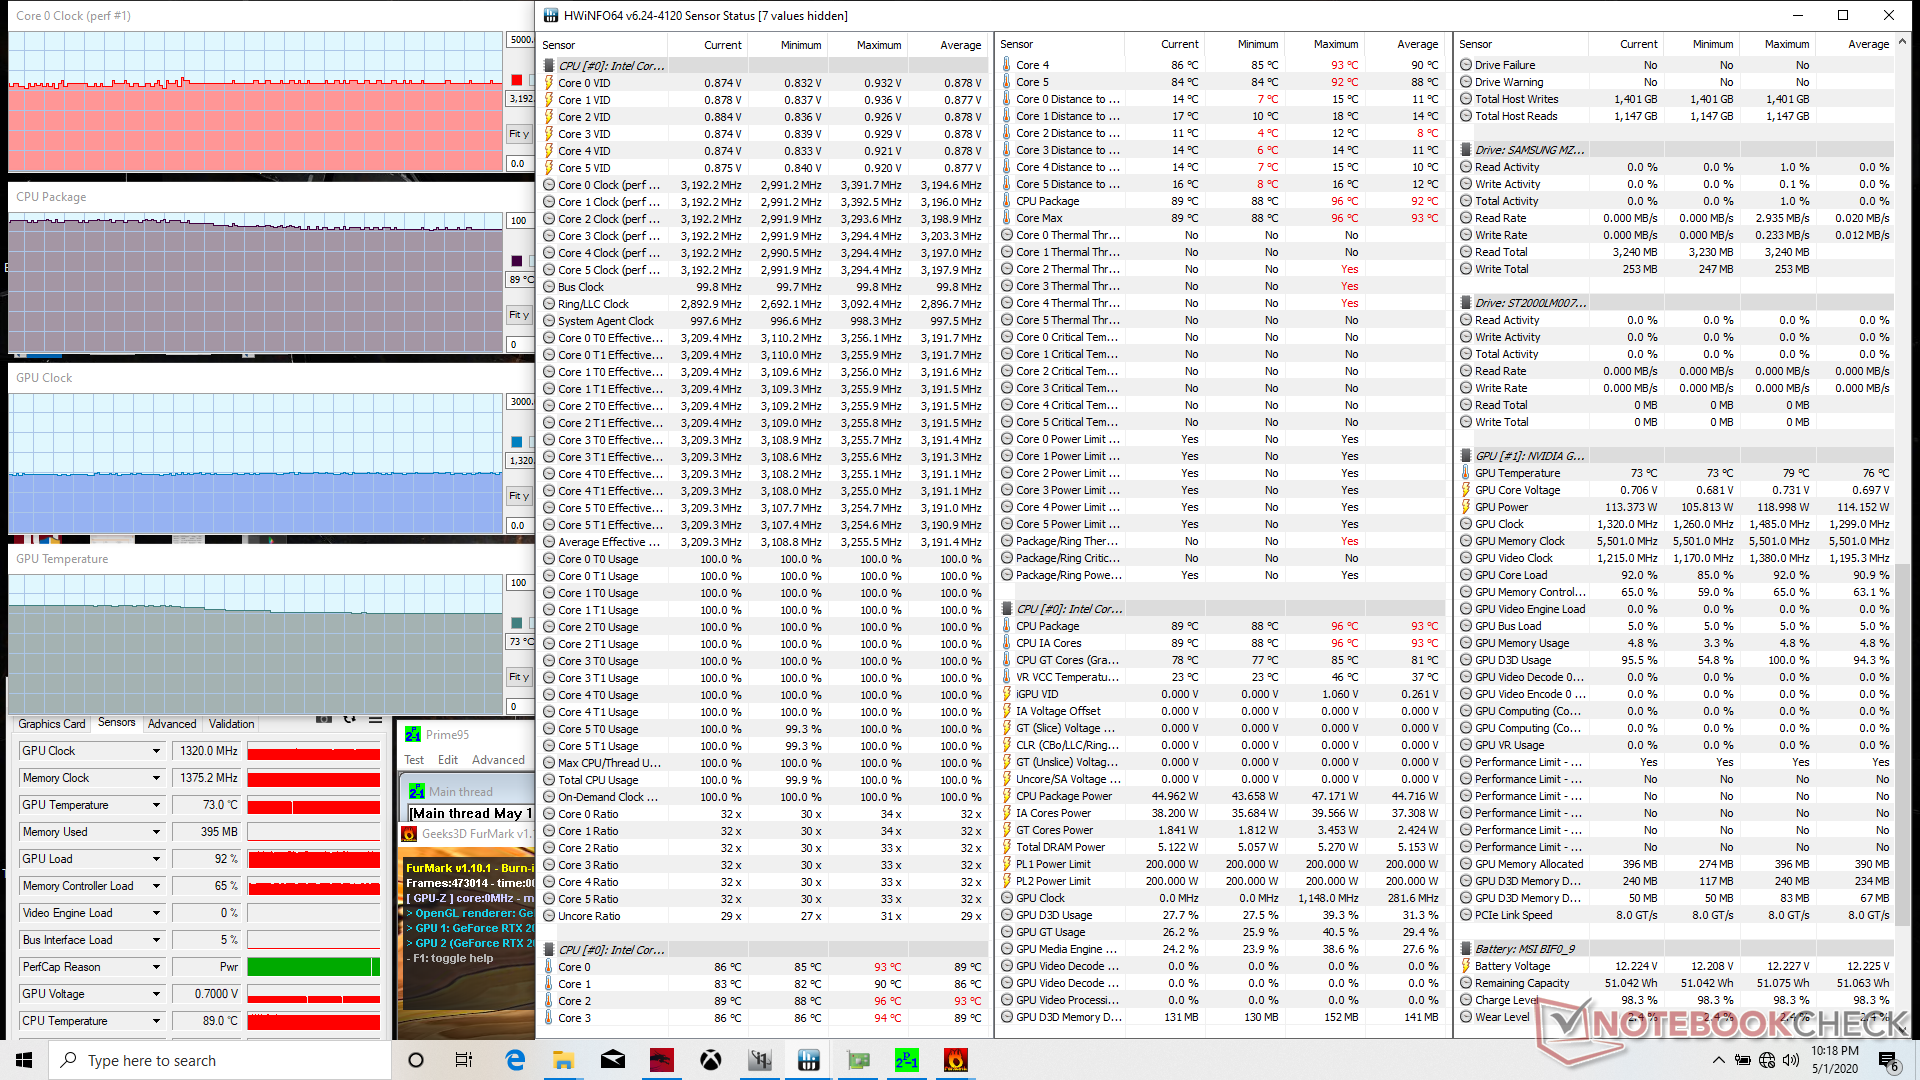
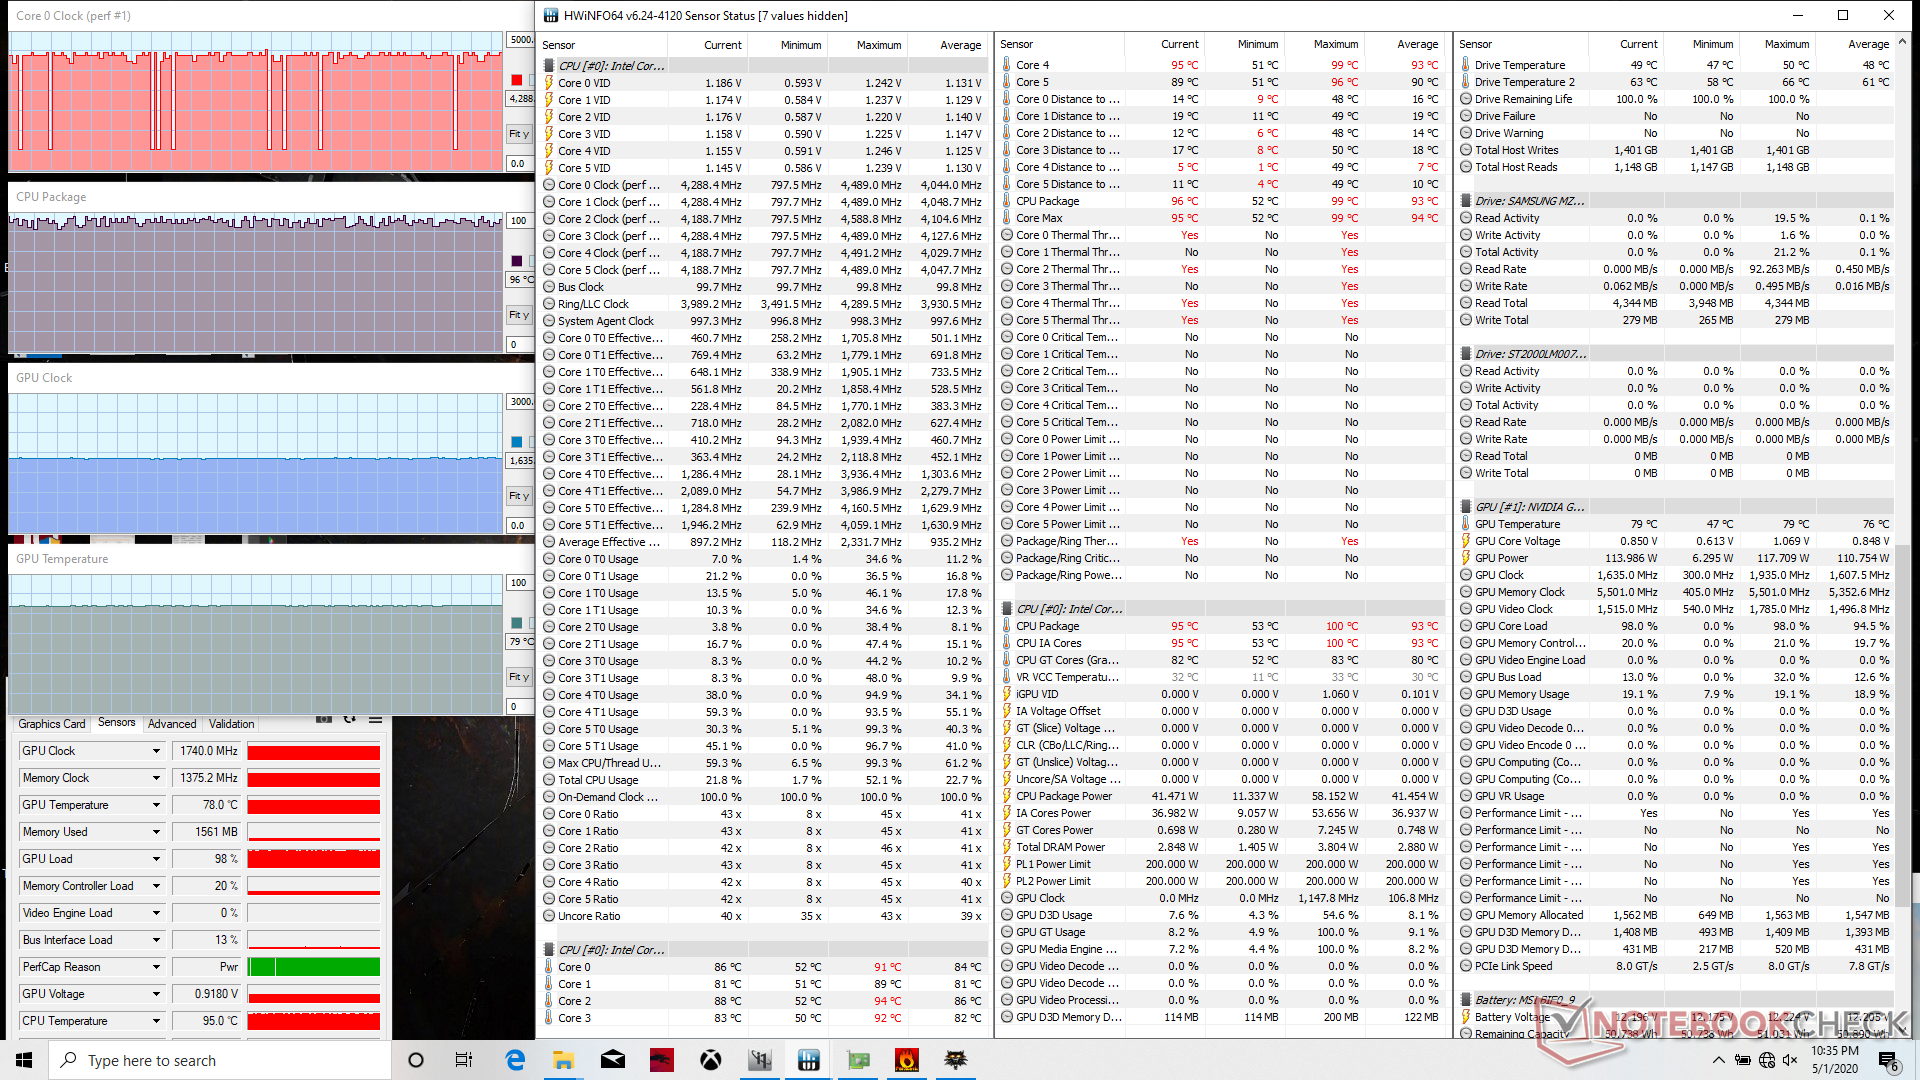
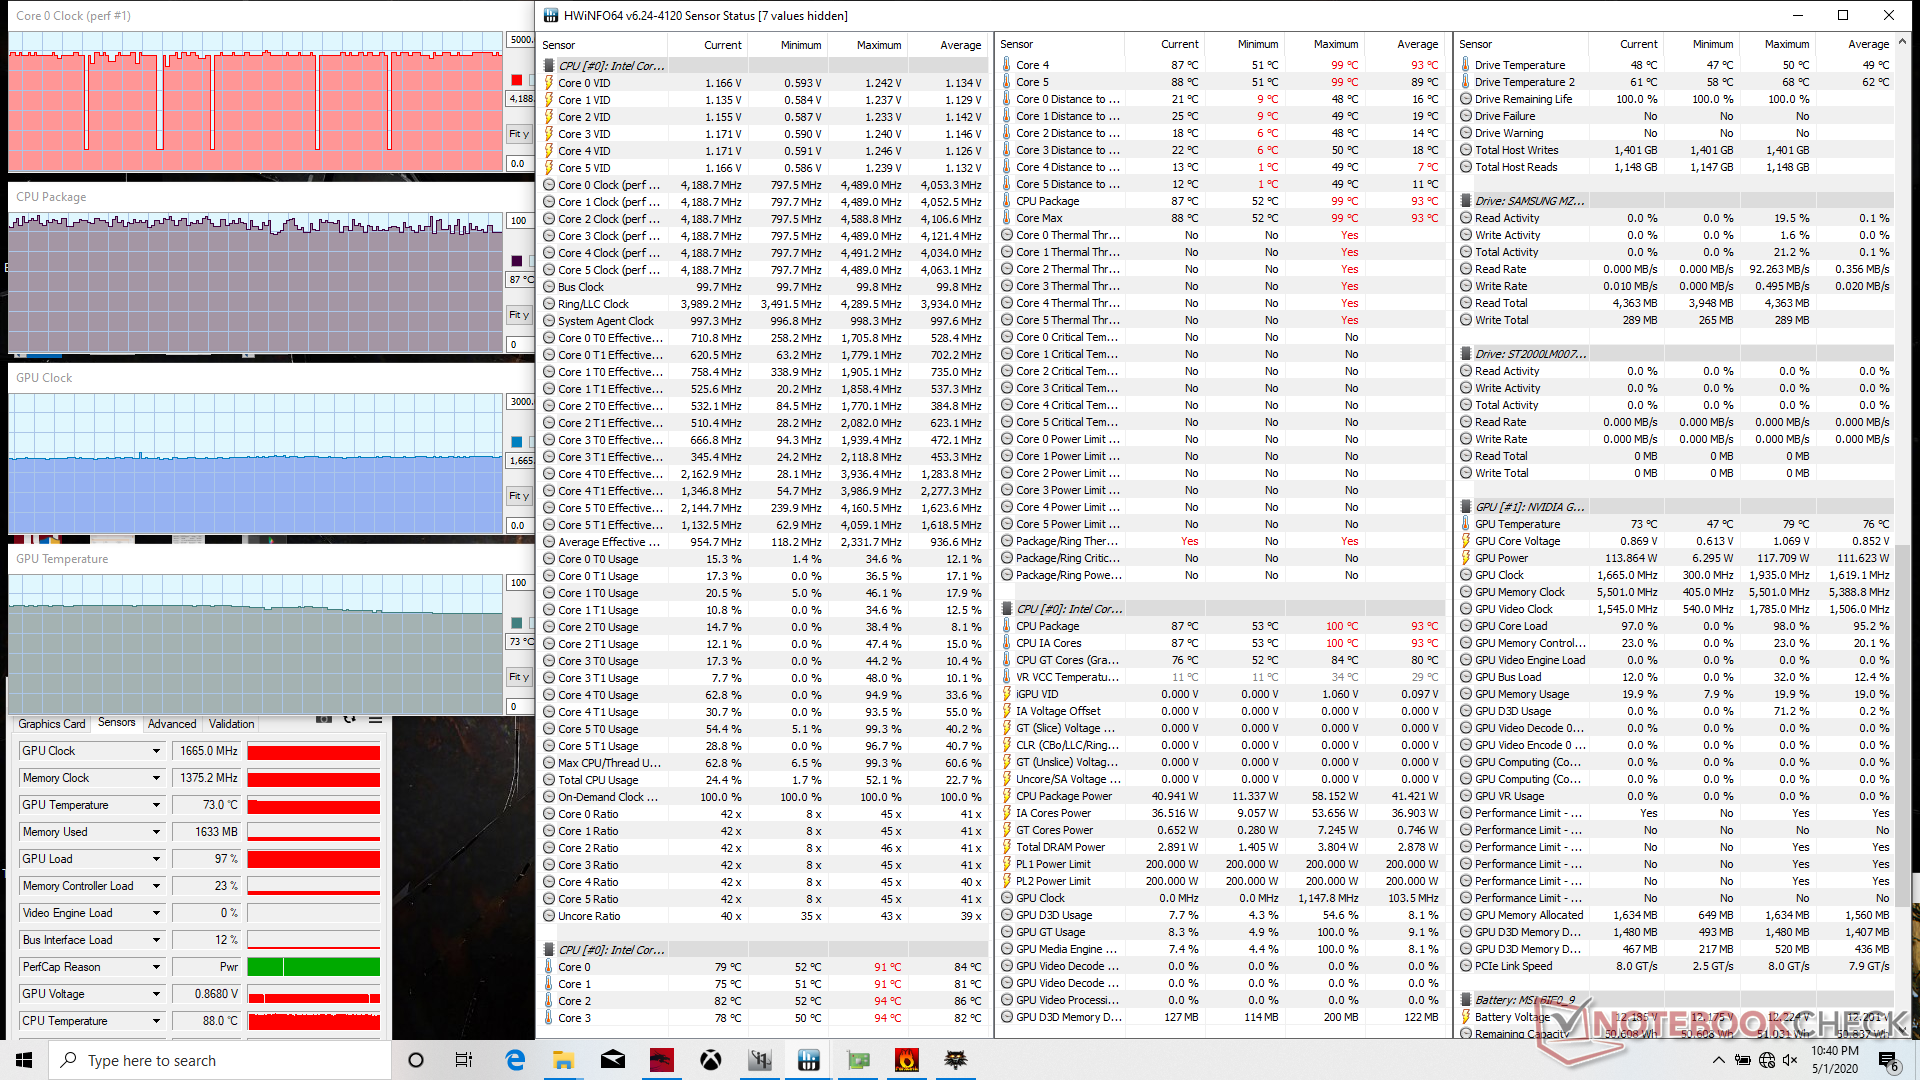

| CPU Clock (GHz) | GPU Clock (MHz) | Average CPU Temperature (°C) | Average GPU Temperature (°C) | |
| System Idle | -- | -- | 43 | 40 |
| Prime95 Stress | 3.7 | -- | 95 | 54 |
| Prime95 + FurMark Stress | 3.1 - 3.2 | 1290 | 95 | 79 |
| Prime95 + FurMark Stress (Cooler Boost on) | 3.1 - 3.2 | 1320 | 89 | 73 |
| Witcher 3 Stress | ~4.2 | 1740 | 96 | 79 |
Hoparlörler


MSI GP65 10SFK-047US ses analizi
(+) | hoparlörler nispeten yüksek sesle çalabilir (90.3 dB)
Bas 100 - 315Hz
(-) | neredeyse hiç bas yok - ortalama olarak medyandan 28.5% daha düşük
(+) | bas doğrusaldır (6.2% delta ile önceki frekans)
Ortalar 400 - 2000 Hz
(±) | azaltılmış orta sesler - ortalama olarak medyandan 8.2% daha düşük
(±) | Ortaların doğrusallığı ortalamadır (9.1% delta - önceki frekans)
Yüksekler 2 - 16 kHz
(+) | dengeli yüksekler - medyandan yalnızca 1.8% uzakta
(+) | yüksekler doğrusaldır (4% deltadan önceki frekansa)
Toplam 100 - 16.000 Hz
(±) | Genel sesin doğrusallığı ortalamadır (23.5% ortancaya göre fark)
Aynı sınıfla karşılaştırıldığında
» Bu sınıftaki tüm test edilen cihazların %85%'si daha iyi, 5% benzer, 10% daha kötüydü
» En iyisinin deltası 6% idi, ortalama 18% idi, en kötüsü 132% idi
Test edilen tüm cihazlarla karşılaştırıldığında
» Test edilen tüm cihazların %70'si daha iyi, 6 benzer, % 24 daha kötüydü
» En iyisinin deltası 4% idi, ortalama 23% idi, en kötüsü 134% idi
Apple MacBook 12 (Early 2016) 1.1 GHz ses analizi
(+) | hoparlörler nispeten yüksek sesle çalabilir (83.6 dB)
Bas 100 - 315Hz
(±) | azaltılmış bas - ortalama olarak medyandan 11.3% daha düşük
(±) | Bas doğrusallığı ortalamadır (14.2% delta - önceki frekans)
Ortalar 400 - 2000 Hz
(+) | dengeli ortalar - medyandan yalnızca 2.4% uzakta
(+) | orta frekanslar doğrusaldır (5.5% deltadan önceki frekansa)
Yüksekler 2 - 16 kHz
(+) | dengeli yüksekler - medyandan yalnızca 2% uzakta
(+) | yüksekler doğrusaldır (4.5% deltadan önceki frekansa)
Toplam 100 - 16.000 Hz
(+) | genel ses doğrusaldır (10.2% ortancaya göre fark)
Aynı sınıfla karşılaştırıldığında
» Bu sınıftaki tüm test edilen cihazların %7%'si daha iyi, 2% benzer, 91% daha kötüydü
» En iyisinin deltası 5% idi, ortalama 18% idi, en kötüsü 53% idi
Test edilen tüm cihazlarla karşılaştırıldığında
» Test edilen tüm cihazların %5'si daha iyi, 1 benzer, % 94 daha kötüydü
» En iyisinin deltası 4% idi, ortalama 23% idi, en kötüsü 134% idi
Enerji yönetimi
Güç tüketimi
GP65'teki 13 W ve 21 W ile karşılaştırıldığında, masaüstü bilgisayarlarda boşta çalışma 14 W ile 24 W arasındadır. Bu arada, Witcher 3'ü çalıştırmak GeForce RTX 2060 ile 2019 GP65'e göre ortalama 185 W ortalama yüzde 20 daha fazla tüketiyor. Tesadüfen değil, RTX 2070, lineer bir performansı temsil etmek için RTM 2060'ı 3DMark kriterlerinde yaklaşık yüzde 20 daha iyi performans gösteriyor. Hem Prime95 hem de FurMark'ı aynı anda çalıştırırken kaydedebileceğimiz maksimum değer büyük (~ 16,8 x 8,3 x 3,5 cm) 230 W AC adaptöründen 233,4 W'dir. Bu pik tüketim oranı yalnızca aşağıdaki grafiklerde gösterildiği gibi geçicidir. Her biri aynı RTX 2070 GPU ancak daha eski Core i7-9750H CPU'ya sahip Asus Strix Scar III G531GW ve Schenker XMG Pro 15 ile karşılaştırıldığında, MSI'mızın pik tüketim oranı hala Asus'un (196 W) çok üzerindedir. Schenker (245 W). İki CPU arasındaki gen-gen güç tüketimi avantajları çok küçük olacaktır.
| Kapalı / Bekleme modu | |
| Boşta | |
| Çalışırken |
|
Key:
min: | |
| MSI GP65 10SFK-047US i7-10750H, GeForce RTX 2070 Mobile, Samsung SSD PM981 MZVLB1T0HALR, IPS, 1920x1080, 15.6" | Asus Strix Scar III G531GW-AZ062T i7-9750H, GeForce RTX 2070 Mobile, Intel SSD 660p SSDPEKNW512G8, IPS, 1920x1080, 15.6" | HP Omen 15-dc1303ng i7-8750H, GeForce RTX 2070 Max-Q, Samsung SSD PM981 MZVLB256HAHQ, IPS, 1920x1080, 15.6" | MSI GP62 7REX-1045US i7-7700HQ, GeForce GTX 1050 Ti Mobile, Toshiba NVMe THNSN5128GP, TN LED, 1920x1080, 15.6" | Aorus 15-SA i7-9750H, GeForce GTX 1660 Ti Mobile, Intel SSD 760p SSDPEKKW512G8, IPS, 1920x1080, 15.6" | MSI GP65 Leopard 9SE-225US i7-9750H, GeForce RTX 2060 Mobile, Toshiba KBG30ZMT512G, IPS, 1920x1080, 15.6" | Schenker XMG Pro 15 i7-9750H, GeForce RTX 2070 Mobile, Samsung SSD 970 EVO Plus 500GB, IPS, 1920x1080, 15.6" | |
|---|---|---|---|---|---|---|---|
| Power Consumption | 11% | 12% | 22% | -4% | 8% | -4% | |
| Idle Minimum * (Watt) | 14.2 | 11.4 20% | 14.7 -4% | 14.6 -3% | 20 -41% | 13.6 4% | 15 -6% |
| Idle Average * (Watt) | 18.8 | 13.5 28% | 18.6 1% | 17.2 9% | 23 -22% | 17.9 5% | 19 -1% |
| Idle Maximum * (Watt) | 23.9 | 21.6 10% | 22.6 5% | 17.3 28% | 29 -21% | 20.6 14% | 26 -9% |
| Load Average * (Watt) | 96.9 | 106 -9% | 90 7% | 82.7 15% | 87 10% | 96 1% | 101 -4% |
| Witcher 3 ultra * (Watt) | 185 | 186 -1% | 107 42% | 136 26% | 154.6 16% | 177 4% | |
| Load Maximum * (Watt) | 233.4 | 196 16% | 120 49% | 136.7 41% | 173 26% | 218.6 6% | 245 -5% |
* ... daha küçük daha iyidir
Pil ömrü
Çalışma zamanları, geçen yılki GP65'te gözlemlediğimizle neredeyse aynı, yani kullanıcılar 4 saatten daha az gerçek dünya WLAN kullanımı bekleyebilirler. Boştan tam kapasiteye şarj etmek 2 saatin biraz altında sürer. Asus Zephyrus M'nin aksine sistem USB Type-C ile şarj edilemez.
| MSI GP65 10SFK-047US i7-10750H, GeForce RTX 2070 Mobile, 51 Wh | Asus Strix Scar III G531GW-AZ062T i7-9750H, GeForce RTX 2070 Mobile, 66 Wh | Asus TUF FX505DT-EB73 R7 3750H, GeForce GTX 1650 Mobile, 48 Wh | HP Omen 15-dc1303ng i7-8750H, GeForce RTX 2070 Max-Q, 70 Wh | MSI GP62 7REX-1045US i7-7700HQ, GeForce GTX 1050 Ti Mobile, 41 Wh | Aorus 15-SA i7-9750H, GeForce GTX 1660 Ti Mobile, 62 Wh | MSI GP65 Leopard 9SE-225US i7-9750H, GeForce RTX 2060 Mobile, 51 Wh | |
|---|---|---|---|---|---|---|---|
| Pil Çalışma Süresi | 51% | 30% | -11% | -22% | -24% | 5% | |
| WiFi v1.3 (h) | 3.7 | 5.6 51% | 4.8 30% | 3.3 -11% | 2.9 -22% | 2.8 -24% | 3.9 5% |
| Reader / Idle (h) | 7.8 | 5 | 4.3 | 3.5 | 6 | ||
| Load (h) | 1.5 | 1.2 | 0.7 | 2 | 1.1 |
Artılar
Eksiler
Karar

Comet Lake-U serisinde, üst düzey Comet Lake-U Core i7-10710U'yu seçmediğiniz sürece, onunla giden Whisky Lake-U serisi arasındaki genler arası performans farklılıkları minimumdur. Aksi takdirde, Core i7-10510U gibi daha az seçenek, eski Core i7-8565U ile hemen hemen aynı performansı gösterecektir. Core i7-10750H, Core i7-9750H'ye, özellikle oyunların CPU'nun bağlı olduğundan GPU'ya bağlı olma olasılığı daha yüksek olduğunda, herhangi bir farkın fark edilmeyeceği noktaya kadar çok yakın bir performans sergiliyor. Bunun yerine, kullanıcılar Core i7-9750H'ye göre önemli ham performans kazançları için üst seviye Core i7-10875H seçeneğini göz önünde bulundurmak zorunda kalacaklar.Ancak en meraklıların duymak istediği haberler olmasa da, eski sürümlerini yükseltmek isteyen oyuncular için iyi bir haber dizüstü bilgisayarlar. 10. nesil Comet Lake-H'nin orta menzilli SKU düzeyinde 9. nesil Coffee Lake-H'den çok az daha hızlı olması, 9. nesil Intel oyun dizüstü bilgisayarına geçebileceğiniz ve yine de daha pahalı bir oyun deneyimine sahip olabileceğiniz anlamına gelir. 10. nesil Intel modeli. Tasarruf edilen para, dizüstü bilgisayarın ekran veya RAM gibi daha somut yönlerini veya MSI GS65, GE65 veya GS65 gibi daha iyi bir modeli yükseltmek için kullanılabilir. MSI GP65 10SFK, geçen yılki GP65 9SE ile aynı dizüstü bilgisayar biraz daha hızlı ve daha yeni bir işlemci. Kullanıcılar, Coffee Lake-H CPU'suna sadık kalarak heyecan verici özelliklerden veya muazzam performans avantajlarından yoksun kalmayacaklar.
MSI GP65 10SFK-047US
- 05/06/2020 v7 (old)
Allen Ngo
Price comparison

