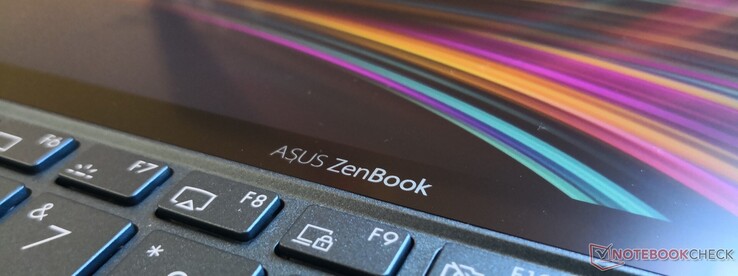
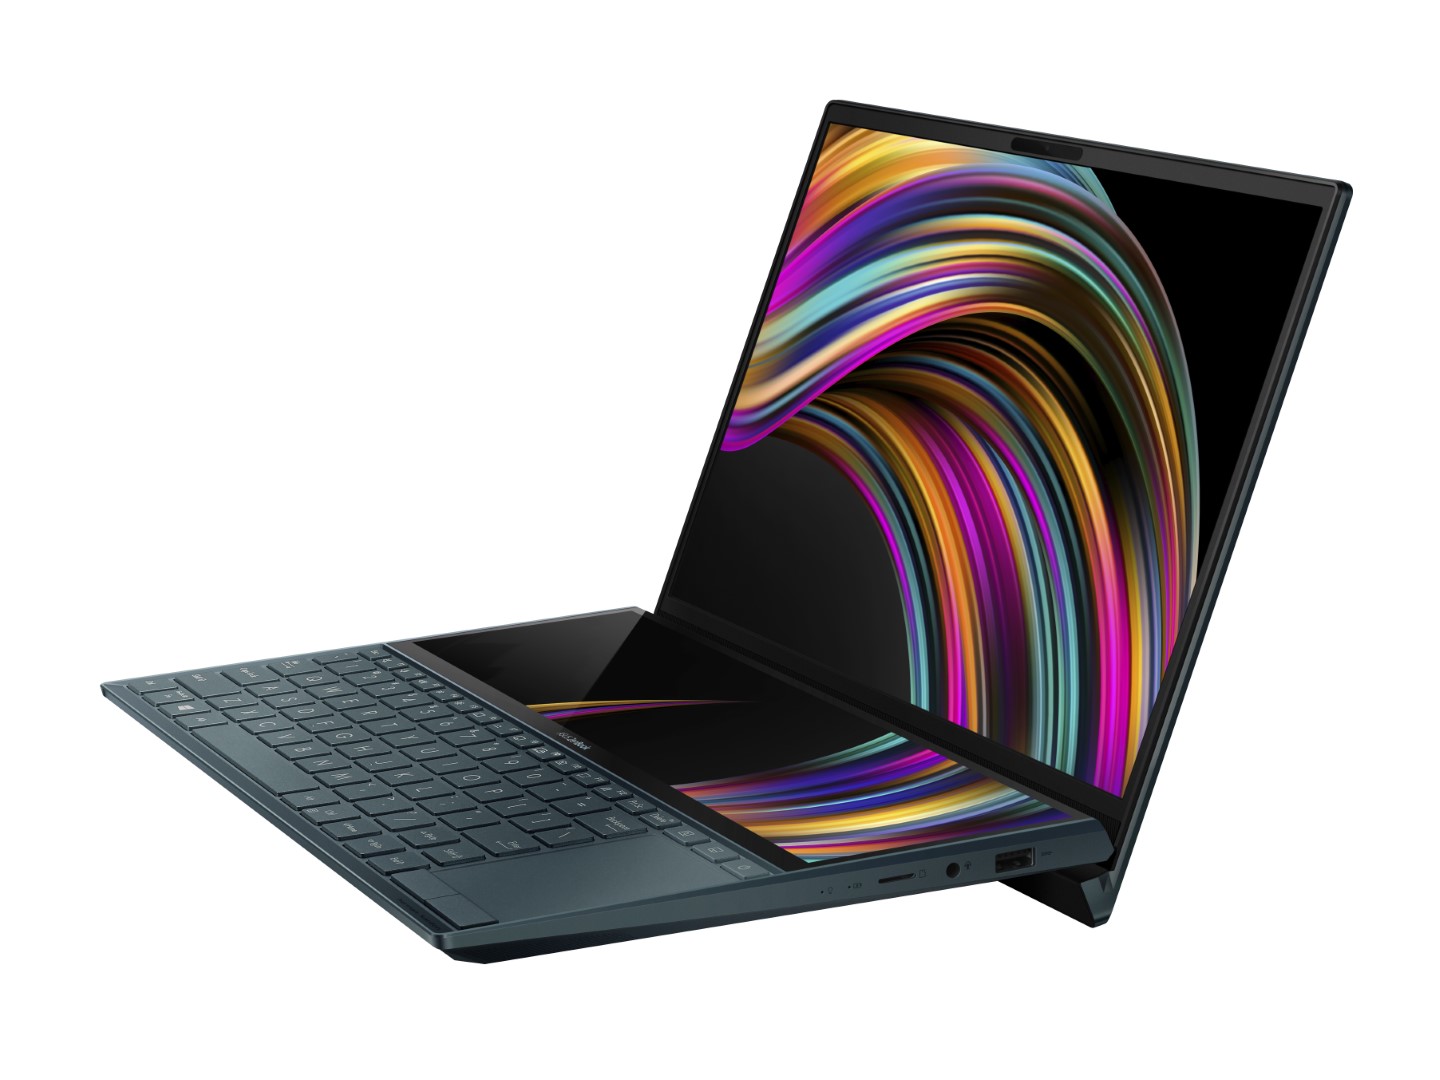
Apple Touch Bar gibi ama daha iyisi: Asus ZenBook Duo UX481 Laptop incelemesi
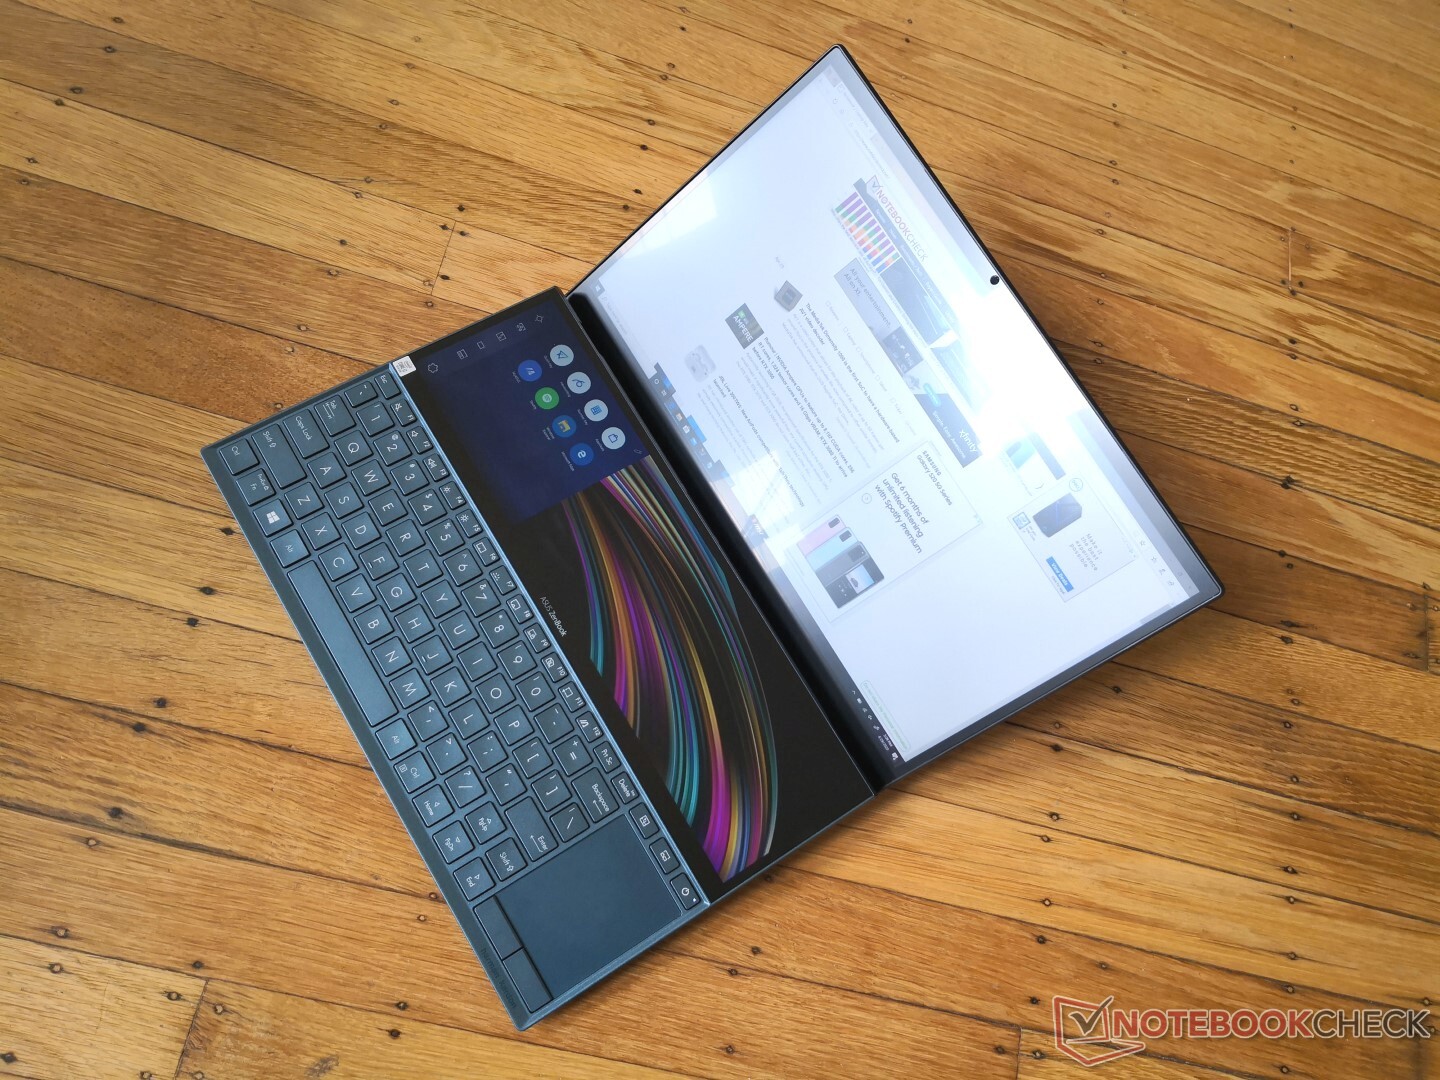
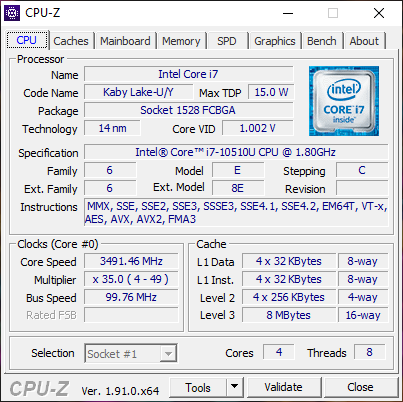
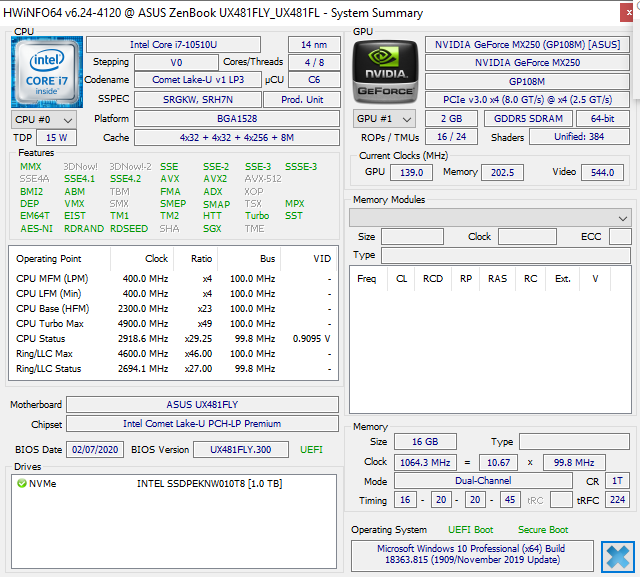
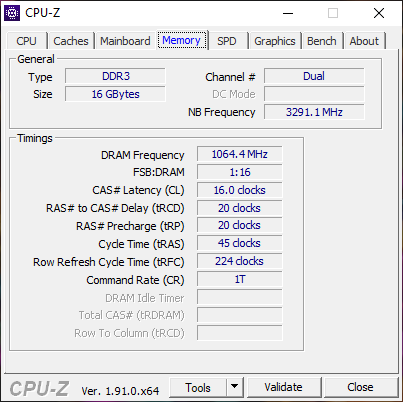
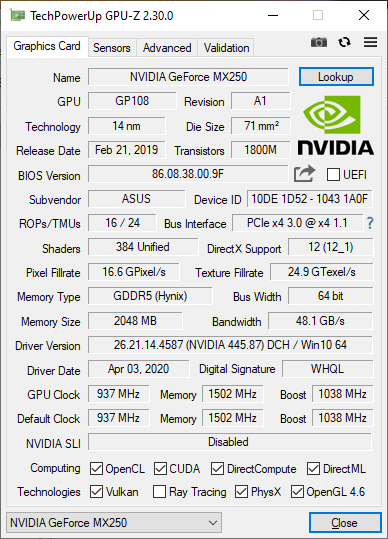
15.6 inç ZenBook Pro Duo 15 incelememizde, ikincil ScreenPad ekranının 14 inçlik bir form faktöründe daha iyi çalışabileceğini, çünkü kullanıcıların tam boyutlu 15.6'dan 14 inçlik bir alt not defteri ile seyahat etme olasılıklarının daha yüksek olacağını belirtti. -inç modeli. Asus görünüşe göre aynı şeyi düşünüyordu - 14 inç ZenBook Duo, daha büyük kardeşinde bulunan Core H serisi CPU ve GeForce GTX GPU'nun yerini daha fazla güç tasarrufu sağlayan Core U serisi ve GeForce MX parçalarıyla değiştiriyor. Basitçe söylemek gerekirse, ZenBook Duo UX481, üst düzey ZenBook Pro 15'in görünümünü ve özelliklerini uygun fiyatlı bir VivoBook S15 işlemcileri ile birleştiriyor. Test ettiğimiz ünite bir Core i7-10510U Comet Lake-U CPU ile tamamen dolu geliyor, GeForce MX250 GPU, 16 GB LPDDR3 RAM ve 1 TB Intel NVMe SSD 1500 $ karşılığında. 14 inç 1080p birincil dokunmatik ekran ve 12,6 inç ikincil (1920 x 515) dokunmatik ekran tüm yapılandırmalarda standarttır. Amazon ve B gibi perakendeciler
Derecelendirme | Tarih | Modeli | Ağırlık | Yükseklik | Boyut | Çözünürlük | Fiyat |
|---|---|---|---|---|---|---|---|
| 82.7 % v7 (old) | 05/2020 | Asus ZenBook Duo UX481FL i7-10510U, GeForce MX250 | 1.8 kg | 19 mm | 14.00" | 1920x1080 | |
| 84.2 % v7 (old) | 05/2020 | MSI Prestige 14 A10SC-009 i7-10710U, GeForce GTX 1650 Max-Q | 1.3 kg | 16 mm | 14.00" | 3840x2160 | |
| 85 % v6 (old) | 06/2019 | Lenovo IdeaPad S940-14IWL i7-8565U, UHD Graphics 620 | 1.2 kg | 12 mm | 14.00" | 3840x2160 | |
| 84 % v7 (old) | 03/2020 | Microsoft Surface Laptop 3 13 Core i5-1035G7 i5-1035G7, Iris Plus Graphics G7 (Ice Lake 64 EU) | 1.3 kg | 14.5 mm | 13.50" | 2256x1504 | |
| 81.2 % v7 (old) | 02/2020 | Asus ZenBook 14 UM431DA-AM020T R7 3700U, Vega 10 | 1.4 kg | 16 mm | 14.00" | 1920x1080 |
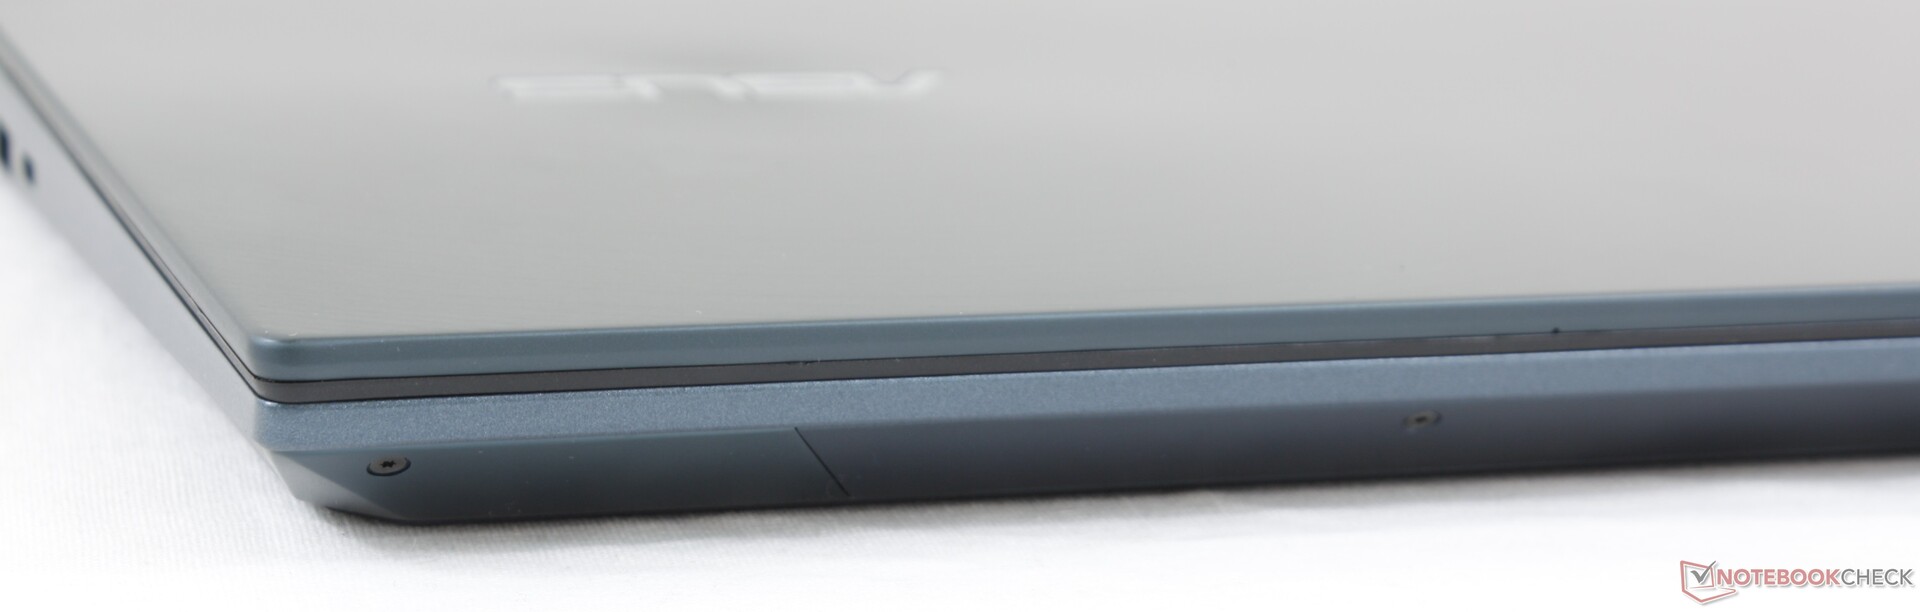
Kasa
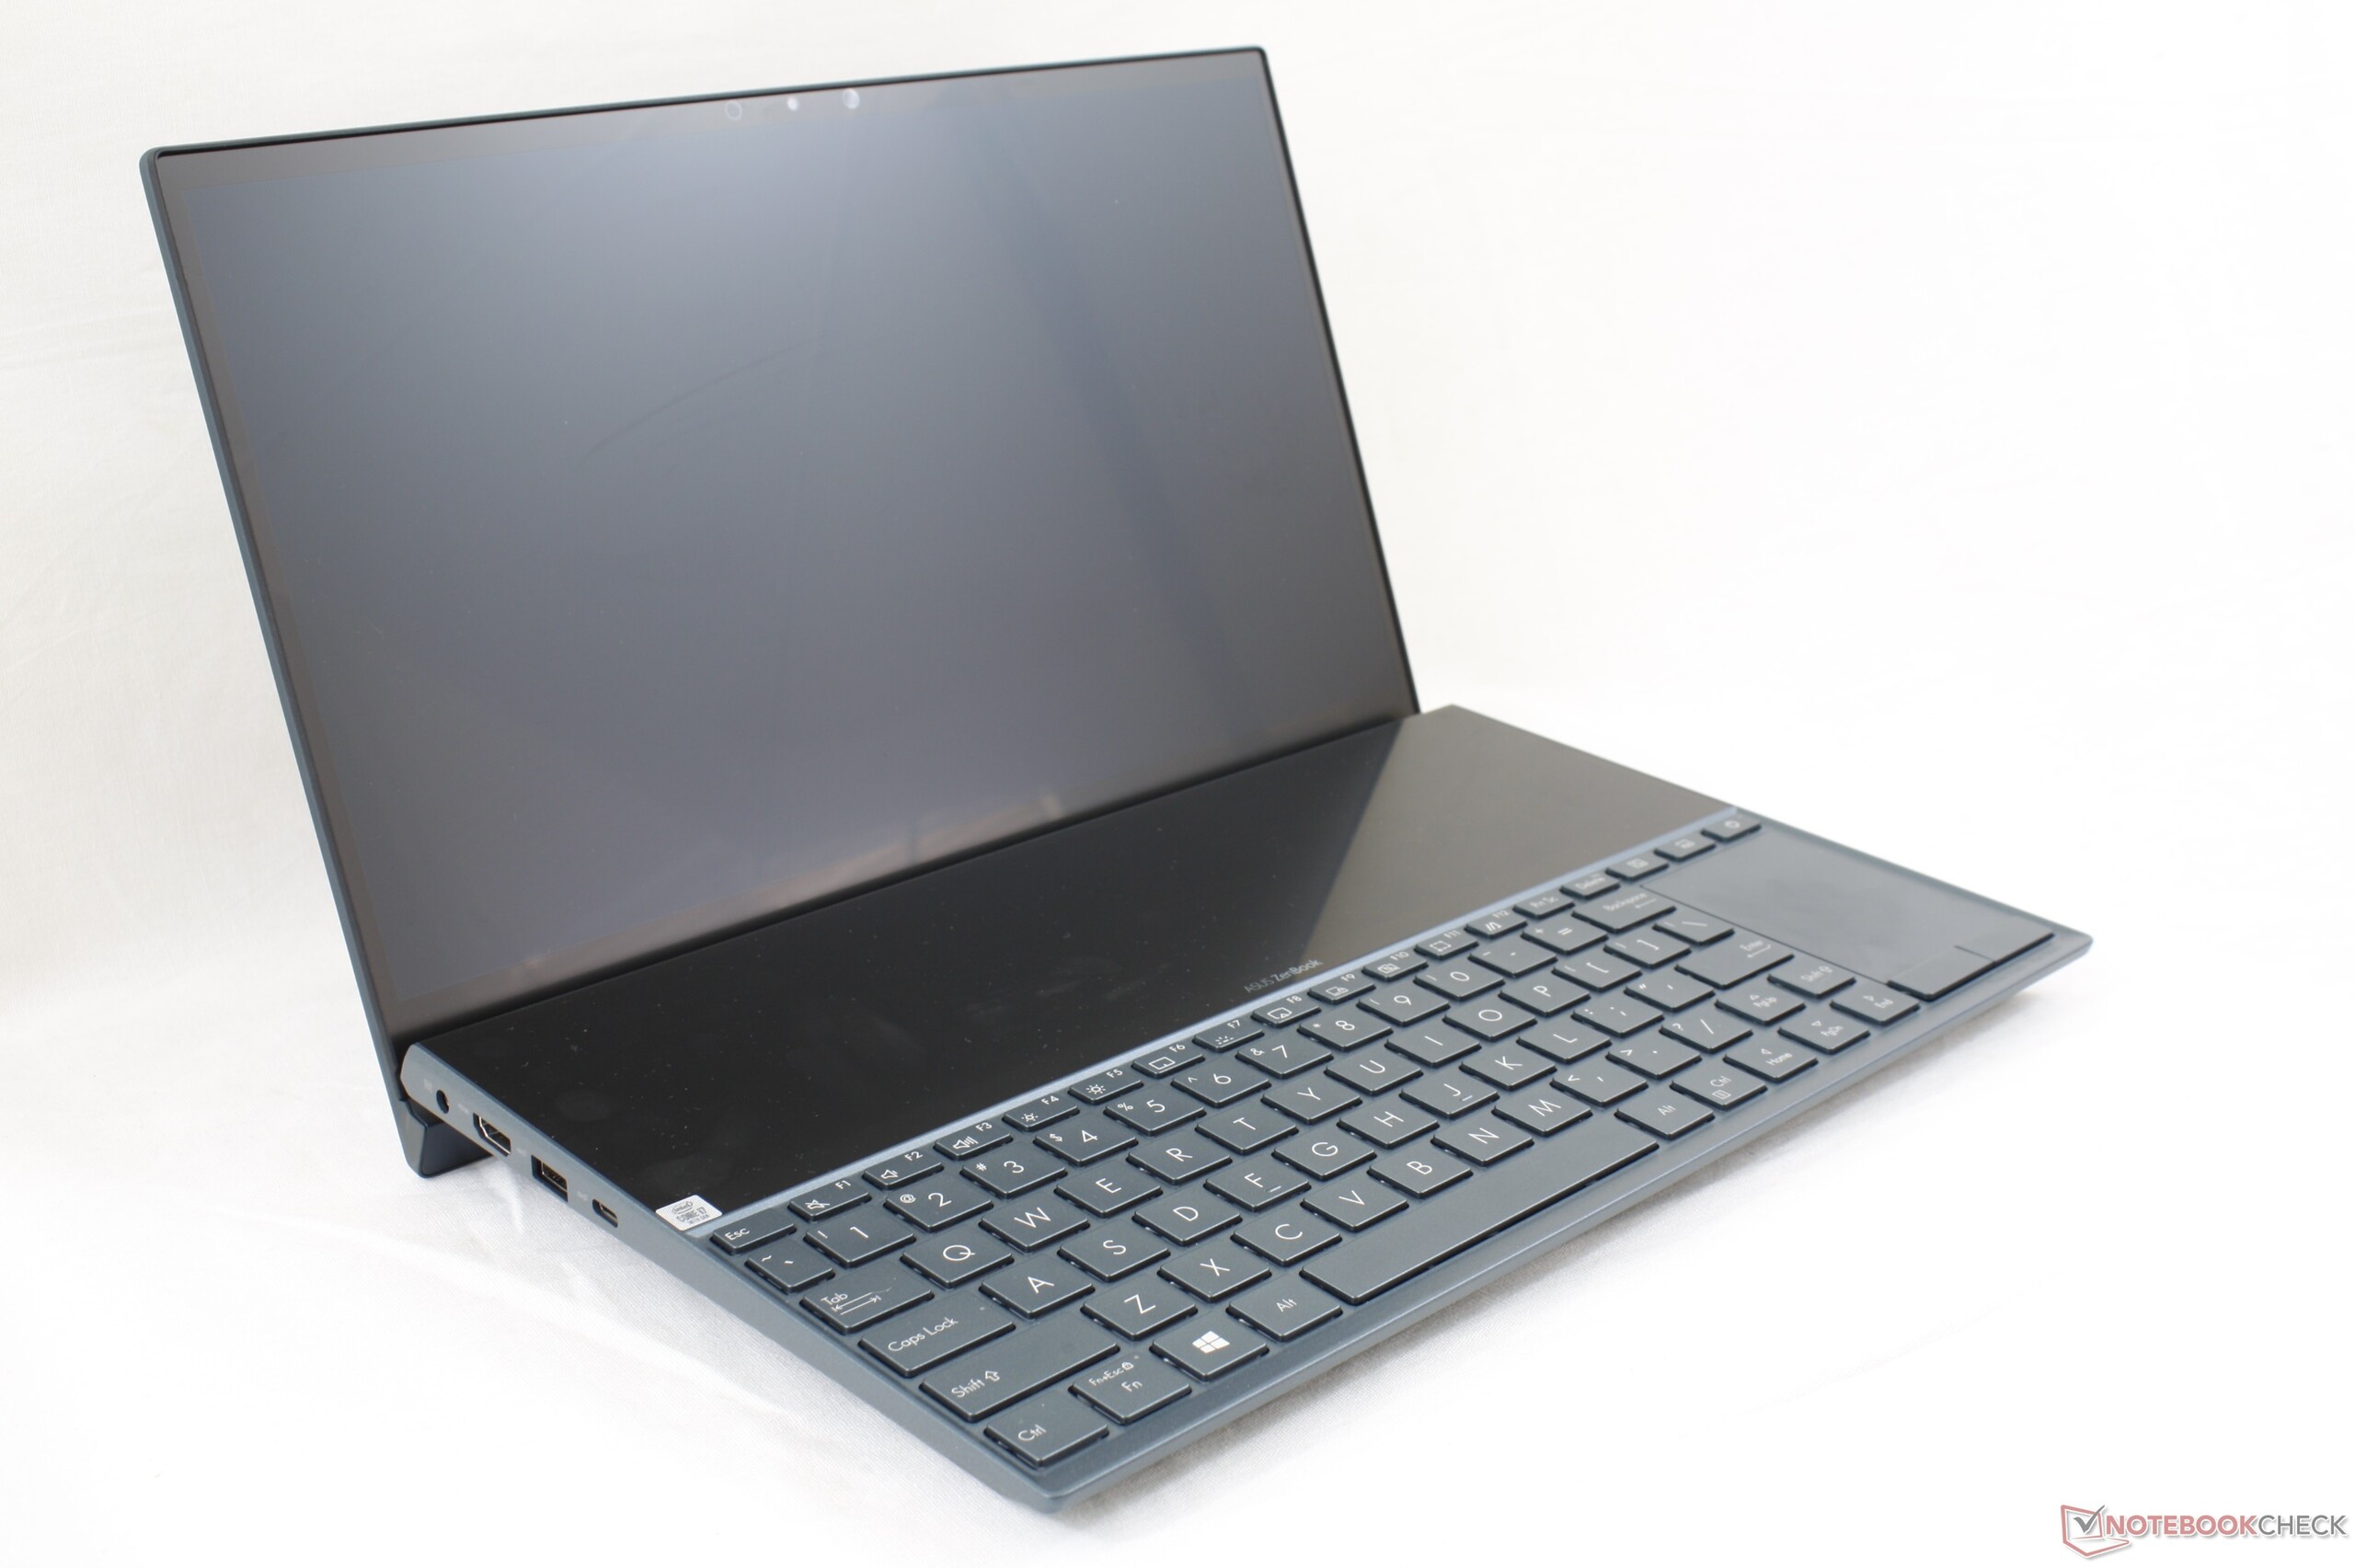
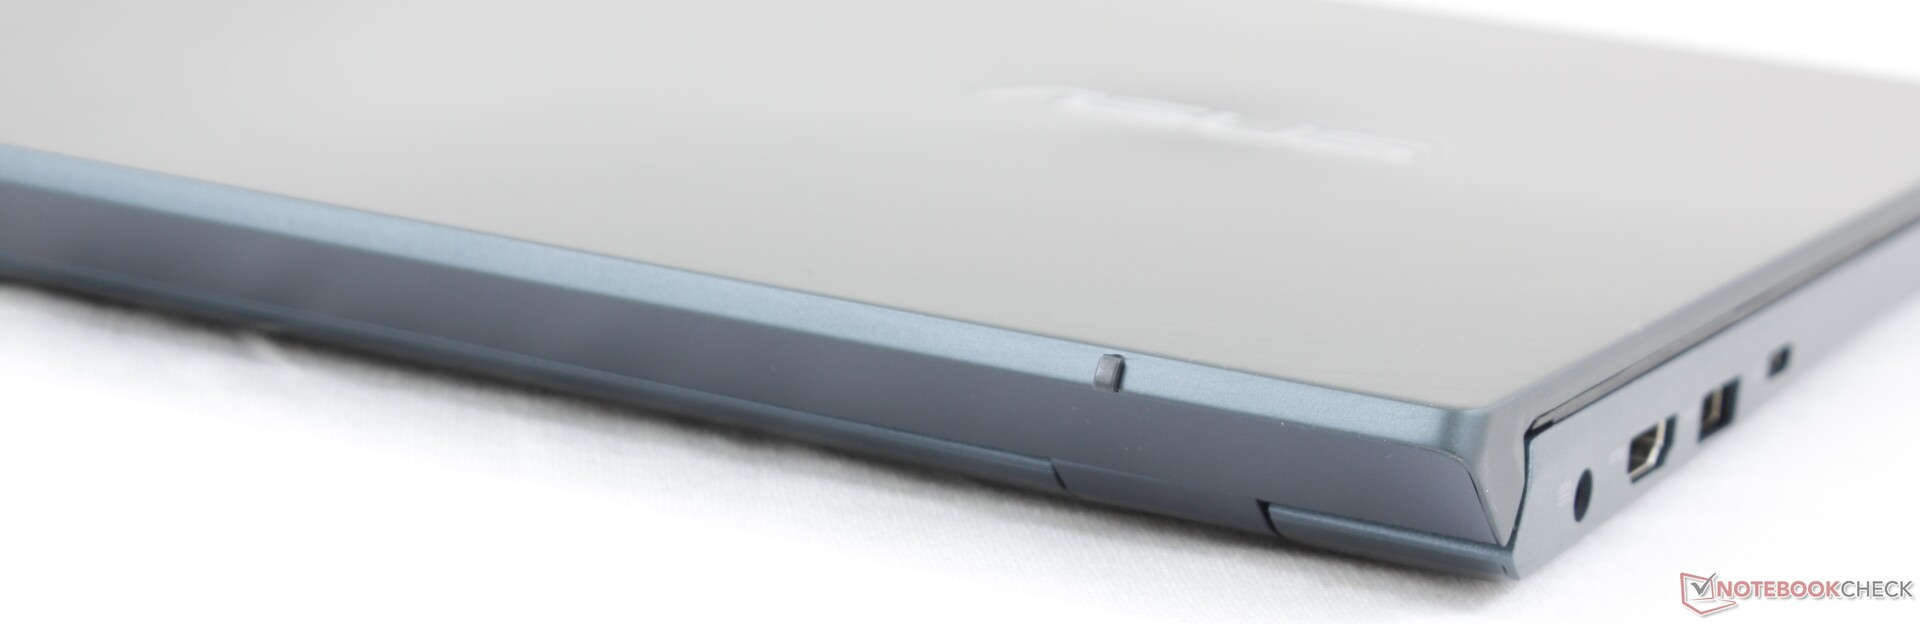
Şasi en iyi şekilde minyatür bir ZenBook Pro Duo olarak tanımlanabilir. Asus, orijinalin sağlam yapısını ve izlenimini korurken, devasa 15.6 inçlik versiyonu daha yönetilebilir 14 inçlik bir boyuta daralttı. Özellikle kapak, Acer Aspire A514 veya MSI Prestige 14 gibi diğer birçok alt defterdeki kapaklardan daha güçlü ve bükülmeye ve bükülmeye karşı daha dayanıklıdır. ve sıkıca paketlenmiş bileşenler içinde.
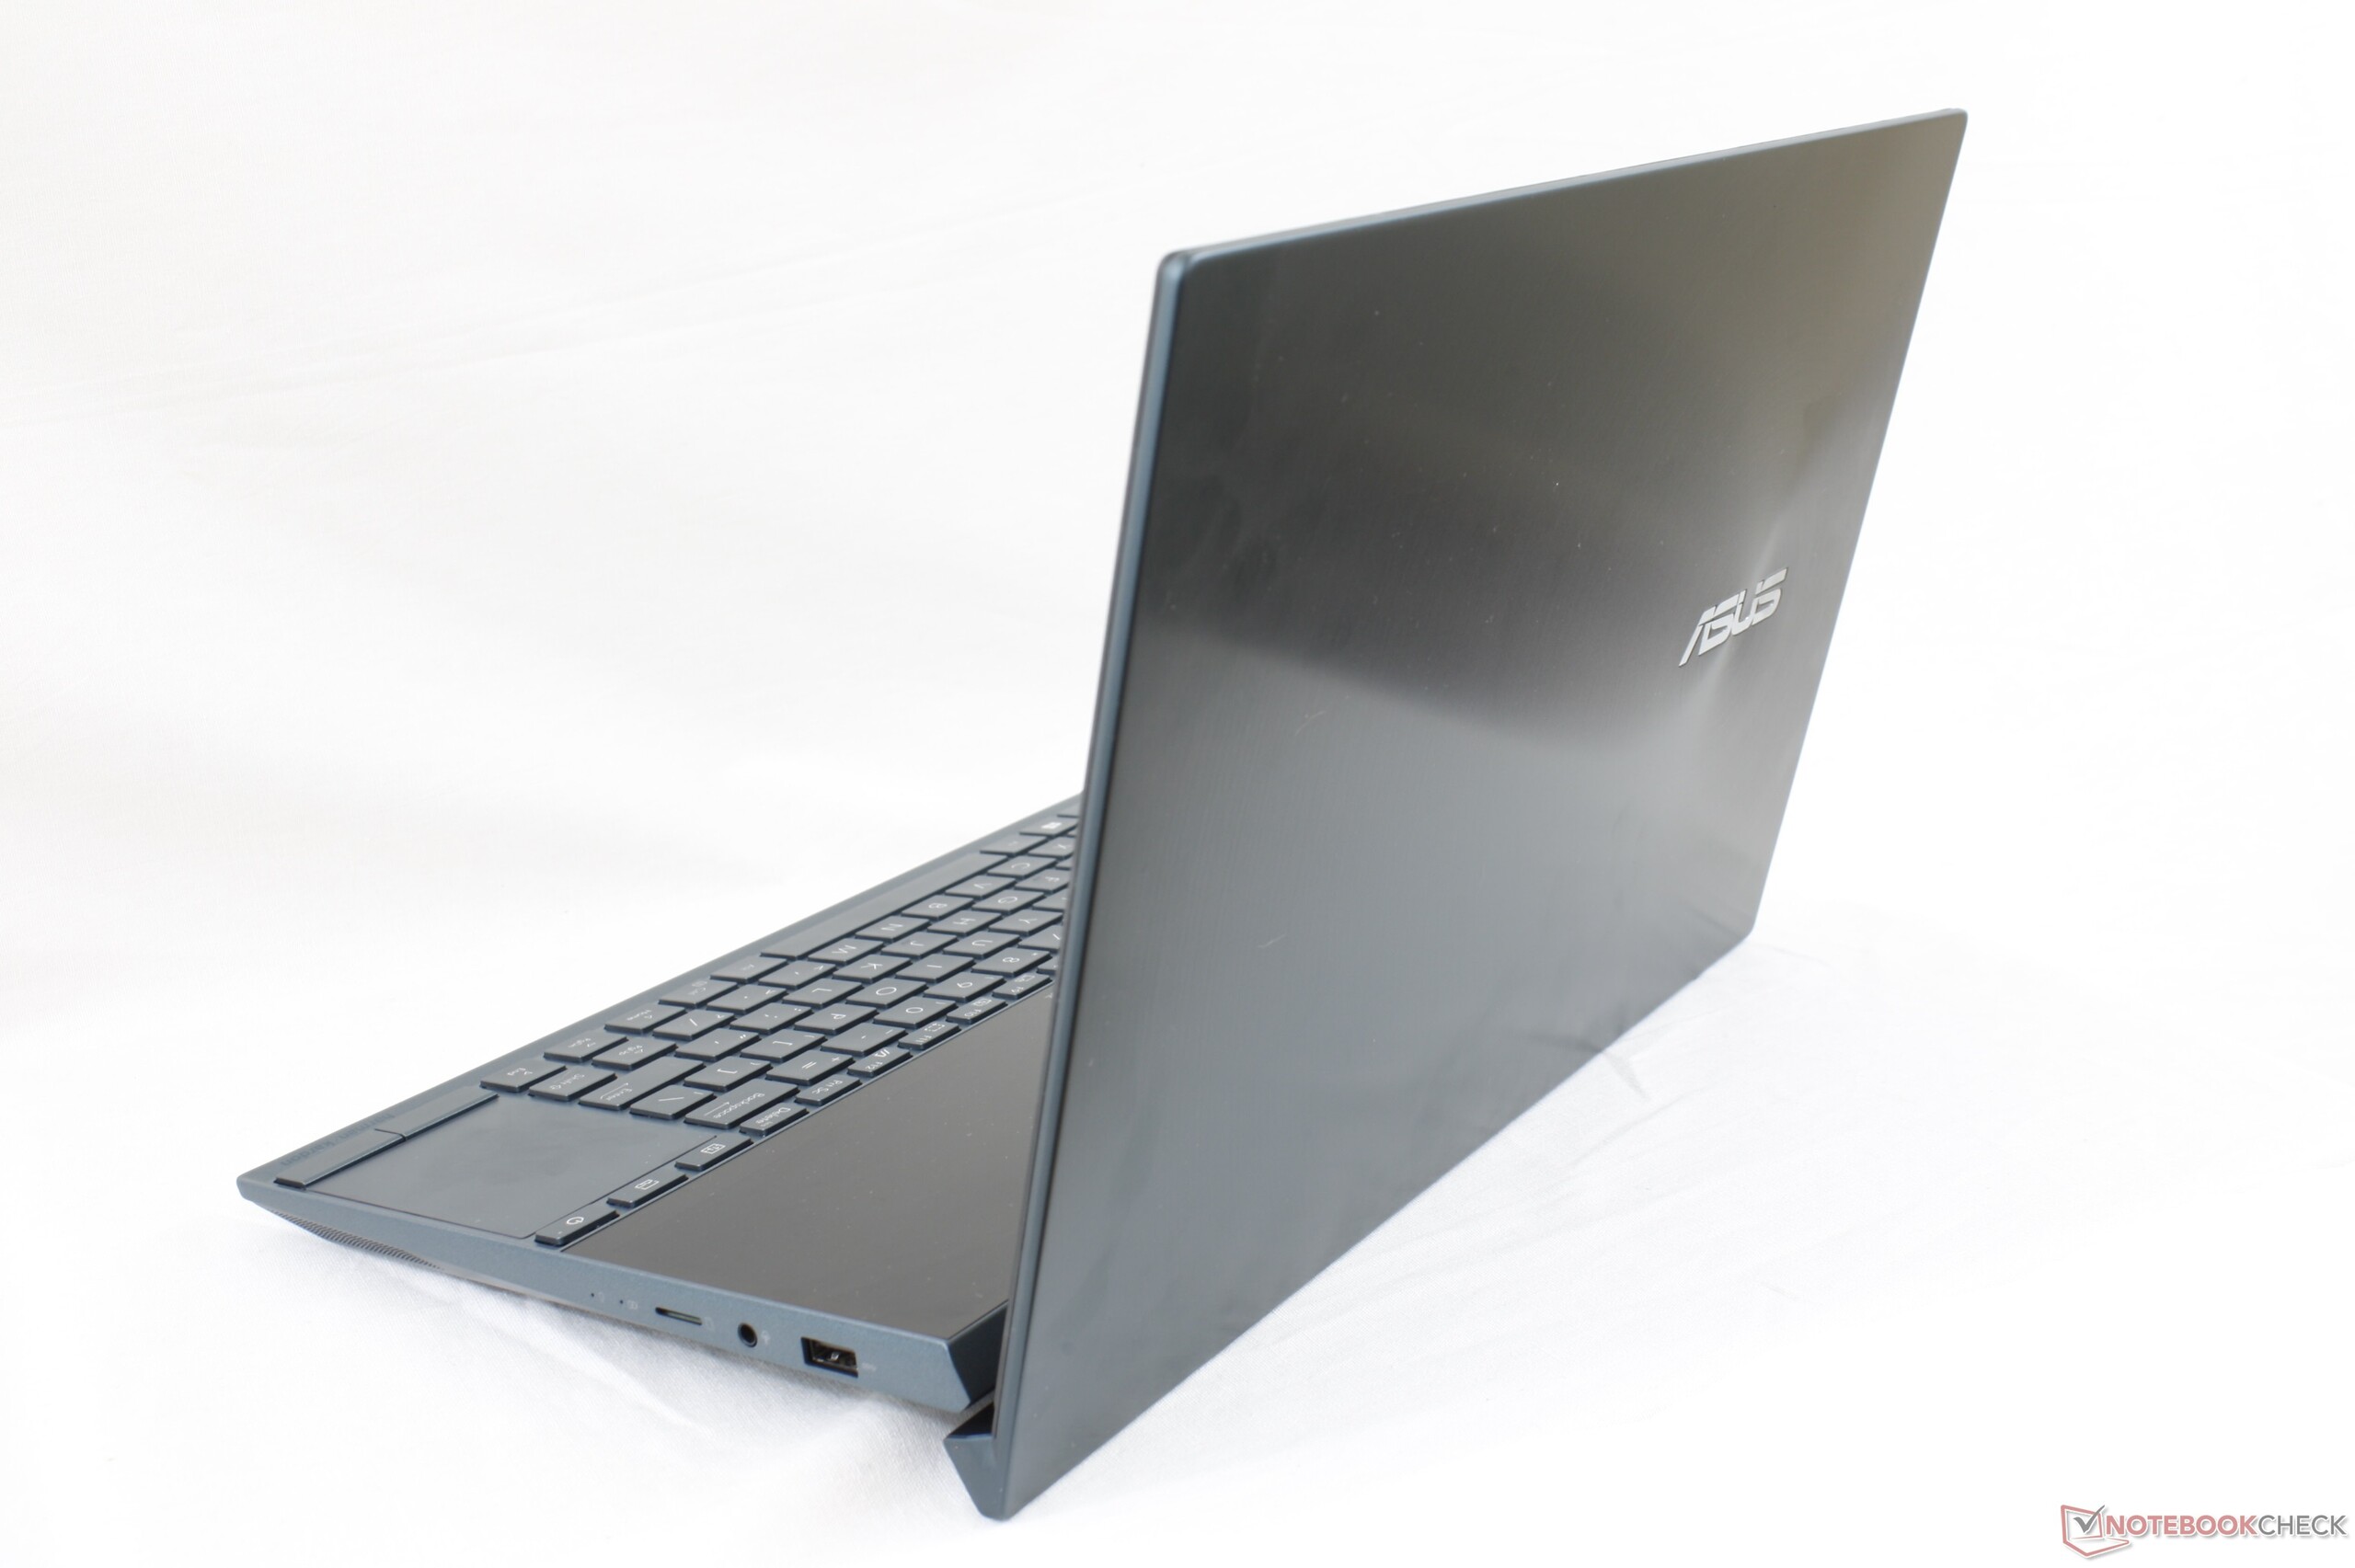
Yoğunluktan bahsetmişken, sistemi ilk alırken entegre bir ikincil ekrana sahip olmanın dezavantajları belirginleşir. 1,8 kg ve 19 mm kalınlığında sistem, Lenovo IdeaPad S940, Huawei MateBook X Pro veya Asus'un kendi ZenBook 14'ü gibi sıradan 13.9 inç veya 14 inçlik dizüstü bilgisayarlardan yaklaşık 500 g daha ağır ve birkaç milimetre daha kalındır. Aslında, ZenBook Duo neredeyse 15,6 inç Dell XPS 15 (1,9 kg) kadar ağırdır ve bu nedenle çift ekranlı dizüstü bilgisayarla sık sık seyahat etmeyi planlıyorsanız ağırlık kesinlikle dikkate alınması gereken bir şeydir.
Bağlantı
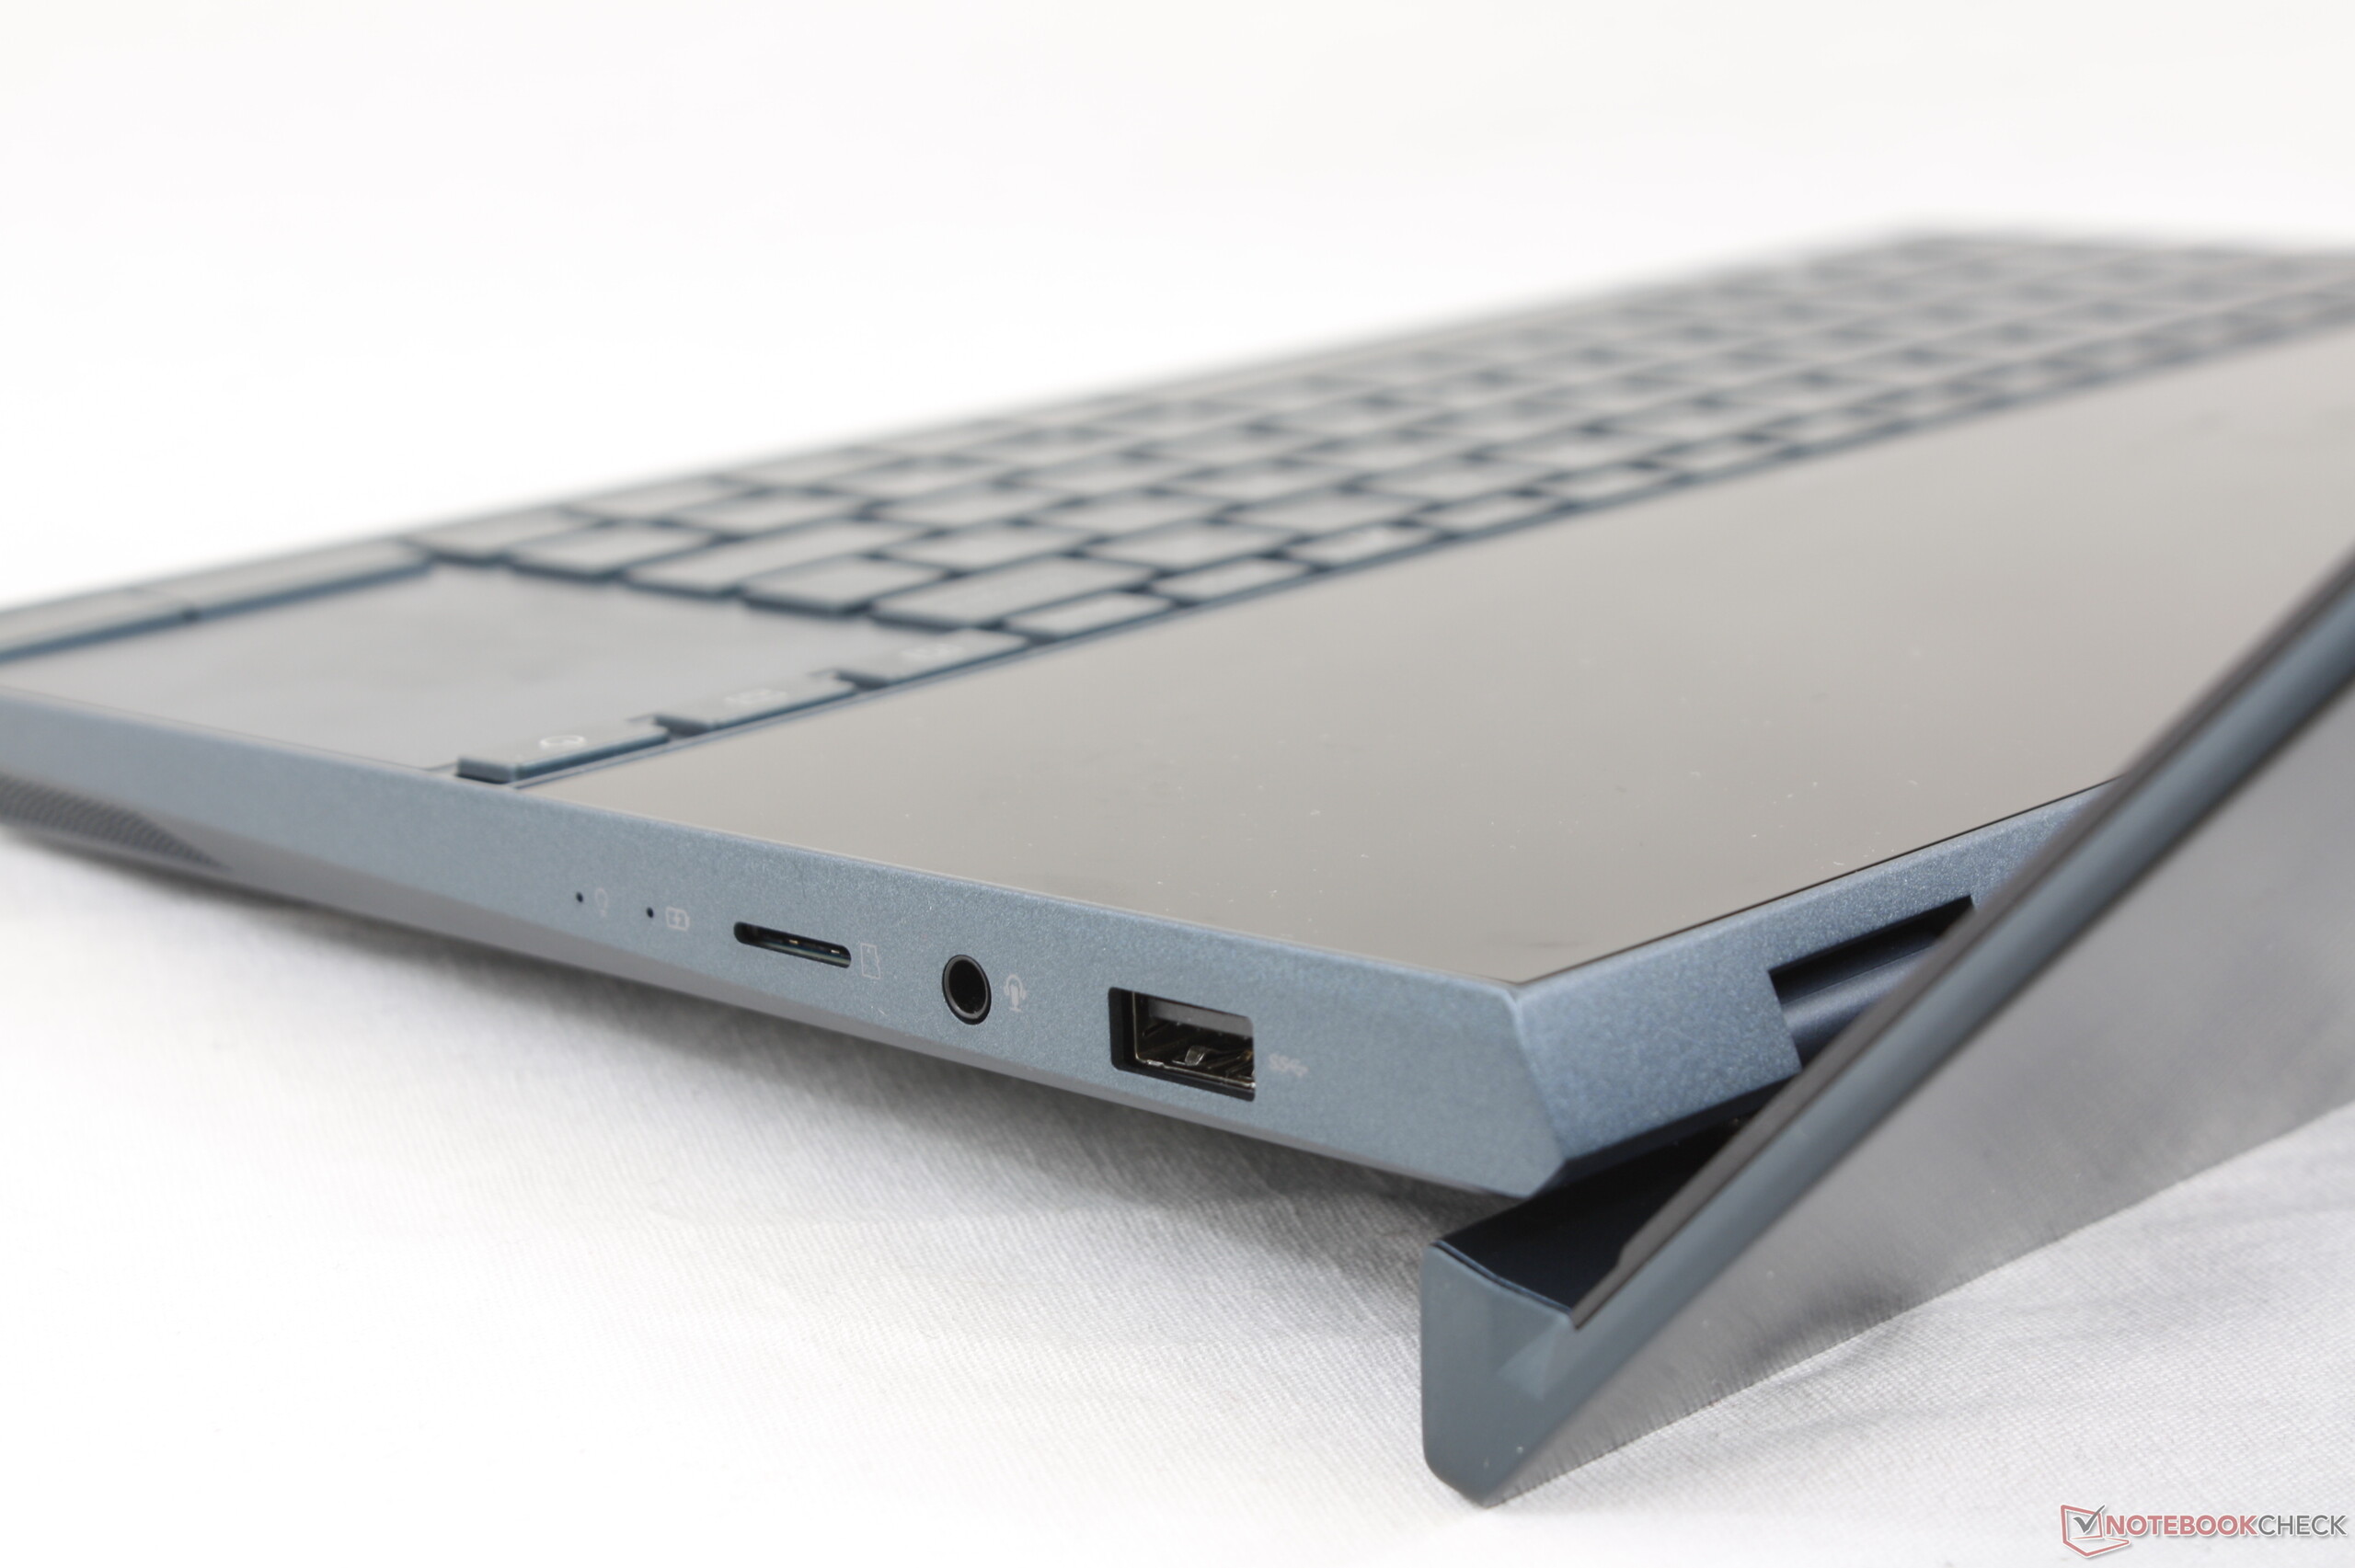
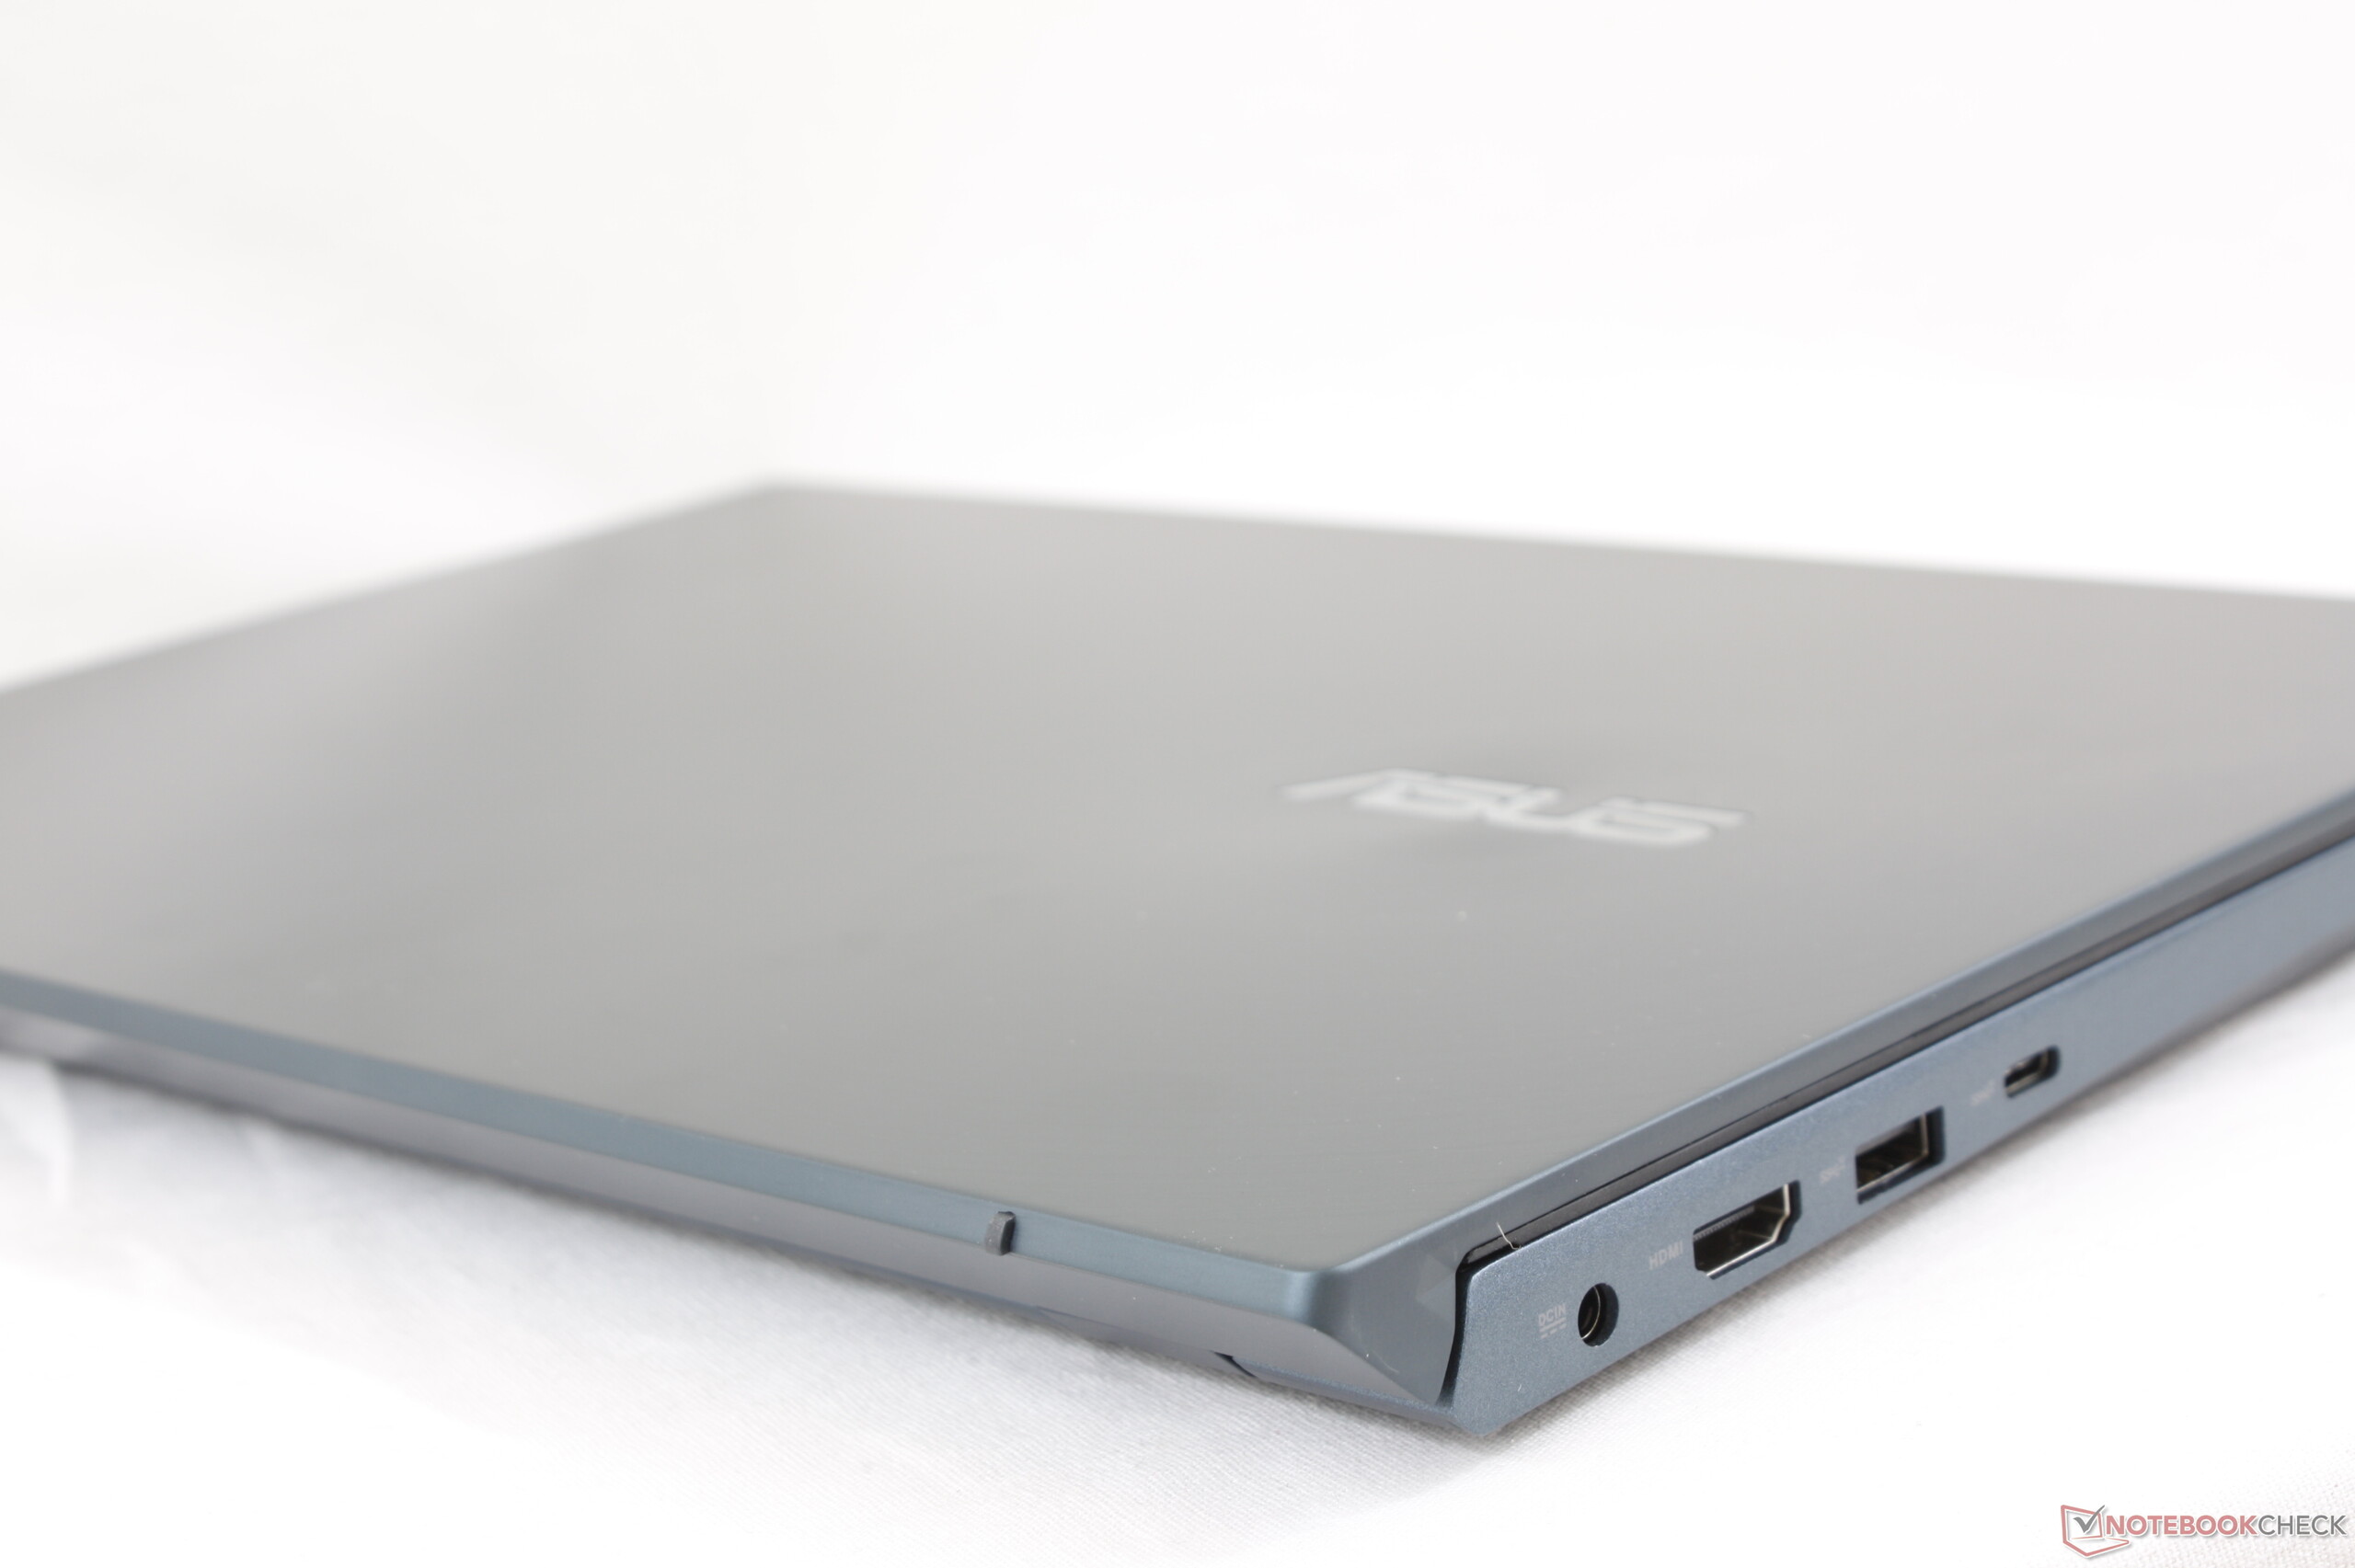
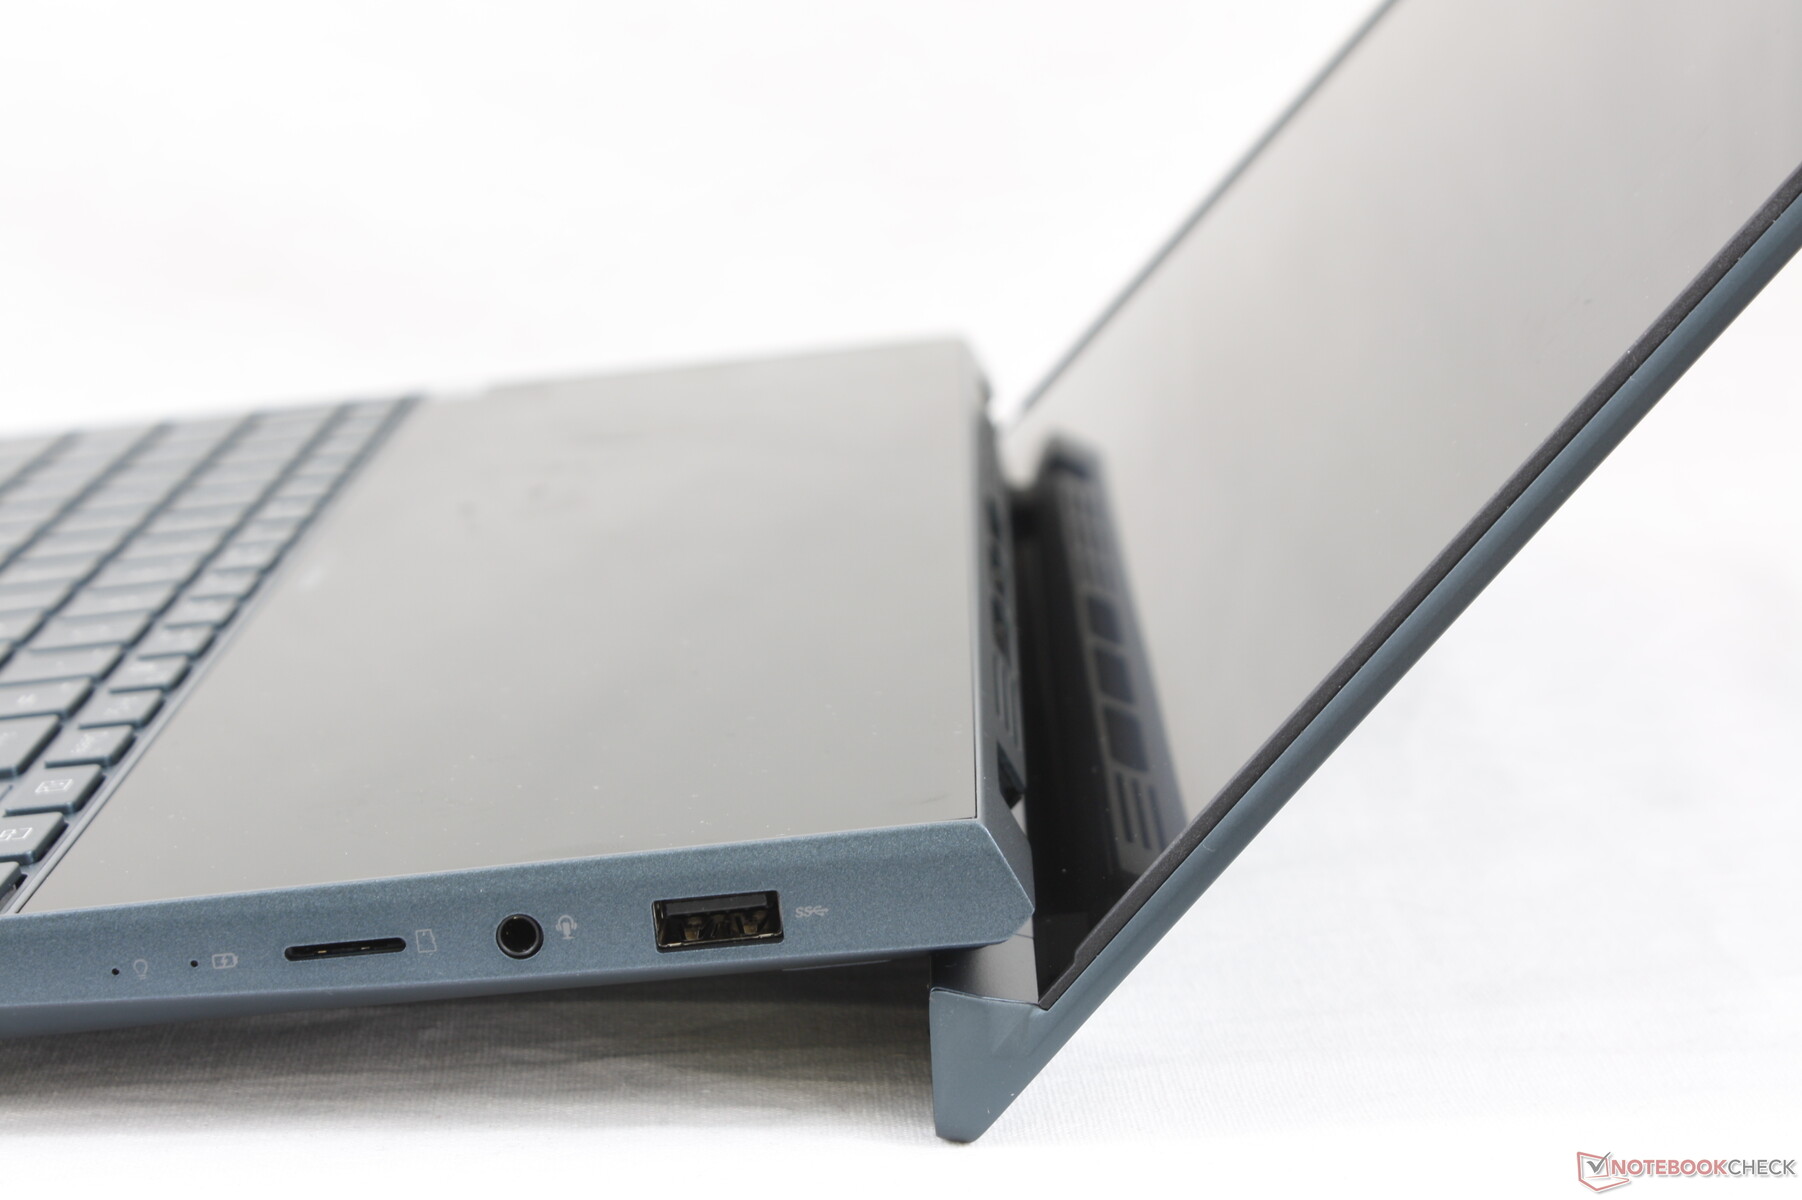
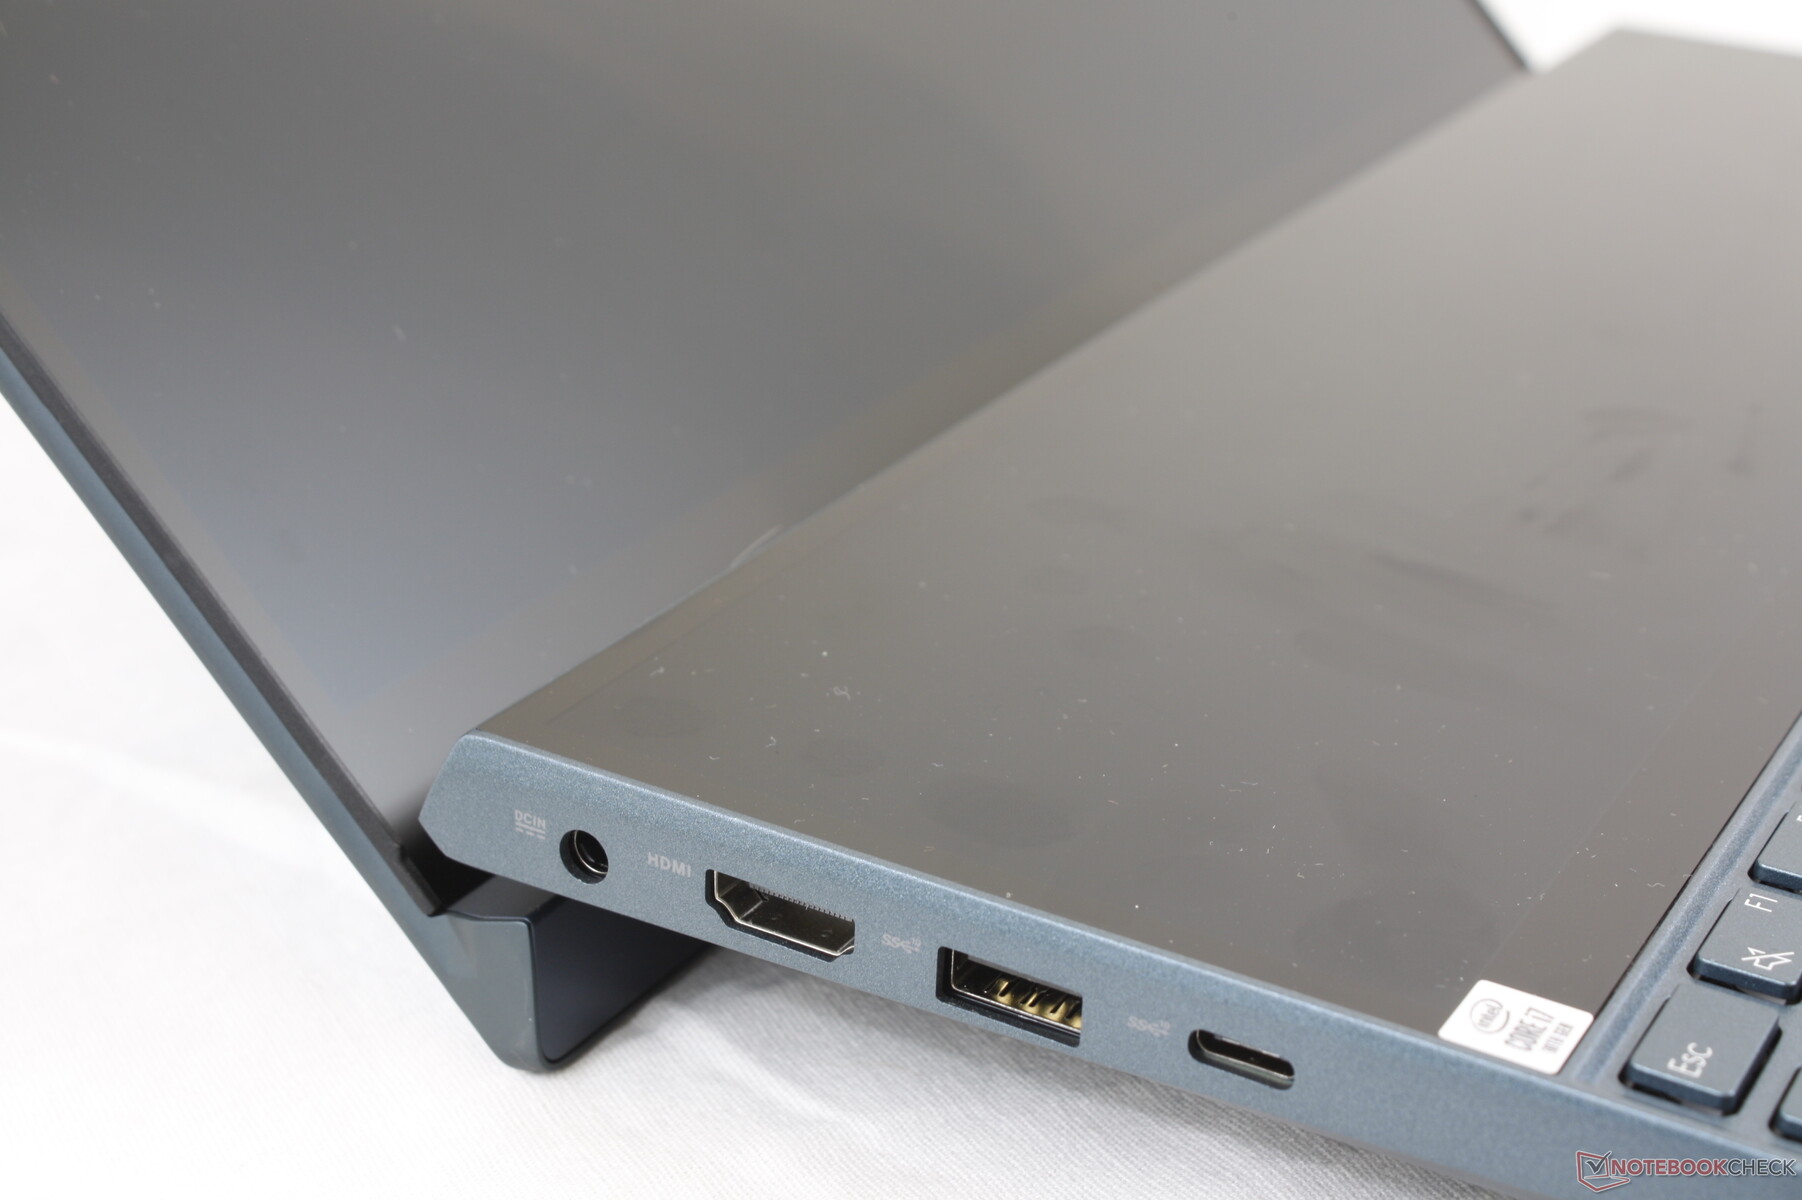
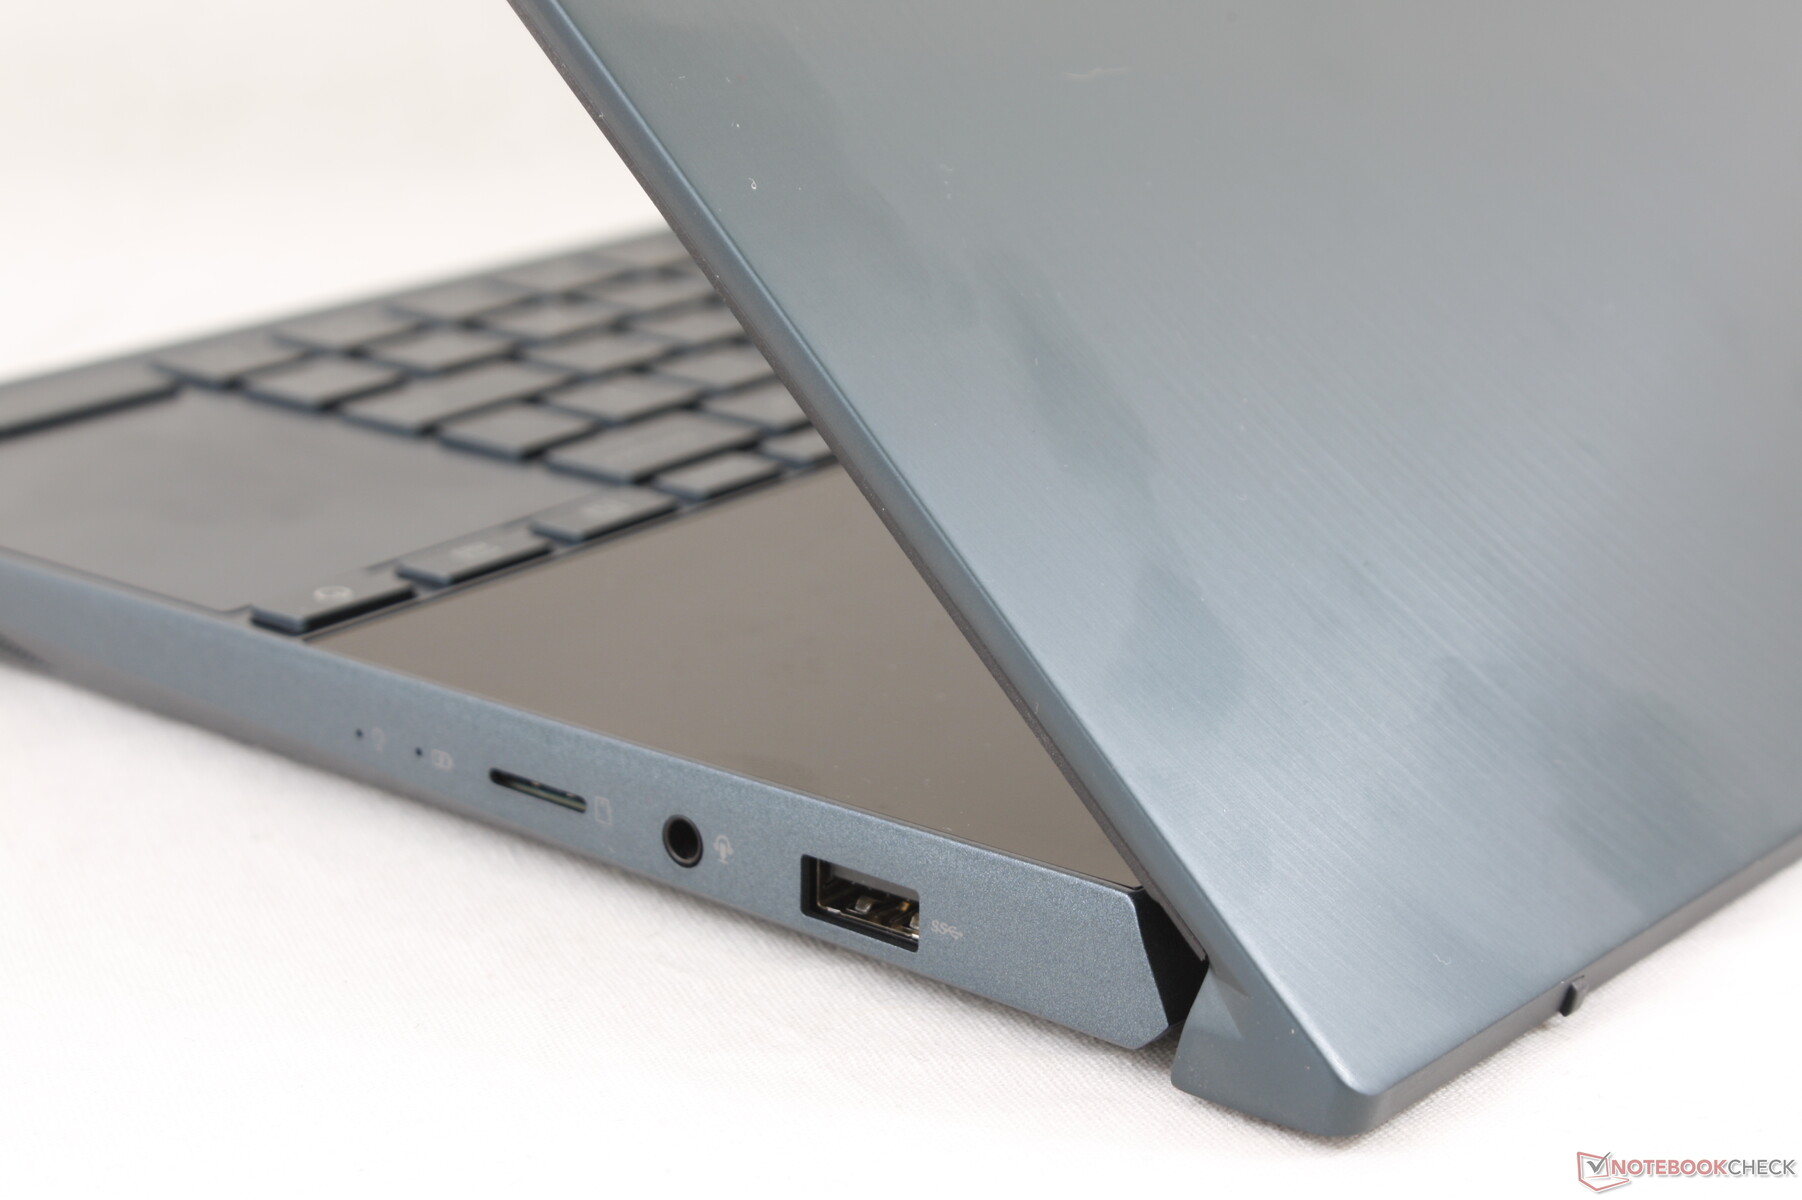
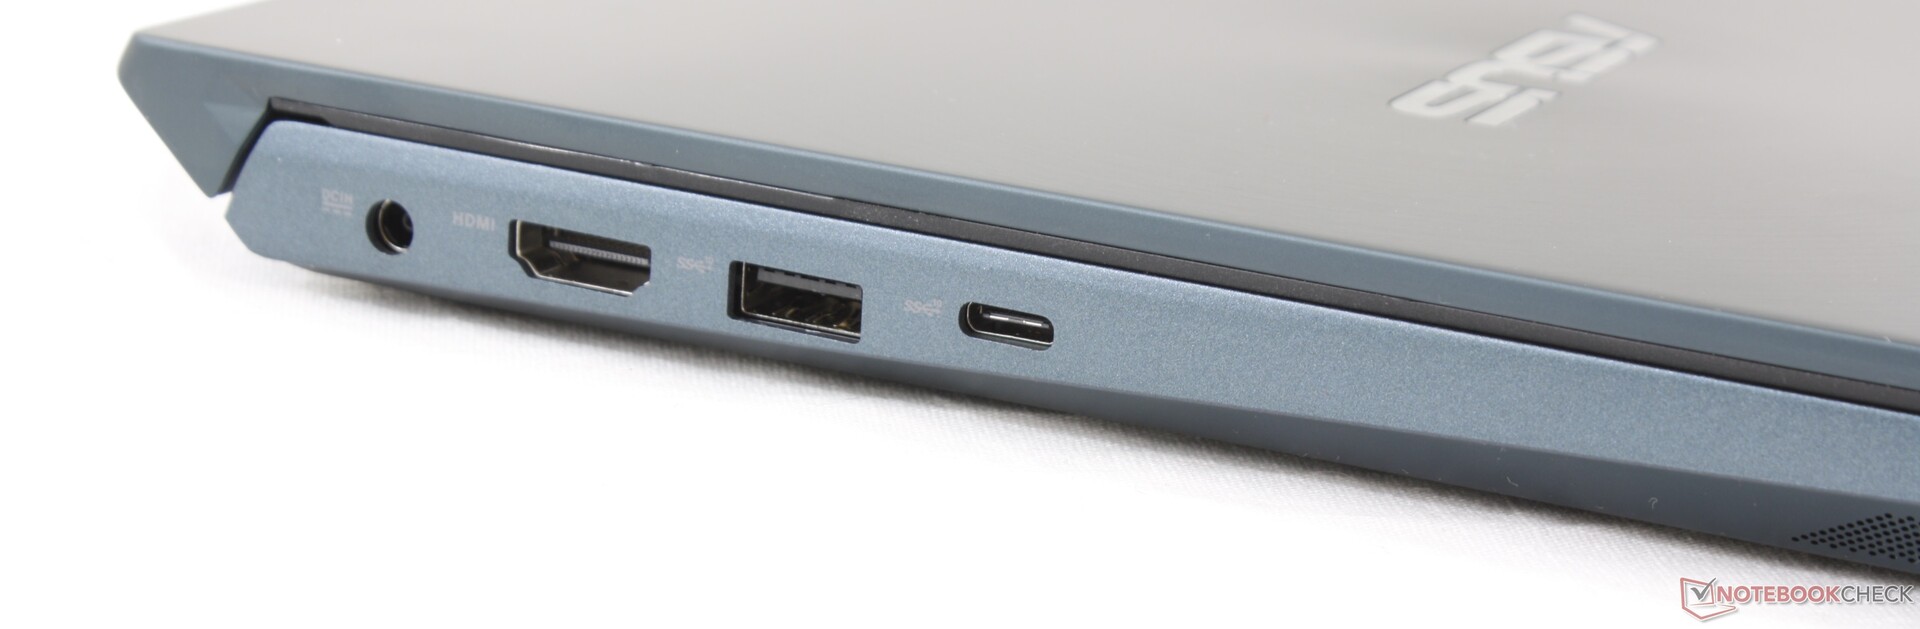
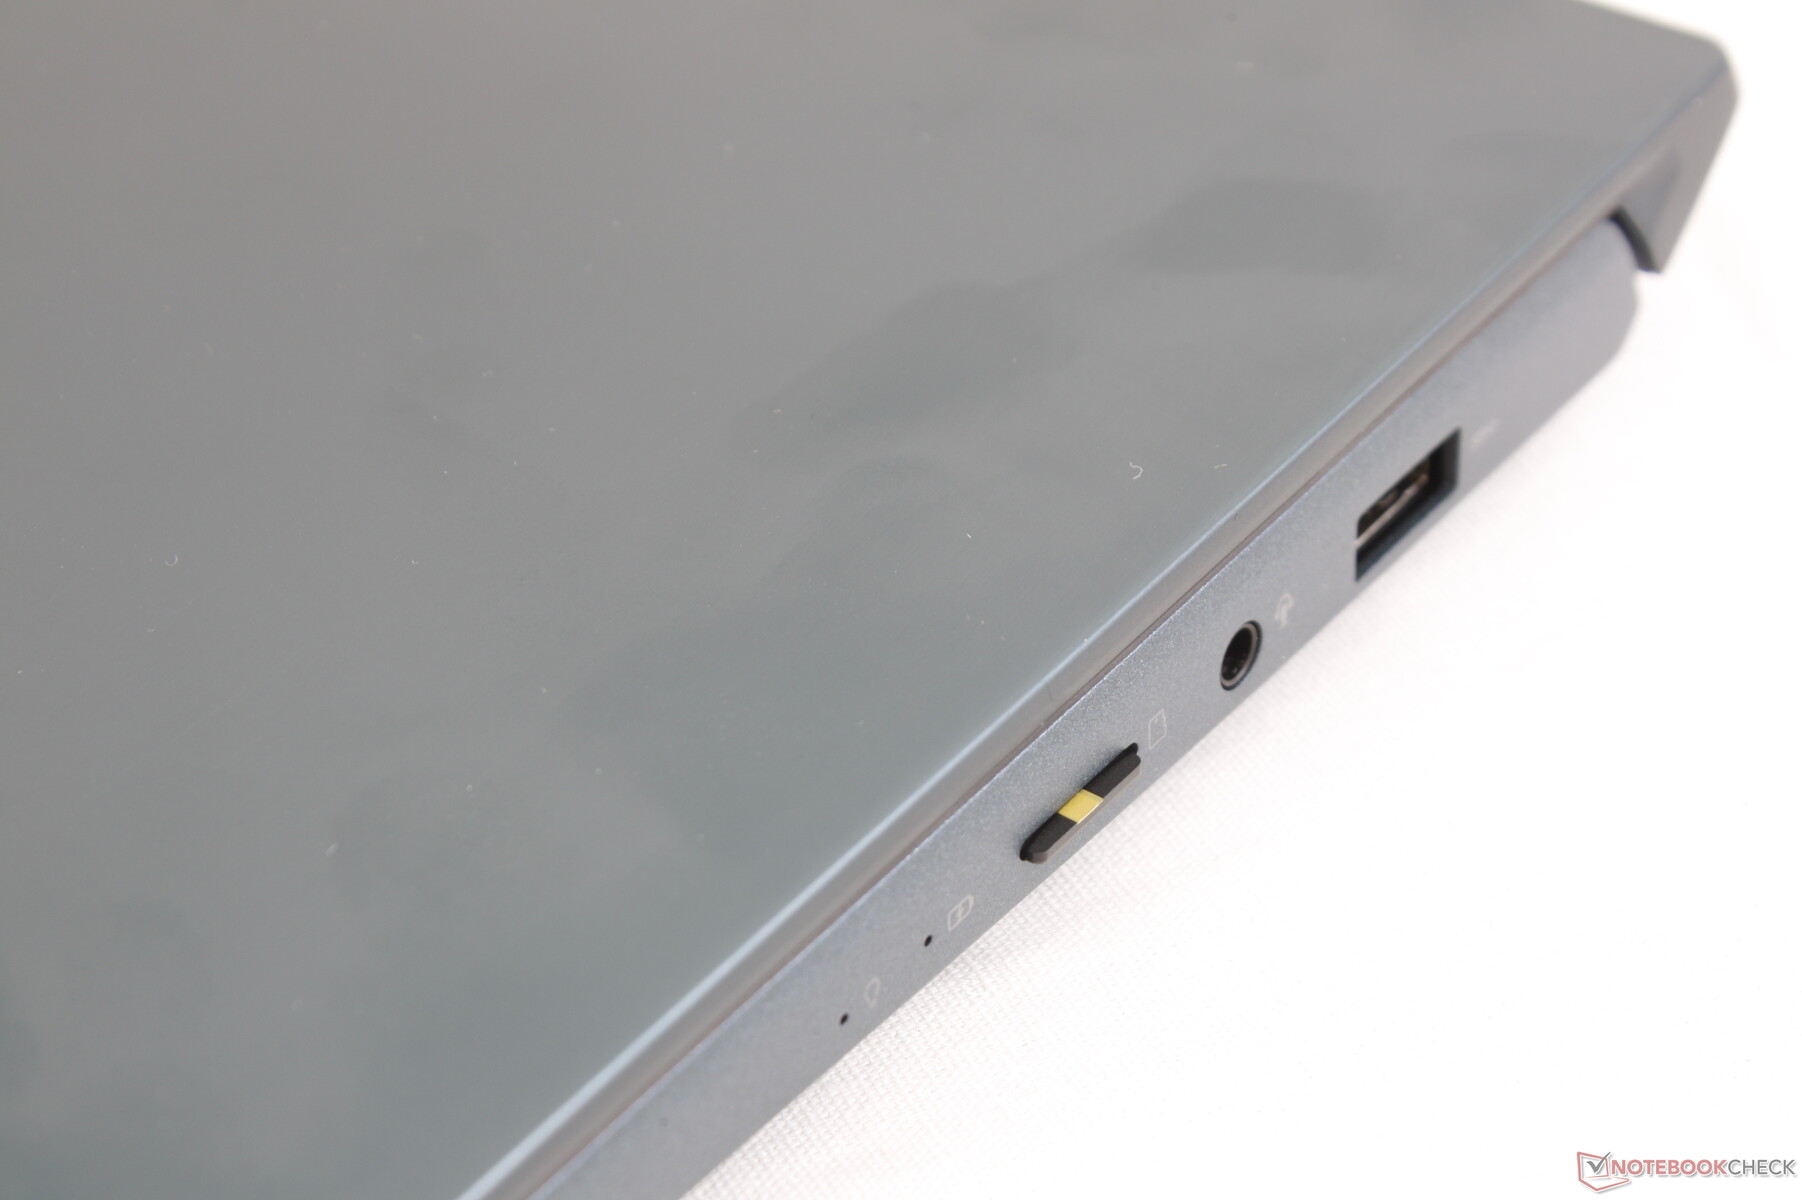
Daha büyük 15,6 inç ZenBook Pro Duo'da bulunan tüm bağlantı noktaları burada bulunur, ancak iki önemli fark vardır. Birincisi, ZenBook Duo bir MicroSD okuyucuyu entegre ederken daha büyük versiyon bunu entegre etmiyor. İkincisi, 14 inçlik modeldeki USB Type-C bağlantı noktası, Zenbol 14 kapak kılıflarında olduğu gibi Thunderbolt 3'ü desteklemiyor. Bağlantı noktası konumlandırma başka bir sorun değildir.
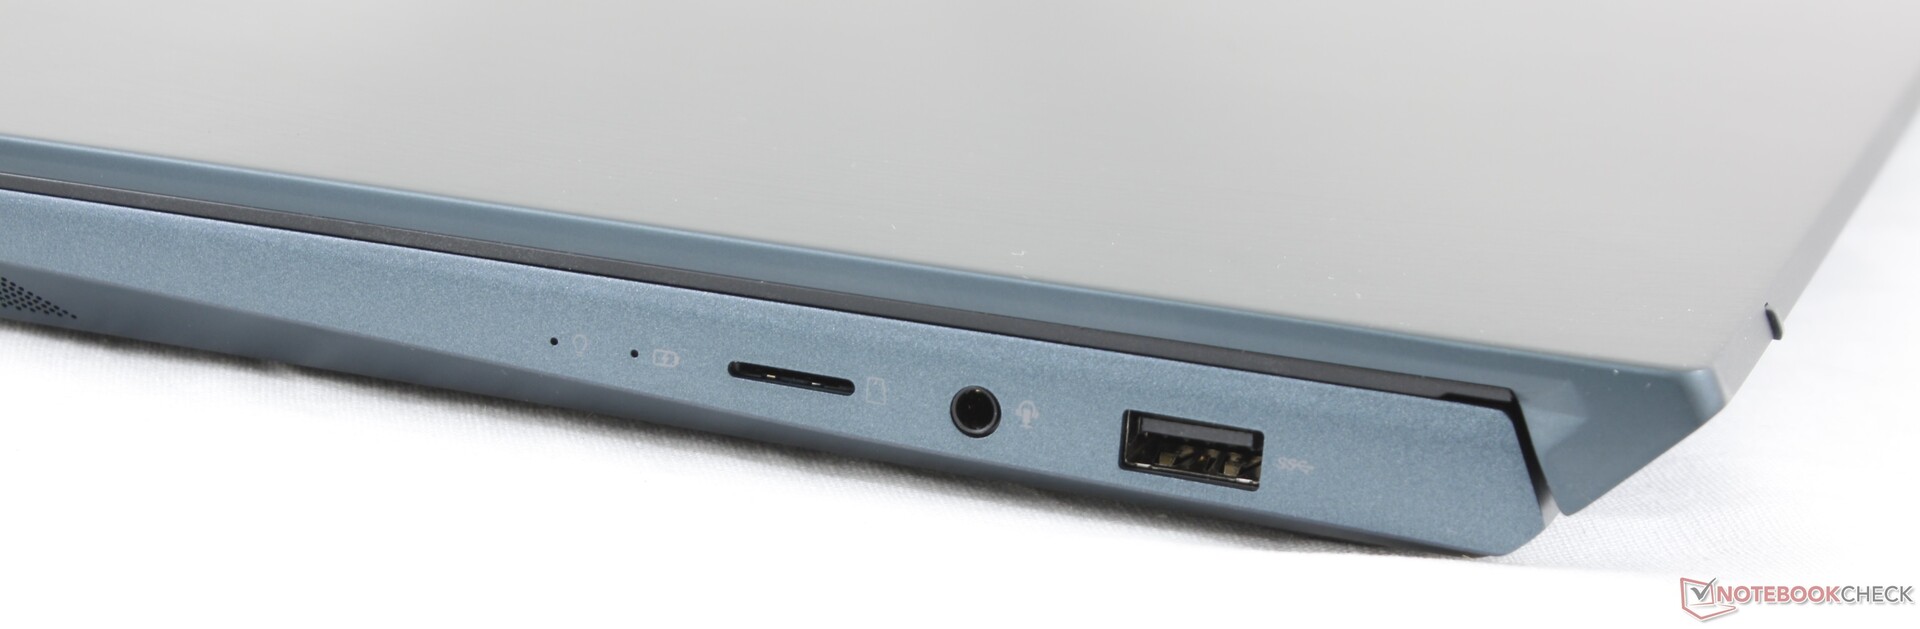
SD Kart Okuyucu
Entegre yaylı MicroSD okuyucu ortalama aktarım hızları sunar. UHS-II MicroSD kartımızdan masaüstünüze 1 GB değerinde fotoğraf taşımak, XPS 13'teki 7 saniyeye veya ZenBook 14'teki 26 saniyeye kıyasla yaklaşık 13 saniye sürer.
| SD Card Reader | |
| average JPG Copy Test (av. of 3 runs) | |
| MSI Prestige 14 A10SC-009 (Toshiba Exceria Pro M501 microSDXC 64GB) | |
| Dell XPS 13 9300 Core i7-1065G7 (Toshiba Exceria Pro M501 64 GB UHS-II) | |
| Asus ZenBook Duo UX481FL (Toshiba Exceria Pro M501 microSDXC 64GB) | |
| Asus ZenBook 14 UM431DA-AM020T (Toshiba Exceria Pro SDXC 64 GB UHS-II) | |
| maximum AS SSD Seq Read Test (1GB) | |
| Dell XPS 13 9300 Core i7-1065G7 (Toshiba Exceria Pro M501 64 GB UHS-II) | |
| MSI Prestige 14 A10SC-009 (Toshiba Exceria Pro M501 microSDXC 64GB) | |
| Asus ZenBook Duo UX481FL (Toshiba Exceria Pro M501 microSDXC 64GB) | |
| Asus ZenBook 14 UM431DA-AM020T (Toshiba Exceria Pro SDXC 64 GB UHS-II) | |
İletişim
Netgear RAX200 yönlendiricimizle eşleştirildiğinde hiçbir bağlantı veya kararlılık sorunu yaşamadık.
| Networking | |
| iperf3 transmit AX12 | |
| Asus Zephyrus G14 GA401IV | |
| Asus ZenBook Duo UX481FL | |
| Lenovo ThinkPad X1 Carbon G7 20R1-000YUS | |
| MSI GF75 Thin 10SCXR | |
| iperf3 receive AX12 | |
| Asus ZenBook Duo UX481FL | |
| MSI GF75 Thin 10SCXR | |
| Asus Zephyrus G14 GA401IV | |
| Lenovo ThinkPad X1 Carbon G7 20R1-000YUS | |
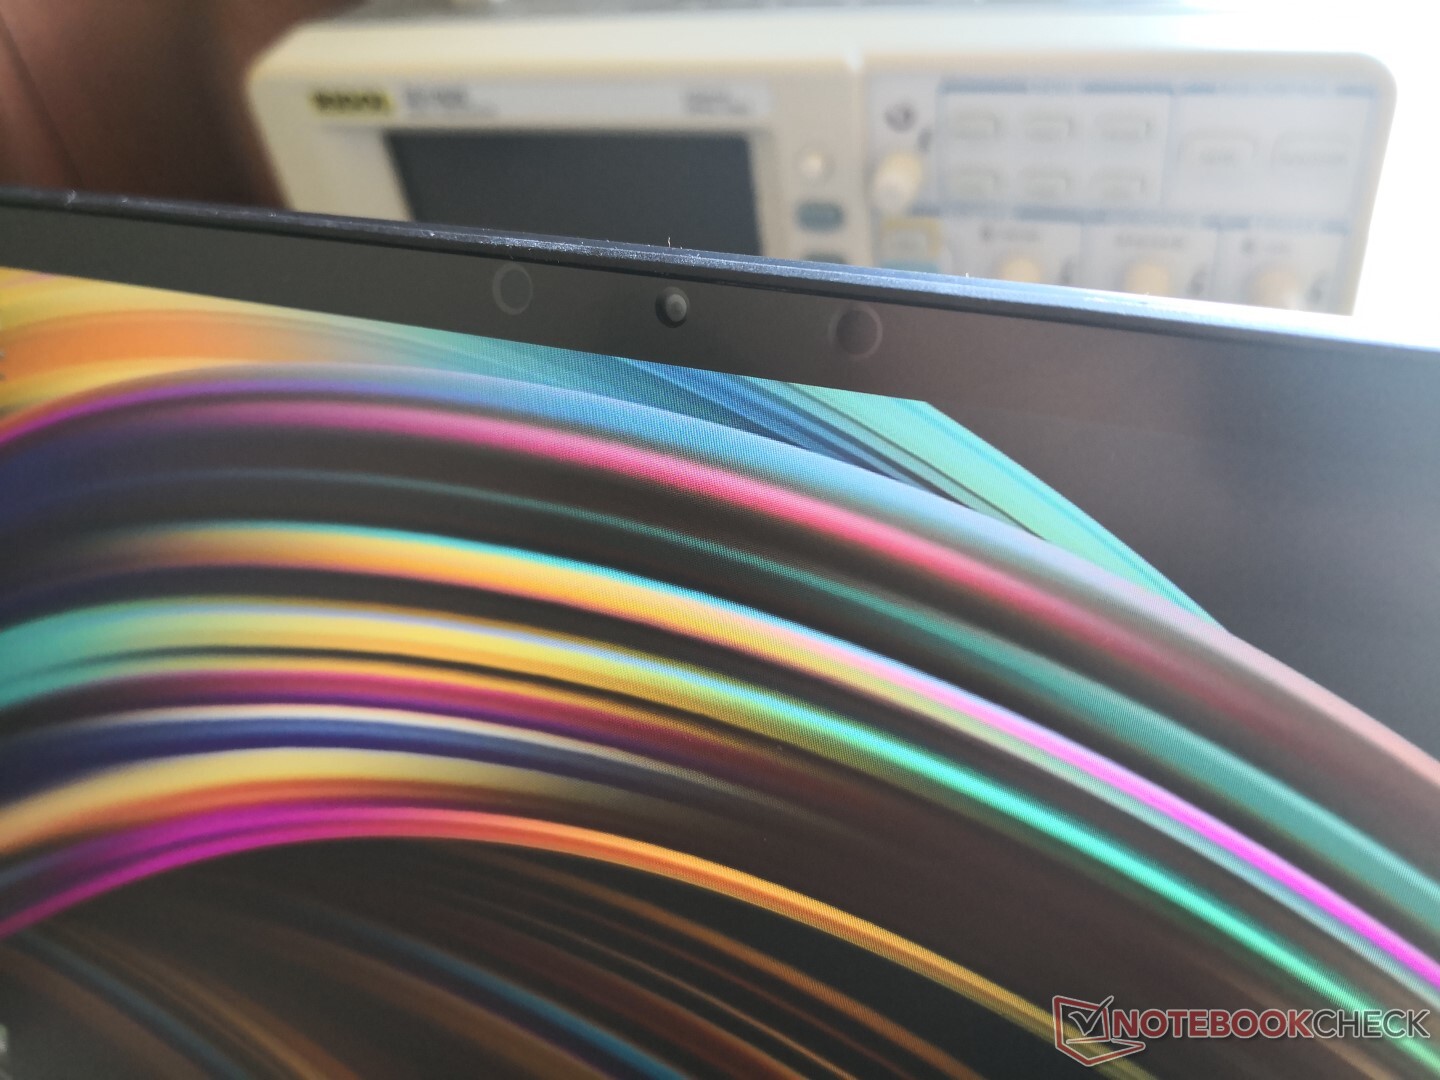
Web kamerası


Bakım
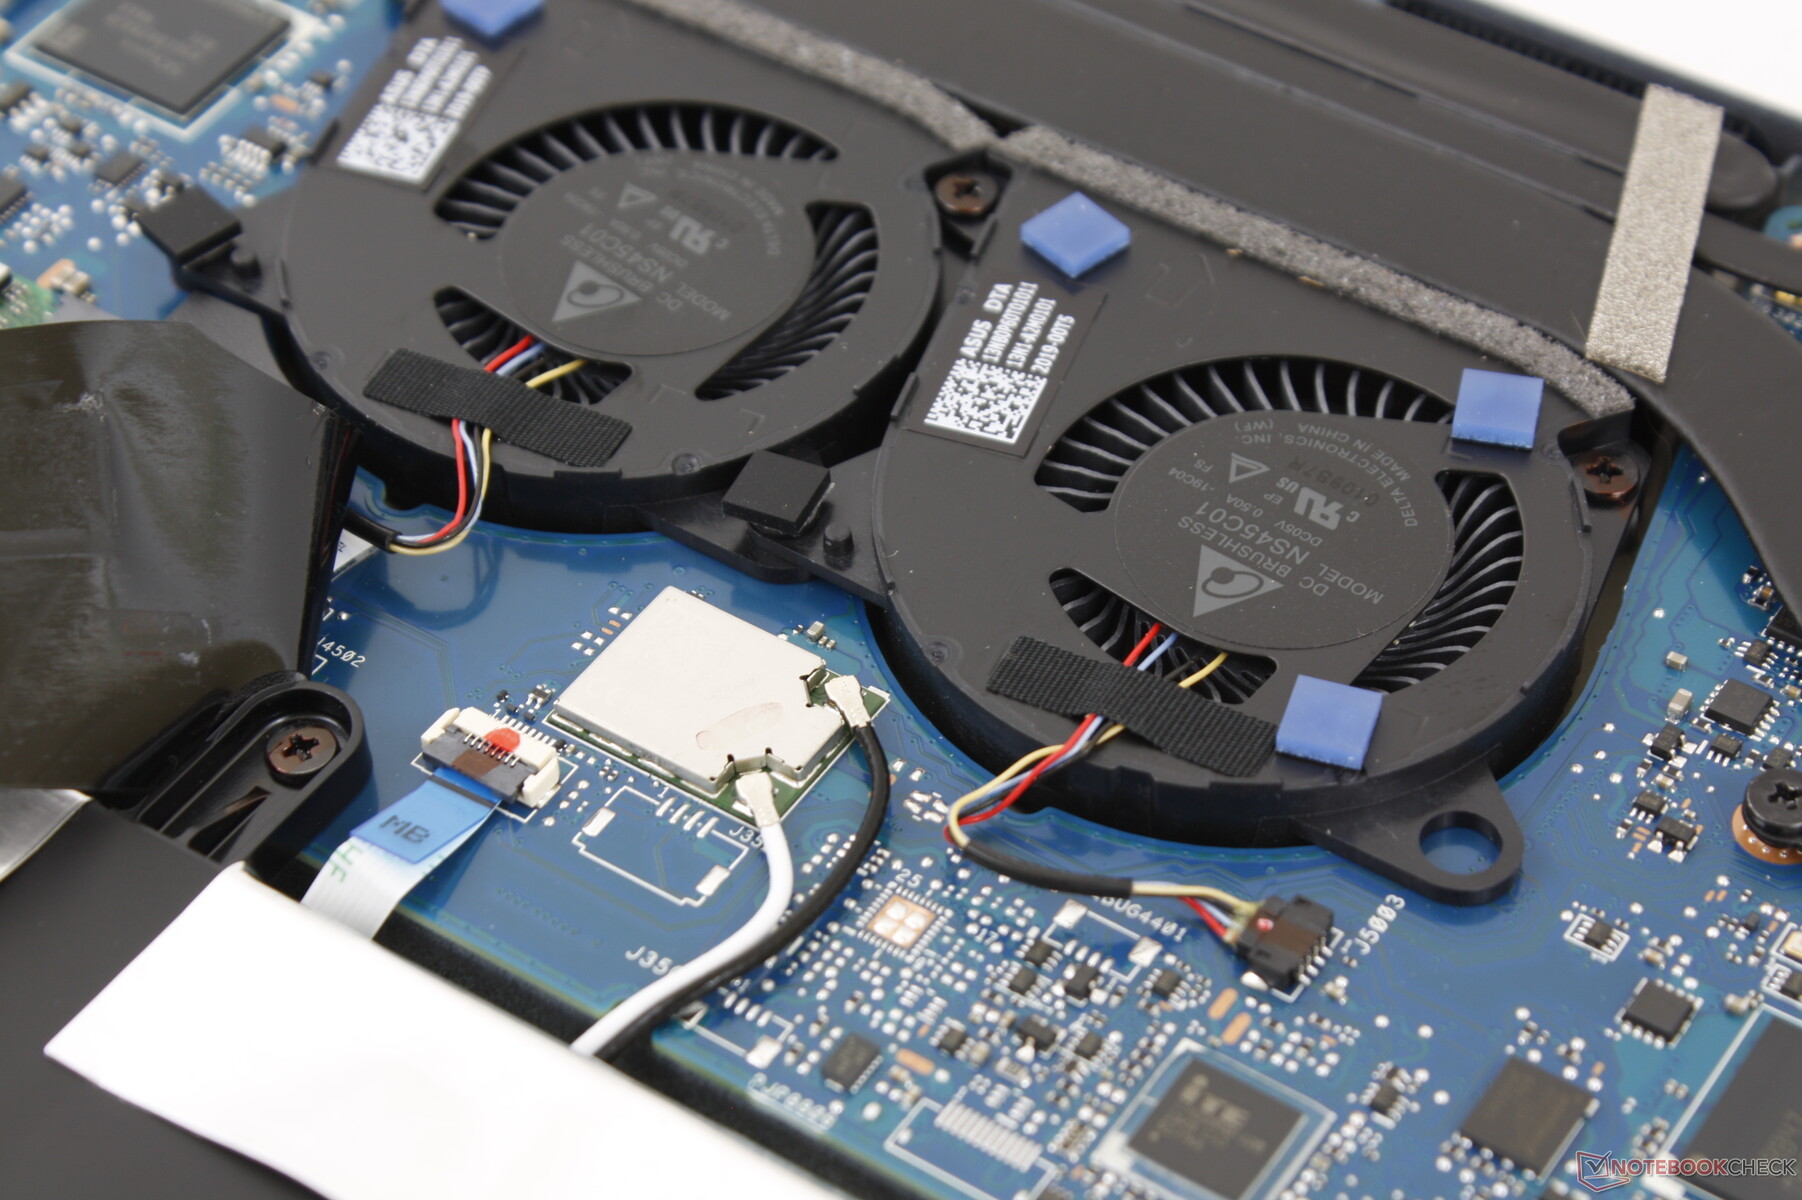
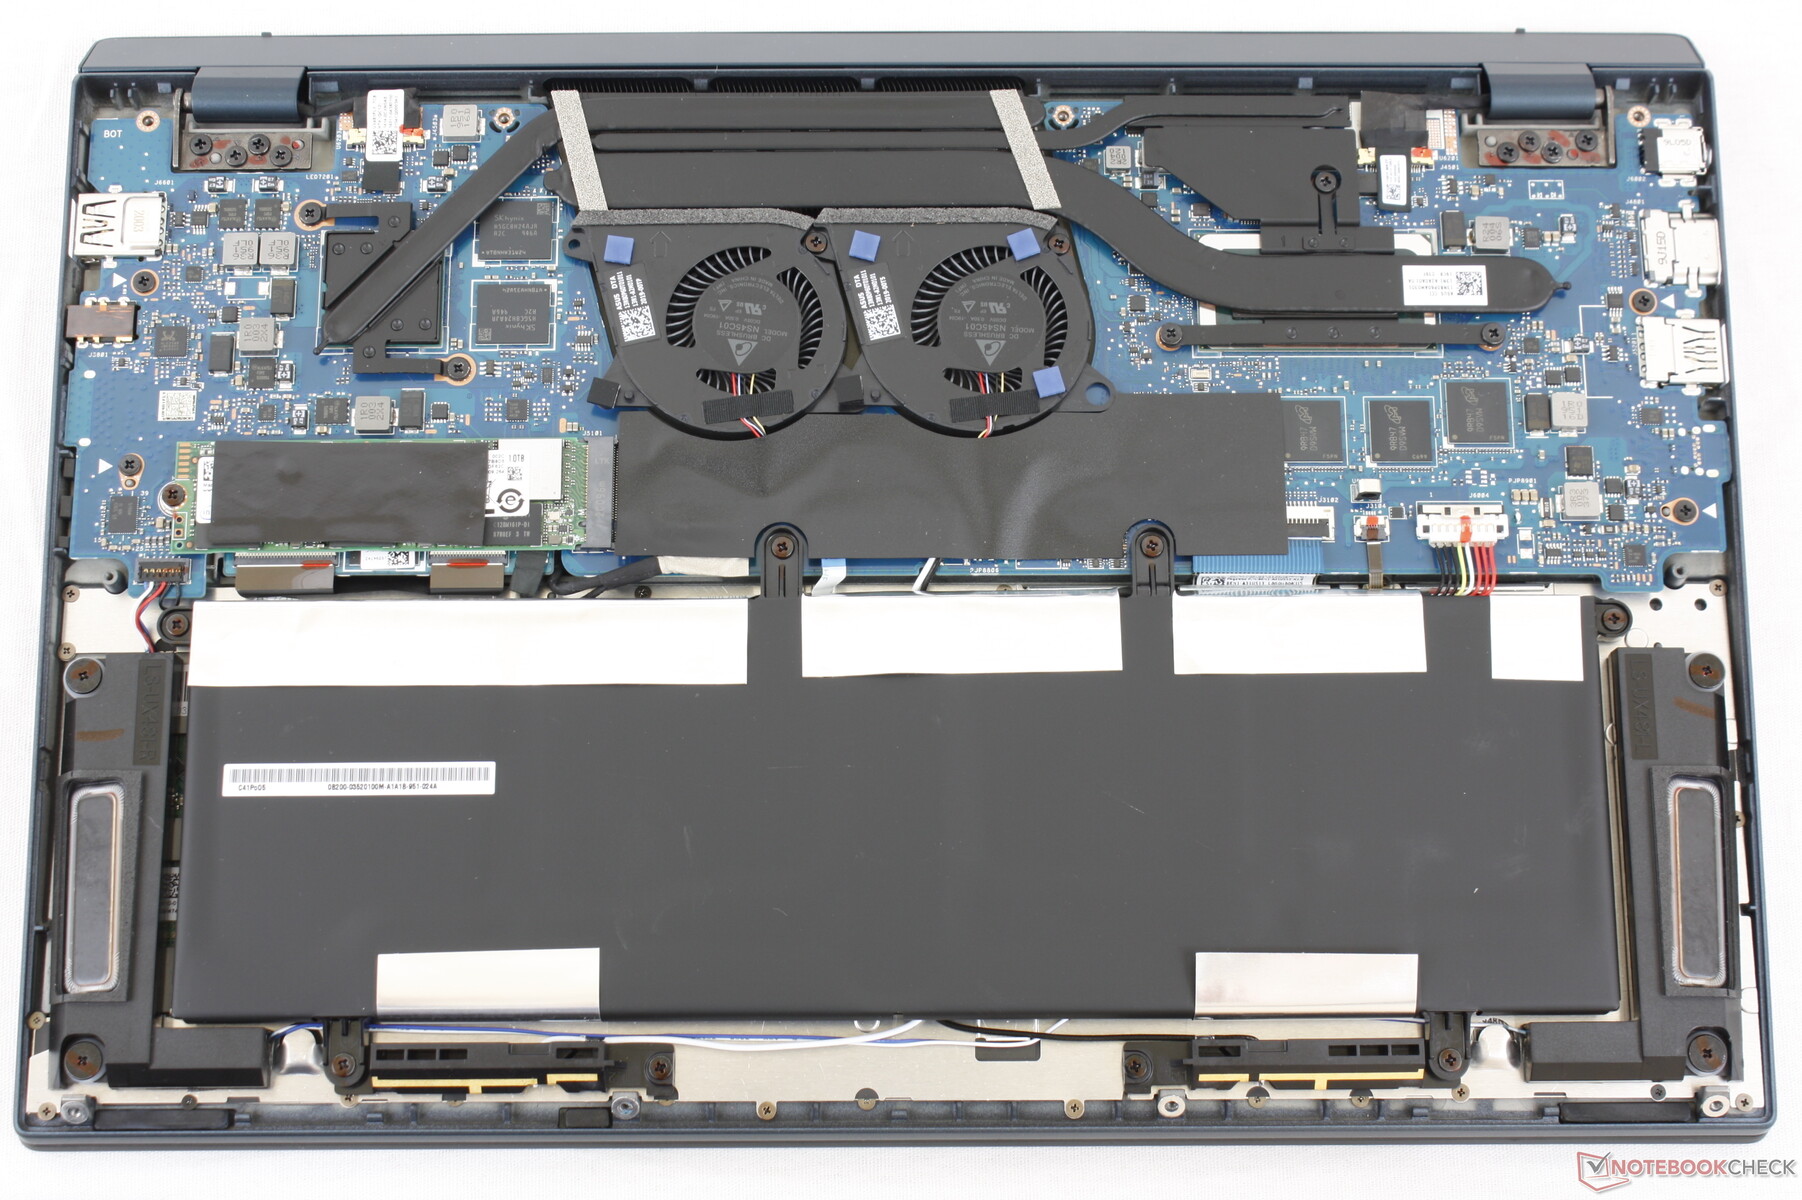
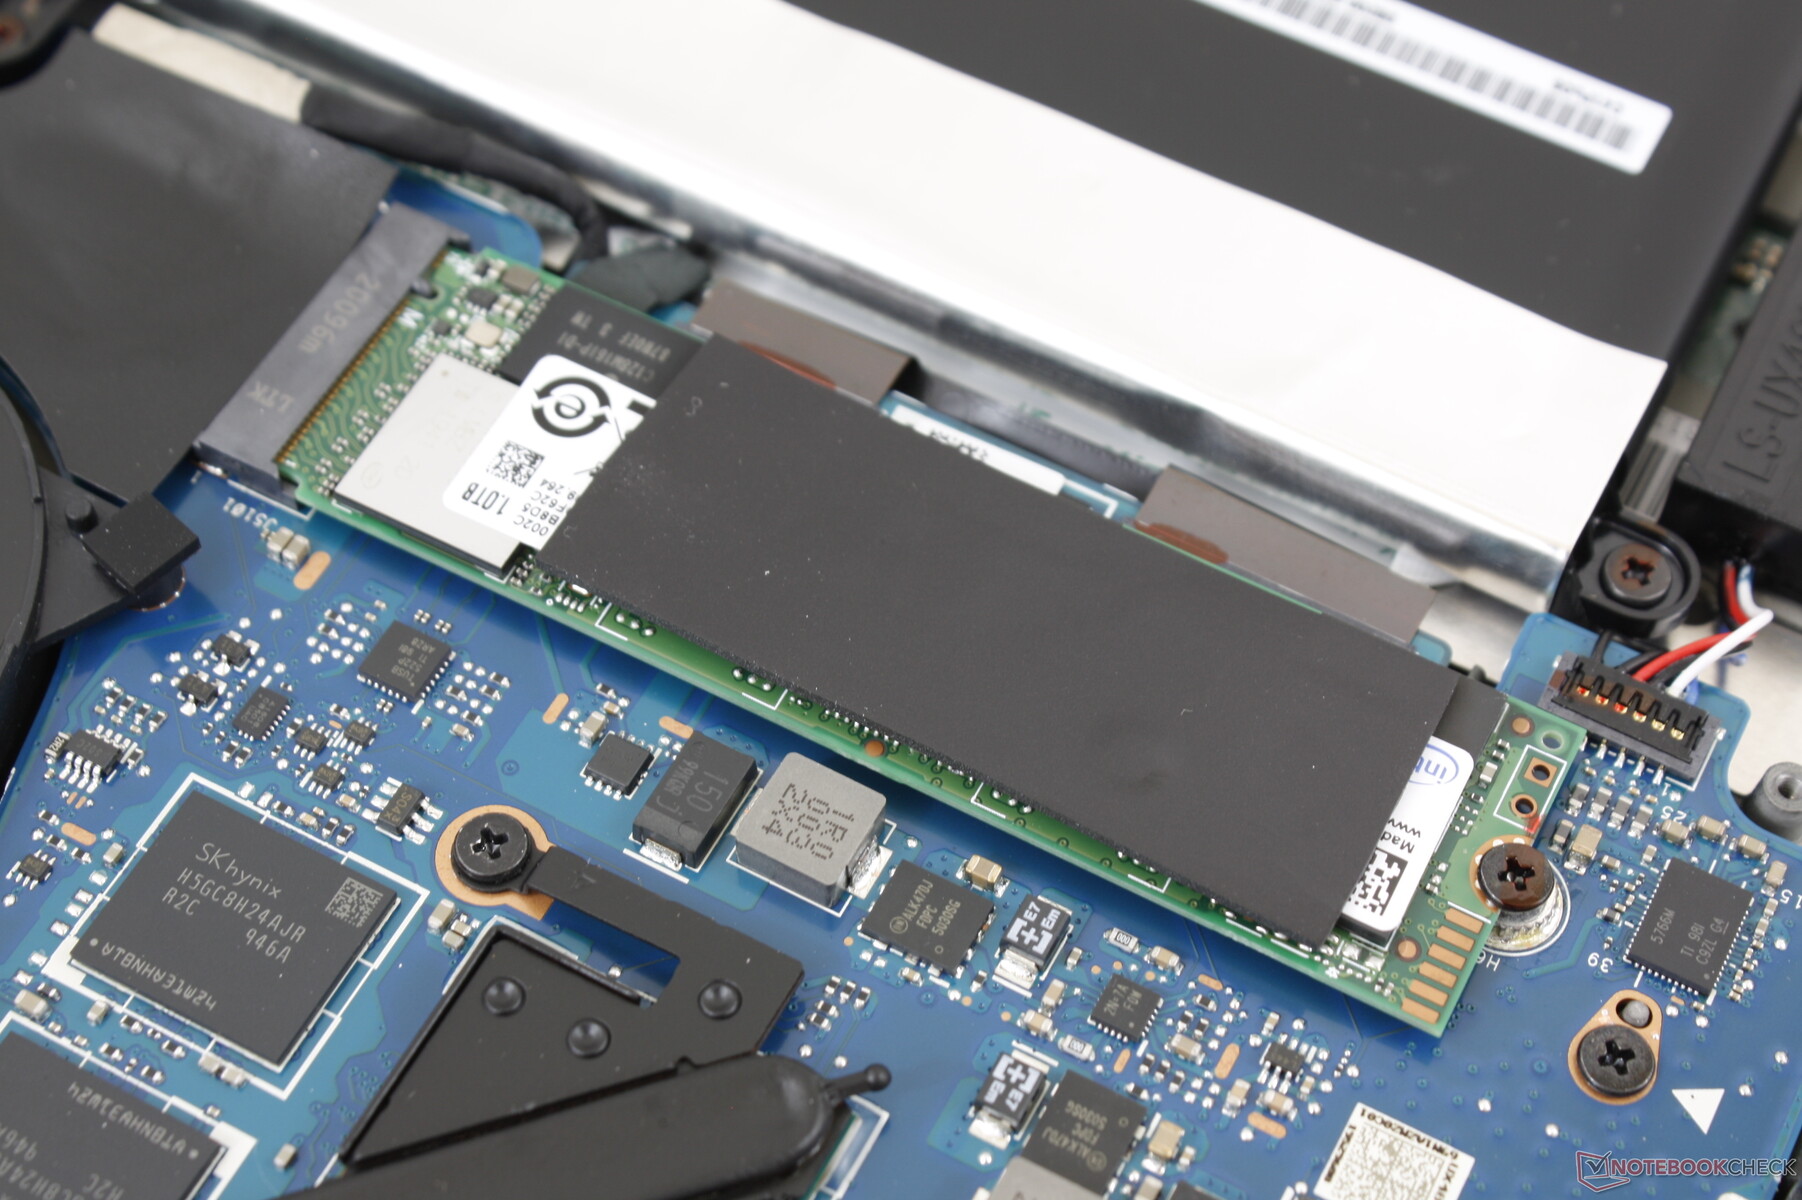
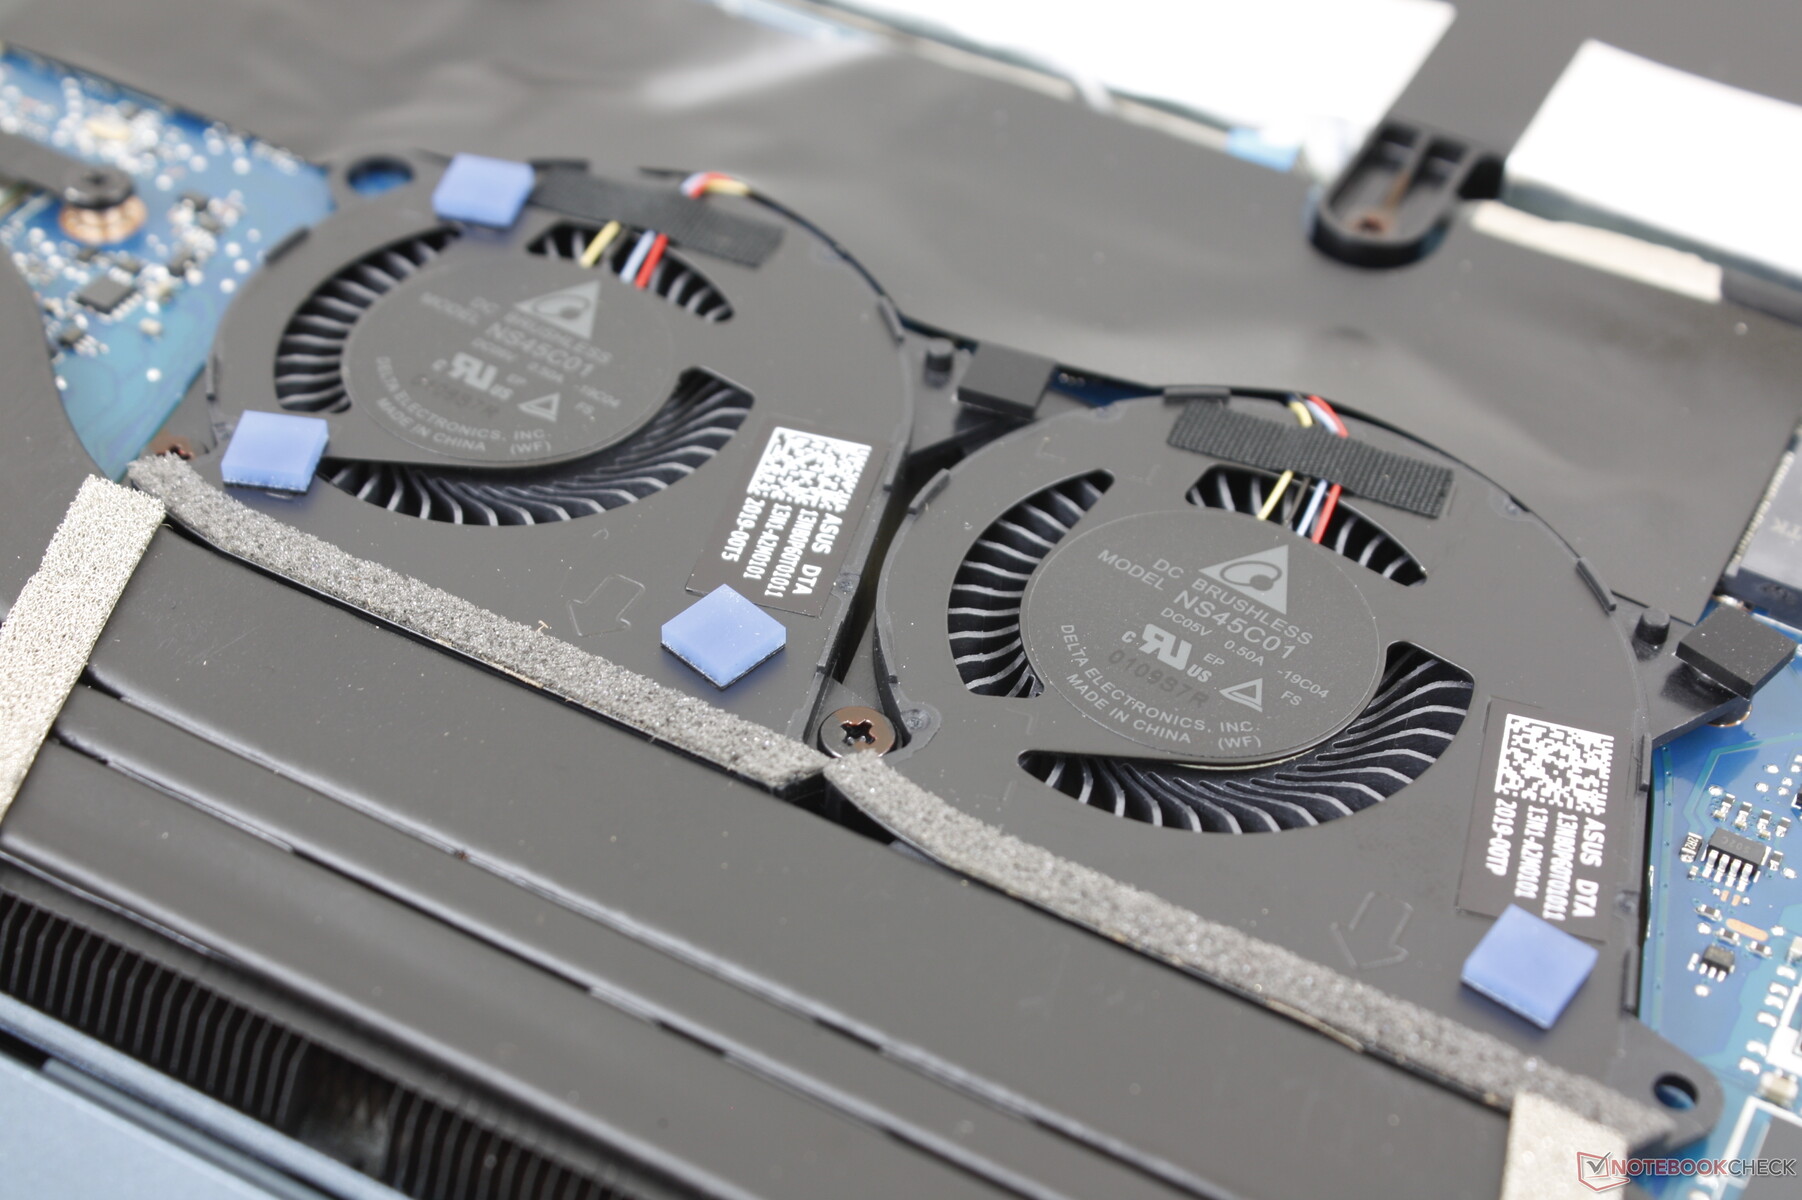
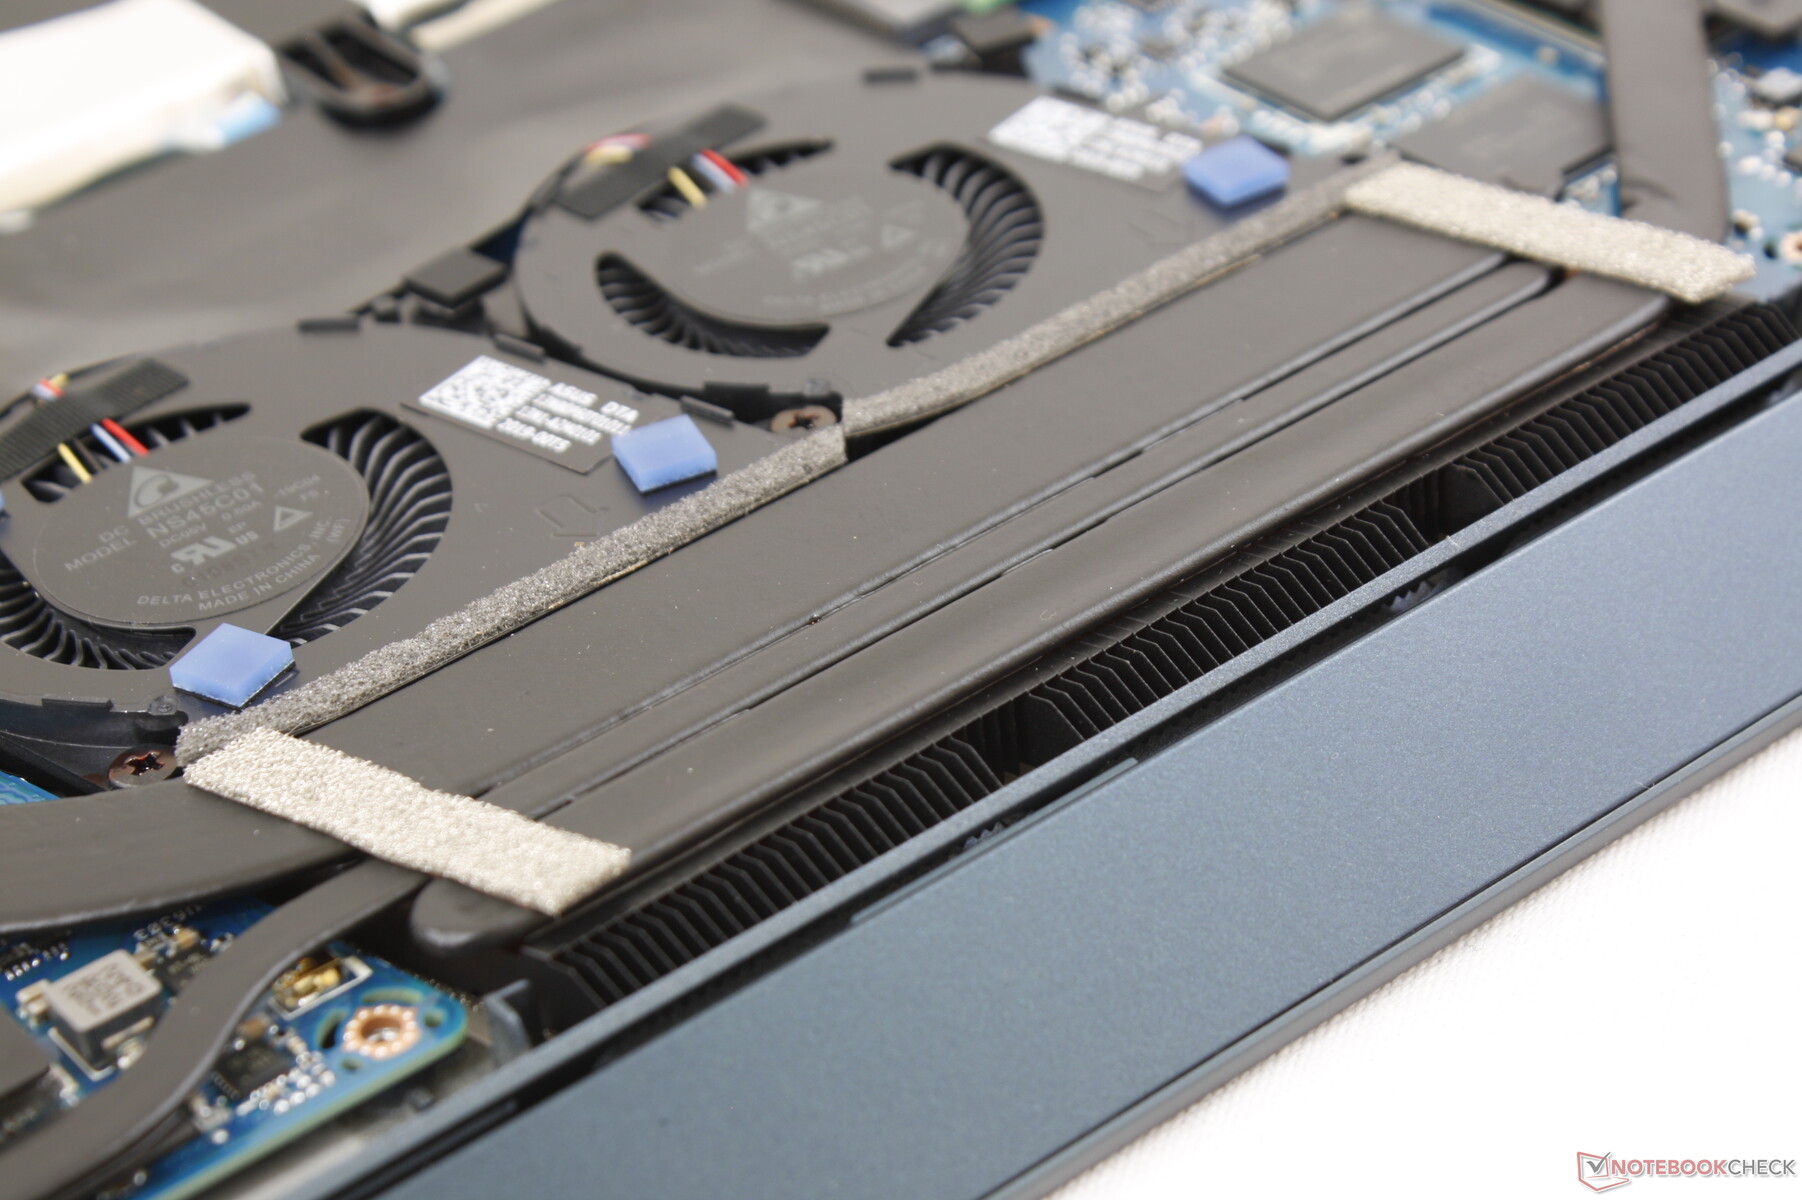
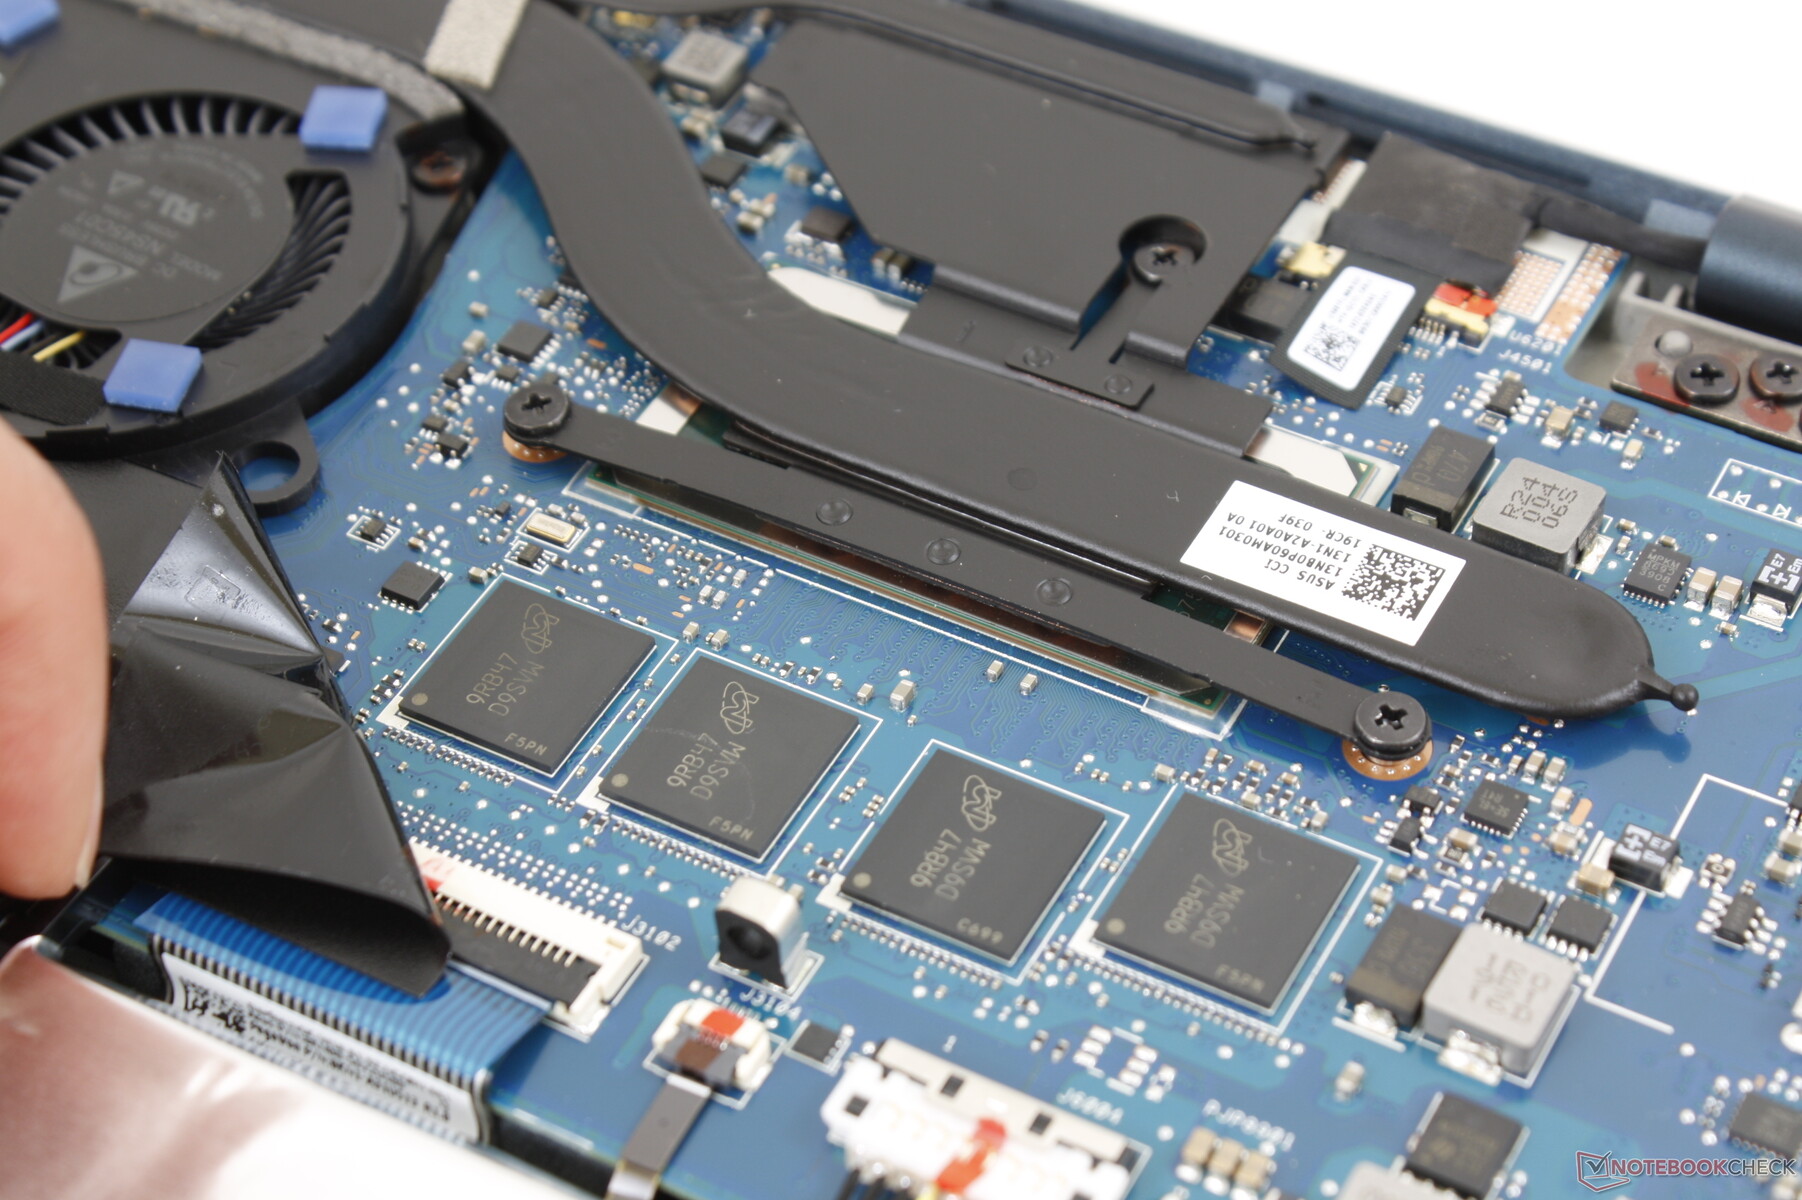
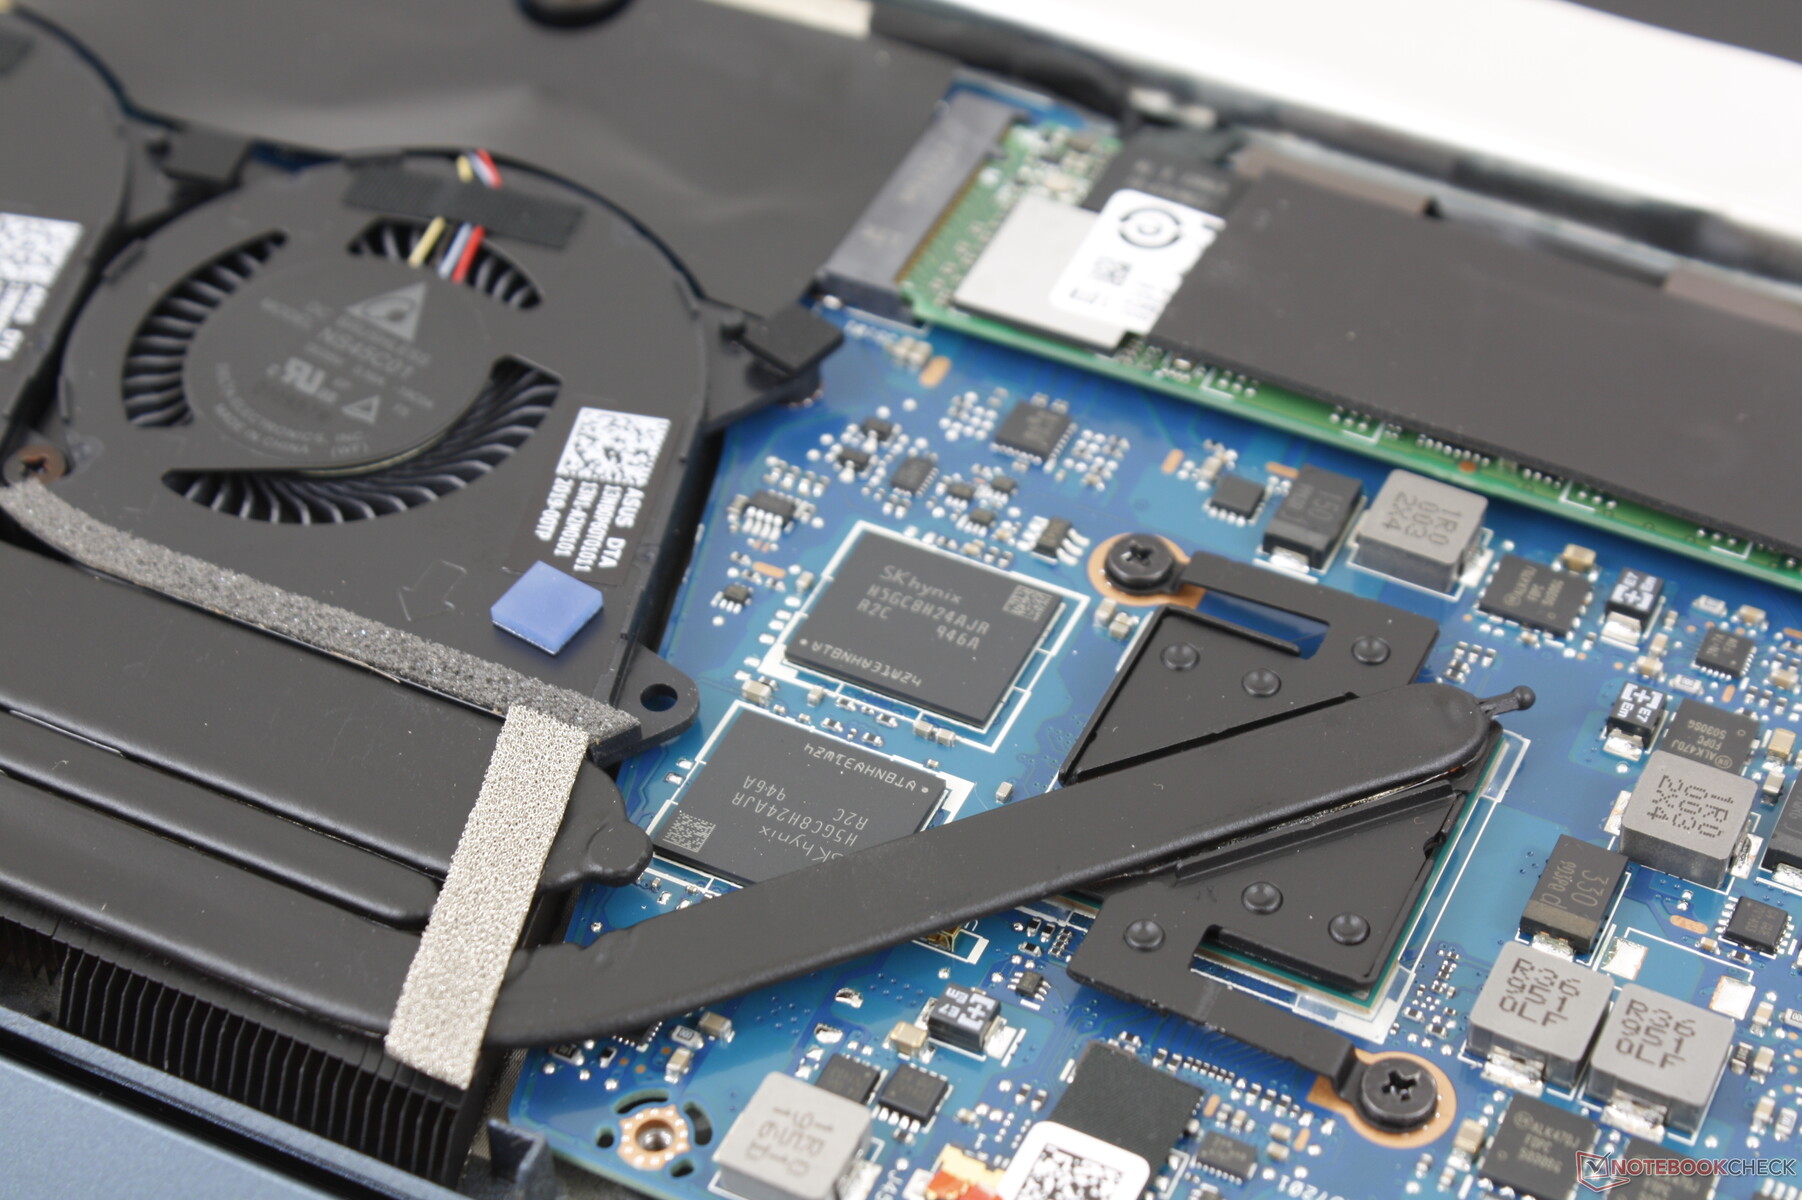
Alt panel on adet T5 Torx vida ile sabitlenmiştir. Bu vidaların çoğu, bir çift çok cımbız olmadan çıkarılması zor olan kauçuk eklerin arkasındadır. İçeri girdikten sonra kullanıcılar yalnızca tek M.2 depolama sürücüsünü yükseltebilir.
Aksesuarlar ve Garanti
Asus, her perakende kutusunda aktif bir stylus kalem ve bir taşıma kılıfı içerir. Standart bir yıllık sınırlı garanti geçerlidir.
Giriş cihazları
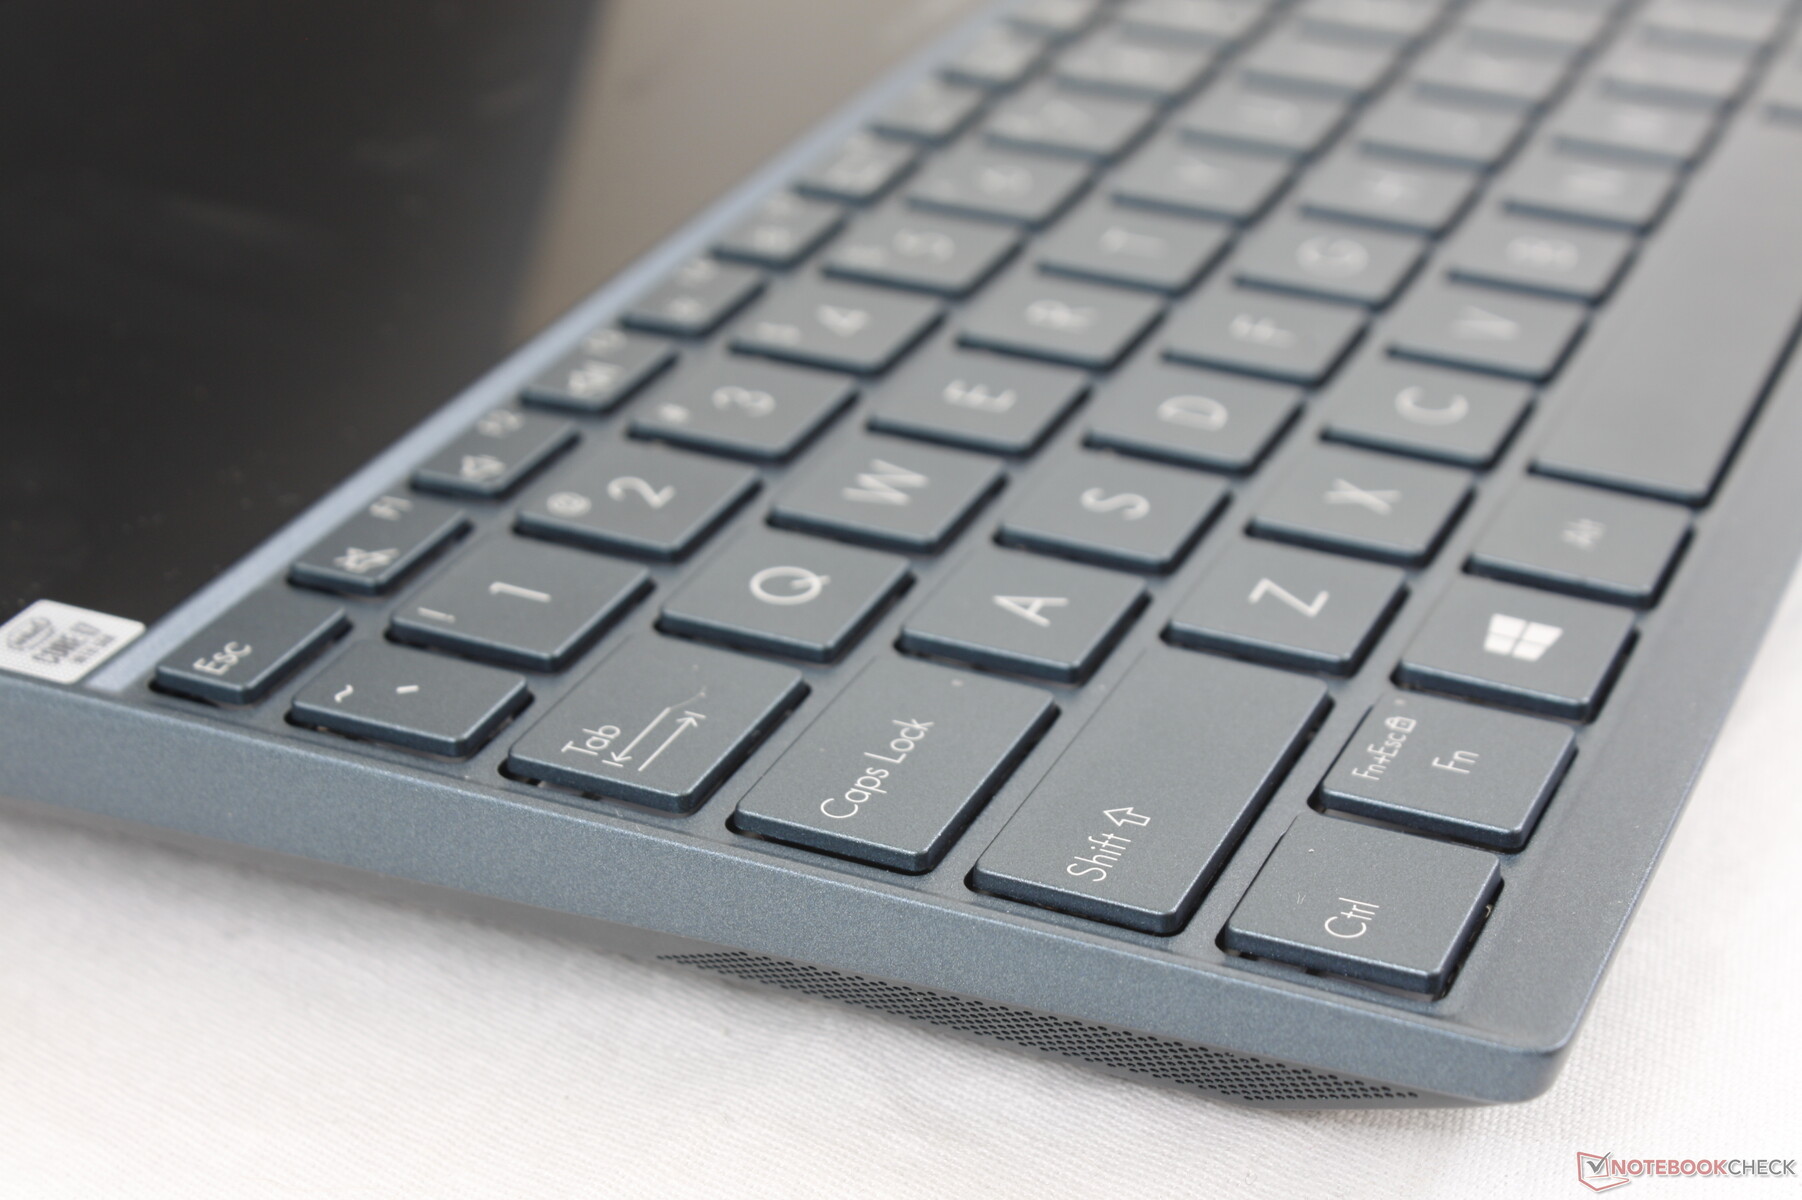
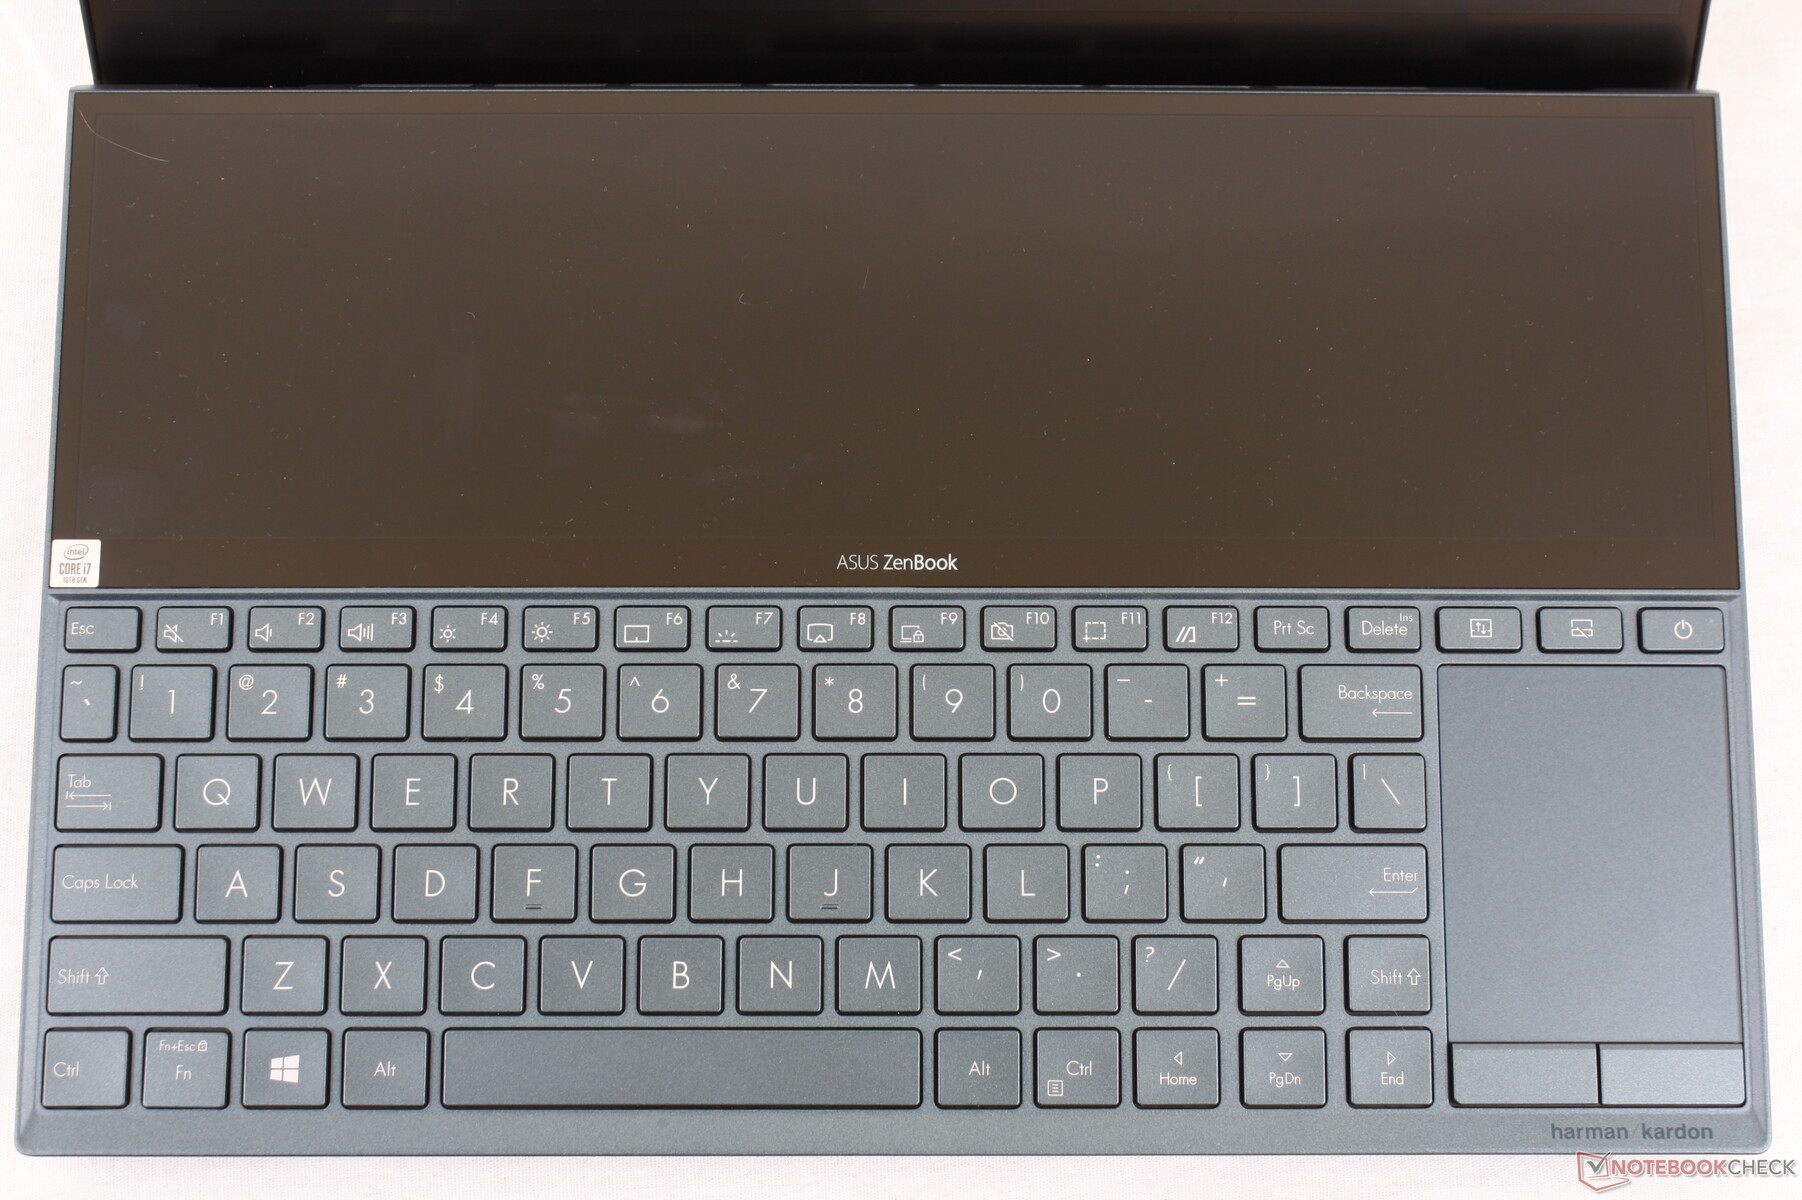
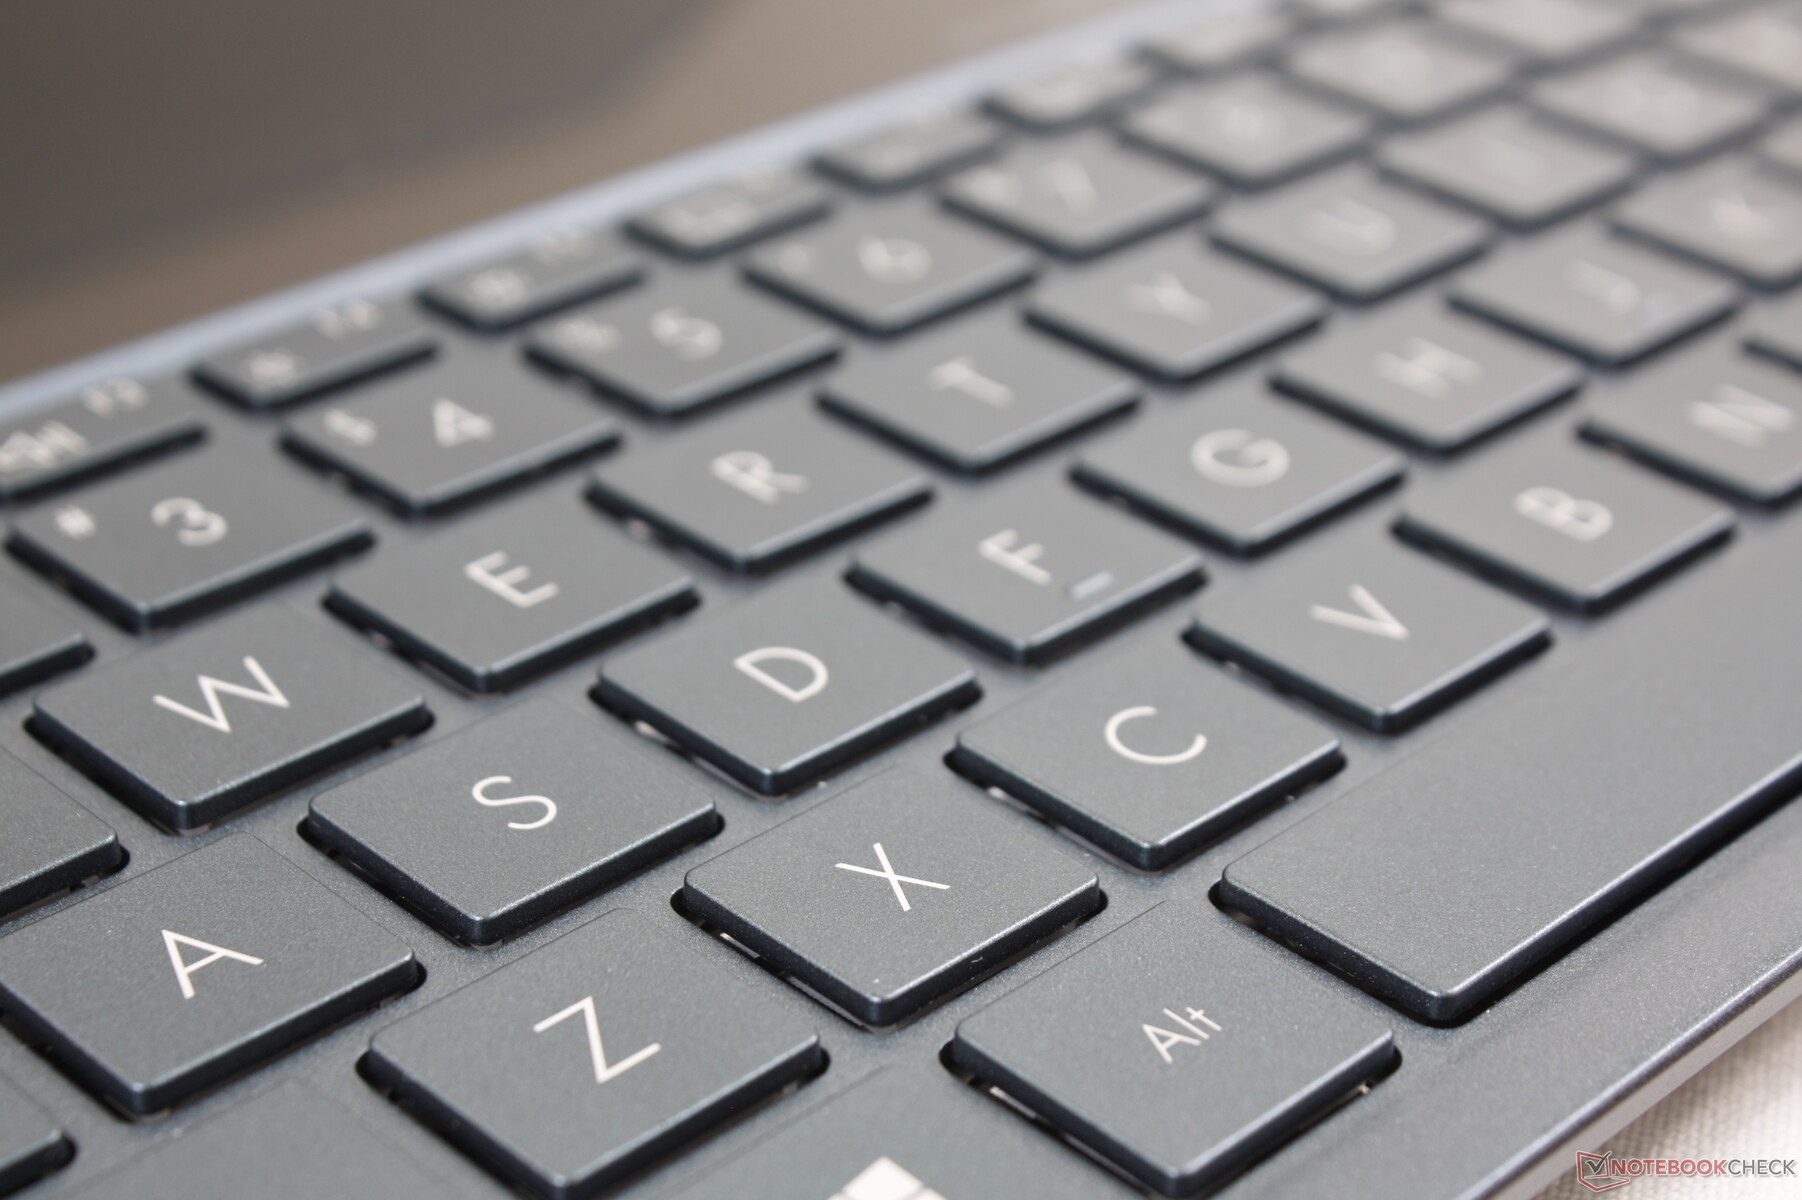
Arkadan aydınlatmalı tuşlar, net geri bildirim ve basıldığında sessiz sesle 1.4 mm seyahat sunar. Klavyeyi eski Zephyrus GX501'in süngerimsi tuşları üzerinde bir gelişme olarak görüyoruz. Bununla birlikte, klavyenin açık konumlandırılması, kullanıcıların daha rahat bir yazma deneyimi için dizüstü bilgisayardan daha uzakta oturmaları ve kendi avuç içi dayanaklarını sağlamaları gerektiği anlamına gelir. Biraz alışmak gerekiyor ve uçaklar gibi dar alanlarda veya hatta masa olmayan trenlerde çalışmak zor olabilir.
Dokunmatik
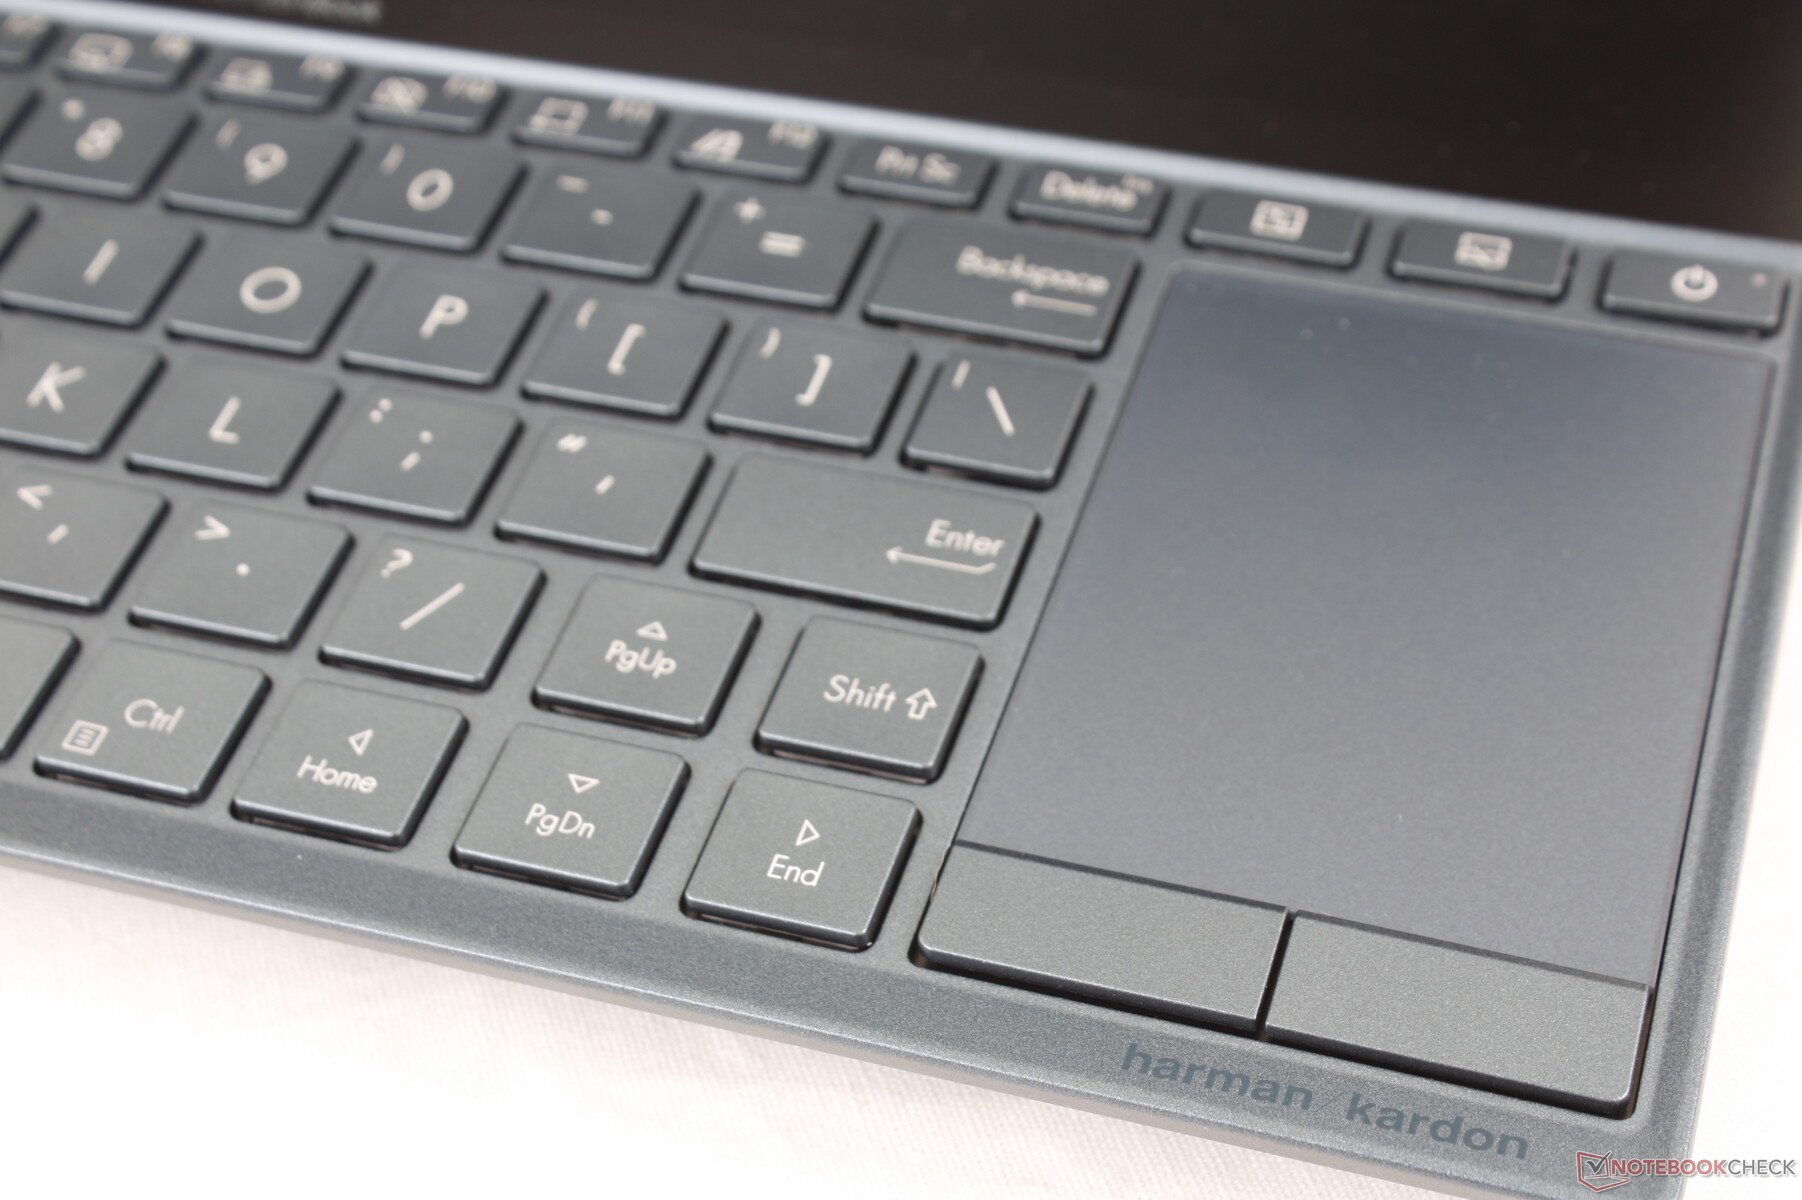
Yüzey alanının büyük bir kısmı klavye ve ScreenPad için ayrıldığından anlaşılabilir bir şekilde, touchpad çubuğun kısa ucunu aldı. Sadece 5,5 x 7 cm'de, her türlü ciddi iş yükü için çok sıkışık. Pürüzsüz yüzey ve özel fare tuşları, doğru tıklamaları biraz daha kolaylaştırır, ancak mümkün olduğunda dokunmatik ekranı, birlikte verilen kalemi veya harici bir fareyi kullanmak isteyeceksiniz.
Görüntüle
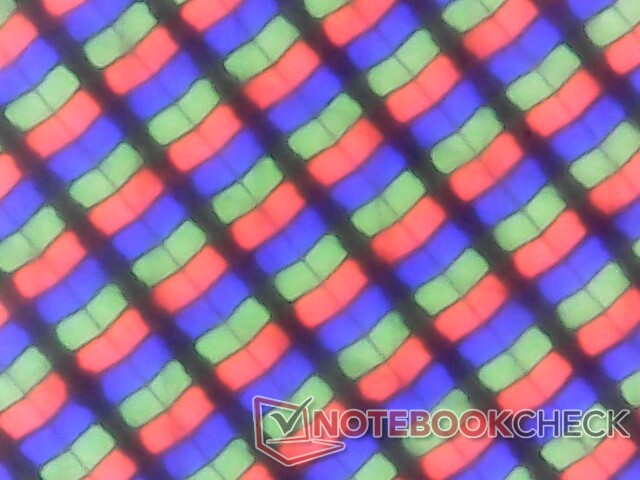
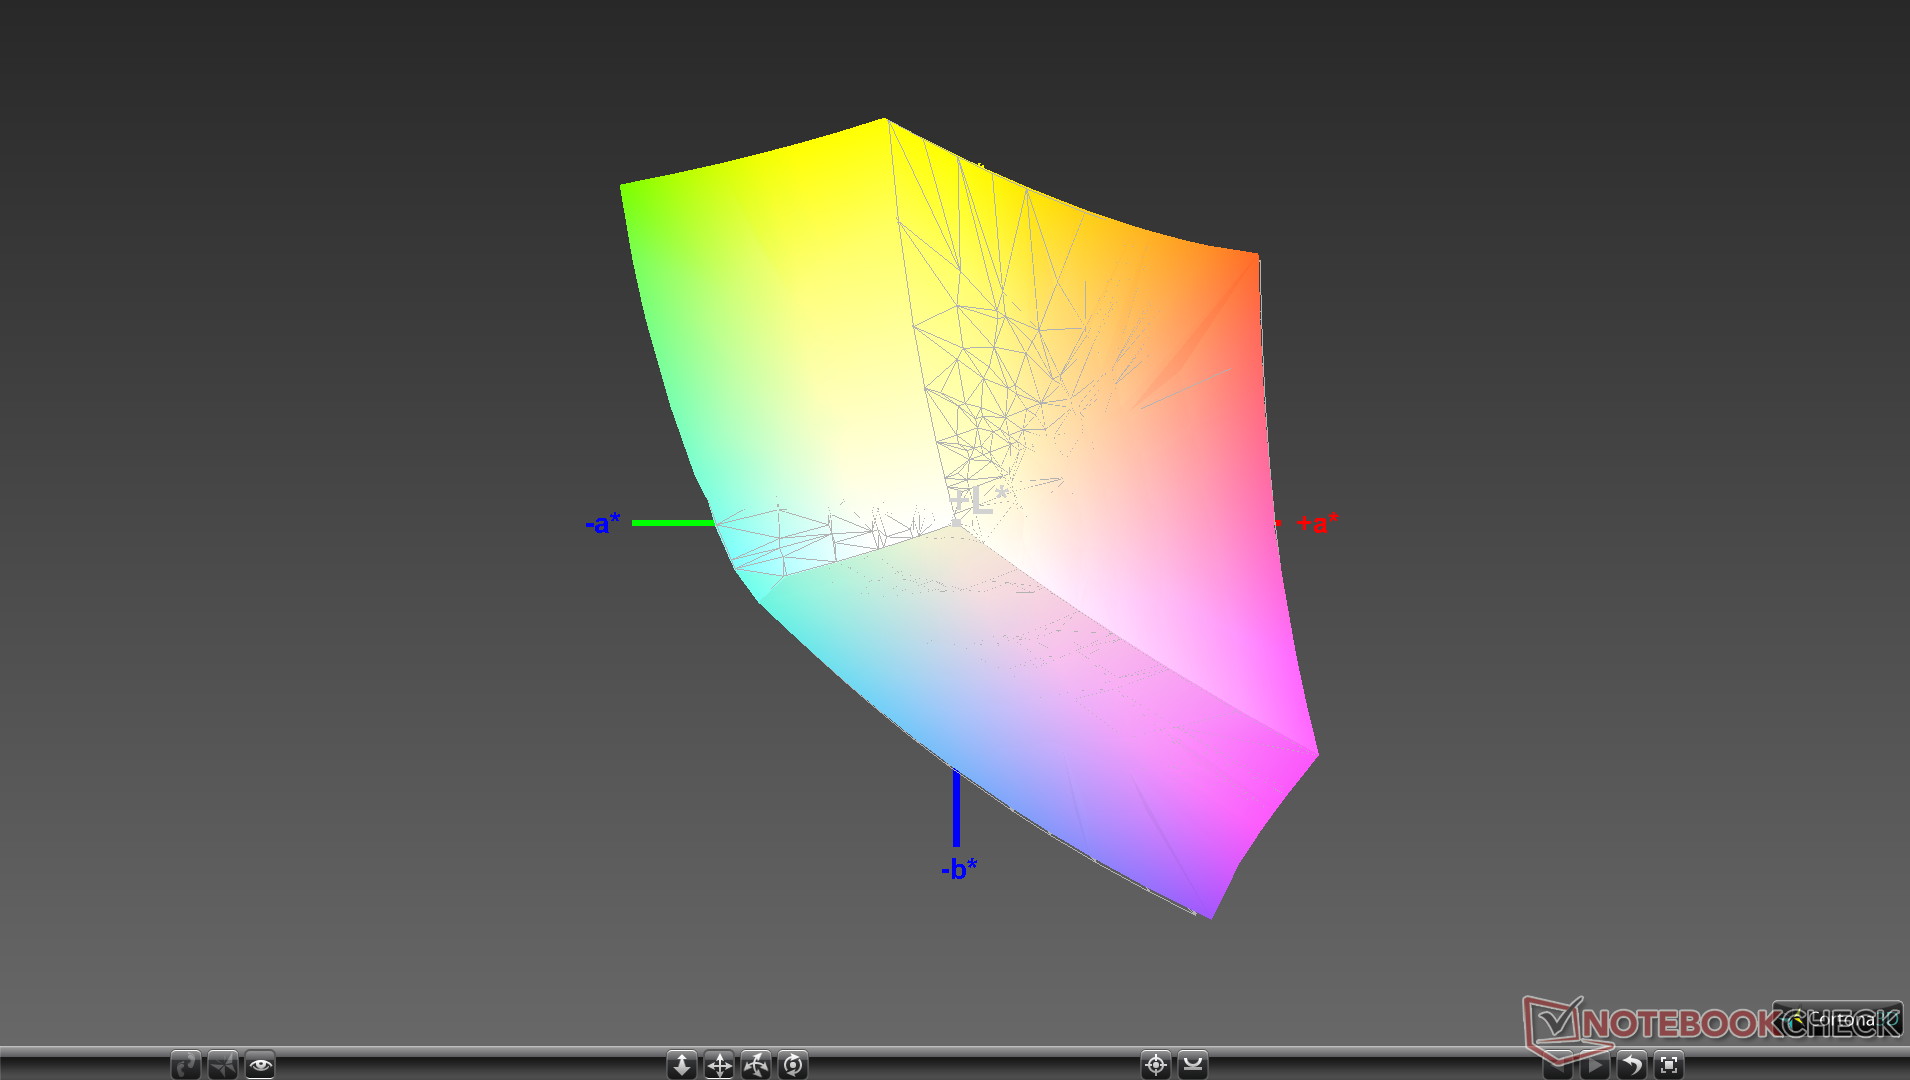
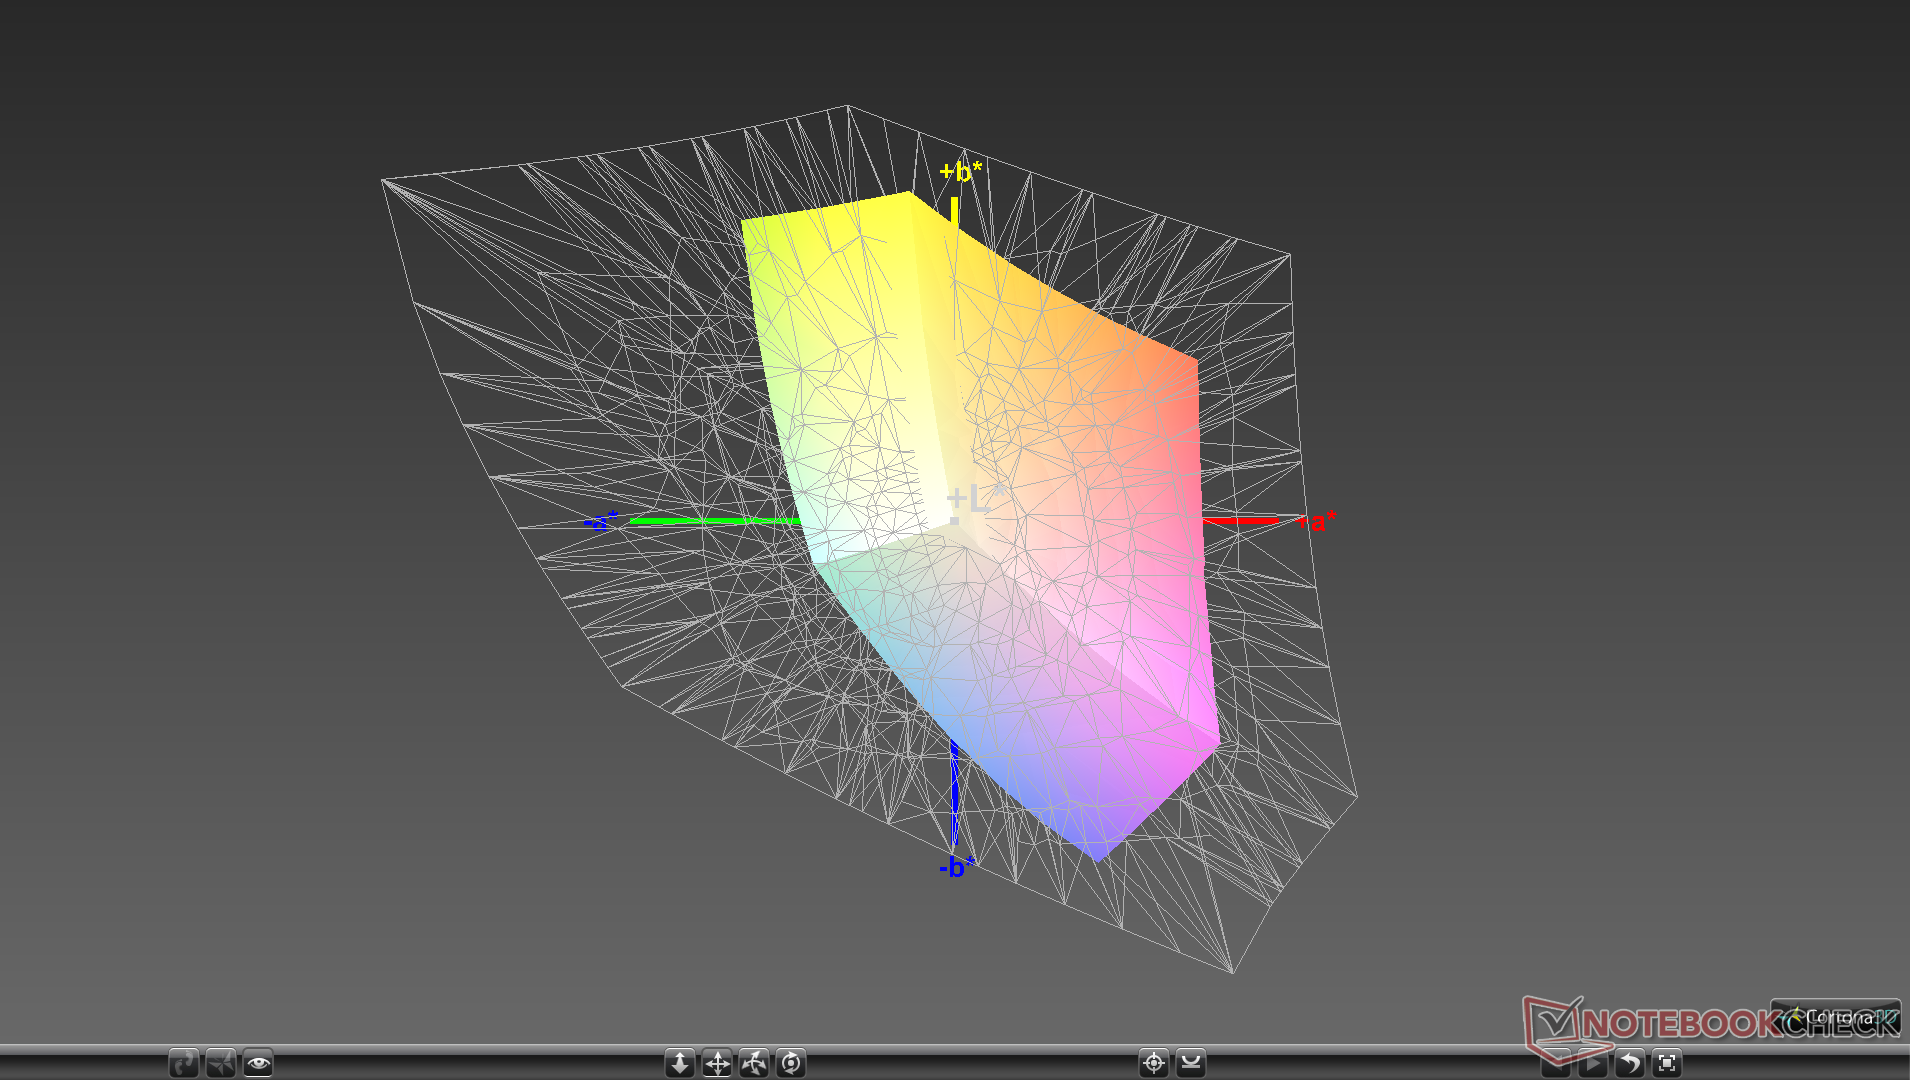
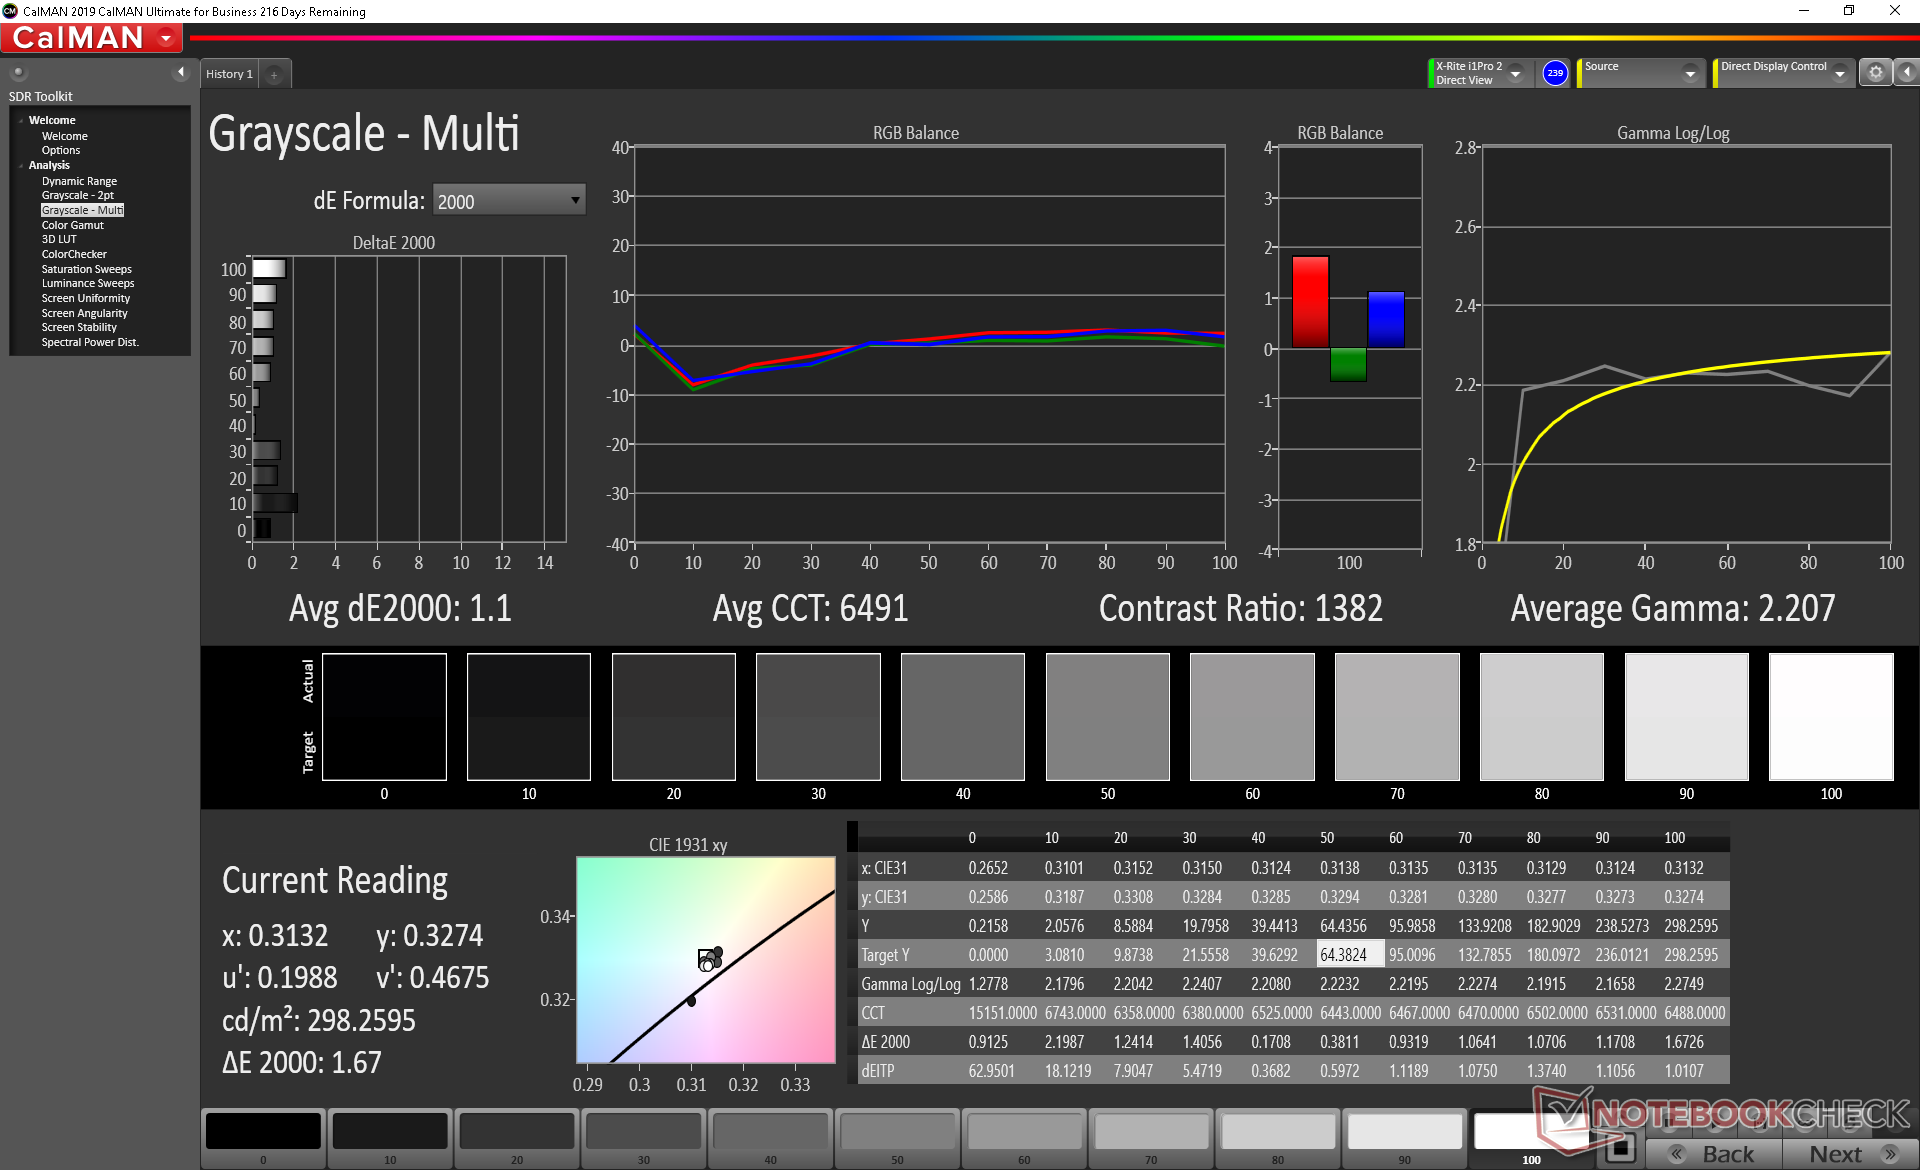
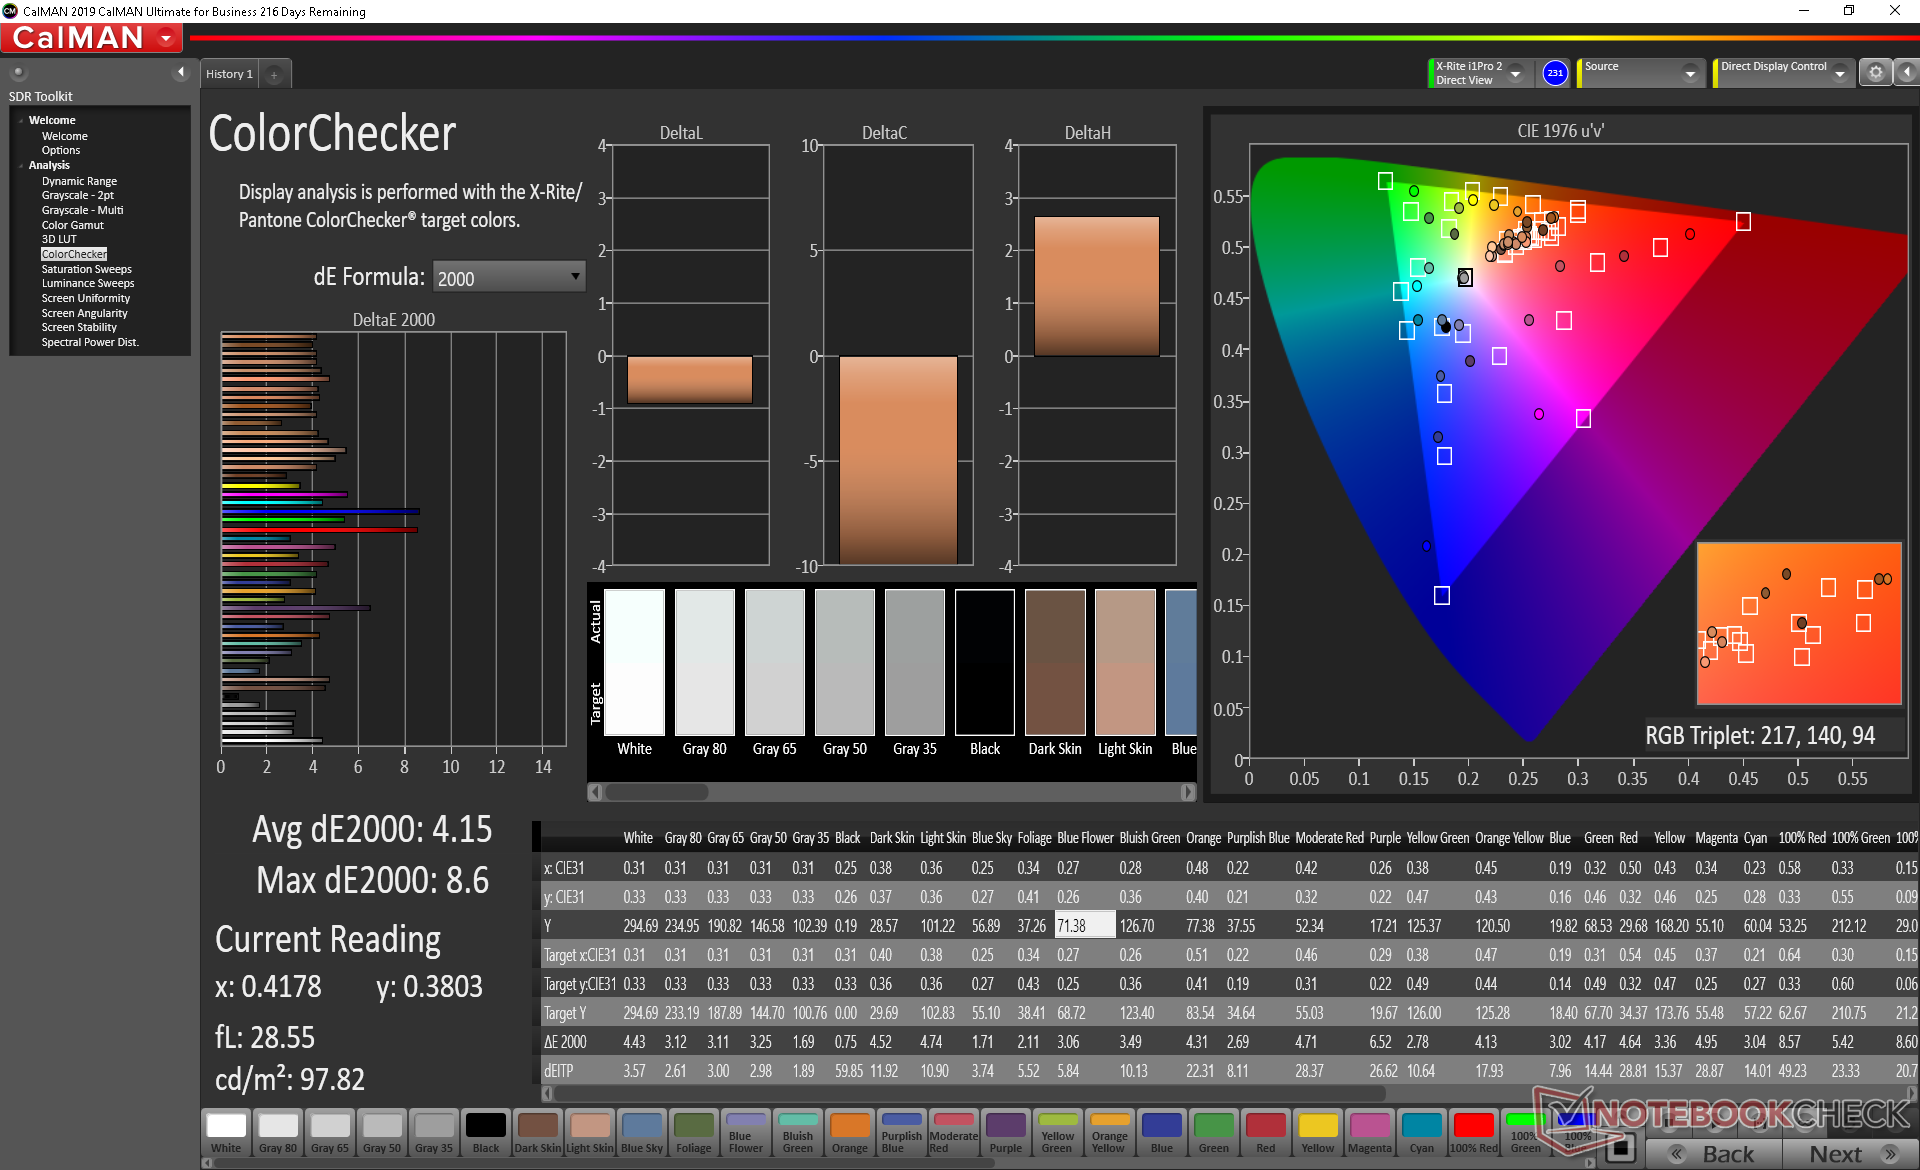
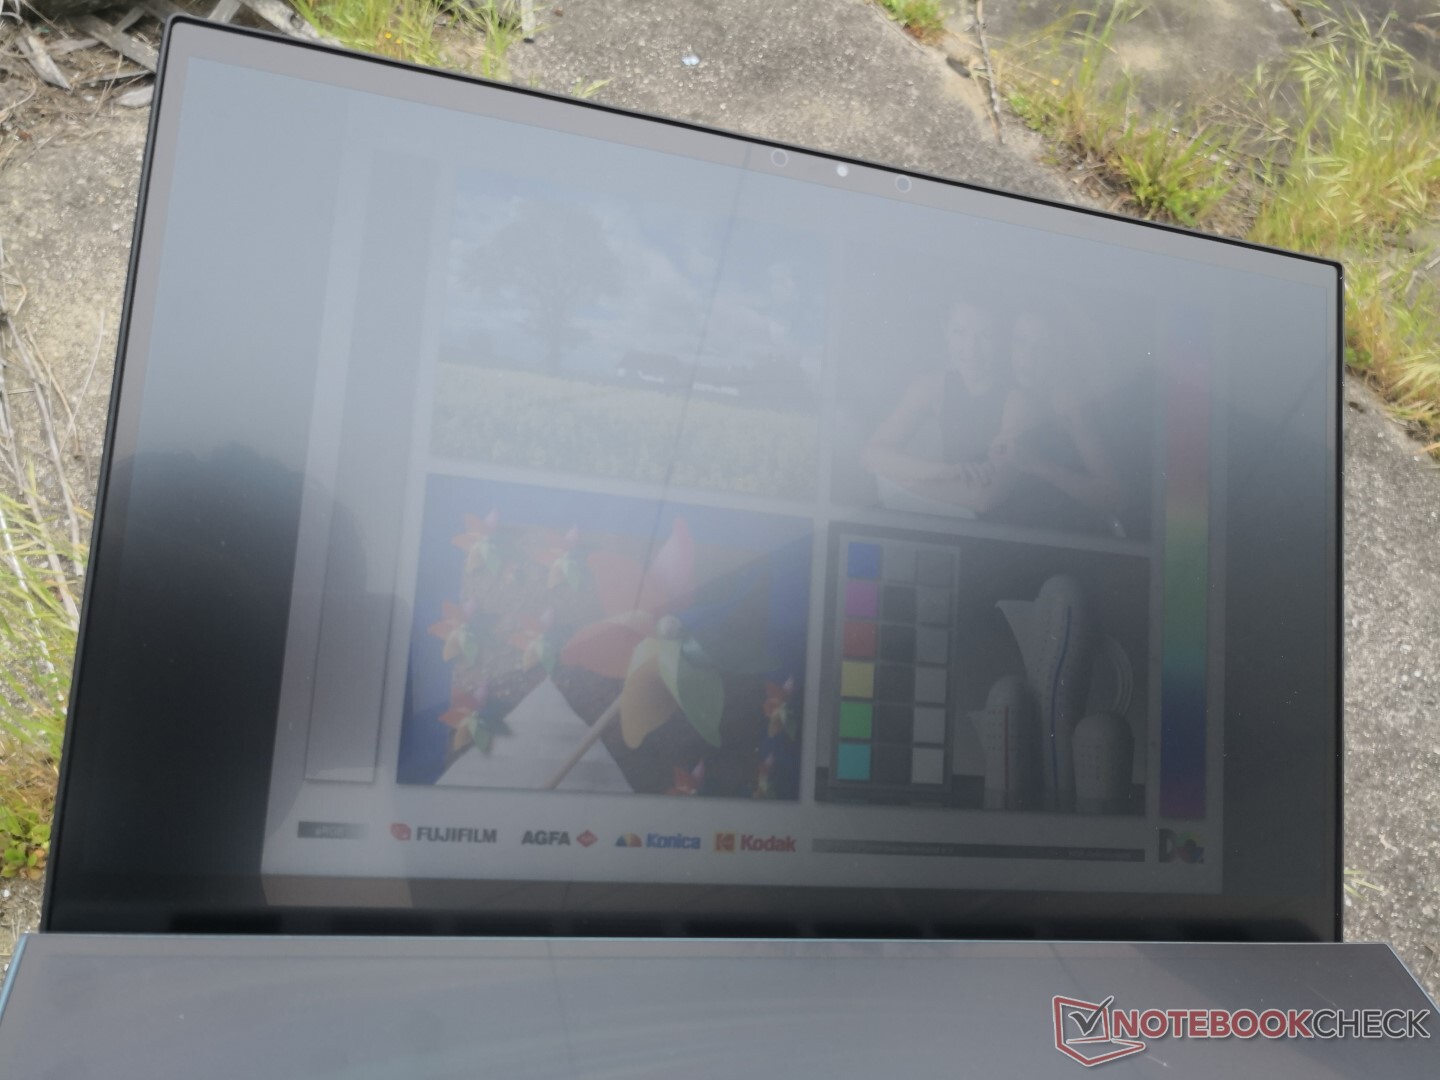
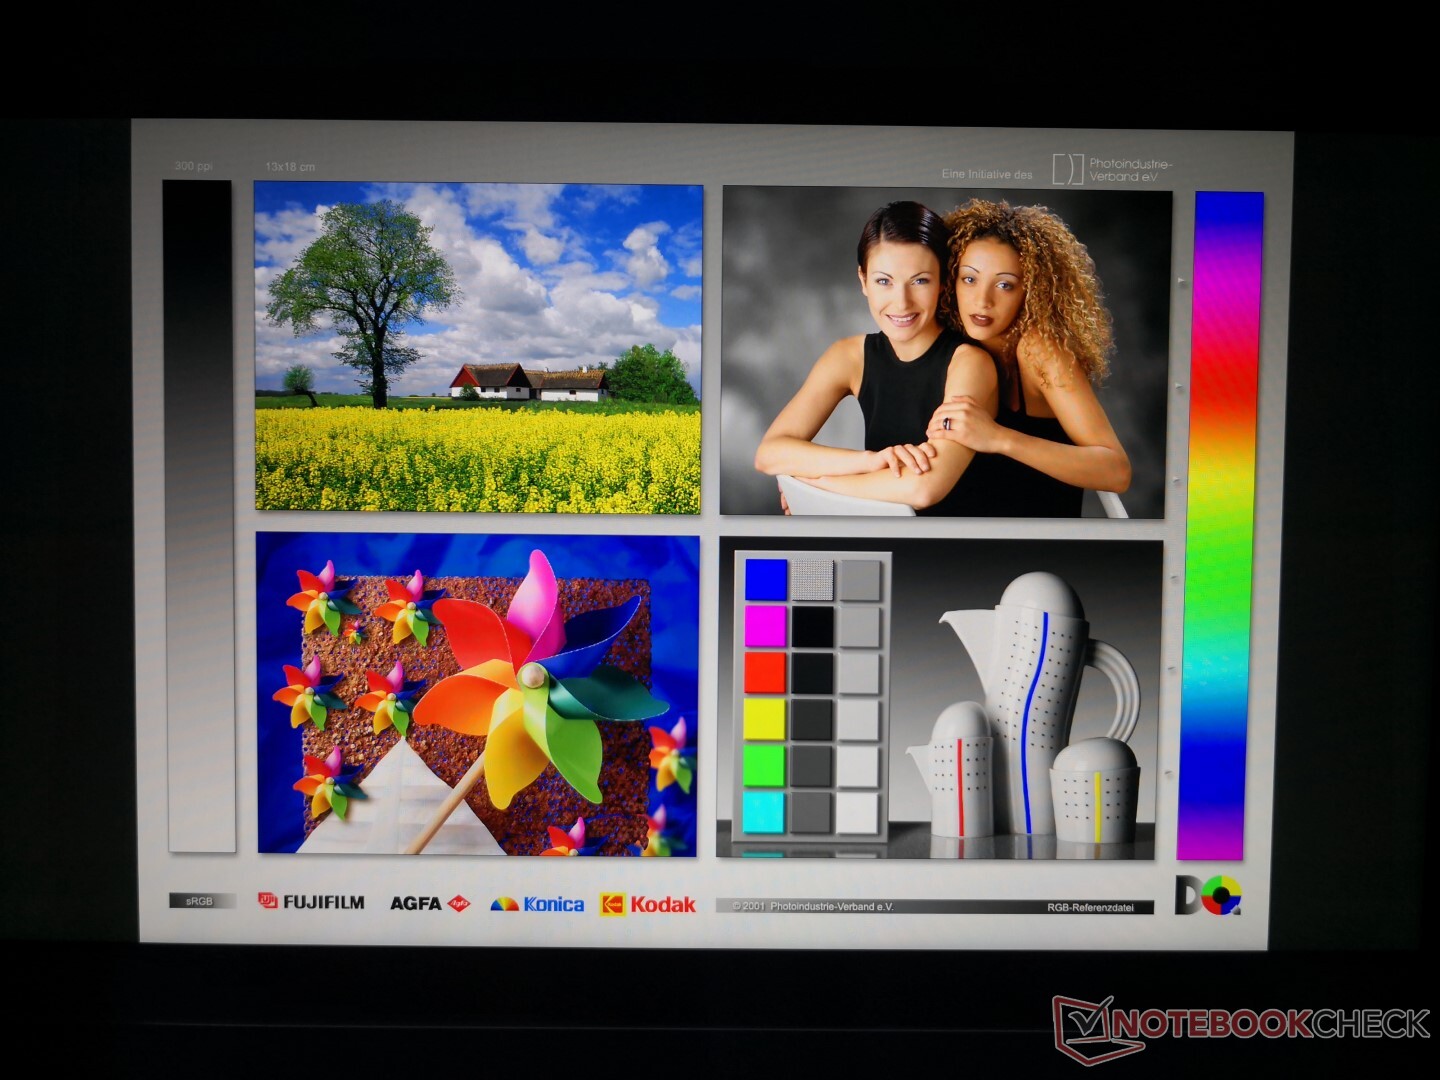
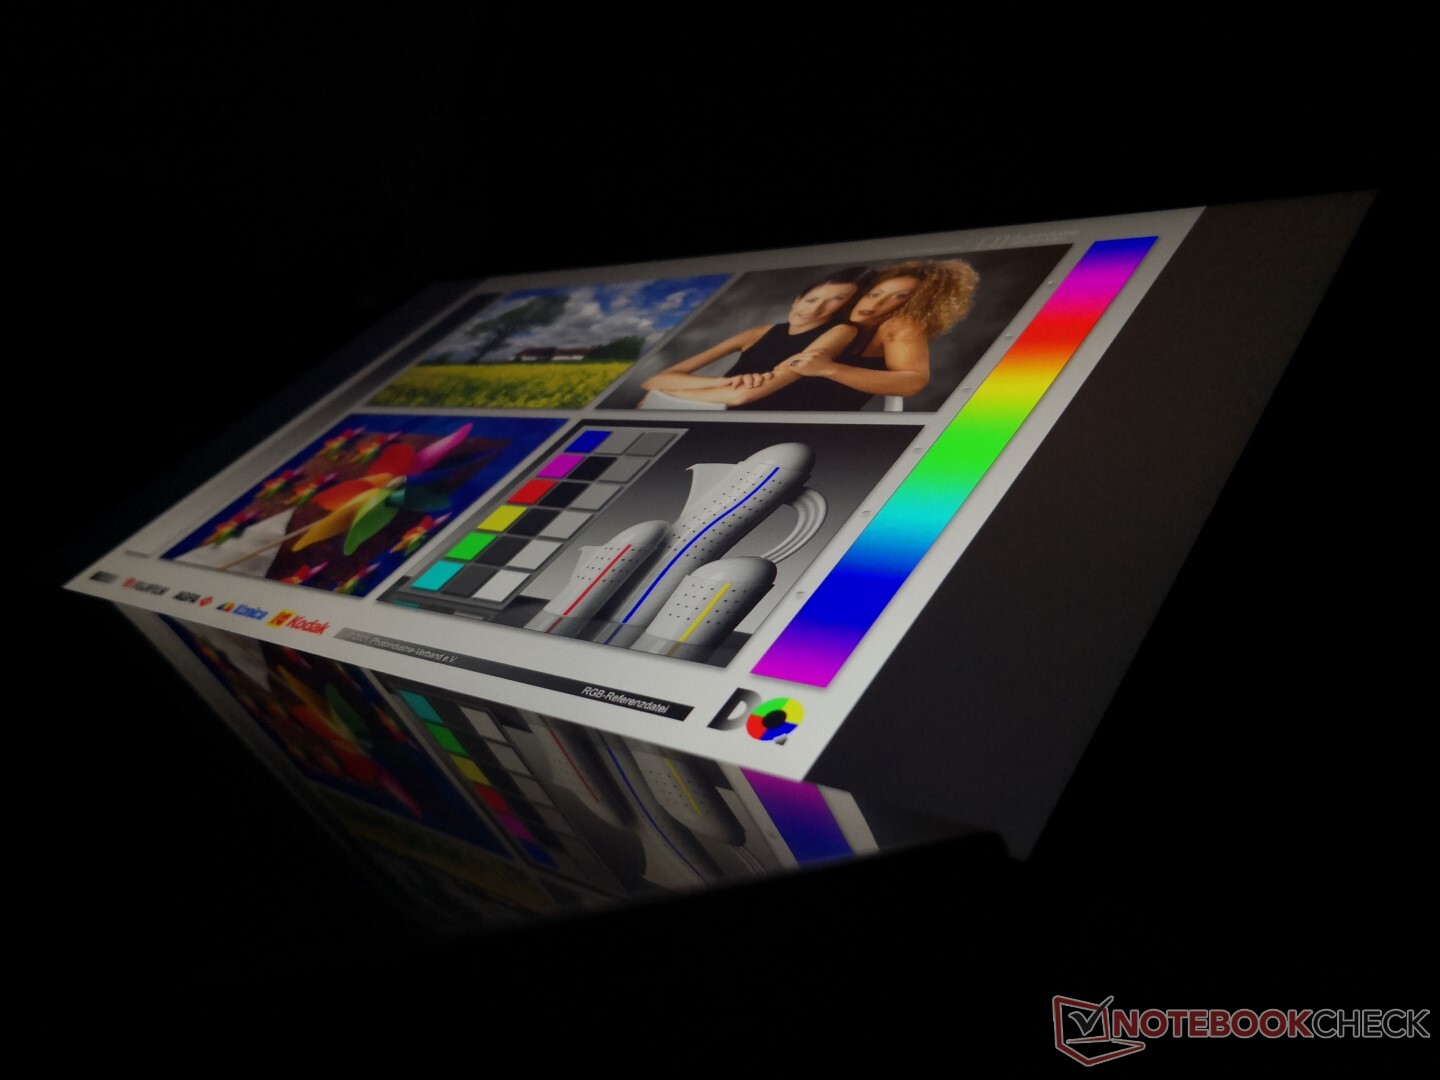
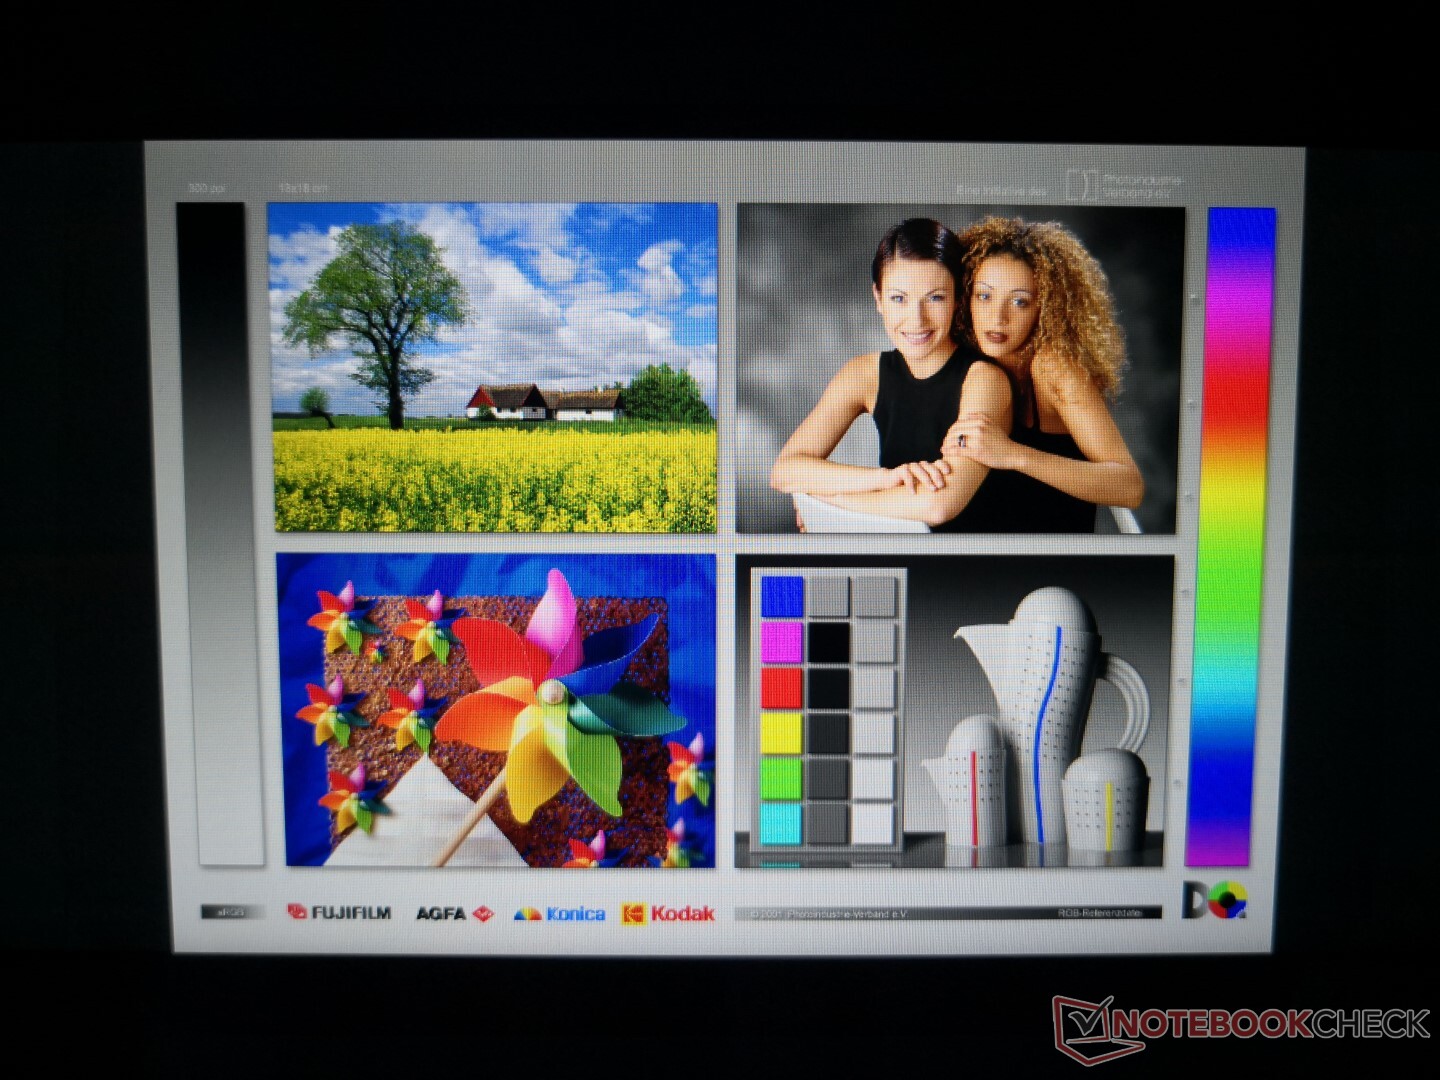
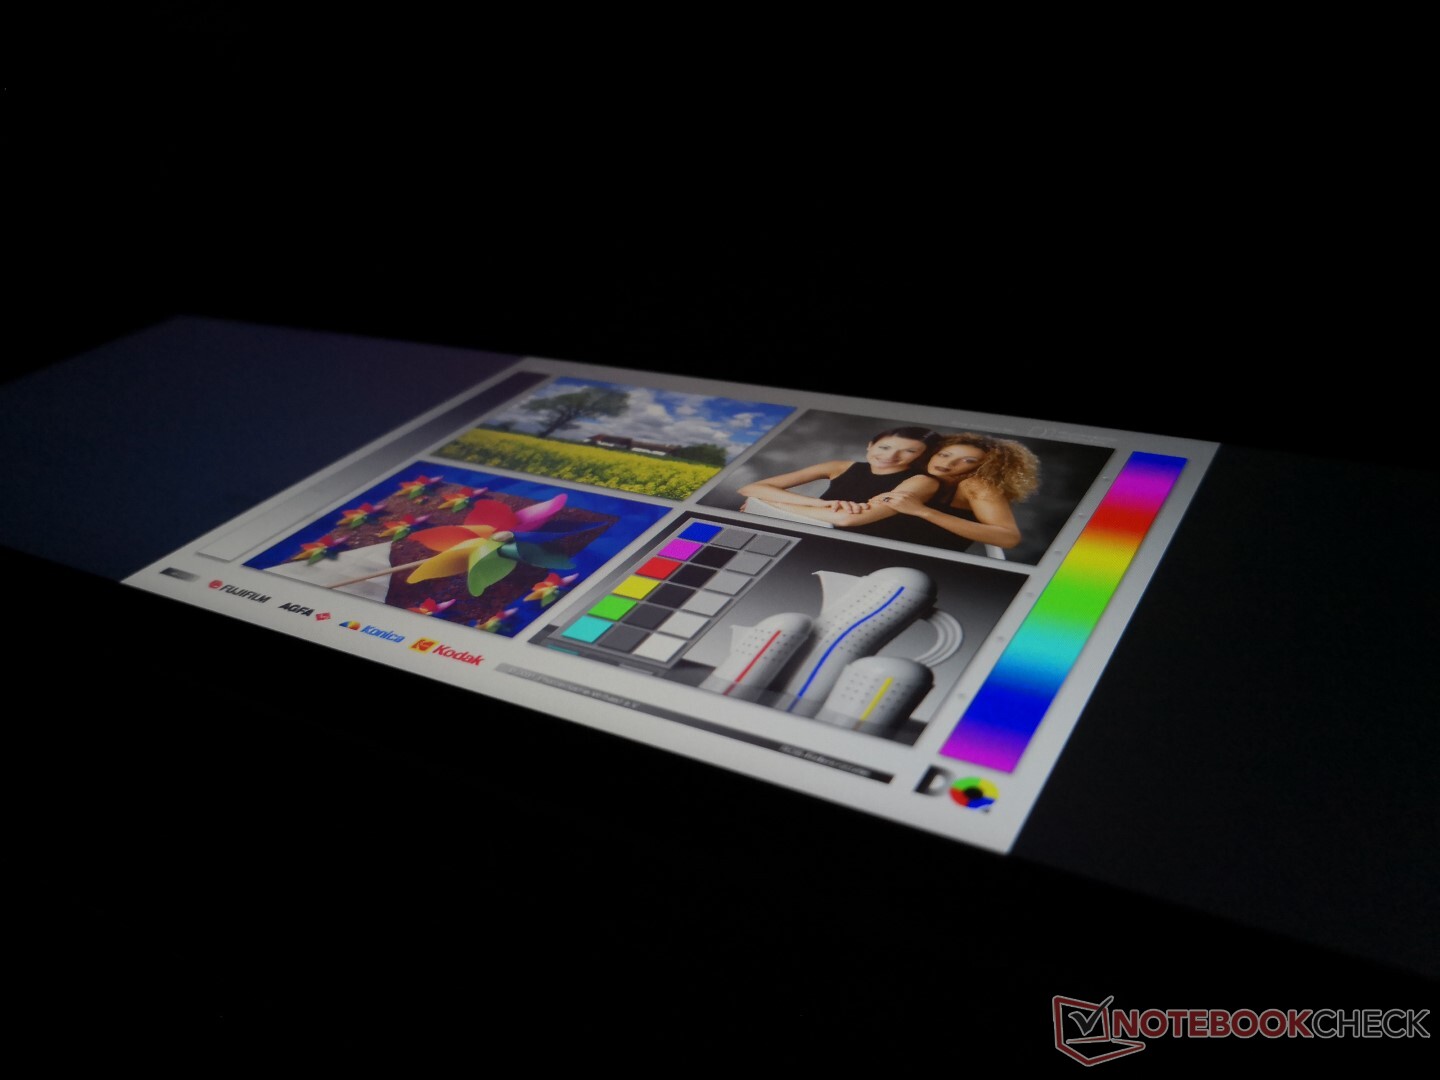
Birincil ekran, MSI PS42, MSI Modern 14 ve Acer Swift 3 SF314'te de bulunan bir Chi Mei N140HCE-EN2 IPS panelidir. Bu nedenle, ZenBook Duo burada pek çok sürpriz sunmuyor çünkü bu dört sistem iyi kontrast oranı, iyi tepki süreleri ve tam sRGB kapsamı gibi benzer ekran özelliklerini paylaşıyor. Bununla birlikte, Asus, yukarıda belirtilen 14 inç modellere kıyasla ekranı biraz kalınlaştıran mat bir dokunmatik ekran kaplaması içeriyordu. Resim, sonuç olarak parlak bir alternatiften biraz daha grenlidir, ancak bu çoğu mat panelde yaygındır. Ekran parlaklığı neredeyse XPS 13, Surface Laptop 3 veya IdeaPad S940 gibi çoğu amiral gemisi Ultrabook kadar parlak değildir. İç mekanda veya sınıfta kullanım için iyi olacak, ancak dizüstü bilgisayarı açık havada sık kullanmayı planlıyorsanız daha iyi seçenekler var.
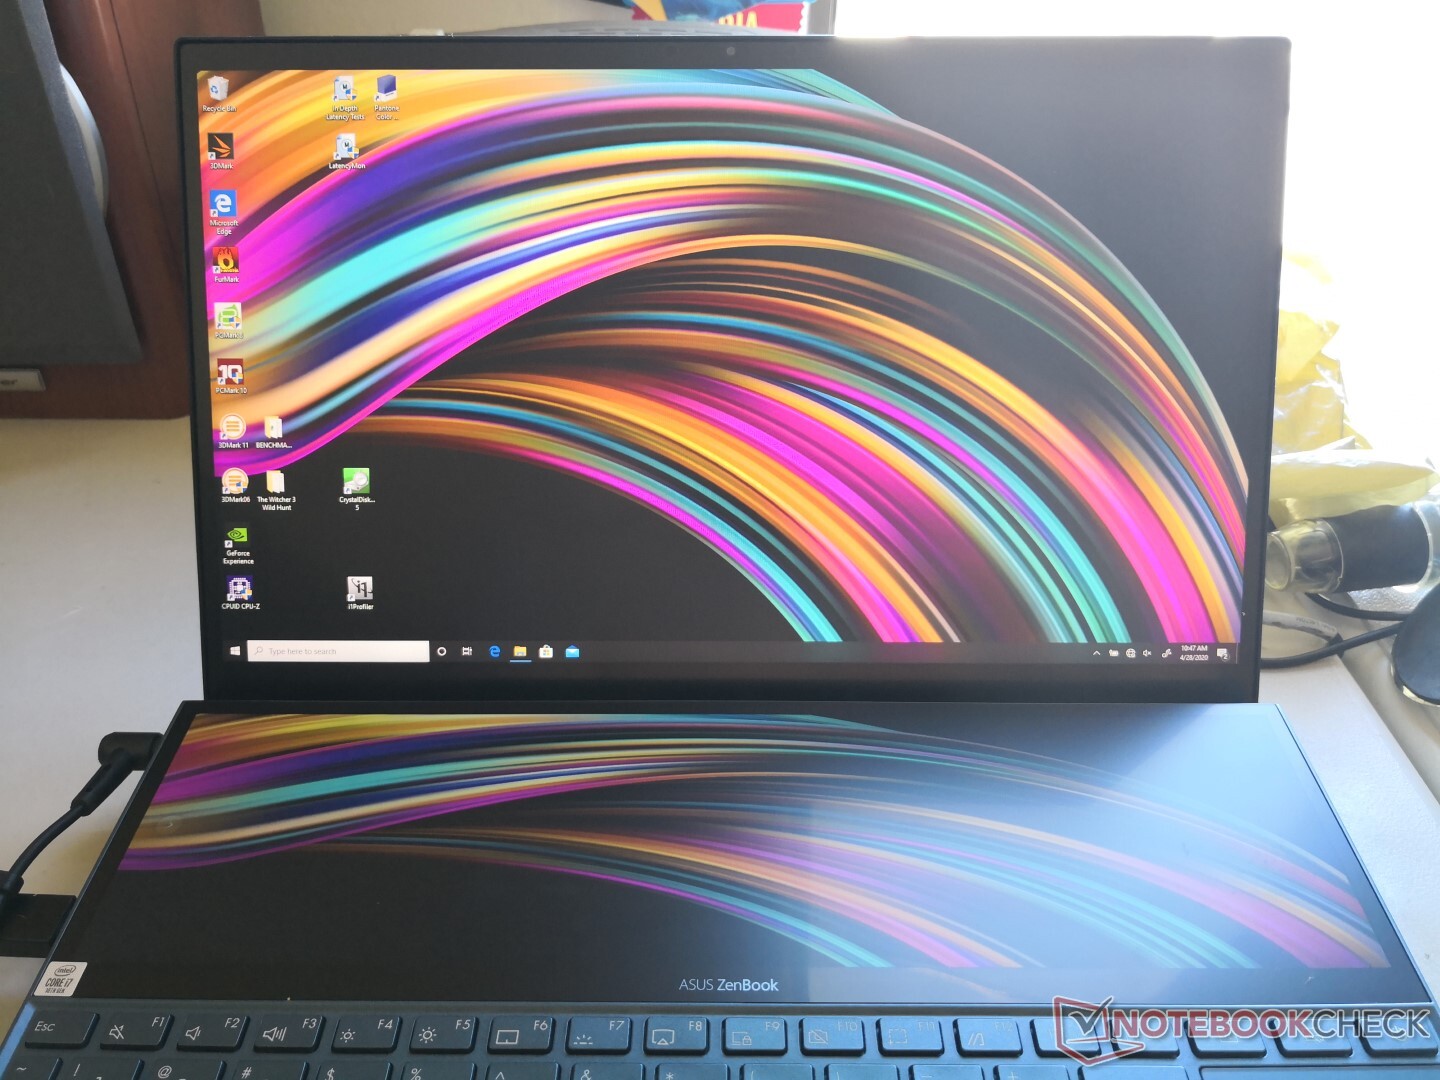
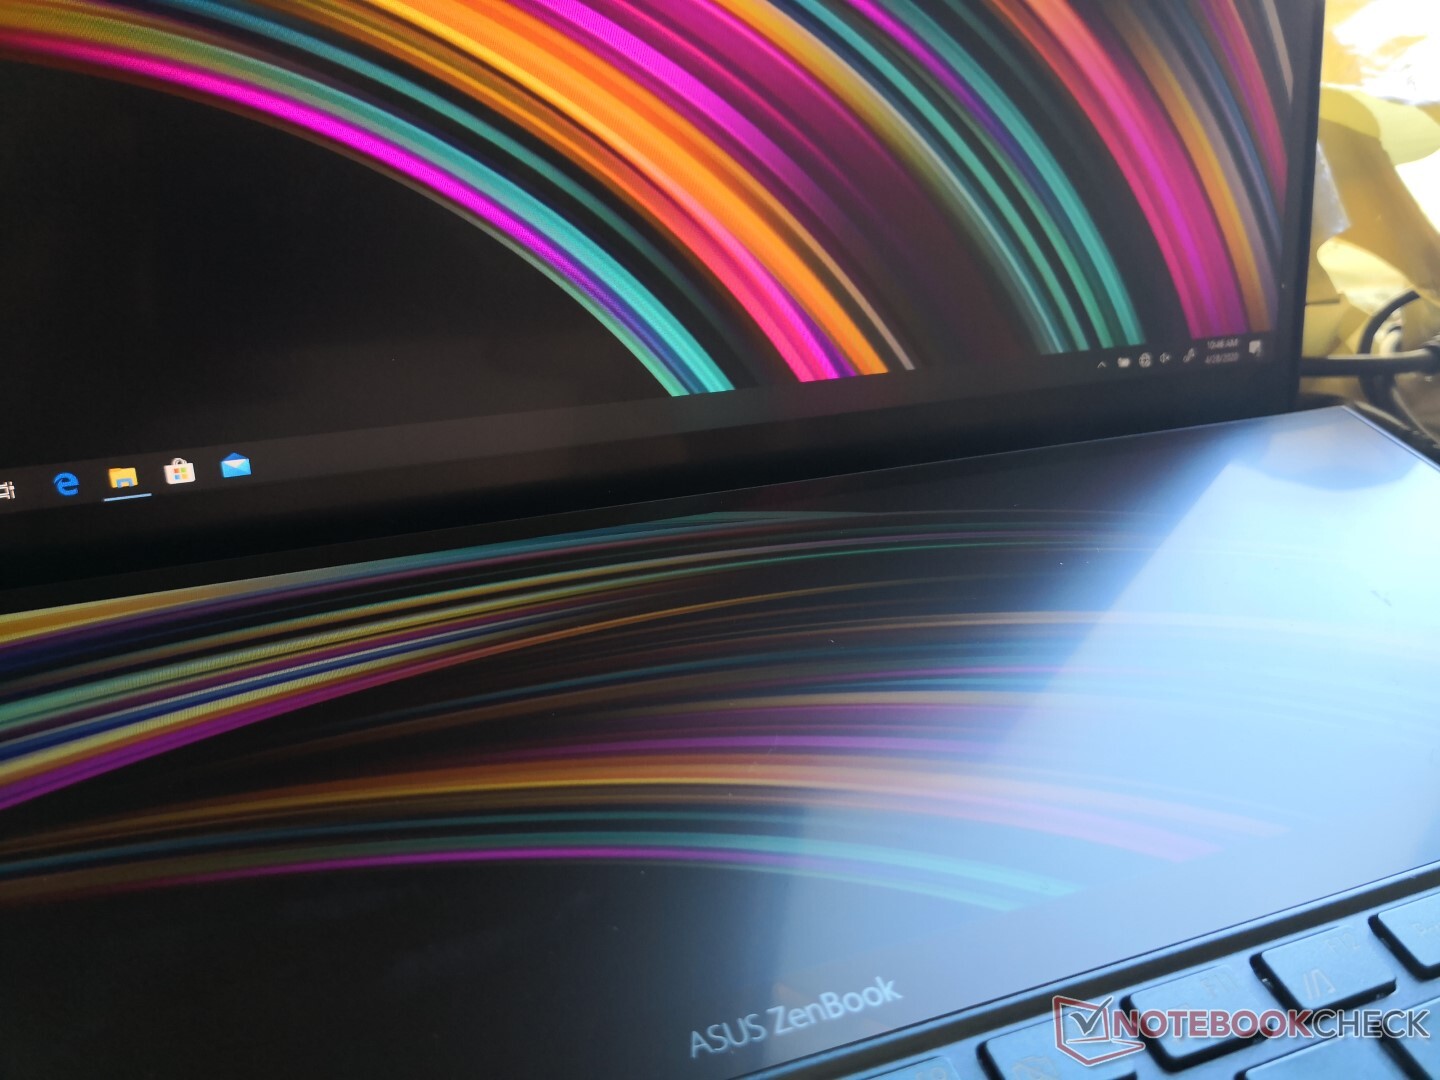
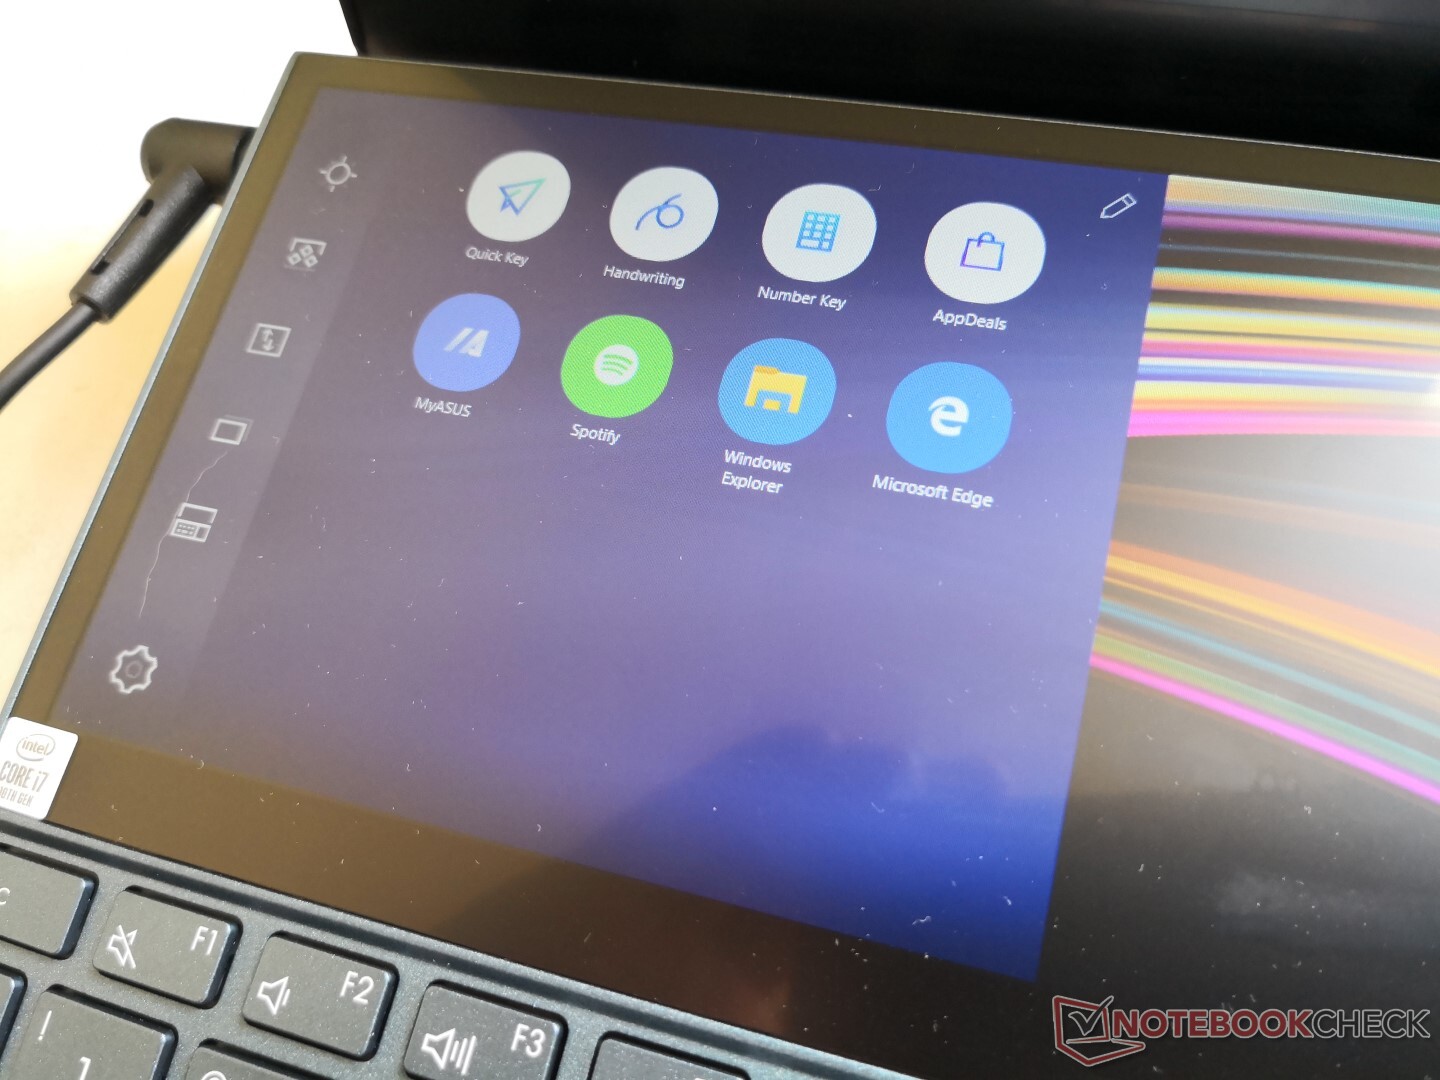
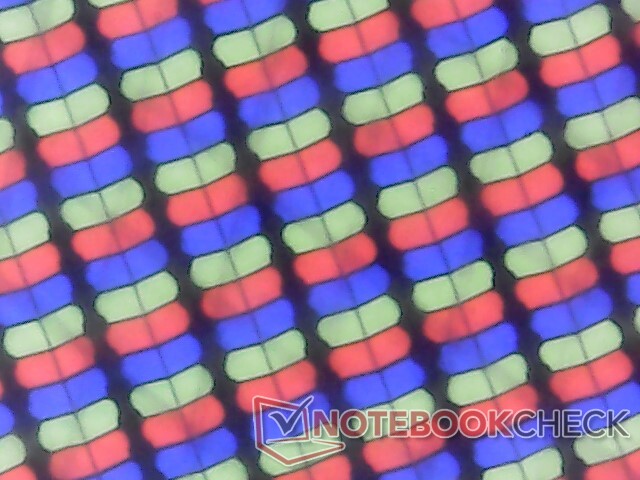
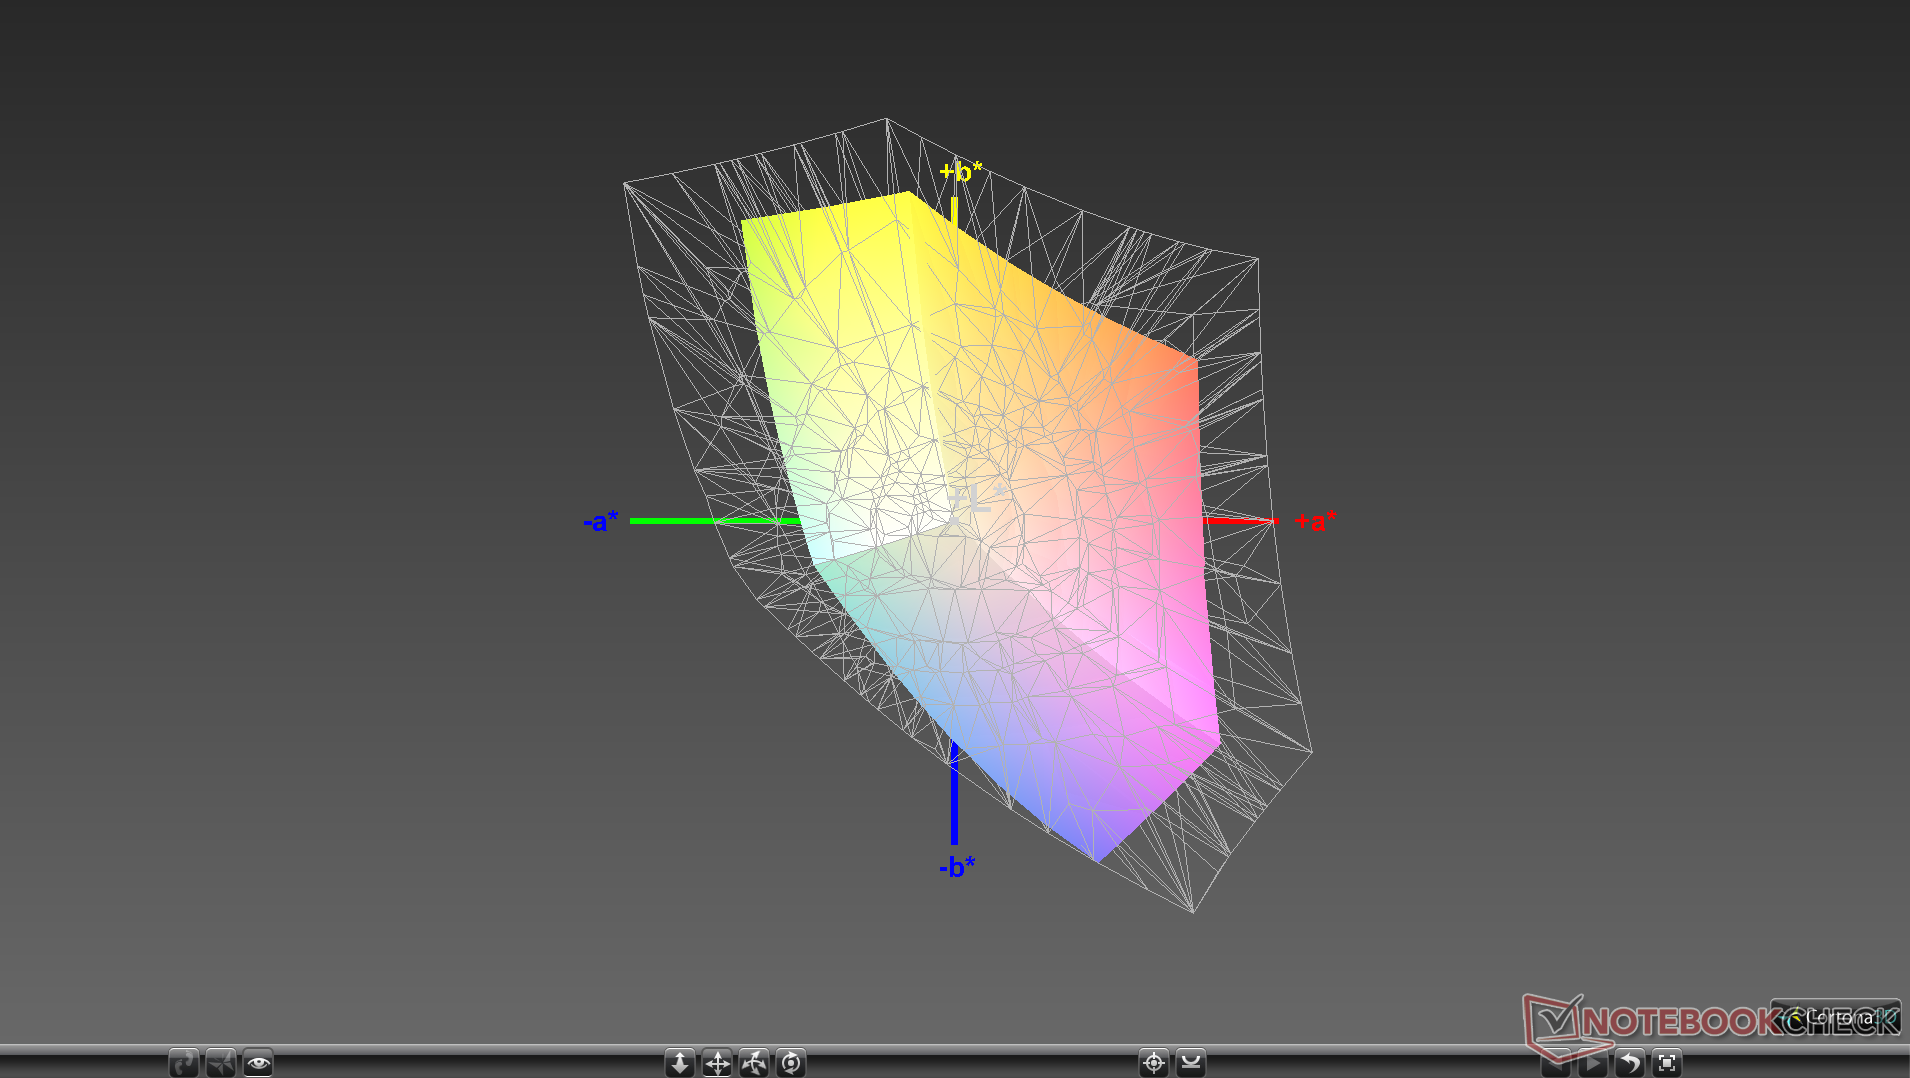
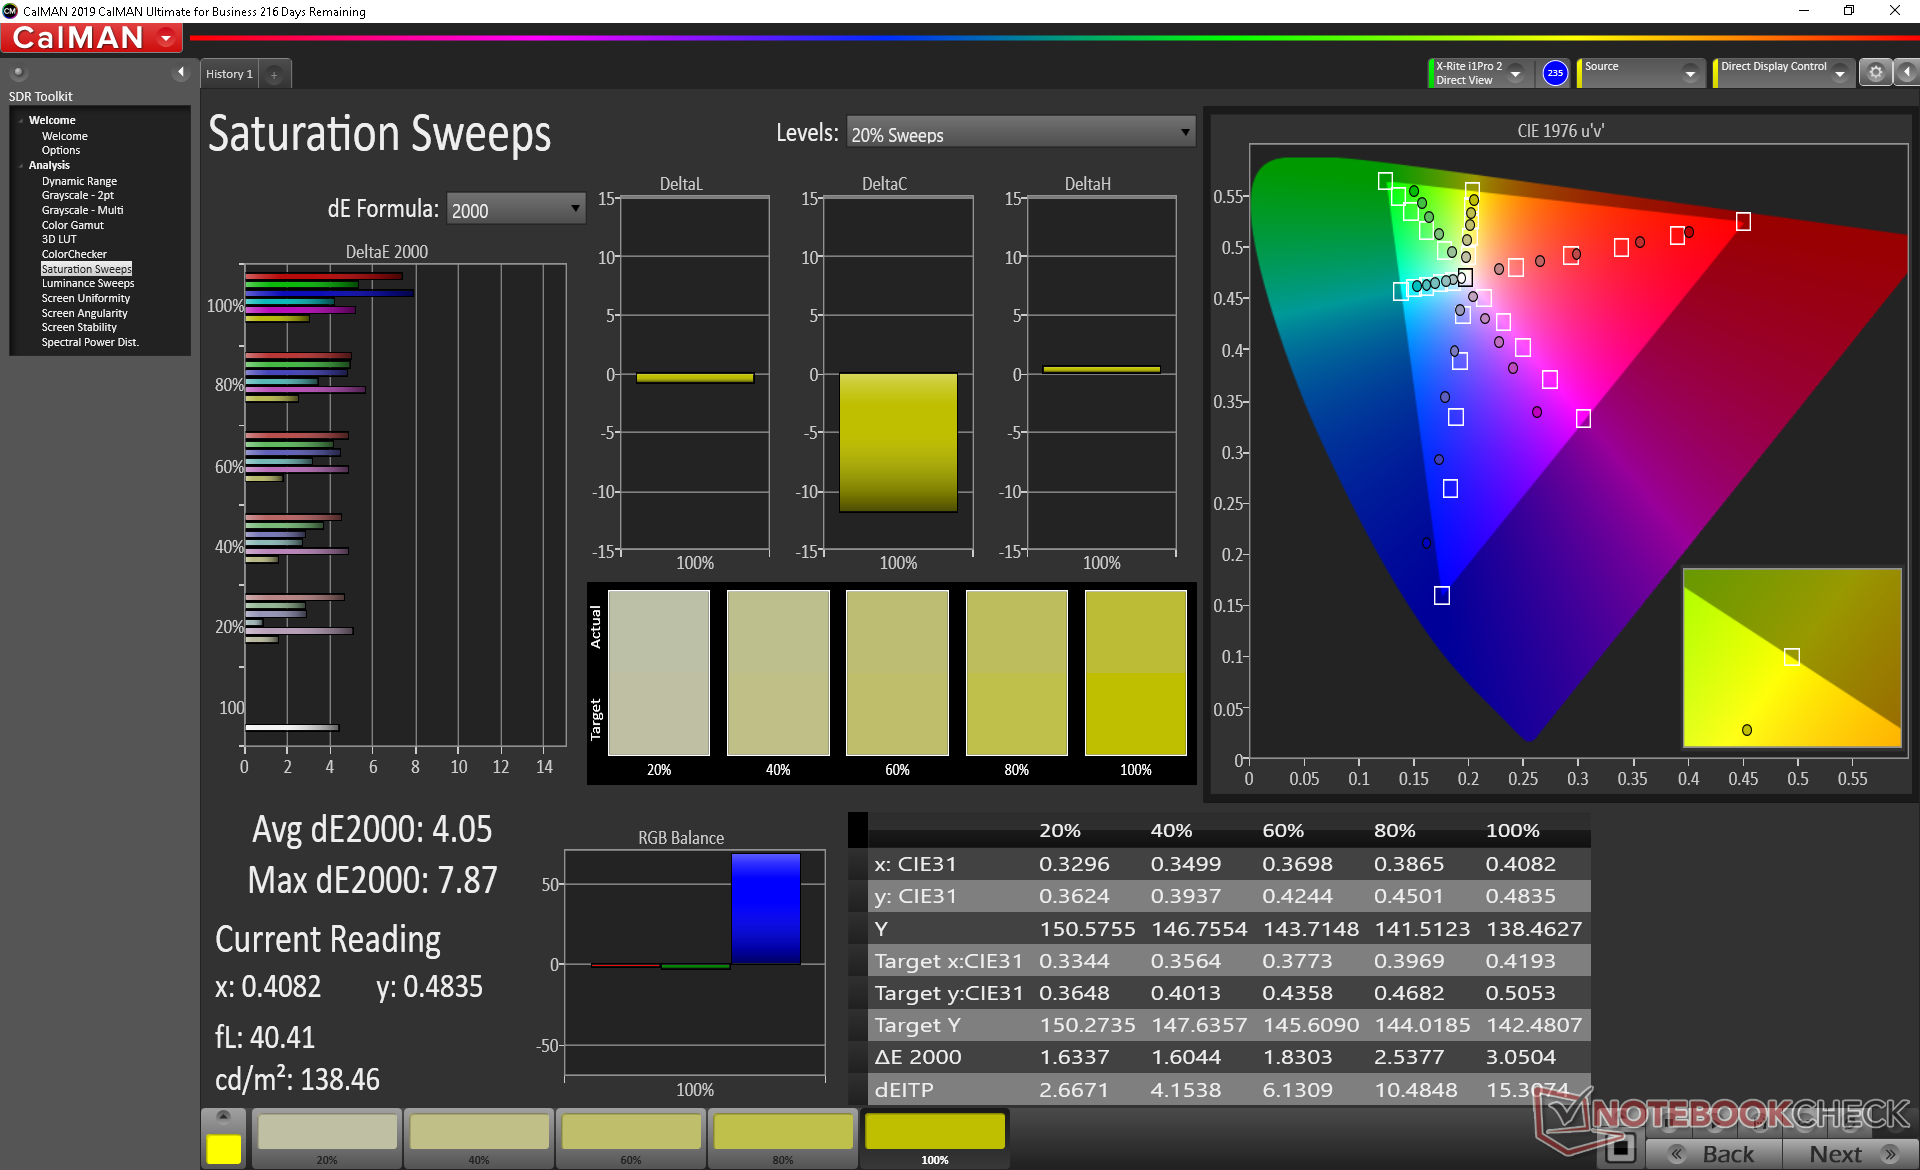
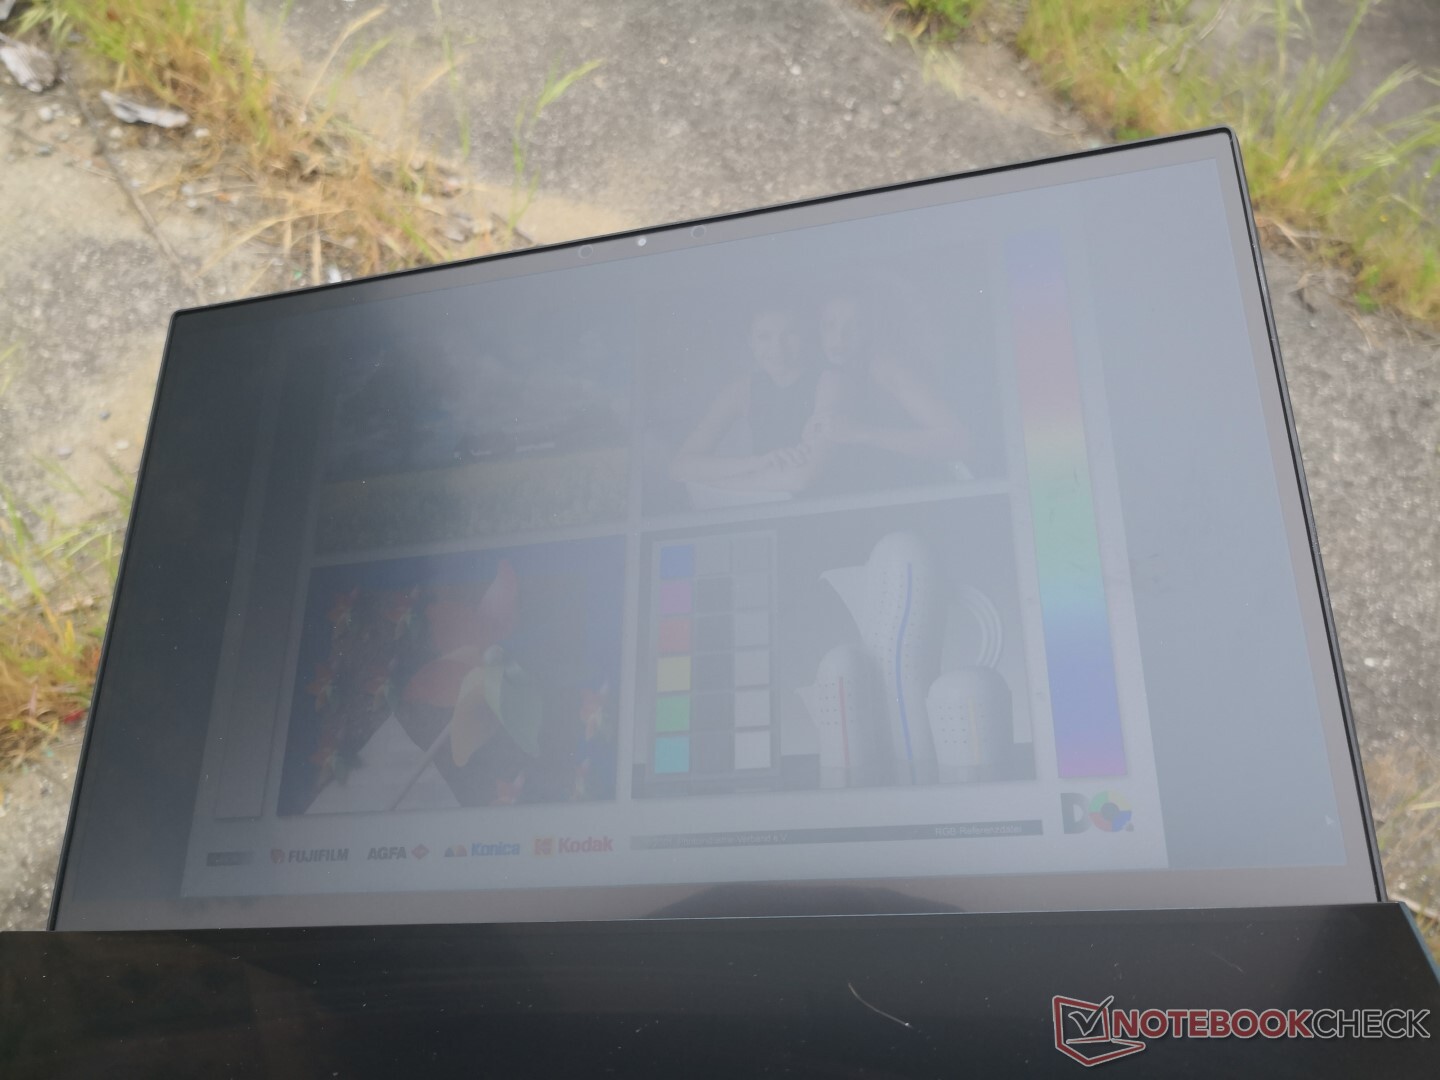
Şovun yıldızı elbette Asus'un ScreenPad Plus olarak adlandırdığı 12,6 inç ikincil mat dokunmatik ekran. Gerçek bir 1: 1 çift ekran deneyimi için birincil ekranla aynı ekran genişliğini ve PPI'yı sunar. Görüntüleme koşulları mükemmel olduğunda, ScreenPad çoklu görev, sohbet, e-posta gönderme ve diğer birçok uygulama için paha biçilmez hale gelir, çünkü bir masaüstü PC'deki ikinci bir monitör gibi davranır. İkinci ekranın en büyük dezavantajı gözleriniz ve gözleriniz neredeyse her zaman sizinle ana ekran arasındaki görüş açısından daha geniş olacaktır. IPS ekrana geniş bir açıdan bakmaya çalıştığınızda, renklerin, kontrastın ve parlaklığın değişebileceğini ve aynı şeyin Ekran Paneli için söylenebileceğini fark edeceksiniz. Bu nedenle, ikinci ekrandaki ekran içeriği, ana ekran kadar canlı değil, daha karanlık olma eğilimindedir. Bunu daha kötü renk üretimi ve daha yoğun parlama ile birleştirin ve video oynatma veya profesyonel düzenleme yerine multimedya kontrolü ve büyük metinler için en iyi şekilde çalışan bir ekranınız var.
| ScreenPad Plus | |
| Response Time Grey 50% / Grey 80% | 34.4 ms combined |
| Response Time Black / White * | 26.8 ms combined |
| Brightness Middle | 301 nits (280 if on battery power) |
| Contrast | 772:1 |
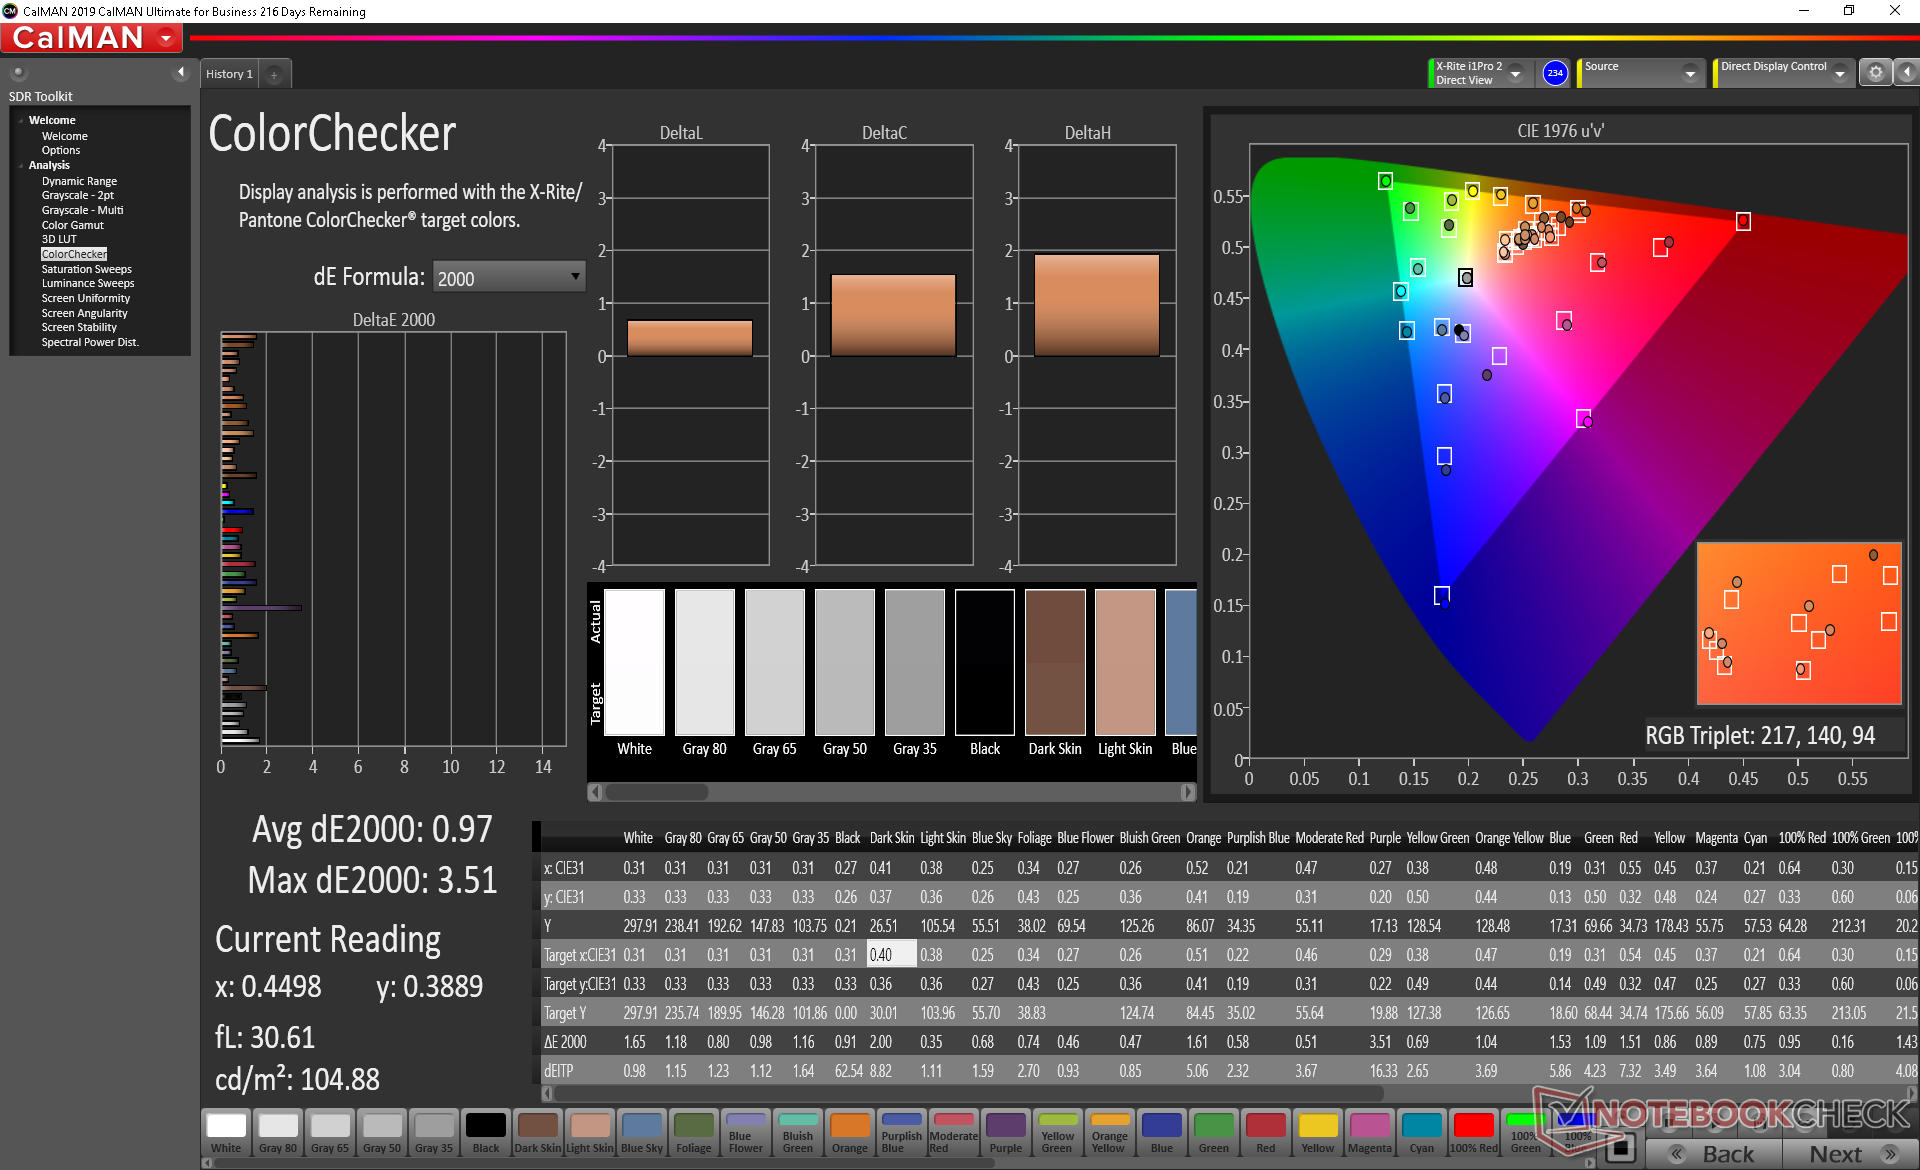
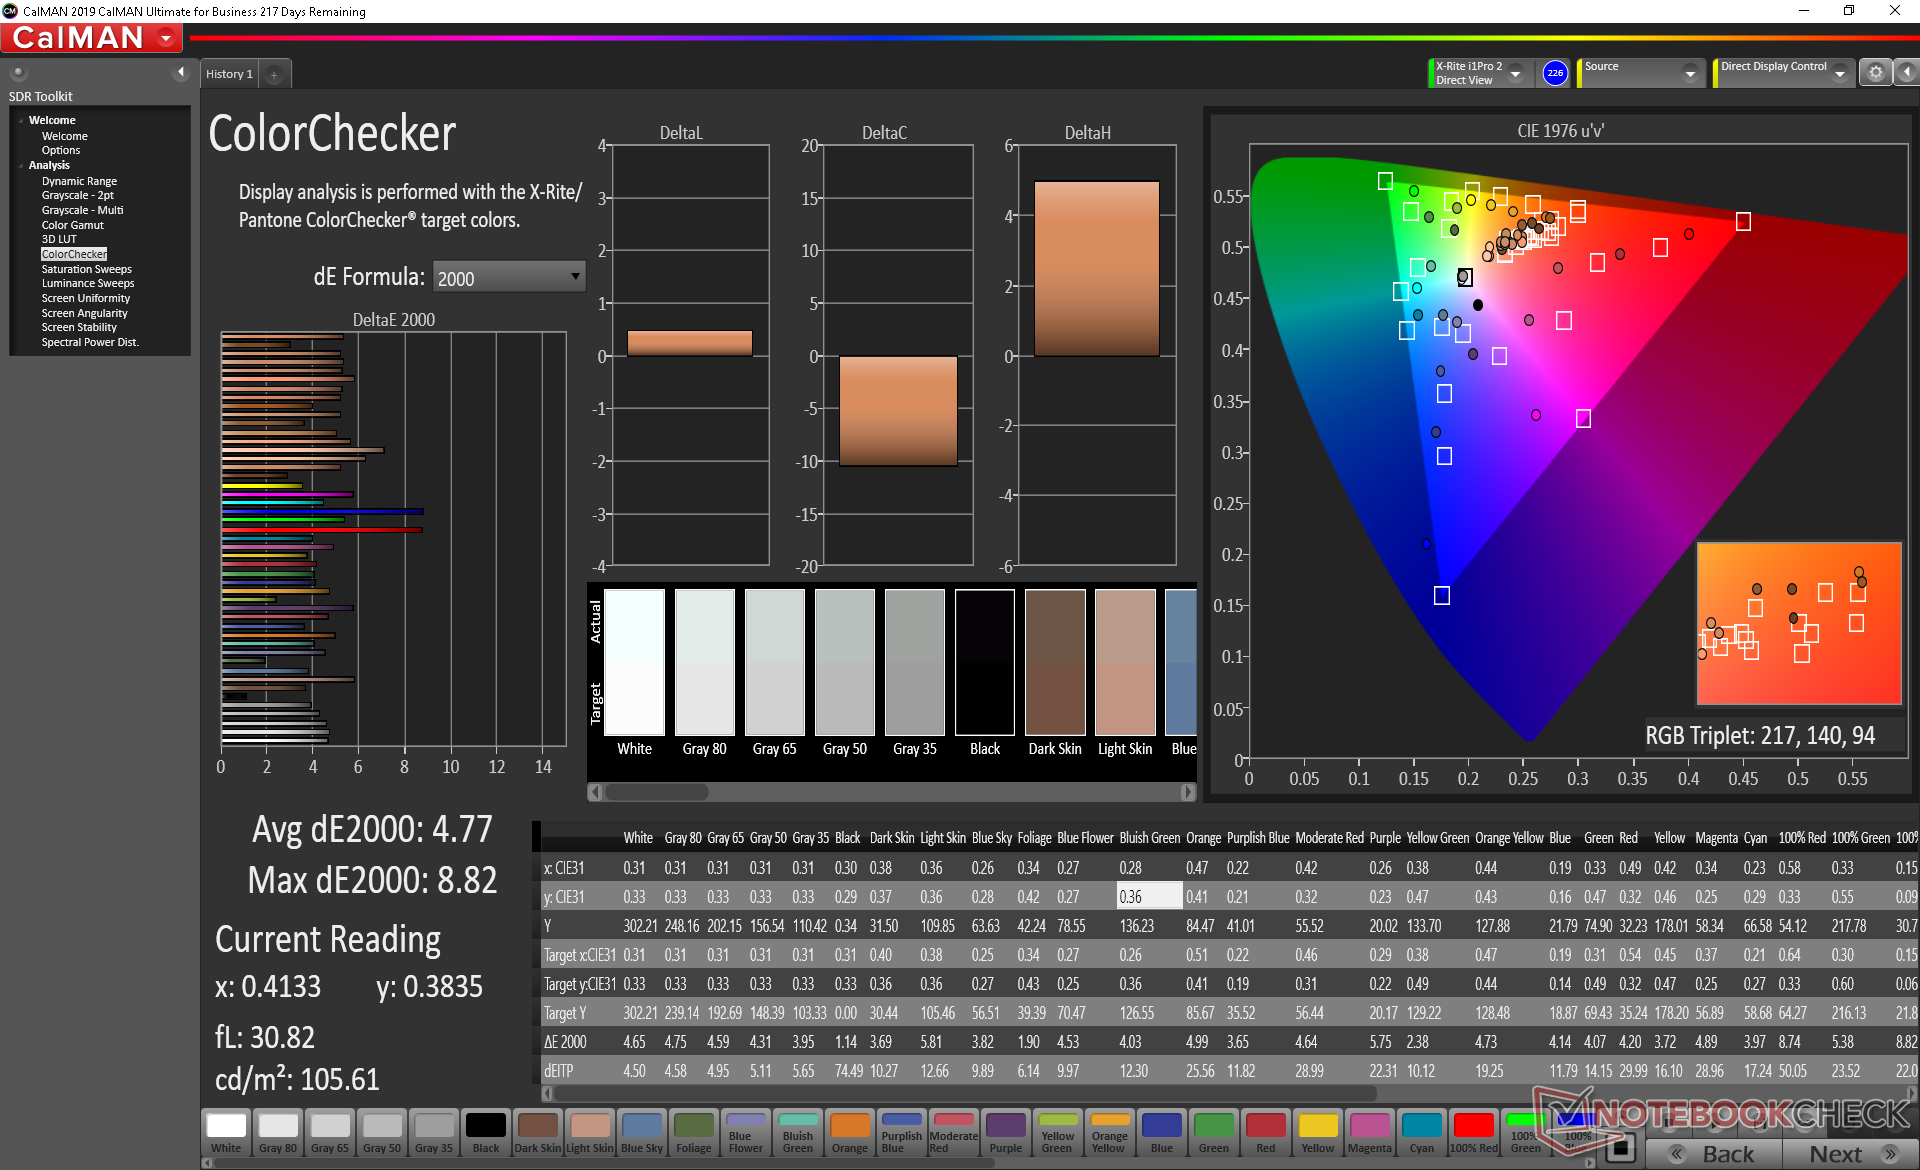
| Colorchecker DeltaE2000 | 4.77 |
| Colorchecker DeltaE2000 max. | 8.82 |
| Colorchecker DeltaE2000 calibrated | 4.15 |
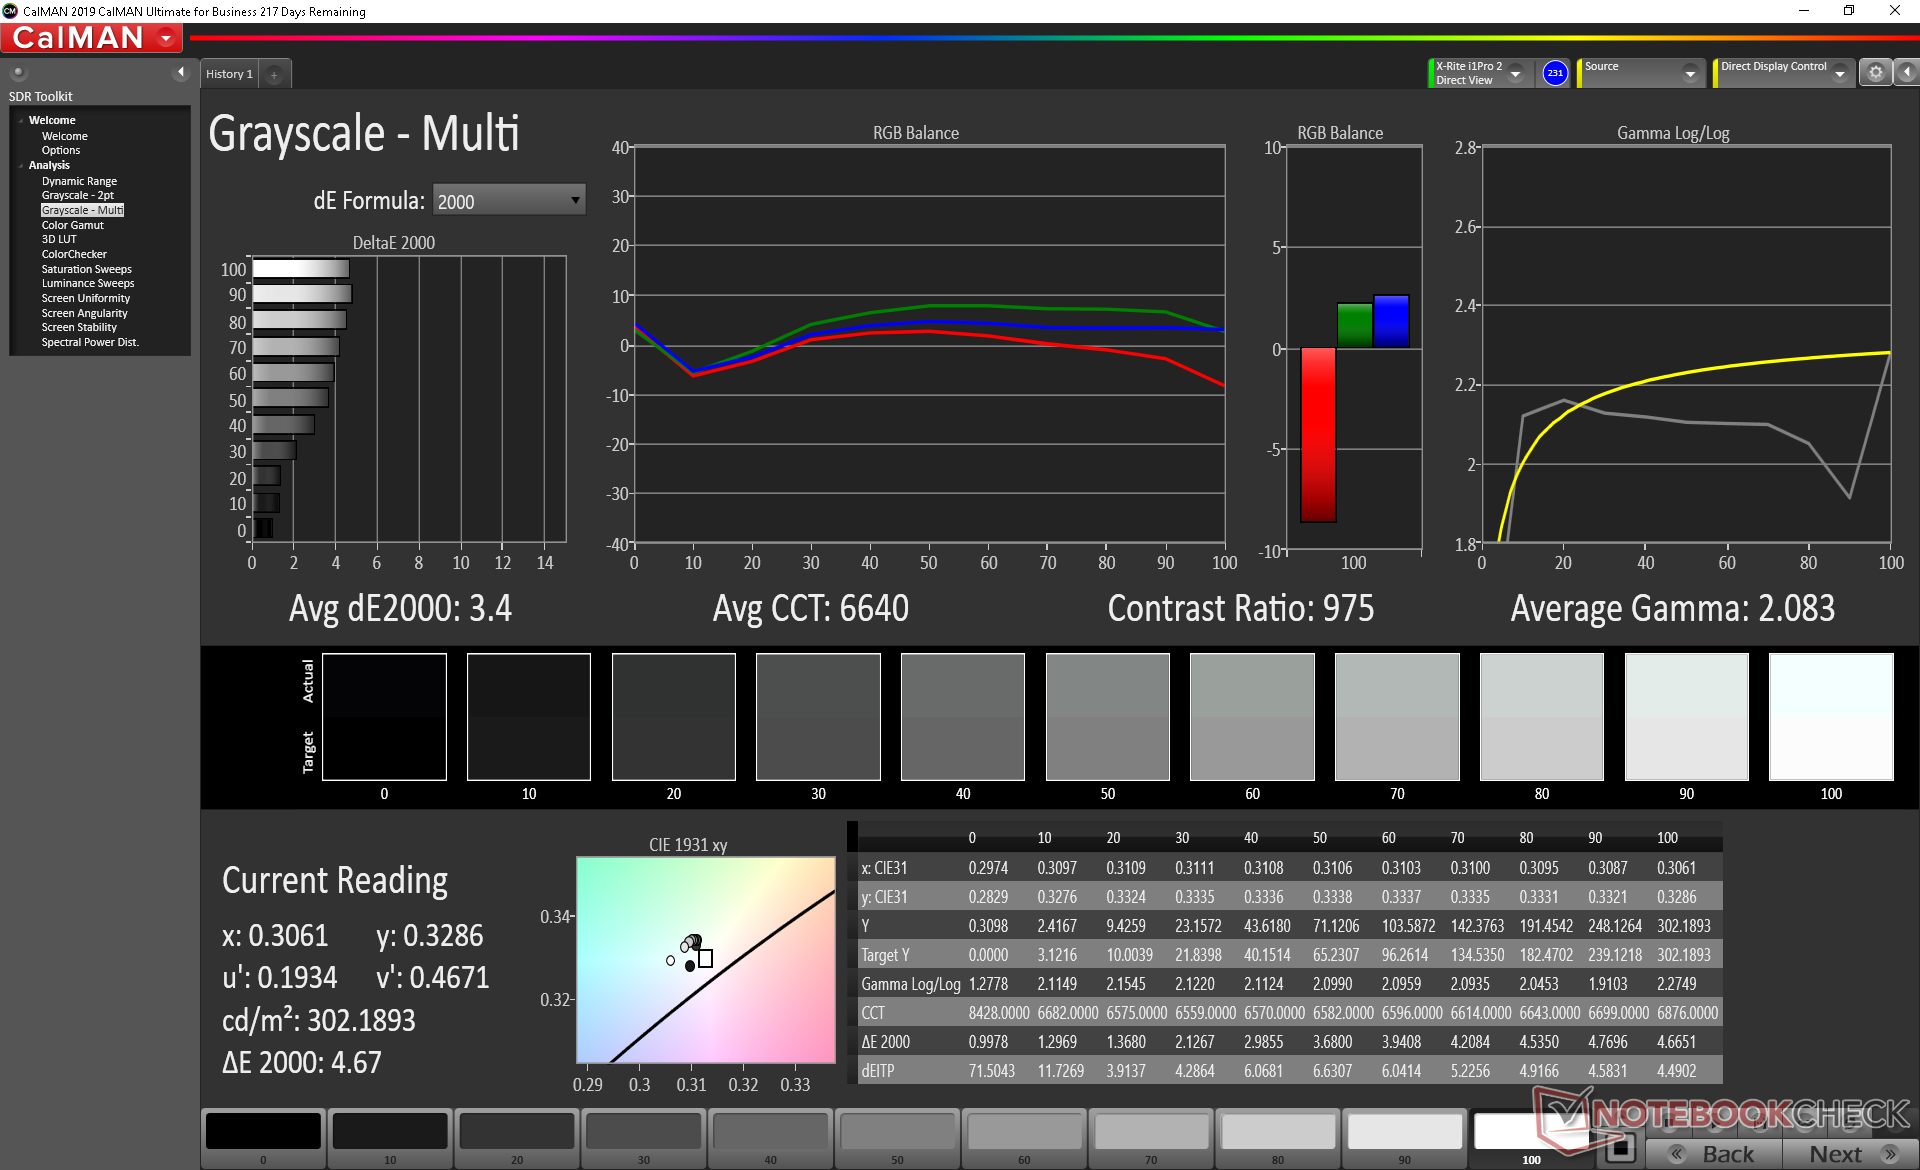
| Greyscale DeltaE2000 | 3.4 |
| Gamma | 2.08 |
| CCT | 6640 |
| Color Space (Percent of AdobeRGB 1998) | 37.7 percent |
| Color Space (Percent of sRGB) | 59.4 percent |
| |||||||||||||||||||||||||
Aydınlatma: 89 %
Batarya modunda parlaklık: 301 cd/m²
Kontrast: 717:1 (Siyah: 0.42 cd/m²)
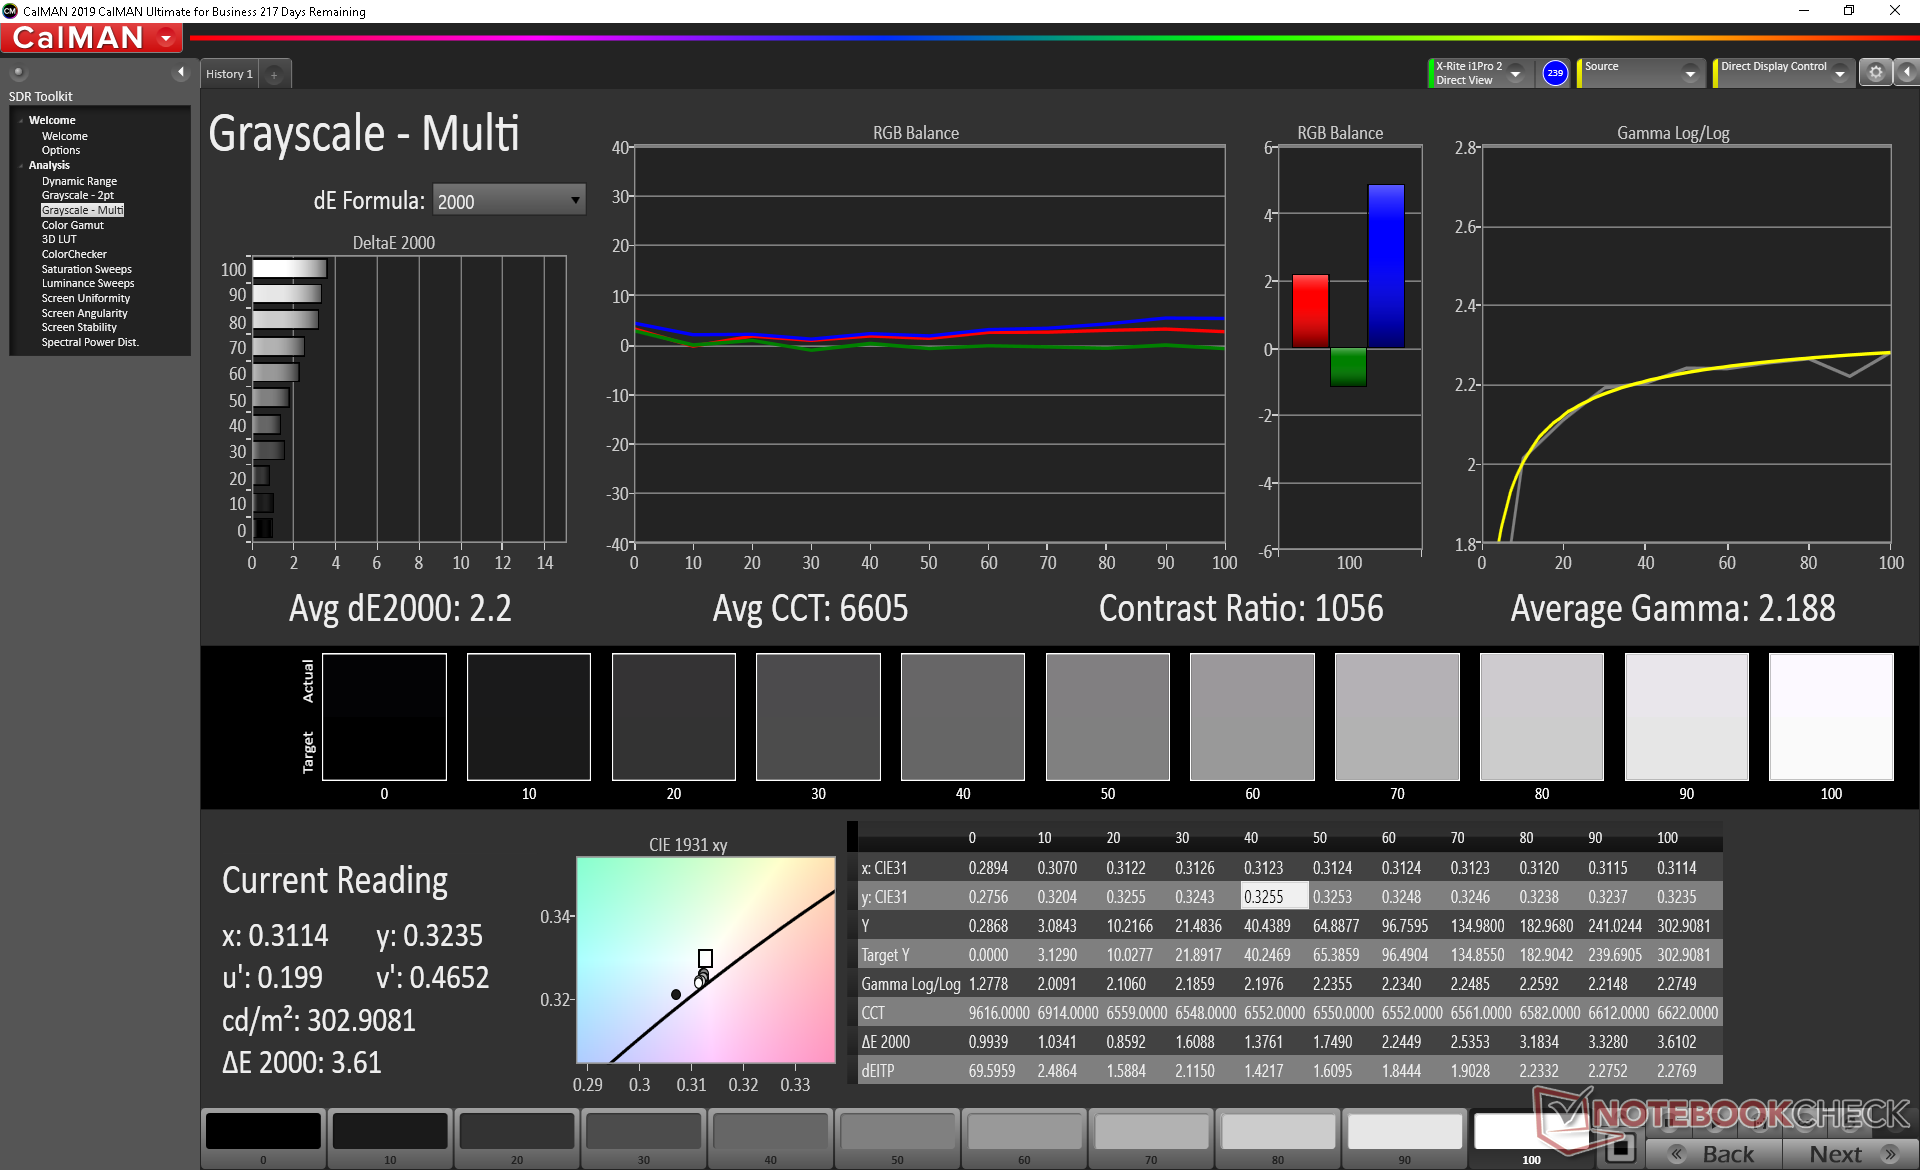
ΔE ColorChecker Calman: 1.01 | ∀{0.5-29.43 Ø4.72}
calibrated: 0.97
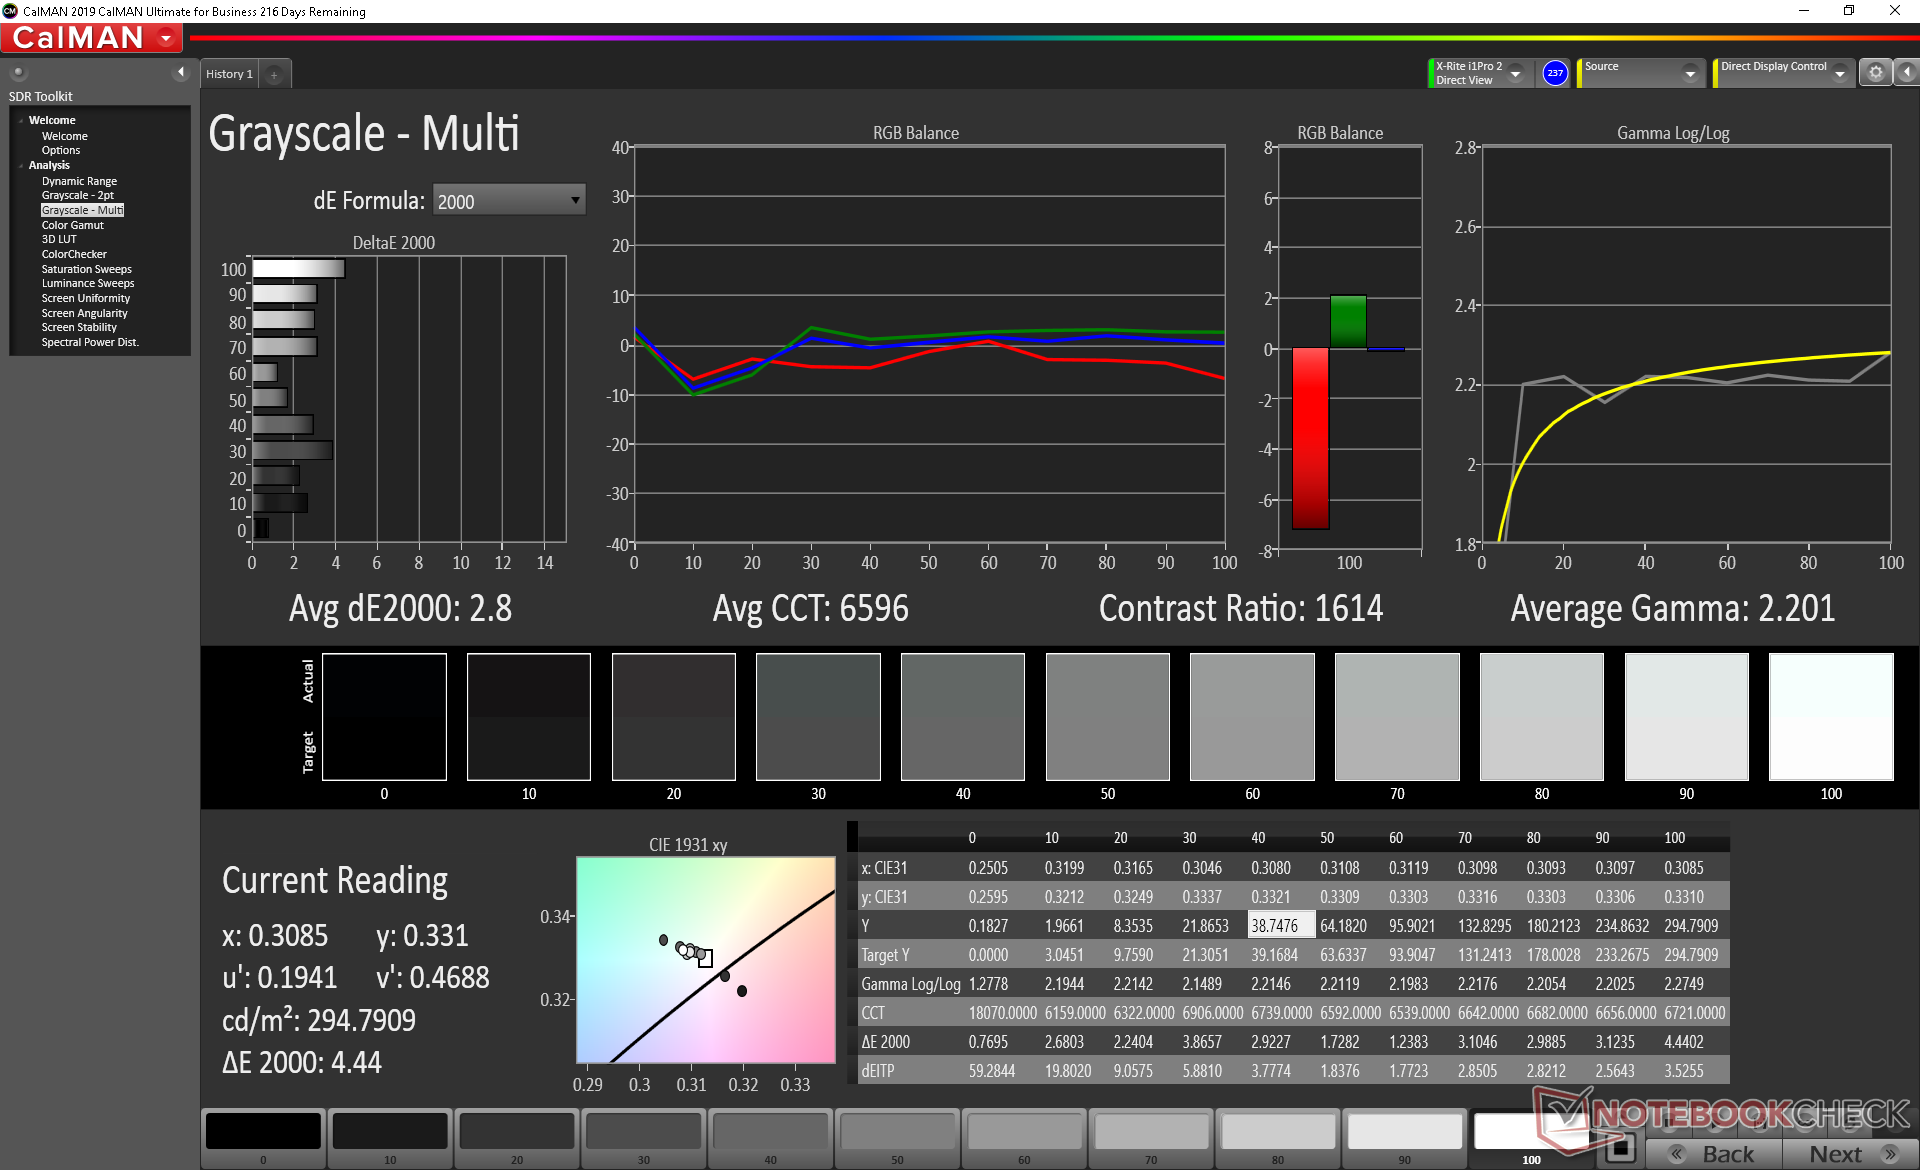
ΔE Greyscale Calman: 2.2 | ∀{0.09-98 Ø4.97}
99.5% sRGB (Argyll 1.6.3 3D)
63.2% AdobeRGB 1998 (Argyll 1.6.3 3D)
68.9% AdobeRGB 1998 (Argyll 3D)
99.5% sRGB (Argyll 3D)
67.1% Display P3 (Argyll 3D)
Gamma: 2.19
CCT: 6605 K
| Asus ZenBook Duo UX481FL Chi Mei N140HCE-EN2, IPS, 14", 1920x1080 | Asus ZenBook 14 UM431DA-AM020T CEC PA LM140LF-3L03, IPS, 14", 1920x1080 | Huawei Matebook X Pro i5 Tianma XM, IPS, 13.9", 3000x2000 | Lenovo IdeaPad S940-14IWL B140ZAN01.3, IPS, 14", 3840x2160 | Lenovo ThinkPad X1 Carbon G7 20R1-000YUS BOE NV140QUM-N53, IPS, 14", 3840x2160 | MSI Prestige 14 A10SC-009 IPS, 14", 3840x2160 | |
|---|---|---|---|---|---|---|
| Display | -3% | -3% | 16% | 15% | ||
| Display P3 Coverage (%) | 67.1 | 66.7 -1% | 65.9 -2% | 87.5 30% | 83 24% | |
| sRGB Coverage (%) | 99.5 | 92.3 -7% | 95.2 -4% | 99.7 0% | 99.7 0% | |
| AdobeRGB 1998 Coverage (%) | 68.9 | 67.5 -2% | 67.6 -2% | 81.1 18% | 83.1 21% | |
| Response Times | -9% | -15% | -54% | -42% | -59% | |
| Response Time Grey 50% / Grey 80% * (ms) | 31.2 ? | 36 ? -15% | 40.4 ? -29% | 57.2 ? -83% | 49.2 ? -58% | 55 ? -76% |
| Response Time Black / White * (ms) | 25.6 ? | 26 ? -2% | 25.6 ? -0% | 32 ? -25% | 32.2 ? -26% | 36 ? -41% |
| PWM Frequency (Hz) | 24750 ? | 44 ? | 201.6 ? | |||
| Screen | -124% | -34% | -57% | -103% | 16% | |
| Brightness middle (cd/m²) | 301 | 253 -16% | 442.7 47% | 594.5 98% | 532 77% | 567 88% |
| Brightness (cd/m²) | 285 | 245 -14% | 428 50% | 536 88% | 513 80% | 516 81% |
| Brightness Distribution (%) | 89 | 78 -12% | 84 -6% | 83 -7% | 90 1% | 86 -3% |
| Black Level * (cd/m²) | 0.42 | 0.225 46% | 0.31 26% | 0.43 -2% | 0.41 2% | 0.445 -6% |
| Contrast (:1) | 717 | 1124 57% | 1428 99% | 1383 93% | 1298 81% | 1274 78% |
| Colorchecker dE 2000 * | 1.01 | 8.89 -780% | 2.24 -122% | 4.87 -382% | 6.88 -581% | 1.55 -53% |
| Colorchecker dE 2000 max. * | 3.42 | 4.56 -33% | 7.19 -110% | 7.9 -131% | 12.65 -270% | 5.14 -50% |
| Colorchecker dE 2000 calibrated * | 0.97 | 4.9 -405% | 1.11 -14% | 2.83 -192% | 2.52 -160% | 1.24 -28% |
| Greyscale dE 2000 * | 2.2 | 6.33 -188% | 9.7 -341% | 6.7 -205% | 10.5 -377% | 1.48 33% |
| Gamma | 2.19 100% | 2.52 87% | 1.42 155% | 2.091 105% | 1.98 111% | 2.19 100% |
| CCT | 6605 98% | 6745 96% | 6227 104% | 6891 94% | 7394 88% | 6741 96% |
| Color Space (Percent of AdobeRGB 1998) (%) | 63.2 | 60 -5% | 61.6 -3% | 72 14% | 74.1 17% | |
| Color Space (Percent of sRGB) (%) | 99.5 | 91 -9% | 95 -5% | 100 1% | 99.7 0% | |
| Toplam Ortalama (Program / Ayarlar) | -45% /
-87% | -17% /
-26% | -32% /
-43% | -43% /
-73% | -22% /
2% |
* ... daha küçük daha iyidir
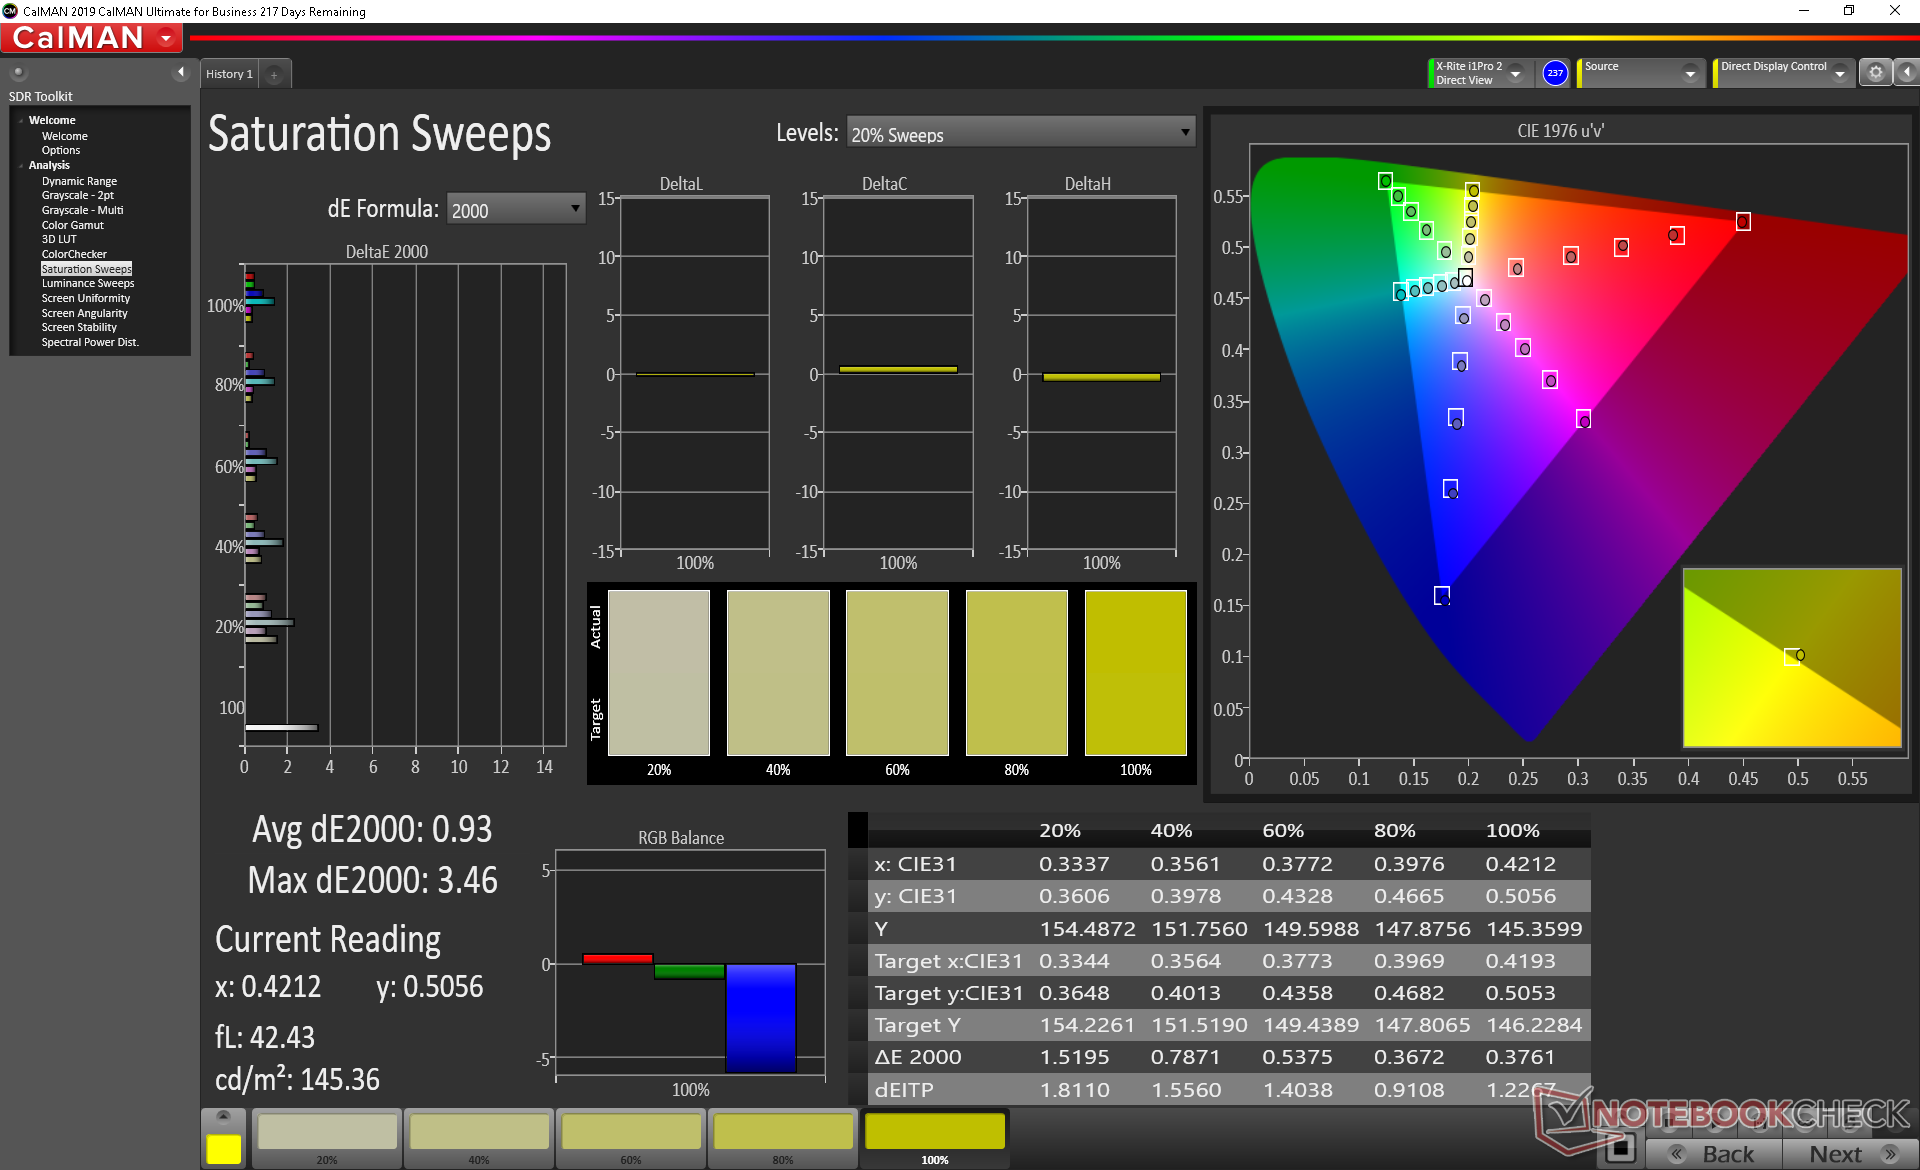
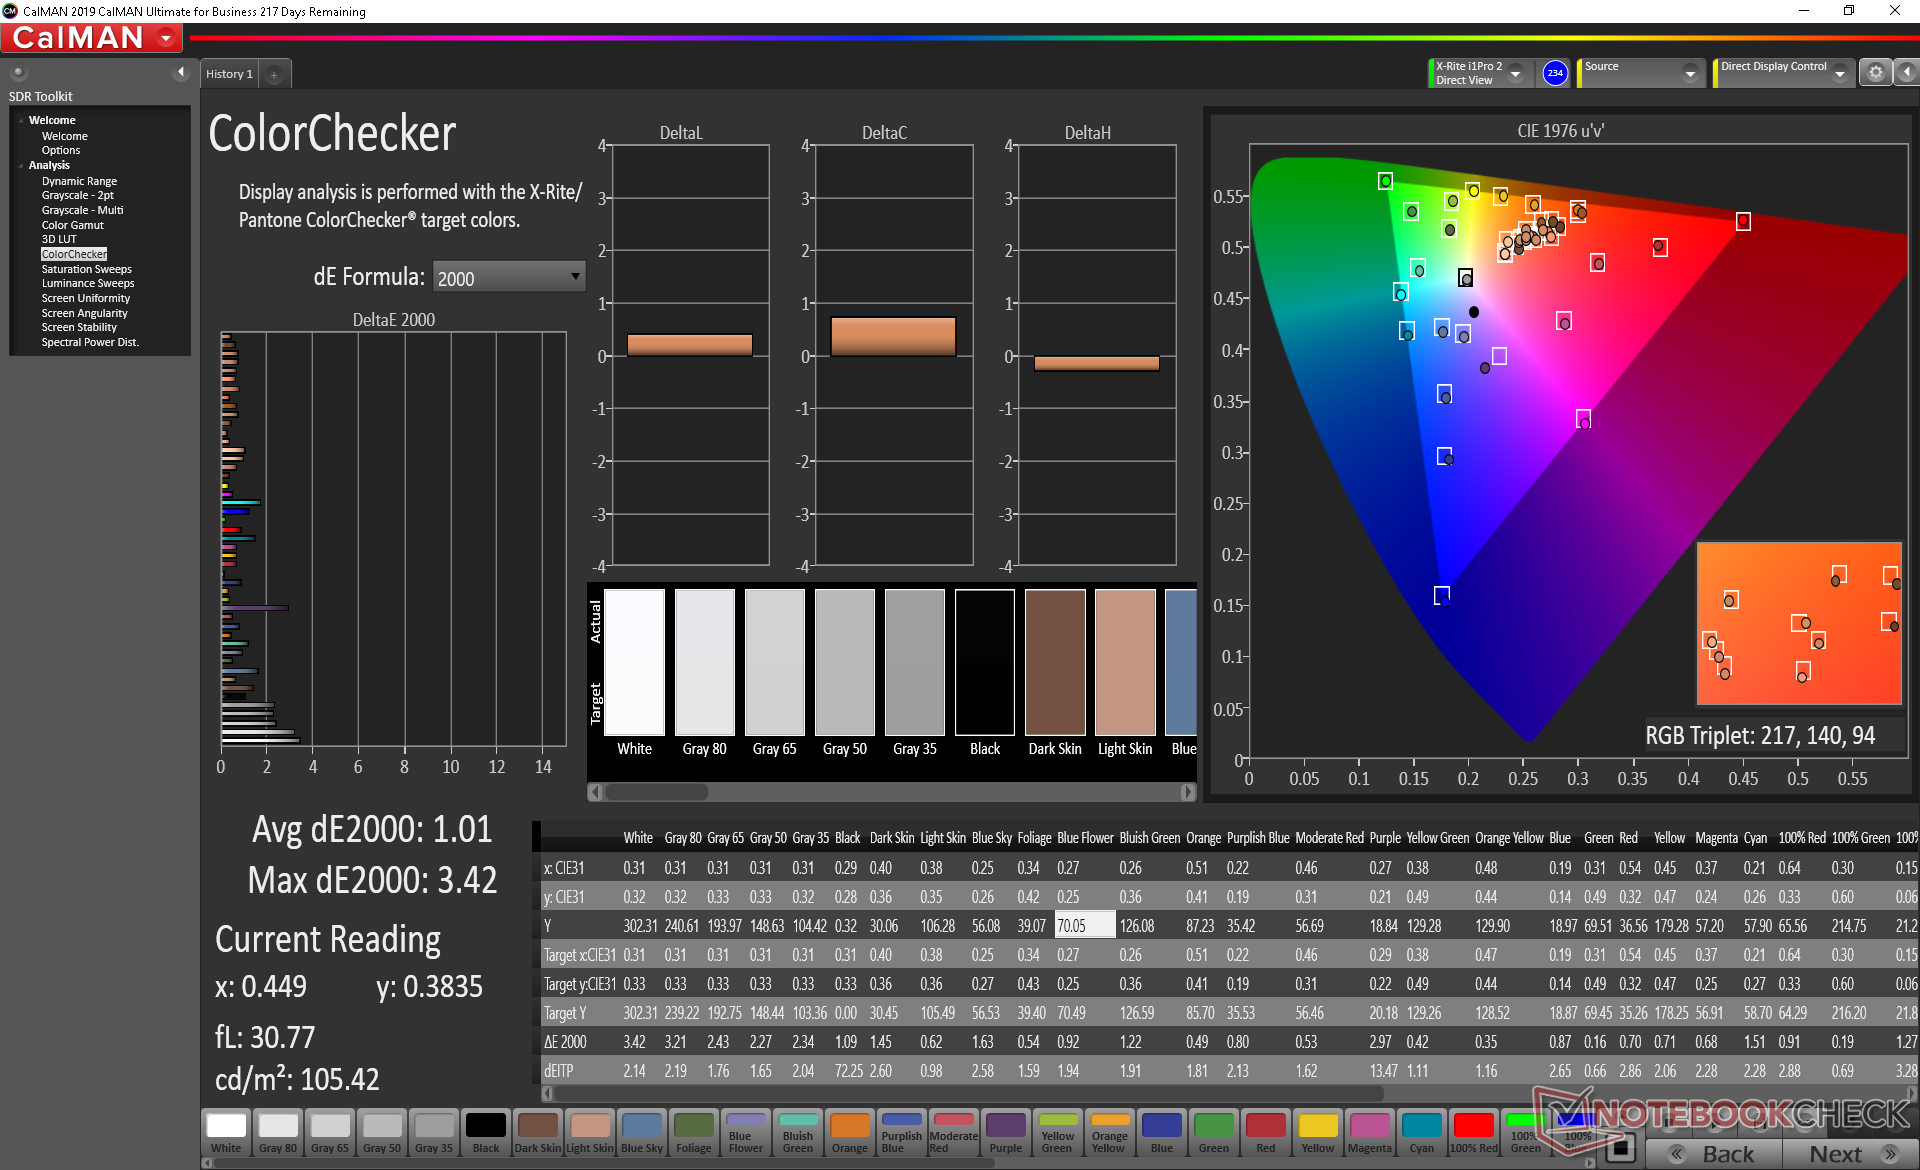
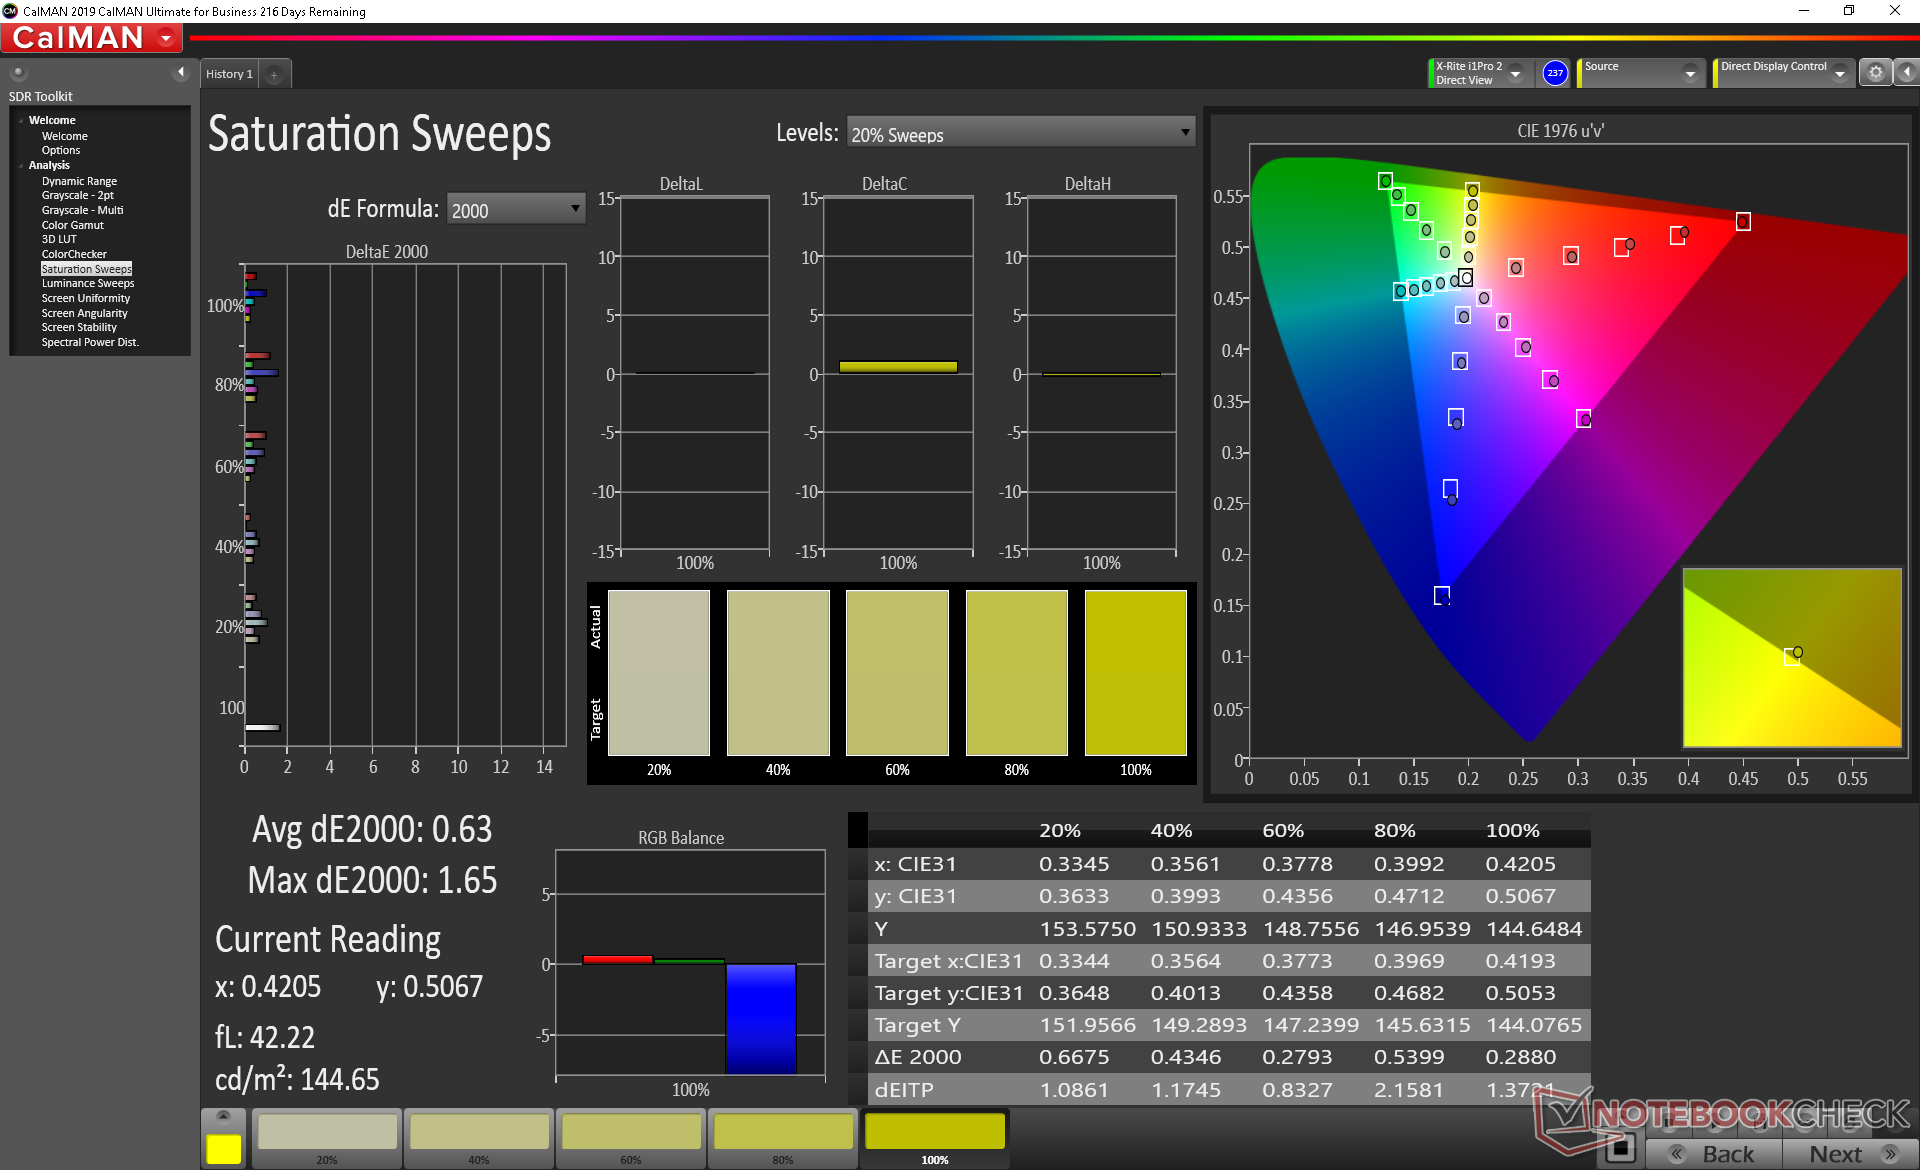
Asus, ZenBook Duo dizüstü bilgisayarı için yüzde 72 NTSC veya tam sRGB kapsamı tanıtıyor. Ancak yakalama, bunun sadece ana ekran için geçerli olmasıdır. İkincil ekran, ana ekranda yüzde 100 ve yüzde 63'e kıyasla sRGB ve AdobeRGB'nin sırasıyla sadece yüzde 59 ve yüzde 38'ini kapsıyor. Grafik düzenleyicileri, renkler iki ekran arasında 1: 1 olmayacağından önemli iş yükleri için ana ekranı kullanmaya devam etmelidir.

Asus, ZenBook Duo için Pantone sertifikalı kalibrasyonun reklamını yapıyor ancak yine de bu sadece ana ekran için geçerli. X-Rite renkölçer ile yaptığımız bağımsız ölçümlerimiz, ana panelde sırasıyla sadece 2,2 ve 0,93'lük ortalama DeltaE değerleri ile çok hassas gri tonlama ve renkler gösteriyor. Buna karşılık, ikinci ekrandaki ortalama gri tonlama ve renkli DeltaE değerleri sırasıyla 3.4 ve 4.38'de daha yüksektir. İkinci ekranı kendimiz daha da kalibre etmeye çalışmak, panelin sınırlı renk alanı nedeniyle önemli gelişmeler sağlamaz. Bu, ikinci ekrandaki renklerin zayıf olduğu anlamına gelmez, ancak ana ekrana göre daha canlı değildir.

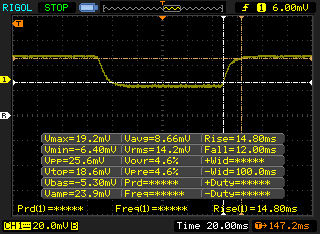
Yanıt Sürelerini Görüntüle
| ↔ Tepki Süresi Siyahtan Beyaza | ||
|---|---|---|
| 25.6 ms ... yükseliş ↗ ve sonbahar↘ birleşimi | ↗ 14.8 ms yükseliş | 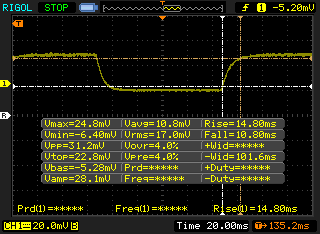 |
| ↘ 10.8 ms sonbahar | ||
| Ekran, testlerimizde nispeten yavaş yanıt oranları gösteriyor ve oyuncular için çok yavaş olabilir. Karşılaştırıldığında, test edilen tüm cihazlar 0.1 (minimum) ile 240 (maksimum) ms arasında değişir. » Tüm cihazların 61 %'si daha iyi. Bu, ölçülen yanıt süresinin test edilen tüm cihazların ortalamasından (19.8 ms) daha kötü olduğu anlamına gelir. | ||
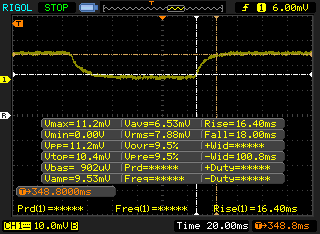
| ↔ Tepki Süresi %50 Griden %80 Griye | ||
| 31.2 ms ... yükseliş ↗ ve sonbahar↘ birleşimi | ↗ 15.6 ms yükseliş | 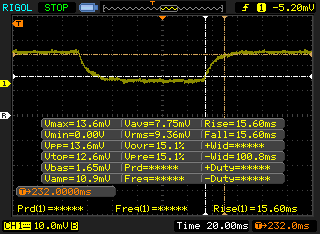 |
| ↘ 15.6 ms sonbahar | ||
| Ekran, testlerimizde yavaş yanıt oranları gösteriyor ve oyuncular için yetersiz olacaktır. Karşılaştırıldığında, test edilen tüm cihazlar 0.165 (minimum) ile 636 (maksimum) ms arasında değişir. » Tüm cihazların 42 %'si daha iyi. Bu, ölçülen yanıt süresinin test edilen tüm cihazların ortalamasına benzer olduğu anlamına gelir (31 ms). | ||
Ekran Titremesi / PWM (Darbe Genişliği Modülasyonu)
| Ekran titriyor / PWM algılandı | 24750 Hz | ≤ 29 % parlaklık ayarı | 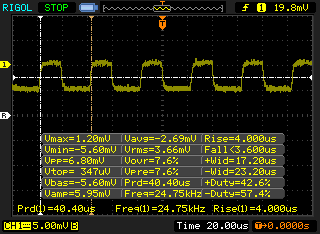 |
Ekran arka ışığı 24750 Hz'de titriyor (en kötü durum, örneğin PWM kullanılması) 29 % ve altındaki parlaklık ayarında titreme algılandı. Bu parlaklık ayarının üzerinde titreme veya PWM olmamalıdır. 24750 Hz frekansı oldukça yüksektir, bu nedenle PWM'ye duyarlı çoğu kullanıcı herhangi bir titremeyi fark etmemelidir. Karşılaştırıldığında: Test edilen tüm cihazların %52 %'si ekranı karartmak için PWM kullanmıyor. PWM tespit edilirse, ortalama 7753 (minimum: 5 - maksimum: 343500) Hz ölçüldü. | |||
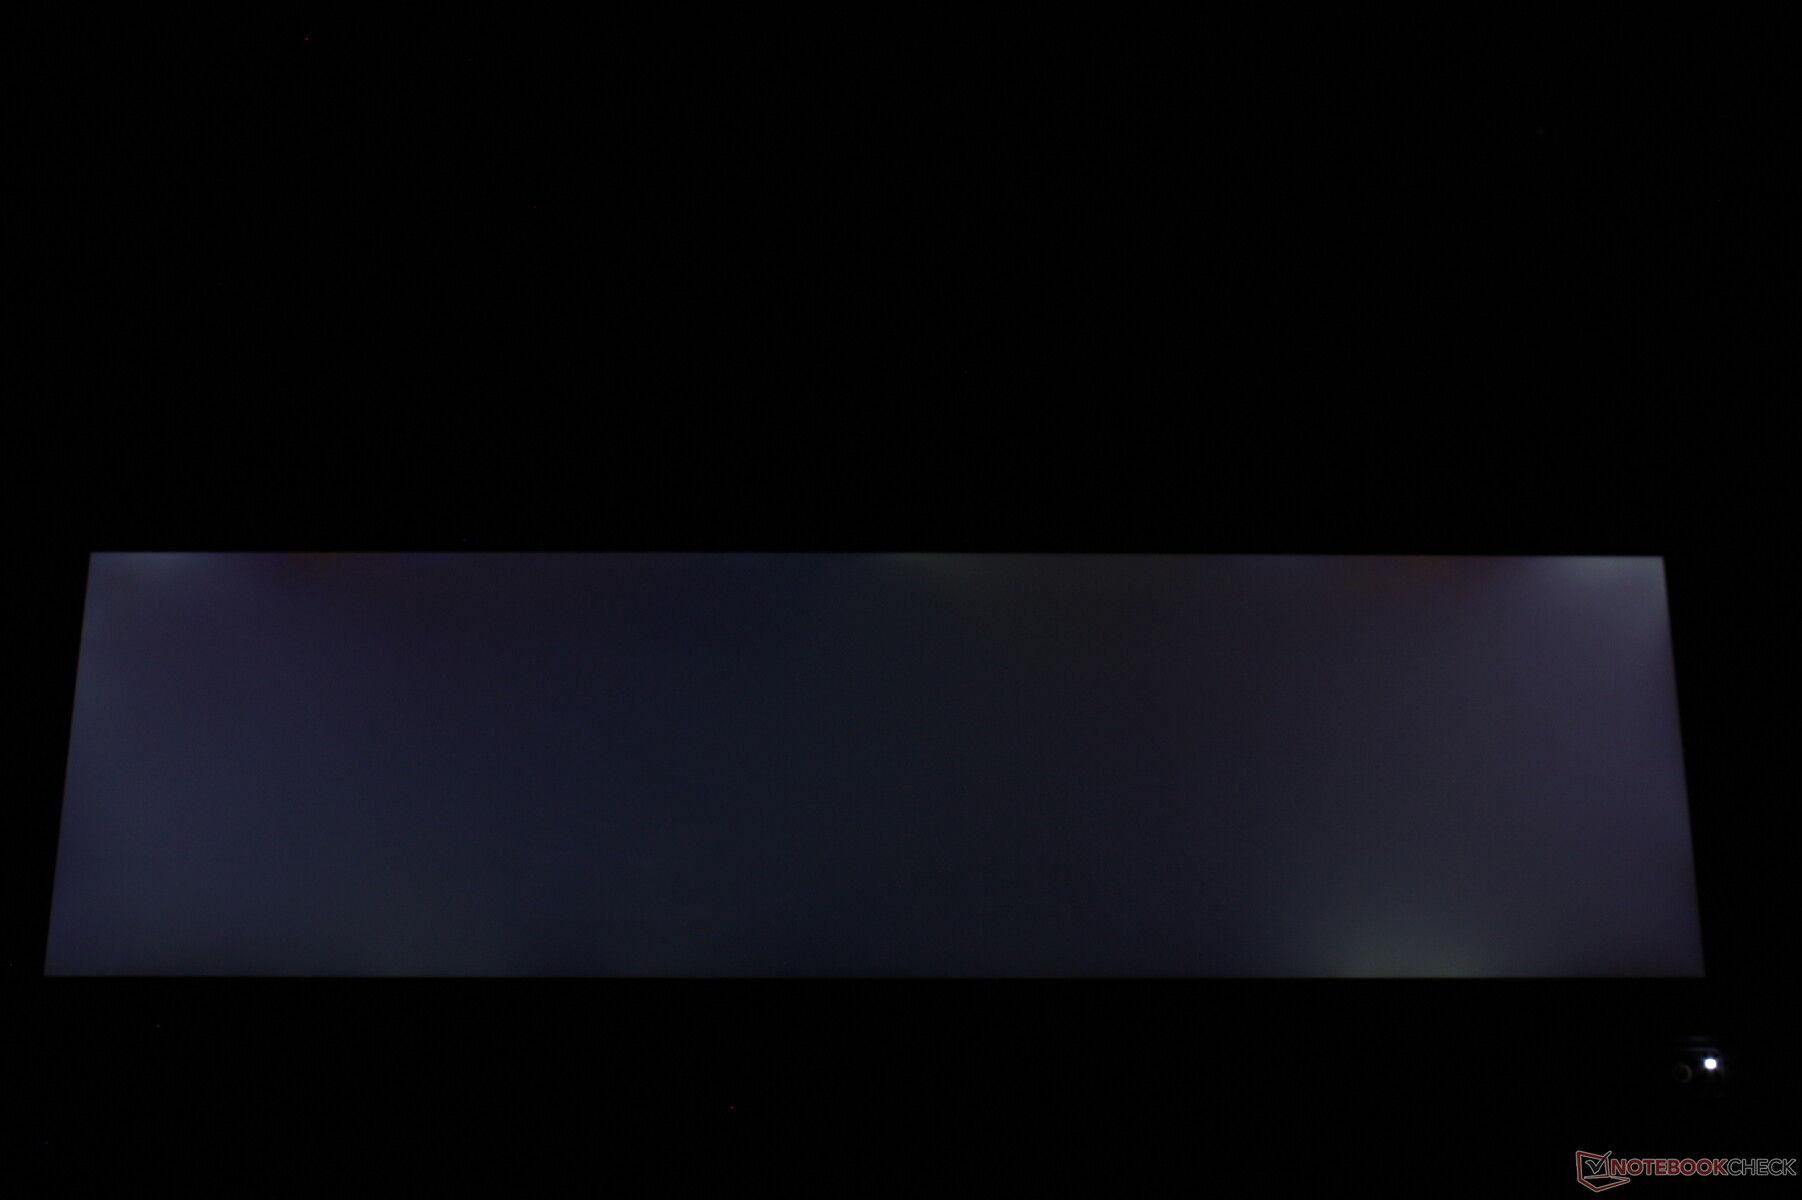
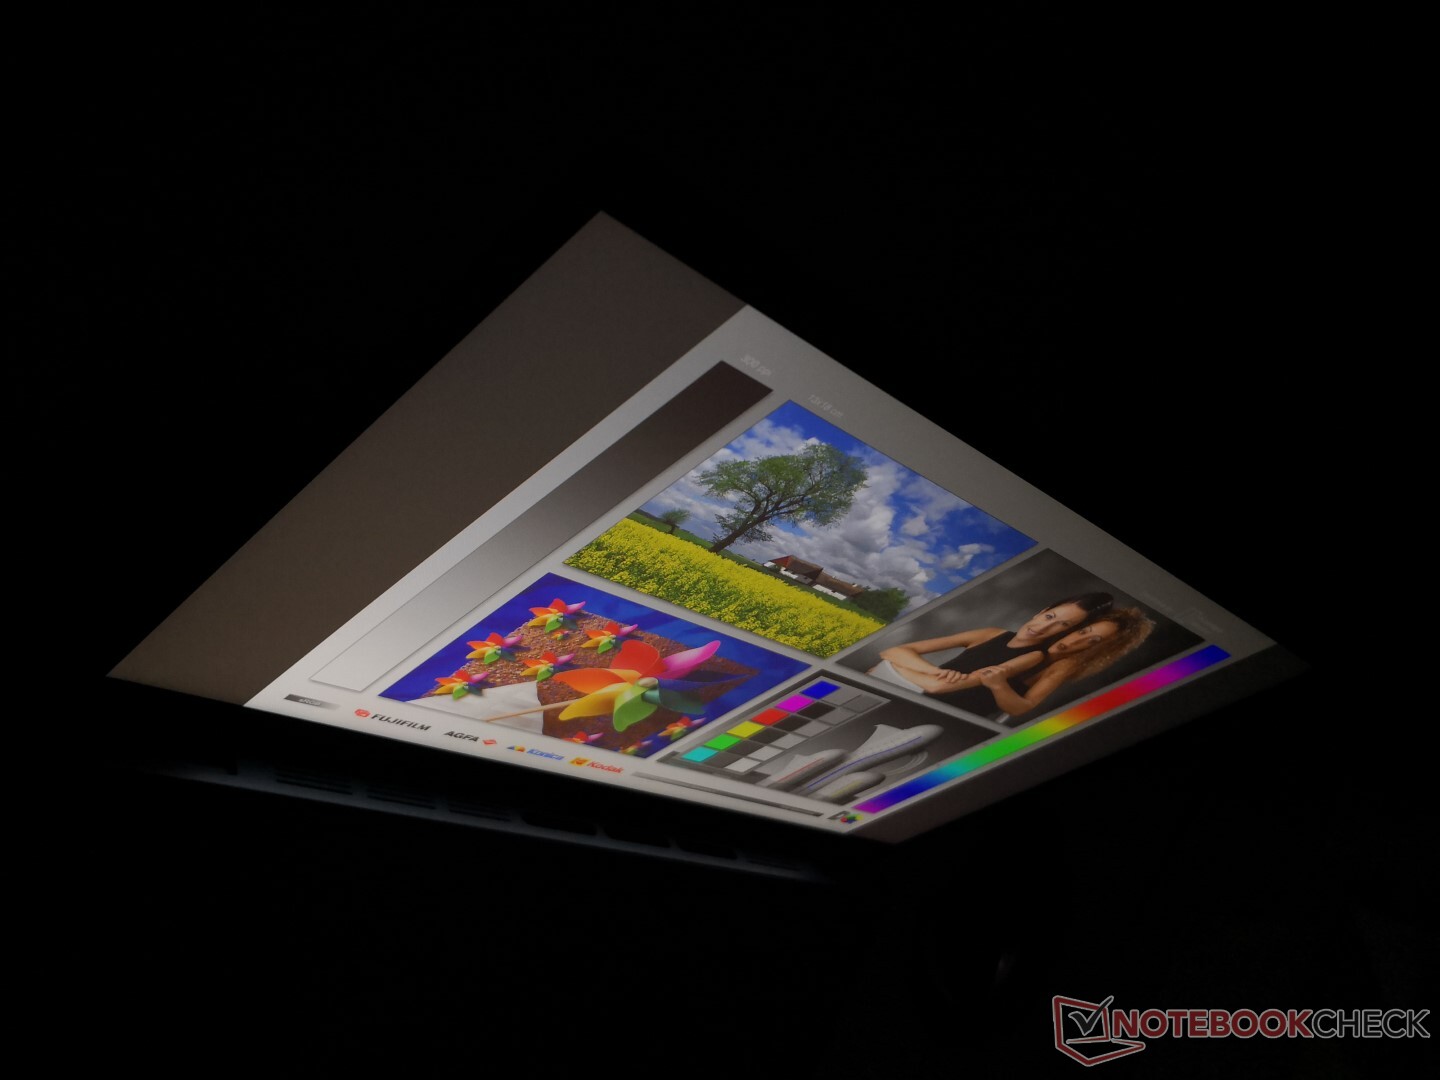
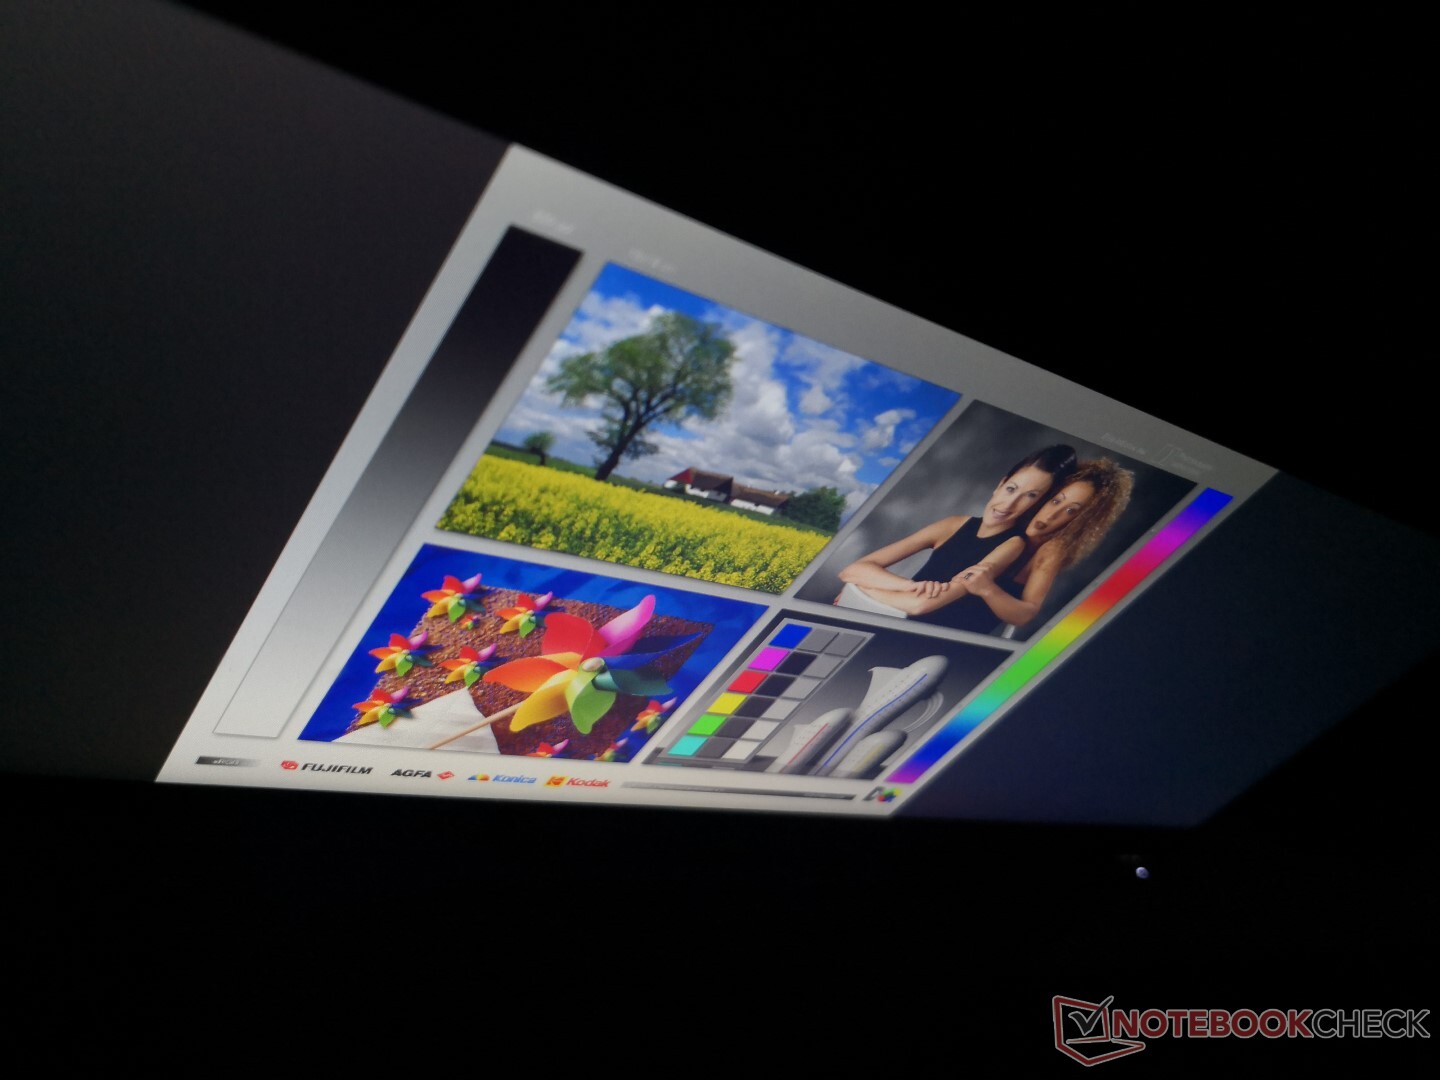
Ekran boyutu küçük olsa da, ZenBook Duo dış mekanlarda sık kullanılan en iyi dizüstü bilgisayar değildir. Ekran arka ışığı, ortamın üstesinden gelmek için yeterince parlak değil ve mat katmana rağmen parlama var. Bu, kullanıcıya göre atipik görüntüleme açısı nedeniyle ScreenPad'de daha da kötüleşir. Aşağıdaki ekran görüntülerimiz dış mekanlarda her iki ekranın da nasıl yıkanacağını göstermektedir.Her iki ekrandaki görüş açıları hala herhangi bir IPS panelinden beklendiği gibi mükemmel. Bununla birlikte, geniş görüş açıları tek başına parlamayı önlemek için yeterli değildir.
Verim
Core U sınıfı CPU ve GeForce MX GPU, yüksek performanslı kullanıcıları hedefleyen Core H serisi ve GTX GPU'ların aksine hem orta sınıf hem de üst düzey Ultrabook'larda yaygın olarak bulunan bulgulardır. ZenBook Duo şu anda dört çekirdekli Core i7-10510U'da Ice Lake veya AMD seçeneği mevcut değil. MSI Modern 14. Temel GPU ve bellek saat hızları, MSI.System RAM'deki 1519 MHz ve 1752 MHz ile karşılaştırıldığında sırasıyla 937 MHz ve 1502 MHz'de daha yavaştır ve kullanıcı tarafından yükseltilemez. Bu dizüstü bilgisayar iki ekranı arasında çoklu görev yapmaktan ibaret olduğu için mümkünse 16 GB yapılandırmalar yapmanızı öneririz.
İşlemci
İşlemci performansı yüzeyde mükemmel ancak stresli ölçütleri tekrar tekrar çalıştırmak dizüstü bilgisayarın zaman içinde zayıf performans sürdürülebilirliğini ortaya çıkaracaktır. Örnek olarak, CineBench R15 Multi-Thread'ın bir döngüde çalıştırılması, düşmeden önce 767 puanlık ilk yüksek bir skorla sonuçlanır ve neredeyse yüzde 30'luk bir performans düşüşünü temsil etmek için 539 noktada sabitlenir. Buna karşılık, 15 inçlik Yüzey Kitabı 3'teki Core i7 Buz Gölü CPU'su aynı döngü testinde zaman içinde sadece yüzde 6 ila 7 oranında düşecekti. Bu, aşağıdaki Stres Testi bölümümüzde daha ayrıntılı olarak incelenmektedir. Daha fazla teknik bilgi ve karşılaştırma karşılaştırmaları için Core i7-10510U üzerindeki özel sayfamıza bakın. Çok iş parçacıklı performansı yaklaşık yüzde 50 artıracak altıgen çekirdekli Core i7-10710U, burada bir seçenek değil.
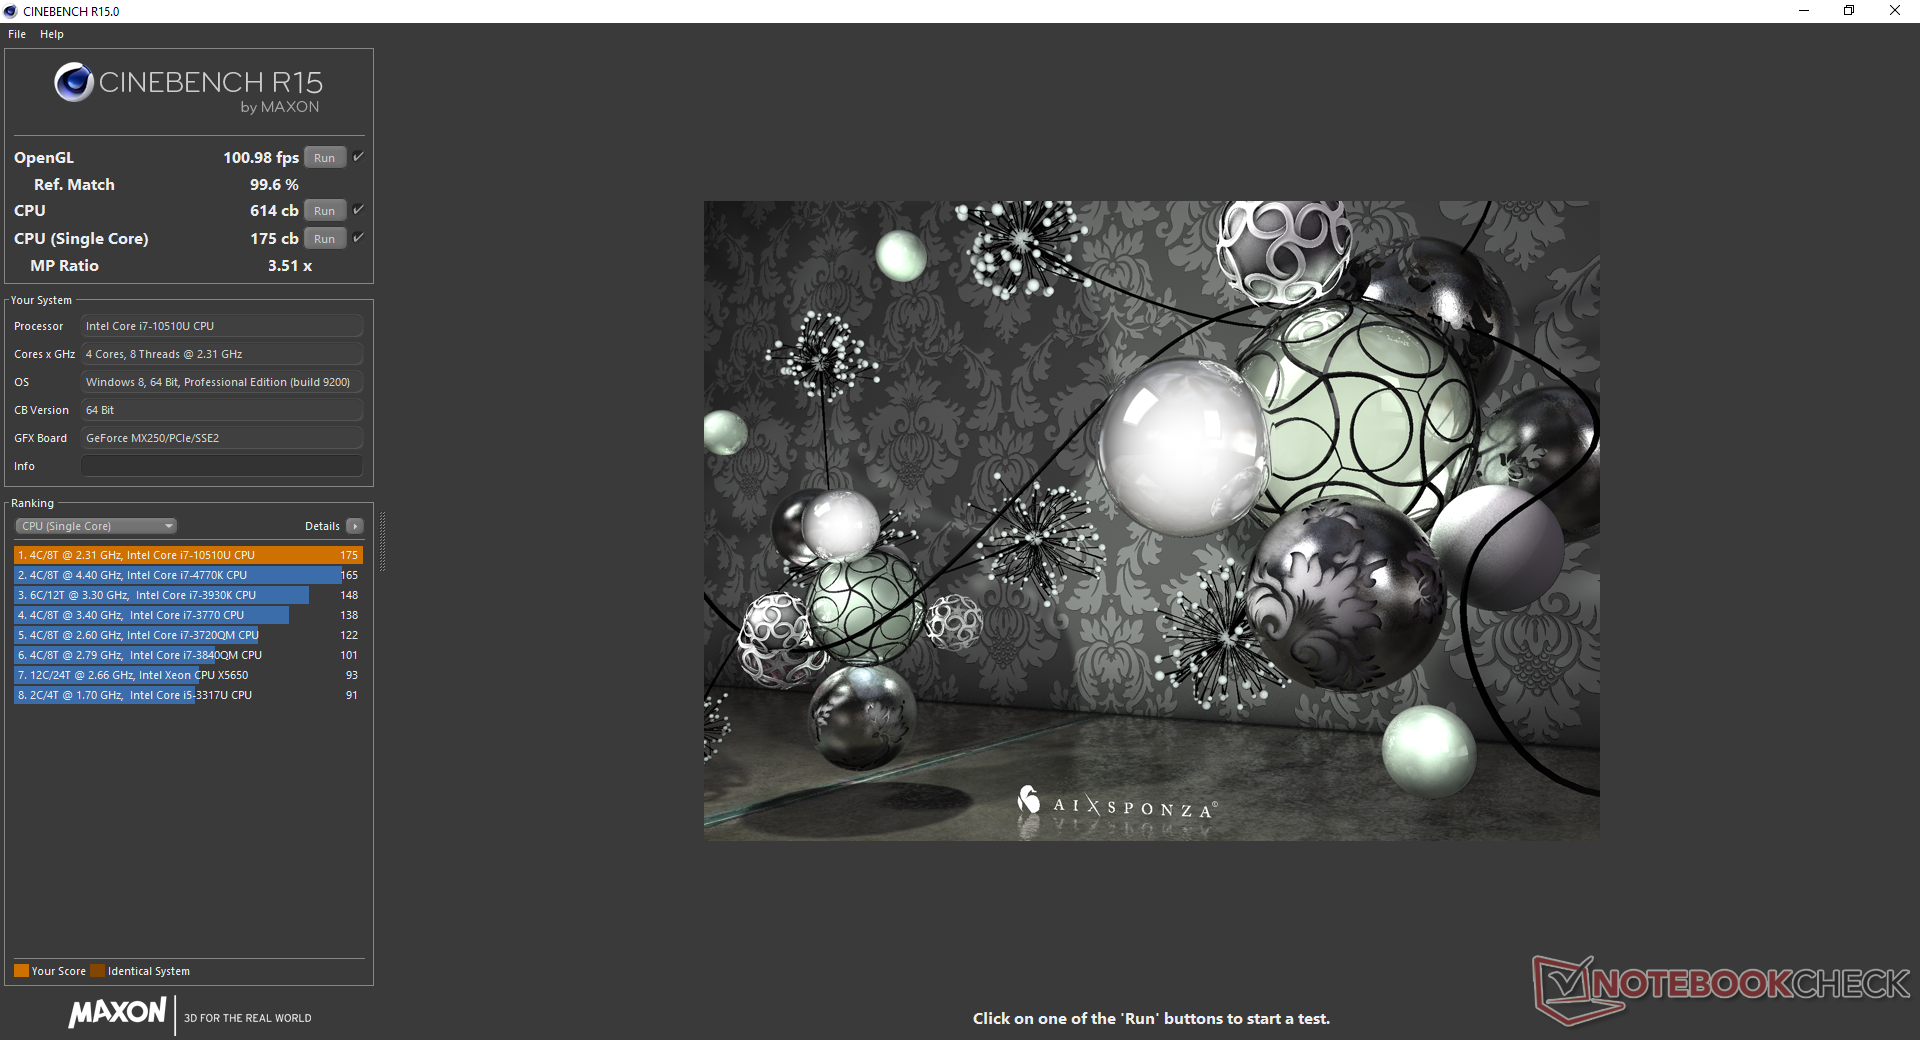
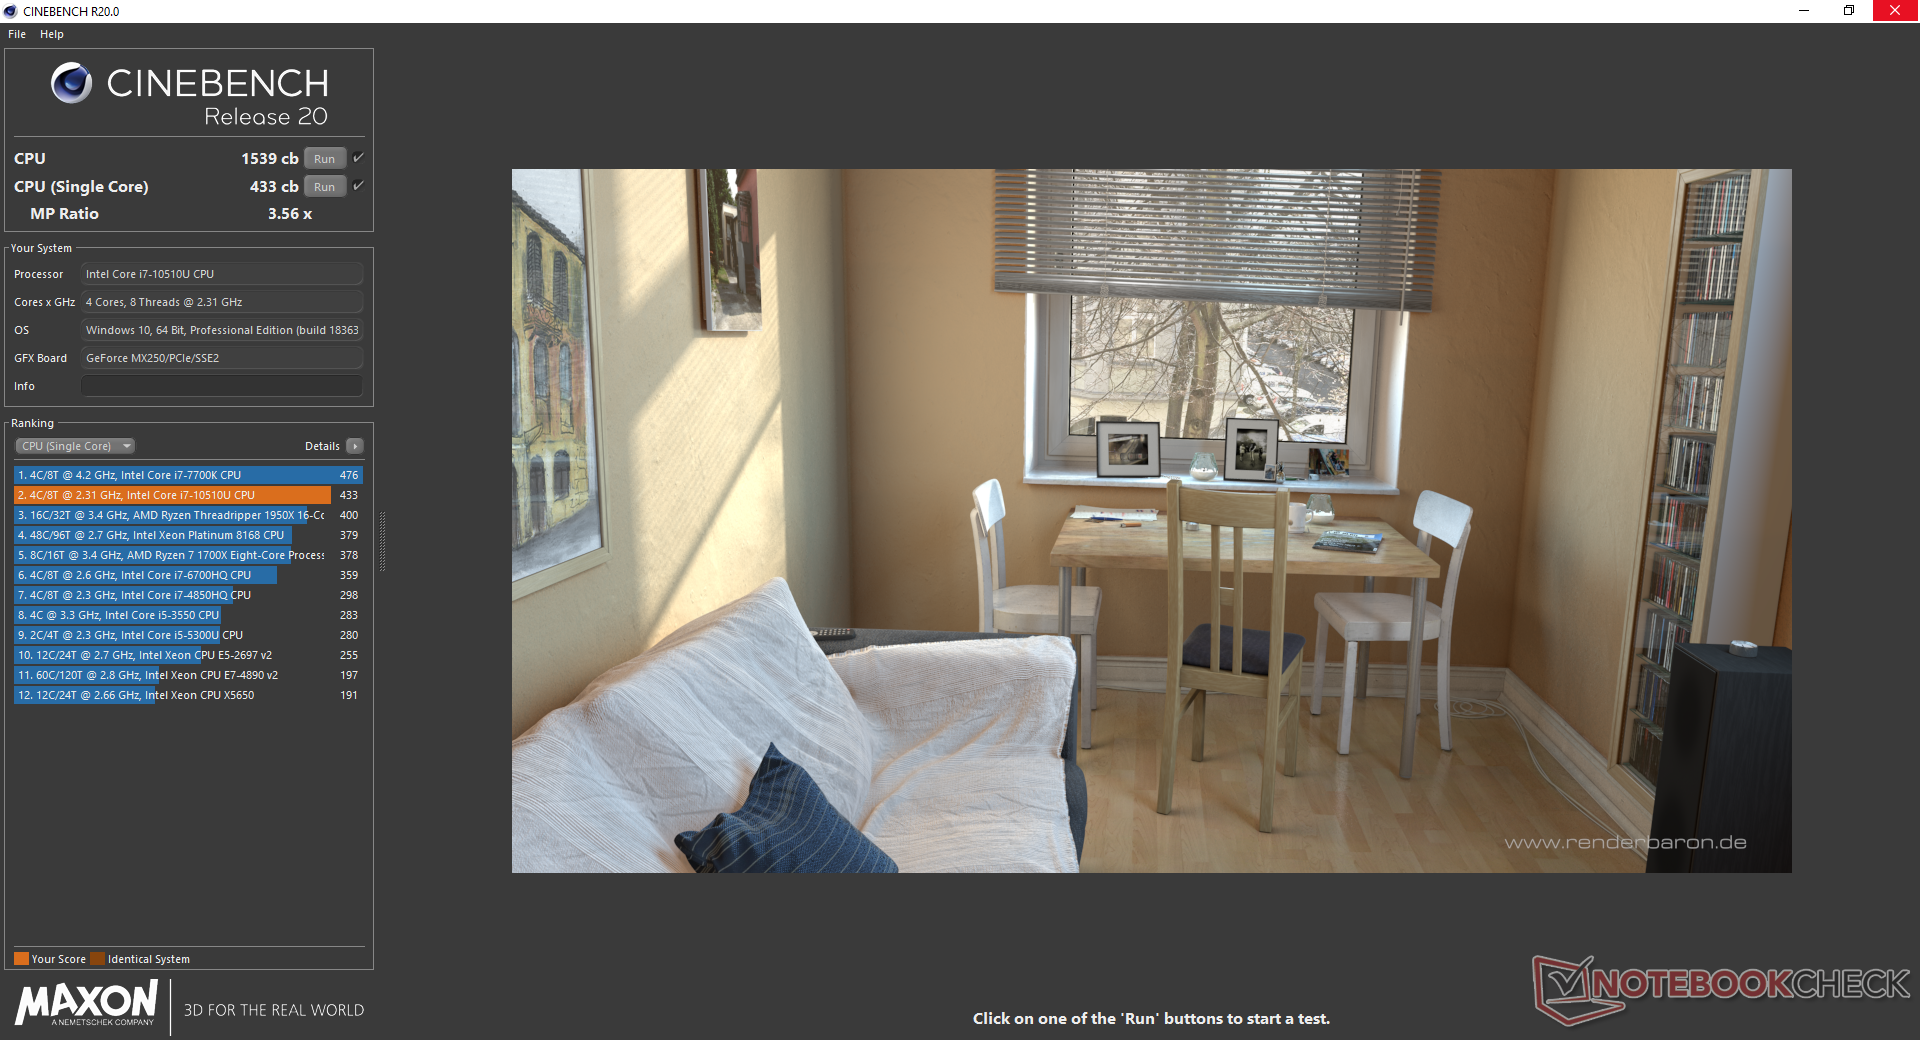
Cinebench R15: CPU Single 64Bit | CPU Multi 64Bit
Blender: v2.79 BMW27 CPU
7-Zip 18.03: 7z b 4 -mmt1 | 7z b 4
Geekbench 5.5: Single-Core | Multi-Core
HWBOT x265 Benchmark v2.2: 4k Preset
LibreOffice : 20 Documents To PDF
R Benchmark 2.5: Overall mean
| Cinebench R20 / CPU (Multi Core) | |
| Dell XPS 13 7390 Core i7-10710U | |
| Dell XPS 13 9300 Core i7-1065G7 | |
| MSI GF63 Thin 9SC | |
| Asus ZenBook 15 UX534FT-DB77 | |
| Microsoft Surface Laptop 3 13 Core i5-1035G7 | |
| Dell Inspiron 15 5000 5585 | |
| Asus ZenBook Duo UX481FL | |
| Ortalama Intel Core i7-10510U (1015 - 1897, n=38) | |
| Dynabook Portege A30-E-174 | |
| HP Elite Dragonfly-8MK79EA | |
| Cinebench R20 / CPU (Single Core) | |
| Dell XPS 13 7390 Core i7-10710U | |
| Dell XPS 13 9300 Core i7-1065G7 | |
| Asus ZenBook 15 UX534FT-DB77 | |
| Asus ZenBook Duo UX481FL | |
| Microsoft Surface Laptop 3 13 Core i5-1035G7 | |
| Ortalama Intel Core i7-10510U (362 - 497, n=37) | |
| MSI GF63 Thin 9SC | |
| Dynabook Portege A30-E-174 | |
| HP Elite Dragonfly-8MK79EA | |
| Dell Inspiron 15 5000 5585 | |
| Cinebench R15 / CPU Single 64Bit | |
| Asus ZenBook 15 UX534FT-DB77 | |
| Dell XPS 13 7390 Core i7-10710U | |
| Dell XPS 13 9300 Core i7-1065G7 | |
| Ortalama Intel Core i7-10510U (113 - 202, n=42) | |
| Asus ZenBook Duo UX481FL | |
| MSI GF63 Thin 9SC | |
| Microsoft Surface Laptop 3 13 Core i5-1035G7 | |
| Dynabook Portege A30-E-174 | |
| HP Elite Dragonfly-8MK79EA | |
| Dell Inspiron 15 5000 5585 | |
| Cinebench R15 / CPU Multi 64Bit | |
| Dell XPS 13 7390 Core i7-10710U | |
| MSI GF63 Thin 9SC | |
| Asus ZenBook Duo UX481FL | |
| Dell XPS 13 9300 Core i7-1065G7 | |
| Microsoft Surface Laptop 3 13 Core i5-1035G7 | |
| Asus ZenBook 15 UX534FT-DB77 | |
| Dell Inspiron 15 5000 5585 | |
| Ortalama Intel Core i7-10510U (482 - 856, n=45) | |
| HP Elite Dragonfly-8MK79EA | |
| Dynabook Portege A30-E-174 | |
| Blender / v2.79 BMW27 CPU | |
| HP Elite Dragonfly-8MK79EA | |
| Ortalama Intel Core i7-10510U (628 - 1051, n=31) | |
| Asus ZenBook Duo UX481FL | |
| Microsoft Surface Laptop 3 13 Core i5-1035G7 | |
| Dell XPS 13 7390 Core i7-10710U | |
| 7-Zip 18.03 / 7z b 4 -mmt1 | |
| Asus ZenBook Duo UX481FL | |
| Ortalama Intel Core i7-10510U (3747 - 4981, n=31) | |
| Dell XPS 13 7390 Core i7-10710U | |
| Microsoft Surface Laptop 3 13 Core i5-1035G7 | |
| HP Elite Dragonfly-8MK79EA | |
| 7-Zip 18.03 / 7z b 4 | |
| Dell XPS 13 7390 Core i7-10710U | |
| Asus ZenBook Duo UX481FL | |
| Microsoft Surface Laptop 3 13 Core i5-1035G7 | |
| Ortalama Intel Core i7-10510U (12196 - 21298, n=31) | |
| HP Elite Dragonfly-8MK79EA | |
| Geekbench 5.5 / Single-Core | |
| Asus ZenBook Duo UX481FL | |
| Ortalama Intel Core i7-10510U (977 - 1287, n=31) | |
| Geekbench 5.5 / Multi-Core | |
| Asus ZenBook Duo UX481FL | |
| Ortalama Intel Core i7-10510U (2474 - 4484, n=31) | |
| HWBOT x265 Benchmark v2.2 / 4k Preset | |
| Dell XPS 13 7390 Core i7-10710U | |
| Asus ZenBook Duo UX481FL | |
| Ortalama Intel Core i7-10510U (3.41 - 6.04, n=31) | |
| Microsoft Surface Laptop 3 13 Core i5-1035G7 | |
| HP Elite Dragonfly-8MK79EA | |
| LibreOffice / 20 Documents To PDF | |
| Asus ZenBook Duo UX481FL | |
| Ortalama Intel Core i7-10510U (50.7 - 77.8, n=27) | |
| R Benchmark 2.5 / Overall mean | |
| Asus ZenBook Duo UX481FL | |
| Ortalama Intel Core i7-10510U (0.637 - 0.81, n=28) | |
* ... daha küçük daha iyidir
Sistem performansı
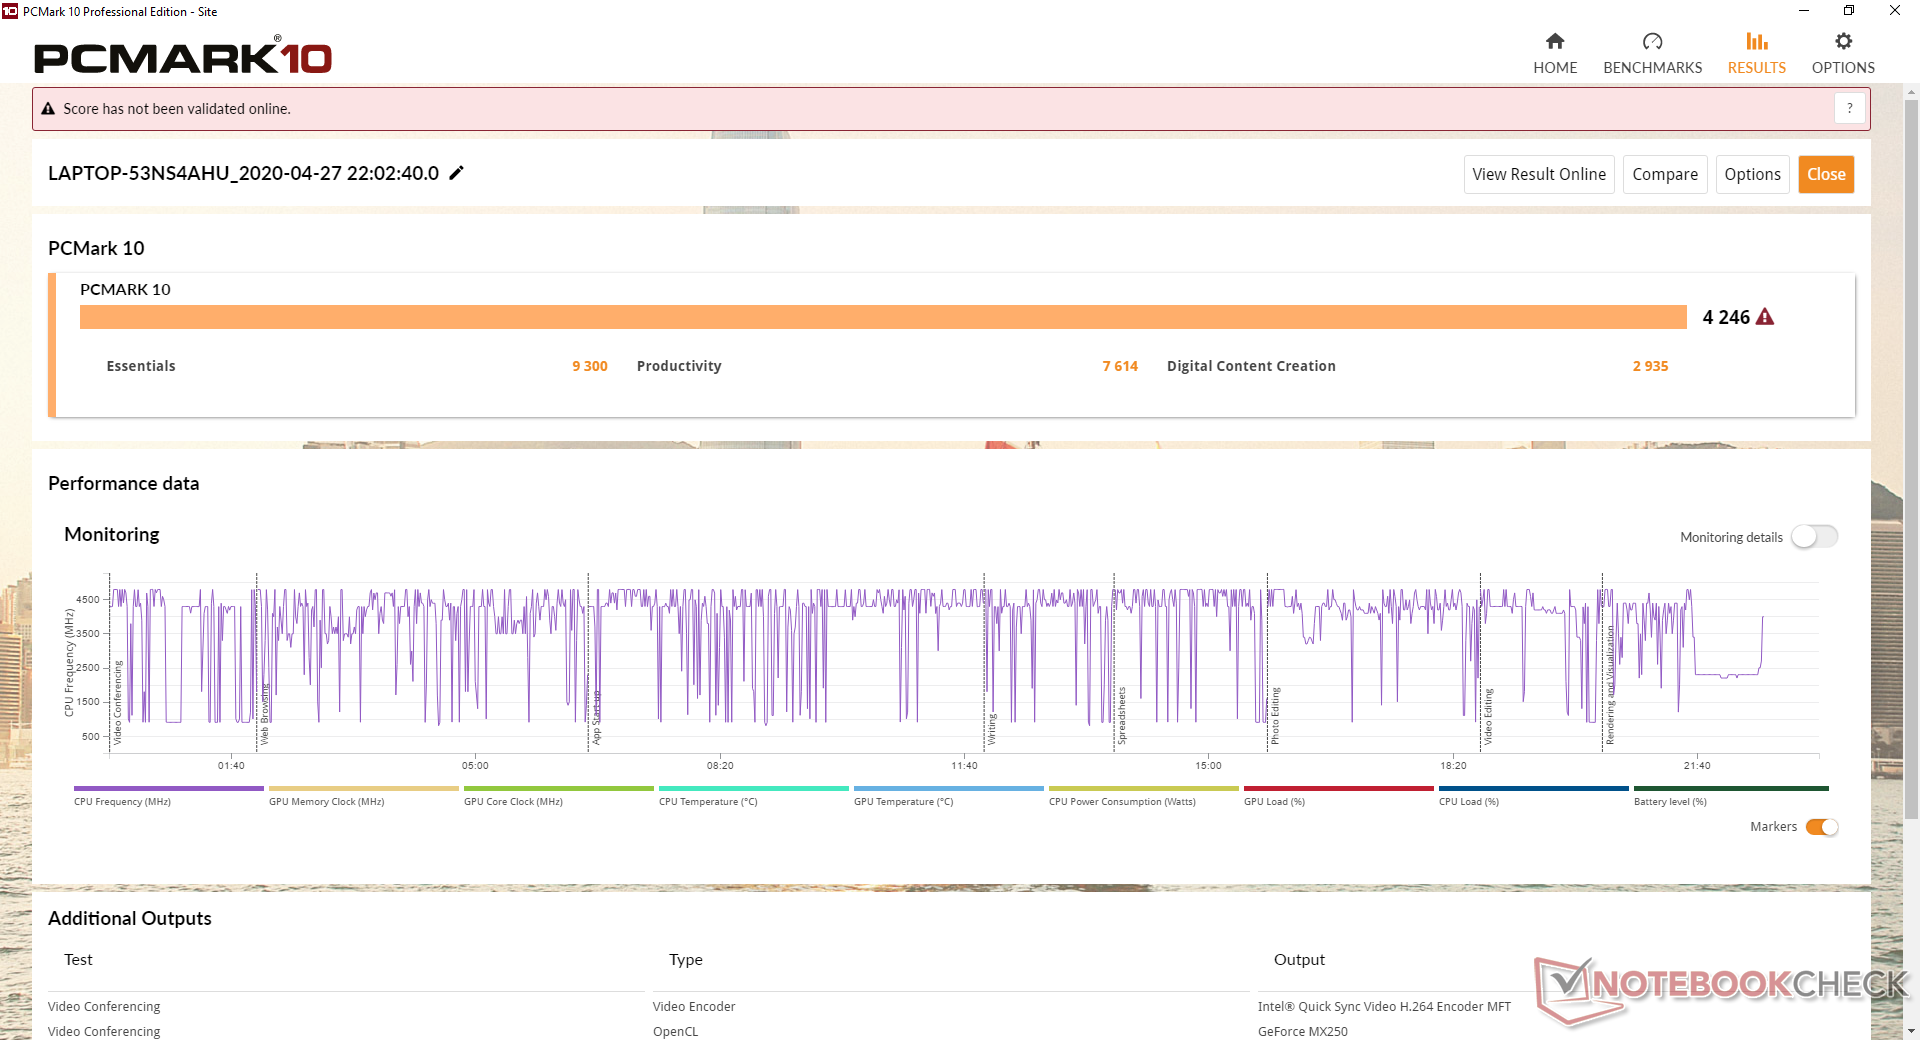
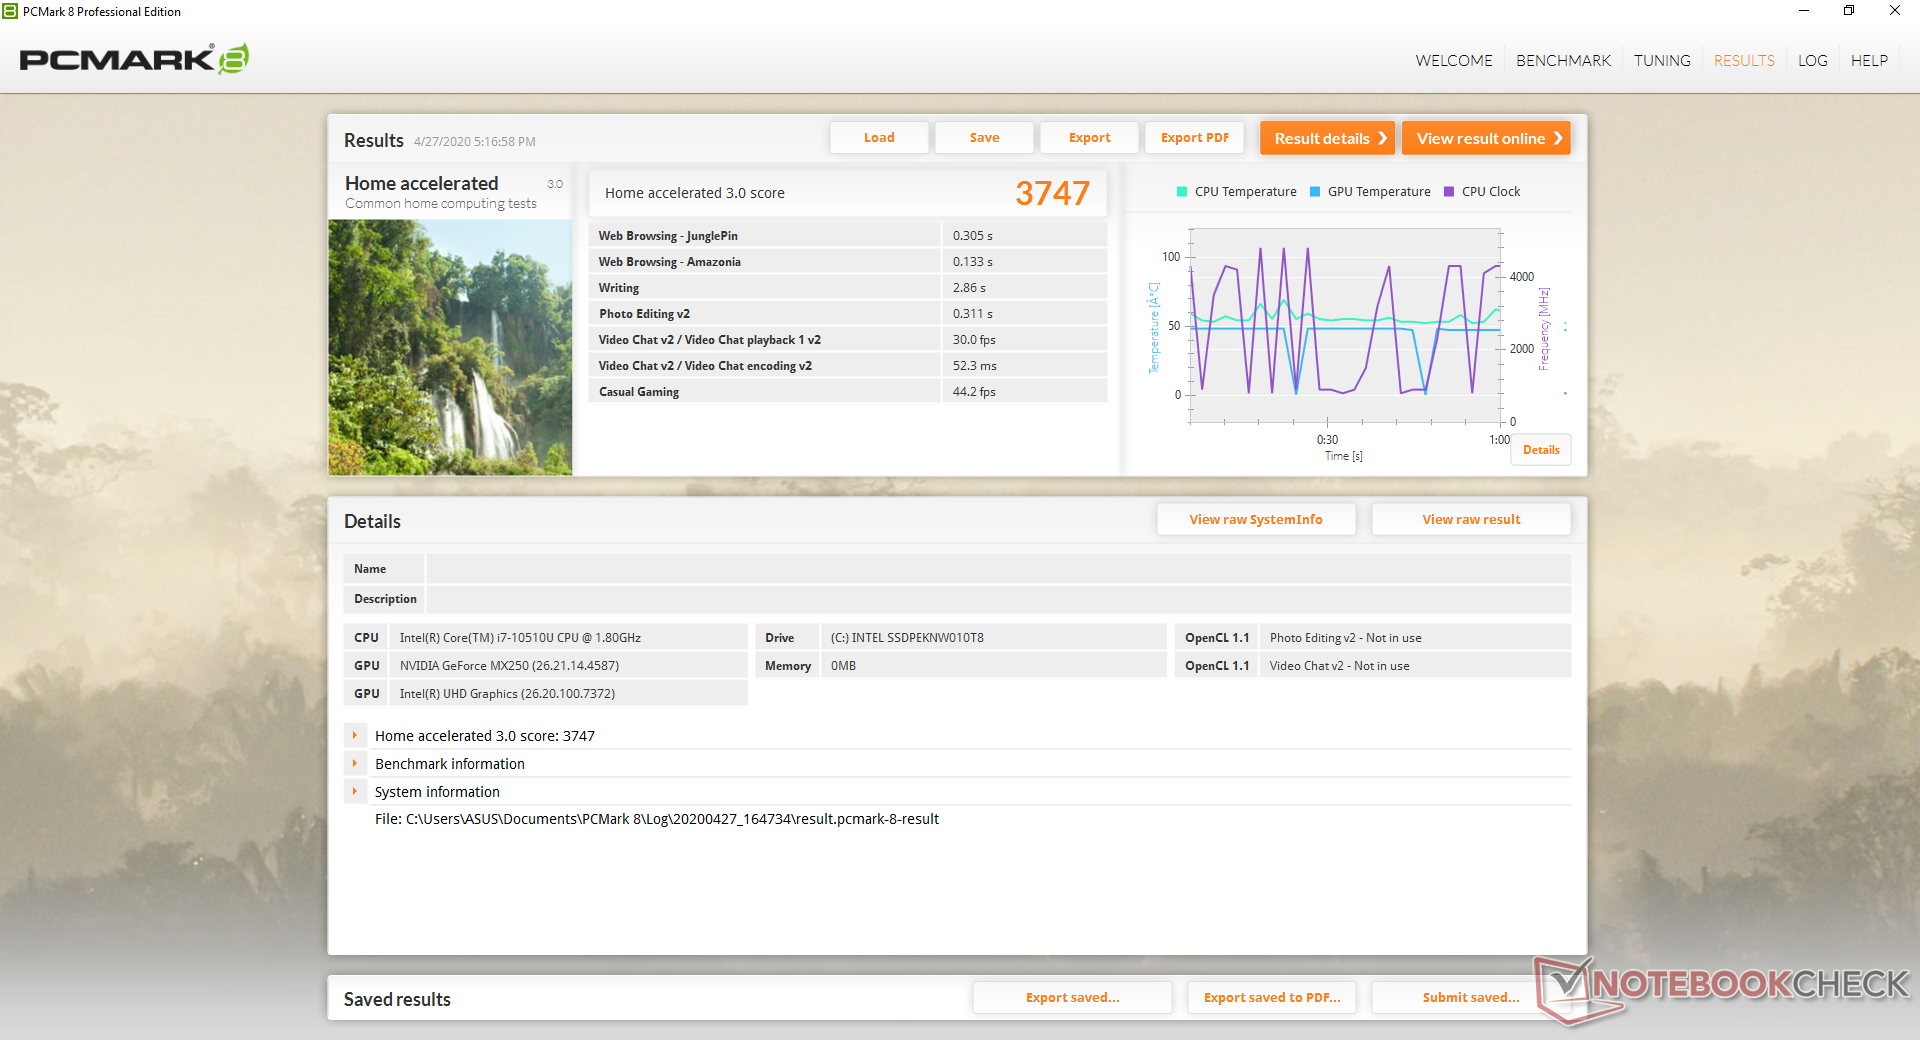
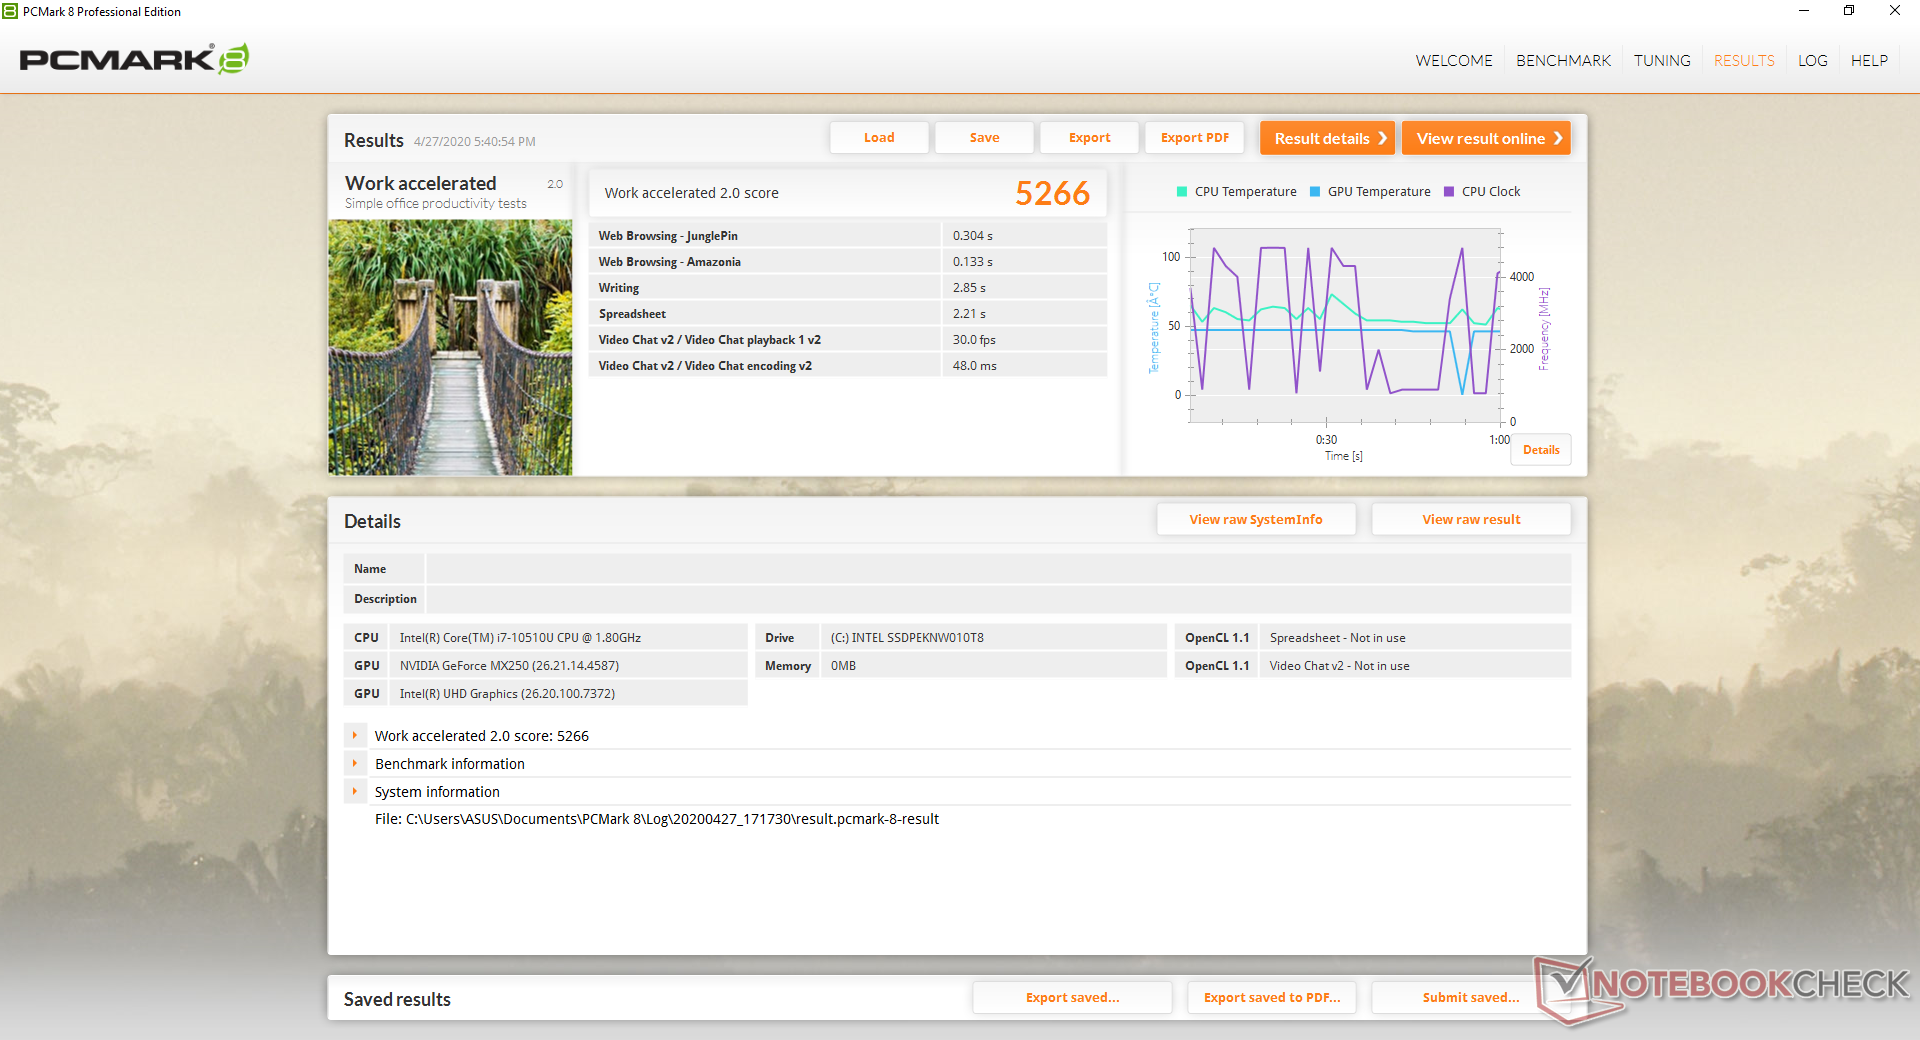
PCMark kriterleri, Core i7 CPU ve GeForce MX250 GPU ile donatılmış diğer dizüstü bilgisayarlara göre olmalarını beklediğimiz yerdir. PCMark 10 Dijital İçerik Oluşturma puanı ise ortalamanın altında. Farklı dizüstü bilgisayarlar arasındaki GPU performansını değerlendirmek söz konusu olduğunda, bu özel kıyaslama hiç bu kadar doğru olmamıştı. Test ünitesi ile zamanımız boyunca hiçbir yazılım veya donanım sorunu yaşamadık. İkinci ekranı ikinci doğa haline gelmeden önce kullanmak için hafif bir öğrenme eğrisi olduğunu unutmayın. Ekranın konumu, ZenBook Pro UX580'deki orijinal ScreenPad'den daha ergonomik bir kullanım sağlar.
| PCMark 8 | |
| Home Score Accelerated v2 | |
| Asus ZenBook Duo UX481FL | |
| Asus ZenBook 14 UM431DA-AM020T | |
| Ortalama Intel Core i7-10510U, NVIDIA GeForce MX250 (3214 - 3958, n=8) | |
| MSI Prestige 14 A10SC-009 | |
| Huawei Matebook X Pro i5 | |
| Lenovo ThinkPad X1 Carbon G7 20R1-000YUS | |
| Lenovo IdeaPad S940-14IWL | |
| Work Score Accelerated v2 | |
| Asus ZenBook Duo UX481FL | |
| Ortalama Intel Core i7-10510U, NVIDIA GeForce MX250 (4599 - 5443, n=8) | |
| Asus ZenBook 14 UM431DA-AM020T | |
| MSI Prestige 14 A10SC-009 | |
| Lenovo ThinkPad X1 Carbon G7 20R1-000YUS | |
| Huawei Matebook X Pro i5 | |
| Lenovo IdeaPad S940-14IWL | |
| PCMark 8 Home Score Accelerated v2 | 3747 puan | |
| PCMark 8 Work Score Accelerated v2 | 5266 puan | |
| PCMark 10 Score | 4246 puan | |
Yardım | ||
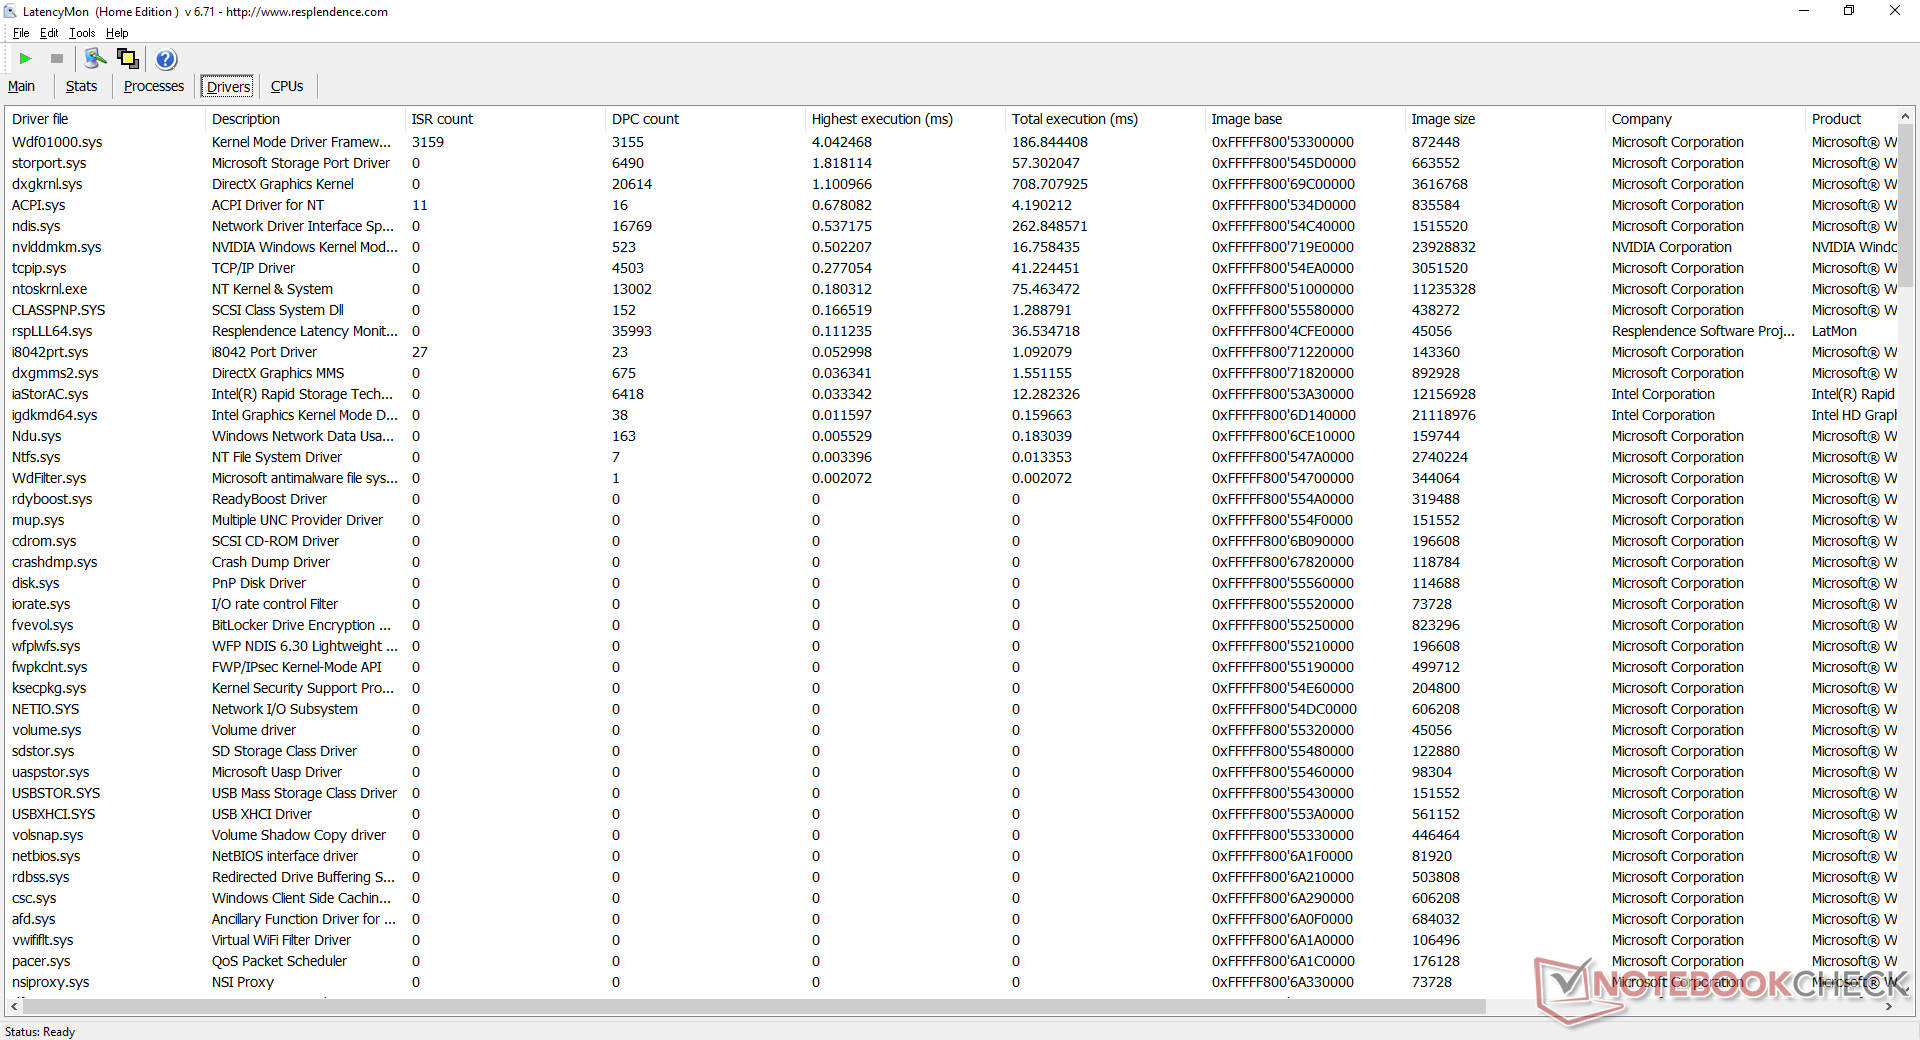
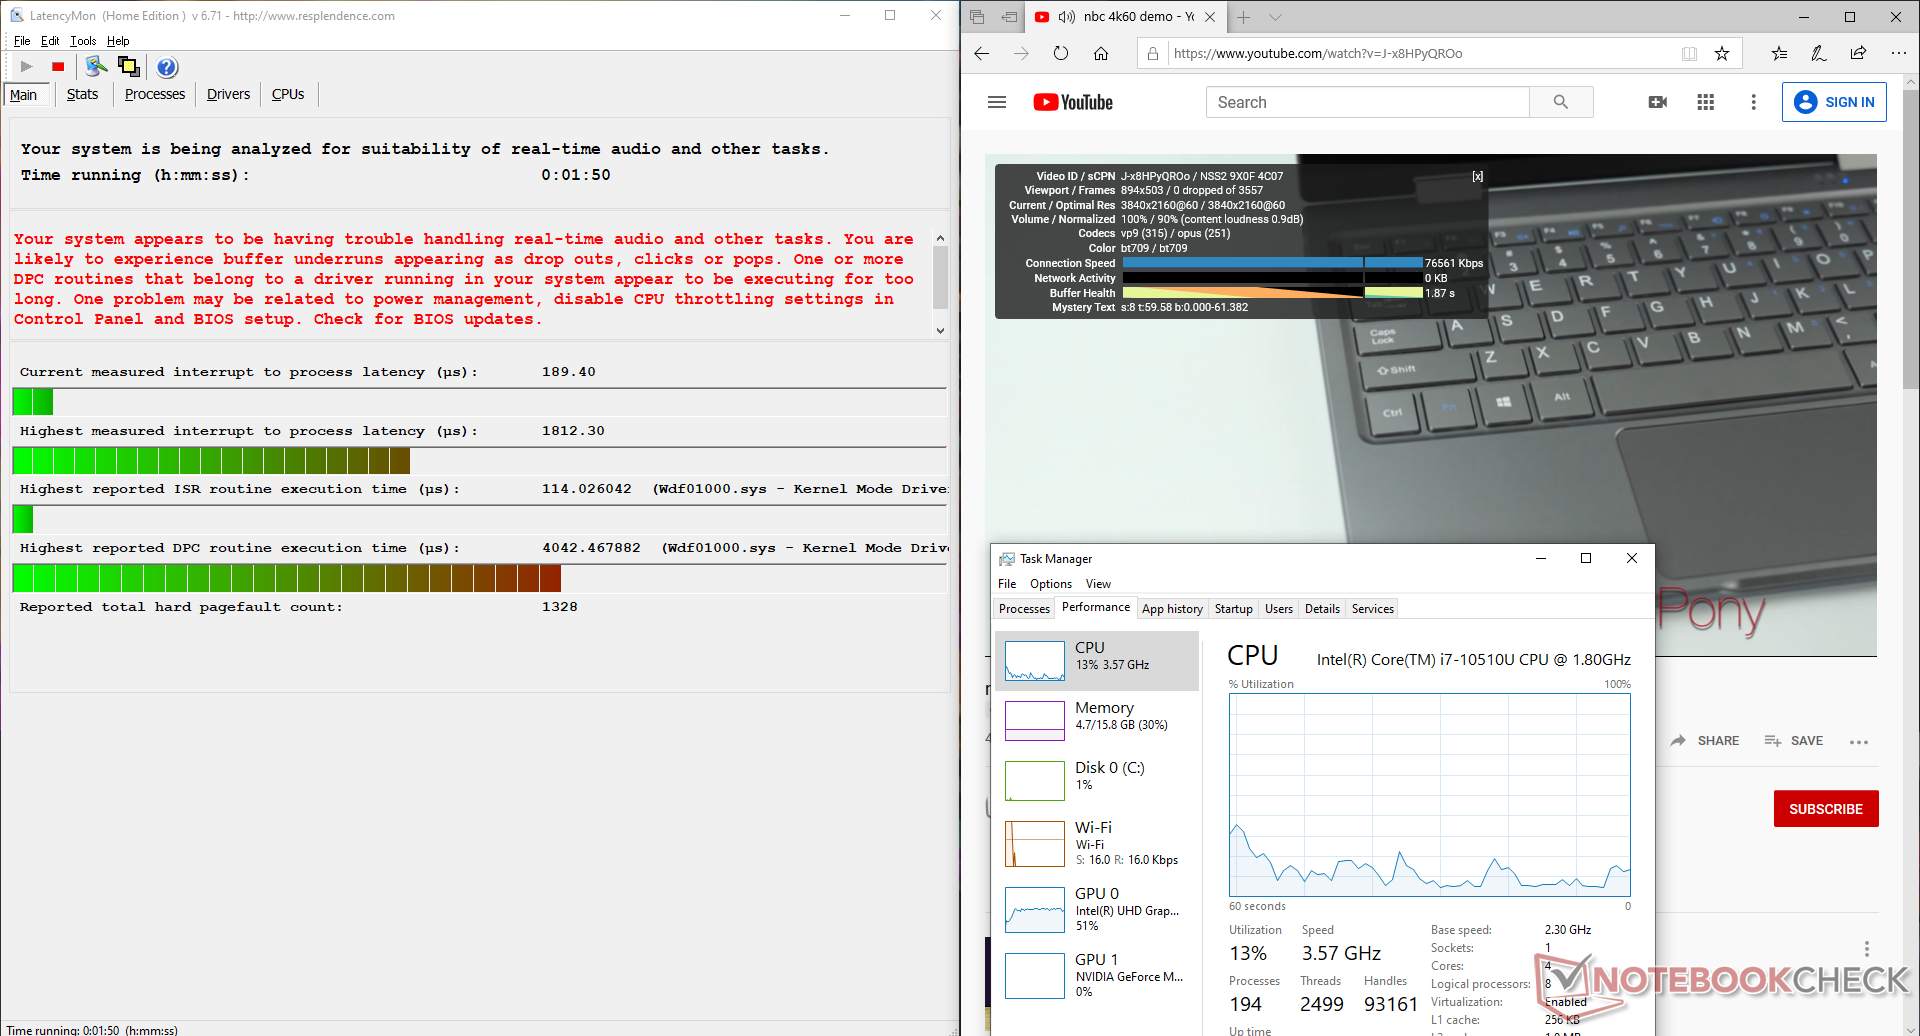
DPC Gecikmesi
LatencyMon, birden çok tarayıcı sekmesi açarken ve Prime95'i sırayla çalıştırırken DPC gecikme sorunlarını gösterir. Neyse ki, YouTube'daki 4K video oynatma testimiz, atlanan karelerin olmadığını ortaya koyuyor. Entegre Intel GPU, video oynatımı sırasında tüm ağır kaldırma işlemlerini yaparken görülebilir.
| DPC Latencies / LatencyMon - interrupt to process latency (max), Web, Youtube, Prime95 | |
| Asus ZenBook Duo UX481FL | |
* ... daha küçük daha iyidir
Depolama aygıtları
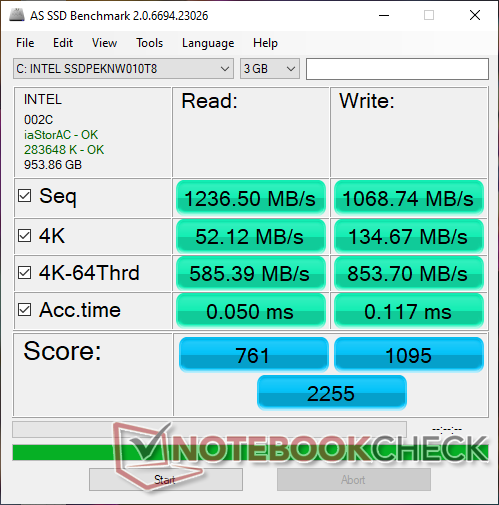
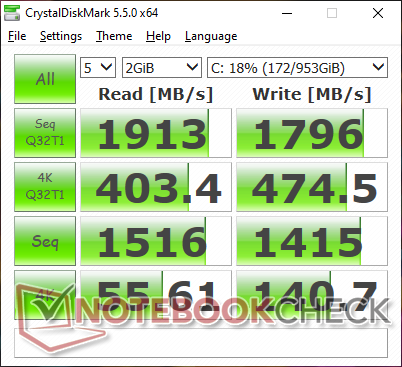
Anlaşılır şekilde, alan kısıtlamaları nedeniyle ikincil seçenek bulunmayan tek bir M.2 2280 yuvası var. Bazı SKU'ların PCIe x4 yerine PCIe x2 SSD'lerle gelebileceğini unutmayın. Test birimimizdeki 1 TB Intel 660p NVMe SSD, AS SSD kriterlerine göre daha pahalı Samsung PM981'in sıralı okuma ve yazma oranlarının yaklaşık yarısını döndürür. Bu, U sınıfı CPU ve güç tasarruflu GeForce MX GPU ile iyi bir şekilde dengelenir. Daha fazla karşılaştırma karşılaştırması için SSD ve HDD tablolarımıza bakın.
| Asus ZenBook Duo UX481FL Intel SSD 660p 1TB SSDPEKNW010T8 | Asus ZenBook 14 UM431DA-AM020T SK hynix BC501 HFM512GDHTNG-8310A | Huawei Matebook X Pro i5 Samsung PM961 MZVLW256HEHP | Lenovo ThinkPad X1 Carbon G7 20R1-000YUS WDC PC SN730 SDBPNTY-512G | MSI Prestige 14 A10SC-009 Samsung SSD PM981 MZVLB1T0HALR | |
|---|---|---|---|---|---|
| AS SSD | 0% | 3% | 14% | 74% | |
| Seq Read (MB/s) | 1237 | 1417 15% | 2416 95% | 1786 44% | 2300 86% |
| Seq Write (MB/s) | 1069 | 781 -27% | 1170 9% | 1259 18% | 2051 92% |
| 4K Read (MB/s) | 52.1 | 37.03 -29% | 48.33 -7% | 45.86 -12% | 46.23 -11% |
| 4K Write (MB/s) | 134.7 | 80.1 -41% | 103.1 -23% | 147.9 10% | 84.6 -37% |
| 4K-64 Read (MB/s) | 585 | 740 26% | 1039 78% | 885 51% | 1552 165% |
| 4K-64 Write (MB/s) | 854 | 748 -12% | 399.6 -53% | 950 11% | 1789 109% |
| Access Time Read * (ms) | 0.05 | 0.047 6% | 0.058 -16% | 0.058 -16% | 0.049 2% |
| Access Time Write * (ms) | 0.117 | 0.045 62% | 0.036 69% | 0.074 37% | 0.045 62% |
| Score Read (Points) | 761 | 918 21% | 1329 75% | 1110 46% | 1828 140% |
| Score Write (Points) | 1095 | 906 -17% | 620 -43% | 1224 12% | 2079 90% |
| Score Total (Points) | 2255 | 2270 1% | 2575 14% | 2885 28% | 4831 114% |
| Copy ISO MB/s (MB/s) | 1714 | 739 -57% | 1384 -19% | ||
| Copy Program MB/s (MB/s) | 511 | 312.3 -39% | 525 3% | ||
| Copy Game MB/s (MB/s) | 1187 | 486.3 -59% | 1008 -15% | ||
| CrystalDiskMark 5.2 / 6 | -32% | -17% | 24% | 20% | |
| Write 4K (MB/s) | 140.7 | 118.8 -16% | 116.5 -17% | 151.5 8% | 163.8 16% |
| Read 4K (MB/s) | 55.6 | 41.62 -25% | 42.18 -24% | 45.83 -18% | 48.6 -13% |
| Write Seq (MB/s) | 1415 | 796 -44% | 1079 -24% | 2060 46% | 2269 60% |
| Read Seq (MB/s) | 1516 | 1101 -27% | 1030 -32% | 1973 30% | 1963 29% |
| Write 4K Q32T1 (MB/s) | 474.5 | 234.7 -51% | 225.7 -52% | 489.8 3% | 289.8 -39% |
| Read 4K Q32T1 (MB/s) | 403.4 | 313.8 -22% | 302.9 -25% | 386.2 -4% | 373.6 -7% |
| Write Seq Q32T1 (MB/s) | 1796 | 842 -53% | 1174 -35% | 2703 51% | 2395 33% |
| Read Seq Q32T1 (MB/s) | 1913 | 1645 -14% | 3394 77% | 3376 76% | 3479 82% |
| Toplam Ortalama (Program / Ayarlar) | -16% /
-13% | -7% /
-4% | 19% /
18% | 47% /
51% |
* ... daha küçük daha iyidir

GPU Performansı
3DMark karşılaştırmaları, Asus birimimizdeki GeForce MX250'nin, diğer 21 dizüstü bilgisayardan alınan veritabanımızdaki ortalama MX250'den yaklaşık yüzde 16 ila 18 daha yavaş olduğunu gösteriyor. Açıkçası, iki dahili ekranın desteklenmesi GPU'ya zarar veriyor. Performansın, daha eski 10 W GeForce MX150 ile donatılmış ZenBook 14 UX433'e en çok benzemesini bekleyin. Flip tarafında, ana ekranda bir oyun oynarken sohbet programları veya videolar için kullanışlı olacaktır. İkinci ekranda herhangi bir kullanıcı girişinin odağı ana oyundan uzaklaştıracağını ve muhtemelen pencereyi en aza indirgeyeceğini veya kilitleyeceğini unutmayın. Daha fazla teknik bilgi ve karşılaştırma karşılaştırmaları için GeForce MX250'deki özel sayfamıza bakın.
| 3DMark | |
| 1280x720 Cloud Gate Standard Graphics | |
| Dell G5 15 5587 | |
| Asus ZenBook 15 UX534FTC-A8190T | |
| Asus ZenBook Flip 15 UX563FD-A1027T | |
| Ortalama NVIDIA GeForce MX250 (13805 - 23863, n=25) | |
| Dell Inspiron 15 5000 5585 | |
| Asus ZenBook Duo UX481FL | |
| Asus Zenbook 14 UX433FN-A6023T | |
| Lenovo Yoga C940-14IIL 81Q9 | |
| Asus VivoBook 15 X510UQ-BQ534T | |
| 1920x1080 Fire Strike Graphics | |
| Dell G5 15 5587 | |
| Asus ZenBook 15 UX534FTC-A8190T | |
| Asus ZenBook Flip 15 UX563FD-A1027T | |
| Ortalama NVIDIA GeForce MX250 (2939 - 3885, n=29) | |
| Dell Inspiron 15 5000 5585 | |
| Lenovo Yoga C940-14IIL 81Q9 | |
| Asus ZenBook Duo UX481FL | |
| Asus Zenbook 14 UX433FN-A6023T | |
| Asus VivoBook 15 X510UQ-BQ534T | |
| 2560x1440 Time Spy Graphics | |
| Dell G5 15 5587 | |
| Asus ZenBook 15 UX534FTC-A8190T | |
| Asus ZenBook Flip 15 UX563FD-A1027T | |
| Ortalama NVIDIA GeForce MX250 (881 - 1169, n=22) | |
| Asus ZenBook Duo UX481FL | |
| Asus Zenbook 14 UX433FN-A6023T | |
| Dell Inspiron 15 5000 5585 | |
| Lenovo Yoga C940-14IIL 81Q9 | |
| Asus VivoBook 15 X510UQ-BQ534T | |
| 3DMark 11 | |
| 1280x720 Performance GPU | |
| Dell G5 15 5587 | |
| Asus ZenBook 15 UX534FTC-A8190T | |
| Asus ZenBook Flip 15 UX563FD-A1027T | |
| Lenovo Yoga C940-14IIL 81Q9 | |
| Ortalama NVIDIA GeForce MX250 (3585 - 4942, n=29) | |
| Dell Inspiron 15 5000 5585 | |
| Asus ZenBook Duo UX481FL | |
| Asus Zenbook 14 UX433FN-A6023T | |
| Asus VivoBook 15 X510UQ-BQ534T | |
| 1280x720 Performance Combined | |
| Dell G5 15 5587 | |
| Asus ZenBook 15 UX534FTC-A8190T | |
| Asus ZenBook Flip 15 UX563FD-A1027T | |
| Ortalama NVIDIA GeForce MX250 (3532 - 4638, n=29) | |
| Lenovo Yoga C940-14IIL 81Q9 | |
| Asus ZenBook Duo UX481FL | |
| Asus Zenbook 14 UX433FN-A6023T | |
| Dell Inspiron 15 5000 5585 | |
| Asus VivoBook 15 X510UQ-BQ534T | |
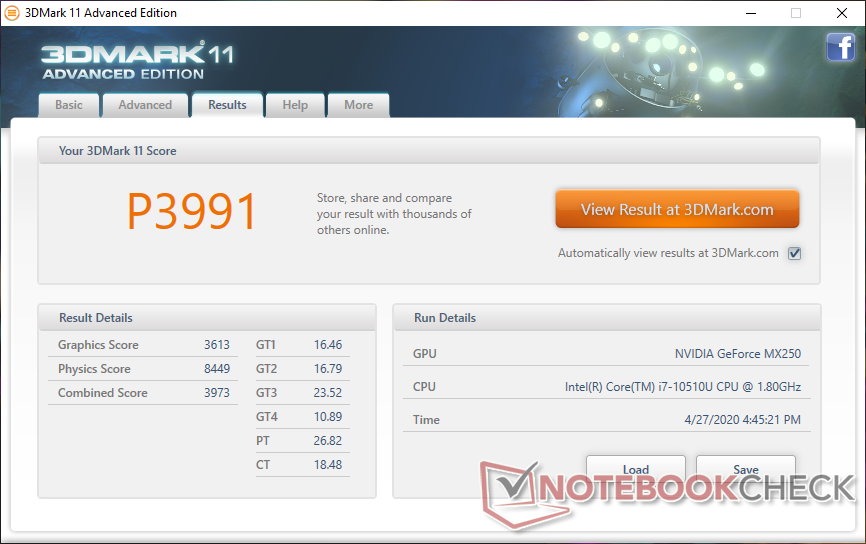
| 3DMark 11 Performance | 3991 puan | |
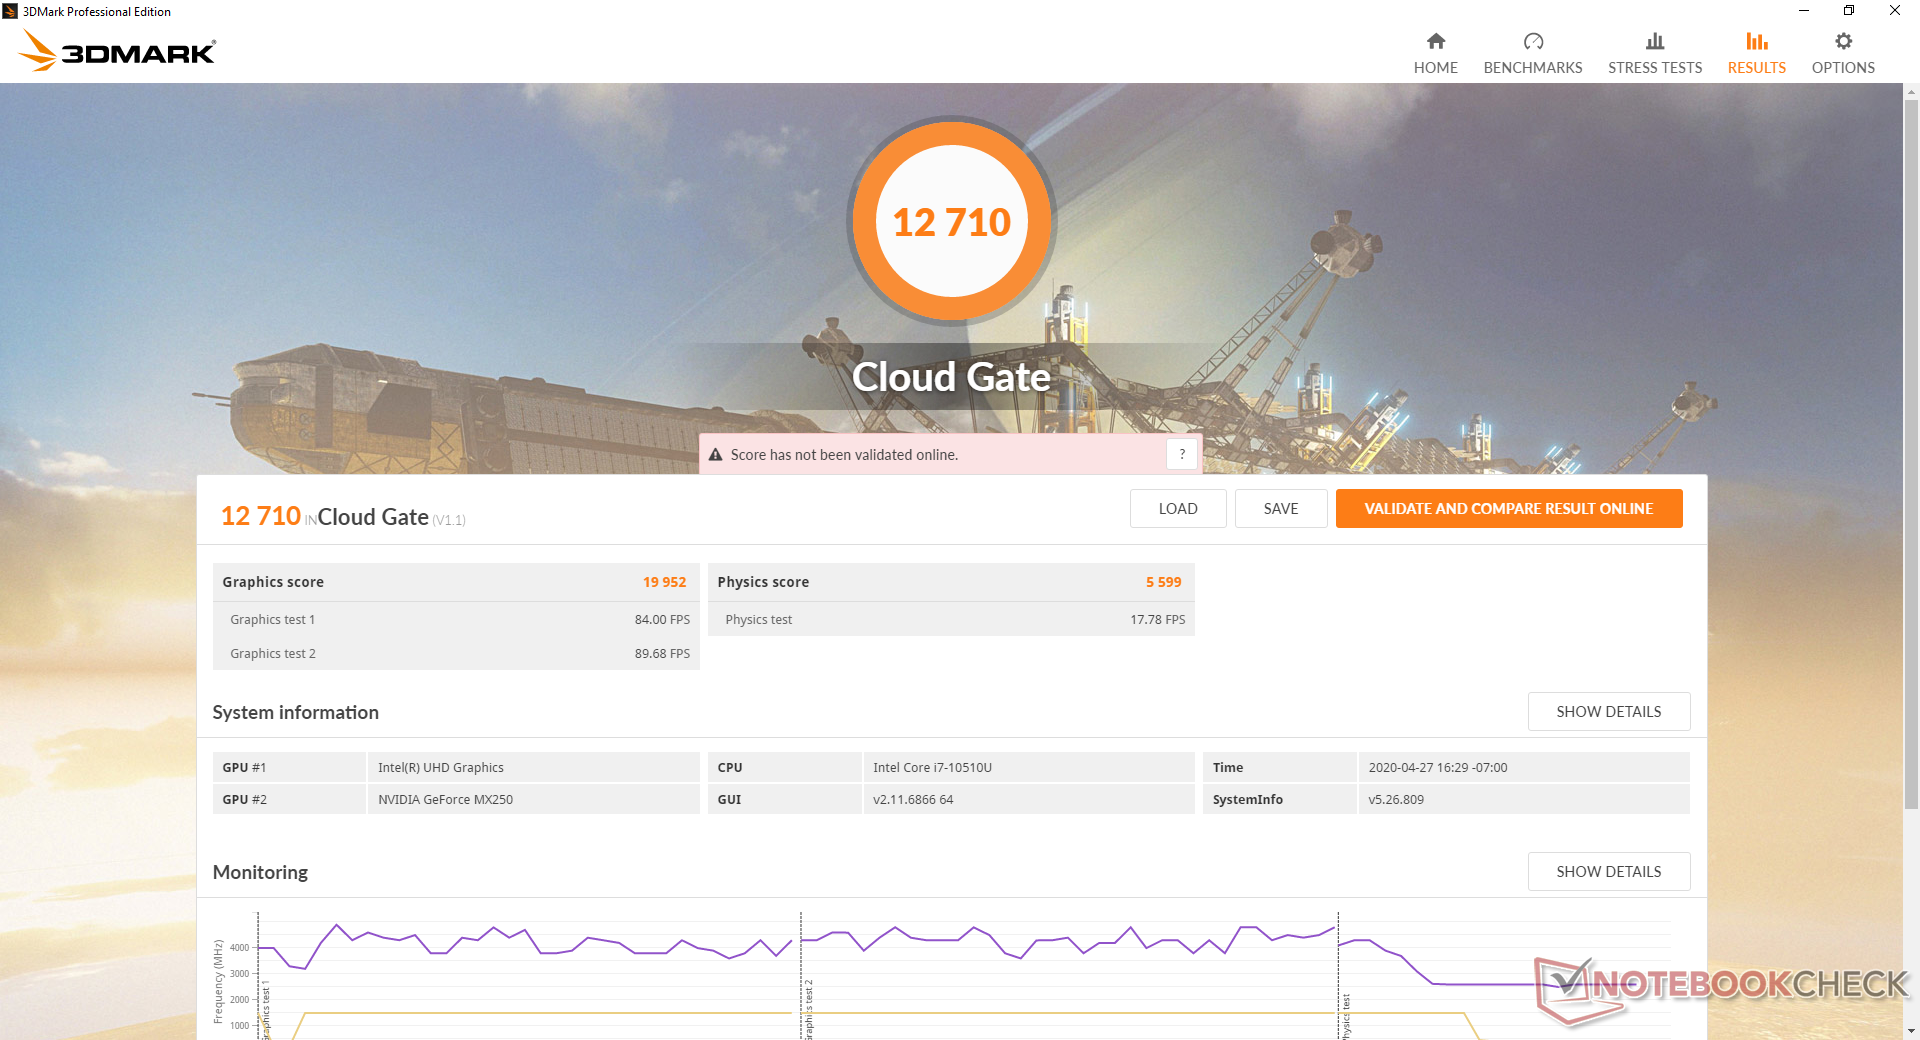
| 3DMark Cloud Gate Standard Score | 12710 puan | |
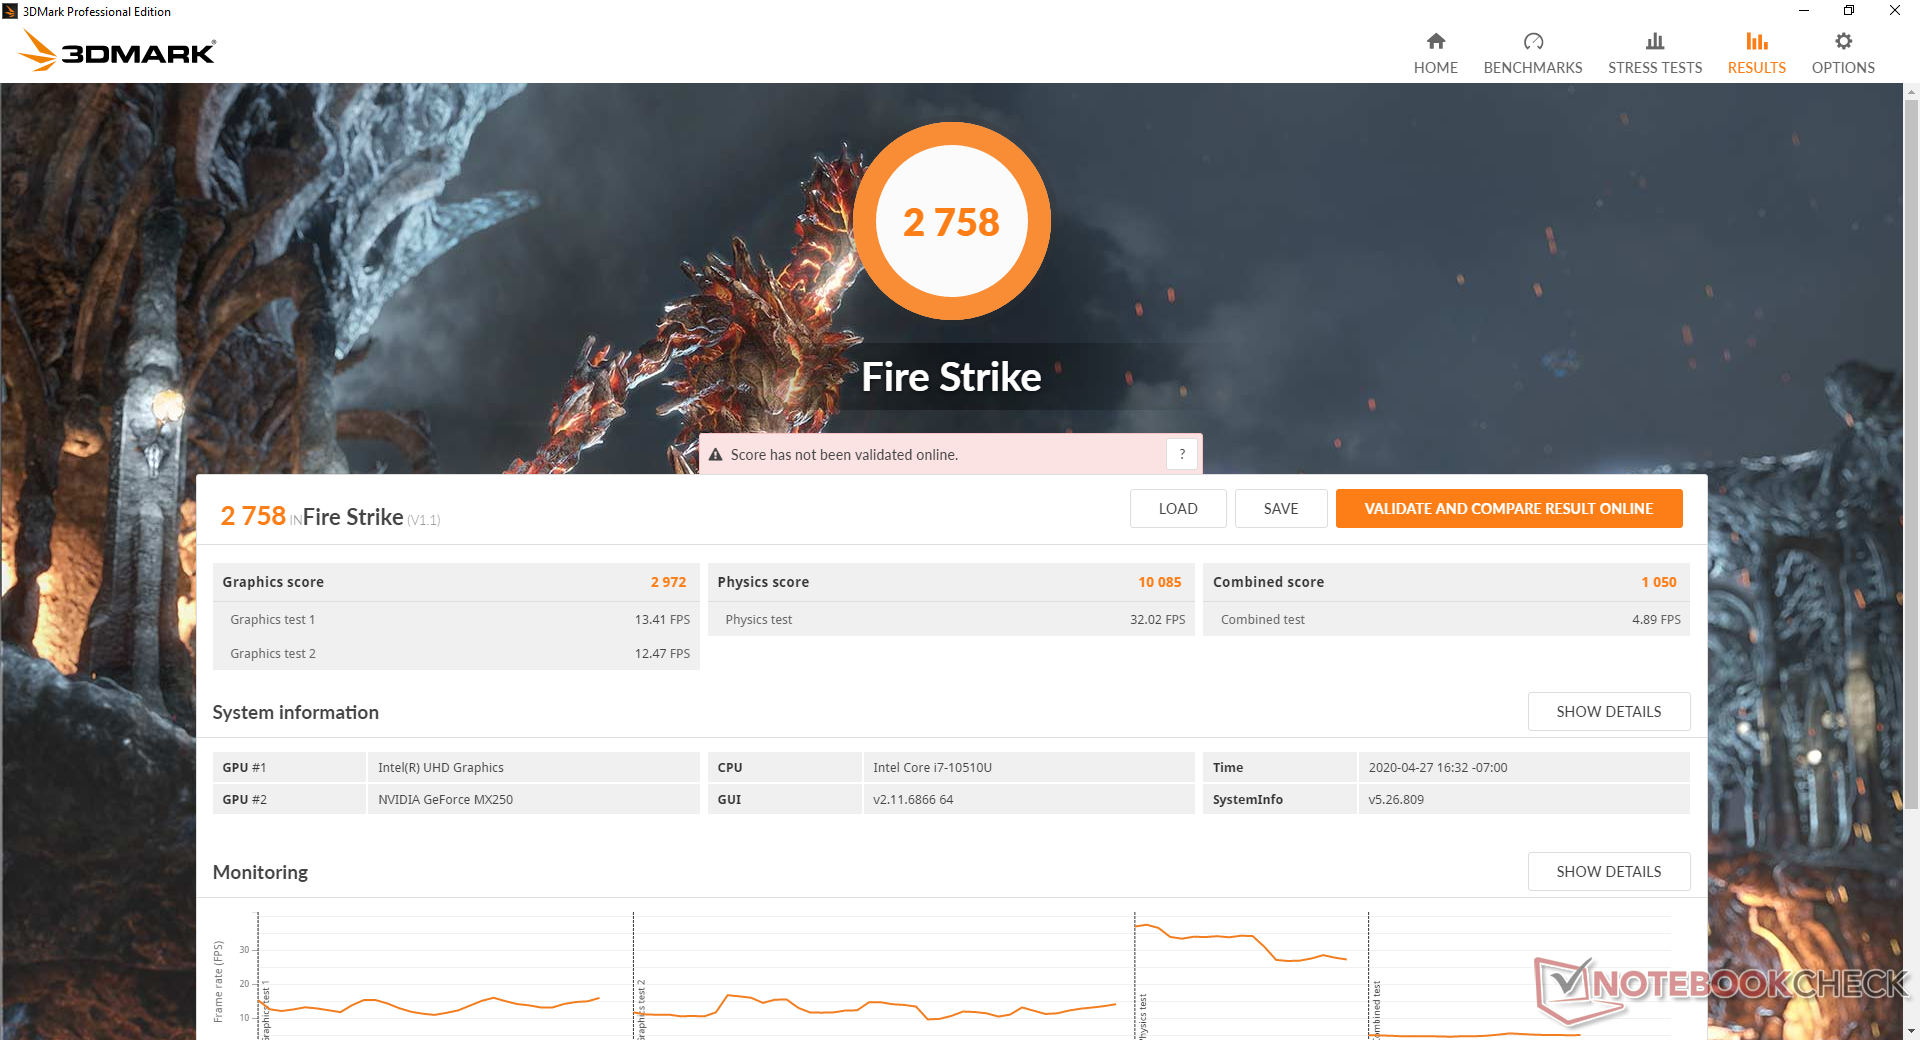
| 3DMark Fire Strike Score | 2758 puan | |
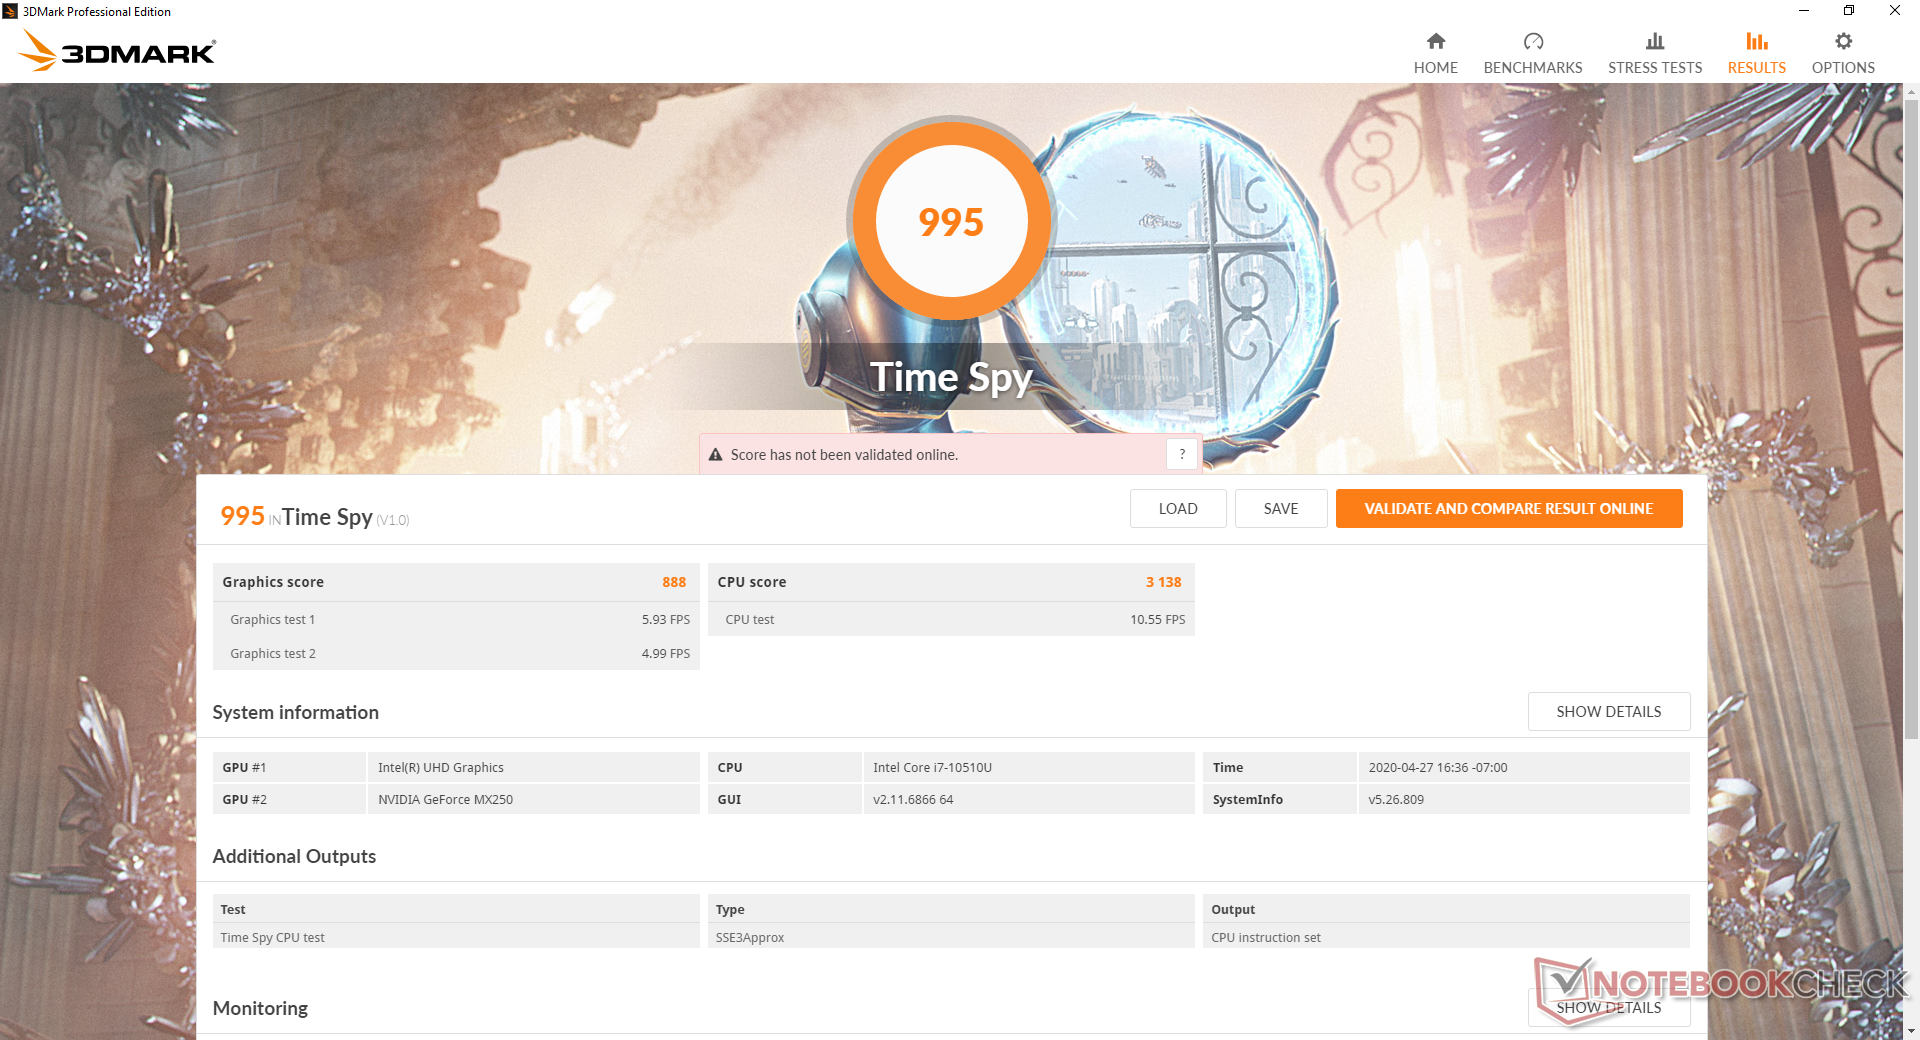
| 3DMark Time Spy Score | 995 puan | |
Yardım | ||
| düşük | orta | yüksek | ultra | |
|---|---|---|---|---|
| The Witcher 3 (2015) | 58.3 | 33.8 | 18 | 9.8 |
| Dota 2 Reborn (2015) | 114 | 102 | 62.3 | 56 |
| X-Plane 11.11 (2018) | 64.8 | 45.5 | 42.5 |
Emissions
System Noise
The cooling solution consists of twin 30 mm to 35 mm fans with three heat pipes. When idling on desktop, the fans remain idle for a completely silent experience. If multi-tasking or video streaming, fan noise will hover in the 29.1 dB(A) range to still be very quiet and generally unnoticeable.
Running higher loads like 3DMark 06 will steadily increase the fan noise until it hits a ceiling of 39.1 dB(A) towards the end of the first benchmark scene. This appears to be the maximum fan noise of the system as results are the same when gaming or when running Prime95 and FurMark loads. Perhaps not coincidentally, this 39 dB(A) maximum can also be observed on the ZenBook 14 UM431DA and Zenbook 14 UX433FN.
We're not able to notice any coil whine or electronic noise from our test unit.
| Asus ZenBook Duo UX481FL GeForce MX250, i7-10510U, Intel SSD 660p 1TB SSDPEKNW010T8 | Asus ZenBook 14 UM431DA-AM020T Vega 10, R7 3700U, SK hynix BC501 HFM512GDHTNG-8310A | Huawei Matebook X Pro i5 GeForce MX150, i5-8250U, Samsung PM961 MZVLW256HEHP | MSI Prestige 14 A10SC-009 GeForce GTX 1650 Max-Q, i7-10710U, Samsung SSD PM981 MZVLB1T0HALR | Asus Zenbook 14 UX433FN-A6023T GeForce MX150, i7-8565U, Intel SSD 660p SSDPEKNW512G8 | |
|---|---|---|---|---|---|
| Noise | 1% | -3% | -7% | -5% | |
| kapalı / ortam * (dB) | 28.3 | 29.8 -5% | 27.9 1% | 30.3 -7% | 30.7 -8% |
| Idle Minimum * (dB) | 28.3 | 28 1% | 27.9 1% | 30.3 -7% | 30.7 -8% |
| Idle Average * (dB) | 28.3 | 28 1% | 27.9 1% | 30.3 -7% | 30.7 -8% |
| Idle Maximum * (dB) | 28.3 | 28 1% | 27.9 1% | 30.3 -7% | 30.7 -8% |
| Load Average * (dB) | 39.1 | 36.8 6% | 36.2 7% | 40.2 -3% | 38.8 1% |
| Witcher 3 ultra * (dB) | 39.1 | 45 -15% | |||
| Load Maximum * (dB) | 39.1 | 39 -0% | 45.2 -16% | 43.5 -11% | 39.3 -1% |
* ... daha küçük daha iyidir
Ses yüksekliği
| Boşta |
| 28.3 / 28.3 / 28.3 dB |
| Çalışırken |
| 39.1 / 39.1 dB |
 | ||
30 dB sessiz 40 dB(A) duyulabilirlik 50 dB(A) gürültülü |
||
min: | ||
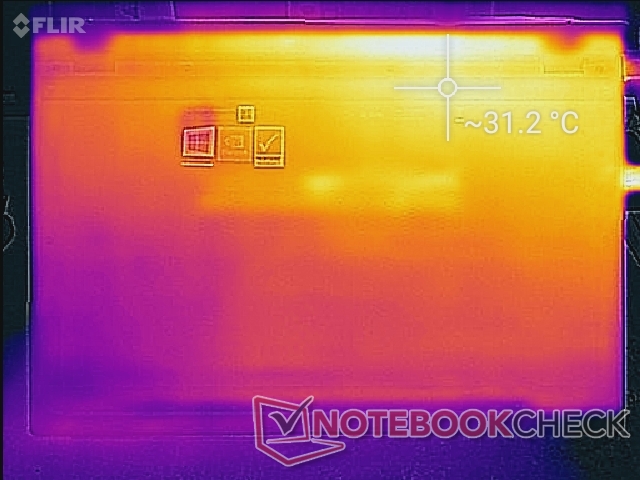
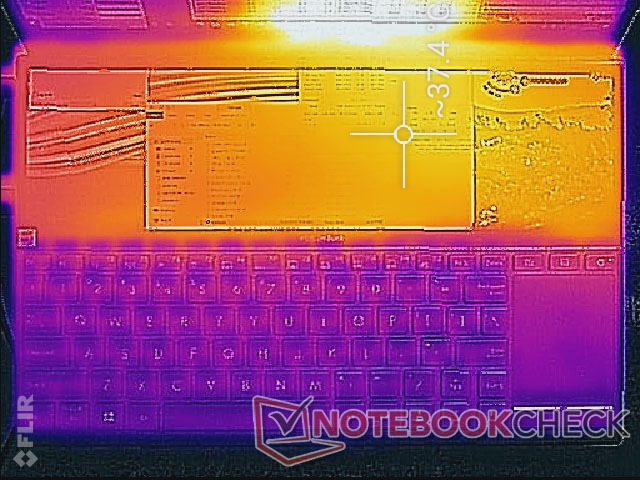
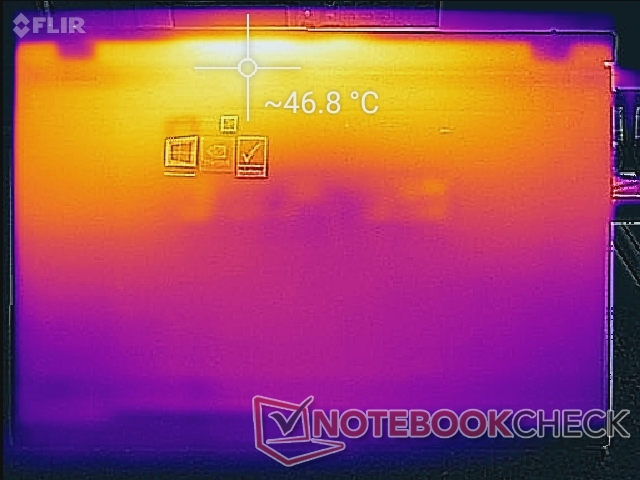
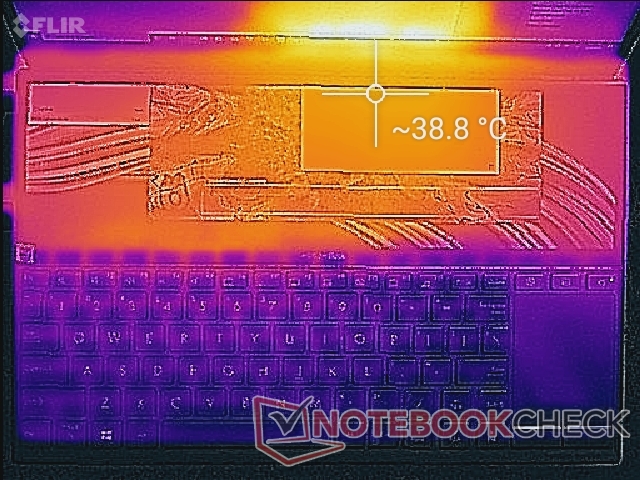
Temperature
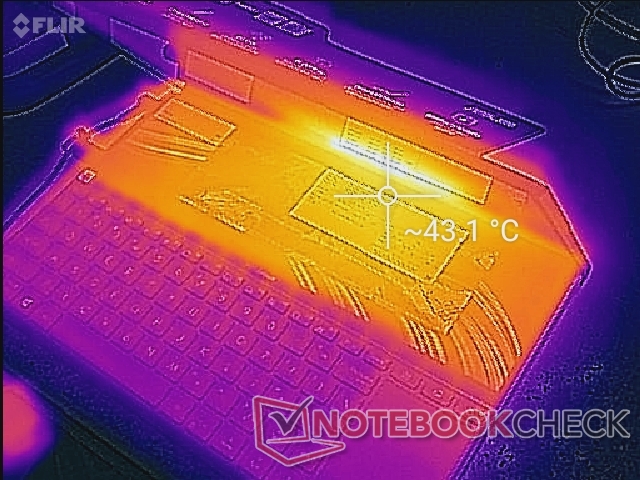
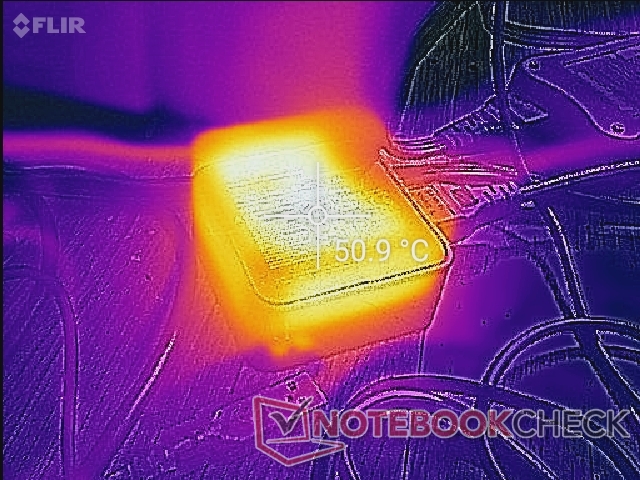
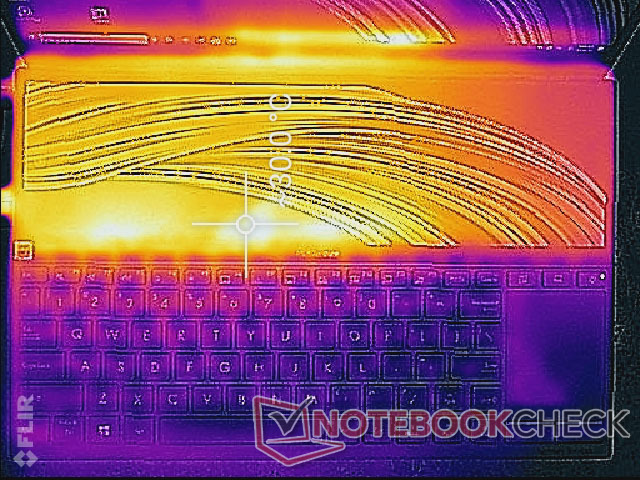
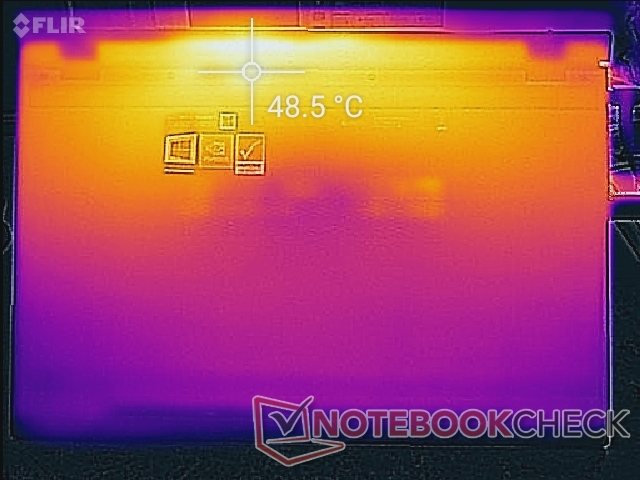
Surface temperature development is more similar to the gaming Zephyrus GX501 or GX531 than to the namesake ZenBook 15 or ZenBook 14 due to the positioning of the keyboard. Owners can expect the keys to be cool at around 28 C no matter the onscreen load whereas sections of the keyboards on most other laptops like the ZenBook 14 can become as warm as 47 C when under high processing stress. The bottom hot spot can reach almost 48 C when gaming as shown by our temperature maps below. We think that surface temperatures could have been even cooler had Asus installed more ventilation grilles instead of the small ones here.
(+) Üst taraftaki maksimum sıcaklık, 36.8 °C / 98 F ortalamasına kıyasla 38.4 °C / 101 F'dir. , Multimedia sınıfı için 21 ile 71 °C arasında değişir.
(-) Alt kısım, 39.1 °C / 102 F ortalamasına kıyasla maksimum 48 °C / 118 F'ye kadar ısınır
(+) Boşta kullanımda, üst tarafın ortalama sıcaklığı 27.8 °C / 82 F olup, cihazın 31.3 °C / 88 F.
(±) The Witcher 3 oynarken, üst tarafın ortalama sıcaklığı 32.6 °C / 91 F olup, cihazın 31.3 °C / 88 F.
(+) Avuç içi dayanakları ve dokunmatik yüzey, maksimum 28 °C / 82.4 F ile cilt sıcaklığından daha soğuktur ve bu nedenle dokunulduğunda soğuktur.
(±) Benzer cihazların avuç içi dayanağı alanının ortalama sıcaklığı 28.7 °C / 83.7 F (+0.7 °C / 1.3 F) idi.
Stress Test
We stress the system with synthetic loads to identify for any potential throttling or stability issues. When running Prime95, the CPU would boost up to 3.8 GHz for the first few 20 seconds or so until hitting a core temperature of 96 C. Thereafter, clock rates drop to just 2.3 to 2.4 GHz in order to maintain a cooler core temperature of 65 C. The significant dip in Turbo Boost performance from 3.8 GHz to 2.4 GHz is reflective of the steep drop in performance observed during our CineBench loop test mentioned above.
Running Witcher 3 is more representative of real-world stressful loads. The CPU and GPU would stabilize at 65 C and 67 C, respectively, compared to 73 C and 75 C on the Huawei MateBook X Pro with the GeForce MX150 when under similar conditions. These temperatures are reasonable considering the low-power CPU and GPU involved.
Running on batteries will limit performance. A 3DMark 11 run on battery power returns Physics and Graphics scores of 7725 and 1163, respectively, compared to 8449 and 3613 points when on mains.
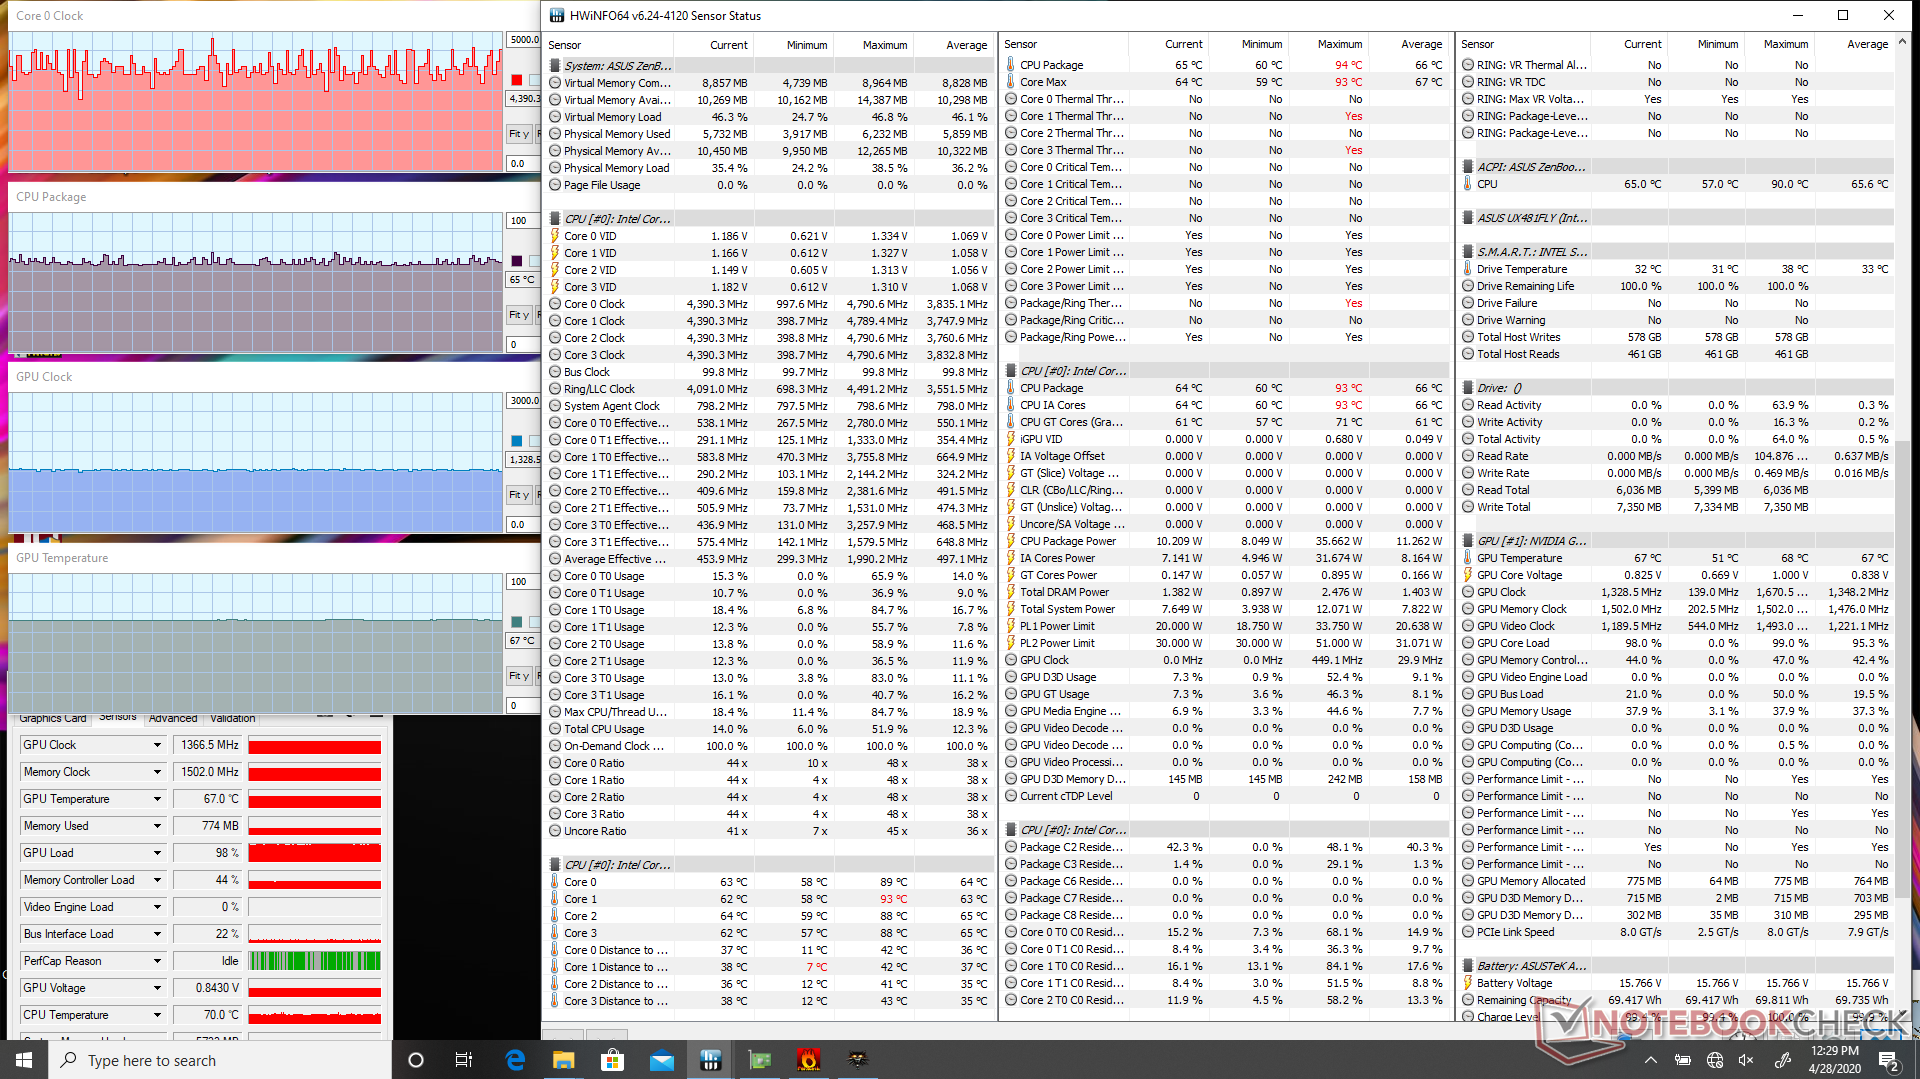
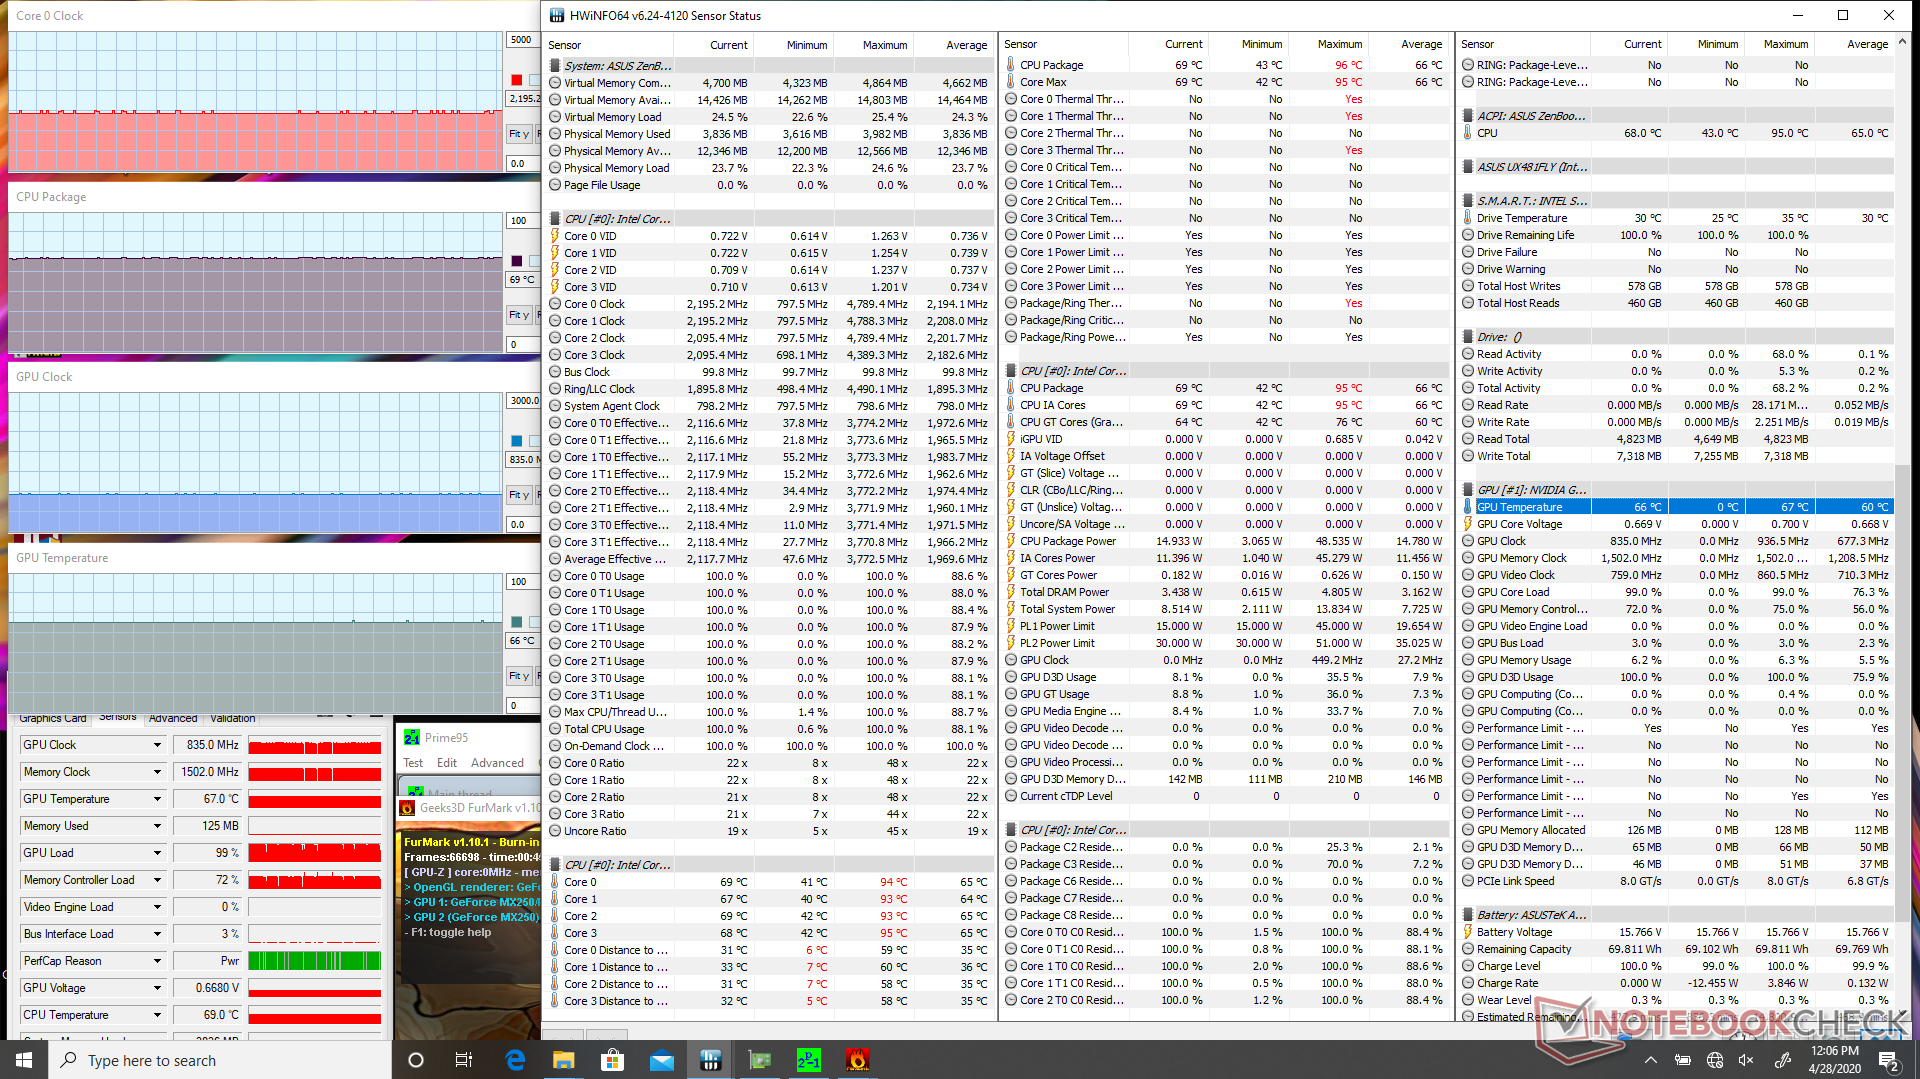
| CPU Clock (GHz) | GPU Clock (MHz) | Average CPU Temperature (°C) | Average GPU Temperature (°C) | |
| System Idle | -- | -- | 44 | 37 |
| Prime95 Stress | 2.3 - 2.4 | -- | 65 | 47 |
| Prime95 + FurMark Stress | 2.1 - 2.2 | 835 | 69 | 66 |
| Witcher 3 Stress | ~4.2 | 1366 | 65 | 67 |
Speakers


Asus ZenBook Duo UX481FL ses analizi
(±) | hoparlör ses yüksekliği ortalama ama iyi (78.7 dB)
Bas 100 - 315Hz
(±) | azaltılmış bas - ortalama olarak medyandan 9.8% daha düşük
(-) | bas doğrusal değildir (16.6% delta ile önceki frekans)
Ortalar 400 - 2000 Hz
(±) | daha yüksek ortalar - ortalama olarak medyandan 5.5% daha yüksek
(+) | orta frekanslar doğrusaldır (6.1% deltadan önceki frekansa)
Yüksekler 2 - 16 kHz
(+) | dengeli yüksekler - medyandan yalnızca 1.9% uzakta
(+) | yüksekler doğrusaldır (4.7% deltadan önceki frekansa)
Toplam 100 - 16.000 Hz
(±) | Genel sesin doğrusallığı ortalamadır (18.9% ortancaya göre fark)
Aynı sınıfla karşılaştırıldığında
» Bu sınıftaki tüm test edilen cihazların %59%'si daha iyi, 7% benzer, 33% daha kötüydü
» En iyisinin deltası 5% idi, ortalama 17% idi, en kötüsü 45% idi
Test edilen tüm cihazlarla karşılaştırıldığında
» Test edilen tüm cihazların %44'si daha iyi, 8 benzer, % 48 daha kötüydü
» En iyisinin deltası 4% idi, ortalama 23% idi, en kötüsü 134% idi
Apple MacBook 12 (Early 2016) 1.1 GHz ses analizi
(+) | hoparlörler nispeten yüksek sesle çalabilir (83.6 dB)
Bas 100 - 315Hz
(±) | azaltılmış bas - ortalama olarak medyandan 11.3% daha düşük
(±) | Bas doğrusallığı ortalamadır (14.2% delta - önceki frekans)
Ortalar 400 - 2000 Hz
(+) | dengeli ortalar - medyandan yalnızca 2.4% uzakta
(+) | orta frekanslar doğrusaldır (5.5% deltadan önceki frekansa)
Yüksekler 2 - 16 kHz
(+) | dengeli yüksekler - medyandan yalnızca 2% uzakta
(+) | yüksekler doğrusaldır (4.5% deltadan önceki frekansa)
Toplam 100 - 16.000 Hz
(+) | genel ses doğrusaldır (10.2% ortancaya göre fark)
Aynı sınıfla karşılaştırıldığında
» Bu sınıftaki tüm test edilen cihazların %7%'si daha iyi, 2% benzer, 91% daha kötüydü
» En iyisinin deltası 5% idi, ortalama 18% idi, en kötüsü 53% idi
Test edilen tüm cihazlarla karşılaştırıldığında
» Test edilen tüm cihazların %5'si daha iyi, 1 benzer, % 94 daha kötüydü
» En iyisinin deltası 4% idi, ortalama 23% idi, en kötüsü 134% idi
Energy Management
Power Consumption
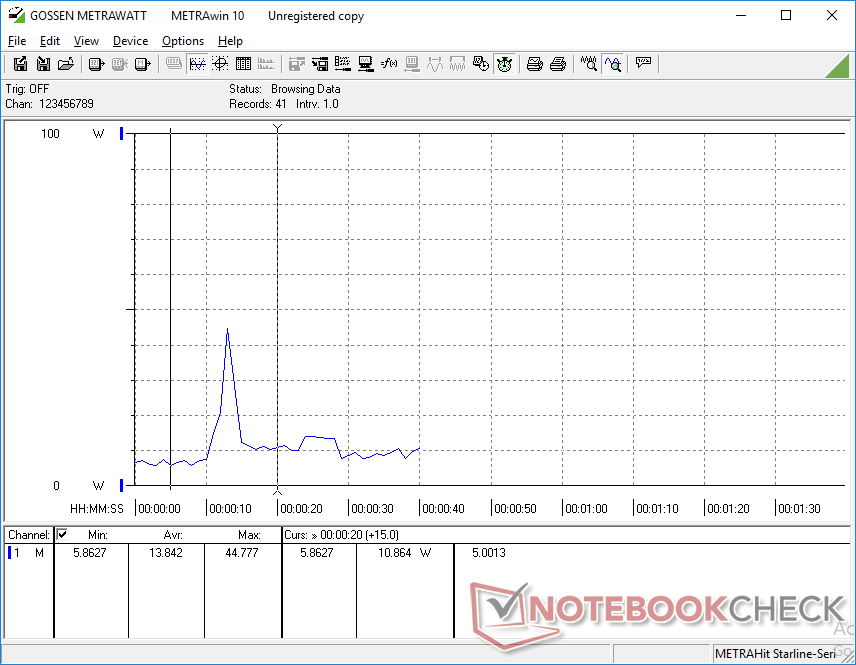
Idling on desktop consumes between 3 W and 11 W depending on the brightness level and if the secondary display is on. Enabling the second display will consume an additional 4 W to 5 W.
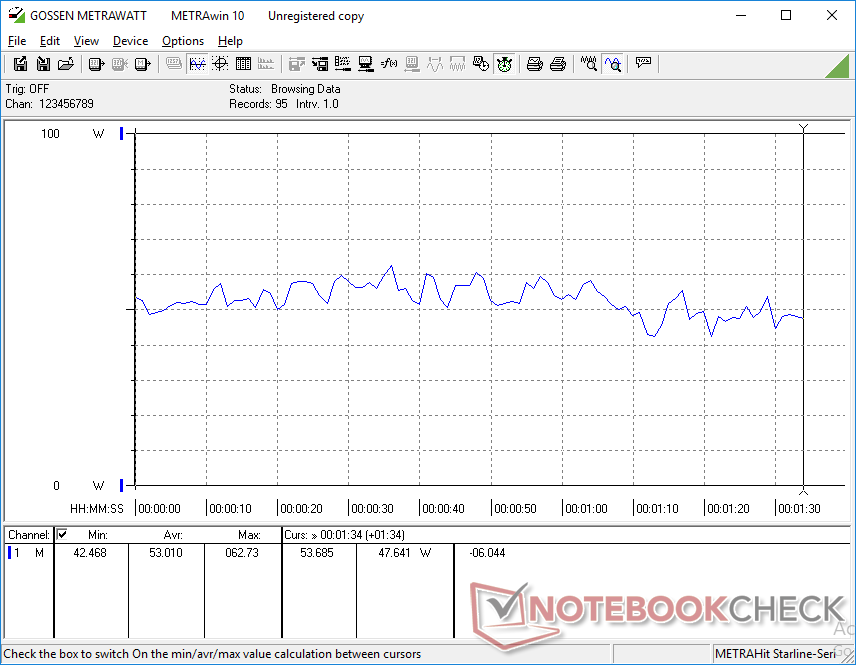
When running 3DMark 06, our system consumes an average of 53 W compared to 47 W on the Asus Zenbook 14 UX433 with the GeForce MX150 even though the ZenBook Duo offers about the same level of GPU performance. It's safe to assume that the slightly higher power consumption can be at least partly attributed to the second display.
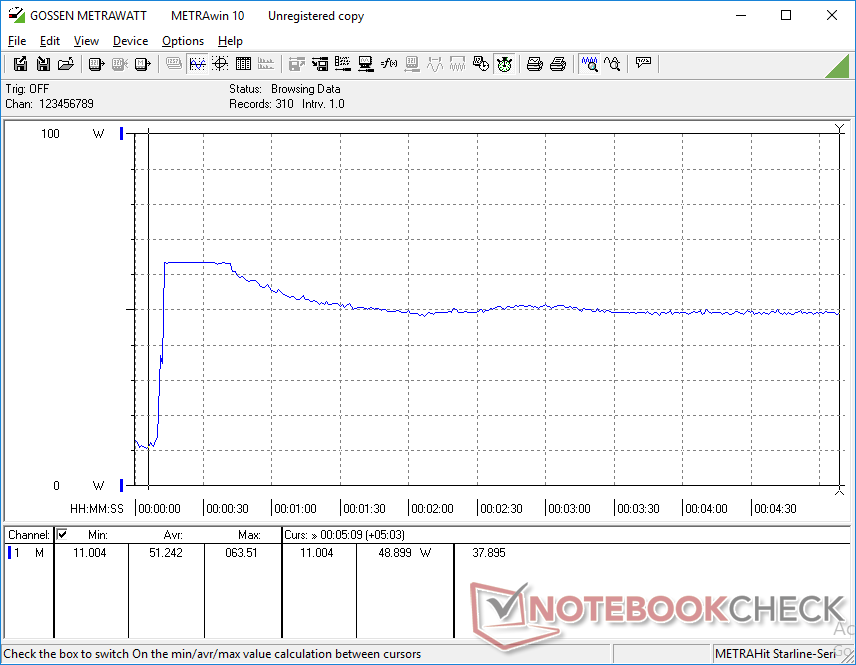
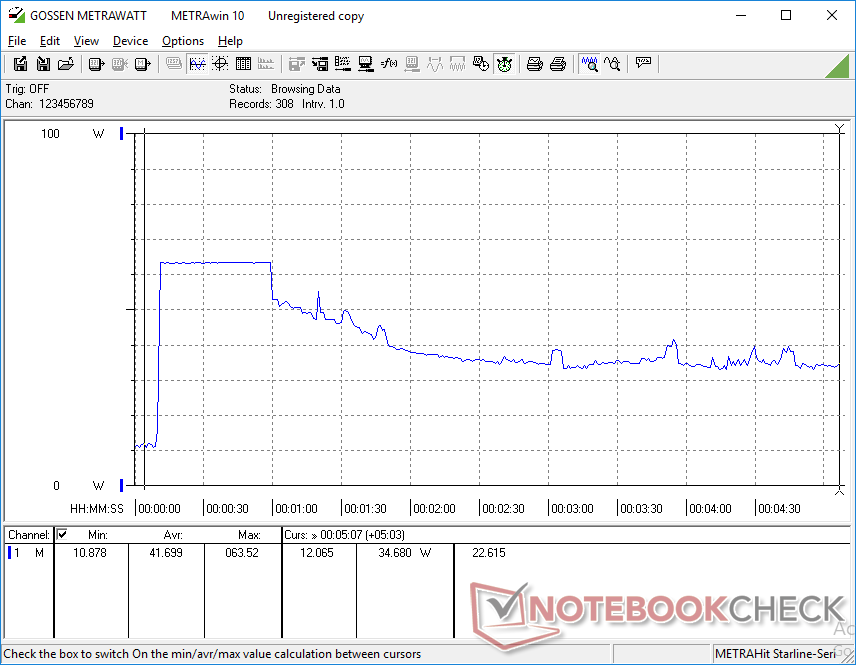
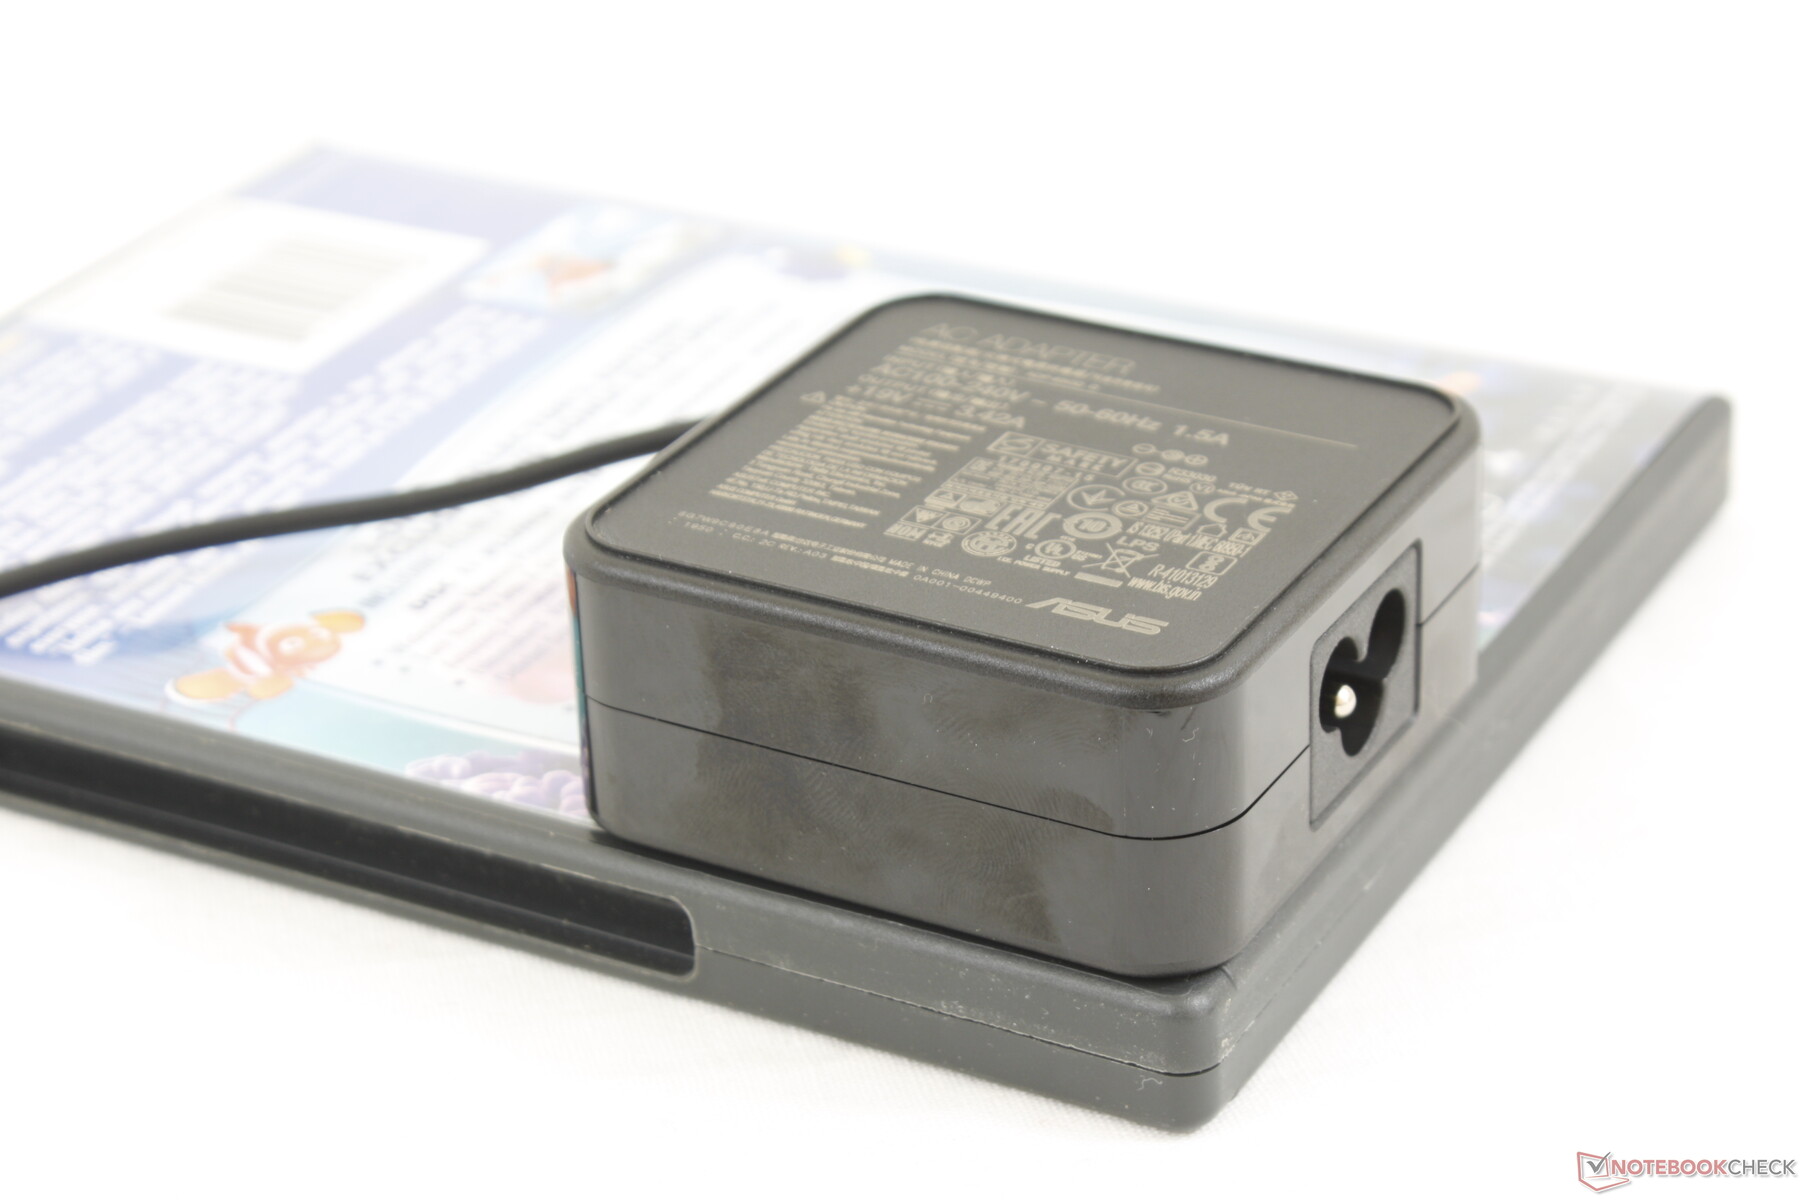
We're able to record a maximum draw of 63.6 W from the small (6.5 x 6.5 x 3 cm) 65 W AC adapter when running Prime95 and FurMark simultaneously. This high of a consumption rate is only temporary as shown by our graphs below. The observation reinforces both the falling clock rates and declining CineBench loop test scores mentioned above.
| Kapalı / Bekleme modu | |
| Boşta | |
| Çalışırken |
|
Key:
min: | |
| Asus ZenBook Duo UX481FL i7-10510U, GeForce MX250, Intel SSD 660p 1TB SSDPEKNW010T8, IPS, 1920x1080, 14" | Asus ZenBook 14 UM431DA-AM020T R7 3700U, Vega 10, SK hynix BC501 HFM512GDHTNG-8310A, IPS, 1920x1080, 14" | Huawei Matebook X Pro i5 i5-8250U, GeForce MX150, Samsung PM961 MZVLW256HEHP, IPS, 3000x2000, 13.9" | Lenovo ThinkPad X1 Carbon G7 20R1-000YUS i7-10510U, UHD Graphics 620, WDC PC SN730 SDBPNTY-512G, IPS, 3840x2160, 14" | MSI Prestige 14 A10SC-009 i7-10710U, GeForce GTX 1650 Max-Q, Samsung SSD PM981 MZVLB1T0HALR, IPS, 3840x2160, 14" | Lenovo IdeaPad S940-14IWL i7-8565U, UHD Graphics 620, Samsung SSD PM981 MZVLB512HAJQ, IPS, 3840x2160, 14" | |
|---|---|---|---|---|---|---|
| Power Consumption | 17% | -1% | -4% | -26% | -4% | |
| Idle Minimum * (Watt) | 3.5 | 3.6 -3% | 3.5 -0% | 3.5 -0% | 5.2 -49% | 5.2 -49% |
| Idle Average * (Watt) | 10 | 7.2 28% | 8.9 11% | 10.8 -8% | 12.2 -22% | 10.2 -2% |
| Idle Maximum * (Watt) | 11 | 10.8 2% | 12.3 -12% | 12.5 -14% | 14.3 -30% | 11.9 -8% |
| Load Average * (Watt) | 53 | 38 28% | 54.2 -2% | 47.2 11% | 67 -26% | 42.1 21% |
| Witcher 3 ultra * (Watt) | 35.6 | 42.4 -19% | ||||
| Load Maximum * (Watt) | 63.6 | 45.2 29% | 52.1 18% | 68.8 -8% | 67 -5% | 53.6 16% |
* ... daha küçük daha iyidir
Battery Life
Asus isn't putting that extra girth to waste; the ZenBook Duo integrates a much larger 70 Wh battery for its size compared to just ~50 Wh on most other 14-inch Ultrabooks like the IdeaPad S940 or ThinkPad X1 Carbon. This approach ensures runtimes that are just as long or even longer than the typical subnotebook despite the power-hungry displays of the ZenBook Duo. We're able to record a real-world WLAN runtime of 9.5 hours even with the secondary display enabled to be longer-lasting than the standard ZenBook 14 by almost three hours.
Charging from empty to full capacity will take just under two hours. The system cannot be charged via USB Type-C.
| Asus ZenBook Duo UX481FL i7-10510U, GeForce MX250, 70 Wh | Asus ZenBook 14 UM431DA-AM020T R7 3700U, Vega 10, 47 Wh | Huawei Matebook X Pro i5 i5-8250U, GeForce MX150, 57.4 Wh | Lenovo ThinkPad X1 Carbon G7 20R1-000YUS i7-10510U, UHD Graphics 620, 51 Wh | MSI Prestige 14 A10SC-009 i7-10710U, GeForce GTX 1650 Max-Q, 52 Wh | Lenovo IdeaPad S940-14IWL i7-8565U, UHD Graphics 620, 52 Wh | |
|---|---|---|---|---|---|---|
| Pil Çalışma Süresi | -30% | -16% | 5% | -45% | -54% | |
| Reader / Idle (h) | 22.1 | 17.8 -19% | 20.7 -6% | 9.9 -55% | 8.4 -62% | |
| WiFi v1.3 (h) | 9.5 | 6.7 -29% | 9.3 -2% | 10 5% | 5.9 -38% | 5 -47% |
| Load (h) | 3.7 | 2.1 -43% | 2.2 -41% | 2.1 -43% | 1.7 -54% |
Artılar
Eksiler
Verdict
As any desktop user can attest, having two screens instead of one can really boost productivity and the ZenBook Duo is no different in this regard. It's tough going back to just one screen after becoming accustomed to spacious dual-screen setups and this is the key advantage that Asus is banking on.
For a laptop form factor, however, users will have to accept some compromises. Firstly, weight is the most obvious drawback as the system is several hundred grams heavier than a regular ZenBook 14. Secondly, colors on the second screen will not be as vivid as on the Pantone-certified main display. Thirdly, the wide viewing angle between the user and second screen will both accentuate glare and reduce apparent brightness more noticeably unless if ambient conditions are perfect. Fourthly, the uncommon keyboard positioning can be a learning curve especially if typing in tight work spaces. And lastly, the screens don't do very well when outdoors despite the compact 14-inch size and surprisingly long battery life. OLED could have potentially addressed many of these issues, but such an approach would have likely driven prices up significantly.
There are a couple other missing features we'd like to see on future revisions. A physical webcam privacy shutter and the ability to charge via USB Type-C, for example, are not available here even though they have become standard on most other flagship laptops.
If the above disadvantages don't bother you or if you think you can overcome them, then you'll find the portable ZenBook Duo and its second screen to be invaluable for your multi-tasking needs.
The Asus ZenBook Duo is at its best when working in an environment with controlled lighting and an external mouse to maximize the visibility and ergonomics of the secondary display. If you travel and like to save space, then the ZenBook Duo makes a lot of sense. If you have table space to spare, however, then a standard ZenBook 14 and a proper external monitor would get you further.
Asus ZenBook Duo UX481FL
- 05/01/2020 v7 (old)
Allen Ngo
Price comparison

