MSI GeForce RTX 3080 Gaming X Trio 10G masaüstü grafik kartı incelemede

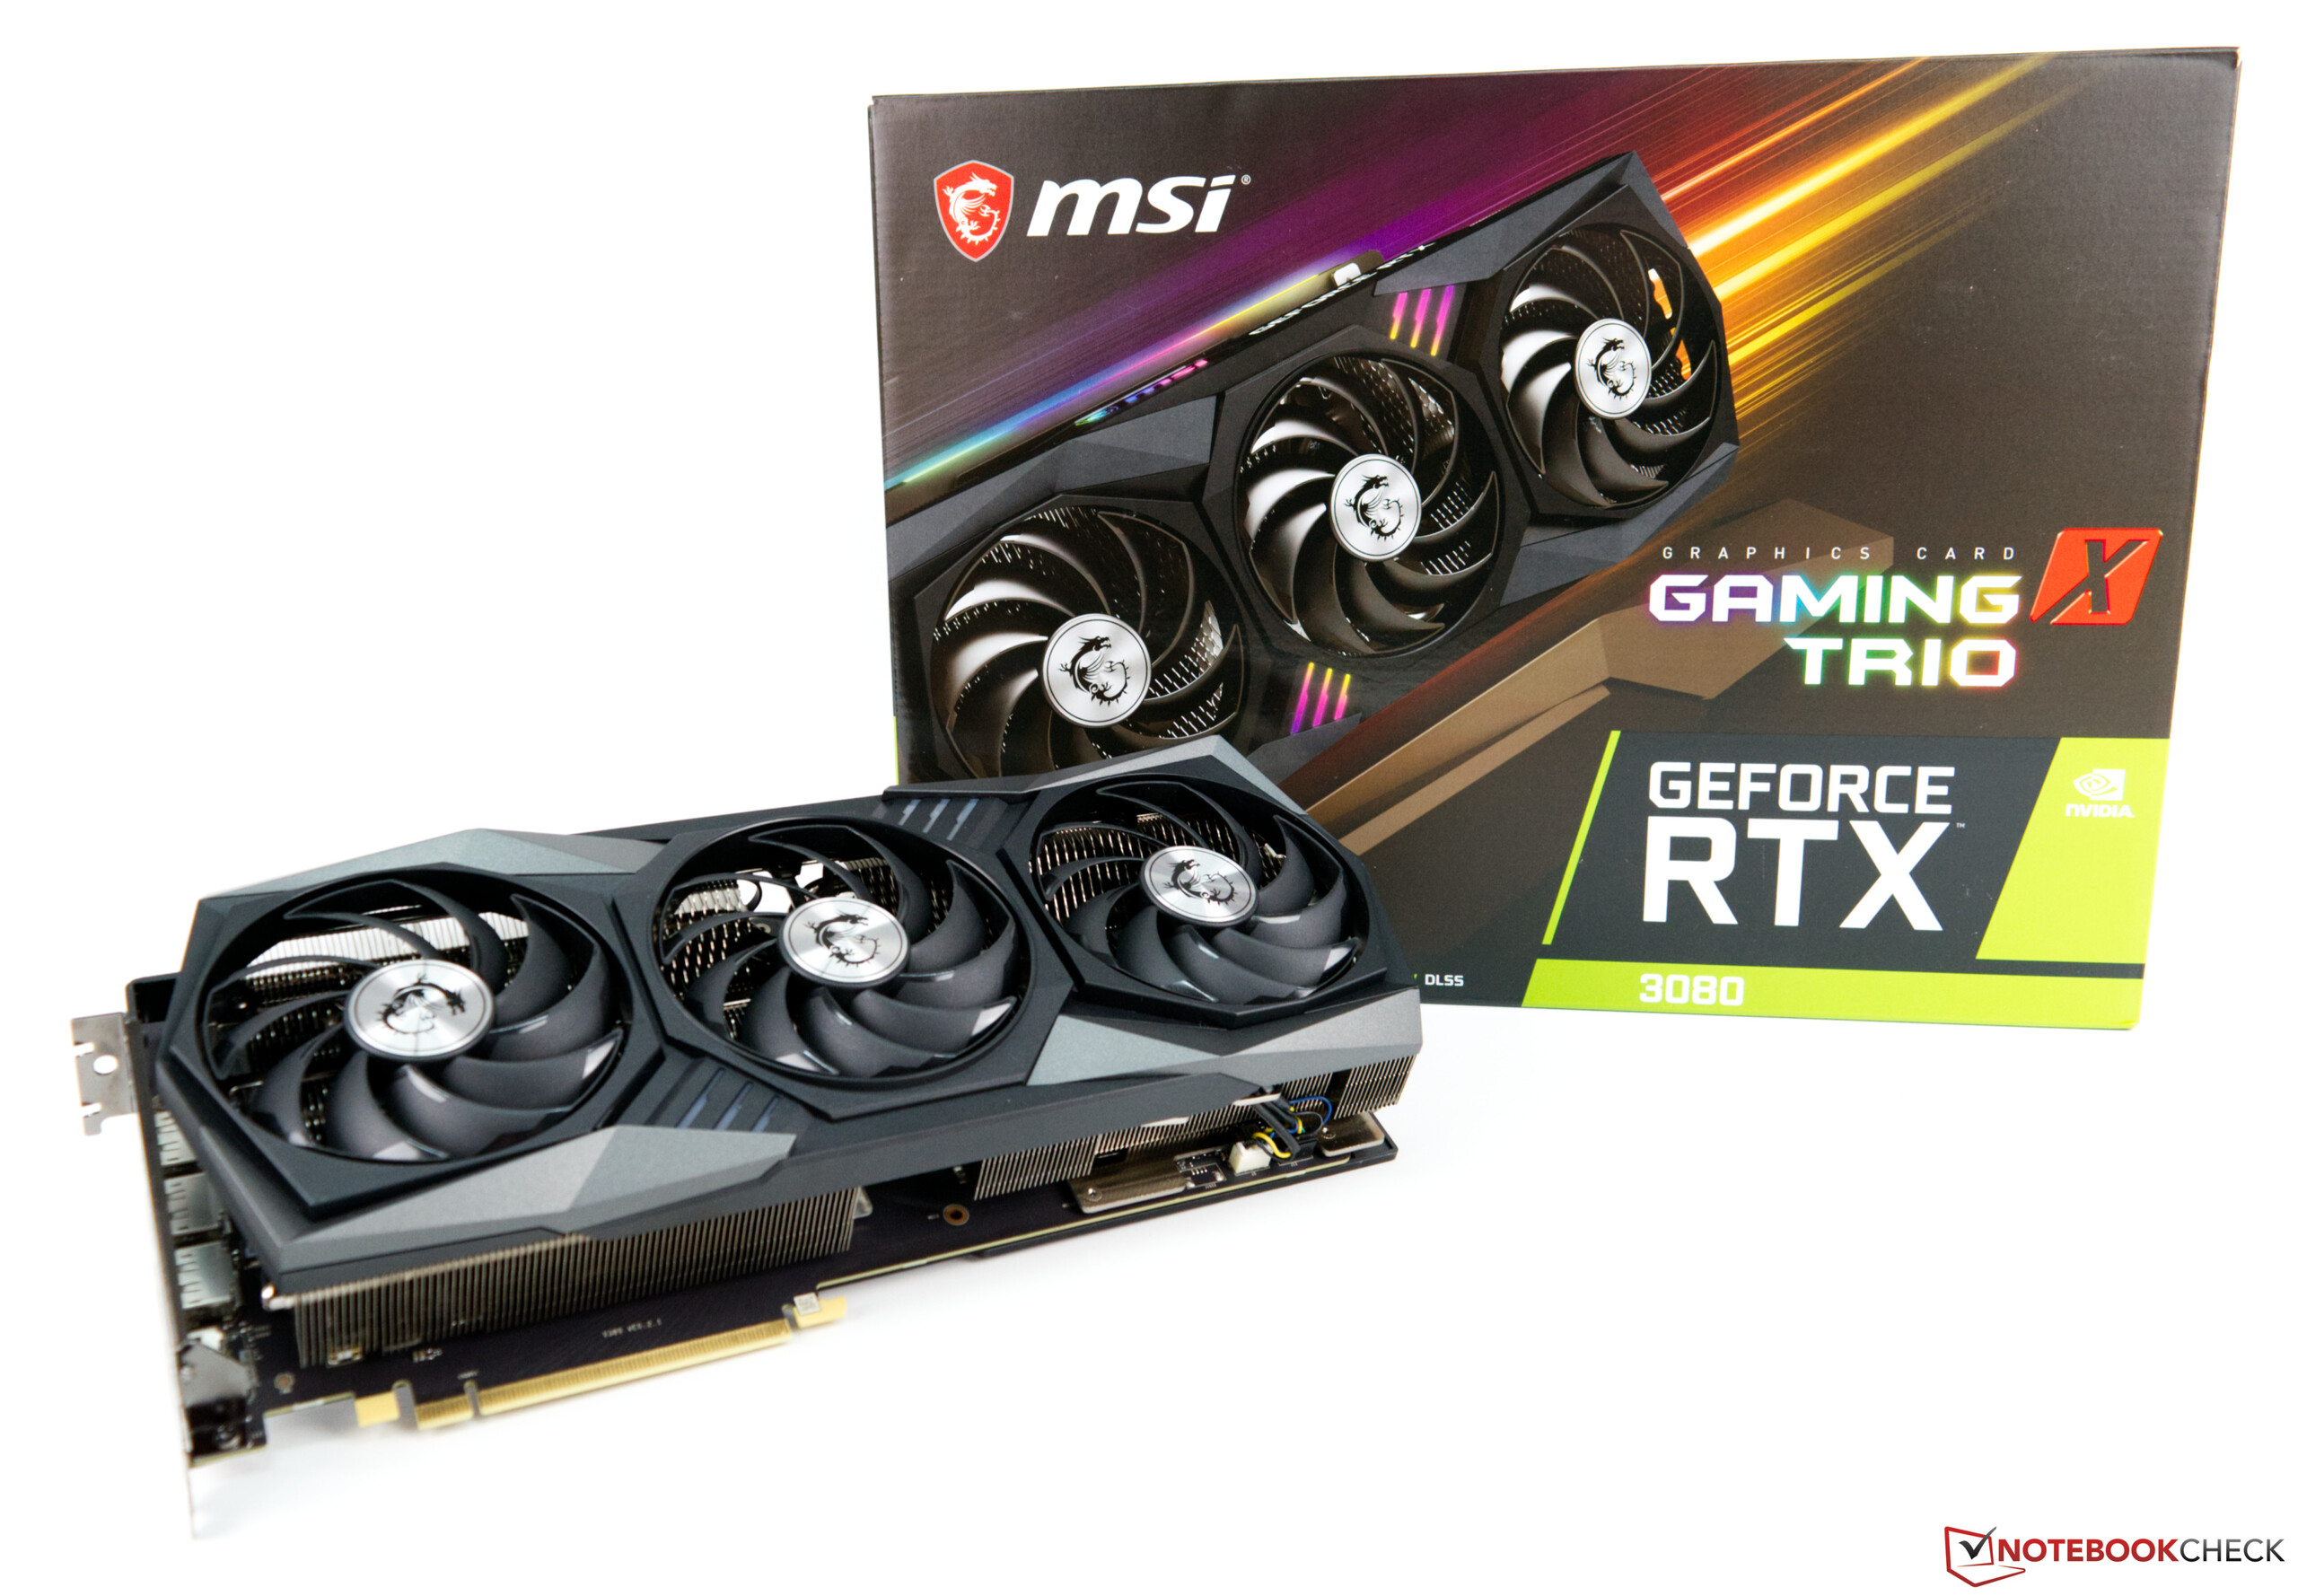
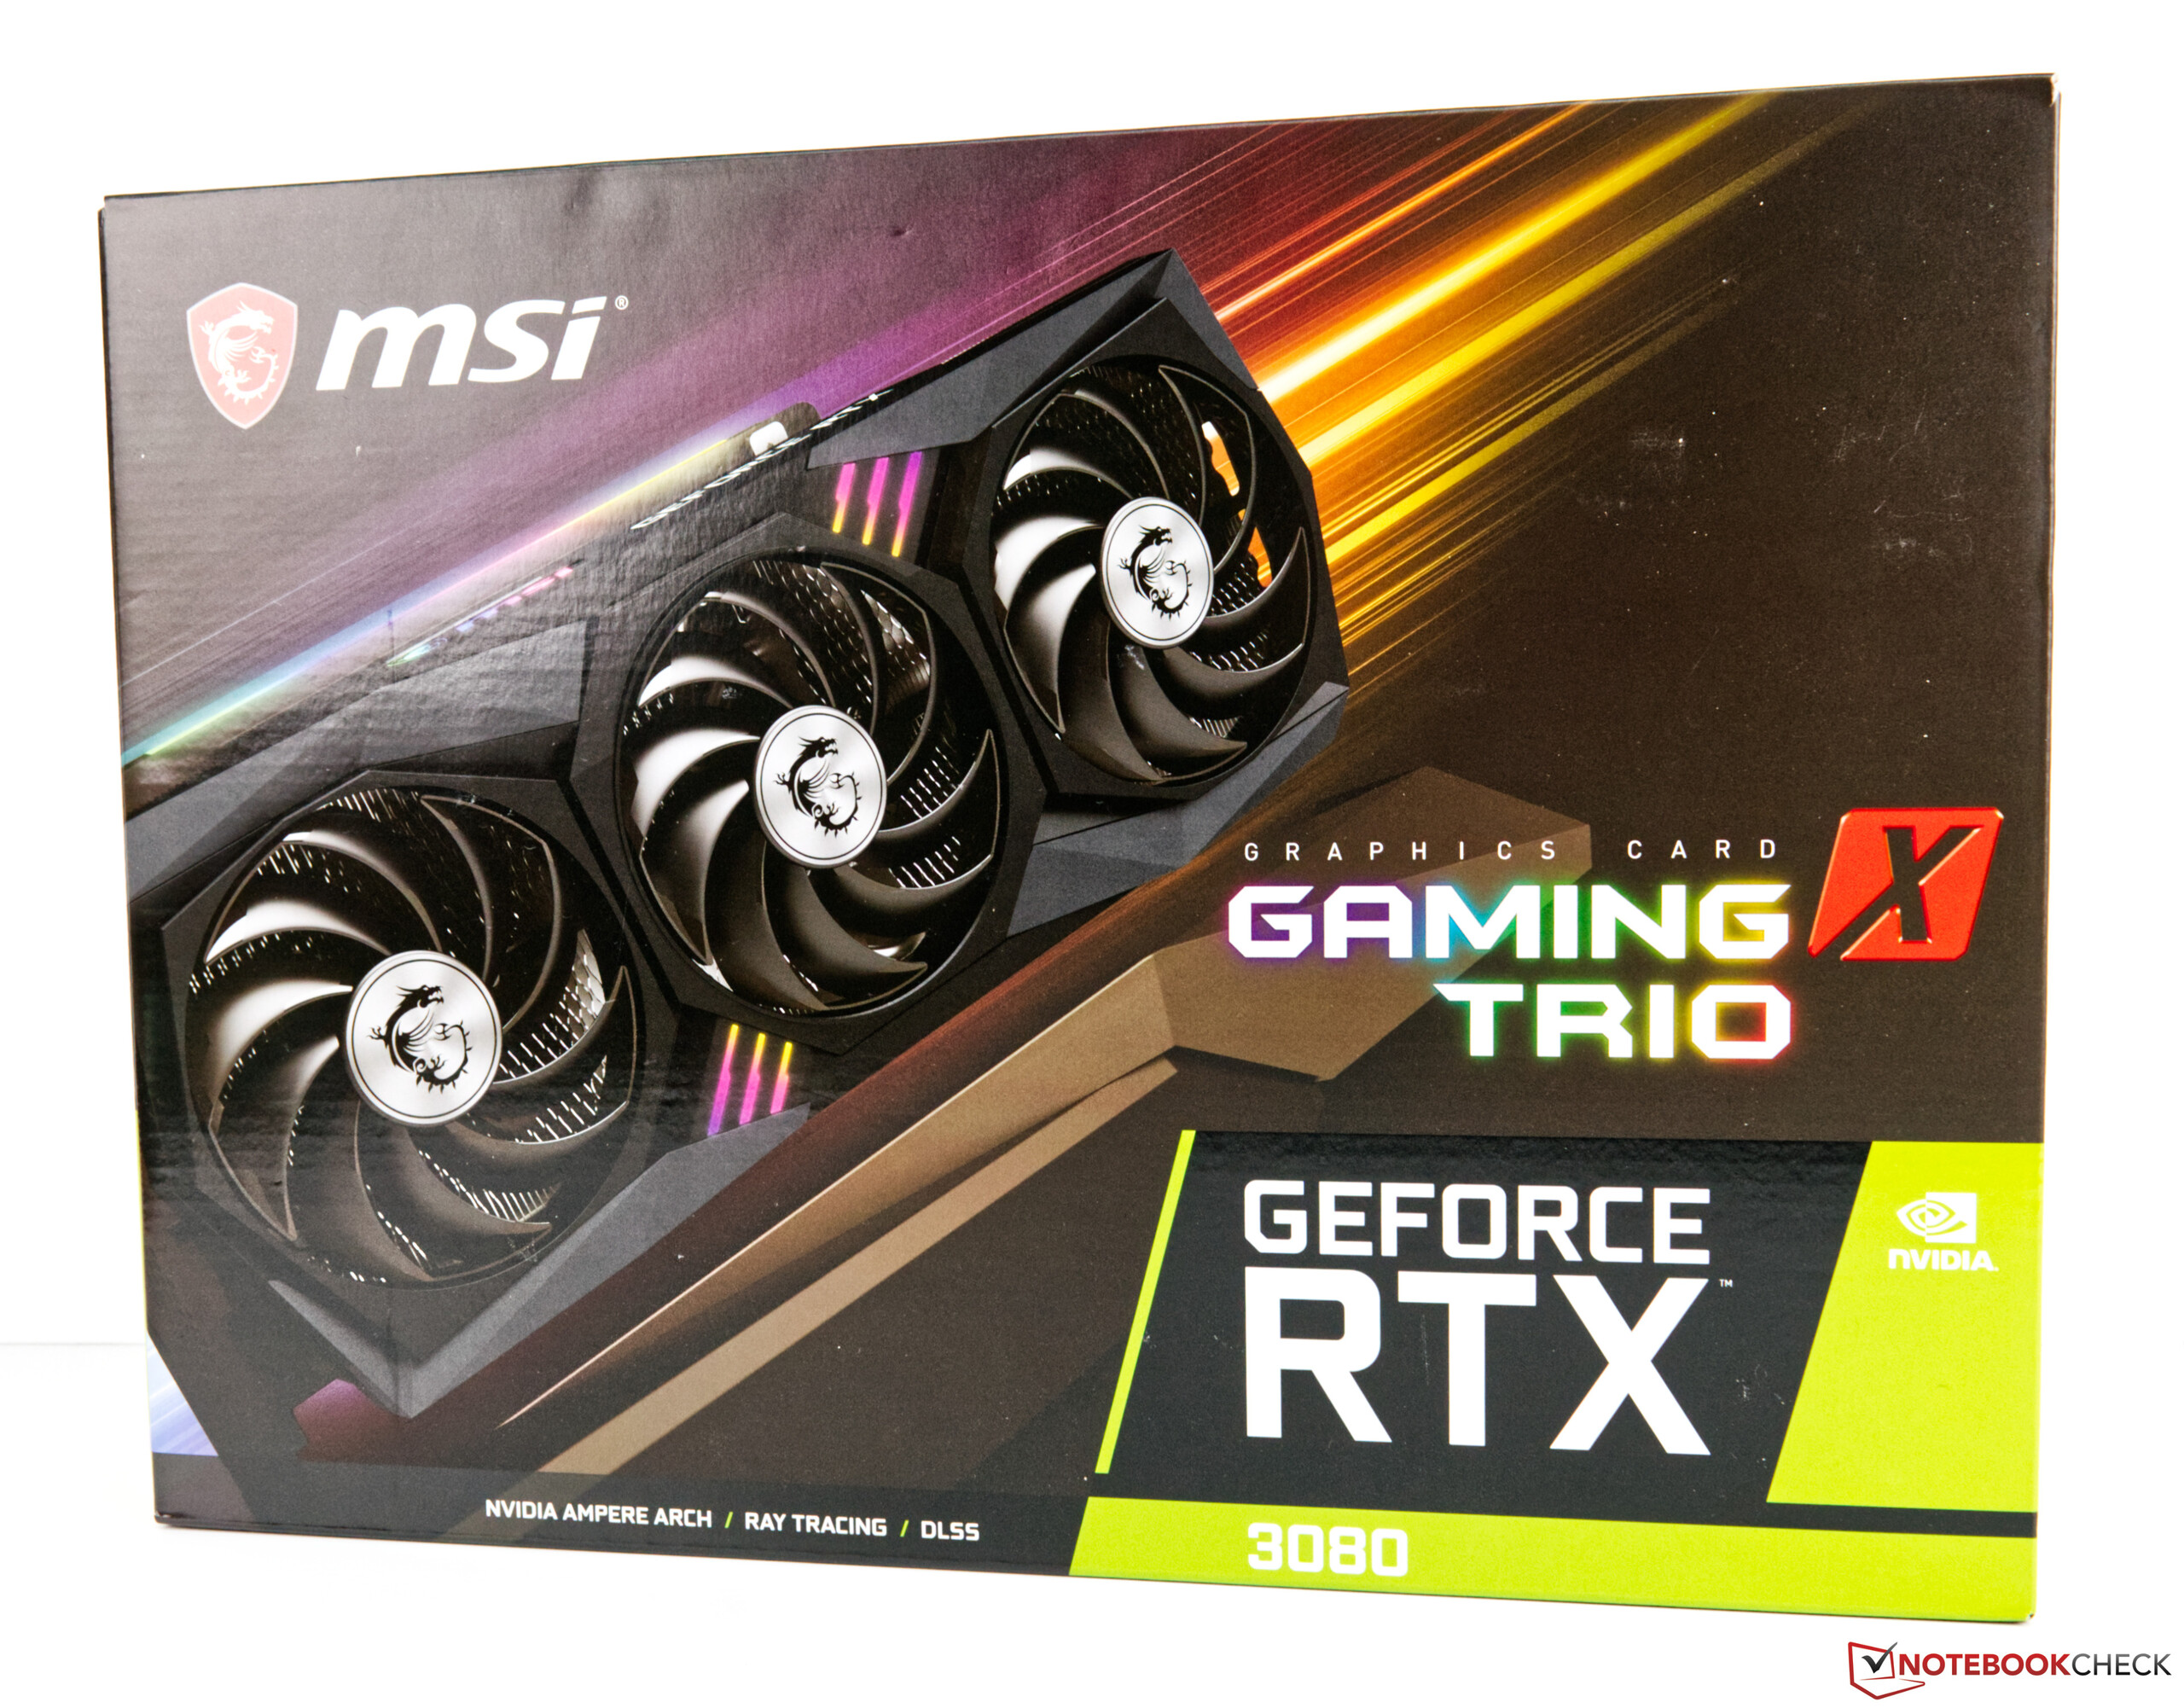
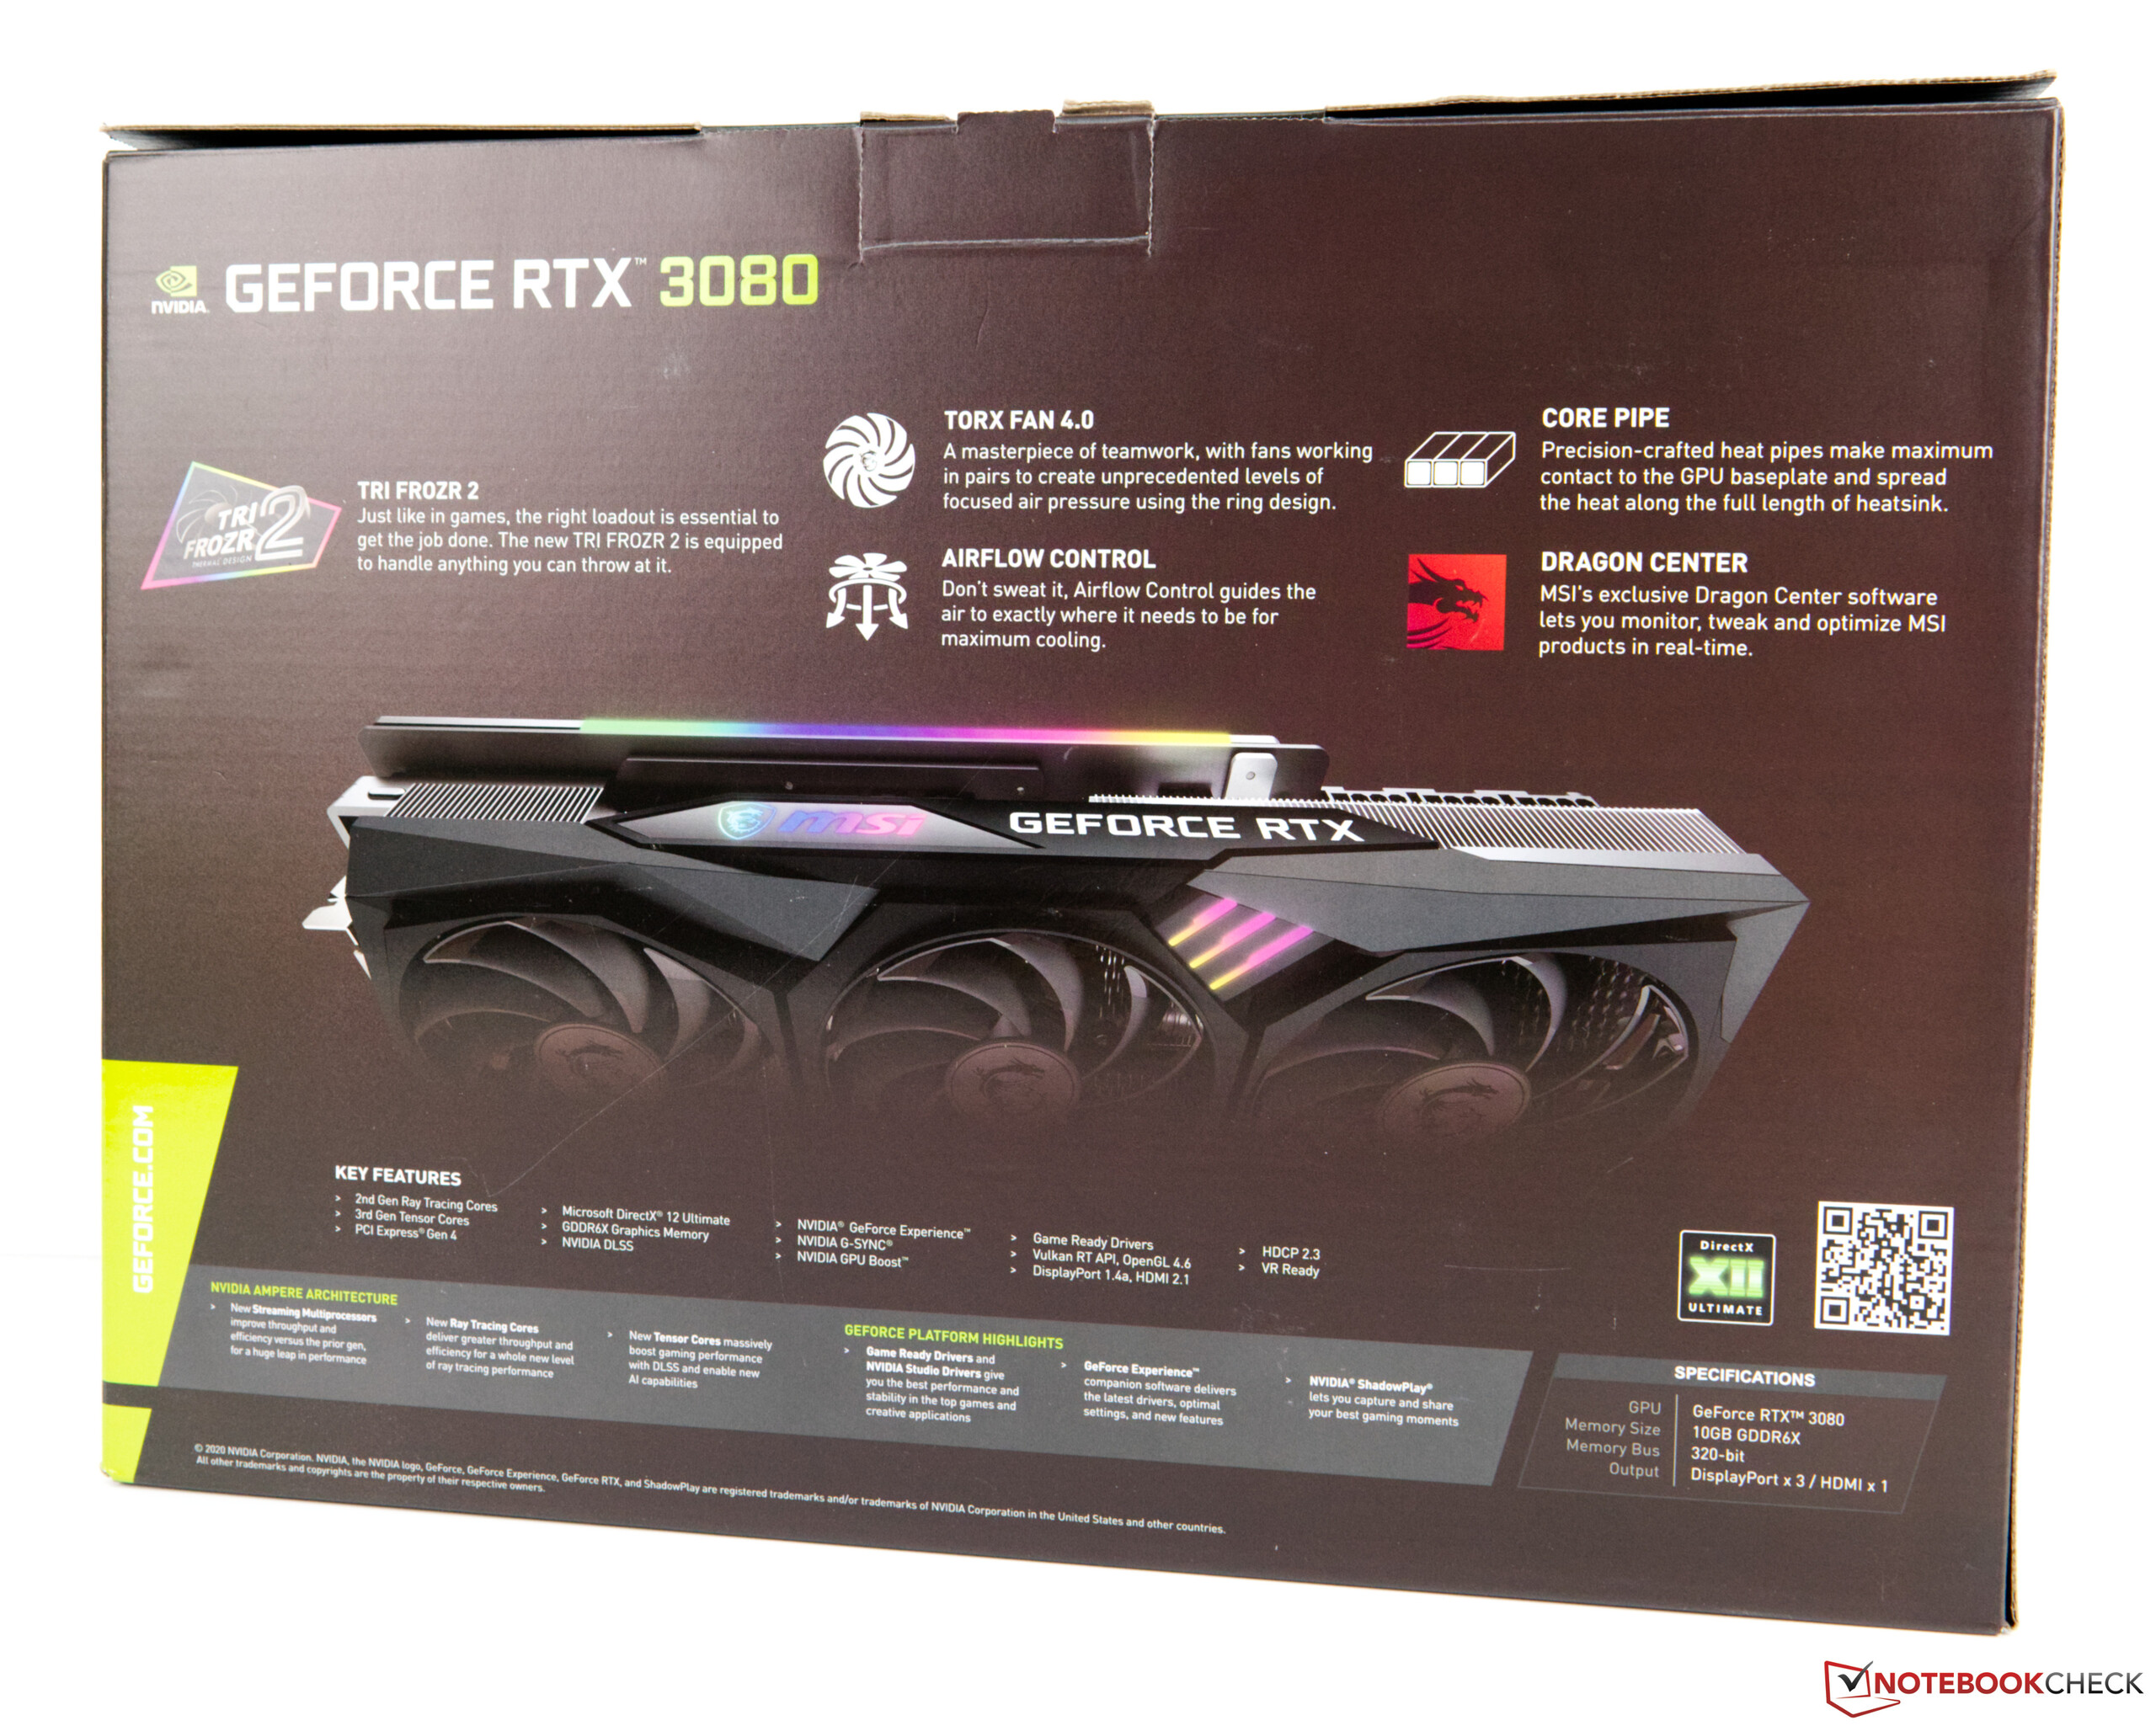
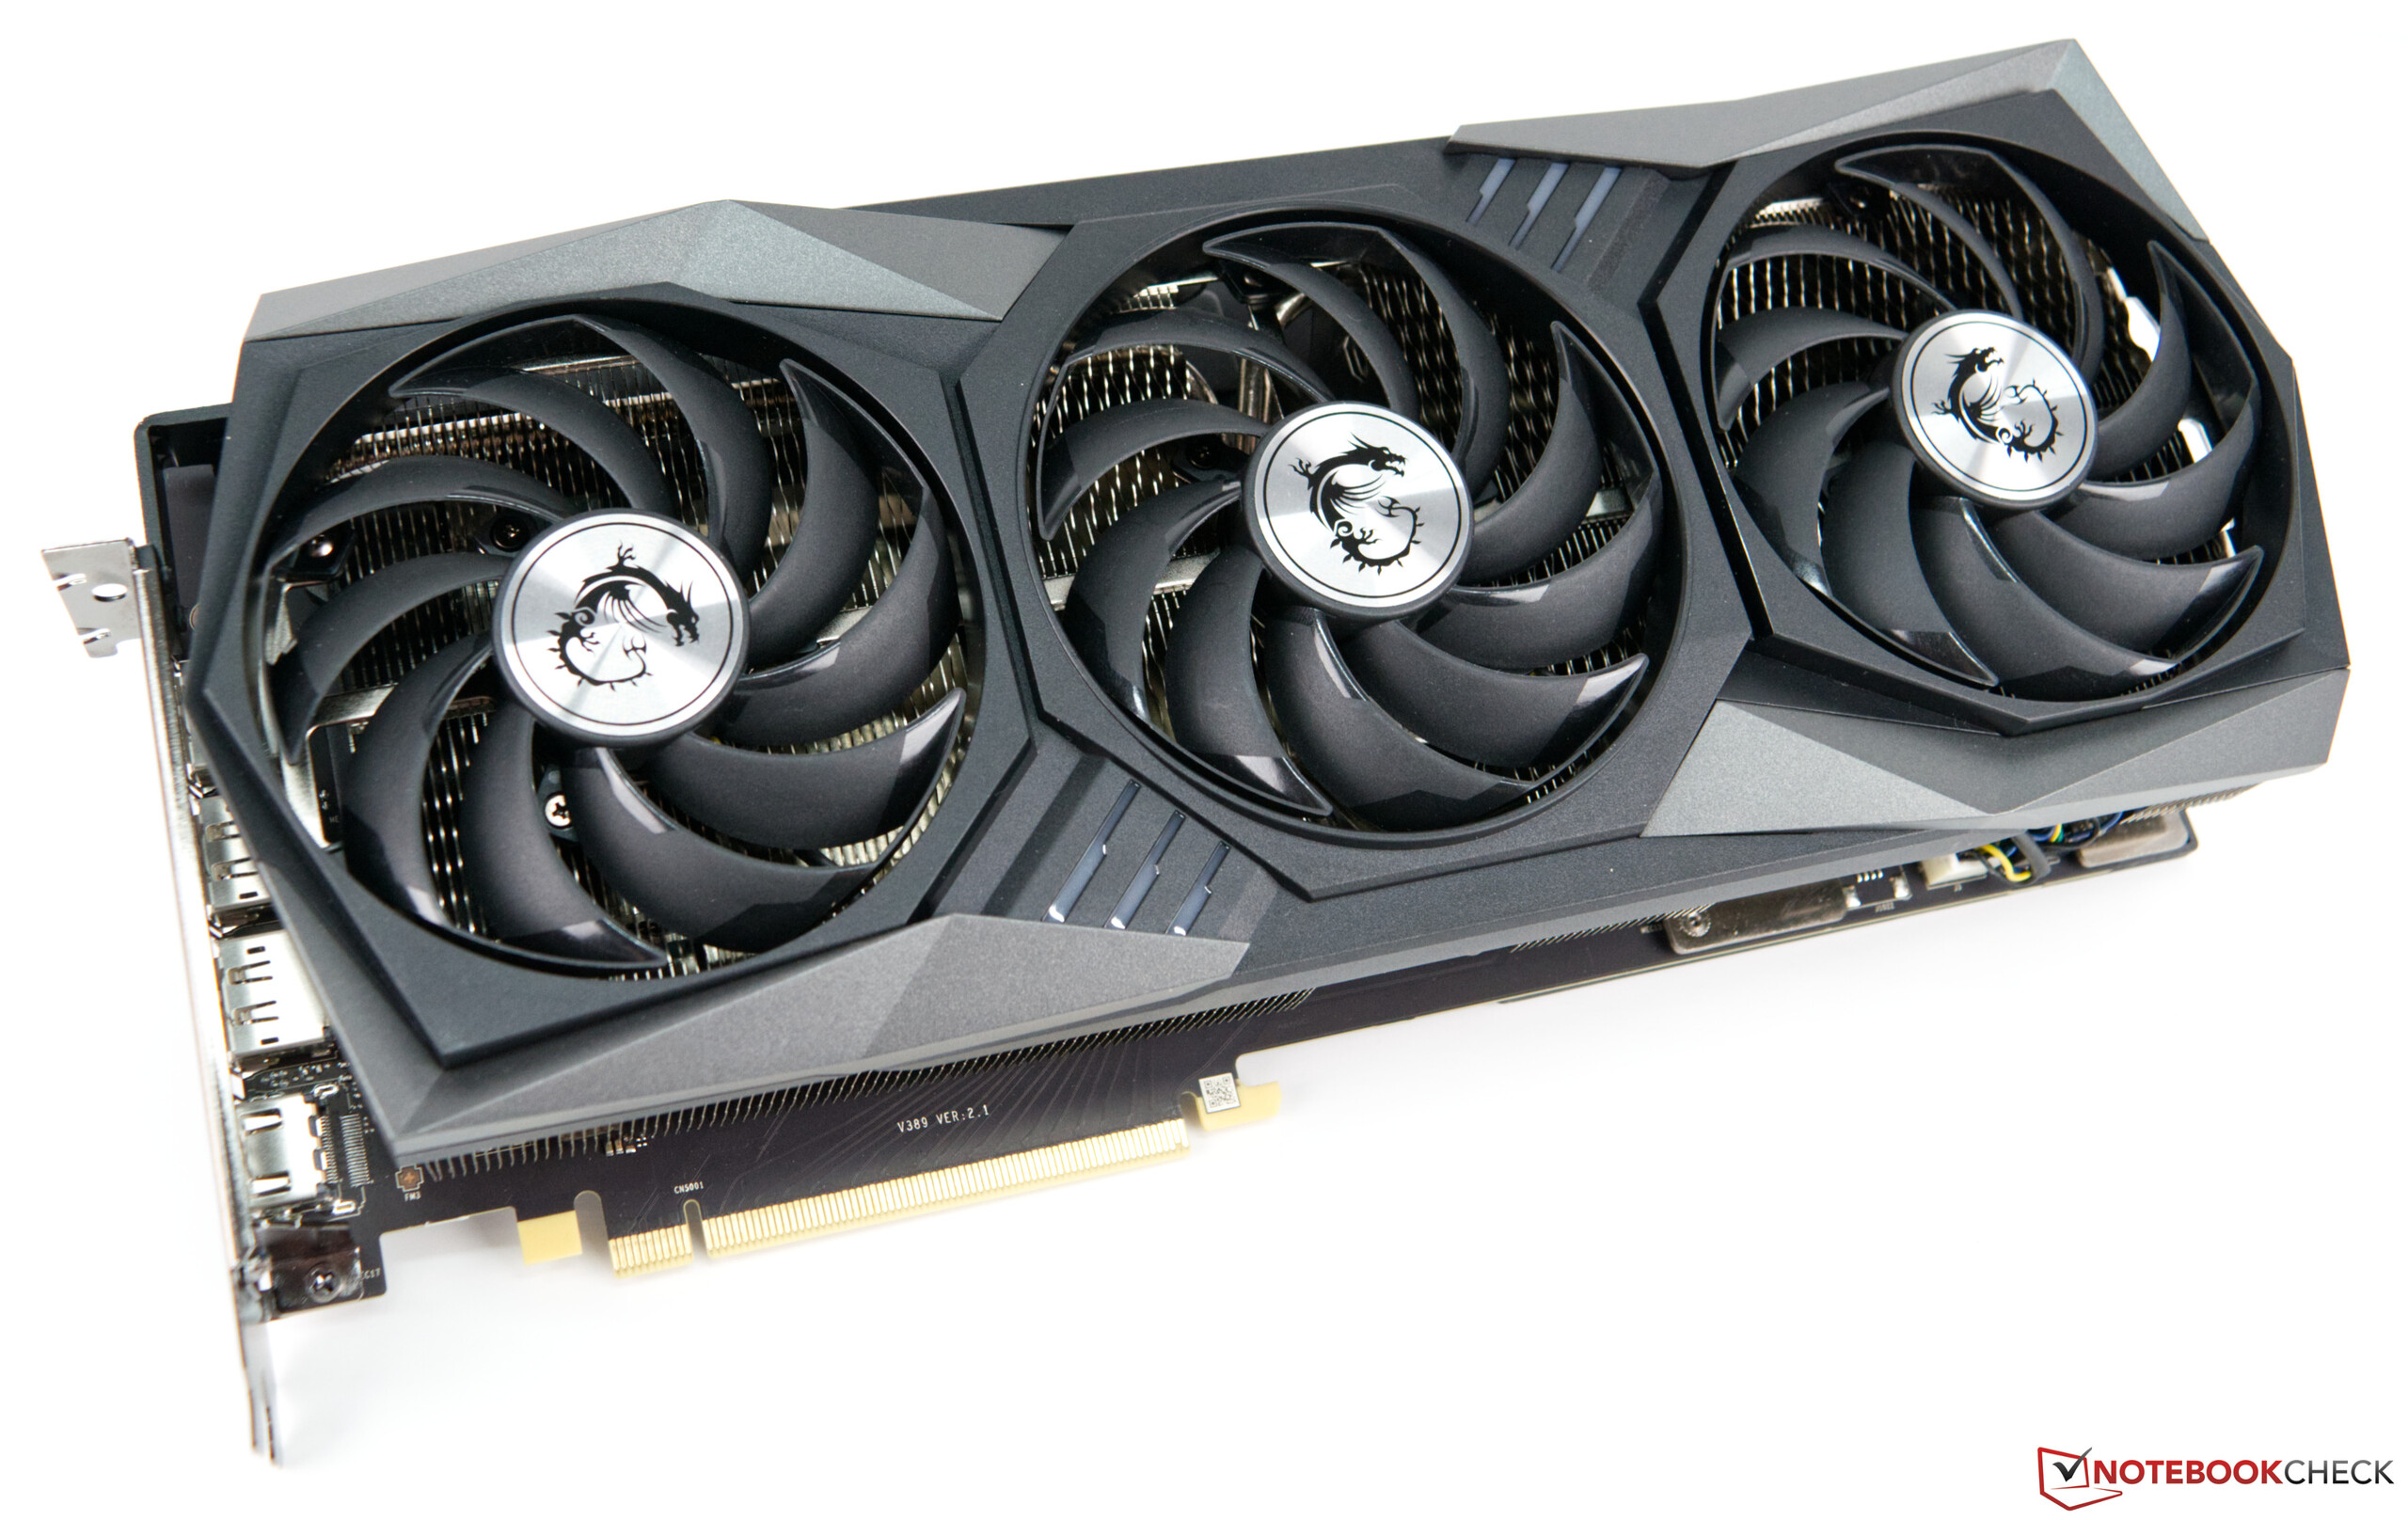
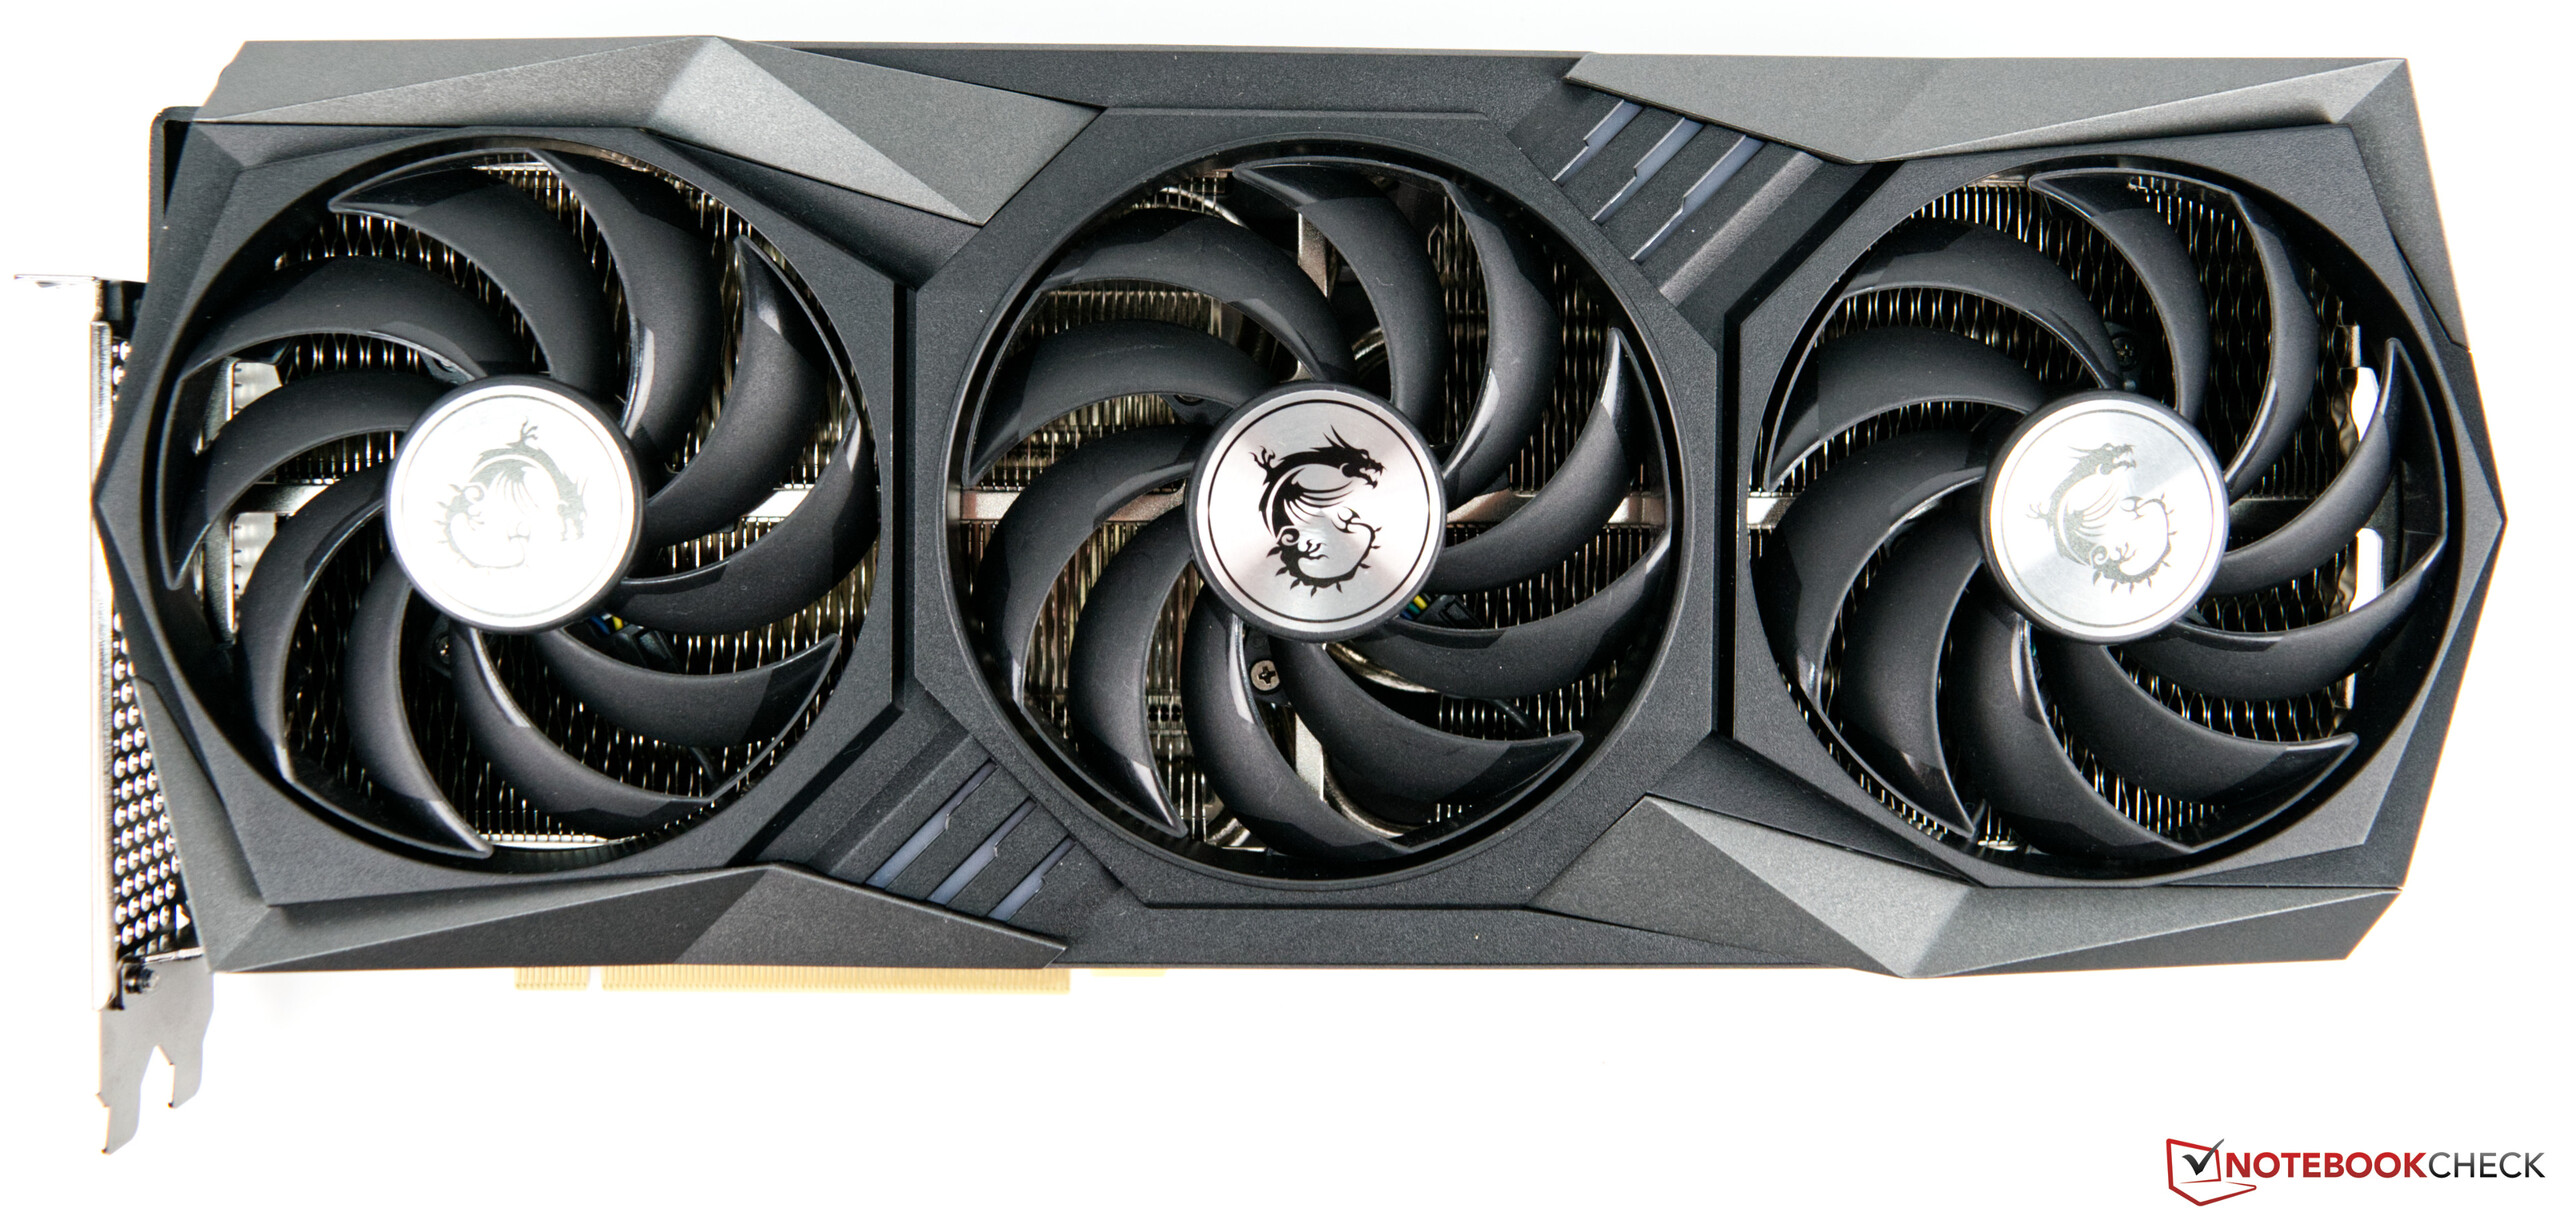
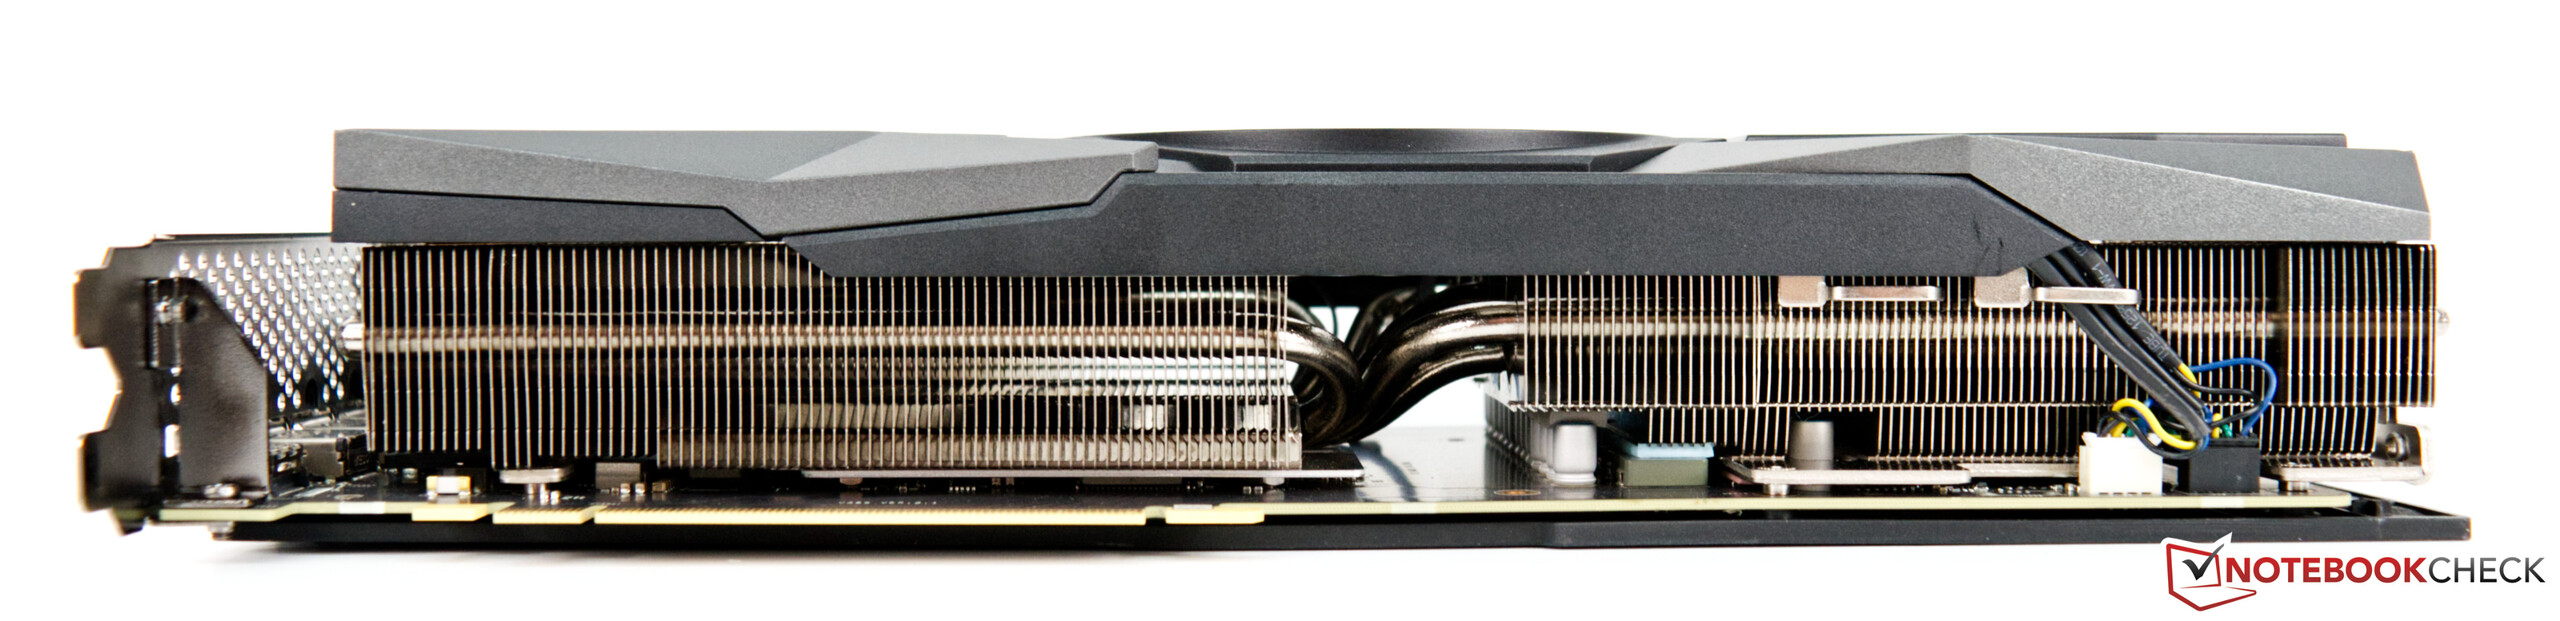
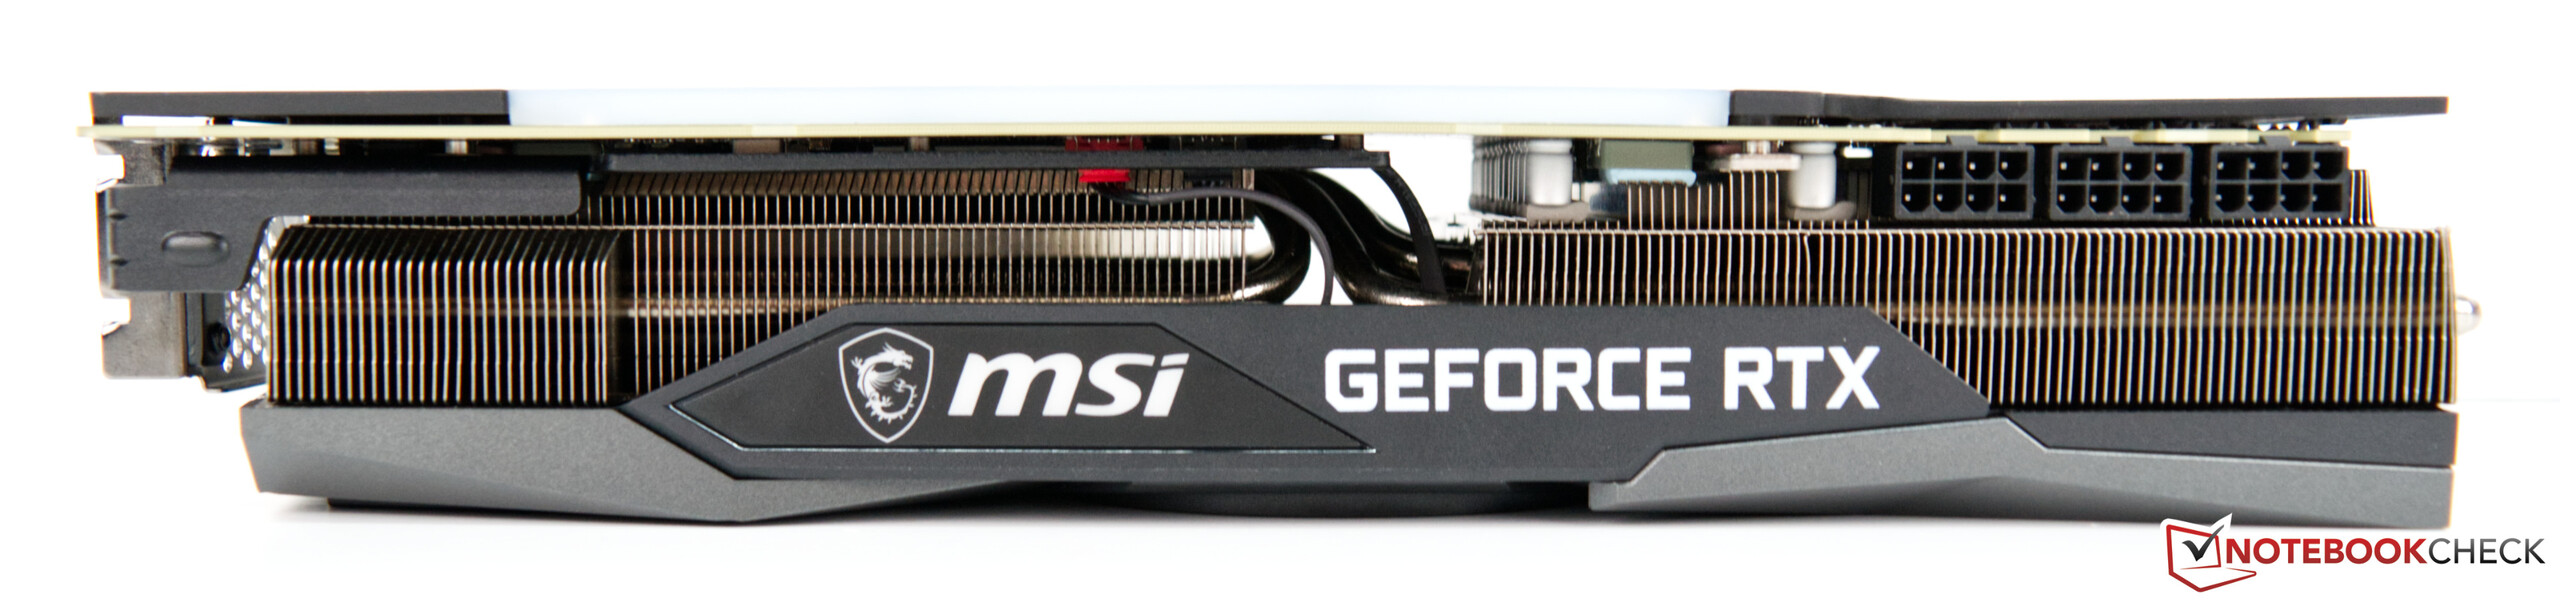
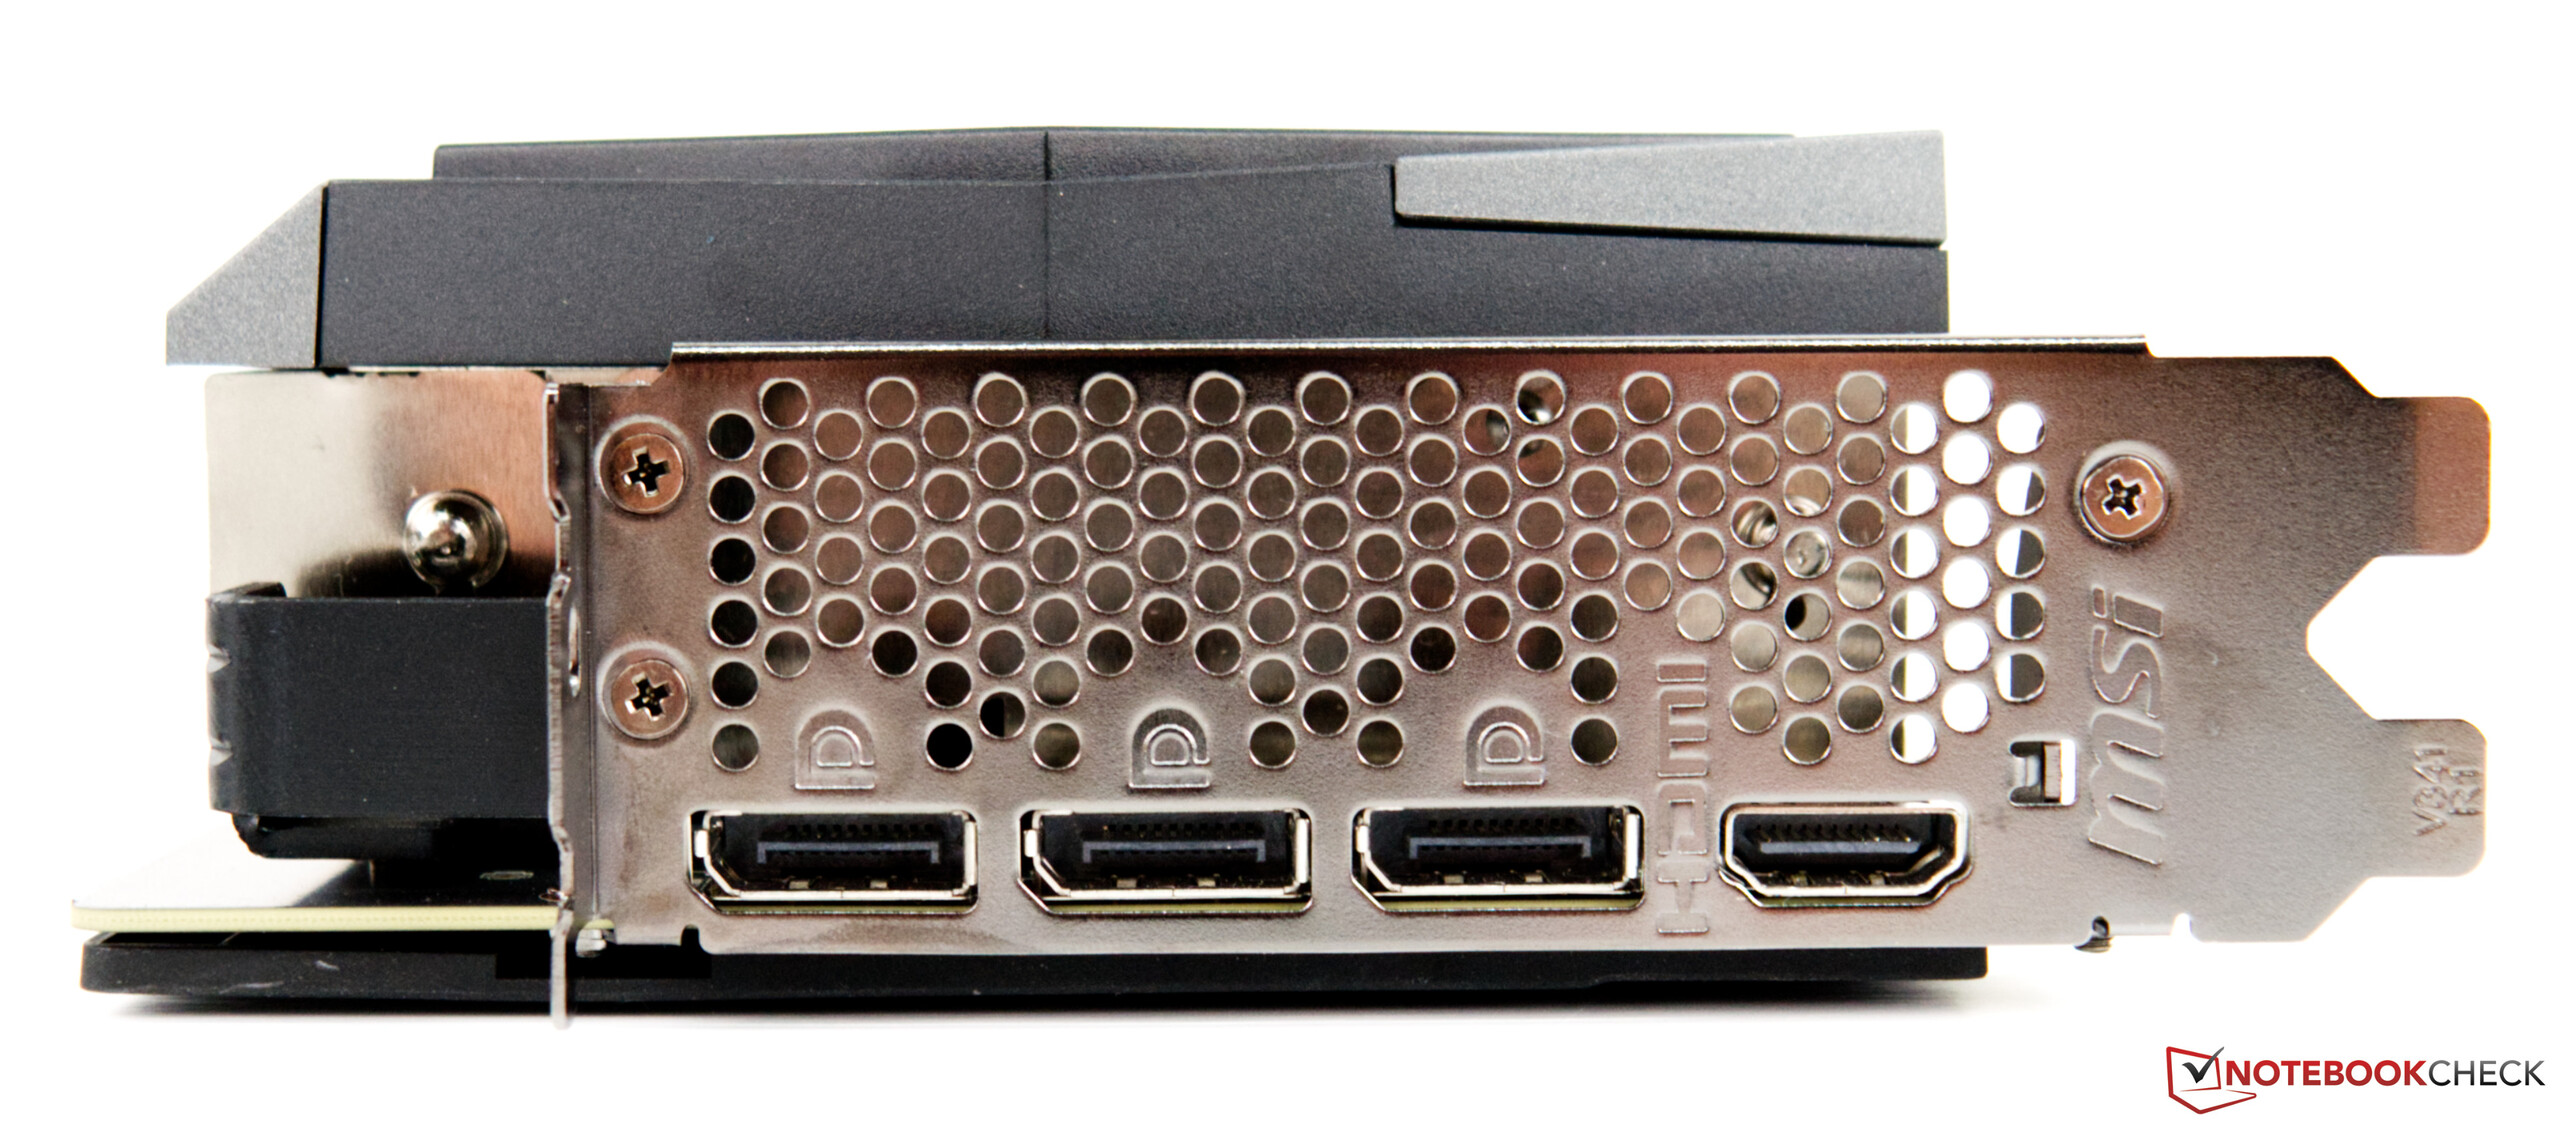
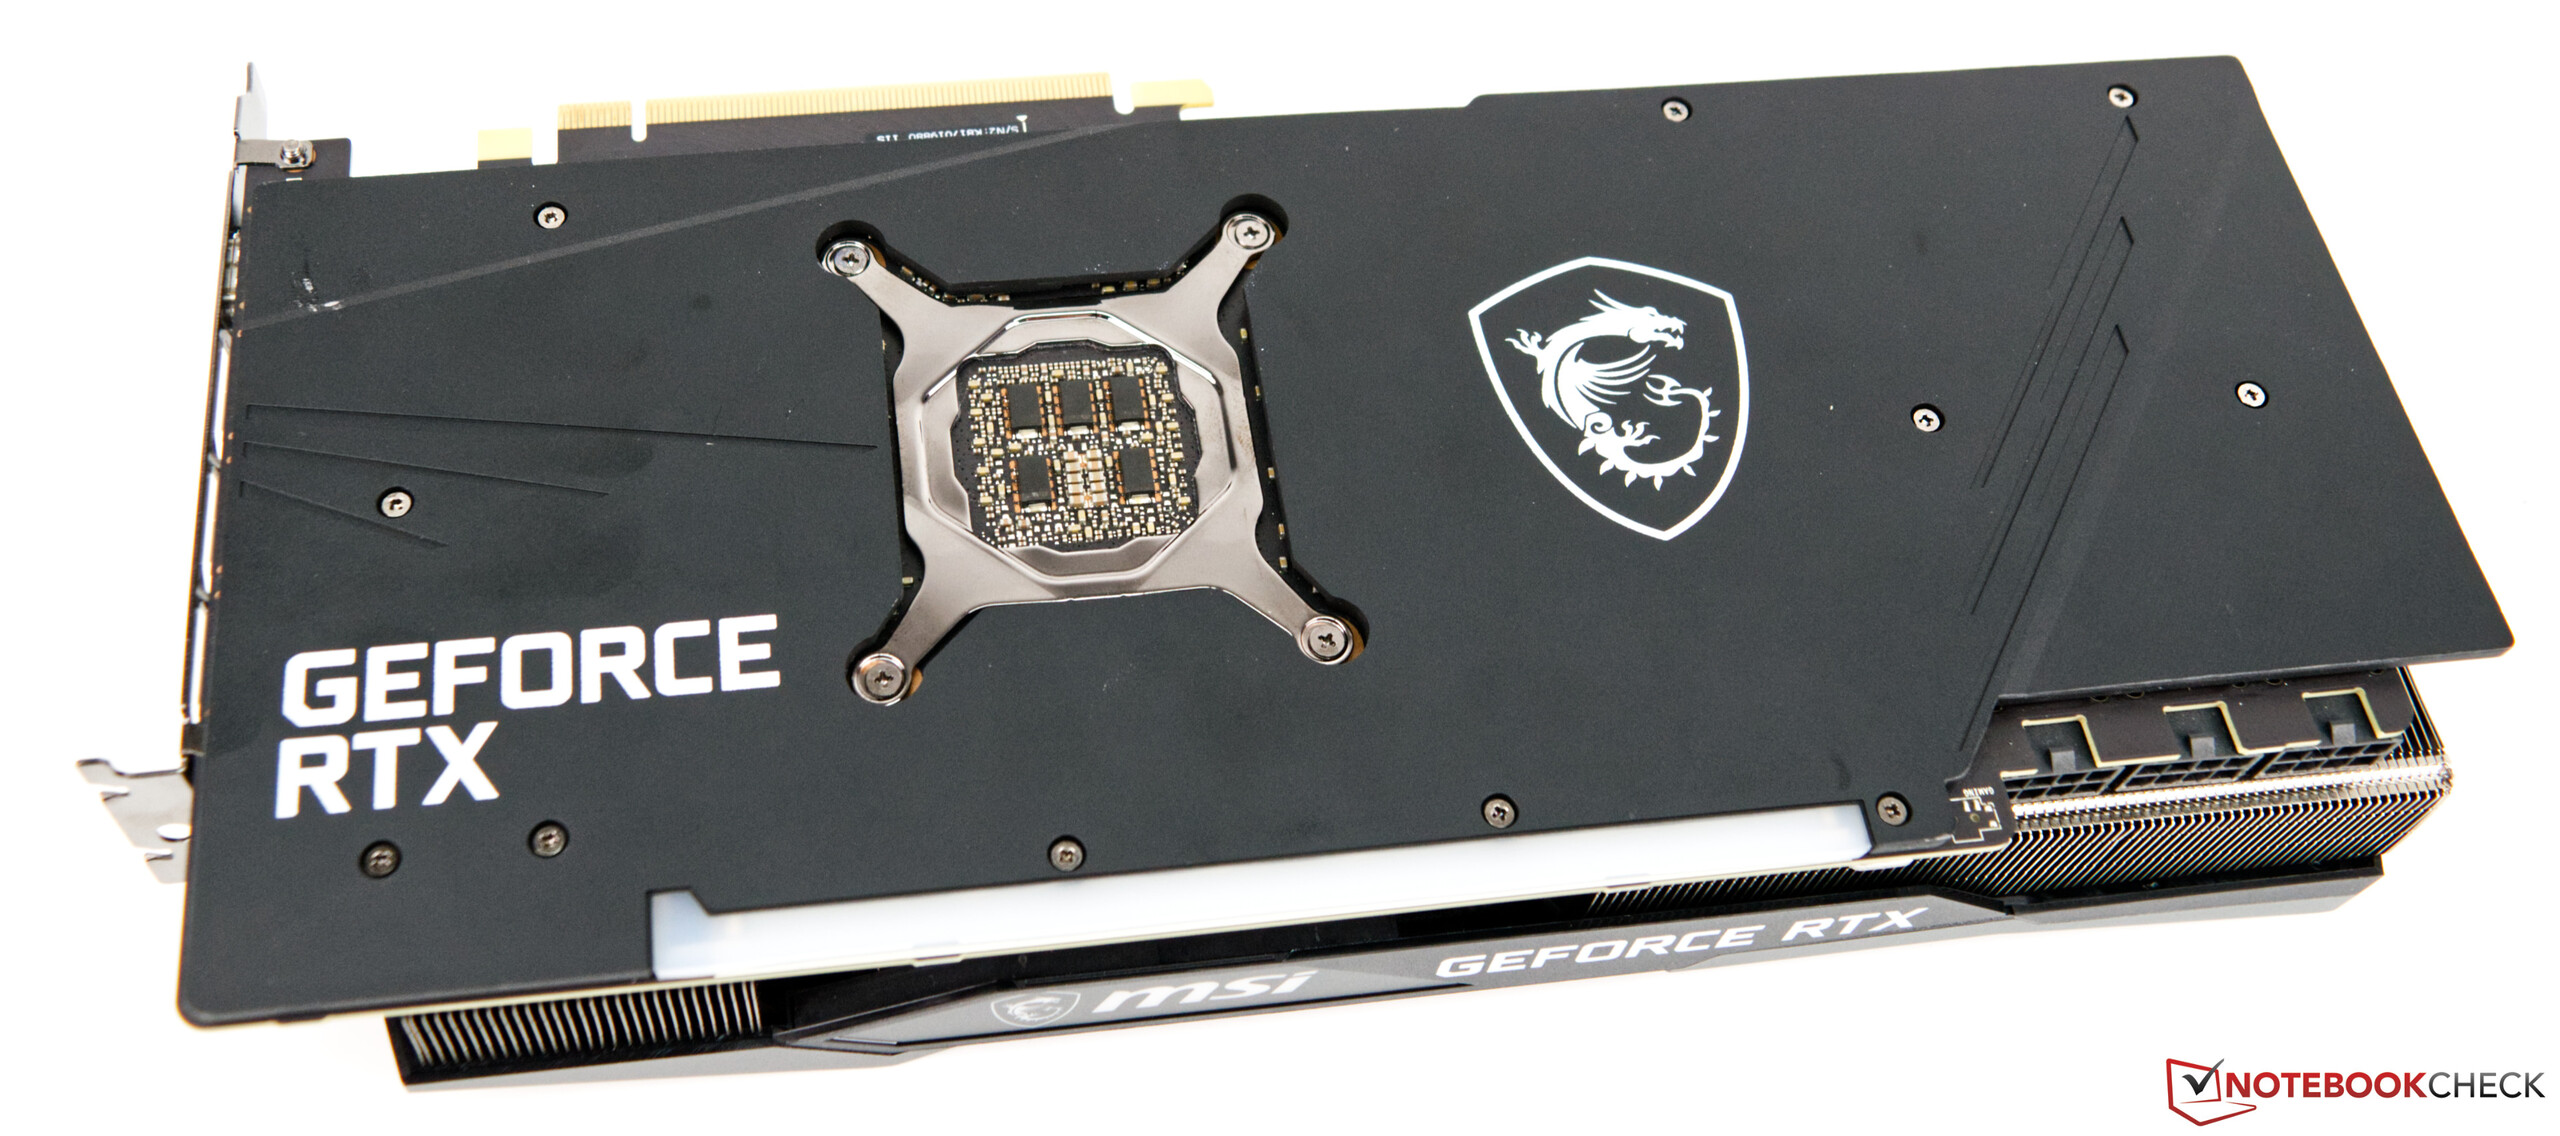
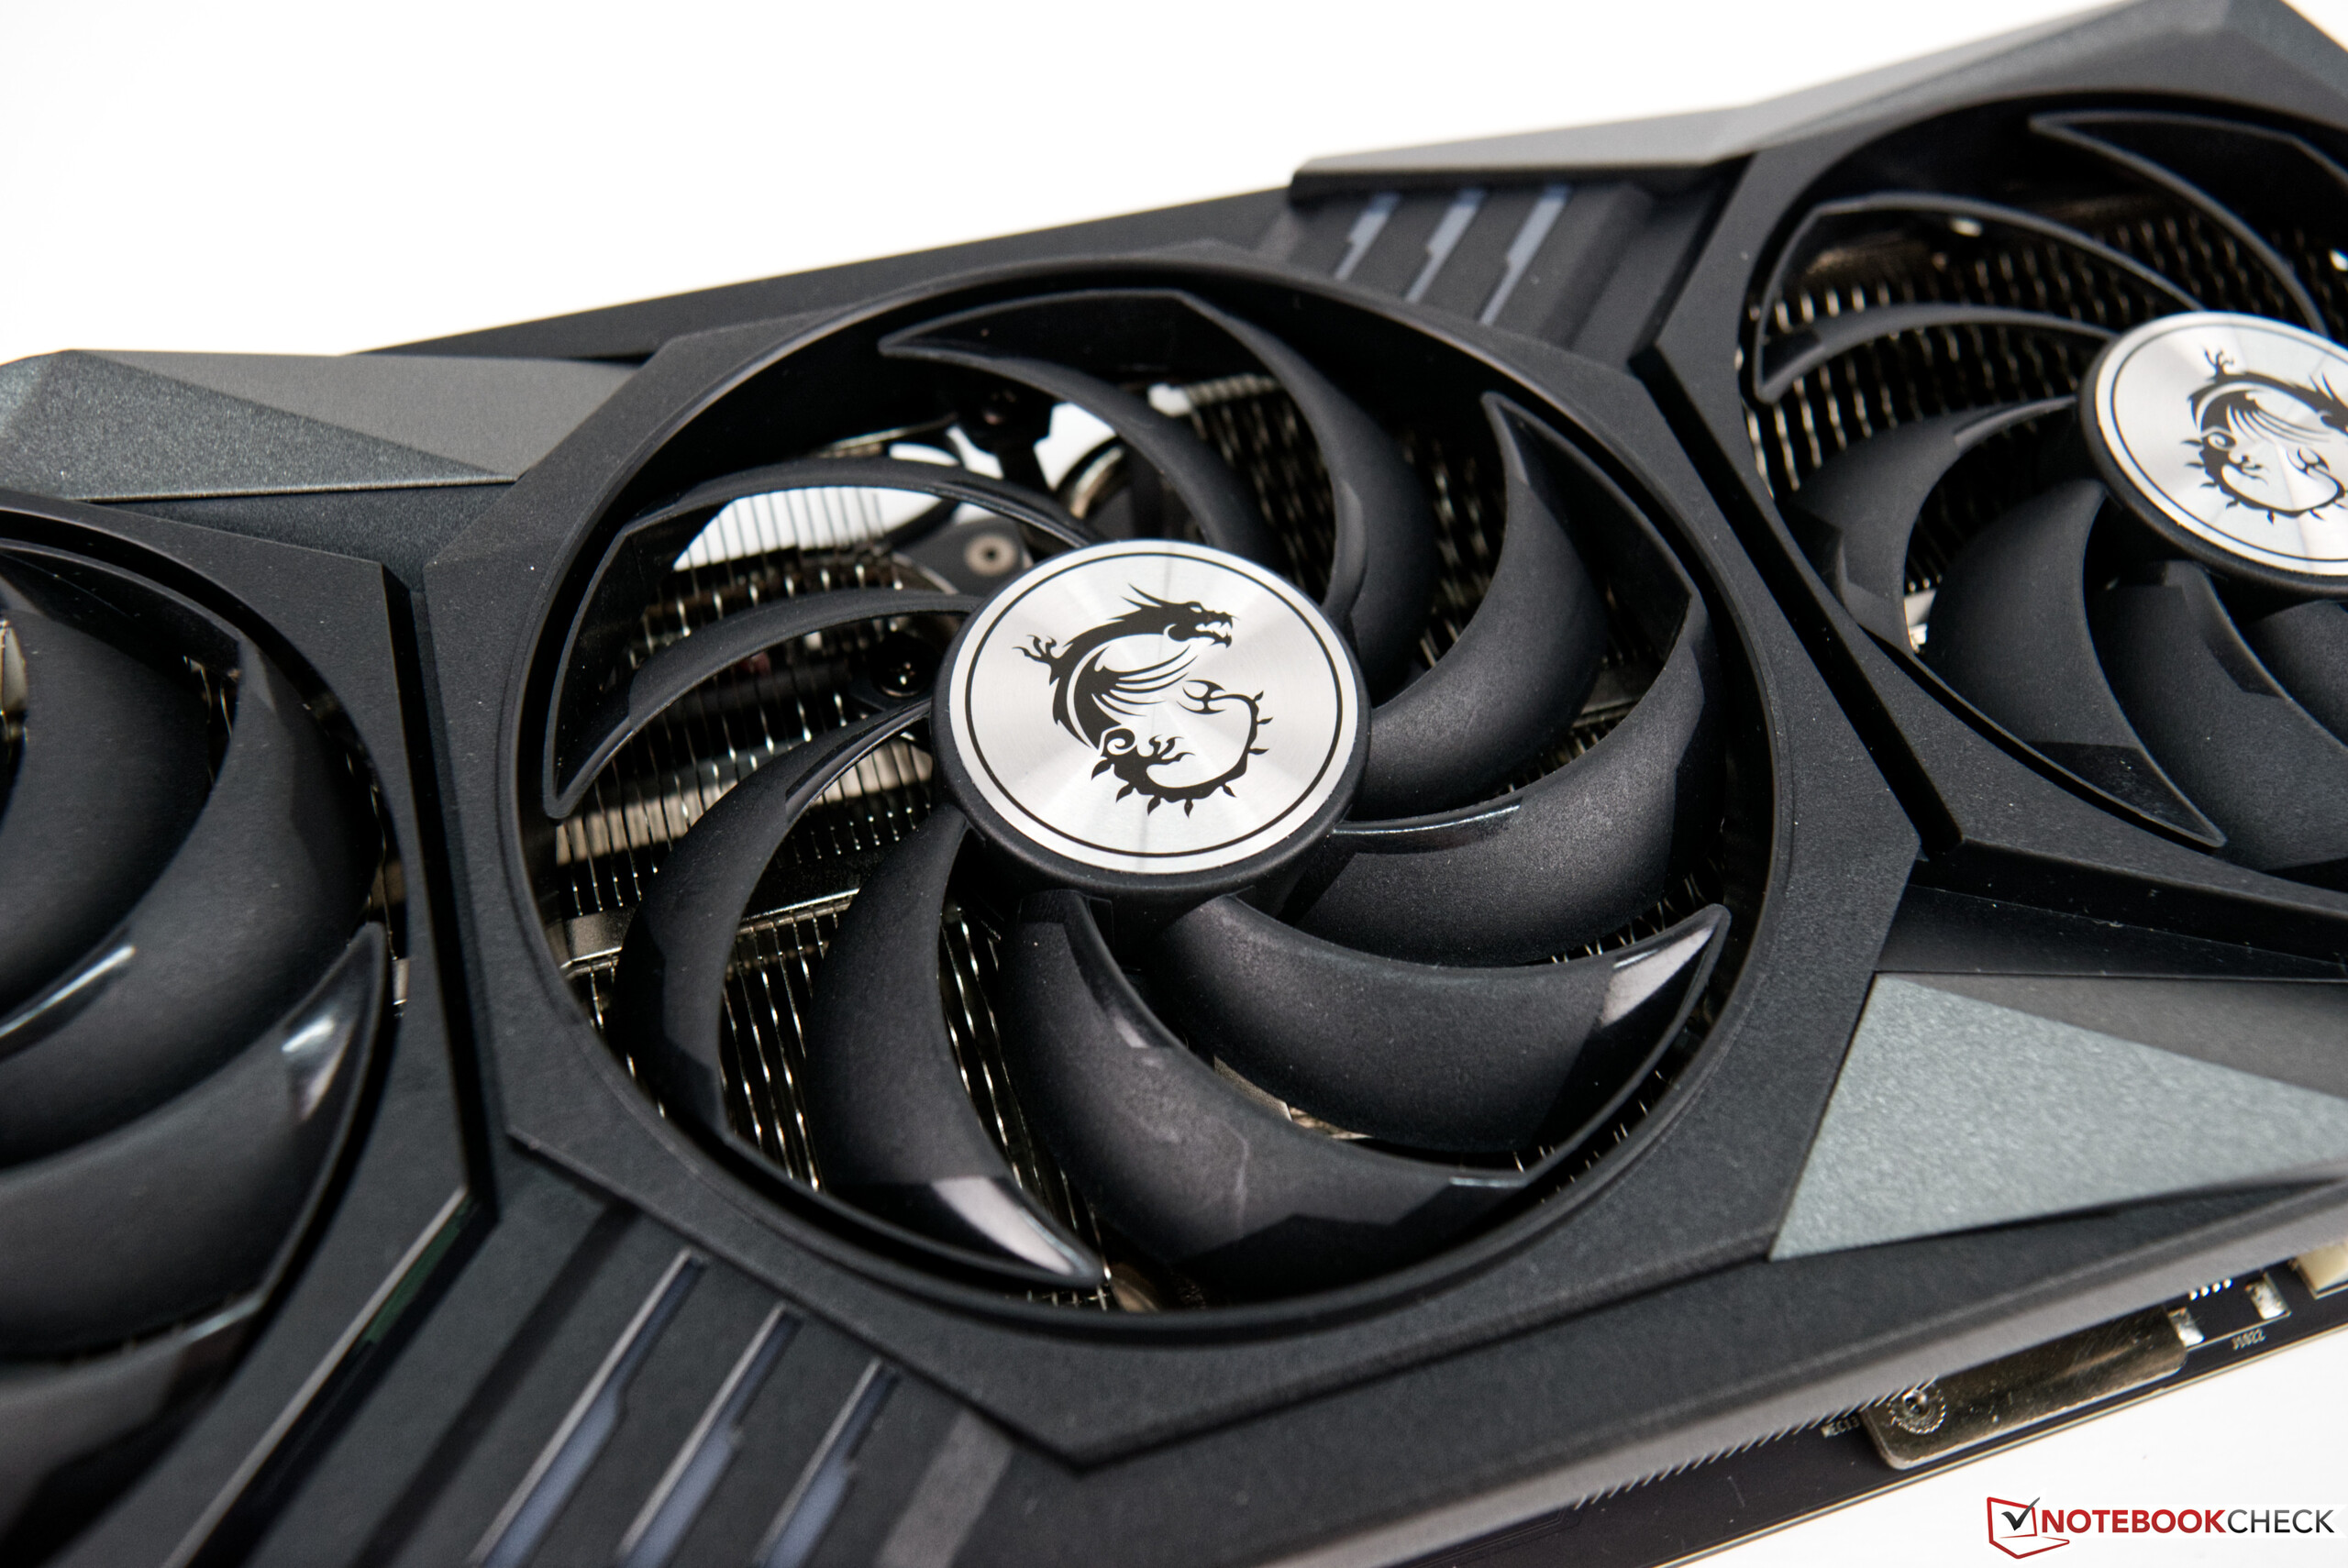
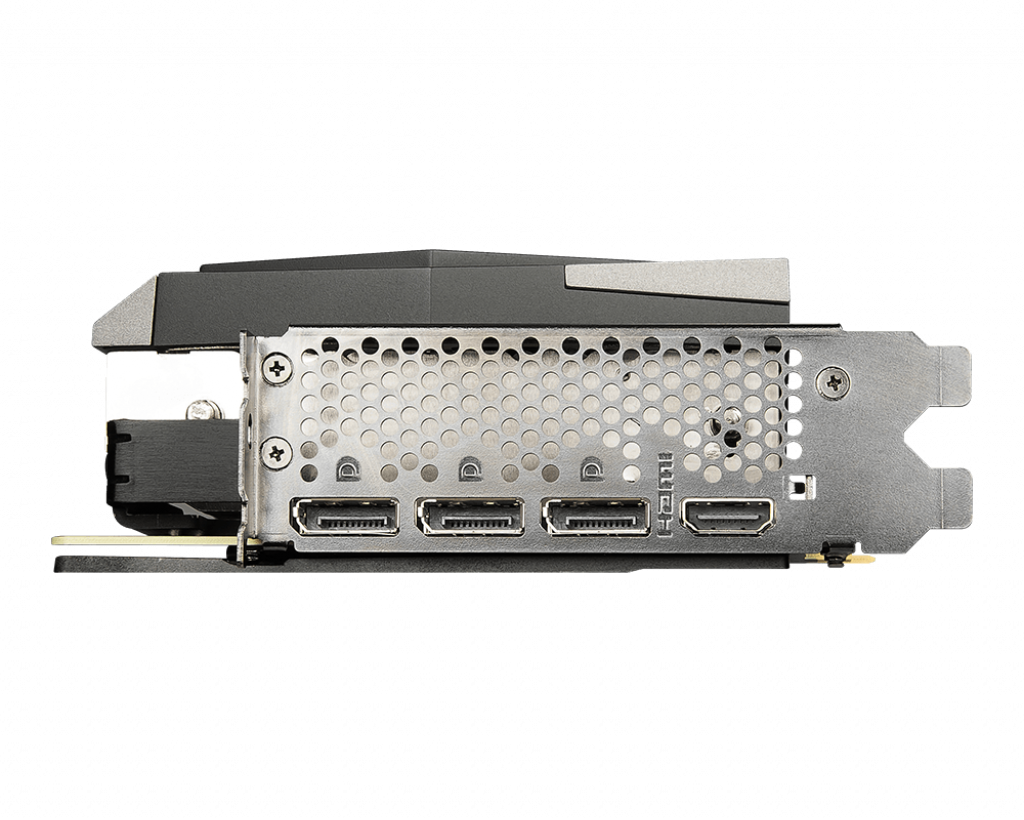
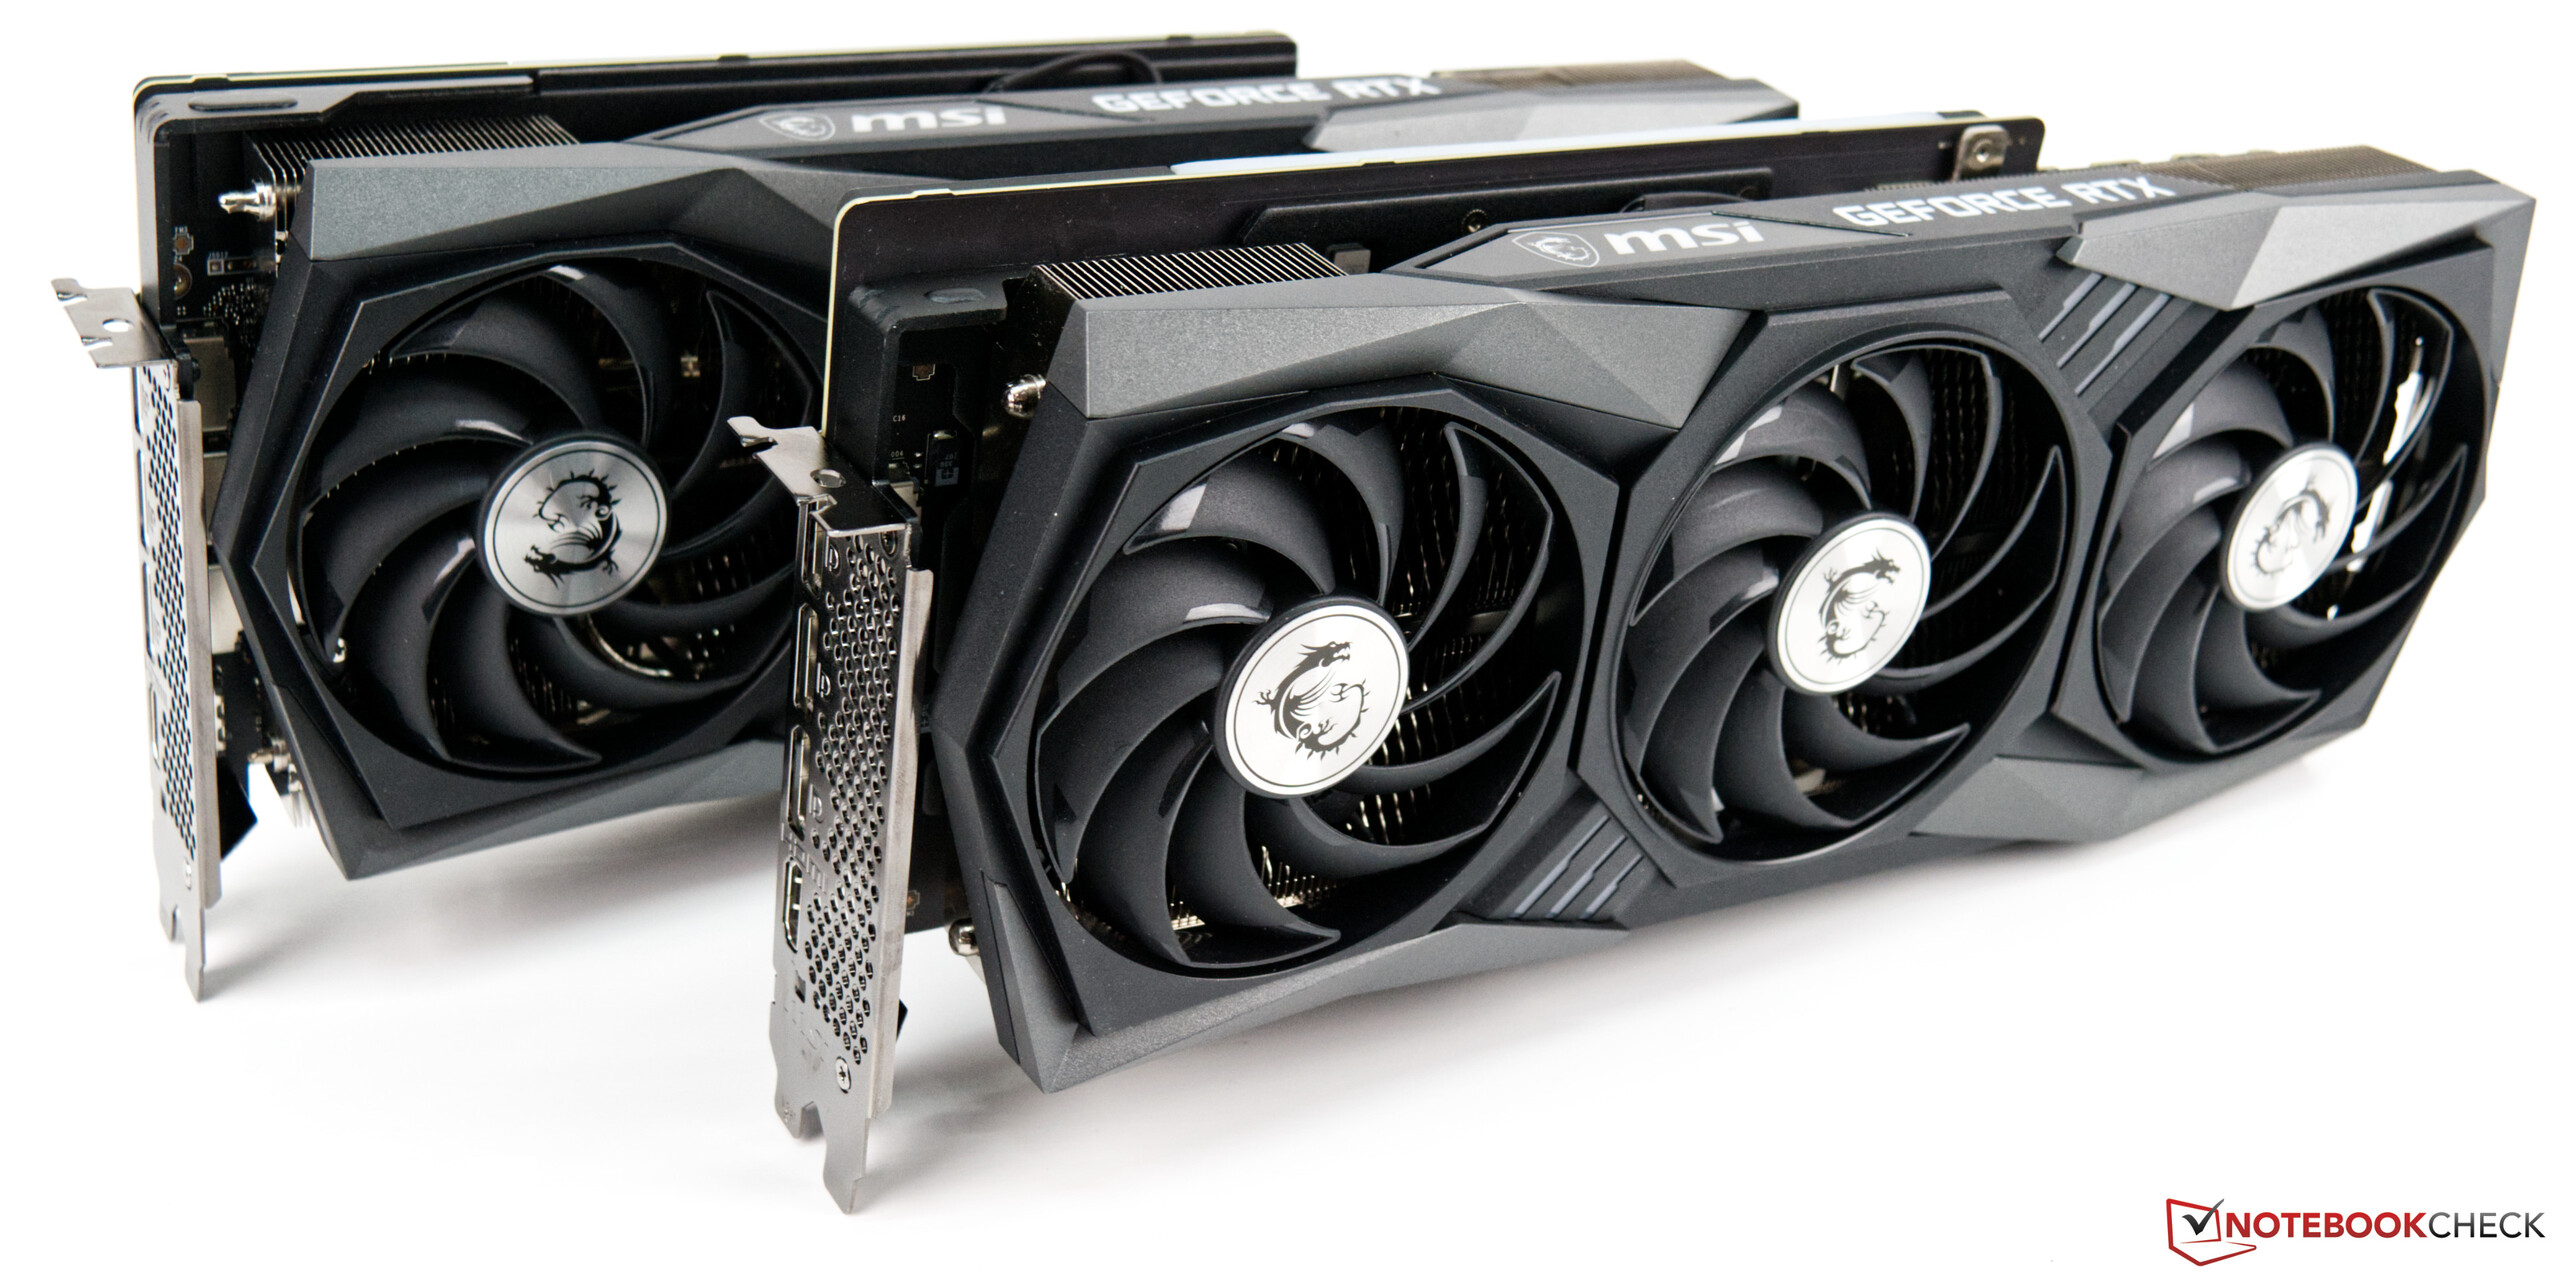
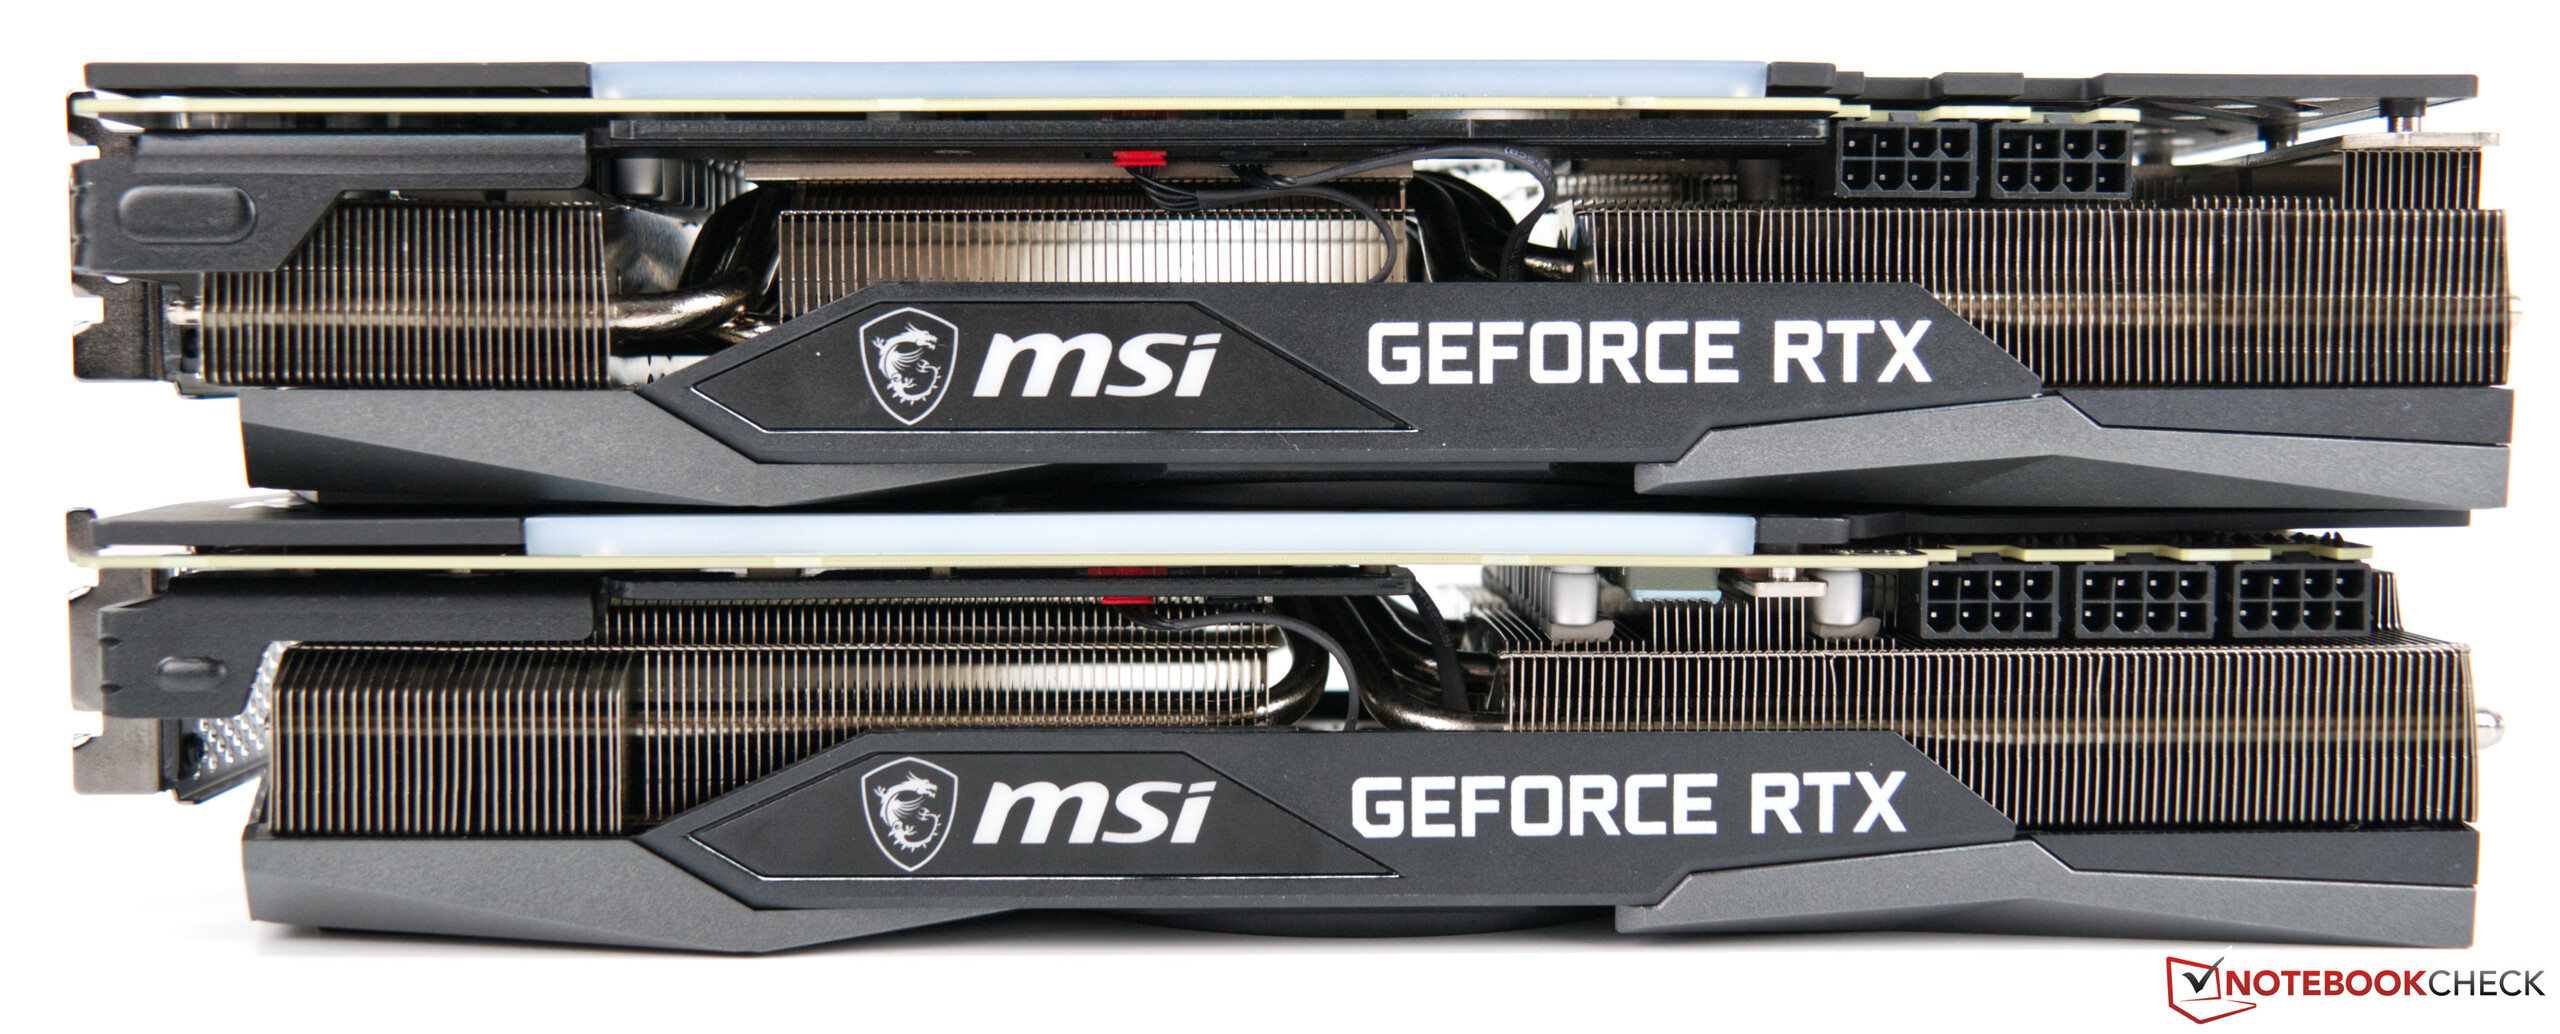
MSI GeForce RTX 3080 Gaming X Trio ile MSI'nın RTX 3080 serisinin en hızlı ikinci modelini incelemeye aldık. Yalnızca yeni Suprim X serisi performans açısından onu geçebilmelidir. Her durumda, teknik özelliklerin gösterdiği budur. MSI'dan aldığımız test örneğimiz, yeni Suprim X modeline kıyasla biraz modası geçmiş görünüyor. Bununla birlikte, Gaming X Trio serisi son birkaç yılda kendini iyi bir şekilde kanıtladı ve çok iyi soğutma sayesinde grafik yongalarından her zaman çok fazla performans elde etti. Bunun için bir diğer önemli faktör de MSI'ın TDP'yi artırması ve referans modeli bir kılavuz olarak kullanmamasıdır. İyi bir 32 santimetre ile MSI GeForce RTX 3080 Gaming X Trio çok uzun ve her kasaya sığmıyor, satın alırken kesinlikle dikkate alınması gereken işçilik çok üst seviyede. Ne yazık ki, arka plaka her zamanki gibi alüminyumdan değil, yalnızca plastikten yapılmıştır. Yüzey burada ek bir ısı dağıtıcısı olarak kullanılabilirdi. Ancak testte bulduğumuz gibi MSI GeForce RTX 3080 Gaming X Trio'da ısı bir sorun değil. RGB aydınlatma tabii ki bir zorunluluktur ve kasanın bir yan penceresi olduğunda dikkat çekiyor. Daha önce daha yüksek güç tüketiminden bahsetmiştik ve daha kesin olmak gerekirse, grafik kartının emrinde 340 watt var. Referans model sadece 320 watt'a sahipti. Aynı zamanda, bu, yük altında daha kararlı ve daha yüksek bir saat hızı anlamına gelir. Grafik kartına yeterli güç sağlamak için dahili olarak üç adet 8 pimli güç konektörü gerektirir, bu da MSI'nın referans tasarımın 12 pimli konektörünü kullanmadığı anlamına gelir. Harici olarak, grafik kartı bir HDMI 2.1 bağlantı noktası ve üç DisplayPort 1.4a bağlantısı sunar. Bu, MSI GeForce RTX 3080 Gaming X Trio'nun 60 Hz'de 8K veya 120 Hz'de 4K çıkış yapmasını sağlar. Bunu testte doğrulamayı başardık.

The RTX 3080 compared with other NVIDIA GPUs
| Specification | RTX 3090 | RTX 3080 (Gaming X Trio) | RTX 3080 FE | RTX 3070 FE | Titan RTX | TITAN X Pascal | RTX 2080 Ti | RTX 2080 |
| Chip | GA102 | GA102 | GA102 | GA104 | TU102 | GP102 | TU102 | TU104 |
| FinFET process | 8 nm | 8 nm | 8 nm | 8 nm | 12 nm | 16 nm | 12 nm | 12 nm |
| CUDA cores | 10,496 | 8,704 | 8,704 | 5,888 | 4,608 | 3,584 | 4,352 | 2,944 |
| Texture units | 328 | 272 | 272 | 184 | 288 | 224 | 272 | 184 |
| Tensor cores | 328 3rd Gen. | 272 3rd Gen. | 272 3rd Gen. | 184 3rd Gen. | 576 2nd Gen. | - | 544 2nd Gen. | 368 2nd Gen. |
| RT cores | 82 | 68 | 68 | 46 | 72 | - | 68 | 46 |
| GPU base clock | 1,395 MHz | 1,440 MHz | 1,440 MHz | 1,500 MHz | 1,350 MHz | 1,417 MHz | 1,350 MHz | 1,515 MHz |
| GPU boost clock | 1,695 MHz | 1,815 MHz | 1,710 MHz | 1,750 MHz | 1,770 MHz | 1,531 MHz | 1,545 MHz | 1,710 MHz |
| Memory bus | 384-bit | 320-bit | 320-bit | 256-bit | 384-bit | 384-bit | 352-bit | 256-bit |
| Memory bandwidth | 936 GB/s | 760 GB/s | 760 GB/s | 448 GB/s | 672 GB/s | 480.4 GB/s | 616 GB/s | 448 GB/s |
| Video memory | 24 GB GDDR6X | 10 GB GDDR6X | 10 GB GDDR6X | 8 GB GDDR6 | 24 GB GDDR6 | 12 GB GDDR5X | 11 GB GDDR6 | 8 GB GDDR6 |
| Power consumption | 350 W | 340 W | 320 W | 220 W | 280 W | 250 W | 250 W | 215 W |
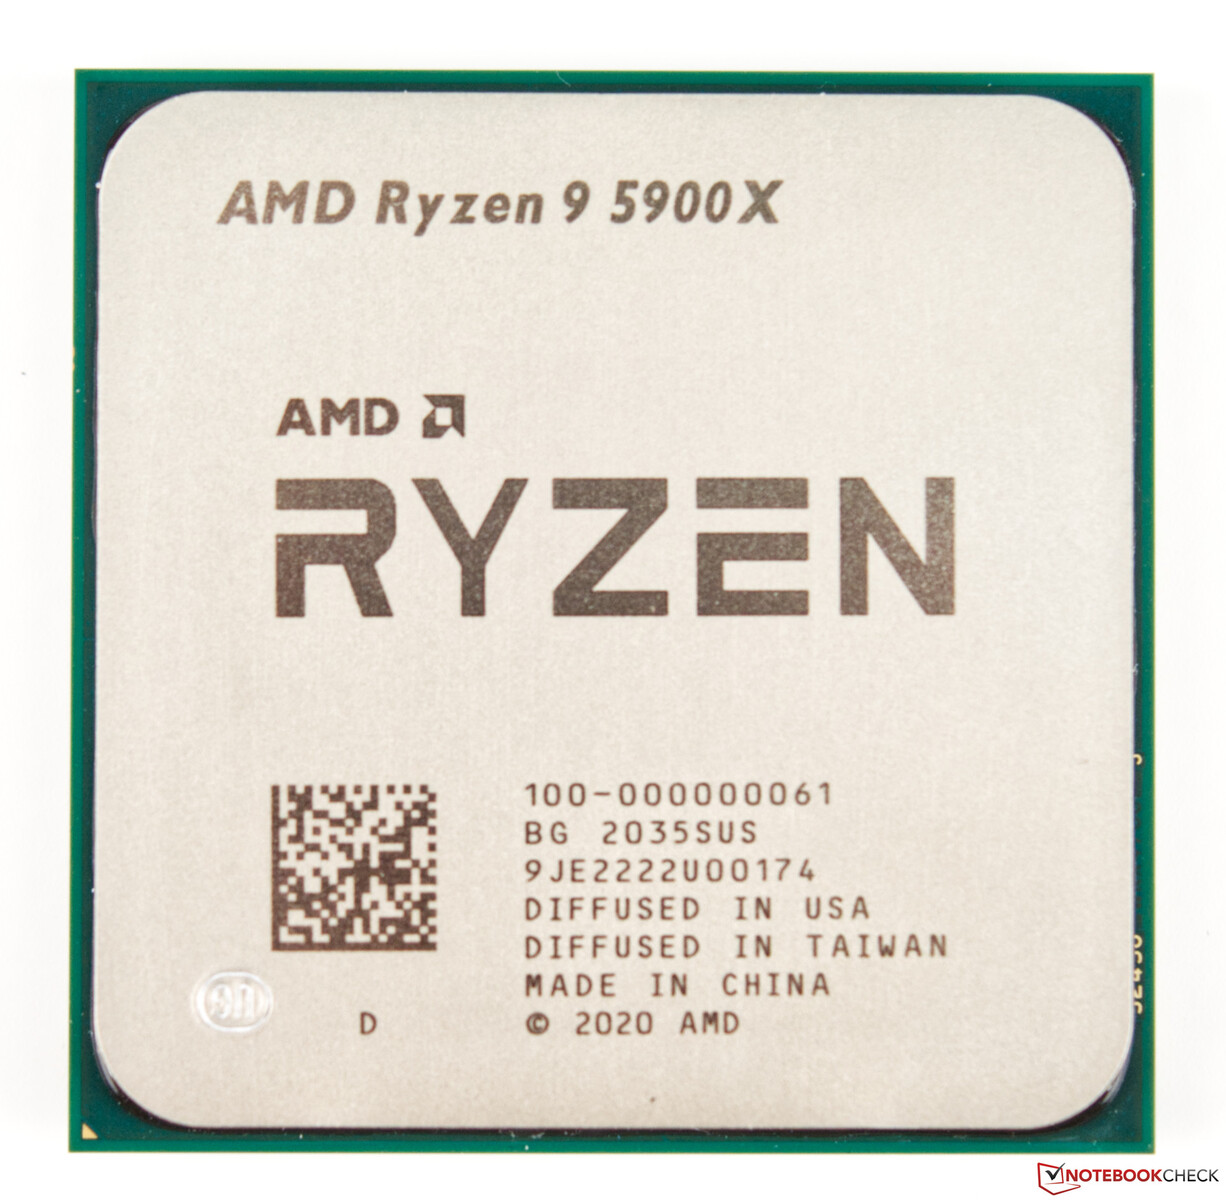
Temel olarak AMD Ryzen 9 5900X ile test sistemimiz
Asus X570 ROG Crosshair VIII tabanlı güncel bir AMD platformu test sistemi olarak hizmet veriyor. CPU (AMD Ryzen 9 5900X) iyi CPU performansı sunuyor ve soğutma için bir AIO (Alphacool Eisbaer Aurora 360mm) kullanıyoruz. 32 GB RAM, Corsair'den geliyor ve 4,000 MHz'de çalışıyor. Acer Predator XB321HK'yi monitör olarak kullanıyoruz. UHD özelliği nedeniyle bizi sınırlamaz. Bu noktada, test platformunu sağladığı için AMD'ye ve RAM kiti için Corsair'e teşekkür ederiz.

Yaklaşan kıyaslamalar ve testler için aşağıdaki sistemi kullanıyoruz: Lian Li O11 DynamicAMD Ryzen 9 5900XMSI GeForce RTX 3080 Gaming X Trio (Nvidia sürücüsü 460.79) Asus X570 ROG Crosshair VIII Hero Wi-Fi (BIOS 2402, varsayılan ayarlar, XMP 1 için DDR4-4000) Corsair RM1000X 1.000 watt güç kaynağı birimiCorsair Vengeance RGB Pro DDR4-4000 2x 16 GB RAM kitiCorsair MP600 2 TB M.2 PCIe 4.0 SSDCrucial MX500 2 TB (oyunlar için)
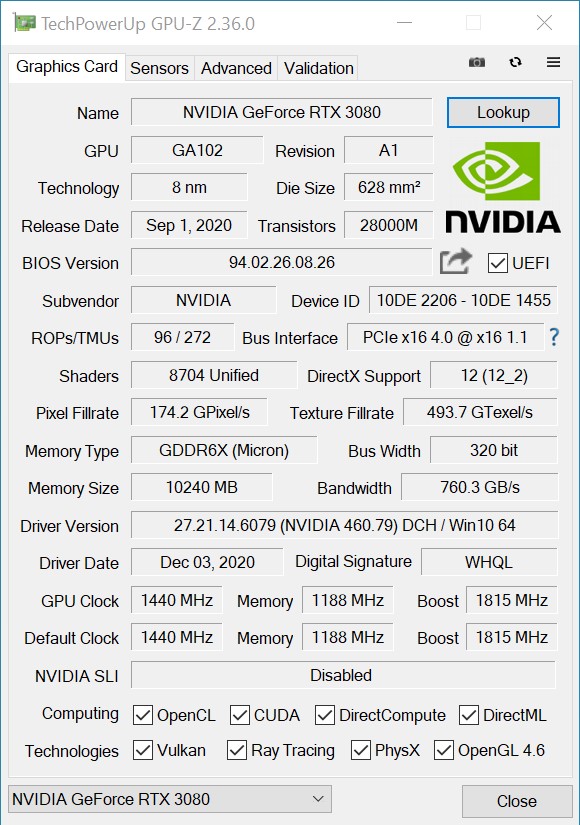
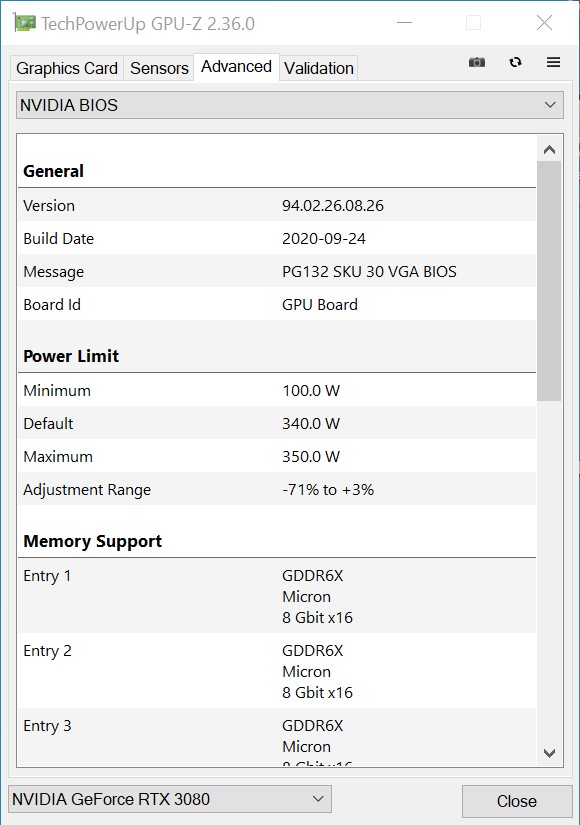
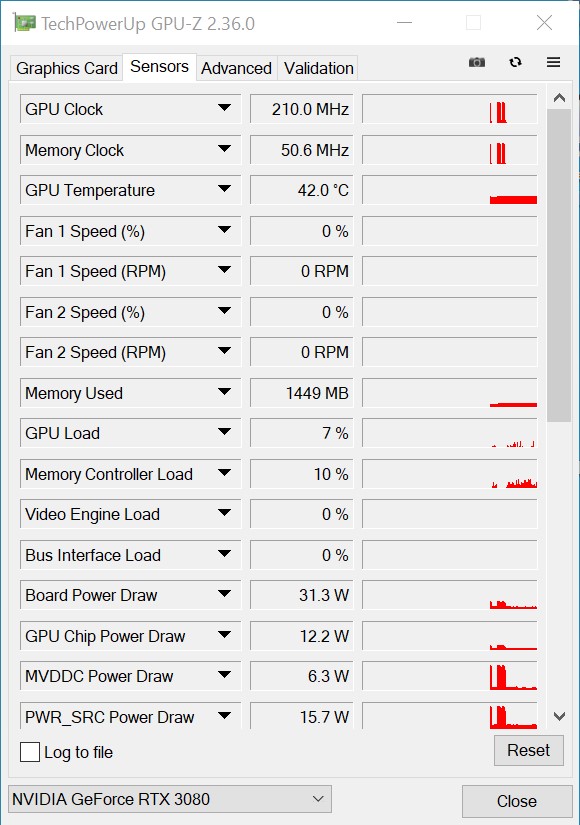
MSI GeForce RTX 3080 Gaming X Trio'nun saat hızları
Temel saat hızı açısından hiçbir şey değişmedi çünkü MSI GeForce RTX 3080 Gaming X Trio da 1.440 MHz'de çalışıyor. Bununla birlikte, hızlandırma saat hızında referans modele kıyasla sapmalar var. MSI'ın modeli iyi bir 100 MHz sunuyor. Yine de Asus, RTX 3080 ROG Strix Gaming OC ile daha da yüksek bir saat hızı sundu. Bunun tam olarak ne anlama geldiğini incelemenin ilerleyen kısımlarında öğreneceksiniz. MSI, VRAM açısından da referans modele sadık kalıyor, bu da tersine, 760 GB / sn bellek bant genişliğinin de değişmediği anlamına geliyor.
Sentetik testler
Sentetik kıyaslamalarda GeForce RTX 3080 Gaming X Trio, GeForce RTX 3080 ROG Strix Gaming OC ile savaşıyor. Bazen MSI önde, bazen Asus'un modeli önde. Bununla birlikte, her iki model de yakın zamanda MSI Suprim X şeklinde incelediğimiz GeForce RTX 3090'ın arkasında. GeForce RTX 2080 Ti ile karşılaştırıldığında GeForce RTX 3080 Gaming X Trio, yaklaşık% 30'luk bir liderlik ile kendisini diğerlerinden ayırabilir. Bir GeForce RTX 3070 şu anda yaklaşık olarak hızlı. Çok pahalı Nvidia Titan RTX, bir GeForce RTX 2080 Ti'den biraz daha iyi performans gösterebilir, ancak GeForce RTX 3080'in performansına ulaşmayı başaramaz.
| 3DMark | |
| 1920x1080 Fire Strike Graphics | |
| Radeon RX 6800 XT | |
| GeForce RTX 3090 | |
| GeForce RTX 3080 | |
| MSI GeForce RTX 3080 Gaming X Trio | |
| Titan RTX | |
| GeForce RTX 2080 Ti (Desktop) | |
| GeForce RTX 3070 | |
| GeForce RTX 2080 (Desktop) | |
| Radeon VII | |
| GeForce RTX 2080 Super (Desktop) | |
| Radeon RX 5700 XT (Desktop) | |
| GeForce RTX 2070 Super (Desktop) | |
| GeForce RTX 2070 (Desktop) | |
| Radeon RX 5700 (Desktop) | |
| RX Vega 64 | |
| GeForce RTX 2060 Super (Desktop) | |
| GeForce RTX 2060 (Desktop) | |
| Fire Strike Extreme Graphics | |
| Radeon RX 6800 XT | |
| GeForce RTX 3090 | |
| GeForce RTX 3080 | |
| MSI GeForce RTX 3080 Gaming X Trio | |
| Titan RTX | |
| GeForce RTX 3070 | |
| GeForce RTX 2080 Ti (Desktop) | |
| Radeon VII | |
| GeForce RTX 2080 (Desktop) | |
| GeForce RTX 2080 Super (Desktop) | |
| Radeon RX 5700 XT (Desktop) | |
| GeForce RTX 2070 Super (Desktop) | |
| GeForce RTX 2070 (Desktop) | |
| Radeon RX 5700 (Desktop) | |
| RX Vega 64 | |
| GeForce RTX 2060 Super (Desktop) | |
| GeForce RTX 2060 (Desktop) | |
| 3840x2160 Fire Strike Ultra Graphics | |
| Radeon RX 6800 XT | |
| GeForce RTX 3090 | |
| GeForce RTX 3080 | |
| MSI GeForce RTX 3080 Gaming X Trio | |
| Titan RTX | |
| GeForce RTX 3070 | |
| GeForce RTX 2080 Ti (Desktop) | |
| Radeon VII | |
| GeForce RTX 2080 (Desktop) | |
| GeForce RTX 2080 Super (Desktop) | |
| Radeon RX 5700 XT (Desktop) | |
| GeForce RTX 2070 Super (Desktop) | |
| GeForce RTX 2070 (Desktop) | |
| RX Vega 64 | |
| Radeon RX 5700 (Desktop) | |
| GeForce RTX 2060 Super (Desktop) | |
| GeForce RTX 2060 (Desktop) | |
| 2560x1440 Time Spy Graphics | |
| GeForce RTX 3090 | |
| MSI GeForce RTX 3080 Gaming X Trio | |
| Radeon RX 6800 XT | |
| GeForce RTX 3080 | |
| Titan RTX | |
| GeForce RTX 2080 Ti (Desktop) | |
| GeForce RTX 3070 | |
| GeForce RTX 2080 Super (Desktop) | |
| GeForce RTX 2080 (Desktop) | |
| GeForce RTX 2070 Super (Desktop) | |
| GeForce RTX 2070 (Desktop) | |
| Radeon VII | |
| GeForce RTX 2060 Super (Desktop) | |
| Radeon RX 5700 XT (Desktop) | |
| GeForce RTX 2060 (Desktop) | |
| Radeon RX 5700 (Desktop) | |
| RX Vega 64 | |
| Unigine Superposition | |
| 1280x720 720p Low | |
| Titan RTX | |
| Radeon RX 6800 XT | |
| GeForce RTX 3090 | |
| MSI GeForce RTX 3080 Gaming X Trio | |
| GeForce RTX 3070 | |
| GeForce RTX 3080 | |
| 1920x1080 1080p High | |
| GeForce RTX 3090 | |
| Radeon RX 6800 XT | |
| MSI GeForce RTX 3080 Gaming X Trio | |
| GeForce RTX 3080 | |
| Titan RTX | |
| GeForce RTX 3070 | |
| 1920x1080 1080p Extreme | |
| GeForce RTX 3090 | |
| MSI GeForce RTX 3080 Gaming X Trio | |
| GeForce RTX 3080 | |
| Radeon RX 6800 XT | |
| Titan RTX | |
| GeForce RTX 3070 | |
| 3840x2160 4k Optimized | |
| GeForce RTX 3090 | |
| MSI GeForce RTX 3080 Gaming X Trio | |
| GeForce RTX 3080 | |
| Radeon RX 6800 XT | |
| Titan RTX | |
| GeForce RTX 3070 | |
| 7680x4320 8k Optimized | |
| GeForce RTX 3090 | |
| MSI GeForce RTX 3080 Gaming X Trio | |
| GeForce RTX 3080 | |
| Titan RTX | |
| Radeon RX 6800 XT | |
| GeForce RTX 3070 | |
| Unigine Heaven 4.0 | |
| Extreme Preset OpenGL | |
| GeForce RTX 3090 | |
| MSI GeForce RTX 3080 Gaming X Trio | |
| GeForce RTX 3080 | |
| Titan RTX | |
| GeForce RTX 2080 Ti (Desktop) | |
| Radeon RX 6800 XT | |
| GeForce RTX 3070 | |
| GeForce RTX 2080 Super (Desktop) | |
| GeForce RTX 2080 (Desktop) | |
| GeForce RTX 2070 Super (Desktop) | |
| GeForce RTX 2070 (Desktop) | |
| GeForce RTX 2060 Super (Desktop) | |
| GeForce RTX 2060 (Desktop) | |
| Radeon RX 5700 XT (Desktop) | |
| Radeon VII | |
| Radeon RX 5700 (Desktop) | |
| Extreme Preset DX11 | |
| GeForce RTX 3090 | |
| MSI GeForce RTX 3080 Gaming X Trio | |
| Radeon RX 6800 XT | |
| Titan RTX | |
| GeForce RTX 3080 | |
| GeForce RTX 2080 Ti (Desktop) | |
| GeForce RTX 3070 | |
| GeForce RTX 2080 (Desktop) | |
| GeForce RTX 2080 Super (Desktop) | |
| GeForce RTX 2070 Super (Desktop) | |
| GeForce RTX 2070 (Desktop) | |
| GeForce RTX 2060 Super (Desktop) | |
| Radeon VII | |
| Radeon RX 5700 XT (Desktop) | |
| GeForce RTX 2060 (Desktop) | |
| Radeon RX 5700 (Desktop) | |
| Unigine Valley 1.0 | |
| 1920x1080 Extreme HD DirectX AA:x8 | |
| GeForce RTX 3090 | |
| Radeon RX 6800 XT | |
| MSI GeForce RTX 3080 Gaming X Trio | |
| Titan RTX | |
| GeForce RTX 3080 | |
| GeForce RTX 2080 Ti (Desktop) | |
| GeForce RTX 3070 | |
| GeForce RTX 2080 Super (Desktop) | |
| GeForce RTX 2080 (Desktop) | |
| GeForce RTX 2070 Super (Desktop) | |
| GeForce RTX 2070 (Desktop) | |
| Radeon VII | |
| GeForce RTX 2060 Super (Desktop) | |
| Radeon RX 5700 XT (Desktop) | |
| Radeon RX 5700 (Desktop) | |
| GeForce RTX 2060 (Desktop) | |
| 1920x1080 Extreme HD Preset OpenGL AA:x8 | |
| GeForce RTX 3090 | |
| MSI GeForce RTX 3080 Gaming X Trio | |
| GeForce RTX 3080 | |
| Titan RTX | |
| Radeon RX 6800 XT | |
| GeForce RTX 2080 Ti (Desktop) | |
| GeForce RTX 3070 | |
| GeForce RTX 2080 Super (Desktop) | |
| GeForce RTX 2080 (Desktop) | |
| GeForce RTX 2070 Super (Desktop) | |
| GeForce RTX 2070 (Desktop) | |
| GeForce RTX 2060 Super (Desktop) | |
| Radeon RX 5700 XT (Desktop) | |
| GeForce RTX 2060 (Desktop) | |
| Radeon RX 5700 (Desktop) | |
| Radeon VII | |
| SiSoft Sandra 2016 | |
| GP Financial Analysis (FP High/Double Precision) | |
| Radeon VII | |
| Radeon RX 6800 XT | |
| GeForce RTX 3090 | |
| MSI GeForce RTX 3080 Gaming X Trio | |
| GeForce RTX 3080 | |
| GeForce RTX 2080 Ti (Desktop) | |
| GeForce RTX 2080 (Desktop) | |
| GeForce RTX 2080 Super (Desktop) | |
| GeForce RTX 3070 | |
| GeForce RTX 2070 Super (Desktop) | |
| GeForce RTX 2070 (Desktop) | |
| GeForce RTX 2060 Super (Desktop) | |
| GeForce RTX 2060 (Desktop) | |
| Radeon RX 5700 XT (Desktop) | |
| Radeon RX 5700 (Desktop) | |
| GP Cryptography (Higher Security AES256+SHA2-512) | |
| GeForce RTX 3090 | |
| MSI GeForce RTX 3080 Gaming X Trio | |
| GeForce RTX 3080 | |
| Radeon RX 6800 XT | |
| GeForce RTX 2080 Ti (Desktop) | |
| GeForce RTX 3070 | |
| GeForce RTX 2080 (Desktop) | |
| Radeon VII | |
| GeForce RTX 2080 Super (Desktop) | |
| GeForce RTX 2070 Super (Desktop) | |
| GeForce RTX 2070 (Desktop) | |
| GeForce RTX 2060 Super (Desktop) | |
| GeForce RTX 2060 (Desktop) | |
| Image Processing | |
| Radeon RX 6800 XT | |
| GeForce RTX 3090 | |
| MSI GeForce RTX 3080 Gaming X Trio | |
| GeForce RTX 3080 | |
| Radeon VII | |
| GeForce RTX 3070 | |
| GeForce RTX 2080 Ti (Desktop) | |
| GeForce RTX 2080 Super (Desktop) | |
| GeForce RTX 2080 (Desktop) | |
| GeForce RTX 2070 Super (Desktop) | |
| GeForce RTX 2070 (Desktop) | |
| GeForce RTX 2060 Super (Desktop) | |
| Radeon RX 5700 XT (Desktop) | |
| GeForce RTX 2060 (Desktop) | |
| Radeon RX 5700 (Desktop) | |
| 3DMark 03 Standard | 136483 puan | |
| 3DMark 05 Standard | 34535 puan | |
| 3DMark 06 Standard Score | 35659 puan | |
| 3DMark Vantage P Result | 62128 puan | |
| 3DMark 11 Performance | 26565 puan | |
| 3DMark Ice Storm Standard Score | 197964 puan | |
| 3DMark Cloud Gate Standard Score | 48366 puan | |
| 3DMark Fire Strike Score | 20451 puan | |
| 3DMark Fire Strike Extreme Score | 12092 puan | |
| 3DMark Time Spy Score | 8797 puan | |
Yardım | ||
Oyun kıyaslamaları
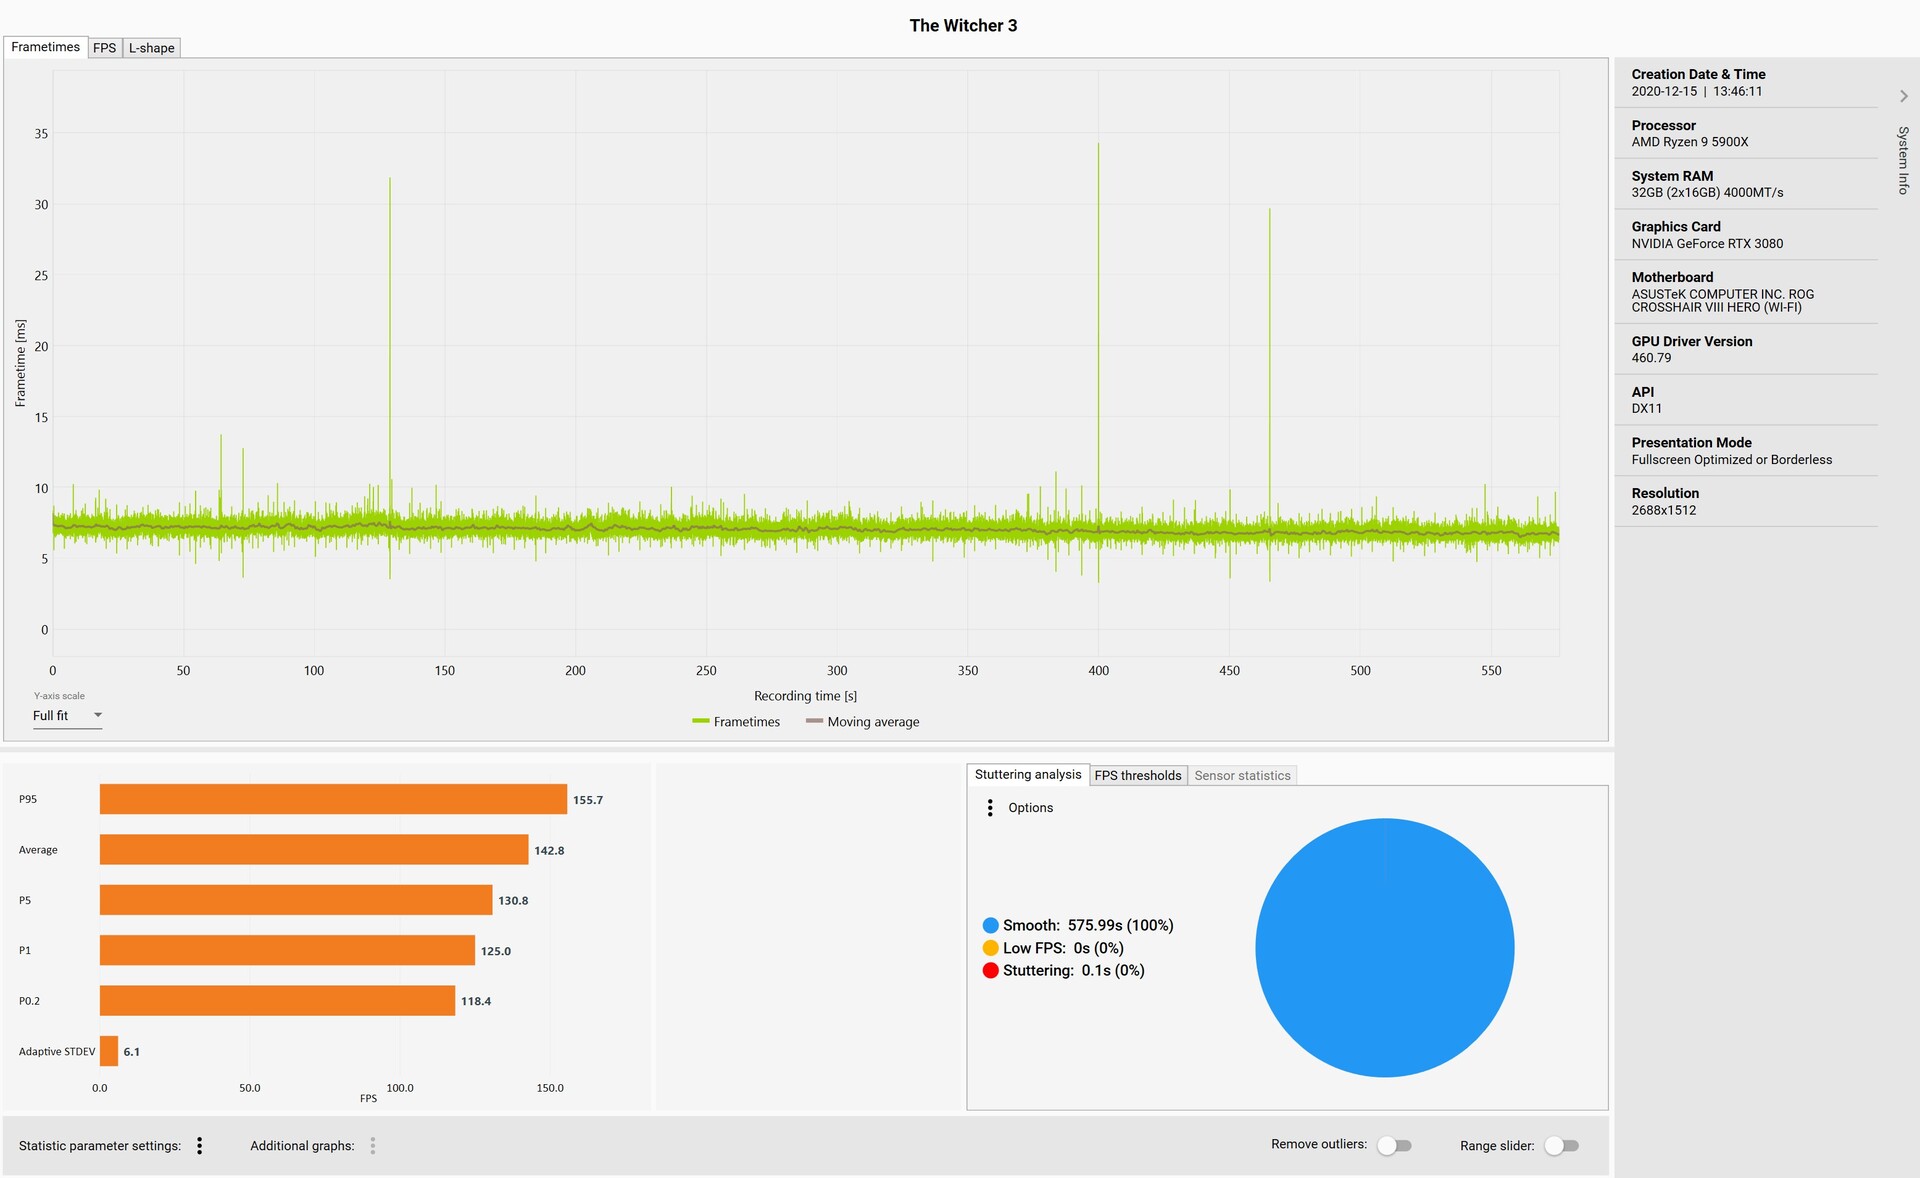
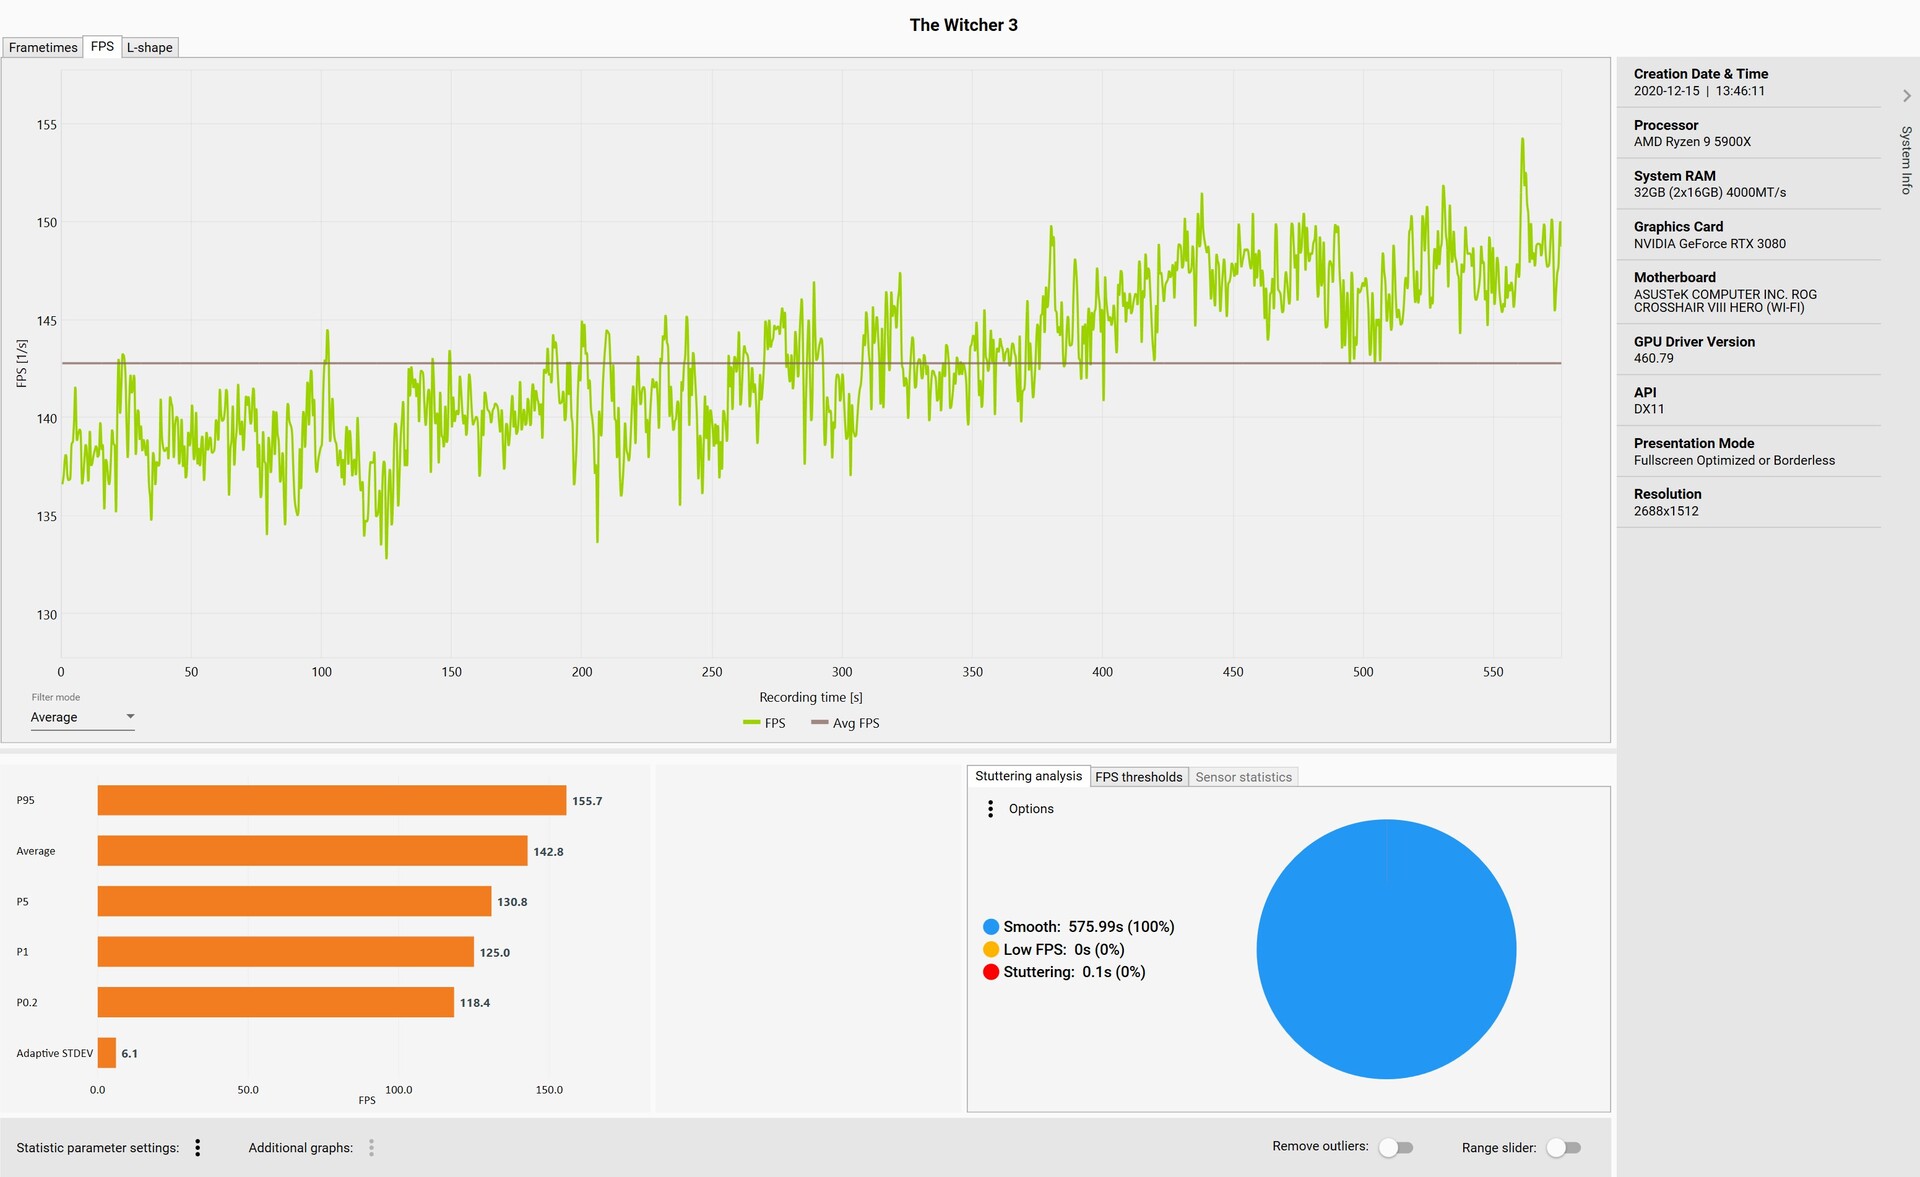
Yaptığımız oyun testleri modern oyunlarda çok iyi performans gösteriyor. Yine de GeForce RTX 3080, CPU sınırına göre yavaşlamamak için yüksek çözünürlükler gerektirir. Asus ile karşılaştırıldığında, MSI'dan aldığımız test örneğimizin genellikle arka planda kalması gerekir, ancak boşluk çok küçüktür ve hatta bir ölçüm toleransı olarak kabul edilebilir. Genel olarak, her iki model de eşit derecede hızlıdır. Yalnızca GeForce RTX 3090, yüksek çözünürlüklerde daha fazla FPS sunar. AMD ile karşılaştırıldığında Nvidia, bazı oyunlarda RTX 3080 ile kendini gösterebiliyor. Ancak AMD, Radeon RX 6800 XT'ye de ayak uydurabilir ve oyuna bağlı olarak AMD, yeni grafik kartıyla kendisini doğrudan GeForce RTX 3090'ın arkasına yerleştirebilir.Sadece saf oyun performansını göz önünde bulundurarak MSI GeForce RTX'i önerebiliriz 3080 Gaming X Trio herhangi bir kısıtlama olmaksızın. Bununla birlikte, biraz düşük VRAM hala kötü bir tat bırakıyor ve maalesef bu, GPU'nun uzun vadede iyi donanımlı olmasına katkıda bulunmuyor. Bununla birlikte, 10 GB VRAM şu anda hala 2160p'de oynatılabilir kare hızlarını ekrana getirmek için yeterli. GeForce RTX 3080, gelecekte daha zor zamanlar geçirebilir. Kare ilerlemesi ve kare süreleri için bir örnek olarak The Witcher 3'ü (Ultra ön ayar) kullanıyoruz. Kaydedilen veriler herhangi bir olumsuz anormallik göstermedi. Tek aykırı değerler görülebilir, ancak bu durumda düzgün oynanışı etkilemediler.
| Far Cry New Dawn - 3840x2160 Ultra Preset | |
| GeForce RTX 3090 | |
| Radeon RX 6800 XT | |
| GeForce RTX 3080 | |
| MSI GeForce RTX 3080 Gaming X Trio | |
| Titan RTX | |
| Titan RTX | |
| GeForce RTX 2080 Ti (Desktop) | |
| GeForce RTX 3070 | |
| GeForce RTX 2080 Super (Desktop) | |
| GeForce RTX 2080 (Desktop) | |
| Radeon VII | |
| GeForce RTX 2070 Super (Desktop) | |
| Radeon RX 5700 XT (Desktop) | |
| GeForce RTX 2070 (Desktop) | |
| Radeon RX 5700 (Desktop) | |
| GeForce RTX 2060 Super (Desktop) | |
| RX Vega 64 | |
| GeForce RTX 2060 (Desktop) | |
| Far Cry 5 - 3840x2160 Ultra Preset AA:T | |
| GeForce RTX 3090 | |
| GeForce RTX 3080 | |
| Radeon RX 6800 XT | |
| MSI GeForce RTX 3080 Gaming X Trio | |
| Titan RTX | |
| Titan RTX | |
| GeForce RTX 2080 Ti (Desktop) | |
| GeForce RTX 3070 | |
| GeForce RTX 2080 Super (Desktop) | |
| GeForce RTX 2080 (Desktop) | |
| Radeon VII | |
| GeForce RTX 2070 Super (Desktop) | |
| Radeon RX 5700 XT (Desktop) | |
| GeForce RTX 2070 (Desktop) | |
| GeForce RTX 2060 Super (Desktop) | |
| Radeon RX 5700 (Desktop) | |
| RX Vega 64 | |
| GeForce RTX 2060 (Desktop) | |
| F1 2020 - 3840x2160 Ultra High Preset AA:T AF:16x | |
| GeForce RTX 3090 | |
| Radeon RX 6800 XT | |
| GeForce RTX 3080 | |
| MSI GeForce RTX 3080 Gaming X Trio | |
| Titan RTX | |
| GeForce RTX 3070 | |
| Borderlands 3 - 3840x2160 Badass Overall Quality (DX11) | |
| GeForce RTX 3090 | |
| MSI GeForce RTX 3080 Gaming X Trio | |
| GeForce RTX 3080 | |
| Radeon RX 6800 XT | |
| Titan RTX | |
| Titan RTX | |
| GeForce RTX 3070 | |
| GeForce RTX 2080 Ti (Desktop) | |
| Metro Exodus - 3840x2160 Ultra Quality AF:16x | |
| GeForce RTX 3090 | |
| MSI GeForce RTX 3080 Gaming X Trio | |
| GeForce RTX 3080 | |
| Radeon RX 6800 XT | |
| Titan RTX | |
| Titan RTX | |
| GeForce RTX 3070 | |
| GeForce RTX 2080 Ti (Desktop) | |
| RX Vega 64 | |
| GeForce RTX 2080 Super (Desktop) | |
| GeForce RTX 2080 (Desktop) | |
| Radeon VII | |
| GeForce RTX 2070 Super (Desktop) | |
| GeForce RTX 2070 (Desktop) | |
| GeForce RTX 2060 Super (Desktop) | |
| Radeon RX 5700 XT (Desktop) | |
| Radeon RX 5700 (Desktop) | |
| GeForce RTX 2060 (Desktop) | |
| Red Dead Redemption 2 - 3840x2160 Maximum Settings | |
| GeForce RTX 3090 | |
| MSI GeForce RTX 3080 Gaming X Trio | |
| GeForce RTX 3080 | |
| Radeon RX 6800 XT | |
| GeForce RTX 3070 | |
| Titan RTX | |
| Rise of the Tomb Raider - 3840x2160 High Preset AA:FX AF:4x | |
| GeForce RTX 3090 | |
| MSI GeForce RTX 3080 Gaming X Trio | |
| GeForce RTX 3080 | |
| Radeon RX 6800 XT | |
| GeForce RTX 2080 Ti (Desktop) | |
| GeForce RTX 3070 | |
| GeForce RTX 2080 Super (Desktop) | |
| GeForce RTX 2080 (Desktop) | |
| GeForce RTX 2070 Super (Desktop) | |
| GeForce RTX 2070 (Desktop) | |
| Radeon VII | |
| GeForce RTX 2060 Super (Desktop) | |
| RX Vega 64 | |
| GeForce RTX 2060 (Desktop) | |
| Shadow of the Tomb Raider - 3840x2160 Highest Preset AA:T | |
| GeForce RTX 3090 | |
| MSI GeForce RTX 3080 Gaming X Trio | |
| GeForce RTX 3080 | |
| Radeon RX 6800 XT | |
| Titan RTX | |
| Titan RTX | |
| GeForce RTX 3070 | |
| GeForce RTX 2080 Ti (Desktop) | |
| GeForce RTX 2080 Super (Desktop) | |
| GeForce RTX 2080 (Desktop) | |
| Radeon VII | |
| GeForce RTX 2070 Super (Desktop) | |
| GeForce RTX 2070 (Desktop) | |
| Radeon RX 5700 XT (Desktop) | |
| GeForce RTX 2060 Super (Desktop) | |
| Radeon RX 5700 (Desktop) | |
| GeForce RTX 2060 (Desktop) | |
| RX Vega 64 | |
| Mafia Definitive Edition - 3840x2160 High Preset | |
| GeForce RTX 3090 | |
| GeForce RTX 3080 | |
| MSI GeForce RTX 3080 Gaming X Trio | |
| Titan RTX | |
| Radeon RX 6800 XT | |
| GeForce RTX 3070 | |
| Watch Dogs Legion - 3840x2160 Ultra Preset (DX12) | |
| GeForce RTX 3090 | |
| GeForce RTX 3080 | |
| MSI GeForce RTX 3080 Gaming X Trio | |
| Radeon RX 6800 XT | |
| Titan RTX | |
| GeForce RTX 3070 | |
| The Witcher 3 - 3840x2160 High Graphics & Postprocessing (Nvidia HairWorks Off) | |
| GeForce RTX 3090 | |
| GeForce RTX 3080 | |
| MSI GeForce RTX 3080 Gaming X Trio | |
| Radeon RX 6800 XT | |
| Titan RTX | |
| Titan RTX | |
| GeForce RTX 2080 Ti (Desktop) | |
| GeForce RTX 3070 | |
| GeForce RTX 2080 Super (Desktop) | |
| GeForce RTX 2080 (Desktop) | |
| GeForce RTX 2070 Super (Desktop) | |
| GeForce RTX 2070 (Desktop) | |
| GeForce RTX 2060 Super (Desktop) | |
| Radeon VII | |
| Radeon RX 5700 XT (Desktop) | |
| GeForce RTX 2060 (Desktop) | |
| RX Vega 64 | |
| Radeon RX 5700 (Desktop) | |
| düşük | orta | yüksek | ultra | QHD | 4K | |
|---|---|---|---|---|---|---|
| GTA V (2015) | 182 | 175 | 169 | 104 | 101 | 150 |
| The Witcher 3 (2015) | 446 | 413 | 320 | 145 | 114 | |
| Dota 2 Reborn (2015) | 124.1 | 113.2 | 109.3 | 101.1 | 98 | |
| Rise of the Tomb Raider (2016) | 388 | 300 | 273 | 233 | 114 | |
| Final Fantasy XV Benchmark (2018) | 148 | 132 | 113 | 91 | 66 | |
| X-Plane 11.11 (2018) | 163 | 153 | 122.5 | 104.8 | ||
| Far Cry 5 (2018) | 175 | 152 | 144 | 135 | 132 | 93 |
| Strange Brigade (2018) | 426 | 350 | 315 | 285 | 218 | 134 |
| Shadow of the Tomb Raider (2018) | 191 | 181 | 186 | 177 | 152 | 87.9 |
| Battlefield V (2018) | 187.3 | 165.8 | 148.6 | 137.9 | 116.1 | 87.2 |
| Apex Legends (2019) | 144 | 144 | 144 | 144 | 144 | 140 |
| Far Cry New Dawn (2019) | 143 | 125 | 120 | 108 | 103 | 88 |
| Metro Exodus (2019) | 220 | 181 | 60.2 | 116 | 97.4 | 65.9 |
| Anno 1800 (2019) | 137 | 135 | 93.9 | 54 | 52.4 | 43.2 |
| Control (2019) | 235 | 185 | 151 | 105 | 56.7 | |
| Borderlands 3 (2019) | 147 | 127 | 120 | 117 | 95.7 | 61.9 |
| Star Wars Jedi Fallen Order (2019) | 128 | 127 | 129 | 128 | 97.2 | |
| Red Dead Redemption 2 (2019) | 152.1 | 149.5 | 141.9 | 103 | 86.4 | 56.4 |
| Hunt Showdown (2020) | 260 | 232 | 228 | 188 | 107 | |
| Doom Eternal (2020) | 305 | 302 | 291 | 290 | 277 | 167 |
| F1 2020 (2020) | 321 | 288 | 249 | 179 | 146 | 114 |
| Death Stranding (2020) | 232 | 219 | 208 | 202 | 163 | 98.7 |
| Horizon Zero Dawn (2020) | 198 | 180 | 164 | 144 | 128 | 82 |
| Crysis Remastered (2020) | 227 | 157 | 98.9 | 62.1 | 59.9 | 49.2 |
| Serious Sam 4 (2020) | 161 | 125.2 | 121.7 | 114.3 | 112.8 | 112.7 |
| Mafia Definitive Edition (2020) | 182 | 159 | 144 | 127 | 78.1 | |
| Star Wars Squadrons (2020) | 360 | 392 | 362 | 362 | 274 | 175 |
| FIFA 21 (2020) | 170 | 184 | 182 | 181 | 199 | 195 |
| Watch Dogs Legion (2020) | 122 | 121 | 113 | 99.3 | 81.1 | 53.5 |
| Dirt 5 (2020) | 186 | 134 | 112 | 97 | 85.5 | 65.7 |
| Assassin´s Creed Valhalla (2020) | 136 | 111 | 96 | 88 | 76 | 52 |
| Call of Duty Black Ops Cold War (2020) | 235 | 201 | 173 | 127 | 104 | 65.6 |
| Yakuza Like a Dragon (2020) | 121 | 116 | 118 | 110 | 112 | 72.4 |
| Immortals Fenyx Rising (2020) | 143 | 121 | 109 | 80 | 74 | 57 |
| Cyberpunk 2077 1.0 (2020) | 132 | 128 | 116 | 103 | 72.5 | 38.9 |
Hesaplama performansı
LuxMark ve ComputeMark'ta, MSI GeForce RTX 3080 Gaming X Trio, Asus GeForce RTX 3080 ROG Strix Gaming OC'den genellikle biraz ileride. Ancak, daha hızlı GeForce RTX 3090'ı kullandığınızda yalnızca gözle görülür bir performans artışı elde edersiniz. Yalnızca Quadro veya FirePro modelleri gibi profesyonel grafik kartları daha fazla performans sunabilir.
| LuxMark v2.0 64Bit | |
| Room GPUs-only | |
| NVIDIA GeForce RTX 3090 | |
| NVIDIA GeForce RTX 3080 | |
| NVIDIA GeForce RTX 3080 | |
| AMD Radeon RX 6800 XT | |
| NVIDIA Titan RTX | |
| NVIDIA GeForce RTX 2080 Ti (Desktop) | |
| NVIDIA GeForce RTX 2080 Ti (Desktop) | |
| NVIDIA GeForce RTX 3070 | |
| AMD Radeon VII | |
| NVIDIA GeForce RTX 2080 (Desktop) | |
| NVIDIA GeForce RTX 2080 Super (Desktop) | |
| NVIDIA GeForce RTX 2070 Super (Desktop) | |
| NVIDIA GeForce RTX 2070 (Desktop) | |
| NVIDIA GeForce RTX 2060 Super (Desktop) | |
| NVIDIA GeForce RTX 2060 (Desktop) | |
| AMD Radeon RX 5700 XT (Desktop) | |
| AMD Radeon RX 5700 (Desktop) | |
| Sala GPUs-only | |
| AMD Radeon RX 6800 XT | |
| NVIDIA GeForce RTX 3090 | |
| NVIDIA GeForce RTX 3080 | |
| NVIDIA GeForce RTX 3080 | |
| NVIDIA Titan RTX | |
| NVIDIA GeForce RTX 2080 Ti (Desktop) | |
| NVIDIA GeForce RTX 3070 | |
| NVIDIA GeForce RTX 2080 Ti (Desktop) | |
| NVIDIA GeForce RTX 2080 (Desktop) | |
| NVIDIA GeForce RTX 2080 Super (Desktop) | |
| NVIDIA GeForce RTX 2070 Super (Desktop) | |
| NVIDIA GeForce RTX 2070 (Desktop) | |
| NVIDIA GeForce RTX 2060 Super (Desktop) | |
| AMD Radeon VII | |
| AMD Radeon RX 5700 XT (Desktop) | |
| NVIDIA GeForce RTX 2060 (Desktop) | |
| AMD Radeon RX 5700 (Desktop) | |
| ComputeMark v2.1 | |
| 1024x600 Normal, QJuliaRayTrace | |
| NVIDIA GeForce RTX 3090 | |
| NVIDIA GeForce RTX 3080 | |
| NVIDIA GeForce RTX 3080 | |
| NVIDIA GeForce RTX 3070 | |
| AMD Radeon RX 6800 XT | |
| NVIDIA GeForce RTX 2080 Ti (Desktop) | |
| NVIDIA Titan RTX | |
| NVIDIA GeForce RTX 2080 Ti (Desktop) | |
| NVIDIA GeForce RTX 2080 (Desktop) | |
| NVIDIA GeForce RTX 2080 Super (Desktop) | |
| NVIDIA GeForce RTX 2070 Super (Desktop) | |
| AMD Radeon VII | |
| AMD Radeon RX 5700 XT (Desktop) | |
| NVIDIA GeForce RTX 2070 (Desktop) | |
| NVIDIA GeForce RTX 2060 Super (Desktop) | |
| NVIDIA GeForce RTX 2060 (Desktop) | |
| AMD Radeon RX 5700 (Desktop) | |
| 1024x600 Normal, Mandel Scalar | |
| NVIDIA GeForce RTX 3090 | |
| AMD Radeon RX 6800 XT | |
| NVIDIA GeForce RTX 3080 | |
| NVIDIA GeForce RTX 3080 | |
| NVIDIA GeForce RTX 3070 | |
| AMD Radeon VII | |
| NVIDIA GeForce RTX 2080 Ti (Desktop) | |
| NVIDIA Titan RTX | |
| NVIDIA GeForce RTX 2080 Ti (Desktop) | |
| AMD Radeon RX 5700 XT (Desktop) | |
| NVIDIA GeForce RTX 2080 (Desktop) | |
| NVIDIA GeForce RTX 2080 Super (Desktop) | |
| AMD Radeon RX 5700 (Desktop) | |
| NVIDIA GeForce RTX 2070 Super (Desktop) | |
| NVIDIA GeForce RTX 2070 (Desktop) | |
| NVIDIA GeForce RTX 2060 Super (Desktop) | |
| NVIDIA GeForce RTX 2060 (Desktop) | |
| 1024x600 Normal, Mandel Vector | |
| AMD Radeon RX 6800 XT | |
| NVIDIA GeForce RTX 3090 | |
| NVIDIA GeForce RTX 3080 | |
| NVIDIA GeForce RTX 3080 | |
| NVIDIA GeForce RTX 3070 | |
| NVIDIA GeForce RTX 2080 Ti (Desktop) | |
| NVIDIA Titan RTX | |
| AMD Radeon VII | |
| NVIDIA GeForce RTX 2080 Ti (Desktop) | |
| AMD Radeon RX 5700 XT (Desktop) | |
| NVIDIA GeForce RTX 2080 (Desktop) | |
| NVIDIA GeForce RTX 2080 Super (Desktop) | |
| AMD Radeon RX 5700 (Desktop) | |
| NVIDIA GeForce RTX 2070 Super (Desktop) | |
| NVIDIA GeForce RTX 2070 (Desktop) | |
| NVIDIA GeForce RTX 2060 Super (Desktop) | |
| NVIDIA GeForce RTX 2060 (Desktop) | |
| 1024x600 Normal, Fluid 2DTexArr | |
| NVIDIA GeForce RTX 3090 | |
| NVIDIA GeForce RTX 3080 | |
| NVIDIA GeForce RTX 3080 | |
| AMD Radeon RX 6800 XT | |
| NVIDIA Titan RTX | |
| NVIDIA GeForce RTX 2080 Ti (Desktop) | |
| NVIDIA GeForce RTX 2080 Ti (Desktop) | |
| NVIDIA GeForce RTX 3070 | |
| NVIDIA GeForce RTX 2080 Super (Desktop) | |
| NVIDIA GeForce RTX 2080 (Desktop) | |
| NVIDIA GeForce RTX 2070 Super (Desktop) | |
| AMD Radeon VII | |
| NVIDIA GeForce RTX 2070 (Desktop) | |
| NVIDIA GeForce RTX 2060 Super (Desktop) | |
| AMD Radeon RX 5700 XT (Desktop) | |
| AMD Radeon RX 5700 (Desktop) | |
| NVIDIA GeForce RTX 2060 (Desktop) | |
| 1024x600 Normal, Fluid 3DTex | |
| NVIDIA GeForce RTX 3090 | |
| AMD Radeon RX 6800 XT | |
| NVIDIA GeForce RTX 3080 | |
| NVIDIA GeForce RTX 3080 | |
| NVIDIA Titan RTX | |
| NVIDIA GeForce RTX 2080 Ti (Desktop) | |
| AMD Radeon VII | |
| NVIDIA GeForce RTX 2080 Ti (Desktop) | |
| NVIDIA GeForce RTX 3070 | |
| NVIDIA GeForce RTX 2080 Super (Desktop) | |
| NVIDIA GeForce RTX 2080 (Desktop) | |
| NVIDIA GeForce RTX 2070 Super (Desktop) | |
| NVIDIA GeForce RTX 2070 (Desktop) | |
| AMD Radeon RX 5700 XT (Desktop) | |
| AMD Radeon RX 5700 (Desktop) | |
| NVIDIA GeForce RTX 2060 Super (Desktop) | |
| NVIDIA GeForce RTX 2060 (Desktop) | |
| 1024x600 Normal, Score | |
| NVIDIA GeForce RTX 3090 | |
| NVIDIA GeForce RTX 3080 | |
| NVIDIA GeForce RTX 3080 | |
| AMD Radeon RX 6800 XT | |
| NVIDIA GeForce RTX 3070 | |
| NVIDIA GeForce RTX 2080 Ti (Desktop) | |
| NVIDIA Titan RTX | |
| NVIDIA GeForce RTX 2080 Ti (Desktop) | |
| AMD Radeon VII | |
| NVIDIA GeForce RTX 2080 Super (Desktop) | |
| NVIDIA GeForce RTX 2080 (Desktop) | |
| AMD Radeon RX 5700 XT (Desktop) | |
| NVIDIA GeForce RTX 2070 Super (Desktop) | |
| NVIDIA GeForce RTX 2070 (Desktop) | |
| AMD Radeon RX 5700 (Desktop) | |
| NVIDIA GeForce RTX 2060 Super (Desktop) | |
| NVIDIA GeForce RTX 2060 (Desktop) | |
| SPECviewperf 13 | |
| Solidworks (sw-04) | |
| NVIDIA Titan RTX | |
| AMD Radeon RX 6800 XT | |
| NVIDIA Titan RTX | |
| AMD Radeon RX 5700 XT (Desktop) | |
| NVIDIA GeForce RTX 2080 Ti (Desktop) | |
| NVIDIA GeForce RTX 2080 Ti (Desktop) | |
| AMD Radeon RX 5700 (Desktop) | |
| NVIDIA GeForce RTX 2080 (Desktop) | |
| NVIDIA GeForce RTX 2080 Super (Desktop) | |
| NVIDIA GeForce RTX 3080 | |
| NVIDIA GeForce RTX 3090 | |
| AMD Radeon VII | |
| NVIDIA GeForce RTX 2070 Super (Desktop) | |
| NVIDIA GeForce RTX 3080 | |
| NVIDIA GeForce RTX 2070 (Desktop) | |
| NVIDIA GeForce RTX 3070 | |
| NVIDIA GeForce RTX 2060 (Desktop) | |
| NVIDIA GeForce RTX 2060 Super (Desktop) | |
| Siemens NX (snx-03) | |
| NVIDIA Titan RTX | |
| NVIDIA Titan RTX | |
| AMD Radeon RX 6800 XT | |
| AMD Radeon RX 5700 XT (Desktop) | |
| AMD Radeon RX 5700 (Desktop) | |
| AMD Radeon VII | |
| NVIDIA GeForce RTX 3090 | |
| NVIDIA GeForce RTX 3080 | |
| NVIDIA GeForce RTX 3080 | |
| NVIDIA GeForce RTX 2080 Ti (Desktop) | |
| NVIDIA GeForce RTX 3070 | |
| NVIDIA GeForce RTX 2080 Ti (Desktop) | |
| NVIDIA GeForce RTX 2080 Super (Desktop) | |
| NVIDIA GeForce RTX 2080 (Desktop) | |
| NVIDIA GeForce RTX 2070 Super (Desktop) | |
| NVIDIA GeForce RTX 2070 (Desktop) | |
| NVIDIA GeForce RTX 2060 Super (Desktop) | |
| NVIDIA GeForce RTX 2060 (Desktop) | |
| Showcase (showcase-02) | |
| NVIDIA GeForce RTX 3090 | |
| AMD Radeon RX 6800 XT | |
| NVIDIA GeForce RTX 3080 | |
| NVIDIA Titan RTX | |
| NVIDIA Titan RTX | |
| NVIDIA GeForce RTX 2080 Ti (Desktop) | |
| NVIDIA GeForce RTX 2080 Ti (Desktop) | |
| NVIDIA GeForce RTX 3070 | |
| NVIDIA GeForce RTX 2080 Super (Desktop) | |
| AMD Radeon RX 5700 XT (Desktop) | |
| NVIDIA GeForce RTX 2070 Super (Desktop) | |
| AMD Radeon RX 5700 (Desktop) | |
| NVIDIA GeForce RTX 2060 Super (Desktop) | |
| NVIDIA GeForce RTX 2060 (Desktop) | |
| Medical (medical-02) | |
| AMD Radeon RX 6800 XT | |
| NVIDIA GeForce RTX 3090 | |
| NVIDIA GeForce RTX 3080 | |
| NVIDIA GeForce RTX 3080 | |
| NVIDIA Titan RTX | |
| NVIDIA Titan RTX | |
| NVIDIA GeForce RTX 2080 Ti (Desktop) | |
| AMD Radeon RX 5700 XT (Desktop) | |
| NVIDIA GeForce RTX 2080 Ti (Desktop) | |
| NVIDIA GeForce RTX 3070 | |
| AMD Radeon VII | |
| NVIDIA GeForce RTX 2080 Super (Desktop) | |
| NVIDIA GeForce RTX 2080 (Desktop) | |
| AMD Radeon RX 5700 (Desktop) | |
| NVIDIA GeForce RTX 2070 Super (Desktop) | |
| NVIDIA GeForce RTX 2070 (Desktop) | |
| NVIDIA GeForce RTX 2060 Super (Desktop) | |
| NVIDIA GeForce RTX 2060 (Desktop) | |
| Maya (maya-05) | |
| NVIDIA GeForce RTX 3090 | |
| NVIDIA Titan RTX | |
| NVIDIA GeForce RTX 3080 | |
| NVIDIA GeForce RTX 2080 Ti (Desktop) | |
| NVIDIA GeForce RTX 2080 Ti (Desktop) | |
| NVIDIA Titan RTX | |
| NVIDIA GeForce RTX 3080 | |
| AMD Radeon RX 6800 XT | |
| NVIDIA GeForce RTX 2080 Super (Desktop) | |
| NVIDIA GeForce RTX 2070 Super (Desktop) | |
| NVIDIA GeForce RTX 2070 (Desktop) | |
| NVIDIA GeForce RTX 2060 Super (Desktop) | |
| NVIDIA GeForce RTX 3070 | |
| NVIDIA GeForce RTX 2060 (Desktop) | |
| AMD Radeon RX 5700 XT (Desktop) | |
| AMD Radeon VII | |
| AMD Radeon RX 5700 (Desktop) | |
| Energy (energy-02) | |
| AMD Radeon RX 6800 XT | |
| NVIDIA Titan RTX | |
| NVIDIA Titan RTX | |
| NVIDIA GeForce RTX 3090 | |
| NVIDIA GeForce RTX 3080 | |
| NVIDIA GeForce RTX 3080 | |
| AMD Radeon VII | |
| NVIDIA GeForce RTX 2080 Ti (Desktop) | |
| NVIDIA GeForce RTX 2080 Ti (Desktop) | |
| NVIDIA GeForce RTX 3070 | |
| AMD Radeon RX 5700 XT (Desktop) | |
| AMD Radeon RX 5700 (Desktop) | |
| NVIDIA GeForce RTX 2080 Super (Desktop) | |
| NVIDIA GeForce RTX 2070 Super (Desktop) | |
| NVIDIA GeForce RTX 2070 (Desktop) | |
| NVIDIA GeForce RTX 2060 Super (Desktop) | |
| NVIDIA GeForce RTX 2060 (Desktop) | |
| Creo (creo-02) | |
| NVIDIA Titan RTX | |
| NVIDIA GeForce RTX 3090 | |
| NVIDIA Titan RTX | |
| NVIDIA GeForce RTX 3080 | |
| NVIDIA GeForce RTX 2080 Ti (Desktop) | |
| NVIDIA GeForce RTX 2080 Ti (Desktop) | |
| NVIDIA GeForce RTX 3080 | |
| AMD Radeon RX 6800 XT | |
| NVIDIA GeForce RTX 3070 | |
| NVIDIA GeForce RTX 2080 (Desktop) | |
| NVIDIA GeForce RTX 2080 Super (Desktop) | |
| NVIDIA GeForce RTX 2070 (Desktop) | |
| NVIDIA GeForce RTX 2060 Super (Desktop) | |
| NVIDIA GeForce RTX 2070 Super (Desktop) | |
| NVIDIA GeForce RTX 2060 (Desktop) | |
| AMD Radeon RX 5700 XT (Desktop) | |
| AMD Radeon RX 5700 (Desktop) | |
| AMD Radeon VII | |
| Catia (catia-05) | |
| AMD Radeon RX 6800 XT | |
| NVIDIA Titan RTX | |
| NVIDIA Titan RTX | |
| AMD Radeon RX 5700 XT (Desktop) | |
| AMD Radeon VII | |
| AMD Radeon RX 5700 (Desktop) | |
| NVIDIA GeForce RTX 3090 | |
| NVIDIA GeForce RTX 3080 | |
| NVIDIA GeForce RTX 3080 | |
| NVIDIA GeForce RTX 2080 Ti (Desktop) | |
| NVIDIA GeForce RTX 2080 Ti (Desktop) | |
| NVIDIA GeForce RTX 3070 | |
| NVIDIA GeForce RTX 2080 Super (Desktop) | |
| NVIDIA GeForce RTX 2070 Super (Desktop) | |
| NVIDIA GeForce RTX 2070 (Desktop) | |
| NVIDIA GeForce RTX 2060 Super (Desktop) | |
| NVIDIA GeForce RTX 2060 (Desktop) | |
| 3ds Max (3dsmax-06) | |
| NVIDIA GeForce RTX 3090 | |
| NVIDIA GeForce RTX 3080 | |
| NVIDIA Titan RTX | |
| AMD Radeon RX 6800 XT | |
| NVIDIA GeForce RTX 2080 Ti (Desktop) | |
| NVIDIA GeForce RTX 2080 Ti (Desktop) | |
| NVIDIA Titan RTX | |
| NVIDIA GeForce RTX 3070 | |
| NVIDIA GeForce RTX 3080 | |
| NVIDIA GeForce RTX 2080 Super (Desktop) | |
| NVIDIA GeForce RTX 2070 Super (Desktop) | |
| NVIDIA GeForce RTX 2070 (Desktop) | |
| NVIDIA GeForce RTX 2060 Super (Desktop) | |
| NVIDIA GeForce RTX 2060 (Desktop) | |
| AMD Radeon RX 5700 XT (Desktop) | |
| AMD Radeon VII | |
| AMD Radeon RX 5700 (Desktop) | |
| SPECviewperf 12 | |
| 1900x1060 Solidworks (sw-03) | |
| NVIDIA Titan RTX | |
| AMD Radeon RX 6800 XT | |
| NVIDIA Titan RTX | |
| AMD Radeon RX 5700 XT (Desktop) | |
| NVIDIA GeForce RTX 2080 Ti (Desktop) | |
| AMD Radeon RX 5700 (Desktop) | |
| NVIDIA GeForce RTX 2080 Ti (Desktop) | |
| AMD Radeon VII | |
| NVIDIA GeForce RTX 3090 | |
| NVIDIA GeForce RTX 3080 | |
| NVIDIA GeForce RTX 2080 Super (Desktop) | |
| NVIDIA GeForce RTX 2080 (Desktop) | |
| NVIDIA GeForce RTX 3080 | |
| NVIDIA GeForce RTX 2070 Super (Desktop) | |
| NVIDIA GeForce RTX 3070 | |
| NVIDIA GeForce RTX 2070 (Desktop) | |
| NVIDIA GeForce RTX 2060 Super (Desktop) | |
| NVIDIA GeForce RTX 2060 (Desktop) | |
| 1900x1060 Siemens NX (snx-02) | |
| NVIDIA Titan RTX | |
| NVIDIA Titan RTX | |
| AMD Radeon RX 6800 XT | |
| AMD Radeon RX 5700 XT (Desktop) | |
| AMD Radeon RX 5700 (Desktop) | |
| AMD Radeon VII | |
| NVIDIA GeForce RTX 3090 | |
| NVIDIA GeForce RTX 3080 | |
| NVIDIA GeForce RTX 3080 | |
| NVIDIA GeForce RTX 3070 | |
| NVIDIA GeForce RTX 2080 Ti (Desktop) | |
| NVIDIA GeForce RTX 2080 Super (Desktop) | |
| NVIDIA GeForce RTX 2080 Ti (Desktop) | |
| NVIDIA GeForce RTX 2080 (Desktop) | |
| NVIDIA GeForce RTX 2070 Super (Desktop) | |
| NVIDIA GeForce RTX 2070 (Desktop) | |
| NVIDIA GeForce RTX 2060 Super (Desktop) | |
| NVIDIA GeForce RTX 2060 (Desktop) | |
| 1900x1060 Showcase (showcase-01) | |
| NVIDIA GeForce RTX 3090 | |
| AMD Radeon RX 6800 XT | |
| NVIDIA GeForce RTX 3080 | |
| NVIDIA Titan RTX | |
| NVIDIA Titan RTX | |
| NVIDIA GeForce RTX 3080 | |
| NVIDIA GeForce RTX 2080 Ti (Desktop) | |
| NVIDIA GeForce RTX 2080 Ti (Desktop) | |
| NVIDIA GeForce RTX 3070 | |
| NVIDIA GeForce RTX 2080 Super (Desktop) | |
| AMD Radeon RX 5700 XT (Desktop) | |
| NVIDIA GeForce RTX 2070 Super (Desktop) | |
| AMD Radeon RX 5700 (Desktop) | |
| NVIDIA GeForce RTX 2060 Super (Desktop) | |
| NVIDIA GeForce RTX 2060 (Desktop) | |
| 1900x1060 Medical (medical-01) | |
| NVIDIA Titan RTX | |
| NVIDIA Titan RTX | |
| AMD Radeon RX 6800 XT | |
| AMD Radeon VII | |
| NVIDIA GeForce RTX 2080 Ti (Desktop) | |
| NVIDIA GeForce RTX 3080 | |
| NVIDIA GeForce RTX 2080 Ti (Desktop) | |
| AMD Radeon RX 5700 XT (Desktop) | |
| NVIDIA GeForce RTX 2080 Super (Desktop) | |
| NVIDIA GeForce RTX 2080 (Desktop) | |
| NVIDIA GeForce RTX 3090 | |
| NVIDIA GeForce RTX 2070 Super (Desktop) | |
| AMD Radeon RX 5700 (Desktop) | |
| NVIDIA GeForce RTX 2070 (Desktop) | |
| NVIDIA GeForce RTX 2060 Super (Desktop) | |
| NVIDIA GeForce RTX 3080 | |
| NVIDIA GeForce RTX 3070 | |
| NVIDIA GeForce RTX 2060 (Desktop) | |
| 1900x1060 Maya (maya-04) | |
| NVIDIA Titan RTX | |
| NVIDIA GeForce RTX 3080 | |
| NVIDIA GeForce RTX 3090 | |
| NVIDIA GeForce RTX 2080 Ti (Desktop) | |
| NVIDIA GeForce RTX 2080 Ti (Desktop) | |
| NVIDIA GeForce RTX 3070 | |
| NVIDIA GeForce RTX 2080 (Desktop) | |
| NVIDIA GeForce RTX 2060 Super (Desktop) | |
| NVIDIA GeForce RTX 2070 (Desktop) | |
| NVIDIA GeForce RTX 3080 | |
| NVIDIA GeForce RTX 2080 Super (Desktop) | |
| NVIDIA Titan RTX | |
| NVIDIA GeForce RTX 2060 (Desktop) | |
| NVIDIA GeForce RTX 2070 Super (Desktop) | |
| AMD Radeon RX 6800 XT | |
| AMD Radeon VII | |
| AMD Radeon RX 5700 XT (Desktop) | |
| AMD Radeon RX 5700 (Desktop) | |
| 1900x1060 Energy (energy-01) | |
| AMD Radeon RX 6800 XT | |
| NVIDIA Titan RTX | |
| NVIDIA Titan RTX | |
| NVIDIA GeForce RTX 3090 | |
| NVIDIA GeForce RTX 3080 | |
| NVIDIA GeForce RTX 2080 Ti (Desktop) | |
| AMD Radeon VII | |
| NVIDIA GeForce RTX 3080 | |
| NVIDIA GeForce RTX 2080 Ti (Desktop) | |
| NVIDIA GeForce RTX 2080 Super (Desktop) | |
| AMD Radeon RX 5700 XT (Desktop) | |
| NVIDIA GeForce RTX 3070 | |
| NVIDIA GeForce RTX 2080 (Desktop) | |
| NVIDIA GeForce RTX 2070 Super (Desktop) | |
| AMD Radeon RX 5700 (Desktop) | |
| NVIDIA GeForce RTX 2070 (Desktop) | |
| NVIDIA GeForce RTX 2060 Super (Desktop) | |
| NVIDIA GeForce RTX 2060 (Desktop) | |
| 1900x1060 Creo (creo-01) | |
| NVIDIA Titan RTX | |
| AMD Radeon RX 6800 XT | |
| NVIDIA Titan RTX | |
| NVIDIA GeForce RTX 3090 | |
| NVIDIA GeForce RTX 3080 | |
| AMD Radeon RX 5700 XT (Desktop) | |
| NVIDIA GeForce RTX 3080 | |
| NVIDIA GeForce RTX 2080 Ti (Desktop) | |
| NVIDIA GeForce RTX 2080 Ti (Desktop) | |
| AMD Radeon RX 5700 (Desktop) | |
| NVIDIA GeForce RTX 3070 | |
| AMD Radeon VII | |
| NVIDIA GeForce RTX 2080 Super (Desktop) | |
| NVIDIA GeForce RTX 2080 (Desktop) | |
| NVIDIA GeForce RTX 2070 Super (Desktop) | |
| NVIDIA GeForce RTX 2070 (Desktop) | |
| NVIDIA GeForce RTX 2060 (Desktop) | |
| NVIDIA GeForce RTX 2060 Super (Desktop) | |
| 1900x1060 Catia (catia-04) | |
| NVIDIA Titan RTX | |
| AMD Radeon RX 6800 XT | |
| NVIDIA Titan RTX | |
| AMD Radeon VII | |
| AMD Radeon RX 5700 XT (Desktop) | |
| AMD Radeon RX 5700 (Desktop) | |
| NVIDIA GeForce RTX 3090 | |
| NVIDIA GeForce RTX 3080 | |
| NVIDIA GeForce RTX 2080 Ti (Desktop) | |
| NVIDIA GeForce RTX 2080 Ti (Desktop) | |
| NVIDIA GeForce RTX 3080 | |
| NVIDIA GeForce RTX 3070 | |
| NVIDIA GeForce RTX 2080 (Desktop) | |
| NVIDIA GeForce RTX 2080 Super (Desktop) | |
| NVIDIA GeForce RTX 2070 Super (Desktop) | |
| NVIDIA GeForce RTX 2070 (Desktop) | |
| NVIDIA GeForce RTX 2060 Super (Desktop) | |
| NVIDIA GeForce RTX 2060 (Desktop) | |
| 1900x1060 3ds Max (3dsmax-05) | |
| NVIDIA GeForce RTX 3090 | |
| NVIDIA Titan RTX | |
| NVIDIA GeForce RTX 3080 | |
| NVIDIA GeForce RTX 3080 | |
| NVIDIA GeForce RTX 2080 Ti (Desktop) | |
| NVIDIA Titan RTX | |
| NVIDIA GeForce RTX 3070 | |
| NVIDIA GeForce RTX 2080 Ti (Desktop) | |
| NVIDIA GeForce RTX 2080 (Desktop) | |
| NVIDIA GeForce RTX 2080 Super (Desktop) | |
| NVIDIA GeForce RTX 2070 Super (Desktop) | |
| NVIDIA GeForce RTX 2070 (Desktop) | |
| NVIDIA GeForce RTX 2060 Super (Desktop) | |
| NVIDIA GeForce RTX 2060 (Desktop) | |
| AMD Radeon RX 5700 XT (Desktop) | |
| AMD Radeon RX 6800 XT | |
| AMD Radeon VII | |
| AMD Radeon RX 5700 (Desktop) | |
| SPECviewperf 2020 | |
| 3840x2160 Solidworks (solidworks-05) | |
| NVIDIA GeForce RTX 3090 | |
| NVIDIA GeForce RTX 3080 | |
| NVIDIA Titan RTX | |
| NVIDIA GeForce RTX 3070 | |
| AMD Radeon RX 6800 XT | |
| 3840x2160 Siemens NX (snx-04) | |
| NVIDIA Titan RTX | |
| AMD Radeon RX 6800 XT | |
| NVIDIA GeForce RTX 3090 | |
| NVIDIA GeForce RTX 3080 | |
| NVIDIA GeForce RTX 3070 | |
| 3840x2160 Medical (medical-03) | |
| AMD Radeon RX 6800 XT | |
| NVIDIA GeForce RTX 3090 | |
| NVIDIA GeForce RTX 3080 | |
| NVIDIA Titan RTX | |
| NVIDIA GeForce RTX 3070 | |
| 3840x2160 Maya (maya-06) | |
| NVIDIA GeForce RTX 3090 | |
| NVIDIA GeForce RTX 3080 | |
| NVIDIA Titan RTX | |
| NVIDIA GeForce RTX 3070 | |
| AMD Radeon RX 6800 XT | |
| 3840x2160 Energy (energy-03) | |
| NVIDIA GeForce RTX 3090 | |
| AMD Radeon RX 6800 XT | |
| NVIDIA Titan RTX | |
| NVIDIA GeForce RTX 3080 | |
| NVIDIA GeForce RTX 3070 | |
| 3840x2160 Creo (creo-03) | |
| NVIDIA Titan RTX | |
| NVIDIA GeForce RTX 3090 | |
| NVIDIA GeForce RTX 3080 | |
| NVIDIA GeForce RTX 3070 | |
| AMD Radeon RX 6800 XT | |
| 3840x2160 CATIA (catia-06) | |
| NVIDIA Titan RTX | |
| NVIDIA GeForce RTX 3090 | |
| NVIDIA GeForce RTX 3080 | |
| NVIDIA GeForce RTX 3070 | |
| AMD Radeon RX 6800 XT | |
| 3840x2160 3ds Max (3dsmax-07) | |
| NVIDIA GeForce RTX 3090 | |
| AMD Radeon RX 6800 XT | |
| NVIDIA Titan RTX | |
| NVIDIA GeForce RTX 3080 | |
| NVIDIA GeForce RTX 3070 | |
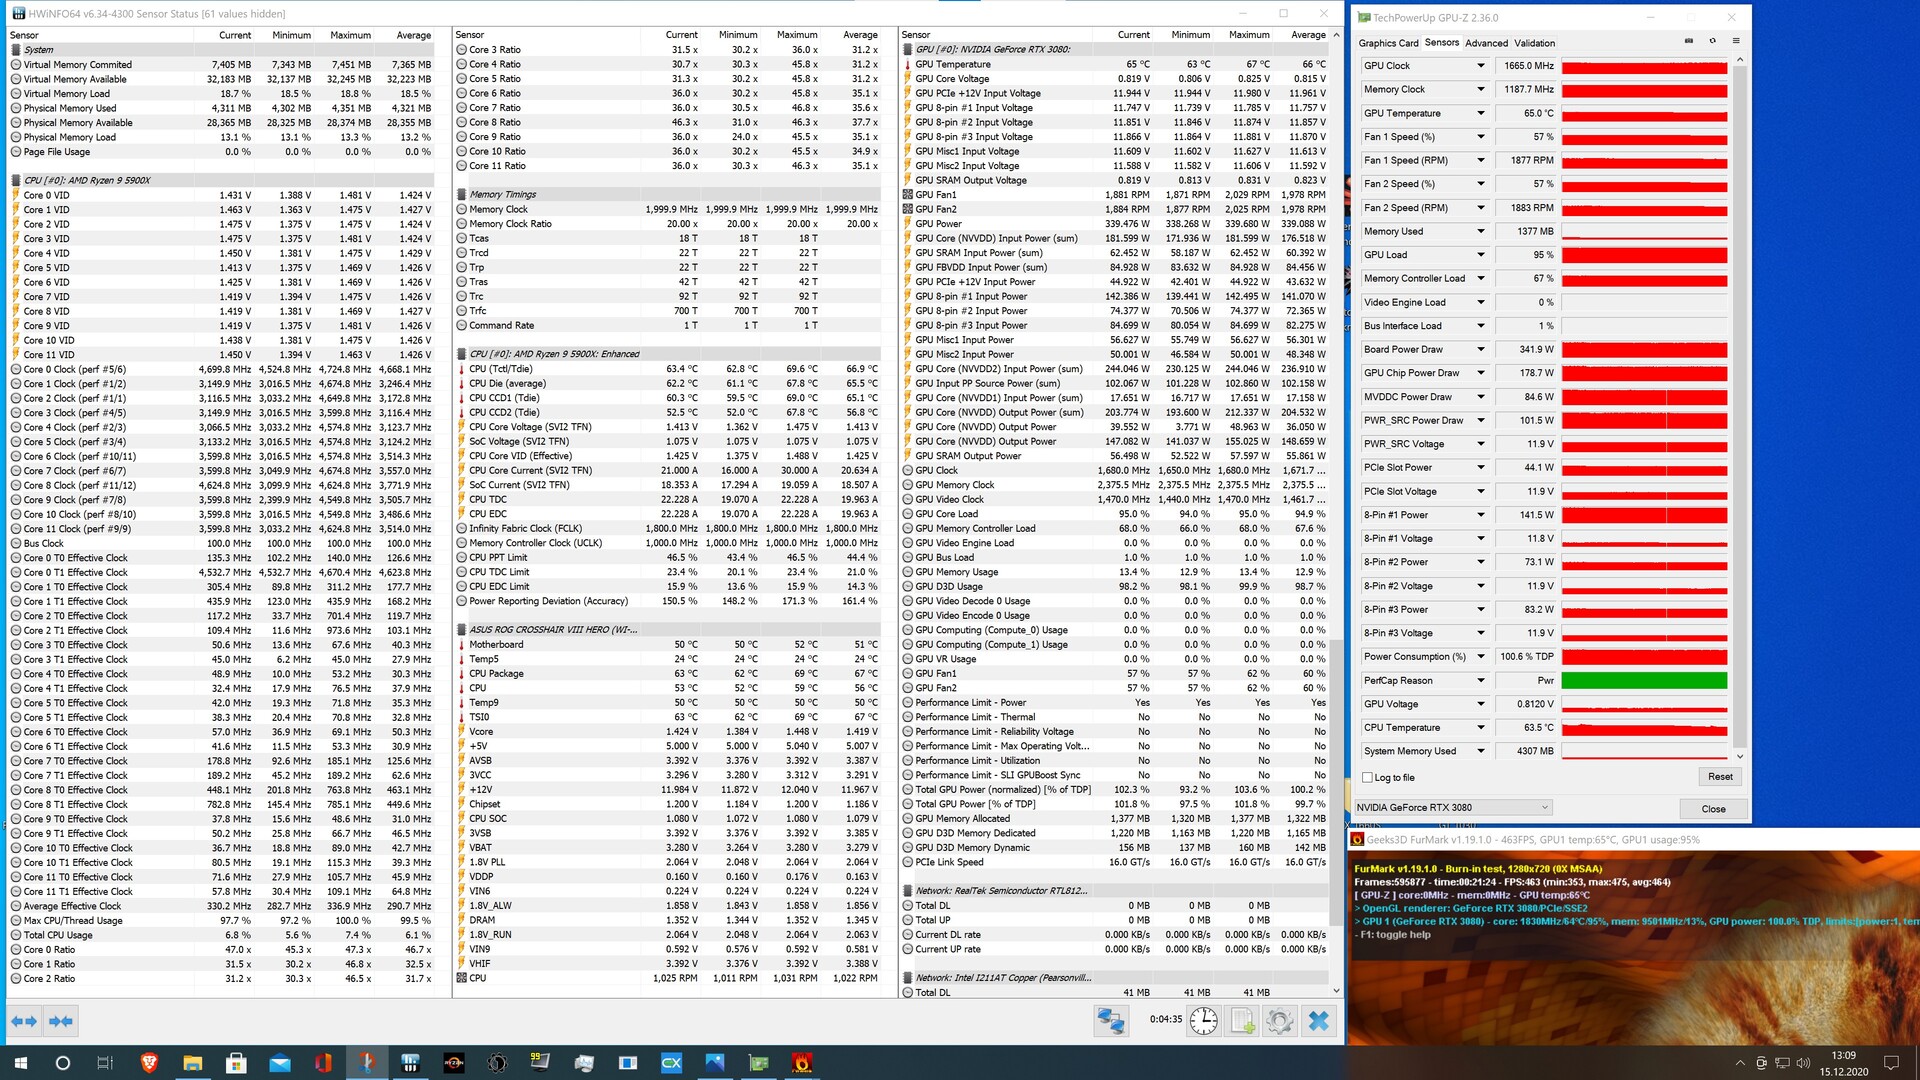
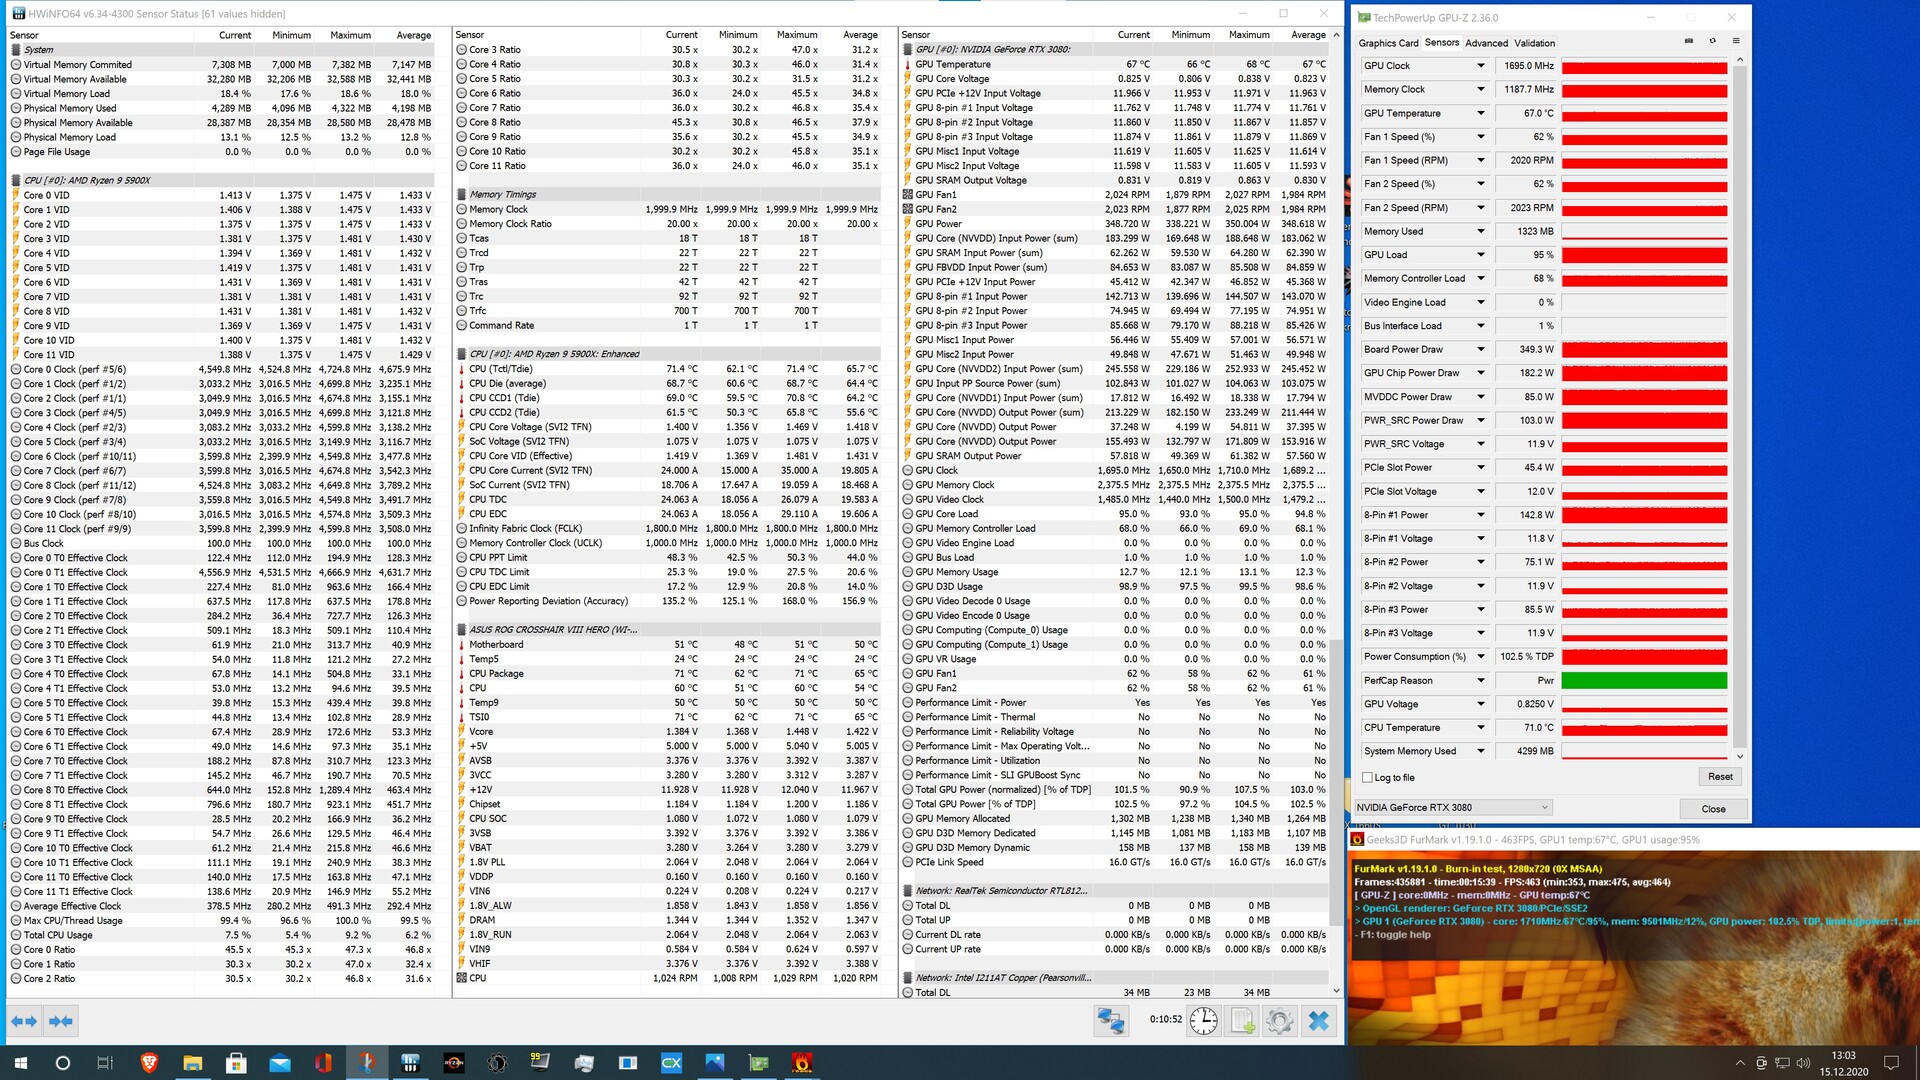
MSI GeForce RTX 3080 Gaming X Trio Emisyonları
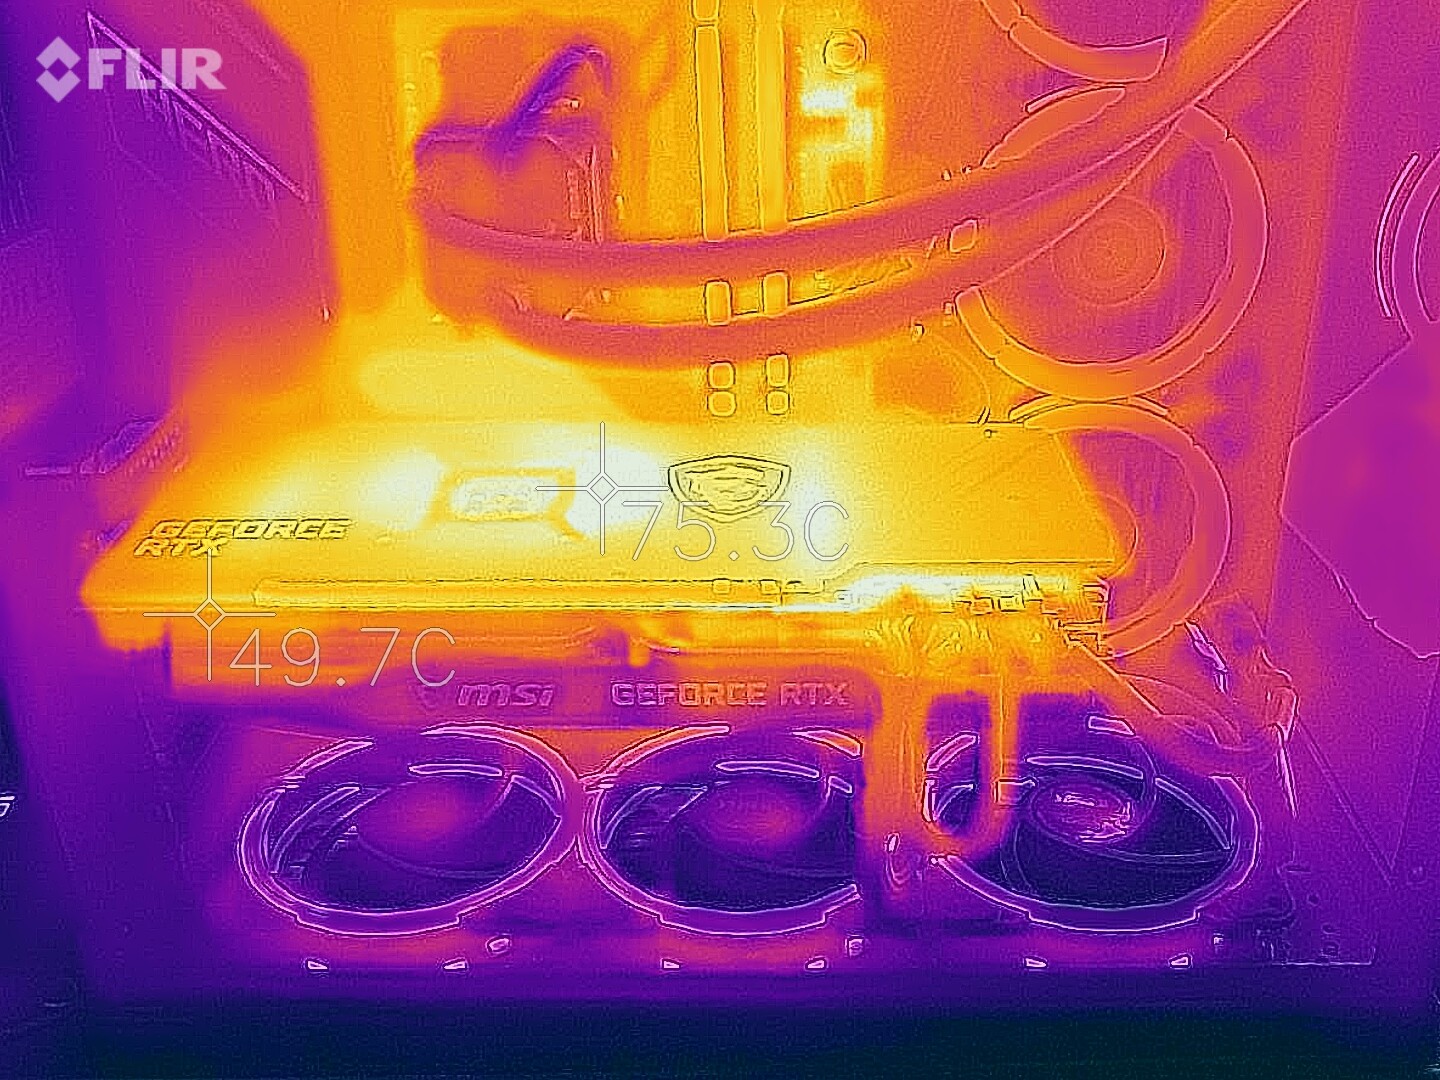
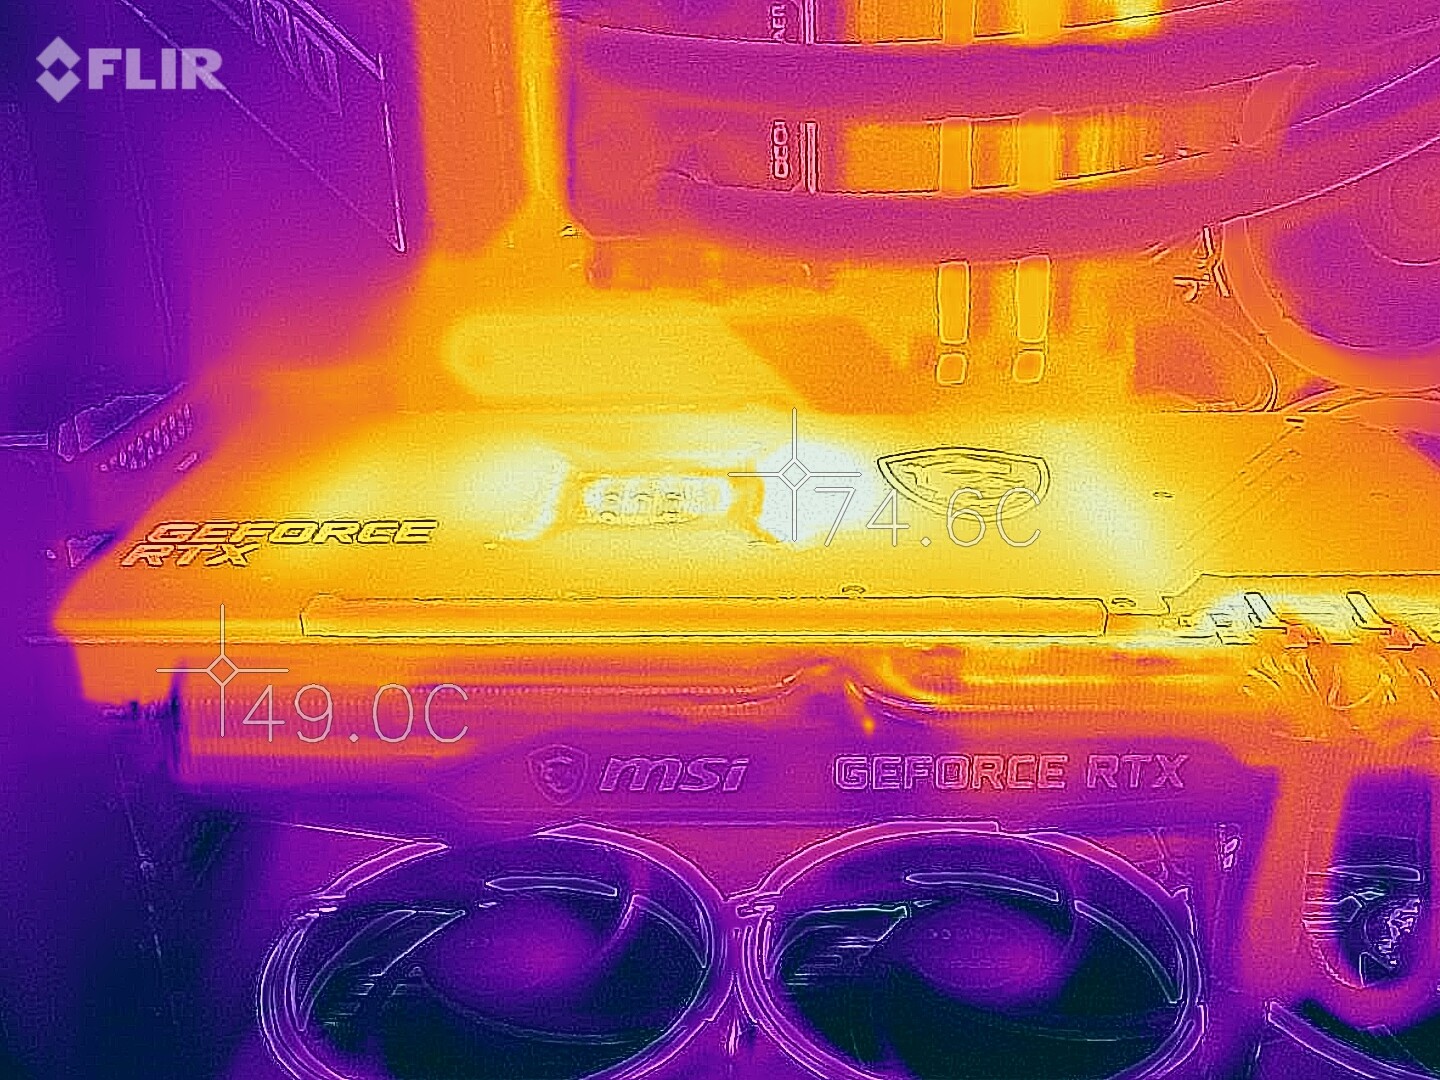
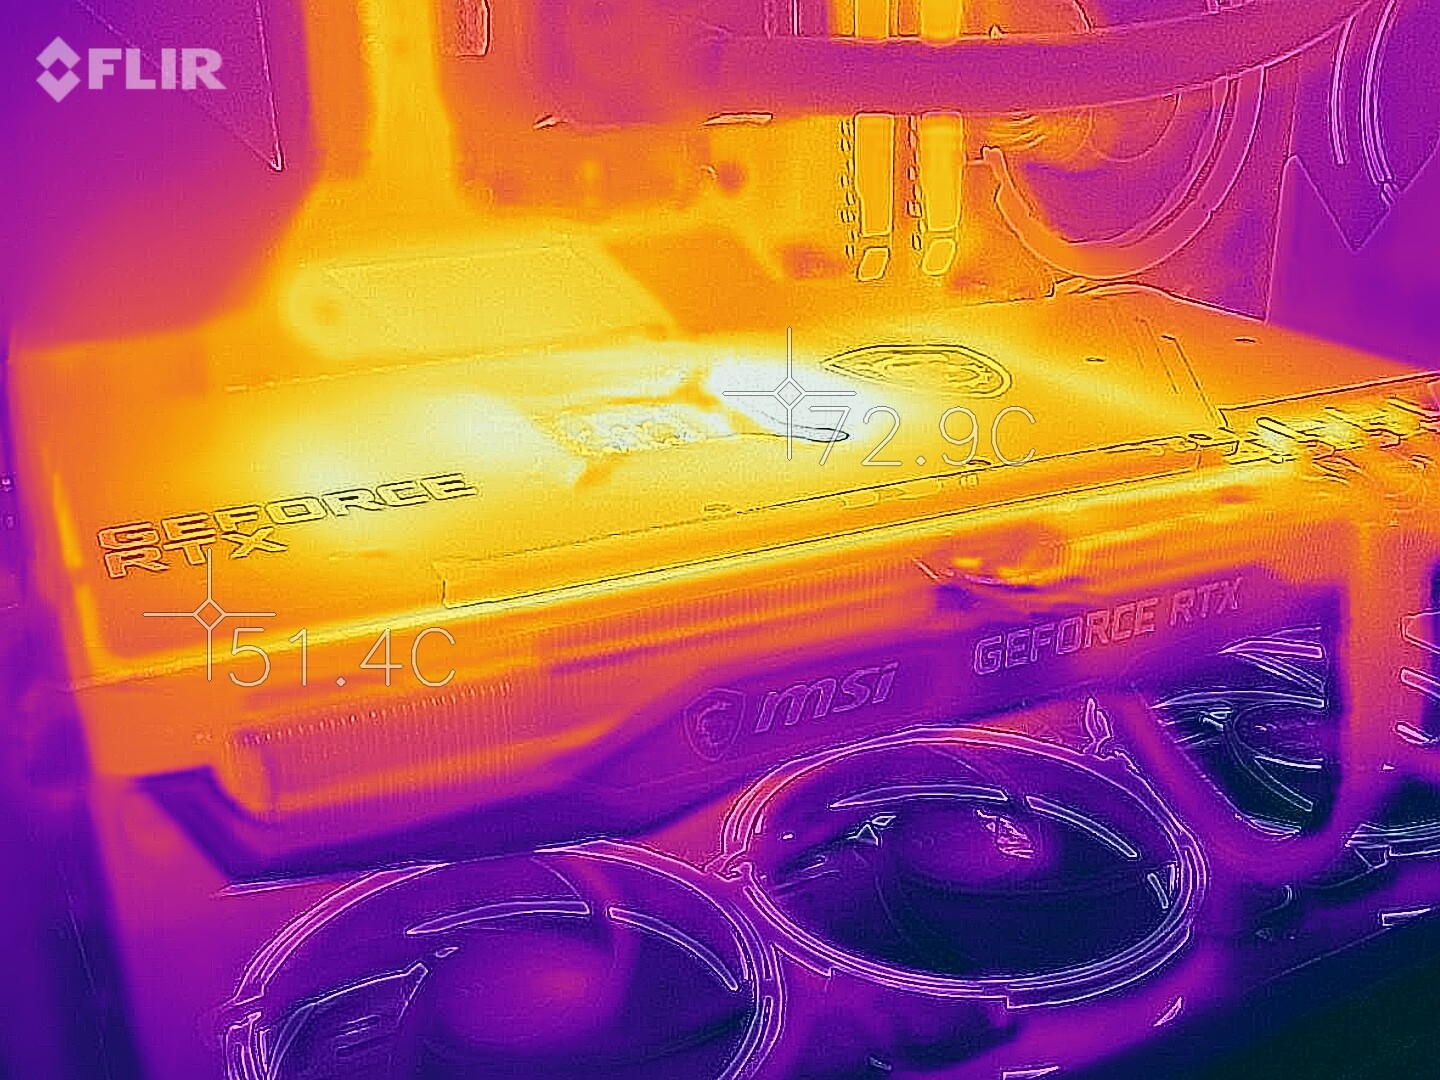
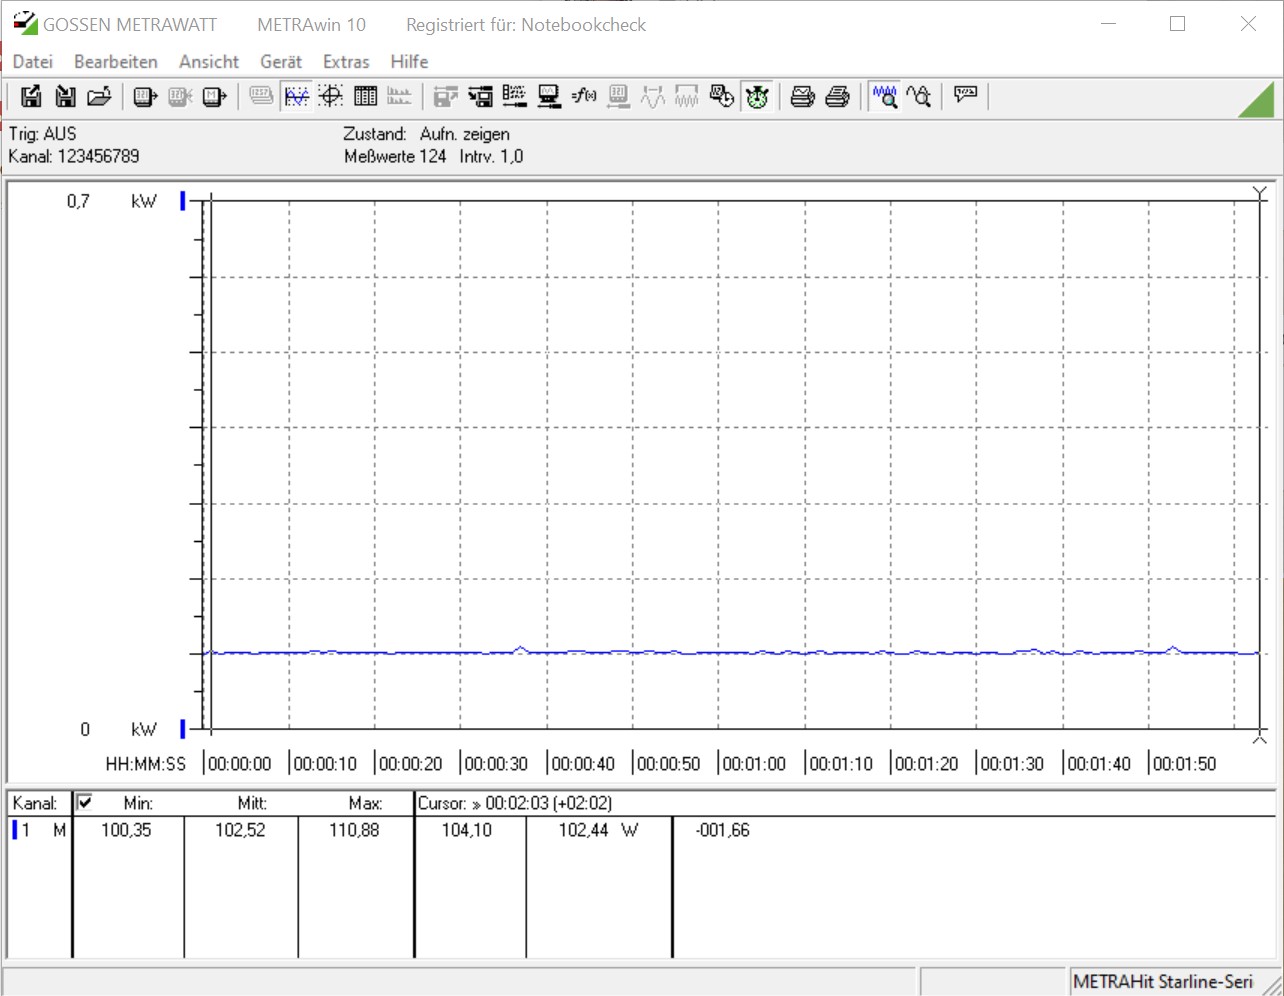
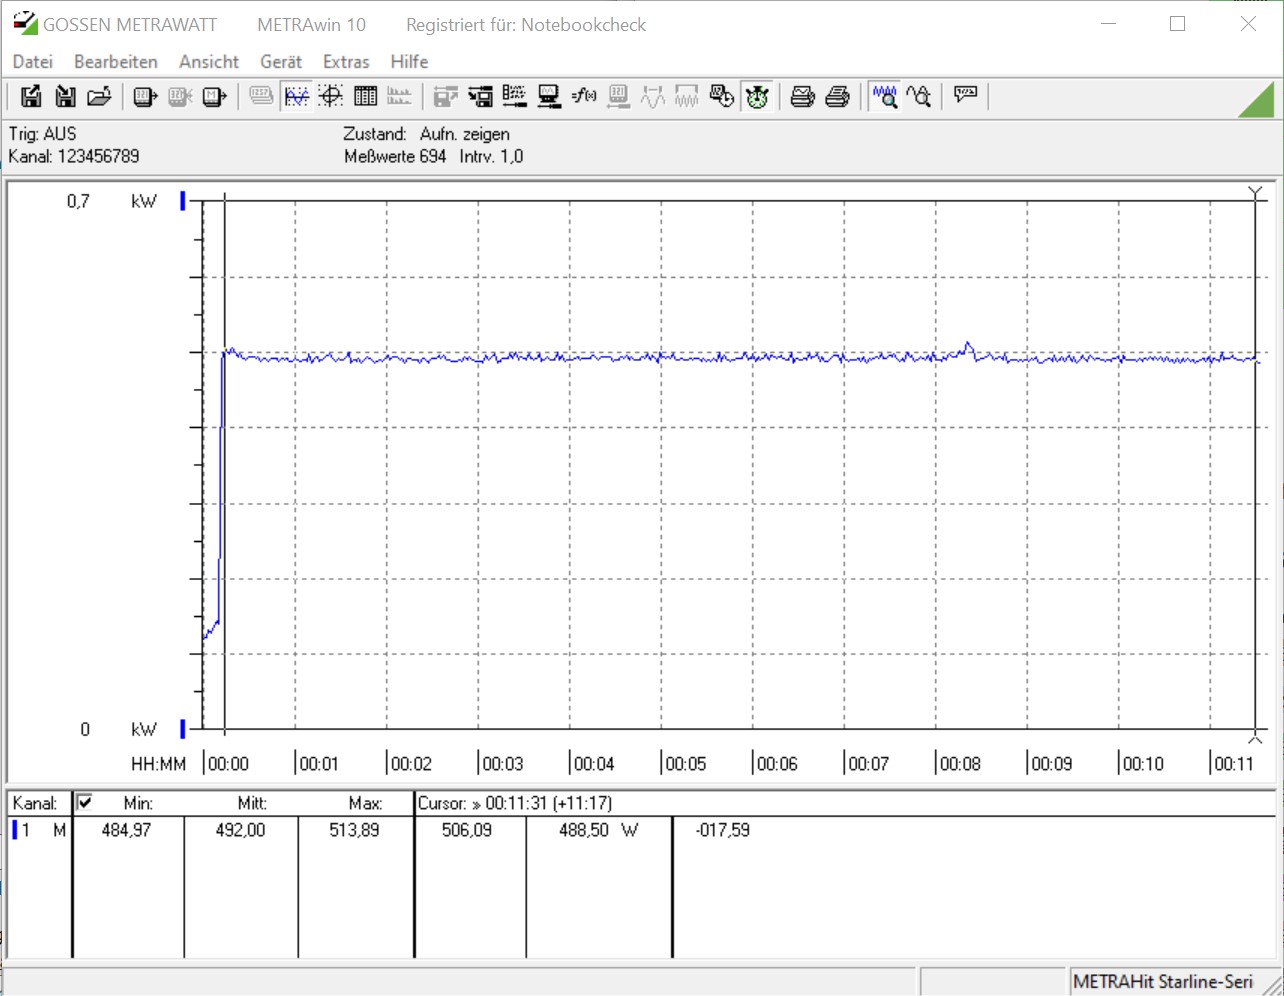
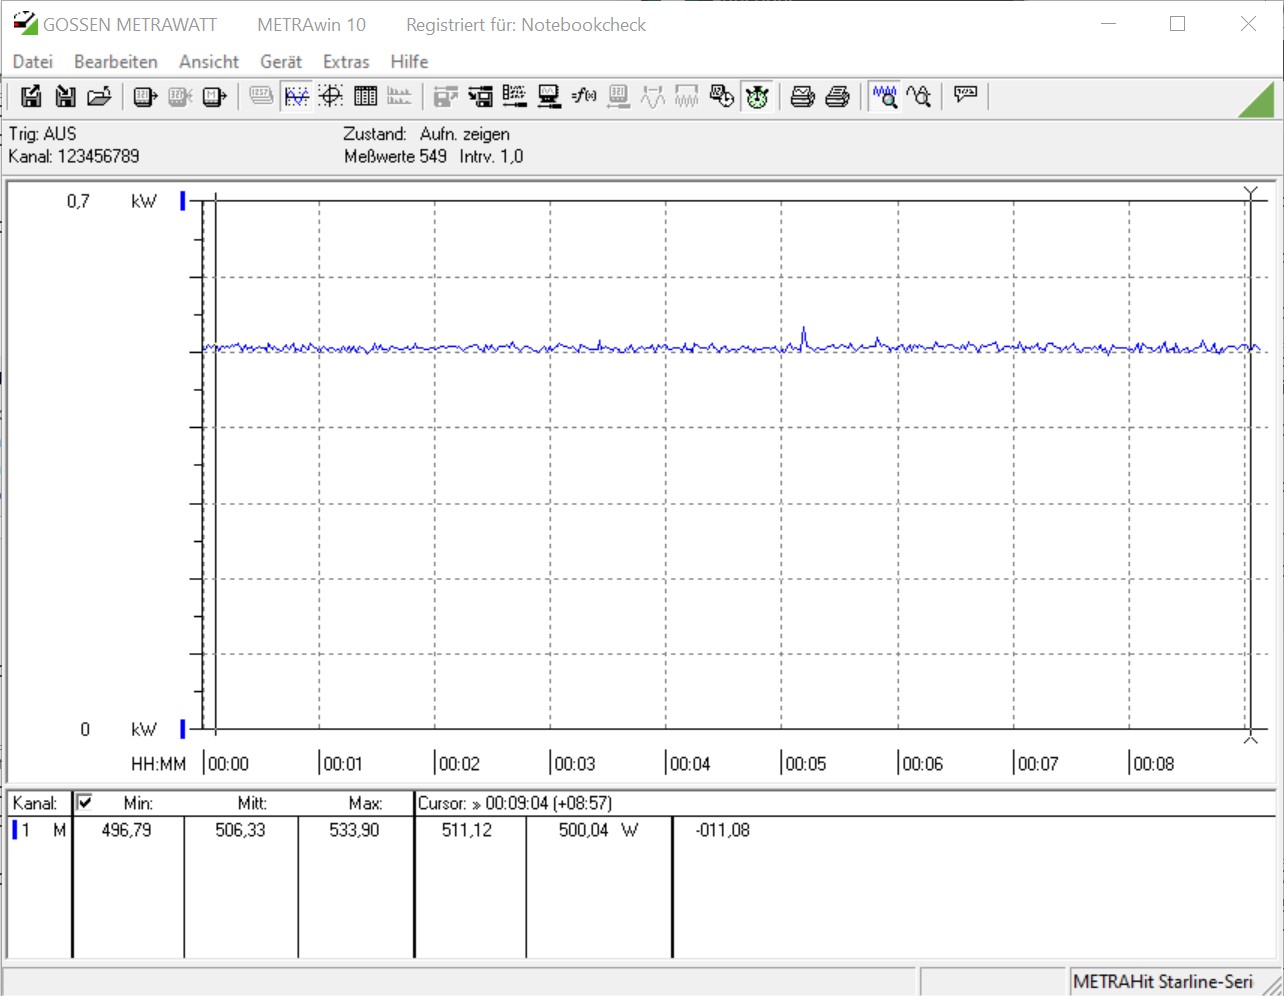
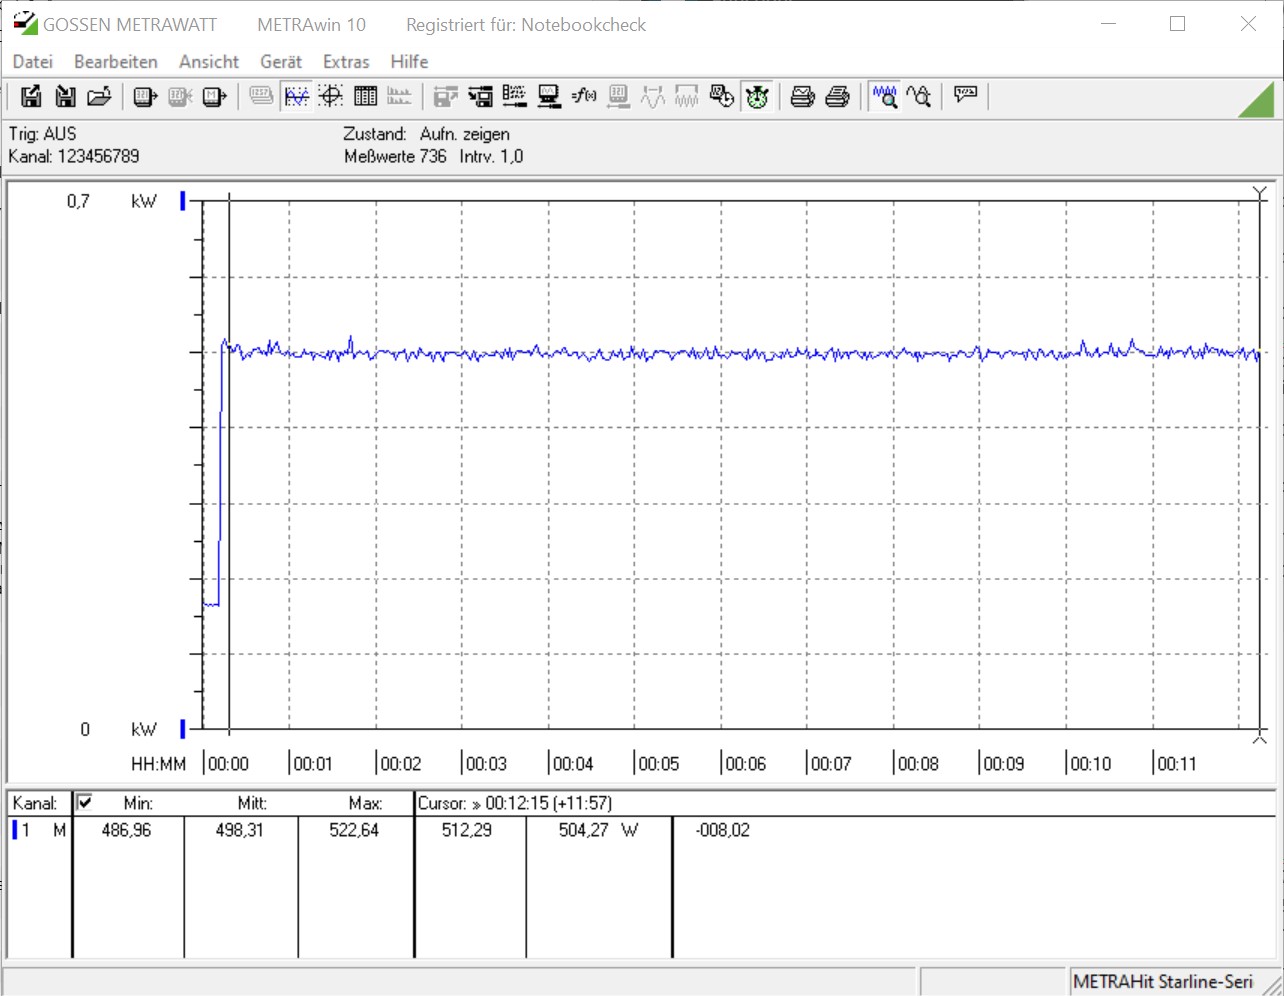
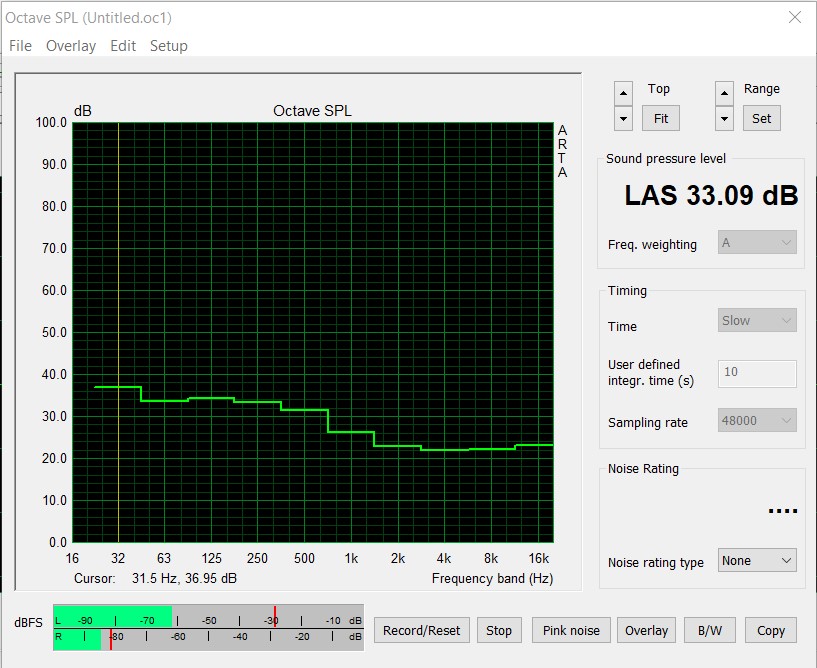
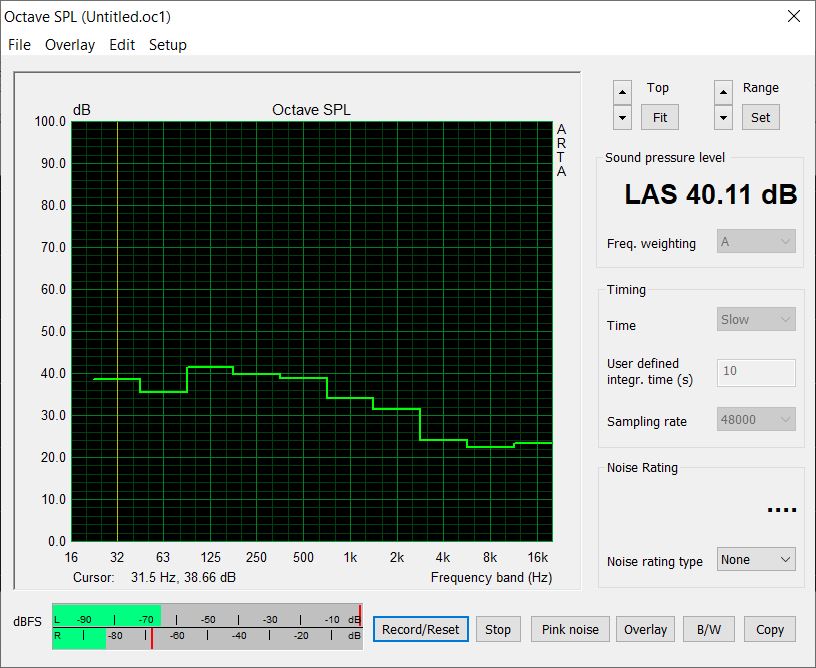
Emisyonlar açısından, her kullanıcı için yüksek kaliteli bir grafik kartının enerji tüketimi açısından herhangi bir rekor kırmayacağı açıkça anlaşılmalıdır. Kısa bir süre önce MSI GeForce RTX 3090 Suprim X'i incelediğimizde tüm bunların nereye varabileceğini gördük. MSI GeForce RTX Gaming X Trio'lu sistem, prizden güç çekmiyor. Yine de, oyun sırasında ortalama olarak test cihazımızın görüntülediği 500 watt'ın biraz altında. Asus'un muadili 500 watt'ın biraz üzerine bile ulaştı. Bu nedenle, bu grafik kartını satın alırken güçlü bir güç kaynağı birimi zorunludur. MSI'ın sorunsuz bir çalışma için önerisi, 750 watt'lık bir güç kaynağıdır. Corsair'den 1.000 watt'lık güç kaynağımız hiçbir sorun yaşamadı ve yük altında çarpışma olmadı. MSI kurulu soğutma konsepti ile gürültü açısından tam anlamıyla vurdum. 2D modunda veya düşük yük altında, fanlar hareketsiz durur ve bu nedenle, yalnızca boşta kullanımdaki kasa fanlarını ölçebiliriz. Kasanın yanında yaklaşık 20 santimetre mesafede, gürültü seviyesi 33 dB (A) idi. Stres testi sırasında, grafik kartı ölçülen 40 dB (A) ile sessizce duyulabiliyordu. Güç hedefini de artırırsanız, gürültü seviyesi biraz artar ve bu da fan devirlerine yansır. Üç eksenel fan, grafik kartına temiz hava sağlamak için dakikada yaklaşık 200 devir daha sürmek zorundadır. Normal kullanımda fan hızı 1.800 ile 1.900 rpm arasındadır ve MSI Geforce RTX Gaming X Trio'da ısı sorunu yoktur. Daha yüksek güç hedefinde maksimum GPU sıcaklığı 68 ° C (~ 154 ° F) idi. Grafik kartı fabrika ayarlarıyla kullanıldığında sıcaklık bir derece düşer.

| Power Consumption | |
| 1920x1080 The Witcher 3 ultra (external Monitor) | |
| MSI GeForce RTX 3090 Suprim X (Idle: 105.9 W) | |
| ASUS GeForce RTX 3080 ROG STRIX OC GAMING (Idle: 88.3 W) | |
| AMD Radeon RX 6800 XT (Idle: 99.5 W) | |
| MSI GeForce RTX 3080 Gaming X Trio (Idle: 103 W) | |
| MSI RTX 2080 Ti Gaming X Trio (Idle: 87.8 W) | |
| KFA2 GeForce RTX 2080 Ti EX (Idle: 100.5 W) | |
| AMD Radeon RX Vega 64 (Idle: 74.3 W) | |
| MSI RTX 2080 Gaming X Trio (Idle: 87.78 W) | |
| MSI GeForce RTX 3070 Gaming X Trio (Idle: 95.1 W) | |
| Nvidia GeForce RTX 2080 Super (Idle: 78.87 W) | |
| AMD Radeon RX 5700 XT (Idle: 69.8 W) | |
| Nvidia GeForce RTX 2070 Super (96.8 fps, Idle: 80.5 W) | |
| MSI RTX 2070 Gaming Z 8G (Idle: 73.3 W) | |
| AMD Radeon VII (Idle: 81.39 W) | |
| Nvidia GeForce RTX 2060 Super (82.7 fps, Idle: 77.12 W) | |
| AMD Radeon RX 5700 (84.2 fps, Idle: 64.5 W) | |
| MSI RTX 2060 Gaming Z 6G (Idle: 74.66 W) | |
| 1280x720 FurMark 1.19 GPU Stress Test (external Monitor) | |
| MSI GeForce RTX 3090 Suprim X (Idle: 105.9 W) | |
| ASUS GeForce RTX 3080 ROG STRIX OC GAMING (Idle: 88.3 W) | |
| MSI GeForce RTX 3080 Gaming X Trio (Idle: 103 W) | |
| AMD Radeon RX 6800 XT (Idle: 99.5 W) | |
| MSI RTX 2080 Ti Gaming X Trio (Idle: 87.8 W) | |
| AMD Radeon VII (Idle: 81.39 W) | |
| MSI RTX 2080 Gaming X Trio | |
| KFA2 GeForce RTX 2080 Ti EX (Idle: 100.5 W) | |
| MSI GeForce RTX 3070 Gaming X Trio (Idle: 95.1 W) | |
| Nvidia GeForce RTX 2080 Super (Idle: 78.87 W) | |
| MSI RTX 2070 Gaming Z 8G (Idle: 73.3 W) | |
| AMD Radeon RX 5700 XT (239 fps, Idle: 69.8 W) | |
| Nvidia GeForce RTX 2070 Super (283 fps, Idle: 80.5 W) | |
| MSI RTX 2060 Gaming Z 6G (Idle: 74.66 W) | |
| Nvidia GeForce RTX 2060 Super (237 fps, Idle: 77.12 W) | |
| AMD Radeon RX 5700 (207 fps, Idle: 64.5 W) | |
* ... daha küçük daha iyidir
Artılar
Eksiler
Karar - İyi soğutmalı güçlü RTX 3080
MSI, tanınmış oyun grafik kartı serisini GeForce RTX 3080 Gaming X Trio ile genişletiyor. Saf performans terimleriyle, bu grafik kartı rekabetin arkasına saklanmak zorunda değil ve teknik özelliklere göre daha da yüksek hızlara sahip Asus GeForce RTX 3080 ROG Strix Gaming OC ile aynı seviyede. Ancak MSI, referans modele göre saat hızını da ayarlıyor ve 105 MHz artırarak 1.815 MHz'e çıkarıyor. Yine de bu, yük altında neredeyse her zaman aşılır, bu da çok iyi soğutmadan kaynaklanır. Sıfır fan modu sayesinde, MSI GeForce RTX 3080 Gaming X Trio 2D modunda veya düşük yük altında bile sessizdir; Yük altında bile, üç büyük fan yalnızca rahatsız edici olmayan sessiz bir ses çıkarıyor. AMD Radeon RX 6800 XT ile Nvidia'nın artık üst düzey sektörde ciddi bir rakibi var. GeForce RTX 3080, performansı karşılaştırırken yaklaşık olarak hızlıdır. GeForce modelleri yalnızca ışın izleme gibi özel özellikler, tercihen DLSS ile birlikte kullanıldığında zemin kazanabilir. Geriye kalan tek eleştiri noktası yük altında yüksek güç tüketimi. Ancak AMD'nin rekabeti, 300 watt'lık bir TGP ile çok daha verimli değil. MSI GeForce RTX 3080 Gaming X Trio, yük altında da oldukça serin kalan, çok hızlı bir RTX 3080 grafik kartı. Peki kim böyle bir grafik kartına ihtiyaç duyar? Cyberpunk 2077 gibi son oyunlara bakarsak, ayrıntılardan fedakarlık etmek istemiyorsanız, güçlü bir RTX 3080'i neredeyse bulamazsınız. Öte yandan biraz daha eski oyunlar, sürekli olarak CPU sınırına takılmamak için yüksek çözünürlük gerektirir. Bu nedenle, esas olarak 2160p veya hatta 1440p (UWQHD) ile oynayanlar bir GeForce RTX 3080 satın almayı düşünebilirler. Ancak bu bizi bir sonraki noktaya getiriyor: Kullanılabilirlik. Şu anda bir GeForce RTX 3080 satın almak neredeyse imkansız, çünkü piyasaya sürüldüğünden beri kullanılabilirlik çok zayıftı. Dahası, mevcut modeller aşırı derecede pahalı. MSI, GeForce RTX 3080 Gaming X Trio için 769 Euro (~ 943 $) MSRP teklif ediyor. Bununla birlikte, bir model mevcutsa gerçek perakende fiyatı 1.000 Euro (~ 1.223 $) veya daha da yüksektir. Bu muhtemelen bir süre daha devam edecek bir senaryo çünkü kimse durumun ne zaman düzeleceğini söyleyemez.

