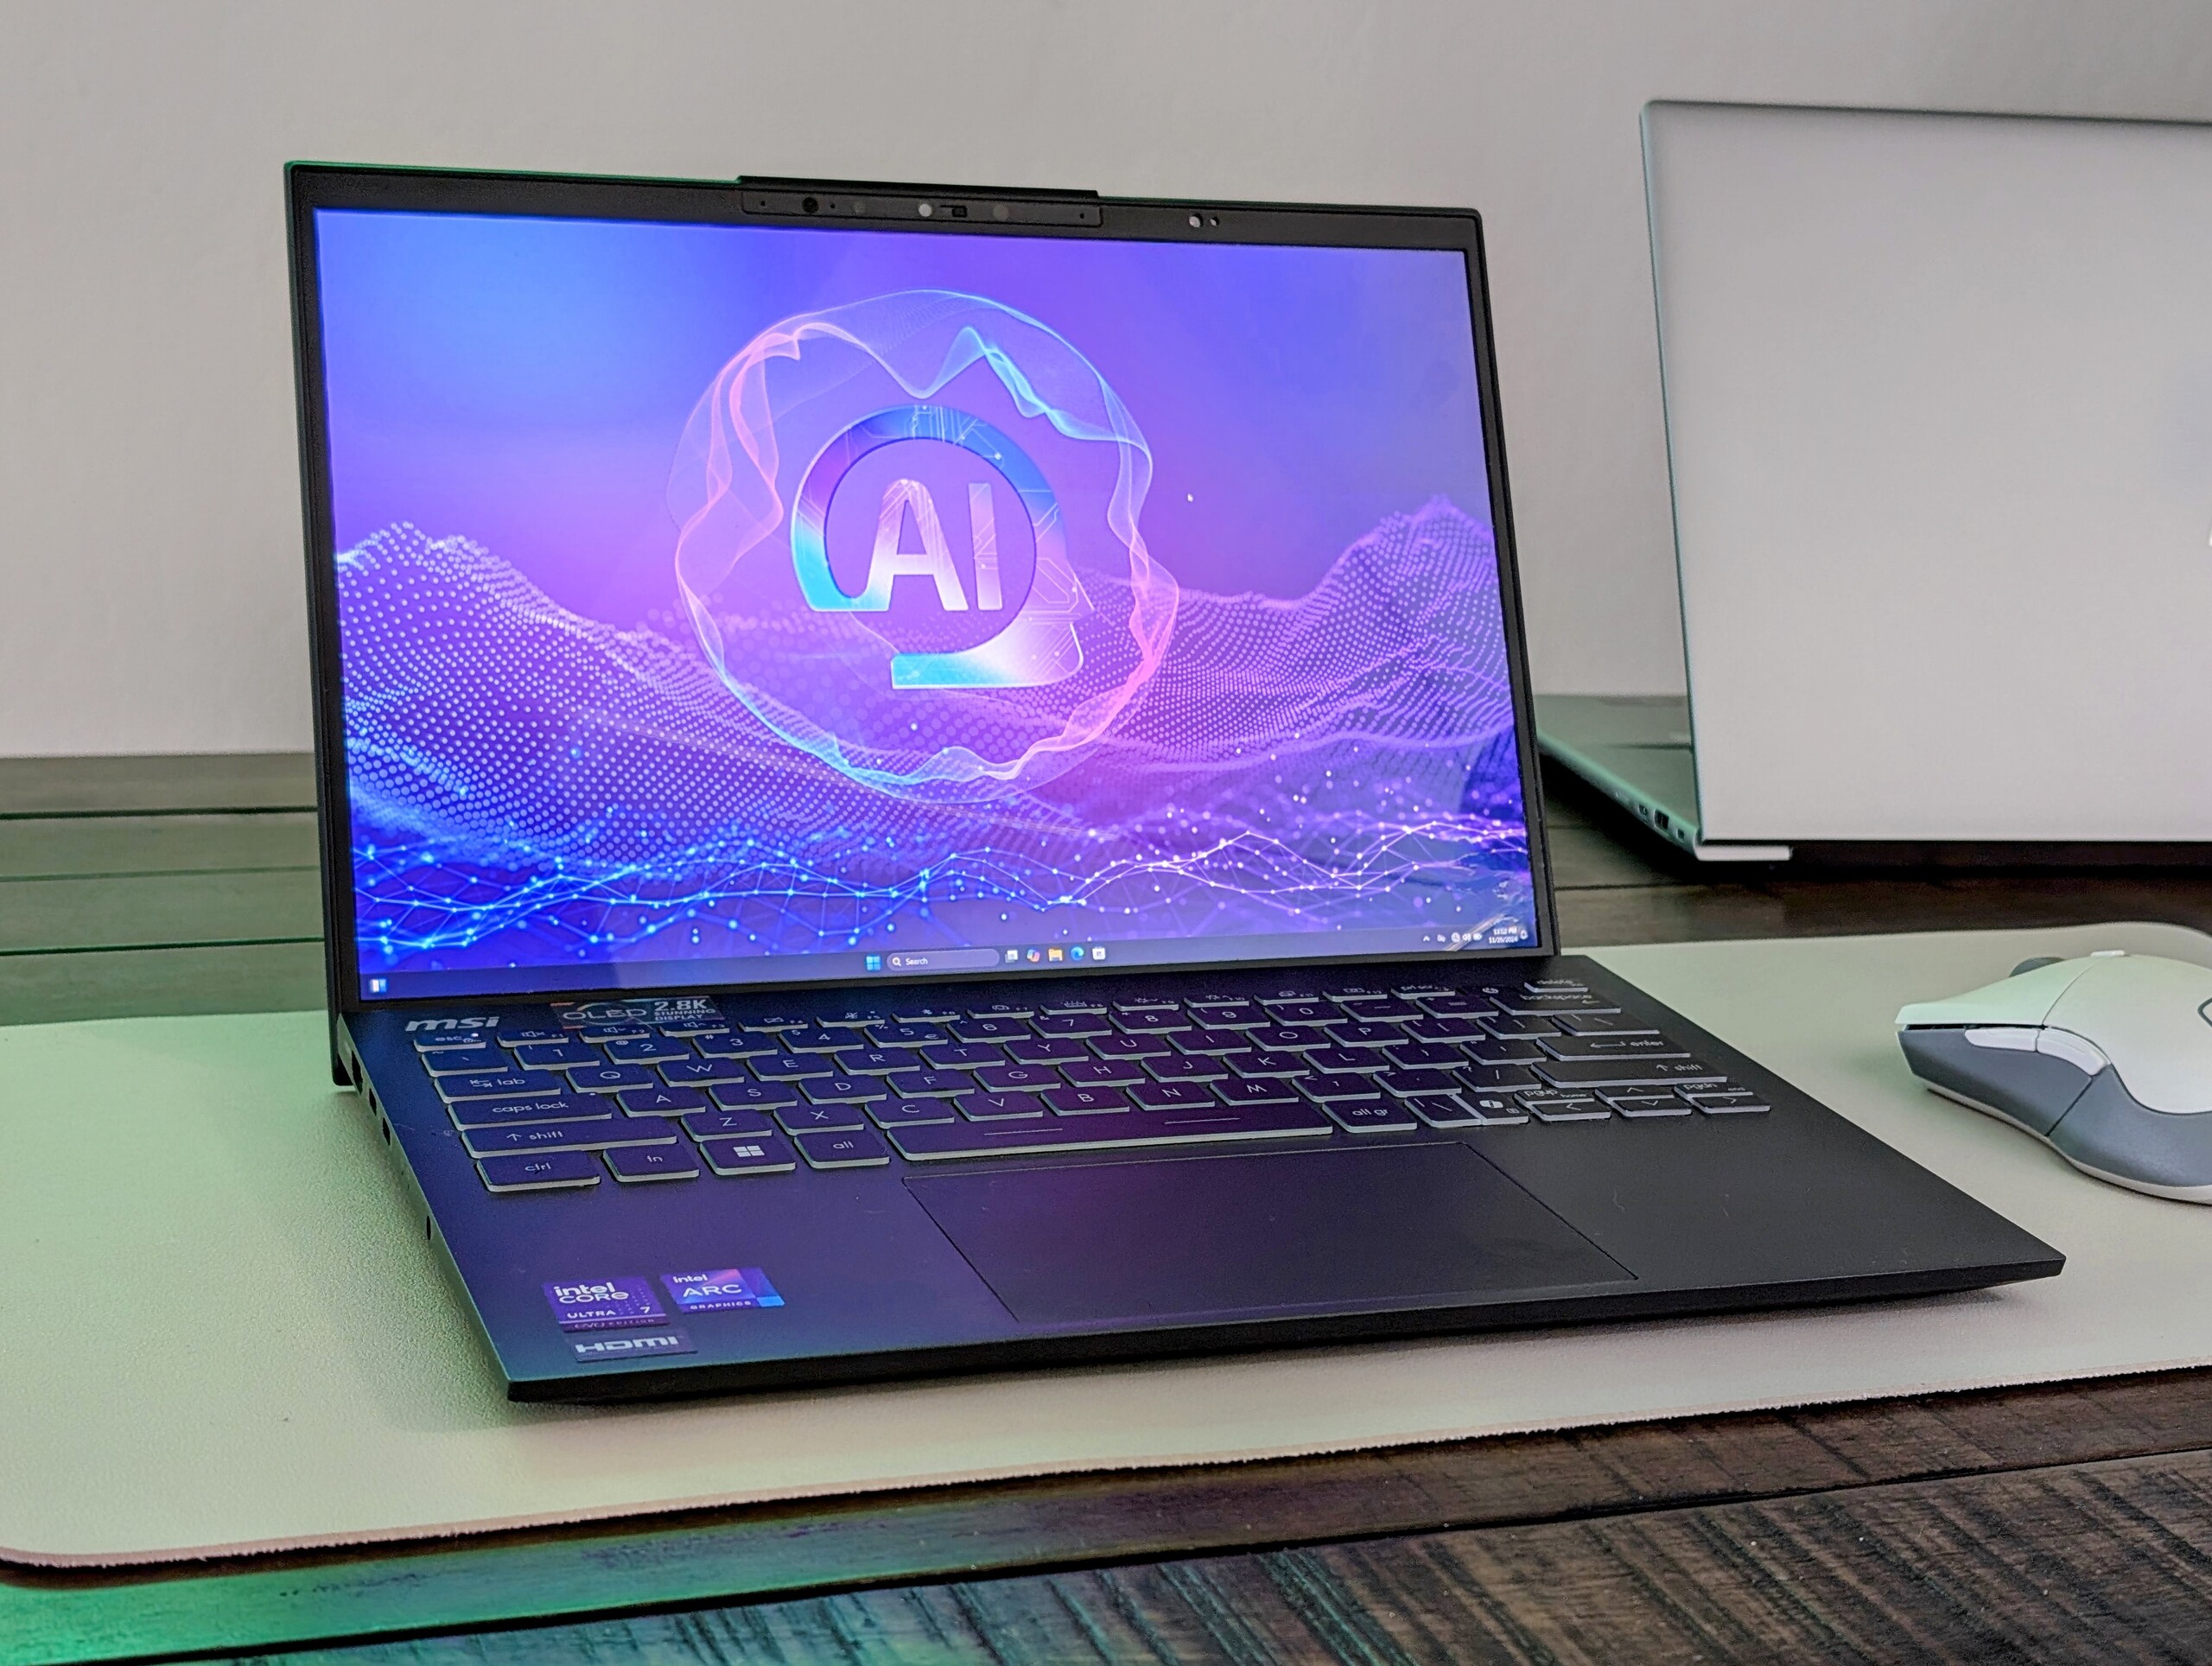
MSI Prestige 13 AI Plus Evo dizüstü bilgisayar incelemesi: 1 kg'ın altında harika grafik performansı
Core Ultra 7 258V ve Core Ultra 7 155H.
MSI, en hafif 13 inç dizüstü bilgisayarını eski Meteor Lake seçeneklerinin yerine Lunar Lake işlemcilerle yeniledi. Değişiklikler, fan gürültüsünü veya ağırlığı artırmadan hem pil ömrünü hem de grafik potansiyelini artırdı.Allen Ngo, 👁 Allen Ngo (Çeviren DeepL / Ninh Duy) Yayınlandı 🇺🇸 🇫🇷 ...
Karar - Ağırlığına Göre Etkileyici Performans ve Bağlantı Noktaları
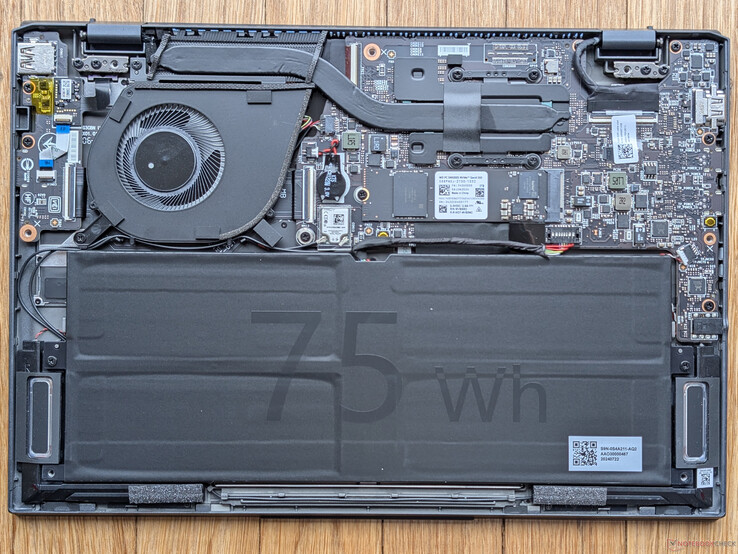
Orijinal Prestige 13 AI Evo ile ilgili ana şikayetlerimizden biri, CPU yoğun yükleri çalıştırırken beklenenden daha dik işlemci azaltmasıydı. Yeni Lunar Lake CPU, bu tür yükleri çalıştırırken minimum performans seviyesini yükseltirken maksimum Turbo Boost potansiyelini düşürerek bu sorunu çözüyor. Bu sayede zaman içinde daha istikrarlı ve daha hızlı bir performans elde edildi ve bu da daha büyük dosyaları veya videoları işlemek veya kodlamak zorunda olan içerik oluşturucuların veya editörlerin ilgisini çekecektir. Ayrıca, bu avantajların Prestige 13 AI Evo ile daha yeni Prestige 13 AI Plus Evo arasında pil ömrünü, sıcaklığı veya fan gürültüsünü fark edilir derecede etkilemediği görülüyor.
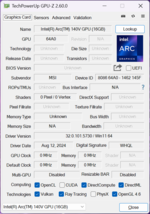
Grafik performansı, uygulamaya bağlı olarak 1,5 kat ila 2 kat arasında önemli ölçüde artmıştır. Bir oyun makinesi olmaktan uzak olsa da Arc 140V, MSI dizüstü bilgisayarın ne kadar hafif olduğu göz önüne alındığında yine de etkileyici.
Performans neredeyse evrensel bir artış göstermiş olsa da, Prestige 13 AI Evo incelememizde bahsettiğimiz diğer tüm dezavantajlar değişmeden kalmıştır. 1800p OLED ekran keskin ve canlı olsa da, VRR veya dokunmatik ekran seçenekleri olmadan yalnızca 60 Hz ile sınırlıdır. Web kamerası kalitesi ve kasa sağlamlığı da daha ağır alternatiflere kıyasla birkaç adım daha düşük Dell veya HP. Yine de MSI, ne kadar hafif olduğu göz önüne alındığında çok fazla performans ve bağlantı noktası sunuyor.
Artılar
Eksiler
Fiyat ve Bulunabilirlik
Amazon, incelediğimiz MSI Prestige 13 AI Plus Evo'yu 1400 USD karşılığında satışa sunuyor.
Karşılaştırmalı olarak olası rakipler
Resim | Modeli / incelemeler | Fiyat | Ağırlık | Yükseklik | Ekran |
|---|---|---|---|---|---|
| MSI Prestige 13 AI Plus Evo A2VMG Intel Core Ultra 7 258V ⎘ Intel Arc Graphics 140V ⎘ 32 GB Bellek | Amazon: Liste fiyatı: 1400 USD | 970 g | 16.9 mm | 13.30" 2880x1800 255 PPI OLED | |
| MSI Prestige 13 AI Evo Intel Core Ultra 7 155H ⎘ Intel Arc 8-Core iGPU ⎘ 32 GB Bellek, 1024 GB SSD | Amazon: Liste fiyatı: 1599€ | 967 g | 16.9 mm | 13.30" 2880x1800 OLED | |
| Dell XPS 13 9350 Intel Core Ultra 7 256V ⎘ Intel Arc Graphics 140V ⎘ 16 GB Bellek, 512 GB SSD | Amazon: 1. Dell XPS 13 9350 AI Business... 2. Dell XPS 13 9350 AI Business... 3. Menlonigt XPS 13 9350 9343 J... Liste fiyatı: 1400 USD | 1.2 kg | 15.3 mm | 13.40" 1920x1200 169 PPI IPS | |
| Framework Laptop 13.5 Core Ultra 7 155H Intel Core Ultra 7 155H ⎘ Intel Arc 8-Core iGPU ⎘ 32 GB Bellek | Liste fiyatı: 1500 USD | 1.4 kg | 15.85 mm | 13.50" 2880x1920 256 PPI IPS | |
| Lenovo Yoga Book 9 13IMU9 Intel Core Ultra 7 155U ⎘ Intel Graphics 4-Core iGPU (Meteor / Arrow Lake) ⎘ 16 GB Bellek | Liste fiyatı: 2000 USD | 1.4 kg | 15.95 mm | 13.30" 2880x1800 255 PPI OLED | |
| HP Dragonfly G4 Intel Core i7-1365U ⎘ Intel Iris Xe Graphics G7 96EUs ⎘ 16 GB Bellek, 512 GB SSD | Amazon: Liste fiyatı: 1700 USD | 1.1 kg | 16.3 mm | 13.50" 1920x1280 171 PPI IPS |
Orijinal Prestige 13 AI Evo'nun piyasaya sürülmesinin üzerinden sadece altı ay geçti ve MSI modeli daha yeni Intel işlemcilerle yeniledi bile. Prestige 13 AI Plus Evo olarak adlandırılan en son iterasyon, Meteor Lake yerine Lunar Lake CPU'larla birlikte geliyor.
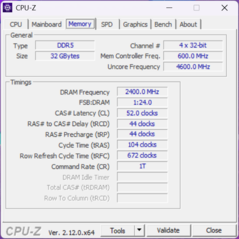
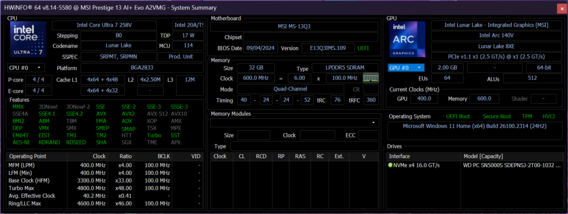
Test ünitemiz Core Ultra 7 258V, 32 GB LPDDR5x-8533 RAM ve 1800p OLED ekran ile yaklaşık 1400$'a orta konfigürasyona sahip. Diğer SKU'lar bunun yerine yarı RAM ile Core Ultra 9 288V veya Core Ultra 7 256V ile gönderilebilir.
Rakipler arasında diğer üst düzey subnotebooklar da yer alıyor Dell XPS 13 9350, Framework Dizüstü Bilgisayar 13.5veya HP Dragonfly 14.
Daha fazla MSI incelemesi:
Teknik Özellikler
Top 10
» Top 10 Multimedia Notebook listesi
» Top 10 oyun notebooku
» Top 10 bütçeye uygun Ofis/İş Notebook Listesi
» Top 10 Premium Ofis/İş notebookları
» Top 10 Çalışma istasyonu laptopları
» Top 10 Subnotebook listesi
» Top 10 Ultrabooklar
» En iyi 10 dönüştürülebilir modeli
» Seçimi en iyi 10 tablet
» Notebookcheck Top 10 Windows Tabletleri
» Top 10 Subnotebook listesi
» NotebookCheck tarafından incelenen en iyi Notebook ekranları
» Notebookcheck'in 500 Euro altındaki en iyi 10 Notebook listesi
» NotebookCheck tarafından seçilen 300 Euro altındaki en iyi 10 Notebook
» Notebookcheck'in 500 Euro altındaki en iyi 10 Notebook listesi
» Notebookcheck'in Top 10 akıllı telefon listesi
» Notebookcheck'in Top 10 hafif oyun notebookları
Dava
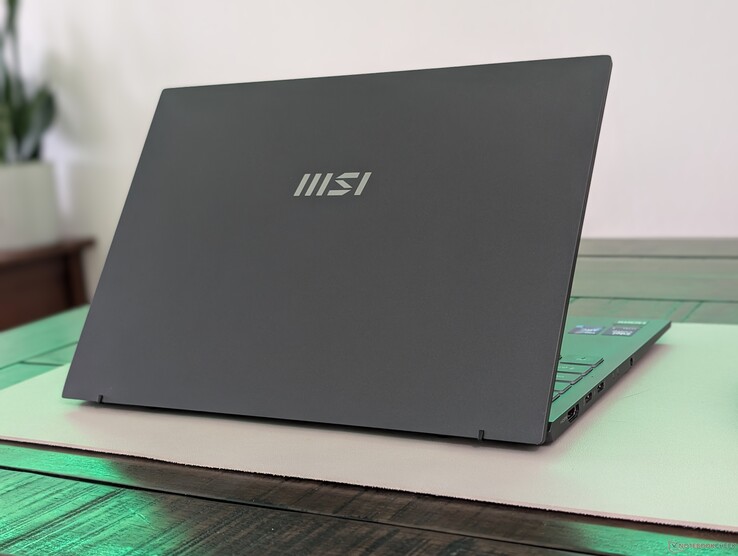
Prestige 13 AI Evo ile Prestige 13 AI Plus Evo arasında harici bir fark olmadığı için Prestige 13 AI Evo incelememize göz atmanızı öneririz. Sistem, 1 kg'ın altında olmasıyla piyasadaki en hafif 13 inçlik dizüstü bilgisayarlardan biridir, ancak kasa, XPS 13 gibi daha ağır modellerle karşılaştırıldığında daha kolay esneme ve gıcırdama eğilimindedir.
Bağlanabilirlik
Prestige 13 AI, hem entegre HDMI hem de USB-A bağlantı noktalarına sahip kalan birkaç alt dizüstü bilgisayardan biridir. Sistemin yalnızca USB-C bağlantı noktalarına güvenmemesini takdir ediyoruz.
SD Kart Okuyucu
| SD Card Reader | |
| average JPG Copy Test (av. of 3 runs) | |
| Framework Laptop 13.5 Core Ultra 7 155H (Toshiba Exceria Pro SDXC 64 GB UHS-II) | |
| MSI Prestige 13 AI Evo (Angelbird AV Pro V60) | |
| MSI Prestige 13 AI Plus Evo A2VMG (Angelbird AV Pro V60) | |
| maximum AS SSD Seq Read Test (1GB) | |
| Framework Laptop 13.5 Core Ultra 7 155H (Toshiba Exceria Pro SDXC 64 GB UHS-II) | |
| MSI Prestige 13 AI Evo (Angelbird AV Pro V60) | |
| MSI Prestige 13 AI Plus Evo A2VMG (Angelbird AV Pro V60) | |
İletişim
İlginç bir şekilde, ünitemiz Core Ultra 7 155H konfigürasyonunda bulunan BE1750W yerine Intel Killer AX1775s ile birlikte gönderiliyor. AX1775s, BE1750W'nin aksine Wi-Fi 7'yi desteklemiyor.
| Networking | |
| iperf3 transmit AXE11000 | |
| MSI Prestige 13 AI Evo | |
| HP Dragonfly G4 | |
| Dell XPS 13 9350 | |
| Lenovo Yoga Book 9 13IMU9 | |
| Framework Laptop 13.5 Core Ultra 7 155H | |
| MSI Prestige 13 AI Plus Evo A2VMG | |
| iperf3 receive AXE11000 | |
| MSI Prestige 13 AI Evo | |
| Lenovo Yoga Book 9 13IMU9 | |
| HP Dragonfly G4 | |
| Framework Laptop 13.5 Core Ultra 7 155H | |
| Dell XPS 13 9350 | |
| MSI Prestige 13 AI Plus Evo A2VMG | |
| iperf3 transmit AXE11000 6GHz | |
| MSI Prestige 13 AI Plus Evo A2VMG | |
| HP Dragonfly G4 | |
| Dell XPS 13 9350 | |
| Framework Laptop 13.5 Core Ultra 7 155H | |
| Lenovo Yoga Book 9 13IMU9 | |
| iperf3 receive AXE11000 6GHz | |
| Dell XPS 13 9350 | |
| MSI Prestige 13 AI Plus Evo A2VMG | |
| HP Dragonfly G4 | |
| Framework Laptop 13.5 Core Ultra 7 155H | |
| Lenovo Yoga Book 9 13IMU9 | |
Web kamerası
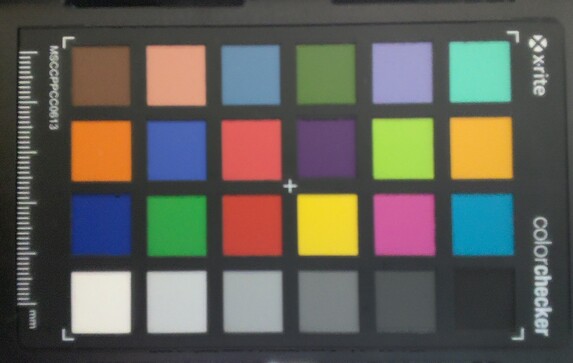
Web kamerası kalitesi, daha net görüntüler için orijinal modeldeki 2 MP'den 5 MP'ye yükseltilmiştir.
Sürdürülebilirlik
Model, sürdürülebilirlik için EPEAT Silver yönergelerini takip ederken, ambalaj çoğunlukla karton ve kağıttan oluşuyor ve dizüstü bilgisayar ile AC adaptörünün etrafına biraz plastik sarılıyor.
Ekran
1800p Samsung OLED ekran daha önce olduğu gibi aynı kalıyor. Görüntü kalitesi mükemmel ve grenlilik sorunu yokken, 60 Hz üst düzey bir alt dizüstü bilgisayar için modası geçmiş görünmeye başladığından, yenileme hızının 90 Hz veya 120 Hz'e yükseltilmesini tercih ederdik.
HDR modundaysa maksimum parlaklık 598 nit'e kadar ulaşabilir. Aksi takdirde, SDR modundaysa 382 nit'te zirve yapar.
| |||||||||||||||||||||||||
Aydınlatma: 99 %
Batarya modunda parlaklık: 382.4 cd/m²
Kontrast: ∞:1 (Siyah: 0 cd/m²)
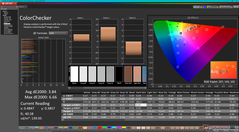
ΔE ColorChecker Calman: 3.84 | ∀{0.5-29.43 Ø4.76}
calibrated: 0.41
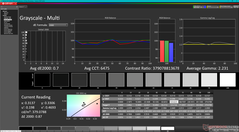
ΔE Greyscale Calman: 0.7 | ∀{0.09-98 Ø5}
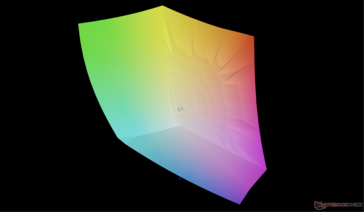
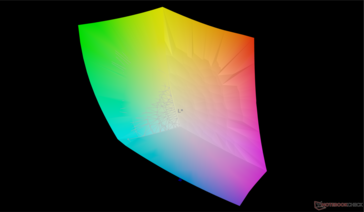
95.8% AdobeRGB 1998 (Argyll 3D)
100% sRGB (Argyll 3D)
99.9% Display P3 (Argyll 3D)
Gamma: 2.23
CCT: 6475 K
| MSI Prestige 13 AI Plus Evo A2VMG ATNA33AA07-0, OLED, 2880x1800, 13.3", 60 Hz | MSI Prestige 13 AI Evo ATNA33AA07-0, OLED, 2880x1800, 13.3", 60 Hz | Dell XPS 13 9350 LG Philips 134WU2, IPS, 1920x1200, 13.4", 120 Hz | Framework Laptop 13.5 Core Ultra 7 155H BOE NE135A1M-NY1, IPS, 2880x1920, 13.5", 120 Hz | Lenovo Yoga Book 9 13IMU9 SDC ATNA33AA02-0, OLED, 2880x1800, 13.3", 60 Hz | HP Dragonfly G4 Chi Mei CMN13C0, IPS, 1920x1280, 13.5", 60 Hz | |
|---|---|---|---|---|---|---|
| Display | 1% | -21% | -17% | 0% | -20% | |
| Display P3 Coverage (%) | 99.9 | 99.9 0% | 67.3 -33% | 72.8 -27% | 99.7 0% | 68.4 -32% |
| sRGB Coverage (%) | 100 | 100 0% | 99 -1% | 98.6 -1% | 100 0% | 98.3 -2% |
| AdobeRGB 1998 Coverage (%) | 95.8 | 97.8 2% | 68.6 -28% | 72.9 -24% | 97 1% | 70.4 -27% |
| Response Times | 25% | -1503% | -1567% | -1% | -1933% | |
| Response Time Grey 50% / Grey 80% * (ms) | 1.94 ? | 1.54 ? 21% | 37.3 ? -1823% | 41.9 ? -2060% | 1.88 ? 3% | 48.8 ? -2415% |
| Response Time Black / White * (ms) | 2.02 ? | 1.44 ? 29% | 25.9 ? -1182% | 23.7 ? -1073% | 2.1 ? -4% | 31.3 ? -1450% |
| PWM Frequency (Hz) | 60 ? | 240 ? | 60 ? | |||
| PWM Amplitude * (%) | 21.9 | |||||
| Screen | 3% | 17% | -108% | -50% | -27% | |
| Brightness middle (cd/m²) | 382.4 | 404 6% | 462.8 21% | 498.5 30% | 362.6 -5% | 408.8 7% |
| Brightness (cd/m²) | 383 | 407 6% | 435 14% | 464 21% | 368 -4% | 399 4% |
| Brightness Distribution (%) | 99 | 98 -1% | 87 -12% | 86 -13% | 97 -2% | 90 -9% |
| Black Level * (cd/m²) | 0.19 | 0.36 | 0.32 | |||
| Colorchecker dE 2000 * | 3.84 | 2.1 45% | 1.92 50% | 4.27 -11% | 4.66 -21% | 2.02 47% |
| Colorchecker dE 2000 max. * | 6.66 | 4.3 35% | 3.45 48% | 7.08 -6% | 7.25 -9% | 3.84 42% |
| Colorchecker dE 2000 calibrated * | 0.41 | 0.48 -17% | 1.26 -207% | 0.56 -37% | 0.61 -49% | |
| Greyscale dE 2000 * | 0.7 | 1.2 -71% | 0.6 14% | 4.7 -571% | 2.6 -271% | 2.3 -229% |
| Gamma | 2.23 99% | 2.16 102% | 2.19 100% | 2.09 105% | 2.2 100% | 2.2 100% |
| CCT | 6475 100% | 6465 101% | 6539 99% | 7417 88% | 6055 107% | 6203 105% |
| Contrast (:1) | 2436 | 1385 | 1278 | |||
| Toplam Ortalama (Program / Ayarlar) | 10% /
7% | -502% /
-246% | -564% /
-329% | -17% /
-29% | -660% /
-343% |
* ... daha küçük daha iyidir
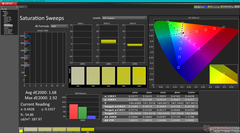
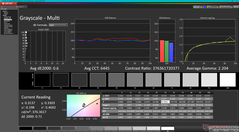
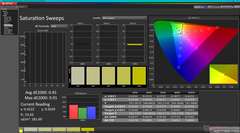
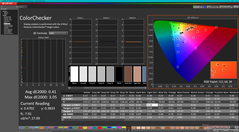
Ekran, P3 standardına göre kutudan çıktığında ortalama gri tonlama ve ColorChecker deltaE değerleri sırasıyla sadece 0,7 ve 3,84 olacak şekilde iyi kalibre edilmiş olarak geliyor.
Yanıt Sürelerini Görüntüle
| ↔ Tepki Süresi Siyahtan Beyaza | ||
|---|---|---|
| 2.02 ms ... yükseliş ↗ ve sonbahar↘ birleşimi | ↗ 0.92 ms yükseliş | |
| ↘ 1.1 ms sonbahar | ||
| Ekran, testlerimizde çok hızlı yanıt oranları gösteriyor ve hızlı oyun oynamaya çok uygun olmalı. Karşılaştırıldığında, test edilen tüm cihazlar 0.1 (minimum) ile 240 (maksimum) ms arasında değişir. » Tüm cihazların 11 %'si daha iyi. Bu, ölçülen yanıt süresinin test edilen tüm cihazların ortalamasından (20.1 ms) daha iyi olduğu anlamına gelir. | ||
| ↔ Tepki Süresi %50 Griden %80 Griye | ||
| 1.94 ms ... yükseliş ↗ ve sonbahar↘ birleşimi | ↗ 1 ms yükseliş | |
| ↘ 0.94 ms sonbahar | ||
| Ekran, testlerimizde çok hızlı yanıt oranları gösteriyor ve hızlı oyun oynamaya çok uygun olmalı. Karşılaştırıldığında, test edilen tüm cihazlar 0.165 (minimum) ile 636 (maksimum) ms arasında değişir. » Tüm cihazların 9 %'si daha iyi. Bu, ölçülen yanıt süresinin test edilen tüm cihazların ortalamasından (31.5 ms) daha iyi olduğu anlamına gelir. | ||
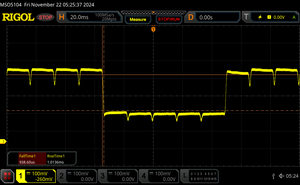
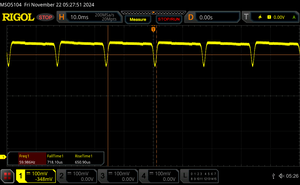
Ekran Titremesi / PWM (Darbe Genişliği Modülasyonu)
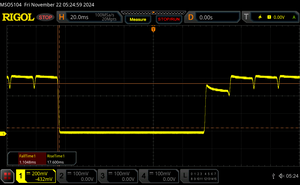
| Ekran titriyor / PWM algılandı | 60 Hz Amplitude: 21.9 % | ≤ 100 % parlaklık ayarı | |
Ekran arka ışığı 60 Hz'de titriyor (en kötü durum, örneğin PWM kullanılması) 100 % ve altındaki parlaklık ayarında titreme algılandı. Bu parlaklık ayarının üzerinde titreme veya PWM olmamalıdır. 60 Hz frekansı çok düşüktür, bu nedenle titreme, uzun süreli kullanımdan sonra göz yorgunluğuna ve baş ağrısına neden olabilir. Karşılaştırıldığında: Test edilen tüm cihazların %53 %'si ekranı karartmak için PWM kullanmıyor. PWM tespit edilirse, ortalama 8023 (minimum: 5 - maksimum: 343500) Hz ölçüldü. | |||
Performans
Test Koşulları
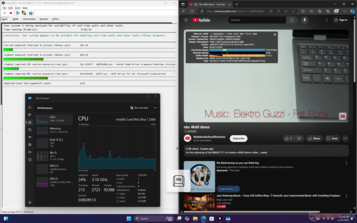
Aşağıdaki kıyaslamaları çalıştırmadan önce hem Windows'u hem de MSI Center'ı Performans moduna ayarladık. Cooler Boost modu (diğer adıyla maksimum fan modu) da mevcut, ancak aşağıdaki kıyaslamalarımızın da göstereceği gibi performansı önemli ölçüde etkilemiyor.
İşlemci
Core Ultra 7 155H ile karşılaştırıldığında, Core Ultra 7 258V daha yavaş Turbo Boost potansiyeline sahiptir, ancak daha uzun süreler boyunca daha istikrarlı ve daha hızlı performans gösterir. Bu durum, aşağıdaki grafikte gösterildiği gibi CineBench R15 xT'yi bir döngüde çalıştırırken açıkça görülmektedir; Core Ultra 7 155H konfigürasyonu testin başlangıcında Core Ultra 7 258V konfigürasyonumuzdan daha iyi performans gösterirken, sadece ilk döngüden sonra daha ağır bir şekilde yavaşlamaktadır.
Cinebench R15 Multi Loop
Cinebench R23: Multi Core | Single Core
Cinebench R20: CPU (Multi Core) | CPU (Single Core)
Cinebench R15: CPU Multi 64Bit | CPU Single 64Bit
Blender: v2.79 BMW27 CPU
7-Zip 18.03: 7z b 4 | 7z b 4 -mmt1
Geekbench 6.5: Multi-Core | Single-Core
Geekbench 5.5: Multi-Core | Single-Core
HWBOT x265 Benchmark v2.2: 4k Preset
LibreOffice : 20 Documents To PDF
R Benchmark 2.5: Overall mean
| CPU Performance rating | |
| Asus ProArt PX13 HN7306 | |
| Lenovo ThinkPad Z13 Gen 2 | |
| Framework Laptop 13.5 Core Ultra 7 155H | |
| MSI Prestige 13 AI Plus Evo A2VMG | |
| Dell XPS 13 9350 | |
| Ortalama Intel Core Ultra 7 258V | |
| Lenovo ThinkPad X13 Gen 4 21J3001VGE | |
| MSI Prestige 13 AI Evo | |
| HP Dragonfly G4 -2! | |
| Dell Latitude 13 7350 | |
| Asus ZenBook S13 OLED UX5304 -2! | |
| Lenovo ThinkPad X13 2-in-1 Gen 5 | |
| Dell Latitude 7350 Detachable | |
| Dell XPS 13 Plus 9320 i5-1240p -2! | |
| Lenovo ThinkPad X13 G3 21CM002UGE -2! | |
| HP Elite Dragonfly G3 -2! | |
| Lenovo Yoga 6 13ALC6 -4! | |
| Cinebench R23 / Multi Core | |
| Asus ProArt PX13 HN7306 | |
| Lenovo ThinkPad Z13 Gen 2 | |
| Framework Laptop 13.5 Core Ultra 7 155H | |
| MSI Prestige 13 AI Plus Evo A2VMG | |
| Lenovo ThinkPad X13 Gen 4 21J3001VGE | |
| Dell XPS 13 9350 | |
| Ortalama Intel Core Ultra 7 258V (7920 - 11097, n=23) | |
| MSI Prestige 13 AI Evo | |
| Dell XPS 13 Plus 9320 i5-1240p | |
| Dell Latitude 13 7350 | |
| Dell Latitude 7350 Detachable | |
| Lenovo ThinkPad X13 2-in-1 Gen 5 | |
| Lenovo ThinkPad X13 G3 21CM002UGE | |
| HP Dragonfly G4 | |
| Lenovo Yoga 6 13ALC6 | |
| Asus ZenBook S13 OLED UX5304 | |
| HP Elite Dragonfly G3 | |
| Cinebench R23 / Single Core | |
| Asus ProArt PX13 HN7306 | |
| HP Dragonfly G4 | |
| Dell XPS 13 9350 | |
| Ortalama Intel Core Ultra 7 258V (1664 - 1957, n=23) | |
| MSI Prestige 13 AI Plus Evo A2VMG | |
| Framework Laptop 13.5 Core Ultra 7 155H | |
| Asus ZenBook S13 OLED UX5304 | |
| Lenovo ThinkPad X13 Gen 4 21J3001VGE | |
| Lenovo ThinkPad Z13 Gen 2 | |
| MSI Prestige 13 AI Evo | |
| Dell XPS 13 Plus 9320 i5-1240p | |
| Dell Latitude 7350 Detachable | |
| Dell Latitude 13 7350 | |
| HP Elite Dragonfly G3 | |
| Lenovo ThinkPad X13 2-in-1 Gen 5 | |
| Lenovo ThinkPad X13 G3 21CM002UGE | |
| Lenovo Yoga 6 13ALC6 | |
| Cinebench R20 / CPU (Multi Core) | |
| Asus ProArt PX13 HN7306 | |
| Lenovo ThinkPad Z13 Gen 2 | |
| Framework Laptop 13.5 Core Ultra 7 155H | |
| MSI Prestige 13 AI Plus Evo A2VMG | |
| Lenovo ThinkPad X13 Gen 4 21J3001VGE | |
| Dell XPS 13 9350 | |
| Ortalama Intel Core Ultra 7 258V (3130 - 4314, n=23) | |
| MSI Prestige 13 AI Evo | |
| Dell Latitude 13 7350 | |
| Dell XPS 13 Plus 9320 i5-1240p | |
| Lenovo ThinkPad X13 2-in-1 Gen 5 | |
| Dell Latitude 7350 Detachable | |
| Lenovo ThinkPad X13 G3 21CM002UGE | |
| Lenovo Yoga 6 13ALC6 | |
| HP Dragonfly G4 | |
| Asus ZenBook S13 OLED UX5304 | |
| HP Elite Dragonfly G3 | |
| Cinebench R20 / CPU (Single Core) | |
| Asus ProArt PX13 HN7306 | |
| Dell XPS 13 9350 | |
| Ortalama Intel Core Ultra 7 258V (643 - 749, n=23) | |
| MSI Prestige 13 AI Plus Evo A2VMG | |
| HP Dragonfly G4 | |
| Asus ZenBook S13 OLED UX5304 | |
| Lenovo ThinkPad Z13 Gen 2 | |
| Framework Laptop 13.5 Core Ultra 7 155H | |
| Lenovo ThinkPad X13 Gen 4 21J3001VGE | |
| MSI Prestige 13 AI Evo | |
| Dell XPS 13 Plus 9320 i5-1240p | |
| Dell Latitude 13 7350 | |
| Lenovo ThinkPad X13 2-in-1 Gen 5 | |
| Dell Latitude 7350 Detachable | |
| HP Elite Dragonfly G3 | |
| Lenovo ThinkPad X13 G3 21CM002UGE | |
| Lenovo Yoga 6 13ALC6 | |
| Cinebench R15 / CPU Multi 64Bit | |
| Asus ProArt PX13 HN7306 | |
| Framework Laptop 13.5 Core Ultra 7 155H | |
| Lenovo ThinkPad Z13 Gen 2 | |
| MSI Prestige 13 AI Evo | |
| Dell Latitude 13 7350 | |
| MSI Prestige 13 AI Plus Evo A2VMG | |
| Dell XPS 13 Plus 9320 i5-1240p | |
| Lenovo ThinkPad X13 Gen 4 21J3001VGE | |
| Dell XPS 13 9350 | |
| Ortalama Intel Core Ultra 7 258V (1280 - 1656, n=23) | |
| Lenovo ThinkPad X13 2-in-1 Gen 5 | |
| Asus ZenBook S13 OLED UX5304 | |
| HP Dragonfly G4 | |
| Dell Latitude 7350 Detachable | |
| Lenovo ThinkPad X13 G3 21CM002UGE | |
| HP Elite Dragonfly G3 | |
| Lenovo Yoga 6 13ALC6 | |
| Cinebench R15 / CPU Single 64Bit | |
| Asus ProArt PX13 HN7306 | |
| Dell XPS 13 9350 | |
| Ortalama Intel Core Ultra 7 258V (258 - 298, n=23) | |
| MSI Prestige 13 AI Plus Evo A2VMG | |
| Lenovo ThinkPad Z13 Gen 2 | |
| HP Dragonfly G4 | |
| Framework Laptop 13.5 Core Ultra 7 155H | |
| Lenovo ThinkPad X13 Gen 4 21J3001VGE | |
| Asus ZenBook S13 OLED UX5304 | |
| MSI Prestige 13 AI Evo | |
| Lenovo ThinkPad X13 G3 21CM002UGE | |
| Dell Latitude 13 7350 | |
| Dell XPS 13 Plus 9320 i5-1240p | |
| Dell Latitude 7350 Detachable | |
| HP Elite Dragonfly G3 | |
| Lenovo ThinkPad X13 2-in-1 Gen 5 | |
| Lenovo Yoga 6 13ALC6 | |
| Blender / v2.79 BMW27 CPU | |
| Lenovo ThinkPad X13 G3 21CM002UGE | |
| Lenovo ThinkPad X13 G3 21CM002UGE | |
| HP Elite Dragonfly G3 | |
| Asus ZenBook S13 OLED UX5304 | |
| Asus ZenBook S13 OLED UX5304 | |
| HP Dragonfly G4 | |
| Dell Latitude 7350 Detachable | |
| Lenovo ThinkPad X13 Gen 4 21J3001VGE | |
| Lenovo ThinkPad X13 2-in-1 Gen 5 | |
| Lenovo Yoga 6 13ALC6 | |
| Dell XPS 13 Plus 9320 i5-1240p | |
| Dell Latitude 13 7350 | |
| Ortalama Intel Core Ultra 7 258V (315 - 452, n=23) | |
| MSI Prestige 13 AI Evo | |
| Dell XPS 13 9350 | |
| MSI Prestige 13 AI Plus Evo A2VMG | |
| Framework Laptop 13.5 Core Ultra 7 155H | |
| Lenovo ThinkPad Z13 Gen 2 | |
| Asus ProArt PX13 HN7306 | |
| 7-Zip 18.03 / 7z b 4 | |
| Asus ProArt PX13 HN7306 | |
| Lenovo ThinkPad Z13 Gen 2 | |
| Framework Laptop 13.5 Core Ultra 7 155H | |
| MSI Prestige 13 AI Evo | |
| Dell XPS 13 Plus 9320 i5-1240p | |
| Lenovo Yoga 6 13ALC6 | |
| Dell Latitude 13 7350 | |
| Lenovo ThinkPad X13 G3 21CM002UGE | |
| Dell XPS 13 9350 | |
| MSI Prestige 13 AI Plus Evo A2VMG | |
| Ortalama Intel Core Ultra 7 258V (28482 - 36724, n=23) | |
| Lenovo ThinkPad X13 Gen 4 21J3001VGE | |
| HP Dragonfly G4 | |
| Asus ZenBook S13 OLED UX5304 | |
| Lenovo ThinkPad X13 2-in-1 Gen 5 | |
| HP Elite Dragonfly G3 | |
| Dell Latitude 7350 Detachable | |
| 7-Zip 18.03 / 7z b 4 -mmt1 | |
| Asus ProArt PX13 HN7306 | |
| Lenovo ThinkPad X13 Gen 4 21J3001VGE | |
| HP Dragonfly G4 | |
| Dell XPS 13 9350 | |
| Ortalama Intel Core Ultra 7 258V (5265 - 5869, n=23) | |
| Asus ZenBook S13 OLED UX5304 | |
| Lenovo ThinkPad Z13 Gen 2 | |
| MSI Prestige 13 AI Plus Evo A2VMG | |
| MSI Prestige 13 AI Evo | |
| Framework Laptop 13.5 Core Ultra 7 155H | |
| Lenovo ThinkPad X13 G3 21CM002UGE | |
| HP Elite Dragonfly G3 | |
| Dell XPS 13 Plus 9320 i5-1240p | |
| Dell Latitude 13 7350 | |
| Lenovo ThinkPad X13 2-in-1 Gen 5 | |
| Dell Latitude 7350 Detachable | |
| Lenovo Yoga 6 13ALC6 | |
| Geekbench 5.5 / Multi-Core | |
| Asus ProArt PX13 HN7306 | |
| Framework Laptop 13.5 Core Ultra 7 155H | |
| Lenovo ThinkPad Z13 Gen 2 | |
| MSI Prestige 13 AI Evo | |
| Lenovo ThinkPad X13 Gen 4 21J3001VGE | |
| MSI Prestige 13 AI Plus Evo A2VMG | |
| Ortalama Intel Core Ultra 7 258V (7574 - 9918, n=23) | |
| Dell XPS 13 9350 | |
| HP Dragonfly G4 | |
| Dell Latitude 13 7350 | |
| Asus ZenBook S13 OLED UX5304 | |
| HP Elite Dragonfly G3 | |
| Lenovo ThinkPad X13 2-in-1 Gen 5 | |
| Dell Latitude 7350 Detachable | |
| Lenovo ThinkPad X13 G3 21CM002UGE | |
| Dell XPS 13 Plus 9320 i5-1240p | |
| Geekbench 5.5 / Single-Core | |
| Asus ProArt PX13 HN7306 | |
| Dell XPS 13 9350 | |
| Ortalama Intel Core Ultra 7 258V (1891 - 2046, n=23) | |
| MSI Prestige 13 AI Plus Evo A2VMG | |
| HP Dragonfly G4 | |
| Lenovo ThinkPad X13 Gen 4 21J3001VGE | |
| Lenovo ThinkPad Z13 Gen 2 | |
| Asus ZenBook S13 OLED UX5304 | |
| MSI Prestige 13 AI Evo | |
| Framework Laptop 13.5 Core Ultra 7 155H | |
| Lenovo ThinkPad X13 2-in-1 Gen 5 | |
| Dell XPS 13 Plus 9320 i5-1240p | |
| Dell Latitude 13 7350 | |
| Dell Latitude 7350 Detachable | |
| HP Elite Dragonfly G3 | |
| Lenovo ThinkPad X13 G3 21CM002UGE | |
| HWBOT x265 Benchmark v2.2 / 4k Preset | |
| Asus ProArt PX13 HN7306 | |
| Lenovo ThinkPad Z13 Gen 2 | |
| MSI Prestige 13 AI Plus Evo A2VMG | |
| Framework Laptop 13.5 Core Ultra 7 155H | |
| Lenovo ThinkPad X13 Gen 4 21J3001VGE | |
| Dell XPS 13 9350 | |
| Ortalama Intel Core Ultra 7 258V (9.65 - 14.2, n=23) | |
| Dell XPS 13 Plus 9320 i5-1240p | |
| MSI Prestige 13 AI Evo | |
| Dell Latitude 13 7350 | |
| Lenovo ThinkPad X13 G3 21CM002UGE | |
| Lenovo Yoga 6 13ALC6 | |
| Lenovo ThinkPad X13 2-in-1 Gen 5 | |
| Dell Latitude 7350 Detachable | |
| HP Dragonfly G4 | |
| Asus ZenBook S13 OLED UX5304 | |
| HP Elite Dragonfly G3 | |
| LibreOffice / 20 Documents To PDF | |
| Lenovo ThinkPad X13 G3 21CM002UGE | |
| Dell XPS 13 Plus 9320 i5-1240p | |
| Lenovo Yoga 6 13ALC6 | |
| HP Elite Dragonfly G3 | |
| Asus ProArt PX13 HN7306 | |
| Lenovo ThinkPad X13 2-in-1 Gen 5 | |
| Dell XPS 13 9350 | |
| Dell Latitude 13 7350 | |
| MSI Prestige 13 AI Plus Evo A2VMG | |
| Ortalama Intel Core Ultra 7 258V (41.1 - 59.3, n=23) | |
| Lenovo ThinkPad Z13 Gen 2 | |
| Dell Latitude 7350 Detachable | |
| Framework Laptop 13.5 Core Ultra 7 155H | |
| Asus ZenBook S13 OLED UX5304 | |
| Lenovo ThinkPad X13 Gen 4 21J3001VGE | |
| HP Dragonfly G4 | |
| MSI Prestige 13 AI Evo | |
| R Benchmark 2.5 / Overall mean | |
| Lenovo ThinkPad X13 G3 21CM002UGE | |
| Lenovo Yoga 6 13ALC6 | |
| Lenovo ThinkPad X13 2-in-1 Gen 5 | |
| Dell Latitude 13 7350 | |
| HP Elite Dragonfly G3 | |
| Dell Latitude 7350 Detachable | |
| Dell XPS 13 Plus 9320 i5-1240p | |
| Lenovo ThinkPad Z13 Gen 2 | |
| Framework Laptop 13.5 Core Ultra 7 155H | |
| Asus ZenBook S13 OLED UX5304 | |
| Lenovo ThinkPad X13 Gen 4 21J3001VGE | |
| MSI Prestige 13 AI Evo | |
| MSI Prestige 13 AI Plus Evo A2VMG | |
| Ortalama Intel Core Ultra 7 258V (0.443 - 0.4998, n=23) | |
| HP Dragonfly G4 | |
| Dell XPS 13 9350 | |
| Asus ProArt PX13 HN7306 | |
Cinebench R23: Multi Core | Single Core
Cinebench R20: CPU (Multi Core) | CPU (Single Core)
Cinebench R15: CPU Multi 64Bit | CPU Single 64Bit
Blender: v2.79 BMW27 CPU
7-Zip 18.03: 7z b 4 | 7z b 4 -mmt1
Geekbench 6.5: Multi-Core | Single-Core
Geekbench 5.5: Multi-Core | Single-Core
HWBOT x265 Benchmark v2.2: 4k Preset
LibreOffice : 20 Documents To PDF
R Benchmark 2.5: Overall mean
* ... daha küçük daha iyidir
AIDA64: FP32 Ray-Trace | FPU Julia | CPU SHA3 | CPU Queen | FPU SinJulia | FPU Mandel | CPU AES | CPU ZLib | FP64 Ray-Trace | CPU PhotoWorxx
| Performance rating | |
| Framework Laptop 13.5 Core Ultra 7 155H | |
| MSI Prestige 13 AI Plus Evo A2VMG | |
| Dell XPS 13 9350 | |
| Ortalama Intel Core Ultra 7 258V | |
| Lenovo Yoga Book 9 13IMU9 | |
| MSI Prestige 13 AI Evo | |
| HP Dragonfly G4 | |
| AIDA64 / FP32 Ray-Trace | |
| MSI Prestige 13 AI Plus Evo A2VMG | |
| Dell XPS 13 9350 | |
| Ortalama Intel Core Ultra 7 258V (8454 - 12781, n=25) | |
| Framework Laptop 13.5 Core Ultra 7 155H | |
| Lenovo Yoga Book 9 13IMU9 | |
| HP Dragonfly G4 | |
| MSI Prestige 13 AI Evo | |
| AIDA64 / FPU Julia | |
| MSI Prestige 13 AI Plus Evo A2VMG | |
| Dell XPS 13 9350 | |
| Framework Laptop 13.5 Core Ultra 7 155H | |
| Ortalama Intel Core Ultra 7 258V (40875 - 63401, n=25) | |
| MSI Prestige 13 AI Evo | |
| Lenovo Yoga Book 9 13IMU9 | |
| HP Dragonfly G4 | |
| AIDA64 / CPU SHA3 | |
| MSI Prestige 13 AI Plus Evo A2VMG | |
| Framework Laptop 13.5 Core Ultra 7 155H | |
| Dell XPS 13 9350 | |
| Ortalama Intel Core Ultra 7 258V (1930 - 2817, n=25) | |
| Lenovo Yoga Book 9 13IMU9 | |
| MSI Prestige 13 AI Evo | |
| HP Dragonfly G4 | |
| AIDA64 / CPU Queen | |
| Framework Laptop 13.5 Core Ultra 7 155H | |
| HP Dragonfly G4 | |
| MSI Prestige 13 AI Evo | |
| MSI Prestige 13 AI Plus Evo A2VMG | |
| Ortalama Intel Core Ultra 7 258V (48816 - 49818, n=24) | |
| Dell XPS 13 9350 | |
| Lenovo Yoga Book 9 13IMU9 | |
| AIDA64 / FPU SinJulia | |
| Framework Laptop 13.5 Core Ultra 7 155H | |
| MSI Prestige 13 AI Evo | |
| Lenovo Yoga Book 9 13IMU9 | |
| HP Dragonfly G4 | |
| Dell XPS 13 9350 | |
| MSI Prestige 13 AI Plus Evo A2VMG | |
| Ortalama Intel Core Ultra 7 258V (3817 - 4440, n=25) | |
| AIDA64 / FPU Mandel | |
| MSI Prestige 13 AI Plus Evo A2VMG | |
| Dell XPS 13 9350 | |
| Ortalama Intel Core Ultra 7 258V (21670 - 33565, n=25) | |
| Framework Laptop 13.5 Core Ultra 7 155H | |
| MSI Prestige 13 AI Evo | |
| Lenovo Yoga Book 9 13IMU9 | |
| HP Dragonfly G4 | |
| AIDA64 / CPU AES | |
| Framework Laptop 13.5 Core Ultra 7 155H | |
| MSI Prestige 13 AI Evo | |
| Lenovo Yoga Book 9 13IMU9 | |
| Dell XPS 13 9350 | |
| MSI Prestige 13 AI Plus Evo A2VMG | |
| Ortalama Intel Core Ultra 7 258V (30957 - 40753, n=25) | |
| HP Dragonfly G4 | |
| AIDA64 / CPU ZLib | |
| Framework Laptop 13.5 Core Ultra 7 155H | |
| Lenovo Yoga Book 9 13IMU9 | |
| MSI Prestige 13 AI Plus Evo A2VMG | |
| Ortalama Intel Core Ultra 7 258V (422 - 632, n=25) | |
| MSI Prestige 13 AI Evo | |
| Dell XPS 13 9350 | |
| HP Dragonfly G4 | |
| AIDA64 / FP64 Ray-Trace | |
| MSI Prestige 13 AI Plus Evo A2VMG | |
| Dell XPS 13 9350 | |
| Ortalama Intel Core Ultra 7 258V (4258 - 6930, n=25) | |
| Framework Laptop 13.5 Core Ultra 7 155H | |
| Lenovo Yoga Book 9 13IMU9 | |
| MSI Prestige 13 AI Evo | |
| HP Dragonfly G4 | |
| AIDA64 / CPU PhotoWorxx | |
| MSI Prestige 13 AI Plus Evo A2VMG | |
| Ortalama Intel Core Ultra 7 258V (44223 - 59245, n=25) | |
| Dell XPS 13 9350 | |
| Framework Laptop 13.5 Core Ultra 7 155H | |
| Lenovo Yoga Book 9 13IMU9 | |
| MSI Prestige 13 AI Evo | |
| HP Dragonfly G4 | |
Sistem Performansı
CrossMark: Overall | Productivity | Creativity | Responsiveness
WebXPRT 3: Overall
WebXPRT 4: Overall
Mozilla Kraken 1.1: Total
| PCMark 10 / Score | |
| Dell XPS 13 9350 | |
| Ortalama Intel Core Ultra 7 258V, Intel Arc Graphics 140V (6265 - 7314, n=22) | |
| Framework Laptop 13.5 Core Ultra 7 155H | |
| MSI Prestige 13 AI Plus Evo A2VMG | |
| Lenovo Yoga Book 9 13IMU9 | |
| MSI Prestige 13 AI Evo | |
| HP Dragonfly G4 | |
| PCMark 10 / Essentials | |
| Lenovo Yoga Book 9 13IMU9 | |
| HP Dragonfly G4 | |
| Framework Laptop 13.5 Core Ultra 7 155H | |
| Ortalama Intel Core Ultra 7 258V, Intel Arc Graphics 140V (9295 - 11467, n=22) | |
| MSI Prestige 13 AI Plus Evo A2VMG | |
| Dell XPS 13 9350 | |
| MSI Prestige 13 AI Evo | |
| PCMark 10 / Productivity | |
| Dell XPS 13 9350 | |
| Ortalama Intel Core Ultra 7 258V, Intel Arc Graphics 140V (7357 - 9619, n=22) | |
| MSI Prestige 13 AI Evo | |
| Framework Laptop 13.5 Core Ultra 7 155H | |
| MSI Prestige 13 AI Plus Evo A2VMG | |
| Lenovo Yoga Book 9 13IMU9 | |
| HP Dragonfly G4 | |
| PCMark 10 / Digital Content Creation | |
| MSI Prestige 13 AI Plus Evo A2VMG | |
| Dell XPS 13 9350 | |
| Ortalama Intel Core Ultra 7 258V, Intel Arc Graphics 140V (8914 - 10308, n=22) | |
| Framework Laptop 13.5 Core Ultra 7 155H | |
| Lenovo Yoga Book 9 13IMU9 | |
| MSI Prestige 13 AI Evo | |
| HP Dragonfly G4 | |
| CrossMark / Overall | |
| Dell XPS 13 9350 | |
| MSI Prestige 13 AI Plus Evo A2VMG | |
| Framework Laptop 13.5 Core Ultra 7 155H | |
| Ortalama Intel Core Ultra 7 258V, Intel Arc Graphics 140V (1551 - 1742, n=21) | |
| HP Dragonfly G4 | |
| Lenovo Yoga Book 9 13IMU9 | |
| MSI Prestige 13 AI Evo | |
| CrossMark / Productivity | |
| Dell XPS 13 9350 | |
| MSI Prestige 13 AI Plus Evo A2VMG | |
| Ortalama Intel Core Ultra 7 258V, Intel Arc Graphics 140V (1479 - 1684, n=21) | |
| HP Dragonfly G4 | |
| Framework Laptop 13.5 Core Ultra 7 155H | |
| MSI Prestige 13 AI Evo | |
| Lenovo Yoga Book 9 13IMU9 | |
| CrossMark / Creativity | |
| MSI Prestige 13 AI Plus Evo A2VMG | |
| Dell XPS 13 9350 | |
| Framework Laptop 13.5 Core Ultra 7 155H | |
| Ortalama Intel Core Ultra 7 258V, Intel Arc Graphics 140V (1727 - 1977, n=21) | |
| HP Dragonfly G4 | |
| Lenovo Yoga Book 9 13IMU9 | |
| MSI Prestige 13 AI Evo | |
| CrossMark / Responsiveness | |
| HP Dragonfly G4 | |
| Framework Laptop 13.5 Core Ultra 7 155H | |
| Dell XPS 13 9350 | |
| MSI Prestige 13 AI Plus Evo A2VMG | |
| Ortalama Intel Core Ultra 7 258V, Intel Arc Graphics 140V (1246 - 1411, n=21) | |
| MSI Prestige 13 AI Evo | |
| Lenovo Yoga Book 9 13IMU9 | |
| WebXPRT 3 / Overall | |
| Dell XPS 13 9350 | |
| HP Dragonfly G4 | |
| MSI Prestige 13 AI Plus Evo A2VMG | |
| Framework Laptop 13.5 Core Ultra 7 155H | |
| Ortalama Intel Core Ultra 7 258V, Intel Arc Graphics 140V (219 - 317, n=21) | |
| Lenovo Yoga Book 9 13IMU9 | |
| MSI Prestige 13 AI Evo | |
| WebXPRT 4 / Overall | |
| MSI Prestige 13 AI Plus Evo A2VMG | |
| Dell XPS 13 9350 | |
| Ortalama Intel Core Ultra 7 258V, Intel Arc Graphics 140V (199.5 - 291, n=21) | |
| HP Dragonfly G4 | |
| Framework Laptop 13.5 Core Ultra 7 155H | |
| Lenovo Yoga Book 9 13IMU9 | |
| MSI Prestige 13 AI Evo | |
| Mozilla Kraken 1.1 / Total | |
| Lenovo Yoga Book 9 13IMU9 | |
| MSI Prestige 13 AI Evo | |
| Framework Laptop 13.5 Core Ultra 7 155H | |
| HP Dragonfly G4 | |
| Ortalama Intel Core Ultra 7 258V, Intel Arc Graphics 140V (468 - 559, n=23) | |
| MSI Prestige 13 AI Plus Evo A2VMG | |
| Dell XPS 13 9350 | |
* ... daha küçük daha iyidir
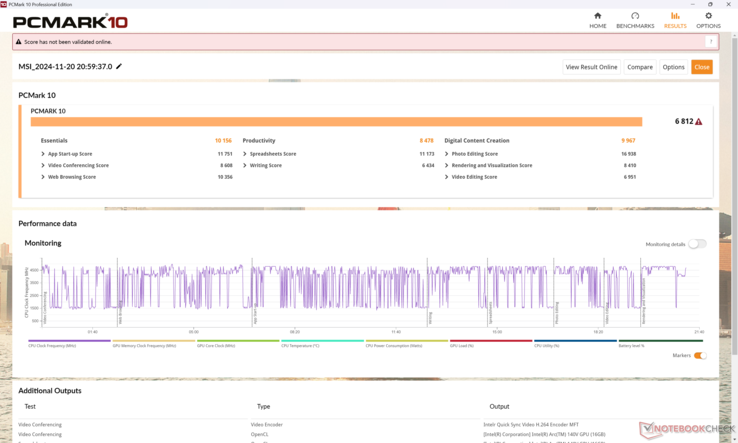
| PCMark 10 Score | 6812 puan | |
Yardım | ||
| AIDA64 / Memory Copy | |
| MSI Prestige 13 AI Plus Evo A2VMG | |
| Ortalama Intel Core Ultra 7 258V (104408 - 114336, n=25) | |
| Dell XPS 13 9350 | |
| MSI Prestige 13 AI Evo | |
| Lenovo Yoga Book 9 13IMU9 | |
| Framework Laptop 13.5 Core Ultra 7 155H | |
| HP Dragonfly G4 | |
| AIDA64 / Memory Read | |
| Dell XPS 13 9350 | |
| Ortalama Intel Core Ultra 7 258V (82846 - 89417, n=25) | |
| MSI Prestige 13 AI Plus Evo A2VMG | |
| Framework Laptop 13.5 Core Ultra 7 155H | |
| MSI Prestige 13 AI Evo | |
| Lenovo Yoga Book 9 13IMU9 | |
| HP Dragonfly G4 | |
| AIDA64 / Memory Write | |
| MSI Prestige 13 AI Plus Evo A2VMG | |
| Ortalama Intel Core Ultra 7 258V (108842 - 117989, n=25) | |
| Dell XPS 13 9350 | |
| MSI Prestige 13 AI Evo | |
| Framework Laptop 13.5 Core Ultra 7 155H | |
| HP Dragonfly G4 | |
| Lenovo Yoga Book 9 13IMU9 | |
| AIDA64 / Memory Latency | |
| MSI Prestige 13 AI Evo | |
| Lenovo Yoga Book 9 13IMU9 | |
| Framework Laptop 13.5 Core Ultra 7 155H | |
| MSI Prestige 13 AI Plus Evo A2VMG | |
| Dell XPS 13 9350 | |
| Ortalama Intel Core Ultra 7 258V (95 - 101.1, n=25) | |
| HP Dragonfly G4 | |
* ... daha küçük daha iyidir
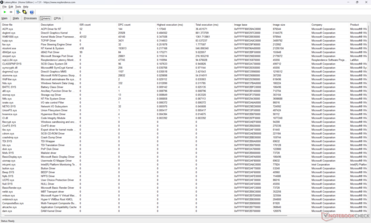
DPC Gecikme Süresi
| DPC Latencies / LatencyMon - interrupt to process latency (max), Web, Youtube, Prime95 | |
| MSI Prestige 13 AI Evo | |
| Lenovo Yoga Book 9 13IMU9 | |
| HP Dragonfly G4 | |
| MSI Prestige 13 AI Plus Evo A2VMG | |
| Framework Laptop 13.5 Core Ultra 7 155H | |
* ... daha küçük daha iyidir
Depolama Cihazları
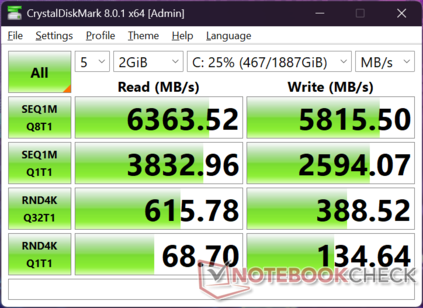
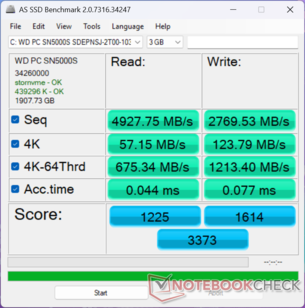
Ünitemiz aşağıdakilerle birlikte gönderilir WD SN5000S core Ultra 7 155H yapılandırmamızda bulunan Samsung PM9A1 yerine. Sürücü, orijinal Prestige 13 AI'da yaşadığımız yavaşlama sorunlarının hiçbirini sergilemiyor.
| Drive Performance rating - Percent | |
| MSI Prestige 13 AI Evo | |
| Framework Laptop 13.5 Core Ultra 7 155H | |
| HP Dragonfly G4 | |
| MSI Prestige 13 AI Plus Evo A2VMG | |
| Lenovo Yoga Book 9 13IMU9 | |
| Dell XPS 13 9350 | |
* ... daha küçük daha iyidir
Disk Throttling: DiskSpd Read Loop, Queue Depth 8
GPU Performansı
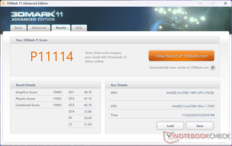
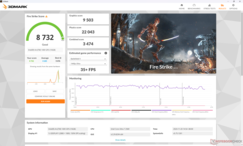
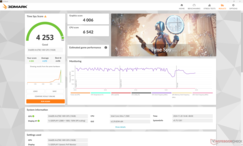
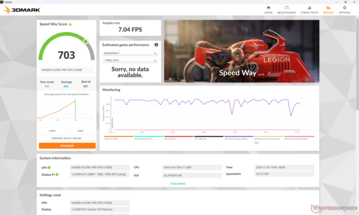
Yeni entegre sistem Arc 140V GPU tartışmasız en büyük yükseltmelerden biridir Ark 8 core Ultra 7 155H konfigürasyonunda. 3DMark sonuçları 1,5 kat ila 2 kat daha hızlıdır ve bu, Core Ultra 7 155H yapılandırmasının düşük performans gösterme eğiliminde olduğu GTA V ve hatta Cyberpunk 2077 gibi oyun senaryolarına oldukça iyi bir şekilde tercüme edilir.
| Güç Profili | Grafik Puanı | Fizik Puanı | Birleşik Puan |
| Performans Modu (Cooler Boost açık) | 9513 | 21842 | 3426 |
| Performans Modu (Cooler Boost kapalı) | 9503 | 22043 | 3474 |
| Dengeli Mod | 9376 | 21037 | 3019 |
| Akü Gücü | 9471 | 21837 | 3440 |
Sistemi Cooler Boost etkinken veya Dengeli modda ya da sadece pil gücüyle çalıştırmak, yukarıdaki Fire Strike sonuç tablomuzda gösterildiği gibi performansı önemli ölçüde etkilemeyecektir.
| 3DMark Performance rating - Percent | |
| Asus ProArt PX13 HN7306 -1! | |
| Dell XPS 13 9350 | |
| Ortalama Intel Arc Graphics 140V | |
| MSI Prestige 13 AI Plus Evo A2VMG | |
| Framework Laptop 13.5 Core Ultra 7 155H | |
| Lenovo ThinkPad X13 2-in-1 Gen 5 | |
| Dell Latitude 13 7350 | |
| Lenovo ThinkPad Z13 Gen 2 -1! | |
| Lenovo ThinkPad X13 G3 21CM002UGE | |
| HP Elite Dragonfly G3 | |
| Lenovo ThinkPad X13 Gen 4 21J3001VGE -2! | |
| Dell Latitude 7350 Detachable | |
| Lenovo Yoga 6 13ALC6 | |
| MSI Prestige 13 AI Evo -1! | |
| HP Dragonfly G4 -1! | |
| Dell XPS 13 Plus 9320 i5-1240p | |
| Asus ZenBook S13 OLED UX5304 -1! | |
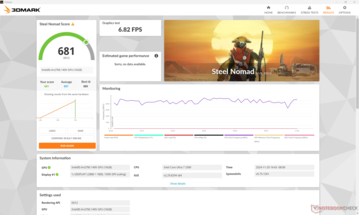
| 3DMark 11 Performance | 11114 puan | |
| 3DMark Cloud Gate Standard Score | 33012 puan | |
| 3DMark Fire Strike Score | 8732 puan | |
| 3DMark Time Spy Score | 4253 puan | |
| 3DMark Steel Nomad Score | 681 puan | |
Yardım | ||
| Blender | |
| v3.3 Classroom HIP/AMD | |
| Lenovo ThinkPad X13 G3 21CM002UGE | |
| v3.3 Classroom OPTIX/RTX | |
| Asus ProArt PX13 HN7306 | |
| v3.3 Classroom CUDA | |
| Asus ProArt PX13 HN7306 | |
| v3.3 Classroom CPU | |
| Lenovo ThinkPad X13 G3 21CM002UGE | |
| HP Elite Dragonfly G3 | |
| Asus ZenBook S13 OLED UX5304 | |
| Lenovo ThinkPad X13 2-in-1 Gen 5 | |
| HP Dragonfly G4 | |
| Dell Latitude 7350 Detachable | |
| Dell Latitude 13 7350 | |
| Lenovo ThinkPad X13 Gen 4 21J3001VGE | |
| MSI Prestige 13 AI Evo | |
| Ortalama Intel Arc Graphics 140V (506 - 772, n=35) | |
| Dell XPS 13 9350 | |
| MSI Prestige 13 AI Plus Evo A2VMG | |
| Framework Laptop 13.5 Core Ultra 7 155H | |
| Lenovo ThinkPad Z13 Gen 2 | |
| v3.3 Classroom oneAPI/Intel | |
| Dell Latitude 7350 Detachable | |
| Dell Latitude 13 7350 | |
| Lenovo ThinkPad X13 2-in-1 Gen 5 | |
| Ortalama Intel Arc Graphics 140V (195 - 405, n=22) | |
| Framework Laptop 13.5 Core Ultra 7 155H | |
| Dell XPS 13 9350 | |
| MSI Prestige 13 AI Plus Evo A2VMG | |
* ... daha küçük daha iyidir
| Performance rating - Percent | |
| MSI Prestige 13 AI Plus Evo A2VMG | |
| Dell XPS 13 9350 | |
| Framework Laptop 13.5 Core Ultra 7 155H | |
| MSI Prestige 13 AI Evo -2! | |
| Lenovo Yoga Book 9 13IMU9 -2! | |
| HP Dragonfly G4 -2! | |
| Cyberpunk 2077 - 1920x1080 Ultra Preset (FSR off) | |
| MSI Prestige 13 AI Plus Evo A2VMG | |
| Framework Laptop 13.5 Core Ultra 7 155H | |
| Dell XPS 13 9350 | |
| Lenovo Yoga Book 9 13IMU9 | |
| Baldur's Gate 3 - 1920x1080 Ultra Preset AA:T | |
| MSI Prestige 13 AI Plus Evo A2VMG | |
| Framework Laptop 13.5 Core Ultra 7 155H | |
| Dell XPS 13 9350 | |
| GTA V - 1920x1080 Highest AA:4xMSAA + FX AF:16x | |
| MSI Prestige 13 AI Plus Evo A2VMG | |
| Dell XPS 13 9350 | |
| Framework Laptop 13.5 Core Ultra 7 155H | |
| HP Dragonfly G4 | |
| MSI Prestige 13 AI Evo | |
| Final Fantasy XV Benchmark - 1920x1080 High Quality | |
| MSI Prestige 13 AI Plus Evo A2VMG | |
| Dell XPS 13 9350 | |
| Framework Laptop 13.5 Core Ultra 7 155H | |
| MSI Prestige 13 AI Evo | |
| HP Dragonfly G4 | |
| Lenovo Yoga Book 9 13IMU9 | |
| Strange Brigade - 1920x1080 ultra AA:ultra AF:16 | |
| Dell XPS 13 9350 | |
| MSI Prestige 13 AI Plus Evo A2VMG | |
| Framework Laptop 13.5 Core Ultra 7 155H | |
| MSI Prestige 13 AI Evo | |
| Lenovo Yoga Book 9 13IMU9 | |
| HP Dragonfly G4 | |
| Dota 2 Reborn - 1920x1080 ultra (3/3) best looking | |
| MSI Prestige 13 AI Plus Evo A2VMG | |
| Dell XPS 13 9350 | |
| Framework Laptop 13.5 Core Ultra 7 155H | |
| Lenovo Yoga Book 9 13IMU9 | |
| HP Dragonfly G4 | |
| MSI Prestige 13 AI Evo | |
| X-Plane 11.11 - 1920x1080 high (fps_test=3) | |
| MSI Prestige 13 AI Plus Evo A2VMG | |
| Framework Laptop 13.5 Core Ultra 7 155H | |
| MSI Prestige 13 AI Evo | |
| Dell XPS 13 9350 | |
| HP Dragonfly G4 | |
| Lenovo Yoga Book 9 13IMU9 | |
Cyberpunk 2077 ultra FPS Chart
| düşük | orta | yüksek | ultra | |
|---|---|---|---|---|
| GTA V (2015) | 161.6 | 155.6 | 67.4 | 26.7 |
| Dota 2 Reborn (2015) | 97.2 | 87.8 | 72.1 | 83 |
| Final Fantasy XV Benchmark (2018) | 84 | 46.2 | 31.7 | |
| X-Plane 11.11 (2018) | 56.6 | 42.6 | 36.9 | |
| Far Cry 5 (2018) | 92 | 57 | 49 | 45 |
| Strange Brigade (2018) | 216 | 74.6 | 63 | 55.4 |
| Tiny Tina's Wonderlands (2022) | 72.1 | 53.3 | 36 | 28 |
| F1 22 (2022) | 96.2 | 88.5 | 63.9 | 19.9 |
| Baldur's Gate 3 (2023) | 39.6 | 33.5 | 29.8 | 29.1 |
| Cyberpunk 2077 (2023) | 46.6 | 37.4 | 32.5 | 28.5 |
Emisyonlar
Sistem Gürültüsü
Fan gürültüsü, oyunlar gibi daha zorlu yükleri çalıştırırken genellikle eskisinden daha yüksektir. Cyberpunk 2077 'yi Performans modunda çalıştırmak 45 dB(A) fan gürültüsü seviyesine neden olurken, Cooler Boost modunda neredeyse 51 dB(A) fan gürültüsüne neden olur.
Ses yüksekliği
| Boşta |
| 24.8 / 24.8 / 26.7 dB |
| Çalışırken |
| 36.8 / 50.8 dB |
 | ||
30 dB sessiz 40 dB(A) duyulabilirlik 50 dB(A) gürültülü |
||
min: | ||
| MSI Prestige 13 AI Plus Evo A2VMG Arc 140V, Core Ultra 7 258V | MSI Prestige 13 AI Evo Arc 8-Core, Ultra 7 155H, Samsung PM9A1 MZVL21T0HCLR | Dell XPS 13 9350 Arc 140V, Core Ultra 7 256V, Micron 2550 512GB | Framework Laptop 13.5 Core Ultra 7 155H Arc 8-Core, Ultra 7 155H | Lenovo Yoga Book 9 13IMU9 Graphics 4-Core iGPU (Arrow Lake), Ultra 7 155U | HP Dragonfly G4 Iris Xe G7 96EUs, i7-1365U, Micron 3400 MTFDKBA512TFH 512GB | |
|---|---|---|---|---|---|---|
| Noise | 6% | 11% | 1% | 16% | 12% | |
| kapalı / ortam * (dB) | 24.1 | 23.4 3% | 24.1 -0% | 24 -0% | 23.3 3% | 23.3 3% |
| Idle Minimum * (dB) | 24.8 | 23.4 6% | 24.4 2% | 24.1 3% | 23.3 6% | 23.5 5% |
| Idle Average * (dB) | 24.8 | 26.9 -8% | 24.4 2% | 25.1 -1% | 23.3 6% | 23.5 5% |
| Idle Maximum * (dB) | 26.7 | 26.9 -1% | 24.4 9% | 27 -1% | 24.6 8% | 26.8 -0% |
| Load Average * (dB) | 36.8 | 32 13% | 26.2 29% | 38.4 -4% | 26.2 29% | 27.2 26% |
| Cyberpunk 2077 ultra * (dB) | 44.5 | 34.2 23% | 43.7 2% | |||
| Load Maximum * (dB) | 50.8 | 40.3 21% | 45.2 11% | 45.8 10% | 27.3 46% | 35 31% |
| Witcher 3 ultra * (dB) | 32 | 27.3 | 32.7 |
* ... daha küçük daha iyidir
Sıcaklık
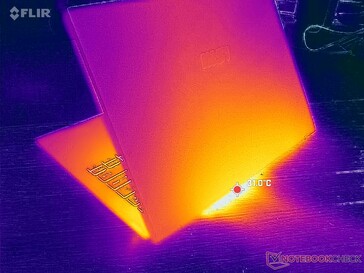
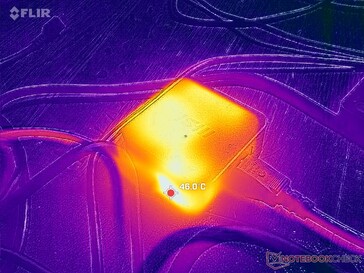
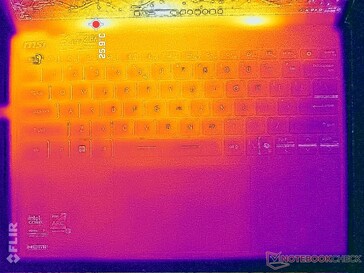
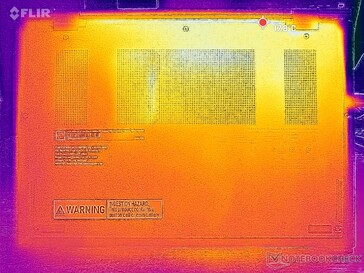
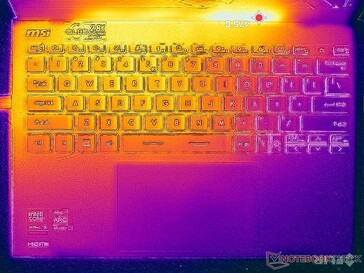
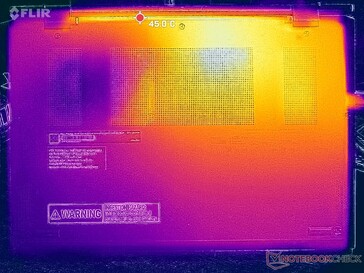
(±) Üst taraftaki maksimum sıcaklık, 35.9 °C / 97 F ortalamasına kıyasla 43.4 °C / 110 F'dir. , Subnotebook sınıfı için 21.4 ile 59 °C arasında değişir.
(±) Alt kısım, 39.3 °C / 103 F ortalamasına kıyasla maksimum 42.4 °C / 108 F'ye kadar ısınır
(+) Boşta kullanımda, üst tarafın ortalama sıcaklığı 23.4 °C / 74 F olup, cihazın 30.8 °C / 87 F.
(+) Avuç içi dayanakları ve dokunmatik yüzey, maksimum 29.8 °C / 85.6 F ile cilt sıcaklığından daha soğuktur ve bu nedenle dokunulduğunda soğuktur.
(±) Benzer cihazların avuç içi dayanağı alanının ortalama sıcaklığı 28.2 °C / 82.8 F (-1.6 °C / -2.8 F) idi.
| MSI Prestige 13 AI Plus Evo A2VMG Intel Core Ultra 7 258V, Intel Arc Graphics 140V | MSI Prestige 13 AI Evo Intel Core Ultra 7 155H, Intel Arc 8-Core iGPU | Dell XPS 13 9350 Intel Core Ultra 7 256V, Intel Arc Graphics 140V | Framework Laptop 13.5 Core Ultra 7 155H Intel Core Ultra 7 155H, Intel Arc 8-Core iGPU | Lenovo Yoga Book 9 13IMU9 Intel Core Ultra 7 155U, Intel Graphics 4-Core iGPU (Meteor / Arrow Lake) | HP Dragonfly G4 Intel Core i7-1365U, Intel Iris Xe Graphics G7 96EUs | |
|---|---|---|---|---|---|---|
| Heat | 3% | 8% | -6% | -9% | -2% | |
| Maximum Upper Side * (°C) | 43.4 | 40.9 6% | 34.8 20% | 42.8 1% | 39.2 10% | 38.6 11% |
| Maximum Bottom * (°C) | 42.4 | 40.4 5% | 37.4 12% | 45.2 -7% | 41 3% | 40.4 5% |
| Idle Upper Side * (°C) | 25.4 | 25 2% | 25.4 -0% | 27.2 -7% | 32.2 -27% | 28.2 -11% |
| Idle Bottom * (°C) | 25.6 | 25.5 -0% | 26.2 -2% | 28.6 -12% | 31.6 -23% | 29 -13% |
* ... daha küçük daha iyidir
Stres Testi
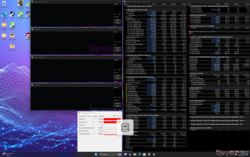
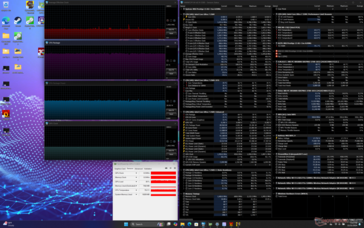
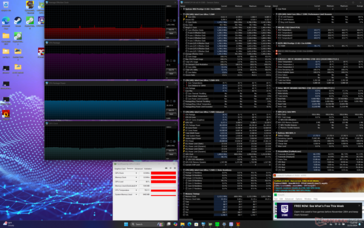
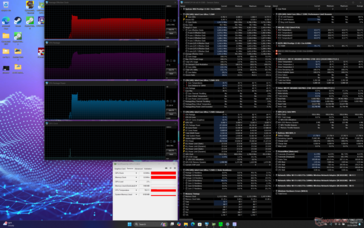
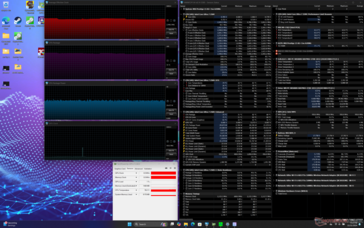
Prime95 stresini çalıştırırken, CPU yaklaşık 30 saniye boyunca 3,6 GHz, 40 W ve 82 C'ye yükselir. Daha sonra, 77 C'lik daha soğuk bir çekirdek sıcaklığını korumak için hızlı bir şekilde düşecek ve 2,9 GHz ve 27 W'da sabitlenecektir. Cooler Boost etkinleştirilirse, saat hızları neredeyse aynı kalırken çekirdek sıcaklığı biraz düşecektir.
Eğer oyun oynanıyorsa, benzer bir Lunar Lake CPU'ya sahip Dell XPS 13'teki 71 C'ye kıyasla çekirdek sıcaklığı 75 C'de sabitlenecektir.
| Ortalama CPU Saati (GHz) | GPU Saati (MHz) | Ortalama CPU Sıcaklığı (°C) | |
| Sistem Boşta | -- | 400 | 32 |
| Prime95 Stres (Cooler Boost kapalı) | 2.9 | -- | 77 |
| Prime95 Stres (Cooler Boost açık) | 3.0 | -- | 75 |
| Prime95 + FurMark Stress | 1.6 | 1800 | 76 |
| Cyberpunk 2077 Stres | 1.5 | 1950 | 75 |
MSI Prestige 13 AI Plus Evo A2VMG ses analizi
(+) | hoparlörler nispeten yüksek sesle çalabilir (84.5 dB)
Bas 100 - 315Hz
(-) | neredeyse hiç bas yok - ortalama olarak medyandan 19.4% daha düşük
(±) | Bas doğrusallığı ortalamadır (9.6% delta - önceki frekans)
Ortalar 400 - 2000 Hz
(±) | daha yüksek ortalar - ortalama olarak medyandan 6.4% daha yüksek
(+) | orta frekanslar doğrusaldır (5.1% deltadan önceki frekansa)
Yüksekler 2 - 16 kHz
(±) | daha yüksek en yüksekler - ortalama olarak medyandan 6.1% daha yüksek
(+) | yüksekler doğrusaldır (4.6% deltadan önceki frekansa)
Toplam 100 - 16.000 Hz
(±) | Genel sesin doğrusallığı ortalamadır (18.2% ortancaya göre fark)
Aynı sınıfla karşılaştırıldığında
» Bu sınıftaki tüm test edilen cihazların %51%'si daha iyi, 7% benzer, 41% daha kötüydü
» En iyisinin deltası 5% idi, ortalama 18% idi, en kötüsü 53% idi
Test edilen tüm cihazlarla karşılaştırıldığında
» Test edilen tüm cihazların %38'si daha iyi, 8 benzer, % 54 daha kötüydü
» En iyisinin deltası 4% idi, ortalama 24% idi, en kötüsü 134% idi
Apple MacBook Pro 16 2021 M1 Pro ses analizi
(+) | hoparlörler nispeten yüksek sesle çalabilir (84.7 dB)
Bas 100 - 315Hz
(+) | iyi bas - medyandan yalnızca 3.8% uzakta
(+) | bas doğrusaldır (5.2% delta ile önceki frekans)
Ortalar 400 - 2000 Hz
(+) | dengeli ortalar - medyandan yalnızca 1.3% uzakta
(+) | orta frekanslar doğrusaldır (2.1% deltadan önceki frekansa)
Yüksekler 2 - 16 kHz
(+) | dengeli yüksekler - medyandan yalnızca 1.9% uzakta
(+) | yüksekler doğrusaldır (2.7% deltadan önceki frekansa)
Toplam 100 - 16.000 Hz
(+) | genel ses doğrusaldır (4.6% ortancaya göre fark)
Aynı sınıfla karşılaştırıldığında
» Bu sınıftaki tüm test edilen cihazların %0%'si daha iyi, 0% benzer, 100% daha kötüydü
» En iyisinin deltası 5% idi, ortalama 17% idi, en kötüsü 45% idi
Test edilen tüm cihazlarla karşılaştırıldığında
» Test edilen tüm cihazların %0'si daha iyi, 0 benzer, % 100 daha kötüydü
» En iyisinin deltası 4% idi, ortalama 24% idi, en kötüsü 134% idi
Enerji Yönetimi
Güç Tüketimi
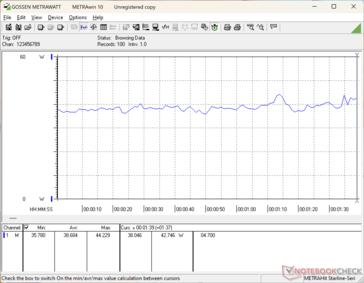
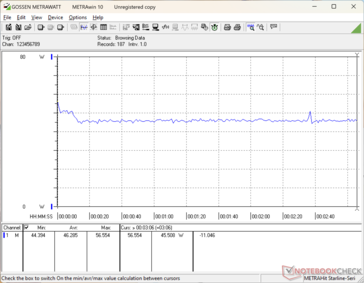
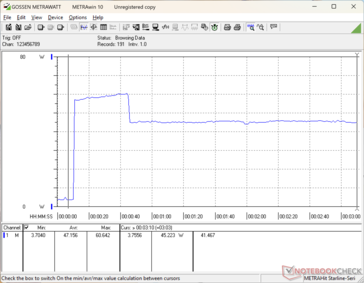
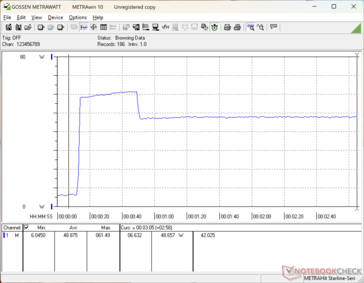
Sistem, CPU ağırlıklı görevleri uzun süreler boyunca çalıştırırken Core Ultra 7 155H konfigürasyonundan daha zorlu hale gelir, çünkü çok fazla gaz vermez. Tüketim ayrıca oyun oynarken yaklaşık yüzde 50 daha yüksektir ve bu da çok daha hızlı grafik performansıyla uyumludur.
| Kapalı / Bekleme modu | |
| Boşta | |
| Çalışırken |
|
Key:
min: | |
| MSI Prestige 13 AI Plus Evo A2VMG Core Ultra 7 258V, Arc 140V, , OLED, 2880x1800, 13.3" | MSI Prestige 13 AI Evo Ultra 7 155H, Arc 8-Core, Samsung PM9A1 MZVL21T0HCLR, OLED, 2880x1800, 13.3" | Dell XPS 13 9350 Core Ultra 7 256V, Arc 140V, Micron 2550 512GB, IPS, 1920x1200, 13.4" | Framework Laptop 13.5 Core Ultra 7 155H Ultra 7 155H, Arc 8-Core, , IPS, 2880x1920, 13.5" | Lenovo Yoga Book 9 13IMU9 Ultra 7 155U, Graphics 4-Core iGPU (Arrow Lake), , OLED, 2880x1800, 13.3" | HP Dragonfly G4 i7-1365U, Iris Xe G7 96EUs, Micron 3400 MTFDKBA512TFH 512GB, IPS, 1920x1280, 13.5" | |
|---|---|---|---|---|---|---|
| Power Consumption | -10% | 27% | 4% | -56% | -5% | |
| Idle Minimum * (Watt) | 3.5 | 4.5 -29% | 1.3 63% | 2.5 29% | 7.1 -103% | 4.1 -17% |
| Idle Average * (Watt) | 5.9 | 8 -36% | 2.5 58% | 5.2 12% | 9.1 -54% | 7.5 -27% |
| Idle Maximum * (Watt) | 10 | 8.7 13% | 4.1 59% | 5.8 42% | 18.4 -84% | 8.2 18% |
| Load Average * (Watt) | 38.7 | 36.1 7% | 40.1 -4% | 47.5 -23% | 51.3 -33% | 35.5 8% |
| Cyberpunk 2077 ultra external monitor * (Watt) | 45.6 | 43.1 5% | 52.4 -15% | |||
| Cyberpunk 2077 ultra * (Watt) | 46.3 | 46.1 -0% | 54.5 -18% | |||
| Load Maximum * (Watt) | 61.5 | 65 -6% | 57.3 7% | 61.5 -0% | 65.5 -7% | 66.5 -8% |
| Witcher 3 ultra * (Watt) | 29.7 | 41.5 | 37.5 |
* ... daha küçük daha iyidir
Power Consumption Cyberpunk / Stress Test
Power Consumption external Monitor
Pil Ömrü
Çalışma süreleri, daha verimli Lunar Lake işlemci sayesinde Core Ultra 7 155H konfigürasyonundan neredeyse iki saat daha uzun.
| MSI Prestige 13 AI Plus Evo A2VMG Core Ultra 7 258V, Arc 140V, 75 Wh | MSI Prestige 13 AI Evo Ultra 7 155H, Arc 8-Core, 75 Wh | Dell XPS 13 9350 Core Ultra 7 256V, Arc 140V, 55 Wh | Framework Laptop 13.5 Core Ultra 7 155H Ultra 7 155H, Arc 8-Core, 61 Wh | Lenovo Yoga Book 9 13IMU9 Ultra 7 155U, Graphics 4-Core iGPU (Arrow Lake), 80 Wh | HP Dragonfly G4 i7-1365U, Iris Xe G7 96EUs, 68 Wh | |
|---|---|---|---|---|---|---|
| Pil Çalışma Süresi | -13% | 54% | -22% | -25% | 19% | |
| WiFi v1.3 (h) | 13.4 | 11.6 -13% | 20.6 54% | 10.5 -22% | 10.1 -25% | 15.9 19% |
| H.264 (h) | 16.7 | |||||
| Load (h) | 2.8 | 2.4 | 1.5 | 3.2 | ||
| Reader / Idle (h) | 56.8 | 38.3 | 42.5 |
Notebookcheck Değerlendirmesi
MSI Prestige 13 AI Plus Evo A2VMG
- 11/26/2024 v8
Allen Ngo
Şeffaflık
İncelenecek cihazların seçimi editör ekibimiz tarafından yapılır. Test örneği, bu incelemenin amacı doğrultusunda üretici veya perakendeci tarafından yazara ödünç olarak sağlanmıştır. Borç verenin bu inceleme üzerinde herhangi bir etkisi olmadığı gibi, üretici de yayınlanmadan önce bu incelemenin bir kopyasını almamıştır. Bu incelemeyi yayınlama zorunluluğu yoktu. Bağımsız bir medya şirketi olarak Notebookcheck, üreticilerin, perakendecilerin veya yayıncıların otoritesine tabi değildir.
Notebookcheck bu şekilde test yapıyor
Notebookcheck, tüm sonuçların karşılaştırılabilir olmasını sağlamak için her yıl yüzlerce dizüstü bilgisayarı ve akıllı telefonu standart prosedürler kullanarak bağımsız olarak inceliyor. Yaklaşık 20 yıldır test yöntemlerimizi sürekli olarak geliştirdik ve bu süreçte endüstri standartlarını belirledik. Test laboratuvarlarımızda deneyimli teknisyenler ve editörler tarafından yüksek kaliteli ölçüm ekipmanları kullanılmaktadır. Bu testler çok aşamalı bir doğrulama sürecini içerir. Karmaşık derecelendirme sistemimiz, nesnelliği koruyan yüzlerce sağlam temellere dayanan ölçüm ve kıyaslamaya dayanmaktadır.











 Total Sustainability Score:
