Medion Erazer Crawler E40 dizüstü bilgisayar incelemesi: İyi RTX 4050 performansına sahip uygun fiyatlı oyuncu
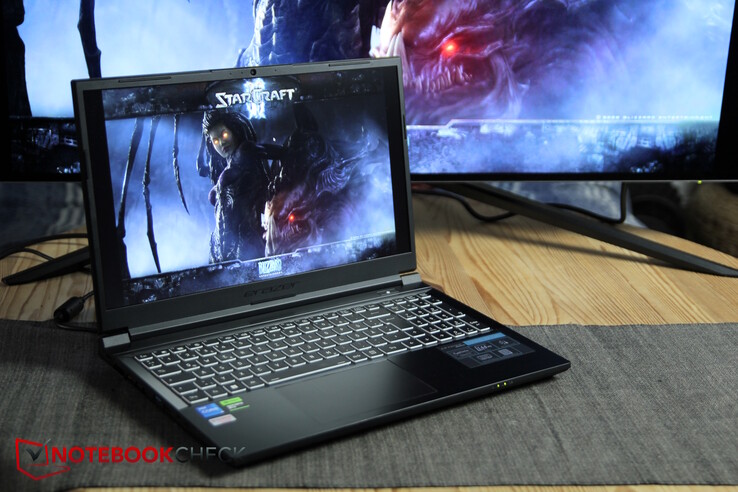
Medion Erazer Crawler E40, E30'un (Intel Gen12 ve RTX 30xx özellikli) yerini alıyor ve seriyi Intel Gen 13 ve RTX 4050 ile en son teknolojiye taşıyor. Bu giriş seviyesi oyun dizüstü bilgisayarının fiyatı şu anda ~1100 ABD dolarının biraz altında.
Diğer ekonomik oyun dizüstü bilgisayarlarıyla rekabet eden Medion Erazer Crawler E40, aşağıdaki gibi rakiplerle karşı karşıya Lenovo LOQ 15, the Asus TUF Gaming A15, the XMG Apex 15veya MSI Katana 15.
Medion, "Erazer" markası altında çok sayıda modeli kapsıyor ve bu da hepsini takip etmeyi zorlaştırıyor. Diğer üreticiler farklı konfigürasyonları aynı kasada birleştirdikleri seriler düzenlerken, Medion her konfigürasyonun yeni bir seri adını haklı çıkardığına inanıyor gibi görünüyor. Erazer Crawler E40 yalnızca bu özel konfigürasyonda mevcut ve bu nedenle yalnızca bu model olarak satılıyor. CPU, GPU veya ekranla ilgili herhangi bir seçenek yoktur.
Daha önce test ettiğimiz diğer Medion Erazer modelleri şunlardır:
Karşılaştırmalı olarak olası rakipler
Derecelendirme | Tarih | Modeli | Ağırlık | Yükseklik | Boyut | Çözünürlük | Fiyat |
|---|---|---|---|---|---|---|---|
| 85.4 % v7 (old) | 12/2023 | Medion Erazer Crawler E40 - MD 62518 i5-13500H, GeForce RTX 4050 Laptop GPU | 2.3 kg | 28 mm | 15.60" | 1920x1080 | |
| 85.9 % v7 (old) | 10/2023 | Lenovo LOQ 15IRH8 Core i7 i7-13620H, GeForce RTX 4050 Laptop GPU | 2.4 kg | 25.2 mm | 15.60" | 2560x1440 | |
| 86.3 % v7 (old) | Asus TUF A15 FA507 R7 7735HS, GeForce RTX 4050 Laptop GPU | 2.2 kg | 24.9 mm | 15.60" | 1920x1080 | ||
| 86.2 % v7 (old) | 10/2023 | Schenker XMG Apex 15 (Late 23) R7 7840HS, GeForce RTX 4050 Laptop GPU | 2.2 kg | 26.7 mm | 15.60" | 2560x1440 | |
| 82.9 % v7 (old) | 05/2023 | MSI Katana 15 B12VEK i7-12650H, GeForce RTX 4050 Laptop GPU | 2.3 kg | 24.9 mm | 15.60" | 1920x1080 |
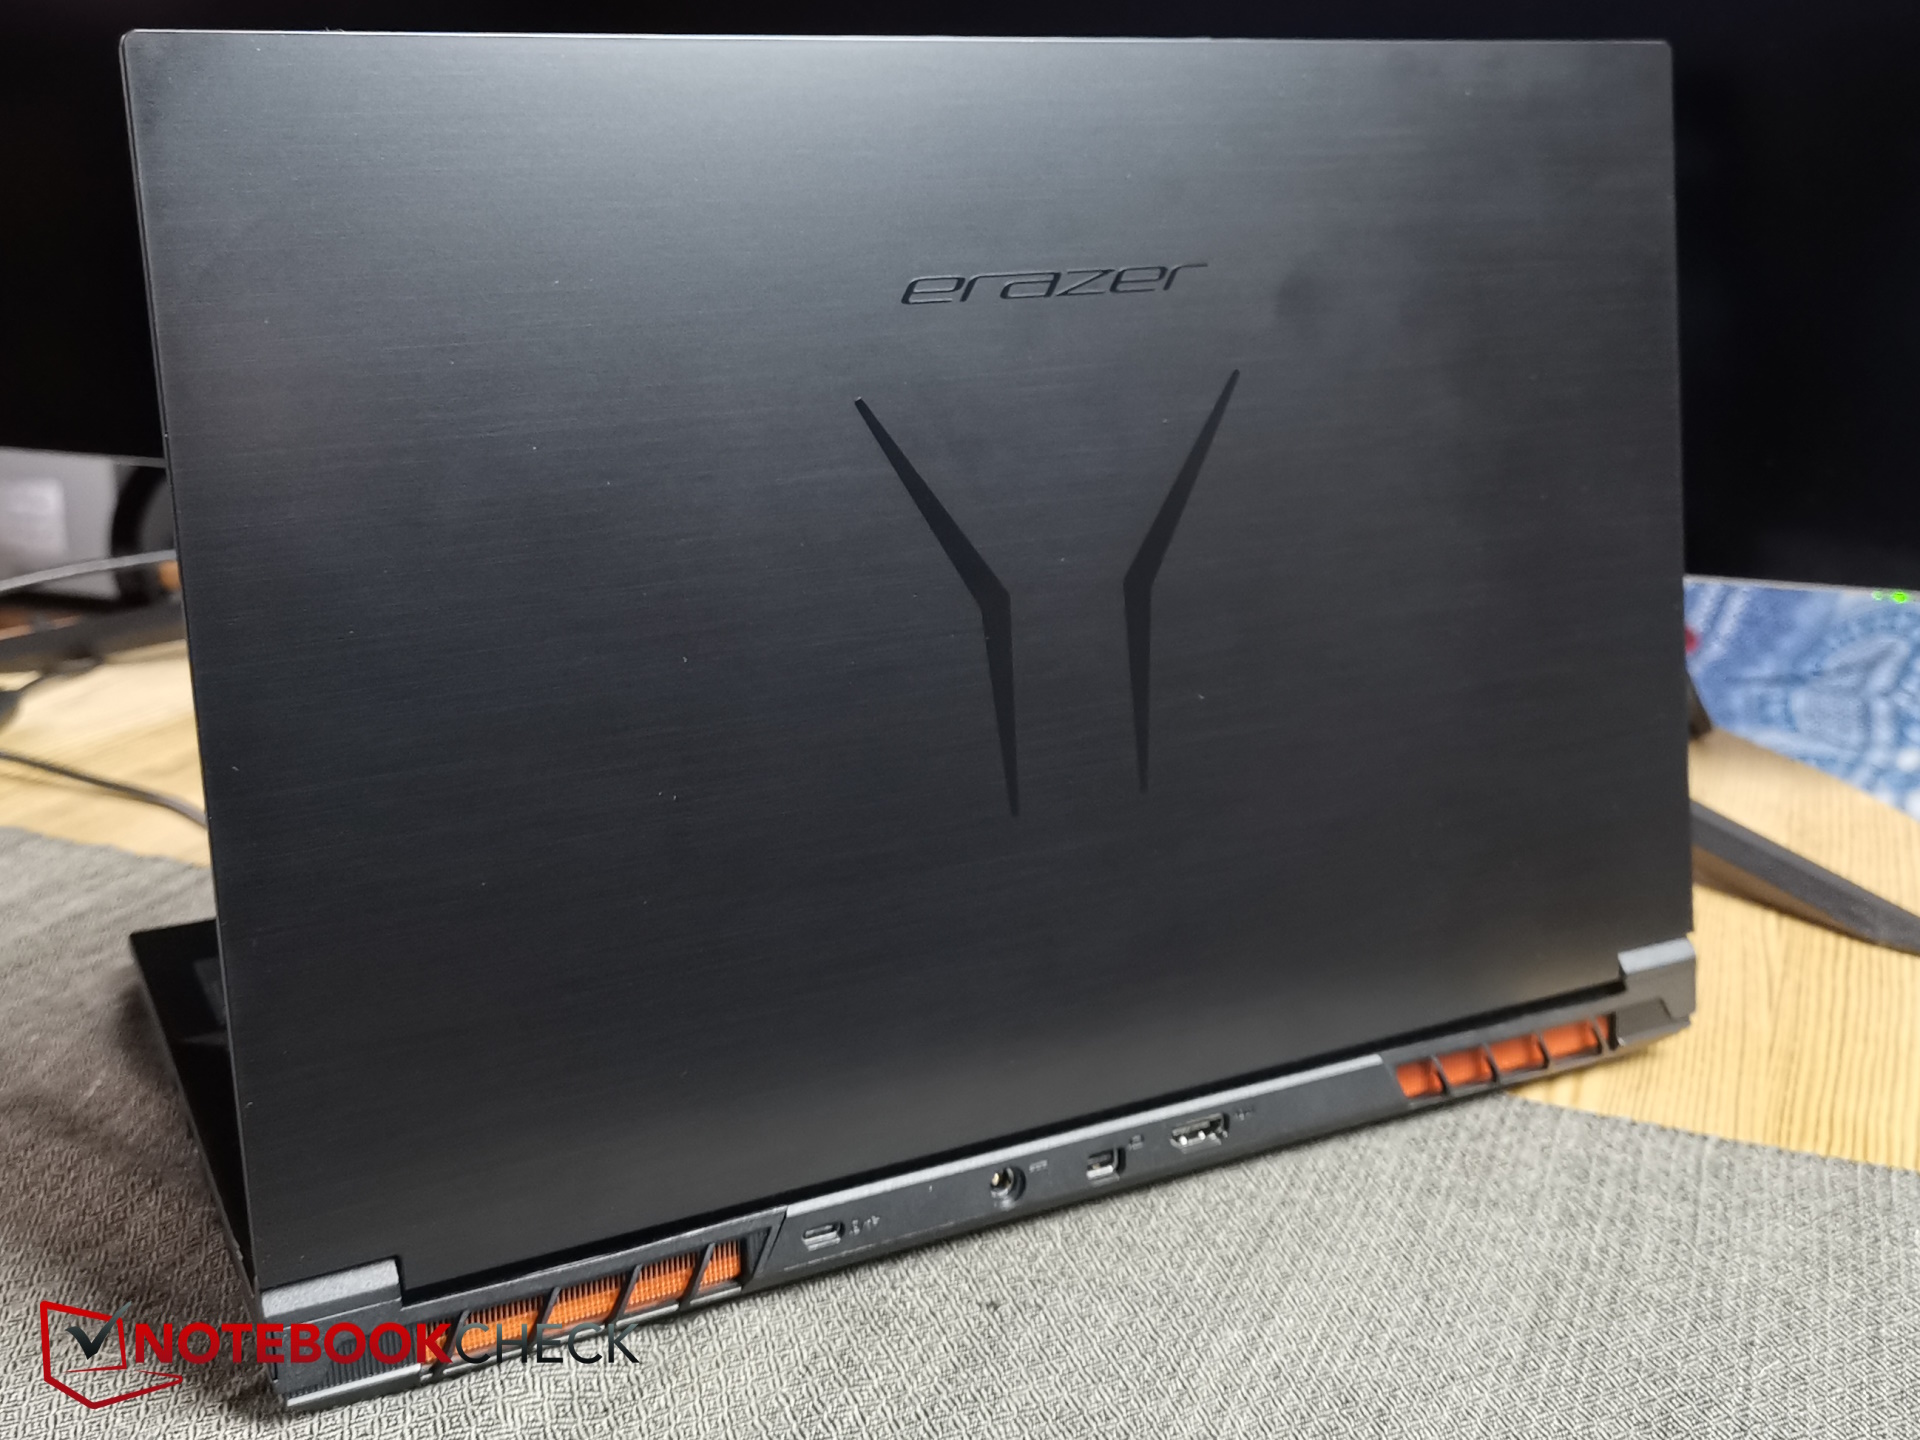
Kasa ve Bağlantı - Fırçalanmış plastik kaplamalı Crawler E40
Ekran kapağı ve tabanı, alüminyuma çok benzeyen sağlam plastikten yapılmıştır ve kasıtlı bir görünüm verir. Ekranın kenarları ve dizüstü bilgisayarın alt tarafı yumuşak plastikten yapılmıştır. Hem pürüzsüz kapak hem de taban parmak izi tutmaya meyillidir.
Kapaktaki Erazer logosu da dahil olmak üzere tamamen siyah bir tasarıma sahip olan dizüstü bilgisayar, nispeten sade bir estetiğe sahip. Taban yüksek düzeyde burulma direnci sergilerken, kapak daha az olmasına rağmen oldukça "yumuşak" görünüyor ve büküldüğünde önemli ölçüde esniyor, ekran ise bunu metanetle karşılıyor. Genel işçilik iyi bir standartta ve görünür boşluklar mevcut değil.
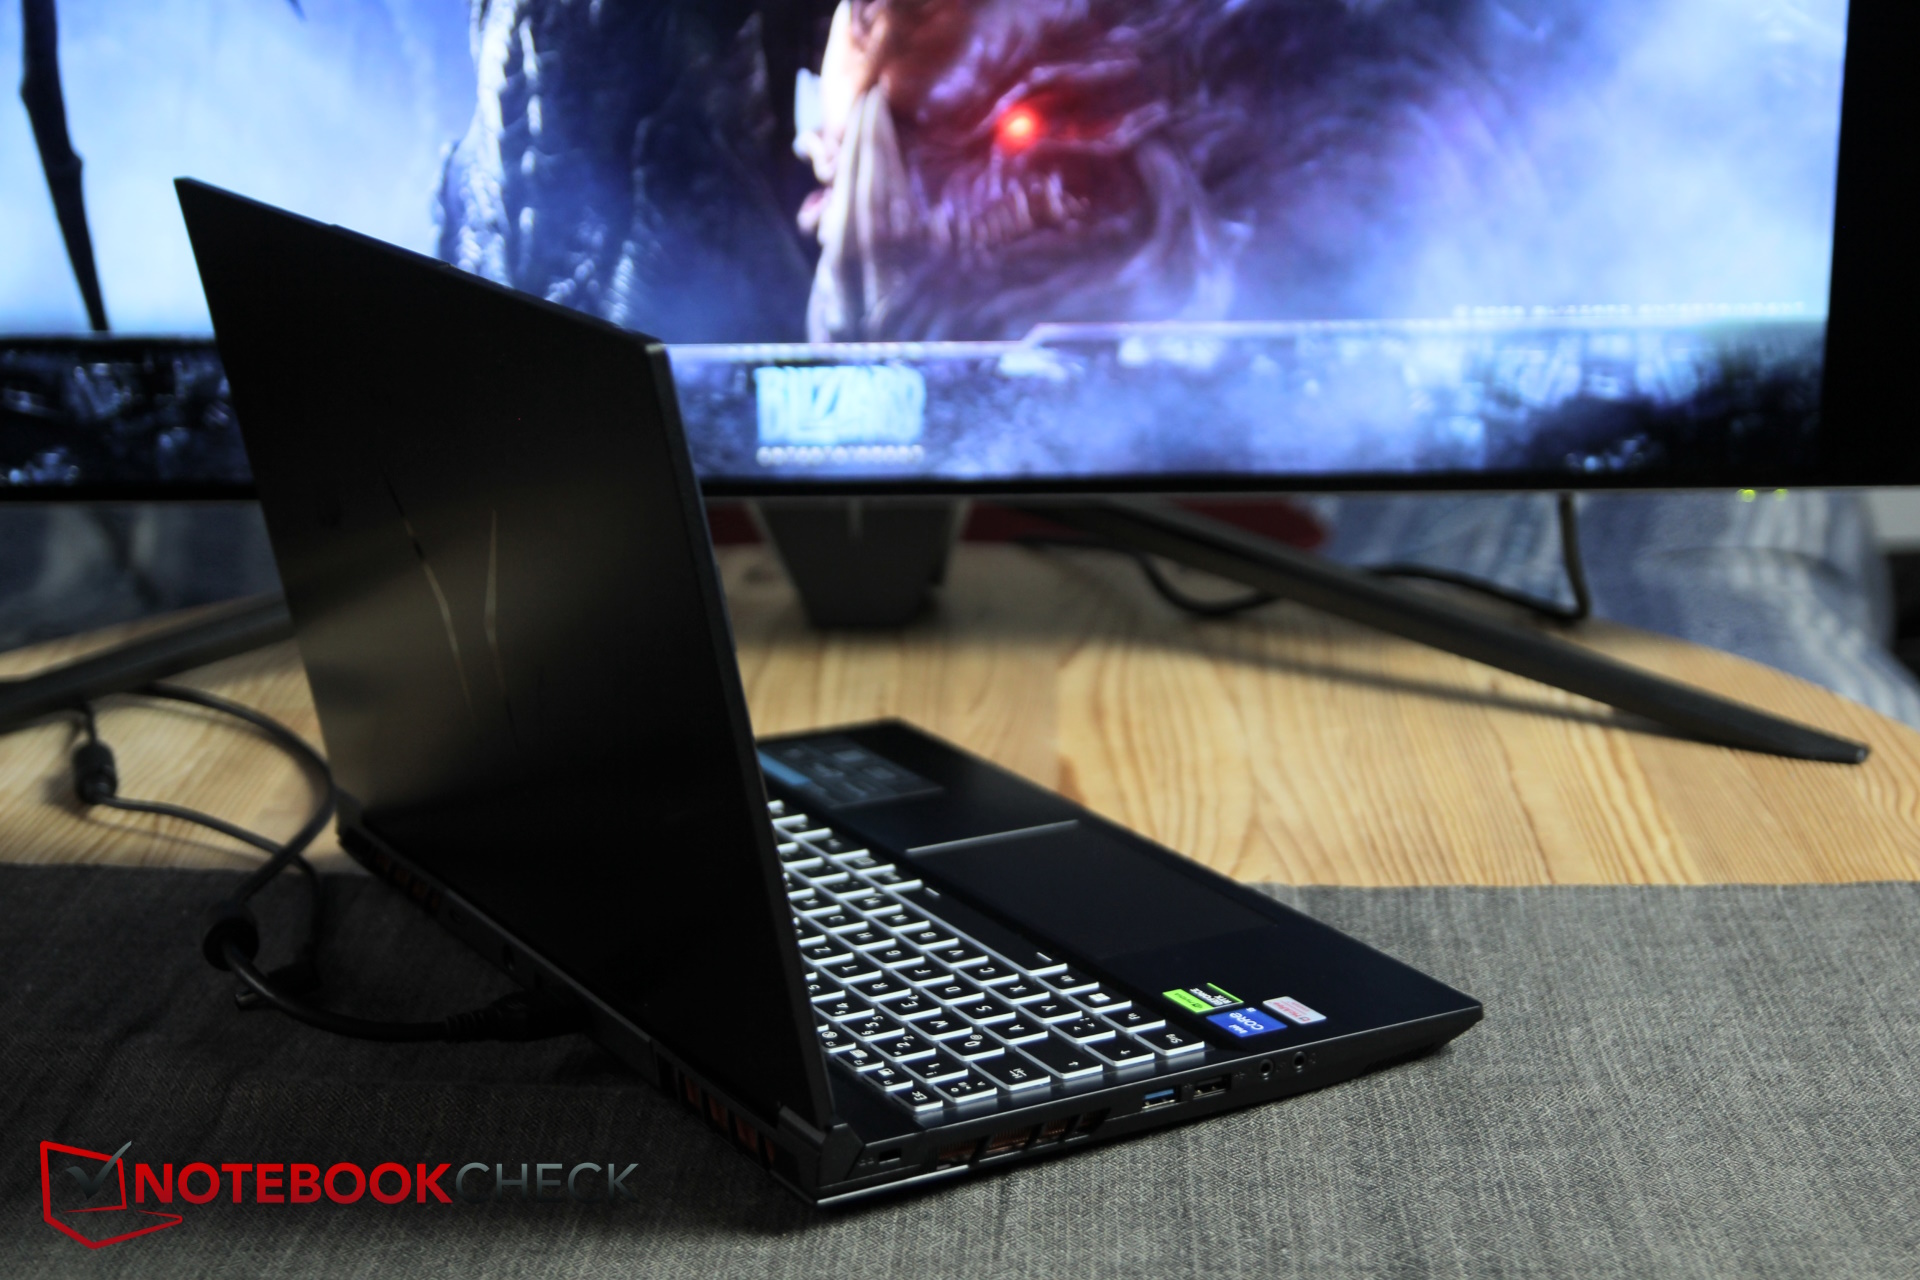
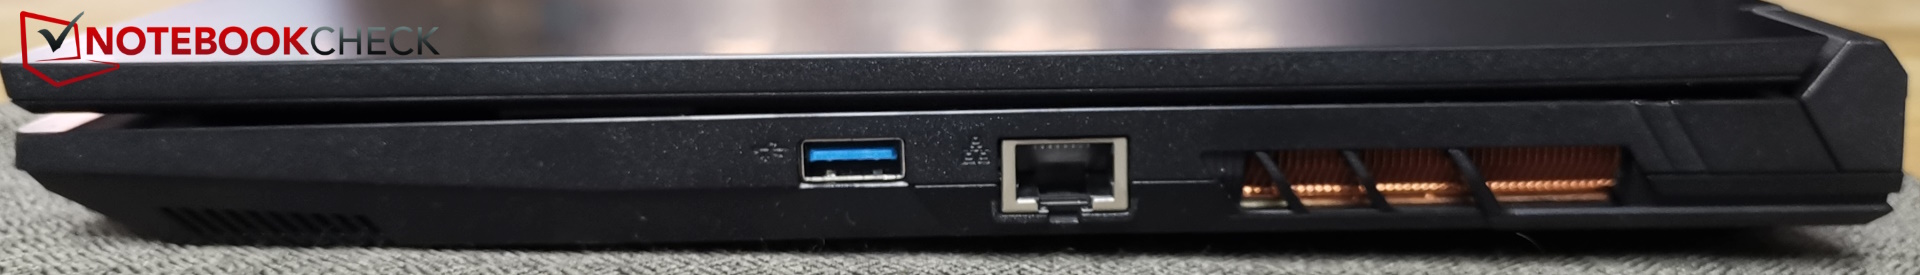
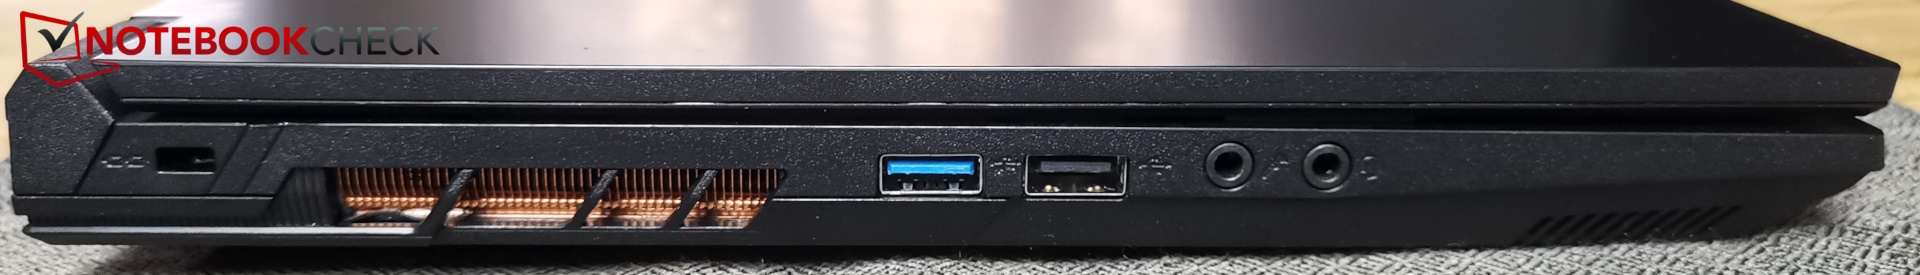
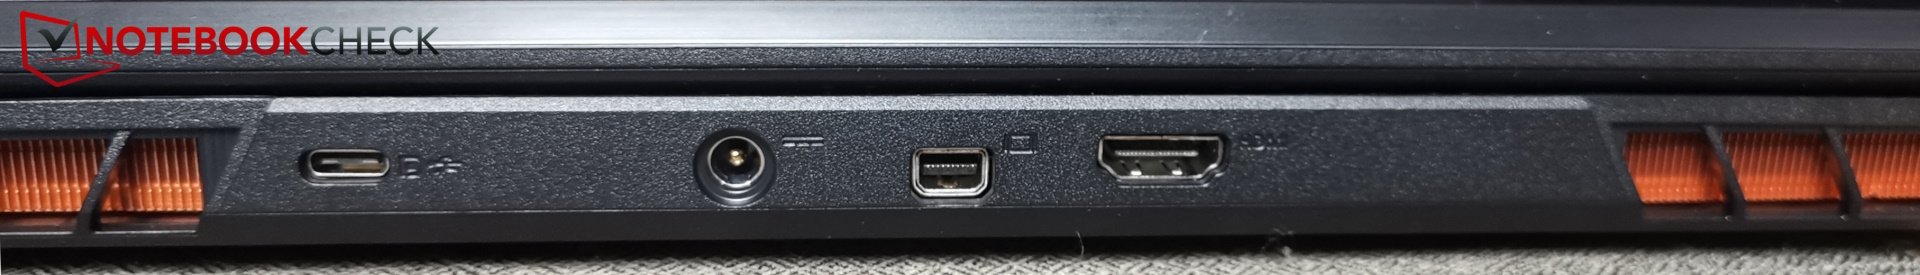
Bağlantılar - Thunderbolt yok, onun yerine USB 2.0 var
Intel CPU'ya sahip olmasına rağmen E40, Thunderbolt desteğinden yoksundur. USB-C 10 Gb/s hıza sahiptir. Bununla birlikte, potansiyel olarak daha hızlı bir alternatife yükseltilebilecek eski bir USB-A 2.0 bağlantı noktası da içeriyor. Özellikle, kart okuyucu mevcut değildir.
| Networking | |
| iperf3 transmit AXE11000 | |
| MSI Katana 15 B12VEK | |
| Medion Erazer Crawler E40 - MD 62518 | |
| Schenker XMG Apex 15 (Late 23) | |
| Sınıf ortalaması Gaming (560 - 1862, n=87, son 2 yıl) | |
| Ortalama Intel Wi-Fi 6E AX211 (64 - 1921, n=276) | |
| Asus TUF A15 FA507 | |
| Lenovo LOQ 15IRH8 Core i7 | |
| iperf3 receive AXE11000 | |
| Schenker XMG Apex 15 (Late 23) | |
| MSI Katana 15 B12VEK | |
| Medion Erazer Crawler E40 - MD 62518 | |
| Sınıf ortalaması Gaming (680 - 1745, n=87, son 2 yıl) | |
| Ortalama Intel Wi-Fi 6E AX211 (582 - 1890, n=276) | |
| Lenovo LOQ 15IRH8 Core i7 | |
| Asus TUF A15 FA507 | |
| iperf3 transmit AXE11000 6GHz | |
| Medion Erazer Crawler E40 - MD 62518 | |
| Sınıf ortalaması Gaming (723 - 1868, n=36, son 2 yıl) | |
| Ortalama Intel Wi-Fi 6E AX211 (385 - 1851, n=226) | |
| iperf3 receive AXE11000 6GHz | |
| Sınıf ortalaması Gaming (975 - 1775, n=35, son 2 yıl) | |
| Medion Erazer Crawler E40 - MD 62518 | |
| Ortalama Intel Wi-Fi 6E AX211 (700 - 1857, n=226) | |


Bakım
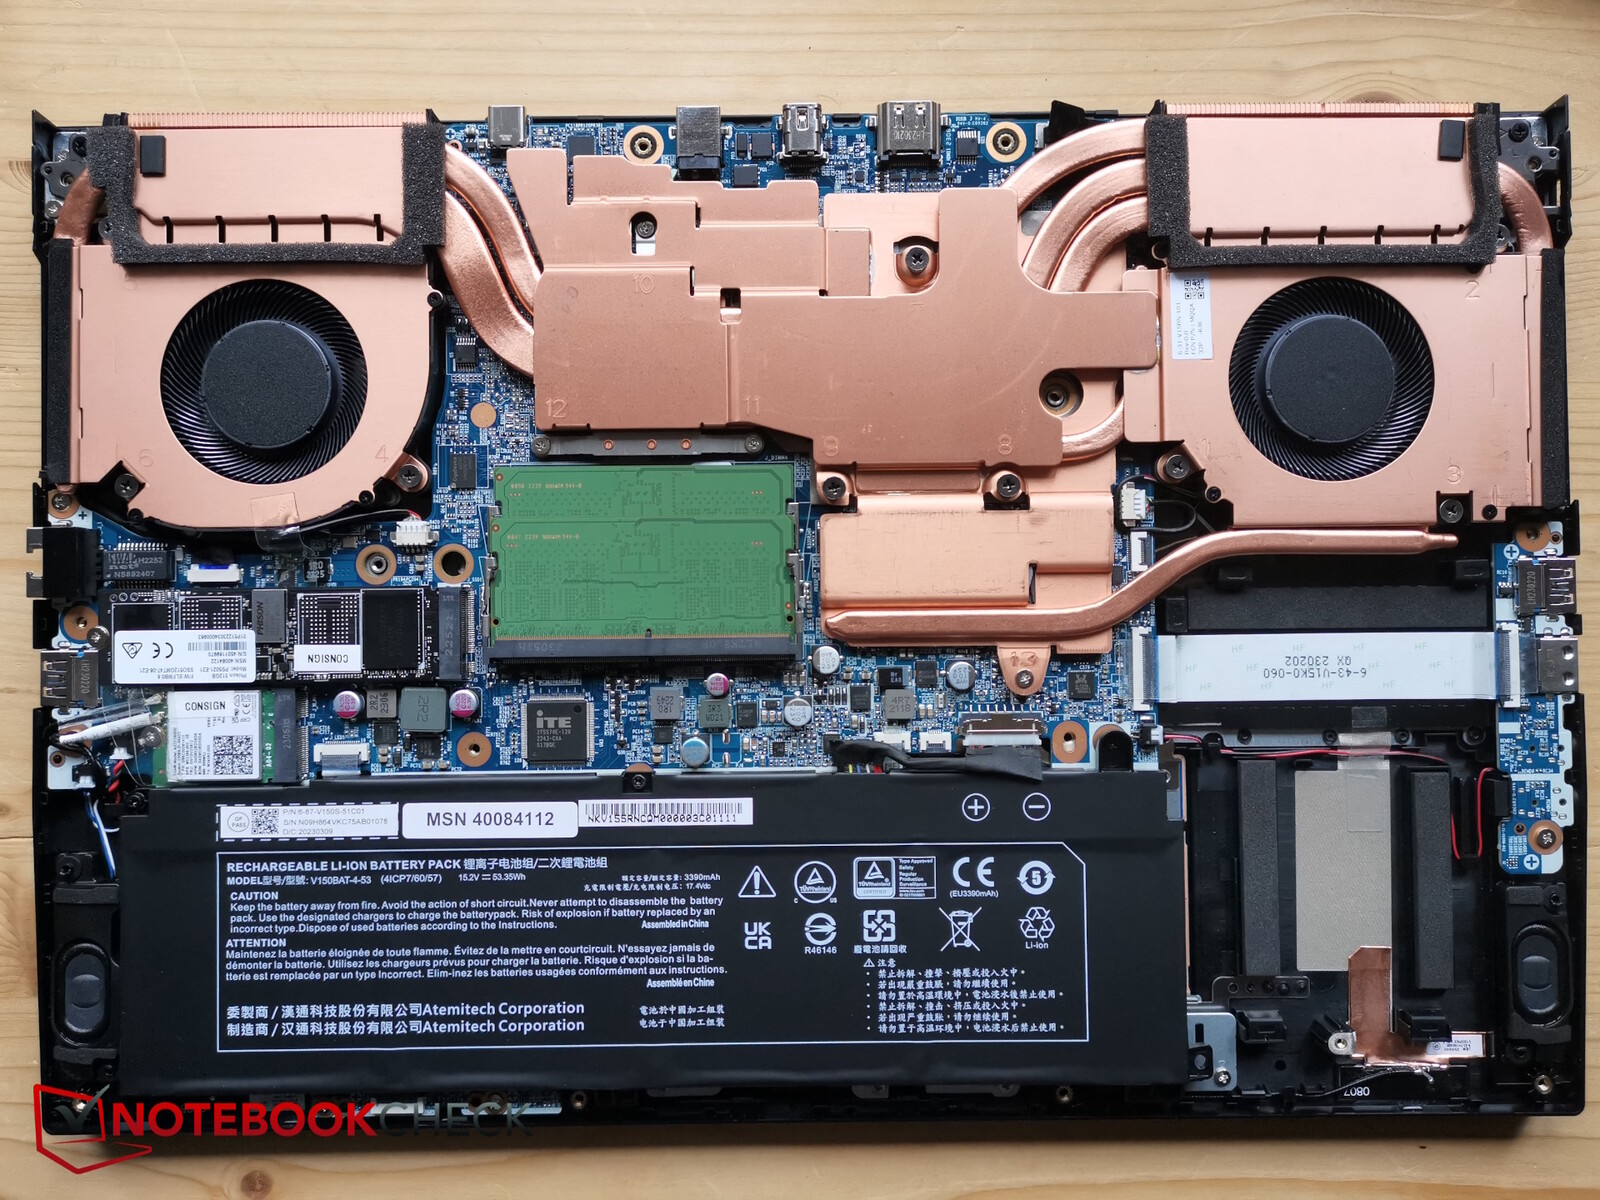
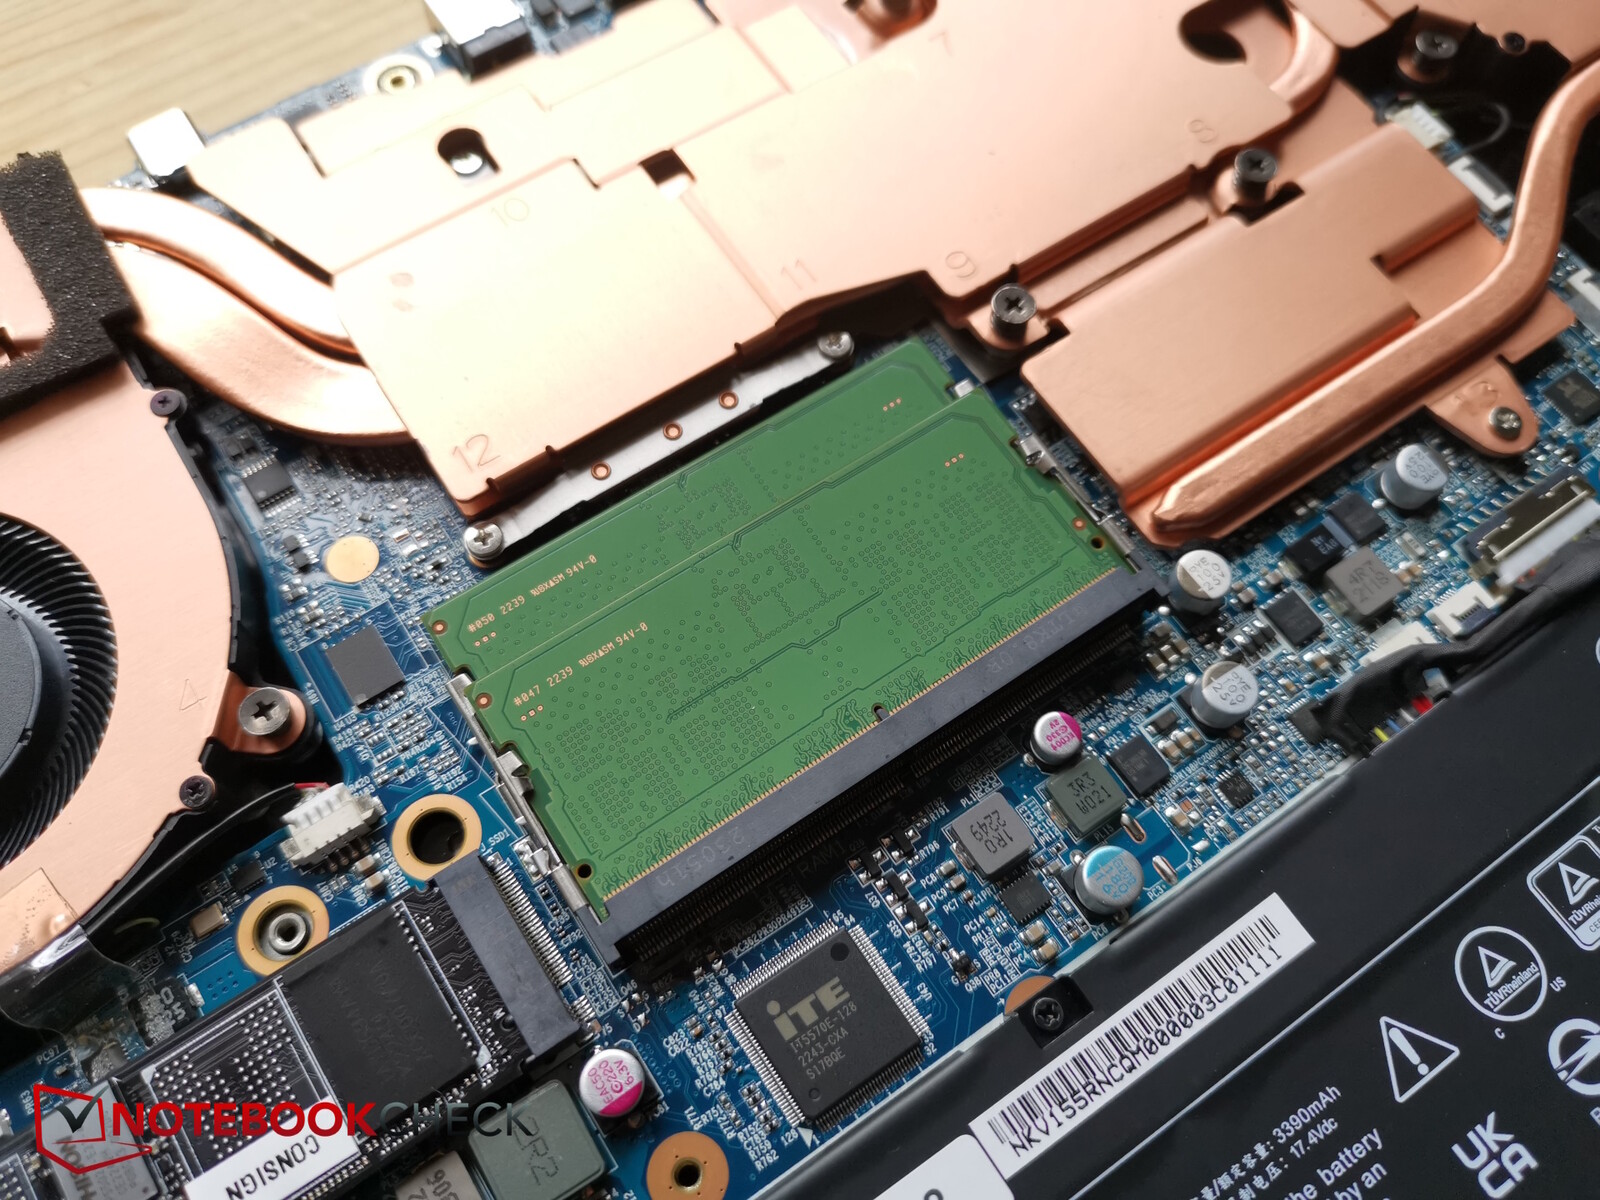
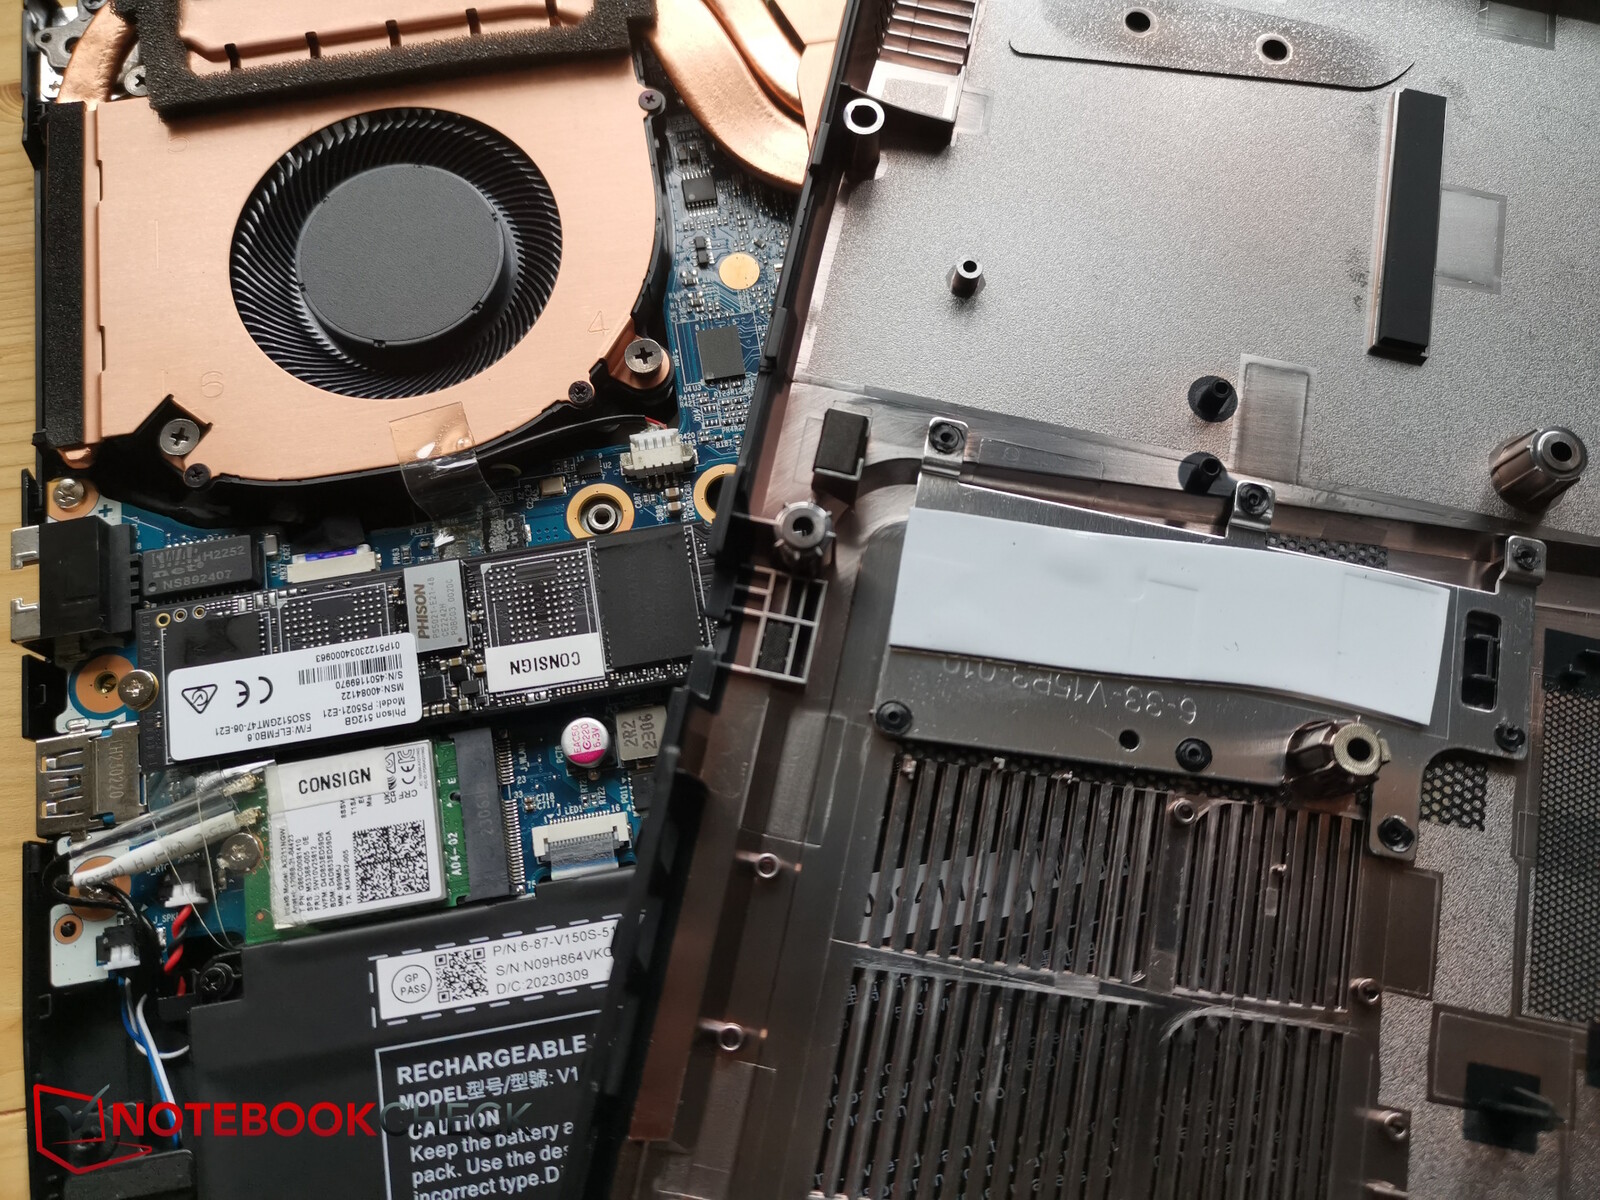
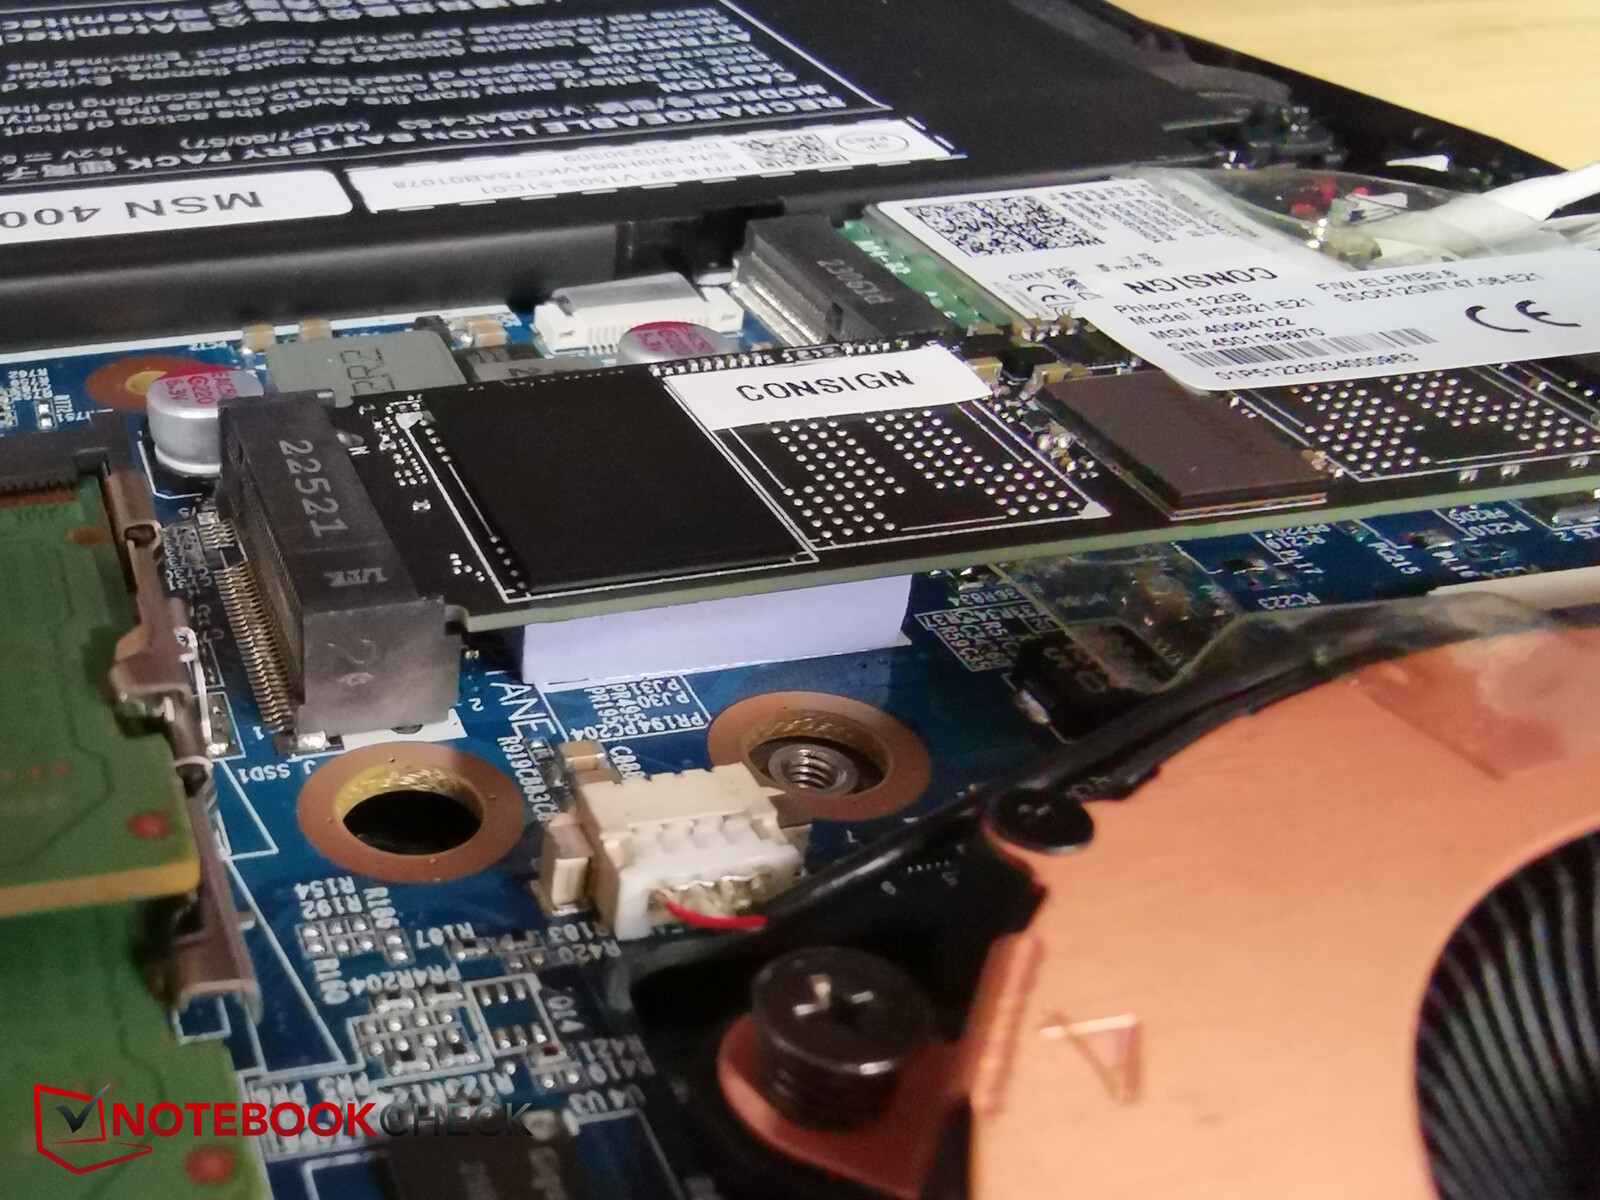
Dahili bileşenlere erişmek için aynı boyuttaki 14 Phillips vidayı çıkarmanız gerekir. Plastik taban plakası daha sonra kolayca kaldırılabilir. Altında bol miktarda bakır içeren bir soğutma sistemi, vidalı bir pil, iki RAM yuvası, iki ped ile soğutulan SSD ve değiştirilebilir WiFi modülü bulacaksınız.
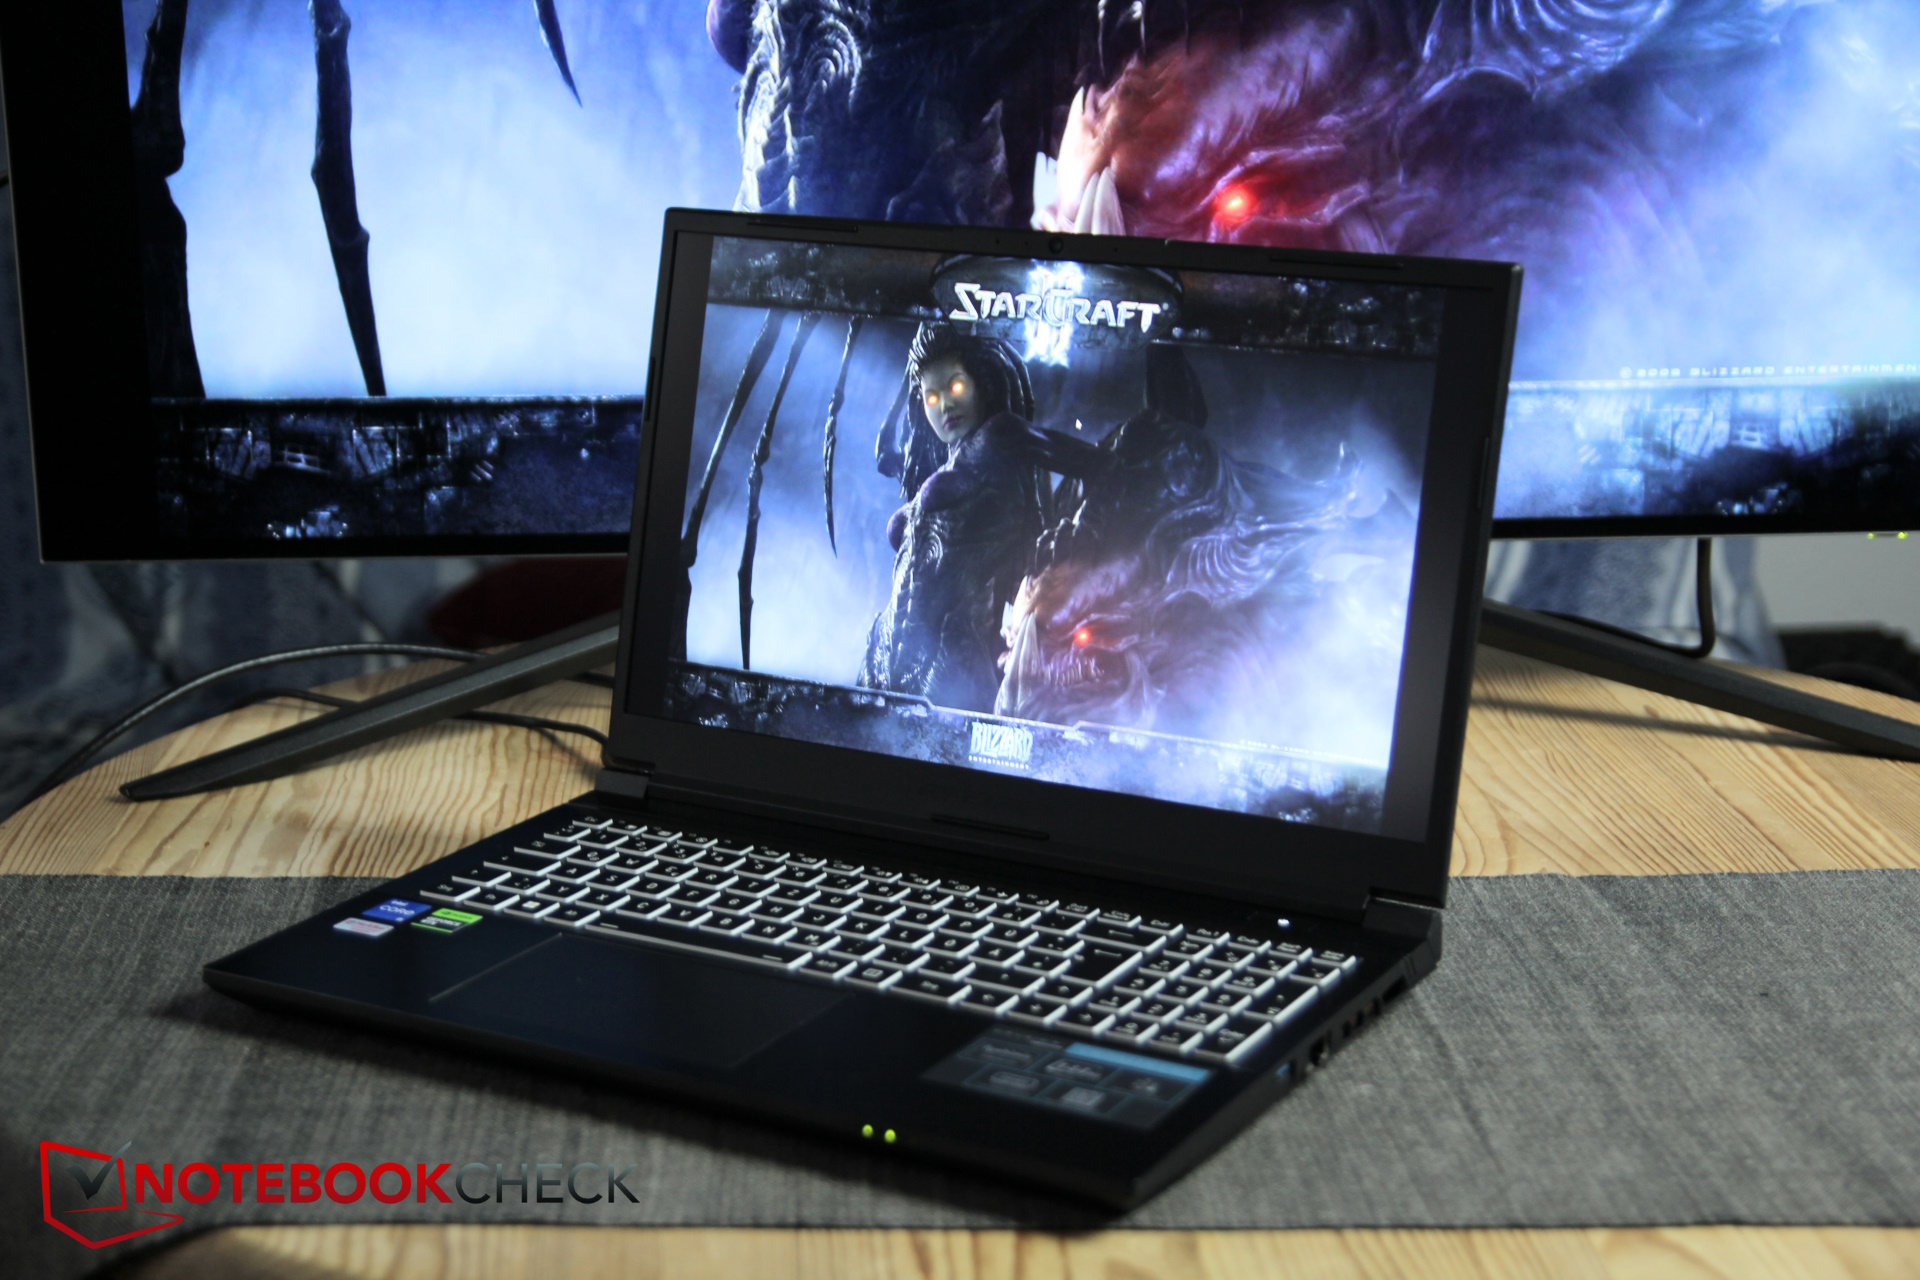
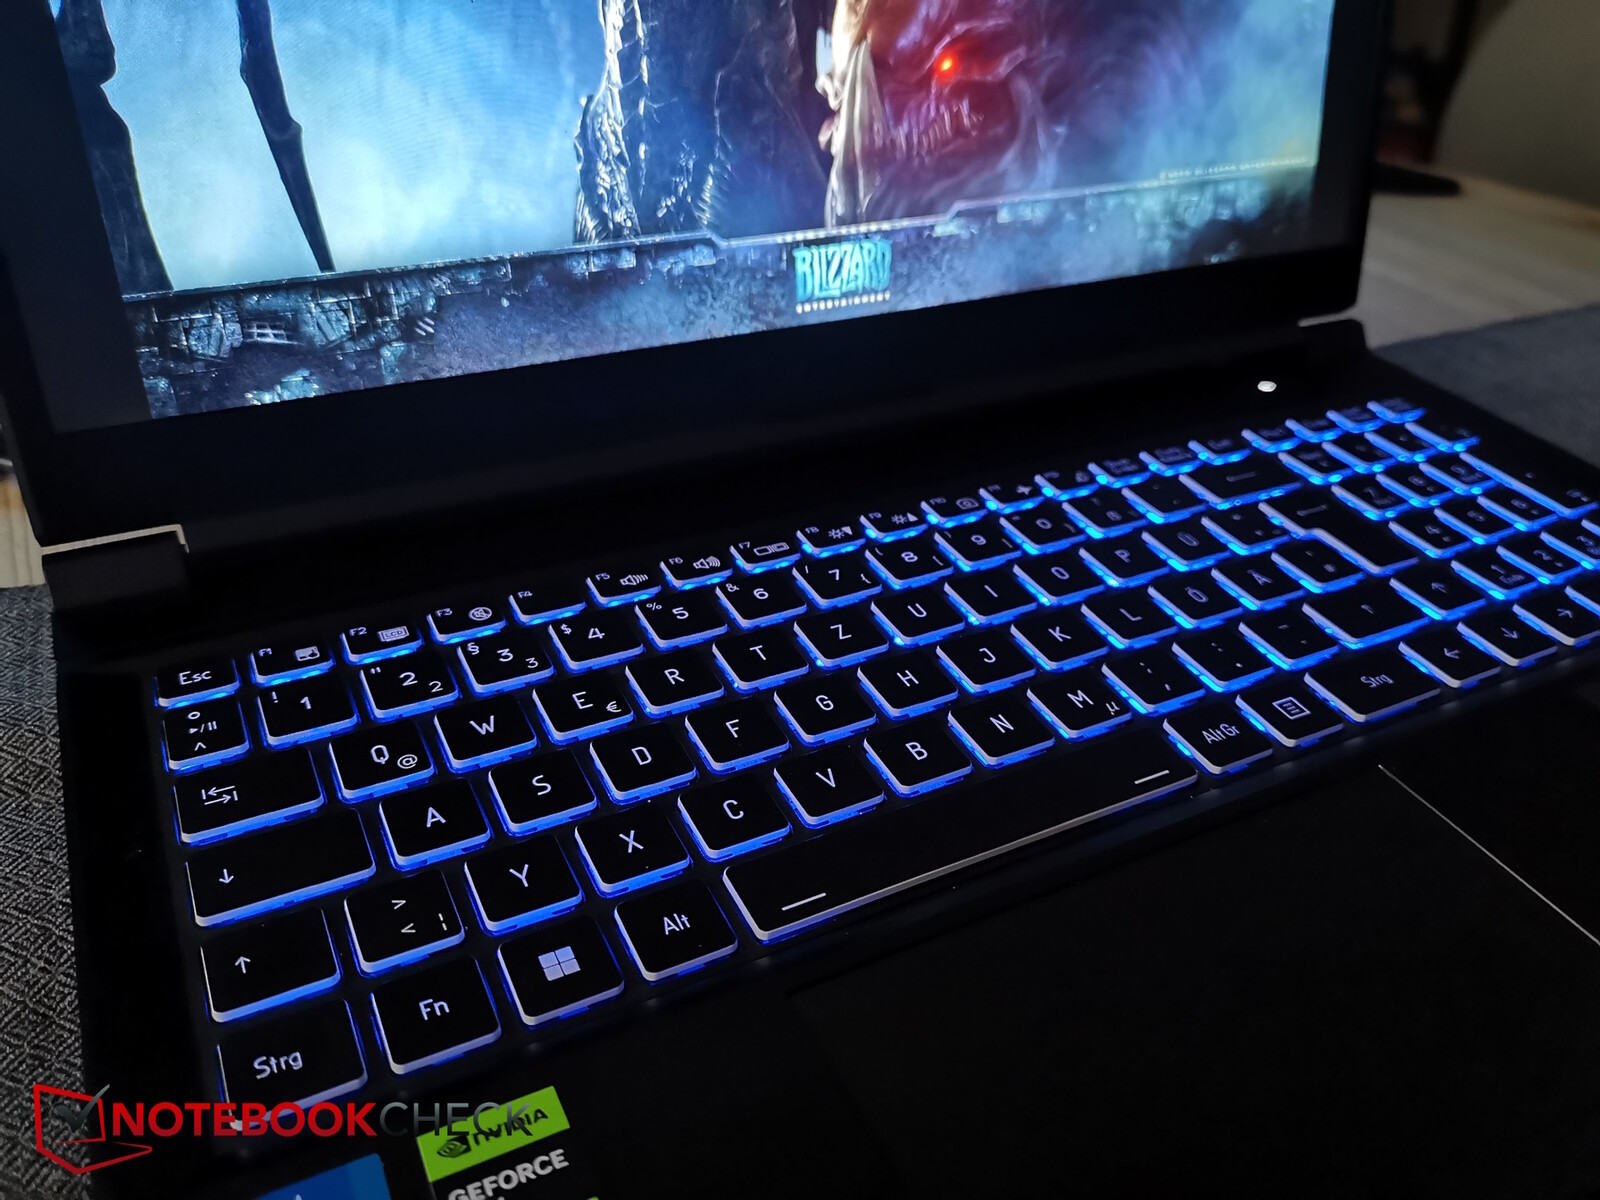
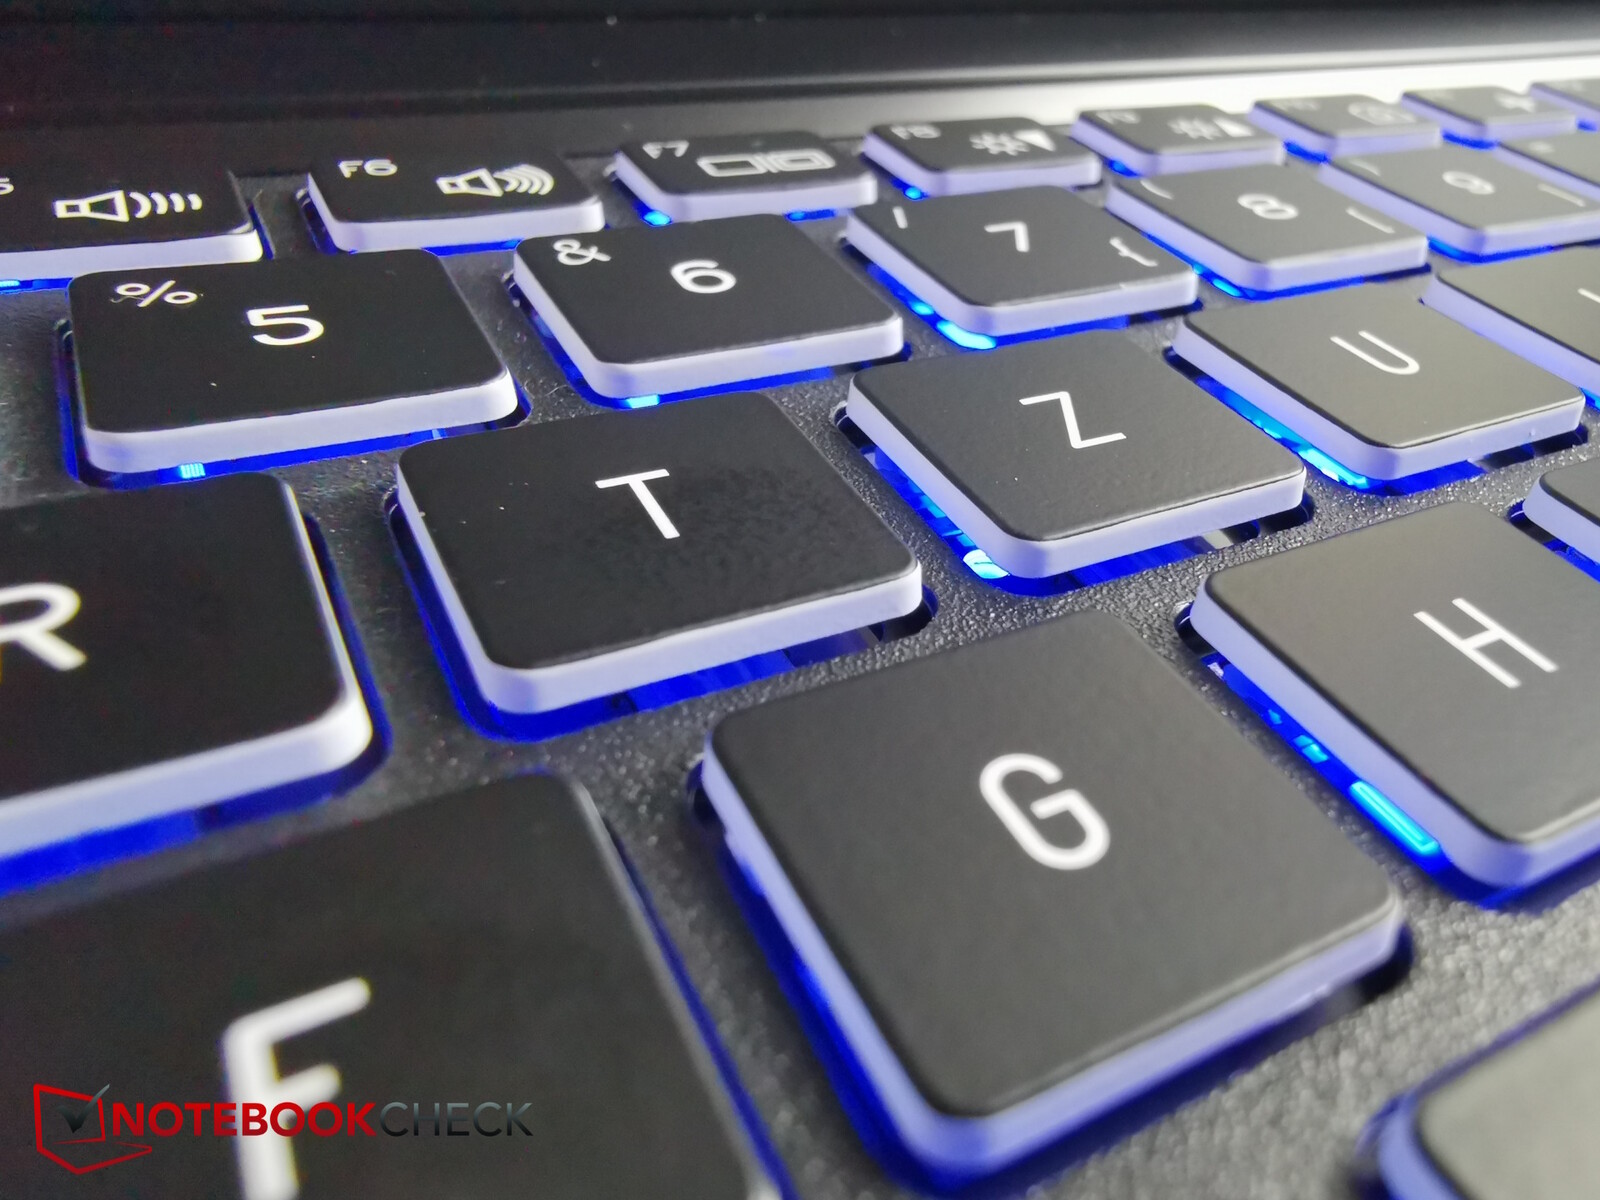
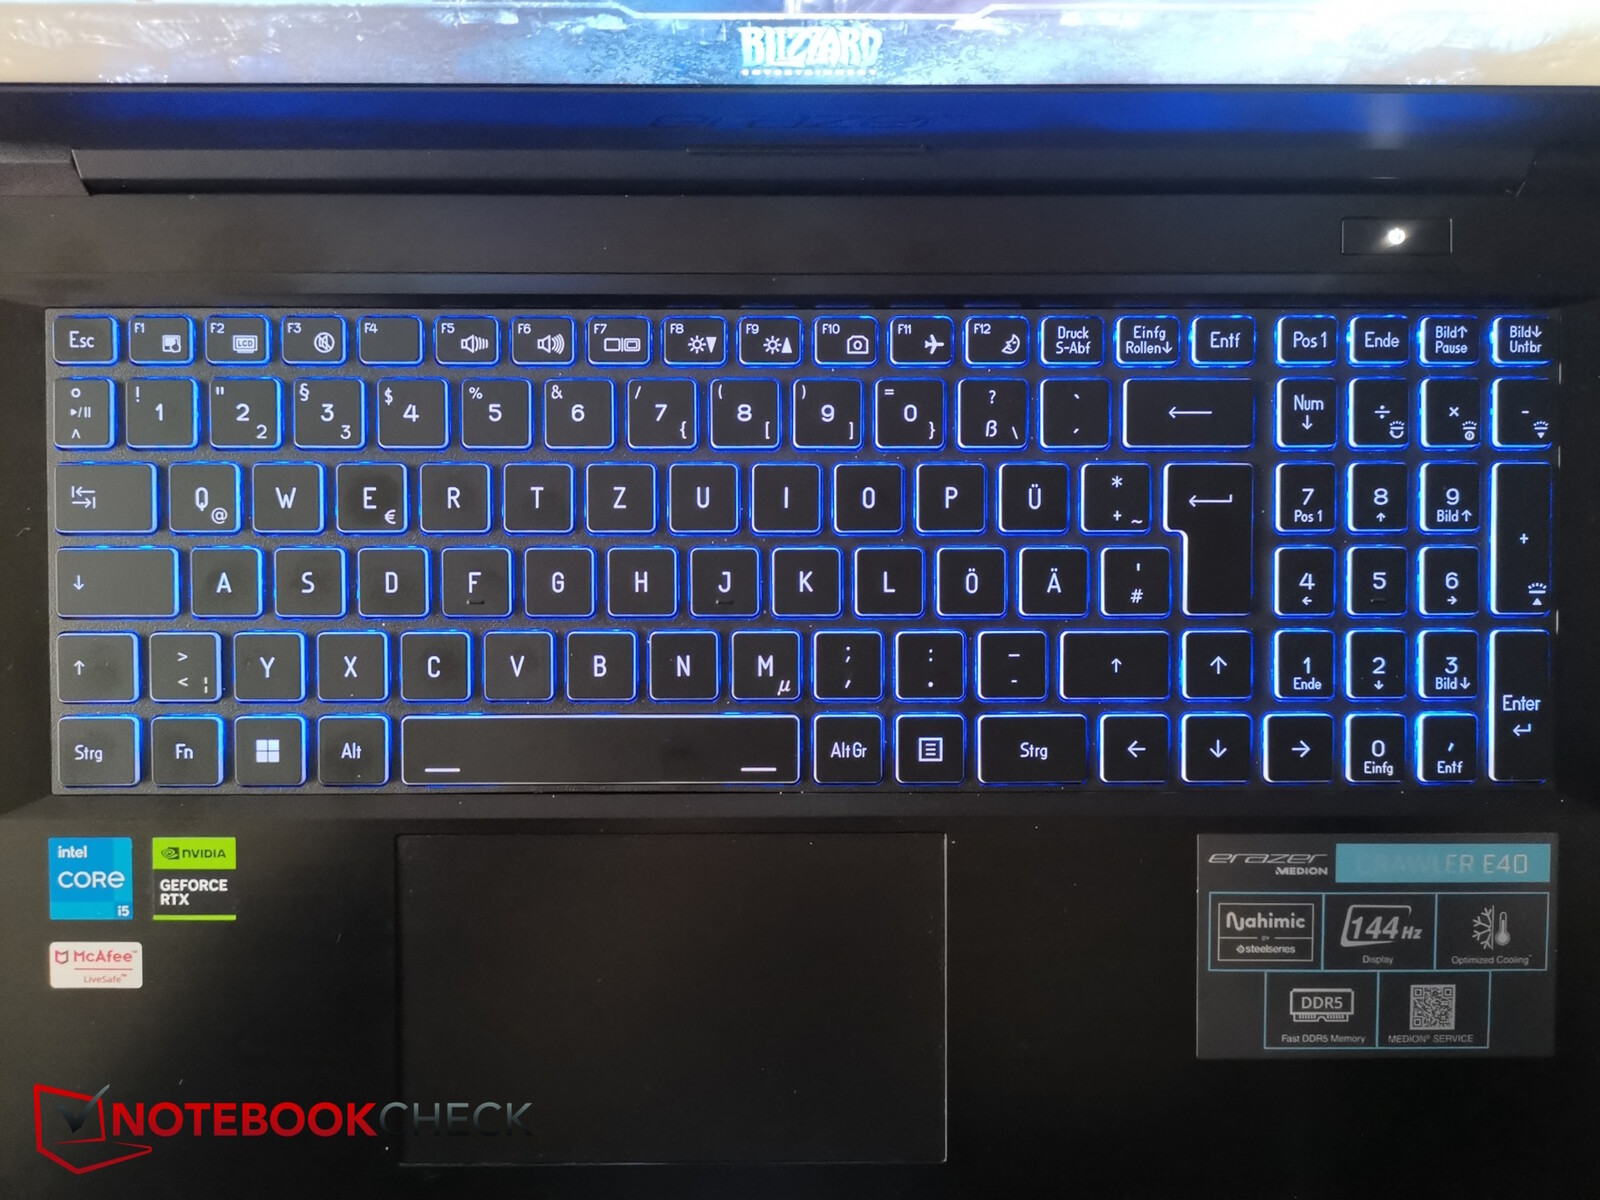
Giriş Aygıtları - Genel olarak sağlam
Klavye düzeni, bu yıl incelenen diğer Medion cihazlarında olduğu gibi oldukça temiz. Bununla birlikte, tuşlar oldukça küçük (1,4 cm), ancak düzgün aralıklarla yerleştirilmişler. Sağ tarafta, daha da küçük tuşlara sahip bir sayısal tuş takımı var.
Tuş hareket mesafesi ortalama ve geri bildirim biraz yumuşak. Bununla birlikte, yazmak kolay ve hızlıdır.
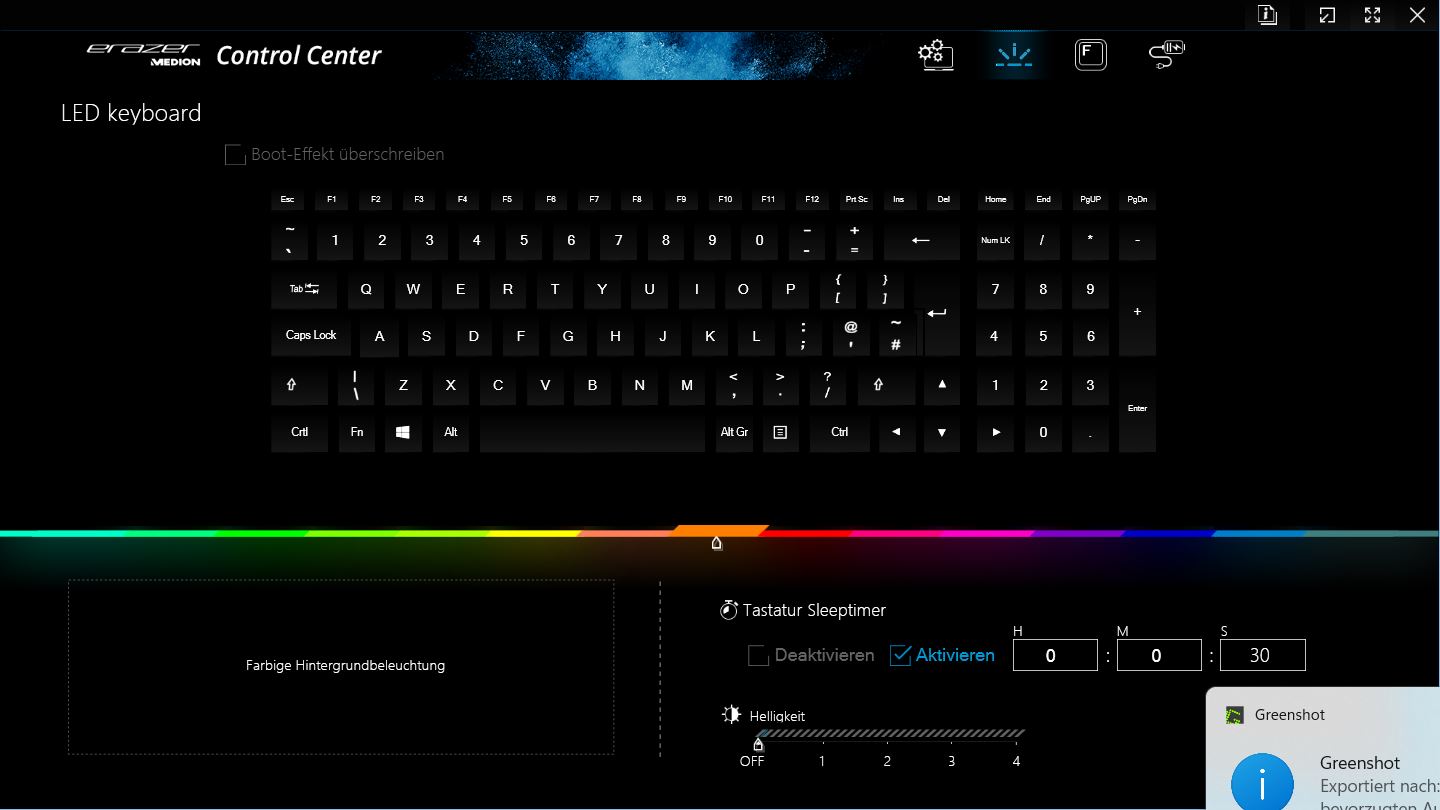
Kontrol Merkezi (çeşitli renkler) aracılığıyla yapılandırılabilen ve özel tuşlarla kontrol edilebilen iki aşamalı RGB arka aydınlatma, karanlık ortamlarda yardımcı olur. Ancak sadece tek bölgeli.
Dokunmatik yüzey (yaklaşık 12,1 x 7,3 cm), sayısal tuş takımı nedeniyle diğer tuşların altında mümkün olduğunca merkezi olması için hafifçe sola kaydırılmıştır. Yüzey kaygan, ancak tam olarak sessiz olmayan tıklama sesleri biraz ucuz görünüyor.
Ekran - 2019'dan eski bir tanıdık
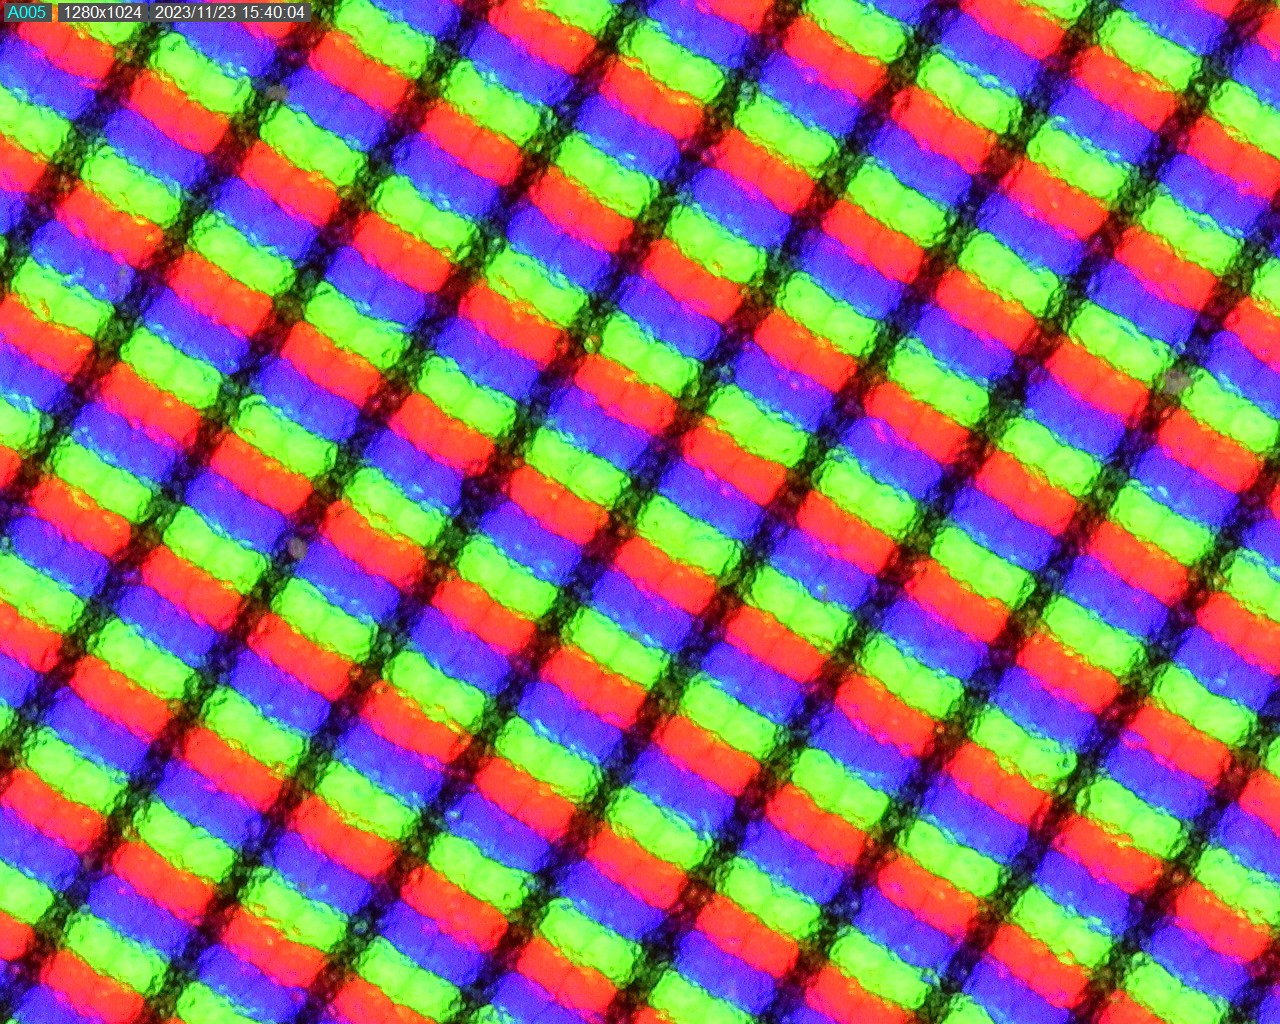
Medion Erazer Crawler E40, daha önce birçok dizüstü bilgisayarda kullanılmış olan tanıdık bir ekrana sahiptir. 144Hz yenileme hızına sahip mat Full HD IPS ekran en yeni ekran değil, daha önce XMG Fusion 15 2019'da geri döndü.
Ekranın 350 nitlik ortalama parlaklığı kabul edilebilir, ancak kontrast zayıf siyah değeri nedeniyle biraz tehlikeye giriyor.
Tepki süreleri bir oyun dizüstü bilgisayarı için iyi ve hafif bir arka ışık kanaması var.
| |||||||||||||||||||||||||
Aydınlatma: 91 %
Batarya modunda parlaklık: 356 cd/m²
Kontrast: 847:1 (Siyah: 0.43 cd/m²)
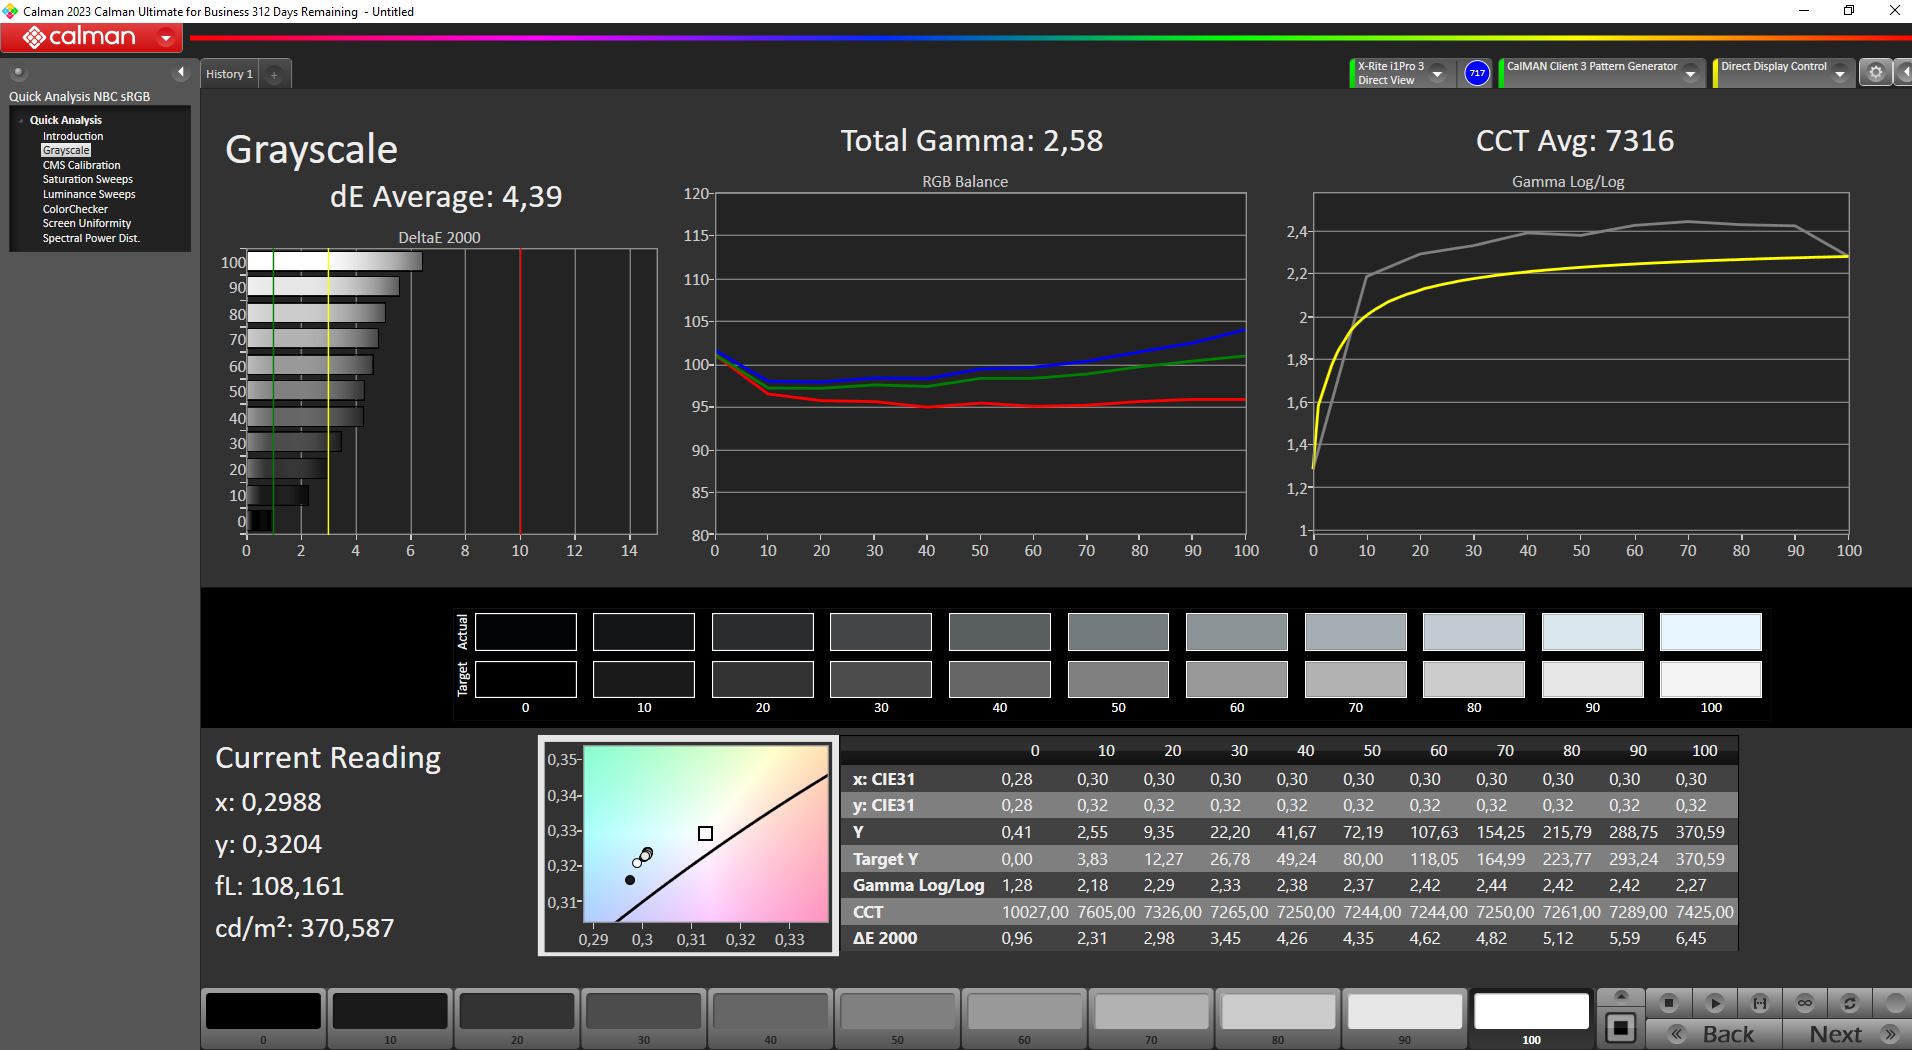
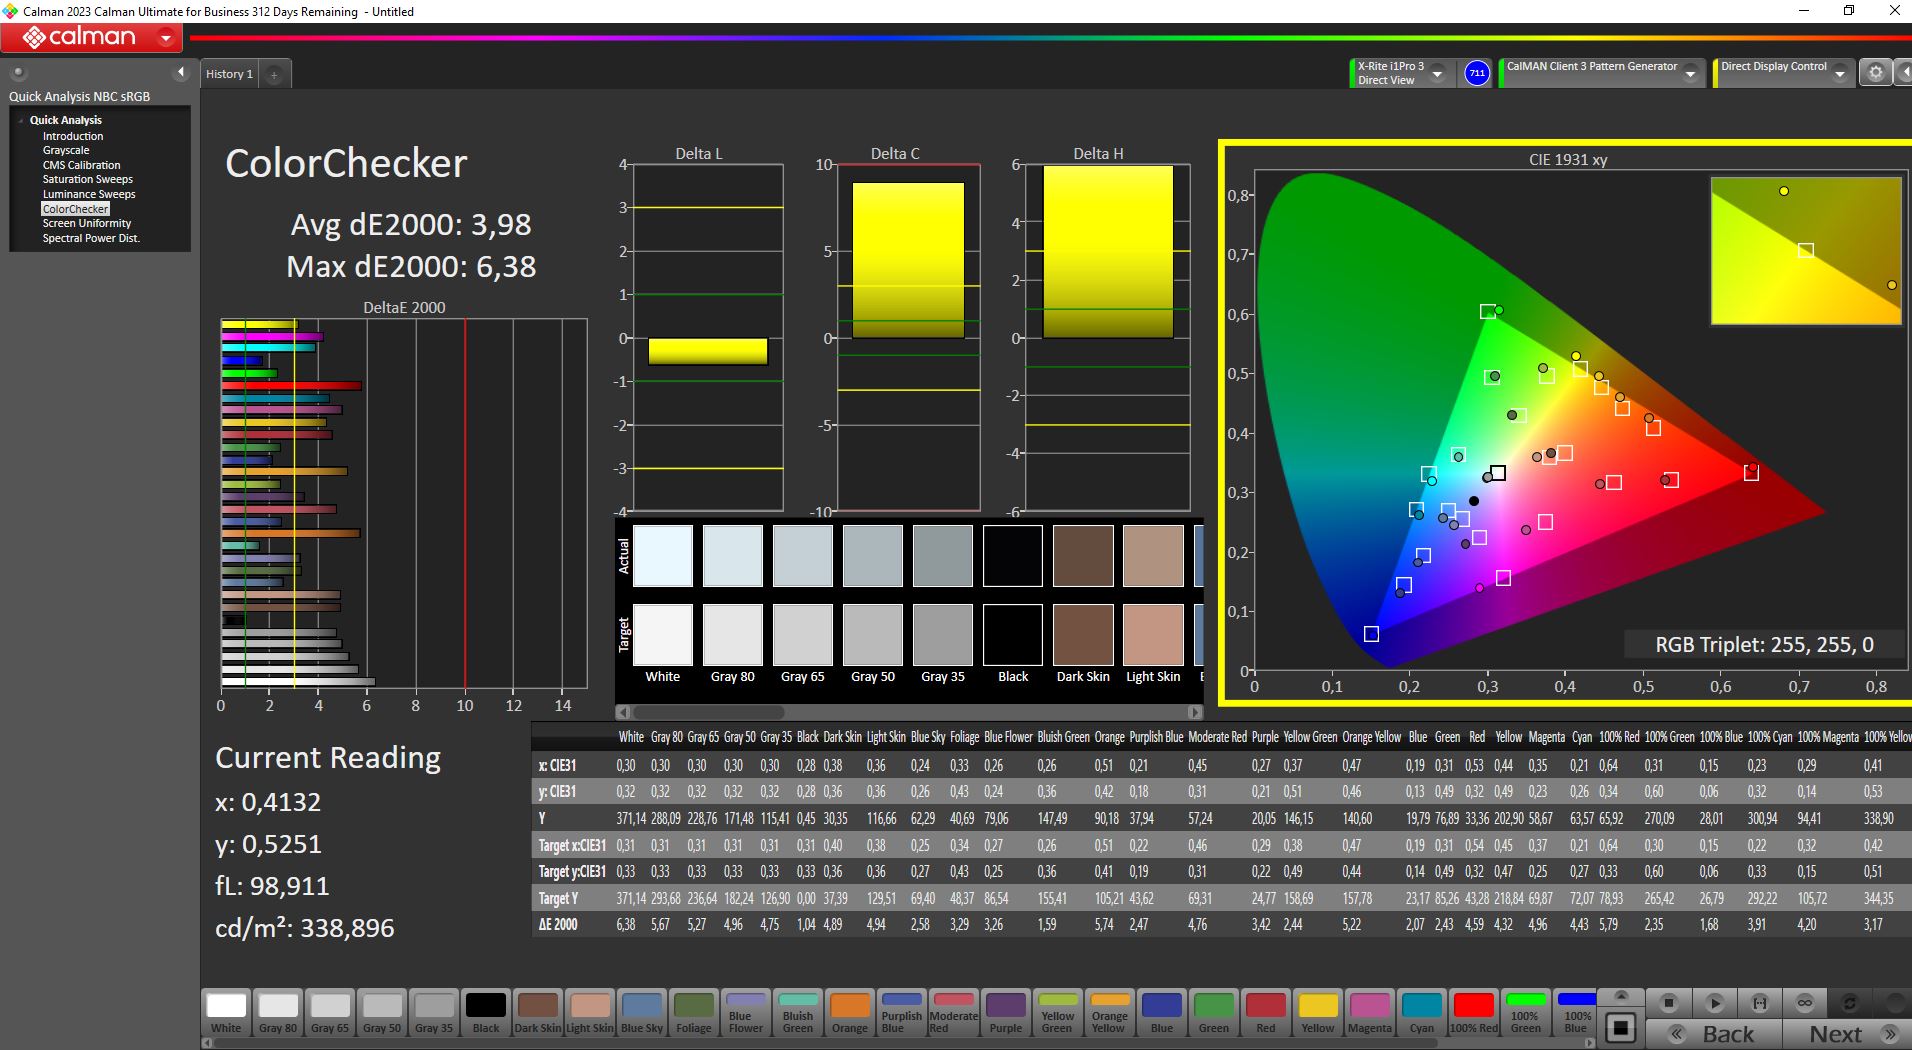
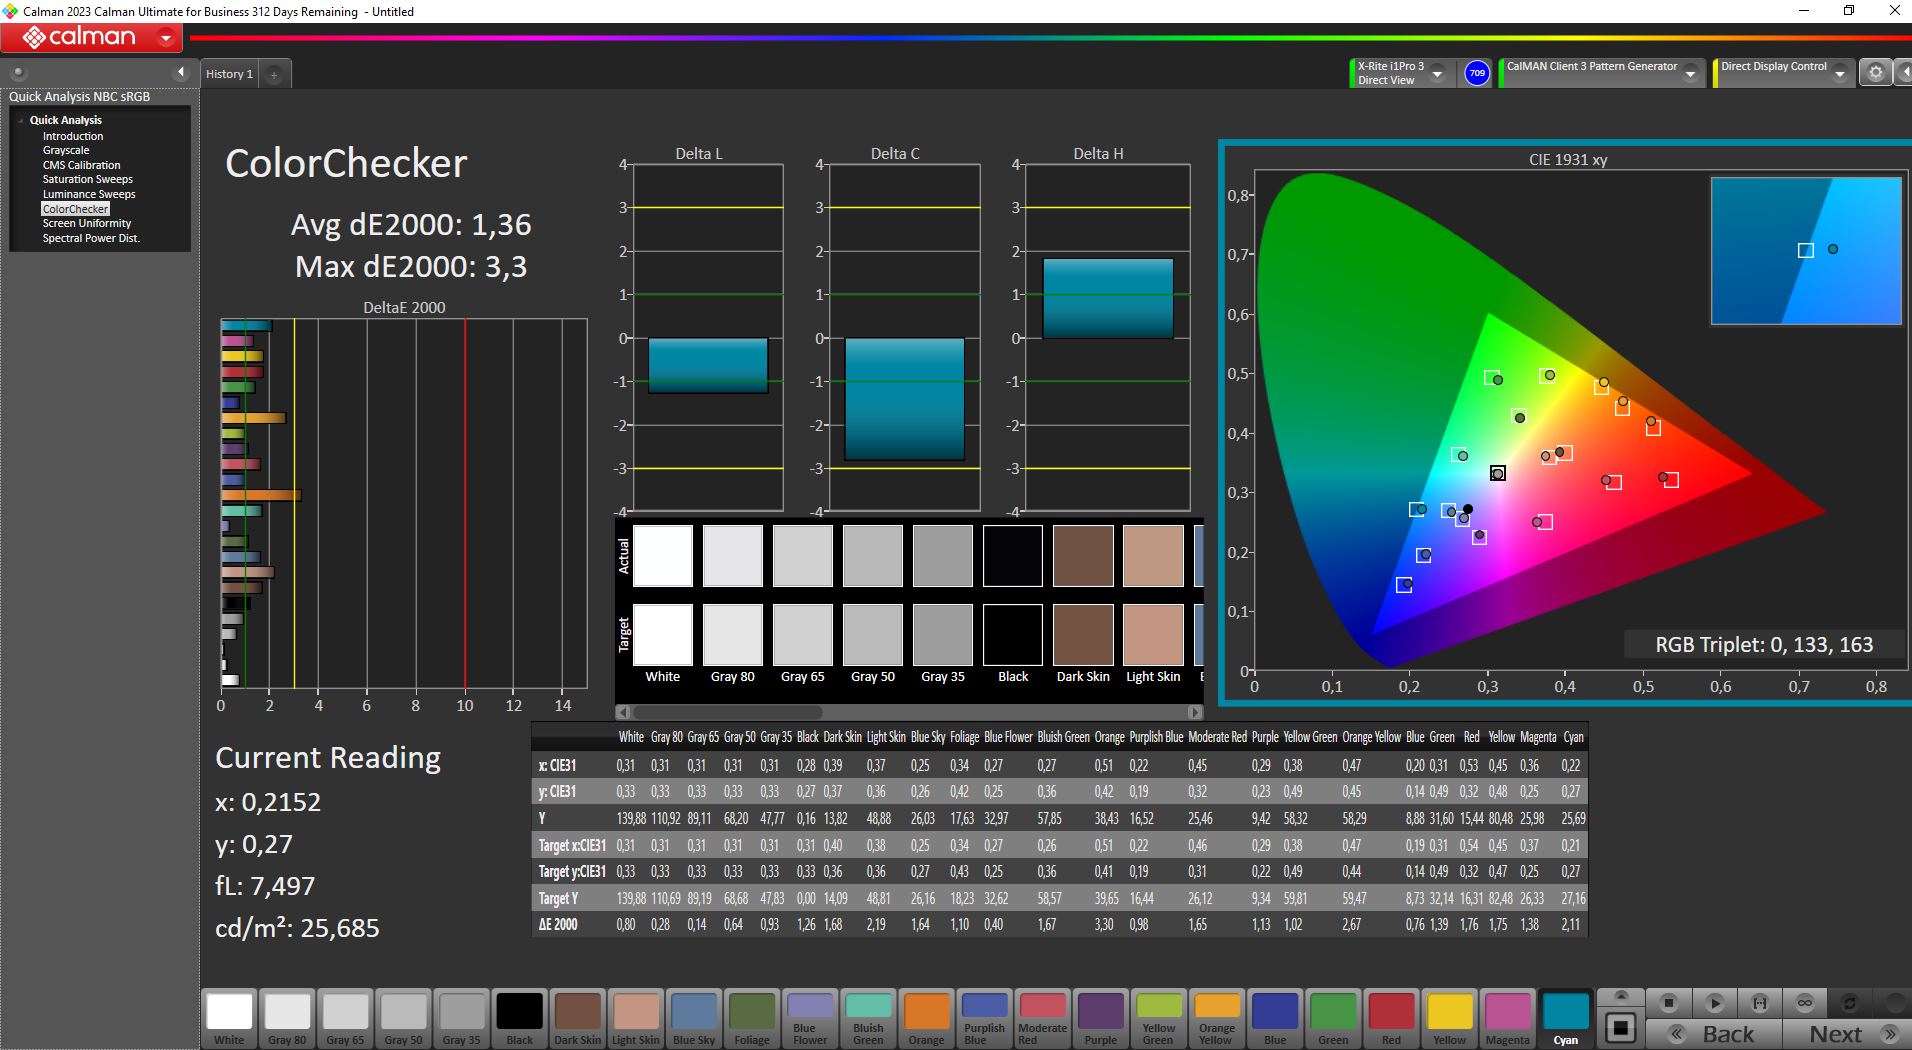
ΔE ColorChecker Calman: 3.98 | ∀{0.5-29.43 Ø4.71}
calibrated: 1.36
ΔE Greyscale Calman: 4.39 | ∀{0.09-98 Ø4.96}
63.2% AdobeRGB 1998 (Argyll 3D)
89.7% sRGB (Argyll 3D)
61.4% Display P3 (Argyll 3D)
Gamma: 2.58
CCT: 7316 K
| Medion Erazer Crawler E40 - MD 62518 BOE HF NV156FHM-N4G, IPS, 1920x1080, 15.6" | Lenovo LOQ 15IRH8 Core i7 BOE CQ NE156QHM-NY4, IPS, 2560x1440, 15.6" | Asus TUF A15 FA507 N156HMA-GA1, IPS, 1920x1080, 15.6" | Schenker XMG Apex 15 (Late 23) BOE CQ NE156QHM-NY2, IPS, 2560x1440, 15.6" | MSI Katana 15 B12VEK AUOAF90 (B156HAN08.4), IPS, 1920x1080, 15.6" | |
|---|---|---|---|---|---|
| Display | 8% | 6% | 9% | -38% | |
| Display P3 Coverage (%) | 61.4 | 66.3 8% | 64.9 6% | 67.5 10% | 38.1 -38% |
| sRGB Coverage (%) | 89.7 | 96.6 8% | 96.5 8% | 97.6 9% | 56.8 -37% |
| AdobeRGB 1998 Coverage (%) | 63.2 | 67.7 7% | 66.6 5% | 68.9 9% | 39.3 -38% |
| Response Times | 25% | -199% | -29% | -282% | |
| Response Time Grey 50% / Grey 80% * (ms) | 8 ? | 5 ? 37% | 30.4 ? -280% | 13.2 ? -65% | 38.8 ? -385% |
| Response Time Black / White * (ms) | 9.6 ? | 8.41 ? 12% | 20.8 ? -117% | 8.8 ? 8% | 26.8 ? -179% |
| PWM Frequency (Hz) | |||||
| Screen | 3% | 32% | 12% | -46% | |
| Brightness middle (cd/m²) | 364 | 373 2% | 288 -21% | 336 -8% | 261 -28% |
| Brightness (cd/m²) | 351 | 365 4% | 271 -23% | 307 -13% | 258 -26% |
| Brightness Distribution (%) | 91 | 90 -1% | 91 0% | 77 -15% | 92 1% |
| Black Level * (cd/m²) | 0.43 | 0.33 23% | 0.17 60% | 0.38 12% | 0.19 56% |
| Contrast (:1) | 847 | 1130 33% | 1694 100% | 884 4% | 1374 62% |
| Colorchecker dE 2000 * | 3.98 | 4.19 -5% | 1.9 52% | 1.96 51% | 5.57 -40% |
| Colorchecker dE 2000 max. * | 6.38 | 8.47 -33% | 3.3 48% | 5.07 21% | 20.6 -223% |
| Colorchecker dE 2000 calibrated * | 1.36 | 1.07 21% | 0.9 34% | 1.27 7% | 4.63 -240% |
| Greyscale dE 2000 * | 4.39 | 5 -14% | 2.7 38% | 2.3 48% | 3.19 27% |
| Gamma | 2.58 85% | 1.93 114% | 2.32 95% | 2.017 109% | 2.45 90% |
| CCT | 7316 89% | 7520 86% | 6535 99% | 6644 98% | 6146 106% |
| Toplam Ortalama (Program / Ayarlar) | 12% /
7% | -54% /
-6% | -3% /
6% | -122% /
-78% |
* ... daha küçük daha iyidir
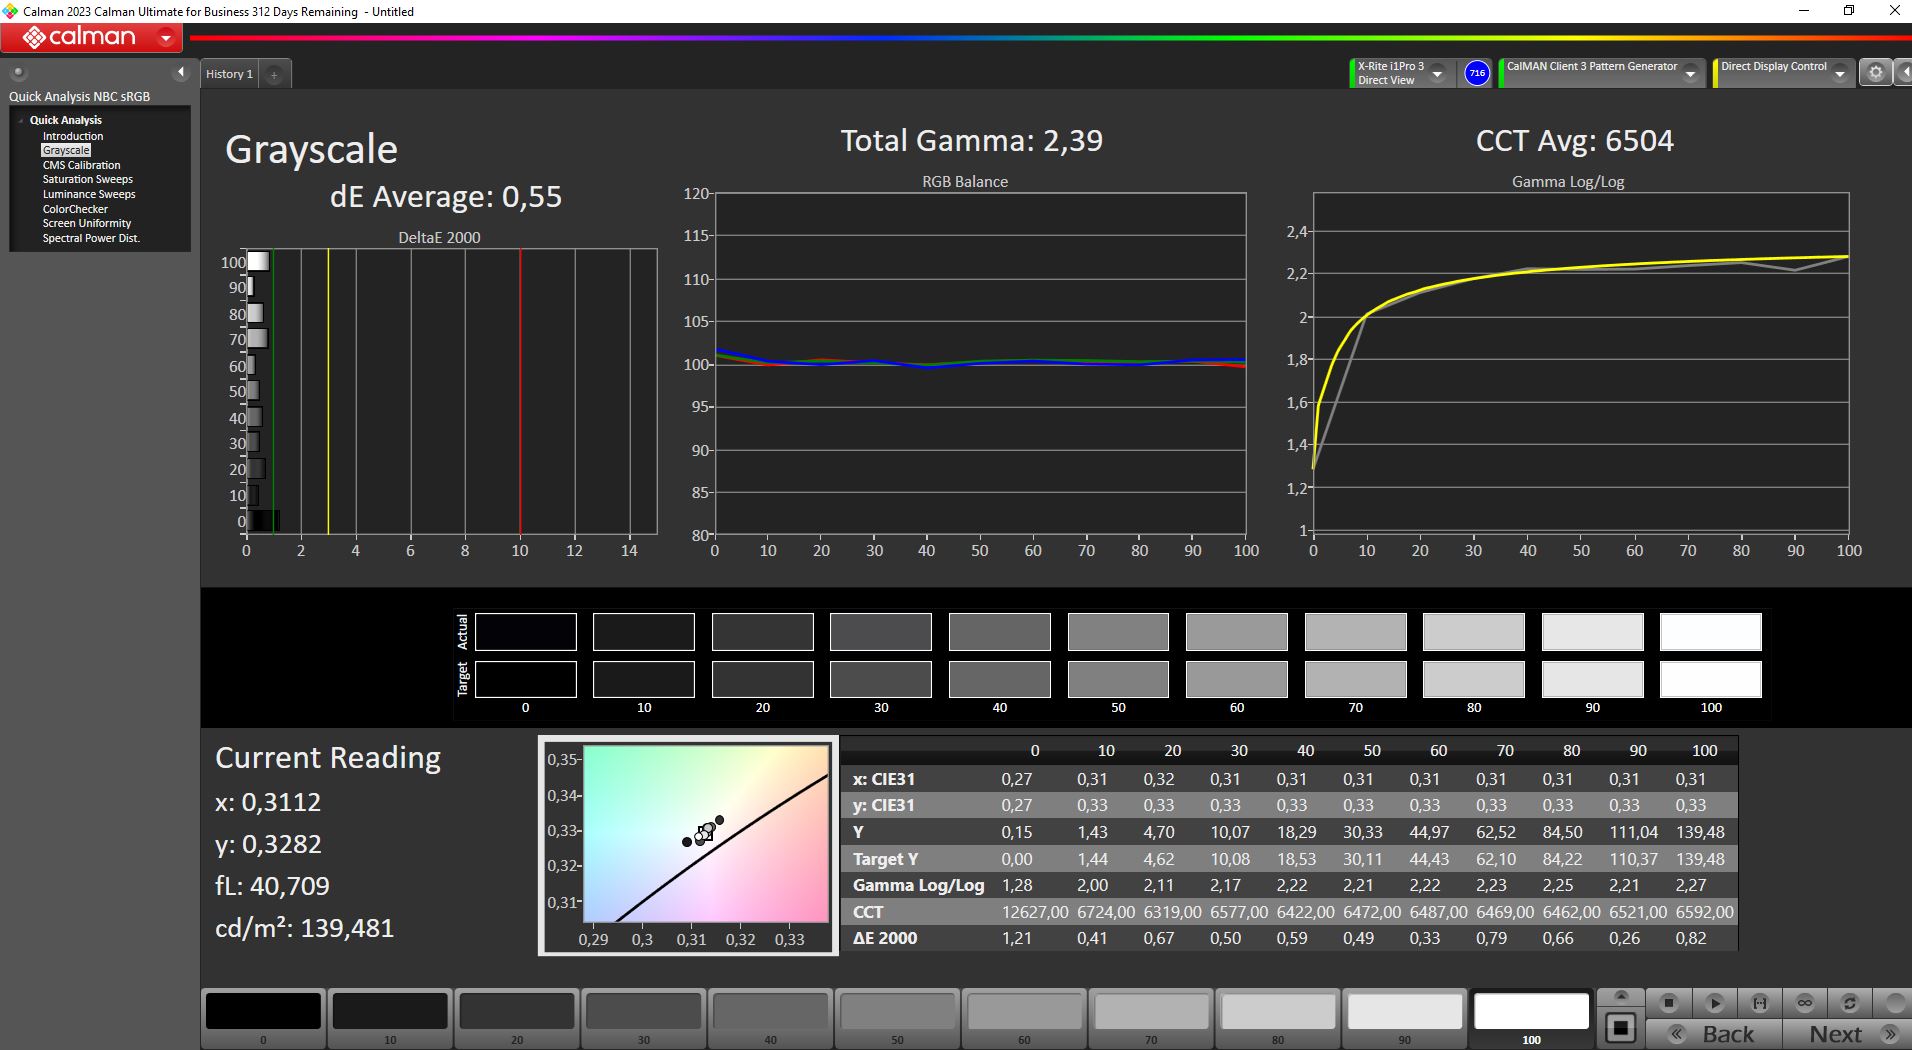
Ekranın kullanıma hazır performansı, renkler ve gri tonlama için DeltaE değerlerinin hedefin çok üzerinde olması ve siyah seviyesinin aşırı yüksek olması nedeniyle optimumun altındadır. Ancak panelin kalibre edilmesi ve parlaklığın azaltılması görüntü kalitesini önemli ölçüde artırıyor. Kalibrasyondan sonra DeltaE değerleri gri tonlama için övgüye değer bir değer olan 0,55'e ve ColorChecker için 1,36'ya düşüyor.
Kalibre edilmiş renk profilimizi yukarıdan ücretsiz olarak indirebilirsiniz.
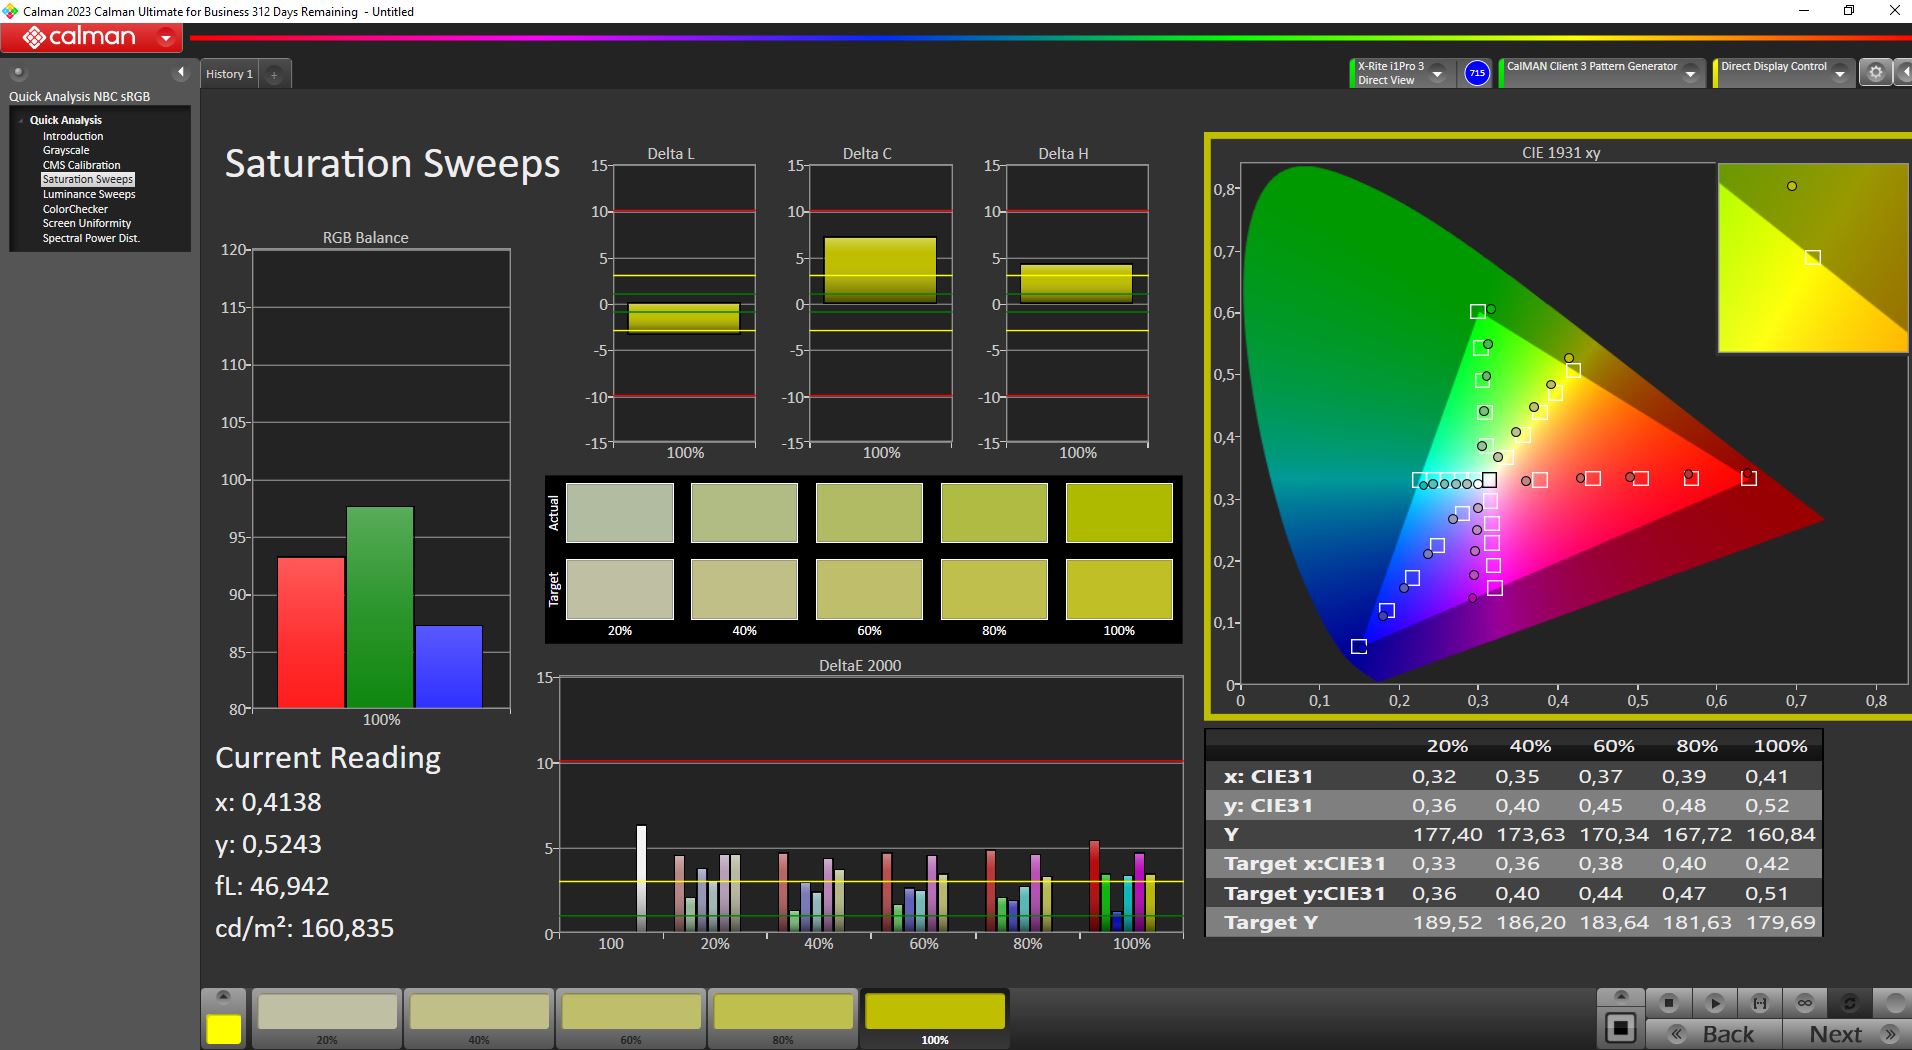
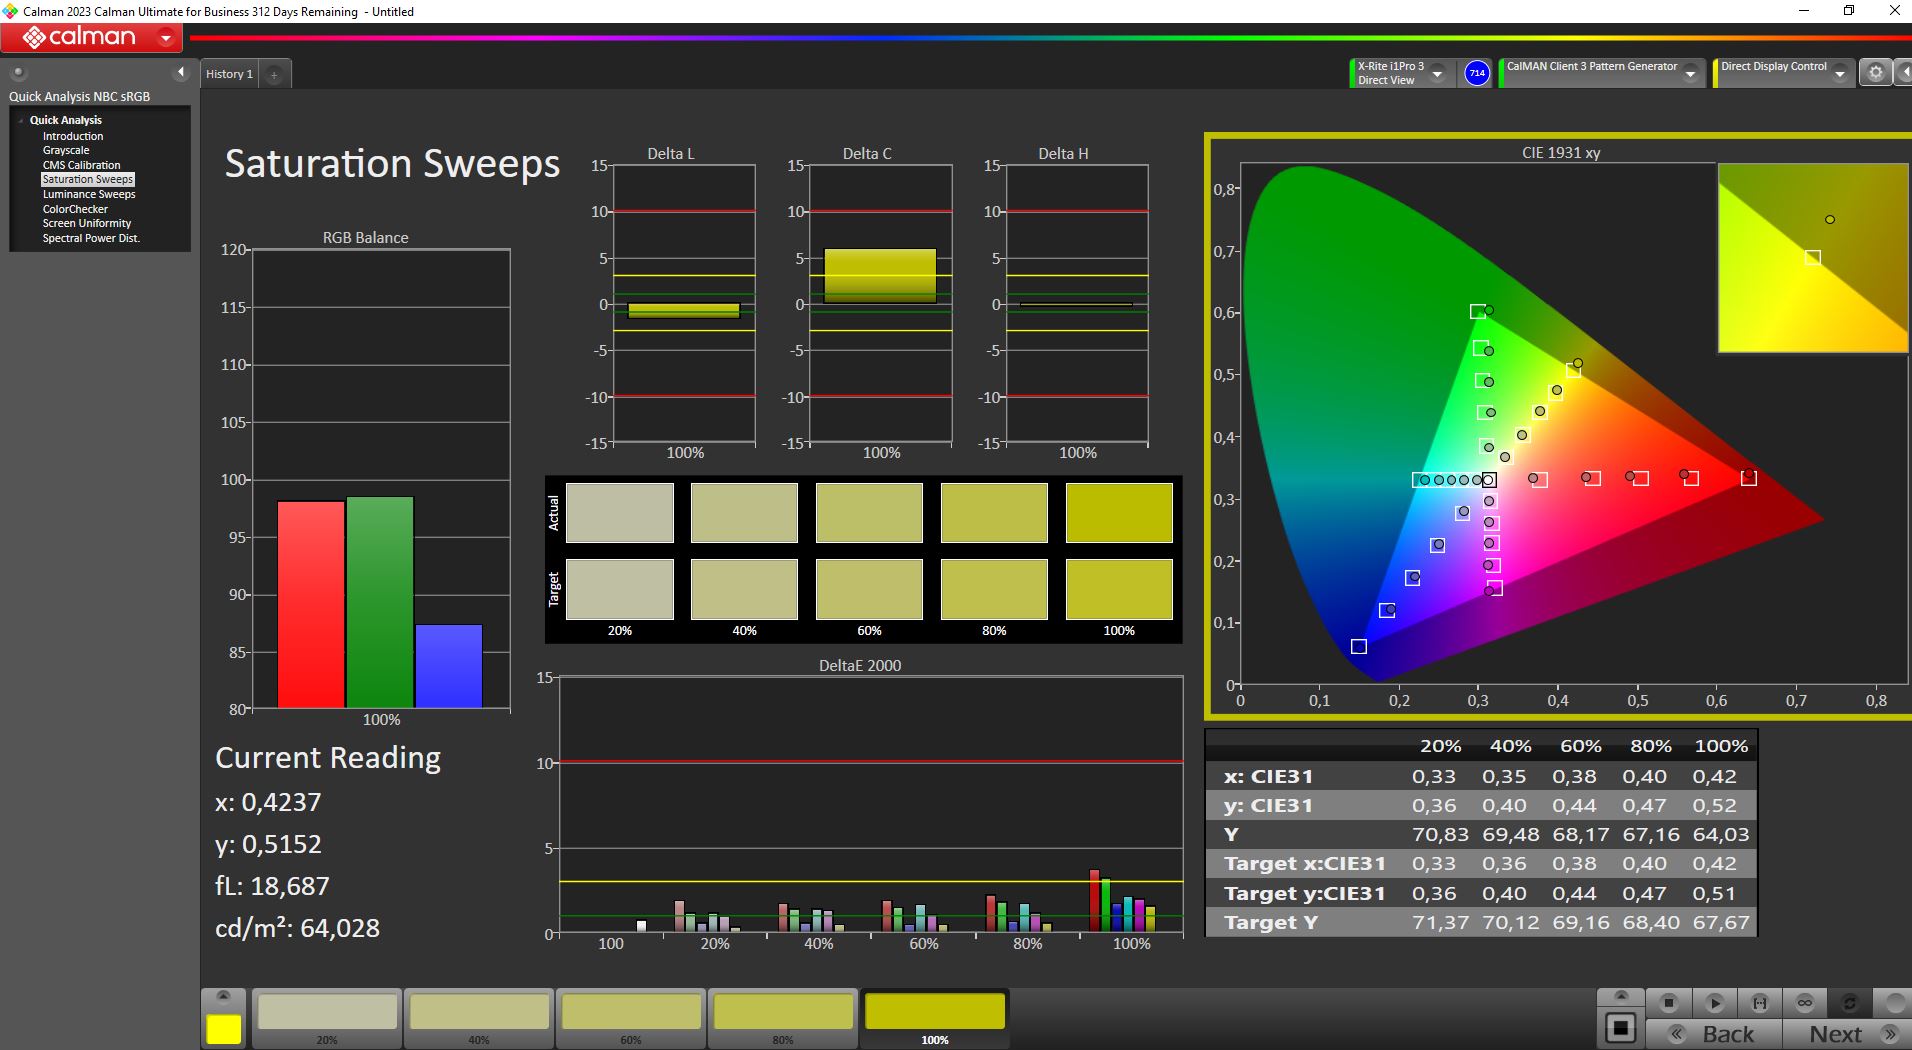
Eski panel, renk alanı kapsamı açısından açık bir zayıflık sergiliyor; sRGB bile en iyi ihtimalle yalnızca yüzde 90 oranında kapsanıyor. İyi DeltaE değerlerine rağmen, panel içerik oluşturucular için daha az uygun olabilir.
Yanıt Sürelerini Görüntüle
| ↔ Tepki Süresi Siyahtan Beyaza | ||
|---|---|---|
| 9.6 ms ... yükseliş ↗ ve sonbahar↘ birleşimi | ↗ 5.4 ms yükseliş | 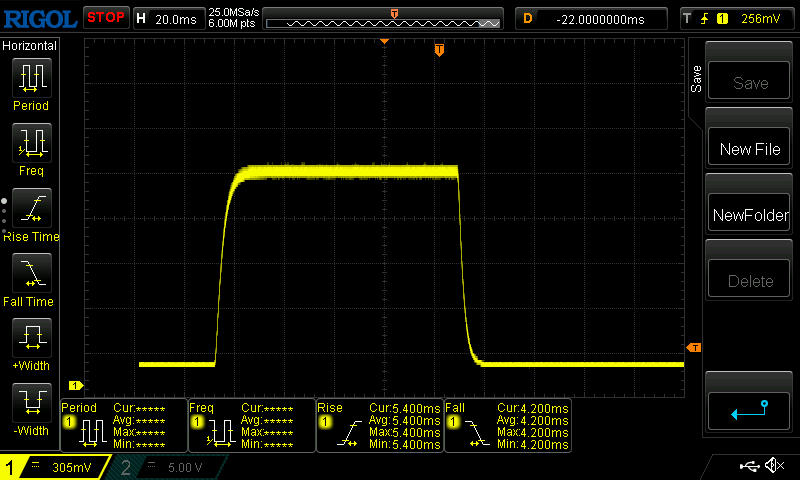 |
| ↘ 4.2 ms sonbahar | ||
| Ekran, testlerimizde hızlı yanıt oranları gösteriyor ve oyun oynamaya uygun olmalı. Karşılaştırıldığında, test edilen tüm cihazlar 0.1 (minimum) ile 240 (maksimum) ms arasında değişir. » Tüm cihazların 26 %'si daha iyi. Bu, ölçülen yanıt süresinin test edilen tüm cihazların ortalamasından (19.8 ms) daha iyi olduğu anlamına gelir. | ||
| ↔ Tepki Süresi %50 Griden %80 Griye | ||
| 8 ms ... yükseliş ↗ ve sonbahar↘ birleşimi | ↗ 3.8 ms yükseliş | 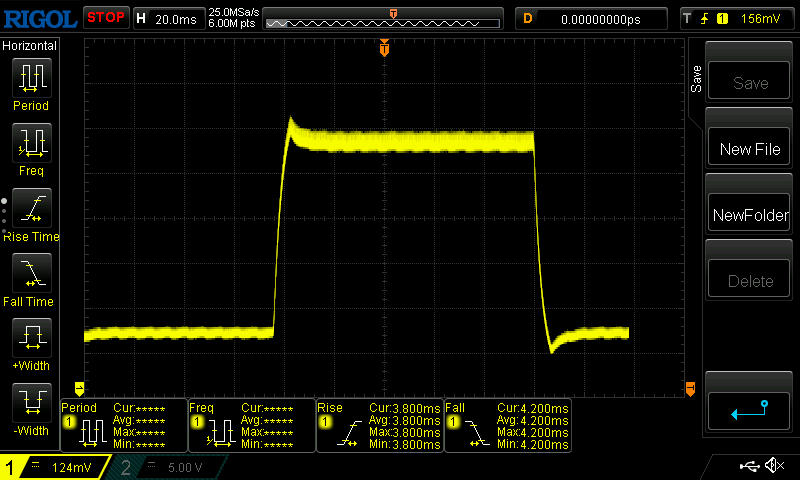 |
| ↘ 4.2 ms sonbahar | ||
| Ekran, testlerimizde hızlı yanıt oranları gösteriyor ve oyun oynamaya uygun olmalı. Karşılaştırıldığında, test edilen tüm cihazlar 0.165 (minimum) ile 636 (maksimum) ms arasında değişir. » Tüm cihazların 21 %'si daha iyi. Bu, ölçülen yanıt süresinin test edilen tüm cihazların ortalamasından (30.9 ms) daha iyi olduğu anlamına gelir. | ||
Ekran Titremesi / PWM (Darbe Genişliği Modülasyonu)
| Ekran titriyor / PWM algılanmadı |  | ||
Karşılaştırıldığında: Test edilen tüm cihazların %52 %'si ekranı karartmak için PWM kullanmıyor. PWM tespit edilirse, ortalama 7741 (minimum: 5 - maksimum: 343500) Hz ölçüldü. | |||
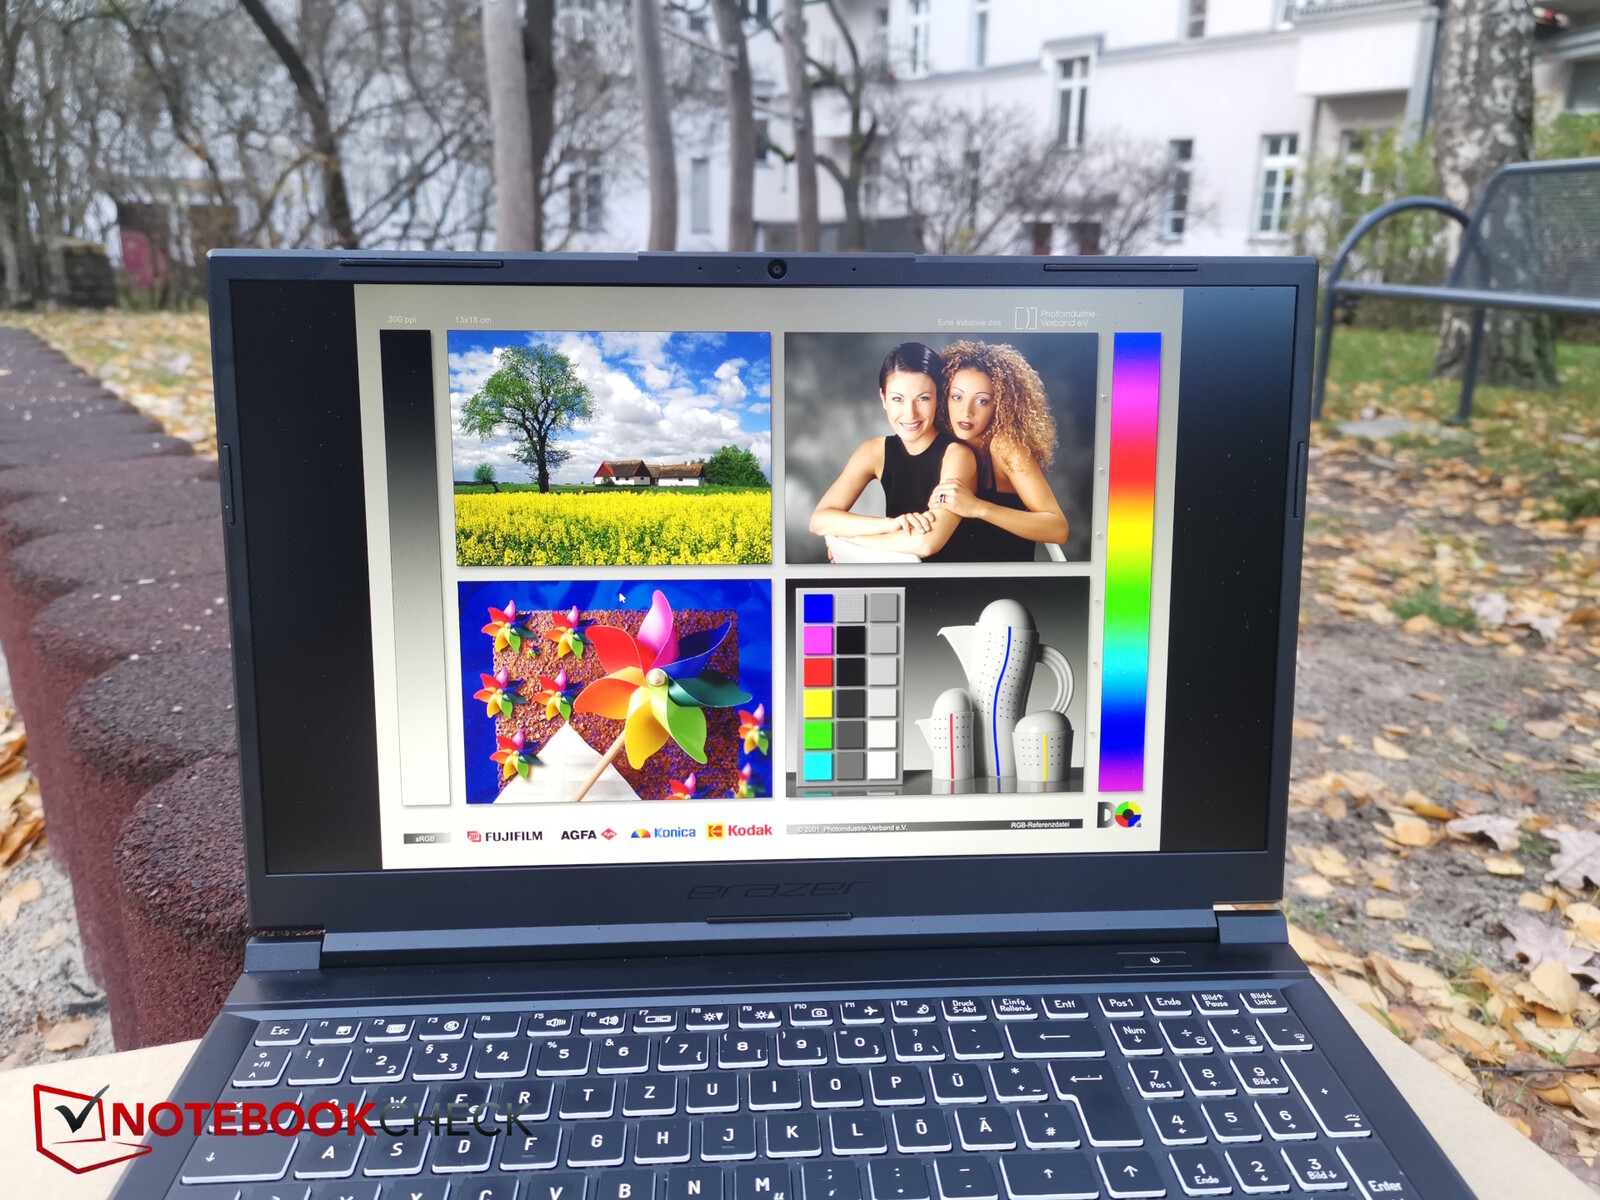
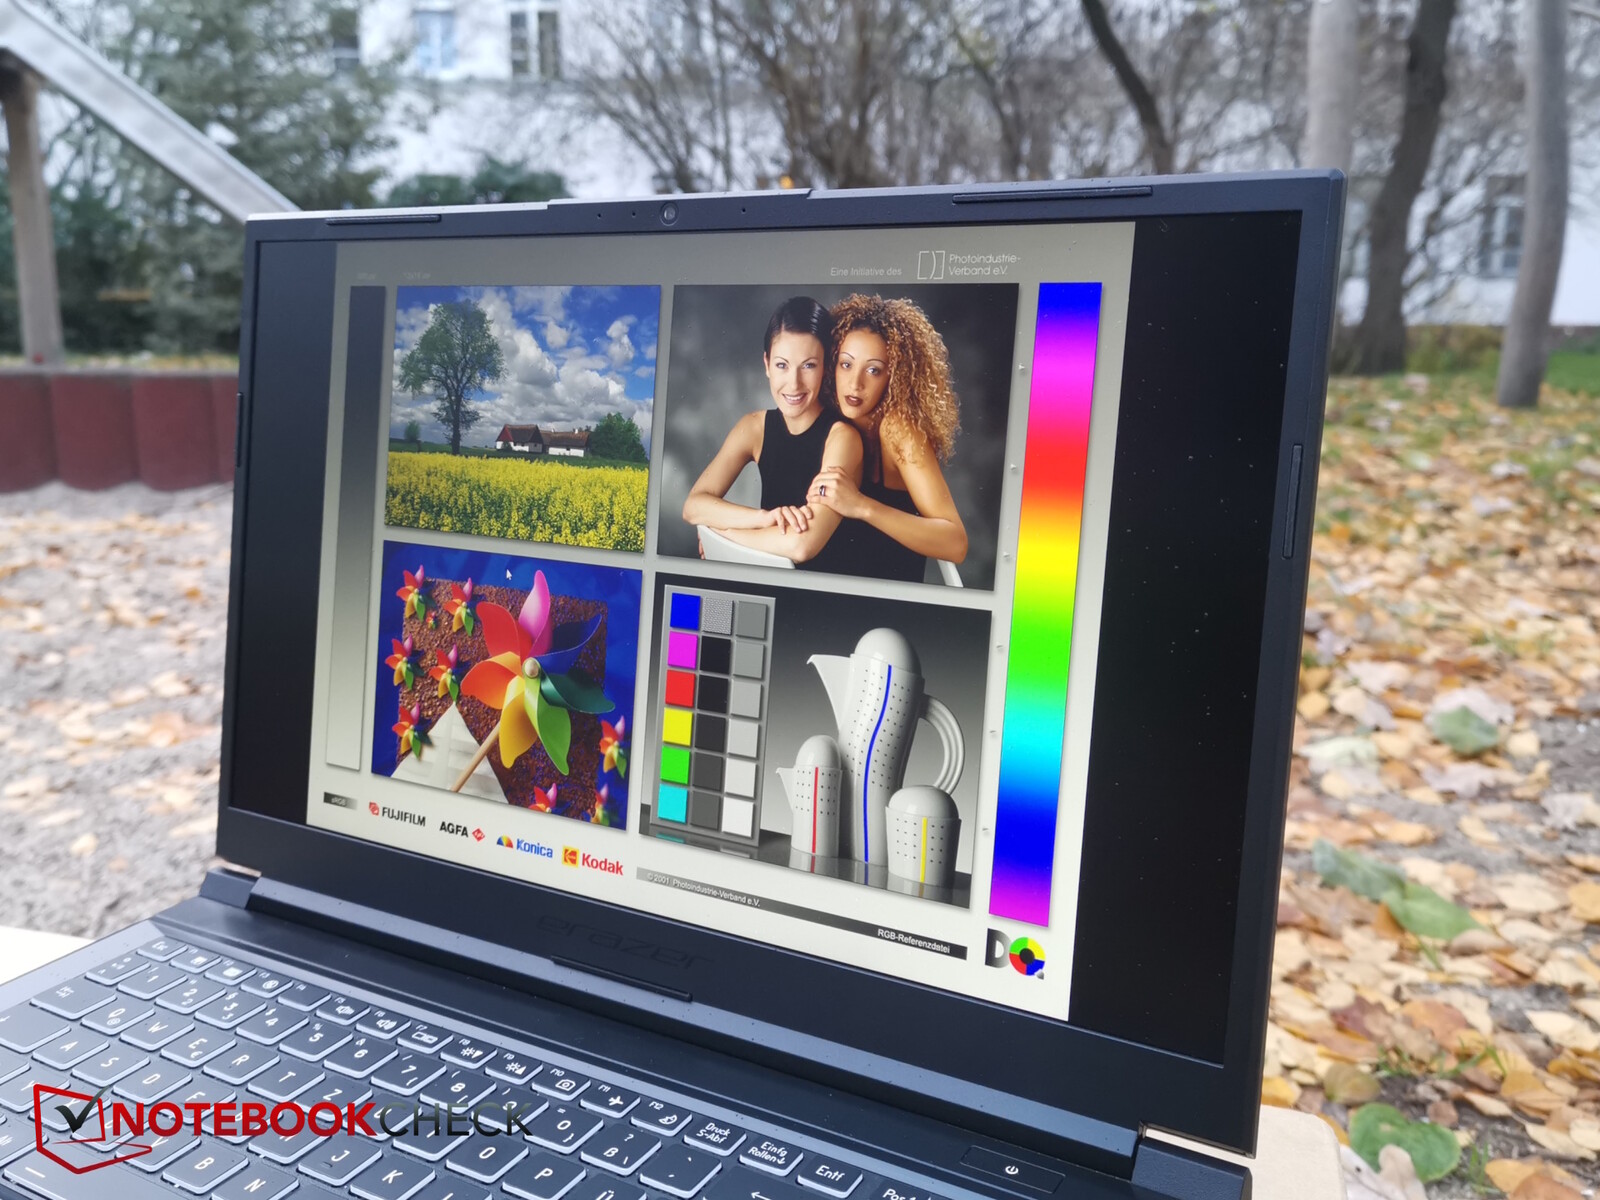
Mat yüzey, 350 nit parlaklıkla birlikte açık havada, en azından gölgeli bir yerde çalışmanın zor olmamasını sağlar.

Performans - i5-13500H ve RTX 4050'nin iyi bir kombinasyonu
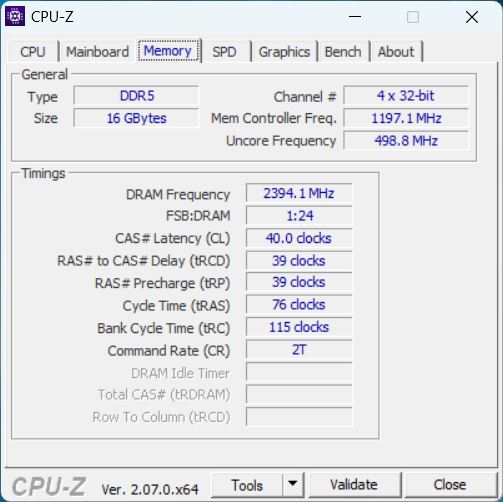
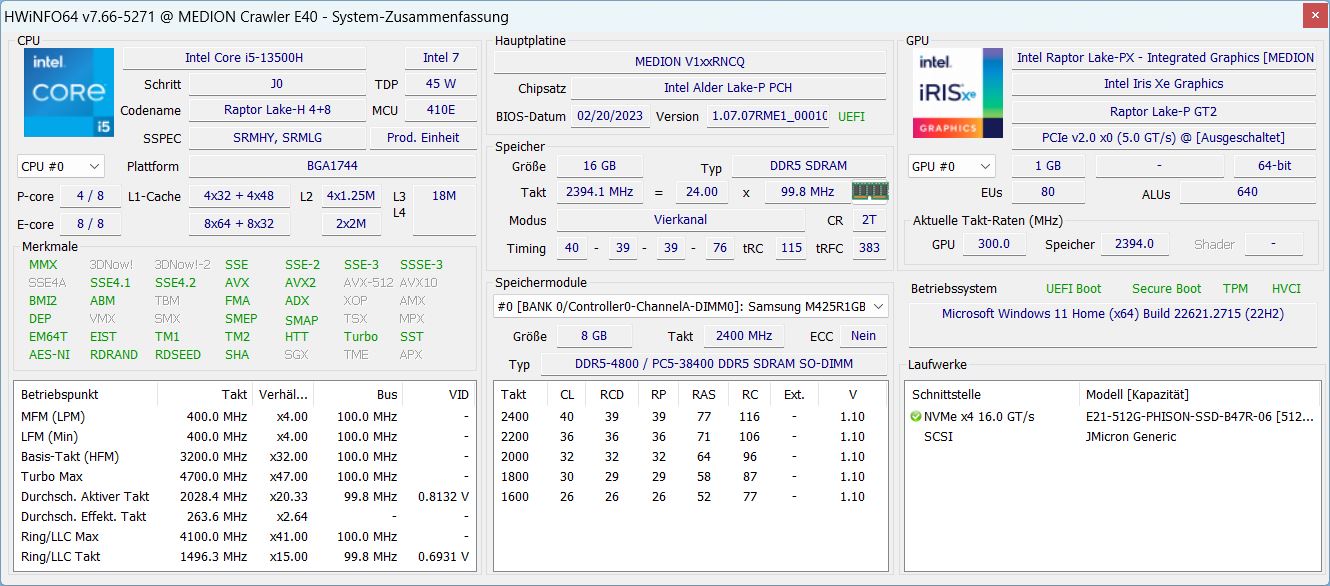
Crawler ile giriş seviyesinde bir oyun dizüstü bilgisayarımız var Nvidia GeForce RTX 4050 ve Intel Core i5-13500Hbunların her ikisi de oyun bileşenleri arasında sağlam bütçe varyantlarıdır. Ayrıca 16 GB modern DDR5-4800 RAM ve 512 GB'lık bir NVMe SSD var ve depolama alanı da daha ekonomik bir seçenek.
Bu, dizüstü bilgisayarı mevcut her oyunu maksimum ayrıntıda oynamak zorunda olmayan herkes için uygun hale getiriyor. Ancak birçok oyun için doğal 1080p çözünürlükteki performans yüksek detaylar için yeterli olacaktır. İçerik oluşturucular da performans ve basit tasarımla ilgilenebilir, ancak ekranın gerçek yaratıcı çalışmalar (resimler, videolar) için bir nakavt kriteri olması muhtemeldir.
Test Koşulları
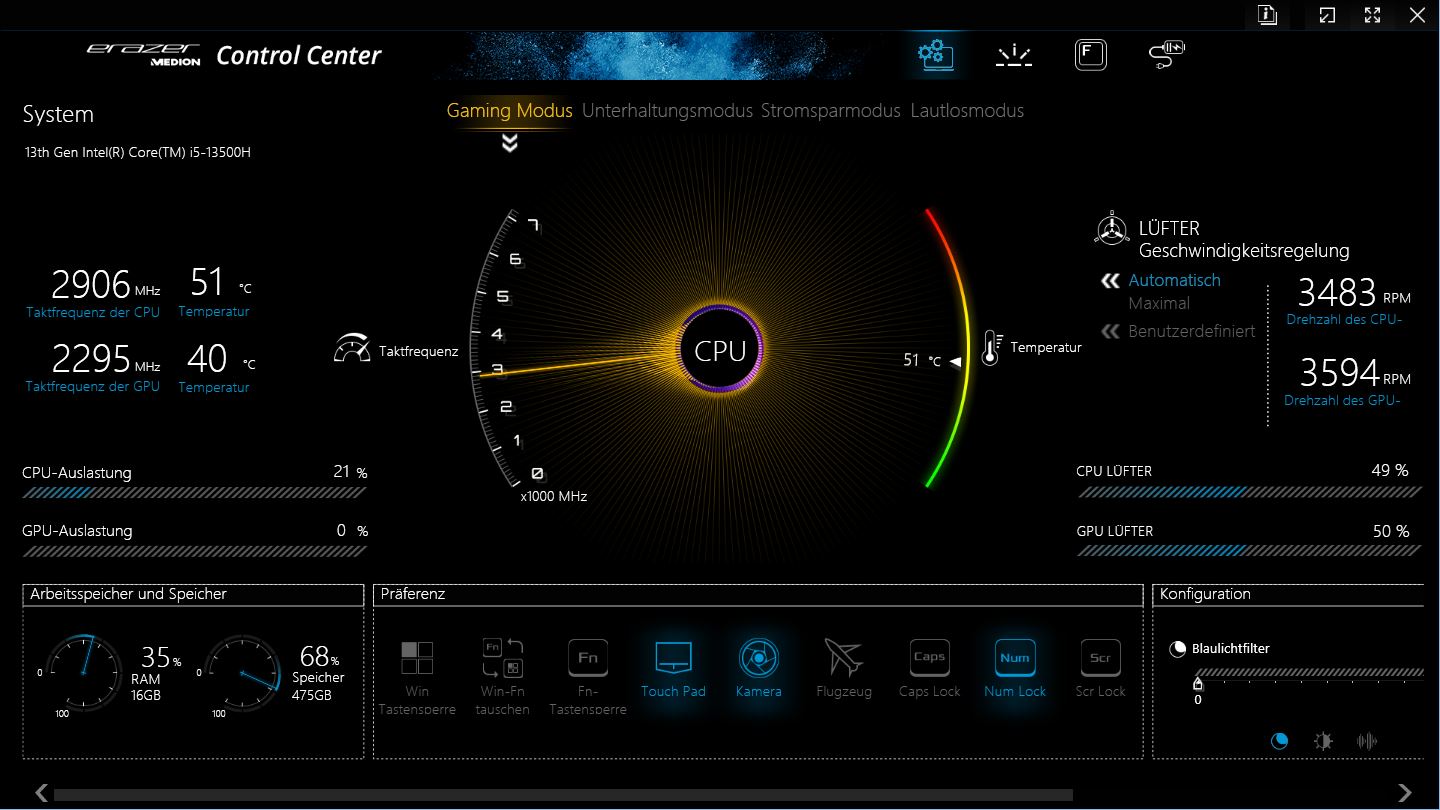
Medion, Crawler E40'a performans profillerini, klavye aydınlatmasını ve diğer ayarları barındıran genel bir Kontrol Merkezi yüklemiştir. Uygulama özellikle hızlı değil ve genellikle girişleri hafif bir gecikmeyle işliyor.
Ana ekranda, örneğin biraz çabayla daha net tasarlanabilecek GPU anahtarına (MSHybrid vs. dGPU, yeniden başlatma gerekli) erişmek için sağ alt tarafa kaydırmanız gerekmesi de biraz can sıkıcı.
Performans kıyaslamaları için oyun modunu ve pil testleri için güç tasarrufu modunu kullandık, çünkü burada dGPU devre dışı bırakılıyor ve entegre GPU devreye giriyor.
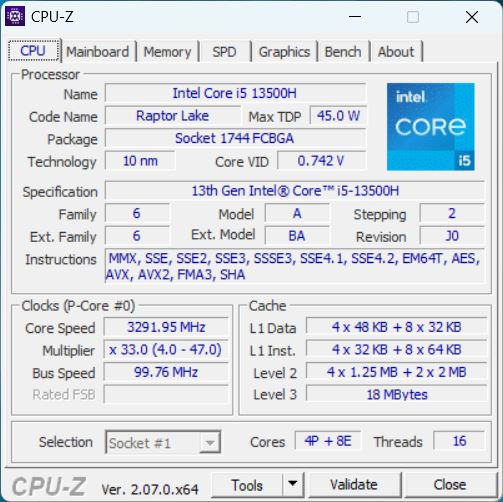
İşlemci
Bu Intel Core i5-13500H mevcut Raptor Lake-H serisinden (Intel Gen13) orta sınıf bir CPU'dur. Olası 6 P-çekirdeğinin 4'üne ve 8 E-çekirdeğine sahiptir. Birlikte 12 çekirdek ve 16 iş parçacığına sahiptir (yalnızca P çekirdekleri hyperthreading'i destekler). E temel saati 1,9 GHz'dir, P çekirdekleri ayrı ayrı 4,7 GHz'e ve birlikte 4,6 GHz'e kadar çıkabilir.
Bu arada, Intel Gen 12 i5-12450H ile bir Medion Erazer Crawler E50 var. Medion'un isimlendirme şeması gerçekten çok opak ve alıcıları yanıltabilir, bu yüzden satın alırken dikkatli olun!
Karşılaştırmalarımızda CPU iyi performans gösterdi ve veritabanımızdaki ortalama bir i5-13500 ile hemen hemen aynı seviyede.
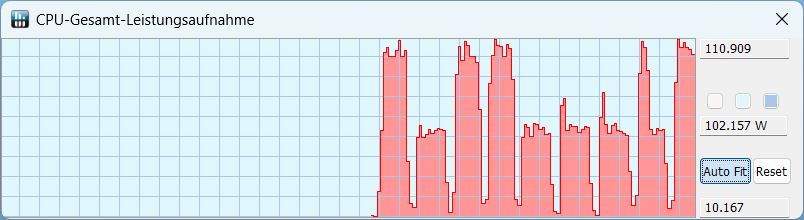
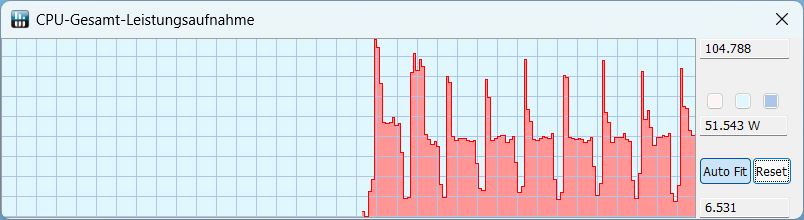
Cinebench R15 döngüsü sırasında, işlemci ilk birkaç çalıştırmadan sonra bir düşüş olmadan başlangıçtan itibaren çok tutarlı bir performans gösteriyor. Aşağıdaki tablo, pil modu da dahil olmak üzere çeşitli performans modlarındaki davranışı göstermektedir.
| Mod/Değer | Cinebench R15 puanı | CPU güç tüketimi Aralık | CPU güç tüketimi tipik |
|---|---|---|---|
| Oyun | 2,331 | 60 - 110 W | 105 |
| Eğlence | 2.135 | 50-105 | 51 |
| Sessiz | 835 | 15-23 | 15 |
| Pil | 1.065 | 19-21 | 21 |
Cinebench R15 Multi Loop
Cinebench R23: Multi Core | Single Core
Cinebench R20: CPU (Multi Core) | CPU (Single Core)
Cinebench R15: CPU Multi 64Bit | CPU Single 64Bit
Blender: v2.79 BMW27 CPU
7-Zip 18.03: 7z b 4 | 7z b 4 -mmt1
Geekbench 5.5: Multi-Core | Single-Core
HWBOT x265 Benchmark v2.2: 4k Preset
LibreOffice : 20 Documents To PDF
R Benchmark 2.5: Overall mean
| CPU Performance rating | |
| Sınıf ortalaması Gaming | |
| Schenker XMG Apex 15 (Late 23) | |
| Lenovo LOQ 15IRH8 Core i7 | |
| MSI Katana 15 B12VEK | |
| Medion Erazer Crawler E40 - MD 62518 | |
| Ortalama Intel Core i5-13500H | |
| Asus TUF A15 FA507 | |
| Cinebench R23 / Multi Core | |
| Sınıf ortalaması Gaming (10488 - 42661, n=104, son 2 yıl) | |
| Schenker XMG Apex 15 (Late 23) | |
| MSI Katana 15 B12VEK | |
| Lenovo LOQ 15IRH8 Core i7 | |
| Ortalama Intel Core i5-13500H (13542 - 16335, n=5) | |
| Medion Erazer Crawler E40 - MD 62518 | |
| Asus TUF A15 FA507 | |
| Cinebench R23 / Single Core | |
| Sınıf ortalaması Gaming (1601 - 2415, n=104, son 2 yıl) | |
| Lenovo LOQ 15IRH8 Core i7 | |
| Medion Erazer Crawler E40 - MD 62518 | |
| Schenker XMG Apex 15 (Late 23) | |
| Ortalama Intel Core i5-13500H (1704 - 1799, n=5) | |
| MSI Katana 15 B12VEK | |
| Asus TUF A15 FA507 | |
| Cinebench R20 / CPU (Multi Core) | |
| Sınıf ortalaması Gaming (4029 - 16433, n=103, son 2 yıl) | |
| Schenker XMG Apex 15 (Late 23) | |
| MSI Katana 15 B12VEK | |
| Lenovo LOQ 15IRH8 Core i7 | |
| Ortalama Intel Core i5-13500H (5108 - 6212, n=5) | |
| Asus TUF A15 FA507 | |
| Medion Erazer Crawler E40 - MD 62518 | |
| Cinebench R20 / CPU (Single Core) | |
| Sınıf ortalaması Gaming (622 - 913, n=103, son 2 yıl) | |
| Lenovo LOQ 15IRH8 Core i7 | |
| Schenker XMG Apex 15 (Late 23) | |
| Medion Erazer Crawler E40 - MD 62518 | |
| Ortalama Intel Core i5-13500H (655 - 687, n=5) | |
| MSI Katana 15 B12VEK | |
| Asus TUF A15 FA507 | |
| Cinebench R15 / CPU Multi 64Bit | |
| Sınıf ortalaması Gaming (1578 - 6330, n=102, son 2 yıl) | |
| Schenker XMG Apex 15 (Late 23) | |
| Medion Erazer Crawler E40 - MD 62518 | |
| Ortalama Intel Core i5-13500H (2234 - 2475, n=5) | |
| Lenovo LOQ 15IRH8 Core i7 | |
| Asus TUF A15 FA507 | |
| MSI Katana 15 B12VEK | |
| Cinebench R15 / CPU Single 64Bit | |
| Sınıf ortalaması Gaming (188.8 - 350, n=103, son 2 yıl) | |
| Schenker XMG Apex 15 (Late 23) | |
| Lenovo LOQ 15IRH8 Core i7 | |
| Ortalama Intel Core i5-13500H (243 - 261, n=5) | |
| Asus TUF A15 FA507 | |
| Medion Erazer Crawler E40 - MD 62518 | |
| MSI Katana 15 B12VEK | |
| Blender / v2.79 BMW27 CPU | |
| Lenovo LOQ 15IRH8 Core i7 | |
| Ortalama Intel Core i5-13500H (205 - 263, n=6) | |
| MSI Katana 15 B12VEK | |
| Asus TUF A15 FA507 | |
| Medion Erazer Crawler E40 - MD 62518 | |
| Schenker XMG Apex 15 (Late 23) | |
| Sınıf ortalaması Gaming (79 - 330, n=101, son 2 yıl) | |
| 7-Zip 18.03 / 7z b 4 | |
| Sınıf ortalaması Gaming (33491 - 148086, n=102, son 2 yıl) | |
| Schenker XMG Apex 15 (Late 23) | |
| Asus TUF A15 FA507 | |
| MSI Katana 15 B12VEK | |
| Medion Erazer Crawler E40 - MD 62518 | |
| Lenovo LOQ 15IRH8 Core i7 | |
| Ortalama Intel Core i5-13500H (50846 - 58567, n=6) | |
| 7-Zip 18.03 / 7z b 4 -mmt1 | |
| Schenker XMG Apex 15 (Late 23) | |
| Sınıf ortalaması Gaming (4824 - 7436, n=102, son 2 yıl) | |
| Lenovo LOQ 15IRH8 Core i7 | |
| Asus TUF A15 FA507 | |
| Ortalama Intel Core i5-13500H (5500 - 5885, n=6) | |
| MSI Katana 15 B12VEK | |
| Medion Erazer Crawler E40 - MD 62518 | |
| Geekbench 5.5 / Multi-Core | |
| Sınıf ortalaması Gaming (6460 - 28263, n=102, son 2 yıl) | |
| Schenker XMG Apex 15 (Late 23) | |
| Lenovo LOQ 15IRH8 Core i7 | |
| MSI Katana 15 B12VEK | |
| Medion Erazer Crawler E40 - MD 62518 | |
| Ortalama Intel Core i5-13500H (9312 - 11465, n=5) | |
| Asus TUF A15 FA507 | |
| Geekbench 5.5 / Single-Core | |
| Sınıf ortalaması Gaming (1403 - 2474, n=102, son 2 yıl) | |
| Schenker XMG Apex 15 (Late 23) | |
| Lenovo LOQ 15IRH8 Core i7 | |
| Ortalama Intel Core i5-13500H (1674 - 1762, n=5) | |
| Medion Erazer Crawler E40 - MD 62518 | |
| MSI Katana 15 B12VEK | |
| Asus TUF A15 FA507 | |
| HWBOT x265 Benchmark v2.2 / 4k Preset | |
| Sınıf ortalaması Gaming (11.5 - 44.4, n=102, son 2 yıl) | |
| Schenker XMG Apex 15 (Late 23) | |
| Medion Erazer Crawler E40 - MD 62518 | |
| MSI Katana 15 B12VEK | |
| Asus TUF A15 FA507 | |
| Lenovo LOQ 15IRH8 Core i7 | |
| Ortalama Intel Core i5-13500H (14.4 - 17.9, n=6) | |
| LibreOffice / 20 Documents To PDF | |
| Medion Erazer Crawler E40 - MD 62518 | |
| Ortalama Intel Core i5-13500H (44 - 65.5, n=5) | |
| Asus TUF A15 FA507 | |
| Sınıf ortalaması Gaming (33.2 - 88.8, n=102, son 2 yıl) | |
| MSI Katana 15 B12VEK | |
| Schenker XMG Apex 15 (Late 23) | |
| Lenovo LOQ 15IRH8 Core i7 | |
| R Benchmark 2.5 / Overall mean | |
| Asus TUF A15 FA507 | |
| MSI Katana 15 B12VEK | |
| Ortalama Intel Core i5-13500H (0.471 - 0.51, n=6) | |
| Medion Erazer Crawler E40 - MD 62518 | |
| Lenovo LOQ 15IRH8 Core i7 | |
| Schenker XMG Apex 15 (Late 23) | |
| Sınıf ortalaması Gaming (0.3439 - 0.59, n=102, son 2 yıl) | |
* ... daha küçük daha iyidir
AIDA64: FP32 Ray-Trace | FPU Julia | CPU SHA3 | CPU Queen | FPU SinJulia | FPU Mandel | CPU AES | CPU ZLib | FP64 Ray-Trace | CPU PhotoWorxx
| Performance rating | |
| Sınıf ortalaması Gaming | |
| Schenker XMG Apex 15 (Late 23) | |
| Asus TUF A15 FA507 | |
| MSI Katana 15 B12VEK | |
| Medion Erazer Crawler E40 - MD 62518 | |
| Ortalama Intel Core i5-13500H | |
| Lenovo LOQ 15IRH8 Core i7 | |
| AIDA64 / FP32 Ray-Trace | |
| Sınıf ortalaması Gaming (10227 - 85542, n=102, son 2 yıl) | |
| Schenker XMG Apex 15 (Late 23) | |
| Asus TUF A15 FA507 | |
| MSI Katana 15 B12VEK | |
| Medion Erazer Crawler E40 - MD 62518 | |
| Ortalama Intel Core i5-13500H (11081 - 15390, n=6) | |
| Lenovo LOQ 15IRH8 Core i7 | |
| AIDA64 / FPU Julia | |
| Sınıf ortalaması Gaming (51376 - 372155, n=102, son 2 yıl) | |
| Schenker XMG Apex 15 (Late 23) | |
| Asus TUF A15 FA507 | |
| MSI Katana 15 B12VEK | |
| Medion Erazer Crawler E40 - MD 62518 | |
| Ortalama Intel Core i5-13500H (56813 - 74251, n=6) | |
| Lenovo LOQ 15IRH8 Core i7 | |
| AIDA64 / CPU SHA3 | |
| Sınıf ortalaması Gaming (2180 - 10115, n=102, son 2 yıl) | |
| Schenker XMG Apex 15 (Late 23) | |
| Medion Erazer Crawler E40 - MD 62518 | |
| Asus TUF A15 FA507 | |
| MSI Katana 15 B12VEK | |
| Ortalama Intel Core i5-13500H (2621 - 3623, n=6) | |
| Lenovo LOQ 15IRH8 Core i7 | |
| AIDA64 / CPU Queen | |
| Sınıf ortalaması Gaming (49785 - 173351, n=86, son 2 yıl) | |
| Schenker XMG Apex 15 (Late 23) | |
| Asus TUF A15 FA507 | |
| MSI Katana 15 B12VEK | |
| Medion Erazer Crawler E40 - MD 62518 | |
| Ortalama Intel Core i5-13500H (77835 - 85727, n=6) | |
| Lenovo LOQ 15IRH8 Core i7 | |
| AIDA64 / FPU SinJulia | |
| Schenker XMG Apex 15 (Late 23) | |
| Sınıf ortalaması Gaming (4424 - 33636, n=102, son 2 yıl) | |
| Asus TUF A15 FA507 | |
| MSI Katana 15 B12VEK | |
| Medion Erazer Crawler E40 - MD 62518 | |
| Ortalama Intel Core i5-13500H (7249 - 8086, n=6) | |
| Lenovo LOQ 15IRH8 Core i7 | |
| AIDA64 / FPU Mandel | |
| Sınıf ortalaması Gaming (25115 - 196829, n=102, son 2 yıl) | |
| Schenker XMG Apex 15 (Late 23) | |
| Asus TUF A15 FA507 | |
| MSI Katana 15 B12VEK | |
| Medion Erazer Crawler E40 - MD 62518 | |
| Ortalama Intel Core i5-13500H (27820 - 38336, n=6) | |
| Lenovo LOQ 15IRH8 Core i7 | |
| AIDA64 / CPU AES | |
| Schenker XMG Apex 15 (Late 23) | |
| Sınıf ortalaması Gaming (39258 - 247074, n=102, son 2 yıl) | |
| Ortalama Intel Core i5-13500H (62657 - 120493, n=6) | |
| MSI Katana 15 B12VEK | |
| Asus TUF A15 FA507 | |
| Medion Erazer Crawler E40 - MD 62518 | |
| Lenovo LOQ 15IRH8 Core i7 | |
| AIDA64 / CPU ZLib | |
| Sınıf ortalaması Gaming (574 - 2531, n=102, son 2 yıl) | |
| Schenker XMG Apex 15 (Late 23) | |
| Medion Erazer Crawler E40 - MD 62518 | |
| Ortalama Intel Core i5-13500H (782 - 992, n=6) | |
| MSI Katana 15 B12VEK | |
| Lenovo LOQ 15IRH8 Core i7 | |
| Asus TUF A15 FA507 | |
| AIDA64 / FP64 Ray-Trace | |
| Sınıf ortalaması Gaming (5509 - 45446, n=102, son 2 yıl) | |
| Schenker XMG Apex 15 (Late 23) | |
| Asus TUF A15 FA507 | |
| MSI Katana 15 B12VEK | |
| Medion Erazer Crawler E40 - MD 62518 | |
| Ortalama Intel Core i5-13500H (5955 - 8495, n=6) | |
| Lenovo LOQ 15IRH8 Core i7 | |
| AIDA64 / CPU PhotoWorxx | |
| Sınıf ortalaması Gaming (12271 - 89891, n=102, son 2 yıl) | |
| MSI Katana 15 B12VEK | |
| Medion Erazer Crawler E40 - MD 62518 | |
| Schenker XMG Apex 15 (Late 23) | |
| Lenovo LOQ 15IRH8 Core i7 | |
| Ortalama Intel Core i5-13500H (20212 - 37618, n=6) | |
| Asus TUF A15 FA507 | |
Sistem Performansı
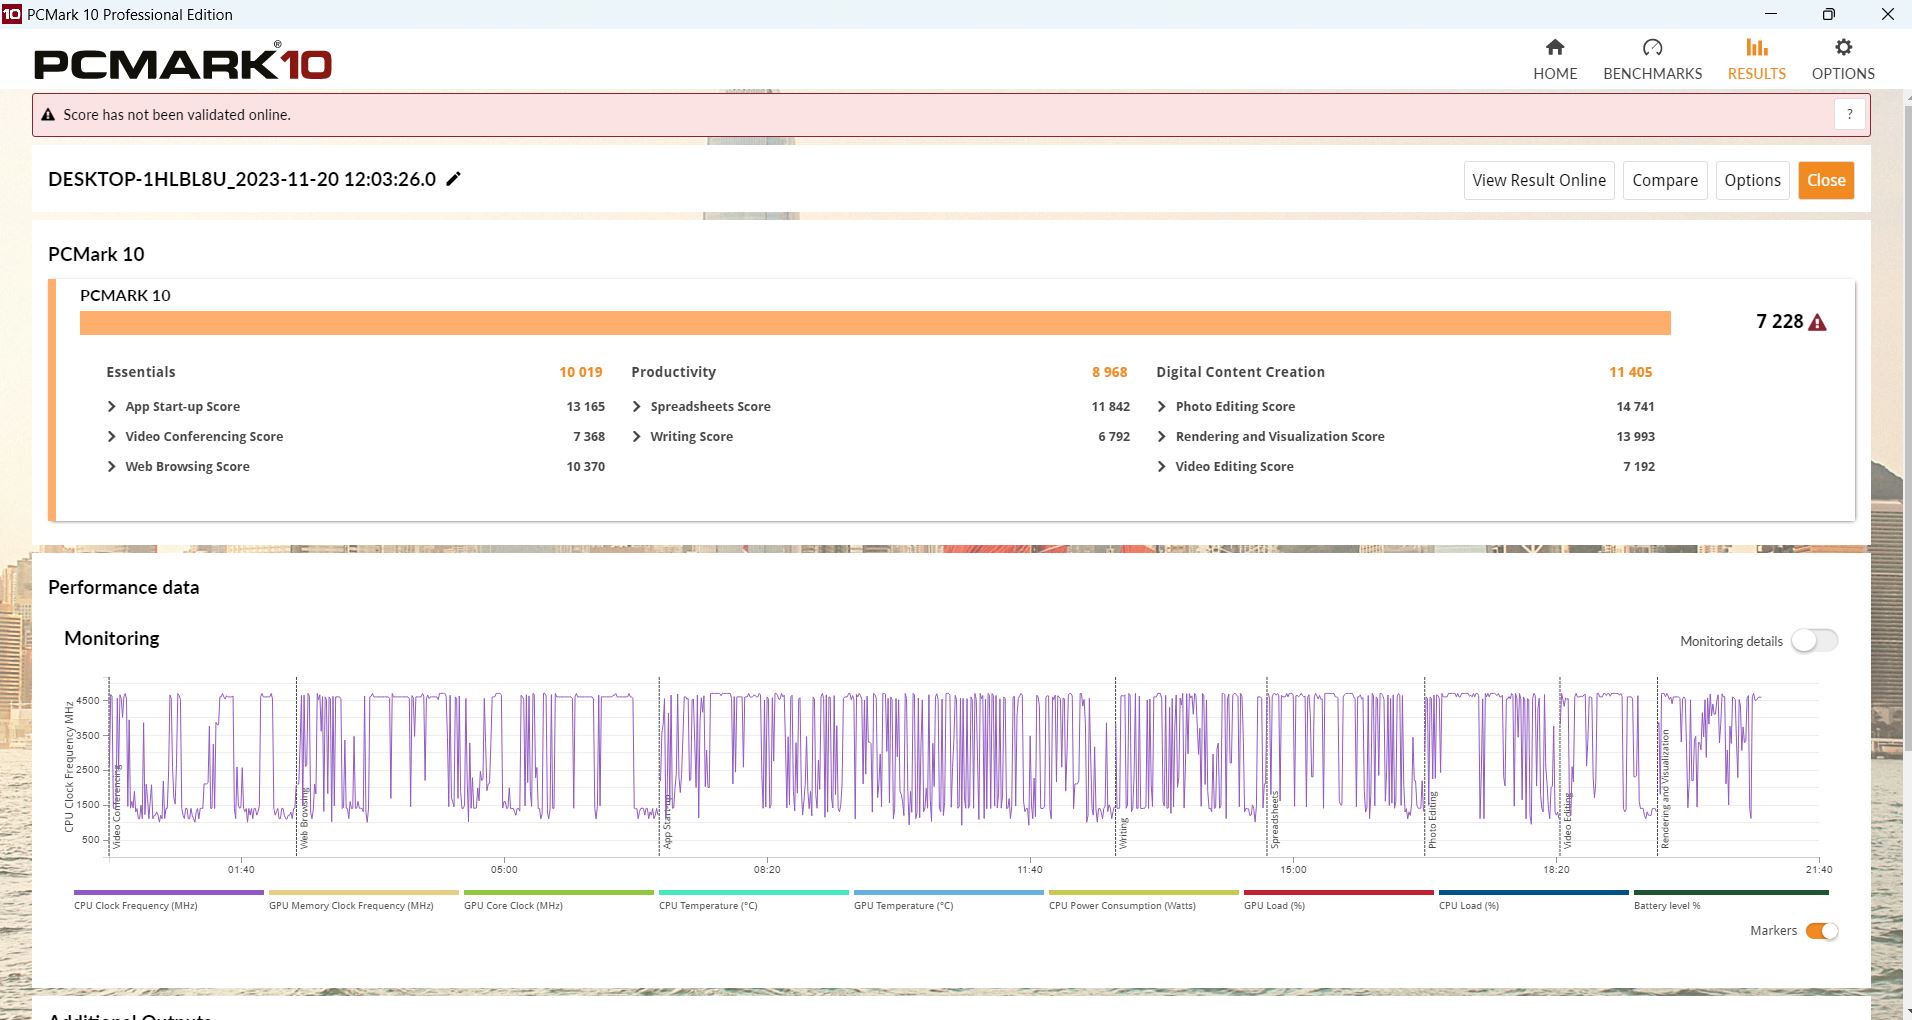
PCMark 10'da XMG Apex 15 ve Lenovo LOQ 15, özellikle Üretkenlik ve Temel Özellikler'de biraz daha önde. Crawler, Dijital İçerik Oluşturma'da eşittir. Sadece LOQ 15 Crossmark'ta biraz daha hızlı.
CrossMark: Overall | Productivity | Creativity | Responsiveness
| PCMark 10 / Score | |
| Sınıf ortalaması Gaming (5828 - 12414, n=93, son 2 yıl) | |
| Schenker XMG Apex 15 (Late 23) | |
| Lenovo LOQ 15IRH8 Core i7 | |
| Medion Erazer Crawler E40 - MD 62518 | |
| Asus TUF A15 FA507 | |
| Ortalama Intel Core i5-13500H, NVIDIA GeForce RTX 4050 Laptop GPU (6812 - 7228, n=2) | |
| MSI Katana 15 B12VEK | |
| PCMark 10 / Essentials | |
| Lenovo LOQ 15IRH8 Core i7 | |
| Schenker XMG Apex 15 (Late 23) | |
| Sınıf ortalaması Gaming (8810 - 11935, n=97, son 2 yıl) | |
| Asus TUF A15 FA507 | |
| MSI Katana 15 B12VEK | |
| Medion Erazer Crawler E40 - MD 62518 | |
| Ortalama Intel Core i5-13500H, NVIDIA GeForce RTX 4050 Laptop GPU (9521 - 10019, n=2) | |
| PCMark 10 / Productivity | |
| Sınıf ortalaması Gaming (6845 - 25323, n=95, son 2 yıl) | |
| Schenker XMG Apex 15 (Late 23) | |
| MSI Katana 15 B12VEK | |
| Lenovo LOQ 15IRH8 Core i7 | |
| Asus TUF A15 FA507 | |
| Medion Erazer Crawler E40 - MD 62518 | |
| Ortalama Intel Core i5-13500H, NVIDIA GeForce RTX 4050 Laptop GPU (8890 - 8968, n=2) | |
| PCMark 10 / Digital Content Creation | |
| Sınıf ortalaması Gaming (7602 - 19954, n=95, son 2 yıl) | |
| Lenovo LOQ 15IRH8 Core i7 | |
| Schenker XMG Apex 15 (Late 23) | |
| Medion Erazer Crawler E40 - MD 62518 | |
| Ortalama Intel Core i5-13500H, NVIDIA GeForce RTX 4050 Laptop GPU (10134 - 11405, n=2) | |
| Asus TUF A15 FA507 | |
| MSI Katana 15 B12VEK | |
| CrossMark / Overall | |
| Sınıf ortalaması Gaming (1366 - 2409, n=94, son 2 yıl) | |
| Lenovo LOQ 15IRH8 Core i7 | |
| Medion Erazer Crawler E40 - MD 62518 | |
| Ortalama Intel Core i5-13500H, NVIDIA GeForce RTX 4050 Laptop GPU (n=1) | |
| Schenker XMG Apex 15 (Late 23) | |
| MSI Katana 15 B12VEK | |
| Asus TUF A15 FA507 | |
| CrossMark / Productivity | |
| Sınıf ortalaması Gaming (1386 - 2254, n=94, son 2 yıl) | |
| Lenovo LOQ 15IRH8 Core i7 | |
| Medion Erazer Crawler E40 - MD 62518 | |
| Ortalama Intel Core i5-13500H, NVIDIA GeForce RTX 4050 Laptop GPU (n=1) | |
| Schenker XMG Apex 15 (Late 23) | |
| MSI Katana 15 B12VEK | |
| Asus TUF A15 FA507 | |
| CrossMark / Creativity | |
| Sınıf ortalaması Gaming (1343 - 2786, n=94, son 2 yıl) | |
| Lenovo LOQ 15IRH8 Core i7 | |
| Schenker XMG Apex 15 (Late 23) | |
| Medion Erazer Crawler E40 - MD 62518 | |
| Ortalama Intel Core i5-13500H, NVIDIA GeForce RTX 4050 Laptop GPU (n=1) | |
| MSI Katana 15 B12VEK | |
| Asus TUF A15 FA507 | |
| CrossMark / Responsiveness | |
| Lenovo LOQ 15IRH8 Core i7 | |
| Medion Erazer Crawler E40 - MD 62518 | |
| Ortalama Intel Core i5-13500H, NVIDIA GeForce RTX 4050 Laptop GPU (n=1) | |
| Sınıf ortalaması Gaming (1226 - 2334, n=94, son 2 yıl) | |
| MSI Katana 15 B12VEK | |
| Schenker XMG Apex 15 (Late 23) | |
| Asus TUF A15 FA507 | |
| PCMark 10 Score | 7228 puan | |
Yardım | ||
| AIDA64 / Memory Copy | |
| Sınıf ortalaması Gaming (21750 - 129946, n=102, son 2 yıl) | |
| Schenker XMG Apex 15 (Late 23) | |
| Medion Erazer Crawler E40 - MD 62518 | |
| MSI Katana 15 B12VEK | |
| Lenovo LOQ 15IRH8 Core i7 | |
| Ortalama Intel Core i5-13500H (36916 - 57830, n=6) | |
| Asus TUF A15 FA507 | |
| AIDA64 / Memory Read | |
| Sınıf ortalaması Gaming (22956 - 118858, n=102, son 2 yıl) | |
| MSI Katana 15 B12VEK | |
| Medion Erazer Crawler E40 - MD 62518 | |
| Lenovo LOQ 15IRH8 Core i7 | |
| Schenker XMG Apex 15 (Late 23) | |
| Ortalama Intel Core i5-13500H (41676 - 65633, n=6) | |
| Asus TUF A15 FA507 | |
| AIDA64 / Memory Write | |
| Schenker XMG Apex 15 (Late 23) | |
| Sınıf ortalaması Gaming (22297 - 135096, n=102, son 2 yıl) | |
| Medion Erazer Crawler E40 - MD 62518 | |
| MSI Katana 15 B12VEK | |
| Asus TUF A15 FA507 | |
| Lenovo LOQ 15IRH8 Core i7 | |
| Ortalama Intel Core i5-13500H (36826 - 60523, n=6) | |
| AIDA64 / Memory Latency | |
| Lenovo LOQ 15IRH8 Core i7 | |
| Sınıf ortalaması Gaming (75.3 - 165.4, n=102, son 2 yıl) | |
| Medion Erazer Crawler E40 - MD 62518 | |
| MSI Katana 15 B12VEK | |
| Ortalama Intel Core i5-13500H (86.2 - 96.1, n=6) | |
| Schenker XMG Apex 15 (Late 23) | |
| Asus TUF A15 FA507 | |
* ... daha küçük daha iyidir
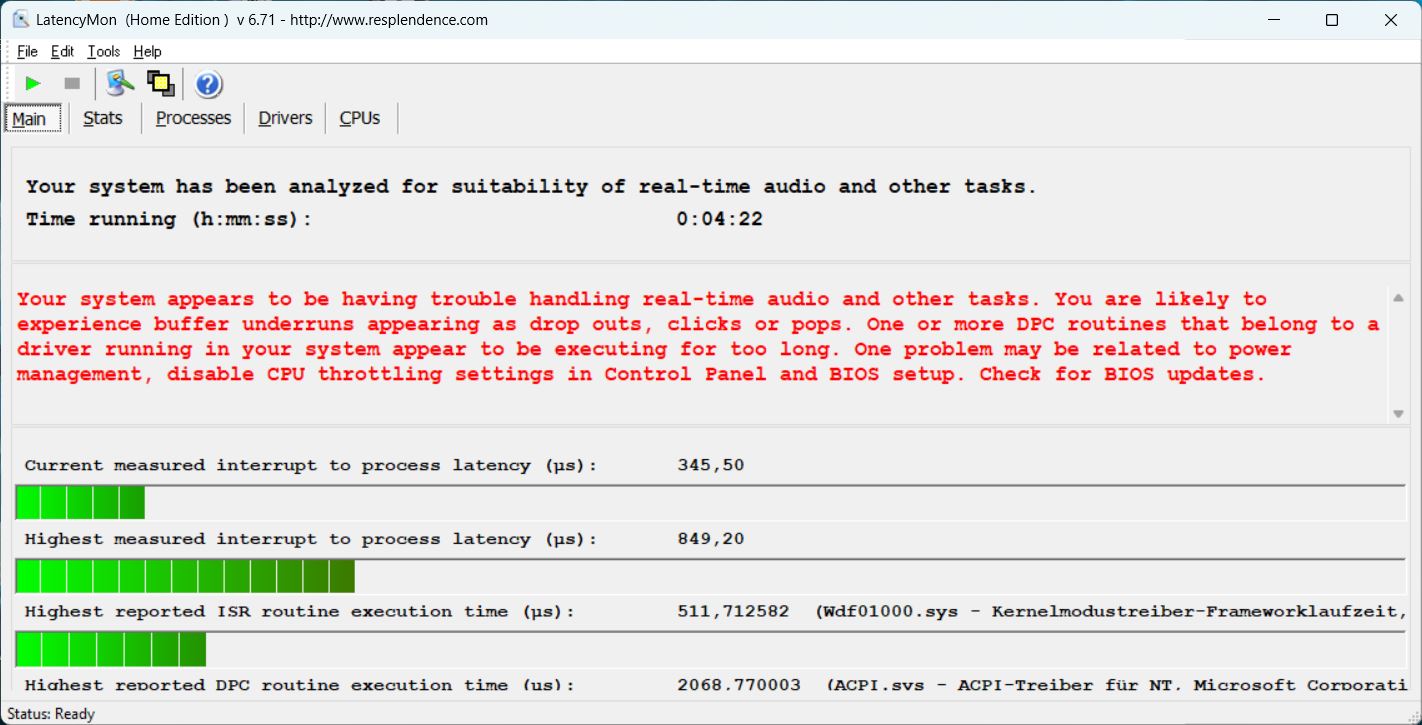
DPC Gecikme Süresi
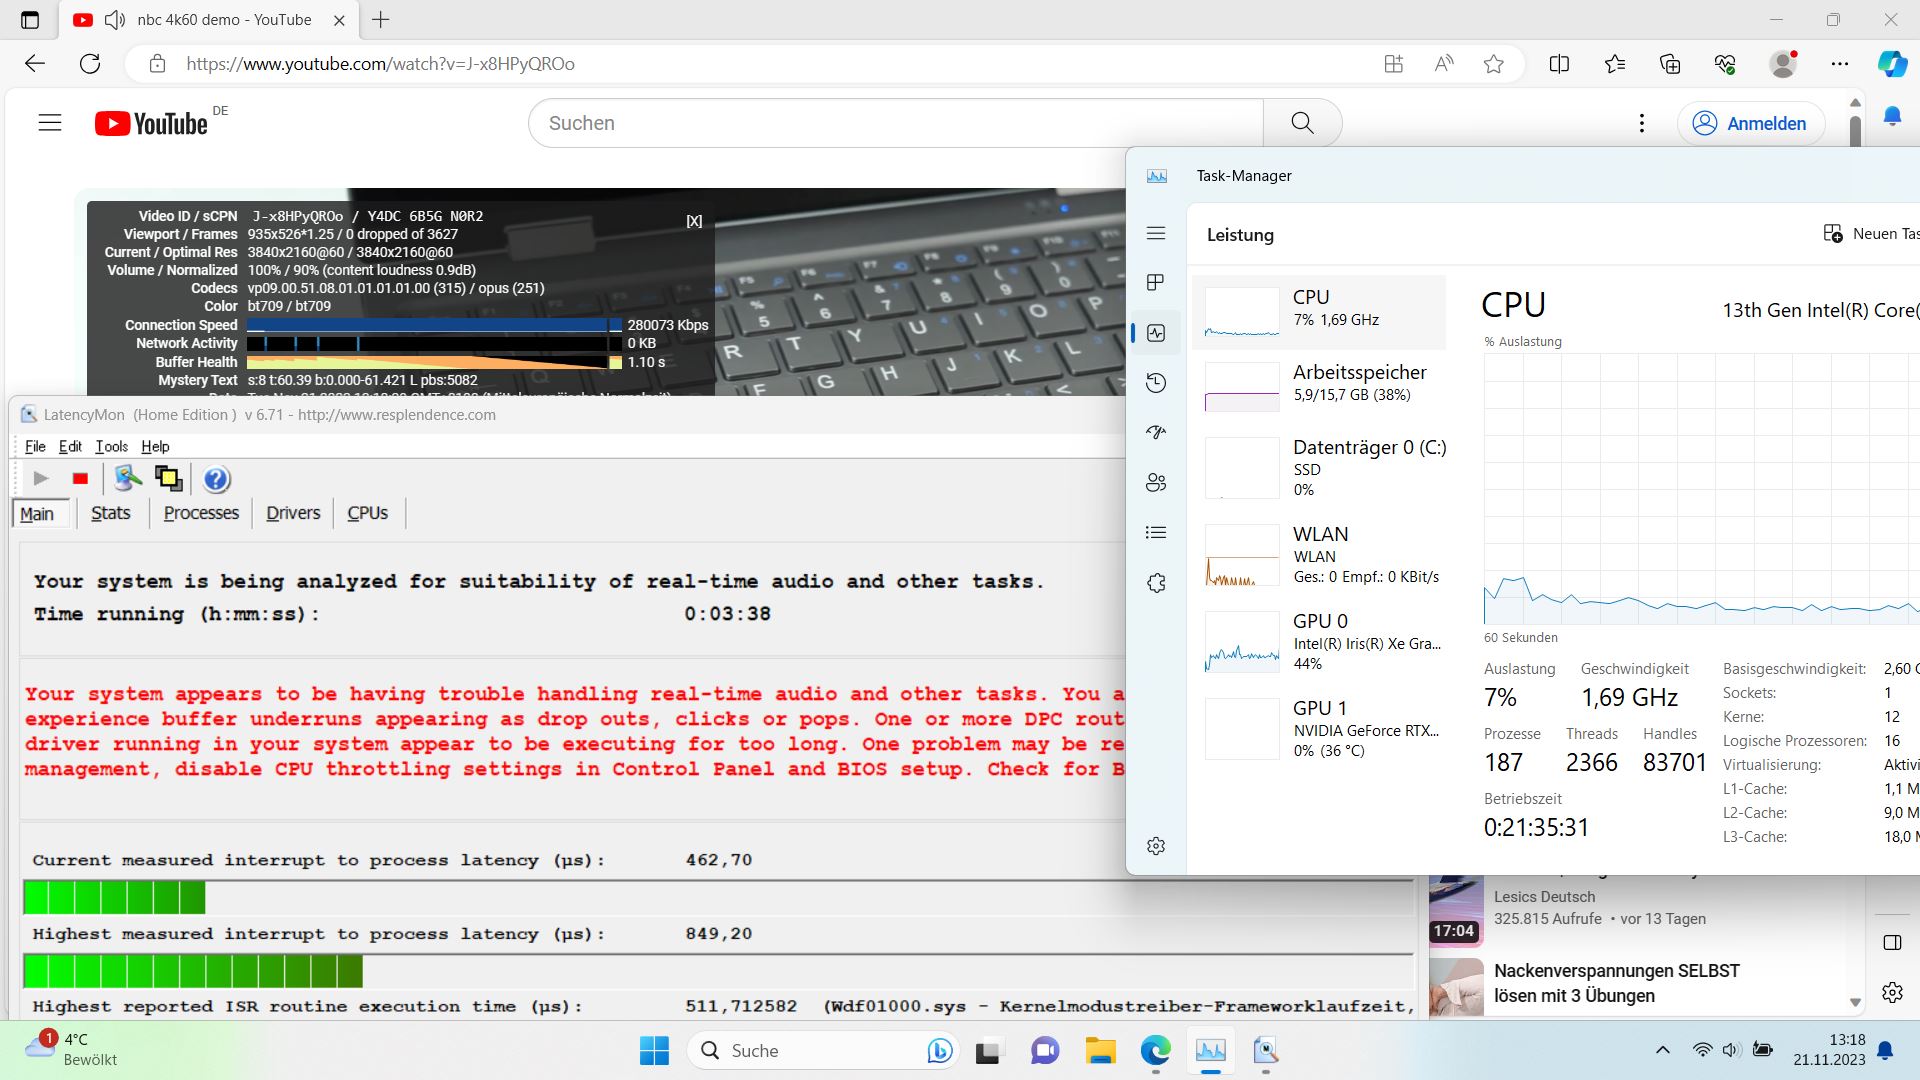
Tarayıcıyı veya birden fazla sekmeyi açarken herhangi bir sorun yok. Ancak LatencyMon, 4K/60 fps YouTube videomuzu oynatırken bazı sorunlar tespit ediyor. En azından bu, herhangi bir kare düşmesi olmadan oynatılıyor. Prime95 altında gecikme değeri biraz artıyor.
| DPC Latencies / LatencyMon - interrupt to process latency (max), Web, Youtube, Prime95 | |
| MSI Katana 15 B12VEK | |
| Medion Erazer Crawler E40 - MD 62518 | |
| Lenovo LOQ 15IRH8 Core i7 | |
| Schenker XMG Apex 15 (Late 23) | |
* ... daha küçük daha iyidir
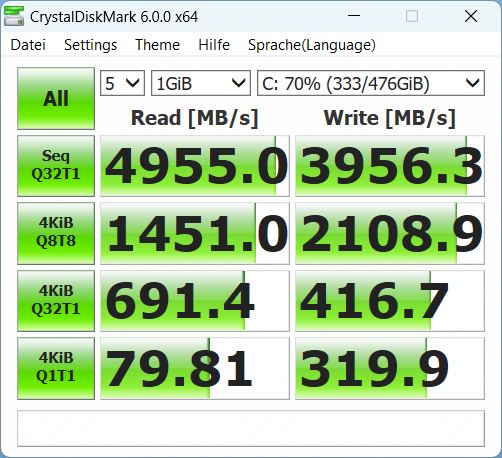
Depolama Cihazları
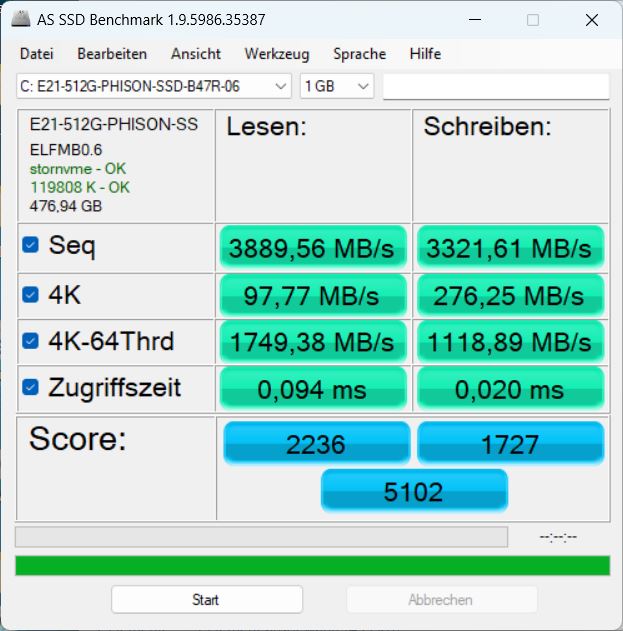
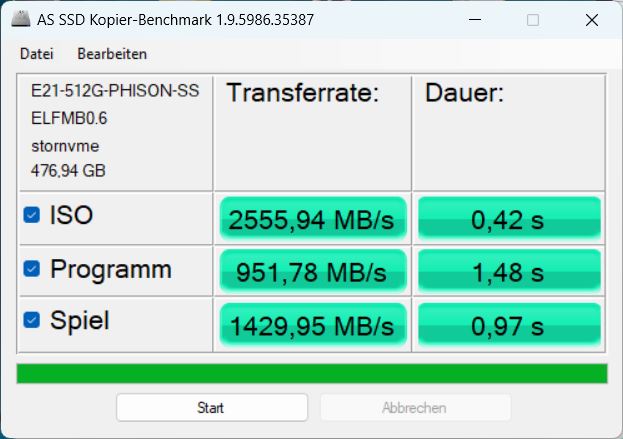
Medion, Phison'dan 512 GB NVMe SSD kullanmaktadır. Bu, XMG Apex 15'teki Samsung 990 Pro'nun hızına yaklaşamasa da diğer üç rakibin depolamasından daha iyi performans gösteriyor ve performansı da daha uzun bir süre boyunca çok tutarlı. En iyi SSD listemizde daha fazla SSD karşılaştırması bulunmaktadır.

| Drive Performance rating - Percent | |
| Schenker XMG Apex 15 (Late 23) | |
| Sınıf ortalaması Gaming | |
| Ortalama Phison PS5021-E21 512GB | |
| Medion Erazer Crawler E40 - MD 62518 | |
| MSI Katana 15 B12VEK | |
| Lenovo LOQ 15IRH8 Core i7 | |
| Asus TUF A15 FA507 | |
* ... daha küçük daha iyidir
Continuous power read: DiskSpd Read Loop, Queue Depth 8
Grafik kartı
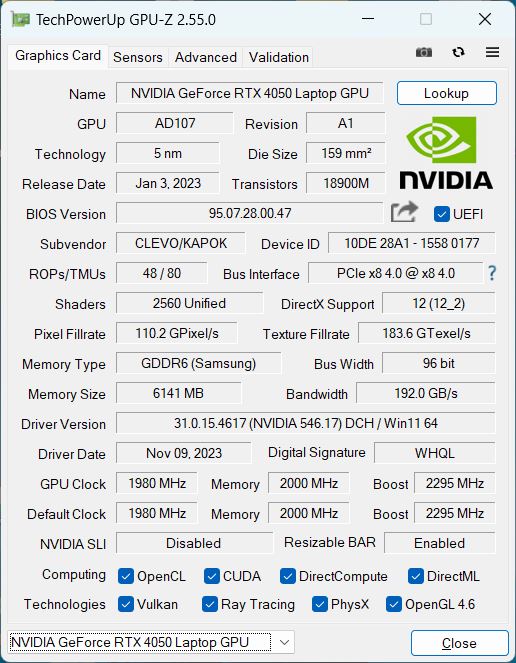
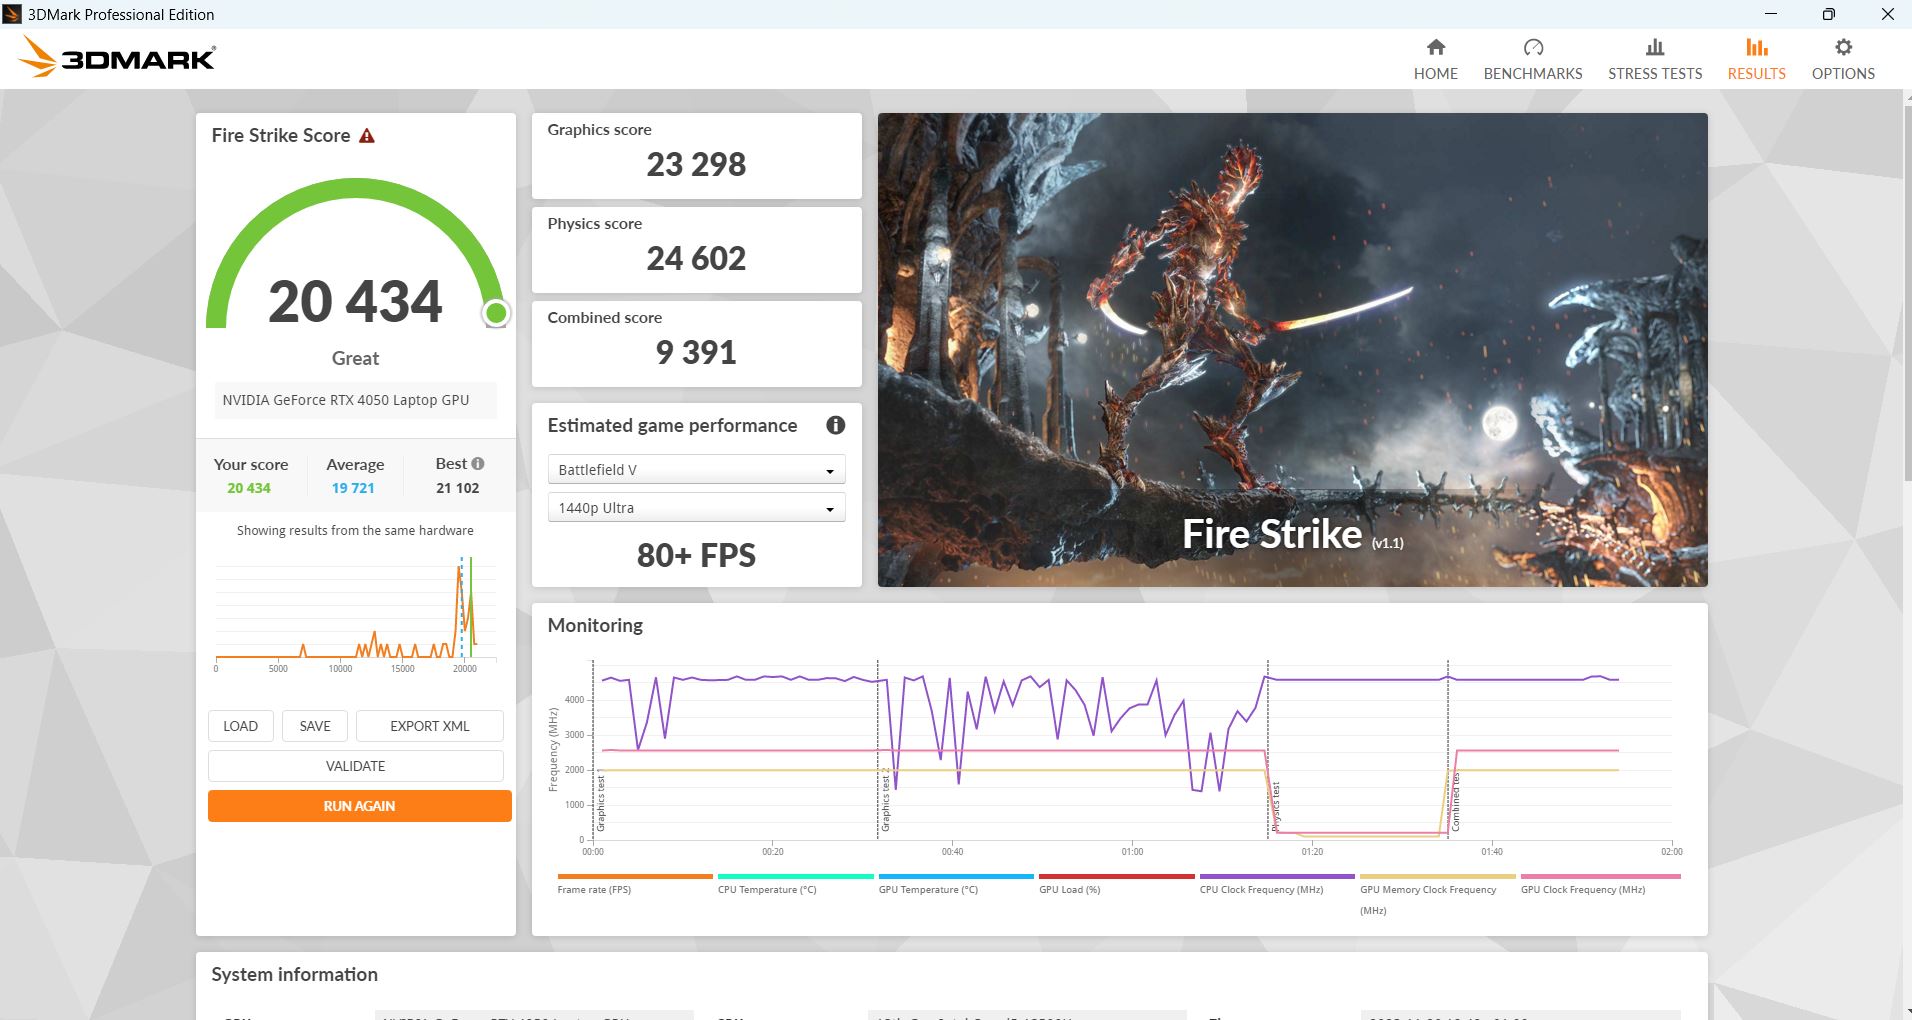
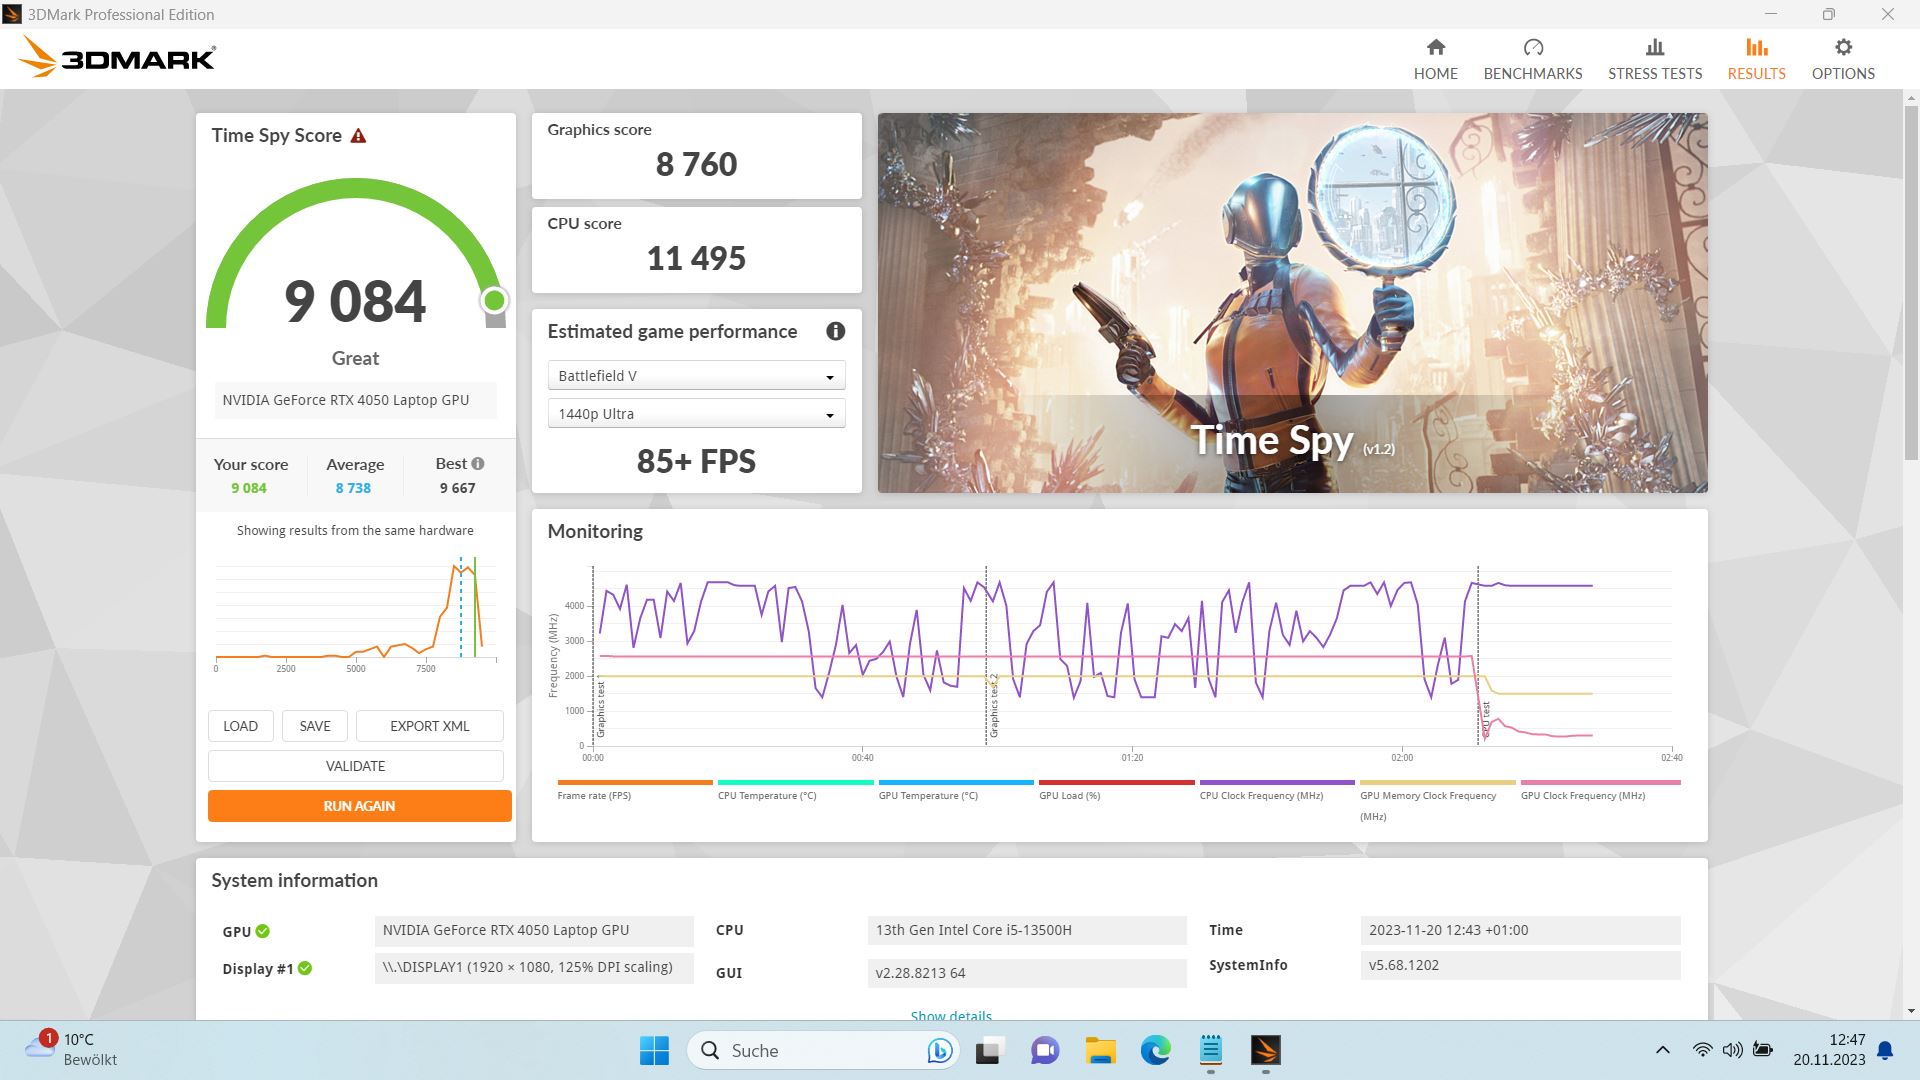
E40 tarayıcımızda, bir RTX 4050 maksimum 100 W güç değeri ile monte edilir.
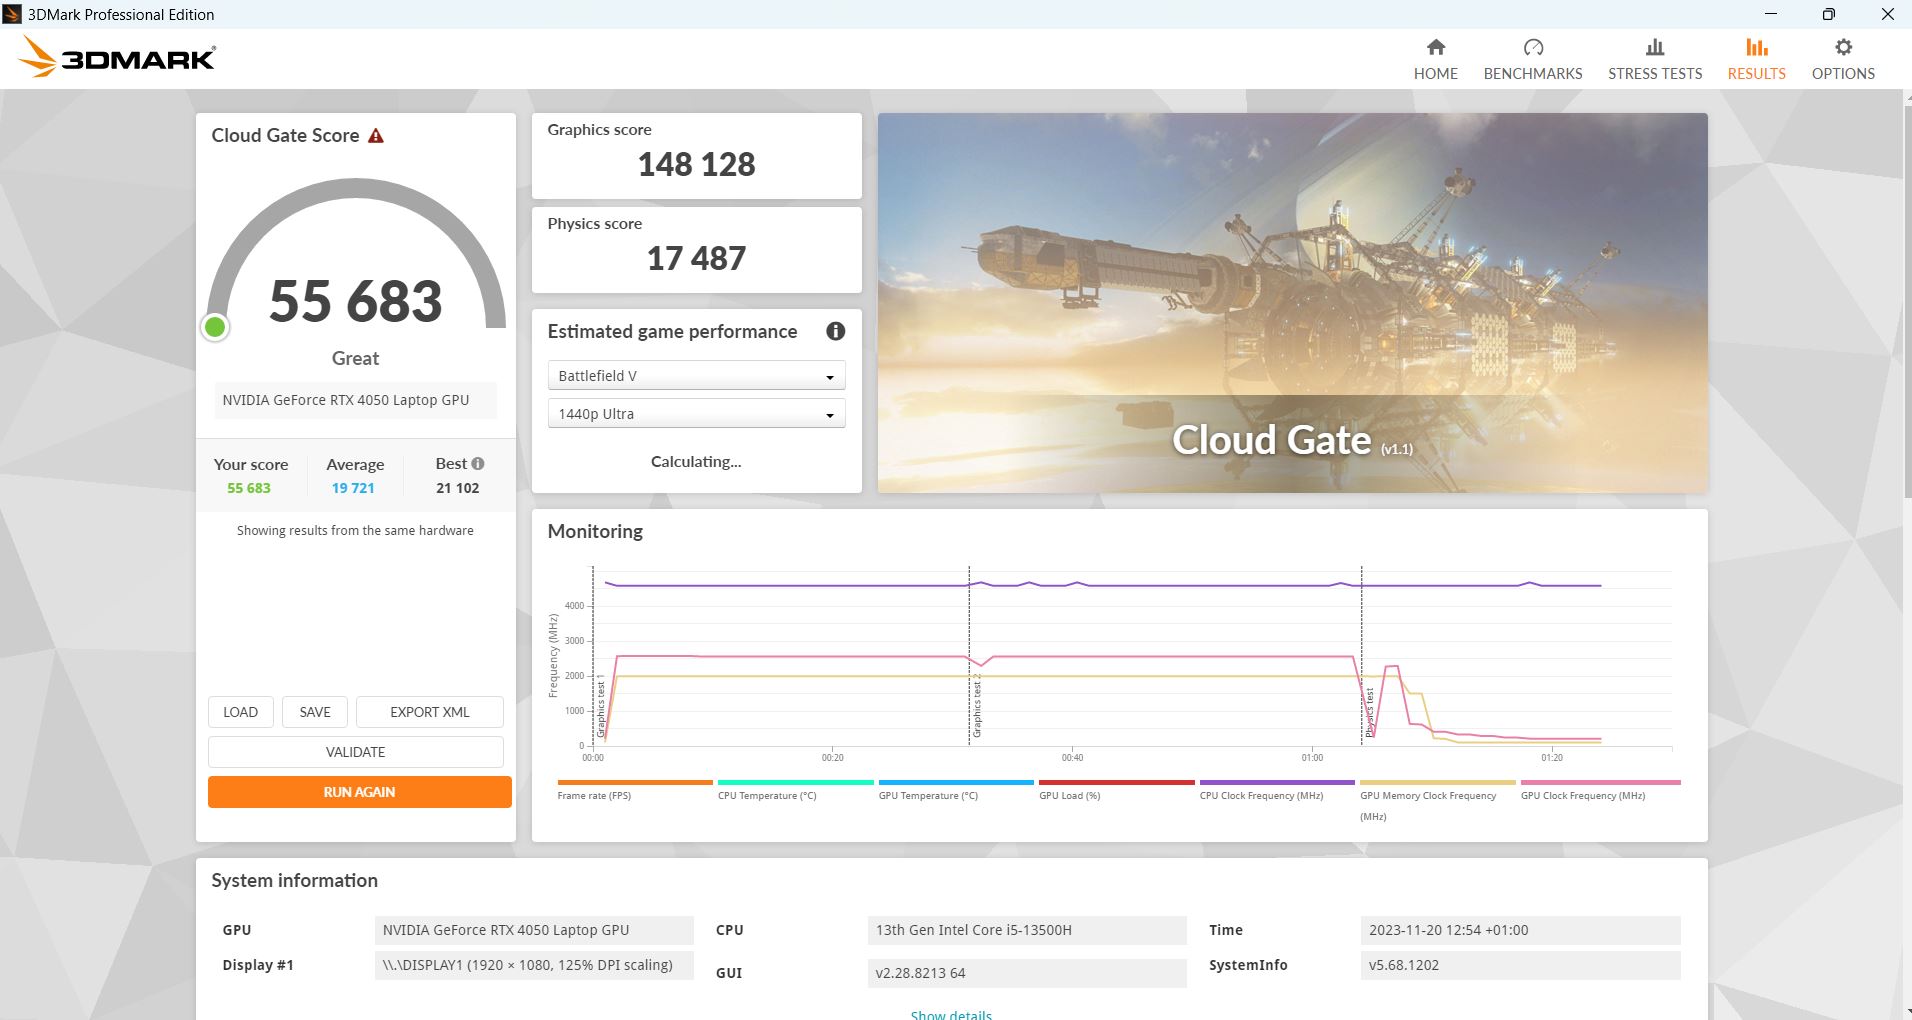
E40, 3DMark kıyaslamalarında gerçekten iyi performans gösteriyor, ortalama bir RTX 4050'nin biraz üzerinde ve bu kategoride de güçlü olan XMG Apex 15 ve MSI Katana 15 ile aynı seviyede.
Pil modunda, Fire Strike adresindeki 3D performansı tam yüzde 70 oranında düşüyor.
| 3DMark Performance rating - Percent | |
| Sınıf ortalaması Gaming | |
| MSI Katana 15 B12VEK | |
| Schenker XMG Apex 15 (Late 23) | |
| Medion Erazer Crawler E40 - MD 62518 | |
| Lenovo LOQ 15IRH8 Core i7 | |
| Ortalama NVIDIA GeForce RTX 4050 Laptop GPU | |
| Asus TUF A15 FA507 -1! | |
| 3DMark 11 - 1280x720 Performance GPU | |
| Sınıf ortalaması Gaming (21841 - 80022, n=103, son 2 yıl) | |
| Schenker XMG Apex 15 (Late 23) | |
| Asus TUF A15 FA507 | |
| Medion Erazer Crawler E40 - MD 62518 | |
| MSI Katana 15 B12VEK | |
| Lenovo LOQ 15IRH8 Core i7 | |
| Ortalama NVIDIA GeForce RTX 4050 Laptop GPU (13339 - 32642, n=41) | |
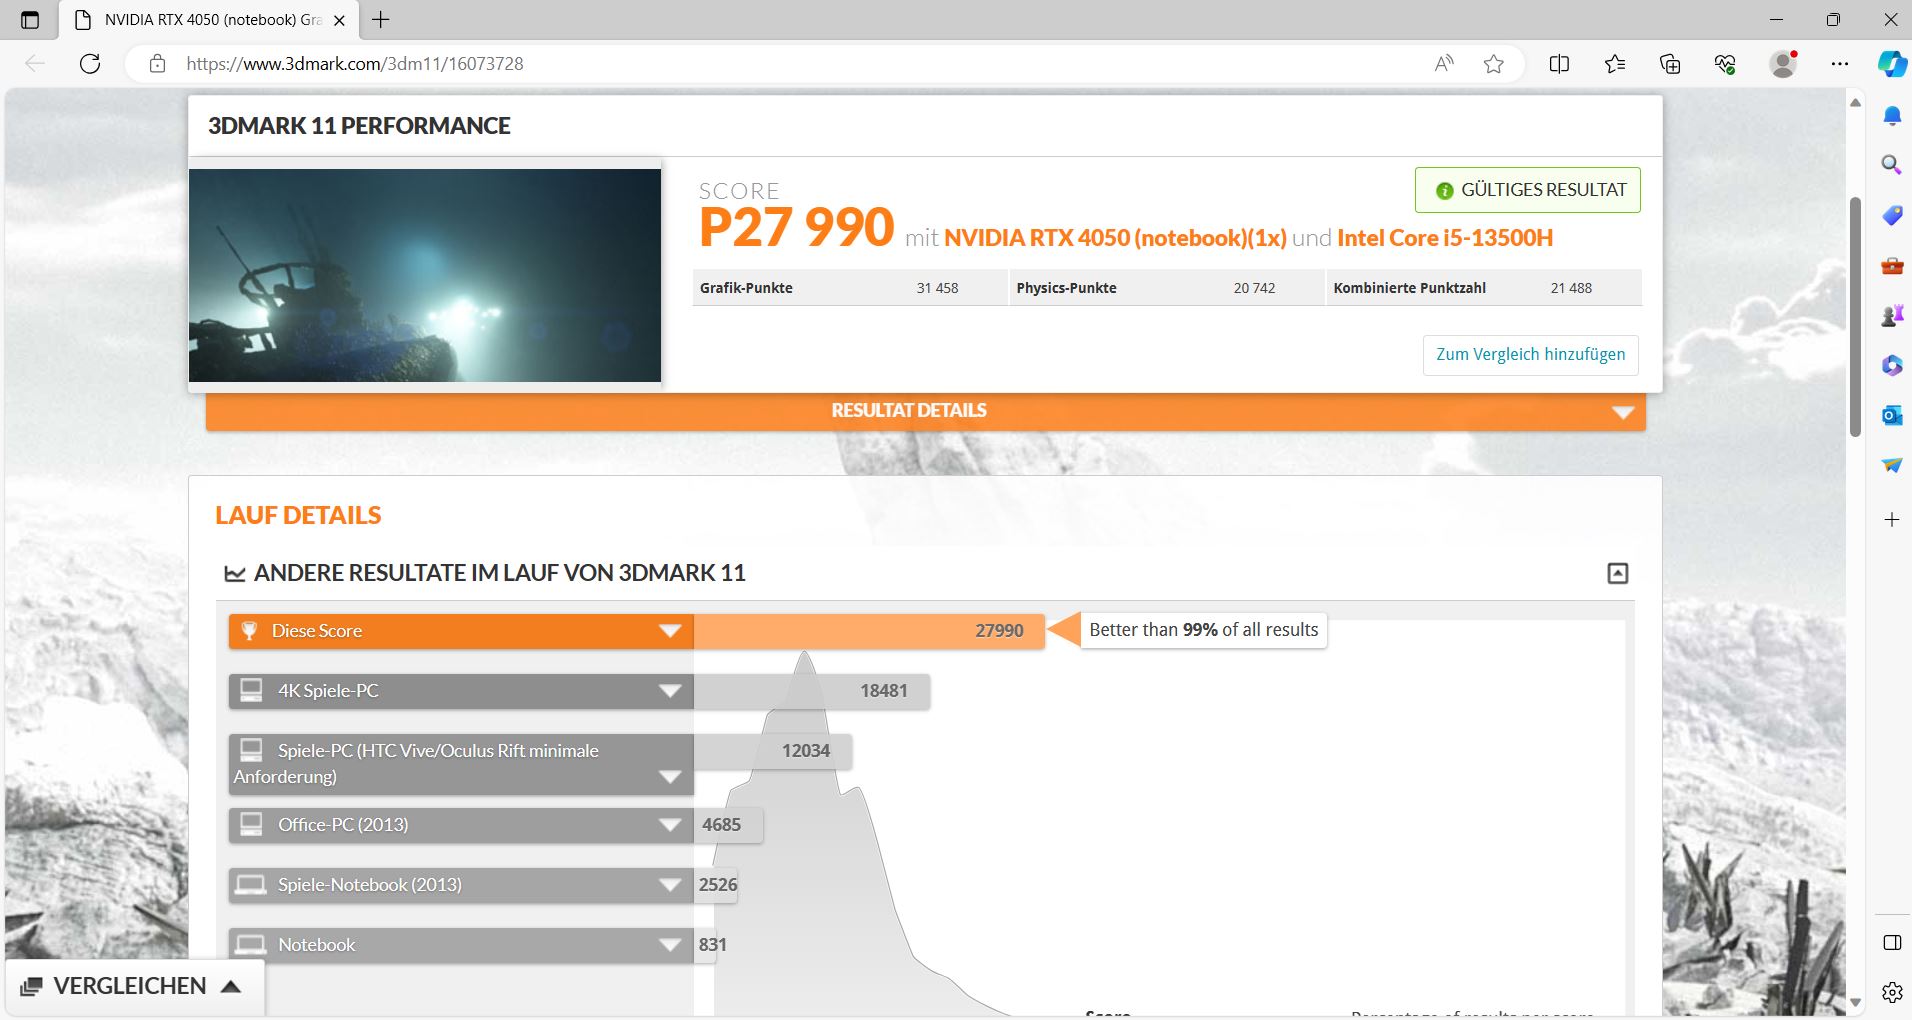
| 3DMark 11 Performance | 27990 puan | |
| 3DMark Cloud Gate Standard Score | 55683 puan | |
| 3DMark Fire Strike Score | 20434 puan | |
| 3DMark Time Spy Score | 9084 puan | |
Yardım | ||
| Blender | |
| v3.3 Classroom OPTIX/RTX | |
| Ortalama NVIDIA GeForce RTX 4050 Laptop GPU (25 - 37, n=40) | |
| Medion Erazer Crawler E40 - MD 62518 | |
| MSI Katana 15 B12VEK | |
| Asus TUF A15 FA507 | |
| Asus TUF A15 FA507 | |
| Schenker XMG Apex 15 (Late 23) | |
| Lenovo LOQ 15IRH8 Core i7 | |
| Sınıf ortalaması Gaming (9 - 32, n=103, son 2 yıl) | |
| v3.3 Classroom CUDA | |
| Ortalama NVIDIA GeForce RTX 4050 Laptop GPU (47 - 68, n=39) | |
| MSI Katana 15 B12VEK | |
| Asus TUF A15 FA507 | |
| Asus TUF A15 FA507 | |
| Schenker XMG Apex 15 (Late 23) | |
| Lenovo LOQ 15IRH8 Core i7 | |
| Medion Erazer Crawler E40 - MD 62518 | |
| Sınıf ortalaması Gaming (15 - 228, n=103, son 2 yıl) | |
| v3.3 Classroom CPU | |
| MSI Katana 15 B12VEK | |
| Lenovo LOQ 15IRH8 Core i7 | |
| Ortalama NVIDIA GeForce RTX 4050 Laptop GPU (243 - 907, n=40) | |
| Asus TUF A15 FA507 | |
| Asus TUF A15 FA507 | |
| Medion Erazer Crawler E40 - MD 62518 | |
| Schenker XMG Apex 15 (Late 23) | |
| Sınıf ortalaması Gaming (122 - 565, n=99, son 2 yıl) | |
* ... daha küçük daha iyidir
Oyun
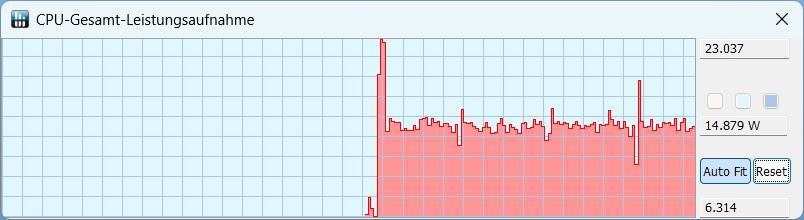
Witcher 3 için günlük verilerimizde (aşağıdaki ekran görüntülerine bakın), eğlence ve sessiz modda GPU saatinin ve güç tüketiminin neredeyse tamamen aynı olduğunu ve oyun modundan sadece biraz daha düşük olduğunu görebilirsiniz. Buna göre, kare hızları neredeyse hiç farklılık göstermiyor. Modlar arasındaki tek fark, farklı bir hacim ve sıcaklık gelişimine yol açan fan davranışıdır. Sessiz modda GPU diğer modlara göre daha fazla ısınıyor. Oyun modunda, Witcher 3 kare hızı çok sabittir.
Rakipleriyle karşılaştırıldığında E40 iyi bir performans sergiliyor. Özellikle Far Cry 5'te en üst sırada yer alıyor. Öte yandan Witcher 3'da sonuncu, ancak farklar çok küçük. Genel oyun sonuçlarında rekabet birbirine yakın, LOQ 15 bizim tarayıcımızdan biraz daha iyi, Katana 15 hemen hemen aynı ve Apex 15 ve özellikle Asus TUF A15 daha zayıf.
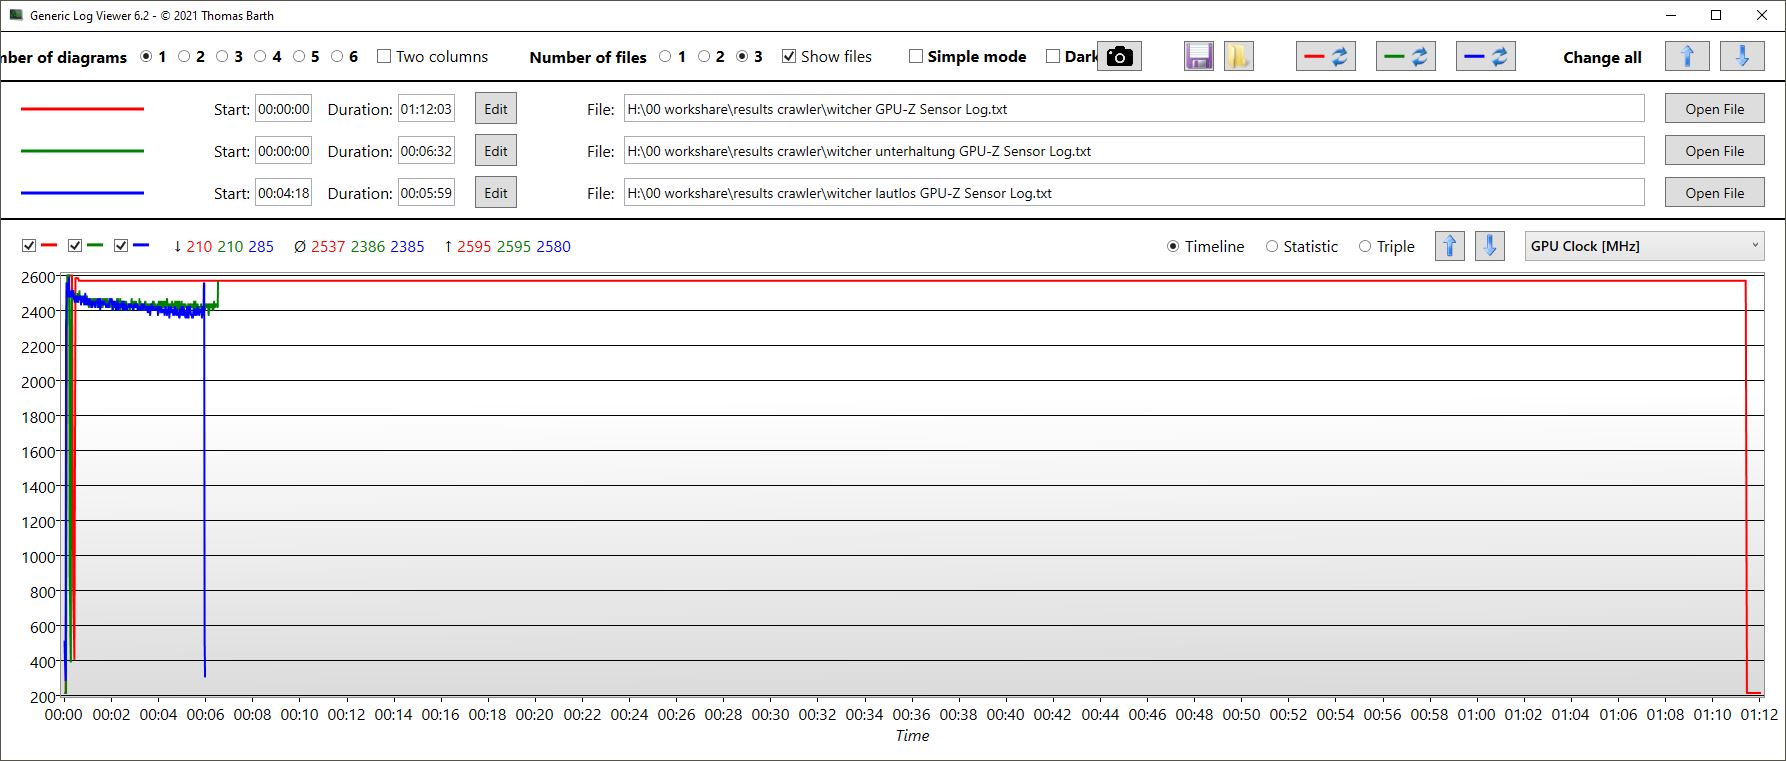
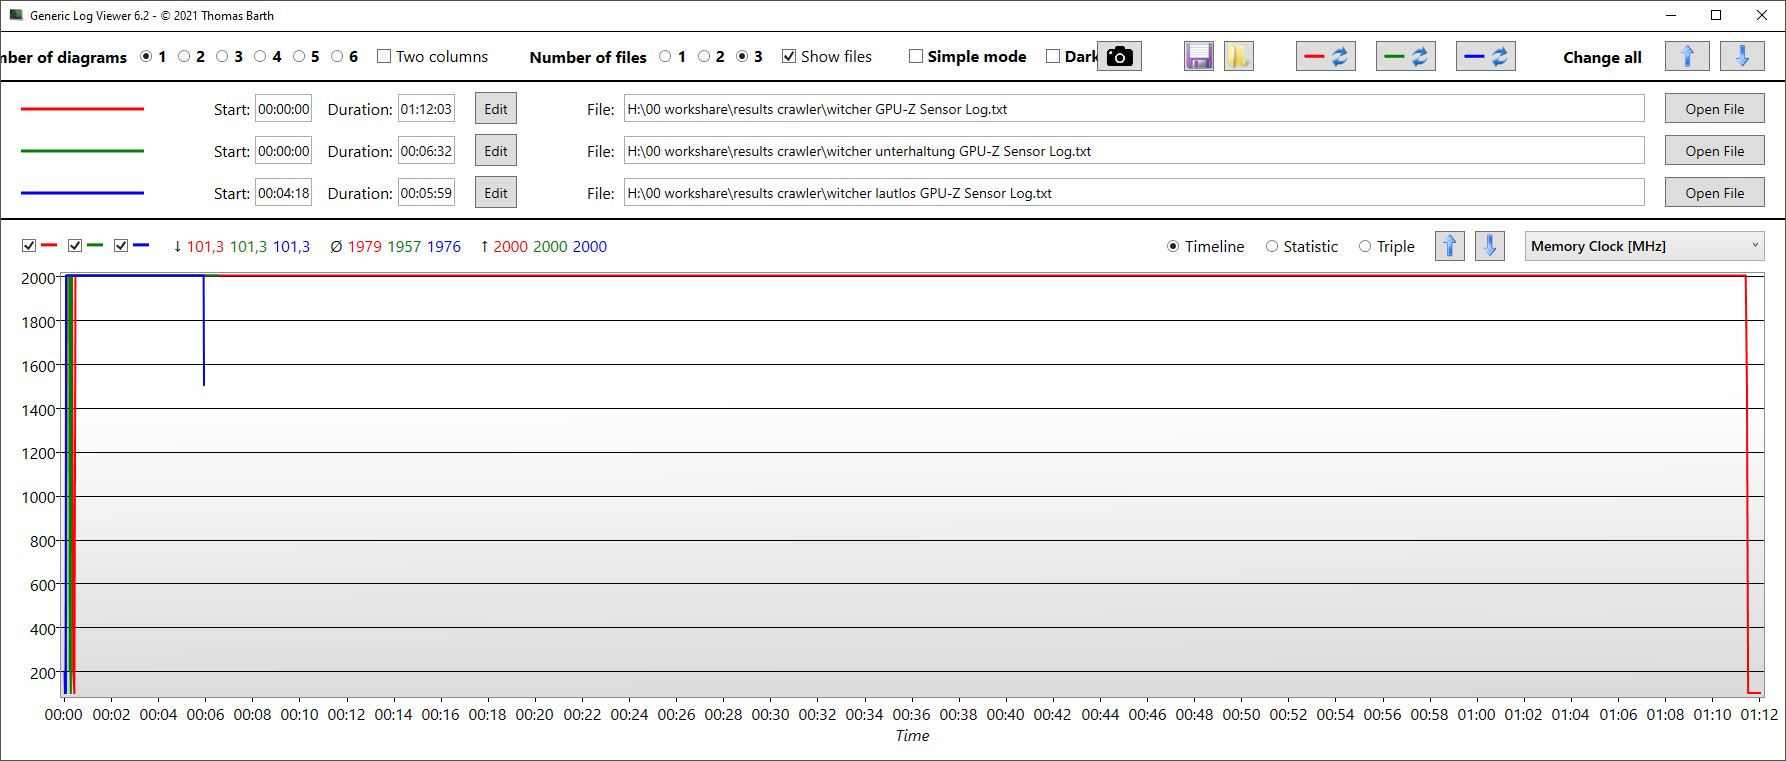
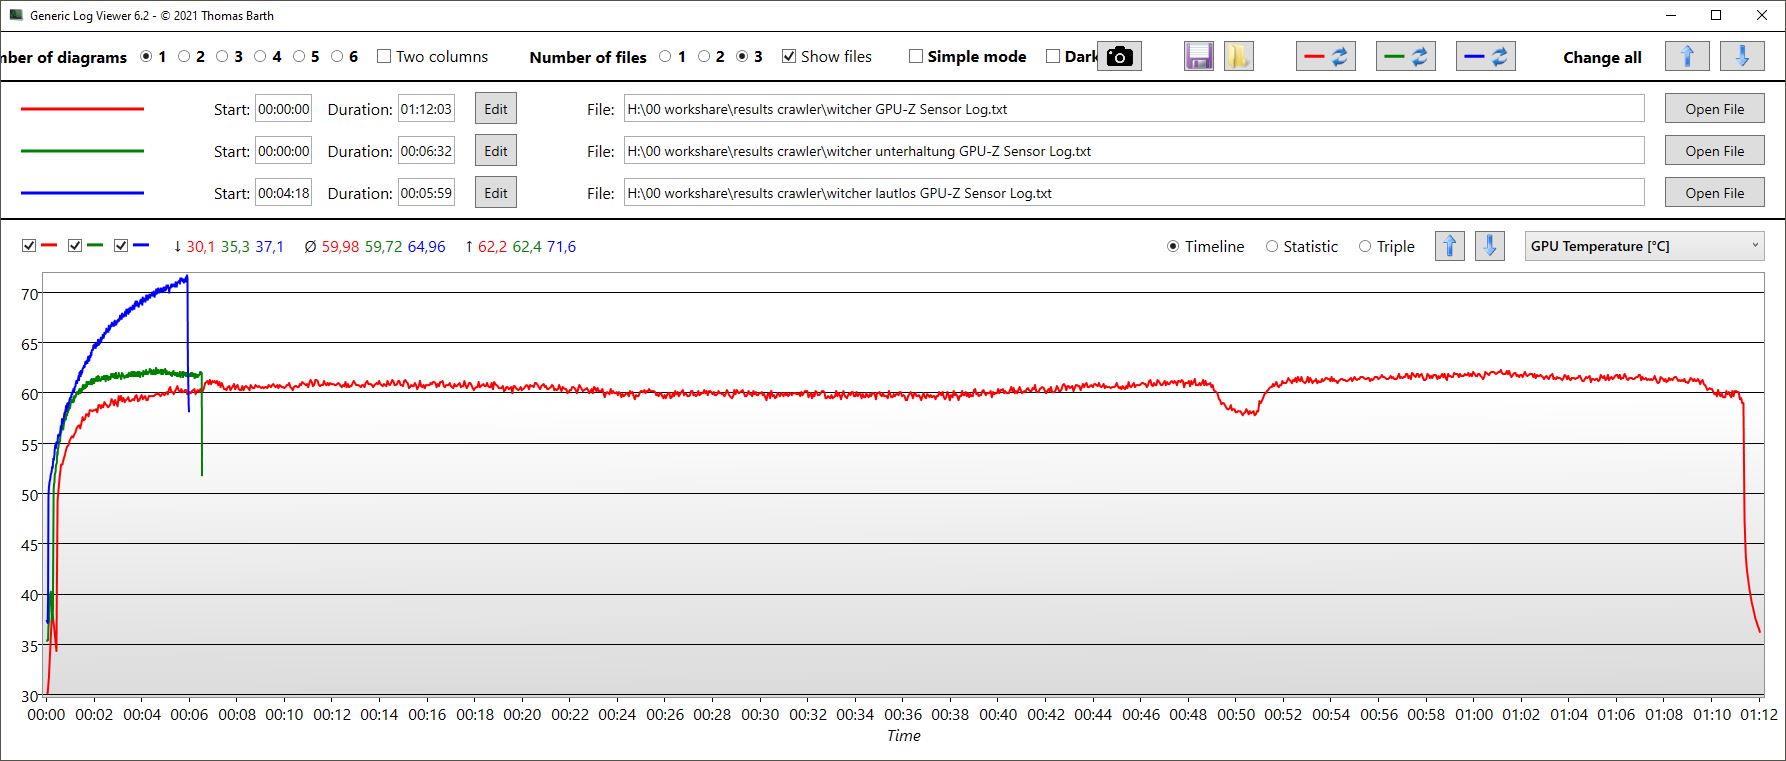
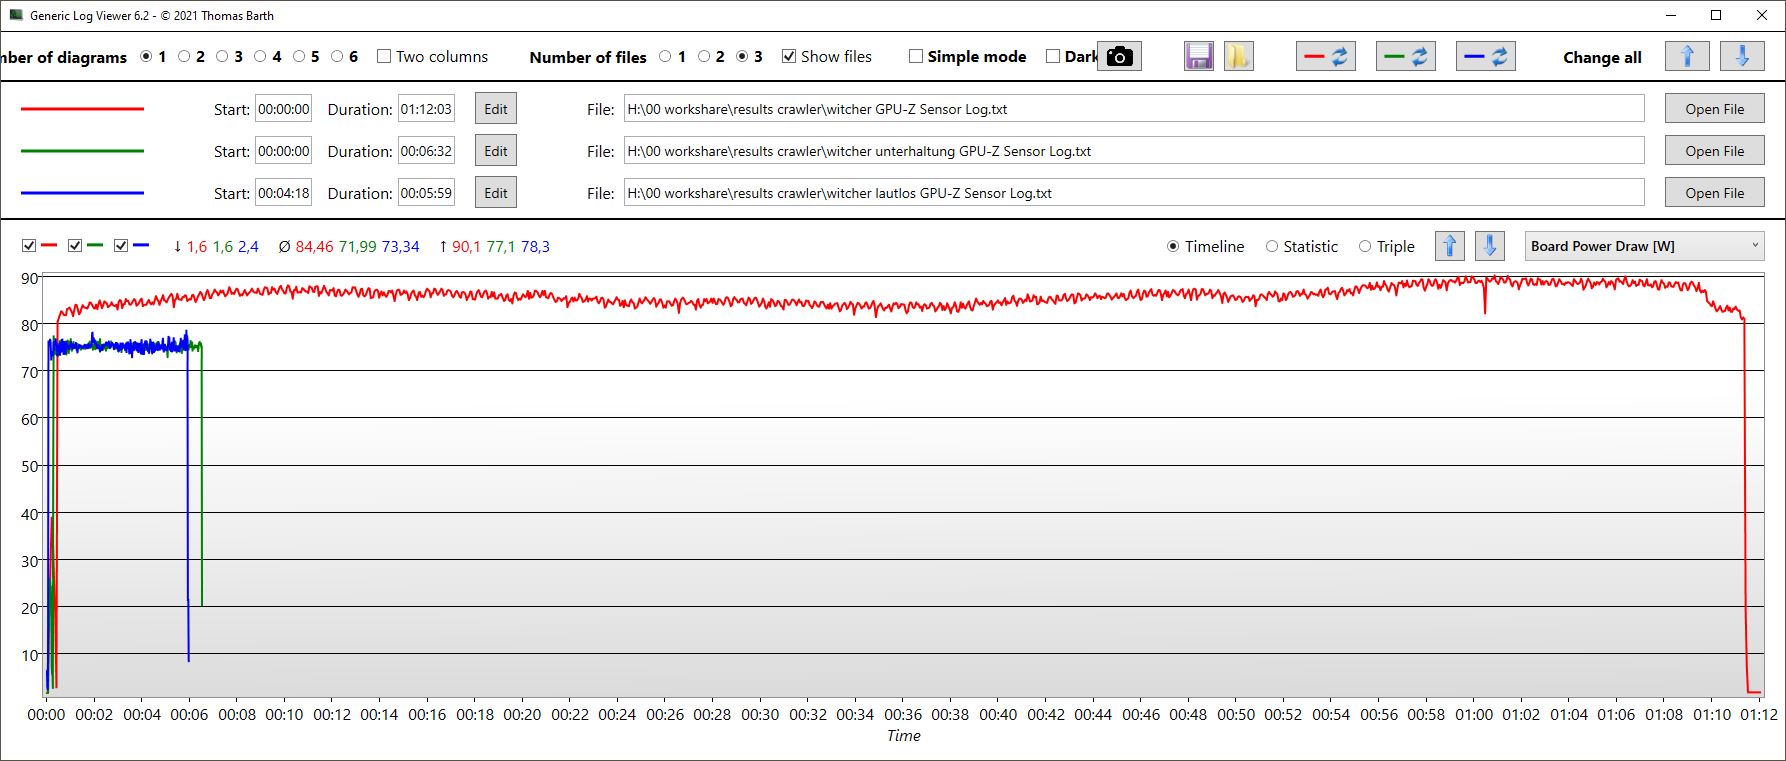
| Mod/Witcher 3 GPU ölçümü | Ortalama FPS | GPU saati | Bellek saati | Ortalama sıcaklık | Güç tüketimi |
|---|---|---|---|---|---|
| Oyun | 79,5 | 2.595 MHz | 2.000 MHz | 60 °C | 85 W |
| Eğlence | 77 | 2.400 MHz | 2.000 MHz | yakl. 62 °C | 72 W |
| Sessiz | 78 | 2.400 MHz | 2.000 MHz | yaklaşık 75 °C | 73 W |
| Performance rating - Percent | |
| Sınıf ortalaması Gaming | |
| Lenovo LOQ 15IRH8 Core i7 | |
| Medion Erazer Crawler E40 - MD 62518 | |
| MSI Katana 15 B12VEK | |
| Schenker XMG Apex 15 (Late 23) -1! | |
| Asus TUF A15 FA507 | |
| The Witcher 3 - 1920x1080 Ultra Graphics & Postprocessing (HBAO+) | |
| Sınıf ortalaması Gaming (104.7 - 240, n=7, son 2 yıl) | |
| Lenovo LOQ 15IRH8 Core i7 | |
| Schenker XMG Apex 15 (Late 23) | |
| MSI Katana 15 B12VEK | |
| Asus TUF A15 FA507 | |
| Medion Erazer Crawler E40 - MD 62518 | |
| GTA V - 1920x1080 Highest AA:4xMSAA + FX AF:16x | |
| Sınıf ortalaması Gaming (67.1 - 186.9, n=90, son 2 yıl) | |
| Medion Erazer Crawler E40 - MD 62518 | |
| Lenovo LOQ 15IRH8 Core i7 | |
| MSI Katana 15 B12VEK | |
| Asus TUF A15 FA507 | |
| Final Fantasy XV Benchmark - 1920x1080 High Quality | |
| Sınıf ortalaması Gaming (64.2 - 215, n=91, son 2 yıl) | |
| Schenker XMG Apex 15 (Late 23) | |
| Medion Erazer Crawler E40 - MD 62518 | |
| Lenovo LOQ 15IRH8 Core i7 | |
| MSI Katana 15 B12VEK | |
| Asus TUF A15 FA507 | |
| Strange Brigade - 1920x1080 ultra AA:ultra AF:16 | |
| Sınıf ortalaması Gaming (113.6 - 458, n=83, son 2 yıl) | |
| Lenovo LOQ 15IRH8 Core i7 | |
| MSI Katana 15 B12VEK | |
| Schenker XMG Apex 15 (Late 23) | |
| Asus TUF A15 FA507 | |
| Medion Erazer Crawler E40 - MD 62518 | |
| Dota 2 Reborn - 1920x1080 ultra (3/3) best looking | |
| Lenovo LOQ 15IRH8 Core i7 | |
| Sınıf ortalaması Gaming (84.8 - 252, n=104, son 2 yıl) | |
| MSI Katana 15 B12VEK | |
| Medion Erazer Crawler E40 - MD 62518 | |
| Schenker XMG Apex 15 (Late 23) | |
| Asus TUF A15 FA507 | |
| X-Plane 11.11 - 1920x1080 high (fps_test=3) | |
| Lenovo LOQ 15IRH8 Core i7 | |
| Sınıf ortalaması Gaming (55.5 - 148.5, n=106, son 2 yıl) | |
| Medion Erazer Crawler E40 - MD 62518 | |
| MSI Katana 15 B12VEK | |
| Schenker XMG Apex 15 (Late 23) | |
| Asus TUF A15 FA507 | |
| Far Cry 5 | |
| 1920x1080 Medium Preset AA:T | |
| Medion Erazer Crawler E40 - MD 62518 | |
| MSI Katana 15 B12VEK | |
| Lenovo LOQ 15IRH8 Core i7 | |
| Sınıf ortalaması Gaming (84 - 173, n=6, son 2 yıl) | |
| Ortalama NVIDIA GeForce RTX 4050 Laptop GPU (73 - 146, n=22) | |
| Asus TUF A15 FA507 | |
| 1920x1080 High Preset AA:T | |
| Medion Erazer Crawler E40 - MD 62518 | |
| Lenovo LOQ 15IRH8 Core i7 | |
| MSI Katana 15 B12VEK | |
| Sınıf ortalaması Gaming (82 - 163, n=6, son 2 yıl) | |
| Ortalama NVIDIA GeForce RTX 4050 Laptop GPU (51 - 135, n=24) | |
| Asus TUF A15 FA507 | |
| 1920x1080 Ultra Preset AA:T | |
| Medion Erazer Crawler E40 - MD 62518 | |
| Lenovo LOQ 15IRH8 Core i7 | |
| MSI Katana 15 B12VEK | |
| Sınıf ortalaması Gaming (70 - 151, n=6, son 2 yıl) | |
| Ortalama NVIDIA GeForce RTX 4050 Laptop GPU (50 - 127, n=24) | |
| Asus TUF A15 FA507 | |
Witcher 3 FPS chart
| düşük | orta | yüksek | ultra | |
|---|---|---|---|---|
| GTA V (2015) | 182.2 | 176.4 | 169.1 | 97.7 |
| The Witcher 3 (2015) | 369 | 283 | 170 | 81 |
| Dota 2 Reborn (2015) | 162.7 | 152.7 | 147.9 | 140.2 |
| Final Fantasy XV Benchmark (2018) | 183.5 | 122.9 | 84.6 | |
| X-Plane 11.11 (2018) | 128.5 | 121.8 | 98.6 | |
| Far Cry 5 (2018) | 146 | 140 | 133 | 124 |
| Strange Brigade (2018) | 391 | 205 | 167.6 | 146.9 |
Emisyonlar & Enerji - Agresif ve gürültülü soğutma sistemi
Sistem Gürültüsü
Crawler hiçbir şekilde sessiz bir performans sergilemiyor. Rakipleriyle karşılaştırıldığında, en gürültülü oyuncu, stres testinde 56 dB'ye kadar ve Witcher 3 altında hala 51 dB'nin üzerinde ölçtük, rakipler genellikle burada 50 dB'nin oldukça altında kalıyor. Aynı durum 3DMark06 çalıştırması için de geçerli: Diğer dizüstü bilgisayarlar burada aşamalı olarak tamamen sessiz kalırken ve sadece testin ikinci yarısında fanların oldukça sessiz dönmesine izin verirken, E40'ta zaten 50 dB'de dönüyorlar.
Soğutma sistemi bizim için çok agresif ve gürültülü. Bir sonraki bölümde görebileceğiniz gibi, sıcaklıklar o kadar düşük ki, daha sessiz fanlar burada kolayca mümkün olabilir. Eğlence veya hatta sessiz modda oyun oynamanızı öneririz.
En azından rölanti modunda, E40 genellikle sessiz kalır, yalnızca arka plan işlemleri rölanti modunda istenenden daha fazla yük oluşturduğunda fanlar açılır. Ancak Crawler E40 daha uzun bir yüke maruz kalsa bile, fanlar tamamen sakinleşmez. Sessiz modda bile fanlar öngörülebilir bir gelecekte kapanmaz.
| Mod/Witcher 3 ölçüm | Hacim | Sistem tüketimi |
|---|---|---|
| Oyun | 51,46 dB | 155 W |
| Eğlence | 48,21 | 139 W |
| Sessiz | 31,37 dB | 117 W |
Ses yüksekliği
| Boşta |
| 23 / 23 / 28.02 dB |
| Çalışırken |
| 50.21 / 56.79 dB |
 | ||
30 dB sessiz 40 dB(A) duyulabilirlik 50 dB(A) gürültülü |
||
min: | ||
| Medion Erazer Crawler E40 - MD 62518 GeForce RTX 4050 Laptop GPU, i5-13500H, Phison PS5021-E21 512GB | Lenovo LOQ 15IRH8 Core i7 GeForce RTX 4050 Laptop GPU, i7-13620H, Kioxia BG5 KBG50ZNT512G | Asus TUF A15 FA507 GeForce RTX 4050 Laptop GPU, R7 7735HS, Micron 2400 MTFDKBA512QFM | Schenker XMG Apex 15 (Late 23) GeForce RTX 4050 Laptop GPU, R7 7840HS, Samsung 990 Pro 1 TB | MSI Katana 15 B12VEK GeForce RTX 4050 Laptop GPU, i7-12650H, Micron 2400 MTFDKBA1T0QFM | |
|---|---|---|---|---|---|
| Noise | -5% | 14% | -2% | 6% | |
| kapalı / ortam * (dB) | 23 | 23.69 -3% | 23.3 -1% | 24 -4% | 24 -4% |
| Idle Minimum * (dB) | 23 | 29.03 -26% | 23.3 -1% | 25 -9% | 24 -4% |
| Idle Average * (dB) | 23 | 29.03 -26% | 23.3 -1% | 29 -26% | 24 -4% |
| Idle Maximum * (dB) | 28.02 | 29.03 -4% | 23.3 17% | 33 -18% | 24 14% |
| Load Average * (dB) | 50.21 | 48.7 3% | 29.6 41% | 36 28% | 37.71 25% |
| Witcher 3 ultra * (dB) | 51.46 | 48.5 6% | 43 16% | 48 7% | 45.75 11% |
| Load Maximum * (dB) | 56.79 | 48.7 14% | 43 24% | 53 7% | 54.55 4% |
* ... daha küçük daha iyidir
Sıcaklık
Agresif soğutma sistemi sayesinde yüzey sıcaklıkları neredeyse şaşırtıcı derecede düşüktür. Maksimum yük altında bile, bunlar oyun modunda 96,8 °F'nin üzerine çıkmaz (ortam sıcaklığı 64,4 °F). Burada daha sessiz bir soğutma sistemi için hala çok fazla alan var.
(+) Üst taraftaki maksimum sıcaklık, 40.4 °C / 105 F ortalamasına kıyasla 36 °C / 97 F'dir. , Gaming sınıfı için 21.2 ile 68.8 °C arasında değişir.
(+) Alt kısım, 43.2 °C / 110 F ortalamasına kıyasla maksimum 36 °C / 97 F'ye kadar ısınır
(+) Boşta kullanımda, üst tarafın ortalama sıcaklığı 23.7 °C / 75 F olup, cihazın 33.9 °C / 93 F.
(+) The Witcher 3 oynarken, üst tarafın ortalama sıcaklığı 27.4 °C / 81 F olup, cihazın 33.9 °C / 93 F.
(+) Avuç içi dayanakları ve dokunmatik yüzey, maksimum 24 °C / 75.2 F ile cilt sıcaklığından daha soğuktur ve bu nedenle dokunulduğunda soğuktur.
(+) Benzer cihazların avuç içi dayanağı alanının ortalama sıcaklığı 28.8 °C / 83.8 F (+4.8 °C / 8.6 F) idi.
| Medion Erazer Crawler E40 - MD 62518 Intel Core i5-13500H, NVIDIA GeForce RTX 4050 Laptop GPU | Lenovo LOQ 15IRH8 Core i7 Intel Core i7-13620H, NVIDIA GeForce RTX 4050 Laptop GPU | Asus TUF A15 FA507 AMD Ryzen 7 7735HS, NVIDIA GeForce RTX 4050 Laptop GPU | Schenker XMG Apex 15 (Late 23) AMD Ryzen 7 7840HS, NVIDIA GeForce RTX 4050 Laptop GPU | MSI Katana 15 B12VEK Intel Core i7-12650H, NVIDIA GeForce RTX 4050 Laptop GPU | |
|---|---|---|---|---|---|
| Heat | -40% | -17% | -31% | -35% | |
| Maximum Upper Side * (°C) | 36 | 46.4 -29% | 48.9 -36% | 52 -44% | 47 -31% |
| Maximum Bottom * (°C) | 36 | 59.2 -64% | 44.6 -24% | 47 -31% | 48 -33% |
| Idle Upper Side * (°C) | 26 | 34.4 -32% | 27.1 -4% | 33 -27% | 35 -35% |
| Idle Bottom * (°C) | 27 | 36.2 -34% | 27.5 -2% | 33 -22% | 38 -41% |
* ... daha küçük daha iyidir
Konuşmacılar
Stereo hoparlörler ön köşelerde yer alıyor ve aşağıya doğru yayılıyor. Tizler dengelidir, ancak neredeyse hiç bas yoktur. Jak çıkışı üzerinden kulaklık bağlamanızı öneririz.
Medion Erazer Crawler E40 - MD 62518 ses analizi
(±) | hoparlör ses yüksekliği ortalama ama iyi (81.47 dB)
Bas 100 - 315Hz
(-) | neredeyse hiç bas yok - ortalama olarak medyandan 32.7% daha düşük
(±) | Bas doğrusallığı ortalamadır (11% delta - önceki frekans)
Ortalar 400 - 2000 Hz
(+) | dengeli ortalar - medyandan yalnızca 4.6% uzakta
(±) | Ortaların doğrusallığı ortalamadır (7.1% delta - önceki frekans)
Yüksekler 2 - 16 kHz
(+) | dengeli yüksekler - medyandan yalnızca 3.1% uzakta
(+) | yüksekler doğrusaldır (5.7% deltadan önceki frekansa)
Toplam 100 - 16.000 Hz
(±) | Genel sesin doğrusallığı ortalamadır (21.8% ortancaya göre fark)
Aynı sınıfla karşılaştırıldığında
» Bu sınıftaki tüm test edilen cihazların %78%'si daha iyi, 6% benzer, 16% daha kötüydü
» En iyisinin deltası 6% idi, ortalama 18% idi, en kötüsü 132% idi
Test edilen tüm cihazlarla karşılaştırıldığında
» Test edilen tüm cihazların %62'si daha iyi, 7 benzer, % 31 daha kötüydü
» En iyisinin deltası 4% idi, ortalama 23% idi, en kötüsü 134% idi
Lenovo LOQ 15IRH8 Core i7 ses analizi
(±) | hoparlör ses yüksekliği ortalama ama iyi (75.9 dB)
Bas 100 - 315Hz
(-) | neredeyse hiç bas yok - ortalama olarak medyandan 18.6% daha düşük
(±) | Bas doğrusallığı ortalamadır (10.2% delta - önceki frekans)
Ortalar 400 - 2000 Hz
(+) | dengeli ortalar - medyandan yalnızca 2.2% uzakta
(+) | orta frekanslar doğrusaldır (3.1% deltadan önceki frekansa)
Yüksekler 2 - 16 kHz
(+) | dengeli yüksekler - medyandan yalnızca 2.3% uzakta
(+) | yüksekler doğrusaldır (4.4% deltadan önceki frekansa)
Toplam 100 - 16.000 Hz
(+) | genel ses doğrusaldır (13.7% ortancaya göre fark)
Aynı sınıfla karşılaştırıldığında
» Bu sınıftaki tüm test edilen cihazların %21%'si daha iyi, 7% benzer, 72% daha kötüydü
» En iyisinin deltası 6% idi, ortalama 18% idi, en kötüsü 132% idi
Test edilen tüm cihazlarla karşılaştırıldığında
» Test edilen tüm cihazların %15'si daha iyi, 4 benzer, % 81 daha kötüydü
» En iyisinin deltası 4% idi, ortalama 23% idi, en kötüsü 134% idi
Güç Tüketimi
Güç tüketimi boşta ve stres testinde biraz yüksektir, ancak gerçekten göze çarpmaz. Normal yük altında, tüketim rakiplerin ortalaması dahilindedir. Oyun oynarken, Lenovo LOQ 15 ile aynı seviyede, ancak diğer rakiplerden daha yüksek.
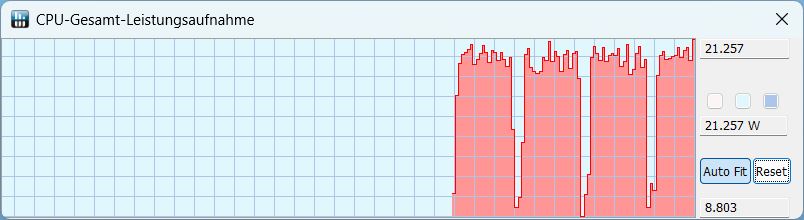
Eşzamanlı CPU ve GPU stres testimiz sırasında 202,5 W'lık geçici bir maksimum tüketim ölçtük. LiteOn'un 230 W güç kaynağı burada herhangi bir sorun yaşamayacaktır.
| Kapalı / Bekleme modu | |
| Boşta | |
| Çalışırken |
|
Key:
min: | |
| Medion Erazer Crawler E40 - MD 62518 GeForce RTX 4050 Laptop GPU, i5-13500H, Phison PS5021-E21 512GB | Lenovo LOQ 15IRH8 Core i7 GeForce RTX 4050 Laptop GPU, i7-13620H, Kioxia BG5 KBG50ZNT512G | Asus TUF A15 FA507 GeForce RTX 4050 Laptop GPU, R7 7735HS, Micron 2400 MTFDKBA512QFM | Schenker XMG Apex 15 (Late 23) GeForce RTX 4050 Laptop GPU, R7 7840HS, Samsung 990 Pro 1 TB | MSI Katana 15 B12VEK GeForce RTX 4050 Laptop GPU, i7-12650H, Micron 2400 MTFDKBA1T0QFM | |
|---|---|---|---|---|---|
| Power Consumption | 1% | 23% | 15% | 18% | |
| Idle 150cd/m2 * (Watt) | 15.3 | 9.48 38% | 10.8 29% | 9.8 36% | |
| 3DMark06 Return To Proxycon * (Watt) | 88 | 94.5 -7% | 84 5% | ||
| Witcher 3 ultra * (Watt) | 155 | 154.4 -0% | 136.6 12% | 136.5 12% | 128 17% |
| 1280x720 Prime95 28.10 and Furmark 1.25 * (Watt) | 190 | 169.2 11% | 156.7 18% | 181 5% | 165 13% |
* ... daha küçük daha iyidir
Power consumption Witcher 3 / stress test
Power consumption with external monitor
Pil Ömrü
Medion 54 Wh'lık bir pil kullanıyor. Sadece MSI Katana benzer şekilde küçük bir bataryaya sahip ancak yine de tüm testlerde biraz daha uzun süre dayanıyor. Rakiplerin geri kalanı en az 60 Wh bataryaya sahipken, Asus TUF A15 90 Wh bataryaya bile sahip. Kısacası: Medion, doğrudan bir karşılaştırmada en kısa çalışma sürelerine sahip. Düşük parlaklıkta video veya tarama testimizde, dizüstü bilgisayar yaklaşık 4 saatlik bir çalışma süresine ulaşıyor - bu heyecan verici değil.
| Medion Erazer Crawler E40 - MD 62518 i5-13500H, GeForce RTX 4050 Laptop GPU, 54 Wh | Lenovo LOQ 15IRH8 Core i7 i7-13620H, GeForce RTX 4050 Laptop GPU, 60 Wh | Asus TUF A15 FA507 R7 7735HS, GeForce RTX 4050 Laptop GPU, 90 Wh | Schenker XMG Apex 15 (Late 23) R7 7840HS, GeForce RTX 4050 Laptop GPU, 62.32 Wh | MSI Katana 15 B12VEK i7-12650H, GeForce RTX 4050 Laptop GPU, 53.5 Wh | Sınıf ortalaması Gaming | |
|---|---|---|---|---|---|---|
| Pil Çalışma Süresi | 50% | 130% | 73% | 14% | 70% | |
| H.264 (h) | 3.9 | 6.1 56% | 12.5 221% | 8.3 113% | 4.4 13% | 8.27 ? 112% |
| WiFi v1.3 (h) | 4.1 | 5.9 44% | 11.7 185% | 7.1 73% | 4.3 5% | 7.08 ? 73% |
| Load (h) | 1.2 | 1 -17% | 1.6 33% | 1.5 25% | 1.496 ? 25% | |
| Reader / Idle (h) | 8.4 | 7.84 ? |
Artılar
Eksiler
Karar - Denk bütçeli ama iyi performanslı bir oyuncu

1300 ABD doları fiyatıyla Medion Crawler E40, RTX 4050'li bir oyun dizüstü bilgisayarı için bütçe dostu bir seçenek sunuyor. Bütçe aralığına girse de, fiyat-performans oranına daha yakından bakmamızı sağlayan daha ucuz modeller de mevcut. Crawler E40, i7-13700H yerine i5-13500H, 2019'dan kalma bir ekran, 720p web kamerası ve USB 2.0 yuvası gibi özelliklerle bütçe kökenlerini ortaya koyuyor. Sonuç olarak, yüksek talepleri olan oyuncuların beklentilerini karşılamayabilir. Bununla birlikte, CPU ve GPU performansı övgüye değer ve SSD iyi performans gösteriyor. Ekran, en yenisi olmasa da 350 nit ile yeterince parlak, duyarlı ve tipik renk alanlarını tam olarak kapsamasa bile 144 Hz yenileme hızı sunuyor.
Bazı eleştiri noktaları olsa da, bunların çoğu ekonomik bir dizüstü bilgisayarda kabul edilebilir. Öte yandan, oldukça zayıf pil ömrü ve aşırı gürültülü soğutma sistemi daha önemli endişelerdir. Yazılımın optimize edilmesi soğutma sistemi sorununu çözebilir, çünkü düşük sıcaklıklar göz önüne alındığında iyileştirme için yer var gibi görünüyor.
Özetle, Medion Crawler E40 bazı ödünler veren bütçe dostu bir oyun dizüstü bilgisayarıdır, ancak bileşenlerinin performansı övgüye değerdir. Ana eleştiriler, yüksek sesli ve agresif soğutma sisteminin yanı sıra zayıf pil ömründe yatmaktadır.
Testte tartışılan rakiplerin her birinin kendine has özellikleri var ve aralarındaki farklar nispeten küçük. Asus TUF A15, biraz daha zayıf performans sunsa da etkileyici pil çalışma süreleriyle öne çıkıyor. Karşılaştırılabilir performansla daha uzun pil ömrü bir öncelikse ve biraz daha fazla harcamaya hazırsanız, Lenovo LOQ 15 bazı dezavantajlara sahip olmasına rağmen uygun bir seçim olabilir. Özellikle XMG Apex 15'in neredeyse ~550 ABD Doları daha yüksek bir fiyata sahip olduğu düşünüldüğünde, net bir kazanan olmadığını belirtmek önemlidir.
Fiyat & Müsaitlik
Medion Erazer Crawler E40'ın fiyatı doğrudan Medion adresinden yaklaşık 1300 ABD dolarıdır.
Medion Erazer Crawler E40 - MD 62518
- 11/28/2023 v7 (old)
Christian Hintze
Şeffaflık
İncelenecek cihazların seçimi editör ekibimiz tarafından yapılır. Test örneği, bu incelemenin amacı doğrultusunda üretici veya perakendeci tarafından yazara ödünç olarak sağlanmıştır. Borç verenin bu inceleme üzerinde herhangi bir etkisi olmadığı gibi, üretici de yayınlanmadan önce bu incelemenin bir kopyasını almamıştır. Bu incelemeyi yayınlama zorunluluğu yoktu. Bağımsız bir medya şirketi olarak Notebookcheck, üreticilerin, perakendecilerin veya yayıncıların otoritesine tabi değildir.
Notebookcheck bu şekilde test yapıyor
Notebookcheck, tüm sonuçların karşılaştırılabilir olmasını sağlamak için her yıl yüzlerce dizüstü bilgisayarı ve akıllı telefonu standart prosedürler kullanarak bağımsız olarak inceliyor. Yaklaşık 20 yıldır test yöntemlerimizi sürekli olarak geliştirdik ve bu süreçte endüstri standartlarını belirledik. Test laboratuvarlarımızda deneyimli teknisyenler ve editörler tarafından yüksek kaliteli ölçüm ekipmanları kullanılmaktadır. Bu testler çok aşamalı bir doğrulama sürecini içerir. Karmaşık derecelendirme sistemimiz, nesnelliği koruyan yüzlerce sağlam temellere dayanan ölçüm ve kıyaslamaya dayanmaktadır.Price comparison

