Renkli EVOL X15 AT 23 İncelemesi: Raptor Lake-HX ve birkaç kaçırılmayacak tuhaflık ile etkileyici QHD oyuncu

Daha çok PC anakartları ve GPU'ları ile tanınan Colorful, Intel 12. nesil Alder Lake dizüstü bilgisayarları da kapsayacak şekilde ufkunu genişletmeye başladı. Çinli teknoloji devi bu yıl ürün gamını 13. nesil Raptor Lake ürünlerini de sunacak şekilde genişletti.
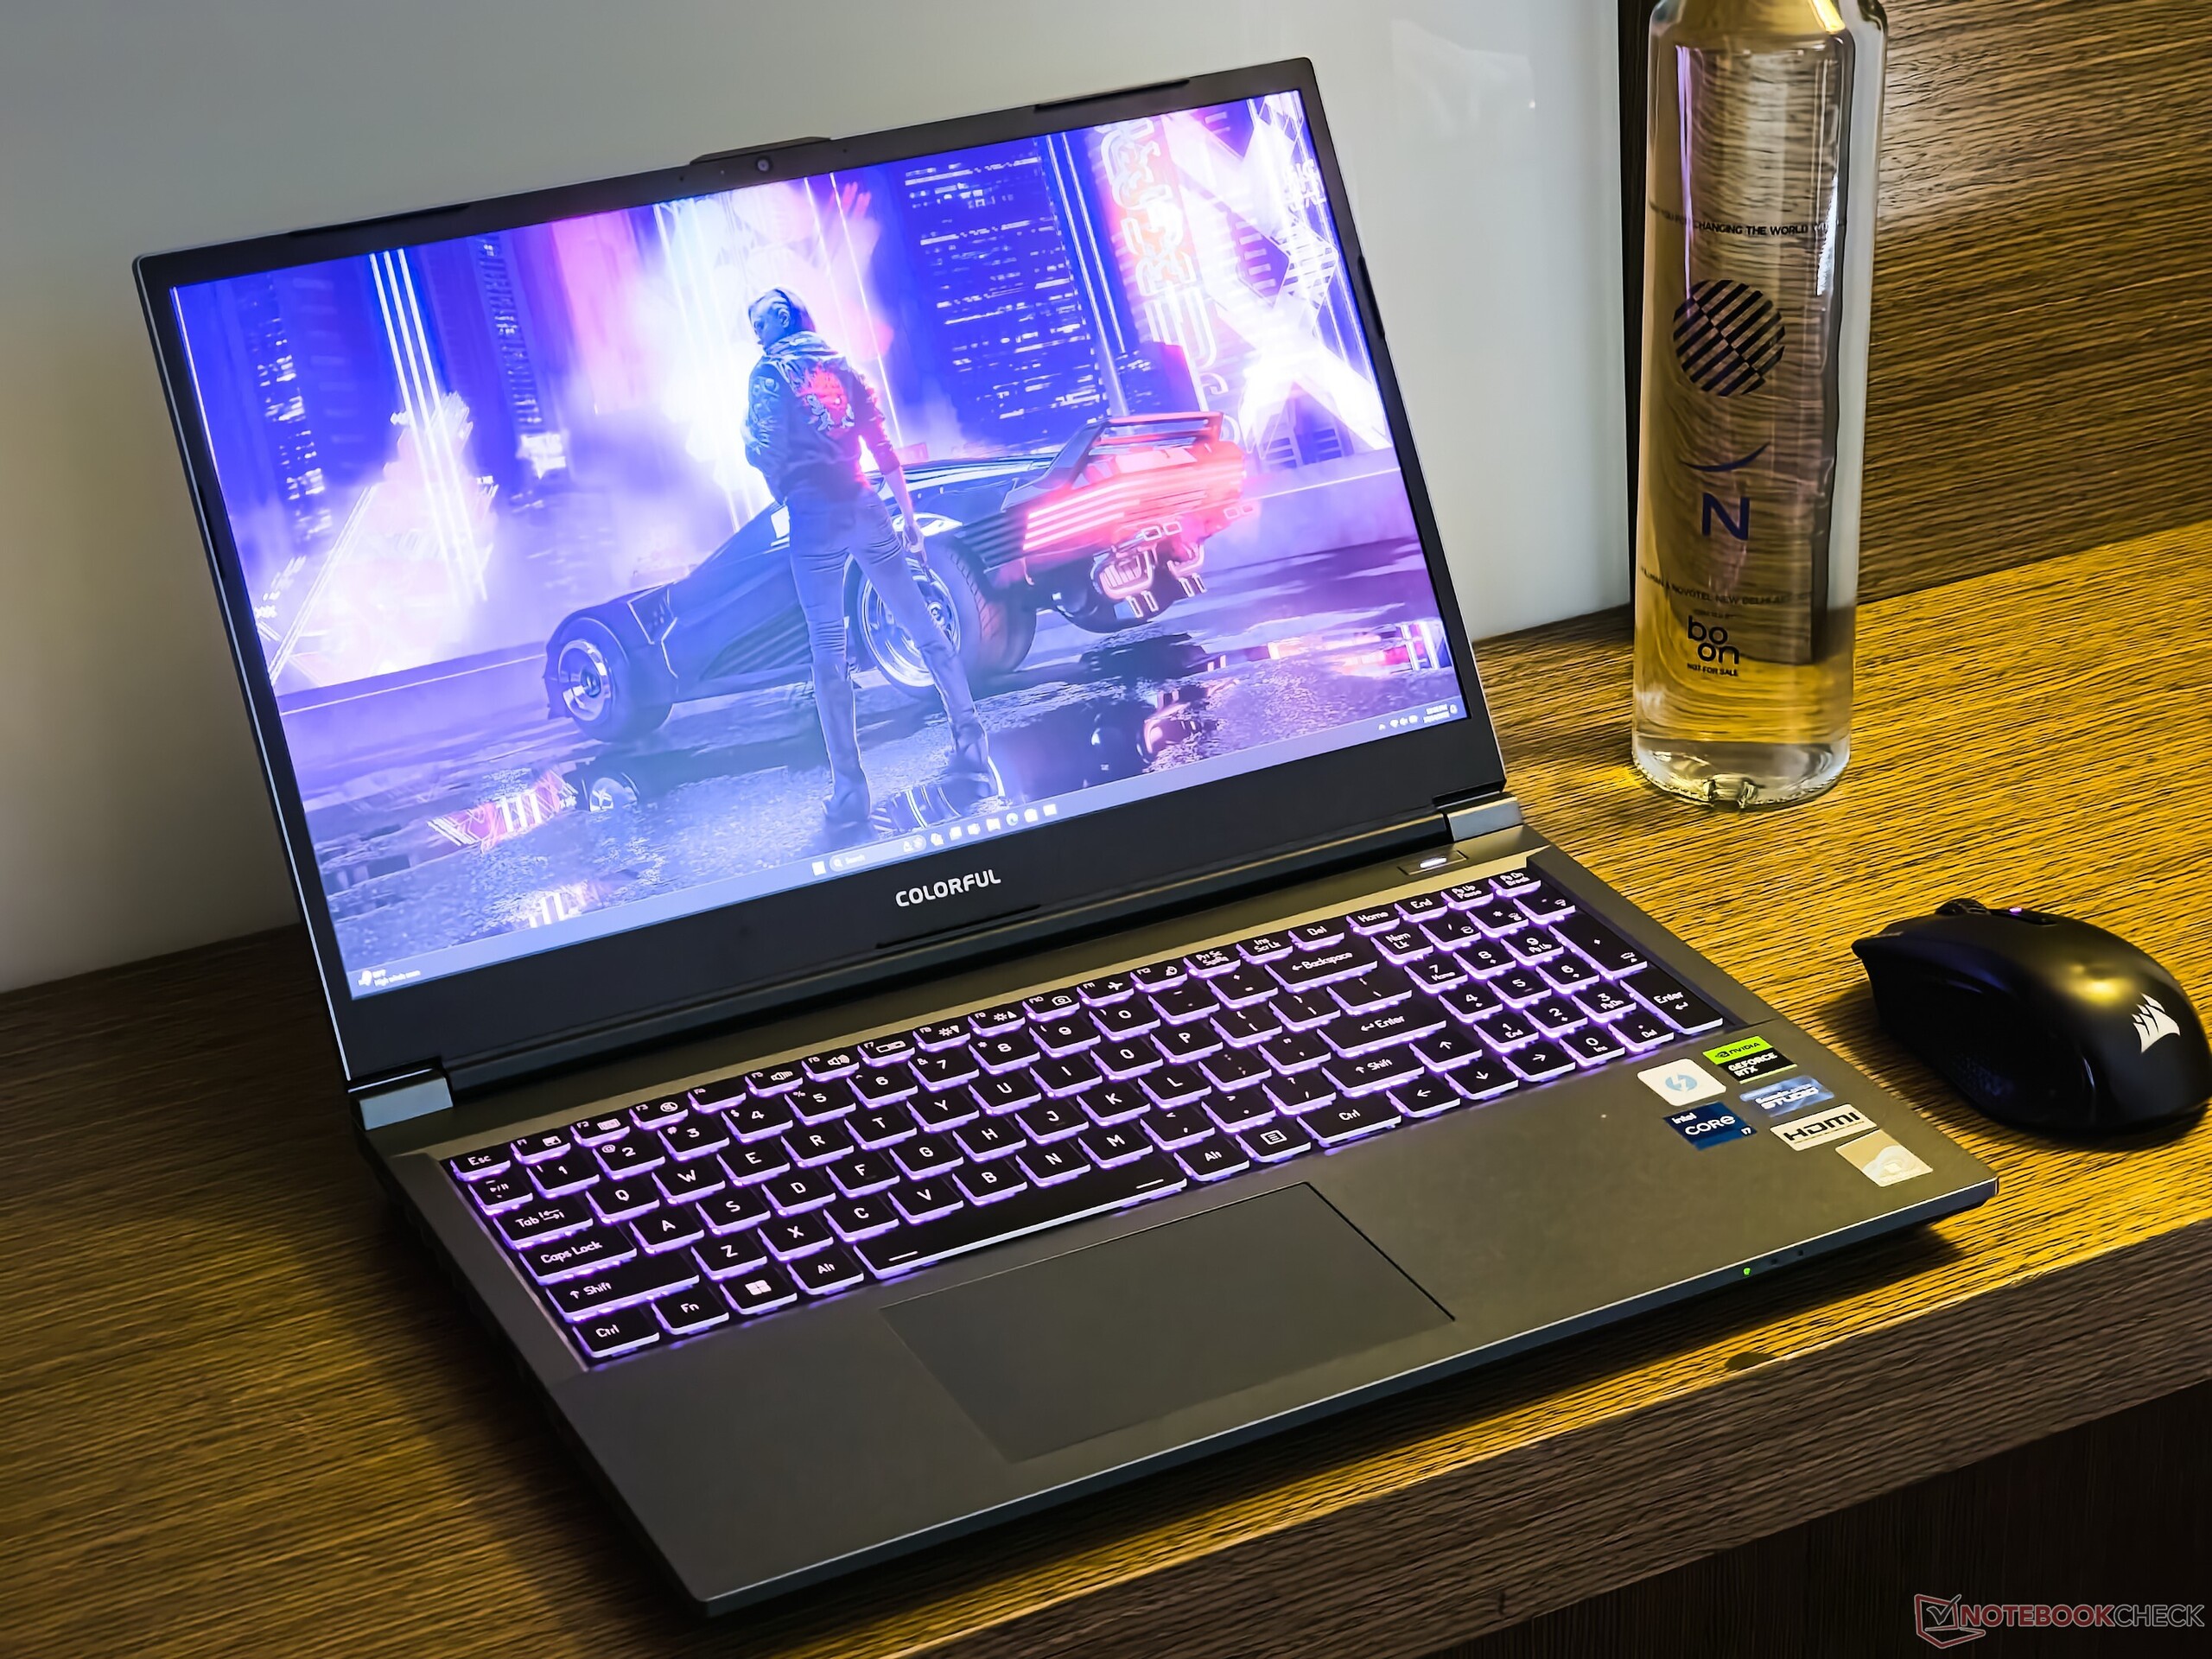
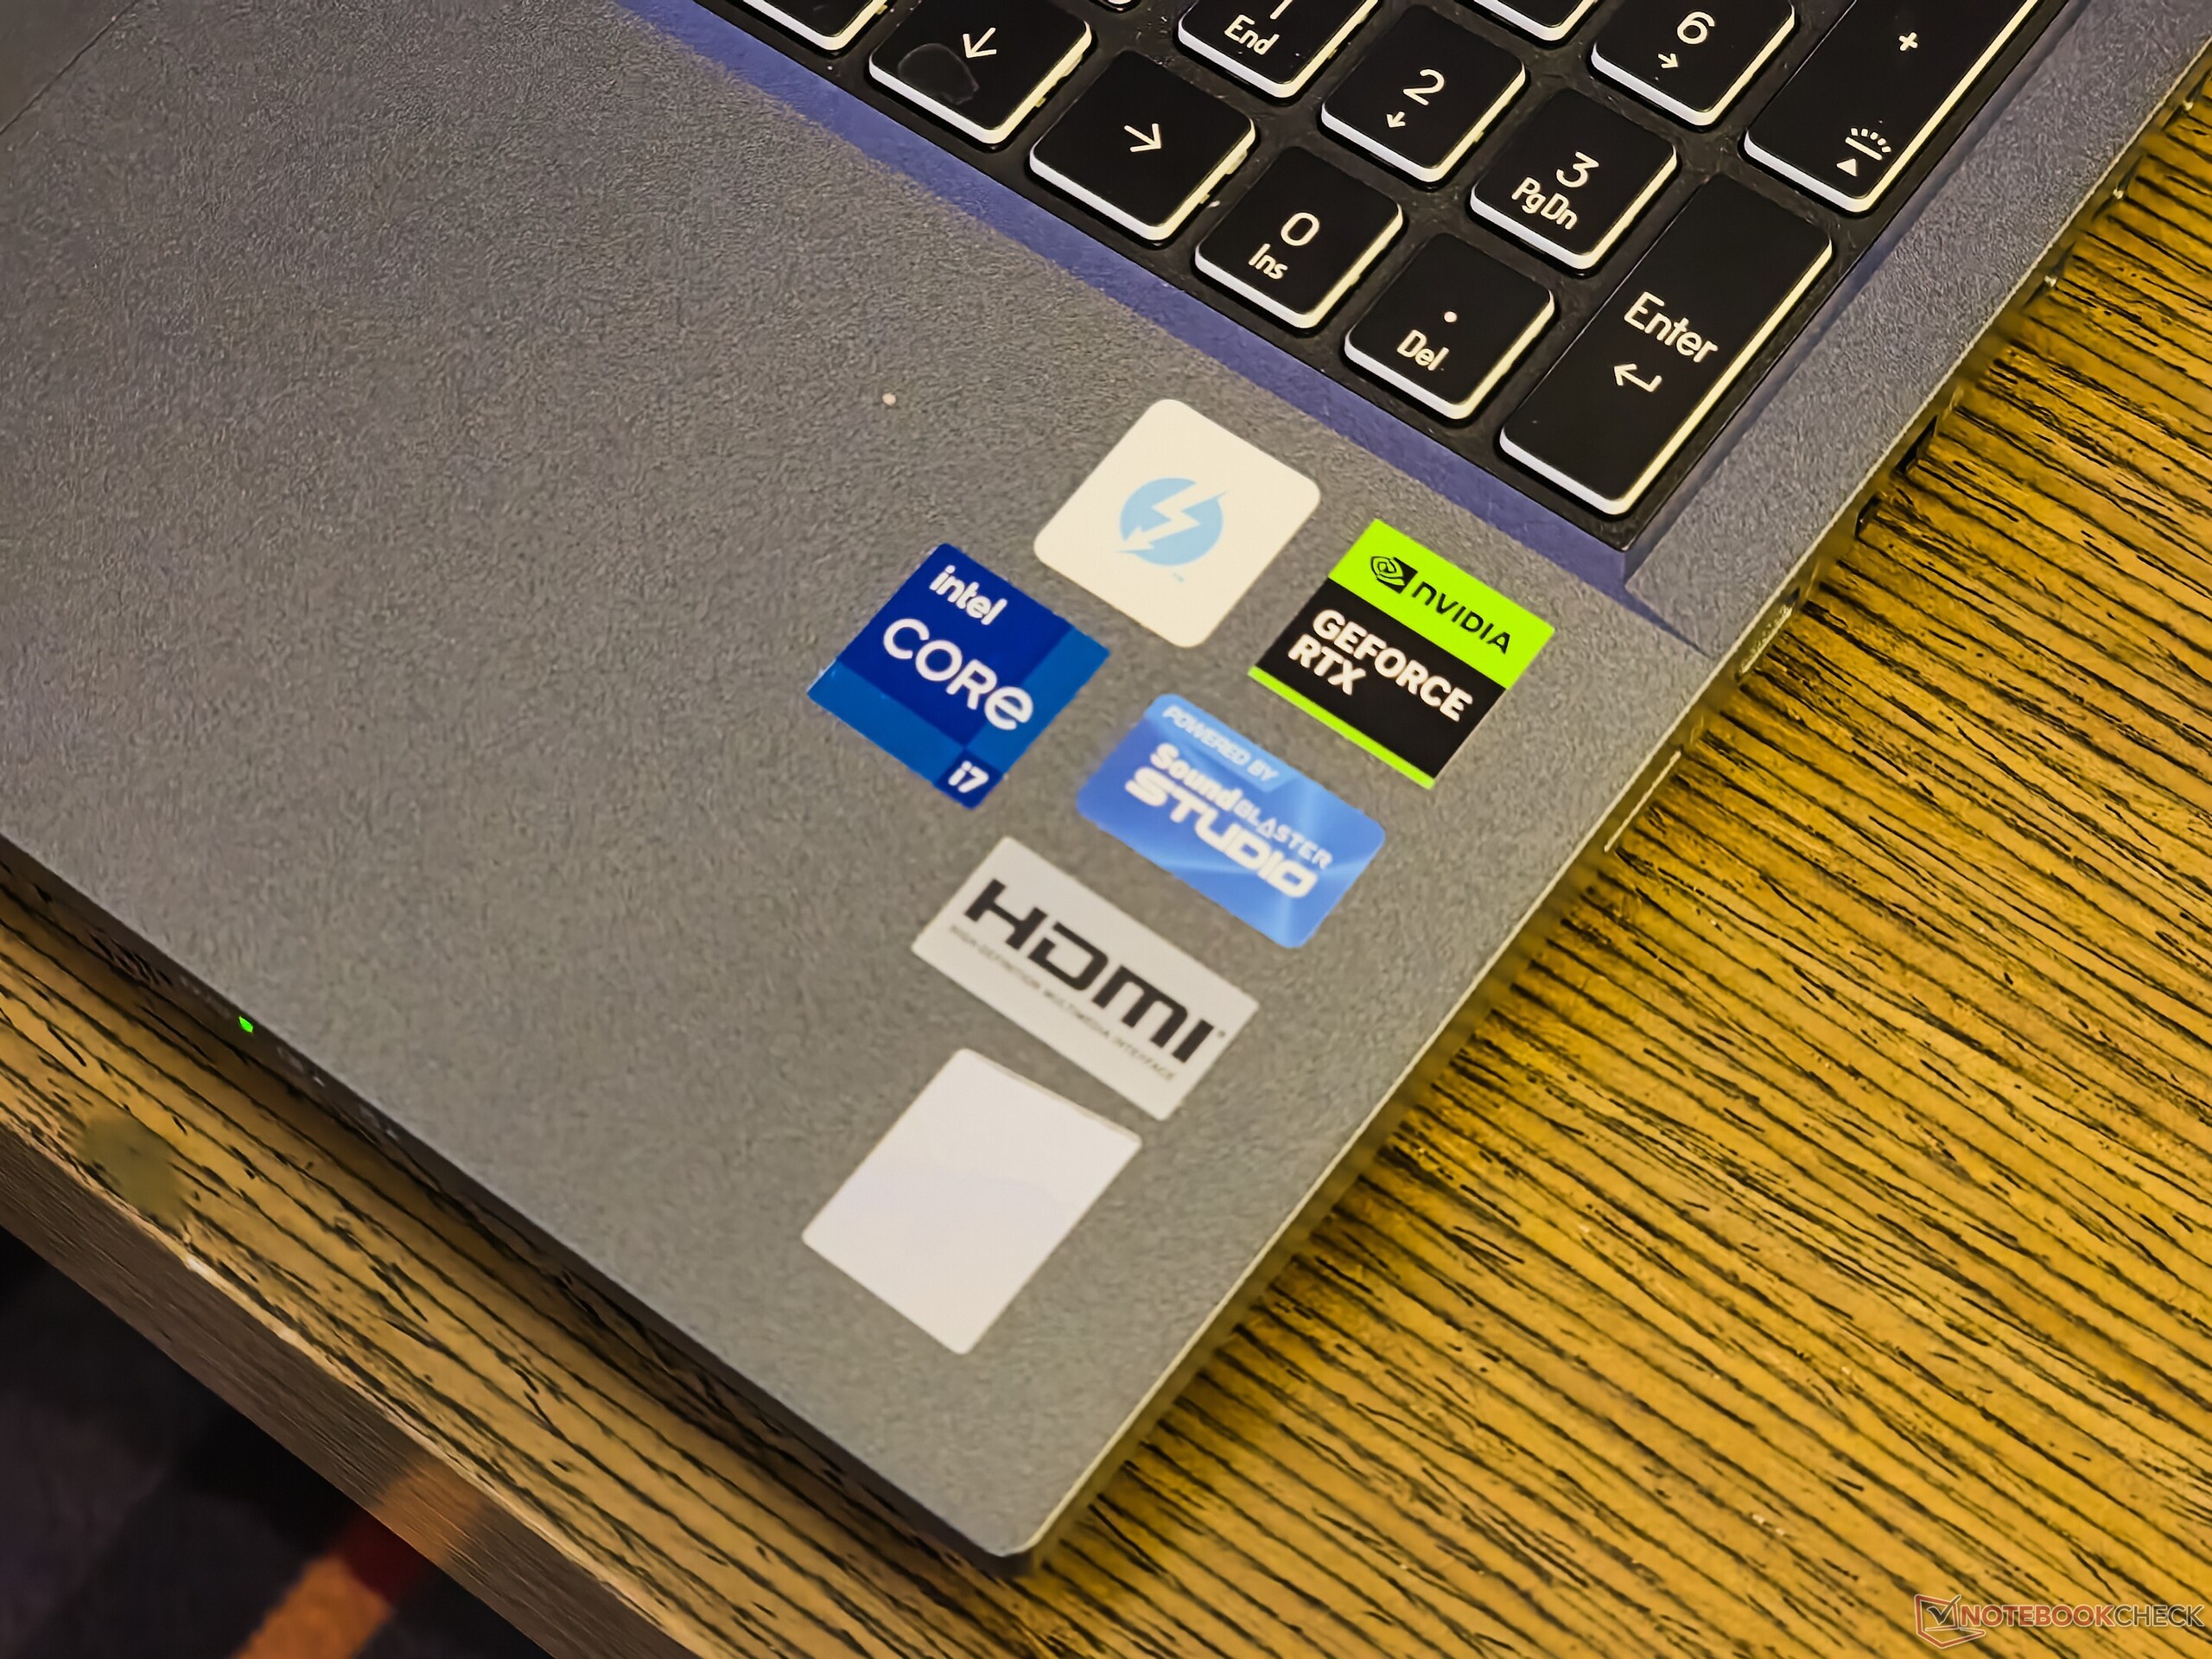
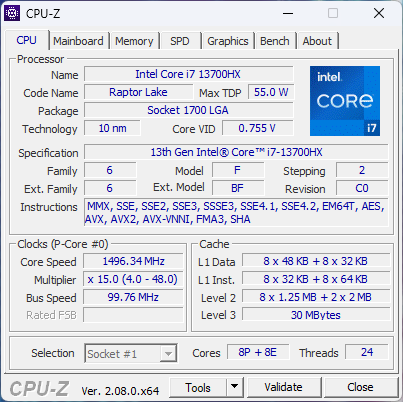
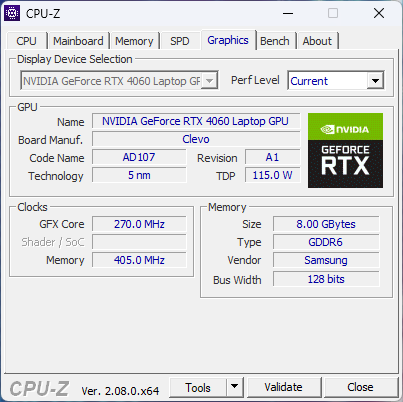
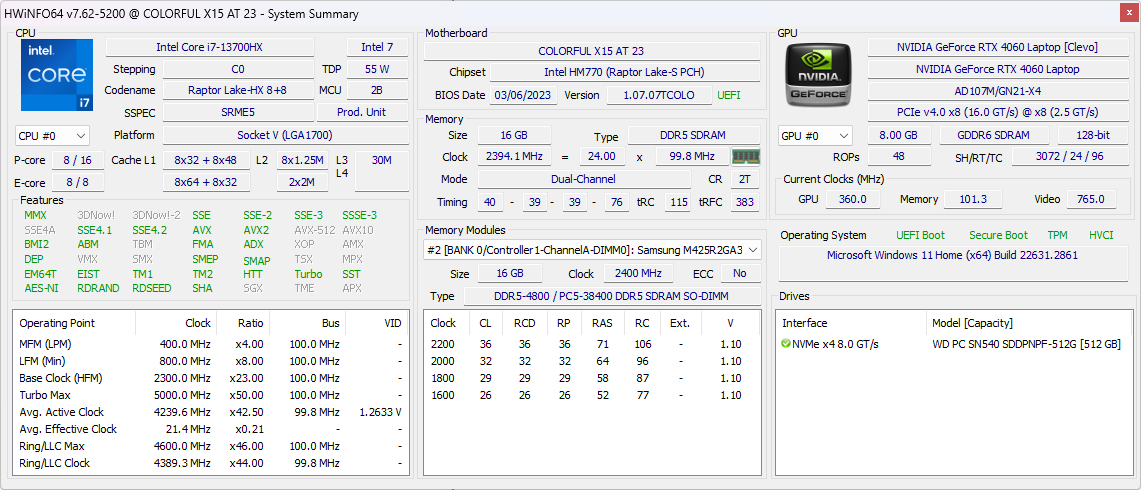
Buna uygun olarak, yeni Colorful EVOL X15 AT 23 kısa süre önce test laboratuvarlarımıza ulaştı. EVOL X15 AT örneğimiz gücünü Intel Core i7-13700HX, Nvidia GeForce RTX 4060 Dizüstü Bilgisayar GPU'su, 16 GB DDR5-4800 bellek (tek çubuk) ve 512 GB NVMe SSD.
Cihaz, QHD 165 Hz ekran ve 73 WHr pil gibi etkileyici özellikler sunuyor ve Çin, Tayland, Malezya, Endonezya, Filipinler gibi belirli Asya pazarlarında ve Rusya'da Ozon'da yaklaşık 969 $'a satılıyor. Newegg bu SKU'yu ABD'de 1.759 ABD doları fiyatla satmaktadır.
Bu incelemede, yeni Colorful EVOL X15 AT'ye bir göz atıyoruz ve daha köklü rakiplerinden bazılarına karşı durup duramayacağını görüyoruz.
Karşılaştırmalı olarak olası rakipler
Derecelendirme | Tarih | Modeli | Ağırlık | Yükseklik | Boyut | Çözünürlük | Fiyat |
|---|---|---|---|---|---|---|---|
| 84.9 % v7 (old) | 12/2023 | Colorful EVOL X15 AT 23 i7-13700HX, GeForce RTX 4060 Laptop GPU | 2.3 kg | 26.9 mm | 15.60" | 2560x1440 | |
| 88.3 % v7 (old) | 07/2023 | Alienware m16 R1 Intel i7-13700HX, GeForce RTX 4060 Laptop GPU | 3 kg | 25.4 mm | 16.00" | 2560x1600 | |
| 87.4 % v7 (old) | 09/2023 | HP Omen 16-wf000 i7-13700HX, GeForce RTX 4080 Laptop GPU | 2.4 kg | 23.6 mm | 16.10" | 2560x1440 | |
| 89.5 % v7 (old) | 07/2023 | Acer Predator Helios 16 PH16-71-731Q i7-13700HX, GeForce RTX 4060 Laptop GPU | 2.6 kg | 26.9 mm | 16.00" | 2560x1600 | |
| 84.2 % v7 (old) | 07/2023 | Dell G15 5530 i7-13650HX, GeForce RTX 4060 Laptop GPU | 3 kg | 26.95 mm | 15.60" | 1920x1080 | |
| 86.2 % v7 (old) | Schenker XMG Pro 15 (E23) i9-13900HX, GeForce RTX 4060 Laptop GPU | 2.4 kg | 24.9 mm | 15.60" | 2560x1440 | ||
| 89.2 % v7 (old) | 09/2023 | Alienware m16 R1 AMD R9 7845HX, GeForce RTX 4080 Laptop GPU | 3.1 kg | 25.4 mm | 16.00" | 2560x1600 | |
| 88.2 % v7 (old) | Uniwill GM6PX7X RTX 4070 i7-13700HX, GeForce RTX 4070 Laptop GPU | 2.2 kg | 22 mm | 16.00" | 2560x1600 |
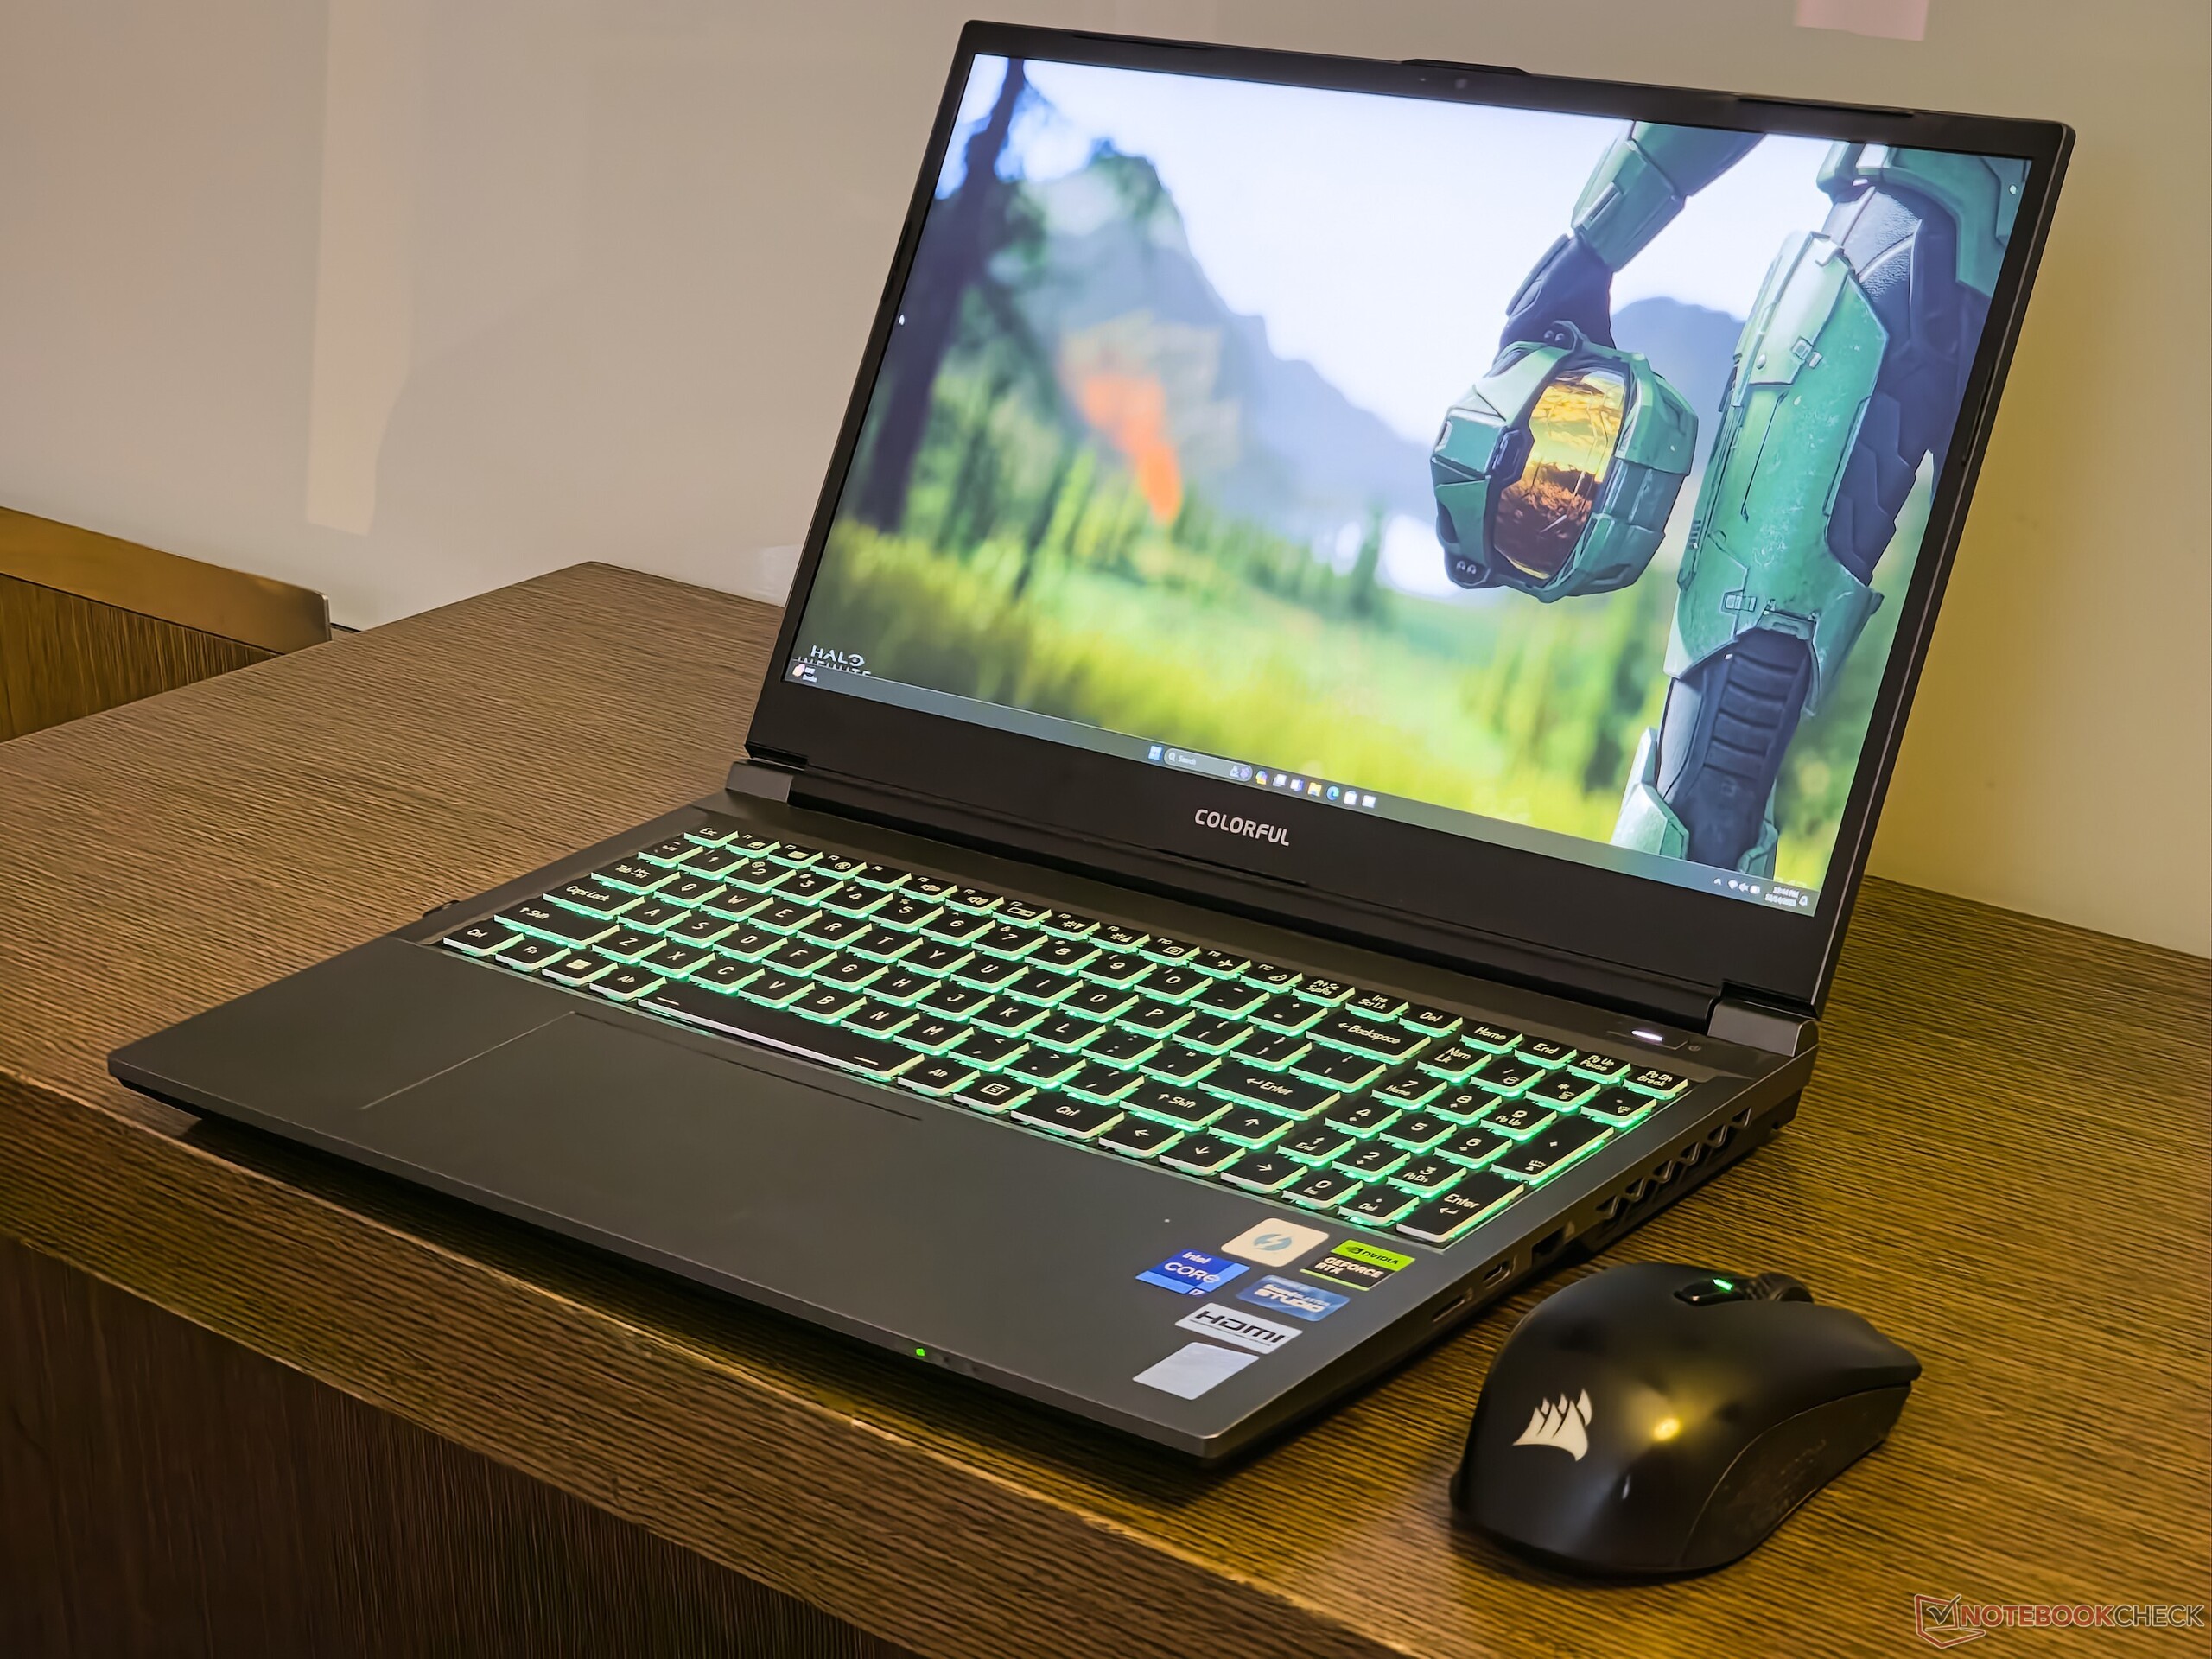
Şasi: Plastik Clevo estetiğinde biçimden çok işlev
Colorful, EVOL X15 AT'yi üç renkte sunuyor: Üzüm Moru, Çam Mavisi ve Sis Grisi (inceleme birimimiz). EVOL XT15 AT, 27,1 mm kalınlığı ve 2,3 kg ağırlığı ile herhangi bir incelik ödülü kazanmayacaktır. Yine de, aşağıdakilerden önemli ölçüde daha taşınabilir Dell G15 5530 ve Alienware m16 R1.
Bir Clevo tasarımı olan EVOL X15 AT, öncelikle sağlam bir plastik kasaya sahiptir. Bu yapı büyük ölçüde yine bir Clevo markası olan Gigabyte G5 KE modelini andırıyor. Yapının sağlamlığına rağmen, klavye güvertesinde önemli ölçüde esneklik gözlemledik.
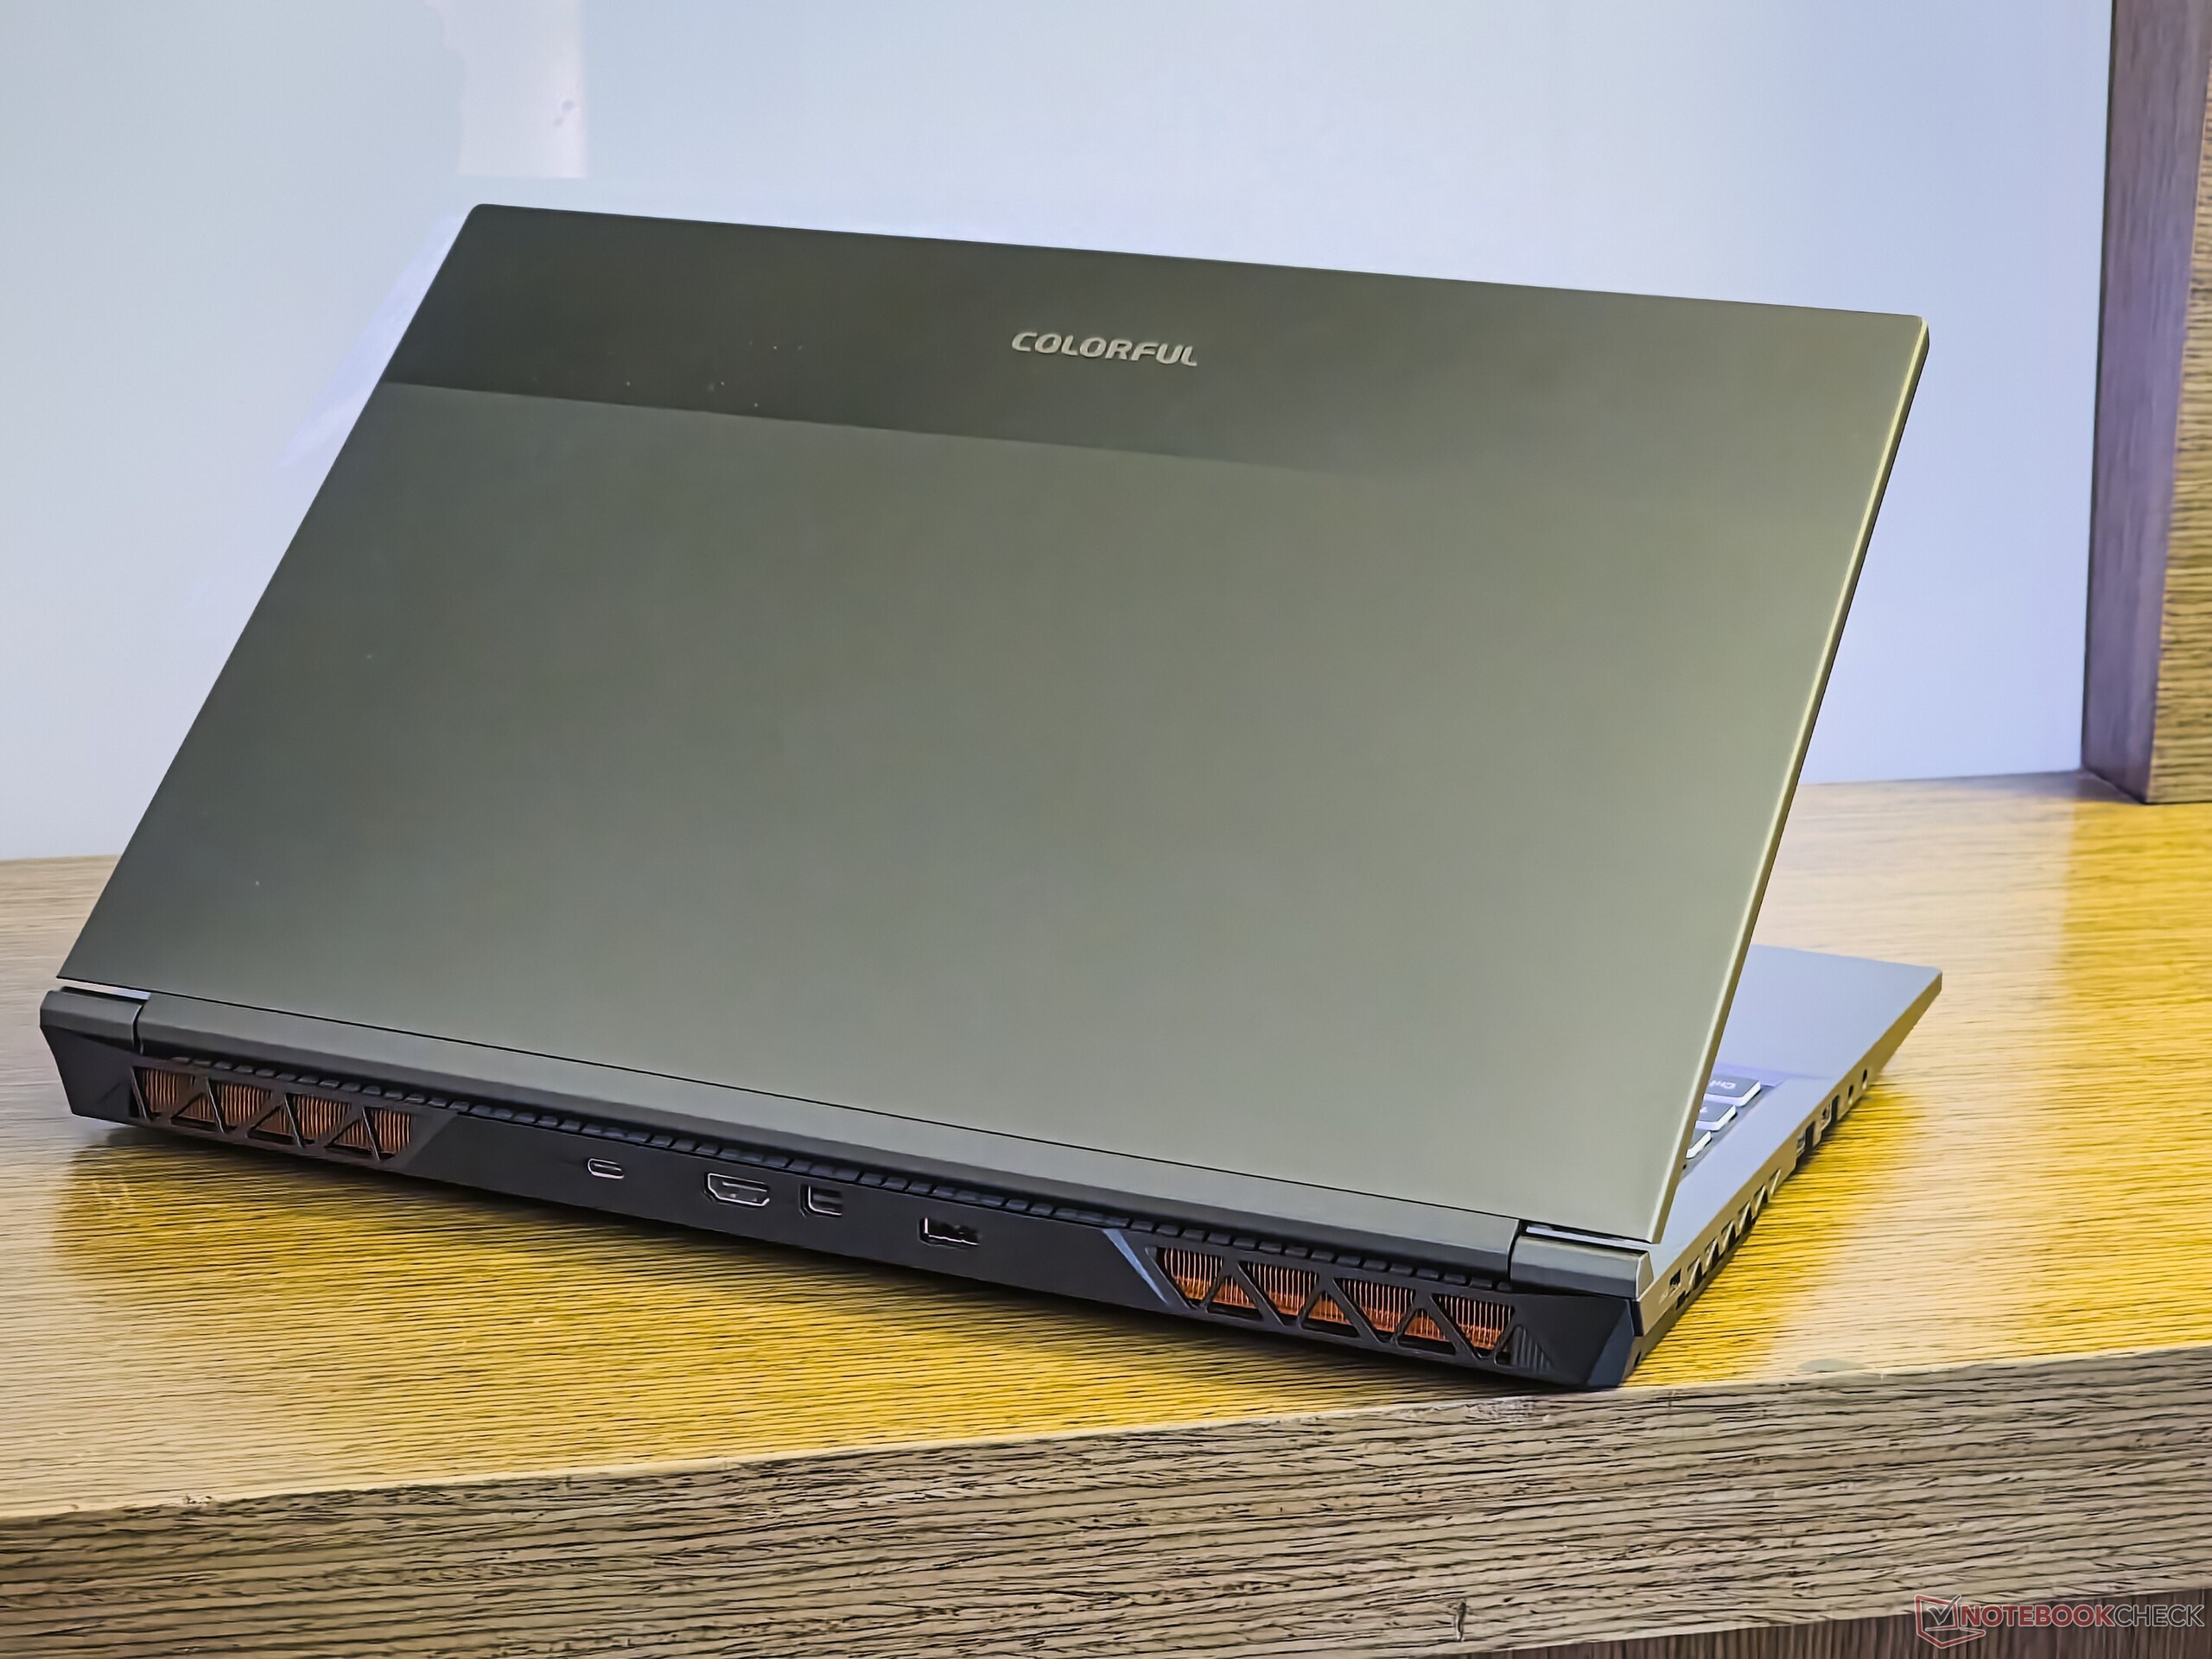
Ekran kapağı metalden yapılmış ve fazla sallanmıyor. Menteşeler ideal bir gerginliğe sahip ve kapağın tabanın kaymasına neden olmadan tek bir parmakla açılmasını sağlıyor
Genel olarak, EVOL X15 AT sizi şık bir tasarım diliyle büyülemeyi amaçlamıyor, ancak bir oyun dizüstü bilgisayarı olarak yeterince faydacı.
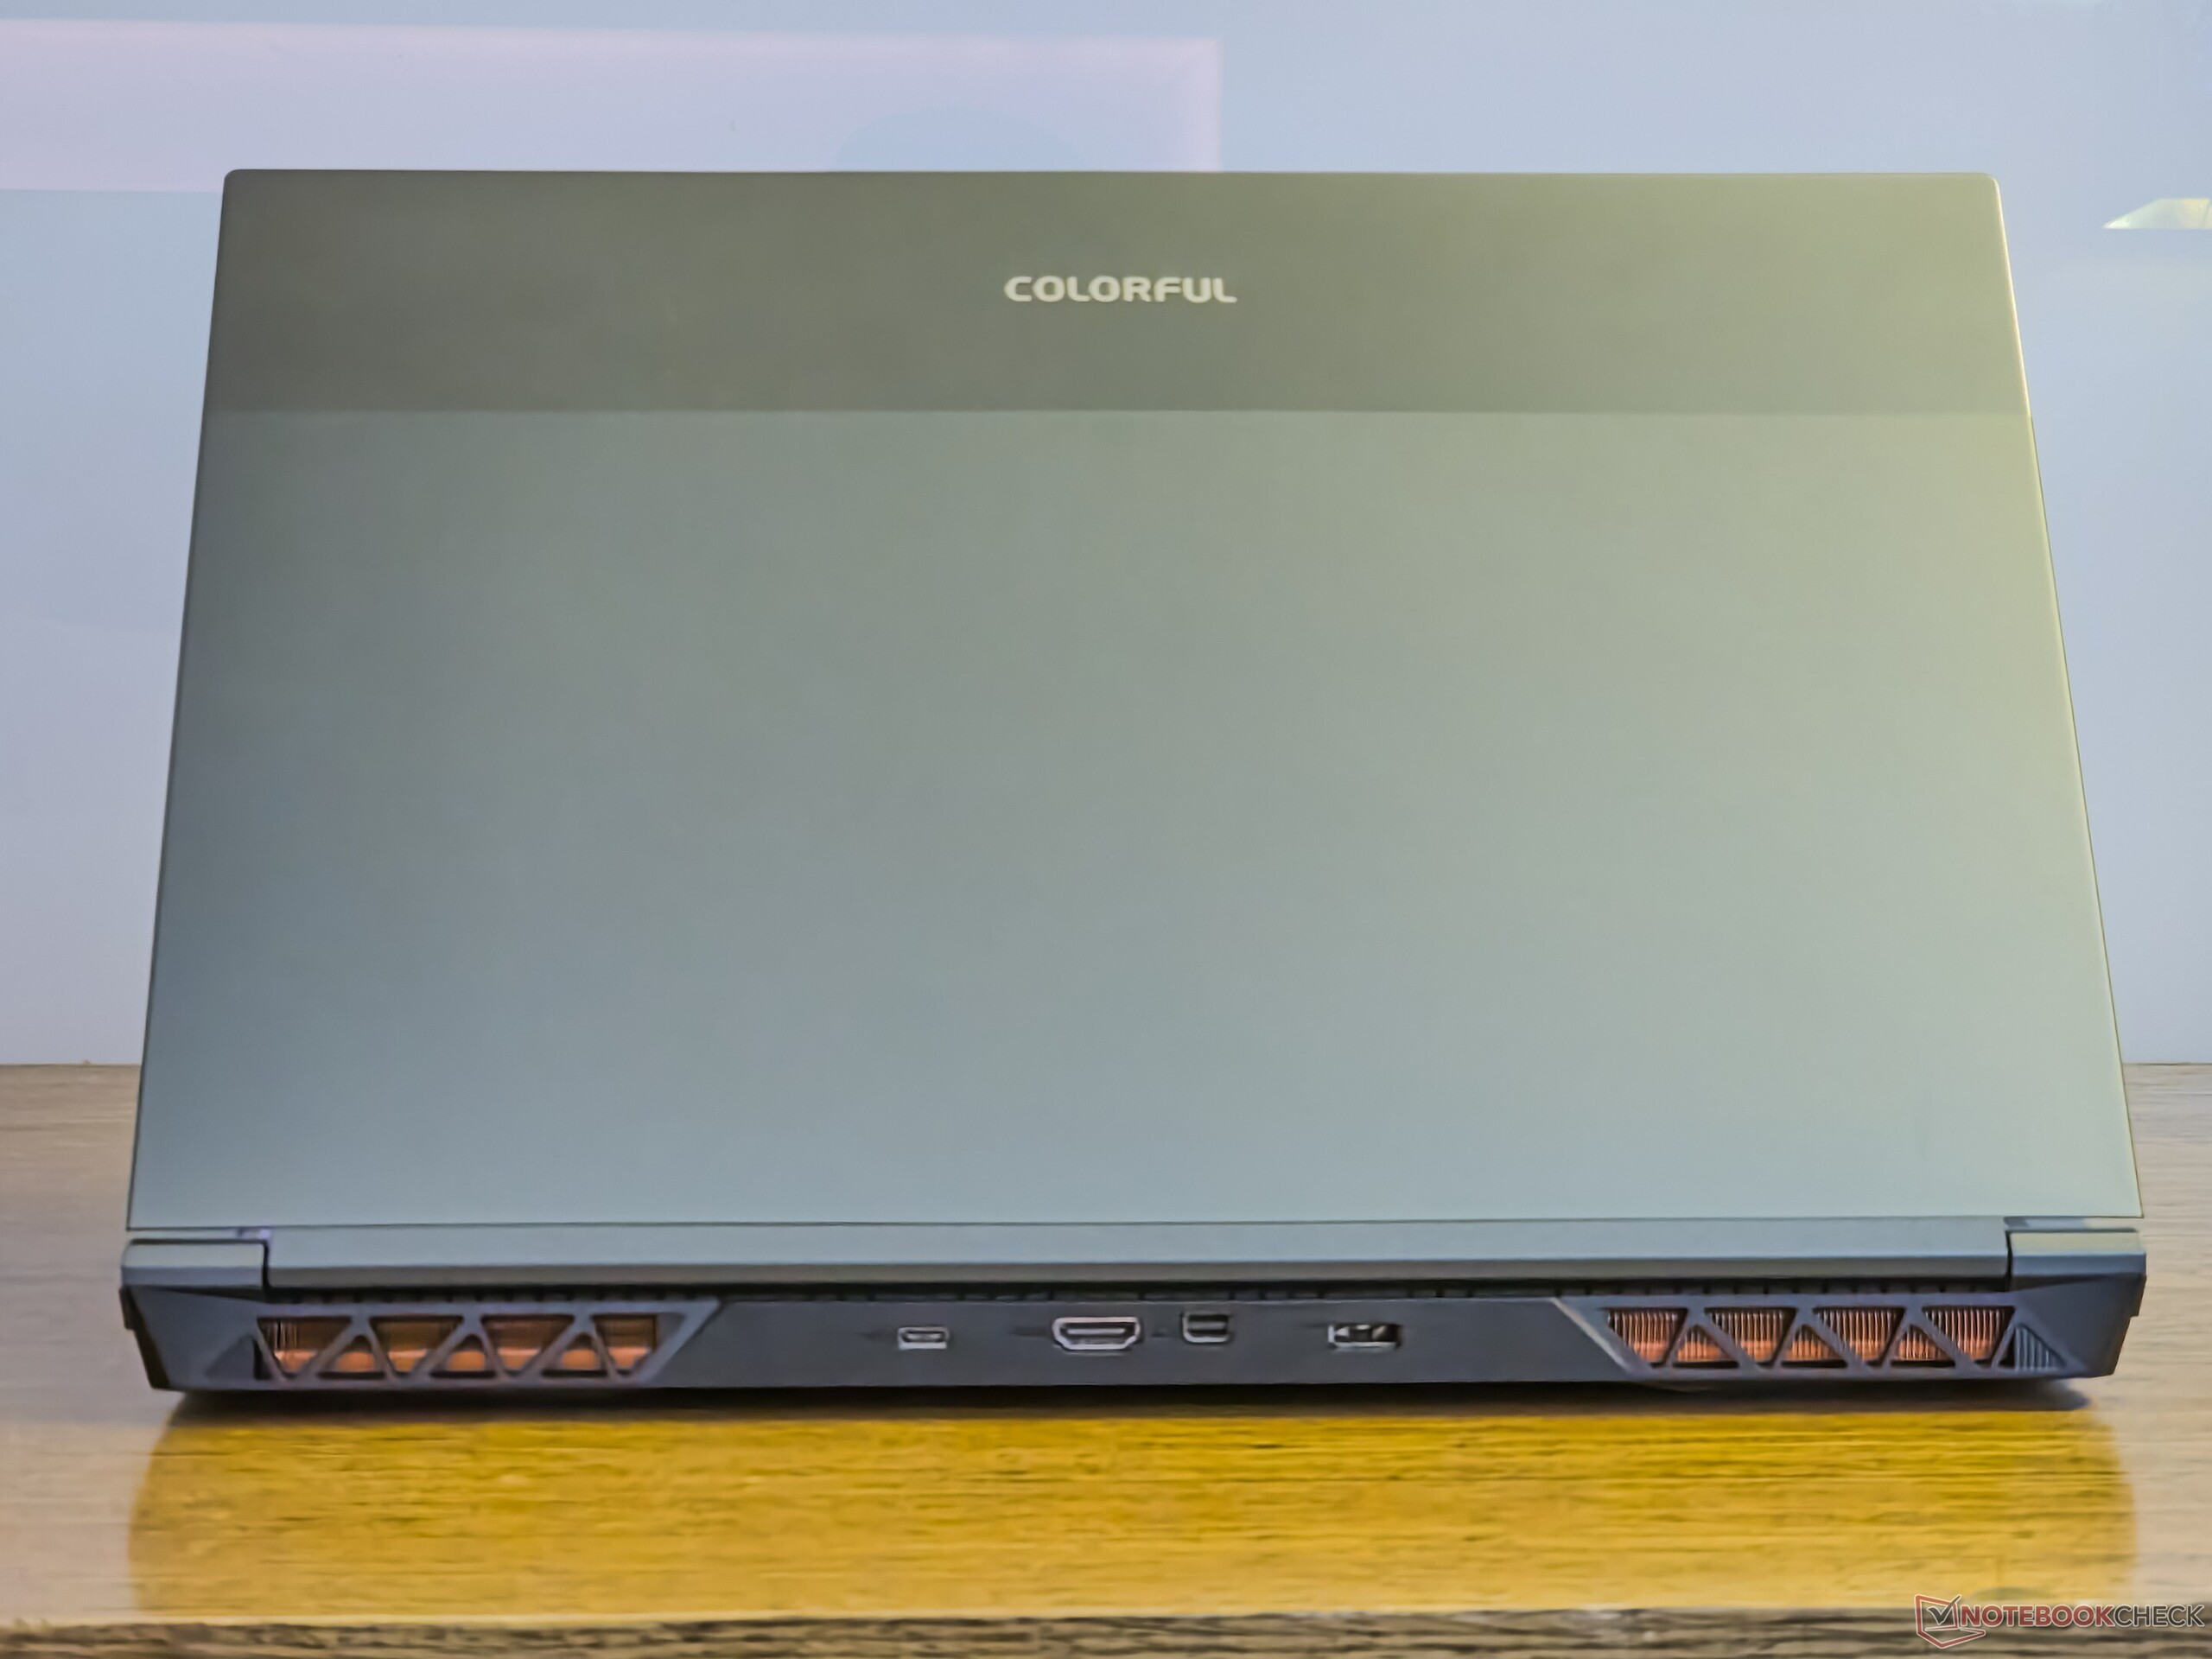
Bağlanabilirlik: Tip-C bağlantı noktaları güç girişi yok
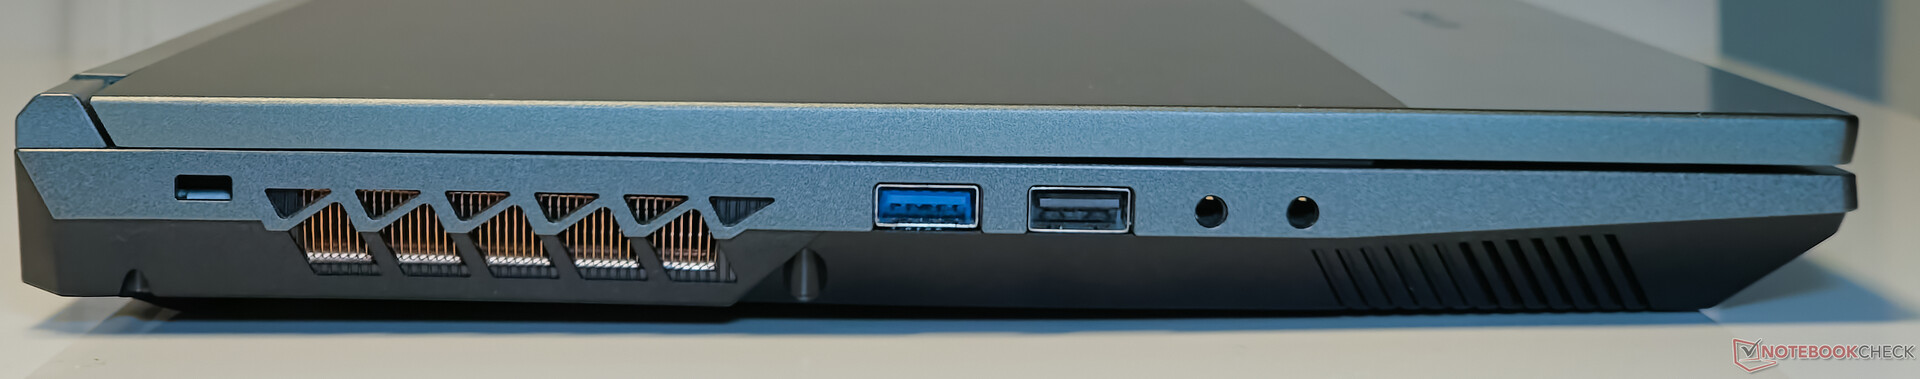
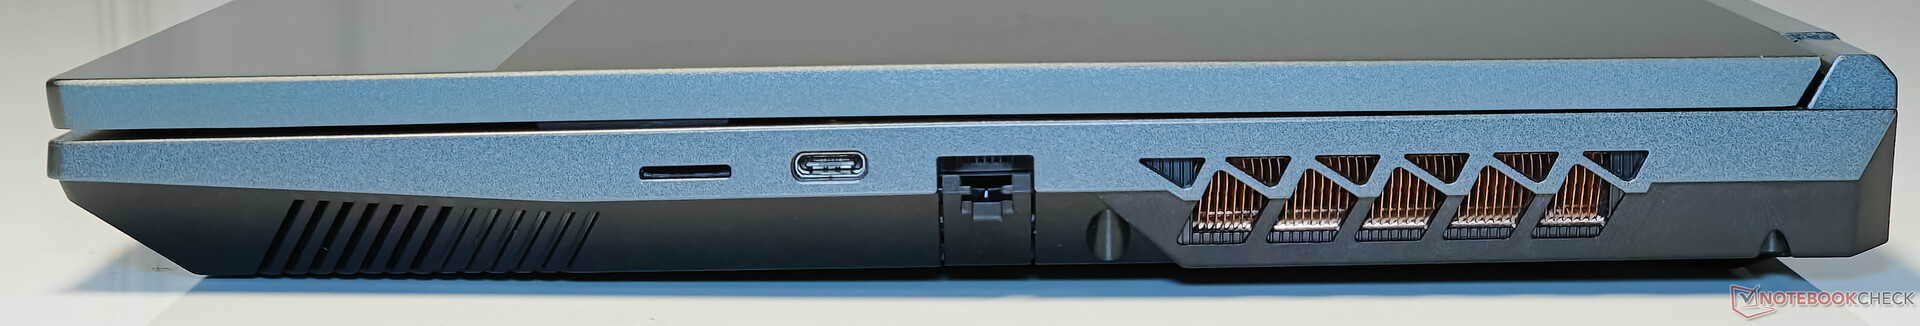
Colorful, EVOL X15 AT'yi oldukça iyi bir port seçimi ile donatmıştır. Sol tarafta iki USB-A seçeneği (USB 2.0 ve USB 3.2 Gen 1) ve analog ses girişi için özel bir hat girişi jakı bulunuyor. Sağ tarafta ise microSD yuvası, Thunderbolt 4 ve Gigabit LAN yer alıyor.
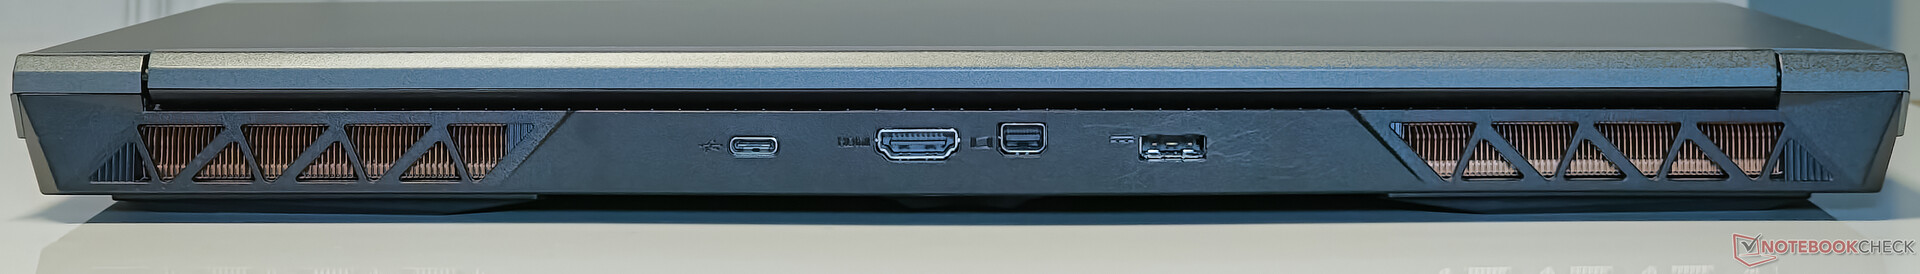
Sağ tarafta bir microSD kart okuyucu, Thunderbolt 4 ve Gigabit LAN görüyoruz. Son olarak, arka kısımda USB 3.2 Gen2 Type-C, mini-DisplayPort-out ve HDMI-out yer alıyor.
Type-C bağlantı noktaları ne yazık ki yalnızca güç dağıtımını destekliyor, bu nedenle dizüstü bilgisayarı beslemek için kaçınılmaz olarak yaklaşık 1 kg'lık güç tuğlasını her yere taşımanız gerekecek.
SD Kart Okuyucu
EVOL X15'in microSD kart okuyucusu herhangi bir hız rekoru kırmıyor ve JPG kopyalama ve AS SSD sıralı okuma testlerinde sınıf ortalamasından yaklaşık %28 daha yavaş.
| SD Card Reader | |
| average JPG Copy Test (av. of 3 runs) | |
| Alienware m16 R1 AMD (Toshiba Exceria Pro SDXC 64 GB UHS-II) | |
| Alienware m16 R1 Intel (AV PRO microSD 128 GB V60) | |
| Sınıf ortalaması Gaming (20.9 - 210, n=54, son 2 yıl) | |
| Schenker XMG Pro 15 (E23) | |
| Colorful EVOL X15 AT 23 (AV PRO microSD 128 GB V60) | |
| Acer Predator Helios 16 PH16-71-731Q | |
| Uniwill GM6PX7X RTX 4070 (AV PRO microSD 128 GB V60) | |
| maximum AS SSD Seq Read Test (1GB) | |
| Alienware m16 R1 AMD (Toshiba Exceria Pro SDXC 64 GB UHS-II) | |
| Alienware m16 R1 Intel (AV PRO microSD 128 GB V60) | |
| Sınıf ortalaması Gaming (25.5 - 261, n=51, son 2 yıl) | |
| Schenker XMG Pro 15 (E23) | |
| Colorful EVOL X15 AT 23 (AV PRO microSD 128 GB V60) | |
| Uniwill GM6PX7X RTX 4070 (AV PRO microSD 128 GB V60) | |
| Acer Predator Helios 16 PH16-71-731Q | |
İletişim
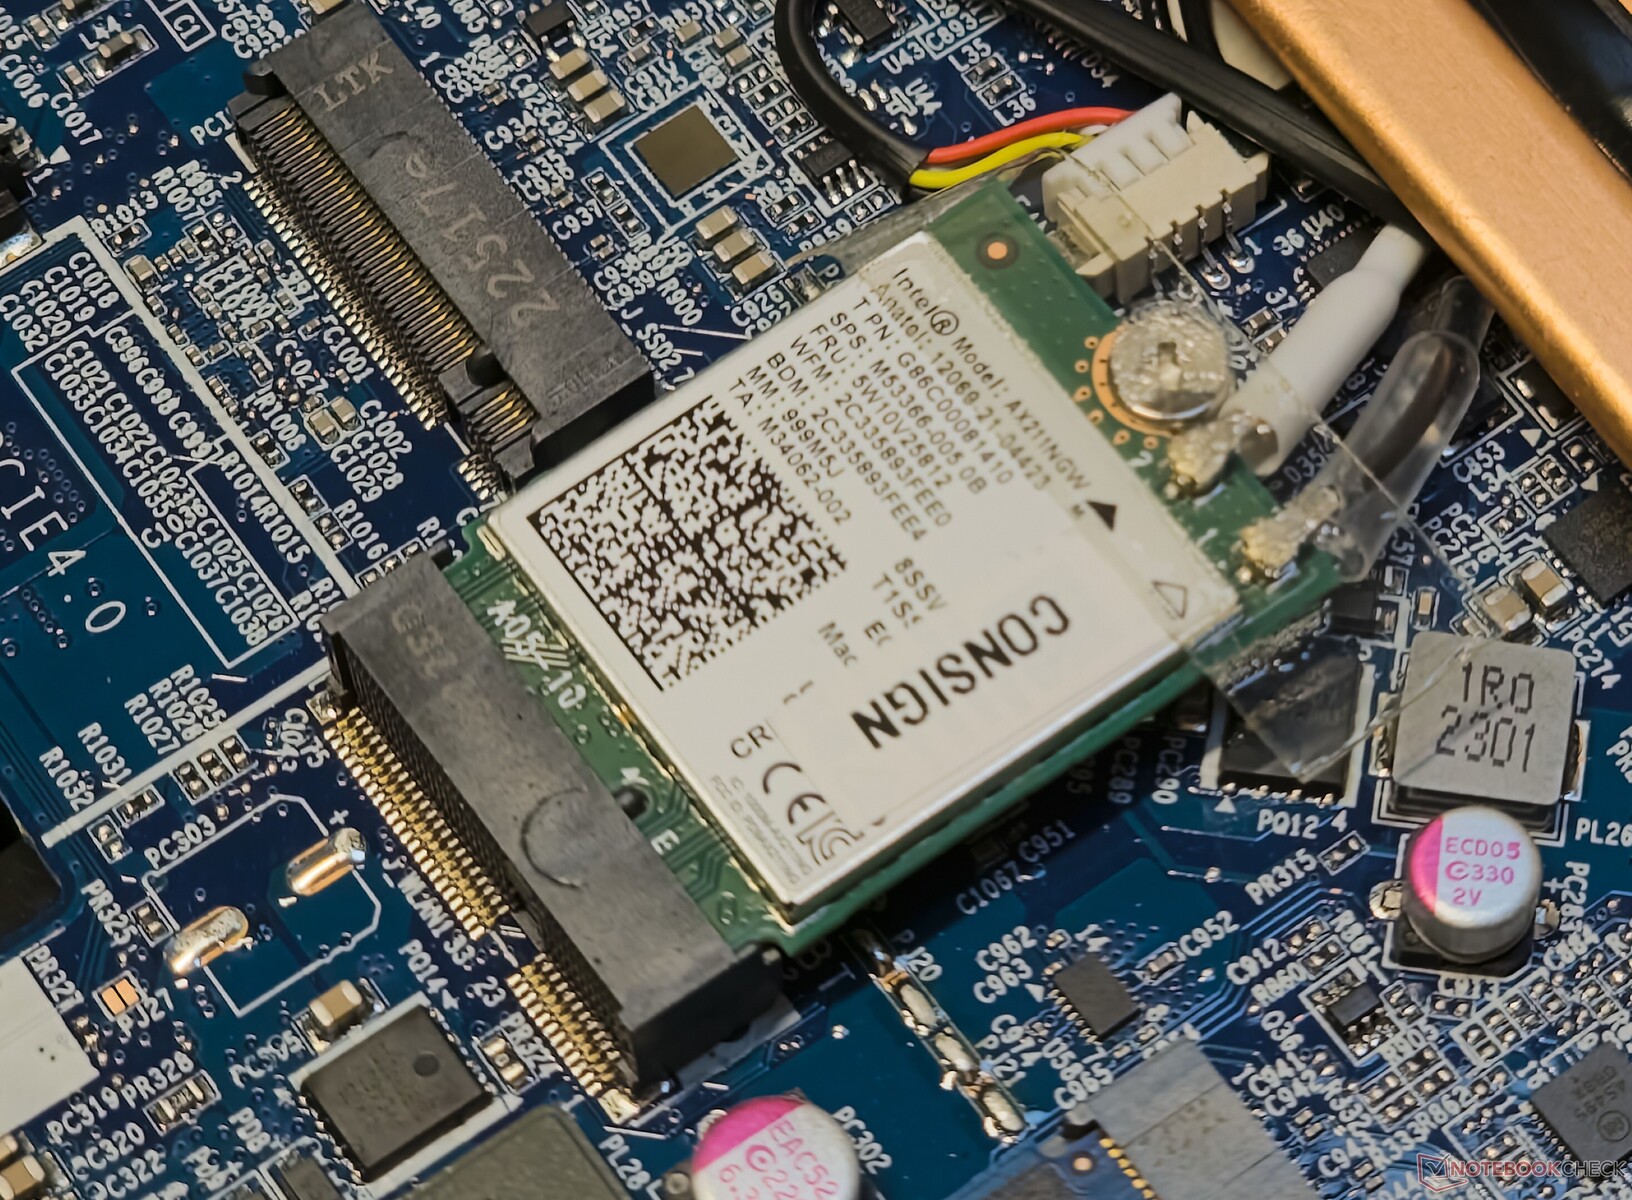
EVOL X15 AT, Intel Wi-Fi 6E AX211 WLAN çipine sahiptir. Referans Asus ROG Rapture GT-AXE11000 yönlendiricimizle test edildiğinde aktarım hızları hem 5 GHz hem de 6 GHz bantlarında oldukça tutarlıdır.
Dizüstü bilgisayar 5 GHz bandında mükemmel iletim ve alım verimi sunuyor. EVOL X15, 6 GHz aralığında ise diğerlerinin gerisinde kalıyor Alienware m16 R1 AMD iPerf3 iletim testlerinde ise 1,7 Gbps'lik tepe verimi ile alım testlerindeki eksikliği telafi etmektedir.
| Networking / iperf3 transmit AXE11000 | |
| Colorful EVOL X15 AT 23 | |
| Dell G15 5530 | |
| Alienware m16 R1 AMD | |
| Acer Predator Helios 16 PH16-71-731Q | |
| Alienware m16 R1 Intel | |
| Sınıf ortalaması Gaming (560 - 1862, n=87, son 2 yıl) | |
| Ortalama Intel Wi-Fi 6E AX211 (64 - 1921, n=276) | |
| Uniwill GM6PX7X RTX 4070 | |
| HP Omen 16-wf000 | |
| Schenker XMG Pro 15 (E23) | |
| Networking / iperf3 receive AXE11000 | |
| Colorful EVOL X15 AT 23 | |
| Alienware m16 R1 Intel | |
| Dell G15 5530 | |
| Sınıf ortalaması Gaming (680 - 1745, n=87, son 2 yıl) | |
| Acer Predator Helios 16 PH16-71-731Q | |
| Alienware m16 R1 AMD | |
| Ortalama Intel Wi-Fi 6E AX211 (582 - 1890, n=276) | |
| HP Omen 16-wf000 | |
| Uniwill GM6PX7X RTX 4070 | |
| Schenker XMG Pro 15 (E23) | |
| Networking / iperf3 transmit AXE11000 6GHz | |
| Alienware m16 R1 AMD | |
| Acer Predator Helios 16 PH16-71-731Q | |
| Schenker XMG Pro 15 (E23) | |
| Colorful EVOL X15 AT 23 | |
| Sınıf ortalaması Gaming (723 - 1868, n=36, son 2 yıl) | |
| Ortalama Intel Wi-Fi 6E AX211 (385 - 1851, n=226) | |
| HP Omen 16-wf000 | |
| Networking / iperf3 receive AXE11000 6GHz | |
| Colorful EVOL X15 AT 23 | |
| Schenker XMG Pro 15 (E23) | |
| Sınıf ortalaması Gaming (975 - 1775, n=35, son 2 yıl) | |
| Alienware m16 R1 AMD | |
| Ortalama Intel Wi-Fi 6E AX211 (700 - 1857, n=226) | |
| Acer Predator Helios 16 PH16-71-731Q | |
| HP Omen 16-wf000 | |
Web kamerası
EVOL X15, öncelikli olarak oyun oynamaya odaklandığı için geleneksel 720p web kamerası ile yetiniyor. Web kamerası hızlı görüntülü sohbetler için yeterlidir, ancak renk doğruluğu, ayrıntıların yeniden üretimi ve genel netlik açısından eksiktir.


Güvenlik
Yerleşik biyometrik oturum açma gibi özel güvenlik özellikleri yoktur. Windows 11'in güvenlik gereksinimlerini karşılamak için bir TPM 2.0 modülü mevcuttur.
Aksesuarlar ve Garanti
Kutuda 280 W adaptör ve olağan evraklar dışında ayrı bir aksesuar bulunmuyor. Colorful EVOL X15 AT, iki yıllık standart garanti ile birlikte gönderilir.
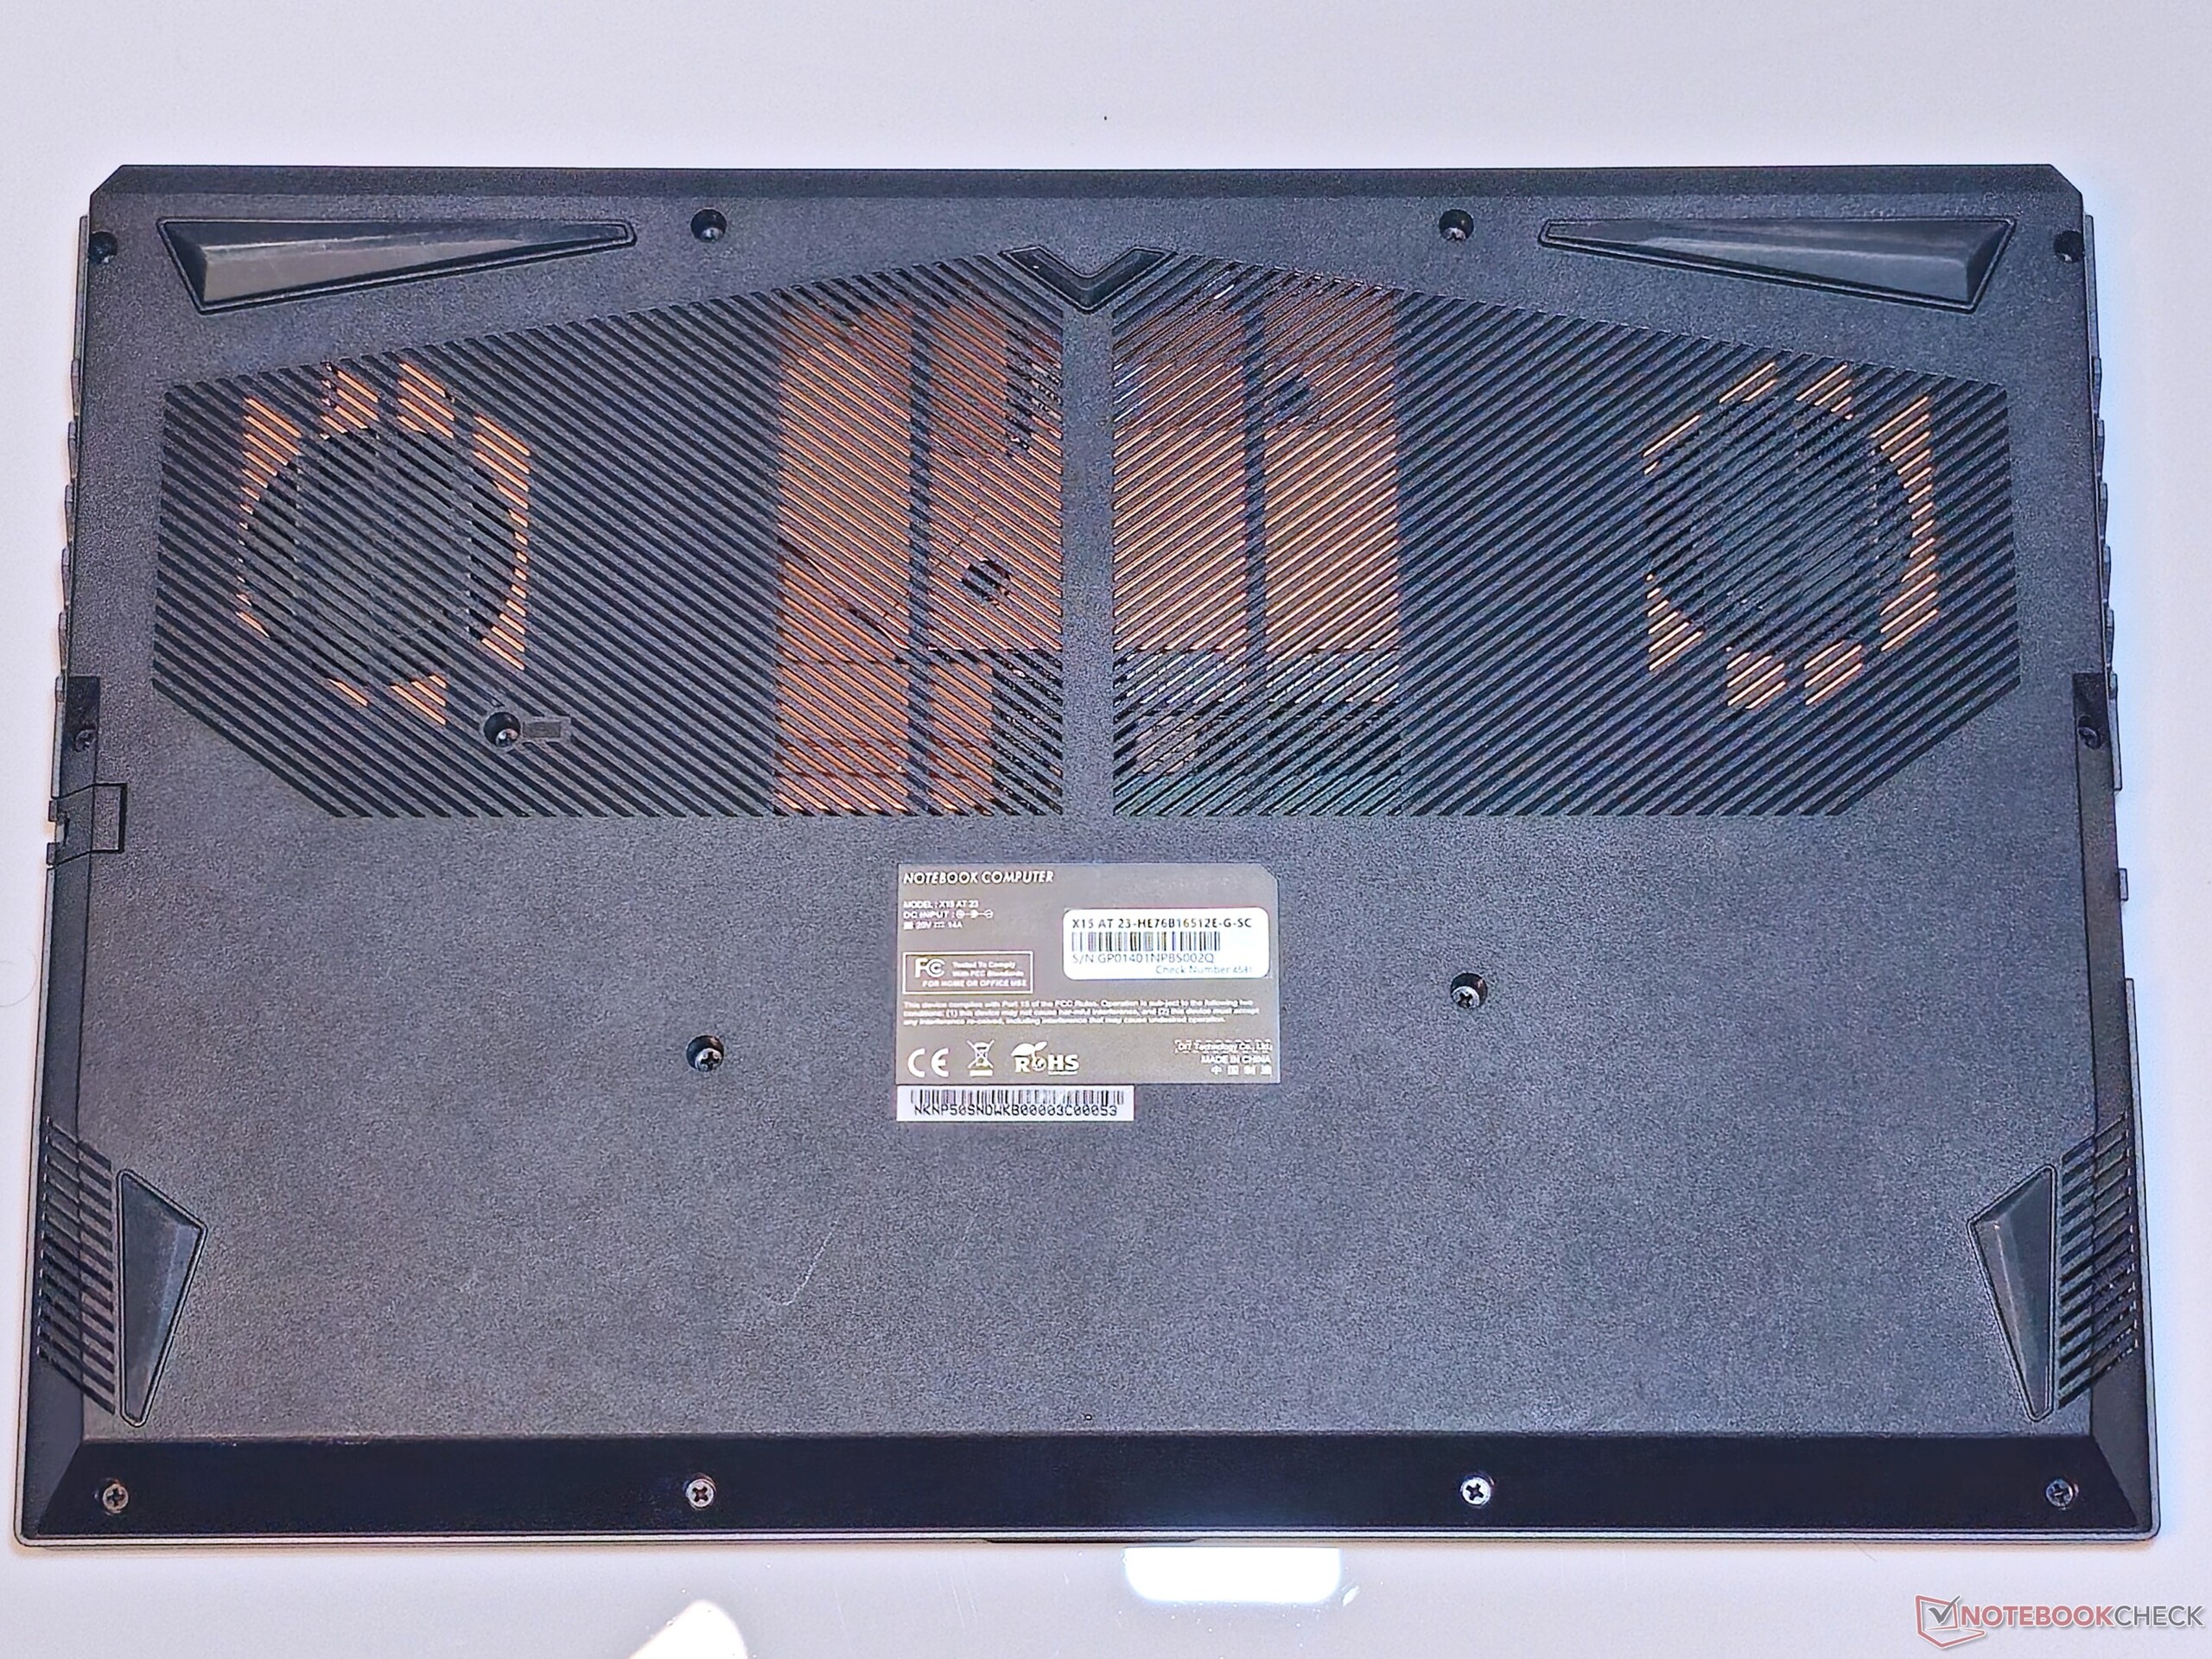
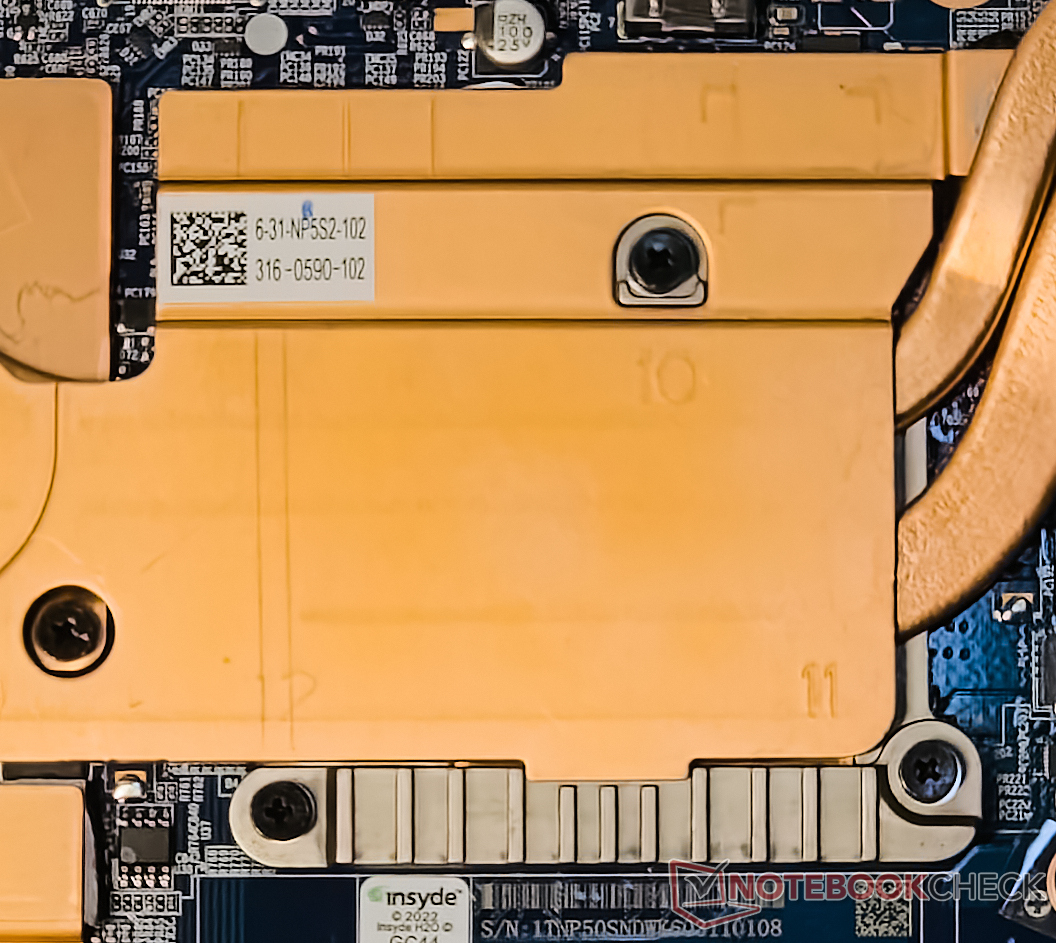
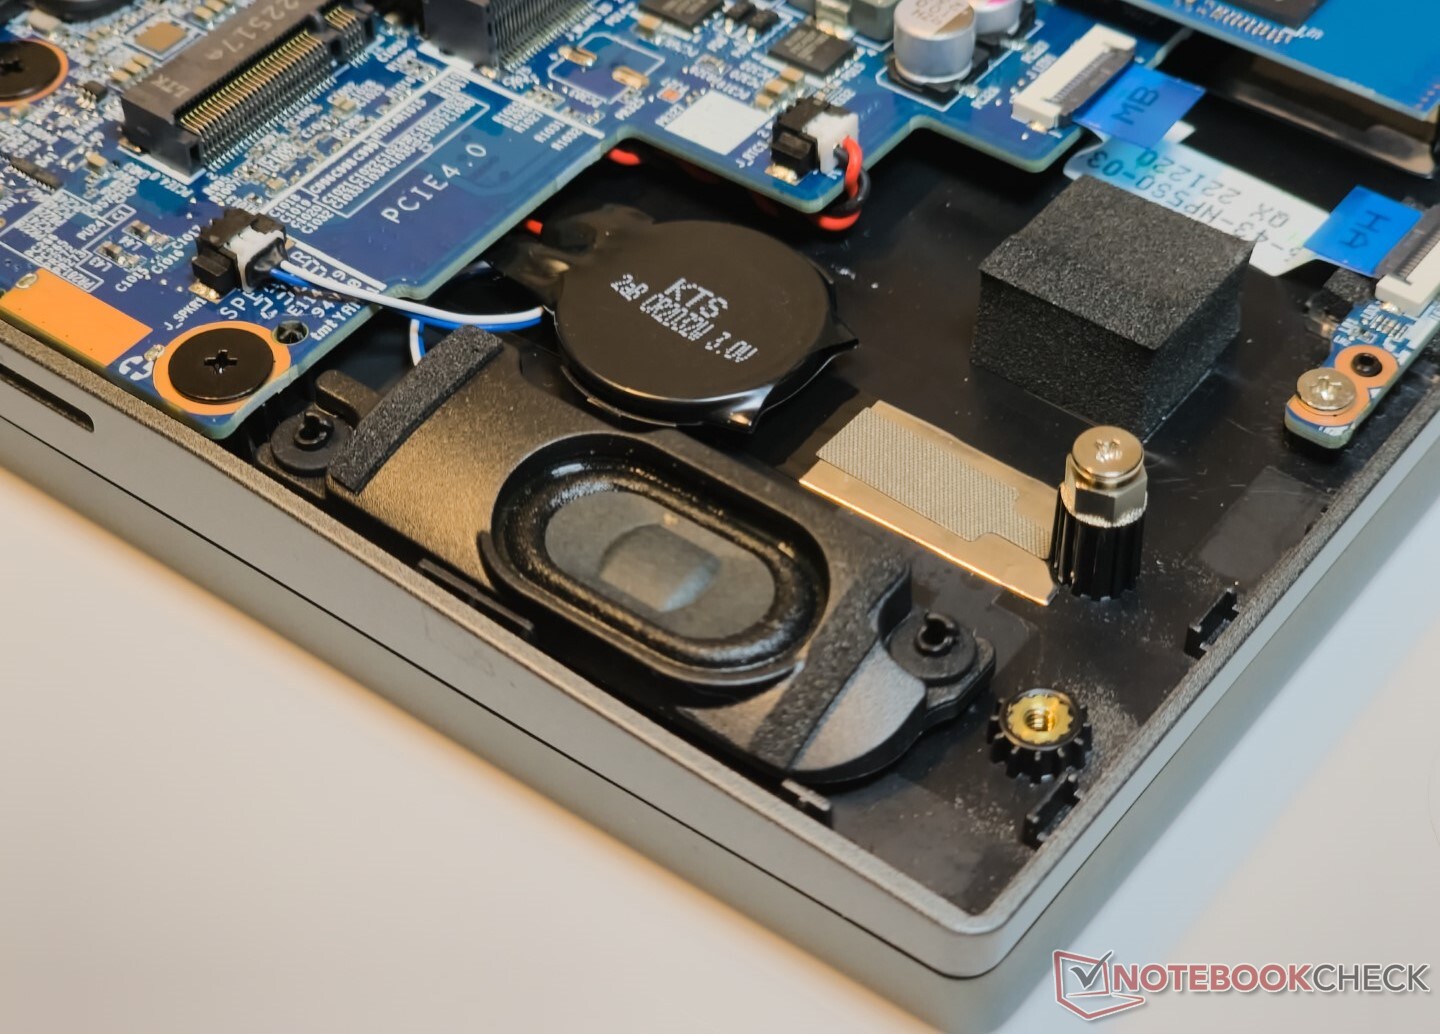
Bakım
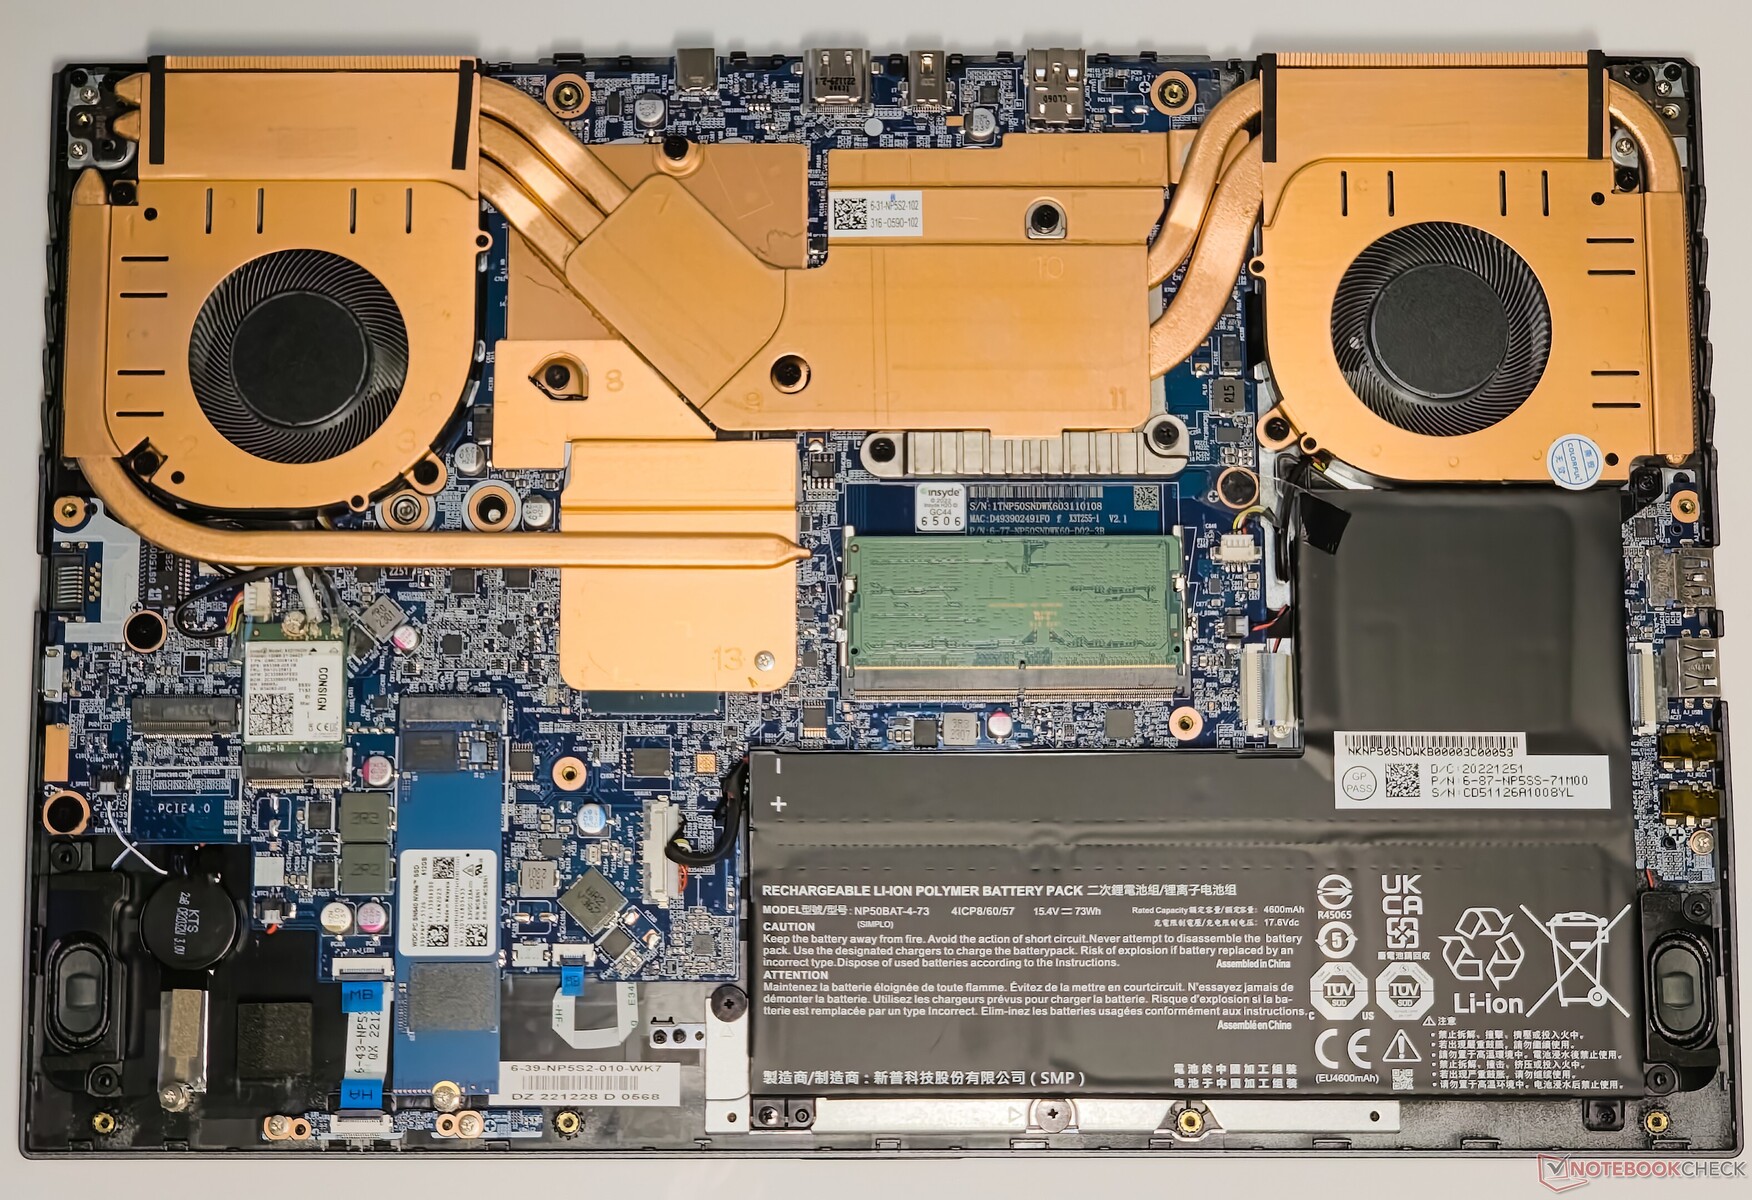
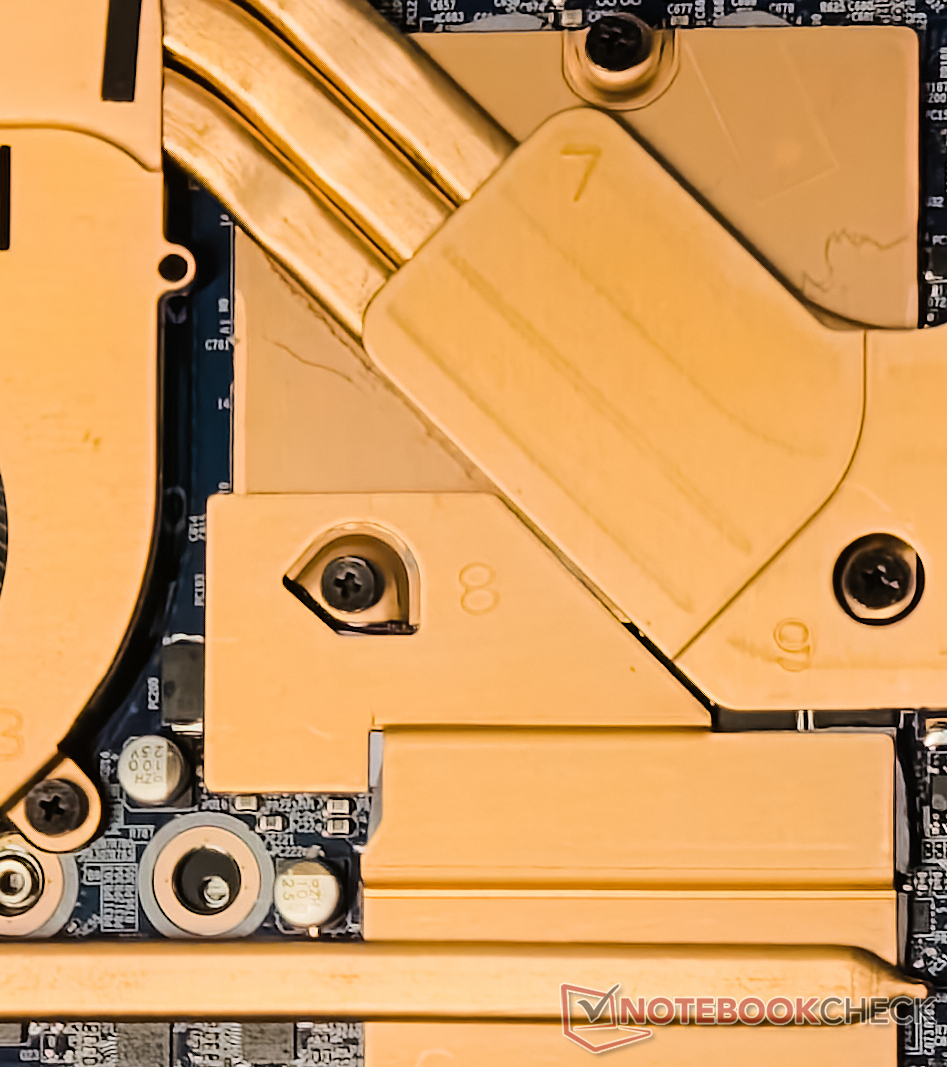
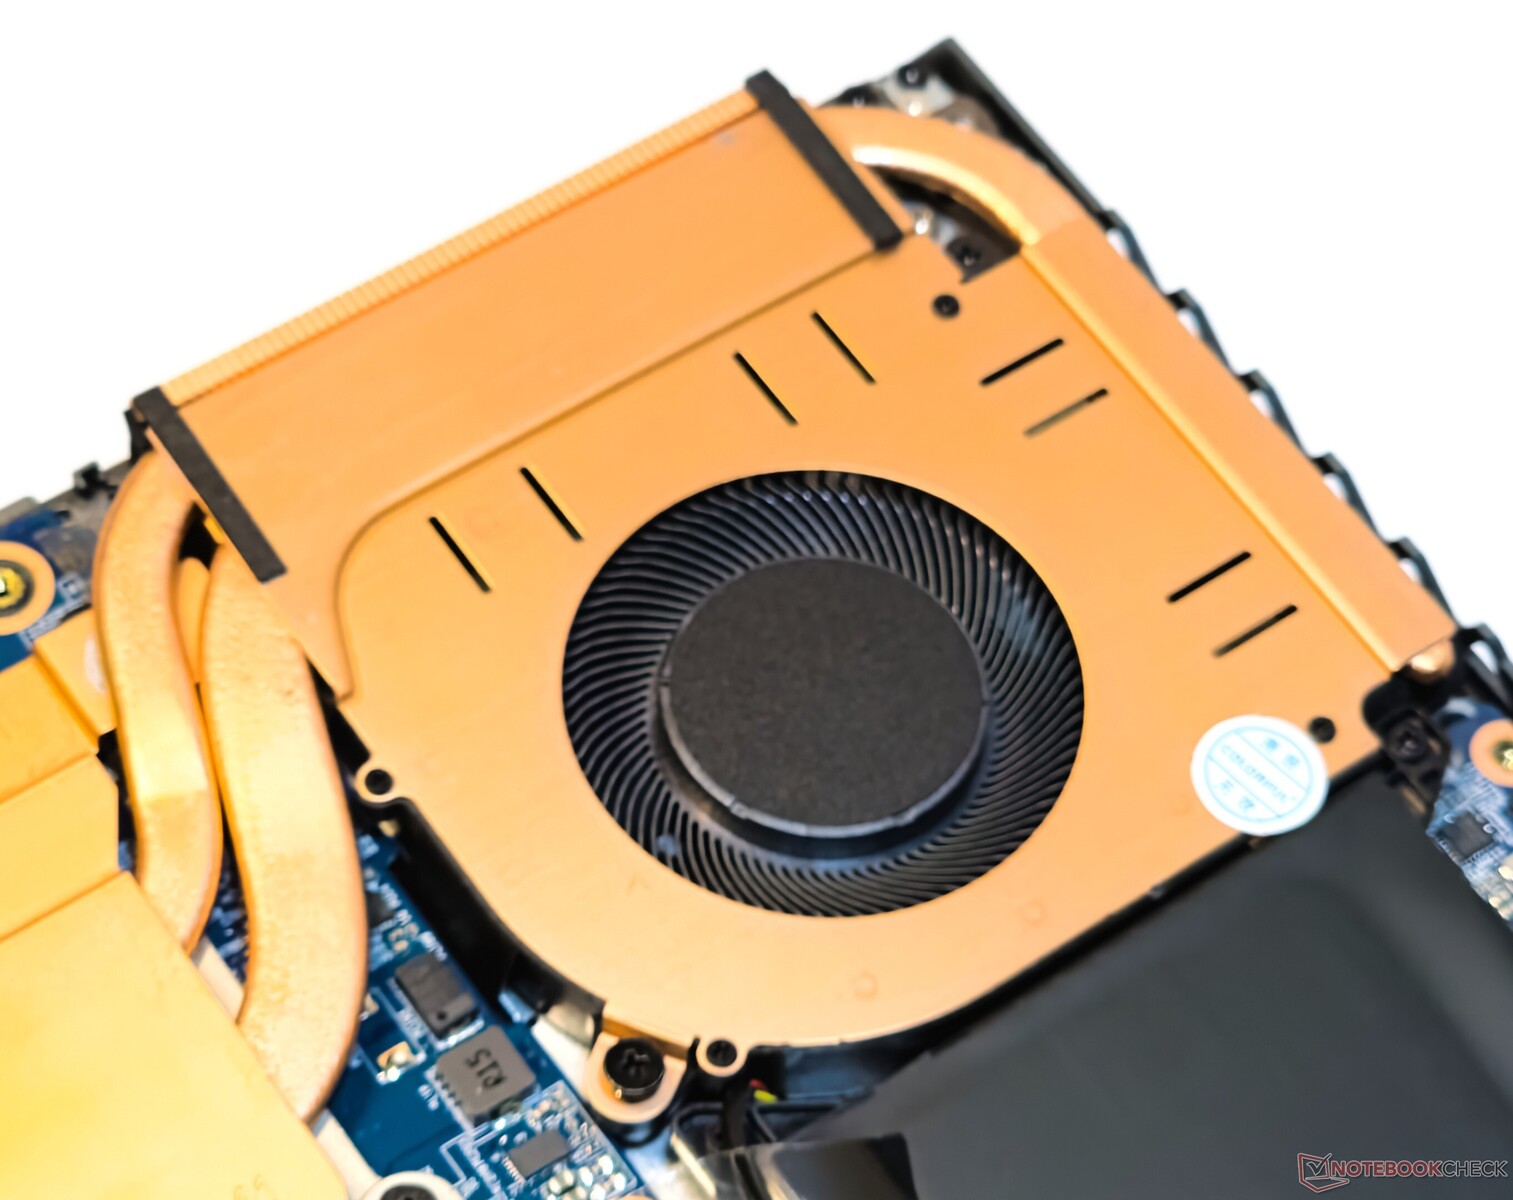
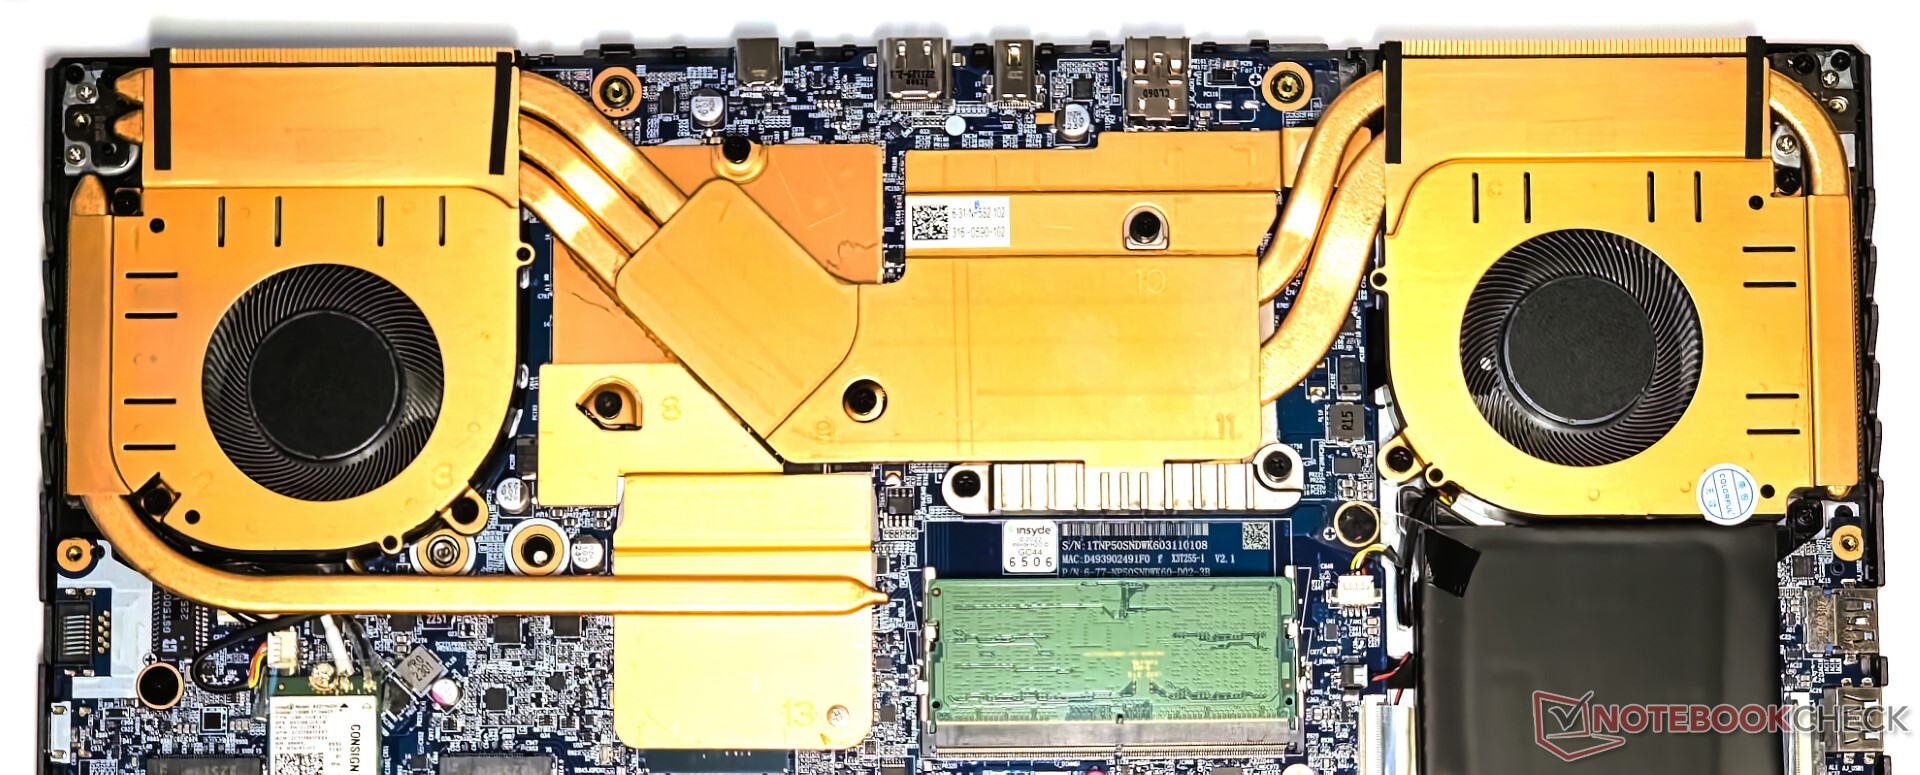
Arka panel, 13 PH0 vidası söküldükten sonra kolayca çıkar. EVOL X15, CPU ve GPU için kapsamlı bir tamamen bakır soğutma sistemi ile birlikte yoğun bir iç düzen gösterir.
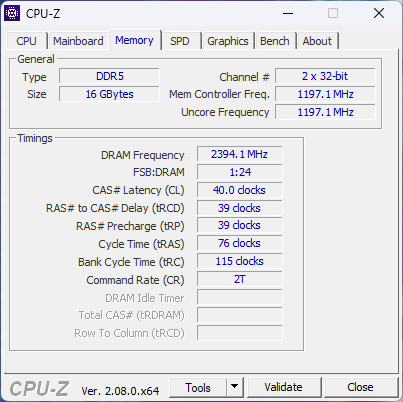
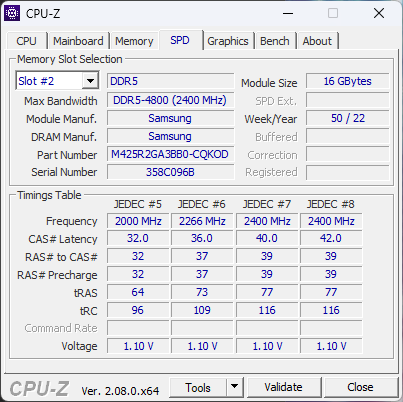
Ünitemiz çift kanal modunda yapılandırılmış tek bir 16 GB DDR5-4800 bellek ile geldi. WLAN kartı, RAM ve NVMe SSD gerektiğinde değiştirilebilir veya yükseltilebilir ve L şeklindeki pil takımı sökülebilir.
Giriş Aygıtları: İyi dokunulabilirliğe sahip yumuşak tuşlar
Klavye
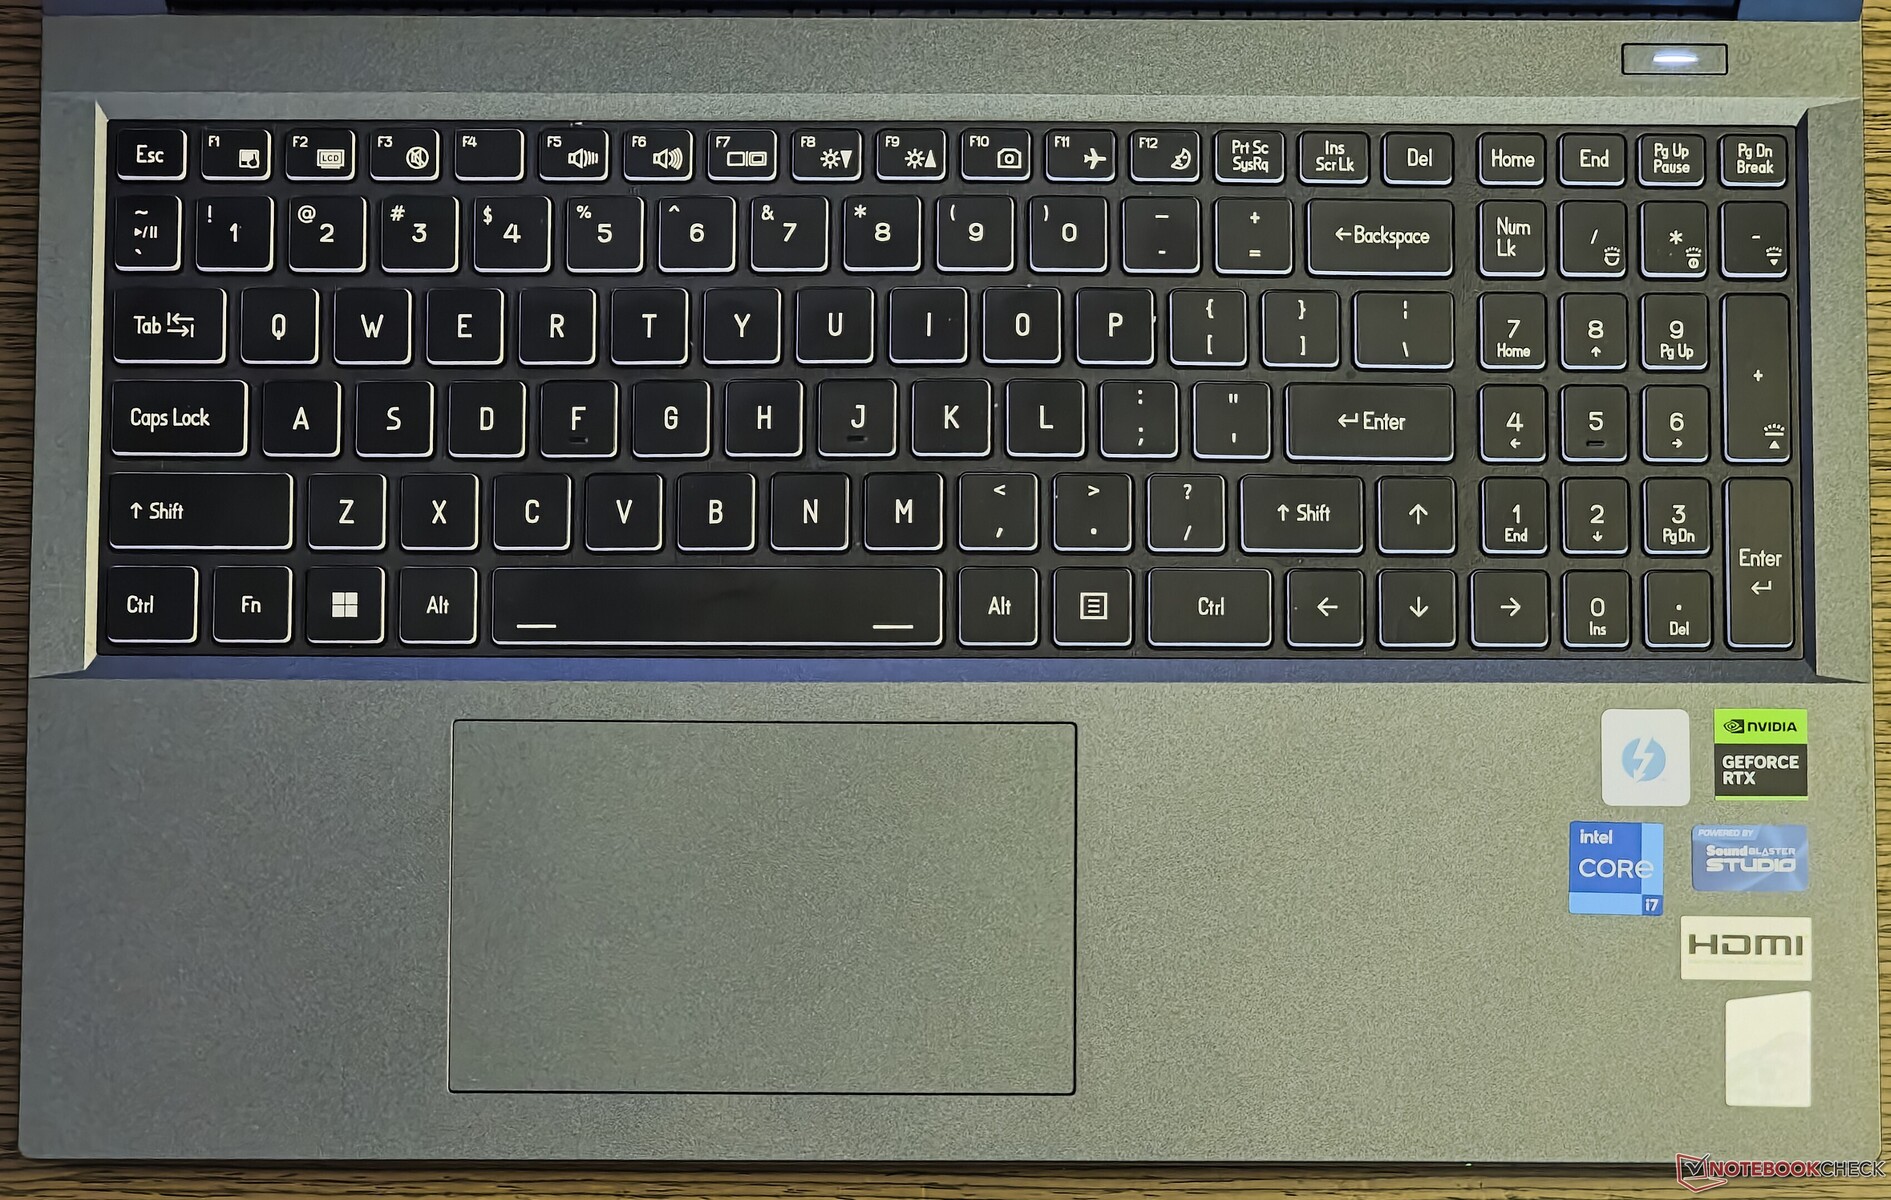
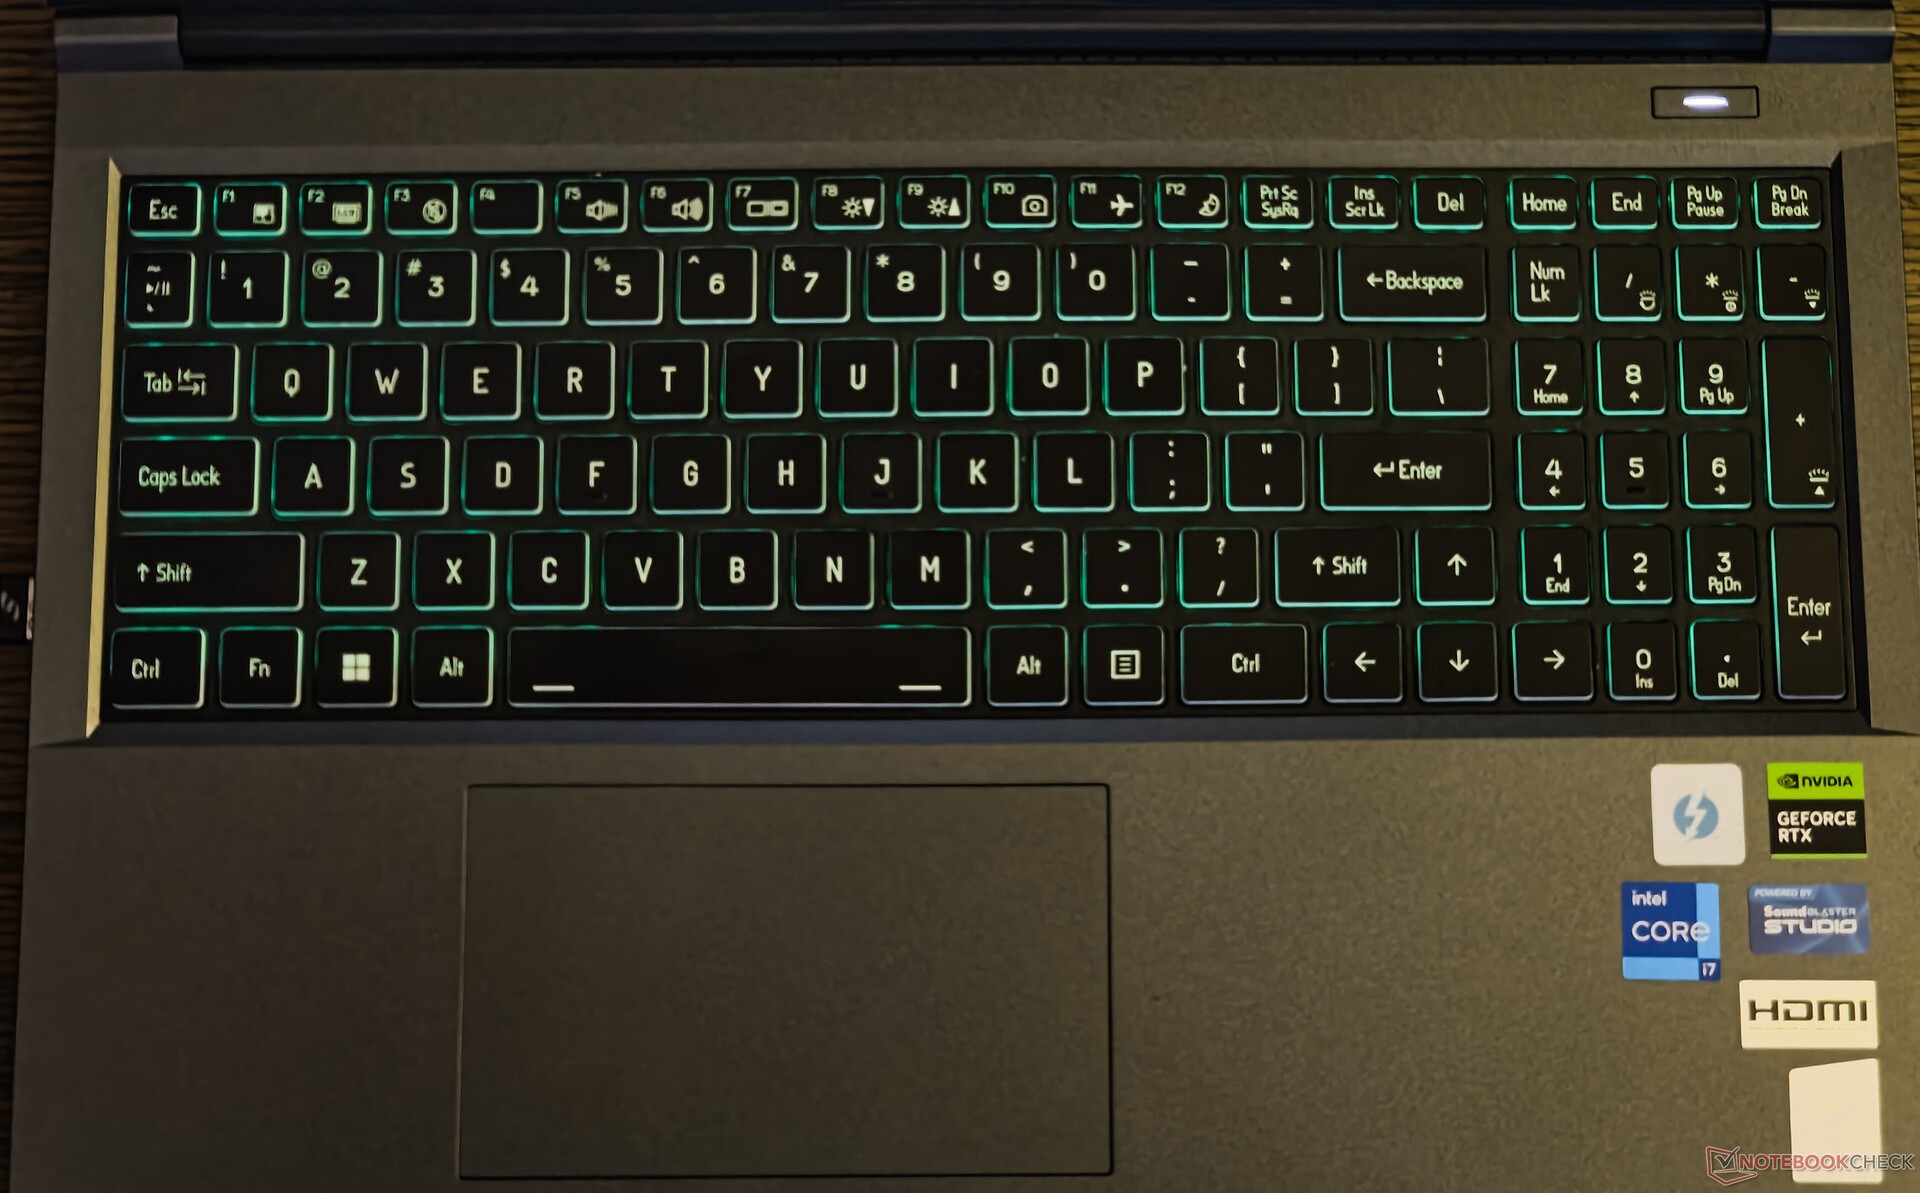
EVOL X15'in tam boyutlu klavyesi, yarış oyunları için bir nimet olan bir sayı tuşu ve uygun boyutta ok tuşları için yer içerir. Bu düzenin bir dezavantajı, tipik bir masaüstü veya hatta bir dizüstü bilgisayar klavyesinden geçiş yapan kullanıcıları rahatsız edebilecek kısaltılmış Sağ Shift tuşudur.
Tuş hareketleri başlangıçta biraz yumuşak hissettiriyor, ancak oyun oynamak ve yazmak için yeterli dokunsallık var. Colorful'un (Clevo'nun diye okuyun) Kontrol Merkezi uygulaması, MMORPG ve MOBA oyuncuları için kullanışlı olacak klavye ve fare makro kaydına izin veriyor.
Çok bölgeli veya tuş başına RGB arka aydınlatma yoktur, bu nedenle Kontrol Merkezi uygulamasında sınırlı bir renk paleti ile uğraşmanız gerekecektir. Arka ışık dört kademede ayarlanabiliyor, ancak tuşlar ışığın geçmesini büyük ölçüde engelliyor.
Dokunmatik yüzey
12 cm x 7 cm boyutlarındaki dokunmatik yüzey, bu yıl oyun dizüstü bilgisayarlarında gördüğümüz en büyük dokunmatik yüzey değil, ancak nispeten yumuşak bir kayma deneyimi sunuyor ve Windows Precision hareketlerini tamamen destekliyor.
Dokunmatik yüzeyin tamamı sol fare düğmesi olarak işlev görür. Bununla birlikte, dokunmatik yüzeyin orta ve alt bölgelerinde tıklamalar üst köşelere kıyasla daha kolay ve daha az gürültülüdür.
Ekran: pWM içermeyen 165 Hz QHD panel
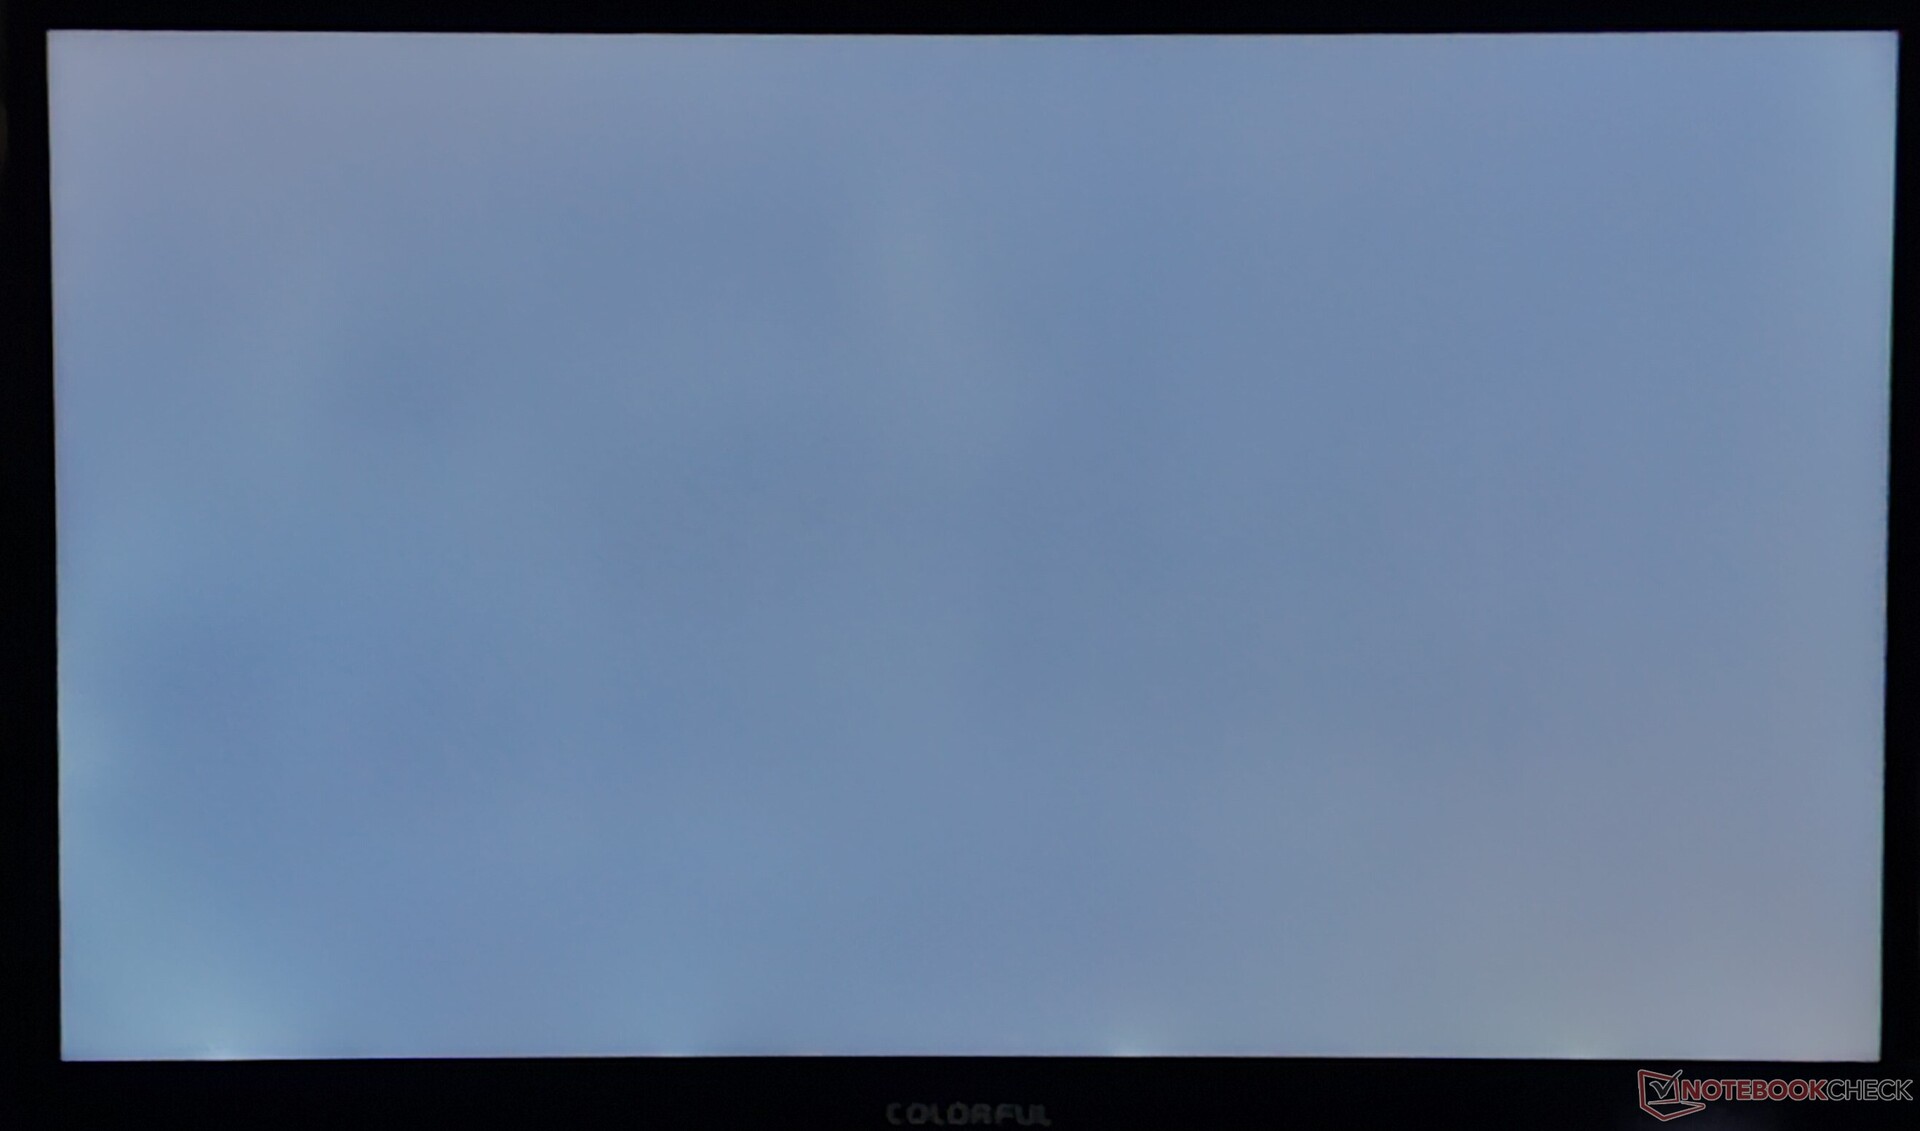
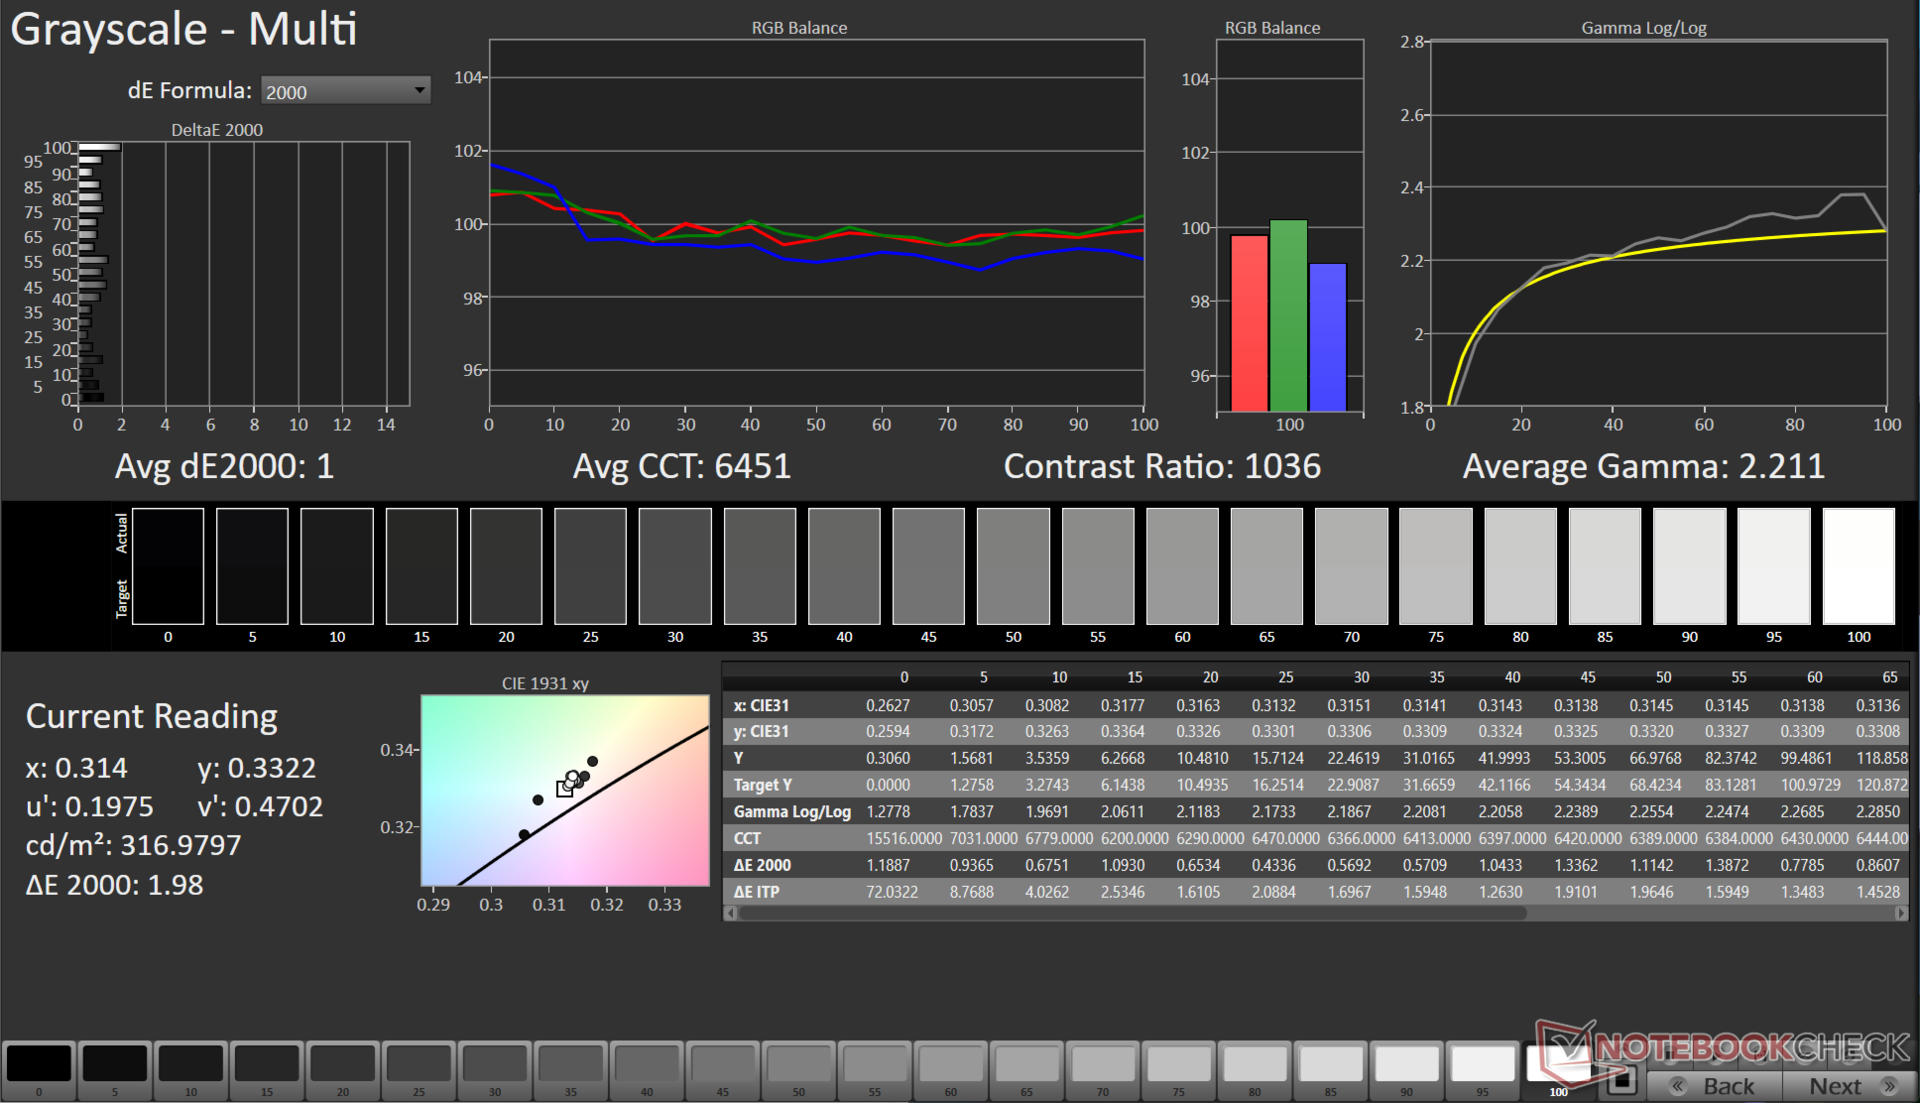
EVOL X15 AT, 15,6 inç QHD 165 Hz BOE panel ile donatılmıştır. Ekran 345 nit tepe ve 318 nit ortalama parlaklığı ile sizi tam olarak şaşırtmıyor, ancak bu fiyattaki çoğu oyun dizüstü bilgisayarıyla aynı seviyede. Köşelerde minimum arka ışık kanaması gözlemleniyor.
Panel %81'lik iyi bir parlaklık dağılımı sergiliyor, ancak ölçülen 607:1 kontrast oranı, özellikle bu karşılaştırmadaki diğer BOE panellerle karşılaştırıldığında alt uçta yer alıyor.

| |||||||||||||||||||||||||
Aydınlatma: 81 %
Batarya modunda parlaklık: 251 cd/m²
Kontrast: 607:1 (Siyah: 0.57 cd/m²)
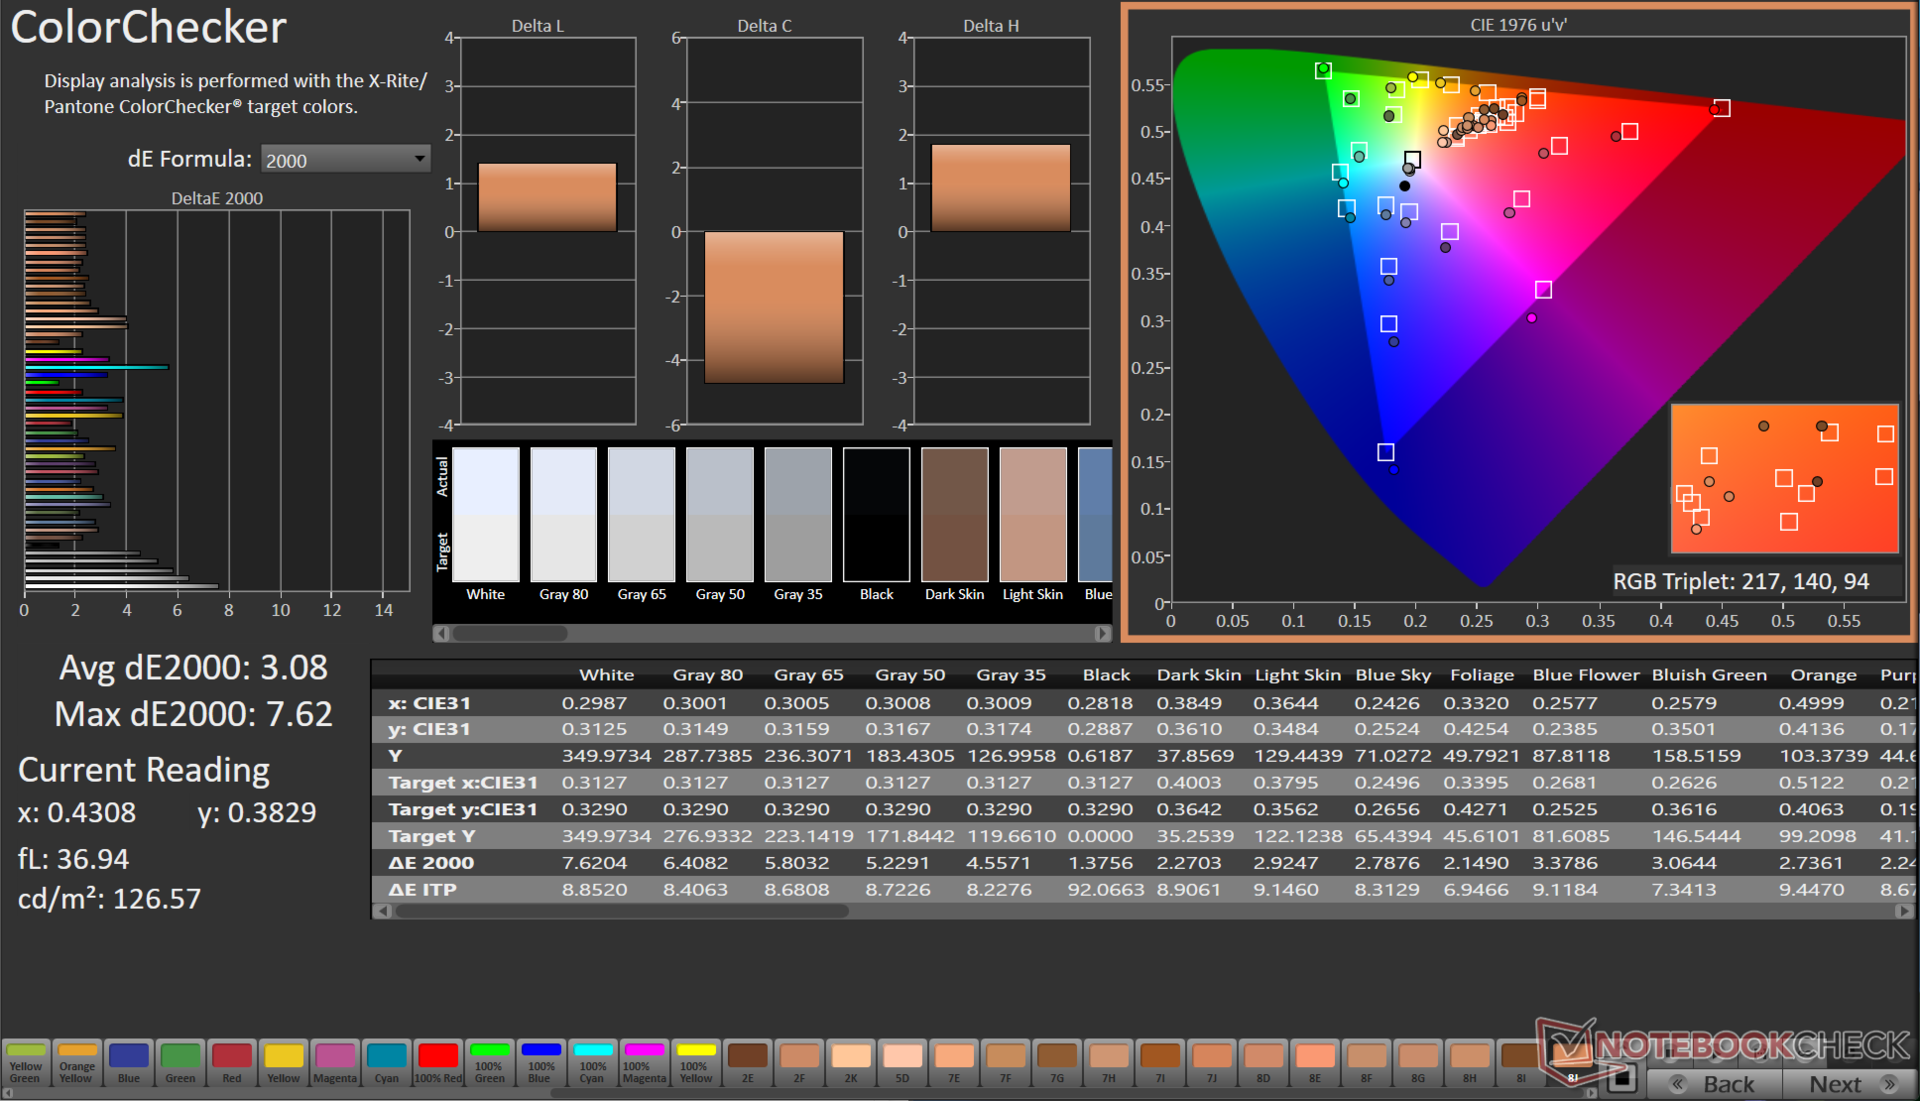
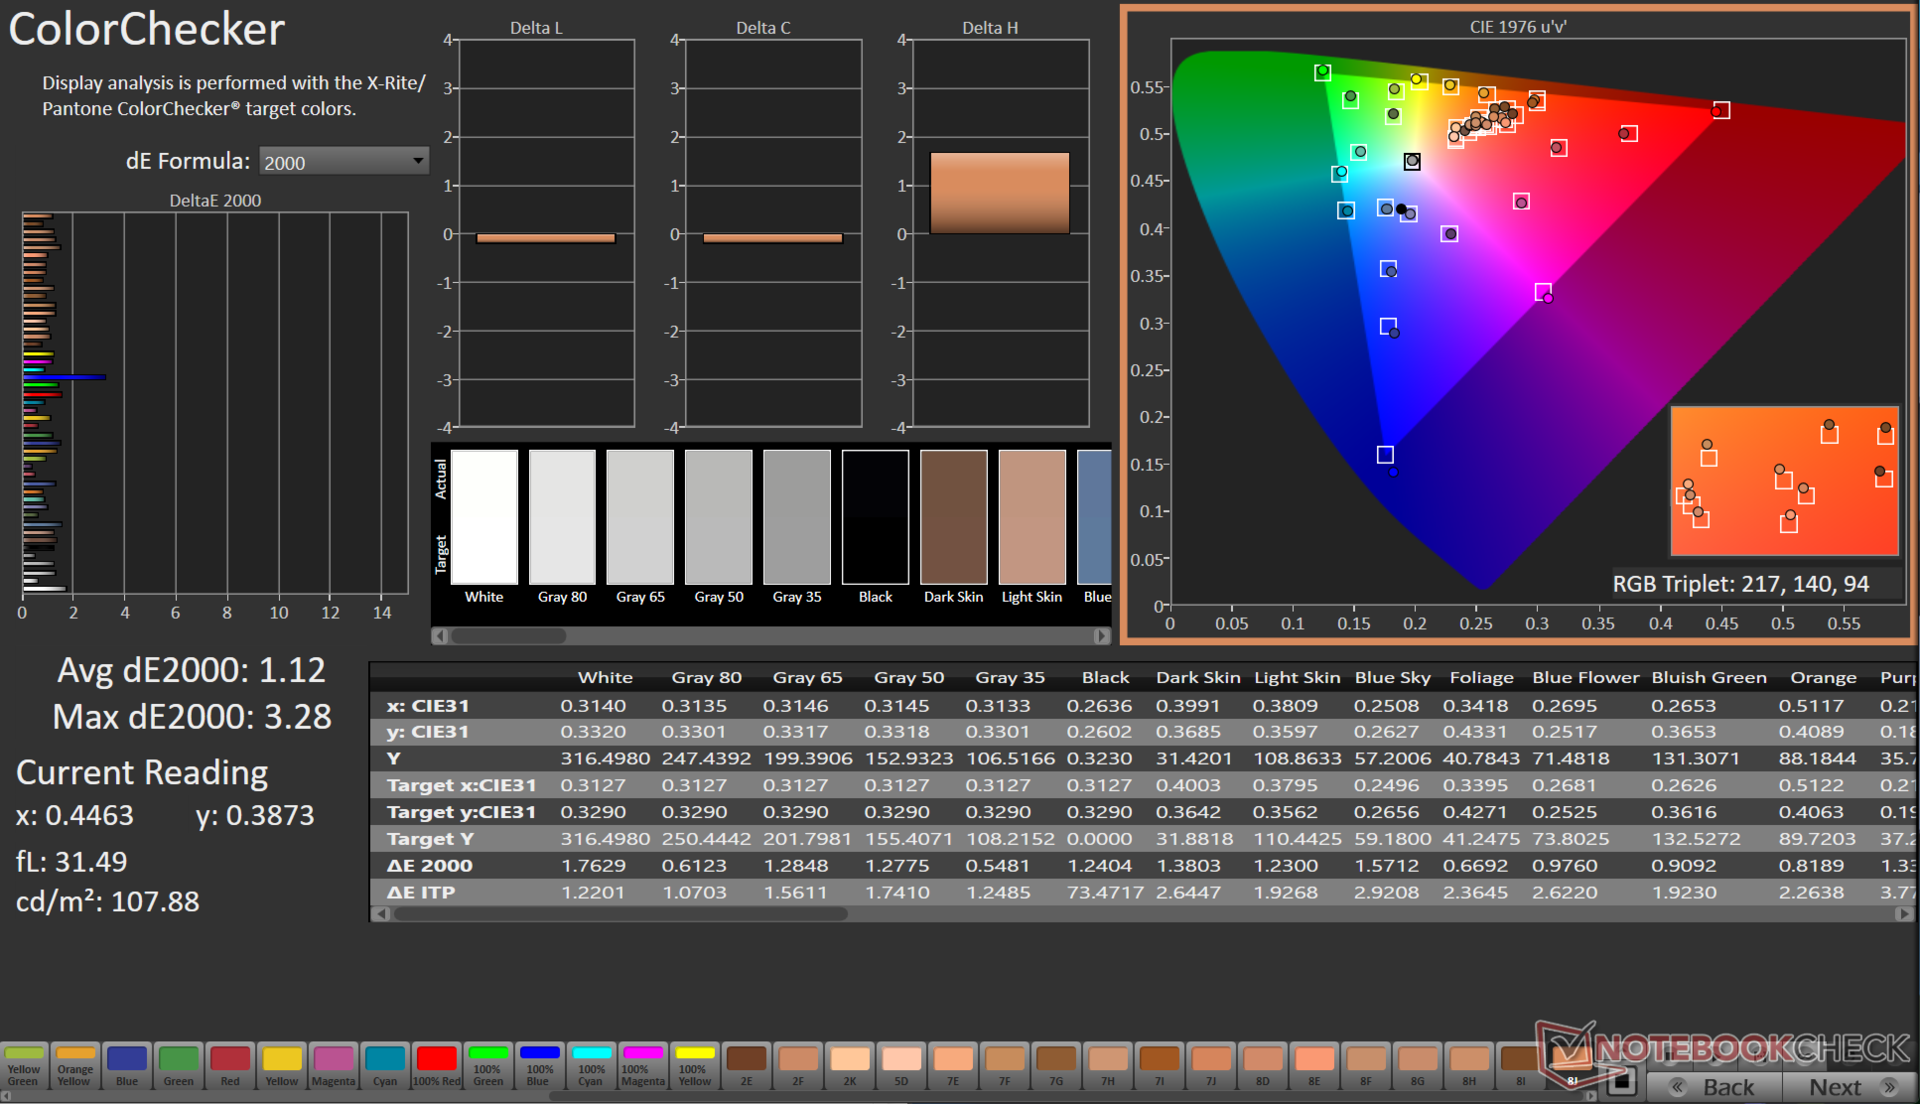
ΔE ColorChecker Calman: 3.08 | ∀{0.5-29.43 Ø4.71}
calibrated: 1.12
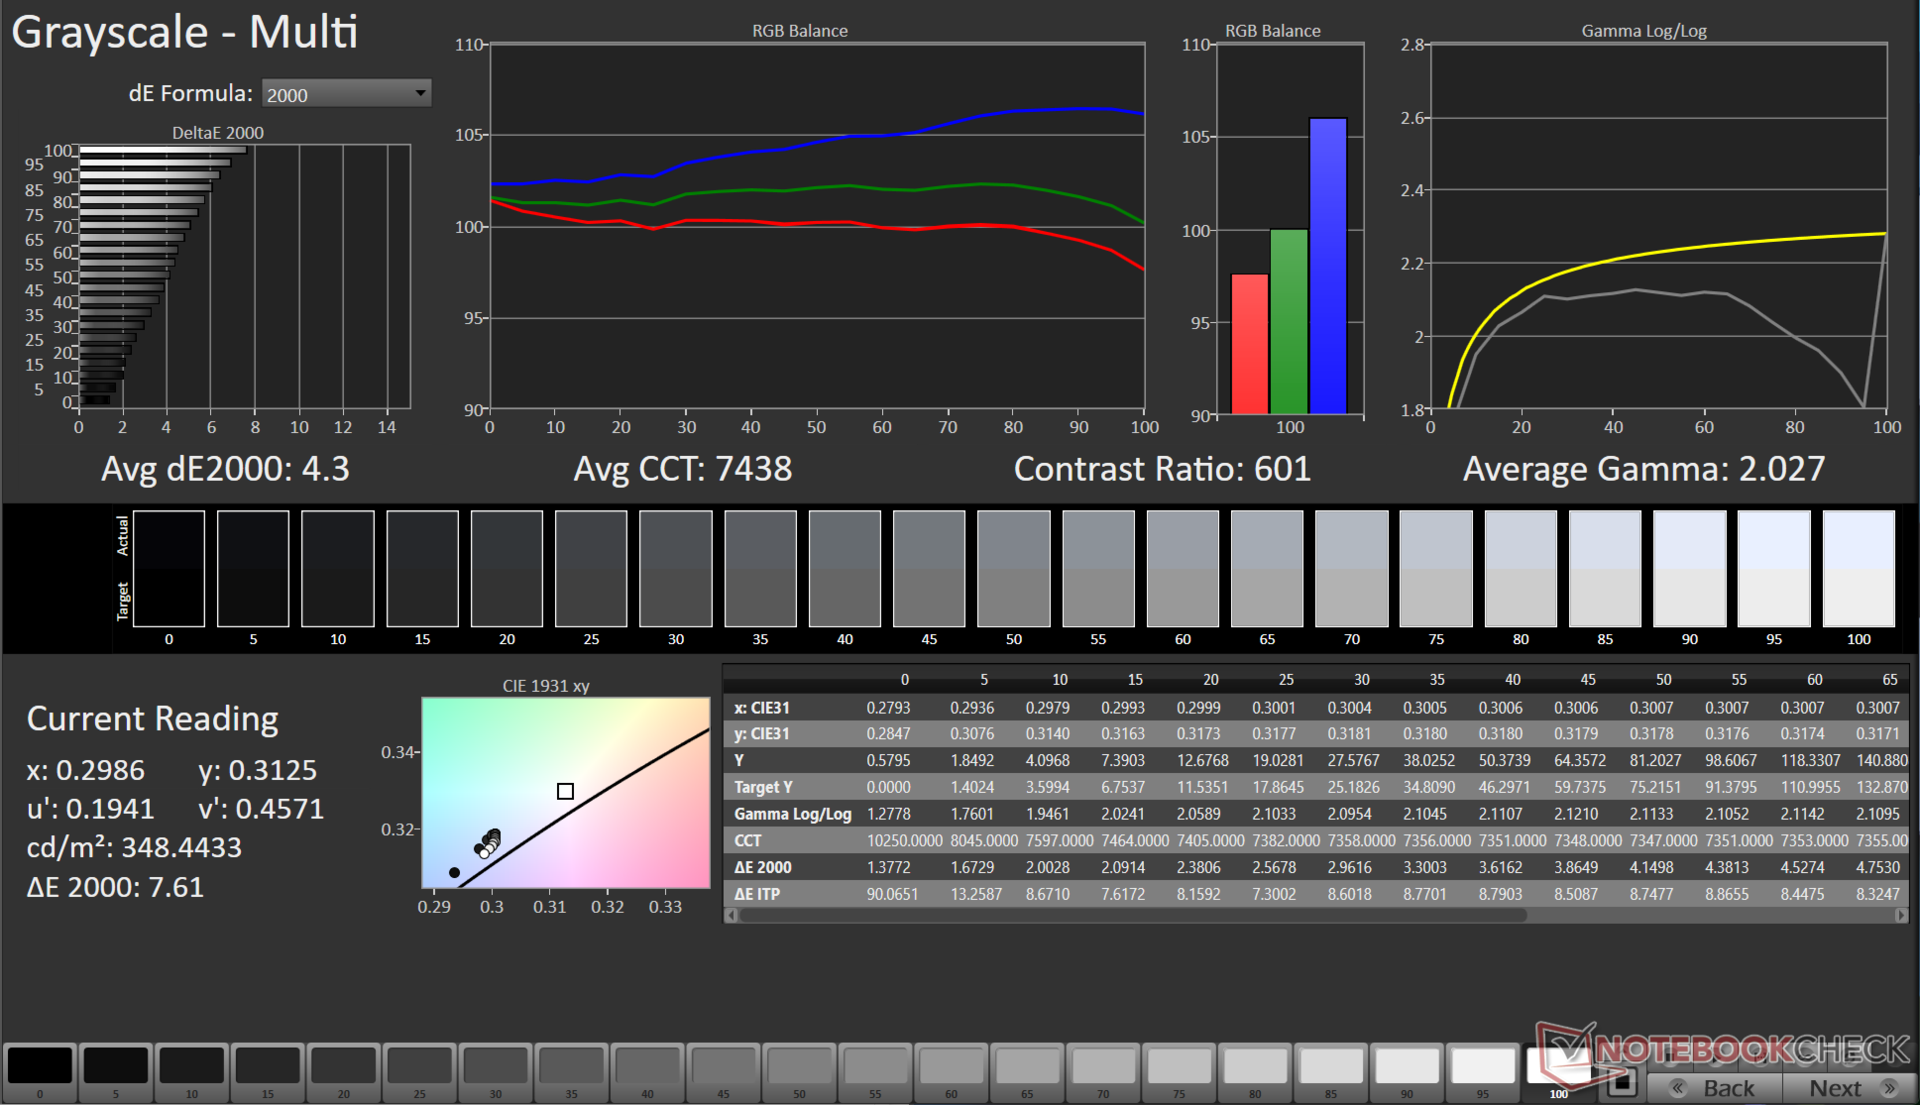
ΔE Greyscale Calman: 4.3 | ∀{0.09-98 Ø4.96}
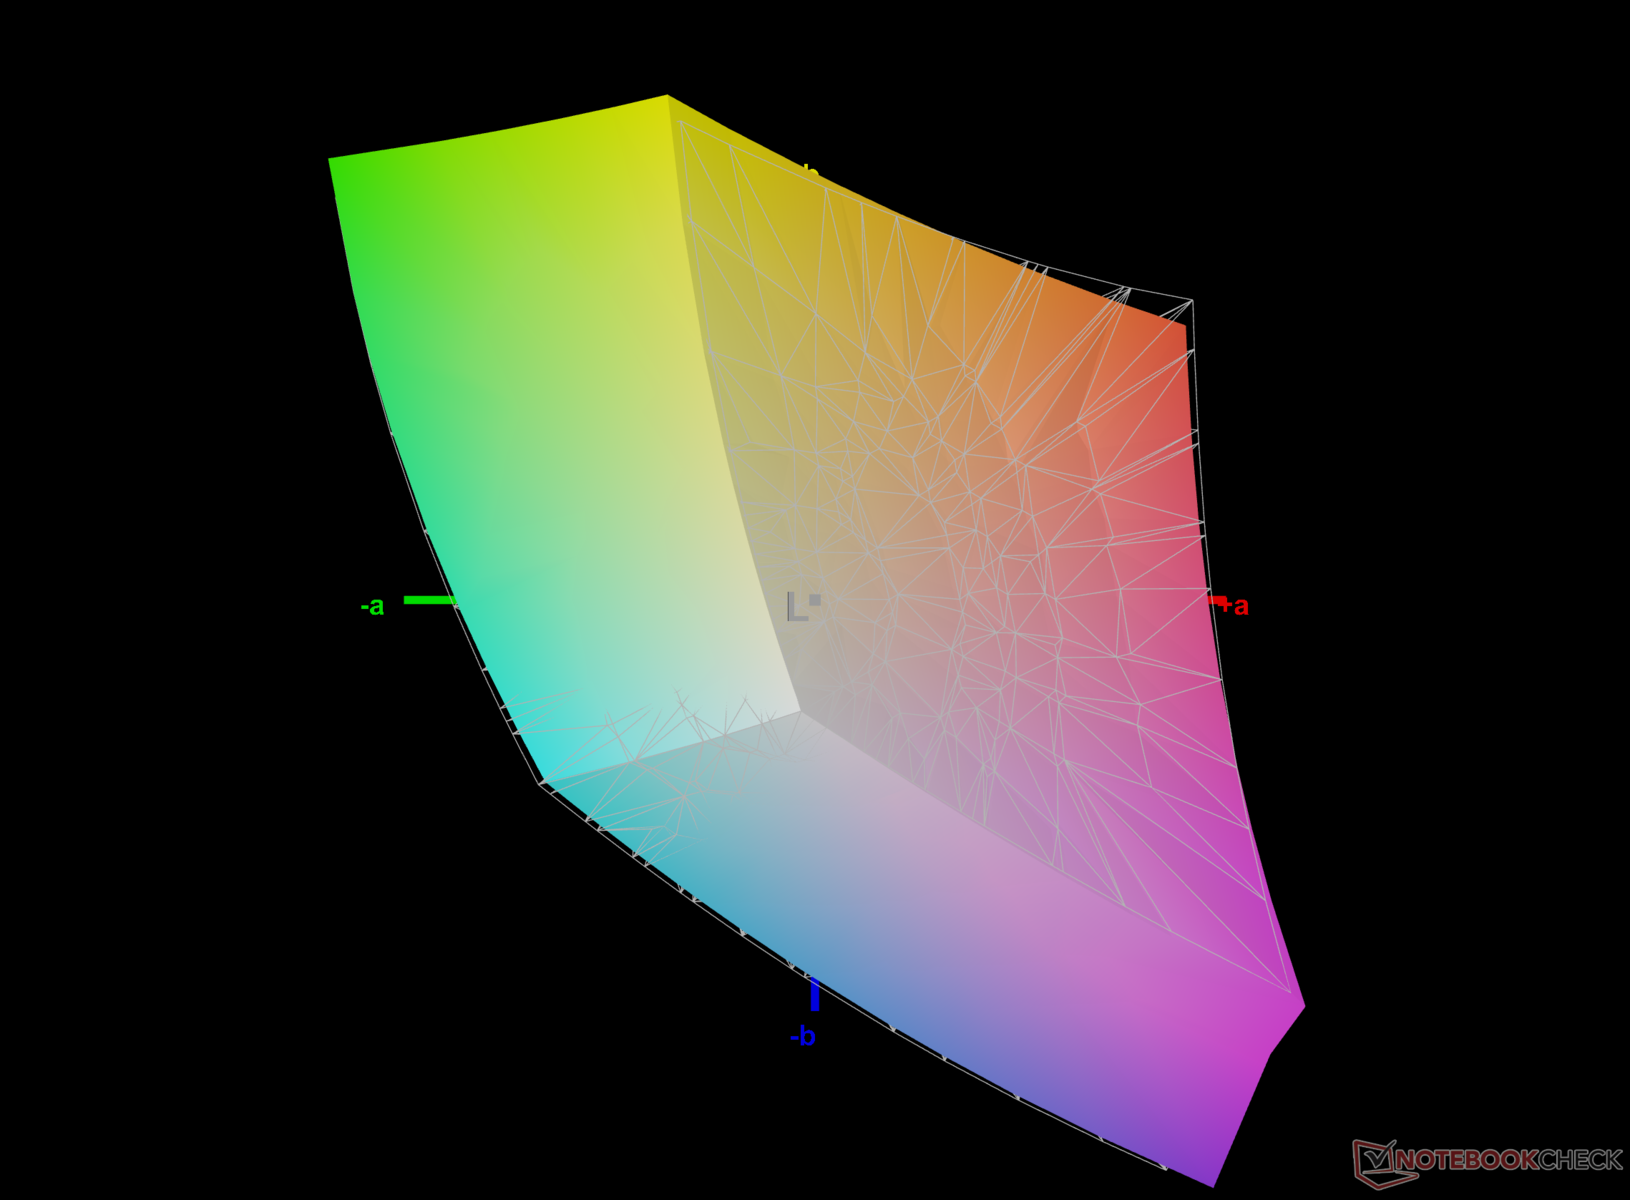
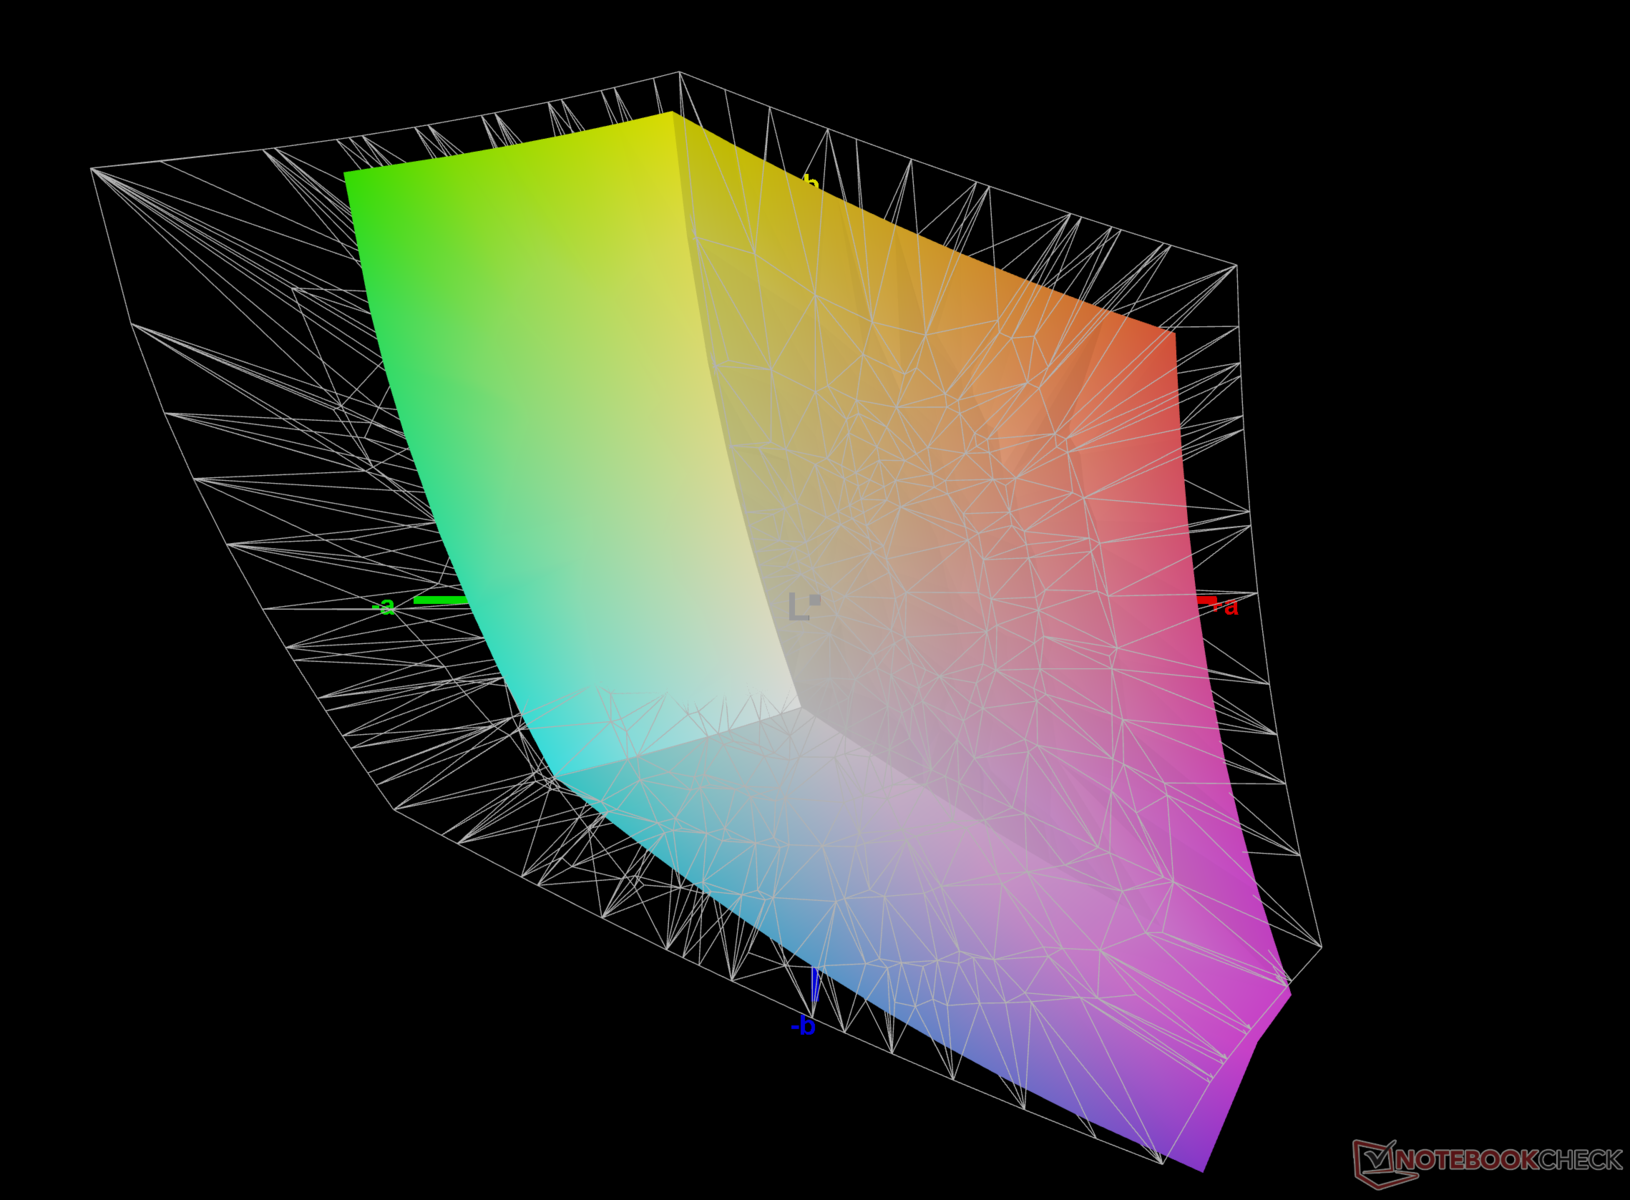
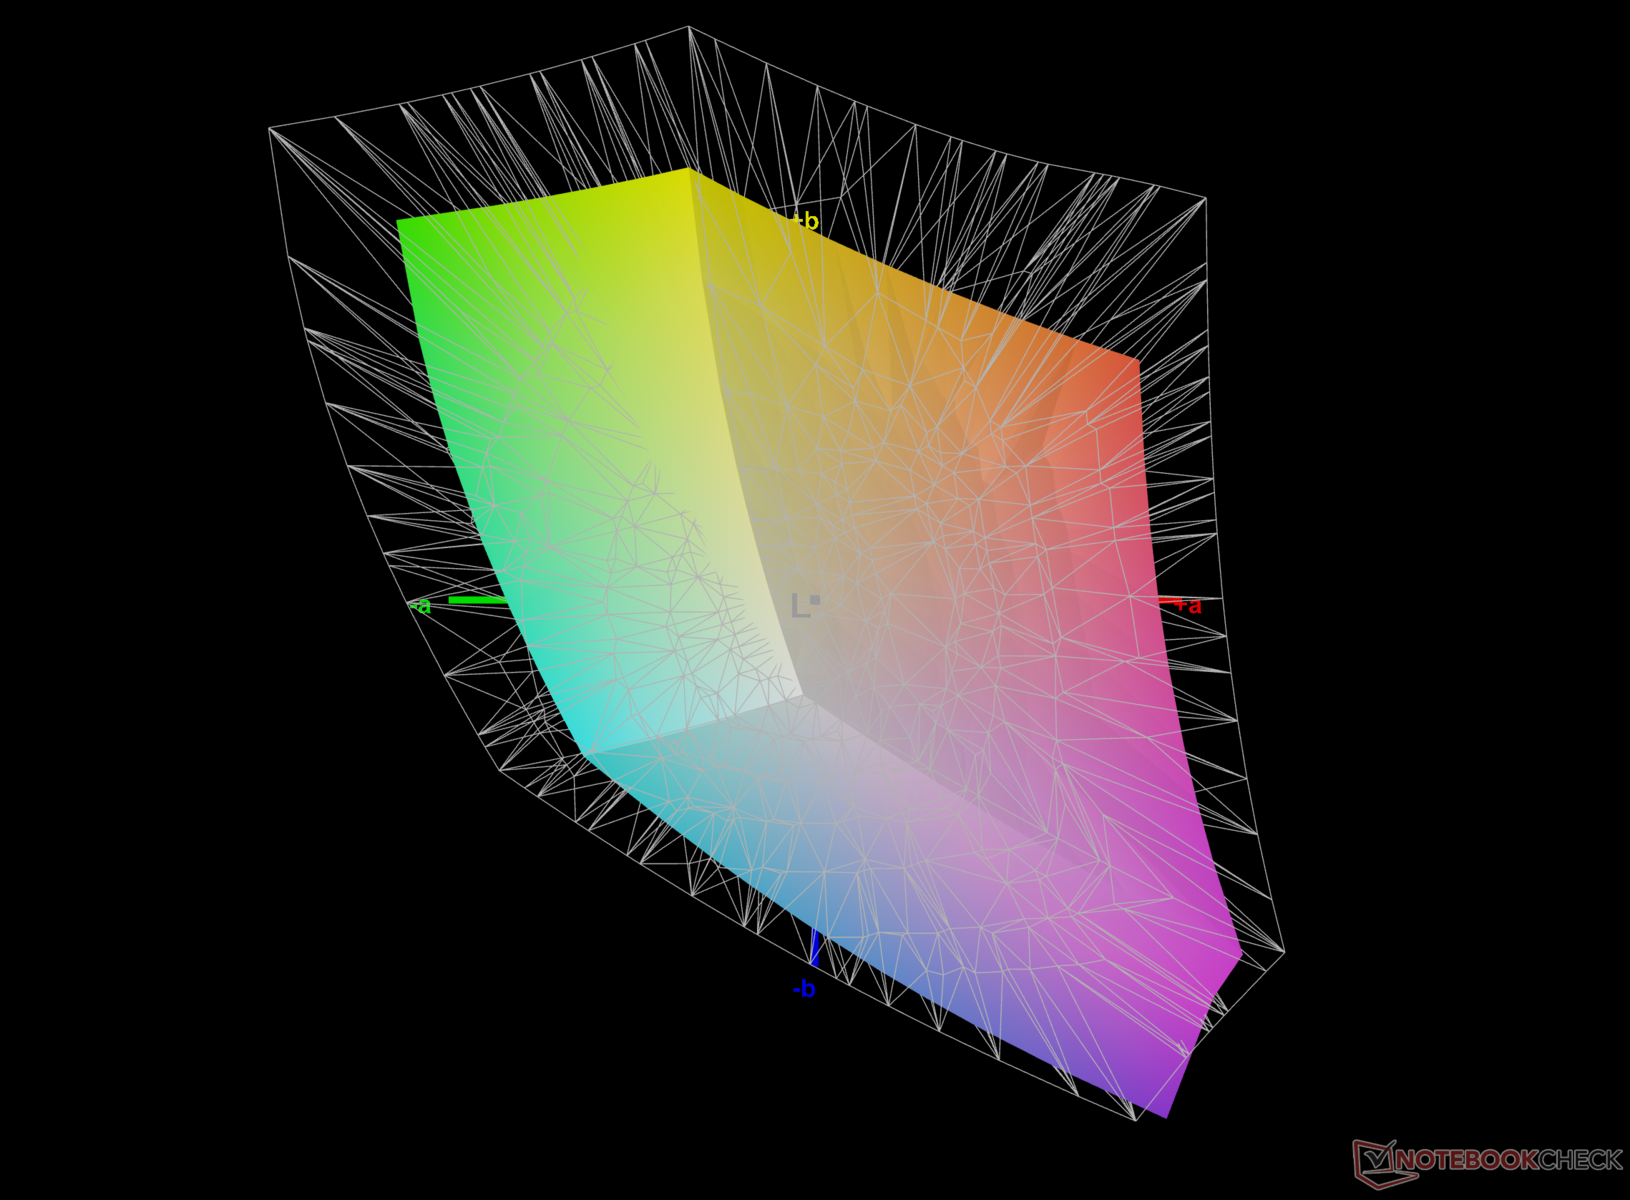
68.2% AdobeRGB 1998 (Argyll 3D)
97.4% sRGB (Argyll 3D)
66.9% Display P3 (Argyll 3D)
Gamma: 2.02
CCT: 7438 K
| Colorful EVOL X15 AT 23 BOE CQ NE156QHM-NY2, IPS, 2560x1440, 15.6" | Alienware m16 R1 Intel BOE NE16NYB, IPS, 2560x1600, 16" | HP Omen 16-wf000 BOE0B7D, IPS, 2560x1440, 16.1" | Acer Predator Helios 16 PH16-71-731Q BOE NE160QDM-NZ2, IPS-LED, 2560x1600, 16" | Dell G15 5530 AUO B156HAN, IPS, 1920x1080, 15.6" | Schenker XMG Pro 15 (E23) BOE0AD1, IPS, 2560x1440, 15.6" | Alienware m16 R1 AMD BOE NE16NZ4, IPS, 2560x1600, 16" | Uniwill GM6PX7X RTX 4070 BOE CQ NE160QDM-NZ1, IPS, 2560x1600, 16" | |
|---|---|---|---|---|---|---|---|---|
| Display | 1% | 3% | 24% | 6% | 25% | 27% | 0% | |
| Display P3 Coverage (%) | 66.9 | 67.7 1% | 69 3% | 97.1 45% | 73.1 9% | 97.8 46% | 98.6 47% | 67.5 1% |
| sRGB Coverage (%) | 97.4 | 97.2 0% | 99.2 2% | 100 3% | 98.4 1% | 99.9 3% | 99.9 3% | 96.4 -1% |
| AdobeRGB 1998 Coverage (%) | 68.2 | 70 3% | 71.2 4% | 84.7 24% | 74.4 9% | 85.4 25% | 88.9 30% | 68.6 1% |
| Response Times | 35% | 16% | -7% | 49% | -29% | 18% | -23% | |
| Response Time Grey 50% / Grey 80% * (ms) | 10.42 ? | 4 ? 62% | 4.6 ? 56% | 13.6 ? -31% | 3.39 ? 67% | 14 ? -34% | 5.1 ? 51% | 12.6 ? -21% |
| Response Time Black / White * (ms) | 7.81 ? | 7.3 ? 7% | 9.7 ? -24% | 6.4 ? 18% | 5.35 ? 31% | 9.6 ? -23% | 9 ? -15% | 9.8 ? -25% |
| PWM Frequency (Hz) | 21620 ? | |||||||
| Screen | 24% | 28% | 42% | 7% | 12% | 0% | 22% | |
| Brightness middle (cd/m²) | 346 | 306 -12% | 310.9 -10% | 511 48% | 320 -8% | 322 -7% | 329 -5% | 338.6 -2% |
| Brightness (cd/m²) | 318 | 302 -5% | 296 -7% | 498 57% | 316 -1% | 301 -5% | 317 0% | 328 3% |
| Brightness Distribution (%) | 81 | 89 10% | 91 12% | 94 16% | 94 16% | 85 5% | 89 10% | 89 10% |
| Black Level * (cd/m²) | 0.57 | 0.3 47% | 0.35 39% | 0.36 37% | 0.21 63% | 0.36 37% | 0.32 44% | 0.32 44% |
| Contrast (:1) | 607 | 1020 68% | 888 46% | 1419 134% | 1524 151% | 894 47% | 1028 69% | 1058 74% |
| Colorchecker dE 2000 * | 3.08 | 2.57 17% | 2.18 29% | 1.76 43% | 4.55 -48% | 1.98 36% | 3.71 -20% | 2.18 29% |
| Colorchecker dE 2000 max. * | 7.62 | 4.26 44% | 3.58 53% | 3.7 51% | 9.83 -29% | 5.24 31% | 7.23 5% | 7.14 6% |
| Colorchecker dE 2000 calibrated * | 1.12 | 0.85 24% | 0.52 54% | 1.56 -39% | 1.51 -35% | 1.98 -77% | 2.82 -152% | 0.93 17% |
| Greyscale dE 2000 * | 4.3 | 3.3 23% | 2.8 35% | 3 30% | 6.2 -44% | 2.44 43% | 2.2 49% | 3.7 14% |
| Gamma | 2.02 109% | 1.997 110% | 2.18 101% | 2.33 94% | 2.07 106% | 2.42 91% | 2.3 96% | 2.18 101% |
| CCT | 7438 87% | 6895 94% | 6002 108% | 6341 103% | 6479 100% | 6984 93% | 6270 104% | 7245 90% |
| Toplam Ortalama (Program / Ayarlar) | 20% /
21% | 16% /
21% | 20% /
31% | 21% /
13% | 3% /
9% | 15% /
8% | -0% /
11% |
* ... daha küçük daha iyidir
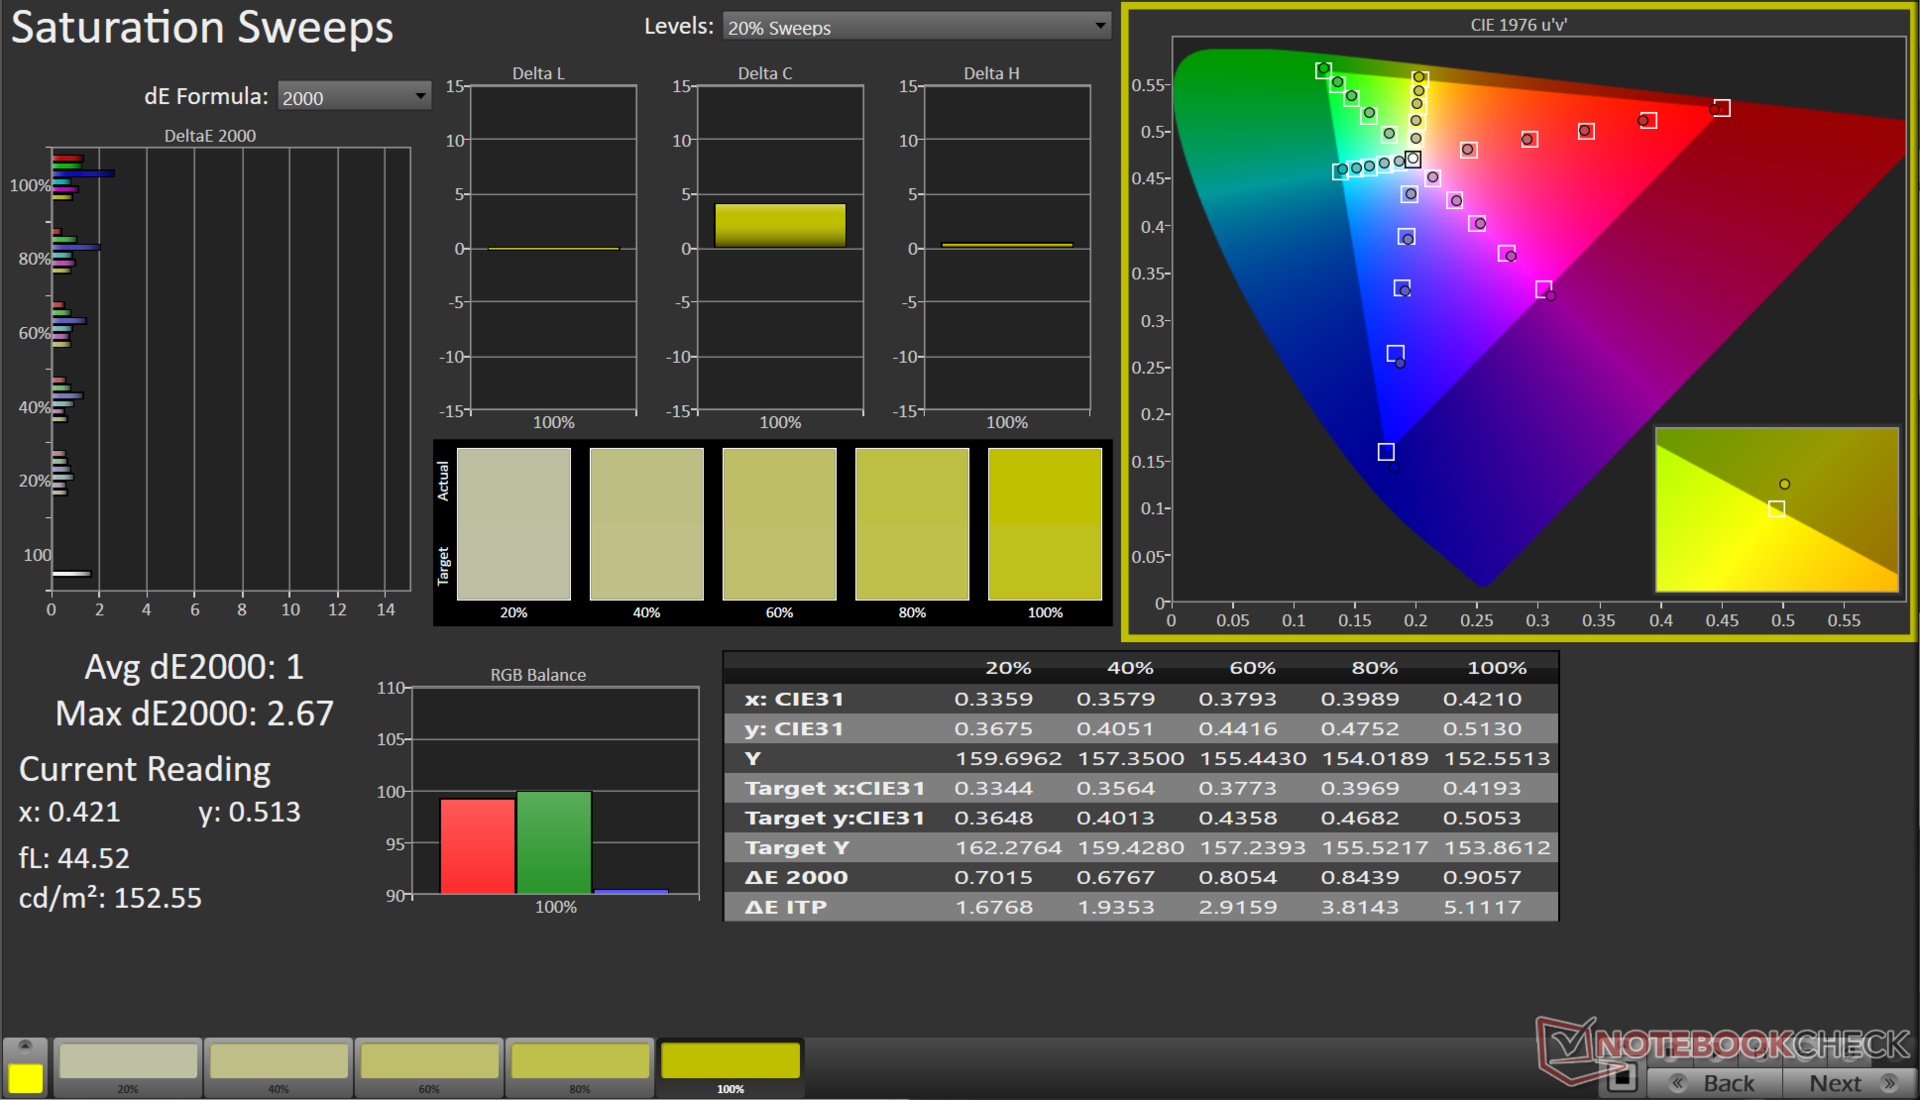
EVOL X15 içerik oluşturucuları hedeflemiyor, ancak %97 sRGB kapsamı oyun, web ve temel düzenlemeler için iyi bir sonuç veriyor. EVOL X15'in yetenekli donanımından yararlanmak isteyen içerik oluşturucular, renk performansını artırmak için harici bir ekran kullanabilirler.
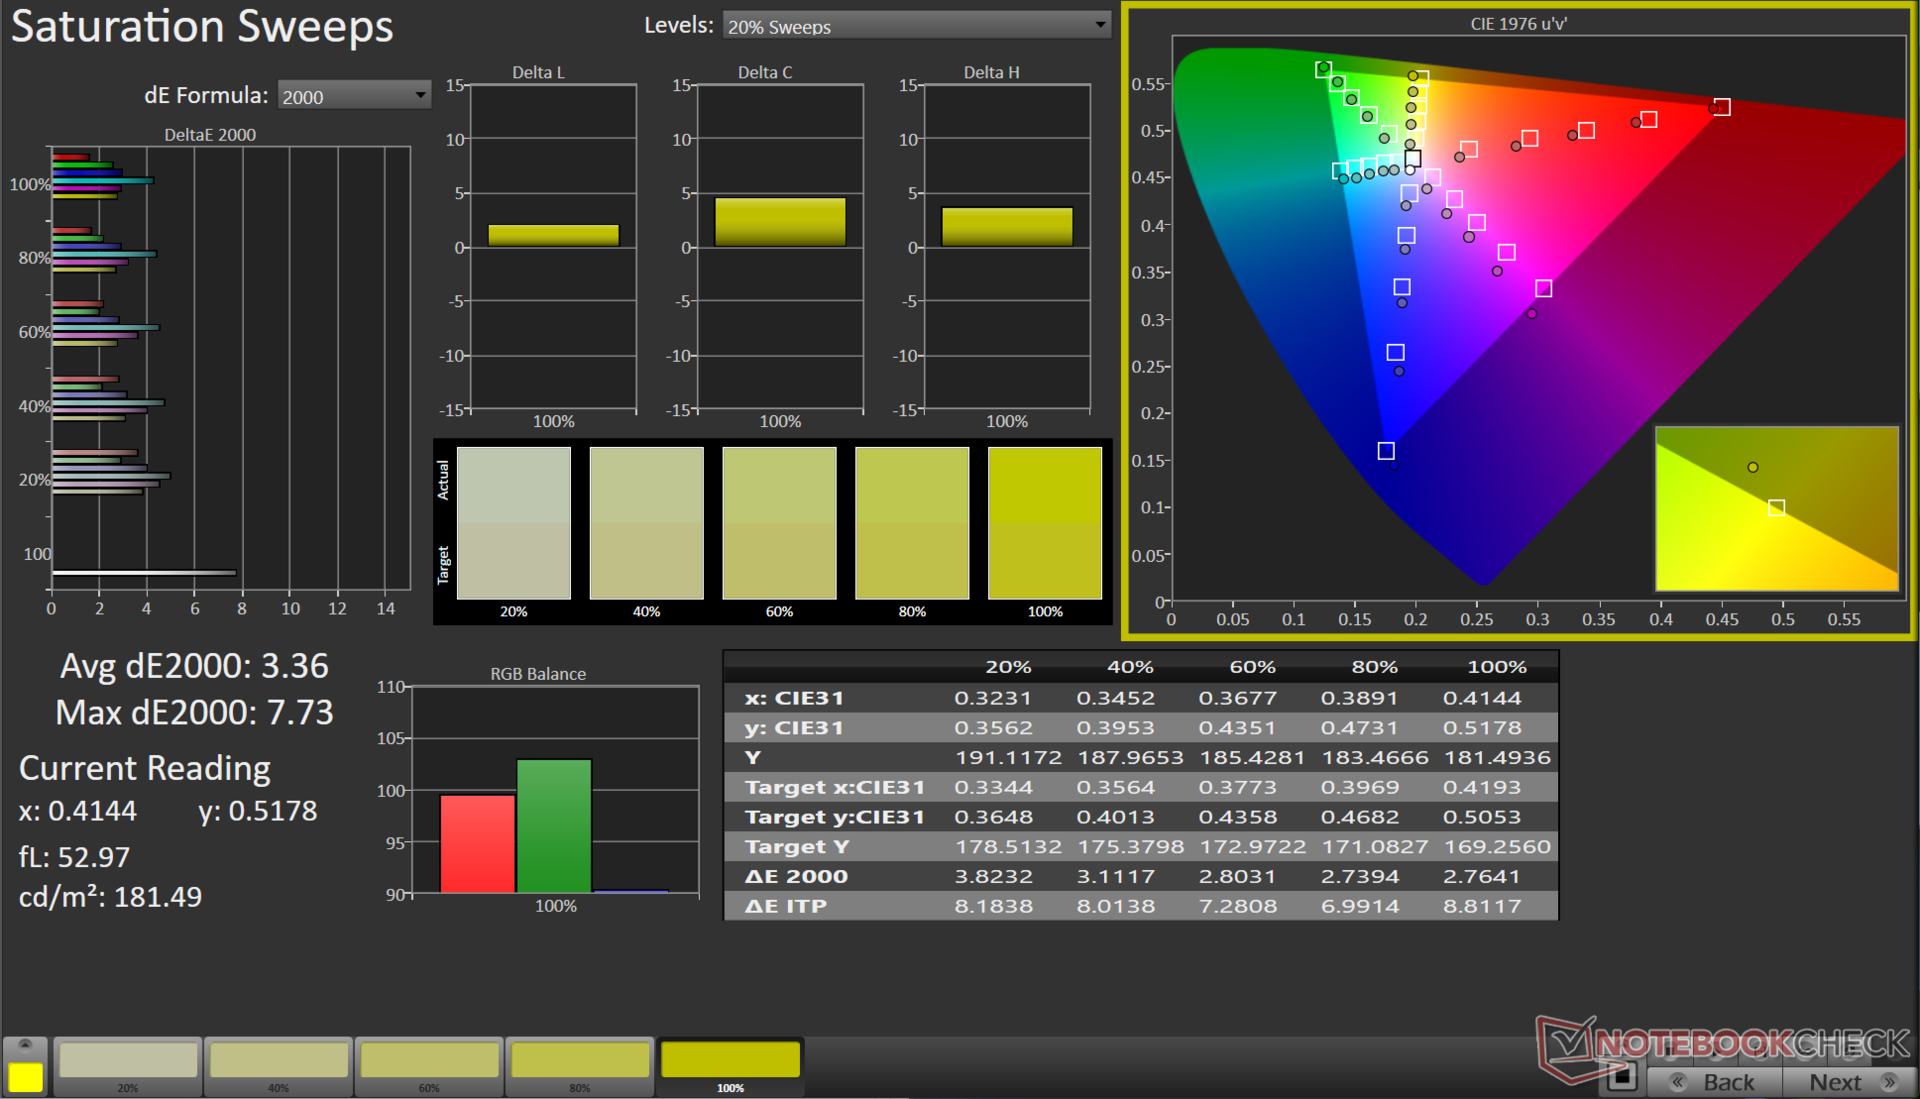
Ekranın kullanıma hazır renk üretimi, ortalama Grayscale ve ColorChecker Delta E 2000 değerleri sırasıyla 4,3 ve 3,08 ile çoğunlukla kullanılabilir.
X-Rite i1Basic Pro 3 spektrofotometre ve Portrait Display'in Calman Ultimate yazılımını kullanan kalibrasyon rutinimiz, bu karşılık gelen değerleri 1 ve 1,12'ye önemli ölçüde iyileştirmektedir.
Kalibre edilmiş ICC dosyası yukarıdaki bağlantıdan indirilebilir.
Yanıt Sürelerini Görüntüle
| ↔ Tepki Süresi Siyahtan Beyaza | ||
|---|---|---|
| 7.81 ms ... yükseliş ↗ ve sonbahar↘ birleşimi | ↗ 4.01 ms yükseliş | 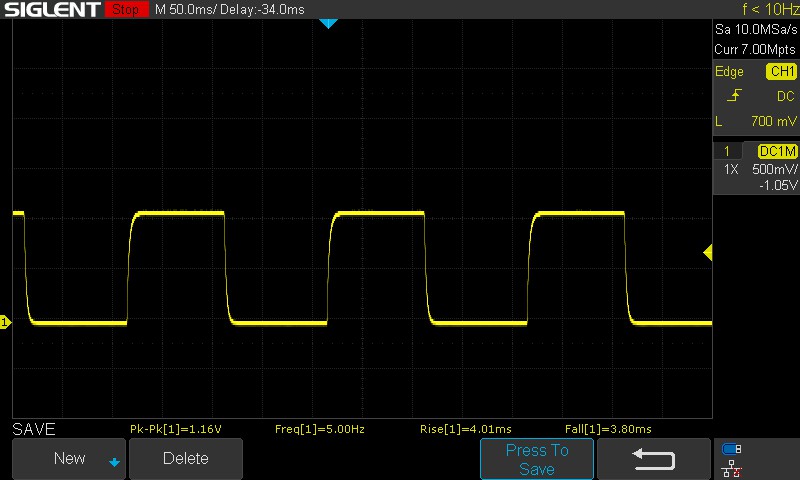 |
| ↘ 3.8 ms sonbahar | ||
| Ekran, testlerimizde çok hızlı yanıt oranları gösteriyor ve hızlı oyun oynamaya çok uygun olmalı. Karşılaştırıldığında, test edilen tüm cihazlar 0.1 (minimum) ile 240 (maksimum) ms arasında değişir. » Tüm cihazların 22 %'si daha iyi. Bu, ölçülen yanıt süresinin test edilen tüm cihazların ortalamasından (19.8 ms) daha iyi olduğu anlamına gelir. | ||
| ↔ Tepki Süresi %50 Griden %80 Griye | ||
| 10.42 ms ... yükseliş ↗ ve sonbahar↘ birleşimi | ↗ 4.73 ms yükseliş | 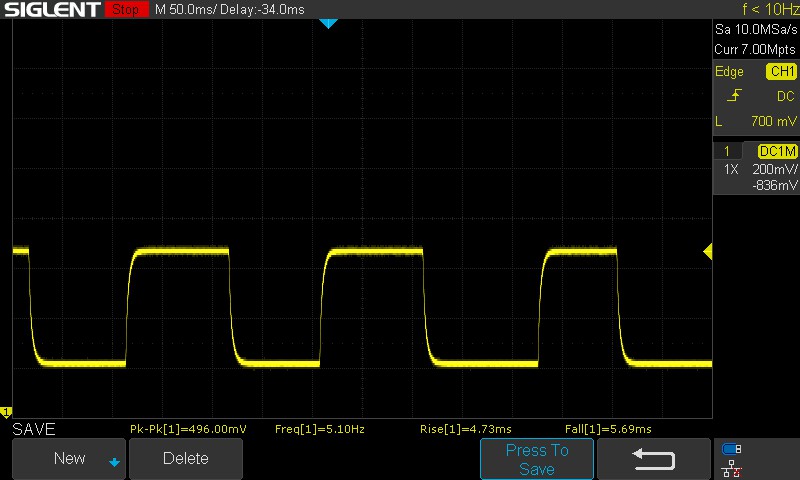 |
| ↘ 5.69 ms sonbahar | ||
| Ekran, testlerimizde iyi yanıt oranları gösteriyor ancak rekabetçi oyuncular için çok yavaş olabilir. Karşılaştırıldığında, test edilen tüm cihazlar 0.165 (minimum) ile 636 (maksimum) ms arasında değişir. » Tüm cihazların 24 %'si daha iyi. Bu, ölçülen yanıt süresinin test edilen tüm cihazların ortalamasından (30.9 ms) daha iyi olduğu anlamına gelir. | ||
Tepki süreleri çoğu oyun ihtiyacı için yeterli. EVOL X15 AT'nin paneli overdrive kullanmıyor ve bunu etkinleştirmek için bir seçenek yok, bu da% 50 griden% 80 griye geçiş sürelerini daha da azaltmaya yardımcı olabilirdi.
Ekran Titremesi / PWM (Darbe Genişliği Modülasyonu)
| Ekran titriyor / PWM algılanmadı | ≤ 100 % parlaklık ayarı | 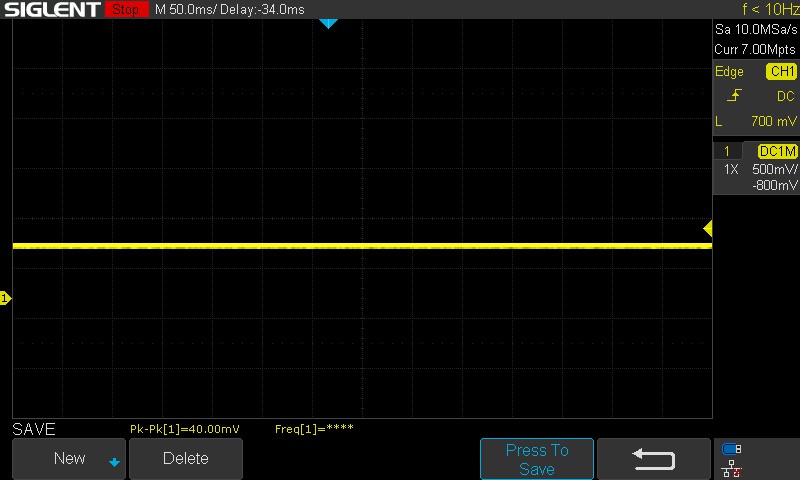 | |
Karşılaştırıldığında: Test edilen tüm cihazların %52 %'si ekranı karartmak için PWM kullanmıyor. PWM tespit edilirse, ortalama 7744 (minimum: 5 - maksimum: 343500) Hz ölçüldü. | |||
Test edilen parlaklık seviyelerinin hiçbirinde PWM veya titreme tespit etmedik.
Daha fazla bilgi için makalemize bakın, "PWM neden bu kadar baş ağrısıdır?" ve ayrıca bizim PWM Sıralama tablosu.
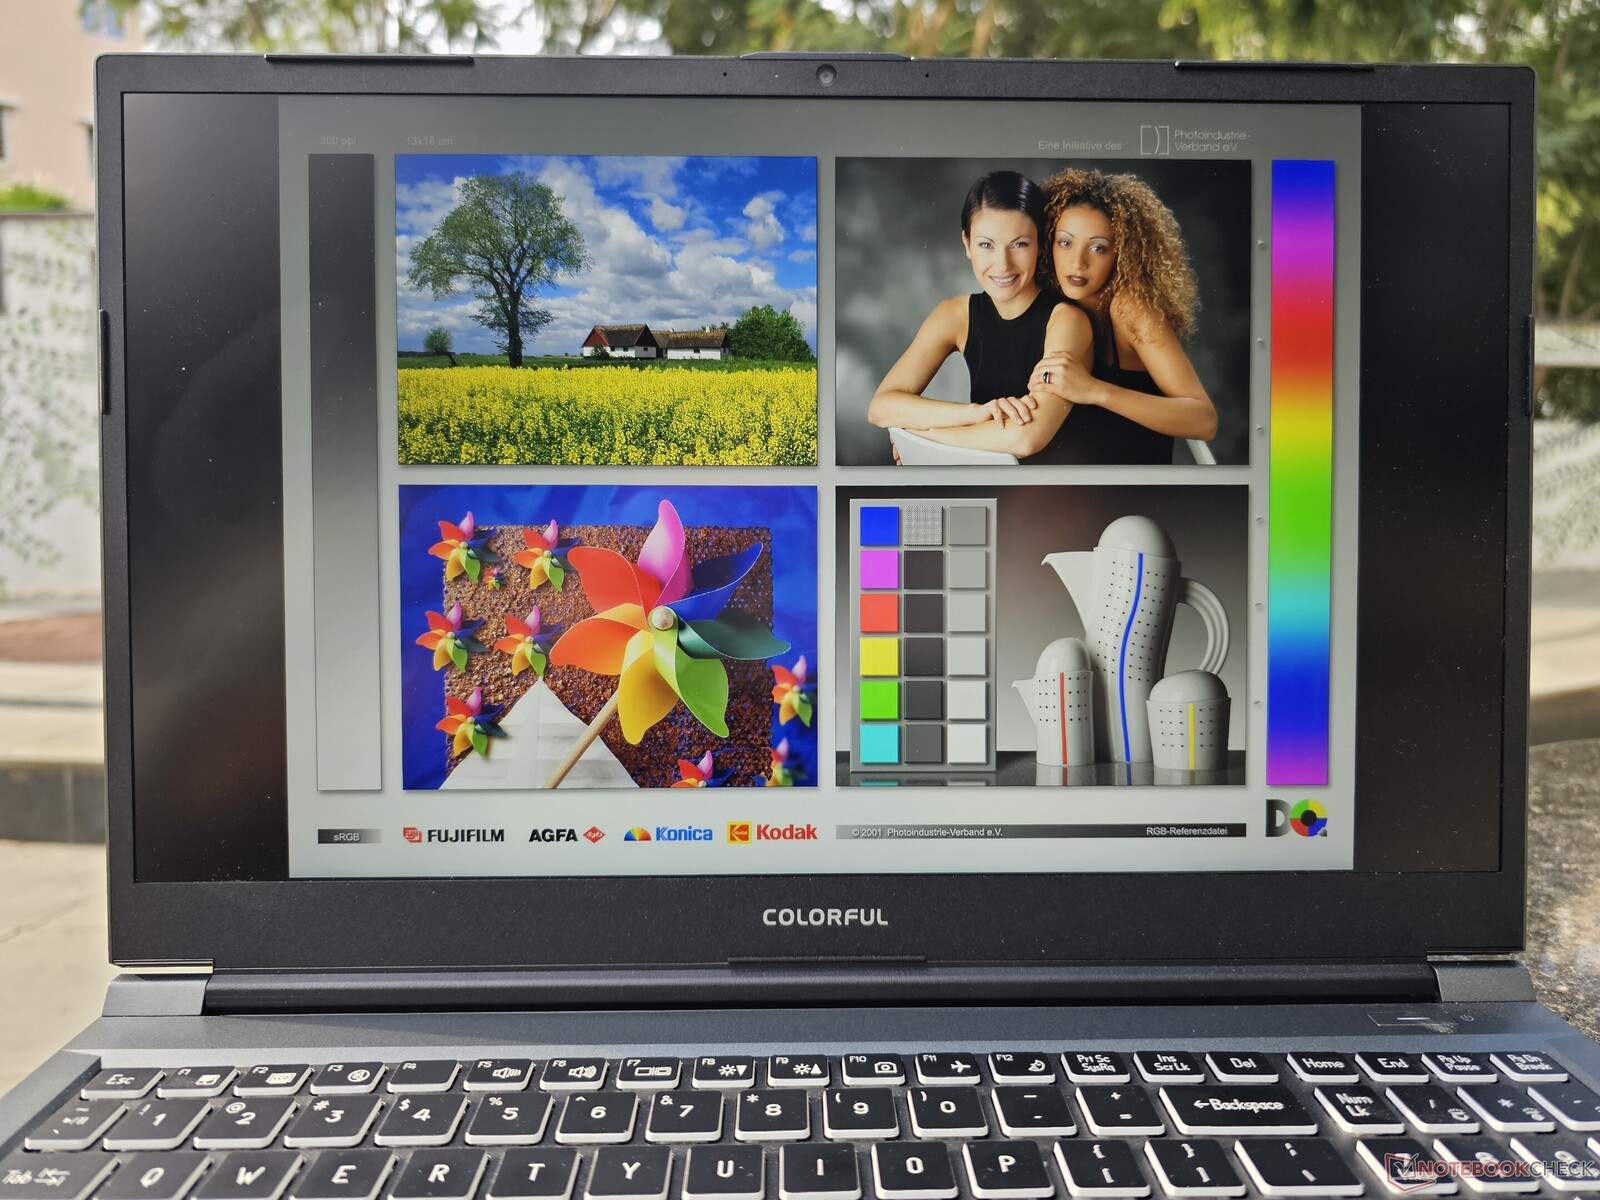
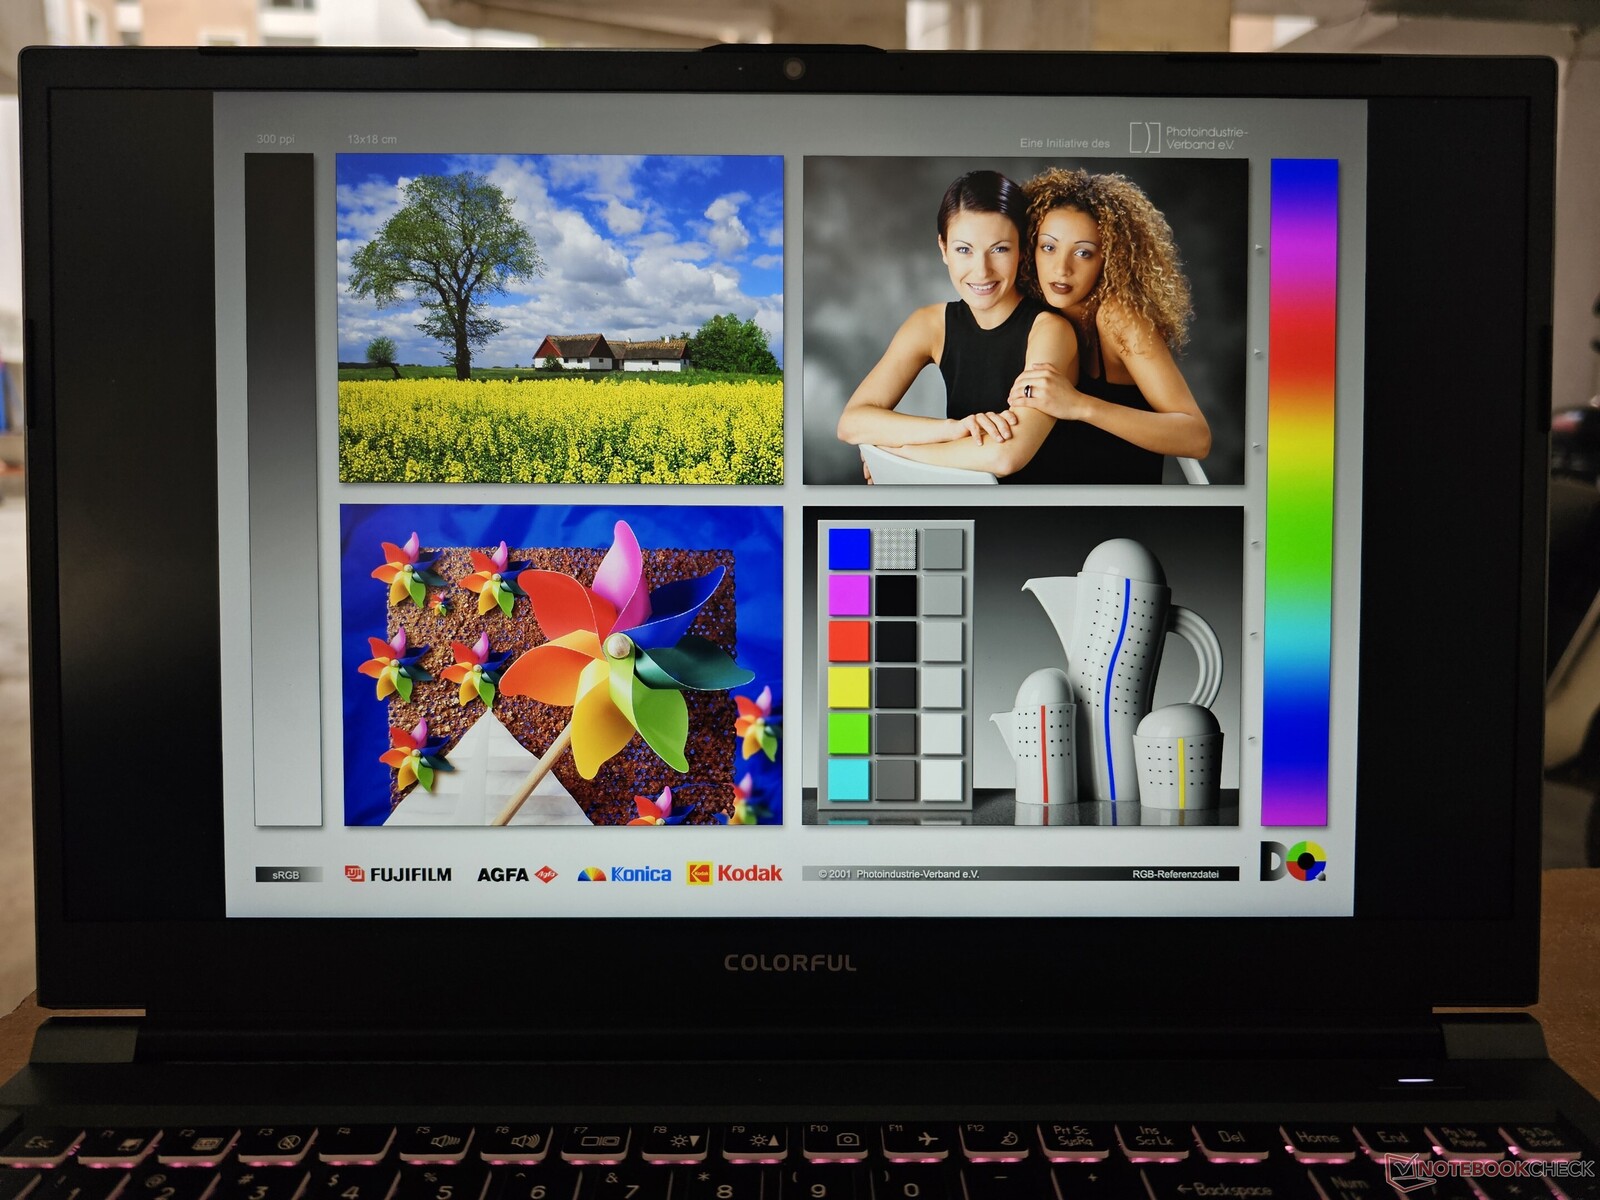
Dış mekanda görüntüleme iyidir, ancak ekranın parlaklığı doğrudan sert güneş ışığında kullanım için yeterli olmayabilir. Görüntüleme açıları, uç noktalarda yalnızca küçük parlaklık kayıplarıyla nispeten sabittir.

Performans: Core i7-13700HX ve RTX 4060, orta sınıf AAA oyunlar için iyi bir seçenek
Renkli EVOL X15 AT her ikisi ile de mevcuttur Intel Core i5-13500HX ve Core i7-13700HX seçeneklerine karşılık gelen GPU seçenekleri şunlardır Nvidia GeForce RTX 4050 Dizüstü Bilgisayar GPU'su ve RTX 4060 Dizüstü Bilgisayar GPU'su.
Test Koşulları
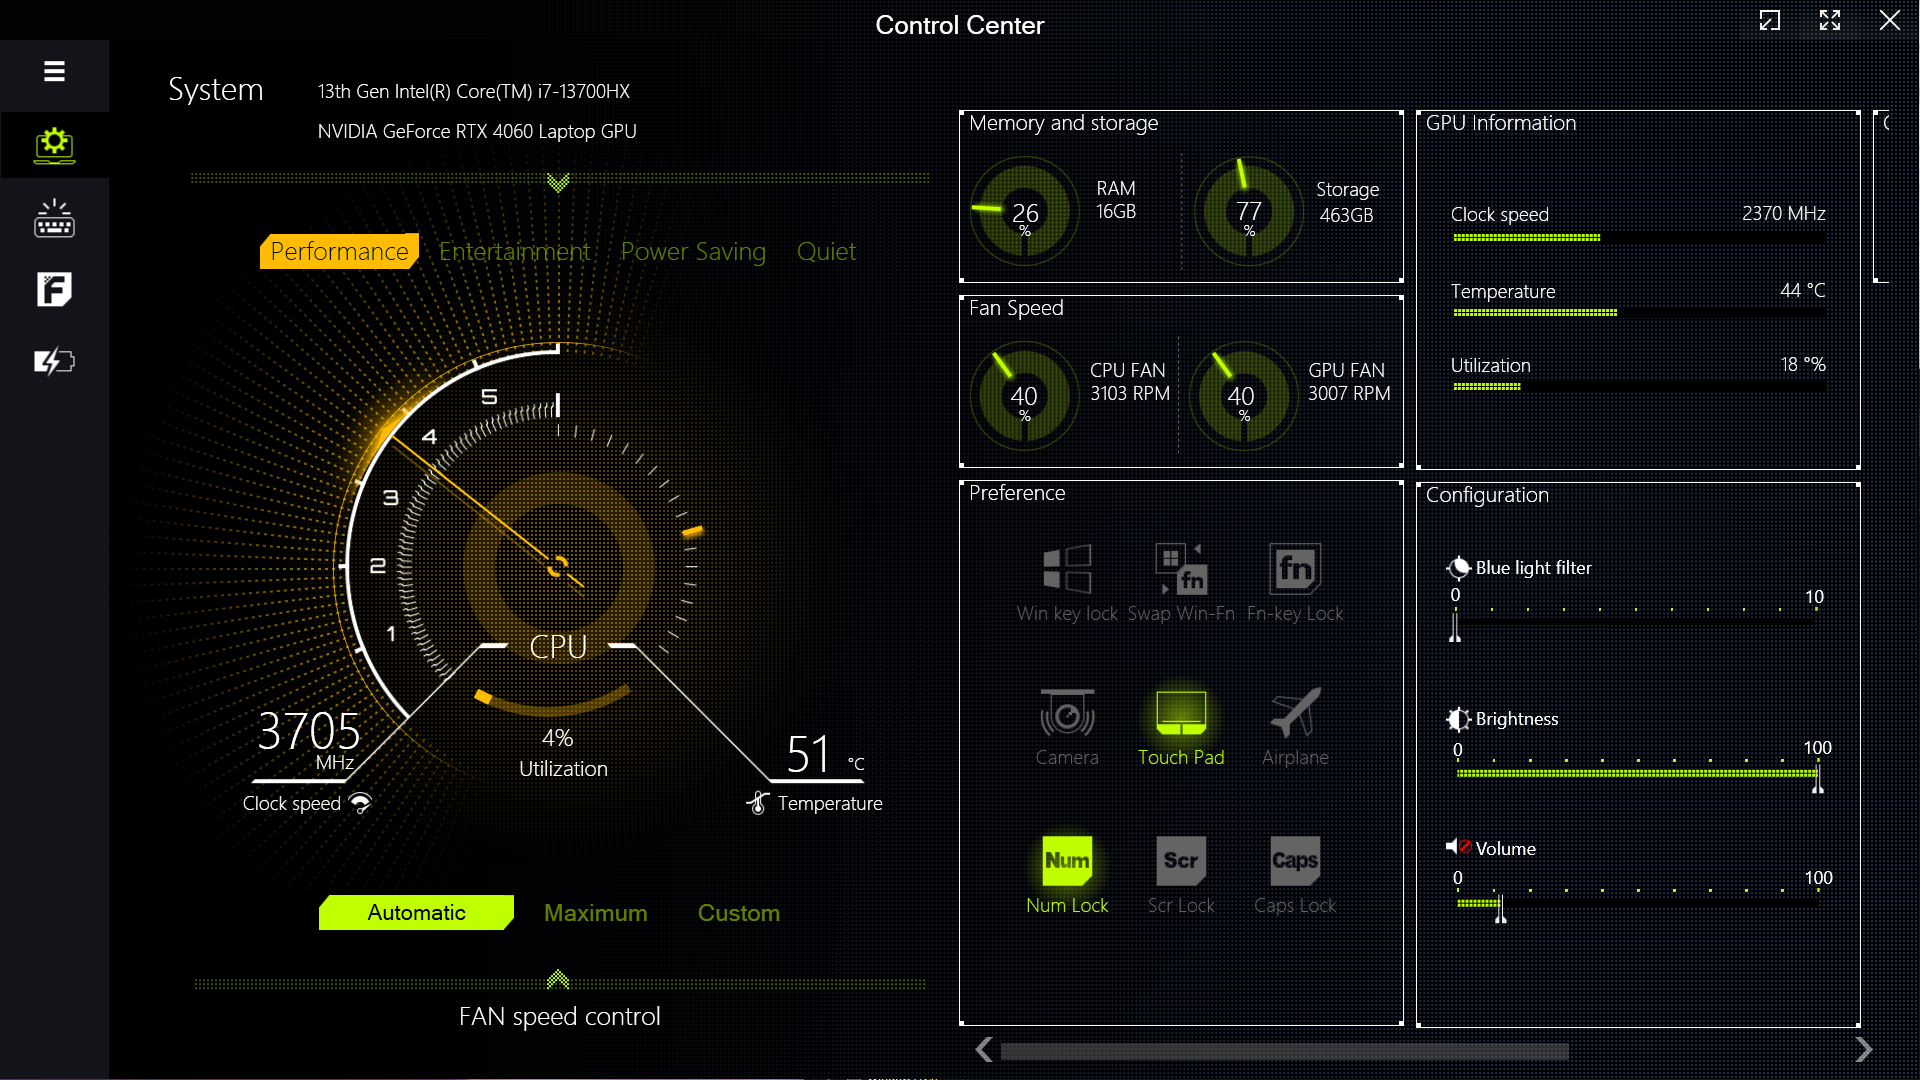
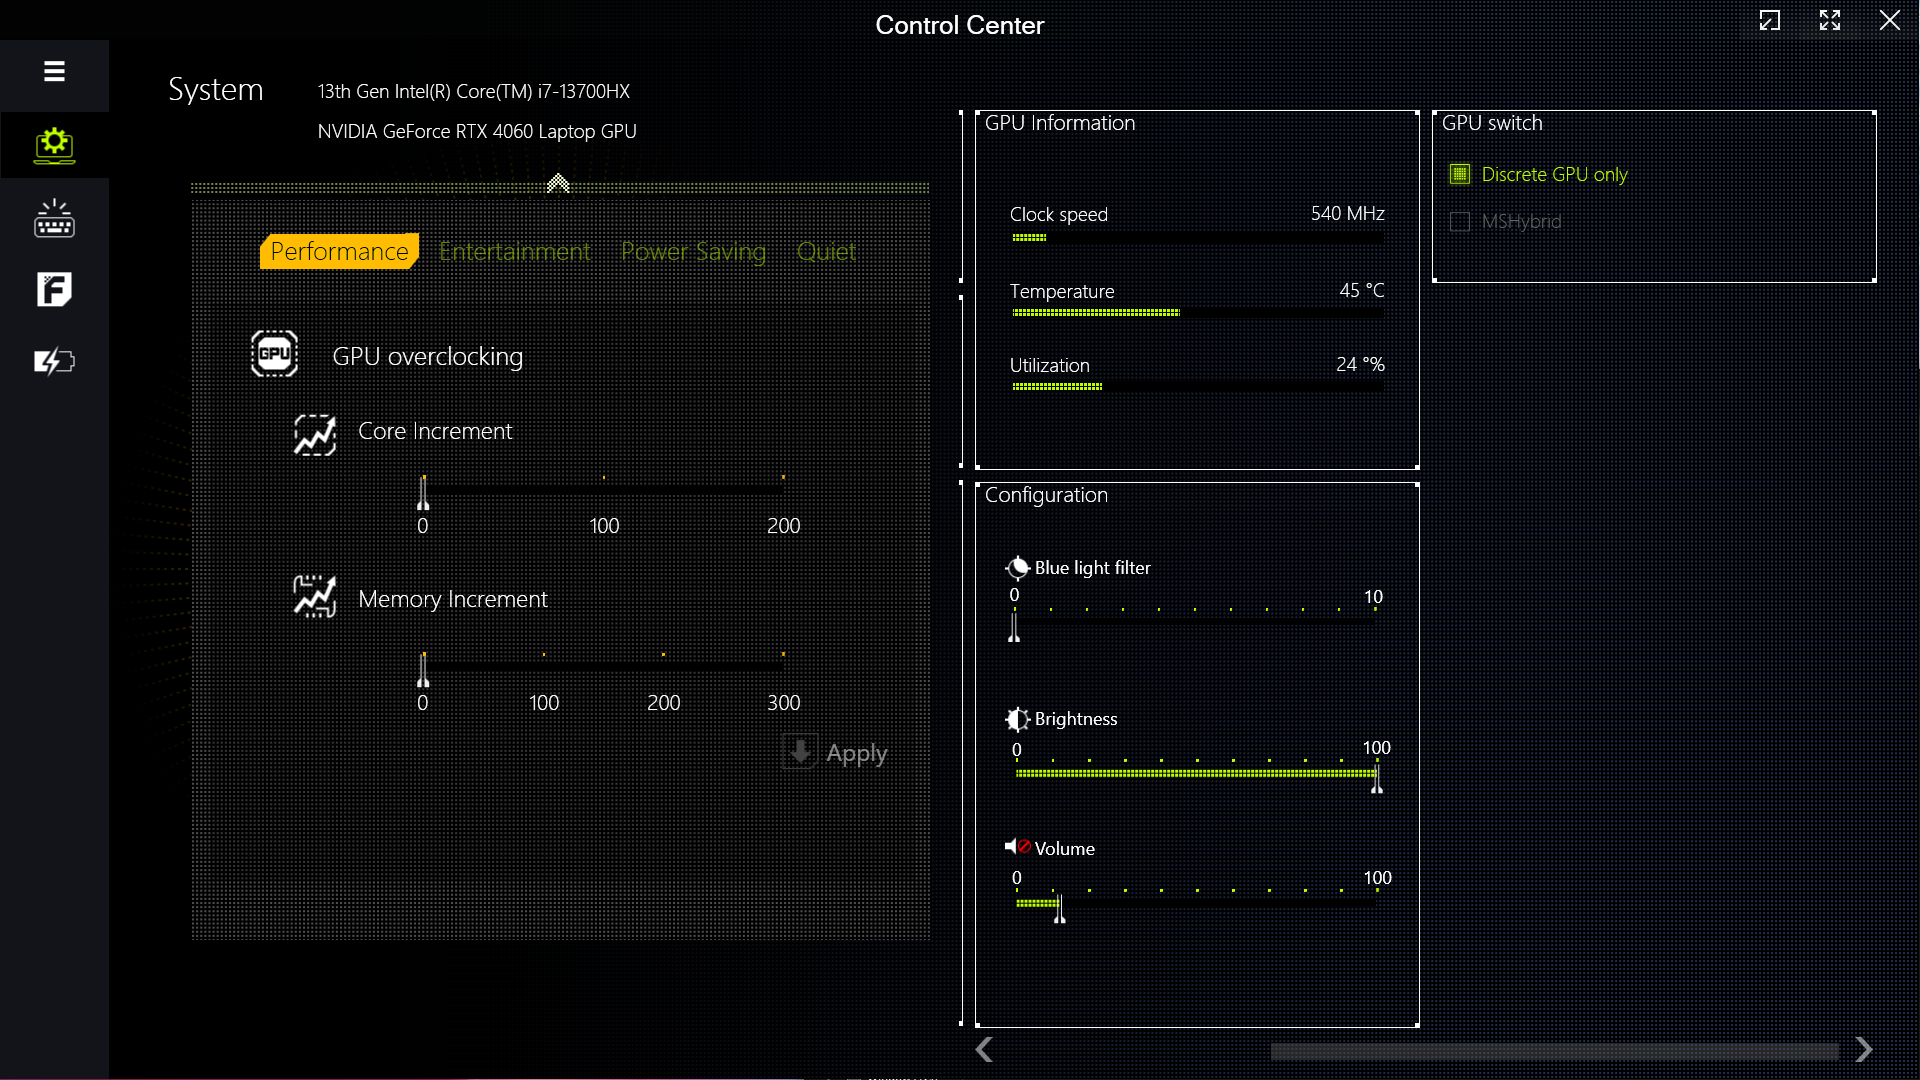
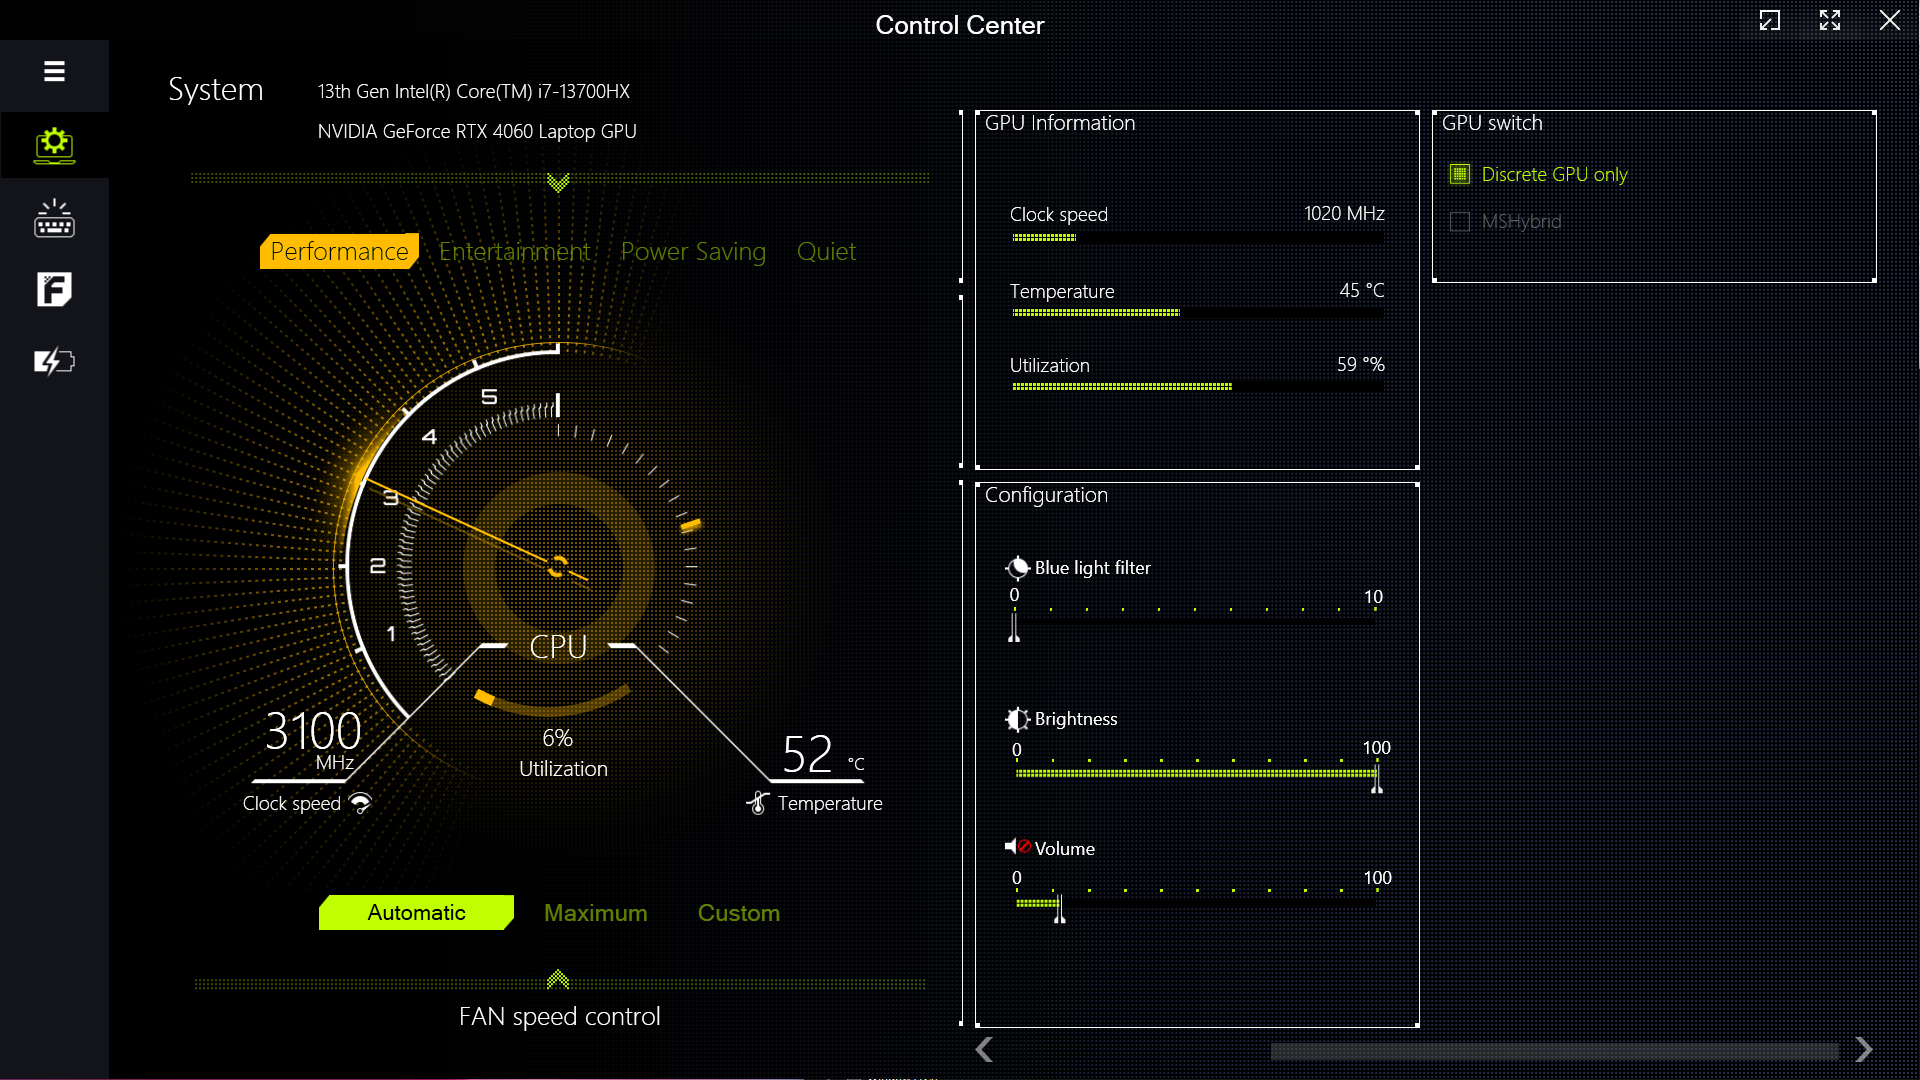
Colorful, performans ayarı ve çeşitli RGB efektlerini ayarlamak için Clevo'nun Kontrol Merkezi uygulamasını sunar. Toplam dört performans modu sunulmaktadır.
Tüm kıyaslamalar Core i7-13700HX'in kaslarını tam olarak kullanmasını sağlayan Performans modunda gerçekleştirilmiştir. Grafik ve oyun testleri için Ayrık GPU modu kullanıldı.
Akü testleri MSHybrid etkinleştirilmiş halde Sessiz profilde gerçekleştirilmiştir.
Colorful, PL2'yi Sessiz ve Güç Tasarrufu modlarında 30 W ile sınırlandırır, bu da diğer modlara kıyasla önemli bir güç azalmasıdır. Bu, aşağıdaki tabloda gösterildiği gibi Cinebench R15 puanlarındaki ciddi düşüşe de yansımaktadır.
| Performans modu | PL1 (PBP) / Tau | PL2 (MTP) / Tau | Cinebench R15 Çoklu skor | Cinebench R15 Çoklu skor (30 döngü) |
|---|---|---|---|---|
| Sessiz | 15 W / 8 s | 30 W / 2,44 ms | 567 (-%83) | 542 (-%82,28) |
| Güç Tasarrufu | 45 W / 8 sn | 30 W / 2,44 ms | 557 (-%84) | 548 (-%82,08) |
| Eğlence | 65 W / 56 s | 130 W / 2,44 ms | 2814 (-%19,18) | 2168 (-%29,12) |
| Performans | 135 W / 96 s | 162 W / 2,44 ms | 3482 (%100) | 3059 (%100) |
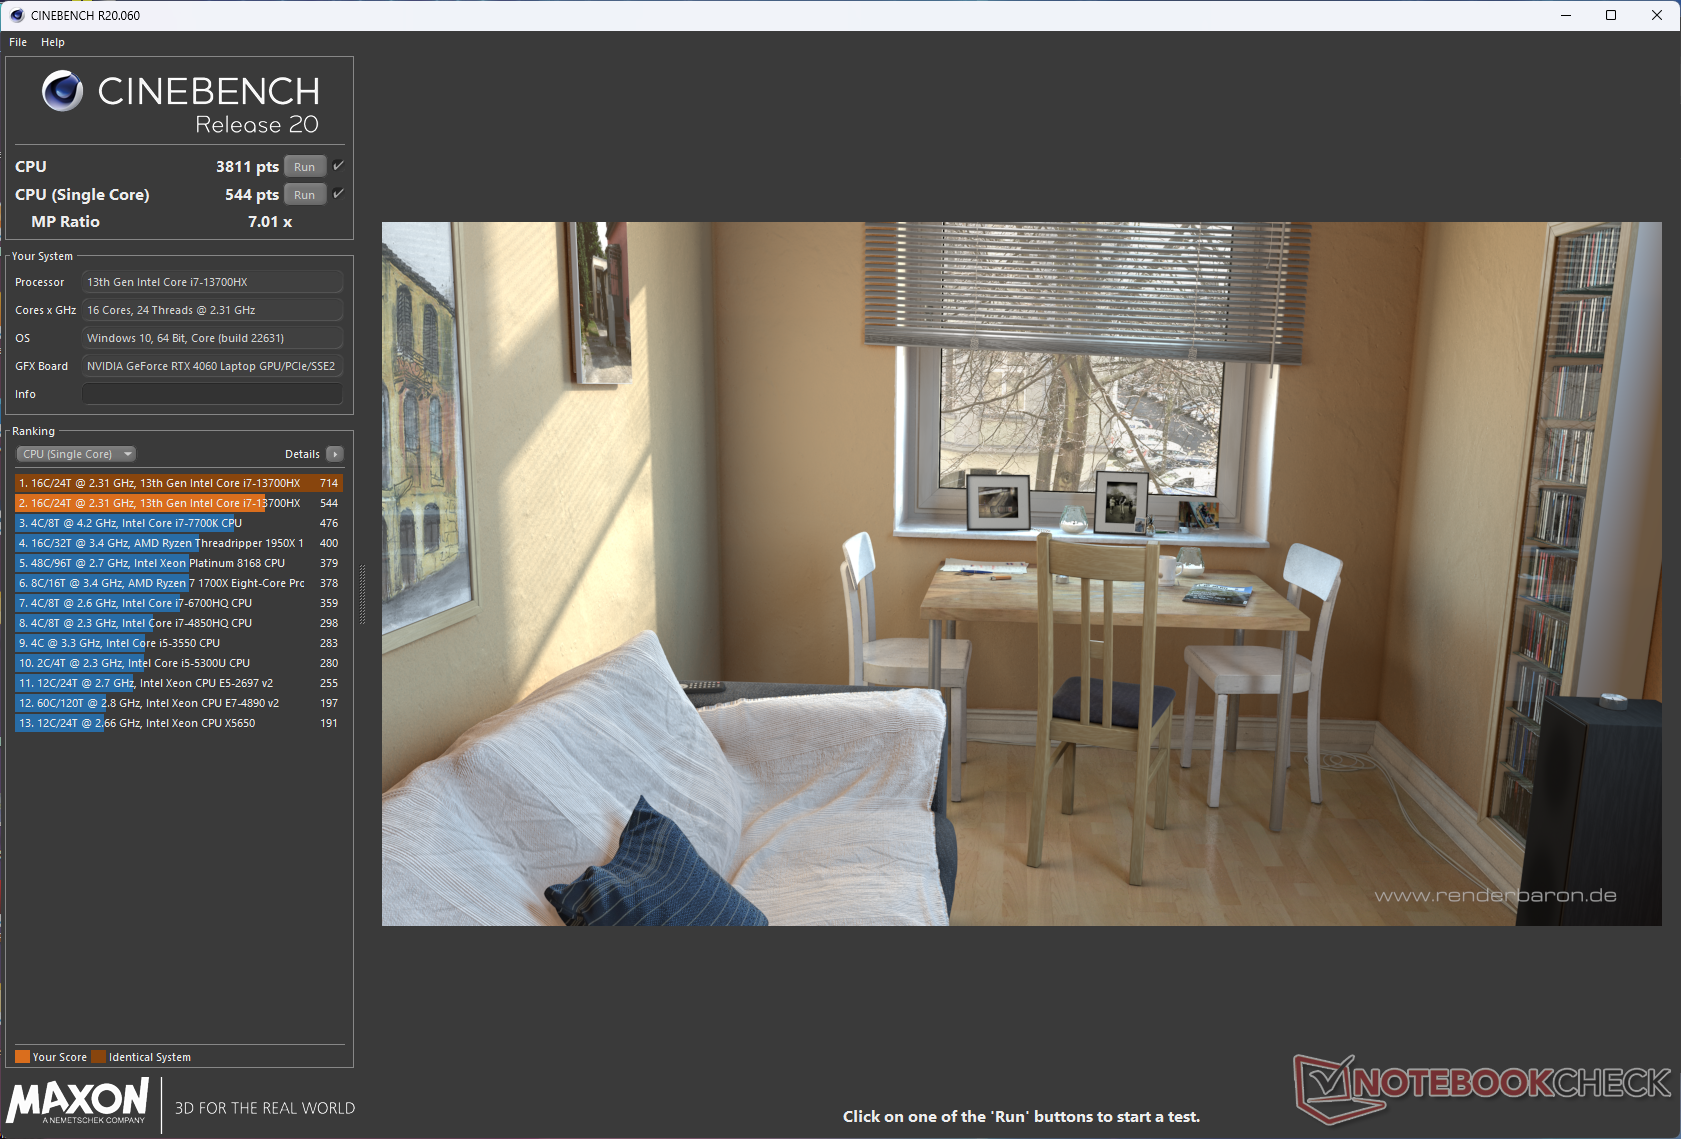
İşlemci
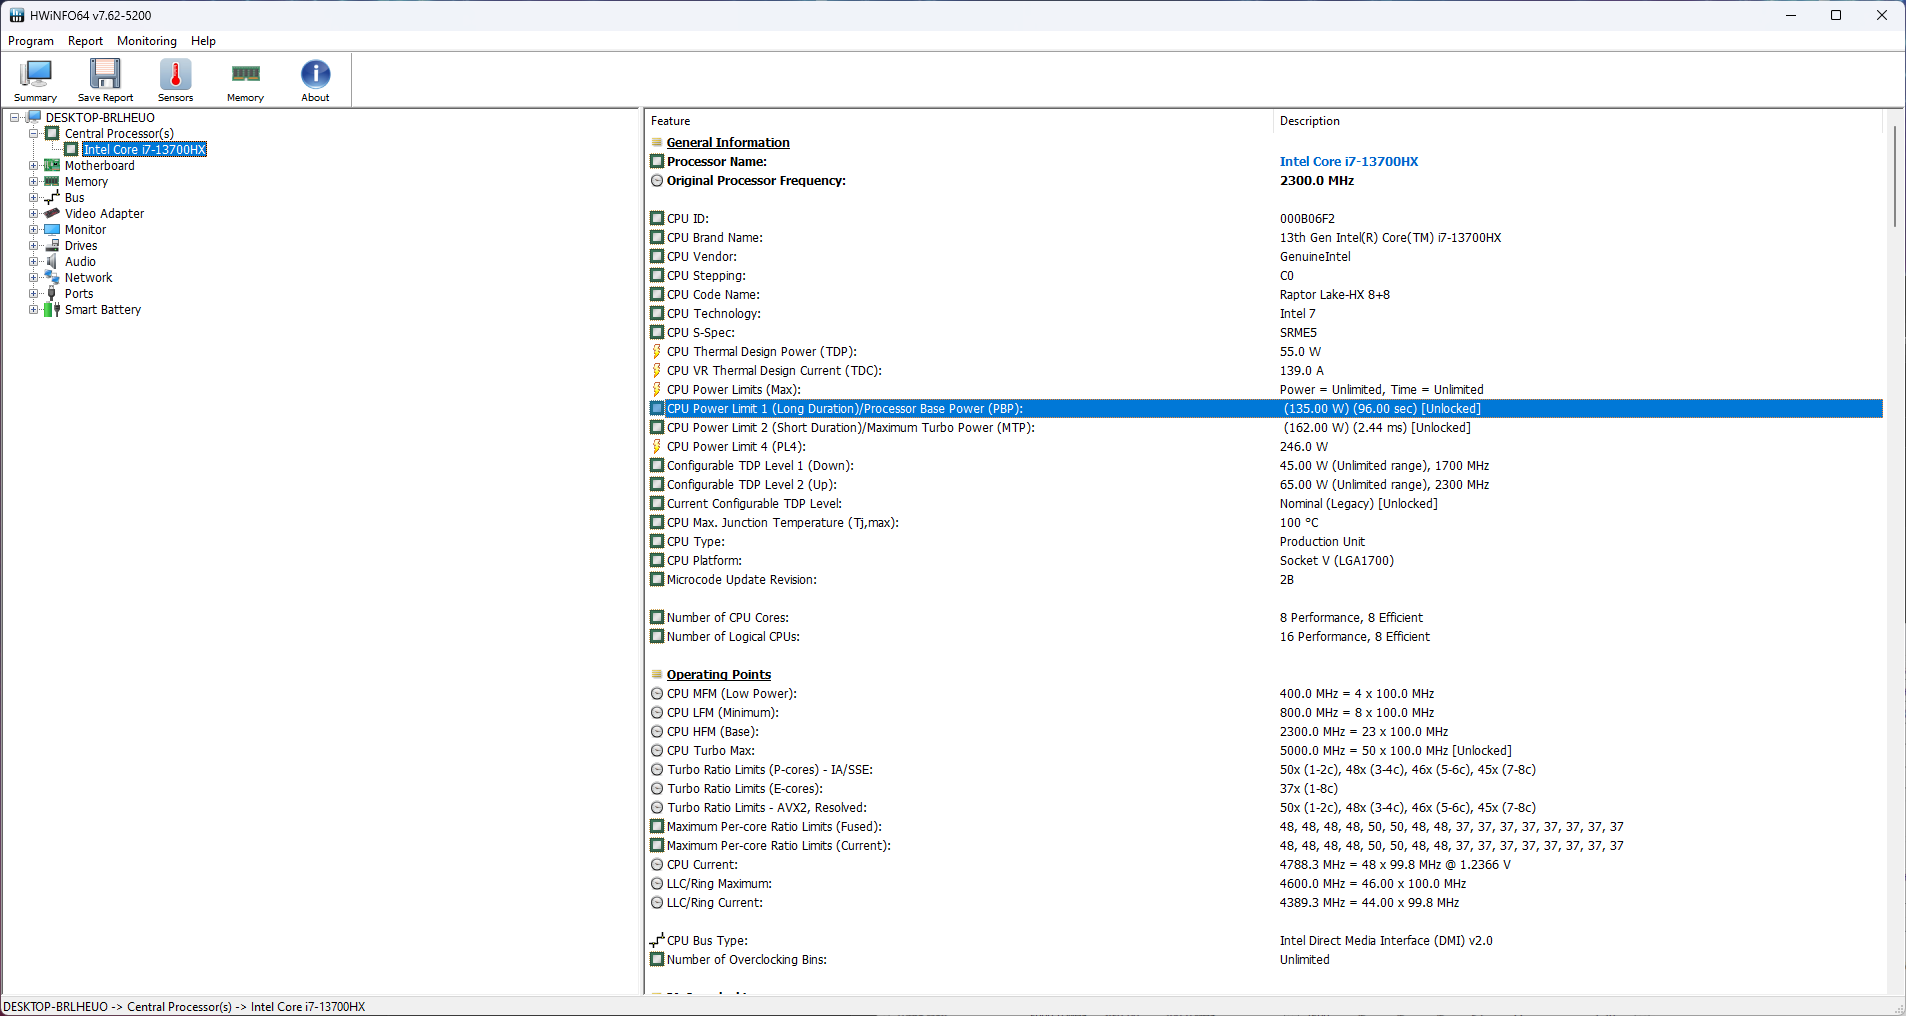
Core i7-13700HX, 5 GHz'e kadar artırma saatiyle 16 çekirdek ve 24 iş parçacığına sahiptir. EVOL X15 AT'deki bu CPU genellikle Alienware m16 R1'deki muadili ve genel olarak diğer dizüstü bilgisayarlarla eşit performans gösterir. Ancak, 12 çekirdekli 24 iş parçacıklı işlemcinin önemli ölçüde gerisinde kalıyor AMD Ryzen 9 7845HX çok çekirdekli testlerde.
162 W olarak derecelendirilmesine rağmen Core i7-13700HX, Performans modunda 145 W'a kadar kullanabilir. Bununla birlikte, bu, tek çekirdekli performansta 115 W PL2'ye göre yalnızca minimum bir avantaj sağlar HP Omen 16.
Skorlardaki ilk kademeli düşüş dışında, Cinebench R15 çok çekirdekli döngü testi sırasında algılanan bir yavaşlama yok.
Cinebench R15 Multi Loop
Cinebench R23: Multi Core | Single Core
Cinebench R20: CPU (Multi Core) | CPU (Single Core)
Cinebench R15: CPU Multi 64Bit | CPU Single 64Bit
Blender: v2.79 BMW27 CPU
7-Zip 18.03: 7z b 4 | 7z b 4 -mmt1
Geekbench 5.5: Multi-Core | Single-Core
HWBOT x265 Benchmark v2.2: 4k Preset
LibreOffice : 20 Documents To PDF
R Benchmark 2.5: Overall mean
| CPU Performance rating | |
| Alienware m16 R1 AMD | |
| Sınıf ortalaması Gaming | |
| Schenker XMG Pro 15 (E23) | |
| Acer Predator Helios 16 PH16-71-731Q | |
| HP Omen 16-wf000 -1! | |
| Uniwill GM6PX7X RTX 4070 | |
| Alienware m16 R1 Intel | |
| Dell G15 5530 | |
| Colorful EVOL X15 AT 23 | |
| Ortalama Intel Core i7-13700HX | |
| Cinebench R23 / Multi Core | |
| Alienware m16 R1 AMD | |
| Sınıf ortalaması Gaming (10488 - 42661, n=104, son 2 yıl) | |
| Schenker XMG Pro 15 (E23) | |
| Acer Predator Helios 16 PH16-71-731Q | |
| Colorful EVOL X15 AT 23 | |
| Alienware m16 R1 Intel | |
| Uniwill GM6PX7X RTX 4070 | |
| Dell G15 5530 | |
| Ortalama Intel Core i7-13700HX (15558 - 22598, n=11) | |
| HP Omen 16-wf000 | |
| Cinebench R23 / Single Core | |
| Sınıf ortalaması Gaming (1601 - 2415, n=104, son 2 yıl) | |
| Alienware m16 R1 Intel | |
| Colorful EVOL X15 AT 23 | |
| Acer Predator Helios 16 PH16-71-731Q | |
| Schenker XMG Pro 15 (E23) | |
| HP Omen 16-wf000 | |
| Alienware m16 R1 AMD | |
| Dell G15 5530 | |
| Ortalama Intel Core i7-13700HX (1666 - 1933, n=11) | |
| Uniwill GM6PX7X RTX 4070 | |
| Cinebench R20 / CPU (Multi Core) | |
| Alienware m16 R1 AMD | |
| Sınıf ortalaması Gaming (4029 - 16433, n=103, son 2 yıl) | |
| Schenker XMG Pro 15 (E23) | |
| Acer Predator Helios 16 PH16-71-731Q | |
| Colorful EVOL X15 AT 23 | |
| Uniwill GM6PX7X RTX 4070 | |
| Alienware m16 R1 Intel | |
| Dell G15 5530 | |
| Ortalama Intel Core i7-13700HX (6160 - 8610, n=11) | |
| HP Omen 16-wf000 | |
| Cinebench R20 / CPU (Single Core) | |
| Sınıf ortalaması Gaming (622 - 913, n=103, son 2 yıl) | |
| Colorful EVOL X15 AT 23 | |
| Alienware m16 R1 Intel | |
| Acer Predator Helios 16 PH16-71-731Q | |
| Schenker XMG Pro 15 (E23) | |
| HP Omen 16-wf000 | |
| Alienware m16 R1 AMD | |
| Dell G15 5530 | |
| Uniwill GM6PX7X RTX 4070 | |
| Ortalama Intel Core i7-13700HX (644 - 740, n=11) | |
| Cinebench R15 / CPU Multi 64Bit | |
| Alienware m16 R1 AMD | |
| Sınıf ortalaması Gaming (1578 - 6330, n=102, son 2 yıl) | |
| Schenker XMG Pro 15 (E23) | |
| Colorful EVOL X15 AT 23 | |
| Acer Predator Helios 16 PH16-71-731Q | |
| Acer Predator Helios 16 PH16-71-731Q | |
| Uniwill GM6PX7X RTX 4070 | |
| Ortalama Intel Core i7-13700HX (2548 - 3482, n=12) | |
| Alienware m16 R1 Intel | |
| Dell G15 5530 | |
| HP Omen 16-wf000 | |
| Cinebench R15 / CPU Single 64Bit | |
| Sınıf ortalaması Gaming (188.8 - 350, n=103, son 2 yıl) | |
| Alienware m16 R1 AMD | |
| Alienware m16 R1 Intel | |
| Colorful EVOL X15 AT 23 | |
| Dell G15 5530 | |
| Acer Predator Helios 16 PH16-71-731Q | |
| Ortalama Intel Core i7-13700HX (243 - 279, n=11) | |
| HP Omen 16-wf000 | |
| Uniwill GM6PX7X RTX 4070 | |
| Schenker XMG Pro 15 (E23) | |
| Blender / v2.79 BMW27 CPU | |
| Ortalama Intel Core i7-13700HX (138 - 207, n=10) | |
| Dell G15 5530 | |
| Acer Predator Helios 16 PH16-71-731Q | |
| Alienware m16 R1 Intel | |
| Colorful EVOL X15 AT 23 | |
| Uniwill GM6PX7X RTX 4070 | |
| Schenker XMG Pro 15 (E23) | |
| Sınıf ortalaması Gaming (79 - 330, n=101, son 2 yıl) | |
| Alienware m16 R1 AMD | |
| 7-Zip 18.03 / 7z b 4 | |
| Alienware m16 R1 AMD | |
| Sınıf ortalaması Gaming (33491 - 148086, n=102, son 2 yıl) | |
| Schenker XMG Pro 15 (E23) | |
| Uniwill GM6PX7X RTX 4070 | |
| Alienware m16 R1 Intel | |
| Acer Predator Helios 16 PH16-71-731Q | |
| HP Omen 16-wf000 | |
| Dell G15 5530 | |
| Ortalama Intel Core i7-13700HX (58912 - 89294, n=11) | |
| Colorful EVOL X15 AT 23 | |
| 7-Zip 18.03 / 7z b 4 -mmt1 | |
| Alienware m16 R1 AMD | |
| Sınıf ortalaması Gaming (4824 - 7436, n=102, son 2 yıl) | |
| Alienware m16 R1 Intel | |
| Colorful EVOL X15 AT 23 | |
| Schenker XMG Pro 15 (E23) | |
| Acer Predator Helios 16 PH16-71-731Q | |
| Ortalama Intel Core i7-13700HX (5552 - 6409, n=11) | |
| Uniwill GM6PX7X RTX 4070 | |
| HP Omen 16-wf000 | |
| Dell G15 5530 | |
| Geekbench 5.5 / Multi-Core | |
| Schenker XMG Pro 15 (E23) | |
| Sınıf ortalaması Gaming (6460 - 28263, n=102, son 2 yıl) | |
| Acer Predator Helios 16 PH16-71-731Q | |
| Uniwill GM6PX7X RTX 4070 | |
| Alienware m16 R1 AMD | |
| HP Omen 16-wf000 | |
| Alienware m16 R1 Intel | |
| Dell G15 5530 | |
| Ortalama Intel Core i7-13700HX (10156 - 15850, n=12) | |
| Colorful EVOL X15 AT 23 | |
| Geekbench 5.5 / Single-Core | |
| Sınıf ortalaması Gaming (1403 - 2474, n=102, son 2 yıl) | |
| Alienware m16 R1 AMD | |
| Acer Predator Helios 16 PH16-71-731Q | |
| HP Omen 16-wf000 | |
| Dell G15 5530 | |
| Alienware m16 R1 Intel | |
| Colorful EVOL X15 AT 23 | |
| Uniwill GM6PX7X RTX 4070 | |
| Schenker XMG Pro 15 (E23) | |
| Ortalama Intel Core i7-13700HX (1666 - 1899, n=12) | |
| HWBOT x265 Benchmark v2.2 / 4k Preset | |
| Alienware m16 R1 AMD | |
| Sınıf ortalaması Gaming (11.5 - 44.4, n=102, son 2 yıl) | |
| Uniwill GM6PX7X RTX 4070 | |
| Acer Predator Helios 16 PH16-71-731Q | |
| Schenker XMG Pro 15 (E23) | |
| Dell G15 5530 | |
| Alienware m16 R1 Intel | |
| Ortalama Intel Core i7-13700HX (17.1 - 25.5, n=11) | |
| Colorful EVOL X15 AT 23 | |
| HP Omen 16-wf000 | |
| LibreOffice / 20 Documents To PDF | |
| Colorful EVOL X15 AT 23 | |
| Schenker XMG Pro 15 (E23) | |
| Sınıf ortalaması Gaming (33.2 - 88.8, n=102, son 2 yıl) | |
| Dell G15 5530 | |
| HP Omen 16-wf000 | |
| Alienware m16 R1 Intel | |
| Ortalama Intel Core i7-13700HX (36.5 - 52.9, n=11) | |
| Alienware m16 R1 AMD | |
| Uniwill GM6PX7X RTX 4070 | |
| Acer Predator Helios 16 PH16-71-731Q | |
| R Benchmark 2.5 / Overall mean | |
| Uniwill GM6PX7X RTX 4070 | |
| Ortalama Intel Core i7-13700HX (0.4274 - 0.513, n=11) | |
| Schenker XMG Pro 15 (E23) | |
| HP Omen 16-wf000 | |
| Colorful EVOL X15 AT 23 | |
| Alienware m16 R1 Intel | |
| Acer Predator Helios 16 PH16-71-731Q | |
| Dell G15 5530 | |
| Alienware m16 R1 AMD | |
| Sınıf ortalaması Gaming (0.3439 - 0.59, n=102, son 2 yıl) | |
* ... daha küçük daha iyidir
EVOL X15'in Core i7-13700HX'i, Performans modunda Cinebench R15 çok çekirdekli döngüsünü çalıştırırken 4,2 GHz'e kadar yükseltmelerle maksimum 145 W kullanabilir. Eğlence modunda, Core i7-13700HX 113 W ile 4,2 GHz'e ulaşmayı başarabilir, ancak çalışma sırasında ortalama güç sadece yaklaşık 21 W'a düşer.
Sessiz modda EVOL X15 sadece 30 W tüketirken 4 GHz tepe noktasına ulaşıyor. Ancak, ortalama saatler 15 W tüketirken 1 GHz'in hemen altına düşüyor.
Bataryadaki Cinebench R20 skorları, tek çekirdekli ve çok çekirdekli olarak sırasıyla %26,5 ve %54 oranında düşer.
AIDA64: FP32 Ray-Trace | FPU Julia | CPU SHA3 | CPU Queen | FPU SinJulia | FPU Mandel | CPU AES | CPU ZLib | FP64 Ray-Trace | CPU PhotoWorxx
| Performance rating | |
| Alienware m16 R1 AMD | |
| Sınıf ortalaması Gaming | |
| Uniwill GM6PX7X RTX 4070 | |
| Alienware m16 R1 Intel | |
| Acer Predator Helios 16 PH16-71-731Q | |
| Schenker XMG Pro 15 (E23) | |
| Ortalama Intel Core i7-13700HX | |
| HP Omen 16-wf000 | |
| Colorful EVOL X15 AT 23 | |
| Dell G15 5530 | |
| AIDA64 / FP32 Ray-Trace | |
| Alienware m16 R1 AMD | |
| Sınıf ortalaması Gaming (10227 - 85542, n=102, son 2 yıl) | |
| Uniwill GM6PX7X RTX 4070 | |
| Alienware m16 R1 Intel | |
| Acer Predator Helios 16 PH16-71-731Q | |
| Colorful EVOL X15 AT 23 | |
| Ortalama Intel Core i7-13700HX (14261 - 21999, n=11) | |
| HP Omen 16-wf000 | |
| Dell G15 5530 | |
| Schenker XMG Pro 15 (E23) | |
| AIDA64 / FPU Julia | |
| Alienware m16 R1 AMD | |
| Sınıf ortalaması Gaming (51376 - 372155, n=102, son 2 yıl) | |
| Uniwill GM6PX7X RTX 4070 | |
| Alienware m16 R1 Intel | |
| Colorful EVOL X15 AT 23 | |
| Acer Predator Helios 16 PH16-71-731Q | |
| HP Omen 16-wf000 | |
| Ortalama Intel Core i7-13700HX (74636 - 109364, n=11) | |
| Schenker XMG Pro 15 (E23) | |
| Dell G15 5530 | |
| AIDA64 / CPU SHA3 | |
| Alienware m16 R1 AMD | |
| Sınıf ortalaması Gaming (2180 - 10115, n=102, son 2 yıl) | |
| Uniwill GM6PX7X RTX 4070 | |
| Alienware m16 R1 Intel | |
| Schenker XMG Pro 15 (E23) | |
| Colorful EVOL X15 AT 23 | |
| Acer Predator Helios 16 PH16-71-731Q | |
| Dell G15 5530 | |
| Ortalama Intel Core i7-13700HX (3359 - 5053, n=11) | |
| HP Omen 16-wf000 | |
| AIDA64 / CPU Queen | |
| Alienware m16 R1 AMD | |
| Schenker XMG Pro 15 (E23) | |
| Sınıf ortalaması Gaming (49785 - 173351, n=86, son 2 yıl) | |
| Alienware m16 R1 Intel | |
| Acer Predator Helios 16 PH16-71-731Q | |
| Colorful EVOL X15 AT 23 | |
| Uniwill GM6PX7X RTX 4070 | |
| Ortalama Intel Core i7-13700HX (86532 - 114717, n=11) | |
| Dell G15 5530 | |
| HP Omen 16-wf000 | |
| AIDA64 / FPU SinJulia | |
| Alienware m16 R1 AMD | |
| Sınıf ortalaması Gaming (4424 - 33636, n=102, son 2 yıl) | |
| Alienware m16 R1 Intel | |
| Uniwill GM6PX7X RTX 4070 | |
| Acer Predator Helios 16 PH16-71-731Q | |
| Colorful EVOL X15 AT 23 | |
| Schenker XMG Pro 15 (E23) | |
| Ortalama Intel Core i7-13700HX (9290 - 13519, n=11) | |
| HP Omen 16-wf000 | |
| Dell G15 5530 | |
| AIDA64 / FPU Mandel | |
| Alienware m16 R1 AMD | |
| Sınıf ortalaması Gaming (25115 - 196829, n=102, son 2 yıl) | |
| Uniwill GM6PX7X RTX 4070 | |
| Alienware m16 R1 Intel | |
| Acer Predator Helios 16 PH16-71-731Q | |
| Colorful EVOL X15 AT 23 | |
| HP Omen 16-wf000 | |
| Ortalama Intel Core i7-13700HX (35751 - 53484, n=11) | |
| Schenker XMG Pro 15 (E23) | |
| Dell G15 5530 | |
| AIDA64 / CPU AES | |
| Uniwill GM6PX7X RTX 4070 | |
| Alienware m16 R1 Intel | |
| Acer Predator Helios 16 PH16-71-731Q | |
| Ortalama Intel Core i7-13700HX (67846 - 182575, n=11) | |
| Sınıf ortalaması Gaming (39258 - 247074, n=102, son 2 yıl) | |
| Alienware m16 R1 AMD | |
| Colorful EVOL X15 AT 23 | |
| Schenker XMG Pro 15 (E23) | |
| HP Omen 16-wf000 | |
| Dell G15 5530 | |
| AIDA64 / CPU ZLib | |
| Alienware m16 R1 AMD | |
| Sınıf ortalaması Gaming (574 - 2531, n=102, son 2 yıl) | |
| Acer Predator Helios 16 PH16-71-731Q | |
| Schenker XMG Pro 15 (E23) | |
| Uniwill GM6PX7X RTX 4070 | |
| Alienware m16 R1 Intel | |
| HP Omen 16-wf000 | |
| Colorful EVOL X15 AT 23 | |
| Dell G15 5530 | |
| Ortalama Intel Core i7-13700HX (981 - 1451, n=11) | |
| AIDA64 / FP64 Ray-Trace | |
| Alienware m16 R1 AMD | |
| Sınıf ortalaması Gaming (5509 - 45446, n=102, son 2 yıl) | |
| Uniwill GM6PX7X RTX 4070 | |
| Alienware m16 R1 Intel | |
| Colorful EVOL X15 AT 23 | |
| Acer Predator Helios 16 PH16-71-731Q | |
| Ortalama Intel Core i7-13700HX (7728 - 11837, n=11) | |
| HP Omen 16-wf000 | |
| Dell G15 5530 | |
| Schenker XMG Pro 15 (E23) | |
| AIDA64 / CPU PhotoWorxx | |
| Schenker XMG Pro 15 (E23) | |
| Sınıf ortalaması Gaming (12271 - 89891, n=102, son 2 yıl) | |
| Uniwill GM6PX7X RTX 4070 | |
| HP Omen 16-wf000 | |
| Dell G15 5530 | |
| Alienware m16 R1 Intel | |
| Acer Predator Helios 16 PH16-71-731Q | |
| Ortalama Intel Core i7-13700HX (19678 - 42415, n=11) | |
| Alienware m16 R1 AMD | |
| Colorful EVOL X15 AT 23 | |
Daha fazla bilgiyi özel sayfamızda bulabilirsiniz Intel Core i7-13700HX sayfa.
Sistem Performansı
EVOL X15 AT, CrossMark'a kıyasla PCMark 10'da daha iyi performans gösteriyor. AIDA64 bellek puanları, rakiplerindeki çift dört kanallı uygulamaya kıyasla EVOL X15'teki tek çift kanallı DDR5-4800 çubuğu nedeniyle daha düşüktür.
Bununla birlikte, EVOL X15'i rutin üretkenlik ve web tarama görevleri için kullanırken herhangi bir sorunla karşılaşmadık.
CrossMark: Overall | Productivity | Creativity | Responsiveness
AIDA64: Memory Copy | Memory Read | Memory Write | Memory Latency
| PCMark 10 / Score | |
| Alienware m16 R1 AMD | |
| Sınıf ortalaması Gaming (5828 - 12414, n=93, son 2 yıl) | |
| Uniwill GM6PX7X RTX 4070 | |
| HP Omen 16-wf000 | |
| Acer Predator Helios 16 PH16-71-731Q | |
| Colorful EVOL X15 AT 23 | |
| Schenker XMG Pro 15 (E23) | |
| Ortalama Intel Core i7-13700HX, NVIDIA GeForce RTX 4060 Laptop GPU (6909 - 7743, n=5) | |
| Alienware m16 R1 Intel | |
| Dell G15 5530 | |
| PCMark 10 / Essentials | |
| Uniwill GM6PX7X RTX 4070 | |
| Alienware m16 R1 AMD | |
| Schenker XMG Pro 15 (E23) | |
| Acer Predator Helios 16 PH16-71-731Q | |
| Dell G15 5530 | |
| Alienware m16 R1 Intel | |
| Sınıf ortalaması Gaming (8810 - 11935, n=97, son 2 yıl) | |
| Ortalama Intel Core i7-13700HX, NVIDIA GeForce RTX 4060 Laptop GPU (9760 - 11313, n=5) | |
| Colorful EVOL X15 AT 23 | |
| HP Omen 16-wf000 | |
| PCMark 10 / Productivity | |
| Sınıf ortalaması Gaming (6845 - 25323, n=95, son 2 yıl) | |
| Acer Predator Helios 16 PH16-71-731Q | |
| Uniwill GM6PX7X RTX 4070 | |
| Schenker XMG Pro 15 (E23) | |
| Alienware m16 R1 AMD | |
| Dell G15 5530 | |
| Ortalama Intel Core i7-13700HX, NVIDIA GeForce RTX 4060 Laptop GPU (9131 - 11018, n=5) | |
| Alienware m16 R1 Intel | |
| Colorful EVOL X15 AT 23 | |
| HP Omen 16-wf000 | |
| PCMark 10 / Digital Content Creation | |
| Alienware m16 R1 AMD | |
| Sınıf ortalaması Gaming (7602 - 19954, n=95, son 2 yıl) | |
| Uniwill GM6PX7X RTX 4070 | |
| HP Omen 16-wf000 | |
| Colorful EVOL X15 AT 23 | |
| Ortalama Intel Core i7-13700HX, NVIDIA GeForce RTX 4060 Laptop GPU (9393 - 12434, n=5) | |
| Acer Predator Helios 16 PH16-71-731Q | |
| Alienware m16 R1 Intel | |
| Schenker XMG Pro 15 (E23) | |
| Dell G15 5530 | |
| CrossMark / Overall | |
| Acer Predator Helios 16 PH16-71-731Q | |
| Alienware m16 R1 Intel | |
| Alienware m16 R1 AMD | |
| Sınıf ortalaması Gaming (1366 - 2409, n=94, son 2 yıl) | |
| Uniwill GM6PX7X RTX 4070 | |
| Schenker XMG Pro 15 (E23) | |
| Ortalama Intel Core i7-13700HX, NVIDIA GeForce RTX 4060 Laptop GPU (1663 - 2105, n=5) | |
| Dell G15 5530 | |
| Colorful EVOL X15 AT 23 | |
| HP Omen 16-wf000 | |
| CrossMark / Productivity | |
| Acer Predator Helios 16 PH16-71-731Q | |
| Alienware m16 R1 Intel | |
| Alienware m16 R1 AMD | |
| Sınıf ortalaması Gaming (1386 - 2254, n=94, son 2 yıl) | |
| Uniwill GM6PX7X RTX 4070 | |
| Schenker XMG Pro 15 (E23) | |
| Ortalama Intel Core i7-13700HX, NVIDIA GeForce RTX 4060 Laptop GPU (1618 - 1989, n=5) | |
| Dell G15 5530 | |
| Colorful EVOL X15 AT 23 | |
| HP Omen 16-wf000 | |
| CrossMark / Creativity | |
| Acer Predator Helios 16 PH16-71-731Q | |
| Sınıf ortalaması Gaming (1343 - 2786, n=94, son 2 yıl) | |
| Alienware m16 R1 Intel | |
| Schenker XMG Pro 15 (E23) | |
| Alienware m16 R1 AMD | |
| Uniwill GM6PX7X RTX 4070 | |
| Dell G15 5530 | |
| Ortalama Intel Core i7-13700HX, NVIDIA GeForce RTX 4060 Laptop GPU (1710 - 2274, n=5) | |
| HP Omen 16-wf000 | |
| Colorful EVOL X15 AT 23 | |
| CrossMark / Responsiveness | |
| Acer Predator Helios 16 PH16-71-731Q | |
| Alienware m16 R1 Intel | |
| Uniwill GM6PX7X RTX 4070 | |
| Schenker XMG Pro 15 (E23) | |
| Alienware m16 R1 AMD | |
| Sınıf ortalaması Gaming (1226 - 2334, n=94, son 2 yıl) | |
| Ortalama Intel Core i7-13700HX, NVIDIA GeForce RTX 4060 Laptop GPU (1269 - 1983, n=5) | |
| Dell G15 5530 | |
| HP Omen 16-wf000 | |
| Colorful EVOL X15 AT 23 | |
| AIDA64 / Memory Copy | |
| Schenker XMG Pro 15 (E23) | |
| Sınıf ortalaması Gaming (21750 - 129946, n=102, son 2 yıl) | |
| Uniwill GM6PX7X RTX 4070 | |
| HP Omen 16-wf000 | |
| Dell G15 5530 | |
| Alienware m16 R1 Intel | |
| Acer Predator Helios 16 PH16-71-731Q | |
| Ortalama Intel Core i7-13700HX, NVIDIA GeForce RTX 4060 Laptop GPU (36504 - 58458, n=5) | |
| Alienware m16 R1 AMD | |
| Colorful EVOL X15 AT 23 | |
| AIDA64 / Memory Read | |
| Schenker XMG Pro 15 (E23) | |
| Sınıf ortalaması Gaming (22956 - 118858, n=102, son 2 yıl) | |
| Uniwill GM6PX7X RTX 4070 | |
| Dell G15 5530 | |
| Alienware m16 R1 Intel | |
| HP Omen 16-wf000 | |
| Acer Predator Helios 16 PH16-71-731Q | |
| Ortalama Intel Core i7-13700HX, NVIDIA GeForce RTX 4060 Laptop GPU (36510 - 67644, n=5) | |
| Alienware m16 R1 AMD | |
| Colorful EVOL X15 AT 23 | |
| AIDA64 / Memory Write | |
| Acer Predator Helios 16 PH16-71-731Q | |
| Sınıf ortalaması Gaming (22297 - 135096, n=102, son 2 yıl) | |
| Schenker XMG Pro 15 (E23) | |
| HP Omen 16-wf000 | |
| Uniwill GM6PX7X RTX 4070 | |
| Ortalama Intel Core i7-13700HX, NVIDIA GeForce RTX 4060 Laptop GPU (33598 - 85675, n=5) | |
| Dell G15 5530 | |
| Alienware m16 R1 Intel | |
| Alienware m16 R1 AMD | |
| Colorful EVOL X15 AT 23 | |
| AIDA64 / Memory Latency | |
| Sınıf ortalaması Gaming (75.3 - 165.4, n=102, son 2 yıl) | |
| Alienware m16 R1 AMD | |
| Dell G15 5530 | |
| Alienware m16 R1 Intel | |
| Uniwill GM6PX7X RTX 4070 | |
| HP Omen 16-wf000 | |
| Ortalama Intel Core i7-13700HX, NVIDIA GeForce RTX 4060 Laptop GPU (81.9 - 93, n=5) | |
| Acer Predator Helios 16 PH16-71-731Q | |
| Schenker XMG Pro 15 (E23) | |
| Colorful EVOL X15 AT 23 | |
* ... daha küçük daha iyidir
| PCMark 8 Home Score Accelerated v2 | 5769 puan | |
| PCMark 8 Work Score Accelerated v2 | 5995 puan | |
| PCMark 10 Score | 7655 puan | |
Yardım | ||
DPC Gecikme Süresi
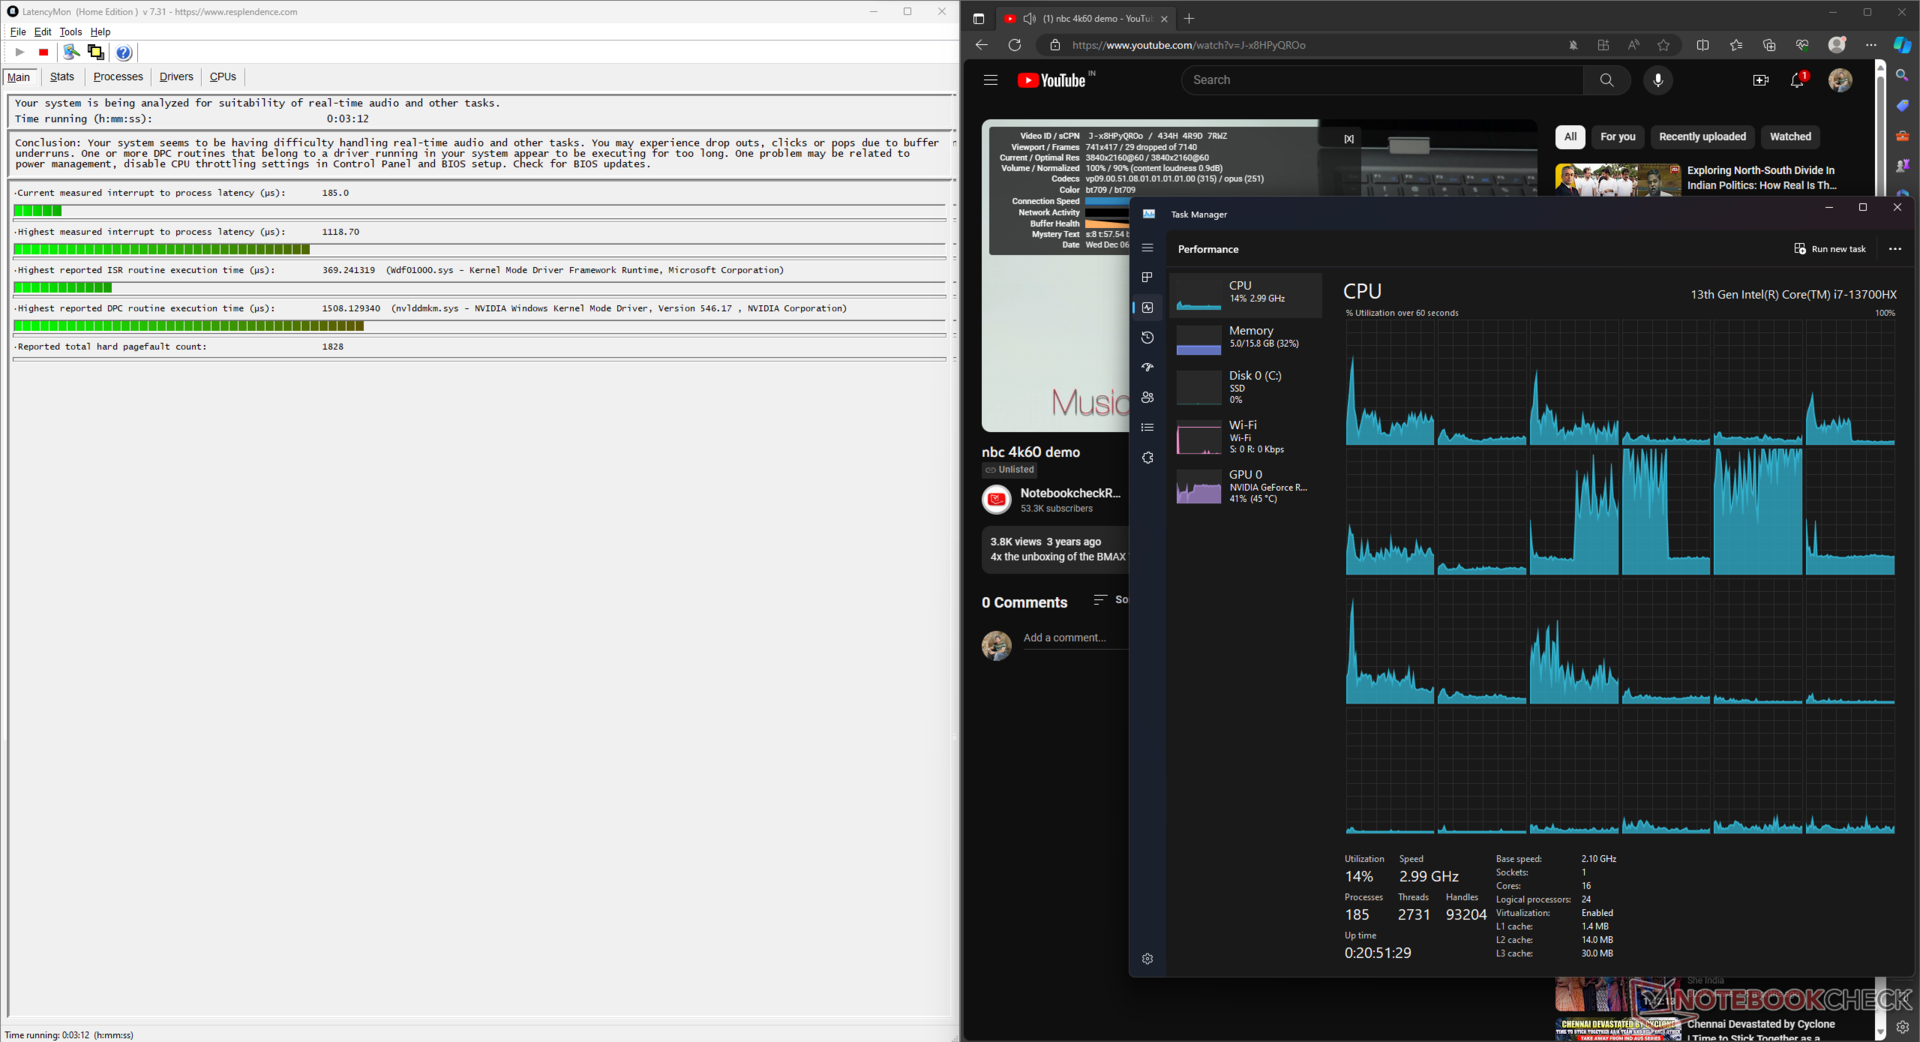
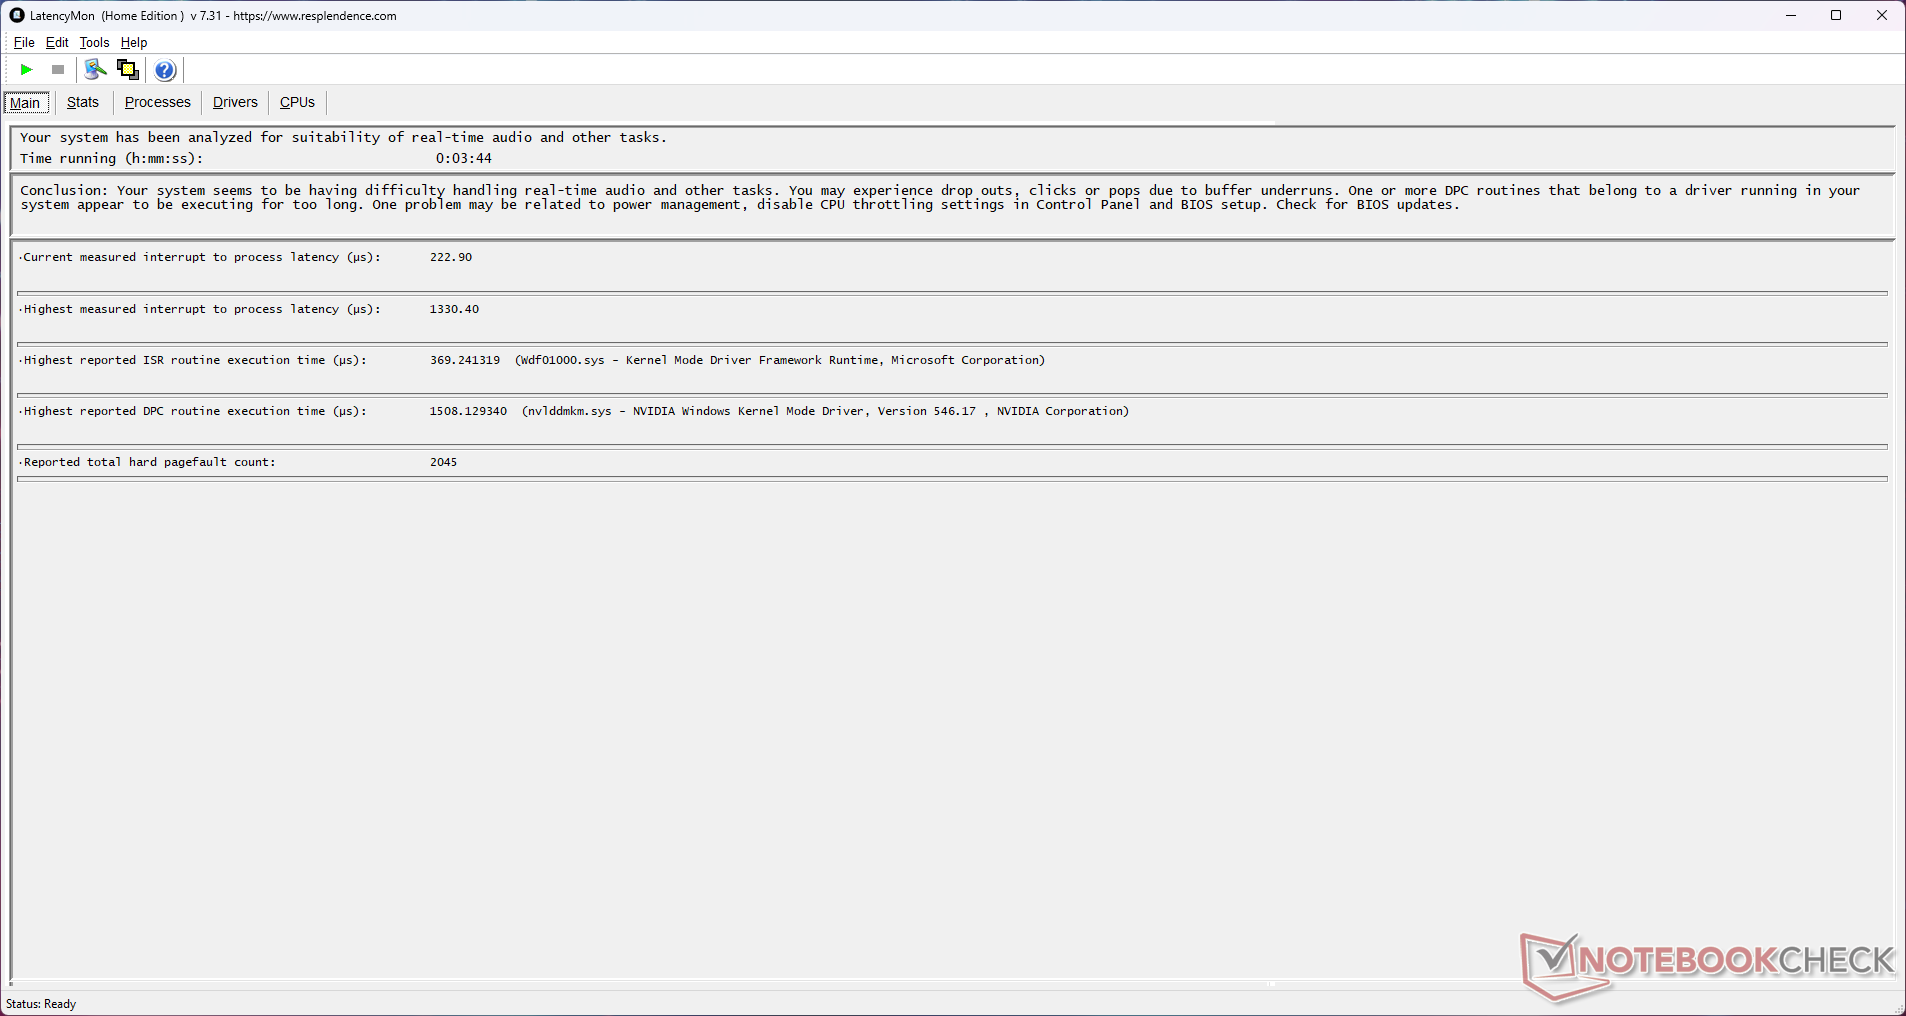
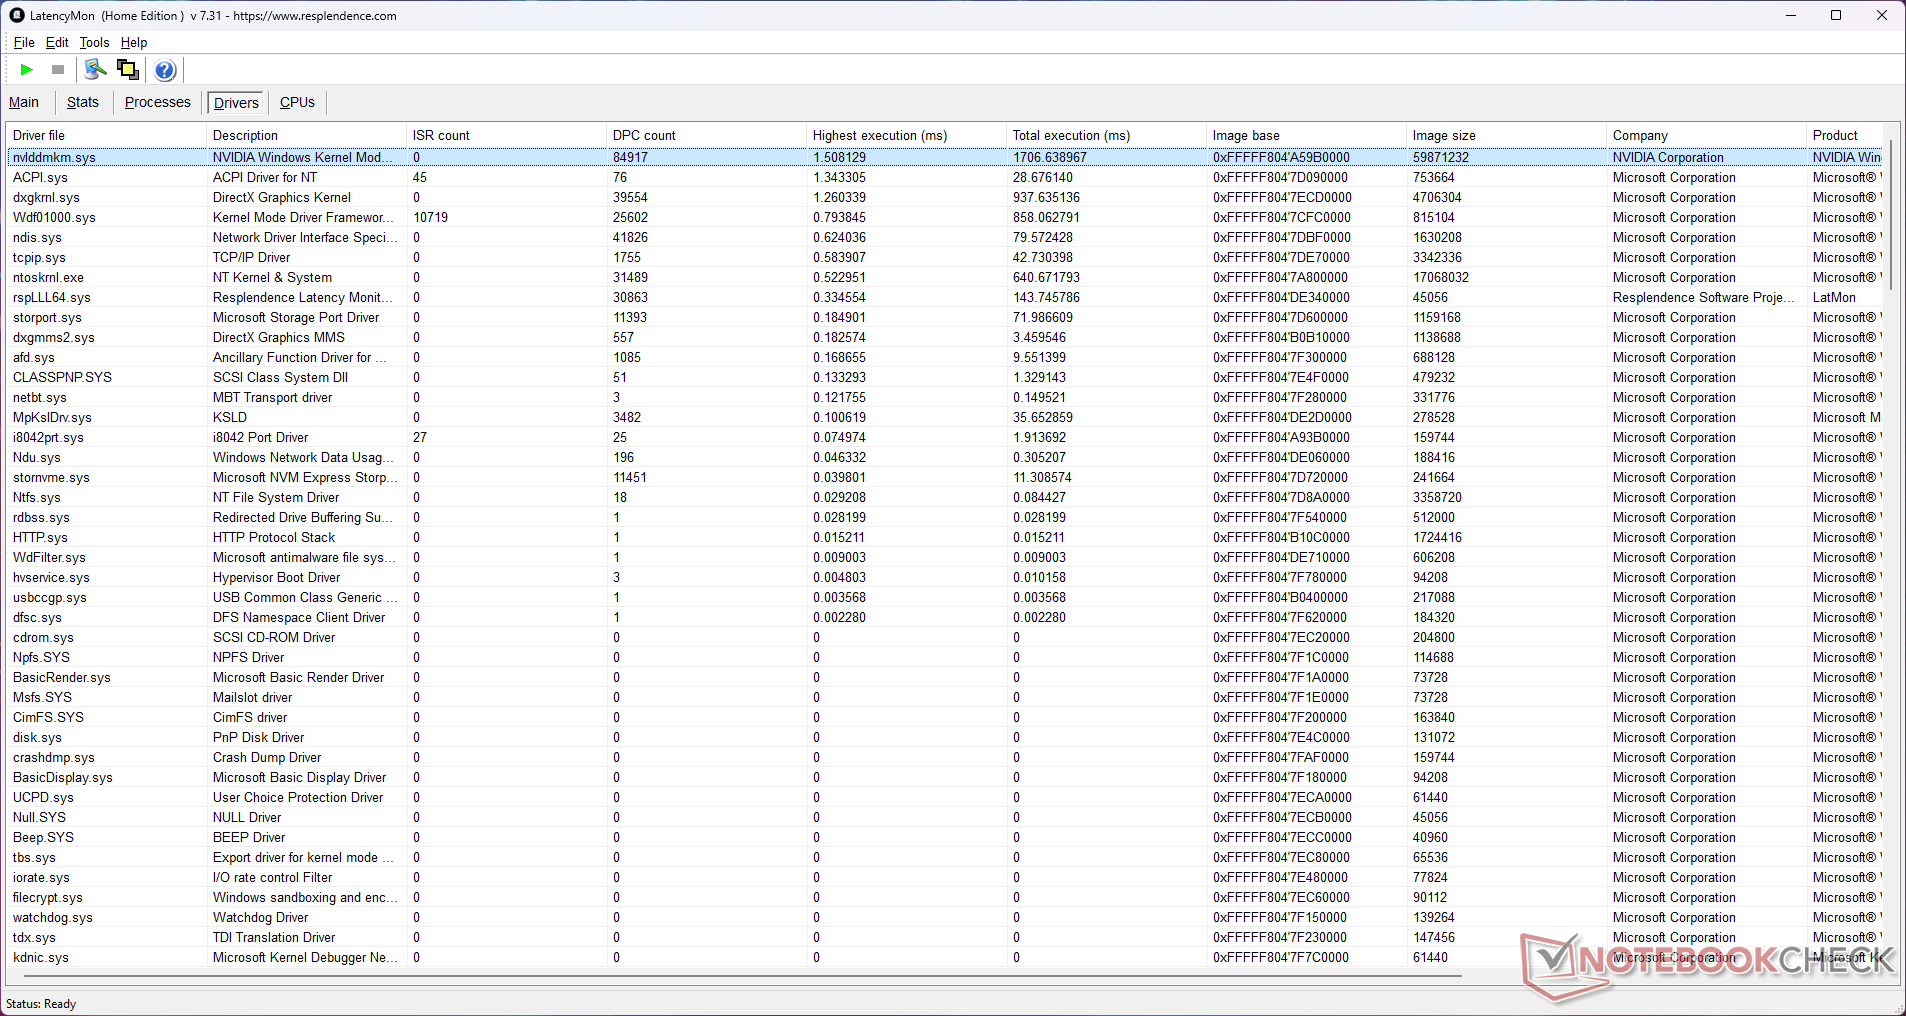
Yüksek DPC gecikmesi, Nvidia kartlı dizüstü bilgisayarlarda bilinen bir sorundur ve EVOL X15, rakiplerinden daha iyi olmasına rağmen bir istisna değildir.
LatencyMon kullanarak, örnek bir YouTube 4K60 oynatma ve 10 saniyelik Prime95 stresinin ardından 1.330,4 µs'lik bir kesmeden işleme gecikme süresi kaydettik. Nvidia Windows Kernel Mode Driver Framework (nvlddmkm.sys) bu yüksek gecikmeye katkıda bulunuyor.
| DPC Latencies / LatencyMon - interrupt to process latency (max), Web, Youtube, Prime95 | |
| Dell G15 5530 | |
| Alienware m16 R1 Intel | |
| HP Omen 16-wf000 | |
| Alienware m16 R1 AMD | |
| Acer Predator Helios 16 PH16-71-731Q | |
| Colorful EVOL X15 AT 23 | |
| Uniwill GM6PX7X RTX 4070 | |
| Schenker XMG Pro 15 (E23) | |
* ... daha küçük daha iyidir
Bizim DPC Gecikme Sıralaması sayfası, test edilen cihazlar arasında daha fazla LatencyMon karşılaştırması sağlar.
Depolama Cihazları
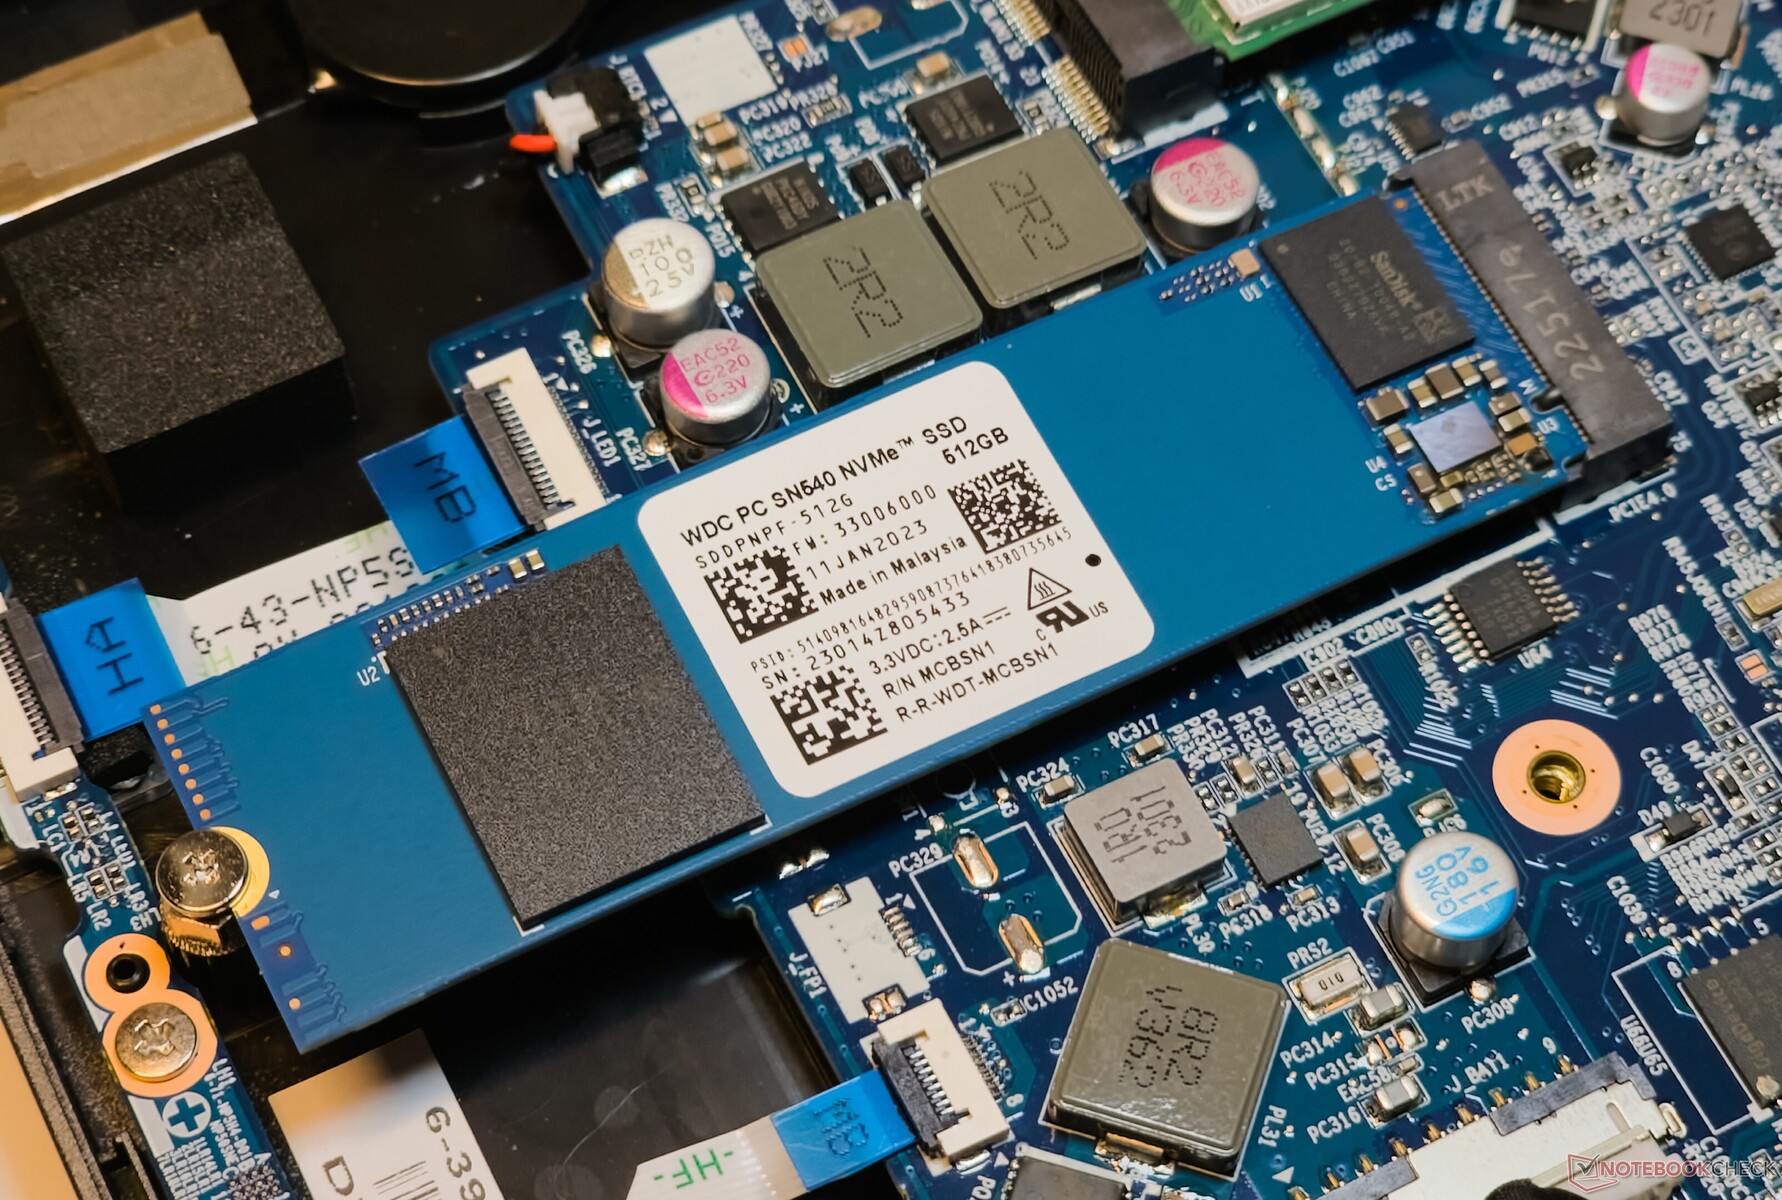
EVOL X15'in 512 GB Western Digital SN540 NVMe SSD'si, rakipleri tarafından kullanılan Kioxia ve SK Hynix sürücülerle boy ölçüşemez. Yine de 4k q1 t1 okuma ve 4k q1 t1 yazma değerleri, Alienware m16 R1 AMD'deki Kioxia XG8'in değerlerini aşmaktadır.
Colorful, başka bir PCIe Gen4 NVMe sürücü eklemenize izin verir. Ancak, 2,5 inç SATA yığın depolama alanı eklemek için bir kapsam yoktur.

| Drive Performance rating - Percent | |
| Uniwill GM6PX7X RTX 4070 | |
| Acer Predator Helios 16 PH16-71-731Q | |
| Alienware m16 R1 AMD | |
| Sınıf ortalaması Gaming | |
| HP Omen 16-wf000 | |
| Schenker XMG Pro 15 (E23) | |
| Alienware m16 R1 Intel | |
| Colorful EVOL X15 AT 23 | |
| Ortalama WDC PC SN540 SDDPNPF-512G | |
| Dell G15 5530 | |
* ... daha küçük daha iyidir
Disk Daraltma: DiskSpd Okuma Döngüsü, Kuyruk Derinliği 8
Sürücü, DiskSpd Okuma Döngüsü testi sırasında 8 kuyruk derinliğinde 17. döngüden sonra yavaşlamaya başlar. Sürücü üzerinde termal kapak veya dolgu yoktur.
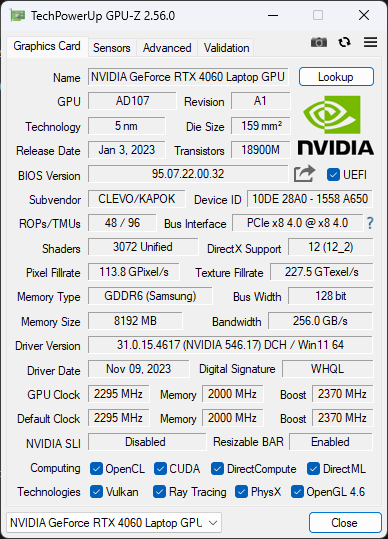
GPU Performansı
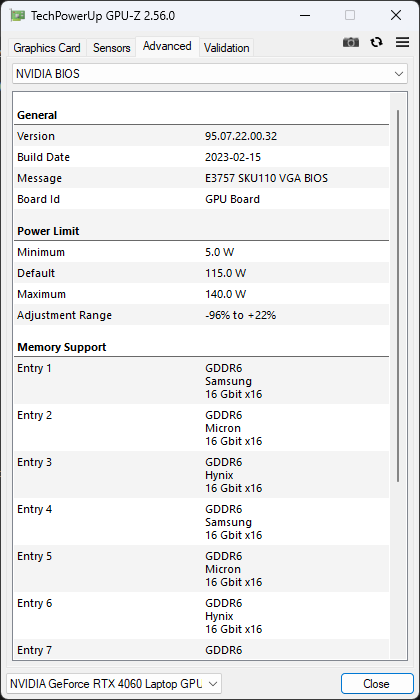
EVOL X15 AT'deki Nvidia GeForce RTX 4060 Dizüstü Bilgisayar GPU'su 140 W TGP'de çalışır. Genel 3DMark performansı, aynı GPU'yu kullanan diğer dizüstü bilgisayarlarla karşılaştırılabilir.
Ayrıca RTX 4060'ın 140 W TGP'ye çok yakın olduğunu görüyoruz RTX 4070 Dizüstü Bilgisayar GPU'su içinde Uniwill GM6PX7Xancak 175 Watt'a kıyasla %31 oranında yetersiz kalmaktadır RTX 4080 Dizüstü Bilgisayar GPU'su güç veren Alienware m16 R1 AMD.
3DMark Time Spy grafik puanları pil gücüyle yaklaşık %54 oranında düşebilir.
| 3DMark Performance rating - Percent | |
| Alienware m16 R1 AMD -1! | |
| HP Omen 16-wf000 -1! | |
| Sınıf ortalaması Gaming | |
| Uniwill GM6PX7X RTX 4070 -1! | |
| Dell G15 5530 | |
| Alienware m16 R1 Intel | |
| Colorful EVOL X15 AT 23 | |
| Acer Predator Helios 16 PH16-71-731Q | |
| Ortalama NVIDIA GeForce RTX 4060 Laptop GPU | |
| Schenker XMG Pro 15 (E23) | |
| 3DMark 11 - 1280x720 Performance GPU | |
| Alienware m16 R1 AMD | |
| HP Omen 16-wf000 | |
| Sınıf ortalaması Gaming (21841 - 80022, n=103, son 2 yıl) | |
| Uniwill GM6PX7X RTX 4070 | |
| Alienware m16 R1 Intel | |
| Dell G15 5530 | |
| Acer Predator Helios 16 PH16-71-731Q | |
| Schenker XMG Pro 15 (E23) | |
| Ortalama NVIDIA GeForce RTX 4060 Laptop GPU (28136 - 38912, n=57) | |
| Colorful EVOL X15 AT 23 | |
| 3DMark | |
| 1280x720 Cloud Gate Standard Graphics | |
| Colorful EVOL X15 AT 23 | |
| Dell G15 5530 | |
| Acer Predator Helios 16 PH16-71-731Q | |
| Alienware m16 R1 Intel | |
| Ortalama NVIDIA GeForce RTX 4060 Laptop GPU (81407 - 180228, n=29) | |
| Sınıf ortalaması Gaming (86886 - 223650, n=60, son 2 yıl) | |
| Schenker XMG Pro 15 (E23) | |
| 1920x1080 Fire Strike Graphics | |
| Alienware m16 R1 AMD | |
| Sınıf ortalaması Gaming (18629 - 62849, n=112, son 2 yıl) | |
| HP Omen 16-wf000 | |
| Uniwill GM6PX7X RTX 4070 | |
| Alienware m16 R1 Intel | |
| Schenker XMG Pro 15 (E23) | |
| Dell G15 5530 | |
| Colorful EVOL X15 AT 23 | |
| Ortalama NVIDIA GeForce RTX 4060 Laptop GPU (20533 - 29656, n=54) | |
| Acer Predator Helios 16 PH16-71-731Q | |
| 2560x1440 Time Spy Graphics | |
| Alienware m16 R1 AMD | |
| HP Omen 16-wf000 | |
| Sınıf ortalaması Gaming (6387 - 26212, n=112, son 2 yıl) | |
| Uniwill GM6PX7X RTX 4070 | |
| Dell G15 5530 | |
| Alienware m16 R1 Intel | |
| Acer Predator Helios 16 PH16-71-731Q | |
| Schenker XMG Pro 15 (E23) | |
| Colorful EVOL X15 AT 23 | |
| Ortalama NVIDIA GeForce RTX 4060 Laptop GPU (7484 - 11451, n=56) | |
| 3DMark 11 Performance | 30245 puan | |
| 3DMark Ice Storm Standard Score | 278340 puan | |
| 3DMark Cloud Gate Standard Score | 63582 puan | |
| 3DMark Fire Strike Score | 24674 puan | |
| 3DMark Fire Strike Extreme Score | 12089 puan | |
| 3DMark Time Spy Score | 10590 puan | |
Yardım | ||
| Blender / v3.3 Classroom OPTIX/RTX | |
| Schenker XMG Pro 15 (E23) | |
| Colorful EVOL X15 AT 23 | |
| Alienware m16 R1 Intel | |
| Ortalama NVIDIA GeForce RTX 4060 Laptop GPU (19 - 28, n=53) | |
| Acer Predator Helios 16 PH16-71-731Q | |
| Dell G15 5530 | |
| Uniwill GM6PX7X RTX 4070 | |
| Sınıf ortalaması Gaming (9 - 32, n=103, son 2 yıl) | |
| HP Omen 16-wf000 | |
| Alienware m16 R1 AMD | |
| Blender / v3.3 Classroom CUDA | |
| Schenker XMG Pro 15 (E23) | |
| Ortalama NVIDIA GeForce RTX 4060 Laptop GPU (39 - 53, n=53) | |
| Colorful EVOL X15 AT 23 | |
| Acer Predator Helios 16 PH16-71-731Q | |
| Dell G15 5530 | |
| Alienware m16 R1 Intel | |
| Uniwill GM6PX7X RTX 4070 | |
| Sınıf ortalaması Gaming (15 - 228, n=103, son 2 yıl) | |
| Alienware m16 R1 AMD | |
| HP Omen 16-wf000 | |
| Blender / v3.3 Classroom CPU | |
| Ortalama NVIDIA GeForce RTX 4060 Laptop GPU (189 - 452, n=53) | |
| HP Omen 16-wf000 | |
| Dell G15 5530 | |
| Acer Predator Helios 16 PH16-71-731Q | |
| Colorful EVOL X15 AT 23 | |
| Schenker XMG Pro 15 (E23) | |
| Alienware m16 R1 Intel | |
| Uniwill GM6PX7X RTX 4070 | |
| Sınıf ortalaması Gaming (122 - 565, n=99, son 2 yıl) | |
| Alienware m16 R1 AMD | |
* ... daha küçük daha iyidir
Oyun Performansı
EVOL X15, benzer özelliklere sahip rakip dizüstü bilgisayarlara göre küçük farklarla öne çıkıyor Acer Predator Helios 16 ve Alienware m16 R1 Intel 1080p Ultra'da genel oyun performansında.
Birçok AAA oyunda QHD 60 fps oyun hızına ulaşılabilir ve Nvidia DLSS, AMD FSR veya Intel XeSS gibi yükselticiler yardımıyla daha da yüksek kare hızları elde etme potansiyeli vardır.
| Performance rating - Percent | |
| Alienware m16 R1 AMD -1! | |
| Sınıf ortalaması Gaming | |
| HP Omen 16-wf000 | |
| Uniwill GM6PX7X RTX 4070 | |
| Schenker XMG Pro 15 (E23) -1! | |
| Colorful EVOL X15 AT 23 | |
| Dell G15 5530 | |
| Alienware m16 R1 Intel -1! | |
| Acer Predator Helios 16 PH16-71-731Q | |
| The Witcher 3 - 1920x1080 Ultra Graphics & Postprocessing (HBAO+) | |
| Sınıf ortalaması Gaming (104.7 - 240, n=7, son 2 yıl) | |
| Alienware m16 R1 AMD | |
| HP Omen 16-wf000 | |
| Schenker XMG Pro 15 (E23) | |
| Uniwill GM6PX7X RTX 4070 | |
| Alienware m16 R1 Intel | |
| Dell G15 5530 | |
| Colorful EVOL X15 AT 23 | |
| Acer Predator Helios 16 PH16-71-731Q | |
| GTA V - 1920x1080 Highest AA:4xMSAA + FX AF:16x | |
| Sınıf ortalaması Gaming (67.1 - 186.9, n=90, son 2 yıl) | |
| Uniwill GM6PX7X RTX 4070 | |
| Colorful EVOL X15 AT 23 | |
| HP Omen 16-wf000 | |
| Acer Predator Helios 16 PH16-71-731Q | |
| Dell G15 5530 | |
| Schenker XMG Pro 15 (E23) | |
| Final Fantasy XV Benchmark - 1920x1080 High Quality | |
| Alienware m16 R1 AMD | |
| HP Omen 16-wf000 | |
| Sınıf ortalaması Gaming (64.2 - 215, n=91, son 2 yıl) | |
| Uniwill GM6PX7X RTX 4070 | |
| Alienware m16 R1 Intel | |
| Colorful EVOL X15 AT 23 | |
| Acer Predator Helios 16 PH16-71-731Q | |
| Dell G15 5530 | |
| Strange Brigade - 1920x1080 ultra AA:ultra AF:16 | |
| Alienware m16 R1 AMD | |
| HP Omen 16-wf000 | |
| Sınıf ortalaması Gaming (113.6 - 458, n=83, son 2 yıl) | |
| Uniwill GM6PX7X RTX 4070 | |
| Colorful EVOL X15 AT 23 | |
| Alienware m16 R1 Intel | |
| Dell G15 5530 | |
| Acer Predator Helios 16 PH16-71-731Q | |
| Schenker XMG Pro 15 (E23) | |
| Dota 2 Reborn - 1920x1080 ultra (3/3) best looking | |
| Uniwill GM6PX7X RTX 4070 | |
| Alienware m16 R1 AMD | |
| Sınıf ortalaması Gaming (84.8 - 252, n=104, son 2 yıl) | |
| Schenker XMG Pro 15 (E23) | |
| HP Omen 16-wf000 | |
| Alienware m16 R1 Intel | |
| Colorful EVOL X15 AT 23 | |
| Acer Predator Helios 16 PH16-71-731Q | |
| Dell G15 5530 | |
| X-Plane 11.11 - 1920x1080 high (fps_test=3) | |
| Uniwill GM6PX7X RTX 4070 | |
| Alienware m16 R1 Intel | |
| HP Omen 16-wf000 | |
| Colorful EVOL X15 AT 23 | |
| Dell G15 5530 | |
| Alienware m16 R1 AMD | |
| Schenker XMG Pro 15 (E23) | |
| Sınıf ortalaması Gaming (55.5 - 148.5, n=106, son 2 yıl) | |
| Acer Predator Helios 16 PH16-71-731Q | |
Witcher 3 FPS Tablosu
EVOL X15'in grafik alt sisteminin soğutması, The Witcher 3 ile 1080p Ultra'da stres altındayken gözlemlenen sabit kare hızlarının da gösterdiği gibi oldukça verimli görünüyor.
| düşük | orta | yüksek | ultra | QHD | |
|---|---|---|---|---|---|
| GTA V (2015) | 185.6 | 182.3 | 177.3 | 114.6 | 85.6 |
| The Witcher 3 (2015) | 450 | 333 | 205 | 103.4 | 75.7 |
| Dota 2 Reborn (2015) | 192.2 | 169.7 | 164.6 | 153.1 | |
| Final Fantasy XV Benchmark (2018) | 206 | 143.9 | 101 | 74 | |
| X-Plane 11.11 (2018) | 176.1 | 155.9 | 116.4 | ||
| Far Cry 5 (2018) | 162 | 146 | 141 | 135 | 101 |
| Strange Brigade (2018) | 480 | 288 | 225 | 192 | 127.4 |
| F1 22 (2022) | 253 | 253 | 194.5 | 65.8 | 42.3 |
| F1 23 (2023) | 248 | 250 | 184.1 | 58.3 | 37 |
| Cyberpunk 2077 (2023) | 119.4 | 96.5 | 82.8 | 71.1 | 42.8 |
| Assassin's Creed Mirage (2023) | 137 | 125 | 116 | 89 | 65 |
| Call of Duty Modern Warfare 3 2023 (2023) | 128 | 114 | 86 | 65 | 56 |
| Avatar Frontiers of Pandora (2023) | 77.3 | 71.1 | 60.8 | 45.2 | 29.8 |
Özel olarak hazırladığımız Nvidia GeForce RTX 4060 Dizüstü Bilgisayar GPU'su sayfasında daha fazla bilgi ve performans karşılaştırmaları bulabilirsiniz.
Emisyonlar: Yüksek fan gürültüsüne eşlik eden düşük yüzey sıcaklıkları
Sistem Gürültüsü
Colorful, EVOL X15 AT'nin fan gürültüsünü Sessiz modda 30 db(A)'nın altında sınırlar.
Bununla birlikte, hem Eğlence hem de Performans modlarında, ortalama 3DMark 06 yükleri altında bile 55 db(A) işaretine yakın gürültü seviyeleri görülür.
Sağlanan güç profillerinin oyun performansı üzerinde algılanabilir bir etkisi var. Örneğin, The Witcher 3 'da 1080p Ultra'da Performans modundan Sessiz moda geçildiğinde ortalama kare hızlarının %33 düştüğünü görüyoruz.
Ses yüksekliği
| Boşta |
| 33.16 / 33.16 / 33.16 dB |
| Çalışırken |
| 54.62 / 54.53 dB |
 | ||
30 dB sessiz 40 dB(A) duyulabilirlik 50 dB(A) gürültülü |
||
min: | ||
| Performans modu | Rölanti dB(A) | Yük ortalama dB(A) | Yük maksimum dB(A) | Witcher 3 1080p Ultra dB(A) |
|---|---|---|---|---|
| Sessiz | 24.73 | 26.61 | 26.08 | 26.82 / 67 fps |
| Güç Tasarrufu | 24.85 | 26.02 | 41.05 | 46.10 / 75 fps |
| Eğlence | 25.07 | 54.06 | 54.56 | 53.29 / 97 fps |
| Performans | 33.16 | 54.62 | 54.53 | 54.62 / 100 fps |
| Colorful EVOL X15 AT 23 i7-13700HX, GeForce RTX 4060 Laptop GPU | Alienware m16 R1 Intel i7-13700HX, GeForce RTX 4060 Laptop GPU | HP Omen 16-wf000 i7-13700HX, GeForce RTX 4080 Laptop GPU | Acer Predator Helios 16 PH16-71-731Q i7-13700HX, GeForce RTX 4060 Laptop GPU | Dell G15 5530 i7-13650HX, GeForce RTX 4060 Laptop GPU | Schenker XMG Pro 15 (E23) i9-13900HX, GeForce RTX 4060 Laptop GPU | Alienware m16 R1 AMD R9 7845HX, GeForce RTX 4080 Laptop GPU | Uniwill GM6PX7X RTX 4070 i7-13700HX, GeForce RTX 4070 Laptop GPU | |
|---|---|---|---|---|---|---|---|---|
| Noise | 9% | 7% | 14% | 19% | 11% | 13% | 13% | |
| kapalı / ortam * (dB) | 21.32 | 25 -17% | 23 -8% | 24 -13% | 20.41 4% | 24 -13% | 22.9 -7% | 22.4 -5% |
| Idle Minimum * (dB) | 33.16 | 25 25% | 29.6 11% | 24 28% | 26.85 19% | 24 28% | 22.9 31% | 22.9 31% |
| Idle Average * (dB) | 33.16 | 26 22% | 29.8 10% | 24 28% | 26.85 19% | 24 28% | 29.7 10% | 29 13% |
| Idle Maximum * (dB) | 33.16 | 27 19% | 30.4 8% | 32.32 3% | 26.85 19% | 24 28% | 29.7 10% | 29 13% |
| Load Average * (dB) | 54.62 | 52 5% | 33.8 38% | 36.66 33% | 27.65 49% | 53.65 2% | 29.8 45% | 40.2 26% |
| Witcher 3 ultra * (dB) | 54.6 | 51 7% | 57 -4% | 49.06 10% | 47.9 12% | 53.53 2% | 54.7 -0% | 48.7 11% |
| Load Maximum * (dB) | 54.53 | 53 3% | 58.3 -7% | 49.49 9% | 47.86 12% | 53.65 2% | 54.7 -0% | 55 -1% |
* ... daha küçük daha iyidir
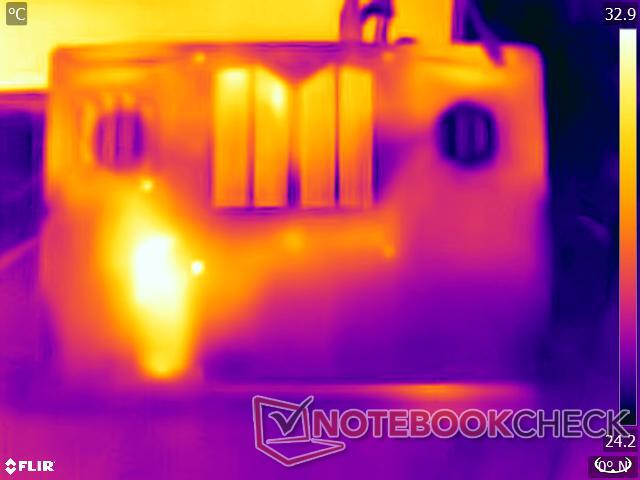
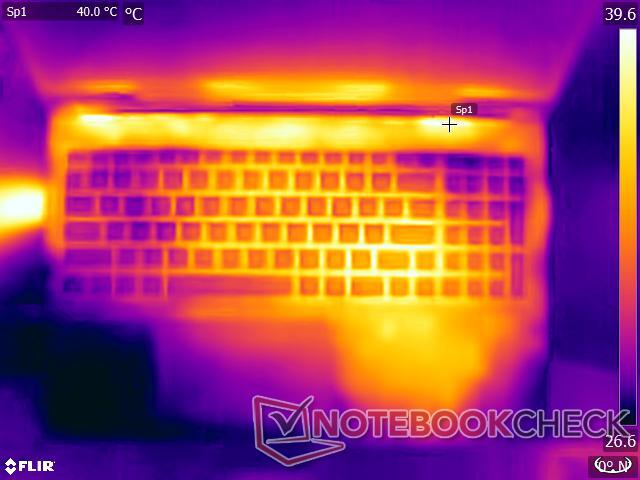
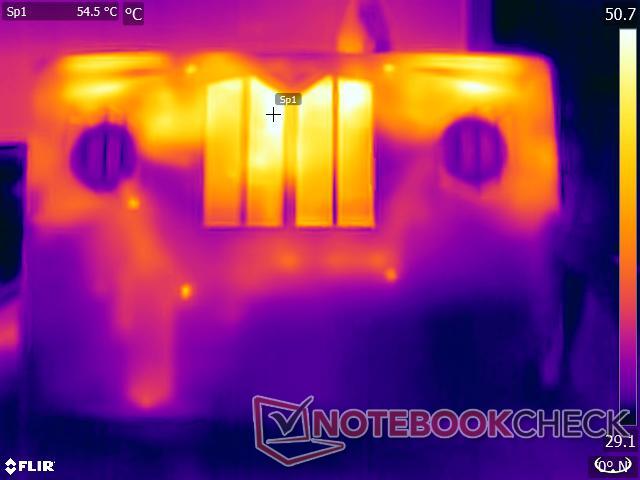
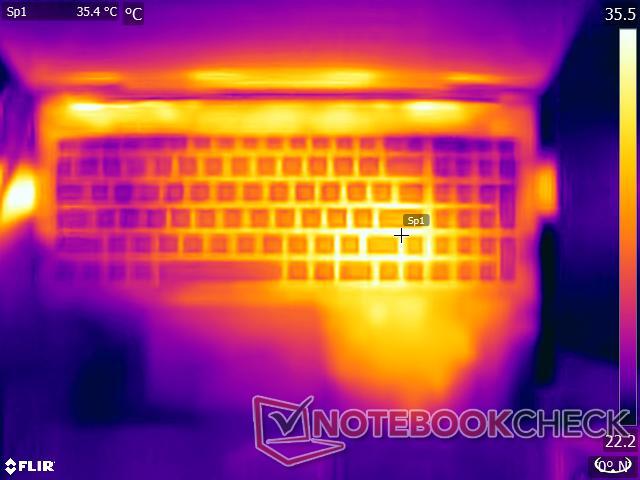
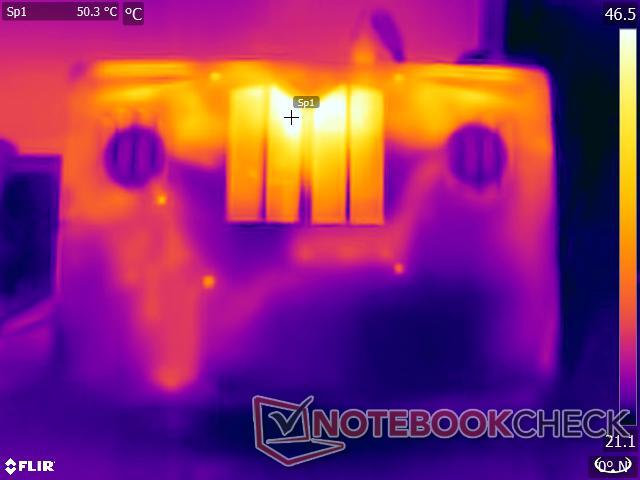
Sıcaklık
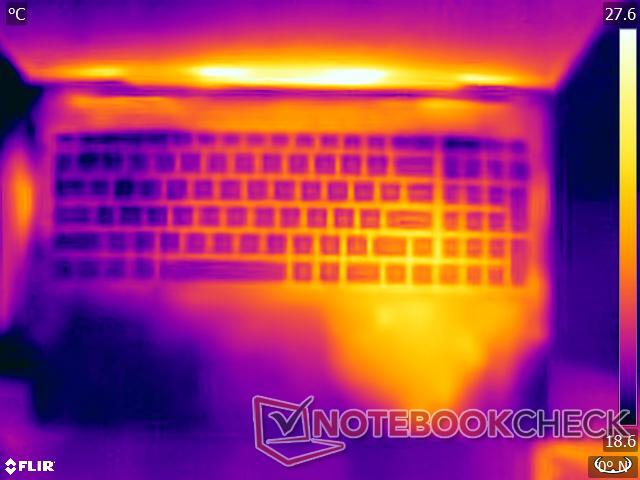
EVOL X15, CPU, GPU ve yonga setini tamamen kapsayan sağlam bir soğutma sistemine sahiptir. Sağlam plastik yapı ve arka panelin anakarttan geniş açıklığı sayesinde yüzey sıcaklıkları ağır yük altında yönetilebilir. Sadece alt kısımdaki bir sıcak nokta 51 °C'ye ulaşıyor.
Ağırlığına rağmen EVOL X15, çok fazla zorlamadığınız sürece kucakta kullanılabilir. Dokunmatik yüzey ve avuç içi dayanak alanları nispeten serin kalıyor, sadece aşırı yük altında hafif ısınıyor.
(+) Üst taraftaki maksimum sıcaklık, 40.4 °C / 105 F ortalamasına kıyasla 37 °C / 99 F'dir. , Gaming sınıfı için 21.2 ile 68.8 °C arasında değişir.
(-) Alt kısım, 43.2 °C / 110 F ortalamasına kıyasla maksimum 51.2 °C / 124 F'ye kadar ısınır
(+) Boşta kullanımda, üst tarafın ortalama sıcaklığı 29.3 °C / 85 F olup, cihazın 33.9 °C / 93 F.
(+) The Witcher 3 oynarken, üst tarafın ortalama sıcaklığı 31.7 °C / 89 F olup, cihazın 33.9 °C / 93 F.
(+) Avuç içi dayanakları ve dokunmatik yüzey maksimum (34.8 °C / 94.6 F) cilt sıcaklığına ulaşıyor ve bu nedenle sıcak değil.
(-) Benzer cihazların avuç içi dayanağı alanının ortalama sıcaklığı 28.8 °C / 83.8 F (-6 °C / -10.8 F) idi.
| Colorful EVOL X15 AT 23 Intel Core i7-13700HX, NVIDIA GeForce RTX 4060 Laptop GPU | Alienware m16 R1 Intel Intel Core i7-13700HX, NVIDIA GeForce RTX 4060 Laptop GPU | HP Omen 16-wf000 Intel Core i7-13700HX, NVIDIA GeForce RTX 4080 Laptop GPU | Acer Predator Helios 16 PH16-71-731Q Intel Core i7-13700HX, NVIDIA GeForce RTX 4060 Laptop GPU | Dell G15 5530 Intel Core i7-13650HX, NVIDIA GeForce RTX 4060 Laptop GPU | Schenker XMG Pro 15 (E23) Intel Core i9-13900HX, NVIDIA GeForce RTX 4060 Laptop GPU | Alienware m16 R1 AMD AMD Ryzen 9 7845HX, NVIDIA GeForce RTX 4080 Laptop GPU | Uniwill GM6PX7X RTX 4070 Intel Core i7-13700HX, NVIDIA GeForce RTX 4070 Laptop GPU | |
|---|---|---|---|---|---|---|---|---|
| Heat | -18% | 0% | -17% | -19% | -9% | -9% | -5% | |
| Maximum Upper Side * (°C) | 37 | 49 -32% | 45 -22% | 41 -11% | 54 -46% | 50 -35% | 48 -30% | 38.2 -3% |
| Maximum Bottom * (°C) | 51.2 | 48 6% | 48.8 5% | 66 -29% | 62.2 -21% | 50 2% | 39 24% | 45 12% |
| Idle Upper Side * (°C) | 31.2 | 40 -28% | 29.2 6% | 36 -15% | 33.4 -7% | 33 -6% | 37 -19% | 33.6 -8% |
| Idle Bottom * (°C) | 32.8 | 39 -19% | 28.8 12% | 37 -13% | 33.4 -2% | 32 2% | 36.2 -10% | 39.6 -21% |
* ... daha küçük daha iyidir
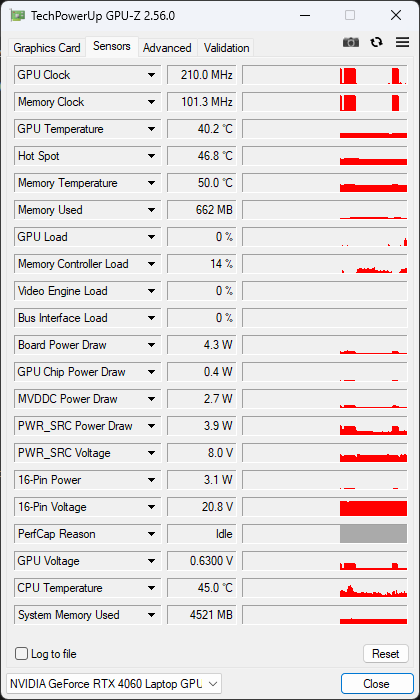
Stres Testi
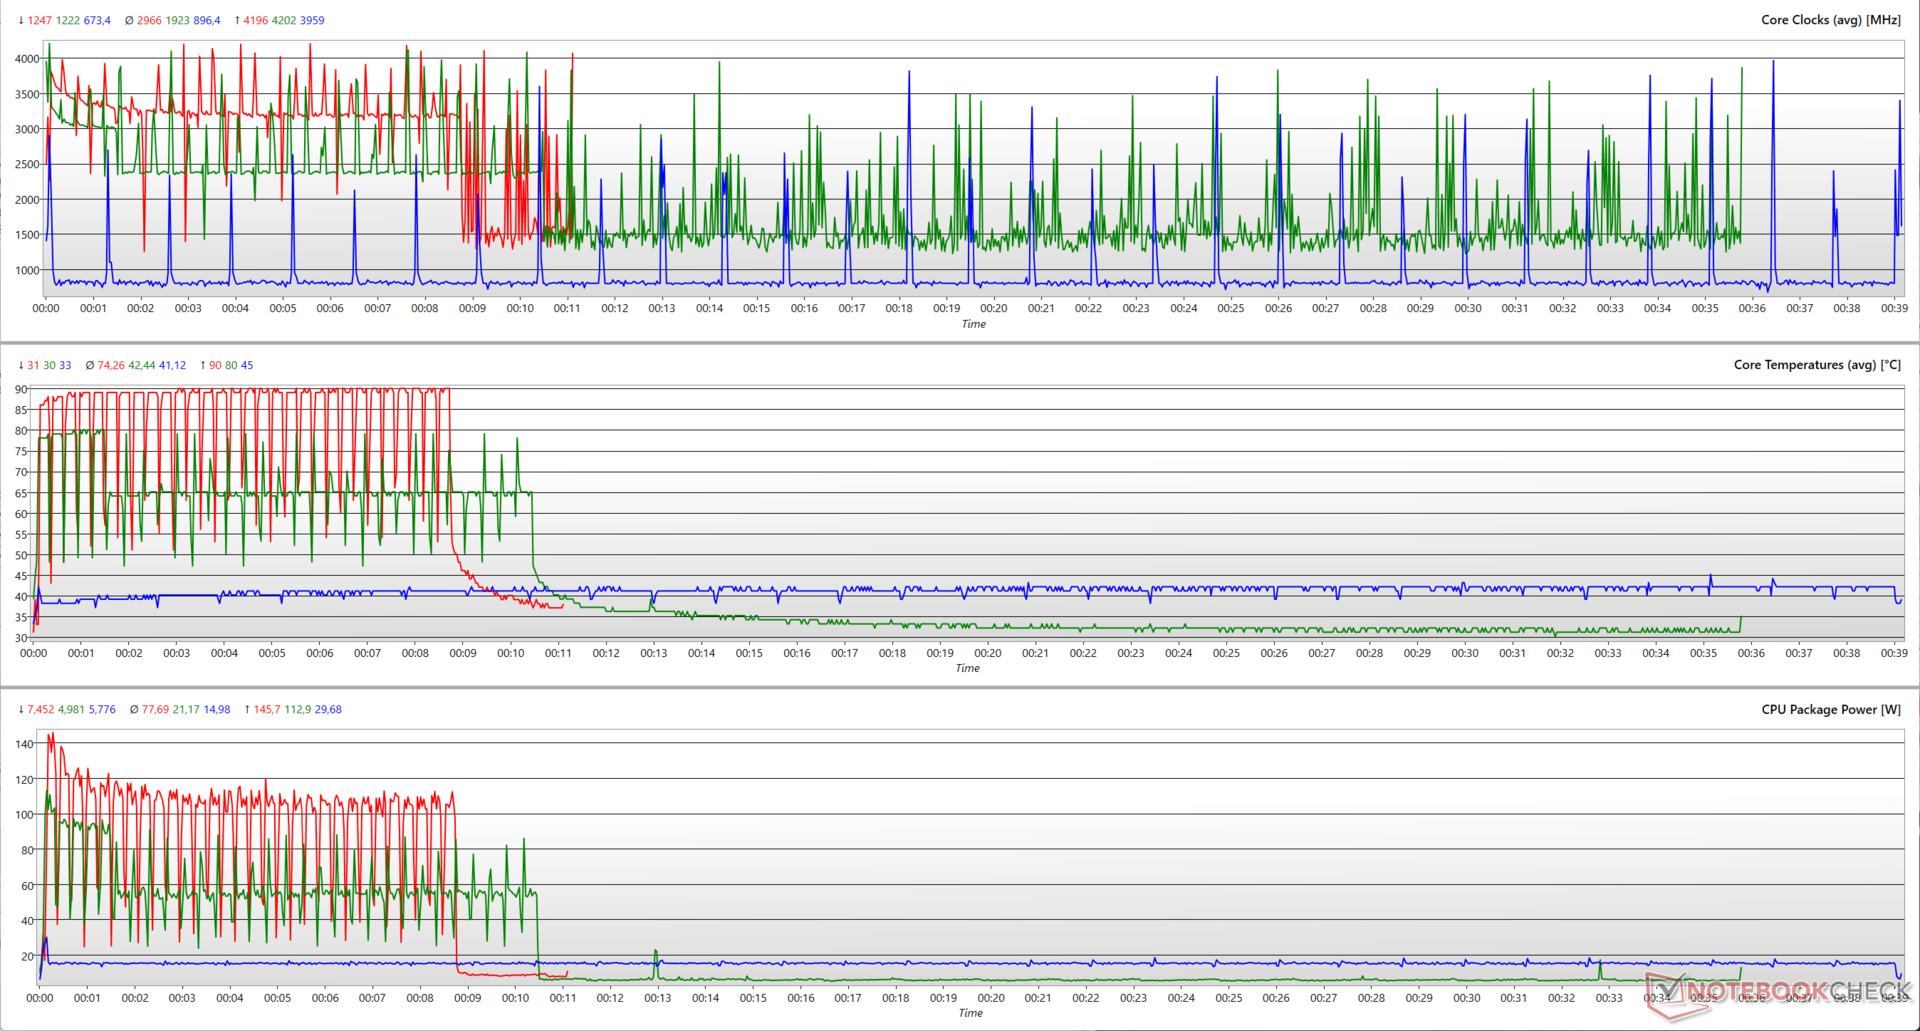
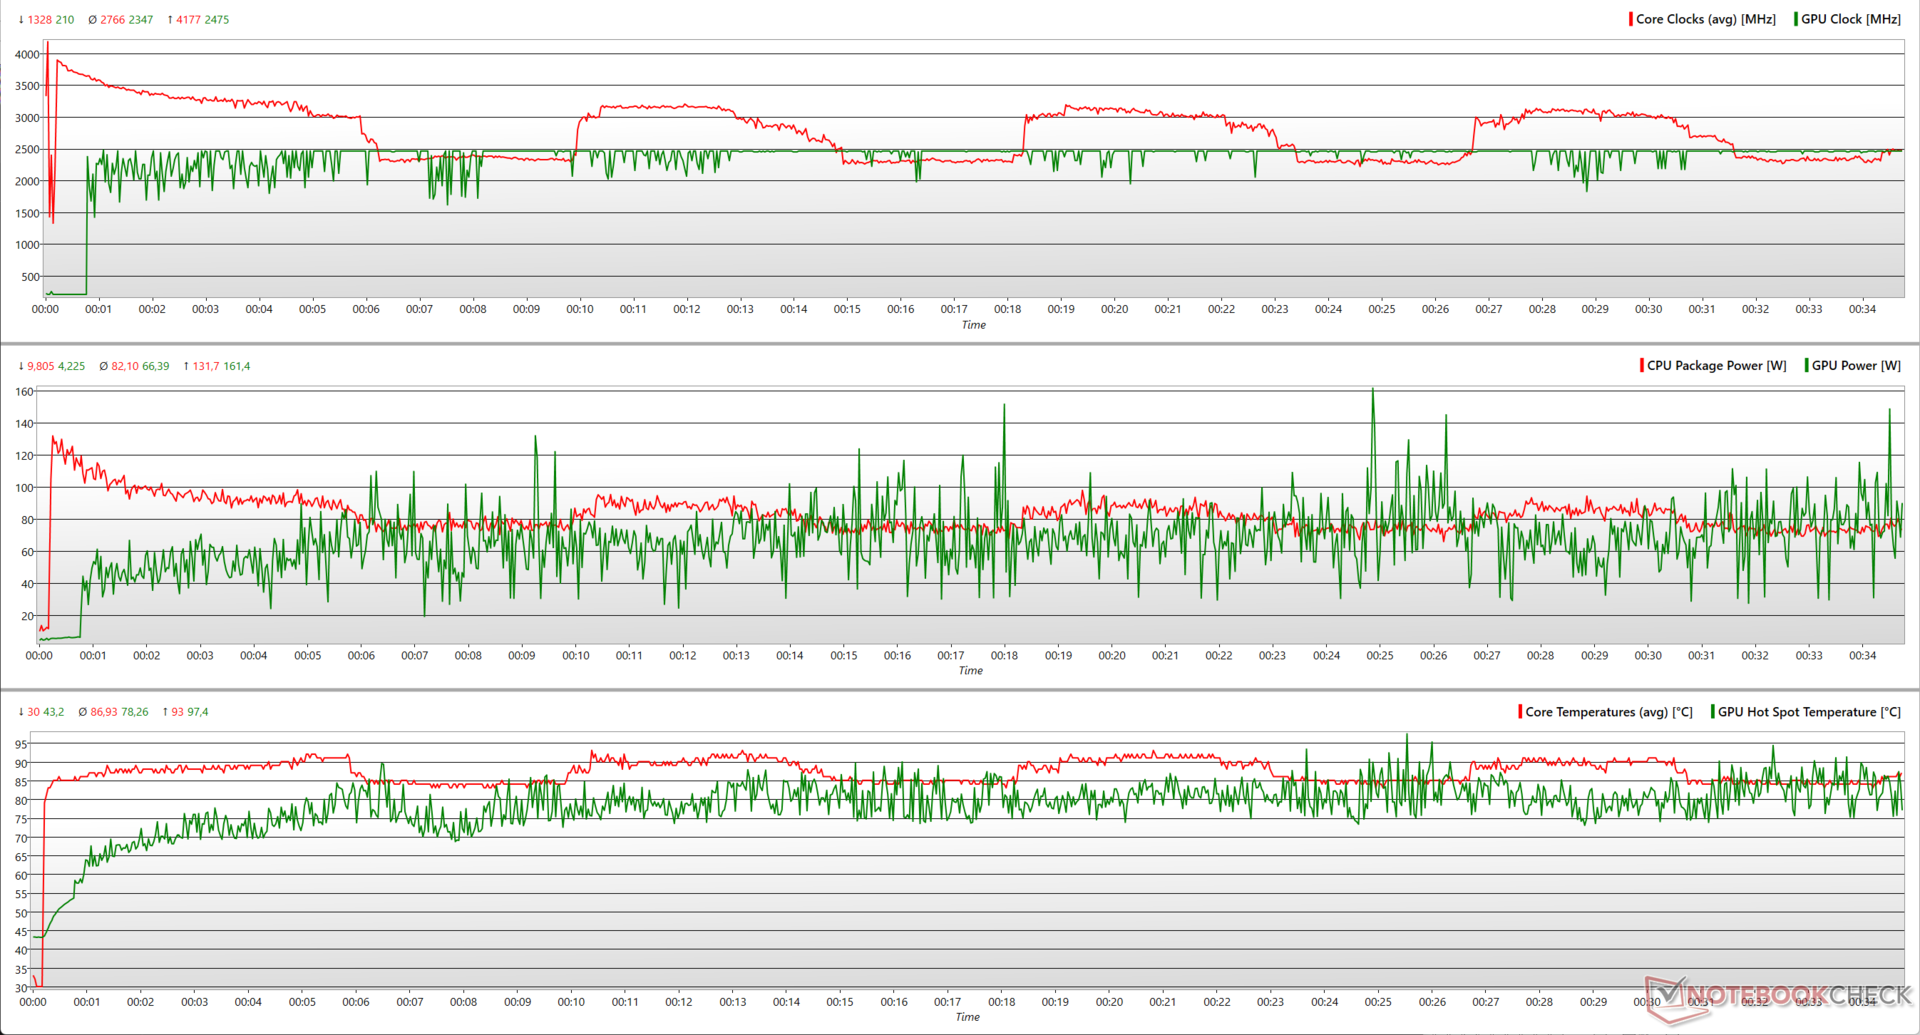
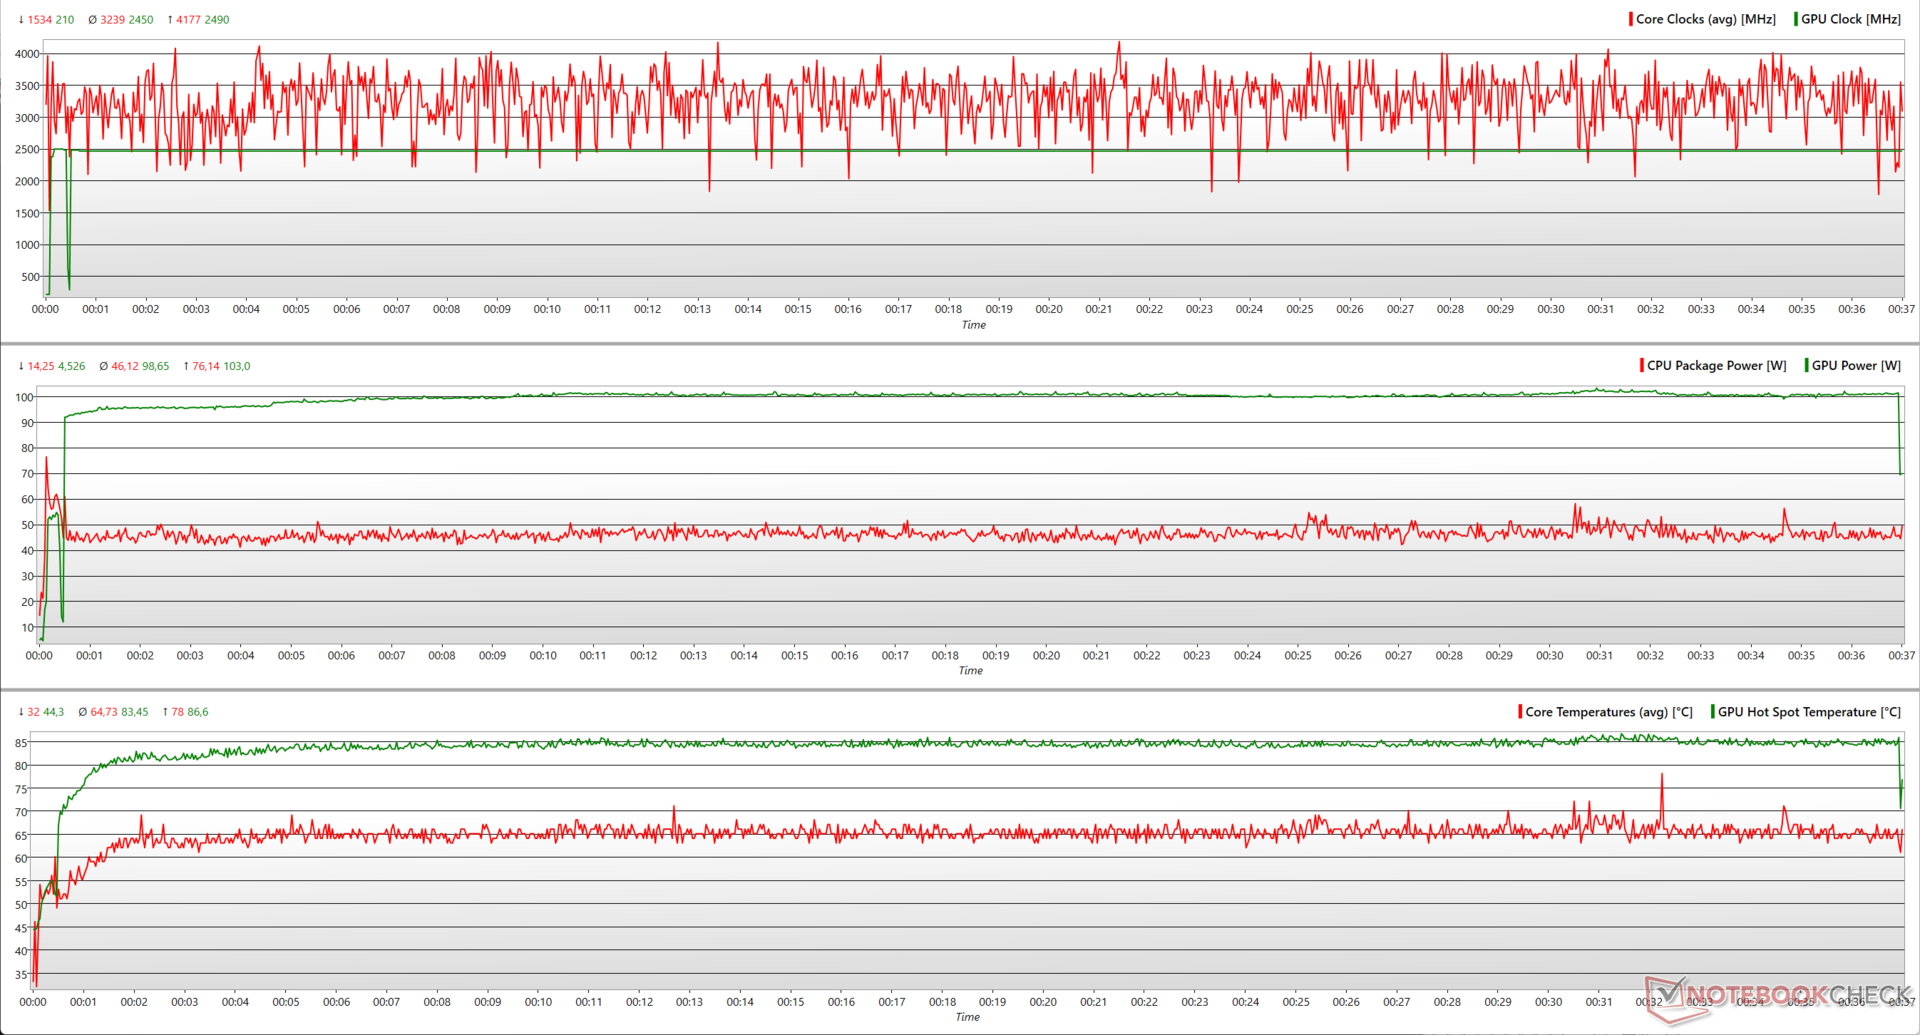
EVOL X15'i Prime95 yerinde büyük FFT'lerle zorlamak Core i7-13700HX'in 123 W kullanırken 3,7 GHz'e kadar en yüksek artışlara ulaştığını görüyor. Kapsamlı soğutmaya rağmen CPU, 3,7 GHz'e geri dönmeye çalışmadan önce periyodik olarak 80 W'ta 2,5 GHz'e düşüyor.
FurMark eklendiğinde, Core i7-13700HX artık 4,2 GHz'e ulaşmak için 132 W'a kadar kullanabiliyor, ancak yine de aralıklı olarak 2,5 GHz sınırına yaklaşıyor. RTX 4060, 161 W kullanırken güç boşluğunu kullanabilir ve 2,475 MHz tepe noktasına ulaşabilir.
| Stres Testi | CPU Saati (GHz) | GPU Saati (MHz) | Ortalama CPU Sıcaklığı (°C) | Ortalama GPU Sıcaklığı (°C) |
| Sistem Boşta | 1.42 | 210 | 31 | 37.1 |
| Prime95 | 3,42 | 210 | 85 | 50,8 |
| Prime95 + FurMark | 2.99 | 2,460 | 86 | 70.8 |
| Witcher 3 1080p Ultra | 3,12 | 2.460 | 64 | 73,7 |
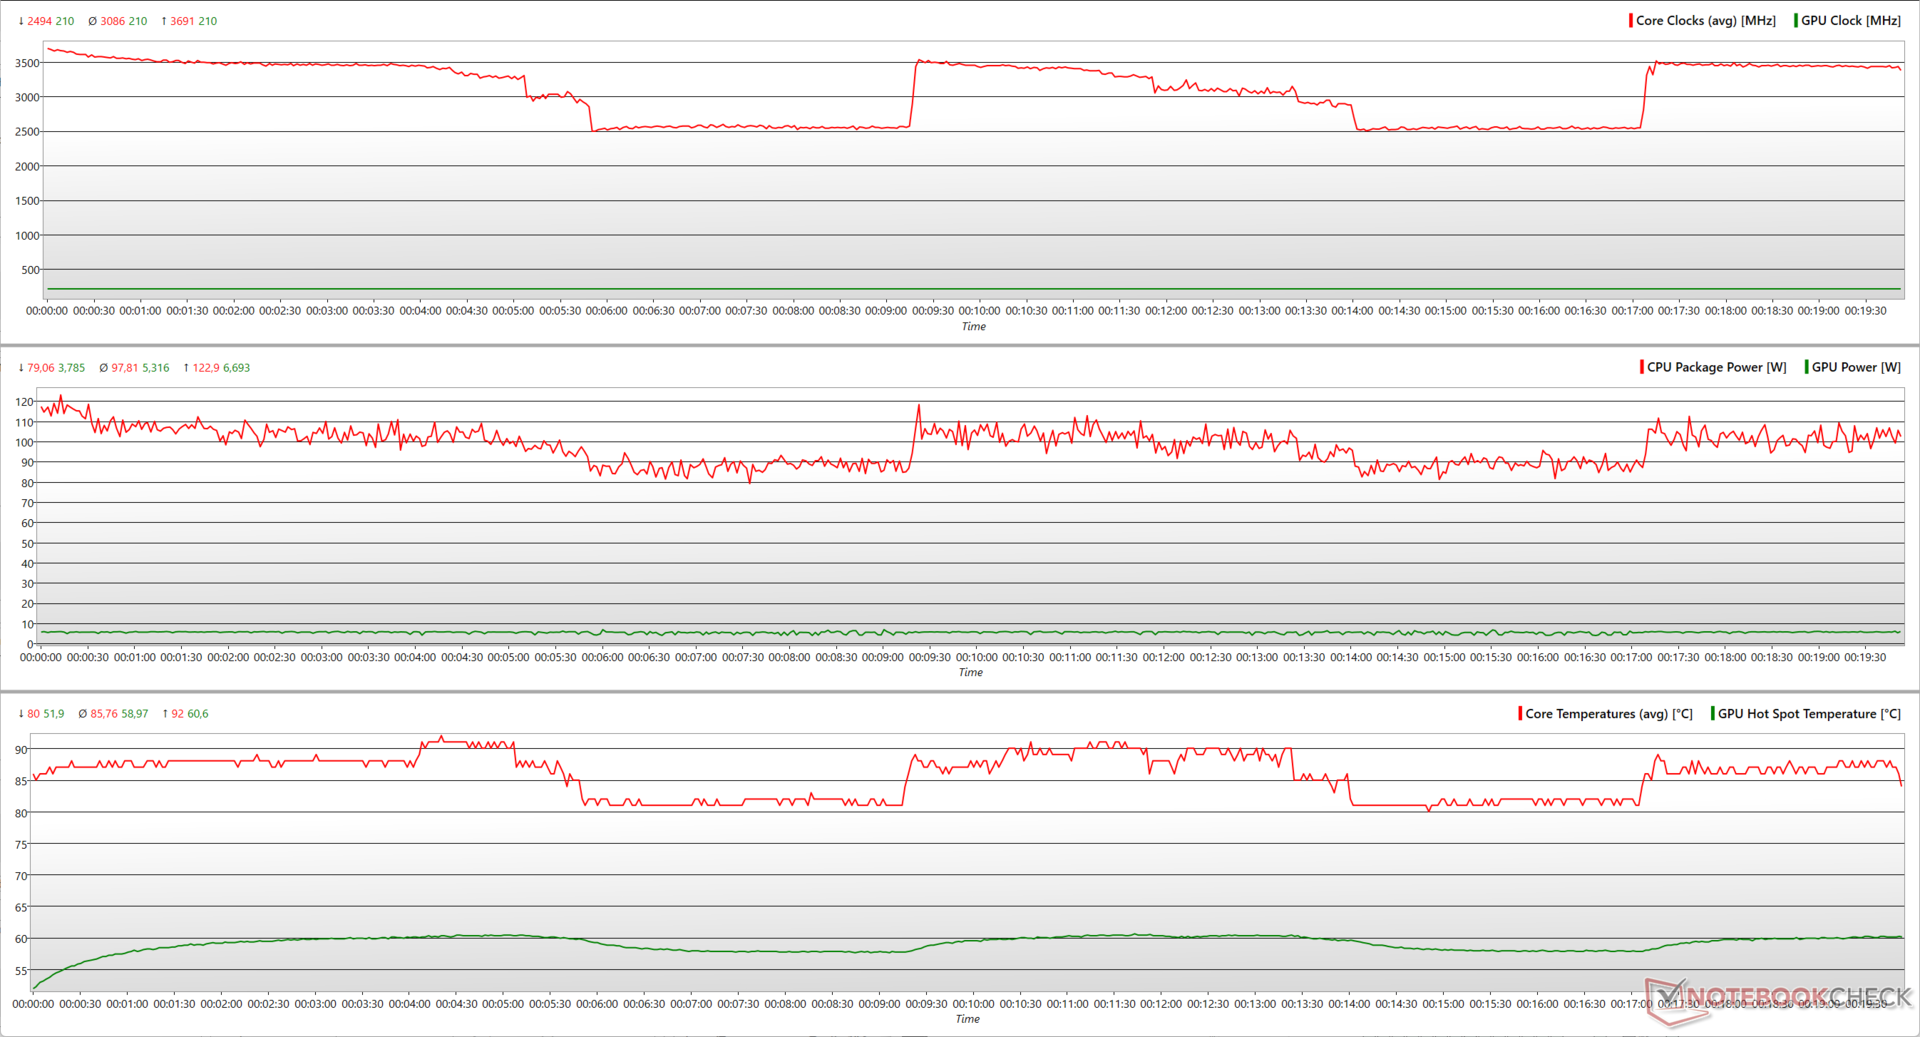
The Witcher 3 ile 1080p Ultra'da Core i7-13700HX, yalnızca 76 W kullanarak 4,2 GHz tepe değerine ulaşabilirken, 46 W'ta 3,2 GHz'lik ortalama saatleri koruyabiliyor. Bu, RTX 4060'ın 103 W'ta 2.490 MHz'lik neredeyse tutarlı bir artış elde etmesi için yeterli boş alan sağlıyor.
Konuşmacılar
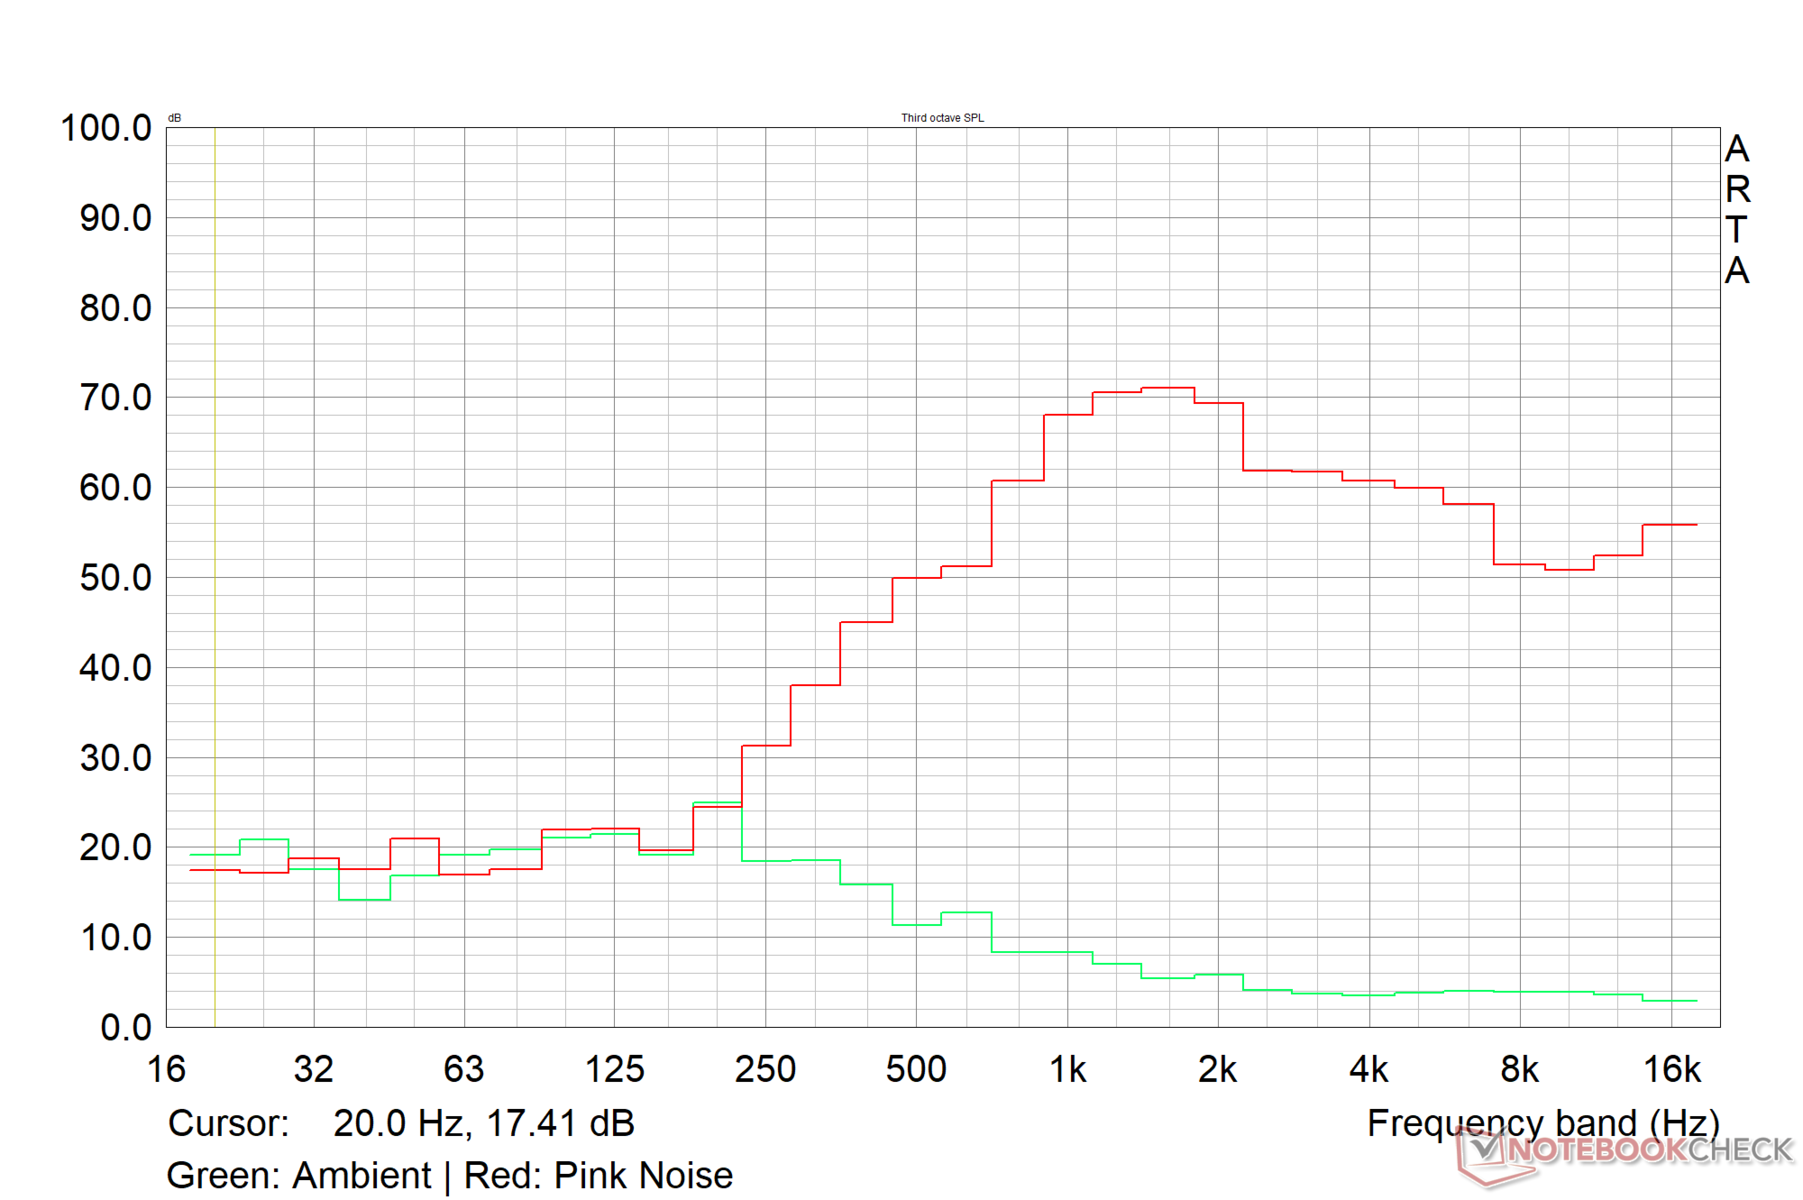
EVOL X15'in stereo hoparlörleri orta büyüklükteki bir oda için yeterince yüksek. Colorful, Creative SoundBlaster Studio ayarının reklamını yapıyor, ancak bas tepkisi eksikliği ve ortalama orta sesler nedeniyle ses tiz geliyor. Öte yandan daha yüksek frekanslar oldukça iyi üretiliyor.
İdeal olarak Colorful, daha güçlü pasif radyatörler eklemek için büyük kasadan yararlanabilirdi. Bununla birlikte, kullanıcılar 3,5 mm combo ses jakı veya Bluetooth 5.2 aracılığıyla daha iyi ses kalitesi elde edebilirler.
Colorful EVOL X15 AT 23 ses analizi
(±) | hoparlör ses yüksekliği ortalama ama iyi (77.5 dB)
Bas 100 - 315Hz
(-) | neredeyse hiç bas yok - ortalama olarak medyandan 26.2% daha düşük
(±) | Bas doğrusallığı ortalamadır (9.2% delta - önceki frekans)
Ortalar 400 - 2000 Hz
(±) | daha yüksek ortalar - ortalama olarak medyandan 11.1% daha yüksek
(±) | Ortaların doğrusallığı ortalamadır (9.6% delta - önceki frekans)
Yüksekler 2 - 16 kHz
(±) | daha yüksek en yüksekler - ortalama olarak medyandan 6.1% daha yüksek
(+) | yüksekler doğrusaldır (5.8% deltadan önceki frekansa)
Toplam 100 - 16.000 Hz
(±) | Genel sesin doğrusallığı ortalamadır (29.7% ortancaya göre fark)
Aynı sınıfla karşılaştırıldığında
» Bu sınıftaki tüm test edilen cihazların %95%'si daha iyi, 2% benzer, 3% daha kötüydü
» En iyisinin deltası 6% idi, ortalama 18% idi, en kötüsü 132% idi
Test edilen tüm cihazlarla karşılaştırıldığında
» Test edilen tüm cihazların %88'si daha iyi, 3 benzer, % 10 daha kötüydü
» En iyisinin deltası 4% idi, ortalama 23% idi, en kötüsü 134% idi
Apple MacBook Pro 16 2021 M1 Pro ses analizi
(+) | hoparlörler nispeten yüksek sesle çalabilir (84.7 dB)
Bas 100 - 315Hz
(+) | iyi bas - medyandan yalnızca 3.8% uzakta
(+) | bas doğrusaldır (5.2% delta ile önceki frekans)
Ortalar 400 - 2000 Hz
(+) | dengeli ortalar - medyandan yalnızca 1.3% uzakta
(+) | orta frekanslar doğrusaldır (2.1% deltadan önceki frekansa)
Yüksekler 2 - 16 kHz
(+) | dengeli yüksekler - medyandan yalnızca 1.9% uzakta
(+) | yüksekler doğrusaldır (2.7% deltadan önceki frekansa)
Toplam 100 - 16.000 Hz
(+) | genel ses doğrusaldır (4.6% ortancaya göre fark)
Aynı sınıfla karşılaştırıldığında
» Bu sınıftaki tüm test edilen cihazların %0%'si daha iyi, 0% benzer, 100% daha kötüydü
» En iyisinin deltası 5% idi, ortalama 17% idi, en kötüsü 45% idi
Test edilen tüm cihazlarla karşılaştırıldığında
» Test edilen tüm cihazların %0'si daha iyi, 0 benzer, % 100 daha kötüydü
» En iyisinin deltası 4% idi, ortalama 23% idi, en kötüsü 134% idi
Enerji Yönetimi: Maksimum yük altında ekonomik
Güç Tüketimi
EVOL X15'in boştaki güç tüketimi, Core i7-13700HX ve RTX 4060 kullanan rakiplerine kıyasla daha yüksektir. Bununla birlikte, maksimum yük altındaki güç çekimleri 224 W ile nispeten daha düşüktür.
RTX 4070'li Uniwill GM6PX7X, maksimum yük altında %33 daha fazla güç çeker, ancak yine de EVOL X15'ten toplamda %16 daha ekonomik olmayı başarır.
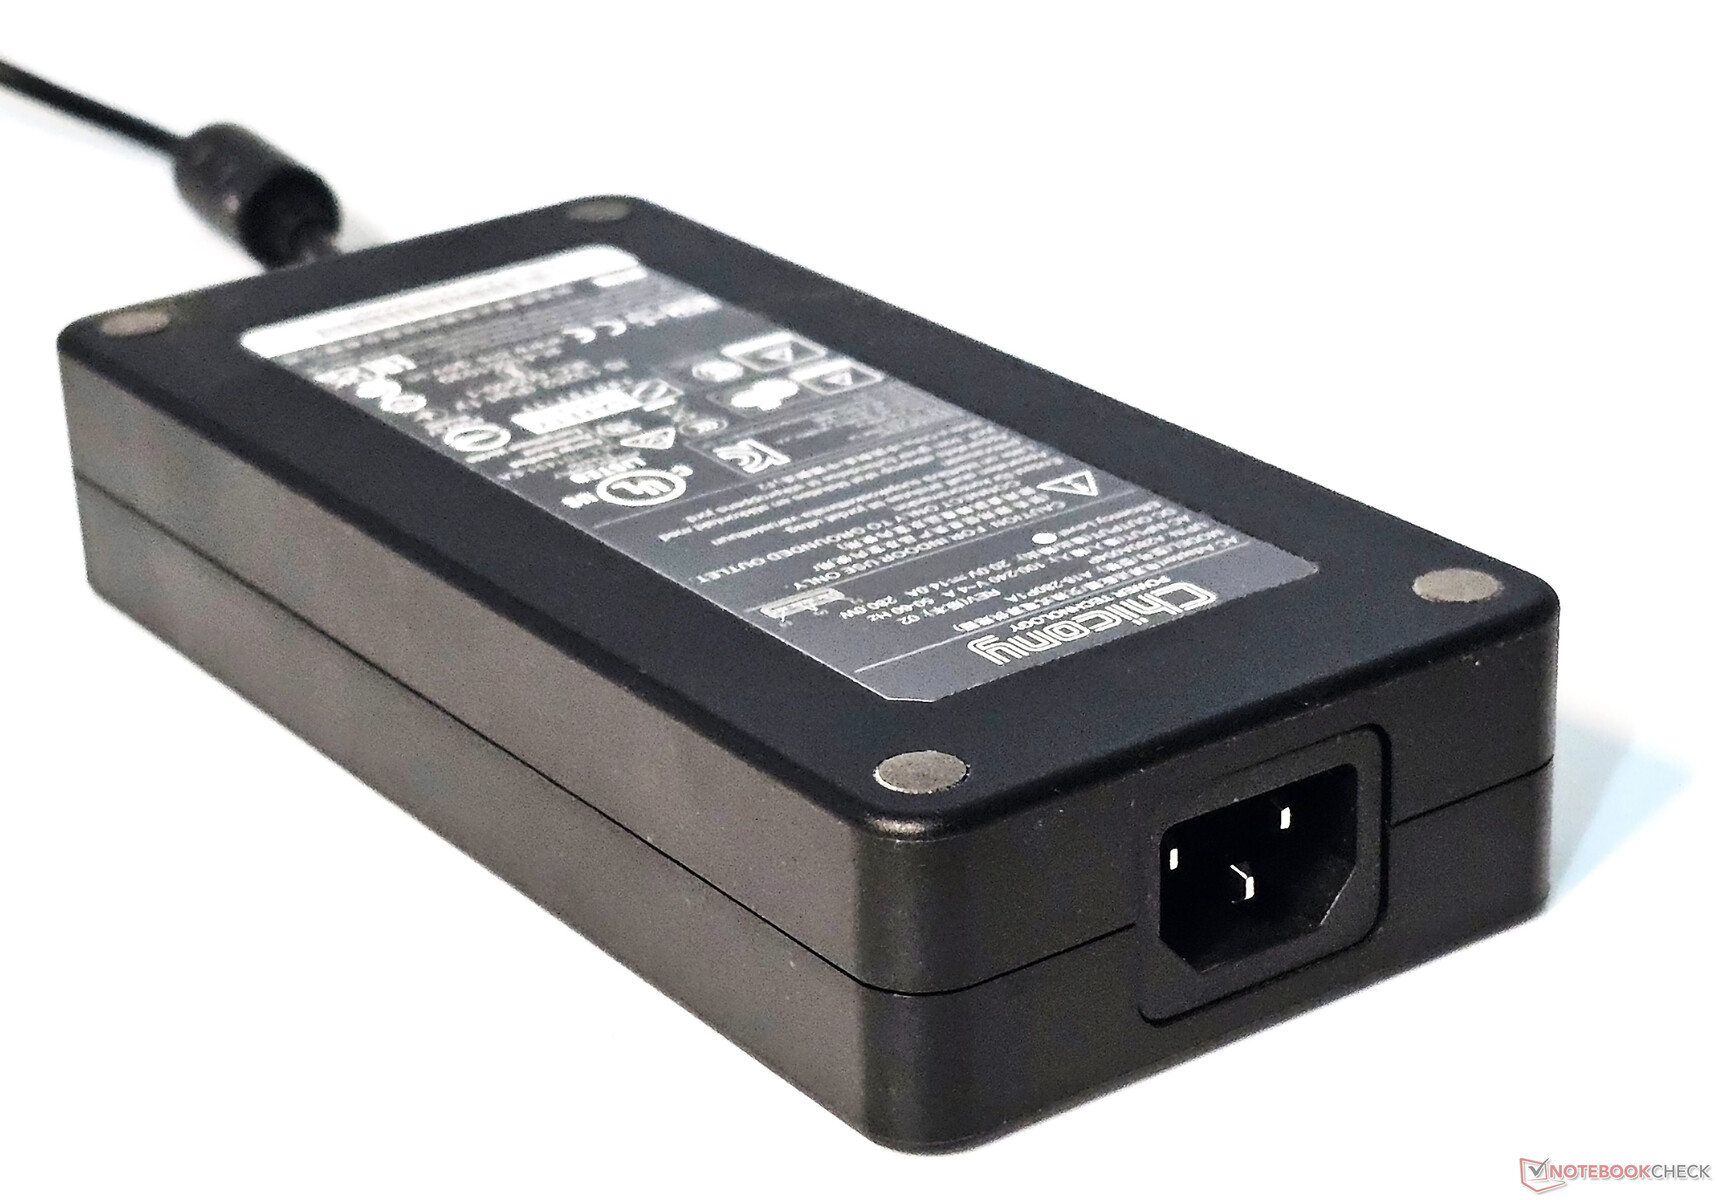
Birlikte verilen 280 W güç tuğlası, dizüstü bilgisayarı stres altında yeterince çalıştırabilir.
| Kapalı / Bekleme modu | |
| Boşta | |
| Çalışırken |
|
Key:
min: | |
| Colorful EVOL X15 AT 23 i7-13700HX, GeForce RTX 4060 Laptop GPU, IPS, 2560x1440, 15.6" | Alienware m16 R1 Intel i7-13700HX, GeForce RTX 4060 Laptop GPU, IPS, 2560x1600, 16" | HP Omen 16-wf000 i7-13700HX, GeForce RTX 4080 Laptop GPU, IPS, 2560x1440, 16.1" | Acer Predator Helios 16 PH16-71-731Q i7-13700HX, GeForce RTX 4060 Laptop GPU, IPS-LED, 2560x1600, 16" | Dell G15 5530 i7-13650HX, GeForce RTX 4060 Laptop GPU, IPS, 1920x1080, 15.6" | Schenker XMG Pro 15 (E23) i9-13900HX, GeForce RTX 4060 Laptop GPU, IPS, 2560x1440, 15.6" | Alienware m16 R1 AMD R9 7845HX, GeForce RTX 4080 Laptop GPU, IPS, 2560x1600, 16" | Uniwill GM6PX7X RTX 4070 i7-13700HX, GeForce RTX 4070 Laptop GPU, IPS, 2560x1600, 16" | Ortalama NVIDIA GeForce RTX 4060 Laptop GPU | Sınıf ortalaması Gaming | |
|---|---|---|---|---|---|---|---|---|---|---|
| Power Consumption | 20% | 2% | 20% | 30% | -11% | -45% | 16% | 36% | 24% | |
| Idle Minimum * (Watt) | 28.3 | 10 65% | 21.8 23% | 15.9 44% | 8.4 70% | 21.6 24% | 39 -38% | 12.6 55% | 11.5 ? 59% | 13.1 ? 54% |
| Idle Average * (Watt) | 32.2 | 14 57% | 26 19% | 20.5 36% | 14.98 53% | 29 10% | 44.6 -39% | 17.7 45% | 16 ? 50% | 19 ? 41% |
| Idle Maximum * (Watt) | 36.5 | 21 42% | 36 1% | 20.9 43% | 15.56 57% | 42.7 -17% | 68.1 -87% | 31.8 13% | 20.3 ? 44% | 24.6 ? 33% |
| Load Average * (Watt) | 119 | 119 -0% | 115.5 3% | 106 11% | 96.8 19% | 190 -60% | 129.8 -9% | 101.4 15% | 92.9 ? 22% | 111.3 ? 6% |
| Witcher 3 ultra * (Watt) | 189.6 | 186.7 2% | 214 -13% | 175 8% | 186 2% | 189 -0% | 285 -50% | 185.3 2% | ||
| Load Maximum * (Watt) | 224.3 | 323 -44% | 269.7 -20% | 276 -23% | 271.42 -21% | 269 -20% | 327.3 -46% | 298 -33% | 210 ? 6% | 260 ? -16% |
* ... daha küçük daha iyidir
Power Consumption: The Witcher 3 / Stress test
Power Consumption: External monitor
Pil Ömrü
EVOL X15'in oldukça güçlü iç aksamı göz önüne alındığında, 73 WHr pil yalnızca ortalama çalışma sürelerini karşılayabilir. Dizüstü bilgisayar 150 nit parlaklıkta, standart Wi-Fi web tarama testimizde yaklaşık 5,5 saat ve H.264 1080p video oynatma sırasında yaklaşık 6,5 saat dayanabiliyor.
| Colorful EVOL X15 AT 23 i7-13700HX, GeForce RTX 4060 Laptop GPU, 73 Wh | Alienware m16 R1 Intel i7-13700HX, GeForce RTX 4060 Laptop GPU, 86 Wh | HP Omen 16-wf000 i7-13700HX, GeForce RTX 4080 Laptop GPU, 83 Wh | Acer Predator Helios 16 PH16-71-731Q i7-13700HX, GeForce RTX 4060 Laptop GPU, 90 Wh | Dell G15 5530 i7-13650HX, GeForce RTX 4060 Laptop GPU, 86 Wh | Schenker XMG Pro 15 (E23) i9-13900HX, GeForce RTX 4060 Laptop GPU, 80 Wh | Alienware m16 R1 AMD R9 7845HX, GeForce RTX 4080 Laptop GPU, 86 Wh | Uniwill GM6PX7X RTX 4070 i7-13700HX, GeForce RTX 4070 Laptop GPU, 62 Wh | Sınıf ortalaması Gaming | |
|---|---|---|---|---|---|---|---|---|---|
| Pil Çalışma Süresi | -15% | -11% | 5% | -11% | 26% | -35% | -26% | 26% | |
| H.264 (h) | 6.3 | 5.6 -11% | 4.8 -24% | 6.8 8% | 8.27 ? 31% | ||||
| WiFi v1.3 (h) | 5.4 | 4.8 -11% | 5.1 -6% | 5.6 4% | 6.5 20% | 5.7 6% | 3.7 -31% | 4 -26% | 7.08 ? 31% |
| Witcher 3 ultra (h) | 1.2 | 1.5 25% | 0.8 -33% | ||||||
| Load (h) | 1.3 | 1 -23% | 1.1 -15% | 1.5 15% | 0.8 -38% | 1.9 46% | 0.8 -38% | 1.496 ? 15% | |
| Reader / Idle (h) | 6.4 | 5.5 | 4 | 7.84 ? |
Artılar
Eksiler
Karar: Eğer 1.000 doların altında bir fiyata alabiliyorsanız iyi bir seçim

Colorful, 1.000 doların altında yetenekli bir QHD oyun dizüstü bilgisayarı sunmayı hedefliyor ve EVOL X15 AT 23 ile büyük ölçüde başarılı oluyor. Öncelikle plastik Clevo yapısıyla inşa edilen EVOL X15'in klavyesinde bir miktar esneme var; ancak EVOL X15 genel olarak yapısal olarak sağlam kalıyor.
EVOL X15 AT'nin sahip olduğu pek çok şey var. Potansiyel alıcılar, iyi bağlantı noktası seçimini, yüksek Wi-Fi 6E hızlarını ve iç kısımlara kolay erişimi takdir edeceklerdir.
Bir kombinasyon Intel Core i7-13700HX masaüstü sınıfı CPU ve Nvidia GeForce RTX 4060 Dizüstü Bilgisayar GPU'su eVOL X15 AT'nin aşağıdaki gibi daha yüksek fiyatlı modellerle etkin bir şekilde rekabet etmesini sağlar Alienware m16 R1 ve Acer Predator Helios 16.
Colorful EVOL X15 AT, köklü rakiplerinde bulunan tüm zil ve ıslıkları sunmayabilir, ancak gözle görülür performans sınırlamaları olmadan temelleri doğru bir şekilde almayı büyük ölçüde başarır."
Bununla birlikte, birkaç eleştiri alanı da var. Type-C bağlantı noktalarıyla güç aktarımı eksikliği ve biraz daha yüksek tepki süreleri gibi hususların ele alınması gerekiyor. Colorful'un ayrıca varsayılan performans profilleri ile fan eğrilerinin ince ayarına odaklanması ve boşta güç tüketimini iyileştirmek için çalışması gerekiyor.
Genel olarak, Colorful EVOL X15 AT, 1.000 dolardan daha düşük bir fiyata alabilmeniz ve bir zam ödemek zorunda kalmamanız koşuluyla, dikkate değer bir üründür.
Bununla birlikte, dizüstü bilgisayarlar RTX 3070 Ti Dizüstü Bilgisayar GPU'suveya hatta Radeon RX 6800MdLSS 3 çerçeve oluşturma ve Ada Lovelace ile verimlilik kazanımlarını kaybetmek istemiyorsanız, benzer fiyatlarla daha iyi bir genel paket sunabilir.
Fiyat ve Bulunabilirlik
Colorful EVOL X15 AT 23 doğrudan Colorful ürünlerinin yerel distribütörlerinden temin edilebilir. Test edilen EVOL X15 AT konfigürasyonu resmi olarak 969 $ fiyat etiketine sahiptir, ancak şu anda Newegg'de satılmaktadır hem de 1.759 $ gibi oldukça yüksek bir fiyatla.
Alternatif olarak, bir QHD varyantı Acer Nitro 5 bir AMD Ryzen 7 6800H ve RTX 3070 Ti Dizüstü Bilgisayar GPU'su Amazon ABD 'den 1.200 dolardan daha düşük bir fiyata satın alınabilir.
Eğer ham CPU performansı bir öncelik değilse Asus ROG Strix G15 içeren bir AMD Ryzen 9 5900HX ve Radeon RX 6800M, Amazon ABD 'de 1.300 doların altında ve Best Buy ABD'de 1.200 doların altında iyi bir seçimdir.
Colorful EVOL X15 AT 23
- 12/20/2023 v7 (old)
Vaidyanathan Subramaniam
Şeffaflık
İncelenecek cihazların seçimi editör ekibimiz tarafından yapılır. Test örneği, inceleme amacıyla üretici tarafından yazara ücretsiz olarak verildi. Bu inceleme üzerinde herhangi bir üçüncü taraf etkisi bulunmamıştır ve üretici, yayınlanmadan önce bu incelemenin bir kopyasını almamıştır. Bu incelemeyi yayınlama zorunluluğu yoktu. Bağımsız bir medya şirketi olarak Notebookcheck, üreticilerin, perakendecilerin veya yayıncıların otoritesine tabi değildir.
Notebookcheck bu şekilde test yapıyor
Notebookcheck, tüm sonuçların karşılaştırılabilir olmasını sağlamak için her yıl yüzlerce dizüstü bilgisayarı ve akıllı telefonu standart prosedürler kullanarak bağımsız olarak inceliyor. Yaklaşık 20 yıldır test yöntemlerimizi sürekli olarak geliştirdik ve bu süreçte endüstri standartlarını belirledik. Test laboratuvarlarımızda deneyimli teknisyenler ve editörler tarafından yüksek kaliteli ölçüm ekipmanları kullanılmaktadır. Bu testler çok aşamalı bir doğrulama sürecini içerir. Karmaşık derecelendirme sistemimiz, nesnelliği koruyan yüzlerce sağlam temellere dayanan ölçüm ve kıyaslamaya dayanmaktadır.Price comparison

