İnceleme: Apple MacBook Pro 16 2019 Laptop, tatmin edici
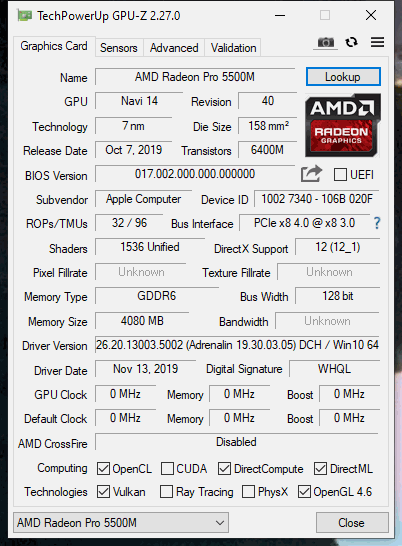
Apple, kelebek klavyesiyle ilgili yıllarca eleştirildikten sonra dördüncü nesil MacBook Pro 15'e veda etti. Şirket, kendisinden öncekilerden daha büyük bir ekrana sahip değil aynı zamanda geleneksel bir makas değiştirme klavyesine de geri dönen bir dizüstü bilgisayar olan MacBook Pro 16'nın yerini aldı. Umarım, dördüncü nesil MacBook Pro 15'in güvenilirlik sorunları MacBook Pro 16'yı da etkilememelidir. Intel Core i9-9880H işlemci ve AMD Radeon Pro 5500M GPU ile birlikte gelen üst düzey modeli test etmeyi seçtik. 4 GB GDDR6 VRAM'a sahiptir. Makine ayrıca 16 GB çift kanallı DDR4-2666 RAM ve 1 TB SSD'ye sahiptir. Test cihazımızın Apple'ın bize sunduğu bir baskı makinesi yerine bir perakende satış birimi olduğunu belirtmek isteriz. Cihazı Avusturya’da satın alırken, Apple ABD’de 2.799 ABD Doları tutarındaki yapılandırmayı satmaktadır. Aynı cihazı, geçen ay yayınladığımız ilk gösterim makalemiz için de kullandık.
Derecelendirme | Tarih | Modeli | Ağırlık | Yükseklik | Boyut | Çözünürlük | Fiyat |
|---|---|---|---|---|---|---|---|
| 89.7 % v7 (old) | 12/2019 | Apple MacBook Pro 16 2019 i9 5500M i9-9880H, Radeon Pro 5500M | 2 kg | 16.2 mm | 16.00" | 3072x1920 | |
| 87.1 % v7 (old) | 02/2020 | Lenovo ThinkPad X1 Extreme 2019 20QV000WGE i7-9750H, GeForce GTX 1650 Mobile | 1.7 kg | 18.7 mm | 15.60" | 3840x2160 | |
| 87.8 % v7 (old) | 08/2019 | Dell XPS 15 7590 9980HK GTX 1650 i9-9980HK, GeForce GTX 1650 Mobile | 2 kg | 17 mm | 15.60" | 3840x2160 | |
| 89.4 % v7 (old) | 03/2020 | Apple MacBook Pro 15 2019 i9 Vega 20 i9-9980HK, Radeon Pro Vega 20 | 1.8 kg | 15.5 mm | 15.40" | 2880x1800 | |
| 87.8 % v6 (old) | 07/2018 | Asus ZenBook Pro 15 UX580GE i9-8950HK, GeForce GTX 1050 Ti Mobile | 1.9 kg | 18.9 mm | 15.60" | 3840x2160 | |
| 85 % v7 (old) | 08/2019 | MSI P65 Creator 9SF-657 i9-9880H, GeForce RTX 2070 Max-Q | 1.9 kg | 18 mm | 15.60" | 3840x2160 |
Kasa - Görkemli ve biraz daha kalın bir tasarım
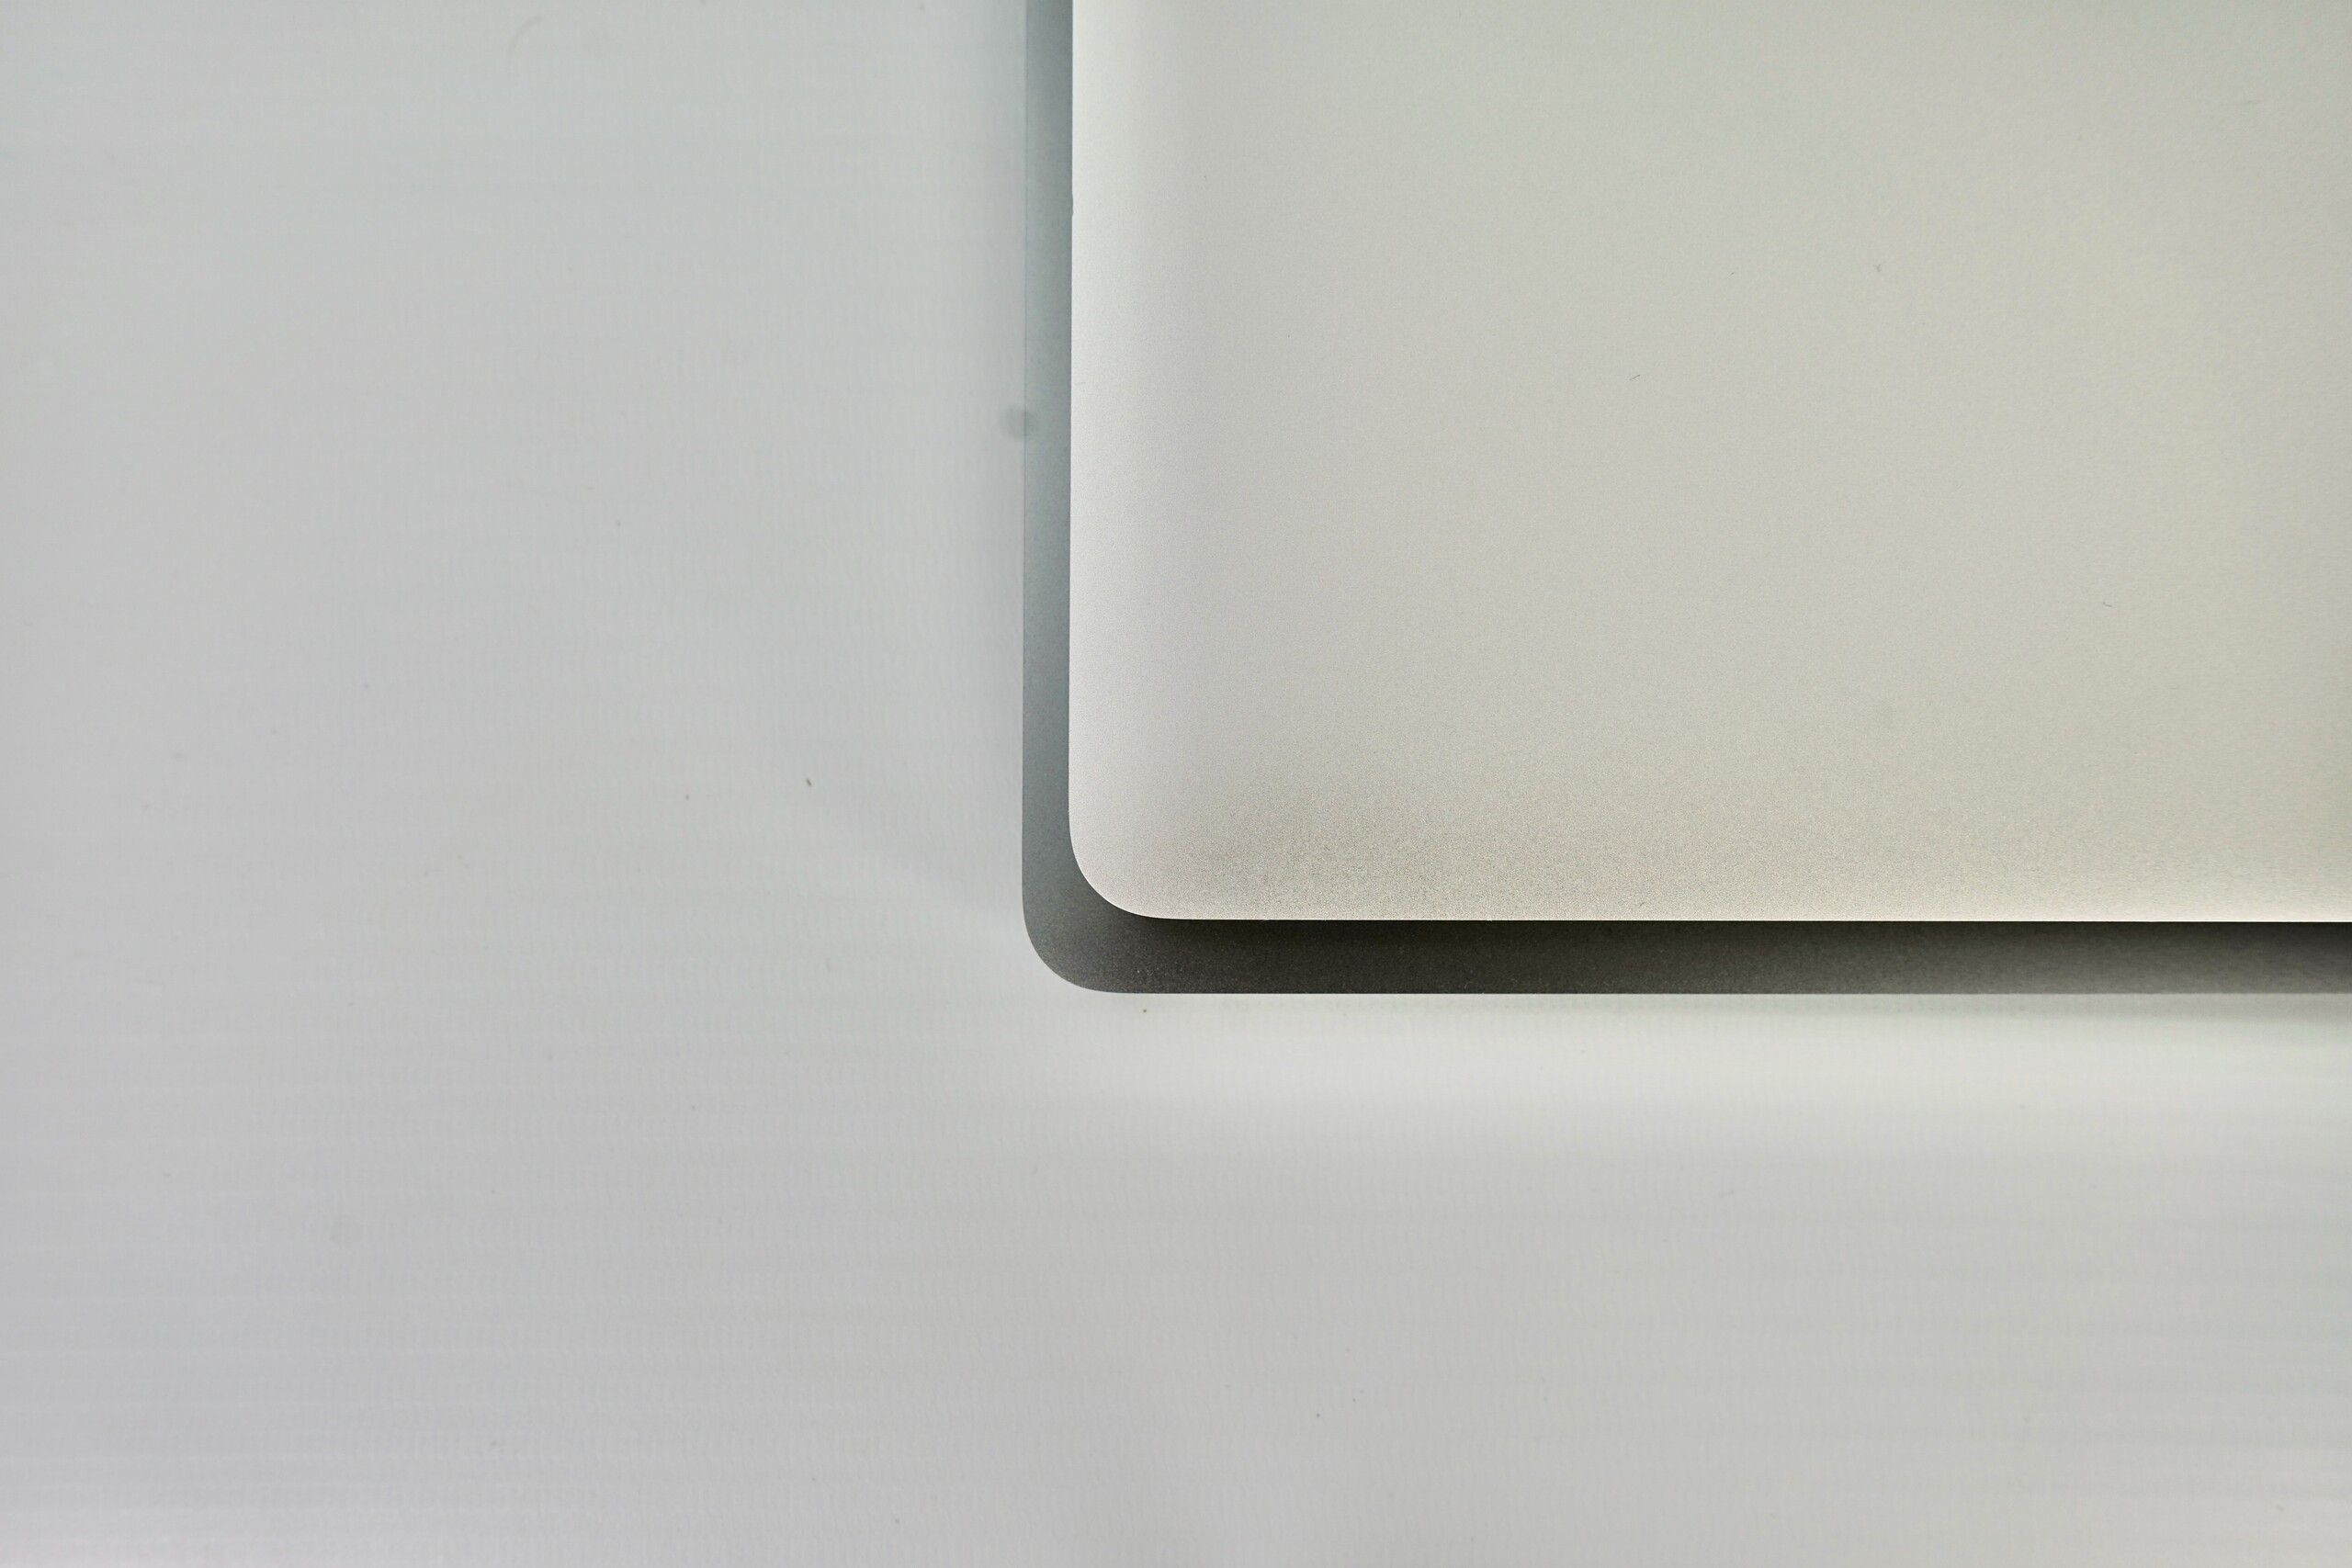
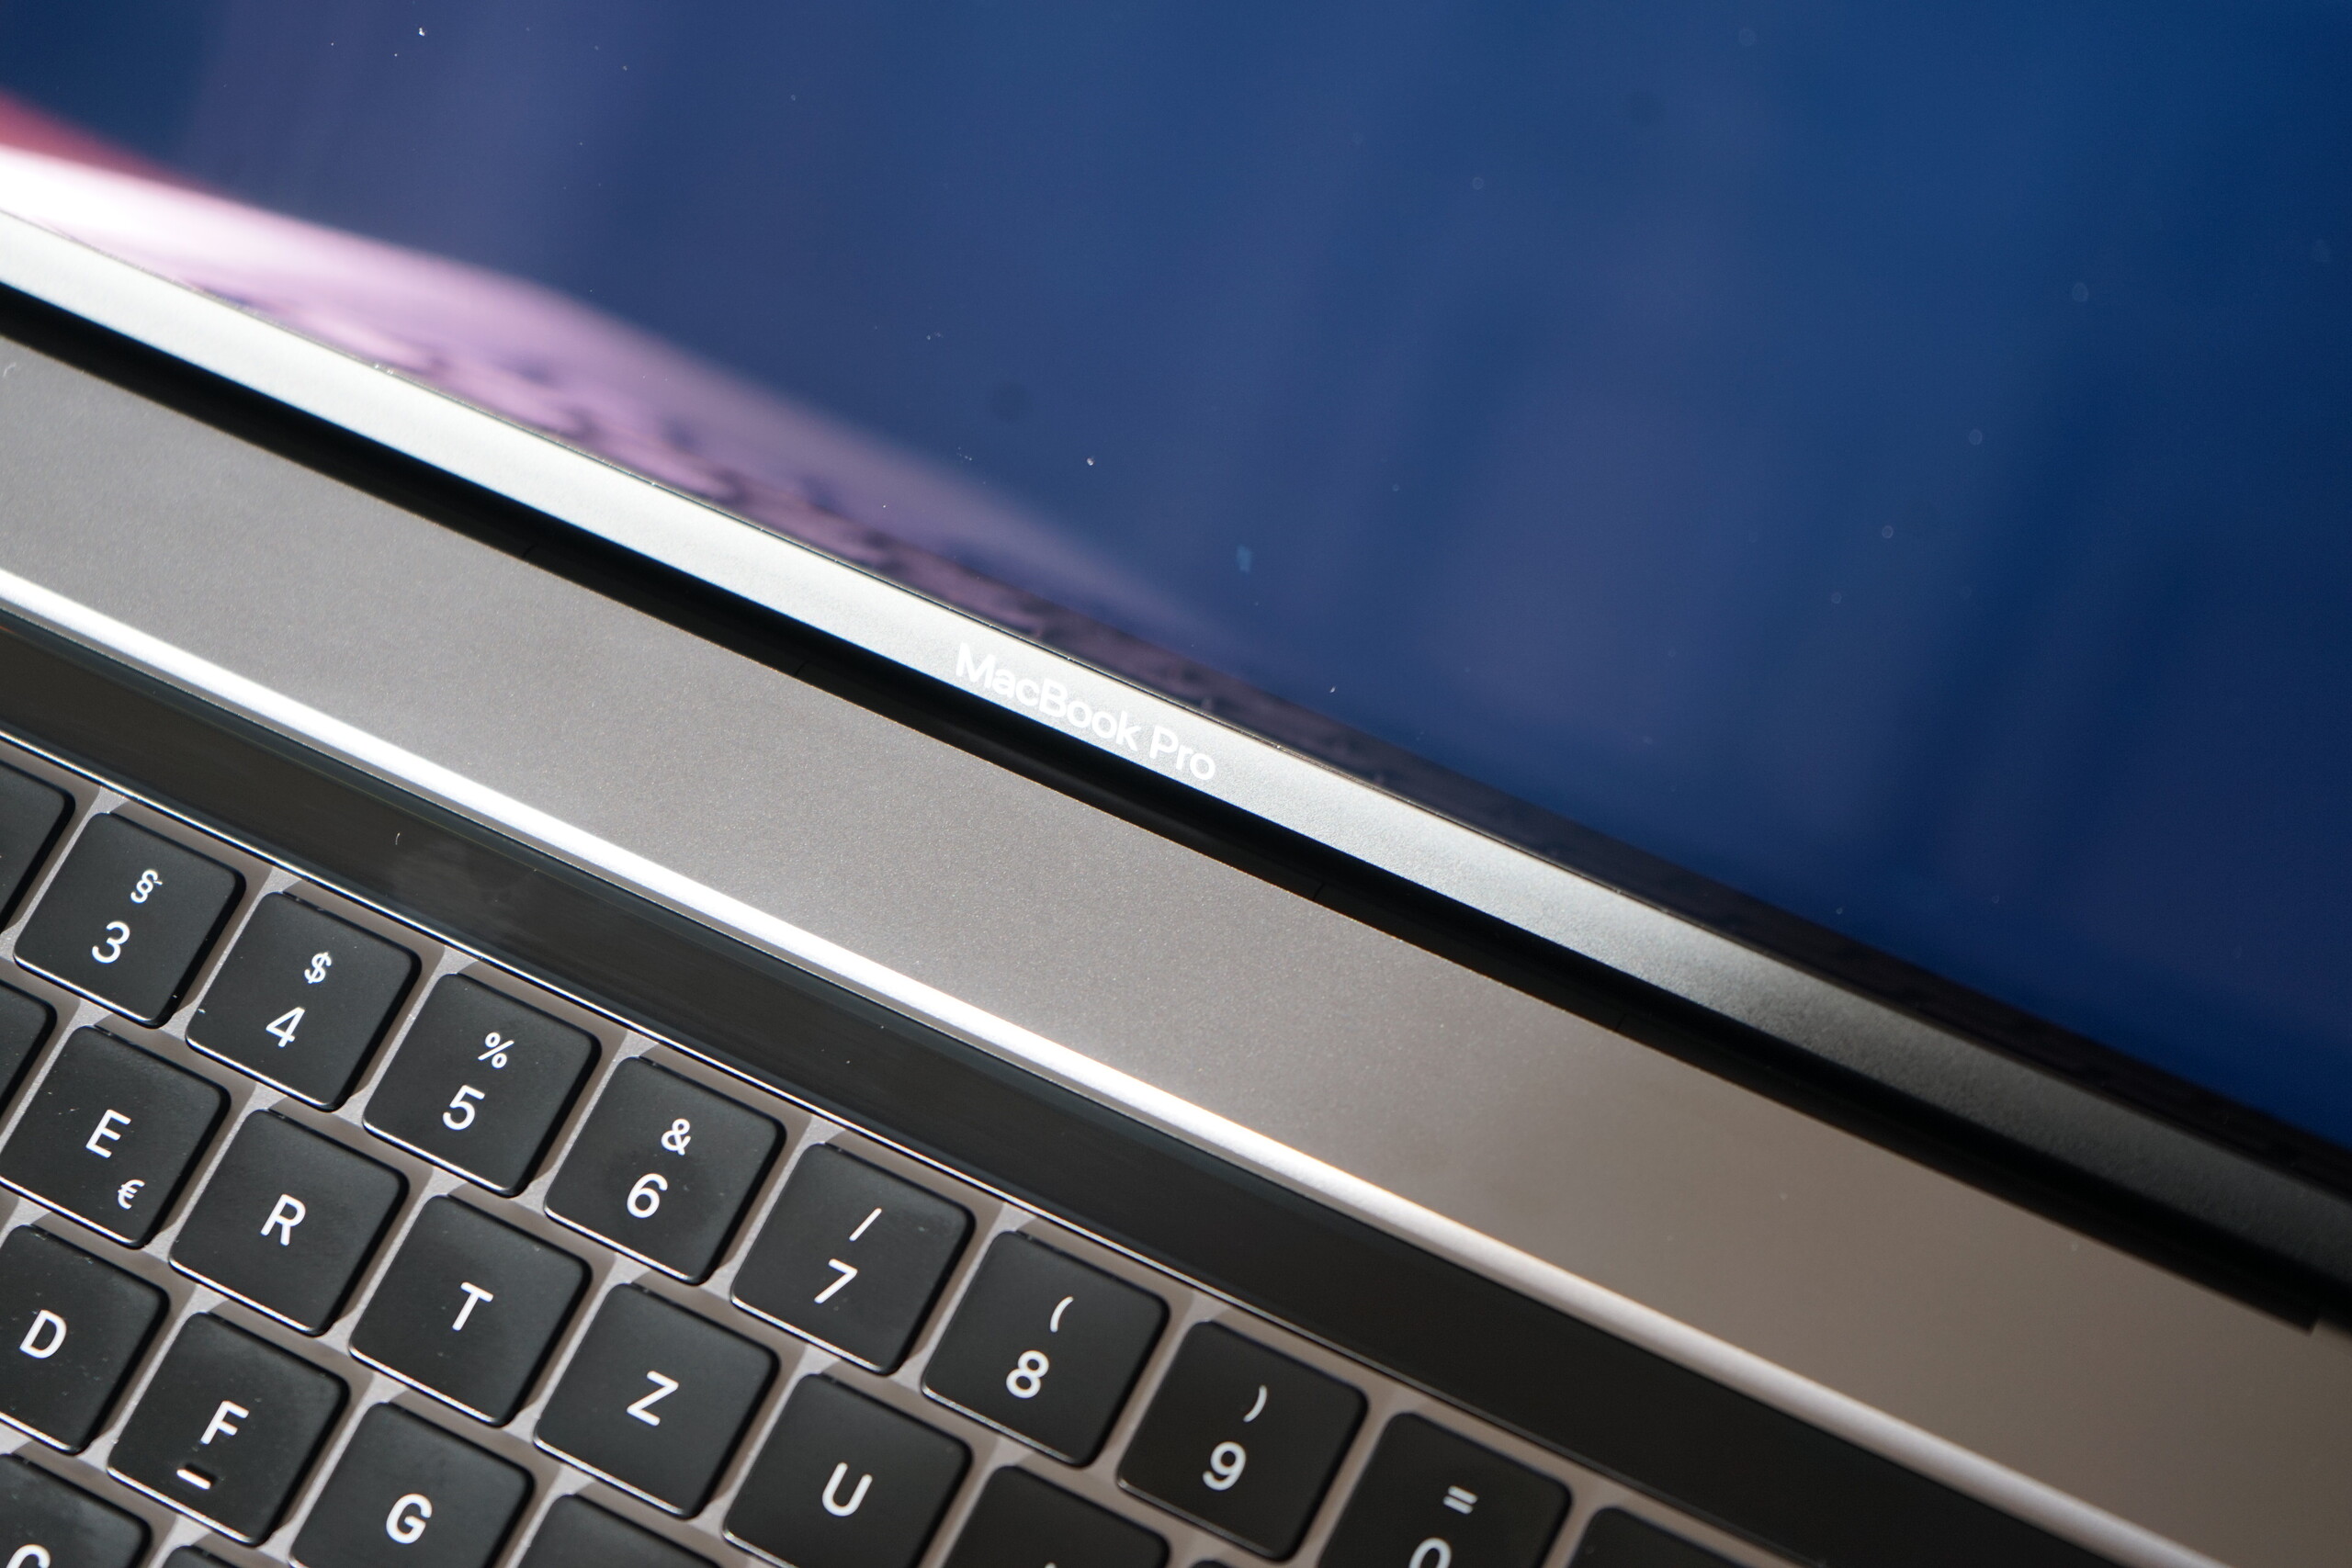
Daha büyük ekran ve daha yüksek kapasiteli pil daha kalın bir şasi kullanmayı zorunlu kılarken, MacBook Pro'nun temel tasarımı değişmedi. MacBook Pro 16, selefine çok benziyor, bence, yan yana olmadıkça ikisini birbirinden ayırmanın zor olacağını. MacBook Pro 16, MacBook Pro 15'ten biraz daha dar ekran çerçevelerine sahip olsa da, Apple hala dizüstü bilgisayarlarında yüksek ekrandan vücuda oranlarını benimsemedi. Apple, en büyük MacBook Pro'yu Silver ve Space Gray'de sunmaya devam ediyor. Ayrıca MacBook Pro adı, mükemmel işçilik ve yapı kalitesi ile eşanlamlı olmaya devam ediyor. Alüminyum kasa MacBook Pro 16'nın üstün hissetmesini sağlarken, yüzeyi rakiplerinden bazı plastik yüzeyler kadar kolay parmak izi almıyor. Size bakıyoruz, Dell XPS 15 7590 ve Lenovo ThinkPad X1 Extreme Gen 2.Çalışma ünitemiz sağlamdır, çünkü en iyi çabalarımıza rağmen kasayı deforme edemedik. Aynı şekilde, şasi, ekran menteşesi gibi sert. Ekran bir eliyle açılabilir ve ayrıca yazı yazarken titremez. Menteşe, en yeni MacBook Pro 15'in açılabileceği açı ile ekranın da yaklaşık 135 ° açılmasına izin veriyor.
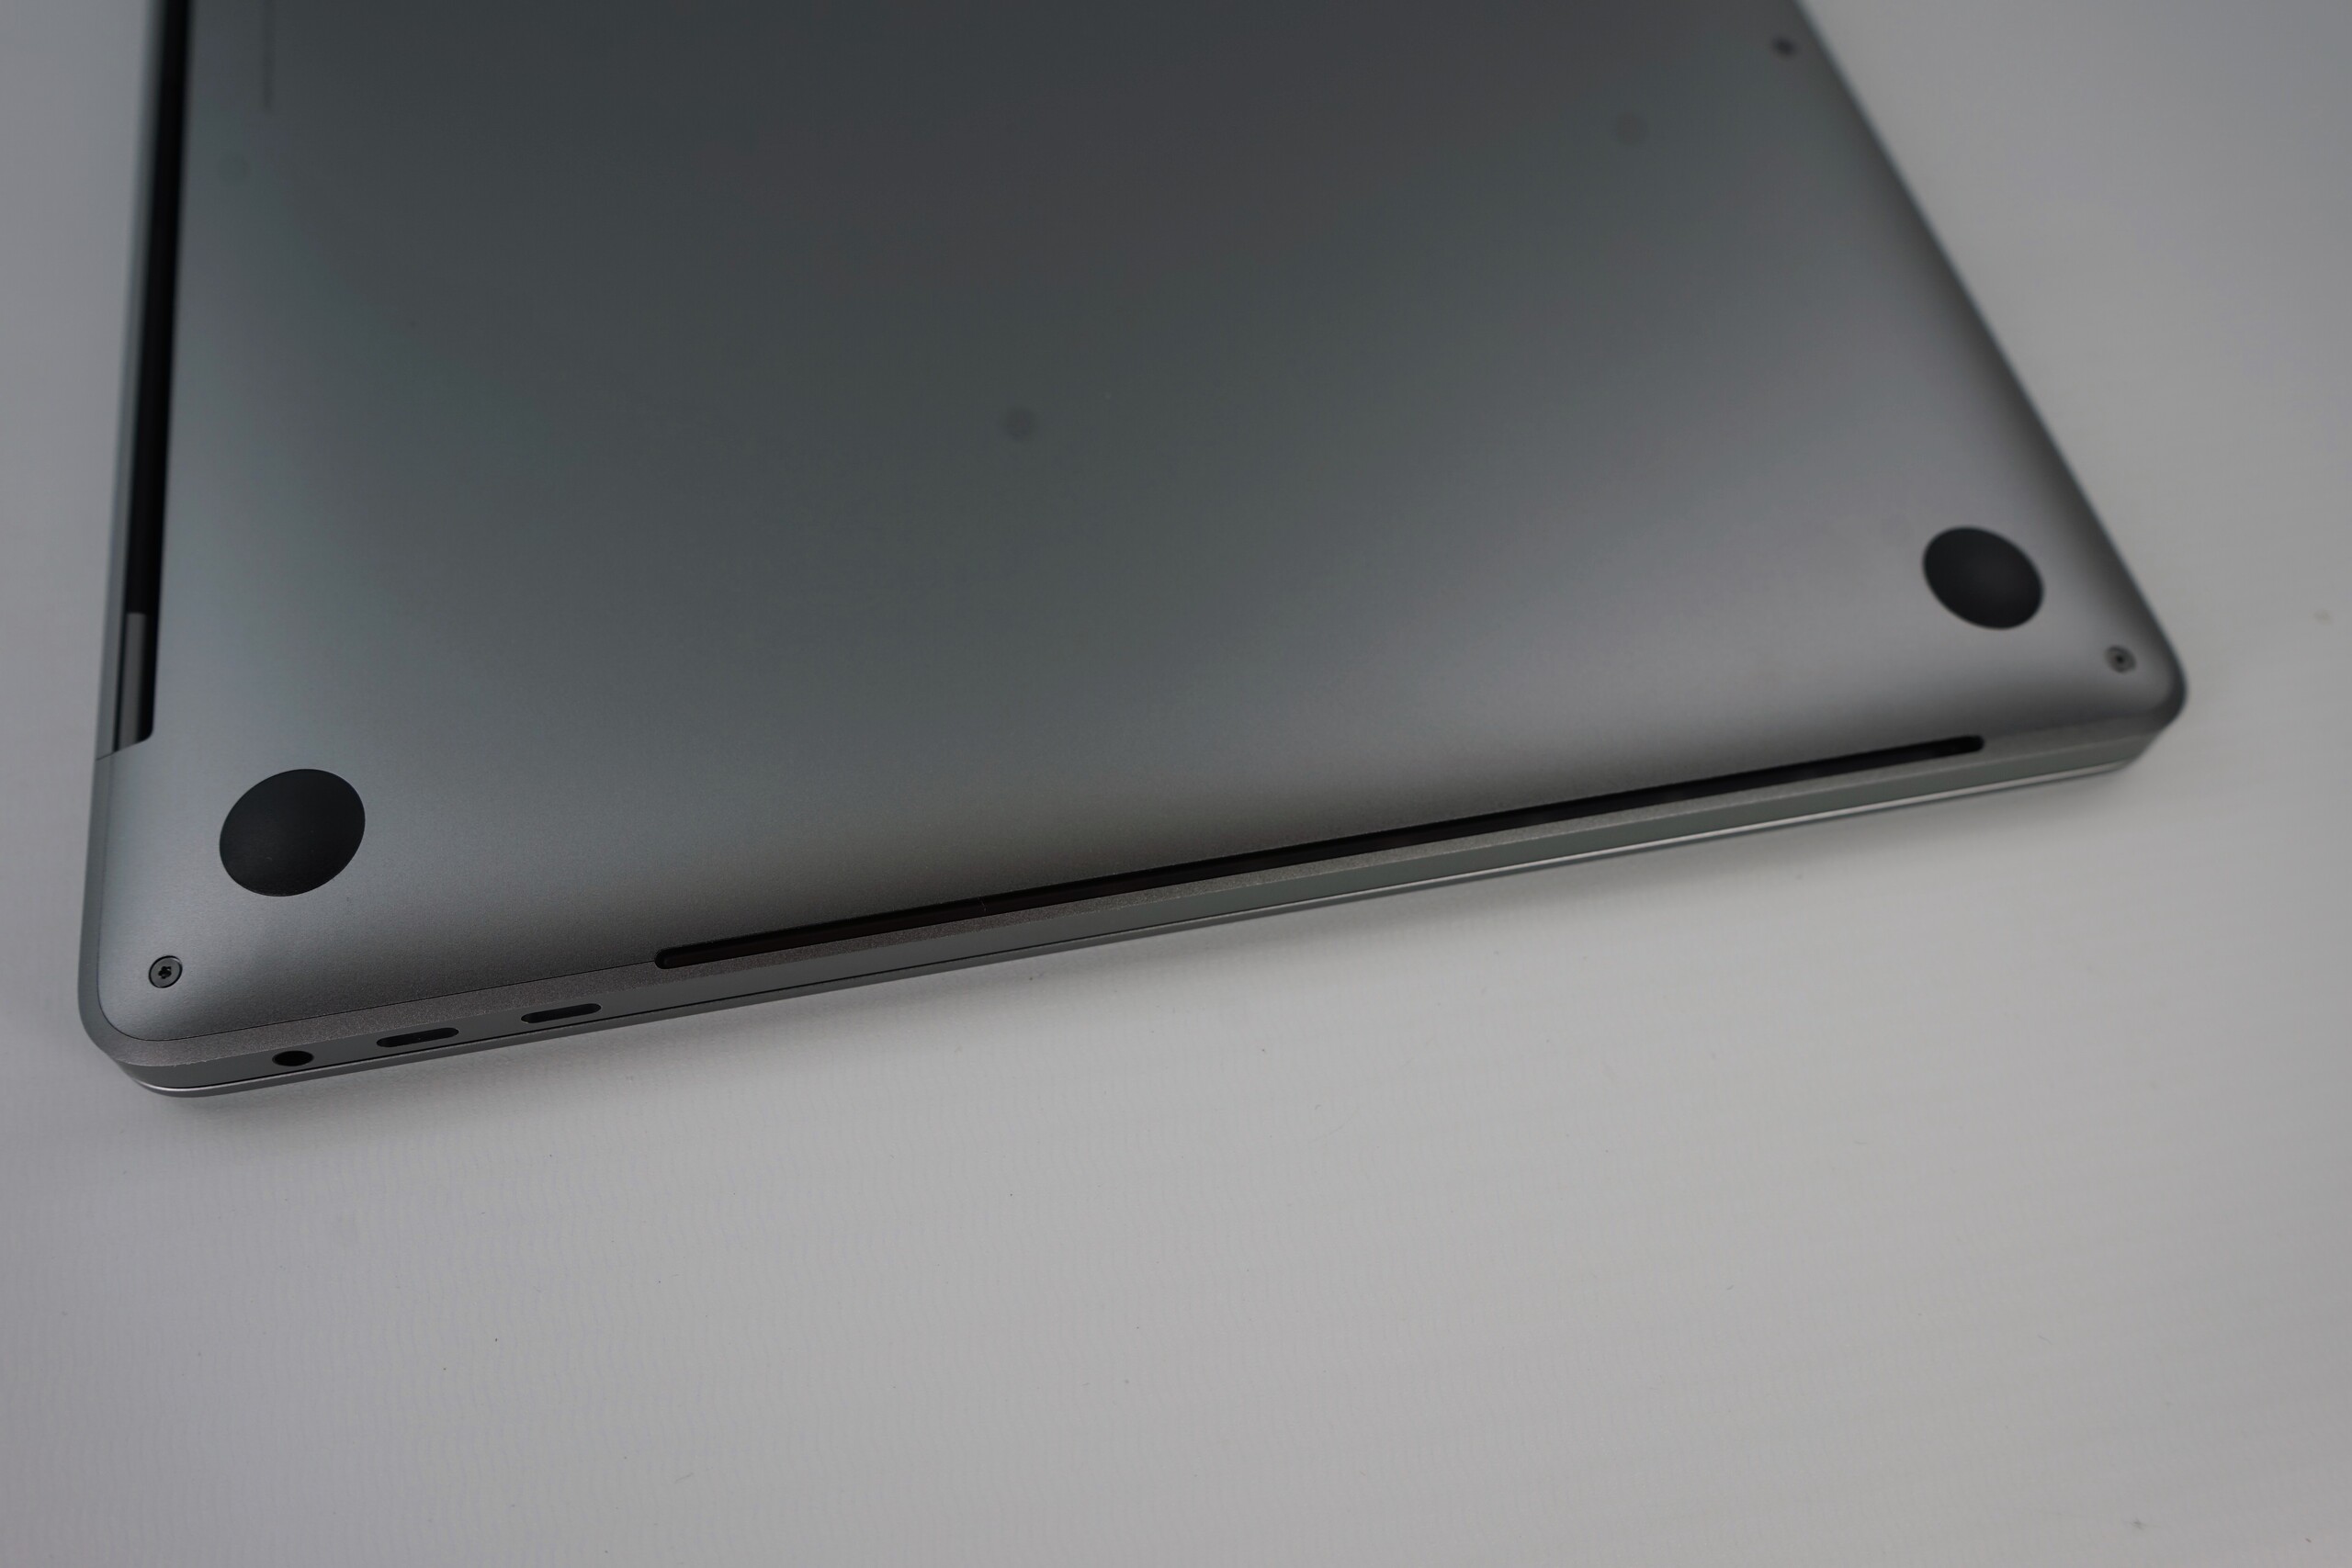
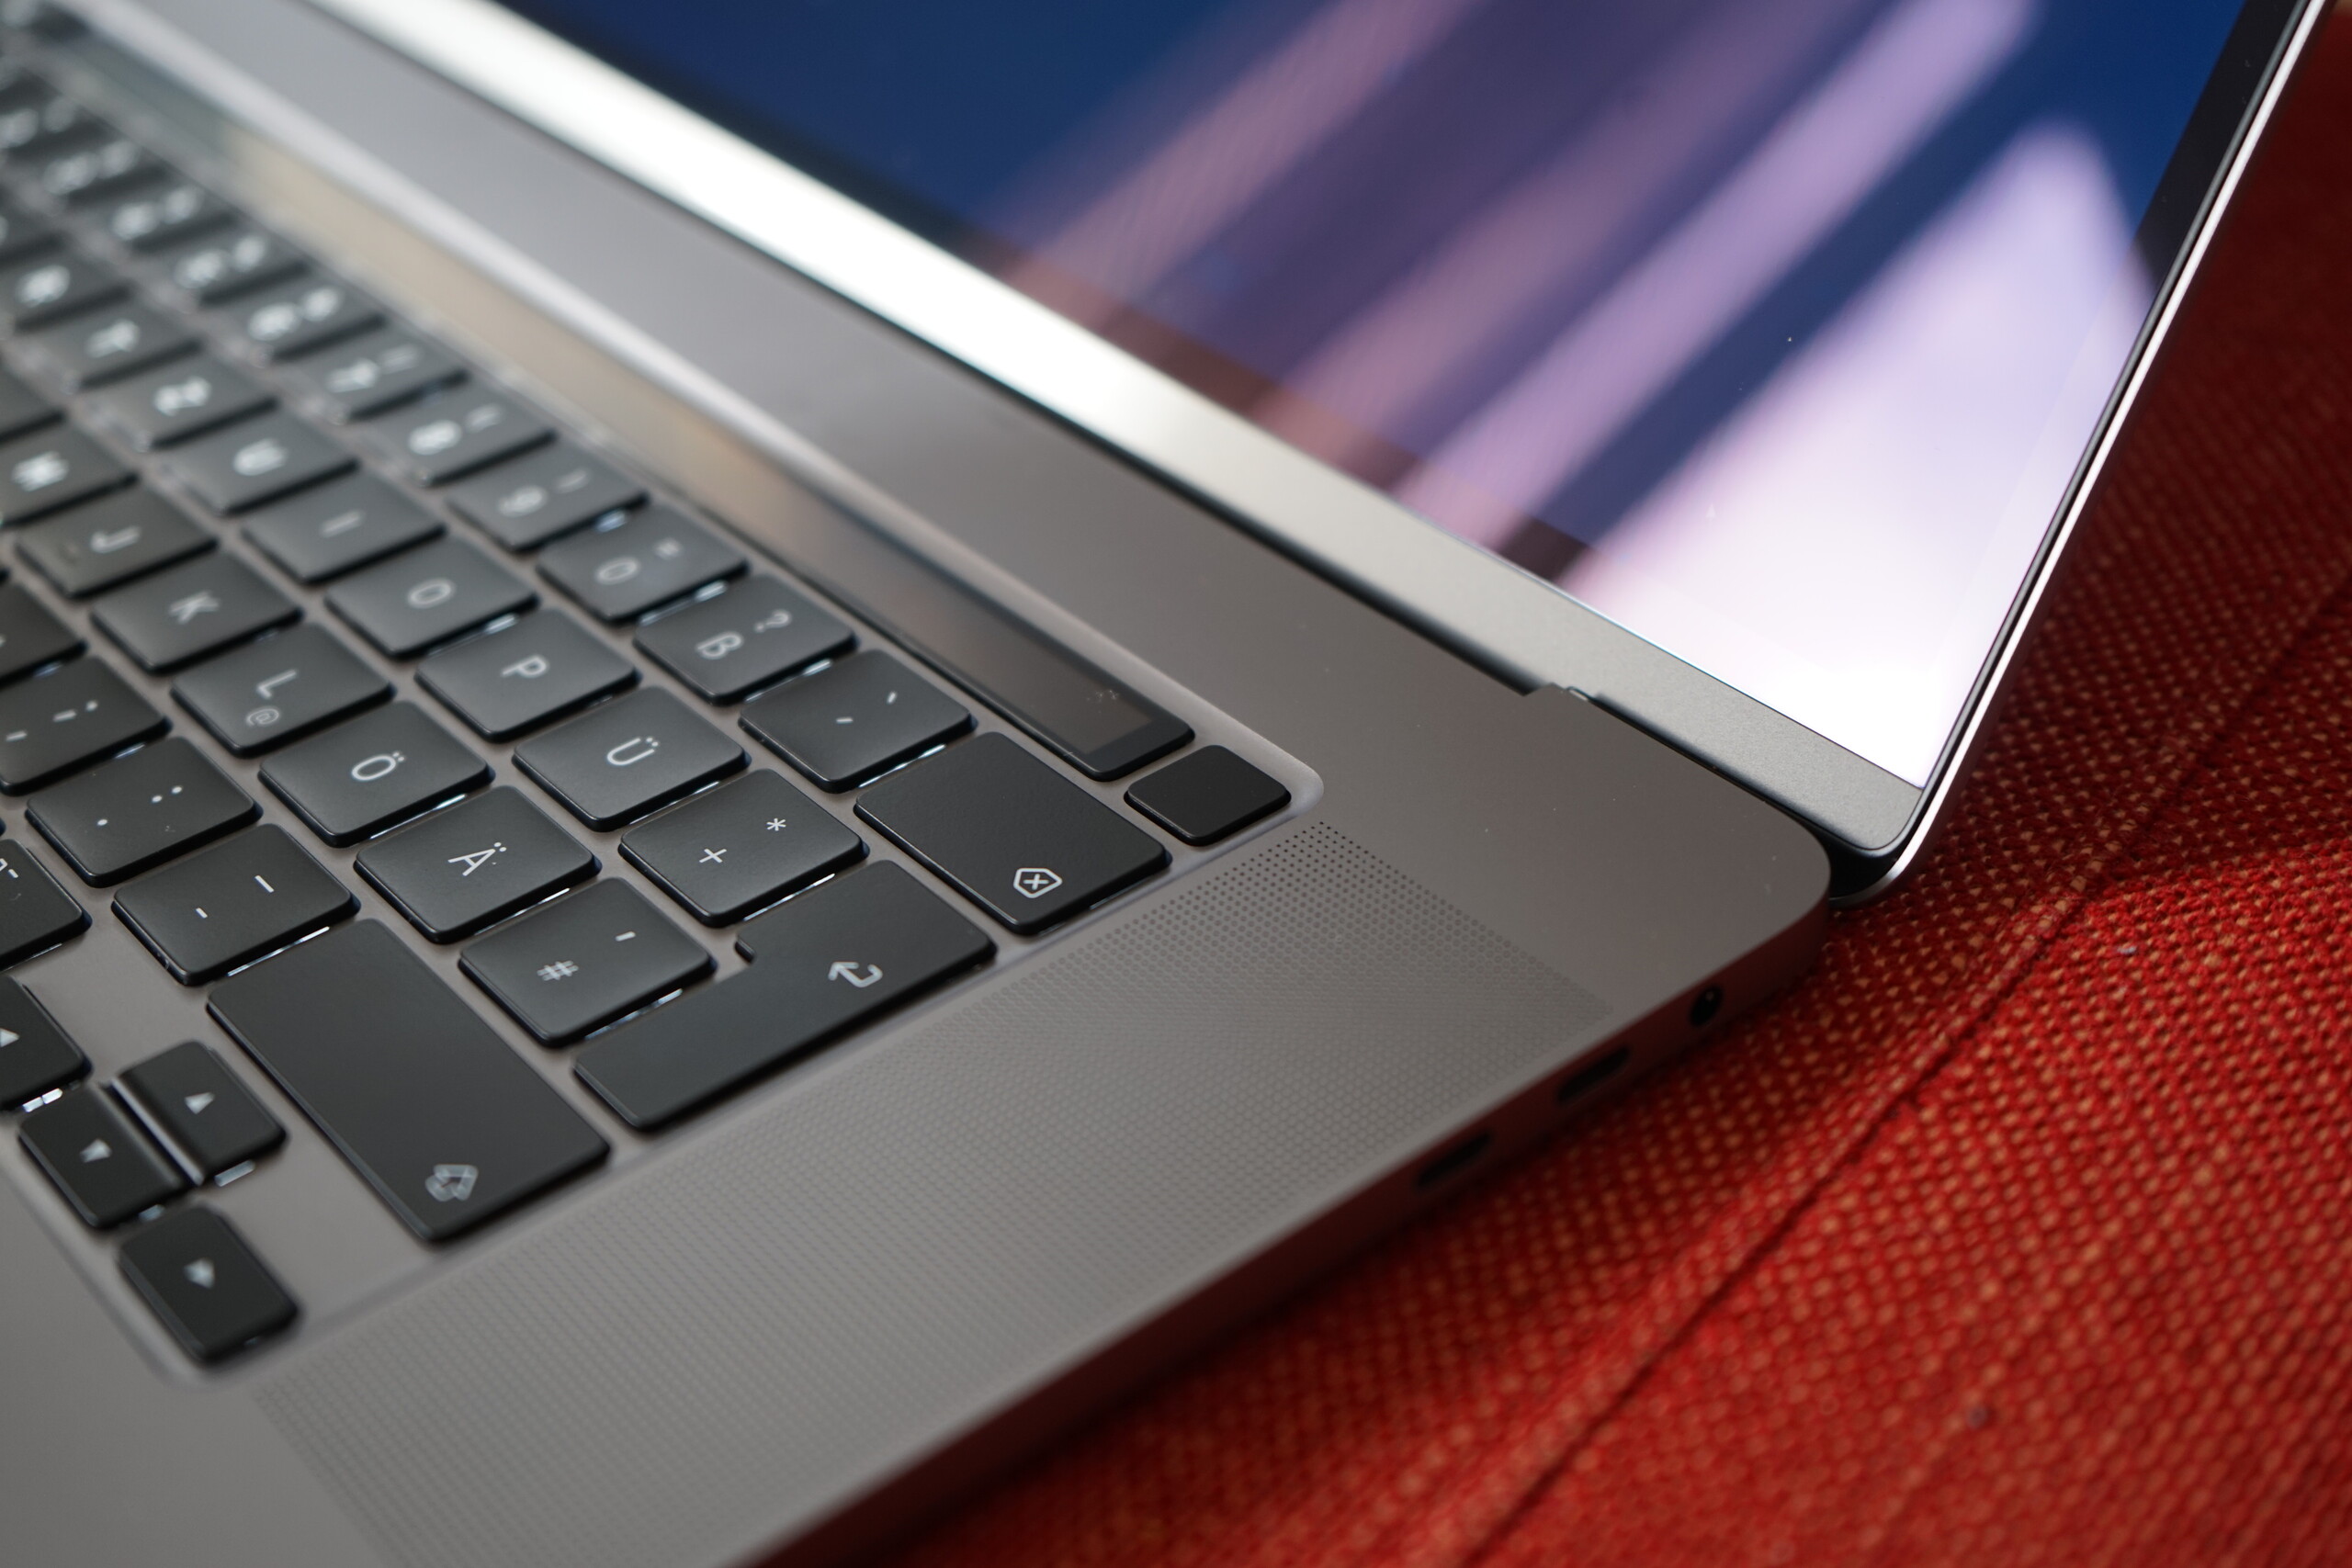
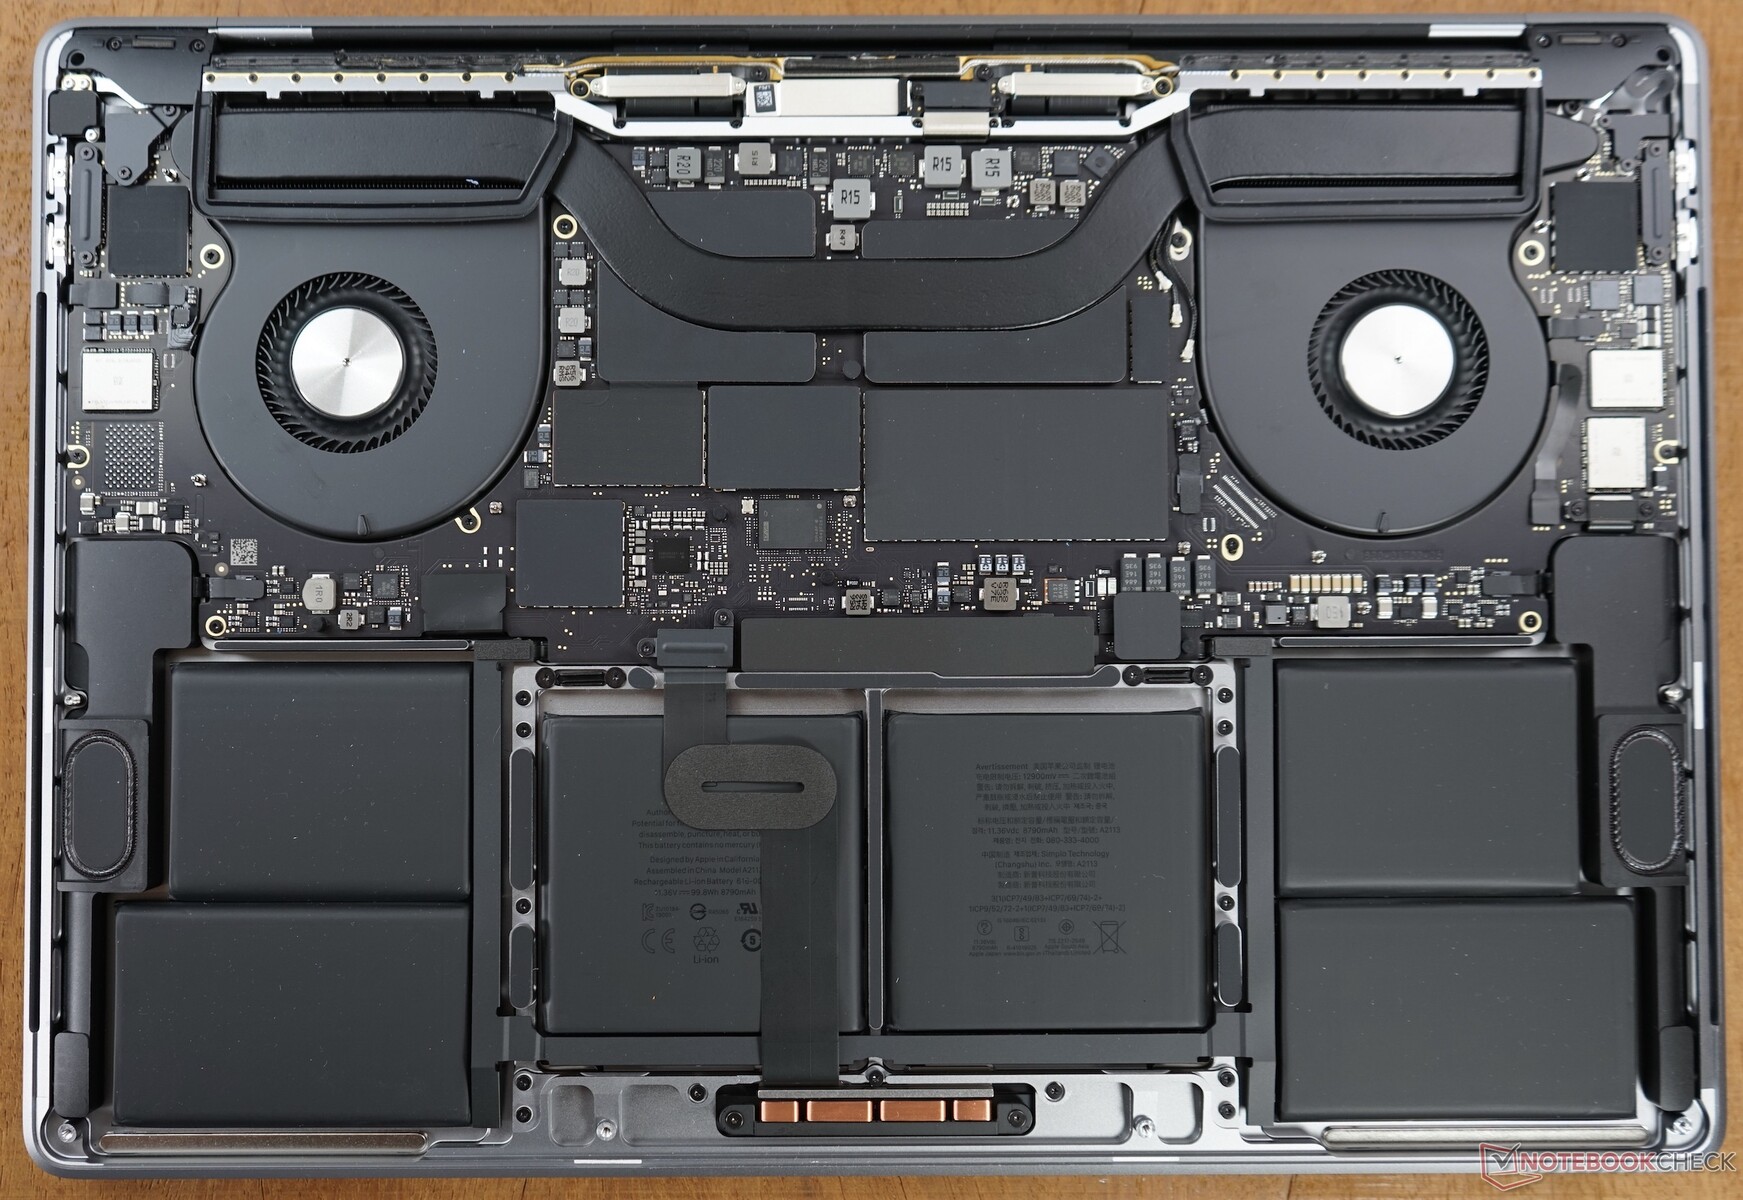
Apple, en son MacBook Pro 16'da özel Pentalobe vidalarını kullanmaya devam ediyor. Bunlar kasayı kasaya sabitliyor, ancak sağ tornavida ile sökülmesi kolay. Alt kapağı çıkarırken dikkatli olmanızı tavsiye etmemize rağmen, bunu yapmanın hiçbir anlamı yoktur. Hemen hemen tüm önemli bileşenler mantık kuruluna lehimlenir veya şasiye yapıştırılır. Son zamanlarda tartıştığımız gibi, alt kasanın sadece vidalanmadığını ve kasaya klipslenmemiş olduğunu not etmek önemlidir. Apple ayrıca alt kasayı da kasaya bağlar, bu nedenle ilkini yalnızca belirli bir şekilde çekip çıkarmanız gerekir. Apple bunu birkaç yıldır yapıyor, ancak MacBook Pro 16 birkaç yıl içinde satın aldığınız ilk MacBook ise sizin için yeni olabilir. Bu arada, iFixit zaten yeni MacBook Pro'yu demonte etti ve tamir edilebilirliği için 1/10 verdi. Tek pozitif, hareket tuşunu kaldırmanın ne kadar basit olduğu.
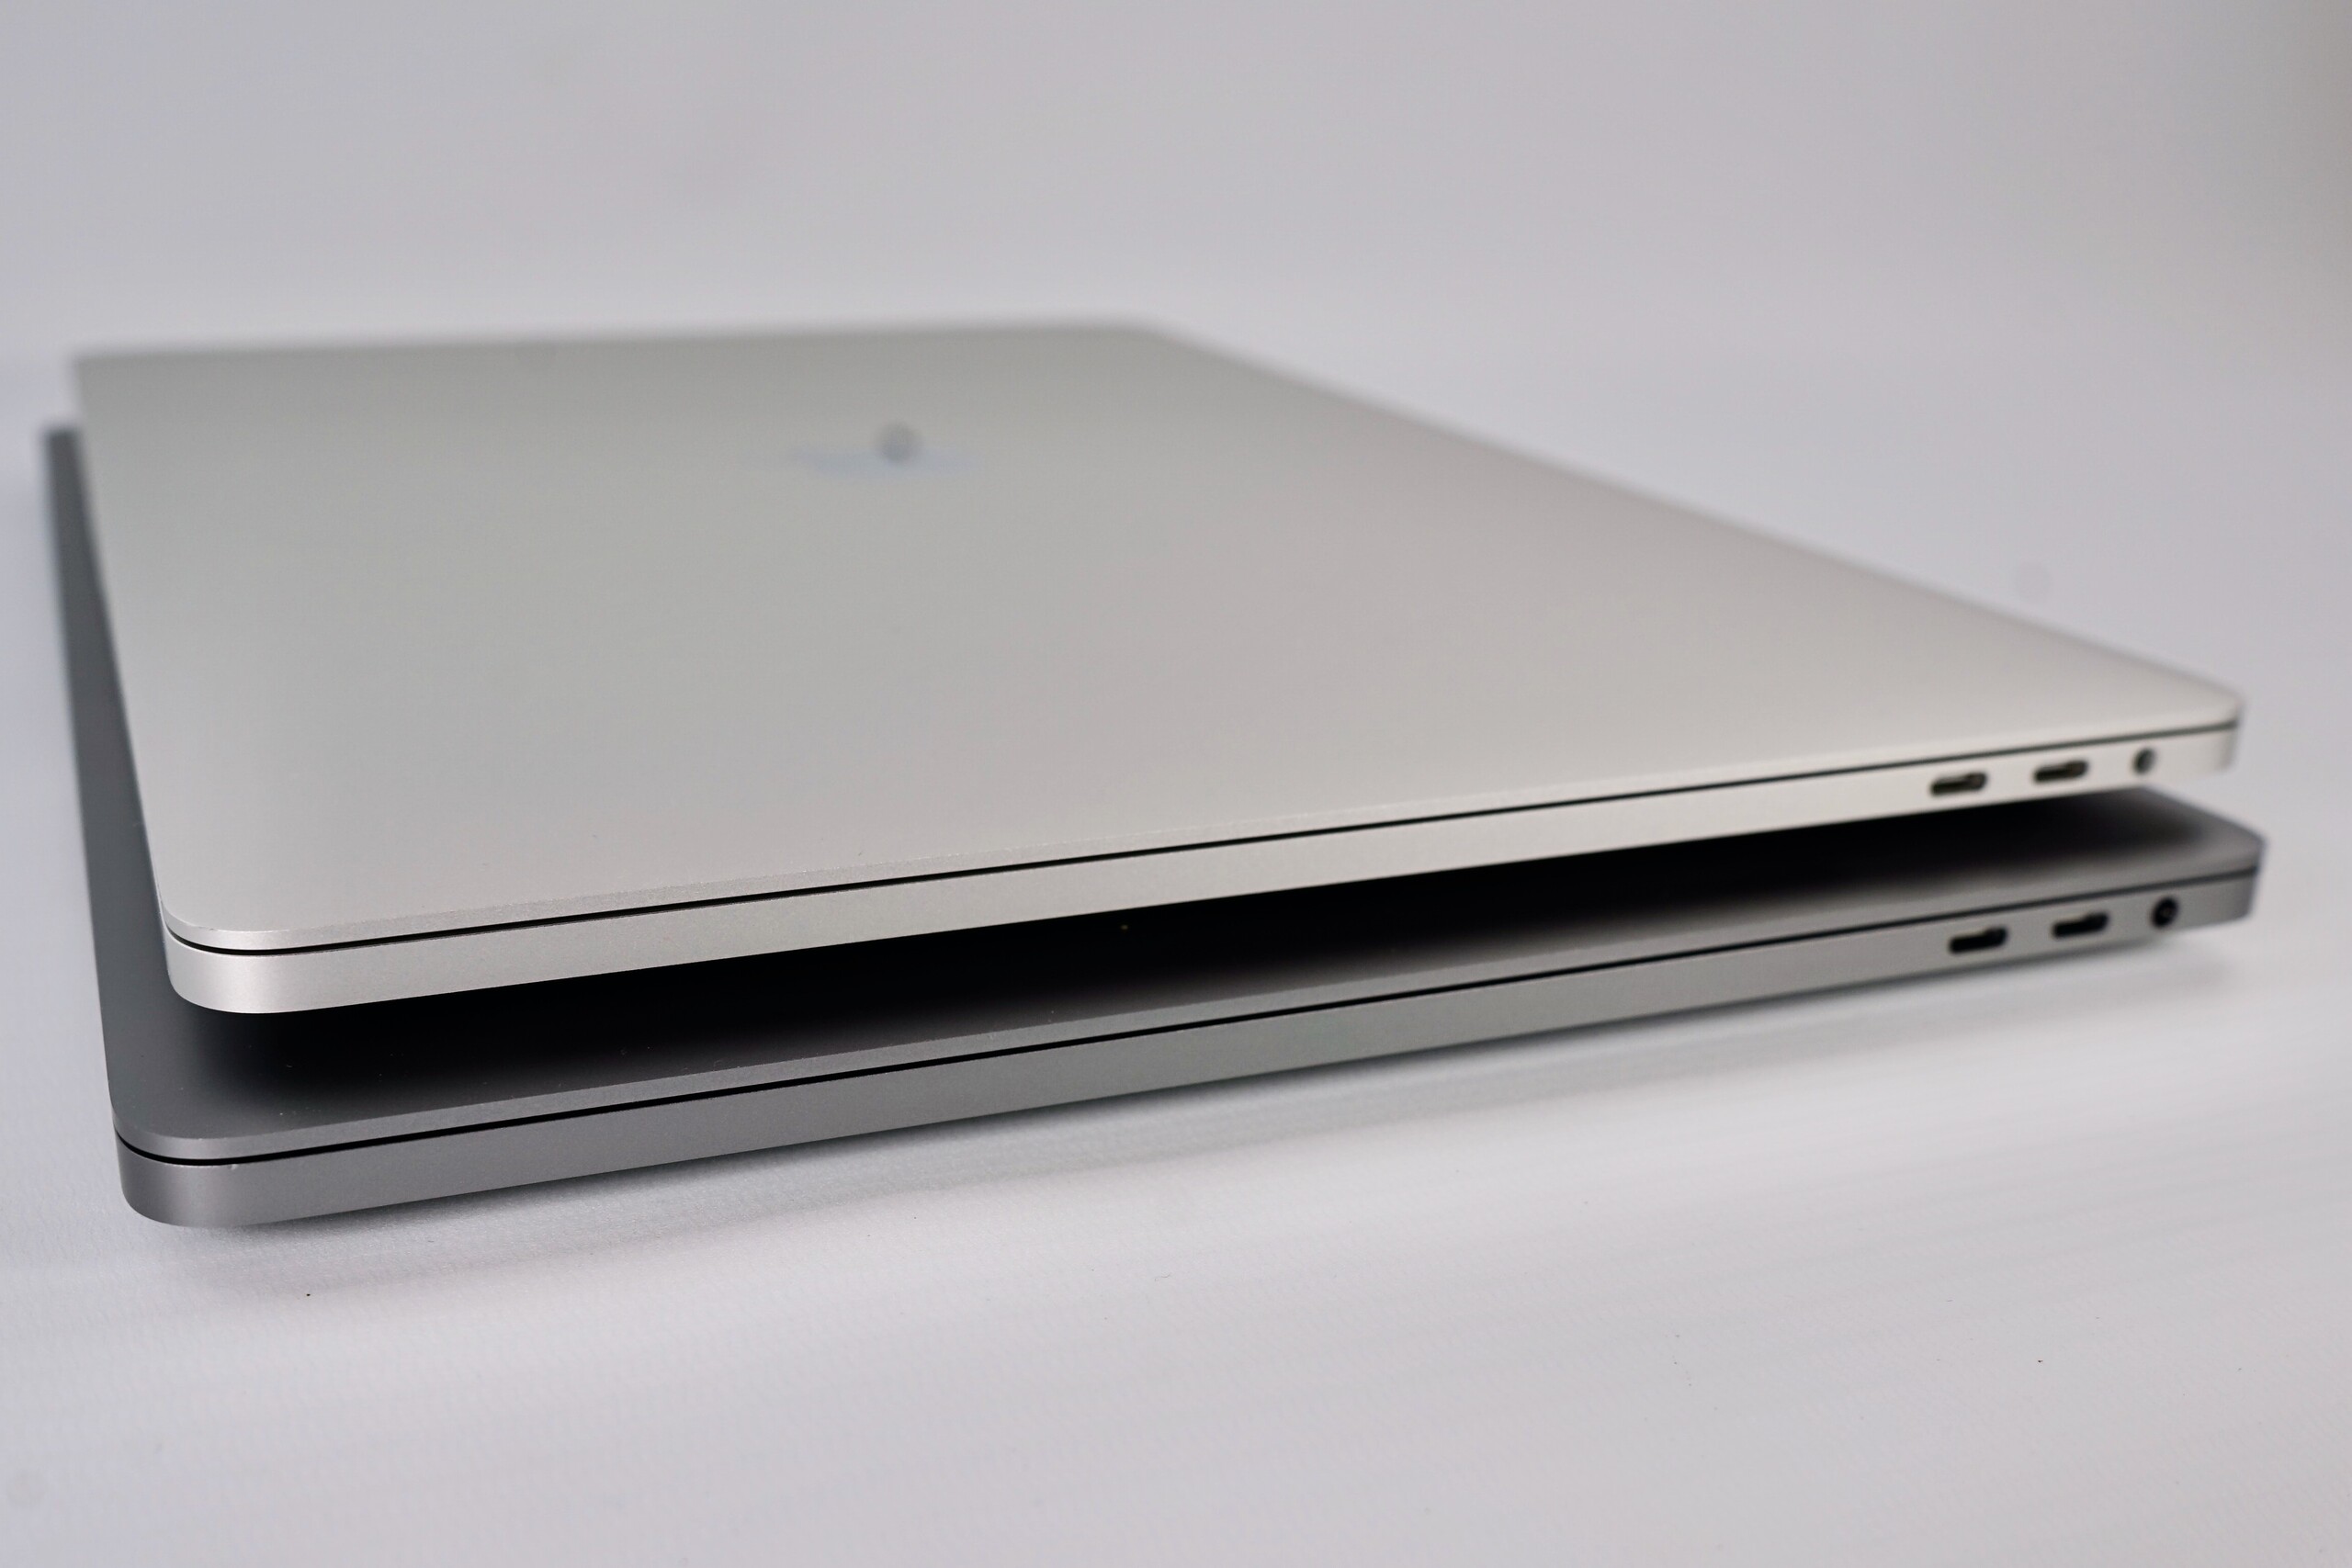
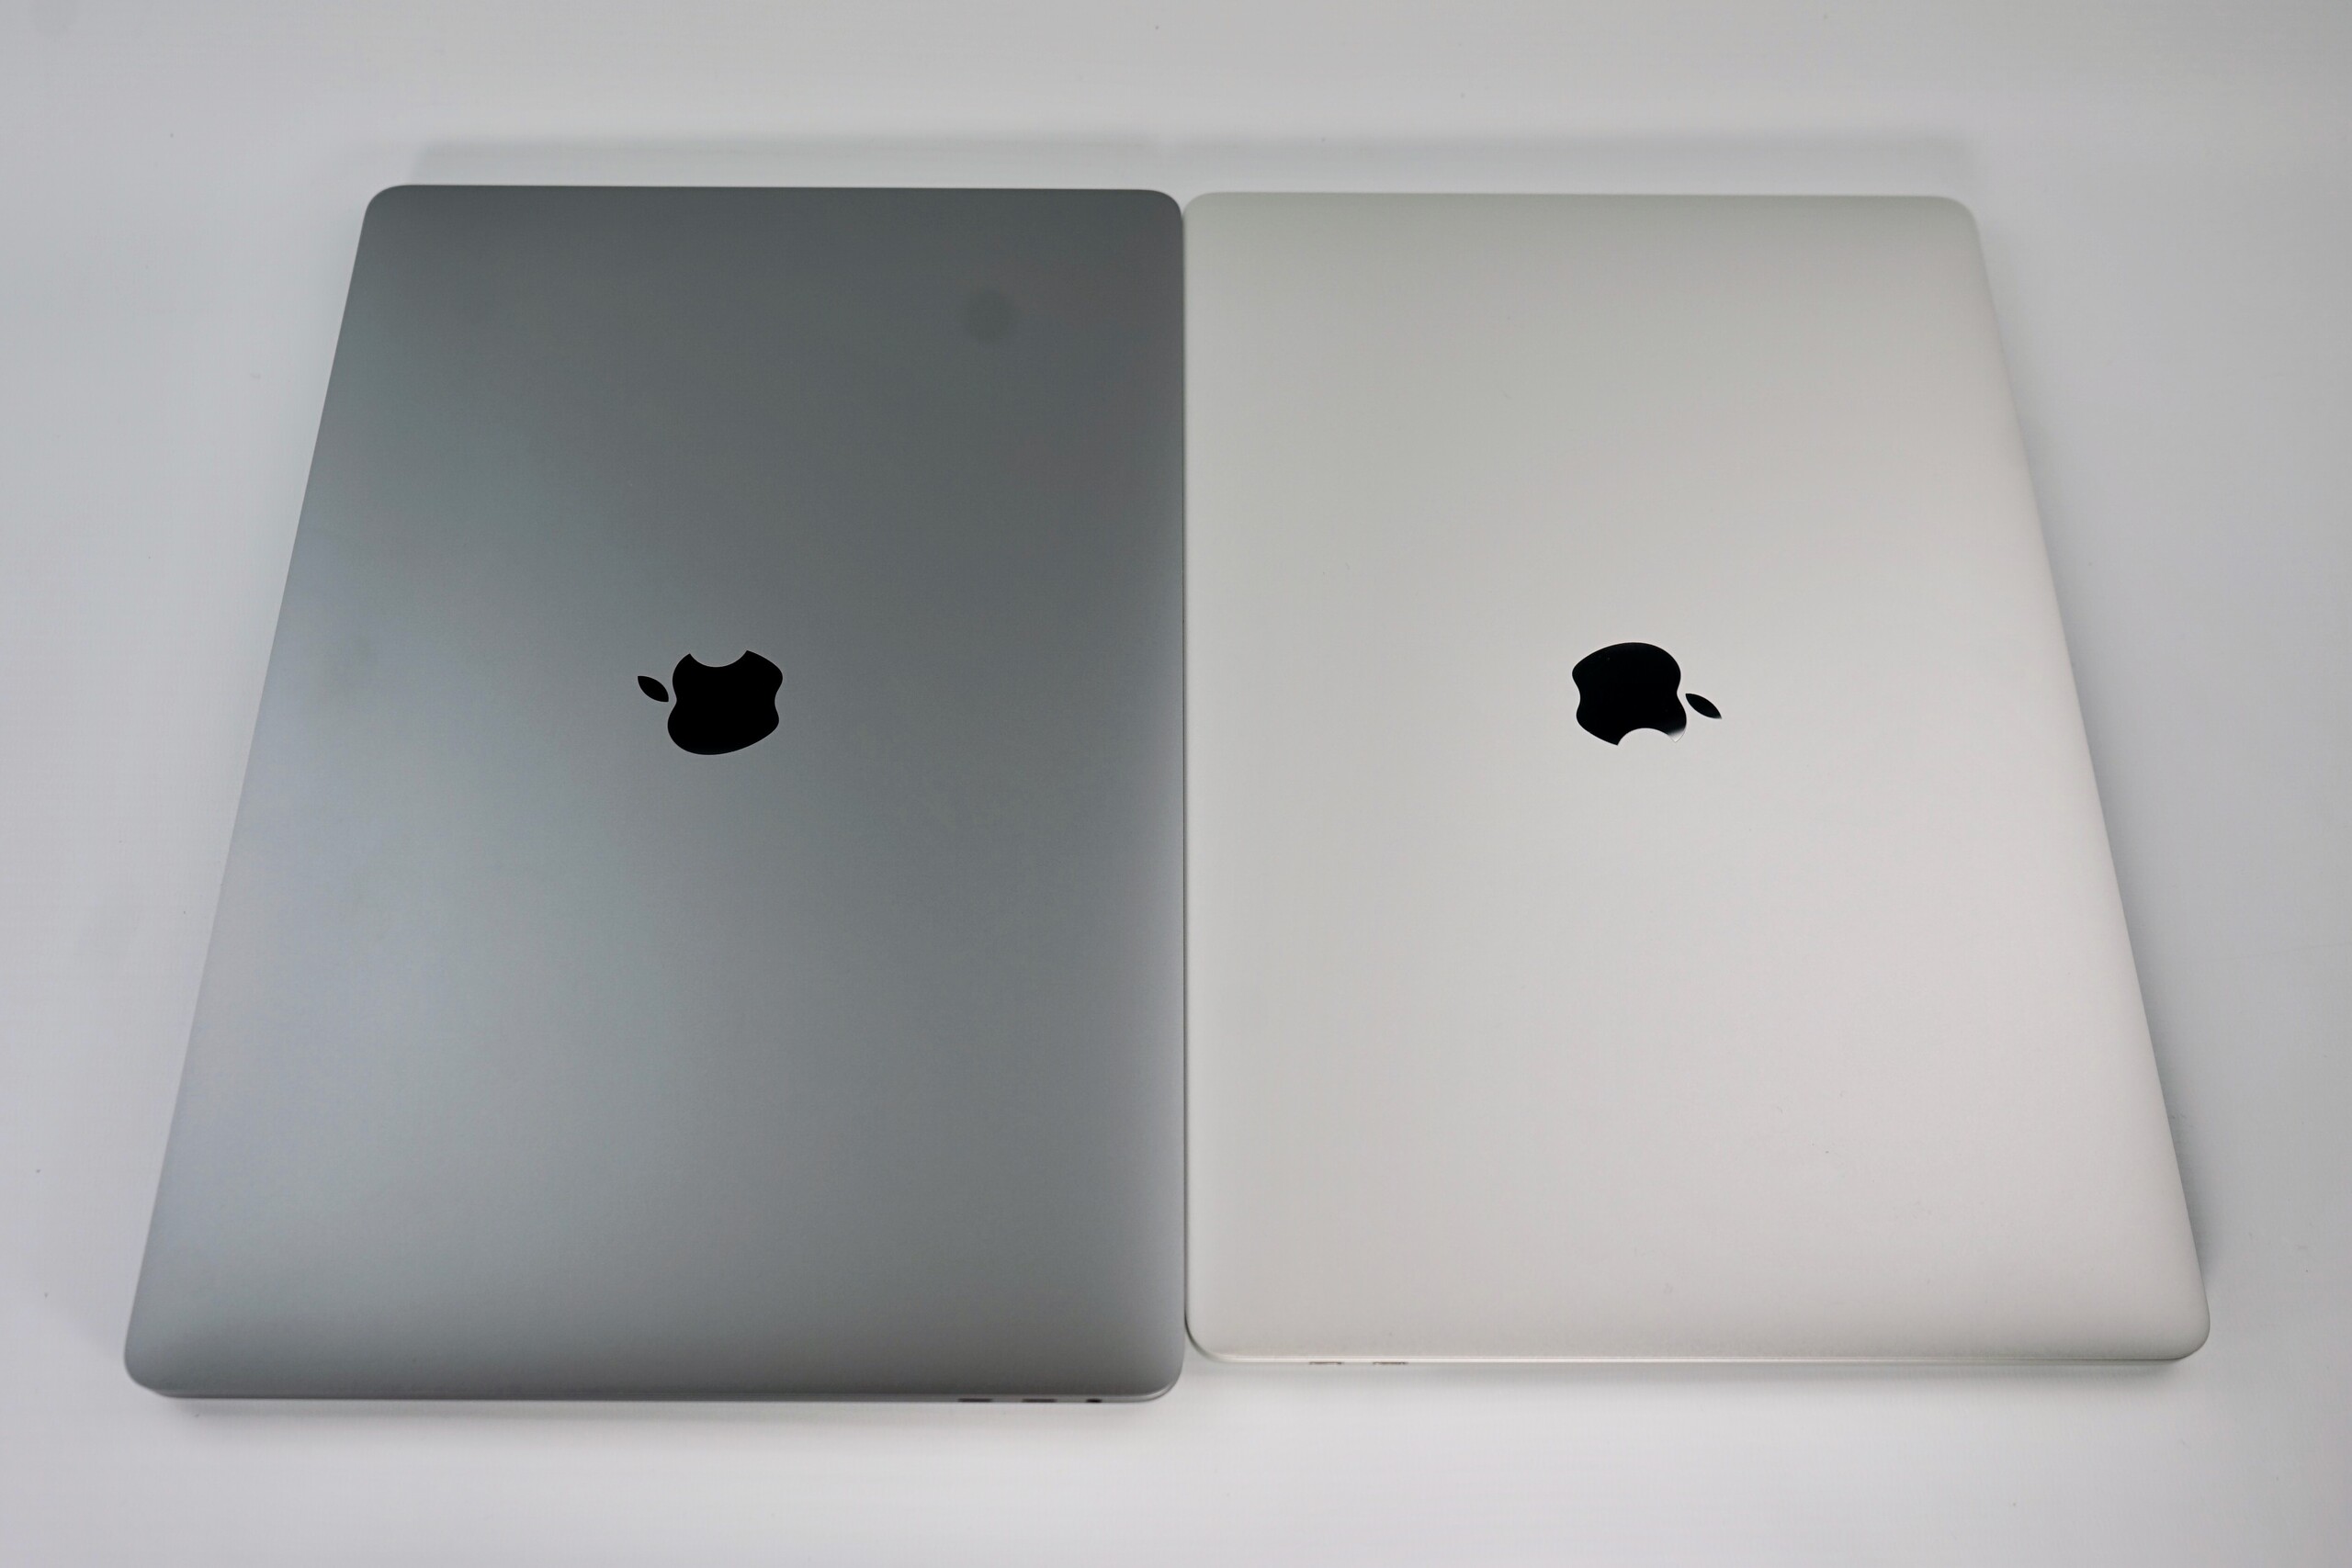
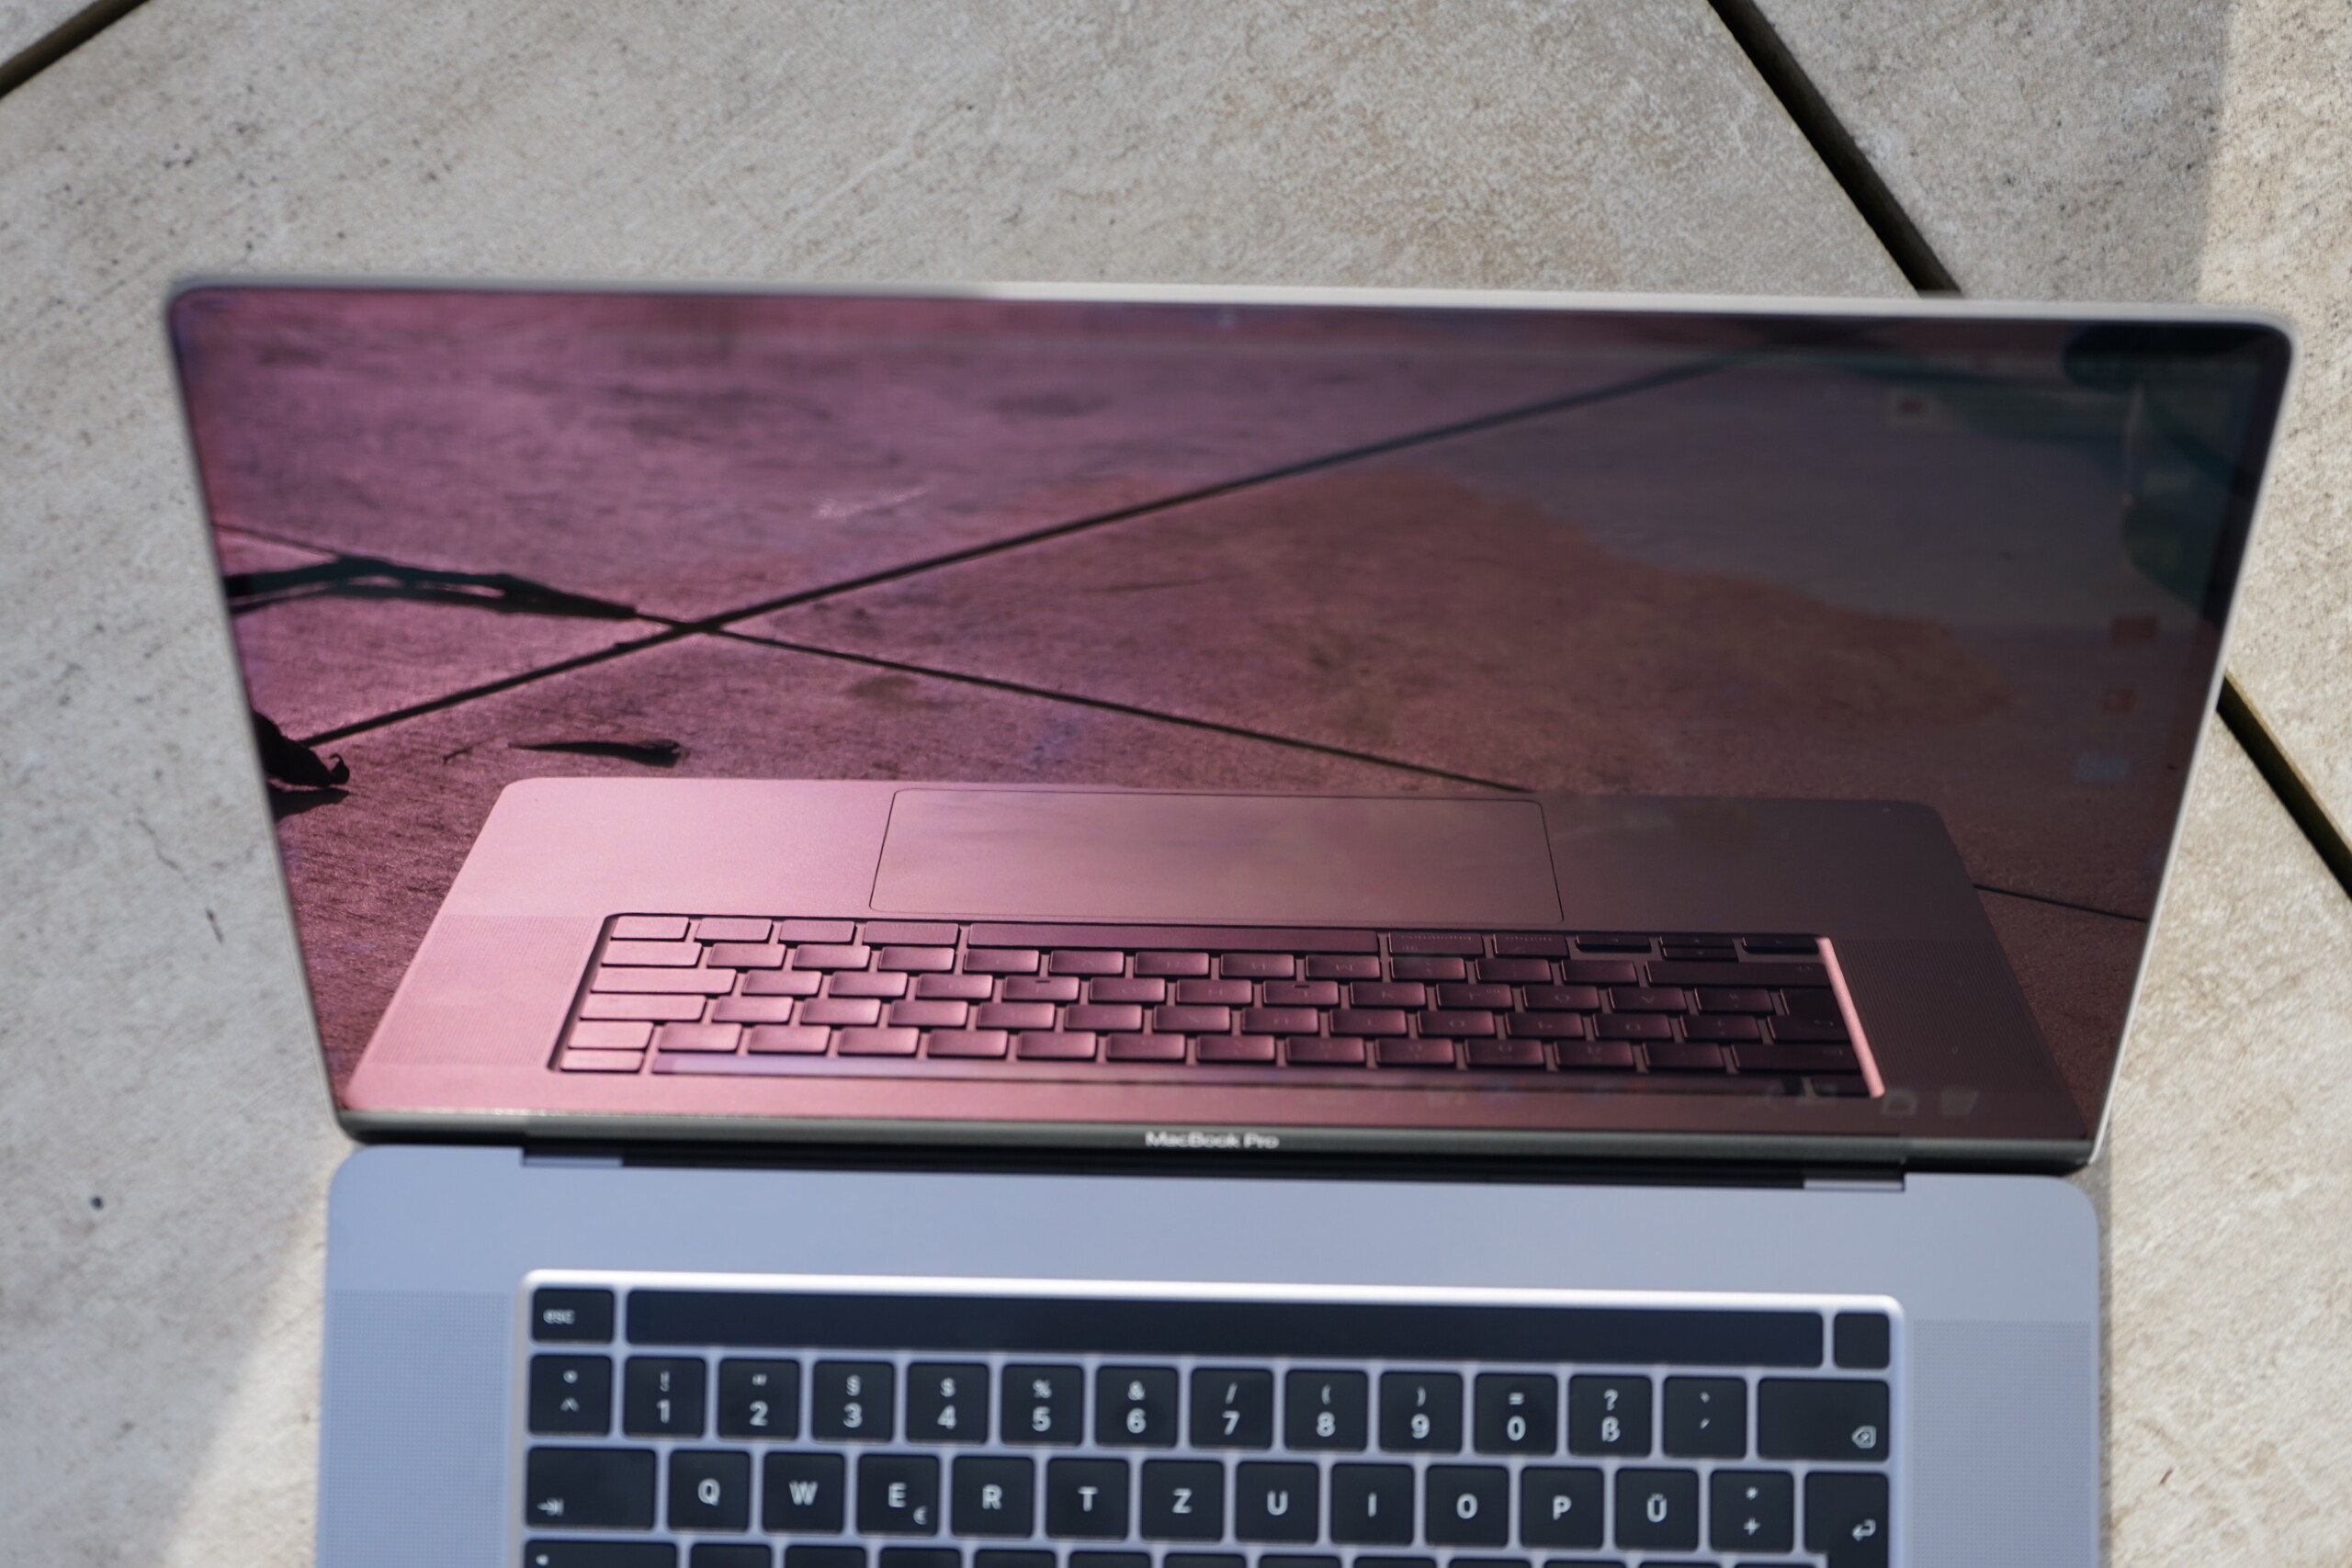
Boyut Karşılaştırma
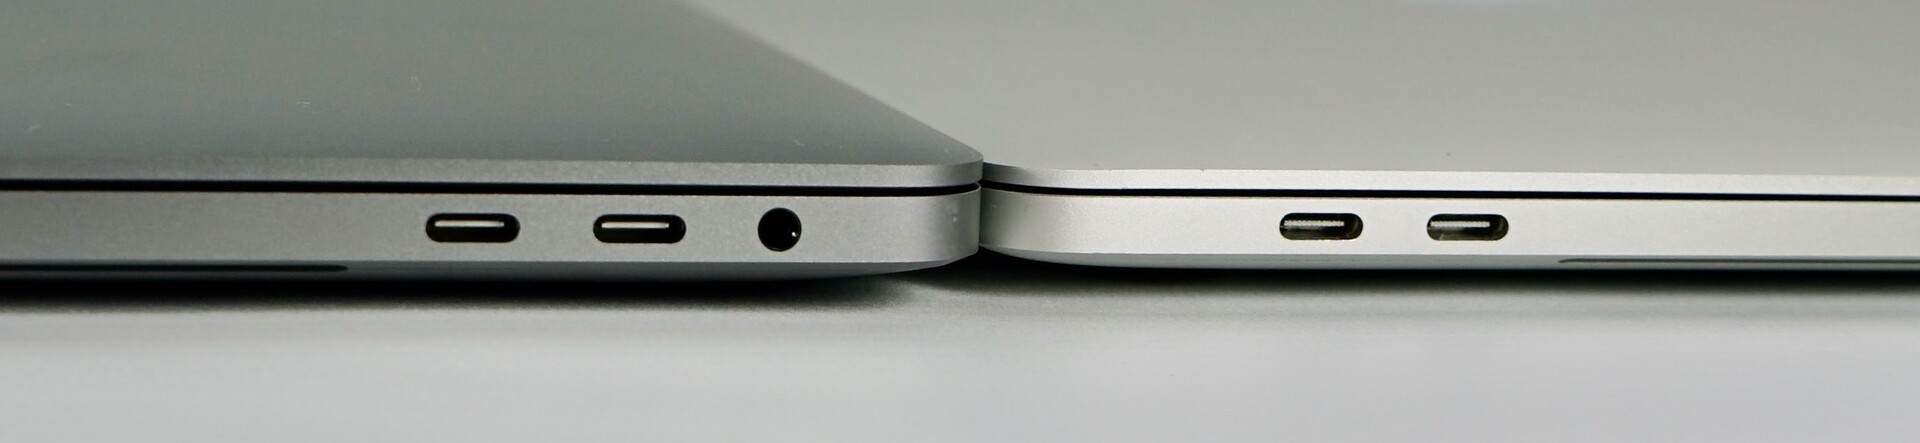
MacBook Pro 16, aşağıdaki resimde gösterildiği gibi, her açıdan öncekilerden biraz daha büyük. Öznel olarak, her ikisinde de bir tane olduğunda, ikisi arasındaki farkları görebiliriz. MacBook Pro 16, karşılaştırma cihazlarımızın çoğundan daha ağır olsa da, Dell XPS 15 7590 dışında hepsinden daha az yer kaplar.
Bağlantı - Thunderbolt 3 ile yapıştırma
Apple'dan bir makas klavyesine geri dönmenin yanı sıra daha geniş bir port seçimi eklemesini bekleyen herkes hayal kırıklığına uğrayacaktır. Şirket, MacBook Pro'larını, sadece dört Thunderbolt 3 portu ve 3,5 mm'lik bir jack ile donatmaya devam ediyor, rakiplerinin sunduğu portların hacmi ve çok yönlülüğünden çok uzakta. Thunderbolt 3 portları çok yönlüdür, ancak örneğin bir HDMI kablosu bağlamak istiyorsanız en az bir USB C Tipi dongle'ye ihtiyacınız olacaktır.


İletişim - bu yılki MacBook Pro'da Wi-Fi 6 yok
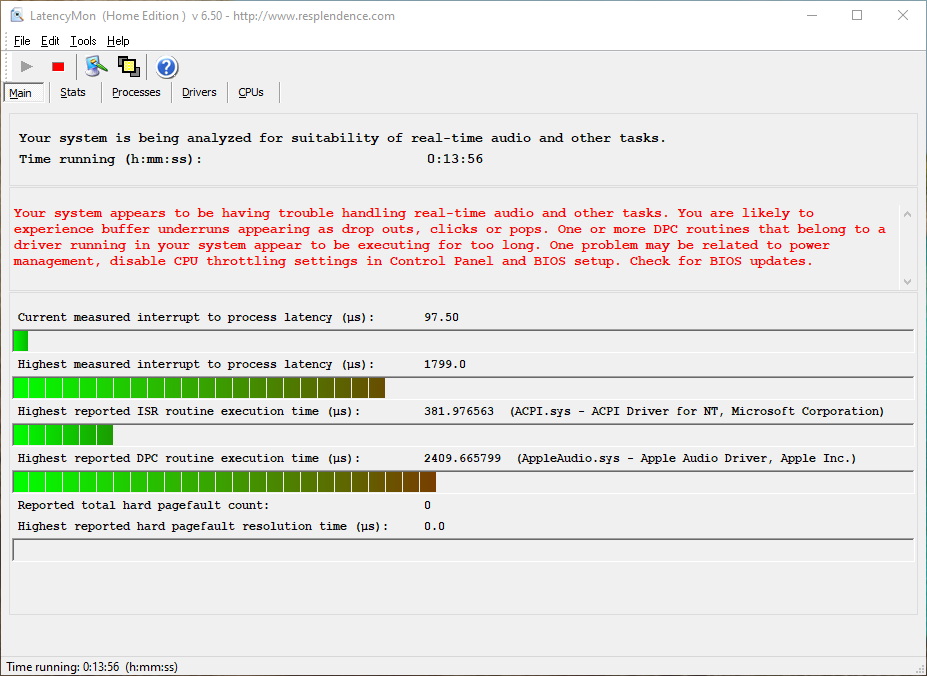
Şaşırtıcı bir şekilde, Apple MacBook Pro 16'yı bir Wi-Fi 6 modem (802.11ax) ile donatmadı. Bunun yerine, şirket bir Wi-Fi 5 Broadcom modemini seçti. Tarihsel olarak, MacBook'lar etrafındaki en iyi Wi-Fi performanslarından bazılarını sunmuşlardır, ancak ThinkPad X1 Extreme Gen 2, MacBook Pro 16'yı utandırmaktadır. . Apple, bir seçenek olarak bile WWAN bağlantısı sunmayı reddetmeye devam ediyor. Bu nedenle, çevresinde Wi-Fi bulunmayan bir ağ bağlantısına ihtiyacınız varsa akıllı telefonunuzu bağlamanız gerekir. Bunu yapmak her zaman pratik değildir, bu nedenle WWAN bağlantısının eksikliği kaçırılmış bir fırsat gibi geliyor. İnceleme birimimizdeki Wi-Fi modülü de bizi Wi-Fi testlerimizde ikna etmedi. MacBook Pro 16, her nedense, iperf3 Client'ı çalıştırdığımız zaman bağlantıyı kesti. Yaptığımız çoklu testlerin ilk birkaç saniyesi, MacBook Pro 16'nın selefi ile aynı seviyeye getirerek 600 ila 800 Mb / s arasında değiştiğini gösteriyor. Bununla birlikte, MacBook Pro 15'in macOS Catalina'da iperf3 Client'ı çalıştırmasıyla ilgili herhangi bir sorunu yoktu. Bu davranışı Linksys EA8500, Fritz! Box 7590 ve Netgear Nighthawk AX12, böylece yönlendirici-uyumluluk sorunu olarak ortadan kaldırıyor. İnceleme birimimiz, Fritz ile istikrarlı ve hızlı bir Wi-Fi 5 bağlantısı sağladı! Ancak günlük kullanımda Kutu 7590 yönlendirici. İperf3 İstemcisini, aşağıda verdiğimiz veriler olan Boot Camp'te çalışan Windows 10'da yeniden çalıştırdık. Bu arada, MacBook Pro 16, macOS yerine Windows 10'da çalışırken daha istikrarlı bir bağlantı sürdürdü.
Webcam - Hala 720p, ancak gelişmiş mikrofonlar
Ne yazık ki, MacBook Pro 16, öncekilerle aynı 720p FaceTime HD webcam'a sahip. Son derece görüntülü aramalar için yeterince iyi olsa da, son iPhone'lar MacBook Pro 16'dan daha üstün öne bakan kameralar sunuyor. Tersine, Apple, MacBook Pro 15'te kullandıklarına kıyasla mikrofonları stüdyoya yakışır hale getirdi. O kadar ileri gitmeyiz, ancak çoğu görev için kulaklıklara ulaşmaktan kaçınmak için yeterince iyidirler.

Garanti
Apple, MacBook Pro 16 ile bir yıllık sınırlı garantiye sahiptir. Garanti kapsamı, yazılım sorunları için bile telefon desteğini kapsar, ancak diğer OEM'ler, benzer dizüstü bilgisayarlarla daha uzun garantiler sunar. Apple, daha uzun garanti kapsamı istiyorsanız, MacBook Pro 16 için AppleCare'i de satmaktadır. Uzatılmış garanti üç yıl sürecek ve son derece pahalı olan 449 ABD Doları'dır. Lütfen Garanti, İade Politikalarımıza bakınız.
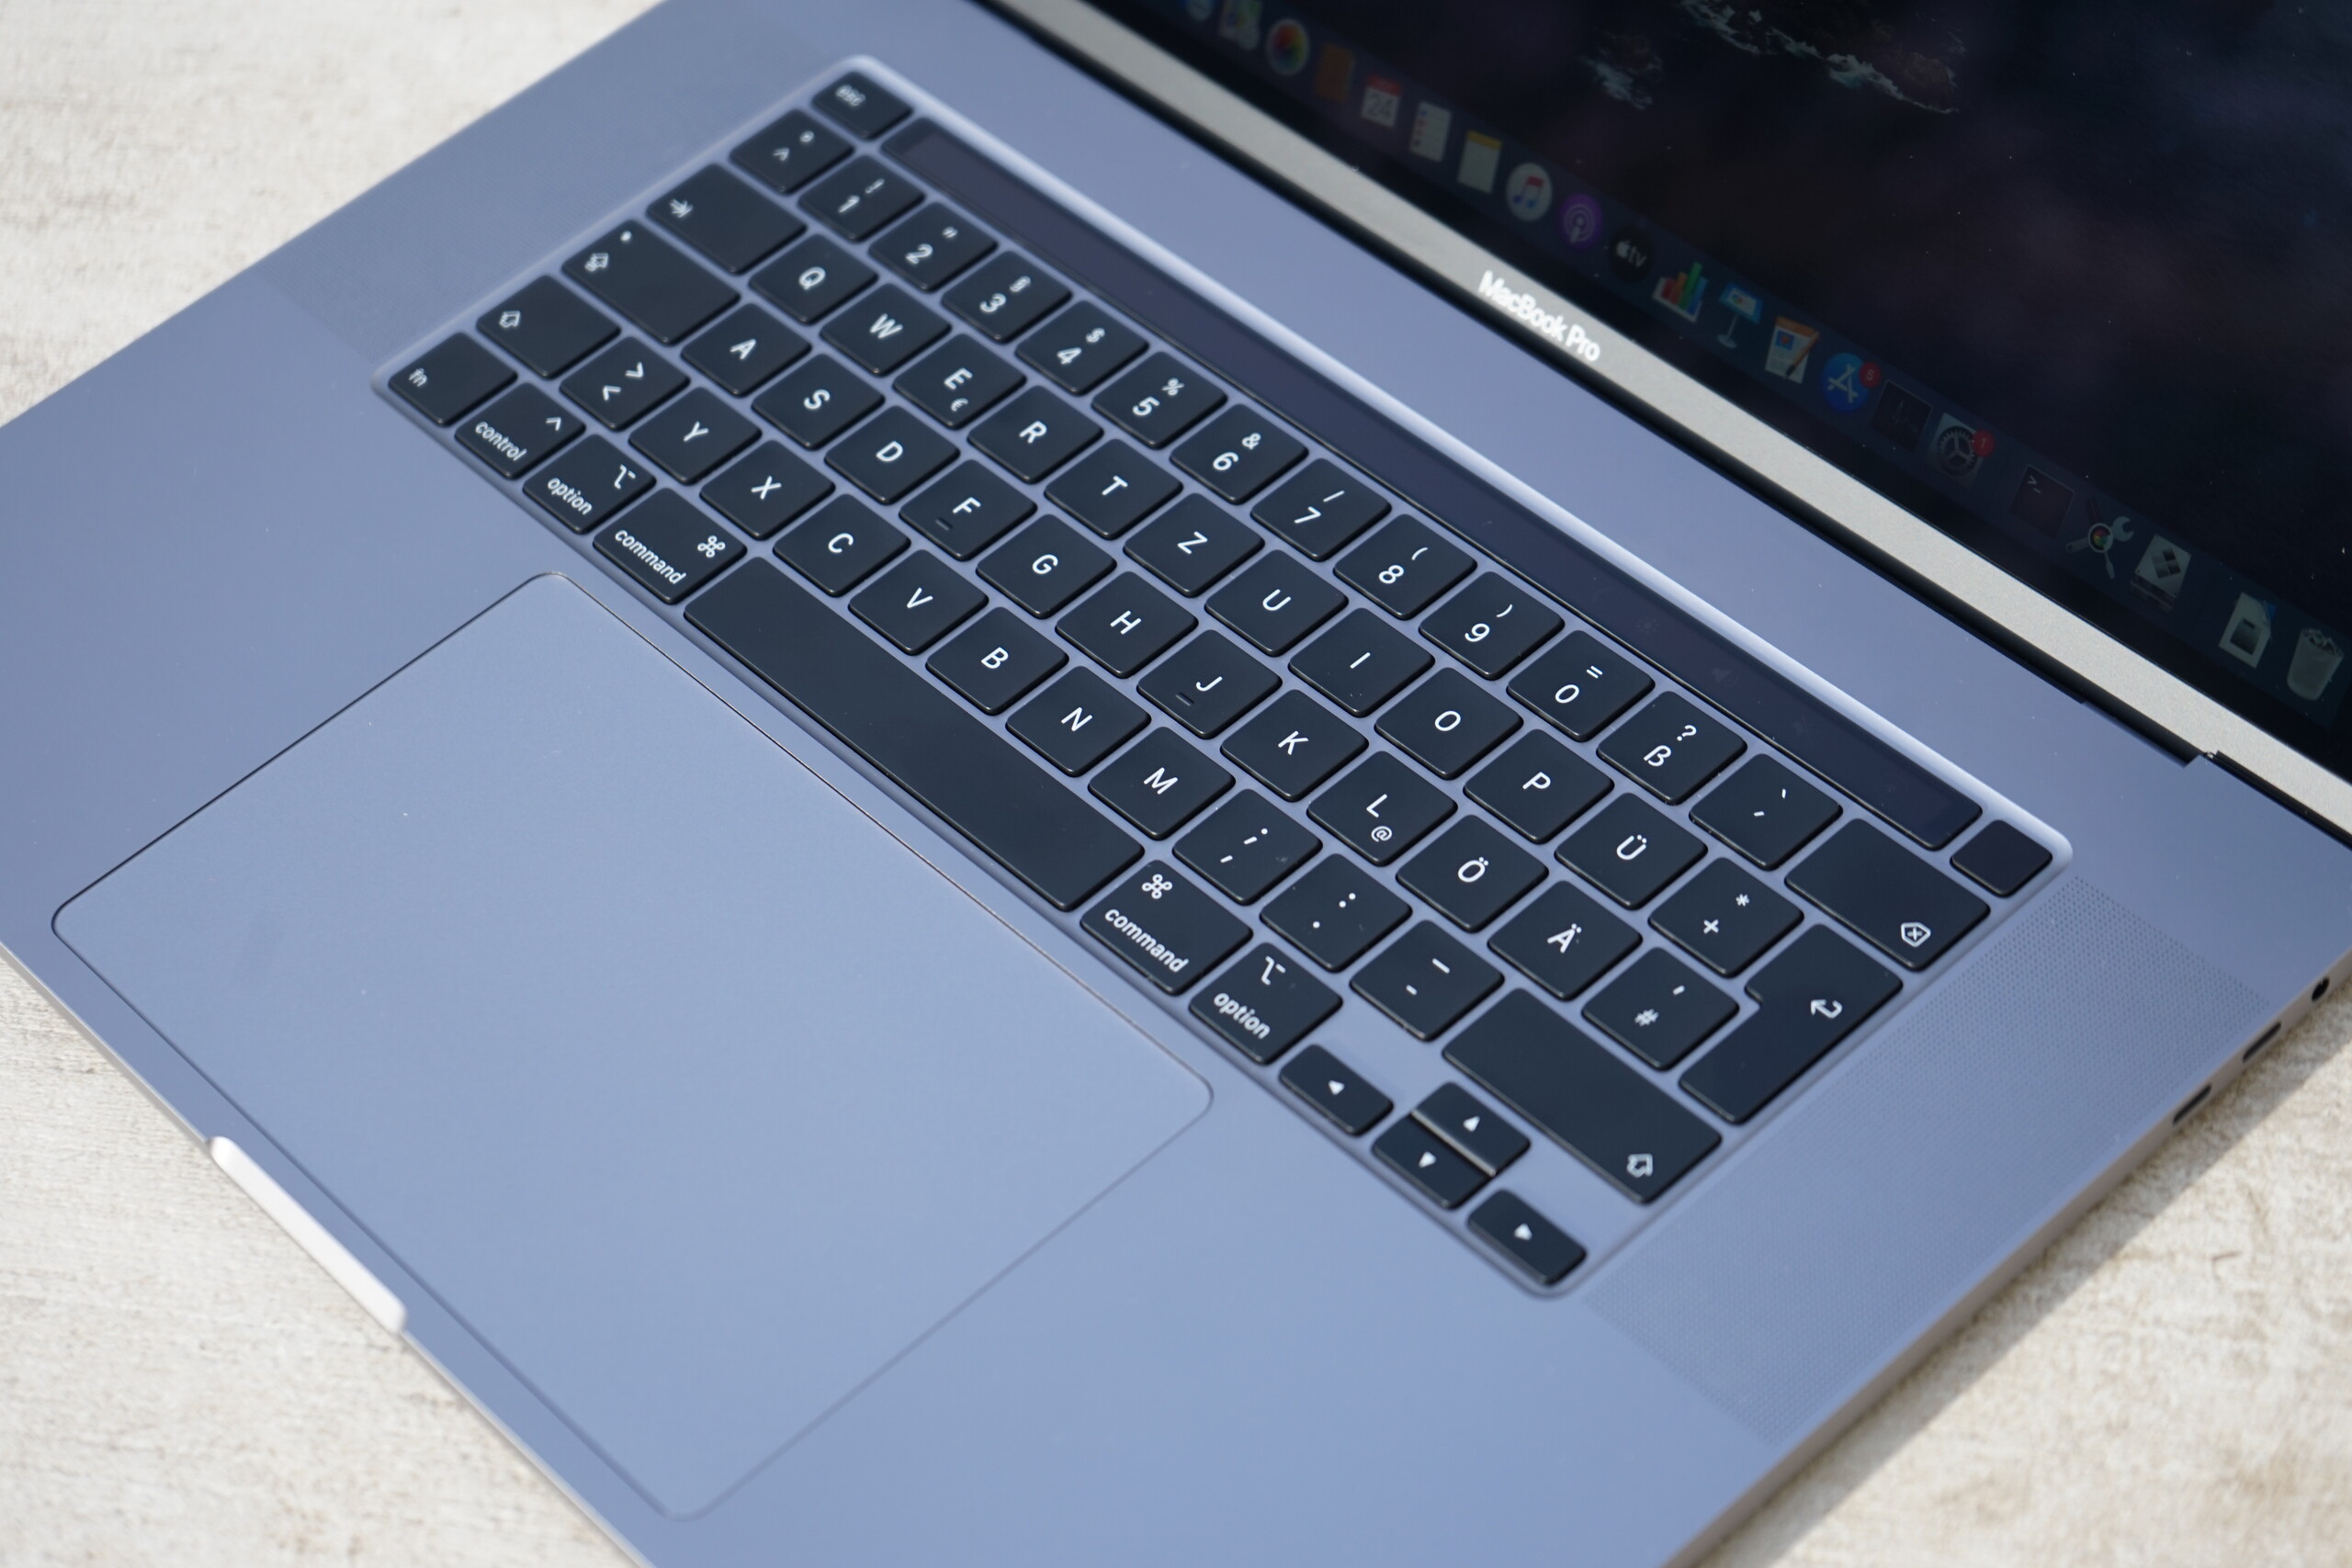
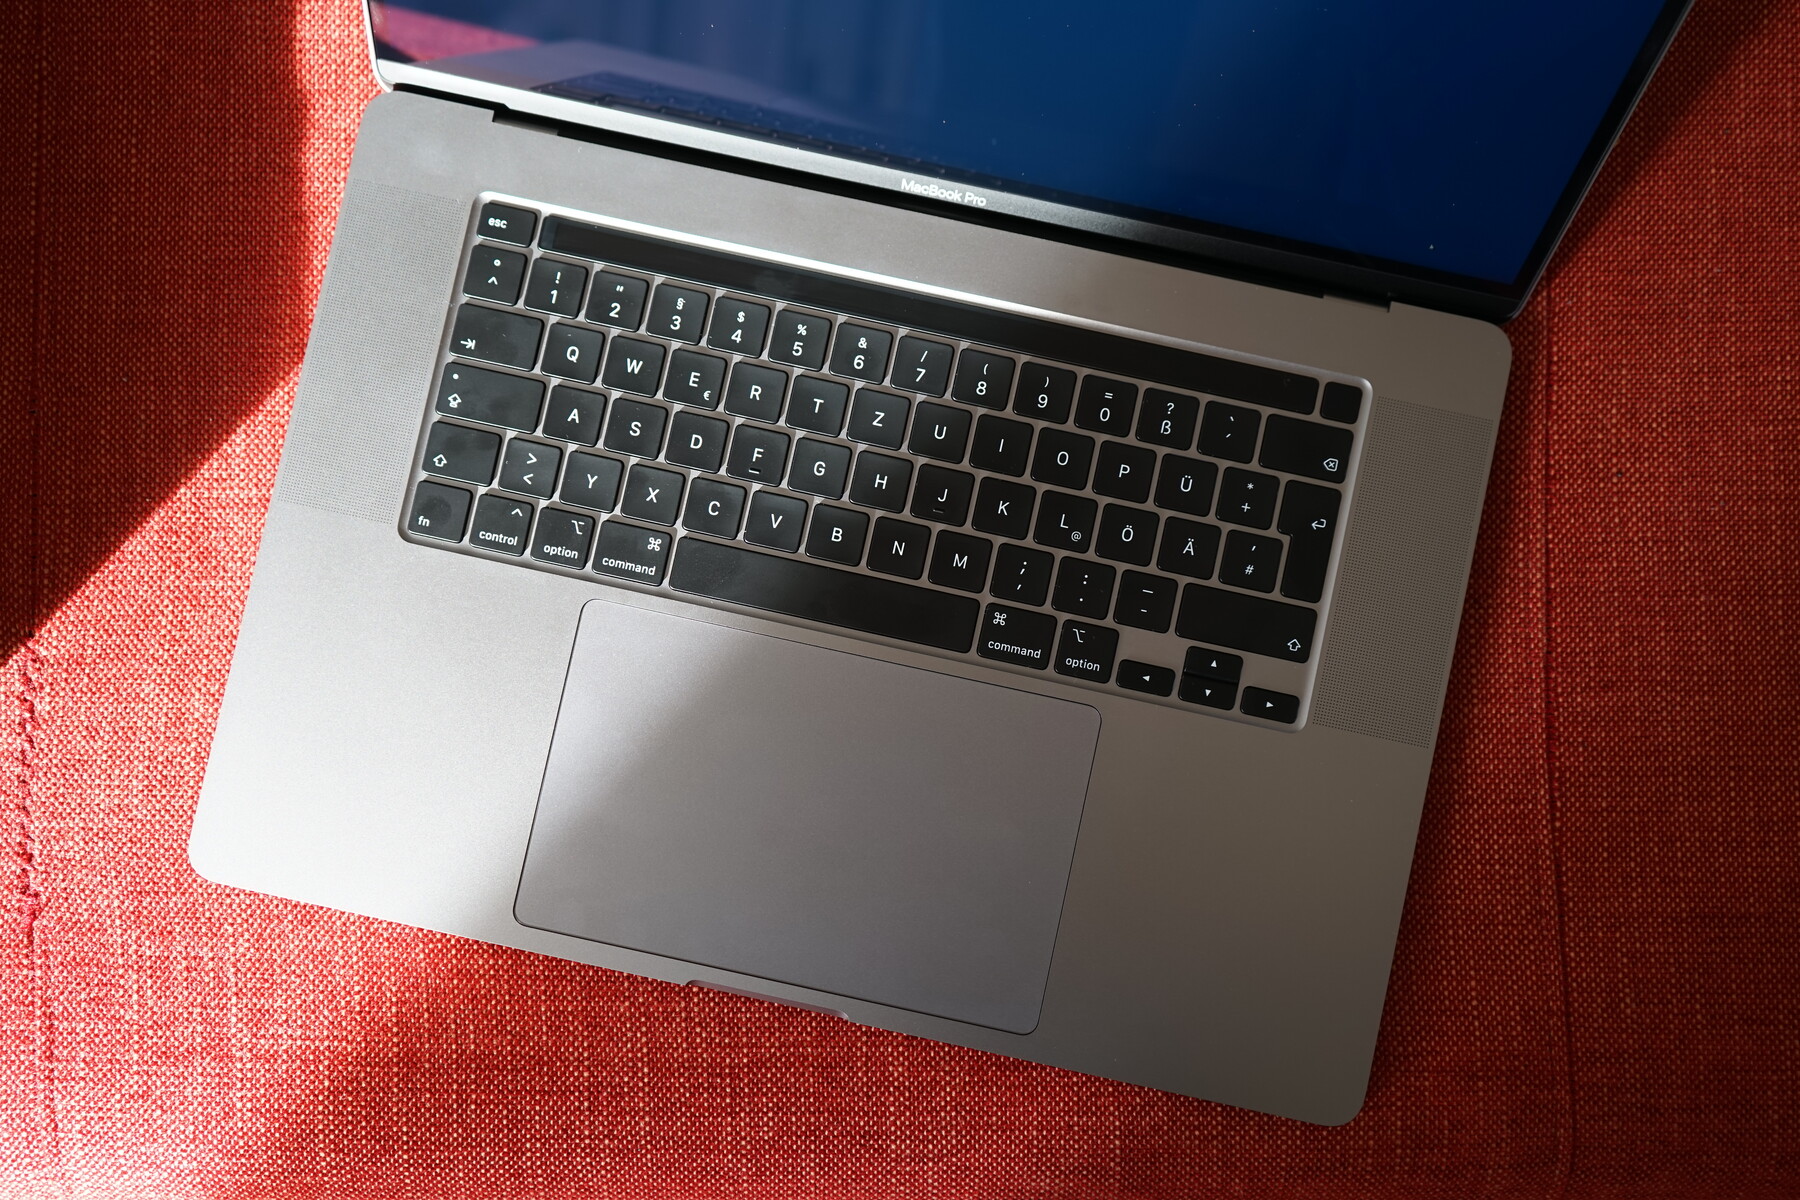
Giriş Aygıtları - Eski bir klavyeye sahip yeni bir MacBook Pro
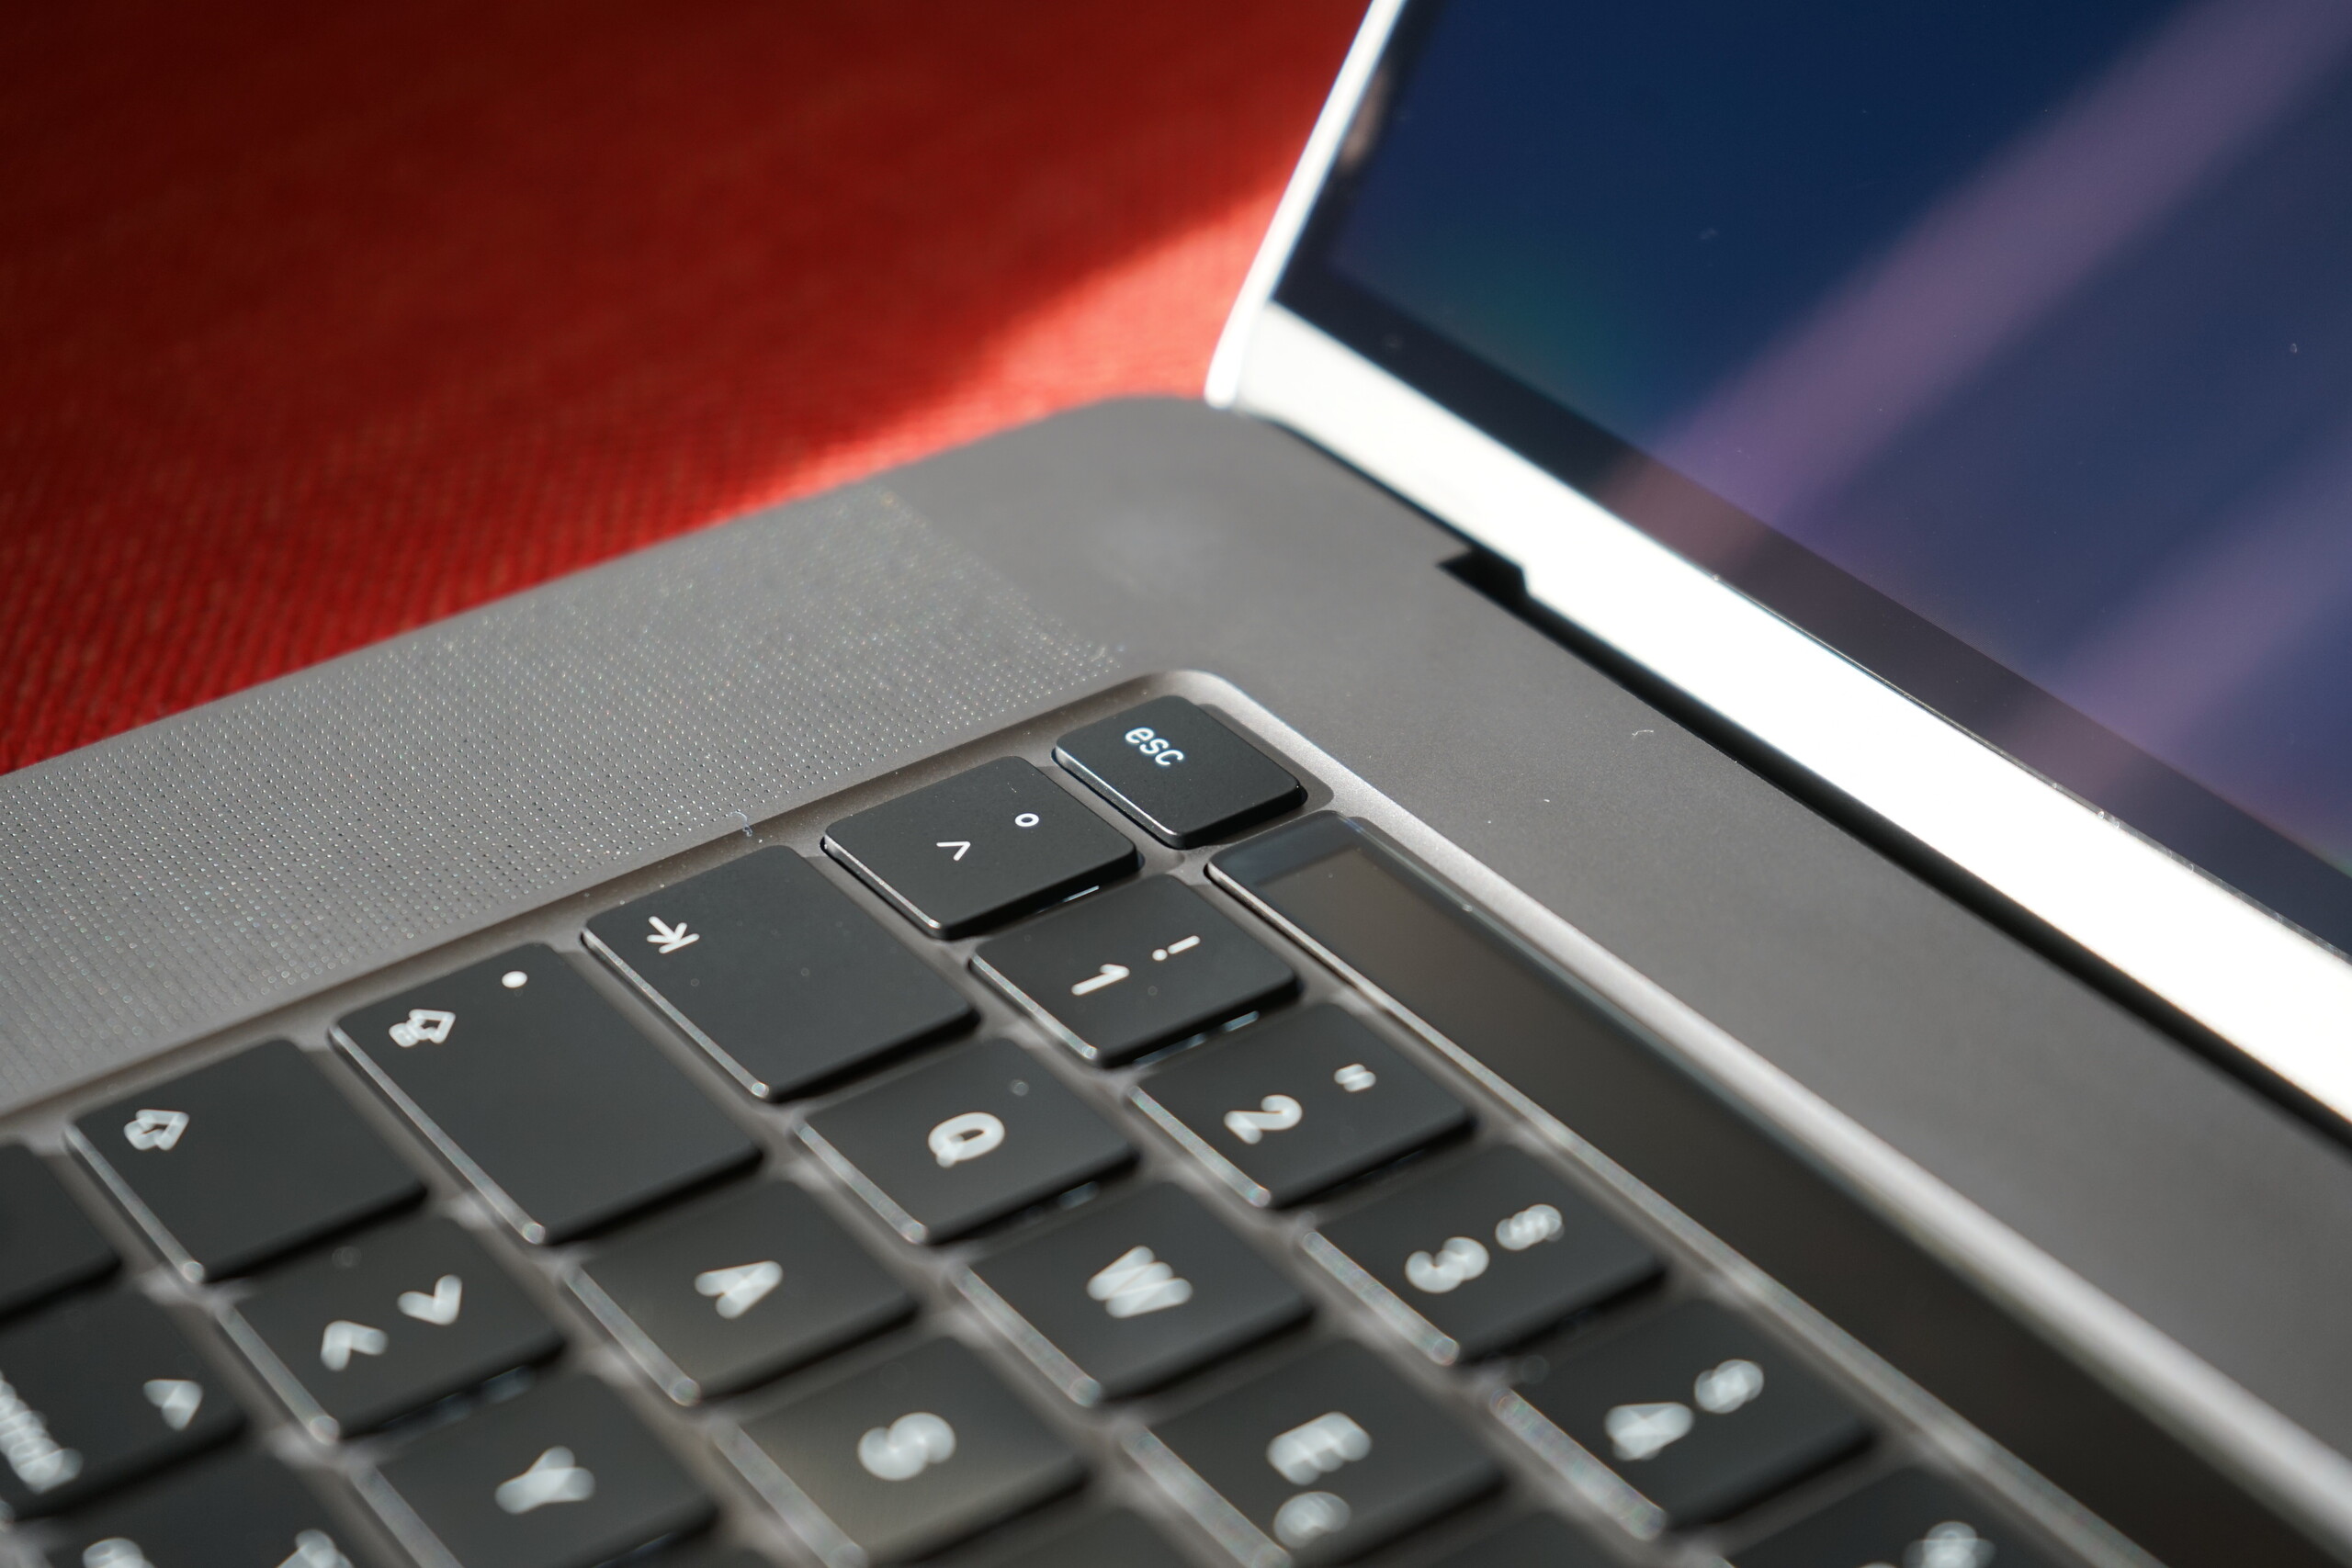
Klavye MacBook Pro 16, yaklaşık dört yıl önce mekanizmayı tanıttığından beri Apple'ın kelebek klavyesiz MacBook'u ilk kez piyasaya sürdüğünü gösteriyor. Kelebek mekanizmasının aldığı olumsuz başlıkların ve uzun ömürlü sorunların hacmi göz önüne alındığında bu durum şaşırtıcı değildir. Aplik aslında bir dönüş yapmıştır ve esas olarak 2015 ortalarında MacBook Pro 15'te kullanılan klavyeye geri dönmüştür. MacBook Pro 16, yaklaşık 1.2 mm seyahate sahiptir, bu da kelebek klavyede yazmakta zorlananları memnun etmelidir. Makaslı klavye de kelebek mekanizmasından daha sessizdir. Genel olarak, burada şikayet edecek çok az şeyimiz var. Apple, ok tuşlarının şeklini de onayımıza göre ayarladı. Anahtarlar MacBook Pro 15'tekinden daha küçük olsa da, bize göre dokunmatik yazarken kullanımı daha kolay. Diğer raporların aksine, klavyeleri tekrar makaslamaya alışma konusunda hiçbir sorun yaşamadık, özellikle de anahtarların sunduğu kesin geri bildirimlerden. Bu arada, MacBook Pro 16 veya MacBook Pro 15'e yazıp yazmamıza bakılmaksızın dakika başına aynı kelimeleri (WPM) elde ettik. MacBook Pro 16, seleflerinin sahip olduğu Touch Bar'ı da yeniden tasarladı. Artık Touch Bar artık MacBook Pro 15'te bulunandan biraz daha dar olmasına rağmen, üst kasa ile aynı hizada oturmuyor. Ayrıca, şimdi özel bir kaçış anahtarı ve güç düğmesi var. Sonuncusu biyometrik kimlik doğrulaması için Touch ID'yi destekliyor ve testlerimiz sırasında mükemmel çalıştı. Parmak izi tarayıcı sadece cihazın kilidini açmak için değil aynı zamanda şifreler ve Apple Pay için de kullanılabilir. Tüm MacBook klavyeleri on yıldan fazla bir süredir kullanıldığından klavye de arkadan aydınlatılmıştır. Apple, bize göre, rakiplerinin çoğundan daha iyi arka aydınlatma sunmaya devam ediyor. MacBook Pro 16, oyun dizüstü bilgisayarları ve RGB klavyeleriyle aynı derecede arkadan aydınlatmalı özelleştirme sunmazken, genellikle yalnızca iki parlaklık düzeyi sunan karşılaştırılabilir Windows dizüstü bilgisayarlardan daha ince denetimlere sahiptir. Yerleşik parlaklık sensörü değişen ortam ışığına iyi tepki verdiğinden, klavye arka ışığını manuel olarak ayarlama gereksinimini nadiren bulacaksınız. Arka ışık, Dokunmatik Çubuk ve ekran gibi, parlaklığı ayarlamak için pals genişliği modülasyonunu (PWM) kullanır. PWM referans olarak bazı insanlar için göz yorgunluğu ve baş ağrısı gibi sağlık sorunlarına neden olabilir.
Dokunmatik yüzey
Windows dizüstü bilgisayarlardaki izleme dörtgenleri son birkaç yılda önemli ölçüde gelişti, ancak hala modern MacBook'takileri yakalamaya devam ediyorlar. Force Touch cam trackpad dizüstü bilgisayarlar arasında standart olmaya devam etmekte olup, diğer OEM'lerin şu anda sunduğu özelliklere göre büyüklüğü ve doğruluğu ile aynıdır. Çok parmaklı hareketler, fareyi bir parmakla hareket ettirirken olduğu gibi kolayca çıkarılabilir. Genel olarak, burada şikayet edecek hiçbir şeyimiz yok ve dokunsal geri bildirim sağlayan Force Touch motoru hakkında da bir şey yapmıyoruz. Motor, trackpadin köşelerinde bile mükemmel çalışıyor ve Windows OEM'lerin henüz eşleşemediği bir şey.
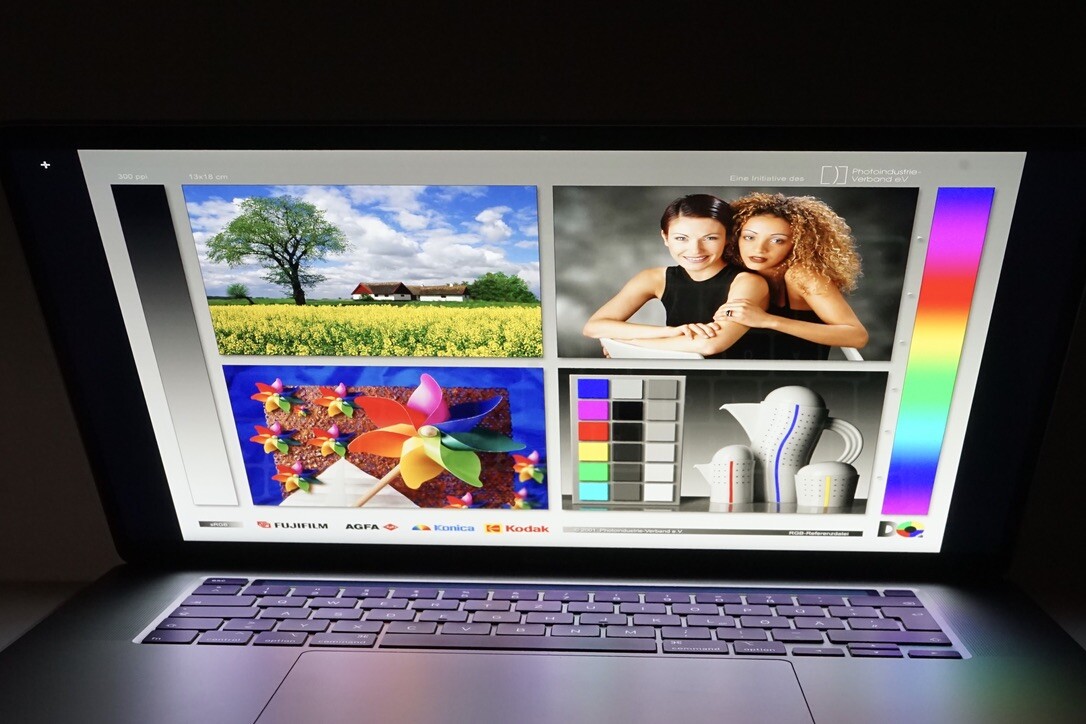
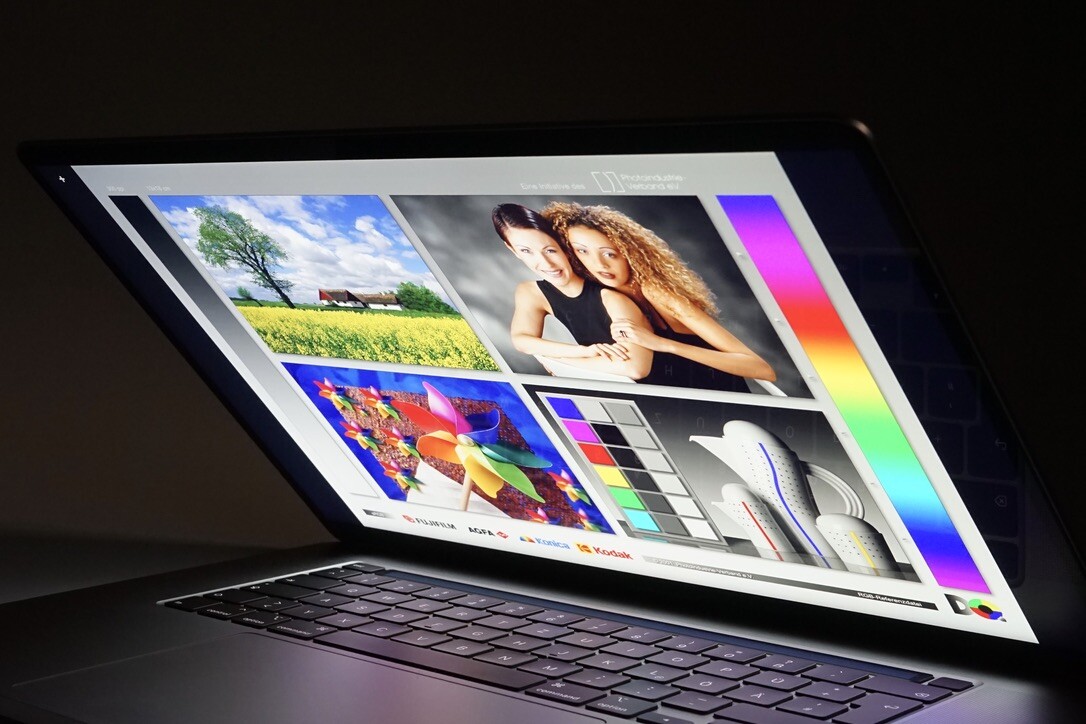
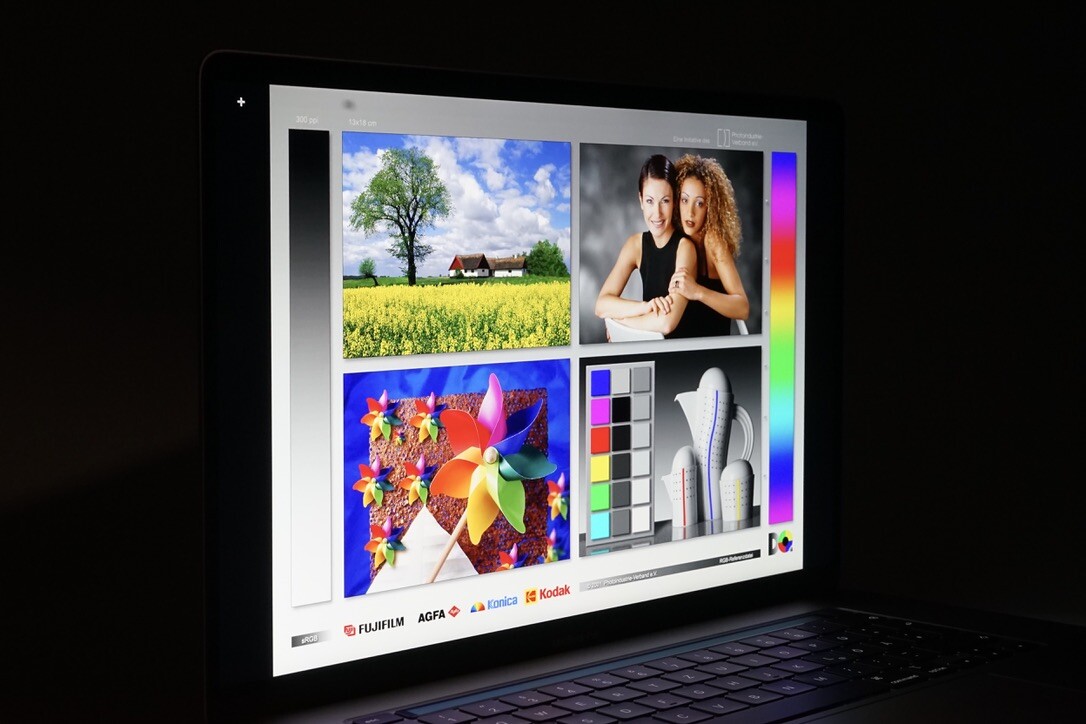
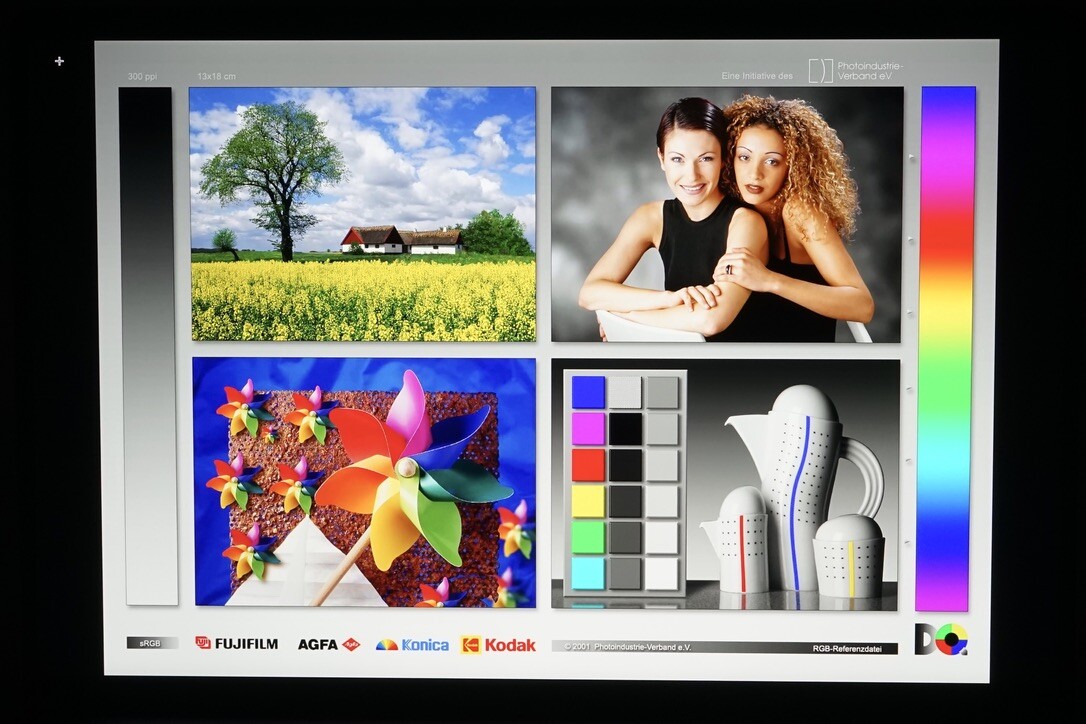
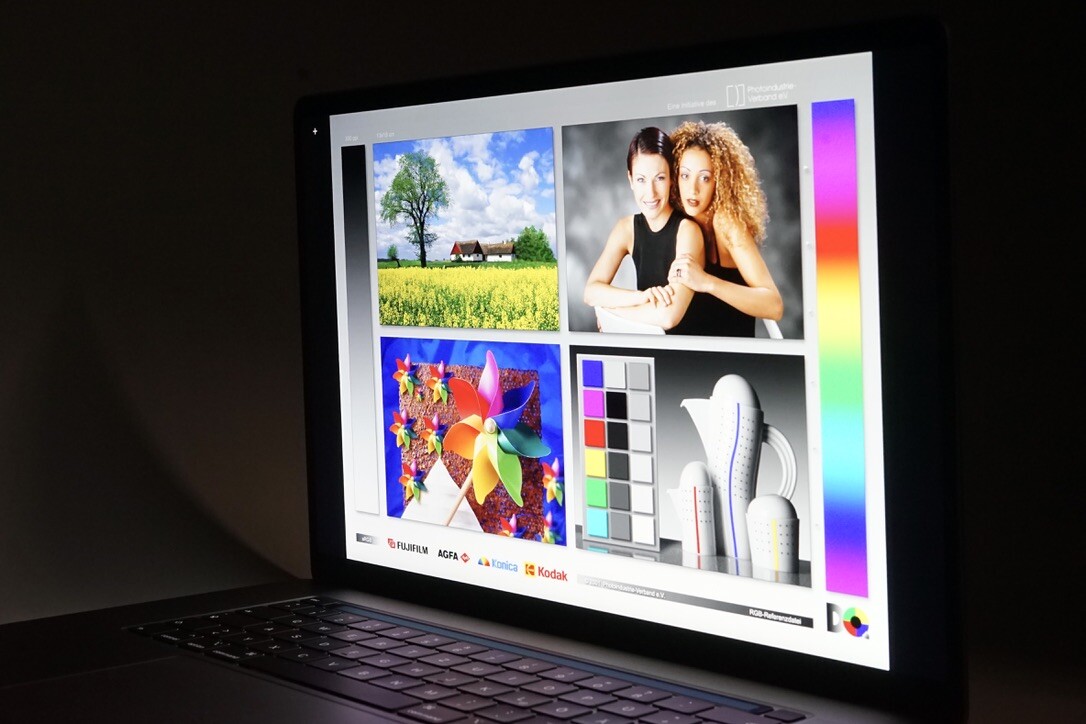
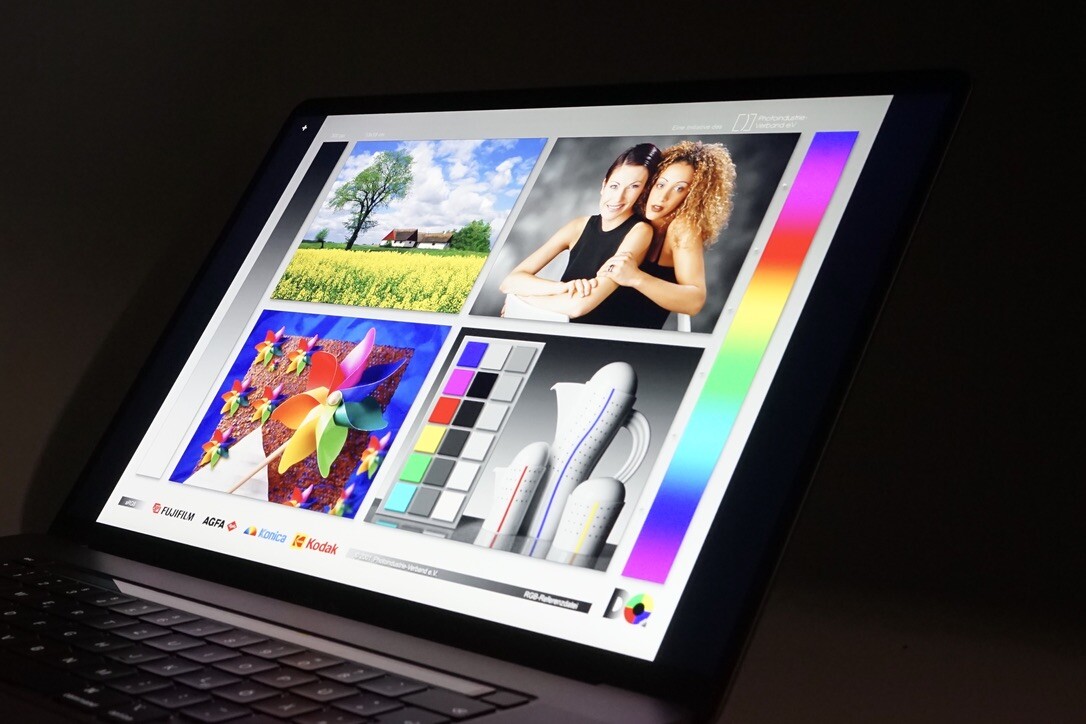
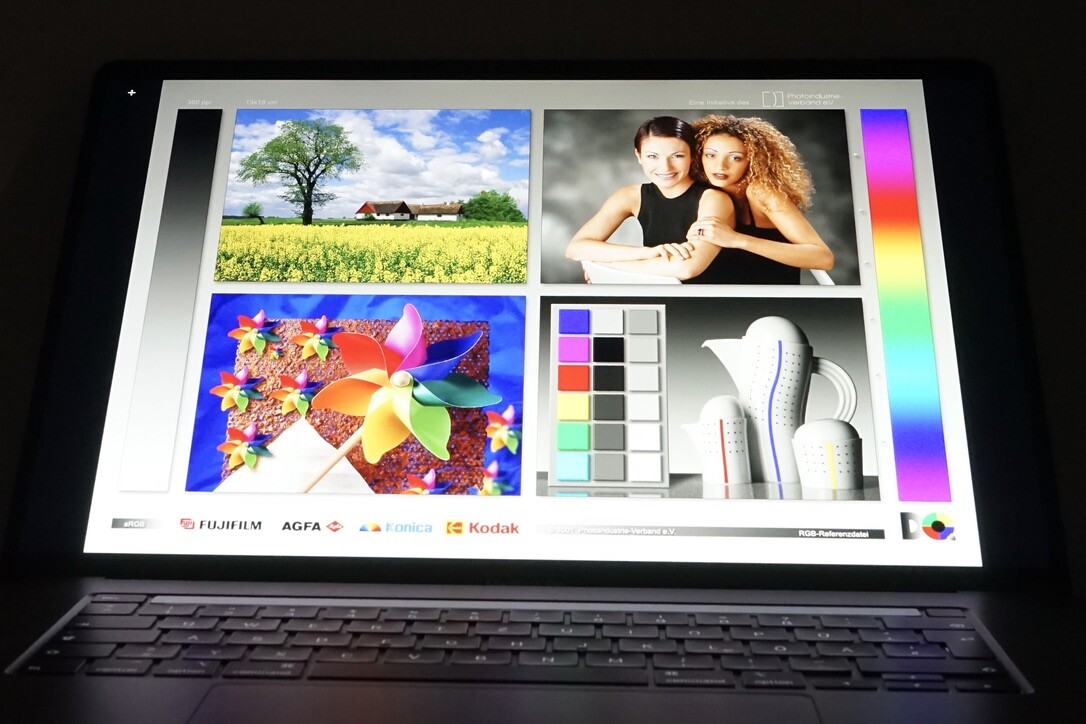
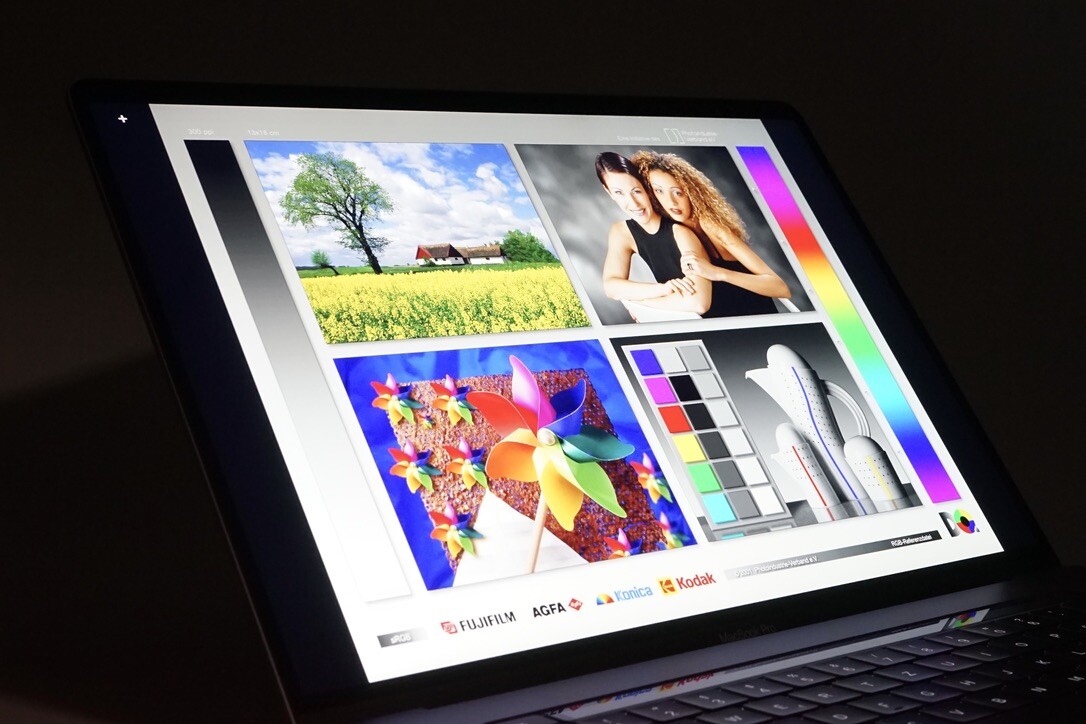
Ekran - Muhteşem 16 inçlik bir Retina ekran
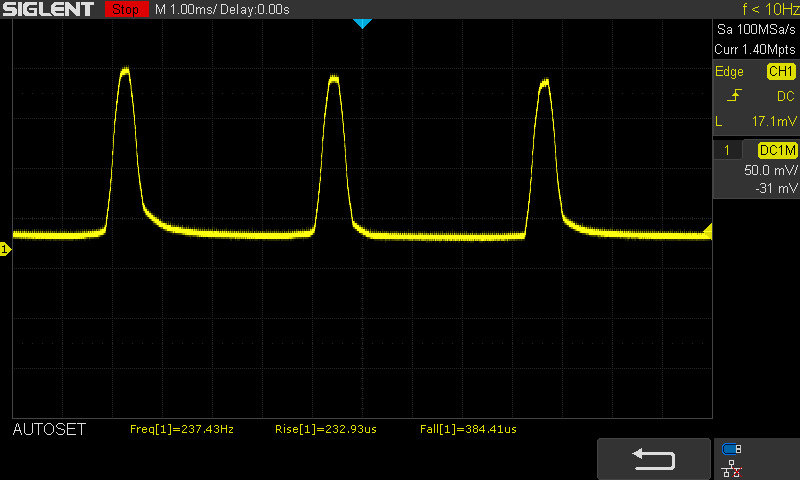
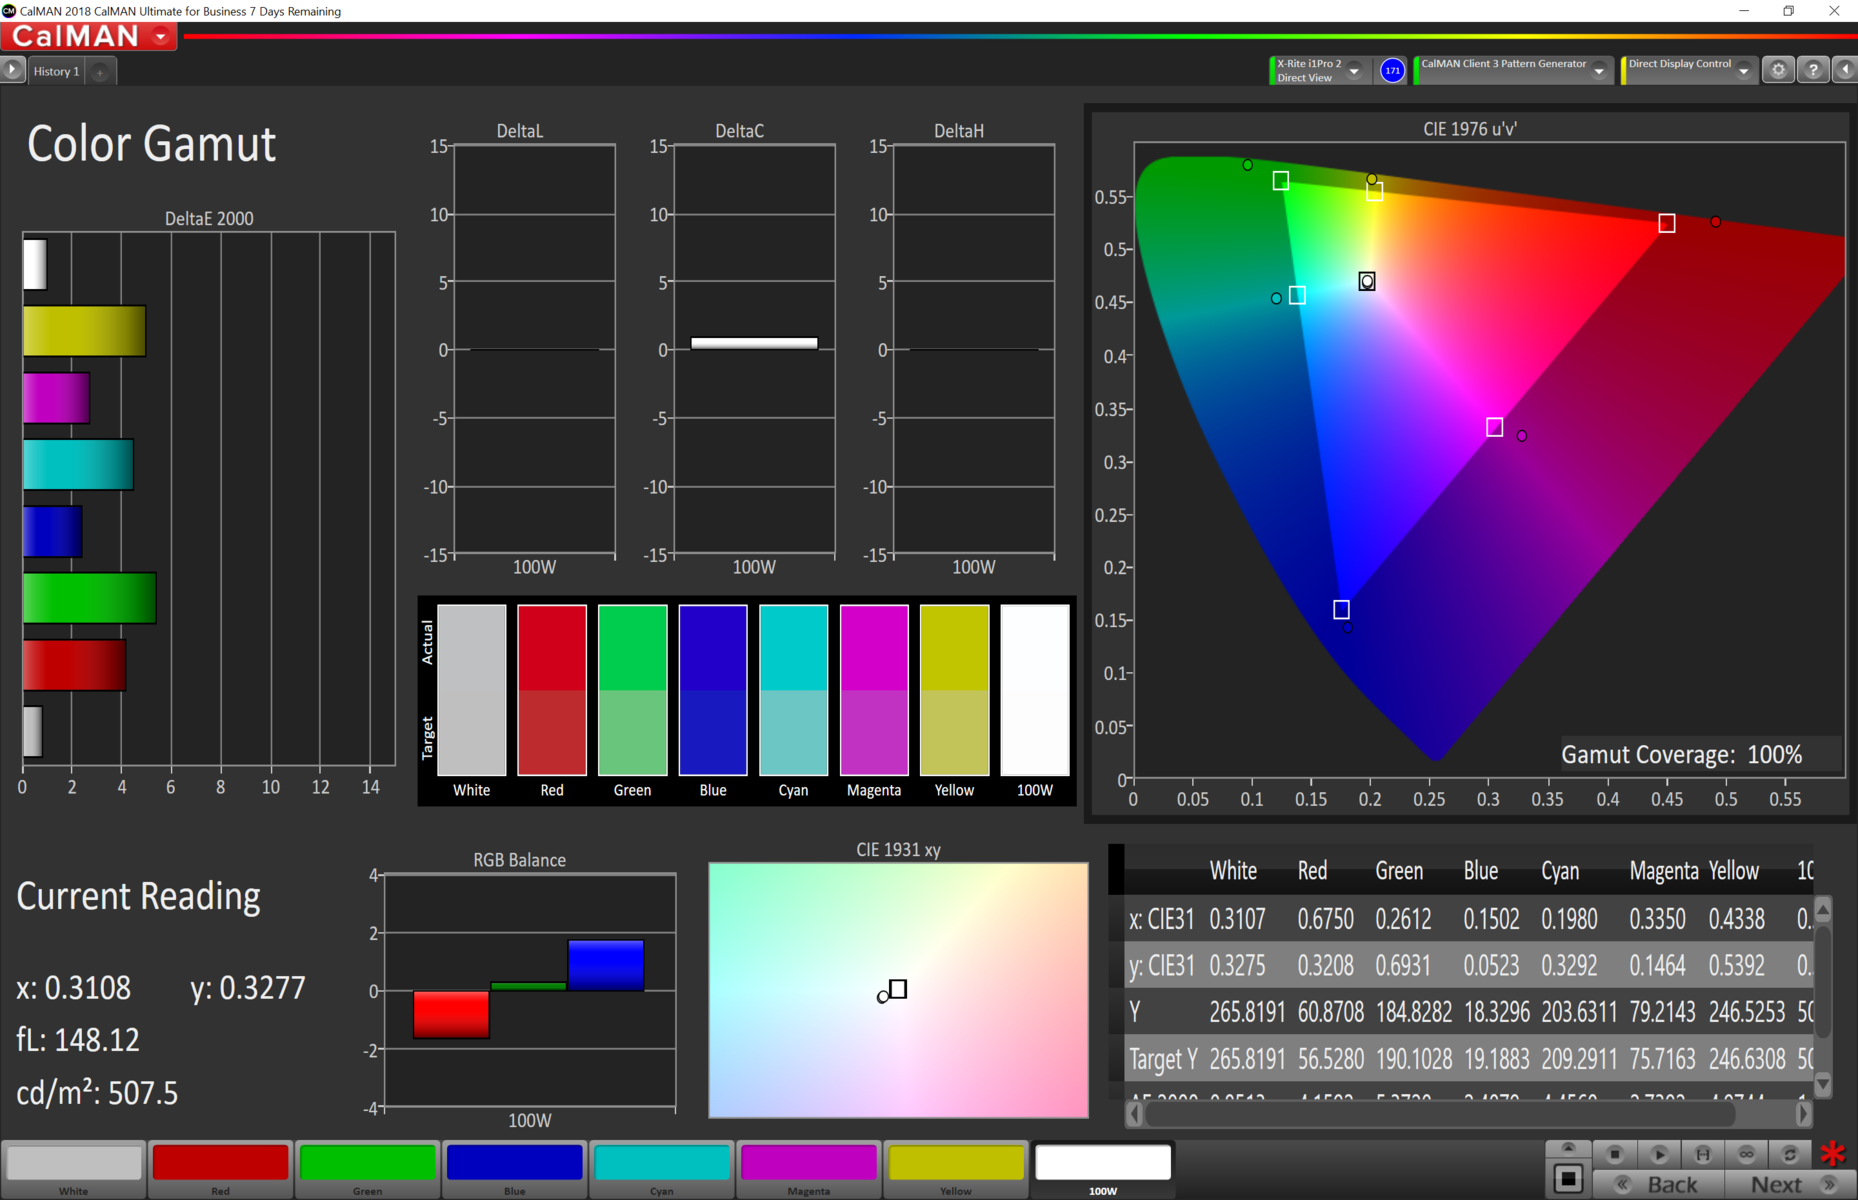
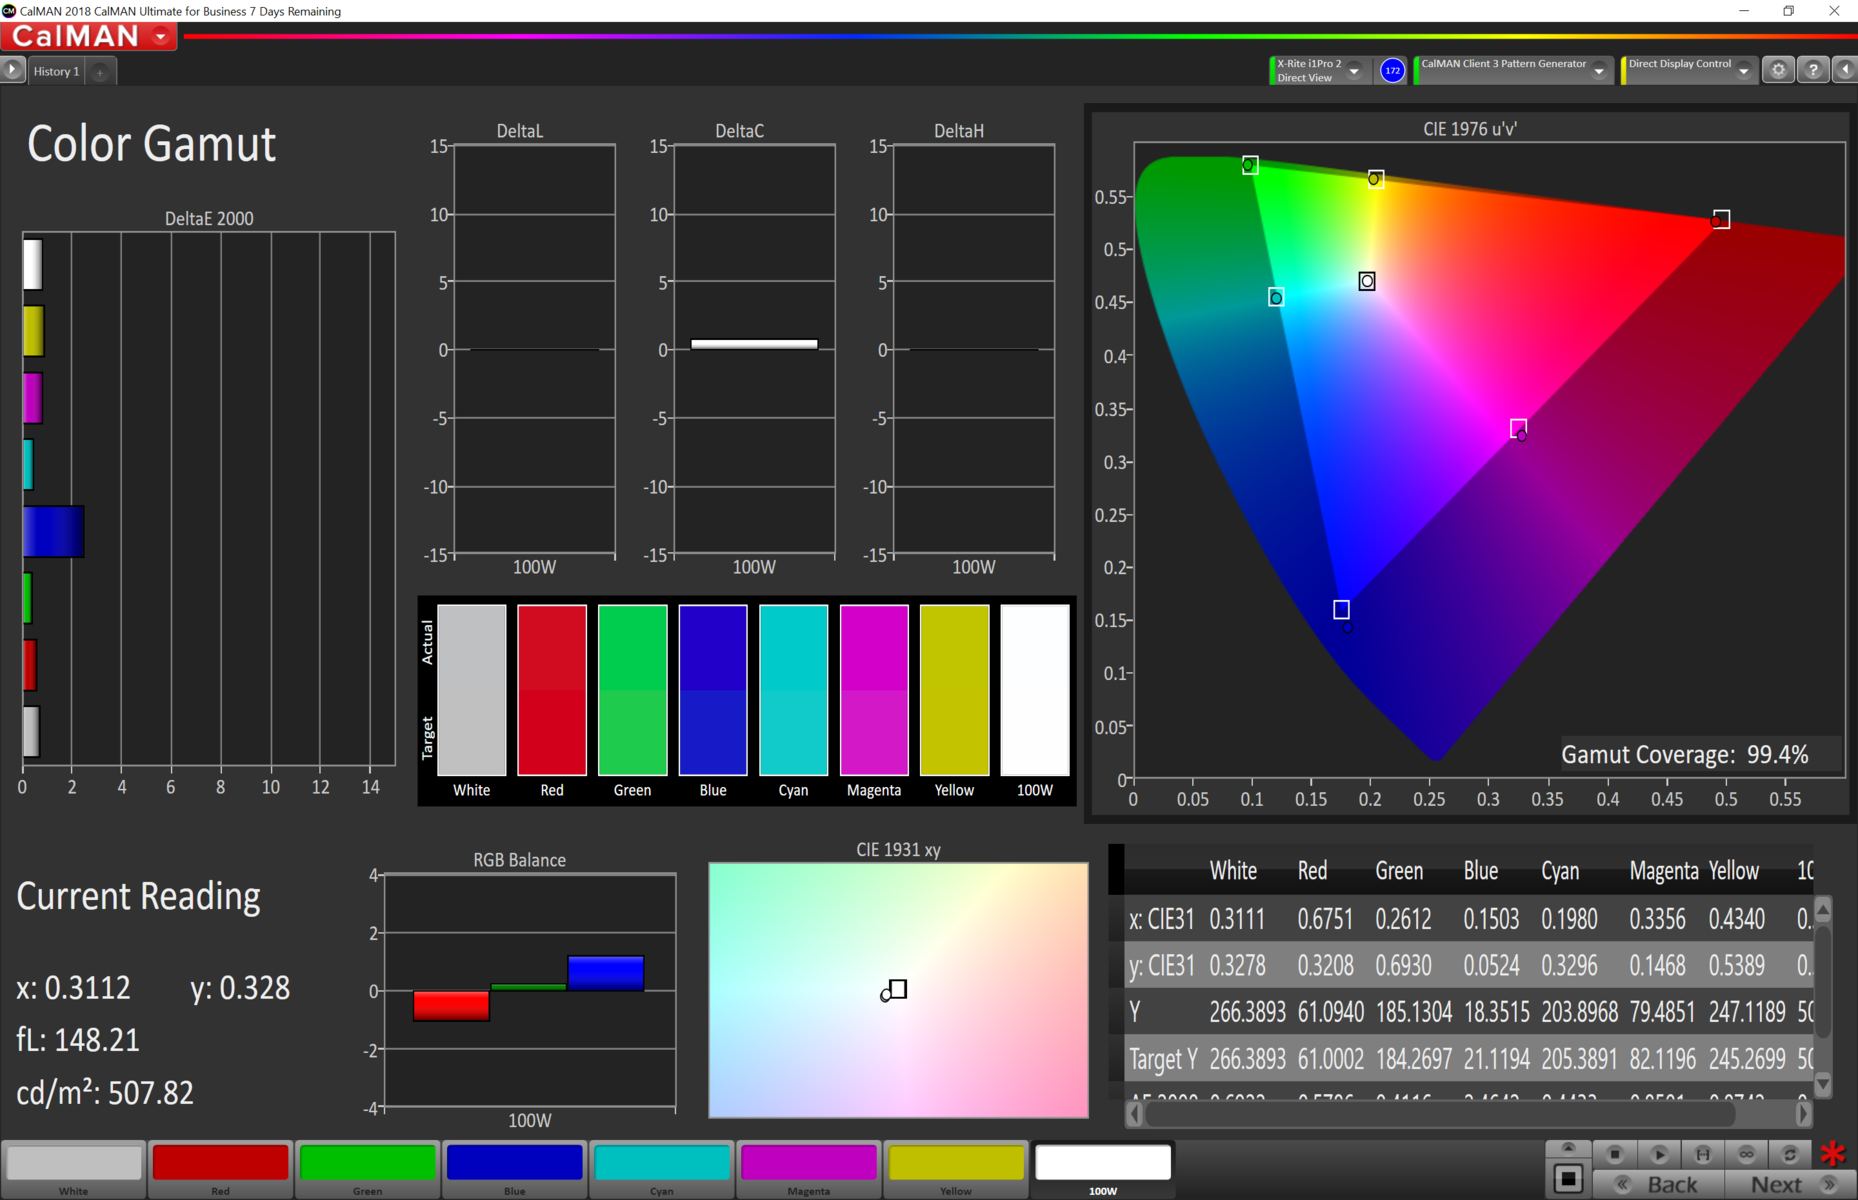
Yeni MacBook Pro'daki en belirgin değişikliklerden biri de ekranı. Yeni 16 inçlik panel OLED yerine IPS'dir ve hala şirketin Retina markalığını taşımaktadır. 3072x1920 panelin 226 PPI piksel yoğunluğu, karşılaştırılabilir 4K ekranlardan daha düşüktür, ancak Dell XPS 15 7590 ve Lenovo ThinkPad X1 Extreme Gen 2'deki gibi. Apple, MacBook Pro serisi ile yalnızca tek bir ekran çeşidi sunmaya devam ediyor, Yüksek yenileme hızları ve HDR özelliklerine sahip değildir. Mac, MacBook Pro 16'nın, X-Rite i1Pro 2'ye göre yalnızca inceleme biriminin ekranının merkezinde geçerli olan bir iddia olan 500 cd / m²'lik 16 inçlik bir ekrana sahip olduğunu duyurur. Yazılım, paneli% 86 eşit aydınlatılmış olarak kaydeder ve bu da ortalama maksimum 477 cd / m² parlaklığa neden olur. İkincisi, aynı testlerde karşılaştığımız karşılaştırma cihazlarımızın çoğunun sağladığı parlaklıklardan daha yüksek olsa da, birincisi daha iyi olabilirdi. Ekranda 0.39 cd / m² olarak ölçtüğümüz kabul edilebilir bir siyah değer var. Karşılaştırma cihazlarımızın hiçbiri, Dell XPS 15 7590 dışında kesinlikle daha düşük siyah değerleri elde etmiyor, ancak bu konuda MacBook Pro 16'dan daha iyi olan birçok dizüstü bilgisayar var. Bu, inceleme birimimizin 1,331: 1 kontrast oranı için de geçerlidir. Birçok Windows dizüstü bilgisayar burada Apple'ı yakaladı, MacBook Pro 16 selefinin elde ettiği değerleri geniş ölçüde eşleştirdi. Sonuç olarak, gözden geçirme ünitemizdeki ekranın görünür bir arka ışık kanaması olmadan mükemmel görüntü kalitesi var. Arka ışık 131 kHz'de yanıp sönse de, klasik PWM'yi kare dalga sinyallerini kastettiğimiz anlamına da getiremiyoruz. Bununla birlikte, bu frekans çok yüksektir ve parlaklık seviyelerini değiştirirken çok az değişiklik gösterir, bundan birkaç kişi etkilenmelidir. Apple'ın güç tüketimini azaltmak için parlaklığı ayarlamak için bu yöntemi kullandığından şüpheleniyoruz. Öte yandan, Touch Bar bazı insanlar için göz yorgunluğuna ve baş ağrısına neden olabilir. Dokunmatik Çubuk, OLED-tipik bir 240 Hz'de titriyor, birçok akıllı telefonun da kullandığını gördüğümüz bir PWM frekansı. Dokunma Çubuğunun bazı insanları etkileme riski olsa da, çoğu kişi PWM'ye duyarlı kişilerin bile uzun süreli kötü etkilere maruz kalmaması için çok az zaman harcayacak.
| |||||||||||||||||||||||||
Aydınlatma: 86 %
Batarya modunda parlaklık: 519 cd/m²
Kontrast: 1331:1 (Siyah: 0.39 cd/m²)
ΔE ColorChecker Calman: 2.28 | ∀{0.5-29.43 Ø4.71}
calibrated: 0.86
ΔE Greyscale Calman: 0.9 | ∀{0.09-98 Ø4.96}
100% sRGB (Calman 2D)
78% AdobeRGB 1998 (Argyll 1.6.3 3D)
Gamma: 2145
CCT: 6572 K
| Apple MacBook Pro 16 2019 i9 5500M APPA044, IPS, 3072x1920, 16" | Dell XPS 15 7590 9980HK GTX 1650 Samsung 156WR04, SDCA029, OLED, 3840x2160, 15.6" | Lenovo ThinkPad X1 Extreme 2019 20QV000WGE NE156QUM-N66, IPS, 3840x2160, 15.6" | Apple MacBook Pro 15 2018 (2.6 GHz, 560X) APPA040, IPS, 2880x1800, 15.4" | Asus ZenBook Pro 15 UX580GE AU Optronics B156ZAN03.1, IPS, 3840x2160, 15.6" | MSI P65 Creator 9SF-657 AU Optronics AUO41EB, IPS, 3840x2160, 15.6" | |
|---|---|---|---|---|---|---|
| Display | ||||||
| Display P3 Coverage (%) | 88.1 | 82 | 98.7 | 85.9 | 84.4 | |
| sRGB Coverage (%) | 99.6 | 99.1 | 99.9 | 100 | 100 | |
| AdobeRGB 1998 Coverage (%) | 91.8 | 96.9 | 86.6 | 99.1 | 98.5 | |
| Response Times | 95% | 12% | 15% | 26% | 7% | |
| Response Time Grey 50% / Grey 80% * (ms) | 52.4 ? | 2.3 ? 96% | 46.4 ? 11% | 43.2 ? 18% | 44 ? 16% | 51 ? 3% |
| Response Time Black / White * (ms) | 34.9 ? | 2.4 ? 93% | 30.4 ? 13% | 31.2 ? 11% | 22.8 ? 35% | 31 ? 11% |
| PWM Frequency (Hz) | 131700 | 59.5 ? | 117000 ? | |||
| Screen | -68% | -85% | 9% | -69% | -66% | |
| Brightness middle (cd/m²) | 519 | 421.2 -19% | 464 -11% | 520 0% | 357.6 -31% | 445 -14% |
| Brightness (cd/m²) | 477 | 417 -13% | 448 -6% | 492 3% | 350 -27% | 462 -3% |
| Brightness Distribution (%) | 86 | 94 9% | 90 5% | 88 2% | 85 -1% | 83 -3% |
| Black Level * (cd/m²) | 0.39 | 0.36 8% | 0.39 -0% | 0.35 10% | 0.5 -28% | |
| Contrast (:1) | 1331 | 1289 -3% | 1333 0% | 1022 -23% | 890 -33% | |
| Colorchecker dE 2000 * | 2.28 | 6.06 -166% | 4.2 -84% | 1.2 47% | 4.12 -81% | 4.75 -108% |
| Colorchecker dE 2000 max. * | 6.54 | 11.89 -82% | 11.4 -74% | 2.3 65% | 9.91 -52% | 7.79 -19% |
| Colorchecker dE 2000 calibrated * | 0.86 | 0.8 7% | 4.23 -392% | |||
| Greyscale dE 2000 * | 0.9 | 2.8 -211% | 7.2 -700% | 1.3 -44% | 1.8 -100% | 4.49 -399% |
| Gamma | 2145 0% | 2.15 102% | 2.17 101% | 2.18 101% | 2.17 101% | 2.49 88% |
| CCT | 6572 99% | 6235 104% | 6345 102% | 6738 96% | 6613 98% | 7374 88% |
| Color Space (Percent of AdobeRGB 1998) (%) | 78 | 81 4% | 85.2 9% | 87.5 12% | 87 12% | |
| Color Space (Percent of sRGB) (%) | 99.6 | 99 | 100 | 100 | ||
| Toplam Ortalama (Program / Ayarlar) | 14% /
-32% | -37% /
-69% | 12% /
10% | -22% /
-53% | -30% /
-53% |
* ... daha küçük daha iyidir
Apple, Windows rakiplerinin aksine, P3'ü MacBook'un hedef renk alanı olarak yıllardır sergiliyor. Buna uygun olarak, renk doğruluğu testlerimizi AdobeRGB veya sRGB yerine P3 renk uzayını kullanarak yaptık. CalMAN Ultimate ve X-Rite i1 Pro2 spektrofotometre, Apple'ın hala fabrikada kalibre edilmiş ekranlar olduğunu belirler. Bununla birlikte, MacBook Pro 16 inceleme birimimizdeki panel, test ettiğimiz MacBook Pro 15'teki ekran kadar hassas değil, yalnızca küçük DeltaE sapmalarına sahip. MacBook Pro 16 etkileyici derecede düşük gri tonlamalı sapmalara sahipken, kahverengi ve turuncu sapmaları beklediğimizden daha yüksek.
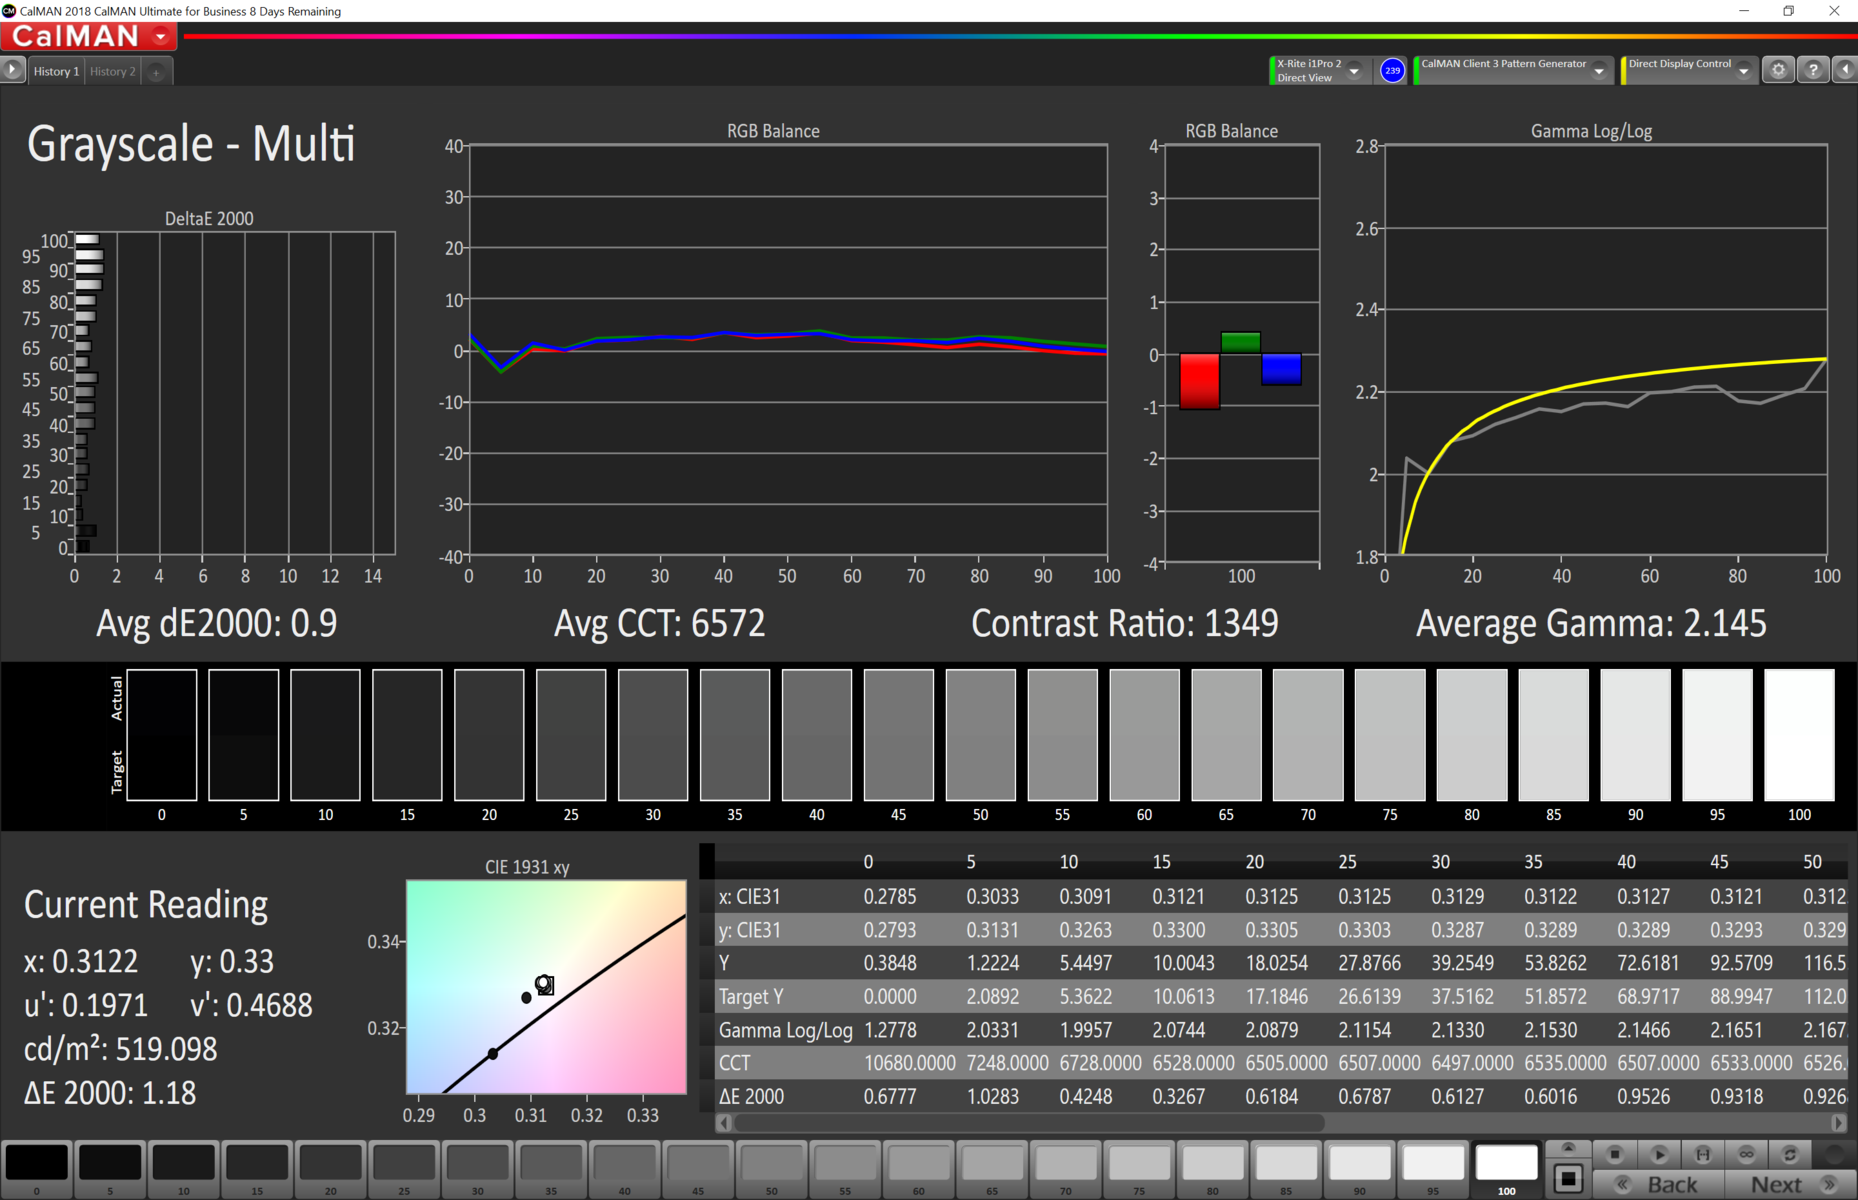
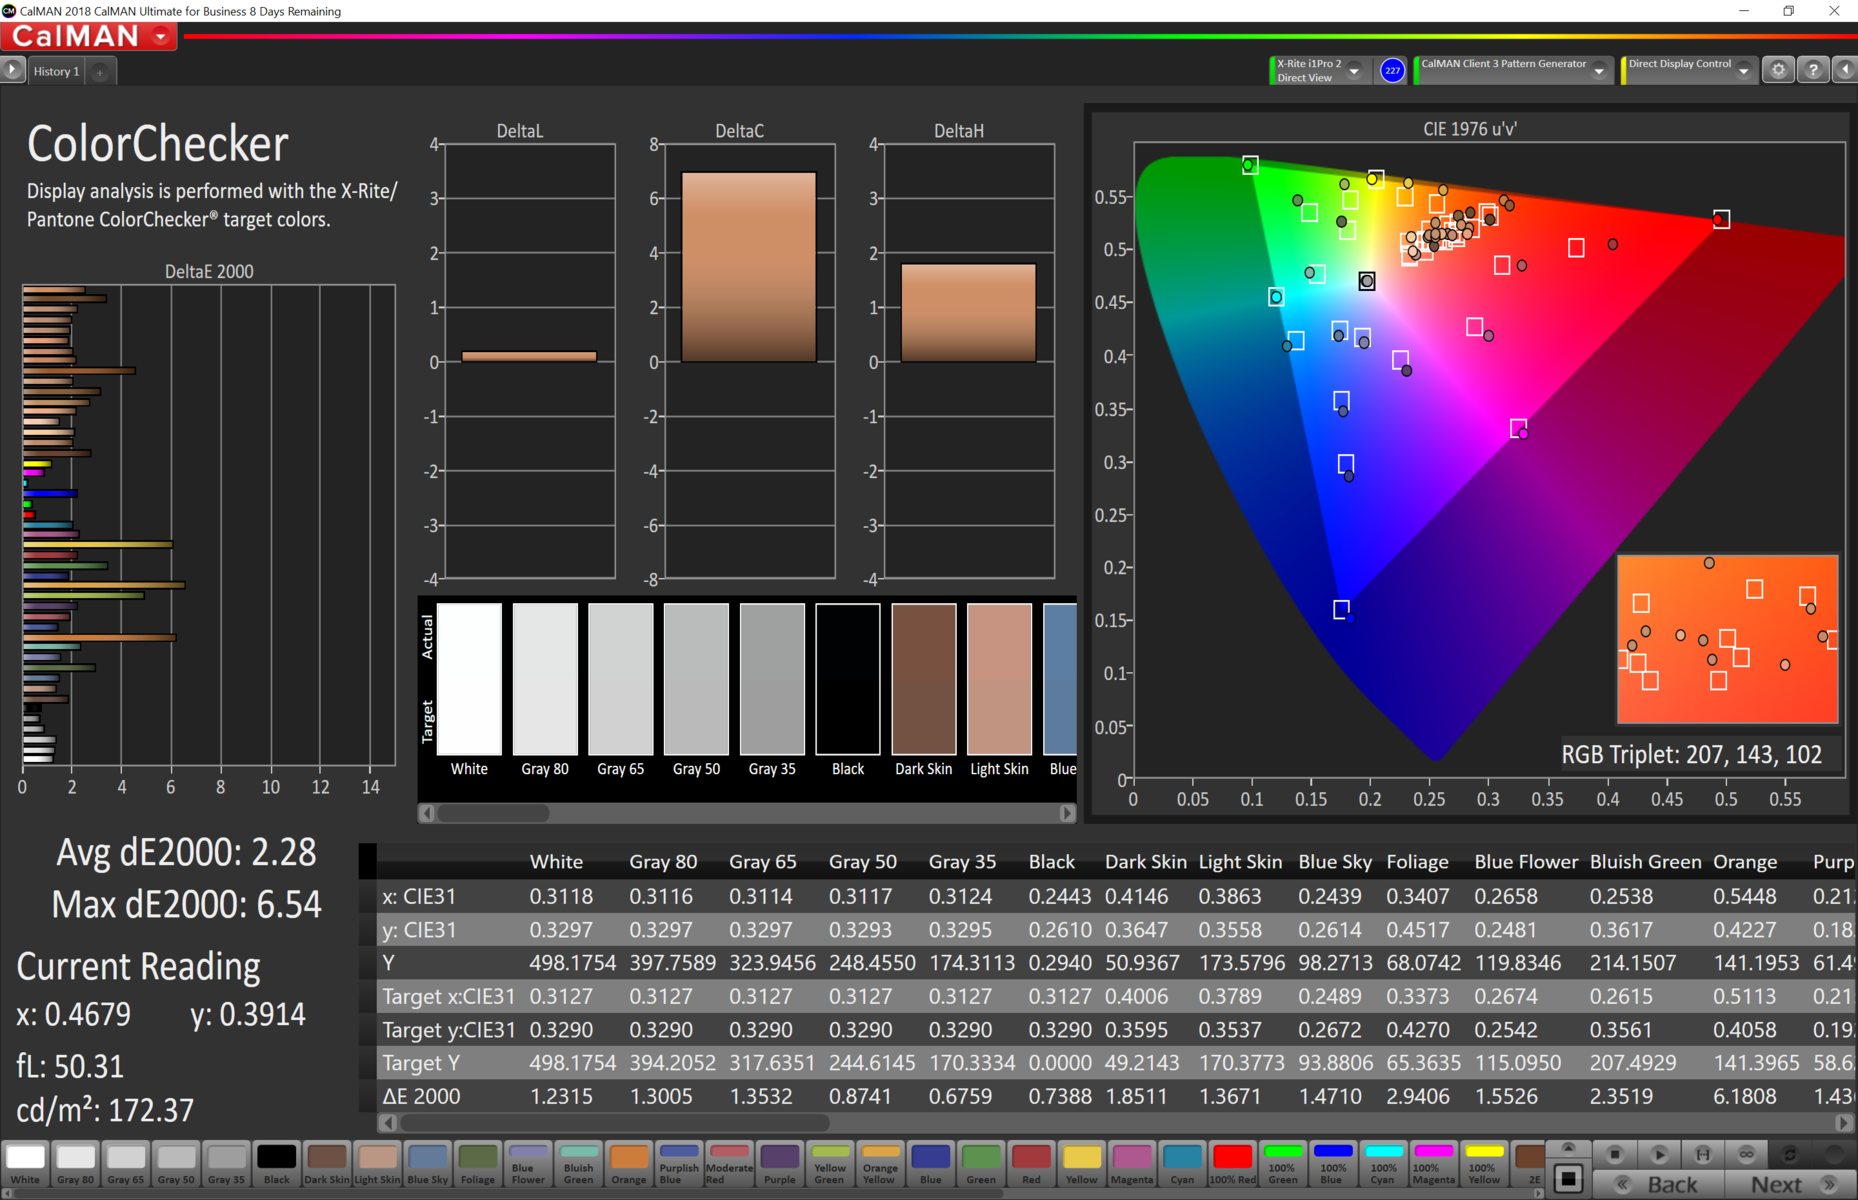
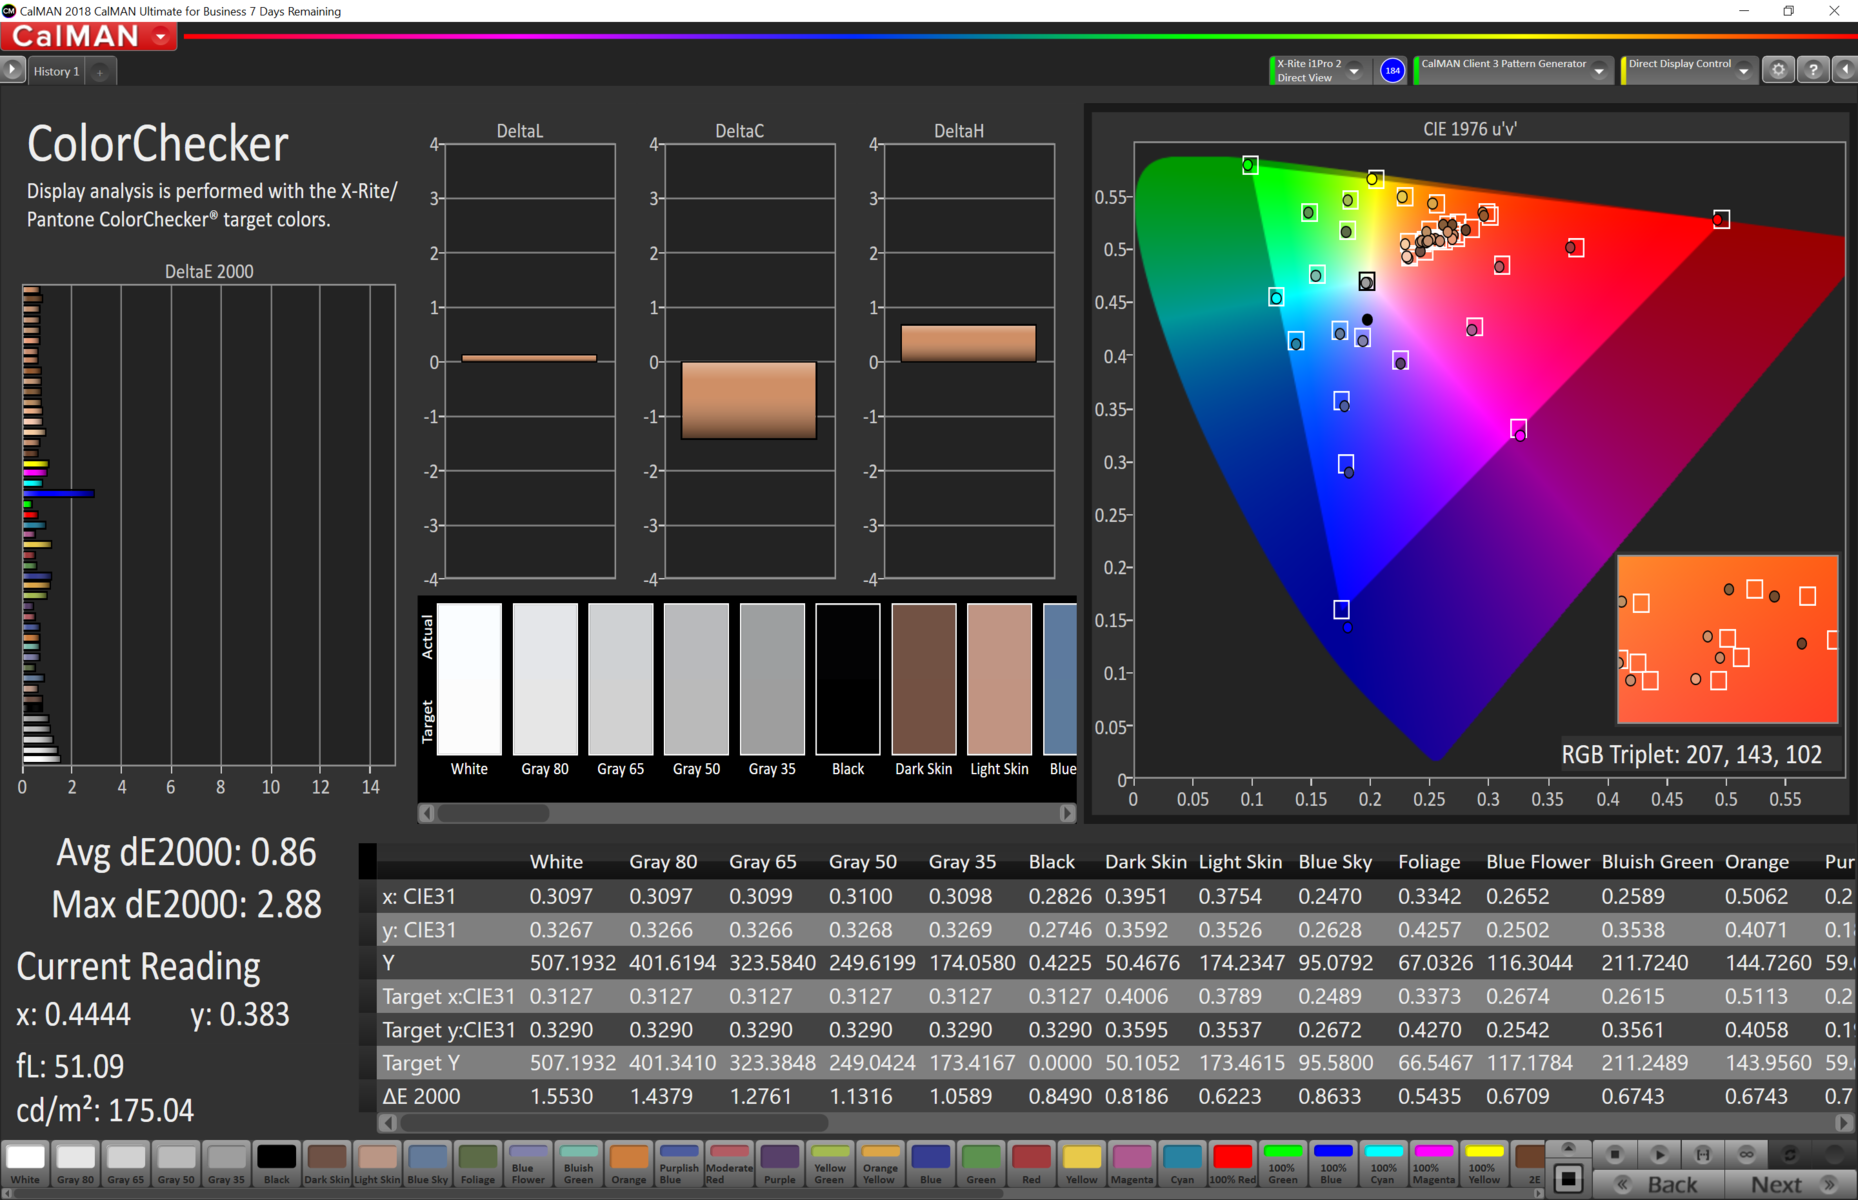
Ek kalibrasyon, tüm ölçümler üçün ideal değerinden daha iyi olduğu için sapmaların en aza indirilmesine yardımcı oldu. Kalibre edilmiş ICC dosyamızı, kullanmak istemeniz durumunda, karşılaştırma tablomuzun üstündeki kutuda bulabilirsiniz. Ekran ayrıca P3 ve sRGB renk alanlarını tamamen kaplarken, AdobeRGB kapsamı% 88,8'dir. Genel olarak, MacBook Pro 16 profesyonel görüntü ve video düzenleme için yeterli renkte.

Yanıt Sürelerini Görüntüle
| ↔ Tepki Süresi Siyahtan Beyaza | ||
|---|---|---|
| 34.9 ms ... yükseliş ↗ ve sonbahar↘ birleşimi | ↗ 17.8 ms yükseliş | 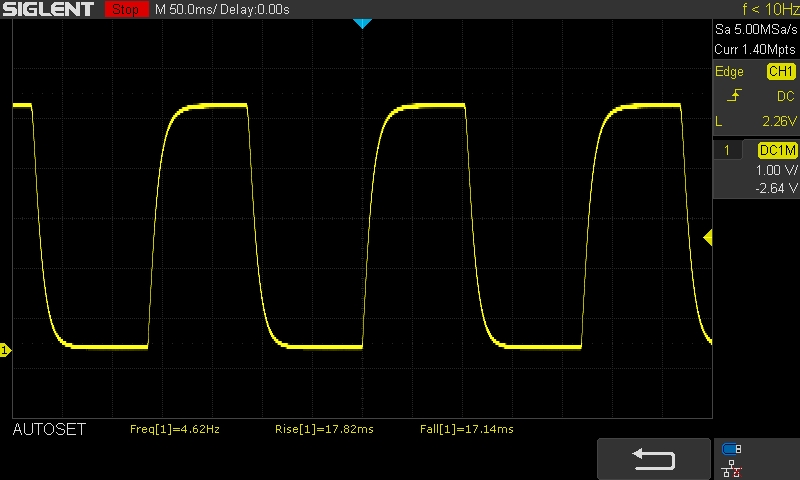 |
| ↘ 17.1 ms sonbahar | ||
| Ekran, testlerimizde yavaş yanıt oranları gösteriyor ve oyuncular için yetersiz olacaktır. Karşılaştırıldığında, test edilen tüm cihazlar 0.1 (minimum) ile 240 (maksimum) ms arasında değişir. » Tüm cihazların 92 %'si daha iyi. Bu, ölçülen yanıt süresinin test edilen tüm cihazların ortalamasından (19.8 ms) daha kötü olduğu anlamına gelir. | ||
| ↔ Tepki Süresi %50 Griden %80 Griye | ||
| 52.4 ms ... yükseliş ↗ ve sonbahar↘ birleşimi | ↗ 23.9 ms yükseliş | 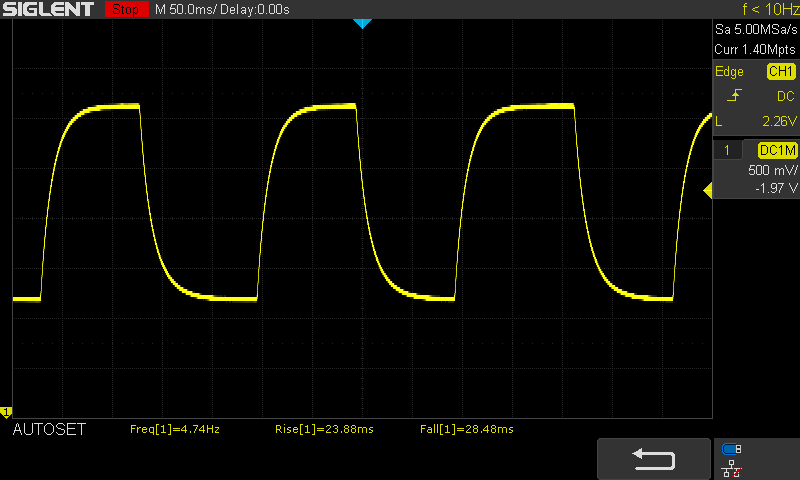 |
| ↘ 28.5 ms sonbahar | ||
| Ekran, testlerimizde yavaş yanıt oranları gösteriyor ve oyuncular için yetersiz olacaktır. Karşılaştırıldığında, test edilen tüm cihazlar 0.165 (minimum) ile 636 (maksimum) ms arasında değişir. » Tüm cihazların 89 %'si daha iyi. Bu, ölçülen yanıt süresinin test edilen tüm cihazların ortalamasından (31 ms) daha kötü olduğu anlamına gelir. | ||
Daha önce de belirttiğimiz gibi, MacBook Pro 16 sürekli 131 kHz'de titriyor. Bu, teorik olarak PWM'ye duyarlı kişiler için sorunlara yol açsa da, çoğu insanın gözünü etkilemeyecek kadar sıklık yüksek olmalıdır. Kısacası, MacBook Pro 16 uzun süreli kullanımdan sonra baş ağrısına veya göz yorgunluğuna neden olmamalıdır.
Ekran Titremesi / PWM (Darbe Genişliği Modülasyonu)
| Ekran titriyor / PWM algılandı | 131700 Hz | 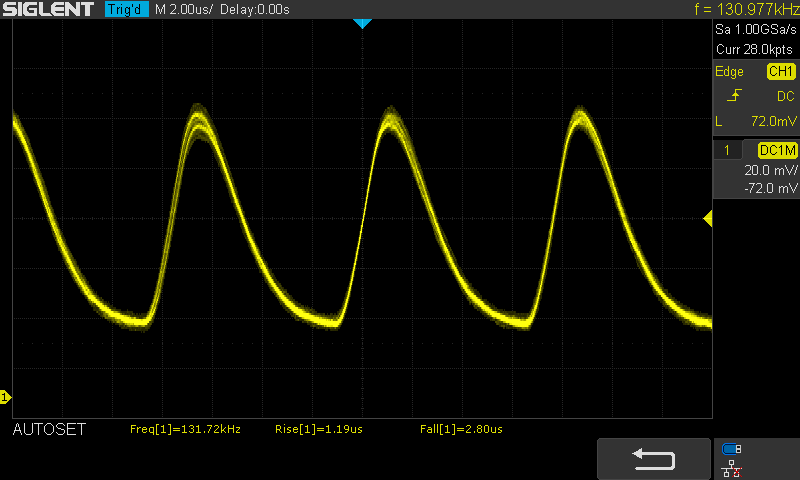 | |
Ekran arka ışığı 131700 Hz'de titriyor (en kötü durum, örneğin PWM kullanılması) . 131700 Hz frekansı oldukça yüksektir, bu nedenle PWM'ye duyarlı çoğu kullanıcı herhangi bir titremeyi fark etmemelidir. Karşılaştırıldığında: Test edilen tüm cihazların %52 %'si ekranı karartmak için PWM kullanmıyor. PWM tespit edilirse, ortalama 7757 (minimum: 5 - maksimum: 343500) Hz ölçüldü. | |||
IPS panelinde ayrıca aşağıdaki montajın gösterdiği gibi sabit görüş açıları vardır. Parlaklık, keskin açılarda hafifçe düşer, ancak endişelenmez. Bu arada, MacBook Pro 16'yı neredeyse her açıdan okunabilir hale getirerek renk bozulmasına rastlamadık.
Performans - Navi ve Kahve Gölünün güçlü karışımı
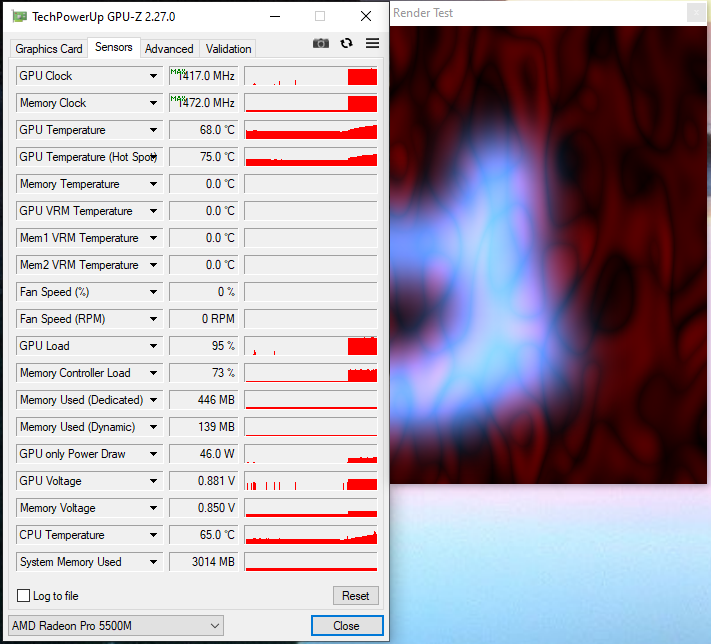
MacBook Pro 16, satın aldığınız sürümden bağımsız olarak çok güçlü bir multimedya dizüstü bilgisayardır. Apple, üç AMD Radeon Pro GPU ile birlikte, heksa veya okta çekirdekli Coffee Lake işlemcilere sahip bir cihaz sunuyor. Açıkçası, sadece iki kişi var ama Radeon Pro 5500M, 4 GB ve 8 GB değişkenlerle geliyor. MacBook Pro 16'yı 64 GB'a kadar DDR4-2666 RAM ve 8 TB'lık bir SSD ile yapılandırabilirsiniz. MacOS'taki kriterlerimizin çoğunu karşılaştırırken, karşılaştırılabilirlik amacıyla Boot Camp'i kullanarak bunları Windows 10'da da çalıştırdık. Apple, çoğu sürücüyü Windows 10 Boot Camp için en iyi duruma getirerek, macOS'a birçok açıdan iyi bir alternatif haline getirmiştir. Ancak, dGPU’nun kalıcı olarak etkinleştirildiğini ve pil ömrünü etkileyeceğini düşünün, bazı kıyaslama sonuçları bazı nedenlerden dolayı macOS’da olduğundan daha düşük.

İşlemci
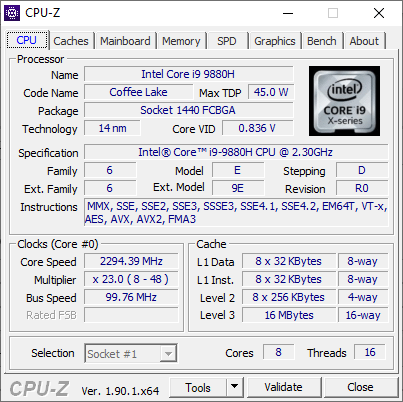
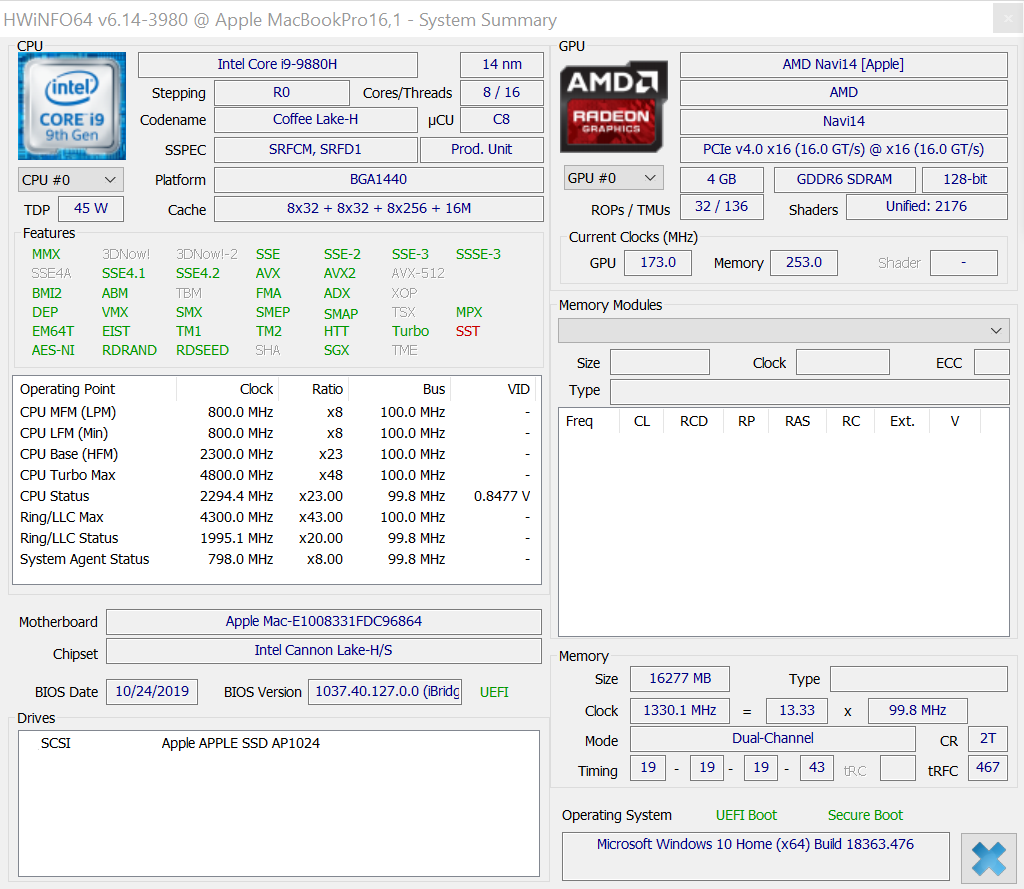
Core i9-9880H, en son MacBook Pro 15'te zaten karşılaştığımız bir okta-çekirdekli işlemci olan inceleme ünitemize güç veriyor. Intel, yongasını 14 nm'lik bir işlemle ürettiği ve ilk kez piyasaya sunulduğu Coffee Lake mimarisine dayandırıyor Q3 2017. Core i9-9880H, Intel Hyper-Threading özelliğini destekliyor ve işlemcinin aynı anda 16 iş parçacığını çalıştırmasına olanak tanıyor ve 2,3 ile 4,8 GHz arasında çalışabiliyor. İşlemci, ancak en yüksek saat hızlarına Termal Hız Artışı kullanarak ulaşabilir. İşlemcinin çalıştığı seviye, OEM'lerin eşleştiği soğutma sisteminin kalitesine bağlıdır. MacBook Pro 16, Apple'ın kendinden önceki modellerinde olduğundan daha güçlü bir soğutma sistemine sahip ve bu da neden en son MacBook Pro 15'ten daha yüksek benchmark puanları elde edebileceğini ve koruyabileceğini açıklıyor. MacBook Pro 16 ve Core i9-9880H, bu yılki MacBook Pro 15'te, önceki soğutma sisteminin üstünlüğünü vurgulayan daha güçlü Core i9-9980HK'dan bile daha iyi performans gösterebiliyor. Bu arada, gözden geçirme birimimiz, MacOS çalıştırırken Windows 10'dan Cinebench R15 Multi 64Bit'te daha iyi puanlar elde etti.
Sistem performansı
MacBook Pro 16 tüm PCMark benchmark masalarımızın başında gelirken, baskınlığı ilk bakışta olduğundan daha da dikkat çekici. Burada Windows 10'da elde edilen sonuçlara dayanmak zorunda kaldık, bu yüzden MacBook Pro 16'nın Windows 10 çalıştıran dizüstü bilgisayarlarla karşılaştırmasını düşünüyoruz. CPU kıyaslamalarımızda gözlemlediğimiz macOS ve Windows 10 arasındaki performans farkını göz önünde bulundurarak, MacBook Pro 16, macOS kullanırken Windows 10 sonuçlarımızın önerdiğinden daha iyi bir sistem performansına sahip olmalıdır.
| PCMark 8 Home Score Accelerated v2 | 4900 puan | |
| PCMark 8 Creative Score Accelerated v2 | 7359 puan | |
| PCMark 8 Work Score Accelerated v2 | 4812 puan | |
| PCMark 10 Score | 5500 puan | |
Yardım | ||
Depolama aygıtları
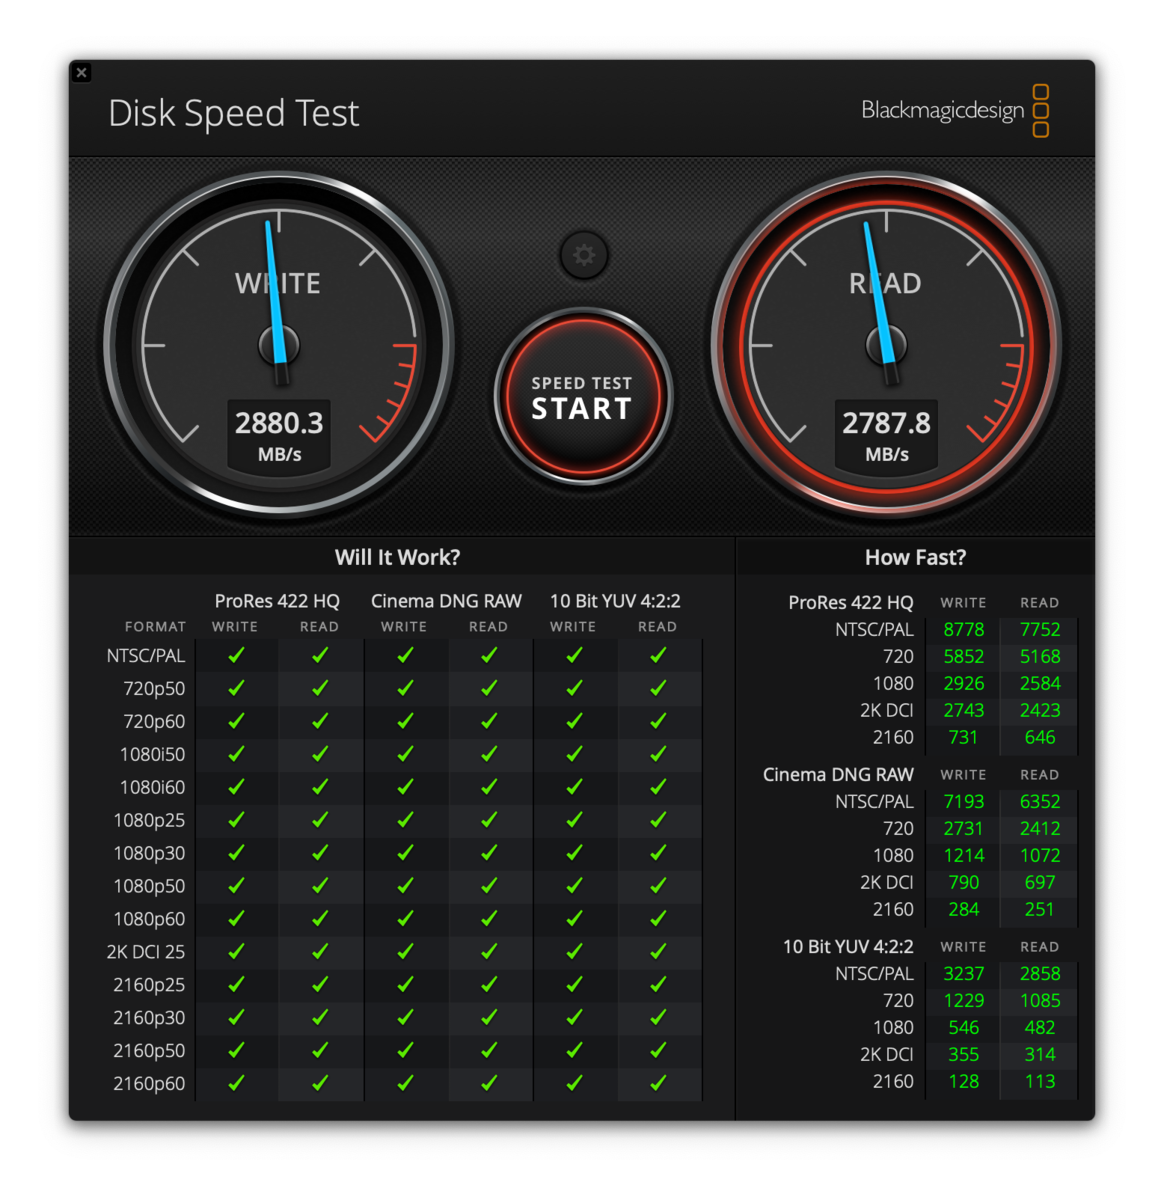
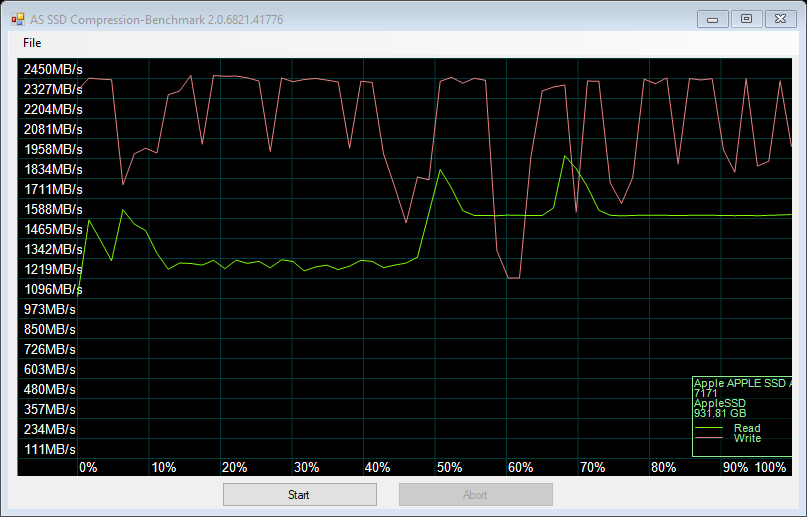
Apple, MacBook'ları yıllardır şirket içi SSD'lerle donatmakta ve T2 güvenlik yongasıyla eşleşmektedir. Şirket, her ikisini de mantık panosuna satar, bu da başarısız olursa ikisini de değiştirmek anlamına gelir. İnceleme birimimizdeki 1 TB sürücü, MacMA 10.15.1'de Blackmagic Disk Speed Test'e göre 2.800 MB / s transfer hızı elde etti. AP1024, yine de kullanılan kıyaslama aracına bağlı olarak bunu Windows'ta üstlenebilir. Ancak, sürücü bazı bölgelerde sınıf ortalamasının altında kalmaktadır. Örneğin, sıra derinliği 1 olan 4K transfer hızları, PCMark 8 Depolama Testinde de şaşırtıcı şekilde zayıf bir şekilde gerçekleştirilirken, ortalamanın altındadır. Genel olarak, Samsung 970 Pro gibi diğer sürücüler AP1024'ü performans konusunda üstün kılar. Farklılıklar marjinal olsa da ve günlük kullanımda neredeyse hiç farkedilmeyecek.
| Apple MacBook Pro 16 2019 i9 5500M Apple SSD AP1024 7171 | Dell XPS 15 7590 9980HK GTX 1650 Toshiba XG6 KXG60ZNV1T02 | Microsoft Surface Laptop 3 15 Ryzen 5 3580U SK hynix BC501 HFM256GDGTNG | Dell Precision 5540 SK hynix PC400 512 GB | Gigabyte Aero 17 XA RP77 Intel SSD 760p SSDPEKKW512G8 | Eurocom Nightsky RX15 Samsung SSD 970 Pro 512GB | |
|---|---|---|---|---|---|---|
| CrystalDiskMark 5.2 / 6 | 30% | -11% | 8% | 52% | 58% | |
| Write 4K (MB/s) | 55.5 | 104.3 88% | 99 78% | 98 77% | 169.6 206% | 153 176% |
| Read 4K (MB/s) | 16.21 | 45.23 179% | 35.63 120% | 41.25 154% | 58 258% | 60.5 273% |
| Write Seq (MB/s) | 1959 | 1729 -12% | 706 -64% | 1295 -34% | 1516 -23% | 1938 -1% |
| Read Seq (MB/s) | 1763 | 1861 6% | 1044 -41% | 1441 -18% | 2362 34% | 1932 10% |
| Write 4K Q32T1 (MB/s) | 398.5 | 509 28% | 326.6 -18% | 429.2 8% | 481.8 21% | 482.5 21% |
| Read 4K Q32T1 (MB/s) | 648 | 388.5 -40% | 270 -58% | 400.1 -38% | 506 -22% | 594 -8% |
| Write Seq Q32T1 (MB/s) | 2727 | 2813 3% | 820 -70% | 1366 -50% | 1530 -44% | 2324 -15% |
| Read Seq Q32T1 (MB/s) | 3242 | 2906 -10% | 2028 -37% | 2201 -32% | 2645 -18% | 3539 9% |
| AS SSD | 34% | -26% | 8% | -17% | 21% | |
| Seq Read (MB/s) | 2531 | 1723 -32% | 1122 -56% | 1743 -31% | 1812 -28% | 2352 -7% |
| Seq Write (MB/s) | 2289 | 1386 -39% | 514 -78% | 930 -59% | 1512 -34% | 2184 -5% |
| 4K Read (MB/s) | 15.85 | 43.25 173% | 34.98 121% | 39.1 147% | 32.68 106% | 28.65 81% |
| 4K Write (MB/s) | 39.88 | 98.3 146% | 96.8 143% | 92.1 131% | 107.7 170% | 61.3 54% |
| 4K-64 Read (MB/s) | 1267 | 1078 -15% | 492 -61% | 956 -25% | 504 -60% | 1317 4% |
| 4K-64 Write (MB/s) | 1749 | 1456 -17% | 339.9 -81% | 863 -51% | 534 -69% | 2156 23% |
| Access Time Read * (ms) | 0.122 | 0.05 59% | 0.056 54% | 0.074 39% | 0.05 59% | 0.101 17% |
| Access Time Write * (ms) | 0.095 | 0.039 59% | 0.11 -16% | 0.053 44% | 0.227 -139% | 0.09 5% |
| Score Read (Points) | 1536 | 1294 -16% | 639 -58% | 1170 -24% | 718 -53% | 1581 3% |
| Score Write (Points) | 2018 | 1693 -16% | 488 -76% | 1048 -48% | 793 -61% | 2435 21% |
| Score Total (Points) | 4317 | 3638 -16% | 1434 -67% | 2781 -36% | 1871 -57% | 4813 11% |
| Copy ISO MB/s (MB/s) | 1995 | 3182 59% | 828 -58% | 946 -53% | 2705 36% | |
| Copy Program MB/s (MB/s) | 584 | 984 68% | 200.5 -66% | 414.3 -29% | 666 14% | |
| Copy Game MB/s (MB/s) | 1135 | 1824 61% | 387.4 -66% | 1263 11% | 1583 39% | |
| PCMark 8 | ||||||
| Storage Score v2 (Points) | 1818 | |||||
| Toplam Ortalama (Program / Ayarlar) | 32% /
33% | -19% /
-21% | 8% /
8% | 18% /
8% | 40% /
35% |
* ... daha küçük daha iyidir

Grafik kartı
GPU performansı, MacBook Pro 16'nın öncekilerden daha büyük avantajlarından biridir. Apple, ikincisini 4 ve 8 GB varyasyonlarda sunmasına rağmen, makine bir Radeon Pro 5300M veya Radeon Pro 5500M ile birlikte geliyor. TSMC, her iki GPU'yu da AMD'nin talimatı doğrultusunda 7 nm'lik modern prosesinde üretmektedir. Radeon Pro modelleri, Radeon RX benzerleriyle aynı Navi mimarilerine dayanmaktadır, ancak ikincisinden iki ek Hesaplama Ünitesine (CU) sahiptir. Bununla birlikte, Radeon Pro kartlar, düşük saat hızlarında ve Radeon RX eşdeğerlerine göre daha düşük TDP'lerde çalışır. Radeon Pro 5500M ve Radeon RX 5500M benzer adlarını paylaşırken, eskilerin çoğu sentetik GPU benchmarklarında oldukça kısa kaldı. Açıkçası, Radeon RX 5500M'in daha yüksek TDP ve saat hızları, Radeon Pro 5500M'nin sahip olduğu iki ilave CU’yu telafi edebilir. Sonuncusu, NVIDIA GeForce GTX 1650'den daha iyi performans gösteriyor. Radeon Pro 5500M, 15 inç önceki modellerinde bulunan Radeon Pro Vega 20 ve Radeon Pro 560X üzerinde de üstünlük sağlıyor. Radeon Pro Vega 16 ve Radeon Pro Vega 20 için ayrıntılı Windows 10 kriter sonuçlarından yoksunuz. Ancak, ikincisi Unigine Valley 1.0'daki Radeon Pro 5500M'den yaklaşık% 20 daha yavaş, bu da size Navi’nin performans avantajı hakkında bir fikir vermeli. Vega mimarisinin üzerinde.
| Unigine Valley 1.0 - 1920x1080 Extreme HD Preset OpenGL AA:x8 | |
| Apple iMac Pro | |
| Apple iMac Pro | |
| Apple MacBook Pro 16 2019 i9 5500M | |
| Ortalama NVIDIA GeForce GTX 1650 Mobile (n=1) | |
| Apple MacBook Pro 15 2019 i9 Vega 20 | |
| Apple MacBook Pro 15 2018 (2.9 GHz, Vega 20) | |
| Apple MacBook Pro 15 2018 (2.9 GHz, Vega 20) | |
| Sınıf ortalaması Multimedia (19.4 - 45.3, n=2, son 2 yıl) | |
| Apple MacBook Pro 15 2018 (2.6 GHz, 560X) | |
| Apple MacBook Pro 13 2018 Touchbar i5 | |
| 3DMark 06 Standard Score | 34321 puan | |
| 3DMark 11 Performance | 14097 puan | |
| 3DMark Cloud Gate Standard Score | 30690 puan | |
| 3DMark Fire Strike Score | 9196 puan | |
| 3DMark Time Spy Score | 3629 puan | |
Yardım | ||
SpecViewPerf 13
| Performance rating - Percent | |
| Lenovo ThinkPad P53-20QN000YGE | |
| Razer Blade 15 Studio Edition | |
| MSI WS75 9TL-636 | |
| Lenovo ThinkPad P73-20QR002DGE | |
| Apple MacBook Pro 16 2019 i9 5500M | |
| Dell Precision 5540 | |
| Acer Aspire Nitro 5 AN517-51-7887 | |
| Lenovo ThinkPad P1 2019-20QT000RGE | |
| Acer Nitro 5 -1! | |
Oyun Performansı
Temel olarak Boot Camp üzerinden oyun performansına odaklandık, çünkü Windows 10, macOS'tan daha üstün standartlara sahip oyunlar sunuyor. Windows 10 ayrıca macOS'dan daha iyi bir oyun performansı sunar. Beklendiği gibi, Radeon Pro 5500M, Radeon RX 5500M'in sunduğu performansla eşleşemiyor, ancak ultra grafiklerde oyunlarda GeForce GTX 1650'den daha iyi performans gösteriyor. GeForce GTX 1660 Ti Max-Q, Radeon Pro 5500M için çok fazla kanıtladı.
| Deus Ex Mankind Divided - 1920x1080 Ultra Preset AA:2xMS AF:8x | |
| Ortalama NVIDIA GeForce GTX 1660 Ti Mobile (n=1) | |
| Apple MacBook Pro 16 2019 i9 5500M | |
| Ortalama NVIDIA GeForce GTX 1650 Mobile (n=1) | |
| Apple MacBook Pro 15 2018 (2.6 GHz, 560X) | |
| Rage 2 - 1920x1080 Ultra Preset (Resolution Scale Off) | |
| Ortalama NVIDIA GeForce GTX 1660 Ti Mobile (67.9 - 68.8, n=2) | |
| Ortalama NVIDIA GeForce GTX 1660 Ti Max-Q (58.2 - 64.8, n=2) | |
| MSI Alpha 15 A3DDK | |
| Ortalama NVIDIA GeForce GTX 1650 Mobile (45.1 - 60, n=3) | |
| Apple MacBook Pro 16 2019 i9 5500M | |
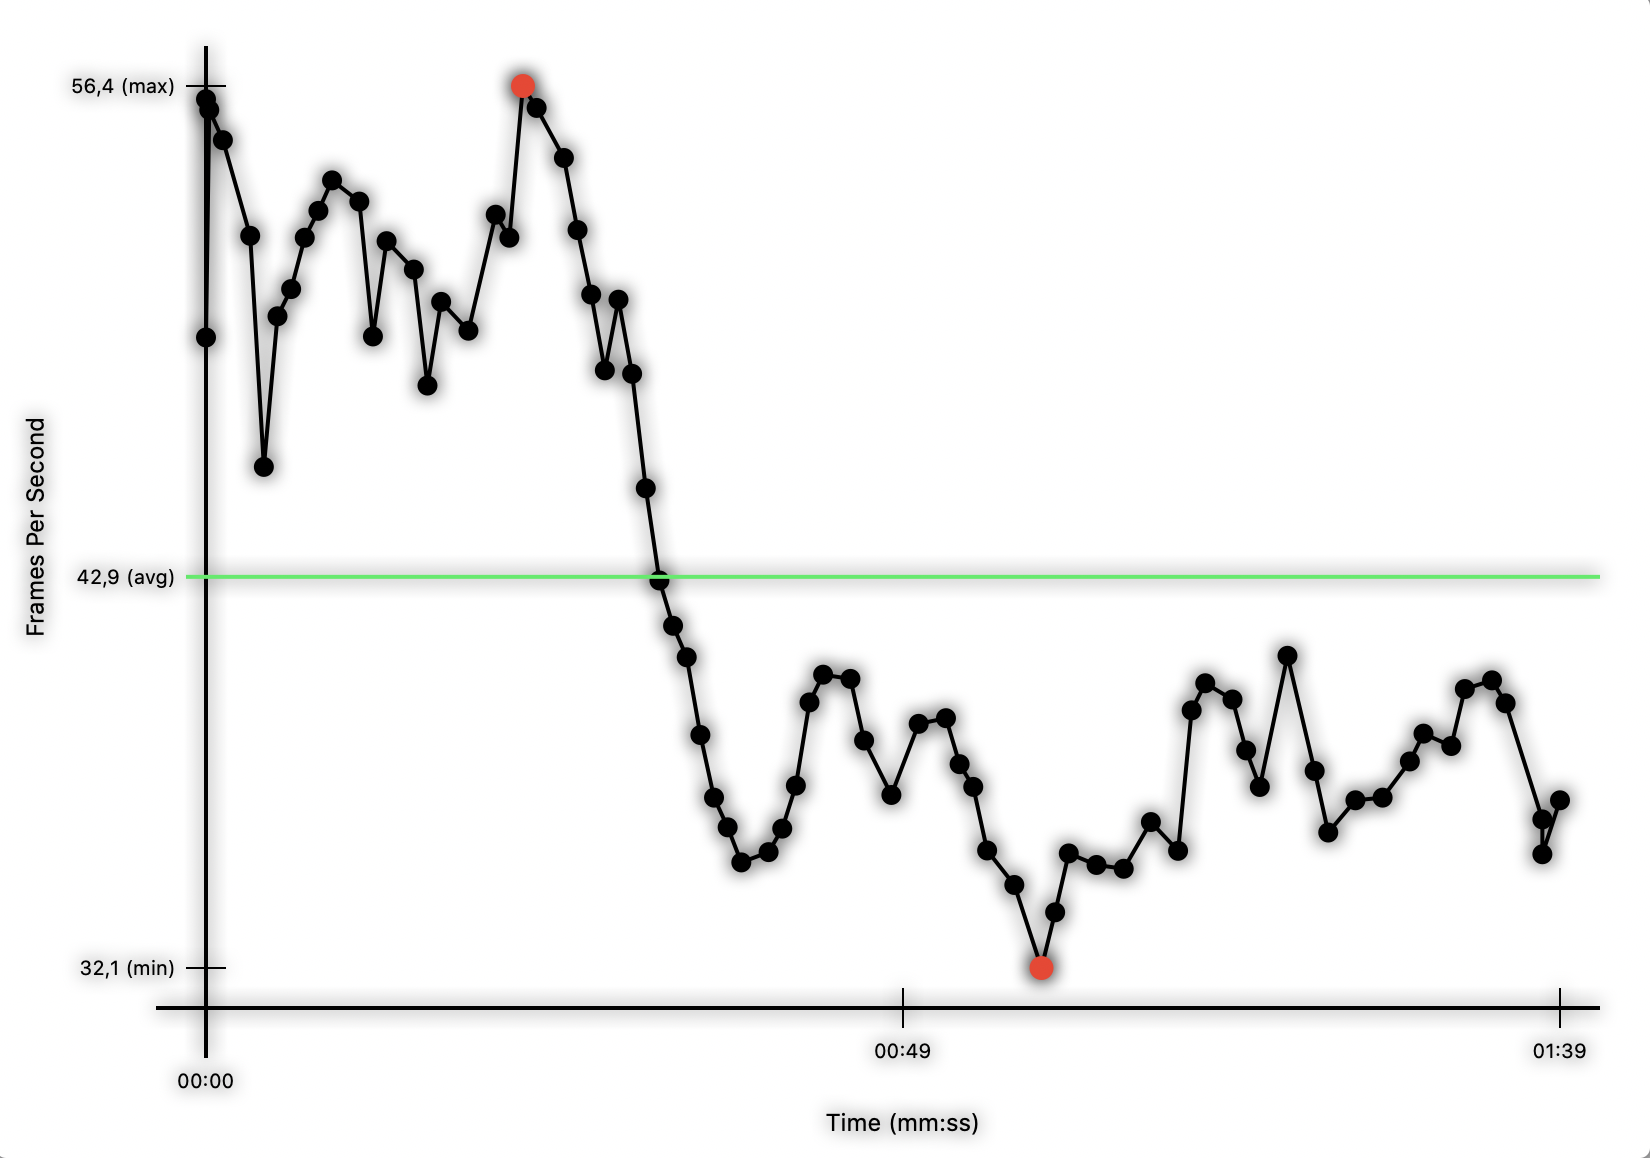
GPU'yu azaltma hakkında iyi haberlerimiz var; yok. İnceleme ünitemiz, The Witcher 3 dayanıklılık testimiz sırasında, aşağıdaki grafikte gösterildiği gibi, en yüksek değerlerde kalmıştır. Aynı şekilde, 3DMark Sky Diver stres testinde% 98.2'ye ulaştı, bu nedenle uzun süreli kullanımda bile GPU'yu azaltmaya gerek yok.
Genel olarak, Radeon Pro 5500M, Windows 10'da 1080p'de yüksek grafik seviyelerinde oyun oynamak için yeterince güçlüdür. Borderlands 3 ve Metro Exodus gibi birkaç istisna vardır, ancak FIFA 20 veya Dota 2 Reborn gibi daha basit oyunlar 4K'da harici olarak oynanabilir durumda izler.
| düşük | orta | yüksek | ultra | QHD | 4K | |
|---|---|---|---|---|---|---|
| Counter-Strike: GO (2012) | 208 | 118 | 71.4 | |||
| GTA V (2015) | 168 | 91.4 | 47.6 | 34.5 | 32.3 | |
| The Witcher 3 (2015) | 68 | 38.8 | ||||
| Dota 2 Reborn (2015) | 137 | 125 | 111 | 107 | 53.9 | |
| World of Warships (2015) | 43.4 | |||||
| Rainbow Six Siege (2015) | 126 | 44.8 | ||||
| Overwatch (2016) | 98 | |||||
| Deus Ex Mankind Divided (2016) | 52 | 27.8 | 16.9 | |||
| Rocket League (2017) | 153 | 107 | 59 | |||
| Final Fantasy XV Benchmark (2018) | 48.4 | 20.4 | ||||
| World of Tanks enCore (2018) | 76 | 49.1 | 24.6 | |||
| Far Cry 5 (2018) | 55 | 40 | 20 | |||
| Shadow of the Tomb Raider (2018) | 120 | 58 | 54 | 46 | 30 | 13 |
| Battlefield V (2018) | 85 | 76 | 62 | 58.9 | 47 | 14.4 |
| Apex Legends (2019) | 63 | 43.5 | ||||
| Far Cry New Dawn (2019) | 86 | 67 | 64 | 57 | 41 | 21 |
| Metro Exodus (2019) | 92 | 47.1 | 34.3 | 28.6 | 22 | |
| Dirt Rally 2.0 (2019) | 90 | 50.2 | 35.8 | |||
| The Division 2 (2019) | 56 | 39 | ||||
| Anno 1800 (2019) | 67 | 44.6 | 21.7 | |||
| Rage 2 (2019) | 113 | 53.7 | 45.2 | 44.4 | 28.4 | |
| Total War: Three Kingdoms (2019) | 175 | 64.1 | 40.5 | 29.7 | 19 | 7 |
| F1 2019 (2019) | 174 | 105 | 97 | 65 | 49 | |
| Control (2019) | 139 | 41.5 | 29.2 | 18.1 | ||
| Borderlands 3 (2019) | 41.4 | 30.8 | 21.4 | 3.8 | ||
| FIFA 20 (2019) | 144 | 124 | 90 | |||
| Ghost Recon Breakpoint (2019) | 50 | 35 | ||||
| GRID 2019 (2019) | 46.3 | 36.6 | 23.2 | |||
| Call of Duty Modern Warfare 2019 (2019) | 34.7 | |||||
| Need for Speed Heat (2019) | 74 | 56.7 | 50.9 | 44.7 | 28 | 12.8 |
| Star Wars Jedi Fallen Order (2019) | 75 | 61 | 54.3 | 35 | 16.2 | |
| Red Dead Redemption 2 (2019) | 97.6 | 55.2 | 35.8 | 20.9 | 0 () | 0 () |
| Fall Guys (2020) | 59.4 | 59.4 | 38.1 | |||
| Hearthstone (2020) | 33.2 | 32 | 59.7 | 59.6 | ||
| Doom Eternal (2020) | 84.8 | 47.5 | 27.5 | 21.9 | 15.1 | |
| Gears Tactics (2020) | 60 | 47.6 | 30.7 | |||
| F1 2020 (2020) | 0 oyun başlamıyor | |||||
| Flight Simulator 2020 (2020) | 47.4 | 28 | 19.2 | 12.2 | ||
| Mafia Definitive Edition (2020) | 52.5 | 37.5 | ||||
| Star Wars Squadrons (2020) | 95.6 | 69.7 | 26.4 | |||
| FIFA 21 (2020) | 151 | 115 | 70 | |||
| Cyberpunk 2077 1.0 (2020) | 54.8 | 29.9 | 23.5 | |||
| Hitman 3 (2021) | 157 | 81.3 | 66.3 | 62 | ||
| Outriders (2021) | 70.7 | 44.4 | 36 | 27.6 | ||
| Resident Evil Village (2021) | 81.7 | 38.9 | 40.6 | |||
| Far Cry 6 (2021) | 0 oyun başlamıyor | |||||
| Riders Republic (2021) | 61 | 41 | 28 | |||
| Call of Duty Vanguard (2021) | 43.1 | 21.7 | ||||
| Forza Horizon 5 (2021) | 85 | 31 |
MacOS'ta oyun - yapılabilir ancak önerilmez
Boot Camp'i çalıştırmaktan hoşlanmamanız durumunda, macOS'taki oyun performansına da baktık. Kısacası, deneyim Windows 10'da olduğu kadar iyi değil. Planetary Annihilation: TITANS maksimum grafiklerde ve ekranın doğal çözünürlüğünde oynanabilir kalırken, hevesli bir oyuncuysanız League of Legends'ı biraz daha düşük bir çözünürlükte çalıştırmanızı tavsiye ederiz. . Maalesef, Legends Ligi oynarken birimin kazandığı kare hızlarını gösteremedik. Aksine, MacBook Pro 16, 1636x960'ta Fortnite'de ortalama 40 FPS ve maksimum grafik elde edebiliyordu. Oyun olsa ölçekleme harika bir iş yapar, bu yüzden çözünürlük sizi ertelemesine izin vermeyin. Bu arada, Gezegensel İmhalar daha önce de belirttiğimiz gibi doğal olarak ve maksimum grafikte 60 FPS'de çalıştı. Referans olarak iki bilgisayarla çarpışma oyunları oynarken 60 FPS elde ettik. Başvuru için, MacBook Pro 16 ile oynamayı planlıyorsanız, Windows 10'u kullanmanızı tavsiye ederiz. Bunu yapmak, yalnızca macOS'un sunduğu kadar iyi bir oyun deneyimi sunmayacak oyunlar DirectX için daha iyi durumdadır ancak aynı zamanda seçim yapabileceğiniz daha geniş bir oyun kütüphanesidir.
Emisyonlar - Sessiz fanlar ve mükemmel hoparlörler, ancak yüksek iç sıcaklıklar
Fan Gürültüsü
Her zamanki gibi, Apple MacBook Pro 16'nın sessiz çalışmasını sağlamak için daha yüksek iç sıcaklıkları tercih ediyor. İki fan, inceleme ünitemiz rölantide iken neredeyse duyulamıyor, ancak kulağımızla durumdan 10 cm uzaktayken onları duyabiliyoruz. Fan gürültüsü, testlerimiz sırasında 46.1 dB (A) 'ya yükseldi, ancak biraz daha sessiz bir 43 dB (A)' da ortalama aldı. Öznel olarak, inceleme ünitemizdeki fanlar, maksimum yük altında bile her zaman kulağımıza hoş geliyordu. Testlerimizde de yüksek frekanslı frekans veya bobin sızıntısı fark etmedik.
Ses yüksekliği
| Boşta |
| 29.9 / 29.9 / 29.9 dB |
| Çalışırken |
| 43 / 46.1 dB |
 | ||
30 dB sessiz 40 dB(A) duyulabilirlik 50 dB(A) gürültülü |
||
min: | ||
Sıcaklık
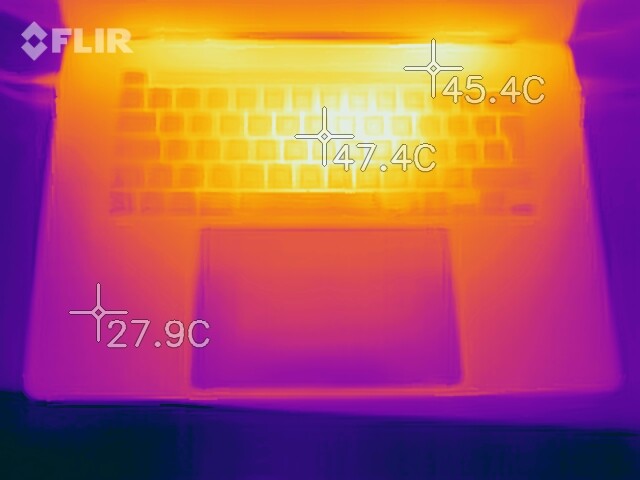
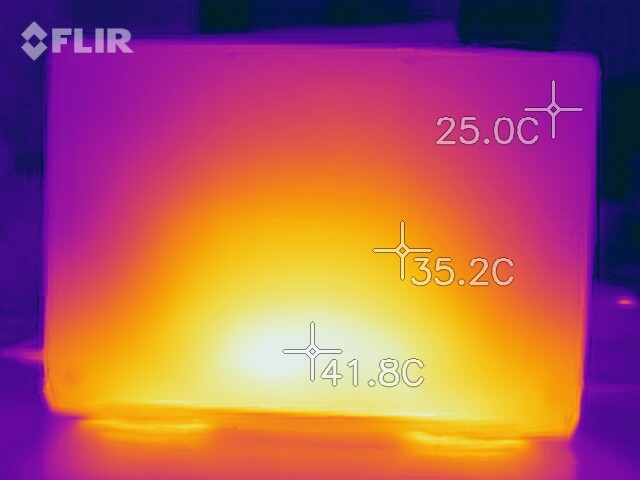
MacBook Pro 16, yük altında da dokunulamayacak kadar soğuk kalıyor. Kalibre edilmiş temas ölçümleri ile belirlediğimiz testlerimizde yüzey sıcaklıkları 42 ° C'ye yükseldi. Kızılötesi görüntülerin daha yüksek değerler kaydettiğini belirtmeliyiz, ancak bunlar o kadar doğru değil. Bu yüzey sıcaklıklarını nispeten düşük ortam sıcaklıklarında da ölçtük, böylece MacBook Pro 16 daha tropik iklimlerde daha yüksek sıcaklıklara çarpabilir.
Ayrıca gözden geçirme ünitemizi, fanların kontrol altına almayı başarmadan önce CPU çekirdek sıcaklıklarının 99 ° C'ye ulaştığı bir stres testine maruz bıraktık. Çekirdek sıcaklıklar nihayetinde sürdürülebilir olan 77 ° C'ye düşer. GPU çekirdek sıcaklıkları bile kritik olmayan bir 79 ° C'de kalır, bu nedenle herhangi bir bileşenle herhangi bir kısıtlama yaşamamalısınız. Benzer bir tablo, CPU ve GPU çekirdek sıcaklıklarının sırasıyla 82 ° C ve 76 ° C'ye düştüğü macOS'ta makinemizi stres testi yaptığımızda meydana geldi.
(±) Üst taraftaki maksimum sıcaklık, 36.8 °C / 98 F ortalamasına kıyasla 42 °C / 108 F'dir. , Multimedia sınıfı için 21 ile 71 °C arasında değişir.
(+) Alt kısım, 39.1 °C / 102 F ortalamasına kıyasla maksimum 38 °C / 100 F'ye kadar ısınır
(+) Boşta kullanımda, üst tarafın ortalama sıcaklığı 22.8 °C / 73 F olup, cihazın 31.3 °C / 88 F.
(+) Avuç içi dayanakları ve dokunmatik yüzey, maksimum 27 °C / 80.6 F ile cilt sıcaklığından daha soğuktur ve bu nedenle dokunulduğunda soğuktur.
(±) Benzer cihazların avuç içi dayanağı alanının ortalama sıcaklığı 28.7 °C / 83.7 F (+1.7 °C / 3.1 F) idi.
Speakers
Although Apple is already the standard for laptop speakers in our opinion, the company has outdone itself on the MacBook Pro 16. The ones in our review unit have a linear frequency spectrum and offer good bass response, something that few other laptops can do. They do not get quite as loud as the speakers in the XPS 15 7590, though. The MacBook Pro 16 offers better bass than the MacBook Pro 15 does too, but at the cost of high-pitched tones.
Overall, the MacBook Pro 16 has excellent speakers. They even offer better audio quality than many Bluetooth speakers, in our opinion.
Apple MacBook Pro 16 2019 i9 5500M ses analizi
(+) | hoparlörler nispeten yüksek sesle çalabilir (82.3 dB)
Bas 100 - 315Hz
(+) | iyi bas - medyandan yalnızca 2.3% uzakta
(+) | bas doğrusaldır (5% delta ile önceki frekans)
Ortalar 400 - 2000 Hz
(+) | dengeli ortalar - medyandan yalnızca 2.7% uzakta
(+) | orta frekanslar doğrusaldır (3.4% deltadan önceki frekansa)
Yüksekler 2 - 16 kHz
(+) | dengeli yüksekler - medyandan yalnızca 2.1% uzakta
(+) | yüksekler doğrusaldır (2.6% deltadan önceki frekansa)
Toplam 100 - 16.000 Hz
(+) | genel ses doğrusaldır (6.9% ortancaya göre fark)
Aynı sınıfla karşılaştırıldığında
» Bu sınıftaki tüm test edilen cihazların %5%'si daha iyi, 1% benzer, 94% daha kötüydü
» En iyisinin deltası 5% idi, ortalama 17% idi, en kötüsü 45% idi
Test edilen tüm cihazlarla karşılaştırıldığında
» Test edilen tüm cihazların %1'si daha iyi, 0 benzer, % 99 daha kötüydü
» En iyisinin deltası 4% idi, ortalama 23% idi, en kötüsü 134% idi
Dell XPS 15 7590 9980HK GTX 1650 ses analizi
(+) | hoparlörler nispeten yüksek sesle çalabilir (88.4 dB)
Bas 100 - 315Hz
(-) | neredeyse hiç bas yok - ortalama olarak medyandan 24.9% daha düşük
(±) | Bas doğrusallığı ortalamadır (14.4% delta - önceki frekans)
Ortalar 400 - 2000 Hz
(+) | dengeli ortalar - medyandan yalnızca 2.8% uzakta
(±) | Ortaların doğrusallığı ortalamadır (7.8% delta - önceki frekans)
Yüksekler 2 - 16 kHz
(+) | dengeli yüksekler - medyandan yalnızca 1.9% uzakta
(+) | yüksekler doğrusaldır (5.3% deltadan önceki frekansa)
Toplam 100 - 16.000 Hz
(±) | Genel sesin doğrusallığı ortalamadır (17.8% ortancaya göre fark)
Aynı sınıfla karşılaştırıldığında
» Bu sınıftaki tüm test edilen cihazların %52%'si daha iyi, 7% benzer, 41% daha kötüydü
» En iyisinin deltası 5% idi, ortalama 17% idi, en kötüsü 45% idi
Test edilen tüm cihazlarla karşılaştırıldığında
» Test edilen tüm cihazların %36'si daha iyi, 8 benzer, % 56 daha kötüydü
» En iyisinin deltası 4% idi, ortalama 23% idi, en kötüsü 134% idi
Apple MacBook Pro 15 2018 (2.6 GHz, 560X) ses analizi
(+) | hoparlörler nispeten yüksek sesle çalabilir (85 dB)
Bas 100 - 315Hz
(+) | iyi bas - medyandan yalnızca 4.7% uzakta
(±) | Bas doğrusallığı ortalamadır (8.3% delta - önceki frekans)
Ortalar 400 - 2000 Hz
(+) | dengeli ortalar - medyandan yalnızca 1.8% uzakta
(+) | orta frekanslar doğrusaldır (3.5% deltadan önceki frekansa)
Yüksekler 2 - 16 kHz
(+) | dengeli yüksekler - medyandan yalnızca 2.6% uzakta
(+) | yüksekler doğrusaldır (5.7% deltadan önceki frekansa)
Toplam 100 - 16.000 Hz
(+) | genel ses doğrusaldır (6.4% ortancaya göre fark)
Aynı sınıfla karşılaştırıldığında
» Bu sınıftaki tüm test edilen cihazların %4%'si daha iyi, 1% benzer, 95% daha kötüydü
» En iyisinin deltası 5% idi, ortalama 17% idi, en kötüsü 45% idi
Test edilen tüm cihazlarla karşılaştırıldığında
» Test edilen tüm cihazların %1'si daha iyi, 0 benzer, % 99 daha kötüydü
» En iyisinin deltası 4% idi, ortalama 23% idi, en kötüsü 134% idi
Power Management - Over 12 hours of battery life under certain conditions
Power Consumption
The MacBook Pro 16 has excellent power consumption, especially when idling. Our measurements only apply to macOS though, as the Radeon Pro 5500M always remains active on Windows 10. Apple has also simply better optimised the MacBook Pro 16 to run macOS than it has Windows 10, unsurprisingly.
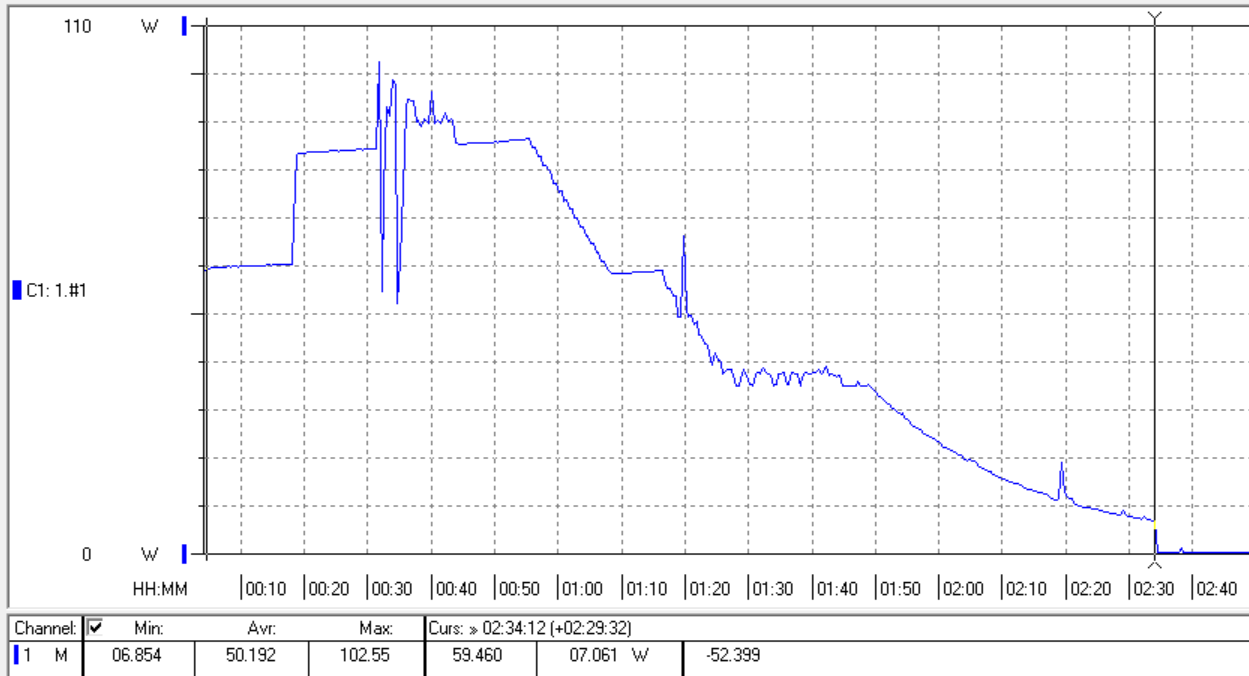
The MacBook Pro 16 runs into its power limitations under load, as its charger can only supply up to 103 W. Our review unit remained fully charged under sustained load too. However, power consumption remains at around 30 W when the machine returns to idling again as if it were charging.
Hence, we should point out that Thunderbolt 3 monitors like the LG 27UD88-W will not provide enough wattage to the MacBook Pro 16 during intensive tasks like gaming. Our review unit used its battery in parallel to receiving power when connected to an external monitor, for example, during our gaming session on macOS.
| Kapalı / Bekleme modu | |
| Boşta | |
| Çalışırken |
|
Key:
min: | |
| Apple MacBook Pro 16 2019 i9 5500M i9-9880H, Radeon Pro 5500M, Apple SSD AP1024 7171, IPS, 3072x1920, 16" | Apple MacBook Pro 15 2018 (2.6 GHz, 560X) i7-8850H, Radeon Pro 560X, Apple SSD AP0512, IPS, 2880x1800, 15.4" | Dell XPS 15 7590 9980HK GTX 1650 i9-9980HK, GeForce GTX 1650 Mobile, Toshiba XG6 KXG60ZNV1T02, OLED, 3840x2160, 15.6" | MSI P65 Creator 9SF-657 i9-9880H, GeForce RTX 2070 Max-Q, 2x Samsung SSD PM981 MZVLB512HAJQ (RAID 0), IPS, 3840x2160, 15.6" | Lenovo ThinkPad X1 Extreme 2019 20QV000WGE i7-9750H, GeForce GTX 1650 Mobile, Samsung SSD PM981 MZVLB512HAJQ, IPS, 3840x2160, 15.6" | Sınıf ortalaması Multimedia | |
|---|---|---|---|---|---|---|
| Power Consumption | 11% | -18% | -67% | -31% | 1% | |
| Idle Minimum * (Watt) | 3.7 | 3.4 8% | 6.2 -68% | 9.4 -154% | 8.5 -130% | 5.66 ? -53% |
| Idle Average * (Watt) | 12.1 | 11 9% | 9.6 21% | 17.4 -44% | 14.7 -21% | 10.2 ? 16% |
| Idle Maximum * (Watt) | 17 | 14.9 12% | 21.2 -25% | 19.6 -15% | 19.4 -14% | 12.5 ? 26% |
| Load Average * (Watt) | 91.5 | 78.9 14% | 104.3 -14% | 103 -13% | 89.6 2% | 65.2 ? 29% |
| Witcher 3 ultra * (Watt) | 103 | 91.7 11% | 96.1 7% | |||
| Load Maximum * (Watt) | 102.3 | 91.2 11% | 135.3 -32% | 216 -111% | 129.8 -27% | 113.5 ? -11% |
* ... daha küçük daha iyidir
Battery Life
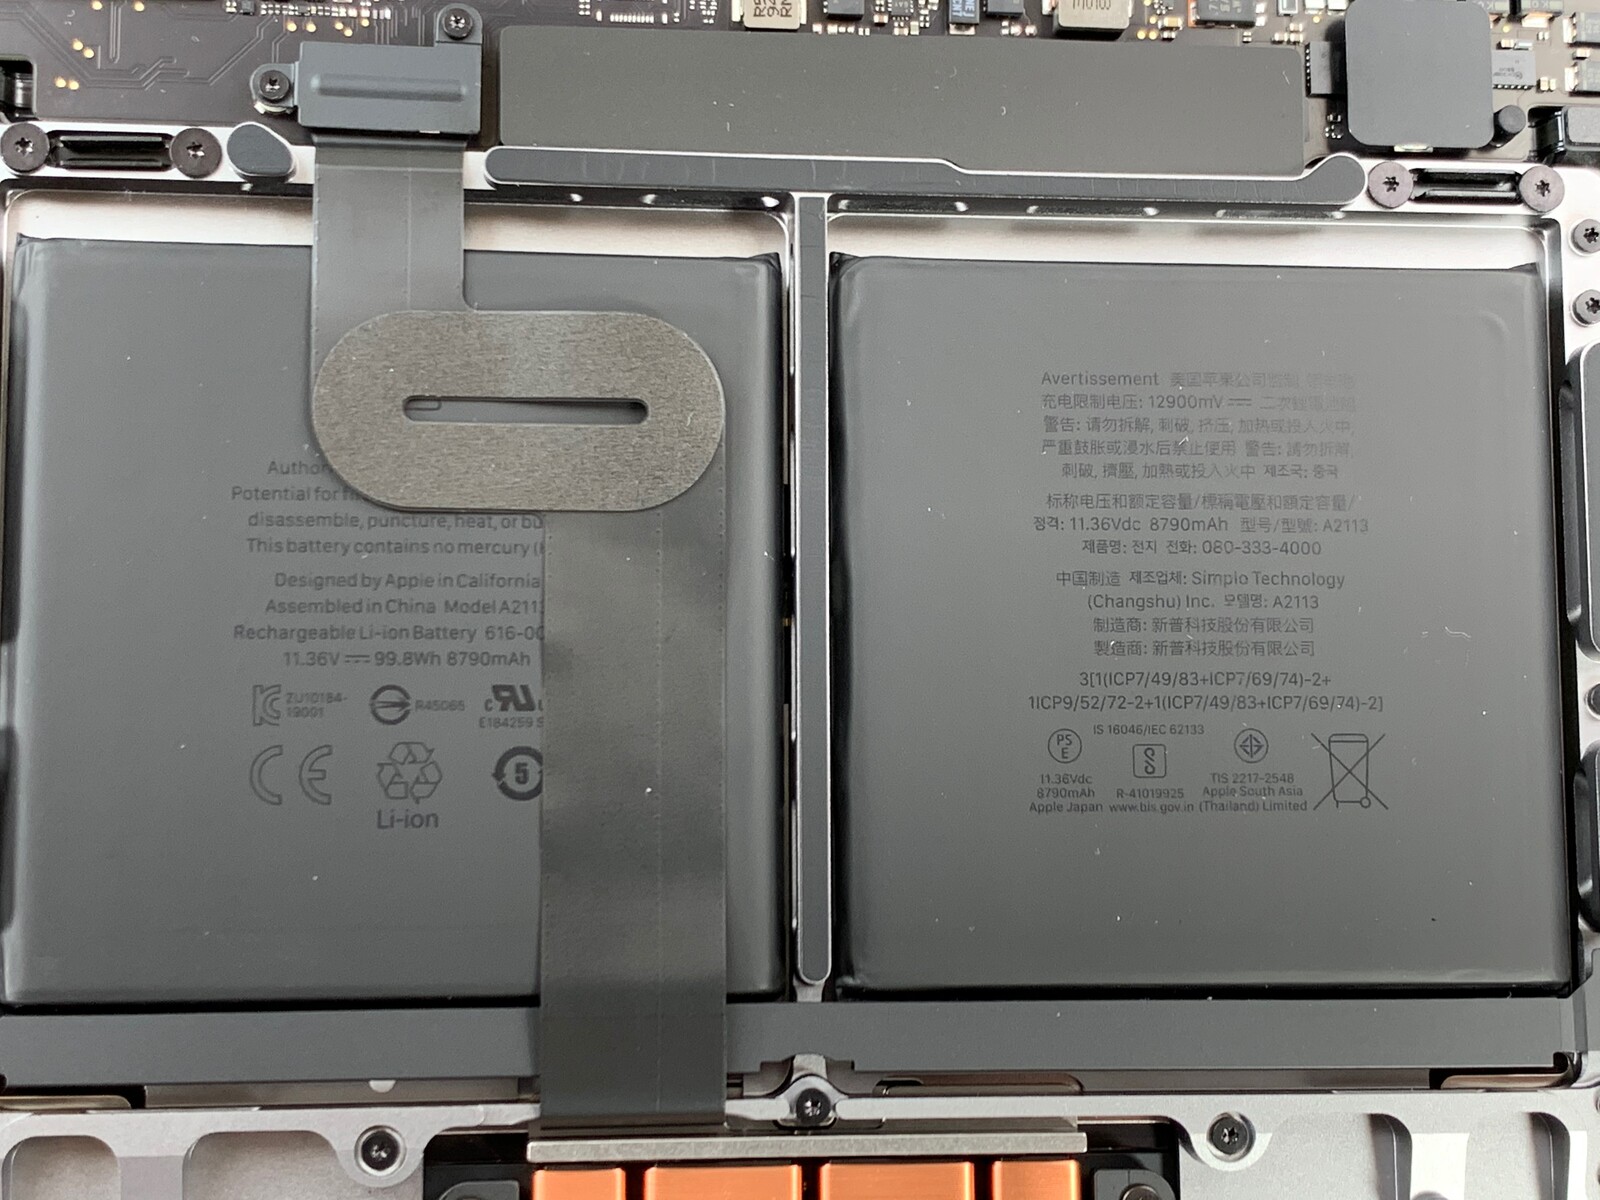
Another improvement that the MacBook Pro 16 offers over its predecessor is battery life. Apple has increased the battery capacity from 83 Wh to 100 Wh for the new 16-inch model, the maximum battery size that most airlines will let on their aircraft.
While the MacBook Pro 16 has excellent battery life, we had hoped that it would achieve better runtimes than it did. Our review unit lasted for 11:58 hours in our practical Wi-Fi test, an admirable runtime. The MacBook Pro 15 lasted for 14% less in the same test, but with a 20% smaller battery. We suspect that the more powerful components in the MacBook Pro 16 are likely at play here.
While the device supports automatic graphics-switching on macOS, its H.264 runtime left us baffled. Typically, laptops better or match their Wi-Fi runtimes in this test, but the MacBook Pro 16 did the opposite. The longest runtime we managed here was only 9:40 hours, which is 21% short of what the MacBook Pro 15 achieved. Seemingly, Apple has some optimisation to do of the CPU and GPU's video decoders, as the MacBook Pro 16 should last much longer than it does here.
Overall, the MacBook Pro 16 should last at least a full workday between charges. You will need to find a mains outlet after under an hour of gaming, though.
In Windows 10, using Bootcamp, the MBP16 offers significantly less battery runtime due to the always running Radeon GPU. We measured only 4 hours and 46 minutes in our Wi-Fi battery test running Edge 44.18362.
| Apple MacBook Pro 16 2019 i9 5500M i9-9880H, Radeon Pro 5500M, 99.8 Wh | Lenovo ThinkPad X1 Extreme 2019 20QV000WGE i7-9750H, GeForce GTX 1650 Mobile, 80 Wh | Dell XPS 15 7590 9980HK GTX 1650 i9-9980HK, GeForce GTX 1650 Mobile, 97 Wh | Asus ZenBook Pro 15 UX580GE i9-8950HK, GeForce GTX 1050 Ti Mobile, 71 Wh | MSI P65 Creator 9SF-657 i9-9880H, GeForce RTX 2070 Max-Q, 82 Wh | Apple MacBook Pro 15 2018 (2.6 GHz, 560X) i7-8850H, Radeon Pro 560X, 83 Wh | Sınıf ortalaması Multimedia | |
|---|---|---|---|---|---|---|---|
| Pil Çalışma Süresi | -31% | 98% | -9% | -20% | 24% | 48% | |
| H.264 (h) | 9.7 | 4.7 -52% | 11.7 21% | 17.1 ? 76% | |||
| WiFi v1.3 (h) | 12 | 4.8 -60% | 7.8 -35% | 6.3 -47% | 6 -50% | 10.2 -15% | 12.2 ? 2% |
| Witcher 3 ultra (h) | 0.9 | 1.5 67% | |||||
| Load (h) | 1 | 1.2 20% | 3.3 230% | 1.3 30% | 1.1 10% | 1.664 ? 66% |
Artılar
Eksiler
Verdict - A fantastic, but expensive multimedia laptop
Apple has refined upon the old 15-inch design with the new 16-inch MacBook Pro by making some small but important changes. Firstly, the company has replaced its much-criticised butterfly keyboard mechanism with a scissor-switch design that is not only proven and provides more travel than butterfly keys but also should be more durable too. While Apple has taken heavily from the design of its most recent MacBook Pro 15 for the new 16-inch model, the latter is slightly thicker than its predecessor and delivers more efficient cooling too.
Unfortunately, Apple has persisted with only including four Thunderbolt 3 ports and a headphone jack in the new MacBook Pro. Ethernet, HDMI, a card reader and USB Type-A ports are all things of the past in Apple's ecosystem, so purchasing at least one dongle is probably necessary. Likewise, upgrade and repair options are as bad as they were previously, with Apple soldering the CPU, GPU, RAM, SSD and Wi-Fi chip to the logic board. This means that you must not only live with an outdated 802.11ac Broadcom Wi-Fi chip but also that you will need to replace the logic board if any of these components develop a fault.
The MacBook Pro 16 is an excellent and luxurious multimedia laptop with poor repairability.
The new 16-inch panel offers no surprises, either. The panel supports neither 120 Hz refresh rates nor Adaptive Sync, but its image quality is just as good as the displays in previous MacBook Pros that we have reviewed. The larger chassis has also allowed Apple to equip the MacBook Pro 16 with significantly better speakers than its 15-inch predecessor had. More efficient cooling has been long overdue too and allows our review unit to get significantly better performance from its Core i9-9880H processor than its predecessor could. While its new Navi GPU does not set the Windows world alight, it represents a good upgrade from the Vega GPUs with which Apple equipped the last MacBook Pro 15.
The MacBook Pro 16 did not set any runtime records for multimedia laptops despite having a 100 Wh battery, as its Core i9 processor, large display and dedicated GPU are all power-hungry components. However, you should get close to two hours longer between charges when browsing the web than you could with the MacBook Pro 15, which is a tangible improvement. The MacBook Pro 16 should last at least a full workday between charges too, something that none of our comparison devices could achieve.
Overall, the MacBook Pro 16 is an excellent multimedia laptop. It suffers from a few weaknesses, the greatest of which is its exorbitant price. US$2,799 only gets you a year's warranty too, and you may want to consider buying at least one USB Type-C dongle.
Apple MacBook Pro 16 2019 i9 5500M
- 12/02/2019 v7 (old)
Klaus Hinum, Andreas Osthoff
Price comparison
