Notebookcheck Logo

Asus TUF Gaming GeForce RTX 4070 Ti Super İncelemesi: RX 7900 XT'ye meydan okuyan ve RTX 3090 Ti'yi 300 ABD Doları daha ucuza yerinden eden AD103 orta seviye oyuncu

AD103 bloğundan bir çip. Asus TUF Gaming GeForce RTX 4070 Ti Super şimdi %10 daha yüksek CUDA çekirdek sayısı ve önemli ölçüde geliştirilmiş 256-bit 16 GB GDDR6X VRAM ile donatılan AD103 güçlerine sahip. Asus'un en yeni giriş seviyesi RTX 4070 Ti Super SKU'su, bir TUF GPU'nun tüm avantajlarını beraberinde getirirken, Radeon RX 7900 XT ve RTX 3090 Ti'ye nispeten daha düşük 799 ABD doları fiyatla rakip oluyor.
Asus TUF Gaming GeForce RTX 4070 Ti Super incelemede

Nvidia başlatıldı rTX 4070 Ti Super ile birlikte RTX 4070 Süper ve RTX 4080 Süper cES 2024 sırasında geri döndü. Bu yenileme ile RTX 4070 Ti Super artık bir AD103 GPU haline geldi ve bu da CUDA çekirdek sayılarındaki alışılmış artışların yanı sıra önemli bir bellek alt sistemi yükseltmesini de beraberinde getirdi.

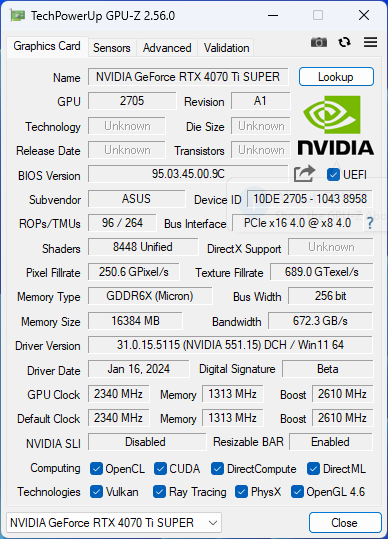
RTX 4070 Ti Super artık 8.448 CUDA çekirdeğine sahip ve bu da orijinal RTX 4070 Ti'deki 7.680 gölgelendiriciye kıyasla %10'luk bir artış anlamına geliyor. AD103 silikona geçiş, karta 672 GB/s bant genişliği sağlayan 16 GB GDDR6X 256-bit bellek veri yolu sağlıyor.

Nvidia bir kez daha RTX 4070 Ti Super için bir Founders Edition sunmamayı tercih etti, ancak eklenti kartı (AiB) ortak teklifleri arasından seçim yapabileceğiniz birçok seçenek var. Çoğu AiB, 799 ABD doları MSRP'yi hedefleyen kartlara sahipken, aynı zamanda bir fiyat artışı için ek incelikler içeren SKU'lar da sunuyor.

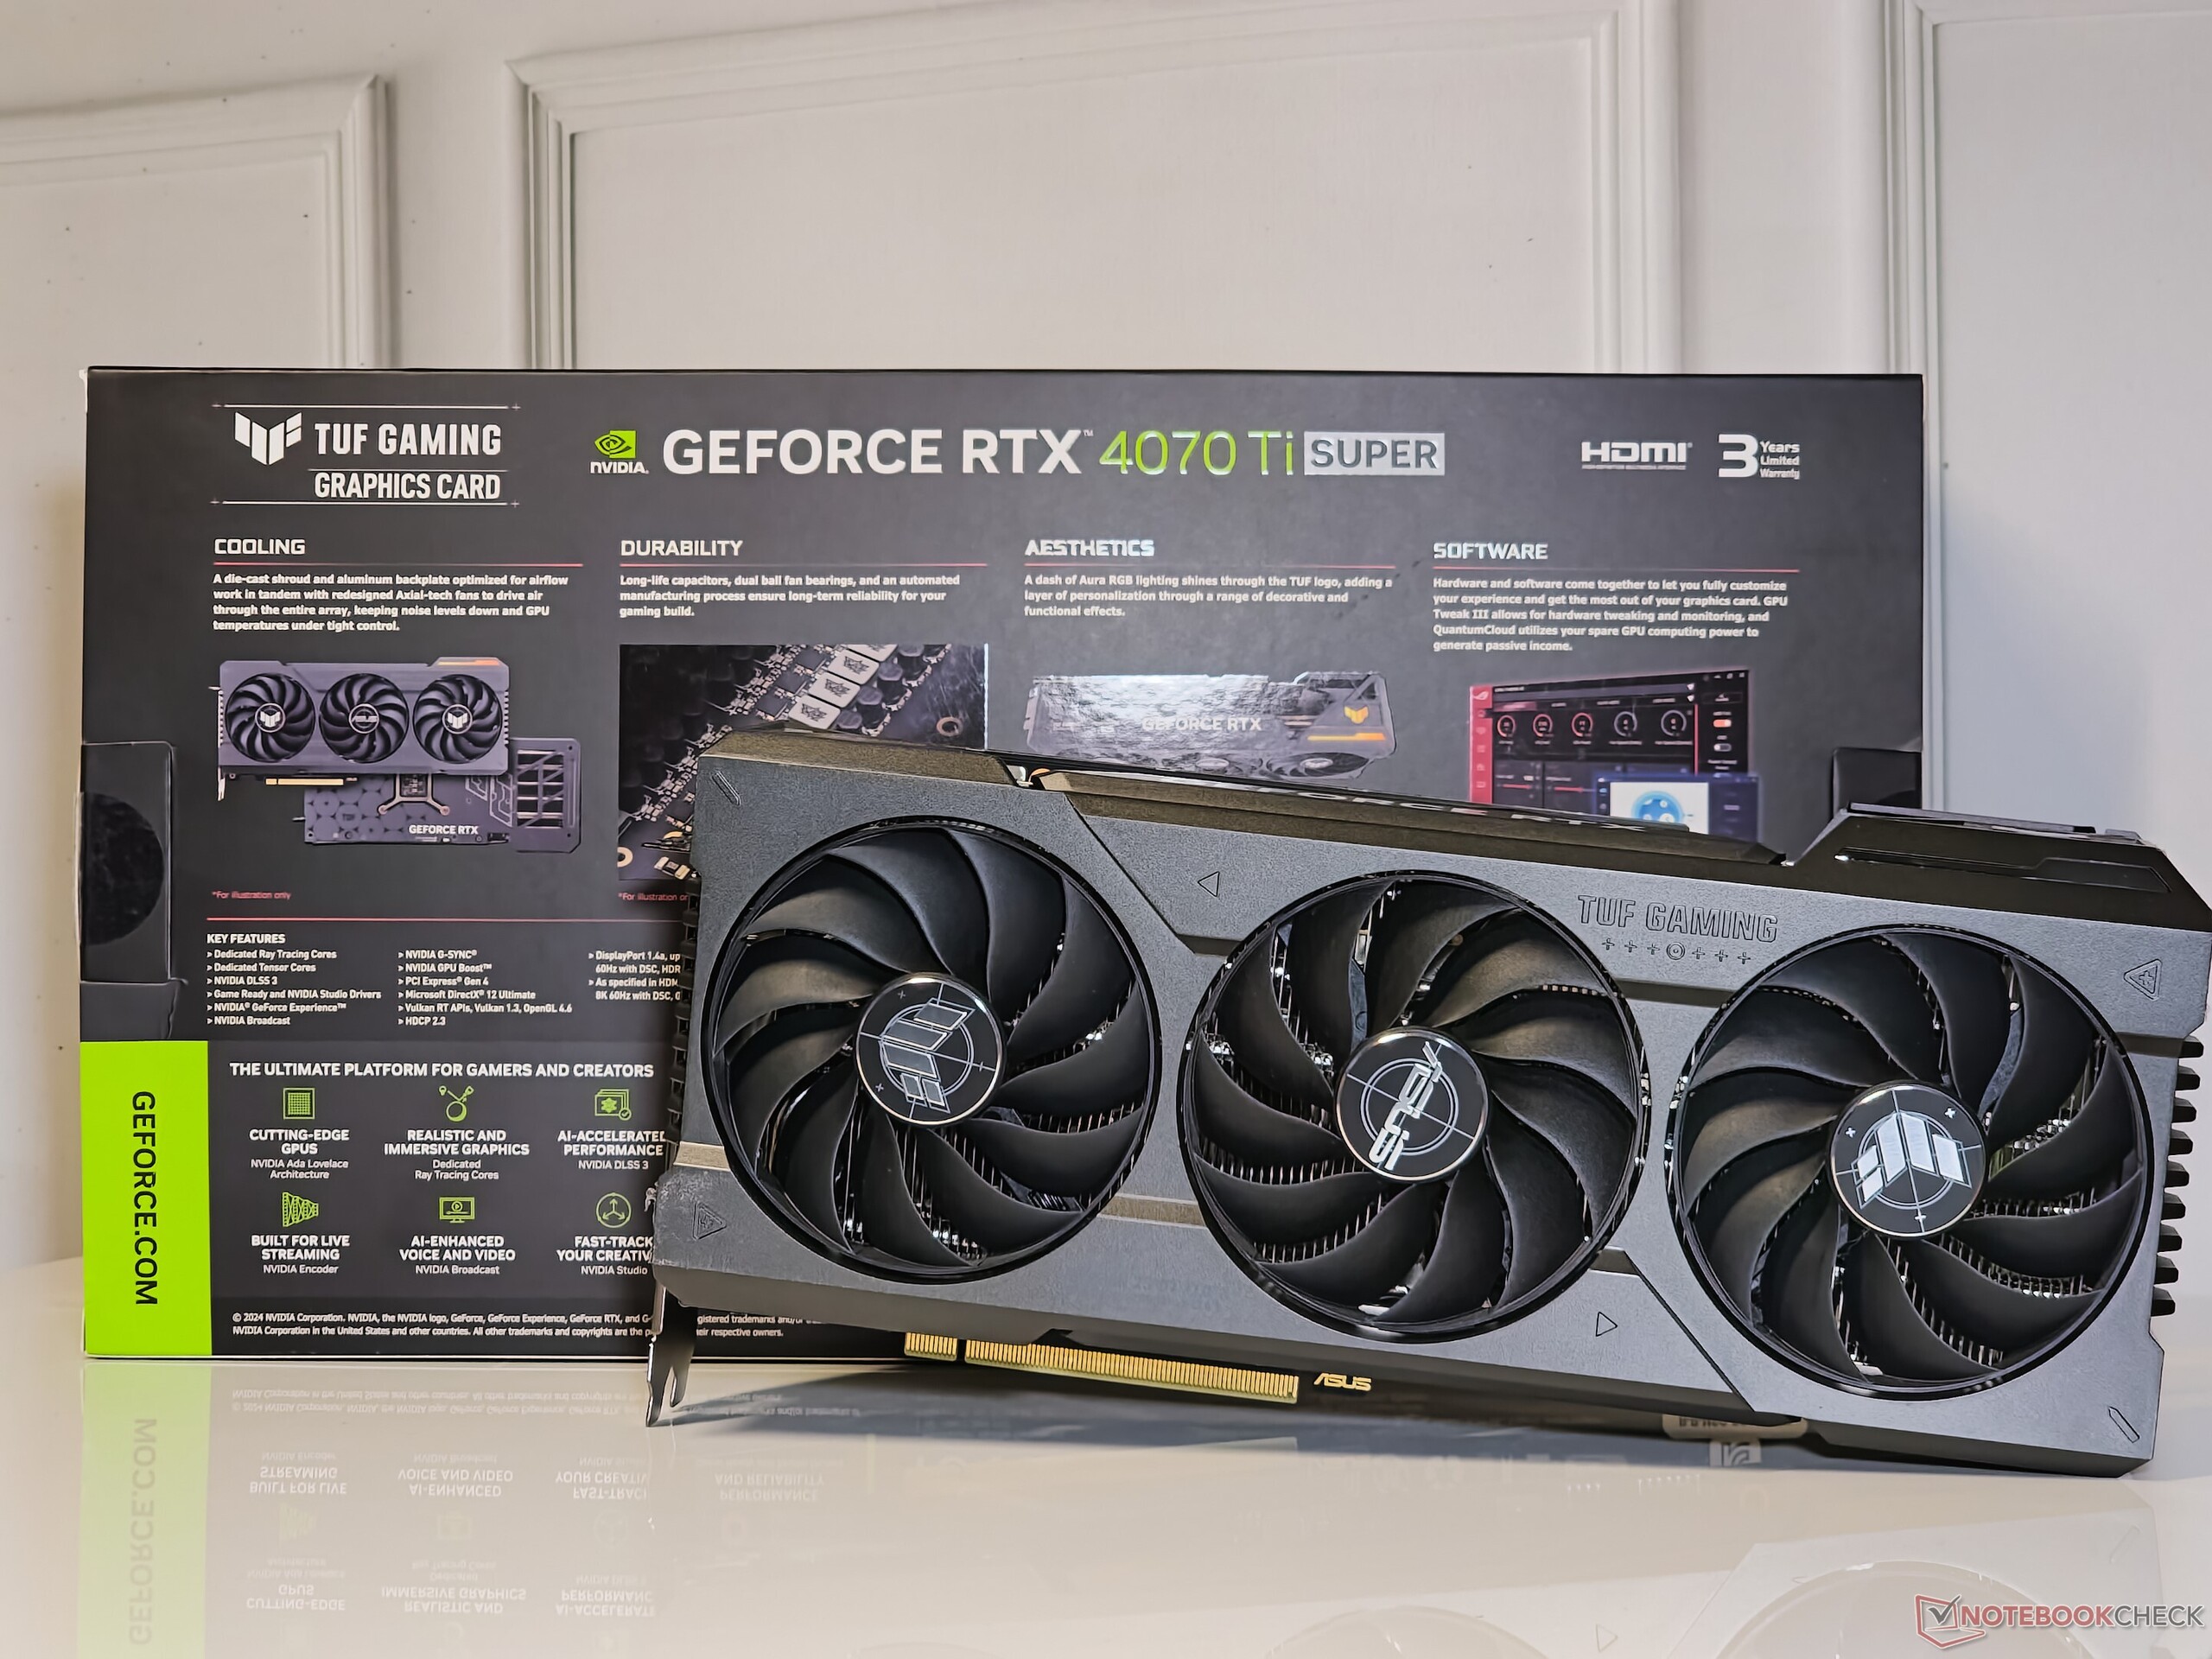
Buna uygun olarak, şimdi elimizde yeni Asus TUF Gaming GeForce RTX 4070 Ti Super var. Bu kart Hindistan'da 799 ABD$ ya da 95.000 ₹95 fiyatla satılıyor ve üç yıllık garantiyle birlikte geliyor. Asus ayrıca bu kartın orijinalini tamamen destekleyen bir OC varyantını da sunuyor TUF Gaming GeForce RTX 4070 Ti OC geçen yıl incelediğimiz.

Bu incelemede, Asus TUF Gaming GeForce RTX 4070 Ti Super'i test ediyor ve bu donanım iyileştirmelerinin sentetik kıyaslamalarda ve oyunlarda herhangi bir somut kazanım sağlayıp sağlamadığını görüyoruz.

Asus TUF Gaming RTX 4070 Ti Super'in diğer Nvidia GPU'larla karşılaştırılması

Özellikler RTX 4090FE RTX 4080 Super FE RTX 4080 FE Asus TUF RTX 4070 Ti Super Asus TUF RTX 4070 Ti RTX 4070 Super ZotacRTX 4070 AMP Airo KFA2 RTX4060 Ti EX RTX 3090 Ti FE RTX 3090 FE RTX 3080 Ti FE RTX 3070 Ti FE RTX 3070 FE TitanRTX
Çip AD102 AD103 AD103 AD103 AD104 AD104 AD104 AD106 GA102 GA102 GA102 GA104 GA104 TU102
FinFET Süreci Özel 4N Özel 4N Özel 4N Özel 4N Özel 4N Özel 4N Özel 4N Özel 4N 8 nm 8 nm 8 nm 8 nm 8 nm 12 nm
CUDA Çekirdekleri 16,384 10,240 9,728 8,448 7,680 7,168 5,888 4,352 10,752 10,496 10,240 6,144 5,888 4,608
Doku Birimleri 512 320 304 264 240 224 184 136 336 328 320 192 184 288
Tensör Çekirdekleri 512 4. Nesil 320 4. Nesil 304 4. Nesil 264 4. Nesil 240 4. Nesil 224 4. Nesil 184 4. Nesil 136 4. Nesil 336 3. Nesil 328 3. Nesil 320 3. Nesil 192 3. Nesil 184 3. Nesil 576 2. Nesil.
RT Çekirdekleri 128 3. Nesil 80 3. Nesil 76 3. Nesil 66 3. Nesil 60 3. Nesil 56 3. Nesil 46 3. Nesil 34 3. Nesil 84 2. Nesil 82 2. Nesil 80 2. Nesil 48 2. Nesil 46 2. Nesil 72
GPU Temel Saati 2,235 MHz 2,295 MHz 2,205 MHz 2,340 MHz 2,310 MHz 1,980 MHz 1,920 MHz 2,310 MHz 1,560 MHz 1,395 MHz 1,365 MHz 1,575 MHz 1,500 MHz 1,350 MHz
GPU Boost Clock 2,520 MHz 2,550 MHz 2,505 MHz 2,610 MHz 2,760 MHz 2,565 MHz 2,535 MHz 2,535 MHz 1,860 MHz 1,695 MHz 1,665 MHz 1,770 MHz 1,750 MHz 1,770 MHz
Bellek Veri Yolu 384-bit 256-bit 256-bit 256-bit 192-bit 192-bit 192-bit 128-bit 384-bit 384-bit 384-bit 256-bit 256-bit 384-bit
Bellek Bant Genişliği 1.008 GB/s 736,3 GB/s 716,8 GB/s 672 GB/s 504 GB/s 504 GB/s 504 GB/s 288 GB/s 1.008 GB/s 936 GB/s 912 GB/s 608 GB/s 448 GB/s 672 GB/s
Video Belleği 24 GB GDDR6X 16 GB GDDR6X 16 GB GDDR6X 16 GB GDDR6X 12 GB GDDR6X 12 GB GDDR6X 12 GB GDDR6X 8 GB GDDR6 24 GB GDDR6X 24 GB GDDR6X 12 GB GDDR6X 8 GB GDDR6X 8 GB GDDR6 24 GB GDDR6
Güç Tüketimi 450 W 320 W 320 W 285 W 285 W 220 W 215 W 160 W 450 W 350 W 350 W 290 W 220 W 280 W

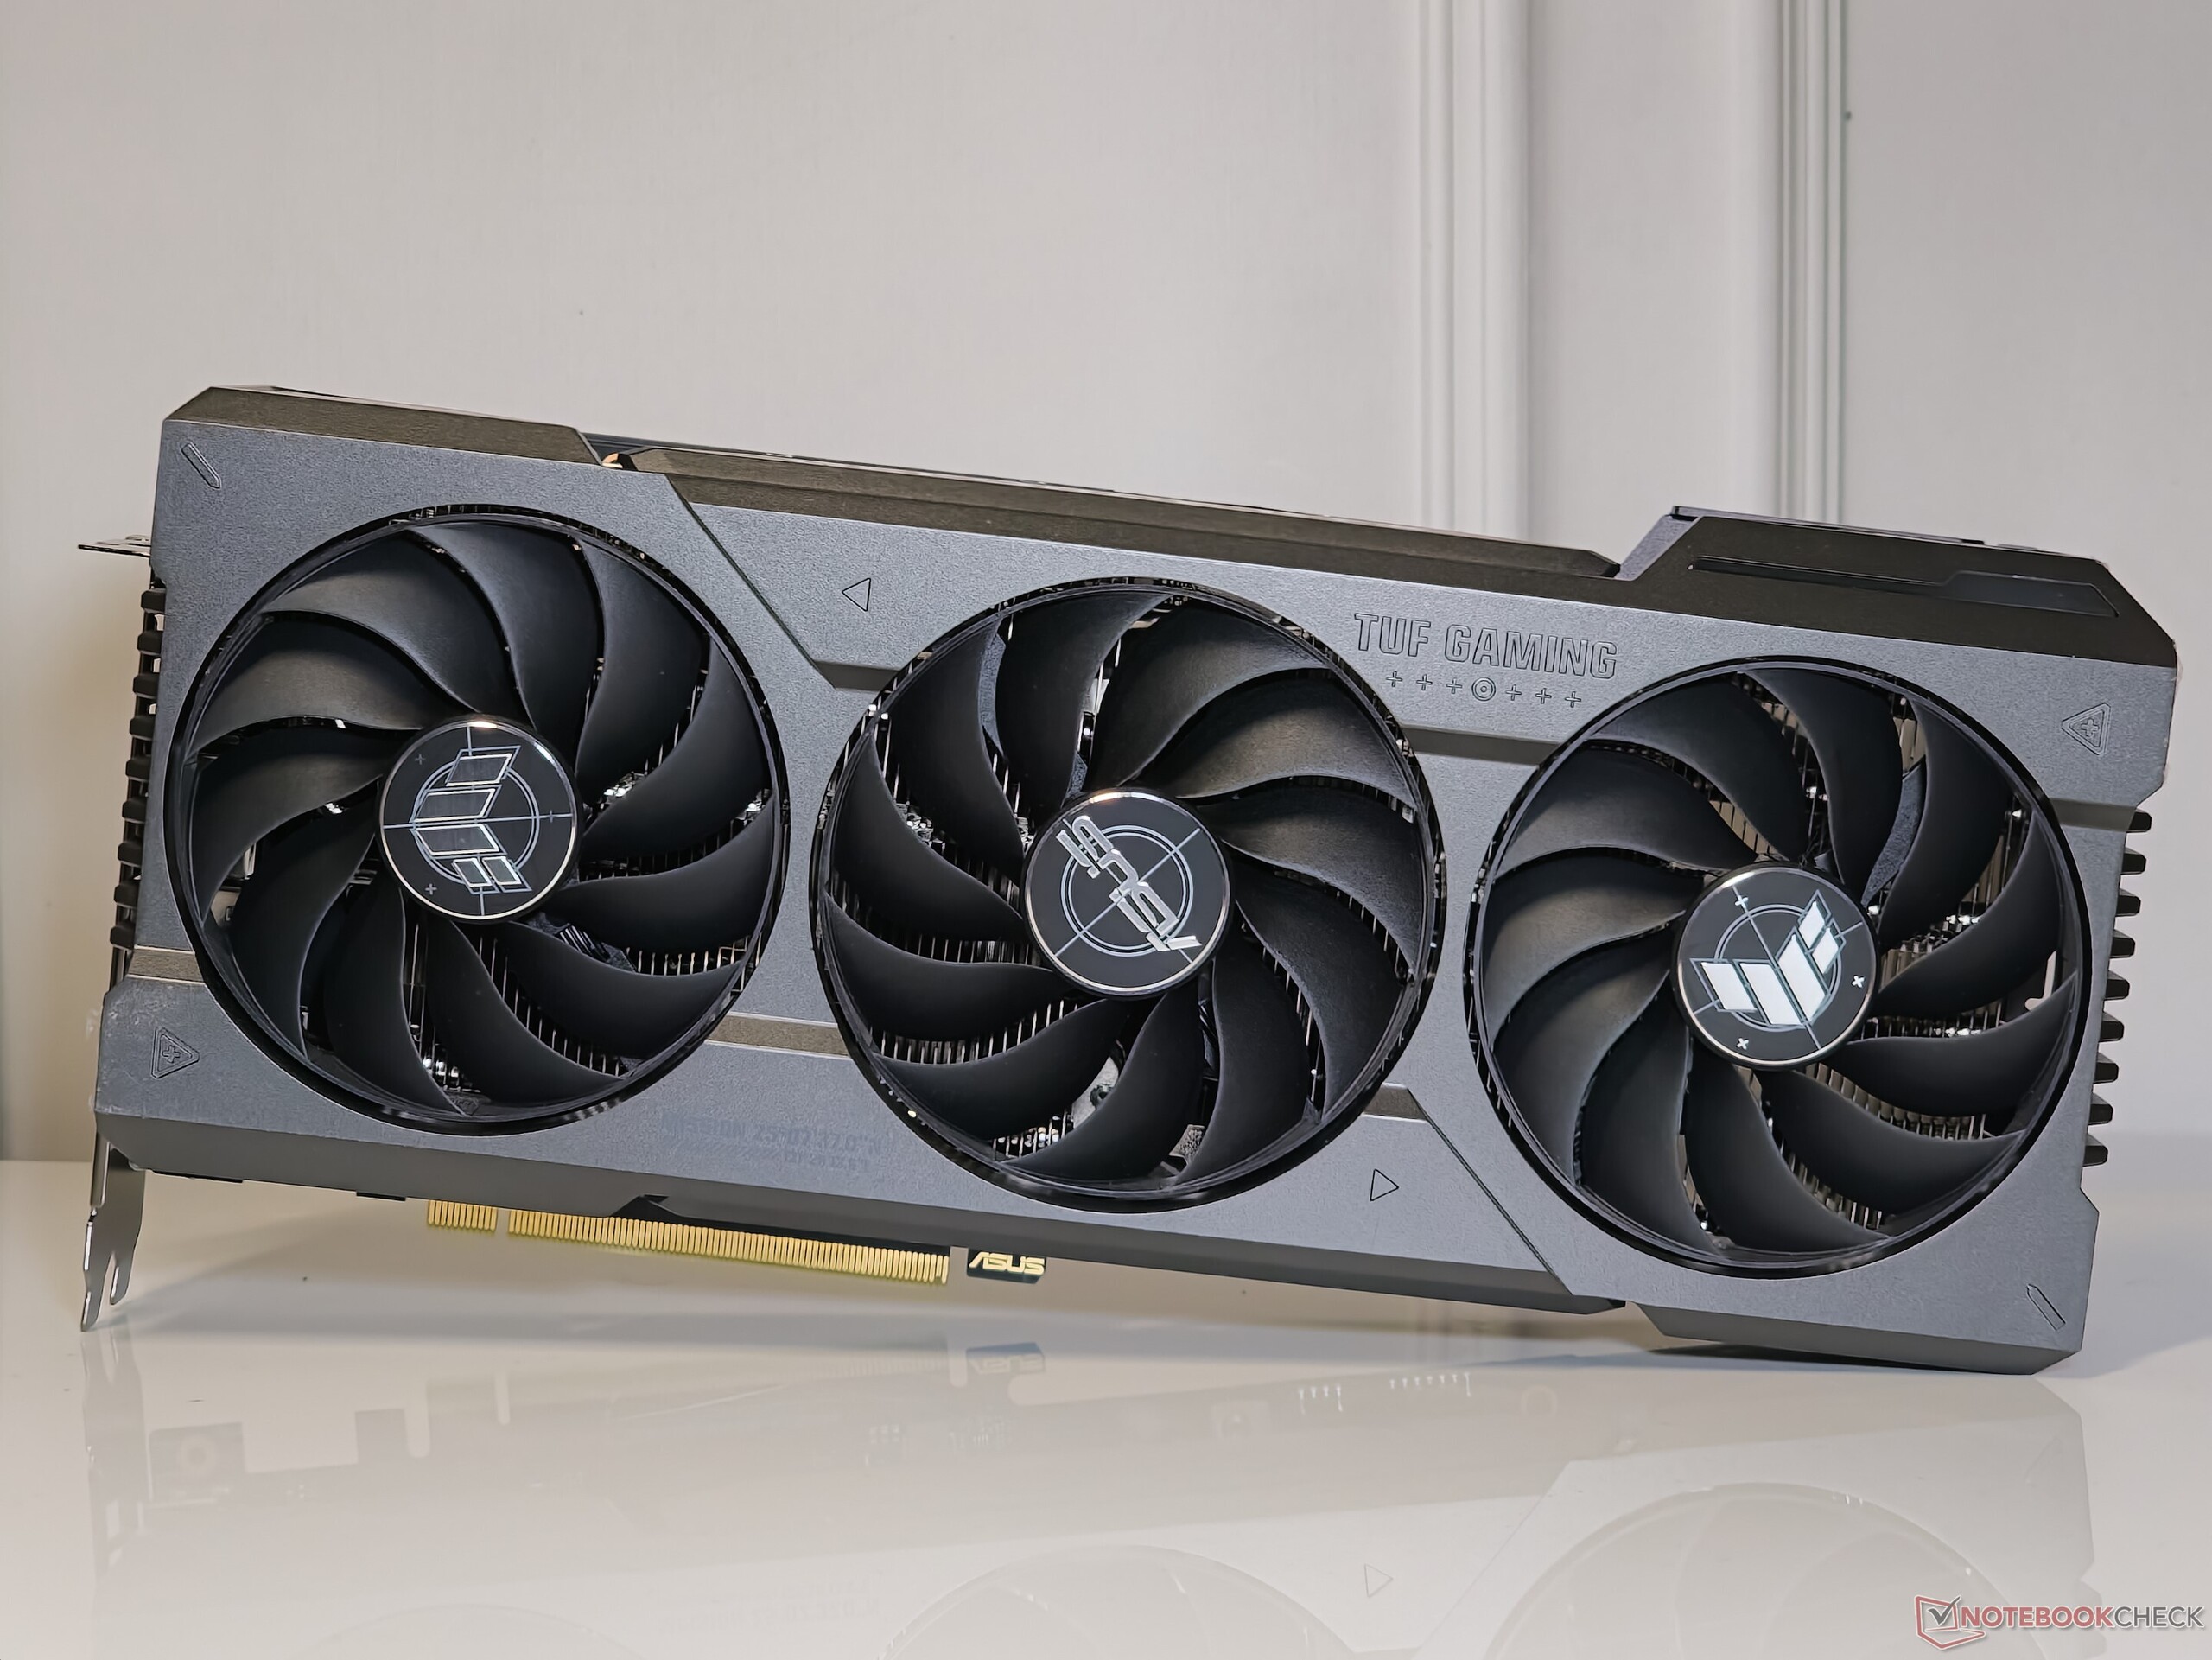
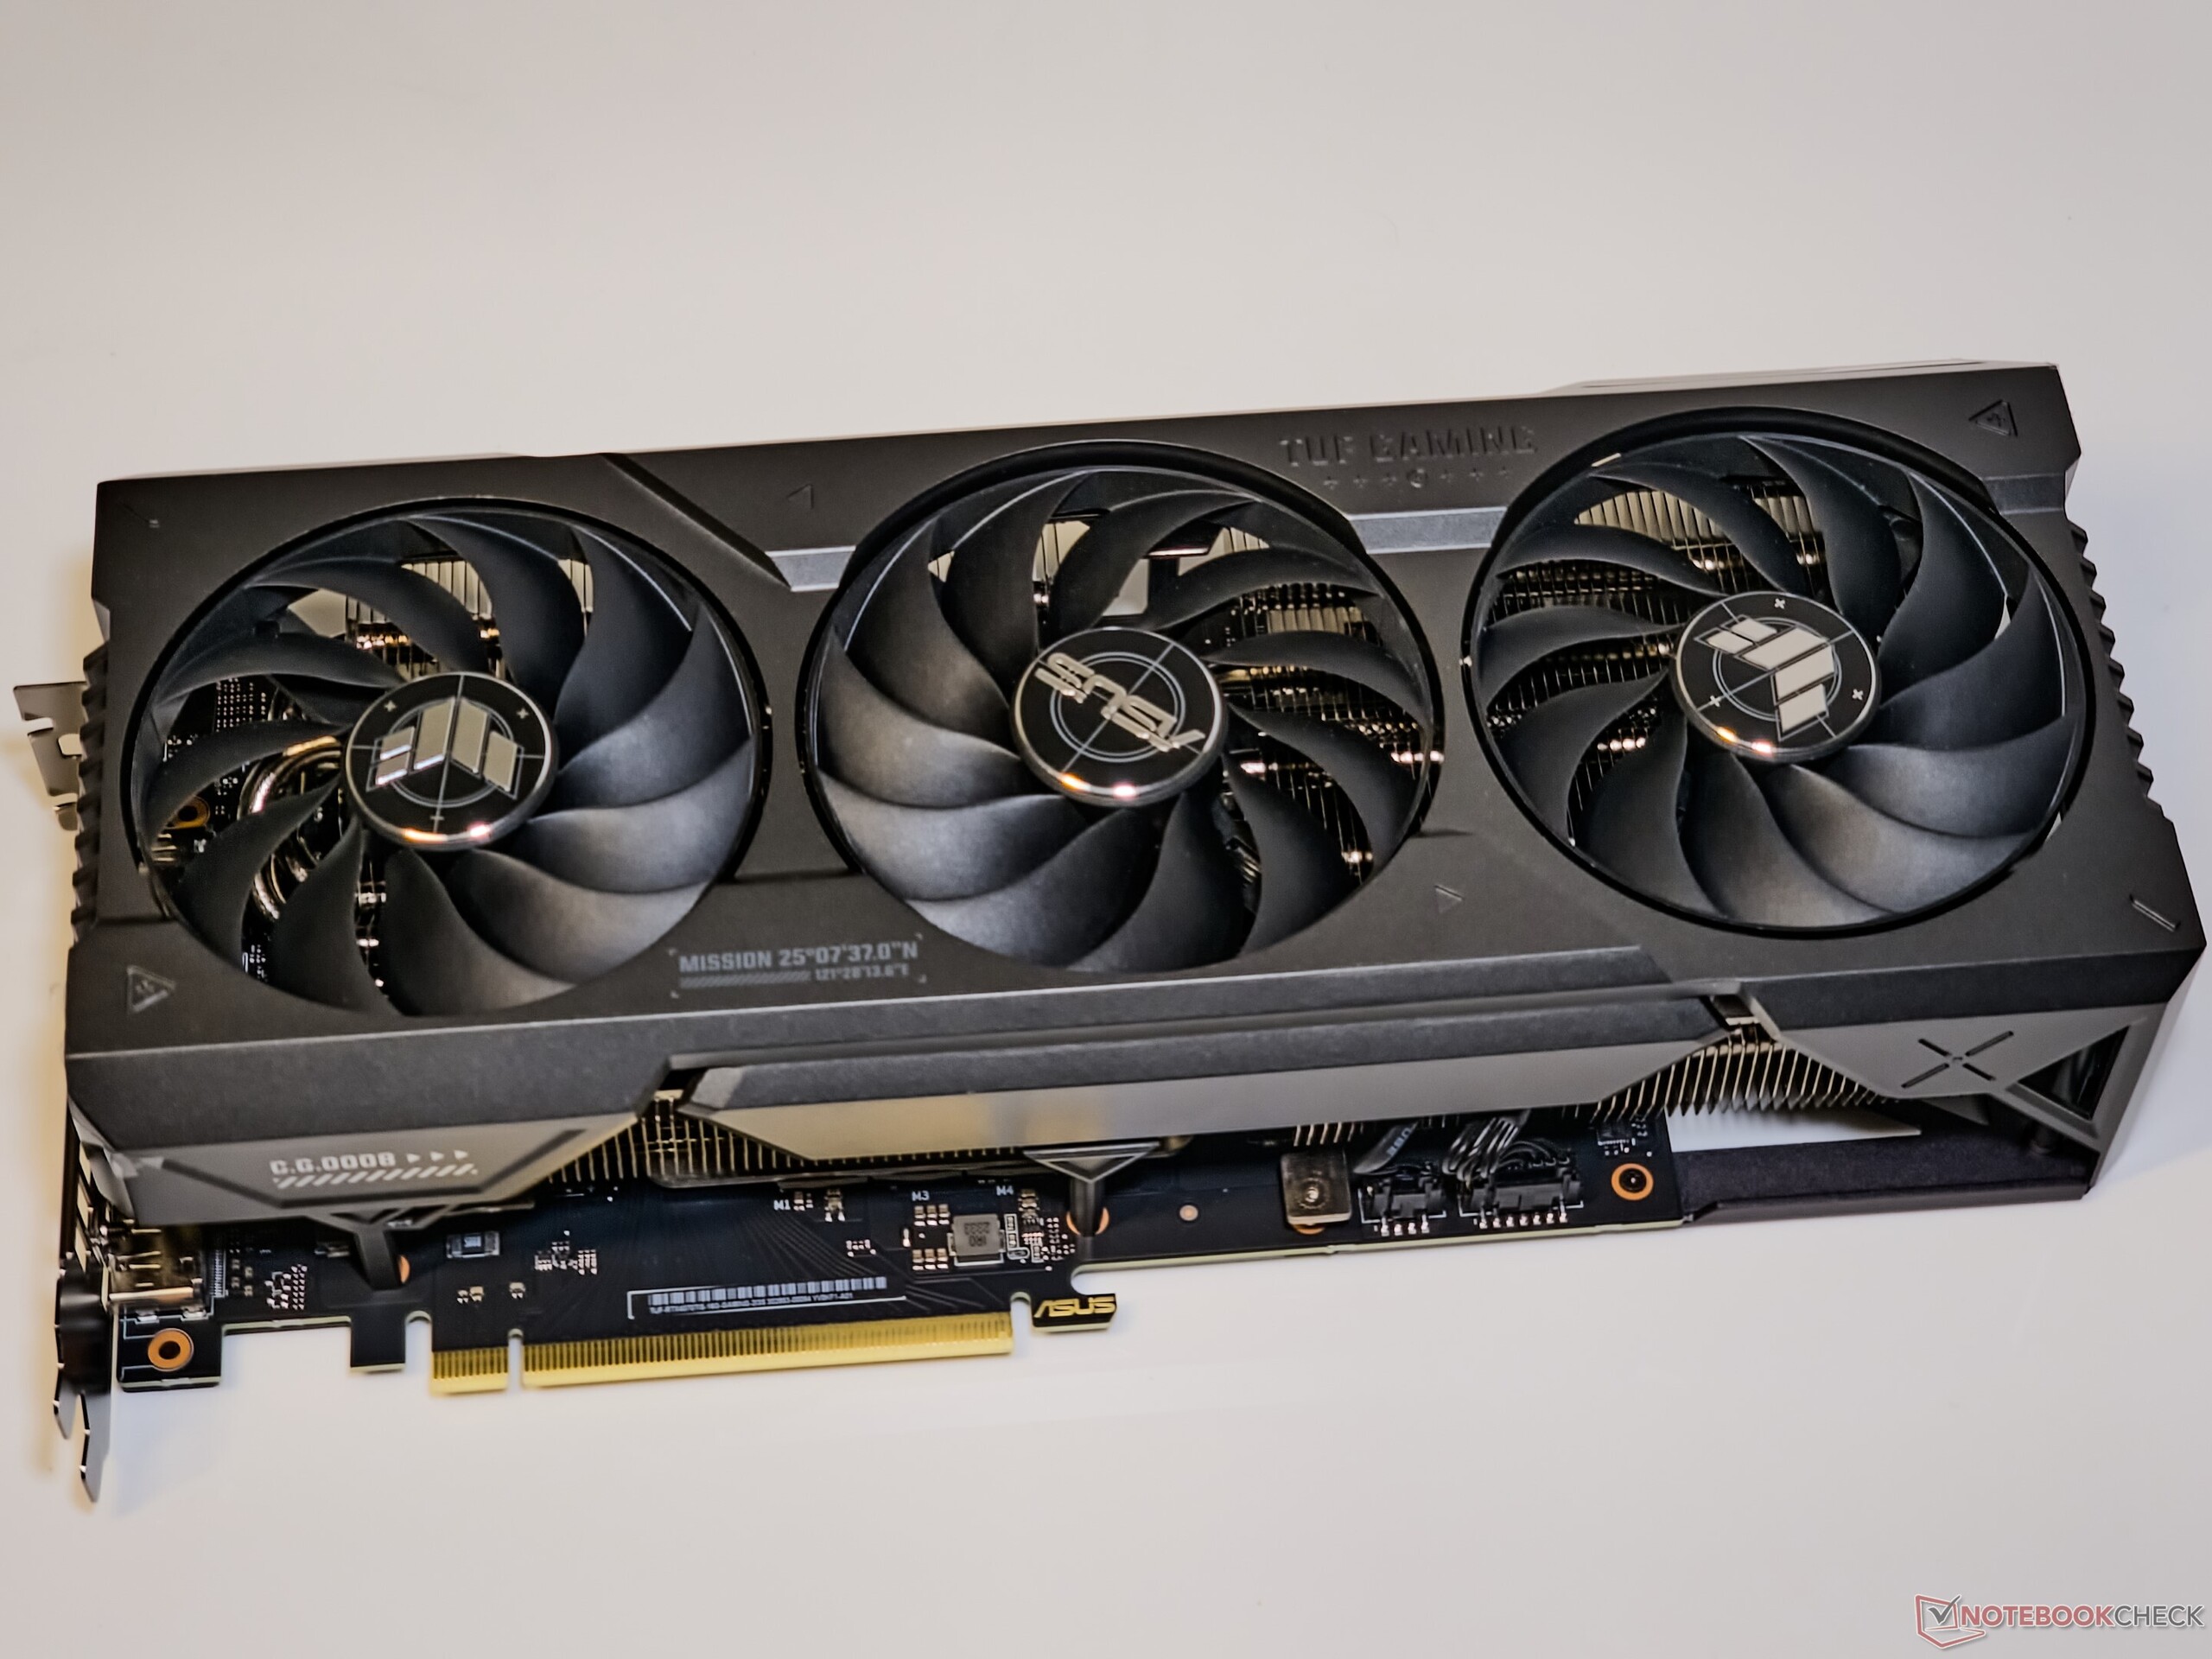
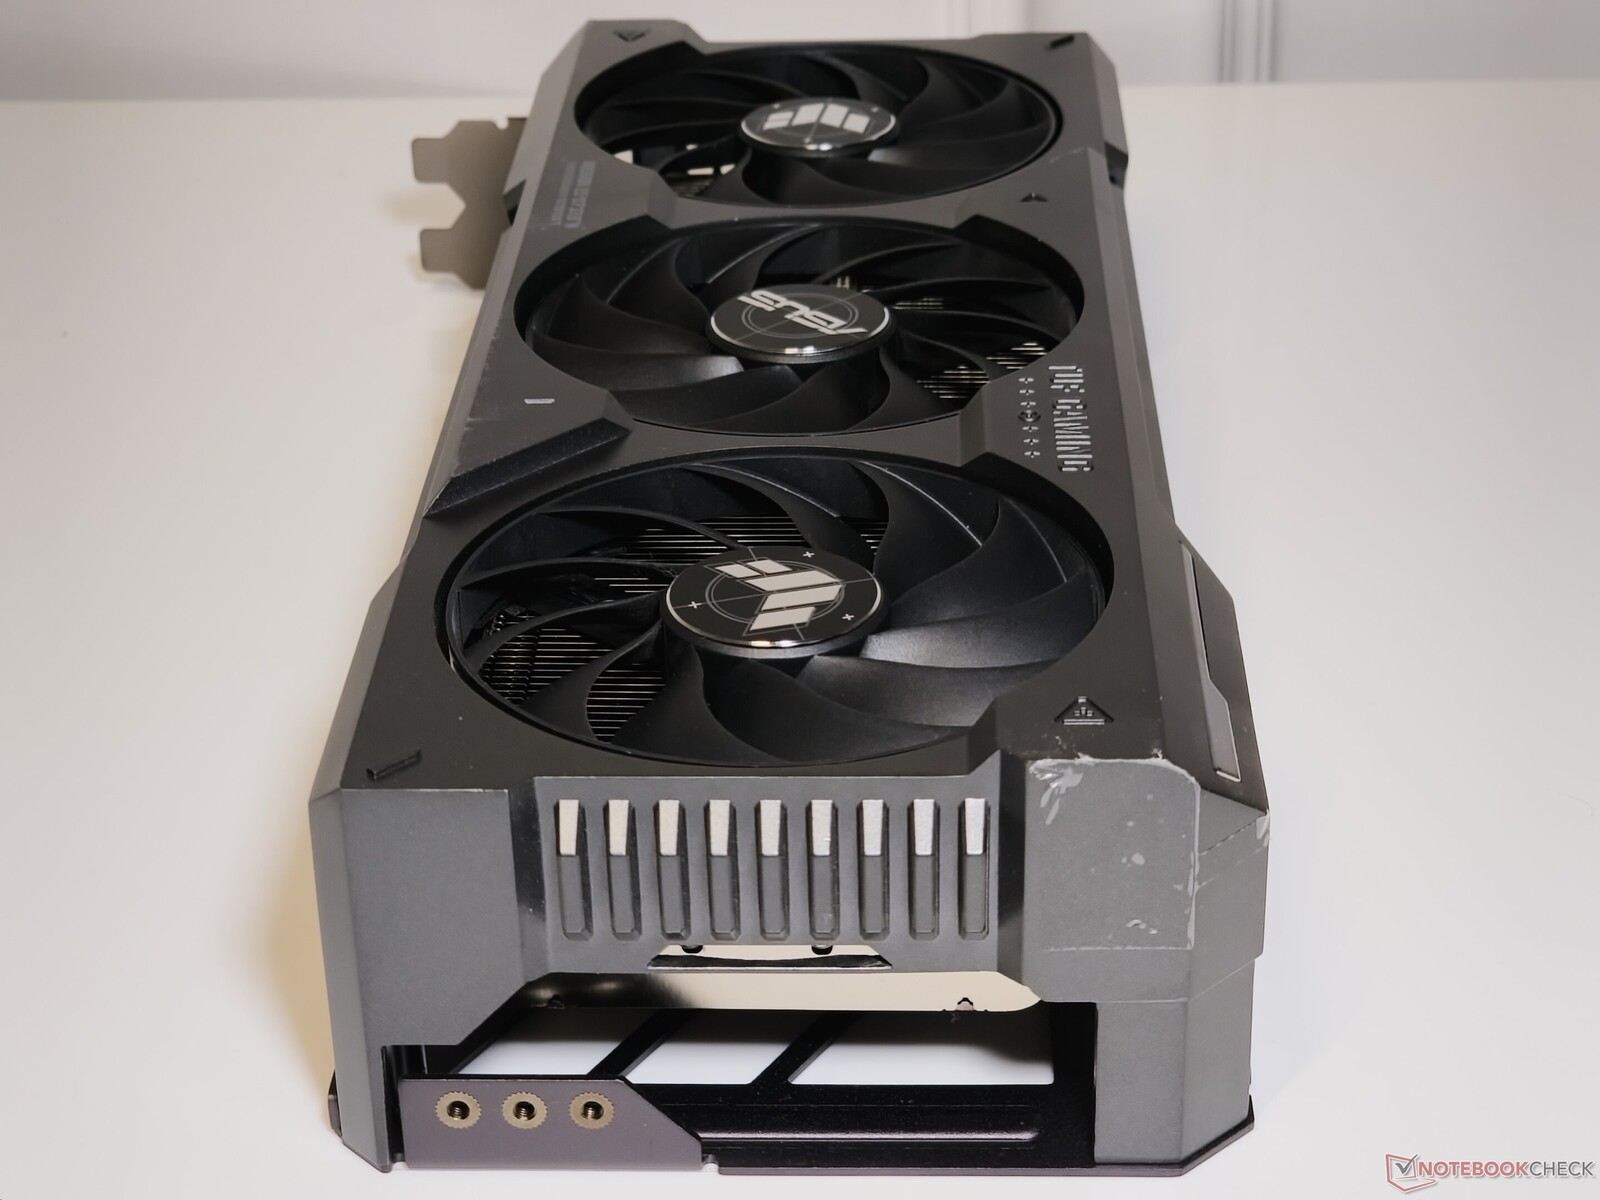
Asus TUF Gaming GeForce RTX 4070 Ti Super yakından

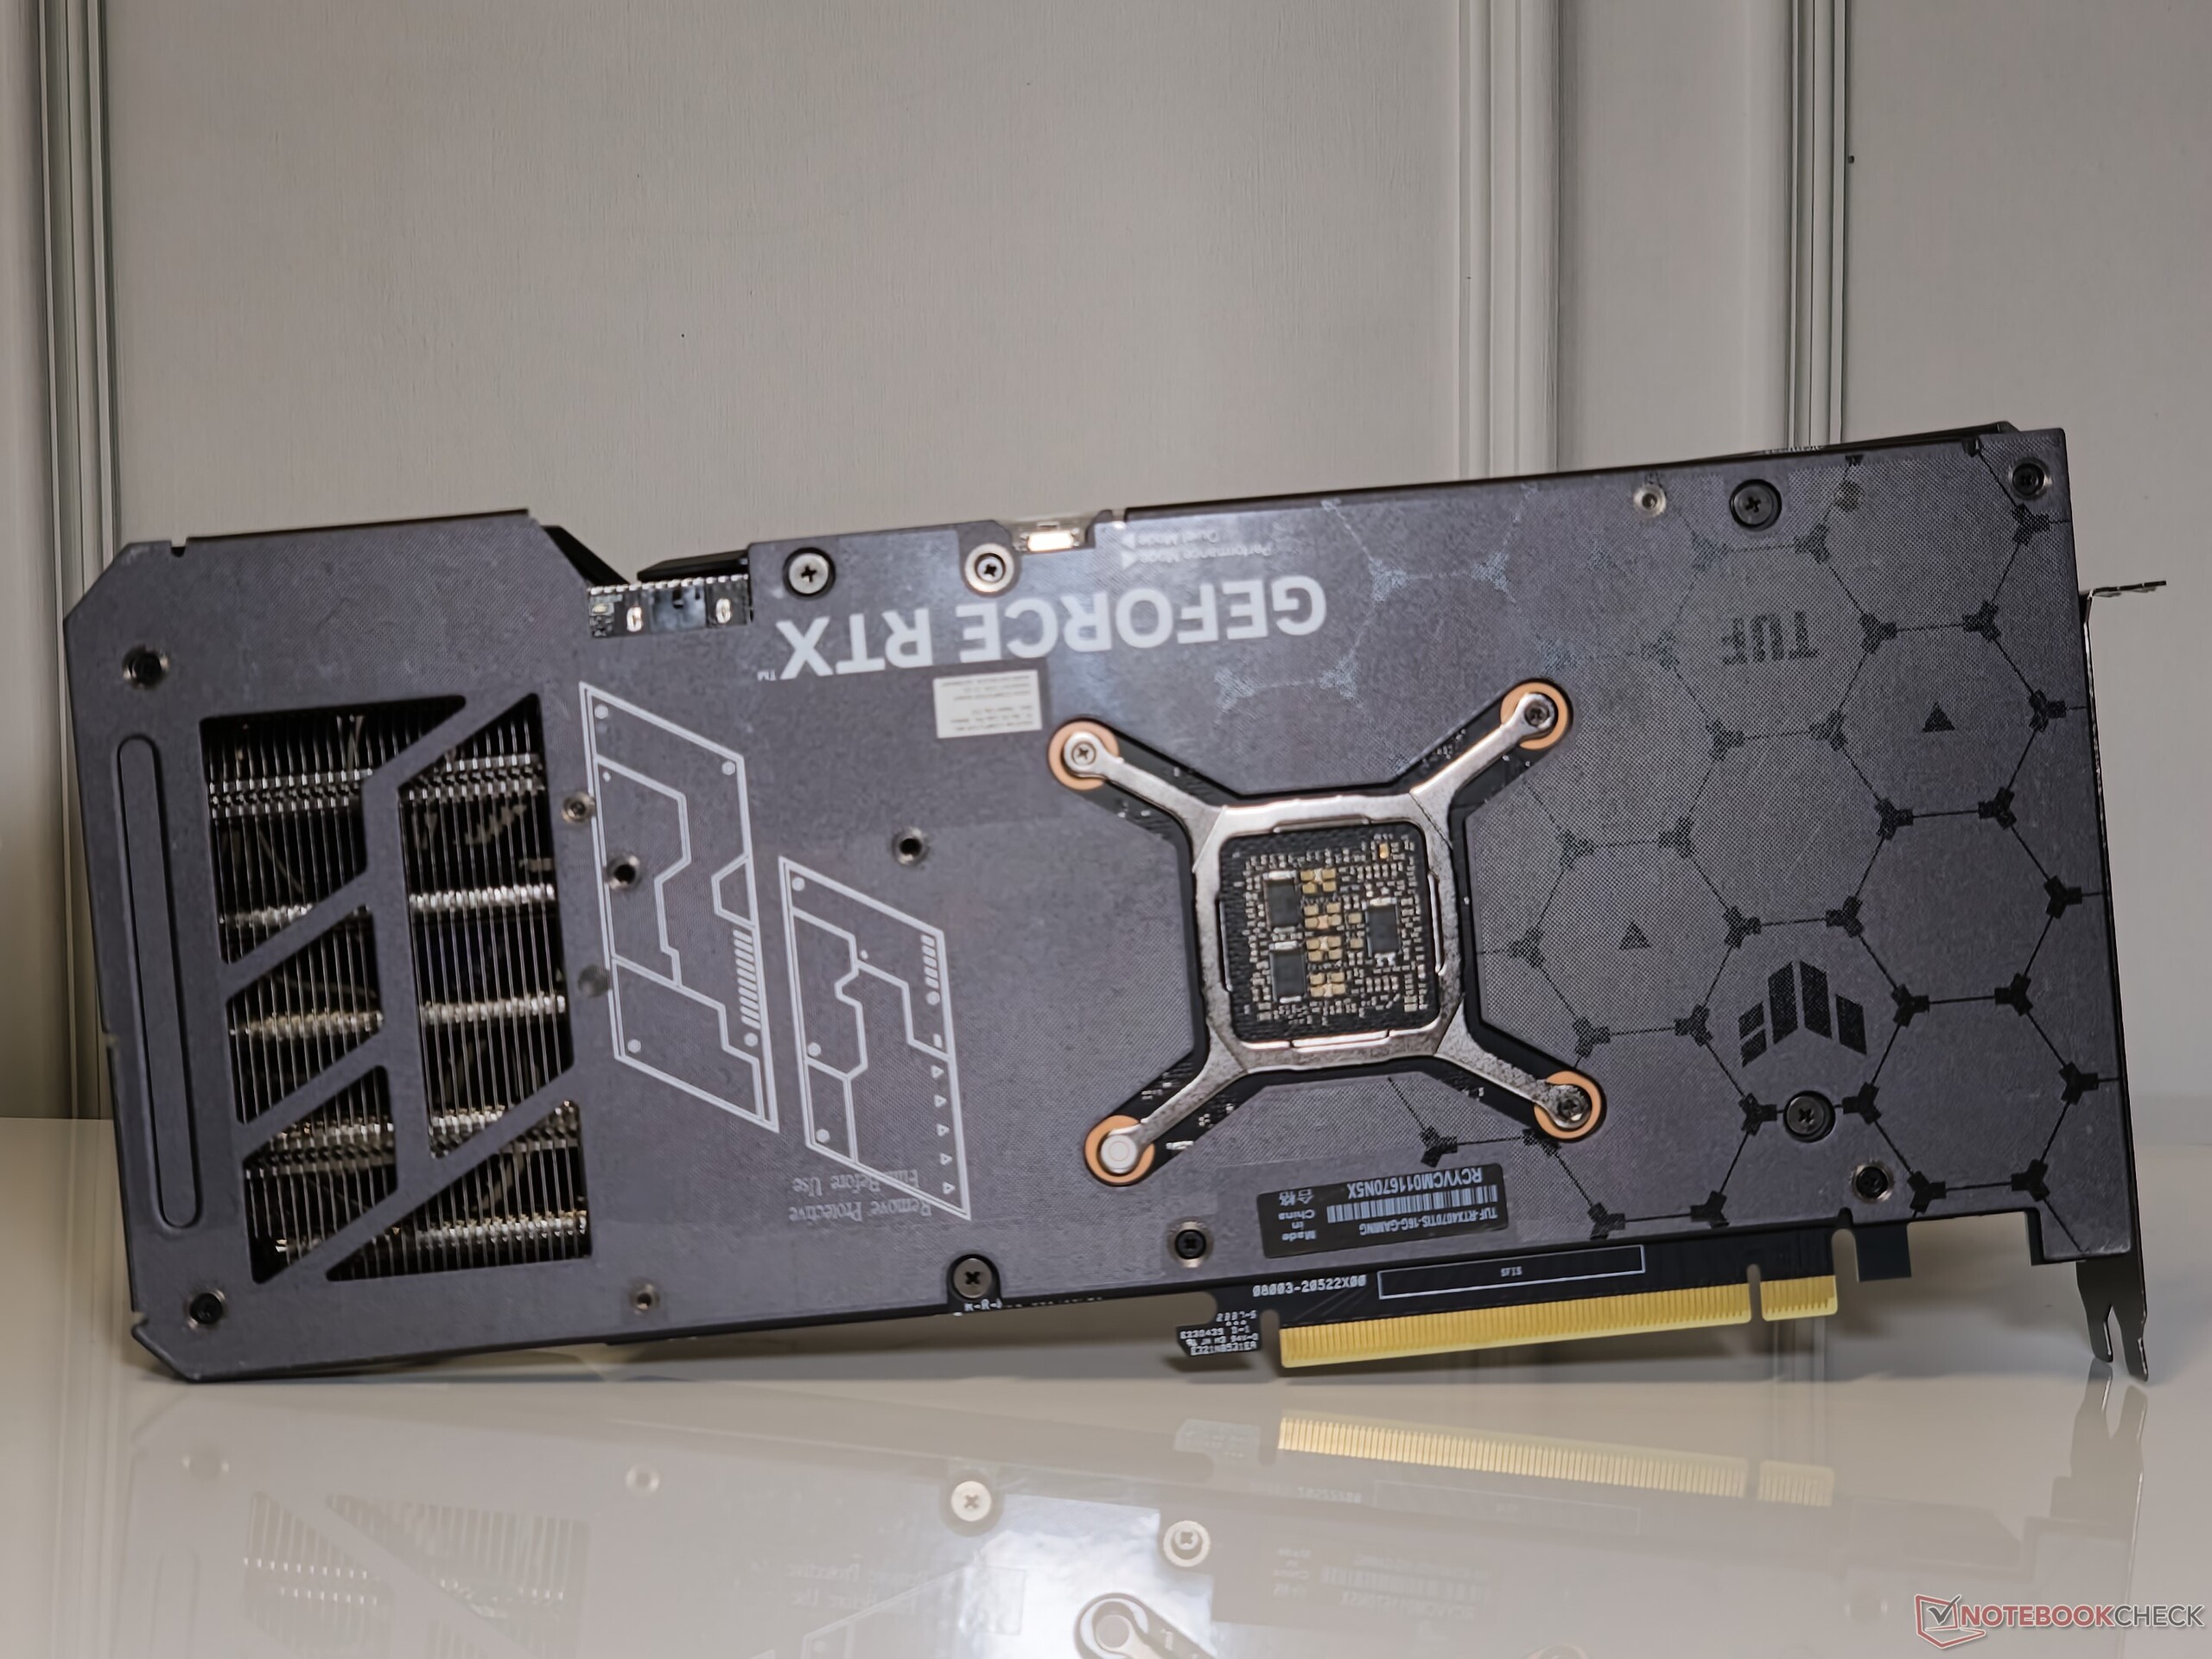
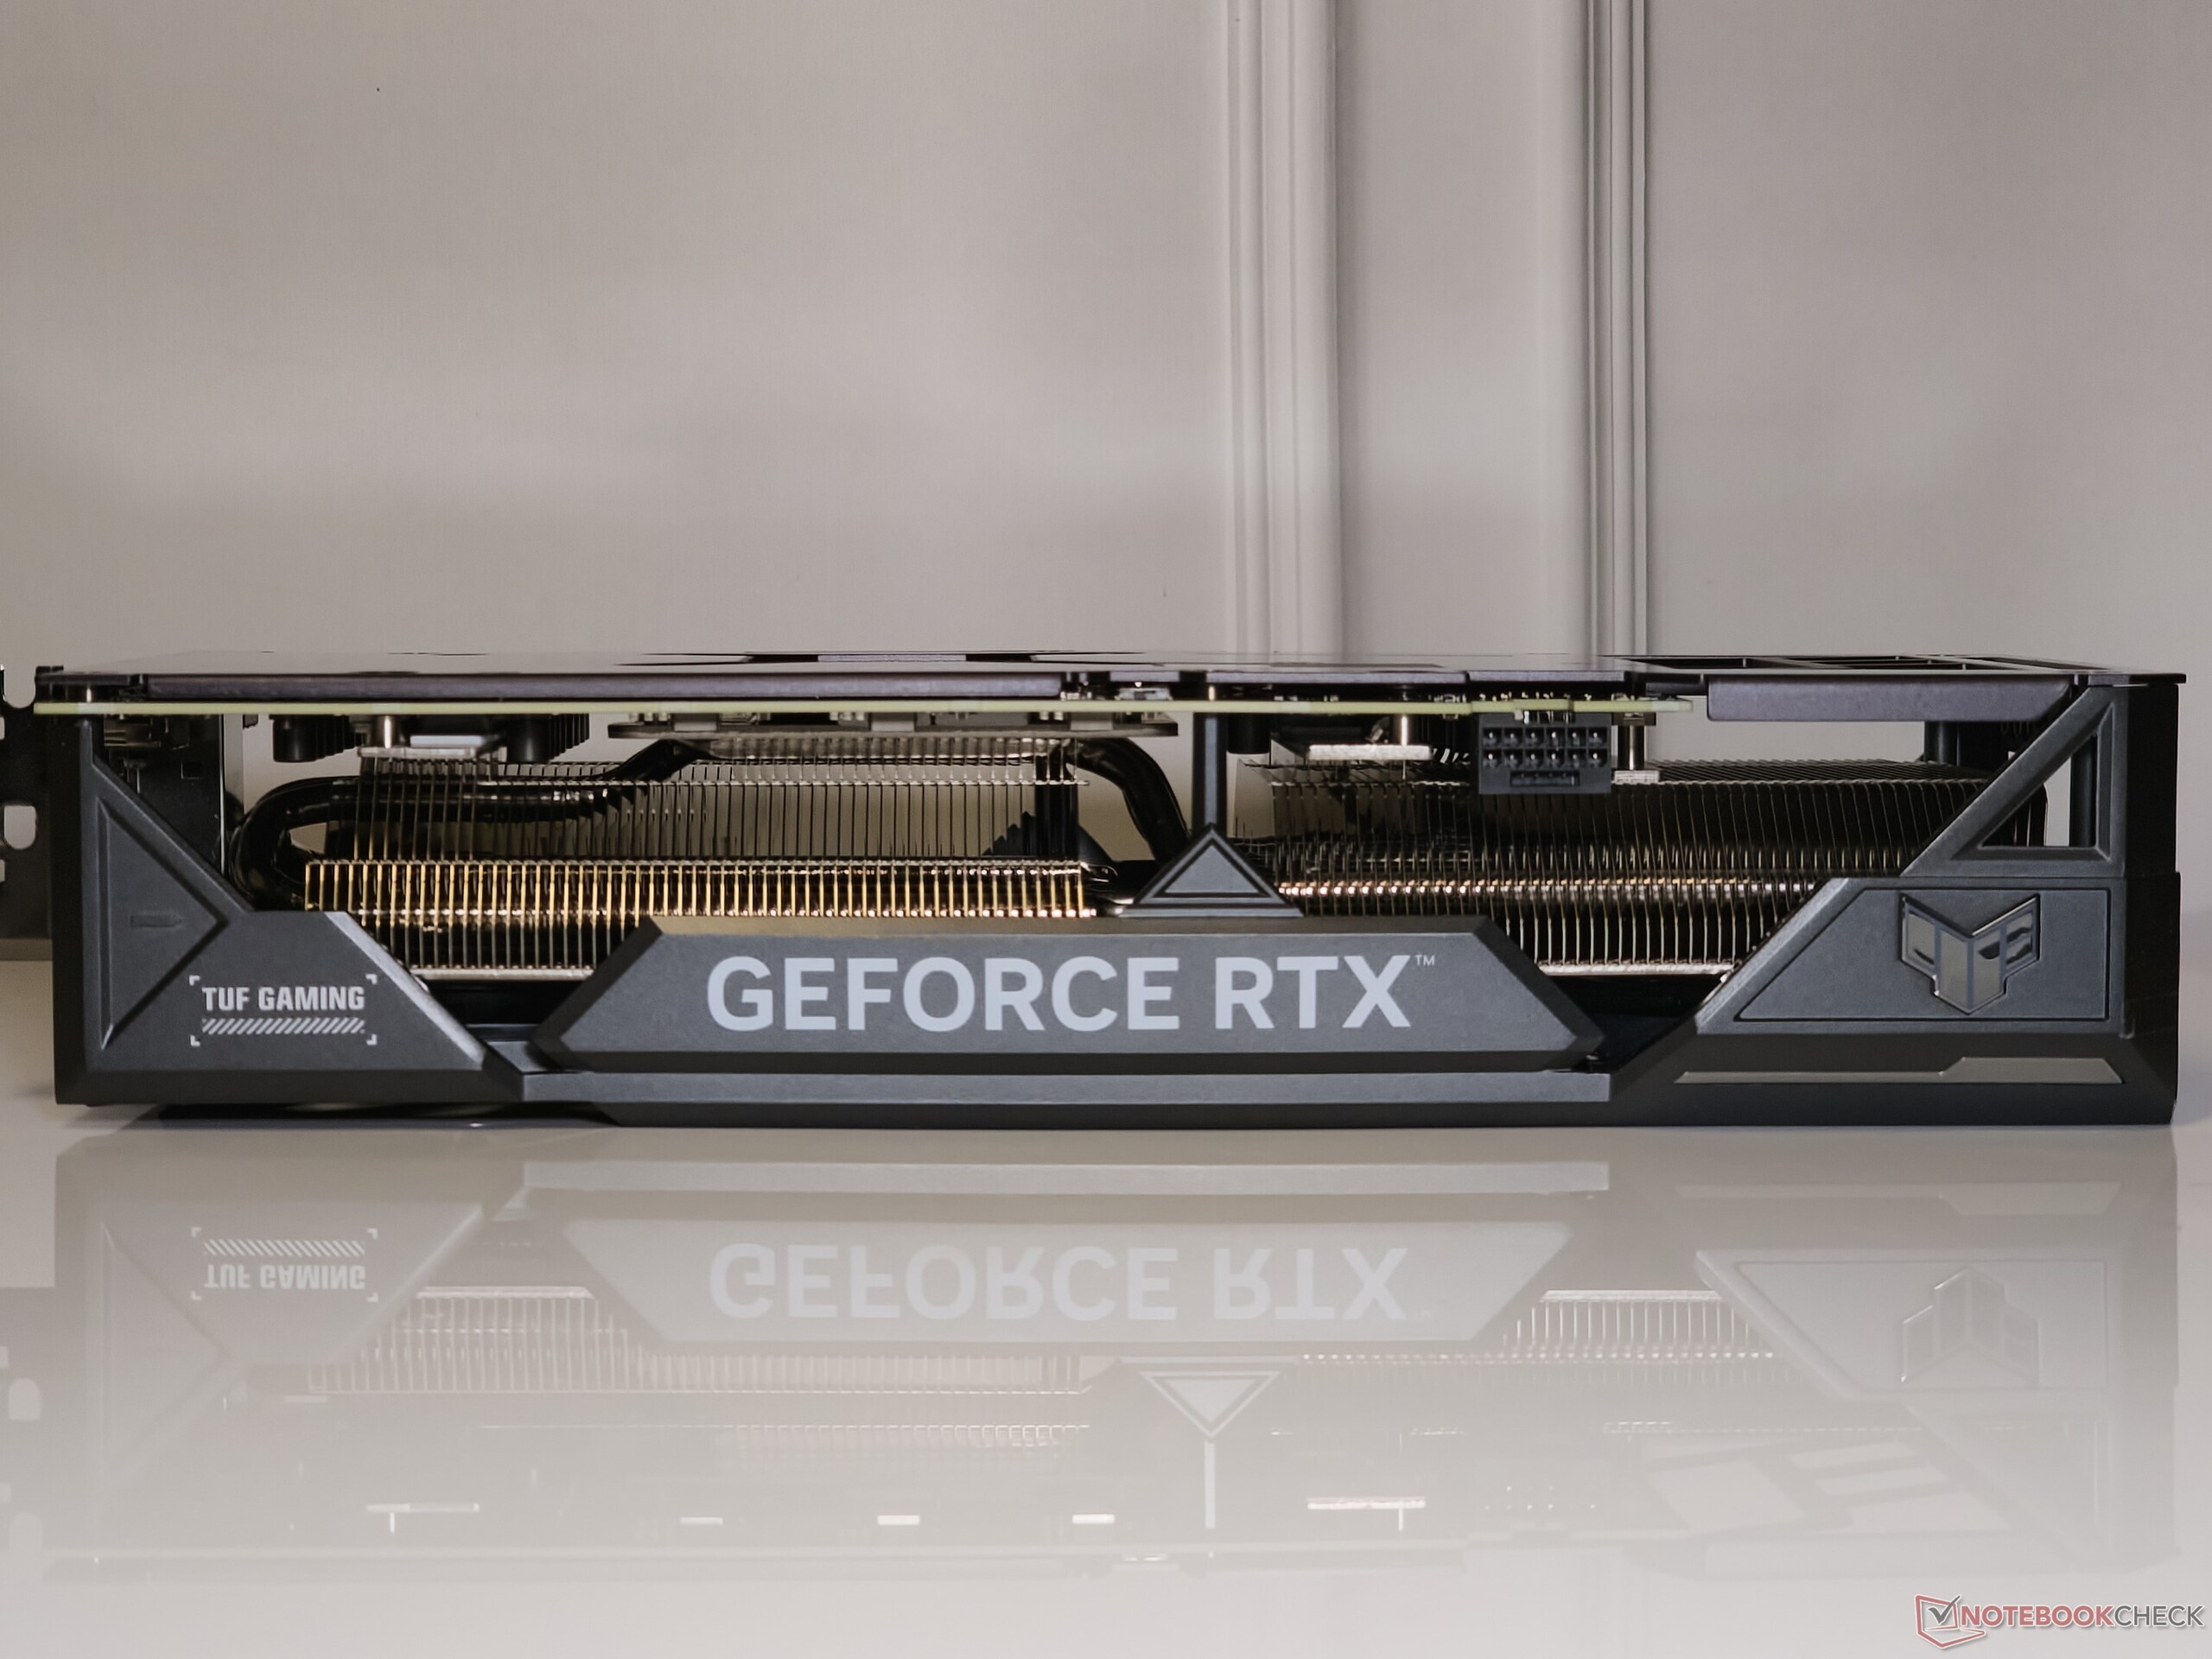
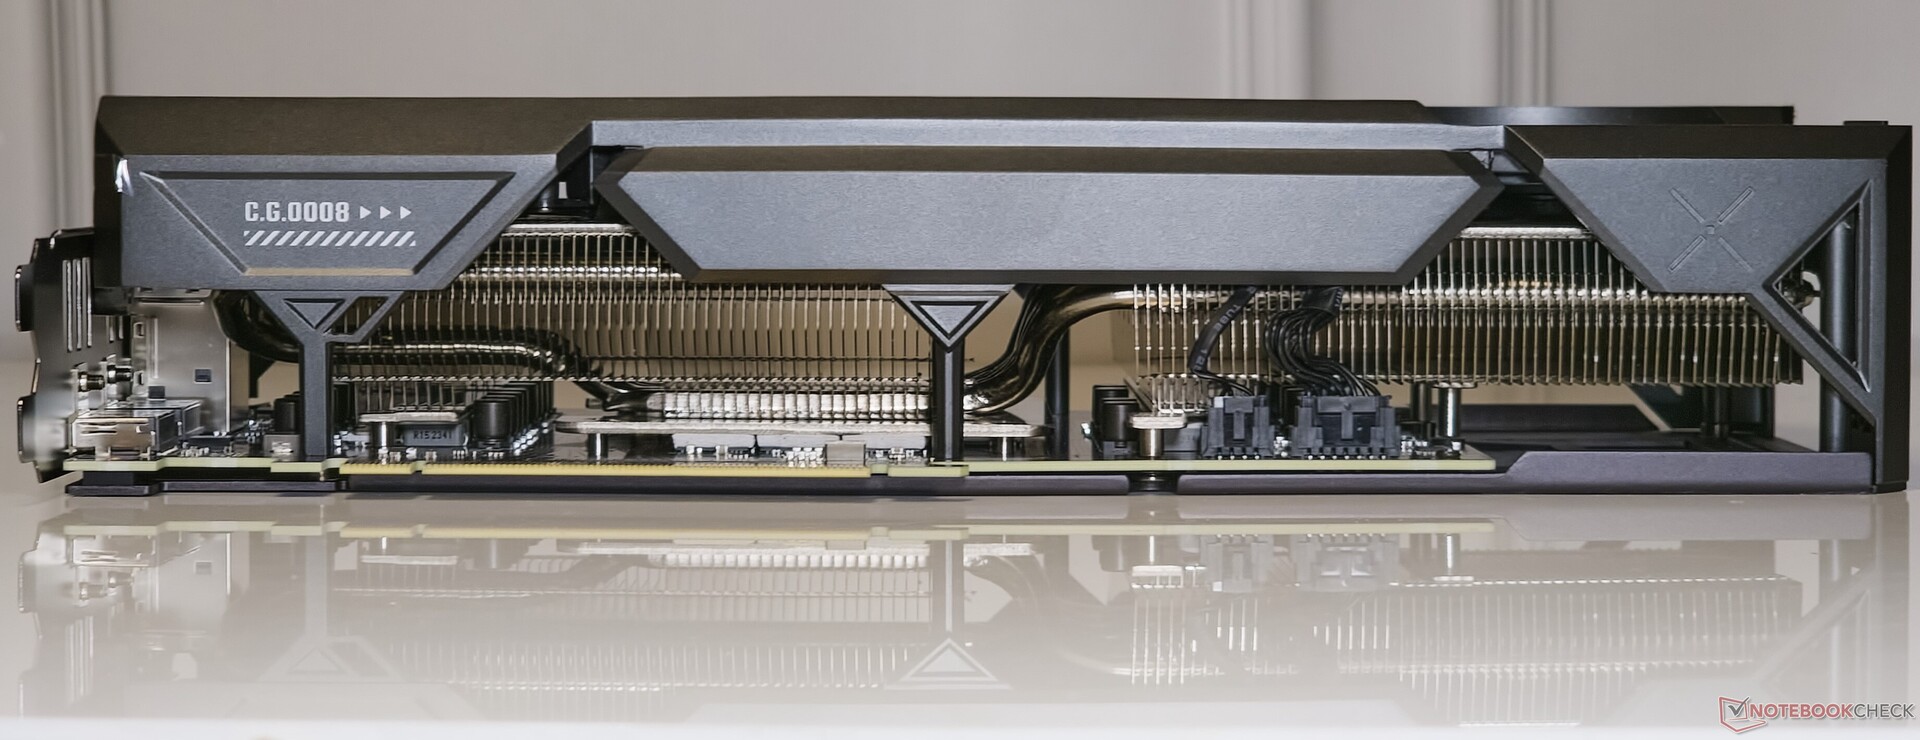
TUF kart, Asus'un RTX 4070 Ti Super için giriş seviyesi teklifi olabilir, ancak bir tank gibi inşa edilmiştir. Kart, premium olmayan ürünlerde nadir görülen metalik bir kılıfa sahip. Metal arka plaka, güven verici ağırlığa katkıda bulunur ve havalandırma için kesiklere sahiptir.

305 x 138 x 65 mm boyutlarındaki TUF Gaming GeForce RTX 4070 Ti Super, kart üzerinde yaklaşık 3,5 yuva işgal etmekten çekinmiyor. Başka genişletme kartları eklemeyi planlıyorsanız ve yakın aralıklı PCIe yuvalarına sahip bir ATX veya daha küçük bir kartınız varsa, bu akılda tutulması gereken bir şeydir.

Asus TUF Gaming GeForce RTX 4070 Ti Süper: Ön
Asus TUF Gaming GeForce RTX 4070 Ti Süper
Asus TUF Gaming GeForce RTX 4070 Ti Super: Arka
Asus TUF Gaming GeForce RTX 4070 Ti Süper
Bağlantı Noktaları: 3x DisplayPort 1.4 çıkışı, 2x HDMI 2.1a çıkışı

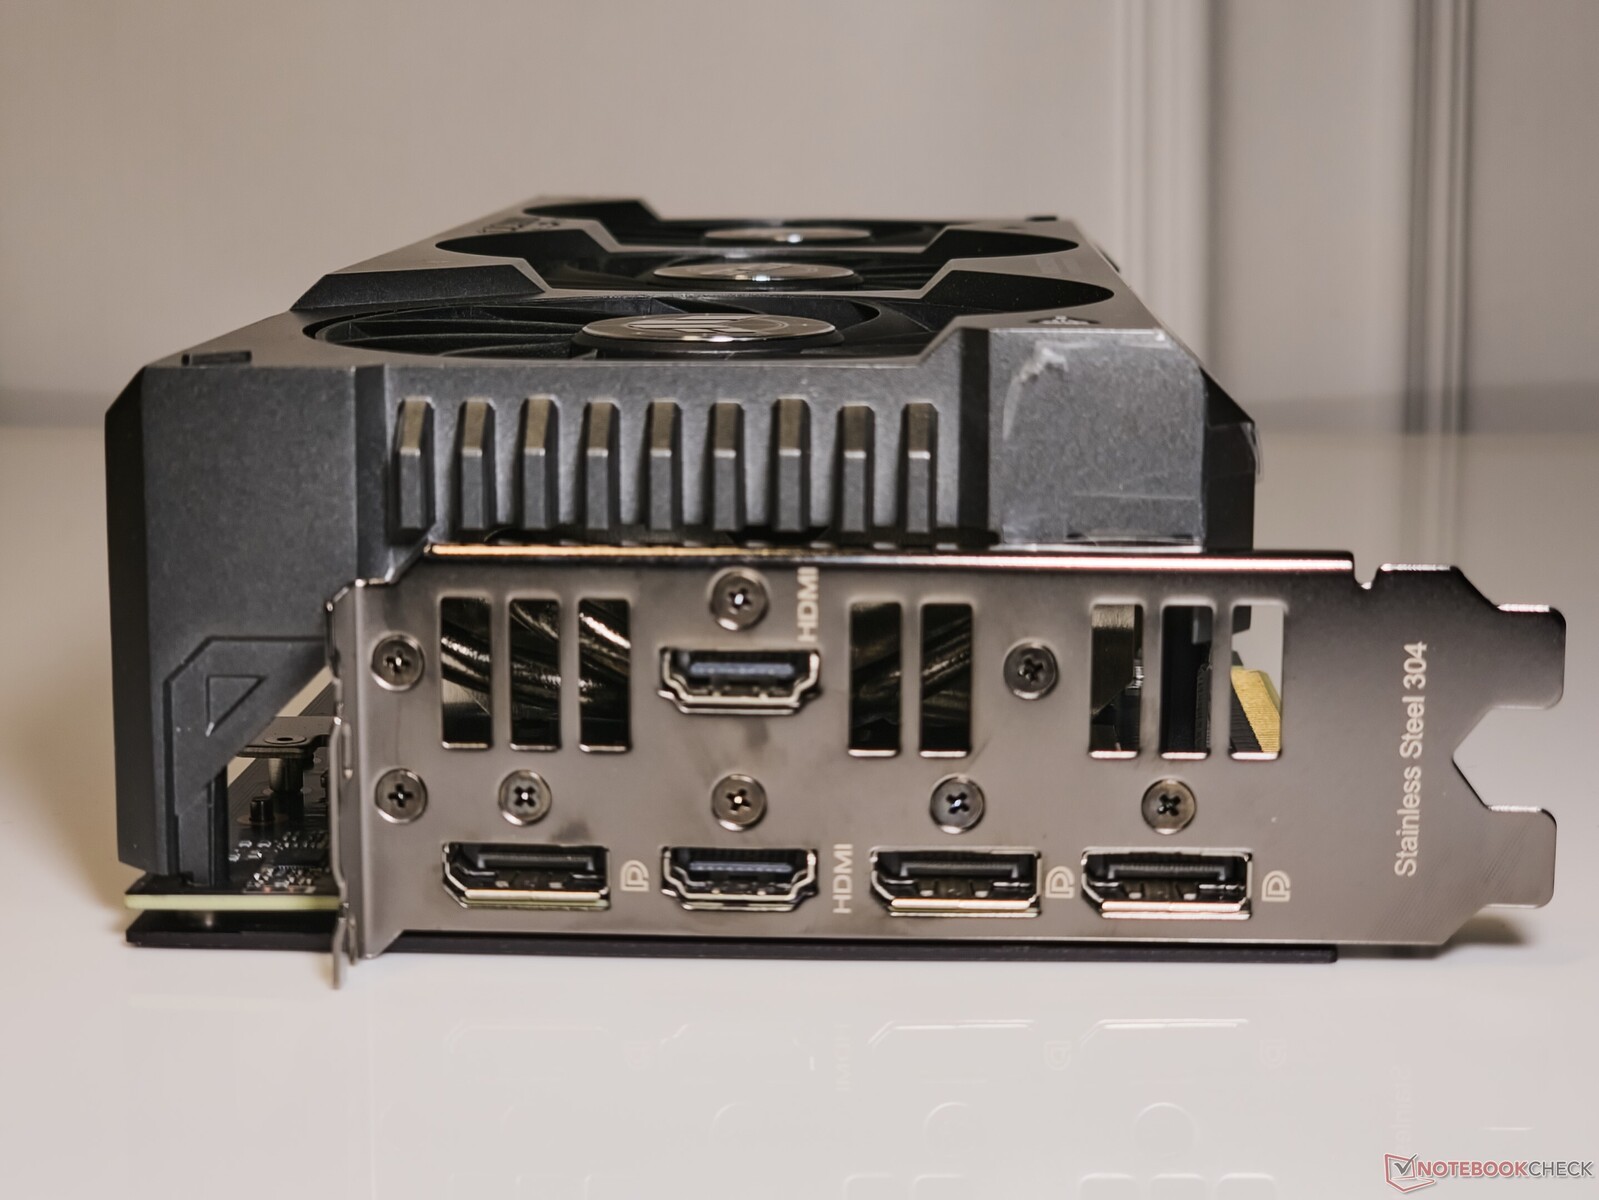
Diğer Asus kartlarının çoğunda olduğu gibi, TUF Gaming GeForce RTX 4070 Ti Super de beş bağlantı noktasıyla birlikte geliyor ki bu, piyasadaki kartların büyük çoğunluğunda pek sık rastlanan bir durum değil.

Her zamanki 3x DisplayPort-1.4 çıkışı ve HDMI 2.1a çıkışının yanı sıra, Asus ayrıca bir TV'yi veya DisplayPort özelliği olmayan ekranları bağlamak için kullanışlı olabilecek ek bir HDMI 2.1a çıkışı bağlantı noktası sunuyor.

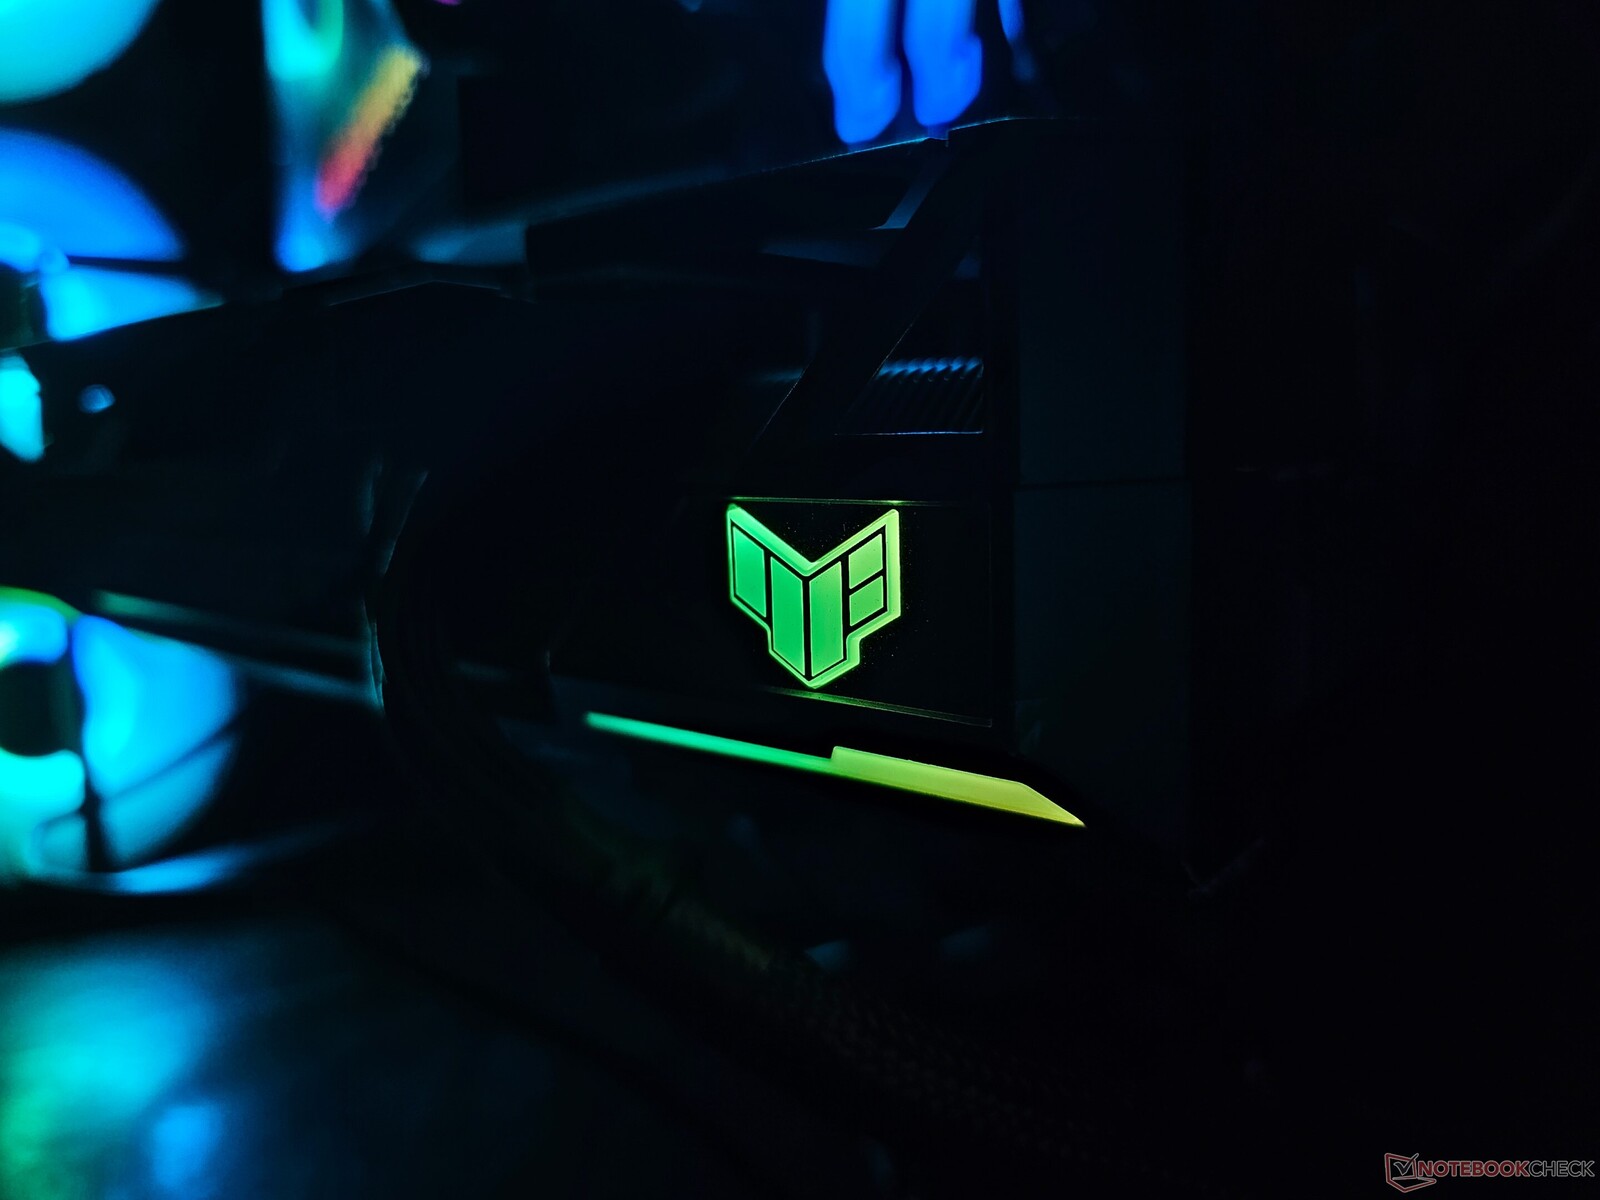
Strix muadillerinin aksine, TUF kartlar daha hafif bir RGB aydınlatmaya sahip. Aydınlatılan tek alan TUF logosu ve altındaki kısa bir ışık çubuğu. Yine de, aydınlatma etkili ve Asus'un GPU Tweak III yazılımı veya Aura Sync uyumlu herhangi bir yardımcı program aracılığıyla özelleştirilebilir.

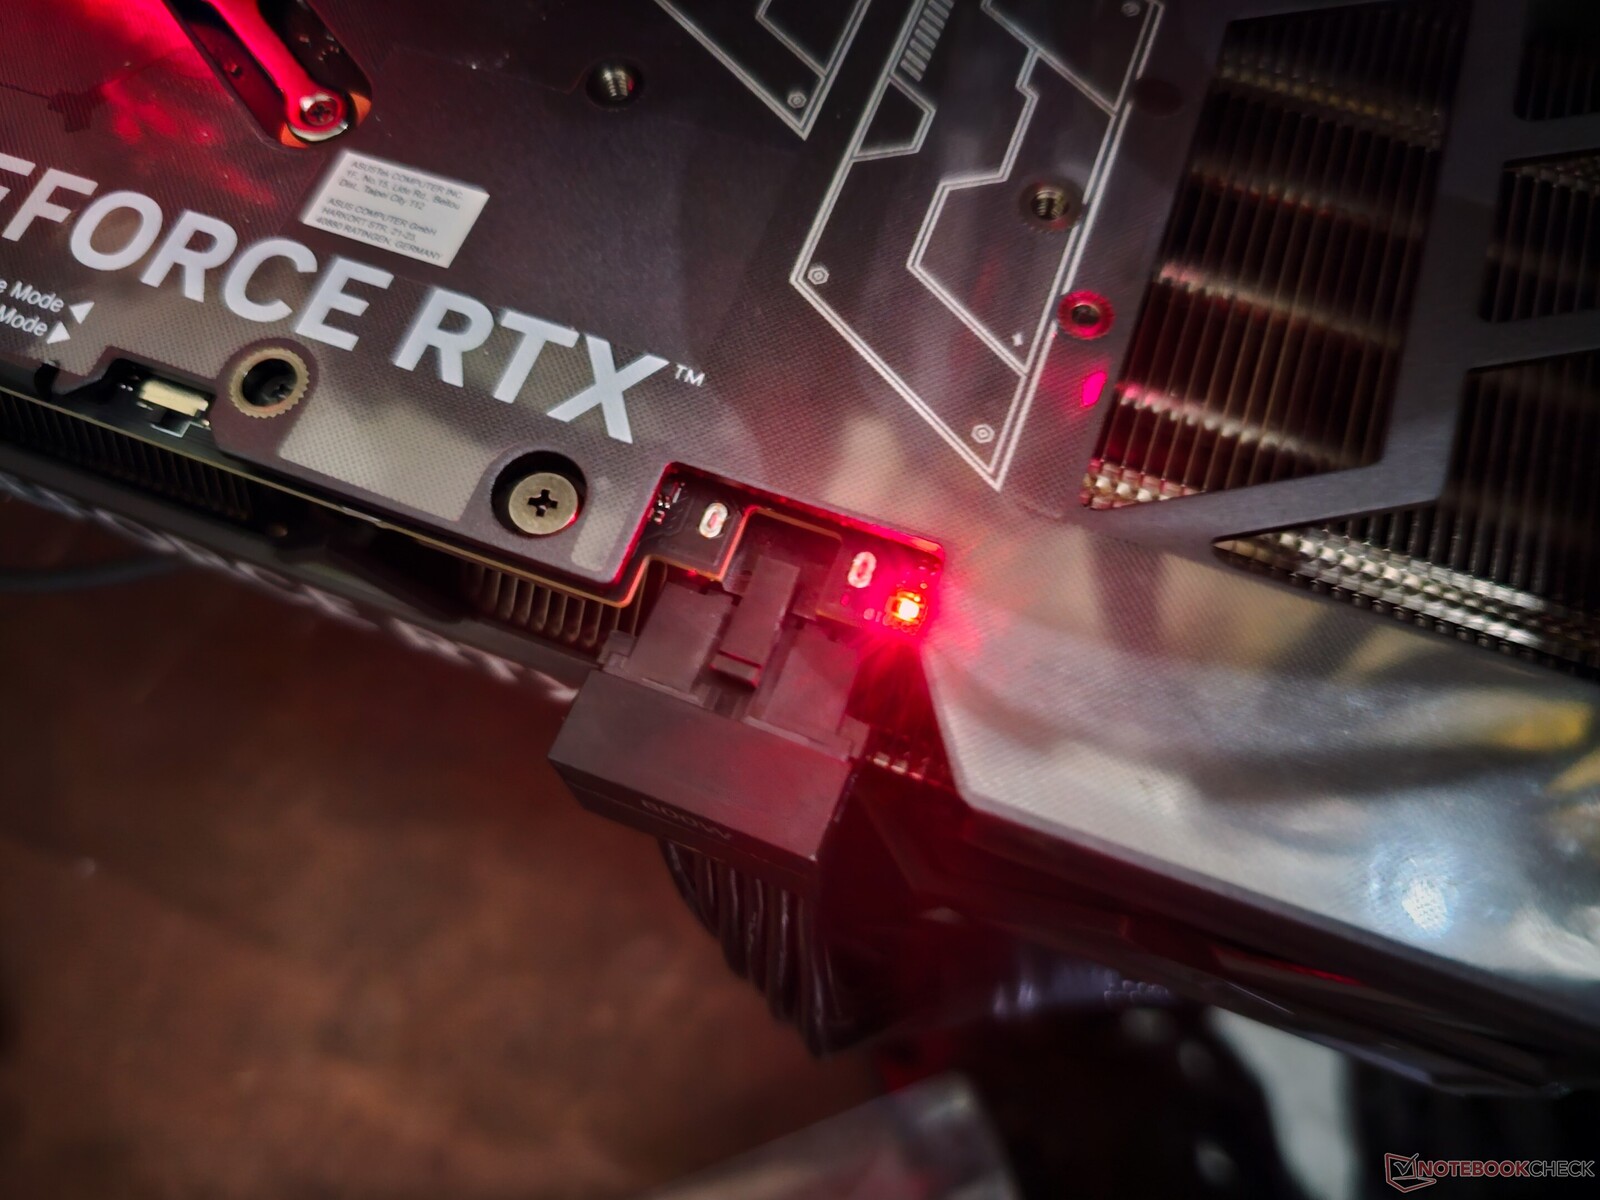
Güç kaynağı standart 12VHPWR konnektörü tarafından sağlanır. Asus, kutuda konektöre tam oturan 12VHPWR - 2x 8 pinli bir adaptör tedarik ediyor.

Güç konektörü ayrıca yanlış bağlantı veya yetersiz güç kaynağını göstermek için yanan kullanışlı bir kırmızı LED göstergeye sahiptir. Ne yazık ki, gösterge sistem kapalıyken bile yanıyor ve bu da kullanıcıların kafasını karıştırabilir.

Asus, Performans ve Sessiz modlar arasında geçiş yapılabilen çift BIOS sistemi sunuyor. Tüm testleri Performans modunda gerçekleştirdik ve fan gürültü seviyelerini karşılaştırmak için Sessiz modu kullandık.

TUF logosunda RGB efektleri
12VHPWR LED göstergesi
Asus TUF Gaming GeForce RTX 4070 Ti Super: Gelen kutusu aksesuarları. (Resim Kaynağı: Asus)

TUF kartları ayrıca aşağıdakileri içeren iyi bir aksesuar setiyle birlikte gelir:

  • TUF koleksiyon kartı
  • 12VHPWR - 2x 8-pin güç adaptörü
  • Teşekkür kartı
  • TUF Oyun Sertifikası
  • Hızlı Başlangıç kılavuzu
  • Garanti bilgileri
  • TUF Velcro kanca ve halka
  • Dahili tornavidalı TUF GPU tutucu

TUF Gaming GeForce RTX 4070 Ti Super, bu GPU için Nvidia referans özelliği olan 2.610 MHz'e kadar nominal bir artışa sahiptir. Bu, orijinal RTX 4070 Ti non-Super ile sunulandan 150 MHz daha düşüktür, ancak temel saat şimdi 30 MHz'lik bir artışla 2.340 MHz'e yükselmiştir.

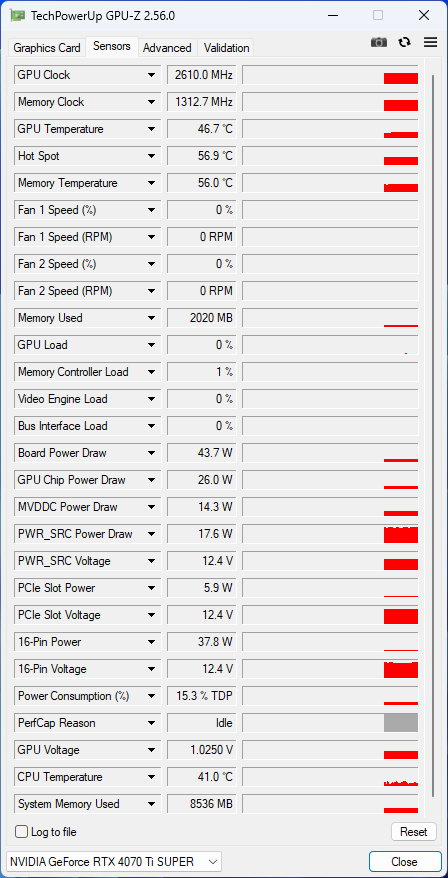
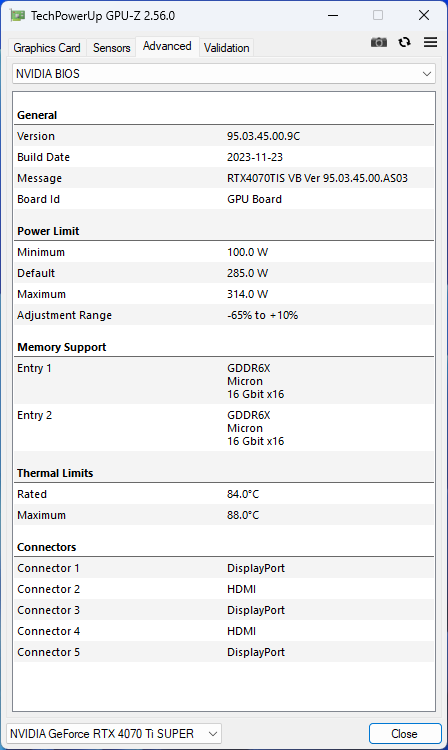
Bellek bant genişliği ve gölgelendirici sayısındaki artışlara rağmen TUF Gaming GeForce RTX 4070 Ti Super, RTX 4070 Ti'ye benzer şekilde 285 W TGP ile çalışıyor.

Güç kullanımını %10 artırarak 314 W'lık daha yüksek bir TGP elde etmek için sınırlı bir potansiyel vardır.

GPU-Z: Asus TUF Gaming GeForce RTX 4070 Ti Super

Test tezgahı: RTX 4070 Ti Super ve Core i9-13900K harika bir ikili oluşturuyor

Test sistemimiz Intel Core i9-13900K ve Z790 platformuna dayanmaktadır. Bu, aşağıdaki bileşenleri içerir:

  • Cooler MasterFrame 700 test tezgahı
  • Intel Core i9-13900K pL1=PL2 ile
  • Gigabyte Z790 Aorus Master anakart
  • Gigabyte Aorus Gen4 2 TB NVMe SSD
  • Sabrent Rocket 4 Plus Gen4 2 TB NVMe SSD
  • 1,40 V'da 32-39-39-80 zamanlamalı 2x 16 GB Kingston Fury Renegade DDR5-6400 RAM
  • Gigabyte M28U 4K 144 Hz monitör
  • Gigabyte Aorus Waterforce X II 360 AiO soğutucu
  • Cooler Master MVE Gold V2 1250 ATX 3.0 tamamen modüler PSU

En son yamalara sahip Windows 11 23H2 ile birlikte Nvidia Game Ready Driver sürüm 551.15 kullanıldı.

Test tezgahını ve PSU'yu sağlayan Cooler Master'a, anakart, CPU, SSD, AiO soğutucu ve monitör için Gigabyte'a, SSD için Sabrent'e ve bellek için Kingston'a teşekkür ederiz.

Sentetik kıyaslamalar: RTX 3090 Ti karşısındaki kazanımlarını sağlamlaştırıyor

Kümülatif sentetik testlerde, TUF Gaming GeForce RTX 4070 Ti Super ile karşılaştırıldığında genel olarak yalnızca %3'lük bir iyileşme görüyoruz RTX 4070 Ti ile karşılaştırıldığında %12'ye kadar RTX 4070 Super Founders Edition.

Bireysel olarak, en iyi kazançlar daha yüksek çözünürlüklerdeki kıyaslamalardan kaynaklanıyor. Örneğin, 3DMark Fire Strike Ultra, RTX 4070 Ti ortalamasına kıyasla %4'lük bir kazanç gösterirken, Unigine Superposition 4K ve 8K Optimized testleri bu deltayı %11'e çıkarıyor.

RTX 4070 Ti Super, Ampere amiral gemisinin daha da önüne geçiyor RTX 3090 Ti %5'lik bir düşüş yaşarken AMD Radeon RX 7900 XT aynı farkla.

Performance Rating
NVIDIA GeForce RTX 4090 Founders Edition
Intel Core i9-13900K, NVIDIA GeForce RTX 4090
99.8 pt
AMD Radeon RX 7900 XTX
AMD Ryzen 9 7950X, AMD Radeon RX 7900 XTX
83 pt
NVIDIA GeForce RTX 4080 Founders Edition
Intel Core i9-13900K, NVIDIA GeForce RTX 4080
81.4 pt
AMD Radeon RX 7900 XT
AMD Ryzen 9 7950X, AMD Radeon RX 7900 XT
73.4 pt
Asus TUF Gaming GeForce RTX 4070 Ti Super
Intel Core i9-13900K, NVIDIA GeForce RTX 4070 Ti SUPER
69.5 pt
Gigabyte Aorus GeForce RTX 4070 Ti Master
Intel Core i9-13900K, NVIDIA GeForce RTX 4070 Ti
68 pt
Asus TUF Gaming GeForce RTX 4070 Ti
Intel Core i9-13900K, NVIDIA GeForce RTX 4070 Ti
67.9 pt
Average NVIDIA GeForce RTX 4070 Ti
 
67.2 pt
Zotac Gaming GeForce RTX 3090 Ti AMP Extreme Holo
AMD Ryzen 7 5800X3D, NVIDIA GeForce RTX 3090 Ti
66.5 pt
Sapphire AMD Radeon RX 6950 XT Nitro+ Pure
AMD Ryzen 9 5900X, AMD Radeon RX 6950 XT
62.8 pt
Gigabyte GeForce RTX 4070 Super Gaming OC 12G
Intel Core i9-13900K, NVIDIA GeForce RTX 4070 SUPER
62.7 pt
Average NVIDIA GeForce RTX 3080 Ti
 
62.1 pt
NVIDIA GeForce RTX 4070 Super Founders Edition
Intel Core i9-13900K, NVIDIA GeForce RTX 4070 SUPER
61.9 pt
Average NVIDIA GeForce RTX 3090
 
61.9 pt
AMD Radeon RX 7800 XT
AMD Ryzen 9 7950X, AMD Radeon RX 7800 XT
57.7 pt
AMD Radeon RX 6900 XT
AMD Ryzen 9 5950X, AMD Radeon RX 6900 XT
56.5 pt
Zotac Gaming GeForce RTX 4070 AMP Airo
Intel Core i9-13900K, NVIDIA GeForce RTX 4070
55 pt
AMD Radeon RX 6800 XT
AMD Ryzen 9 5950X, AMD Radeon RX 6800 XT
53.5 pt
Average NVIDIA GeForce RTX 3080
 
51.7 pt
KFA2 GeForce RTX 3070 Ti SG
AMD Ryzen 9 7950X, NVIDIA GeForce RTX 3070 Ti
50.7 pt
Sapphire Pulse Radeon RX 7700 XT
AMD Ryzen 9 7950X, AMD Radeon RX 7700 XT
49.5 pt
Average of class Desktop
 
49.2 pt
Average NVIDIA Titan RTX
 
48.4 pt
Average NVIDIA GeForce RTX 3070
 
42.2 pt
Average NVIDIA GeForce RTX 4060 Ti 8G
 
41.6 pt
KFA2 GeForce RTX 4060 Ti EX, 16GB GDDR6
AMD Ryzen 9 7950X, NVIDIA GeForce RTX 4060 Ti 16G
40.1 pt
XFX Speedster QICK 308 Radeon RX 7600 Black Edition
AMD Ryzen 9 7950X, AMD Radeon RX 7600
36.4 pt
KFA2 GeForce RTX 4060 1-Click-OC 2X
AMD Ryzen 9 7950X, NVIDIA GeForce RTX 4060
35.4 pt
3DMark 11 / Performance GPU
NVIDIA GeForce RTX 4090 Founders Edition
Intel Core i9-13900K, NVIDIA GeForce RTX 4090
99834 Points +33%
NVIDIA GeForce RTX 4080 Founders Edition
Intel Core i9-13900K, NVIDIA GeForce RTX 4080
86838 Points +16%
AMD Radeon RX 7900 XTX
AMD Ryzen 9 7950X, AMD Radeon RX 7900 XTX
83322 Points +11%
AMD Radeon RX 7900 XT
AMD Ryzen 9 7950X, AMD Radeon RX 7900 XT
77784 Points +4%
Gigabyte Aorus GeForce RTX 4070 Ti Master
Intel Core i9-13900K, NVIDIA GeForce RTX 4070 Ti
76483 Points +2%
Asus TUF Gaming GeForce RTX 4070 Ti
Intel Core i9-13900K, NVIDIA GeForce RTX 4070 Ti
75990 Points +2%
Asus TUF Gaming GeForce RTX 4070 Ti
Intel Core i9-13900K, NVIDIA GeForce RTX 4070 Ti (Quiet BIOS)
75612 Points +1%
Average NVIDIA GeForce RTX 4070 Ti
  (74228 - 76483, n=5)
75509 Points +1%
Asus TUF Gaming GeForce RTX 4070 Ti Super
Intel Core i9-13900K, NVIDIA GeForce RTX 4070 Ti SUPER
74834 Points
Sapphire AMD Radeon RX 6950 XT Nitro+ Pure
AMD Ryzen 9 5900X, AMD Radeon RX 6950 XT
70480 Points -6%
Zotac Gaming GeForce RTX 3090 Ti AMP Extreme Holo
AMD Ryzen 7 5800X3D, NVIDIA GeForce RTX 3090 Ti
69481 Points -7%
Gigabyte GeForce RTX 4070 Super Gaming OC 12G
Intel Core i9-13900K, NVIDIA GeForce RTX 4070 SUPER
68894 Points -8%
NVIDIA GeForce RTX 4070 Super Founders Edition
Intel Core i9-13900K, NVIDIA GeForce RTX 4070 SUPER
67852 Points -9%
AMD Radeon RX 7800 XT
AMD Ryzen 9 7950X, AMD Radeon RX 7800 XT
63292 Points -15%
Average NVIDIA GeForce RTX 3080 Ti
  (59799 - 62189, n=4)
60987 Points -19%
Average NVIDIA GeForce RTX 3090
  (55144 - 66934, n=17)
60853 Points -19%
Zotac Gaming GeForce RTX 4070 AMP Airo
Intel Core i9-13900K, NVIDIA GeForce RTX 4070
59510 Points -20%
AMD Radeon RX 6900 XT
AMD Ryzen 9 5950X, AMD Radeon RX 6900 XT
59119 Points -21%
Sapphire Pulse Radeon RX 7700 XT
AMD Ryzen 9 7950X, AMD Radeon RX 7700 XT
57340 Points -23%
Average NVIDIA GeForce RTX 3080
  (47287 - 57662, n=4)
53094 Points -29%
AMD Radeon RX 6800 XT
AMD Ryzen 9 5950X, AMD Radeon RX 6800 XT
52046 Points -30%
KFA2 GeForce RTX 3070 Ti SG
AMD Ryzen 9 7950X, NVIDIA GeForce RTX 3070 Ti
49760 Points -34%
Average of class Desktop
  (650 - 104464, n=36, last 2 years)
49254 Points -34%
Average NVIDIA Titan RTX
  (43461 - 51863, n=30)
49062 Points -34%
Average NVIDIA GeForce RTX 4060 Ti 8G
  (47481 - 48363, n=3)
47882 Points -36%
XFX Speedster QICK 308 Radeon RX 7600 Black Edition
AMD Ryzen 9 7950X, AMD Radeon RX 7600
43430 Points -42%
KFA2 GeForce RTX 4060 Ti EX, 16GB GDDR6
AMD Ryzen 9 7950X, NVIDIA GeForce RTX 4060 Ti 16G
43112 Points -42%
Average NVIDIA GeForce RTX 3070
  (26812 - 46878, n=9)
40835 Points -45%
KFA2 GeForce RTX 4060 1-Click-OC 2X
AMD Ryzen 9 7950X, NVIDIA GeForce RTX 4060
38191 Points -49%
3DMark / Fire Strike Graphics
AMD Radeon RX 7900 XTX
AMD Ryzen 9 7950X, AMD Radeon RX 7900 XTX
66967 Points +27%
NVIDIA GeForce RTX 4090 Founders Edition
Intel Core i9-13900K, NVIDIA GeForce RTX 4090
65879 Points +25%
AMD Radeon RX 7900 XT
AMD Ryzen 9 7950X, AMD Radeon RX 7900 XT
63712 Points +21%
Sapphire AMD Radeon RX 6950 XT Nitro+ Pure
AMD Ryzen 9 5900X, AMD Radeon RX 6950 XT
60092 Points +14%
NVIDIA GeForce RTX 4080 Founders Edition
Intel Core i9-13900K, NVIDIA GeForce RTX 4080
58893 Points +12%
Asus TUF Gaming GeForce RTX 4070 Ti
Intel Core i9-13900K, NVIDIA GeForce RTX 4070 Ti
53729 Points +2%
Asus TUF Gaming GeForce RTX 4070 Ti
Intel Core i9-13900K, NVIDIA GeForce RTX 4070 Ti (Quiet BIOS)
52903 Points 0%
Average NVIDIA GeForce RTX 4070 Ti
  (52769 - 53736, n=5)
53299 Points +1%
Zotac Gaming GeForce RTX 3090 Ti AMP Extreme Holo
AMD Ryzen 7 5800X3D, NVIDIA GeForce RTX 3090 Ti
53110 Points +1%
Gigabyte Aorus GeForce RTX 4070 Ti Master
Intel Core i9-13900K, NVIDIA GeForce RTX 4070 Ti
52769 Points 0%
Asus TUF Gaming GeForce RTX 4070 Ti Super
Intel Core i9-13900K, NVIDIA GeForce RTX 4070 Ti SUPER
52738 Points
AMD Radeon RX 6900 XT
AMD Ryzen 9 5950X, AMD Radeon RX 6900 XT
50587 Points -4%
AMD Radeon RX 7800 XT
AMD Ryzen 9 7950X, AMD Radeon RX 7800 XT
50181 Points -5%
AMD Radeon RX 6800 XT
AMD Ryzen 9 5950X, AMD Radeon RX 6800 XT
49735 Points -6%
Gigabyte GeForce RTX 4070 Super Gaming OC 12G
Intel Core i9-13900K, NVIDIA GeForce RTX 4070 SUPER
49709 Points -6%
NVIDIA GeForce RTX 4070 Super Founders Edition
Intel Core i9-13900K, NVIDIA GeForce RTX 4070 SUPER
48043 Points -9%
Average NVIDIA GeForce RTX 3080 Ti
  (45785 - 48709, n=4)
47180 Points -11%
Average NVIDIA GeForce RTX 3090
  (41298 - 49282, n=17)
46856 Points -11%
Zotac Gaming GeForce RTX 4070 AMP Airo
Intel Core i9-13900K, NVIDIA GeForce RTX 4070
43583 Points -17%
Sapphire Pulse Radeon RX 7700 XT
AMD Ryzen 9 7950X, AMD Radeon RX 7700 XT
42801 Points -19%
Average NVIDIA GeForce RTX 3080
  (37604 - 40910, n=2)
39257 Points -26%
KFA2 GeForce RTX 3070 Ti SG
AMD Ryzen 9 7950X, NVIDIA GeForce RTX 3070 Ti
37663 Points -29%
Average NVIDIA Titan RTX
  (33377 - 40910, n=30)
36062 Points -32%
Average NVIDIA GeForce RTX 4060 Ti 8G
  (33762 - 34547, n=3)
34185 Points -35%
XFX Speedster QICK 308 Radeon RX 7600 Black Edition
AMD Ryzen 9 7950X, AMD Radeon RX 7600
32404 Points -39%
KFA2 GeForce RTX 4060 Ti EX, 16GB GDDR6
AMD Ryzen 9 7950X, NVIDIA GeForce RTX 4060 Ti 16G
32275 Points -39%
Average of class Desktop
  (523 - 70246, n=34, last 2 years)
31665 Points -40%
Average NVIDIA GeForce RTX 3070
  (20357 - 33270, n=7)
28949 Points -45%
KFA2 GeForce RTX 4060 1-Click-OC 2X
AMD Ryzen 9 7950X, NVIDIA GeForce RTX 4060
28111 Points -47%
3DMark / Fire Strike Ultra Graphics
NVIDIA GeForce RTX 4090 Founders Edition
Intel Core i9-13900K, NVIDIA GeForce RTX 4090
24276 Points +73%
AMD Radeon RX 7900 XTX
AMD Ryzen 9 7950X, AMD Radeon RX 7900 XTX
20214 Points +44%
NVIDIA GeForce RTX 4080 Founders Edition
Intel Core i9-13900K, NVIDIA GeForce RTX 4080
17122 Points +22%
AMD Radeon RX 7900 XT
AMD Ryzen 9 7950X, AMD Radeon RX 7900 XT
17078 Points +22%
Sapphire AMD Radeon RX 6950 XT Nitro+ Pure
AMD Ryzen 9 5900X, AMD Radeon RX 6950 XT
14978 Points +7%
Zotac Gaming GeForce RTX 3090 Ti AMP Extreme Holo
AMD Ryzen 7 5800X3D, NVIDIA GeForce RTX 3090 Ti
14026 Points 0%
Asus TUF Gaming GeForce RTX 4070 Ti Super
Intel Core i9-13900K, NVIDIA GeForce RTX 4070 Ti SUPER
13998 Points
Gigabyte Aorus GeForce RTX 4070 Ti Master
Intel Core i9-13900K, NVIDIA GeForce RTX 4070 Ti
13616 Points -3%
Asus TUF Gaming GeForce RTX 4070 Ti
Intel Core i9-13900K, NVIDIA GeForce RTX 4070 Ti
13546 Points -3%
Asus TUF Gaming GeForce RTX 4070 Ti
Intel Core i9-13900K, NVIDIA GeForce RTX 4070 Ti (Quiet BIOS)
13487 Points -4%
Average NVIDIA GeForce RTX 4070 Ti
  (13112 - 13616, n=5)
13390 Points -4%
AMD Radeon RX 6900 XT
AMD Ryzen 9 5950X, AMD Radeon RX 6900 XT
13370 Points -4%
AMD Radeon RX 6800 XT
AMD Ryzen 9 5950X, AMD Radeon RX 6800 XT
12626 Points -10%
AMD Radeon RX 7800 XT
AMD Ryzen 9 7950X, AMD Radeon RX 7800 XT
12529 Points -10%
Gigabyte GeForce RTX 4070 Super Gaming OC 12G
Intel Core i9-13900K, NVIDIA GeForce RTX 4070 SUPER
12389 Points -11%
Average NVIDIA GeForce RTX 3090
  (11613 - 12587, n=14)
12289 Points -12%
Average NVIDIA GeForce RTX 3080 Ti
  (12050 - 12341, n=4)
12173 Points -13%
NVIDIA GeForce RTX 4070 Super Founders Edition
Intel Core i9-13900K, NVIDIA GeForce RTX 4070 SUPER
12086 Points -14%
Average NVIDIA GeForce RTX 3080
  (10645 - 10793, n=2)
10719 Points -23%
Sapphire Pulse Radeon RX 7700 XT
AMD Ryzen 9 7950X, AMD Radeon RX 7700 XT
10596 Points -24%
Average of class Desktop
  (141 - 24650, n=24, last 2 years)
10444 Points -25%
Zotac Gaming GeForce RTX 4070 AMP Airo
Intel Core i9-13900K, NVIDIA GeForce RTX 4070
10103 Points -28%
KFA2 GeForce RTX 3070 Ti SG
AMD Ryzen 9 7950X, NVIDIA GeForce RTX 3070 Ti
9301 Points -34%
Average NVIDIA Titan RTX
  (8461 - 10793, n=29)
8868 Points -37%
Average NVIDIA GeForce RTX 3070
  (8043 - 8483, n=5)
8250 Points -41%
XFX Speedster QICK 308 Radeon RX 7600 Black Edition
AMD Ryzen 9 7950X, AMD Radeon RX 7600
7305 Points -48%
Average NVIDIA GeForce RTX 4060 Ti 8G
  (7152 - 7298, n=3)
7223 Points -48%
KFA2 GeForce RTX 4060 Ti EX, 16GB GDDR6
AMD Ryzen 9 7950X, NVIDIA GeForce RTX 4060 Ti 16G
7058 Points -50%
KFA2 GeForce RTX 4060 1-Click-OC 2X
AMD Ryzen 9 7950X, NVIDIA GeForce RTX 4060
5668 Points -60%
3DMark / Fire Strike Extreme Graphics
NVIDIA GeForce RTX 4090 Founders Edition
Intel Core i9-13900K, NVIDIA GeForce RTX 4090
44295 Points +58%
AMD Radeon RX 7900 XTX
AMD Ryzen 9 7950X, AMD Radeon RX 7900 XTX
39570 Points +41%
AMD Radeon RX 7900 XT
AMD Ryzen 9 7950X, AMD Radeon RX 7900 XT
33747 Points +21%
NVIDIA GeForce RTX 4080 Founders Edition
Intel Core i9-13900K, NVIDIA GeForce RTX 4080
33475 Points +20%
Sapphire AMD Radeon RX 6950 XT Nitro+ Pure
AMD Ryzen 9 5900X, AMD Radeon RX 6950 XT
29704 Points +6%
Asus TUF Gaming GeForce RTX 4070 Ti Super
Intel Core i9-13900K, NVIDIA GeForce RTX 4070 Ti SUPER
27984 Points
Gigabyte Aorus GeForce RTX 4070 Ti Master
Intel Core i9-13900K, NVIDIA GeForce RTX 4070 Ti
27167 Points -3%
Asus TUF Gaming GeForce RTX 4070 Ti
Intel Core i9-13900K, NVIDIA GeForce RTX 4070 Ti
26970 Points -4%
Asus TUF Gaming GeForce RTX 4070 Ti
Intel Core i9-13900K, NVIDIA GeForce RTX 4070 Ti (Quiet BIOS)
26925 Points -4%
Average NVIDIA GeForce RTX 4070 Ti
  (26470 - 27167, n=5)
26845 Points -4%
Zotac Gaming GeForce RTX 3090 Ti AMP Extreme Holo
AMD Ryzen 7 5800X3D, NVIDIA GeForce RTX 3090 Ti
26797 Points -4%
AMD Radeon RX 6900 XT
AMD Ryzen 9 5950X, AMD Radeon RX 6900 XT
26650 Points -5%
AMD Radeon RX 7800 XT
AMD Ryzen 9 7950X, AMD Radeon RX 7800 XT
25279 Points -10%
AMD Radeon RX 6800 XT
AMD Ryzen 9 5950X, AMD Radeon RX 6800 XT
25015 Points -11%
Gigabyte GeForce RTX 4070 Super Gaming OC 12G
Intel Core i9-13900K, NVIDIA GeForce RTX 4070 SUPER
24874 Points -11%
NVIDIA GeForce RTX 4070 Super Founders Edition
Intel Core i9-13900K, NVIDIA GeForce RTX 4070 SUPER
24154 Points -14%
Average NVIDIA GeForce RTX 3090
  (22075 - 24730, n=14)
23806 Points -15%
Average NVIDIA GeForce RTX 3080 Ti
  (23127 - 24250, n=4)
23668 Points -15%
Zotac Gaming GeForce RTX 4070 AMP Airo
Intel Core i9-13900K, NVIDIA GeForce RTX 4070
21053 Points -25%
Sapphire Pulse Radeon RX 7700 XT
AMD Ryzen 9 7950X, AMD Radeon RX 7700 XT
21006 Points -25%
Average NVIDIA GeForce RTX 3080
  (20007 - 20861, n=2)
20434 Points -27%
Average of class Desktop
  (1053 - 44549, n=24, last 2 years)
20318 Points -27%
KFA2 GeForce RTX 3070 Ti SG
AMD Ryzen 9 7950X, NVIDIA GeForce RTX 3070 Ti
18417 Points -34%
Average NVIDIA Titan RTX
  (16484 - 20861, n=29)
17649 Points -37%
Average NVIDIA GeForce RTX 4060 Ti 8G
  (15846 - 16250, n=3)
16051 Points -43%
Average NVIDIA GeForce RTX 3070
  (15503 - 16276, n=5)
15859 Points -43%
KFA2 GeForce RTX 4060 Ti EX, 16GB GDDR6
AMD Ryzen 9 7950X, NVIDIA GeForce RTX 4060 Ti 16G
15511 Points -45%
XFX Speedster QICK 308 Radeon RX 7600 Black Edition
AMD Ryzen 9 7950X, AMD Radeon RX 7600
14966 Points -47%
KFA2 GeForce RTX 4060 1-Click-OC 2X
AMD Ryzen 9 7950X, NVIDIA GeForce RTX 4060
13086 Points -53%
3DMark / Time Spy Graphics
NVIDIA GeForce RTX 4090 Founders Edition
Intel Core i9-13900K, NVIDIA GeForce RTX 4090
36101 Points +52%
AMD Radeon RX 7900 XTX
AMD Ryzen 9 7950X, AMD Radeon RX 7900 XTX
29699 Points +25%
NVIDIA GeForce RTX 4080 Founders Edition
Intel Core i9-13900K, NVIDIA GeForce RTX 4080
28133 Points +19%
AMD Radeon RX 7900 XT
AMD Ryzen 9 7950X, AMD Radeon RX 7900 XT
25874 Points +9%
Asus TUF Gaming GeForce RTX 4070 Ti Super
Intel Core i9-13900K, NVIDIA GeForce RTX 4070 Ti SUPER
23695 Points
Gigabyte Aorus GeForce RTX 4070 Ti Master
Intel Core i9-13900K, NVIDIA GeForce RTX 4070 Ti
23136 Points -2%
Asus TUF Gaming GeForce RTX 4070 Ti
Intel Core i9-13900K, NVIDIA GeForce RTX 4070 Ti
22982 Points -3%
Asus TUF Gaming GeForce RTX 4070 Ti
Intel Core i9-13900K, NVIDIA GeForce RTX 4070 Ti (Quiet BIOS)
22949 Points -3%
Average NVIDIA GeForce RTX 4070 Ti
  (22304 - 23136, n=5)
22791 Points -4%
Sapphire AMD Radeon RX 6950 XT Nitro+ Pure
AMD Ryzen 9 5900X, AMD Radeon RX 6950 XT
21719 Points -8%
Zotac Gaming GeForce RTX 3090 Ti AMP Extreme Holo
AMD Ryzen 7 5800X3D, NVIDIA GeForce RTX 3090 Ti
21645 Points -9%
Gigabyte GeForce RTX 4070 Super Gaming OC 12G
Intel Core i9-13900K, NVIDIA GeForce RTX 4070 SUPER
21117 Points -11%
NVIDIA GeForce RTX 4070 Super Founders Edition
Intel Core i9-13900K, NVIDIA GeForce RTX 4070 SUPER
20867 Points -12%
AMD Radeon RX 7800 XT
AMD Ryzen 9 7950X, AMD Radeon RX 7800 XT
19369 Points -18%
Average NVIDIA GeForce RTX 3090
  (18685 - 20433, n=17)
19266 Points -19%
Average NVIDIA GeForce RTX 3080 Ti
  (19041 - 19460, n=4)
19237 Points -19%
AMD Radeon RX 6900 XT
AMD Ryzen 9 5950X, AMD Radeon RX 6900 XT
18210 Points -23%
Zotac Gaming GeForce RTX 4070 AMP Airo
Intel Core i9-13900K, NVIDIA GeForce RTX 4070
17847 Points -25%
AMD Radeon RX 6800 XT
AMD Ryzen 9 5950X, AMD Radeon RX 6800 XT
17603 Points -26%
Average NVIDIA GeForce RTX 3080
  (17467 - 17604, n=2)
17536 Points -26%
Average of class Desktop
  (173 - 37589, n=33, last 2 years)
17279 Points -27%
Sapphire Pulse Radeon RX 7700 XT
AMD Ryzen 9 7950X, AMD Radeon RX 7700 XT
16777 Points -29%
Average NVIDIA Titan RTX
  (14216 - 15283, n=29)
14884 Points -37%
KFA2 GeForce RTX 3070 Ti SG
AMD Ryzen 9 7950X, NVIDIA GeForce RTX 3070 Ti
14783 Points -38%
Average NVIDIA GeForce RTX 4060 Ti 8G
  (13293 - 13549, n=3)
13423 Points -43%
KFA2 GeForce RTX 4060 Ti EX, 16GB GDDR6
AMD Ryzen 9 7950X, NVIDIA GeForce RTX 4060 Ti 16G
13359 Points -44%
Average NVIDIA GeForce RTX 3070
  (11043 - 13579, n=7)
12616 Points -47%
XFX Speedster QICK 308 Radeon RX 7600 Black Edition
AMD Ryzen 9 7950X, AMD Radeon RX 7600
11062 Points -53%
KFA2 GeForce RTX 4060 1-Click-OC 2X
AMD Ryzen 9 7950X, NVIDIA GeForce RTX 4060
10494 Points -56%
Unigine Heaven 4.0 / Extreme Preset DX11
NVIDIA GeForce RTX 4090 Founders Edition
Intel Core i9-13900K, NVIDIA GeForce RTX 4090
466 (11min - 1031max) fps +49%
NVIDIA GeForce RTX 4080 Founders Edition
Intel Core i9-13900K, NVIDIA GeForce RTX 4080
389.4 (11.3min - 813.1max) fps +25%
AMD Radeon RX 7900 XTX
AMD Ryzen 9 7950X, AMD Radeon RX 7900 XTX
357.6 fps +15%
AMD Radeon RX 7900 XT
AMD Ryzen 9 7950X, AMD Radeon RX 7900 XT
319.7 fps +3%
Gigabyte Aorus GeForce RTX 4070 Ti Master
Intel Core i9-13900K, NVIDIA GeForce RTX 4070 Ti
317.9 (52.3min - 701.6max) fps +2%
Asus TUF Gaming GeForce RTX 4070 Ti
Intel Core i9-13900K, NVIDIA GeForce RTX 4070 Ti
317.6 (57.8min - 692.1max) fps +2%
Average NVIDIA GeForce RTX 4070 Ti
  (312 - 319, n=4)
317 fps +2%
Asus TUF Gaming GeForce RTX 4070 Ti Super
Intel Core i9-13900K, NVIDIA GeForce RTX 4070 Ti SUPER
311.9 (47.1min - 651.4max) fps
Zotac Gaming GeForce RTX 3090 Ti AMP Extreme Holo
AMD Ryzen 7 5800X3D, NVIDIA GeForce RTX 3090 Ti
308.5 (9.7min - 627.1max) fps -1%
Average NVIDIA GeForce RTX 3090
  (272 - 315, n=11)
300 fps -4%
Average NVIDIA GeForce RTX 3080 Ti
  (290 - 312, n=4)
300 fps -4%
Sapphire AMD Radeon RX 6950 XT Nitro+ Pure
AMD Ryzen 9 5900X, AMD Radeon RX 6950 XT
293.8 fps -6%
Gigabyte GeForce RTX 4070 Super Gaming OC 12G
Intel Core i9-13900K, NVIDIA GeForce RTX 4070 SUPER
280.8 (51.7min - 649.1max) fps -10%
NVIDIA GeForce RTX 4070 Super Founders Edition
Intel Core i9-13900K, NVIDIA GeForce RTX 4070 SUPER
276.1 (50.9min - 603max) fps -11%
AMD Radeon RX 6900 XT
AMD Ryzen 9 5950X, AMD Radeon RX 6900 XT
259.5 (49.3min - 537.2max) fps -17%
Zotac Gaming GeForce RTX 4070 AMP Airo
Intel Core i9-13900K, NVIDIA GeForce RTX 4070
248 (11min - 572.3max) fps -20%
AMD Radeon RX 6800 XT
AMD Ryzen 9 5950X, AMD Radeon RX 6800 XT
247.9 fps -21%
KFA2 GeForce RTX 3070 Ti SG
AMD Ryzen 9 7950X, NVIDIA GeForce RTX 3070 Ti
244.2 fps -22%
Average NVIDIA GeForce RTX 3080
  (233 - 253, n=2)
243 fps -22%
AMD Radeon RX 7800 XT
AMD Ryzen 9 7950X, AMD Radeon RX 7800 XT
242.7 fps -22%
Average NVIDIA Titan RTX
  (207 - 248, n=12)
236 fps -24%
Average of class Desktop
  (4.5 - 472, n=24, last 2 years)
220 fps -29%
Sapphire Pulse Radeon RX 7700 XT
AMD Ryzen 9 7950X, AMD Radeon RX 7700 XT
211.7 fps -32%
Average NVIDIA GeForce RTX 3070
  (196.4 - 214, n=5)
206 fps -34%
Average NVIDIA GeForce RTX 4060 Ti 8G
  (178.9 - 181.6, n=3)
180.6 fps -42%
KFA2 GeForce RTX 4060 Ti EX, 16GB GDDR6
AMD Ryzen 9 7950X, NVIDIA GeForce RTX 4060 Ti 16G
174.8 fps -44%
KFA2 GeForce RTX 4060 1-Click-OC 2X
AMD Ryzen 9 7950X, NVIDIA GeForce RTX 4060
153.7 fps -51%
XFX Speedster QICK 308 Radeon RX 7600 Black Edition
AMD Ryzen 9 7950X, AMD Radeon RX 7600
148.1 fps -53%
Unigine Heaven 4.0 / Extreme Preset OpenGL
NVIDIA GeForce RTX 4090 Founders Edition
Intel Core i9-13900K, NVIDIA GeForce RTX 4090
443 (15min - 902max) fps +43%
AMD Radeon RX 7900 XTX
AMD Ryzen 9 7950X, AMD Radeon RX 7900 XTX
370.2 fps +19%
NVIDIA GeForce RTX 4080 Founders Edition
Intel Core i9-13900K, NVIDIA GeForce RTX 4080
364.2 (15min - 770.5max) fps +17%
AMD Radeon RX 7900 XT
AMD Ryzen 9 7950X, AMD Radeon RX 7900 XT
330.2 fps +6%
Asus TUF Gaming GeForce RTX 4070 Ti Super
Intel Core i9-13900K, NVIDIA GeForce RTX 4070 Ti SUPER
310.3 (14.5min - 698.3max) fps
Gigabyte Aorus GeForce RTX 4070 Ti Master
Intel Core i9-13900K, NVIDIA GeForce RTX 4070 Ti
295.5 (50.3min - 602max) fps -5%
Average NVIDIA GeForce RTX 4070 Ti
  (291 - 297, n=4)
294 fps -5%
Asus TUF Gaming GeForce RTX 4070 Ti
Intel Core i9-13900K, NVIDIA GeForce RTX 4070 Ti
292.6 (15.2min - 600.3max) fps -6%
Zotac Gaming GeForce RTX 3090 Ti AMP Extreme Holo
AMD Ryzen 7 5800X3D, NVIDIA GeForce RTX 3090 Ti
292.5 (11.4min - 577.9max) fps -6%
Gigabyte GeForce RTX 4070 Super Gaming OC 12G
Intel Core i9-13900K, NVIDIA GeForce RTX 4070 SUPER
279.9 (14.2min - 655.5max) fps -10%
NVIDIA GeForce RTX 4070 Super Founders Edition
Intel Core i9-13900K, NVIDIA GeForce RTX 4070 SUPER
276.1 (57.7min - 579max) fps -11%
Average NVIDIA GeForce RTX 3080 Ti
  (264 - 282, n=4)
274 fps -12%
Average NVIDIA GeForce RTX 3090
  (188.2 - 284, n=10)
270 fps -13%
AMD Radeon RX 7800 XT
AMD Ryzen 9 7950X, AMD Radeon RX 7800 XT
257.9 fps -17%
Average NVIDIA GeForce RTX 3080
  (232 - 243, n=2)
238 fps -23%
Zotac Gaming GeForce RTX 4070 AMP Airo
Intel Core i9-13900K, NVIDIA GeForce RTX 4070
230.2 (14.6min - 500.6max) fps -26%
Average NVIDIA Titan RTX
  (203 - 299, n=12)
223 fps -28%
Sapphire AMD Radeon RX 6950 XT Nitro+ Pure
AMD Ryzen 9 5900X, AMD Radeon RX 6950 XT
222.7 fps -28%
KFA2 GeForce RTX 3070 Ti SG
AMD Ryzen 9 7950X, NVIDIA GeForce RTX 3070 Ti
218.8 fps -29%
Sapphire Pulse Radeon RX 7700 XT
AMD Ryzen 9 7950X, AMD Radeon RX 7700 XT
213.2 fps -31%
Average of class Desktop
  (4 - 450, n=24, last 2 years)
209 fps -33%
AMD Radeon RX 6900 XT
AMD Ryzen 9 5950X, AMD Radeon RX 6900 XT
206.5 (8.2min - 453.7max) fps -33%
AMD Radeon RX 6800 XT
AMD Ryzen 9 5950X, AMD Radeon RX 6800 XT
204 fps -34%
Average NVIDIA GeForce RTX 3070
  (187.5 - 196.1, n=4)
192.5 fps -38%
Average NVIDIA GeForce RTX 4060 Ti 8G
  (173 - 176, n=3)
174.7 fps -44%
KFA2 GeForce RTX 4060 Ti EX, 16GB GDDR6
AMD Ryzen 9 7950X, NVIDIA GeForce RTX 4060 Ti 16G
170.3 fps -45%
XFX Speedster QICK 308 Radeon RX 7600 Black Edition
AMD Ryzen 9 7950X, AMD Radeon RX 7600
147.2 fps -53%
KFA2 GeForce RTX 4060 1-Click-OC 2X
AMD Ryzen 9 7950X, NVIDIA GeForce RTX 4060
147 fps -53%
Unigine Valley 1.0 / Extreme HD DirectX
NVIDIA GeForce RTX 4090 Founders Edition
Intel Core i9-13900K, NVIDIA GeForce RTX 4090
283 (80min - 527max) fps +17%
NVIDIA GeForce RTX 4080 Founders Edition
Intel Core i9-13900K, NVIDIA GeForce RTX 4080
277.5 (71.7min - 487.9max) fps +14%
AMD Radeon RX 7900 XTX
AMD Ryzen 9 7950X, AMD Radeon RX 7900 XTX
264.5 fps +9%
AMD Radeon RX 7900 XT
AMD Ryzen 9 7950X, AMD Radeon RX 7900 XT
243.3 fps 0%
Asus TUF Gaming GeForce RTX 4070 Ti Super
Intel Core i9-13900K, NVIDIA GeForce RTX 4070 Ti SUPER
242.6 (75.4min - 480.6max) fps
Asus TUF Gaming GeForce RTX 4070 Ti
Intel Core i9-13900K, NVIDIA GeForce RTX 4070 Ti
230.3 (78.9min - 451.1max) fps -5%
Average NVIDIA GeForce RTX 3080 Ti
  (206 - 240, n=4)
228 fps -6%
Average NVIDIA GeForce RTX 3090
  (184.2 - 247, n=11)
225 fps -7%
Average NVIDIA GeForce RTX 4070 Ti
  (208 - 230, n=4)
218 fps -10%
Gigabyte GeForce RTX 4070 Super Gaming OC 12G
Intel Core i9-13900K, NVIDIA GeForce RTX 4070 SUPER
215.3 (73.3min - 409.2max) fps -11%
NVIDIA GeForce RTX 4070 Super Founders Edition
Intel Core i9-13900K, NVIDIA GeForce RTX 4070 SUPER
213.8 (75min - 414.5max) fps -12%
Sapphire AMD Radeon RX 6950 XT Nitro+ Pure
AMD Ryzen 9 5900X, AMD Radeon RX 6950 XT
209.2 fps -14%
Gigabyte Aorus GeForce RTX 4070 Ti Master
Intel Core i9-13900K, NVIDIA GeForce RTX 4070 Ti
207.5 (75.3min - 371.2max) fps -14%
Zotac Gaming GeForce RTX 3090 Ti AMP Extreme Holo
AMD Ryzen 7 5800X3D, NVIDIA GeForce RTX 3090 Ti
201.7 (48.5min - 338.7max) fps -17%
AMD Radeon RX 6900 XT
AMD Ryzen 9 5950X, AMD Radeon RX 6900 XT
200.8 (53.4min - 359.1max) fps -17%
Zotac Gaming GeForce RTX 4070 AMP Airo
Intel Core i9-13900K, NVIDIA GeForce RTX 4070
195.2 (57.6min - 374.2max) fps -20%
KFA2 GeForce RTX 3070 Ti SG
AMD Ryzen 9 7950X, NVIDIA GeForce RTX 3070 Ti
193.2 fps -20%
AMD Radeon RX 7800 XT
AMD Ryzen 9 7950X, AMD Radeon RX 7800 XT
191.3 fps -21%
AMD Radeon RX 6800 XT
AMD Ryzen 9 5950X, AMD Radeon RX 6800 XT
190.6 fps -21%
Average NVIDIA GeForce RTX 3080
  (176.2 - 181.8, n=2)
179 fps -26%
Average NVIDIA Titan RTX
  (135 - 191.4, n=12)
173.3 fps -29%
Average NVIDIA GeForce RTX 3070
  (155.1 - 168.5, n=5)
161.2 fps -34%
Sapphire Pulse Radeon RX 7700 XT
AMD Ryzen 9 7950X, AMD Radeon RX 7700 XT
160.1 fps -34%
Average of class Desktop
  (3.7 - 292, n=24, last 2 years)
158.9 fps -35%
Average NVIDIA GeForce RTX 4060 Ti 8G
  (128.3 - 131.2, n=3)
129.8 fps -46%
KFA2 GeForce RTX 4060 Ti EX, 16GB GDDR6
AMD Ryzen 9 7950X, NVIDIA GeForce RTX 4060 Ti 16G
127.8 fps -47%
KFA2 GeForce RTX 4060 1-Click-OC 2X
AMD Ryzen 9 7950X, NVIDIA GeForce RTX 4060
115.3 fps -52%
XFX Speedster QICK 308 Radeon RX 7600 Black Edition
AMD Ryzen 9 7950X, AMD Radeon RX 7600
107.5 fps -56%
Unigine Valley 1.0 / Extreme HD Preset OpenGL
NVIDIA GeForce RTX 4090 Founders Edition
Intel Core i9-13900K, NVIDIA GeForce RTX 4090
315 (64min - 559max) fps +36%
NVIDIA GeForce RTX 4080 Founders Edition
Intel Core i9-13900K, NVIDIA GeForce RTX 4080
257 (79.3min - 462.8max) fps +11%
AMD Radeon RX 7900 XTX
AMD Ryzen 9 7950X, AMD Radeon RX 7900 XTX
254.2 fps +10%
Asus TUF Gaming GeForce RTX 4070 Ti Super
Intel Core i9-13900K, NVIDIA GeForce RTX 4070 Ti SUPER
232.1 (62.3min - 435.4max) fps
Gigabyte Aorus GeForce RTX 4070 Ti Master
Intel Core i9-13900K, NVIDIA GeForce RTX 4070 Ti
230.9 (56.3min - 480.2max) fps -1%
AMD Radeon RX 7900 XT
AMD Ryzen 9 7950X, AMD Radeon RX 7900 XT
225.9 fps -3%
Zotac Gaming GeForce RTX 3090 Ti AMP Extreme Holo
AMD Ryzen 7 5800X3D, NVIDIA GeForce RTX 3090 Ti
208.4 (49.3min - 353max) fps -10%
Average NVIDIA GeForce RTX 4070 Ti
  (197.4 - 231, n=4)
208 fps -10%
Asus TUF Gaming GeForce RTX 4070 Ti
Intel Core i9-13900K, NVIDIA GeForce RTX 4070 Ti
206.8 (64.6min - 374.1max) fps -11%
Average NVIDIA GeForce RTX 3080 Ti
  (195.1 - 210, n=4)
204 fps -12%
Average NVIDIA GeForce RTX 3090
  (158.8 - 226, n=10)
203 fps -13%
NVIDIA GeForce RTX 4070 Super Founders Edition
Intel Core i9-13900K, NVIDIA GeForce RTX 4070 SUPER
200.4 (62.1min - 392.1max) fps -14%
Gigabyte GeForce RTX 4070 Super Gaming OC 12G
Intel Core i9-13900K, NVIDIA GeForce RTX 4070 SUPER
200 (63.6min - 393.8max) fps -14%
AMD Radeon RX 7800 XT
AMD Ryzen 9 7950X, AMD Radeon RX 7800 XT
182 fps -22%
Sapphire AMD Radeon RX 6950 XT Nitro+ Pure
AMD Ryzen 9 5900X, AMD Radeon RX 6950 XT
176.9 fps -24%
Zotac Gaming GeForce RTX 4070 AMP Airo
Intel Core i9-13900K, NVIDIA GeForce RTX 4070
171.8 (61.5min - 301.3max) fps -26%
Average NVIDIA GeForce RTX 3080
  (163.8 - 172, n=2)
167.9 fps -28%
AMD Radeon RX 6900 XT
AMD Ryzen 9 5950X, AMD Radeon RX 6900 XT
167.4 (56.7min - 375.7max) fps -28%
KFA2 GeForce RTX 3070 Ti SG
AMD Ryzen 9 7950X, NVIDIA GeForce RTX 3070 Ti
165.2 fps -29%
AMD Radeon RX 6800 XT
AMD Ryzen 9 5950X, AMD Radeon RX 6800 XT
158.2 fps -32%
Average NVIDIA Titan RTX
  (139.2 - 181.2, n=12)
158.1 fps -32%
Average of class Desktop
  (3.4 - 315, n=24, last 2 years)
151.3 fps -35%
Sapphire Pulse Radeon RX 7700 XT
AMD Ryzen 9 7950X, AMD Radeon RX 7700 XT
143 fps -38%
Average NVIDIA GeForce RTX 3070
  (140.2 - 144.9, n=4)
142.7 fps -39%
Average NVIDIA GeForce RTX 4060 Ti 8G
  (116.5 - 118.8, n=3)
117.8 fps -49%
KFA2 GeForce RTX 4060 Ti EX, 16GB GDDR6
AMD Ryzen 9 7950X, NVIDIA GeForce RTX 4060 Ti 16G
114.9 fps -50%
KFA2 GeForce RTX 4060 1-Click-OC 2X
AMD Ryzen 9 7950X, NVIDIA GeForce RTX 4060
104.5 fps -55%
XFX Speedster QICK 308 Radeon RX 7600 Black Edition
AMD Ryzen 9 7950X, AMD Radeon RX 7600
94.8 fps -59%
Unigine Superposition / 720p Low
Asus TUF Gaming GeForce RTX 4070 Ti
Intel Core i9-13900K, NVIDIA GeForce RTX 4070 Ti
56132 Points +12%
NVIDIA GeForce RTX 4090 Founders Edition
Intel Core i9-13900K, NVIDIA GeForce RTX 4090
55915 Points +11%
NVIDIA GeForce RTX 4080 Founders Edition
Intel Core i9-13900K, NVIDIA GeForce RTX 4080
55670 Points +11%
Gigabyte Aorus GeForce RTX 4070 Ti Master
Intel Core i9-13900K, NVIDIA GeForce RTX 4070 Ti
55232 Points +10%
Average NVIDIA GeForce RTX 4070 Ti
  (48835 - 56396, n=4)
54149 Points +8%
Zotac Gaming GeForce RTX 4070 AMP Airo
Intel Core i9-13900K, NVIDIA GeForce RTX 4070
52713 Points +5%
NVIDIA GeForce RTX 4070 Super Founders Edition
Intel Core i9-13900K, NVIDIA GeForce RTX 4070 SUPER
50724 Points +1%
Gigabyte GeForce RTX 4070 Super Gaming OC 12G
Intel Core i9-13900K, NVIDIA GeForce RTX 4070 SUPER
50629 Points +1%
Asus TUF Gaming GeForce RTX 4070 Ti Super
Intel Core i9-13900K, NVIDIA GeForce RTX 4070 Ti SUPER
50322 Points
KFA2 GeForce RTX 3070 Ti SG
AMD Ryzen 9 7950X, NVIDIA GeForce RTX 3070 Ti
48391 Points -4%
Average NVIDIA GeForce RTX 3080 Ti
  (43163 - 50738, n=4)
47400 Points -6%
Average NVIDIA GeForce RTX 4060 Ti 8G
  (46504 - 47695, n=3)
47288 Points -6%
AMD Radeon RX 7900 XTX
AMD Ryzen 9 7950X, AMD Radeon RX 7900 XTX
47274 Points -6%
Average NVIDIA GeForce RTX 3090
  (33329 - 54879, n=10)
46049 Points -8%
AMD Radeon RX 7900 XT
AMD Ryzen 9 7950X, AMD Radeon RX 7900 XT
45904 Points -9%
KFA2 GeForce RTX 4060 1-Click-OC 2X
AMD Ryzen 9 7950X, NVIDIA GeForce RTX 4060
45864 Points -9%
AMD Radeon RX 7800 XT
AMD Ryzen 9 7950X, AMD Radeon RX 7800 XT
45745 Points -9%
Zotac Gaming GeForce RTX 3090 Ti AMP Extreme Holo
AMD Ryzen 7 5800X3D, NVIDIA GeForce RTX 3090 Ti
45444 Points -10%
Sapphire Pulse Radeon RX 7700 XT
AMD Ryzen 9 7950X, AMD Radeon RX 7700 XT
45299 Points -10%
KFA2 GeForce RTX 4060 Ti EX, 16GB GDDR6
AMD Ryzen 9 7950X, NVIDIA GeForce RTX 4060 Ti 16G
43851 Points -13%
XFX Speedster QICK 308 Radeon RX 7600 Black Edition
AMD Ryzen 9 7950X, AMD Radeon RX 7600
42477 Points -16%
Average NVIDIA Titan RTX
  (25622 - 50876, n=9)
40891 Points -19%
Average of class Desktop
  (2704 - 56132, n=22, last 2 years)
38418 Points -24%
AMD Radeon RX 6900 XT
AMD Ryzen 9 5950X, AMD Radeon RX 6900 XT
37023 Points -26%
AMD Radeon RX 6800 XT
AMD Ryzen 9 5950X, AMD Radeon RX 6800 XT
36452 Points -28%
Average NVIDIA GeForce RTX 3070
  (27330 - 40007, n=5)
34576 Points -31%
Sapphire AMD Radeon RX 6950 XT Nitro+ Pure
AMD Ryzen 9 5900X, AMD Radeon RX 6950 XT
33955 Points -33%
Average NVIDIA GeForce RTX 3080
  (30851 - 32183, n=2)
31517 Points -37%
Unigine Superposition / 1080p Extreme
NVIDIA GeForce RTX 4090 Founders Edition
Intel Core i9-13900K, NVIDIA GeForce RTX 4090
20729 Points +56%
AMD Radeon RX 7900 XTX
AMD Ryzen 9 7950X, AMD Radeon RX 7900 XTX
17264 Points +30%
NVIDIA GeForce RTX 4080 Founders Edition
Intel Core i9-13900K, NVIDIA GeForce RTX 4080
16623 Points +25%
AMD Radeon RX 7900 XT
AMD Ryzen 9 7950X, AMD Radeon RX 7900 XT
14181 Points +7%
Zotac Gaming GeForce RTX 3090 Ti AMP Extreme Holo
AMD Ryzen 7 5800X3D, NVIDIA GeForce RTX 3090 Ti
13803 Points +4%
Gigabyte Aorus GeForce RTX 4070 Ti Master
Intel Core i9-13900K, NVIDIA GeForce RTX 4070 Ti
13448 Points +1%
Asus TUF Gaming GeForce RTX 4070 Ti Super
Intel Core i9-13900K, NVIDIA GeForce RTX 4070 Ti SUPER
13312 Points
Asus TUF Gaming GeForce RTX 4070 Ti
Intel Core i9-13900K, NVIDIA GeForce RTX 4070 Ti
13266 Points 0%
Average NVIDIA GeForce RTX 4070 Ti
  (12837 - 13448, n=4)
13168 Points -1%
Average NVIDIA GeForce RTX 3090
  (11806 - 12694, n=11)
12209 Points -8%
Gigabyte GeForce RTX 4070 Super Gaming OC 12G
Intel Core i9-13900K, NVIDIA GeForce RTX 4070 SUPER
12163 Points -9%
Average NVIDIA GeForce RTX 3080 Ti
  (12038 - 12347, n=4)
12139 Points -9%
Sapphire AMD Radeon RX 6950 XT Nitro+ Pure
AMD Ryzen 9 5900X, AMD Radeon RX 6950 XT
12079 Points -9%
NVIDIA GeForce RTX 4070 Super Founders Edition
Intel Core i9-13900K, NVIDIA GeForce RTX 4070 SUPER
12019 Points -10%
Average NVIDIA GeForce RTX 3080
  (10572 - 10822, n=2)
10697 Points -20%
AMD Radeon RX 6900 XT
AMD Ryzen 9 5950X, AMD Radeon RX 6900 XT
10683 Points -20%
AMD Radeon RX 7800 XT
AMD Ryzen 9 7950X, AMD Radeon RX 7800 XT
10145 Points -24%
Average of class Desktop
  (286 - 21332, n=22, last 2 years)
10122 Points -24%
AMD Radeon RX 6800 XT
AMD Ryzen 9 5950X, AMD Radeon RX 6800 XT
10046 Points -25%
Zotac Gaming GeForce RTX 4070 AMP Airo
Intel Core i9-13900K, NVIDIA GeForce RTX 4070
9764 Points -27%
KFA2 GeForce RTX 3070 Ti SG
AMD Ryzen 9 7950X, NVIDIA GeForce RTX 3070 Ti
9272 Points -30%
Average NVIDIA Titan RTX
  (8916 - 9285, n=9)
9051 Points -32%
Sapphire Pulse Radeon RX 7700 XT
AMD Ryzen 9 7950X, AMD Radeon RX 7700 XT
8732 Points -34%
Average NVIDIA GeForce RTX 3070
  (8276 - 8507, n=5)
8354 Points -37%
KFA2 GeForce RTX 4060 Ti EX, 16GB GDDR6
AMD Ryzen 9 7950X, NVIDIA GeForce RTX 4060 Ti 16G
7712 Points -42%
Average NVIDIA GeForce RTX 4060 Ti 8G
  (7085 - 7833, n=3)
7438 Points -44%
XFX Speedster QICK 308 Radeon RX 7600 Black Edition
AMD Ryzen 9 7950X, AMD Radeon RX 7600
6419 Points -52%
KFA2 GeForce RTX 4060 1-Click-OC 2X
AMD Ryzen 9 7950X, NVIDIA GeForce RTX 4060
5974 Points -55%
Unigine Superposition / 4k Optimized
NVIDIA GeForce RTX 4090 Founders Edition
Intel Core i9-13900K, NVIDIA GeForce RTX 4090
32977 Points +75%
AMD Radeon RX 7900 XTX
AMD Ryzen 9 7950X, AMD Radeon RX 7900 XTX
23174 Points +23%
NVIDIA GeForce RTX 4080 Founders Edition
Intel Core i9-13900K, NVIDIA GeForce RTX 4080
22343 Points +19%
Asus TUF Gaming GeForce RTX 4070 Ti Super
Intel Core i9-13900K, NVIDIA GeForce RTX 4070 Ti SUPER
18817 Points
AMD Radeon RX 7900 XT
AMD Ryzen 9 7950X, AMD Radeon RX 7900 XT
18806 Points 0%
Zotac Gaming GeForce RTX 3090 Ti AMP Extreme Holo
AMD Ryzen 7 5800X3D, NVIDIA GeForce RTX 3090 Ti
18426 Points -2%
Sapphire AMD Radeon RX 6950 XT Nitro+ Pure
AMD Ryzen 9 5900X, AMD Radeon RX 6950 XT
17725 Points -6%
Gigabyte Aorus GeForce RTX 4070 Ti Master
Intel Core i9-13900K, NVIDIA GeForce RTX 4070 Ti
17290 Points -8%
Asus TUF Gaming GeForce RTX 4070 Ti
Intel Core i9-13900K, NVIDIA GeForce RTX 4070 Ti
17184 Points -9%
Average NVIDIA GeForce RTX 4070 Ti
  (16889 - 17290, n=4)
17118 Points -9%
Average NVIDIA GeForce RTX 3090
  (15794 - 16868, n=11)
16326 Points -13%
Average NVIDIA GeForce RTX 3080 Ti
  (16108 - 16412, n=4)
16199 Points -14%
Gigabyte GeForce RTX 4070 Super Gaming OC 12G
Intel Core i9-13900K, NVIDIA GeForce RTX 4070 SUPER
15913 Points -15%
NVIDIA GeForce RTX 4070 Super Founders Edition
Intel Core i9-13900K, NVIDIA GeForce RTX 4070 SUPER
15803 Points -16%
AMD Radeon RX 6900 XT
AMD Ryzen 9 5950X, AMD Radeon RX 6900 XT
14955 Points -21%
Average of class Desktop
  (559 - 33488, n=21, last 2 years)
14724 Points -22%
Average NVIDIA GeForce RTX 3080
  (13984 - 14243, n=2)
14114 Points -25%
AMD Radeon RX 7800 XT
AMD Ryzen 9 7950X, AMD Radeon RX 7800 XT
13776 Points -27%
Zotac Gaming GeForce RTX 4070 AMP Airo
Intel Core i9-13900K, NVIDIA GeForce RTX 4070
13715 Points -27%
AMD Radeon RX 6800 XT
AMD Ryzen 9 5950X, AMD Radeon RX 6800 XT
13471 Points -28%
Average NVIDIA Titan RTX
  (11937 - 12644, n=9)
12203 Points -35%
KFA2 GeForce RTX 3070 Ti SG
AMD Ryzen 9 7950X, NVIDIA GeForce RTX 3070 Ti
12171 Points -35%
Sapphire Pulse Radeon RX 7700 XT
AMD Ryzen 9 7950X, AMD Radeon RX 7700 XT
11256 Points -40%
Average NVIDIA GeForce RTX 3070
  (10544 - 10755, n=5)
10667 Points -43%
Average NVIDIA GeForce RTX 4060 Ti 8G
  (9579 - 9722, n=3)
9651 Points -49%
KFA2 GeForce RTX 4060 Ti EX, 16GB GDDR6
AMD Ryzen 9 7950X, NVIDIA GeForce RTX 4060 Ti 16G
9516 Points -49%
KFA2 GeForce RTX 4060 1-Click-OC 2X
AMD Ryzen 9 7950X, NVIDIA GeForce RTX 4060
7959 Points -58%
XFX Speedster QICK 308 Radeon RX 7600 Black Edition
AMD Ryzen 9 7950X, AMD Radeon RX 7600
7817 Points -58%
Unigine Superposition / 8k Optimized
NVIDIA GeForce RTX 4090 Founders Edition
Intel Core i9-13900K, NVIDIA GeForce RTX 4090
12826 Points +80%
AMD Radeon RX 7900 XTX
AMD Ryzen 9 7950X, AMD Radeon RX 7900 XTX
8751 Points +23%
NVIDIA GeForce RTX 4080 Founders Edition
Intel Core i9-13900K, NVIDIA GeForce RTX 4080
8556 Points +20%
Zotac Gaming GeForce RTX 3090 Ti AMP Extreme Holo
AMD Ryzen 7 5800X3D, NVIDIA GeForce RTX 3090 Ti
8213 Points +15%
Average NVIDIA GeForce RTX 3090
  (6969 - 7521, n=11)
7144 Points 0%
Asus TUF Gaming GeForce RTX 4070 Ti Super
Intel Core i9-13900K, NVIDIA GeForce RTX 4070 Ti SUPER
7121 Points
Average NVIDIA GeForce RTX 3080 Ti
  (6920 - 7161, n=4)
7070 Points -1%
AMD Radeon RX 7900 XT
AMD Ryzen 9 7950X, AMD Radeon RX 7900 XT
7034 Points -1%
Sapphire AMD Radeon RX 6950 XT Nitro+ Pure
AMD Ryzen 9 5900X, AMD Radeon RX 6950 XT
6645 Points -7%
Gigabyte Aorus GeForce RTX 4070 Ti Master
Intel Core i9-13900K, NVIDIA GeForce RTX 4070 Ti
6454 Points -9%
Asus TUF Gaming GeForce RTX 4070 Ti
Intel Core i9-13900K, NVIDIA GeForce RTX 4070 Ti
6427 Points -10%
Average NVIDIA GeForce RTX 4070 Ti
  (6380 - 6454, n=4)
6425 Points -10%
Average NVIDIA GeForce RTX 3080
  (6243 - 6346, n=2)
6295 Points -12%
Gigabyte GeForce RTX 4070 Super Gaming OC 12G
Intel Core i9-13900K, NVIDIA GeForce RTX 4070 SUPER
5892 Points -17%
NVIDIA GeForce RTX 4070 Super Founders Edition
Intel Core i9-13900K, NVIDIA GeForce RTX 4070 SUPER
5844 Points -18%
Average of class Desktop
  (237 - 13008, n=21, last 2 years)
5826 Points -18%
AMD Radeon RX 6900 XT
AMD Ryzen 9 5950X, AMD Radeon RX 6900 XT
5764 Points -19%
Average NVIDIA Titan RTX
  (5255 - 5571, n=9)
5393 Points -24%
KFA2 GeForce RTX 3070 Ti SG
AMD Ryzen 9 7950X, NVIDIA GeForce RTX 3070 Ti
5309 Points -25%
AMD Radeon RX 7800 XT
AMD Ryzen 9 7950X, AMD Radeon RX 7800 XT
5307 Points -25%
AMD Radeon RX 6800 XT
AMD Ryzen 9 5950X, AMD Radeon RX 6800 XT
5256 Points -26%
Zotac Gaming GeForce RTX 4070 AMP Airo
Intel Core i9-13900K, NVIDIA GeForce RTX 4070
5253 Points -26%
Average NVIDIA GeForce RTX 3070
  (4587 - 4695, n=5)
4624 Points -35%
Sapphire Pulse Radeon RX 7700 XT
AMD Ryzen 9 7950X, AMD Radeon RX 7700 XT
4085 Points -43%
Average NVIDIA GeForce RTX 4060 Ti 8G
  (3520 - 3571, n=3)
3546 Points -50%
KFA2 GeForce RTX 4060 Ti EX, 16GB GDDR6
AMD Ryzen 9 7950X, NVIDIA GeForce RTX 4060 Ti 16G
3517 Points -51%
KFA2 GeForce RTX 4060 1-Click-OC 2X
AMD Ryzen 9 7950X, NVIDIA GeForce RTX 4060
3066 Points -57%
XFX Speedster QICK 308 Radeon RX 7600 Black Edition
AMD Ryzen 9 7950X, AMD Radeon RX 7600
2964 Points -58%
3DMark 11 Performance
54278 puan
3DMark Ice Storm Standard Score
287297 puan
3DMark Cloud Gate Standard Score
79438 puan
3DMark Fire Strike Score
42631 puan
3DMark Fire Strike Extreme Score
27105 puan
3DMark Time Spy Score
23540 puan
Yardım

Hesaplama performansı: Artan CUDA çekirdek sayılarına karşılık gelen ölçekler

Artan CUDA çekirdek sayılarının etkisi, V-Ray ve Blender gibi işlem testlerinde daha belirgin bir şekilde görülüyor. V-Ray 5'te TUF Gaming GeForce RTX 4070 Ti Super, RTX 4070 Ti ortalamasına kıyasla CUDA ve RTX kıyaslamalarında %11 ve %14'lük etkileyici bir üstünlük elde ediyor. AMD kartlar bu testlerde bariz bir dezavantaja sahip.

Bununla birlikte, LuxMark Sala GPU testlerinde RX 6950 XT bile RTX 4090 Founders Edition üzerinde iyi bir liderlik gösteriyor. Bununla birlikte RTX 4070 Ti Super, LuxMark Room GPU'da hem TUF Gaming GeForce RTX 4070 Ti OC hem de Aorus GeForce RTX 4070 Ti Master üzerinde %11'lik iyi bir artış gösteriyor.

TUF Gaming GeForce RTX 4070 Ti Super ayrıca Blender 3.3 Classroom CUDA ve Optix render işlemlerini RTX 4070 Ti ortalamasından 1,5 saniye daha hızlı tamamlayabiliyor.

V-Ray 5 Benchmark / GPU CUDA
NVIDIA GeForce RTX 4090 Founders Edition
Intel Core i9-13900K, NVIDIA GeForce RTX 4090 (5.0.1)
4224 mpaths +64%
NVIDIA GeForce RTX 4080 Founders Edition
Intel Core i9-13900K, NVIDIA GeForce RTX 4080 (5.0.1)
3067 mpaths +19%
Asus TUF Gaming GeForce RTX 4070 Ti Super
Intel Core i9-13900K, NVIDIA GeForce RTX 4070 Ti SUPER (5.0.1)
2578 mpaths
Gigabyte Aorus GeForce RTX 4070 Ti Master
Intel Core i9-13900K, NVIDIA GeForce RTX 4070 Ti (5.0.1)
2371 mpaths -8%
Asus TUF Gaming GeForce RTX 4070 Ti
Intel Core i9-13900K, NVIDIA GeForce RTX 4070 Ti (5.0.1)
2322 mpaths -10%
Average NVIDIA GeForce RTX 4070 Ti
  (2278 - 2371, n=4)
2318 mpaths -10%
Gigabyte GeForce RTX 4070 Super Gaming OC 12G
Intel Core i9-13900K, NVIDIA GeForce RTX 4070 SUPER (5.0.1)
2254 mpaths -13%
NVIDIA GeForce RTX 4070 Super Founders Edition
Intel Core i9-13900K, NVIDIA GeForce RTX 4070 SUPER (5.0.1)
2238 mpaths -13%
Zotac Gaming GeForce RTX 3090 Ti AMP Extreme Holo
AMD Ryzen 7 5800X3D, NVIDIA GeForce RTX 3090 Ti (5.0.1)
2195 mpaths -15%
Average NVIDIA GeForce RTX 3080 Ti
  (2045 - 2070, n=3)
2057 mpaths -20%
Average NVIDIA GeForce RTX 3090
  (1616 - 2131, n=14)
2019 mpaths -22%
Zotac Gaming GeForce RTX 4070 AMP Airo
Intel Core i9-13900K, NVIDIA GeForce RTX 4070 (5.0.1)
1874 mpaths -27%
Average of class Desktop
  (13 - 4322, n=27, last 2 years)
1808 mpaths -30%
KFA2 GeForce RTX 3070 Ti SG
AMD Ryzen 9 7950X, NVIDIA GeForce RTX 3070 Ti (5.0.1)
1518 mpaths -41%
Average NVIDIA GeForce RTX 4060 Ti 8G
  (1375 - 1400, n=2)
1388 mpaths -46%
KFA2 GeForce RTX 4060 Ti EX, 16GB GDDR6
AMD Ryzen 9 7950X, NVIDIA GeForce RTX 4060 Ti 16G (5.0.1)
1387 mpaths -46%
Average NVIDIA GeForce RTX 3070
  (1109 - 1422, n=2)
1266 mpaths -51%
KFA2 GeForce RTX 4060 1-Click-OC 2X
AMD Ryzen 9 7950X, NVIDIA GeForce RTX 4060 (5.0.1)
1246 mpaths -52%
Average NVIDIA Titan RTX
  (668 - 1052, n=7)
910 mpaths -65%
AMD Radeon RX 7800 XT
AMD Ryzen 9 7950X, AMD Radeon RX 7800 XT (5.0.1)
666 mpaths -74%
Sapphire Pulse Radeon RX 7700 XT
AMD Ryzen 9 7950X, AMD Radeon RX 7700 XT (5.0.1)
663 mpaths -74%
XFX Speedster QICK 308 Radeon RX 7600 Black Edition
AMD Ryzen 9 7950X, AMD Radeon RX 7600 (5.0.1)
662 mpaths -74%
Sapphire AMD Radeon RX 6950 XT Nitro+ Pure
AMD Ryzen 9 5900X, AMD Radeon RX 6950 XT (5.0.1)
383 mpaths -85%
V-Ray 5 Benchmark / GPU RTX
NVIDIA GeForce RTX 4090 Founders Edition
Intel Core i9-13900K, NVIDIA GeForce RTX 4090 (5.0.1)
5935 mpaths +65%
NVIDIA GeForce RTX 4080 Founders Edition
Intel Core i9-13900K, NVIDIA GeForce RTX 4080 (5.0.1)
4193 mpaths +16%
Asus TUF Gaming GeForce RTX 4070 Ti Super
Intel Core i9-13900K, NVIDIA GeForce RTX 4070 Ti SUPER (5.0.1)
3606 mpaths
Average of class Desktop
  (992 - 6019, n=18, last 2 years)
3574 mpaths -1%
Gigabyte Aorus GeForce RTX 4070 Ti Master
Intel Core i9-13900K, NVIDIA GeForce RTX 4070 Ti (5.0.1)
3221 mpaths -11%
Asus TUF Gaming GeForce RTX 4070 Ti
Intel Core i9-13900K, NVIDIA GeForce RTX 4070 Ti (5.0.1)
3180 mpaths -12%
Average NVIDIA GeForce RTX 4070 Ti
  (3054 - 3221, n=4)
3151 mpaths -13%
Gigabyte GeForce RTX 4070 Super Gaming OC 12G
Intel Core i9-13900K, NVIDIA GeForce RTX 4070 SUPER (5.0.1)
3122 mpaths -13%
NVIDIA GeForce RTX 4070 Super Founders Edition
Intel Core i9-13900K, NVIDIA GeForce RTX 4070 SUPER (5.0.1)
3088 mpaths -14%
Zotac Gaming GeForce RTX 3090 Ti AMP Extreme Holo
AMD Ryzen 7 5800X3D, NVIDIA GeForce RTX 3090 Ti (5.0.1)
2880 mpaths -20%
Average NVIDIA GeForce RTX 3090
  (2551 - 2979, n=14)
2813 mpaths -22%
Average NVIDIA GeForce RTX 3080 Ti
  (2727 - 2883, n=3)
2784 mpaths -23%
Zotac Gaming GeForce RTX 4070 AMP Airo
Intel Core i9-13900K, NVIDIA GeForce RTX 4070 (5.0.1)
2660 mpaths -26%
KFA2 GeForce RTX 3070 Ti SG
AMD Ryzen 9 7950X, NVIDIA GeForce RTX 3070 Ti (5.0.1)
2026 mpaths -44%
AMD Radeon RX 7800 XT
AMD Ryzen 9 7950X, AMD Radeon RX 7800 XT (5.0.1)
2024 mpaths -44%
Average NVIDIA GeForce RTX 4060 Ti 8G
  (1974 - 2024, n=2)
1999 mpaths -45%
KFA2 GeForce RTX 4060 Ti EX, 16GB GDDR6
AMD Ryzen 9 7950X, NVIDIA GeForce RTX 4060 Ti 16G (5.0.1)
1967 mpaths -45%
Sapphire Pulse Radeon RX 7700 XT
AMD Ryzen 9 7950X, AMD Radeon RX 7700 XT (5.0.1)
1967 mpaths -45%
KFA2 GeForce RTX 4060 1-Click-OC 2X
AMD Ryzen 9 7950X, NVIDIA GeForce RTX 4060 (5.0.1)
1856 mpaths -49%
Average NVIDIA GeForce RTX 3070
  (1610 - 1756, n=2)
1683 mpaths -53%
Average NVIDIA Titan RTX
  (1246 - 1348, n=7)
1299 mpaths -64%
V-Ray Benchmark Next 4.10 / GPU
NVIDIA GeForce RTX 4090 Founders Edition
Intel Core i9-13900K, NVIDIA GeForce RTX 4090 (v4.10.07 )
1847 mpaths +43%
NVIDIA GeForce RTX 4080 Founders Edition
Intel Core i9-13900K, NVIDIA GeForce RTX 4080 (v4.10.07 )
1455 mpaths +13%
Asus TUF Gaming GeForce RTX 4070 Ti Super
Intel Core i9-13900K, NVIDIA GeForce RTX 4070 Ti SUPER (v4.10.07 )
1290 mpaths
NVIDIA GeForce RTX 4070 Super Founders Edition
Intel Core i9-13900K, NVIDIA GeForce RTX 4070 SUPER (v4.10.07 )
1075 mpaths -17%
Gigabyte GeForce RTX 4070 Super Gaming OC 12G
Intel Core i9-13900K, NVIDIA GeForce RTX 4070 SUPER (v4.10.07 )
1075 mpaths -17%
Average NVIDIA GeForce RTX 4070 Ti
  (1056 - 1076, n=3)
1064 mpaths -18%
Asus TUF Gaming GeForce RTX 4070 Ti
Intel Core i9-13900K, NVIDIA GeForce RTX 4070 Ti (v4.10.07 )
1060 mpaths -18%
Gigabyte Aorus GeForce RTX 4070 Ti Master
Intel Core i9-13900K, NVIDIA GeForce RTX 4070 Ti (v4.10.07 )
1056 mpaths -18%
Zotac Gaming GeForce RTX 4070 AMP Airo
Intel Core i9-13900K, NVIDIA GeForce RTX 4070 (v4.10.07 )
966 mpaths -25%
Zotac Gaming GeForce RTX 3090 Ti AMP Extreme Holo
AMD Ryzen 7 5800X3D, NVIDIA GeForce RTX 3090 Ti (v4.10.07 )
902 mpaths -30%
Average NVIDIA GeForce RTX 3090
  (781 - 877, n=16)
856 mpaths -34%
Average NVIDIA GeForce RTX 3080 Ti
  (854 - 855, n=3)
854 mpaths -34%
Average of class Desktop
  (4 - 1880, n=29, last 2 years)
792 mpaths -39%
Average NVIDIA GeForce RTX 3080
  (636 - 643, n=2)
640 mpaths -50%
Average NVIDIA GeForce RTX 4060 Ti 8G
  (626 - 649, n=2)
638 mpaths -51%
KFA2 GeForce RTX 4060 Ti EX, 16GB GDDR6
AMD Ryzen 9 7950X, NVIDIA GeForce RTX 4060 Ti 16G (v4.10.07 )
620 mpaths -52%
KFA2 GeForce RTX 4060 1-Click-OC 2X
AMD Ryzen 9 7950X, NVIDIA GeForce RTX 4060 (v4.10.07 )
601 mpaths -53%
Average NVIDIA GeForce RTX 3070
  (464 - 508, n=4)
478 mpaths -63%
Average NVIDIA Titan RTX
  (386 - 439, n=16)
400 mpaths -69%
XFX Speedster QICK 308 Radeon RX 7600 Black Edition
AMD Ryzen 9 7950X, AMD Radeon RX 7600 (v4.10.07 )
221 mpaths -83%
AMD Radeon RX 7800 XT
AMD Ryzen 9 7950X, AMD Radeon RX 7800 XT (v4.10.07 )
220 mpaths -83%
Sapphire Pulse Radeon RX 7700 XT
AMD Ryzen 9 7950X, AMD Radeon RX 7700 XT (v4.10.07 )
220 mpaths -83%
AMD Radeon RX 6800 XT
AMD Ryzen 9 5950X, AMD Radeon RX 6800 XT (v4.10.07 )
157 mpaths -88%
Sapphire AMD Radeon RX 6950 XT Nitro+ Pure
AMD Ryzen 9 5900X, AMD Radeon RX 6950 XT (v4.10.07 )
137 mpaths -89%
Blender / v3.3 Classroom CUDA
KFA2 GeForce RTX 4060 1-Click-OC 2X
AMD Ryzen 9 7950X, NVIDIA GeForce RTX 4060 (3.3.3)
40 Seconds * -135%
KFA2 GeForce RTX 3070 Ti SG
AMD Ryzen 9 7950X, NVIDIA GeForce RTX 3070 Ti (3.3.0)
33 Seconds * -94%
Average NVIDIA Titan RTX
  ()
31 Seconds * -82%
Zotac Gaming GeForce RTX 4070 AMP Airo
Intel Core i9-13900K, NVIDIA GeForce RTX 4070 (3.3.3)
23 Seconds * -35%
Average NVIDIA GeForce RTX 3080 Ti
  (21 - 22, n=2)
21.5 Seconds * -26%
Average NVIDIA GeForce RTX 3090
  (20 - 22, n=11)
21.4 Seconds * -26%
NVIDIA GeForce RTX 4070 Super Founders Edition
Intel Core i9-13900K, NVIDIA GeForce RTX 4070 SUPER (3.3.3)
19 Seconds * -12%
Gigabyte GeForce RTX 4070 Super Gaming OC 12G
Intel Core i9-13900K, NVIDIA GeForce RTX 4070 SUPER (3.3.3)
19 Seconds * -12%
Average NVIDIA GeForce RTX 4070 Ti
  (18 - 19, n=2)
18.5 Seconds * -9%
Gigabyte Aorus GeForce RTX 4070 Ti Master
Intel Core i9-13900K, NVIDIA GeForce RTX 4070 Ti (3.3.2)
18 Seconds * -6%
Asus TUF Gaming GeForce RTX 4070 Ti Super
Intel Core i9-13900K, NVIDIA GeForce RTX 4070 Ti SUPER (3.3.3)
17 Seconds *
Average of class Desktop
  (10 - 23, n=15, last 2 years)
16.2 Seconds * +5%
Blender / v3.3 Classroom OPTIX/RTX
KFA2 GeForce RTX 4060 1-Click-OC 2X
AMD Ryzen 9 7950X, NVIDIA GeForce RTX 4060 (3.3.3)
21 Seconds * -110%
Average NVIDIA Titan RTX
  ()
21 Seconds * -110%
KFA2 GeForce RTX 3070 Ti SG
AMD Ryzen 9 7950X, NVIDIA GeForce RTX 3070 Ti (3.3.0)
20 Seconds * -100%
KFA2 GeForce RTX 4060 Ti EX, 16GB GDDR6
AMD Ryzen 9 7950X, NVIDIA GeForce RTX 4060 Ti 16G (3.3.3)
18 Seconds * -80%
Average NVIDIA GeForce RTX 4060 Ti 8G
  (18 - 18, n=2)
18 Seconds * -80%
Average NVIDIA GeForce RTX 3080 Ti
  (14 - 15, n=2)
14.5 Seconds * -45%
Zotac Gaming GeForce RTX 4070 AMP Airo
Intel Core i9-13900K, NVIDIA GeForce RTX 4070 (3.3.3)
14 Seconds * -40%
Average NVIDIA GeForce RTX 3090
  (13 - 14, n=11)
13.4 Seconds * -34%
Asus TUF Gaming GeForce RTX 4070 Ti
Intel Core i9-13900K, NVIDIA GeForce RTX 4070 Ti (3.3.2)
12 Seconds * -20%
Average NVIDIA GeForce RTX 4070 Ti
  (11 - 12, n=4)
11.5 Seconds * -15%
Gigabyte Aorus GeForce RTX 4070 Ti Master
Intel Core i9-13900K, NVIDIA GeForce RTX 4070 Ti (3.3.2)
11 Seconds * -10%
NVIDIA GeForce RTX 4070 Super Founders Edition
Intel Core i9-13900K, NVIDIA GeForce RTX 4070 SUPER (3.3.3)
11 Seconds * -10%
Gigabyte GeForce RTX 4070 Super Gaming OC 12G
Intel Core i9-13900K, NVIDIA GeForce RTX 4070 SUPER (3.3.3)
11 Seconds * -10%
Average of class Desktop
  (7 - 15, n=17, last 2 years)
10.6 Seconds * -6%
NVIDIA GeForce RTX 4080 Founders Edition
Intel Core i9-13900K, NVIDIA GeForce RTX 4080 (3.3.0)
10 Seconds * -0%
Asus TUF Gaming GeForce RTX 4070 Ti Super
Intel Core i9-13900K, NVIDIA GeForce RTX 4070 Ti SUPER (3.3.3)
10 Seconds *
NVIDIA GeForce RTX 4090 Founders Edition
Intel Core i9-13900K, NVIDIA GeForce RTX 4090 (3.3.0)
8 Seconds * +20%
LuxMark v2.0 64Bit / Room GPUs-only
NVIDIA GeForce RTX 4090 Founders Edition
Intel Core i9-13900K, NVIDIA GeForce RTX 4090
12730 Samples/s +36%
NVIDIA GeForce RTX 4080 Founders Edition
Intel Core i9-13900K, NVIDIA GeForce RTX 4080
10491 Samples/s +12%
Asus TUF Gaming GeForce RTX 4070 Ti Super
Intel Core i9-13900K, NVIDIA GeForce RTX 4070 Ti SUPER
9355 Samples/s
Gigabyte Aorus GeForce RTX 4070 Ti Master
Intel Core i9-13900K, NVIDIA GeForce RTX 4070 Ti
8436 Samples/s -10%
Asus TUF Gaming GeForce RTX 4070 Ti
Intel Core i9-13900K, NVIDIA GeForce RTX 4070 Ti
8413 Samples/s -10%
NVIDIA GeForce RTX 4070 Super Founders Edition
Intel Core i9-13900K, NVIDIA GeForce RTX 4070 SUPER
8262 Samples/s -12%
Gigabyte GeForce RTX 4070 Super Gaming OC 12G
Intel Core i9-13900K, NVIDIA GeForce RTX 4070 SUPER
8257 Samples/s -12%
Average NVIDIA GeForce RTX 4070 Ti
  (7625 - 8436, n=4)
8065 Samples/s -14%
Zotac Gaming GeForce RTX 4070 AMP Airo
Intel Core i9-13900K, NVIDIA GeForce RTX 4070
7402 Samples/s -21%
Zotac Gaming GeForce RTX 3090 Ti AMP Extreme Holo
AMD Ryzen 7 5800X3D, NVIDIA GeForce RTX 3090 Ti
6221 Samples/s -34%
Average NVIDIA GeForce RTX 3080 Ti
  (5772 - 6464, n=4)
6138 Samples/s -34%
Average NVIDIA GeForce RTX 3090
  (5727 - 5985, n=9)
5893 Samples/s -37%
Average of class Desktop
  (81 - 12730, n=23, last 2 years)
5398 Samples/s -42%
AMD Radeon RX 7900 XTX
AMD Ryzen 9 7950X, AMD Radeon RX 7900 XTX
5161 Samples/s -45%
Average NVIDIA GeForce RTX 3080
  (5112 - 5198, n=2)
5155 Samples/s -45%
Sapphire AMD Radeon RX 6950 XT Nitro+ Pure
AMD Ryzen 9 5900X, AMD Radeon RX 6950 XT
5097 Samples/s -46%
AMD Radeon RX 6900 XT
AMD Ryzen 9 5950X, AMD Radeon RX 6900 XT
5084 Samples/s -46%
AMD Radeon RX 6800 XT
AMD Ryzen 9 5950X, AMD Radeon RX 6800 XT
5057 Samples/s -46%
Average NVIDIA Titan RTX
  (4643 - 4703, n=2)
4673 Samples/s -50%
Average NVIDIA GeForce RTX 4060 Ti 8G
  (4558 - 4790, n=3)
4641 Samples/s -50%
KFA2 GeForce RTX 4060 Ti EX, 16GB GDDR6
AMD Ryzen 9 7950X, NVIDIA GeForce RTX 4060 Ti 16G
4570 Samples/s -51%
KFA2 GeForce RTX 3070 Ti SG
AMD Ryzen 9 7950X, NVIDIA GeForce RTX 3070 Ti
4481 Samples/s -52%
AMD Radeon RX 7900 XT
AMD Ryzen 9 7950X, AMD Radeon RX 7900 XT
4451 Samples/s -52%
KFA2 GeForce RTX 4060 1-Click-OC 2X
AMD Ryzen 9 7950X, NVIDIA GeForce RTX 4060
4063 Samples/s -57%
Average NVIDIA GeForce RTX 3070
  (2187 - 4293, n=3)
3588 Samples/s -62%
AMD Radeon RX 7800 XT
AMD Ryzen 9 7950X, AMD Radeon RX 7800 XT
3446 Samples/s -63%
Sapphire Pulse Radeon RX 7700 XT
AMD Ryzen 9 7950X, AMD Radeon RX 7700 XT
3258 Samples/s -65%
XFX Speedster QICK 308 Radeon RX 7600 Black Edition
AMD Ryzen 9 7950X, AMD Radeon RX 7600
2227 Samples/s -76%
LuxMark v2.0 64Bit / Sala GPUs-only
Sapphire AMD Radeon RX 6950 XT Nitro+ Pure
AMD Ryzen 9 5900X, AMD Radeon RX 6950 XT
31954 Samples/s +63%
AMD Radeon RX 6900 XT
AMD Ryzen 9 5950X, AMD Radeon RX 6900 XT
31400 Samples/s +60%
AMD Radeon RX 6800 XT
AMD Ryzen 9 5950X, AMD Radeon RX 6800 XT
28023 Samples/s +43%
NVIDIA GeForce RTX 4090 Founders Edition
Intel Core i9-13900K, NVIDIA GeForce RTX 4090
27828 Samples/s +42%
NVIDIA GeForce RTX 4080 Founders Edition
Intel Core i9-13900K, NVIDIA GeForce RTX 4080
24835 Samples/s +27%
Gigabyte Aorus GeForce RTX 4070 Ti Master
Intel Core i9-13900K, NVIDIA GeForce RTX 4070 Ti
20305 Samples/s +3%
Asus TUF Gaming GeForce RTX 4070 Ti
Intel Core i9-13900K, NVIDIA GeForce RTX 4070 Ti
20171 Samples/s +3%
Asus TUF Gaming GeForce RTX 4070 Ti Super
Intel Core i9-13900K, NVIDIA GeForce RTX 4070 Ti SUPER
19620 Samples/s
Average NVIDIA GeForce RTX 4070 Ti
  (17719 - 20305, n=4)
19151 Samples/s -2%
Gigabyte GeForce RTX 4070 Super Gaming OC 12G
Intel Core i9-13900K, NVIDIA GeForce RTX 4070 SUPER
19131 Samples/s -2%
NVIDIA GeForce RTX 4070 Super Founders Edition
Intel Core i9-13900K, NVIDIA GeForce RTX 4070 SUPER
19072 Samples/s -3%
Zotac Gaming GeForce RTX 3090 Ti AMP Extreme Holo
AMD Ryzen 7 5800X3D, NVIDIA GeForce RTX 3090 Ti
16046 Samples/s -18%
Average NVIDIA GeForce RTX 3080 Ti
  (14871 - 16438, n=4)
15612 Samples/s -20%
Zotac Gaming GeForce RTX 4070 AMP Airo
Intel Core i9-13900K, NVIDIA GeForce RTX 4070
15100 Samples/s -23%
AMD Radeon RX 7900 XTX
AMD Ryzen 9 7950X, AMD Radeon RX 7900 XTX
15019 Samples/s -23%
Average NVIDIA GeForce RTX 3090
  (14590 - 15242, n=9)
14945 Samples/s -24%
AMD Radeon RX 7900 XT
AMD Ryzen 9 7950X, AMD Radeon RX 7900 XT
13489 Samples/s -31%
Average NVIDIA GeForce RTX 3080
  (12797 - 12980, n=2)
12889 Samples/s -34%
Average of class Desktop
  (147 - 27828, n=23, last 2 years)
12288 Samples/s -37%
Average NVIDIA GeForce RTX 4060 Ti 8G
  (11159 - 11281, n=3)
11235 Samples/s -43%
KFA2 GeForce RTX 4060 Ti EX, 16GB GDDR6
AMD Ryzen 9 7950X, NVIDIA GeForce RTX 4060 Ti 16G
11226 Samples/s -43%
KFA2 GeForce RTX 3070 Ti SG
AMD Ryzen 9 7950X, NVIDIA GeForce RTX 3070 Ti
11083 Samples/s -44%
Average NVIDIA Titan RTX
  (10799 - 10996, n=2)
10898 Samples/s -44%
AMD Radeon RX 7800 XT
AMD Ryzen 9 7950X, AMD Radeon RX 7800 XT
10158 Samples/s -48%
Average NVIDIA GeForce RTX 3070
  (10096 - 10115, n=3)
10107 Samples/s -48%
KFA2 GeForce RTX 4060 1-Click-OC 2X
AMD Ryzen 9 7950X, NVIDIA GeForce RTX 4060
8991 Samples/s -54%
Sapphire Pulse Radeon RX 7700 XT
AMD Ryzen 9 7950X, AMD Radeon RX 7700 XT
8614 Samples/s -56%
XFX Speedster QICK 308 Radeon RX 7600 Black Edition
AMD Ryzen 9 7950X, AMD Radeon RX 7600
5583 Samples/s -72%
ComputeMark v2.1 / Normal, Score
NVIDIA GeForce RTX 4090 Founders Edition
Intel Core i9-13900K, NVIDIA GeForce RTX 4090
86583 Points +58%
AMD Radeon RX 7900 XTX
AMD Ryzen 9 7950X, AMD Radeon RX 7900 XTX
62963 Points +15%
NVIDIA GeForce RTX 4080 Founders Edition
Intel Core i9-13900K, NVIDIA GeForce RTX 4080
62720 Points +15%
AMD Radeon RX 7900 XT
AMD Ryzen 9 7950X, AMD Radeon RX 7900 XT
57570 Points +5%
Asus TUF Gaming GeForce RTX 4070 Ti Super
Intel Core i9-13900K, NVIDIA GeForce RTX 4070 Ti SUPER
54675 Points
Zotac Gaming GeForce RTX 3090 Ti AMP Extreme Holo
AMD Ryzen 7 5800X3D, NVIDIA GeForce RTX 3090 Ti
52258 Points -4%
Gigabyte Aorus GeForce RTX 4070 Ti Master
Intel Core i9-13900K, NVIDIA GeForce RTX 4070 Ti
52251 Points -4%
Average NVIDIA GeForce RTX 4070 Ti
  (51287 - 52251, n=4)
51747 Points -5%
Asus TUF Gaming GeForce RTX 4070 Ti
Intel Core i9-13900K, NVIDIA GeForce RTX 4070 Ti
51616 Points -6%
Average NVIDIA GeForce RTX 3080 Ti
  (47377 - 48892, n=4)
48266 Points -12%
Gigabyte GeForce RTX 4070 Super Gaming OC 12G
Intel Core i9-13900K, NVIDIA GeForce RTX 4070 SUPER
48163 Points -12%
NVIDIA GeForce RTX 4070 Super Founders Edition
Intel Core i9-13900K, NVIDIA GeForce RTX 4070 SUPER
47808 Points -13%
Average NVIDIA GeForce RTX 3090
  (44948 - 49118, n=9)
47804 Points -13%
Sapphire AMD Radeon RX 6950 XT Nitro+ Pure
AMD Ryzen 9 5900X, AMD Radeon RX 6950 XT
44959 Points -18%
AMD Radeon RX 7800 XT
AMD Ryzen 9 7950X, AMD Radeon RX 7800 XT
43852 Points -20%
Zotac Gaming GeForce RTX 4070 AMP Airo
Intel Core i9-13900K, NVIDIA GeForce RTX 4070
41933 Points -23%
AMD Radeon RX 6900 XT
AMD Ryzen 9 5950X, AMD Radeon RX 6900 XT
40857 Points -25%
Average NVIDIA GeForce RTX 3080
  (39924 - 41594, n=2)
40759 Points -25%
AMD Radeon RX 6800 XT
AMD Ryzen 9 5950X, AMD Radeon RX 6800 XT
38823 Points -29%
Sapphire Pulse Radeon RX 7700 XT
AMD Ryzen 9 7950X, AMD Radeon RX 7700 XT
38363 Points -30%
Average of class Desktop
  (476 - 90920, n=24, last 2 years)
35064 Points -36%
KFA2 GeForce RTX 3070 Ti SG
AMD Ryzen 9 7950X, NVIDIA GeForce RTX 3070 Ti
34007 Points -38%
KFA2 GeForce RTX 4060 Ti EX, 16GB GDDR6
AMD Ryzen 9 7950X, NVIDIA GeForce RTX 4060 Ti 16G
32285 Points -41%
Average NVIDIA GeForce RTX 4060 Ti 8G
  (31884 - 32410, n=3)
32125 Points -41%
Average NVIDIA GeForce RTX 3070
  (29330 - 30581, n=3)
30004 Points -45%
Average NVIDIA Titan RTX
  (27907 - 29830, n=3)
28802 Points -47%
XFX Speedster QICK 308 Radeon RX 7600 Black Edition
AMD Ryzen 9 7950X, AMD Radeon RX 7600
25119 Points -54%
KFA2 GeForce RTX 4060 1-Click-OC 2X
AMD Ryzen 9 7950X, NVIDIA GeForce RTX 4060
23841 Points -56%
ComputeMark v2.1 / Normal, QJuliaRayTrace
NVIDIA GeForce RTX 4090 Founders Edition
Intel Core i9-13900K, NVIDIA GeForce RTX 4090
31780 Points +49%
NVIDIA GeForce RTX 4080 Founders Edition
Intel Core i9-13900K, NVIDIA GeForce RTX 4080
24307 Points +14%
Gigabyte Aorus GeForce RTX 4070 Ti Master
Intel Core i9-13900K, NVIDIA GeForce RTX 4070 Ti
21619 Points +1%
Asus TUF Gaming GeForce RTX 4070 Ti Super
Intel Core i9-13900K, NVIDIA GeForce RTX 4070 Ti SUPER
21382 Points
Average NVIDIA GeForce RTX 4070 Ti
  (21107 - 21619, n=4)
21333 Points 0%
Asus TUF Gaming GeForce RTX 4070 Ti
Intel Core i9-13900K, NVIDIA GeForce RTX 4070 Ti
21276 Points 0%
Gigabyte GeForce RTX 4070 Super Gaming OC 12G
Intel Core i9-13900K, NVIDIA GeForce RTX 4070 SUPER
19861 Points -7%
NVIDIA GeForce RTX 4070 Super Founders Edition
Intel Core i9-13900K, NVIDIA GeForce RTX 4070 SUPER
19738 Points -8%
Zotac Gaming GeForce RTX 3090 Ti AMP Extreme Holo
AMD Ryzen 7 5800X3D, NVIDIA GeForce RTX 3090 Ti
18550 Points -13%
AMD Radeon RX 7900 XTX
AMD Ryzen 9 7950X, AMD Radeon RX 7900 XTX
17915 Points -16%
Average NVIDIA GeForce RTX 3080 Ti
  (17050 - 17749, n=4)
17475 Points -18%
Average NVIDIA GeForce RTX 3090
  (16403 - 18223, n=10)
17454 Points -18%
Zotac Gaming GeForce RTX 4070 AMP Airo
Intel Core i9-13900K, NVIDIA GeForce RTX 4070
17091 Points -20%
AMD Radeon RX 7900 XT
AMD Ryzen 9 7950X, AMD Radeon RX 7900 XT
16990 Points -21%
Average NVIDIA GeForce RTX 3080
  (14718 - 15508, n=2)
15113 Points -29%
KFA2 GeForce RTX 4060 Ti EX, 16GB GDDR6
AMD Ryzen 9 7950X, NVIDIA GeForce RTX 4060 Ti 16G
13856 Points -35%
Average NVIDIA GeForce RTX 4060 Ti 8G
  (13563 - 13822, n=3)
13702 Points -36%
Sapphire AMD Radeon RX 6950 XT Nitro+ Pure
AMD Ryzen 9 5900X, AMD Radeon RX 6950 XT
13580 Points -36%
AMD Radeon RX 7800 XT
AMD Ryzen 9 7950X, AMD Radeon RX 7800 XT
13454 Points -37%
Average of class Desktop
  (159 - 33698, n=24, last 2 years)
13343 Points -38%
Sapphire Pulse Radeon RX 7700 XT
AMD Ryzen 9 7950X, AMD Radeon RX 7700 XT
12925 Points -40%
KFA2 GeForce RTX 3070 Ti SG
AMD Ryzen 9 7950X, NVIDIA GeForce RTX 3070 Ti
12517 Points -41%
AMD Radeon RX 6900 XT
AMD Ryzen 9 5950X, AMD Radeon RX 6900 XT
12255 Points -43%
Average NVIDIA GeForce RTX 3070
  (11510 - 11816, n=3)
11665 Points -45%
AMD Radeon RX 6800 XT
AMD Ryzen 9 5950X, AMD Radeon RX 6800 XT
11304 Points -47%
KFA2 GeForce RTX 4060 1-Click-OC 2X
AMD Ryzen 9 7950X, NVIDIA GeForce RTX 4060
9916 Points -54%
Average NVIDIA Titan RTX
  (9418 - 10129, n=3)
9748 Points -54%
XFX Speedster QICK 308 Radeon RX 7600 Black Edition
AMD Ryzen 9 7950X, AMD Radeon RX 7600
8897 Points -58%
ComputeMark v2.1 / Normal, Mandel Scalar
NVIDIA GeForce RTX 4090 Founders Edition
Intel Core i9-13900K, NVIDIA GeForce RTX 4090
21571 Points +71%
AMD Radeon RX 7900 XTX
AMD Ryzen 9 7950X, AMD Radeon RX 7900 XTX
15458 Points +23%
NVIDIA GeForce RTX 4080 Founders Edition
Intel Core i9-13900K, NVIDIA GeForce RTX 4080
14733 Points +17%
AMD Radeon RX 7900 XT
AMD Ryzen 9 7950X, AMD Radeon RX 7900 XT
13989 Points +11%
Asus TUF Gaming GeForce RTX 4070 Ti Super
Intel Core i9-13900K, NVIDIA GeForce RTX 4070 Ti SUPER
12599 Points
Gigabyte Aorus GeForce RTX 4070 Ti Master
Intel Core i9-13900K, NVIDIA GeForce RTX 4070 Ti
12449 Points -1%
Zotac Gaming GeForce RTX 3090 Ti AMP Extreme Holo
AMD Ryzen 7 5800X3D, NVIDIA GeForce RTX 3090 Ti
12406 Points -2%
Asus TUF Gaming GeForce RTX 4070 Ti
Intel Core i9-13900K, NVIDIA GeForce RTX 4070 Ti
12320 Points -2%
Average NVIDIA GeForce RTX 4070 Ti
  (12126 - 12449, n=4)
12302 Points -2%
Sapphire AMD Radeon RX 6950 XT Nitro+ Pure
AMD Ryzen 9 5900X, AMD Radeon RX 6950 XT
11854 Points -6%
Gigabyte GeForce RTX 4070 Super Gaming OC 12G
Intel Core i9-13900K, NVIDIA GeForce RTX 4070 SUPER
11317 Points -10%
AMD Radeon RX 7800 XT
AMD Ryzen 9 7950X, AMD Radeon RX 7800 XT
11209 Points -11%
Average NVIDIA GeForce RTX 3080 Ti
  (11049 - 11318, n=4)
11196 Points -11%
Average NVIDIA GeForce RTX 3090
  (10650 - 11564, n=10)
11162 Points -11%
NVIDIA GeForce RTX 4070 Super Founders Edition
Intel Core i9-13900K, NVIDIA GeForce RTX 4070 SUPER
11149 Points -12%
AMD Radeon RX 6900 XT
AMD Ryzen 9 5950X, AMD Radeon RX 6900 XT
10834 Points -14%
Sapphire Pulse Radeon RX 7700 XT
AMD Ryzen 9 7950X, AMD Radeon RX 7700 XT
10601 Points -16%
AMD Radeon RX 6800 XT
AMD Ryzen 9 5950X, AMD Radeon RX 6800 XT
10018 Points -20%
Average NVIDIA GeForce RTX 3080
  (9554 - 9938, n=2)
9746 Points -23%
Zotac Gaming GeForce RTX 4070 AMP Airo
Intel Core i9-13900K, NVIDIA GeForce RTX 4070
9578 Points -24%
Average of class Desktop
  (75 - 22731, n=24, last 2 years)
8325 Points -34%
KFA2 GeForce RTX 3070 Ti SG
AMD Ryzen 9 7950X, NVIDIA GeForce RTX 3070 Ti
7702 Points -39%
KFA2 GeForce RTX 4060 Ti EX, 16GB GDDR6
AMD Ryzen 9 7950X, NVIDIA GeForce RTX 4060 Ti 16G
7454 Points -41%
Average NVIDIA GeForce RTX 4060 Ti 8G
  (7374 - 7511, n=3)
7431 Points -41%
Average NVIDIA GeForce RTX 3070
  (7042 - 7314, n=3)
7169 Points -43%
XFX Speedster QICK 308 Radeon RX 7600 Black Edition
AMD Ryzen 9 7950X, AMD Radeon RX 7600
6746 Points -46%
Average NVIDIA Titan RTX
  (5977 - 6406, n=3)
6184 Points -51%
KFA2 GeForce RTX 4060 1-Click-OC 2X
AMD Ryzen 9 7950X, NVIDIA GeForce RTX 4060
5153 Points -59%
ComputeMark v2.1 / Normal, Mandel Vector
NVIDIA GeForce RTX 4090 Founders Edition
Intel Core i9-13900K, NVIDIA GeForce RTX 4090
16199 Points +49%
AMD Radeon RX 7900 XTX
AMD Ryzen 9 7950X, AMD Radeon RX 7900 XTX
13737 Points +26%
AMD Radeon RX 7900 XT
AMD Ryzen 9 7950X, AMD Radeon RX 7900 XT
13022 Points +20%
NVIDIA GeForce RTX 4080 Founders Edition
Intel Core i9-13900K, NVIDIA GeForce RTX 4080
11772 Points +8%
Gigabyte Aorus GeForce RTX 4070 Ti Master
Intel Core i9-13900K, NVIDIA GeForce RTX 4070 Ti
10888 Points 0%
Asus TUF Gaming GeForce RTX 4070 Ti Super
Intel Core i9-13900K, NVIDIA GeForce RTX 4070 Ti SUPER
10883 Points
Asus TUF Gaming GeForce RTX 4070 Ti
Intel Core i9-13900K, NVIDIA GeForce RTX 4070 Ti
10771 Points -1%
Average NVIDIA GeForce RTX 4070 Ti
  (10541 - 10888, n=4)
10728 Points -1%
Zotac Gaming GeForce RTX 3090 Ti AMP Extreme Holo
AMD Ryzen 7 5800X3D, NVIDIA GeForce RTX 3090 Ti
10652 Points -2%
AMD Radeon RX 7800 XT
AMD Ryzen 9 7950X, AMD Radeon RX 7800 XT
9963 Points -8%
Gigabyte GeForce RTX 4070 Super Gaming OC 12G
Intel Core i9-13900K, NVIDIA GeForce RTX 4070 SUPER
9748 Points -10%
Average NVIDIA GeForce RTX 3080 Ti
  (9513 - 9860, n=4)
9730 Points -11%
NVIDIA GeForce RTX 4070 Super Founders Edition
Intel Core i9-13900K, NVIDIA GeForce RTX 4070 SUPER
9629 Points -12%
Sapphire Pulse Radeon RX 7700 XT
AMD Ryzen 9 7950X, AMD Radeon RX 7700 XT
9568 Points -12%
Sapphire AMD Radeon RX 6950 XT Nitro+ Pure
AMD Ryzen 9 5900X, AMD Radeon RX 6950 XT
9555 Points -12%
Average NVIDIA GeForce RTX 3090
  (8038 - 10097, n=10)
9467 Points -13%
AMD Radeon RX 6900 XT
AMD Ryzen 9 5950X, AMD Radeon RX 6900 XT
8690 Points -20%
Zotac Gaming GeForce RTX 4070 AMP Airo
Intel Core i9-13900K, NVIDIA GeForce RTX 4070
8421 Points -23%
AMD Radeon RX 6800 XT
AMD Ryzen 9 5950X, AMD Radeon RX 6800 XT
8399 Points -23%
Average NVIDIA GeForce RTX 3080
  (7148 - 7540, n=2)
7344 Points -33%
Average of class Desktop
  (97 - 16942, n=24, last 2 years)
6936 Points -36%
Average NVIDIA GeForce RTX 4060 Ti 8G
  (6815 - 6929, n=3)
6854 Points -37%
KFA2 GeForce RTX 4060 Ti EX, 16GB GDDR6
AMD Ryzen 9 7950X, NVIDIA GeForce RTX 4060 Ti 16G
6852 Points -37%
KFA2 GeForce RTX 3070 Ti SG
AMD Ryzen 9 7950X, NVIDIA GeForce RTX 3070 Ti
6762 Points -38%
XFX Speedster QICK 308 Radeon RX 7600 Black Edition
AMD Ryzen 9 7950X, AMD Radeon RX 7600
5764 Points -47%
Average NVIDIA GeForce RTX 3070
  (5364 - 6266, n=3)
5707 Points -48%
Average NVIDIA Titan RTX
  (4944 - 5440, n=3)
5158 Points -53%
KFA2 GeForce RTX 4060 1-Click-OC 2X
AMD Ryzen 9 7950X, NVIDIA GeForce RTX 4060
4916 Points -55%
ComputeMark v2.1 / Normal, Fluid 2DTexArr
AMD Radeon RX 7900 XTX
AMD Ryzen 9 7950X, AMD Radeon RX 7900 XTX
7315 Points +50%
NVIDIA GeForce RTX 4090 Founders Edition
Intel Core i9-13900K, NVIDIA GeForce RTX 4090
6567 Points +35%
AMD Radeon RX 7900 XT
AMD Ryzen 9 7950X, AMD Radeon RX 7900 XT
6460 Points +32%
NVIDIA GeForce RTX 4080 Founders Edition
Intel Core i9-13900K, NVIDIA GeForce RTX 4080
5523 Points +13%
Zotac Gaming GeForce RTX 3090 Ti AMP Extreme Holo
AMD Ryzen 7 5800X3D, NVIDIA GeForce RTX 3090 Ti
4886 Points 0%
Asus TUF Gaming GeForce RTX 4070 Ti Super
Intel Core i9-13900K, NVIDIA GeForce RTX 4070 Ti SUPER
4876 Points
Average NVIDIA GeForce RTX 3080 Ti
  (4453 - 4546, n=4)
4498 Points -8%
Average NVIDIA GeForce RTX 3090
  (4344 - 4608, n=10)
4492 Points -8%
AMD Radeon RX 7800 XT
AMD Ryzen 9 7950X, AMD Radeon RX 7800 XT
4489 Points -8%
Sapphire AMD Radeon RX 6950 XT Nitro+ Pure
AMD Ryzen 9 5900X, AMD Radeon RX 6950 XT
4455 Points -9%
Average NVIDIA GeForce RTX 3080
  (4087 - 4159, n=2)
4123 Points -15%
AMD Radeon RX 6800 XT
AMD Ryzen 9 5950X, AMD Radeon RX 6800 XT
3947 Points -19%
AMD Radeon RX 6900 XT
AMD Ryzen 9 5950X, AMD Radeon RX 6900 XT
3924 Points -20%
Average NVIDIA Titan RTX
  (3691 - 3828, n=3)
3757 Points -23%
Average NVIDIA GeForce RTX 4070 Ti
  (3566 - 3724, n=4)
3647 Points -25%
Gigabyte GeForce RTX 4070 Super Gaming OC 12G
Intel Core i9-13900K, NVIDIA GeForce RTX 4070 SUPER
3599 Points -26%
NVIDIA GeForce RTX 4070 Super Founders Edition
Intel Core i9-13900K, NVIDIA GeForce RTX 4070 SUPER
3592 Points -26%
Gigabyte Aorus GeForce RTX 4070 Ti Master
Intel Core i9-13900K, NVIDIA GeForce RTX 4070 Ti
3590 Points -26%
Asus TUF Gaming GeForce RTX 4070 Ti
Intel Core i9-13900K, NVIDIA GeForce RTX 4070 Ti
3566 Points -27%
KFA2 GeForce RTX 3070 Ti SG
AMD Ryzen 9 7950X, NVIDIA GeForce RTX 3070 Ti
3457 Points -29%
Zotac Gaming GeForce RTX 4070 AMP Airo
Intel Core i9-13900K, NVIDIA GeForce RTX 4070
3404 Points -30%
Average of class Desktop
  (60 - 6800, n=24, last 2 years)
2929 Points -40%
Average NVIDIA GeForce RTX 3070
  (2666 - 2706, n=3)
2692 Points -45%
Sapphire Pulse Radeon RX 7700 XT
AMD Ryzen 9 7950X, AMD Radeon RX 7700 XT
2666 Points -45%
Average NVIDIA GeForce RTX 4060 Ti 8G
  (2044 - 2060, n=3)
2049 Points -58%
KFA2 GeForce RTX 4060 Ti EX, 16GB GDDR6
AMD Ryzen 9 7950X, NVIDIA GeForce RTX 4060 Ti 16G
2039 Points -58%
KFA2 GeForce RTX 4060 1-Click-OC 2X
AMD Ryzen 9 7950X, NVIDIA GeForce RTX 4060
1912 Points -61%
XFX Speedster QICK 308 Radeon RX 7600 Black Edition
AMD Ryzen 9 7950X, AMD Radeon RX 7600
1878 Points -61%
ComputeMark v2.1 / Normal, Fluid 3DTex
NVIDIA GeForce RTX 4090 Founders Edition
Intel Core i9-13900K, NVIDIA GeForce RTX 4090
10465 Points +112%
AMD Radeon RX 7900 XTX
AMD Ryzen 9 7950X, AMD Radeon RX 7900 XTX
8537 Points +73%
AMD Radeon RX 7900 XT
AMD Ryzen 9 7950X, AMD Radeon RX 7900 XT
7109 Points +44%
NVIDIA GeForce RTX 4080 Founders Edition
Intel Core i9-13900K, NVIDIA GeForce RTX 4080
6385 Points +29%
Zotac Gaming GeForce RTX 3090 Ti AMP Extreme Holo
AMD Ryzen 7 5800X3D, NVIDIA GeForce RTX 3090 Ti
5764 Points +17%
Sapphire AMD Radeon RX 6950 XT Nitro+ Pure
AMD Ryzen 9 5900X, AMD Radeon RX 6950 XT
5515 Points +12%
Average NVIDIA GeForce RTX 3090
  (5246 - 5520, n=10)
5448 Points +10%
Average NVIDIA GeForce RTX 3080 Ti
  (5312 - 5422, n=4)
5368 Points +9%
AMD Radeon RX 6800 XT
AMD Ryzen 9 5950X, AMD Radeon RX 6800 XT
5154 Points +4%
AMD Radeon RX 6900 XT
AMD Ryzen 9 5950X, AMD Radeon RX 6900 XT
5154 Points +4%
Asus TUF Gaming GeForce RTX 4070 Ti Super
Intel Core i9-13900K, NVIDIA GeForce RTX 4070 Ti SUPER
4935 Points
AMD Radeon RX 7800 XT
AMD Ryzen 9 7950X, AMD Radeon RX 7800 XT
4736 Points -4%
Average NVIDIA GeForce RTX 3080
  (4417 - 4450, n=2)
4434 Points -10%
Average NVIDIA Titan RTX
  (3877 - 4027, n=3)
3955 Points -20%
Average NVIDIA GeForce RTX 4070 Ti
  (3683 - 3789, n=4)
3738 Points -24%
Gigabyte Aorus GeForce RTX 4070 Ti Master
Intel Core i9-13900K, NVIDIA GeForce RTX 4070 Ti
3705 Points -25%
NVIDIA GeForce RTX 4070 Super Founders Edition
Intel Core i9-13900K, NVIDIA GeForce RTX 4070 SUPER
3701 Points -25%
Asus TUF Gaming GeForce RTX 4070 Ti
Intel Core i9-13900K, NVIDIA GeForce RTX 4070 Ti
3683 Points -25%
Gigabyte GeForce RTX 4070 Super Gaming OC 12G
Intel Core i9-13900K, NVIDIA GeForce RTX 4070 SUPER
3638 Points -26%
KFA2 GeForce RTX 3070 Ti SG
AMD Ryzen 9 7950X, NVIDIA GeForce RTX 3070 Ti
3569 Points -28%
Average of class Desktop
  (65 - 10749, n=24, last 2 years)
3532 Points -28%
Zotac Gaming GeForce RTX 4070 AMP Airo
Intel Core i9-13900K, NVIDIA GeForce RTX 4070
3438 Points -30%
Average NVIDIA GeForce RTX 3070
  (2749 - 2791, n=3)
2772 Points -44%
Sapphire Pulse Radeon RX 7700 XT
AMD Ryzen 9 7950X, AMD Radeon RX 7700 XT
2603 Points -47%
Average NVIDIA GeForce RTX 4060 Ti 8G
  (2088 - 2090, n=3)
2089 Points -58%
KFA2 GeForce RTX 4060 Ti EX, 16GB GDDR6
AMD Ryzen 9 7950X, NVIDIA GeForce RTX 4060 Ti 16G
2085 Points -58%
KFA2 GeForce RTX 4060 1-Click-OC 2X
AMD Ryzen 9 7950X, NVIDIA GeForce RTX 4060
1943 Points -61%
XFX Speedster QICK 308 Radeon RX 7600 Black Edition
AMD Ryzen 9 7950X, AMD Radeon RX 7600
1835 Points -63%

* ... smaller is better

Oyun performansı: QHD ve 4K Ultra'da RTX 3090 Ti ve RX 7900 XT ile aynı seviyede

Sentetik testlerin aksine, tüm oyunlar gölgelendirici sayılarındaki artışlara göre ölçeklenmez. Buna göre, kümülatif QHD ve 4K oyun performansında Süper olmayan ortalama RTX 4070 Ti'ye göre yalnızca %4'lük bir artış görüyoruz.

The Witcher 3 ve Shadow of the Tomb Raider gibi oyunlar, RTX 4070 Ti Super ile 4K Ultra'da ortalama RTX 4070 Ti non-Super'a kıyasla %5'e varan kazançlar gösteriyor. Bu farklar Borderlands 3 ile %8'e ve Final Fantasy XV ile 4K Ultra'da %11'e kadar çıkıyor.

Bu da RTX 4070 Ti Super'i, özellikle QHD ve 4K Ultra ayarlarında oyun söz konusu olduğunda RTX 3090 Ti ve Radeon RX 7900 XT ile aynı lige yerleştiriyor.

RTX 4070 Super gibi, Nvidia da RTX 4070 Ti Super'i QHD oyuncular için sunmaya devam ediyor. Bu kart, yüksek yenileme hızına sahip QHD ekranlara sahip olanlara kesinlikle fayda sağlarken, RTX 4070 Ti Super, çok sayıda modern ve biraz daha eski AAA oyununu 4K 60 veya üzerinde rahatça çalıştırabilir.

Bununla birlikte, Cyberpunk 2077 Phantom Liberty, Alan Wake 2, Avatar: Frontiers of Pandora ve benzerleri gibi özellikle doku ağırlıklı olanlardan bazıları, 4K Ultra'da daha akıcı bir oyun deneyimi için biraz yükseltme yardımı gerektirecektir.

Performance Rating - Percent
NVIDIA GeForce RTX 4090 Founders Edition
Intel Core i9-13900K, NVIDIA GeForce RTX 4090
100 pt
NVIDIA GeForce RTX 4080 Founders Edition
Intel Core i9-13900K, NVIDIA GeForce RTX 4080
80.8 pt
AMD Radeon RX 7900 XTX
AMD Ryzen 9 7950X, AMD Radeon RX 7900 XTX
78 pt
AMD Radeon RX 7900 XT
AMD Ryzen 9 7950X, AMD Radeon RX 7900 XT
67 pt
Asus TUF Gaming GeForce RTX 4070 Ti Super
Intel Core i9-13900K, NVIDIA GeForce RTX 4070 Ti SUPER
66.5 pt
Zotac Gaming GeForce RTX 3090 Ti AMP Extreme Holo
AMD Ryzen 7 5800X3D, NVIDIA GeForce RTX 3090 Ti
66.4 pt
Gigabyte Aorus GeForce RTX 4070 Ti Master
Intel Core i9-13900K, NVIDIA GeForce RTX 4070 Ti
65.1 pt
Asus TUF Gaming GeForce RTX 4070 Ti
Intel Core i9-13900K, NVIDIA GeForce RTX 4070 Ti
65 pt
Average NVIDIA GeForce RTX 4070 Ti
 
63.8 pt
Average of class Desktop
 
63 pt
Gigabyte GeForce RTX 4070 Super Gaming OC 12G
Intel Core i9-13900K, NVIDIA GeForce RTX 4070 SUPER
59.4 pt
Sapphire AMD Radeon RX 6950 XT Nitro+ Pure
AMD Ryzen 9 5900X, AMD Radeon RX 6950 XT
59.1 pt
Average NVIDIA GeForce RTX 3080 Ti
 
58.9 pt
Average NVIDIA GeForce RTX 3090
 
58.8 pt
NVIDIA GeForce RTX 4070 Super Founders Edition
Intel Core i9-13900K, NVIDIA GeForce RTX 4070 SUPER
57 pt
AMD Radeon RX 7800 XT
AMD Ryzen 9 7950X, AMD Radeon RX 7800 XT
52 pt
Zotac Gaming GeForce RTX 4070 AMP Airo
Intel Core i9-13900K, NVIDIA GeForce RTX 4070
51.4 pt
AMD Radeon RX 6900 XT -2!
AMD Ryzen 9 5950X, AMD Radeon RX 6900 XT
51.3 pt
Average NVIDIA GeForce RTX 3080
 
50 pt
AMD Radeon RX 6800 XT -1!
AMD Ryzen 9 5950X, AMD Radeon RX 6800 XT
47.7 pt
KFA2 GeForce RTX 3070 Ti SG -2!
AMD Ryzen 9 7950X, NVIDIA GeForce RTX 3070 Ti
45 pt
Sapphire Pulse Radeon RX 7700 XT
AMD Ryzen 9 7950X, AMD Radeon RX 7700 XT
42.9 pt
Average NVIDIA Titan RTX
 
42.4 pt
Average NVIDIA GeForce RTX 3070
 
38.3 pt
Average NVIDIA GeForce RTX 4060 Ti 8G
 
37.5 pt
KFA2 GeForce RTX 4060 Ti EX, 16GB GDDR6
AMD Ryzen 9 7950X, NVIDIA GeForce RTX 4060 Ti 16G
36.9 pt
KFA2 GeForce RTX 4060 1-Click-OC 2X
AMD Ryzen 9 7950X, NVIDIA GeForce RTX 4060
29.9 pt
XFX Speedster QICK 308 Radeon RX 7600 Black Edition
AMD Ryzen 9 7950X, AMD Radeon RX 7600
29.7 pt
The Witcher 3 - 3840x2160 Ultra Graphics & Postprocessing (HBAO+)
NVIDIA GeForce RTX 4090 Founders Edition
Intel Core i9-13900K, NVIDIA GeForce RTX 4090
170.7 (154min, 154.59P1) fps +71%
NVIDIA GeForce RTX 4080 Founders Edition
Intel Core i9-13900K, NVIDIA GeForce RTX 4080
128 (113min, 114.12P1) fps +28%
AMD Radeon RX 7900 XTX
AMD Ryzen 9 7950X, AMD Radeon RX 7900 XTX
125.8 (9.5min, 66.1P0.1, 94.8P1) fps +26%
Average of class Desktop
  (55.9 - 178.6, n=20, last 2 years)
114.9 fps +15%
AMD Radeon RX 7900 XT
AMD Ryzen 9 7950X, AMD Radeon RX 7900 XT
109.4 (57.5min, 60.1P0.1, 86.2P1) fps +10%
Zotac Gaming GeForce RTX 3090 Ti AMP Extreme Holo
AMD Ryzen 7 5800X3D, NVIDIA GeForce RTX 3090 Ti
107.5 (97min, 97.56P1) fps +8%
Asus TUF Gaming GeForce RTX 4070 Ti Super
Intel Core i9-13900K, NVIDIA GeForce RTX 4070 Ti SUPER
99.7 (91min, 91.3P1) fps
Asus TUF Gaming GeForce RTX 4070 Ti
Intel Core i9-13900K, NVIDIA GeForce RTX 4070 Ti
98.3 (88min, 88.56P1) fps -1%
Average NVIDIA GeForce RTX 4070 Ti
  (92.4 - 98.3, n=4)
95.2 fps -5%
Average NVIDIA GeForce RTX 3080 Ti
  (93.1 - 96.4, n=4)
94.7 fps -5%
Gigabyte Aorus GeForce RTX 4070 Ti Master
Intel Core i9-13900K, NVIDIA GeForce RTX 4070 Ti
94.4 (86min, 86.46P1) fps -5%
Average NVIDIA GeForce RTX 3090
  (85.4 - 98.5, n=8)
93.4 fps -6%
Sapphire AMD Radeon RX 6950 XT Nitro+ Pure
AMD Ryzen 9 5900X, AMD Radeon RX 6950 XT
92.3 (10.8min, 48.8P0.1, 54.2P1) fps -7%
Gigabyte GeForce RTX 4070 Super Gaming OC 12G
Intel Core i9-13900K, NVIDIA GeForce RTX 4070 SUPER
89.1 (81min, 81.6P1) fps -11%
NVIDIA GeForce RTX 4070 Super Founders Edition
Intel Core i9-13900K, NVIDIA GeForce RTX 4070 SUPER
84.5 (77min, 77P1) fps -15%
Average NVIDIA GeForce RTX 3080
  (78 - 85.7, n=2)
81.9 fps -18%
AMD Radeon RX 7800 XT
AMD Ryzen 9 7950X, AMD Radeon RX 7800 XT
80.4 fps -19%
Zotac Gaming GeForce RTX 4070 AMP Airo
Intel Core i9-13900K, NVIDIA GeForce RTX 4070
77.1 (69min, 69P1) fps -23%
AMD Radeon RX 6900 XT
AMD Ryzen 9 5950X, AMD Radeon RX 6900 XT
76.6 (70min, 70P1) fps -23%
KFA2 GeForce RTX 3070 Ti SG
AMD Ryzen 9 7950X, NVIDIA GeForce RTX 3070 Ti
72.2 (41.4min, 52.7P0.1, 63.4P1) fps -28%
Average NVIDIA Titan RTX
  ()
71.8 fps -28%
Sapphire Pulse Radeon RX 7700 XT
AMD Ryzen 9 7950X, AMD Radeon RX 7700 XT
64.4 (33min, 33.3P0.1, 56.3P1) fps -35%
Average NVIDIA GeForce RTX 3070
  (59 - 60.3, n=2)
59.7 fps -40%
Average NVIDIA GeForce RTX 4060 Ti 8G
  (53.9 - 54.3, n=3)
54.1 fps -46%
KFA2 GeForce RTX 4060 Ti EX, 16GB GDDR6
AMD Ryzen 9 7950X, NVIDIA GeForce RTX 4060 Ti 16G
53.1 fps -47%
XFX Speedster QICK 308 Radeon RX 7600 Black Edition
AMD Ryzen 9 7950X, AMD Radeon RX 7600
43.9 fps -56%
KFA2 GeForce RTX 4060 1-Click-OC 2X
AMD Ryzen 9 7950X, NVIDIA GeForce RTX 4060
43.7 fps -56%
Metro Exodus
3840x2160 Ultra Quality AF:16x
NVIDIA GeForce RTX 4090 Founders Edition
Intel Core i9-13900K, NVIDIA GeForce RTX 4090
135 (72.48min) fps +60%
NVIDIA GeForce RTX 4080 Founders Edition
Intel Core i9-13900K, NVIDIA GeForce RTX 4080
105.7 (67.17min) fps +25%
AMD Radeon RX 7900 XTX
AMD Ryzen 9 7950X, AMD Radeon RX 7900 XTX
103.5 (66.43min) fps +23%
AMD Radeon RX 7900 XT
AMD Ryzen 9 7950X, AMD Radeon RX 7900 XT
86.9 (56.86min) fps +3%
Gigabyte Aorus GeForce RTX 4070 Ti Master
Intel Core i9-13900K, NVIDIA GeForce RTX 4070 Ti
85 (54.63min) fps +1%
Asus TUF Gaming GeForce RTX 4070 Ti
Intel Core i9-13900K, NVIDIA GeForce RTX 4070 Ti
84.5 (55.02min) fps 0%
Asus TUF Gaming GeForce RTX 4070 Ti Super
Intel Core i9-13900K, NVIDIA GeForce RTX 4070 Ti SUPER
84.4 (52.73min) fps
Zotac Gaming GeForce RTX 3090 Ti AMP Extreme Holo
AMD Ryzen 7 5800X3D, NVIDIA GeForce RTX 3090 Ti
84.3 (52.3min) fps 0%
Average of class Desktop
  (8.47 - 138.5, n=23, last 2 years)
83.6 fps -1%
Average NVIDIA GeForce RTX 4070 Ti
  (81.2 - 85, n=4)
83.4 fps -1%
Gigabyte GeForce RTX 4070 Super Gaming OC 12G
Intel Core i9-13900K, NVIDIA GeForce RTX 4070 SUPER
76.1 (49.56min) fps -10%
Average NVIDIA GeForce RTX 3080 Ti
  (74.2 - 77.1, n=4)
75.7 fps -10%
Sapphire AMD Radeon RX 6950 XT Nitro+ Pure
AMD Ryzen 9 5900X, AMD Radeon RX 6950 XT
75 (50.07min) fps -11%
Average NVIDIA GeForce RTX 3090
  (70.6 - 77.3, n=12)
75 fps -11%
NVIDIA GeForce RTX 4070 Super Founders Edition
Intel Core i9-13900K, NVIDIA GeForce RTX 4070 SUPER
72.8 (46.78min) fps -14%
AMD Radeon RX 6900 XT
AMD Ryzen 9 5950X, AMD Radeon RX 6900 XT
66.7 (42.71min) fps -21%
AMD Radeon RX 7800 XT
AMD Ryzen 9 7950X, AMD Radeon RX 7800 XT
66.7 (43.89min) fps -21%
Zotac Gaming GeForce RTX 4070 AMP Airo
Intel Core i9-13900K, NVIDIA GeForce RTX 4070
65 (41.89min) fps -23%
Average NVIDIA GeForce RTX 3080
  (64.1 - 65.9, n=2)
65 fps -23%
Sapphire Pulse Radeon RX 7700 XT
AMD Ryzen 9 7950X, AMD Radeon RX 7700 XT
57 (38.42min) fps -32%
AMD Radeon RX 6800 XT
AMD Ryzen 9 5950X, AMD Radeon RX 6800 XT
56.3 (40.14min) fps -33%
KFA2 GeForce RTX 3070 Ti SG
AMD Ryzen 9 7950X, NVIDIA GeForce RTX 3070 Ti
55.9 (35.4min) fps -34%
Average NVIDIA Titan RTX
  (51.3 - 57.9, n=27)
54.9 fps -35%
Average NVIDIA GeForce RTX 3070
  (48.3 - 49.7, n=5)
48.9 fps -42%
Average NVIDIA GeForce RTX 4060 Ti 8G
  (48.4 - 49.3, n=3)
48.8 fps -42%
KFA2 GeForce RTX 4060 Ti EX, 16GB GDDR6
AMD Ryzen 9 7950X, NVIDIA GeForce RTX 4060 Ti 16G
48.1 (32min) fps -43%
KFA2 GeForce RTX 4060 1-Click-OC 2X
AMD Ryzen 9 7950X, NVIDIA GeForce RTX 4060
38.3 (25.16min) fps -55%
XFX Speedster QICK 308 Radeon RX 7600 Black Edition
AMD Ryzen 9 7950X, AMD Radeon RX 7600
38.1 (25.45min) fps -55%
2560x1440 Ultra Quality AF:16x
NVIDIA GeForce RTX 4090 Founders Edition
Intel Core i9-13900K, NVIDIA GeForce RTX 4090
176 (81.25min) fps +34%
NVIDIA GeForce RTX 4080 Founders Edition
Intel Core i9-13900K, NVIDIA GeForce RTX 4080
155.1 (77.58min) fps +18%
AMD Radeon RX 7900 XTX
AMD Ryzen 9 7950X, AMD Radeon RX 7900 XTX
154.5 (90.83min) fps +18%
AMD Radeon RX 7900 XT
AMD Ryzen 9 7950X, AMD Radeon RX 7900 XT
135 (79.57min) fps +3%
Gigabyte Aorus GeForce RTX 4070 Ti Master
Intel Core i9-13900K, NVIDIA GeForce RTX 4070 Ti
132.3 (73.1min) fps +1%
Asus TUF Gaming GeForce RTX 4070 Ti
Intel Core i9-13900K, NVIDIA GeForce RTX 4070 Ti
132.1 (72.92min) fps +1%
Asus TUF Gaming GeForce RTX 4070 Ti Super
Intel Core i9-13900K, NVIDIA GeForce RTX 4070 Ti SUPER
130.9 (70.75min) fps
Average NVIDIA GeForce RTX 4070 Ti
  (126.7 - 132.3, n=4)
130 fps -1%
Zotac Gaming GeForce RTX 3090 Ti AMP Extreme Holo
AMD Ryzen 7 5800X3D, NVIDIA GeForce RTX 3090 Ti
125.3 (64.48min) fps -4%
Gigabyte GeForce RTX 4070 Super Gaming OC 12G
Intel Core i9-13900K, NVIDIA GeForce RTX 4070 SUPER
120.8 (68.31min) fps -8%
Average of class Desktop
  (14.8 - 181.3, n=23, last 2 years)
120.8 fps -8%
NVIDIA GeForce RTX 4070 Super Founders Edition
Intel Core i9-13900K, NVIDIA GeForce RTX 4070 SUPER
116.1 (66.05min) fps -11%
Sapphire AMD Radeon RX 6950 XT Nitro+ Pure
AMD Ryzen 9 5900X, AMD Radeon RX 6950 XT
115.5 (70.52min) fps -12%
Average NVIDIA GeForce RTX 3080 Ti
  (110 - 118, n=4)
114 fps -13%
Average NVIDIA GeForce RTX 3090
  (102 - 118.2, n=12)
113.2 fps -14%
Zotac Gaming GeForce RTX 4070 AMP Airo
Intel Core i9-13900K, NVIDIA GeForce RTX 4070
103.8 (60.52min) fps -21%
AMD Radeon RX 7800 XT
AMD Ryzen 9 7950X, AMD Radeon RX 7800 XT
102.6 (62.24min) fps -22%
AMD Radeon RX 6900 XT
AMD Ryzen 9 5950X, AMD Radeon RX 6900 XT
102 (59.52min) fps -22%
Average NVIDIA GeForce RTX 3080
  (92.2 - 97.4, n=2)
94.8 fps -28%
AMD Radeon RX 6800 XT
AMD Ryzen 9 5950X, AMD Radeon RX 6800 XT
94.6 (55.44min) fps -28%
Sapphire Pulse Radeon RX 7700 XT
AMD Ryzen 9 7950X, AMD Radeon RX 7700 XT
89.6 (55.65min) fps -32%
KFA2 GeForce RTX 3070 Ti SG
AMD Ryzen 9 7950X, NVIDIA GeForce RTX 3070 Ti
87.9 (48.28min) fps -33%
Average NVIDIA Titan RTX
  (69 - 92.9, n=26)
84 fps -36%
Average NVIDIA GeForce RTX 4060 Ti 8G
  (78.9 - 80.1, n=3)
79.4 fps -39%
KFA2 GeForce RTX 4060 Ti EX, 16GB GDDR6
AMD Ryzen 9 7950X, NVIDIA GeForce RTX 4060 Ti 16G
78.6 (46.09min) fps -40%
Average NVIDIA GeForce RTX 3070
  (74.4 - 78.3, n=5)
75.8 fps -42%
XFX Speedster QICK 308 Radeon RX 7600 Black Edition
AMD Ryzen 9 7950X, AMD Radeon RX 7600
64.9 (40.24min) fps -50%
KFA2 GeForce RTX 4060 1-Click-OC 2X
AMD Ryzen 9 7950X, NVIDIA GeForce RTX 4060
62.9 (36.84min) fps -52%
Control
3840x2160 High Quality Preset (DX11)
NVIDIA GeForce RTX 4090 Founders Edition
Intel Core i9-13900K, NVIDIA GeForce RTX 4090
107.7 (83.4min, 85.3P0.1, 91.1P1) fps +62%
AMD Radeon RX 7900 XTX
AMD Ryzen 9 7950X, AMD Radeon RX 7900 XTX
89.4 (46.8min, 48.3P0.1, 52.1P1) fps +35%
NVIDIA GeForce RTX 4080 Founders Edition
Intel Core i9-13900K, NVIDIA GeForce RTX 4080
82.6 (15.4min, 68.7P0.1, 71.9P1) fps +24%
AMD Radeon RX 7900 XT
AMD Ryzen 9 7950X, AMD Radeon RX 7900 XT
75.8 (40.1min, 41.7P0.1, 43.6P1) fps +14%
Zotac Gaming GeForce RTX 3090 Ti AMP Extreme Holo
AMD Ryzen 7 5800X3D, NVIDIA GeForce RTX 3090 Ti
73.9 (46.2min, 53.2P0.1, 62.6P1) fps +11%
Average of class Desktop
  (30.3 - 114.4, n=15, last 2 years)
66.5 fps 0%
Asus TUF Gaming GeForce RTX 4070 Ti Super
Intel Core i9-13900K, NVIDIA GeForce RTX 4070 Ti SUPER
66.4 (21.2min, 44.4P0.1, 55.9P1) fps
Average NVIDIA GeForce RTX 4070 Ti
  (63.8 - 66.2, n=4)
65 fps -2%
Asus TUF Gaming GeForce RTX 4070 Ti
Intel Core i9-13900K, NVIDIA GeForce RTX 4070 Ti
64.9 (50min, 51.9P0.1, 56.5P1) fps -2%
Gigabyte Aorus GeForce RTX 4070 Ti Master
Intel Core i9-13900K, NVIDIA GeForce RTX 4070 Ti
64.9 (26.4min, 32.6P0.1, 55.9P1) fps -2%
Sapphire AMD Radeon RX 6950 XT Nitro+ Pure
AMD Ryzen 9 5900X, AMD Radeon RX 6950 XT
64.8 (33.1min, 33.6P0.1, 36.3P1) fps -2%
Average NVIDIA GeForce RTX 3080 Ti
  (63.9 - 64.9, n=3)
64.3 fps -3%
Average NVIDIA GeForce RTX 3090
  (61.3 - 66, n=5)
62.9 fps -5%
AMD Radeon RX 7800 XT
AMD Ryzen 9 7950X, AMD Radeon RX 7800 XT
58.2 (30.4min, 30.9P0.1, 32.7P1) fps -12%
Gigabyte GeForce RTX 4070 Super Gaming OC 12G
Intel Core i9-13900K, NVIDIA GeForce RTX 4070 SUPER
58.2 (43.4min, 48.2P0.1, 50.4P1) fps -12%
NVIDIA GeForce RTX 4070 Super Founders Edition
Intel Core i9-13900K, NVIDIA GeForce RTX 4070 SUPER
57.4 (47.8min, 47.9P0.1, 50.2P1) fps -14%
Average NVIDIA GeForce RTX 3080
  (56.2 - 56.7, n=2)
56.5 fps -15%
AMD Radeon RX 6900 XT
AMD Ryzen 9 5950X, AMD Radeon RX 6900 XT
54.7 (39.8min, 41.7P0.1, 44.9P1) fps -18%
AMD Radeon RX 6900 XT
AMD Ryzen 9 5950X, AMD Radeon RX 6900 XT (SAM ENABLED)
53.9 (36.6min, 41.7P0.1, 43.5P1) fps -19%
AMD Radeon RX 6800 XT
AMD Ryzen 9 5950X, AMD Radeon RX 6800 XT
51.6 (46min) fps -22%
Zotac Gaming GeForce RTX 4070 AMP Airo
Intel Core i9-13900K, NVIDIA GeForce RTX 4070
50.2 (29.1min, 30P0.1, 37.6P1) fps -24%
Average NVIDIA Titan RTX
  (45.2 - 47.3, n=3)
46.5 fps -30%
Sapphire Pulse Radeon RX 7700 XT
AMD Ryzen 9 7950X, AMD Radeon RX 7700 XT
46.4 (24.9min, 25.5P0.1, 26.2P1) fps -30%
Average NVIDIA GeForce RTX 3070
  (40.6 - 42.3, n=3)
41.3 fps -38%
KFA2 GeForce RTX 4060 Ti EX, 16GB GDDR6
AMD Ryzen 9 7950X, NVIDIA GeForce RTX 4060 Ti 16G
36 (19.1min, 24.7P0.1, 31.1P1) fps -46%
Average NVIDIA GeForce RTX 4060 Ti 8G
  (34.3 - 37.3, n=3)
35.7 fps -46%
XFX Speedster QICK 308 Radeon RX 7600 Black Edition
AMD Ryzen 9 7950X, AMD Radeon RX 7600
31.3 (17.1min, 17.1P0.1, 17.6P1) fps -53%
KFA2 GeForce RTX 4060 1-Click-OC 2X
AMD Ryzen 9 7950X, NVIDIA GeForce RTX 4060
28.4 (20.2min, 21.3P0.1, 24.9P1) fps -57%
2560x1440 High Quality Preset (DX11)
NVIDIA GeForce RTX 4090 Founders Edition
Intel Core i9-13900K, NVIDIA GeForce RTX 4090
201 (84.1min, 146.6P0.1, 159P1) fps +54%
AMD Radeon RX 7900 XTX
AMD Ryzen 9 7950X, AMD Radeon RX 7900 XTX
184.9 (66.6min, 105.1P0.1, 121.7P1) fps +42%
NVIDIA GeForce RTX 4080 Founders Edition
Intel Core i9-13900K, NVIDIA GeForce RTX 4080
164.2 (59.2min, 121.2P0.1, 135.5P1) fps +26%
AMD Radeon RX 7900 XT
AMD Ryzen 9 7950X, AMD Radeon RX 7900 XT
156.4 (53.3min, 89.4P0.1, 95.9P1) fps +20%
Zotac Gaming GeForce RTX 3090 Ti AMP Extreme Holo
AMD Ryzen 7 5800X3D, NVIDIA GeForce RTX 3090 Ti
142.5 (51.8min, 81.9P0.1, 115.5P1) fps +9%
Sapphire AMD Radeon RX 6950 XT Nitro+ Pure
AMD Ryzen 9 5900X, AMD Radeon RX 6950 XT
133.5 (73.5min, 75.3P0.1, 83.4P1) fps +2%
Asus TUF Gaming GeForce RTX 4070 Ti
Intel Core i9-13900K, NVIDIA GeForce RTX 4070 Ti
130.6 (59min, 74P0.1, 107.3P1) fps 0%
Gigabyte Aorus GeForce RTX 4070 Ti Master
Intel Core i9-13900K, NVIDIA GeForce RTX 4070 Ti
130.6 (24.9min, 47.8P0.1, 108.8P1) fps 0%
Asus TUF Gaming GeForce RTX 4070 Ti Super
Intel Core i9-13900K, NVIDIA GeForce RTX 4070 Ti SUPER
130.3 (60.1min, 82.7P0.1, 108P1) fps
Average of class Desktop
  (60.9 - 232, n=15, last 2 years)
129.4 fps -1%
Average NVIDIA GeForce RTX 3080 Ti
  (122 - 125.5, n=3)
123.8 fps -5%
Average NVIDIA GeForce RTX 4070 Ti
  (100 - 130.6, n=4)
121.9 fps -6%
Average NVIDIA GeForce RTX 3090
  (115.8 - 123.7, n=5)
120.4 fps -8%
AMD Radeon RX 7800 XT
AMD Ryzen 9 7950X, AMD Radeon RX 7800 XT
120.3 (60.2min, 62.9P0.1, 68.1P1) fps -8%
Gigabyte GeForce RTX 4070 Super Gaming OC 12G
Intel Core i9-13900K, NVIDIA GeForce RTX 4070 SUPER
115.5 (64.7min, 91.1P0.1, 96.7P1) fps -11%
AMD Radeon RX 6900 XT
AMD Ryzen 9 5950X, AMD Radeon RX 6900 XT
113 (71.5min, 73.2P0.1, 79.6P1) fps -13%
AMD Radeon RX 6900 XT
AMD Ryzen 9 5950X, AMD Radeon RX 6900 XT (SAM ENABLED)
113 (68min, 71.3P0.1, 81.1P1) fps -13%
NVIDIA GeForce RTX 4070 Super Founders Edition
Intel Core i9-13900K, NVIDIA GeForce RTX 4070 SUPER
112.6 (83.1min, 89.4P0.1, 94.5P1) fps -14%
AMD Radeon RX 6800 XT
AMD Ryzen 9 5950X, AMD Radeon RX 6800 XT
108 (93min) fps -17%
Average NVIDIA GeForce RTX 3080
  (105 - 106, n=2)
105.5 fps -19%
Zotac Gaming GeForce RTX 4070 AMP Airo
Intel Core i9-13900K, NVIDIA GeForce RTX 4070
101.8 (15.7min, 26.9P0.1, 84P1) fps -22%
Sapphire Pulse Radeon RX 7700 XT
AMD Ryzen 9 7950X, AMD Radeon RX 7700 XT
96.1 (51.5min, 52P0.1, 55P1) fps -26%
Average NVIDIA Titan RTX
  (89 - 93.6, n=3)
91.5 fps -30%
Average NVIDIA GeForce RTX 3070
  (79.8 - 82.5, n=3)
81.2 fps -38%
Average NVIDIA GeForce RTX 4060 Ti 8G
  (69.2 - 75.3, n=3)
73.2 fps -44%
KFA2 GeForce RTX 4060 Ti EX, 16GB GDDR6
AMD Ryzen 9 7950X, NVIDIA GeForce RTX 4060 Ti 16G
73.1 (43.1min, 53.6P0.1, 62.7P1) fps -44%
XFX Speedster QICK 308 Radeon RX 7600 Black Edition
AMD Ryzen 9 7950X, AMD Radeon RX 7600
63.6 (33.4min, 34.3P0.1, 36.6P1) fps -51%
KFA2 GeForce RTX 4060 1-Click-OC 2X
AMD Ryzen 9 7950X, NVIDIA GeForce RTX 4060
58.4 (38.3min, 43.3P0.1, 50.2P1) fps -55%
Borderlands 3
3840x2160 Badass Overall Quality (DX11)
NVIDIA GeForce RTX 4090 Founders Edition
Intel Core i9-13900K, NVIDIA GeForce RTX 4090
133.4 fps +68%
NVIDIA GeForce RTX 4080 Founders Edition
Intel Core i9-13900K, NVIDIA GeForce RTX 4080
95.7 fps +21%
AMD Radeon RX 7900 XTX
AMD Ryzen 9 7950X, AMD Radeon RX 7900 XTX
88.4 fps +11%
Zotac Gaming GeForce RTX 3090 Ti AMP Extreme Holo
AMD Ryzen 7 5800X3D, NVIDIA GeForce RTX 3090 Ti
83.8 fps +6%
Asus TUF Gaming GeForce RTX 4070 Ti Super
Intel Core i9-13900K, NVIDIA GeForce RTX 4070 Ti SUPER
79.4 fps
Gigabyte Aorus GeForce RTX 4070 Ti Master
Intel Core i9-13900K, NVIDIA GeForce RTX 4070 Ti
74.9 fps -6%
AMD Radeon RX 7900 XT
AMD Ryzen 9 7950X, AMD Radeon RX 7900 XT
74.6 fps -6%
Average of class Desktop
  (5.54 - 133.4, n=22, last 2 years)
74.4 fps -6%
Asus TUF Gaming GeForce RTX 4070 Ti
Intel Core i9-13900K, NVIDIA GeForce RTX 4070 Ti
74.1 fps -7%
Average NVIDIA GeForce RTX 4070 Ti
  (71.9 - 74.9, n=4)
73.4 fps -8%
Average NVIDIA GeForce RTX 3090
  (68 - 75.3, n=13)
72.8 fps -8%
Average NVIDIA GeForce RTX 3080 Ti
  (71.2 - 74, n=4)
72.8 fps -8%
Gigabyte GeForce RTX 4070 Super Gaming OC 12G
Intel Core i9-13900K, NVIDIA GeForce RTX 4070 SUPER
68.9 fps -13%
NVIDIA GeForce RTX 4070 Super Founders Edition
Intel Core i9-13900K, NVIDIA GeForce RTX 4070 SUPER
66.2 fps -17%
Average NVIDIA GeForce RTX 3080
  (61.5 - 61.9, n=2)
61.7 fps -22%
Sapphire AMD Radeon RX 6950 XT Nitro+ Pure
AMD Ryzen 9 5900X, AMD Radeon RX 6950 XT
59.9 fps -25%
AMD Radeon RX 6900 XT
AMD Ryzen 9 5950X, AMD Radeon RX 6900 XT (SAM ENABLED)
59.8 fps -25%
AMD Radeon RX 6900 XT
AMD Ryzen 9 5950X, AMD Radeon RX 6900 XT
57.1 fps -28%
Zotac Gaming GeForce RTX 4070 AMP Airo
Intel Core i9-13900K, NVIDIA GeForce RTX 4070
58.8 fps -26%
AMD Radeon RX 7800 XT
AMD Ryzen 9 7950X, AMD Radeon RX 7800 XT
57.9 fps -27%
AMD Radeon RX 6800 XT
AMD Ryzen 9 5950X, AMD Radeon RX 6800 XT
53.6 fps -32%
KFA2 GeForce RTX 3070 Ti SG
AMD Ryzen 9 7950X, NVIDIA GeForce RTX 3070 Ti
53 fps -33%
Sapphire Pulse Radeon RX 7700 XT
AMD Ryzen 9 7950X, AMD Radeon RX 7700 XT
48 fps -40%
Average NVIDIA Titan RTX
  (46 - 52.8, n=29)
47.3 fps -40%
Average NVIDIA GeForce RTX 3070
  (42.7 - 46.3, n=5)
44.3 fps -44%
Average NVIDIA GeForce RTX 4060 Ti 8G
  (43.1 - 43.7, n=3)
43.5 fps -45%
KFA2 GeForce RTX 4060 Ti EX, 16GB GDDR6
AMD Ryzen 9 7950X, NVIDIA GeForce RTX 4060 Ti 16G
42.5 fps -46%
XFX Speedster QICK 308 Radeon RX 7600 Black Edition
AMD Ryzen 9 7950X, AMD Radeon RX 7600
34.5 fps -57%
KFA2 GeForce RTX 4060 1-Click-OC 2X
AMD Ryzen 9 7950X, NVIDIA GeForce RTX 4060
33.8 fps -57%
2560x1440 Badass Overall Quality (DX11)
NVIDIA GeForce RTX 4090 Founders Edition
Intel Core i9-13900K, NVIDIA GeForce RTX 4090
190 fps +32%
NVIDIA GeForce RTX 4080 Founders Edition
Intel Core i9-13900K, NVIDIA GeForce RTX 4080
170.5 fps +19%
AMD Radeon RX 7900 XTX
AMD Ryzen 9 7950X, AMD Radeon RX 7900 XTX
152.2 fps +6%
Asus TUF Gaming GeForce RTX 4070 Ti Super
Intel Core i9-13900K, NVIDIA GeForce RTX 4070 Ti SUPER
143.6 fps
Zotac Gaming GeForce RTX 3090 Ti AMP Extreme Holo
AMD Ryzen 7 5800X3D, NVIDIA GeForce RTX 3090 Ti
143.1 fps 0%
Gigabyte Aorus GeForce RTX 4070 Ti Master
Intel Core i9-13900K, NVIDIA GeForce RTX 4070 Ti
142 fps -1%
Asus TUF Gaming GeForce RTX 4070 Ti
Intel Core i9-13900K, NVIDIA GeForce RTX 4070 Ti
140.6 fps -2%
Average NVIDIA GeForce RTX 4070 Ti
  (134.3 - 142, n=4)
138.3 fps -4%
AMD Radeon RX 7900 XT
AMD Ryzen 9 7950X, AMD Radeon RX 7900 XT
135.2 fps -6%
Gigabyte GeForce RTX 4070 Super Gaming OC 12G
Intel Core i9-13900K, NVIDIA GeForce RTX 4070 SUPER
131.2 fps -9%
NVIDIA GeForce RTX 4070 Super Founders Edition
Intel Core i9-13900K, NVIDIA GeForce RTX 4070 SUPER
125.4 fps -13%
Average NVIDIA GeForce RTX 3080 Ti
  (114 - 130.2, n=4)
124.5 fps -13%
Average NVIDIA GeForce RTX 3090
  (105 - 131.6, n=13)
123.8 fps -14%
Average of class Desktop
  (13.4 - 190, n=23, last 2 years)
120.8 fps -16%
Zotac Gaming GeForce RTX 4070 AMP Airo
Intel Core i9-13900K, NVIDIA GeForce RTX 4070
110.8 fps -23%
Sapphire AMD Radeon RX 6950 XT Nitro+ Pure
AMD Ryzen 9 5900X, AMD Radeon RX 6950 XT
110 fps -23%
AMD Radeon RX 6900 XT
AMD Ryzen 9 5950X, AMD Radeon RX 6900 XT (SAM ENABLED)
107 fps -25%
AMD Radeon RX 6900 XT
AMD Ryzen 9 5950X, AMD Radeon RX 6900 XT
105 fps -27%
AMD Radeon RX 7800 XT
AMD Ryzen 9 7950X, AMD Radeon RX 7800 XT
105.5 fps -27%
Average NVIDIA GeForce RTX 3080
  (95.7 - 103, n=2)
99.4 fps -31%
KFA2 GeForce RTX 3070 Ti SG
AMD Ryzen 9 7950X, NVIDIA GeForce RTX 3070 Ti
95.9 fps -33%
AMD Radeon RX 6800 XT
AMD Ryzen 9 5950X, AMD Radeon RX 6800 XT
93.6 fps -35%
Sapphire Pulse Radeon RX 7700 XT
AMD Ryzen 9 7950X, AMD Radeon RX 7700 XT
89.4 fps -38%
Average NVIDIA Titan RTX
  (74 - 93.1, n=29)
84.7 fps -41%
Average NVIDIA GeForce RTX 4060 Ti 8G
  (83.9 - 85.2, n=3)
84.4 fps -41%
KFA2 GeForce RTX 4060 Ti EX, 16GB GDDR6
AMD Ryzen 9 7950X, NVIDIA GeForce RTX 4060 Ti 16G
81.7 fps -43%
Average NVIDIA GeForce RTX 3070
  (75.1 - 82.9, n=5)
77.7 fps -46%
XFX Speedster QICK 308 Radeon RX 7600 Black Edition
AMD Ryzen 9 7950X, AMD Radeon RX 7600
65.7 fps -54%
KFA2 GeForce RTX 4060 1-Click-OC 2X
AMD Ryzen 9 7950X, NVIDIA GeForce RTX 4060
64.8 fps -55%
Shadow of the Tomb Raider
3840x2160 Highest Preset AA:T
NVIDIA GeForce RTX 4090 Founders Edition
Intel Core i9-13900K, NVIDIA GeForce RTX 4090
182 fps +66%
NVIDIA GeForce RTX 4080 Founders Edition
Intel Core i9-13900K, NVIDIA GeForce RTX 4080
134 fps +22%
AMD Radeon RX 7900 XTX
AMD Ryzen 9 7950X, AMD Radeon RX 7900 XTX
130.1 fps +19%
AMD Radeon RX 7900 XT
AMD Ryzen 9 7950X, AMD Radeon RX 7900 XT
109.6 fps 0%
Asus TUF Gaming GeForce RTX 4070 Ti Super
Intel Core i9-13900K, NVIDIA GeForce RTX 4070 Ti SUPER
109.5 fps
Zotac Gaming GeForce RTX 3090 Ti AMP Extreme Holo
AMD Ryzen 7 5800X3D, NVIDIA GeForce RTX 3090 Ti
106 fps -3%
Gigabyte Aorus GeForce RTX 4070 Ti Master
Intel Core i9-13900K, NVIDIA GeForce RTX 4070 Ti
104.9 fps -4%
Asus TUF Gaming GeForce RTX 4070 Ti
Intel Core i9-13900K, NVIDIA GeForce RTX 4070 Ti
104.4 fps -5%
Average NVIDIA GeForce RTX 4070 Ti
  (102.7 - 104.9, n=4)
103.8 fps -5%
Average of class Desktop
  (33 - 186, n=20, last 2 years)
103.4 fps -6%
Sapphire AMD Radeon RX 6950 XT Nitro+ Pure
AMD Ryzen 9 5900X, AMD Radeon RX 6950 XT
97.4 fps -11%
Gigabyte GeForce RTX 4070 Super Gaming OC 12G
Intel Core i9-13900K, NVIDIA GeForce RTX 4070 SUPER
96.7 fps -12%
Average NVIDIA GeForce RTX 3090
  (89.3 - 99.7, n=12)
96.4 fps -12%
Average NVIDIA GeForce RTX 3080 Ti
  (93 - 98.6, n=3)
95.1 fps -13%
NVIDIA GeForce RTX 4070 Super Founders Edition
Intel Core i9-13900K, NVIDIA GeForce RTX 4070 SUPER
91.5 fps -16%
AMD Radeon RX 6900 XT
AMD Ryzen 9 5950X, AMD Radeon RX 6900 XT (SAM ENABLED)
86 fps -21%
AMD Radeon RX 6900 XT
AMD Ryzen 9 5950X, AMD Radeon RX 6900 XT
84 fps -23%
Average NVIDIA GeForce RTX 3080
  (83.9 - 87.9, n=2)
85.9 fps -22%
Zotac Gaming GeForce RTX 4070 AMP Airo
Intel Core i9-13900K, NVIDIA GeForce RTX 4070
83.7 fps -24%
AMD Radeon RX 7800 XT
AMD Ryzen 9 7950X, AMD Radeon RX 7800 XT
82.7 fps -24%
AMD Radeon RX 6800 XT
AMD Ryzen 9 5950X, AMD Radeon RX 6800 XT
79.6 fps -27%
KFA2 GeForce RTX 3070 Ti SG
AMD Ryzen 9 7950X, NVIDIA GeForce RTX 3070 Ti
72.8 fps -34%
Average NVIDIA Titan RTX
  (59 - 71.1, n=24)
66.9 fps -39%
Sapphire Pulse Radeon RX 7700 XT
AMD Ryzen 9 7950X, AMD Radeon RX 7700 XT
65.5 fps -40%
Average NVIDIA GeForce RTX 3070
  (61 - 63.5, n=4)
62.3 fps -43%
KFA2 GeForce RTX 4060 Ti EX, 16GB GDDR6
AMD Ryzen 9 7950X, NVIDIA GeForce RTX 4060 Ti 16G
58.5 fps -47%
Average NVIDIA GeForce RTX 4060 Ti 8G
  (58.1 - 58.7, n=3)
58.5 fps -47%
KFA2 GeForce RTX 4060 1-Click-OC 2X
AMD Ryzen 9 7950X, NVIDIA GeForce RTX 4060
46.4 fps -58%
XFX Speedster QICK 308 Radeon RX 7600 Black Edition
AMD Ryzen 9 7950X, AMD Radeon RX 7600
41.6 fps -62%
2560x1440 Highest Preset AA:T
NVIDIA GeForce RTX 4090 Founders Edition
Intel Core i9-13900K, NVIDIA GeForce RTX 4090
282 fps +38%
NVIDIA GeForce RTX 4080 Founders Edition
Intel Core i9-13900K, NVIDIA GeForce RTX 4080
248 fps +21%
AMD Radeon RX 7900 XTX
AMD Ryzen 9 7950X, AMD Radeon RX 7900 XTX
230 fps +12%
Asus TUF Gaming GeForce RTX 4070 Ti Super
Intel Core i9-13900K, NVIDIA GeForce RTX 4070 Ti SUPER
205 fps
Gigabyte Aorus GeForce RTX 4070 Ti Master
Intel Core i9-13900K, NVIDIA GeForce RTX 4070 Ti
204 fps 0%
AMD Radeon RX 7900 XT
AMD Ryzen 9 7950X, AMD Radeon RX 7900 XT
203 fps -1%
Asus TUF Gaming GeForce RTX 4070 Ti
Intel Core i9-13900K, NVIDIA GeForce RTX 4070 Ti
202 fps -1%
Average NVIDIA GeForce RTX 4070 Ti
  (195.9 - 204, n=4)
199.9 fps -2%
Gigabyte GeForce RTX 4070 Super Gaming OC 12G
Intel Core i9-13900K, NVIDIA GeForce RTX 4070 SUPER
188 fps -8%
Zotac Gaming GeForce RTX 3090 Ti AMP Extreme Holo
AMD Ryzen 7 5800X3D, NVIDIA GeForce RTX 3090 Ti
184 fps -10%
Sapphire AMD Radeon RX 6950 XT Nitro+ Pure
AMD Ryzen 9 5900X, AMD Radeon RX 6950 XT
184 fps -10%
Average of class Desktop
  (61 - 282, n=21, last 2 years)
173.6 fps -15%
Average NVIDIA GeForce RTX 3090
  (137 - 172.3, n=12)
165.6 fps -19%
NVIDIA GeForce RTX 4070 Super Founders Edition
Intel Core i9-13900K, NVIDIA GeForce RTX 4070 SUPER
165.3 fps -19%
Average NVIDIA GeForce RTX 3080 Ti
  (157 - 173.3, n=3)
164.8 fps -20%
AMD Radeon RX 6900 XT
AMD Ryzen 9 5950X, AMD Radeon RX 6900 XT (SAM ENABLED)
163 fps -20%
AMD Radeon RX 6900 XT
AMD Ryzen 9 5950X, AMD Radeon RX 6900 XT
155 fps -24%
Zotac Gaming GeForce RTX 4070 AMP Airo
Intel Core i9-13900K, NVIDIA GeForce RTX 4070
162.6 fps -21%
AMD Radeon RX 7800 XT
AMD Ryzen 9 7950X, AMD Radeon RX 7800 XT
158.1 fps -23%
Average NVIDIA GeForce RTX 3080
  (147 - 152, n=2)
149.5 fps -27%
AMD Radeon RX 6800 XT
AMD Ryzen 9 5950X, AMD Radeon RX 6800 XT
148 fps -28%
KFA2 GeForce RTX 3070 Ti SG
AMD Ryzen 9 7950X, NVIDIA GeForce RTX 3070 Ti
132.5 fps -35%
Sapphire Pulse Radeon RX 7700 XT
AMD Ryzen 9 7950X, AMD Radeon RX 7700 XT
131.9 fps -36%
Average NVIDIA GeForce RTX 4060 Ti 8G
  (119.3 - 121.2, n=3)
120.3 fps -41%
KFA2 GeForce RTX 4060 Ti EX, 16GB GDDR6
AMD Ryzen 9 7950X, NVIDIA GeForce RTX 4060 Ti 16G
119.6 fps -42%
Average NVIDIA Titan RTX
  (98 - 128, n=23)
117.8 fps -43%
Average NVIDIA GeForce RTX 3070
  (108 - 116, n=4)
113.2 fps -45%
KFA2 GeForce RTX 4060 1-Click-OC 2X
AMD Ryzen 9 7950X, NVIDIA GeForce RTX 4060
96 fps -53%
XFX Speedster QICK 308 Radeon RX 7600 Black Edition
AMD Ryzen 9 7950X, AMD Radeon RX 7600
89.3 fps -56%
Final Fantasy XV Benchmark
3840x2160 High Quality
NVIDIA GeForce RTX 4090 Founders Edition
Intel Core i9-13900K, NVIDIA GeForce RTX 4090 (1.3)
151.5 fps +53%
NVIDIA GeForce RTX 4080 Founders Edition
Intel Core i9-13900K, NVIDIA GeForce RTX 4080 (1.3)
115.4 fps +17%
AMD Radeon RX 7900 XTX
AMD Ryzen 9 7950X, AMD Radeon RX 7900 XTX (1.3)
101.6 fps +3%
Asus TUF Gaming GeForce RTX 4070 Ti Super
Intel Core i9-13900K, NVIDIA GeForce RTX 4070 Ti SUPER (1.3)
98.9 fps
Zotac Gaming GeForce RTX 3090 Ti AMP Extreme Holo
AMD Ryzen 7 5800X3D, NVIDIA GeForce RTX 3090 Ti (1.3)
96.3 fps -3%
Average of class Desktop
  (9.98 - 159.2, n=24, last 2 years)
95.3 fps -4%
Gigabyte Aorus GeForce RTX 4070 Ti Master
Intel Core i9-13900K, NVIDIA GeForce RTX 4070 Ti (1.3)
90.9 fps -8%
Asus TUF Gaming GeForce RTX 4070 Ti
Intel Core i9-13900K, NVIDIA GeForce RTX 4070 Ti (1.3)
90.5 fps -8%
Average NVIDIA GeForce RTX 4070 Ti
  (87.1 - 90.9, n=4)
89 fps -10%
Average NVIDIA GeForce RTX 3090
  (81.5 - 92.4, n=15)
87.5 fps -12%
Sapphire AMD Radeon RX 6950 XT Nitro+ Pure
AMD Ryzen 9 5900X, AMD Radeon RX 6950 XT (1.3)
86 fps -13%
Gigabyte GeForce RTX 4070 Super Gaming OC 12G
Intel Core i9-13900K, NVIDIA GeForce RTX 4070 SUPER (1.3)
85.2 fps -14%
AMD Radeon RX 7900 XT
AMD Ryzen 9 7950X, AMD Radeon RX 7900 XT (1.3)
84.9 fps -14%
Average NVIDIA GeForce RTX 3080 Ti
  (84 - 86.4, n=3)
84.9 fps -14%
NVIDIA GeForce RTX 4070 Super Founders Edition
Intel Core i9-13900K, NVIDIA GeForce RTX 4070 SUPER (1.3)
84.8 fps -14%
Zotac Gaming GeForce RTX 4070 AMP Airo
Intel Core i9-13900K, NVIDIA GeForce RTX 4070 (1.3)
74 fps -25%
Average NVIDIA GeForce RTX 3080
  (66 - 76.1, n=2)
71.1 fps -28%
AMD Radeon RX 7800 XT
AMD Ryzen 9 7950X, AMD Radeon RX 7800 XT (1.3)
70.5 fps -29%
AMD Radeon RX 6800 XT
AMD Ryzen 9 5950X, AMD Radeon RX 6800 XT (1.3)
65.2 fps -34%
KFA2 GeForce RTX 3070 Ti SG
AMD Ryzen 9 7950X, NVIDIA GeForce RTX 3070 Ti (1.3)
64.9 fps -34%
Average NVIDIA Titan RTX
  (57.4 - 66.7, n=32)
62.3 fps -37%
Sapphire Pulse Radeon RX 7700 XT
AMD Ryzen 9 7950X, AMD Radeon RX 7700 XT (1.3)
57.4 fps -42%
Average NVIDIA GeForce RTX 3070
  (54.8 - 58.2, n=4)
56.9 fps -42%
Average NVIDIA GeForce RTX 4060 Ti 8G
  (51.5 - 52.7, n=3)
52.2 fps -47%
KFA2 GeForce RTX 4060 Ti EX, 16GB GDDR6
AMD Ryzen 9 7950X, NVIDIA GeForce RTX 4060 Ti 16G (1.3)
51.2 fps -48%
KFA2 GeForce RTX 4060 1-Click-OC 2X
AMD Ryzen 9 7950X, NVIDIA GeForce RTX 4060 (1.3)
43 fps -57%
XFX Speedster QICK 308 Radeon RX 7600 Black Edition
AMD Ryzen 9 7950X, AMD Radeon RX 7600 (1.3)
39.3 fps -60%
2560x1440 High Quality
NVIDIA GeForce RTX 4090 Founders Edition
Intel Core i9-13900K, NVIDIA GeForce RTX 4090 (1.3)
220 fps +30%
NVIDIA GeForce RTX 4080 Founders Edition
Intel Core i9-13900K, NVIDIA GeForce RTX 4080 (1.3)
198.4 fps +18%
AMD Radeon RX 7900 XTX
AMD Ryzen 9 7950X, AMD Radeon RX 7900 XTX (1.3)
172.8 fps +2%
Gigabyte Aorus GeForce RTX 4070 Ti Master
Intel Core i9-13900K, NVIDIA GeForce RTX 4070 Ti (1.3)
169.2 fps 0%
Asus TUF Gaming GeForce RTX 4070 Ti Super
Intel Core i9-13900K, NVIDIA GeForce RTX 4070 Ti SUPER (1.3)
168.8 fps
Asus TUF Gaming GeForce RTX 4070 Ti
Intel Core i9-13900K, NVIDIA GeForce RTX 4070 Ti (1.3)
167 fps -1%
Average NVIDIA GeForce RTX 4070 Ti
  (160.1 - 169.2, n=4)
164.9 fps -2%
Sapphire AMD Radeon RX 6950 XT Nitro+ Pure
AMD Ryzen 9 5900X, AMD Radeon RX 6950 XT (1.3)
153 fps -9%
Zotac Gaming GeForce RTX 3090 Ti AMP Extreme Holo
AMD Ryzen 7 5800X3D, NVIDIA GeForce RTX 3090 Ti (1.3)
151.6 fps -10%
Average of class Desktop
  (17.8 - 237, n=23, last 2 years)
150.9 fps -11%
Gigabyte GeForce RTX 4070 Super Gaming OC 12G
Intel Core i9-13900K, NVIDIA GeForce RTX 4070 SUPER (1.3)
150.5 fps -11%
AMD Radeon RX 7900 XT
AMD Ryzen 9 7950X, AMD Radeon RX 7900 XT (1.3)
149.9 fps -11%
NVIDIA GeForce RTX 4070 Super Founders Edition
Intel Core i9-13900K, NVIDIA GeForce RTX 4070 SUPER (1.3)
148 fps -12%
Average NVIDIA GeForce RTX 3090
  (128 - 153, n=15)
143.1 fps -15%
Average NVIDIA GeForce RTX 3080 Ti
  (136 - 142, n=3)
139.7 fps -17%
Zotac Gaming GeForce RTX 4070 AMP Airo
Intel Core i9-13900K, NVIDIA GeForce RTX 4070 (1.3)
133.7 fps -21%
AMD Radeon RX 7800 XT
AMD Ryzen 9 7950X, AMD Radeon RX 7800 XT (1.3)
124.6 fps -26%
AMD Radeon RX 6800 XT
AMD Ryzen 9 5950X, AMD Radeon RX 6800 XT (1.3)
113 fps -33%
KFA2 GeForce RTX 3070 Ti SG
AMD Ryzen 9 7950X, NVIDIA GeForce RTX 3070 Ti (1.3)
112.7 fps -33%
Average NVIDIA GeForce RTX 3080
  (91 - 124, n=2)
107.5 fps -36%
Average NVIDIA Titan RTX
  (80.6 - 113.3, n=20)
104 fps -38%
Sapphire Pulse Radeon RX 7700 XT
AMD Ryzen 9 7950X, AMD Radeon RX 7700 XT (1.3)
103.1 fps -39%
Average NVIDIA GeForce RTX 4060 Ti 8G
  (95.5 - 96.7, n=3)
96 fps -43%
Average NVIDIA GeForce RTX 3070
  (89.2 - 99.3, n=4)
94.1 fps -44%
KFA2 GeForce RTX 4060 Ti EX, 16GB GDDR6
AMD Ryzen 9 7950X, NVIDIA GeForce RTX 4060 Ti 16G (1.3)
90.5 fps -46%
KFA2 GeForce RTX 4060 1-Click-OC 2X
AMD Ryzen 9 7950X, NVIDIA GeForce RTX 4060 (1.3)
79.3 fps -53%
XFX Speedster QICK 308 Radeon RX 7600 Black Edition
AMD Ryzen 9 7950X, AMD Radeon RX 7600 (1.3)
74.2 fps -56%

Yerel ışın izleme performansı

1080p Ultra'da ışın izleme performansı RTX 4070 Ti ile ya aynı seviyede ya da çok az daha iyi; The Callisto Protocol %9'luk makul bir kazanç gösteriyor.

RTX 4070 Ti Super, 4K Ultra ışın izlemede Cyberpunk 2077 1.6 'da %4 ve Control'de %10 artışla kanıtlanan bir avantaja sahiptir.

RTX 4070 Super Founders Edition ile karşılaştırıldığında fark daha belirgin hale geliyor. Burada RTX 4070 Ti Super, Alan Wake 2 1080p ve Cyberpunk 2077 Phantom Liberty 4K ışın izlemede %22'lik önemli bir avantaj gösteriyor.

Metro Exodus - 1920x1080 Ultra Quality DXR AF:16x
AMD Radeon RX 7900 XTX
AMD Ryzen 9 7950X, AMD Radeon RX 7900 XTX
141.2 (89.03min) fps +6%
NVIDIA GeForce RTX 4080 Founders Edition
Intel Core i9-13900K, NVIDIA GeForce RTX 4080
137.2 (68.42min) fps +3%
NVIDIA GeForce RTX 4090 Founders Edition
Intel Core i9-13900K, NVIDIA GeForce RTX 4090
135 (73.53min) fps +1%
Asus TUF Gaming GeForce RTX 4070 Ti Super
Intel Core i9-13900K, NVIDIA GeForce RTX 4070 Ti SUPER
133.4 (69.17min) fps
Average NVIDIA GeForce RTX 4070 Ti
  (128.8 - 133.3, n=4)
130.9 fps -2%
Gigabyte Aorus GeForce RTX 4070 Ti Master
Intel Core i9-13900K, NVIDIA GeForce RTX 4070 Ti
129 (64.57min) fps -3%
Asus TUF Gaming GeForce RTX 4070 Ti
Intel Core i9-13900K, NVIDIA GeForce RTX 4070 Ti
128.8 (62.96min) fps -3%
Zotac Gaming GeForce RTX 3090 Ti AMP Extreme Holo
AMD Ryzen 7 5800X3D, NVIDIA GeForce RTX 3090 Ti
128.5 (64.07min) fps -4%
Gigabyte GeForce RTX 4070 Super Gaming OC 12G
Intel Core i9-13900K, NVIDIA GeForce RTX 4070 SUPER
126.3 (69.94min) fps -5%
AMD Radeon RX 7900 XT
AMD Ryzen 9 7950X, AMD Radeon RX 7900 XT
124.3 (78.88min) fps -7%
NVIDIA GeForce RTX 4070 Super Founders Edition
Intel Core i9-13900K, NVIDIA GeForce RTX 4070 SUPER
121.7 (67.66min) fps -9%
Average of class Desktop
  (62.8 - 163.7, n=22, last 2 years)
119.4 fps -10%
Average NVIDIA GeForce RTX 3080 Ti
  (110 - 121.2, n=4)
114.8 fps -14%
Average NVIDIA GeForce RTX 3090
  (68.6 - 122.2, n=12)
111.4 fps -16%
Zotac Gaming GeForce RTX 4070 AMP Airo
Intel Core i9-13900K, NVIDIA GeForce RTX 4070
107.1 (58.82min) fps -20%
AMD Radeon RX 7800 XT
AMD Ryzen 9 7950X, AMD Radeon RX 7800 XT
98.4 (61.39min) fps -26%
Average NVIDIA GeForce RTX 3080
  (91.5 - 102, n=2)
96.8 fps -27%
KFA2 GeForce RTX 3070 Ti SG
AMD Ryzen 9 7950X, NVIDIA GeForce RTX 3070 Ti
92.4 (50.51min) fps -31%
AMD Radeon RX 6900 XT
AMD Ryzen 9 5950X, AMD Radeon RX 6900 XT
90.5 (55.53min) fps -32%
Sapphire Pulse Radeon RX 7700 XT
AMD Ryzen 9 7950X, AMD Radeon RX 7700 XT
88.1 (56.03min) fps -34%
Average NVIDIA Titan RTX
  (69 - 95.5, n=23)
86.1 fps -35%
AMD Radeon RX 6800 XT
AMD Ryzen 9 5950X, AMD Radeon RX 6800 XT
85.5 (52.71min) fps -36%
Average NVIDIA GeForce RTX 4060 Ti 8G
  (84.6 - 86.1, n=3)
85.2 fps -36%
KFA2 GeForce RTX 4060 Ti EX, 16GB GDDR6
AMD Ryzen 9 7950X, NVIDIA GeForce RTX 4060 Ti 16G
84.5 (47.97min) fps -37%
Average NVIDIA GeForce RTX 3070
  (80.4 - 83, n=5)
81.6 fps -39%
KFA2 GeForce RTX 4060 1-Click-OC 2X
AMD Ryzen 9 7950X, NVIDIA GeForce RTX 4060
67.2 (36.94min) fps -50%
XFX Speedster QICK 308 Radeon RX 7600 Black Edition
AMD Ryzen 9 7950X, AMD Radeon RX 7600
62.9 (40.28min) fps -53%
Control
1920x1080 High Quality Preset & High Ray Tracing Preset (DX12)
NVIDIA GeForce RTX 4090 Founders Edition
Intel Core i9-13900K, NVIDIA GeForce RTX 4090
185.1 (103.4min, 132.2P0.1, 140.8P1) fps +43%
NVIDIA GeForce RTX 4080 Founders Edition
Intel Core i9-13900K, NVIDIA GeForce RTX 4080
162.8 (28.9min, 60.8P0.1, 129.4P1) fps +26%
AMD Radeon RX 7900 XTX
AMD Ryzen 9 7950X, AMD Radeon RX 7900 XTX
133.7 (23.2min, 92.6P0.1, 104.6P1) fps +3%
Zotac Gaming GeForce RTX 3090 Ti AMP Extreme Holo
AMD Ryzen 7 5800X3D, NVIDIA GeForce RTX 3090 Ti
130.8 (62.6min, 107.5P0.1, 113.8P1) fps +1%
Asus TUF Gaming GeForce RTX 4070 Ti Super
Intel Core i9-13900K, NVIDIA GeForce RTX 4070 Ti SUPER
129.7 (14.9min, 100.7P0.1, 110.4P1) fps
Gigabyte Aorus GeForce RTX 4070 Ti Master
Intel Core i9-13900K, NVIDIA GeForce RTX 4070 Ti
129.1 (38.7min, 49.1P0.1, 101.2P1) fps 0%
Asus TUF Gaming GeForce RTX 4070 Ti
Intel Core i9-13900K, NVIDIA GeForce RTX 4070 Ti
128.3 (6.22min, 61.8P0.1, 107P1) fps -1%
Average NVIDIA GeForce RTX 4070 Ti
  (123.5 - 129.1, n=4)
126.7 fps -2%
Gigabyte GeForce RTX 4070 Super Gaming OC 12G
Intel Core i9-13900K, NVIDIA GeForce RTX 4070 SUPER
116.7 (28.4min, 92.4P0.1, 101.1P1) fps -10%
Average of class Desktop
  (58.6 - 185.1, n=15, last 2 years)
116.6 fps -10%
AMD Radeon RX 7900 XT
AMD Ryzen 9 7950X, AMD Radeon RX 7900 XT
116.1 (8.47min, 62.1P0.1, 91.4P1) fps -10%
Average NVIDIA GeForce RTX 3080 Ti
  (111 - 120.6, n=3)
115.2 fps -11%
NVIDIA GeForce RTX 4070 Super Founders Edition
Intel Core i9-13900K, NVIDIA GeForce RTX 4070 SUPER
113.8 (66.1min, 87.5P0.1, 97.9P1) fps -12%
Average NVIDIA GeForce RTX 3090
  (91.4 - 122.6, n=5)
111.1 fps -14%
Zotac Gaming GeForce RTX 4070 AMP Airo
Intel Core i9-13900K, NVIDIA GeForce RTX 4070
101.8 (30.1min, 42.5P0.1, 86.1P1) fps -22%
Average NVIDIA GeForce RTX 3080
  (98.1 - 103, n=2)
100.6 fps -22%
Sapphire AMD Radeon RX 6950 XT Nitro+ Pure
AMD Ryzen 9 5900X, AMD Radeon RX 6950 XT
97.7 (7.66min, 62.8P0.1, 73.5P1) fps -25%
AMD Radeon RX 7800 XT
AMD Ryzen 9 7950X, AMD Radeon RX 7800 XT
96.1 (18.2min, 69.2P0.1, 76.4P1) fps -26%
Average NVIDIA Titan RTX
  (63 - 120, n=3)
88.1 fps -32%
Sapphire Pulse Radeon RX 7700 XT
AMD Ryzen 9 7950X, AMD Radeon RX 7700 XT
79.9 (18.5min, 55.7P0.1, 65.6P1) fps -38%
AMD Radeon RX 6900 XT
AMD Ryzen 9 5950X, AMD Radeon RX 6900 XT (SAM ENABLED)
76.2 (38.7min, 43.3P0.1, 62.8P1) fps -41%
AMD Radeon RX 6900 XT
AMD Ryzen 9 5950X, AMD Radeon RX 6900 XT
73.1 (31.6min, 40.9P0.1, 62.6P1) fps -44%
KFA2 GeForce RTX 4060 Ti EX, 16GB GDDR6
AMD Ryzen 9 7950X, NVIDIA GeForce RTX 4060 Ti 16G
73 (15.8min, 59.4P0.1, 63.3P1) fps -44%
Average NVIDIA GeForce RTX 4060 Ti 8G
  (72.5 - 73.6, n=3)
73 fps -44%
Average NVIDIA GeForce RTX 3070
  (57.9 - 75.1, n=3)
68.5 fps -47%
AMD Radeon RX 6800 XT
AMD Ryzen 9 5950X, AMD Radeon RX 6800 XT
66.9 (60min) fps -48%
KFA2 GeForce RTX 4060 1-Click-OC 2X
AMD Ryzen 9 7950X, NVIDIA GeForce RTX 4060
57.5 (14.9min, 44.3P0.1, 50.6P1) fps -56%
XFX Speedster QICK 308 Radeon RX 7600 Black Edition
AMD Ryzen 9 7950X, AMD Radeon RX 7600
51.7 (6.96min, 38.6P0.1, 42P1) fps -60%
3840x2160 High Quality Preset & High Ray Tracing Preset (DX12)
Average of class Desktop
  (30.8 - 72, n=7, last 2 years)
43.4 fps +6%
Asus TUF Gaming GeForce RTX 4070 Ti Super
Intel Core i9-13900K, NVIDIA GeForce RTX 4070 Ti SUPER
41 (4.64min, 6.82P0.1, 35.8P1) fps
Average NVIDIA GeForce RTX 3090
  (40 - 40.3, n=2)
40.2 fps -2%
Average NVIDIA GeForce RTX 4070 Ti
  ()
37.3 fps -9%
Gigabyte GeForce RTX 4070 Super Gaming OC 12G
Intel Core i9-13900K, NVIDIA GeForce RTX 4070 SUPER
35.6 (8.25min, 10.9P0.1, 32.2P1) fps -13%
NVIDIA GeForce RTX 4070 Super Founders Edition
Intel Core i9-13900K, NVIDIA GeForce RTX 4070 SUPER
34.7 (5.84min, 14.2P0.1, 29.9P1) fps -15%
Zotac Gaming GeForce RTX 4070 AMP Airo
Intel Core i9-13900K, NVIDIA GeForce RTX 4070
30.8 (3.8min, 9.57P0.1, 27P1) fps -25%
AMD Radeon RX 7800 XT
AMD Ryzen 9 7950X, AMD Radeon RX 7800 XT
28.9 (19.6min, 24.3P0.1, 25.1P1) fps -30%
Sapphire Pulse Radeon RX 7700 XT
AMD Ryzen 9 7950X, AMD Radeon RX 7700 XT
23.6 (15.1min, 15.3P0.1, 17P1) fps -42%
KFA2 GeForce RTX 4060 Ti EX, 16GB GDDR6
AMD Ryzen 9 7950X, NVIDIA GeForce RTX 4060 Ti 16G
21.6 (19.6min, 19.6P0.1, 20P1) fps -47%
Average NVIDIA GeForce RTX 4060 Ti 8G
  (16.6 - 17.8, n=3)
17.1 fps -58%
KFA2 GeForce RTX 4060 1-Click-OC 2X
AMD Ryzen 9 7950X, NVIDIA GeForce RTX 4060
16.9 (3.97min, 4P0.1, 9.91P1) fps -59%
XFX Speedster QICK 308 Radeon RX 7600 Black Edition
AMD Ryzen 9 7950X, AMD Radeon RX 7600
7.2 (5.79min, 5.82P0.1, 5.95P1) fps -82%
Far Cry 6 - 1920x1080 Ultra Graphics Quality + HD Textures + DXR AA:T
NVIDIA GeForce RTX 4080 Founders Edition
Intel Core i9-13900K, NVIDIA GeForce RTX 4080
154 (125min) fps +7%
AMD Radeon RX 7900 XTX
AMD Ryzen 9 7950X, AMD Radeon RX 7900 XTX
152.1 (75min) fps +6%
NVIDIA GeForce RTX 4090 Founders Edition
Intel Core i9-13900K, NVIDIA GeForce RTX 4090
147 (125min) fps +2%
Asus TUF Gaming GeForce RTX 4070 Ti
Intel Core i9-13900K, NVIDIA GeForce RTX 4070 Ti
146 (122min) fps +1%
Asus TUF Gaming GeForce RTX 4070 Ti Super
Intel Core i9-13900K, NVIDIA GeForce RTX 4070 Ti SUPER
144 (125min) fps
Gigabyte GeForce RTX 4070 Super Gaming OC 12G
Intel Core i9-13900K, NVIDIA GeForce RTX 4070 SUPER
144 (99min) fps 0%
AMD Radeon RX 7900 XT
AMD Ryzen 9 7950X, AMD Radeon RX 7900 XT
143.6 (46min) fps 0%
Gigabyte Aorus GeForce RTX 4070 Ti Master
Intel Core i9-13900K, NVIDIA GeForce RTX 4070 Ti
139.5 (114min) fps -3%
Average NVIDIA GeForce RTX 4070 Ti
  (133.4 - 146, n=4)
138.9 fps -4%
Zotac Gaming GeForce RTX 4070 AMP Airo
Intel Core i9-13900K, NVIDIA GeForce RTX 4070
138 (108min) fps -4%
NVIDIA GeForce RTX 4070 Super Founders Edition
Intel Core i9-13900K, NVIDIA GeForce RTX 4070 SUPER
134 (119min) fps -7%
AMD Radeon RX 7800 XT
AMD Ryzen 9 7950X, AMD Radeon RX 7800 XT
129.4 (36min) fps -10%
Average of class Desktop
  (19.1 - 154, n=17, last 2 years)
125 fps -13%
Zotac Gaming GeForce RTX 3090 Ti AMP Extreme Holo
AMD Ryzen 7 5800X3D, NVIDIA GeForce RTX 3090 Ti
122 (95min) fps -15%
Average NVIDIA GeForce RTX 3080 Ti
  (112 - 128.6, n=2)
120.3 fps -16%
Average NVIDIA GeForce RTX 3090
  (76 - 138.2, n=8)
112.6 fps -22%
KFA2 GeForce RTX 4060 Ti EX, 16GB GDDR6
AMD Ryzen 9 7950X, NVIDIA GeForce RTX 4060 Ti 16G
111.1 (100min) fps -23%
Sapphire Pulse Radeon RX 7700 XT
AMD Ryzen 9 7950X, AMD Radeon RX 7700 XT
104.1 (18min) fps -28%
Average NVIDIA Titan RTX
  (97 - 109.3, n=2)
103.2 fps -28%
Sapphire AMD Radeon RX 6950 XT Nitro+ Pure
AMD Ryzen 9 5900X, AMD Radeon RX 6950 XT
101.6 (24min) fps -29%
Average NVIDIA GeForce RTX 4060 Ti 8G
  (61.9 - 88, n=2)
75 fps -48%
Average NVIDIA GeForce RTX 3080
  ()
73 fps -49%
Average NVIDIA GeForce RTX 3070
  ()
71 fps -51%
XFX Speedster QICK 308 Radeon RX 7600 Black Edition
AMD Ryzen 9 7950X, AMD Radeon RX 7600
63.6 (31min) fps -56%
KFA2 GeForce RTX 3070 Ti SG
AMD Ryzen 9 7950X, NVIDIA GeForce RTX 3070 Ti
55.4 fps -62%
KFA2 GeForce RTX 4060 1-Click-OC 2X
AMD Ryzen 9 7950X, NVIDIA GeForce RTX 4060
34.8 (13min) fps -76%
Cyberpunk 2077 1.6
1920x1080 Ray Tracing Ultra Preset (DLSS off)
NVIDIA GeForce RTX 4090 Founders Edition
Intel Core i9-13900K, NVIDIA GeForce RTX 4090 (1.6)
118.4 (92min) fps +48%
NVIDIA GeForce RTX 4080 Founders Edition
Intel Core i9-13900K, NVIDIA GeForce RTX 4080 (1.6)
100.1 (77.6min) fps +25%
Gigabyte Aorus GeForce RTX 4070 Ti Master
Intel Core i9-13900K, NVIDIA GeForce RTX 4070 Ti (1.61)
82.5 (32.1min) fps +3%
Asus TUF Gaming GeForce RTX 4070 Ti
Intel Core i9-13900K, NVIDIA GeForce RTX 4070 Ti (1.61)
81 (62.6min) fps +1%
Average NVIDIA GeForce RTX 4070 Ti
  (78.9 - 82.5, n=4)
81 fps +1%
Asus TUF Gaming GeForce RTX 4070 Ti Super
Intel Core i9-13900K, NVIDIA GeForce RTX 4070 Ti SUPER (1.63)
79.9 (63.5min) fps
Average of class Desktop
  (23.8 - 130.1, n=20, last 2 years)
77.1 fps -4%
Zotac Gaming GeForce RTX 3090 Ti AMP Extreme Holo
AMD Ryzen 7 5800X3D, NVIDIA GeForce RTX 3090 Ti (1.52)
74.7 (57.7min) fps -7%
Gigabyte GeForce RTX 4070 Super Gaming OC 12G
Intel Core i9-13900K, NVIDIA GeForce RTX 4070 SUPER (1.63)
71.5 (56.7min) fps -11%
Average NVIDIA GeForce RTX 3080 Ti
  ()
69.1 fps -14%
NVIDIA GeForce RTX 4070 Super Founders Edition
Intel Core i9-13900K, NVIDIA GeForce RTX 4070 SUPER (1.63)
68.9 (54.4min) fps -14%
Average NVIDIA GeForce RTX 3090
  (61.3 - 68, n=5)
65.5 fps -18%
AMD Radeon RX 7900 XTX
AMD Ryzen 9 7950X, AMD Radeon RX 7900 XTX (1.61)
64.6 (49.1min) fps -19%
Average NVIDIA GeForce RTX 3080
  ()
61.1 fps -24%
Zotac Gaming GeForce RTX 4070 AMP Airo
Intel Core i9-13900K, NVIDIA GeForce RTX 4070 (1.62)
60 (47.6min) fps -25%
AMD Radeon RX 7900 XT
AMD Ryzen 9 7950X, AMD Radeon RX 7900 XT (1.61)
57.1 (41.7min) fps -29%
KFA2 GeForce RTX 4060 Ti EX, 16GB GDDR6
AMD Ryzen 9 7950X, NVIDIA GeForce RTX 4060 Ti 16G (1.6)
49 (37min) fps -39%
Average NVIDIA GeForce RTX 4060 Ti 8G
  (48 - 49.6, n=3)
48.9 fps -39%
KFA2 GeForce RTX 3070 Ti SG
AMD Ryzen 9 7950X, NVIDIA GeForce RTX 3070 Ti (1.61)
47.6 (6.07min) fps -40%
AMD Radeon RX 7800 XT
AMD Ryzen 9 7950X, AMD Radeon RX 7800 XT (1.6)
46 (33.3min) fps -42%
Average NVIDIA Titan RTX
  ()
43.3 fps -46%
Average NVIDIA GeForce RTX 3070
  (41.6 - 43.9, n=2)
42.8 fps -46%
Sapphire Pulse Radeon RX 7700 XT
AMD Ryzen 9 7950X, AMD Radeon RX 7700 XT (1.6)
39.8 (30min) fps -50%
Sapphire Pulse Radeon RX 7700 XT
AMD Ryzen 9 7950X, AMD Radeon RX 7700 XT (1.6)
39.8 (30min) fps -50%
Sapphire Pulse Radeon RX 7700 XT
AMD Ryzen 9 7950X, AMD Radeon RX 7700 XT (1.6)
39.8 (30min) fps -50%
KFA2 GeForce RTX 4060 1-Click-OC 2X
AMD Ryzen 9 7950X, NVIDIA GeForce RTX 4060 (1.6)
37.1 (27.9min) fps -54%
XFX Speedster QICK 308 Radeon RX 7600 Black Edition
AMD Ryzen 9 7950X, AMD Radeon RX 7600 (1.6)
22.4 (13.9min) fps -72%
3840x2160 Ray Tracing Ultra Preset (DLSS off)
NVIDIA GeForce RTX 4090 Founders Edition
Intel Core i9-13900K, NVIDIA GeForce RTX 4090 (1.6)
42.6 (32min) fps +76%
NVIDIA GeForce RTX 4080 Founders Edition
Intel Core i9-13900K, NVIDIA GeForce RTX 4080 (1.6)
30.7 (23.5min) fps +27%
Average of class Desktop
  (1.4 - 43.8, n=19, last 2 years)
24.4 fps +1%
Zotac Gaming GeForce RTX 3090 Ti AMP Extreme Holo
AMD Ryzen 7 5800X3D, NVIDIA GeForce RTX 3090 Ti (1.52)
24.3 (16.3min) fps 0%
Asus TUF Gaming GeForce RTX 4070 Ti Super
Intel Core i9-13900K, NVIDIA GeForce RTX 4070 Ti SUPER (1.63)
24.2 (19.3min) fps
Gigabyte Aorus GeForce RTX 4070 Ti Master
Intel Core i9-13900K, NVIDIA GeForce RTX 4070 Ti (1.61)
23.9 (18min) fps -1%
Asus TUF Gaming GeForce RTX 4070 Ti
Intel Core i9-13900K, NVIDIA GeForce RTX 4070 Ti (1.61)
23.7 (18.1min) fps -2%
Average NVIDIA GeForce RTX 4070 Ti
  (21.6 - 23.9, n=4)
23.2 fps -4%
Gigabyte GeForce RTX 4070 Super Gaming OC 12G
Intel Core i9-13900K, NVIDIA GeForce RTX 4070 SUPER (1.63)
21.1 (2.68min) fps -13%
Average NVIDIA GeForce RTX 3090
  (19.8 - 22.1, n=5)
21 fps -13%
AMD Radeon RX 7900 XTX
AMD Ryzen 9 7950X, AMD Radeon RX 7900 XTX (1.61)
20.7 (14.4min) fps -14%
NVIDIA GeForce RTX 4070 Super Founders Edition
Intel Core i9-13900K, NVIDIA GeForce RTX 4070 SUPER (1.63)
20 (9.7min) fps -17%
Average NVIDIA GeForce RTX 3080 Ti
  ()
18.6 fps -23%
AMD Radeon RX 7900 XT
AMD Ryzen 9 7950X, AMD Radeon RX 7900 XT (1.61)
17.6 (12min) fps -27%
Zotac Gaming GeForce RTX 4070 AMP Airo
Intel Core i9-13900K, NVIDIA GeForce RTX 4070 (1.62)
15.3 (11.7min) fps -37%
AMD Radeon RX 7800 XT
AMD Ryzen 9 7950X, AMD Radeon RX 7800 XT (1.6)
13.7 (10.2min) fps -43%
Average NVIDIA Titan RTX
  ()
13.4 fps -45%
KFA2 GeForce RTX 4060 Ti EX, 16GB GDDR6
AMD Ryzen 9 7950X, NVIDIA GeForce RTX 4060 Ti 16G (1.6)
13.2 (10min) fps -45%
Average NVIDIA GeForce RTX 3080
  ()
12.1 fps -50%
Sapphire Pulse Radeon RX 7700 XT
AMD Ryzen 9 7950X, AMD Radeon RX 7700 XT (1.6)
11.5 (7.84min) fps -52%
Sapphire Pulse Radeon RX 7700 XT
AMD Ryzen 9 7950X, AMD Radeon RX 7700 XT (1.6)
11.5 (7.84min) fps -52%
Average NVIDIA GeForce RTX 3070
  (5.4 - 6.6, n=2)
6 fps -75%
KFA2 GeForce RTX 3070 Ti SG
AMD Ryzen 9 7950X, NVIDIA GeForce RTX 3070 Ti (1.61)
3.19 (2.21min) fps -87%
Average NVIDIA GeForce RTX 4060 Ti 8G
  (2.2 - 3.2, n=3)
2.6 fps -89%
KFA2 GeForce RTX 4060 1-Click-OC 2X
AMD Ryzen 9 7950X, NVIDIA GeForce RTX 4060 (1.6)
2.19 (1.635min) fps -91%
XFX Speedster QICK 308 Radeon RX 7600 Black Edition
AMD Ryzen 9 7950X, AMD Radeon RX 7600 (1.6)
2.05 (0.904min) fps -92%
Ghostwire Tokyo - 1920x1080 Highest Settings + Maximum Ray Tracing
NVIDIA GeForce RTX 4090 Founders Edition
Intel Core i9-13900K, NVIDIA GeForce RTX 4090
193.7 (38.5min, 66.5P0.1, 142.5P1) fps +36%
NVIDIA GeForce RTX 4080 Founders Edition
Intel Core i9-13900K, NVIDIA GeForce RTX 4080
166.2 (30.4min, 60P0.1, 115.2P1) fps +17%
Asus TUF Gaming GeForce RTX 4070 Ti Super
Intel Core i9-13900K, NVIDIA GeForce RTX 4070 Ti SUPER
142.2 (32.5min, 52.5P0.1, 88.4P1) fps
Asus TUF Gaming GeForce RTX 4070 Ti
Intel Core i9-13900K, NVIDIA GeForce RTX 4070 Ti
139.3 (31.3min, 53.2P0.1, 89.7P1) fps -2%
Gigabyte Aorus GeForce RTX 4070 Ti Master
Intel Core i9-13900K, NVIDIA GeForce RTX 4070 Ti
138.7 (38.5min, 54.6P0.1, 89.8P1) fps -2%
Average NVIDIA GeForce RTX 4070 Ti
  (130.7 - 139.3, n=4)
136.5 fps -4%
AMD Radeon RX 7900 XTX
AMD Ryzen 9 7950X, AMD Radeon RX 7900 XTX
136.3 (39.1min, 76.4P0.1, 95.8P1) fps -4%
Average of class Desktop
  (55.9 - 193.7, n=13, last 2 years)
136.3 fps -4%
Gigabyte GeForce RTX 4070 Super Gaming OC 12G
Intel Core i9-13900K, NVIDIA GeForce RTX 4070 SUPER
132.9 (13.7min, 19.3P0.1, 81.6P1) fps -7%
NVIDIA GeForce RTX 4070 Super Founders Edition
Intel Core i9-13900K, NVIDIA GeForce RTX 4070 SUPER
128.3 (23.1min, 40.3P0.1, 80.7P1) fps -10%
Zotac Gaming GeForce RTX 3090 Ti AMP Extreme Holo
AMD Ryzen 7 5800X3D, NVIDIA GeForce RTX 3090 Ti
120.2 (33.8min, 55.2P0.1, 79.1P1) fps -15%
Average NVIDIA GeForce RTX 3080 Ti
  ()
119.9 fps -16%
AMD Radeon RX 7900 XT
AMD Ryzen 9 7950X, AMD Radeon RX 7900 XT
116.5 (30.3min, 71.6P0.1, 78.1P1) fps -18%
Zotac Gaming GeForce RTX 4070 AMP Airo
Intel Core i9-13900K, NVIDIA GeForce RTX 4070
112.2 (16.9min, 37.9P0.1, 67.5P1) fps -21%
Average NVIDIA GeForce RTX 3090
  (106 - 122, n=3)
111.6 fps -22%
Average NVIDIA GeForce RTX 3080
  ()
97.9 fps -31%
AMD Radeon RX 7800 XT
AMD Ryzen 9 7950X, AMD Radeon RX 7800 XT
95.3 (30.1min, 39.9P0.1, 57.5P1) fps -33%
KFA2 GeForce RTX 4060 Ti EX, 16GB GDDR6
AMD Ryzen 9 7950X, NVIDIA GeForce RTX 4060 Ti 16G
89.1 (34.3min, 49.2P0.1, 52.3P1) fps -37%
Average NVIDIA GeForce RTX 4060 Ti 8G
  (88 - 90.4, n=3)
89.1 fps -37%
Sapphire Pulse Radeon RX 7700 XT
AMD Ryzen 9 7950X, AMD Radeon RX 7700 XT
82.5 (20.2min, 38.6P0.1, 48.8P1) fps -42%
Average NVIDIA Titan RTX
  (74.5 - 79, n=2)
76.8 fps -46%
Average NVIDIA GeForce RTX 3070
  ()
76.3 fps -46%
KFA2 GeForce RTX 4060 1-Click-OC 2X
AMD Ryzen 9 7950X, NVIDIA GeForce RTX 4060
72.3 (38min, 39.5P0.1, 40.8P1) fps -49%
XFX Speedster QICK 308 Radeon RX 7600 Black Edition
AMD Ryzen 9 7950X, AMD Radeon RX 7600
52.8 (26.9min, 27.7P0.1, 28.6P1) fps -63%
The Callisto Protocol - 1920x1080 Ultra Preset (without FSR Upscaling) + Full Ray-Tracing
AMD Radeon RX 7800 XT
AMD Ryzen 9 7950X, AMD Radeon RX 7800 XT
99.3 fps +3%
AMD Radeon RX 7900 XTX
AMD Ryzen 9 7950X, AMD Radeon RX 7900 XTX
98 fps +1%
Gigabyte GeForce RTX 4070 Super Gaming OC 12G
Intel Core i9-13900K, NVIDIA GeForce RTX 4070 SUPER
97.64 fps +1%
Asus TUF Gaming GeForce RTX 4070 Ti Super
Intel Core i9-13900K, NVIDIA GeForce RTX 4070 Ti SUPER
96.75 fps
NVIDIA GeForce RTX 4070 Super Founders Edition
Intel Core i9-13900K, NVIDIA GeForce RTX 4070 SUPER
94.09 fps -3%
Sapphire Pulse Radeon RX 7700 XT
AMD Ryzen 9 7950X, AMD Radeon RX 7700 XT
92.4 fps -4%
AMD Radeon RX 7900 XT
AMD Ryzen 9 7950X, AMD Radeon RX 7900 XT
89 fps -8%
Average NVIDIA GeForce RTX 4070 Ti
  (82.1 - 97.5, n=4)
88.8 fps -8%
Asus TUF Gaming GeForce RTX 4070 Ti
Intel Core i9-13900K, NVIDIA GeForce RTX 4070 Ti
88.58 fps -8%
Gigabyte Aorus GeForce RTX 4070 Ti Master
Intel Core i9-13900K, NVIDIA GeForce RTX 4070 Ti
87 fps -10%
KFA2 GeForce RTX 4060 Ti EX, 16GB GDDR6
AMD Ryzen 9 7950X, NVIDIA GeForce RTX 4060 Ti 16G
86.6 fps -10%
Average of class Desktop
  (50.2 - 97.6, n=7, last 2 years)
86 fps -11%
Zotac Gaming GeForce RTX 4070 AMP Airo
Intel Core i9-13900K, NVIDIA GeForce RTX 4070
82 fps -15%
Average NVIDIA GeForce RTX 4060 Ti 8G
  (66.8 - 90.7, n=3)
81.1 fps -16%
Average NVIDIA GeForce RTX 3080 Ti
  ()
76 fps -21%
Average NVIDIA GeForce RTX 3080
  ()
71.3 fps -26%
XFX Speedster QICK 308 Radeon RX 7600 Black Edition
AMD Ryzen 9 7950X, AMD Radeon RX 7600
65.8 fps -32%
KFA2 GeForce RTX 3070 Ti SG
AMD Ryzen 9 7950X, NVIDIA GeForce RTX 3070 Ti
65.6 fps -32%
Average NVIDIA GeForce RTX 3070
  ()
61.8 fps -36%
Average NVIDIA Titan RTX
  ()
58.7 fps -39%
Alan Wake 2 - 1920x1080 High Preset + High Ray Tracing
Asus TUF Gaming GeForce RTX 4070 Ti Super
Intel Core i9-13900K, NVIDIA GeForce RTX 4070 Ti SUPER
69.8 (45.3min, 48.6P0.1, 57.5P1) fps
Gigabyte GeForce RTX 4070 Super Gaming OC 12G
Intel Core i9-13900K, NVIDIA GeForce RTX 4070 SUPER
61.6 (41.6min, 43.9P0.1, 50.7P1) fps -12%
NVIDIA GeForce RTX 4070 Super Founders Edition
Intel Core i9-13900K, NVIDIA GeForce RTX 4070 SUPER
57.1 (41.5min, 42.9P0.1, 47.1P1) fps -18%
Average of class Desktop
  (4.7 - 77.7, n=6, last 2 years)
56.3 fps -19%
Average NVIDIA GeForce RTX 3090
  (49.8 - 52, n=2)
50.9 fps -27%
Average NVIDIA Titan RTX
  ()
27.9 fps -60%
Sapphire Pulse Radeon RX 7700 XT
AMD Ryzen 9 7950X, AMD Radeon RX 7700 XT
26.7 (18.3min, 18.4P0.1, 20.9P1) fps -62%
XFX Speedster QICK 308 Radeon RX 7600 Black Edition
AMD Ryzen 9 7950X, AMD Radeon RX 7600
4.4 (2.21min, 2.21P0.1, 2.24P1) fps -94%
Cyberpunk 2077 2.0 Phantom Liberty
3840x2160 Ray Tracing Ultra Preset (DLSS off, no Path Tracing)
Average of class Desktop
  (20.5 - 42.5, n=6, last 2 years)
28.3 fps +13%
Asus TUF Gaming GeForce RTX 4070 Ti Super
Intel Core i9-13900K, NVIDIA GeForce RTX 4070 Ti SUPER (2.1)
25 (16.2min) fps
Gigabyte GeForce RTX 4070 Super Gaming OC 12G
Intel Core i9-13900K, NVIDIA GeForce RTX 4070 SUPER (2.11)
21.9 (19.4min) fps -12%
Average NVIDIA GeForce RTX 3090
  (21.1 - 21.8, n=2)
21.5 fps -14%
NVIDIA GeForce RTX 4070 Super Founders Edition
Intel Core i9-13900K, NVIDIA GeForce RTX 4070 SUPER (2.1)
20.5 (15.6min) fps -18%
XFX Speedster QICK 308 Radeon RX 7600 Black Edition
AMD Ryzen 9 7950X, AMD Radeon RX 7600 (2.02)
3.2 (0.817min) fps -87%
1920x1080 Ray Tracing Ultra Preset (DLSS off)
Asus TUF Gaming GeForce RTX 4070 Ti Super
Intel Core i9-13900K, NVIDIA GeForce RTX 4070 Ti SUPER (2.1)
81.8 (63.1min) fps
Average of class Desktop
  (31.6 - 119.8, n=7, last 2 years)
81.6 fps 0%
Gigabyte GeForce RTX 4070 Super Gaming OC 12G
Intel Core i9-13900K, NVIDIA GeForce RTX 4070 SUPER (2.11)
74 (65.2min) fps -10%
NVIDIA GeForce RTX 4070 Super Founders Edition
Intel Core i9-13900K, NVIDIA GeForce RTX 4070 SUPER (2.1)
70.4 (17.1min) fps -14%
Average NVIDIA GeForce RTX 3090
  ()
69.7 fps -15%
Average NVIDIA Titan RTX
  ()
42.7 fps -48%
Sapphire Pulse Radeon RX 7700 XT
AMD Ryzen 9 7950X, AMD Radeon RX 7700 XT (2.02)
37 (29.3min) fps -55%
XFX Speedster QICK 308 Radeon RX 7600 Black Edition
AMD Ryzen 9 7950X, AMD Radeon RX 7600 (2.02)
23.9 (17.8min) fps -71%
düşük orta yüksek ultraQHD4K DLSS4K
GTA V (2015) 187.6 187.6 187.4 160.1 155.3 182.1
The Witcher 3 (2015) 558 430 210 159.3
Dota 2 Reborn (2015) 245 228 226 202 203
Final Fantasy XV Benchmark (2018) 235 235 209 168.8 98.9
X-Plane 11.11 (2018) 224 196.7 150 127.8
Far Cry 5 (2018) 203 197 188 187 119
Strange Brigade (2018) 568 467 442 407 306 161.9
Shadow of the Tomb Raider (2018) 273 269 256 205 109.5
Metro Exodus (2019) 236 193.5 158.3 130.9 84.4
Control (2019) 226 196.9 130.3 78.9 66.4
Borderlands 3 (2019) 192.1 176.8 169.6 143.6 79.4
Mafia Definitive Edition (2020) 239 231 181 96.6
Watch Dogs Legion (2020) 171.2 159.3 144.2 115.9 68.6
Far Cry 6 (2021) 209 191 169 154 91
Dying Light 2 (2022) 213 162.2 121.5 63.7
Cyberpunk 2077 1.6 (2022) 196.9 195.9 172.3 157.5 103.6 49.7
Ghostwire Tokyo (2022) 278 282 283 217 99.2
F1 22 (2022) 371 384 336 144.9 95.1 48.9
The Callisto Protocol (2022) 210.62 202.94 149.39 114.82 70.04
F1 23 (2023) 385 402 363 138.2 90 77.4 45.1
Baldur's Gate 3 (2023) 246 223 218 157.8 133.9 117.2
Cyberpunk 2077 2.0 Phantom Liberty (2023) 188.5 188.5 170.8 150.3 94.9 42.3
Assassin's Creed Mirage (2023) 221 206 170 136 112 84
Alan Wake 2 (2023) 124.7 114.4 82.5 63.7 44.7
Call of Duty Modern Warfare 3 2023 (2023) 227 184 179 133 112 84
Avatar Frontiers of Pandora (2023) 163 141.8 113.2 76.6 68.9 39.8

Emisyonlar: Düşük fan gürültüsü ancak yük altında daha yüksek yüzey sıcaklıkları

TUF Gaming GeForce RTX 4070 Ti Super altı ısı borusuna sahiptir

Asus TUF Gaming GeForce RTX 4070 Ti Super, şirketin gürültüyü azaltmak ve daha uzun süre dayanmak için çift bilyalı rulmanlara sahip eksenel teknoloji fanlar olarak adlandırdığı özelliklere sahiptir.

Hoş bir dokunuş, gerektiğinde kartın kendisini sökmek zorunda kalmadan fanları temizlemek için metal örtüyü çıkarma yeteneğidir.

TUF Gaming GeForce RTX 4070 Ti Super, GPU, VRM ve bellekten verimli ısı transferi için toplam altı ısı borusu kullanıyor.
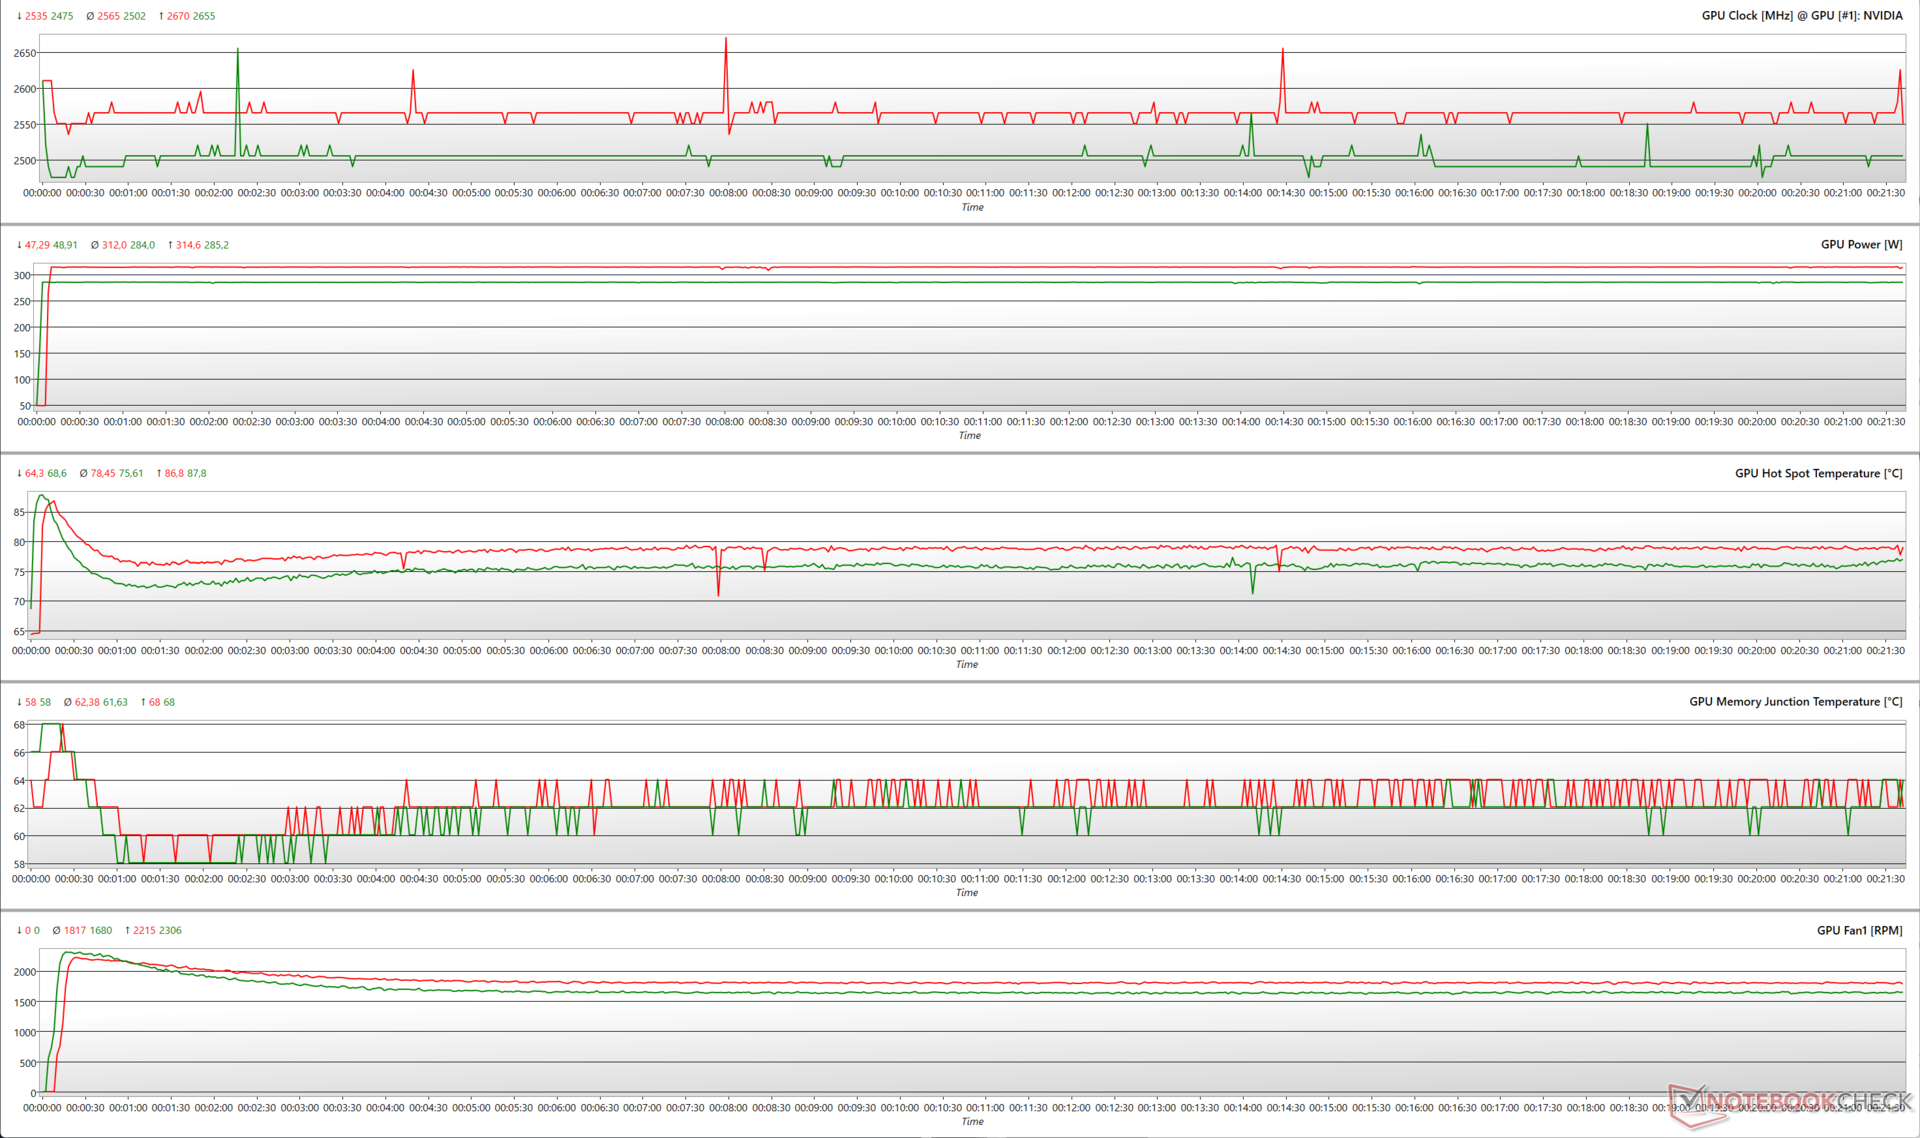
Stres testleri

100 güç hedefinde (PT), TUF Gaming GeForce RTX 4070 Ti Super, 285 W TGP kullanırken AA olmadan 1280 x 720'de FurMark stresi sırasında 2.655 MHz'e kadar artırabilir.

Güç hedefi %110'a yükseltildiğinde kart 2.670 MHz'e kadar hızlanma sağlarken yaklaşık 315 W tüketiyor. Bu aynı zamanda ~78,5 °C'lik biraz daha yüksek bir ortalama sıcak nokta sıcaklığı ve 1.817 RPM'lik daha yüksek bir ortalama fan hızı ile sonuçlanıyor.

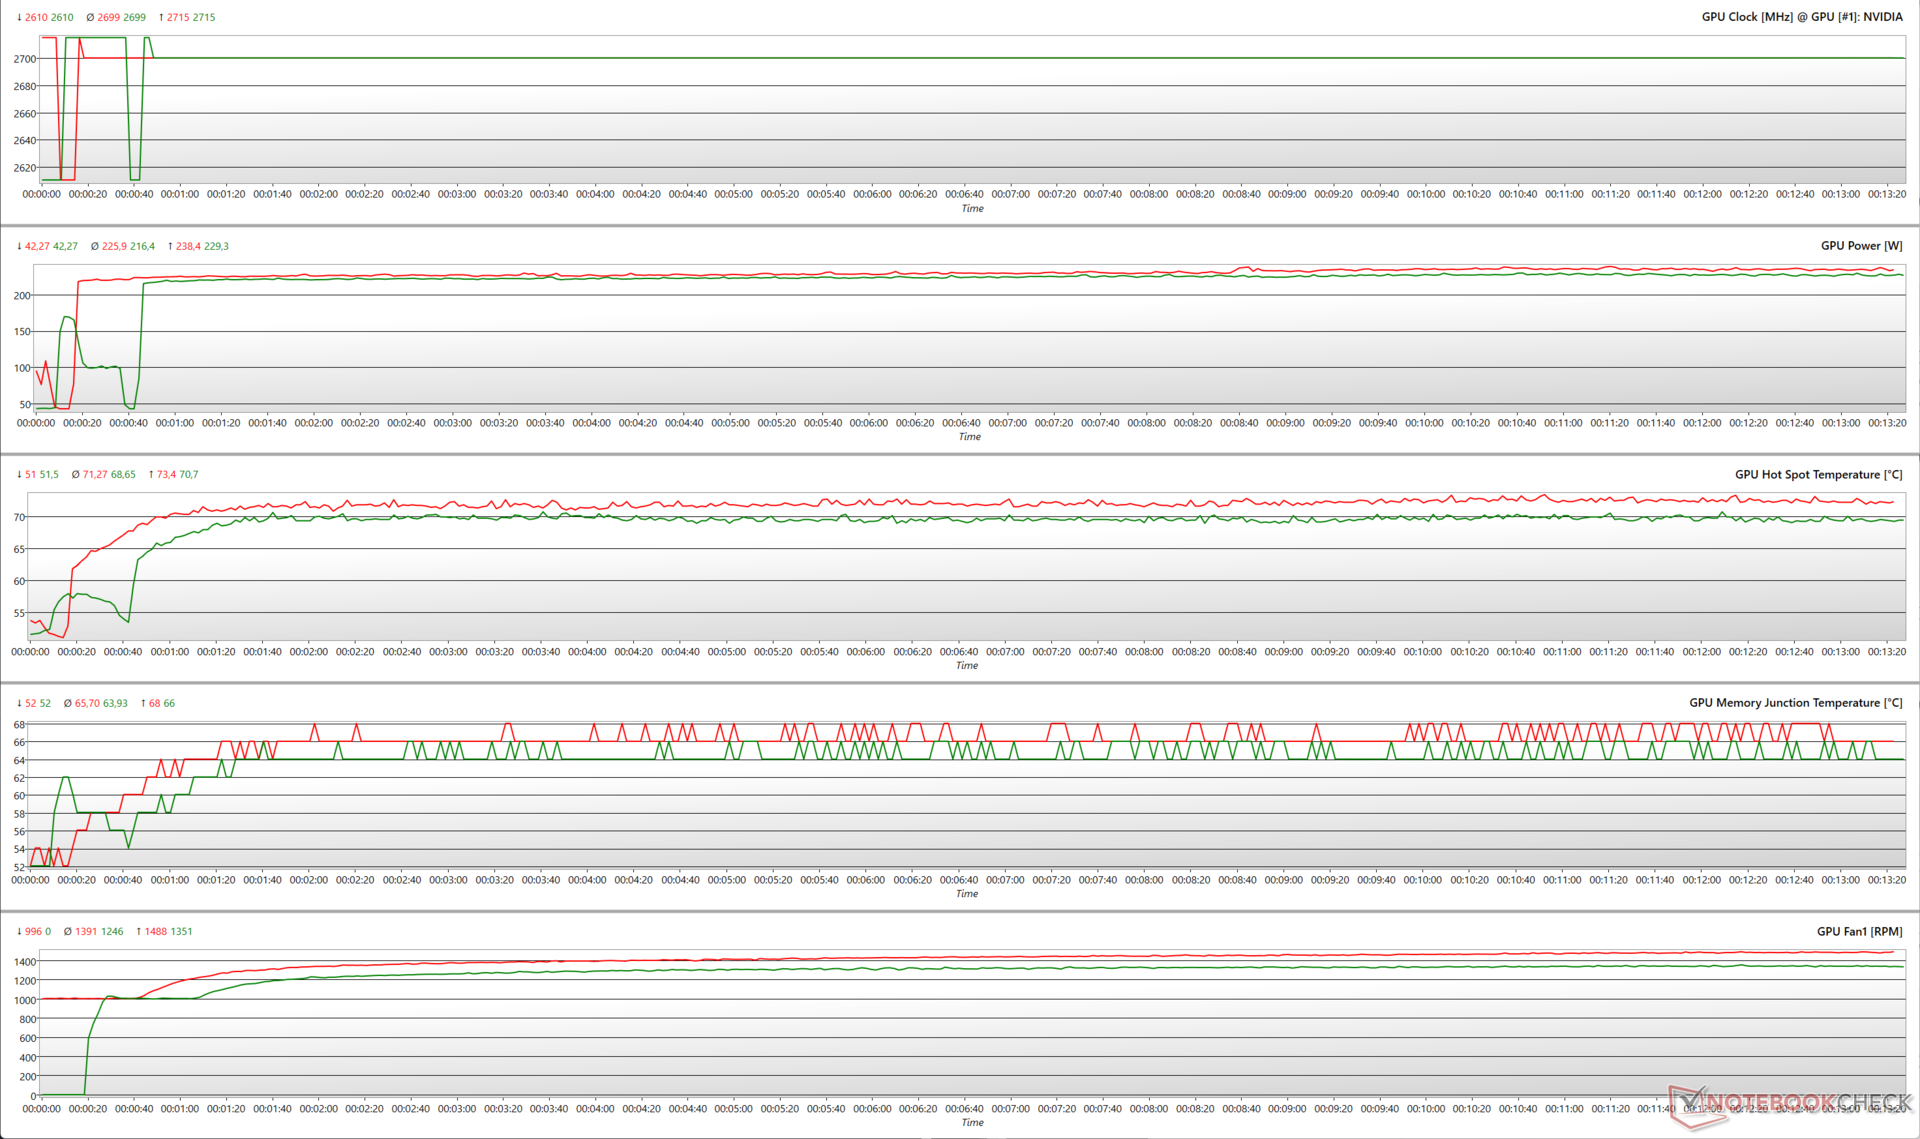
The Witcher 3 ile 1080p Ultra'da yapılan stres, hem %100 PT hem de %110 PT'de 2.715 MHz'de maksimum güçlendirme ile benzer bir saat profili gösterir. RTX 4070 Ti Super'in bu saate ulaşmak için mevcut 315 W'lık boşluğun tamamını kullanması gerekmiyor - bu, şimdiye kadar incelediğimiz diğer Ada GPU'larla tutarlı bir davranış.

Ortalama GPU sıcak nokta sıcaklığı ve ortalama fan hızları %110 PT'de sırasıyla yalnızca %3,8 ve %11'lik nominal artışlar gösteriyor.

FurMark stresi sırasında GPU parametreleri (Yeşil - %100 PT; Kırmızı - %110 PT; Performans BIOS'u)
1080p Ultra'da The Witcher 3 stresi sırasında GPU parametreleri (Yeşil - %100 PT; Kırmızı - %110 PT; Performans BIOS'u)

Witcher 3 FPS Tablosu

Asus'un soğutma sistemi, TUF Gaming GeForce RTX 4070 Ti Super'in The Witcher 3 'da hem 1080p Ultra hem de 4K Ultra'da sabit kare hızlarını korumasına yardımcı olmak için iyi bir iş çıkarıyor gibi görünüyor.

4K Ultra'da başlangıçta 109 fps'den 101 fps'ye bir düşüş görülüyor, ancak kart daha sonra oldukça tutarlı bir kare hızını yönetiyor.
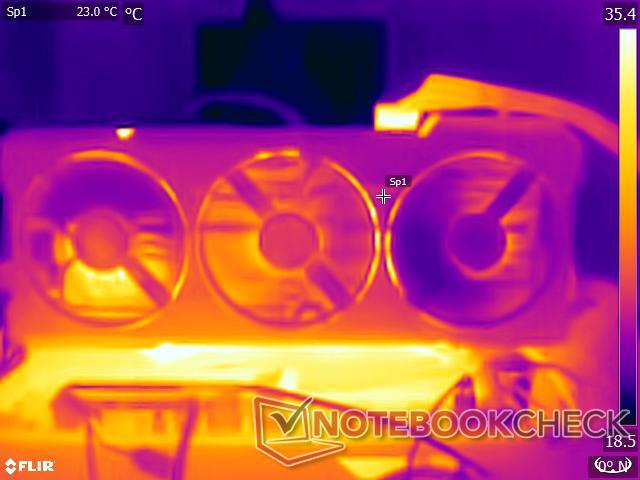
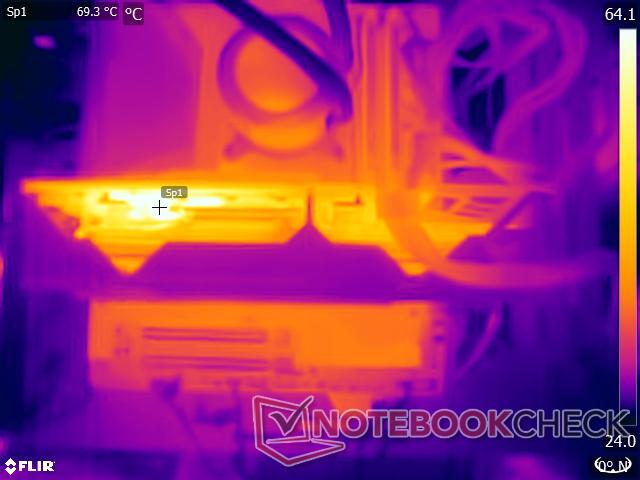
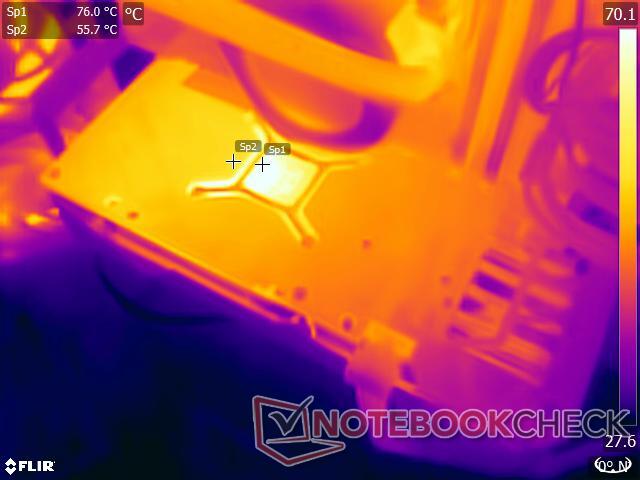
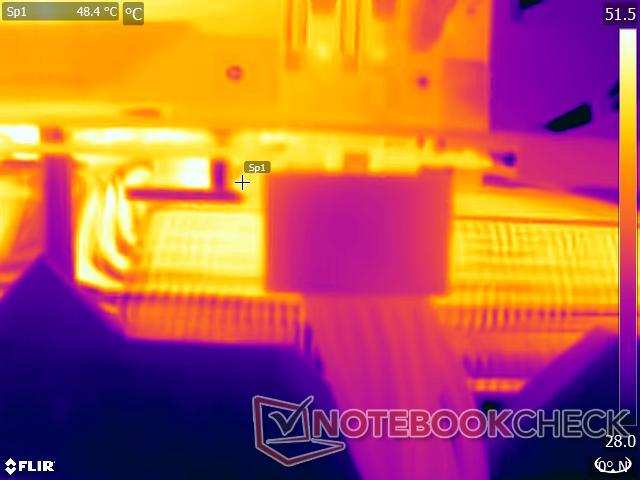
0102030405060708090100110120130140150160170180190Tooltip
Asus TUF Gaming GeForce RTX 4070 Ti Super i9-13900K, NVIDIA GeForce RTX 4070 Ti SUPER; 1920x1080 Ultra Graphics & Postprocessing (HBAO+): Ø196 (192-200)
Asus TUF Gaming GeForce RTX 4070 Ti Super i9-13900K, NVIDIA GeForce RTX 4070 Ti SUPER; 3840x2160 Ultra Graphics & Postprocessing (HBAO+): Ø101.4 (98-109)

Yüzey sıcaklıkları

Soğutma sistemi GPU'nun kendisi için gazsız bir performans sağlayabilse de, TUF Gaming GeForce RTX 4070 Ti Super'in nispeten yüksek yüzey sıcaklıkları gösterdiğini görüyoruz.

Ortam sıcaklığı 22 °C olduğunda, metal ön örtü çok ısınmaz, ancak arka plaka ~56 °C'ye kadar ısınırken GPU alanı 76 °C'ye ulaşabilir. 12VHPWR konektörünün etrafındaki alan 48,4 °C'de nispeten serin kalıyor.

Yüzey sıcaklıkları: Ön örtü
Yüzey sıcaklıkları: Üst
Yüzey sıcaklıkları: Arka plaka
Yüzey sıcaklıkları: 12VHPWR güç konektörü

Gürültü seviyeleri

TUF Gaming GeForce RTX 4070 Ti Super, stres altında düşük fan gürültüsü profiline sahiptir

Asus'un üçlü fan uygulaması genellikle tolere edilebilir fan gürültüsü emisyonlarına sahiptir ve bunu daha önce TUF Gaming GeForce RTX 4070 Ti OC aynı zamanda.

TUF RTX 4070 Ti Super'deki üç fandan ikisi saat yönünün tersine dönerken ortadaki fan saat yönünde dönerek dengeyi sağlıyor. Asus, fanlar çalışmaya başlamadan önce çekirdek sıcaklık eşiği olan 55 °C ile boştayken tam bir fan durdurma uyguluyor.

TUF Gaming RTX 4070 Ti Super, Performans ve Sessiz VBIOS modları arasında geçiş yapmaya izin verir. Sessiz mod, daha sıkı fan eğrilerine izin verir ve diğer tüm parametreler etkilenmez. Bununla birlikte, tüm pratik amaçlar için bu VBIOS modları arasında fark edilebilir bir fark yoktur.

Kart, tüm FurMark yüklemelerinde 35 dB(A)'nın altında ve The Witcher 3 1080p Ultra stresi sırasında 30 dB(A)'nın altında kaldı. Kaydettiğimiz maksimum ses basınç seviyesi (SPL) Performans VBIOS'unda %110 PT'de 35,88 dB(A) idi.

Bu, FurMark yükünde 46 dB(A)'ya yakın emisyonlara sahip olan önceki TUF RTX 4070 Ti OC'ye göre iyi bir gelişme. Ayrıca, SPL ölçümlerimizin açık bir test tezgahı kurulumuyla alındığını unutmayın; bu, fanların tipik bir ATX kasasında neredeyse duyulmaması gerektiği anlamına gelir.

Ambient: 19.50 dB(A); System Idle: 24 dB(A)
Stres Testi VBIOSModu / Güç Hedefi Fan Gürültüsü dB(A)
FurMark 1280 x 720, AA yok Performans / %100 33,71
FurMark 1280 x 720, AA yok Sessiz / %100 33,05
FurMark 1280 x 720, AA yok Performans / %110 35,88
FurMark 1280 x 720, AA yok Sessiz / %110 35,55
Witcher 3 1080p Ultra Performans / %100 28,40
Witcher 3 1080p Ultra Sessiz / %100 27,77
Witcher 3 1080p Ultra Performans / %110 29,51
Witcher 3 1080p Ultra Sessiz / %110 28,55

Enerji Yönetimi: RTX 4070 Ti'dan daha tutumlu güç çeker

Özellik artışına rağmen, TUF RTX 4070 Ti Super güç tüketimi konusunda oldukça tutumlu ve hem FurMark hem de The Witcher 3 güç tüketimi testlerinde RTX 4070 Ti ortalamasından bile daha ekonomik. Güç verimliliği açısından TUF RTX 4070 Ti Super, RTX 4090 Founders Edition'ın hemen arkasından geliyor.

Nvidia Ada Lovelace kartlarında olduğu gibi, RTX 4070 Ti Super, The Witcher 3 at 1080p Ultra'da hem %100 hem de %110 güç hedeflerinde duvardan benzer toplam sistem gücü çekimleri gösteriyor. Bu, yukarıdaki stres testindeki gözlemlerimizle uyumludur.

Power Consumption: External monitor

0255075100125150175200225250275300325350375400425450Tooltip
Asus TUF Gaming GeForce RTX 4070 Ti Super; 1280x720 FurMark 1.19 GPU Stress Test (external Monitor); 110% PT, Perf. BIOS: Ø426 (419-452)
Asus TUF Gaming GeForce RTX 4070 Ti Super; 1280x720 FurMark 1.19 GPU Stress Test (external Monitor); 100% PT, Perf. BIOS: Ø395 (389-425)
Asus TUF Gaming GeForce RTX 4070 Ti Super; 1920x1080 The Witcher 3 ultra (external Monitor); 110% PT, Perf. BIOS: Ø398 (386-431)
Asus TUF Gaming GeForce RTX 4070 Ti Super; 1920x1080 The Witcher 3 ultra (external Monitor); 100% PT, Perf. BIOS: Ø393 (382-420)
Asus TUF Gaming GeForce RTX 4070 Ti Super; Idle 1min (external Monitor): Ø138.2 (129.5-168.8)
Power Consumption / FurMark 1.19 GPU Stress Test (external Monitor)
NVIDIA GeForce RTX 4090 Founders Edition
Intel Core i9-13900K, NVIDIA GeForce RTX 4090 (133% PT OC, Idle: 81.25 W)
704 (666min, 670P1 - 717max) Watt * -65%
NVIDIA GeForce RTX 4090 Founders Edition
Intel Core i9-13900K, NVIDIA GeForce RTX 4090 (100% PT, Idle: 81.25 W)
558 (551min, 553P1 - 566max) Watt * -31%
Zotac Gaming GeForce RTX 3090 Ti AMP Extreme Holo
AMD Ryzen 7 5800X3D, NVIDIA GeForce RTX 3090 Ti (110% PT, Idle: 102 W)
648 (629min, 637P1 - 658max) Watt * -52%
Zotac Gaming GeForce RTX 3090 Ti AMP Extreme Holo
AMD Ryzen 7 5800X3D, NVIDIA GeForce RTX 3090 Ti (100% PT; Quiet BIOS, Idle: 102 W)
599 (587min, 588P1 - 666max) Watt * -41%
Zotac Gaming GeForce RTX 3090 Ti AMP Extreme Holo
AMD Ryzen 7 5800X3D, NVIDIA GeForce RTX 3090 Ti (100% PT; Amplify BIOS, Idle: 102 W)
598 (584min, 595P1 - 608max) Watt * -40%
Sapphire AMD Radeon RX 6950 XT Nitro+ Pure
AMD Ryzen 9 5900X, AMD Radeon RX 6950 XT
564 (525min, 551P1 - 601max) Watt * -32%
AMD Radeon RX 7900 XTX
AMD Ryzen 9 7950X, AMD Radeon RX 7900 XTX (Idle: 86.5 W)
518 (501min, 502P1 - 525max) Watt * -22%
AMD Radeon RX 7900 XT
AMD Ryzen 9 7950X, AMD Radeon RX 7900 XT (Idle: 84.6 W)
513 (500min, 506P1 - 527max) Watt * -20%
Average NVIDIA GeForce RTX 3080
  (Idle: 492 - 505, n=2 W)
499 Watt * -17%
KFA2 GeForce RTX 3070 Ti SG
AMD Ryzen 9 7950X, NVIDIA GeForce RTX 3070 Ti (Idle: 88.9 W)
472 (464min, 465P1 - 531max) Watt * -11%
Average NVIDIA GeForce RTX 3090
  (Idle: 281 - 551, n=8 W)
469 Watt * -10%
NVIDIA GeForce RTX 4080 Founders Edition
Intel Core i9-13900K, NVIDIA GeForce RTX 4080 (110% PT, Idle: 78.45 W)
466 (461min, 462P1 - 488max) Watt * -9%
NVIDIA GeForce RTX 4080 Founders Edition
Intel Core i9-13900K, NVIDIA GeForce RTX 4080 (100% PT, Idle: 78.45 W)
429 (423min, 424P1 - 436max) Watt * -1%
Average NVIDIA GeForce RTX 3080 Ti
  (Idle: 427 - 513, n=3 W)
464 Watt * -9%
AMD Radeon RX 6900 XT
AMD Ryzen 9 5950X, AMD Radeon RX 6900 XT (Idle: 99.15 W)
456.8 (378.13min - 484.67max) Watt * -7%
AMD Radeon RX 6800 XT
AMD Ryzen 9 5950X, AMD Radeon RX 6800 XT (Idle: 99.5 W)
447.9 (413min - 484max) Watt * -5%
Gigabyte Aorus GeForce RTX 4070 Ti Master
Intel Core i9-13900K, NVIDIA GeForce RTX 4070 Ti (OC BIOS; 128% PT, Idle: 75.5 W)
446 (436min, 437P1 - 452max) Watt * -5%
Gigabyte Aorus GeForce RTX 4070 Ti Master
Intel Core i9-13900K, NVIDIA GeForce RTX 4070 Ti (OC BIOS; 100% PT, Idle: 75.5 W)
405 (397min, 398P1 - 416max) Watt * +5%
Gigabyte Aorus GeForce RTX 4070 Ti Master
Intel Core i9-13900K, NVIDIA GeForce RTX 4070 Ti (Silent BIOS; 100% PT, Idle: 75.5 W)
404 (396min, 398P1 - 417max) Watt * +5%
Asus TUF Gaming GeForce RTX 4070 Ti
Intel Core i9-13900K, NVIDIA GeForce RTX 4070 Ti (Perf BIOS / 110% PT, Idle: 75.4 W)
443 (440min, 440P1 - 465max) Watt * -4%
Asus TUF Gaming GeForce RTX 4070 Ti
Intel Core i9-13900K, NVIDIA GeForce RTX 4070 Ti (Quiet BIOS / 100% PT, Idle: 75.4 W)
410 (408min, 409P1 - 415max) Watt * +4%
Asus TUF Gaming GeForce RTX 4070 Ti
Intel Core i9-13900K, NVIDIA GeForce RTX 4070 Ti (Perf BIOS / 100% PT, Idle: 75.4 W)
406 (401min, 402P1 - 430max) Watt * +5%
Asus TUF Gaming GeForce RTX 4070 Ti Super
Intel Core i9-13900K, NVIDIA GeForce RTX 4070 Ti SUPER (110% PT, Perf. BIOS, Idle: 138 W)
426 (419min, 420P1 - 452max) Watt *
Asus TUF Gaming GeForce RTX 4070 Ti Super
Intel Core i9-13900K, NVIDIA GeForce RTX 4070 Ti SUPER (100% PT, Perf. BIOS, Idle: 138 W)
395 (389min, 389P1 - 425max) Watt * +7%
Average NVIDIA GeForce RTX 4070 Ti
  (Idle: 404 - 451, n=8 W)
422 Watt * +1%
Average NVIDIA Titan RTX
  (Idle:  W)
419 Watt * +2%
Gigabyte GeForce RTX 4070 Super Gaming OC 12G
Intel Core i9-13900K, NVIDIA GeForce RTX 4070 SUPER (145% PT, BIOS OC, Idle: 122.6 W)
413 (403min, 404P1 - 440max) Watt * +3%
Gigabyte GeForce RTX 4070 Super Gaming OC 12G
Intel Core i9-13900K, NVIDIA GeForce RTX 4070 SUPER (100% PT, BIOS OC, Idle: 122.6 W)
335 (330min, 330P1 - 359max) Watt * +21%
AMD Radeon RX 7800 XT
AMD Ryzen 9 7950X, AMD Radeon RX 7800 XT
408 (375min, 380P1 - 434max) Watt * +4%
Sapphire Pulse Radeon RX 7700 XT
AMD Ryzen 9 7950X, AMD Radeon RX 7700 XT
365 (359min, 360P1 - 373max) Watt * +14%
NVIDIA GeForce RTX 4070 Super Founders Edition
Intel Core i9-13900K, NVIDIA GeForce RTX 4070 SUPER (109% PT, Idle: 114.9 W)
355 (344min, 346P1 - 372max) Watt * +17%
NVIDIA GeForce RTX 4070 Super Founders Edition
Intel Core i9-13900K, NVIDIA GeForce RTX 4070 SUPER (100% PT, Idle: 114.9 W)
333 (321min, 323P1 - 351max) Watt * +22%
Zotac Gaming GeForce RTX 4070 AMP Airo
Intel Core i9-13900K, NVIDIA GeForce RTX 4070 (120% PT, Idle: 94.4 W)
351 (344min, 345P1 - 400max) Watt * +18%
Zotac Gaming GeForce RTX 4070 AMP Airo
Intel Core i9-13900K, NVIDIA GeForce RTX 4070 (100% PT, Idle: 94.4 W)
311 (307min, 307P1 - 371max) Watt * +27%
Average NVIDIA GeForce RTX 3070
  (Idle: 281 - 393, n=6 W)
348 Watt * +18%
XFX Speedster QICK 308 Radeon RX 7600 Black Edition
AMD Ryzen 9 7950X, AMD Radeon RX 7600
333 (323min, 325P1 - 352max) Watt * +22%
Average of class Desktop
  (Idle: 11.3 - 704, n=33, last 2 years W)
307 Watt * +28%
KFA2 GeForce RTX 4060 Ti EX, 16GB GDDR6
AMD Ryzen 9 7950X, NVIDIA GeForce RTX 4060 Ti 16G
304 (297min, 298P1 - 311max) Watt * +29%
KFA2 GeForce RTX 4060 1-Click-OC 2X
AMD Ryzen 9 7950X, NVIDIA GeForce RTX 4060
251 (244min, 245P1 - 259max) Watt * +41%
Power Consumption / The Witcher 3 ultra (external Monitor)
Sapphire AMD Radeon RX 6950 XT Nitro+ Pure
AMD Ryzen 9 5900X, AMD Radeon RX 6950 XT
589 (583min, 584P1 - 598max) Watt * -48%
Zotac Gaming GeForce RTX 3090 Ti AMP Extreme Holo
AMD Ryzen 7 5800X3D, NVIDIA GeForce RTX 3090 Ti (110% PT, Idle: 102 W)
569 (555min, 557P1 - 580max) Watt * -43%
Zotac Gaming GeForce RTX 3090 Ti AMP Extreme Holo
AMD Ryzen 7 5800X3D, NVIDIA GeForce RTX 3090 Ti (100% PT, Idle: 102 W)
561 (533min, 542P1 - 582max) Watt * -41%
NVIDIA GeForce RTX 4090 Founders Edition
Intel Core i9-13900K, NVIDIA GeForce RTX 4090 (133% PT OC, Idle: 81.25 W)
552 (541min, 545P1 - 569max) Watt * -39%
NVIDIA GeForce RTX 4090 Founders Edition
Intel Core i9-13900K, NVIDIA GeForce RTX 4090 (100% PT, Idle: 81.25 W)
499 (493min, 494P1 - 519max) Watt * -25%
AMD Radeon RX 7900 XTX
AMD Ryzen 9 7950X, AMD Radeon RX 7900 XTX (Idle: 86.5 W)
540 (527min, 530P1 - 564max) Watt * -36%
Average NVIDIA GeForce RTX 3090
  (Idle: 464 - 597, n=17 W)
524 Watt * -32%
Average NVIDIA GeForce RTX 3080 Ti
  (Idle: 490 - 528, n=3 W)
506 Watt * -27%
AMD Radeon RX 6800 XT
AMD Ryzen 9 5950X, AMD Radeon RX 6800 XT (Idle: 99.5 W)
505 (389min - 543max) Watt * -27%
Average NVIDIA GeForce RTX 3080
  (Idle: 498 - 505, n=2 W)
502 Watt * -26%
AMD Radeon RX 6900 XT
AMD Ryzen 9 5950X, AMD Radeon RX 6900 XT (Idle: 99.15 W)
488.3 (459.99min - 512.79max) Watt * -23%
NVIDIA GeForce RTX 4080 Founders Edition
Intel Core i9-13900K, NVIDIA GeForce RTX 4080 (110% PT, Idle: 78.45 W)
463 (451min, 453P1 - 481max) Watt * -16%
NVIDIA GeForce RTX 4080 Founders Edition
Intel Core i9-13900K, NVIDIA GeForce RTX 4080 (100% PT, Idle: 78.45 W)
420 (410min, 411P1 - 448max) Watt * -6%
AMD Radeon RX 7900 XT
AMD Ryzen 9 7950X, AMD Radeon RX 7900 XT (Idle: 84.6 W)
459 (451min, 453P1 - 488max) Watt * -15%
KFA2 GeForce RTX 3070 Ti SG
AMD Ryzen 9 7950X, NVIDIA GeForce RTX 3070 Ti (Idle: 88.9 W)
453 (447min, 448P1 - 469max) Watt * -14%
AMD Radeon RX 7800 XT
AMD Ryzen 9 7950X, AMD Radeon RX 7800 XT
425 (421min, 422P1 - 429max) Watt * -7%
Asus TUF Gaming GeForce RTX 4070 Ti
Intel Core i9-13900K, NVIDIA GeForce RTX 4070 Ti (Perf BIOS / 110% PT, Idle: 75.4 W)
422 (412min, 413P1 - 452max) Watt * -6%
Asus TUF Gaming GeForce RTX 4070 Ti
Intel Core i9-13900K, NVIDIA GeForce RTX 4070 Ti (Perf BIOS / 100% PT, Idle: 75.4 W)
419 (414min, 415P1 - 438max) Watt * -5%
Asus TUF Gaming GeForce RTX 4070 Ti
Intel Core i9-13900K, NVIDIA GeForce RTX 4070 Ti (Quiet BIOS / 100% PT, Idle: 75.4 W)
418 (411min, 412P1 - 433max) Watt * -5%
Average NVIDIA GeForce RTX 4070 Ti
  (Idle: 404 - 426, n=8 W)
415 Watt * -4%
Gigabyte Aorus GeForce RTX 4070 Ti Master
Intel Core i9-13900K, NVIDIA GeForce RTX 4070 Ti (Silent BIOS; 100% PT, Idle: 75.5 W)
414 (406min, 407P1 - 432max) Watt * -4%
Gigabyte Aorus GeForce RTX 4070 Ti Master
Intel Core i9-13900K, NVIDIA GeForce RTX 4070 Ti (OC BIOS; 128% PT, Idle: 75.5 W)
410 (401min, 403P1 - 435max) Watt * -3%
Gigabyte Aorus GeForce RTX 4070 Ti Master
Intel Core i9-13900K, NVIDIA GeForce RTX 4070 Ti (OC BIOS; 100% PT, Idle: 75.5 W)
404 (397min, 398P1 - 427max) Watt * -2%
Average NVIDIA Titan RTX
  (Idle: 371 - 463, n=27 W)
408 Watt * -3%
Average NVIDIA GeForce RTX 3070
  (Idle: 317 - 550, n=5 W)
401 Watt * -1%
Asus TUF Gaming GeForce RTX 4070 Ti Super
Intel Core i9-13900K, NVIDIA GeForce RTX 4070 Ti SUPER (110% PT, Perf. BIOS, Idle: 138 W)
398 (386min, 387P1 - 431max) Watt *
Asus TUF Gaming GeForce RTX 4070 Ti Super
Intel Core i9-13900K, NVIDIA GeForce RTX 4070 Ti SUPER (100% PT, Perf. BIOS, Idle: 138 W)
393 (382min, 383P1 - 420max) Watt * +1%
Gigabyte GeForce RTX 4070 Super Gaming OC 12G
Intel Core i9-13900K, NVIDIA GeForce RTX 4070 SUPER (100% PT, BIOS OC, Idle: 122.6 W)
388 (373min, 375P1 - 438max) Watt * +3%
Gigabyte GeForce RTX 4070 Super Gaming OC 12G
Intel Core i9-13900K, NVIDIA GeForce RTX 4070 SUPER (145% PT, BIOS OC, Idle: 122.6 W)
388 (377min, 377P1 - 418max) Watt * +3%
Sapphire Pulse Radeon RX 7700 XT
AMD Ryzen 9 7950X, AMD Radeon RX 7700 XT
384 (379min, 380P1 - 391max) Watt * +4%
NVIDIA GeForce RTX 4070 Super Founders Edition
Intel Core i9-13900K, NVIDIA GeForce RTX 4070 SUPER (109% PT, Idle: 114.9 W)
377 (365min, 366P1 - 407max) Watt * +5%
NVIDIA GeForce RTX 4070 Super Founders Edition
Intel Core i9-13900K, NVIDIA GeForce RTX 4070 SUPER (100% PT, Idle: 114.9 W)
372 (359min, 361P1 - 402max) Watt * +7%
Zotac Gaming GeForce RTX 4070 AMP Airo
Intel Core i9-13900K, NVIDIA GeForce RTX 4070 (120% PT, Idle: 94.4 W)
358 (348min, 350P1 - 400max) Watt * +10%
Zotac Gaming GeForce RTX 4070 AMP Airo
Intel Core i9-13900K, NVIDIA GeForce RTX 4070 (100% PT, Idle: 94.4 W)
353 (347min, 348P1 - 440max) Watt * +11%
Average of class Desktop
  (Idle: 19.1 - 569, n=37, last 2 years W)
354 Watt * +11%
XFX Speedster QICK 308 Radeon RX 7600 Black Edition
AMD Ryzen 9 7950X, AMD Radeon RX 7600
346 (340min, 341P1 - 351max) Watt * +13%
KFA2 GeForce RTX 4060 Ti EX, 16GB GDDR6
AMD Ryzen 9 7950X, NVIDIA GeForce RTX 4060 Ti 16G
310 (306min, 307P1 - 336max) Watt * +22%
KFA2 GeForce RTX 4060 1-Click-OC 2X
AMD Ryzen 9 7950X, NVIDIA GeForce RTX 4060
272 (264min, 266P1 - 297max) Watt * +32%
Power Consumption / Witcher 3 ultra Efficiency (external Monitor)
AMD Radeon RX 7900 XT
AMD Ryzen 9 7950X, AMD Radeon RX 7900 XT
0.577 fps per Watt +9%
AMD Radeon RX 7900 XTX
AMD Ryzen 9 7950X, AMD Radeon RX 7900 XTX
0.55 fps per Watt +4%
NVIDIA GeForce RTX 4080 Founders Edition
Intel Core i9-13900K, NVIDIA GeForce RTX 4080
0.549 fps per Watt +4%
Asus TUF Gaming GeForce RTX 4070 Ti
Intel Core i9-13900K, NVIDIA GeForce RTX 4070 Ti
0.545 fps per Watt +3%
Gigabyte GeForce RTX 4070 Super Gaming OC 12G
Intel Core i9-13900K, NVIDIA GeForce RTX 4070 SUPER
0.541 fps per Watt +2%
NVIDIA GeForce RTX 4090 Founders Edition
Intel Core i9-13900K, NVIDIA GeForce RTX 4090
0.538 fps per Watt +2%
Average NVIDIA GeForce RTX 4070 Ti
  (0.509 - 0.548, n=4)
0.533 fps per Watt +1%
Gigabyte Aorus GeForce RTX 4070 Ti Master
Intel Core i9-13900K, NVIDIA GeForce RTX 4070 Ti
0.531 fps per Watt +1%
Asus TUF Gaming GeForce RTX 4070 Ti Super
Intel Core i9-13900K, NVIDIA GeForce RTX 4070 Ti SUPER
0.528 fps per Watt
NVIDIA GeForce RTX 4070 Super Founders Edition
Intel Core i9-13900K, NVIDIA GeForce RTX 4070 SUPER
0.509 fps per Watt -4%
Zotac Gaming GeForce RTX 4070 AMP Airo
Intel Core i9-13900K, NVIDIA GeForce RTX 4070
0.4709 fps per Watt -11%
AMD Radeon RX 7800 XT
AMD Ryzen 9 7950X, AMD Radeon RX 7800 XT
0.4461 fps per Watt -16%
Sapphire Pulse Radeon RX 7700 XT
AMD Ryzen 9 7950X, AMD Radeon RX 7700 XT
0.4383 fps per Watt -17%
Average of class Desktop
  (0.1429 - 0.652, n=26, last 2 years)
0.437 fps per Watt -17%
KFA2 GeForce RTX 4060 Ti EX, 16GB GDDR6
AMD Ryzen 9 7950X, NVIDIA GeForce RTX 4060 Ti 16G
0.4268 fps per Watt -19%
KFA2 GeForce RTX 4060 1-Click-OC 2X
AMD Ryzen 9 7950X, NVIDIA GeForce RTX 4060
0.4103 fps per Watt -22%
Average NVIDIA GeForce RTX 3080 Ti
  (0.3496 - 0.3735, n=3)
0.3607 fps per Watt -32%
XFX Speedster QICK 308 Radeon RX 7600 Black Edition
AMD Ryzen 9 7950X, AMD Radeon RX 7600
0.354 fps per Watt -33%
Sapphire AMD Radeon RX 6950 XT Nitro+ Pure
AMD Ryzen 9 5900X, AMD Radeon RX 6950 XT
0.348 fps per Watt -34%
Zotac Gaming GeForce RTX 3090 Ti AMP Extreme Holo
AMD Ryzen 7 5800X3D, NVIDIA GeForce RTX 3090 Ti
0.345 fps per Watt -35%
Average NVIDIA GeForce RTX 3090
  (0.268 - 0.3954, n=14)
0.3429 fps per Watt -35%
Average NVIDIA Titan RTX
  (0.2926 - 0.385, n=26)
0.3382 fps per Watt -36%
AMD Radeon RX 6900 XT
AMD Ryzen 9 5950X, AMD Radeon RX 6900 XT
0.335 fps per Watt -37%
KFA2 GeForce RTX 3070 Ti SG
AMD Ryzen 9 7950X, NVIDIA GeForce RTX 3070 Ti
0.3241 fps per Watt -39%
Average NVIDIA GeForce RTX 3070
  (0.22 - 0.3911, n=5)
0.3211 fps per Watt -39%
AMD Radeon RX 6800 XT
AMD Ryzen 9 5950X, AMD Radeon RX 6800 XT
0.3168 fps per Watt -40%
Average NVIDIA GeForce RTX 3080
  (0.291 - 0.301, n=2)
0.296 fps per Watt -44%
1280x720 FurMark 1.19 GPU Stress Test (external Monitor)
350.77
1920x1080 The Witcher 3 ultra (external Monitor)
357.59

* ... smaller is better

Artılar

+ Ek HDMI 2.1a çıkışı ile sağlam, tamamen metalik yapı
+ 256 bit 16 GB VRAM'e sahip AD103 GPU
+ Radeon RX 7900 XT ve RTX 3090 Ti ile yarışan performans
+ Düşük fan gürültü seviyeleri ve yüksek enerji verimliliği
+ MSRP fiyatlandırması

Eksiler

- Orijinal RTX 4070 Ti'ye göre önemli bir kazanım yok
- Yük altında daha yüksek yüzey sıcaklıkları
- Performans ve Sessiz VBIOS modları arasında algılanabilir fan gürültüsü farkı yok
- Sınırlı hız aşırtma potansiyeli

Karar: Orijinal RTX 4070 Ti'nin olması gereken şey

Asus TUF Gaming GeForce RTX 4070 Ti Super. İnceleme birimi Asus Hindistan'ın izniyle.

RTX 4070 Ti Super, yeni modelin yerini alıyor orijinal RTX 4070 Ti aynı 799 ABD Doları MSRP ile. Farklı olarak RTX 4070 Süper'ye göre gölgelendiricilerde %21'lik önemli bir artış görülüyor RTX 4070rTX 4070 Ti Super, RTX 4070 Ti'ye kıyasla CUDA çekirdeklerinde yalnızca %10'luk bir artış sunuyor ve bu da gerçek dünya oyun senaryolarında her zaman somut kazanımlar sunmayabilir.

Bununla birlikte, AD103 silikona geçiş, RTX 4070 Ti Super'in artık yemek masasını aşağıdakilerle paylaşan bir tür daha "eksiksiz orta sınıf GPU" olduğu anlamına geliyor RTX 4080 ve RTX 4080 Super. AD104'ün destekleyemediği daha hızlı 256 bit bellek alt sistemi ve 16 GB GDDR6X VRAM de bunun önemli bir avantajı.

Asus TUF Gaming GeForce RTX 4070 Ti Super ise üstün yapı kalitesi, ek bağlantı noktaları ve referans özelliklere göre mükemmel performans sunuyor. Bir OC SKU'su da bulunsa da, test edilen 799 ABD Doları tutarındaki temel SKU, en son AD103 katılımcısından en iyi şekilde yararlanmak için ihtiyacınız olan her şeyi sağlar.

Yeni AD103 tabanlı Asus TUF Gaming GeForce RTX 4070 Ti Super, 1440p Ultra yüksek kare hızında oyun oynamanın yanı sıra iyi 4K Ultra ve işlem yetenekleri de sunarak 799 ABD doları fiyatıyla ciddi bir değerlendirmeyi hak ediyor.

Asus, TUF Gaming GeForce RTX 4070 Ti Super'i sağlam bir soğutma sistemiyle donattı. Yüzey sıcaklıkları daha yüksek görünse de, üç fanlı altı ısı borulu soğutma, AD103 GPU'nun son derece tolere edilebilir fan gürültü seviyeleri ile kısılma endişesi olmadan performans göstermesini sağlar.

RTX 4070 Ti Super, 1440p Ultra oyun için harikalar yaratıyor, ancak açıkçası bu çözünürlük için aşırıya kaçıyor. Bilgi işlem iş yükleriyle fazla uğraşmayan 1440p oyunculardansanız, RTX 4070 Super'i tercih ederek 200 ABD doları tasarruf edebilirsiniz.

AMD Radeon RX 7900 XT xFX Speedster MERC310(Amazon'da 740 ABD doları) veya Asus TUF Gaming RX 7900 XT OC(Amazon'da 880 ABD doları) gibi kartlar da, özellikle yalnızca raster performansına öncelik veriyorsanız ve FSR yükseltmesinden memnunsanız, uygun seçeneklerdir.

Bununla birlikte, TUF Gaming RTX 4070 Ti Super, üstün ışın izleme becerisi ve DLSS 3 kare oluşturma ve DLSS 3.5 ışın yeniden yapılandırma desteği göz önüne alındığında genel olarak daha iyi bir teklif sunuyor.

İlginç olan şu ki RTX 3090 Tibu kartın cömertçe yerini aldığı kart, zamanında MSRP'de 2,5 katına mal olmuştu.

Fiyat ve Bulunabilirlik

Asus TUF Gaming GeForce RTX 4070 Ti Super, Best Buy ABD 'den temel varyant için 800 ABD dolarına alınabilirken, OC SKU 850 ABD dolarına satılmaktadır.

Hindistan'da, TUF Gaming GeForce RTX 4070 Ti Super resmi olarak 95.000 ₹95 olarak fiyatlandırılmıştır ve gerçek fiyat distribütöre bağlıdır. Amazon Hindistan şu anda bu kartın OC sürümünü ₹1,08,499'a sunuyor.

Transparency

The present review sample was made available to the author as a loan by the manufacturer or a shop for the purposes of review. The lender had no influence on this review, nor did the manufacturer receive a copy of this review before publication. There was no obligation to publish this review.

Pricecompare

Please share our article, every link counts!
> Notebooklar Hakkında Aradığınız Herşey > İnceleme > Asus TUF Gaming GeForce RTX 4070 Ti Super İncelemesi: RX 7900 XT'ye meydan okuyan ve RTX 3090 Ti'yi 300 ABD Doları daha ucuza yerinden eden AD103 orta seviye oyuncu
Vaidyanathan Subramaniam, 2024-02-25 (Update: 2024-02-25)