GPD Win 3 İncelemesi: Resmi Olmayan Microsoft Switch
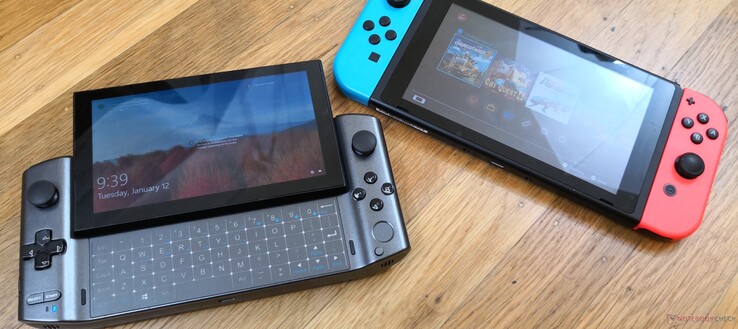
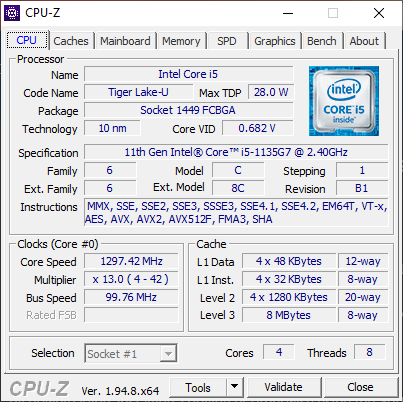
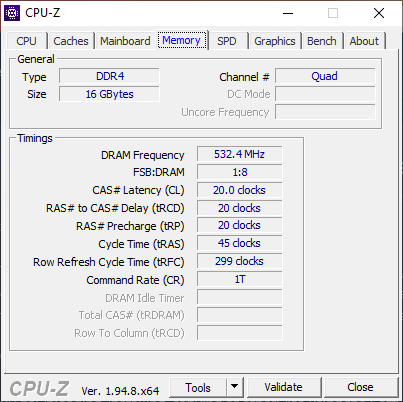
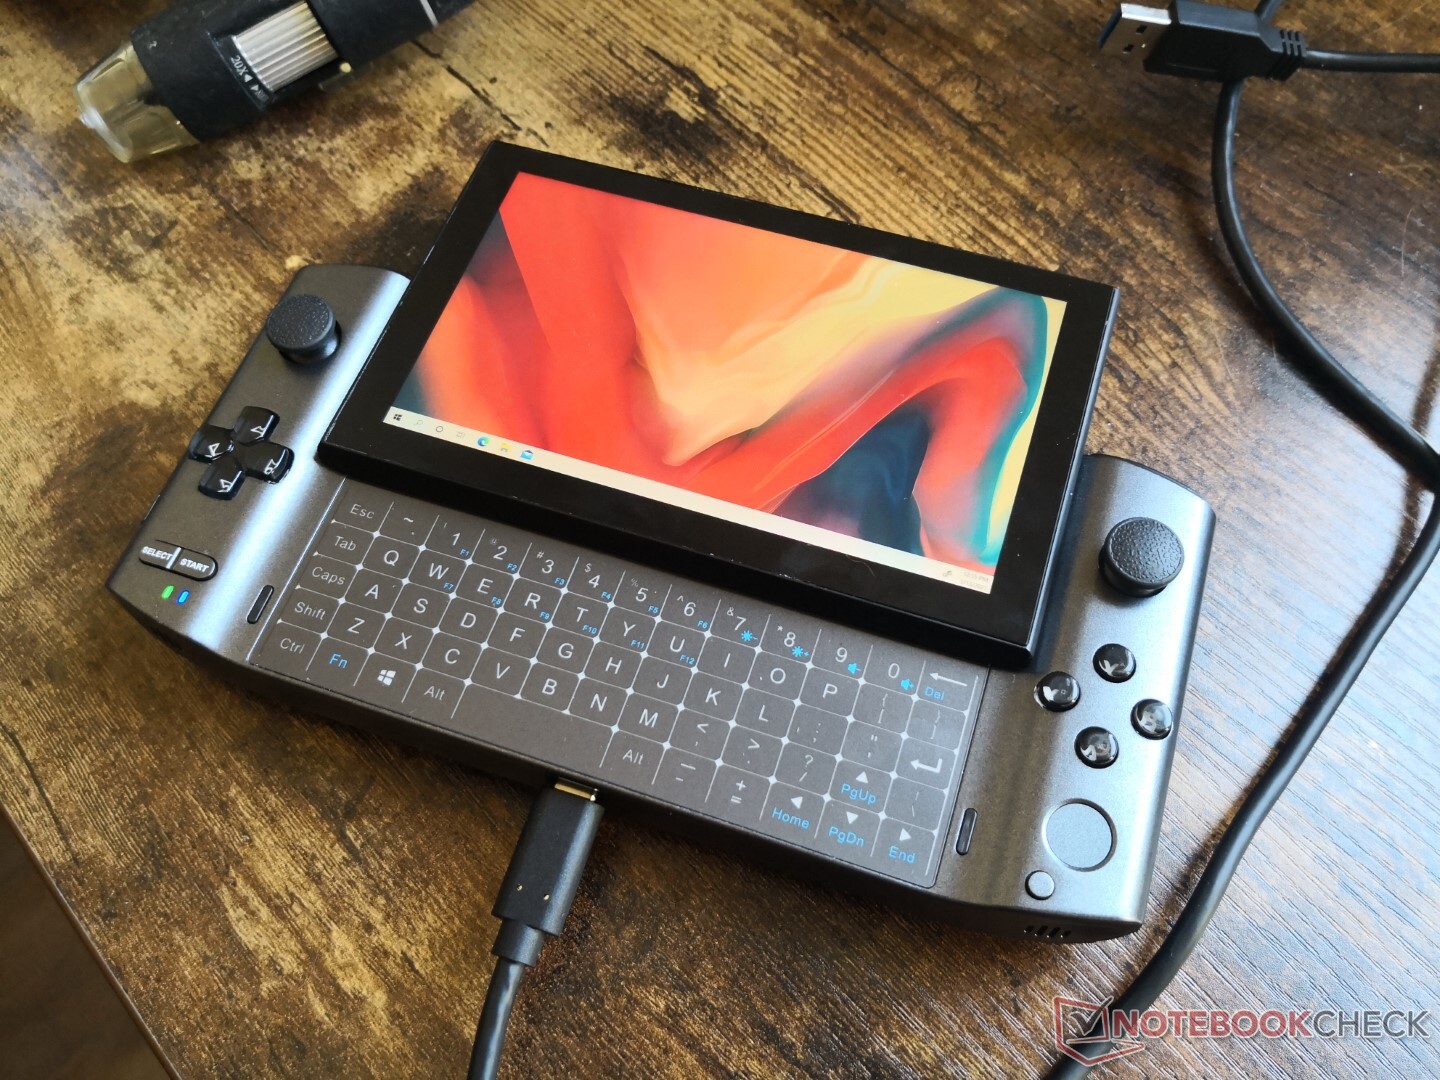
GPD Win 3, 5.5 inç 720p dokunmatik ekrana ve tümleşik bir denetleyiciye sahip taşınabilir bir Windows bilgisayardır. Yeni bir kayar ekran tasarımı ve geçen yılın 10. nesil Ice Lake serisinin yerini alacak yükseltilmiş bir 11. nesil Tiger Lake CPU sunarak Win Max'i başardı. işlemci, 16 GB LPDDR4X RAM, 1 TB NVMe 1.4 M.2 SSD, Wi-Fi 6 ve hatta Thunderbolt 4 desteği. Win 3'ün performansını benzer Intel U serisi CPU'ları kullanan Ultrabook'larla karşılaştırarak, eğer varsa, Win 3'ün küçük form faktörü altında ne kadar bir performans açığının gizlendiğini göreceğiz. Dell'in geçen yıl CES 2020'de henüz piyasaya çıkmamış benzer bir projeyi yayınladığını belirtmekte fayda var. GPD Win 3 hakkında daha fazla bilgiyi burada resmi Indiegogo sayfasında okuyun. İnceleme birimimiz, alıcıların nihayetinde daha az büyük hatayla karşılaşacağını umduğumuz bir üretim öncesi örneğidir.
potential competitors in comparison
Derecelendirme | Tarih | Modeli | Ağırlık | Yükseklik | Boyut | Çözünürlük | Fiyat |
|---|---|---|---|---|---|---|---|
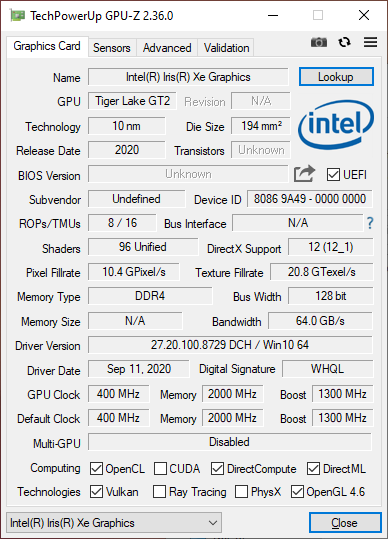
v (old) | 02/2021 | GPD Win 3 i5-1135G7, Iris Xe G7 80EUs | 553 g | 27 mm | 5.50" | 1280x720 | |
| 88.1 % v7 (old) | 12/2020 | Dell XPS 13 9310 Core i7 FHD i7-1165G7, Iris Xe G7 96EUs | 1.3 kg | 14.8 mm | 13.40" | 1920x1200 | |
| 91.1 % v7 (old) | 01/2021 | Apple MacBook Air 2020 M1 Entry M1, M1 7-Core GPU | 1.3 kg | 16.1 mm | 13.30" | 2560x1600 | |
| 88.4 % v7 (old) | 01/2020 | HP Spectre x360 13-aw0013dx i7-1065G7, Iris Plus Graphics G7 (Ice Lake 64 EU) | 1.2 kg | 16.9 mm | 13.30" | 1920x1080 | |
| 87.5 % v7 (old) | 08/2020 | Asus ZenBook 13 UX325JA i7-1065G7, Iris Plus Graphics G7 (Ice Lake 64 EU) | 1.1 kg | 13.9 mm | 13.30" | 1920x1080 | |
| 84 % v7 (old) | 03/2020 | Microsoft Surface Laptop 3 13 Core i5-1035G7 i5-1035G7, Iris Plus Graphics G7 (Ice Lake 64 EU) | 1.3 kg | 14.5 mm | 13.50" | 2256x1504 |
Durum
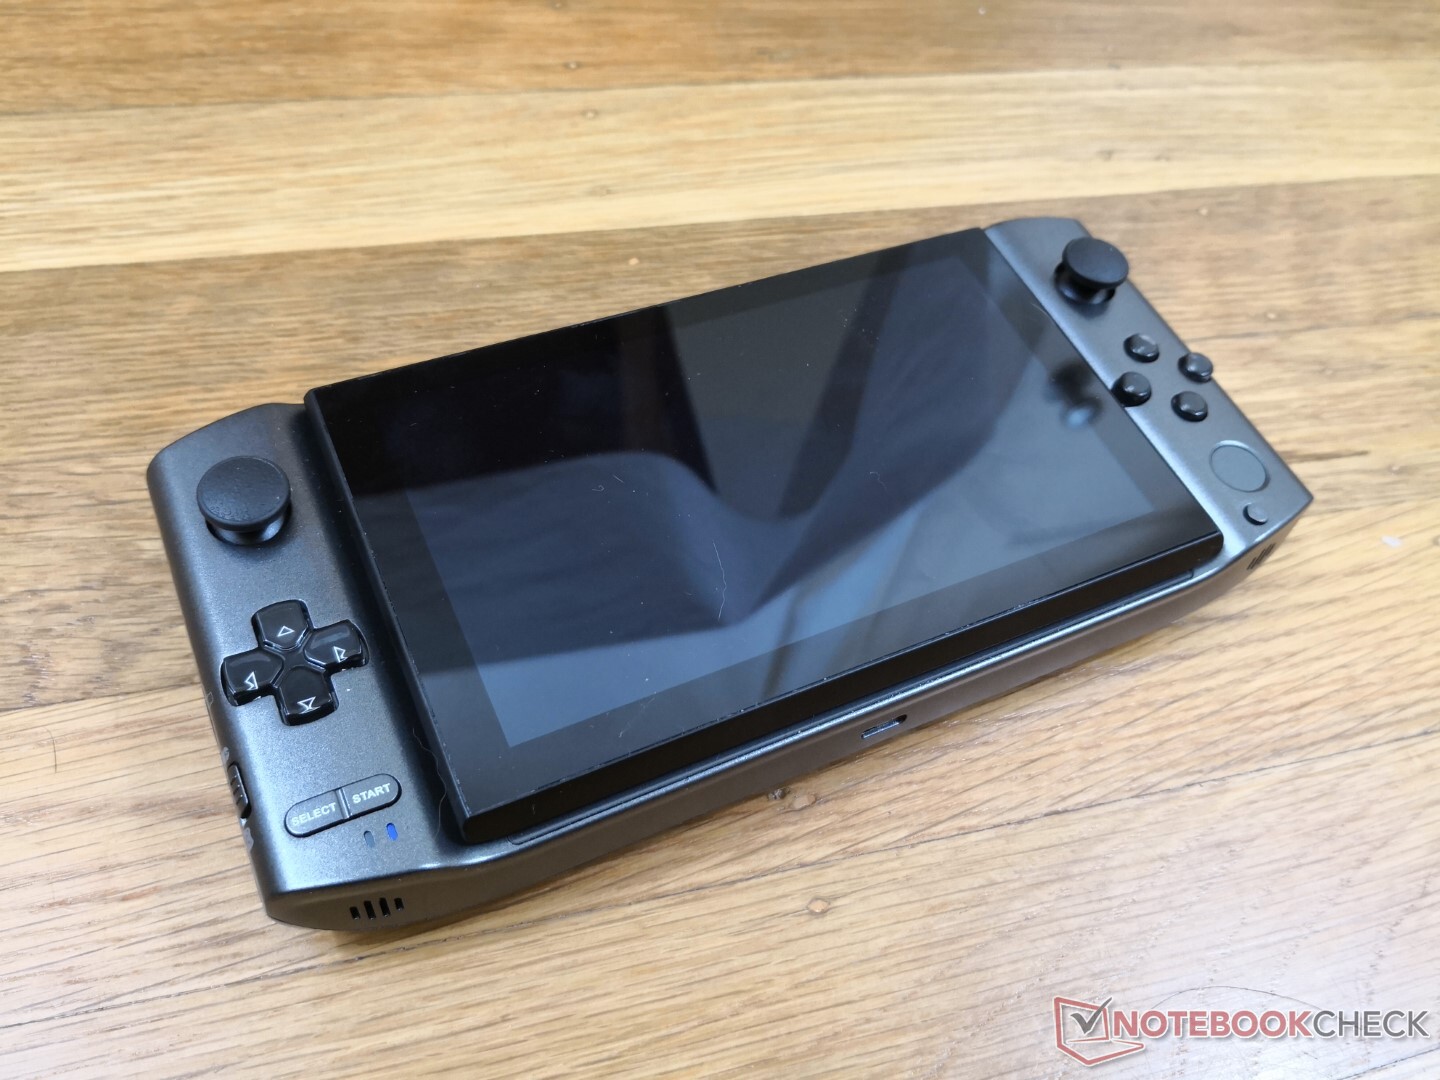
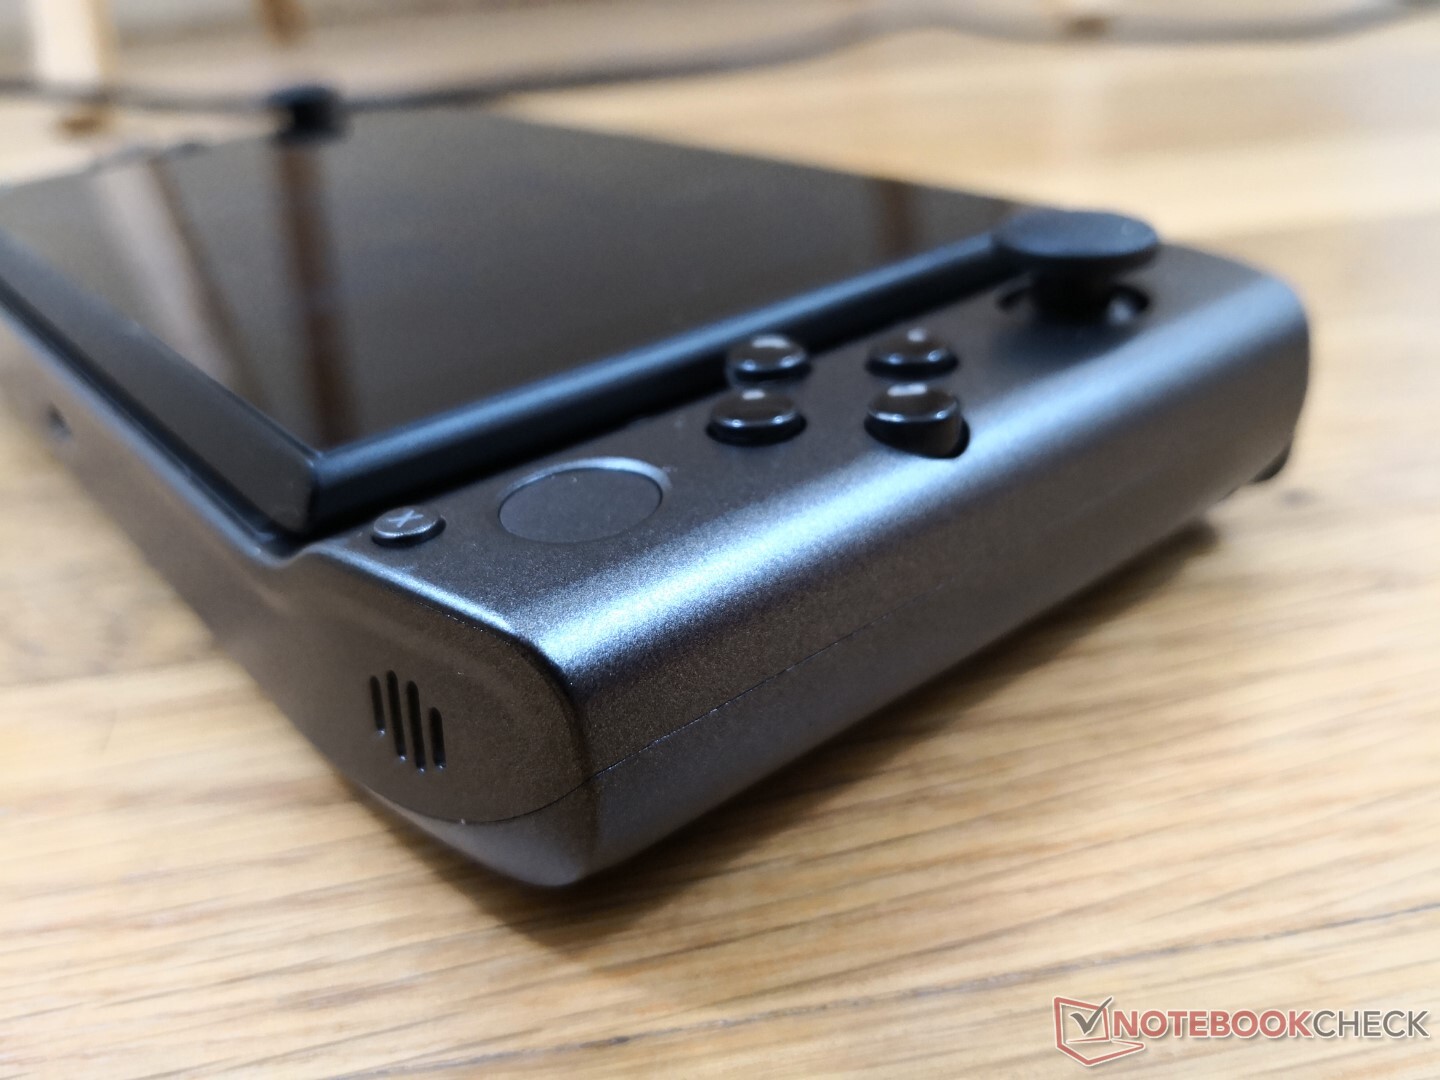
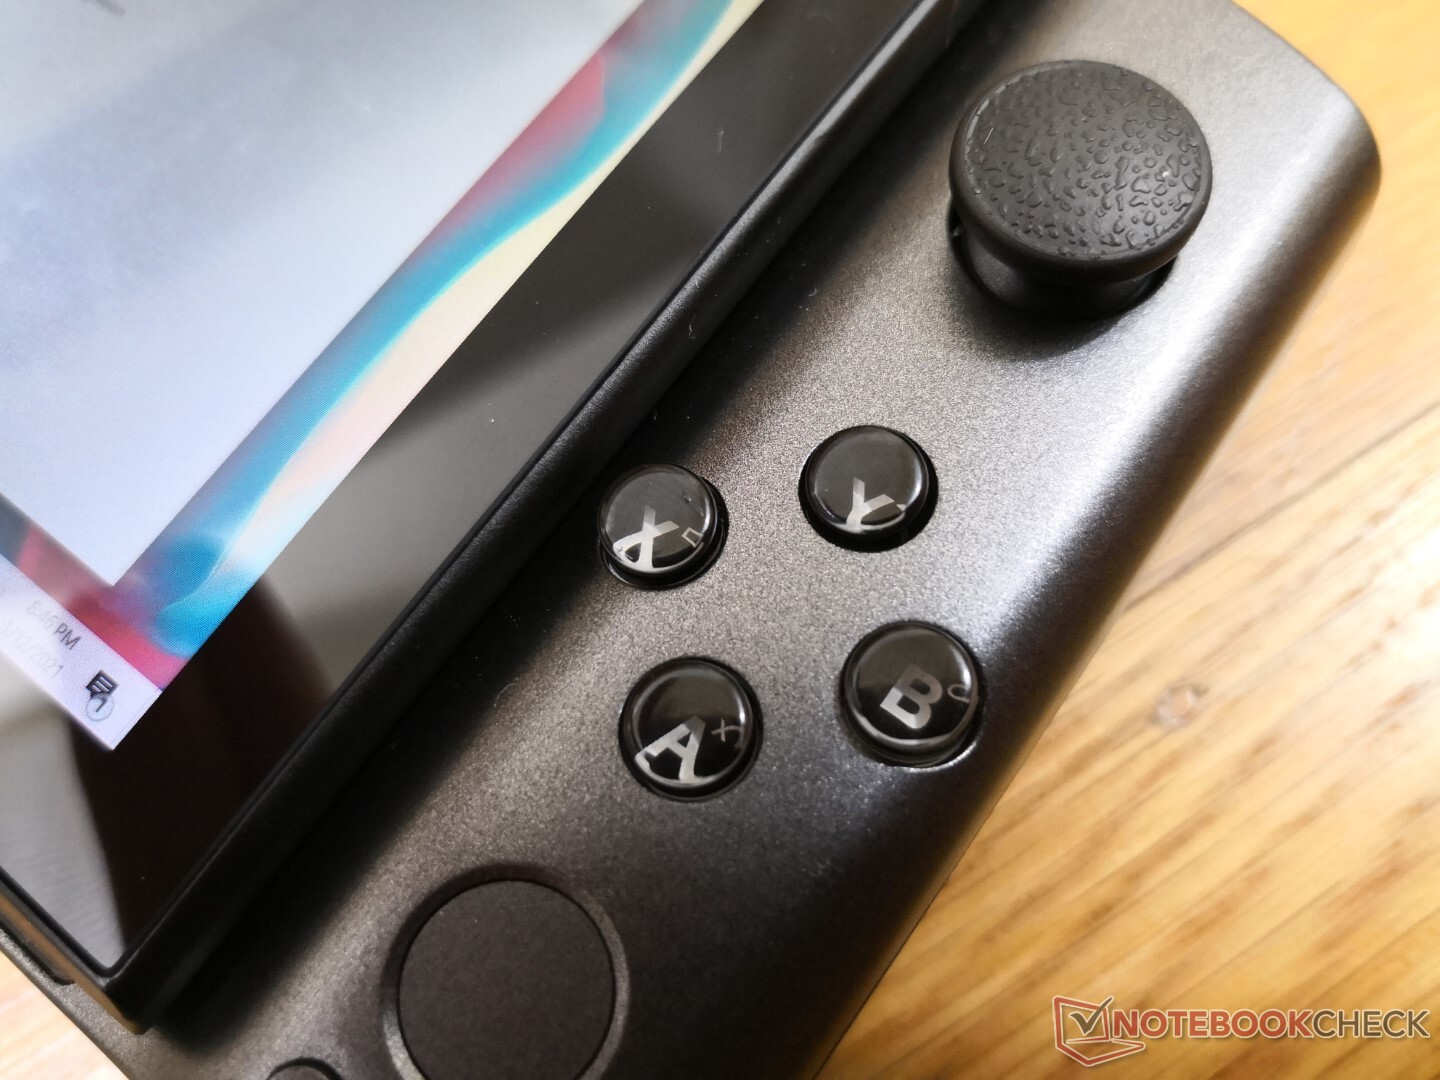
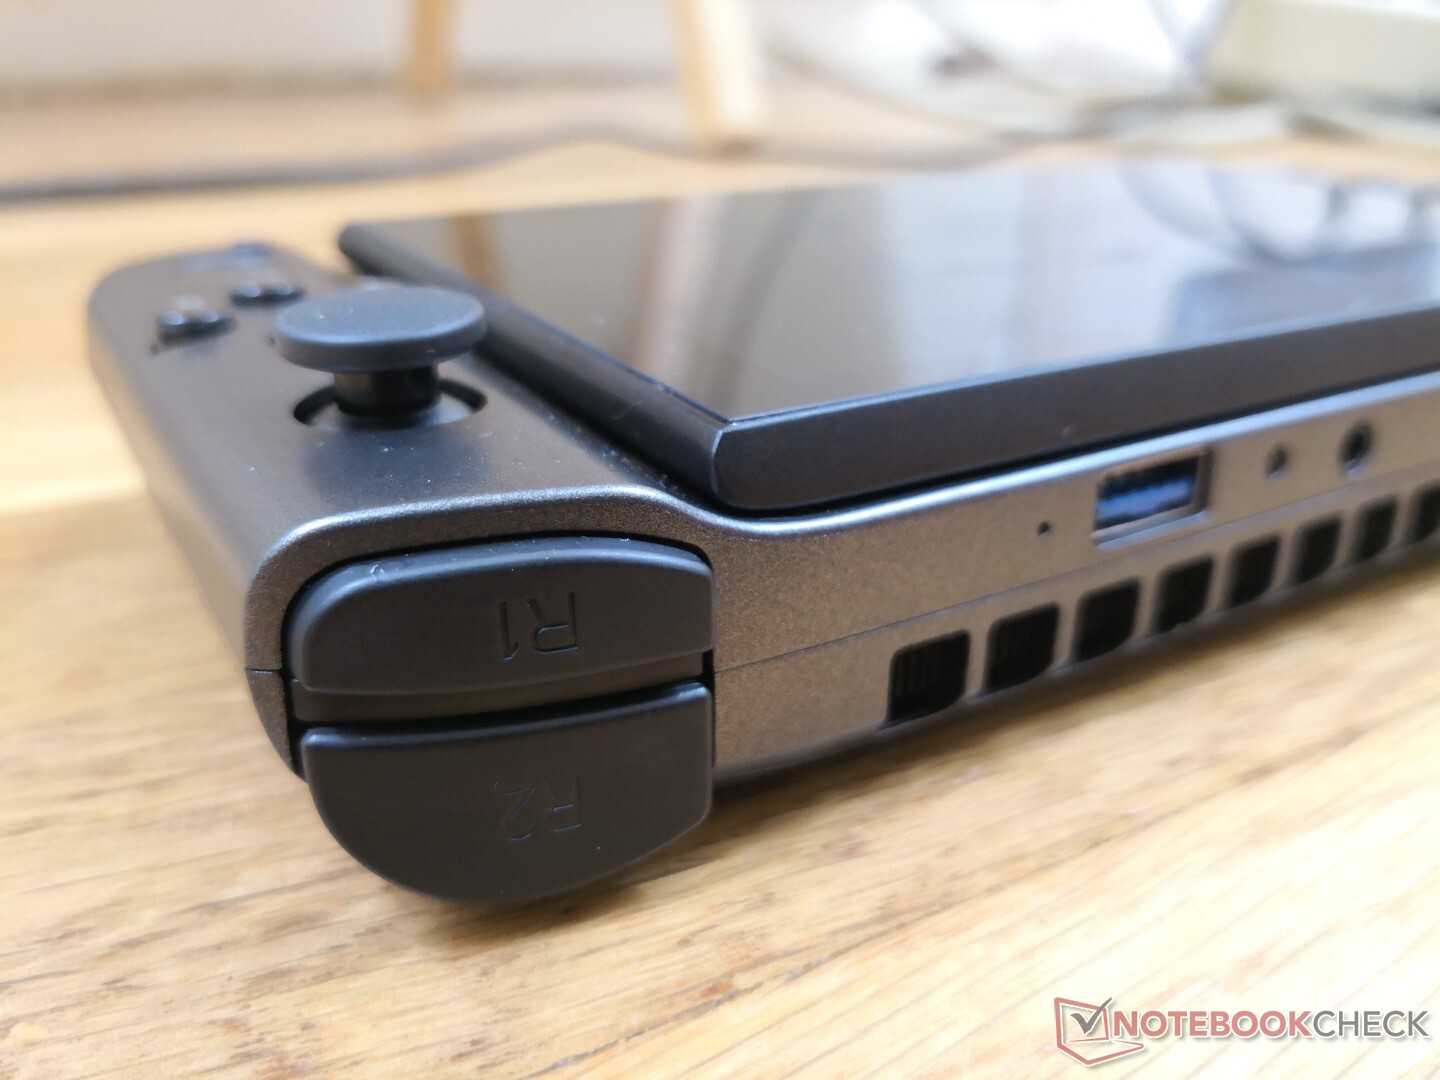
Şasi hem ABS plastik hem de magnezyum alaşımından oluşur. Yeterince sağlam görünüyor ve hissediyor, ancak şeytan ayrıntıda gizlidir. Özellikle, denetleyici ok tuşları ve omuz düğmeleri, Sony DualShock veya Nintendo Switch'teki aynı tuşlarla karşılaştırıldığında geri bildirimde zayıf ve sığdır. Kullanılabilirler, ancak kesinlikle daha iyi olabilirler. Fark ettiğimiz ikinci bir sorun, bazı düğmelerin bazen takılı kalması ve bu nedenle ekranın bu düğmeye tekrar basılıncaya kadar girişi sürekli olarak kaydetmesiydi. Bu, testlerimiz sırasında yalnızca birkaç kez meydana gelmesine rağmen, birkaç kez çok fazlaydı ve son olarak, ünitemizdeki üçüncü bir sorun, dokunmatik ekranın kayma mekanizmasıyla ilgilidir. Ekranı yukarı doğru kaydırmak dokunmaya duyarlı klavyeyi ortaya çıkarır, ancak kayan ekran neredeyse her zaman istemeden bazı tuşlara basar ve işlem sırasında bazı tuşlara kaydolur. Yalnızca üzerinde çalıştığınız e-postada aniden "29999" yazdığını görmek için ekranı aşağı kaydırmak çok can sıkıcı.
GPD'nin bir başka dezavantajı, 553 g'lık nispeten ağır ağırlığının 10.2 inçlik Apple iPad Air'den bile daha ağır olmasıdır. Cihazın kullanımı, ayakta durmaktan çok daha rahattır.
Bağlantı
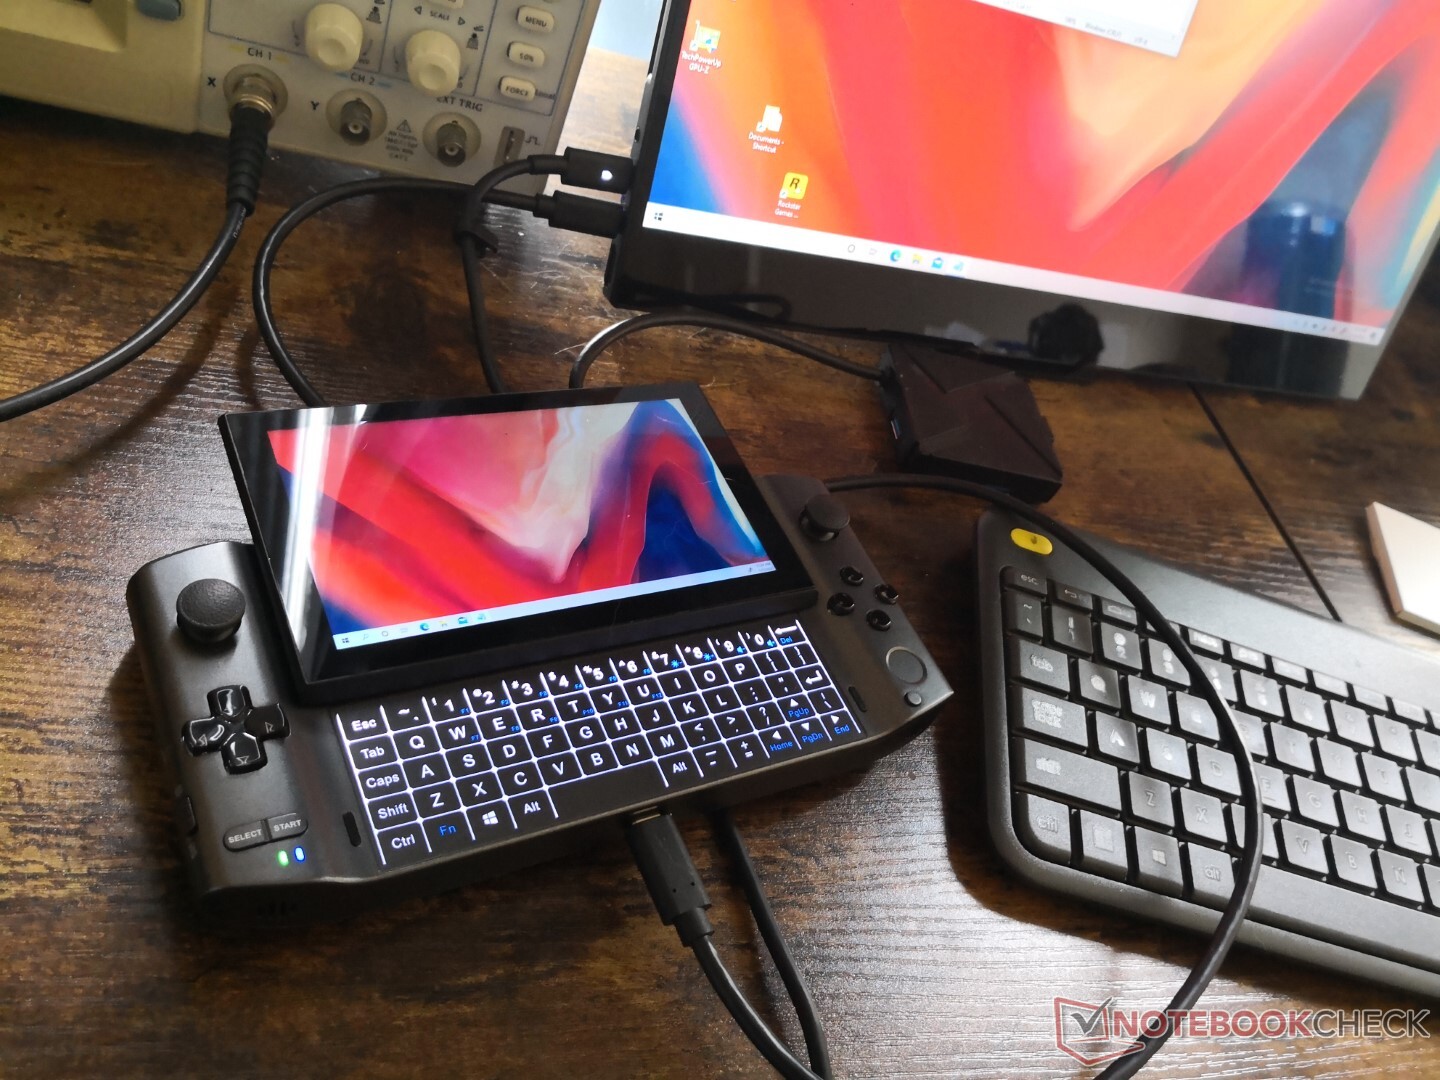
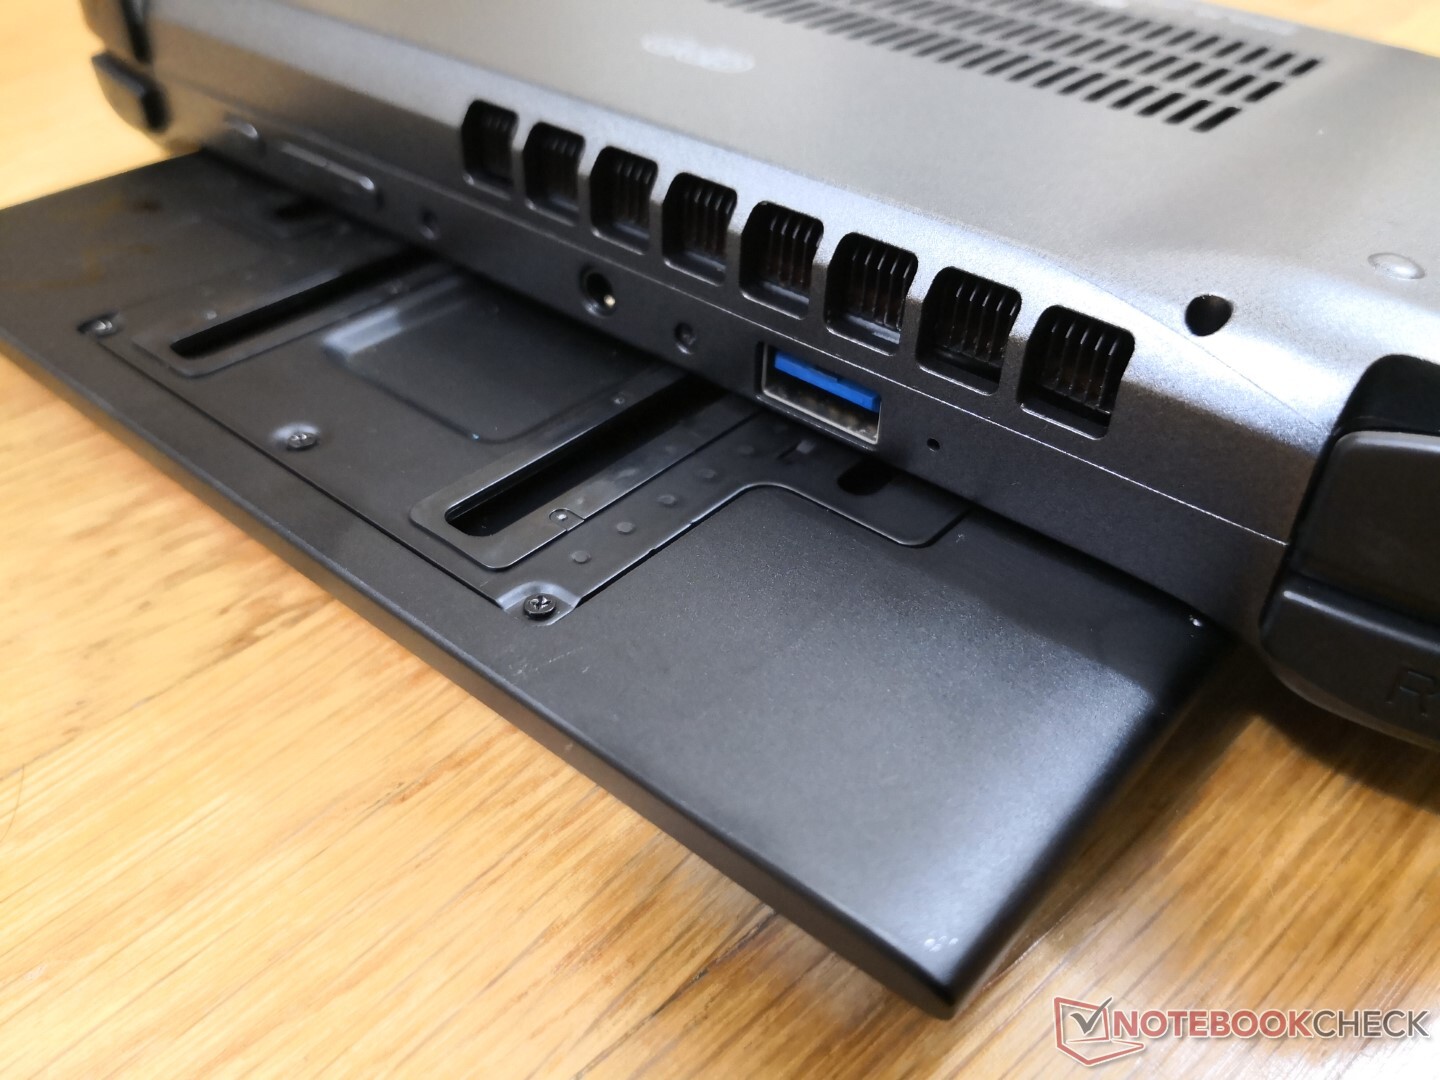
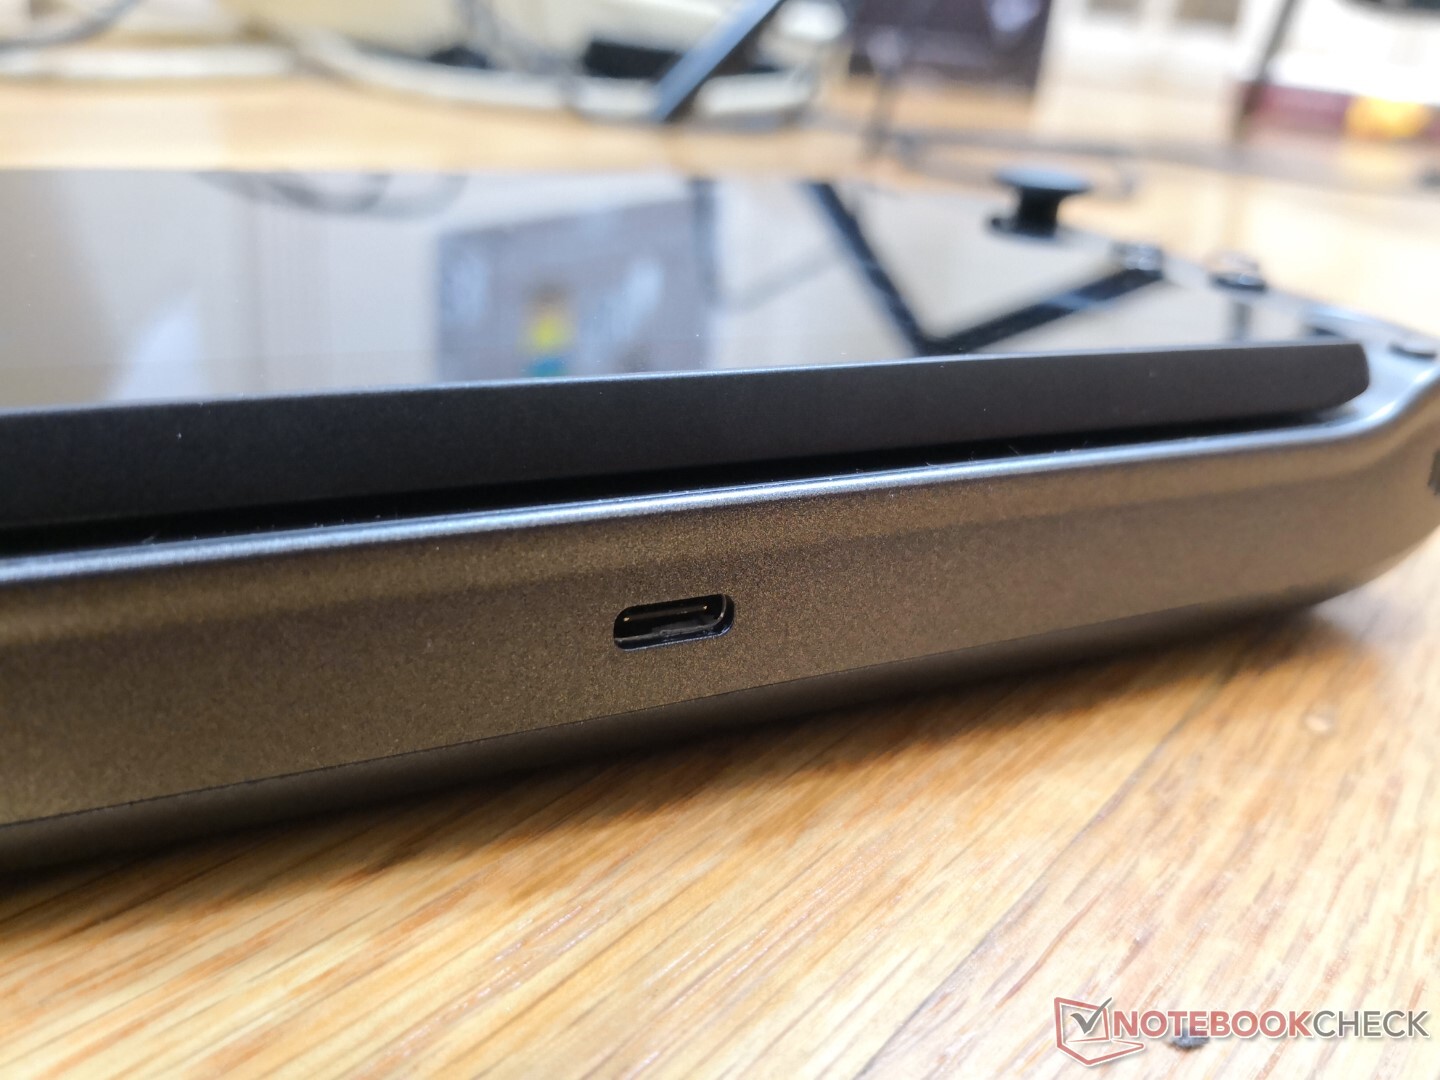
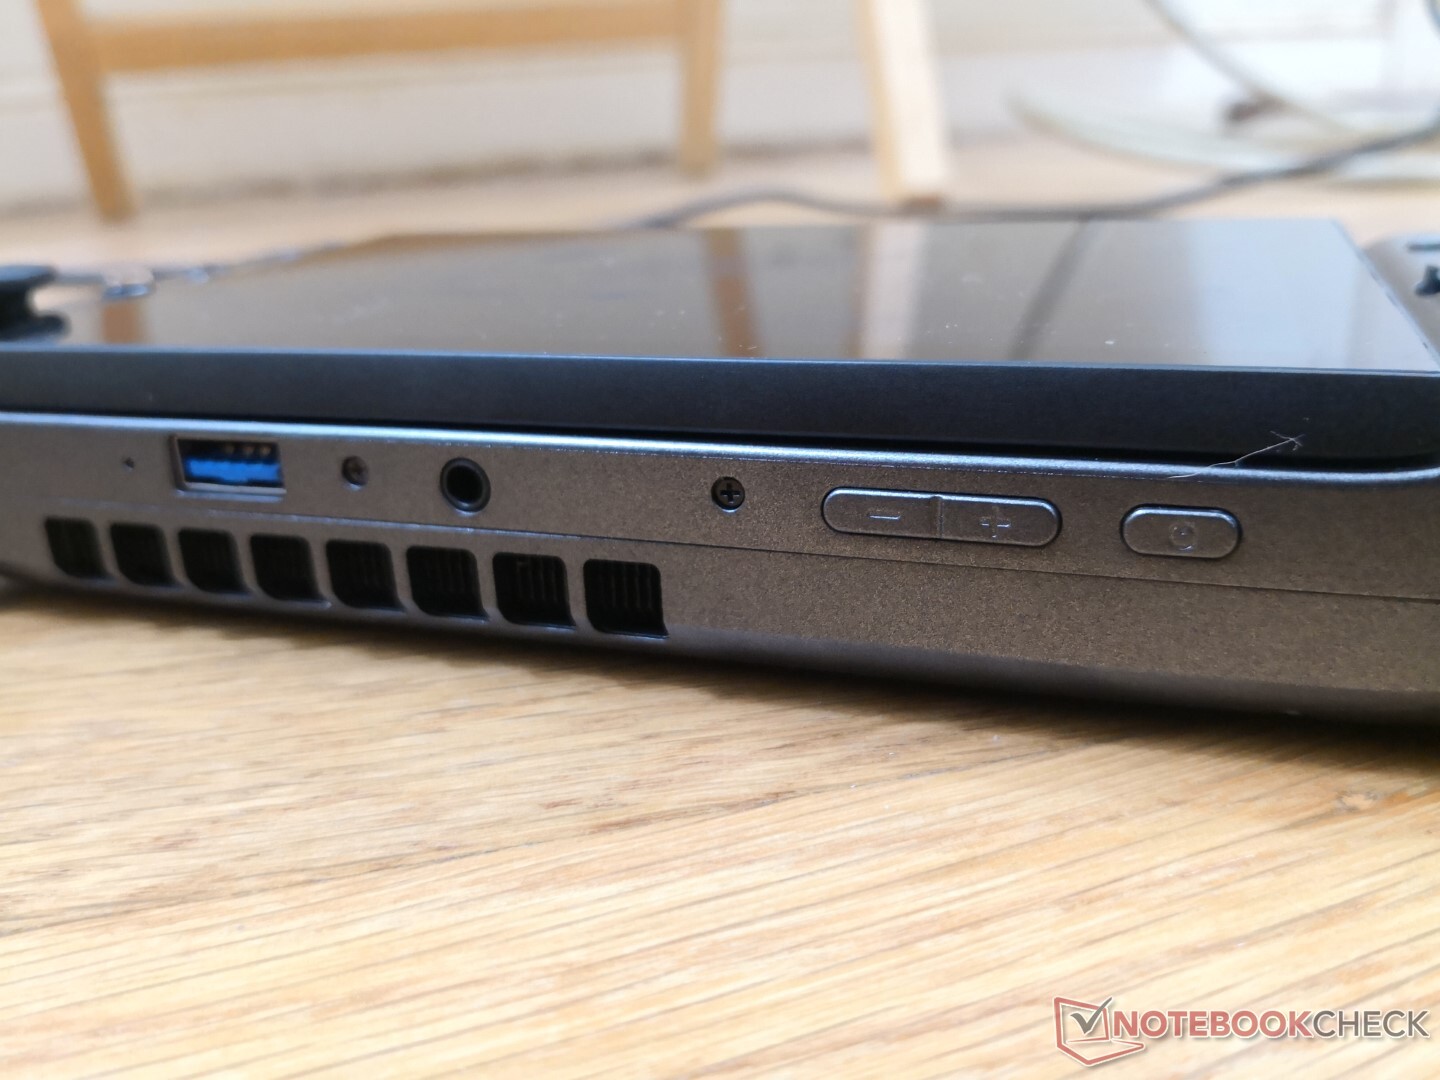
Tümleşik bağlantı noktaları arasında USB-A ve en önemlisi Thunderbolt 4 destekli USB-C bulunur. Kullanıcılar harici monitörleri veya yerleştirme istasyonlarını bağlayabilir, geçiş yoluyla harici cihazlar üzerinden şarj edebilir ve hatta eGPU'ları bağlayabilir. Ana ekran için ölçeklendirme varsayılan olarak yüksek olduğundan, kullanıcıların harici monitörleri bağlarken ölçeklendirmeyi ayarlaması gerekecektir.
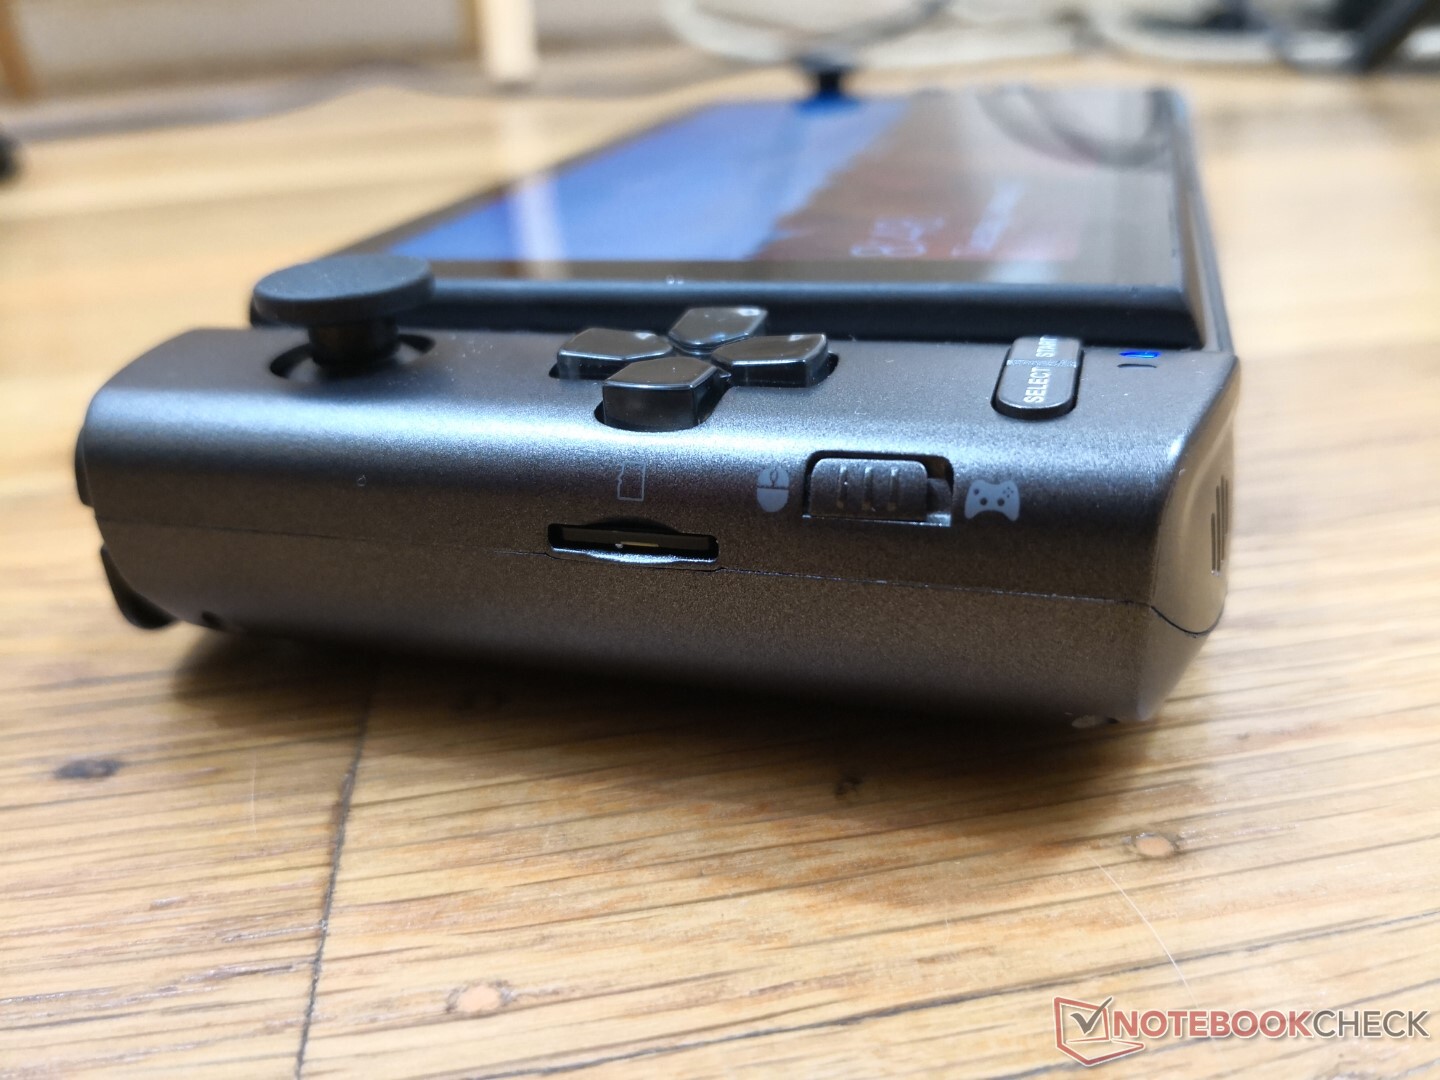
SD Kart Okuyucu
Yaylı MicroSD okuyucu nispeten hızlıdır. 1 GB'lık resimleri UHS-II kartımızdan masaüstüne aktarmak yaklaşık 13 saniye sürer.
| SD Card Reader | |
| average JPG Copy Test (av. of 3 runs) | |
| Dell XPS 13 9310 Core i7 FHD (Toshiba Exceria Pro M501 64 GB UHS-II) | |
| HP Spectre x360 13-aw0013dx (Toshiba Exceria Pro M501 microSDXC 64GB) | |
| GPD Win 3 (Toshiba Exceria Pro M501 32 GB UHS-II) | |
| Asus ZenBook 13 UX325JA (Toshiba Exceria Pro M501 microSDXC 64GB) | |
| maximum AS SSD Seq Read Test (1GB) | |
| Dell XPS 13 9310 Core i7 FHD (Toshiba Exceria Pro M501 64 GB UHS-II) | |
| HP Spectre x360 13-aw0013dx (Toshiba Exceria Pro M501 microSDXC 64GB) | |
| GPD Win 3 (Toshiba Exceria Pro M501 32 GB UHS-II) | |
| Asus ZenBook 13 UX325JA (Toshiba Exceria Pro M501 microSDXC 64GB) | |
İletişim
Wi-Fi 6 ve Bluetooth 5 bağlantısı standart olarak gelir. Netgear RAX200 test yönlendiricimize bağlanırken herhangi bir sorun yaşamadık.
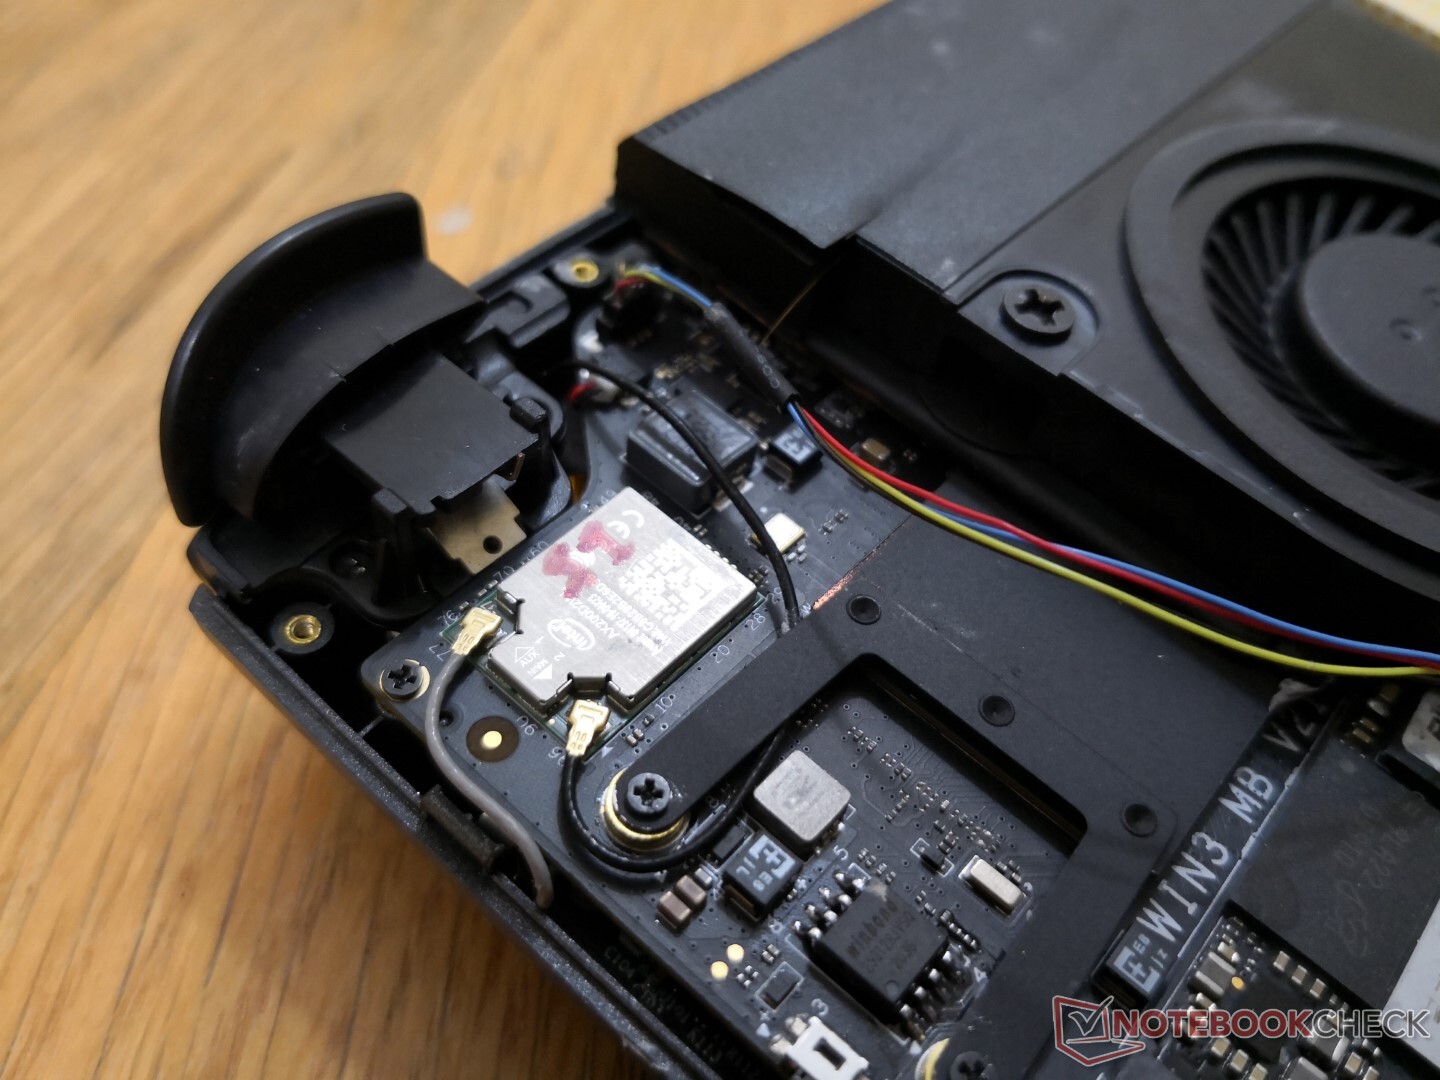
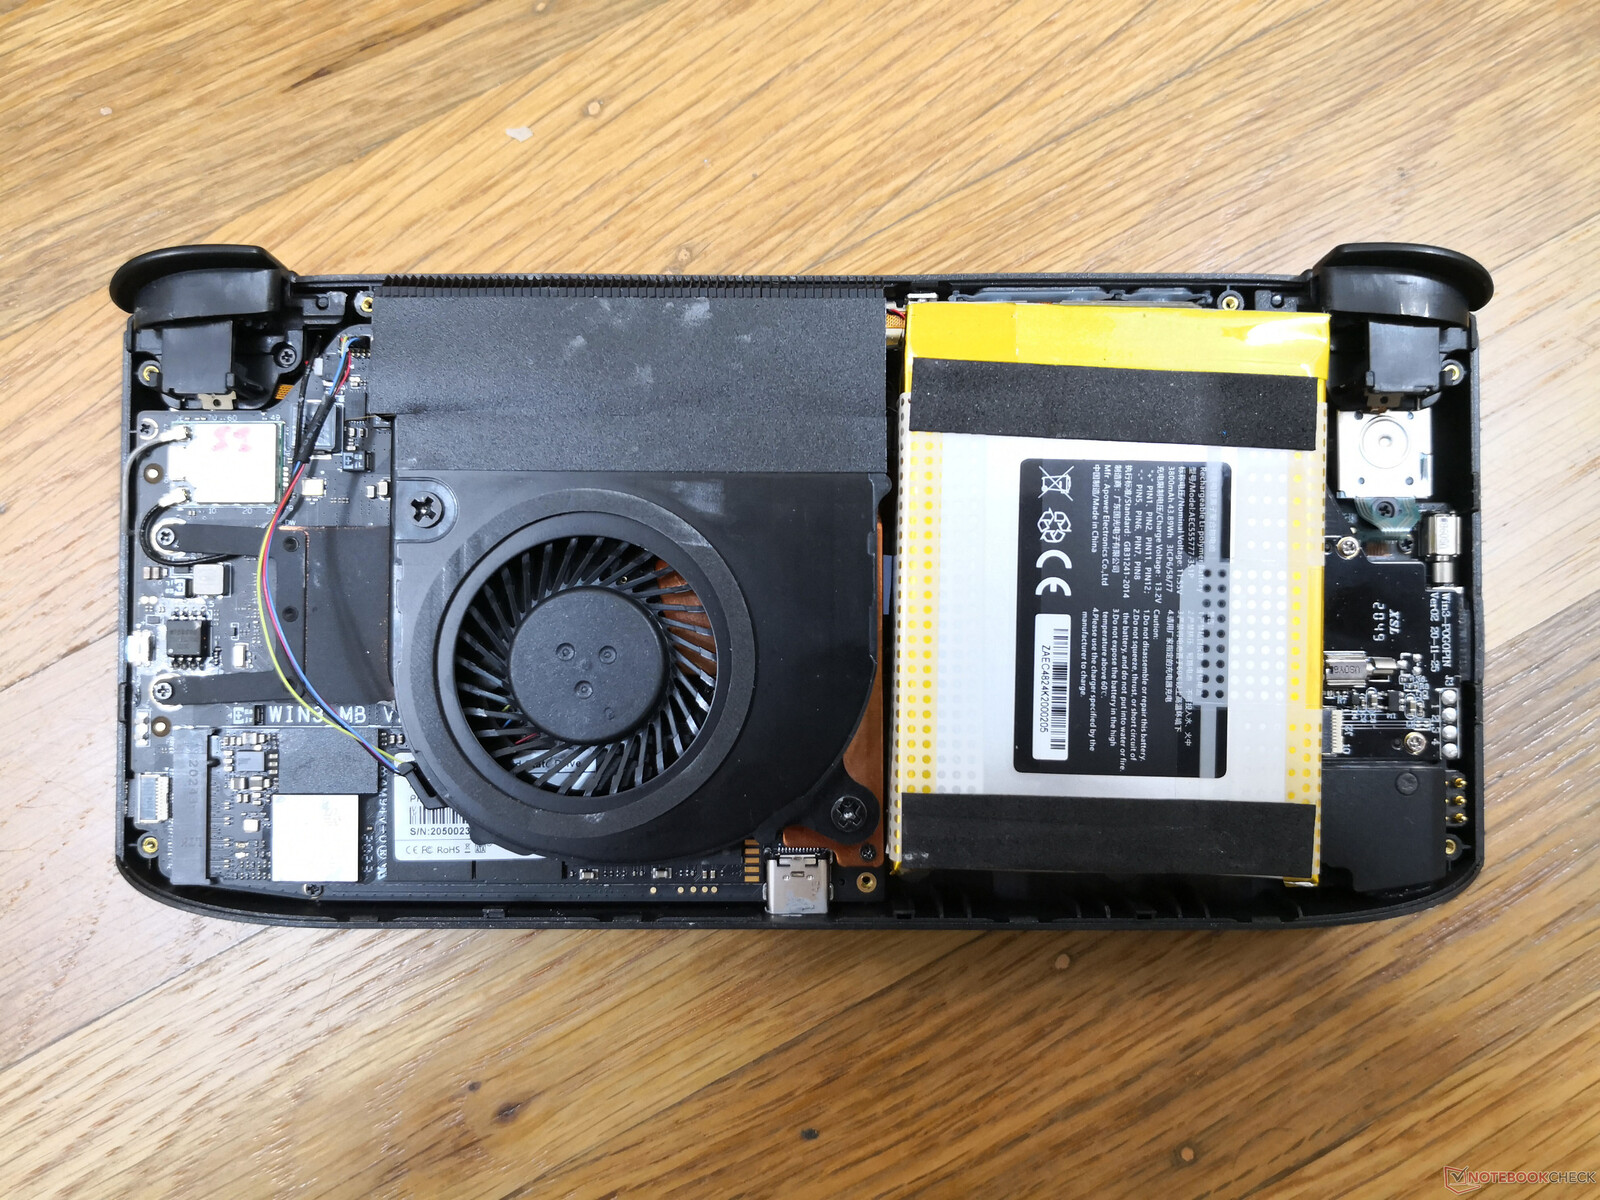
Bakım
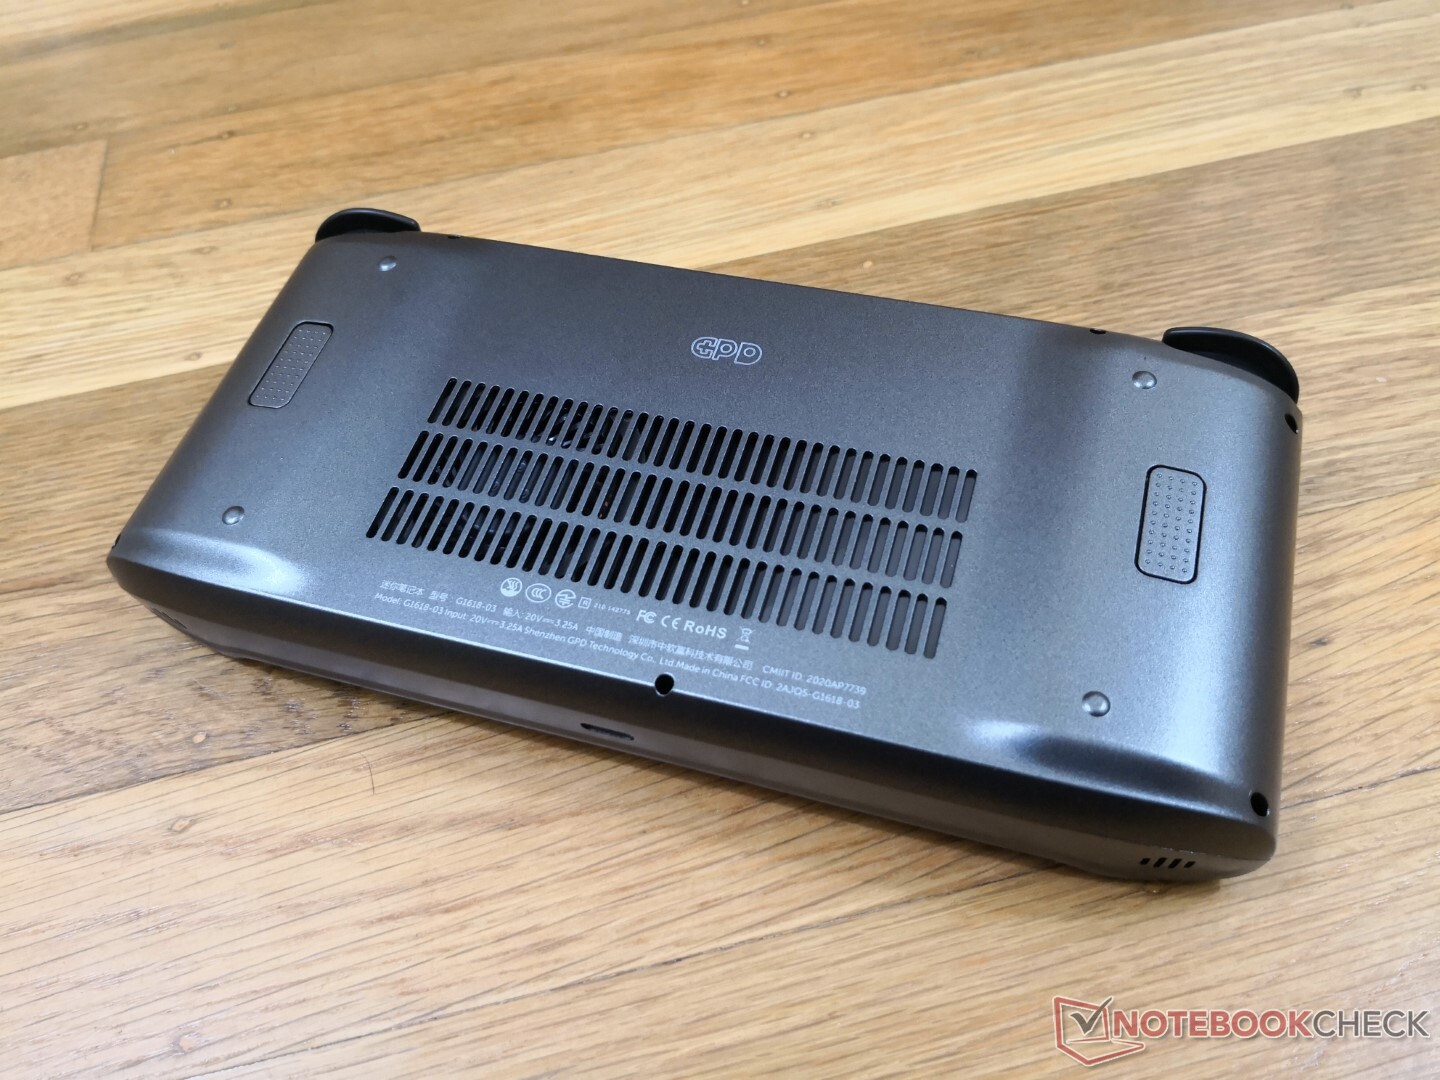
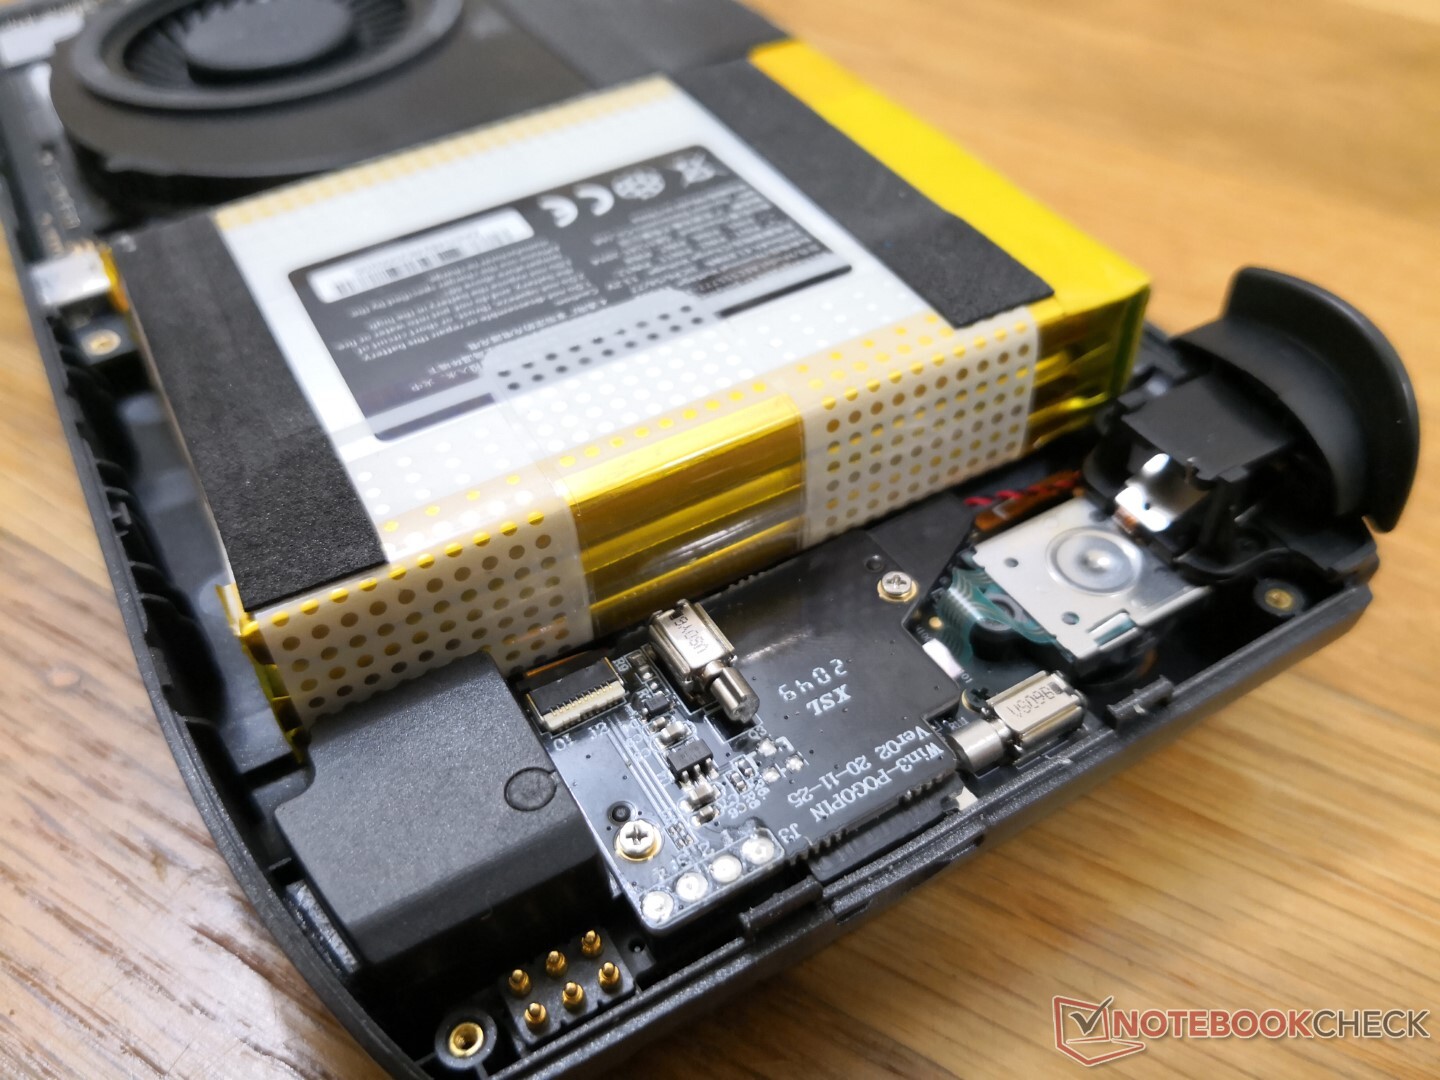
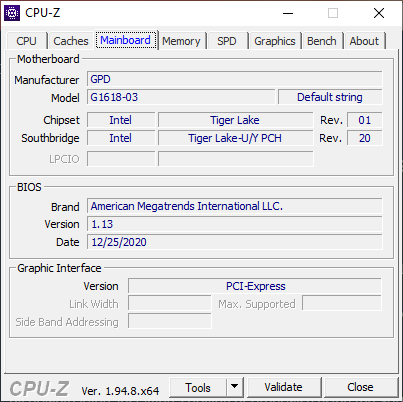
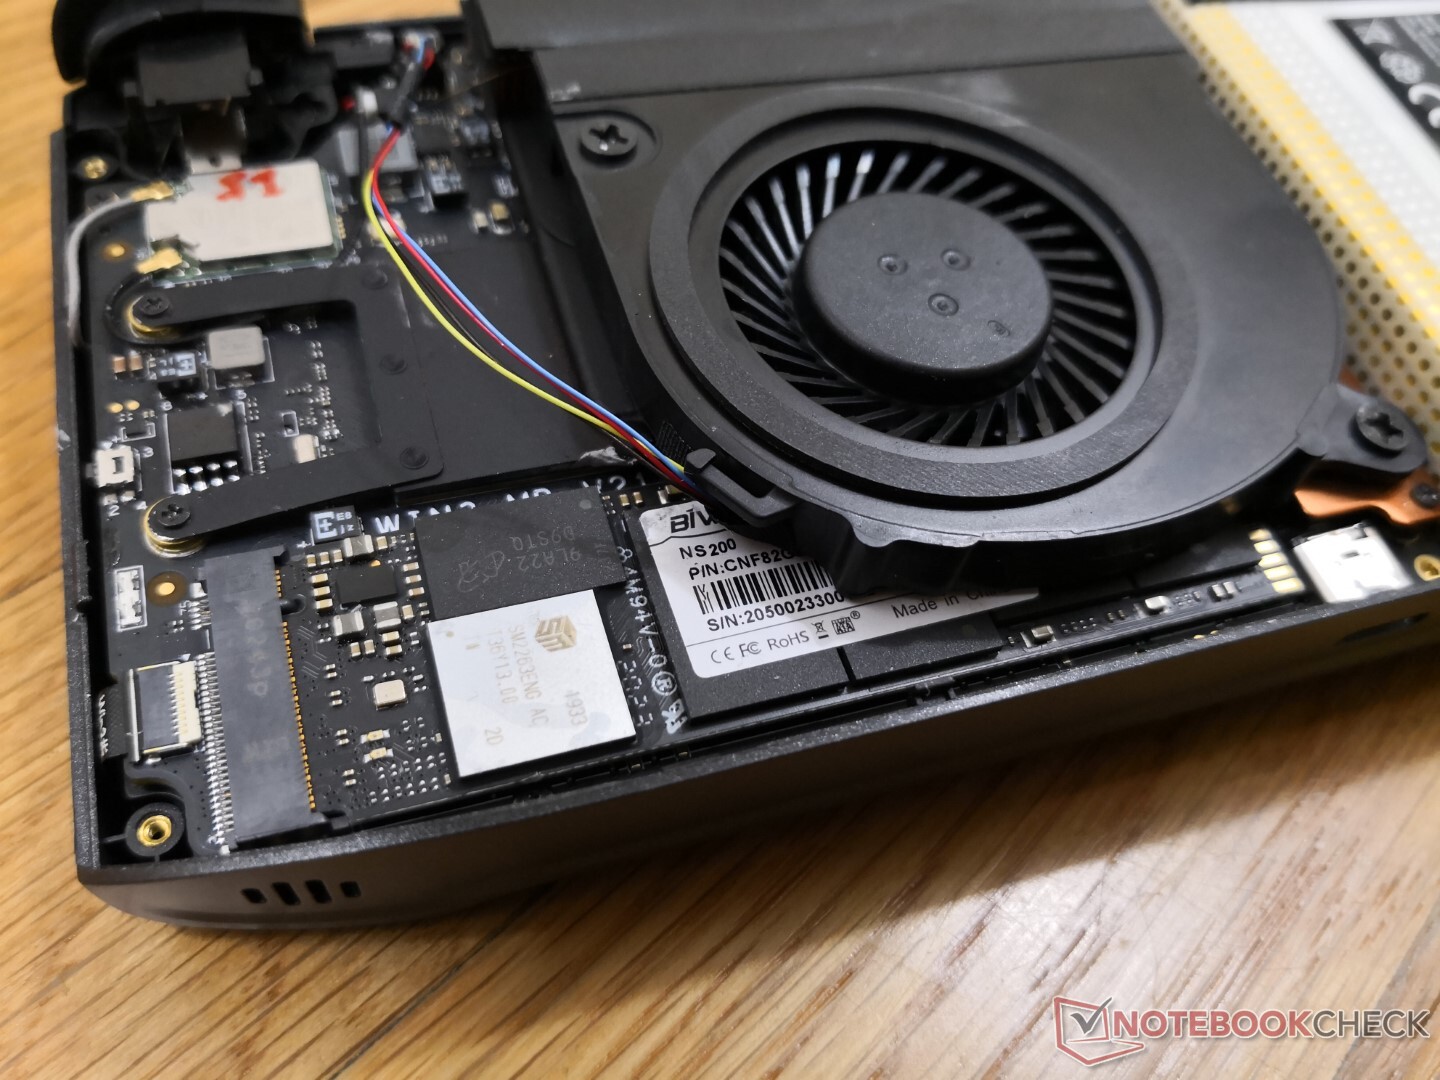
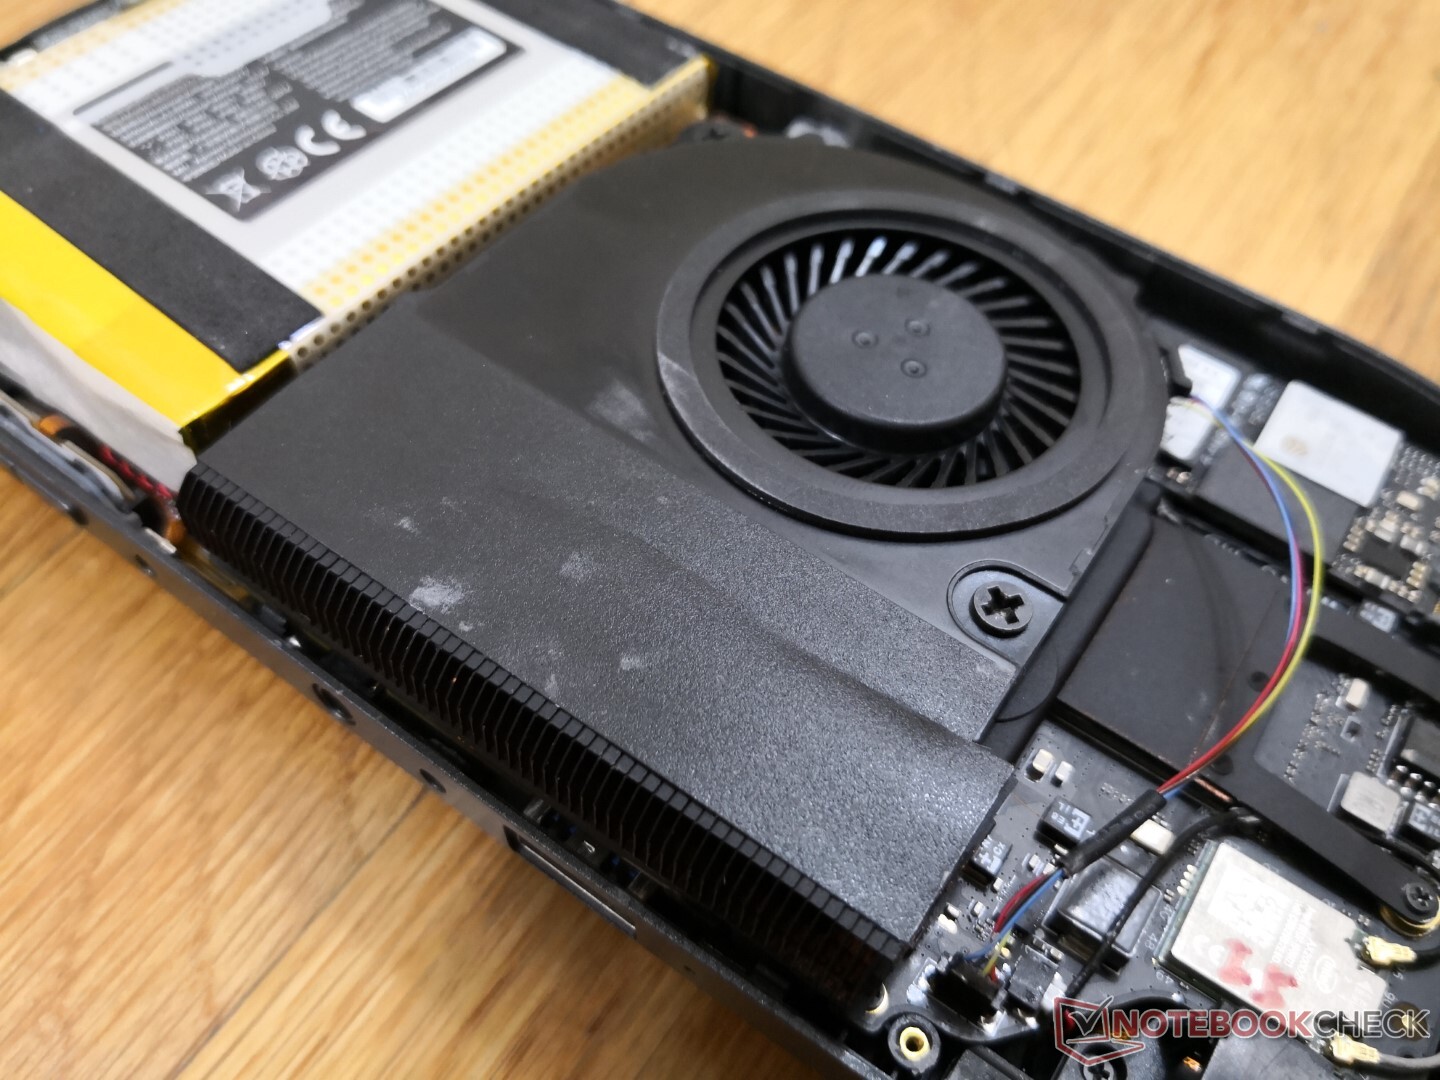
Alt panel, yedi Philips vida ile sabitlenmiştir. Fan temizliği veya SSD yükseltmeleri için çıkarma işlemi nispeten kolaydır. Hem WLAN hem de RAM lehimlenmiştir.
Aksesuarlar ve Garanti
Kağıt işlerinin ve AC adaptörünün dışında kutuda ekstra yok. GPD, aygıt için isteğe bağlı bir yerleştirme istasyonu satar, ancak sahipler neredeyse tüm USB veya Thunderbolt tabanlı yerleştirme istasyonlarını kullanabilir. Bir ekran koruyucu veya ekran silme işlemi güzel eklemeler olabilirdi. Standart bir yıllık sınırlı garanti geçerlidir. Garanti talebinde bulunmak, uluslararası nakliye nedeniyle çok zamanında olmayabilir.
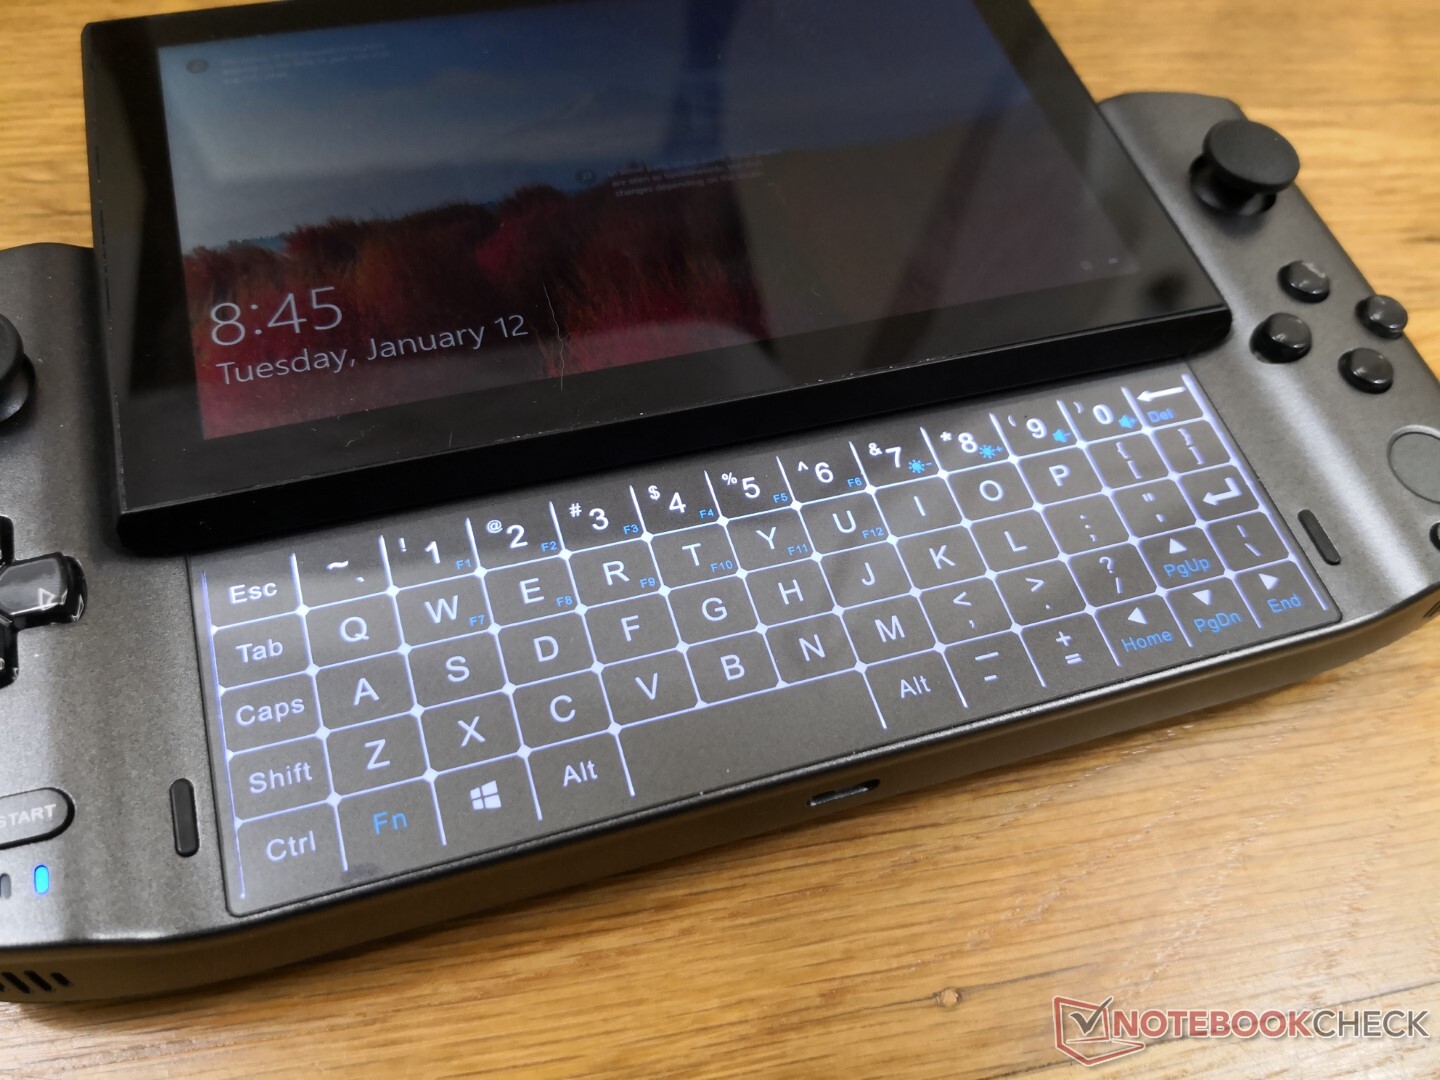
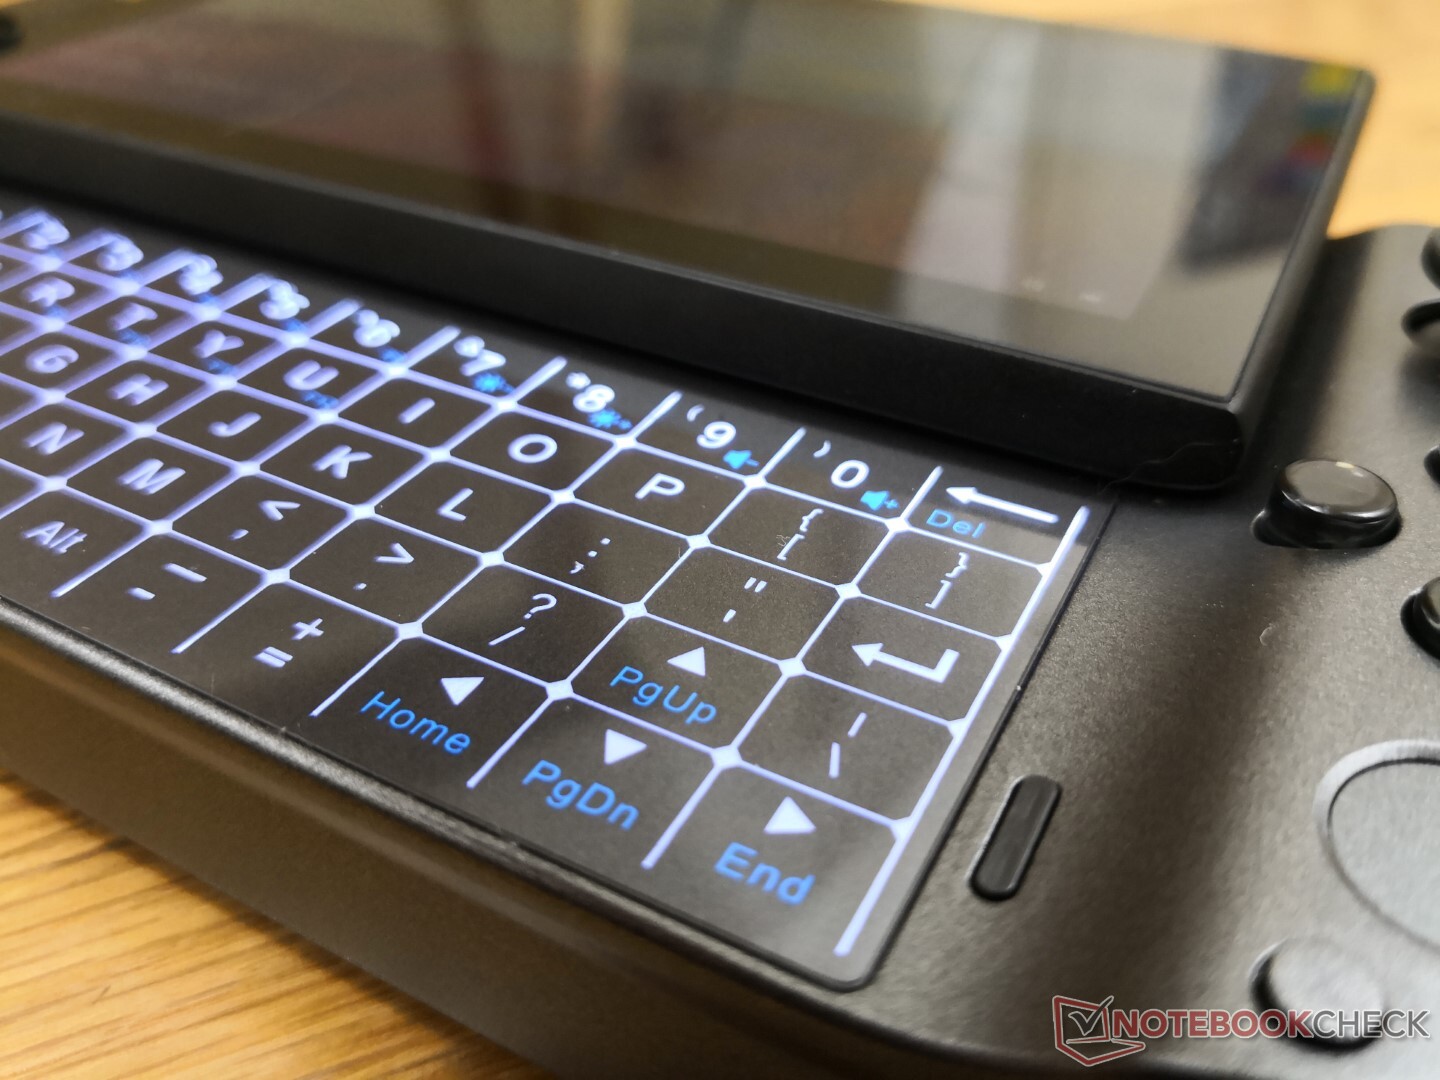
Giriş cihazları
KeyboardBlackBerry kullanıcıları, tüm kayar ekran konseptini ve klavye tasarımını çok tanıdık bulabilir. Bununla birlikte, Win 3'te, arkadan aydınlatmalı klavye esasen sanaldır ve dokunsal tuşlar içermez. Girişleri kaydederken bir miktar dokunsal geri bildirim gürültüsü var, ancak özellikle akıllı telefonlarda dokunarak yazmaya kıyasla çok zayıf. Mevcut sınırlı alan göz önünde bulundurulduğunda servis yapılabilir. Rahatsız edici bir şekilde, bir denetleyici düğmesine veya omuz düğmesine basmak ekranı uyku modundan çıkarır ve bunu devre dışı bırakmanın bir yolu yok gibi görünür. Bu nedenle, yanlışlıkla uyandırmadan Win 3'ü bir çantada veya sırt çantasında tutmak neredeyse imkansızdır.
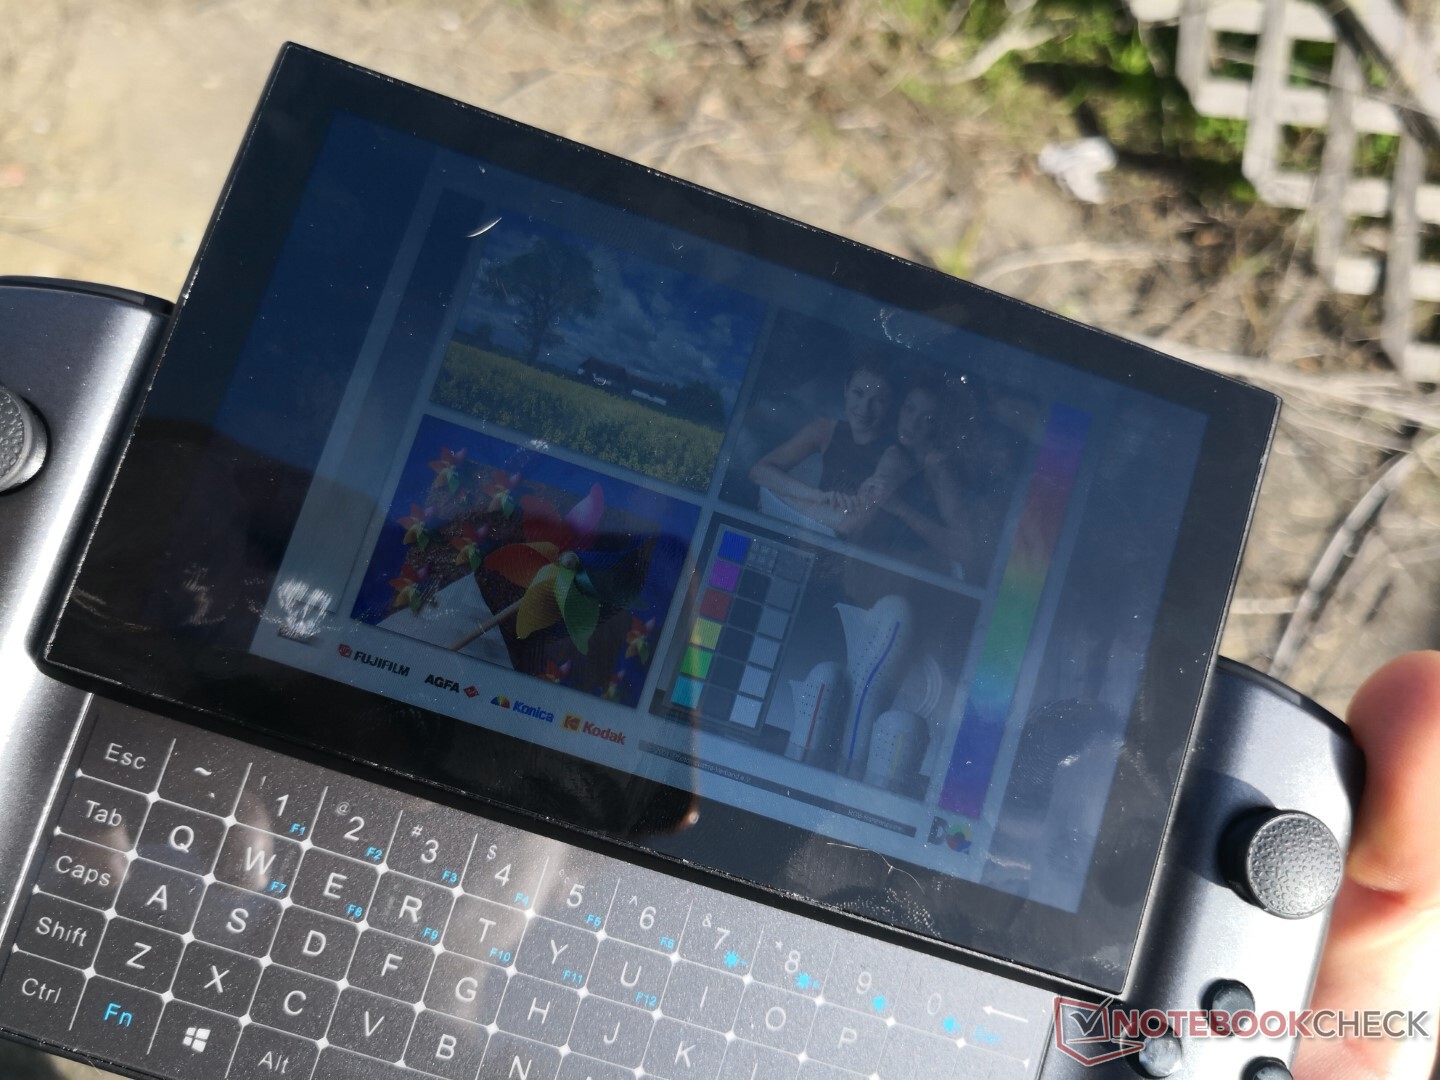
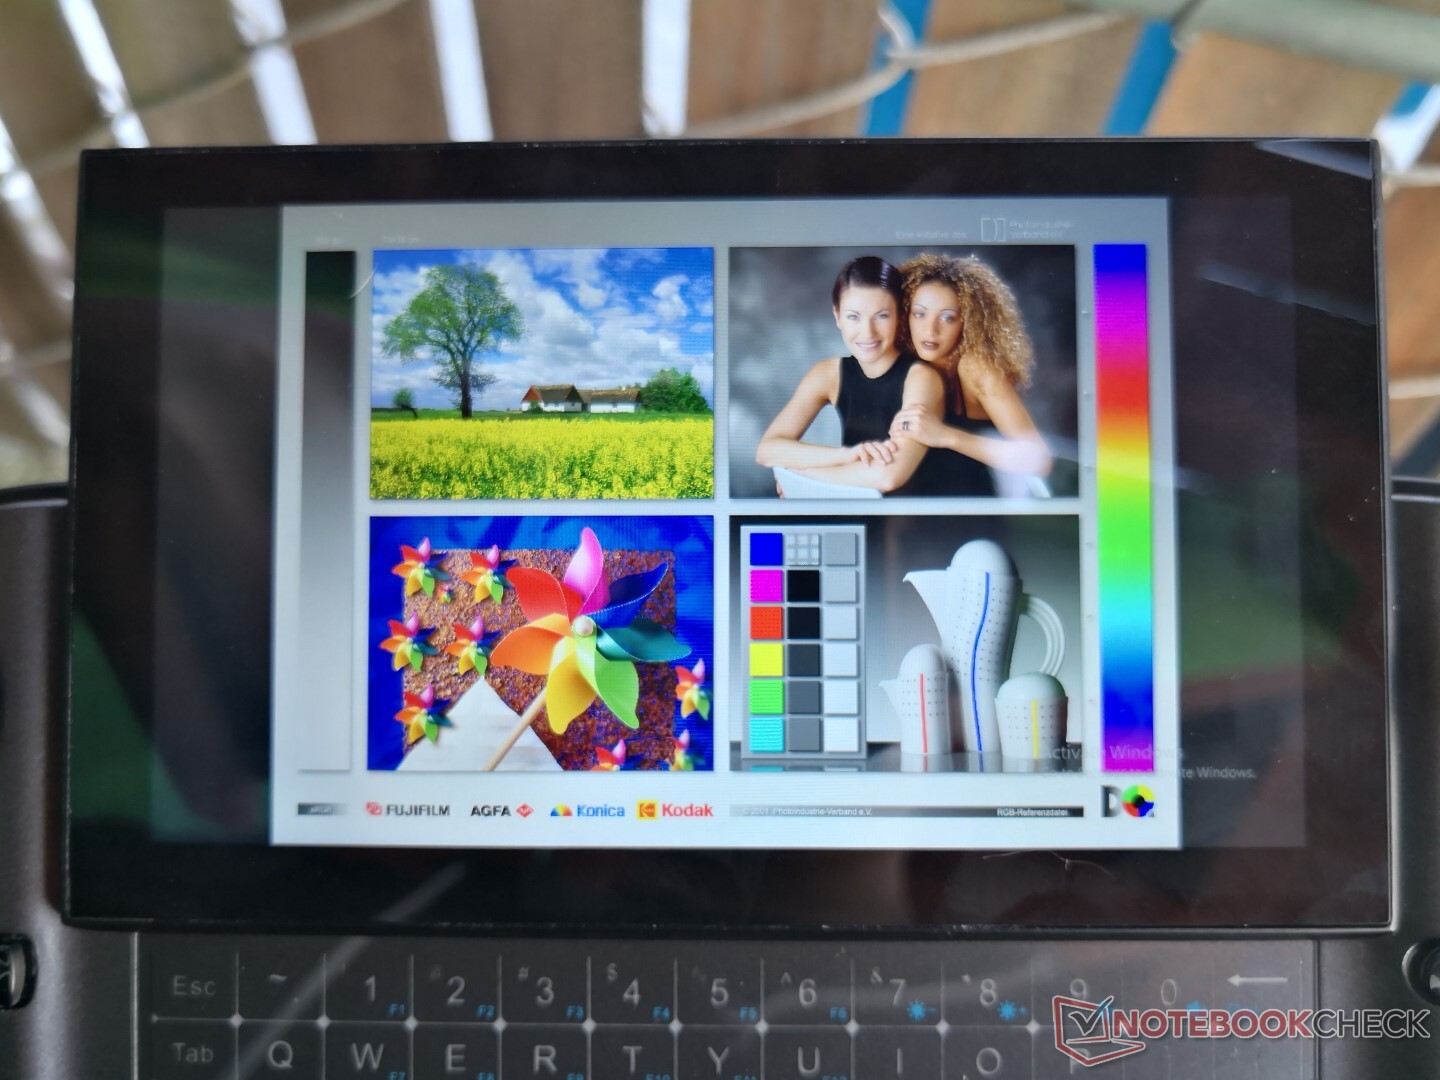
Display
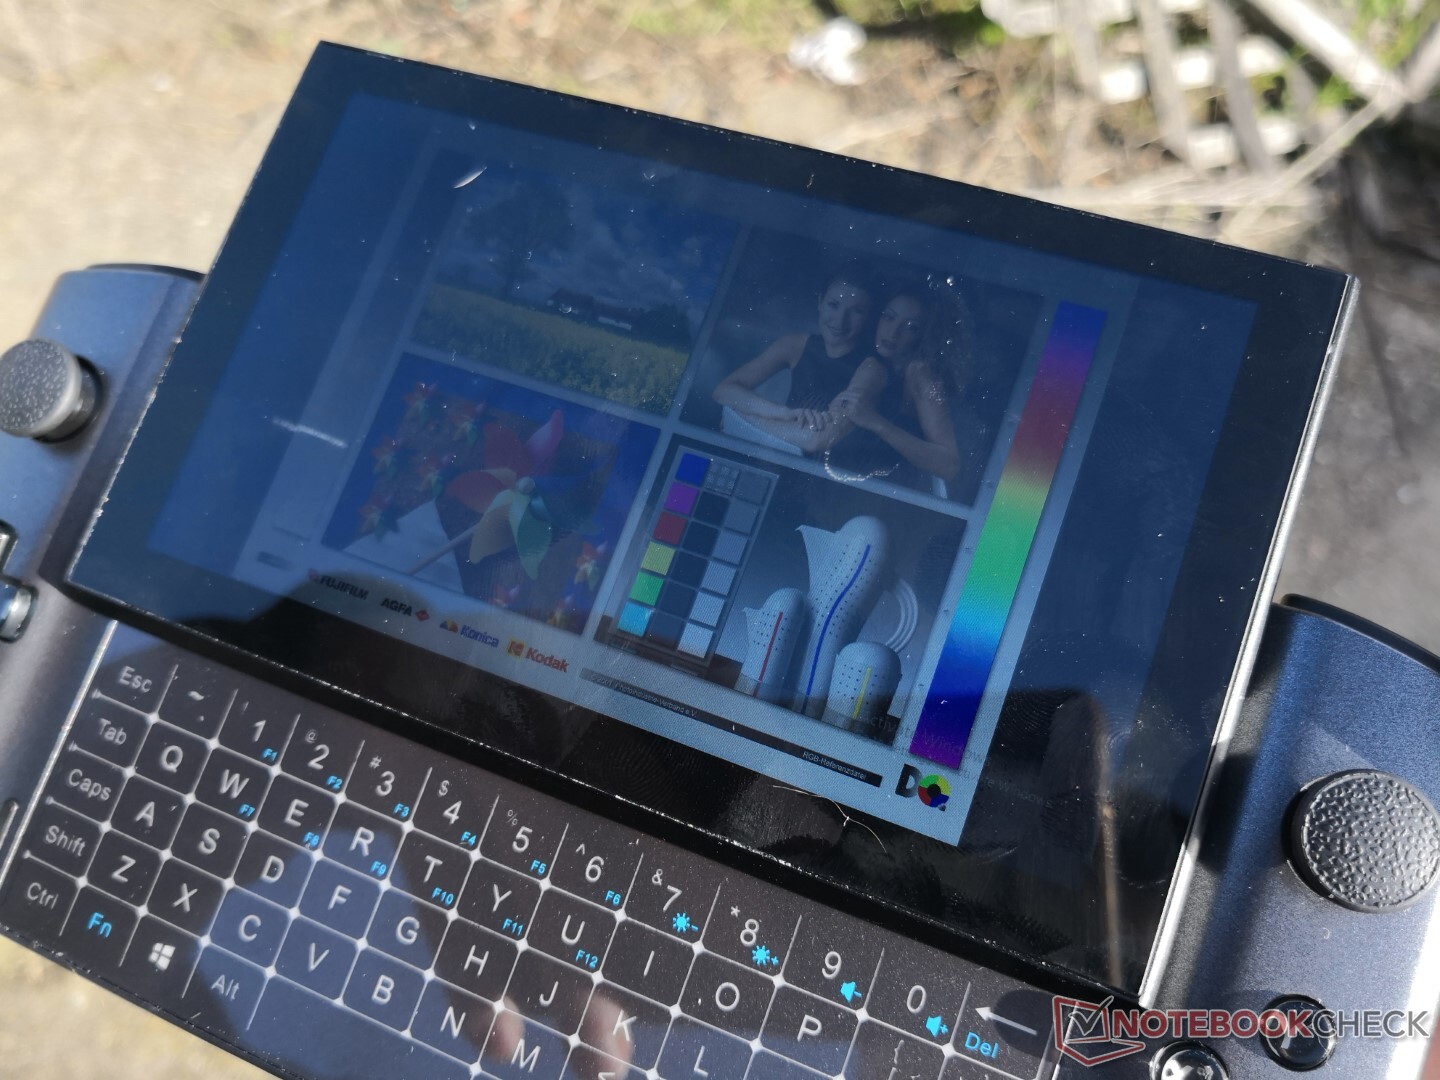
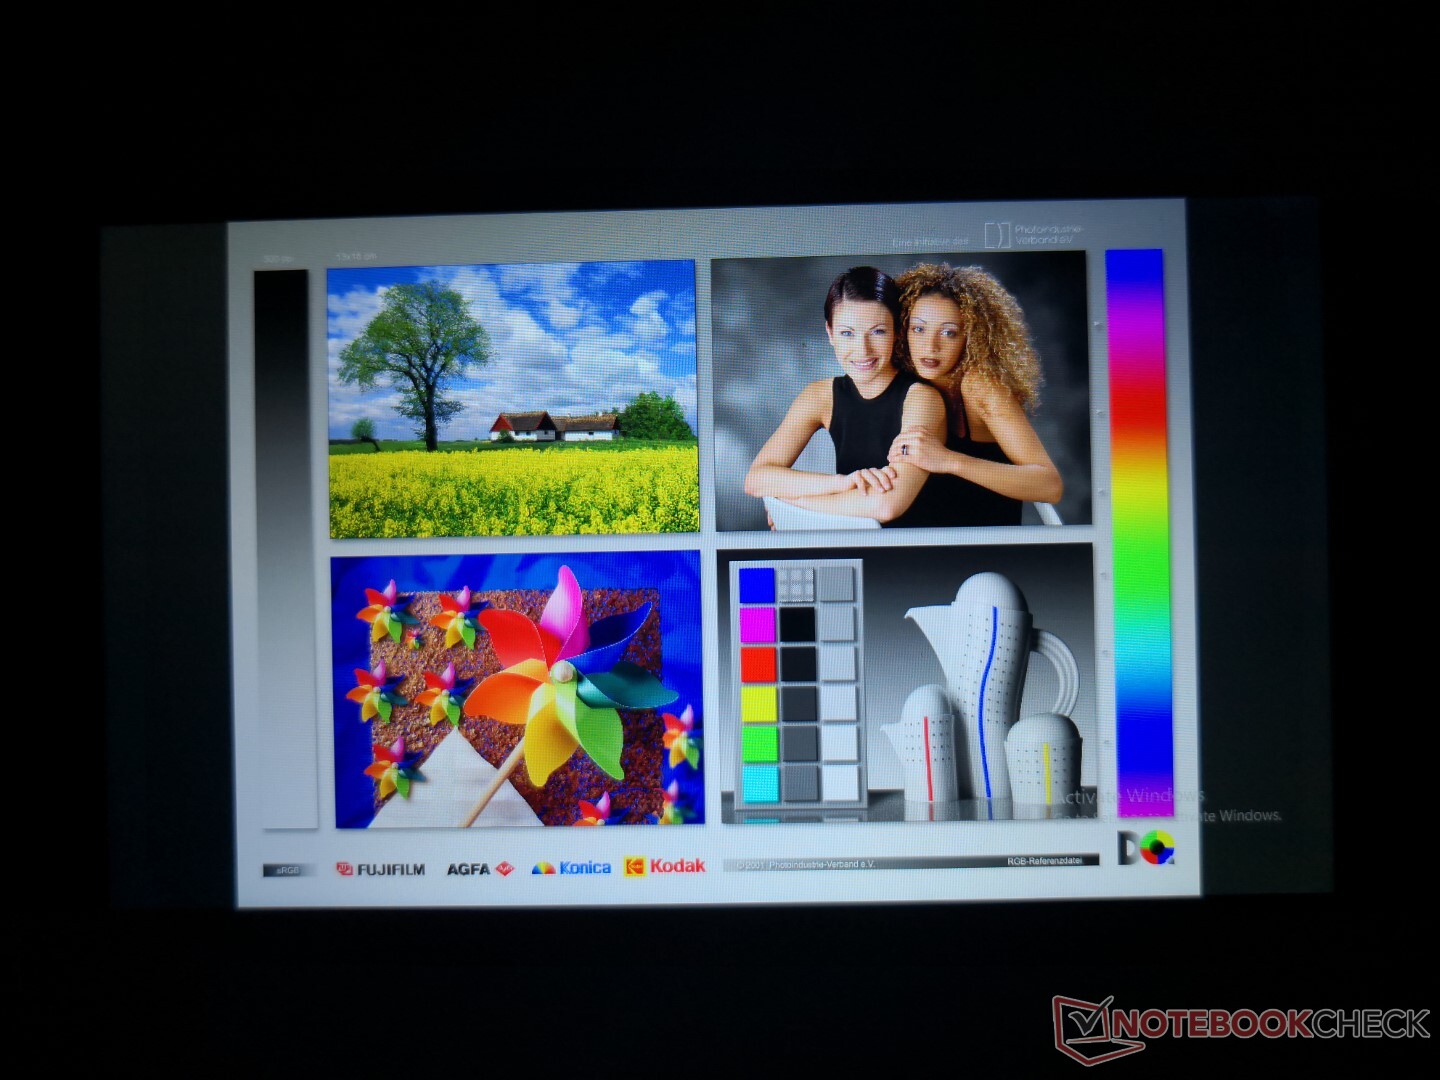
The touchscreen is bright and with excellent contrast. Black-white response times are only average, however, and there will be a bit of ghosting when gaming. We thankfully didn't find it to be much of an issue during our time with the unit.
Native resolution is identical to the Nintendo Switch at 720p which pairs perfectly with the Iris Xe GPU. In fact, games appear even crisper on the GPD than on the Switch because of the higher PPI here.
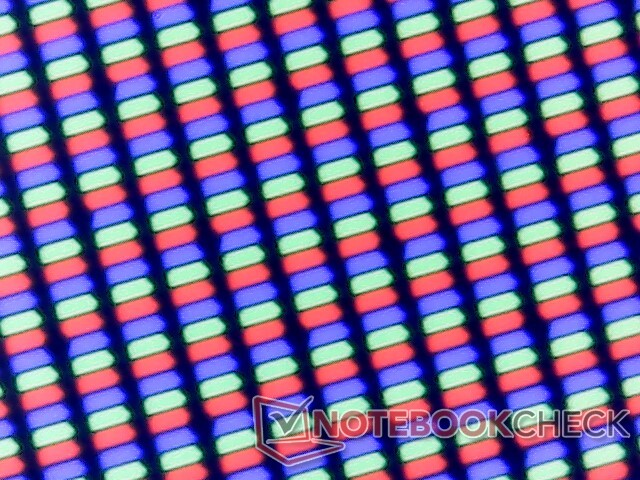
A notable drawback to the display is that the actual pixels are underneath a relatively thick layer of Gorilla Glass. Colors consequently don't "pop" or appear as colorful as they do as on a Galaxy Tab or iPad tablet where the overlying glass layer is thinner. It's not a deal breaker so long as users aren't expecting iPhone-level display quality.
The backlight does not utilize pulse-width modulation even if at the lowest brightness setting which should prove useful if gaming in dimly-lit environments.
| |||||||||||||||||||||||||
Aydınlatma: 93 %
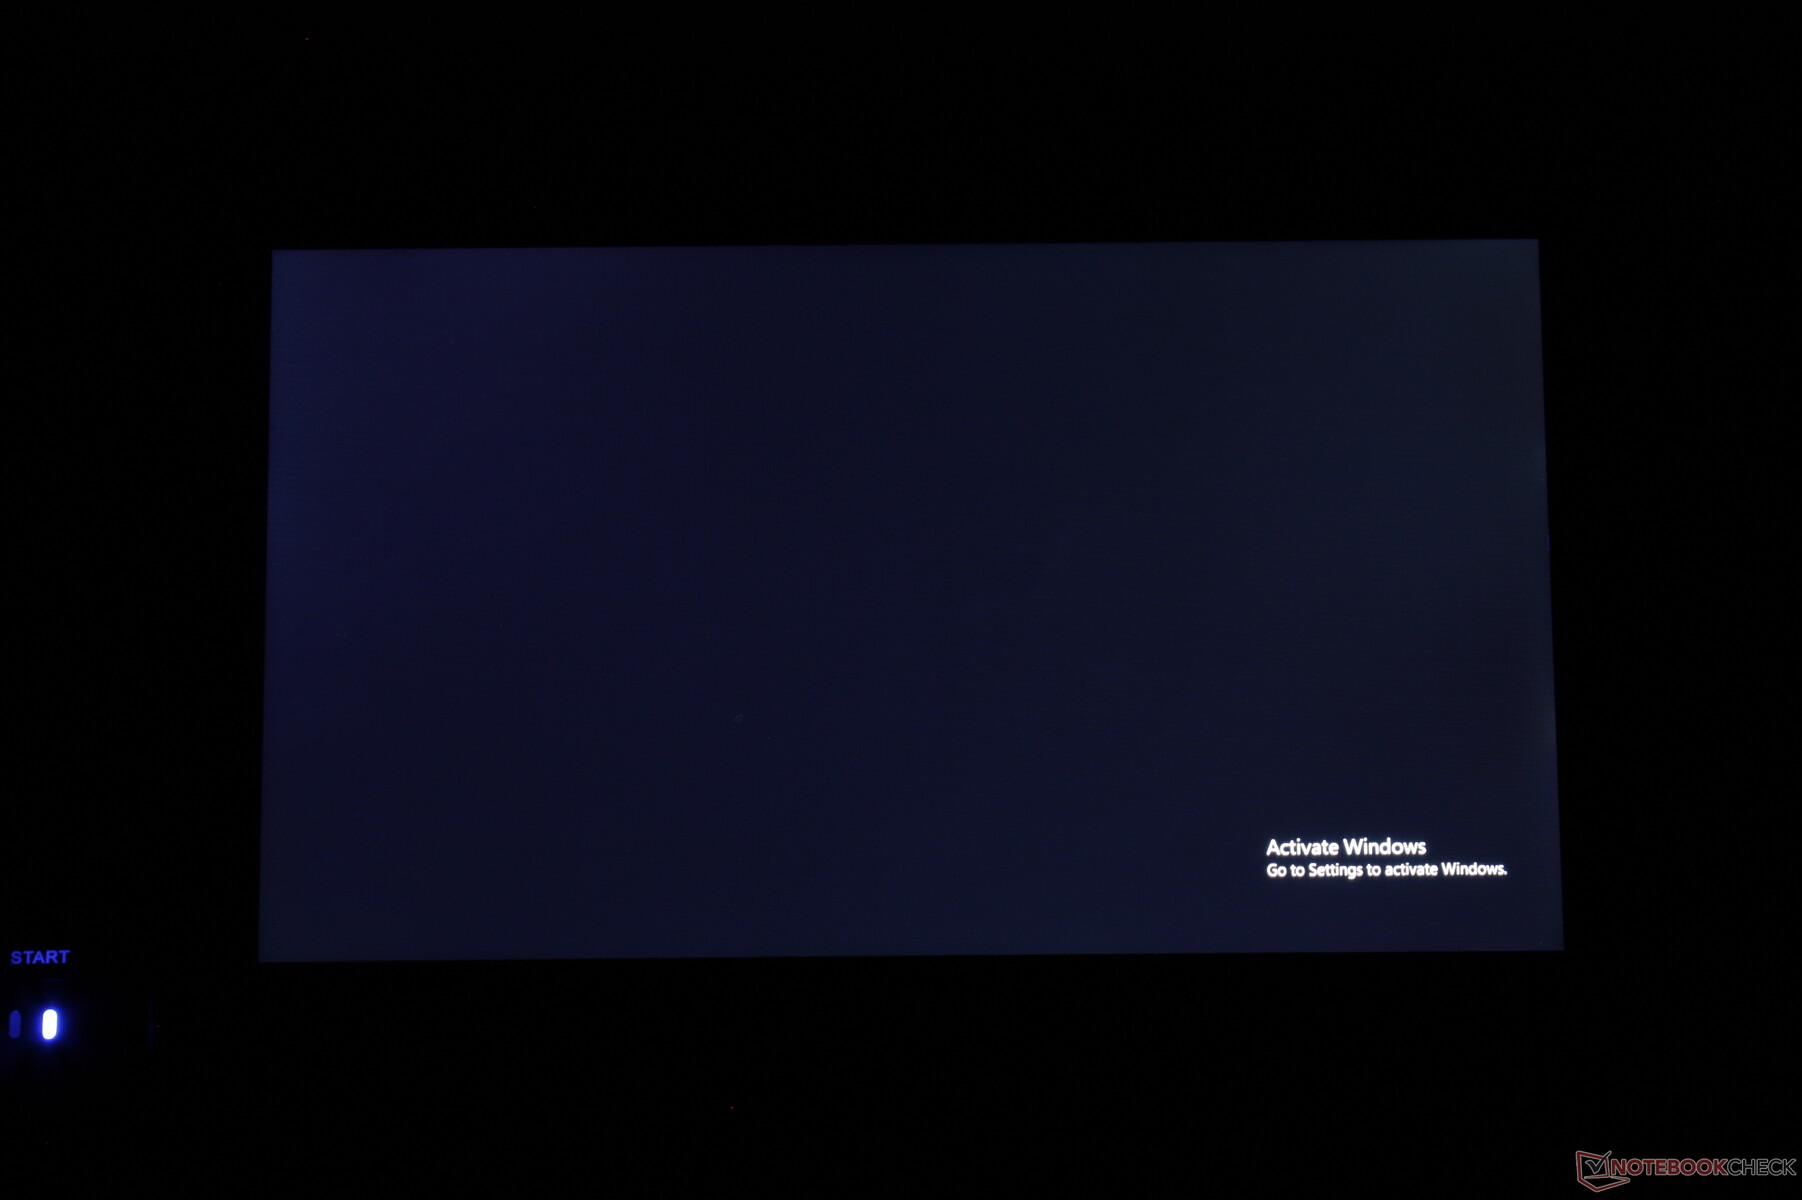
Batarya modunda parlaklık: 468.8 cd/m²
Kontrast: 1042:1 (Siyah: 0.45 cd/m²)
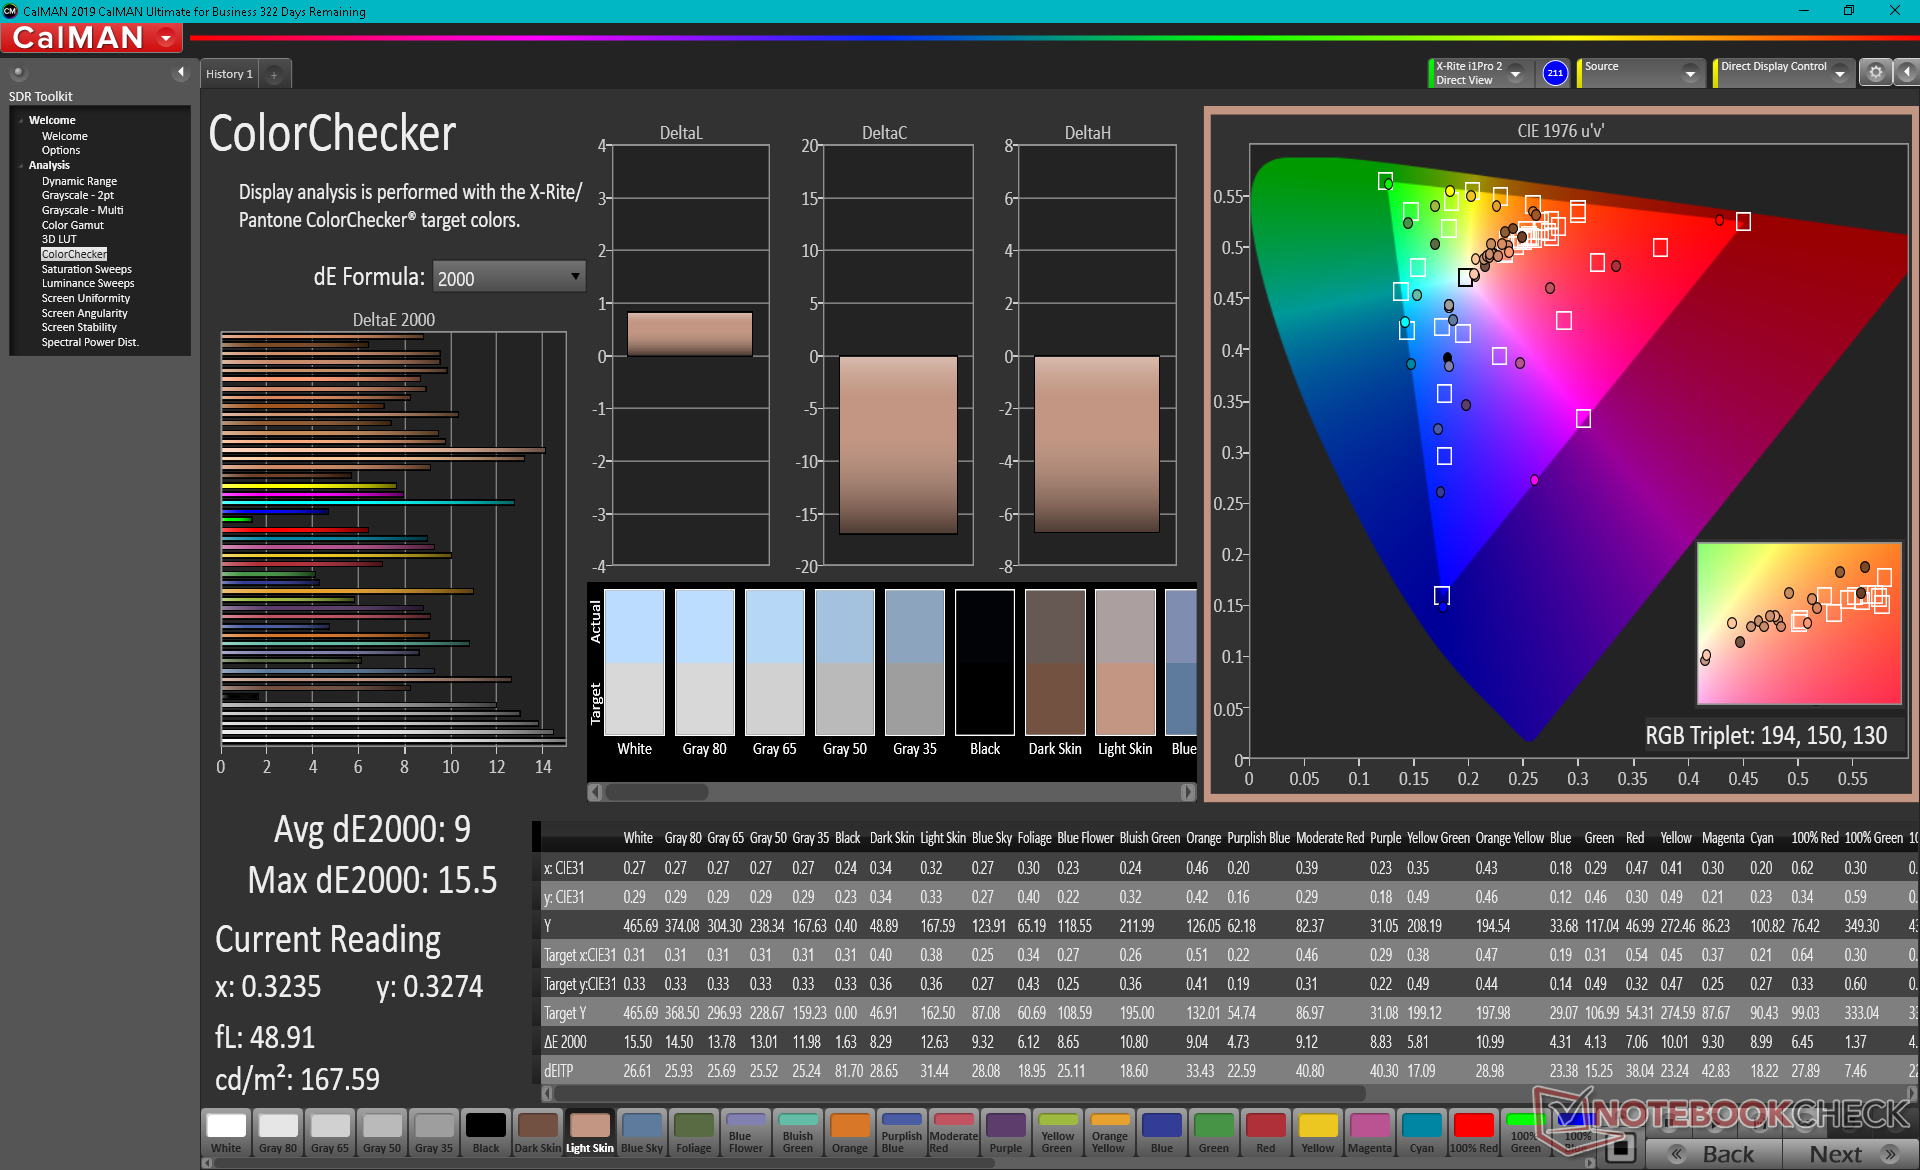
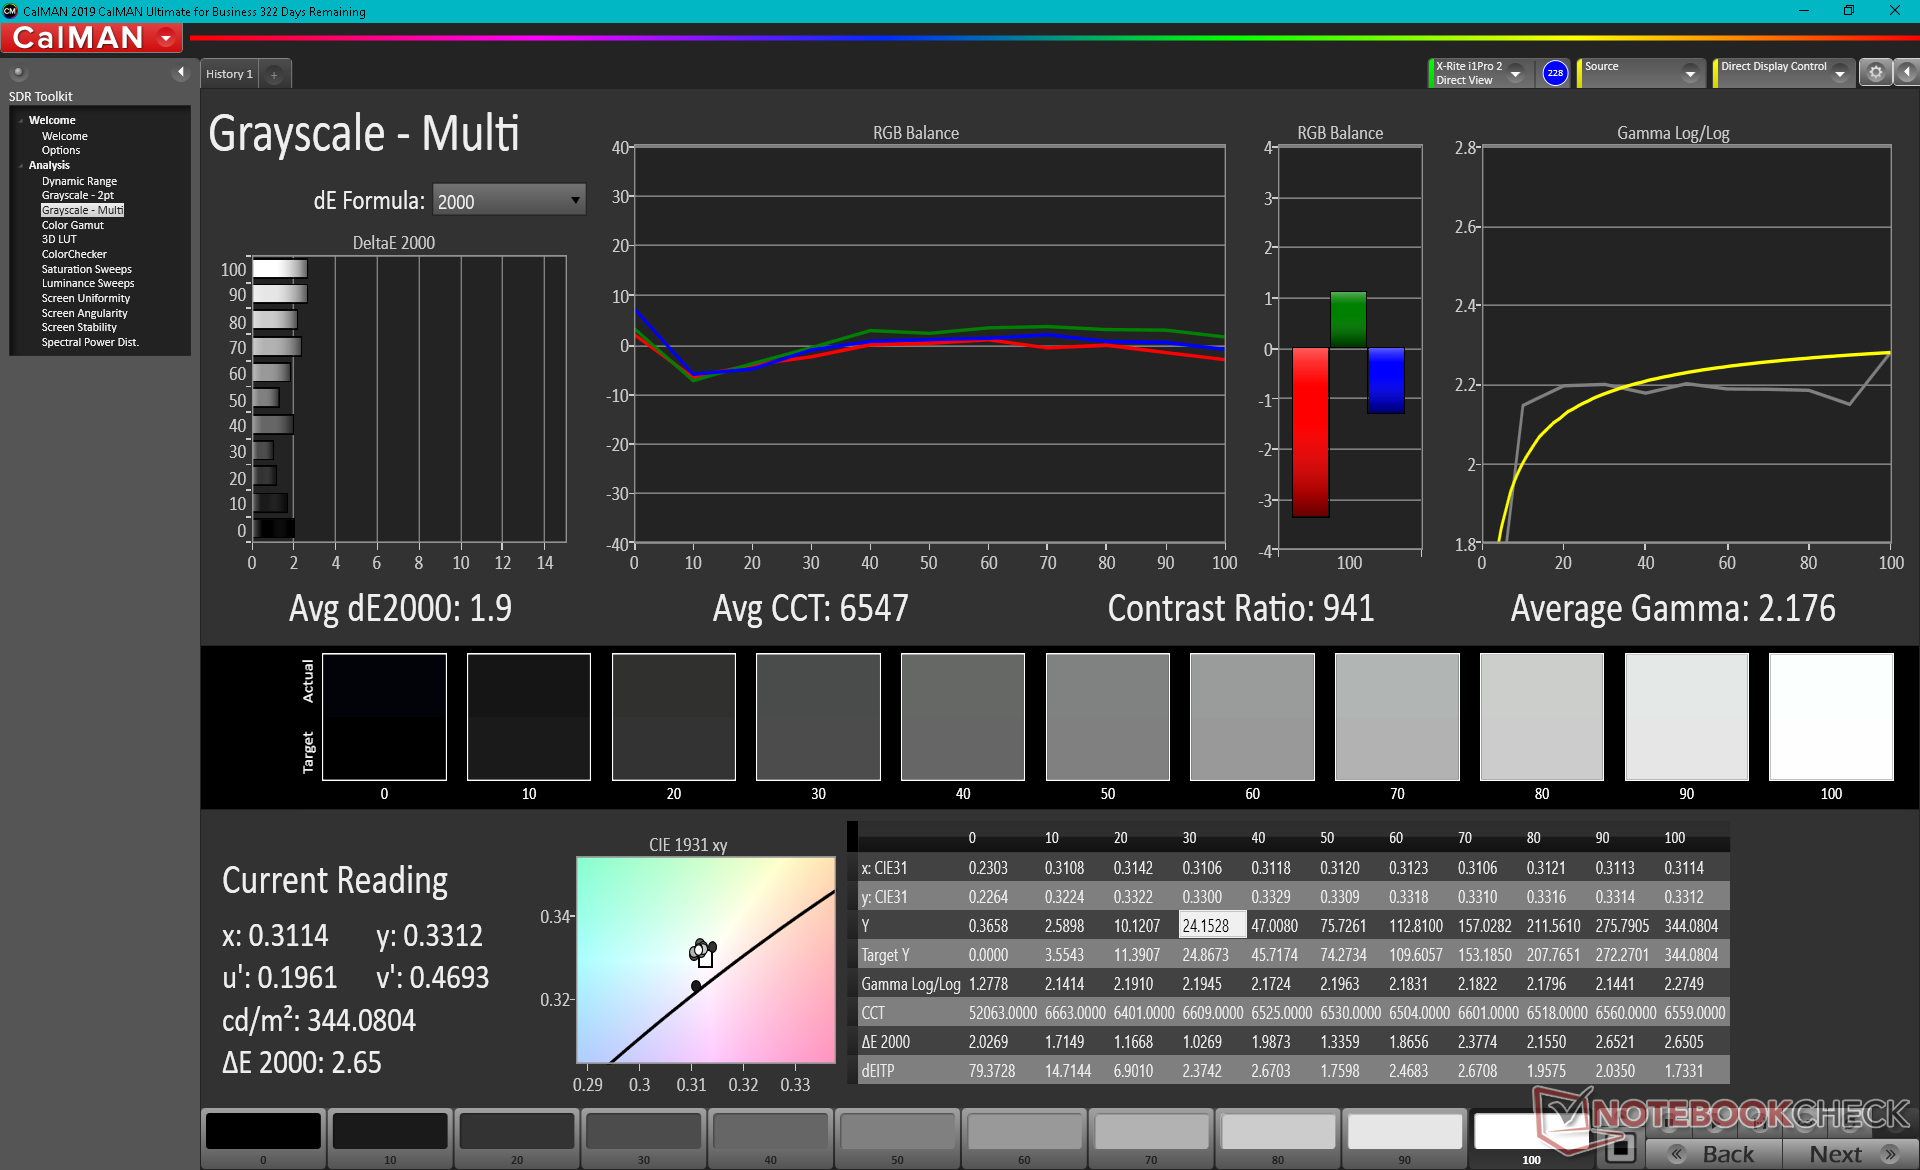
ΔE ColorChecker Calman: 9 | ∀{0.5-29.43 Ø4.71}
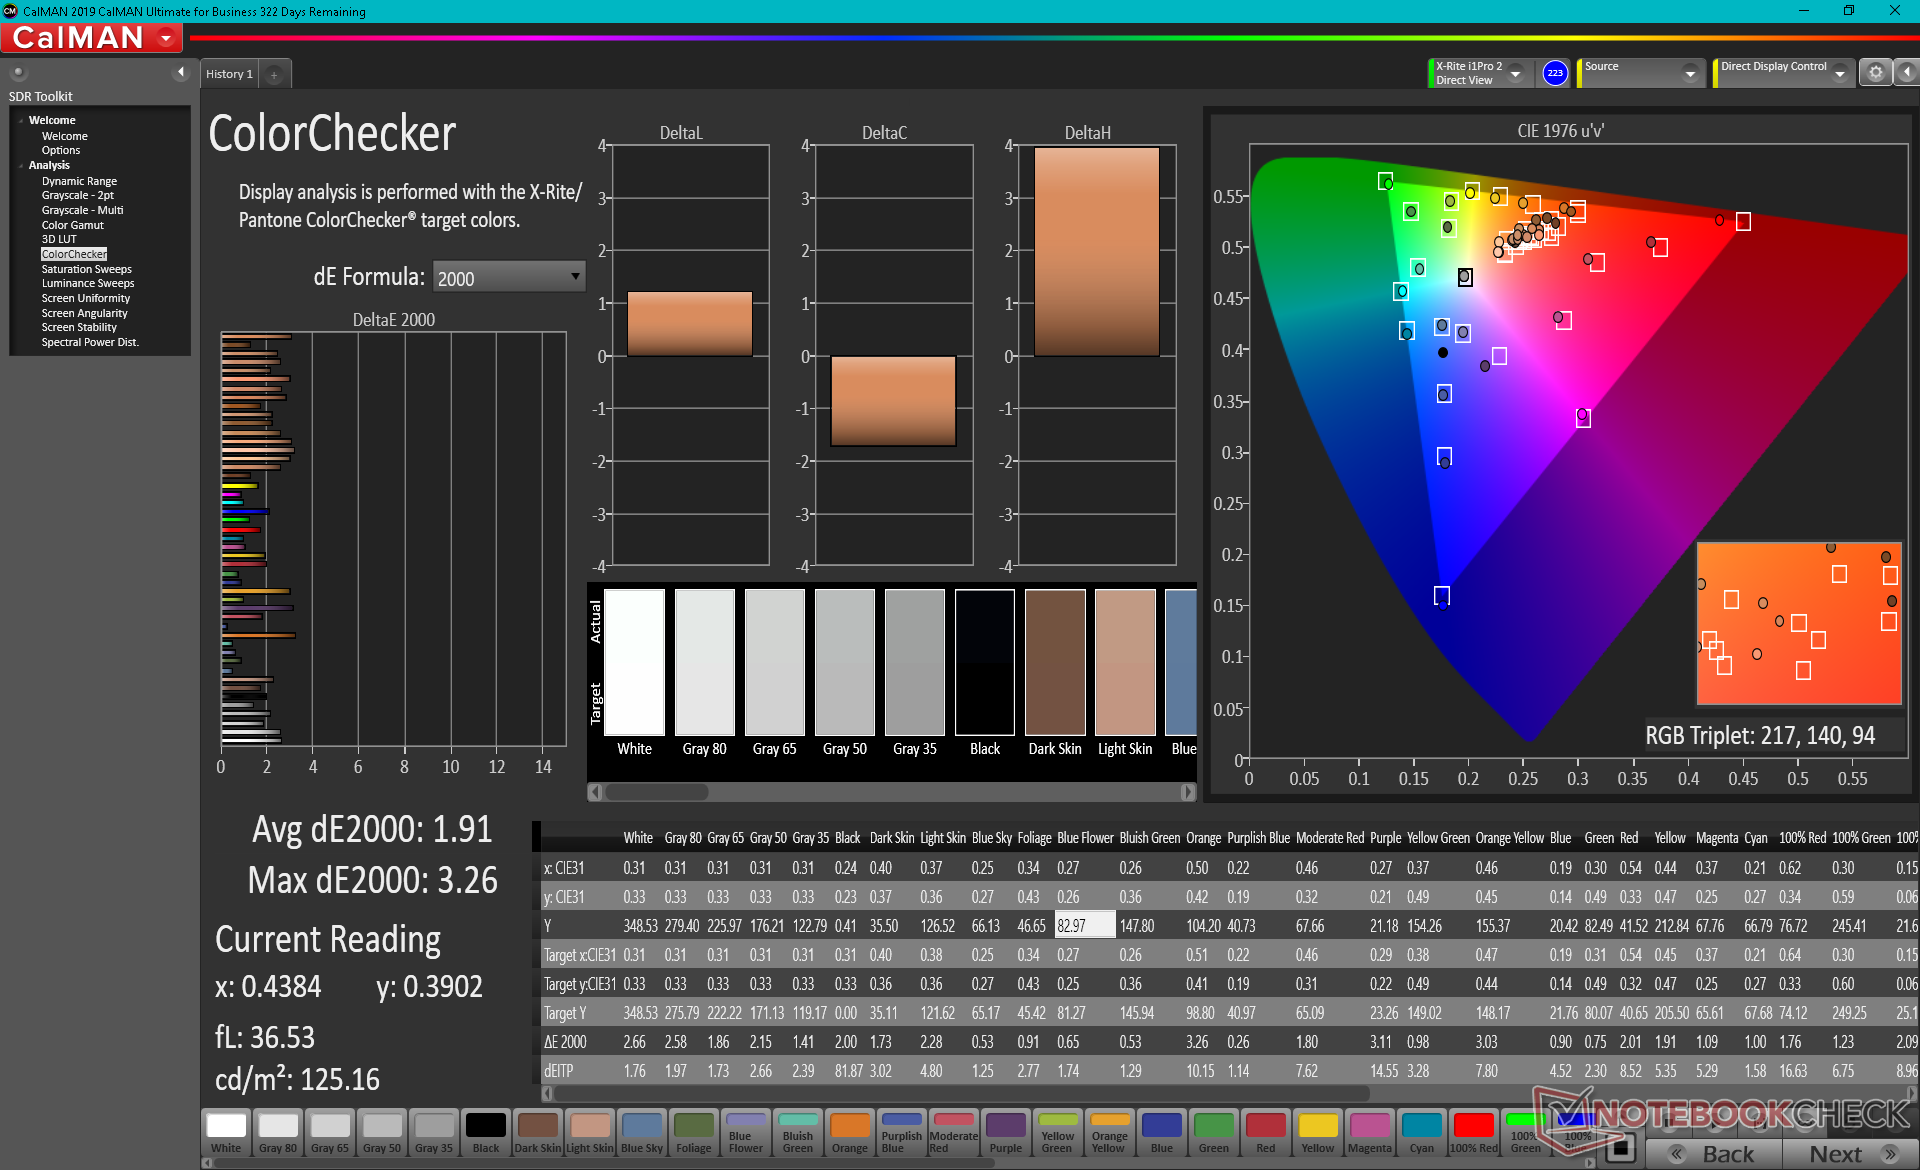
calibrated: 1.91
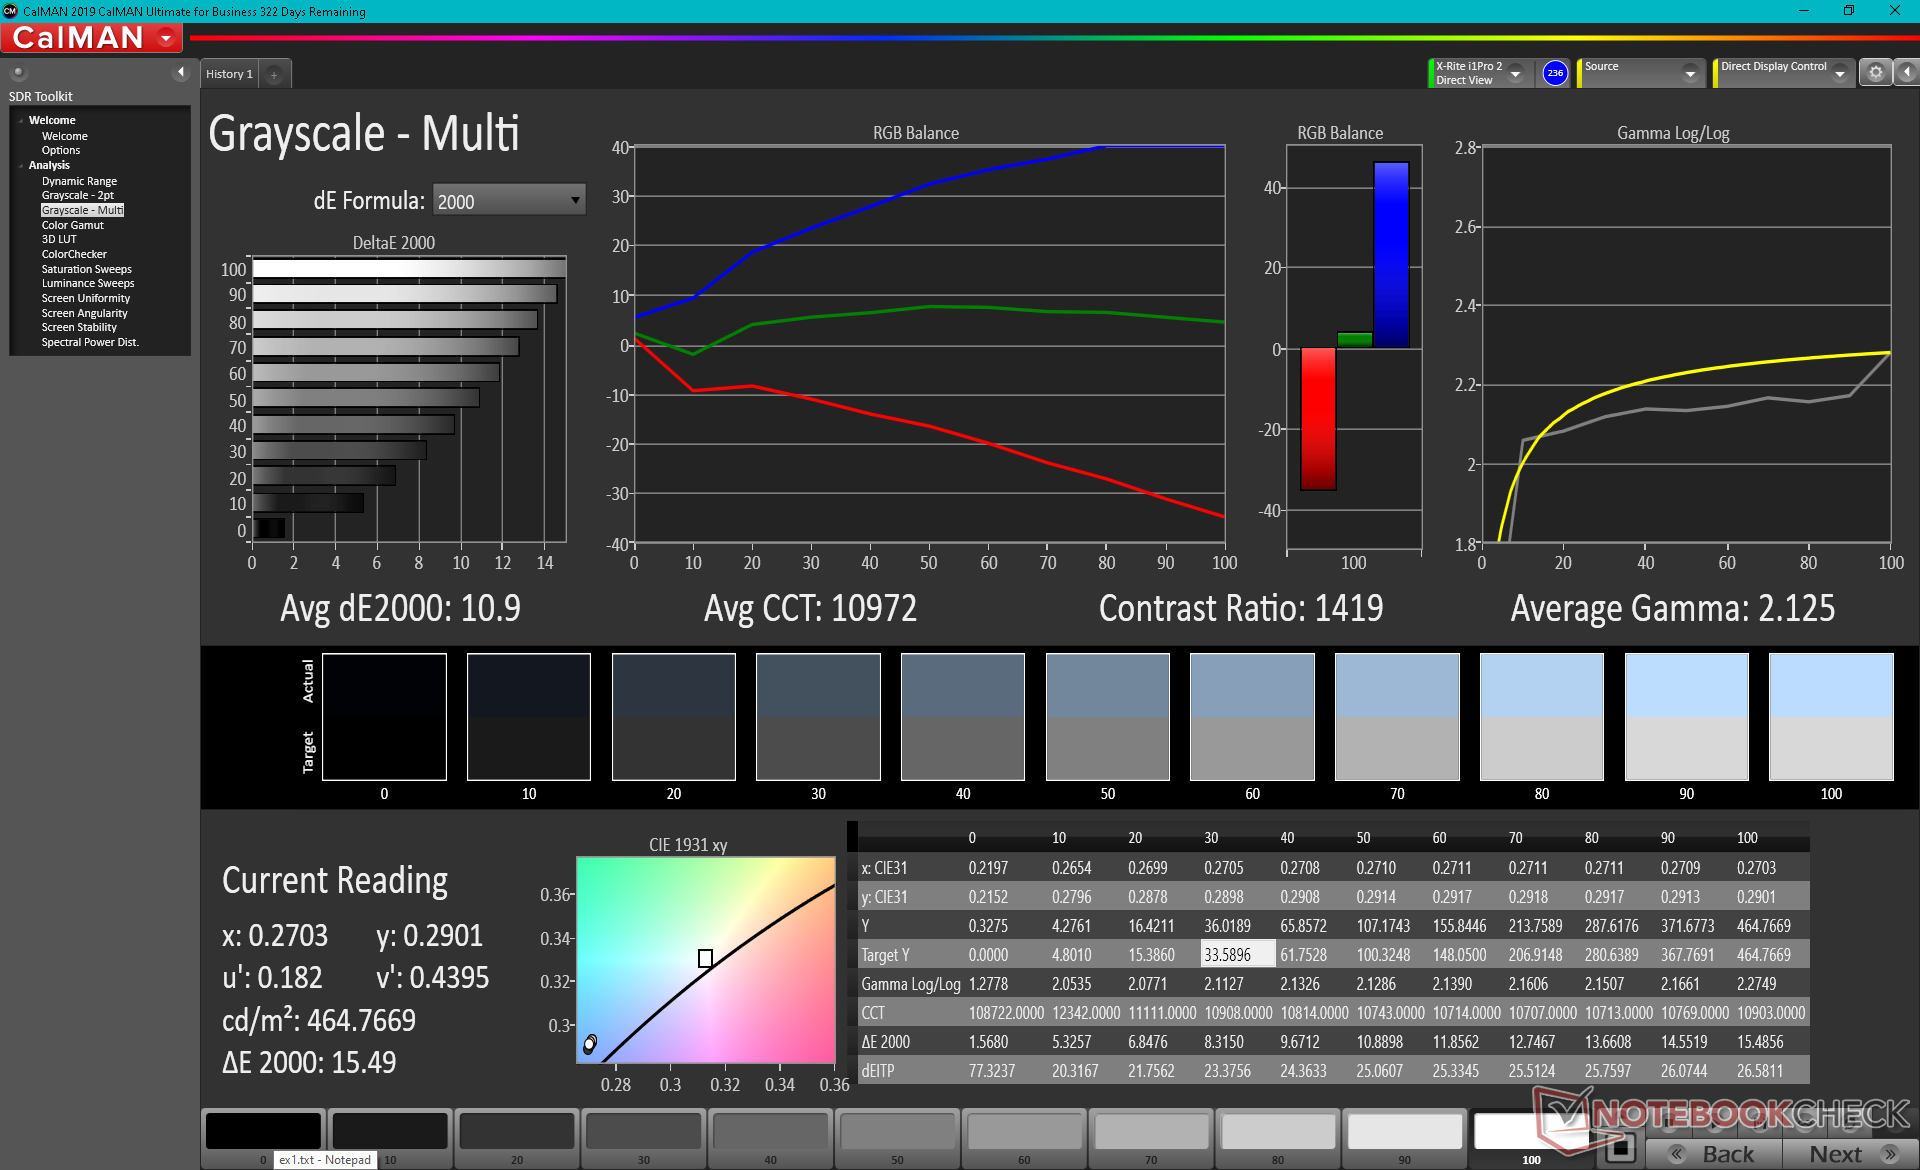
ΔE Greyscale Calman: 10.9 | ∀{0.09-98 Ø4.96}
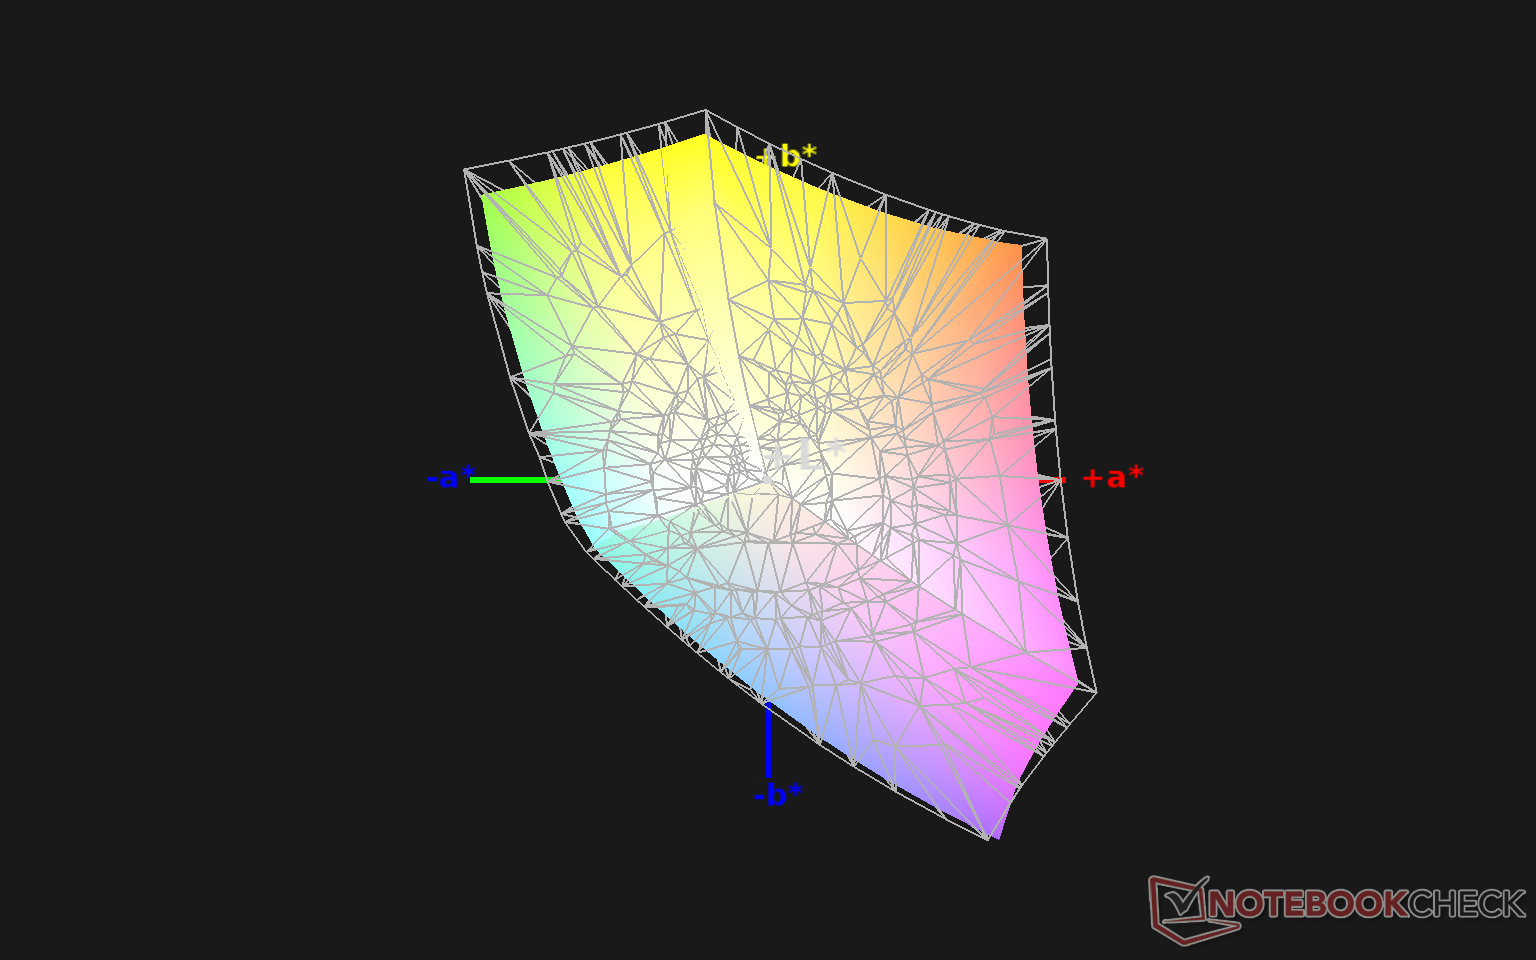
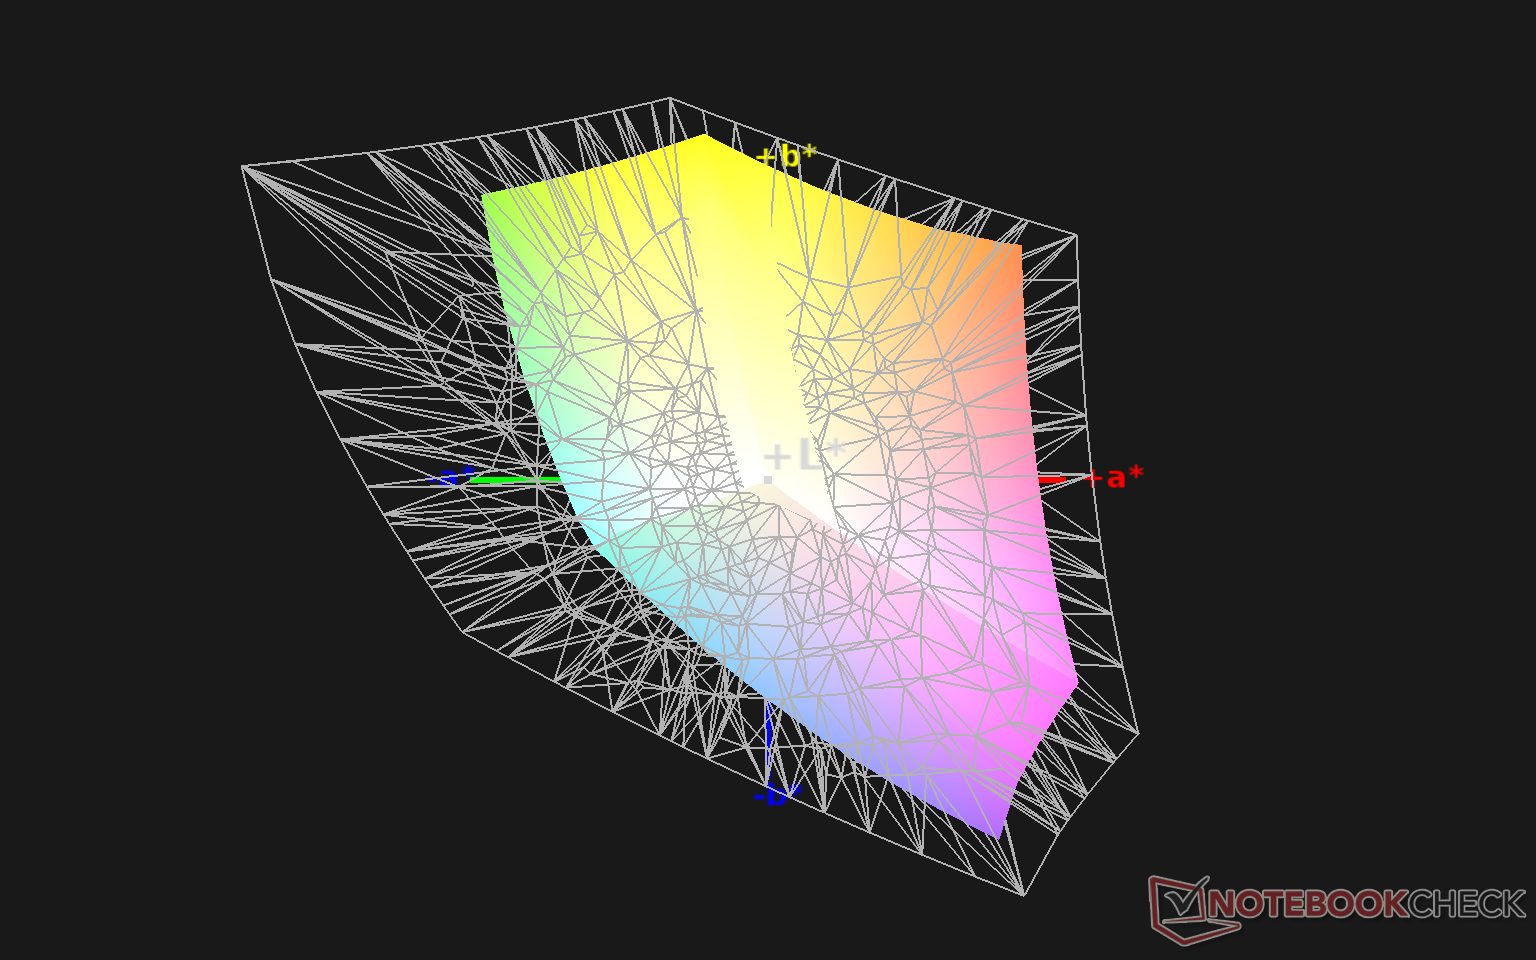
89.2% sRGB (Argyll 1.6.3 3D)
56.6% AdobeRGB 1998 (Argyll 1.6.3 3D)
61.4% AdobeRGB 1998 (Argyll 3D)
89.6% sRGB (Argyll 3D)
59.5% Display P3 (Argyll 3D)
Gamma: 2.13
CCT: 10972 K
| GPD Win 3 IPS, 5.5", 1280x720 | Dell XPS 13 9310 Core i7 FHD Sharp LQ134N1, IPS, 13.4", 1920x1200 | Apple MacBook Air 2020 M1 Entry IPS, 13.3", 2560x1600 | HP Spectre x360 13-aw0013dx AU Optronics AUO5E2D, IPS, 13.3", 1920x1080 | Asus ZenBook 13 UX325JA Sharp LQ133M1JW40, IPS, 13.3", 1920x1080 | Microsoft Surface Laptop 3 13 Core i5-1035G7 Sharp LQ135P1JX51, IPS, 13.5", 2256x1504 | |
|---|---|---|---|---|---|---|
| Display | 16% | 39% | 14% | 6% | 10% | |
| Display P3 Coverage (%) | 59.5 | 70.9 19% | 98.6 66% | 69.6 17% | 63.8 7% | 65.7 10% |
| sRGB Coverage (%) | 89.6 | 99.1 11% | 100 12% | 98.9 10% | 94.5 5% | 98.6 10% |
| AdobeRGB 1998 Coverage (%) | 61.4 | 72.9 19% | 85.9 40% | 71.5 16% | 64.9 6% | 67.8 10% |
| Response Times | -30% | 10% | -48% | 0% | -56% | |
| Response Time Grey 50% / Grey 80% * (ms) | 40 ? | 52 ? -30% | 31 ? 22% | 60.8 ? -52% | 47 ? -18% | 59.2 ? -48% |
| Response Time Black / White * (ms) | 25.6 ? | 33.2 ? -30% | 26.1 ? -2% | 36.8 ? -44% | 21 ? 18% | 41.6 ? -63% |
| PWM Frequency (Hz) | 2475 ? | 118000 ? | 250 ? | 21740 ? | ||
| Screen | 29% | 34% | 22% | 16% | 31% | |
| Brightness middle (cd/m²) | 468.8 | 543.3 16% | 417 -11% | 447.4 -5% | 435 -7% | 403.4 -14% |
| Brightness (cd/m²) | 460 | 524 14% | 395 -14% | 420 -9% | 404 -12% | 397 -14% |
| Brightness Distribution (%) | 93 | 92 -1% | 91 -2% | 85 -9% | 83 -11% | 89 -4% |
| Black Level * (cd/m²) | 0.45 | 0.38 16% | 0.39 13% | 0.31 31% | 0.565 -26% | 0.34 24% |
| Contrast (:1) | 1042 | 1430 37% | 1069 3% | 1443 38% | 770 -26% | 1186 14% |
| Colorchecker dE 2000 * | 9 | 3.02 66% | 1.12 88% | 4.23 53% | 2.66 70% | 0.94 90% |
| Colorchecker dE 2000 max. * | 15.5 | 7.61 51% | 2.71 83% | 9.34 40% | 4.73 69% | 2.92 81% |
| Colorchecker dE 2000 calibrated * | 1.91 | 1.23 36% | 0.77 60% | 1.32 31% | 1.19 38% | 0.99 48% |
| Greyscale dE 2000 * | 10.9 | 5 54% | 1.7 84% | 6.1 44% | 3.65 67% | 0.9 92% |
| Gamma | 2.13 103% | 2.02 109% | 2207 0% | 2.11 104% | 2.34 94% | 2.13 103% |
| CCT | 10972 59% | 6550 99% | 6870 95% | 6136 106% | 7109 91% | 6620 98% |
| Color Space (Percent of AdobeRGB 1998) (%) | 56.6 | 66.8 18% | 64.8 14% | 60 6% | 62.3 10% | |
| Color Space (Percent of sRGB) (%) | 89.2 | 99.6 12% | 98.9 11% | 95 7% | 98.7 11% | |
| Toplam Ortalama (Program / Ayarlar) | 5% /
19% | 28% /
32% | -4% /
12% | 7% /
12% | -5% /
16% |
* ... daha küçük daha iyidir
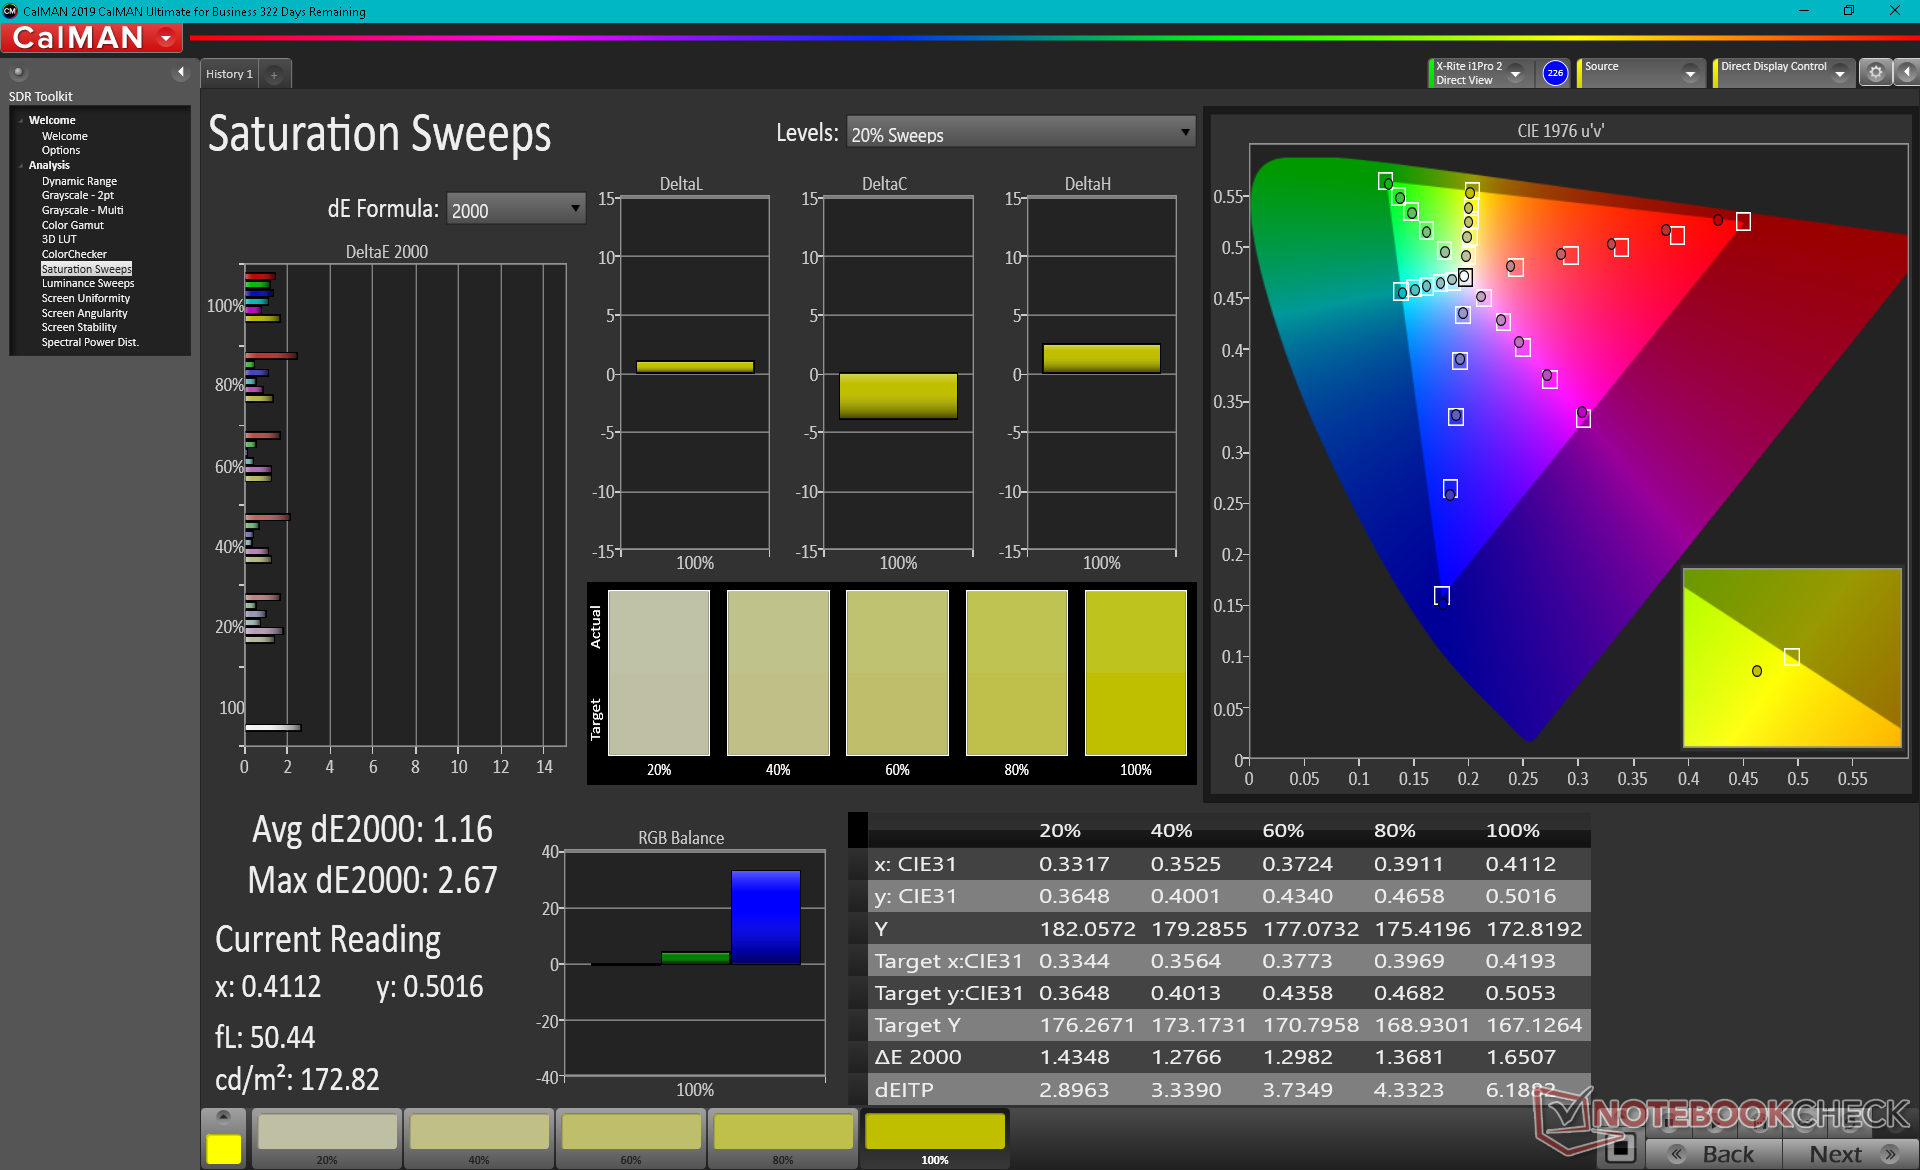
Color space covers approximately 89 percent of sRGB and 57 percent of AdobeRGB to be a bit narrower than the displays of most mid-range Ultrabooks but still much greater than low-end laptops that typically cover 60 percent of sRGB only. The deeper colors are welcomed even though the GPD isn't designed for any sort of professional editing.
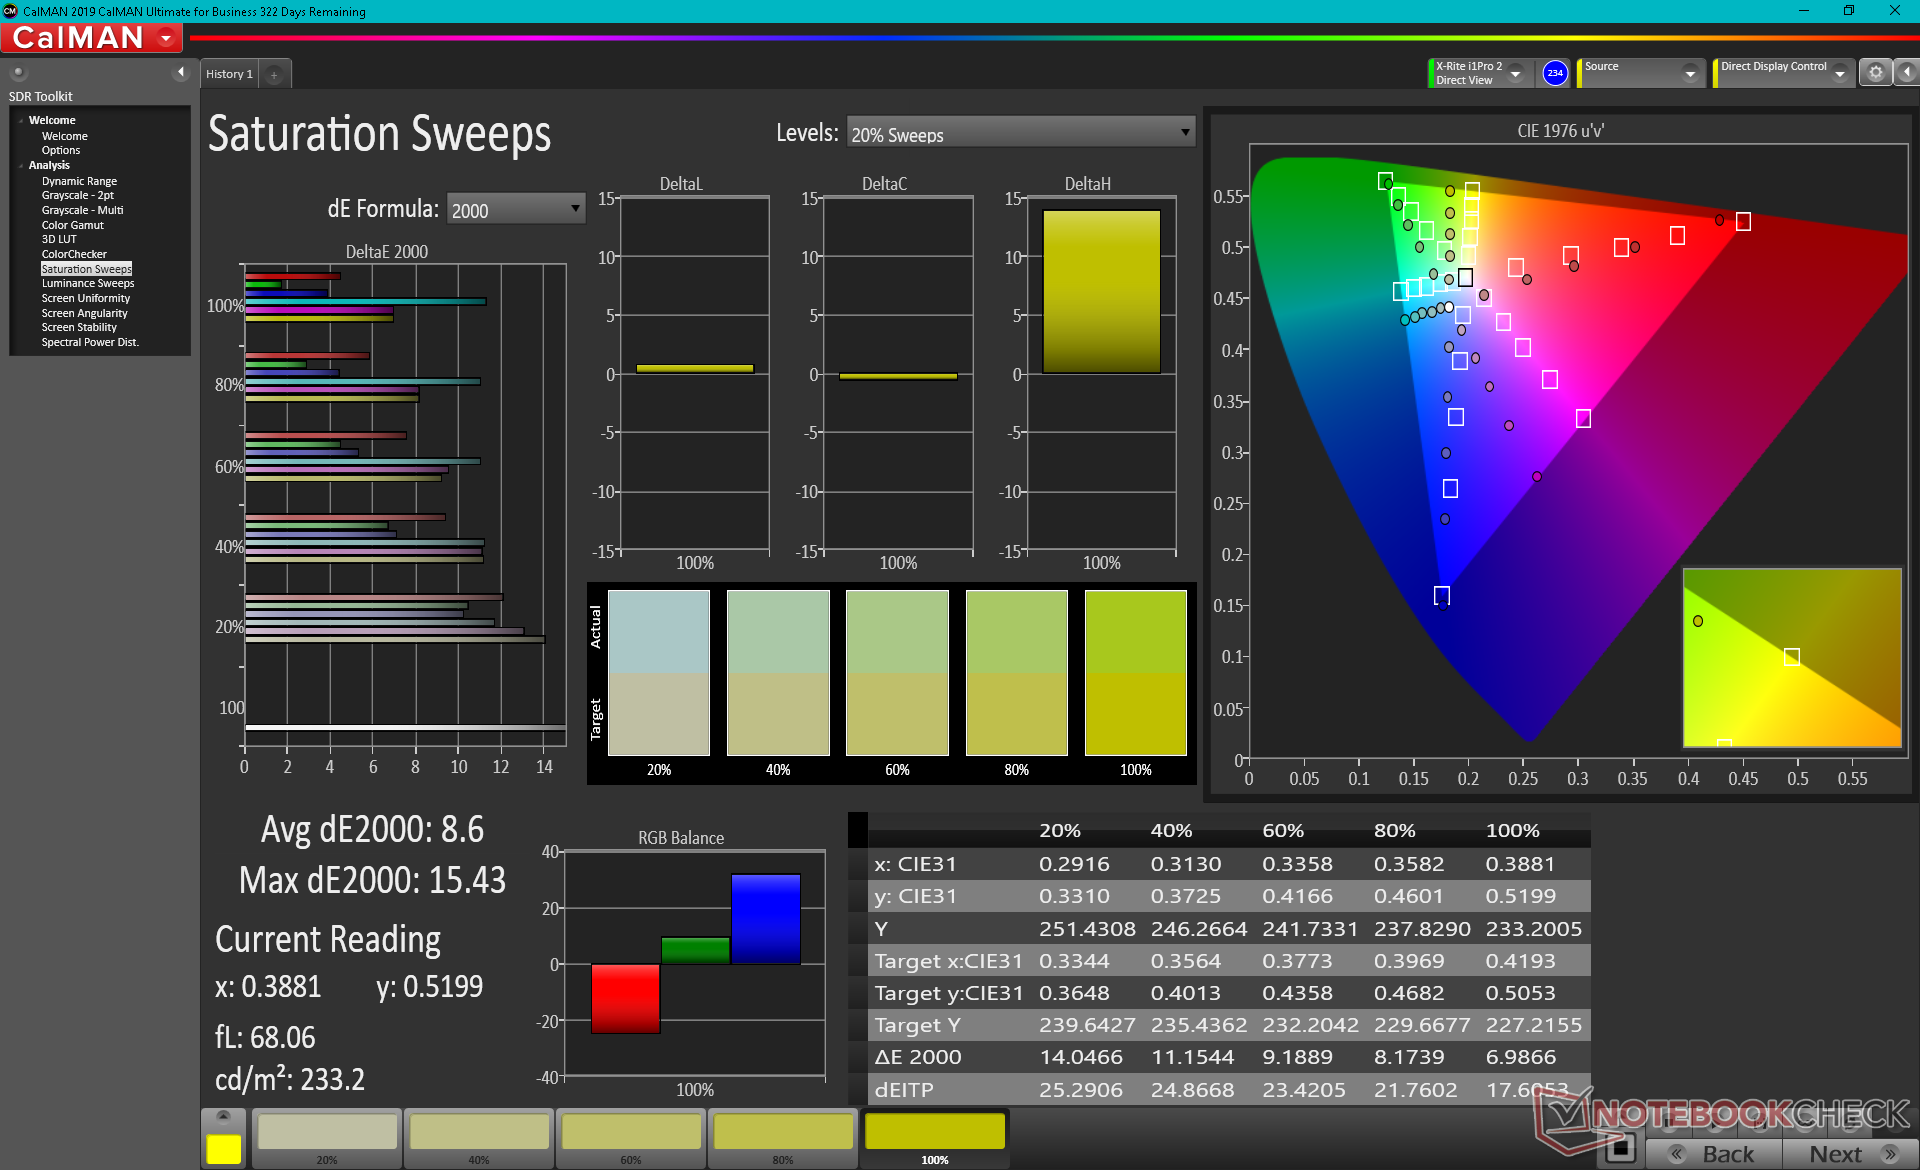
X-Rite colorimeter measurements show a very poorly calibrated display out of the box to the point where even the naked eye can notice the imbalance. Color temperature in particular is far too cool for a bluish tint. Colors and grayscale improve dramatically after calibrating the panel ourselves as shown by the CalMan screenshots below. We recommend applying our calibrated ICM profile above if possible.
Yanıt Sürelerini Görüntüle
| ↔ Tepki Süresi Siyahtan Beyaza | ||
|---|---|---|
| 25.6 ms ... yükseliş ↗ ve sonbahar↘ birleşimi | ↗ 13.6 ms yükseliş | 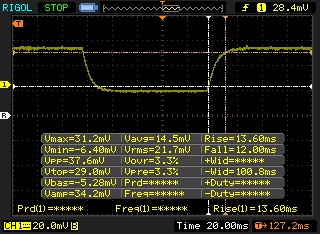 |
| ↘ 12 ms sonbahar | ||
| Ekran, testlerimizde nispeten yavaş yanıt oranları gösteriyor ve oyuncular için çok yavaş olabilir. Karşılaştırıldığında, test edilen tüm cihazlar 0.1 (minimum) ile 240 (maksimum) ms arasında değişir. » Tüm cihazların 61 %'si daha iyi. Bu, ölçülen yanıt süresinin test edilen tüm cihazların ortalamasından (19.8 ms) daha kötü olduğu anlamına gelir. | ||
| ↔ Tepki Süresi %50 Griden %80 Griye | ||
| 40 ms ... yükseliş ↗ ve sonbahar↘ birleşimi | ↗ 22 ms yükseliş | 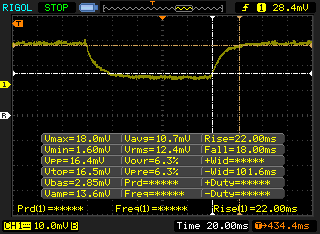 |
| ↘ 18 ms sonbahar | ||
| Ekran, testlerimizde yavaş yanıt oranları gösteriyor ve oyuncular için yetersiz olacaktır. Karşılaştırıldığında, test edilen tüm cihazlar 0.165 (minimum) ile 636 (maksimum) ms arasında değişir. » Tüm cihazların 61 %'si daha iyi. Bu, ölçülen yanıt süresinin test edilen tüm cihazların ortalamasından (30.9 ms) daha kötü olduğu anlamına gelir. | ||
Ekran Titremesi / PWM (Darbe Genişliği Modülasyonu)
| Ekran titriyor / PWM algılanmadı | 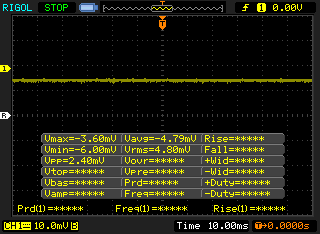 | ||
Karşılaştırıldığında: Test edilen tüm cihazların %52 %'si ekranı karartmak için PWM kullanmıyor. PWM tespit edilirse, ortalama 7744 (minimum: 5 - maksimum: 343500) Hz ölçüldü. | |||
Performance
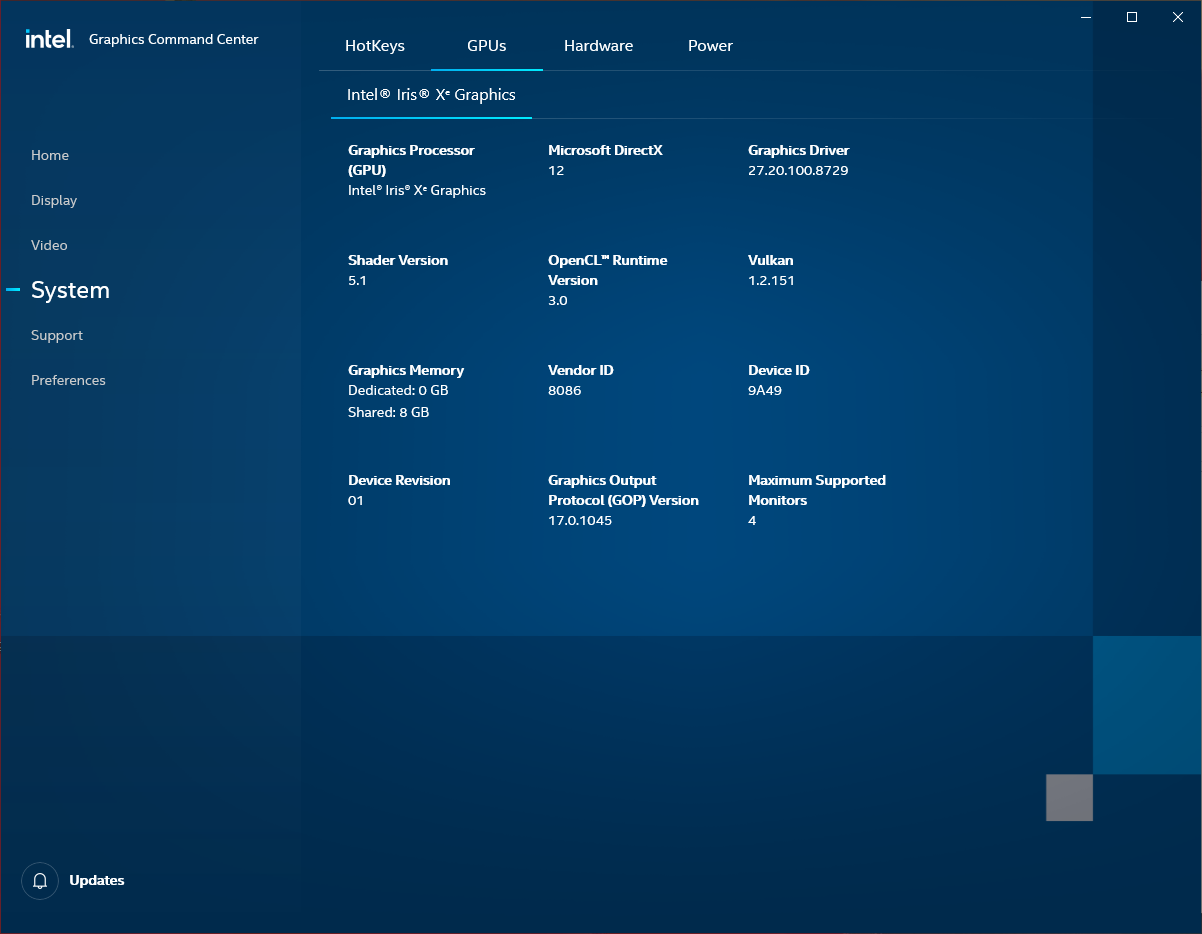
GPD offers two SKUs at the moment: one with the Core i5-1135G7 and the other with the Core i7-1165G7. The latter includes a faster Iris Xe 96EUs GPU while the former uses a slightly slower Iris Xe 80 EUs GPU. All our benchmarks reflect the Core i5 SKU.
Processor
CPU performance is excellent despite the small and portable design as benchmark results are where we expect them to be relative to laptops with the same Core i5-1135G7 CPU. Though Turbo Boost sustainability is limited, we appreciate that performance throttling isn't an issue which was our biggest fear going in to this review.
Upgrading to the more expensive Core i7-1165G7 SKU is only expected to increase raw CPU performance by just a few percentage points.
Cinebench R15: CPU Multi 64Bit | CPU Single 64Bit
Blender: v2.79 BMW27 CPU
7-Zip 18.03: 7z b 4 -mmt1 | 7z b 4
Geekbench 5.5: Single-Core | Multi-Core
HWBOT x265 Benchmark v2.2: 4k Preset
LibreOffice : 20 Documents To PDF
R Benchmark 2.5: Overall mean
| Cinebench R20 / CPU (Multi Core) | |
| Lenovo Yoga Slim 7 14ARE05 82A20008GE | |
| Razer Book 13 FHD | |
| Ortalama Intel Core i7-1165G7 (1060 - 2657, n=81) | |
| Dell XPS 13 9310 Core i7 4K | |
| GPD Win 3 | |
| Ortalama Intel Core i5-1135G7 (979 - 2382, n=62) | |
| Acer Swift 3 SF314-42-R27B | |
| Asus ZenBook 13 UX325JA | |
| Samsung Galaxy Book Flex 13.3 | |
| Lenovo ThinkBook 13s-20R90071GE | |
| HP Envy 13-aq0003ng | |
| Dynabook Portege A30-E-174 | |
| Cinebench R20 / CPU (Single Core) | |
| Razer Book 13 FHD | |
| Dell XPS 13 9310 Core i7 4K | |
| Ortalama Intel Core i7-1165G7 (442 - 589, n=81) | |
| GPD Win 3 | |
| Ortalama Intel Core i5-1135G7 (375 - 527, n=62) | |
| Lenovo Yoga Slim 7 14ARE05 82A20008GE | |
| Asus ZenBook 13 UX325JA | |
| Acer Swift 3 SF314-42-R27B | |
| Samsung Galaxy Book Flex 13.3 | |
| Lenovo ThinkBook 13s-20R90071GE | |
| Dynabook Portege A30-E-174 | |
| HP Envy 13-aq0003ng | |
| Cinebench R15 / CPU Multi 64Bit | |
| Lenovo Yoga Slim 7 14ARE05 82A20008GE | |
| Razer Book 13 FHD | |
| Dell XPS 13 9310 Core i7 4K | |
| Ortalama Intel Core i7-1165G7 (553 - 1027, n=86) | |
| Ortalama Intel Core i5-1135G7 (431 - 941, n=65) | |
| Asus ZenBook 13 UX325JA | |
| GPD Win 3 | |
| Lenovo ThinkBook 13s-20R90071GE | |
| Acer Swift 3 SF314-42-R27B | |
| Samsung Galaxy Book Flex 13.3 | |
| HP Envy 13-aq0003ng | |
| Dynabook Portege A30-E-174 | |
| Cinebench R15 / CPU Single 64Bit | |
| Razer Book 13 FHD | |
| Dell XPS 13 9310 Core i7 4K | |
| Ortalama Intel Core i7-1165G7 (115 - 230, n=78) | |
| GPD Win 3 | |
| Ortalama Intel Core i5-1135G7 (141.4 - 205, n=61) | |
| Asus ZenBook 13 UX325JA | |
| Lenovo Yoga Slim 7 14ARE05 82A20008GE | |
| HP Envy 13-aq0003ng | |
| Acer Swift 3 SF314-42-R27B | |
| Samsung Galaxy Book Flex 13.3 | |
| Lenovo ThinkBook 13s-20R90071GE | |
| Dynabook Portege A30-E-174 | |
| Blender / v2.79 BMW27 CPU | |
| Samsung Galaxy Book Flex 13.3 | |
| Asus ZenBook 13 UX325JA | |
| Acer Swift 3 SF314-42-R27B | |
| Lenovo ThinkBook 13s-20R90071GE | |
| HP Envy x360 13-ay0359ng | |
| Ortalama Intel Core i5-1135G7 (499 - 1044, n=60) | |
| Dell XPS 13 9310 Core i7 4K | |
| GPD Win 3 | |
| Ortalama Intel Core i7-1165G7 (468 - 1138, n=80) | |
| Razer Book 13 FHD | |
| Lenovo Yoga Slim 7 14ARE05 82A20008GE | |
| 7-Zip 18.03 / 7z b 4 -mmt1 | |
| Razer Book 13 FHD | |
| Ortalama Intel Core i7-1165G7 (4478 - 5507, n=80) | |
| Dell XPS 13 9310 Core i7 4K | |
| GPD Win 3 | |
| Ortalama Intel Core i5-1135G7 (3924 - 4921, n=62) | |
| Lenovo Yoga Slim 7 14ARE05 82A20008GE | |
| Asus ZenBook 13 UX325JA | |
| HP Envy x360 13-ay0359ng | |
| Samsung Galaxy Book Flex 13.3 | |
| Acer Swift 3 SF314-42-R27B | |
| Lenovo ThinkBook 13s-20R90071GE | |
| 7-Zip 18.03 / 7z b 4 | |
| Lenovo Yoga Slim 7 14ARE05 82A20008GE | |
| Razer Book 13 FHD | |
| Ortalama Intel Core i7-1165G7 (15347 - 27405, n=80) | |
| HP Envy x360 13-ay0359ng | |
| GPD Win 3 | |
| Ortalama Intel Core i5-1135G7 (14745 - 24873, n=62) | |
| Dell XPS 13 9310 Core i7 4K | |
| Lenovo ThinkBook 13s-20R90071GE | |
| Acer Swift 3 SF314-42-R27B | |
| Asus ZenBook 13 UX325JA | |
| Samsung Galaxy Book Flex 13.3 | |
| Geekbench 5.5 / Single-Core | |
| Razer Book 13 FHD | |
| Dell XPS 13 9310 Core i7 4K | |
| Ortalama Intel Core i7-1165G7 (1302 - 1595, n=77) | |
| GPD Win 3 | |
| Ortalama Intel Core i5-1135G7 (1147 - 1428, n=58) | |
| Asus ZenBook 13 UX325JA | |
| Samsung Galaxy Book Flex 13.3 | |
| Lenovo Yoga Slim 7 14ARE05 82A20008GE | |
| Acer Swift 3 SF314-42-R27B | |
| Geekbench 5.5 / Multi-Core | |
| Lenovo Yoga Slim 7 14ARE05 82A20008GE | |
| Razer Book 13 FHD | |
| Dell XPS 13 9310 Core i7 4K | |
| Ortalama Intel Core i7-1165G7 (3078 - 5926, n=77) | |
| GPD Win 3 | |
| Ortalama Intel Core i5-1135G7 (3475 - 5472, n=58) | |
| Asus ZenBook 13 UX325JA | |
| Samsung Galaxy Book Flex 13.3 | |
| Acer Swift 3 SF314-42-R27B | |
| HWBOT x265 Benchmark v2.2 / 4k Preset | |
| Lenovo Yoga Slim 7 14ARE05 82A20008GE | |
| Razer Book 13 FHD | |
| Ortalama Intel Core i7-1165G7 (1.39 - 8.47, n=80) | |
| GPD Win 3 | |
| HP Envy x360 13-ay0359ng | |
| Ortalama Intel Core i5-1135G7 (3.57 - 7.6, n=57) | |
| Dell XPS 13 9310 Core i7 4K | |
| Lenovo ThinkBook 13s-20R90071GE | |
| Acer Swift 3 SF314-42-R27B | |
| Asus ZenBook 13 UX325JA | |
| Samsung Galaxy Book Flex 13.3 | |
| LibreOffice / 20 Documents To PDF | |
| HP Envy x360 13-ay0359ng | |
| Lenovo Yoga Slim 7 14ARE05 82A20008GE | |
| Acer Swift 3 SF314-42-R27B | |
| Samsung Galaxy Book Flex 13.3 | |
| Ortalama Intel Core i5-1135G7 (44.2 - 62.9, n=60) | |
| Asus ZenBook 13 UX325JA | |
| Razer Book 13 FHD | |
| Ortalama Intel Core i7-1165G7 (21.5 - 88.1, n=78) | |
| GPD Win 3 | |
| Dell XPS 13 9310 Core i7 4K | |
| R Benchmark 2.5 / Overall mean | |
| Samsung Galaxy Book Flex 13.3 | |
| Acer Swift 3 SF314-42-R27B | |
| Asus ZenBook 13 UX325JA | |
| Ortalama Intel Core i5-1135G7 (0.619 - 0.727, n=59) | |
| HP Envy x360 13-ay0359ng | |
| GPD Win 3 | |
| Lenovo Yoga Slim 7 14ARE05 82A20008GE | |
| Dell XPS 13 9310 Core i7 4K | |
| Ortalama Intel Core i7-1165G7 (0.552 - 1.002, n=80) | |
| Razer Book 13 FHD | |
* ... daha küçük daha iyidir
System Performance
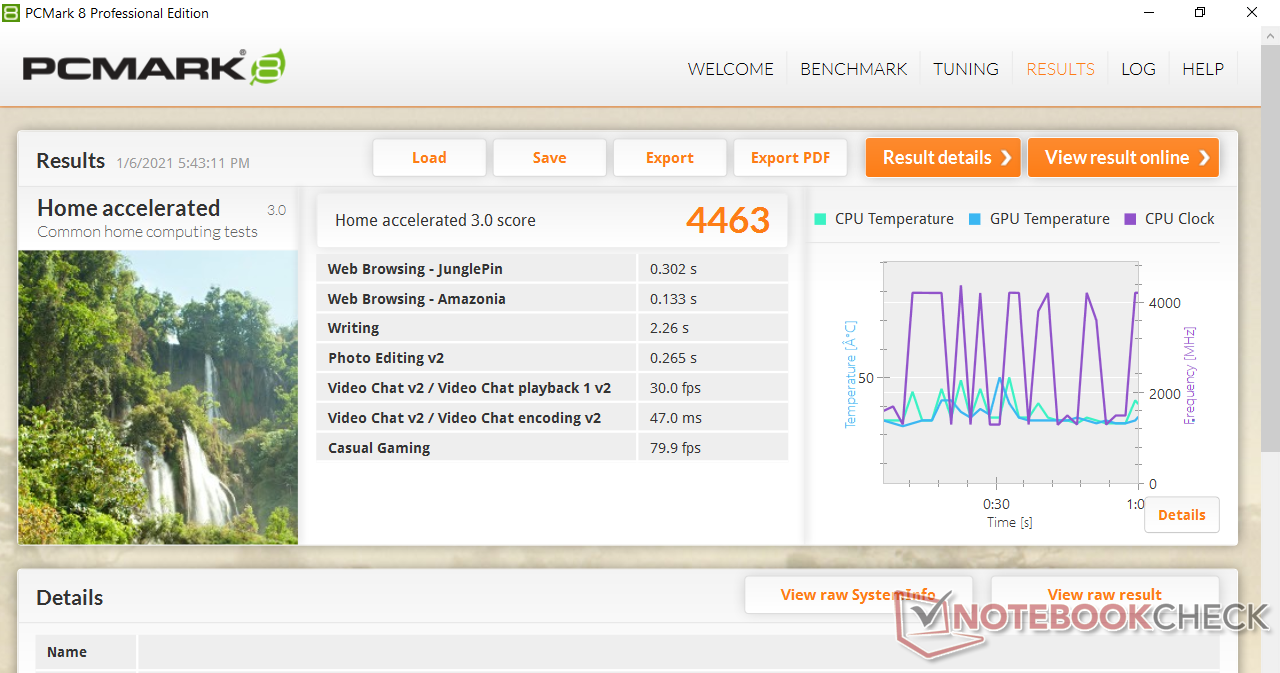
| PCMark 8 Home Score Accelerated v2 | 4463 puan | |
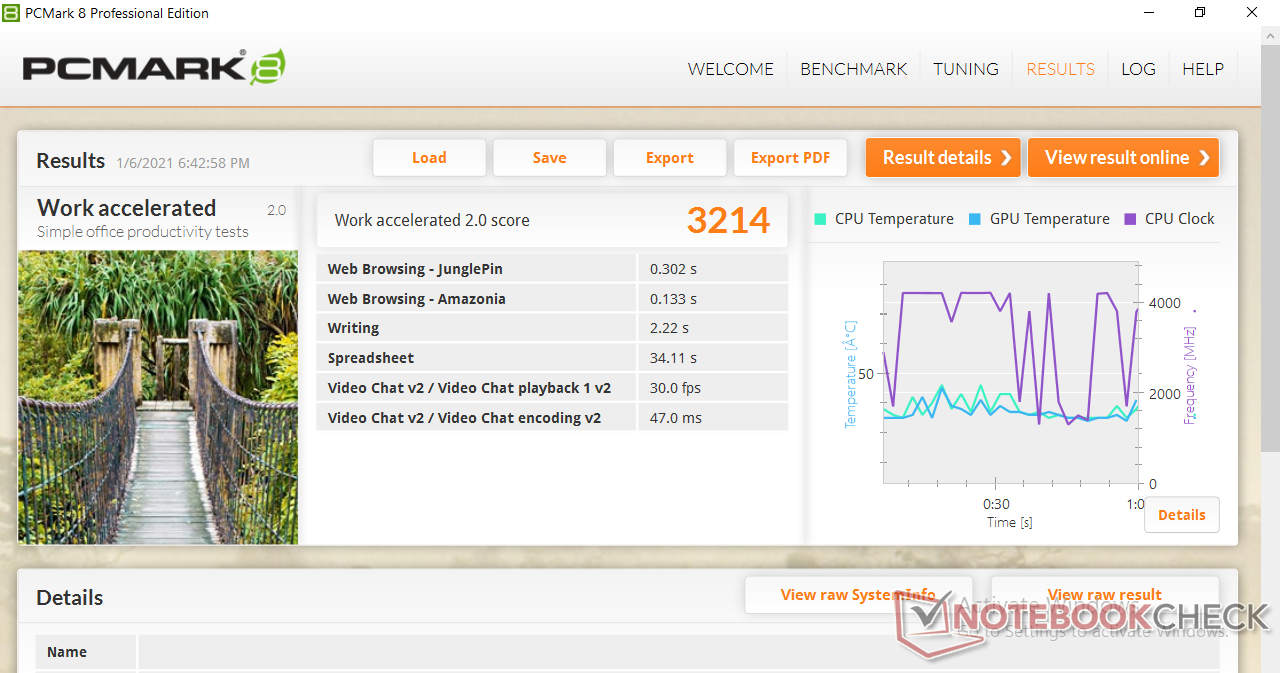
| PCMark 8 Work Score Accelerated v2 | 3214 puan | |
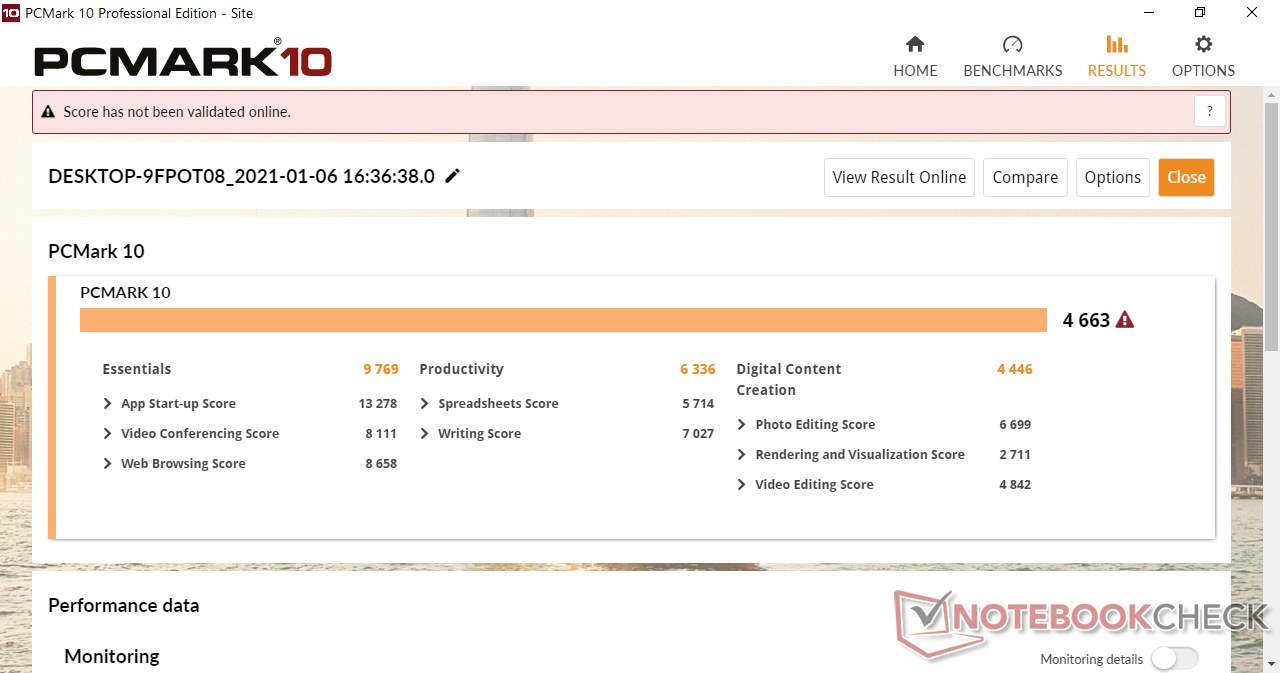
| PCMark 10 Score | 4663 puan | |
Yardım | ||
DPC Latency
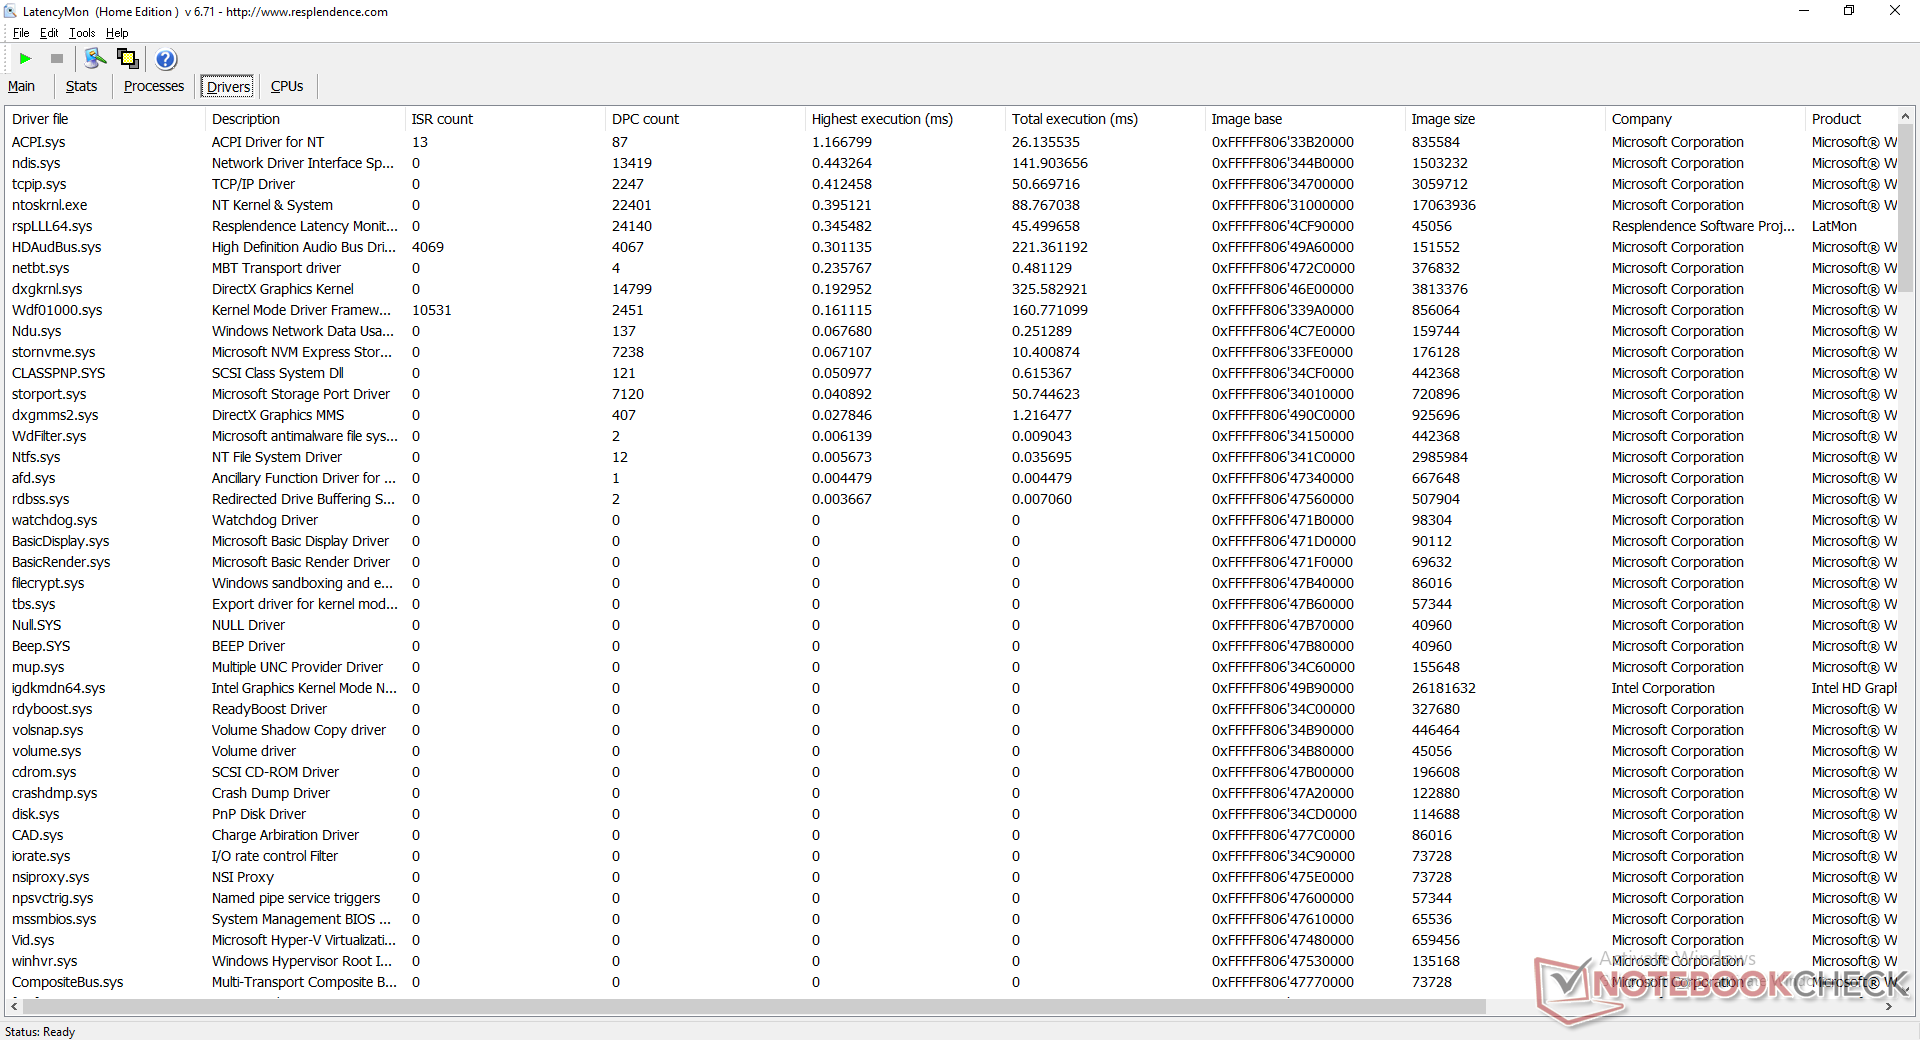
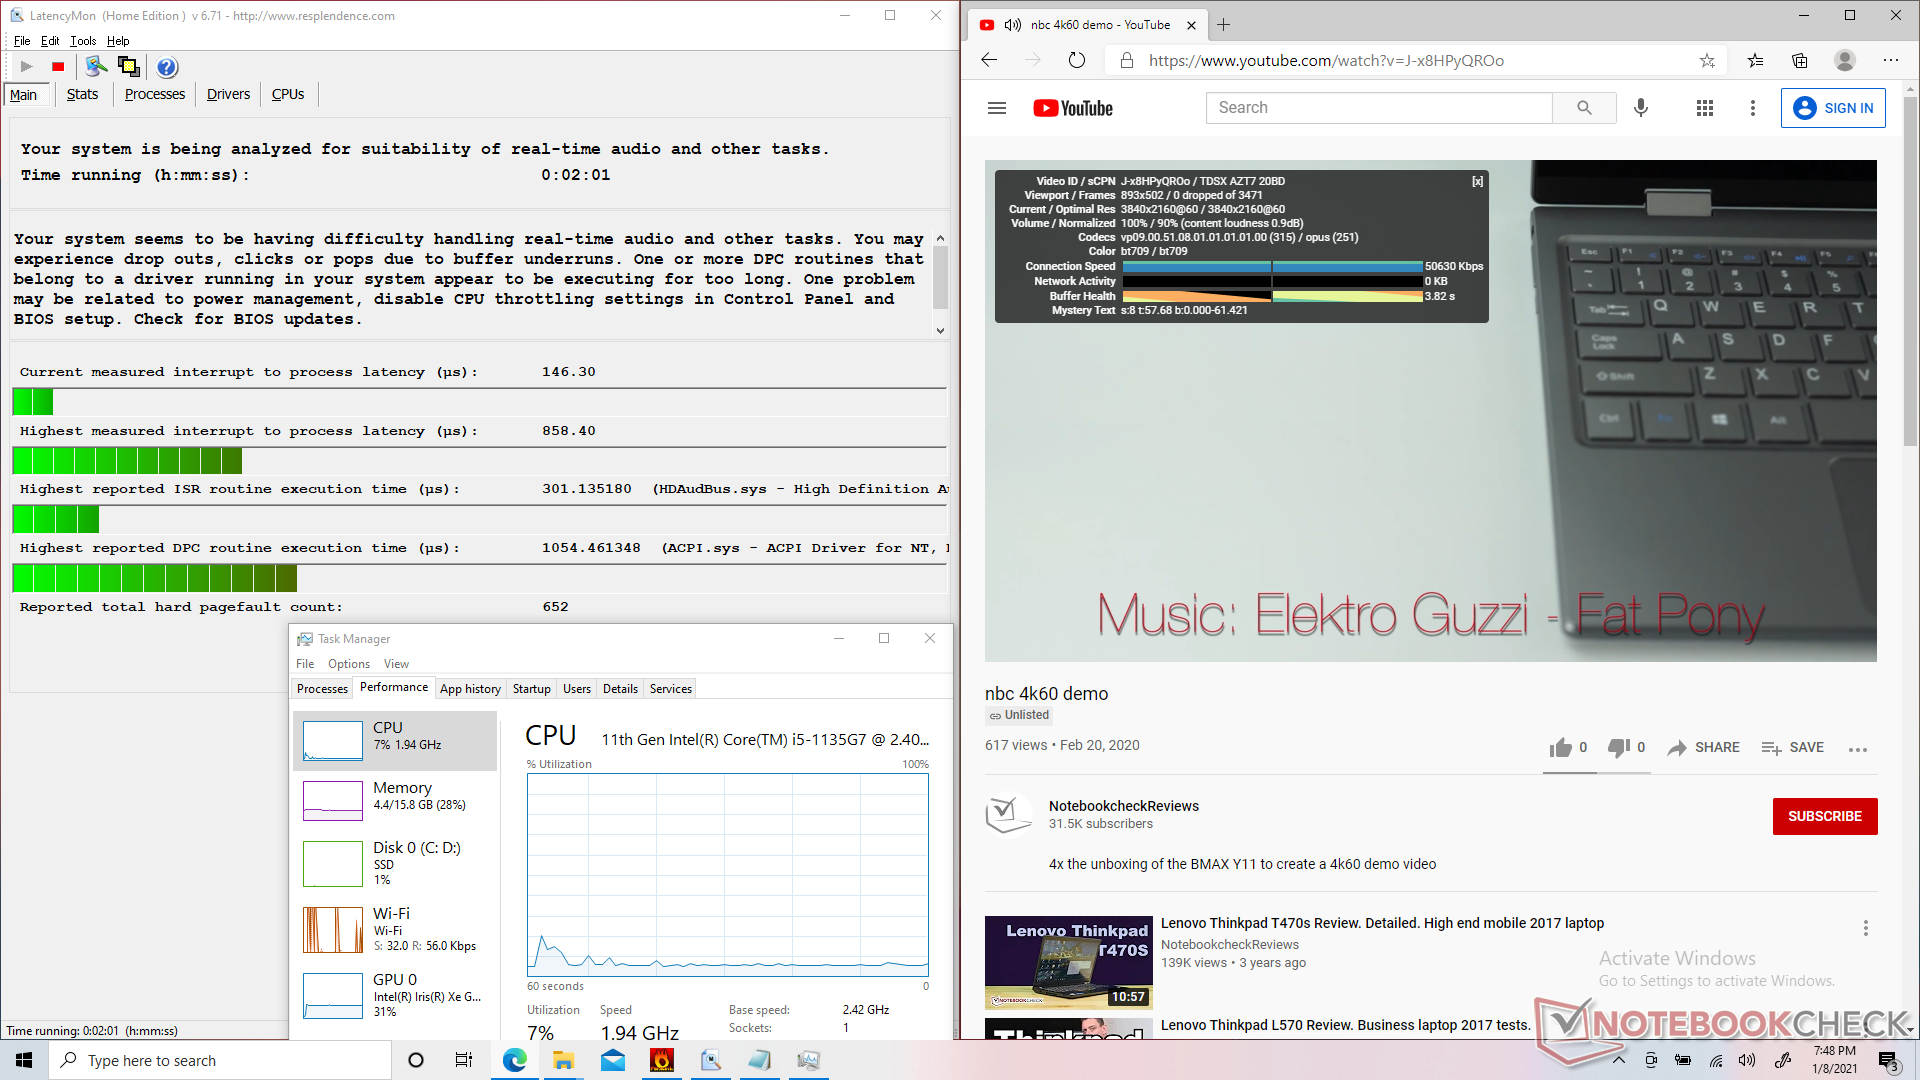
LatencyMon shows DPC latency issues related to ACPI.sys when opening multiple browser tabs on our home page. 4K UHD video playback at 60 FPS is otherwise smooth and with no dropped frames during our minute-long YouTube test.
| DPC Latencies / LatencyMon - interrupt to process latency (max), Web, Youtube, Prime95 | |
| Asus ZenBook 13 UX325JA | |
| Razer Book 13 FHD | |
| Dell XPS 13 9310 Core i7 4K | |
| Lenovo Yoga 9i 14ITL5 | |
| Dell XPS 13 9310 Core i7 FHD | |
| Samsung Galaxy Book Flex 13.3 | |
| GPD Win 3 | |
| Lenovo ThinkBook 13s-ITL-20V90003GE | |
| Acer Swift 3 SF314-42-R27B | |
| Lenovo Yoga 7 14ITL5 | |
* ... daha küçük daha iyidir
Storage Devices
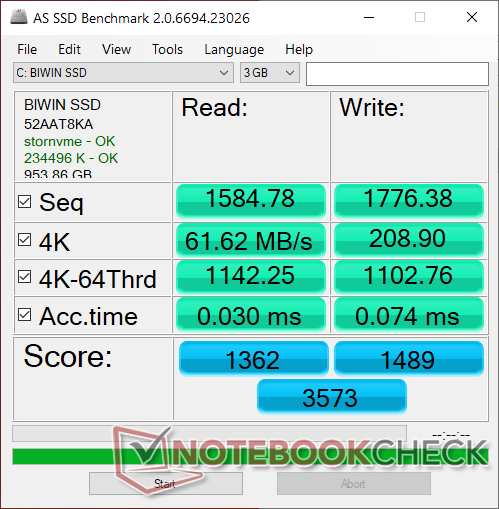
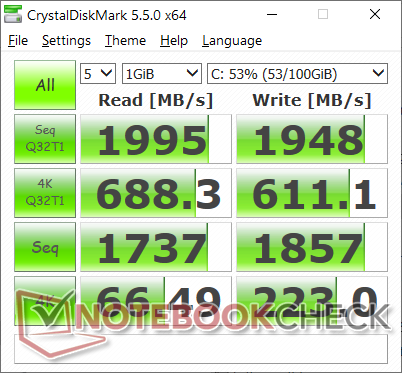
A roomy 1 TB M.2 2280 SSD comes standard for storing all those inevitable games. Instead of the usual Samsung, SK Hynix, Micron, or Western Digital SSD, however, the GPD uses BIWIN drives. Transfer rates are still excellent with sequential read and write rates of about 2000 MB/s according to our own tests.
| GPD Win 3 BIWIN NS200 1TB CNF82GS1G02-1TB | Dell XPS 13 9310 Core i7 FHD Micron 2300 512GB MTFDHBA512TDV | HP Spectre x360 13-aw0013dx Intel Optane Memory H10 with Solid State Storage 32GB + 512GB HBRPEKNX0202A(L/H) | Asus ZenBook 13 UX325JA Intel SSD 660p 1TB SSDPEKNW010T8 | Microsoft Surface Laptop 3 13 Core i5-1035G7 SK hynix BC501 HFM256GDGTNG | |
|---|---|---|---|---|---|
| AS SSD | -38% | -54% | -40% | -53% | |
| Seq Read (MB/s) | 1585 | 2091 32% | 1039 -34% | 1587 0% | 1387 -12% |
| Seq Write (MB/s) | 1776 | 1396 -21% | 310.1 -83% | 938 -47% | 504 -72% |
| 4K Read (MB/s) | 61.6 | 49.29 -20% | 76 23% | 51 -17% | 42.35 -31% |
| 4K Write (MB/s) | 208.9 | 104.2 -50% | 118 -44% | 141.9 -32% | 120 -43% |
| 4K-64 Read (MB/s) | 1142 | 827 -28% | 371.8 -67% | 576 -50% | 497.4 -56% |
| 4K-64 Write (MB/s) | 1103 | 1636 48% | 469.5 -57% | 584 -47% | 354.9 -68% |
| Access Time Read * (ms) | 0.03 | 0.066 -120% | 0.067 -123% | 0.083 -177% | 0.055 -83% |
| Access Time Write * (ms) | 0.074 | 0.365 -393% | 0.138 -86% | 0.04 46% | 0.093 -26% |
| Score Read (Points) | 1362 | 1086 -20% | 552 -59% | 785 -42% | 678 -50% |
| Score Write (Points) | 1489 | 1880 26% | 618 -58% | 820 -45% | 525 -65% |
| Score Total (Points) | 3573 | 3499 -2% | 1448 -59% | 1990 -44% | 1520 -57% |
| Copy ISO MB/s (MB/s) | 1741 | 1544 -11% | 764 -56% | 1311 -25% | 764 -56% |
| Copy Program MB/s (MB/s) | 543 | 613 13% | 465.8 -14% | 310.3 -43% | 256.1 -53% |
| Copy Game MB/s (MB/s) | 1318 | 1451 10% | 764 -42% | 801 -39% | 368.4 -72% |
| CrystalDiskMark 5.2 / 6 | -4% | -20% | -25% | -42% | |
| Write 4K (MB/s) | 223 | 97.5 -56% | 112.6 -50% | 139.7 -37% | 112.3 -50% |
| Read 4K (MB/s) | 66.5 | 50.9 -23% | 131 97% | 56.4 -15% | 42.13 -37% |
| Write Seq (MB/s) | 1857 | 1811 -2% | 458.9 -75% | 1265 -32% | 630 -66% |
| Read Seq (MB/s) | 1737 | 1836 6% | 1355 -22% | 1492 -14% | 1023 -41% |
| Write 4K Q32T1 (MB/s) | 611 | 521 -15% | 341.3 -44% | 402.5 -34% | 336.6 -45% |
| Read 4K Q32T1 (MB/s) | 688 | 357.5 -48% | 320.6 -53% | 329.3 -52% | 399.6 -42% |
| Write Seq Q32T1 (MB/s) | 1948 | 2879 48% | 1219 -37% | 1786 -8% | 821 -58% |
| Read Seq Q32T1 (MB/s) | 1995 | 3204 61% | 2462 23% | 1923 -4% | 2030 2% |
| Toplam Ortalama (Program / Ayarlar) | -21% /
-26% | -37% /
-42% | -33% /
-34% | -48% /
-49% |
* ... daha küçük daha iyidir

Disk Throttling: DiskSpd Read Loop, Queue Depth 8
GPU Performance
Gaming performance is generally close to the GeForce MX250 albeit with some exceptions where the Iris Xe can fall behind much further. However, users will be running most games at 720p anyway which is where the Win 3 really shines. We highly recommend enabling v-sync whenever possible as screen tearing is rampant. It's very unfortunate that the integrated display does not support adaptive sync.
The integrated controller is automatically recognized as an XBox controller when launching Steam games. It would have been nice to be able to quickly spoof the controller into a PS4 DualShock for quick compatibility with Sony Remote Play.
See our dedicated pages on the Iris Xe 80 EUs and Iris Xe 96 EUs for additional benchmarks. In short, most games run well and look sharp on the small native 720p display.
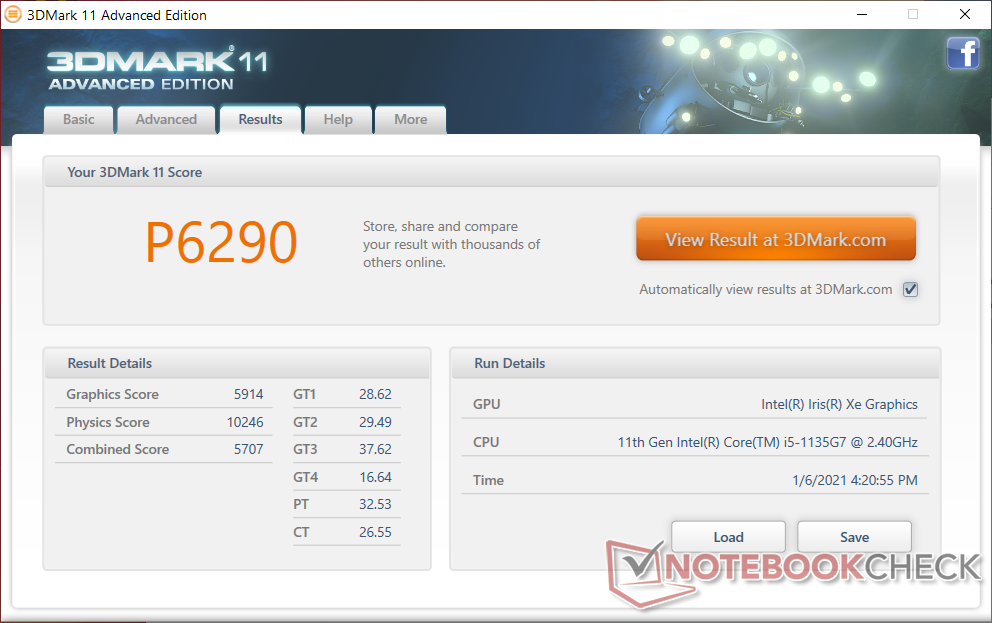

| 3DMark 11 Performance | 6290 puan | |
| 3DMark Cloud Gate Standard Score | 18709 puan | |
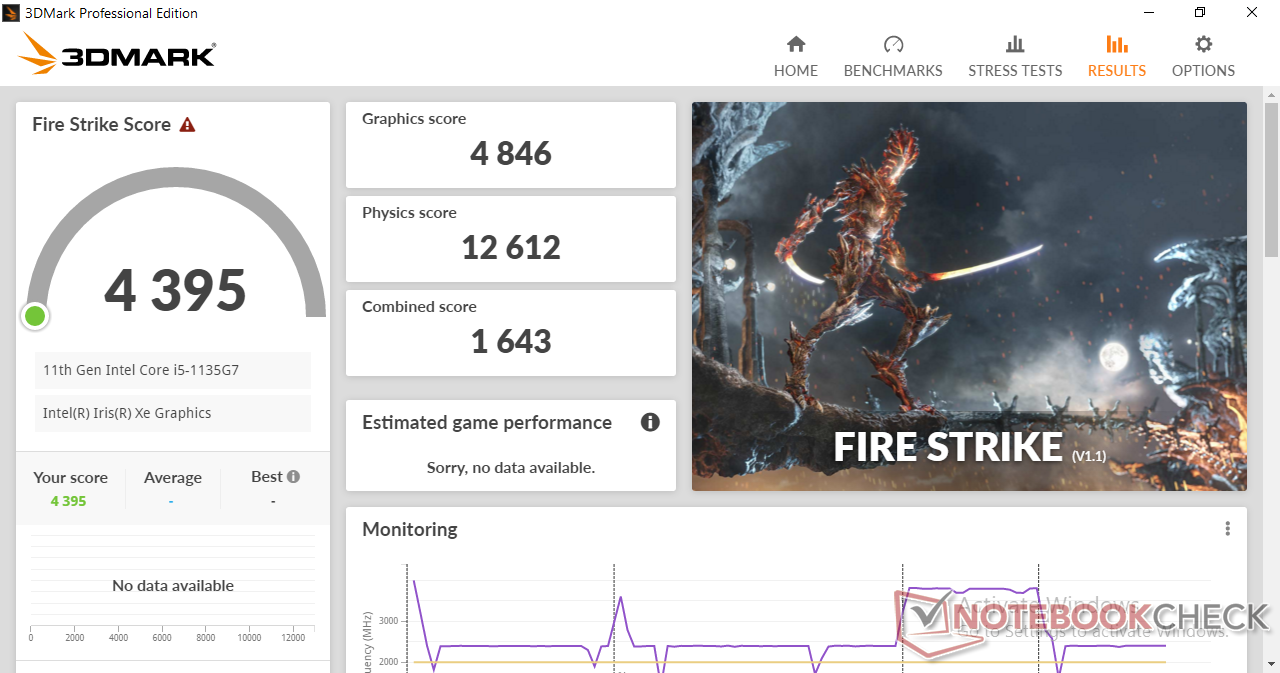
| 3DMark Fire Strike Score | 4395 puan | |
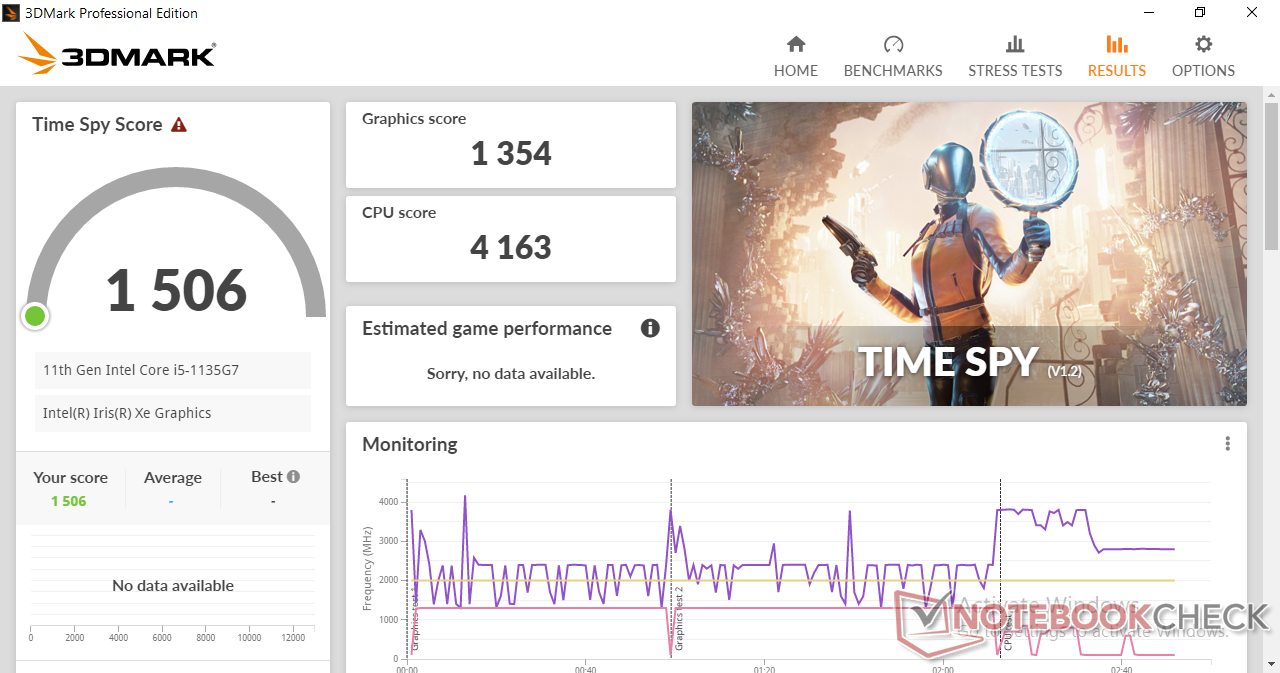
| 3DMark Time Spy Score | 1506 puan | |
Yardım | ||
| düşük | orta | yüksek | ultra | |
|---|---|---|---|---|
| GTA V (2015) | 73.6 | 60.9 | 23.5 | |
| The Witcher 3 (2015) | 90.6 | 55.6 | 31.7 | 14.1 |
| Dota 2 Reborn (2015) | 81.4 | 64.2 | 44.3 | 44.2 |
| Final Fantasy XV Benchmark (2018) | 38.9 | 21 | 16.5 | |
| X-Plane 11.11 (2018) | 26.6 | 35.6 | 31.6 | |
| Strange Brigade (2018) | 87.7 | 36.2 | 28 | 22.8 |
Emissions
System Noise
The internal fan is quiet when under low loads but will occasionally rise to 34.9 dB(A) against a background of 27.4 dB(A) if web browsing or video streaming. RPM changes are thankfully steady instead of abrupt to not be vexing.
Higher loads like gaming will bump fan noise up to the 42 to 46 dB(A) range to be louder than most Ultrabooks powered by similar U-series CPUs. This is indubitably louder than the Switch and enough to be noticeable in quiet rooms or lecture halls. In public areas like buses or trains, however, the fan isn't bothersome at all.
| GPD Win 3 Iris Xe G7 80EUs, i5-1135G7, BIWIN NS200 1TB CNF82GS1G02-1TB | Dell XPS 13 9310 Core i7 FHD Iris Xe G7 96EUs, i7-1165G7, Micron 2300 512GB MTFDHBA512TDV | HP Spectre x360 13-aw0013dx Iris Plus Graphics G7 (Ice Lake 64 EU), i7-1065G7, Intel Optane Memory H10 with Solid State Storage 32GB + 512GB HBRPEKNX0202A(L/H) | Asus ZenBook 13 UX325JA Iris Plus Graphics G7 (Ice Lake 64 EU), i7-1065G7, Intel SSD 660p 1TB SSDPEKNW010T8 | Microsoft Surface Laptop 3 13 Core i5-1035G7 Iris Plus Graphics G7 (Ice Lake 64 EU), i5-1035G7, SK hynix BC501 HFM256GDGTNG | |
|---|---|---|---|---|---|
| Noise | 16% | 11% | 4% | 7% | |
| kapalı / ortam * (dB) | 27.4 | 25.7 6% | 28.5 -4% | 30.1 -10% | 28.5 -4% |
| Idle Minimum * (dB) | 29.1 | 25.7 12% | 28.5 2% | 30.1 -3% | 28.5 2% |
| Idle Average * (dB) | 29.1 | 25.7 12% | 28.5 2% | 30.1 -3% | 28.5 2% |
| Idle Maximum * (dB) | 29.1 | 25.9 11% | 28.5 2% | 30.1 -3% | 28.5 2% |
| Load Average * (dB) | 40.7 | 26.2 36% | 28.5 30% | 32.7 20% | 28.5 30% |
| Witcher 3 ultra * (dB) | 42.8 | 36.5 15% | 35.3 18% | 38.6 10% | 40.4 6% |
| Load Maximum * (dB) | 46.3 | 36.6 21% | 35.3 24% | 38.5 17% | 40.4 13% |
* ... daha küçük daha iyidir
Ses yüksekliği
| Boşta |
| 29.1 / 29.1 / 29.1 dB |
| Çalışırken |
| 40.7 / 46.3 dB |
 | ||
30 dB sessiz 40 dB(A) duyulabilirlik 50 dB(A) gürültülü |
||
min: | ||
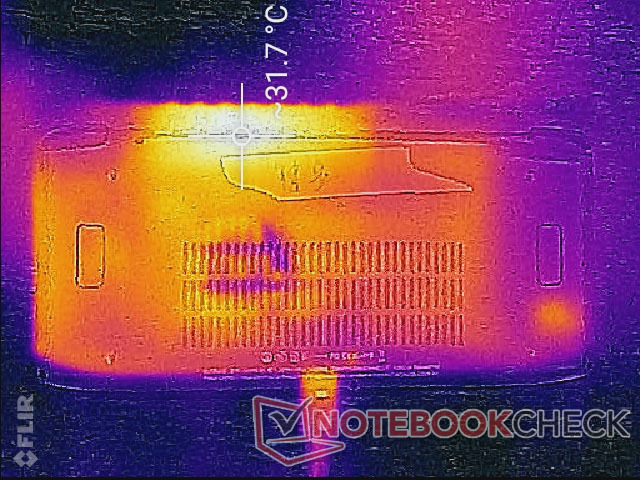
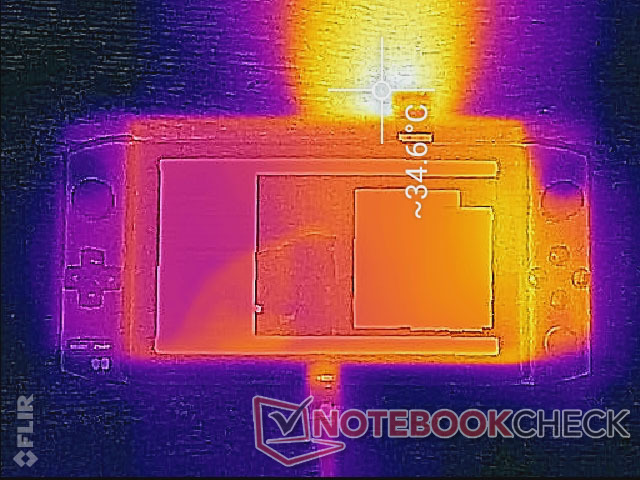
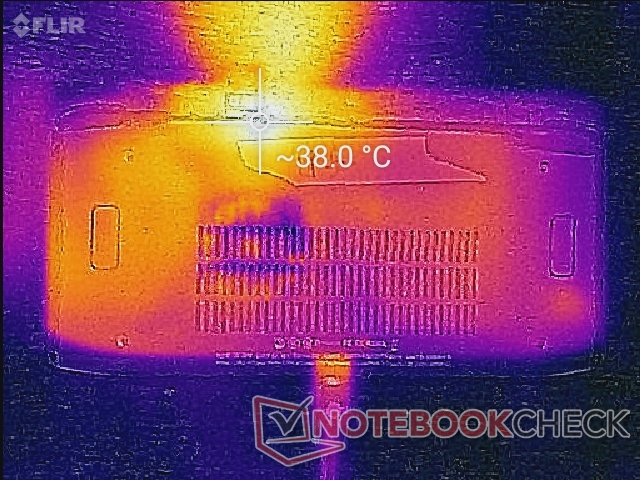
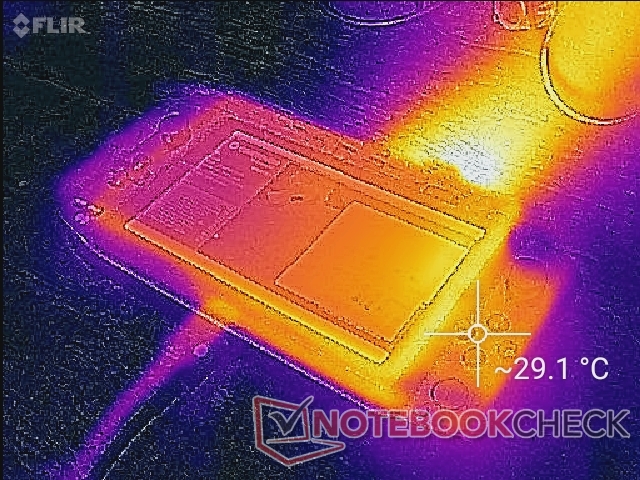
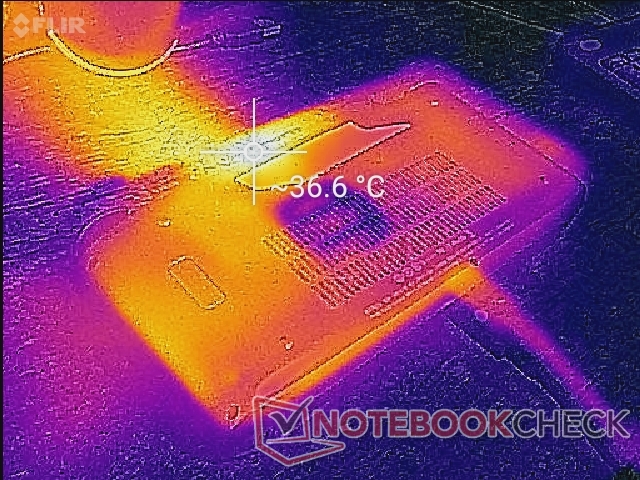
Temperature
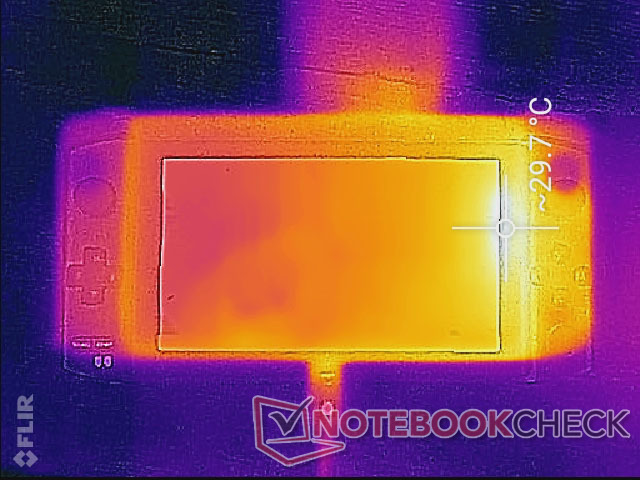
Surface temperatures are never uncomfortable. The hot spot is closest to the ventilation grilles along the top where it can reach 38 C when under load, but users won't be touching this area when gaming.
Stress Test
Running Prime95 to stress the CPU would cause clock rates to spike to 3 GHz for about 30 seconds with temperatures plateauing at 67 C. Afterwards, clock rates would settle at about 2.7 GHz for a slightly cooler core temperature of 62 C. Core temperature would also remain stable at 62 C when gaming which is similar to what we've observed on some Ultrabooks including the Razer Blade Stealth.
Running on battery will not significantly impact performance. A 3DMark 11 test on batteries would return Physics and Graphics scores of 10374 and 5766 points compared to 10246 and 5916 points when on mains.
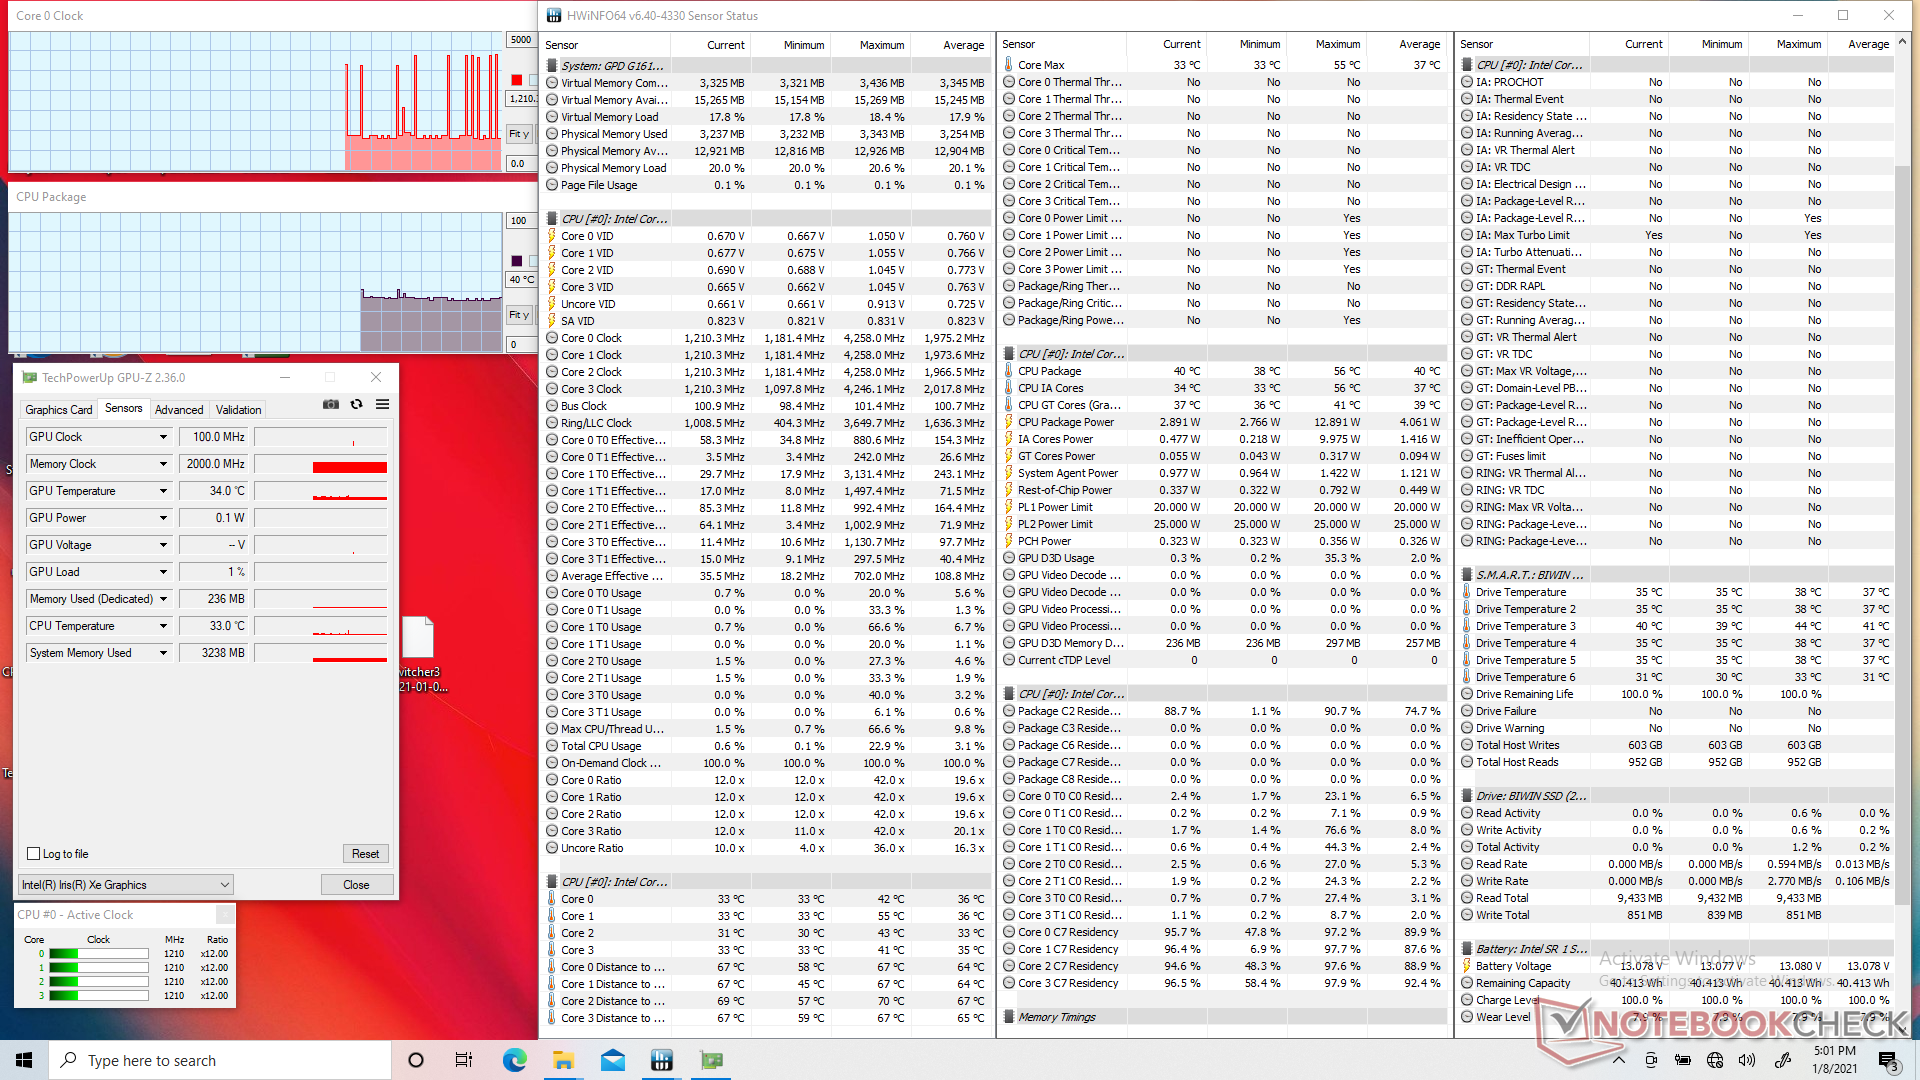
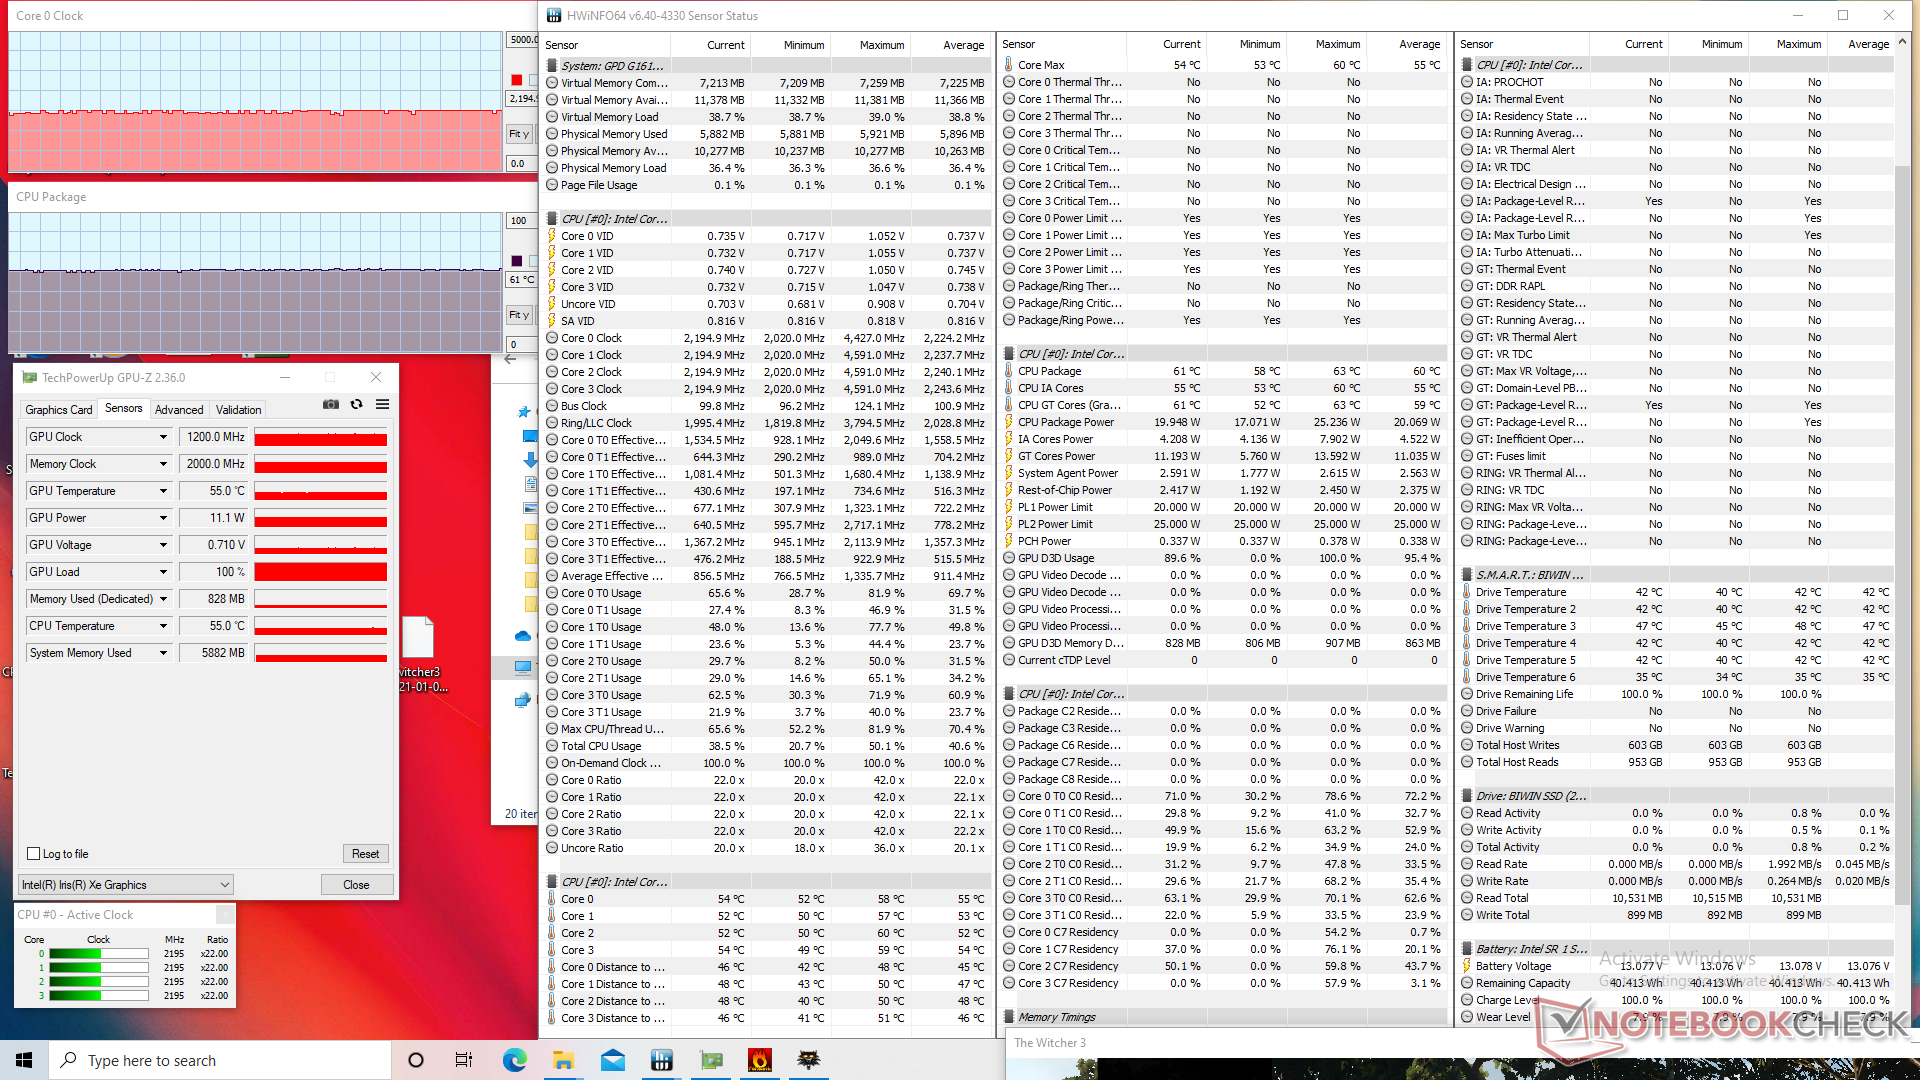
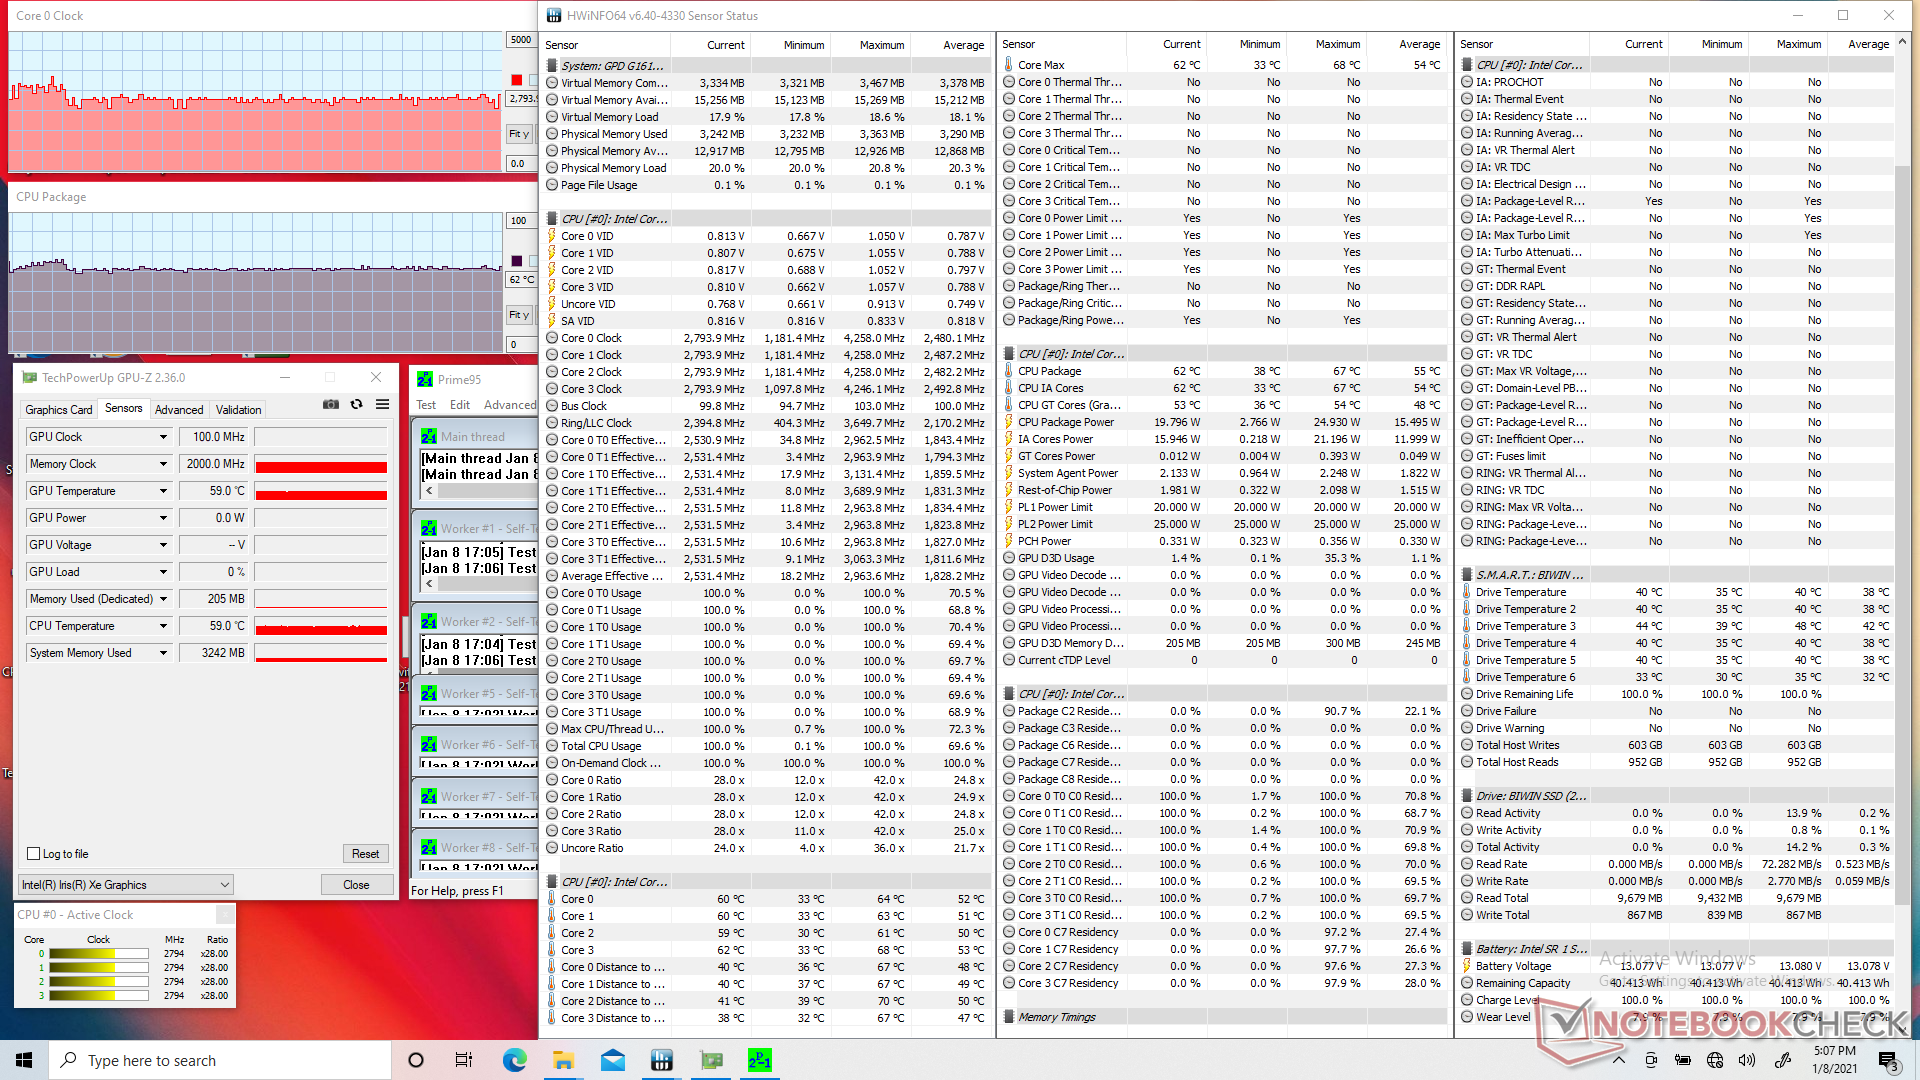
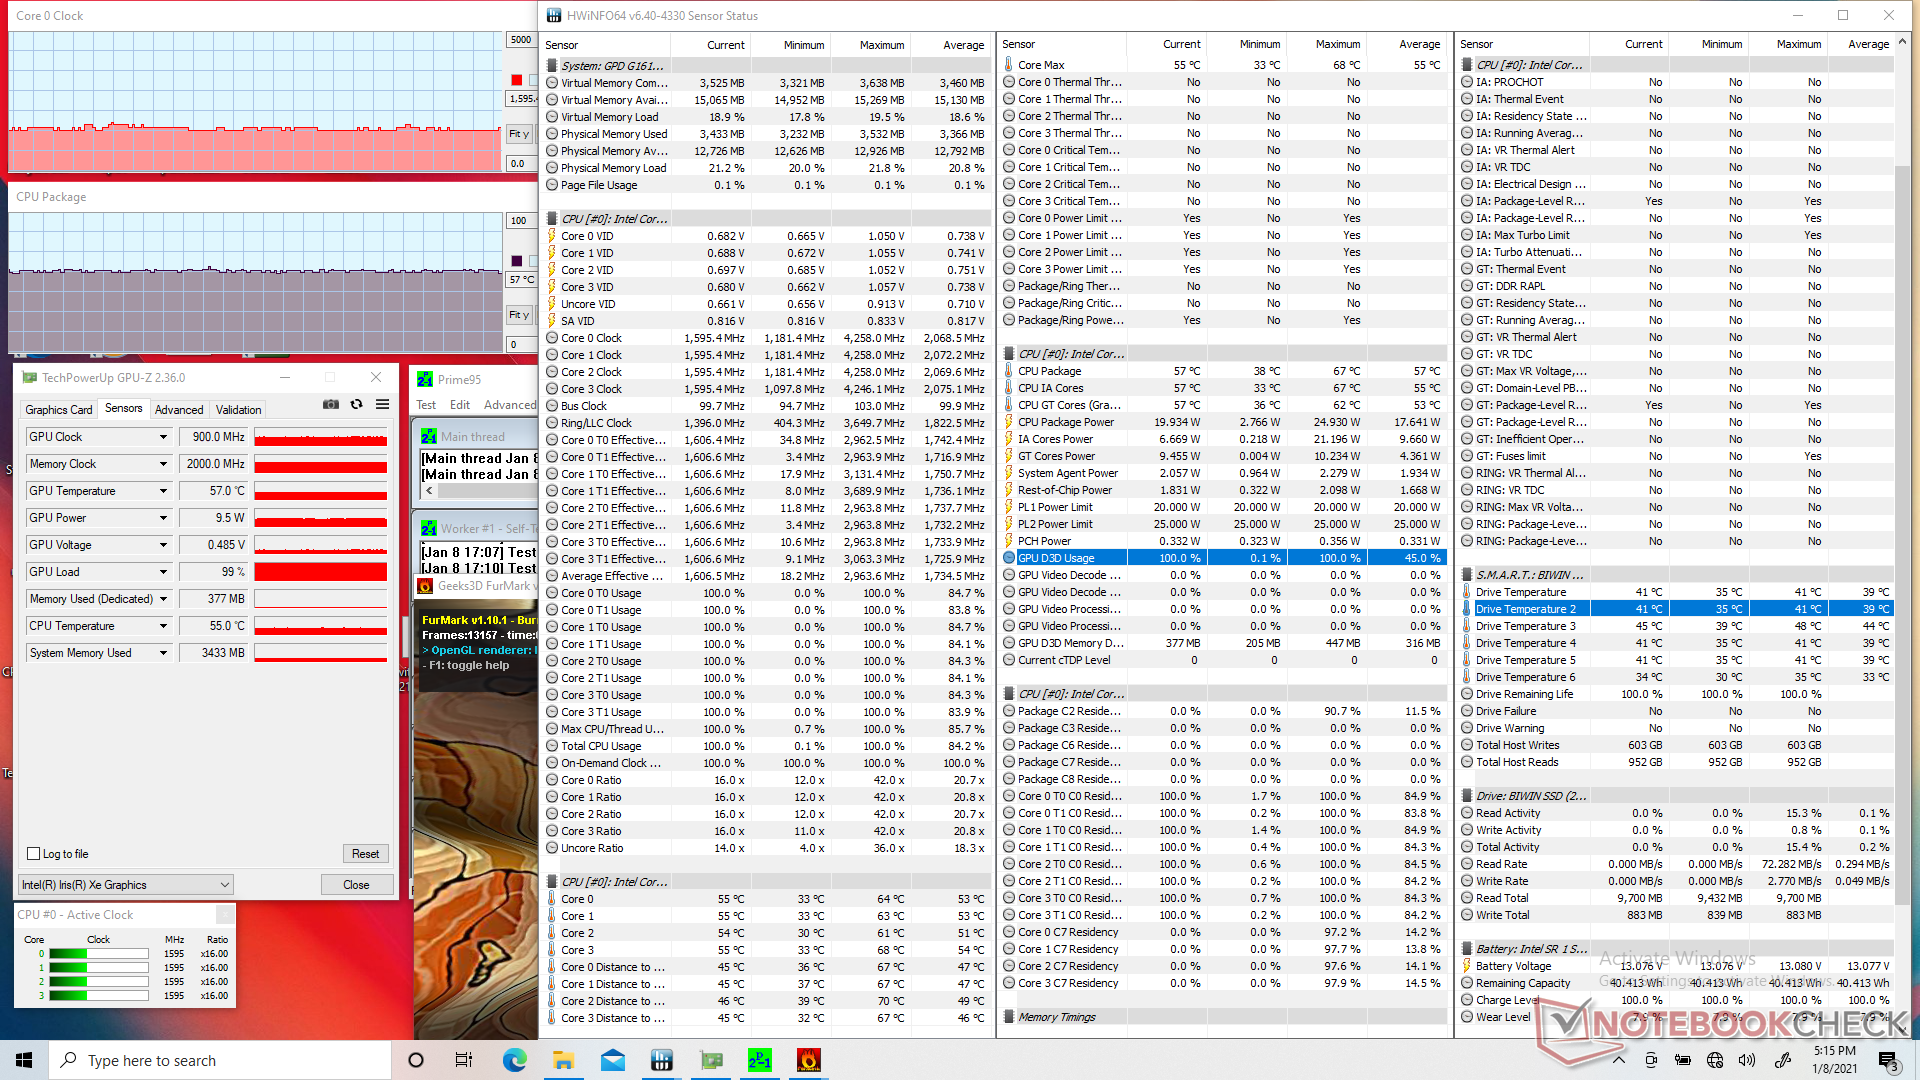
| CPU Clock (GHz) | GPU Clock (MHz) | Average CPU Temperature (°C) | |
| System Idle | -- | -- | 40 |
| Prime95 Stress | ~2.6 | -- | 62 |
| Prime95 + FurMark Stress | 1.5 - 1.6 | 900 | 58 |
| Witcher 3 Stress | 2.1 - 2.2 | 1200 | 61 |
Speakers

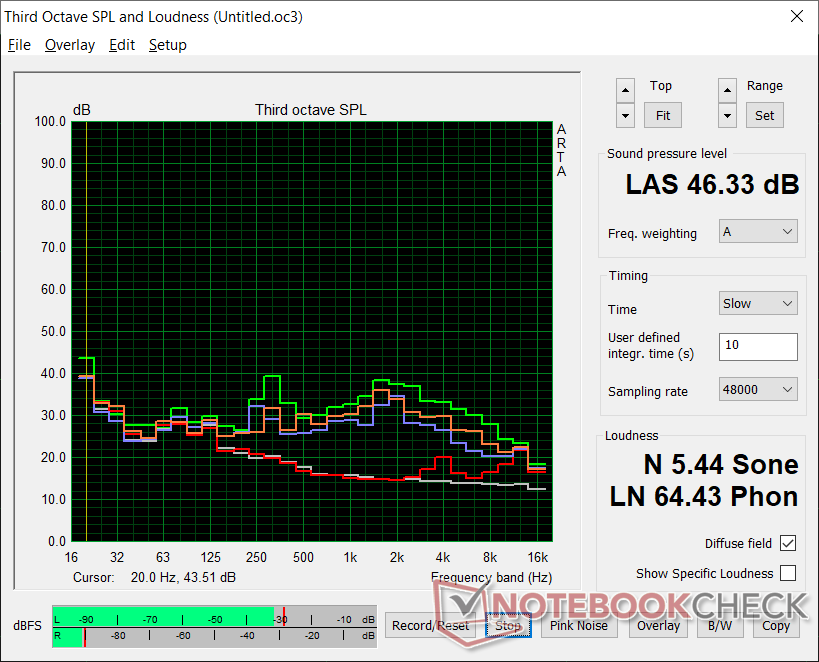
GPD Win 3 ses analizi
(+) | hoparlörler nispeten yüksek sesle çalabilir (92.6 dB)
Bas 100 - 315Hz
(-) | neredeyse hiç bas yok - ortalama olarak medyandan 22.3% daha düşük
(+) | bas doğrusaldır (5.8% delta ile önceki frekans)
Ortalar 400 - 2000 Hz
(±) | daha yüksek ortalar - ortalama olarak medyandan 6% daha yüksek
(+) | orta frekanslar doğrusaldır (6% deltadan önceki frekansa)
Yüksekler 2 - 16 kHz
(±) | daha yüksek en yüksekler - ortalama olarak medyandan 7.5% daha yüksek
(±) | Yükseklerin doğrusallığı ortalamadır (7.4% delta - önceki frekans)
Toplam 100 - 16.000 Hz
(±) | Genel sesin doğrusallığı ortalamadır (21.6% ortancaya göre fark)
Aynı sınıfla karşılaştırıldığında
» Bu sınıftaki tüm test edilen cihazların %83%'si daha iyi, 8% benzer, 8% daha kötüydü
» En iyisinin deltası 12% idi, ortalama 17% idi, en kötüsü 23% idi
Test edilen tüm cihazlarla karşılaştırıldığında
» Test edilen tüm cihazların %61'si daha iyi, 7 benzer, % 32 daha kötüydü
» En iyisinin deltası 4% idi, ortalama 23% idi, en kötüsü 134% idi
Apple MacBook 12 (Early 2016) 1.1 GHz ses analizi
(+) | hoparlörler nispeten yüksek sesle çalabilir (83.6 dB)
Bas 100 - 315Hz
(±) | azaltılmış bas - ortalama olarak medyandan 11.3% daha düşük
(±) | Bas doğrusallığı ortalamadır (14.2% delta - önceki frekans)
Ortalar 400 - 2000 Hz
(+) | dengeli ortalar - medyandan yalnızca 2.4% uzakta
(+) | orta frekanslar doğrusaldır (5.5% deltadan önceki frekansa)
Yüksekler 2 - 16 kHz
(+) | dengeli yüksekler - medyandan yalnızca 2% uzakta
(+) | yüksekler doğrusaldır (4.5% deltadan önceki frekansa)
Toplam 100 - 16.000 Hz
(+) | genel ses doğrusaldır (10.2% ortancaya göre fark)
Aynı sınıfla karşılaştırıldığında
» Bu sınıftaki tüm test edilen cihazların %7%'si daha iyi, 2% benzer, 90% daha kötüydü
» En iyisinin deltası 5% idi, ortalama 18% idi, en kötüsü 53% idi
Test edilen tüm cihazlarla karşılaştırıldığında
» Test edilen tüm cihazların %5'si daha iyi, 1 benzer, % 94 daha kötüydü
» En iyisinin deltası 4% idi, ortalama 23% idi, en kötüsü 134% idi
Energy Management
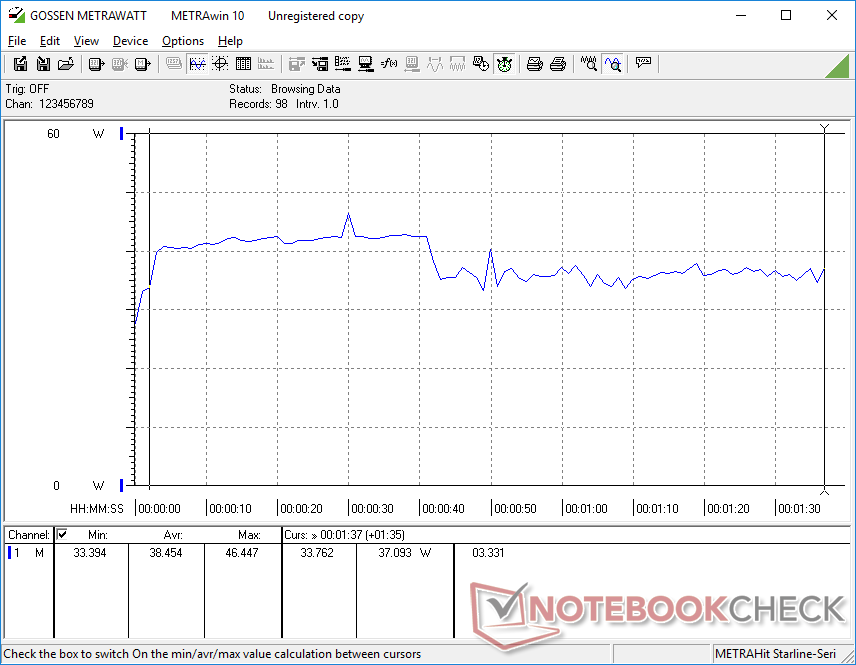
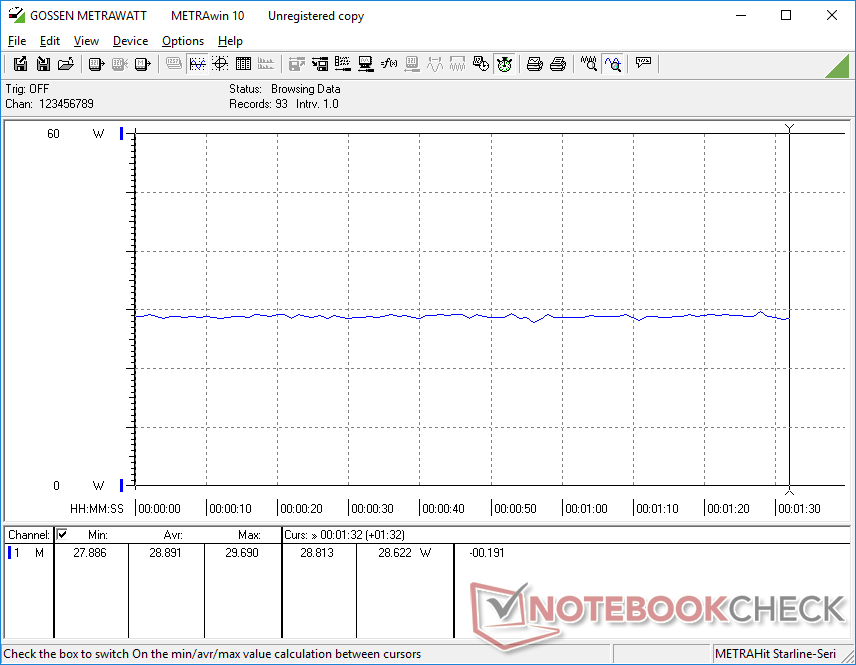
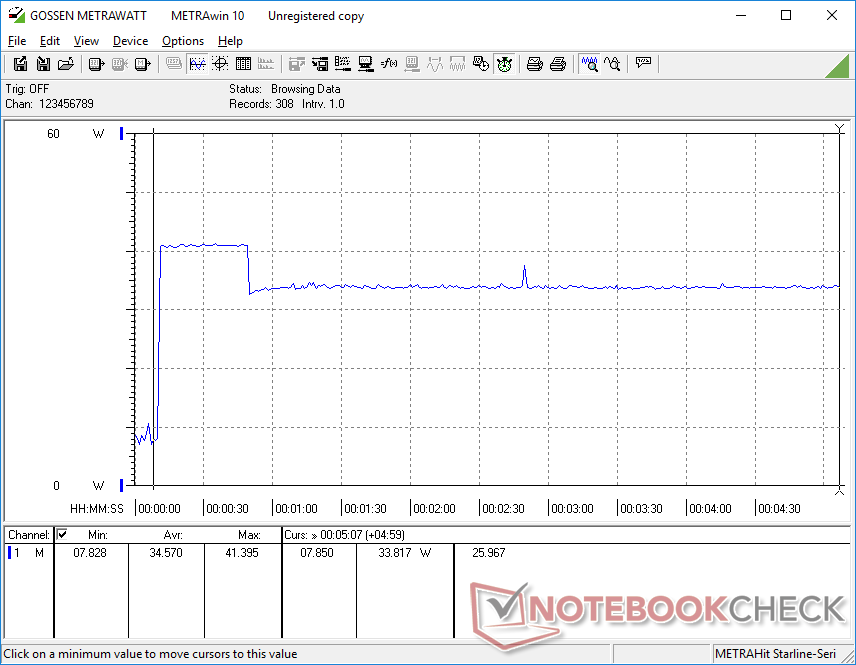
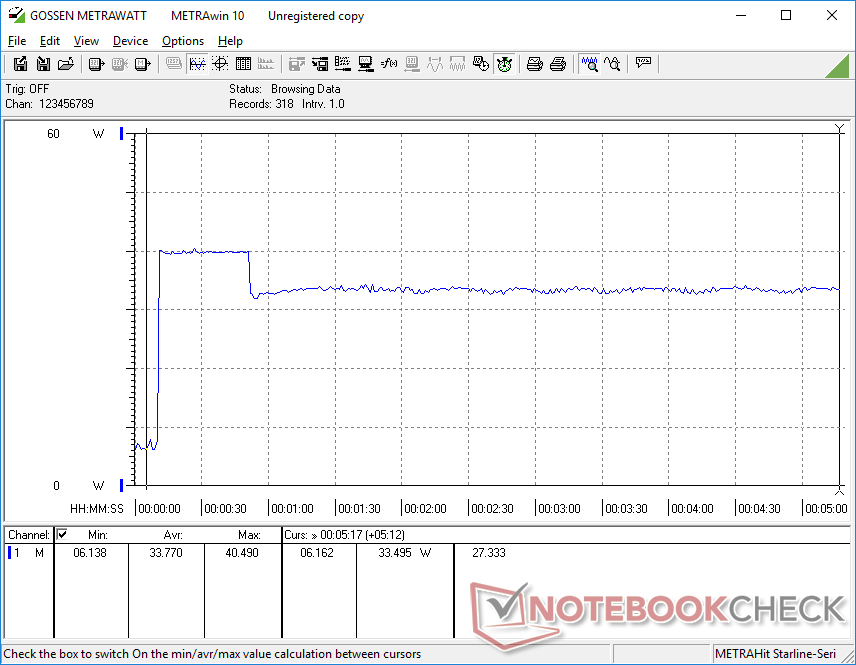
Power Consumption
Idling on desktop at the lowest brightness setting draws just under 3 W while the maximum brightness setting demands about 1.5 W more. Gaming draws between 29 W and 39 W to be even greater than many laptops running on Core i7 Ice Lake CPUs like the HP Spectre x360 13 or ZenBook 13. Results are also close to what we observed on the XPS 13 9310 with a higher-end Core i7-1165G7 CPU. This can be quite the power-hungry machine in spite of its diminutive size.
| Kapalı / Bekleme modu | |
| Boşta | |
| Çalışırken |
|
Key:
min: | |
| GPD Win 3 i5-1135G7, Iris Xe G7 80EUs, BIWIN NS200 1TB CNF82GS1G02-1TB, IPS, 1280x720, 5.5" | Dell XPS 13 9310 Core i7 FHD i7-1165G7, Iris Xe G7 96EUs, Micron 2300 512GB MTFDHBA512TDV, IPS, 1920x1200, 13.4" | Apple MacBook Air 2020 M1 Entry M1, M1 7-Core GPU, Apple SSD AP0256Q, IPS, 2560x1600, 13.3" | HP Spectre x360 13-aw0013dx i7-1065G7, Iris Plus Graphics G7 (Ice Lake 64 EU), Intel Optane Memory H10 with Solid State Storage 32GB + 512GB HBRPEKNX0202A(L/H), IPS, 1920x1080, 13.3" | Asus ZenBook 13 UX325JA i7-1065G7, Iris Plus Graphics G7 (Ice Lake 64 EU), Intel SSD 660p 1TB SSDPEKNW010T8, IPS, 1920x1080, 13.3" | Microsoft Surface Laptop 3 13 Core i5-1035G7 i5-1035G7, Iris Plus Graphics G7 (Ice Lake 64 EU), SK hynix BC501 HFM256GDGTNG, IPS, 2256x1504, 13.5" | |
|---|---|---|---|---|---|---|
| Power Consumption | -24% | -0% | -24% | -10% | -49% | |
| Idle Minimum * (Watt) | 2.9 | 3.9 -34% | 1.9 34% | 3.9 -34% | 2.4 17% | 4.4 -52% |
| Idle Average * (Watt) | 4.5 | 5.9 -31% | 6.4 -42% | 6.3 -40% | 4.6 -2% | 7.5 -67% |
| Idle Maximum * (Watt) | 4.5 | 6.3 -40% | 7 -56% | 6.8 -51% | 9 -100% | 7.8 -73% |
| Load Average * (Watt) | 38.5 | 39.7 -3% | 25 35% | 32.6 15% | 36 6% | 41.9 -9% |
| Witcher 3 ultra * (Watt) | 28.9 | 34.8 -20% | 25.6 11% | 27 7% | 40.8 -41% | |
| Load Maximum * (Watt) | 41.4 | 47.5 -15% | 30.3 27% | 59 -43% | 36 13% | 63.9 -54% |
* ... daha küçük daha iyidir
Battery Life
The integrated 44 Wh battery relatively large for a 5.5-inch portable. Standard WLAN loads can last just over 11 hours before automatic shutdown. If running 3D games, however, expect no more than 1.5 hours of play time.
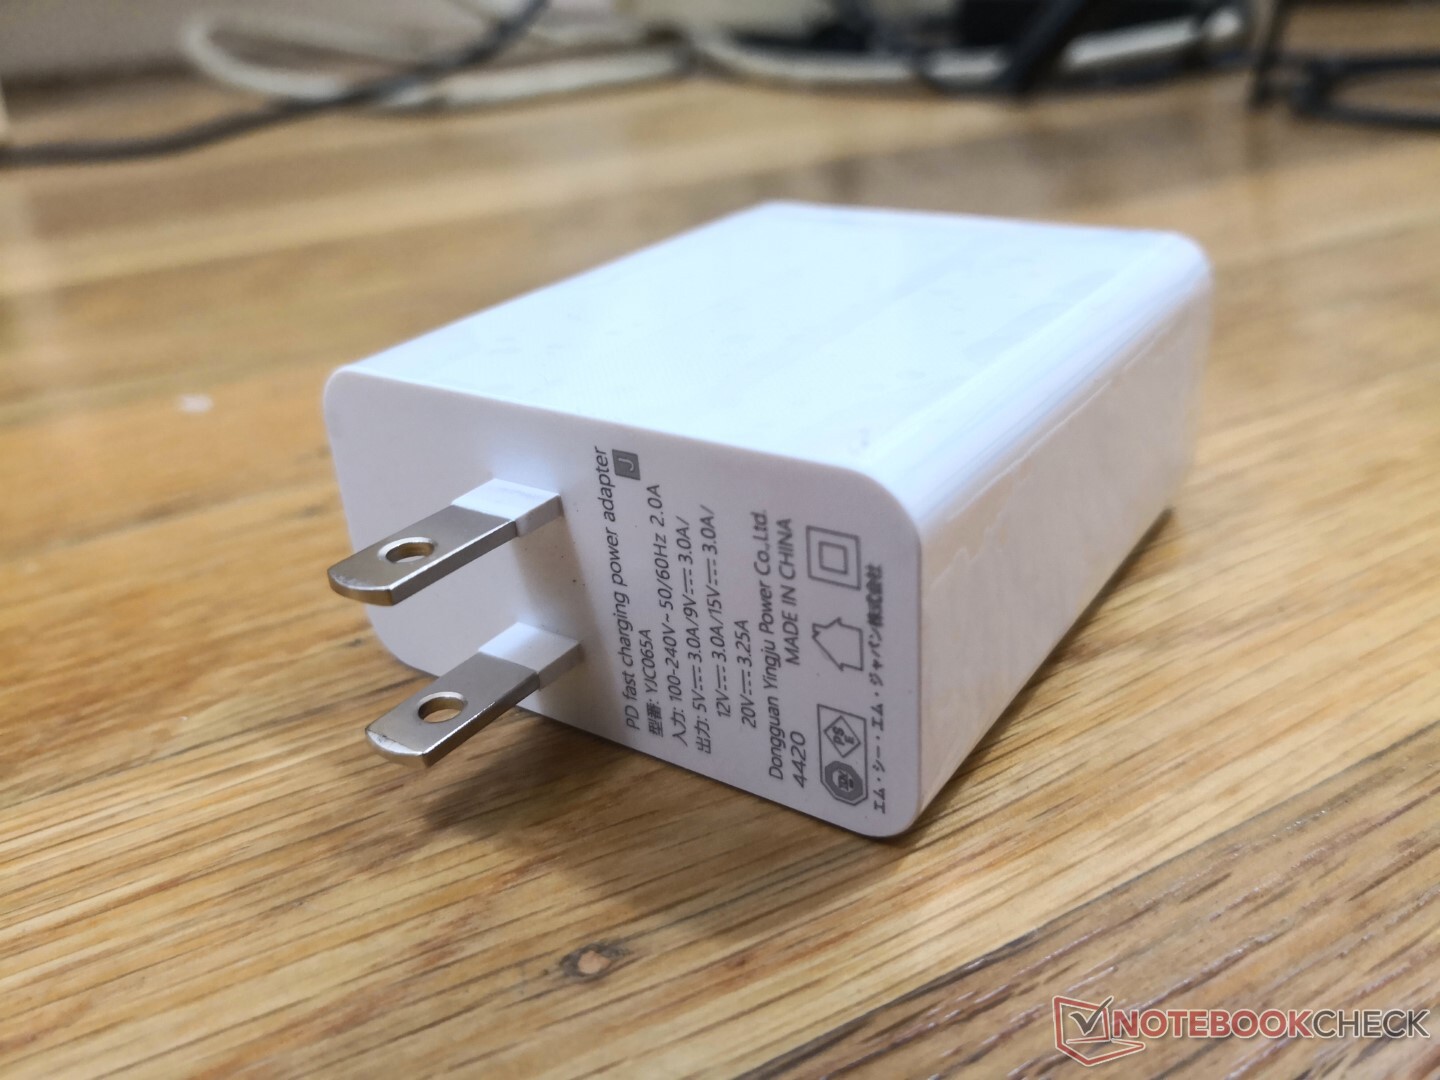
Charging from empty to full capacity takes about 1.5 hours with the included 65 W AC adapter. Almost any USB-C charger will work, but low watt adapters will charge at a much slower rate.
| GPD Win 3 i5-1135G7, Iris Xe G7 80EUs, 44 Wh | Dell XPS 13 9310 Core i7 FHD i7-1165G7, Iris Xe G7 96EUs, 52 Wh | Apple MacBook Air 2020 M1 Entry M1, M1 7-Core GPU, 49.9 Wh | HP Spectre x360 13-aw0013dx i7-1065G7, Iris Plus Graphics G7 (Ice Lake 64 EU), 60 Wh | Asus ZenBook 13 UX325JA i7-1065G7, Iris Plus Graphics G7 (Ice Lake 64 EU), 67 Wh | Microsoft Surface Laptop 3 13 Core i5-1035G7 i5-1035G7, Iris Plus Graphics G7 (Ice Lake 64 EU), 45 Wh | |
|---|---|---|---|---|---|---|
| Pil Çalışma Süresi | 72% | 42% | 48% | 80% | 10% | |
| WiFi v1.3 (h) | 11.3 | 11 -3% | 16 42% | 9.9 -12% | 13.8 22% | 8.3 -27% |
| Load (h) | 1.3 | 3.2 146% | 2.7 108% | 3.1 138% | 1.9 46% | |
| Reader / Idle (h) | 30 | 37.1 | 26.6 | 34.4 |
Artılar
Eksiler
Verdict
The Win 3 is more powerful than it looks since it is essentially running on the same hardware that powers the latest full-size Intel Evo Ultrabooks. Its integrated Thunderbolt 4 docking capabilities and upgradeable M.2 NVMe SSD only add to the versatility of the handheld.
A powerful handheld that could use some better buttons.
There are features we would love to see on potential revisions. Adaptive sync support, XBox-DualShock controller recognition toggle, higher screen-to-body ratio, webcam, and lighter weight would make the handheld even better to use.
With that said, there are a handful of annoyances that should be addressed. The random keyboard inputs, spongy controller buttons, random wake-from-sleep, and occasional stuck button make the Win 3 feel like a bargain bin controller in spite of its capable hardware within. It's not impossible to get used to, but if you're already accustomed to a standard XBox, Playstation, or Switch controller, then you'll likely wish these Win 3 buttons could have more depth and feedback.
Price and availability
The GPD Win 3 is still on Indiegogo and not yet widely available.
Price comparison

