Apple MacBook Air 2020 M1 Giriş İncelemesi: Apple M1 CPU, Intel ve AMD'yi alt üst ediyor

Yıllarca süren söylentiler ve Haziran ayında yapılan bir duyurudan sonra nihayet zaman geldi: Yeni MacBook Pro 13 ve MacBook Air ile Apple M1 işlemcili iki dizüstü bilgisayarı test ediyoruz. Yeni Air özellikle heyecan verici. Pro modeliyle aynı güçlü M1 SoC'yi sunarken, fansız soğutmasıyla sessizdir ve önemli ölçüde daha az maliyetlidir. Apple, sekiz grafik çekirdeğinden birini devre dışı bıraktığından, yalnızca en uygun fiyatlı sürümde tümleşik grafik kartının bir sınırlamasını kabul etmeniz gerekir. Bununla birlikte, GPU ve CPU'nun maksimum saat hızları karşılaştırılabilir ve gerekirse, daha büyük SSD'li daha pahalı Air modelinde sekizinci grafik çekirdeğini elde edebilirsiniz. Ağır bir prim için, Apple M1 SoC'yi 16 GB RAM ile sipariş edebilirsiniz. RAM, SoC'nin hemen yanında aynı panoya yerleştirildiği için yükseltilemez. Doğrudan rakiplerin ikisi Apple'ın kendi kampından geliyor: MacBook Pro 13, sürekli yük altında daha iyi performans için bir fan, bir Touchbar, daha büyük pil (ve ayrıca kasa) ve biraz daha parlak bir ekran. Air'in altında isteğe bağlı klavye kapağı / Magic Keyboard bulunan iPad'ler bulunur. Örneğin, Magic Keyboard ile yakın zamanda güncellenen iPad Air 4, kendisini daha kompakt bir alternatif olarak sunuyor. Bununla birlikte, 256 GB sürümü ile zaten benzer bir fiyat aralığındasınız ve klavyeli bir iPad Pro daha da pahalı. Ancak isteğe bağlı kalem operasyonu avantajına sahiptir. Daha ucuz bir Apple alternatifi olarak klavye kapaklı iPad 4'ten de bahsedebiliriz. Windows dizüstü bilgisayarlar arasında çok sayıda rakip var. MacBook Air'in en iyi rakiplerinin sürekli güncellenen bir listesini burada bulabilirsiniz. En çok bilinen cihaz, en yeni 9310 sürümü Tiger Lake ile birlikte sunulan Dell XPS 13'tür. Test ünitemizi normal ticari kaynaklardan satın aldık ve yedi çekirdekli bir GPU'ya sahip en uygun giriş seviyesi sürümüne karar verdik. Gümüş renkli 256 GB SSD ve 8 GB RAM.
Comparison of possible competitors
Derecelendirme | Tarih | Modeli | Ağırlık | Yükseklik | Boyut | Çözünürlük | Fiyat |
|---|---|---|---|---|---|---|---|
| 91.1 % v7 (old) | 01/2021 | Apple MacBook Air 2020 M1 Entry M1, M1 7-Core GPU | 1.3 kg | 16.1 mm | 13.30" | 2560x1600 | |
| 88.1 % v7 (old) | 12/2020 | Dell XPS 13 9310 Core i7 FHD i7-1165G7, Iris Xe G7 96EUs | 1.3 kg | 14.8 mm | 13.40" | 1920x1200 | |
| 87.9 % v7 (old) | 02/2021 | Lenovo ThinkPad X13 Yoga 20SX0004GE i7-10510U, UHD Graphics 620 | 1.3 kg | 15.95 mm | 13.30" | 1920x1080 | |
| 88.8 % v7 (old) | 10/2019 | Lenovo ThinkPad X395 R3 PRO 3300U, Vega 6 | 1.3 kg | 16.9 mm | 13.30" | 1920x1080 | |
| 89.5 % v7 (old) | Lenovo ThinkPad X13-20UGS00800 R7 PRO 4750U, Vega 7 | 1.3 kg | 16.9 mm | 13.30" | 1920x1080 | ||
| 90.7 % v7 (old) | 12/2020 | Apple iPad Air 4 2020 A14, A14 Bionic GPU | 458 g | 6.1 mm | 10.90" | 2360x1640 | |
| 89.3 % v7 (old) | 06/2020 | Apple iPad Pro 12.9 2020 A12Z Bionic, A12Z Bionic GPU | 641 g | 5.9 mm | 12.90" | 2732x2048 | |
| 85.4 % v7 (old) | 10/2019 | Apple iPad 7 2019 A10 Fusion, A10 Fusion GPU | 483 g | 7.5 mm | 10.20" | 2160x1620 |
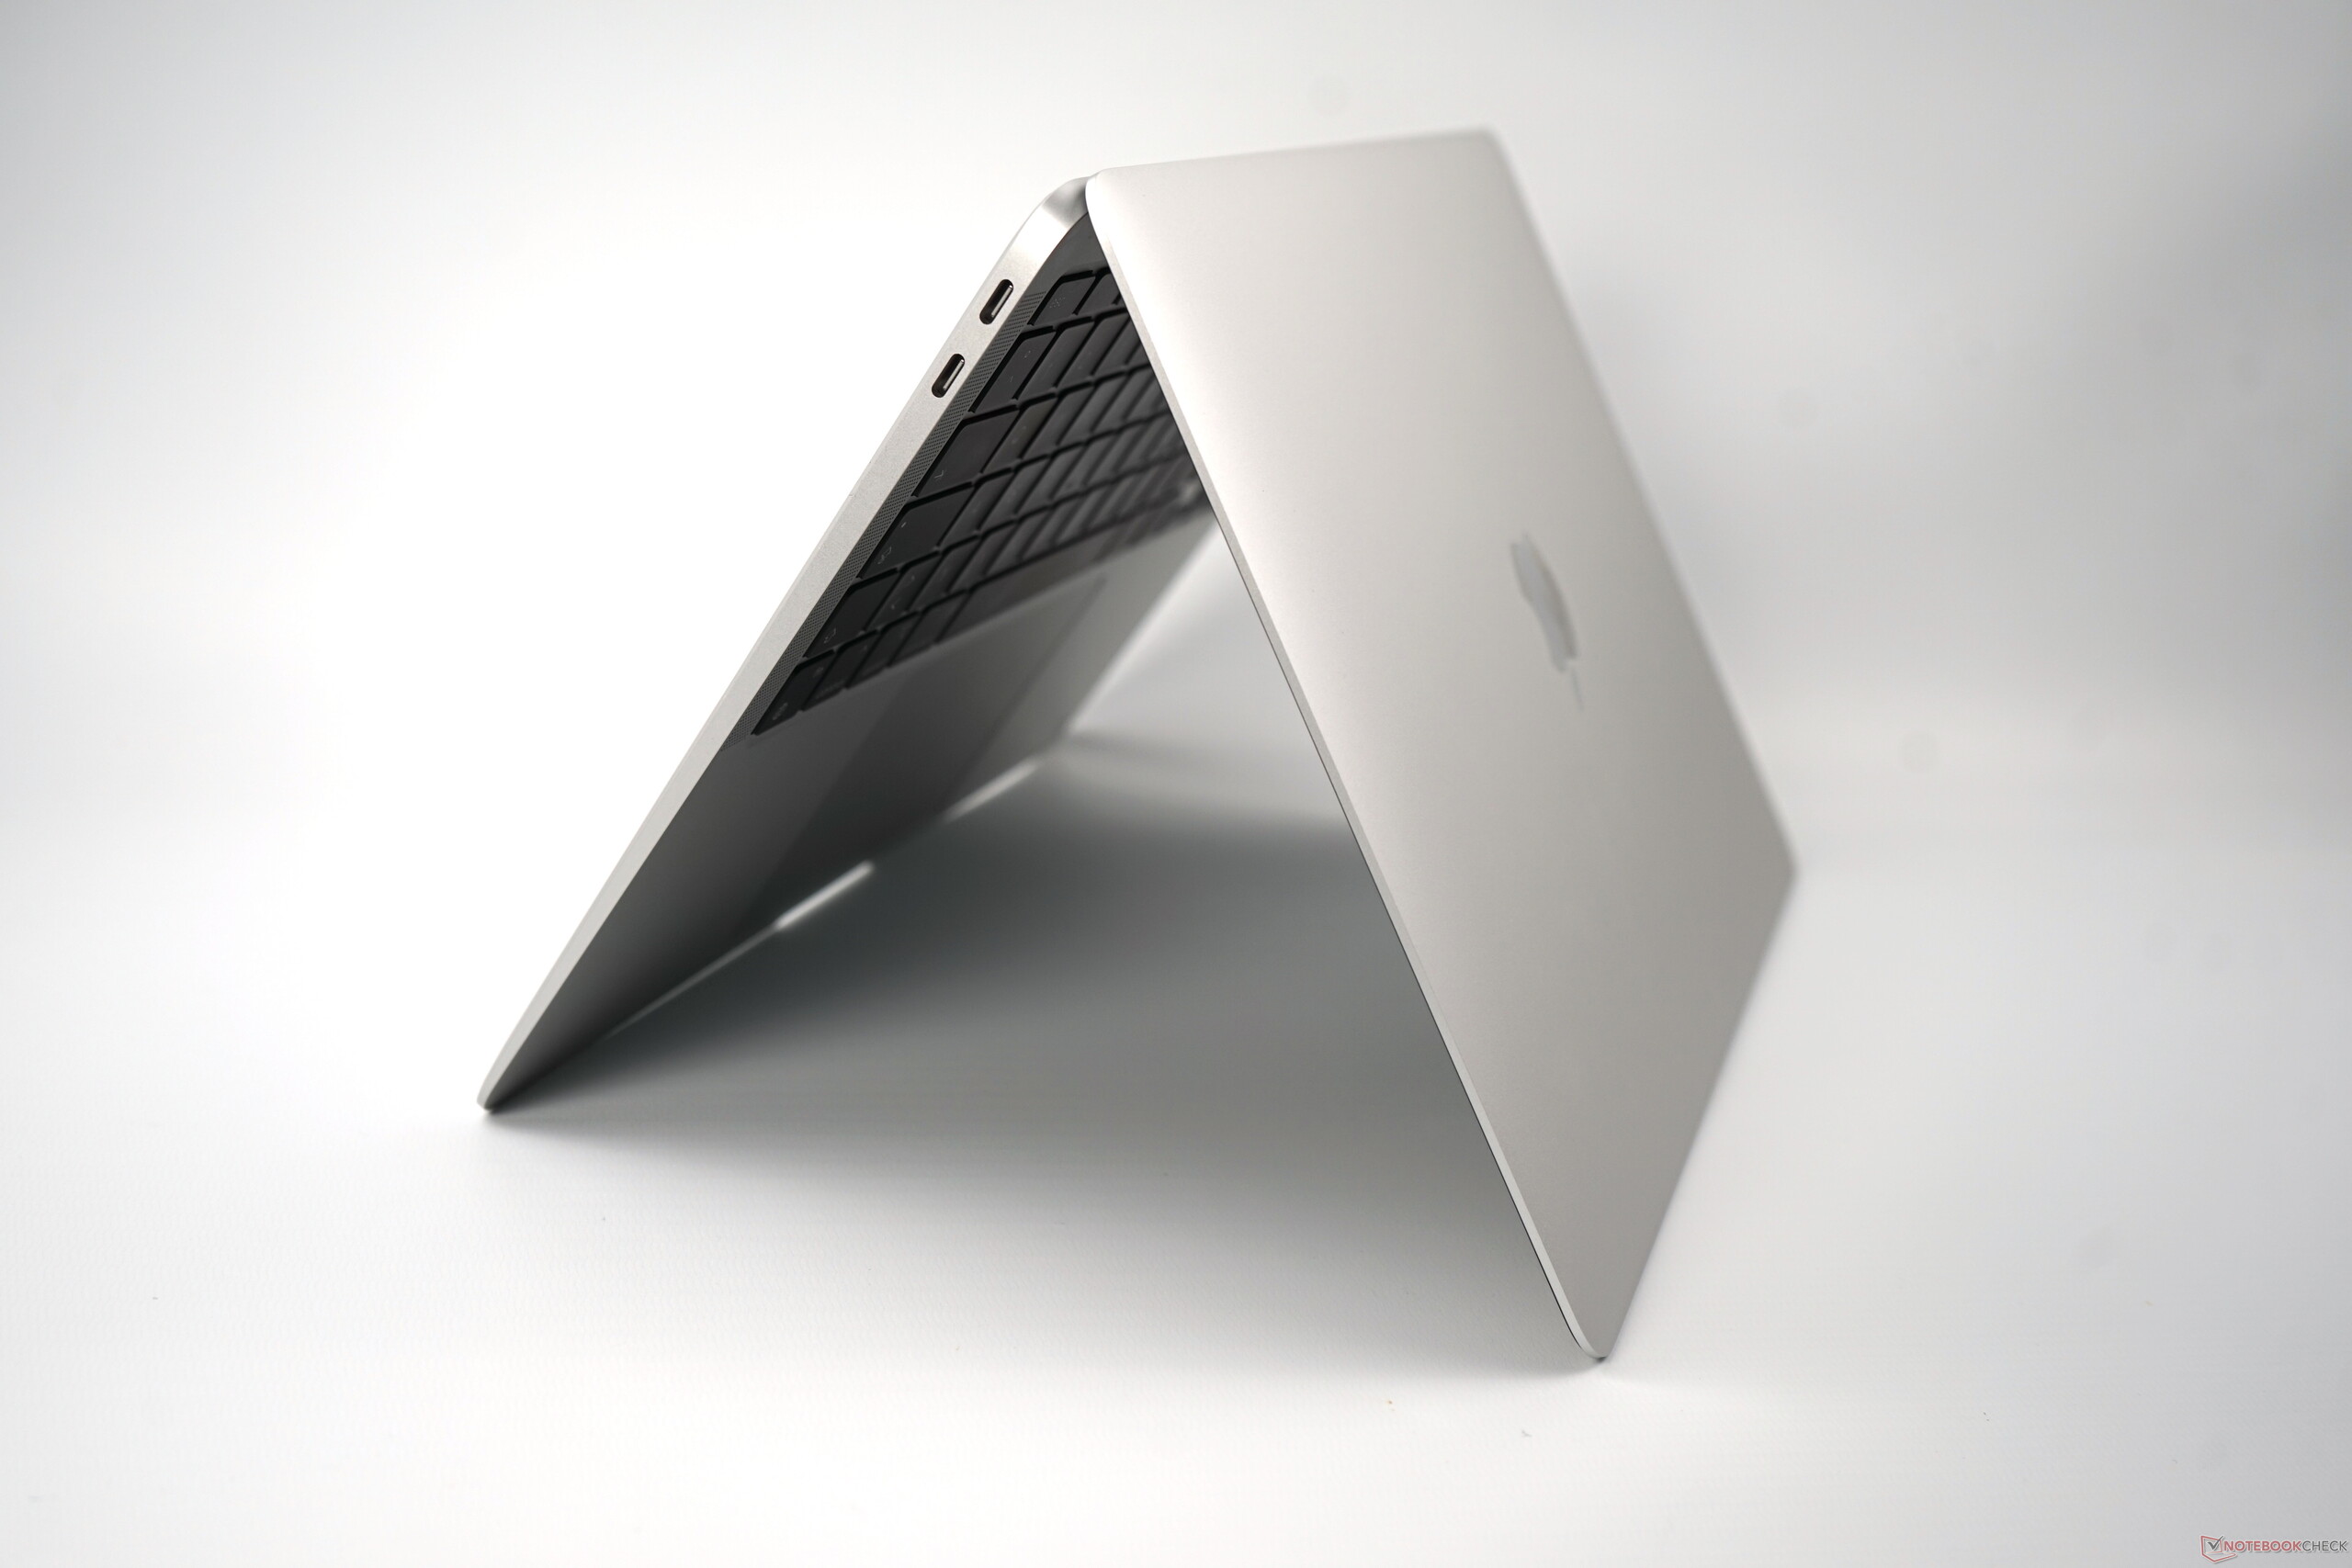
Durum
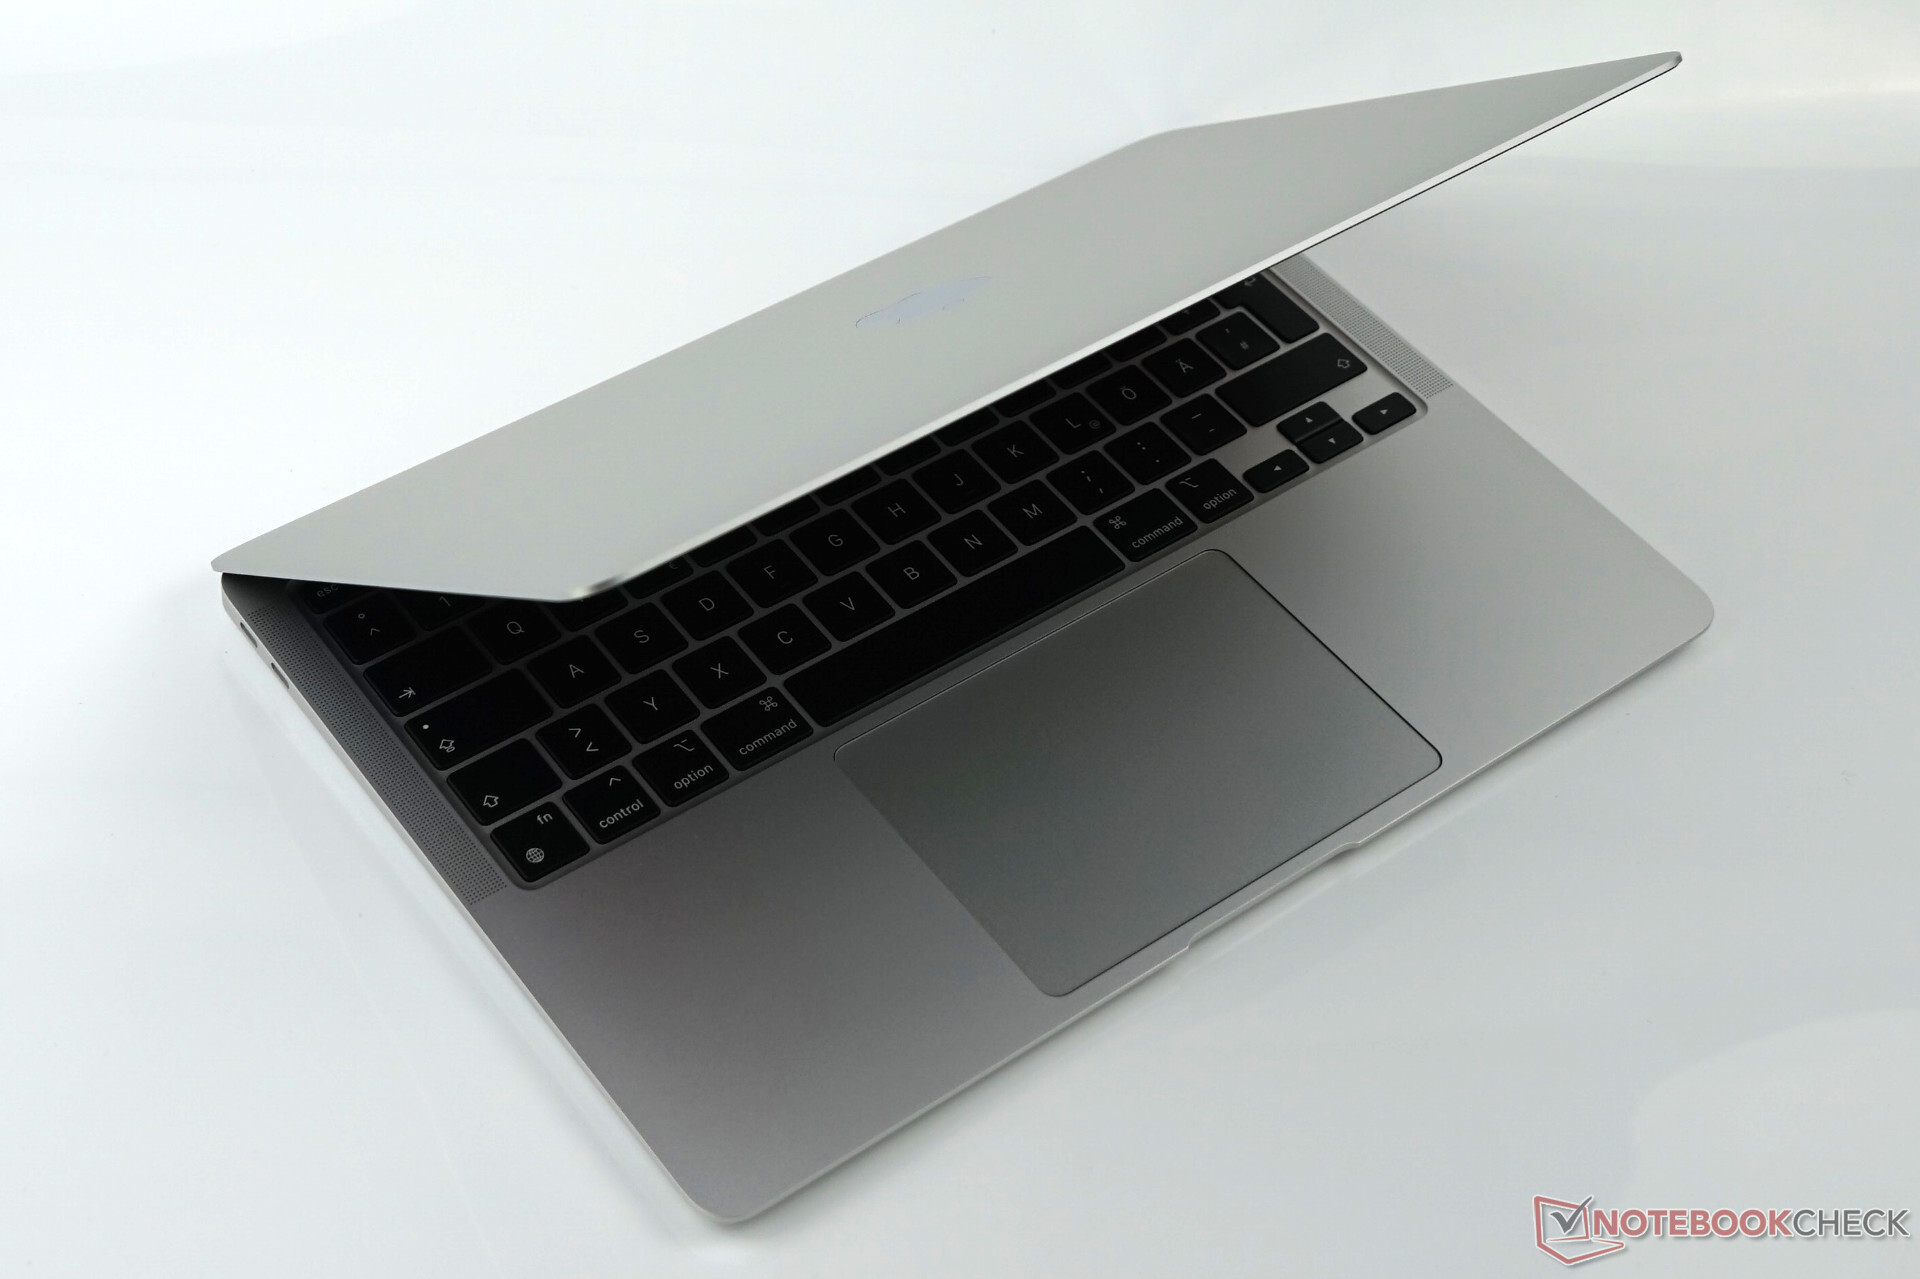
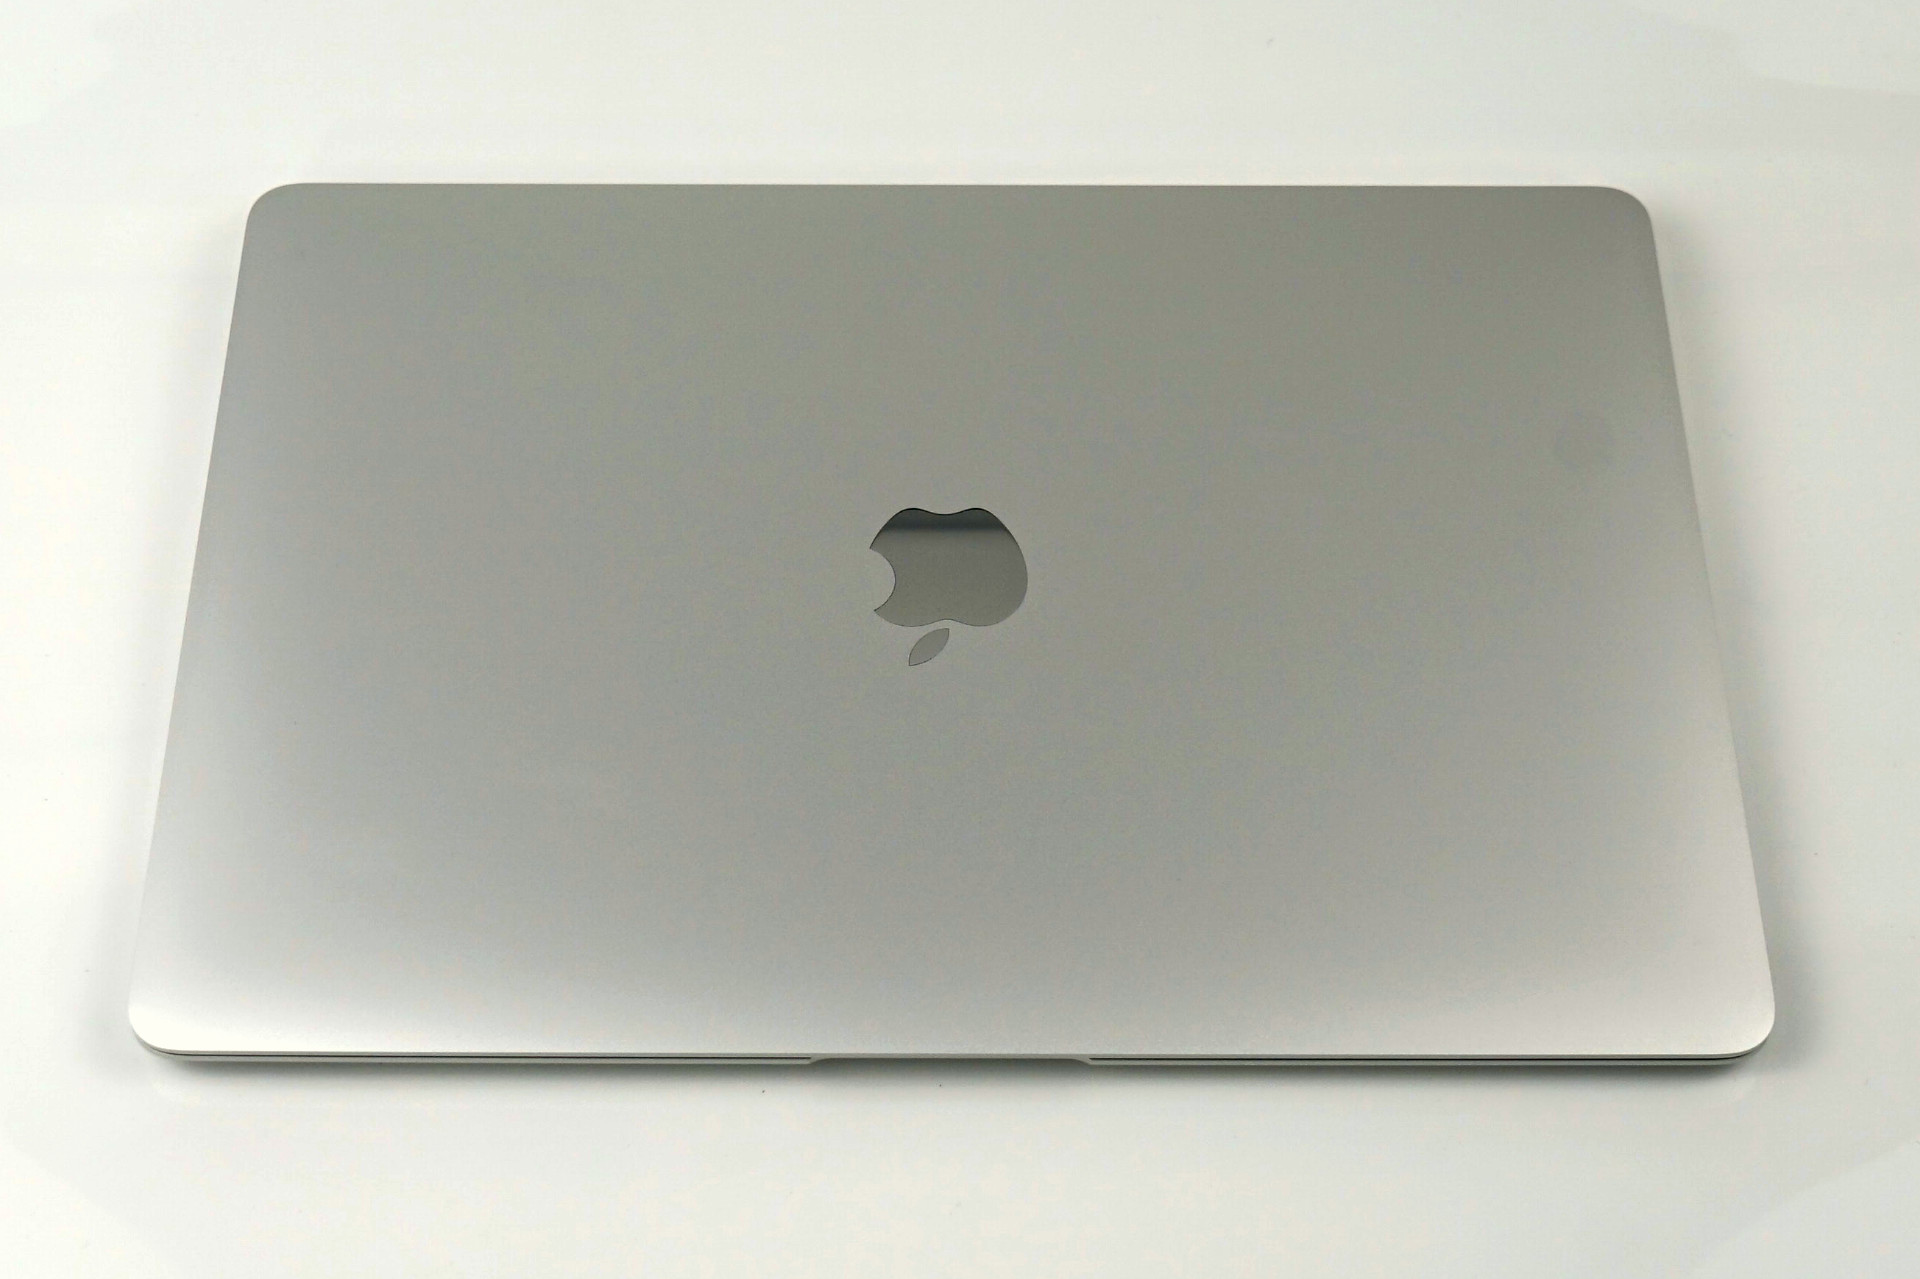
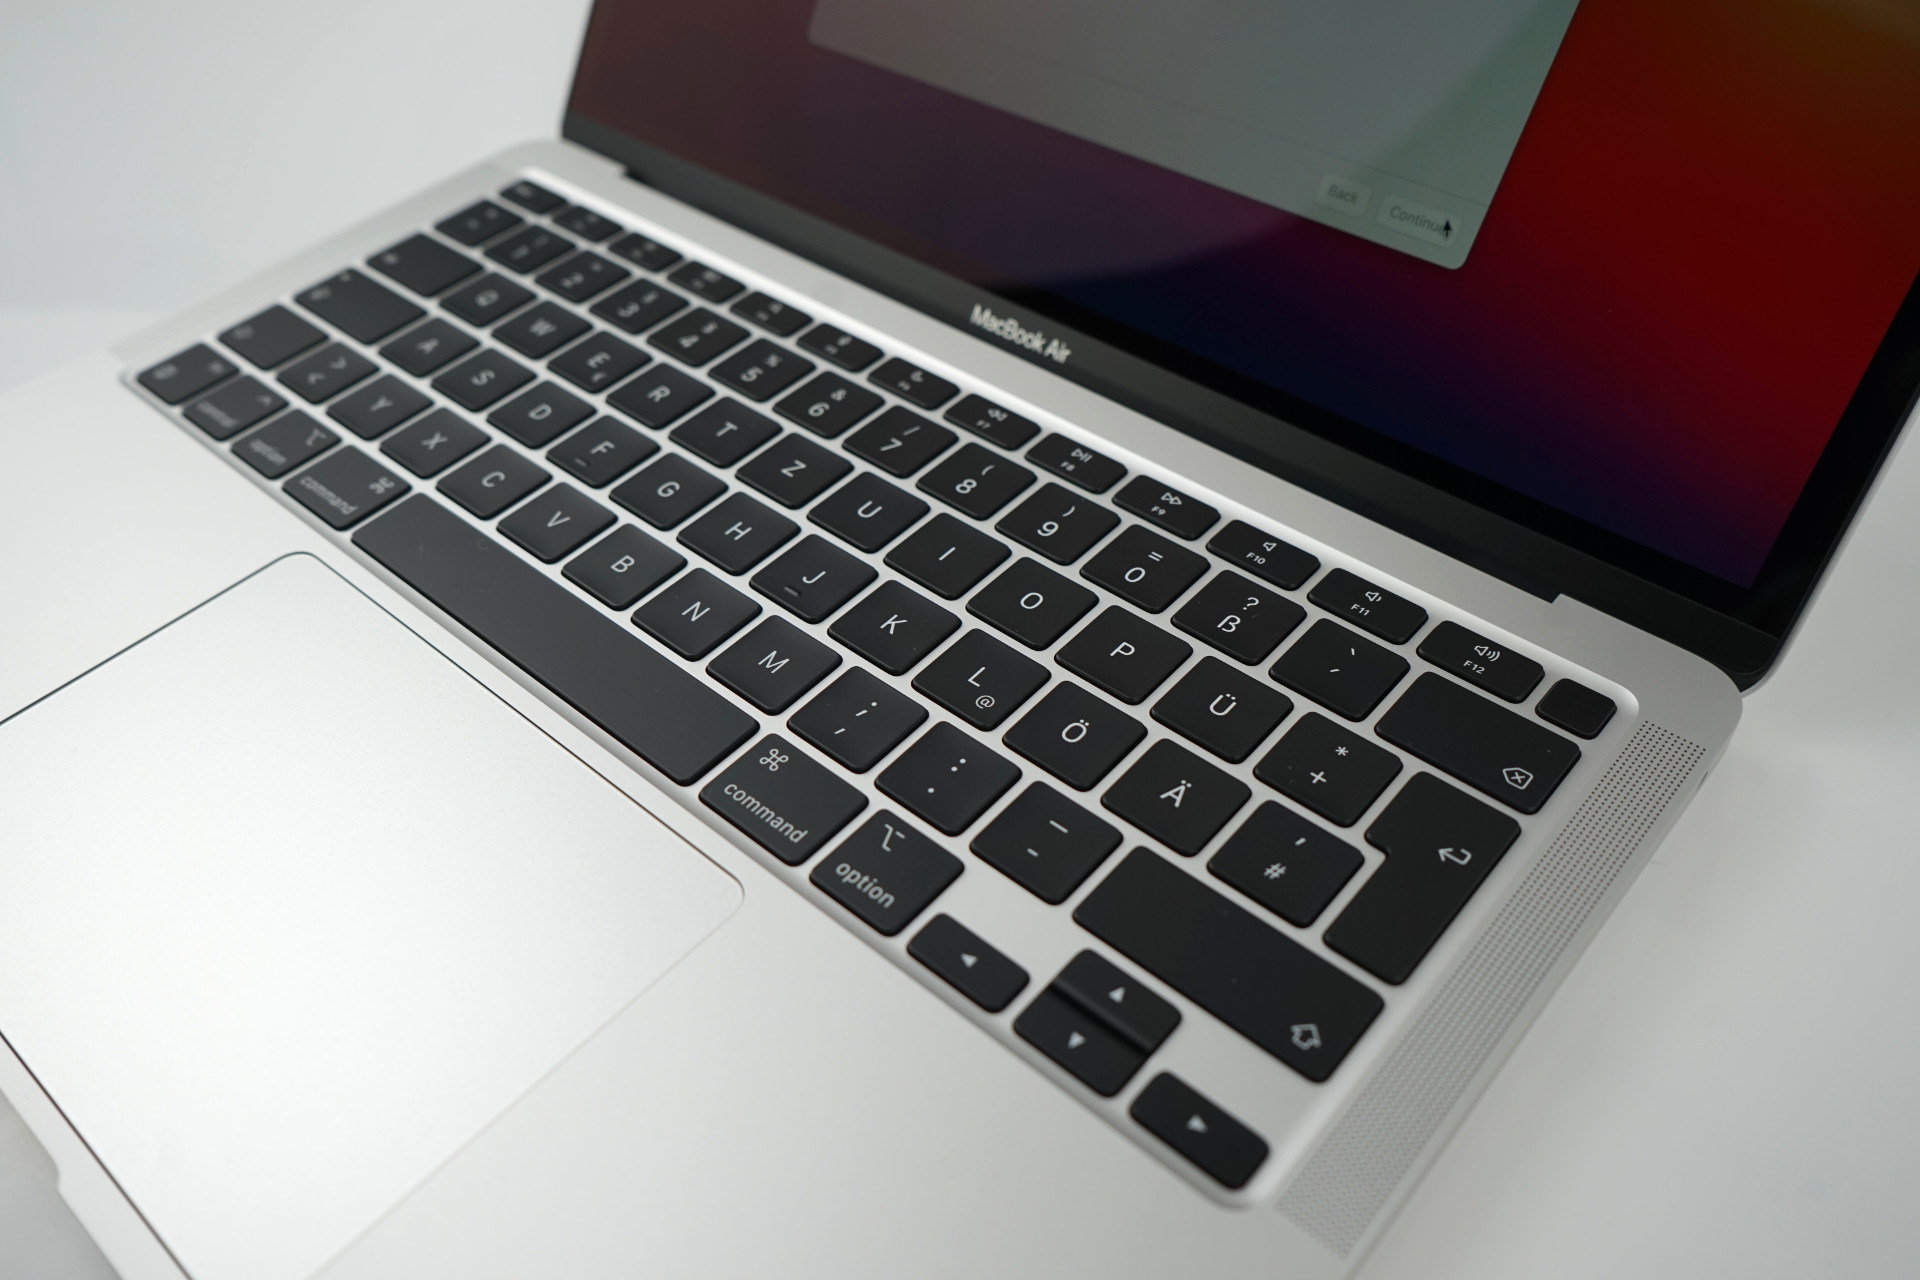
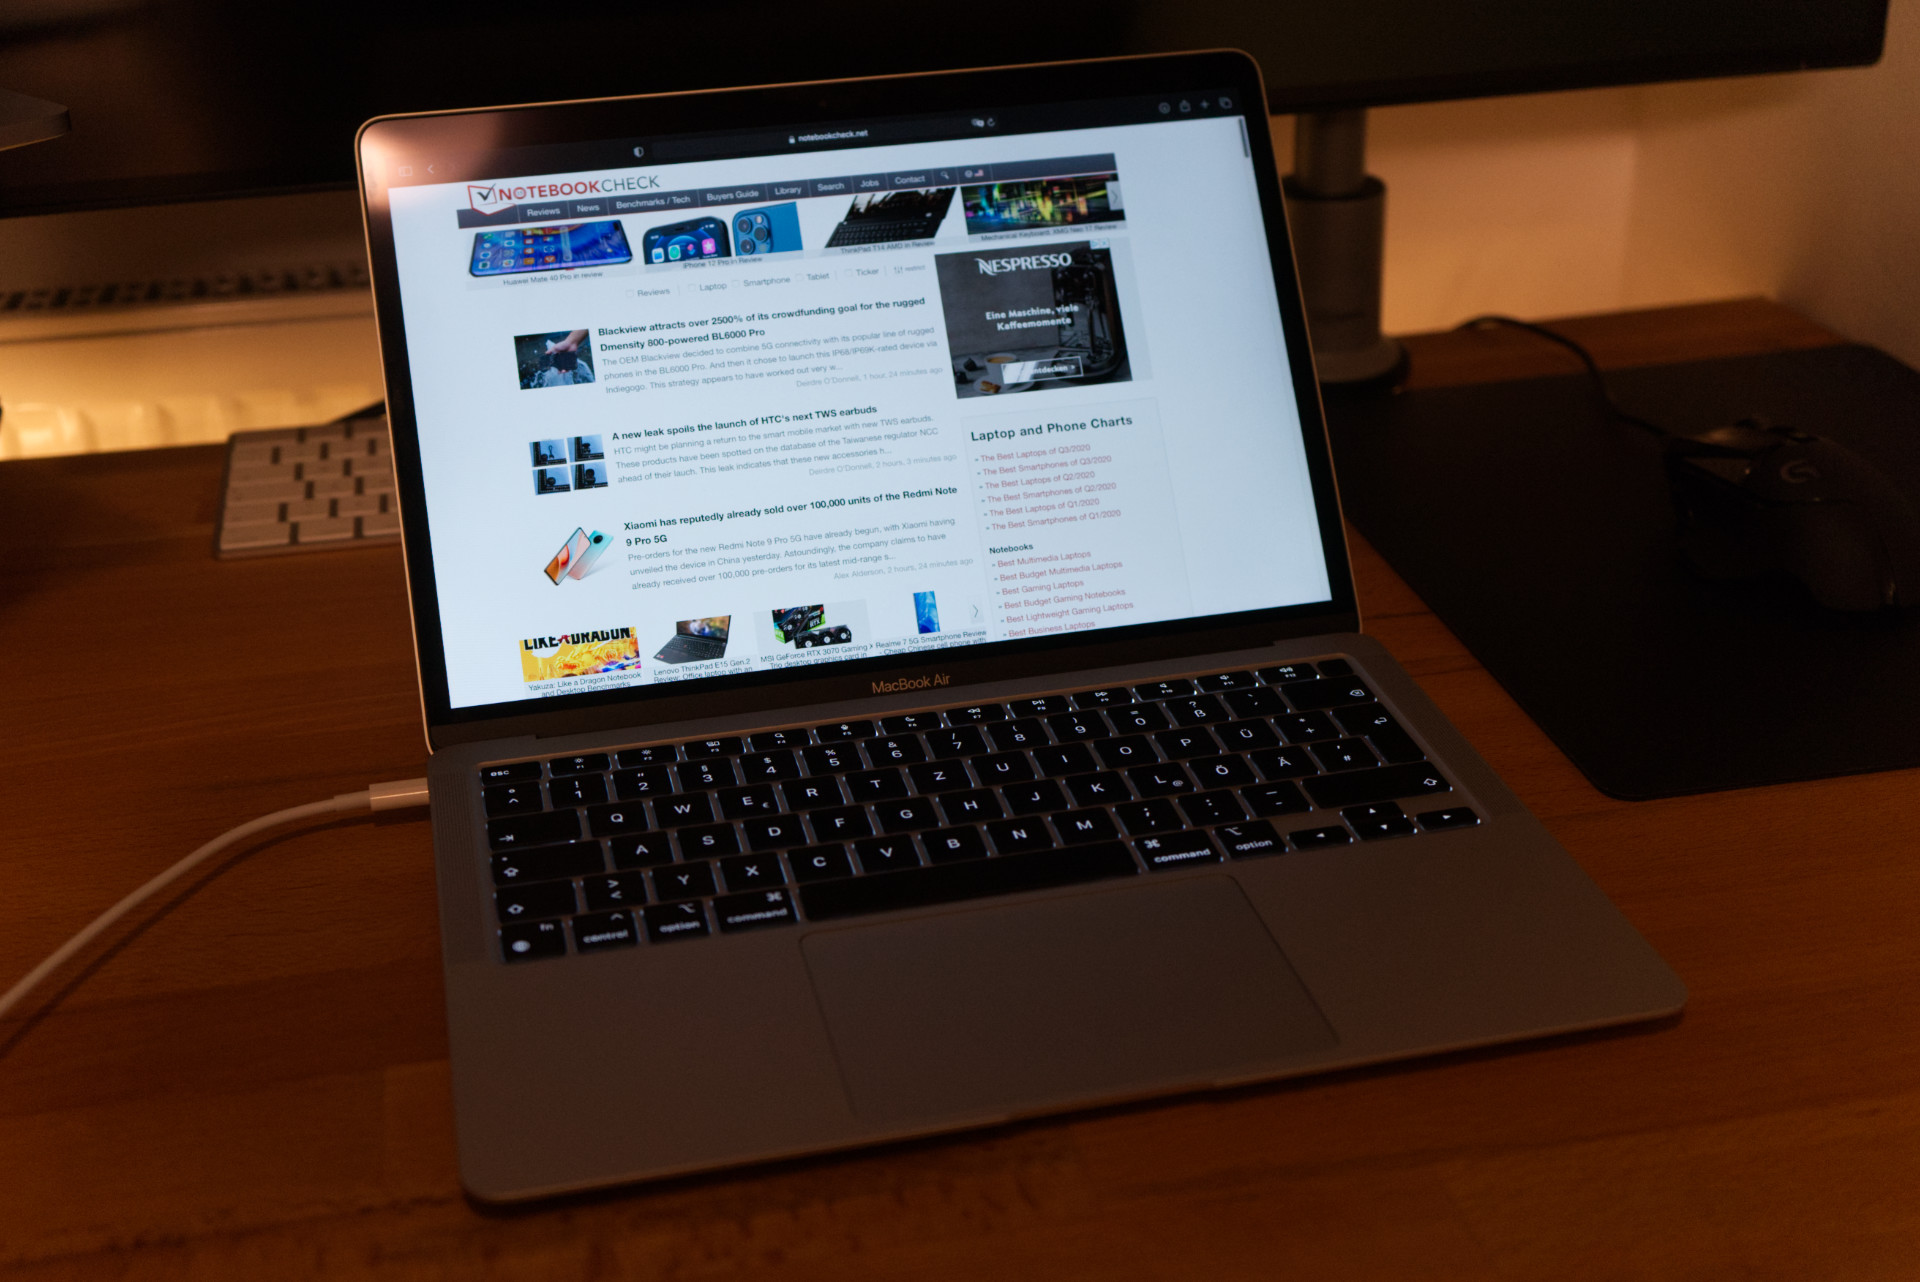
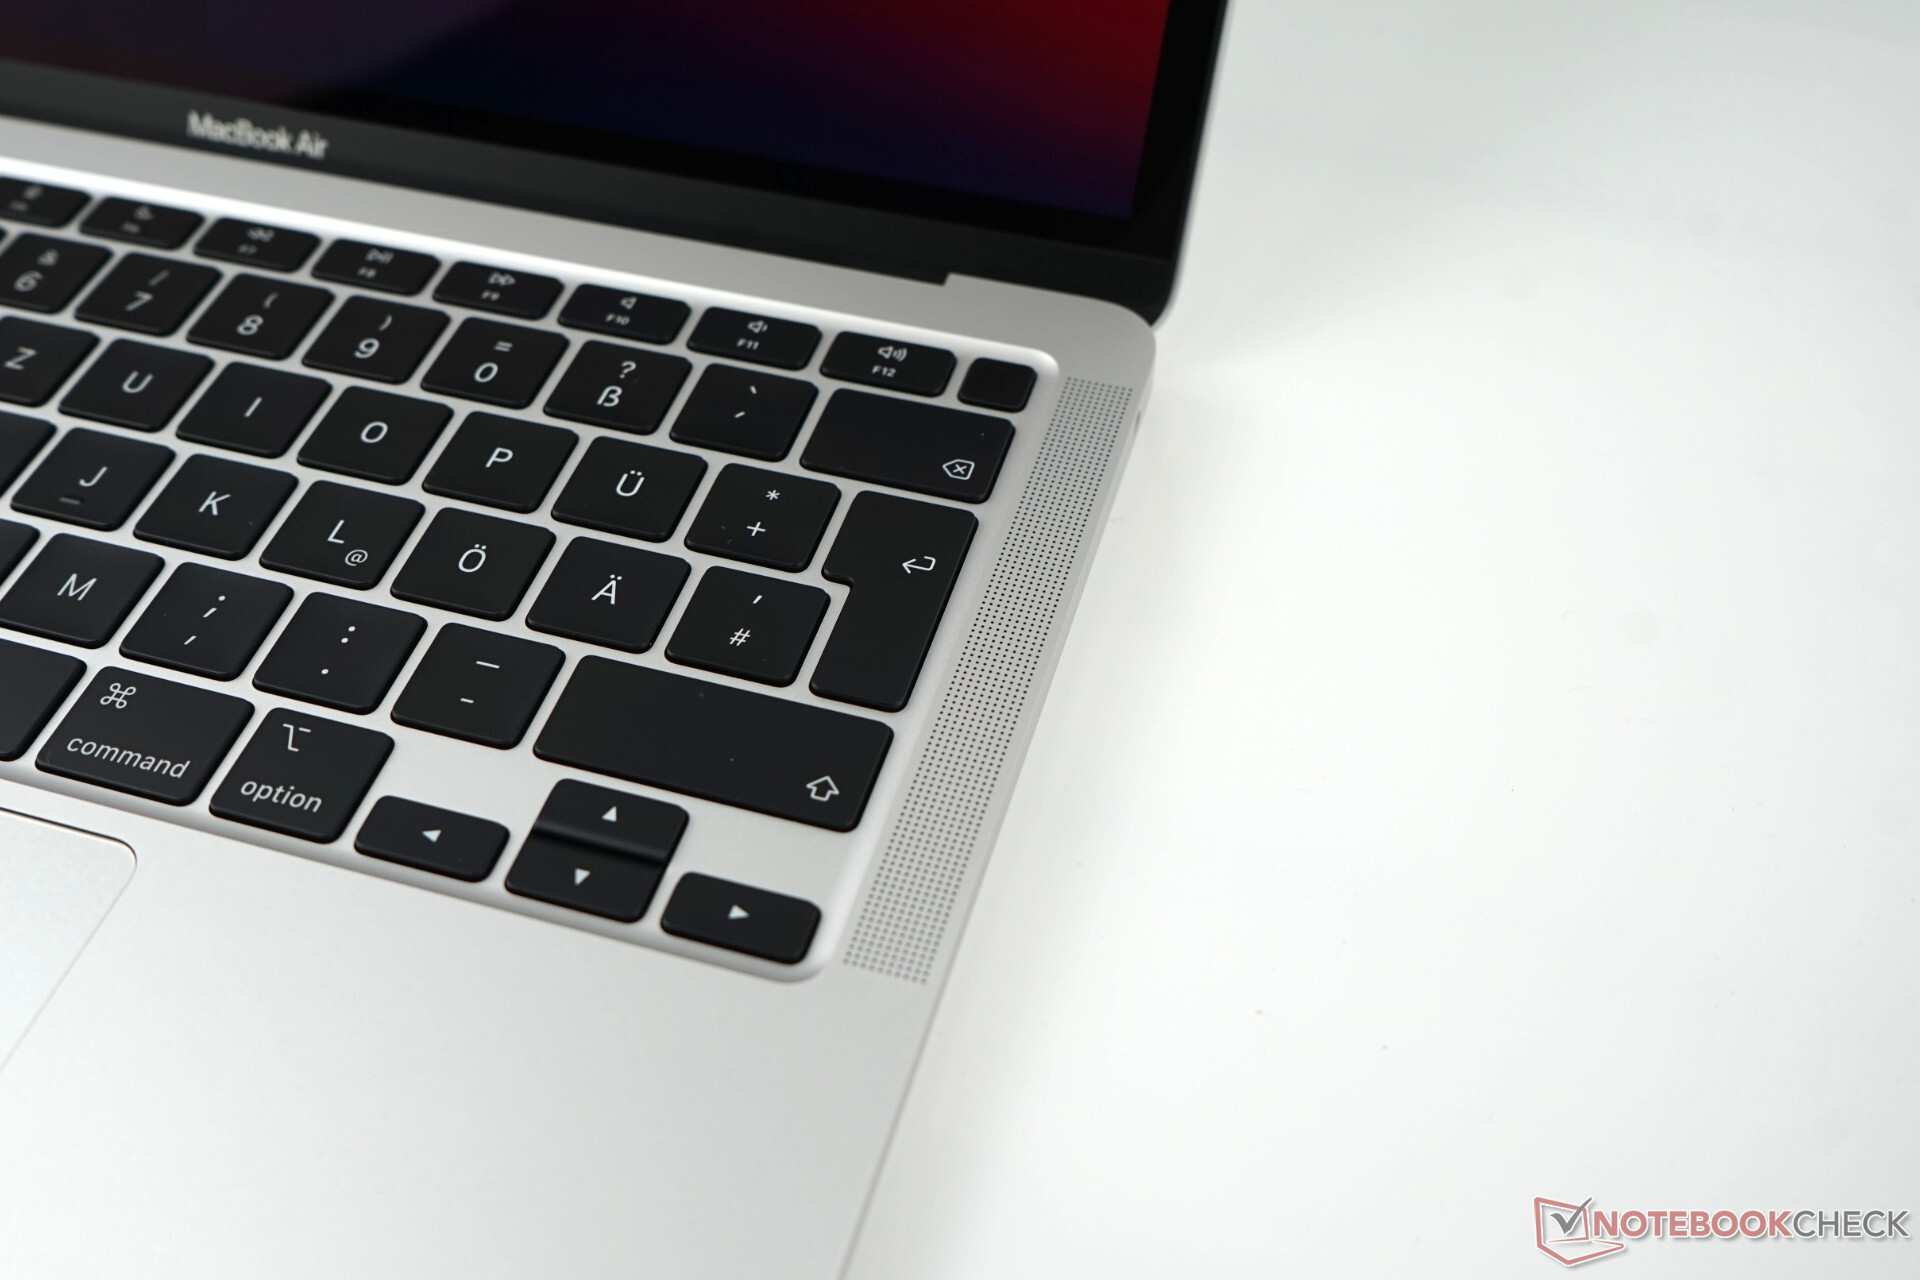
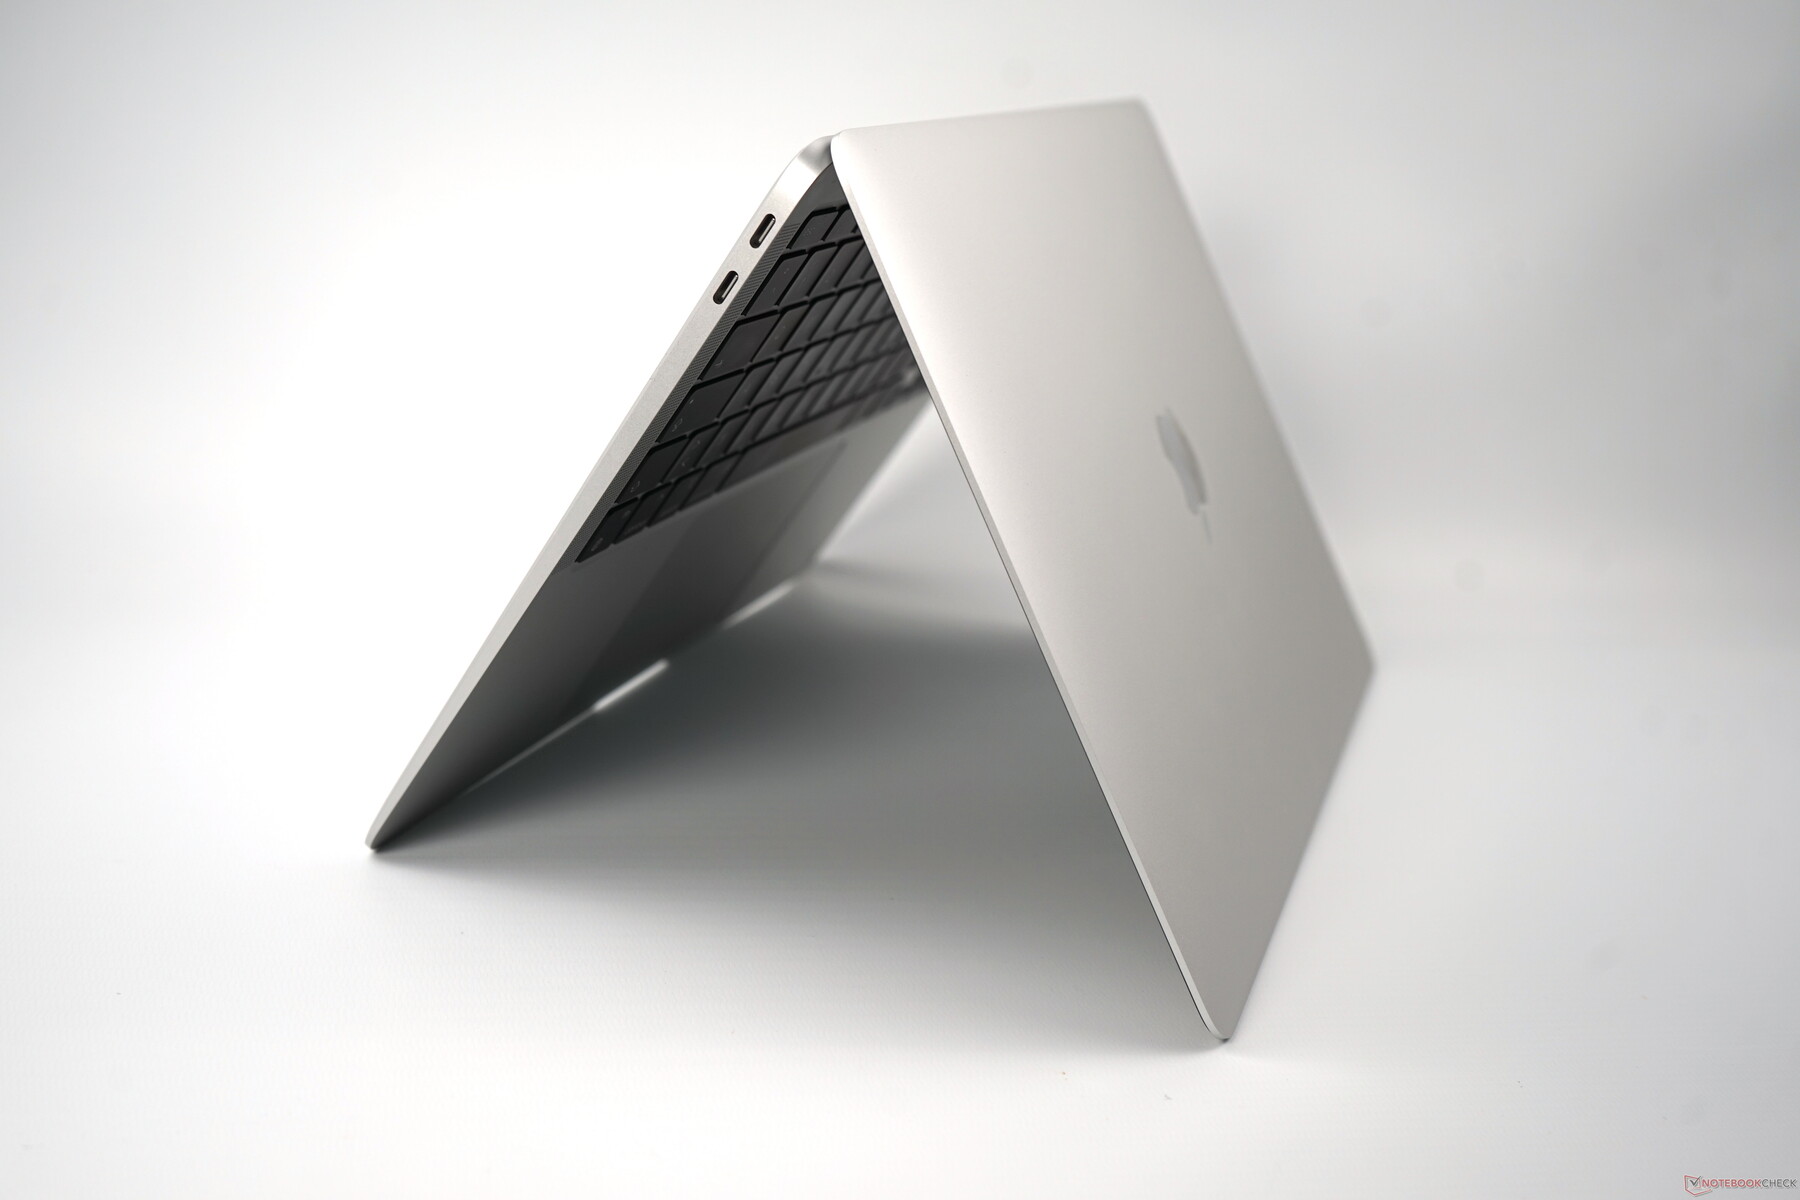
Hemen konuya gelmek gerekirse: dava açısından yeni bir şey yok. Apple yalnızca iç değerlerle ilgileniyordu ve MacBook Air'in 2020 yenilemesine kıyasla hiçbir harici değişiklik yok. Sadece büyük ekran çerçeveleri eskimiş olarak karşımıza çıkıyor. Windows dünyasında, bunlar zaten önemli ölçüde küçüldü (bkz. XPS 13). Ayrıca, Big Sur'un ayarlamaları ve IOS uygulamalarının uyumluluğu nedeniyle oldukça faydalı olabilecek bir dokunmatik ekran için boşuna bakacaksınız. Öte yandan alüminyum yekpare kasanın olumlu özellikleri devam ediyor. Çok sağlam, yüksek kaliteli ve sade tasarımı ile çekicidir. Air hiçbir şey için bir stil ikonu olarak görülmedi ve çok sayıda üretici tarafından taklit edildi. Kasanın daha ince hale gelmesi nedeniyle, Pro modellerin aksine öndeki keskin kenarlar sorun olmaktan çıkıyor.Yandaki küçük bir ayrıntı: Testimizdeki ikinci MacBook Air (sekiz çekirdekli GPU ve 512 GB ile daha pahalı model) SSD) menteşeyi hareket ettirirken hafif bir gıcırtı üretir. Giriş seviyesi test ünitemiz bu davranışı göstermiyor ve önceki nesillerin birçok test ünitesinde de hiç karşılaşmadık.
Rakiplere bakıldığında MacBook Air'in 2020'de artık boyut ve ağırlık açısından yeni standartlar belirlemediği aşikar. Bazı önemli ölçüde daha ince ve daha küçük dizüstü bilgisayarlar var. Karşılaştırılabilir bir ağırlıkta, Dell XPS 13 tüm bu ölçümlerde puan alabilir.
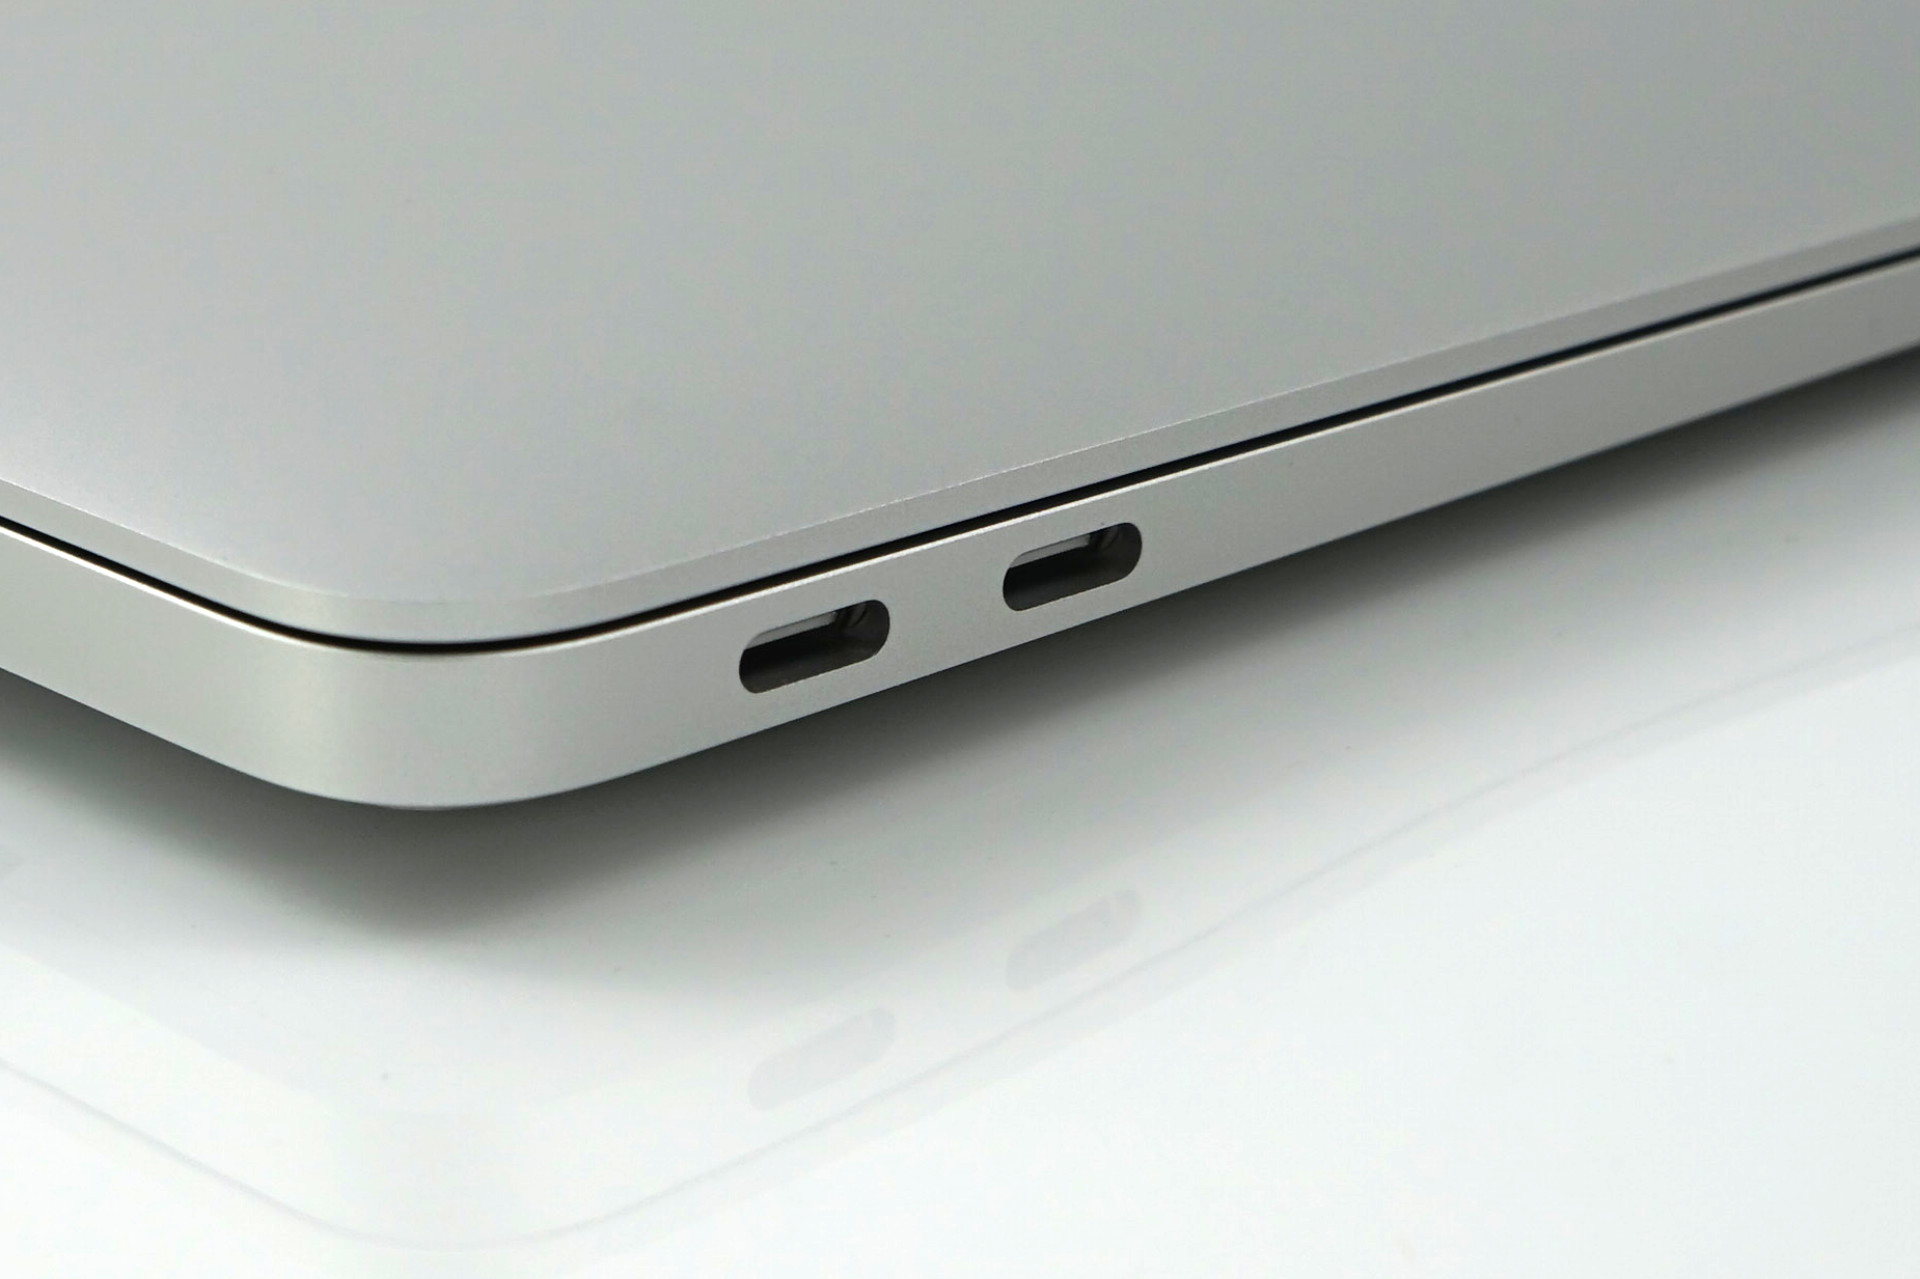
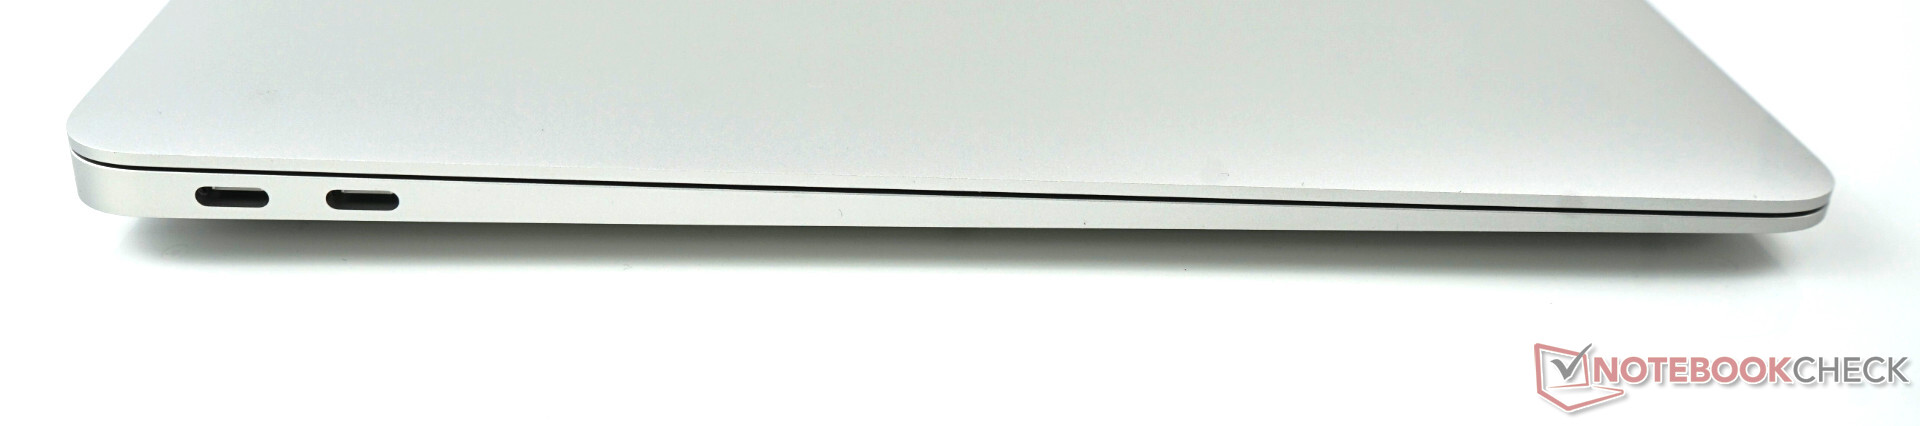
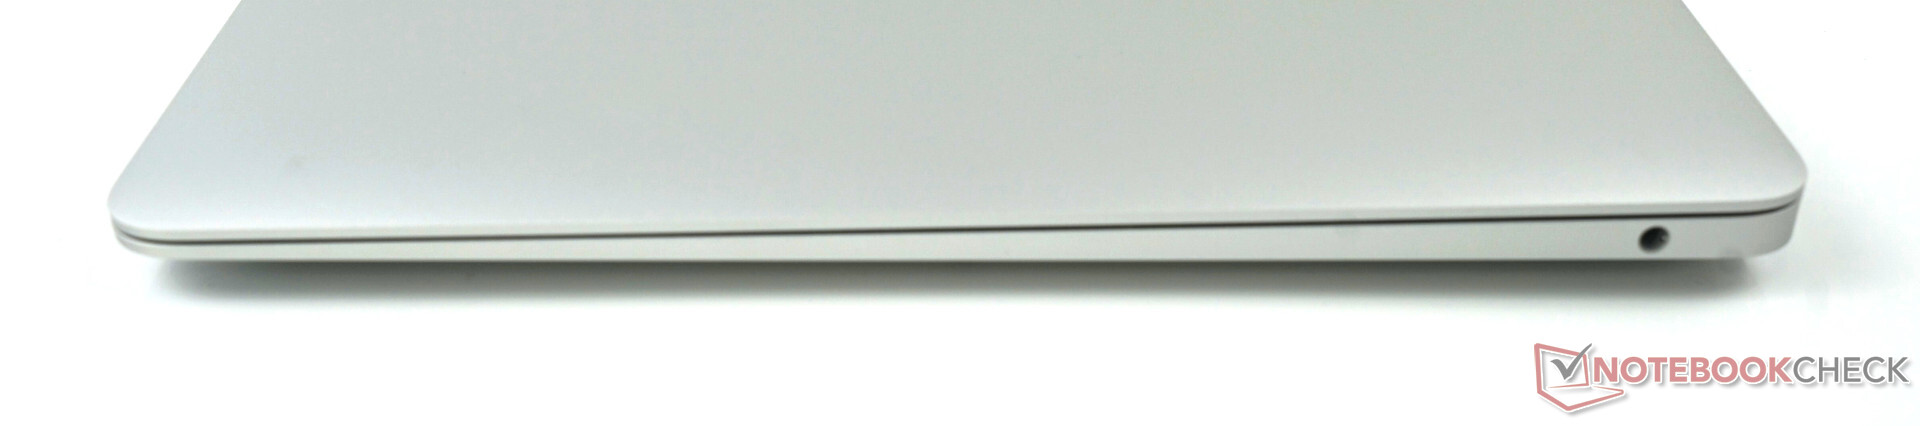
Bağlantı Ekipmanları
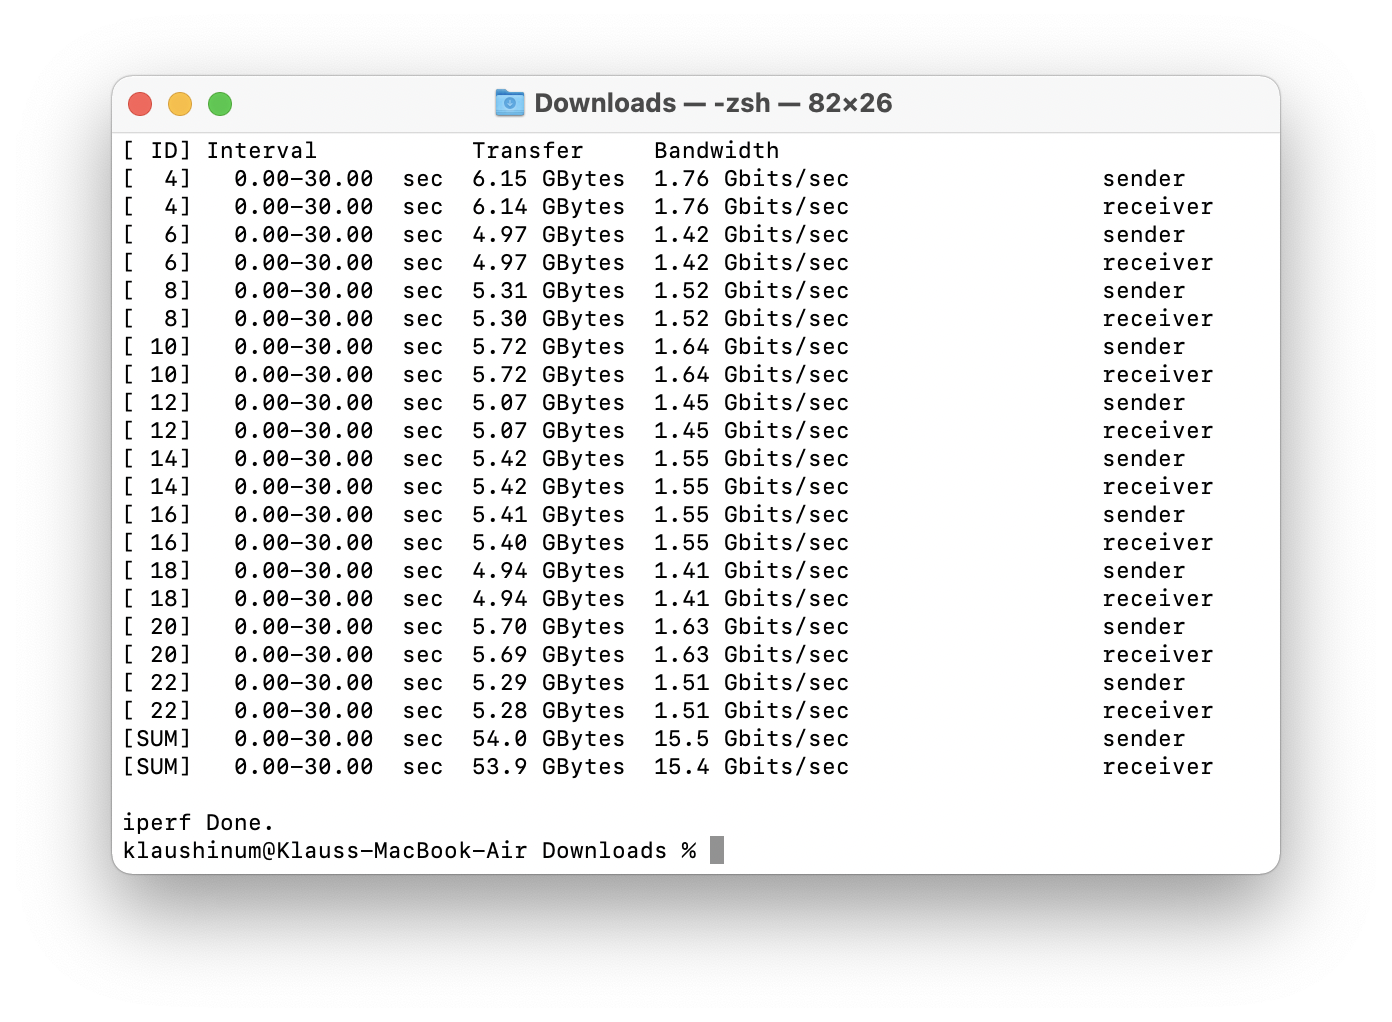
Her zamanki gibi, MacBook Air, bağlantılar açısından yalnızca yetersiz ücretler sunuyor. Neyse ki sol taraftaki iki USB-C bağlantı noktası Thunderbolt 3'ü destekliyor. Ancak uyumluluk, Intel tabanlı dizüstü bilgisayarlardan alıştığımız düzeyde değil. Birincisi olumlu: her iki bağlantı noktası da şarj için kullanılabilir ve çeşitli şarj cihazlarıyla (MBP16, Anker, Philips USB-C Monitör) testimizde kusursuz bir şekilde çalışabilir. Her iki bağlantı noktası da DisplayPort olarak kullanılabilir, ancak MacBook Air'deki M1 yalnızca tek bir ek monitörü destekler. Testimizde, 60 Hz'de 4K, Philips Brilliance 329P9H ve ayrıca bir LG 4K monitör ile mükemmel bir şekilde çalıştı. Bununla birlikte, bir Asus PB287Q yalnızca 4K'da 30 Hz'de çalışıyordu ve ayrıca internette bazı izole sorunları duyabilirsiniz. Bu noktada, harici Thunderbolt aksesuarları henüz güvenilir bir şekilde kullanılamıyor. Harici grafik kartları henüz desteklenmiyor (görünüşe göre, Mantiz Venus ile test edilen AMD'den bir ARM sürücüsü yok) ve Mantiz Titan TB Dock da en iyi ihtimalle yalnızca parçalar halinde çalıştı ve güvenilmezdi. USB 3.2 Gen 2 cihazlarının veri hızları da Intel tabanlı Thunderbolt cihazlarınkilerle karşılaştırılamaz. Görünüşe göre USB 4 yalnızca 10 Gbit / sn'lik en düşük sürümde destekleniyor, ancak Thunderbolt 3 ile daha yüksek veri hızlarına (örneğin, ağ testinde 15,4 Gbit / sn) ulaşabilirsiniz. Ayrıca kulaklık bağlantı noktasından bahsetmeyi de unutmamalıyız. sağ tarafta, çekici kalitesini beğendik (bundan sonra daha fazlası).
İletişim
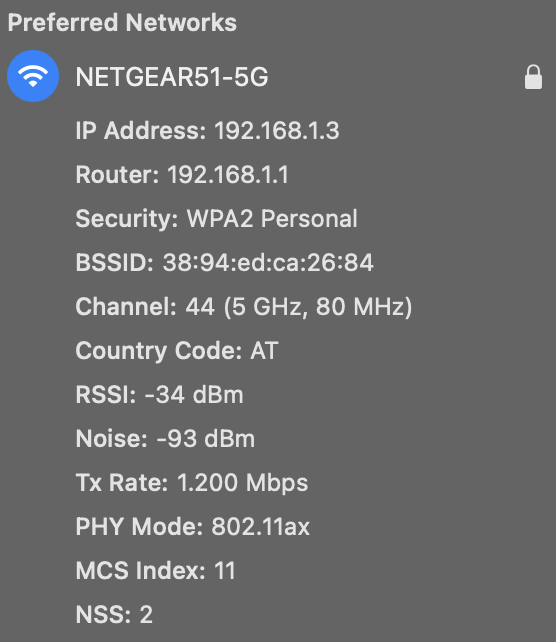
Apple M1'e geçişle birlikte nihayet WiFi 6 olarak da bilinen 802.11ax desteği geldi. Ancak, Netgear Nighthawk Stream RAX120 yönlendiricimizle yapılan testte, Air yalnızca 80 MHz ve maksimum 1200 Mbit / s hızda bağlanabildi. Bu, testimizde bir WiFi 6 cihazı için çok zayıf veri hızlarına yol açtı. Karşılaştırmamızda, Asus PCE-AX58BT WiFi 6 kartı (Intel AX200 Çipini kullanan) bundan hemen sonra 1.5 Gbit / s elde etti. Rakip dizüstü bilgisayarlar karşılaştırıldığında, örneğin XPS 13 önemli bir avantaja sahipti. Önceki modele (yalnızca Wifi 5) kıyasla neredeyse hiçbir avantajı olmasa da, en azından MacBook Air iPad Air 4'ü biraz geride bırakabiliyor (muhtemelen daha iyi antenler nedeniyle).
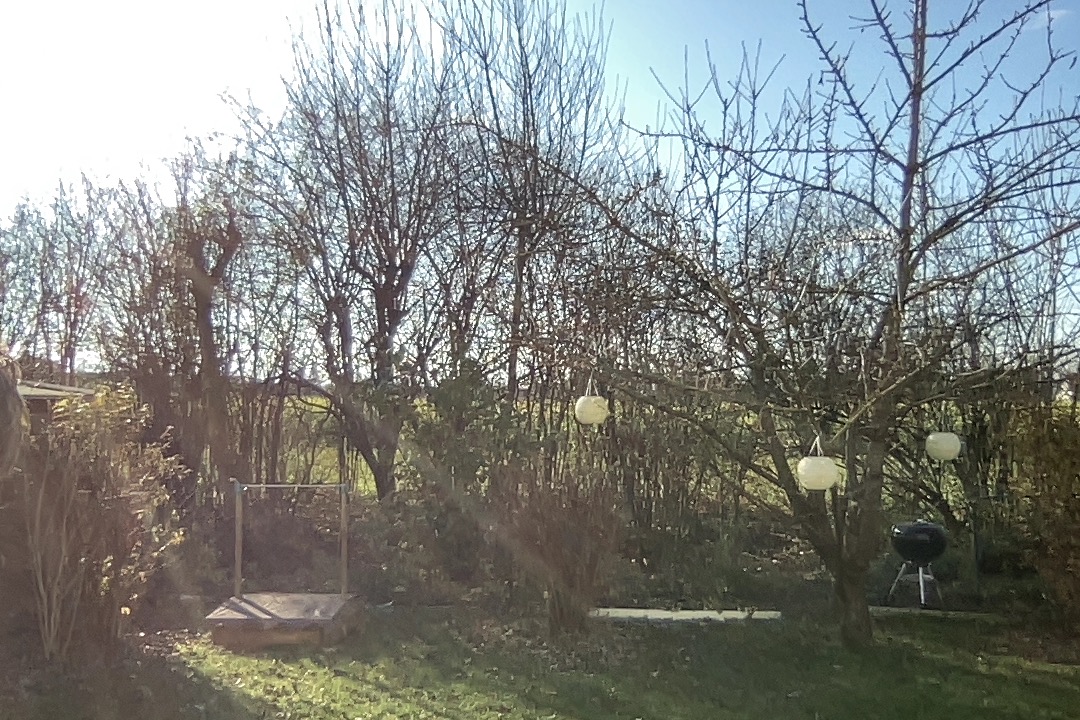
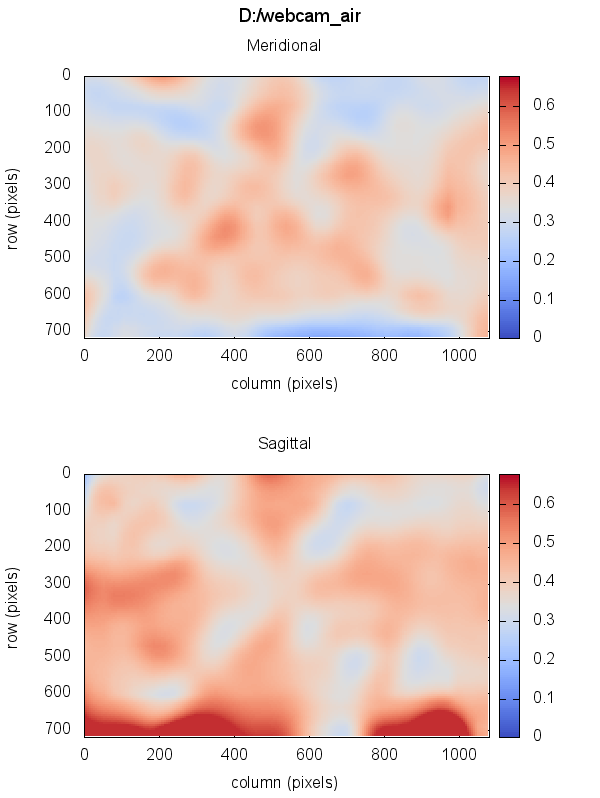
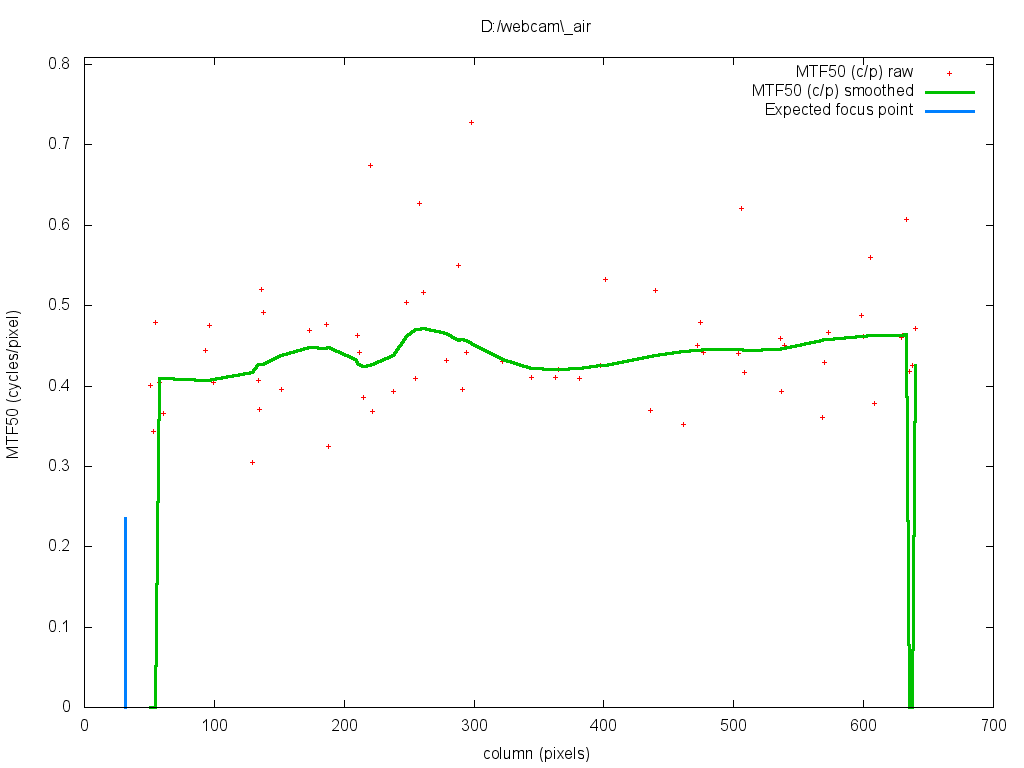
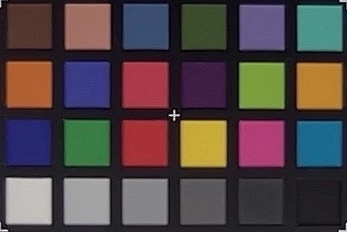
Web kamerası
Ne yazık ki, web kamerası açısından da pek bir şey değişmedi. Apple, zayıf 720p çözünürlükte aynı vasat kamera modülünü kullanmaya devam ediyor. En azından Apple M1 çipi, gelişmiş görüntü işleme sunarak renklerin ve kontrastın da daha iyi olmasını sağlıyor. Duruma bağlı olarak bu oldukça belirgin olabilir.


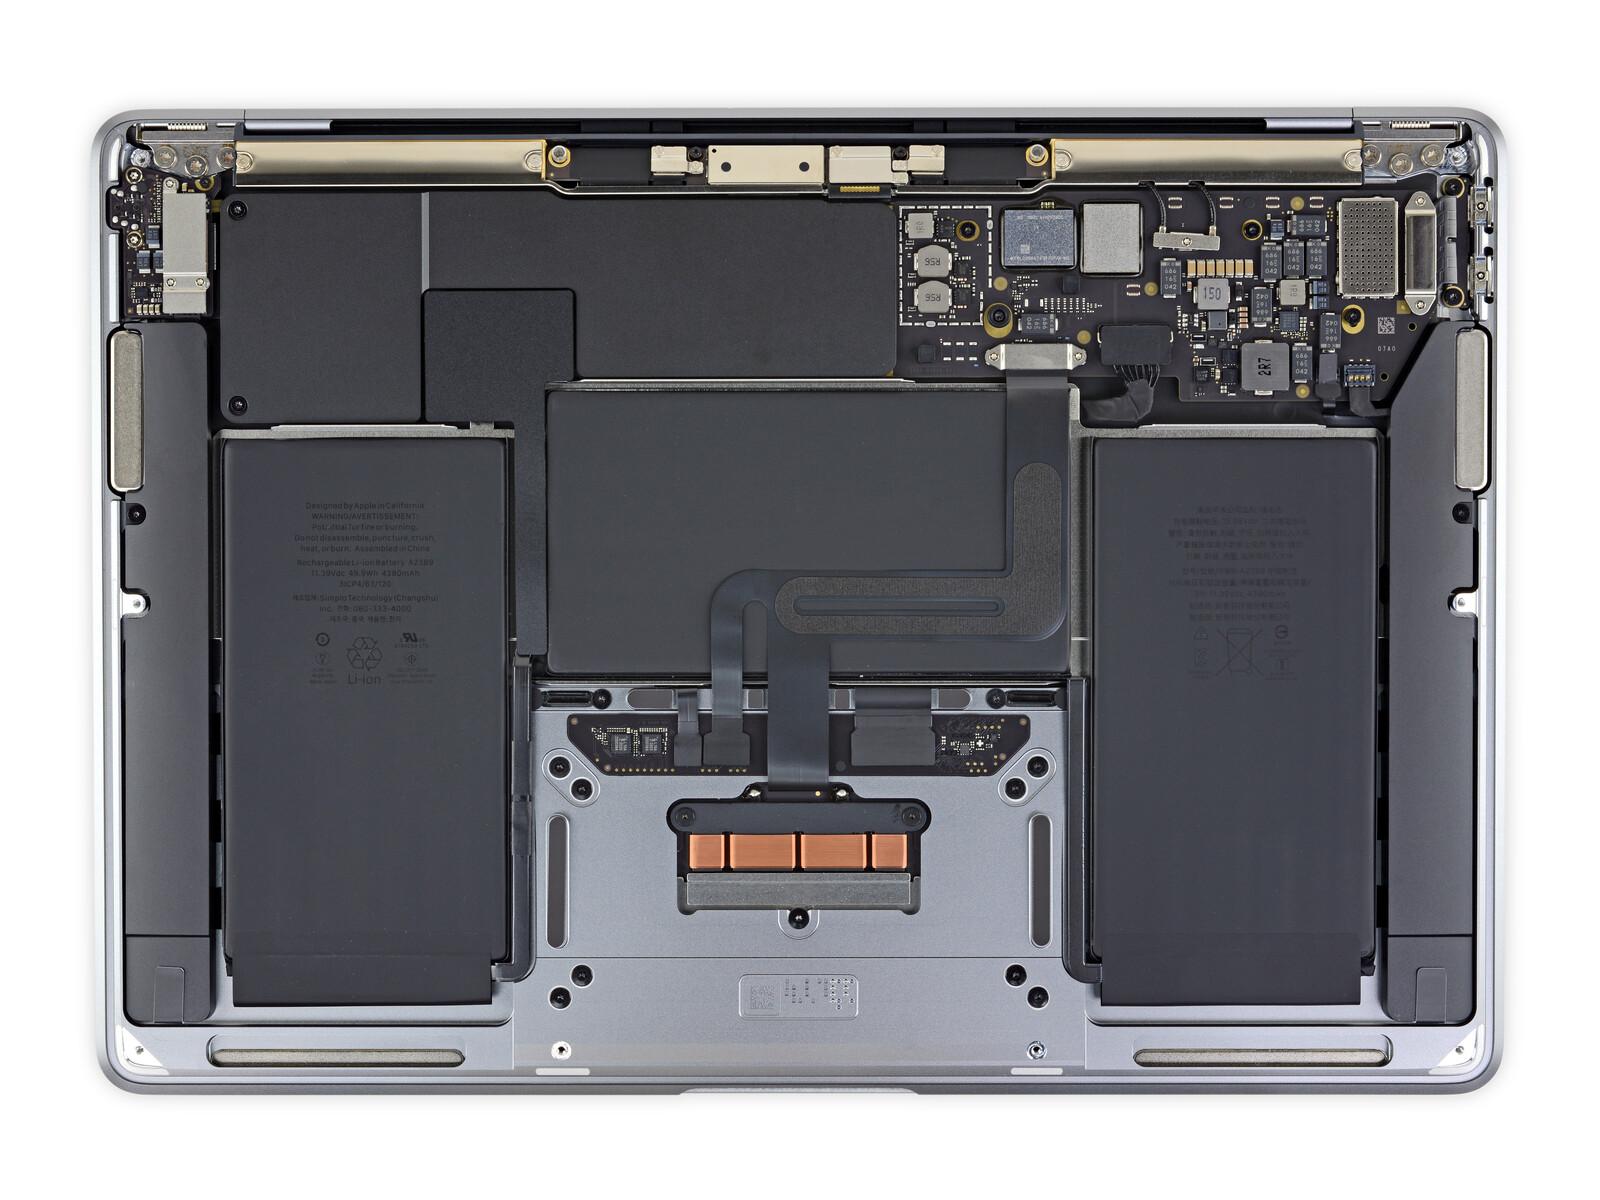
Bakım
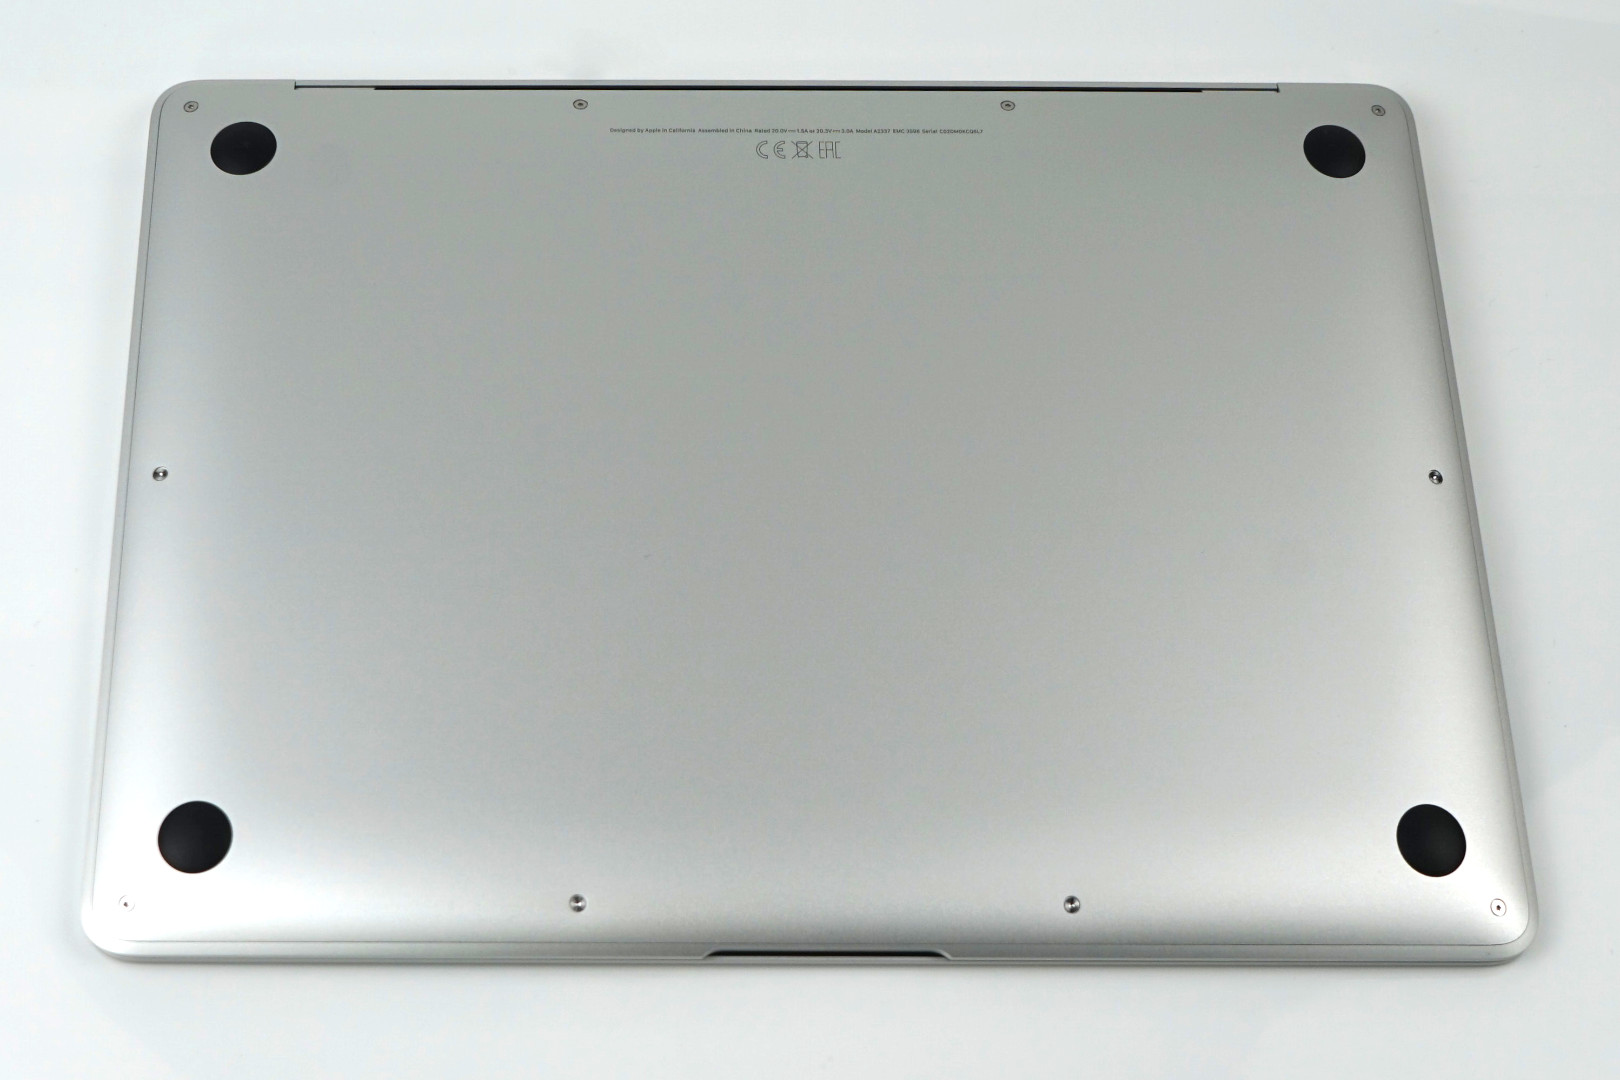
Dizüstü bilgisayarın alt kısmı Pentalobe vidalarla sabitlenmeye devam ediyor. Bununla birlikte, sadece batarya nispeten kolay bir şekilde değiştirilebildiğinden, iç kısımlara erişmek için neredeyse hiçbir neden yoktur. Bakıma ihtiyaç duyan bir fan yoktur ve CPU, GPU, SSD, RAM ve WLAN kartı gibi tüm bileşenler doğrudan ana karta lehimlenmiştir. İFixit'teki kolejlerimiz cihazı çoktan parçalara ayırdı ve eski Air ile olan farklarını gösterdi.
Garanti
Apple, telefon yardım hattı dahil (ayrıca yazılım sorunları için) tüm ürünleri için bir yıllık garanti sunmaktadır. Daha uzun bir garanti süresi için, Apple Care adlı pahalı garanti uzatmasını satın alma seçeneğiniz vardır (yardım hattı dahil).
Giriş cihazları
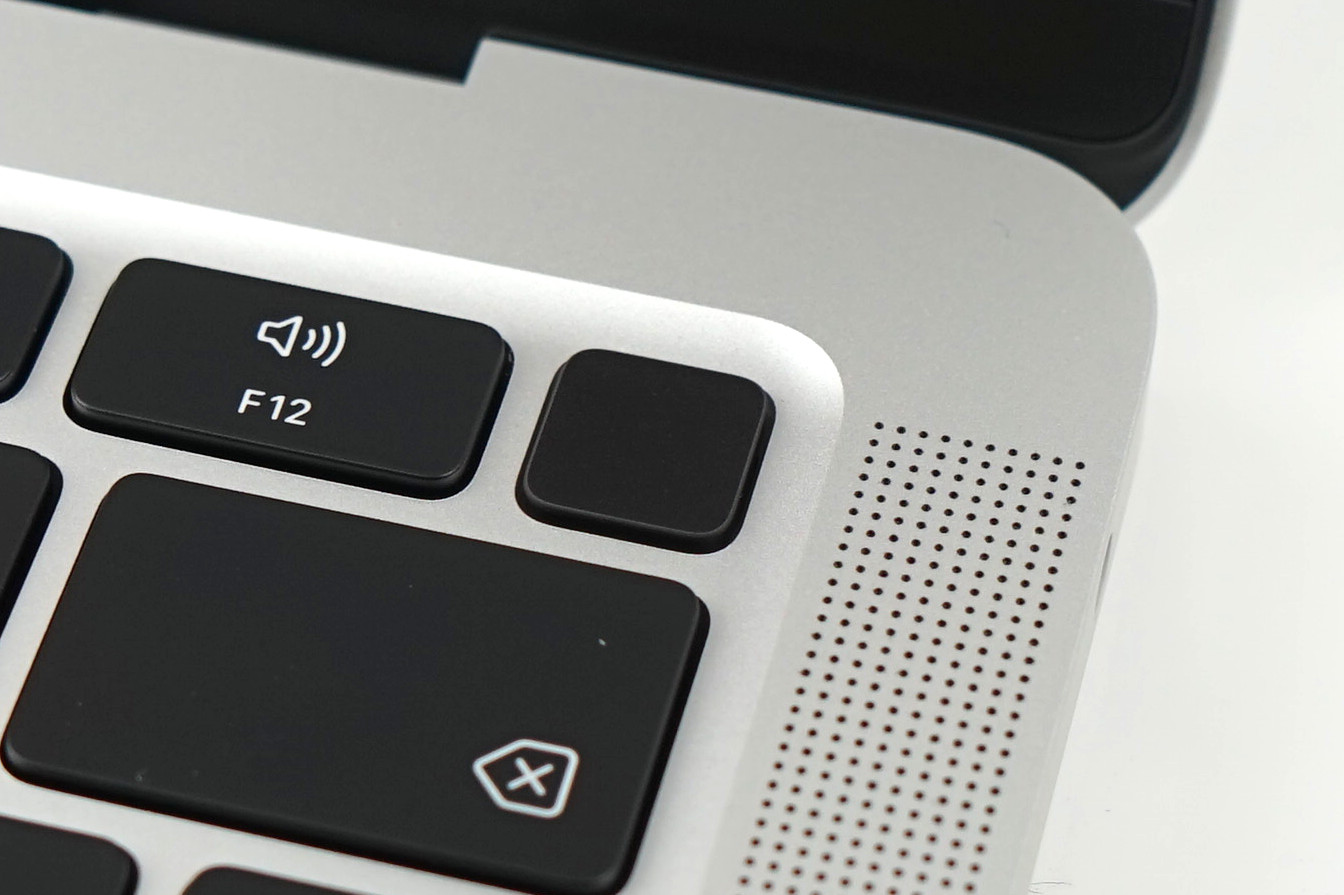
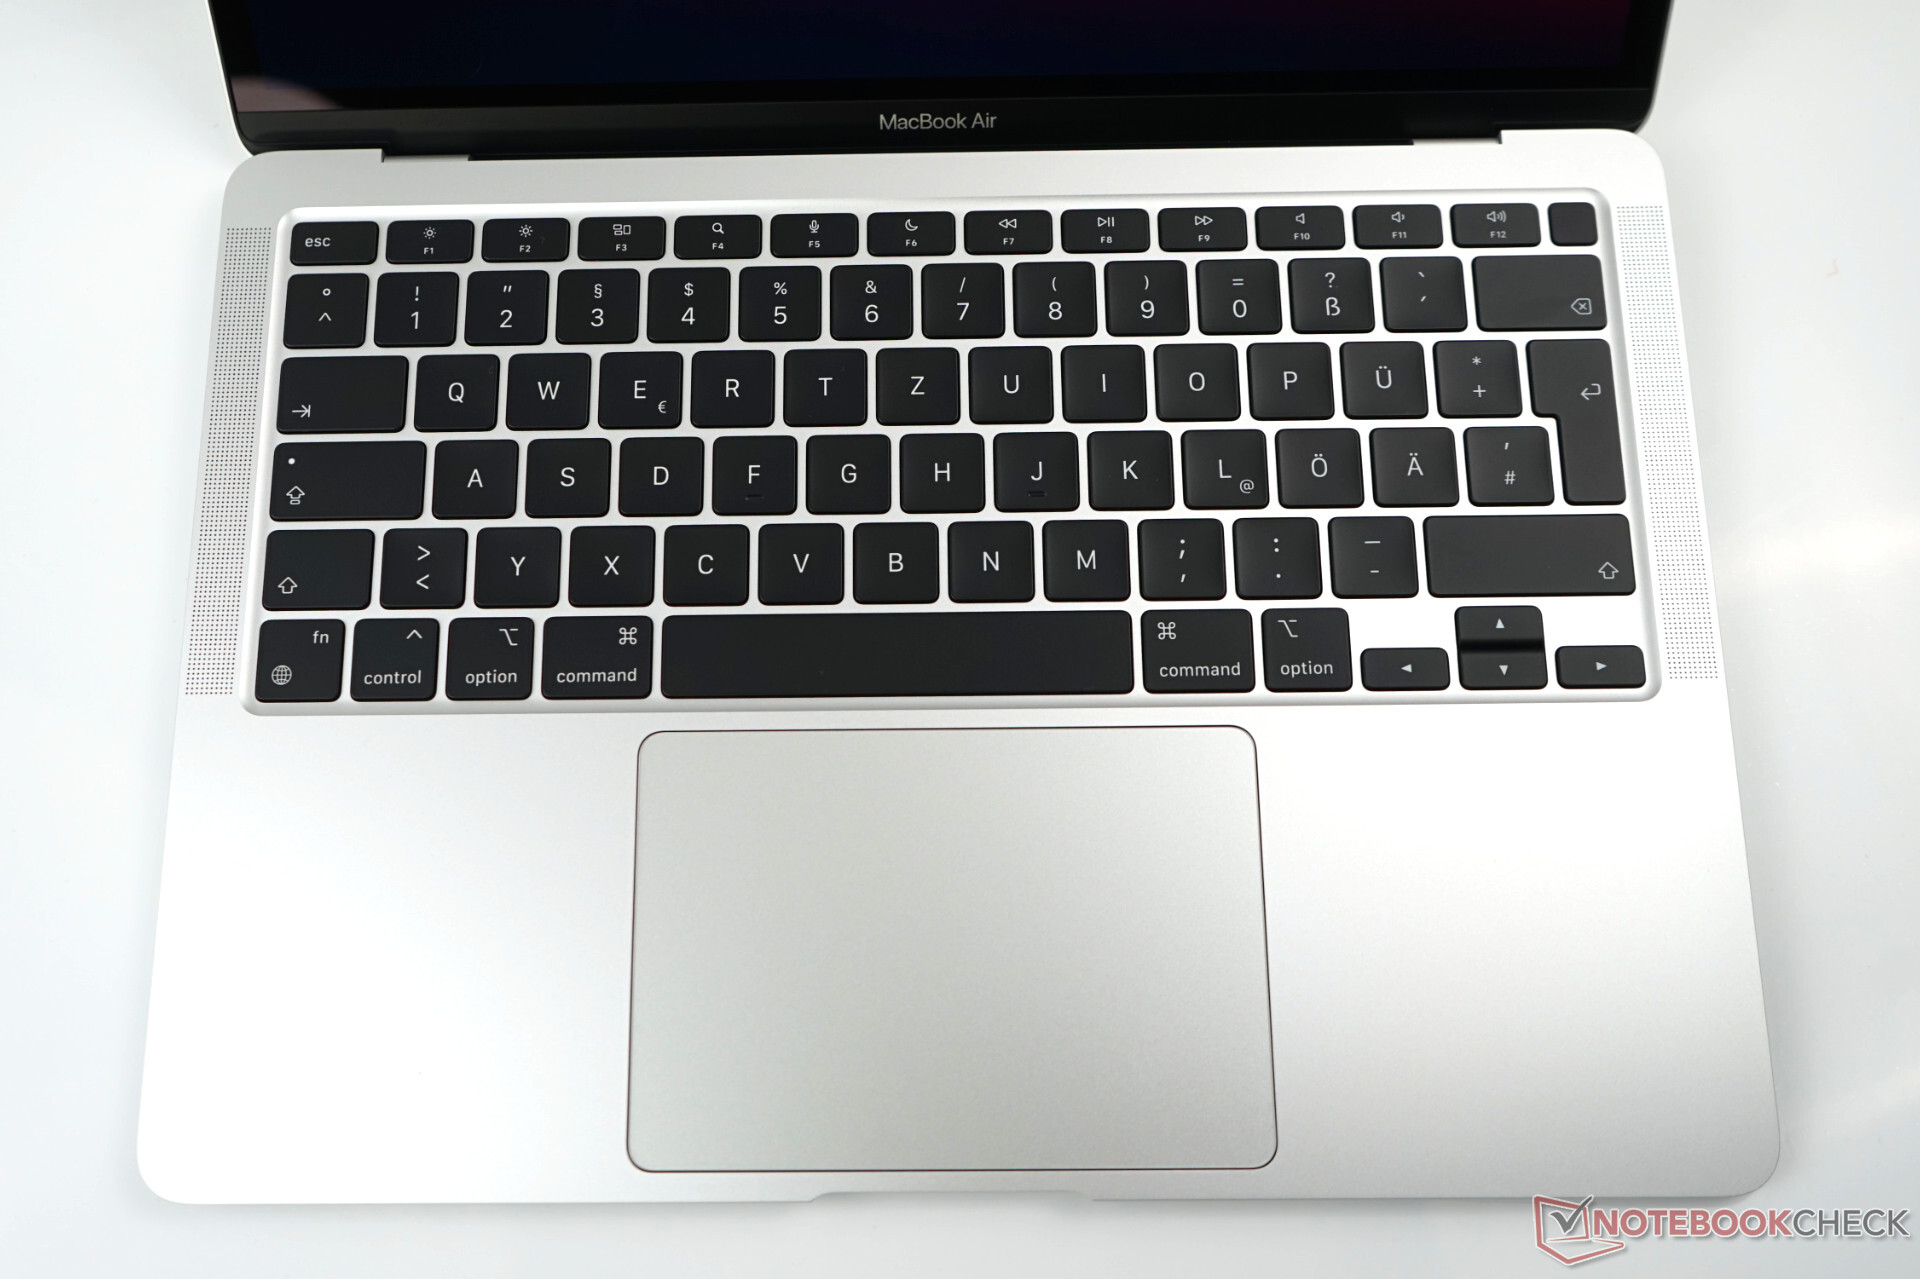
Klavye Klavyenin mekaniği önceki modele göre değişmedi. Apple, kullanıcıların çoğunluğu tarafından çok daha fazla takdir edilen ve aynı zamanda daha güvenilir olduğu varsayılan iyi makas anahtarları kullanır. Hızlı tip testinde 89 WPM'de, yazar kendini tanımak için herhangi bir zaman olmadan çok iyi bir sonuç elde etti (eski kelebek anahtarlarının hayranı olmasına rağmen). Dolayısıyla, çizgi, boyut ve düzen Apple kullanıcıları için ideal olmaya devam ediyor. Daha önce olduğu gibi, Windows kullanıcılarının yeniden ayarlama yapması gerekiyor ve bazı özel tuşlardaki etiketlerin olmaması (Almanca düzenindeki parantezler [] {} gibi) can sıkıcı olmaya devam ediyor. MacBook Pro 13 ile karşılaştırıldığında, Air bunu yapmak zorunda Touchbar olmadan, bunun yerine geleneksel F1 - F12 işlev tuşlarını sunar. Widget'lar için Touchbar'ı kullanmak istemediğiniz sürece, bu büyük bir dezavantaj değildir.
Dokunmatik yüzey
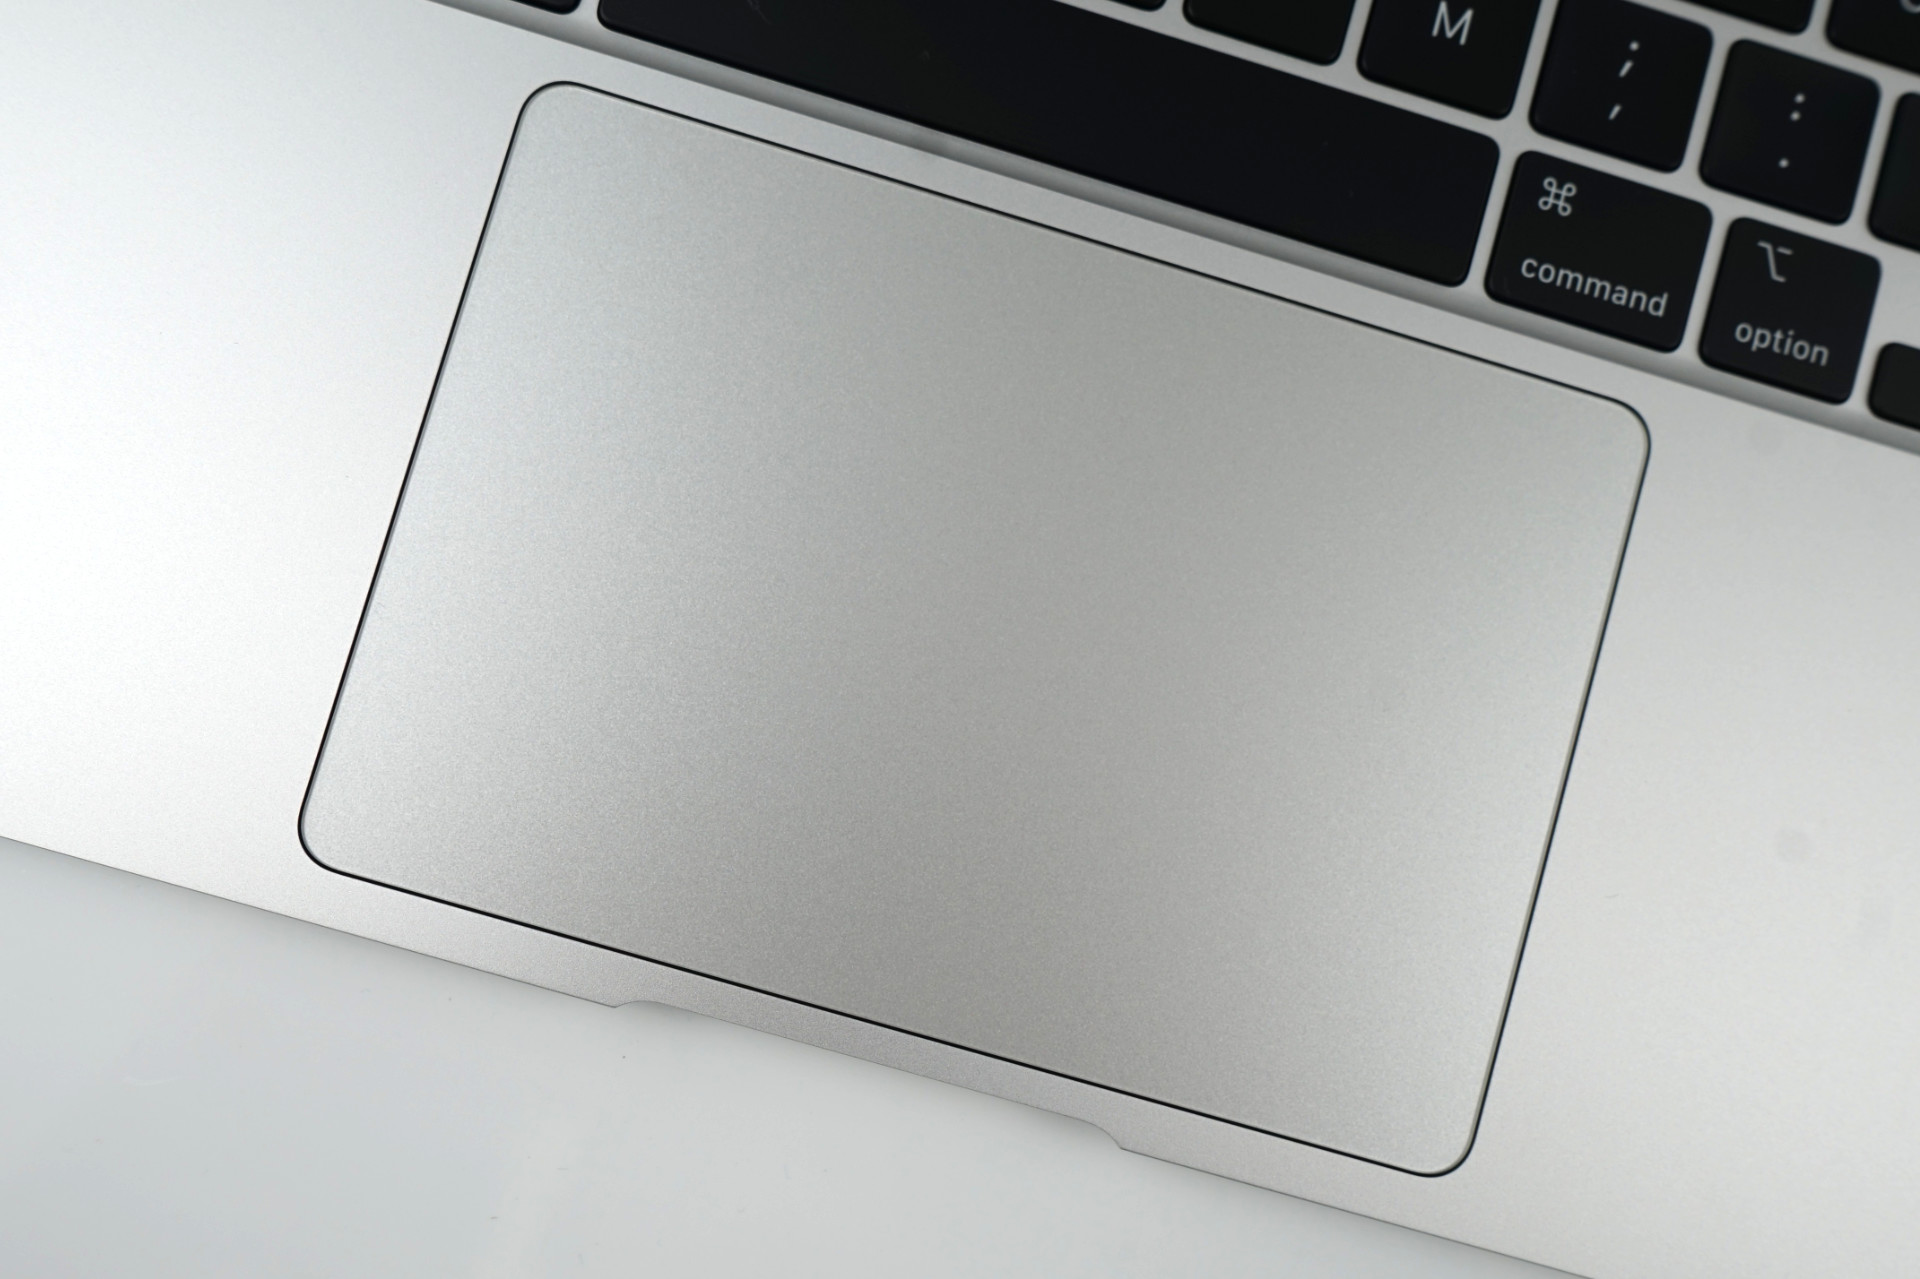
Burada da değişiklik yok, ancak burada neleri geliştirebileceğinizi bilemeyiz zaten. Titreşim motorlu cam dokunmatik yüzey köşelere kadar mükemmel çalışır. Dokunmatik yüzey, Windows dünyasında eşi benzeri olmayan olmaya devam ediyor. Daha büyük dizüstü bilgisayar modellerinde, Apple yalnızca izleme dörtgeninin boyutunu değiştirir, ancak iPad serisinin Magic Keyboard'una kıyasla çok daha iyidir.
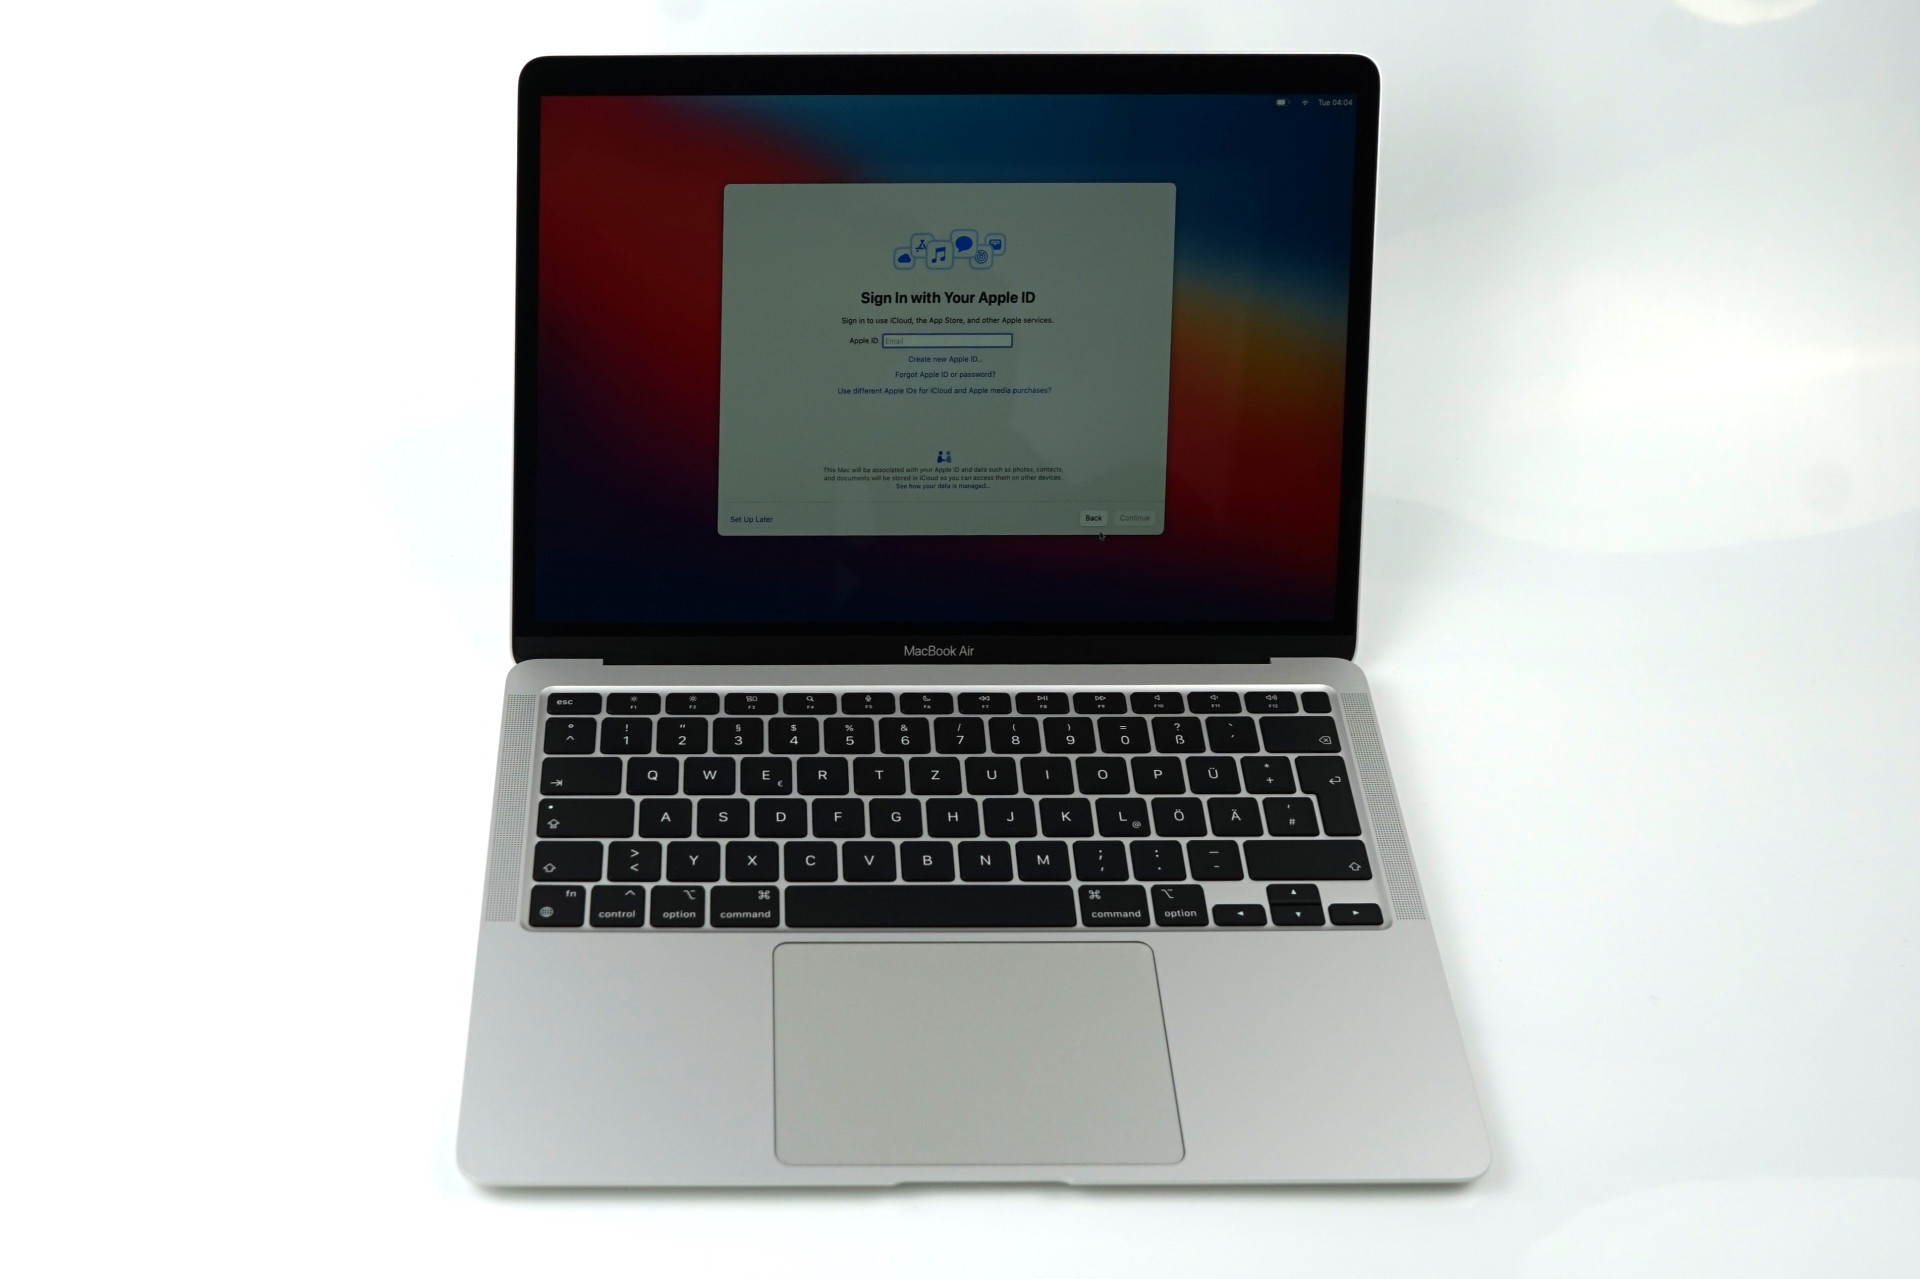
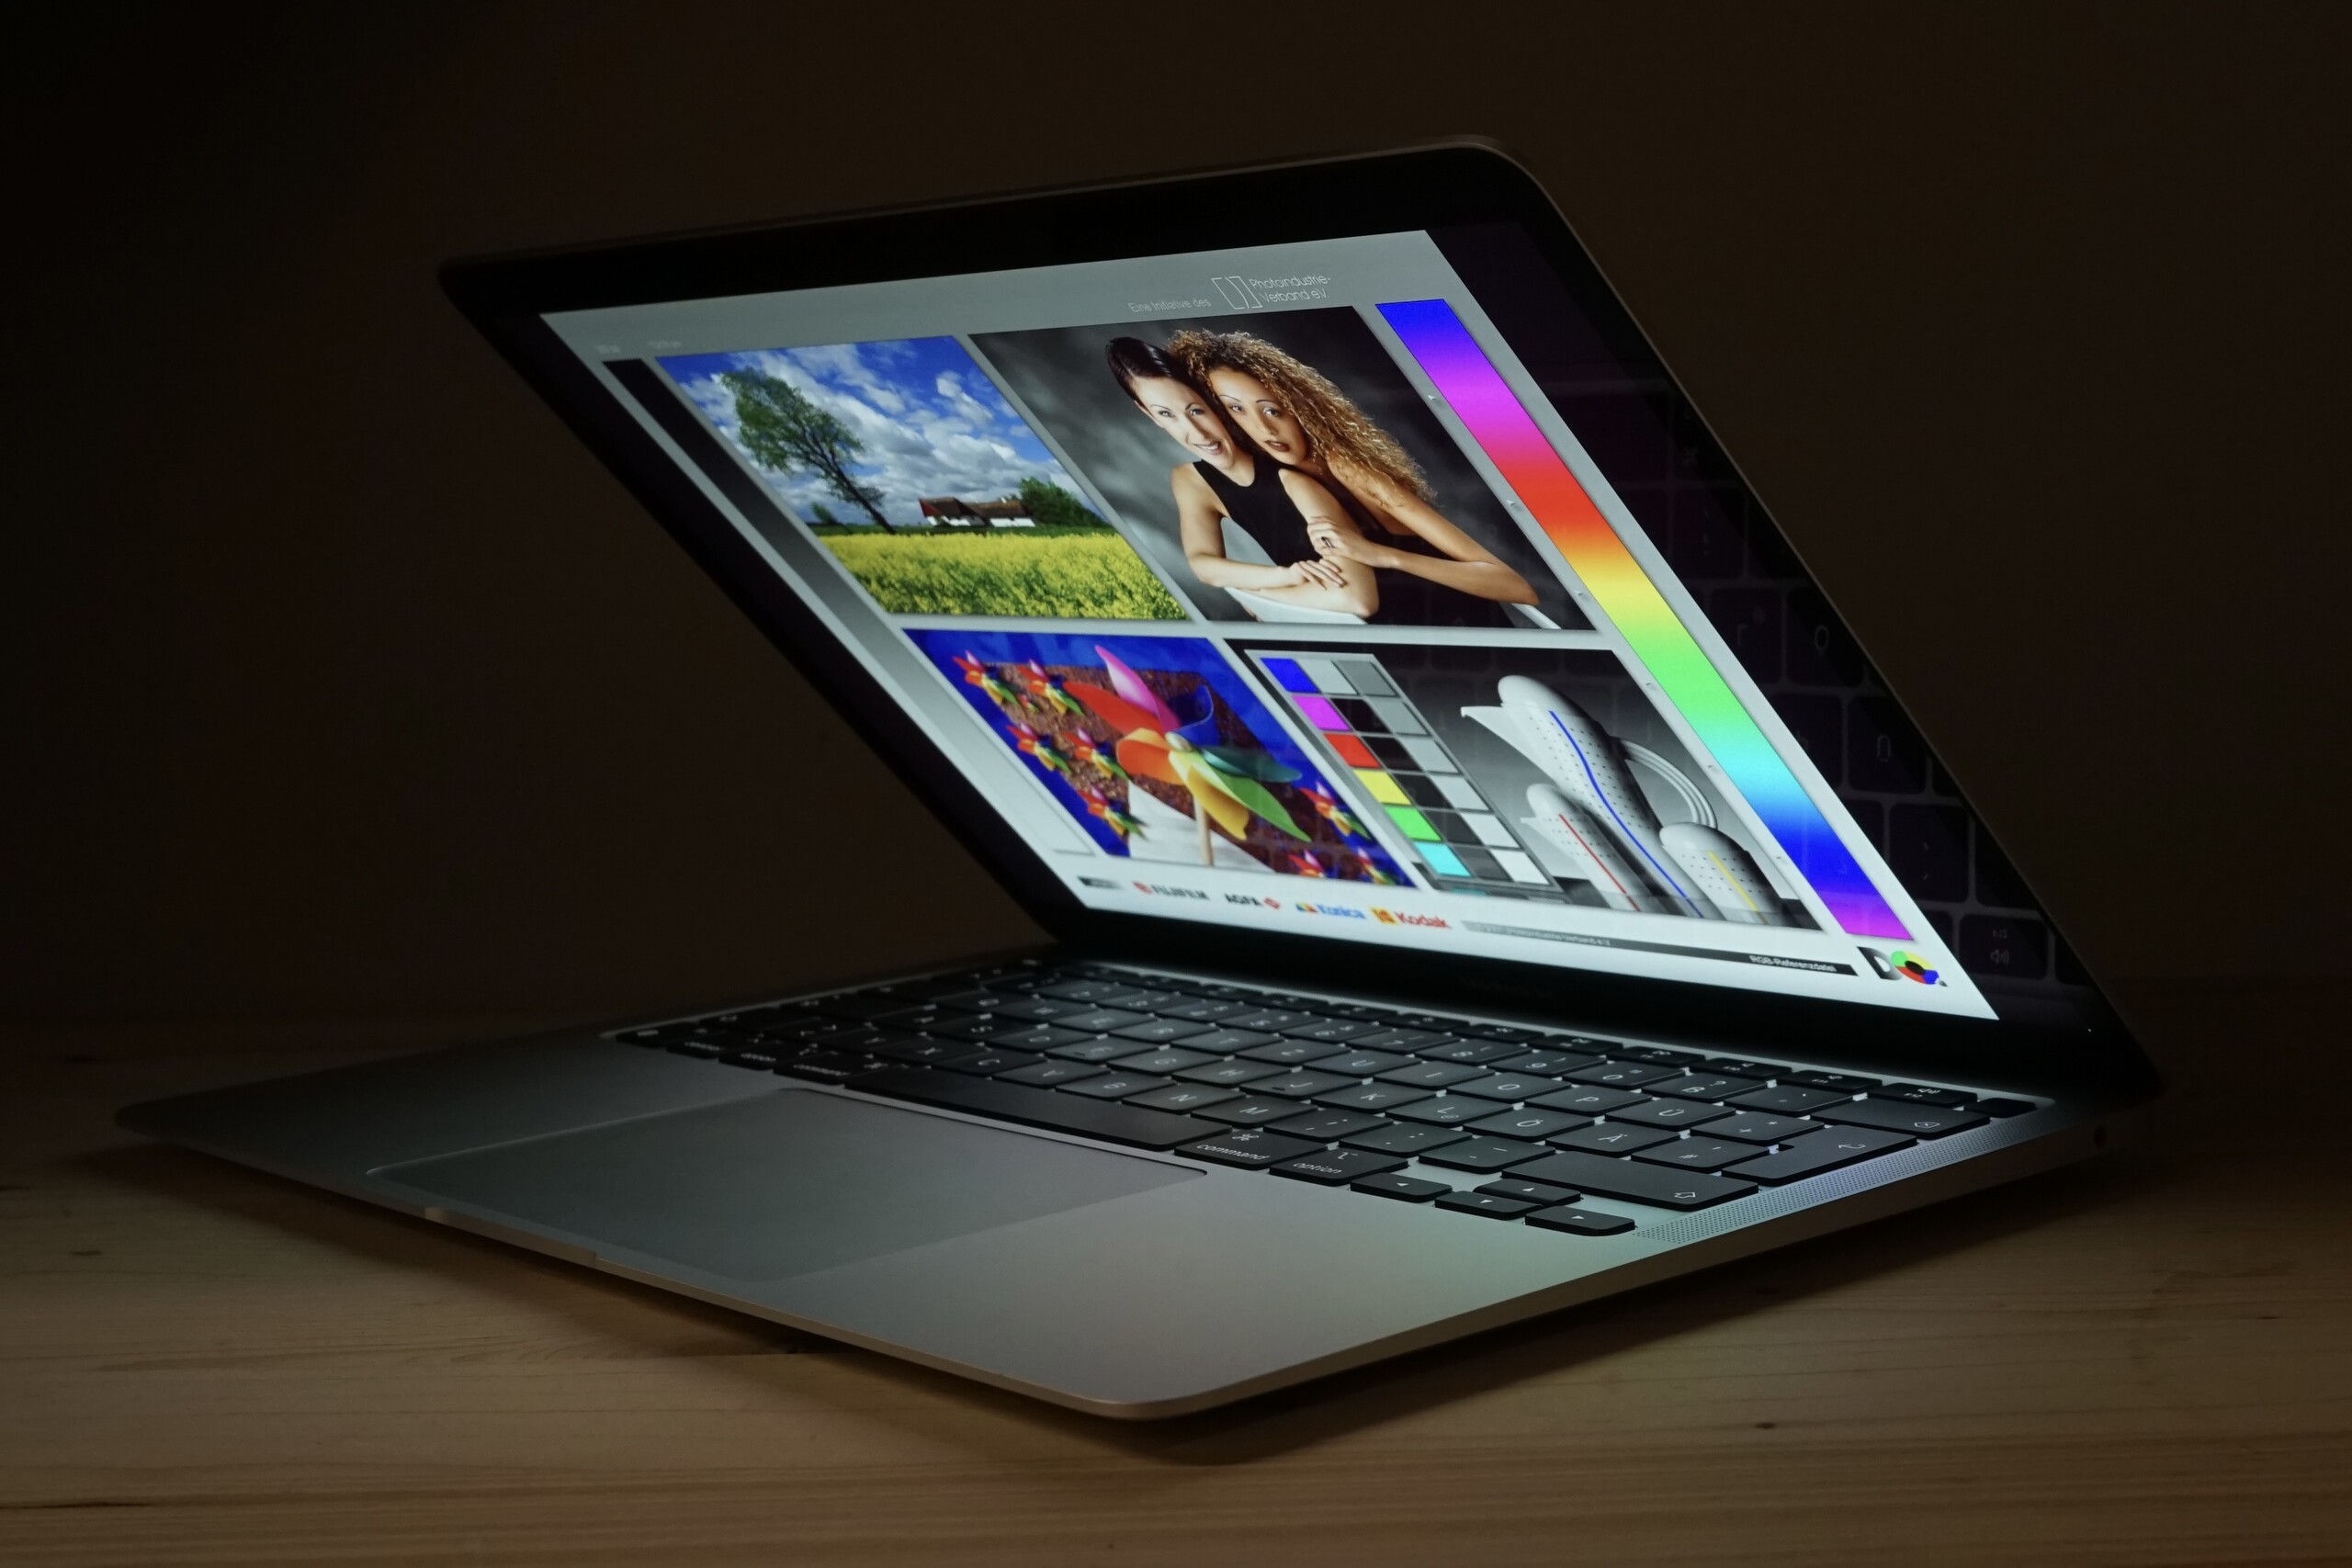
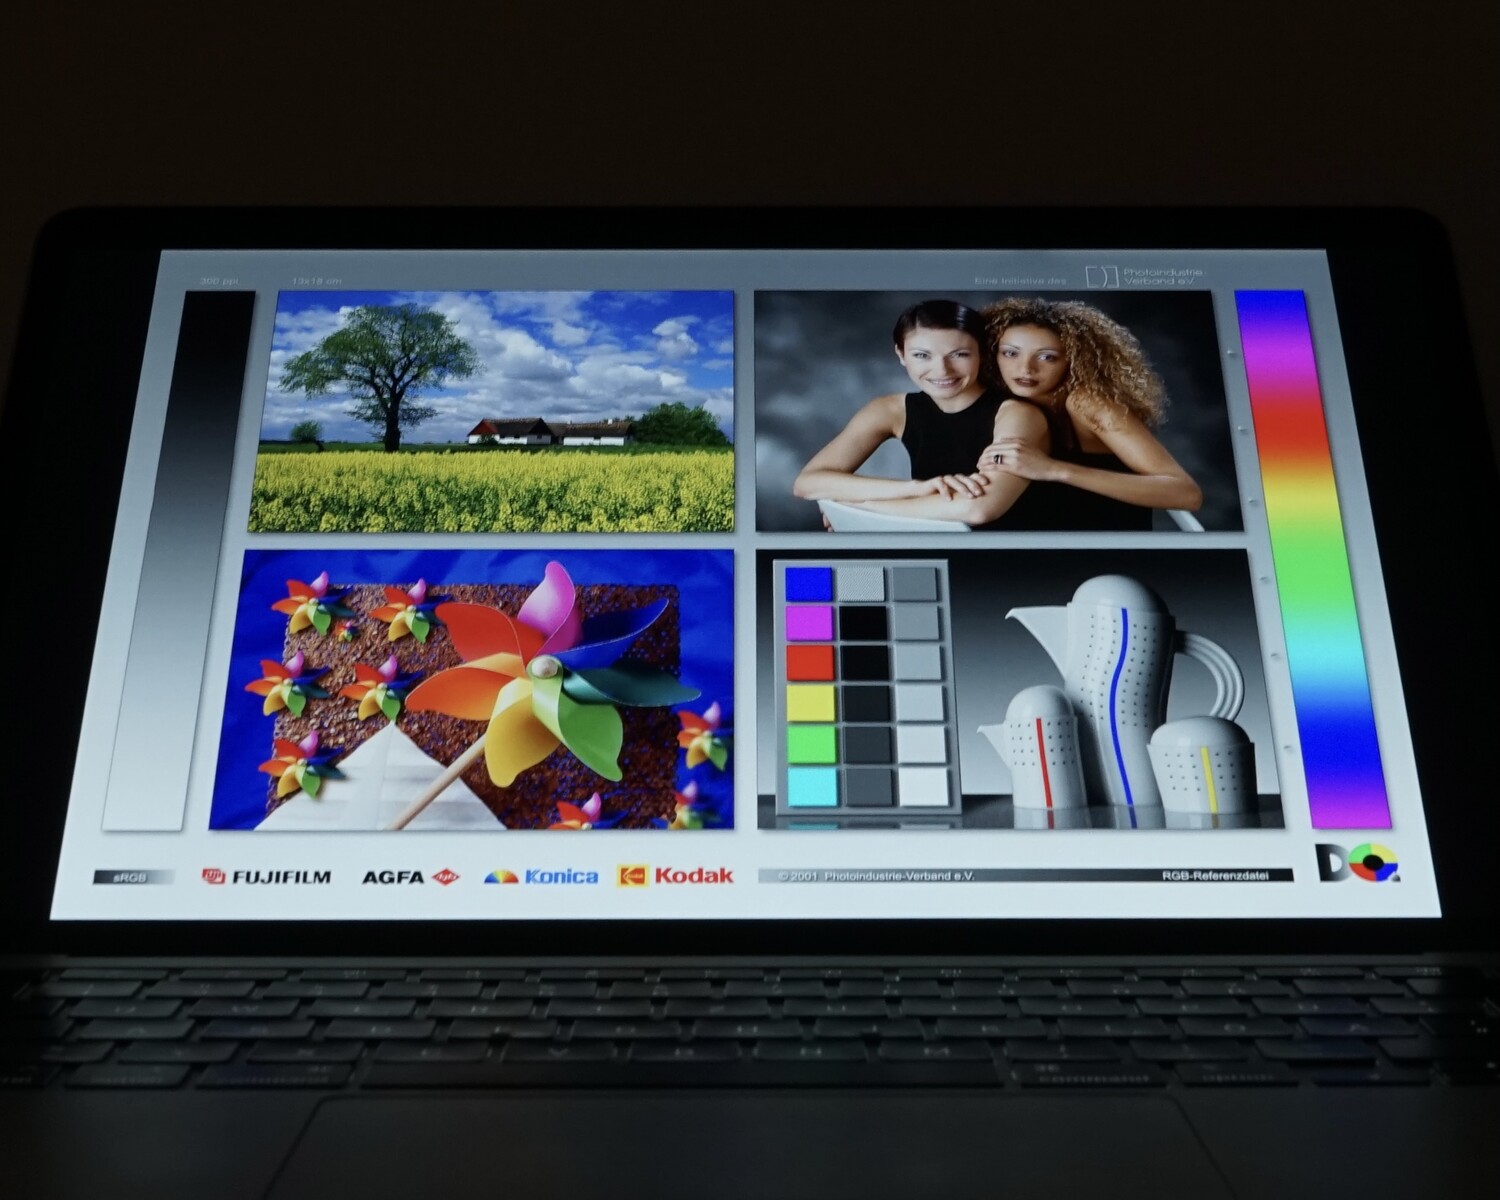
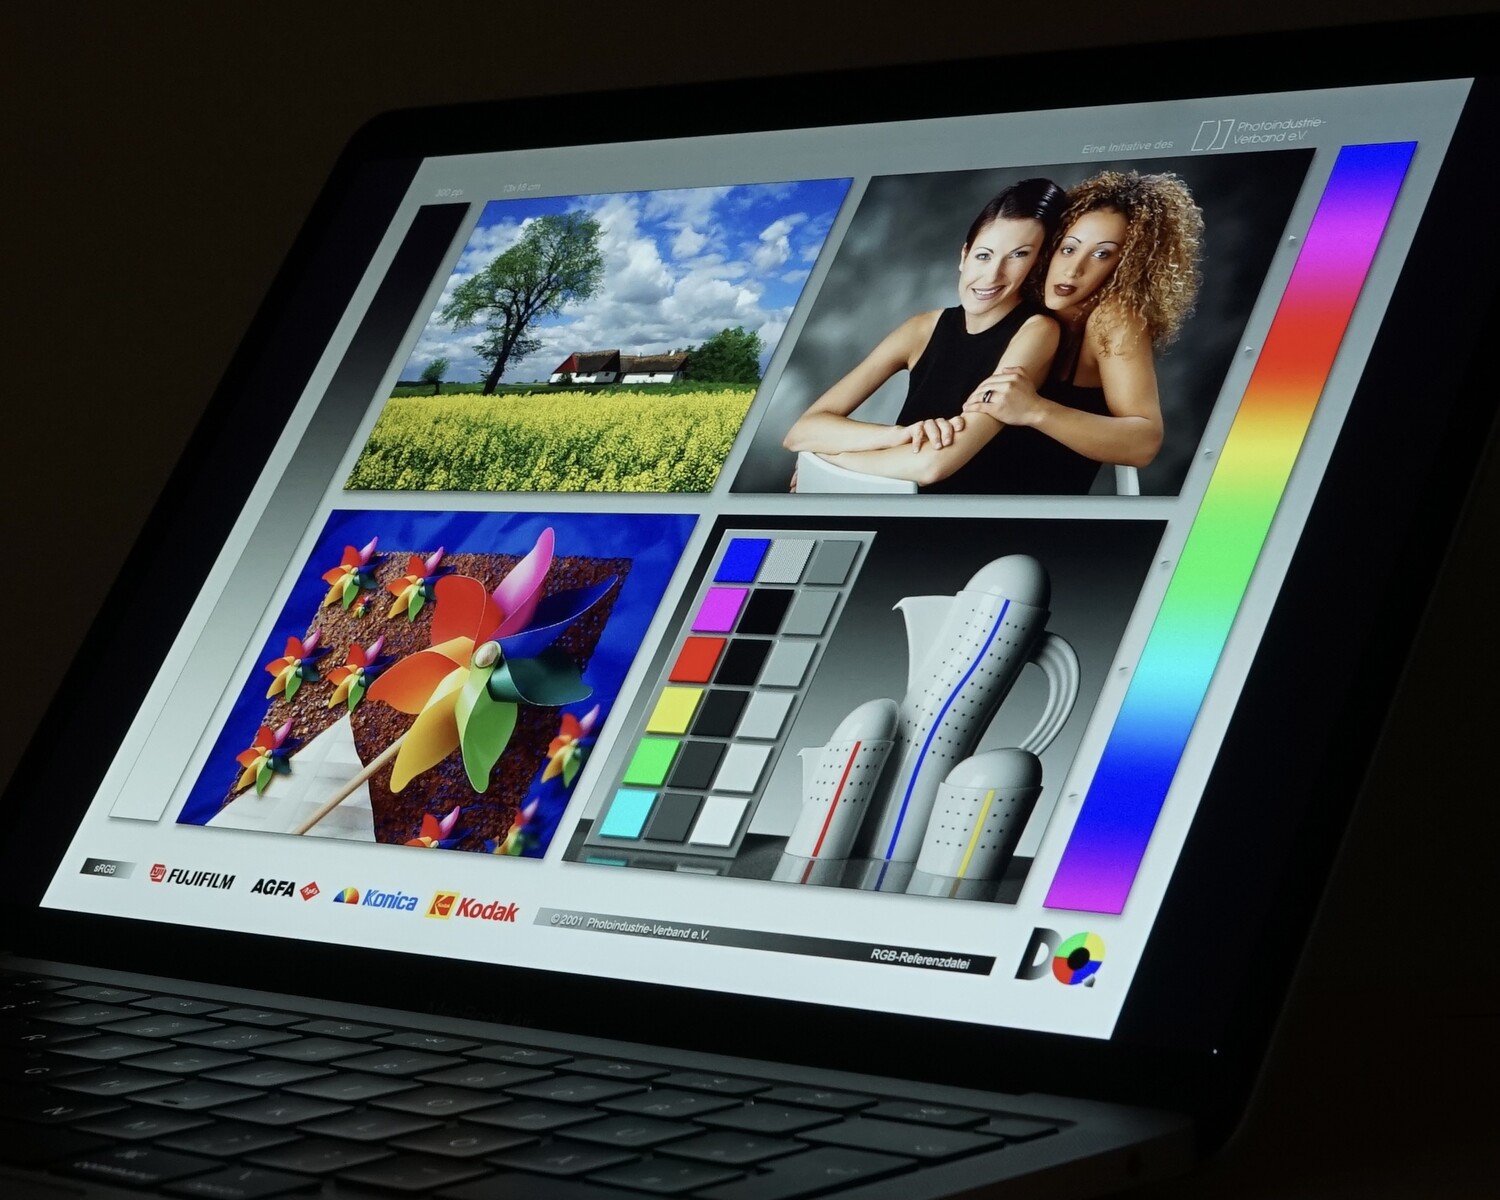
Görüntüle
Apple'a göre ekranda bazı küçük değişiklikler de var. Hala 2560 x 1600 piksel ile aynı 16:10 çözünürlüğü kullanırken, şimdi biraz artırılmış maksimum parlaklık ve daha geniş bir renk alanı sunuyor. Daha yüksek parlaklığı onayladık. Rakiplerimizle karşılaştırmamızda, iPad'ler önemli ölçüde daha parlaktır ve XPS 13 ayrıca fark edilir şekilde daha yüksek bir maksimum parlaklık üretebilir. Her zamanki gibi, ThinkPad'ler maalesef bu disiplinde yeniliyor. Nispeten yüksek siyah değeri maalesef yalnızca ortalama 1000: 1 kontrastına yol açar.
| |||||||||||||||||||||||||
Aydınlatma: 91 %
Batarya modunda parlaklık: 417 cd/m²
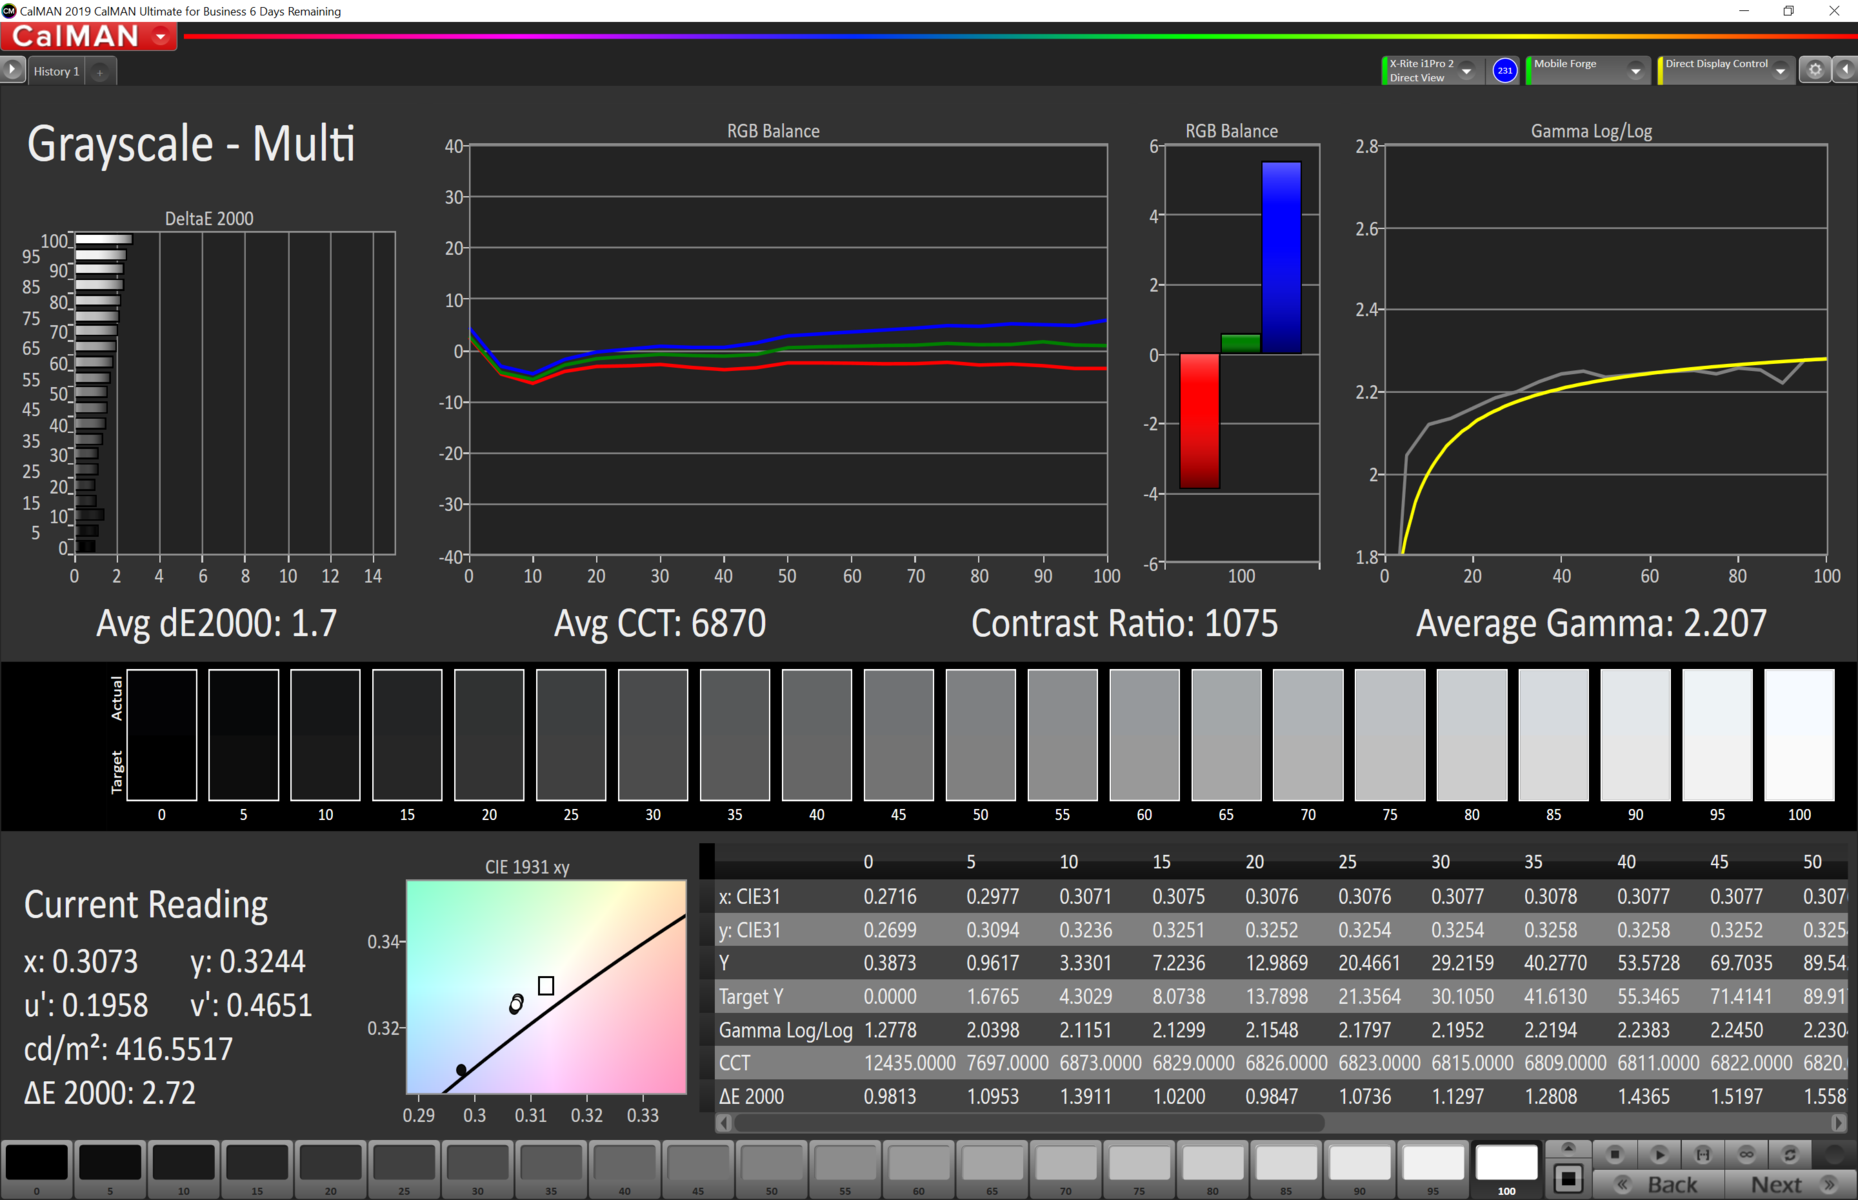
Kontrast: 1069:1 (Siyah: 0.39 cd/m²)
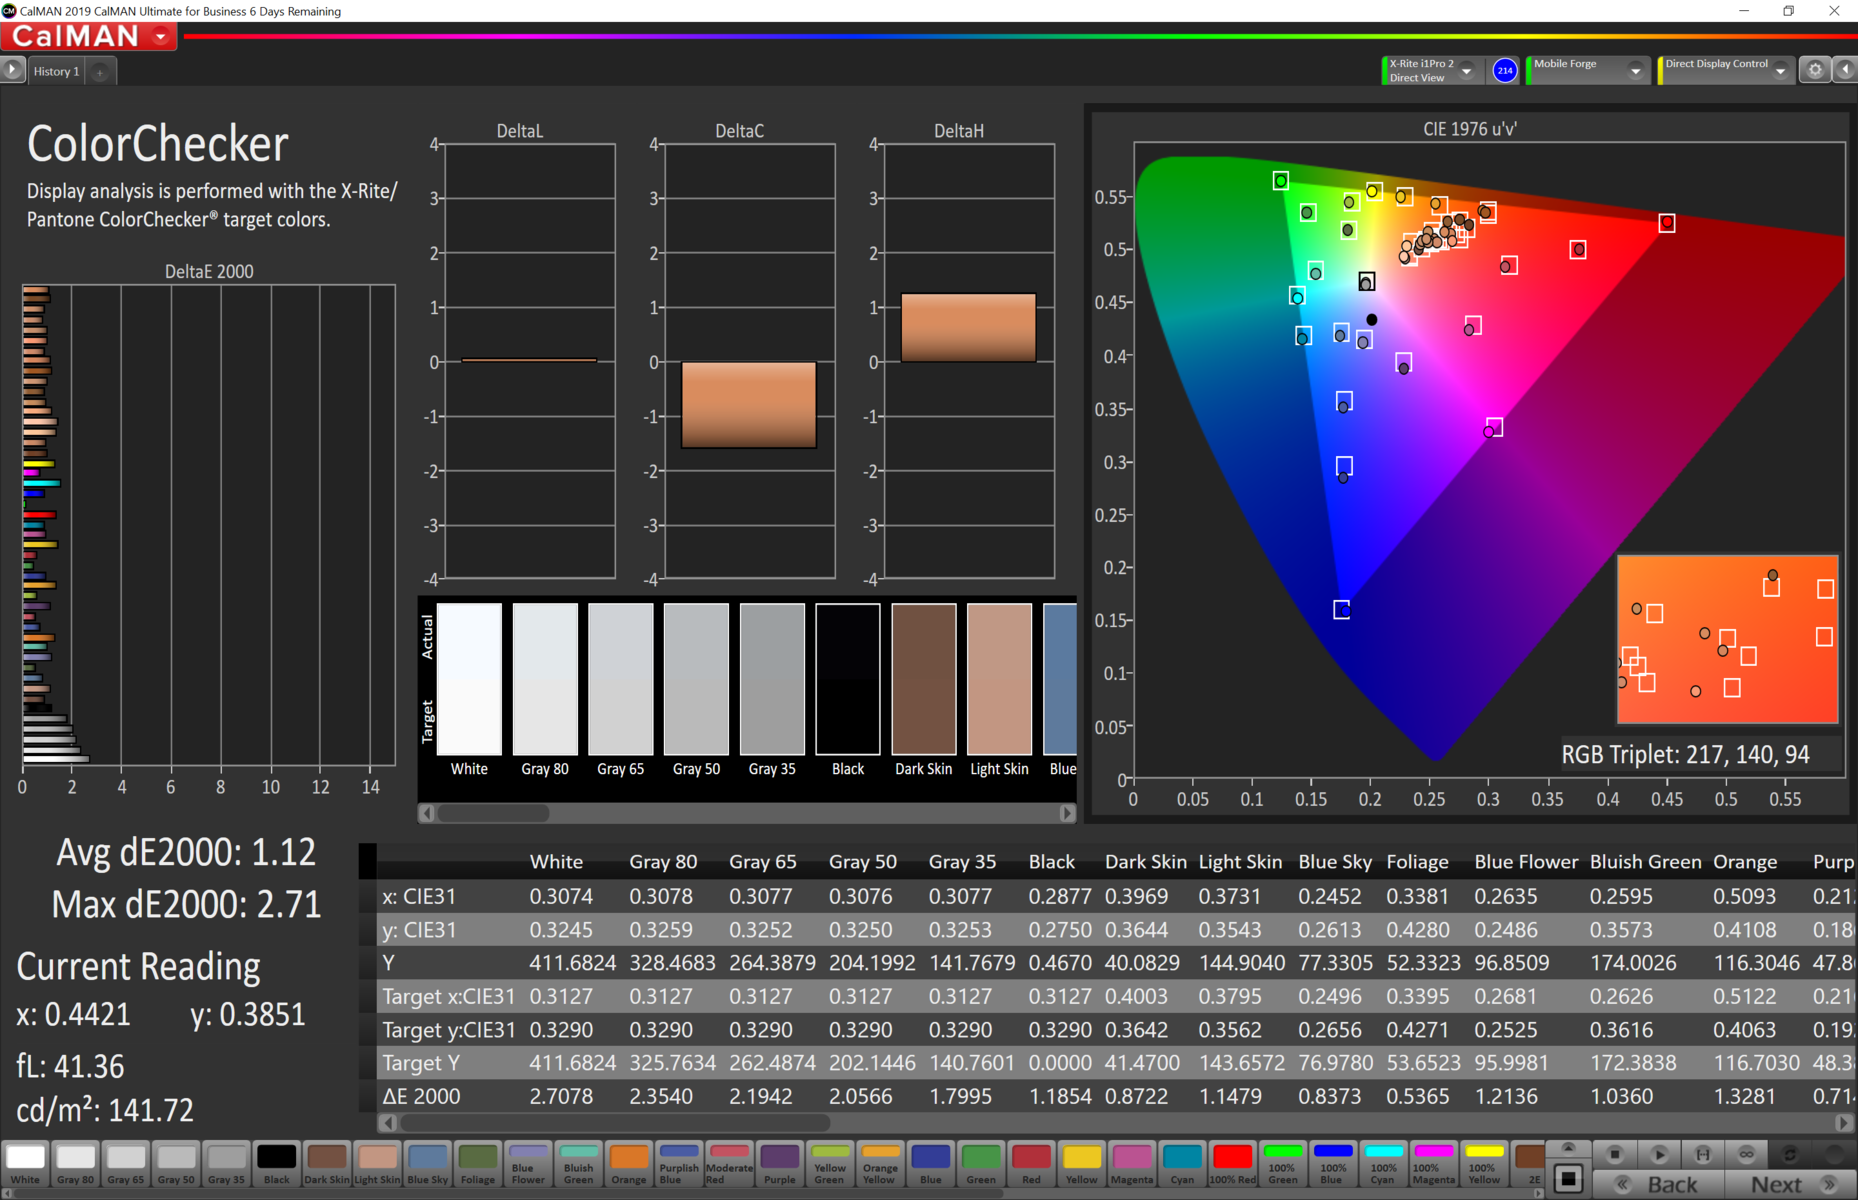
ΔE ColorChecker Calman: 1.12 | ∀{0.5-29.43 Ø4.72}
calibrated: 0.77
ΔE Greyscale Calman: 1.7 | ∀{0.09-98 Ø4.97}
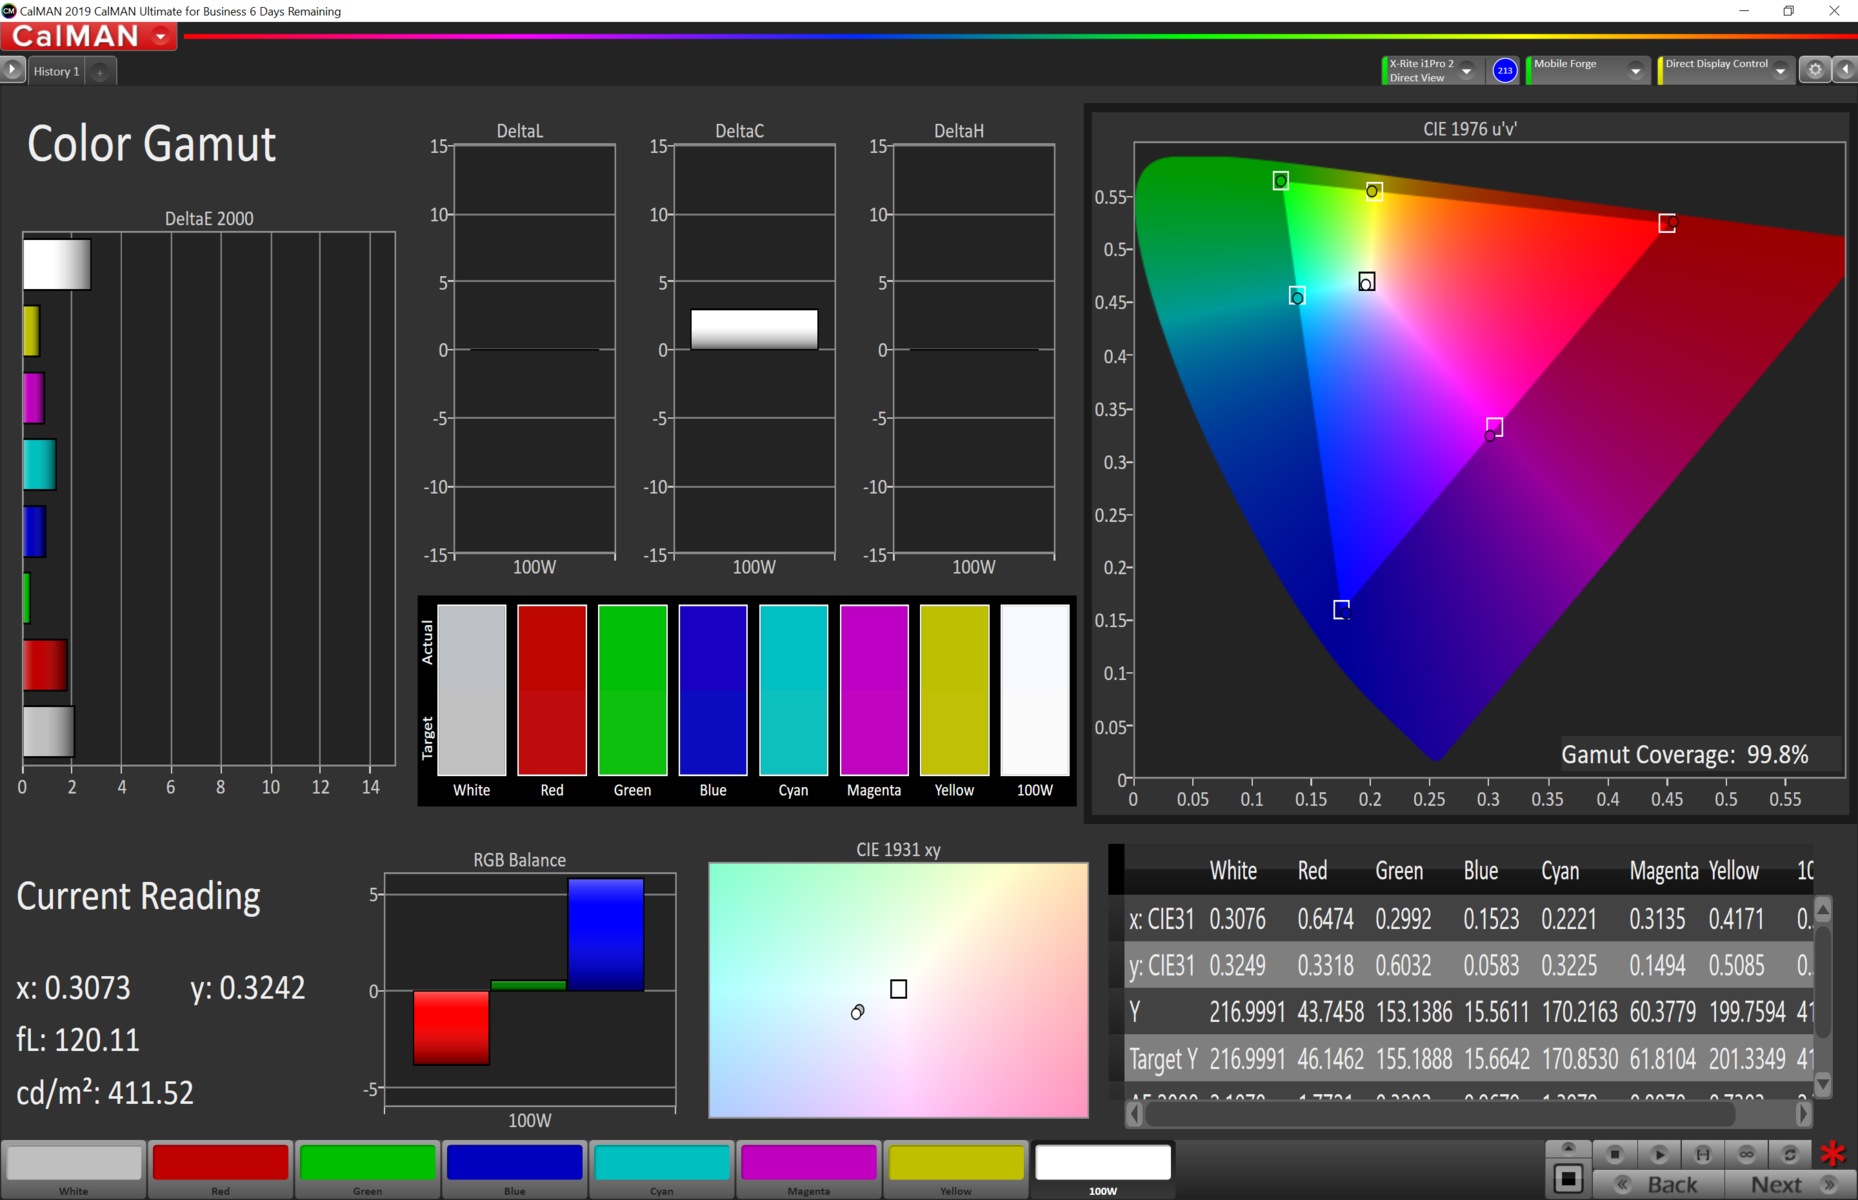
99.8% sRGB (Calman 2D)
85.9% AdobeRGB 1998 (Argyll 3D)
100% sRGB (Argyll 3D)
98.6% Display P3 (Argyll 3D)
Gamma: 2207
CCT: 6870 K
| Apple MacBook Air 2020 M1 Entry IPS, 2560x1600, 13.3" | Dell XPS 13 9310 Core i7 FHD Sharp LQ134N1, IPS, 1920x1200, 13.4" | Lenovo ThinkPad X13 Yoga 20SX0004GE N133HCG-GR3, IPS, 1920x1080, 13.3" | Lenovo ThinkPad X395 LP133WF7-SPB1, IPS, 1920x1080, 13.3" | Lenovo ThinkPad X13-20UGS00800 B133HAK01.1, IPS LED, 1920x1080, 13.3" | Apple iPad Air 4 2020 IPS, 2360x1640, 10.9" | Apple iPad Pro 12.9 2020 Liquid Retina Display, IPS, 2732x2048, 12.9" | Apple iPad 7 2019 IPS, 2160x1620, 10.2" | |
|---|---|---|---|---|---|---|---|---|
| Display | -15% | -18% | -21% | -21% | ||||
| Display P3 Coverage (%) | 98.6 | 70.9 -28% | 67.2 -32% | 64.1 -35% | 64.8 -34% | |||
| sRGB Coverage (%) | 100 | 99.1 -1% | 98.1 -2% | 95.2 -5% | 95.6 -4% | |||
| AdobeRGB 1998 Coverage (%) | 85.9 | 72.9 -15% | 69 -20% | 65.8 -23% | 65.7 -24% | |||
| Response Times | -48% | -44% | -50% | -49% | -25% | -22% | 4% | |
| Response Time Grey 50% / Grey 80% * (ms) | 31 ? | 52 ? -68% | 56 ? -81% | 55 ? -77% | 56.8 ? -83% | 46.8 ? -51% | 46.8 ? -51% | 38 ? -23% |
| Response Time Black / White * (ms) | 26.1 ? | 33.2 ? -27% | 28 ? -7% | 32 ? -23% | 30 ? -15% | 25.6 ? 2% | 24.4 ? 7% | 18 ? 31% |
| PWM Frequency (Hz) | 118000 ? | 2475 ? | 58820 ? | |||||
| Screen | -56% | -12% | -46% | -110% | 3% | 10% | 11% | |
| Brightness middle (cd/m²) | 417 | 543.3 30% | 401 -4% | 356 -15% | 331 -21% | 509 22% | 625 50% | 499 20% |
| Brightness (cd/m²) | 395 | 524 33% | 383 -3% | 336 -15% | 315 -20% | 486 23% | 599 52% | 470 19% |
| Brightness Distribution (%) | 91 | 92 1% | 91 0% | 88 -3% | 90 -1% | 93 2% | 87 -4% | 87 -4% |
| Black Level * (cd/m²) | 0.39 | 0.38 3% | 0.16 59% | 0.16 59% | 0.21 46% | 0.39 -0% | 0.47 -21% | 0.49 -26% |
| Contrast (:1) | 1069 | 1430 34% | 2506 134% | 2225 108% | 1576 47% | 1305 22% | 1330 24% | 1018 -5% |
| Colorchecker dE 2000 * | 1.12 | 3.02 -170% | 2.6 -132% | 3.6 -221% | 6.1 -445% | 1.3 -16% | 1.3 -16% | 0.97 13% |
| Colorchecker dE 2000 max. * | 2.71 | 7.61 -181% | 4.2 -55% | 5.5 -103% | 10 -269% | 2.8 -3% | 2.7 -0% | 1.98 27% |
| Colorchecker dE 2000 calibrated * | 0.77 | 1.23 -60% | 0.9 -17% | 1.11 -44% | 1.2 -56% | |||
| Greyscale dE 2000 * | 1.7 | 5 -194% | 3.3 -94% | 4.7 -176% | 6.3 -271% | 2.2 -29% | 1.8 -6% | 0.9 47% |
| Gamma | 2207 0% | 2.02 109% | 2.01 109% | 2.92 75% | 2.77 79% | 2.21 100% | 2.23 99% | 2.135 103% |
| CCT | 6870 95% | 6550 99% | 6076 107% | 6222 104% | 6938 94% | 6833 95% | 6765 96% | 6571 99% |
| Color Space (Percent of AdobeRGB 1998) (%) | 66.8 | 62.7 | 61 | 60.7 | 99.3 | |||
| Color Space (Percent of sRGB) (%) | 99.6 | 98.1 | 96 | 95.4 | ||||
| Toplam Ortalama (Program / Ayarlar) | -40% /
-46% | -25% /
-18% | -39% /
-41% | -60% /
-82% | -11% /
-3% | -6% /
4% | 8% /
10% |
* ... daha küçük daha iyidir
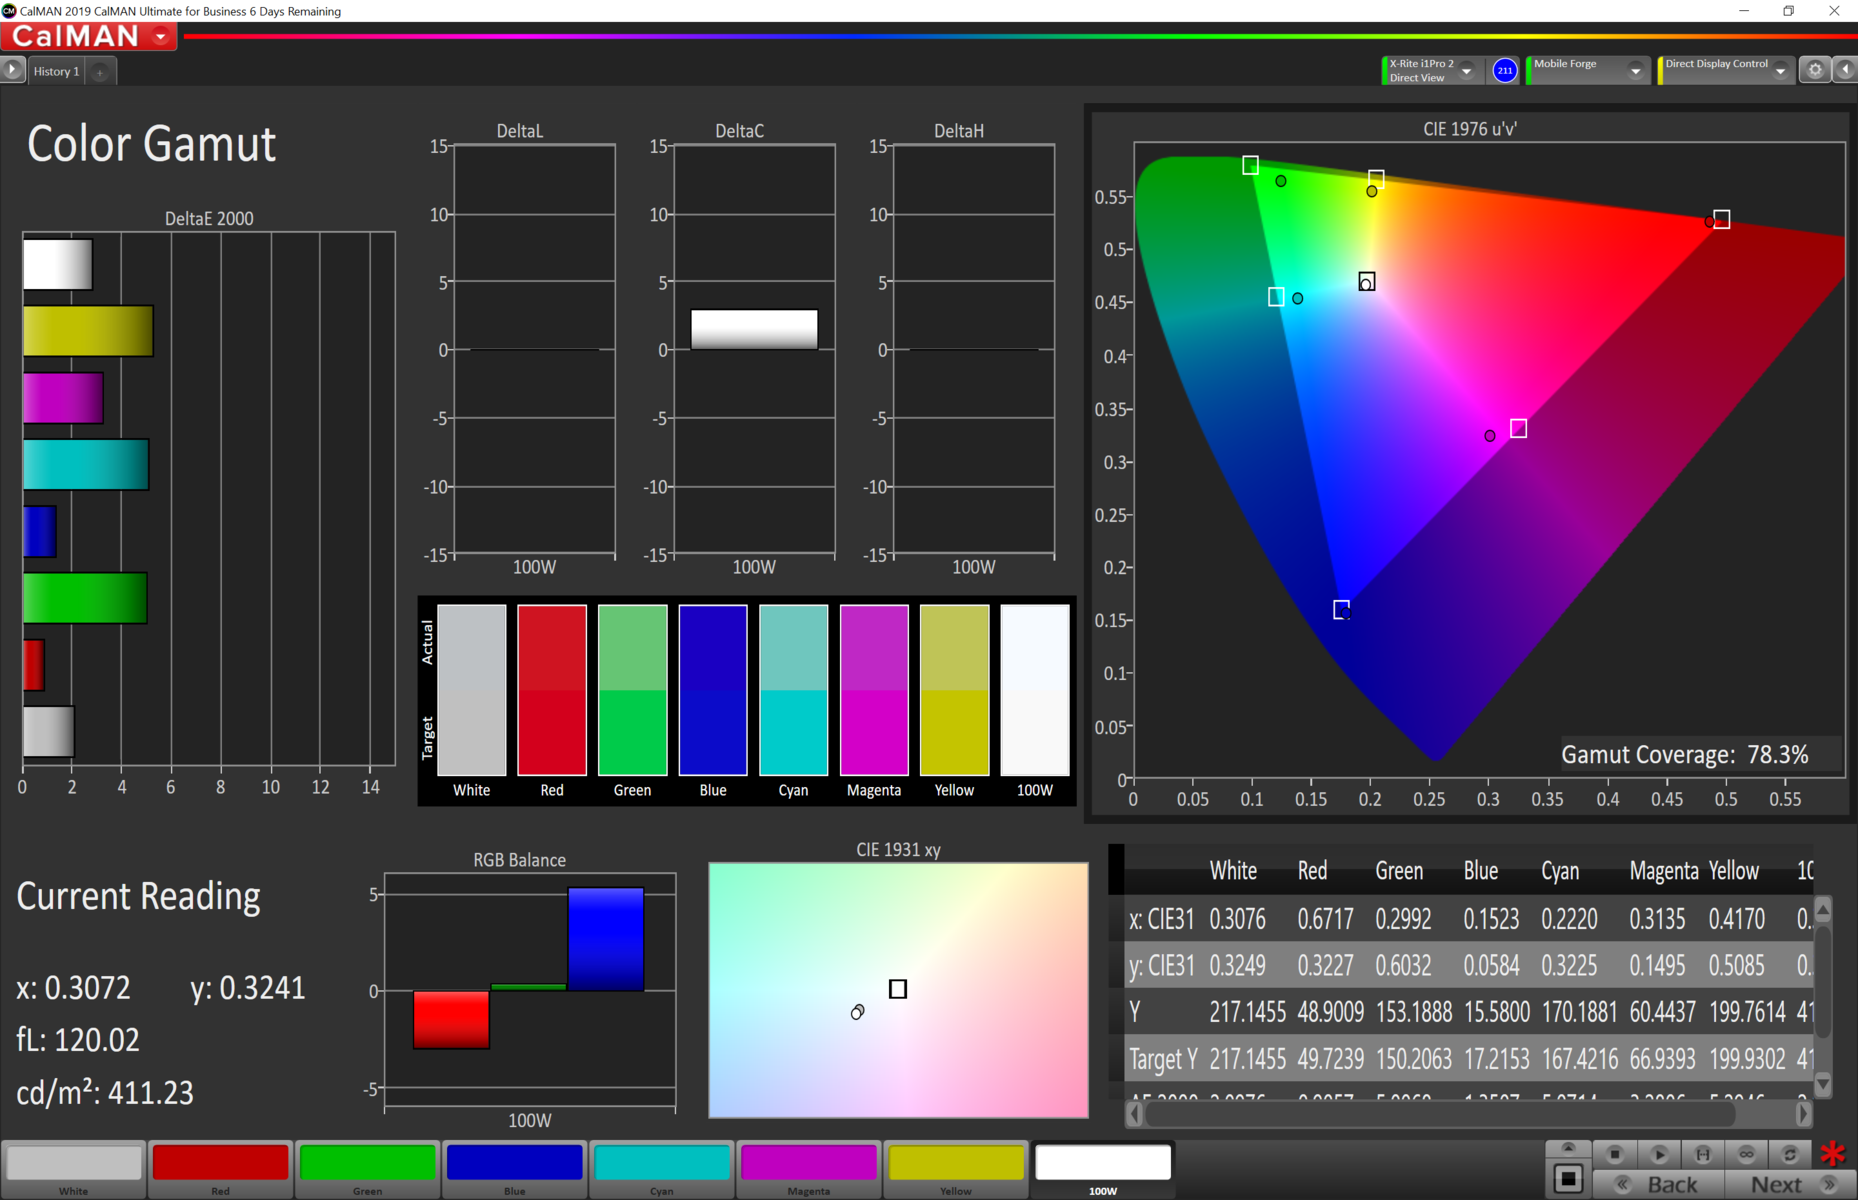
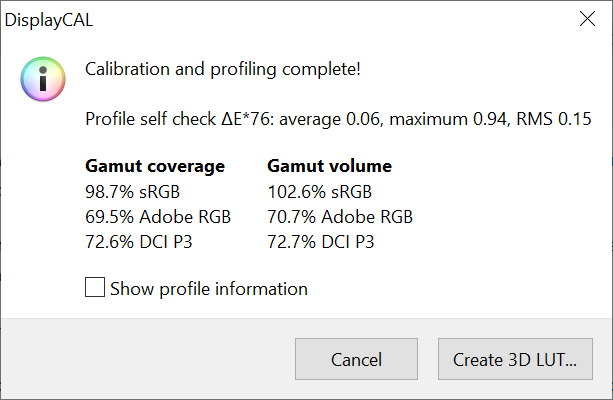
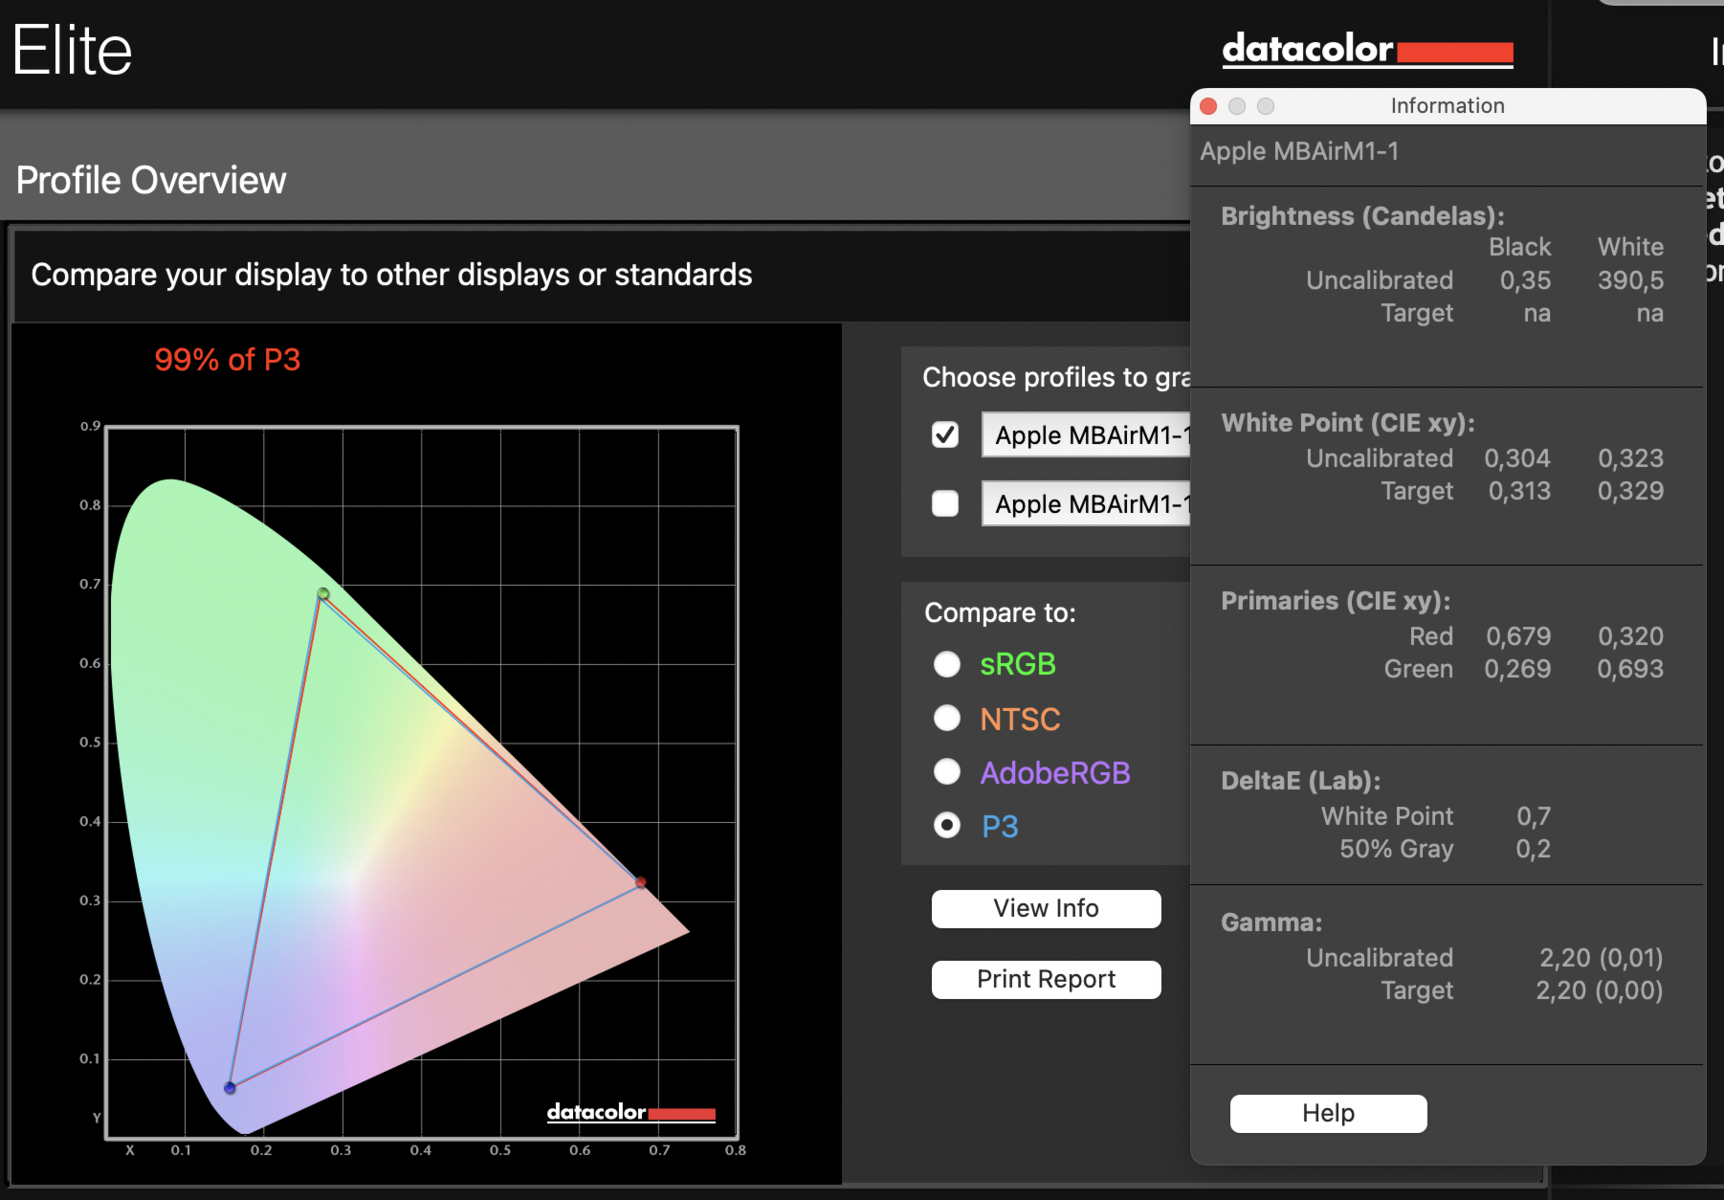
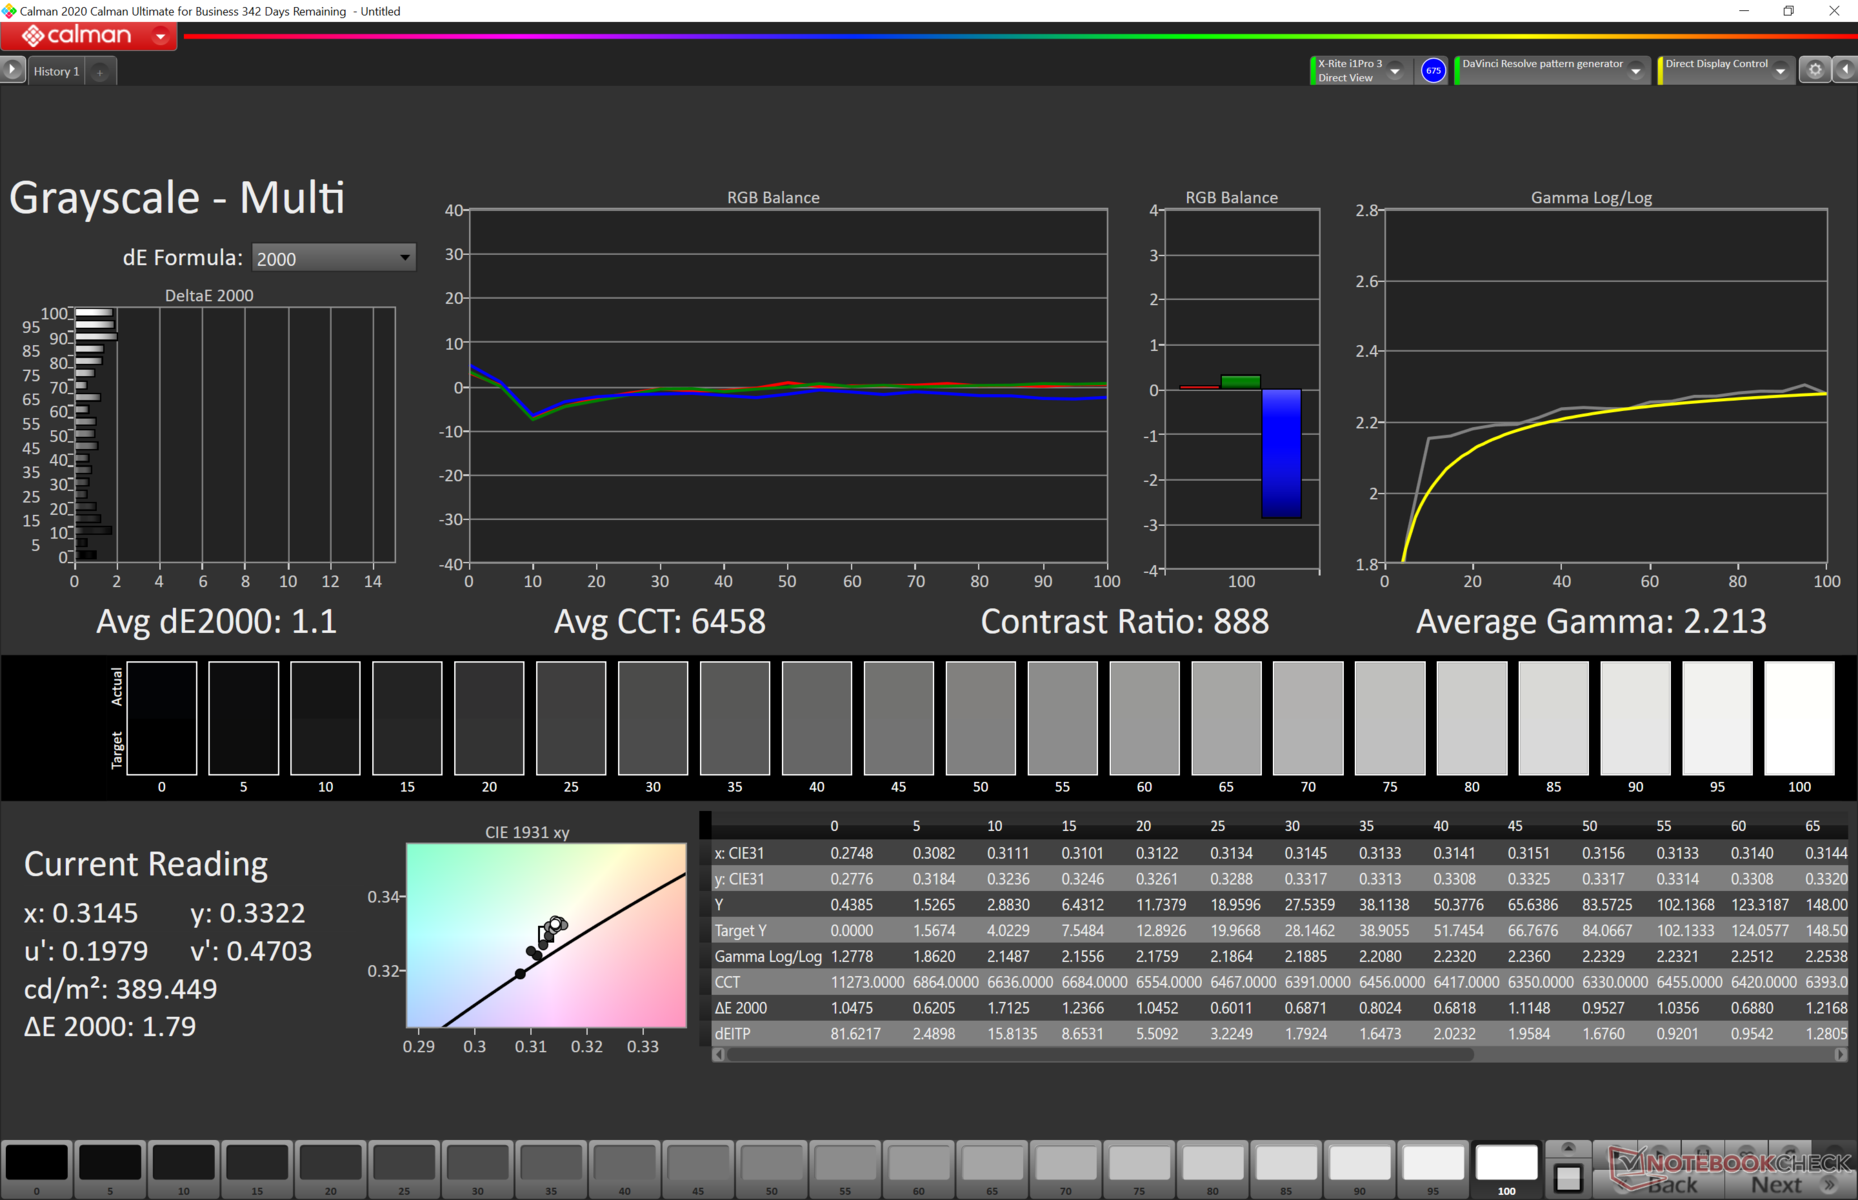
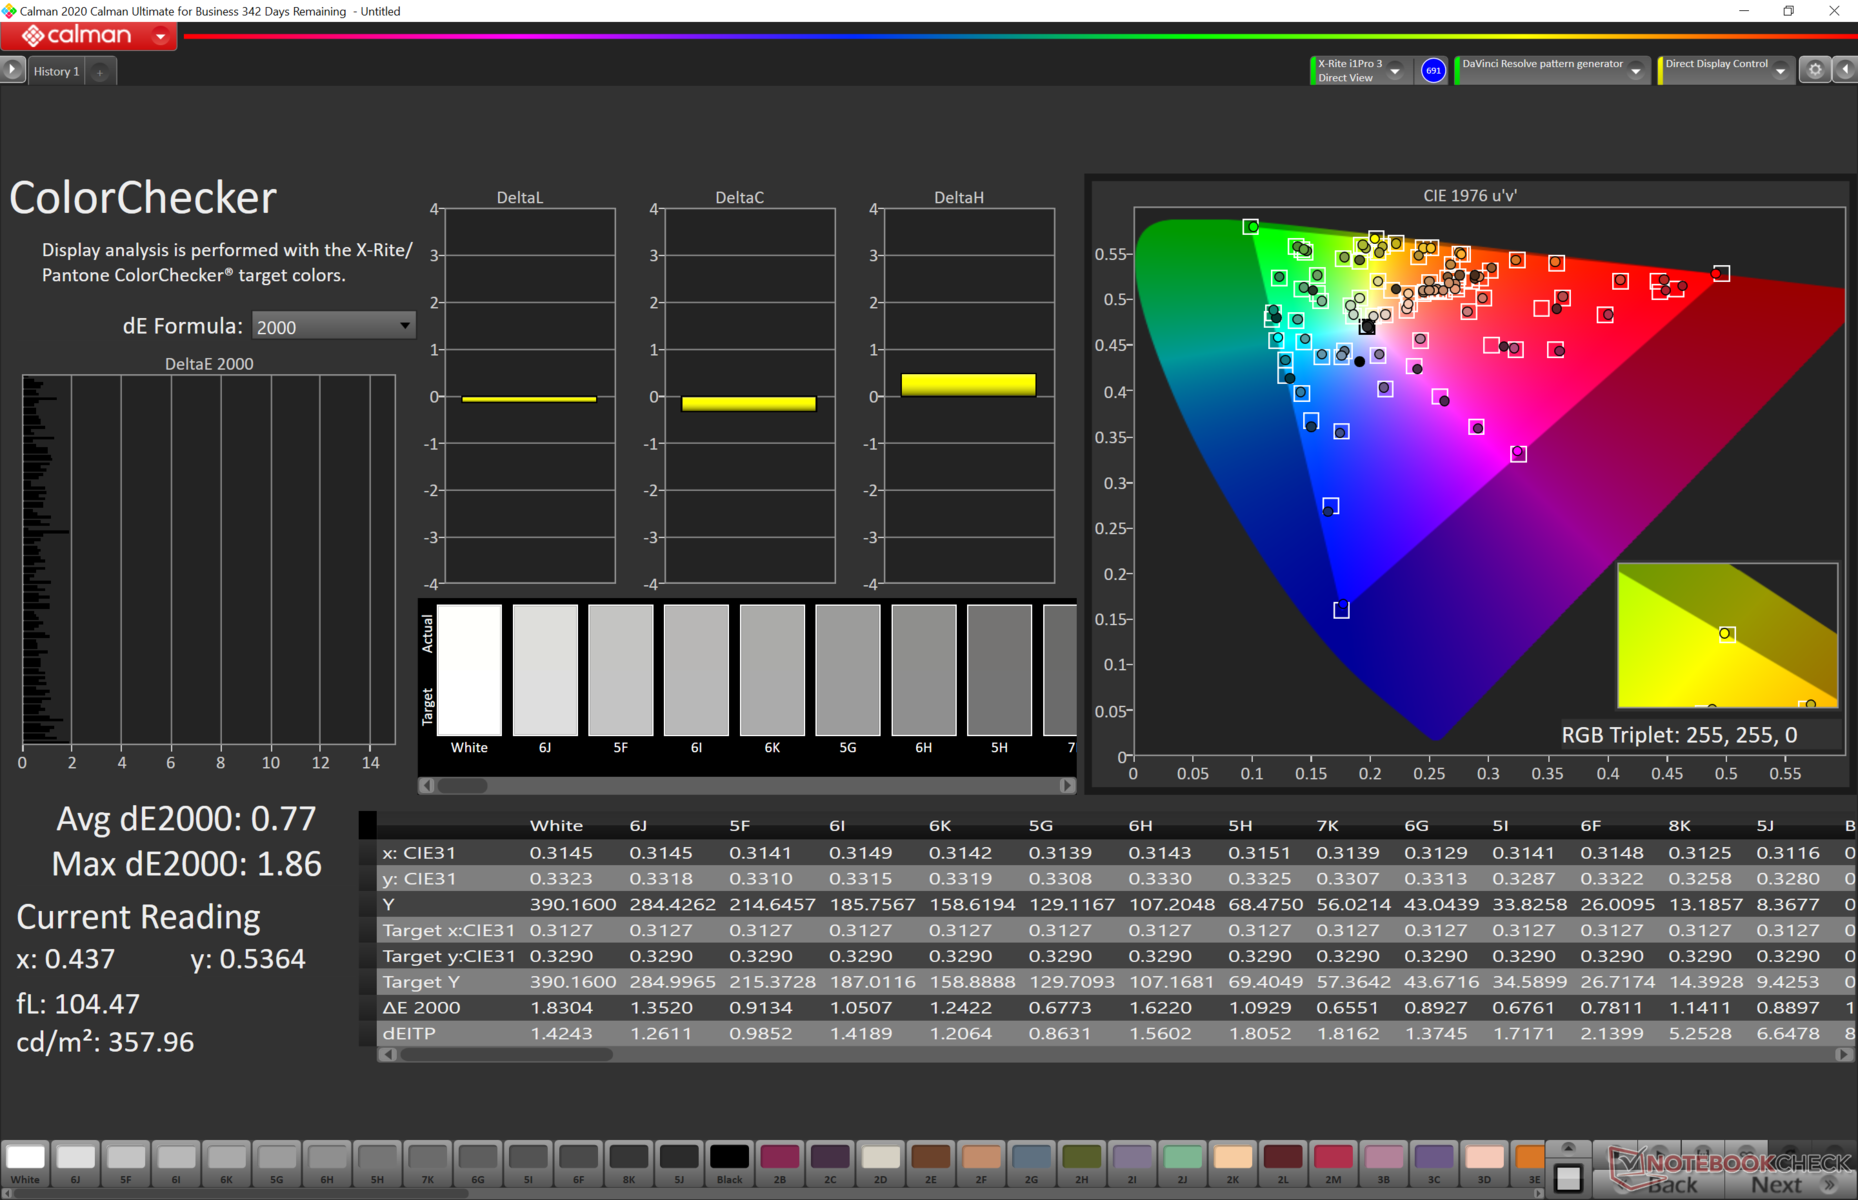
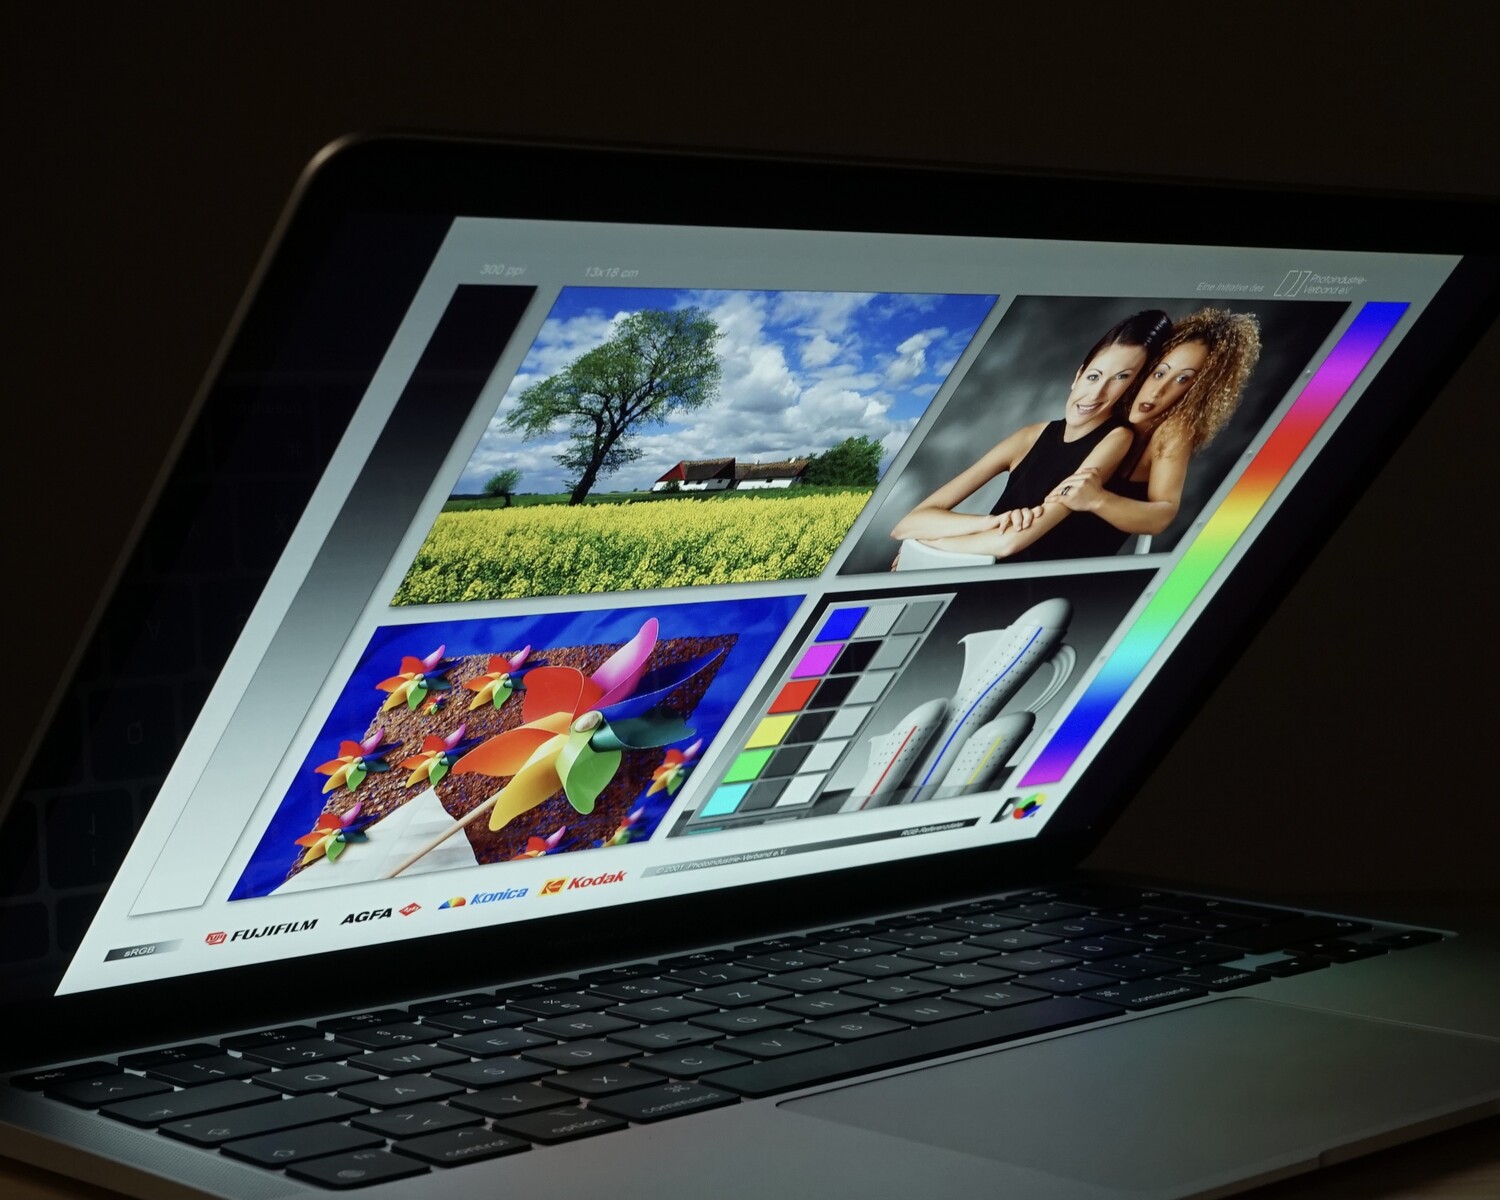
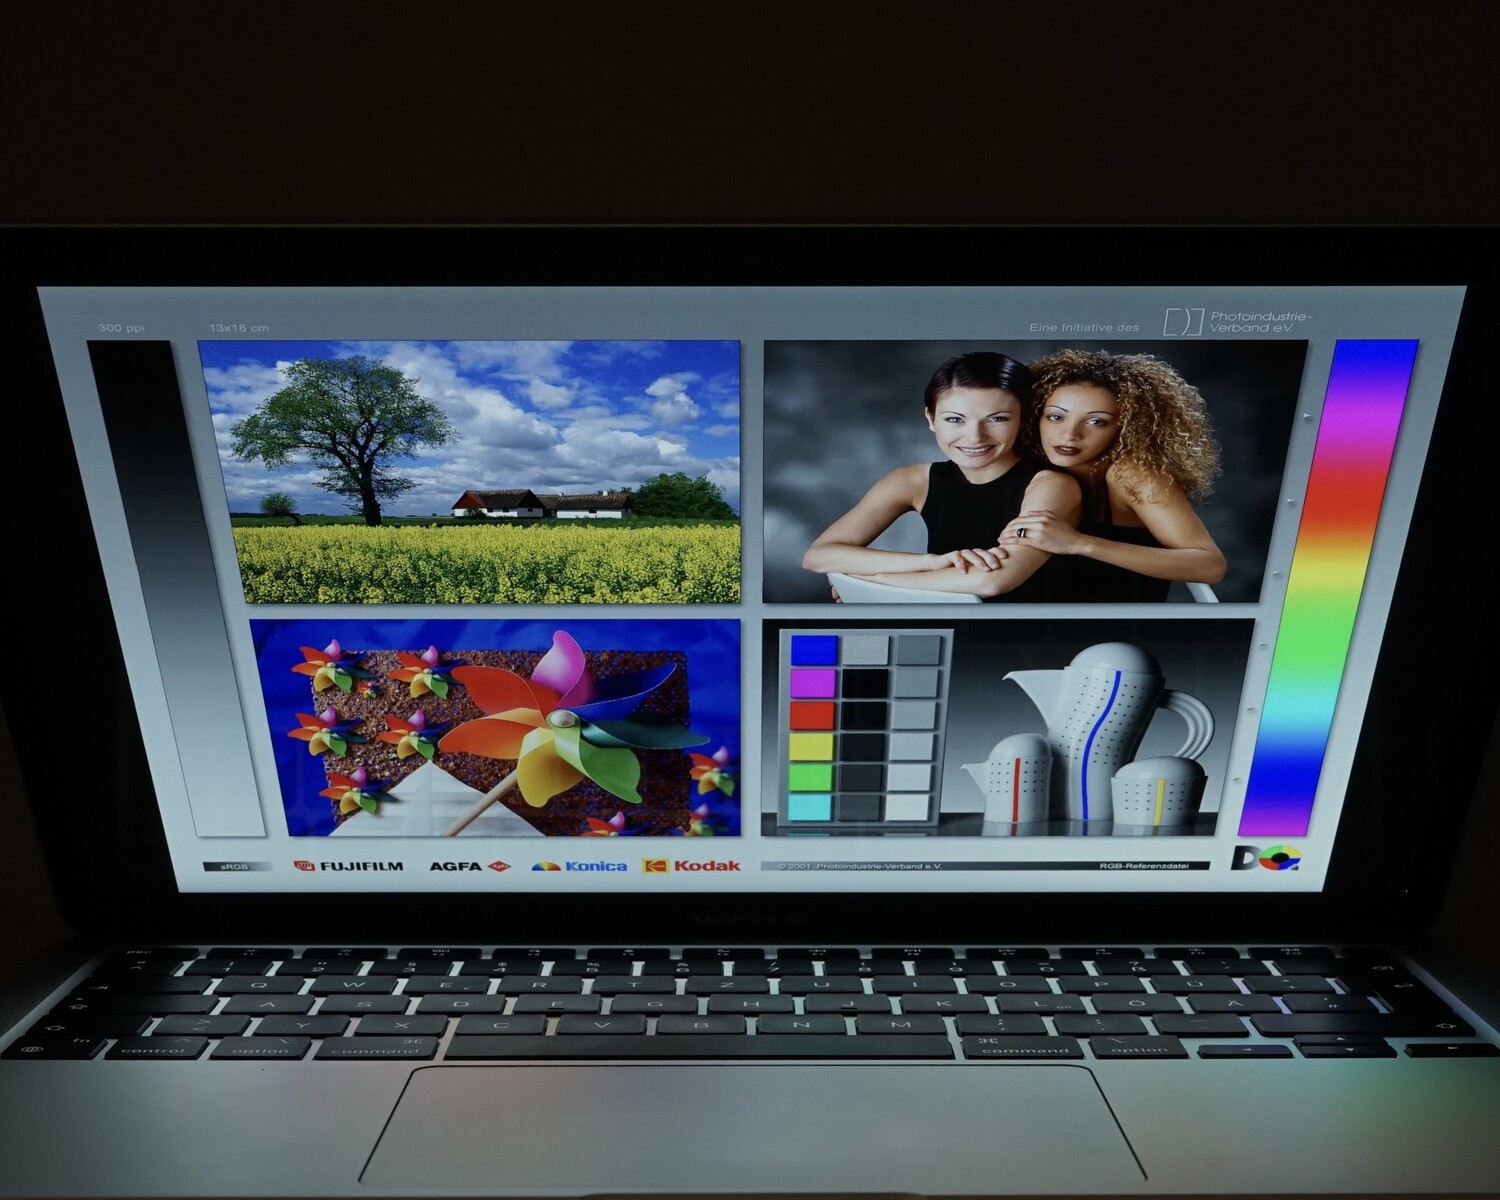
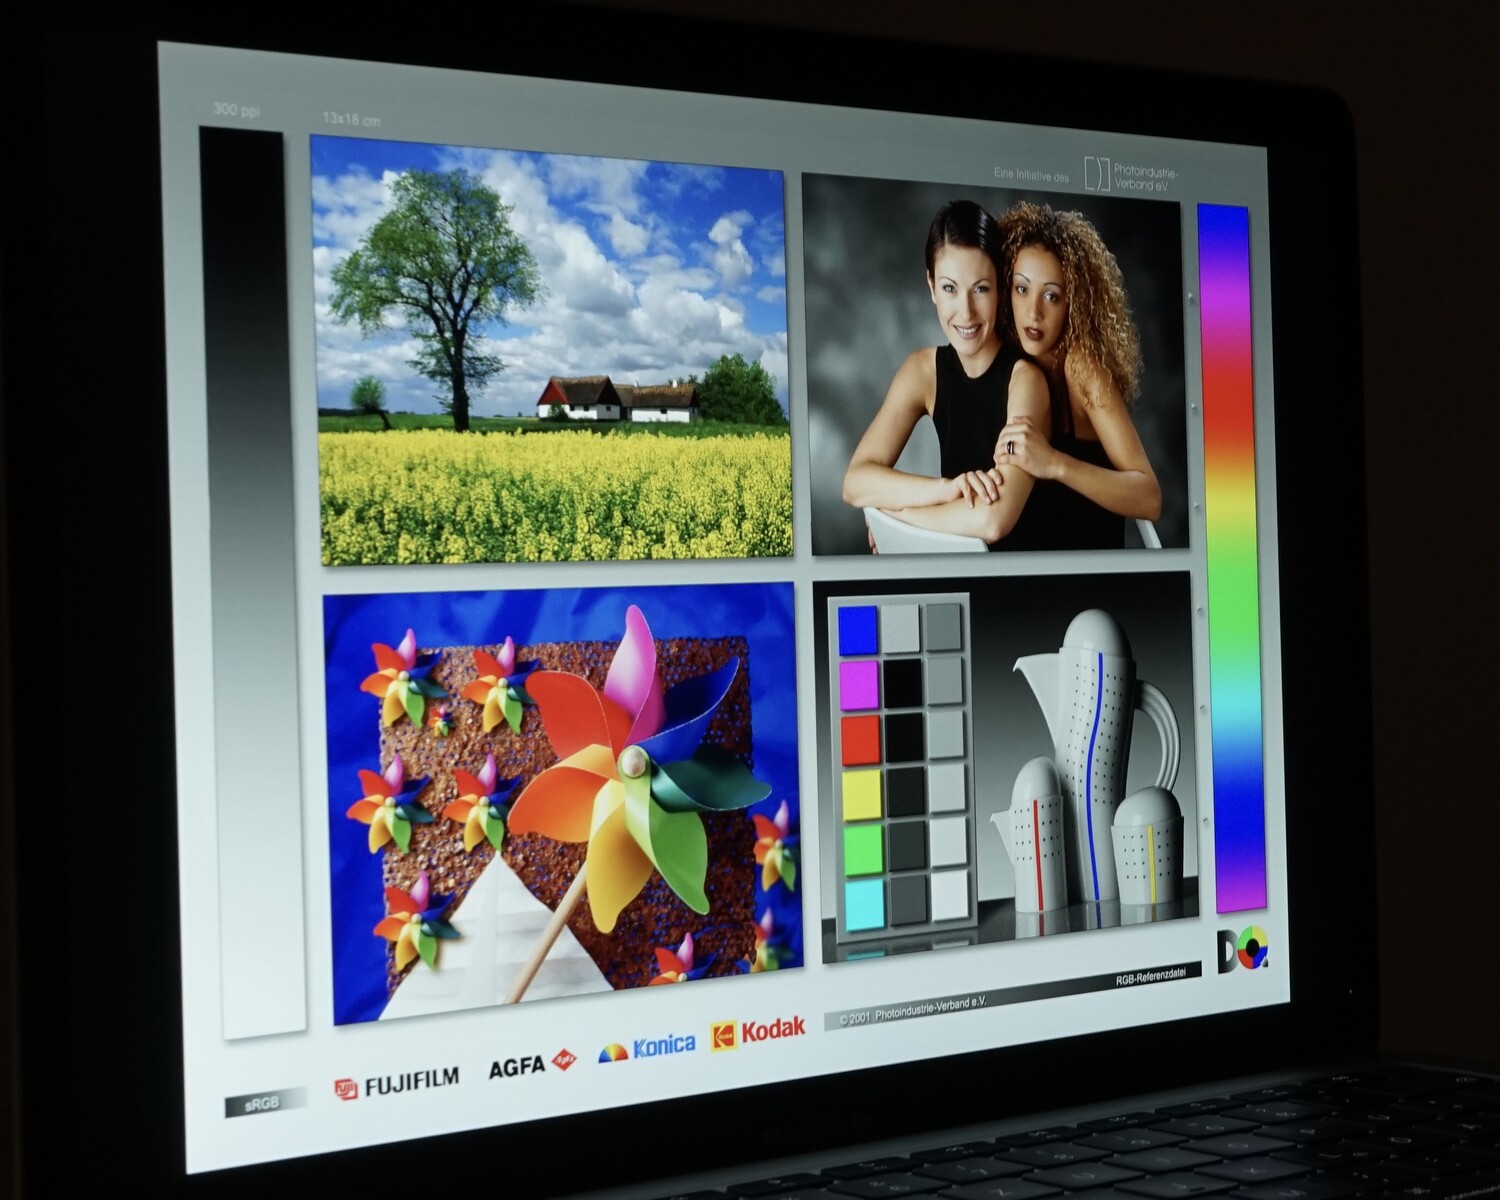
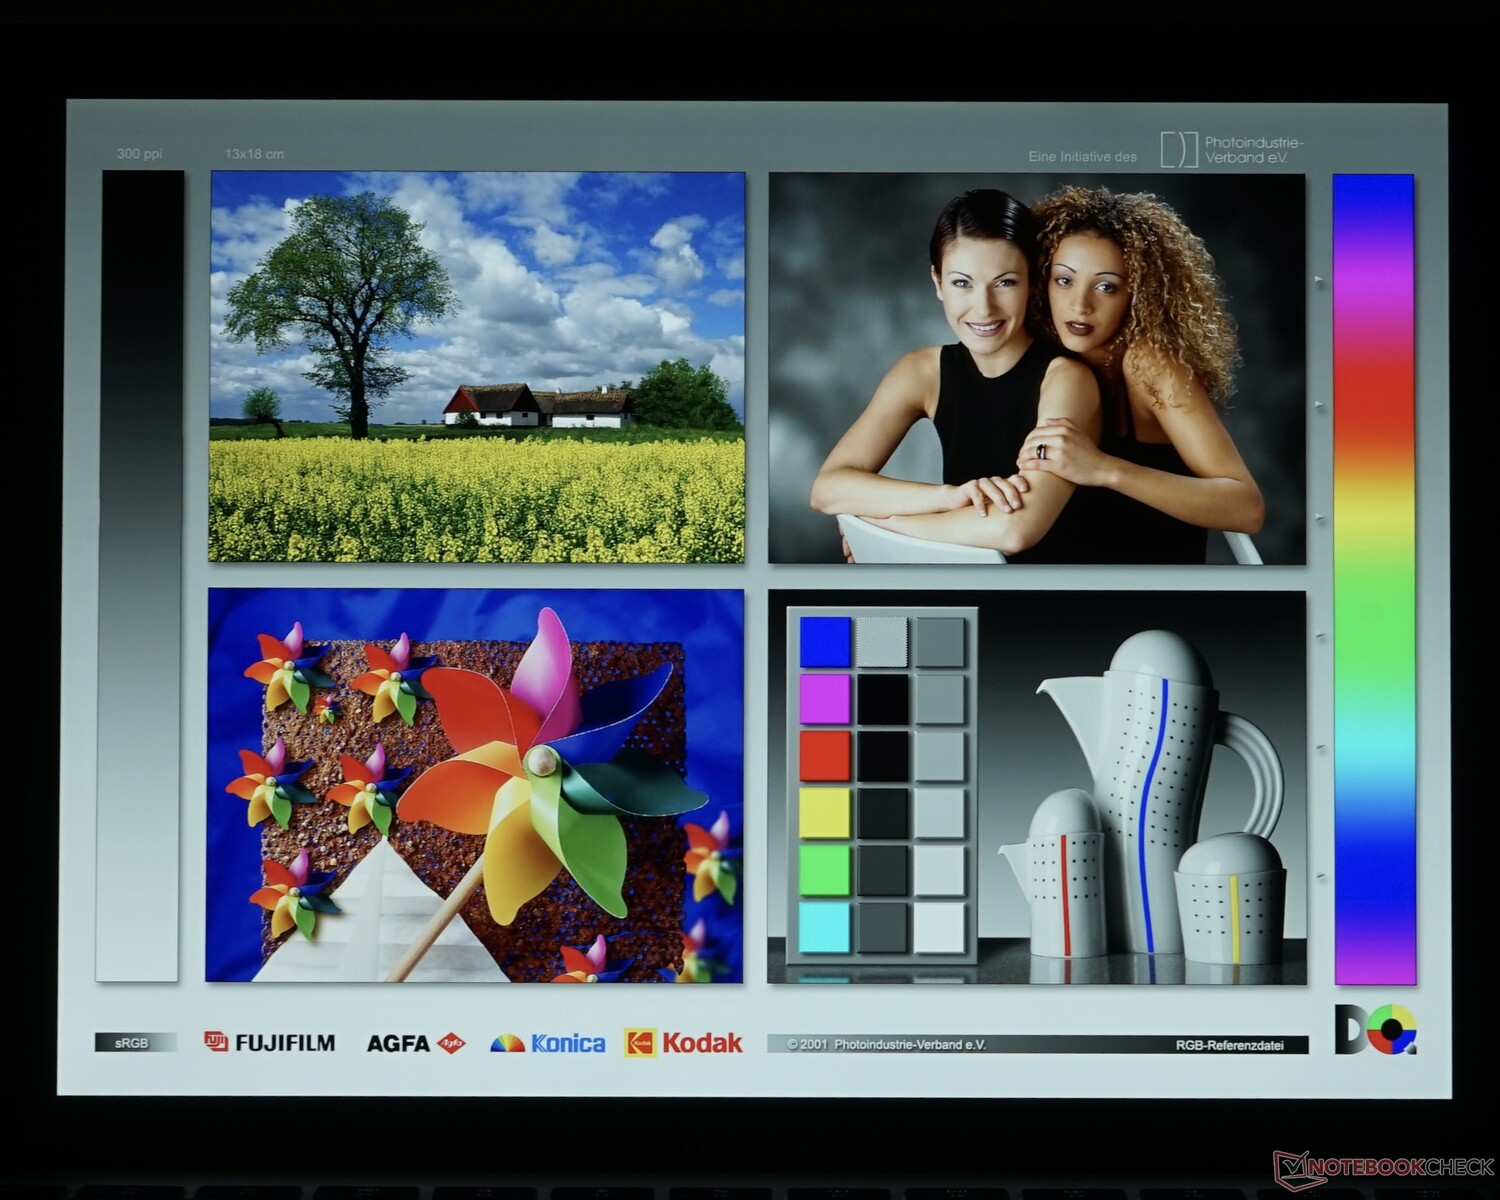
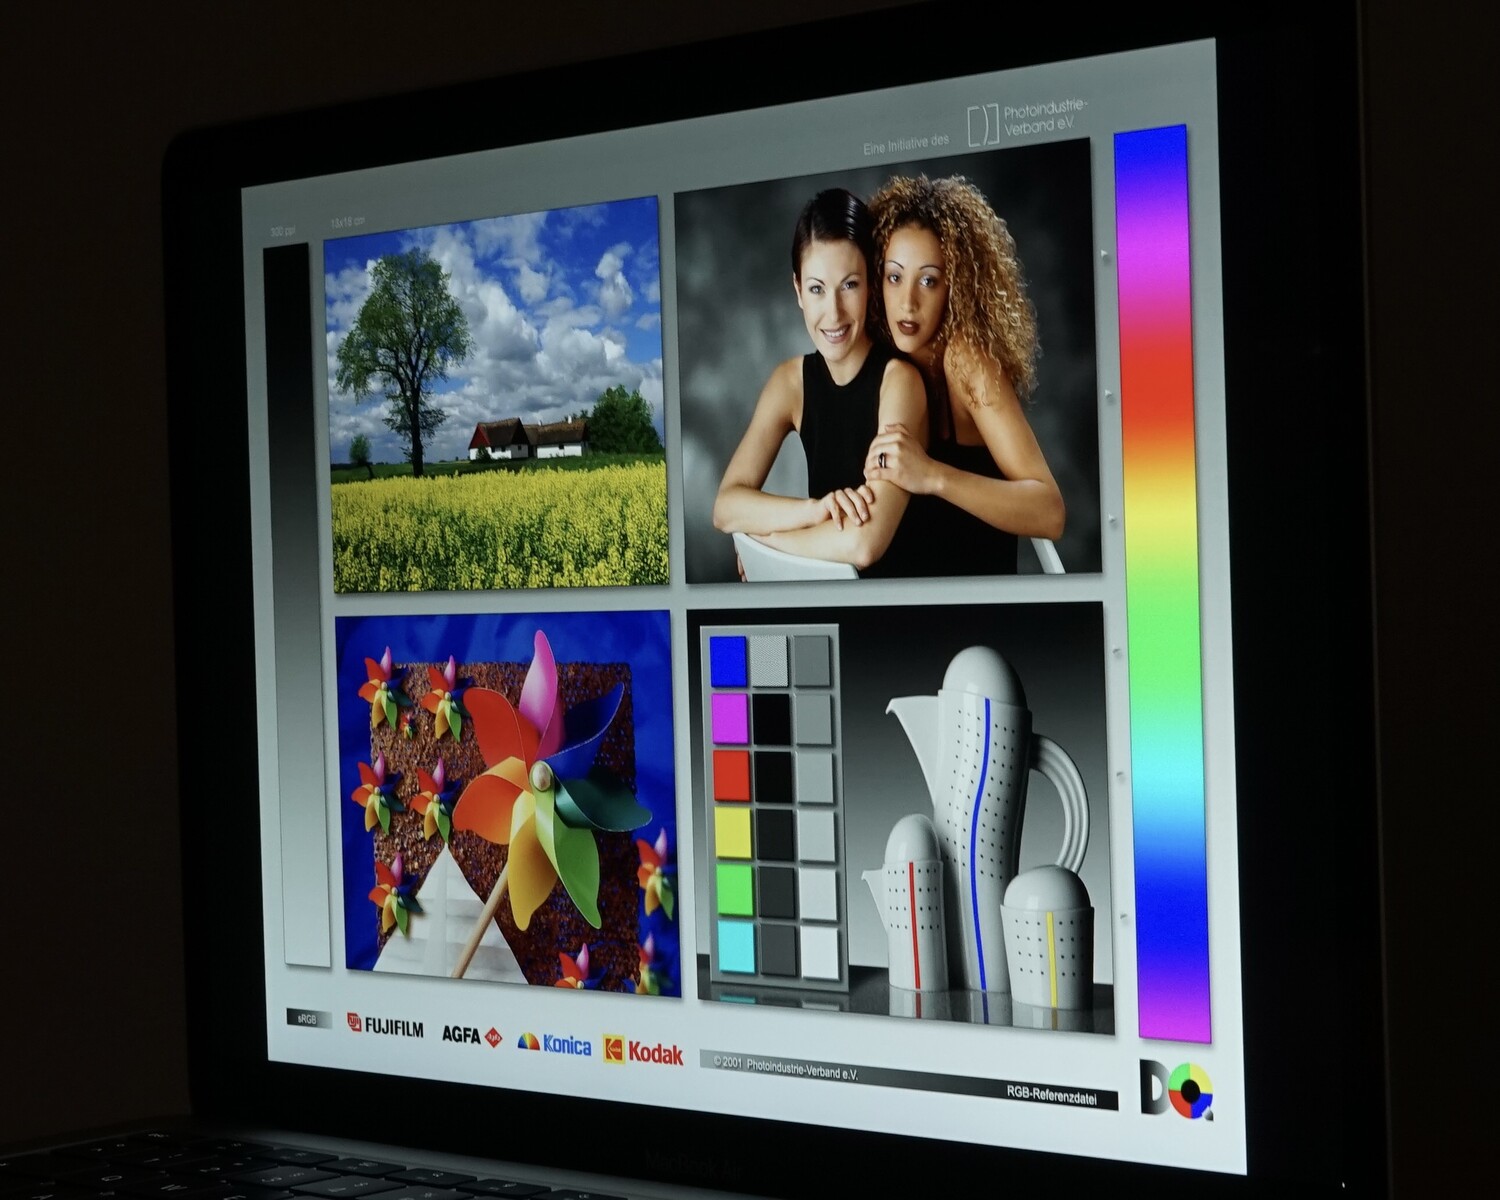
Panelin renk doğruluğu testlerimizde mükemmel. Renk testleri ve gri tonlama, Windows rakiplerinden önemli ölçüde daha iyidir. Bu nedenle ekran, fotoğrafçılar ve renk doğruluğuna bağlı uygulamaları kullanan diğerleri için çok uygundur. Bununla birlikte, ekranlarını düzenli olarak test etmeli ve yeniden kalibre etmelidirler. Bu bağlamda, daha sonra, örneğin, eski donanımın artık desteklenmediğini ve M1 ile bazı uyumluluk sorunları olabileceğini öğrendik. SRGB renk alanı pratik olarak tamamen kaplanmıştır ve DCI P3 (daVinci Resolve altında) % 98.2. Her zamanki gibi, MobileForge veya tarayıcı üzerinden yapılan testler yalnızca sRGB renk alanında çalışır. İ1pro'nun i1Profiler kalibrasyon yazılımı şu anda M1 Mac'lerle uyumlu değildir, bu nedenle ekranı kalibre etmek için SyperX'i kullandık (ölçümler hala i1pro ile yapılır).
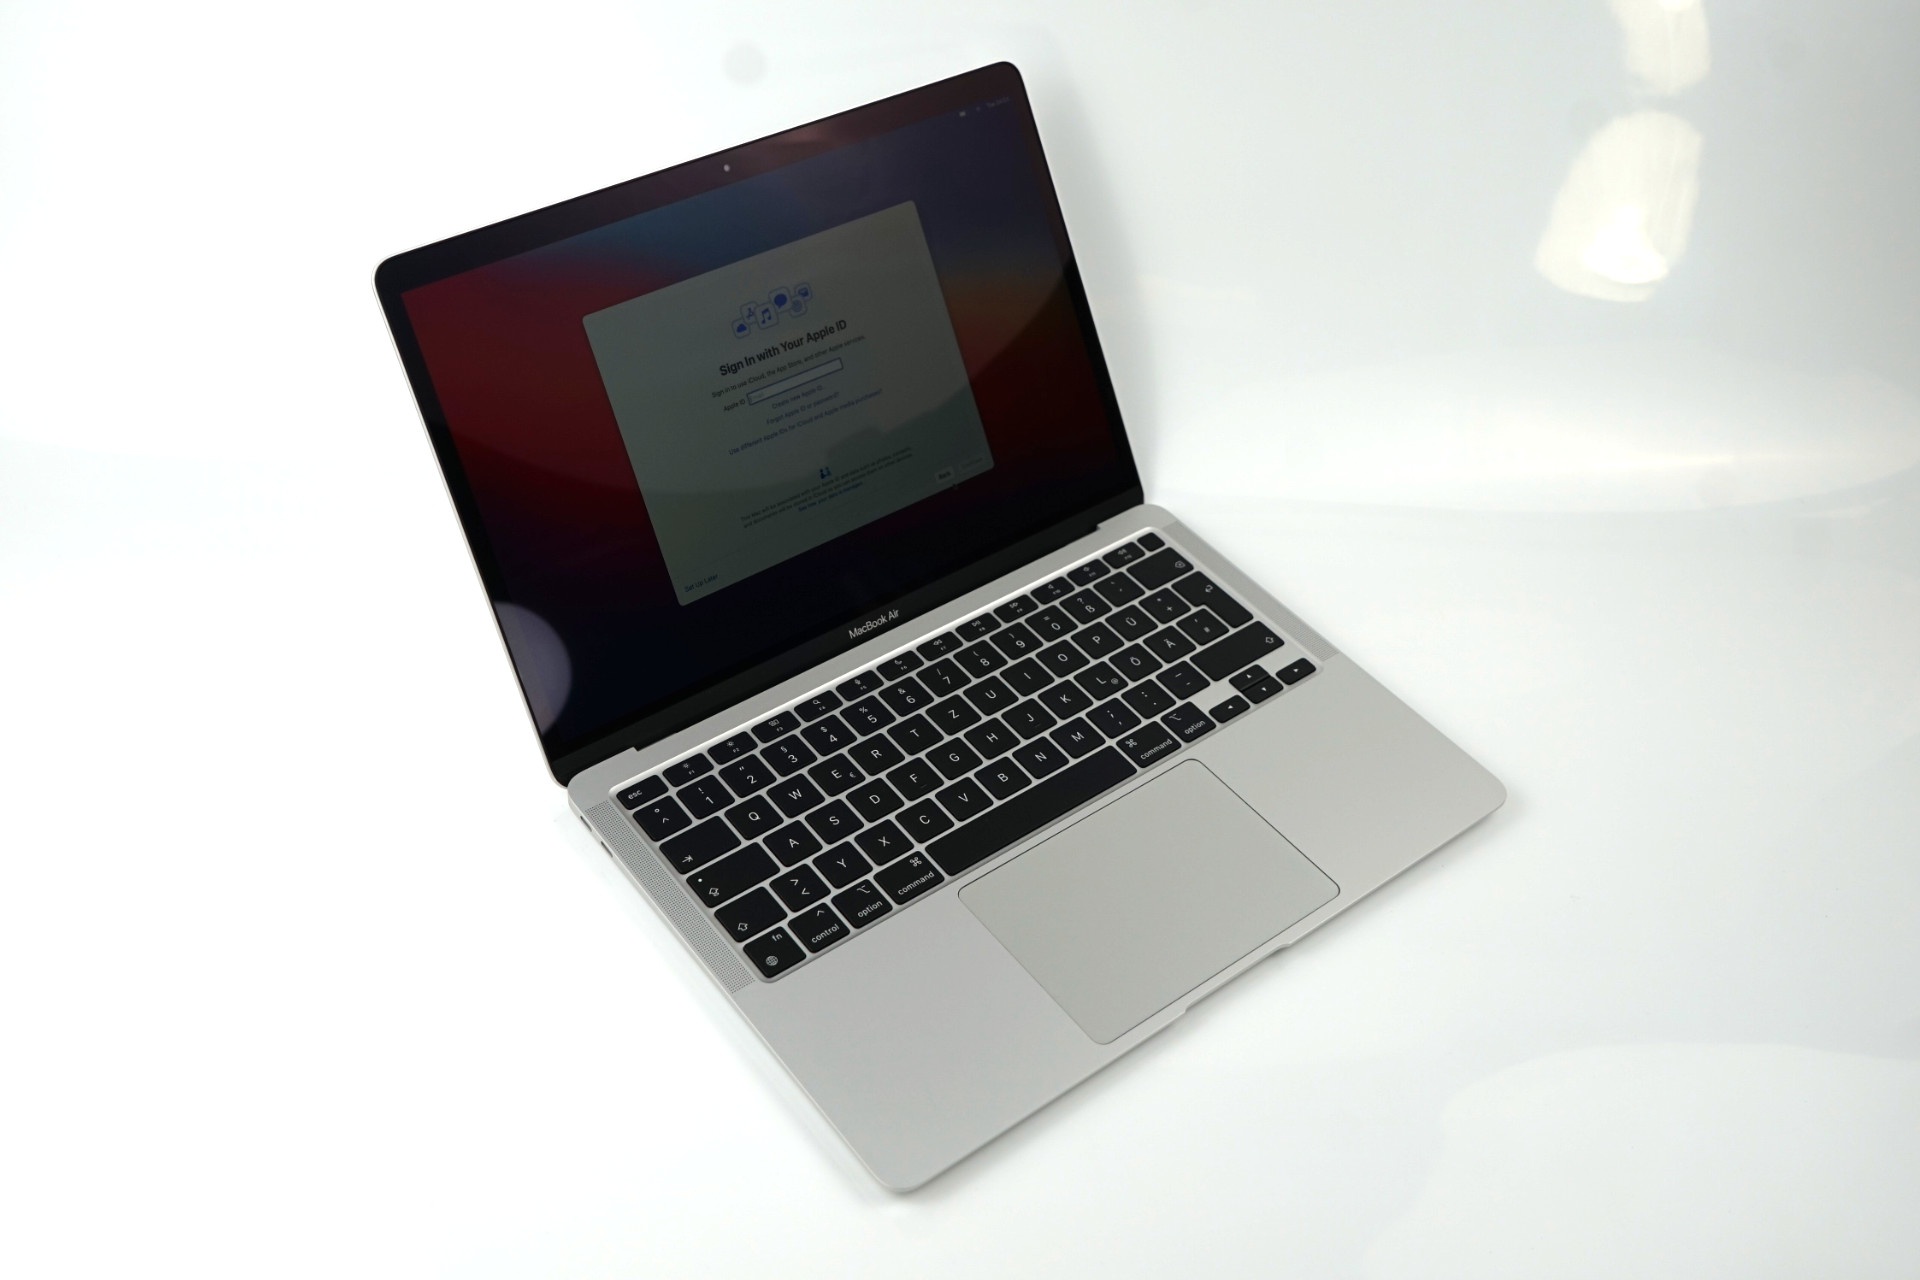
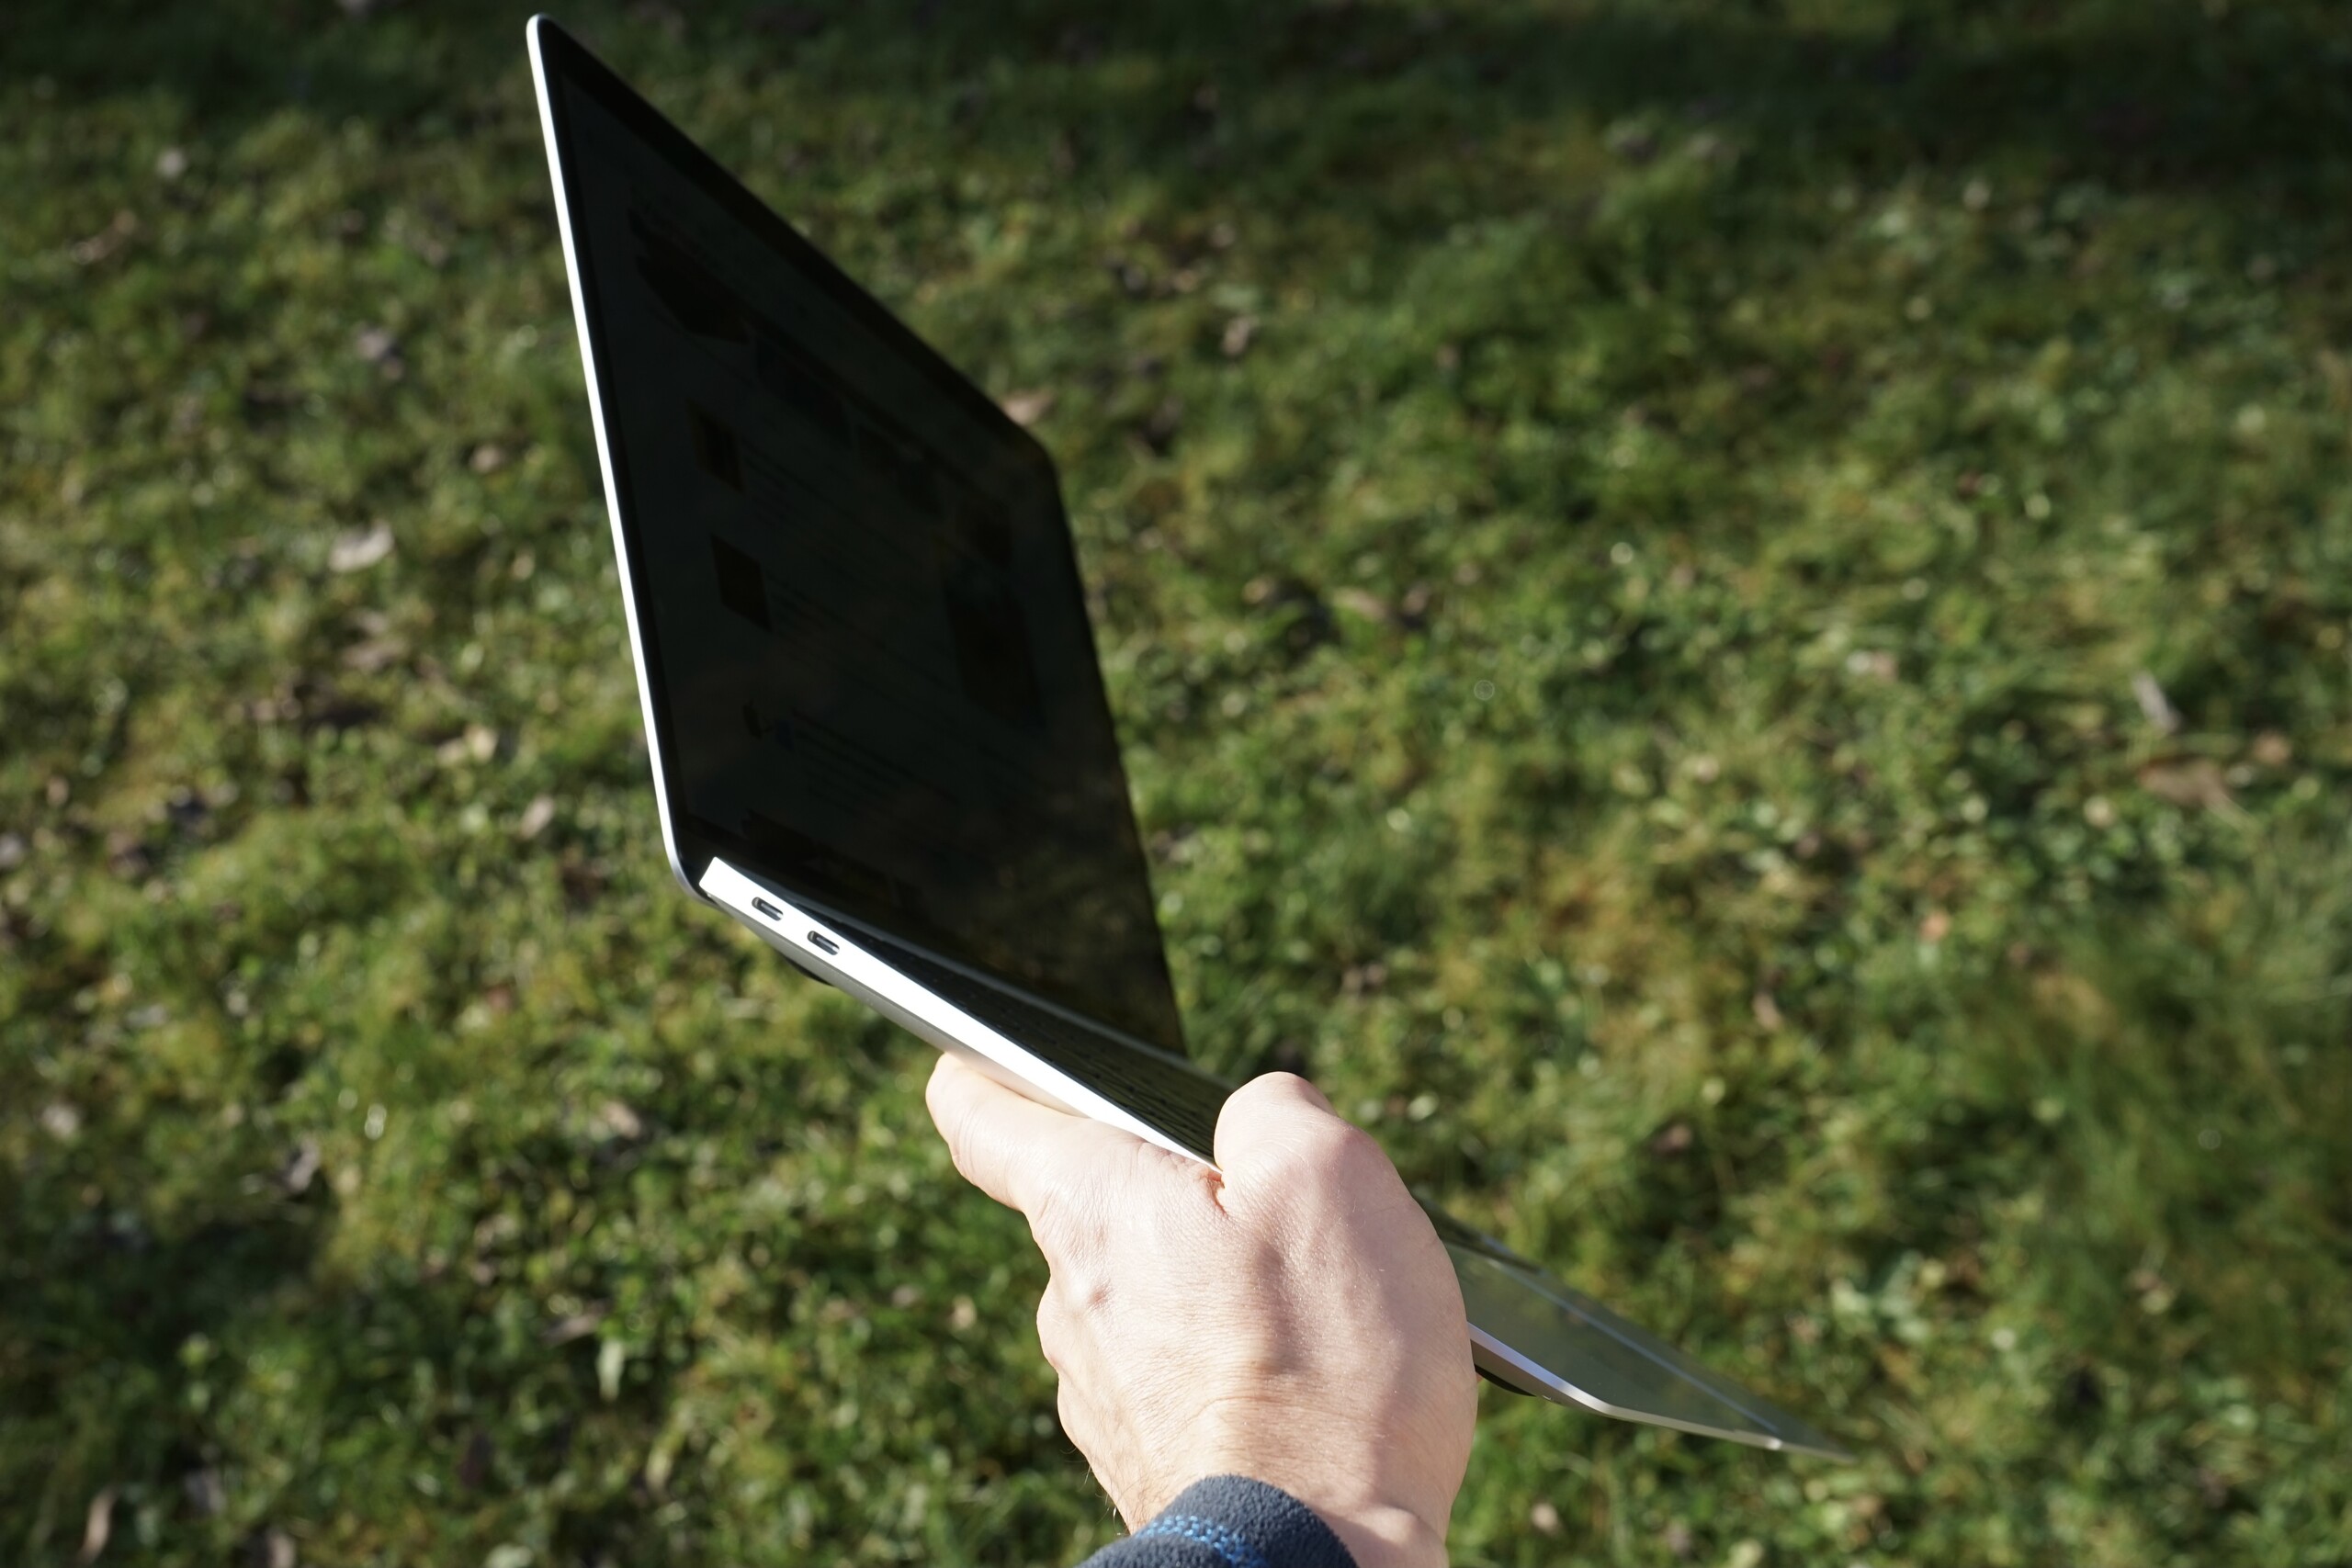
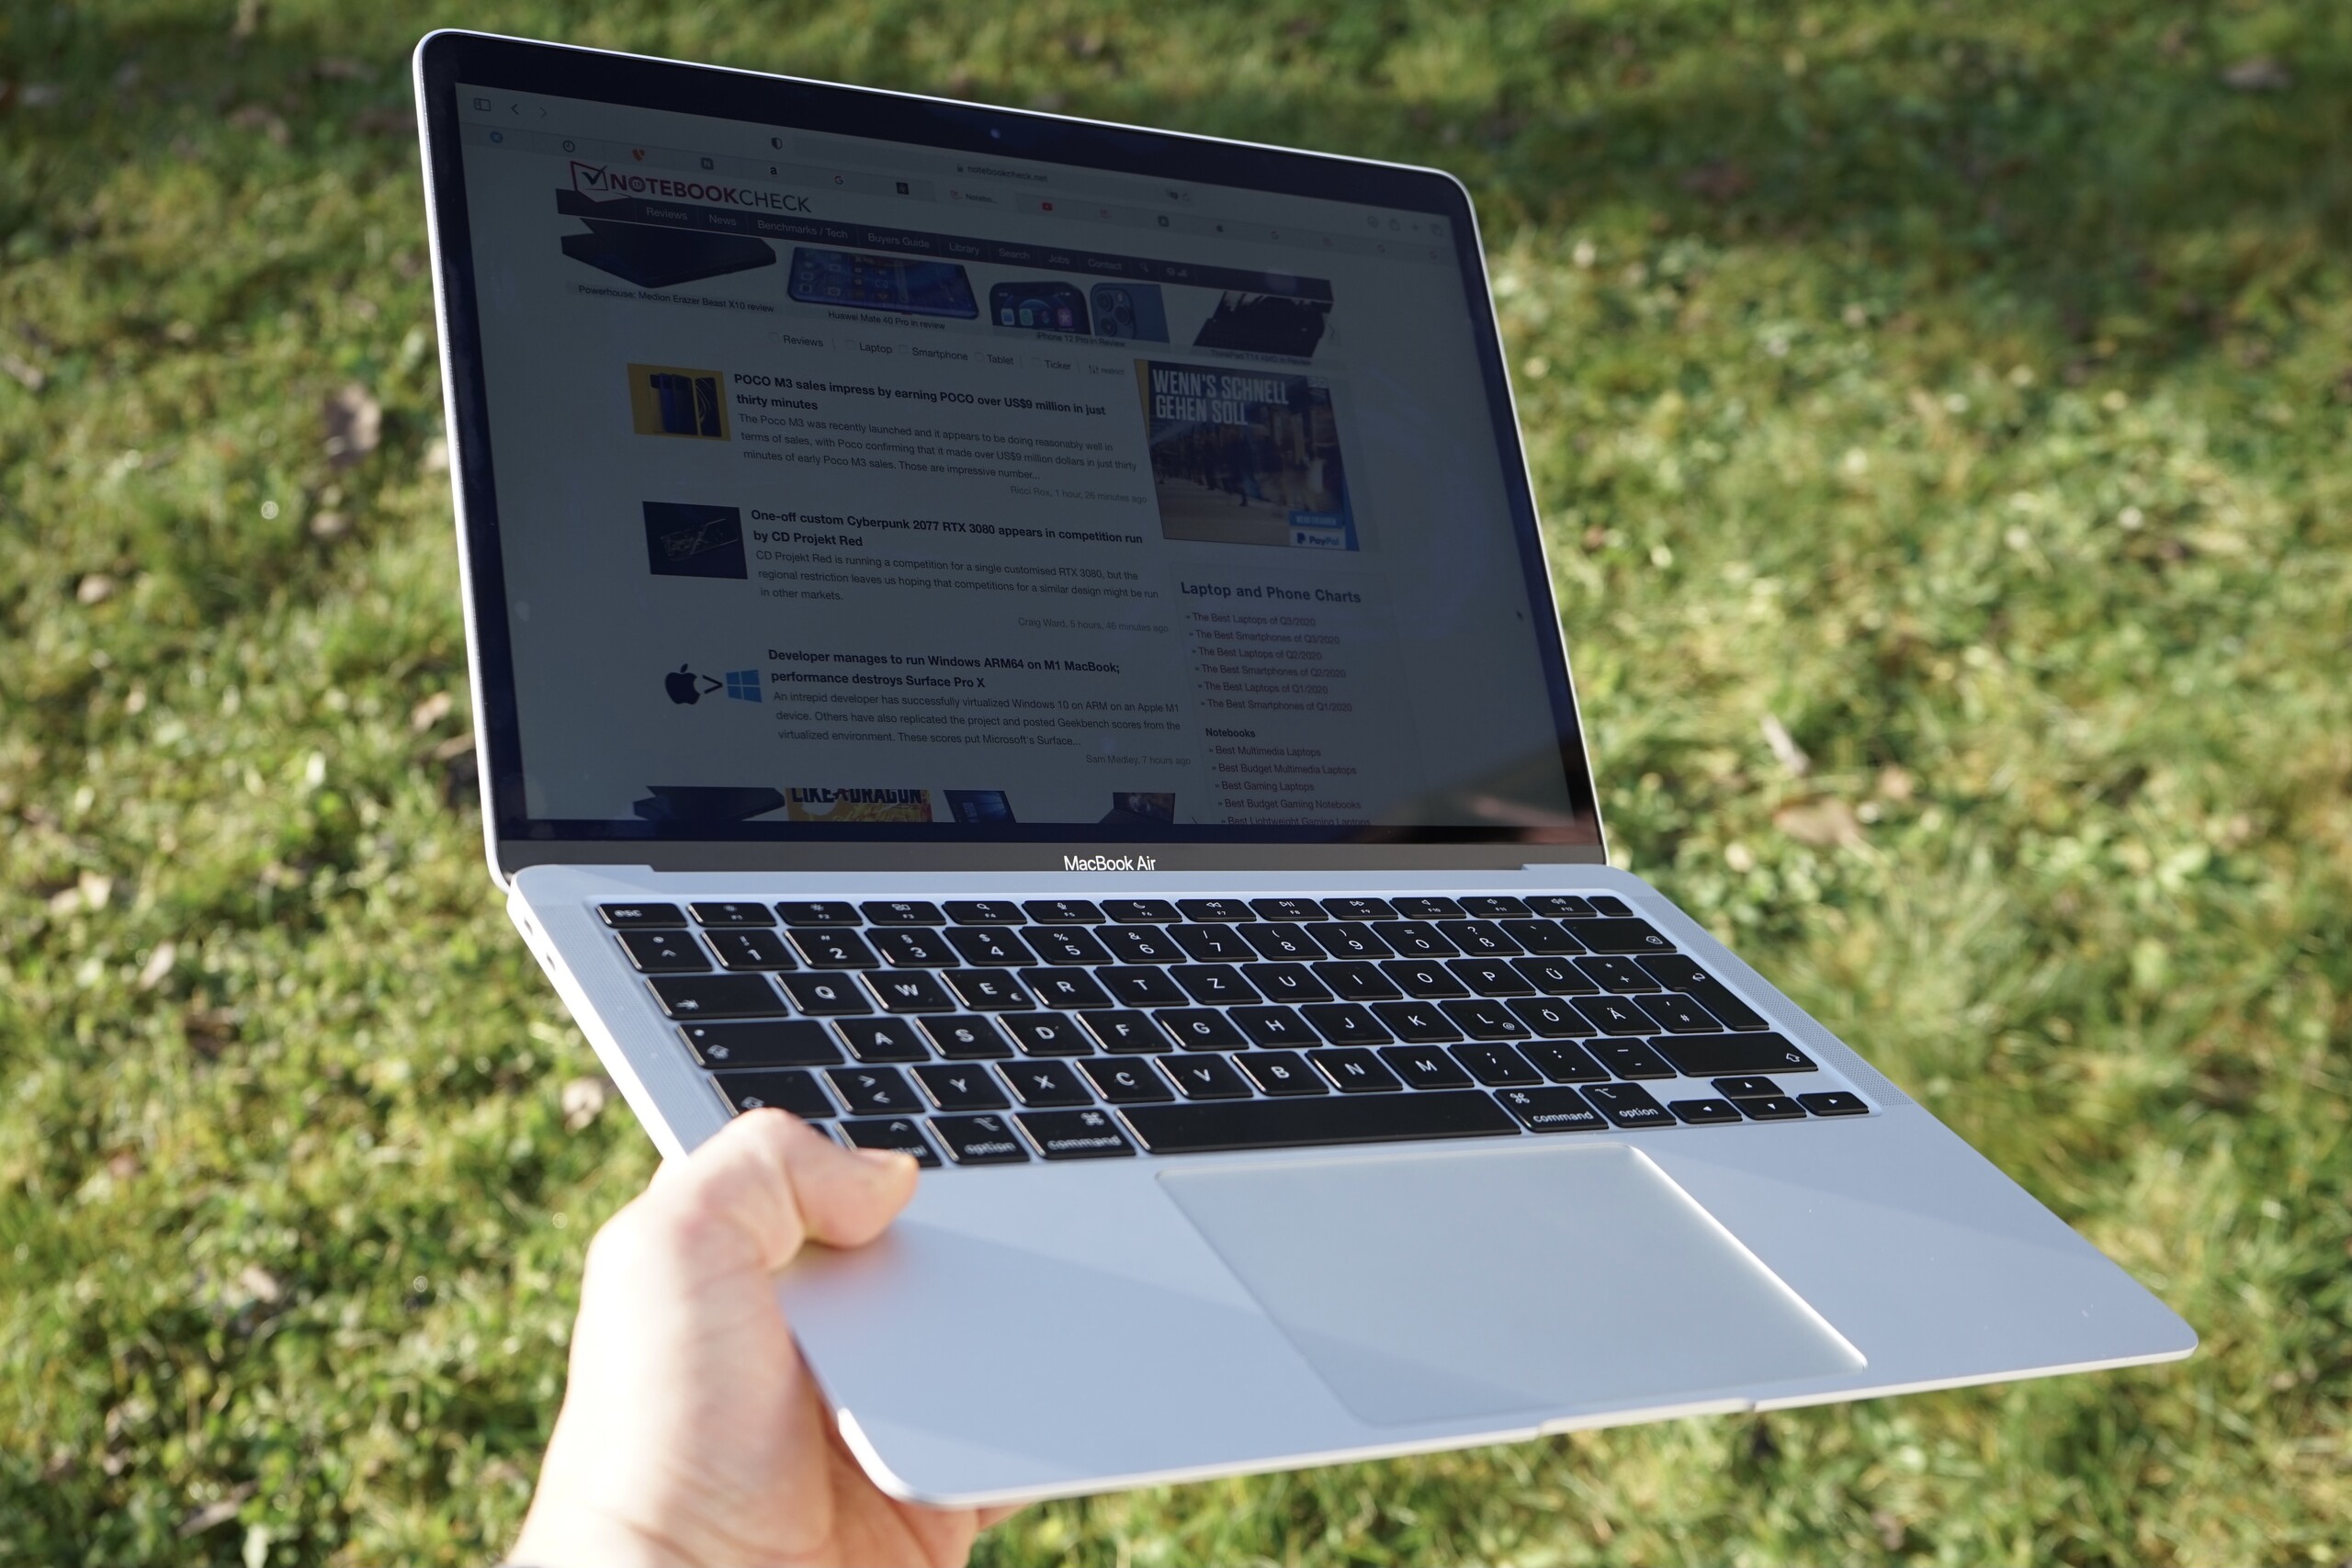
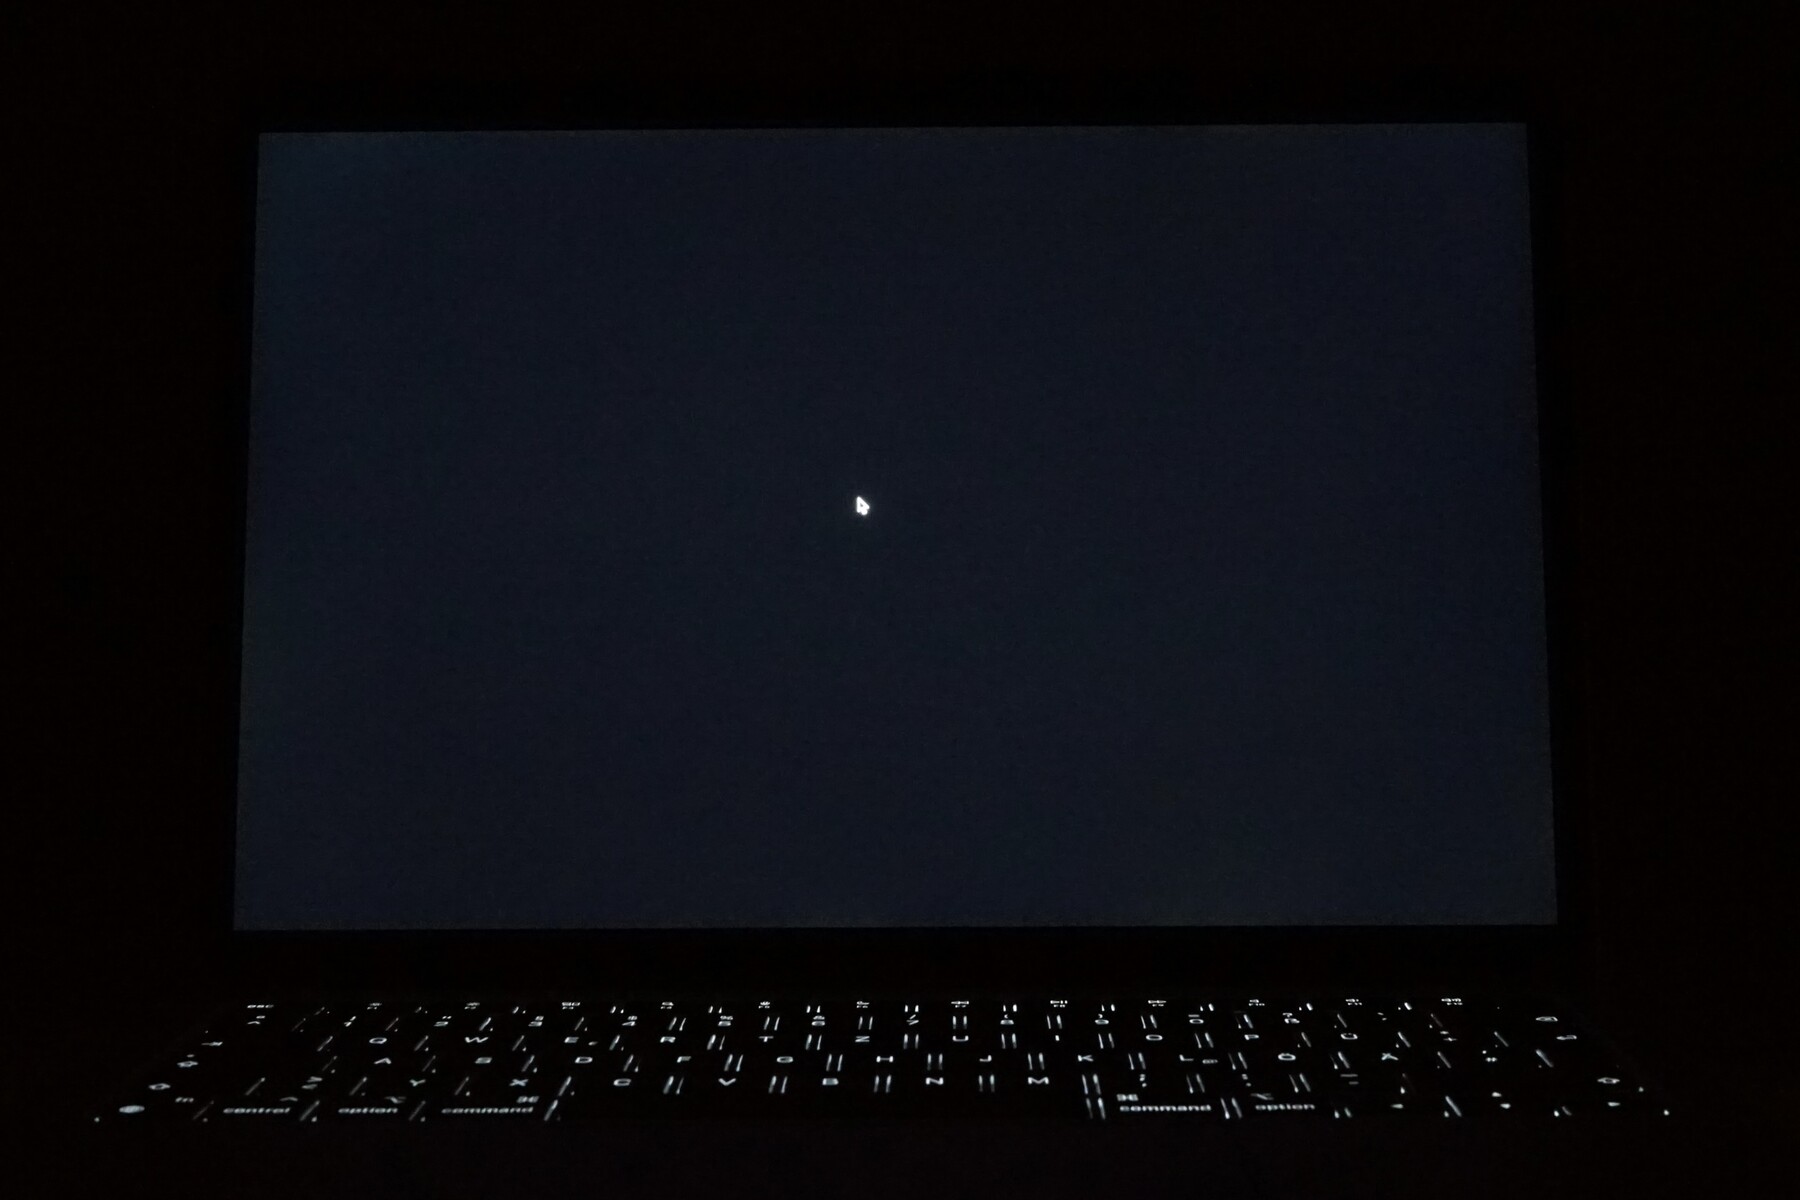
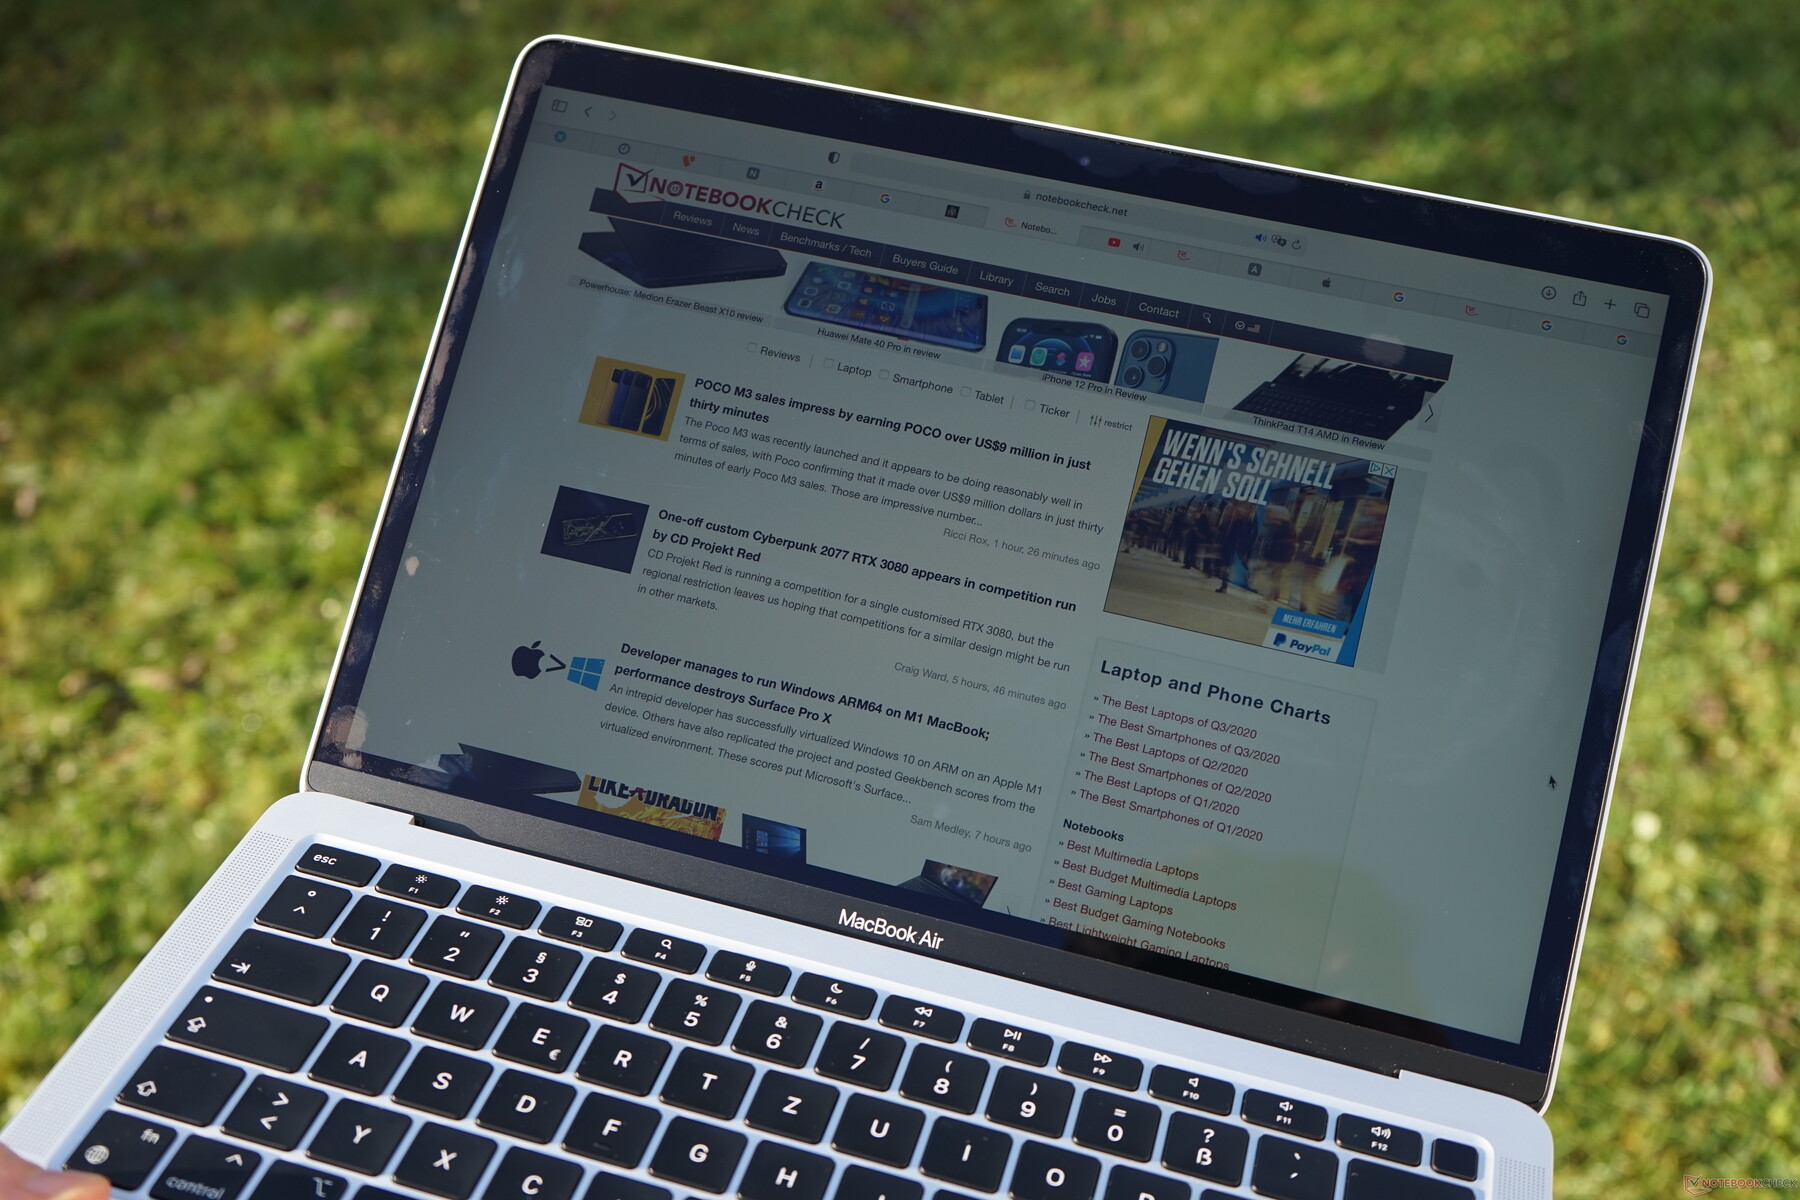
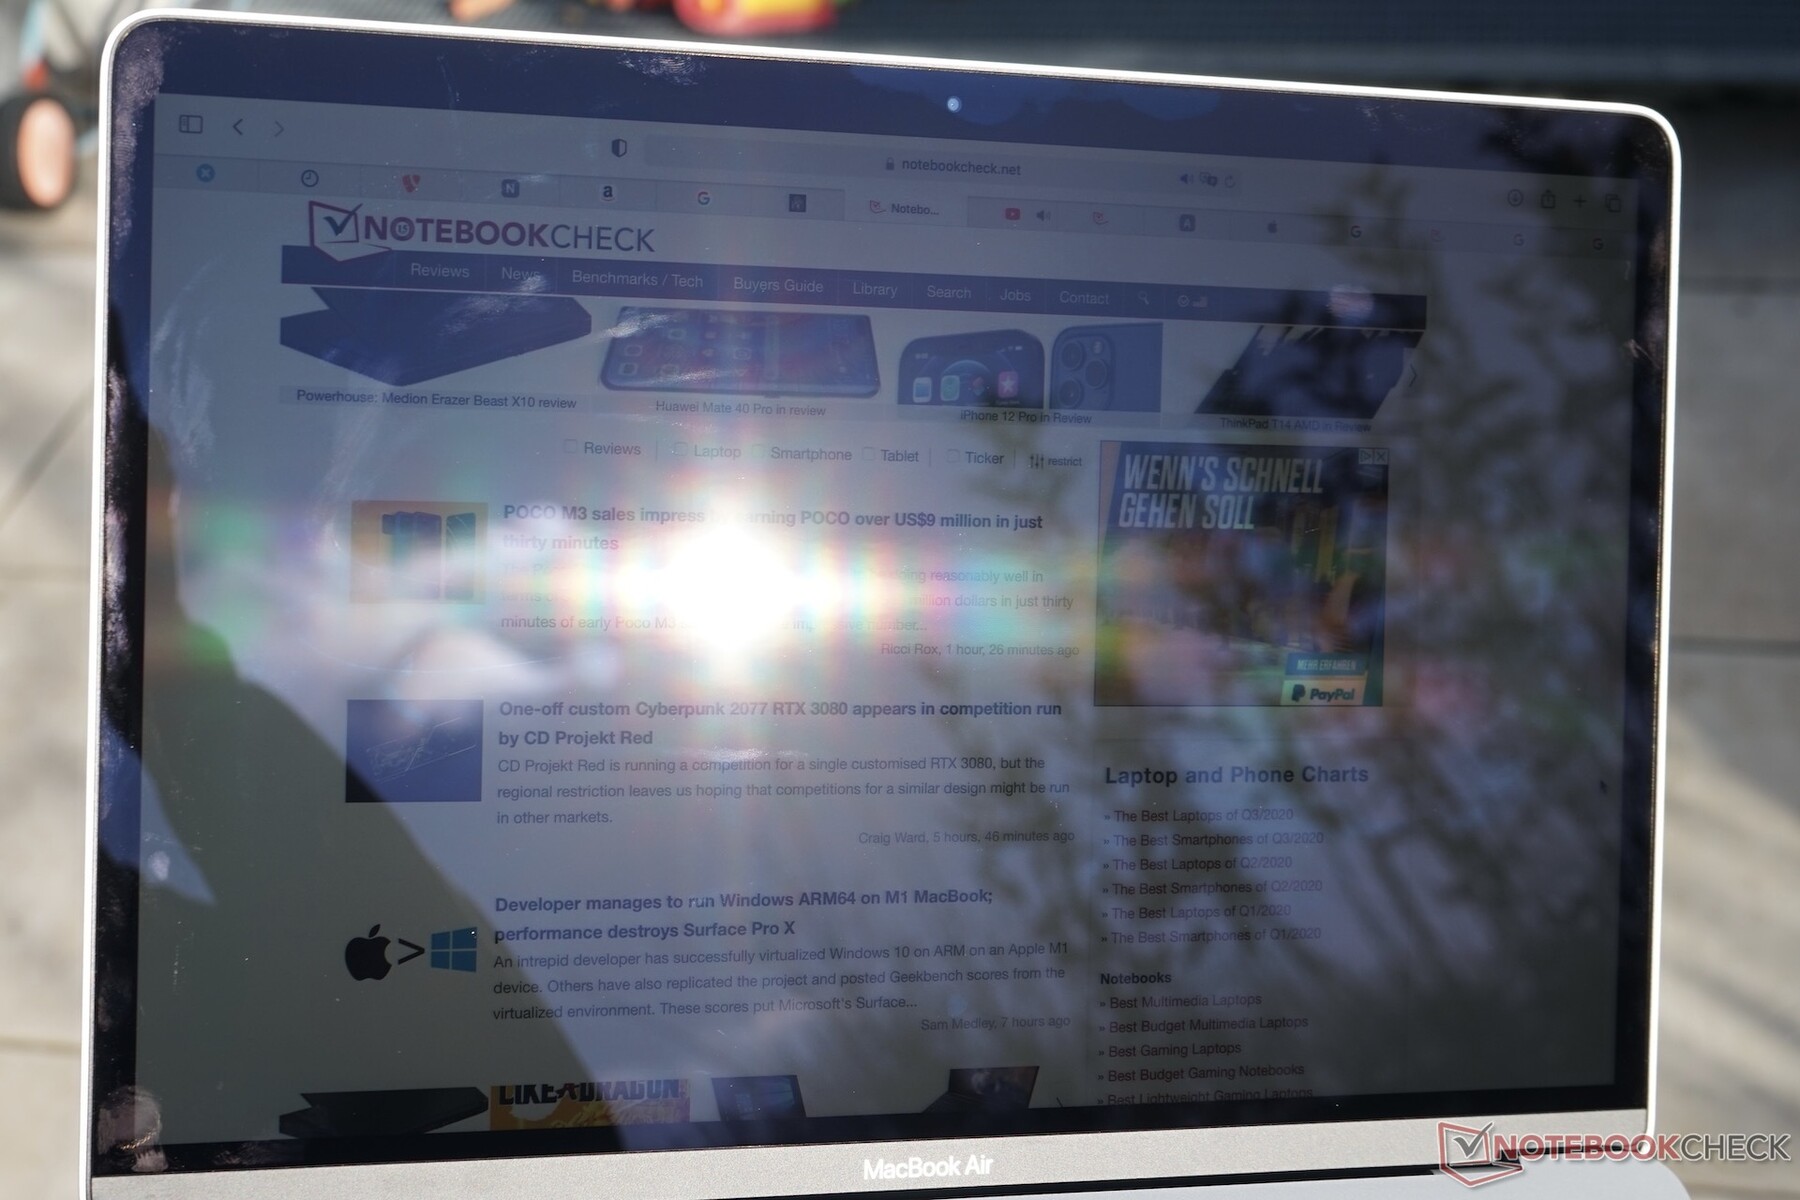
The display is protected by reflective glass as usual. There is, however, a special layer on top that is supposed to reduce annoying reflections. But you should definitely still avoid bright light sources from behind. The brightness is also only sufficient for shady conditions, and things become difficult in direct sunlight.
To save energy, Apple uses PWM at a very high frequency of 117 kHz for brightness up to about 50% (about 160 cd/m2). Above that, we measure some slight flickering at 60 Hz, but this only shows some very small brightness variations (with or without the charger). Neither should lead to any difficulties for more than very few users.
The response times of the display are good for an IPS display, but only average when considering all the displays we tested. However, there are no limitations at all in everyday operation.
Yanıt Sürelerini Görüntüle
| ↔ Tepki Süresi Siyahtan Beyaza | ||
|---|---|---|
| 26.1 ms ... yükseliş ↗ ve sonbahar↘ birleşimi | ↗ 14.9 ms yükseliş | |
| ↘ 11.2 ms sonbahar | ||
| Ekran, testlerimizde nispeten yavaş yanıt oranları gösteriyor ve oyuncular için çok yavaş olabilir. Karşılaştırıldığında, test edilen tüm cihazlar 0.1 (minimum) ile 240 (maksimum) ms arasında değişir. » Tüm cihazların 65 %'si daha iyi. Bu, ölçülen yanıt süresinin test edilen tüm cihazların ortalamasından (19.8 ms) daha kötü olduğu anlamına gelir. | ||
| ↔ Tepki Süresi %50 Griden %80 Griye | ||
| 31 ms ... yükseliş ↗ ve sonbahar↘ birleşimi | ↗ 14 ms yükseliş | |
| ↘ 17 ms sonbahar | ||
| Ekran, testlerimizde yavaş yanıt oranları gösteriyor ve oyuncular için yetersiz olacaktır. Karşılaştırıldığında, test edilen tüm cihazlar 0.165 (minimum) ile 636 (maksimum) ms arasında değişir. » Tüm cihazların 42 %'si daha iyi. Bu, ölçülen yanıt süresinin test edilen tüm cihazların ortalamasına benzer olduğu anlamına gelir (31 ms). | ||
Ekran Titremesi / PWM (Darbe Genişliği Modülasyonu)
| Ekran titriyor / PWM algılandı | 118000 Hz | ≤ 49 % parlaklık ayarı | 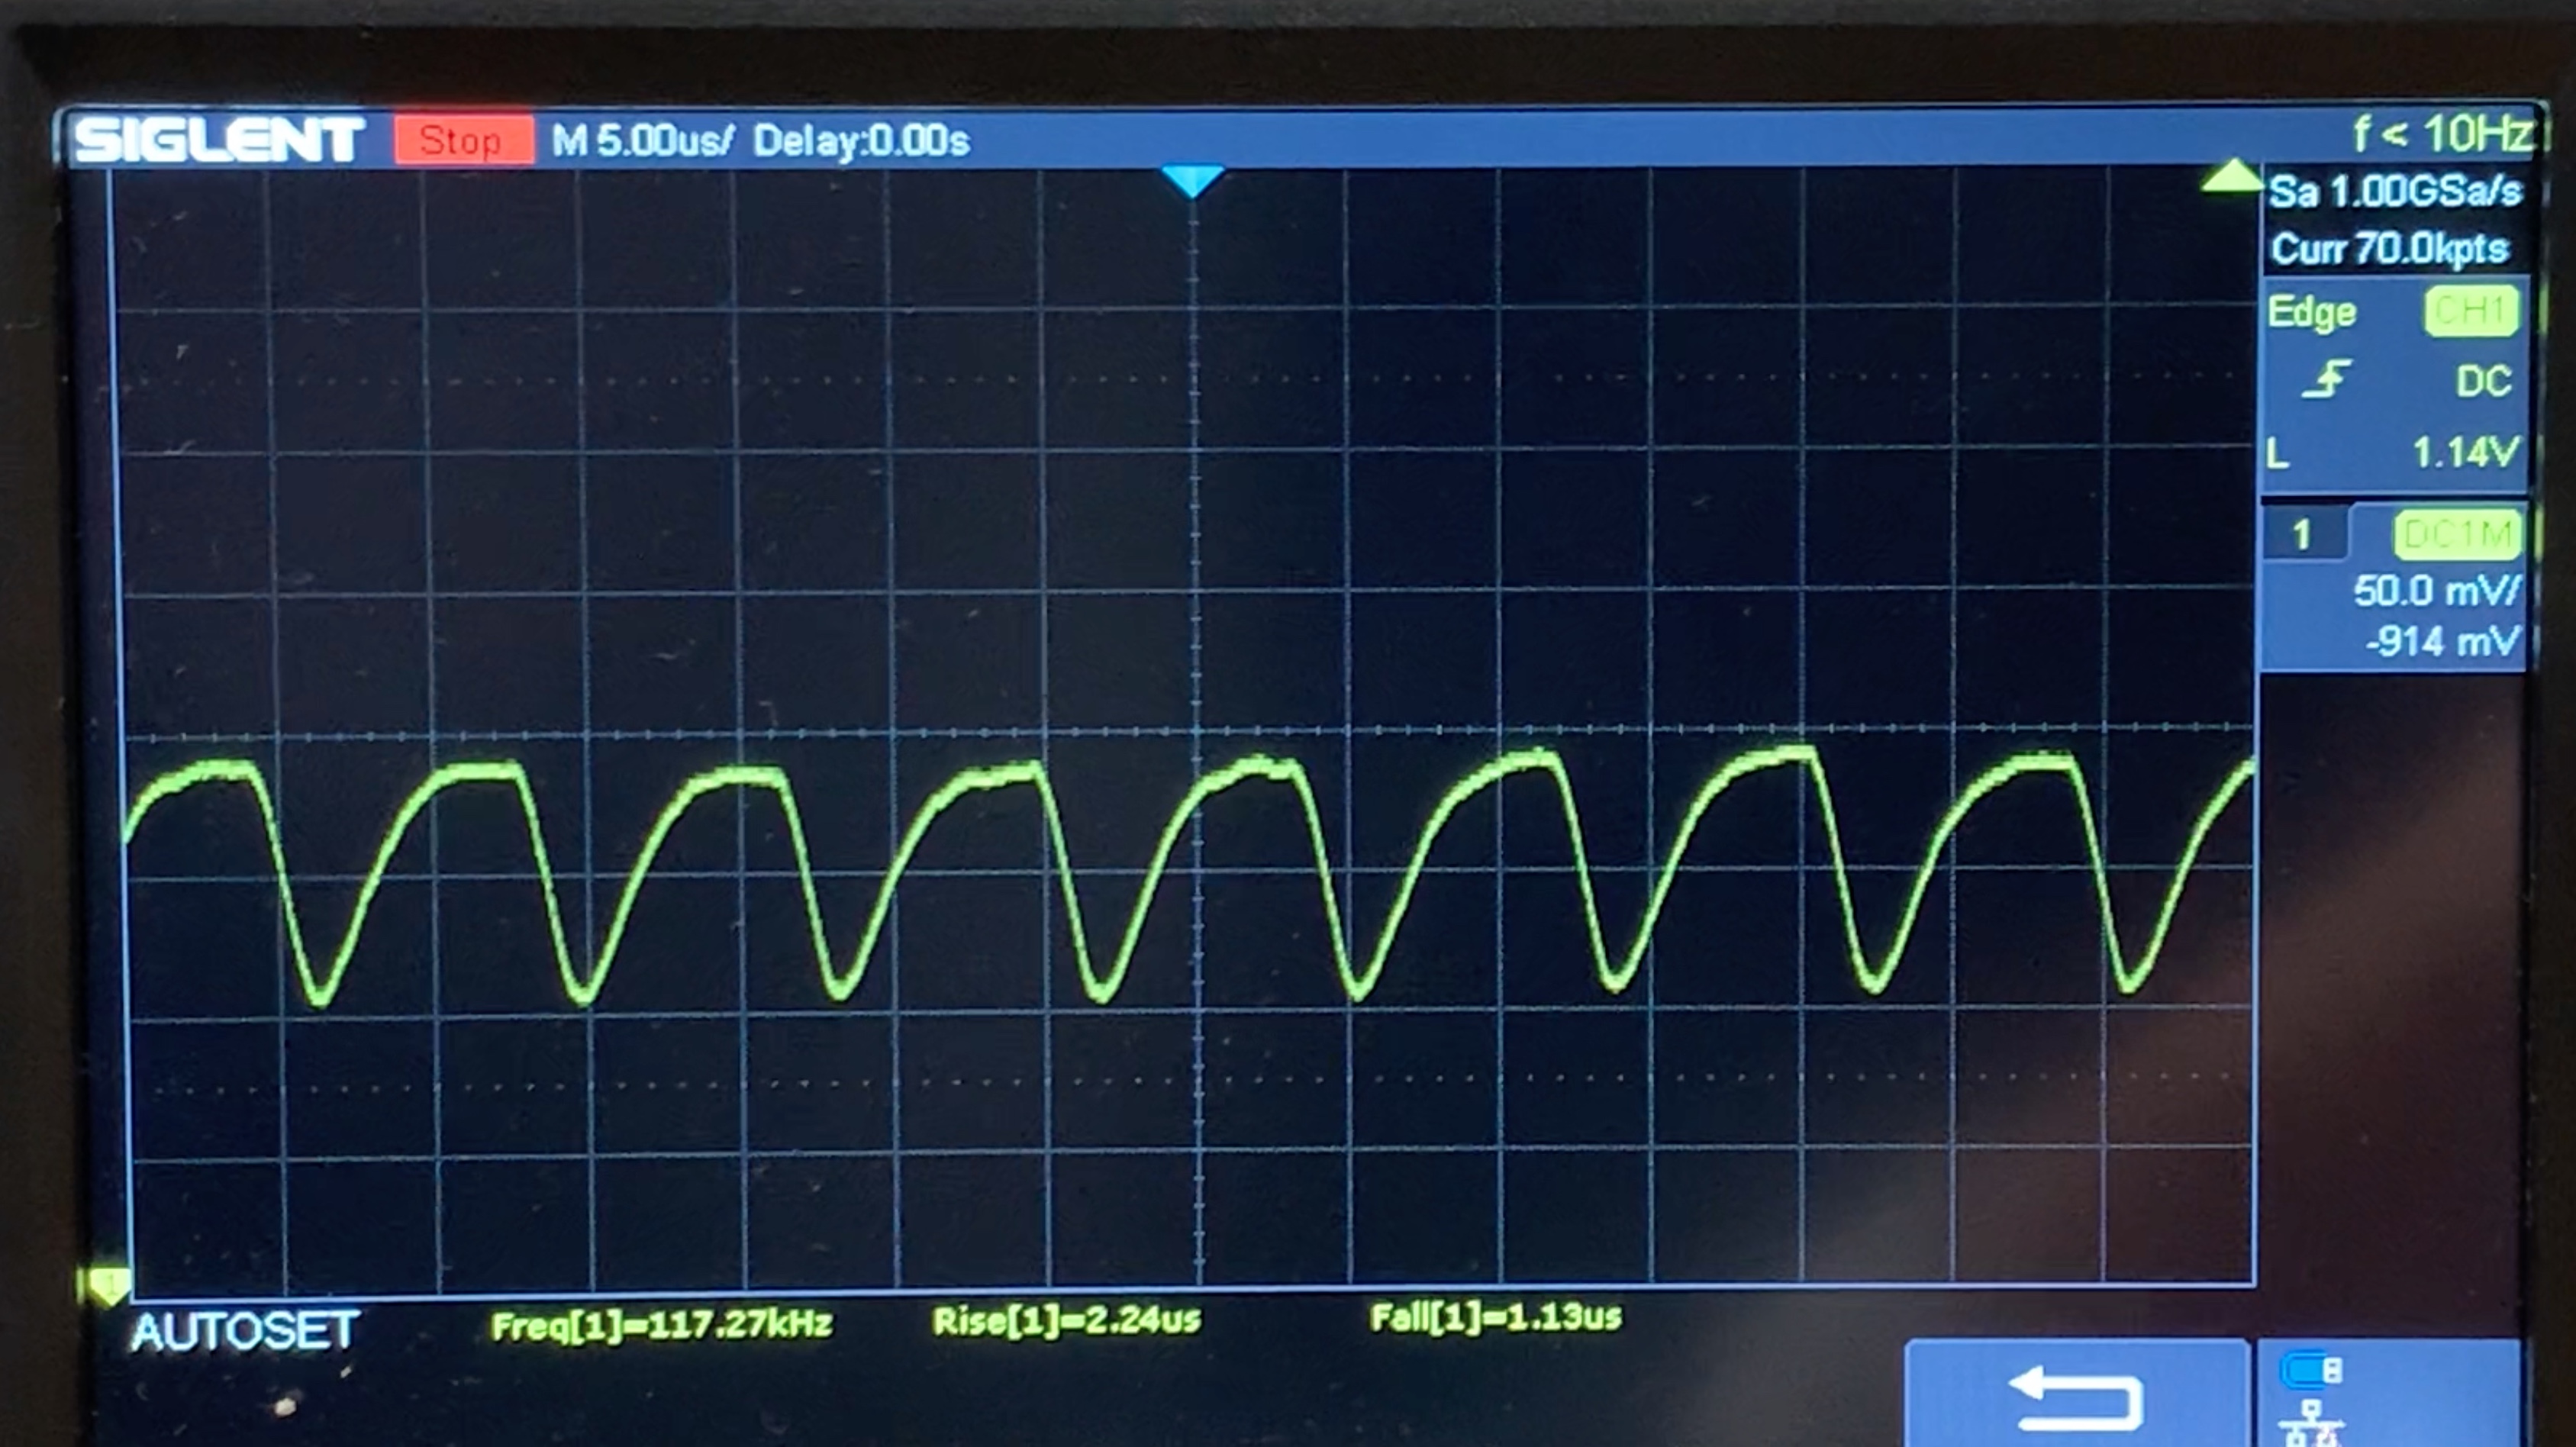 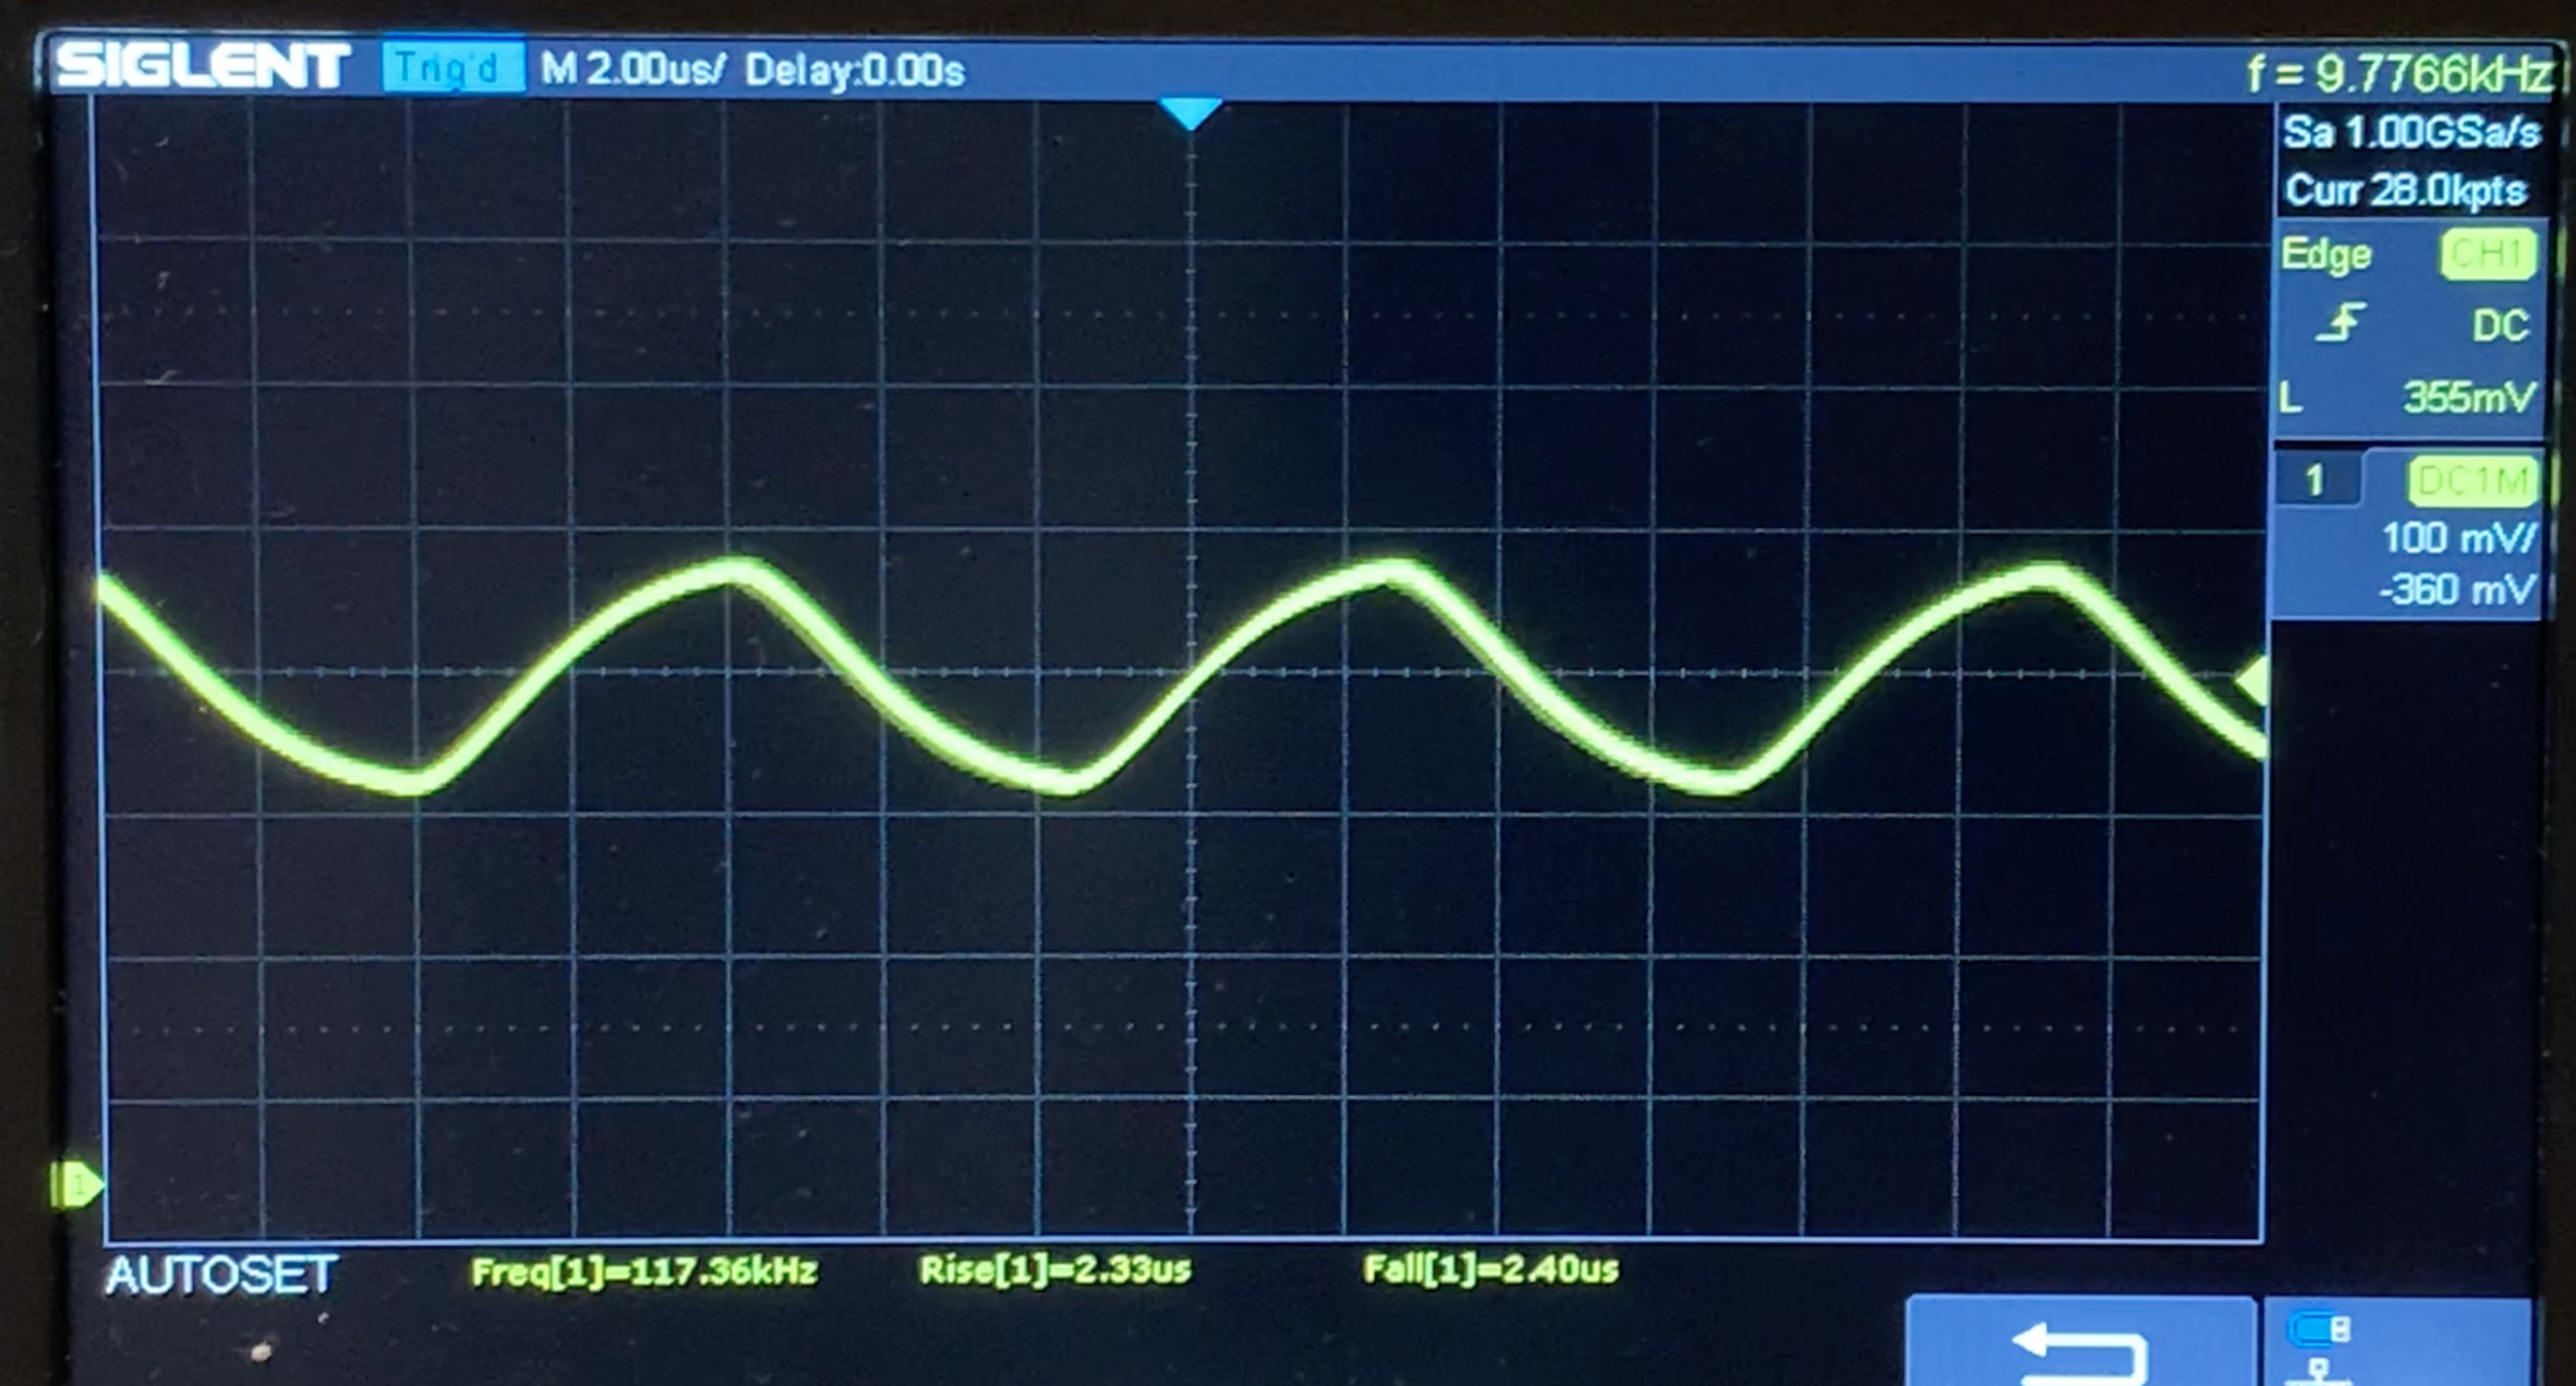 |
| ≤ 155 cd/m² parlaklık | |||
Ekran arka ışığı 118000 Hz'de titriyor (en kötü durum, örneğin PWM kullanılması) 49 % (155 cd/m²) ve altındaki parlaklık ayarında titreme algılandı. Bu parlaklık ayarının üzerinde titreme veya PWM olmamalıdır. 118000 Hz frekansı oldukça yüksektir, bu nedenle PWM'ye duyarlı çoğu kullanıcı herhangi bir titremeyi fark etmemelidir. Titreşim, yüksek parlaklık ayarında bile meydana gelir ve günlük kullanım sırasında kullanıcıyı etkileyebilir. Karşılaştırıldığında: Test edilen tüm cihazların %52 %'si ekranı karartmak için PWM kullanmıyor. PWM tespit edilirse, ortalama 7781 (minimum: 5 - maksimum: 343500) Hz ölçüldü. | |||
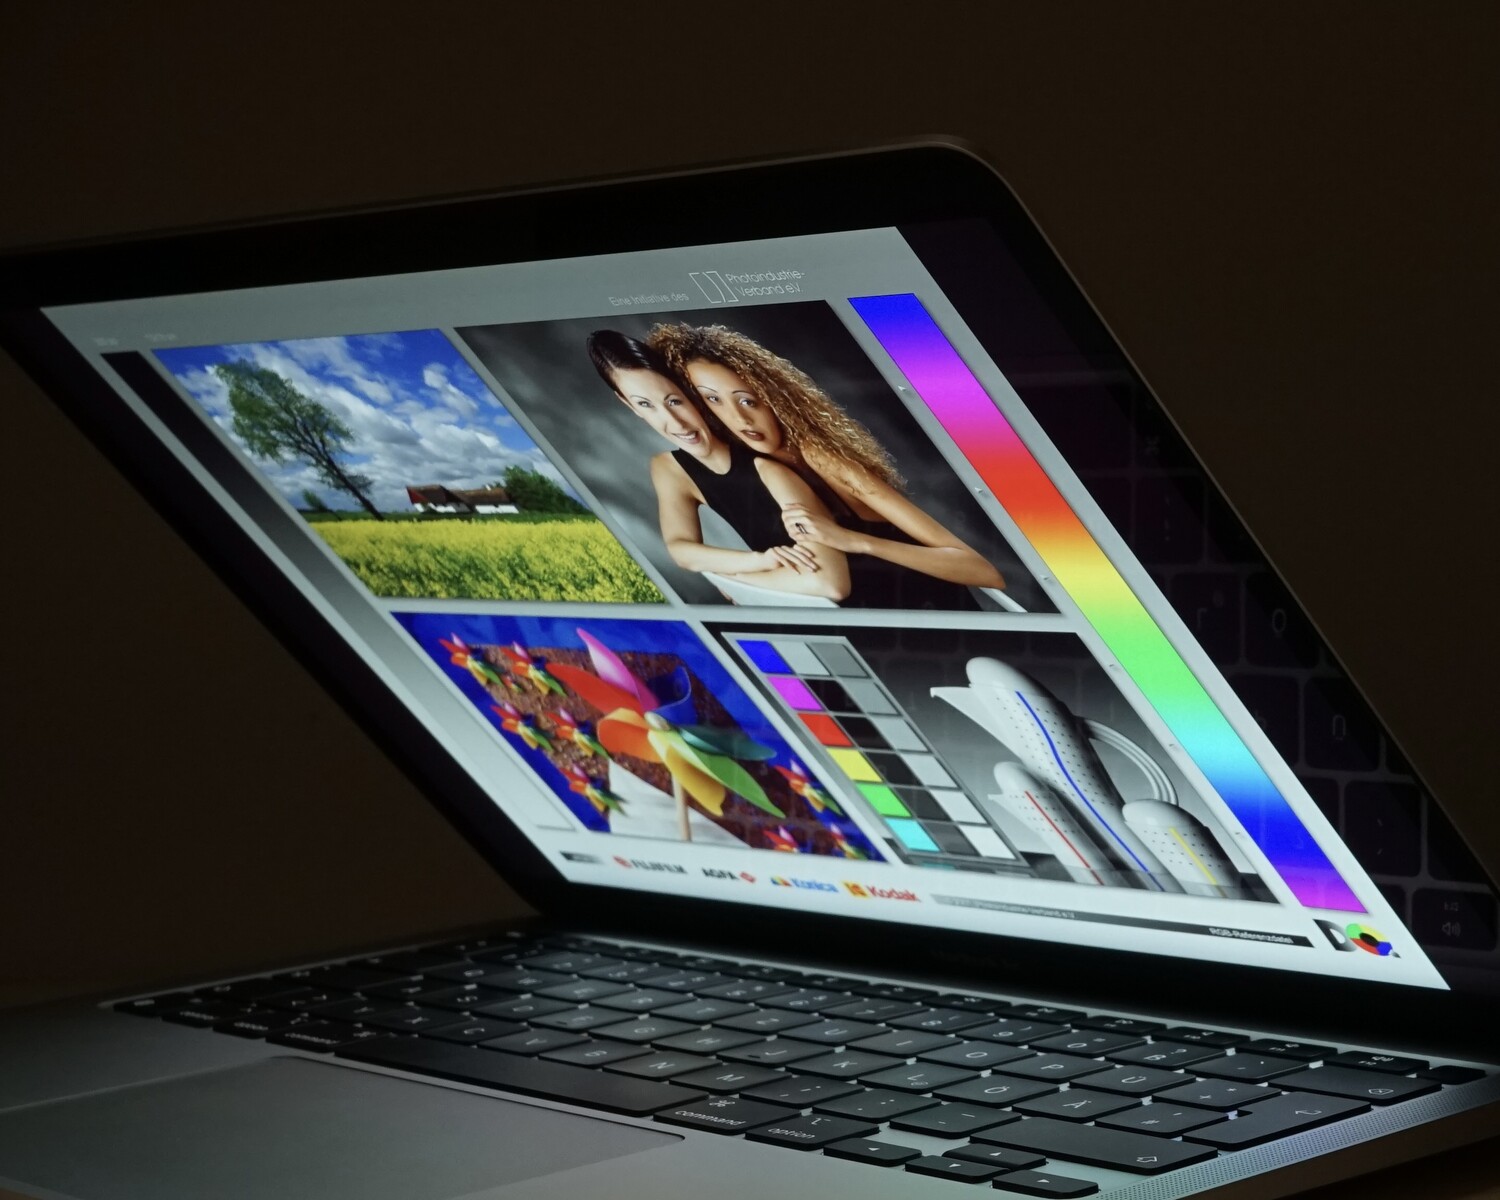
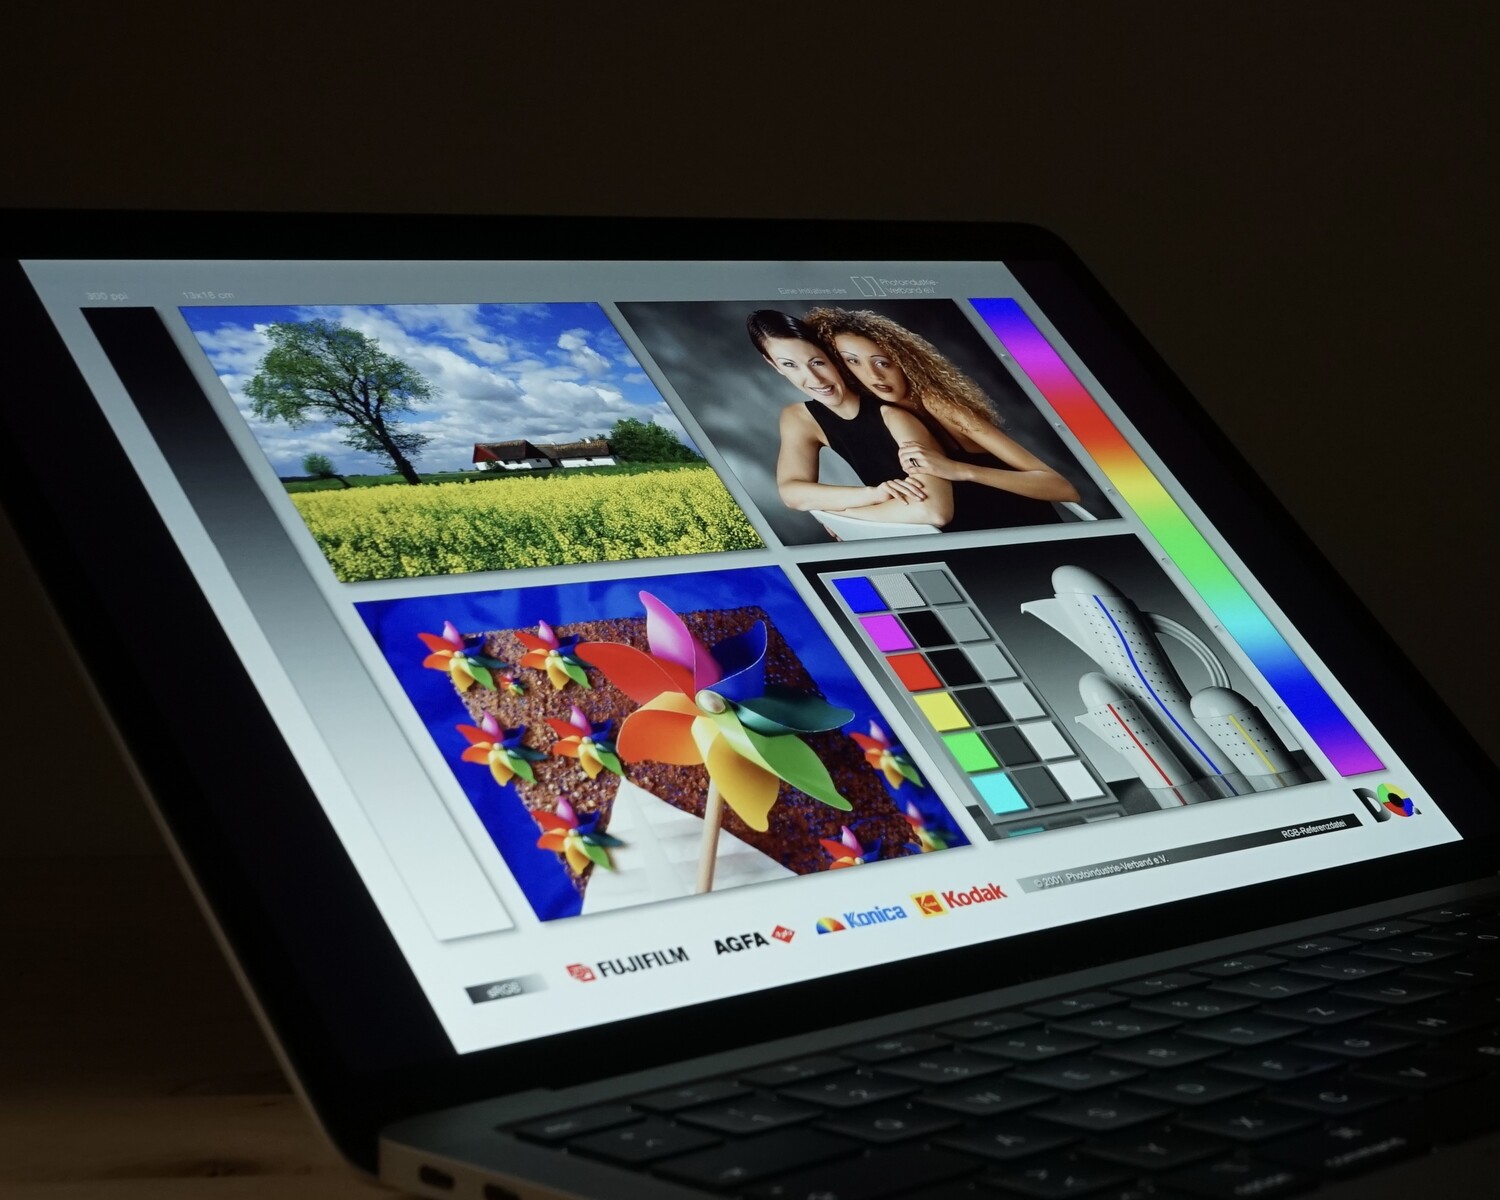
Thanks to the IPS panel, the image remains stable even from extreme viewing angles, maintaining the brightness relatively well.
Performance
The most important innovation is of course the Apple M1 SoC. With this, Apple integrates its own processor and graphics units also in notebooks for the first time. Because the architecture has changed from x86 to ARM, old programs have to be emulated (Rosetta 2) under MacOS, causing some loss in performance. On the other hand, you gain compatibility to IOS programs, which run without emulation. Unfortunately, some manufacturers lock their apps for usage under MacOS, so that the whole software library of the iPads will not be available. The lack of a touchscreen is also a point here. Directly integrated into the chip, you can also find the LPDDR4X-4266 main storage as Unified Memory with either 8 or 16 GB. An advantage of the Unified Memory architecture is the fact that the CPU and GPU are able to access the memory simultaneously without the need of copying shared elements (as was the case until now).
Processor
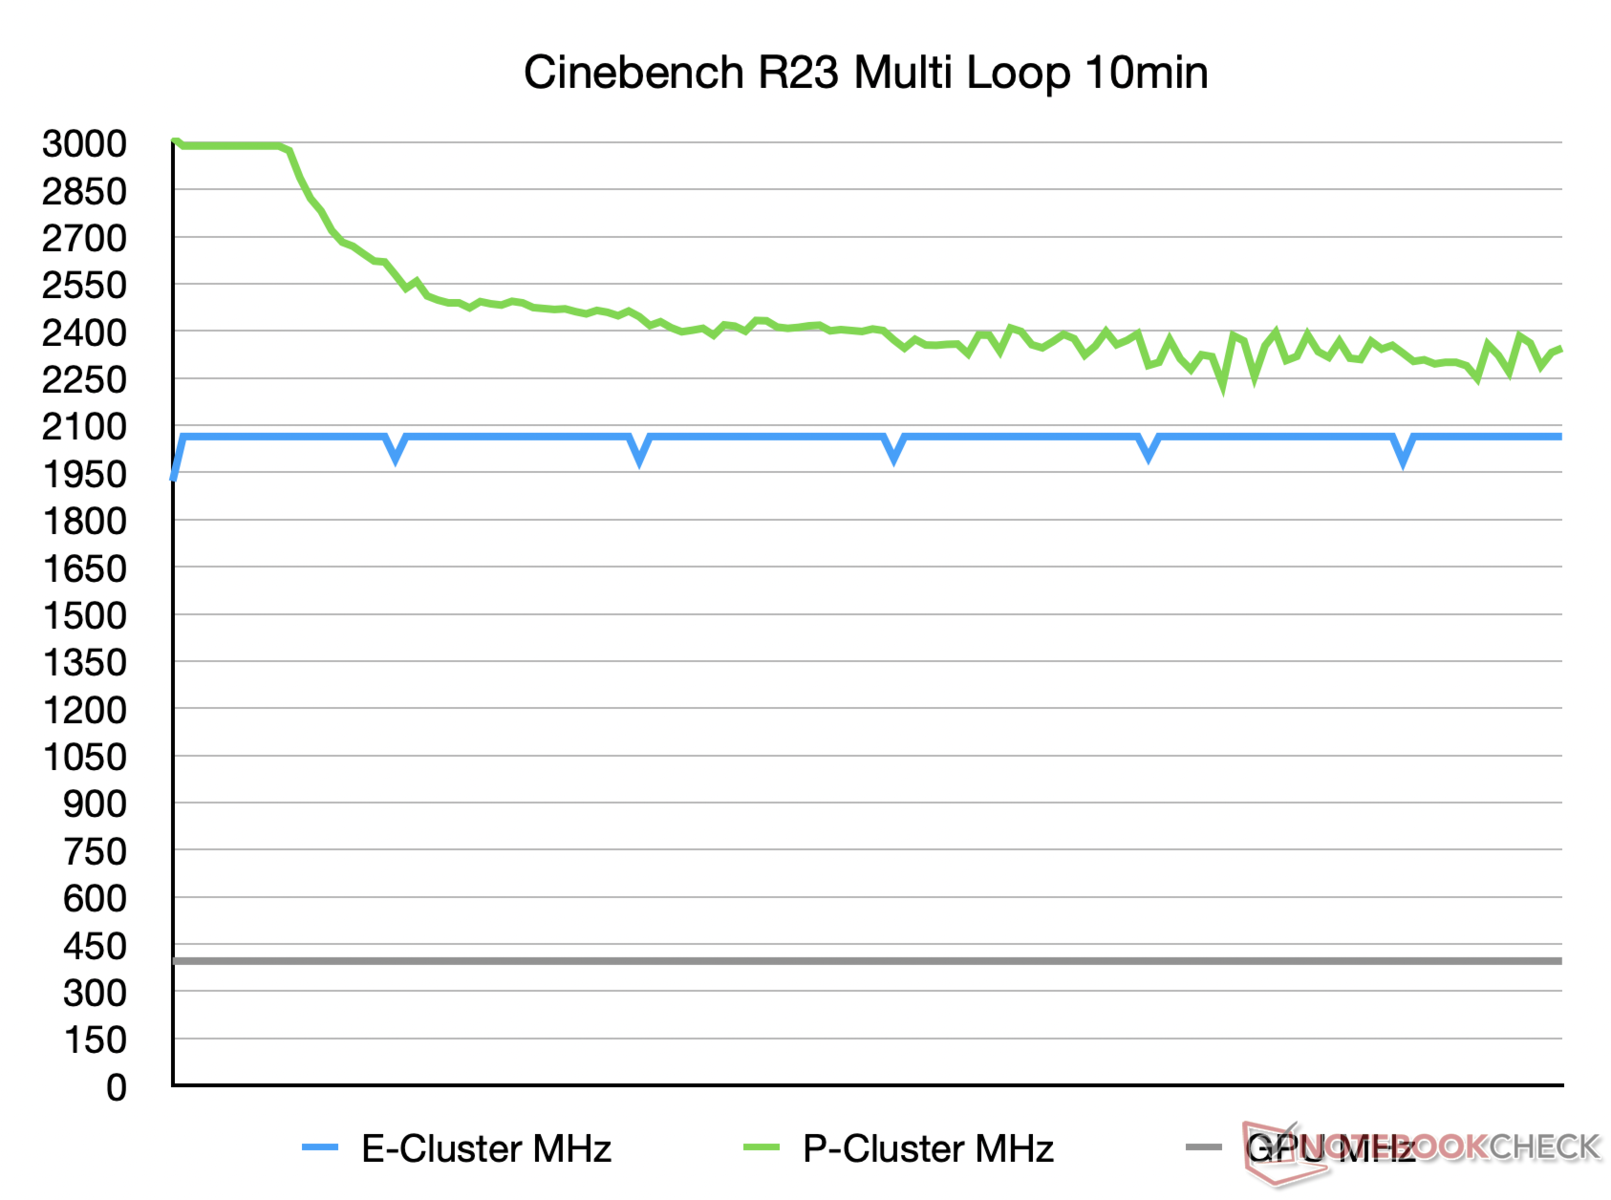
The integrated processor in the M1 SoC is the most important innovation. It offers four fast and large Firestorm cores with a clock speed of up to 3.2 GHz (P Cluster) and four energy saving cores with the codename Icestorm (up to 2.1 GHz, E Cluster). While all eight cores can be used simultaneously, only the Icestorm cores run under low loads, ensuring a long battery life. In contrast to the MacBook Pro, there is no fan in the Air but only a passive cooling block instead. This has a significant effect under longer loads. We therefore have to differentiate in our tests now: either native execution or Rosetta 2 emulation and short or longer loads.
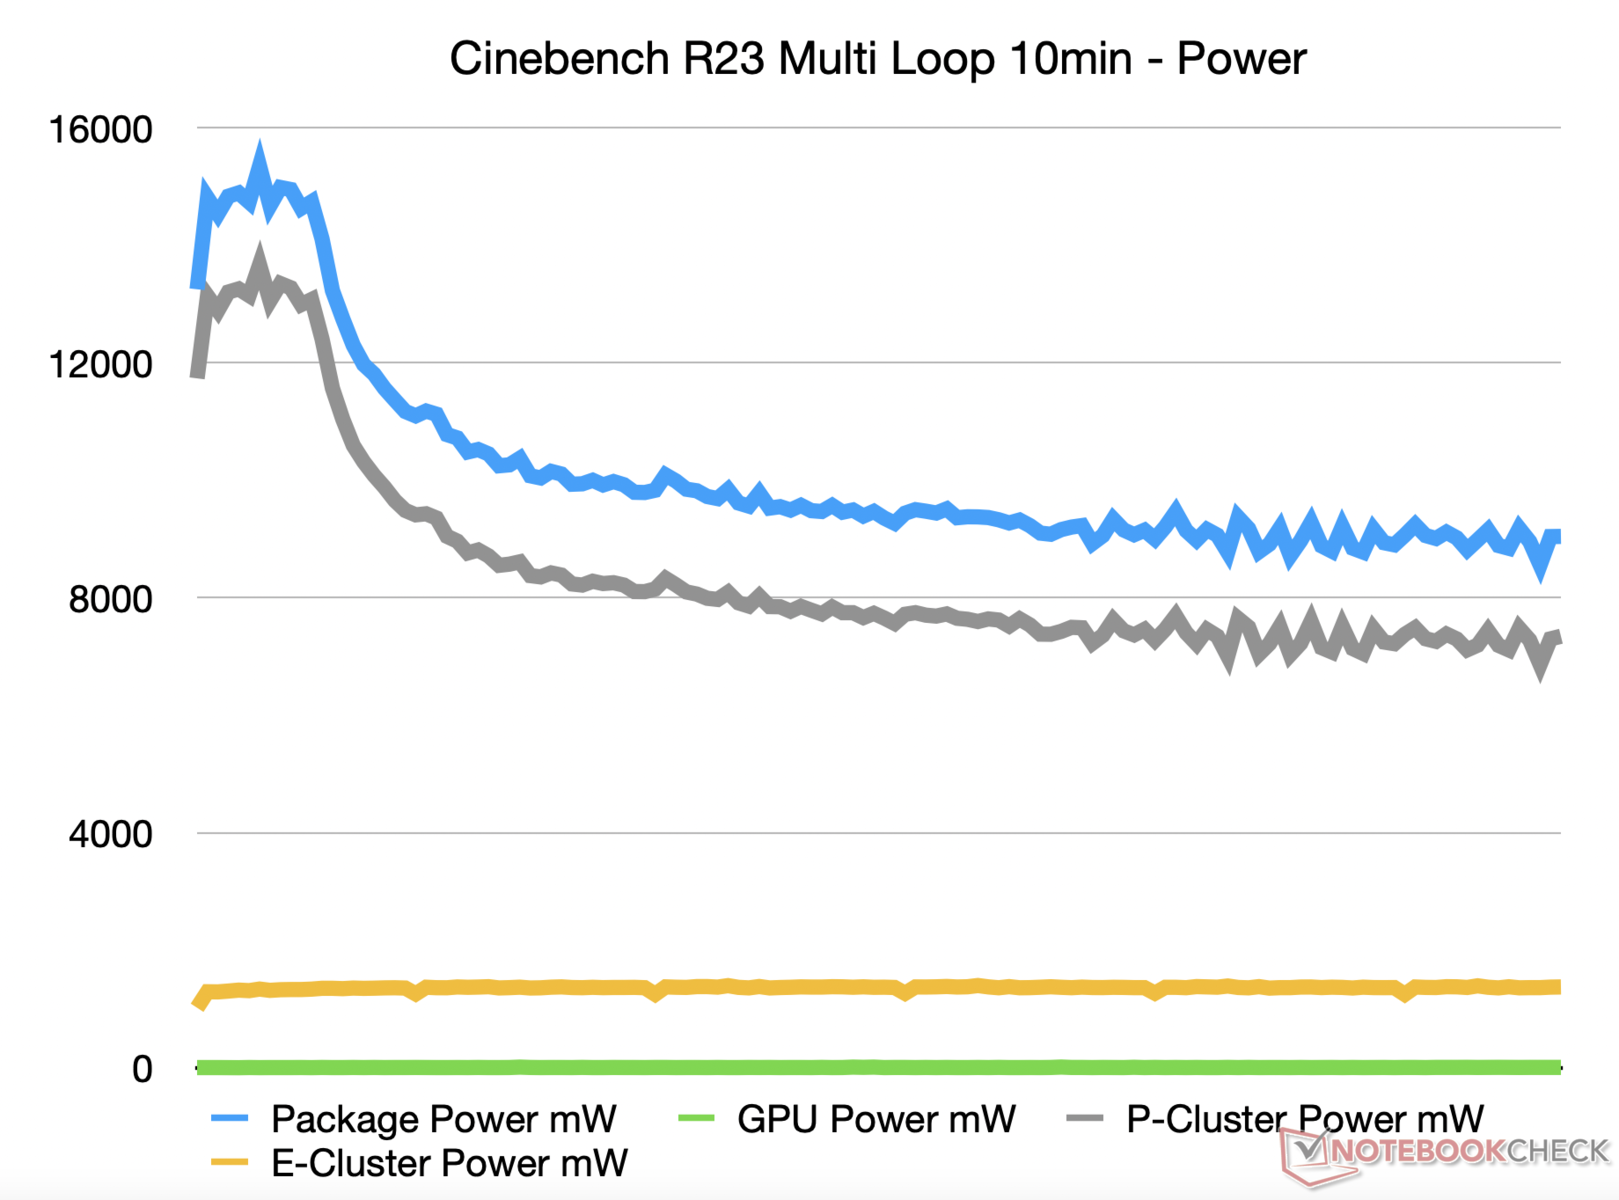
In the Cinebench loops, the throttling of the M1 immediately becomes apparent. After the first run, the performance in Cinebench R23 drops by 8%, and then levels out at a 12% reduction after six runs. For passive cooling and the high level of performance, this really isn't bad. The MacBook Pro 13 is able to maintain its performance thanks to the active fans. In the comparison with the Intel competitors, the M1 is even able to perform in Rosetta 2 emulated benchmarks at the level of a Tiger Lake i7-1165G7. Compared to the old MacBook Air (even with a Core i5), the M1 plays in a different league - very impressive!
Cinebench R15 loop (emulated via Rosetta 2)
Cinebench R23 loop (native)
Cinebench R20: CPU (Single Core) | CPU (Multi Core)
Cinebench R15: CPU Single 64Bit | CPU Multi 64Bit
Blender: v2.79 BMW27 CPU
7-Zip 18.03: 7z b 4 -mmt1 | 7z b 4
Geekbench 5.5: Single-Core | Multi-Core
R Benchmark 2.5: Overall mean
| Performance rating | |
| Sınıf ortalaması Subnotebook | |
| Ortalama Apple M1 | |
| Intel Reference Design Laptop 28W -2! | |
| Lenovo ThinkPad X13-20UGS00800 | |
| Apple MacBook Air 2020 M1 Entry | |
| Razer Blade Stealth i7-1165G7 GTX 1650 Ti Max-Q | |
| Dell XPS 13 9310 Core i7 FHD | |
| Lenovo ThinkPad X13 Yoga 20SX0004GE | |
| Apple MacBook Air 2020 i5 | |
| Apple MacBook Air 2020 i3 | |
| Cinebench R20 / CPU (Single Core) | |
| Sınıf ortalaması Subnotebook (128 - 832, n=56, son 2 yıl) | |
| Intel Reference Design Laptop 28W | |
| Razer Blade Stealth i7-1165G7 GTX 1650 Ti Max-Q | |
| Dell XPS 13 9310 Core i7 FHD | |
| Lenovo ThinkPad X13-20UGS00800 | |
| Lenovo ThinkPad X13 Yoga 20SX0004GE | |
| Ortalama Apple M1 (401 - 406, n=4) | |
| Apple MacBook Air 2020 M1 Entry | |
| Apple MacBook Air 2020 i5 | |
| Apple MacBook Air 2020 i5 | |
| Apple MacBook Air 2020 i3 | |
| Cinebench R20 / CPU (Multi Core) | |
| Sınıf ortalaması Subnotebook (579 - 8541, n=56, son 2 yıl) | |
| Lenovo ThinkPad X13-20UGS00800 | |
| Intel Reference Design Laptop 28W | |
| Ortalama Apple M1 (1863 - 2109, n=4) | |
| Razer Blade Stealth i7-1165G7 GTX 1650 Ti Max-Q | |
| Dell XPS 13 9310 Core i7 FHD | |
| Apple MacBook Air 2020 M1 Entry | |
| Lenovo ThinkPad X13 Yoga 20SX0004GE | |
| Apple MacBook Air 2020 i5 | |
| Apple MacBook Air 2020 i5 | |
| Apple MacBook Air 2020 i3 | |
| Cinebench R15 / CPU Single 64Bit | |
| Sınıf ortalaması Subnotebook (72.4 - 322, n=56, son 2 yıl) | |
| Intel Reference Design Laptop 28W | |
| Razer Blade Stealth i7-1165G7 GTX 1650 Ti Max-Q | |
| Dell XPS 13 9310 Core i7 FHD | |
| Apple MacBook Air 2020 M1 Entry | |
| Ortalama Apple M1 (206 - 208, n=3) | |
| Lenovo ThinkPad X13-20UGS00800 | |
| Lenovo ThinkPad X13 Yoga 20SX0004GE | |
| Apple MacBook Air 2020 i3 | |
| Apple MacBook Air 2020 i5 | |
| Cinebench R15 / CPU Multi 64Bit | |
| Sınıf ortalaması Subnotebook (327 - 3345, n=56, son 2 yıl) | |
| Lenovo ThinkPad X13-20UGS00800 | |
| Ortalama Apple M1 (1020 - 1087, n=4) | |
| Apple MacBook Air 2020 M1 Entry | |
| Intel Reference Design Laptop 28W | |
| Intel Reference Design Laptop 28W | |
| Dell XPS 13 9310 Core i7 FHD | |
| Razer Blade Stealth i7-1165G7 GTX 1650 Ti Max-Q | |
| Lenovo ThinkPad X13 Yoga 20SX0004GE | |
| Apple MacBook Air 2020 i5 | |
| Apple MacBook Air 2020 i3 | |
| Blender / v2.79 BMW27 CPU | |
| Apple MacBook Air 2020 i3 | |
| Apple MacBook Air 2020 i5 | |
| Lenovo ThinkPad X13 Yoga 20SX0004GE | |
| Apple MacBook Air 2020 M1 Entry | |
| Dell XPS 13 9310 Core i7 FHD | |
| Razer Blade Stealth i7-1165G7 GTX 1650 Ti Max-Q | |
| Ortalama Apple M1 (412 - 710, n=2) | |
| Intel Reference Design Laptop 28W | |
| Lenovo ThinkPad X13-20UGS00800 | |
| Sınıf ortalaması Subnotebook (159 - 2271, n=57, son 2 yıl) | |
| 7-Zip 18.03 / 7z b 4 -mmt1 | |
| Sınıf ortalaması Subnotebook (2643 - 6699, n=58, son 2 yıl) | |
| Apple MacBook Air 2020 M1 Entry | |
| Ortalama Apple M1 (n=1) | |
| Intel Reference Design Laptop 28W | |
| Dell XPS 13 9310 Core i7 FHD | |
| Razer Blade Stealth i7-1165G7 GTX 1650 Ti Max-Q | |
| Lenovo ThinkPad X13 Yoga 20SX0004GE | |
| Lenovo ThinkPad X13-20UGS00800 | |
| Apple MacBook Air 2020 i5 | |
| Apple MacBook Air 2020 i3 | |
| 7-Zip 18.03 / 7z b 4 | |
| Sınıf ortalaması Subnotebook (11668 - 77867, n=56, son 2 yıl) | |
| Lenovo ThinkPad X13-20UGS00800 | |
| Apple MacBook Air 2020 M1 Entry | |
| Ortalama Apple M1 (n=1) | |
| Intel Reference Design Laptop 28W | |
| Razer Blade Stealth i7-1165G7 GTX 1650 Ti Max-Q | |
| Dell XPS 13 9310 Core i7 FHD | |
| Lenovo ThinkPad X13 Yoga 20SX0004GE | |
| Apple MacBook Air 2020 i5 | |
| Apple MacBook Air 2020 i3 | |
| Geekbench 5.5 / Single-Core | |
| Sınıf ortalaması Subnotebook (726 - 2224, n=48, son 2 yıl) | |
| Ortalama Apple M1 (1710 - 1745, n=9) | |
| Apple MacBook Air 2020 M1 Entry | |
| Razer Blade Stealth i7-1165G7 GTX 1650 Ti Max-Q | |
| Dell XPS 13 9310 Core i7 FHD | |
| Lenovo ThinkPad X13 Yoga 20SX0004GE | |
| Apple MacBook Air 2020 i5 | |
| Apple MacBook Air 2020 i5 | |
| Lenovo ThinkPad X13-20UGS00800 | |
| Apple MacBook Air 2020 i3 | |
| Geekbench 5.5 / Multi-Core | |
| Sınıf ortalaması Subnotebook (2557 - 17218, n=48, son 2 yıl) | |
| Apple MacBook Air 2020 M1 Entry | |
| Ortalama Apple M1 (7034 - 7710, n=9) | |
| Dell XPS 13 9310 Core i7 FHD | |
| Lenovo ThinkPad X13-20UGS00800 | |
| Razer Blade Stealth i7-1165G7 GTX 1650 Ti Max-Q | |
| Lenovo ThinkPad X13 Yoga 20SX0004GE | |
| Apple MacBook Air 2020 i5 | |
| Apple MacBook Air 2020 i5 | |
| Apple MacBook Air 2020 i3 | |
| R Benchmark 2.5 / Overall mean | |
| Apple MacBook Air 2020 i5 | |
| Apple MacBook Air 2020 i5 | |
| Apple MacBook Air 2020 i3 | |
| Apple MacBook Air 2020 M1 Entry | |
| Ortalama Apple M1 (n=1) | |
| Lenovo ThinkPad X13 Yoga 20SX0004GE | |
| Lenovo ThinkPad X13-20UGS00800 | |
| Dell XPS 13 9310 Core i7 FHD | |
| Intel Reference Design Laptop 28W | |
| Razer Blade Stealth i7-1165G7 GTX 1650 Ti Max-Q | |
| Sınıf ortalaması Subnotebook (0.4024 - 1.456, n=57, son 2 yıl) | |
* ... daha küçük daha iyidir
System Performance
Since there are no classic system benchmarks such as the PCMark from UL under Mac OS X, we use the browser benchmarks here. Apple's own Safari browser offers an outstanding Javascript performance, and in combination with the fast M1 SoC, RAM, and SSD, the MacBook Air produces top values here.
If we consider the WebXPRT 3, which is often used by Intel for comparisons, we can see that even the fast Core i7-1185G7 and also i7-10900K processors (desktop) are left behind. Ahead of the M1, we can only find the new Zen 3 based desktop CPUs with high clock speeds (such as the Ryzen 9 5950X).
In well-optimized apps, the M1 SoC is also able to take advantage of the additional dedicated functional units (video decoding, AI acceleration, encryption). In this way, it is able to process 4K videos (of the correct format) smoothly in Final Cut X from Apple, for example.
| WebXPRT 3 - Overall | |
| Sınıf ortalaması Subnotebook (156 - 530, n=55, son 2 yıl) | |
| Apple MacBook Air 2020 M1 Entry | |
| Apple MacBook Air 2020 M1 Entry | |
| AMD Radeon RX 6800 XT | |
| Intel Reference Design Laptop 28W | |
| Intel Reference Design Laptop 15W | |
| MSI Prestige 14 Evo A11M-056US | |
| Dell XPS 13 9310 Core i7 FHD | |
| Lenovo Yoga Slim 7-14ARE | |
| Lenovo ThinkPad X13-20UGS00800 | |
| Apple iPad Air 4 2020 | |
| Apple iPad Pro 12.9 2020 | |
| Samsung Galaxy Book S | |
| Apple iPad 7 2019 | |
| Mozilla Kraken 1.1 - Total | |
| Samsung Galaxy Book S | |
| Apple iPad 7 2019 | |
| Lenovo ThinkPad X13 Yoga 20SX0004GE | |
| Lenovo Yoga Slim 7-14ARE | |
| Lenovo ThinkPad X13-20UGS00800 | |
| Apple iPad Pro 12.9 2020 | |
| Dell XPS 13 9310 Core i7 FHD | |
| MSI Prestige 14 Evo A11M-056US | |
| Intel Reference Design Laptop 15W | |
| AMD Radeon RX 6800 XT | |
| Apple MacBook Air 2020 M1 Entry | |
| Apple MacBook Air 2020 M1 Entry | |
| Sınıf ortalaması Subnotebook (234 - 1104, n=60, son 2 yıl) | |
| Apple iPad Air 4 2020 | |
| Octane V2 - Total Score | |
| Sınıf ortalaması Subnotebook (35801 - 142020, n=28, son 2 yıl) | |
| Apple MacBook Air 2020 M1 Entry | |
| Apple MacBook Air 2020 M1 Entry | |
| MSI Prestige 14 Evo A11M-056US | |
| Apple iPad Air 4 2020 | |
| Lenovo ThinkPad X13-20UGS00800 | |
| Apple iPad Pro 12.9 2020 | |
| Lenovo Yoga Slim 7-14ARE | |
| Samsung Galaxy Book S | |
| Apple iPad 7 2019 | |
| Speedometer 2.0 - Result 2.0 | |
| Sınıf ortalaması Subnotebook (110 - 793, n=26, son 2 yıl) | |
| Apple MacBook Air 2020 M1 Entry | |
| Apple MacBook Air 2020 M1 Entry | |
| Apple iPad Air 4 2020 | |
| MSI Prestige 14 Evo A11M-056US | |
| Apple iPad Pro 12.9 2020 | |
| Apple iPad 7 2019 | |
| Samsung Galaxy Book S | |
| Jetstream 2 - 2.0 Total | |
| Sınıf ortalaması Subnotebook (117 - 476, n=28, son 2 yıl) | |
| Apple MacBook Air 2020 M1 Entry | |
| Apple MacBook Air 2020 M1 Entry | |
| MSI Prestige 14 Evo A11M-056US | |
| Apple iPad Air 4 2020 | |
| Lenovo ThinkPad X13-20UGS00800 | |
| Apple iPad Pro 12.9 2020 | |
| Apple iPad 7 2019 | |
| Samsung Galaxy Book S | |
| Youtube - 2160p60 CPU Load | |
| Apple MacBook Air 2020 M1 Entry (5) | |
| Sınıf ortalaması Subnotebook (1 - 27, n=41, son 2 yıl) | |
| Lenovo ThinkPad X13-20UGS00800 (68, 2) | |
| Lenovo Yoga Slim 7-14ARE (66) | |
| Dell XPS 13 9310 Core i7 FHD (31, 2) | |
* ... daha küçük daha iyidir
Storage Solution
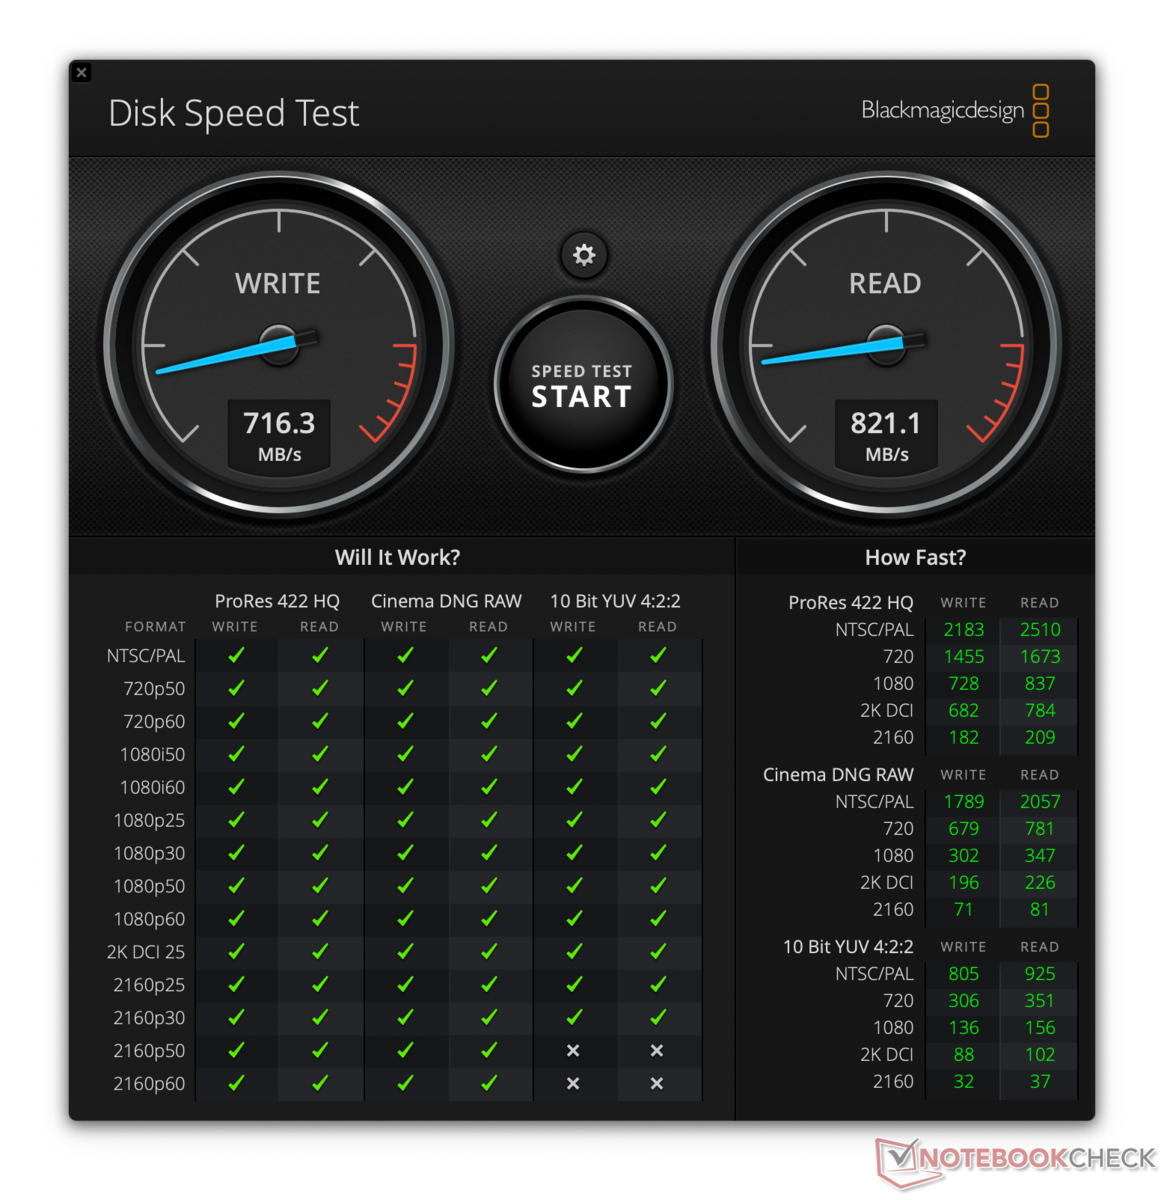
The Air also achieves a huge jump ahead with the SSD, almost catching up with the current MacBook Pro 16 - note that this is the entry-level model with 256 GB versus the 1 TB SSD for an additional premium.
Graphics Card
Unfortunately, you won't get the full graphics performance of the M1 chip in the entry-level model of the MacBook Air, but you have to make do without one of the eight cores. This also makes the performance noticeably slower than that of the more expensive devices. Despite that, the performance is still excellent compared to the predecessor devices and also the iPads. The performance is at a comparable level as that of the Radeon Pro 5300M in the most affordable MacBook Pro 16.
Gaming Performance
In the gaming performance, macOS isn't able to keep up with Windows devices. Most of the games are only ports of their Windows version, so they already lose some of their optimizations and performance in this process. In better optimized games such as "Borderlands 3," the M1 GPU achieves about the performance of a GeForce MX350 under Windows. It is, however, able to leave the integrated Intel graphics cards significantly behind.
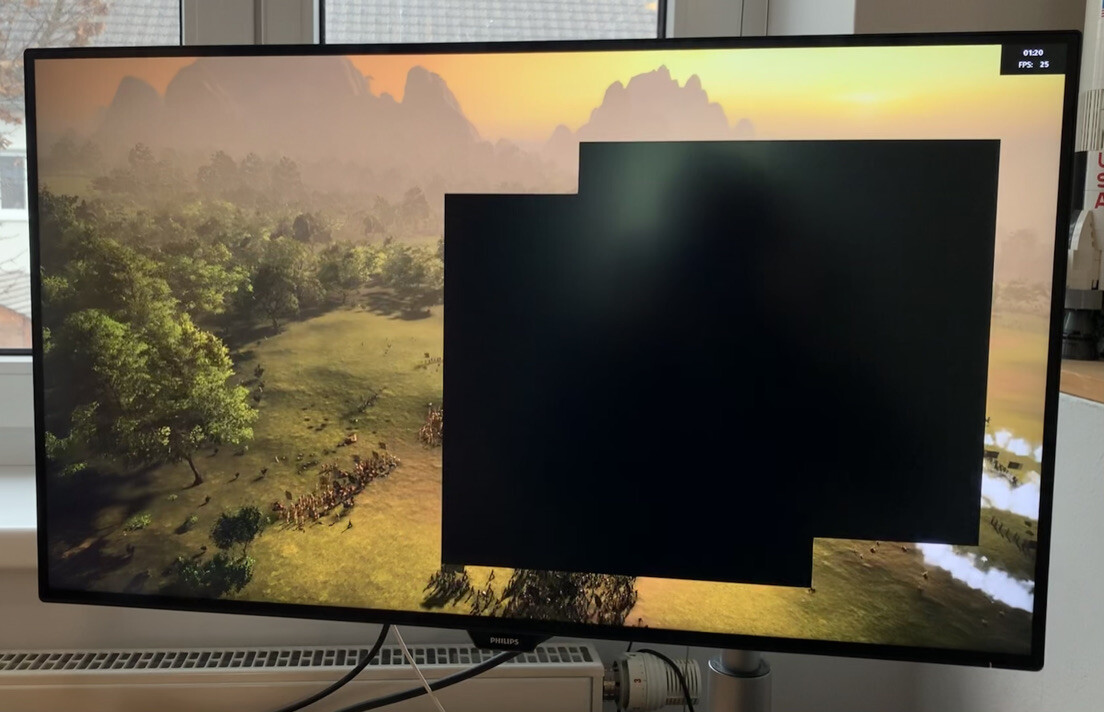
Despite the very good performance, we still see many compatibility problems with the new graphics chip. At 8x AA, Unigine Valley displays only a black screen, "Borderlands 3" leaves a black screen after closing it (sometimes even requiring a reboot), "Counter-Strike: GO" doesn't start, and "Total War: Three Kingdoms" has some texture errors and we noticed several more details in the test.
In addition, numerous IOS games can also run. But you won't find popular and demanding games such as "Call of Duty Mobile" or "PUBG Mobile" in the App Store at this point. Since the theoretical raw performance (see GFXBench and 3DMark) lies significantly above that of the fastest iPads, you shouldn't have any performance problems here, and the architecture is also the same. In our test, this is proven by "World of Tanks Blizz," for example, which runs smoothly at maximum details (high incl. 4x AA) and in native resolution, and even on an external 4K monitor at 60 fps.
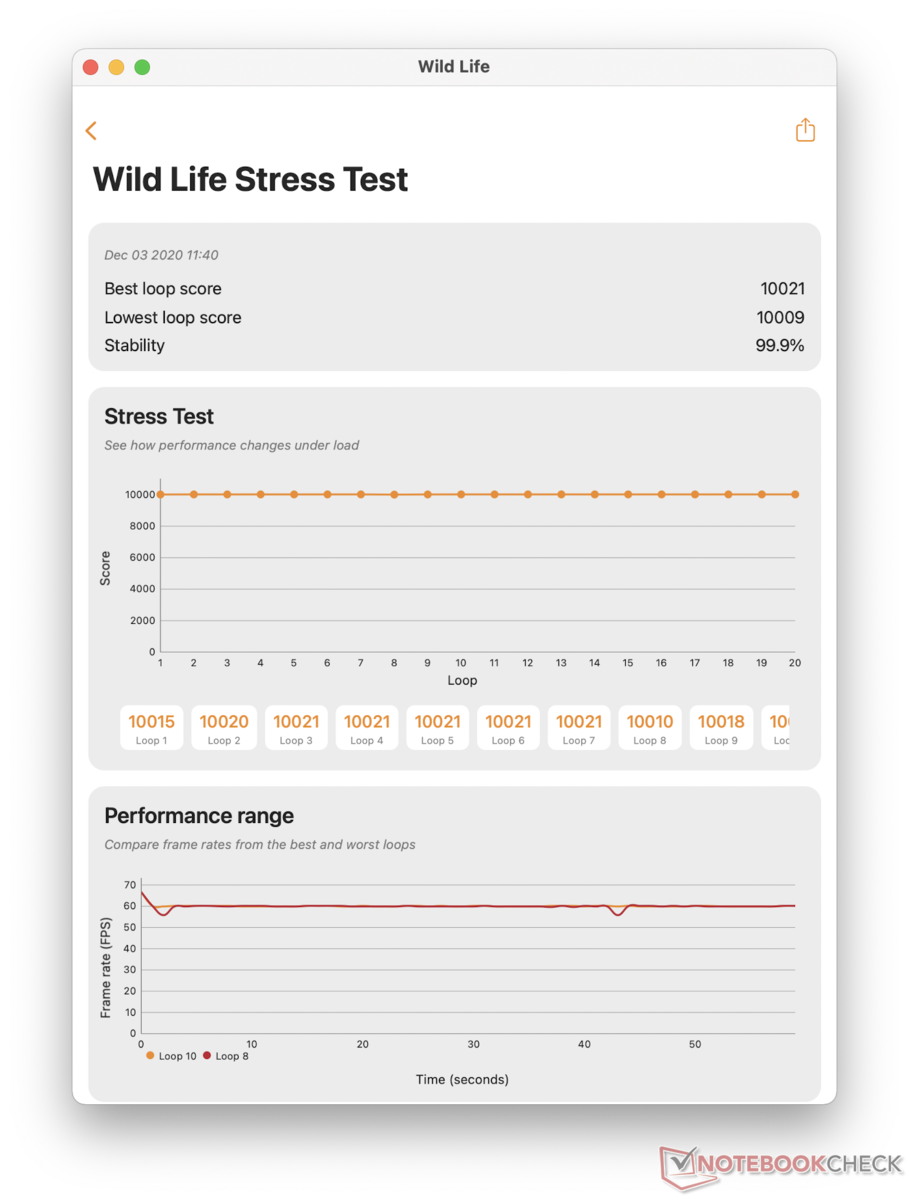
In terms of throttling and performance in battery operation, we can also reassure you: During 20 minutes of stress test, the 3DMark Wild Life measurements did not show any performance drops (99% stability), and the GFXBench Metal Manhattan test also ran with stable frame rates in battery operation (unfortunately at limited 60 fps).
| düşük | orta | yüksek | ultra | QHD | 4K | |
|---|---|---|---|---|---|---|
| Batman: Arkham City (2011) | 86 | 47 | ||||
| Counter-Strike: GO (2012) | 109 | 69 | 44.4 | |||
| Deus Ex Mankind Divided (2016) | 47.6 | 35.3 | 19 | |||
| Civilization 6 (2016) | 80.3 | 30.1 | 27 | 15.8 | ||
| Warhammer 40.000: Dawn of War III (2017) | 43.9 | 32.5 | ||||
| F1 2017 (2017) | 60 | 54 | 43 | |||
| Shadow of the Tomb Raider (2018) | 65 | 22 | ||||
| Total War: Three Kingdoms (2019) | 95 küçük grafik sorunları (smog not perfect) | 26 küçük grafik sorunları (smog not perfect) | 17 küçük grafik sorunları | |||
| Borderlands 3 (2019) | 45.2 | 28 | 17.7 | |||
| Hearthstone (2020) | 58 | |||||
| Cyberpunk 2077 (2023) | 17.8 |
Emissions
Noise Emissions
The cooling of the small MacBook Air is fully passive, and its operation is therefore completely silent. Our test unit did not produce any audible coil whine or transistor noises either.
Temperature
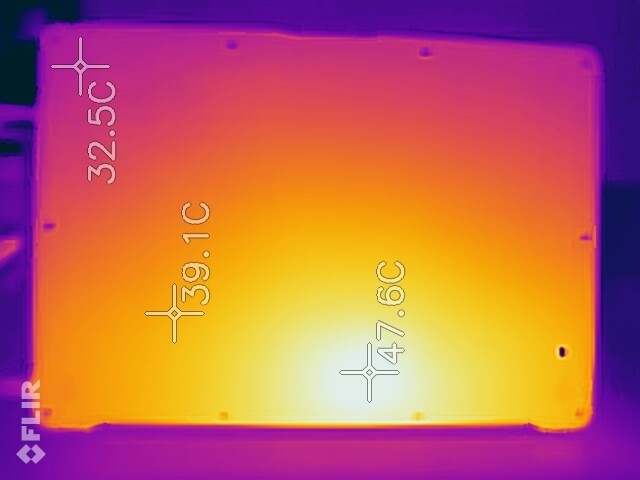
The passive cooling and excellent performance gives rise to some apprehension about the surface temperatures. However, we can also reassure you here. Even though the hotspot above the computing unit can become quite hot during longer-lasting load, all the important places where the notebook is touched remain comfortably cool. In regular load situations, the Air even remains particularly cool, which is a sign of the great efficiency of the Apple M1.
As is typical for Apple, the internal temperatures often approach the limits. The GPU in particular reaches 87 °C (189 °F) in "Mankind Divided," for example, with the speed leveling out at 790 MHz and a consumption of 2.8 watts. The whole SoC reports 87 °C (189 °F). In the extreme load test with Cinebench R15 and Unigine Valley, the GPU even reaches 97 °C (207 °F), with the SoC again reporting 87 °C and the SSD, 52 °C (126 °F).
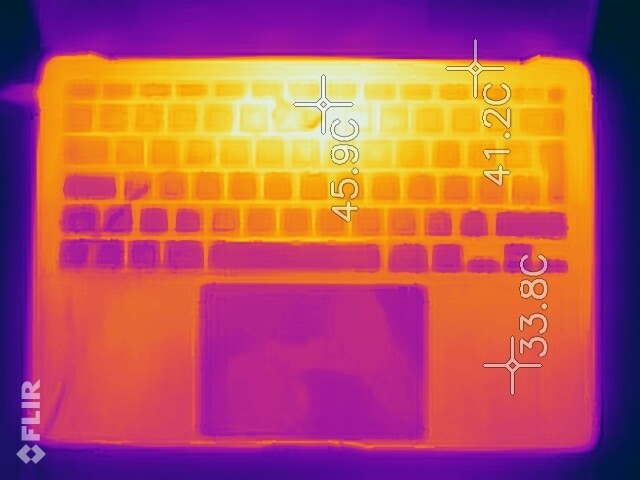
(±) Üst taraftaki maksimum sıcaklık, 35.9 °C / 97 F ortalamasına kıyasla 44 °C / 111 F'dir. , Subnotebook sınıfı için 21.4 ile 59 °C arasında değişir.
(±) Alt kısım, 39.2 °C / 103 F ortalamasına kıyasla maksimum 44 °C / 111 F'ye kadar ısınır
(+) Boşta kullanımda, üst tarafın ortalama sıcaklığı 25.8 °C / 78 F olup, cihazın 30.8 °C / 87 F.
(+) Avuç içi dayanakları ve dokunmatik yüzey maksimum (32 °C / 89.6 F) cilt sıcaklığına ulaşıyor ve bu nedenle sıcak değil.
(-) Benzer cihazların avuç içi dayanağı alanının ortalama sıcaklığı 28.2 °C / 82.8 F (-3.8 °C / -6.8 F) idi.
Speaker
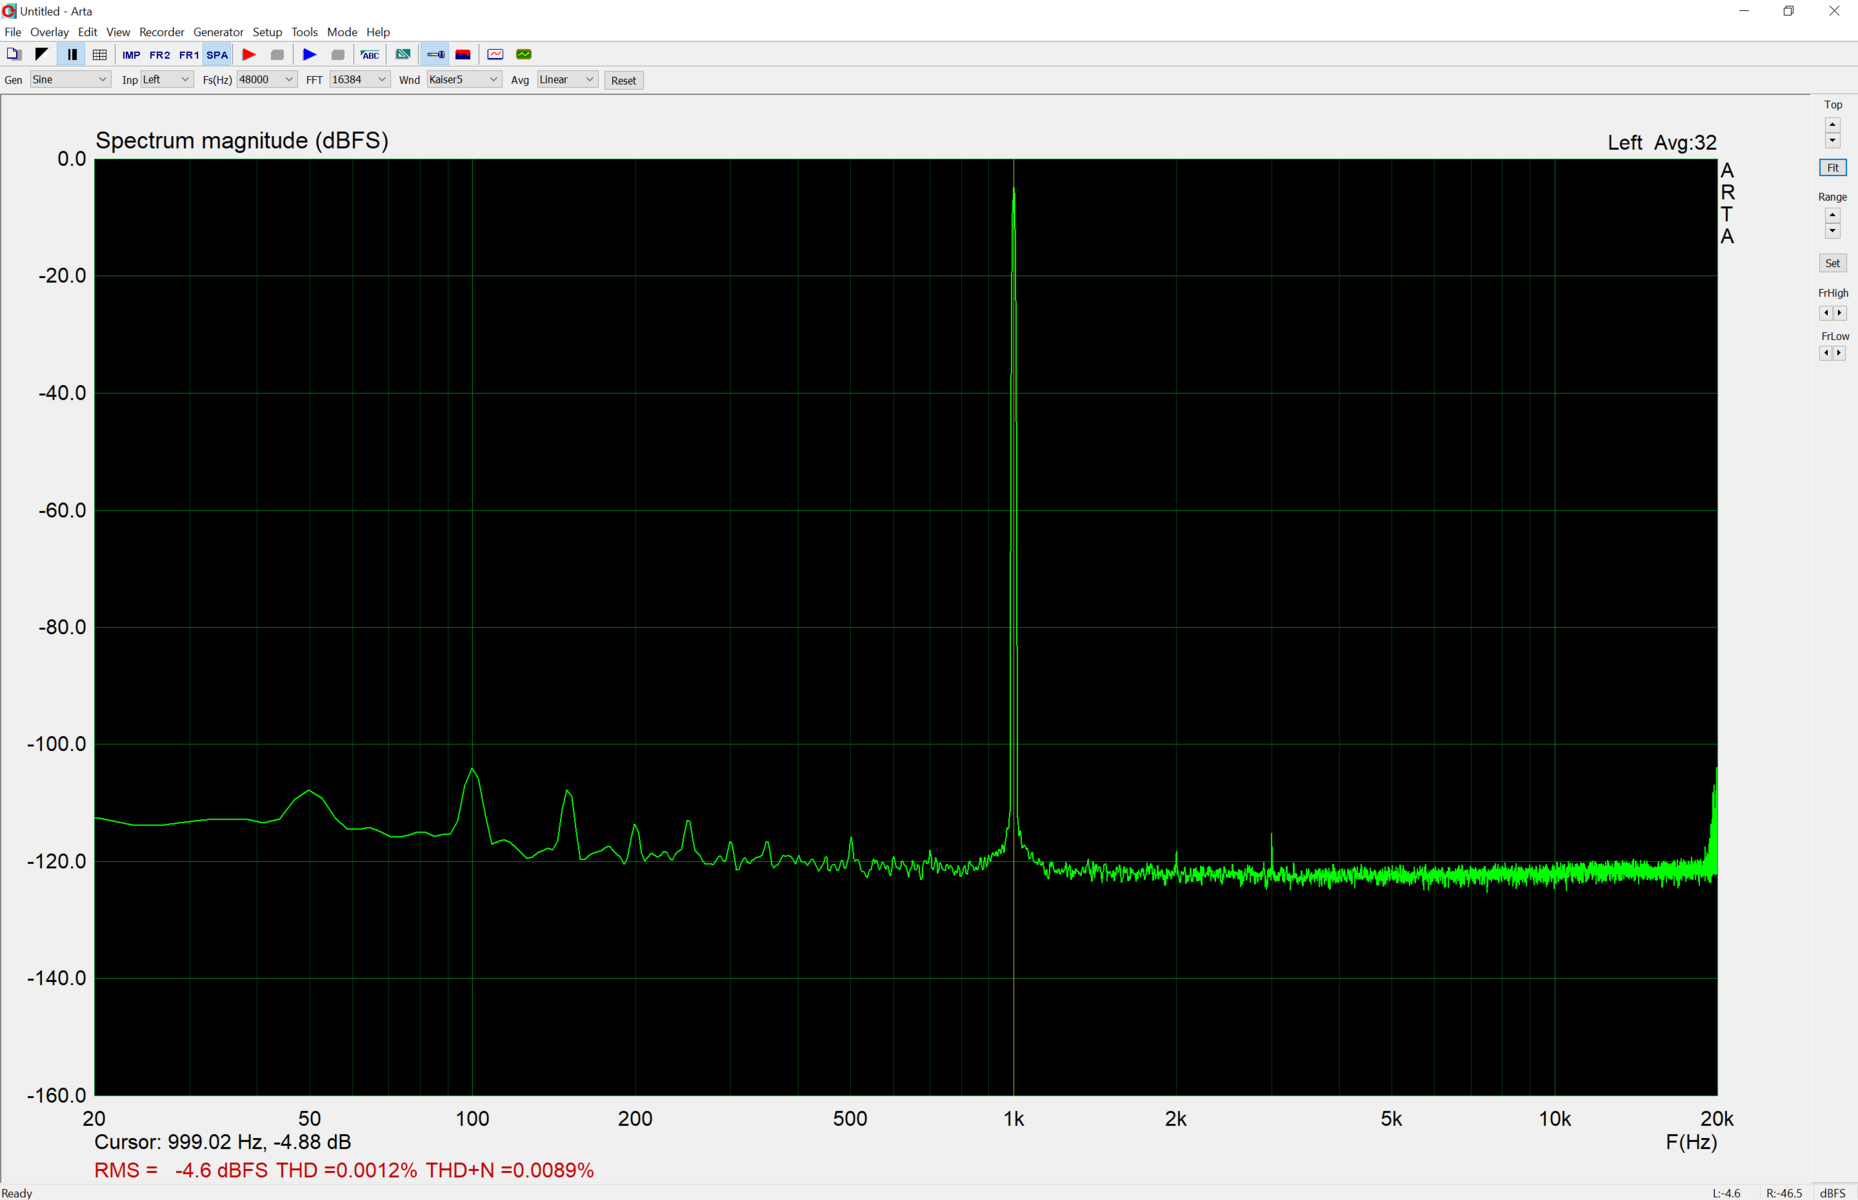
Our audio measurements produce a minimally better result than for the old MacBook Air, but whether the difference is caused by the new components inside (no fan, more resonance space) or our new, improved microphone for the measurements, is not clear. What remains is the excellent impression - particularly considering the build. While the more expensive MacBooks are able to achieve a better result, the Air strikes a great figure in the comparison of the competitors.
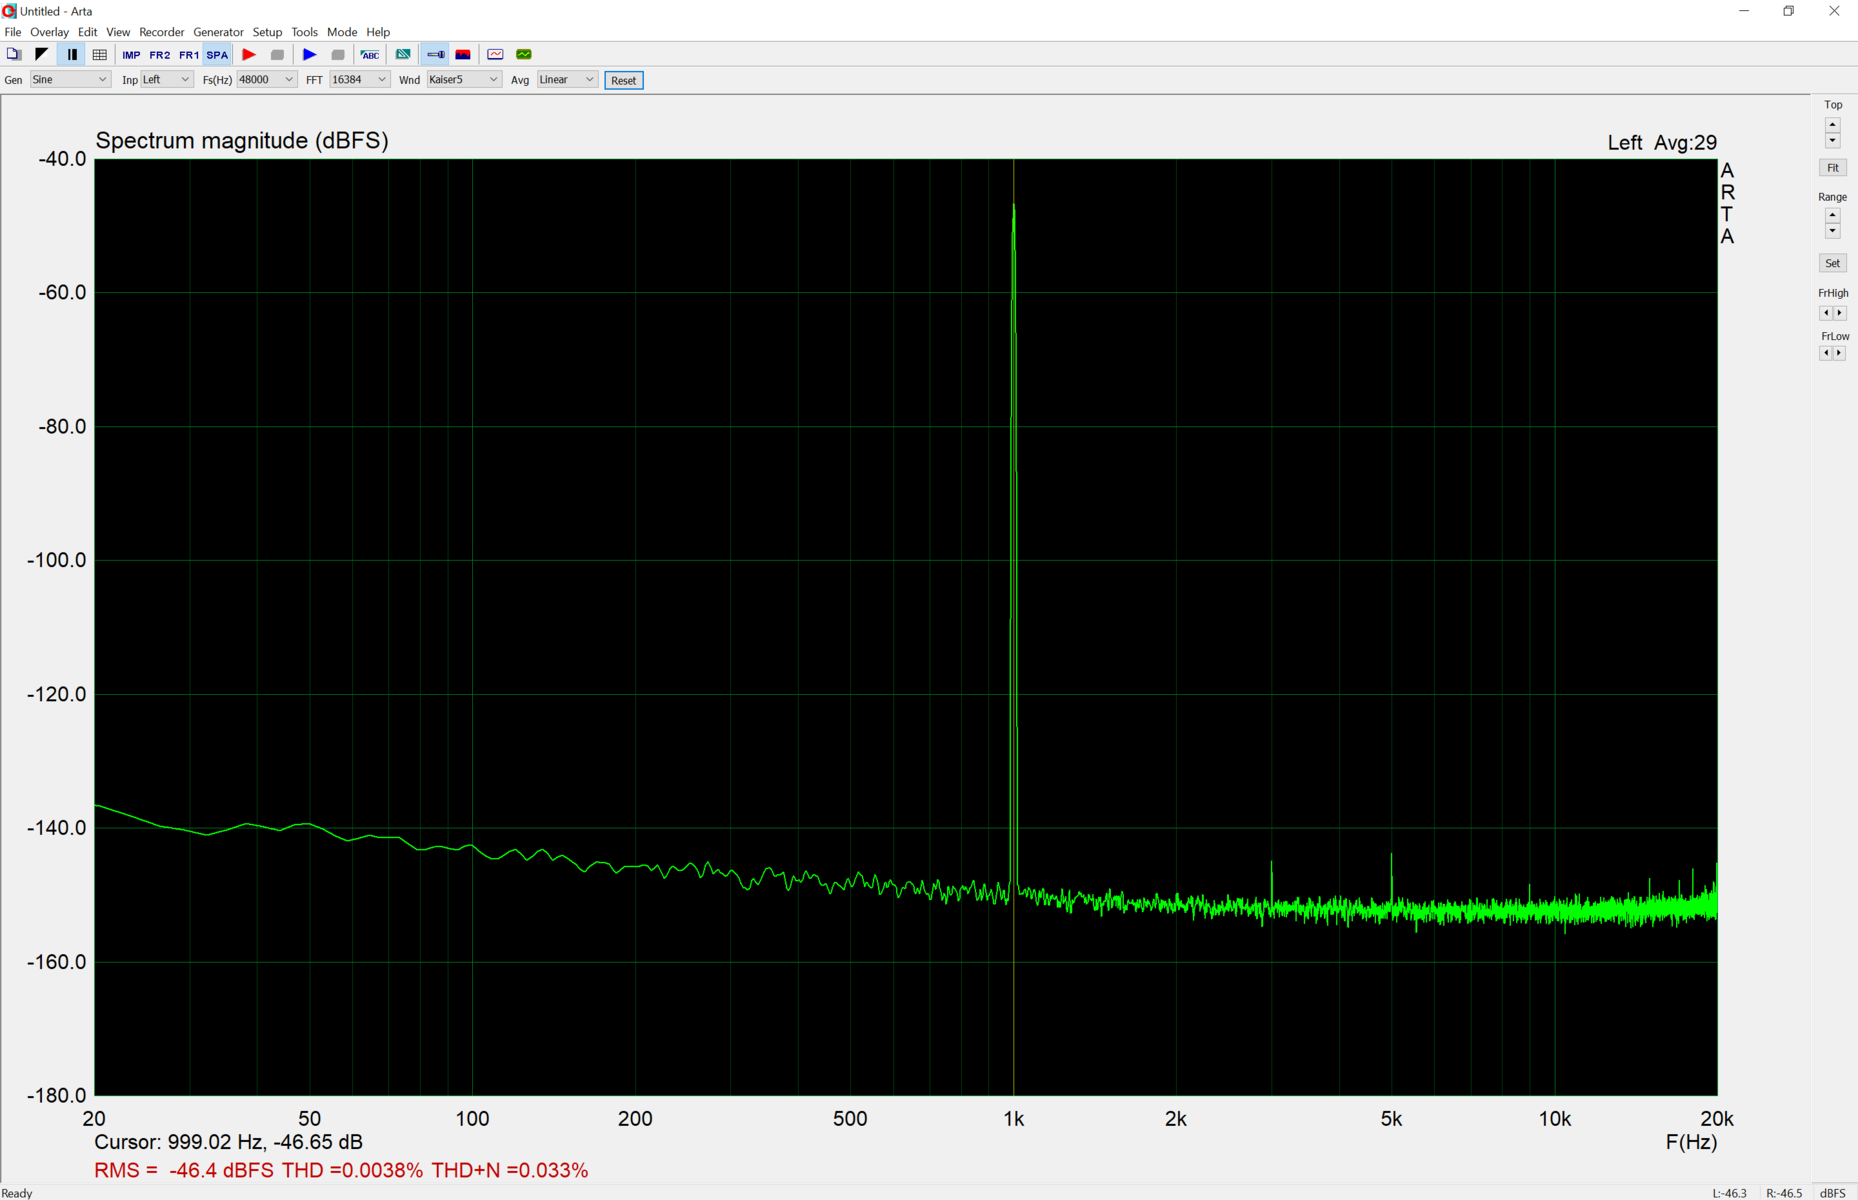
The headset port also received a welcome and significant improvement with the M1 upgrade. The results of the measurement are very good, and the subjective audio quality using JBL Club headphones (on loan from Intel Tiger Lake) is also flawless.
Apple MacBook Air 2020 M1 Entry ses analizi
(±) | hoparlör ses yüksekliği ortalama ama iyi (79.6 dB)
Bas 100 - 315Hz
(±) | azaltılmış bas - ortalama olarak medyandan 7.1% daha düşük
(±) | Bas doğrusallığı ortalamadır (9.5% delta - önceki frekans)
Ortalar 400 - 2000 Hz
(+) | dengeli ortalar - medyandan yalnızca 2.2% uzakta
(+) | orta frekanslar doğrusaldır (5.3% deltadan önceki frekansa)
Yüksekler 2 - 16 kHz
(+) | dengeli yüksekler - medyandan yalnızca 2.3% uzakta
(+) | yüksekler doğrusaldır (4% deltadan önceki frekansa)
Toplam 100 - 16.000 Hz
(+) | genel ses doğrusaldır (8.7% ortancaya göre fark)
Aynı sınıfla karşılaştırıldığında
» Bu sınıftaki tüm test edilen cihazların %3%'si daha iyi, 1% benzer, 96% daha kötüydü
» En iyisinin deltası 5% idi, ortalama 18% idi, en kötüsü 53% idi
Test edilen tüm cihazlarla karşılaştırıldığında
» Test edilen tüm cihazların %3'si daha iyi, 1 benzer, % 97 daha kötüydü
» En iyisinin deltası 4% idi, ortalama 24% idi, en kötüsü 134% idi
Apple MacBook 12 (Early 2016) 1.1 GHz ses analizi
(+) | hoparlörler nispeten yüksek sesle çalabilir (83.6 dB)
Bas 100 - 315Hz
(±) | azaltılmış bas - ortalama olarak medyandan 11.3% daha düşük
(±) | Bas doğrusallığı ortalamadır (14.2% delta - önceki frekans)
Ortalar 400 - 2000 Hz
(+) | dengeli ortalar - medyandan yalnızca 2.4% uzakta
(+) | orta frekanslar doğrusaldır (5.5% deltadan önceki frekansa)
Yüksekler 2 - 16 kHz
(+) | dengeli yüksekler - medyandan yalnızca 2% uzakta
(+) | yüksekler doğrusaldır (4.5% deltadan önceki frekansa)
Toplam 100 - 16.000 Hz
(+) | genel ses doğrusaldır (10.2% ortancaya göre fark)
Aynı sınıfla karşılaştırıldığında
» Bu sınıftaki tüm test edilen cihazların %7%'si daha iyi, 2% benzer, 91% daha kötüydü
» En iyisinin deltası 5% idi, ortalama 18% idi, en kötüsü 53% idi
Test edilen tüm cihazlarla karşılaştırıldığında
» Test edilen tüm cihazların %5'si daha iyi, 1 benzer, % 94 daha kötüydü
» En iyisinin deltası 4% idi, ortalama 24% idi, en kötüsü 134% idi
Power Management
Power Consumption
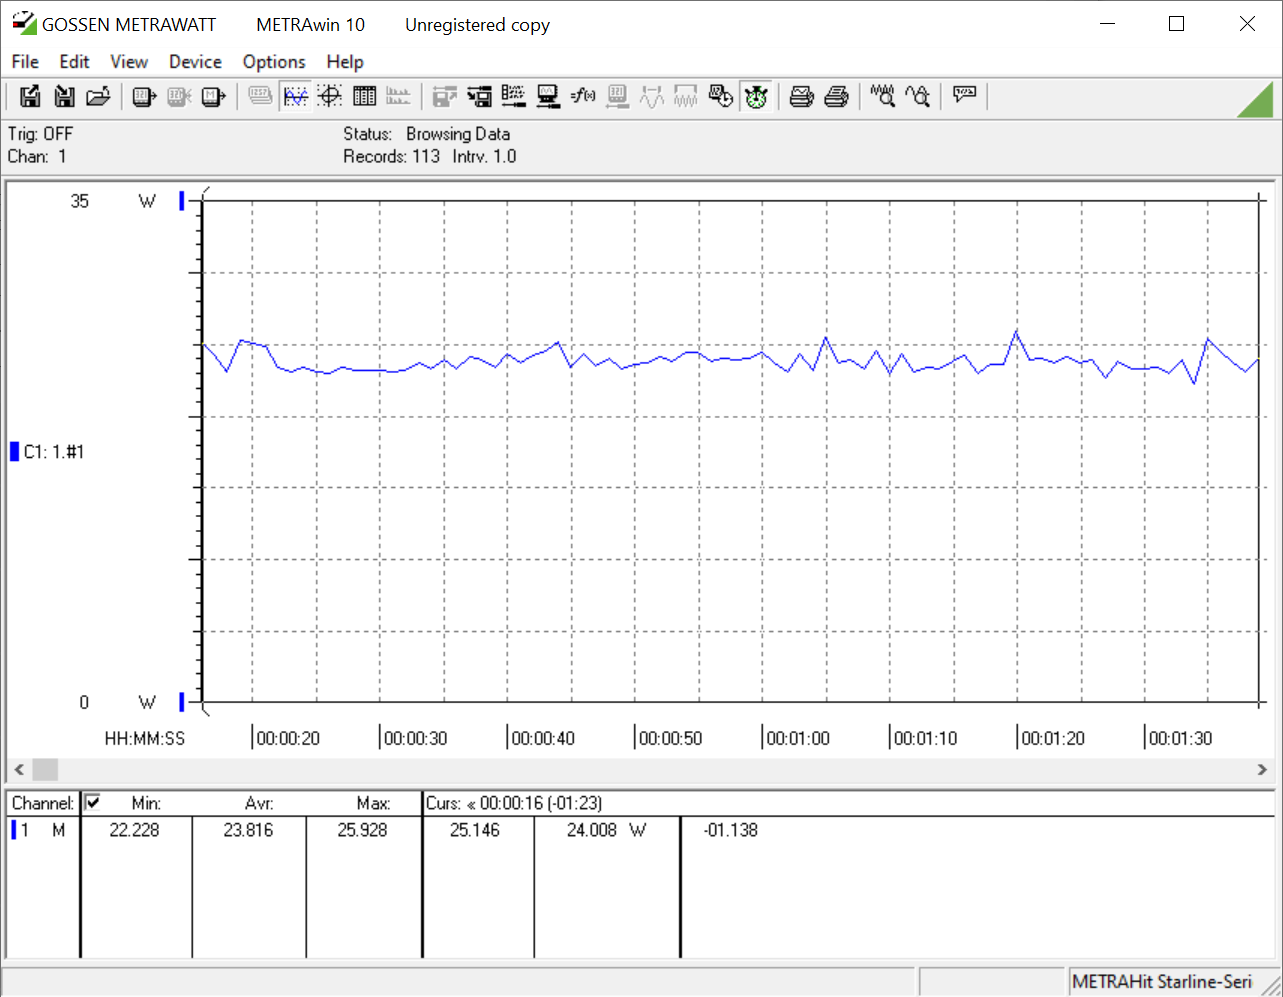
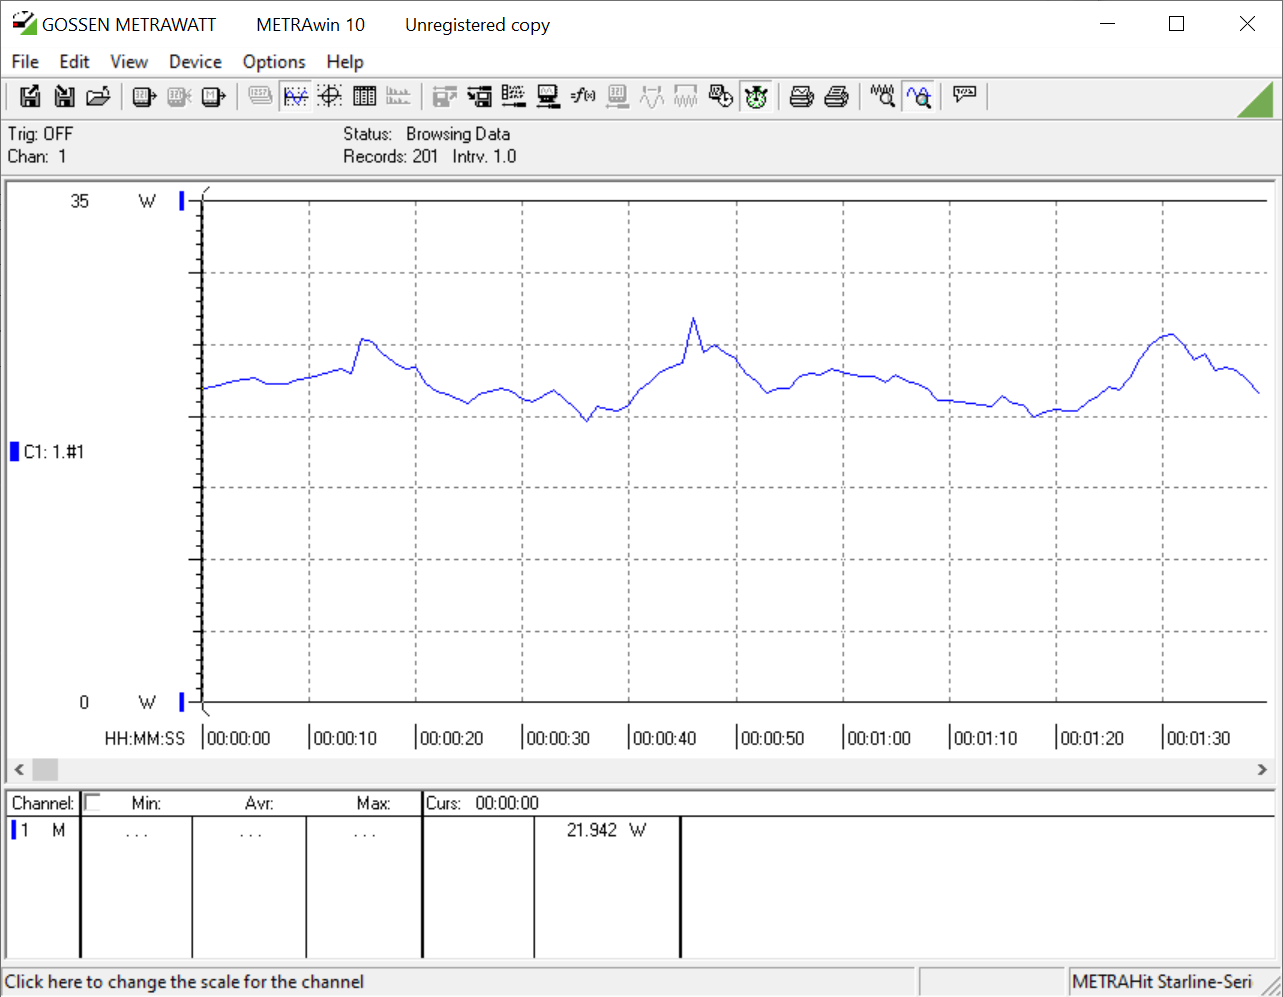
The MacBook Air shows very good values in the power consumption from the outlet for the class of subnotebooks. We are seeing values here that are all comparable across the board to those of the Acer Swift 3 SF313-52-z1Y7 with the Ice Lake i7-1065G7, for example. The values are also very similar to those from the old Intel based MacBook Air notebooks that still had to be cooled actively, and only weak devices with the Pentium N5000 or Celeron SoCs and small screens show significantly better values. Only the Samsung Galaxy Book S with an ARM based Snapdragon 8cx is much more efficient. While the Intel Lakefield version also consumes less power, it is not to the same extent as the 8cx.
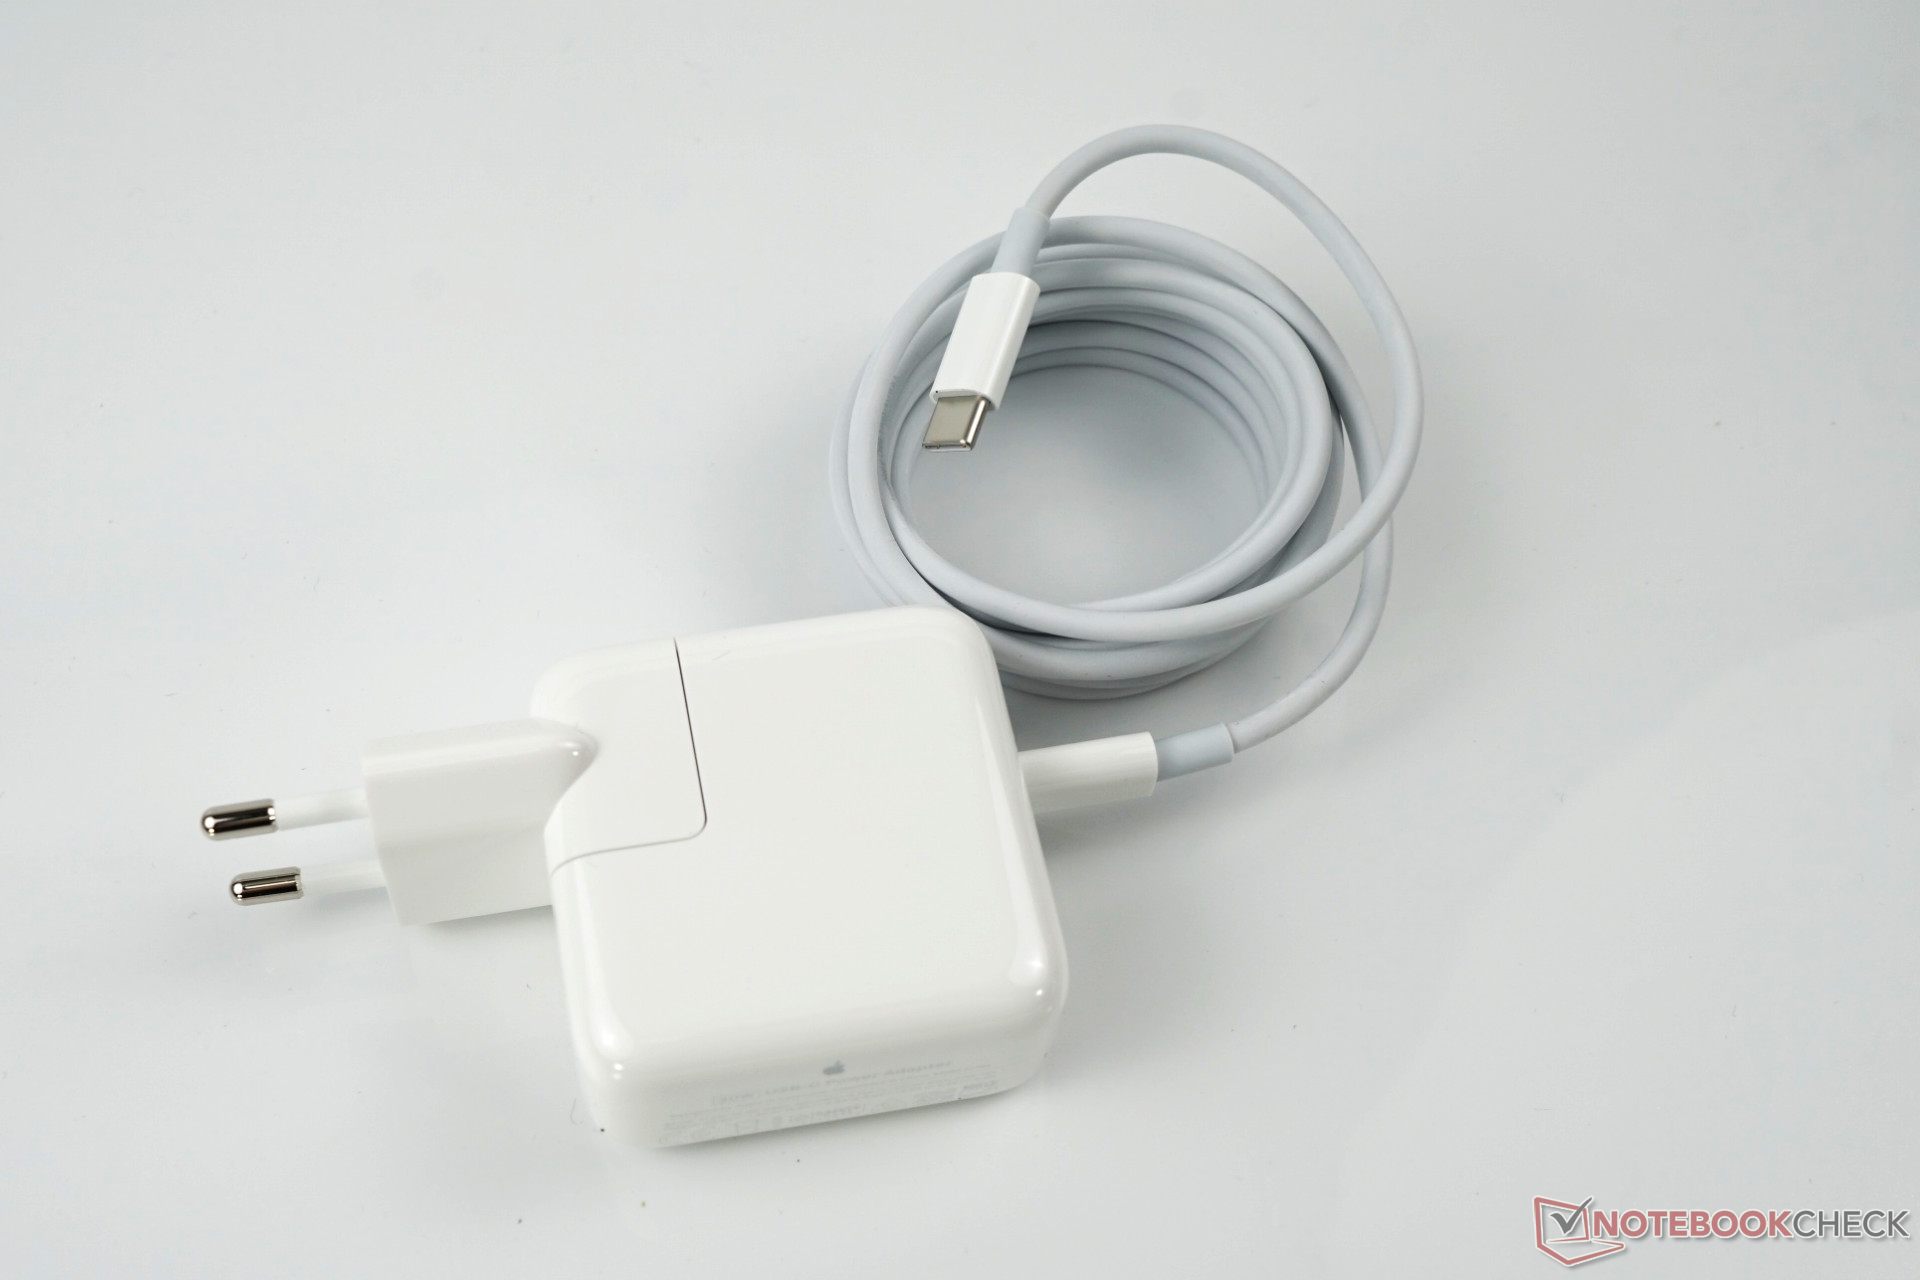
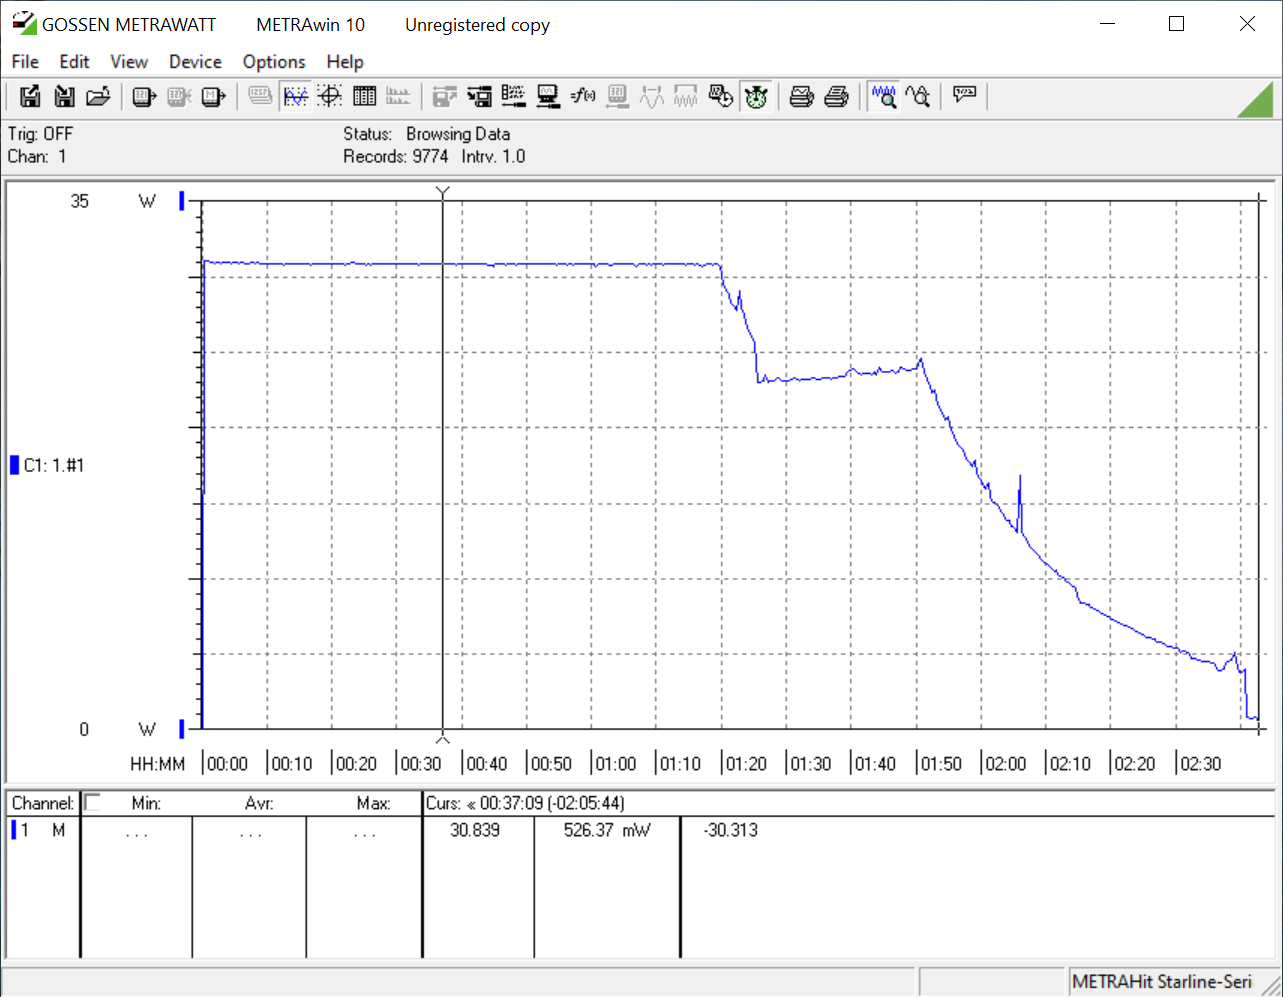
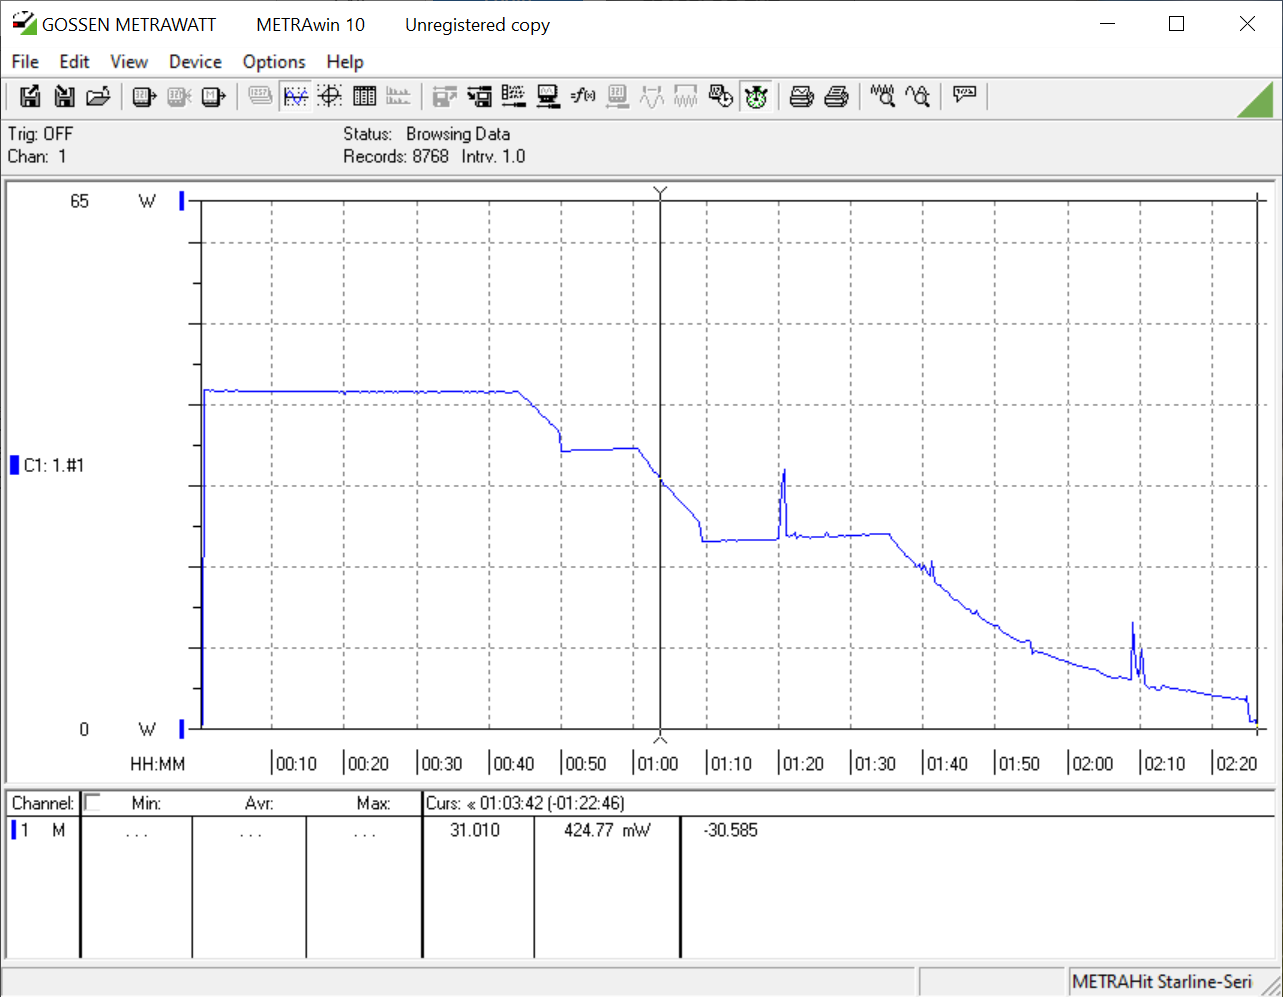
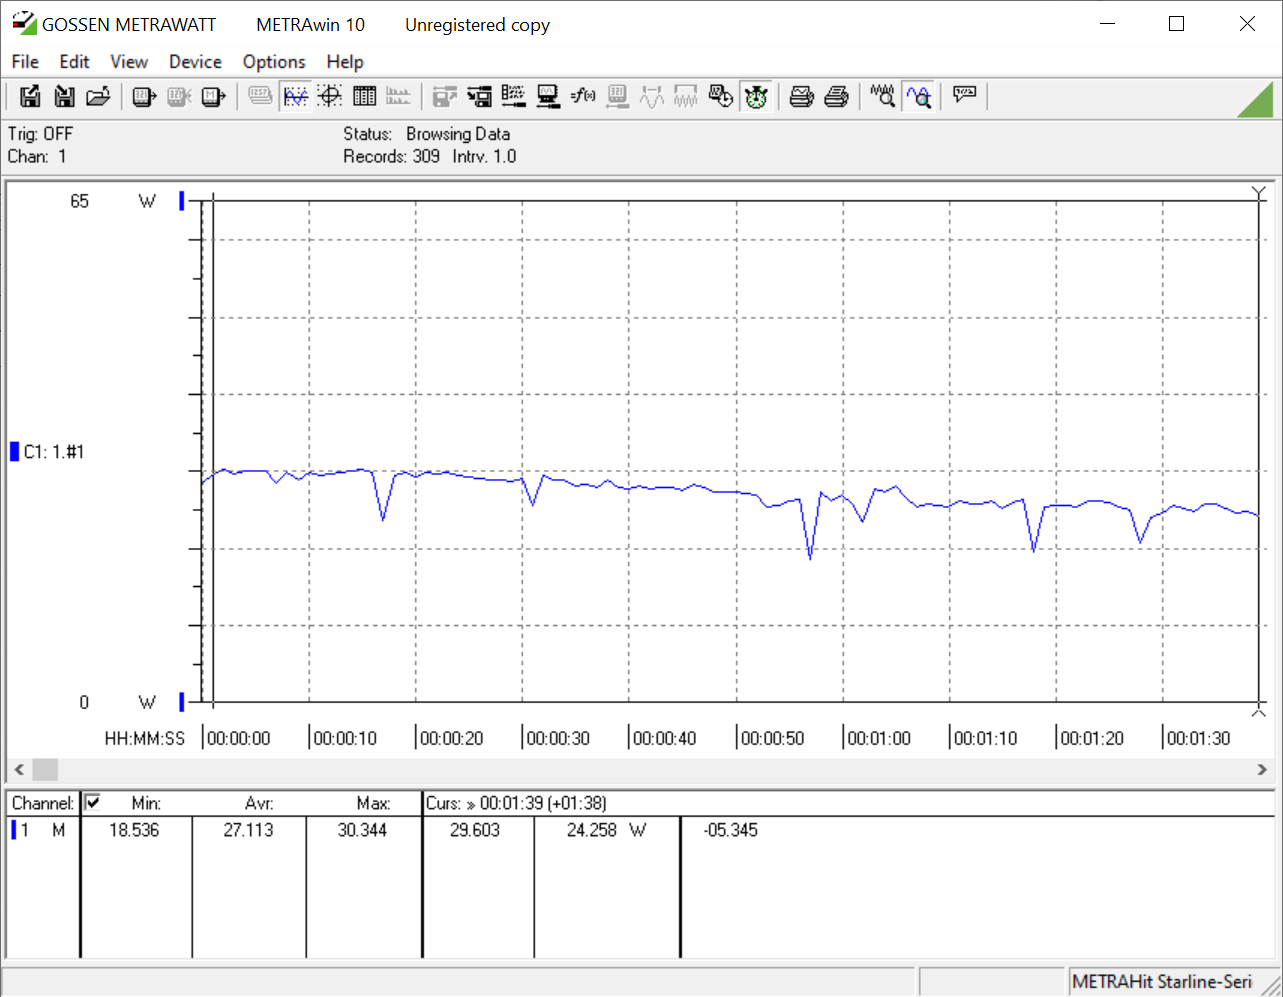
Using the included small 30-watt charger, the battery is completely recharged from 0 to 100% in 2h 40min. If you use the more powerful charger of the MacBook Pro 16, the time it takes to recharge is shortened by 17 minutes, since it initially delivers significantly more power (see chart below).
| Kapalı / Bekleme modu | |
| Boşta | |
| Çalışırken |
|
Key:
min: | |
| Apple MacBook Air 2020 M1 Entry M1, M1 7-Core GPU, Apple SSD AP0256Q, IPS, 2560x1600, 13.3" | Samsung Galaxy Book S Intel i5-L16G7, UHD Graphics G7 (Lakefield GT2 64 EU), 256 GB UFS 3.0 Flash, IPS, 1920x1080, 13.3" | Samsung Galaxy Book S SD 8cx, Adreno 680, 256 GB NVMe, IPS, 1920x1080, 13.3" | Acer Swift 3 SF313-52-71Y7 i7-1065G7, Iris Plus Graphics G7 (Ice Lake 64 EU), Intel SSD 660p 1TB SSDPEKNW010T8, IPS, 2256x1504, 13.5" | Dell XPS 13 9310 Core i7 FHD i7-1165G7, Iris Xe G7 96EUs, Micron 2300 512GB MTFDHBA512TDV, IPS, 1920x1200, 13.4" | Sınıf ortalaması Subnotebook | |
|---|---|---|---|---|---|---|
| Power Consumption | 16% | 33% | 9% | -41% | -60% | |
| Idle Minimum * (Watt) | 1.9 | 2.5 -32% | 1.61 15% | 1.8 5% | 3.9 -105% | 3.86 ? -103% |
| Idle Average * (Watt) | 6.4 | 4.8 25% | 4.3 33% | 4.6 28% | 5.9 8% | 6.61 ? -3% |
| Idle Maximum * (Watt) | 7 | 6 14% | 5 29% | 6.1 13% | 6.3 10% | 8 ? -14% |
| Load Average * (Watt) | 25 | 14.9 40% | 13.2 47% | 27.4 -10% | 39.7 -59% | 42.2 ? -69% |
| Load Maximum * (Watt) | 30.3 | 20.1 34% | 18.3 40% | 27 11% | 47.5 -57% | 64.5 ? -113% |
| Witcher 3 ultra * (Watt) | 34.8 |
* ... daha küçük daha iyidir
Battery Life
The small subnotebook with the M1 processor is able to score in terms of the battery life. It clearly surpasses the old MacBook Air based on the Core i5 in the browsing test at 150 cd/m² of brightness, and in the subnotebook class there are really only the new MacBook Pro 13 and the Asus ExpertBook B9450FA that are better. Surprisingly, the battery life with Safari in full-screen mode is not significantly longer anymore, but it even got slightly shorter.
At maximum brightness, we only measure 8.5 hours in our WLAN script test. The efficient SoC matters less here, and the bright display demands its due. However, the test still shows that you can easily last through a working day without a charger under moderate load.
Things look worse if you want to play games while on the road. With the Unigine Valley Extreme (with 4x AA) benchmark, it lasted only 2 hours and 23 minutes at maximum brightness. While there are several notebooks in the Windows world that last longer, none of them offer a comparable graphics performance.
| Apple MacBook Air 2020 M1 Entry M1, M1 7-Core GPU, 49.9 Wh | Dell XPS 13 9310 Core i7 FHD i7-1165G7, Iris Xe G7 96EUs, 52 Wh | Lenovo ThinkPad X13 Yoga 20SX0004GE i7-10510U, UHD Graphics 620, 50 Wh | Lenovo ThinkPad X395 R3 PRO 3300U, Vega 6, 48 Wh | Lenovo ThinkPad X13-20UGS00800 R7 PRO 4750U, Vega 7, 48 Wh | Apple iPad Air 4 2020 A14, A14 Bionic GPU, 28.6 Wh | Apple iPad Pro 12.9 2020 A12Z Bionic, A12Z Bionic GPU, 36.71 Wh | Apple iPad 7 2019 A10 Fusion, A10 Fusion GPU, 32.4 Wh | Apple MacBook Air 2020 i5 i5-1030NG7, Iris Plus Graphics G7 (Ice Lake 64 EU), 49.9 Wh | Sınıf ortalaması Subnotebook | |
|---|---|---|---|---|---|---|---|---|---|---|
| Pil Çalışma Süresi | ||||||||||
| WiFi v1.3 (h) | 16 | 11 -31% | 8.2 -49% | 10.9 -32% | 8.7 -46% | 11.7 -27% | 15.1 -6% | 11.8 -26% | 10.3 -36% | 14 ? -12% |
Artılar
Eksiler
Verdict
The new M1 processor with ARM architecture makes an impressive debut in the MacBook Air. In CPU as well as GPU performance, comparable chips from Intel and AMD are surpassed in terms of the theoretical raw performance - and this is the entry-level configuration of the Air. The passive cooling hardly impacts the everyday performance, the graphics performance does not drop noticeably over time, and only during demanding tasks for the processor there is a noticeable drop after several minutes. But at 11%, this also remains within limits. We can also reassure you about the surface temperatures, with only the internals getting very hot, as is typical for Apple. A huge advantage of the lack of a fan is the silent operation of the notebook, which is perfect in quiet surroundings. The new Apple M1 also has a positive effect on the battery life. With its energy-saving cores, it is able to save a lot of power in our WLAN battery test, and it can even last through a full work day at maximum display brightness.
However, the change to the Apple in-house chips does not only bring advantages. Many older apps have to run via Rosetta 2 emulation and significantly lose in performance. On the other hand, the emulation is fast enough to still get better results than when using the old entry-level processors from Intel. Unfortunately, not everything works perfectly yet. From stuttering interfaces and longer load times up to app crashes, there are many open problems. So you have to hope for native versions of the software or updates from Apple. Buyers should find out in advance whether the software they use could run into trouble or whether there are alternatives. However, any limitations in the app selection from this are balanced by the numerous newly added iOS apps that will run perfectly thanks to the ARM chip.
The new Apple chips celebrate a successful debut in the MacBook Air. With maturing software, probably no one will miss the Intel chips in the Mac in the future.
The case and the display remained practically unchanged. Here we would have wished at least for a touchscreen - particularly because of the iOS compatibility - and smaller display bezels. Otherwise there are no reasons for complaint at all in terms of the case, input devices, and speakers.
In terms of its price, the entry level is particularly attractive, especially since there are always some good offers from vendors over the years. The additional charge for the octa-core GPU and 16 GB of RAM are not necessarily worthwhile, and the fast 8 GB of Unified RAM should be completely sufficient for most users. The 256-GB SSD represents more of a limitation, and the premiums for more storage space are very hefty. The additional charge for the MacBook Pro 13 with active cooling is also only worthwhile for very few users. Active cooling, a larger battery, a slightly brighter display, and a Touchbar only really matter to very few people. And power users should better wait anyway for the M1X in more powerful models, where you can also hope for more than only 2 TB3 ports.
Price and Availability
The new MacBook Air with the M1 chip is already available starting from about 1,000 USD from Amazon (free shipping), among other places.
Apple MacBook Air 2020 M1 Entry
- 12/18/2020 v7 (old)
Klaus Hinum
Price comparison

