Razer Book 13 Core i7 Dizüstü Bilgisayar İncelemesi: XPS 13 Gibi Ama Daha Hızlı

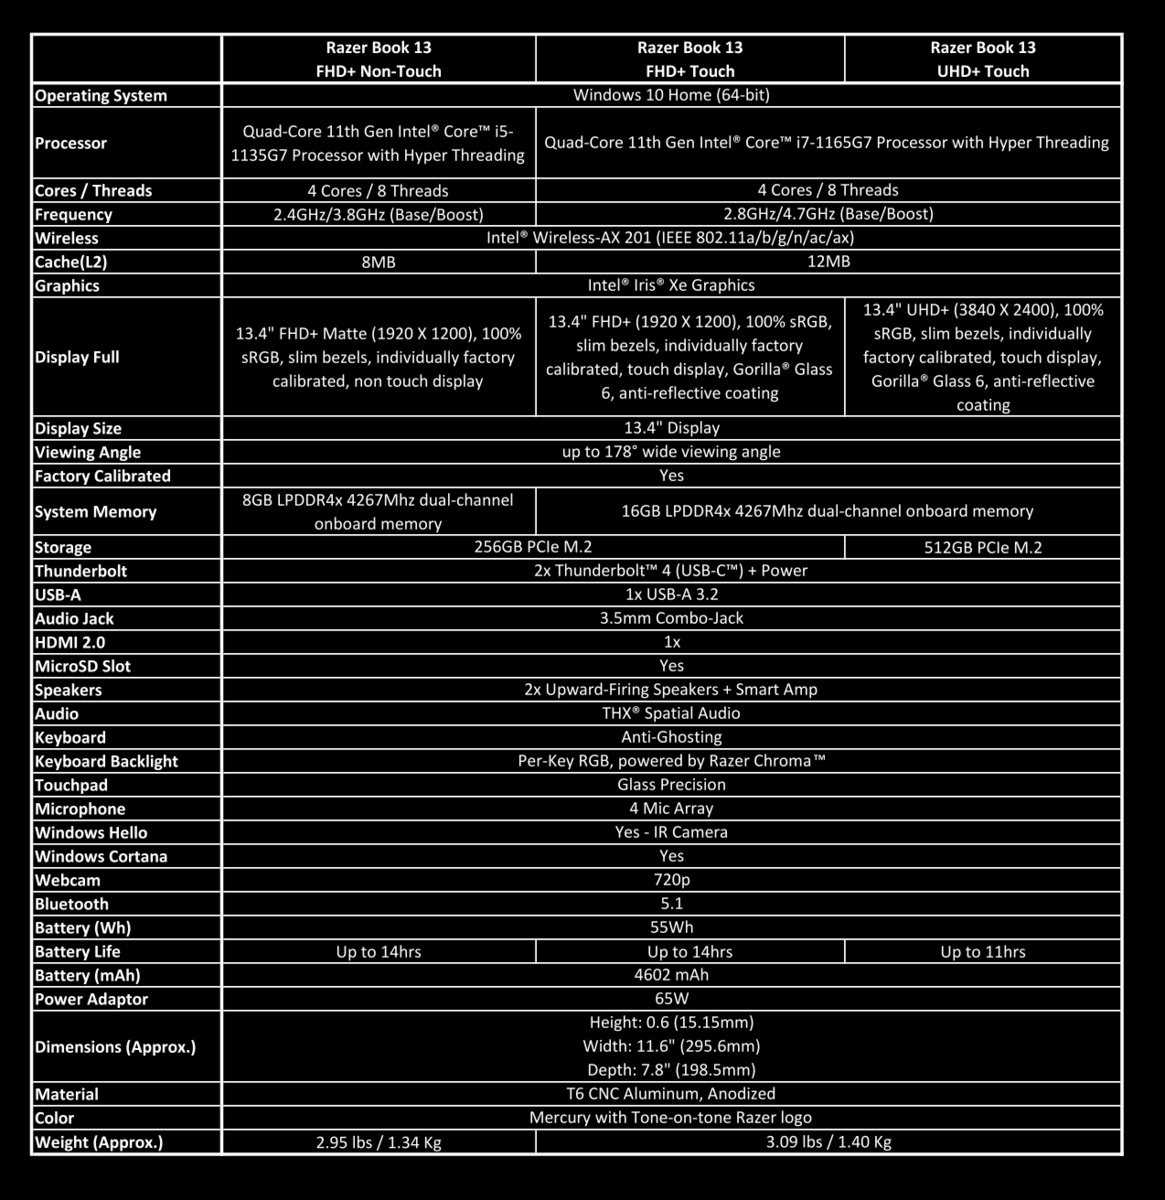
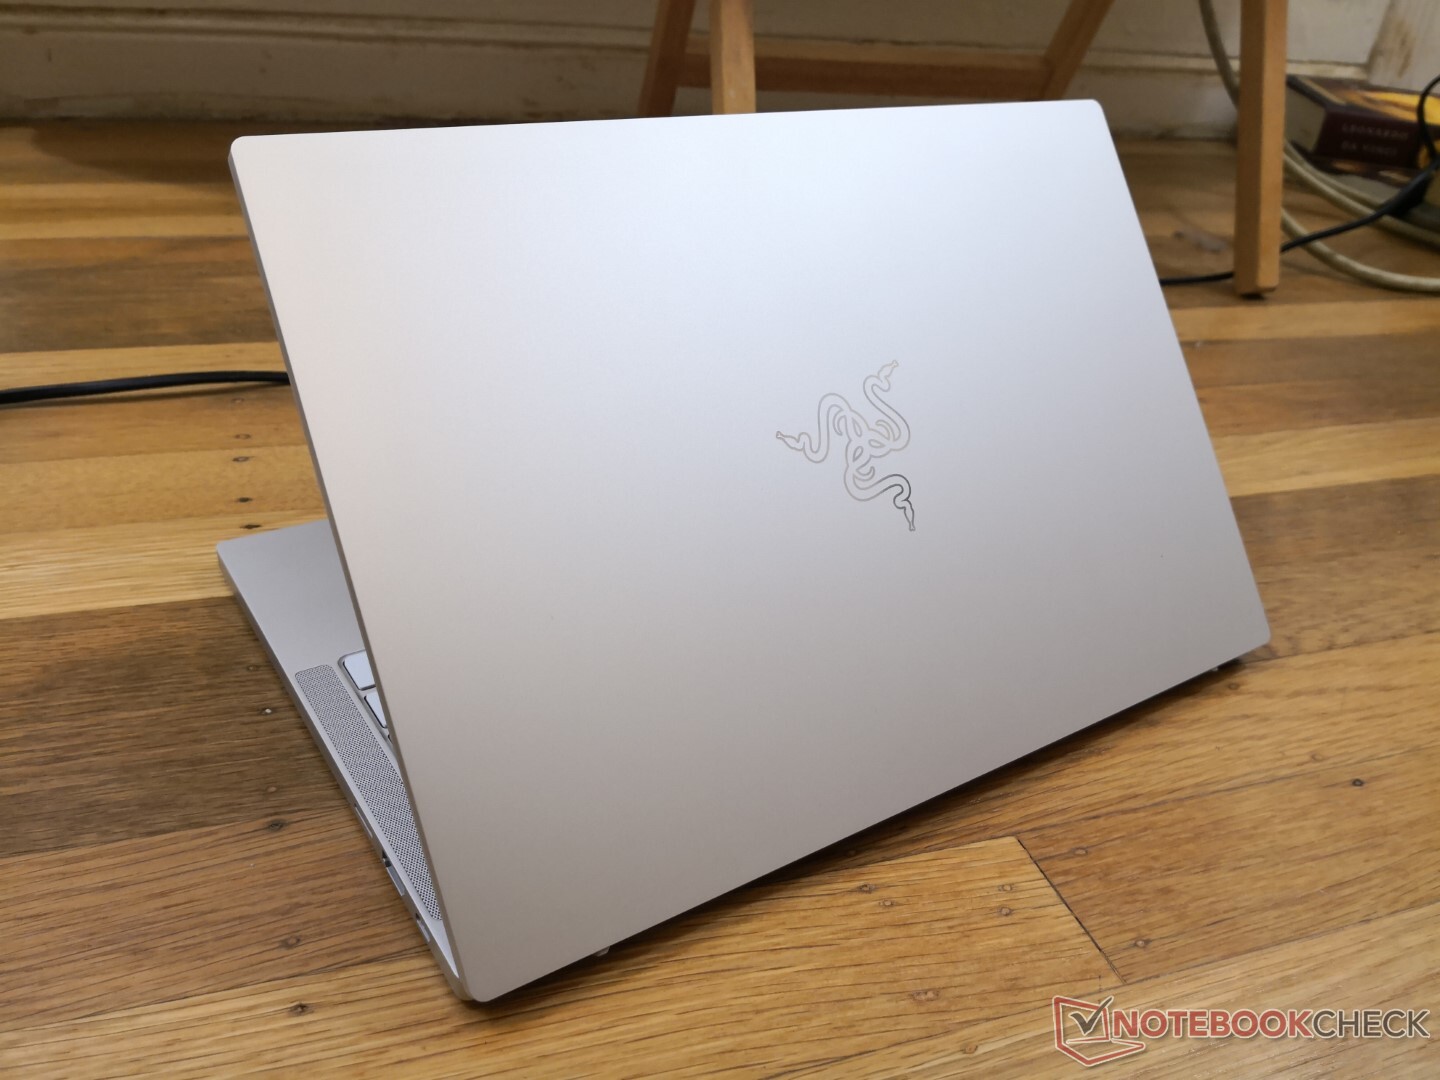
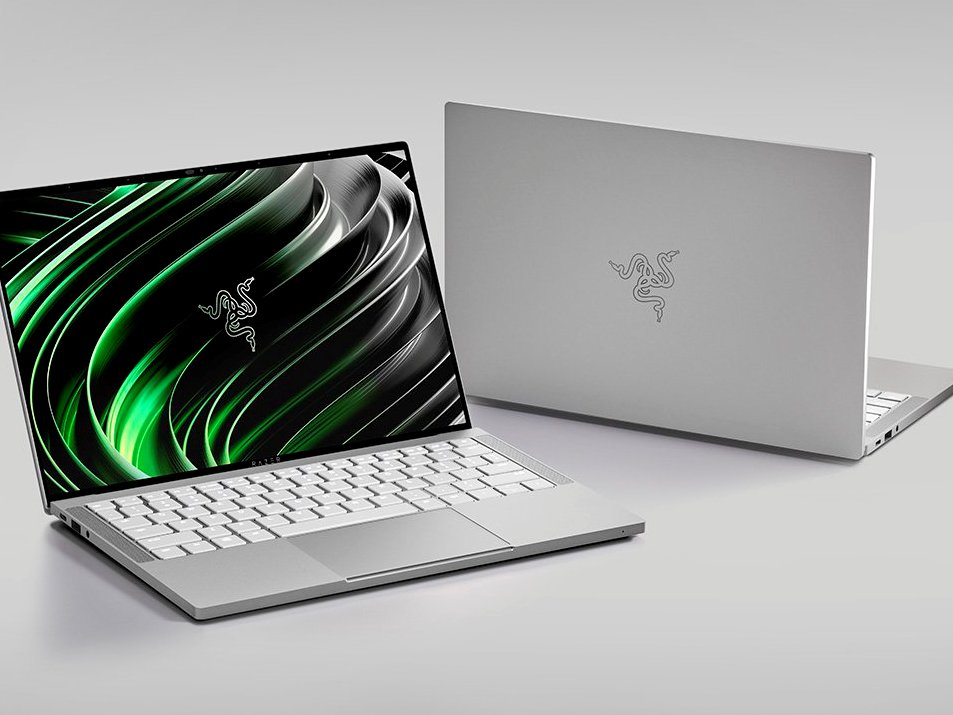
İlk bakışta, Razer Book 13'ün sadece profesyoneller ve üretkenlik için yeniden markalanmış bir Mercury White Blade Stealth olduğu varsayılabilir. Gerçekte, bu yepyeni bir kasa ve 16:10 form faktörü Blade serisinin başka hiçbir yerinde bulunmadı. Razer, Blade serisinin oyunculara odaklanmaya devam edebilmesi için, Blade isminden ayrı profesyoneller için haklı olarak yeni bir dizüstü bilgisayar ailesi tahsis ediyor.Tabii ki, Book 13 doğal olarak Blade Stealth'in birkaç özelliğini devralacak. bu inceleme için ayrıntılı olarak. SKU'lar Core i5-1135G7 CPU, 1200p mat ekran, 8 GB LPDDR4x RAM ve Core i7-1165G7'ye kadar 1200 USD karşılığında 256 GB PCIe depolama, 2400p parlak dokunmatik ekran, 16 GB RAM ve 2000 $ karşılığında 512 GB SSD ile başlar . Ünitemiz aşağıdaki tablodaki orta seçenektir. Kitap 13'ün rakipleri, Dell XPS 13, HP Spectre 13, Huawei MateBook X Pro, Asus ZenBook S, Microsoft gibi diğer 13 inç "prosumer" subnotebook'ları veya ofis merkezli dizüstü bilgisayarları içerir. Surface Laptop 3 13 veya Lenovo ThinkBook serisi Daha fazla Razer incelemesi: Blade Stealth (Core i7-1165G7) Blade Stealth (Core i7-1065G7) Blade 15Blade 15 Studio EditionBlade Pro
potential competitors in comparison
Derecelendirme | Tarih | Modeli | Ağırlık | Yükseklik | Boyut | Çözünürlük | Fiyat |
|---|---|---|---|---|---|---|---|
| 86.6 % v7 (old) | 01/2021 | Razer Book 13 FHD i7-1165G7, Iris Xe G7 96EUs | 1.4 kg | 15.15 mm | 13.40" | 1920x1200 | |
| 88.1 % v7 (old) | 12/2020 | Dell XPS 13 9310 Core i7 FHD i7-1165G7, Iris Xe G7 96EUs | 1.3 kg | 14.8 mm | 13.40" | 1920x1200 | |
| 85.1 % v7 (old) | Asus Zenbook S UX393JA i7-1065G7, Iris Plus Graphics G7 (Ice Lake 64 EU) | 1.4 kg | 15.7 mm | 13.90" | 3300x2200 | ||
| 87.4 % v7 (old) | 05/2020 | Huawei MateBook X Pro 2020 i7 i7-10510U, GeForce MX250 | 1.3 kg | 14.6 mm | 13.90" | 3000x2000 | |
| 87.3 % v6 (old) | 11/2018 | Lenovo Yoga C930-13IKB i5-8250U, UHD Graphics 620 | 1.4 kg | 14.9 mm | 13.90" | 1920x1080 | |
| 85.5 % v7 (old) | 04/2021 | Razer Blade Stealth i7-1165G7 GTX 1650 Ti Max-Q i7-1165G7, GeForce GTX 1650 Ti Max-Q | 1.4 kg | 15.3 mm | 13.30" | 1920x1080 |
Durum
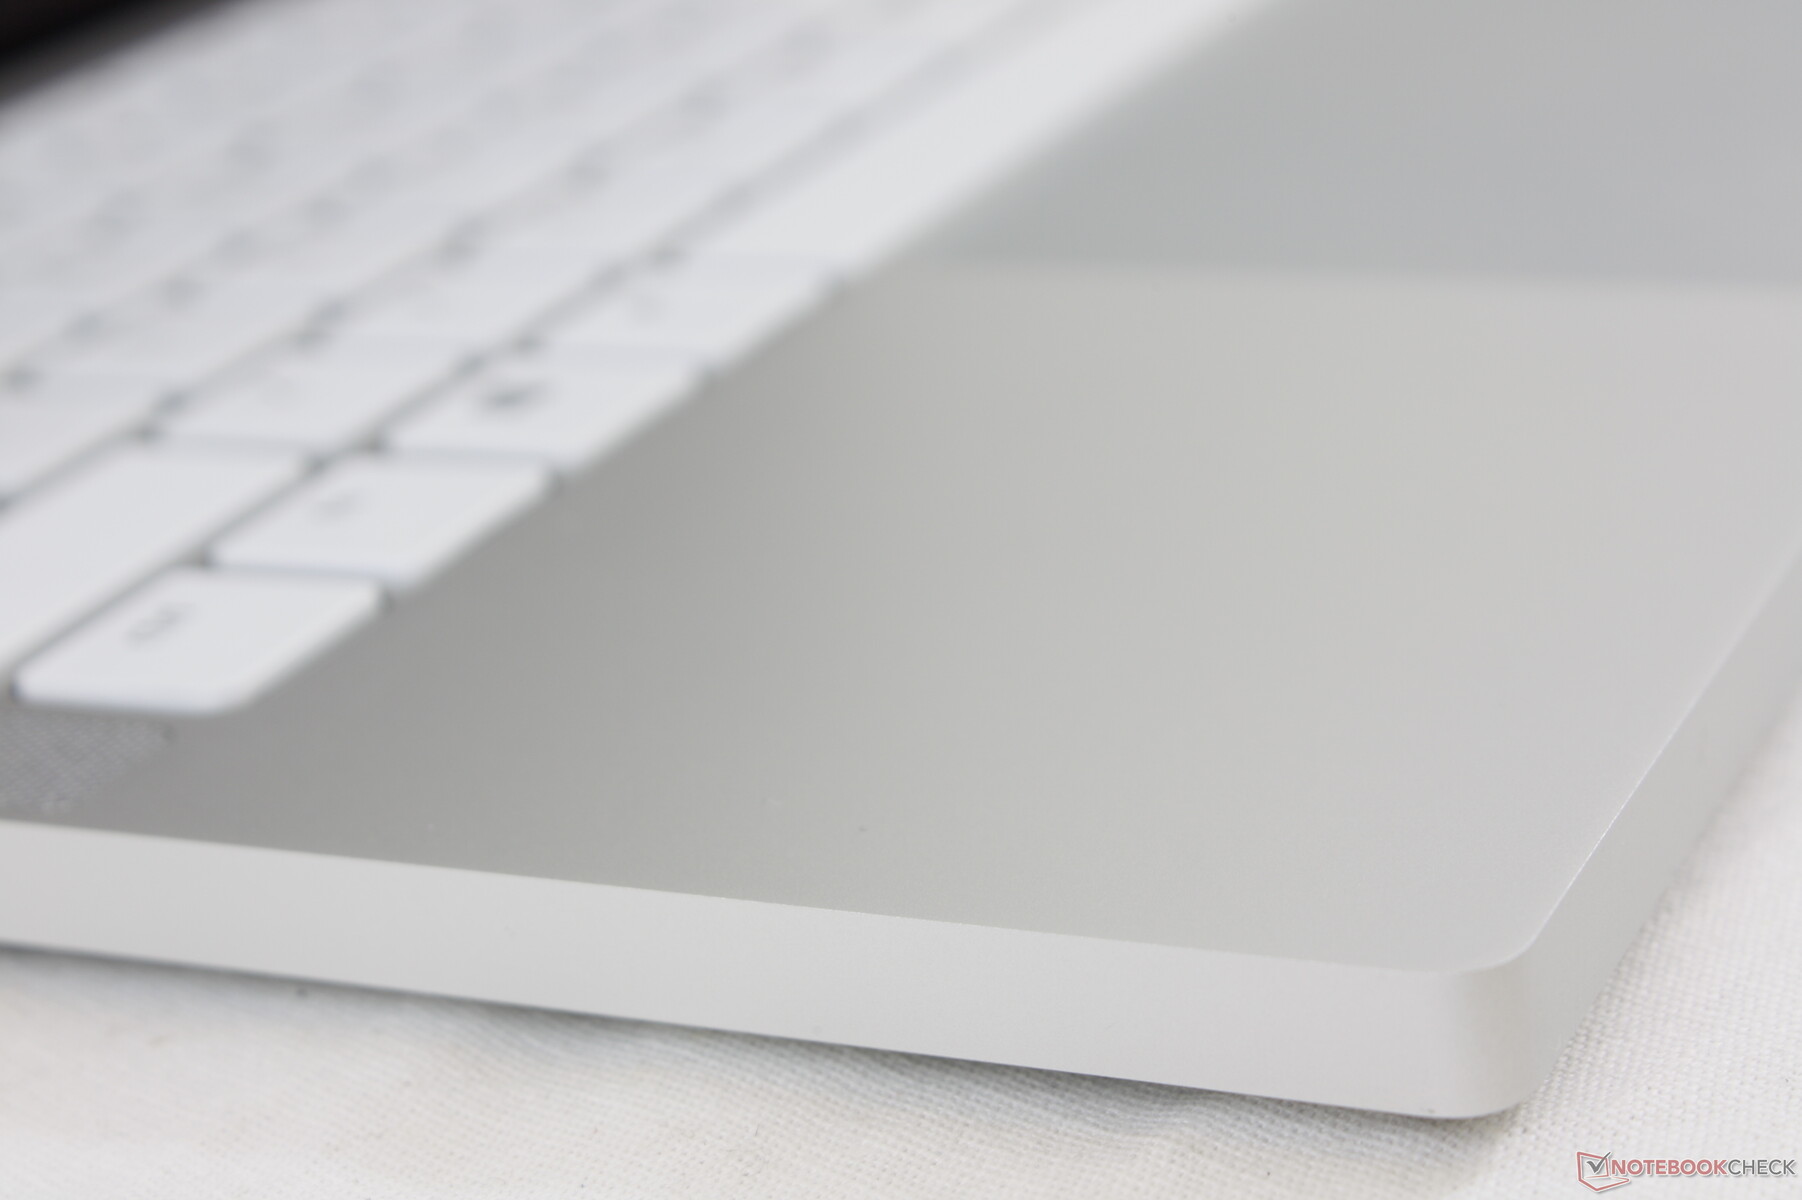
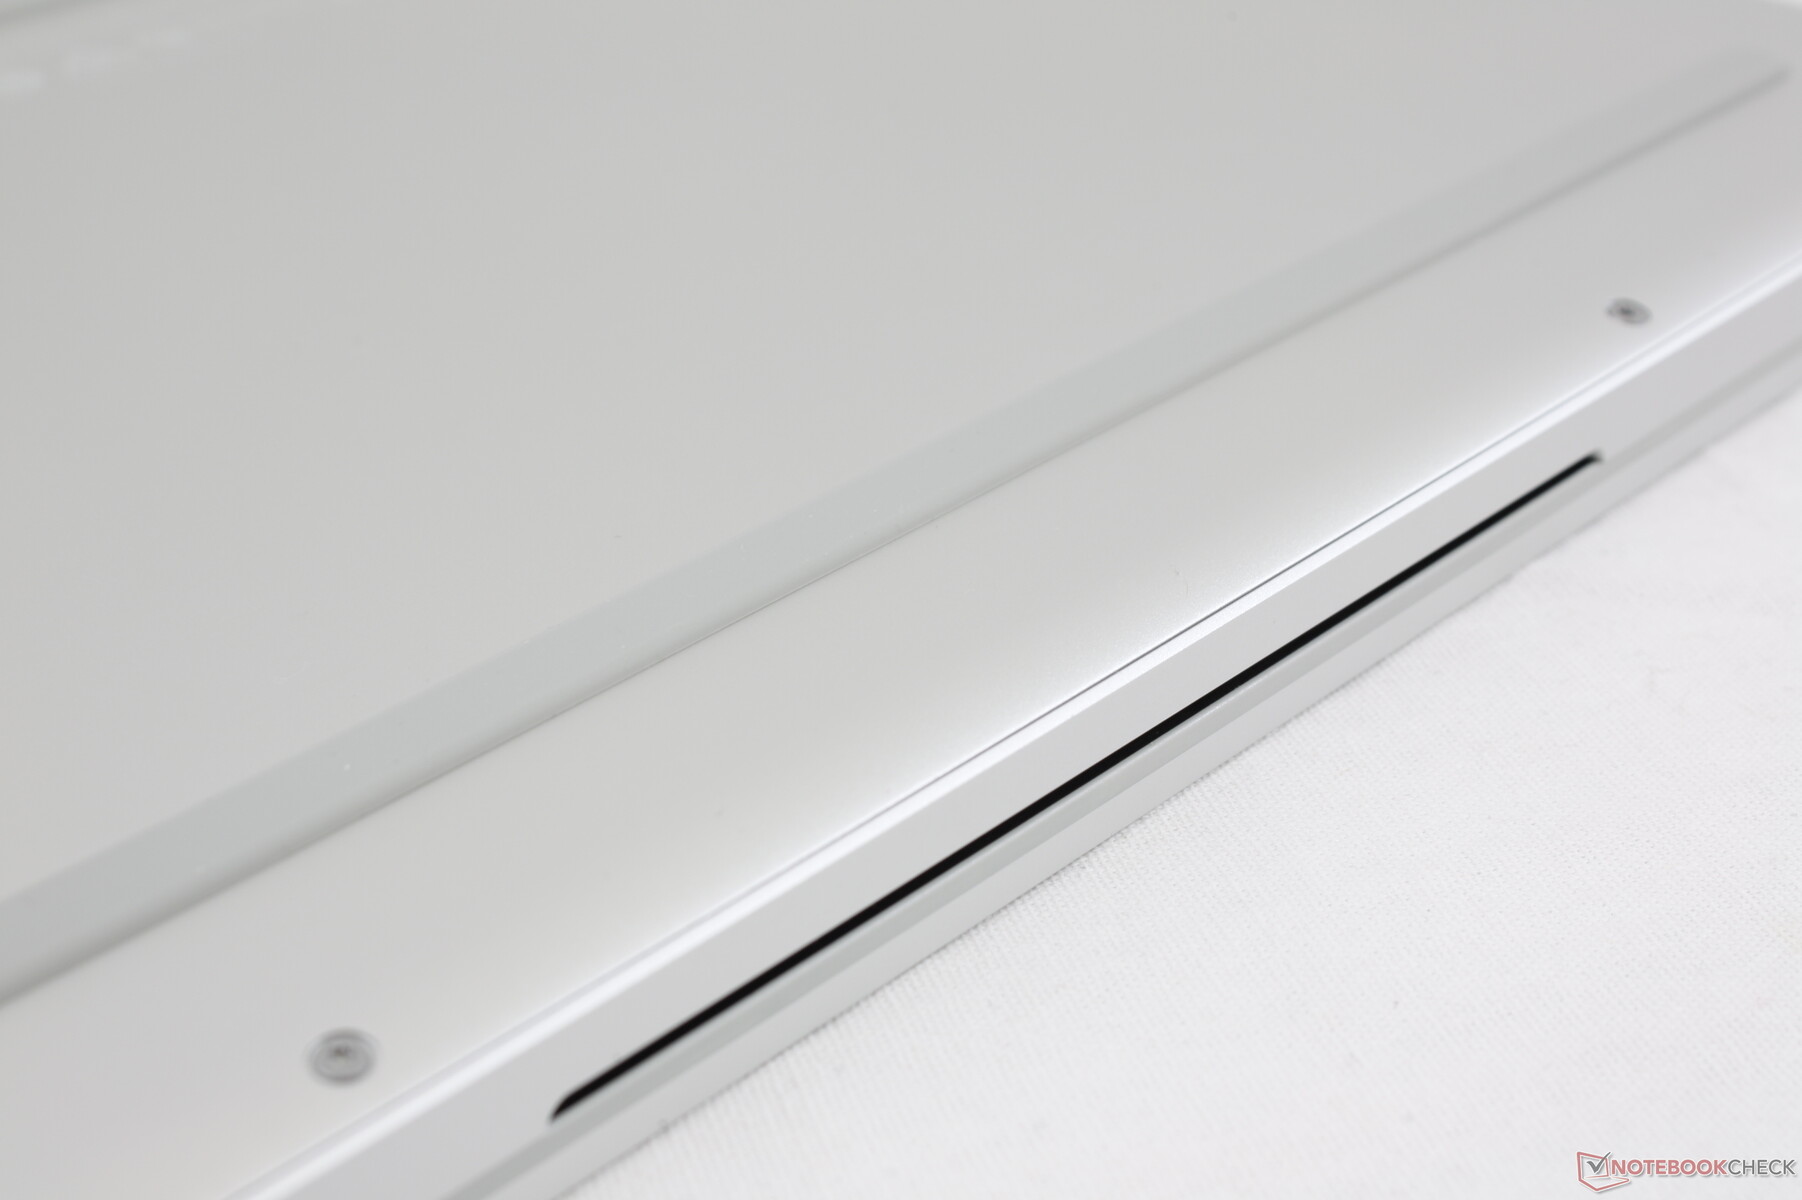
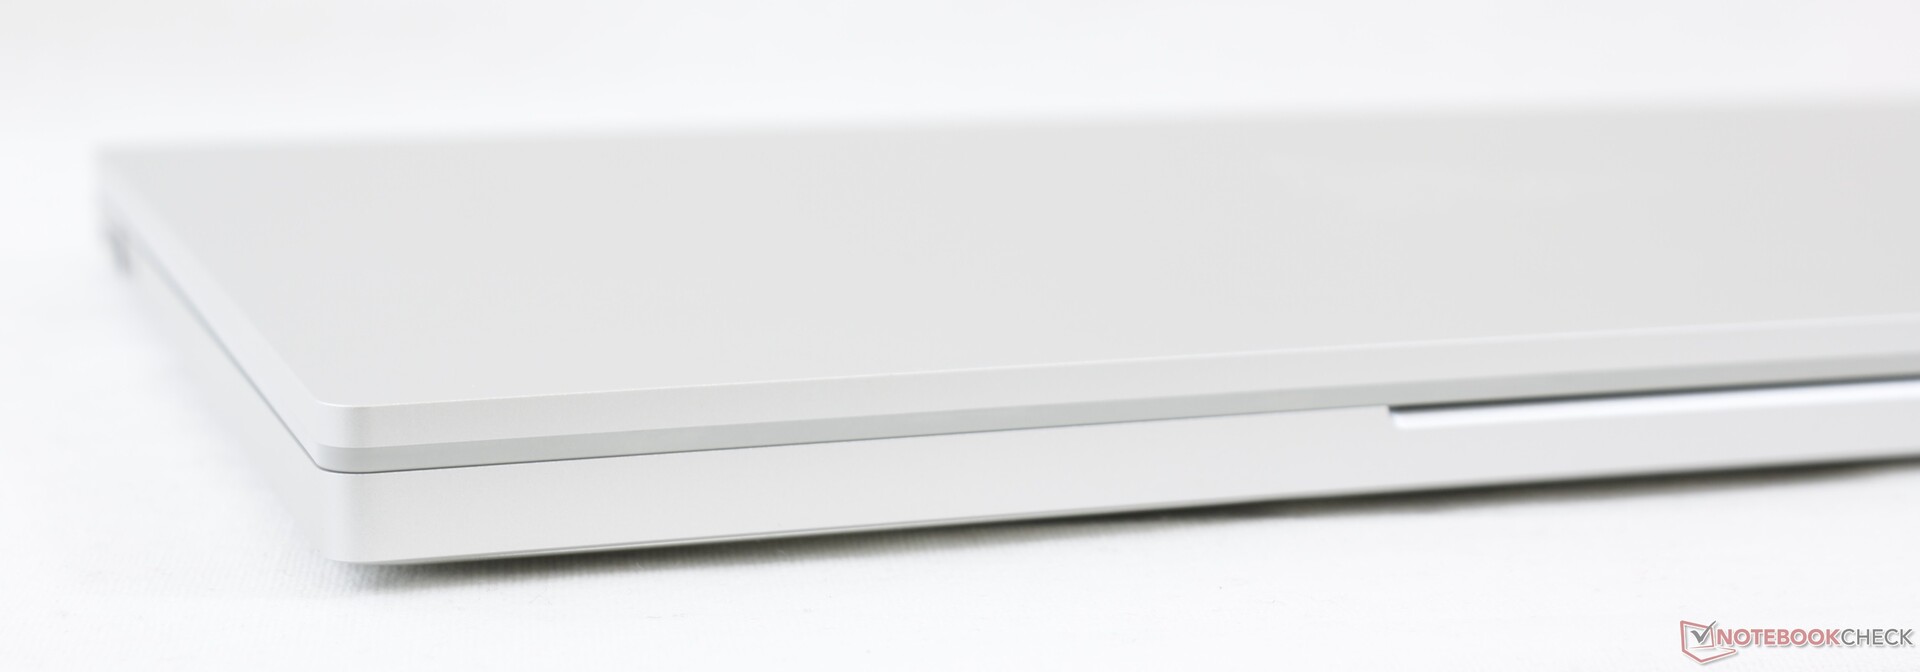
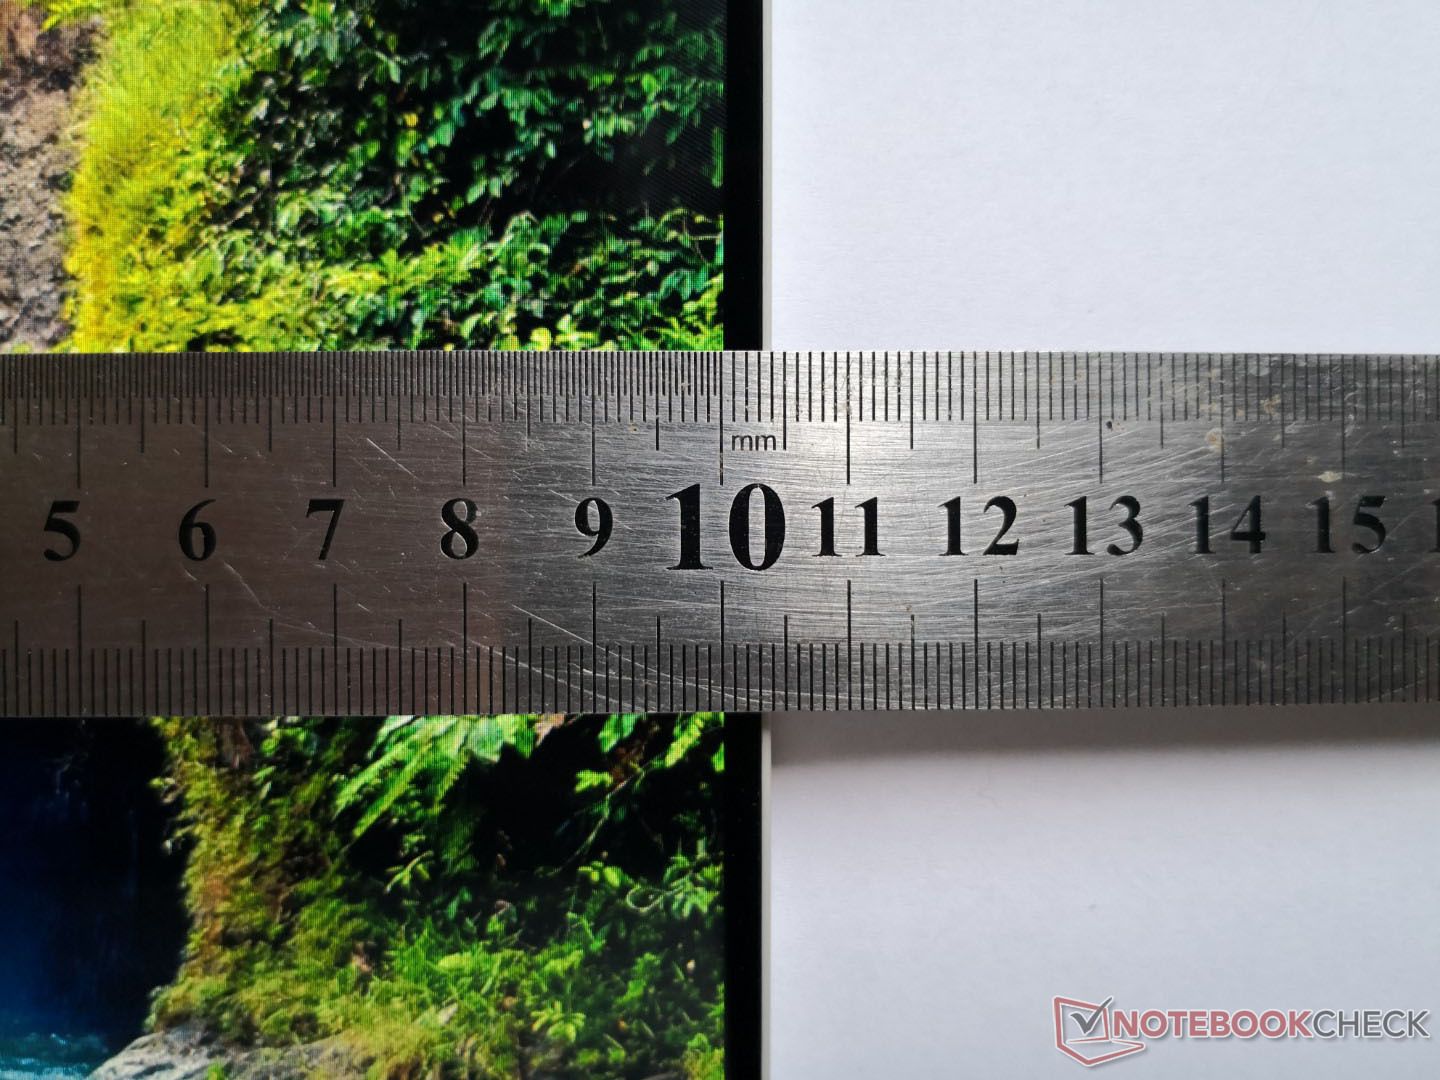
Kalite, doku ve sertlik açısından, Kitap 13, aynı metal malzemeleri kullandıkları için Blade Stealth ile özdeştir. Blade'in hissini ve tasarımını seviyorsanız, Kitap 13 hayal kırıklığına uğramayacak. Book 13 ile Blade Stealth arasındaki en büyük kasa farkı yeni menteşelerde yatıyor. Razer, alt çerçevenin kalınlığını artırmadan yeni ekran en boy oranı için bunları yeniden tasarlamak zorunda kaldı. Sonuç, menteşelerin tabanın altına sıkıştırıldığı ve tabanın kendisinin açıldığında hafifçe kalkacağı ZenBook S'ye benzer. Menteşe sertliği, Blade Stealth'ten daha iyi veya daha kötü hissettirmiyor, ancak ünitemizdeki açıları ayarlarken hafif bir gıcırtı fark ettik. 140 derecelik maksimum açı, zevklerimiz için de biraz sığdır.
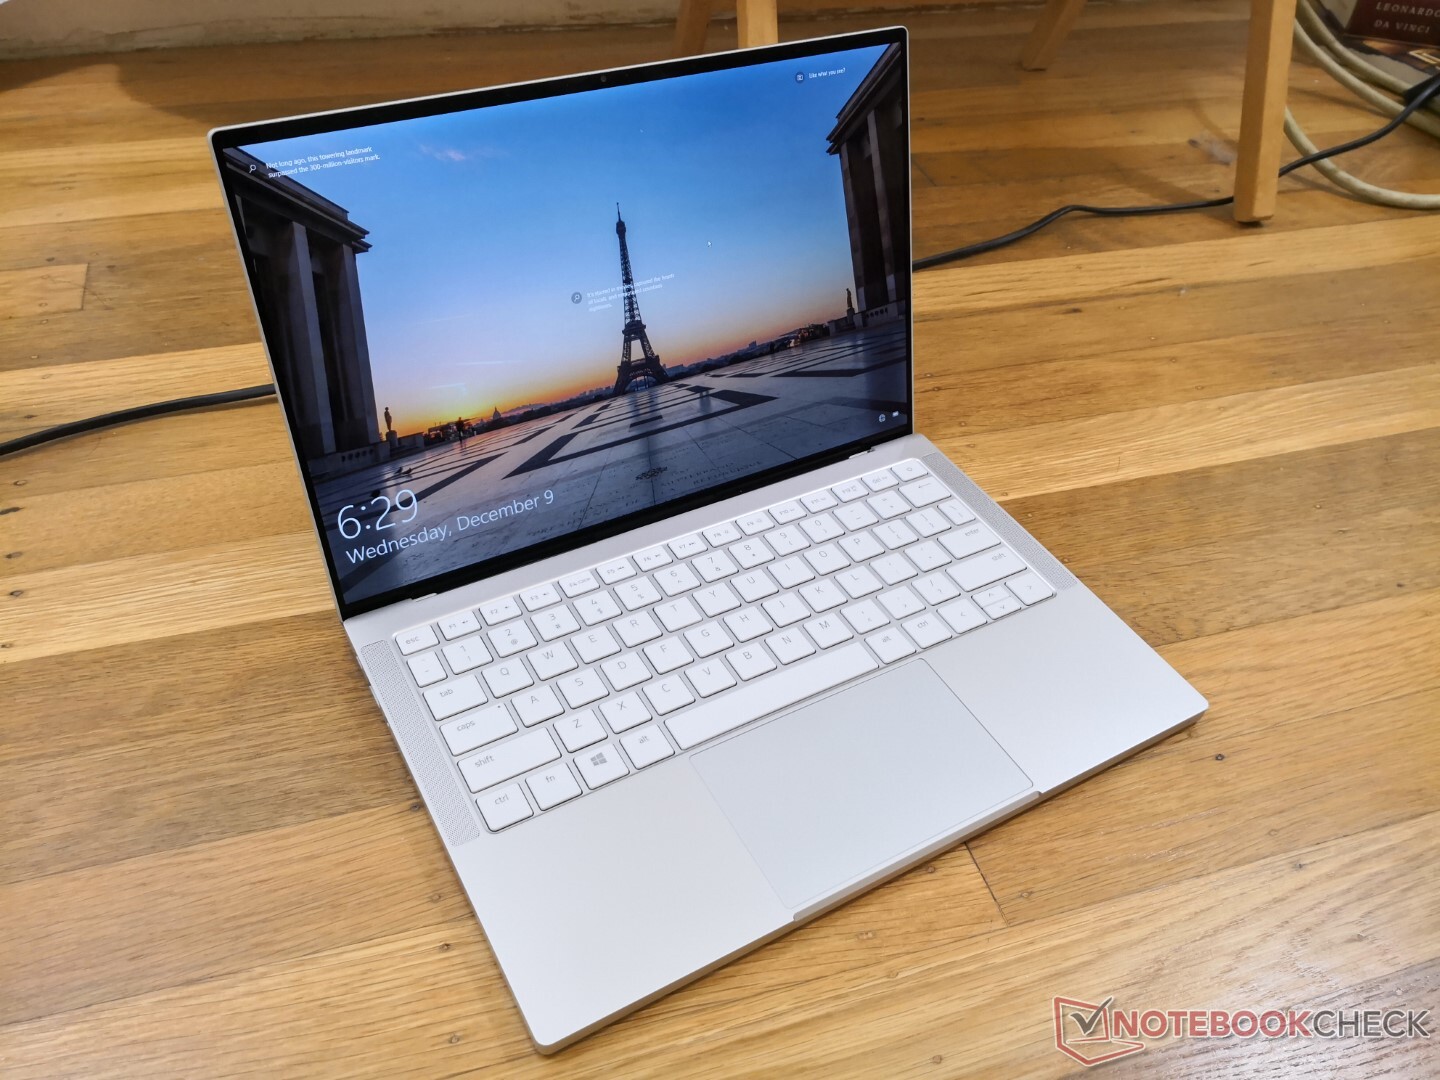
Blade Stealth, halihazırda piyasadaki en küçük 13 inçlik dizüstü bilgisayarlardan biridir ve Kitap 13, ekran boyutunu küçültmeye gerek kalmadan daha da küçük olarak eğilimi sürdürmektedir. Boyutları, biraz daha kalın (15,2 mm'ye karşı 14,8 mm) ve daha ağır (1,3 kg'ya karşı 1,4 kg) olmak üzere XPS 13'e çok yakındır.
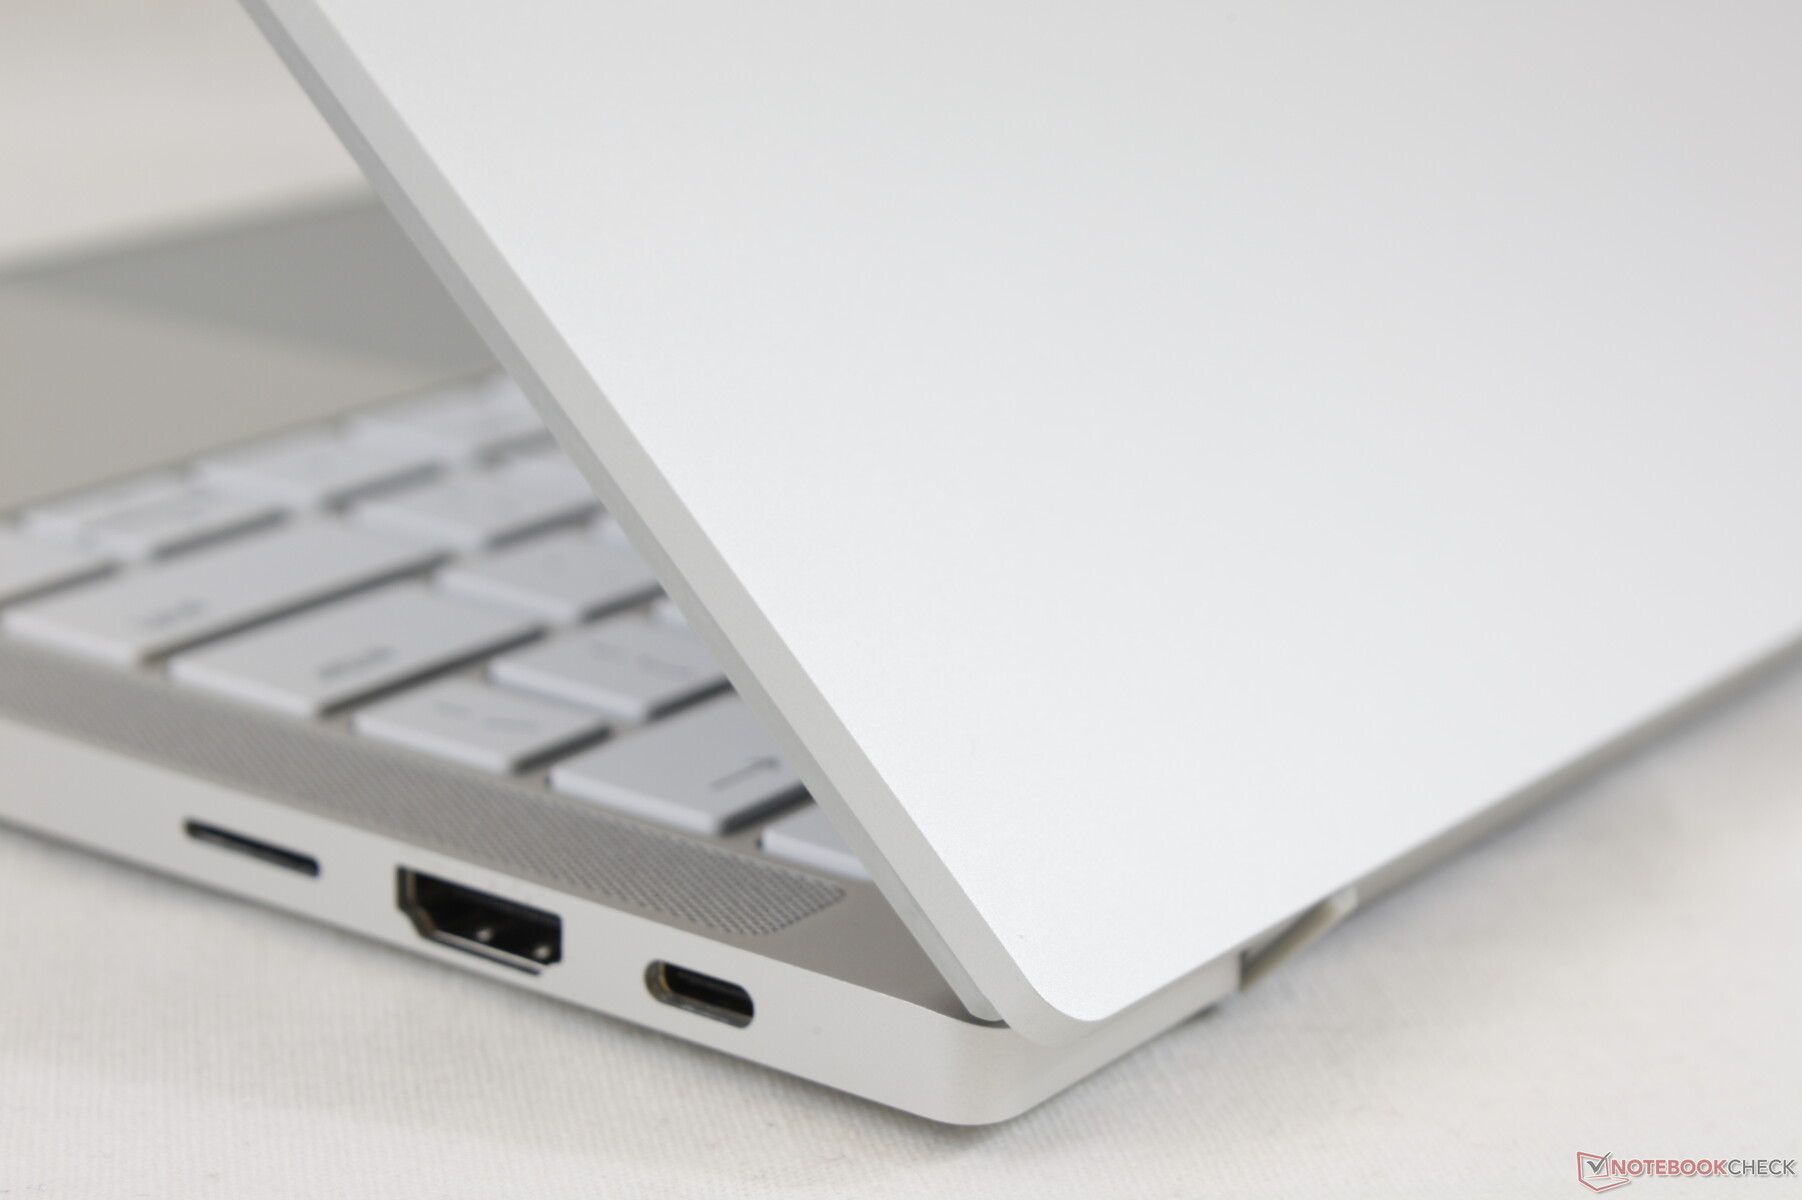
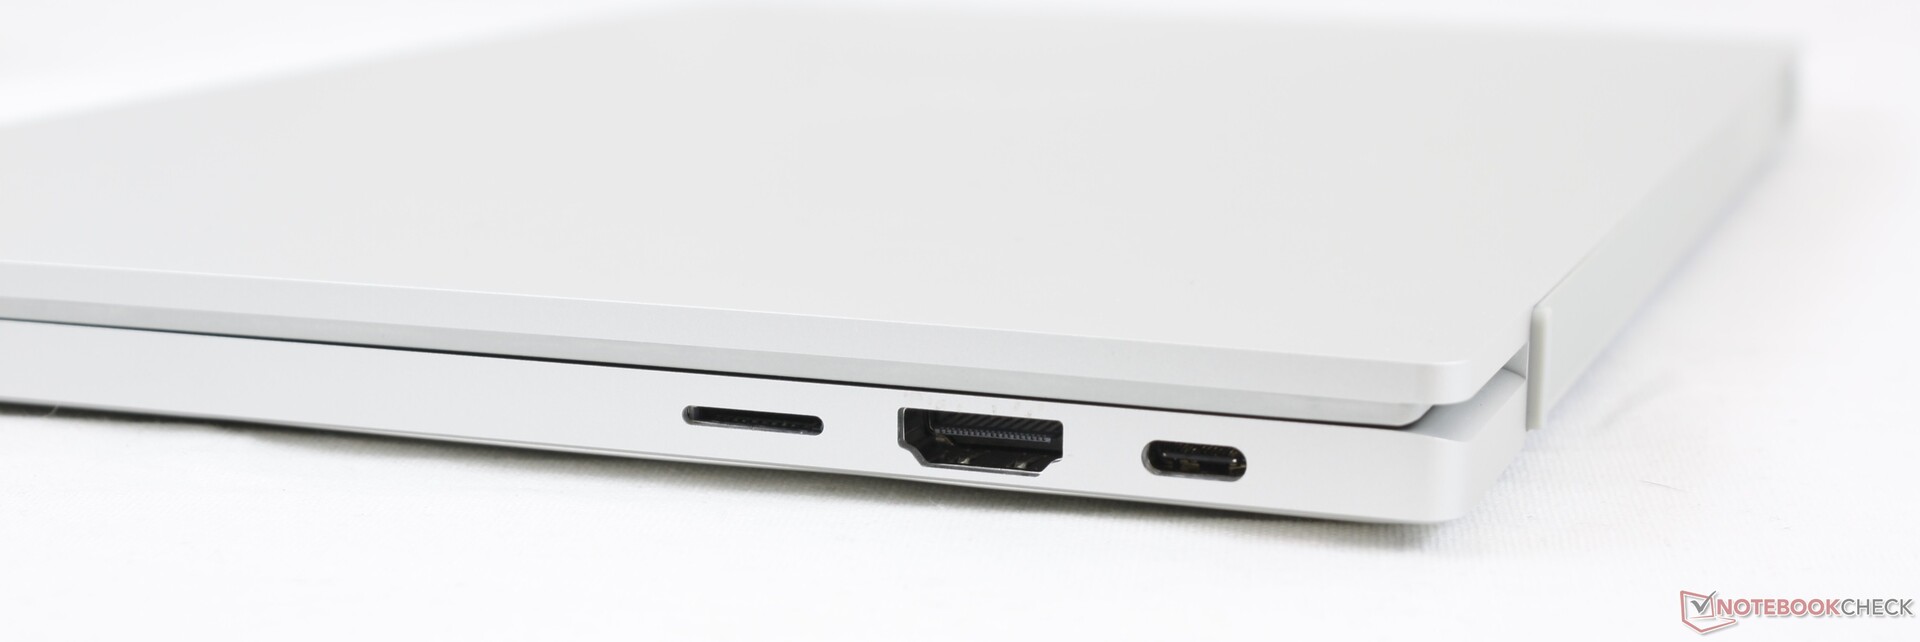
Bağlantı
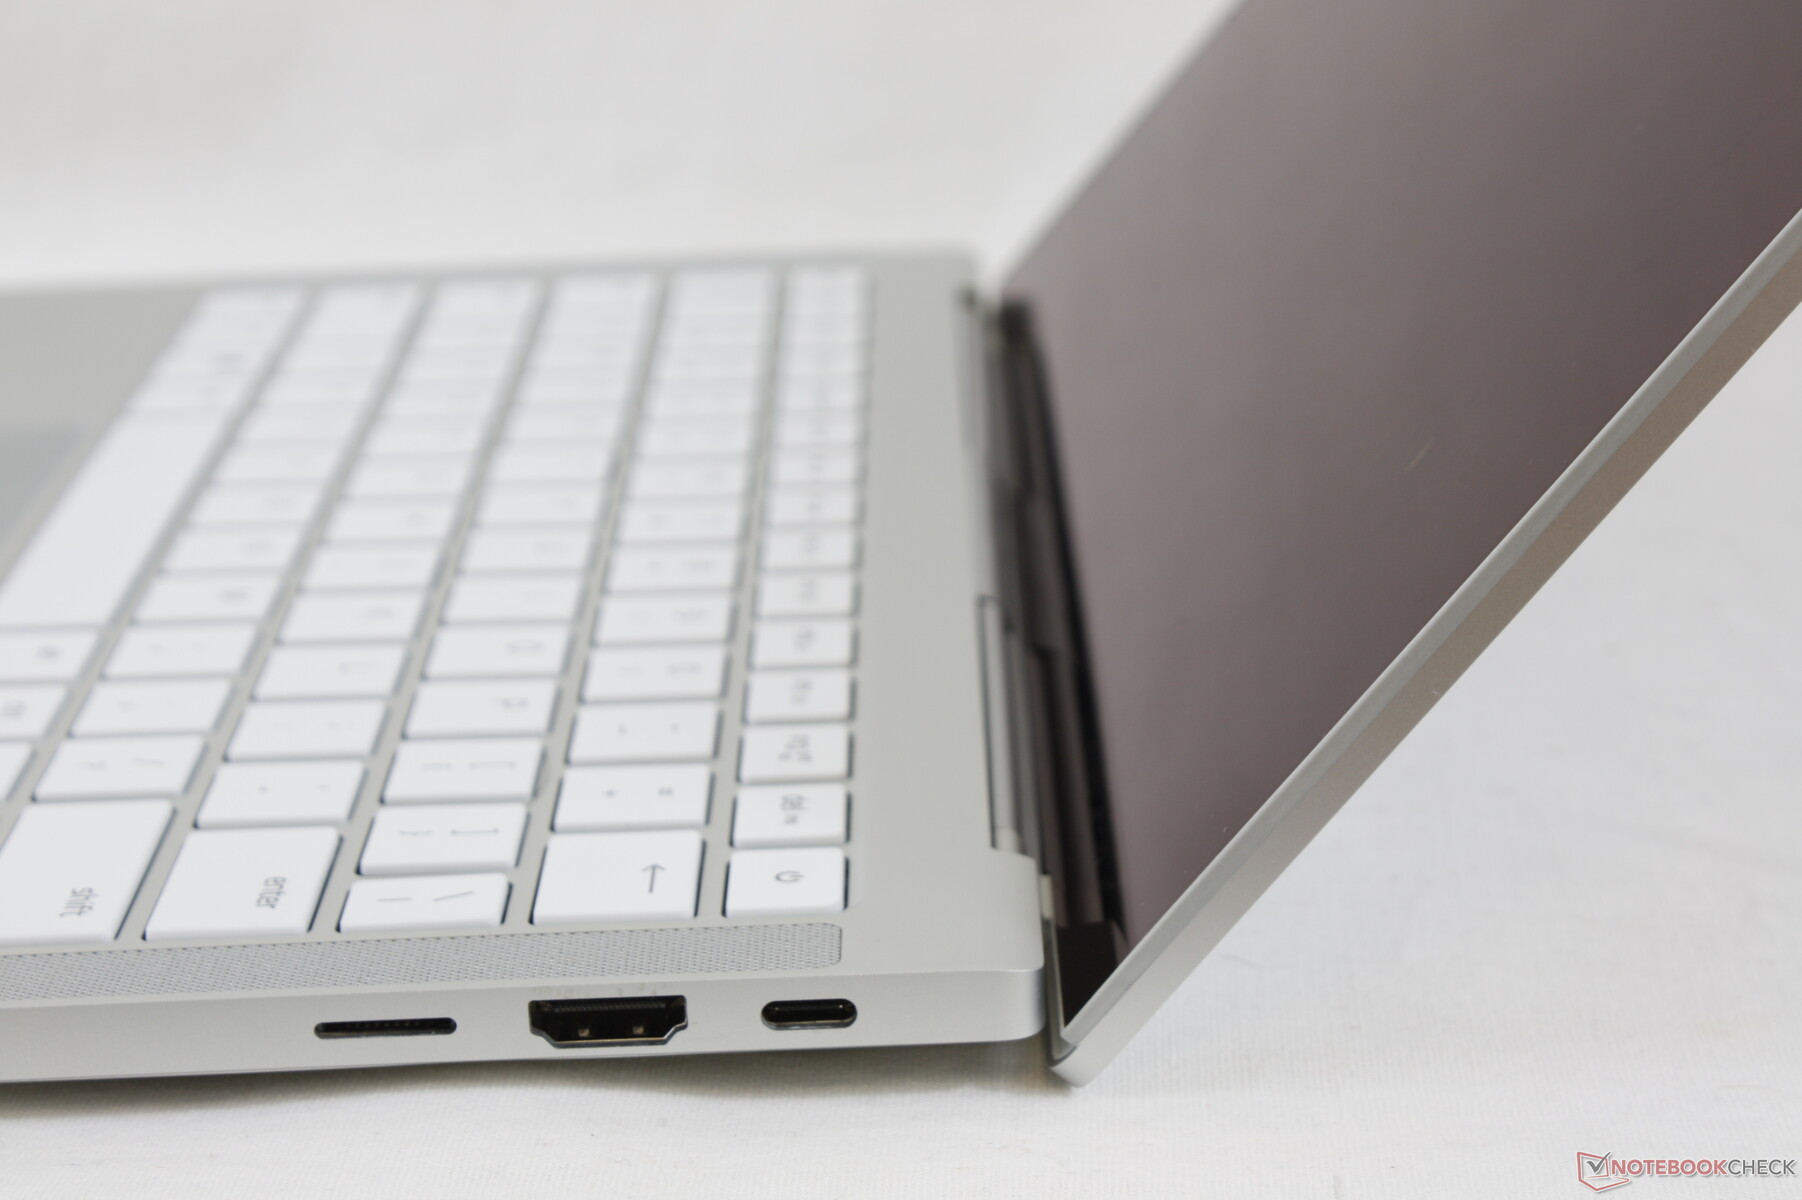
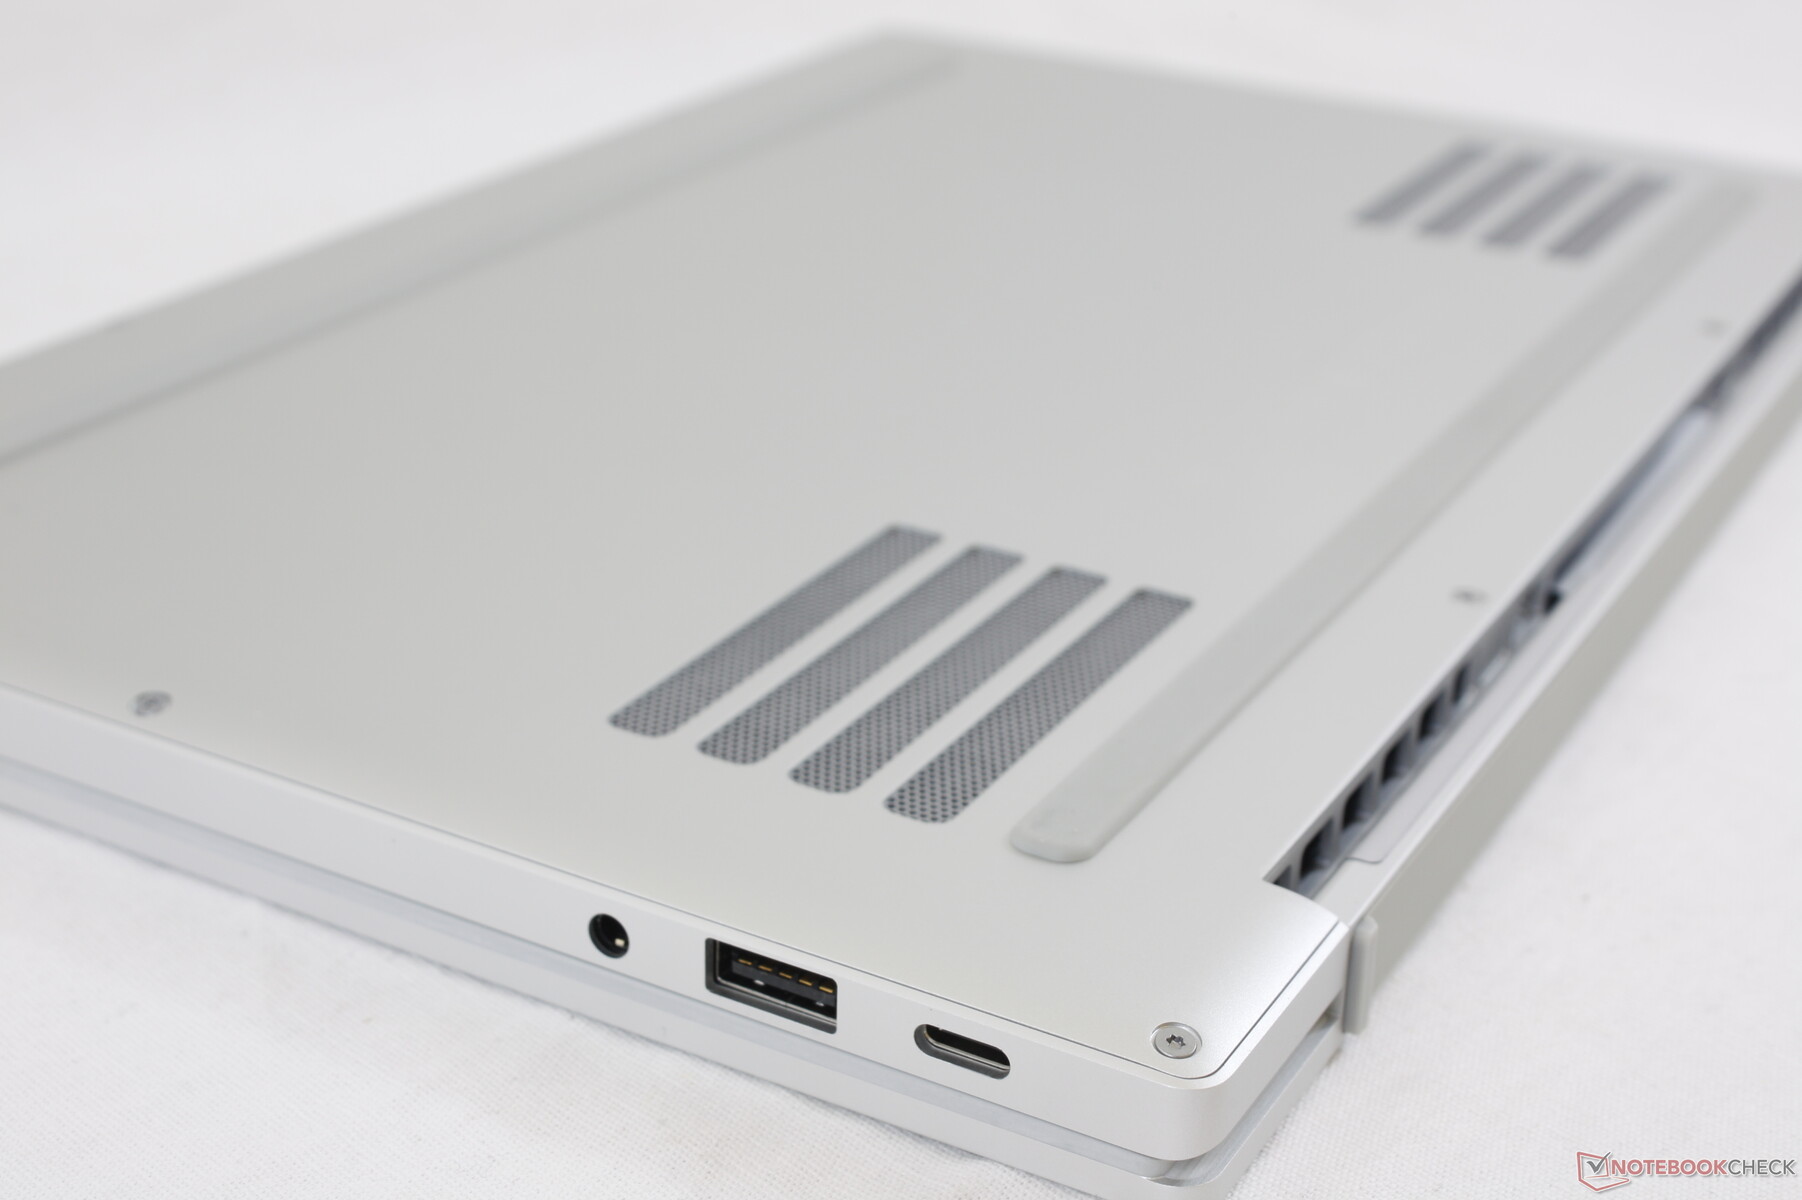
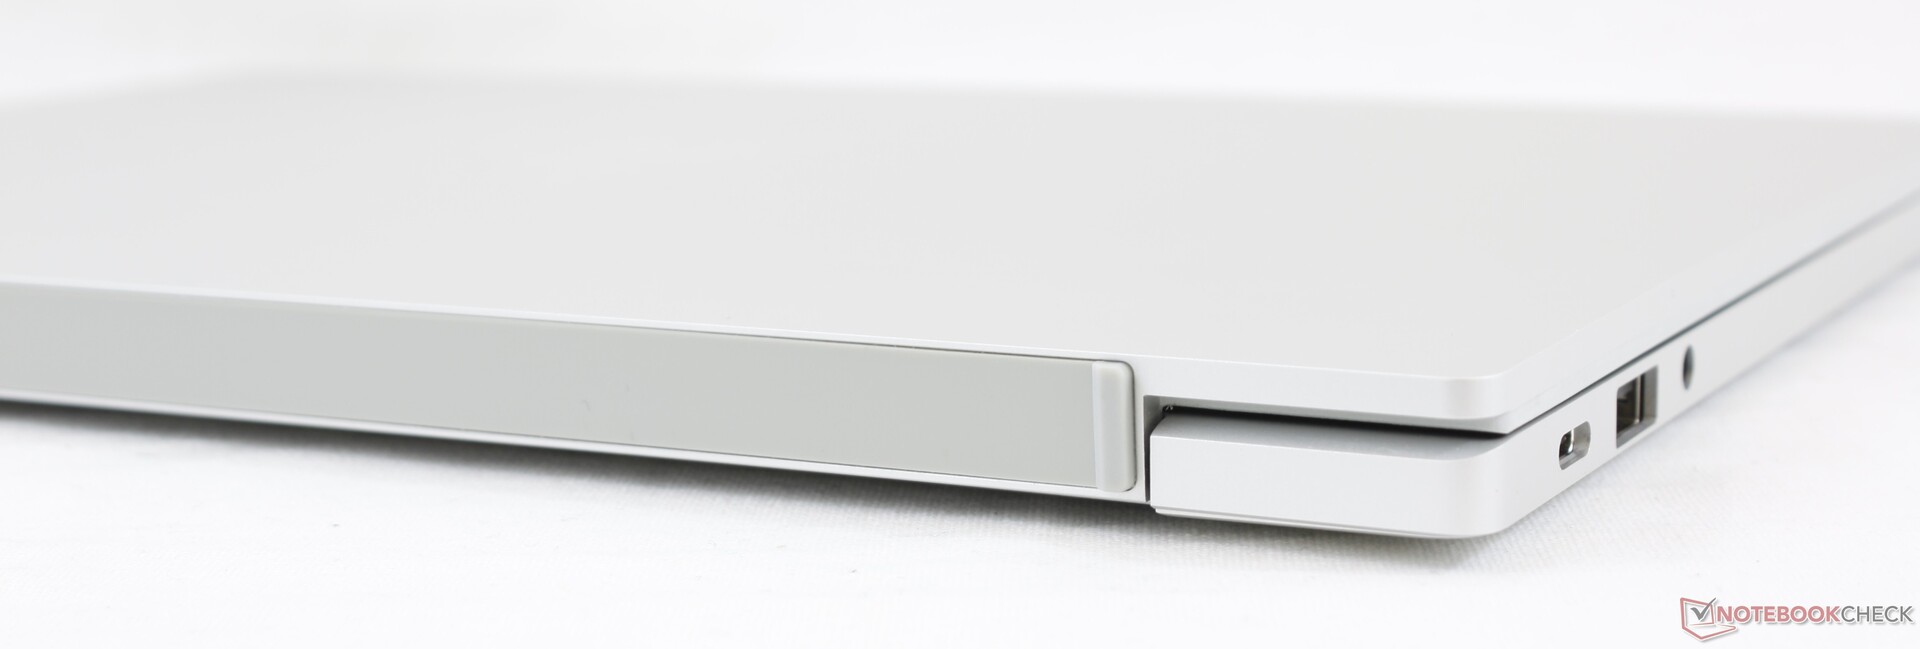
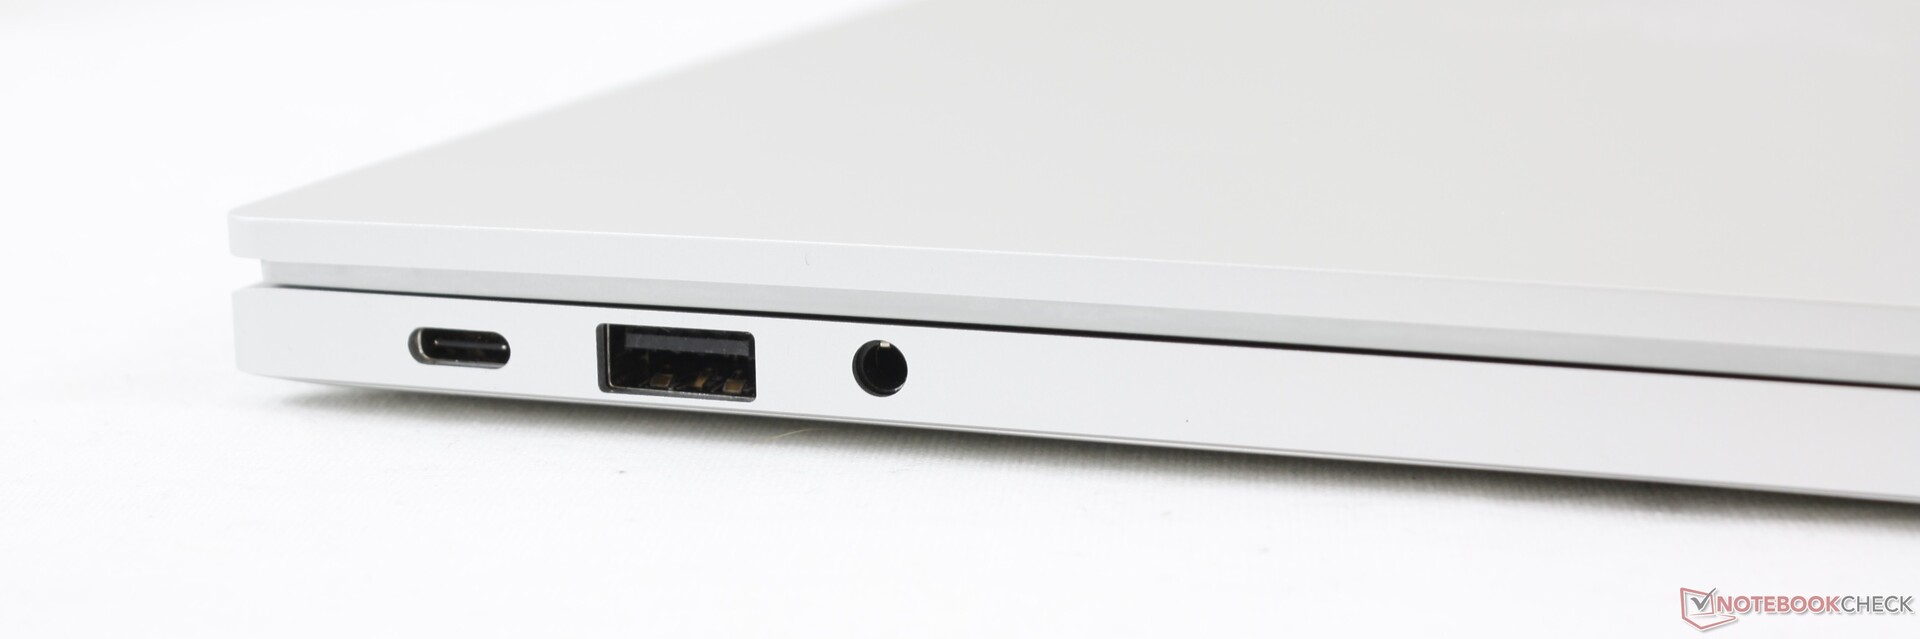
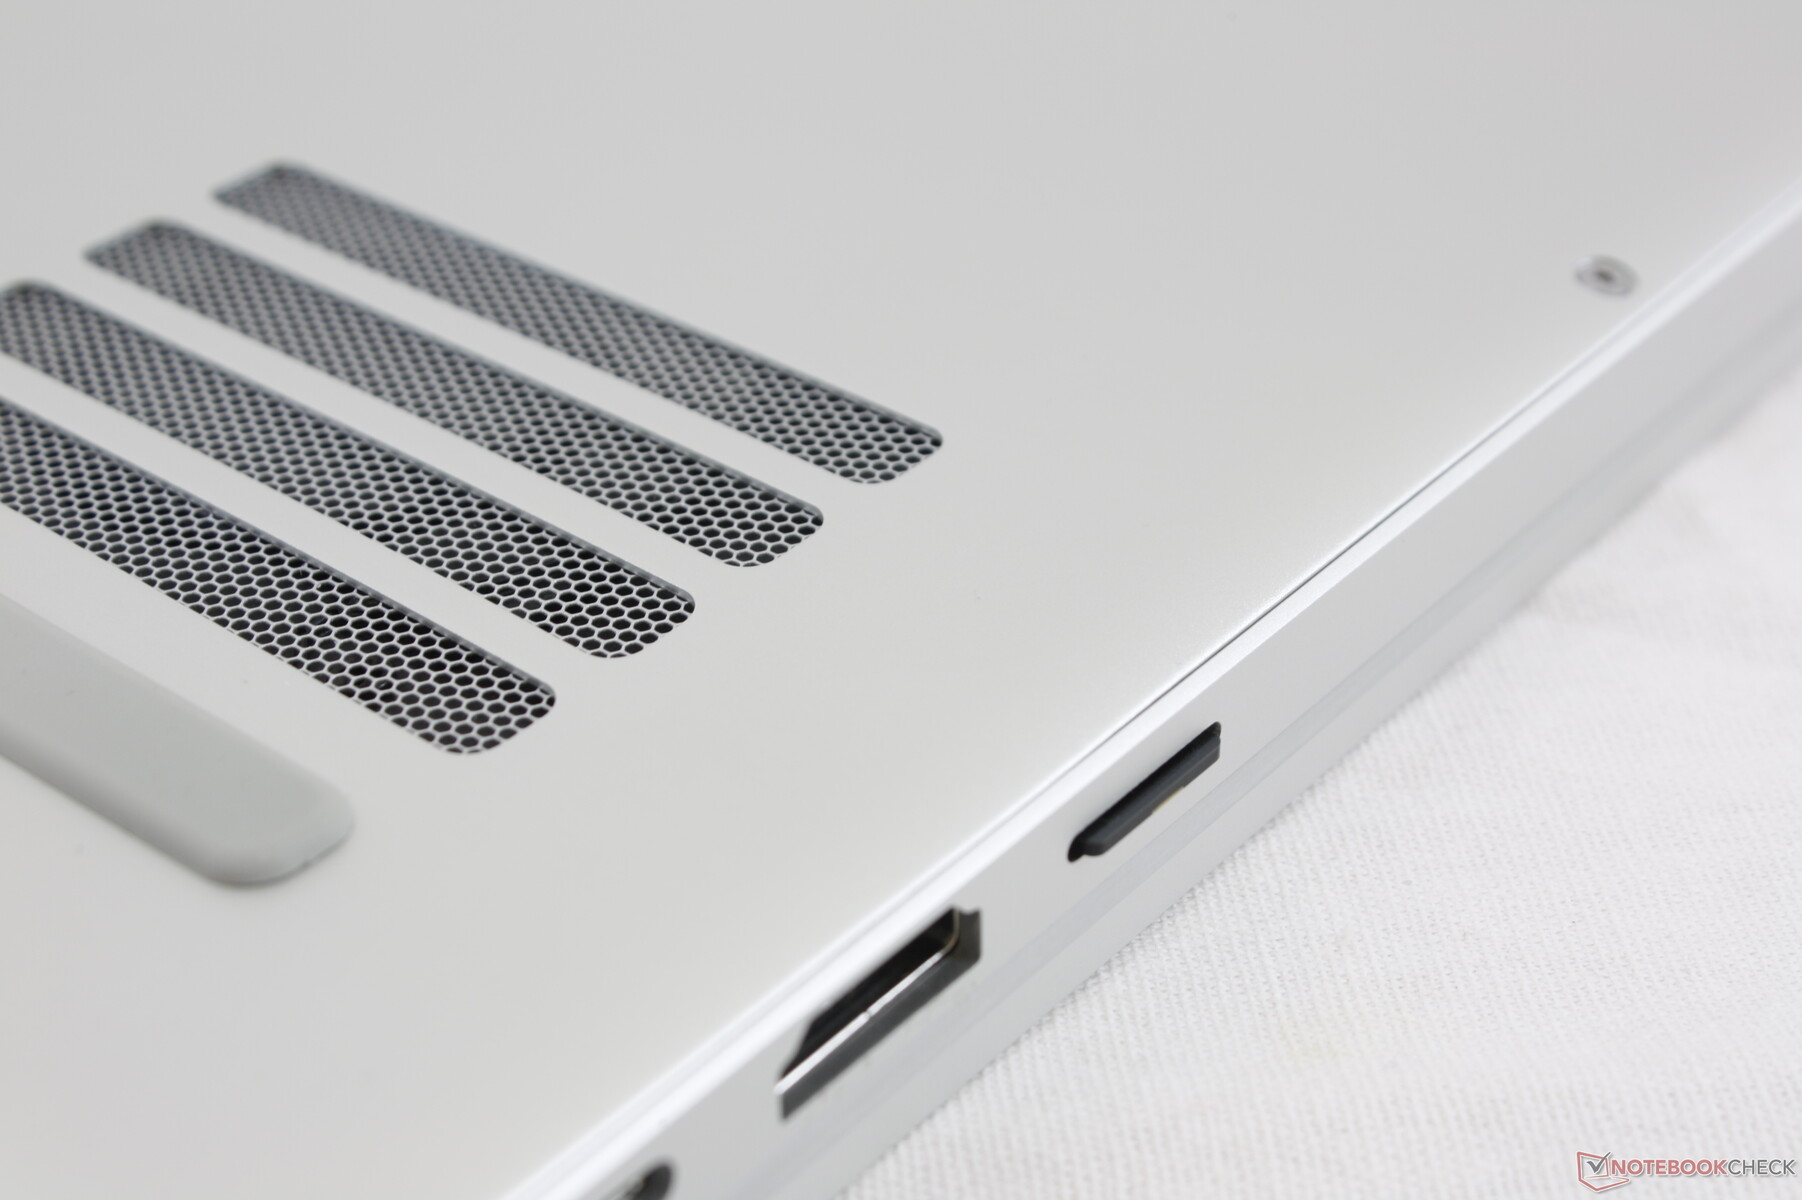
Kitap 13, USB-C, Thunderbolt, tam boyutlu HDMI, 3,5 mm ses, MicroSD okuyucu ve USB-A'yı hiçbir dizi takılı olmadan entegre ettiğinden, bağlantı noktası seçenekleri çoğu subnotebook'tan daha iyidir. Rakip subnotebook'ların çoğu, sahiplerini dongle veya adaptör kullanmaya zorlayacak bir veya daha fazla subnotebooktan yoksun. Blade Stealth bile HDMI veya MicroSD okuyucuya sahip değil, çünkü Razer, Kitap 13 sahiplerinin kameralardan fotoğraf ve video aktarma olasılığının daha yüksek olduğunu biliyor.
SD Kart Okuyucu
| SD Card Reader | |
| average JPG Copy Test (av. of 3 runs) | |
| Dell XPS 13 9310 Core i7 FHD (Toshiba Exceria Pro M501 64 GB UHS-II) | |
| Razer Book 13 FHD (Toshiba Exceria Pro M501 32 GB UHS-II) | |
| Asus Zenbook S UX393JA (Toshiba Exceria Pro M501 64 GB UHS-II) | |
| maximum AS SSD Seq Read Test (1GB) | |
| Dell XPS 13 9310 Core i7 FHD (Toshiba Exceria Pro M501 64 GB UHS-II) | |
| Razer Book 13 FHD (Toshiba Exceria Pro M501 32 GB UHS-II) | |
| Asus Zenbook S UX393JA (Toshiba Exceria Pro M501 64 GB UHS-II) | |
İletişim
Intel AX201, Intel Evo dizüstü bilgisayar olmanın gerekliliklerinden biri olan Wi-Fi 6 için standart olarak gelir. Netgear RAX200 test yönlendiricimizle eşleştirildiğinde hiçbir bağlantı sorunu yaşamadık.
| Networking | |
| iperf3 transmit AX12 | |
| Huawei MateBook X Pro 2020 i7 | |
| Razer Book 13 FHD | |
| Razer Blade Stealth i7-1165G7 GTX 1650 Ti Max-Q | |
| Dell XPS 13 9310 Core i7 FHD | |
| Asus Zenbook S UX393JA | |
| Lenovo Yoga C930-13IKB | |
| iperf3 receive AX12 | |
| Razer Book 13 FHD | |
| Asus Zenbook S UX393JA | |
| Dell XPS 13 9310 Core i7 FHD | |
| Razer Blade Stealth i7-1165G7 GTX 1650 Ti Max-Q | |
| Huawei MateBook X Pro 2020 i7 | |
| Lenovo Yoga C930-13IKB | |
Web kamerası


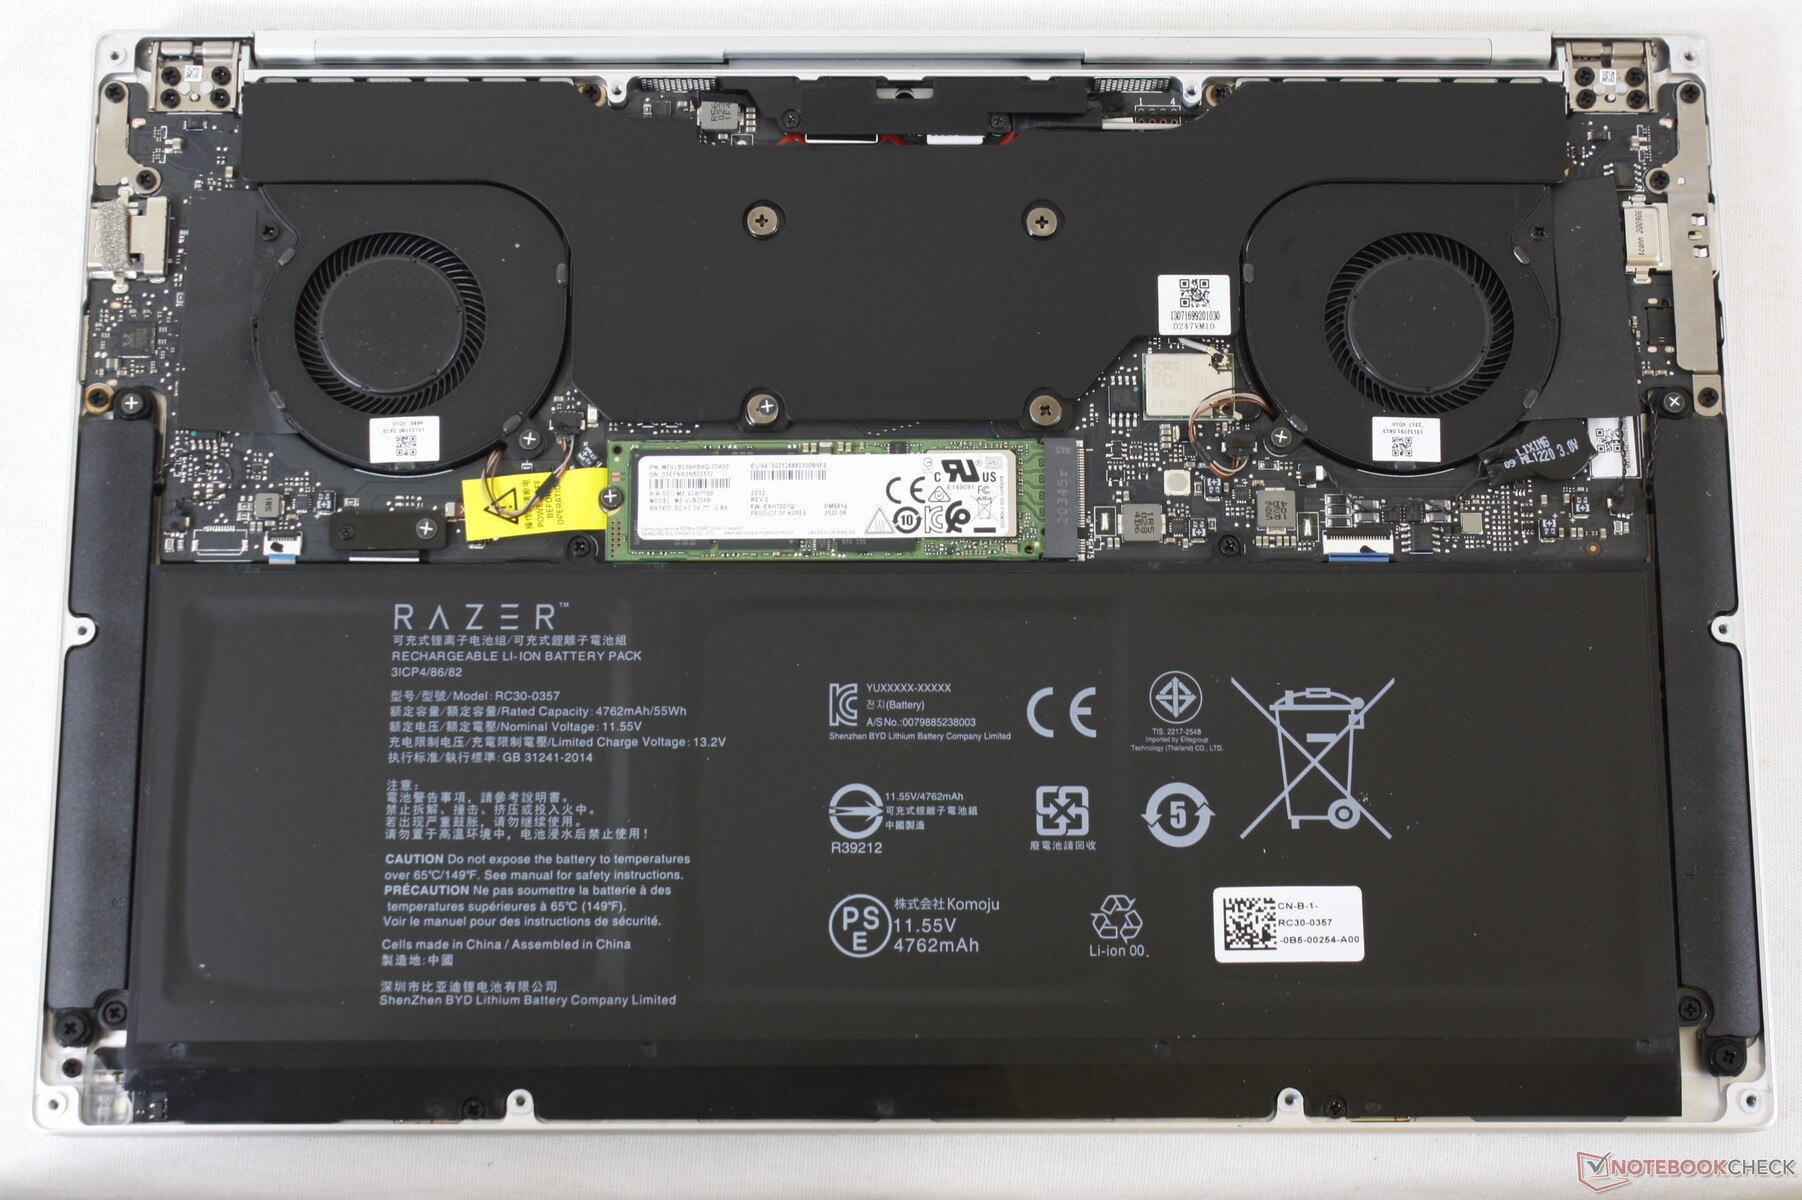
Bakım
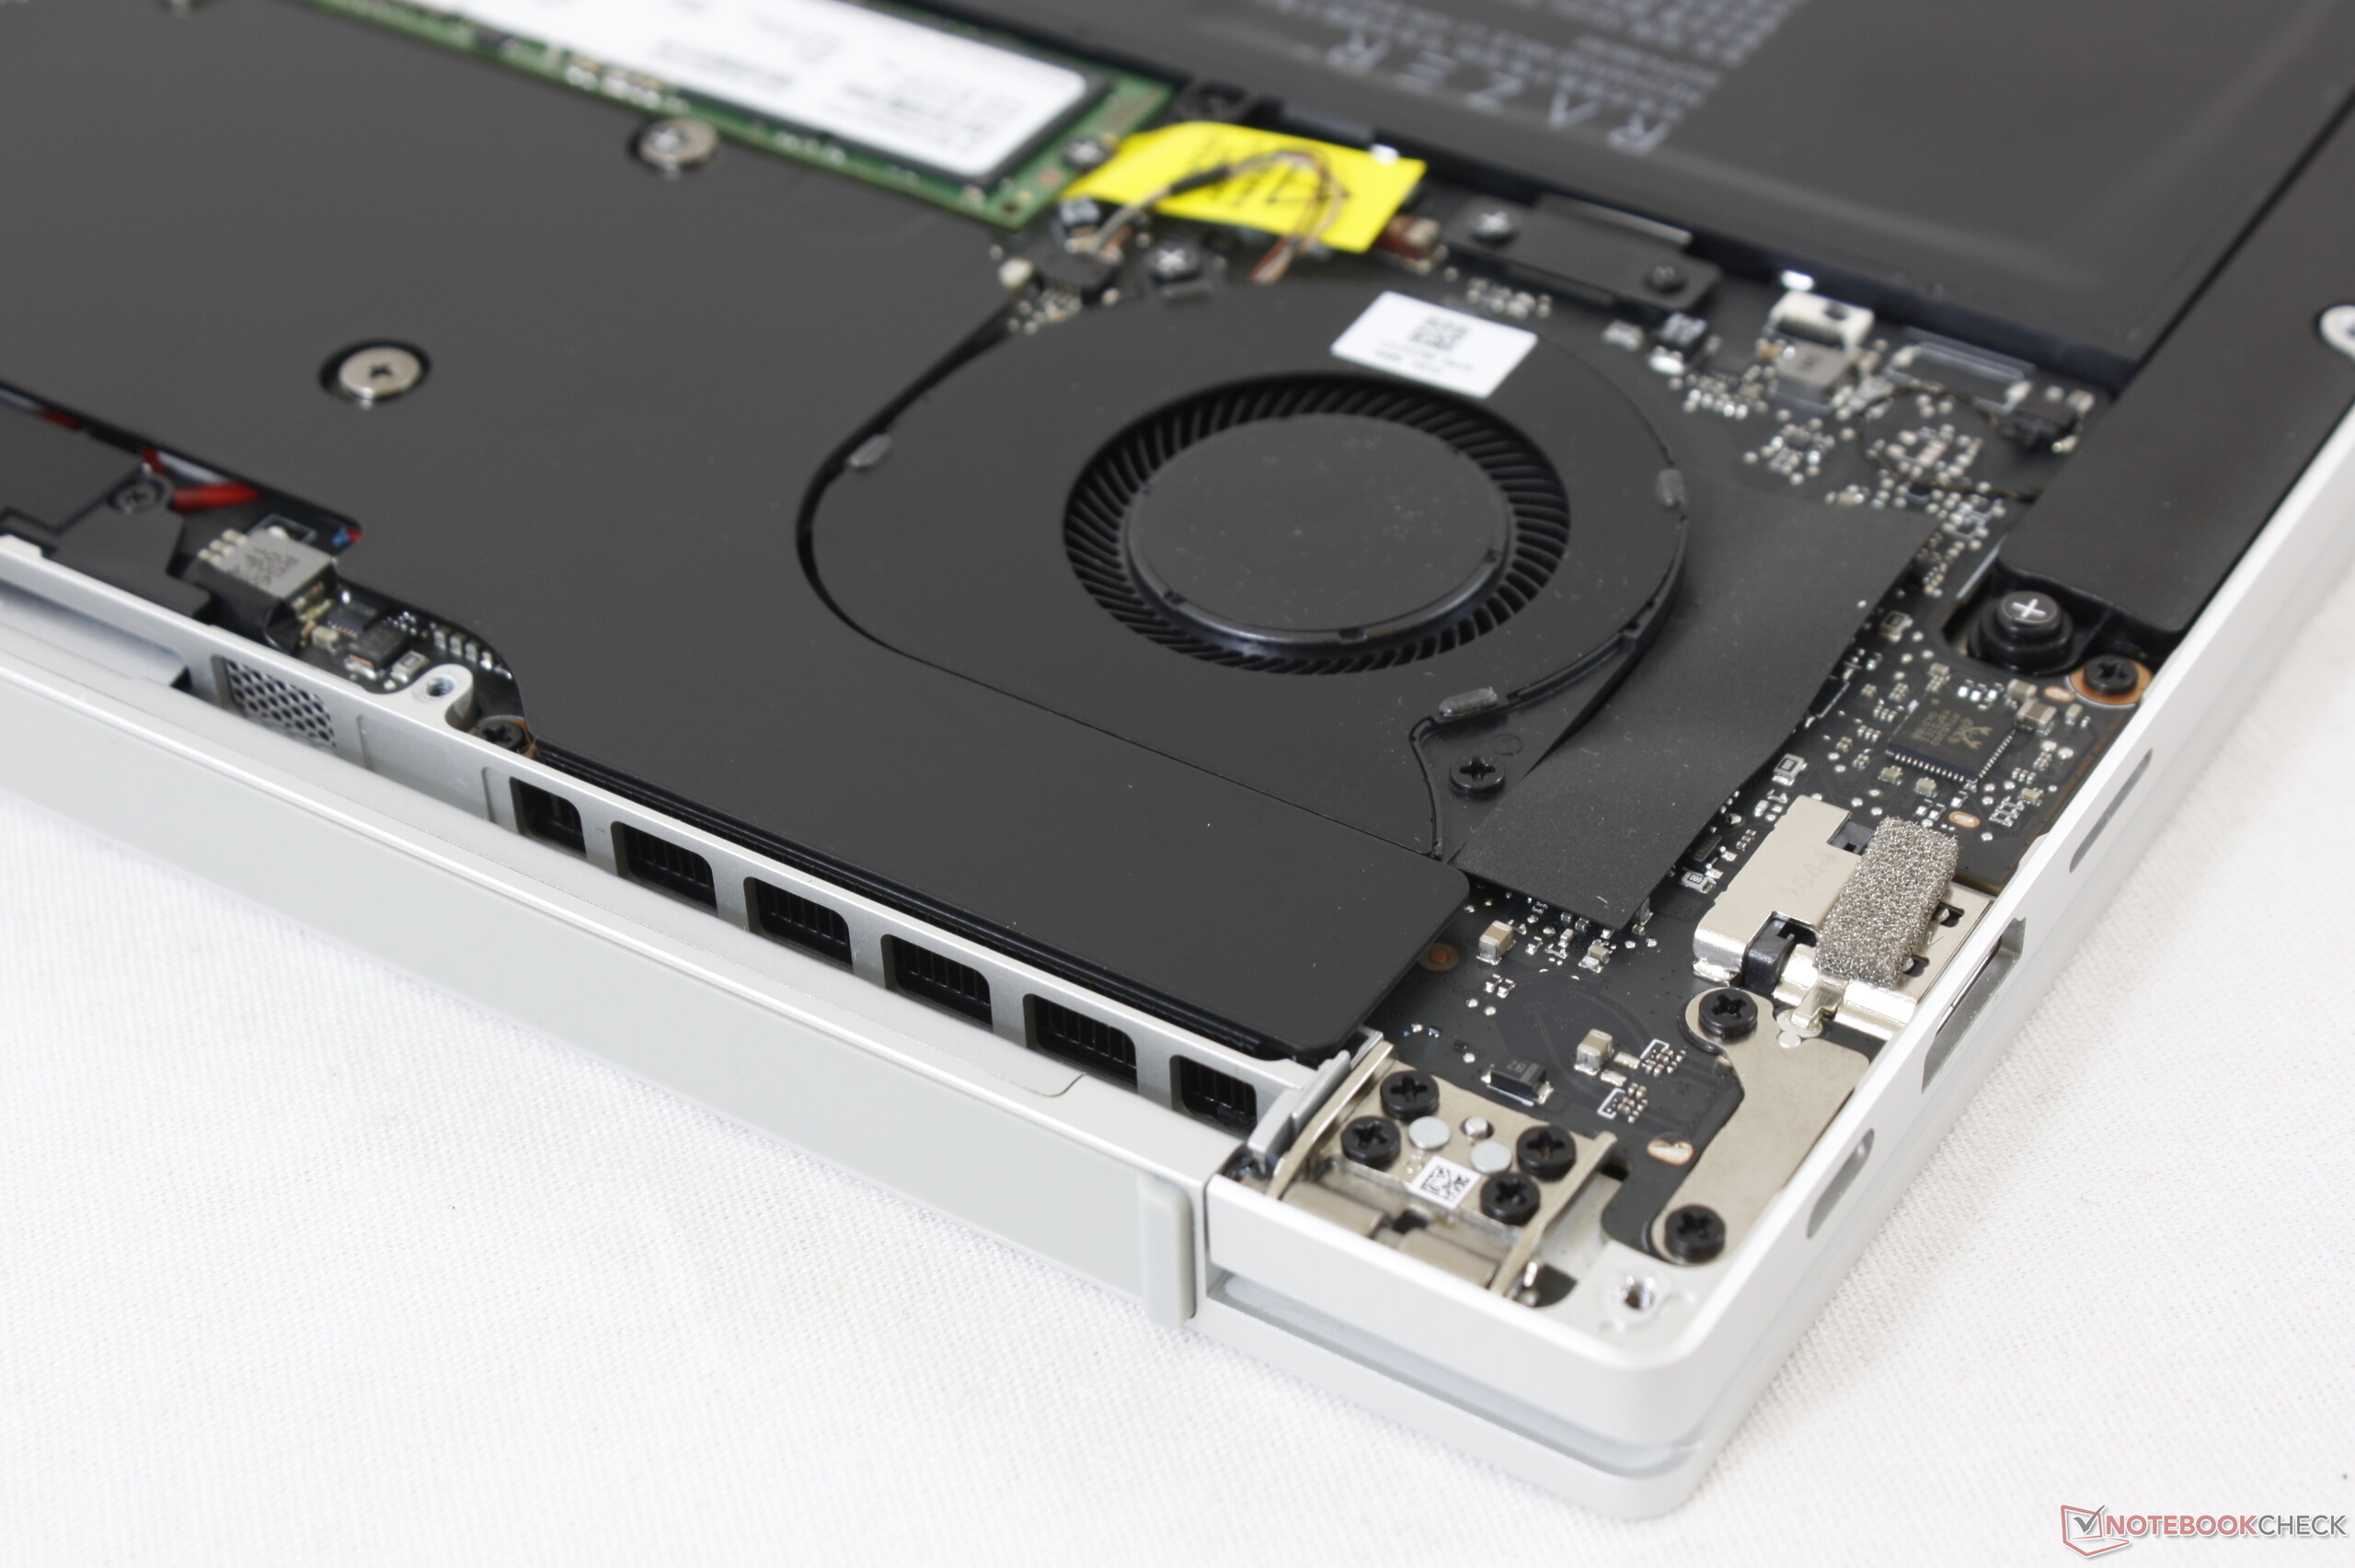
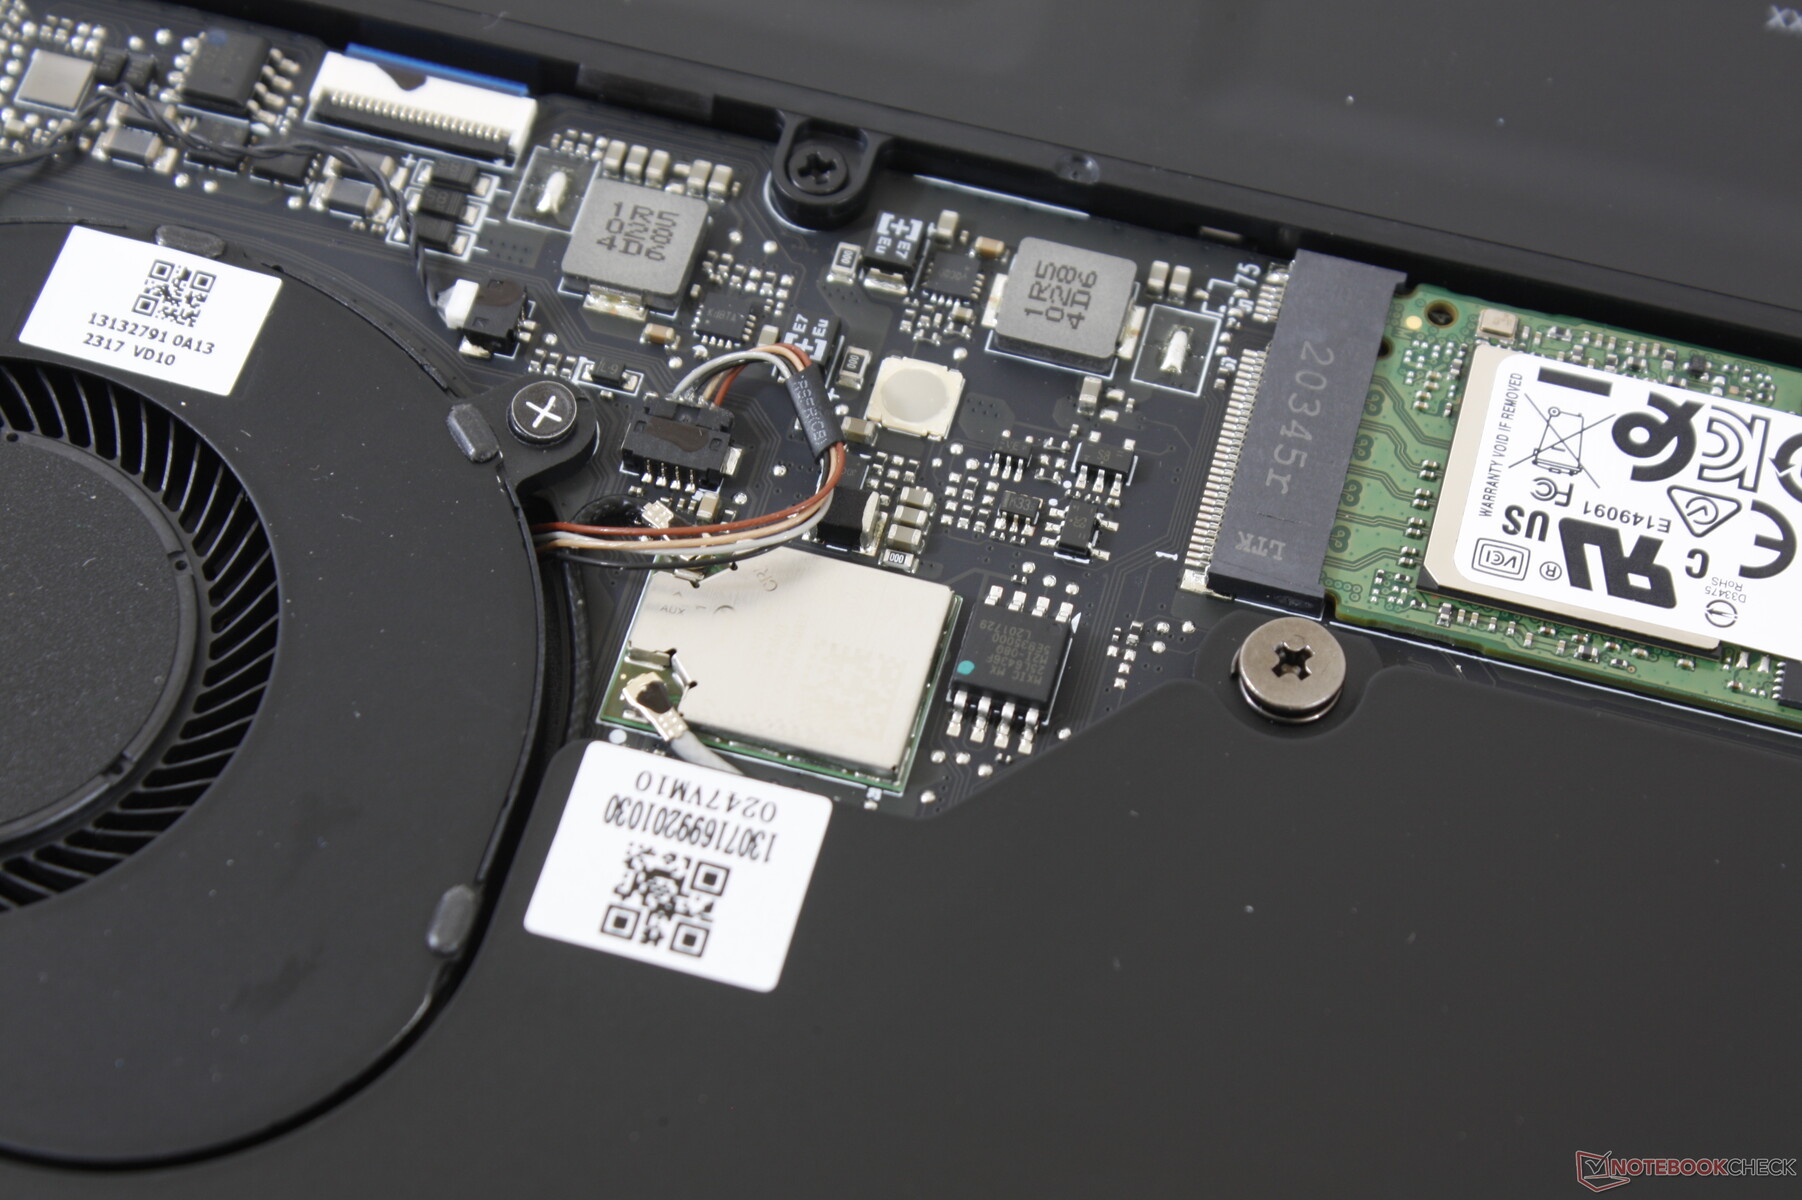
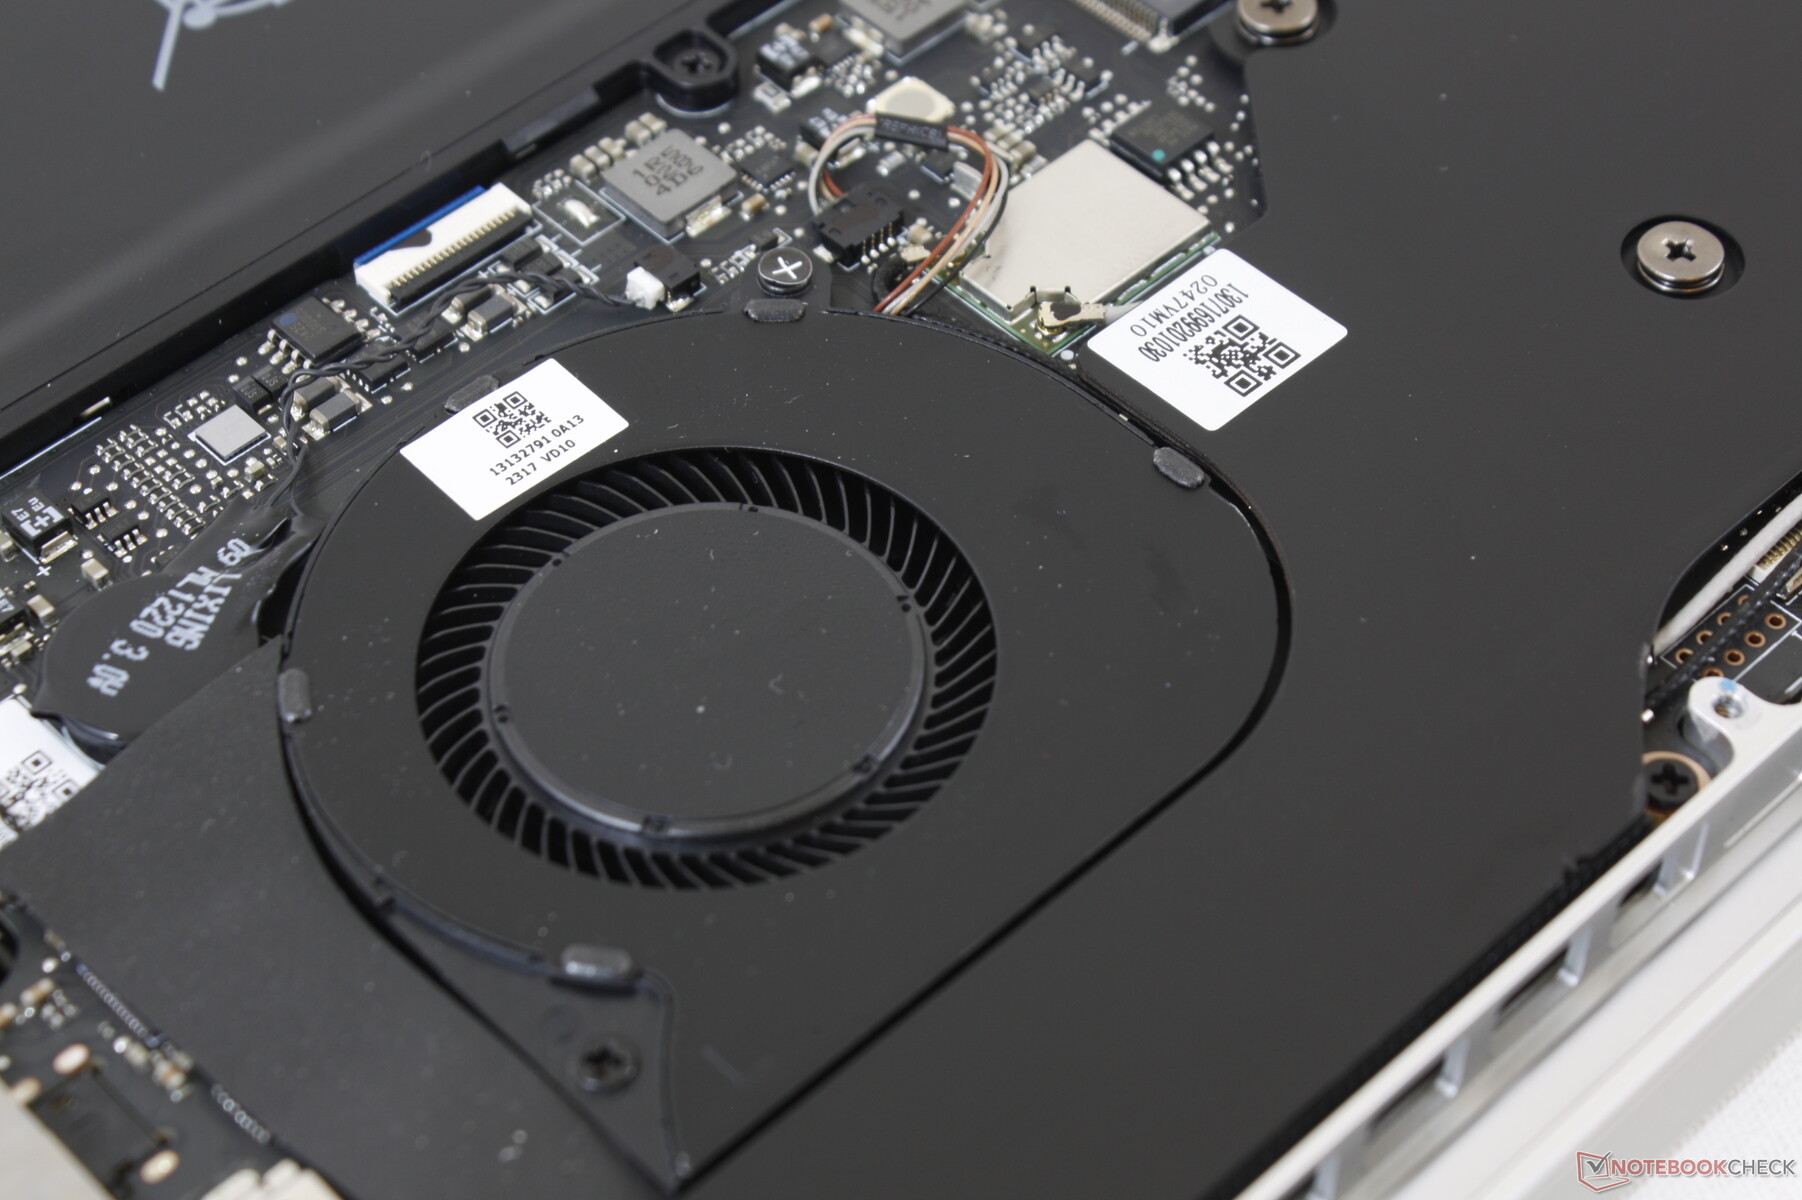
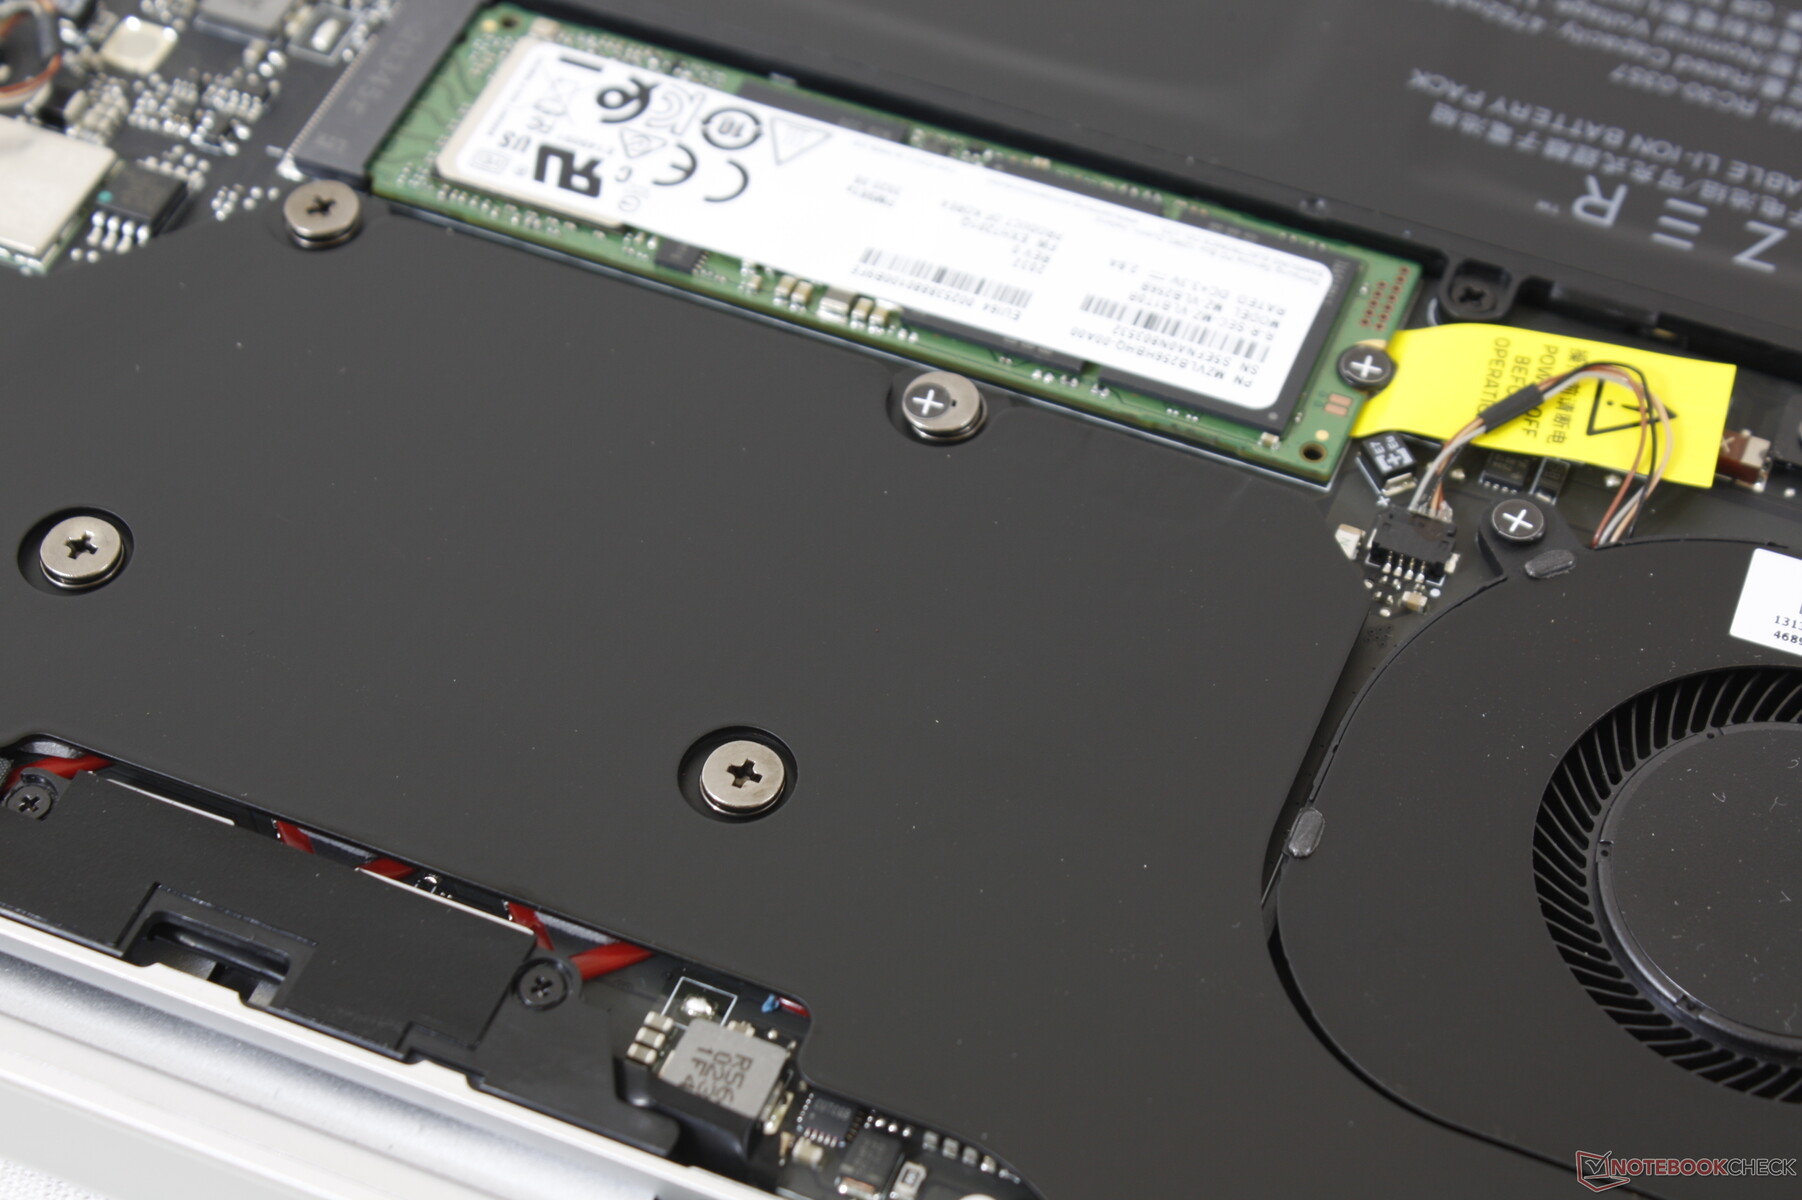
Alt panelin çıkarılması için bir T5 Torx anahtarı gerekir. Ancak, pil ve M.2 SSD dışında yükseltilecek veya servis edilecek çok şey yoktur.
Aksesuarlar ve Garanti
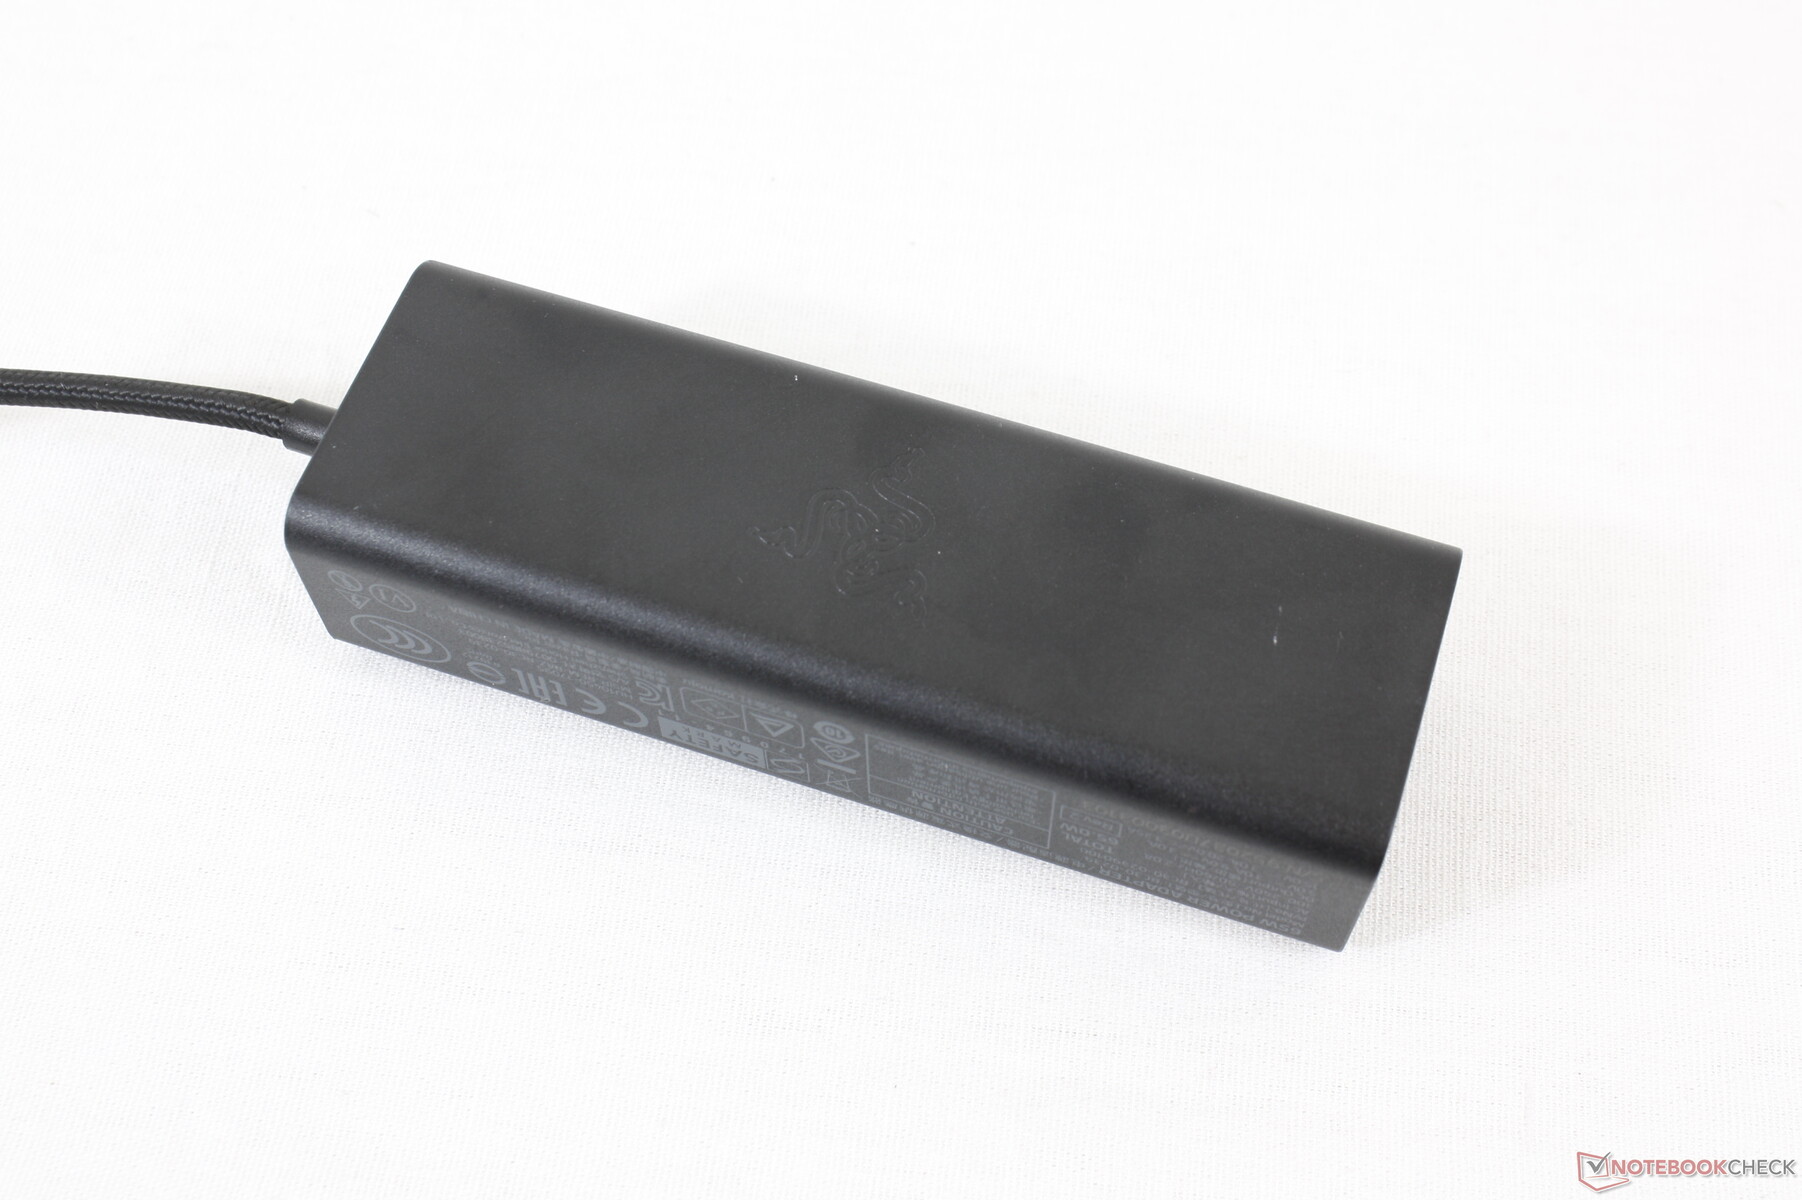
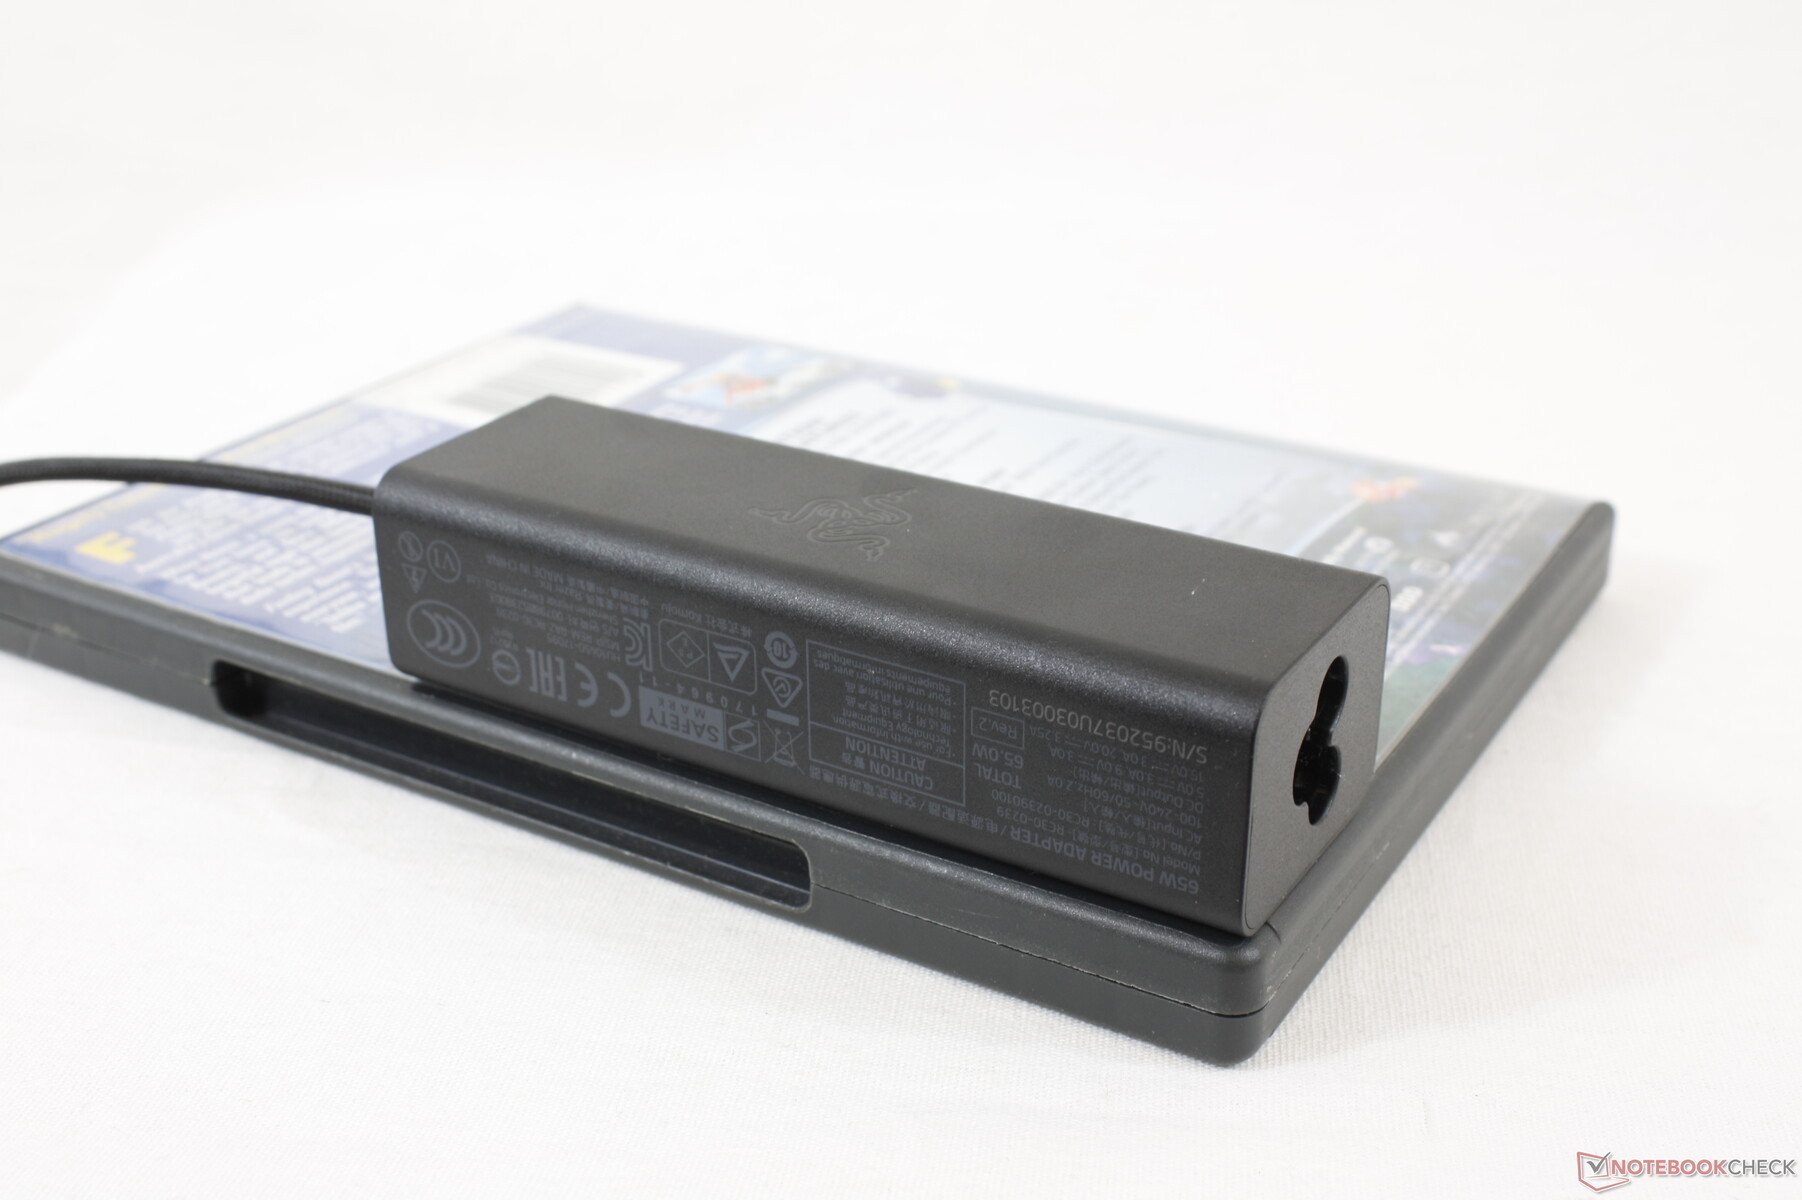
Perakende kutusu, normal AC adaptörü ve evrak işlerine ek olarak küçük bir kadife mendil ve bir Razer logo çıkartması içerir. Üretici, Razer Core eGPU yerleştirme istasyonuyla da tam uyumluluk vaat ediyor. Bir yıllık garanti, daha geleneksel iş dizüstü bilgisayarlarında üç yıla kıyasla standart olarak geliyor.
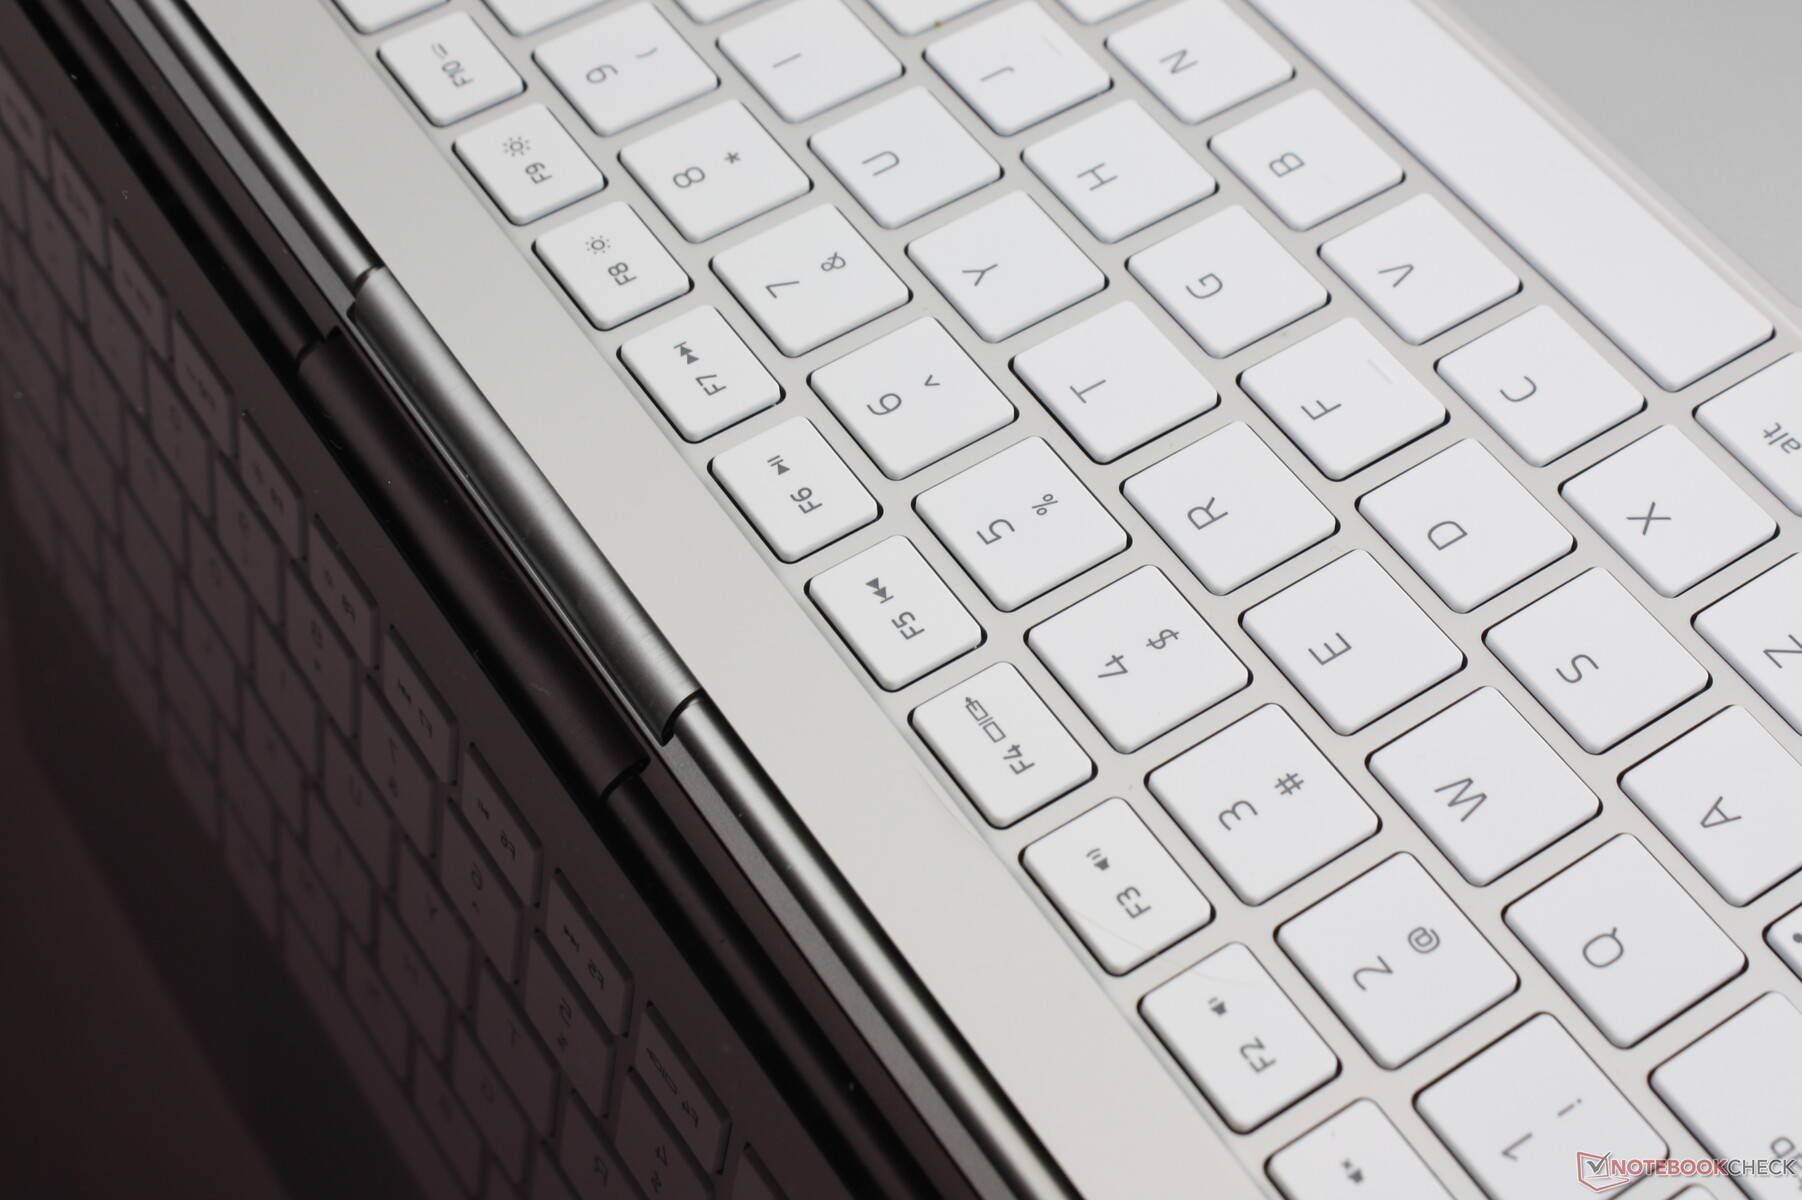
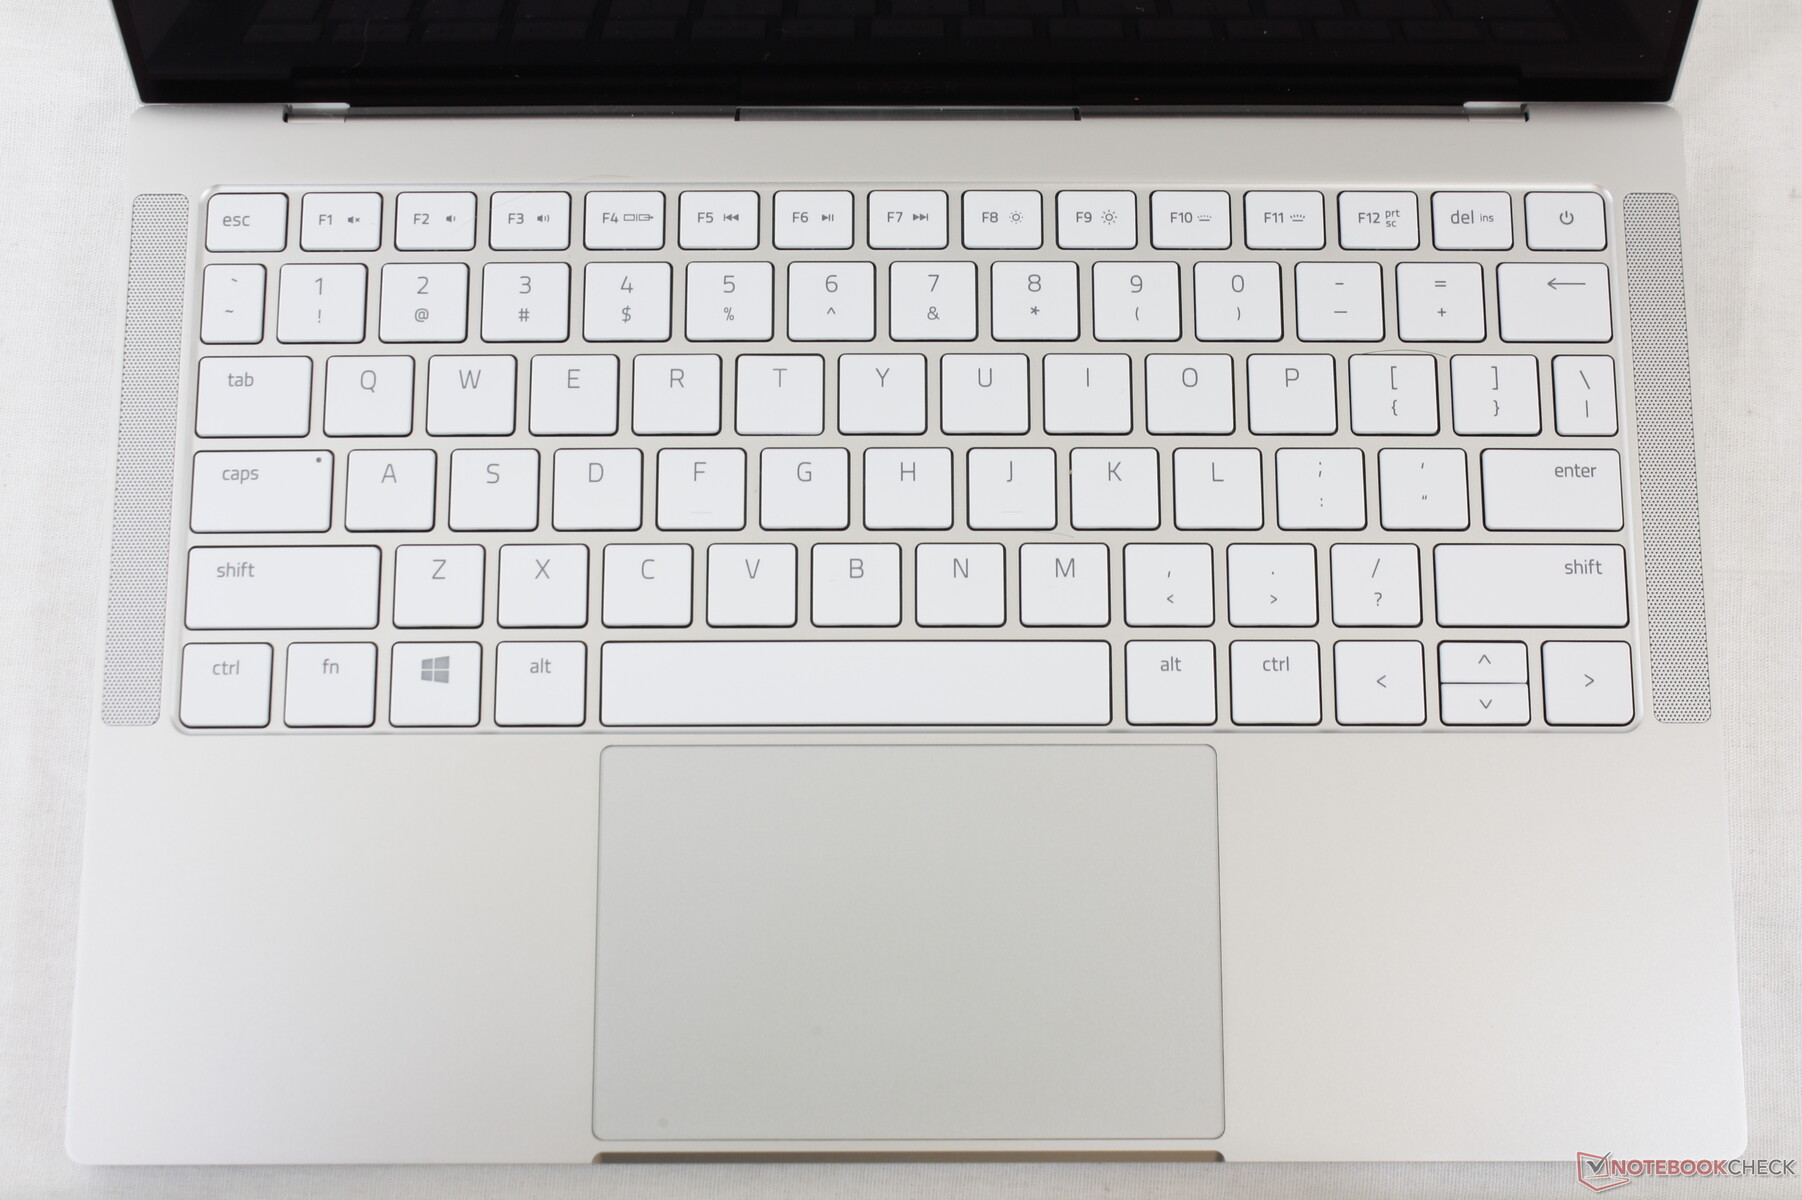
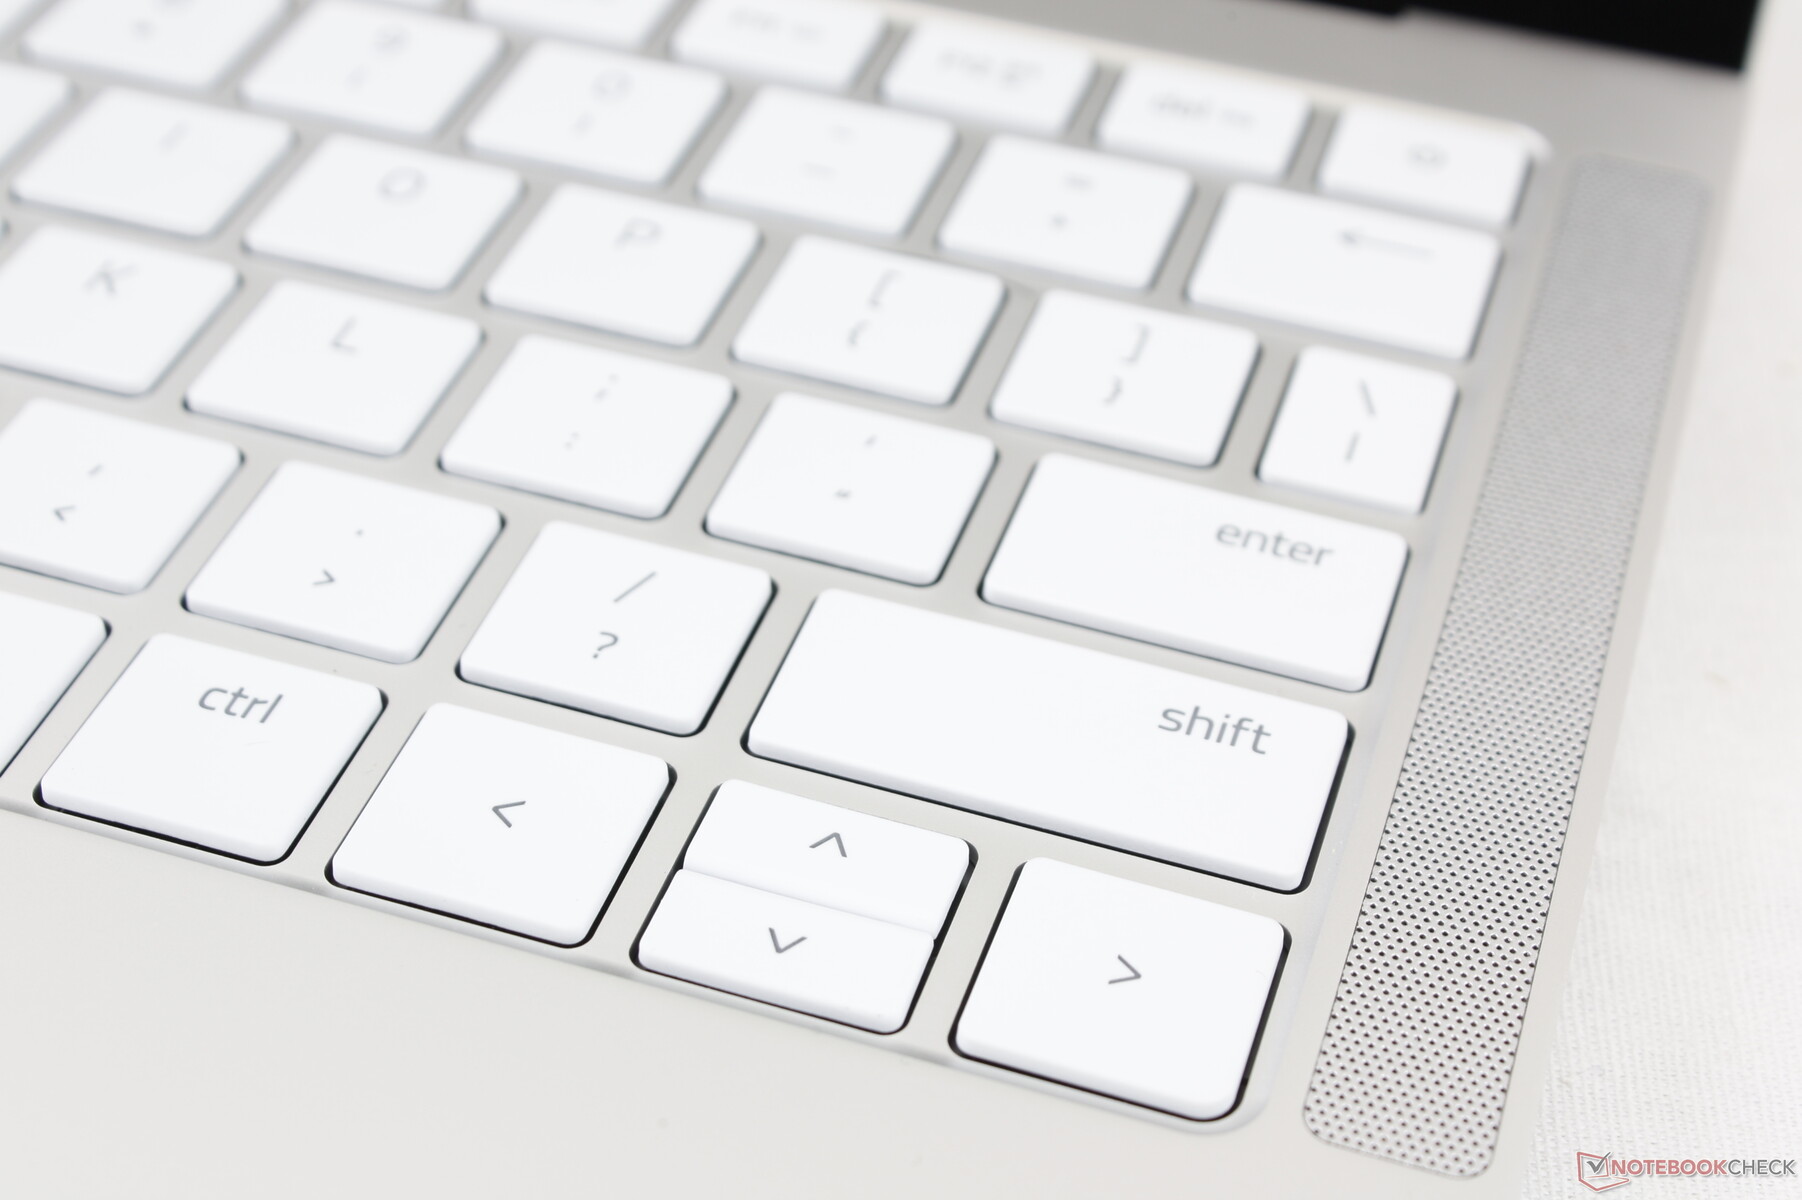
Giriş cihazları
Klavye: Book 13 klavyesi, genel boyut ve anahtar geribildirimi açısından Blade Stealth ile aynıdır. Anahtar başına RGB Chroma arka ışığı bile, bunu böyle bir özelliğe sahip bildiğimiz tek üretkenlik alt not defteri yapmak için mevcut. Bir yandan, Kitap 13'e yazmak doğal ve tanıdık geleceği için mevcut Blade Stealth sahipleri için mükemmeldir. Öte yandan, sığ seyahat ve zayıf anahtar geri bildirimlerinin hayranları değiliz. HP Spectre, EliteBook, ThinkPad ve MateBook X Pro'nun tümü, uzun yazma oturumları için tercih ettiğimiz daha sağlam tuşlara sahiptir.
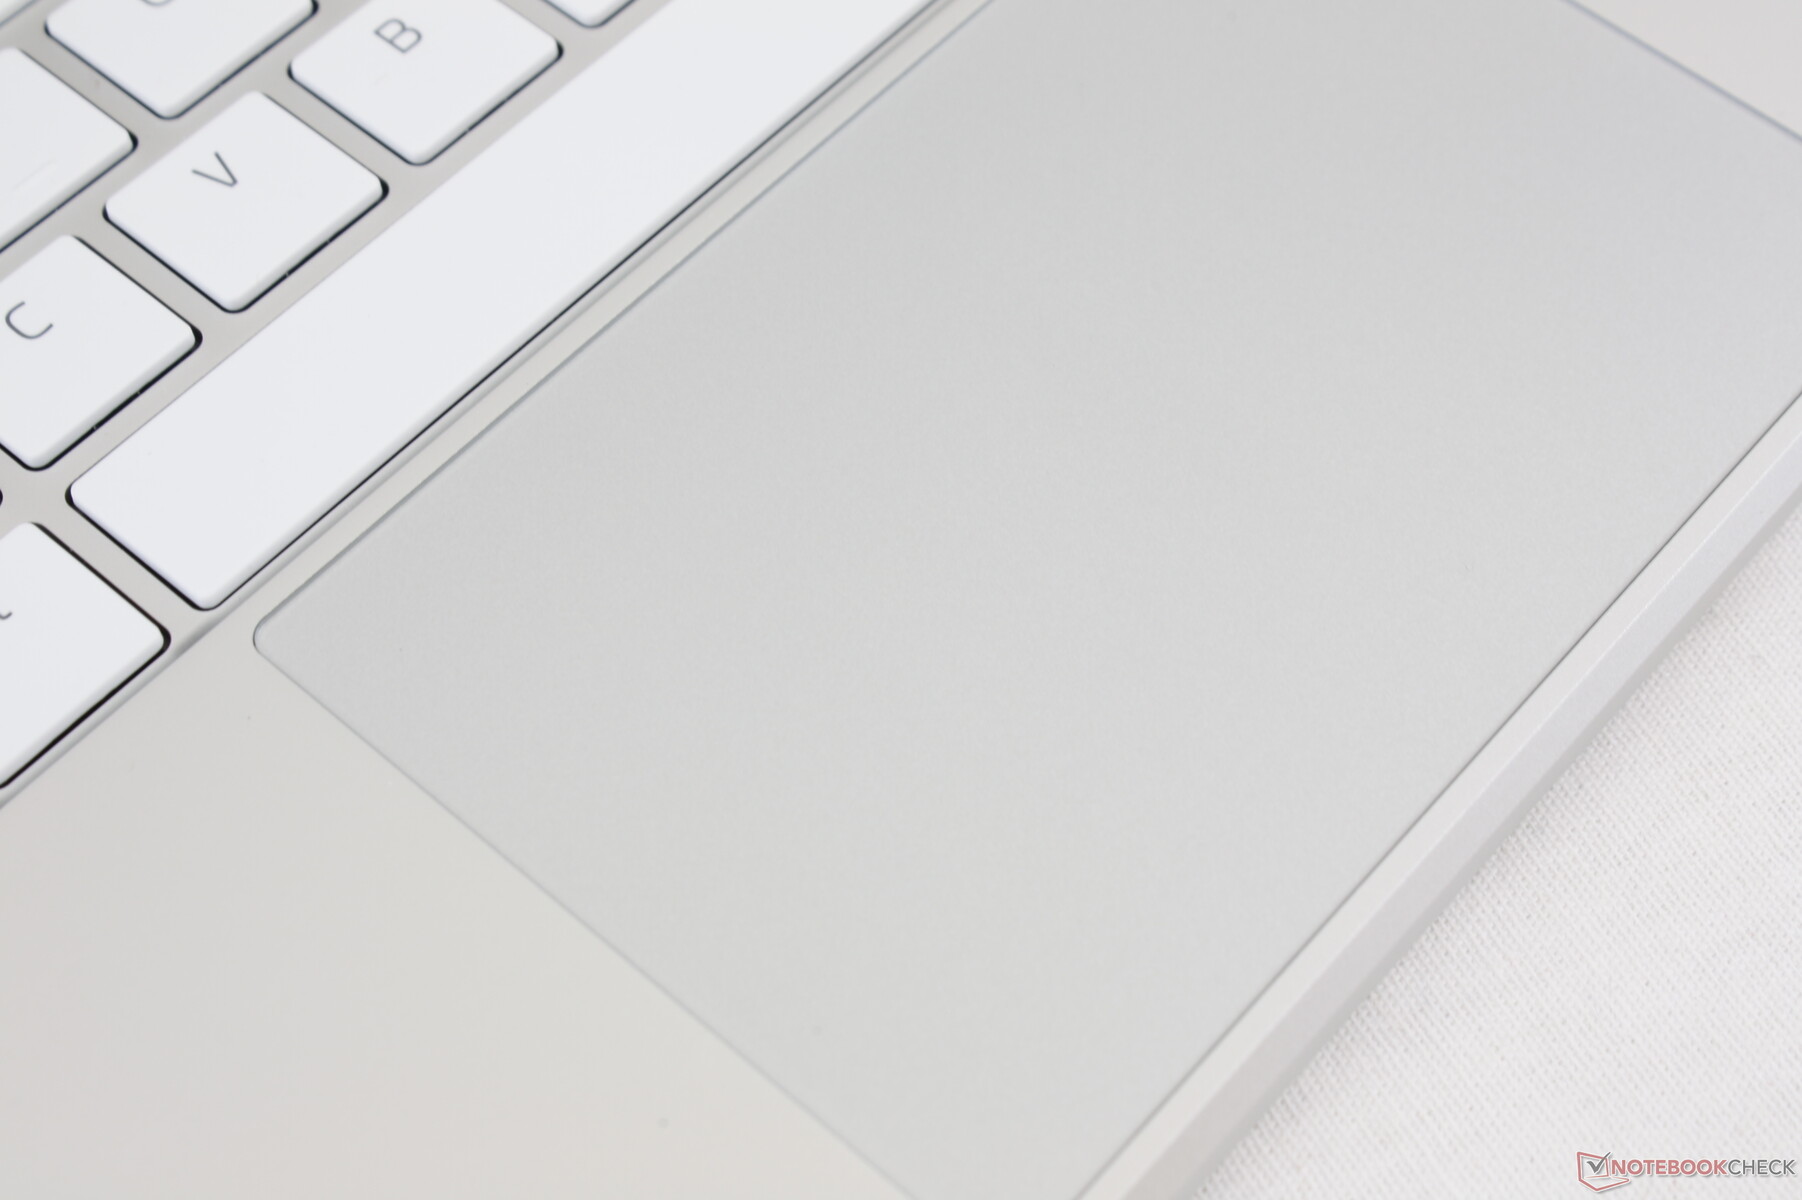
Dokunmatik yüzey
Clickpad, Blade Stealth ile aynıdır, yani aynı artıları ve eksileri miras alır. Kısacası, bu kadar küçük bir form faktörü için geniş yüzeyi (~ 11,1 x 7 cm) seviyoruz, zayıf ve süngerimsi tıklama geri bildirimi biraz çalışma gerektirebilir. ThinkPad T490 veya HP EliteBook 735 G6 gibi daha geleneksel iş dizüstü bilgisayarları, harici bir fare olmadığında kullanımı daha kolay ve daha doğru bulduğumuz özel fare düğmelerini hala entegre ediyor.

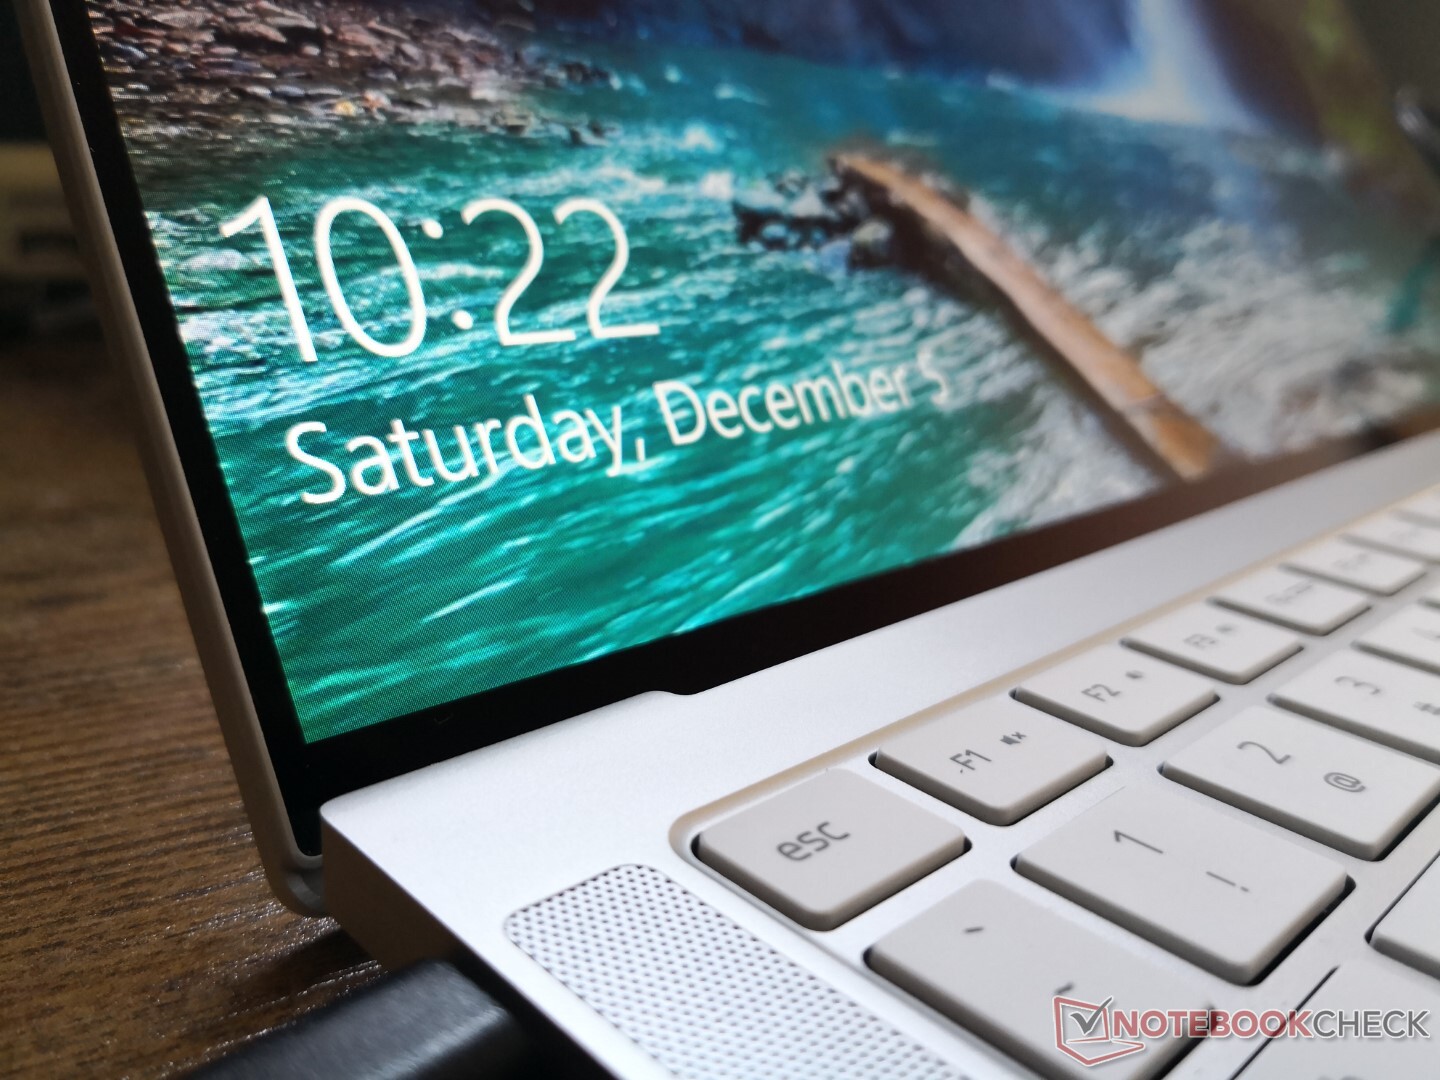
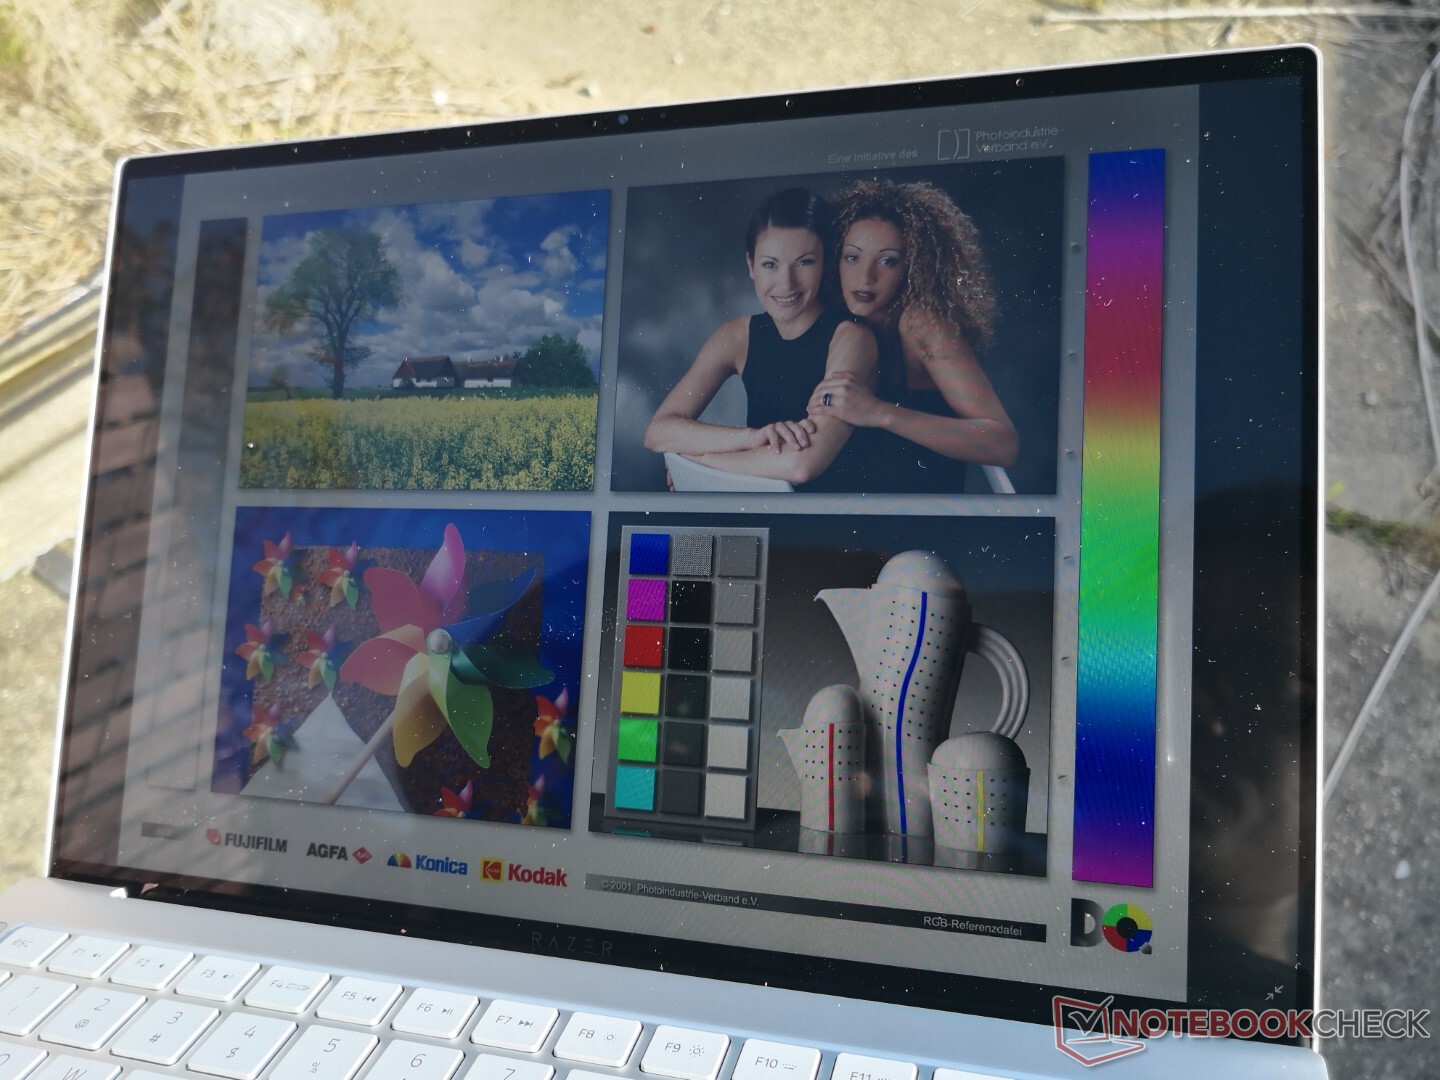
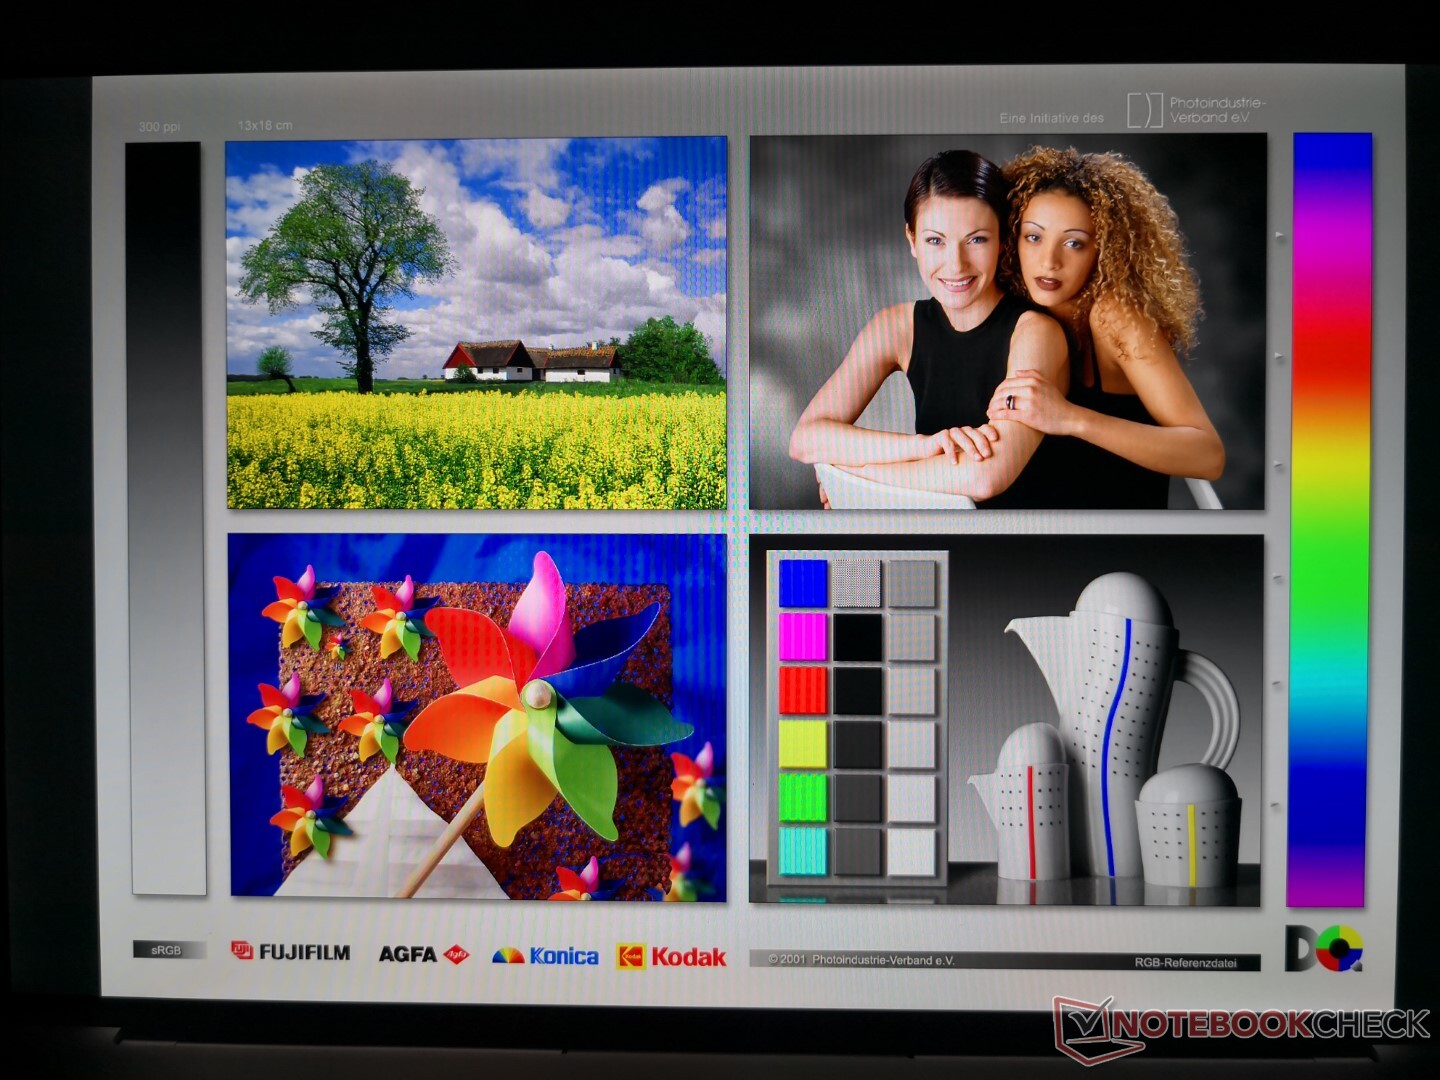
Görüntüle
Tahmin ettiğimiz gibi Kitap 13, Dell XPS 13 9300 / 9310'da bulunanla aynı veya çok benzer Sharp LQ134N1 IPS panelini kullanıyor. Aslında, her iki dizüstü bilgisayar da neredeyse aynı maksimum parlaklık seviyelerini ve hatta düşük parlaklık ayarlarında aynı darbe genişliği modülasyon frekansını paylaşır. Ancak bu ekran XPS 13'ün ve şimdi de Kitap 13'ün öne çıkan bir özelliği olduğundan bu kötü bir şey değil. Renkler göze çarpıyor, metinler net ve mükemmel ilk izlenimler için kontrast yüksek. Ekran aynı zamanda büyük bir neden. Kitap 13 neden bir dizüstü oyun bilgisayarı kadar iyi çalışmıyor? Siyah-beyaz ve gri-gri tepki süreleri, yukarıda bahsedilen mükemmel özelliklere rağmen Blade Stealth'teki ekrandan daha yavaştır. Bu nedenle, Kitap 13 kağıt üzerinde bazı eski Ice Lake veya GeForce MX destekli Blade Stealth SKU'lardan daha güçlü olsa bile oyun sırasında gölgelenme daha belirgindir.
| |||||||||||||||||||||||||
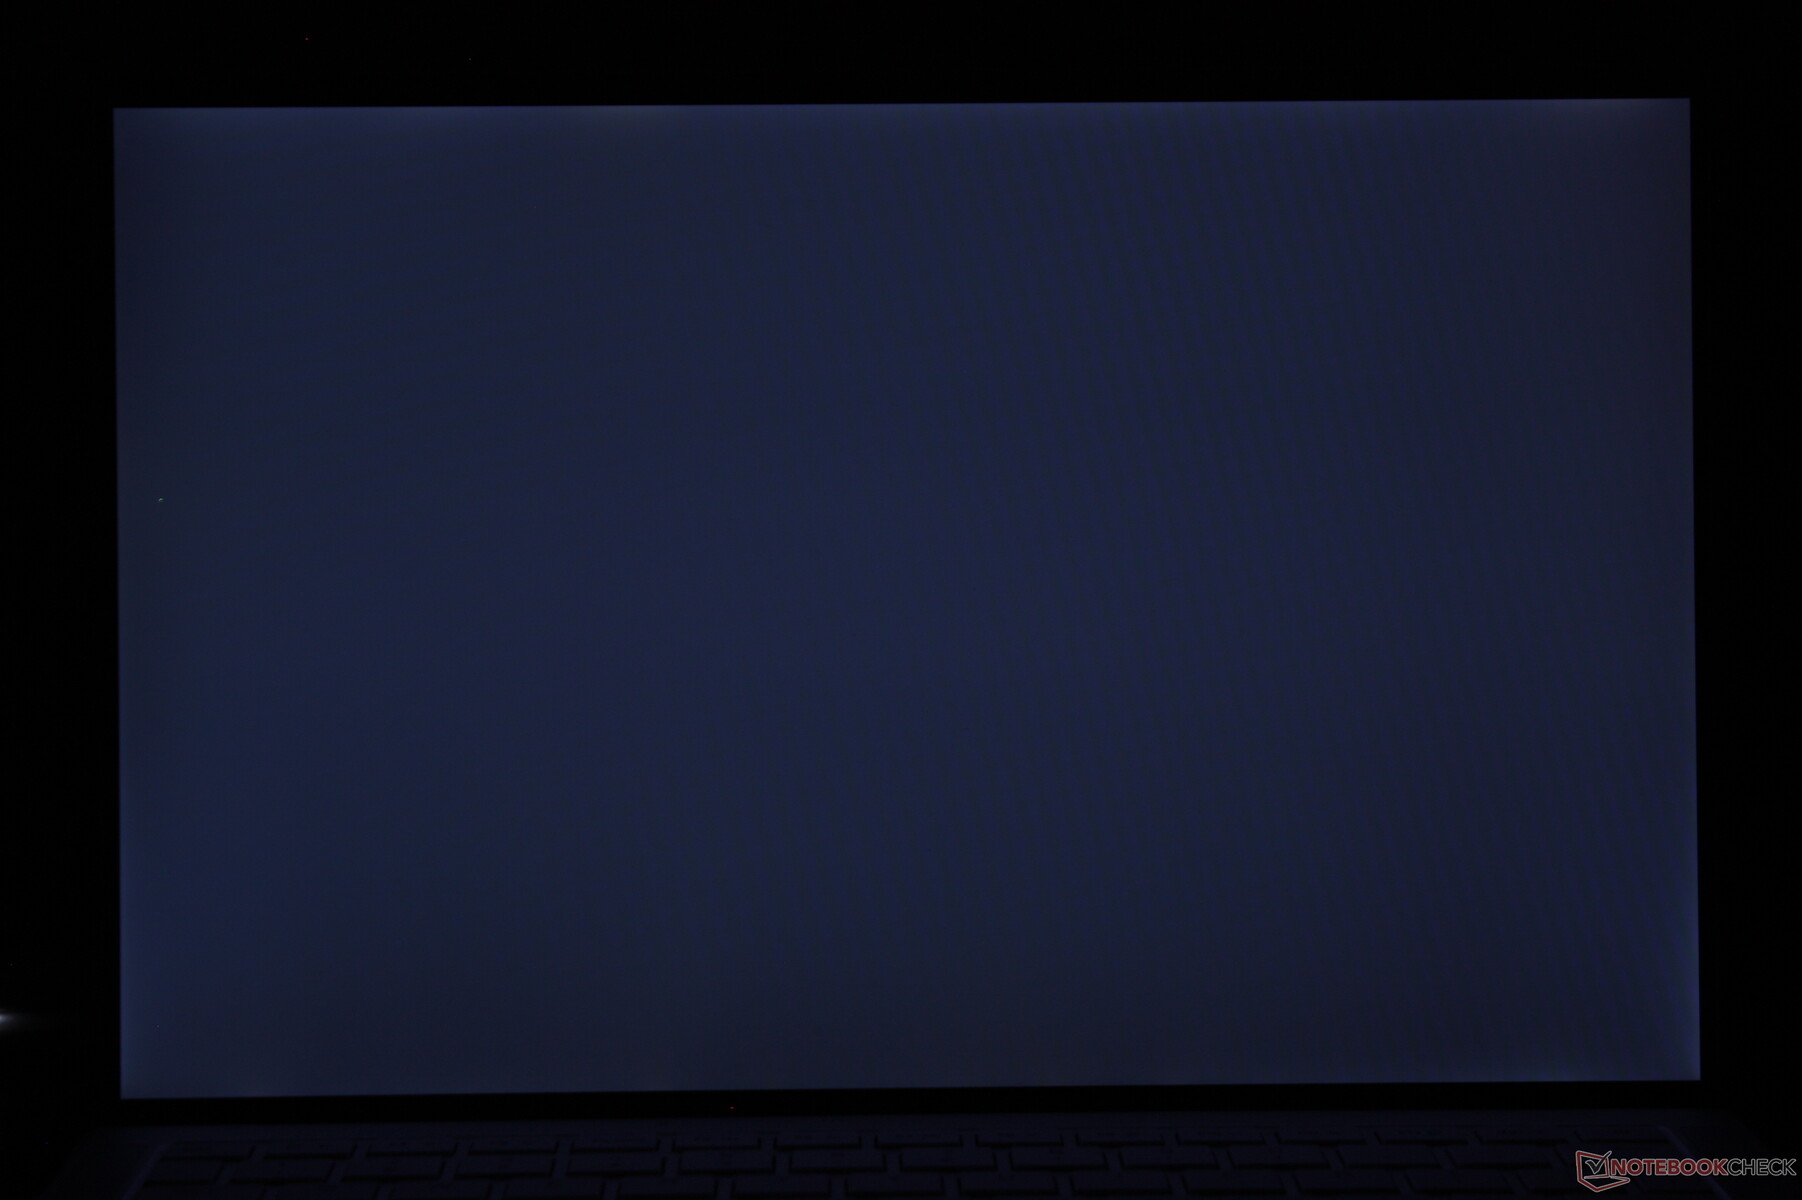
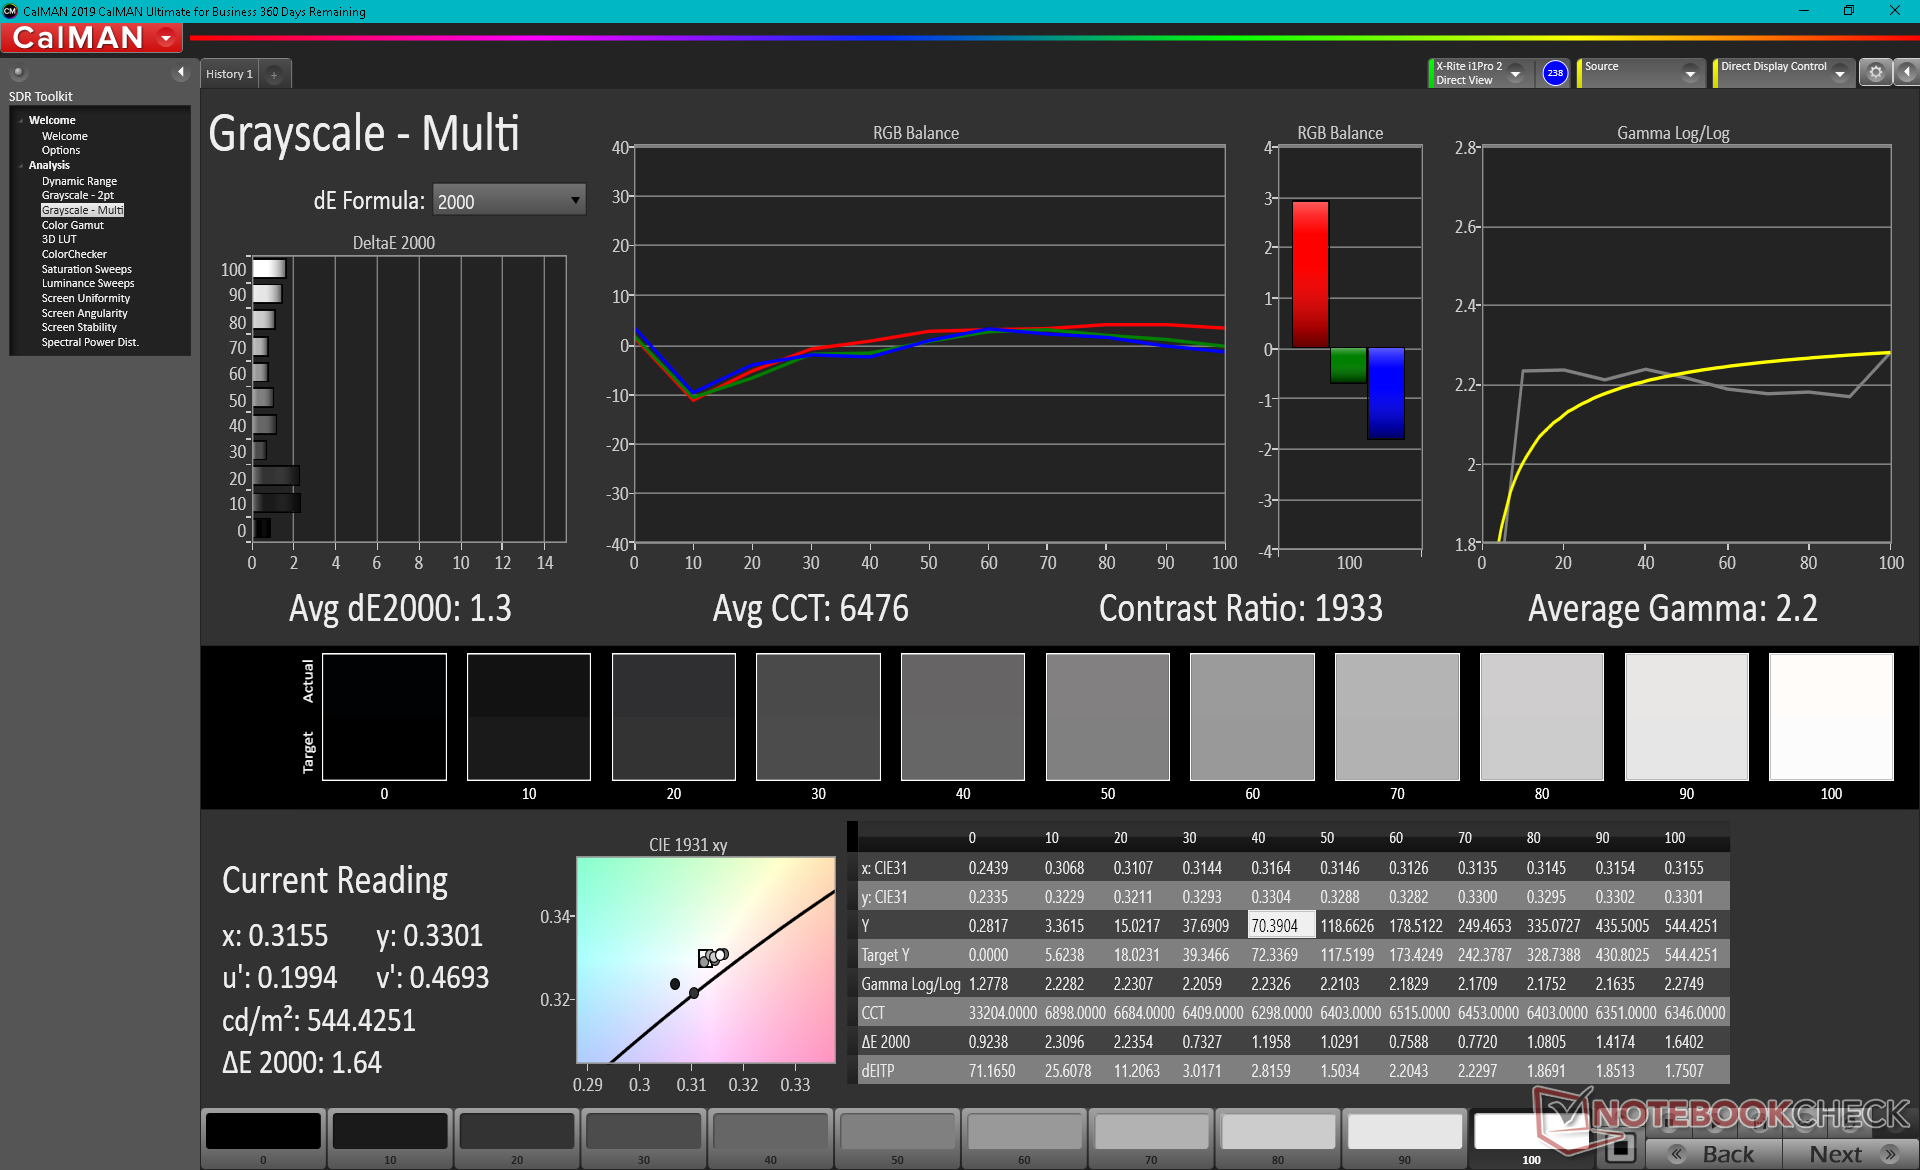
Aydınlatma: 88 %
Batarya modunda parlaklık: 545.3 cd/m²
Kontrast: 1759:1 (Siyah: 0.31 cd/m²)
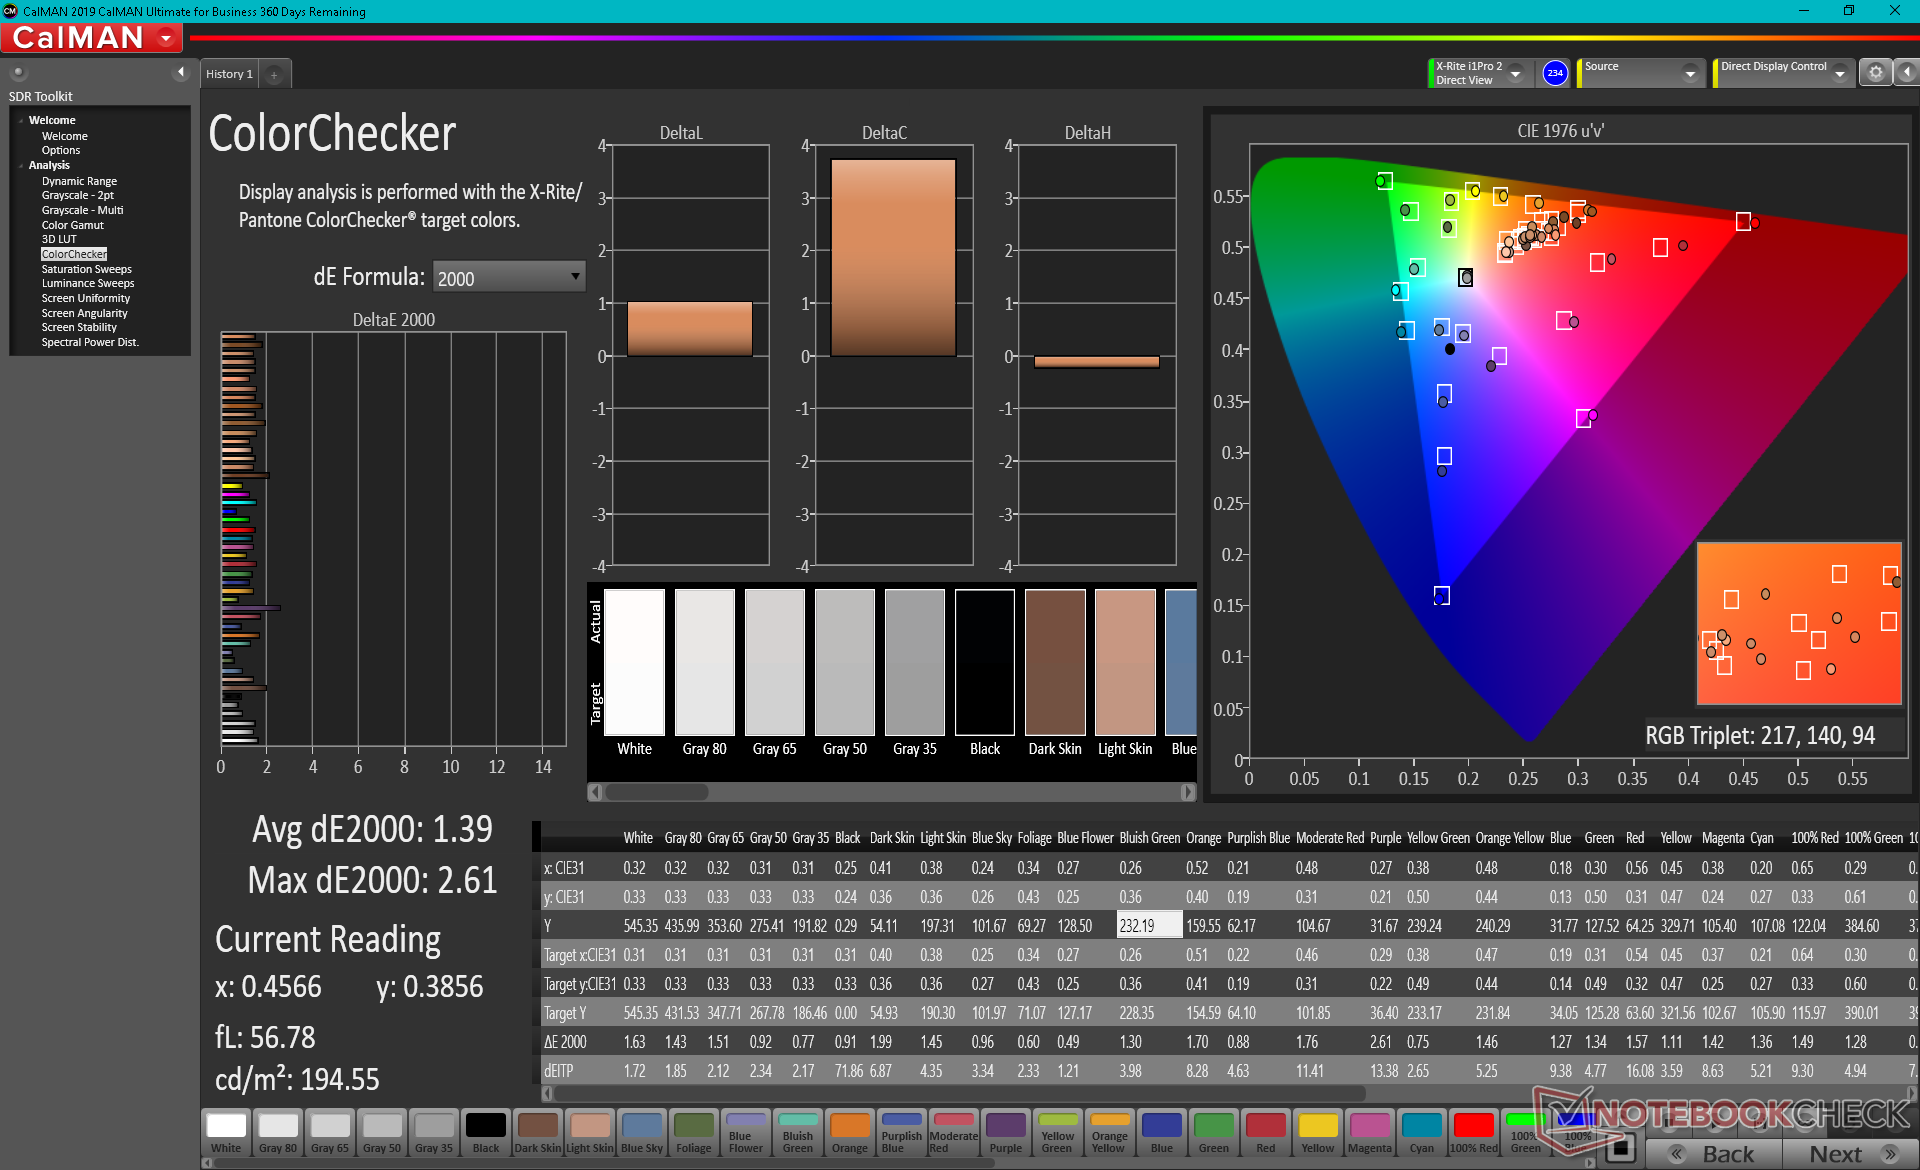
ΔE ColorChecker Calman: 1.39 | ∀{0.5-29.43 Ø4.72}
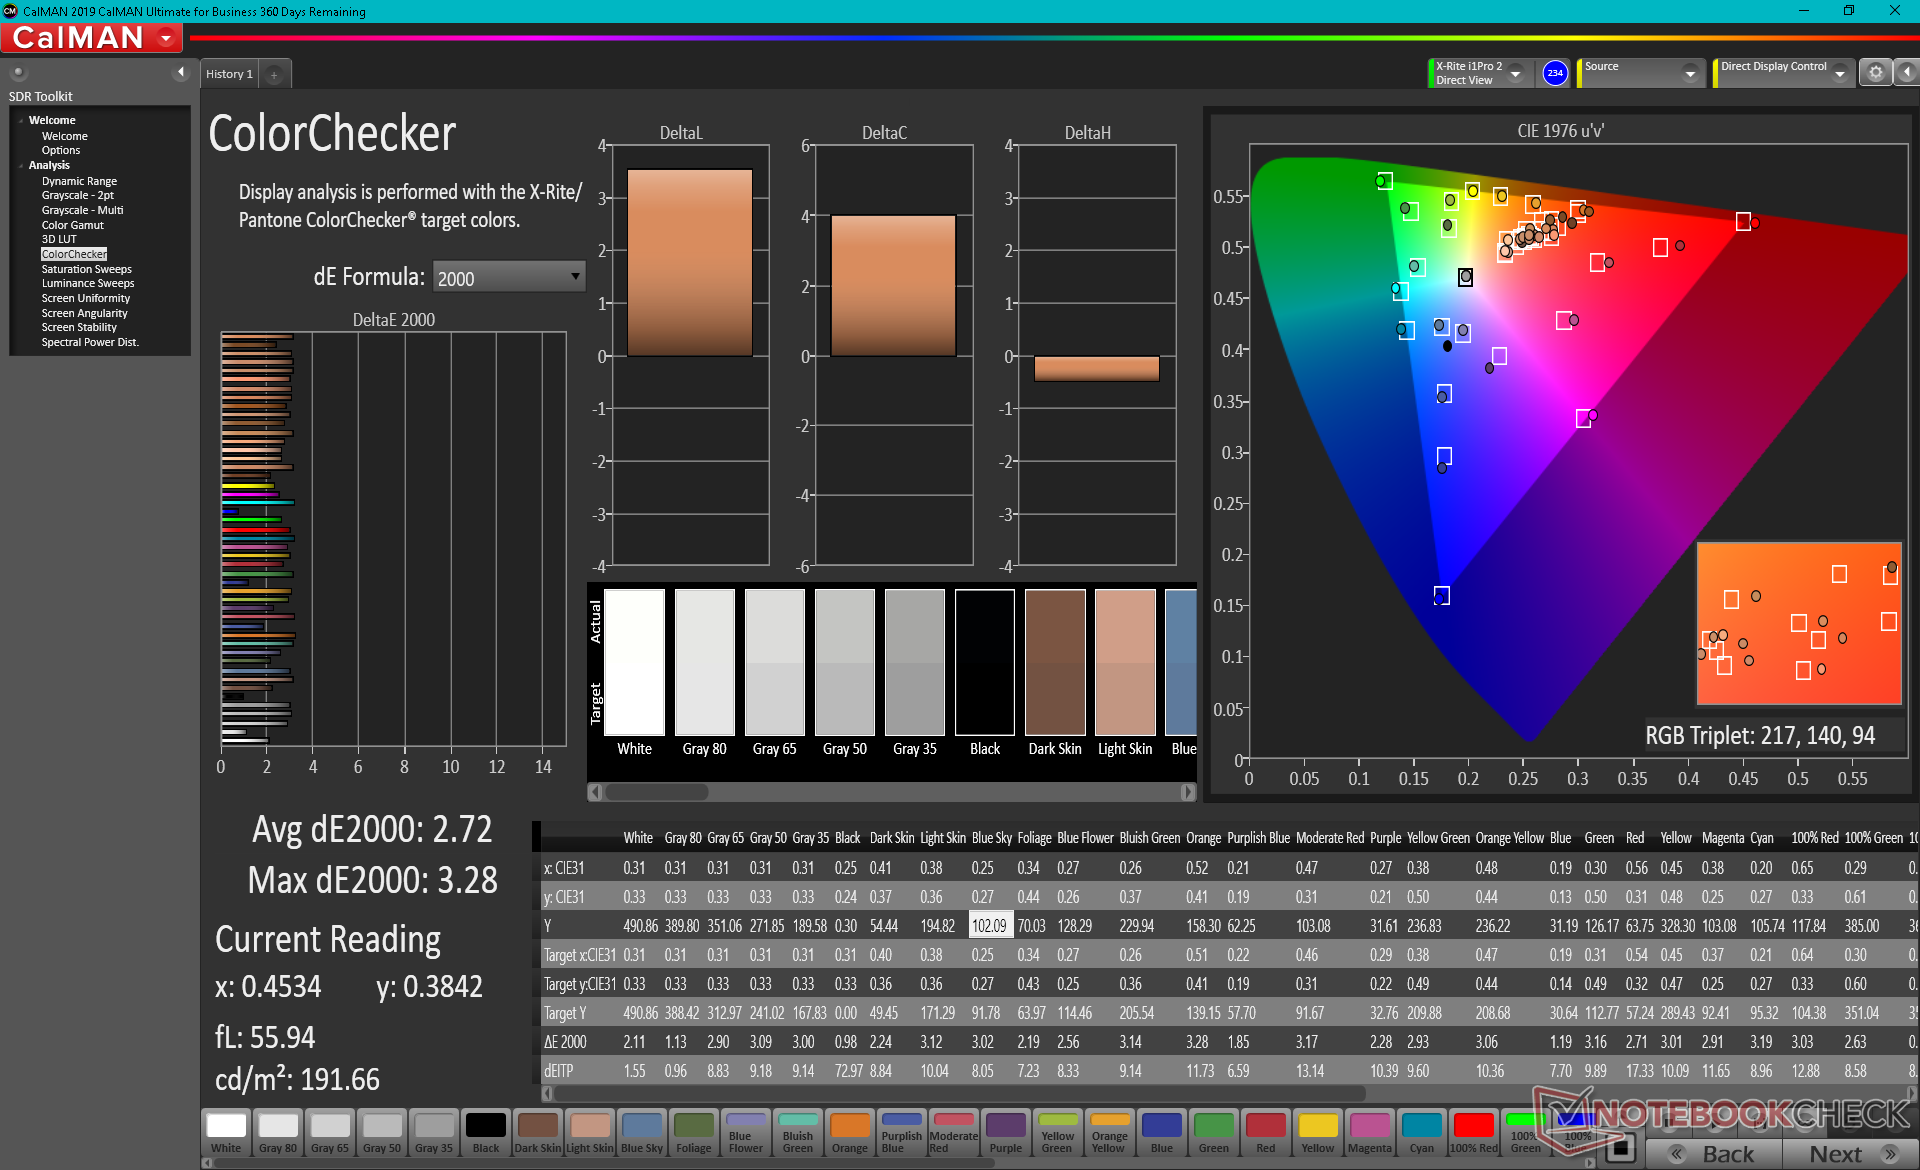
calibrated: 2.72
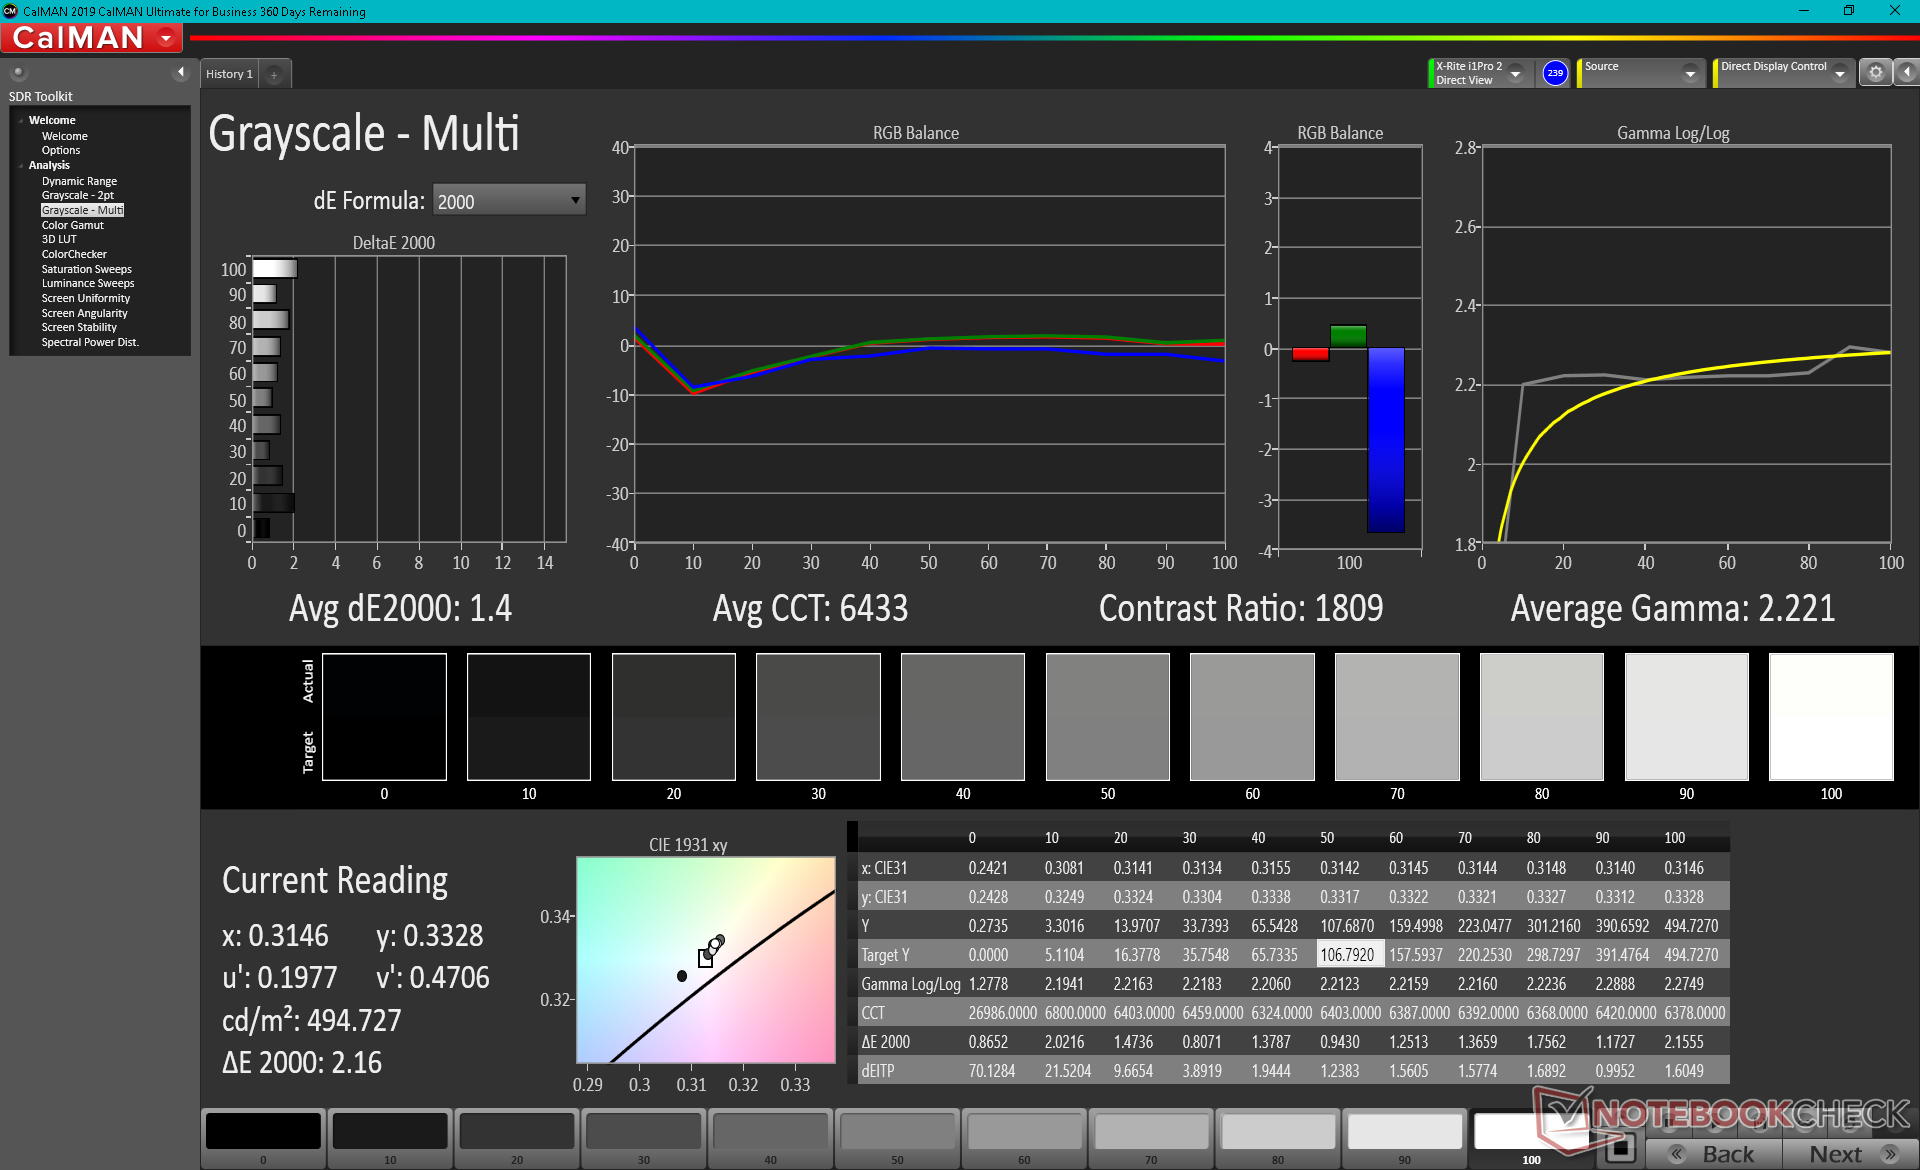
ΔE Greyscale Calman: 1.3 | ∀{0.09-98 Ø4.97}
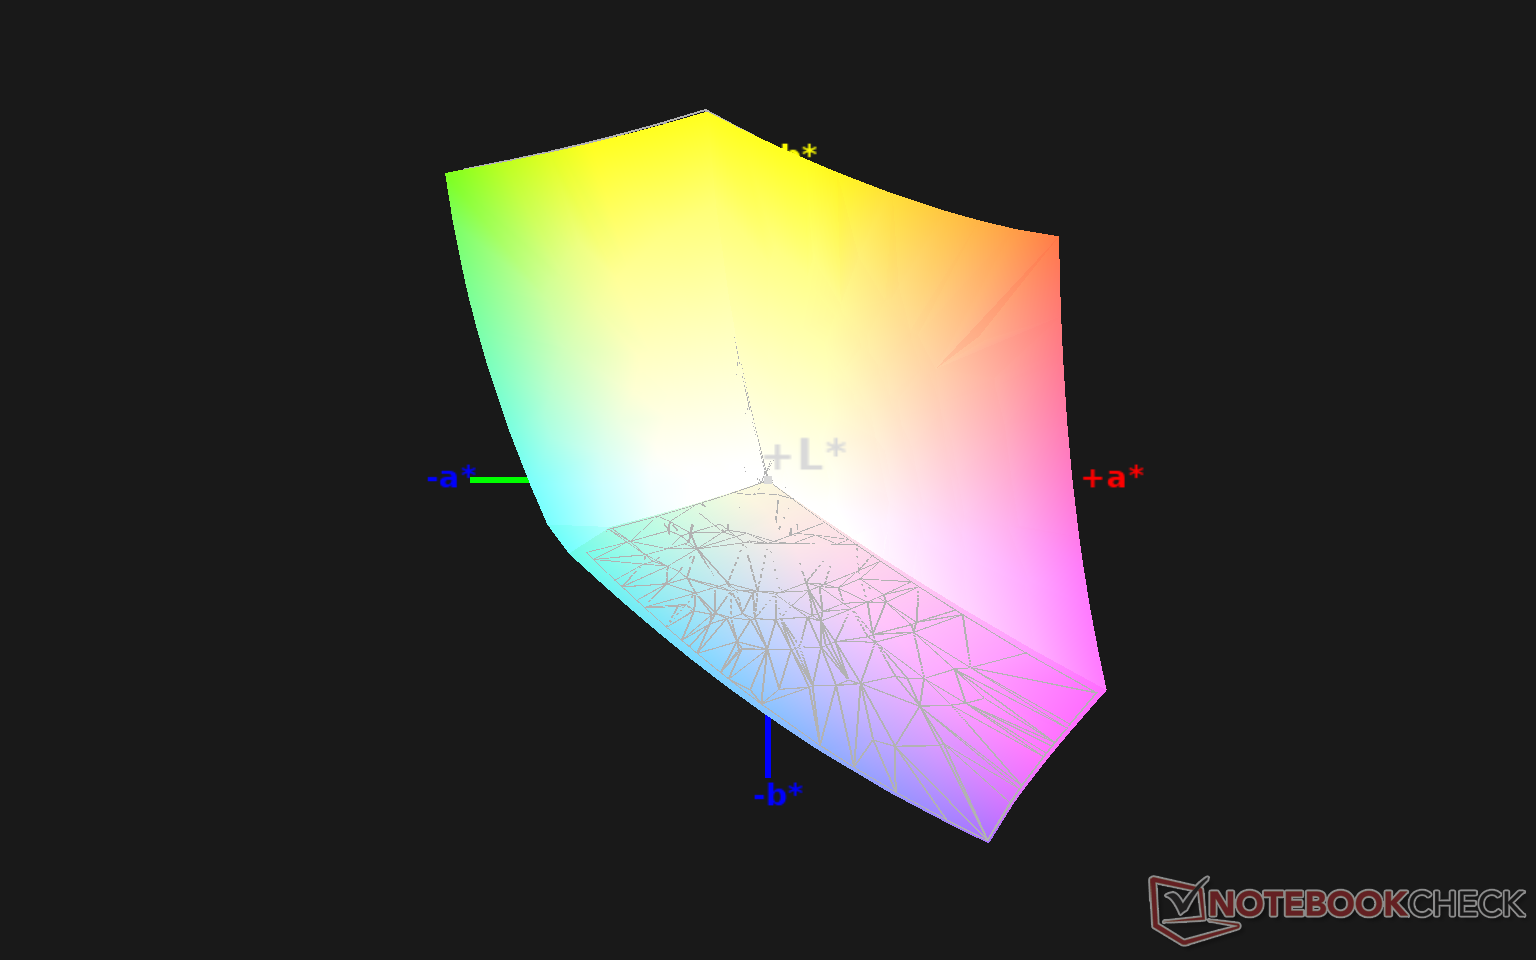
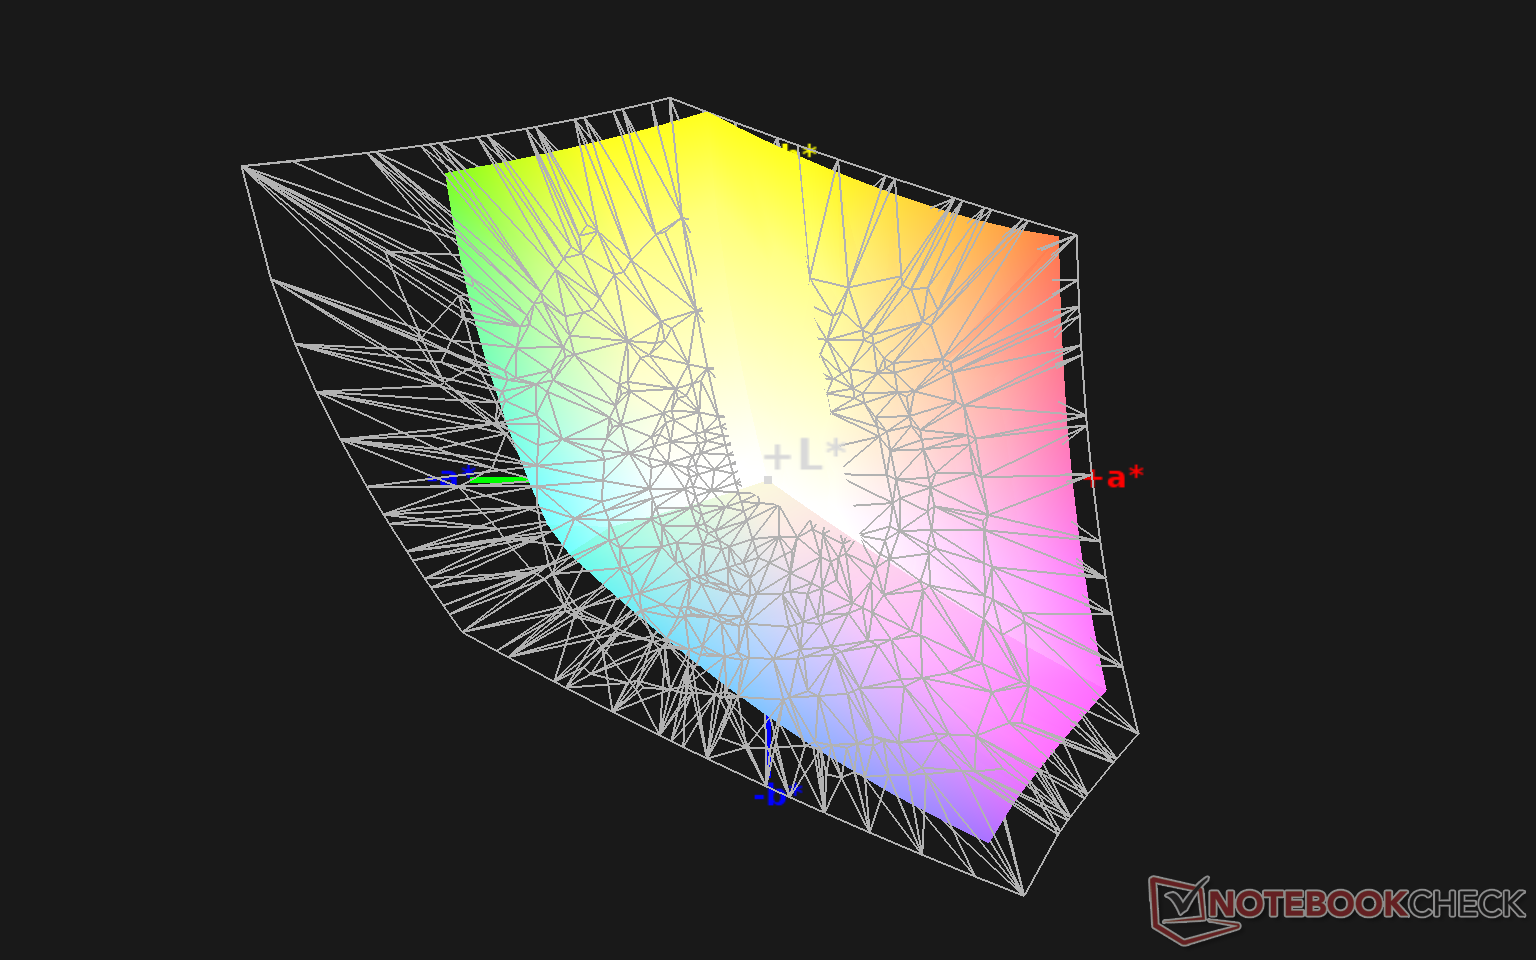
99.6% sRGB (Argyll 1.6.3 3D)
65.9% AdobeRGB 1998 (Argyll 1.6.3 3D)
71.6% AdobeRGB 1998 (Argyll 3D)
99.3% sRGB (Argyll 3D)
70.1% Display P3 (Argyll 3D)
Gamma: 2.2
CCT: 6476 K
| Razer Book 13 FHD Sharp LQ134N1JW48, IPS, 13.4", 1920x1200 | Dell XPS 13 9310 Core i7 FHD Sharp LQ134N1, IPS, 13.4", 1920x1200 | Asus Zenbook S UX393JA AU Optronics B139KAN01.0, IPS, 13.9", 3300x2200 | Huawei MateBook X Pro 2020 i7 JDI LPM139M422A, LTPS, 13.9", 3000x2000 | Microsoft Surface Laptop 3 13 Core i5-1035G7 Sharp LQ135P1JX51, IPS, 13.5", 2256x1504 | Razer Blade Stealth i7-1065G7 Iris Plus Sharp LQ133M1JW41, IPS, 13.3", 1920x1080 | |
|---|---|---|---|---|---|---|
| Display | 1% | 21% | -3% | -4% | -5% | |
| Display P3 Coverage (%) | 70.1 | 70.9 1% | 97.7 39% | 66.6 -5% | 65.7 -6% | 66.2 -6% |
| sRGB Coverage (%) | 99.3 | 99.1 0% | 99.8 1% | 99.4 0% | 98.6 -1% | 97.2 -2% |
| AdobeRGB 1998 Coverage (%) | 71.6 | 72.9 2% | 87.9 23% | 68.6 -4% | 67.8 -5% | 67.1 -6% |
| Response Times | 11% | 1% | 17% | -6% | 17% | |
| Response Time Grey 50% / Grey 80% * (ms) | 56.8 ? | 52 ? 8% | 56.4 ? 1% | 49.6 ? 13% | 59.2 ? -4% | 45.2 ? 20% |
| Response Time Black / White * (ms) | 38.8 ? | 33.2 ? 14% | 38.8 ? -0% | 30.8 ? 21% | 41.6 ? -7% | 33.2 ? 14% |
| PWM Frequency (Hz) | 2475 ? | 2475 ? | 29070 ? | 21740 ? | 22730 ? | |
| Screen | -52% | -45% | 1% | 2% | 0% | |
| Brightness middle (cd/m²) | 545.3 | 543.3 0% | 444.1 -19% | 557 2% | 403.4 -26% | 422.6 -23% |
| Brightness (cd/m²) | 507 | 524 3% | 423 -17% | 532 5% | 397 -22% | 404 -20% |
| Brightness Distribution (%) | 88 | 92 5% | 89 1% | 87 -1% | 89 1% | 87 -1% |
| Black Level * (cd/m²) | 0.31 | 0.38 -23% | 0.37 -19% | 0.33 -6% | 0.34 -10% | 0.35 -13% |
| Contrast (:1) | 1759 | 1430 -19% | 1200 -32% | 1688 -4% | 1186 -33% | 1207 -31% |
| Colorchecker dE 2000 * | 1.39 | 3.02 -117% | 2.94 -112% | 1.4 -1% | 0.94 32% | 1.02 27% |
| Colorchecker dE 2000 max. * | 2.61 | 7.61 -192% | 7.37 -182% | 2.5 4% | 2.92 -12% | 3.06 -17% |
| Colorchecker dE 2000 calibrated * | 2.72 | 1.23 55% | 3.05 -12% | 0.7 74% | 0.99 64% | 0.95 65% |
| Greyscale dE 2000 * | 1.3 | 5 -285% | 2.9 -123% | 2 -54% | 0.9 31% | 1 23% |
| Gamma | 2.2 100% | 2.02 109% | 2.1 105% | 2.14 103% | 2.13 103% | 2.21 100% |
| CCT | 6476 100% | 6550 99% | 6766 96% | 6689 97% | 6620 98% | 6502 100% |
| Color Space (Percent of AdobeRGB 1998) (%) | 65.9 | 66.8 1% | 78.2 19% | 62.5 -5% | 62.3 -5% | 62.1 -6% |
| Color Space (Percent of sRGB) (%) | 99.6 | 99.6 0% | 99.8 0% | 99.5 0% | 98.7 -1% | 97.1 -3% |
| Toplam Ortalama (Program / Ayarlar) | -13% /
-34% | -8% /
-27% | 5% /
2% | -3% /
-0% | 4% /
1% |
* ... daha küçük daha iyidir
Renk alanı neredeyse tüm sRGB'yi ve Blade Stealth'ten veya çoğu amiral gemisi Ultrabook'tan farklı olarak AdobeRGB'nin yaklaşık yüzde 66'sını kapsar. Bununla birlikte, MacBook Pro 13, AdobeRGB'nin yüzde 77'sini kapsayan daha derin renkler sunabilirken, HP Spectre 15 veya XPS 15'te bulunan bazı daha büyük 4K paneller, tüm AdobeRGB'yi kapsayabilir. Book 13'teki 4K seçeneğinin FHD seçeneğinden daha geniş renk kapsamı sunmadığını belirtmekte fayda var.
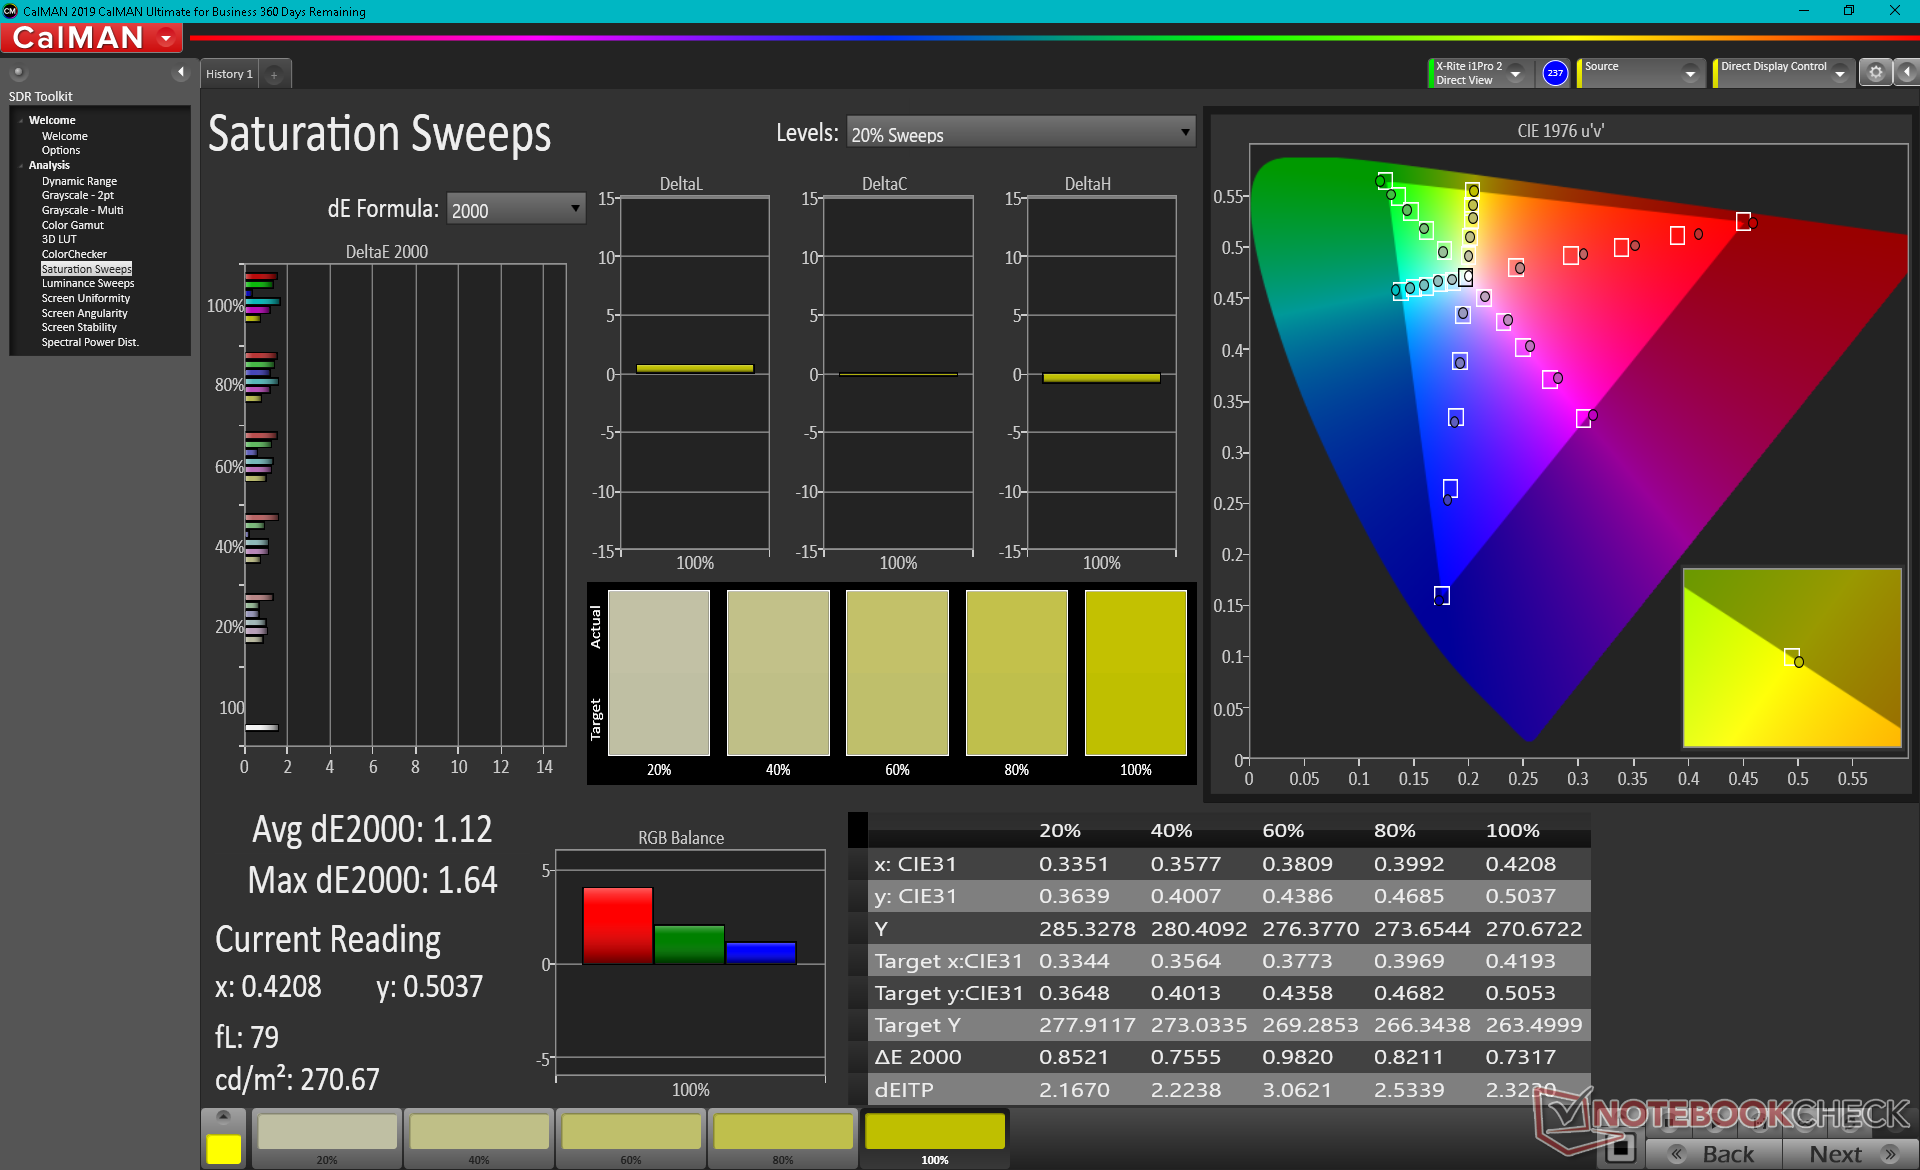
X-Rite kolorimetre ölçümleri, ekranın sırasıyla yalnızca 1,3 ve 1,39 ortalama gri tonlama ve renk DeltaE değerleri ve 2,2'lik mükemmel bir gama ile reklamlarda vaat edildiği gibi kutudan çıkar çıkmaz iyi kalibre edildiğini göstermektedir. Paneli kendimiz kalibre etmeye çalışmak, esasen hiçbir değişikliğe yol açmaz.

Yanıt Sürelerini Görüntüle
| ↔ Tepki Süresi Siyahtan Beyaza | ||
|---|---|---|
| 38.8 ms ... yükseliş ↗ ve sonbahar↘ birleşimi | ↗ 20.4 ms yükseliş | 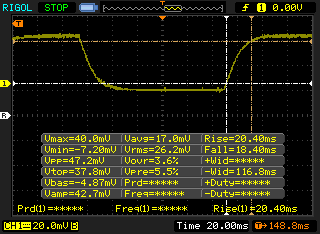 |
| ↘ 18.4 ms sonbahar | ||
| Ekran, testlerimizde yavaş yanıt oranları gösteriyor ve oyuncular için yetersiz olacaktır. Karşılaştırıldığında, test edilen tüm cihazlar 0.1 (minimum) ile 240 (maksimum) ms arasında değişir. » Tüm cihazların 96 %'si daha iyi. Bu, ölçülen yanıt süresinin test edilen tüm cihazların ortalamasından (19.8 ms) daha kötü olduğu anlamına gelir. | ||
| ↔ Tepki Süresi %50 Griden %80 Griye | ||
| 56.8 ms ... yükseliş ↗ ve sonbahar↘ birleşimi | ↗ 29.2 ms yükseliş | 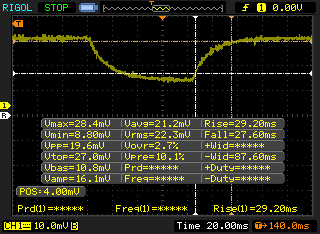 |
| ↘ 27.6 ms sonbahar | ||
| Ekran, testlerimizde yavaş yanıt oranları gösteriyor ve oyuncular için yetersiz olacaktır. Karşılaştırıldığında, test edilen tüm cihazlar 0.165 (minimum) ile 636 (maksimum) ms arasında değişir. » Tüm cihazların 94 %'si daha iyi. Bu, ölçülen yanıt süresinin test edilen tüm cihazların ortalamasından (31 ms) daha kötü olduğu anlamına gelir. | ||
Ekran Titremesi / PWM (Darbe Genişliği Modülasyonu)
| Ekran titriyor / PWM algılandı | 2475 Hz | ≤ 25 % parlaklık ayarı | 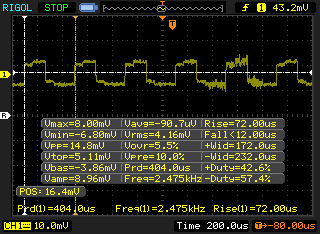 |
Ekran arka ışığı 2475 Hz'de titriyor (en kötü durum, örneğin PWM kullanılması) 25 % ve altındaki parlaklık ayarında titreme algılandı. Bu parlaklık ayarının üzerinde titreme veya PWM olmamalıdır. 2475 Hz frekansı oldukça yüksektir, bu nedenle PWM'ye duyarlı çoğu kullanıcı herhangi bir titremeyi fark etmemelidir. Karşılaştırıldığında: Test edilen tüm cihazların %52 %'si ekranı karartmak için PWM kullanmıyor. PWM tespit edilirse, ortalama 7781 (minimum: 5 - maksimum: 343500) Hz ölçüldü. | |||
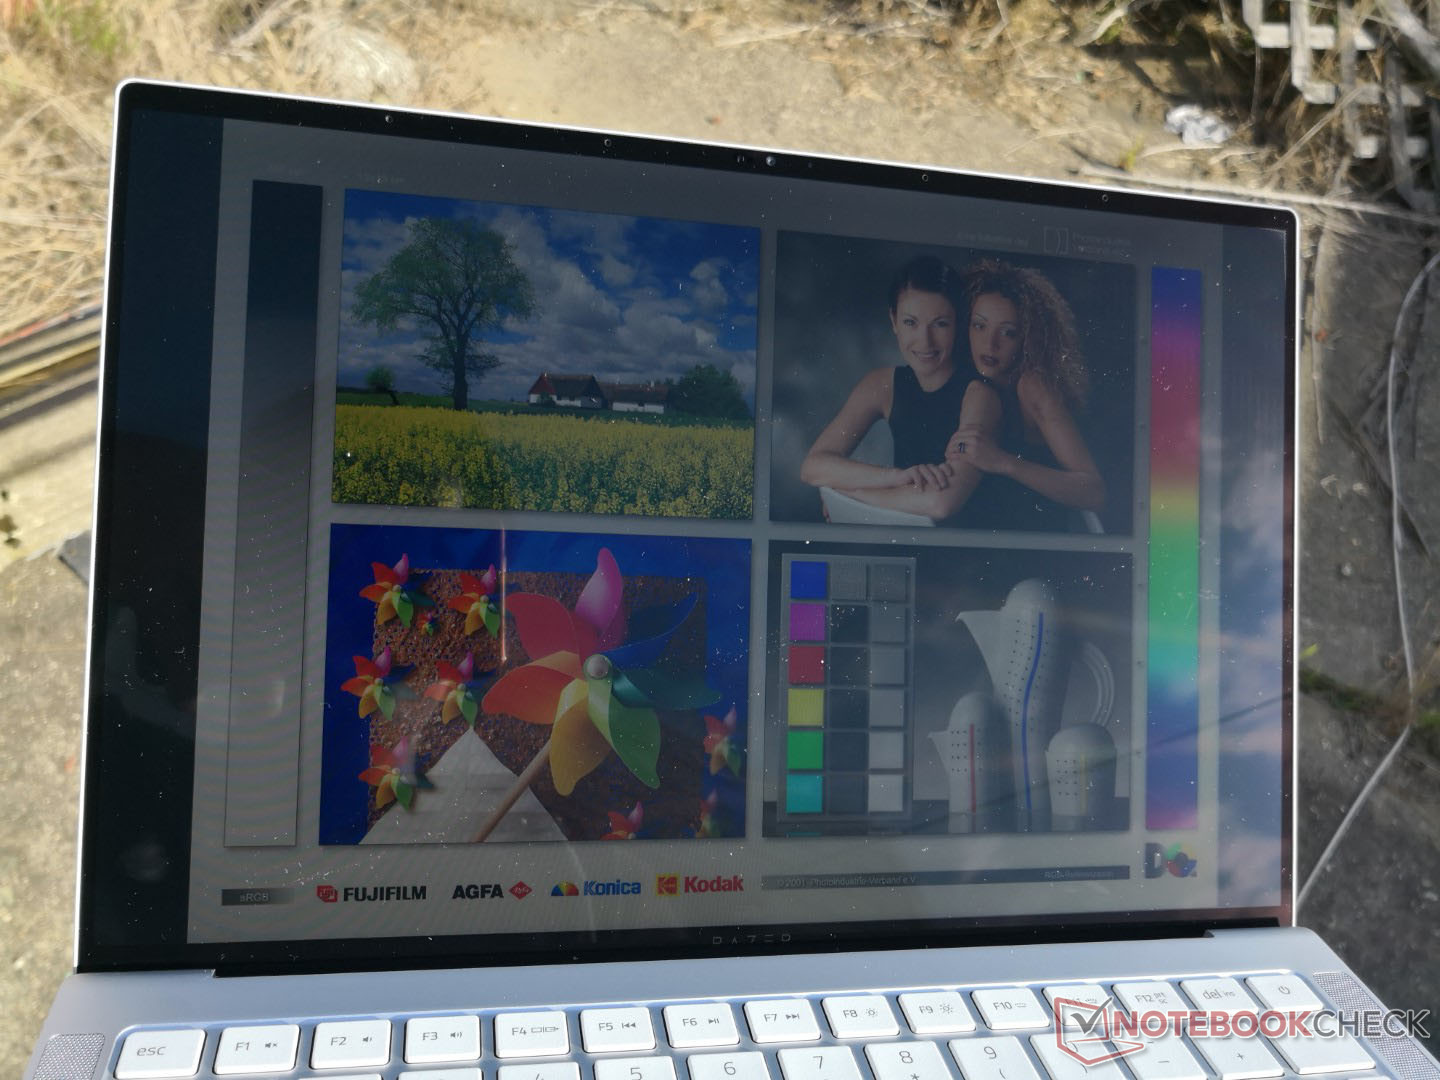
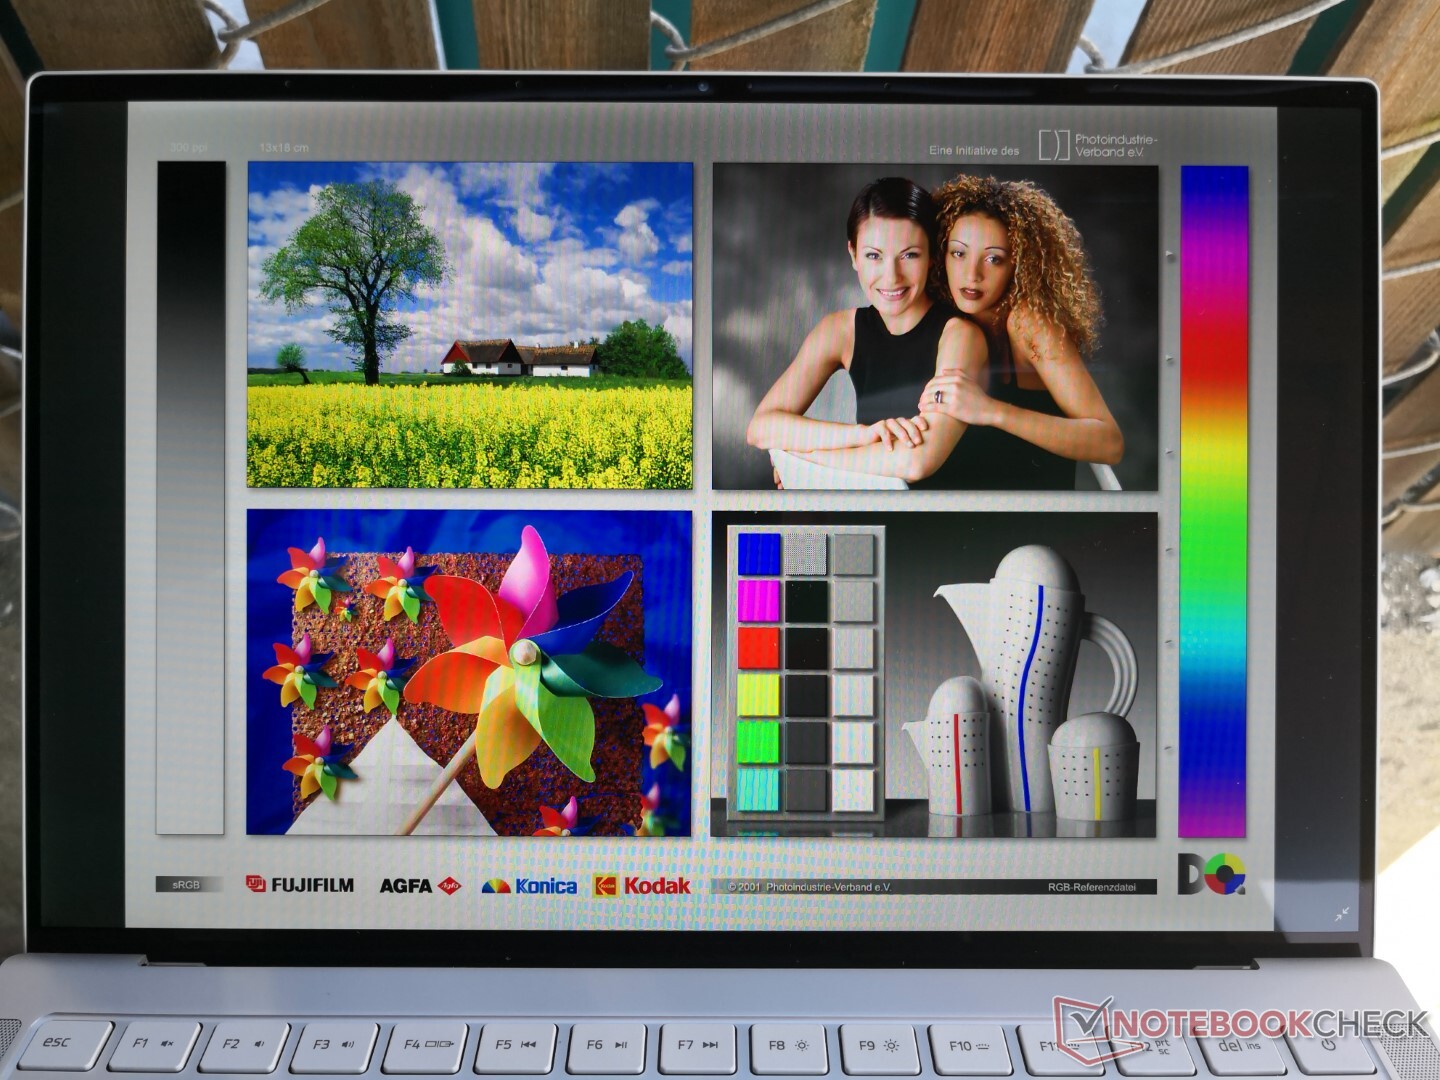
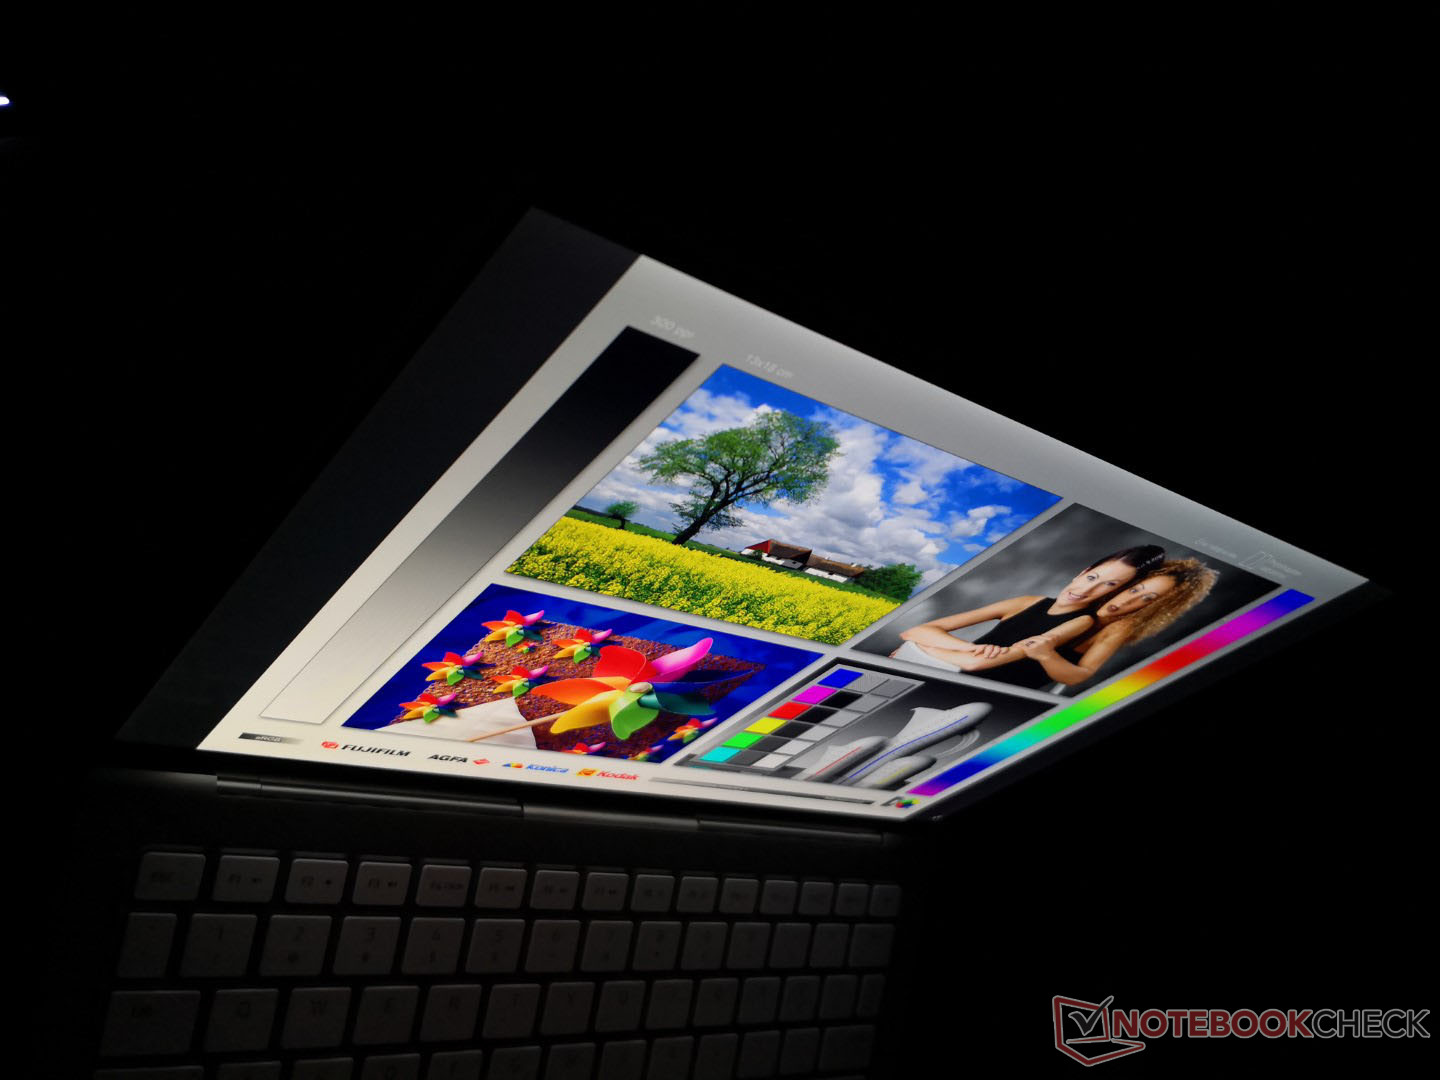
Outdoor visibility is a bit better than the Blade Stealth due to the brighter display on the Book 13. Nonetheless, this is negated somewhat by the glossy overlay of the touchscreen. The less expensive matte SKU may fare better in this regard.
Performance
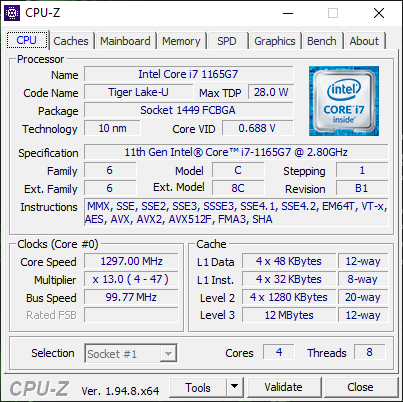
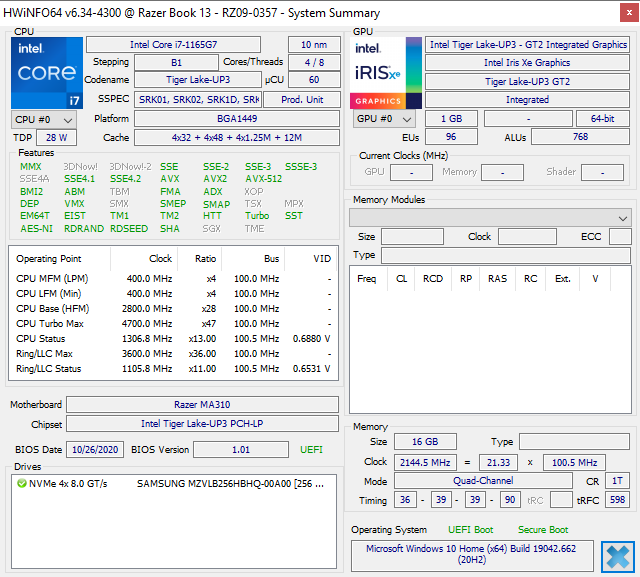
The Book 13 comes with the Intel 11th gen Tiger Lake Core i7-1165G7 CPU or, for the first time ever on a Razer laptop, a lesser Core i5 option as well. The i7-1185G7 or Iris Xe Max, which would have made the laptop even faster, are not available.
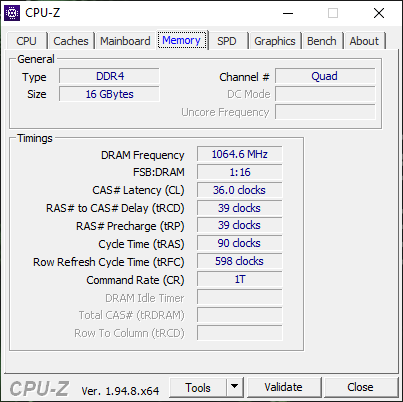
RAM is soldered at up to 16 GB of LPDDR4X running at 4267 MHz. Both CPU-Z and HWiNFO report quad-channel memory while Razer's own specifications claim dual-channel only. We'll update this once we've double-checked with Razer.
We set our system to Performance mode via Razer Synapse prior to running any performance benchmarks below. We recommend becoming familiar with Synapse since key system settings can be found here.
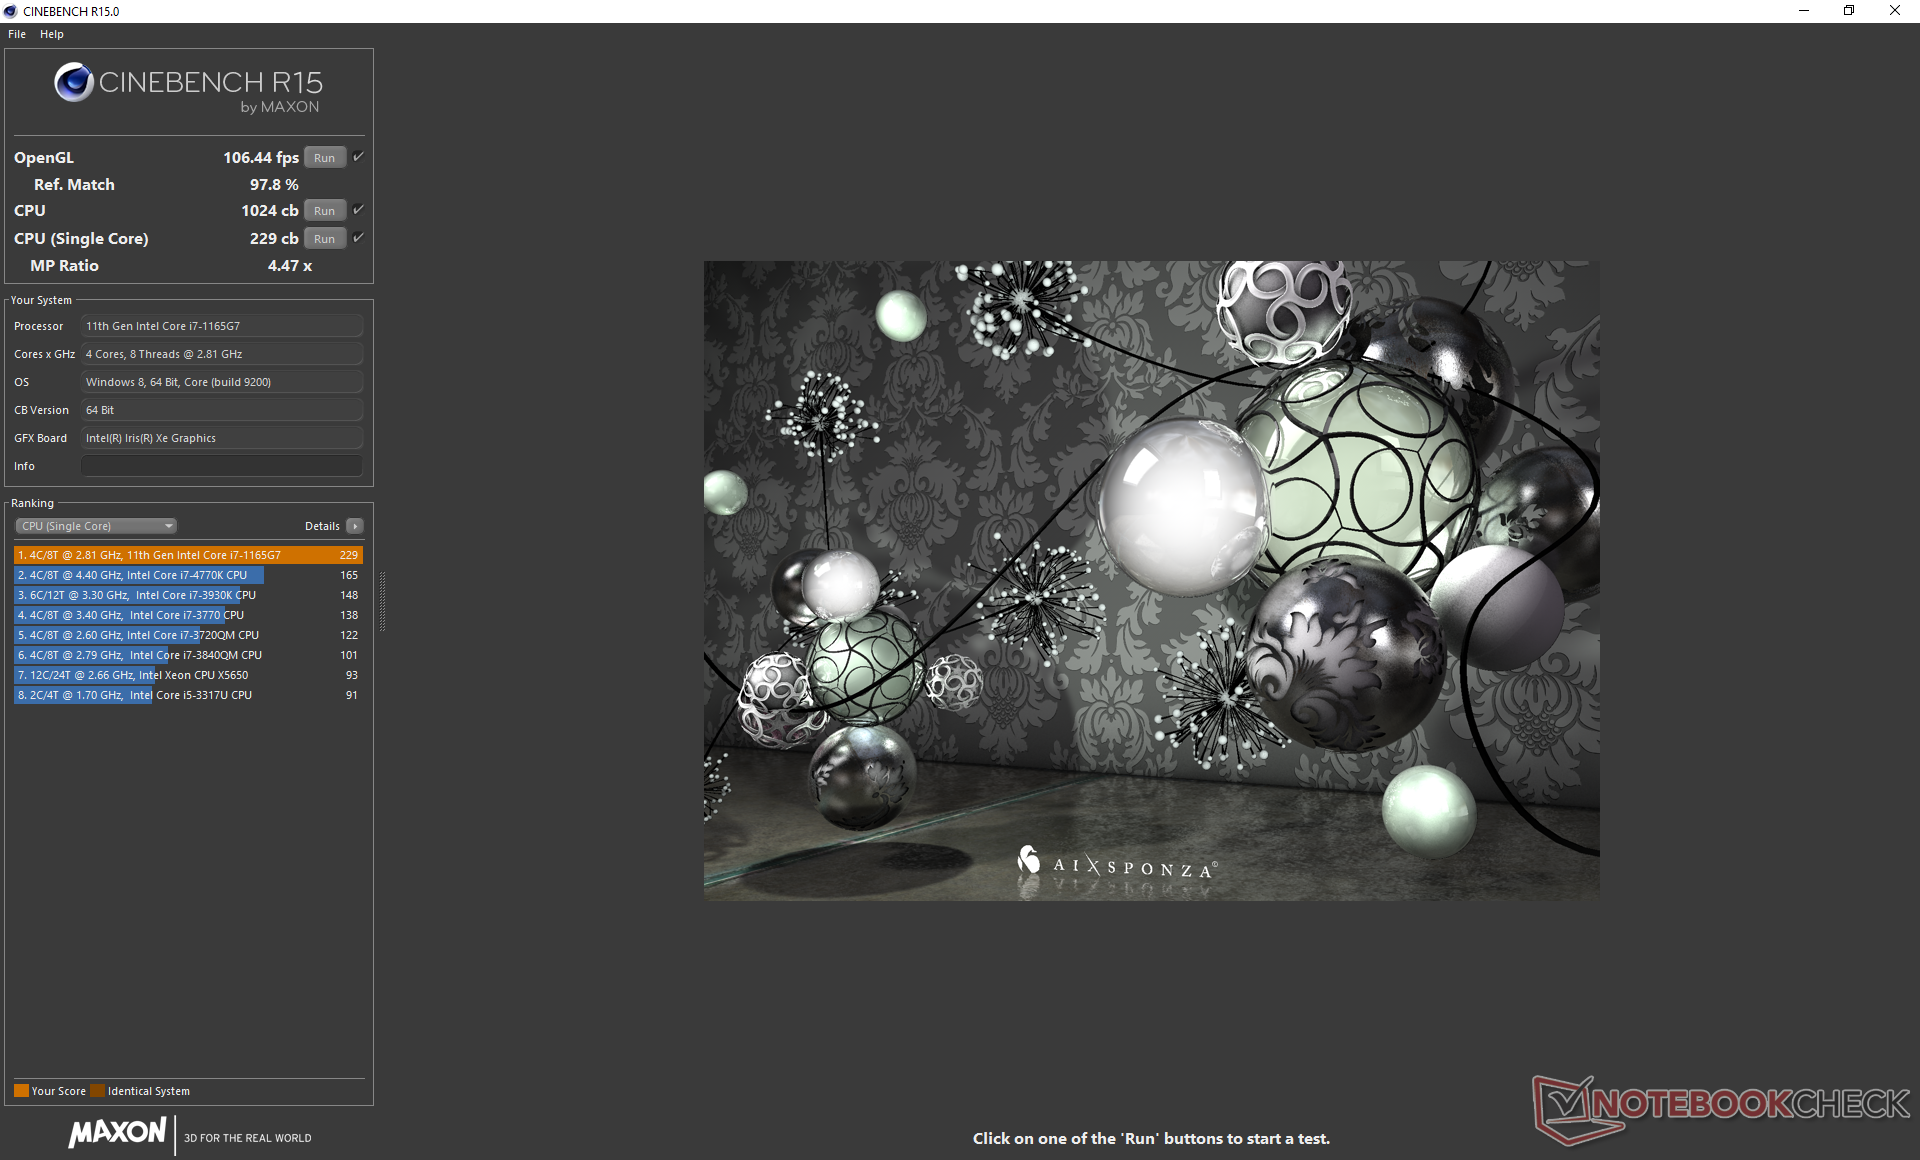
Processor
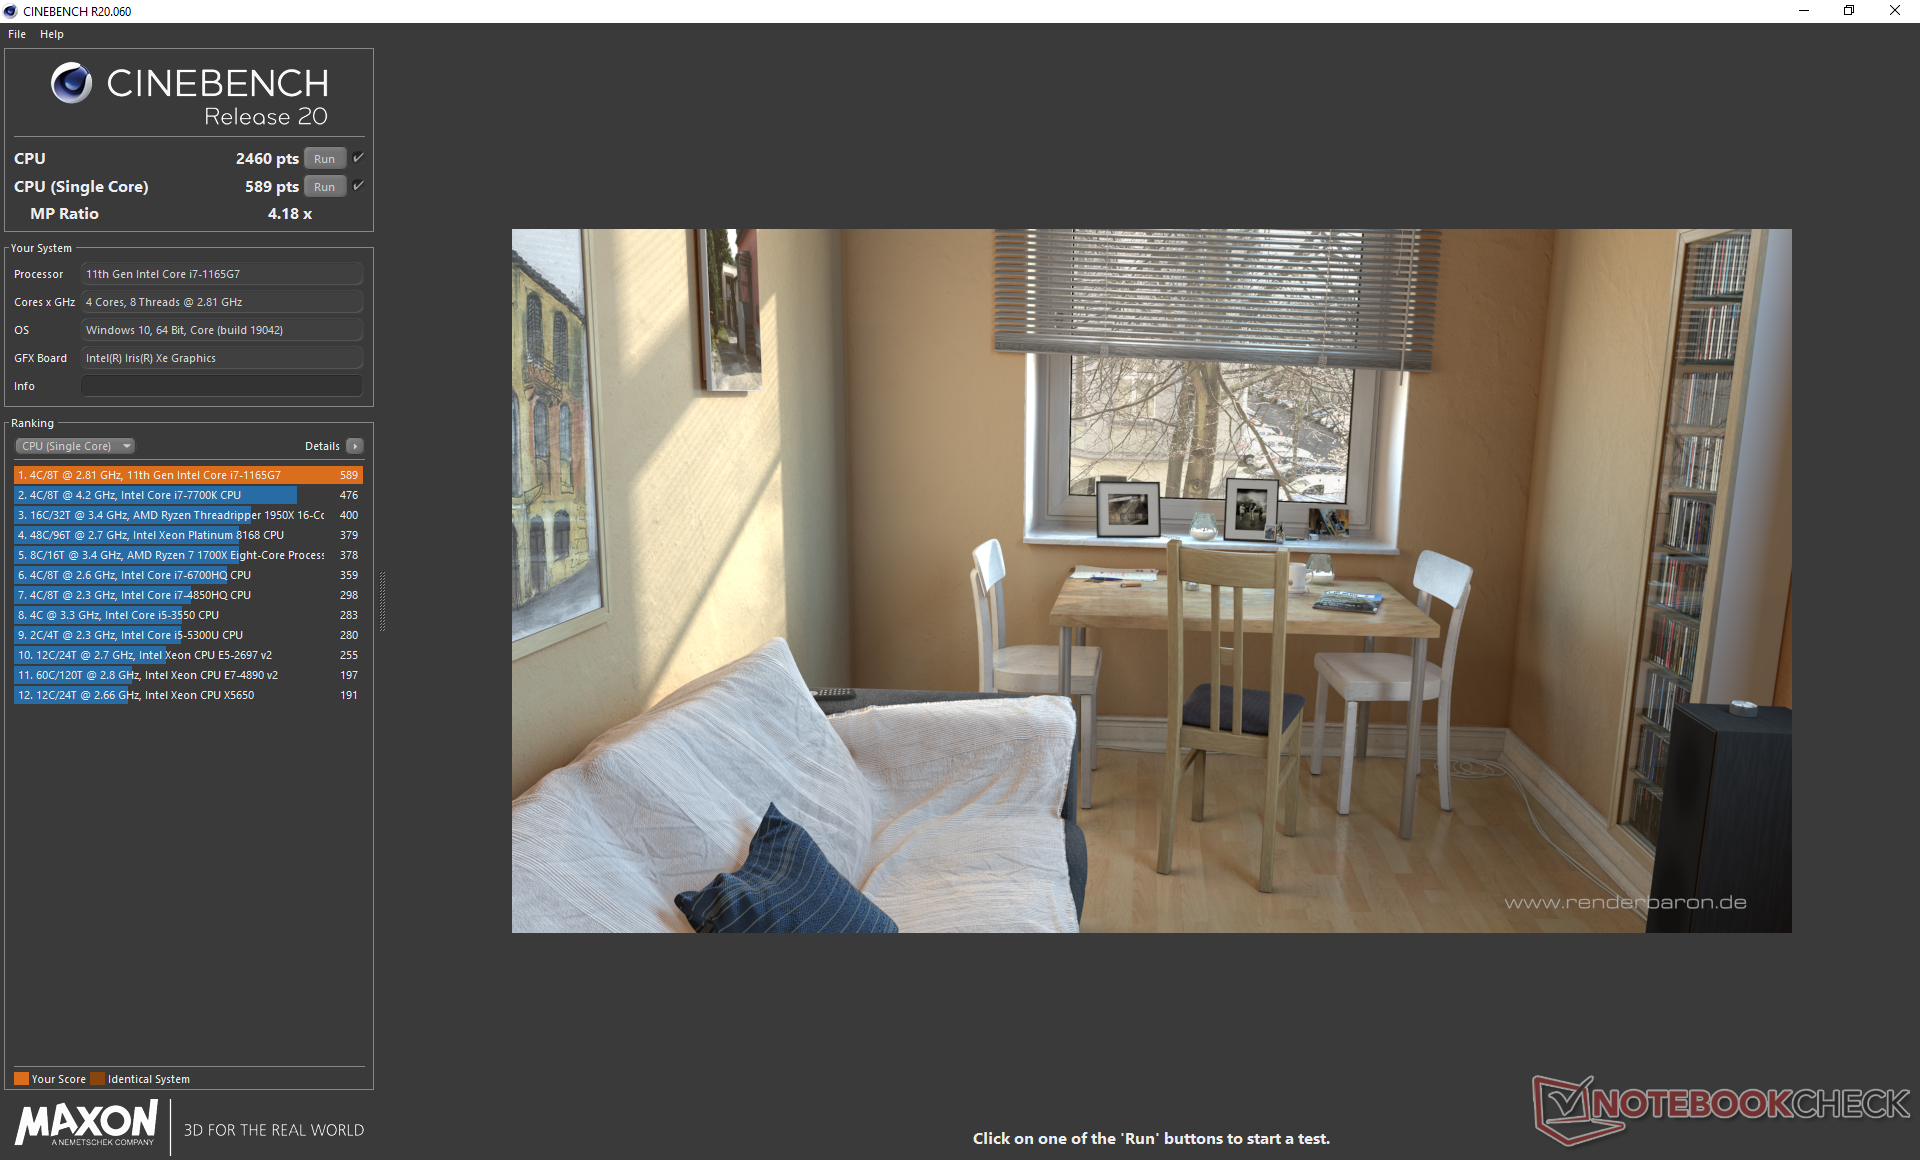
Multi-thread performance is higher than the average Core i7-1165G7 in our database by about 20 percent to edge out even the Core i7-1185G7 in the MSI Prestige 14 Evo. The wide delta can be attributed to the decent Turbo Boost sustainability of the Book 13 as shown by our CineBench R15 xT loop graph below. Interestingly, the recent Blade Stealth with the same Core i7-1165G7 CPU returns lower scores than our Book 13 by about 10 to 15 percent.
Opting for the less expensive Core i5-1135G7 SKU will entail a 15 to 25 percent performance deficit by our estimates. It's too bad that there are no AMD options as the Ryzen 5 4500U, Ryzen 7 4700U, or Ryzen 7 4800U could have been excellent alternatives without needing to sacrifice multi-thread performance.
See our dedicated page on the Core i7-1165G7 for more technical information and benchmark comparisons.
Cinebench R15: CPU Multi 64Bit | CPU Single 64Bit
Blender: v2.79 BMW27 CPU
7-Zip 18.03: 7z b 4 -mmt1 | 7z b 4
Geekbench 5.5: Single-Core | Multi-Core
HWBOT x265 Benchmark v2.2: 4k Preset
LibreOffice : 20 Documents To PDF
R Benchmark 2.5: Overall mean
| Cinebench R20 / CPU (Multi Core) | |
| Lenovo Yoga Slim 7-14ARE | |
| Lenovo Yoga Slim 7 14ARE05 82A20008GE | |
| Razer Book 13 FHD | |
| Lenovo ThinkPad L14-20U50003GE | |
| Lenovo Yoga 9i 14ITL5 | |
| Ortalama Intel Core i7-1165G7 (1060 - 2657, n=81) | |
| Dell XPS 13 9310 Core i7 FHD | |
| Apple MacBook Air 2020 M1 Entry | |
| Razer Blade Stealth Core i7 GTX 1650 Ti Max-Q 4K | |
| Microsoft Surface Laptop 3 13 Core i5-1035G7 | |
| Dell XPS 13 9300 4K UHD | |
| Asus ZenBook 14 UX434FL-DB77 | |
| HP Elite Dragonfly-8MK79EA | |
| Cinebench R20 / CPU (Single Core) | |
| Razer Book 13 FHD | |
| Dell XPS 13 9310 Core i7 FHD | |
| Ortalama Intel Core i7-1165G7 (442 - 589, n=81) | |
| Lenovo Yoga 9i 14ITL5 | |
| Lenovo Yoga Slim 7-14ARE | |
| Lenovo Yoga Slim 7 14ARE05 82A20008GE | |
| Dell XPS 13 9300 4K UHD | |
| Lenovo ThinkPad L14-20U50003GE | |
| Asus ZenBook 14 UX434FL-DB77 | |
| Microsoft Surface Laptop 3 13 Core i5-1035G7 | |
| Razer Blade Stealth Core i7 GTX 1650 Ti Max-Q 4K | |
| Apple MacBook Air 2020 M1 Entry | |
| HP Elite Dragonfly-8MK79EA | |
| Cinebench R15 / CPU Multi 64Bit | |
| Lenovo Yoga Slim 7-14ARE | |
| Lenovo Yoga Slim 7 14ARE05 82A20008GE | |
| Apple MacBook Air 2020 M1 Entry | |
| Razer Book 13 FHD | |
| Dell XPS 13 9310 Core i7 FHD | |
| Lenovo ThinkPad L14-20U50003GE | |
| Ortalama Intel Core i7-1165G7 (553 - 1027, n=86) | |
| Dell XPS 13 9300 4K UHD | |
| Lenovo Yoga 9i 14ITL5 | |
| Microsoft Surface Laptop 3 13 Core i5-1035G7 | |
| Razer Blade Stealth Core i7 GTX 1650 Ti Max-Q 4K | |
| Asus ZenBook 14 UX434FL-DB77 | |
| HP Elite Dragonfly-8MK79EA | |
| Cinebench R15 / CPU Single 64Bit | |
| Razer Book 13 FHD | |
| Dell XPS 13 9310 Core i7 FHD | |
| Ortalama Intel Core i7-1165G7 (115 - 230, n=78) | |
| Apple MacBook Air 2020 M1 Entry | |
| Lenovo Yoga 9i 14ITL5 | |
| Lenovo Yoga Slim 7-14ARE | |
| Dell XPS 13 9300 4K UHD | |
| Asus ZenBook 14 UX434FL-DB77 | |
| Lenovo Yoga Slim 7 14ARE05 82A20008GE | |
| Lenovo ThinkPad L14-20U50003GE | |
| Microsoft Surface Laptop 3 13 Core i5-1035G7 | |
| Razer Blade Stealth Core i7 GTX 1650 Ti Max-Q 4K | |
| HP Elite Dragonfly-8MK79EA | |
| Blender / v2.79 BMW27 CPU | |
| HP Elite Dragonfly-8MK79EA | |
| Microsoft Surface Laptop 3 13 Core i5-1035G7 | |
| Asus ZenBook 14 UX434FL-DB77 | |
| Apple MacBook Air 2020 M1 Entry | |
| Dell XPS 13 9300 4K UHD | |
| Dell XPS 13 9310 Core i7 FHD | |
| Lenovo Yoga 9i 14ITL5 | |
| Ortalama Intel Core i7-1165G7 (468 - 1138, n=80) | |
| Lenovo ThinkPad L14-20U50003GE | |
| Razer Book 13 FHD | |
| Lenovo Yoga Slim 7 14ARE05 82A20008GE | |
| Lenovo Yoga Slim 7-14ARE | |
| 7-Zip 18.03 / 7z b 4 -mmt1 | |
| Apple MacBook Air 2020 M1 Entry | |
| Razer Book 13 FHD | |
| Dell XPS 13 9310 Core i7 FHD | |
| Ortalama Intel Core i7-1165G7 (4478 - 5507, n=80) | |
| Lenovo Yoga 9i 14ITL5 | |
| Dell XPS 13 9300 4K UHD | |
| Lenovo Yoga Slim 7-14ARE | |
| Lenovo Yoga Slim 7 14ARE05 82A20008GE | |
| Lenovo ThinkPad L14-20U50003GE | |
| Microsoft Surface Laptop 3 13 Core i5-1035G7 | |
| Razer Blade Stealth Core i7 GTX 1650 Ti Max-Q 4K | |
| HP Elite Dragonfly-8MK79EA | |
| Asus ZenBook 14 UX434FL-DB77 | |
| 7-Zip 18.03 / 7z b 4 | |
| Lenovo Yoga Slim 7-14ARE | |
| Apple MacBook Air 2020 M1 Entry | |
| Lenovo Yoga Slim 7 14ARE05 82A20008GE | |
| Razer Book 13 FHD | |
| Lenovo ThinkPad L14-20U50003GE | |
| Ortalama Intel Core i7-1165G7 (15347 - 27405, n=80) | |
| Lenovo Yoga 9i 14ITL5 | |
| Dell XPS 13 9300 4K UHD | |
| Dell XPS 13 9310 Core i7 FHD | |
| Razer Blade Stealth Core i7 GTX 1650 Ti Max-Q 4K | |
| Microsoft Surface Laptop 3 13 Core i5-1035G7 | |
| Asus ZenBook 14 UX434FL-DB77 | |
| HP Elite Dragonfly-8MK79EA | |
| Geekbench 5.5 / Single-Core | |
| Apple MacBook Air 2020 M1 Entry | |
| Razer Book 13 FHD | |
| Dell XPS 13 9310 Core i7 FHD | |
| Ortalama Intel Core i7-1165G7 (1302 - 1595, n=77) | |
| Lenovo Yoga 9i 14ITL5 | |
| Dell XPS 13 9300 4K UHD | |
| Razer Blade Stealth Core i7 GTX 1650 Ti Max-Q 4K | |
| Asus ZenBook 14 UX434FL-DB77 | |
| Lenovo Yoga Slim 7-14ARE | |
| Lenovo Yoga Slim 7-14ARE | |
| Lenovo Yoga Slim 7 14ARE05 82A20008GE | |
| Lenovo ThinkPad L14-20U50003GE | |
| Geekbench 5.5 / Multi-Core | |
| Apple MacBook Air 2020 M1 Entry | |
| Lenovo Yoga Slim 7-14ARE | |
| Lenovo Yoga Slim 7-14ARE | |
| Lenovo Yoga Slim 7 14ARE05 82A20008GE | |
| Razer Book 13 FHD | |
| Dell XPS 13 9310 Core i7 FHD | |
| Lenovo Yoga 9i 14ITL5 | |
| Ortalama Intel Core i7-1165G7 (3078 - 5926, n=77) | |
| Dell XPS 13 9300 4K UHD | |
| Razer Blade Stealth Core i7 GTX 1650 Ti Max-Q 4K | |
| Lenovo ThinkPad L14-20U50003GE | |
| Asus ZenBook 14 UX434FL-DB77 | |
| HWBOT x265 Benchmark v2.2 / 4k Preset | |
| Lenovo Yoga Slim 7-14ARE | |
| Lenovo Yoga Slim 7 14ARE05 82A20008GE | |
| Razer Book 13 FHD | |
| Lenovo ThinkPad L14-20U50003GE | |
| Lenovo Yoga 9i 14ITL5 | |
| Ortalama Intel Core i7-1165G7 (1.39 - 8.47, n=80) | |
| Dell XPS 13 9300 4K UHD | |
| Dell XPS 13 9310 Core i7 FHD | |
| Asus ZenBook 14 UX434FL-DB77 | |
| Microsoft Surface Laptop 3 13 Core i5-1035G7 | |
| HP Elite Dragonfly-8MK79EA | |
| LibreOffice / 20 Documents To PDF | |
| Dell XPS 13 9300 4K UHD | |
| Asus ZenBook 14 UX434FL-DB77 | |
| Lenovo Yoga Slim 7 14ARE05 82A20008GE | |
| Razer Blade Stealth Core i7 GTX 1650 Ti Max-Q 4K | |
| Lenovo ThinkPad L14-20U50003GE | |
| Lenovo Yoga Slim 7-14ARE | |
| Razer Book 13 FHD | |
| Ortalama Intel Core i7-1165G7 (21.5 - 88.1, n=78) | |
| Lenovo Yoga 9i 14ITL5 | |
| Dell XPS 13 9310 Core i7 FHD | |
| Apple MacBook Air 2020 M1 Entry | |
| R Benchmark 2.5 / Overall mean | |
| Asus ZenBook 14 UX434FL-DB77 | |
| Apple MacBook Air 2020 M1 Entry | |
| Dell XPS 13 9300 4K UHD | |
| Lenovo ThinkPad L14-20U50003GE | |
| Lenovo Yoga 9i 14ITL5 | |
| Lenovo Yoga Slim 7 14ARE05 82A20008GE | |
| Lenovo Yoga Slim 7-14ARE | |
| Ortalama Intel Core i7-1165G7 (0.552 - 1.002, n=80) | |
| Dell XPS 13 9310 Core i7 FHD | |
| Razer Book 13 FHD | |
Cinebench R15: CPU Multi 64Bit | CPU Single 64Bit
Blender: v2.79 BMW27 CPU
7-Zip 18.03: 7z b 4 -mmt1 | 7z b 4
Geekbench 5.5: Single-Core | Multi-Core
HWBOT x265 Benchmark v2.2: 4k Preset
LibreOffice : 20 Documents To PDF
R Benchmark 2.5: Overall mean
* ... daha küçük daha iyidir
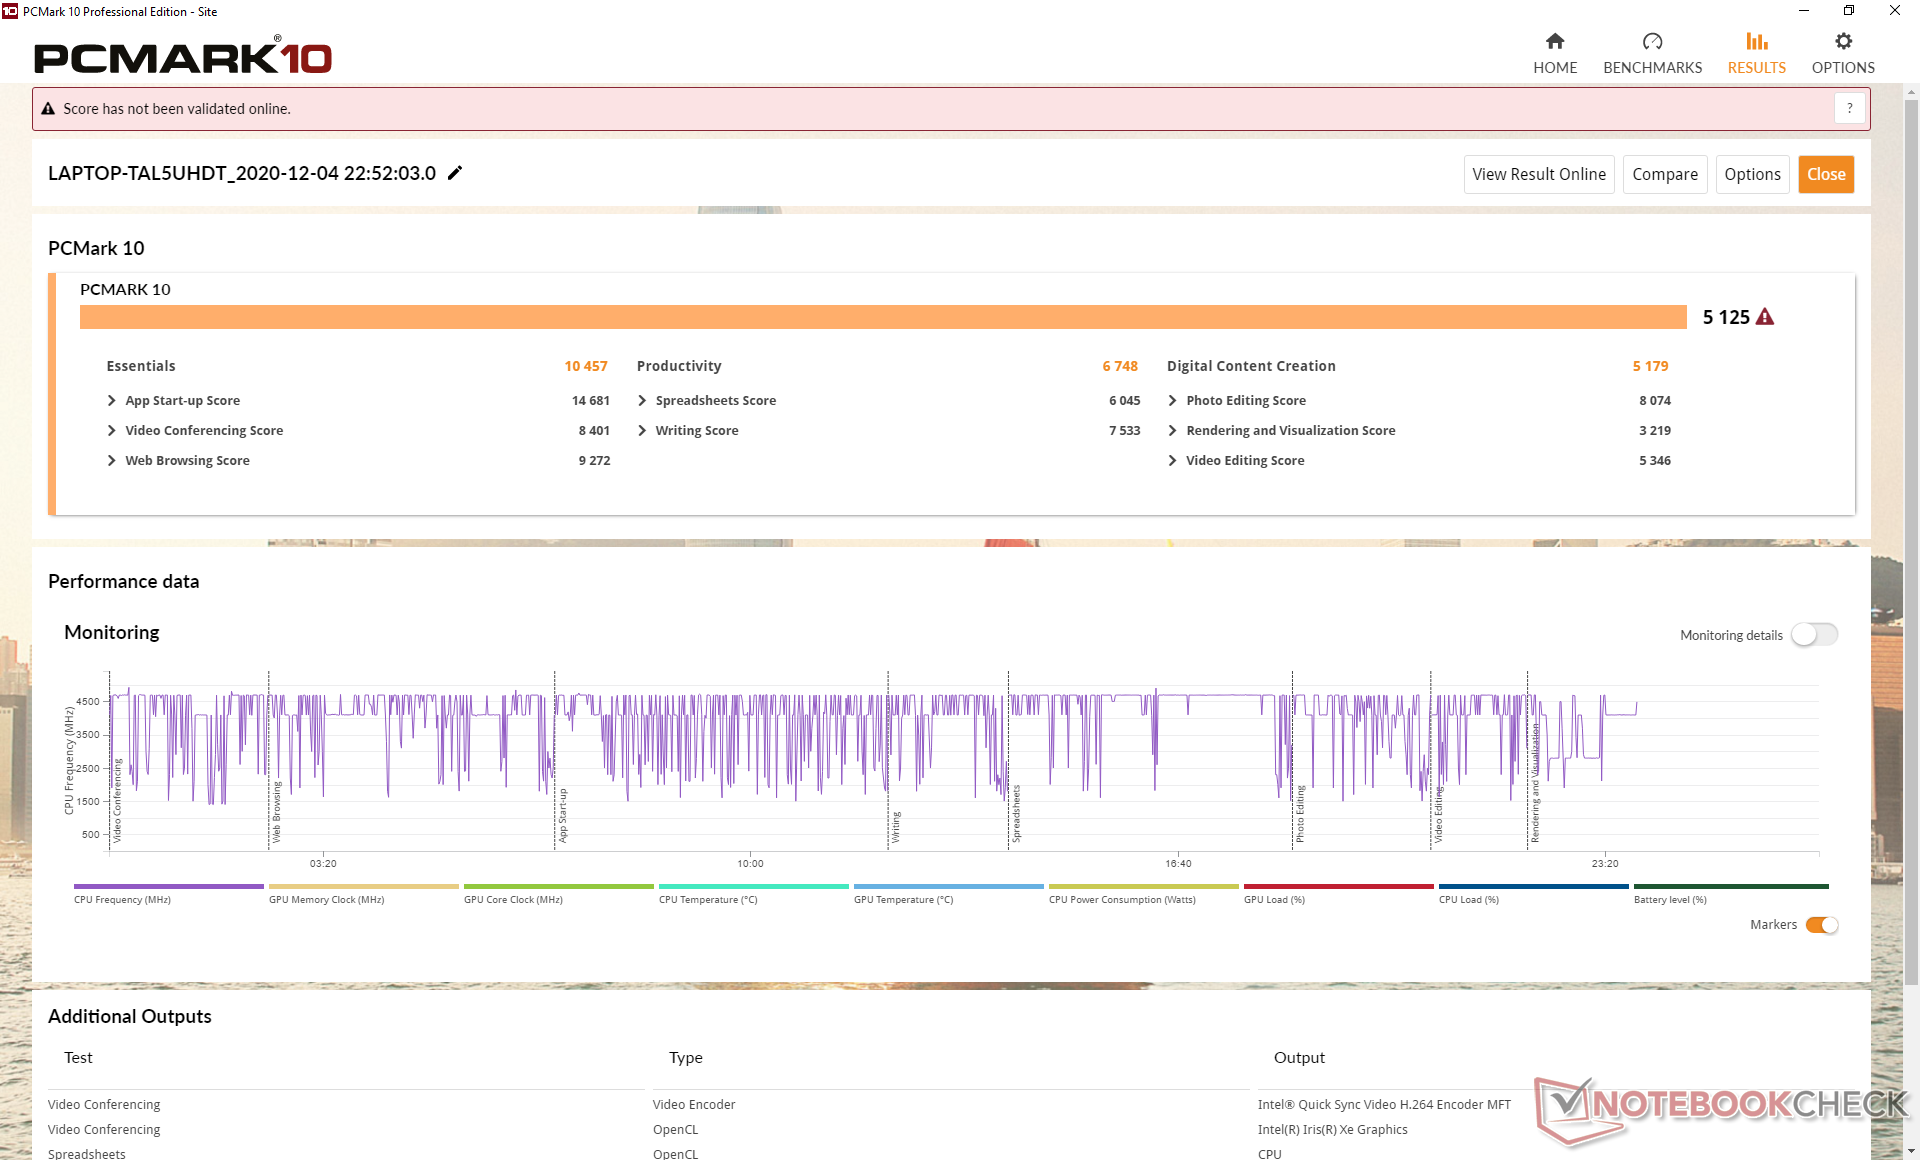
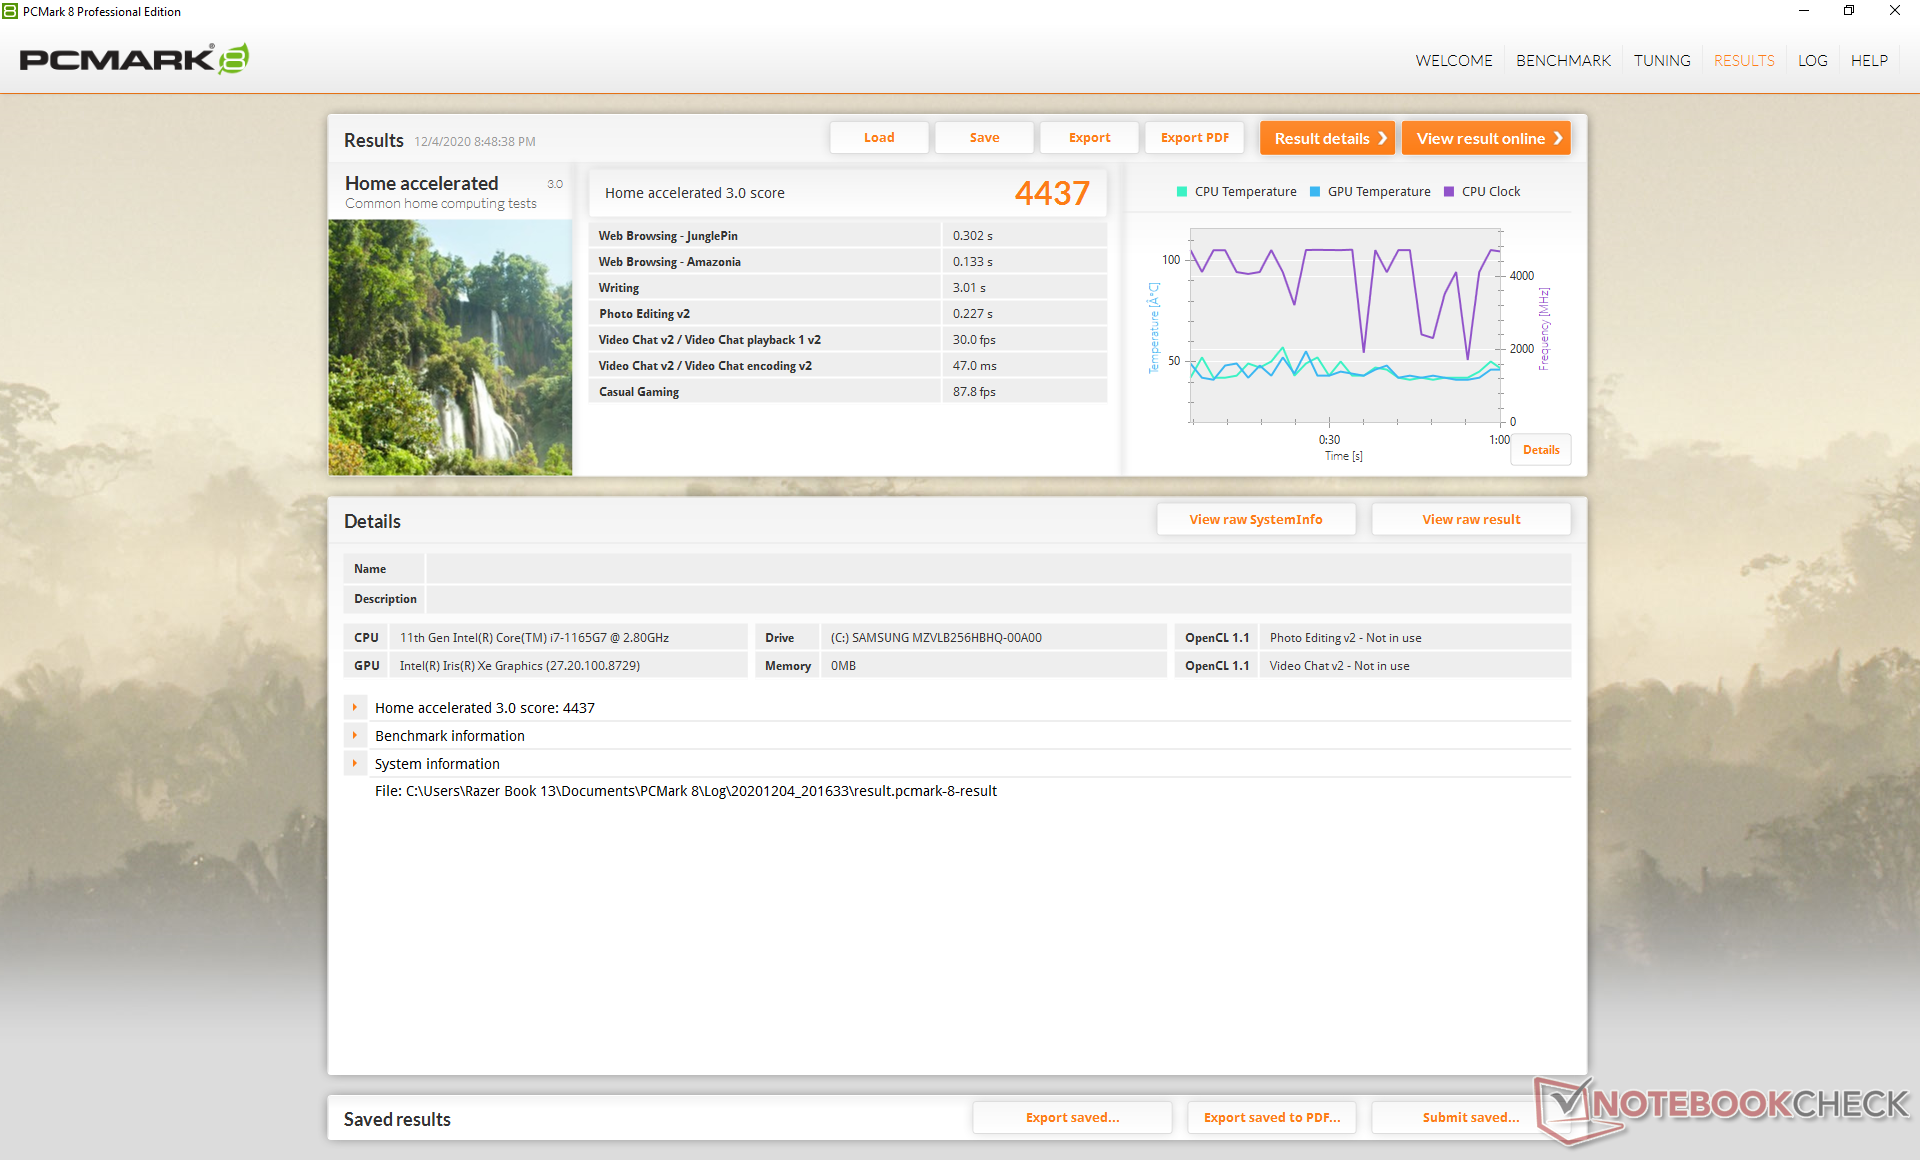
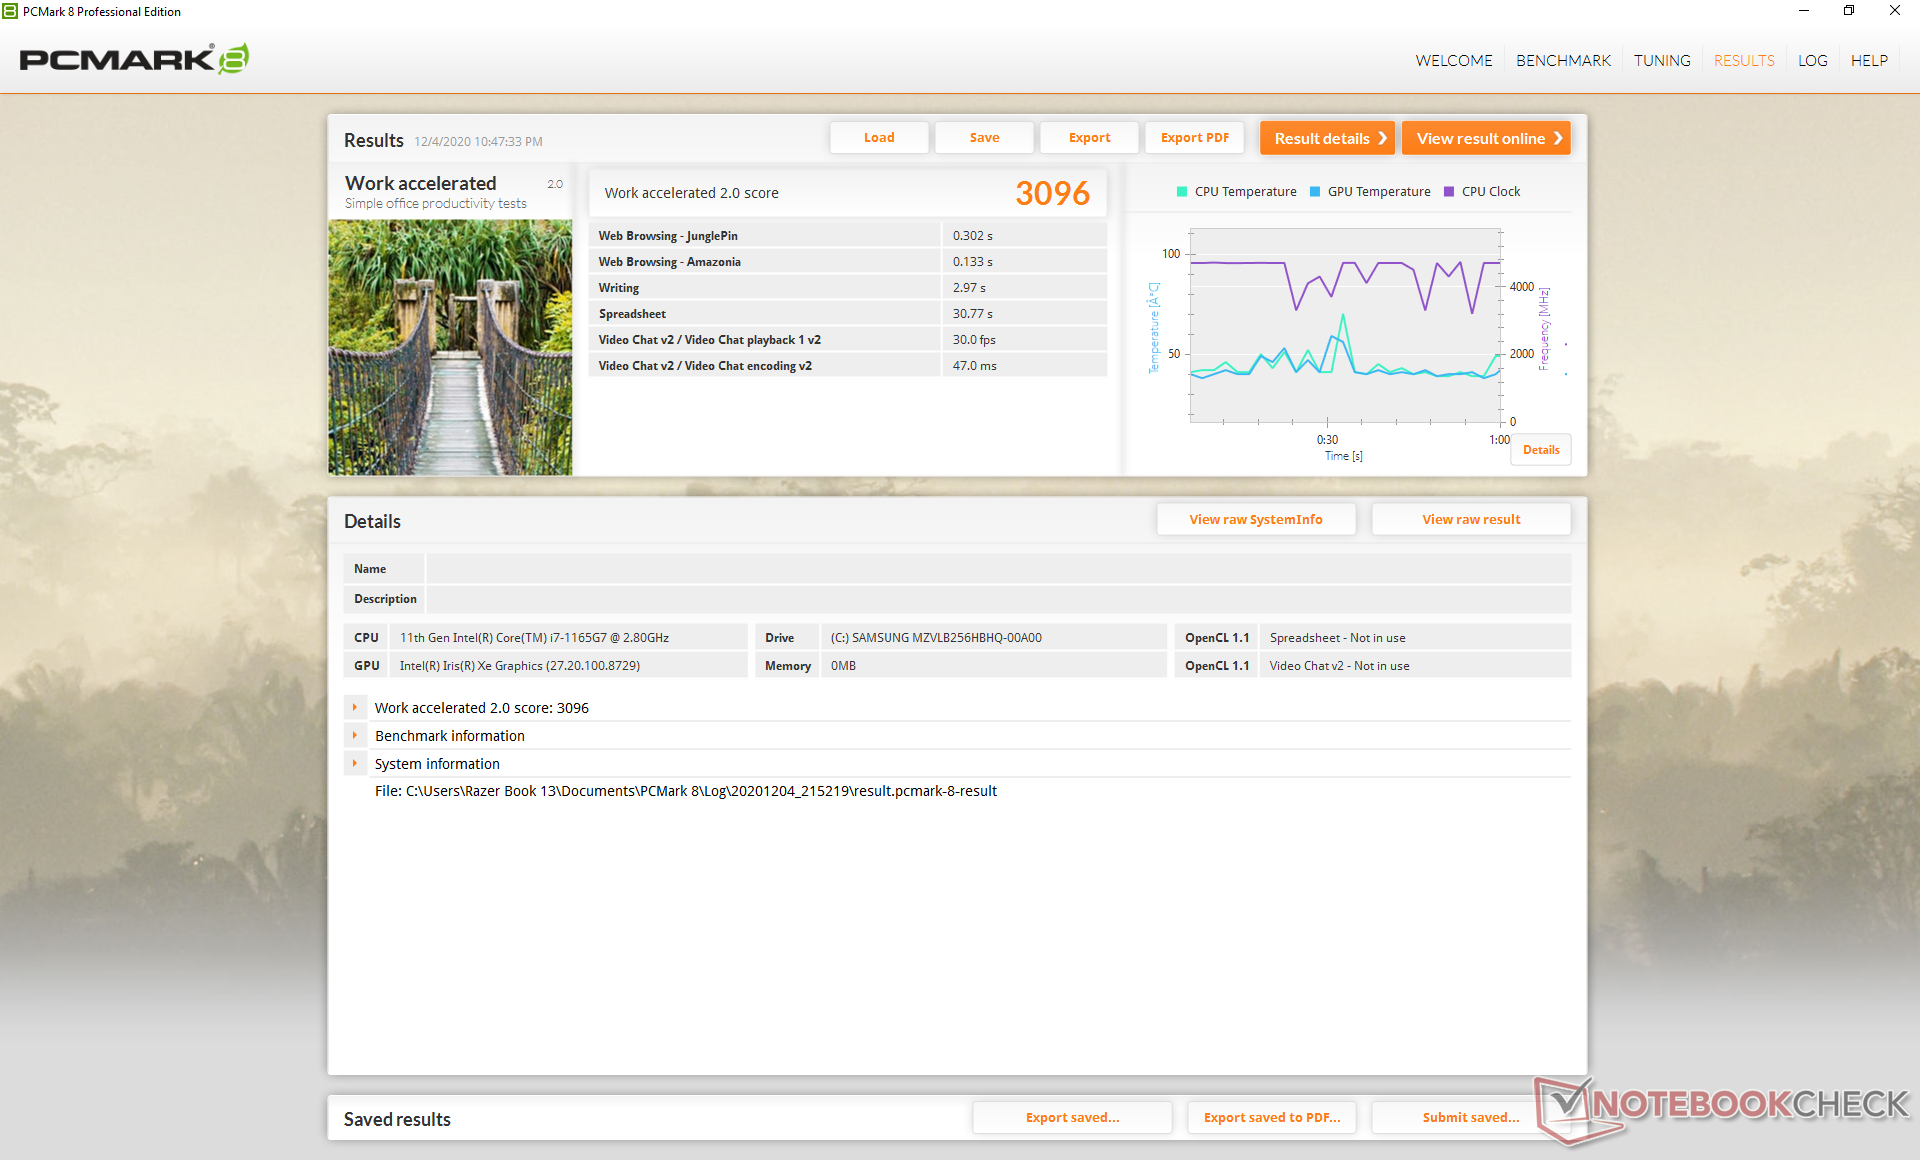
System Performance
PCMark results are slightly higher than the average laptop with the same CPU to edge out the XPS 13 9310 by just a few percentage points. We didn't experience any issues on our test unit save for a Razer Synapse bug where the application would always freeze if disconnected from the Internet after a system boot.
| PCMark 8 | |
| Home Score Accelerated v2 | |
| Lenovo Yoga Slim 7-14ARE | |
| Ortalama Intel Core i7-1165G7, Intel Iris Xe Graphics G7 96EUs (3769 - 5686, n=17) | |
| Razer Book 13 FHD | |
| Dell XPS 13 9310 Core i7 FHD | |
| Razer Blade Stealth i7-1065G7 Iris Plus | |
| Huawei MateBook X Pro 2020 i7 | |
| Asus Zenbook S UX393JA | |
| Work Score Accelerated v2 | |
| Lenovo Yoga Slim 7-14ARE | |
| Razer Blade Stealth i7-1065G7 Iris Plus | |
| Huawei MateBook X Pro 2020 i7 | |
| Razer Book 13 FHD | |
| Dell XPS 13 9310 Core i7 FHD | |
| Ortalama Intel Core i7-1165G7, Intel Iris Xe Graphics G7 96EUs (2431 - 3221, n=15) | |
| Asus Zenbook S UX393JA | |
| PCMark 8 Home Score Accelerated v2 | 4437 puan | |
| PCMark 8 Work Score Accelerated v2 | 3096 puan | |
| PCMark 10 Score | 5125 puan | |
Yardım | ||
DPC Latency
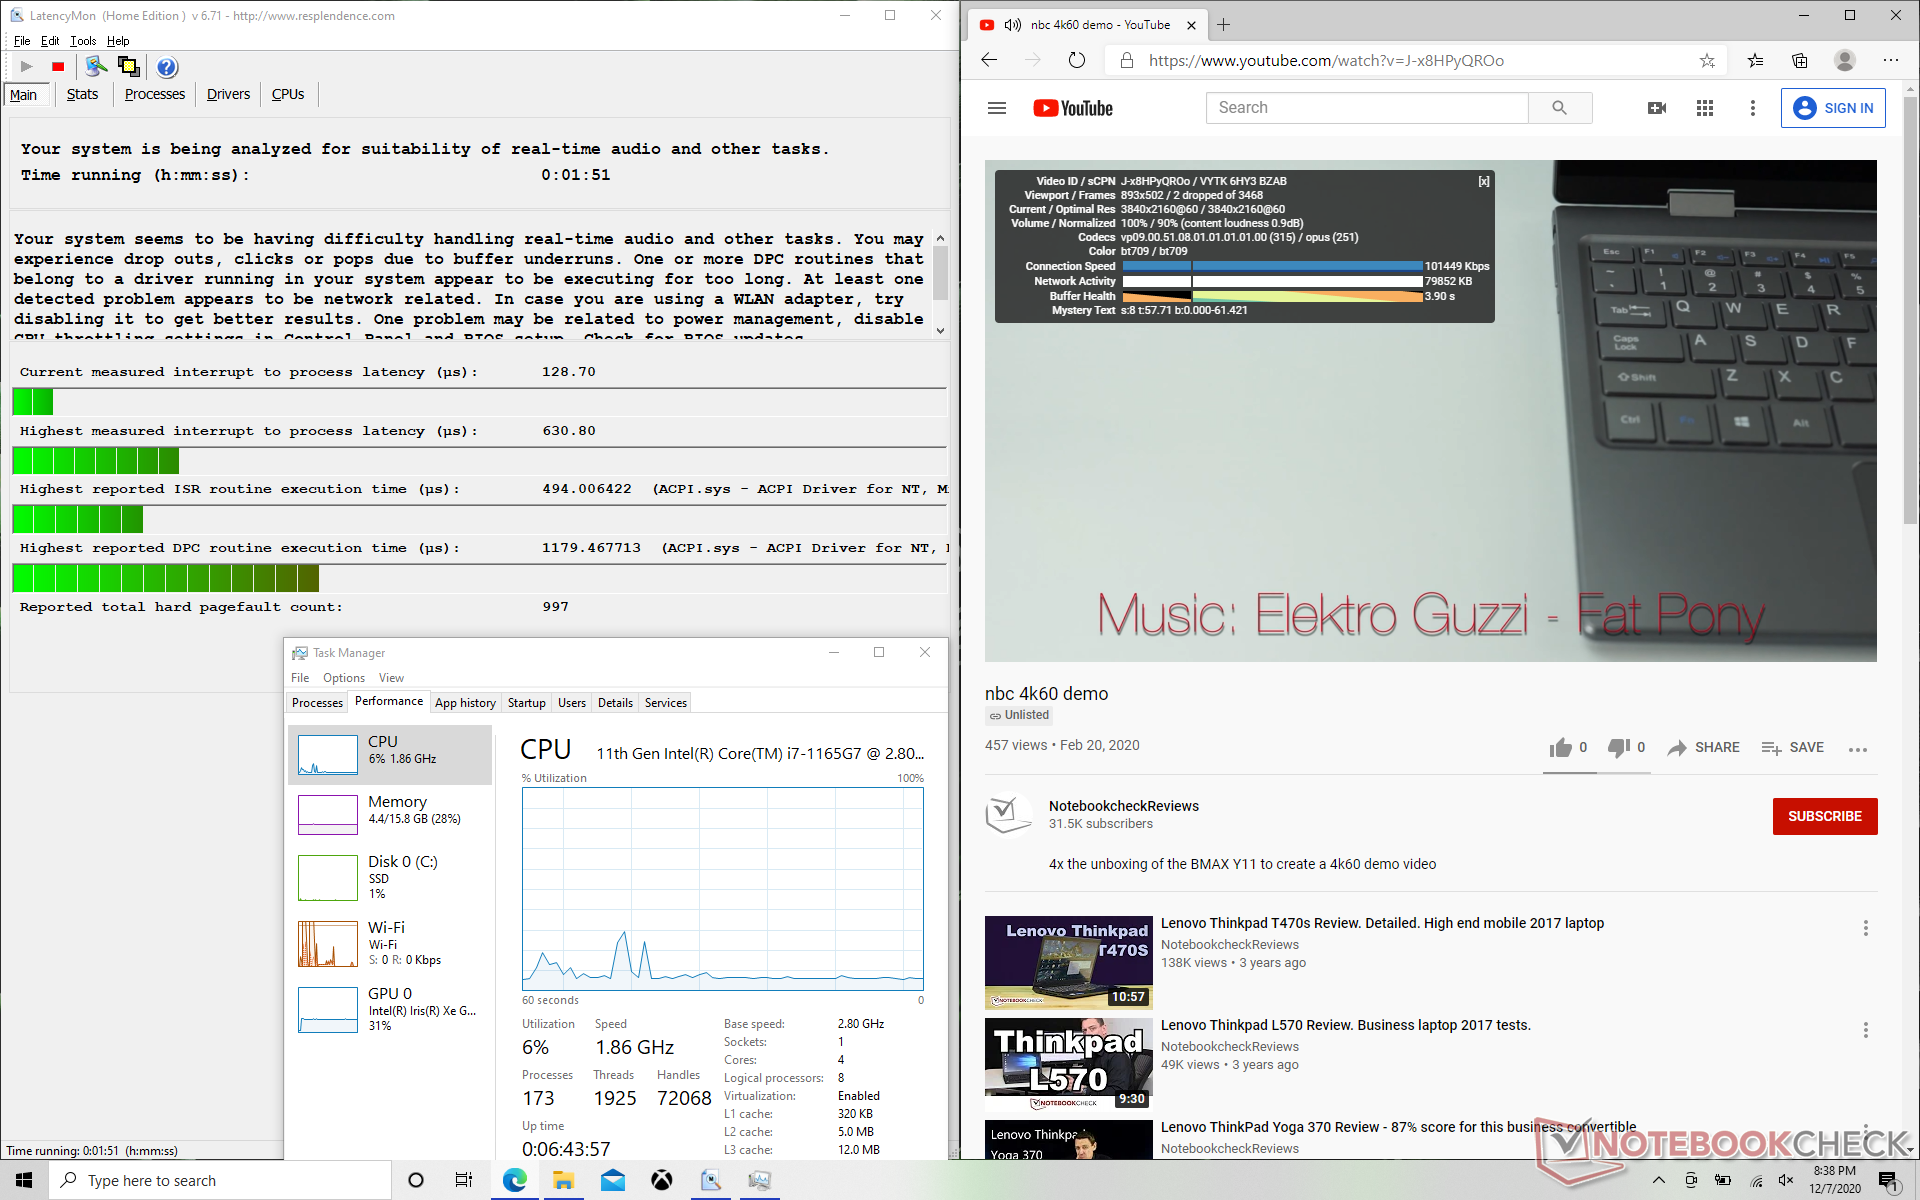
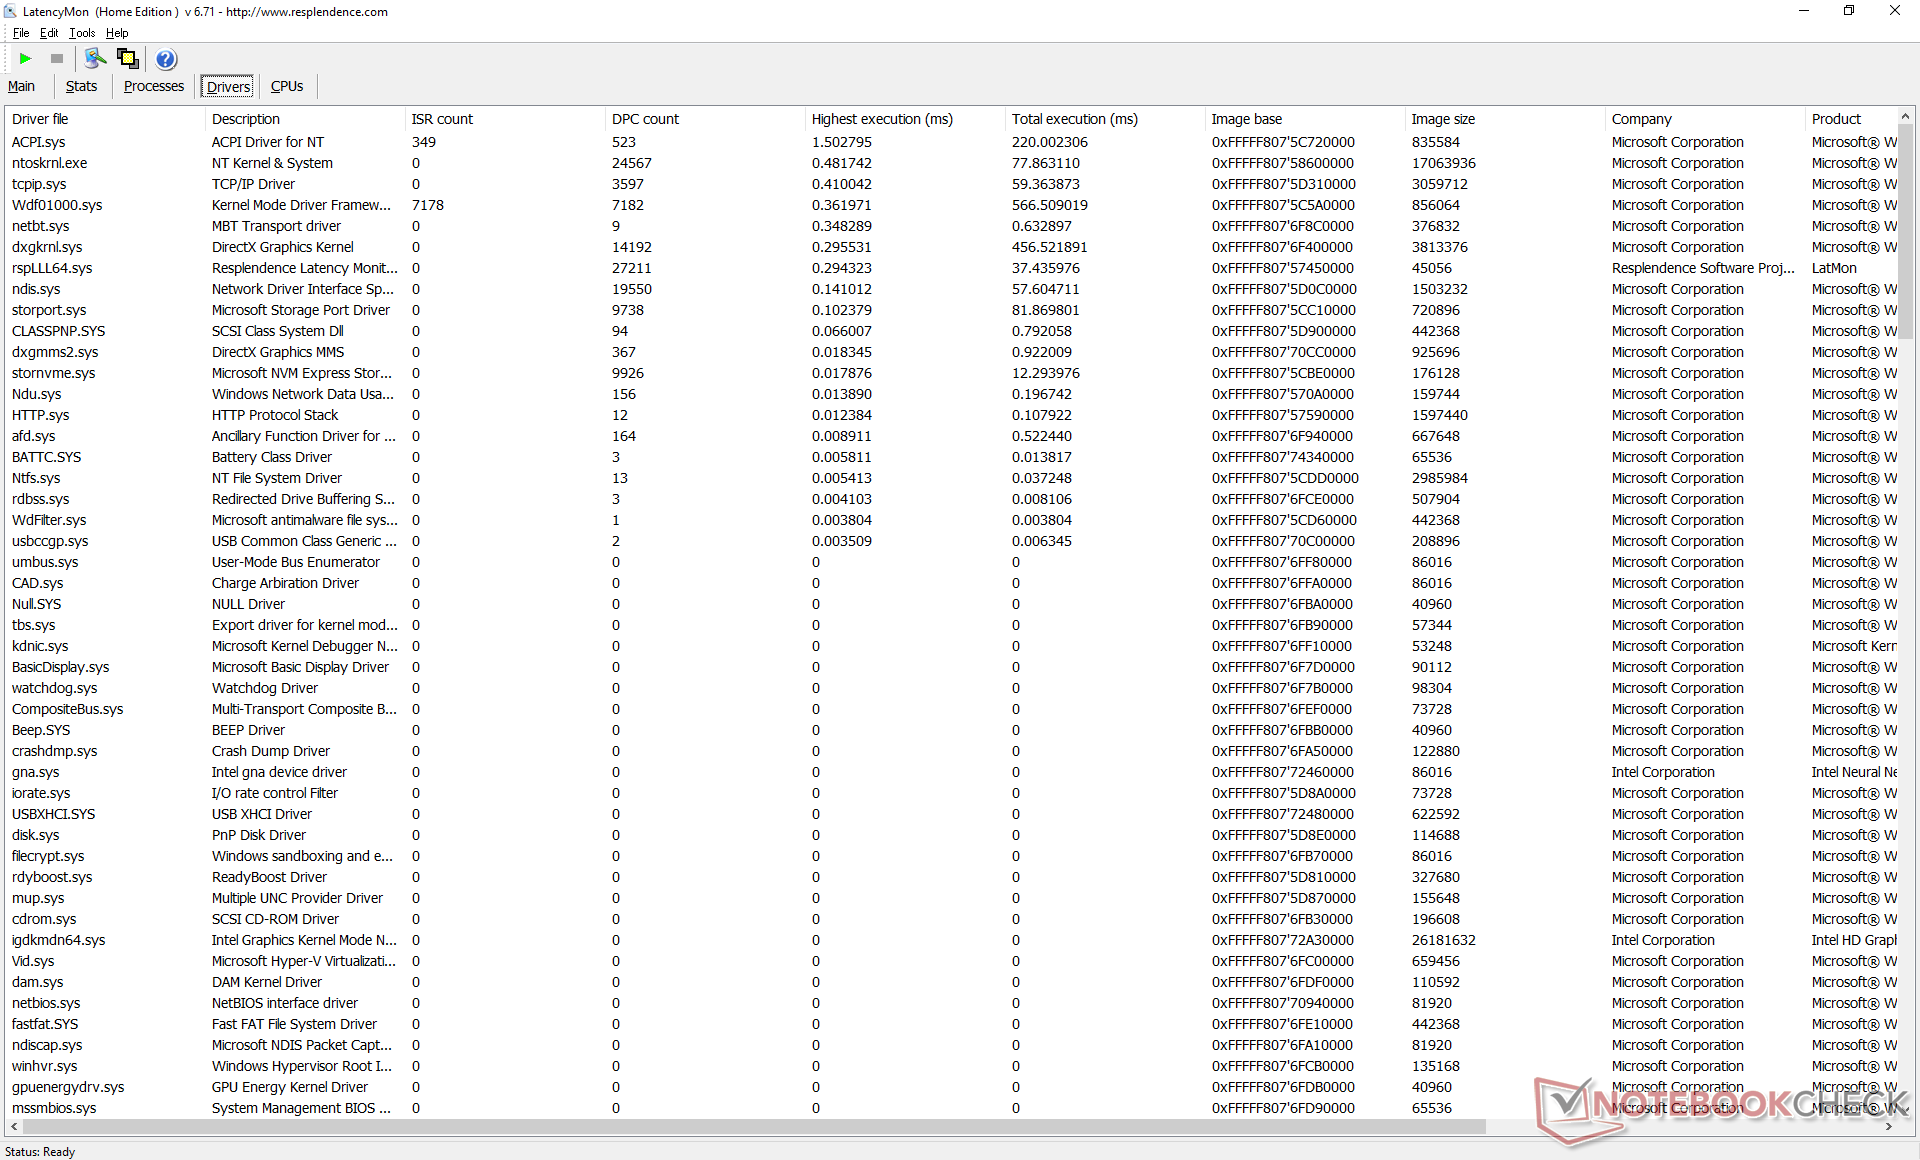
| DPC Latencies / LatencyMon - interrupt to process latency (max), Web, Youtube, Prime95 | |
| Razer Blade Stealth Core i7 GTX 1650 Ti Max-Q 4K | |
| Dell XPS 13 9300 4K UHD | |
| Asus Zenbook S UX393JA | |
| Asus ZenBook 14 UX434FL-DB77 | |
| Razer Book 13 FHD | |
| Lenovo ThinkPad L14-20U50003GE | |
| Razer Blade Stealth i7-1165G7 GTX 1650 Ti Max-Q | |
| Asus ZenBook 14 UX425EA | |
| Dell XPS 13 9310 Core i7 FHD | |
| Lenovo Yoga Slim 7 14ARE05 82A20008GE | |
* ... daha küçük daha iyidir
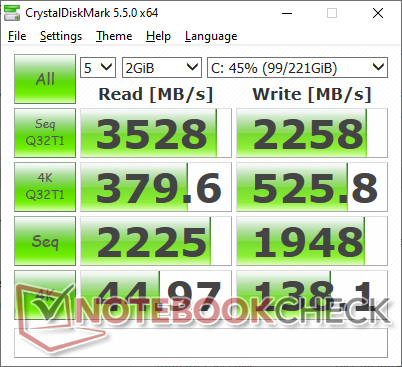
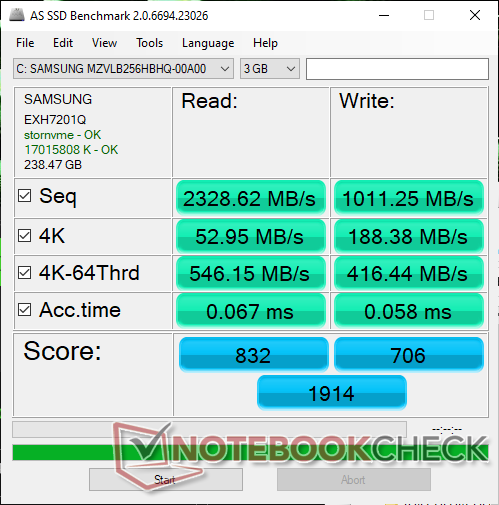
Storage Devices
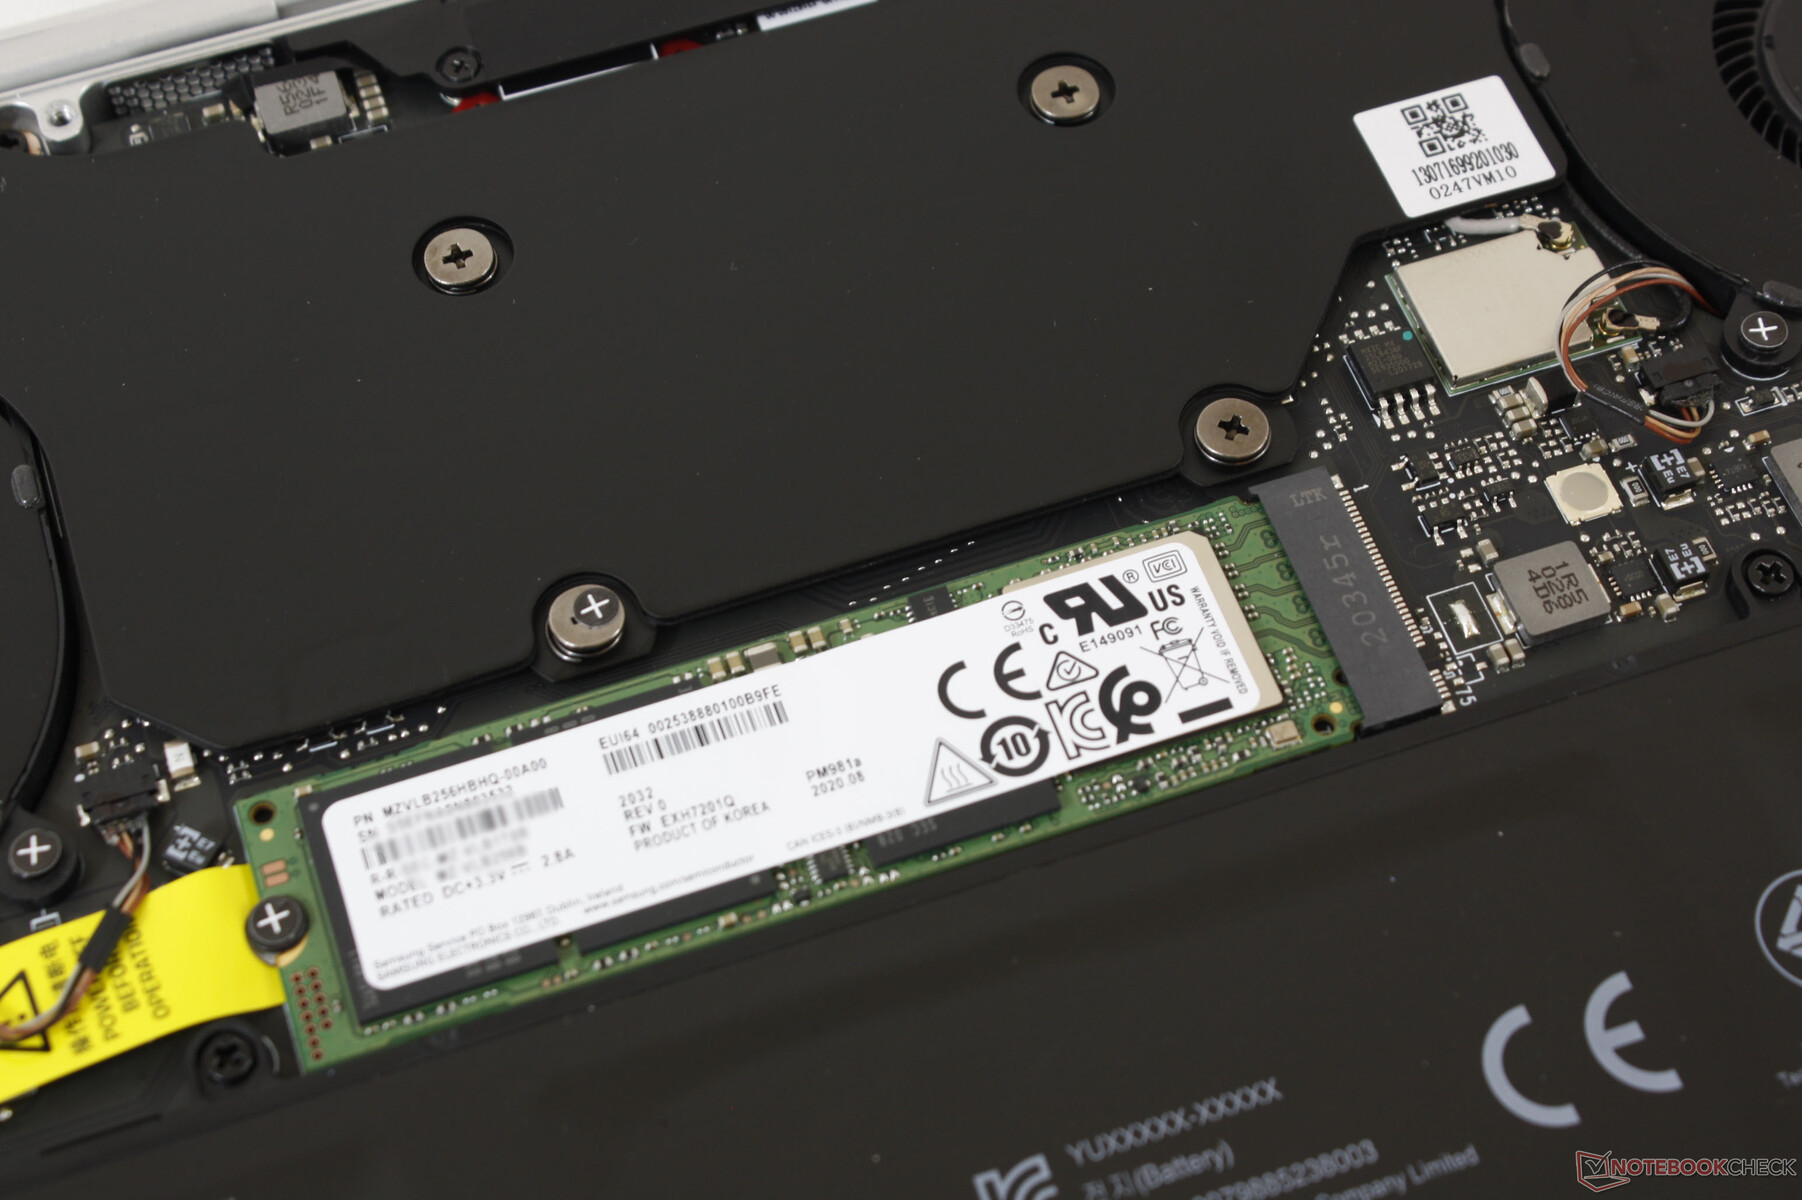
Most Razer laptops ship with Samsung SSDs while a select few SKUs ship with slower Lite-On SSDs instead. Our unit comes with the Samsung PM981a for much faster performance than the mid-range Intel 660p of similar capacity.
| Razer Book 13 FHD Samsung SSD PM981a MZVLB256HBHQ | Dell XPS 13 9310 Core i7 FHD Micron 2300 512GB MTFDHBA512TDV | Asus Zenbook S UX393JA Intel SSD 660p 1TB SSDPEKNW010T8 | Huawei MateBook X Pro 2020 i7 Samsung PM981a MZVLB1T0HBLR | Lenovo Yoga C930-13IKB SK hynix PC401 HFS256GD9TNG | Razer Blade Stealth i7-1065G7 Iris Plus Samsung SSD PM981 MZVLB256HAHQ | |
|---|---|---|---|---|---|---|
| AS SSD | 26% | 22% | 106% | -30% | -20% | |
| Seq Read (MB/s) | 2329 | 2091 -10% | 1405 -40% | 2737 18% | 1850 -21% | 1989 -15% |
| Seq Write (MB/s) | 1011 | 1396 38% | 1062 5% | 2530 150% | 661 -35% | 827 -18% |
| 4K Read (MB/s) | 53 | 49.29 -7% | 50.8 -4% | 54 2% | 38.04 -28% | 40.12 -24% |
| 4K Write (MB/s) | 188.4 | 104.2 -45% | 124.9 -34% | 152.5 -19% | 95 -50% | 135.1 -28% |
| 4K-64 Read (MB/s) | 546 | 827 51% | 590 8% | 2011 268% | 434.3 -20% | 531 -3% |
| 4K-64 Write (MB/s) | 416.4 | 1636 293% | 840 102% | 1260 203% | 266.3 -36% | 309.9 -26% |
| Access Time Read * (ms) | 0.067 | 0.066 1% | 0.041 39% | 0.066 1% | 0.069 -3% | 0.085 -27% |
| Access Time Write * (ms) | 0.058 | 0.365 -529% | 0.118 -103% | 0.024 59% | 0.056 3% | 0.09 -55% |
| Score Read (Points) | 832 | 1086 31% | 781 -6% | 2339 181% | 657 -21% | 770 -7% |
| Score Write (Points) | 706 | 1880 166% | 1071 52% | 1666 136% | 427 -40% | 528 -25% |
| Score Total (Points) | 1914 | 3499 83% | 2251 18% | 5191 171% | 1373 -28% | 1644 -14% |
| Copy ISO MB/s (MB/s) | 1664 | 1544 -7% | 1459 -12% | 539 -68% | 1418 -15% | |
| Copy Program MB/s (MB/s) | 415.2 | 613 48% | 600 45% | 209.7 -49% | 382.7 -8% | |
| Copy Game MB/s (MB/s) | 420.2 | 1451 245% | 1411 236% | 340 -19% | 334.2 -20% | |
| CrystalDiskMark 5.2 / 6 | -4% | -20% | 8% | -38% | -5% | |
| Write 4K (MB/s) | 138.1 | 97.5 -29% | 129.5 -6% | 165.6 20% | 94.5 -32% | 176.8 28% |
| Read 4K (MB/s) | 44.97 | 50.9 13% | 54 20% | 50.2 12% | 39.95 -11% | 48.38 8% |
| Write Seq (MB/s) | 1948 | 1811 -7% | 1265 -35% | 1905 -2% | 531 -73% | 1332 -32% |
| Read Seq (MB/s) | 2225 | 1836 -17% | 1410 -37% | 1669 -25% | 1499 -33% | 1644 -26% |
| Write 4K Q32T1 (MB/s) | 526 | 521 -1% | 420.3 -20% | 474.6 -10% | 315.3 -40% | 440.6 -16% |
| Read 4K Q32T1 (MB/s) | 379.6 | 357.5 -6% | 357.7 -6% | 508 34% | 279.8 -26% | 559 47% |
| Write Seq Q32T1 (MB/s) | 2258 | 2879 28% | 1799 -20% | 3007 33% | 829 -63% | 1104 -51% |
| Read Seq Q32T1 (MB/s) | 3528 | 3204 -9% | 1616 -54% | 3556 1% | 2570 -27% | 3481 -1% |
| Write 4K Q8T8 (MB/s) | 332 | |||||
| Read 4K Q8T8 (MB/s) | 488.6 | |||||
| Toplam Ortalama (Program / Ayarlar) | 11% /
15% | 1% /
7% | 57% /
65% | -34% /
-33% | -13% /
-15% |
* ... daha küçük daha iyidir

Disk Throttling: DiskSpd Read Loop, Queue Depth 8
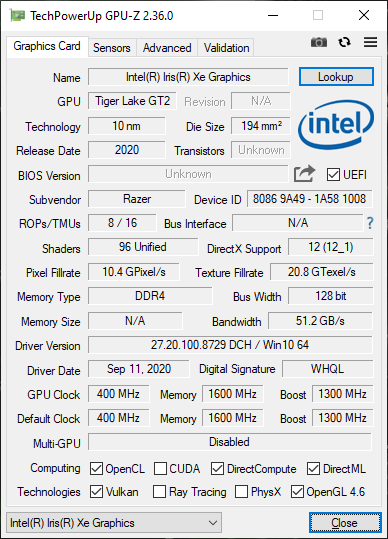
GPU Performance
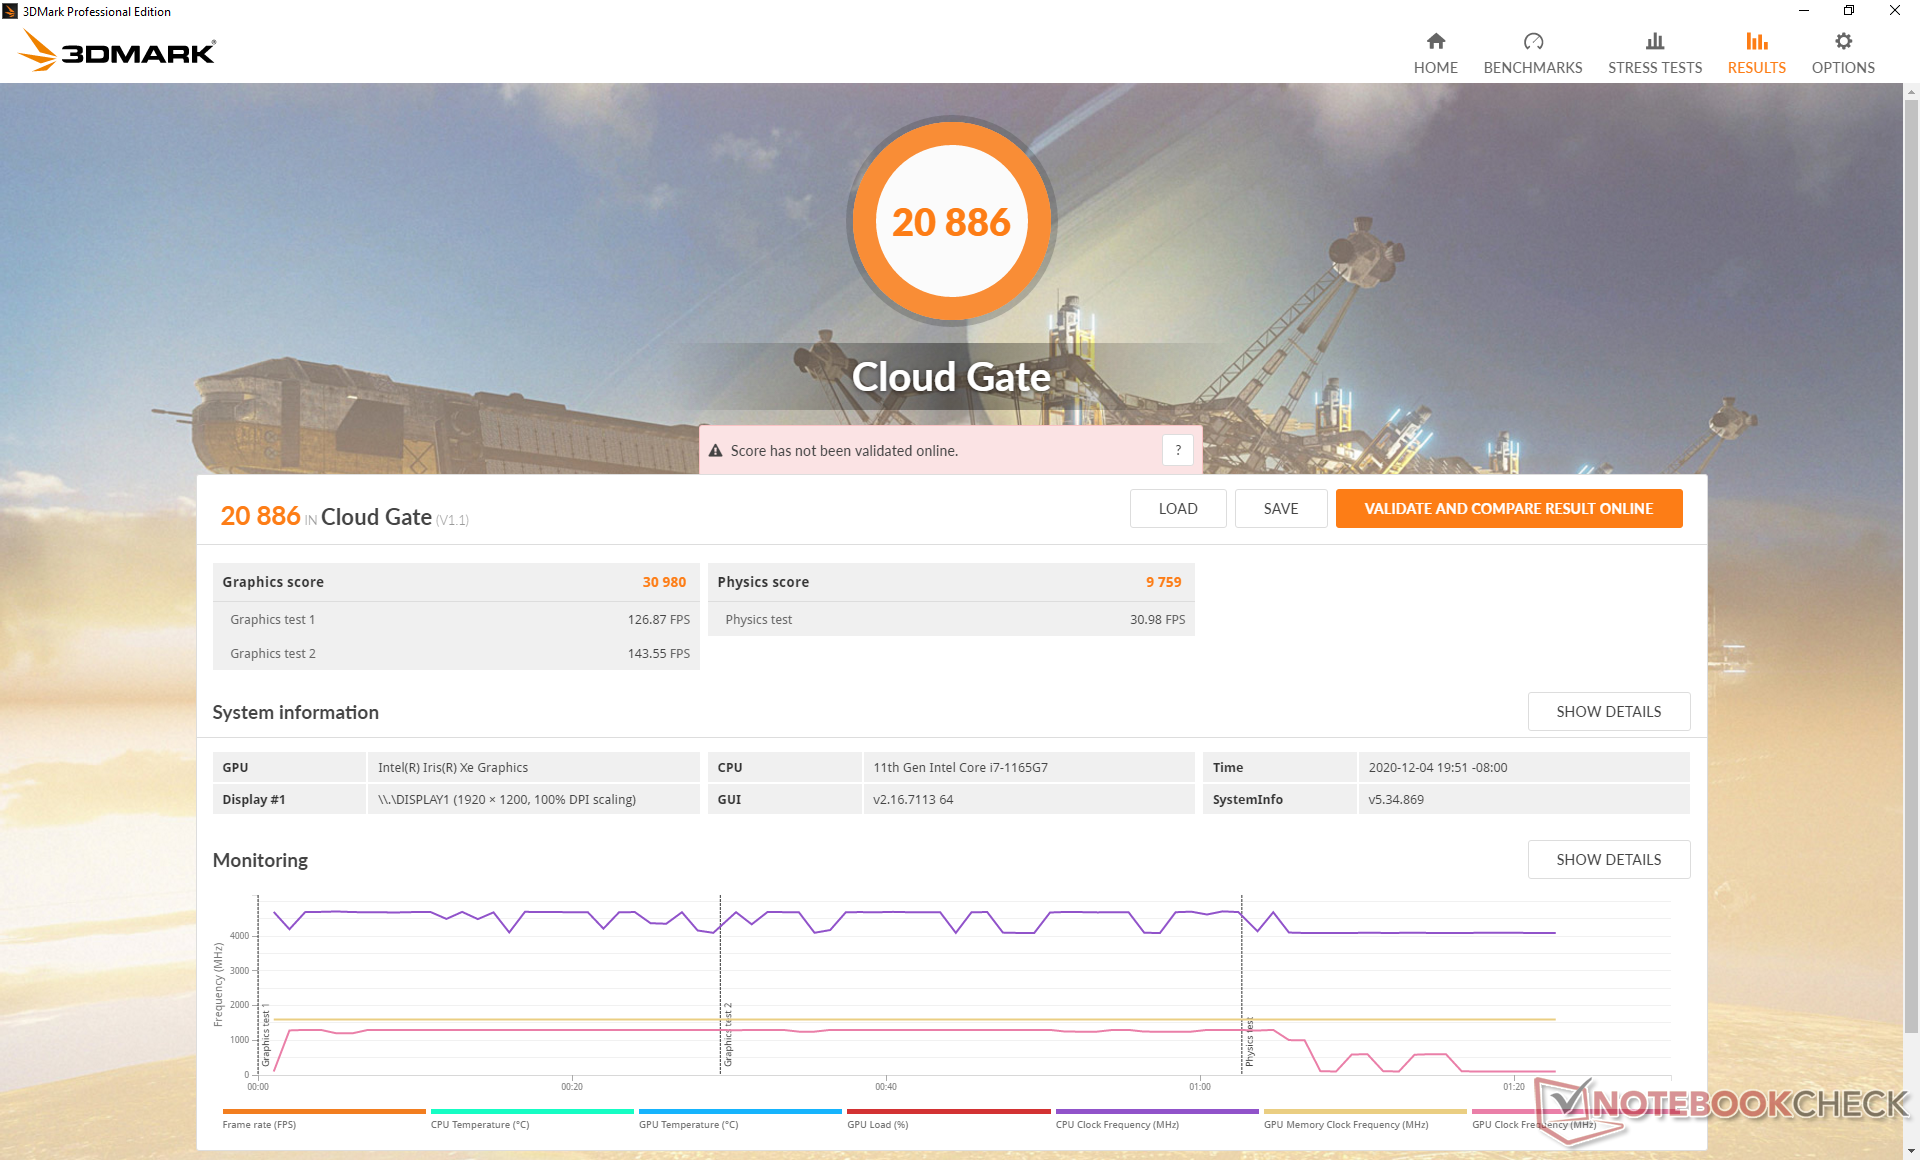
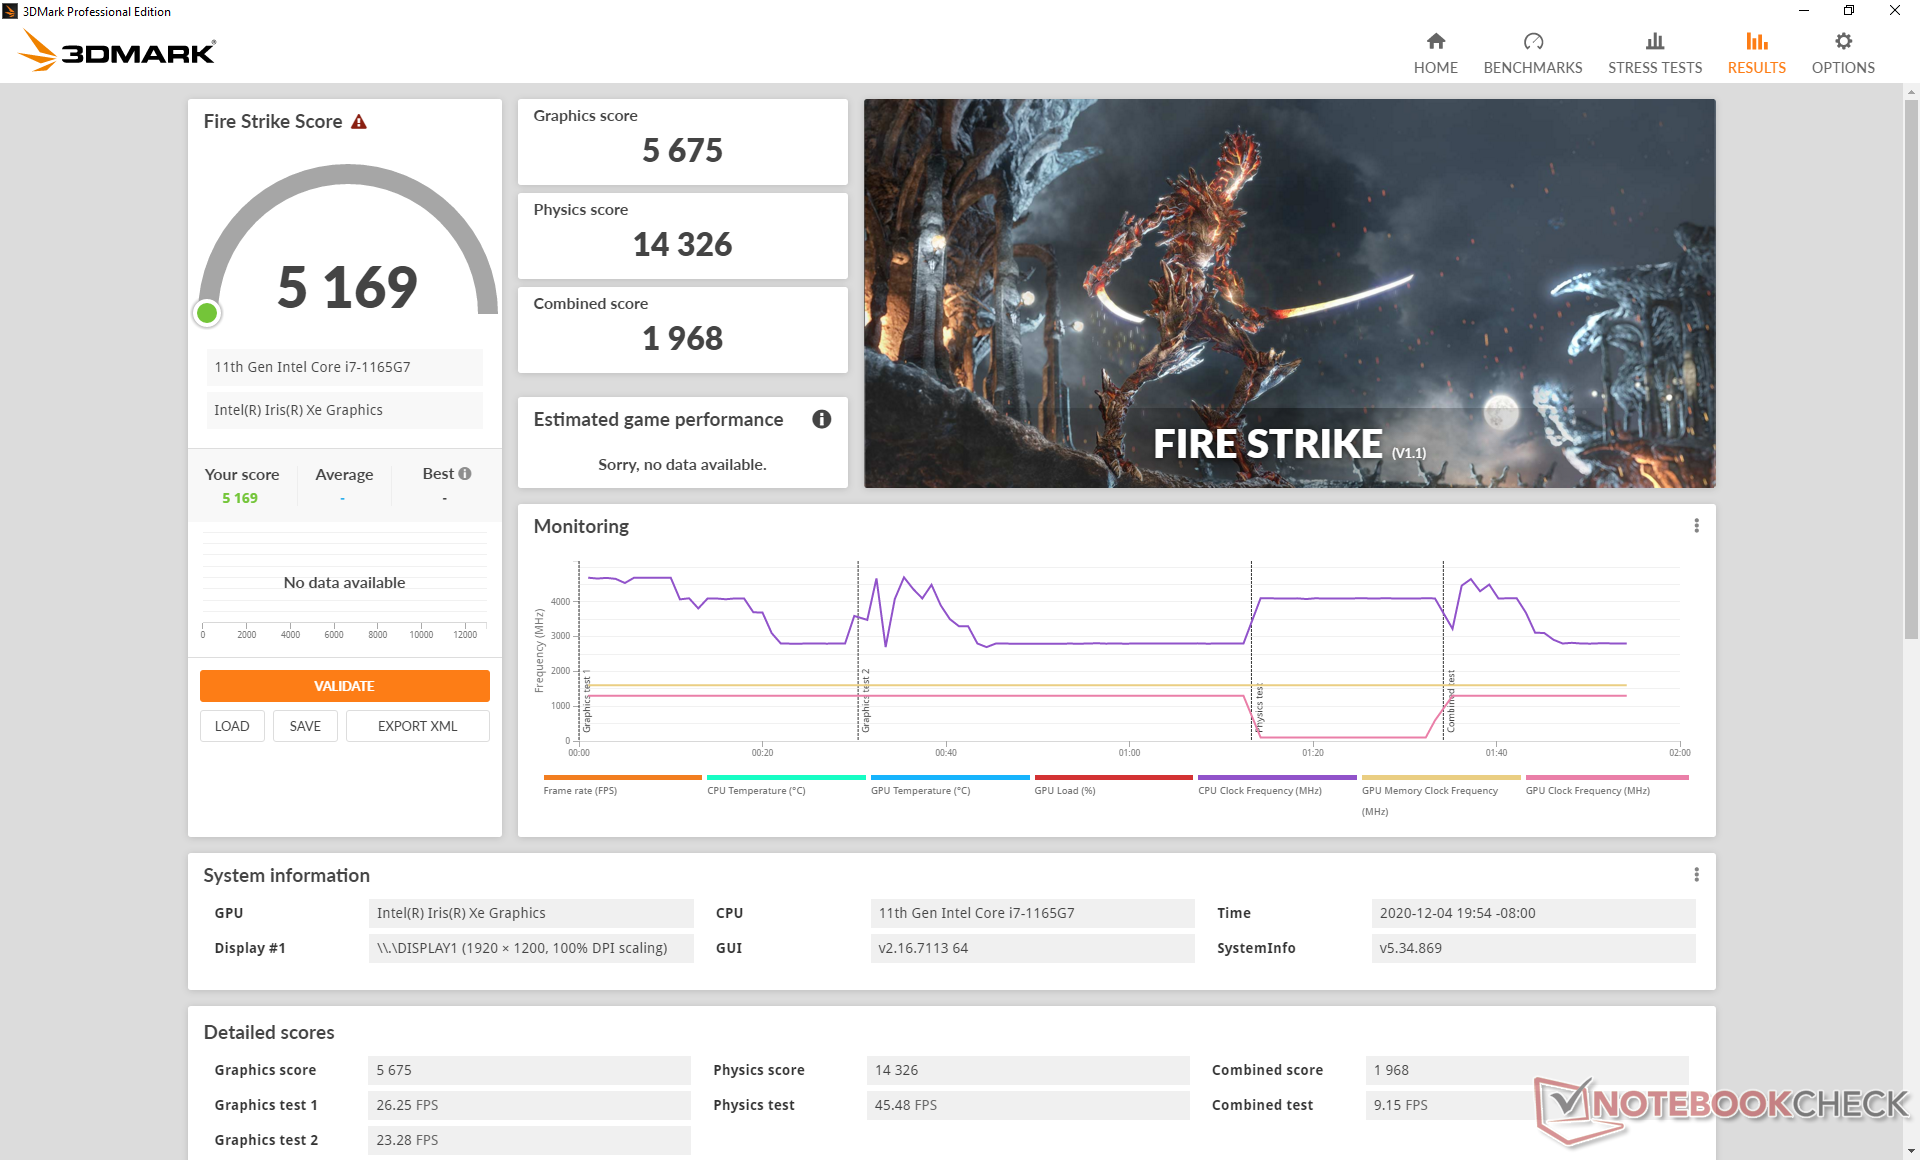
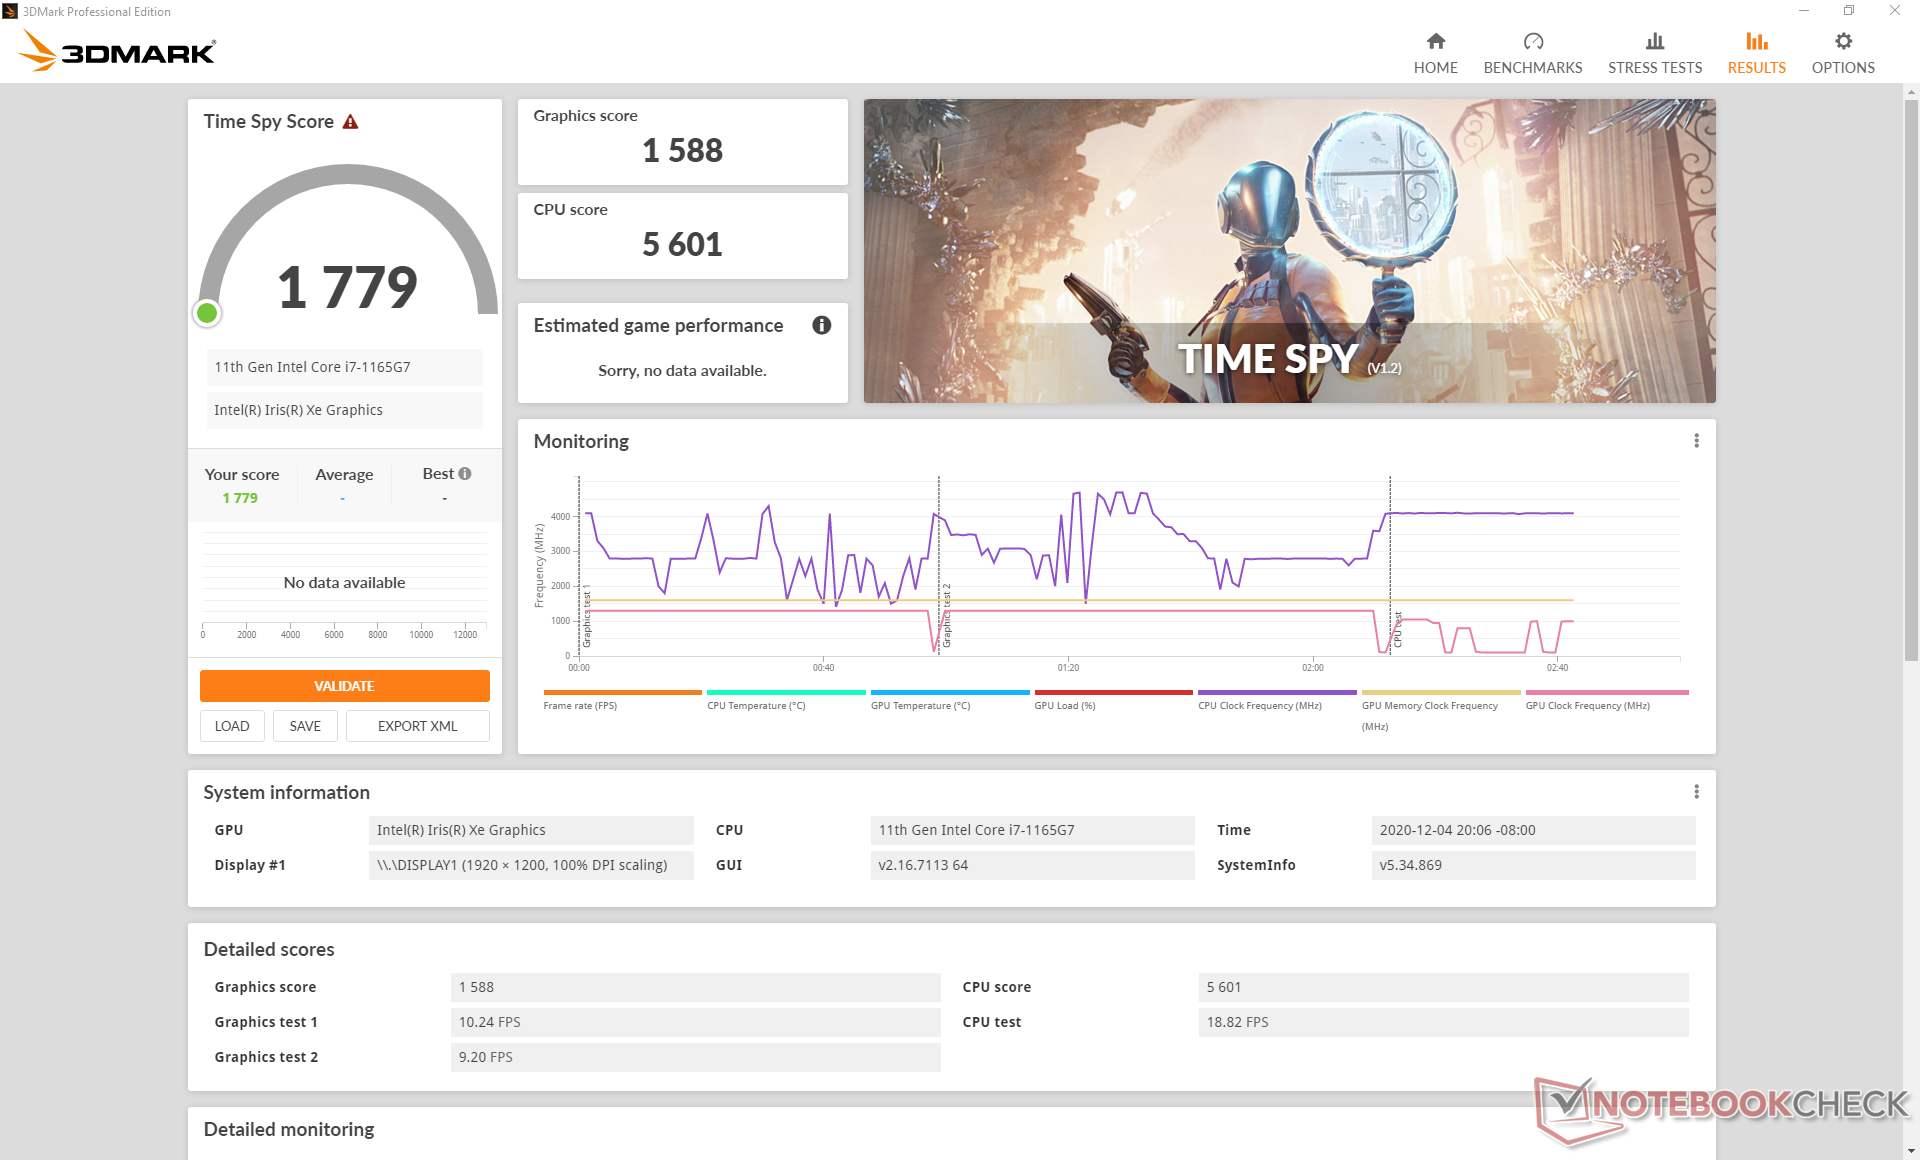
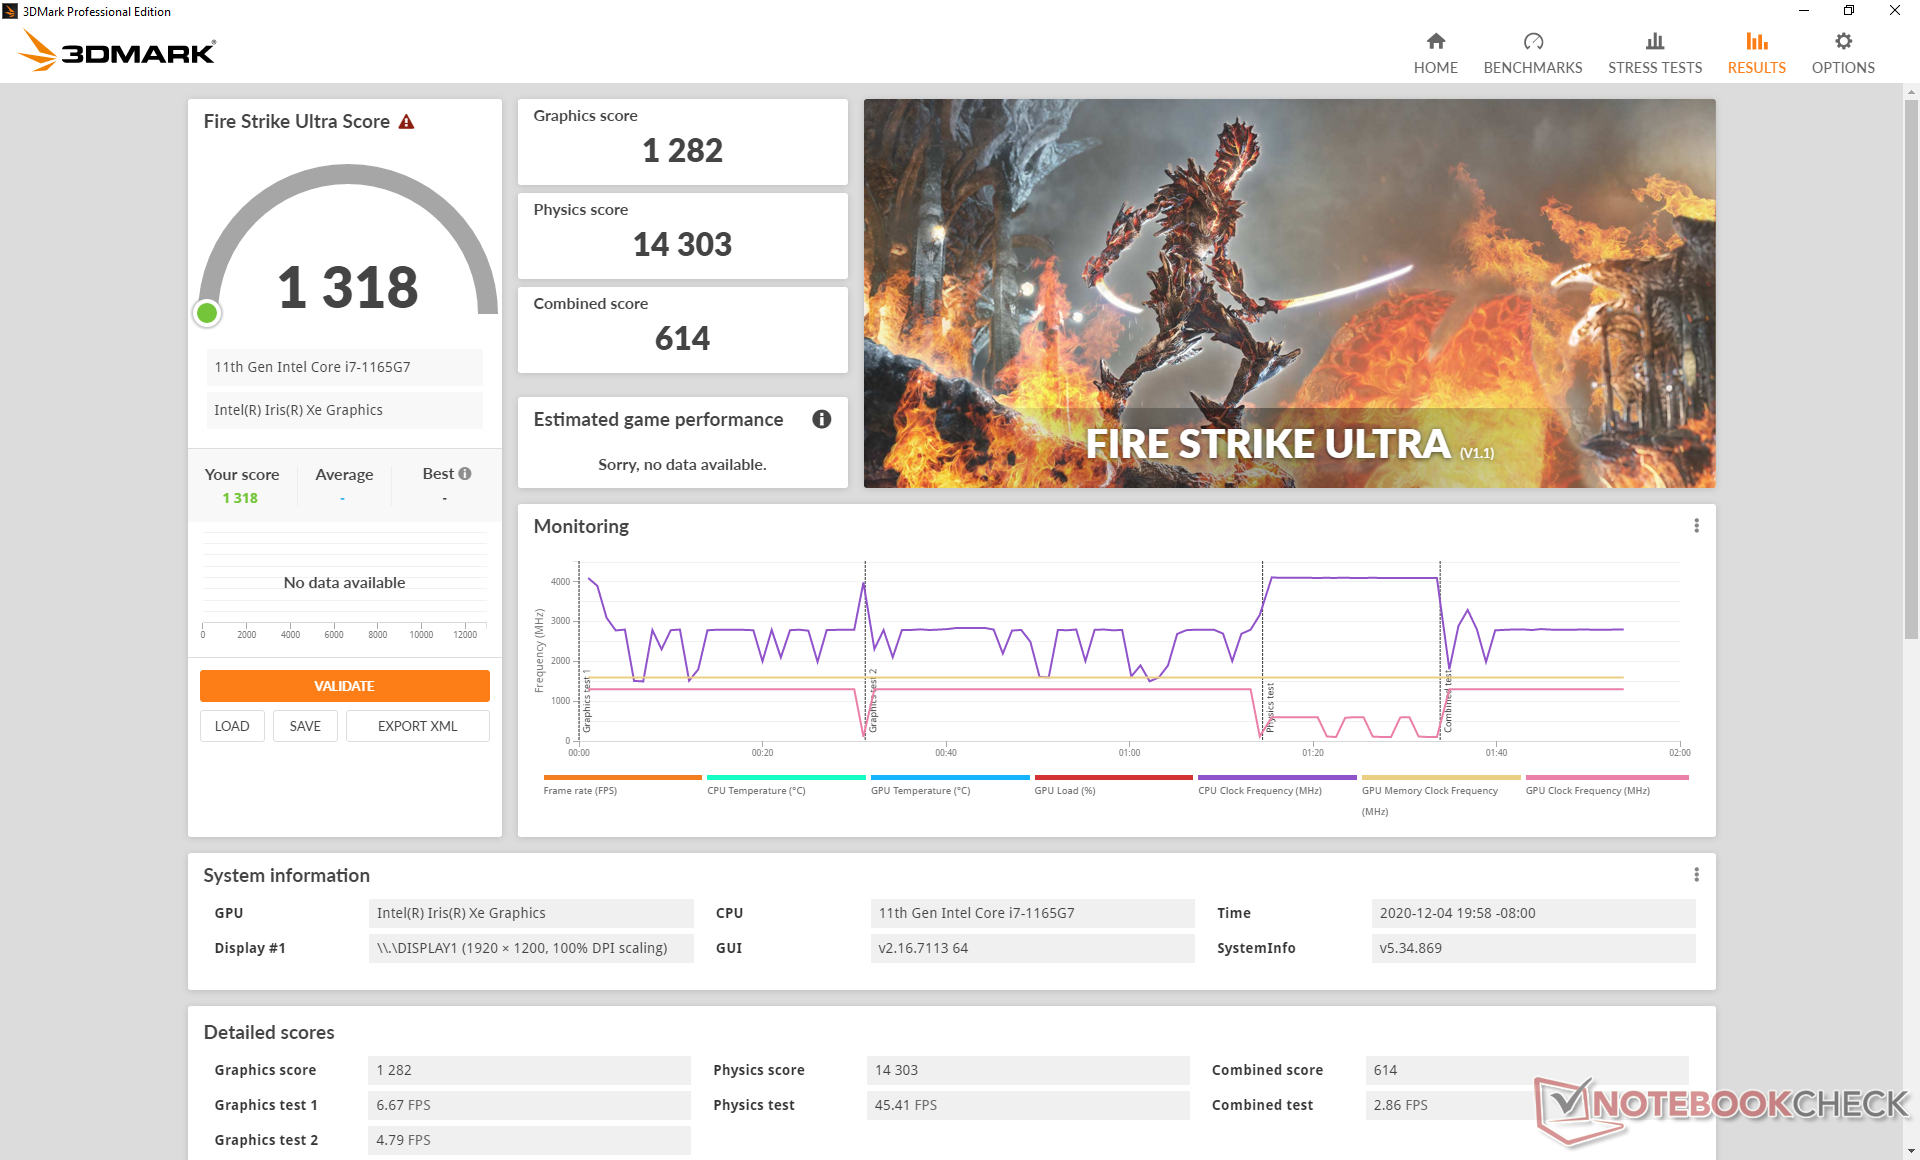
3DMark results are higher than the average Iris Xe in our database at the moment by about 10 percent. Scores are even higher than the GeForce MX250 or MX350, but actual performance in most games will vary greatly as detailed here.
See our dedicated page on Iris Xe for more technical information and benchmark comparisons.
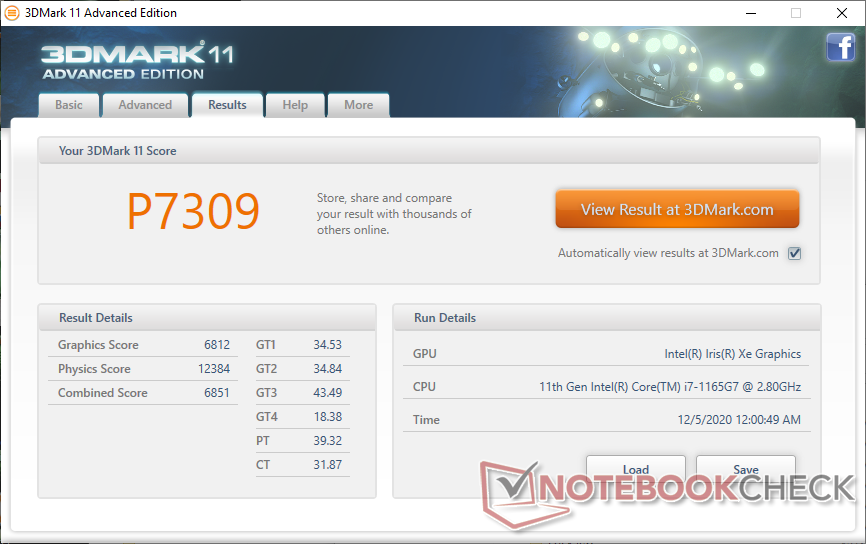
| 3DMark 11 Performance | 7309 puan | |
| 3DMark Cloud Gate Standard Score | 20886 puan | |
| 3DMark Fire Strike Score | 5169 puan | |
| 3DMark Time Spy Score | 1779 puan | |
Yardım | ||
| düşük | orta | yüksek | ultra | |
|---|---|---|---|---|
| GTA V (2015) | 101 | 83.5 | 26.2 | 12.8 |
| The Witcher 3 (2015) | 103.1 | 60.1 | 34.1 | 15.2 |
| Dota 2 Reborn (2015) | 83.7 | 74.4 | 52 | 48.8 |
| Final Fantasy XV Benchmark (2018) | 46.3 | 25.3 | 18.8 | |
| X-Plane 11.11 (2018) | 31.1 | 40.1 | 41.3 |
Emissions
System Noise
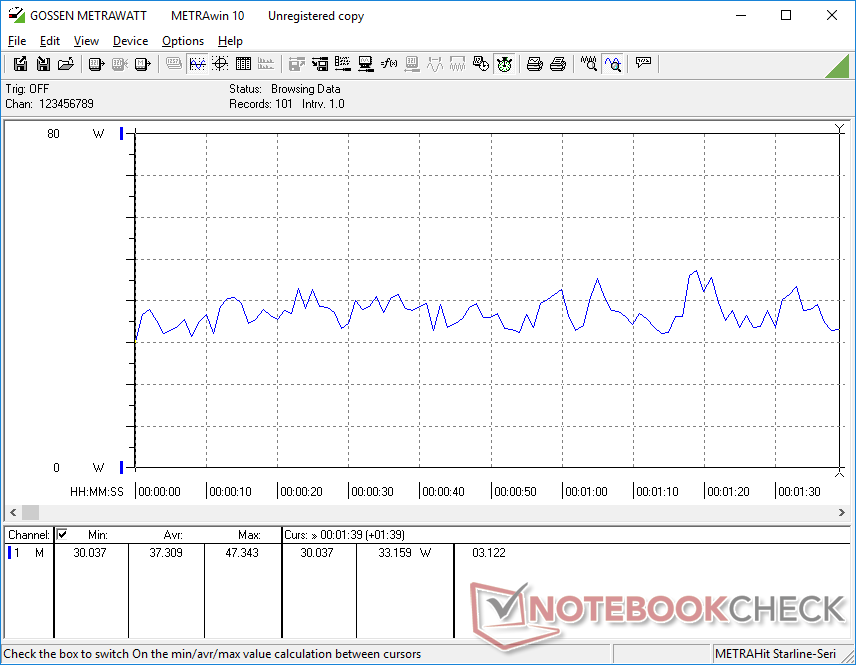
The system remains silent when browsing or video streaming with no noticeable pulsing behavior. At worse, fan noise would top out at just 29 dB(A) against a background of 27 dB(A) to be essentially inaudible in a typical office or conference room. We're able to record 33 dB(A) when running higher loads like Witcher 3.
If the fan is manually set to maximum via the Synapse software, then fan noise can jump as high as 45 dB(A) to be louder than most other subnotebooks with integrated GPUs. However, we never reached this maximum even whilst benchmarking unless if the fan was manually set this way meaning the internal fans will rarely reach their maximum RPMs when on the default automatic mode.
| Razer Book 13 FHD Iris Xe G7 96EUs, i7-1165G7, Samsung SSD PM981a MZVLB256HBHQ | Dell XPS 13 9310 Core i7 FHD Iris Xe G7 96EUs, i7-1165G7, Micron 2300 512GB MTFDHBA512TDV | Asus Zenbook S UX393JA Iris Plus Graphics G7 (Ice Lake 64 EU), i7-1065G7, Intel SSD 660p 1TB SSDPEKNW010T8 | Huawei MateBook X Pro 2020 i7 GeForce MX250, i7-10510U, Samsung PM981a MZVLB1T0HBLR | Microsoft Surface Laptop 3 13 Core i5-1035G7 Iris Plus Graphics G7 (Ice Lake 64 EU), i5-1035G7, SK hynix BC501 HFM256GDGTNG | Razer Blade Stealth i7-1065G7 Iris Plus Iris Plus Graphics G7 (Ice Lake 64 EU), i7-1065G7, Samsung SSD PM981 MZVLB256HAHQ | |
|---|---|---|---|---|---|---|
| Noise | 5% | -8% | -10% | -5% | -7% | |
| kapalı / ortam * (dB) | 27 | 25.7 5% | 26.9 -0% | 29.6 -10% | 28.5 -6% | 28.3 -5% |
| Idle Minimum * (dB) | 27 | 25.7 5% | 26.9 -0% | 29.6 -10% | 28.5 -6% | 28.3 -5% |
| Idle Average * (dB) | 27 | 25.7 5% | 29 -7% | 29.6 -10% | 28.5 -6% | 28.3 -5% |
| Idle Maximum * (dB) | 27.1 | 25.9 4% | 31.1 -15% | 30.3 -12% | 28.5 -5% | 28.3 -4% |
| Load Average * (dB) | 29 | 26.2 10% | 37.7 -30% | 38 -31% | 28.5 2% | 33.5 -16% |
| Witcher 3 ultra * (dB) | 33.3 | 36.5 -10% | 40.2 -21% | 38 -14% | 40.4 -21% | 34.5 -4% |
| Load Maximum * (dB) | 44.8 | 36.6 18% | 38.1 15% | 38 15% | 40.4 10% | 49.4 -10% |
* ... daha küçük daha iyidir
Ses yüksekliği
| Boşta |
| 27 / 27 / 27.1 dB |
| Çalışırken |
| 29 / 44.8 dB |
 | ||
30 dB sessiz 40 dB(A) duyulabilirlik 50 dB(A) gürültülü |
||
min: | ||
Temperature
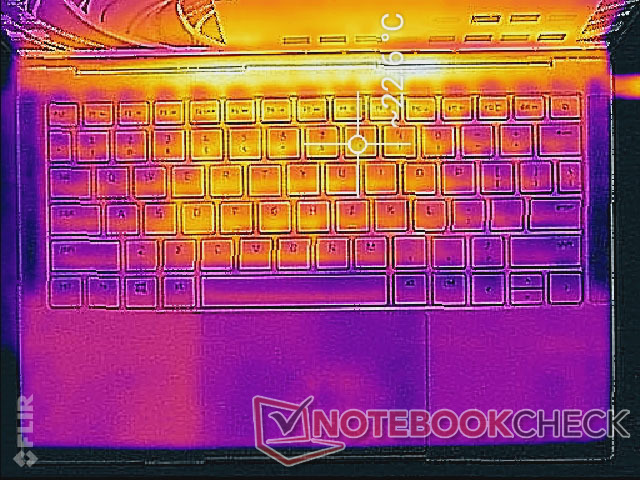
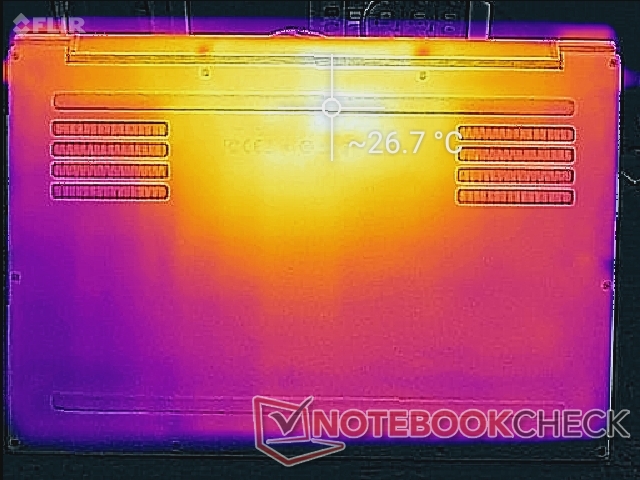
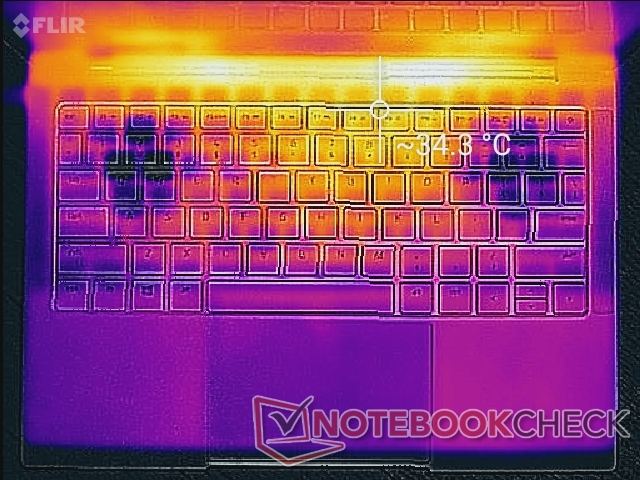
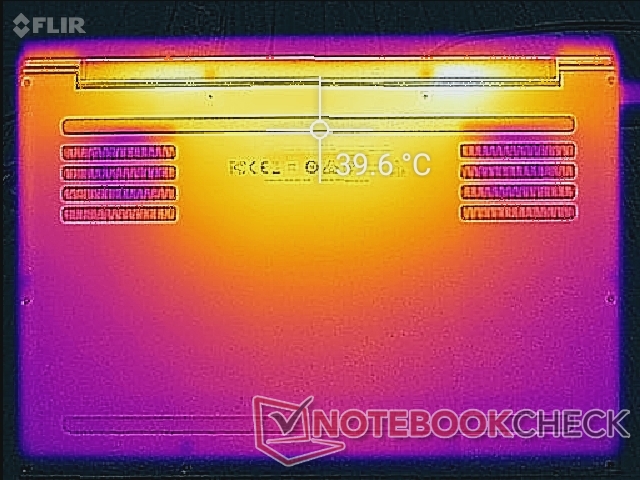
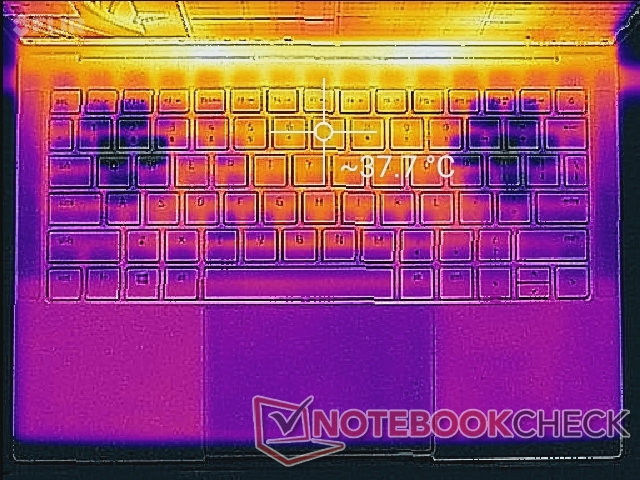
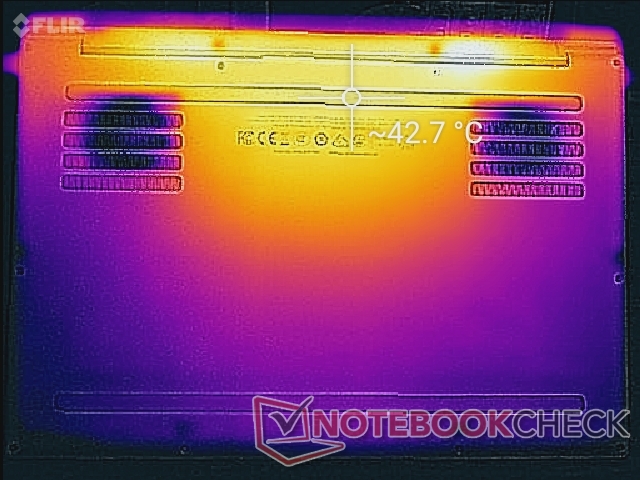
Surface temperatures are slightly warmer than what we recorded on the Ice Lake Blade Stealth. When running high loads for extended periods, hot spots on the top and bottom can be as warm as 34 C to 38 C and 40 C to 43 C, respectively. Temperature gradient is otherwise symmetrical much like on the Blade Stealth. The warmth is noticeable but not distracting since the hot spots are toward the rear away from the palm rests and most of the keyboard keys.
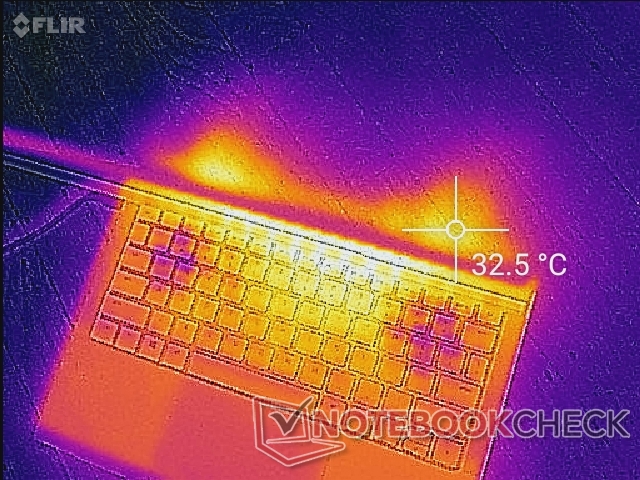
(+) Üst taraftaki maksimum sıcaklık, 34.3 °C / 94 F ortalamasına kıyasla 39.2 °C / 103 F'dir. , Office sınıfı için 21.2 ile 62.5 °C arasında değişir.
(±) Alt kısım, 36.8 °C / 98 F ortalamasına kıyasla maksimum 44 °C / 111 F'ye kadar ısınır
(+) Boşta kullanımda, üst tarafın ortalama sıcaklığı 21.5 °C / 71 F olup, cihazın 29.5 °C / 85 F.
(+) The Witcher 3 oynarken, üst tarafın ortalama sıcaklığı 28 °C / 82 F olup, cihazın 29.5 °C / 85 F.
(+) Avuç içi dayanakları ve dokunmatik yüzey, maksimum 31 °C / 87.8 F ile cilt sıcaklığından daha soğuktur ve bu nedenle dokunulduğunda soğuktur.
(-) Benzer cihazların avuç içi dayanağı alanının ortalama sıcaklığı 27.5 °C / 81.5 F (-3.5 °C / -6.3 F) idi.
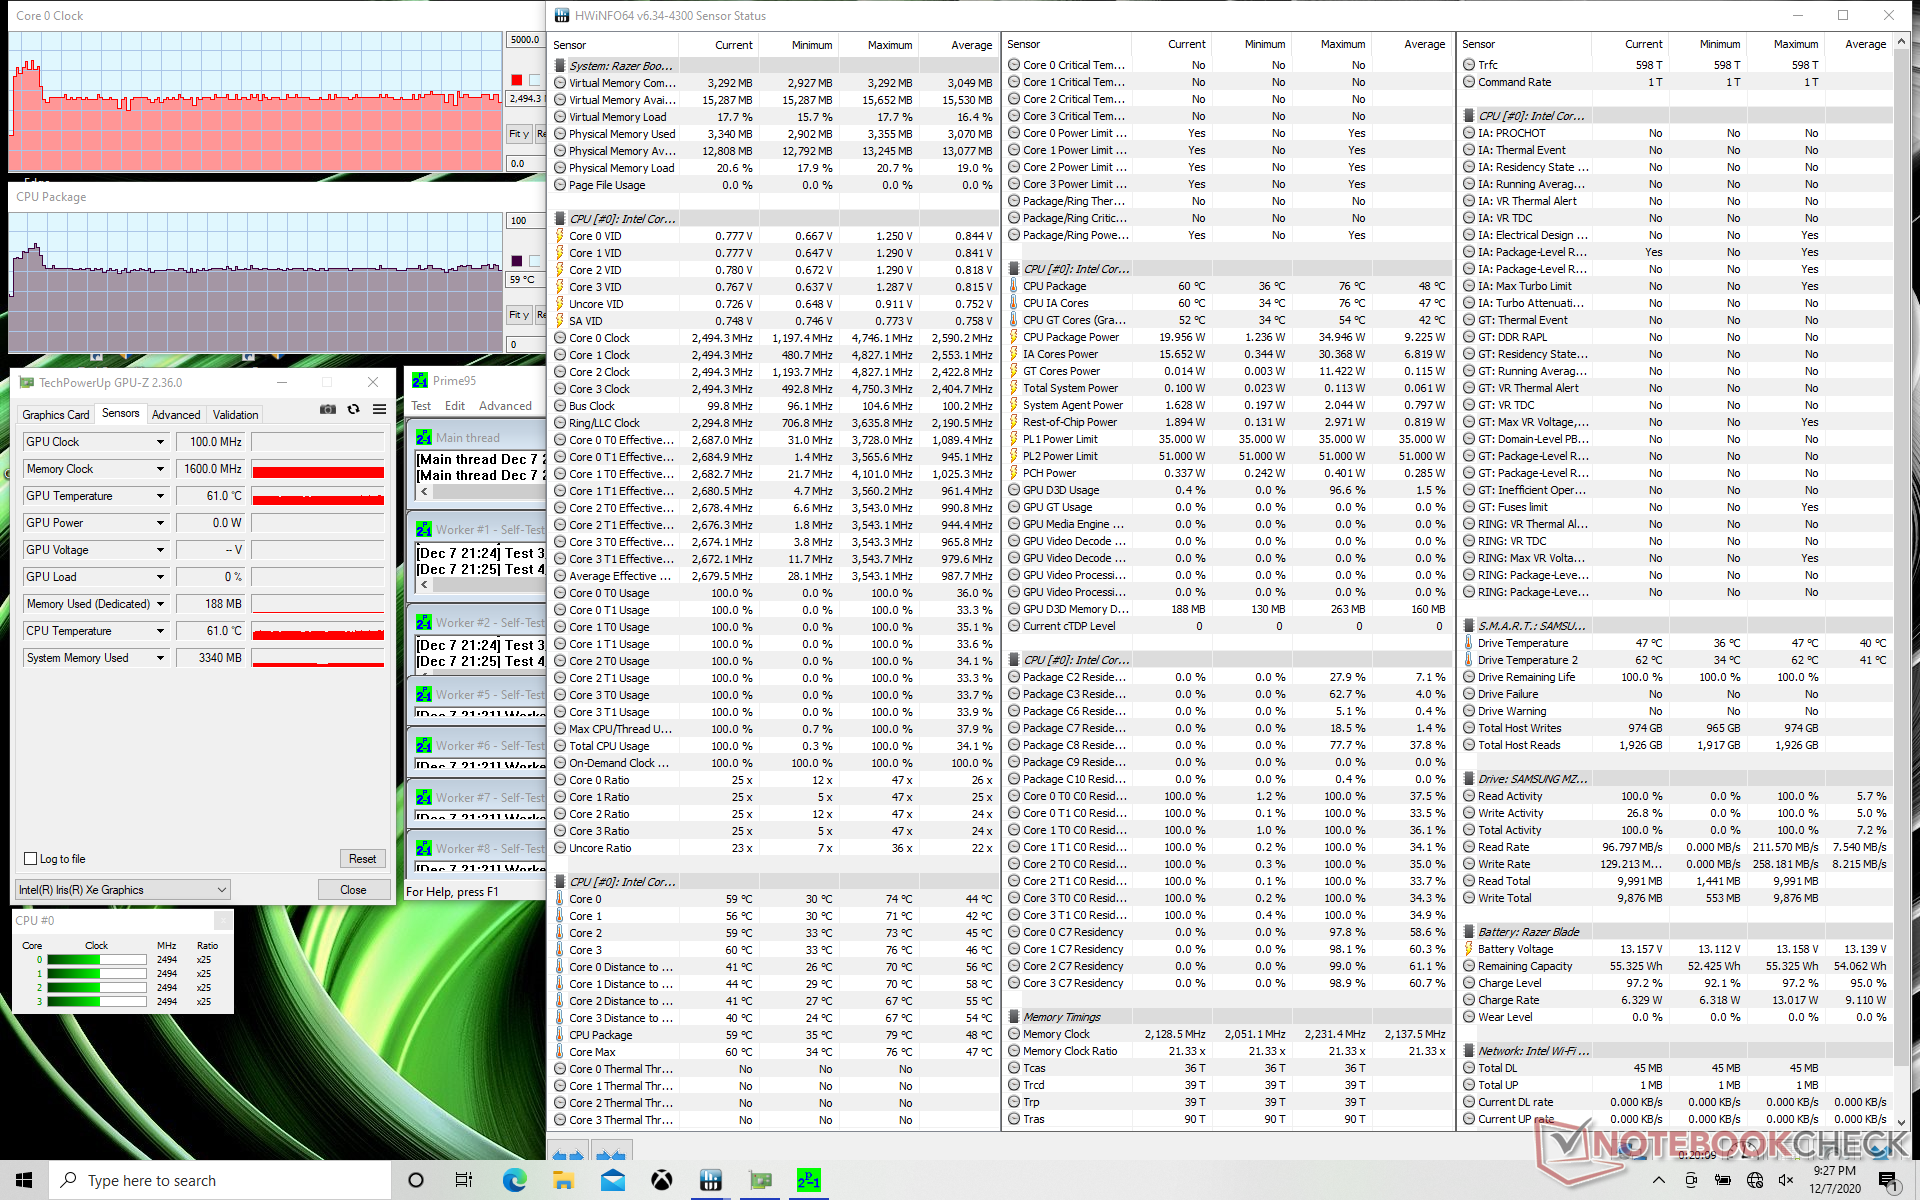
Stress Test
When stressed with Prime95, the CPU would boost to 3.8 GHz for the first few seconds until hitting a core temperature of 79 C. Thereafter, clock rates would drop and stabilize at the 2.5 to 2.7 GHz range in order to maintain a cooler core temperature of 60 C. In comparison, running this same test on the Core i7 XPS 13 9310 would cause clock rates to fall and cycle to as low as 1.9 GHz with even warmer core temperatures reaching 78 C. In other words, the Book 13 is able to run both faster than cooler than on the XPS 13 when the processor is stressed which backs up our CineBench R15 xT loop test results from above.
Core temperature appears to plateau at 60 C when running high loads similar to what we recorded on the recent Asus ZenBook UX425 equipped with the same CPU.
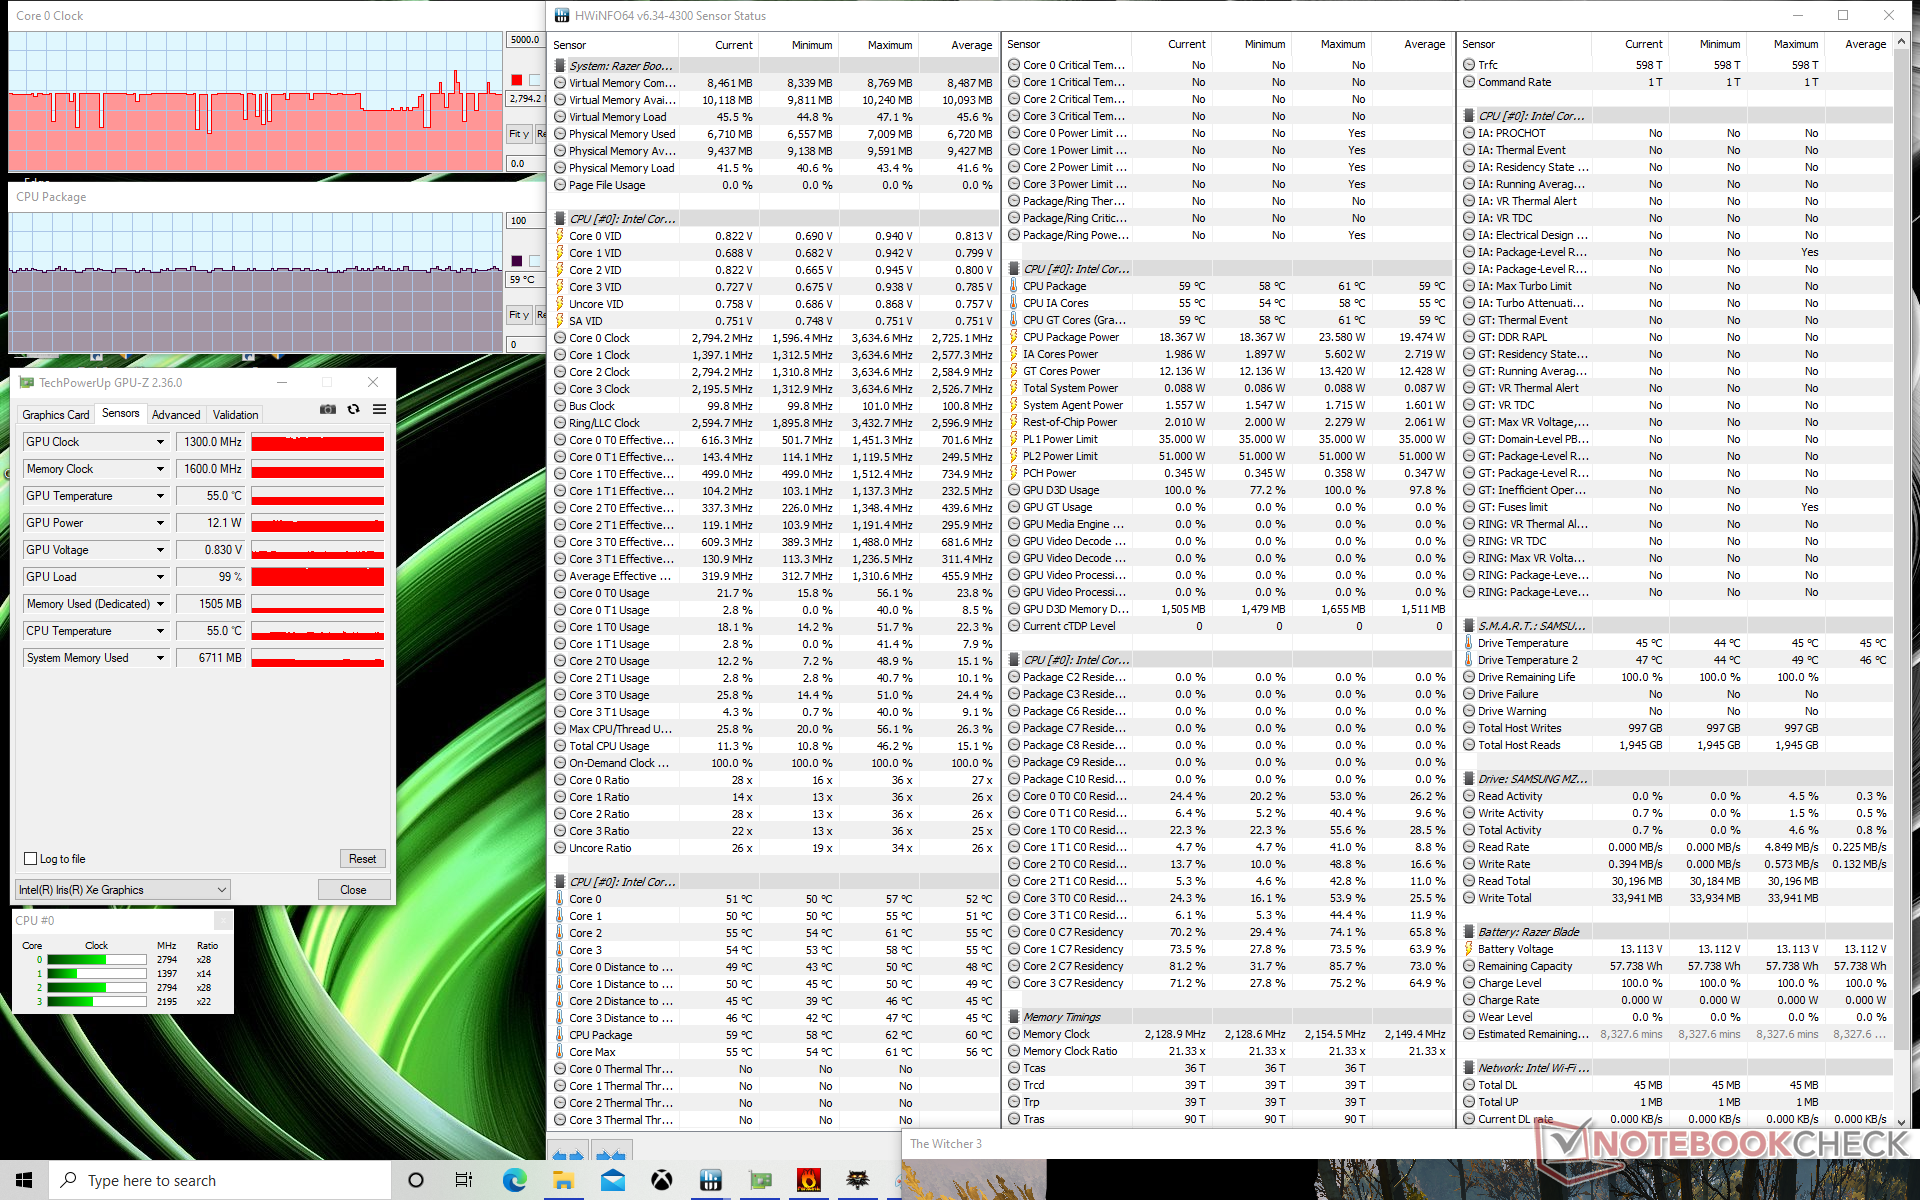
CPU performance drops slightly if running on battery power. A 3DMark 11 test on batteries would return Physics and Graphics scores of 10608 and 6973 points, respectively, compared to 12384 and 6812 points when on mains. Note that the Synapse "Performance" power profile becomes grayed out when not on mains.
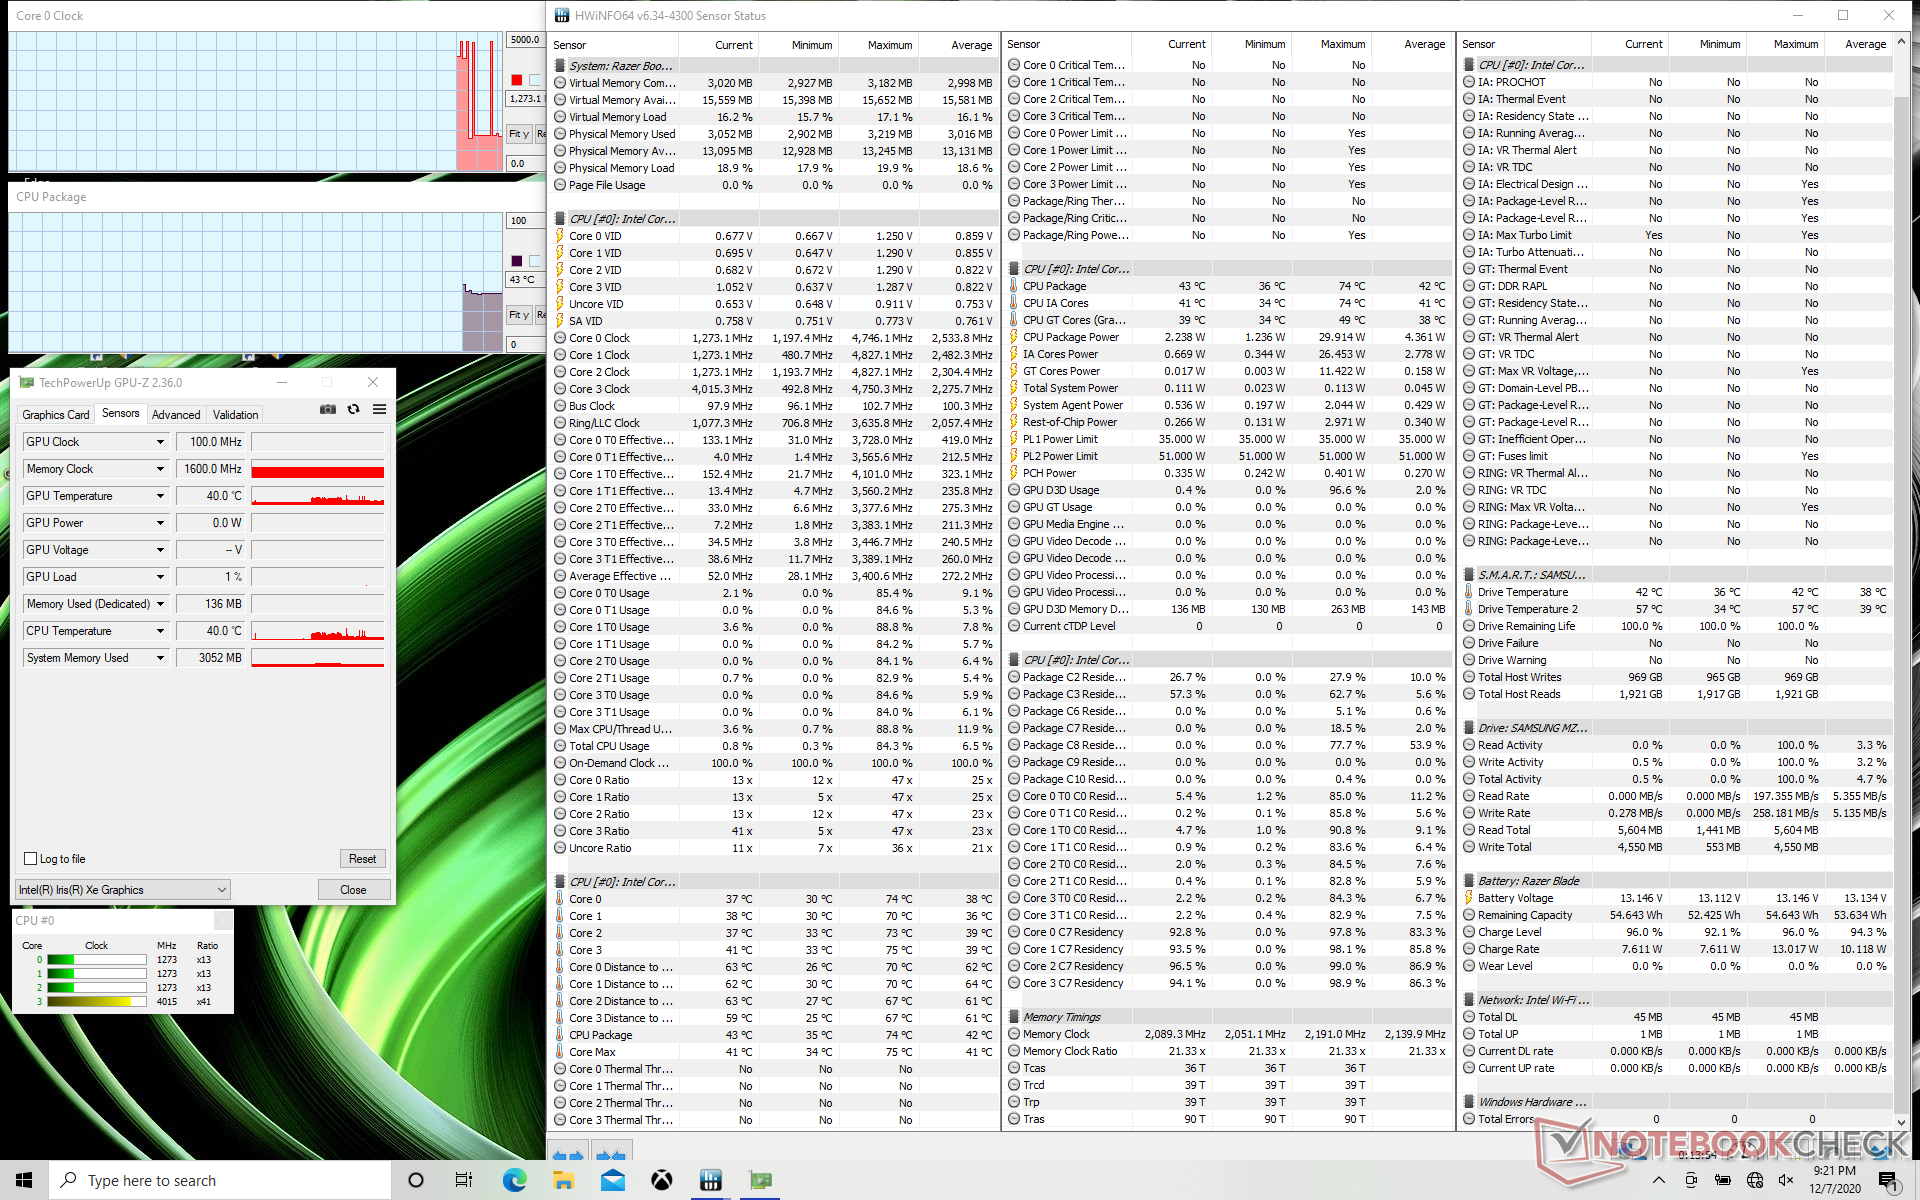
| CPU Clock (GHz) | GPU Clock (MHz) | Average CPU Temperature (°C) | |
| System Idle | -- | -- | 43 |
| Prime95 Stress | 2.5 - 2.7 | -- | 60 |
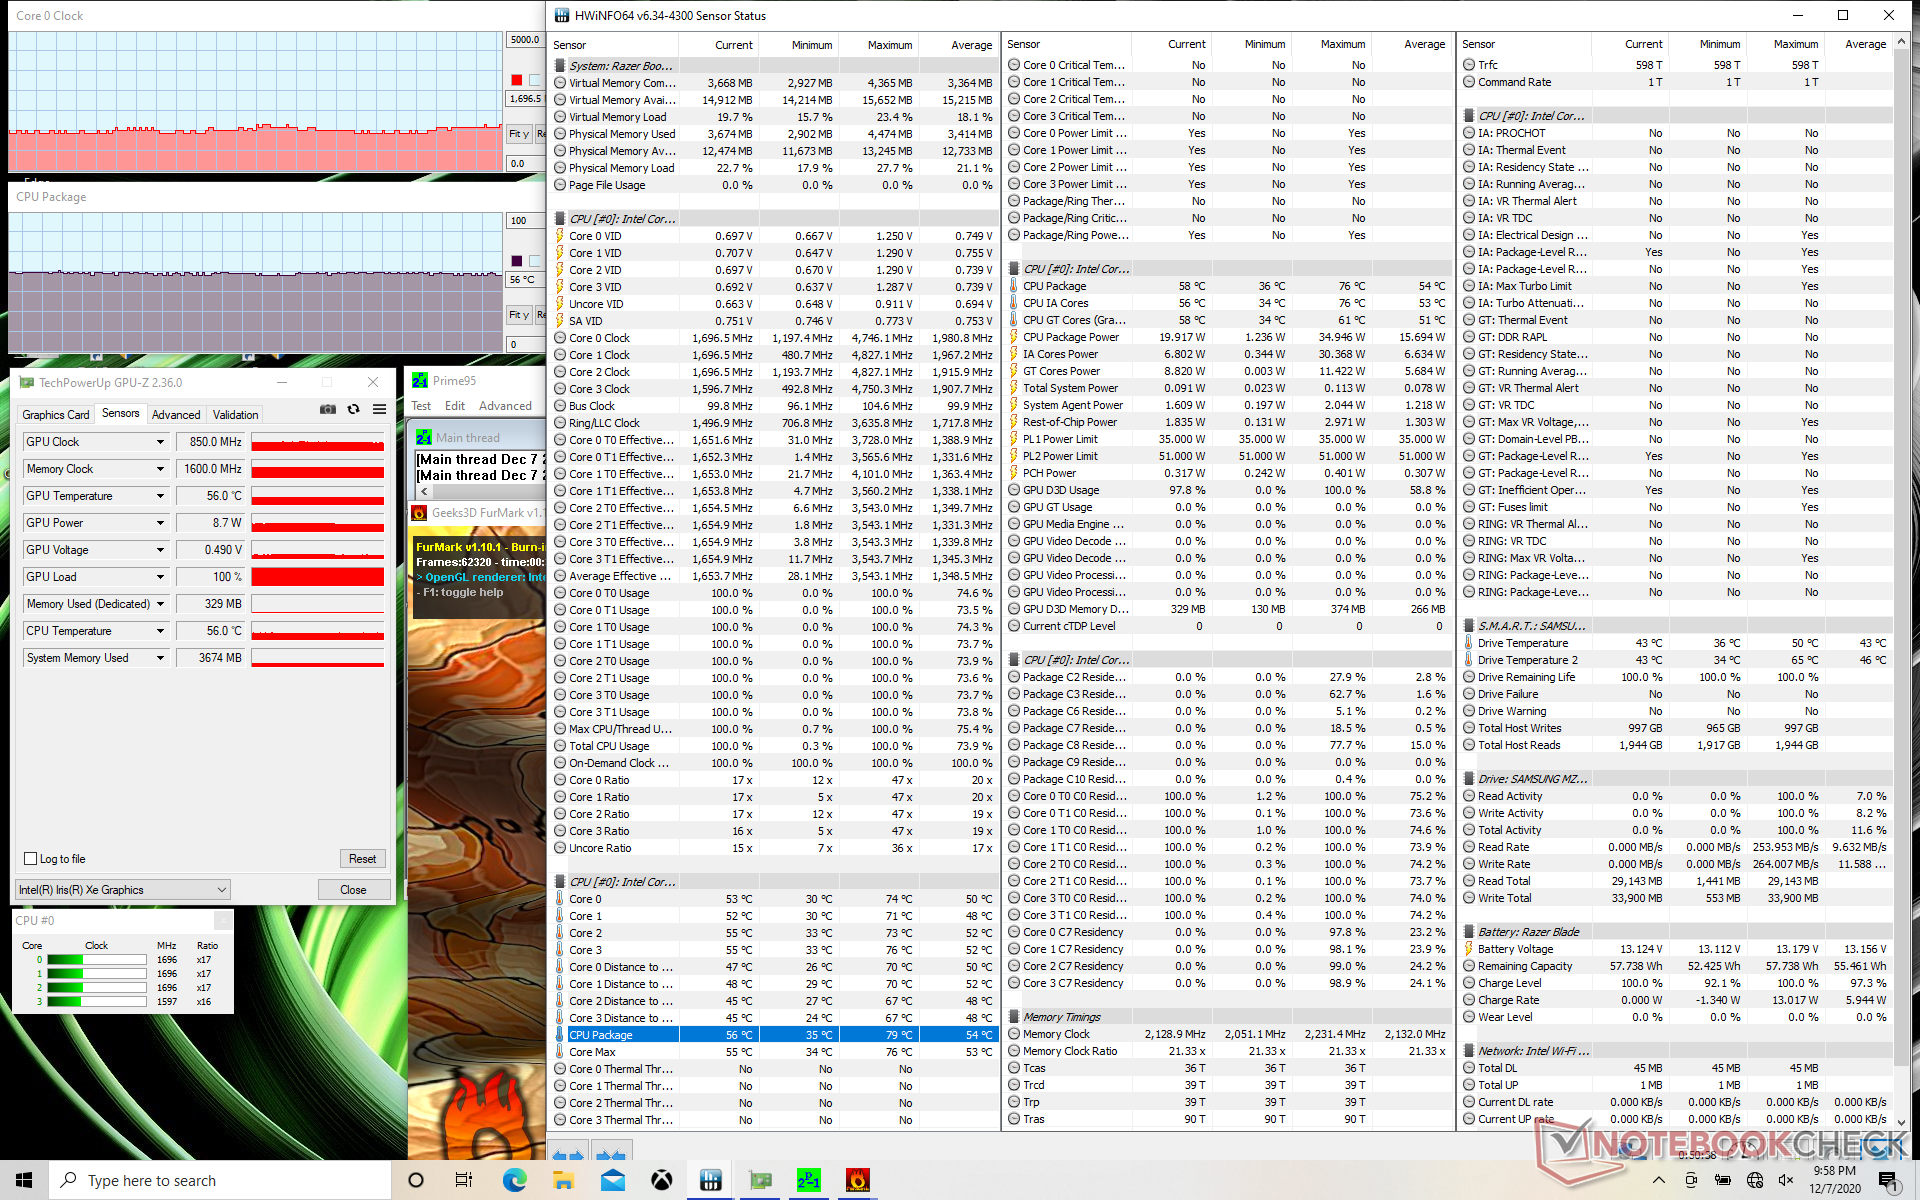
| Prime95 + FurMark Stress | 1.5 - 1.7 | 850 | 56 |
| Witcher 3 Stress | 2.2 - 2.8 | 1300 | 59 |
Speakers


Razer Book 13 FHD ses analizi
(±) | hoparlör ses yüksekliği ortalama ama iyi (78.7 dB)
Bas 100 - 315Hz
(-) | neredeyse hiç bas yok - ortalama olarak medyandan 15.1% daha düşük
(±) | Bas doğrusallığı ortalamadır (11.1% delta - önceki frekans)
Ortalar 400 - 2000 Hz
(+) | dengeli ortalar - medyandan yalnızca 2.7% uzakta
(+) | orta frekanslar doğrusaldır (4.5% deltadan önceki frekansa)
Yüksekler 2 - 16 kHz
(+) | dengeli yüksekler - medyandan yalnızca 4% uzakta
(±) | Yükseklerin doğrusallığı ortalamadır (8.8% delta - önceki frekans)
Toplam 100 - 16.000 Hz
(+) | genel ses doğrusaldır (13.7% ortancaya göre fark)
Aynı sınıfla karşılaştırıldığında
» Bu sınıftaki tüm test edilen cihazların %8%'si daha iyi, 4% benzer, 88% daha kötüydü
» En iyisinin deltası 7% idi, ortalama 21% idi, en kötüsü 53% idi
Test edilen tüm cihazlarla karşılaştırıldığında
» Test edilen tüm cihazların %15'si daha iyi, 4 benzer, % 81 daha kötüydü
» En iyisinin deltası 4% idi, ortalama 24% idi, en kötüsü 134% idi
Apple MacBook 12 (Early 2016) 1.1 GHz ses analizi
(+) | hoparlörler nispeten yüksek sesle çalabilir (83.6 dB)
Bas 100 - 315Hz
(±) | azaltılmış bas - ortalama olarak medyandan 11.3% daha düşük
(±) | Bas doğrusallığı ortalamadır (14.2% delta - önceki frekans)
Ortalar 400 - 2000 Hz
(+) | dengeli ortalar - medyandan yalnızca 2.4% uzakta
(+) | orta frekanslar doğrusaldır (5.5% deltadan önceki frekansa)
Yüksekler 2 - 16 kHz
(+) | dengeli yüksekler - medyandan yalnızca 2% uzakta
(+) | yüksekler doğrusaldır (4.5% deltadan önceki frekansa)
Toplam 100 - 16.000 Hz
(+) | genel ses doğrusaldır (10.2% ortancaya göre fark)
Aynı sınıfla karşılaştırıldığında
» Bu sınıftaki tüm test edilen cihazların %7%'si daha iyi, 2% benzer, 91% daha kötüydü
» En iyisinin deltası 5% idi, ortalama 18% idi, en kötüsü 53% idi
Test edilen tüm cihazlarla karşılaştırıldığında
» Test edilen tüm cihazların %5'si daha iyi, 1 benzer, % 94 daha kötüydü
» En iyisinin deltası 4% idi, ortalama 24% idi, en kötüsü 134% idi
Energy Management
Power Consumption
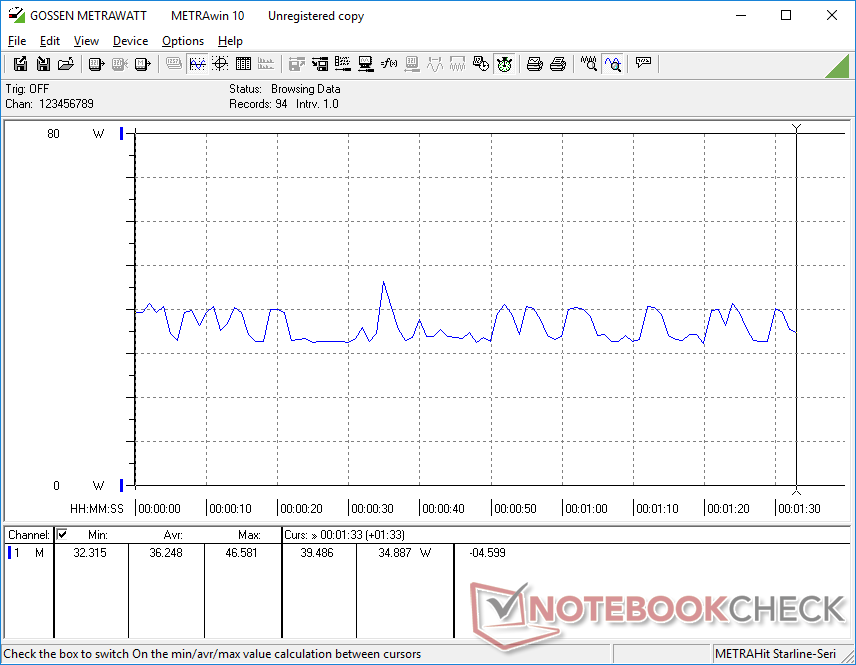
Idling on desktop consumes just 3 W on the minimum brightness level up to 7 W if brightness is set to maximum. The high performance-per-watt of Tiger Lake becomes obvious when comparing power consumption to the GeForce MX150-powered Blade Stealth. Gaming, for example, consumes about 37 W on the Book 13 compared to 64 W on the GeForce MX Blade Stealth even though the Book 13 offers both faster CPU and GPU performance.
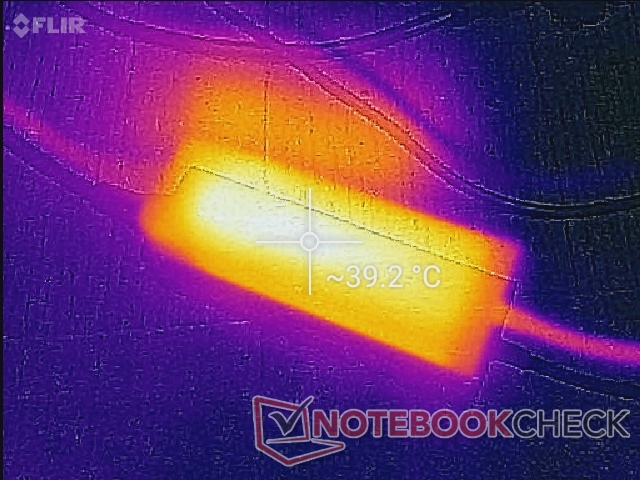
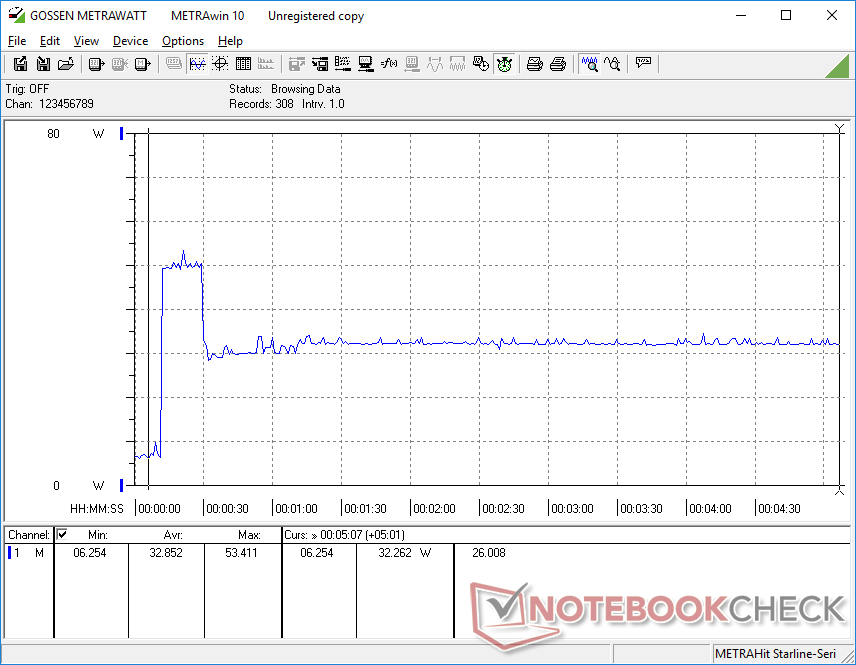
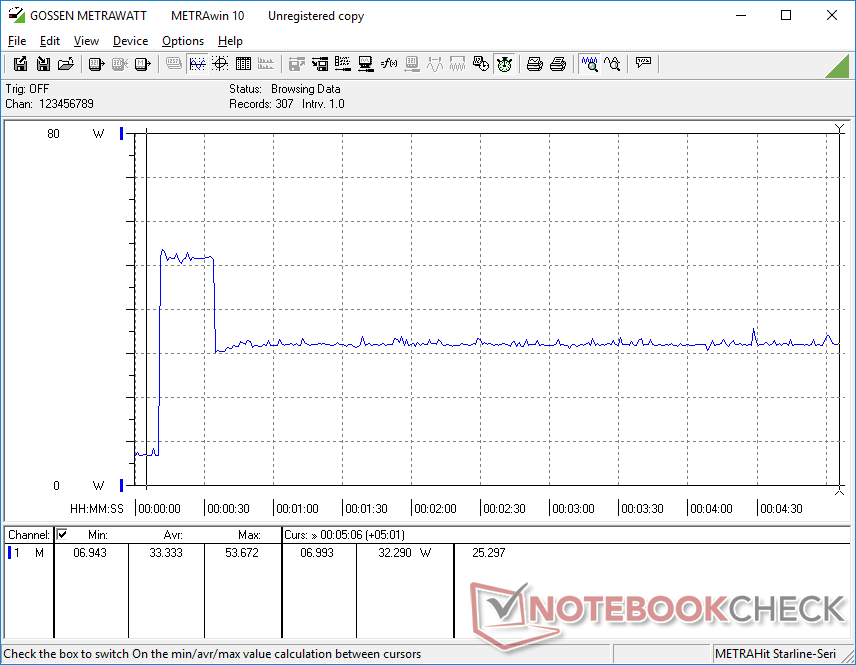
We're able to measure a maximum consumption of 53.7 W from the small (~10.8 x 3.5 x 2.7 cm) 65 W AC adapter. This rate lasts for only 20 seconds when Turbo Boost clock rates are highest before they both eventually fall due to thermal soak. This can also be observed during our Prime95 stress test as noted above.
| Kapalı / Bekleme modu | |
| Boşta | |
| Çalışırken |
|
Key:
min: | |
| Razer Book 13 FHD i7-1165G7, Iris Xe G7 96EUs, Samsung SSD PM981a MZVLB256HBHQ, IPS, 1920x1200, 13.4" | Dell XPS 13 9310 Core i7 FHD i7-1165G7, Iris Xe G7 96EUs, Micron 2300 512GB MTFDHBA512TDV, IPS, 1920x1200, 13.4" | Asus Zenbook S UX393JA i7-1065G7, Iris Plus Graphics G7 (Ice Lake 64 EU), Intel SSD 660p 1TB SSDPEKNW010T8, IPS, 3300x2200, 13.9" | Huawei MateBook X Pro 2020 i7 i7-10510U, GeForce MX250, Samsung PM981a MZVLB1T0HBLR, LTPS, 3000x2000, 13.9" | Microsoft Surface Laptop 3 13 Core i5-1035G7 i5-1035G7, Iris Plus Graphics G7 (Ice Lake 64 EU), SK hynix BC501 HFM256GDGTNG, IPS, 2256x1504, 13.5" | Razer Blade Stealth i7-1065G7 Iris Plus i7-1065G7, Iris Plus Graphics G7 (Ice Lake 64 EU), Samsung SSD PM981 MZVLB256HAHQ, IPS, 1920x1080, 13.3" | |
|---|---|---|---|---|---|---|
| Power Consumption | 2% | -14% | -38% | -17% | -32% | |
| Idle Minimum * (Watt) | 3.3 | 3.9 -18% | 4.1 -24% | 4.3 -30% | 4.4 -33% | 5.9 -79% |
| Idle Average * (Watt) | 6.4 | 5.9 8% | 7.5 -17% | 8.5 -33% | 7.5 -17% | 8.1 -27% |
| Idle Maximum * (Watt) | 7 | 6.3 10% | 8.5 -21% | 12 -71% | 7.8 -11% | 11.2 -60% |
| Load Average * (Watt) | 37.3 | 39.7 -6% | 36.8 1% | 54.8 -47% | 41.9 -12% | 44.3 -19% |
| Witcher 3 ultra * (Watt) | 36.4 | 34.8 4% | 39.2 -8% | 47.1 -29% | 40.8 -12% | 41.9 -15% |
| Load Maximum * (Watt) | 53.7 | 47.5 12% | 61.6 -15% | 61.5 -15% | 63.9 -19% | 50.2 7% |
* ... daha küçük daha iyidir
Battery Life
Though battery capacity is almost the same as on the Blade Stealth (55 Wh vs. 53 Wh), runtimes are much longer on the Book 13. We were able to squeeze almost 15 hours of WLAN use from a full charge to be a few hours more than what we recorded on both of the XPS 13 or Blade Stealth when under similar WLAN conditions.
Charging from empty to full capacity takes about 1.5 hours with the included AC adapter. We appreciate the fact that there are USB-C ports along both edges of the laptop meaning you can recharge from either side as opposed to most other Ultrabooks.
| Razer Book 13 FHD i7-1165G7, Iris Xe G7 96EUs, 55 Wh | Dell XPS 13 9310 Core i7 FHD i7-1165G7, Iris Xe G7 96EUs, 52 Wh | Asus Zenbook S UX393JA i7-1065G7, Iris Plus Graphics G7 (Ice Lake 64 EU), 67 Wh | Huawei MateBook X Pro 2020 i7 i7-10510U, GeForce MX250, 57.4 Wh | Microsoft Surface Laptop 3 13 Core i5-1035G7 i5-1035G7, Iris Plus Graphics G7 (Ice Lake 64 EU), 45 Wh | Razer Blade Stealth i7-1065G7 Iris Plus i7-1065G7, Iris Plus Graphics G7 (Ice Lake 64 EU), 53.1 Wh | |
|---|---|---|---|---|---|---|
| Pil Çalışma Süresi | 3% | -4% | -8% | -20% | -34% | |
| Reader / Idle (h) | 36.8 | 30 -18% | 38.4 4% | 34.4 -7% | ||
| WiFi v1.3 (h) | 14.8 | 11 -26% | 8.3 -44% | 10.4 -30% | 8.3 -44% | 9.7 -34% |
| Load (h) | 2.1 | 3.2 52% | 2.7 29% | 2.4 14% | 1.9 -10% |
Artılar
Eksiler
Verdict
Slap the 16:10 display from the Dell XPS 13 onto a Razer Blade Stealth and you'll essentially have the Book 13. The new Razer laptop incorporates the best of both worlds and with a stronger emphasis on performance and visual style than the Dell alternative. The fact that it uses the same Core i7-1165G7 processor as the XPS 13 and is able to run it 20 to 30 percent faster shows how well Razer has optimized the chassis for Intel's new 11th gen platform. It's slightly heavier and thicker than the Dell, but the extra horsepower, additional ports, and stronger design might be worth it to many users.
On the flip side, the Book 13 skips over a handful of common security features including support for a fingerprint reader and a Kensington lock. You're also not going to find any advanced vPro or handsfree sign-in options that are available on the Latitude 7400 or HP EliteBook x360 1030 G7. The RGB-lit keys, while visually appealing, have weaker feedback than the keys on most other business-class subnotebooks. Call us old school, but dedicated mouse buttons and wider hinge angles like on most Lenovo ThinkPads ultimately feel more ergonomic when on the road. If your priorities are to have the best-looking and fastest 13-inch laptop in the office over such auxiliary features, however, then the Book 13 proudly fulfills that niche.
The Razer Book 13 is a stellar Intel Evo laptop with the performance and connectivity to back up its sharp looks. It's missing a few security features here and there while the shallow keyboard keys and spongy clickpad aren't as good as most traditional business laptops.
Razer Book 13 FHD
- 12/13/2020 v7 (old)
Allen Ngo
Price comparison

