Gigabyte GeForce RTX 4080 Super Gaming OC 16G İncelemesi: Süper olmayan RTX 4080'den 200 ABD doları daha ucuza RX 7900 XTX ile takas ediliyor

Şimdiye kadar aşağıdakiler de dahil olmak üzere birkaç yeni RTX 40 Super serisi GPU'yu inceledik RTX 4070 Super Founders Edition, Gigabyte RTX 4070 Super Gaming OCve Asus TUF Gaming RTX 4070 Ti Süper.
Şimdi elimizde Gigabyte GeForce RTX 4080 Super Gaming OC 16G var - önceki RTX 4080 muadilinin yerini tamamen alan bir yaşam döngüsü ortası yenilemesi.
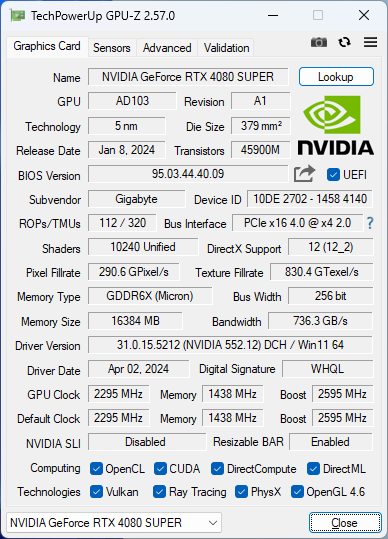
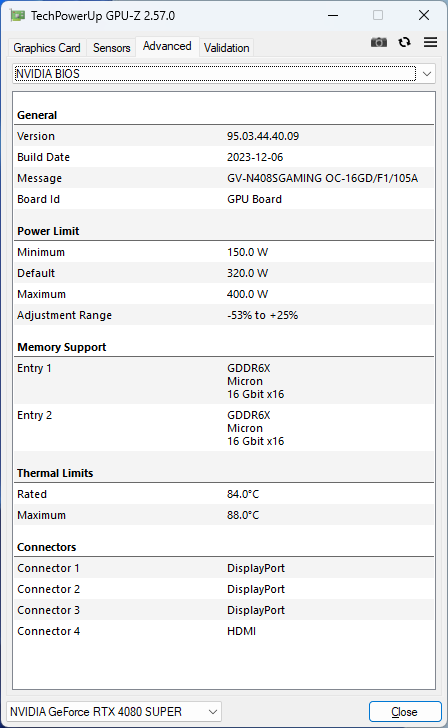
Orijinal RTX 4080 9.728 CUDA çekirdeğine sahipken, yeni RTX 4080 Super 10.240 CUDA çekirdeğinin tamamını tam kapasite çalıştırarak AD103 kalıbını en üst düzeye çıkarıyor. Bu, RTX 4070 Super (+%21) ve RTX 4070 Super Ti'nin (+%10) aksine çok etkileyici olmayan gölgelendirici sayısında yalnızca %5'lik bir artış anlamına geliyor. VRAM 16 GB GDDR6X'te aynı kalıyor, ancak genel bant genişliği RTX 4080 non-Super ile 716,8 GB/sn'ye kıyasla 736,3 GB/sn'ye biraz yükseliyor.
RTX 4080 Super, orijinalinin 200 ABD doları daha yüksek fiyatına kıyasla 1.000 ABD doları MSRP ile satılmaktadır. Gigabyte'ın RTX 4080 Super'i, 1.050 ABD Doları MSRP'de nominal 50 ABD Doları prim karşılığında bazı ekstra avantajlar ekliyor.
Hindistan'da bu GPU şu anda perakendeciye bağlı olarak ₹1,20,000 ila ₹1,28,000 aralığında bulunabilir ve bir yıl daha uzatılabilen standart üç yıllık garantiyle birlikte gelir.
Bu incelemede, Gigabyte RTX 4080 Super Gaming OC'ye bir göz atıyor ve özellikle Blackwell'in bu yılın sonlarına doğru piyasaya sürülmesi planlanırken, iddia edilen performans kazanımlarının ve fiyatlandırmanın makul olup olmadığını görüyoruz.
Gigabyte GeForce RTX 4080 Super Gaming OC 16G ile diğer Nvidia GPU'larının karşılaştırılması
| Özellikler | RTX 4090 FE | Gigabyte RTX 4080 Super Gaming OC | RTX 4080 FE | Asus TUF RTX 4070 TiSuper | RTX 4070 Super FE | Zotac RTX 4070AMP Airo | KFA2 RTX4060 Ti EX | RTX 3090 Ti FE | RTX 3090 FE | RTX 3080 Ti FE | RTX 3070 FE | TitanRTX |
|---|---|---|---|---|---|---|---|---|---|---|---|---|
| Çip | AD102 | AD103 | AD103 | AD103 | AD104 | AD104 | AD106 | GA102 | GA102 | GA102 | GA104 | TU102 |
| FinFET Süreci | Özel 4N | Özel 4N | Özel 4N | Özel 4N | Özel 4N | Özel 4N | Özel 4N | 8 nm | 8 nm | 8 nm | 8 nm | 12 nm |
| CUDA Çekirdekleri | 16,384 | 10,240 | 9,728 | 8,448 | 7,168 | 5,888 | 4,352 | 10,752 | 10,496 | 10,240 | 5,888 | 4,608 |
| Doku Birimleri | 512 | 320 | 304 | 264 | 224 | 184 | 136 | 336 | 328 | 320 | 184 | 288 |
| Tensör Çekirdekleri | 512 4. Nesil | 320 4. Nesil | 304 4. Nesil | 264 4. Nesil | 224 4. Nesil | 184 4. Nesil | 136 4. Nesil | 336 3. Nesil | 328 3. Nesil | 320 3. Nesil | 184 3. Nesil | 576 2. Nesil. |
| RT Çekirdekleri | 128 3. Nesil | 80 3. Nesil | 76 3. Nesil | 66 3. Nesil | 56 3. Nesil | 46 3. Nesil | 34 3. Nesil | 84 2. Nesil | 82 2. Nesil | 80 2. Nesil | 46 2. Nesil | 72 |
| GPU Temel Saati | 2,235 MHz | 2,295 MHz | 2,205 MHz | 2,340 MHz | 1,980 MHz | 1,920 MHz | 2,310 MHz | 1,560 MHz | 1,395 MHz | 1,365 MHz | 1,500 MHz | 1,350 MHz |
| GPU Boost Clock | 2,520 MHz | 2,595 MHz | 2,505 MHz | 2,610 MHz | 2,475 MHz | 2,535 MHz | 2,535 MHz | 1,860 MHz | 1,695 MHz | 1,665 MHz | 1,750 MHz | 1,770 MHz |
| Bellek Veri Yolu | 384-bit | 256-bit | 256-bit | 256-bit | 192-bit | 192-bit | 128-bit | 384-bit | 384-bit | 384-bit | 256-bit | 384-bit |
| Bellek Bant Genişliği | 1.008 GB/s | 736,3 GB/s | 716,8 GB/s | 672 GB/s | 504 GB/s | 504 GB/s | 288 GB/s | 1.008 GB/s | 936 GB/s | 912 GB/s | 448 GB/s | 672 GB/s |
| Video Belleği | 24 GB GDDR6X | 16 GB GDDR6X | 16 GB GDDR6X | 16 GB GDDR6X | 12 GB GDDR6X | 12 GB GDDR6X | 8 GB GDDR6 | 24 GB GDDR6X | 24 GB GDDR6X | 12 GB GDDR6X | 8 GB GDDR6 | 24 GB GDDR6 |
| Güç Tüketimi | 450 W | 320 W | 320 W | 285 W | 220 W | 215 W | 160 W | 450 W | 350 W | 350 W | 220 W | 280 W |
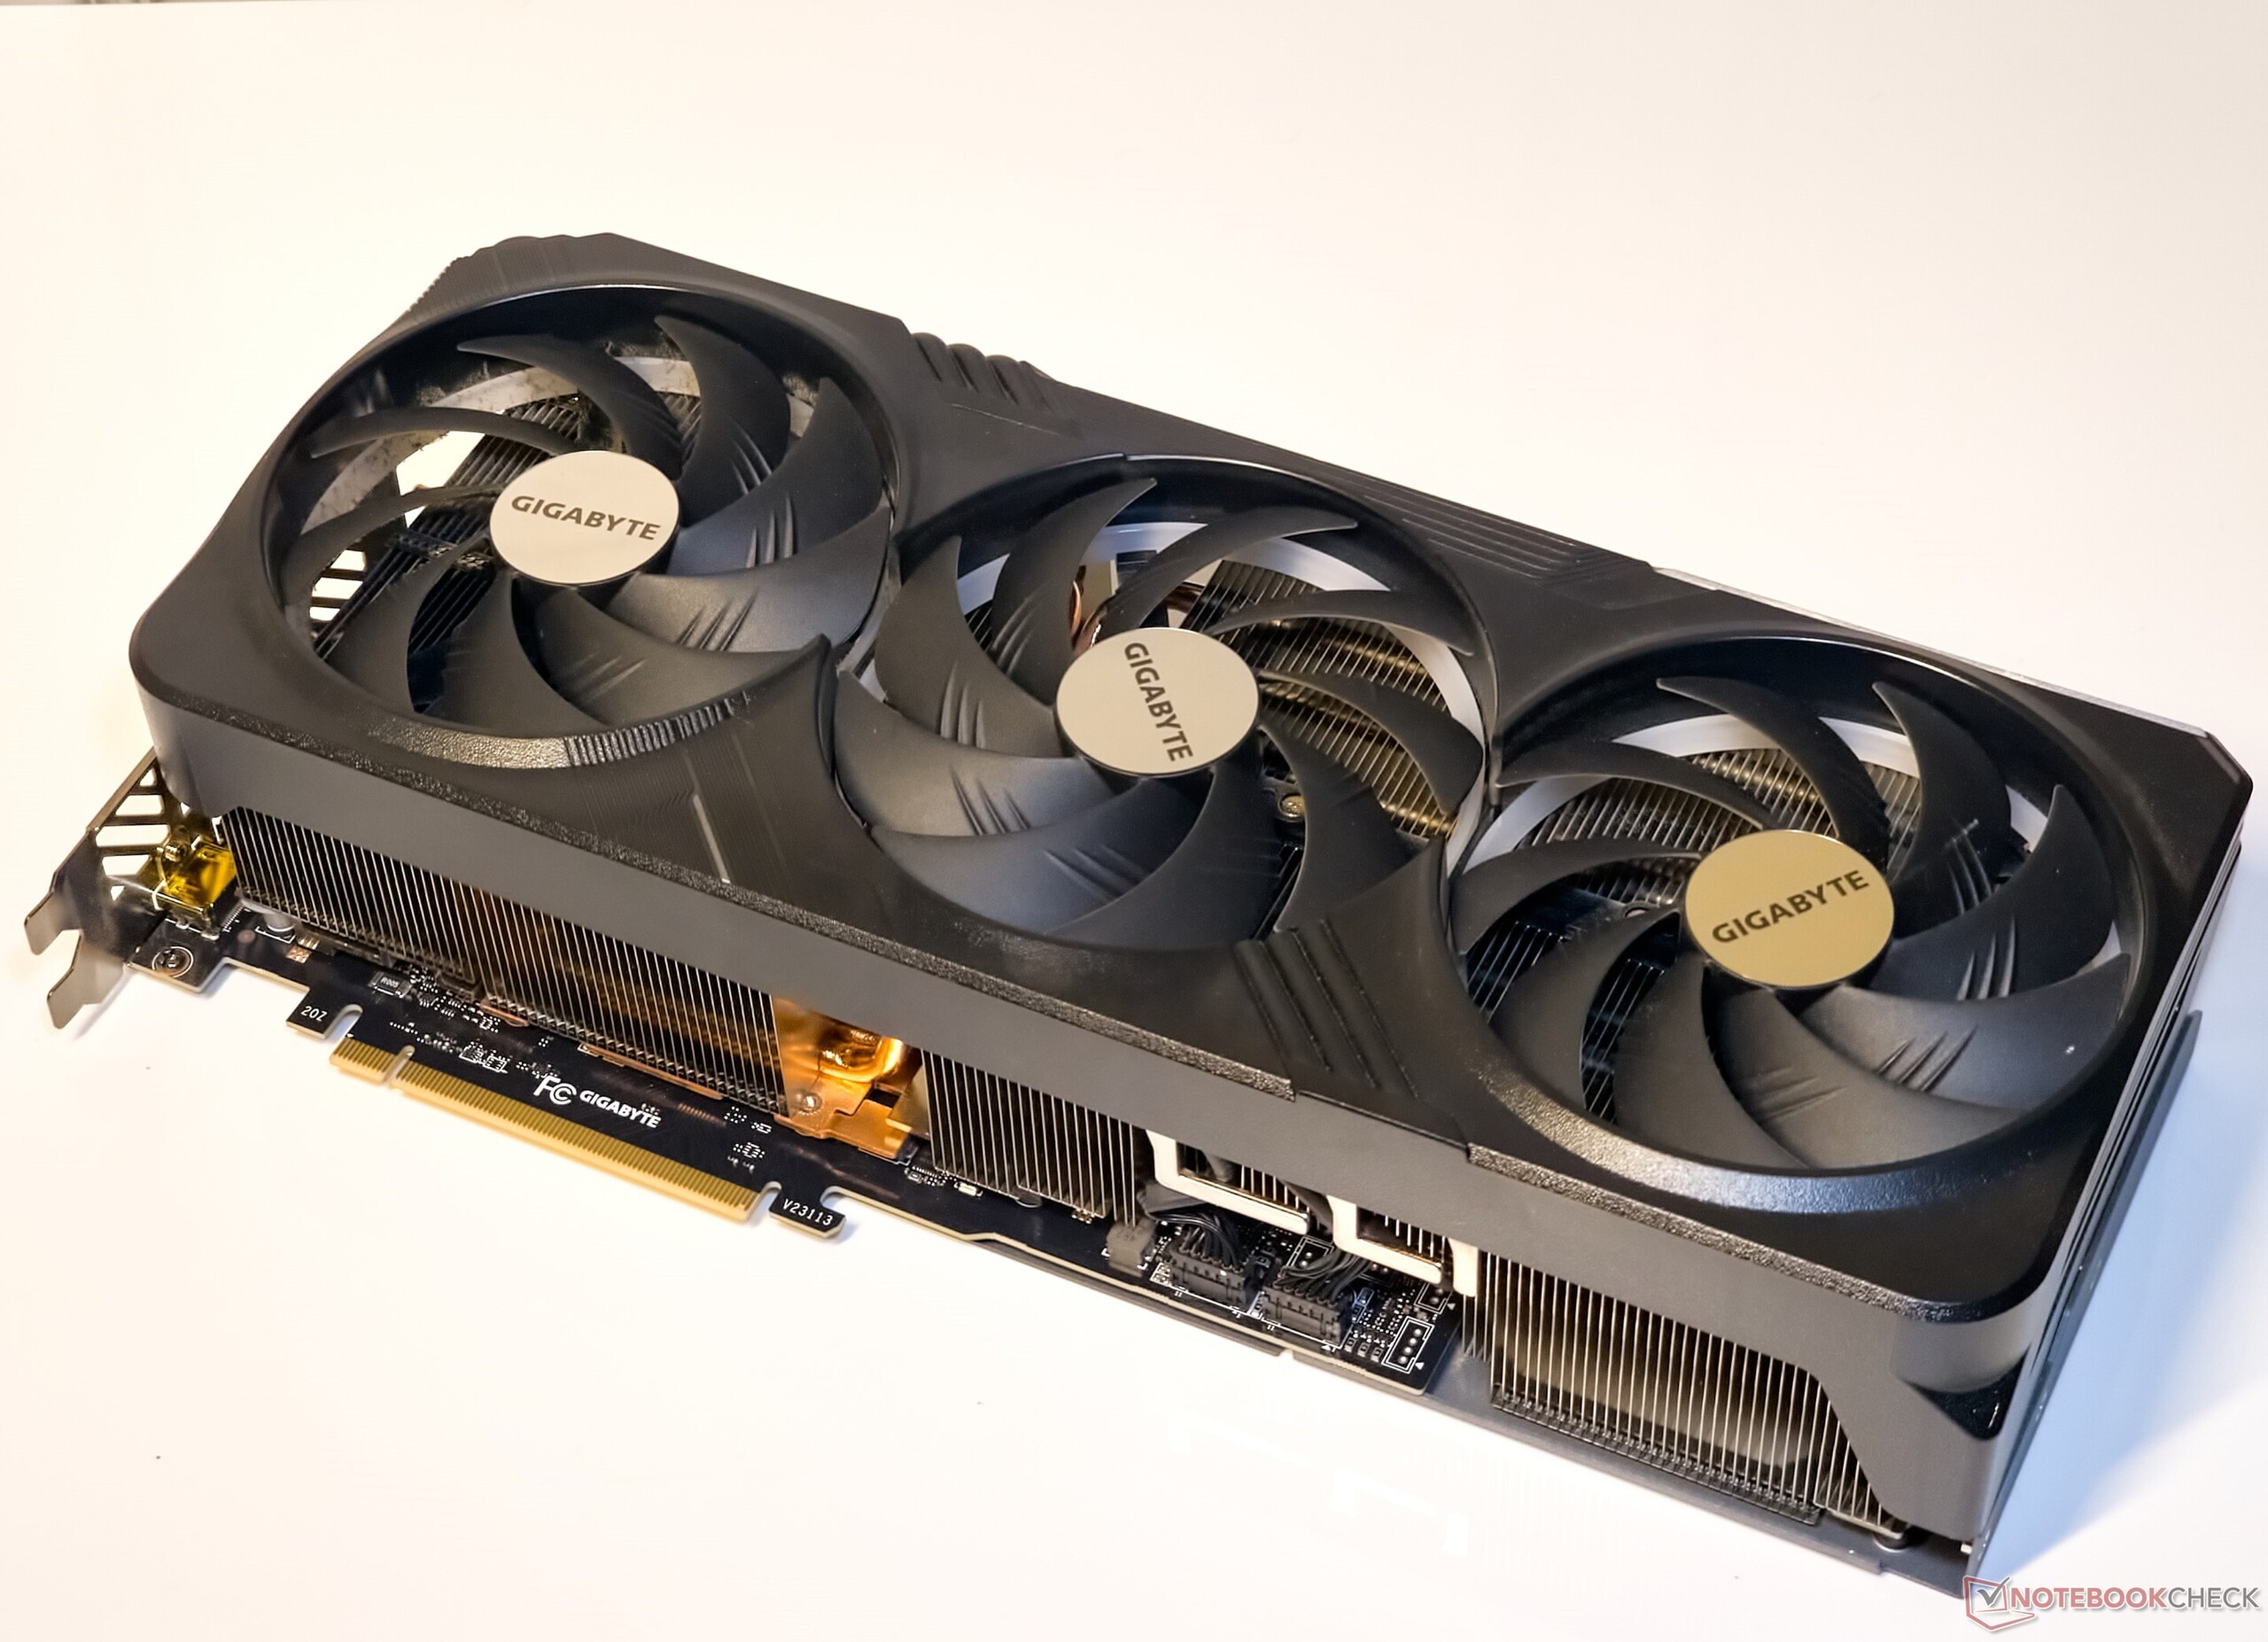
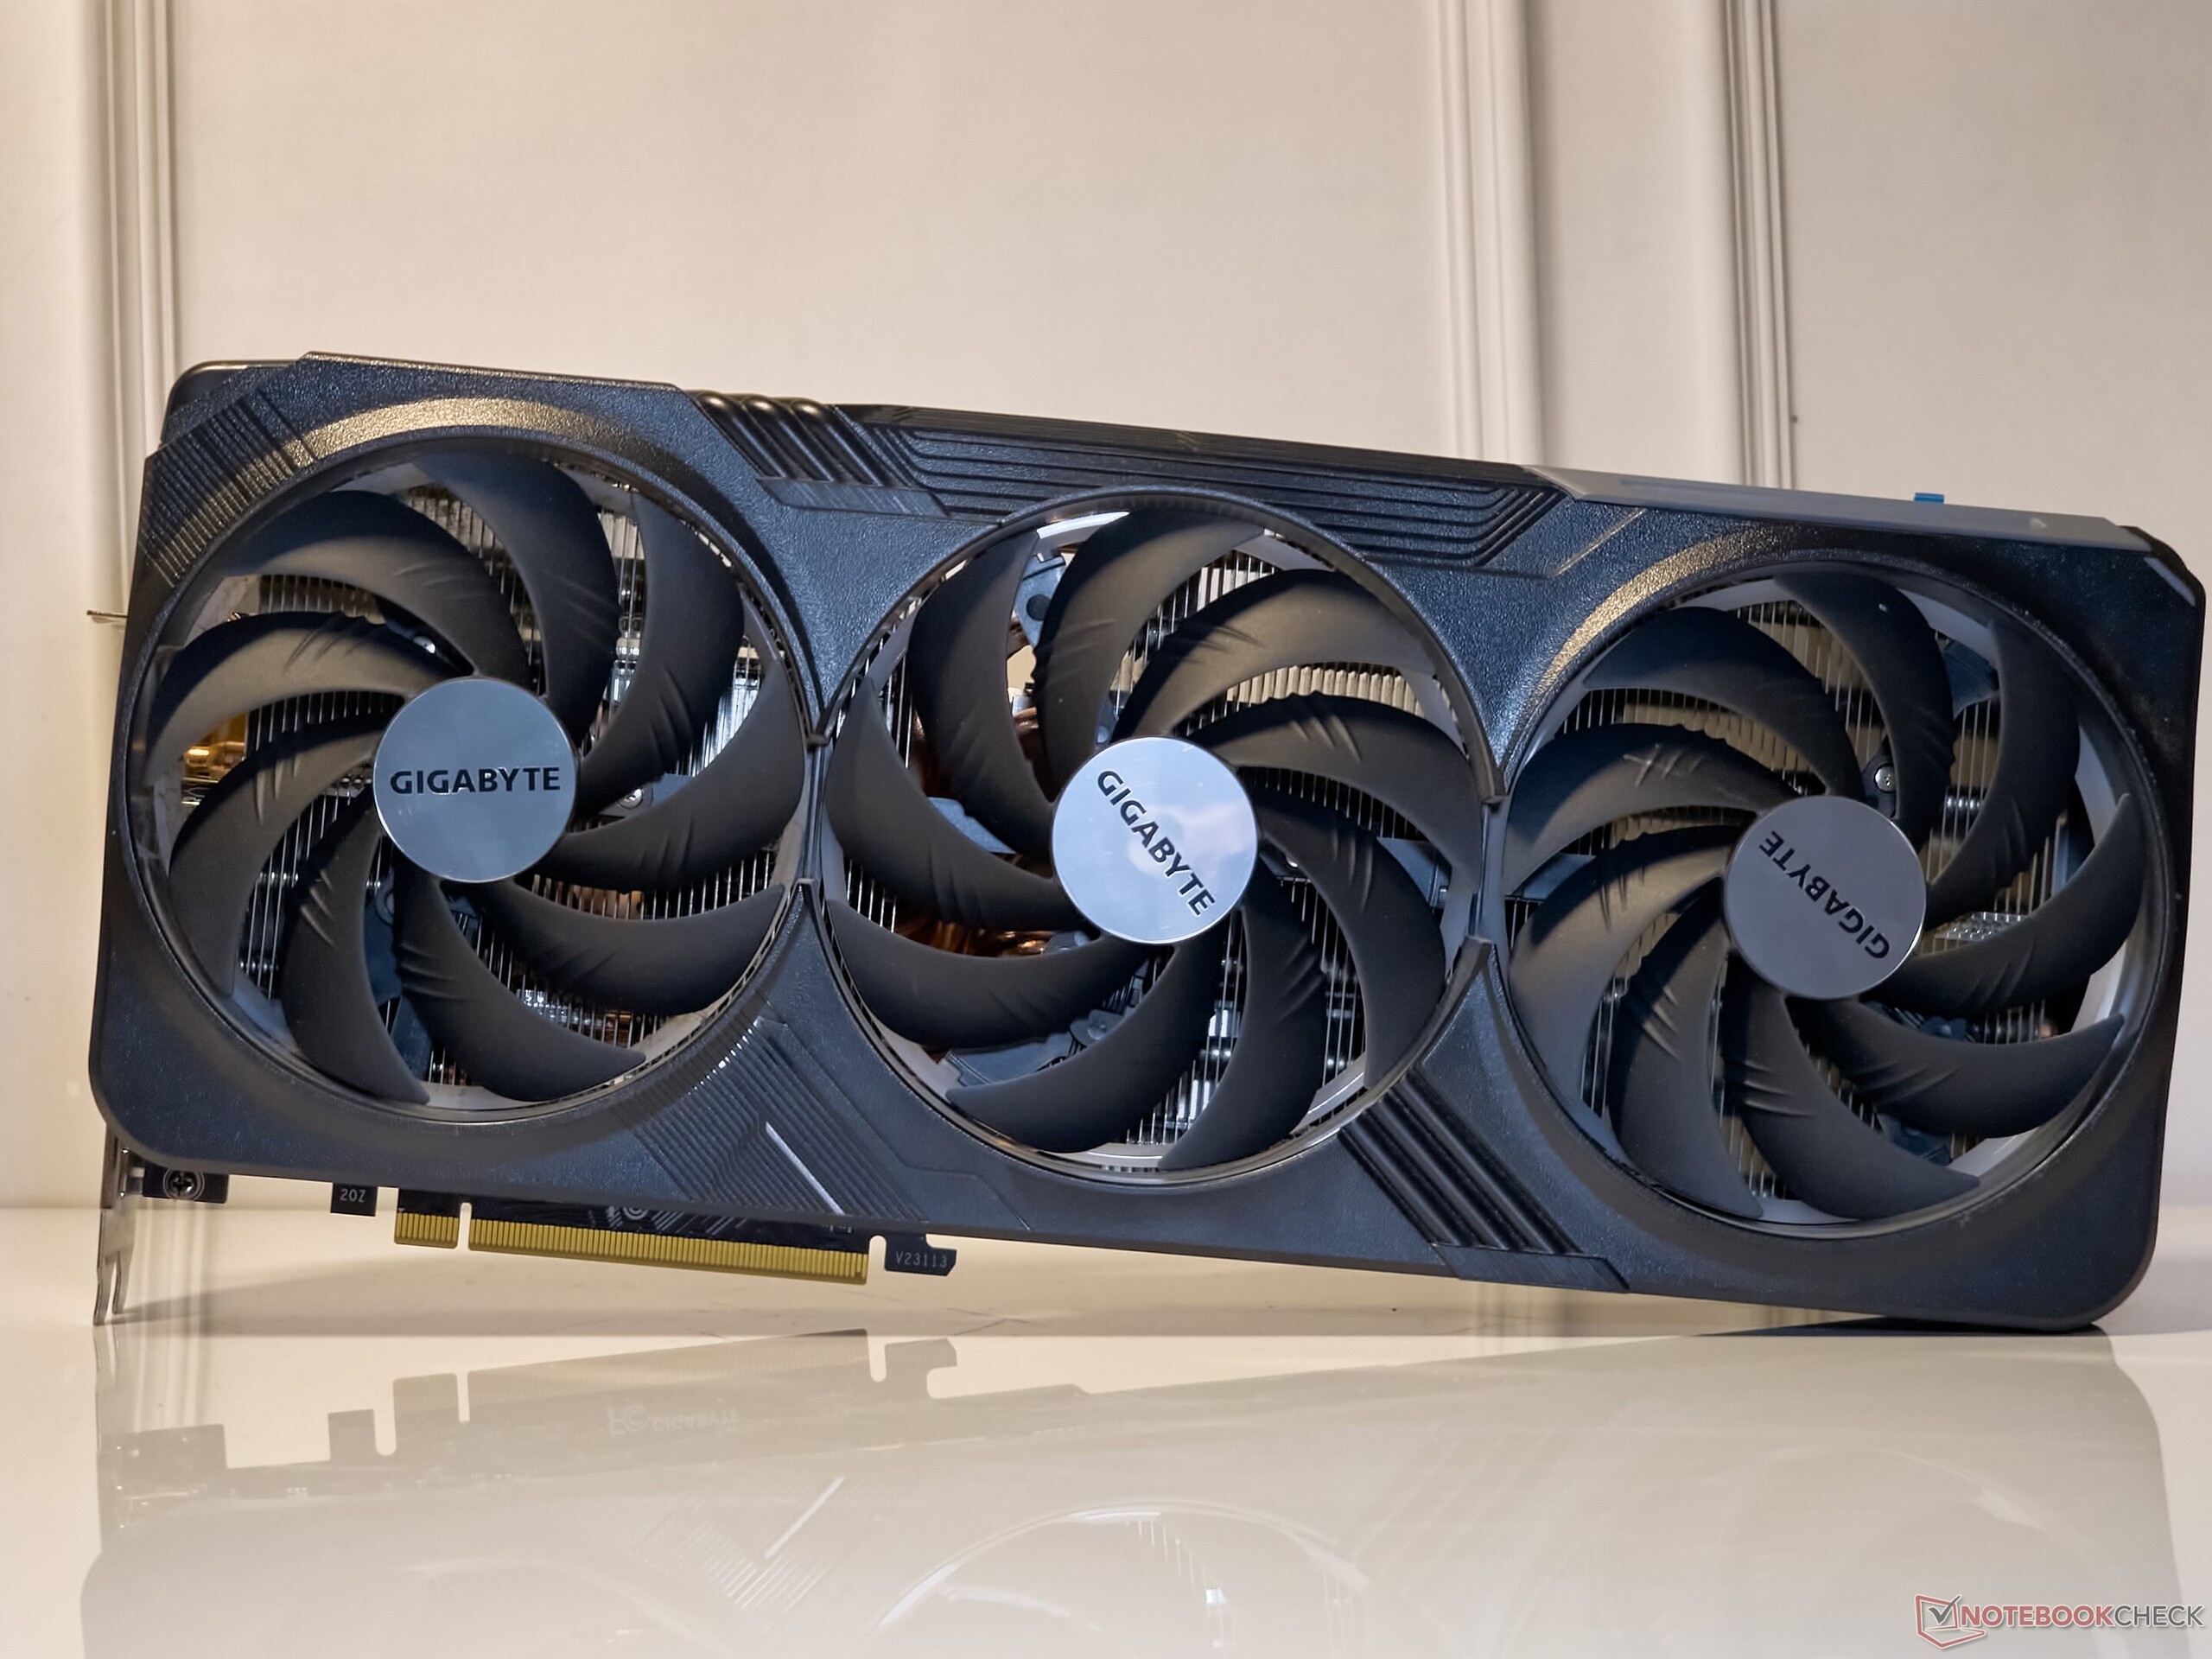
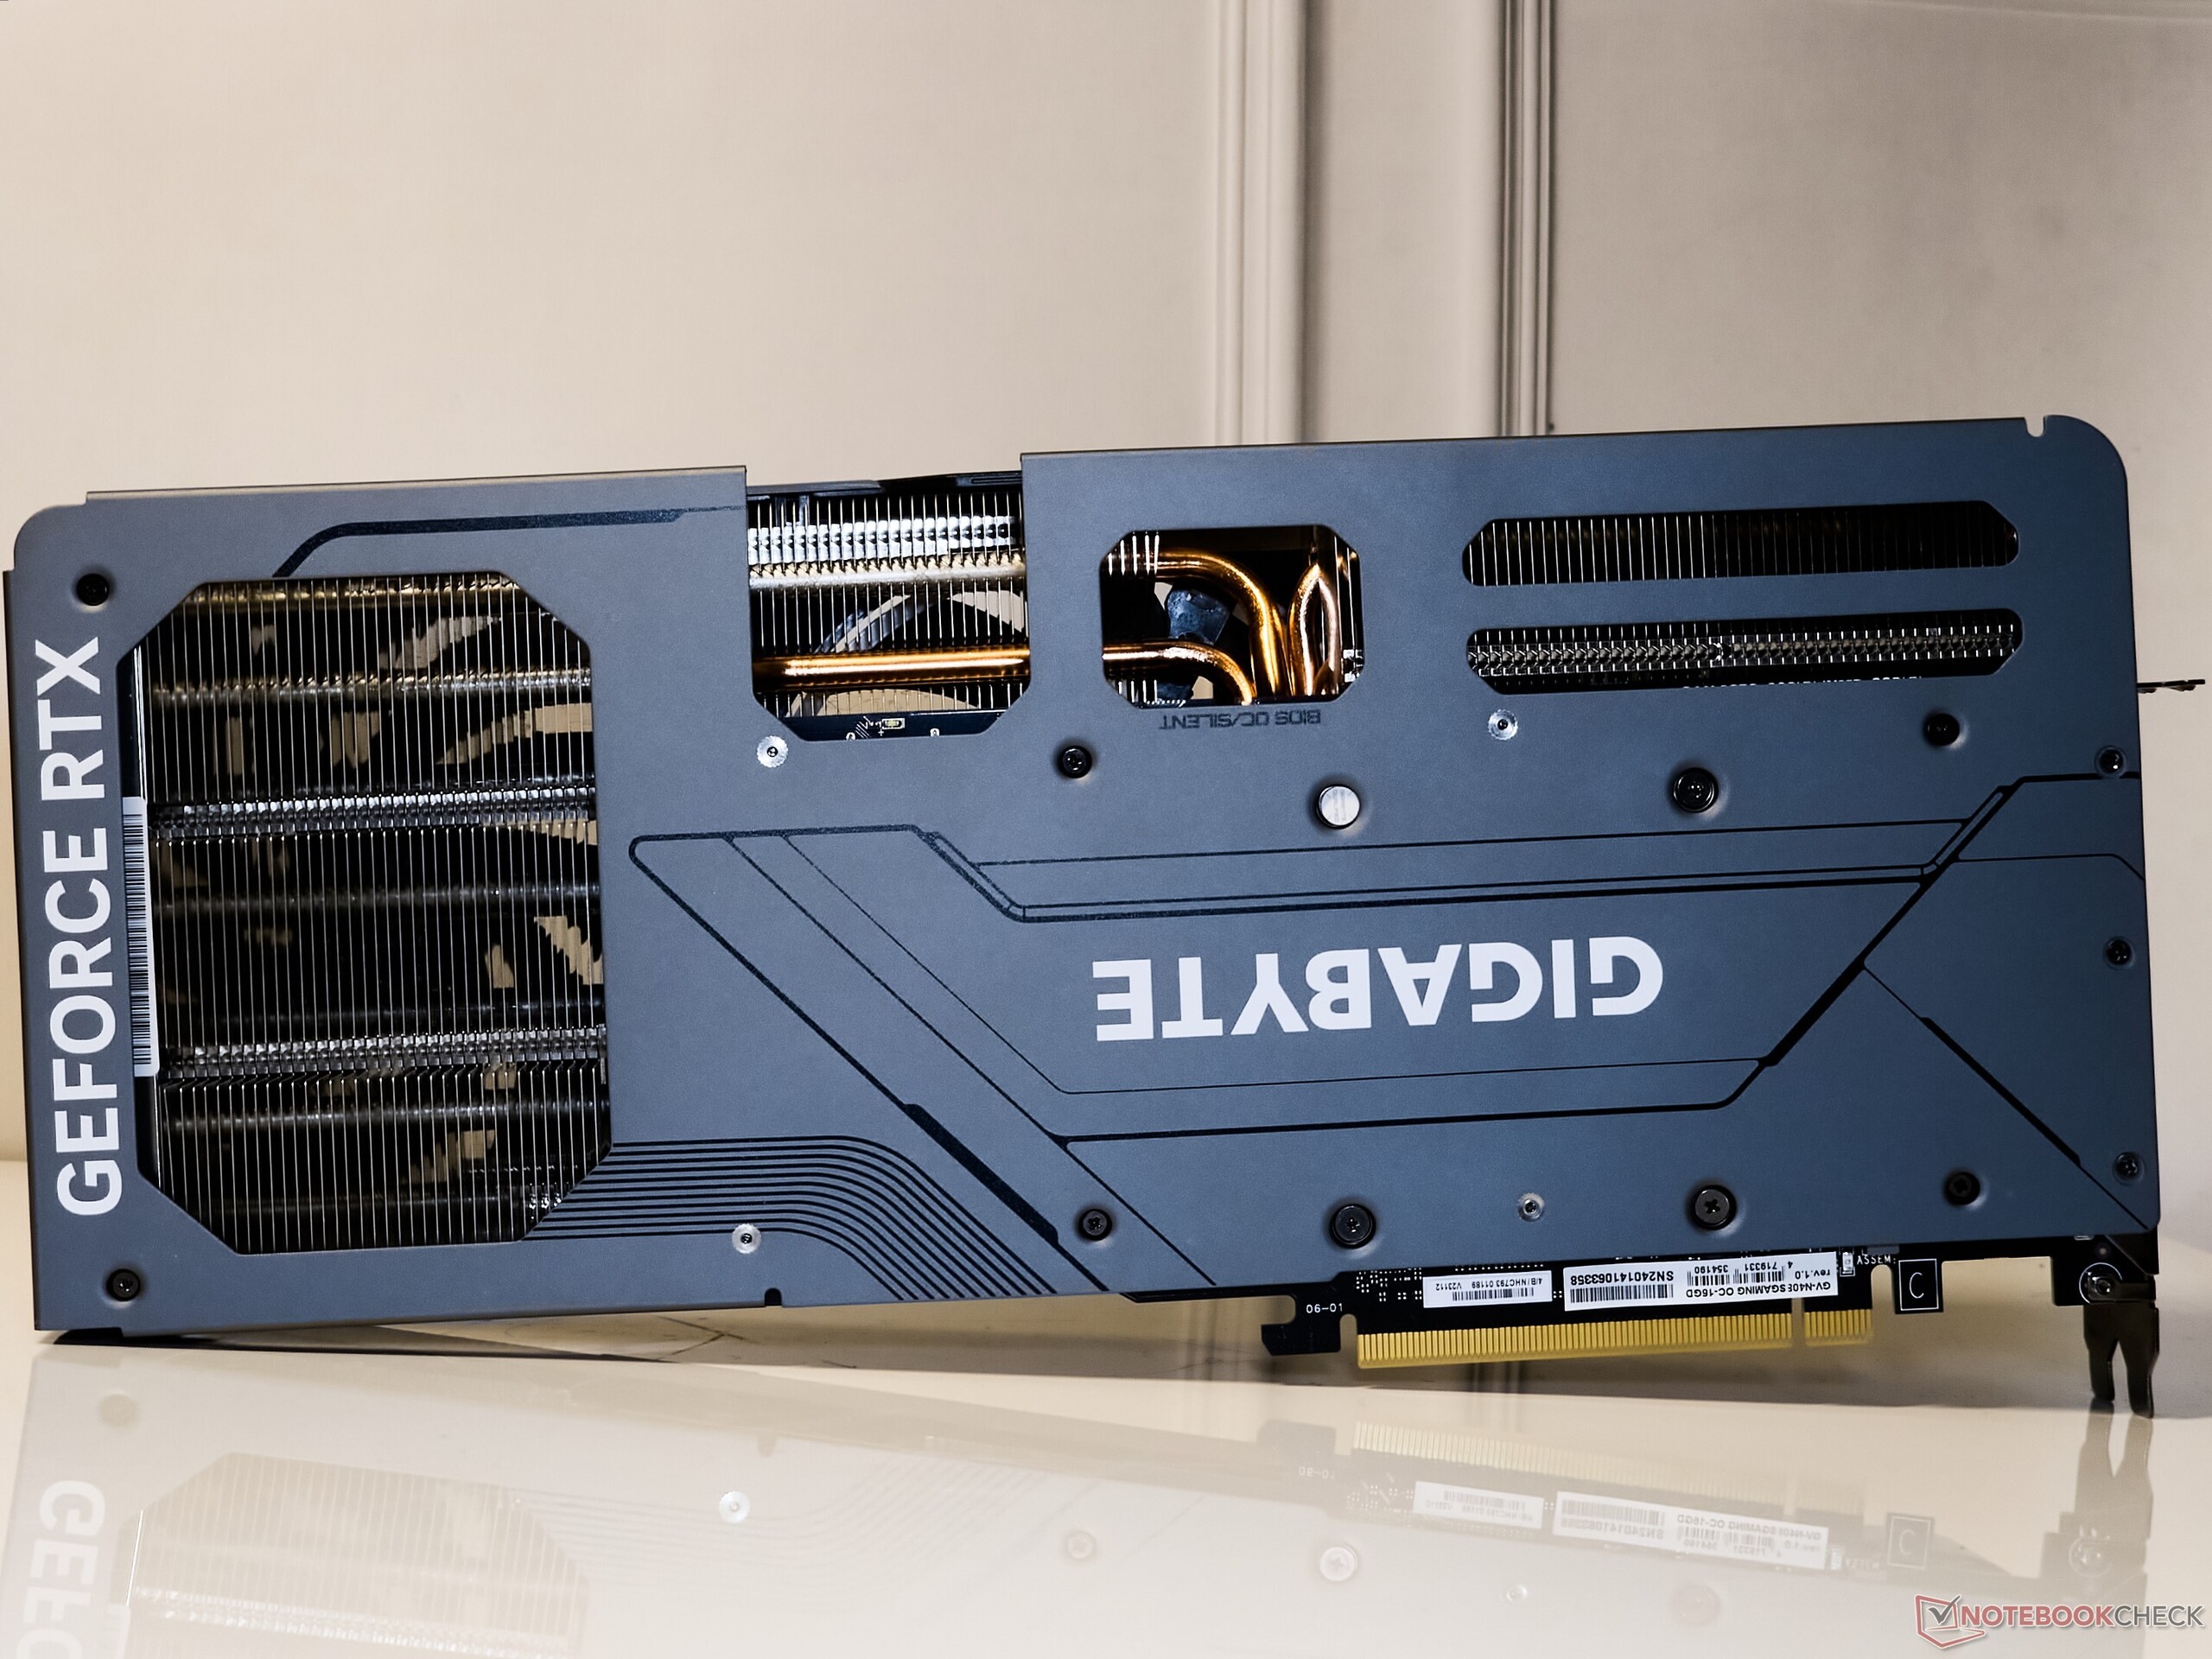
Gigabyte GeForce RTX 4080 Super Gaming OC yakından
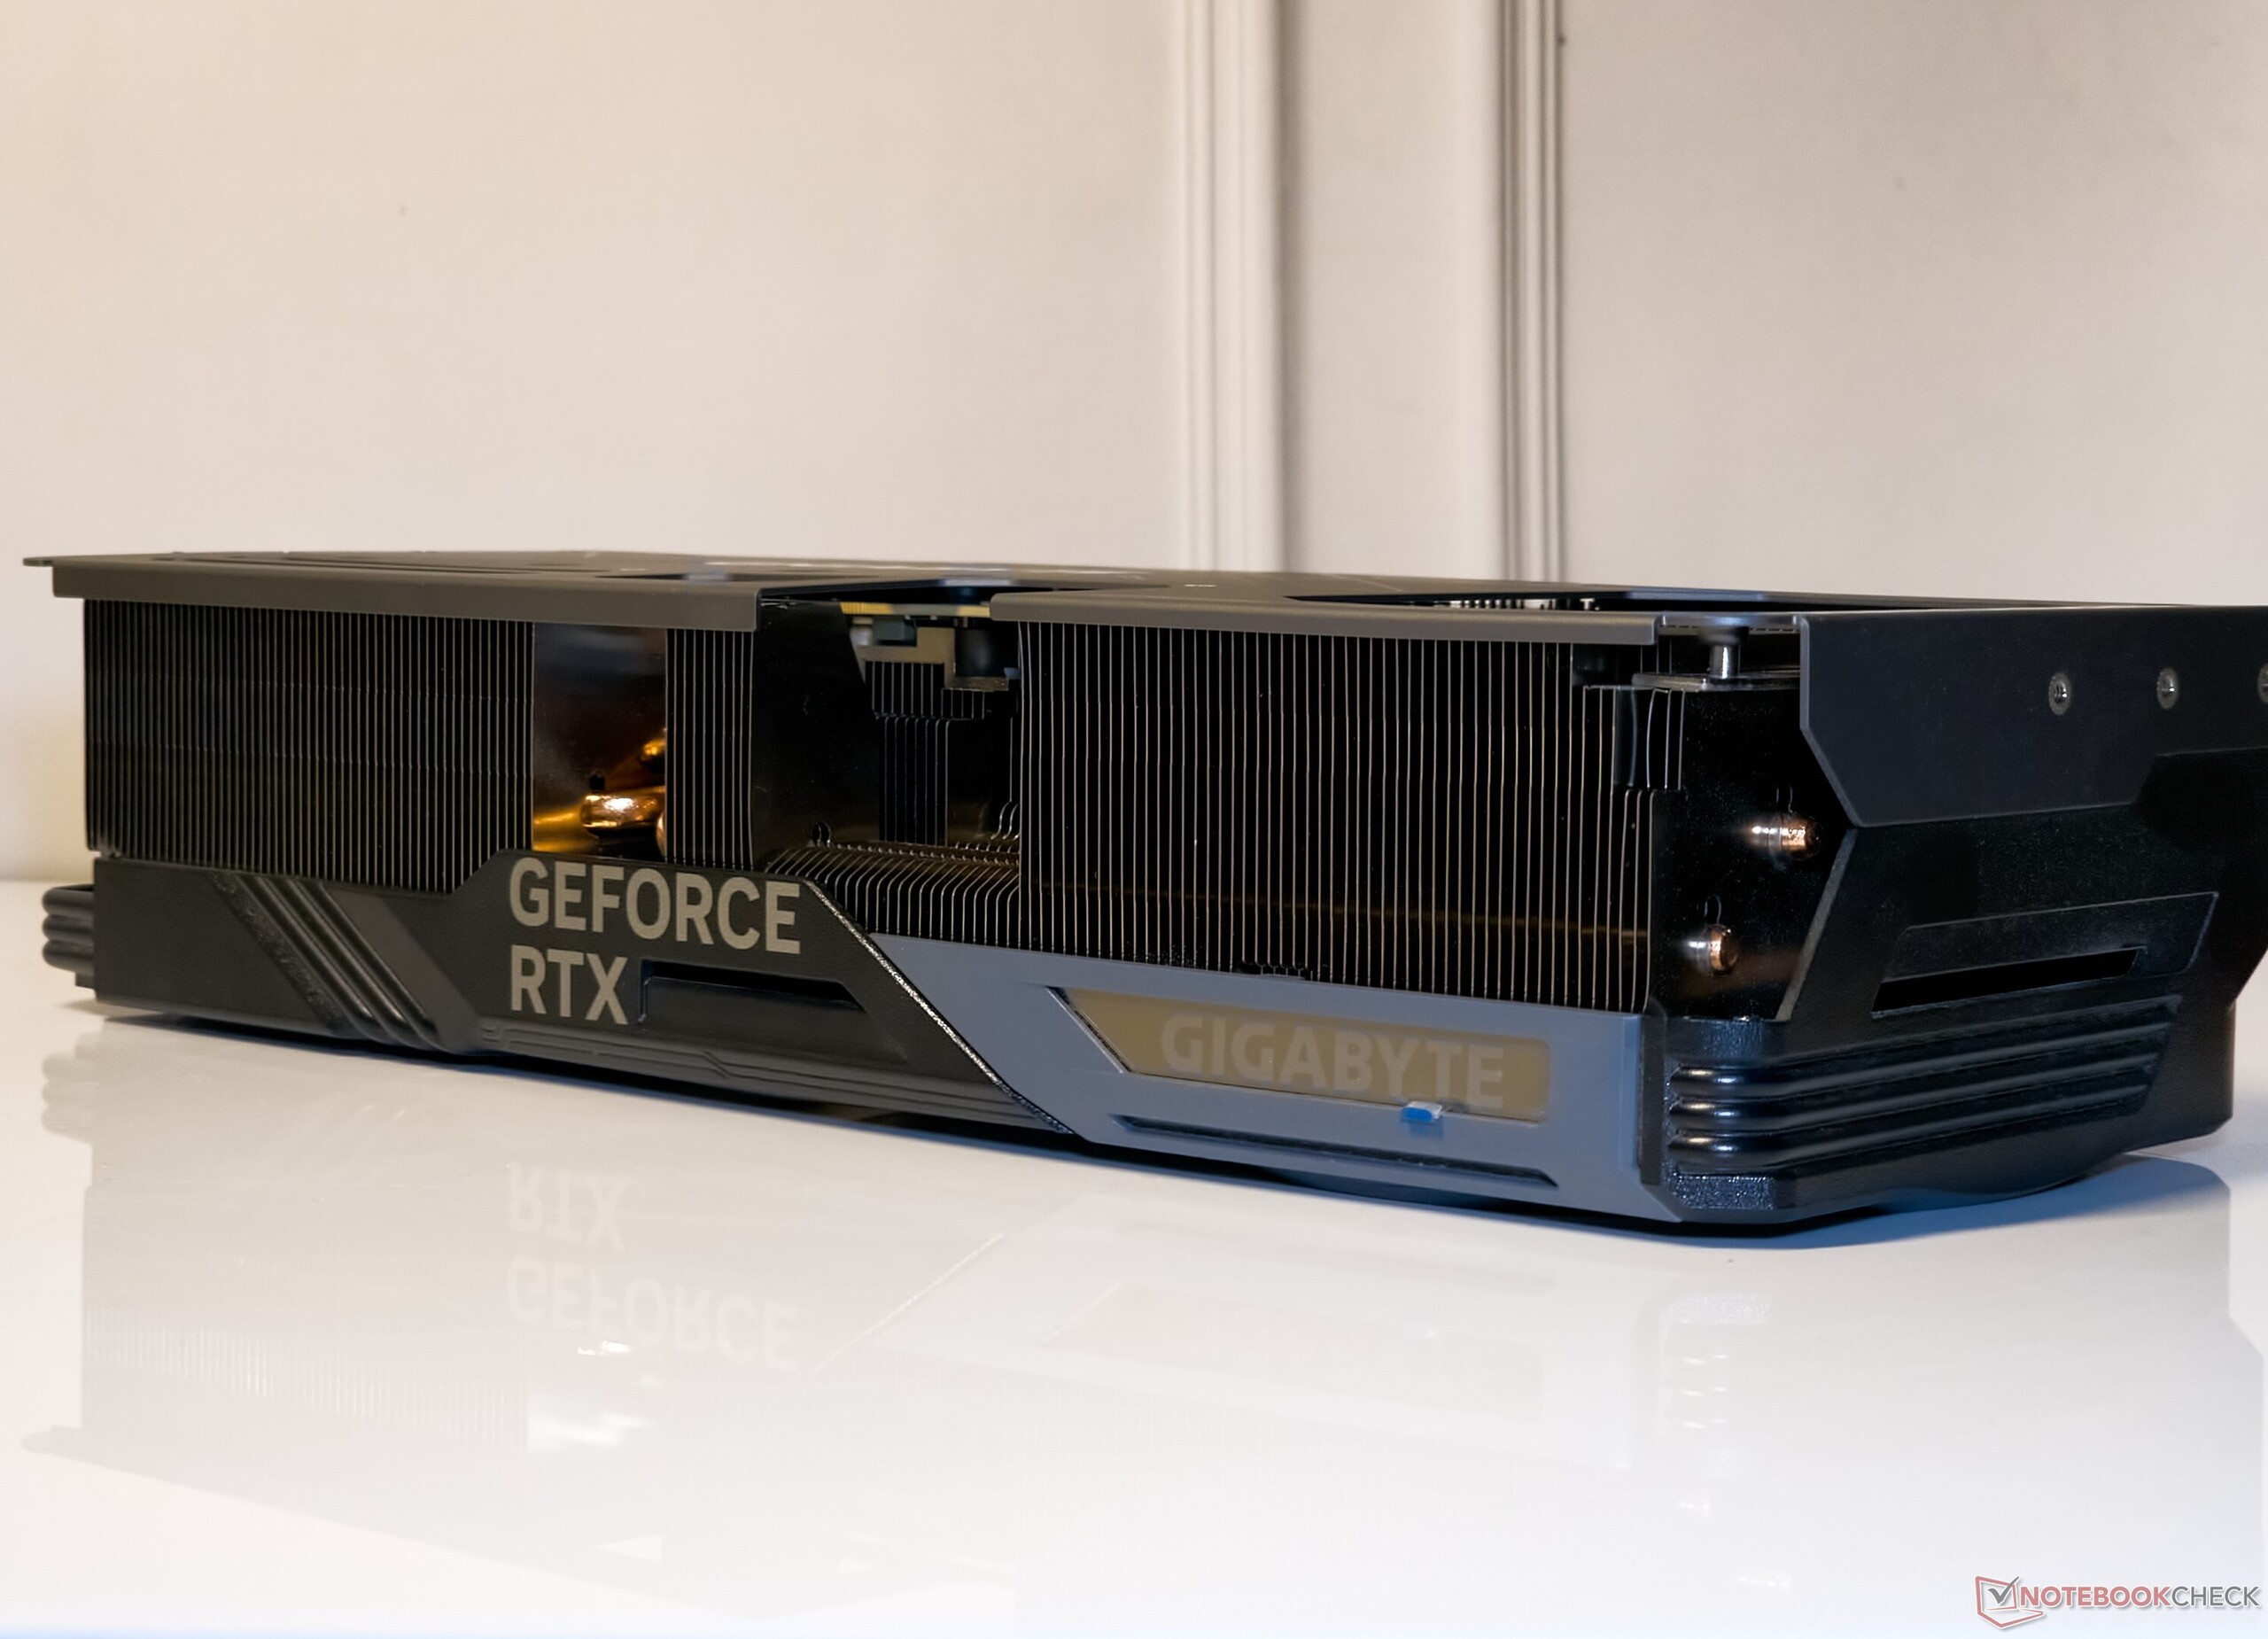
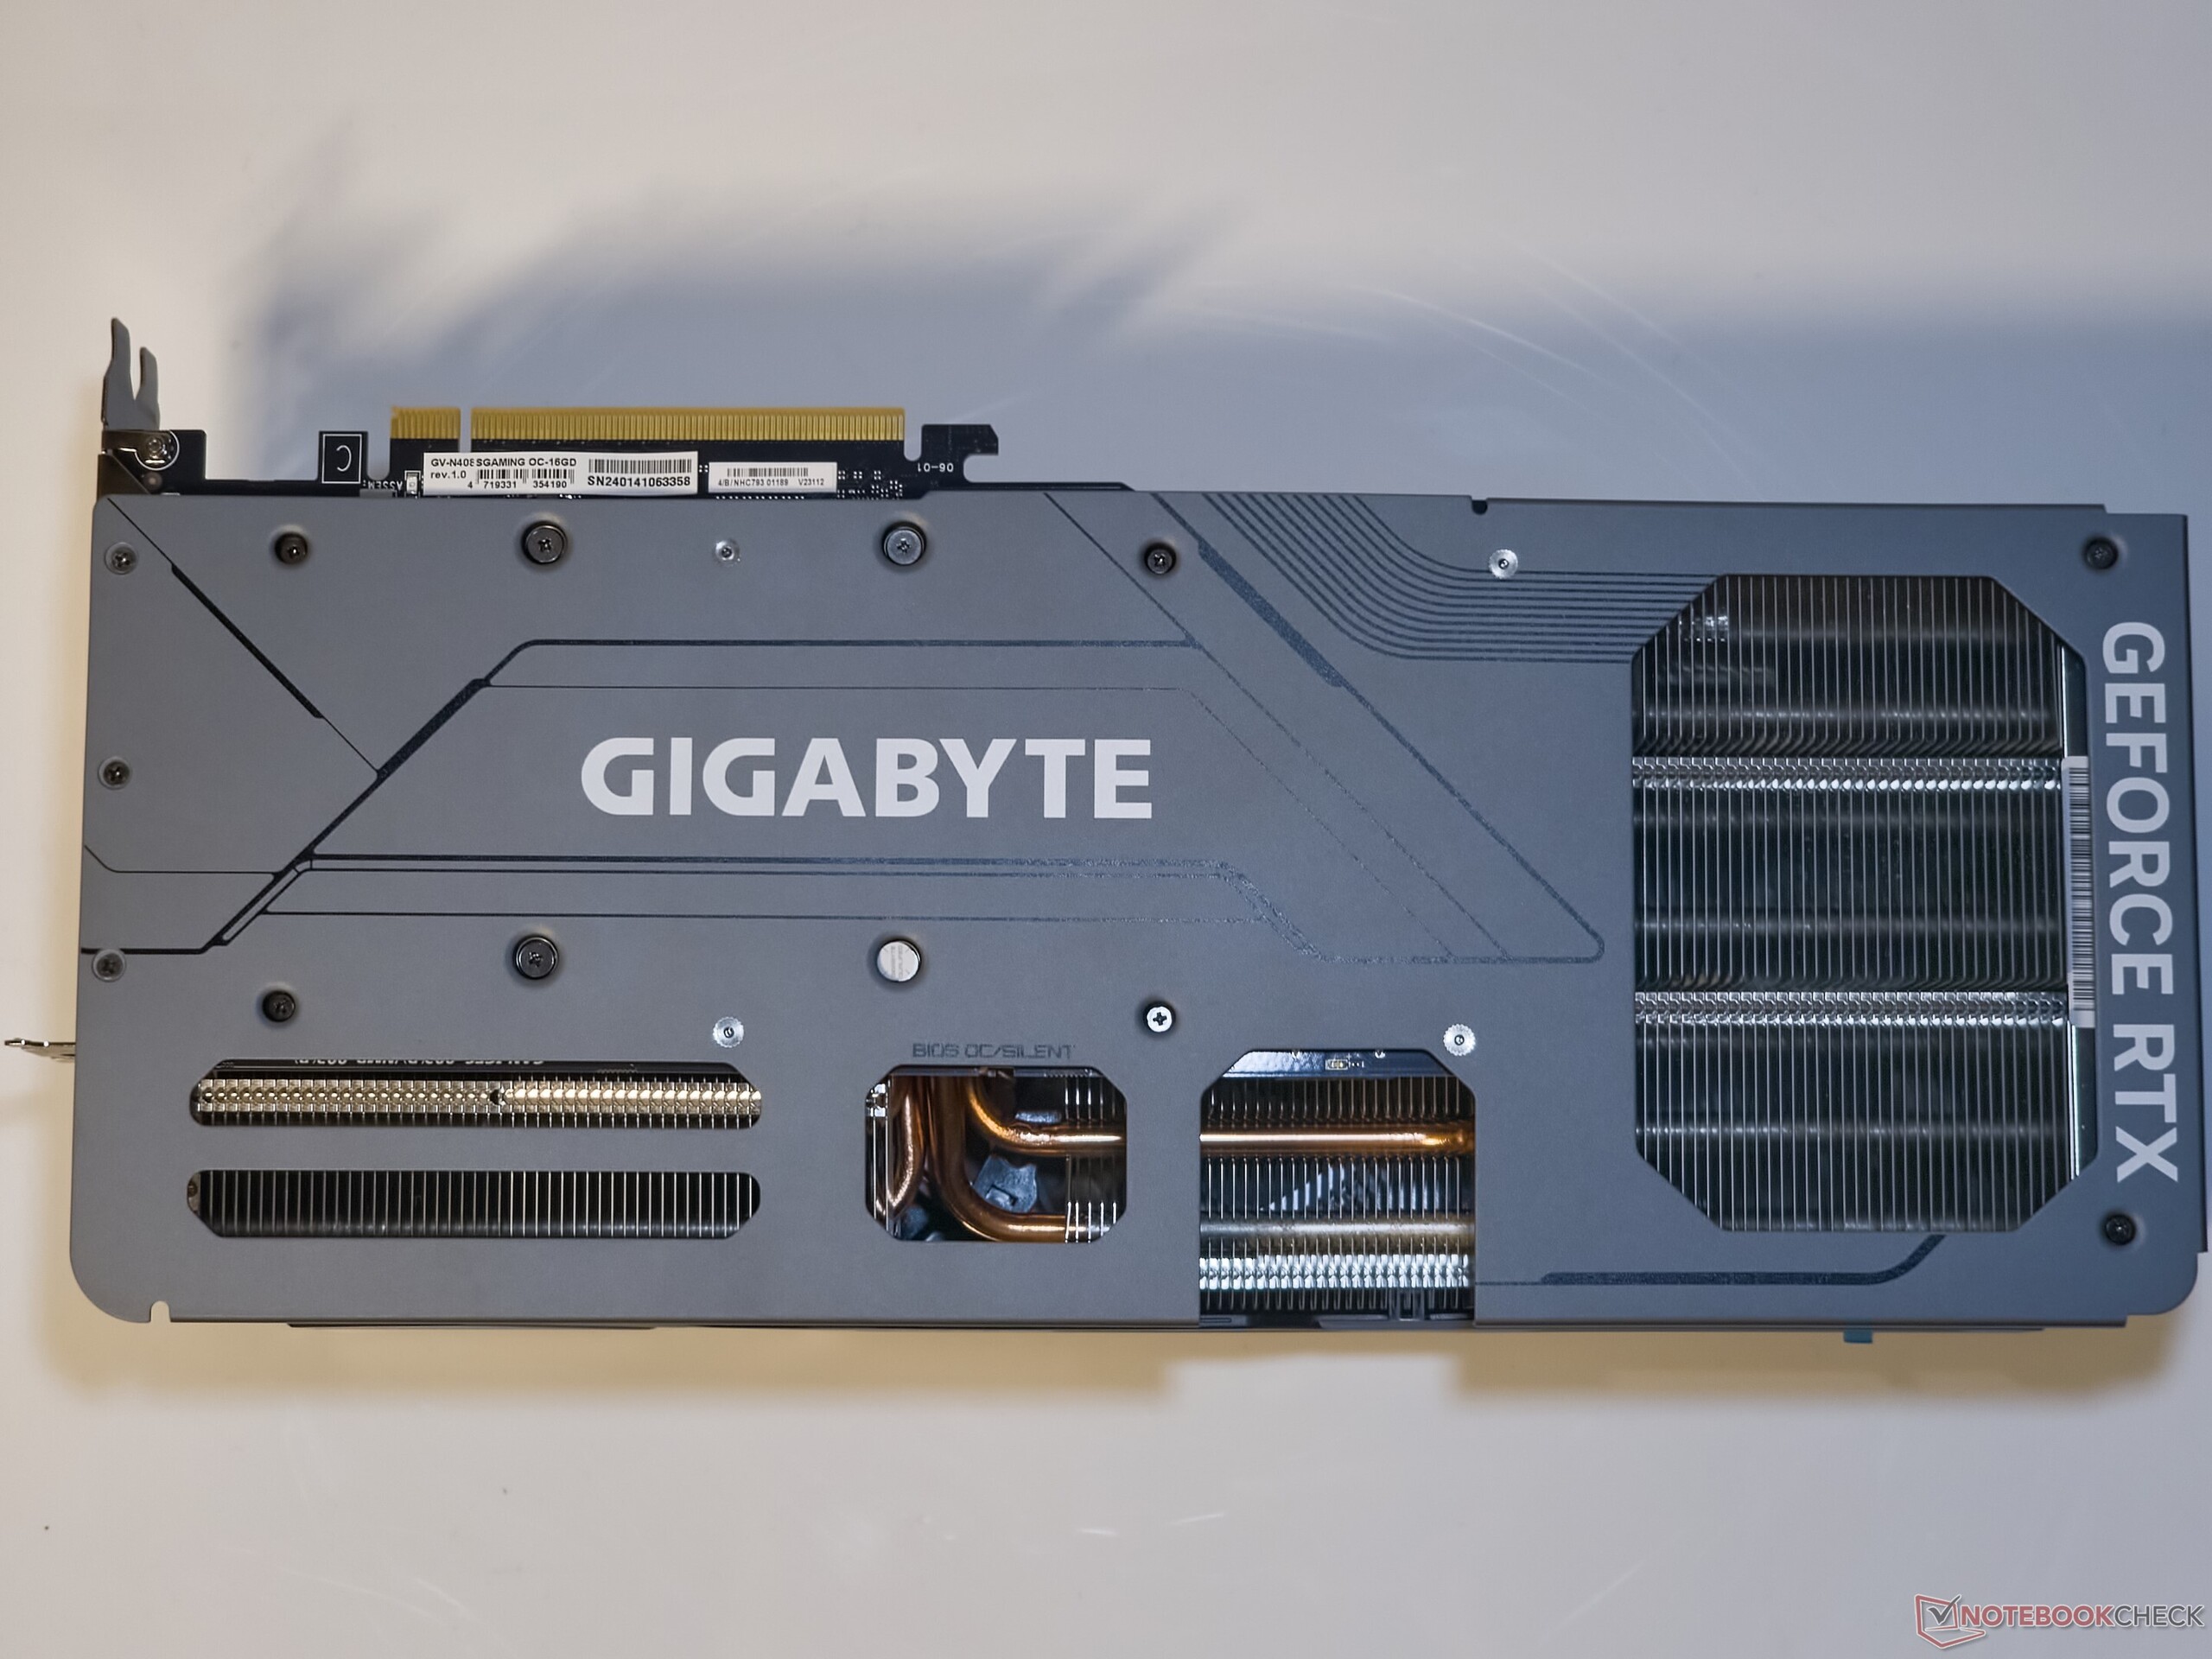
Gigabyte, RTX 4080 Super Gaming OC 16G'nin tasarımını Super olmayan selefine göre değiştirmedi. 342 x 150 x 75 mm boyutlarında ve yaklaşık 1,74 kg ağırlığındaki RTX 4080 Super Gaming OC, kart üzerinde neredeyse üç PCIe yuvası kaplıyor, bu nedenle daha büyük bir kasadan ve ideal olarak bir E-ATX anakarttan yararlanıyor.
Kart plastik ama sağlam bir ön kaplamaya ve metal bir arka plakaya sahip. RGB efektleri RTX 4070 Super Gaming OC'de gördüğümüze benziyor - üstte parlayan bir Gigabyte logosu ve her fanın çevresi boyunca halka aydınlatma.
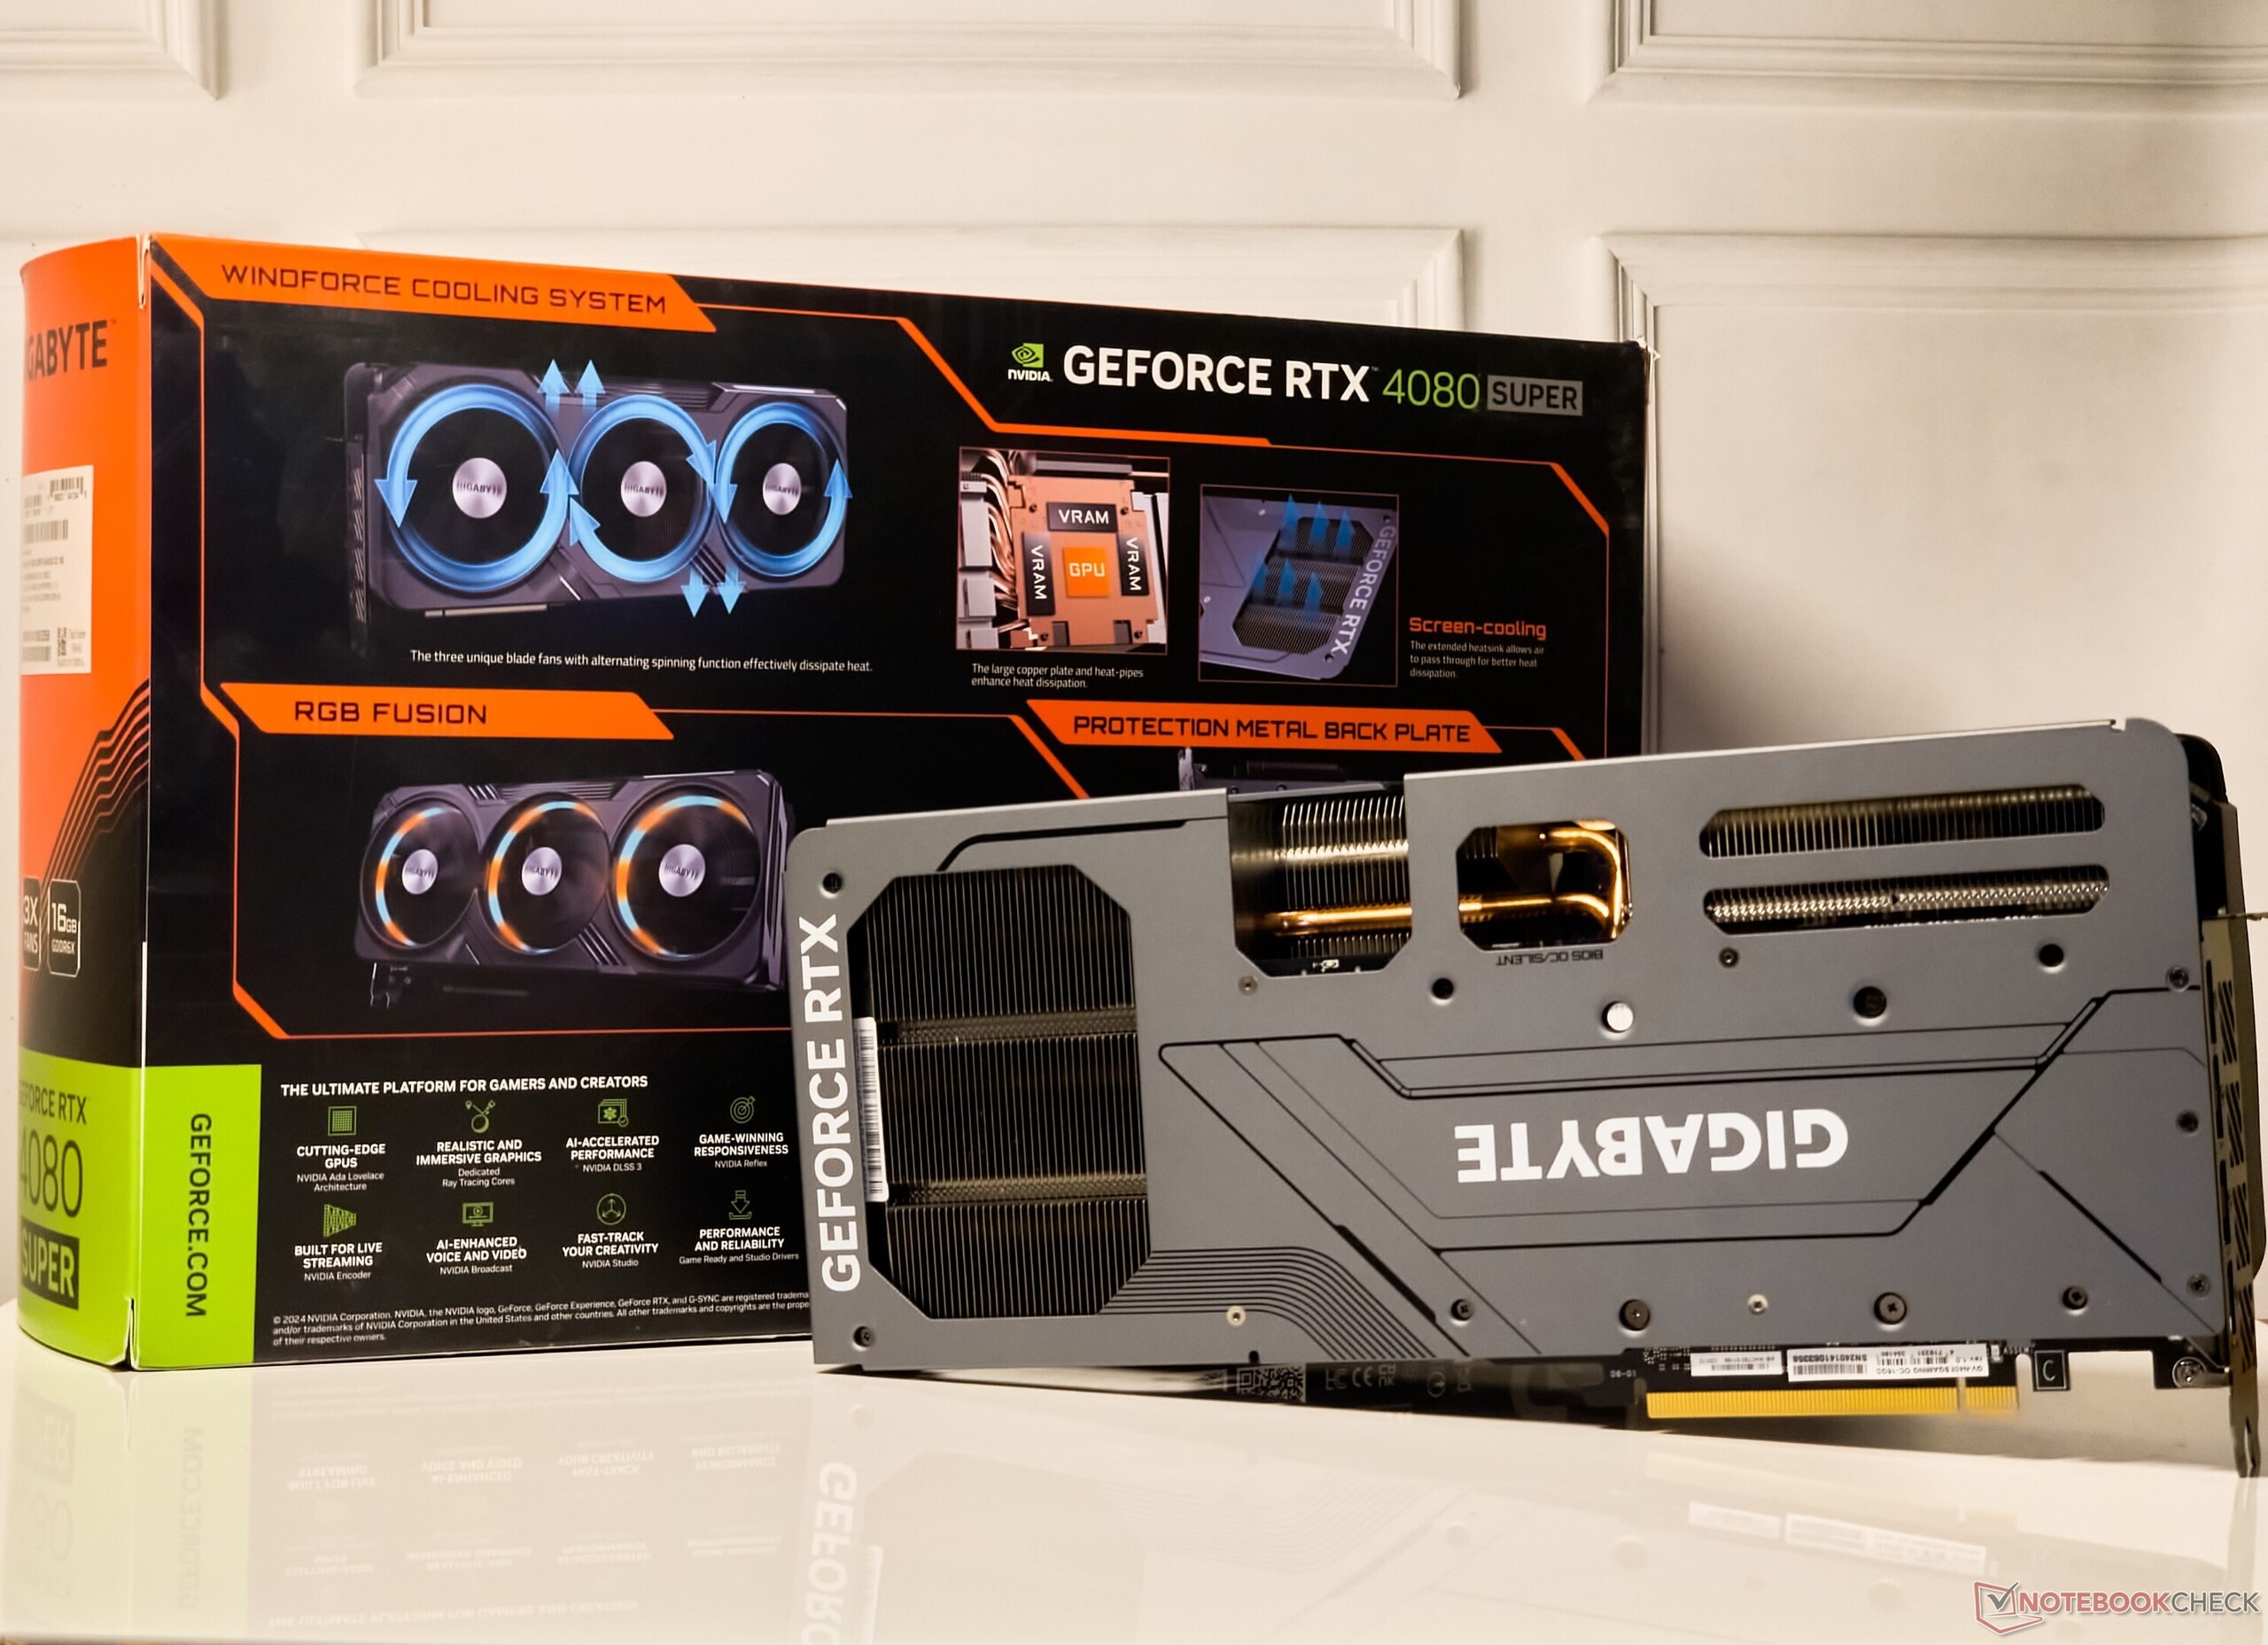
Kutu içeriğinde Hızlı başlangıç kılavuzu, garanti kartı, 12VHPWR - 3x 8-pin güç konektörü, destek braketleri ve vidalar bulunmaktadır.
RTX 4080 Super Gaming OC, 3x DisplayPort 1.4 çıkışı ve 1x HDMI 2.1a çıkışı dahil olmak üzere standart bağlantı noktaları seti sunar.
Gigabyte kartlarda standart olduğu üzere, BIOS OC ve Sessiz modlar arasında geçiş yapmak için çift BIOS anahtarı mevcut.
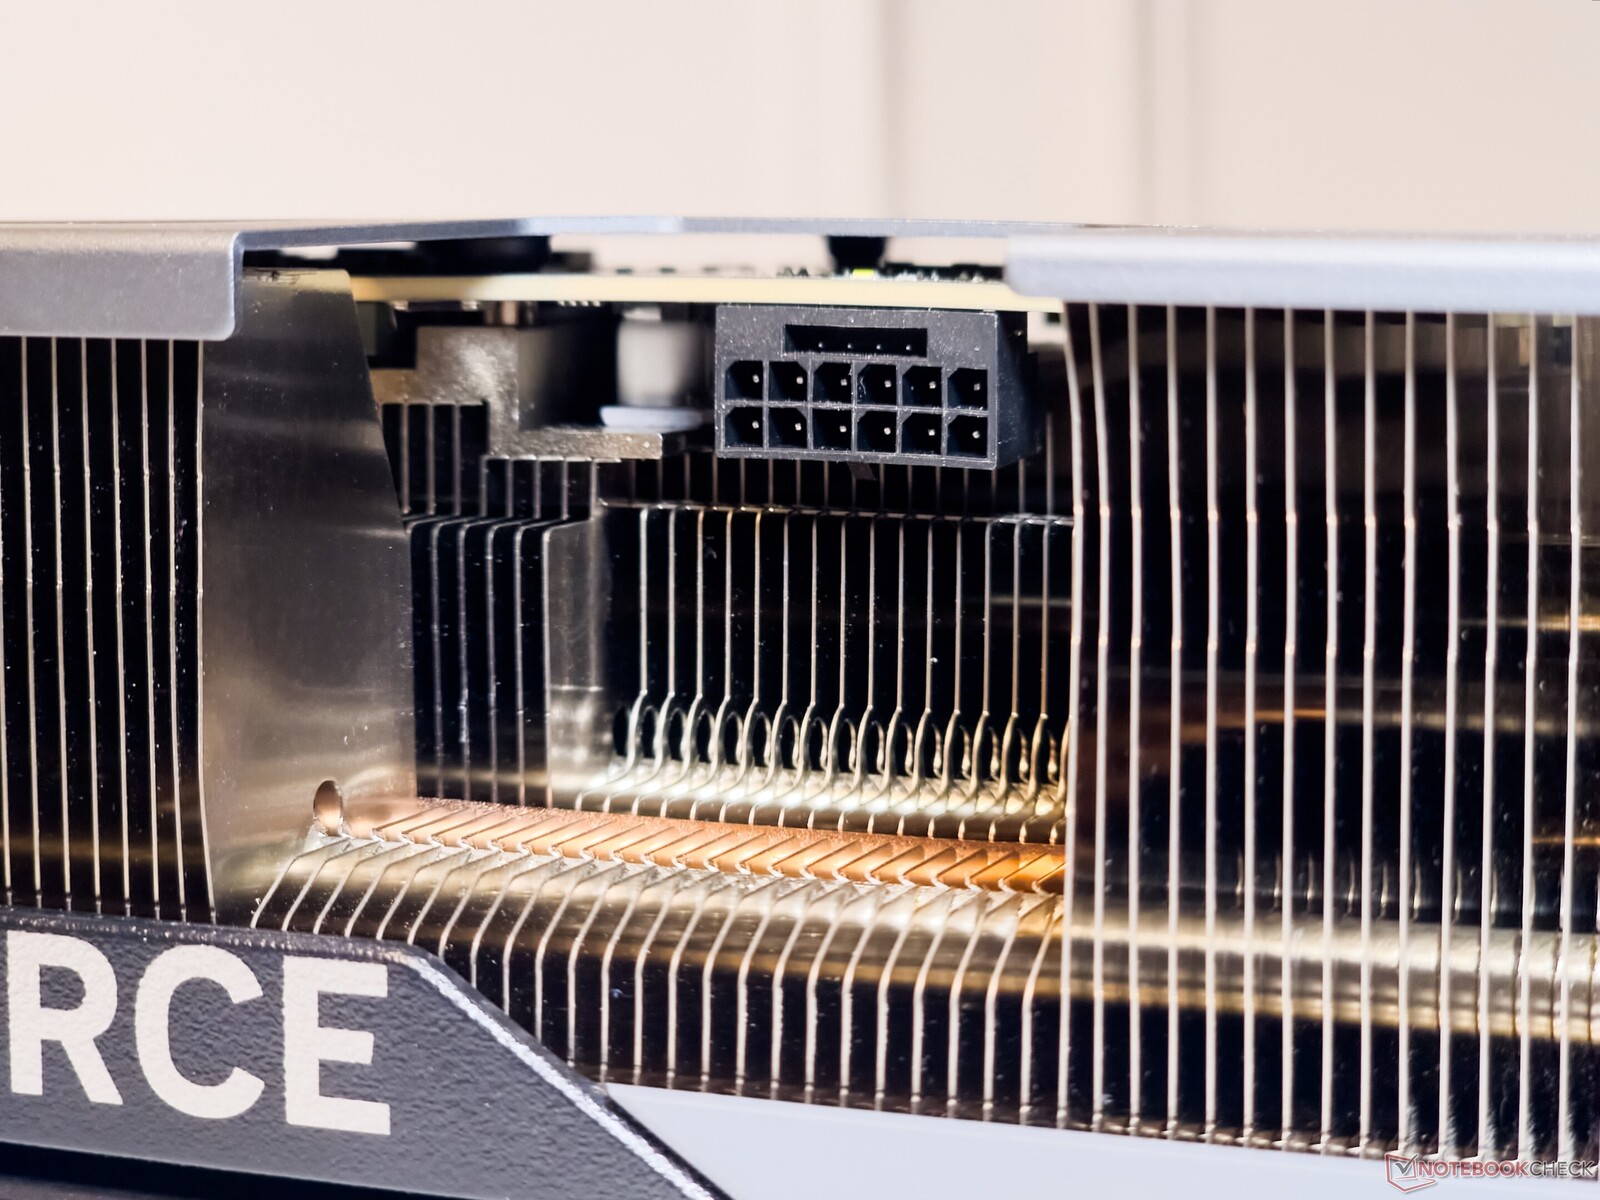
GPU'ya güç beslemesi, artık varsayılan 12VHPWR konektörü tarafından gerçekleştiriliyor. PSU'nun PCIe Gen 5 16 pinli konnektörüne tam oturması konusunda herhangi bir sorunla karşılaşmadık. Önlem olarak Gigabyte, herhangi bir bağlantı sorununu göstermek için yanan bir LED göstergesi de sağlıyor.


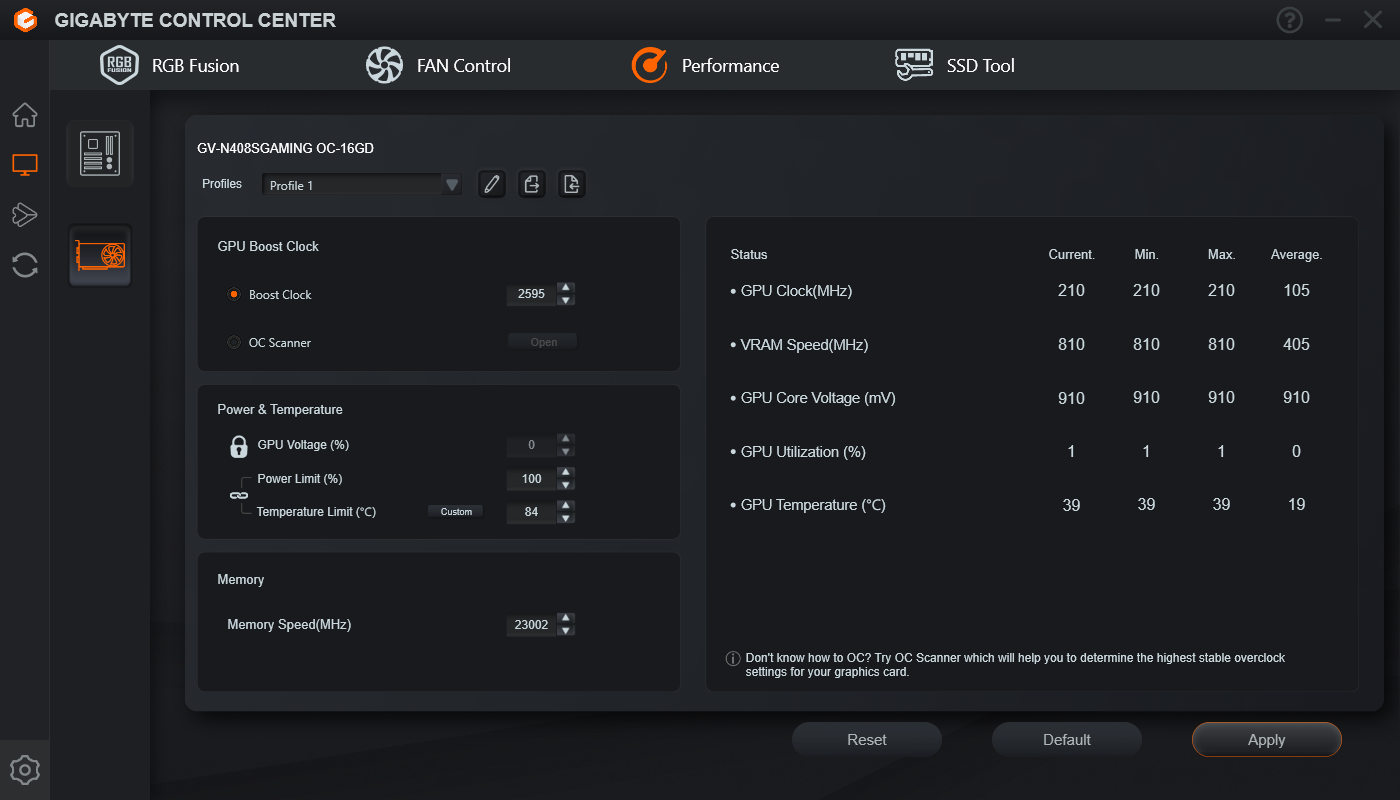
Gigabyte GeForce RTX 4080 Super Gaming OC 16G, 2.595 MHz'e kadar artırabilir ve 400 W'a kadar TGP artışlarına izin vermek için ek %25 güç boşluğuna sahiptir.
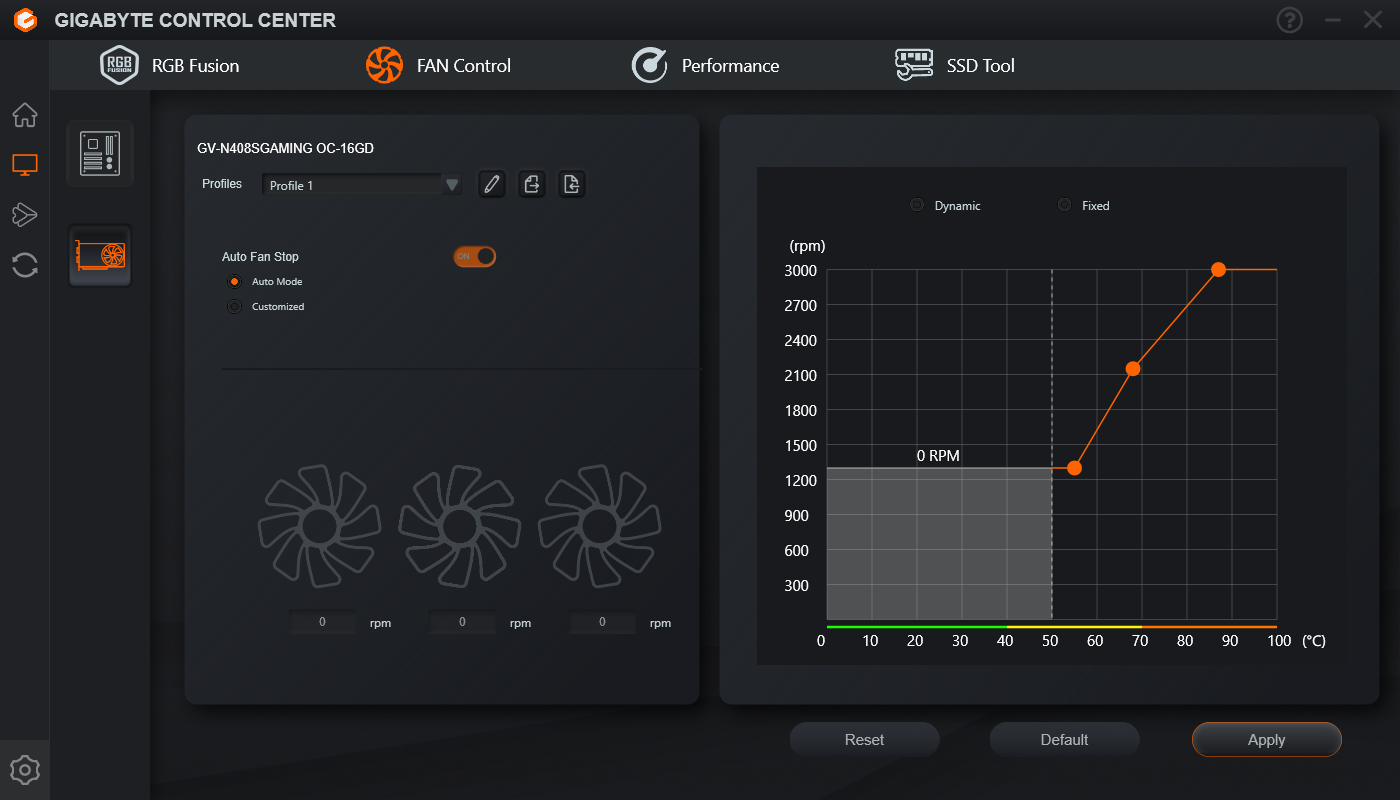
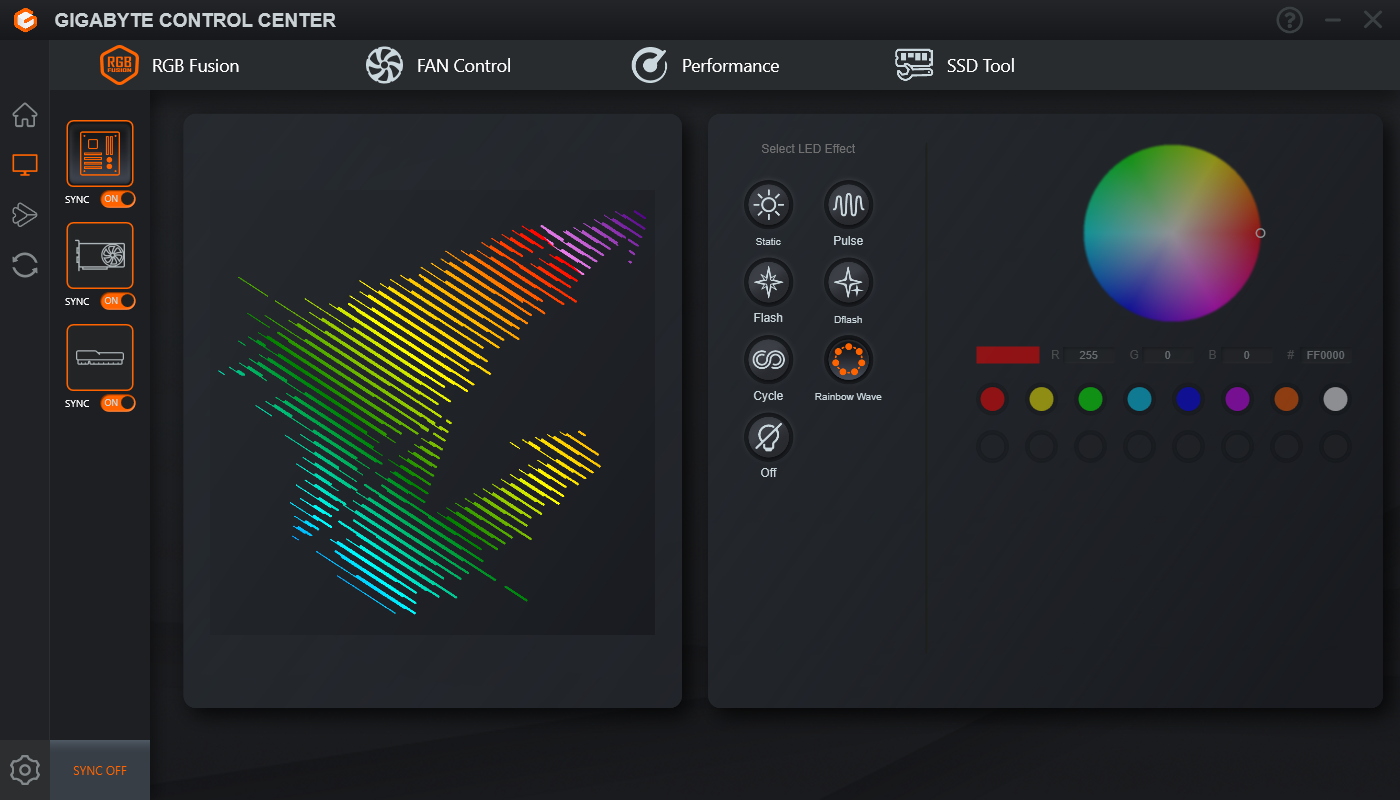
GPU'nun hız aşırtma, fan eğrileri ve RGB efektleri gibi yönleri Gigabyte Kontrol Merkezi aracılığıyla kontrol edilebilir.
Test tezgahı: Core i9-13900K ile birlikte RTX 4080 Super Gaming OC
Test sistemimiz, kartların CPU darboğazına girmemesini sağlamak için Intel Core i9-13900K ve Z790 platformunu temel almaya devam ediyor. Yapılandırma şunları içerir:
- Cooler MasterFrame 700 test tezgahı
- PL1=PL2 ileIntel Core i9-13900K
- Gigabyte Z790 Aorus Master anakart
- Gigabyte Aorus Gen4 2 TB NVMe SSD
- Sabrent Rocket 4 Plus Gen4 2 TB NVMe SSD
- 1,40 V'da 32-39-39-80 zamanlamalı 2x 16 GB Kingston Fury Renegade DDR5-6400 RAM
- MSI MAG 274UPF 4K 144 Hz monitör
- Cooler Master MasterLiquid ML360L V2 ARGB AiO soğutucu
- Cooler Master MVE Gold V2 1250 ATX 3.0 tamamen modüler PSU
En son yamalara sahip Windows 11 23H2 ile birlikte Nvidia Game Ready Driver sürüm 552.12 kullanıldı.
Dahili testlerimize göre, Core i9-13900K ve Z790 yonga setinden elde edilen performans rakamları, bir Core i9-13900K AMD Ryzen 9 7950X ve X670E kurulumu.
Test tezgahını, soğutucuyu ve PSU'yu sağlayan Cooler Master'a, anakart, CPU ve SSD için Gigabyte'a, SSD için Sabrent'e, monitör için MSI'a ve bellek için Kingston'a teşekkür ederiz.
Sentetik kıyaslamalar: RTX 4080'e kıyasla genel olarak %5 kazanç
Kümülatif sentetik kıyaslama performansı, RTX 4080 Super Gaming OC'nin diğer modellere göre %5'lik bir üstünlük sağladığını gösteriyor RTX 4080 Founders Edition (FE), bu da CUDA çekirdeklerinde eşdeğer bir artışa karşılık gelir. Bu iki kart arasında 3DMark Port Royal (+%7) ve 3DMark 11 Performance GPU'da (%11) daha büyük farklar gözlemlenmiştir.
RTX 4080 Super Gaming OC büyük ölçüde aşağıdakilerle bağlantılıdır AMD Radeon RX 7900 XTX genel sentetik testlerde, ancak ikincisi 3DMark Fire Strike ve Time Spy'de iyi kazançlar gösteriyor.
Unigine skorları, RTX 4080 Super Gaming OC ile RTX 4080 Founders Edition'a kıyasla %2-5 arasında bir kazanç gösteriyor.
Bu RTX 4090 Founders Edition rTX 4080 Super Gaming OC'den %25 daha yüksek skorlarla yenilmesi gereken kart olmaya devam ediyor.
3DMark 11: 1280x720 Performance GPU
3DMark: 1920x1080 Fire Strike Graphics | 3840x2160 Fire Strike Ultra Graphics | Fire Strike Extreme Graphics | 2560x1440 Time Spy Graphics | 2560x1440 Port Royal Graphics | 2560x1440 Speed Way Score
Unigine Heaven 4.0: Extreme Preset DX11 | Extreme Preset OpenGL
Unigine Valley 1.0: 1920x1080 Extreme HD DirectX AA:x8 | 1920x1080 Extreme HD Preset OpenGL AA:x8
Unigine Superposition: 1280x720 720p Low | 1920x1080 1080p Extreme | 3840x2160 4k Optimized | 7680x4320 8k Optimized
| Performance rating | |
| NVIDIA GeForce RTX 4090 Founders Edition | |
| AMD Radeon RX 7900 XTX | |
| Gigabyte GeForce RTX 4080 Super Gaming OC | |
| NVIDIA GeForce RTX 4080 Founders Edition | |
| Sınıf ortalaması Desktop | |
| AMD Radeon RX 7900 XT | |
| Asus TUF Gaming GeForce RTX 4070 Ti Super | |
| Gigabyte Aorus GeForce RTX 4070 Ti Master | |
| Asus TUF Gaming GeForce RTX 4070 Ti | |
| Ortalama NVIDIA GeForce RTX 4070 Ti | |
| Gigabyte GeForce RTX 4070 Super Gaming OC 12G | |
| Ortalama NVIDIA GeForce RTX 3090 | |
| Ortalama NVIDIA GeForce RTX 3080 Ti | |
| NVIDIA GeForce RTX 4070 Super Founders Edition | |
| AMD Radeon RX 7800 XT | |
| Zotac Gaming GeForce RTX 4070 AMP Airo | |
| Ortalama NVIDIA GeForce RTX 3080 -1! | |
| Sapphire Pulse Radeon RX 7700 XT | |
| Ortalama NVIDIA Titan RTX | |
| Ortalama NVIDIA GeForce RTX 4060 Ti 8G | |
| KFA2 GeForce RTX 4060 Ti EX, 16GB GDDR6 | |
| XFX Speedster QICK 308 Radeon RX 7600 Black Edition | |
| KFA2 GeForce RTX 4060 1-Click-OC 2X | |
| 3DMark 11 / Performance GPU | |
| NVIDIA GeForce RTX 4090 Founders Edition | |
| Gigabyte GeForce RTX 4080 Super Gaming OC | |
| AMD Radeon RX 7900 XTX | |
| AMD Radeon RX 7900 XT | |
| Sınıf ortalaması Desktop (3175 - 130697, n=34, son 2 yıl) | |
| Gigabyte Aorus GeForce RTX 4070 Ti Master | |
| NVIDIA GeForce RTX 4080 Founders Edition | |
| Asus TUF Gaming GeForce RTX 4070 Ti | |
| Asus TUF Gaming GeForce RTX 4070 Ti (Quiet BIOS) | |
| Ortalama NVIDIA GeForce RTX 4070 Ti (74228 - 76483, n=5) | |
| Asus TUF Gaming GeForce RTX 4070 Ti Super | |
| Gigabyte GeForce RTX 4070 Super Gaming OC 12G | |
| NVIDIA GeForce RTX 4070 Super Founders Edition | |
| AMD Radeon RX 7800 XT | |
| Ortalama NVIDIA GeForce RTX 3080 Ti (59799 - 62189, n=4) | |
| Ortalama NVIDIA GeForce RTX 3090 (55144 - 66934, n=18) | |
| Zotac Gaming GeForce RTX 4070 AMP Airo | |
| Sapphire Pulse Radeon RX 7700 XT | |
| Ortalama NVIDIA GeForce RTX 3080 (47287 - 57662, n=4) | |
| Ortalama NVIDIA Titan RTX (43461 - 51863, n=31) | |
| Ortalama NVIDIA GeForce RTX 4060 Ti 8G (47481 - 48363, n=3) | |
| XFX Speedster QICK 308 Radeon RX 7600 Black Edition | |
| KFA2 GeForce RTX 4060 Ti EX, 16GB GDDR6 | |
| KFA2 GeForce RTX 4060 1-Click-OC 2X | |
| 3DMark / Fire Strike Graphics | |
| AMD Radeon RX 7900 XTX | |
| NVIDIA GeForce RTX 4090 Founders Edition | |
| AMD Radeon RX 7900 XT | |
| Sınıf ortalaması Desktop (2192 - 108886, n=51, son 2 yıl) | |
| Gigabyte GeForce RTX 4080 Super Gaming OC | |
| NVIDIA GeForce RTX 4080 Founders Edition | |
| Asus TUF Gaming GeForce RTX 4070 Ti | |
| Asus TUF Gaming GeForce RTX 4070 Ti (Quiet BIOS) | |
| Ortalama NVIDIA GeForce RTX 4070 Ti (51254 - 53736, n=6) | |
| Gigabyte Aorus GeForce RTX 4070 Ti Master | |
| Asus TUF Gaming GeForce RTX 4070 Ti Super | |
| AMD Radeon RX 7800 XT | |
| Gigabyte GeForce RTX 4070 Super Gaming OC 12G | |
| NVIDIA GeForce RTX 4070 Super Founders Edition | |
| Ortalama NVIDIA GeForce RTX 3080 Ti (45785 - 48709, n=4) | |
| Ortalama NVIDIA GeForce RTX 3090 (41298 - 49282, n=18) | |
| Zotac Gaming GeForce RTX 4070 AMP Airo | |
| Sapphire Pulse Radeon RX 7700 XT | |
| Ortalama NVIDIA GeForce RTX 3080 (37604 - 40910, n=2) | |
| Ortalama NVIDIA Titan RTX (33377 - 40910, n=31) | |
| Ortalama NVIDIA GeForce RTX 4060 Ti 8G (33421 - 34547, n=4) | |
| XFX Speedster QICK 308 Radeon RX 7600 Black Edition | |
| KFA2 GeForce RTX 4060 Ti EX, 16GB GDDR6 | |
| KFA2 GeForce RTX 4060 1-Click-OC 2X | |
| 3DMark / Fire Strike Ultra Graphics | |
| NVIDIA GeForce RTX 4090 Founders Edition | |
| AMD Radeon RX 7900 XTX | |
| Gigabyte GeForce RTX 4080 Super Gaming OC | |
| AMD Radeon RX 7900 XT | |
| Sınıf ortalaması Desktop (473 - 33689, n=44, son 2 yıl) | |
| NVIDIA GeForce RTX 4080 Founders Edition | |
| Asus TUF Gaming GeForce RTX 4070 Ti Super | |
| Gigabyte Aorus GeForce RTX 4070 Ti Master | |
| Asus TUF Gaming GeForce RTX 4070 Ti | |
| Asus TUF Gaming GeForce RTX 4070 Ti (Quiet BIOS) | |
| Ortalama NVIDIA GeForce RTX 4070 Ti (13112 - 13616, n=6) | |
| AMD Radeon RX 7800 XT | |
| Gigabyte GeForce RTX 4070 Super Gaming OC 12G | |
| Ortalama NVIDIA GeForce RTX 3090 (11613 - 12587, n=15) | |
| Ortalama NVIDIA GeForce RTX 3080 Ti (12050 - 12341, n=4) | |
| NVIDIA GeForce RTX 4070 Super Founders Edition | |
| Ortalama NVIDIA GeForce RTX 3080 (10645 - 10793, n=2) | |
| Sapphire Pulse Radeon RX 7700 XT | |
| Zotac Gaming GeForce RTX 4070 AMP Airo | |
| Ortalama NVIDIA Titan RTX (8461 - 10793, n=30) | |
| XFX Speedster QICK 308 Radeon RX 7600 Black Edition | |
| Ortalama NVIDIA GeForce RTX 4060 Ti 8G (7152 - 7298, n=4) | |
| KFA2 GeForce RTX 4060 Ti EX, 16GB GDDR6 | |
| KFA2 GeForce RTX 4060 1-Click-OC 2X | |
| 3DMark / Fire Strike Extreme Graphics | |
| NVIDIA GeForce RTX 4090 Founders Edition | |
| AMD Radeon RX 7900 XTX | |
| AMD Radeon RX 7900 XT | |
| Gigabyte GeForce RTX 4080 Super Gaming OC | |
| NVIDIA GeForce RTX 4080 Founders Edition | |
| Sınıf ortalaması Desktop (1015 - 62405, n=44, son 2 yıl) | |
| Asus TUF Gaming GeForce RTX 4070 Ti Super | |
| Gigabyte Aorus GeForce RTX 4070 Ti Master | |
| Asus TUF Gaming GeForce RTX 4070 Ti | |
| Asus TUF Gaming GeForce RTX 4070 Ti (Quiet BIOS) | |
| Ortalama NVIDIA GeForce RTX 4070 Ti (26470 - 27167, n=6) | |
| AMD Radeon RX 7800 XT | |
| Gigabyte GeForce RTX 4070 Super Gaming OC 12G | |
| NVIDIA GeForce RTX 4070 Super Founders Edition | |
| Ortalama NVIDIA GeForce RTX 3090 (22075 - 24730, n=15) | |
| Ortalama NVIDIA GeForce RTX 3080 Ti (23127 - 24250, n=4) | |
| Zotac Gaming GeForce RTX 4070 AMP Airo | |
| Sapphire Pulse Radeon RX 7700 XT | |
| Ortalama NVIDIA GeForce RTX 3080 (20007 - 20861, n=2) | |
| Ortalama NVIDIA Titan RTX (16484 - 20861, n=30) | |
| Ortalama NVIDIA GeForce RTX 4060 Ti 8G (15551 - 16250, n=4) | |
| KFA2 GeForce RTX 4060 Ti EX, 16GB GDDR6 | |
| XFX Speedster QICK 308 Radeon RX 7600 Black Edition | |
| KFA2 GeForce RTX 4060 1-Click-OC 2X | |
| 3DMark / Time Spy Graphics | |
| NVIDIA GeForce RTX 4090 Founders Edition | |
| AMD Radeon RX 7900 XTX | |
| Gigabyte GeForce RTX 4080 Super Gaming OC | |
| Sınıf ortalaması Desktop (669 - 49144, n=50, son 2 yıl) | |
| NVIDIA GeForce RTX 4080 Founders Edition | |
| AMD Radeon RX 7900 XT | |
| Asus TUF Gaming GeForce RTX 4070 Ti Super | |
| Gigabyte Aorus GeForce RTX 4070 Ti Master | |
| Asus TUF Gaming GeForce RTX 4070 Ti | |
| Asus TUF Gaming GeForce RTX 4070 Ti (Quiet BIOS) | |
| Ortalama NVIDIA GeForce RTX 4070 Ti (22304 - 23136, n=6) | |
| Gigabyte GeForce RTX 4070 Super Gaming OC 12G | |
| NVIDIA GeForce RTX 4070 Super Founders Edition | |
| AMD Radeon RX 7800 XT | |
| Ortalama NVIDIA GeForce RTX 3090 (18685 - 20433, n=18) | |
| Ortalama NVIDIA GeForce RTX 3080 Ti (19041 - 19460, n=4) | |
| Zotac Gaming GeForce RTX 4070 AMP Airo | |
| Ortalama NVIDIA GeForce RTX 3080 (17467 - 17604, n=2) | |
| Sapphire Pulse Radeon RX 7700 XT | |
| Ortalama NVIDIA Titan RTX (14216 - 15283, n=30) | |
| Ortalama NVIDIA GeForce RTX 4060 Ti 8G (13271 - 13549, n=4) | |
| KFA2 GeForce RTX 4060 Ti EX, 16GB GDDR6 | |
| XFX Speedster QICK 308 Radeon RX 7600 Black Edition | |
| KFA2 GeForce RTX 4060 1-Click-OC 2X | |
| 3DMark / Port Royal Graphics | |
| NVIDIA GeForce RTX 4090 Founders Edition | |
| Gigabyte GeForce RTX 4080 Super Gaming OC | |
| Sınıf ortalaması Desktop (196 - 37524, n=43, son 2 yıl) | |
| NVIDIA GeForce RTX 4080 Founders Edition | |
| AMD Radeon RX 7900 XTX | |
| Asus TUF Gaming GeForce RTX 4070 Ti Super | |
| Gigabyte Aorus GeForce RTX 4070 Ti Master | |
| Asus TUF Gaming GeForce RTX 4070 Ti (Quiet BIOS) | |
| Asus TUF Gaming GeForce RTX 4070 Ti | |
| Ortalama NVIDIA GeForce RTX 4070 Ti (13911 - 14349, n=6) | |
| AMD Radeon RX 7900 XT | |
| Gigabyte GeForce RTX 4070 Super Gaming OC 12G | |
| NVIDIA GeForce RTX 4070 Super Founders Edition | |
| Ortalama NVIDIA GeForce RTX 3080 Ti (12711 - 12938, n=3) | |
| Ortalama NVIDIA GeForce RTX 3090 (12255 - 13075, n=7) | |
| Ortalama NVIDIA GeForce RTX 3080 (11238 - 11433, n=2) | |
| Zotac Gaming GeForce RTX 4070 AMP Airo | |
| AMD Radeon RX 7800 XT | |
| Ortalama NVIDIA Titan RTX (8945 - 9528, n=25) | |
| Sapphire Pulse Radeon RX 7700 XT | |
| Ortalama NVIDIA GeForce RTX 4060 Ti 8G (7996 - 8091, n=3) | |
| KFA2 GeForce RTX 4060 Ti EX, 16GB GDDR6 | |
| KFA2 GeForce RTX 4060 1-Click-OC 2X | |
| XFX Speedster QICK 308 Radeon RX 7600 Black Edition | |
| 3DMark / Speed Way Score | |
| NVIDIA GeForce RTX 4090 Founders Edition | |
| Gigabyte GeForce RTX 4080 Super Gaming OC | |
| Sınıf ortalaması Desktop (492 - 14564, n=42, son 2 yıl) | |
| NVIDIA GeForce RTX 4080 Founders Edition | |
| Asus TUF Gaming GeForce RTX 4070 Ti Super | |
| AMD Radeon RX 7900 XTX | |
| Gigabyte Aorus GeForce RTX 4070 Ti Master | |
| Ortalama NVIDIA GeForce RTX 4070 Ti (5392 - 5546, n=6) | |
| Asus TUF Gaming GeForce RTX 4070 Ti | |
| Asus TUF Gaming GeForce RTX 4070 Ti (Quiet BIOS) | |
| Gigabyte GeForce RTX 4070 Super Gaming OC 12G | |
| Ortalama NVIDIA GeForce RTX 3090 (5173 - 5299, n=4) | |
| Ortalama NVIDIA GeForce RTX 3080 Ti (5195 - 5223, n=2) | |
| NVIDIA GeForce RTX 4070 Super Founders Edition | |
| AMD Radeon RX 7900 XT | |
| Zotac Gaming GeForce RTX 4070 AMP Airo | |
| AMD Radeon RX 7800 XT | |
| Ortalama NVIDIA Titan RTX (3182 - 3205, n=3) | |
| Ortalama NVIDIA GeForce RTX 4060 Ti 8G (3158 - 3206, n=3) | |
| KFA2 GeForce RTX 4060 Ti EX, 16GB GDDR6 | |
| Sapphire Pulse Radeon RX 7700 XT | |
| KFA2 GeForce RTX 4060 1-Click-OC 2X | |
| XFX Speedster QICK 308 Radeon RX 7600 Black Edition | |
| Unigine Heaven 4.0 / Extreme Preset DX11 | |
| NVIDIA GeForce RTX 4090 Founders Edition | |
| Gigabyte GeForce RTX 4080 Super Gaming OC | |
| AMD Radeon RX 7900 XTX | |
| NVIDIA GeForce RTX 4080 Founders Edition | |
| AMD Radeon RX 7900 XT | |
| Gigabyte Aorus GeForce RTX 4070 Ti Master | |
| Asus TUF Gaming GeForce RTX 4070 Ti | |
| Sınıf ortalaması Desktop (10.9 - 545, n=44, son 2 yıl) | |
| Ortalama NVIDIA GeForce RTX 4070 Ti (298 - 319, n=5) | |
| Asus TUF Gaming GeForce RTX 4070 Ti Super | |
| Ortalama NVIDIA GeForce RTX 3090 (272 - 315, n=12) | |
| Ortalama NVIDIA GeForce RTX 3080 Ti (290 - 312, n=4) | |
| Gigabyte GeForce RTX 4070 Super Gaming OC 12G | |
| NVIDIA GeForce RTX 4070 Super Founders Edition | |
| Zotac Gaming GeForce RTX 4070 AMP Airo | |
| Ortalama NVIDIA GeForce RTX 3080 (233 - 253, n=2) | |
| AMD Radeon RX 7800 XT | |
| Ortalama NVIDIA Titan RTX (207 - 248, n=12) | |
| Sapphire Pulse Radeon RX 7700 XT | |
| Ortalama NVIDIA GeForce RTX 4060 Ti 8G (170.7 - 181.6, n=4) | |
| KFA2 GeForce RTX 4060 Ti EX, 16GB GDDR6 | |
| KFA2 GeForce RTX 4060 1-Click-OC 2X | |
| XFX Speedster QICK 308 Radeon RX 7600 Black Edition | |
| Unigine Heaven 4.0 / Extreme Preset OpenGL | |
| NVIDIA GeForce RTX 4090 Founders Edition | |
| Gigabyte GeForce RTX 4080 Super Gaming OC | |
| AMD Radeon RX 7900 XTX | |
| NVIDIA GeForce RTX 4080 Founders Edition | |
| AMD Radeon RX 7900 XT | |
| Asus TUF Gaming GeForce RTX 4070 Ti Super | |
| Sınıf ortalaması Desktop (11.7 - 551, n=30, son 2 yıl) | |
| Gigabyte Aorus GeForce RTX 4070 Ti Master | |
| Ortalama NVIDIA GeForce RTX 4070 Ti (291 - 297, n=4) | |
| Asus TUF Gaming GeForce RTX 4070 Ti | |
| Gigabyte GeForce RTX 4070 Super Gaming OC 12G | |
| NVIDIA GeForce RTX 4070 Super Founders Edition | |
| Ortalama NVIDIA GeForce RTX 3080 Ti (264 - 282, n=4) | |
| Ortalama NVIDIA GeForce RTX 3090 (188.2 - 284, n=11) | |
| AMD Radeon RX 7800 XT | |
| Ortalama NVIDIA GeForce RTX 3080 (232 - 243, n=2) | |
| Zotac Gaming GeForce RTX 4070 AMP Airo | |
| Ortalama NVIDIA Titan RTX (203 - 299, n=12) | |
| Sapphire Pulse Radeon RX 7700 XT | |
| Ortalama NVIDIA GeForce RTX 4060 Ti 8G (173 - 176, n=3) | |
| KFA2 GeForce RTX 4060 Ti EX, 16GB GDDR6 | |
| XFX Speedster QICK 308 Radeon RX 7600 Black Edition | |
| KFA2 GeForce RTX 4060 1-Click-OC 2X | |
| Unigine Valley 1.0 / Extreme HD DirectX | |
| NVIDIA GeForce RTX 4090 Founders Edition | |
| Gigabyte GeForce RTX 4080 Super Gaming OC | |
| NVIDIA GeForce RTX 4080 Founders Edition | |
| AMD Radeon RX 7900 XTX | |
| AMD Radeon RX 7900 XT | |
| Asus TUF Gaming GeForce RTX 4070 Ti Super | |
| Asus TUF Gaming GeForce RTX 4070 Ti | |
| Ortalama NVIDIA GeForce RTX 3080 Ti (206 - 240, n=4) | |
| Ortalama NVIDIA GeForce RTX 3090 (184.2 - 247, n=12) | |
| Ortalama NVIDIA GeForce RTX 4070 Ti (208 - 230, n=5) | |
| Gigabyte GeForce RTX 4070 Super Gaming OC 12G | |
| NVIDIA GeForce RTX 4070 Super Founders Edition | |
| Gigabyte Aorus GeForce RTX 4070 Ti Master | |
| Sınıf ortalaması Desktop (9.8 - 295, n=44, son 2 yıl) | |
| Zotac Gaming GeForce RTX 4070 AMP Airo | |
| AMD Radeon RX 7800 XT | |
| Ortalama NVIDIA GeForce RTX 3080 (176.2 - 181.8, n=2) | |
| Ortalama NVIDIA Titan RTX (135 - 191.4, n=12) | |
| Sapphire Pulse Radeon RX 7700 XT | |
| Ortalama NVIDIA GeForce RTX 4060 Ti 8G (128.3 - 132.9, n=4) | |
| KFA2 GeForce RTX 4060 Ti EX, 16GB GDDR6 | |
| KFA2 GeForce RTX 4060 1-Click-OC 2X | |
| XFX Speedster QICK 308 Radeon RX 7600 Black Edition | |
| Unigine Valley 1.0 / Extreme HD Preset OpenGL | |
| NVIDIA GeForce RTX 4090 Founders Edition | |
| Gigabyte GeForce RTX 4080 Super Gaming OC | |
| NVIDIA GeForce RTX 4080 Founders Edition | |
| AMD Radeon RX 7900 XTX | |
| Asus TUF Gaming GeForce RTX 4070 Ti Super | |
| Gigabyte Aorus GeForce RTX 4070 Ti Master | |
| AMD Radeon RX 7900 XT | |
| Ortalama NVIDIA GeForce RTX 4070 Ti (197.4 - 231, n=4) | |
| Asus TUF Gaming GeForce RTX 4070 Ti | |
| Ortalama NVIDIA GeForce RTX 3090 (158.8 - 226, n=11) | |
| Ortalama NVIDIA GeForce RTX 3080 Ti (195.1 - 210, n=4) | |
| Sınıf ortalaması Desktop (9.1 - 313, n=30, son 2 yıl) | |
| NVIDIA GeForce RTX 4070 Super Founders Edition | |
| Gigabyte GeForce RTX 4070 Super Gaming OC 12G | |
| AMD Radeon RX 7800 XT | |
| Zotac Gaming GeForce RTX 4070 AMP Airo | |
| Ortalama NVIDIA GeForce RTX 3080 (163.8 - 172, n=2) | |
| Ortalama NVIDIA Titan RTX (139.2 - 181.2, n=12) | |
| Sapphire Pulse Radeon RX 7700 XT | |
| Ortalama NVIDIA GeForce RTX 4060 Ti 8G (116.5 - 118.8, n=3) | |
| KFA2 GeForce RTX 4060 Ti EX, 16GB GDDR6 | |
| KFA2 GeForce RTX 4060 1-Click-OC 2X | |
| XFX Speedster QICK 308 Radeon RX 7600 Black Edition | |
| Unigine Superposition / 720p Low | |
| Asus TUF Gaming GeForce RTX 4070 Ti | |
| NVIDIA GeForce RTX 4090 Founders Edition | |
| Gigabyte Aorus GeForce RTX 4070 Ti Master | |
| Ortalama NVIDIA GeForce RTX 4070 Ti (48835 - 56396, n=4) | |
| Zotac Gaming GeForce RTX 4070 AMP Airo | |
| Gigabyte GeForce RTX 4080 Super Gaming OC | |
| NVIDIA GeForce RTX 4080 Founders Edition | |
| NVIDIA GeForce RTX 4070 Super Founders Edition | |
| Gigabyte GeForce RTX 4070 Super Gaming OC 12G | |
| Asus TUF Gaming GeForce RTX 4070 Ti Super | |
| Sınıf ortalaması Desktop (4614 - 64541, n=27, son 2 yıl) | |
| Ortalama NVIDIA GeForce RTX 3090 (33329 - 63518, n=11) | |
| Ortalama NVIDIA GeForce RTX 3080 Ti (43163 - 50738, n=4) | |
| Ortalama NVIDIA GeForce RTX 4060 Ti 8G (46504 - 47695, n=3) | |
| AMD Radeon RX 7900 XTX | |
| AMD Radeon RX 7900 XT | |
| KFA2 GeForce RTX 4060 1-Click-OC 2X | |
| AMD Radeon RX 7800 XT | |
| Sapphire Pulse Radeon RX 7700 XT | |
| KFA2 GeForce RTX 4060 Ti EX, 16GB GDDR6 | |
| XFX Speedster QICK 308 Radeon RX 7600 Black Edition | |
| Ortalama NVIDIA Titan RTX (25622 - 50876, n=9) | |
| Ortalama NVIDIA GeForce RTX 3080 (30851 - 32183, n=2) | |
| Unigine Superposition / 1080p Extreme | |
| NVIDIA GeForce RTX 4090 Founders Edition | |
| AMD Radeon RX 7900 XTX | |
| Gigabyte GeForce RTX 4080 Super Gaming OC | |
| Sınıf ortalaması Desktop (280 - 28841, n=30, son 2 yıl) | |
| NVIDIA GeForce RTX 4080 Founders Edition | |
| AMD Radeon RX 7900 XT | |
| Gigabyte Aorus GeForce RTX 4070 Ti Master | |
| Asus TUF Gaming GeForce RTX 4070 Ti Super | |
| Asus TUF Gaming GeForce RTX 4070 Ti | |
| Ortalama NVIDIA GeForce RTX 4070 Ti (12837 - 13448, n=4) | |
| Ortalama NVIDIA GeForce RTX 3090 (11806 - 12694, n=12) | |
| Gigabyte GeForce RTX 4070 Super Gaming OC 12G | |
| Ortalama NVIDIA GeForce RTX 3080 Ti (12038 - 12347, n=4) | |
| NVIDIA GeForce RTX 4070 Super Founders Edition | |
| Ortalama NVIDIA GeForce RTX 3080 (10572 - 10822, n=2) | |
| AMD Radeon RX 7800 XT | |
| Zotac Gaming GeForce RTX 4070 AMP Airo | |
| Ortalama NVIDIA Titan RTX (8916 - 9285, n=9) | |
| Sapphire Pulse Radeon RX 7700 XT | |
| KFA2 GeForce RTX 4060 Ti EX, 16GB GDDR6 | |
| Ortalama NVIDIA GeForce RTX 4060 Ti 8G (7085 - 7833, n=3) | |
| XFX Speedster QICK 308 Radeon RX 7600 Black Edition | |
| KFA2 GeForce RTX 4060 1-Click-OC 2X | |
| Unigine Superposition / 4k Optimized | |
| NVIDIA GeForce RTX 4090 Founders Edition | |
| AMD Radeon RX 7900 XTX | |
| Gigabyte GeForce RTX 4080 Super Gaming OC | |
| Sınıf ortalaması Desktop (2379 - 45354, n=42, son 2 yıl) | |
| NVIDIA GeForce RTX 4080 Founders Edition | |
| Asus TUF Gaming GeForce RTX 4070 Ti Super | |
| AMD Radeon RX 7900 XT | |
| Gigabyte Aorus GeForce RTX 4070 Ti Master | |
| Asus TUF Gaming GeForce RTX 4070 Ti | |
| Ortalama NVIDIA GeForce RTX 4070 Ti (16889 - 17290, n=5) | |
| Ortalama NVIDIA GeForce RTX 3090 (15794 - 16868, n=12) | |
| Ortalama NVIDIA GeForce RTX 3080 Ti (16108 - 16412, n=4) | |
| Gigabyte GeForce RTX 4070 Super Gaming OC 12G | |
| NVIDIA GeForce RTX 4070 Super Founders Edition | |
| Ortalama NVIDIA GeForce RTX 3080 (13984 - 14243, n=2) | |
| AMD Radeon RX 7800 XT | |
| Zotac Gaming GeForce RTX 4070 AMP Airo | |
| Ortalama NVIDIA Titan RTX (11937 - 12644, n=9) | |
| Sapphire Pulse Radeon RX 7700 XT | |
| Ortalama NVIDIA GeForce RTX 4060 Ti 8G (9438 - 9722, n=4) | |
| KFA2 GeForce RTX 4060 Ti EX, 16GB GDDR6 | |
| KFA2 GeForce RTX 4060 1-Click-OC 2X | |
| XFX Speedster QICK 308 Radeon RX 7600 Black Edition | |
| Unigine Superposition / 8k Optimized | |
| NVIDIA GeForce RTX 4090 Founders Edition | |
| Sınıf ortalaması Desktop (914 - 18770, n=42, son 2 yıl) | |
| AMD Radeon RX 7900 XTX | |
| Gigabyte GeForce RTX 4080 Super Gaming OC | |
| NVIDIA GeForce RTX 4080 Founders Edition | |
| Ortalama NVIDIA GeForce RTX 3090 (6961 - 7521, n=12) | |
| Asus TUF Gaming GeForce RTX 4070 Ti Super | |
| Ortalama NVIDIA GeForce RTX 3080 Ti (6920 - 7161, n=4) | |
| AMD Radeon RX 7900 XT | |
| Gigabyte Aorus GeForce RTX 4070 Ti Master | |
| Asus TUF Gaming GeForce RTX 4070 Ti | |
| Ortalama NVIDIA GeForce RTX 4070 Ti (6276 - 6454, n=5) | |
| Ortalama NVIDIA GeForce RTX 3080 (6243 - 6346, n=2) | |
| Gigabyte GeForce RTX 4070 Super Gaming OC 12G | |
| NVIDIA GeForce RTX 4070 Super Founders Edition | |
| Ortalama NVIDIA Titan RTX (5255 - 5571, n=9) | |
| AMD Radeon RX 7800 XT | |
| Zotac Gaming GeForce RTX 4070 AMP Airo | |
| Sapphire Pulse Radeon RX 7700 XT | |
| Ortalama NVIDIA GeForce RTX 4060 Ti 8G (3477 - 3571, n=4) | |
| KFA2 GeForce RTX 4060 Ti EX, 16GB GDDR6 | |
| KFA2 GeForce RTX 4060 1-Click-OC 2X | |
| XFX Speedster QICK 308 Radeon RX 7600 Black Edition | |
3DMark 11: 1280x720 Performance GPU
3DMark: 1920x1080 Fire Strike Graphics | 3840x2160 Fire Strike Ultra Graphics | Fire Strike Extreme Graphics | 2560x1440 Time Spy Graphics | 2560x1440 Port Royal Graphics | 2560x1440 Speed Way Score
Unigine Heaven 4.0: Extreme Preset DX11 | Extreme Preset OpenGL
Unigine Valley 1.0: 1920x1080 Extreme HD DirectX AA:x8 | 1920x1080 Extreme HD Preset OpenGL AA:x8
Unigine Superposition: 1280x720 720p Low | 1920x1080 1080p Extreme | 3840x2160 4k Optimized | 7680x4320 8k Optimized
| 3DMark 11 Performance | 57532 puan | |
| 3DMark Ice Storm Standard Score | 294683 puan | |
| 3DMark Cloud Gate Standard Score | 80761 puan | |
| 3DMark Fire Strike Score | 45427 puan | |
| 3DMark Fire Strike Extreme Score | 31385 puan | |
| 3DMark Time Spy Score | 27111 puan | |
Yardım | ||
Hesaplama performansı: RX 7900 XTX'e göre önemli kazanımlar
RTX 4080 Super Gaming OC, Blender CUDA Classroom render işlemini RTX 4080 FE'den bir saniye daha hızlı tamamlayabiliyor ve V-Ray 5 CUDA'da yaklaşık %3 daha hızlı.
LuxMark Sala skorları bu iki GPU arasında eşit ve RTX 4080 Super Gaming OC bu testte RX 7900 XTX'e karşı %62'lik büyük bir üstünlük sağlıyor.
Her ne kadar her iki RX 7900 XT ve RX 7900 XTX, ComputeMark testlerinin çoğunda iyi performans gösterirken RTX 4080 Super Gaming OC, QJuliaRayTrace'de Gigabyte'ın kartını bu karşılaştırmada iki AMD amiral gemisinin biraz önüne geçiren önemli bir avantaj elde ediyor.
Blender: v3.3 Classroom CUDA | v3.3 Classroom OPTIX/RTX
LuxMark v2.0 64Bit: Room GPUs-only | Sala GPUs-only
ComputeMark v2.1: 1024x600 Normal, Score | 1024x600 Normal, QJuliaRayTrace | 1024x600 Normal, Mandel Scalar | 1024x600 Normal, Mandel Vector | 1024x600 Normal, Fluid 2DTexArr | 1024x600 Normal, Fluid 3DTex
| V-Ray 5 Benchmark / GPU CUDA | |
| NVIDIA GeForce RTX 4090 Founders Edition (5.0.1) | |
| Gigabyte GeForce RTX 4080 Super Gaming OC (5.0.1) | |
| NVIDIA GeForce RTX 4080 Founders Edition | |
| Sınıf ortalaması Desktop (356 - 5824, n=40, son 2 yıl) | |
| Asus TUF Gaming GeForce RTX 4070 Ti Super (5.0.1) | |
| Gigabyte Aorus GeForce RTX 4070 Ti Master (5.0.1) | |
| Ortalama NVIDIA GeForce RTX 4070 Ti (2278 - 2395, n=5) | |
| Asus TUF Gaming GeForce RTX 4070 Ti (5.0.1) | |
| Gigabyte GeForce RTX 4070 Super Gaming OC 12G (5.0.1) | |
| NVIDIA GeForce RTX 4070 Super Founders Edition (5.0.1) | |
| Ortalama NVIDIA GeForce RTX 3080 Ti (2045 - 2070, n=3) | |
| Ortalama NVIDIA GeForce RTX 3090 (1616 - 2131, n=15) | |
| Zotac Gaming GeForce RTX 4070 AMP Airo (5.0.1) | |
| KFA2 GeForce RTX 4060 Ti EX, 16GB GDDR6 (5.0.1) | |
| Ortalama NVIDIA GeForce RTX 4060 Ti 8G (1375 - 1400, n=3) | |
| KFA2 GeForce RTX 4060 1-Click-OC 2X (5.0.1) | |
| Ortalama NVIDIA Titan RTX (668 - 1052, n=7) | |
| AMD Radeon RX 7800 XT (5.0.1) | |
| Sapphire Pulse Radeon RX 7700 XT (5.0.1) | |
| XFX Speedster QICK 308 Radeon RX 7600 Black Edition (5.0.1) | |
| V-Ray 5 Benchmark / GPU RTX | |
| NVIDIA GeForce RTX 4090 Founders Edition (5.0.1) | |
| Sınıf ortalaması Desktop (1408 - 7496, n=35, son 2 yıl) | |
| Gigabyte GeForce RTX 4080 Super Gaming OC (5.0.1) | |
| NVIDIA GeForce RTX 4080 Founders Edition | |
| Asus TUF Gaming GeForce RTX 4070 Ti Super (5.0.1) | |
| Gigabyte Aorus GeForce RTX 4070 Ti Master (5.0.1) | |
| Asus TUF Gaming GeForce RTX 4070 Ti (5.0.1) | |
| Ortalama NVIDIA GeForce RTX 4070 Ti (3054 - 3221, n=5) | |
| Gigabyte GeForce RTX 4070 Super Gaming OC 12G (5.0.1) | |
| NVIDIA GeForce RTX 4070 Super Founders Edition (5.0.1) | |
| Ortalama NVIDIA GeForce RTX 3090 (2551 - 2979, n=15) | |
| Ortalama NVIDIA GeForce RTX 3080 Ti (2727 - 2883, n=3) | |
| Zotac Gaming GeForce RTX 4070 AMP Airo (5.0.1) | |
| AMD Radeon RX 7800 XT (5.0.1) | |
| KFA2 GeForce RTX 4060 Ti EX, 16GB GDDR6 (5.0.1) | |
| Sapphire Pulse Radeon RX 7700 XT (5.0.1) | |
| Ortalama NVIDIA GeForce RTX 4060 Ti 8G (1860 - 2024, n=3) | |
| KFA2 GeForce RTX 4060 1-Click-OC 2X (5.0.1) | |
| Ortalama NVIDIA Titan RTX (1246 - 1348, n=7) | |
| Blender / v3.3 Classroom CUDA | |
| KFA2 GeForce RTX 4060 1-Click-OC 2X (3.3.3) | |
| Ortalama NVIDIA Titan RTX (n=1) | |
| Ortalama NVIDIA GeForce RTX 4060 Ti 8G (n=1) | |
| Zotac Gaming GeForce RTX 4070 AMP Airo (3.3.3) | |
| Ortalama NVIDIA GeForce RTX 3080 Ti (21 - 22, n=2) | |
| Ortalama NVIDIA GeForce RTX 3090 (20 - 22, n=13) | |
| NVIDIA GeForce RTX 4070 Super Founders Edition (3.3.3) | |
| Gigabyte GeForce RTX 4070 Super Gaming OC 12G (3.3.3) | |
| Ortalama NVIDIA GeForce RTX 4070 Ti (18 - 19, n=3) | |
| Sınıf ortalaması Desktop (8 - 54, n=31, son 2 yıl) | |
| Gigabyte Aorus GeForce RTX 4070 Ti Master (3.3.2) | |
| Asus TUF Gaming GeForce RTX 4070 Ti Super (3.3.3) | |
| NVIDIA GeForce RTX 4080 Founders Edition (3.3.3) | |
| Gigabyte GeForce RTX 4080 Super Gaming OC (3.3.3) | |
| Blender / v3.3 Classroom OPTIX/RTX | |
| KFA2 GeForce RTX 4060 1-Click-OC 2X (3.3.3) | |
| Ortalama NVIDIA Titan RTX (n=1) | |
| KFA2 GeForce RTX 4060 Ti EX, 16GB GDDR6 (3.3.3) | |
| Ortalama NVIDIA GeForce RTX 4060 Ti 8G (17 - 18, n=3) | |
| Ortalama NVIDIA GeForce RTX 3080 Ti (14 - 15, n=2) | |
| Zotac Gaming GeForce RTX 4070 AMP Airo (3.3.3) | |
| Ortalama NVIDIA GeForce RTX 3090 (13 - 14, n=13) | |
| Asus TUF Gaming GeForce RTX 4070 Ti (3.3.2) | |
| Ortalama NVIDIA GeForce RTX 4070 Ti (11 - 12, n=5) | |
| Gigabyte Aorus GeForce RTX 4070 Ti Master (3.3.2) | |
| NVIDIA GeForce RTX 4070 Super Founders Edition (3.3.3) | |
| Gigabyte GeForce RTX 4070 Super Gaming OC 12G (3.3.3) | |
| Sınıf ortalaması Desktop (5 - 19, n=30, son 2 yıl) | |
| Asus TUF Gaming GeForce RTX 4070 Ti Super (3.3.3) | |
| NVIDIA GeForce RTX 4080 Founders Edition (3.3.3) | |
| NVIDIA GeForce RTX 4090 Founders Edition (3.3.0) | |
| Gigabyte GeForce RTX 4080 Super Gaming OC (3.3.3) | |
| LuxMark v2.0 64Bit / Room GPUs-only | |
| NVIDIA GeForce RTX 4090 Founders Edition | |
| Gigabyte GeForce RTX 4080 Super Gaming OC | |
| NVIDIA GeForce RTX 4080 Founders Edition | |
| Asus TUF Gaming GeForce RTX 4070 Ti Super | |
| Sınıf ortalaması Desktop (370 - 14722, n=40, son 2 yıl) | |
| Gigabyte Aorus GeForce RTX 4070 Ti Master | |
| Asus TUF Gaming GeForce RTX 4070 Ti | |
| NVIDIA GeForce RTX 4070 Super Founders Edition | |
| Gigabyte GeForce RTX 4070 Super Gaming OC 12G | |
| Ortalama NVIDIA GeForce RTX 4070 Ti (7625 - 8436, n=5) | |
| Zotac Gaming GeForce RTX 4070 AMP Airo | |
| Ortalama NVIDIA GeForce RTX 3080 Ti (5772 - 6464, n=4) | |
| Ortalama NVIDIA GeForce RTX 3090 (5727 - 5985, n=10) | |
| AMD Radeon RX 7900 XTX | |
| Ortalama NVIDIA GeForce RTX 3080 (5112 - 5198, n=2) | |
| Ortalama NVIDIA GeForce RTX 4060 Ti 8G (4558 - 5058, n=4) | |
| Ortalama NVIDIA Titan RTX (4643 - 4703, n=2) | |
| KFA2 GeForce RTX 4060 Ti EX, 16GB GDDR6 | |
| AMD Radeon RX 7900 XT | |
| KFA2 GeForce RTX 4060 1-Click-OC 2X | |
| AMD Radeon RX 7800 XT | |
| Sapphire Pulse Radeon RX 7700 XT | |
| XFX Speedster QICK 308 Radeon RX 7600 Black Edition | |
| LuxMark v2.0 64Bit / Sala GPUs-only | |
| NVIDIA GeForce RTX 4090 Founders Edition | |
| NVIDIA GeForce RTX 4080 Founders Edition | |
| Gigabyte GeForce RTX 4080 Super Gaming OC | |
| Gigabyte Aorus GeForce RTX 4070 Ti Master | |
| Asus TUF Gaming GeForce RTX 4070 Ti | |
| Asus TUF Gaming GeForce RTX 4070 Ti Super | |
| Ortalama NVIDIA GeForce RTX 4070 Ti (17719 - 20305, n=5) | |
| Sınıf ortalaması Desktop (600 - 33461, n=40, son 2 yıl) | |
| Gigabyte GeForce RTX 4070 Super Gaming OC 12G | |
| NVIDIA GeForce RTX 4070 Super Founders Edition | |
| Ortalama NVIDIA GeForce RTX 3080 Ti (14871 - 16438, n=4) | |
| Zotac Gaming GeForce RTX 4070 AMP Airo | |
| AMD Radeon RX 7900 XTX | |
| Ortalama NVIDIA GeForce RTX 3090 (14590 - 15242, n=10) | |
| AMD Radeon RX 7900 XT | |
| Ortalama NVIDIA GeForce RTX 3080 (12797 - 12980, n=2) | |
| Ortalama NVIDIA GeForce RTX 4060 Ti 8G (11159 - 12428, n=4) | |
| KFA2 GeForce RTX 4060 Ti EX, 16GB GDDR6 | |
| Ortalama NVIDIA Titan RTX (10799 - 10996, n=2) | |
| AMD Radeon RX 7800 XT | |
| KFA2 GeForce RTX 4060 1-Click-OC 2X | |
| Sapphire Pulse Radeon RX 7700 XT | |
| XFX Speedster QICK 308 Radeon RX 7600 Black Edition | |
| ComputeMark v2.1 / Normal, Score | |
| NVIDIA GeForce RTX 4090 Founders Edition | |
| Gigabyte GeForce RTX 4080 Super Gaming OC | |
| AMD Radeon RX 7900 XTX | |
| NVIDIA GeForce RTX 4080 Founders Edition | |
| Sınıf ortalaması Desktop (1629 - 120417, n=44, son 2 yıl) | |
| AMD Radeon RX 7900 XT | |
| Asus TUF Gaming GeForce RTX 4070 Ti Super | |
| Gigabyte Aorus GeForce RTX 4070 Ti Master | |
| Asus TUF Gaming GeForce RTX 4070 Ti | |
| Ortalama NVIDIA GeForce RTX 4070 Ti (49909 - 52251, n=5) | |
| Ortalama NVIDIA GeForce RTX 3080 Ti (47377 - 48892, n=4) | |
| Gigabyte GeForce RTX 4070 Super Gaming OC 12G | |
| NVIDIA GeForce RTX 4070 Super Founders Edition | |
| Ortalama NVIDIA GeForce RTX 3090 (44948 - 49118, n=10) | |
| AMD Radeon RX 7800 XT | |
| Zotac Gaming GeForce RTX 4070 AMP Airo | |
| Ortalama NVIDIA GeForce RTX 3080 (39924 - 41594, n=2) | |
| Sapphire Pulse Radeon RX 7700 XT | |
| KFA2 GeForce RTX 4060 Ti EX, 16GB GDDR6 | |
| Ortalama NVIDIA GeForce RTX 4060 Ti 8G (29999 - 32410, n=4) | |
| Ortalama NVIDIA Titan RTX (27907 - 29830, n=3) | |
| XFX Speedster QICK 308 Radeon RX 7600 Black Edition | |
| KFA2 GeForce RTX 4060 1-Click-OC 2X | |
| ComputeMark v2.1 / Normal, QJuliaRayTrace | |
| NVIDIA GeForce RTX 4090 Founders Edition | |
| Gigabyte GeForce RTX 4080 Super Gaming OC | |
| NVIDIA GeForce RTX 4080 Founders Edition | |
| Gigabyte Aorus GeForce RTX 4070 Ti Master | |
| Asus TUF Gaming GeForce RTX 4070 Ti Super | |
| Asus TUF Gaming GeForce RTX 4070 Ti | |
| Ortalama NVIDIA GeForce RTX 4070 Ti (20405 - 21619, n=5) | |
| Sınıf ortalaması Desktop (403 - 40008, n=44, son 2 yıl) | |
| Gigabyte GeForce RTX 4070 Super Gaming OC 12G | |
| NVIDIA GeForce RTX 4070 Super Founders Edition | |
| AMD Radeon RX 7900 XTX | |
| Ortalama NVIDIA GeForce RTX 3080 Ti (17050 - 17749, n=4) | |
| Ortalama NVIDIA GeForce RTX 3090 (16403 - 18223, n=11) | |
| Zotac Gaming GeForce RTX 4070 AMP Airo | |
| AMD Radeon RX 7900 XT | |
| Ortalama NVIDIA GeForce RTX 3080 (14718 - 15508, n=2) | |
| KFA2 GeForce RTX 4060 Ti EX, 16GB GDDR6 | |
| AMD Radeon RX 7800 XT | |
| Ortalama NVIDIA GeForce RTX 4060 Ti 8G (12697 - 13822, n=4) | |
| Sapphire Pulse Radeon RX 7700 XT | |
| KFA2 GeForce RTX 4060 1-Click-OC 2X | |
| Ortalama NVIDIA Titan RTX (9418 - 10129, n=3) | |
| XFX Speedster QICK 308 Radeon RX 7600 Black Edition | |
| ComputeMark v2.1 / Normal, Mandel Scalar | |
| NVIDIA GeForce RTX 4090 Founders Edition | |
| AMD Radeon RX 7900 XTX | |
| Gigabyte GeForce RTX 4080 Super Gaming OC | |
| NVIDIA GeForce RTX 4080 Founders Edition | |
| AMD Radeon RX 7900 XT | |
| Sınıf ortalaması Desktop (490 - 28468, n=44, son 2 yıl) | |
| Asus TUF Gaming GeForce RTX 4070 Ti Super | |
| Gigabyte Aorus GeForce RTX 4070 Ti Master | |
| Asus TUF Gaming GeForce RTX 4070 Ti | |
| Ortalama NVIDIA GeForce RTX 4070 Ti (11924 - 12449, n=5) | |
| Gigabyte GeForce RTX 4070 Super Gaming OC 12G | |
| AMD Radeon RX 7800 XT | |
| Ortalama NVIDIA GeForce RTX 3080 Ti (11049 - 11318, n=4) | |
| NVIDIA GeForce RTX 4070 Super Founders Edition | |
| Ortalama NVIDIA GeForce RTX 3090 (10650 - 11564, n=11) | |
| Sapphire Pulse Radeon RX 7700 XT | |
| Ortalama NVIDIA GeForce RTX 3080 (9554 - 9938, n=2) | |
| Zotac Gaming GeForce RTX 4070 AMP Airo | |
| KFA2 GeForce RTX 4060 Ti EX, 16GB GDDR6 | |
| Ortalama NVIDIA GeForce RTX 4060 Ti 8G (6996 - 7511, n=4) | |
| XFX Speedster QICK 308 Radeon RX 7600 Black Edition | |
| Ortalama NVIDIA Titan RTX (5977 - 6406, n=3) | |
| KFA2 GeForce RTX 4060 1-Click-OC 2X | |
| ComputeMark v2.1 / Normal, Mandel Vector | |
| NVIDIA GeForce RTX 4090 Founders Edition | |
| AMD Radeon RX 7900 XTX | |
| AMD Radeon RX 7900 XT | |
| Gigabyte GeForce RTX 4080 Super Gaming OC | |
| Sınıf ortalaması Desktop (318 - 24838, n=44, son 2 yıl) | |
| NVIDIA GeForce RTX 4080 Founders Edition | |
| Gigabyte Aorus GeForce RTX 4070 Ti Master | |
| Asus TUF Gaming GeForce RTX 4070 Ti Super | |
| Asus TUF Gaming GeForce RTX 4070 Ti | |
| Ortalama NVIDIA GeForce RTX 4070 Ti (10424 - 10888, n=5) | |
| AMD Radeon RX 7800 XT | |
| Gigabyte GeForce RTX 4070 Super Gaming OC 12G | |
| Ortalama NVIDIA GeForce RTX 3080 Ti (9513 - 9860, n=4) | |
| NVIDIA GeForce RTX 4070 Super Founders Edition | |
| Sapphire Pulse Radeon RX 7700 XT | |
| Ortalama NVIDIA GeForce RTX 3090 (8038 - 10097, n=11) | |
| Zotac Gaming GeForce RTX 4070 AMP Airo | |
| Ortalama NVIDIA GeForce RTX 3080 (7148 - 7540, n=2) | |
| KFA2 GeForce RTX 4060 Ti EX, 16GB GDDR6 | |
| Ortalama NVIDIA GeForce RTX 4060 Ti 8G (6419 - 6929, n=4) | |
| XFX Speedster QICK 308 Radeon RX 7600 Black Edition | |
| Ortalama NVIDIA Titan RTX (4944 - 5440, n=3) | |
| KFA2 GeForce RTX 4060 1-Click-OC 2X | |
| ComputeMark v2.1 / Normal, Fluid 2DTexArr | |
| AMD Radeon RX 7900 XTX | |
| NVIDIA GeForce RTX 4090 Founders Edition | |
| AMD Radeon RX 7900 XT | |
| Gigabyte GeForce RTX 4080 Super Gaming OC | |
| NVIDIA GeForce RTX 4080 Founders Edition | |
| Sınıf ortalaması Desktop (188 - 8647, n=44, son 2 yıl) | |
| Asus TUF Gaming GeForce RTX 4070 Ti Super | |
| Ortalama NVIDIA GeForce RTX 3080 Ti (4453 - 4546, n=4) | |
| AMD Radeon RX 7800 XT | |
| Ortalama NVIDIA GeForce RTX 3090 (4344 - 4608, n=11) | |
| Ortalama NVIDIA GeForce RTX 3080 (4087 - 4159, n=2) | |
| Ortalama NVIDIA Titan RTX (3691 - 3828, n=3) | |
| Ortalama NVIDIA GeForce RTX 4070 Ti (3539 - 3724, n=5) | |
| Gigabyte GeForce RTX 4070 Super Gaming OC 12G | |
| NVIDIA GeForce RTX 4070 Super Founders Edition | |
| Gigabyte Aorus GeForce RTX 4070 Ti Master | |
| Asus TUF Gaming GeForce RTX 4070 Ti | |
| Zotac Gaming GeForce RTX 4070 AMP Airo | |
| Sapphire Pulse Radeon RX 7700 XT | |
| KFA2 GeForce RTX 4060 Ti EX, 16GB GDDR6 | |
| Ortalama NVIDIA GeForce RTX 4060 Ti 8G (1924 - 2060, n=4) | |
| KFA2 GeForce RTX 4060 1-Click-OC 2X | |
| XFX Speedster QICK 308 Radeon RX 7600 Black Edition | |
| ComputeMark v2.1 / Normal, Fluid 3DTex | |
| NVIDIA GeForce RTX 4090 Founders Edition | |
| AMD Radeon RX 7900 XTX | |
| Sınıf ortalaması Desktop (222 - 18731, n=44, son 2 yıl) | |
| AMD Radeon RX 7900 XT | |
| Gigabyte GeForce RTX 4080 Super Gaming OC | |
| NVIDIA GeForce RTX 4080 Founders Edition | |
| Ortalama NVIDIA GeForce RTX 3090 (5246 - 5520, n=11) | |
| Ortalama NVIDIA GeForce RTX 3080 Ti (5312 - 5422, n=4) | |
| Asus TUF Gaming GeForce RTX 4070 Ti Super | |
| AMD Radeon RX 7800 XT | |
| Ortalama NVIDIA GeForce RTX 3080 (4417 - 4450, n=2) | |
| Ortalama NVIDIA Titan RTX (3877 - 4027, n=3) | |
| Ortalama NVIDIA GeForce RTX 4070 Ti (3616 - 3789, n=5) | |
| Gigabyte Aorus GeForce RTX 4070 Ti Master | |
| NVIDIA GeForce RTX 4070 Super Founders Edition | |
| Asus TUF Gaming GeForce RTX 4070 Ti | |
| Gigabyte GeForce RTX 4070 Super Gaming OC 12G | |
| Zotac Gaming GeForce RTX 4070 AMP Airo | |
| Sapphire Pulse Radeon RX 7700 XT | |
| KFA2 GeForce RTX 4060 Ti EX, 16GB GDDR6 | |
| Ortalama NVIDIA GeForce RTX 4060 Ti 8G (1962 - 2090, n=4) | |
| KFA2 GeForce RTX 4060 1-Click-OC 2X | |
| XFX Speedster QICK 308 Radeon RX 7600 Black Edition | |
Blender: v3.3 Classroom CUDA | v3.3 Classroom OPTIX/RTX
LuxMark v2.0 64Bit: Room GPUs-only | Sala GPUs-only
ComputeMark v2.1: 1024x600 Normal, Score | 1024x600 Normal, QJuliaRayTrace | 1024x600 Normal, Mandel Scalar | 1024x600 Normal, Mandel Vector | 1024x600 Normal, Fluid 2DTexArr | 1024x600 Normal, Fluid 3DTex
* ... daha küçük daha iyidir
Oyun Performansı: RX 7900 XTX taramada öne geçiyor
RTX 4090, piyasaya sürülmesinden iki yıl sonra hala en çok rağbet gören GPU olmaya devam ederken, yeni RTX 4080 Super, Nvidia'nın oyuncular için sunduğu ana akım amiral gemisi.
RTX 4080 Super Gaming OC, 1080p, 1440p ve 4K Ultra'da yapılan kümülatif oyun testlerinde RTX 4080 FE'nin %12 önünde yer alırken RTX 3090 ortalama %28 oranında azalmıştır.
RX 7900 XTX, RTX 4080 Super Gaming OC'ye karşı %4'lük bir üstünlük elde etmesine rağmen, RTX 4080 Super Gaming OC F1 22, Borderlands 3ve Final Fantasy XV.
RTX 4080 Super, 4K Ultra'da birçok AAA oyunda 100 fps'ye ulaşabiliyor. Aşağıdakiler dahil doku ağırlıklı modern oyunlarda daha akıcı bir oyun deneyimi için DLSS, FSR ve XeSS gibi yükselticilerin kullanılması önerilir Cyberpunk 2077 2.0 Phantom Liberty, Alan Wake 2, ve Avatar: Pandora'nın Sınırları.
The Witcher 3: 3840x2160 Ultra Graphics & Postprocessing (HBAO+) | 3840x2160 High Graphics & Postprocessing (Nvidia HairWorks Off) | 1920x1080 Ultra Graphics & Postprocessing (HBAO+)
Metro Exodus: 3840x2160 Ultra Quality AF:16x | 2560x1440 Ultra Quality AF:16x | 1920x1080 Ultra Quality AF:16x
Control: 3840x2160 High Quality Preset | 2560x1440 High Quality Preset | 1920x1080 High Quality Preset
Borderlands 3: 3840x2160 Badass Overall Quality (DX11) | 2560x1440 Badass Overall Quality (DX11) | 1920x1080 Badass Overall Quality (DX11)
Shadow of the Tomb Raider: 3840x2160 Highest Preset AA:T | 2560x1440 Highest Preset AA:T | 1920x1080 Highest Preset AA:T
F1 22: 3840x2160 Ultra High Preset AA:T AF:16x | 2560x1440 Ultra High Preset AA:T AF:16x | 1920x1080 Ultra High Preset AA:T AF:16x
Final Fantasy XV Benchmark: 3840x2160 High Quality | 2560x1440 High Quality | 1920x1080 High Quality
| Performance rating | |
| NVIDIA GeForce RTX 4090 Founders Edition | |
| AMD Radeon RX 7900 XTX | |
| Gigabyte GeForce RTX 4080 Super Gaming OC | |
| AMD Radeon RX 7900 XT | |
| NVIDIA GeForce RTX 4080 Founders Edition | |
| Asus TUF Gaming GeForce RTX 4070 Ti Super -1! | |
| Asus TUF Gaming GeForce RTX 4070 Ti | |
| Gigabyte Aorus GeForce RTX 4070 Ti Master | |
| Ortalama NVIDIA GeForce RTX 4070 Ti | |
| Gigabyte GeForce RTX 4070 Super Gaming OC 12G | |
| Ortalama NVIDIA GeForce RTX 3080 Ti | |
| Ortalama NVIDIA GeForce RTX 3090 | |
| NVIDIA GeForce RTX 4070 Super Founders Edition | |
| AMD Radeon RX 7800 XT | |
| Zotac Gaming GeForce RTX 4070 AMP Airo | |
| Ortalama NVIDIA GeForce RTX 3080 | |
| Sapphire Pulse Radeon RX 7700 XT | |
| Ortalama NVIDIA Titan RTX | |
| Ortalama NVIDIA GeForce RTX 4060 Ti 8G | |
| KFA2 GeForce RTX 4060 Ti EX, 16GB GDDR6 | |
| KFA2 GeForce RTX 4060 1-Click-OC 2X | |
| XFX Speedster QICK 308 Radeon RX 7600 Black Edition | |
| The Witcher 3 / Ultra Graphics & Postprocessing (HBAO+) | |
| NVIDIA GeForce RTX 4090 Founders Edition | |
| AMD Radeon RX 7900 XTX | |
| Gigabyte GeForce RTX 4080 Super Gaming OC | |
| NVIDIA GeForce RTX 4080 Founders Edition | |
| AMD Radeon RX 7900 XT | |
| Asus TUF Gaming GeForce RTX 4070 Ti Super | |
| Asus TUF Gaming GeForce RTX 4070 Ti | |
| Ortalama NVIDIA GeForce RTX 4070 Ti (92.4 - 98.3, n=4) | |
| Ortalama NVIDIA GeForce RTX 3080 Ti (93.1 - 96.4, n=4) | |
| Gigabyte Aorus GeForce RTX 4070 Ti Master | |
| Ortalama NVIDIA GeForce RTX 3090 (85.4 - 98.5, n=10) | |
| Gigabyte GeForce RTX 4070 Super Gaming OC 12G | |
| NVIDIA GeForce RTX 4070 Super Founders Edition | |
| Ortalama NVIDIA GeForce RTX 3080 (78 - 85.7, n=2) | |
| AMD Radeon RX 7800 XT | |
| Zotac Gaming GeForce RTX 4070 AMP Airo | |
| Ortalama NVIDIA Titan RTX (n=1) | |
| Sapphire Pulse Radeon RX 7700 XT | |
| Ortalama NVIDIA GeForce RTX 4060 Ti 8G (53.9 - 54.3, n=3) | |
| KFA2 GeForce RTX 4060 Ti EX, 16GB GDDR6 | |
| XFX Speedster QICK 308 Radeon RX 7600 Black Edition | |
| KFA2 GeForce RTX 4060 1-Click-OC 2X | |
| The Witcher 3 / High Graphics & Postprocessing (Nvidia HairWorks Off) | |
| NVIDIA GeForce RTX 4090 Founders Edition | |
| Gigabyte GeForce RTX 4080 Super Gaming OC | |
| NVIDIA GeForce RTX 4080 Founders Edition | |
| AMD Radeon RX 7900 XTX | |
| AMD Radeon RX 7900 XT | |
| Ortalama NVIDIA GeForce RTX 3080 Ti (149 - 156.8, n=4) | |
| Ortalama NVIDIA GeForce RTX 3090 (128 - 160.2, n=14) | |
| Asus TUF Gaming GeForce RTX 4070 Ti | |
| Gigabyte Aorus GeForce RTX 4070 Ti Master | |
| Ortalama NVIDIA GeForce RTX 4070 Ti (143 - 151.9, n=4) | |
| Gigabyte GeForce RTX 4070 Super Gaming OC 12G | |
| NVIDIA GeForce RTX 4070 Super Founders Edition | |
| Zotac Gaming GeForce RTX 4070 AMP Airo | |
| Ortalama NVIDIA GeForce RTX 3080 (114 - 115, n=2) | |
| AMD Radeon RX 7800 XT | |
| Ortalama NVIDIA Titan RTX (94 - 107.1, n=28) | |
| Sapphire Pulse Radeon RX 7700 XT | |
| Ortalama NVIDIA GeForce RTX 4060 Ti 8G (78.5 - 80.4, n=3) | |
| KFA2 GeForce RTX 4060 Ti EX, 16GB GDDR6 | |
| KFA2 GeForce RTX 4060 1-Click-OC 2X | |
| XFX Speedster QICK 308 Radeon RX 7600 Black Edition | |
| The Witcher 3 / Ultra Graphics & Postprocessing (HBAO+) | |
| NVIDIA GeForce RTX 4090 Founders Edition | |
| AMD Radeon RX 7900 XTX | |
| AMD Radeon RX 7900 XT | |
| NVIDIA GeForce RTX 4080 Founders Edition | |
| Gigabyte GeForce RTX 4080 Super Gaming OC | |
| Asus TUF Gaming GeForce RTX 4070 Ti | |
| Ortalama NVIDIA GeForce RTX 4070 Ti (217 - 230, n=5) | |
| Gigabyte Aorus GeForce RTX 4070 Ti Master | |
| Asus TUF Gaming GeForce RTX 4070 Ti Super | |
| Gigabyte GeForce RTX 4070 Super Gaming OC 12G | |
| NVIDIA GeForce RTX 4070 Super Founders Edition | |
| AMD Radeon RX 7800 XT | |
| Ortalama NVIDIA GeForce RTX 3090 (160 - 192.6, n=18) | |
| Ortalama NVIDIA GeForce RTX 3080 Ti (174 - 184.6, n=4) | |
| Zotac Gaming GeForce RTX 4070 AMP Airo | |
| Sapphire Pulse Radeon RX 7700 XT | |
| Ortalama NVIDIA GeForce RTX 3080 (145 - 152, n=2) | |
| Ortalama NVIDIA GeForce RTX 4060 Ti 8G (134.1 - 140.6, n=4) | |
| Ortalama NVIDIA Titan RTX (124 - 150, n=28) | |
| KFA2 GeForce RTX 4060 Ti EX, 16GB GDDR6 | |
| XFX Speedster QICK 308 Radeon RX 7600 Black Edition | |
| KFA2 GeForce RTX 4060 1-Click-OC 2X | |
| Metro Exodus / Ultra Quality | |
| NVIDIA GeForce RTX 4090 Founders Edition | |
| AMD Radeon RX 7900 XTX | |
| Gigabyte GeForce RTX 4080 Super Gaming OC | |
| NVIDIA GeForce RTX 4080 Founders Edition | |
| AMD Radeon RX 7900 XT | |
| Gigabyte Aorus GeForce RTX 4070 Ti Master | |
| Asus TUF Gaming GeForce RTX 4070 Ti | |
| Asus TUF Gaming GeForce RTX 4070 Ti Super | |
| Ortalama NVIDIA GeForce RTX 4070 Ti (81.2 - 85, n=4) | |
| Gigabyte GeForce RTX 4070 Super Gaming OC 12G | |
| Ortalama NVIDIA GeForce RTX 3080 Ti (74.2 - 77.1, n=4) | |
| Ortalama NVIDIA GeForce RTX 3090 (70.6 - 77.3, n=12) | |
| NVIDIA GeForce RTX 4070 Super Founders Edition | |
| AMD Radeon RX 7800 XT | |
| Zotac Gaming GeForce RTX 4070 AMP Airo | |
| Ortalama NVIDIA GeForce RTX 3080 (64.1 - 65.9, n=2) | |
| Sapphire Pulse Radeon RX 7700 XT | |
| Ortalama NVIDIA Titan RTX (51.3 - 57.9, n=27) | |
| Ortalama NVIDIA GeForce RTX 4060 Ti 8G (48.4 - 49.3, n=3) | |
| KFA2 GeForce RTX 4060 Ti EX, 16GB GDDR6 | |
| KFA2 GeForce RTX 4060 1-Click-OC 2X | |
| XFX Speedster QICK 308 Radeon RX 7600 Black Edition | |
| Metro Exodus / Ultra Quality | |
| NVIDIA GeForce RTX 4090 Founders Edition | |
| AMD Radeon RX 7900 XTX | |
| Gigabyte GeForce RTX 4080 Super Gaming OC | |
| AMD Radeon RX 7900 XT | |
| Gigabyte Aorus GeForce RTX 4070 Ti Master | |
| Asus TUF Gaming GeForce RTX 4070 Ti | |
| Asus TUF Gaming GeForce RTX 4070 Ti Super | |
| Ortalama NVIDIA GeForce RTX 4070 Ti (126.7 - 132.3, n=4) | |
| NVIDIA GeForce RTX 4080 Founders Edition | |
| Gigabyte GeForce RTX 4070 Super Gaming OC 12G | |
| NVIDIA GeForce RTX 4070 Super Founders Edition | |
| Ortalama NVIDIA GeForce RTX 3080 Ti (110 - 118, n=4) | |
| Ortalama NVIDIA GeForce RTX 3090 (102 - 118.2, n=12) | |
| Zotac Gaming GeForce RTX 4070 AMP Airo | |
| AMD Radeon RX 7800 XT | |
| Ortalama NVIDIA GeForce RTX 3080 (92.2 - 97.4, n=2) | |
| Sapphire Pulse Radeon RX 7700 XT | |
| Ortalama NVIDIA Titan RTX (69 - 92.9, n=26) | |
| Ortalama NVIDIA GeForce RTX 4060 Ti 8G (78.9 - 80.1, n=3) | |
| KFA2 GeForce RTX 4060 Ti EX, 16GB GDDR6 | |
| XFX Speedster QICK 308 Radeon RX 7600 Black Edition | |
| KFA2 GeForce RTX 4060 1-Click-OC 2X | |
| Metro Exodus / Ultra Quality | |
| NVIDIA GeForce RTX 4090 Founders Edition | |
| AMD Radeon RX 7900 XTX | |
| Gigabyte GeForce RTX 4080 Super Gaming OC | |
| AMD Radeon RX 7900 XT | |
| Asus TUF Gaming GeForce RTX 4070 Ti | |
| Gigabyte Aorus GeForce RTX 4070 Ti Master | |
| Ortalama NVIDIA GeForce RTX 4070 Ti (155.6 - 161.4, n=4) | |
| Asus TUF Gaming GeForce RTX 4070 Ti Super | |
| Gigabyte GeForce RTX 4070 Super Gaming OC 12G | |
| NVIDIA GeForce RTX 4080 Founders Edition | |
| NVIDIA GeForce RTX 4070 Super Founders Edition | |
| Ortalama NVIDIA GeForce RTX 3080 Ti (131 - 144.2, n=5) | |
| Ortalama NVIDIA GeForce RTX 3090 (108 - 145, n=12) | |
| Zotac Gaming GeForce RTX 4070 AMP Airo | |
| AMD Radeon RX 7800 XT | |
| Sapphire Pulse Radeon RX 7700 XT | |
| Ortalama NVIDIA GeForce RTX 3080 (111 - 116, n=2) | |
| Ortalama NVIDIA Titan RTX (73 - 116, n=27) | |
| Ortalama NVIDIA GeForce RTX 4060 Ti 8G (100.6 - 101.8, n=3) | |
| KFA2 GeForce RTX 4060 Ti EX, 16GB GDDR6 | |
| XFX Speedster QICK 308 Radeon RX 7600 Black Edition | |
| KFA2 GeForce RTX 4060 1-Click-OC 2X | |
| Control / High Quality Preset | |
| NVIDIA GeForce RTX 4090 Founders Edition | |
| AMD Radeon RX 7900 XTX | |
| Gigabyte GeForce RTX 4080 Super Gaming OC | |
| AMD Radeon RX 7900 XT | |
| NVIDIA GeForce RTX 4080 Founders Edition | |
| Asus TUF Gaming GeForce RTX 4070 Ti Super | |
| Ortalama NVIDIA GeForce RTX 4070 Ti (63.8 - 66.2, n=4) | |
| Asus TUF Gaming GeForce RTX 4070 Ti | |
| Gigabyte Aorus GeForce RTX 4070 Ti Master | |
| Ortalama NVIDIA GeForce RTX 3080 Ti (63.9 - 64.9, n=3) | |
| Ortalama NVIDIA GeForce RTX 3090 (61.3 - 66, n=5) | |
| AMD Radeon RX 7800 XT | |
| Gigabyte GeForce RTX 4070 Super Gaming OC 12G | |
| NVIDIA GeForce RTX 4070 Super Founders Edition | |
| Ortalama NVIDIA GeForce RTX 3080 (56.2 - 56.7, n=2) | |
| Zotac Gaming GeForce RTX 4070 AMP Airo | |
| Ortalama NVIDIA Titan RTX (45.2 - 47.3, n=3) | |
| Sapphire Pulse Radeon RX 7700 XT | |
| KFA2 GeForce RTX 4060 Ti EX, 16GB GDDR6 | |
| Ortalama NVIDIA GeForce RTX 4060 Ti 8G (34.3 - 37.3, n=3) | |
| XFX Speedster QICK 308 Radeon RX 7600 Black Edition | |
| KFA2 GeForce RTX 4060 1-Click-OC 2X | |
| Control / High Quality Preset | |
| NVIDIA GeForce RTX 4090 Founders Edition | |
| AMD Radeon RX 7900 XTX | |
| AMD Radeon RX 7900 XT | |
| Gigabyte GeForce RTX 4080 Super Gaming OC | |
| Asus TUF Gaming GeForce RTX 4070 Ti | |
| Gigabyte Aorus GeForce RTX 4070 Ti Master | |
| Asus TUF Gaming GeForce RTX 4070 Ti Super | |
| Ortalama NVIDIA GeForce RTX 3080 Ti (122 - 125.5, n=3) | |
| Ortalama NVIDIA GeForce RTX 4070 Ti (100 - 130.6, n=4) | |
| Ortalama NVIDIA GeForce RTX 3090 (115.8 - 123.7, n=5) | |
| AMD Radeon RX 7800 XT | |
| NVIDIA GeForce RTX 4080 Founders Edition | |
| Gigabyte GeForce RTX 4070 Super Gaming OC 12G | |
| NVIDIA GeForce RTX 4070 Super Founders Edition | |
| Ortalama NVIDIA GeForce RTX 3080 (105 - 106, n=2) | |
| Zotac Gaming GeForce RTX 4070 AMP Airo | |
| Sapphire Pulse Radeon RX 7700 XT | |
| Ortalama NVIDIA Titan RTX (89 - 93.6, n=3) | |
| Ortalama NVIDIA GeForce RTX 4060 Ti 8G (69.2 - 75.3, n=3) | |
| KFA2 GeForce RTX 4060 Ti EX, 16GB GDDR6 | |
| XFX Speedster QICK 308 Radeon RX 7600 Black Edition | |
| KFA2 GeForce RTX 4060 1-Click-OC 2X | |
| Control / High Quality Preset | |
| AMD Radeon RX 7900 XTX | |
| NVIDIA GeForce RTX 4090 Founders Edition | |
| AMD Radeon RX 7900 XT | |
| Gigabyte GeForce RTX 4080 Super Gaming OC | |
| Asus TUF Gaming GeForce RTX 4070 Ti | |
| Gigabyte Aorus GeForce RTX 4070 Ti Master | |
| Ortalama NVIDIA GeForce RTX 4070 Ti (196.6 - 202, n=4) | |
| Asus TUF Gaming GeForce RTX 4070 Ti Super | |
| AMD Radeon RX 7800 XT | |
| Ortalama NVIDIA GeForce RTX 3080 Ti (181 - 190.7, n=3) | |
| Gigabyte GeForce RTX 4070 Super Gaming OC 12G | |
| Ortalama NVIDIA GeForce RTX 3090 (172.2 - 189.2, n=5) | |
| NVIDIA GeForce RTX 4070 Super Founders Edition | |
| NVIDIA GeForce RTX 4080 Founders Edition | |
| Zotac Gaming GeForce RTX 4070 AMP Airo | |
| Sapphire Pulse Radeon RX 7700 XT | |
| Ortalama NVIDIA GeForce RTX 3080 (151 - 155, n=2) | |
| Ortalama NVIDIA Titan RTX (135 - 141.9, n=3) | |
| Ortalama NVIDIA GeForce RTX 4060 Ti 8G (115.7 - 120.2, n=3) | |
| KFA2 GeForce RTX 4060 Ti EX, 16GB GDDR6 | |
| XFX Speedster QICK 308 Radeon RX 7600 Black Edition | |
| KFA2 GeForce RTX 4060 1-Click-OC 2X | |
| Borderlands 3 / Badass Overall Quality (DX11) | |
| NVIDIA GeForce RTX 4090 Founders Edition | |
| Gigabyte GeForce RTX 4080 Super Gaming OC | |
| NVIDIA GeForce RTX 4080 Founders Edition | |
| AMD Radeon RX 7900 XTX | |
| Asus TUF Gaming GeForce RTX 4070 Ti Super | |
| Gigabyte Aorus GeForce RTX 4070 Ti Master | |
| AMD Radeon RX 7900 XT | |
| Asus TUF Gaming GeForce RTX 4070 Ti | |
| Ortalama NVIDIA GeForce RTX 4070 Ti (71.9 - 74.9, n=4) | |
| Ortalama NVIDIA GeForce RTX 3090 (68 - 75.3, n=13) | |
| Ortalama NVIDIA GeForce RTX 3080 Ti (71.2 - 74, n=4) | |
| Gigabyte GeForce RTX 4070 Super Gaming OC 12G | |
| NVIDIA GeForce RTX 4070 Super Founders Edition | |
| Ortalama NVIDIA GeForce RTX 3080 (61.5 - 61.9, n=2) | |
| Zotac Gaming GeForce RTX 4070 AMP Airo | |
| AMD Radeon RX 7800 XT | |
| Sapphire Pulse Radeon RX 7700 XT | |
| Ortalama NVIDIA Titan RTX (46 - 52.8, n=29) | |
| Ortalama NVIDIA GeForce RTX 4060 Ti 8G (43.1 - 43.7, n=3) | |
| KFA2 GeForce RTX 4060 Ti EX, 16GB GDDR6 | |
| XFX Speedster QICK 308 Radeon RX 7600 Black Edition | |
| KFA2 GeForce RTX 4060 1-Click-OC 2X | |
| Borderlands 3 / Badass Overall Quality (DX11) | |
| NVIDIA GeForce RTX 4090 Founders Edition | |
| Gigabyte GeForce RTX 4080 Super Gaming OC | |
| NVIDIA GeForce RTX 4080 Founders Edition | |
| AMD Radeon RX 7900 XTX | |
| Asus TUF Gaming GeForce RTX 4070 Ti Super | |
| Gigabyte Aorus GeForce RTX 4070 Ti Master | |
| Asus TUF Gaming GeForce RTX 4070 Ti | |
| Ortalama NVIDIA GeForce RTX 4070 Ti (134.3 - 142, n=4) | |
| AMD Radeon RX 7900 XT | |
| Gigabyte GeForce RTX 4070 Super Gaming OC 12G | |
| NVIDIA GeForce RTX 4070 Super Founders Edition | |
| Ortalama NVIDIA GeForce RTX 3080 Ti (114 - 130.2, n=4) | |
| Ortalama NVIDIA GeForce RTX 3090 (105 - 131.6, n=13) | |
| Zotac Gaming GeForce RTX 4070 AMP Airo | |
| AMD Radeon RX 7800 XT | |
| Ortalama NVIDIA GeForce RTX 3080 (95.7 - 103, n=2) | |
| Sapphire Pulse Radeon RX 7700 XT | |
| Ortalama NVIDIA Titan RTX (74 - 93.1, n=29) | |
| Ortalama NVIDIA GeForce RTX 4060 Ti 8G (83.9 - 85.2, n=3) | |
| KFA2 GeForce RTX 4060 Ti EX, 16GB GDDR6 | |
| XFX Speedster QICK 308 Radeon RX 7600 Black Edition | |
| KFA2 GeForce RTX 4060 1-Click-OC 2X | |
| Borderlands 3 / Badass Overall Quality (DX11) | |
| NVIDIA GeForce RTX 4090 Founders Edition | |
| Asus TUF Gaming GeForce RTX 4070 Ti | |
| Gigabyte GeForce RTX 4080 Super Gaming OC | |
| Gigabyte Aorus GeForce RTX 4070 Ti Master | |
| AMD Radeon RX 7900 XTX | |
| Ortalama NVIDIA GeForce RTX 4070 Ti (171.4 - 186.9, n=4) | |
| NVIDIA GeForce RTX 4080 Founders Edition | |
| Asus TUF Gaming GeForce RTX 4070 Ti Super | |
| AMD Radeon RX 7900 XT | |
| Gigabyte GeForce RTX 4070 Super Gaming OC 12G | |
| NVIDIA GeForce RTX 4070 Super Founders Edition | |
| Zotac Gaming GeForce RTX 4070 AMP Airo | |
| Ortalama NVIDIA GeForce RTX 3080 Ti (129 - 164.9, n=4) | |
| Ortalama NVIDIA GeForce RTX 3090 (117 - 170.1, n=13) | |
| AMD Radeon RX 7800 XT | |
| Sapphire Pulse Radeon RX 7700 XT | |
| Ortalama NVIDIA GeForce RTX 3080 (117 - 128, n=2) | |
| Ortalama NVIDIA GeForce RTX 4060 Ti 8G (121.5 - 123.5, n=3) | |
| KFA2 GeForce RTX 4060 Ti EX, 16GB GDDR6 | |
| Ortalama NVIDIA Titan RTX (77.2 - 128.7, n=29) | |
| XFX Speedster QICK 308 Radeon RX 7600 Black Edition | |
| KFA2 GeForce RTX 4060 1-Click-OC 2X | |
| Shadow of the Tomb Raider / Highest Preset | |
| NVIDIA GeForce RTX 4090 Founders Edition | |
| AMD Radeon RX 7900 XTX | |
| Gigabyte GeForce RTX 4080 Super Gaming OC | |
| NVIDIA GeForce RTX 4080 Founders Edition | |
| AMD Radeon RX 7900 XT | |
| Asus TUF Gaming GeForce RTX 4070 Ti Super | |
| Gigabyte Aorus GeForce RTX 4070 Ti Master | |
| Asus TUF Gaming GeForce RTX 4070 Ti | |
| Ortalama NVIDIA GeForce RTX 4070 Ti (102.7 - 104.9, n=4) | |
| Gigabyte GeForce RTX 4070 Super Gaming OC 12G | |
| Ortalama NVIDIA GeForce RTX 3090 (89.3 - 99.7, n=12) | |
| Ortalama NVIDIA GeForce RTX 3080 Ti (93 - 98.6, n=3) | |
| NVIDIA GeForce RTX 4070 Super Founders Edition | |
| Ortalama NVIDIA GeForce RTX 3080 (83.9 - 87.9, n=2) | |
| Zotac Gaming GeForce RTX 4070 AMP Airo | |
| AMD Radeon RX 7800 XT | |
| Ortalama NVIDIA Titan RTX (59 - 71.1, n=24) | |
| Sapphire Pulse Radeon RX 7700 XT | |
| KFA2 GeForce RTX 4060 Ti EX, 16GB GDDR6 | |
| Ortalama NVIDIA GeForce RTX 4060 Ti 8G (58.1 - 58.7, n=3) | |
| KFA2 GeForce RTX 4060 1-Click-OC 2X | |
| XFX Speedster QICK 308 Radeon RX 7600 Black Edition | |
| Shadow of the Tomb Raider / Highest Preset | |
| NVIDIA GeForce RTX 4090 Founders Edition | |
| AMD Radeon RX 7900 XTX | |
| Gigabyte GeForce RTX 4080 Super Gaming OC | |
| Asus TUF Gaming GeForce RTX 4070 Ti Super | |
| Gigabyte Aorus GeForce RTX 4070 Ti Master | |
| AMD Radeon RX 7900 XT | |
| Asus TUF Gaming GeForce RTX 4070 Ti | |
| Ortalama NVIDIA GeForce RTX 4070 Ti (195.9 - 204, n=4) | |
| NVIDIA GeForce RTX 4080 Founders Edition | |
| Gigabyte GeForce RTX 4070 Super Gaming OC 12G | |
| Ortalama NVIDIA GeForce RTX 3090 (137 - 172.3, n=12) | |
| NVIDIA GeForce RTX 4070 Super Founders Edition | |
| Ortalama NVIDIA GeForce RTX 3080 Ti (157 - 173.3, n=3) | |
| Zotac Gaming GeForce RTX 4070 AMP Airo | |
| AMD Radeon RX 7800 XT | |
| Ortalama NVIDIA GeForce RTX 3080 (147 - 152, n=2) | |
| Sapphire Pulse Radeon RX 7700 XT | |
| Ortalama NVIDIA GeForce RTX 4060 Ti 8G (119.3 - 121.2, n=3) | |
| KFA2 GeForce RTX 4060 Ti EX, 16GB GDDR6 | |
| Ortalama NVIDIA Titan RTX (98 - 128, n=23) | |
| KFA2 GeForce RTX 4060 1-Click-OC 2X | |
| XFX Speedster QICK 308 Radeon RX 7600 Black Edition | |
| Shadow of the Tomb Raider / Highest Preset | |
| NVIDIA GeForce RTX 4090 Founders Edition | |
| AMD Radeon RX 7900 XTX | |
| AMD Radeon RX 7900 XT | |
| Asus TUF Gaming GeForce RTX 4070 Ti | |
| Gigabyte Aorus GeForce RTX 4070 Ti Master | |
| Ortalama NVIDIA GeForce RTX 4070 Ti (263 - 280, n=4) | |
| Gigabyte GeForce RTX 4080 Super Gaming OC | |
| Asus TUF Gaming GeForce RTX 4070 Ti Super | |
| Gigabyte GeForce RTX 4070 Super Gaming OC 12G | |
| NVIDIA GeForce RTX 4070 Super Founders Edition | |
| Zotac Gaming GeForce RTX 4070 AMP Airo | |
| NVIDIA GeForce RTX 4080 Founders Edition | |
| AMD Radeon RX 7800 XT | |
| Ortalama NVIDIA GeForce RTX 3080 Ti (178 - 238, n=3) | |
| Ortalama NVIDIA GeForce RTX 3090 (145 - 240, n=14) | |
| Sapphire Pulse Radeon RX 7700 XT | |
| KFA2 GeForce RTX 4060 Ti EX, 16GB GDDR6 | |
| Ortalama NVIDIA GeForce RTX 4060 Ti 8G (181.6 - 184, n=3) | |
| Ortalama NVIDIA GeForce RTX 3080 (177 - 185, n=2) | |
| Ortalama NVIDIA Titan RTX (106 - 178.8, n=24) | |
| KFA2 GeForce RTX 4060 1-Click-OC 2X | |
| XFX Speedster QICK 308 Radeon RX 7600 Black Edition | |
| F1 22 / Ultra High Preset | |
| NVIDIA GeForce RTX 4090 Founders Edition (928484) | |
| Gigabyte GeForce RTX 4080 Super Gaming OC (959964) | |
| NVIDIA GeForce RTX 4080 Founders Edition (959964) | |
| AMD Radeon RX 7900 XTX (939134) | |
| Asus TUF Gaming GeForce RTX 4070 Ti Super (959964) | |
| Gigabyte Aorus GeForce RTX 4070 Ti Master (939134) | |
| Asus TUF Gaming GeForce RTX 4070 Ti (939134) | |
| Ortalama NVIDIA GeForce RTX 4070 Ti (46.6 - 47.3, n=4) | |
| AMD Radeon RX 7900 XT (939134) | |
| Gigabyte GeForce RTX 4070 Super Gaming OC 12G (959964) | |
| Ortalama NVIDIA GeForce RTX 3080 Ti (43 - 43.4, n=2) | |
| Ortalama NVIDIA GeForce RTX 3090 (41.8 - 45.7, n=12) | |
| NVIDIA GeForce RTX 4070 Super Founders Edition (959964) | |
| Ortalama NVIDIA GeForce RTX 3080 (n=1) | |
| Zotac Gaming GeForce RTX 4070 AMP Airo (959964) | |
| AMD Radeon RX 7800 XT (959964) | |
| Sapphire Pulse Radeon RX 7700 XT (959964) | |
| Ortalama NVIDIA Titan RTX (28.2 - 29.3, n=2) | |
| Ortalama NVIDIA GeForce RTX 4060 Ti 8G (27.3 - 28.2, n=3) | |
| KFA2 GeForce RTX 4060 Ti EX, 16GB GDDR6 (959964) | |
| KFA2 GeForce RTX 4060 1-Click-OC 2X (959964) | |
| XFX Speedster QICK 308 Radeon RX 7600 Black Edition (959964) | |
| F1 22 / Ultra High Preset | |
| NVIDIA GeForce RTX 4090 Founders Edition (928484) | |
| Gigabyte GeForce RTX 4080 Super Gaming OC (959964) | |
| AMD Radeon RX 7900 XTX (939134) | |
| NVIDIA GeForce RTX 4080 Founders Edition (959964) | |
| Asus TUF Gaming GeForce RTX 4070 Ti Super (959964) | |
| Gigabyte Aorus GeForce RTX 4070 Ti Master (939134) | |
| Ortalama NVIDIA GeForce RTX 4070 Ti (92.4 - 94.4, n=4) | |
| Asus TUF Gaming GeForce RTX 4070 Ti (939134) | |
| Gigabyte GeForce RTX 4070 Super Gaming OC 12G (959964) | |
| AMD Radeon RX 7900 XT (939134) | |
| Ortalama NVIDIA GeForce RTX 3080 Ti (85.6 - 86.6, n=2) | |
| Ortalama NVIDIA GeForce RTX 3090 (82.5 - 89.9, n=12) | |
| NVIDIA GeForce RTX 4070 Super Founders Edition (959964) | |
| Ortalama NVIDIA GeForce RTX 3080 (n=1) | |
| Zotac Gaming GeForce RTX 4070 AMP Airo (959964) | |
| AMD Radeon RX 7800 XT (959964) | |
| Sapphire Pulse Radeon RX 7700 XT (959964) | |
| Ortalama NVIDIA Titan RTX (56.3 - 58.9, n=2) | |
| KFA2 GeForce RTX 4060 Ti EX, 16GB GDDR6 (959964) | |
| Ortalama NVIDIA GeForce RTX 4060 Ti 8G (55.4 - 56.5, n=3) | |
| KFA2 GeForce RTX 4060 1-Click-OC 2X (959964) | |
| XFX Speedster QICK 308 Radeon RX 7600 Black Edition (959964) | |
| F1 22 / Ultra High Preset | |
| NVIDIA GeForce RTX 4090 Founders Edition (928484) | |
| Gigabyte GeForce RTX 4080 Super Gaming OC (959964) | |
| AMD Radeon RX 7900 XTX (939134) | |
| Asus TUF Gaming GeForce RTX 4070 Ti Super (959964) | |
| Asus TUF Gaming GeForce RTX 4070 Ti (939134) | |
| Ortalama NVIDIA GeForce RTX 4070 Ti (142.5 - 144.5, n=4) | |
| Gigabyte Aorus GeForce RTX 4070 Ti Master (939134) | |
| NVIDIA GeForce RTX 4080 Founders Edition (959964) | |
| Gigabyte GeForce RTX 4070 Super Gaming OC 12G (959964) | |
| Ortalama NVIDIA GeForce RTX 3080 Ti (128.8 - 131.6, n=2) | |
| AMD Radeon RX 7900 XT (939134) | |
| Ortalama NVIDIA GeForce RTX 3090 (122.6 - 136.9, n=13) | |
| NVIDIA GeForce RTX 4070 Super Founders Edition (959964) | |
| Ortalama NVIDIA GeForce RTX 3080 (n=1) | |
| Zotac Gaming GeForce RTX 4070 AMP Airo (959964) | |
| AMD Radeon RX 7800 XT (959964) | |
| Sapphire Pulse Radeon RX 7700 XT (959964) | |
| Ortalama NVIDIA GeForce RTX 4060 Ti 8G (87.8 - 89.6, n=3) | |
| Ortalama NVIDIA Titan RTX (86 - 91.5, n=2) | |
| KFA2 GeForce RTX 4060 Ti EX, 16GB GDDR6 (959964) | |
| KFA2 GeForce RTX 4060 1-Click-OC 2X (959964) | |
| XFX Speedster QICK 308 Radeon RX 7600 Black Edition (959964) | |
| Final Fantasy XV Benchmark / High Quality | |
| NVIDIA GeForce RTX 4090 Founders Edition (1.3) | |
| Gigabyte GeForce RTX 4080 Super Gaming OC (1.3) | |
| NVIDIA GeForce RTX 4080 Founders Edition (1.3) | |
| AMD Radeon RX 7900 XTX (1.3) | |
| Asus TUF Gaming GeForce RTX 4070 Ti Super (1.3) | |
| Gigabyte Aorus GeForce RTX 4070 Ti Master (1.3) | |
| Asus TUF Gaming GeForce RTX 4070 Ti (1.3) | |
| Ortalama NVIDIA GeForce RTX 4070 Ti (87.1 - 90.9, n=4) | |
| Ortalama NVIDIA GeForce RTX 3090 (81.5 - 92.4, n=15) | |
| Gigabyte GeForce RTX 4070 Super Gaming OC 12G (1.3) | |
| AMD Radeon RX 7900 XT (1.3) | |
| Ortalama NVIDIA GeForce RTX 3080 Ti (84 - 86.4, n=3) | |
| NVIDIA GeForce RTX 4070 Super Founders Edition (1.3) | |
| Zotac Gaming GeForce RTX 4070 AMP Airo (1.3) | |
| Ortalama NVIDIA GeForce RTX 3080 (66 - 76.1, n=2) | |
| AMD Radeon RX 7800 XT (1.3) | |
| Ortalama NVIDIA Titan RTX (57.4 - 66.7, n=32) | |
| Sapphire Pulse Radeon RX 7700 XT (1.3) | |
| Ortalama NVIDIA GeForce RTX 4060 Ti 8G (51.5 - 52.7, n=3) | |
| KFA2 GeForce RTX 4060 Ti EX, 16GB GDDR6 (1.3) | |
| KFA2 GeForce RTX 4060 1-Click-OC 2X (1.3) | |
| XFX Speedster QICK 308 Radeon RX 7600 Black Edition (1.3) | |
| Final Fantasy XV Benchmark / High Quality | |
| NVIDIA GeForce RTX 4090 Founders Edition (1.3) | |
| Gigabyte GeForce RTX 4080 Super Gaming OC (1.3) | |
| AMD Radeon RX 7900 XTX (1.3) | |
| NVIDIA GeForce RTX 4080 Founders Edition (1.3) | |
| Gigabyte Aorus GeForce RTX 4070 Ti Master (1.3) | |
| Asus TUF Gaming GeForce RTX 4070 Ti Super (1.3) | |
| Asus TUF Gaming GeForce RTX 4070 Ti (1.3) | |
| Ortalama NVIDIA GeForce RTX 4070 Ti (160.1 - 169.2, n=4) | |
| Gigabyte GeForce RTX 4070 Super Gaming OC 12G (1.3) | |
| AMD Radeon RX 7900 XT (1.3) | |
| NVIDIA GeForce RTX 4070 Super Founders Edition (1.3) | |
| Ortalama NVIDIA GeForce RTX 3090 (128 - 153, n=15) | |
| Ortalama NVIDIA GeForce RTX 3080 Ti (136 - 142, n=3) | |
| Zotac Gaming GeForce RTX 4070 AMP Airo (1.3) | |
| AMD Radeon RX 7800 XT (1.3) | |
| Ortalama NVIDIA GeForce RTX 3080 (91 - 124, n=2) | |
| Ortalama NVIDIA Titan RTX (80.6 - 113.3, n=20) | |
| Sapphire Pulse Radeon RX 7700 XT (1.3) | |
| Ortalama NVIDIA GeForce RTX 4060 Ti 8G (95.5 - 96.7, n=3) | |
| KFA2 GeForce RTX 4060 Ti EX, 16GB GDDR6 (1.3) | |
| KFA2 GeForce RTX 4060 1-Click-OC 2X (1.3) | |
| XFX Speedster QICK 308 Radeon RX 7600 Black Edition (1.3) | |
| Final Fantasy XV Benchmark / High Quality | |
| NVIDIA GeForce RTX 4090 Founders Edition (1.3) | |
| Gigabyte GeForce RTX 4080 Super Gaming OC (1.3) | |
| AMD Radeon RX 7900 XTX (1.3) | |
| Gigabyte Aorus GeForce RTX 4070 Ti Master (1.3) | |
| Asus TUF Gaming GeForce RTX 4070 Ti (1.3) | |
| Asus TUF Gaming GeForce RTX 4070 Ti Super (1.3) | |
| Ortalama NVIDIA GeForce RTX 4070 Ti (204 - 212, n=4) | |
| NVIDIA GeForce RTX 4080 Founders Edition (1.3) | |
| AMD Radeon RX 7900 XT (1.3) | |
| Gigabyte GeForce RTX 4070 Super Gaming OC 12G (1.3) | |
| NVIDIA GeForce RTX 4070 Super Founders Edition (1.3) | |
| Ortalama NVIDIA GeForce RTX 3090 (153 - 229, n=16) | |
| Ortalama NVIDIA GeForce RTX 3080 Ti (175 - 186.4, n=3) | |
| Zotac Gaming GeForce RTX 4070 AMP Airo (1.3) | |
| AMD Radeon RX 7800 XT (1.3) | |
| Sapphire Pulse Radeon RX 7700 XT (1.3) | |
| Ortalama NVIDIA GeForce RTX 3080 (113 - 156, n=2) | |
| Ortalama NVIDIA GeForce RTX 4060 Ti 8G (130.6 - 133.8, n=3) | |
| Ortalama NVIDIA Titan RTX (84.7 - 150.5, n=32) | |
| KFA2 GeForce RTX 4060 Ti EX, 16GB GDDR6 (1.3) | |
| KFA2 GeForce RTX 4060 1-Click-OC 2X (1.3) | |
| XFX Speedster QICK 308 Radeon RX 7600 Black Edition (1.3) | |
The Witcher 3: 3840x2160 Ultra Graphics & Postprocessing (HBAO+) | 3840x2160 High Graphics & Postprocessing (Nvidia HairWorks Off) | 1920x1080 Ultra Graphics & Postprocessing (HBAO+)
Metro Exodus: 3840x2160 Ultra Quality AF:16x | 2560x1440 Ultra Quality AF:16x | 1920x1080 Ultra Quality AF:16x
Control: 3840x2160 High Quality Preset | 2560x1440 High Quality Preset | 1920x1080 High Quality Preset
Borderlands 3: 3840x2160 Badass Overall Quality (DX11) | 2560x1440 Badass Overall Quality (DX11) | 1920x1080 Badass Overall Quality (DX11)
Shadow of the Tomb Raider: 3840x2160 Highest Preset AA:T | 2560x1440 Highest Preset AA:T | 1920x1080 Highest Preset AA:T
F1 22: 3840x2160 Ultra High Preset AA:T AF:16x | 2560x1440 Ultra High Preset AA:T AF:16x | 1920x1080 Ultra High Preset AA:T AF:16x
Final Fantasy XV Benchmark: 3840x2160 High Quality | 2560x1440 High Quality | 1920x1080 High Quality
Işın izleme performansı
Gibi oyunlar Metro Exodus (Geliştirilmemiş Baskı), Kontrolve Far Cry 6 rX 7900 XTX'in yerel 1080p Ultra ışın izlemede RTX 4080 Super Gaming OC'yi kıl payı geçmeyi başardığını görüyoruz.
Bununla birlikte, RTX 4080 Super Gaming OC, doğal çözünürlüklü ışın izlemede RTX 4080 FE'ye göre %3-17 arasında bir üstünlük sağlıyor.
| Alan Wake 2 | |
| 3840x2160 High Preset + High Ray Tracing + Quality DLSS + FG | |
| Sınıf ortalaması Desktop (26.2 - 152.7, n=18, son 2 yıl) | |
| Gigabyte GeForce RTX 4080 Super Gaming OC | |
| NVIDIA GeForce RTX 4080 Founders Edition | |
| Asus TUF Gaming GeForce RTX 4070 Ti Super | |
| Ortalama NVIDIA GeForce RTX 4070 Ti (n=1) | |
| Gigabyte GeForce RTX 4070 Super Gaming OC 12G | |
| NVIDIA GeForce RTX 4070 Super Founders Edition | |
| Ortalama NVIDIA GeForce RTX 4060 Ti 8G (n=1) | |
| 1920x1080 High Preset + High Ray Tracing | |
| Gigabyte GeForce RTX 4080 Super Gaming OC | |
| Asus TUF Gaming GeForce RTX 4070 Ti Super | |
| NVIDIA GeForce RTX 4080 Founders Edition | |
| Ortalama NVIDIA GeForce RTX 4070 Ti (n=1) | |
| Sınıf ortalaması Desktop (23.8 - 132.2, n=28, son 2 yıl) | |
| Gigabyte GeForce RTX 4070 Super Gaming OC 12G | |
| NVIDIA GeForce RTX 4070 Super Founders Edition | |
| Ortalama NVIDIA GeForce RTX 3090 (44.6 - 52, n=3) | |
| Ortalama NVIDIA GeForce RTX 4060 Ti 8G (n=1) | |
| Ortalama NVIDIA Titan RTX (n=1) | |
| Sapphire Pulse Radeon RX 7700 XT | |
| XFX Speedster QICK 308 Radeon RX 7600 Black Edition | |
| Watch Dogs Legion - 1920x1080 Ultra Preset + Ultra Ray Tracing (DX12) | |
| NVIDIA GeForce RTX 4090 Founders Edition | |
| Gigabyte GeForce RTX 4080 Super Gaming OC | |
| Gigabyte Aorus GeForce RTX 4070 Ti Master | |
| Ortalama NVIDIA GeForce RTX 4070 Ti (98.9 - 99.4, n=2) | |
| Asus TUF Gaming GeForce RTX 4070 Ti | |
| Asus TUF Gaming GeForce RTX 4070 Ti Super | |
| Gigabyte GeForce RTX 4070 Super Gaming OC 12G | |
| Ortalama NVIDIA GeForce RTX 3090 (75.7 - 110, n=3) | |
| NVIDIA GeForce RTX 4070 Super Founders Edition | |
| NVIDIA GeForce RTX 4080 Founders Edition | |
| Zotac Gaming GeForce RTX 4070 AMP Airo | |
| Ortalama NVIDIA GeForce RTX 3080 Ti (n=1) | |
| Ortalama NVIDIA GeForce RTX 3080 (70.9 - 71.3, n=2) | |
| Ortalama NVIDIA Titan RTX (n=1) | |
| Dying Light 2 - 1920x1080 High Quality Raytracing | |
| NVIDIA GeForce RTX 4090 Founders Edition | |
| Gigabyte GeForce RTX 4080 Super Gaming OC | |
| Ortalama NVIDIA GeForce RTX 3090 (67.9 - 109.9, n=3) | |
| NVIDIA GeForce RTX 4080 Founders Edition | |
| Ortalama NVIDIA GeForce RTX 3080 Ti (n=1) | |
| Asus TUF Gaming GeForce RTX 4070 Ti | |
| Ortalama NVIDIA GeForce RTX 4070 Ti (82.8 - 82.9, n=2) | |
| Gigabyte Aorus GeForce RTX 4070 Ti Master | |
| Ortalama NVIDIA Titan RTX (n=1) | |
| Asus TUF Gaming GeForce RTX 4070 Ti Super | |
| Gigabyte GeForce RTX 4070 Super Gaming OC 12G | |
| NVIDIA GeForce RTX 4070 Super Founders Edition | |
| Ortalama NVIDIA GeForce RTX 3080 (n=1) | |
| Zotac Gaming GeForce RTX 4070 AMP Airo | |
| Ghostwire Tokyo - 1920x1080 Highest Settings + Maximum Ray Tracing | |
| Sınıf ortalaması Desktop (n=1son 2 yıl) | |
| NVIDIA GeForce RTX 4090 Founders Edition | |
| Gigabyte GeForce RTX 4080 Super Gaming OC | |
| Asus TUF Gaming GeForce RTX 4070 Ti Super | |
| Asus TUF Gaming GeForce RTX 4070 Ti | |
| Gigabyte Aorus GeForce RTX 4070 Ti Master | |
| Ortalama NVIDIA GeForce RTX 4070 Ti (130.7 - 139.3, n=4) | |
| AMD Radeon RX 7900 XTX | |
| Gigabyte GeForce RTX 4070 Super Gaming OC 12G | |
| NVIDIA GeForce RTX 4080 Founders Edition | |
| NVIDIA GeForce RTX 4070 Super Founders Edition | |
| Ortalama NVIDIA GeForce RTX 3080 Ti (n=1) | |
| AMD Radeon RX 7900 XT | |
| Ortalama NVIDIA GeForce RTX 3090 (106 - 122, n=4) | |
| Zotac Gaming GeForce RTX 4070 AMP Airo | |
| Ortalama NVIDIA GeForce RTX 3080 (n=1) | |
| AMD Radeon RX 7800 XT | |
| KFA2 GeForce RTX 4060 Ti EX, 16GB GDDR6 | |
| Ortalama NVIDIA GeForce RTX 4060 Ti 8G (88 - 90.4, n=3) | |
| Sapphire Pulse Radeon RX 7700 XT | |
| Ortalama NVIDIA Titan RTX (74.5 - 79, n=2) | |
| KFA2 GeForce RTX 4060 1-Click-OC 2X | |
| XFX Speedster QICK 308 Radeon RX 7600 Black Edition | |
| düşük | orta | yüksek | ultra | QHD | 4K DLSS | 4K FSR | 4K | |
|---|---|---|---|---|---|---|---|---|
| GTA V (2015) | 188.2 | 188 | 186.9 | 165.4 | 164.6 | 163.6 | ||
| The Witcher 3 (2015) | 470 | 241 | 196.2 | 186.4 | ||||
| Dota 2 Reborn (2015) | 273 | 245 | 236 | 222 | 214 | |||
| Final Fantasy XV Benchmark (2018) | 235 | 236 | 225 | 193.5 | 117.8 | |||
| X-Plane 11.11 (2018) | 236 | 207 | 154.9 | 132.2 | ||||
| Far Cry 5 (2018) | 206 | 202 | 193 | 134 | ||||
| Strange Brigade (2018) | 626 | 519 | 501 | 480 | 389 | 197.3 | ||
| Shadow of the Tomb Raider (2018) | 271 | 262 | 224 | 127.5 | ||||
| Metro Exodus (2019) | 203 | 169.4 | 144.9 | 97.7 | ||||
| Control (2019) | 221 | 206 | 145 | 86.4 | 76.5 | |||
| Borderlands 3 (2019) | 184.4 | 186.3 | 161.6 | 97.6 | ||||
| Mafia Definitive Edition (2020) | 248 | 232 | 202 | 111.4 | ||||
| Watch Dogs Legion (2020) | 149 | 144.5 | 127 | 80.5 | ||||
| Far Cry 6 (2021) | 212 | 194.4 | 179.8 | 162.8 | 99.3 | |||
| Dying Light 2 (2022) | 217 | 165.9 | 123.7 | 65 | ||||
| Cyberpunk 2077 1.6 (2022) | 209 | 208 | 198.4 | 187.8 | 127.9 | 63 | ||
| Ghostwire Tokyo (2022) | 299 | 298 | 247 | 120 | ||||
| F1 22 (2022) | 368 | 166.4 | 112.9 | 59.2 | ||||
| F1 23 (2023) | 393 | 165.4 | 108.3 | 94.5 | 54.5 | |||
| Baldur's Gate 3 (2023) | 245 | 237 | 232 | 186.8 | 160.7 | 97.6 | ||
| Cyberpunk 2077 (2023) | 197.5 | 198.3 | 186.9 | 173.8 | 121.7 | 55.6 | ||
| Assassin's Creed Mirage (2023) | 243 | 191 | 158 | 135 | 101 | |||
| Alan Wake 2 (2023) | 130.1 | 122.4 | 90.1 | 77.6 | 53.5 | |||
| Avatar Frontiers of Pandora (2023) | 158.9 | 128.8 | 90.1 | 81.1 | 48.4 | |||
| Skull & Bones (2024) | 205 | 172 | 137 | 114 | 105 | 101 | 78 |
Emisyonlar: Daha yüksek gürültü ancak stres altında nispeten gaz kelebeksiz performans
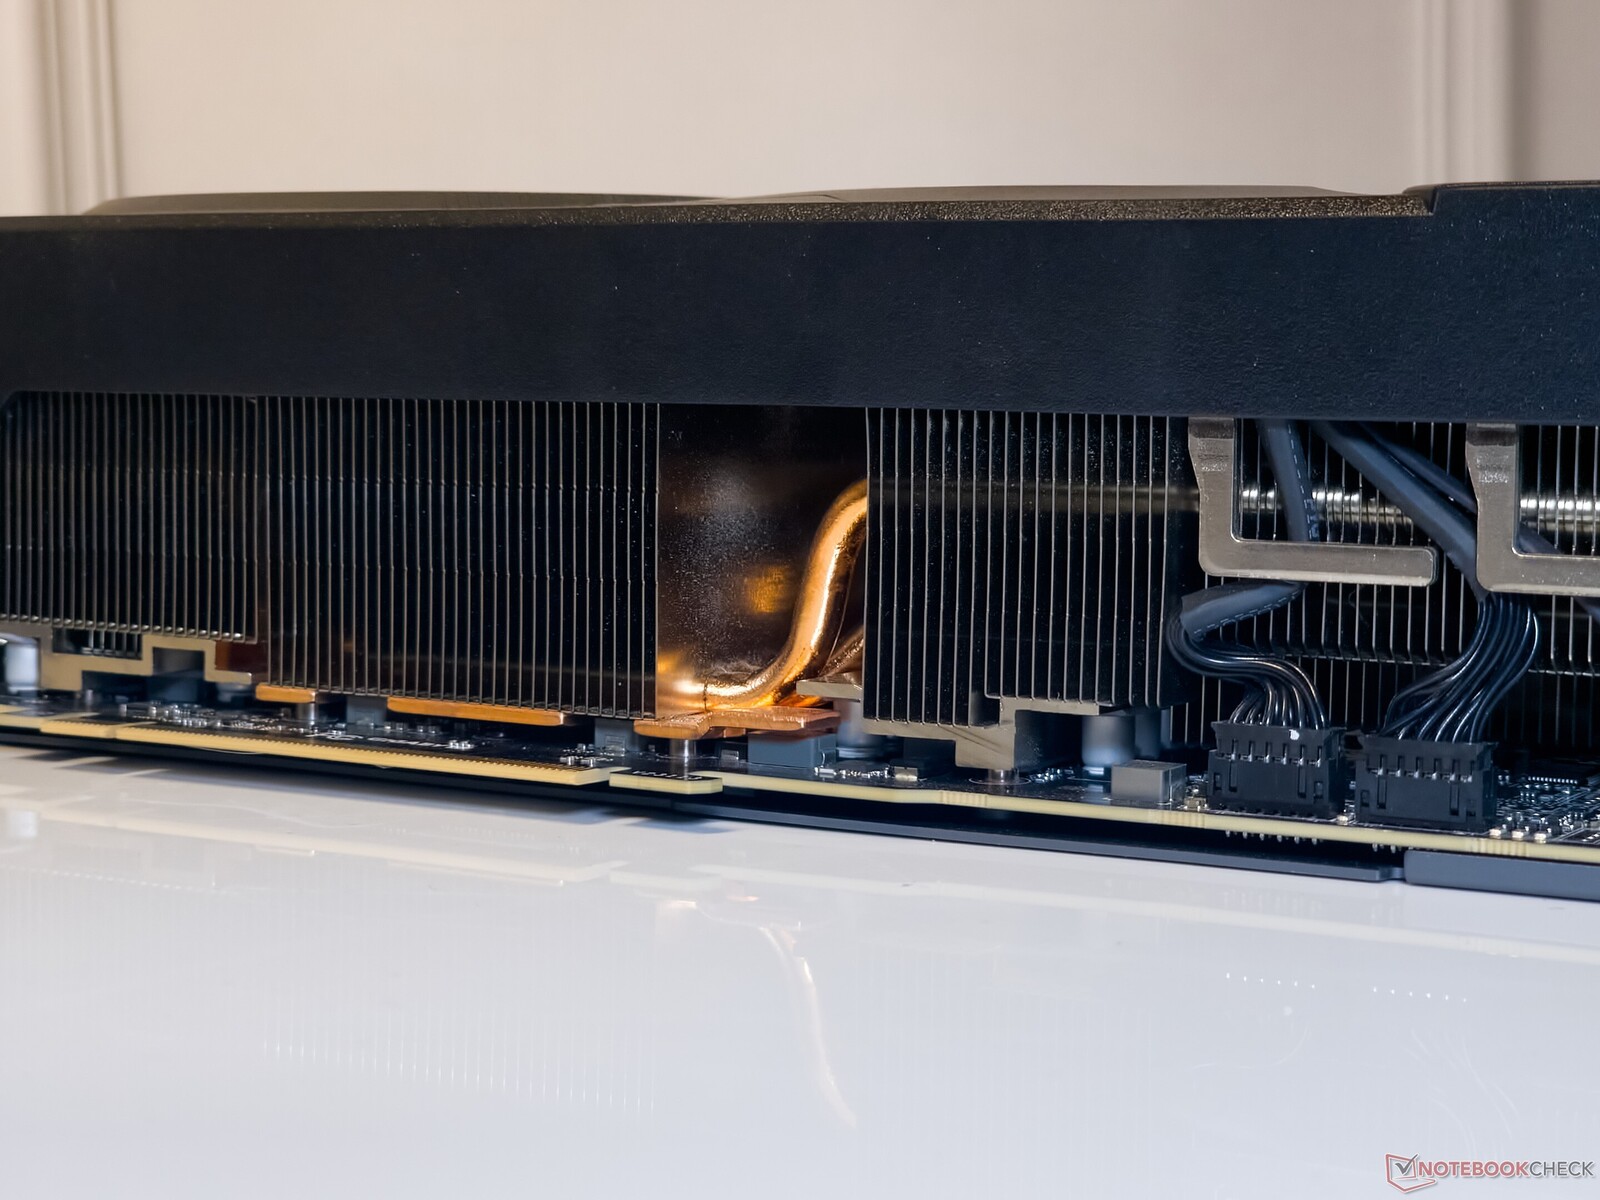
RTX 4080 Super Gaming OC, Gigabyte'ın üç adet 110 mm'lik alternatif dönen fan ve dokuz ısı borusu ile doğrudan temaslı bakır plakadan oluşan WindForce soğutma sisteminden yararlanıyor.
Gigabyte'a göre, kovan yataklı fanlar, çift bilyalı yataklı fanlara benzer şekilde kullanım ömrünü uzatmaya yardımcı olduğu varsayılan bir grafen nano yağlayıcı kullanıyor.
Metal arka plaka, aslında soğutucunun bir uzantısı olan hava çıkışı için büyük bir oyuk içeriyor.
Stres testleri
RTX 4080 Super Gaming OC'yi FurMark (1.280 x 720, AA yok) ile zorladığımızda GPU'nun mevcut 320 W TGP'yi %100 güç hedefinde (PT) kullandığını görüyoruz. Bu da ortalama 2.458 MHz boost saati ve 75 °C'ye yakın sıcak nokta sıcaklıklarıyla sonuçlanıyor.
125 PT'de GPU, teorik olarak mevcut olan 400 W'ın yalnızca 383 W'ını kullanabiliyor. Bu durum daha önce RTX 4070 Super Gaming OC ile de gözlemlenmişti.
GPU'nun ortalama 2.634 MHz saat hızına ulaştığını ve buna bağlı olarak sıcak nokta sıcaklığının 84°C'ye yükseldiğini görüyoruz.
Çalışırken Bu Witcher 3 1080p Ultra'da RTX 4080 Super Gaming OC, 254 W tüketirken %100 PT'de sabit 2.760 MHz saati sürdürmeyi başarıyor.
Ada kartlarında olduğu gibi, oyun iş yüklerinde güç hedefini artırmak belirgin bir fayda sağlamıyor. Saat hızı, güç çekimi ve sıcak nokta sıcaklıkları gibi parametreler %125 PT'de bile The Witcher 3 stresinde aynıdır.
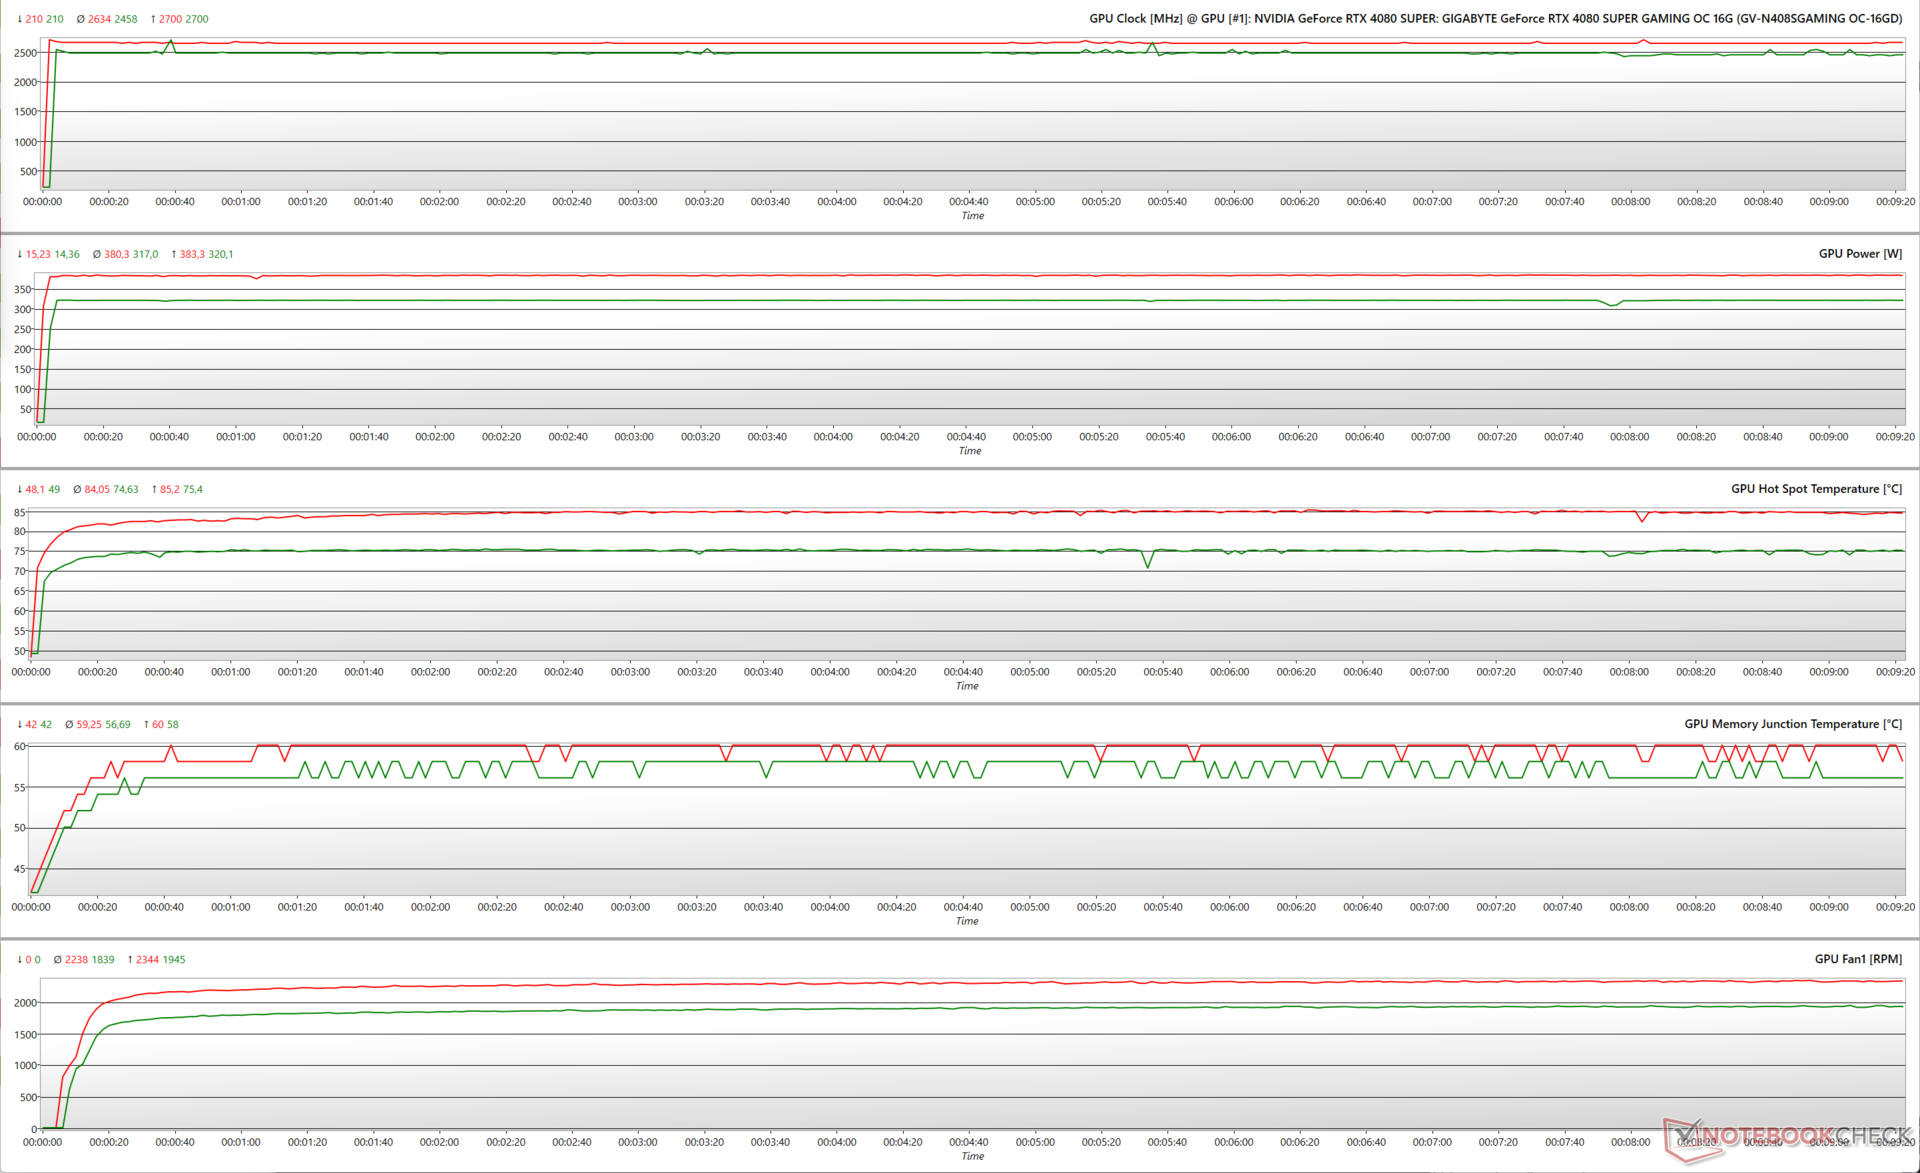
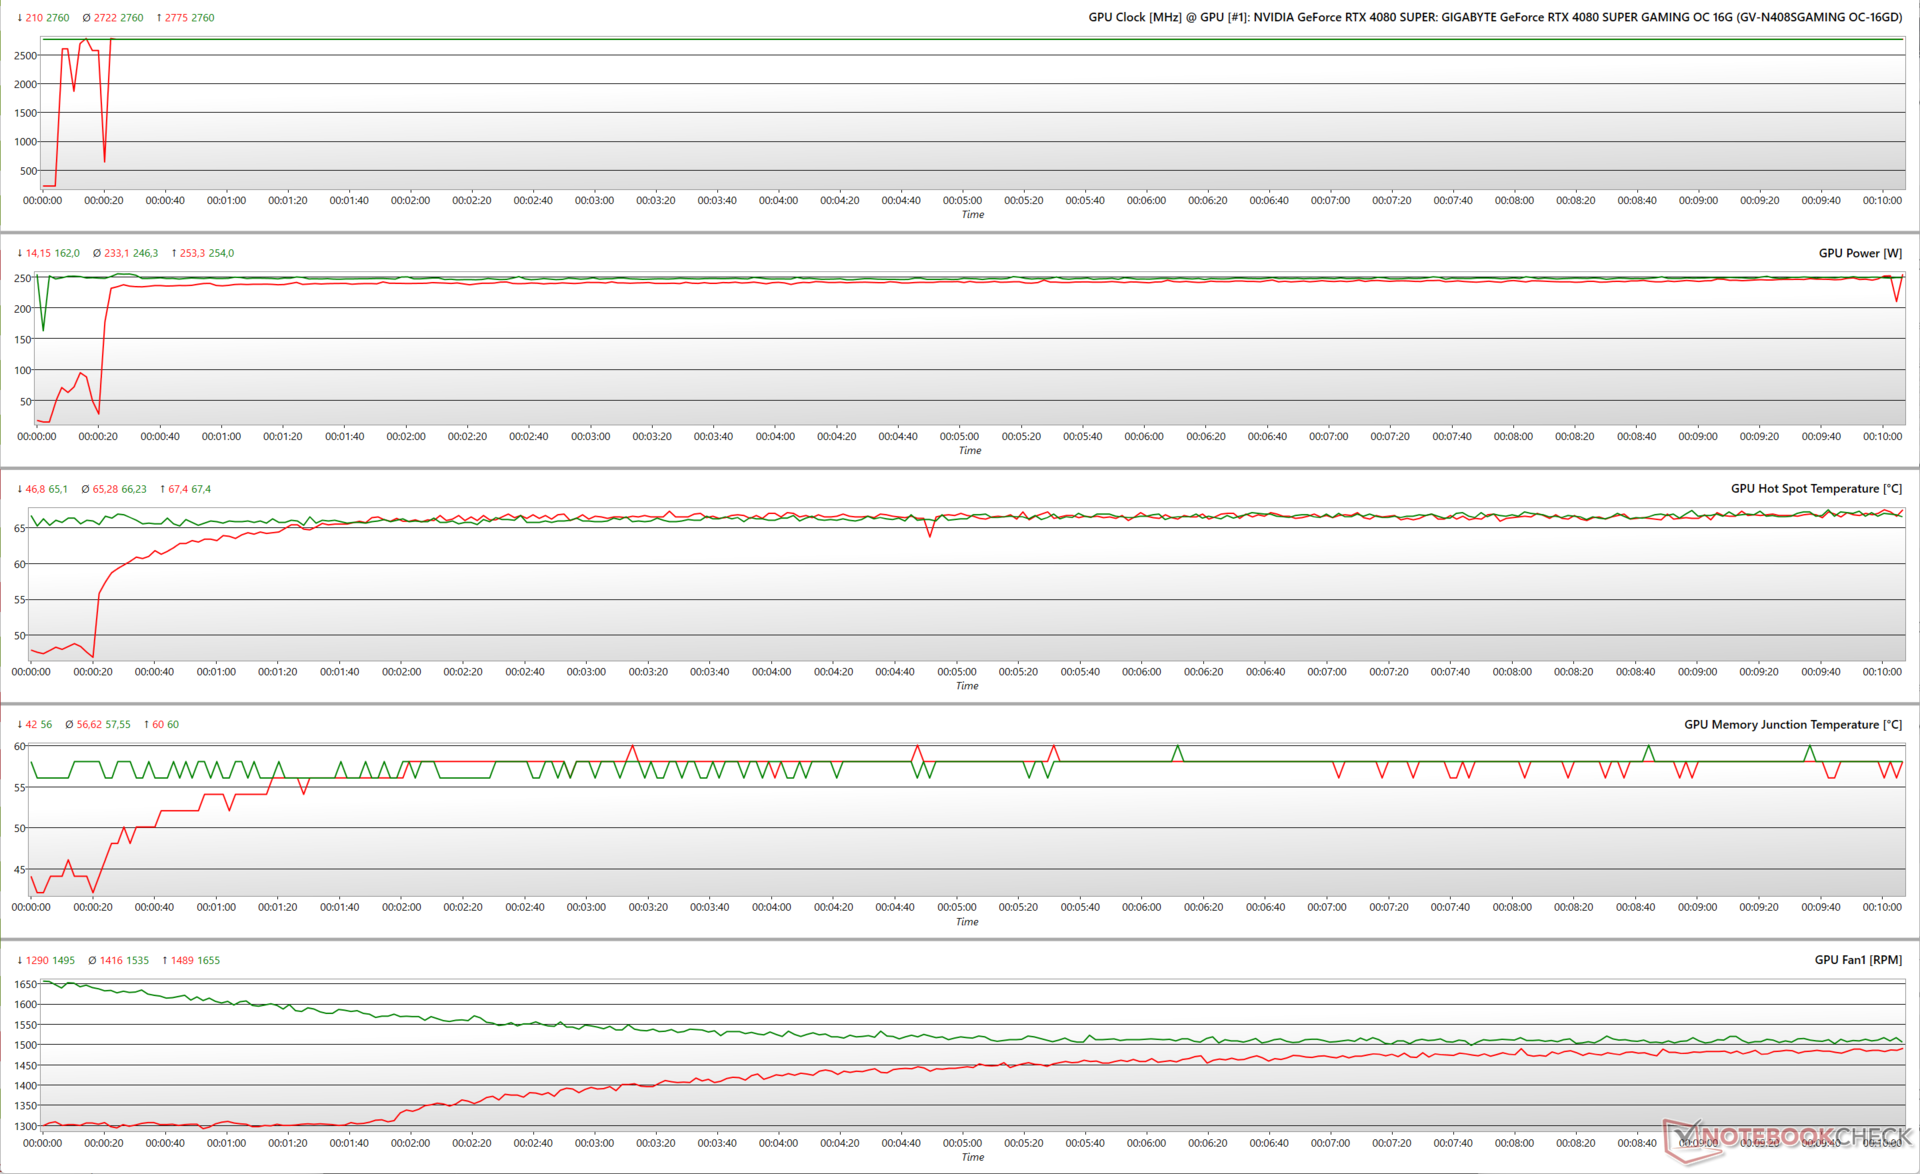
Witcher 3 FPS Tablosu
Gigabyte'ın WindForce soğutma sistemi, herhangi bir yavaşlama endişesini hafifletmek için iyi çalışıyor gibi görünüyor. The Witcher 3 ile 1080p Ultra ve 4K Ultra'da stres testi yaparken karelerde herhangi bir düşüş gözlemlemedik.
Yüzey sıcaklıkları
Yük altındaki yüzey sıcaklıkları çoğunlukla tolere edilebilir düzeydedir. 23 °C ortam sıcaklığında, ön plastik örtü 28,5 °C ile nispeten serin kalırken, metal arka panel yaklaşık 48 °C'ye dokunur.
12VHPWR konnektörünün yakınındaki bölge de oldukça ısınarak 50 °C'ye ulaşıyor.
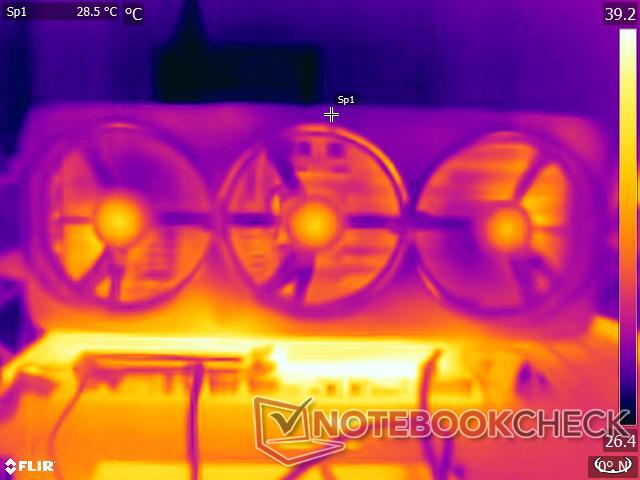
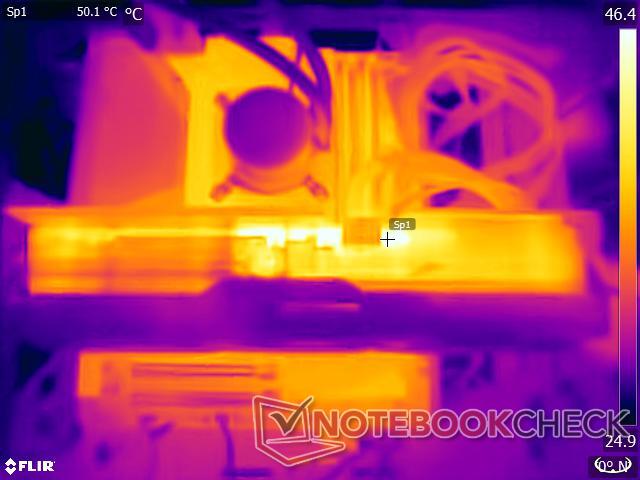
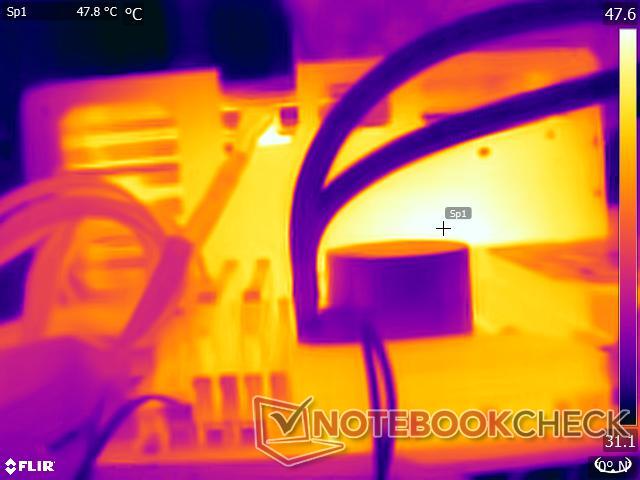
Gürültü seviyeleri
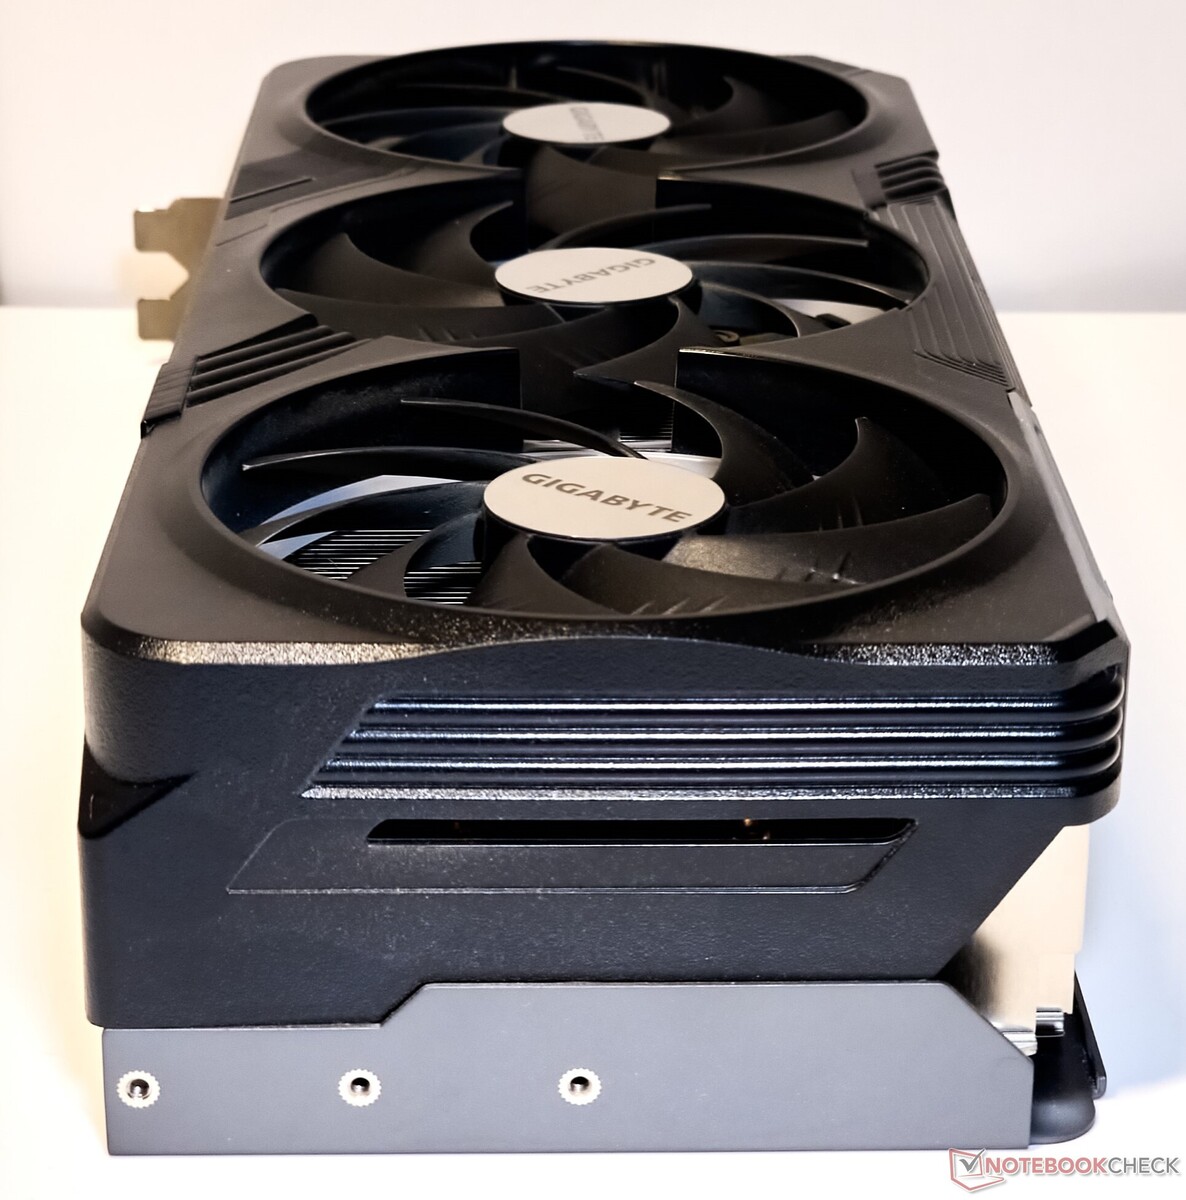
RTX 4080 Super Gaming OC, daha önce RTX 4070 Super Gaming OC ile gözlemlediğimize kıyasla daha yüksek bir gürültü profiline sahip.
Bununla birlikte, fanlar rölantide tamamen durur ve yalnızca çekirdek sıcaklıkları varsayılan fan eğrisine göre 55 ° C işaretine dokunduktan sonra hızlanmaya başlar.
Kullanıcılar BIOS OC ve Sessiz VBIOS modları arasında seçim yapabilir, ancak test sırasında bu ikisi arasında önemli bir fark gözlemlemedik. Gigabyte Control Center uygulamasında fan eğrilerini istediğiniz gibi kolayca ayarlayabileceğiniz için VBIOS anahtarı aslında gereksiz görünüyor.
Bununla birlikte, BIOS OC modunda FurMark ile GPU'yu %125 PT'de zorlarken maksimum 54,21 dB(A) ses basınç seviyesi (SPL) kaydettik.
The Witcher 3 ile 1080p Ultra'da oyun oynarken gürültü seviyeleri test edilen tüm modlarda 50 dB(A) SPL'nin altında kaldı.
| Stres Testi | VBIOSModu / Güç Hedefi | Maks. Fan Hızı (RPM) | Fan Gürültüsü dB(A) |
| FurMark 1280 x 720, AA yok | BIOS OC / %100 | 1,937 | 49.37 |
| FurMark 1280 x 720, AA yok | Sessiz BIOS / %100 | 1.997 | 50,09 |
| FurMark 1280 x 720, AA yok | BIOS OC / %125 | 2.326 | 54,21 |
| FurMark 1280 x 720, AA yok | Sessiz BIOS / %125 | 2.302 | 54,10 |
| The Witcher 3 1080p Ultra | BIOS OC / %100 | 1,814 | 48.24 |
| Witcher 3 1080p Ultra | Sessiz BIOS / %100 | 1.801 | 48,66 |
| Witcher 3 1080p Ultra | BIOS OC / %125 | 1.866 | 49,29 |
| Witcher 3 1080p Ultra | Sessiz BIOS / %125 | 1.813 | 49,13 |
Enerji Yönetimi: 100 PT'de RTX 4080 FE ile karşılaştırılabilir
RTX 4080 Super Gaming OC, güçlü AD103 kalıbı göz önüne alındığında güç tüketimi söz konusu olduğunda en tutumlu değildir, ancak yine de RX 7900 XTX'e kıyasla% 20 daha ekonomiktir.
Gigabyte kartın FurMark ve The Witcher 3 testlerindeki güç tüketimi, %100 PT'de RTX 4080 FE ile karşılaştırılabilirken, ikincisinden %6 daha az verimlidir.
The Witcher 3 'u 1080p Ultra'da oynarken çekilen güç, FurMark'taki daha hissedilir %15'lik deltaya kıyasla %100'den %125 PT'ye geçerken yalnızca marjinal olarak daha yüksektir.
Power Consumption: External monitor
| Power Consumption / FurMark 1.19 GPU Stress Test (external Monitor) | |
| NVIDIA GeForce RTX 4090 Founders Edition (133% PT OC, Idle: 81.25 W) | |
| NVIDIA GeForce RTX 4090 Founders Edition (100% PT, Idle: 81.25 W) | |
| AMD Radeon RX 7900 XTX (Idle: 86.5 W) | |
| AMD Radeon RX 7900 XT (Idle: 84.6 W) | |
| Ortalama NVIDIA GeForce RTX 3080 (Idle: 492 - 505, n=2 W) | |
| Gigabyte GeForce RTX 4080 Super Gaming OC (125% PT, BIOS OC, Idle: 96.2 W) | |
| Gigabyte GeForce RTX 4080 Super Gaming OC (100% PT, BIOS OC, Idle: 96.2 W) | |
| Ortalama NVIDIA GeForce RTX 3090 (Idle: 281 - 551, n=9 W) | |
| NVIDIA GeForce RTX 4080 Founders Edition (110% PT, Idle: 78.45 W) | |
| NVIDIA GeForce RTX 4080 Founders Edition (100% PT, Idle: 78.45 W) | |
| Ortalama NVIDIA GeForce RTX 3080 Ti (Idle: 427 - 513, n=3 W) | |
| Gigabyte Aorus GeForce RTX 4070 Ti Master (OC BIOS; 128% PT, Idle: 75.5 W) | |
| Gigabyte Aorus GeForce RTX 4070 Ti Master (OC BIOS; 100% PT, Idle: 75.5 W) | |
| Gigabyte Aorus GeForce RTX 4070 Ti Master (Silent BIOS; 100% PT, Idle: 75.5 W) | |
| Asus TUF Gaming GeForce RTX 4070 Ti (Perf BIOS / 110% PT, Idle: 75.4 W) | |
| Asus TUF Gaming GeForce RTX 4070 Ti (Quiet BIOS / 100% PT, Idle: 75.4 W) | |
| Asus TUF Gaming GeForce RTX 4070 Ti (Perf BIOS / 100% PT, Idle: 75.4 W) | |
| Asus TUF Gaming GeForce RTX 4070 Ti Super (110% PT, Perf. BIOS, Idle: 138 W) | |
| Asus TUF Gaming GeForce RTX 4070 Ti Super (100% PT, Perf. BIOS, Idle: 138 W) | |
| Ortalama NVIDIA Titan RTX (Idle: n=1 W) | |
| Ortalama NVIDIA GeForce RTX 4070 Ti (Idle: 400 - 451, n=9 W) | |
| Sınıf ortalaması Desktop (Idle: 70 - 743, n=38, son 2 yıl W) | |
| Gigabyte GeForce RTX 4070 Super Gaming OC 12G (145% PT, BIOS OC, Idle: 122.6 W) | |
| Gigabyte GeForce RTX 4070 Super Gaming OC 12G (100% PT, BIOS OC, Idle: 122.6 W) | |
| AMD Radeon RX 7800 XT | |
| Sapphire Pulse Radeon RX 7700 XT | |
| NVIDIA GeForce RTX 4070 Super Founders Edition (109% PT, Idle: 114.9 W) | |
| NVIDIA GeForce RTX 4070 Super Founders Edition (100% PT, Idle: 114.9 W) | |
| Zotac Gaming GeForce RTX 4070 AMP Airo (120% PT, Idle: 94.4 W) | |
| Zotac Gaming GeForce RTX 4070 AMP Airo (100% PT, Idle: 94.4 W) | |
| XFX Speedster QICK 308 Radeon RX 7600 Black Edition | |
| KFA2 GeForce RTX 4060 Ti EX, 16GB GDDR6 | |
| Ortalama NVIDIA GeForce RTX 4060 Ti 8G (Idle: 282 - 308, n=4 W) | |
| KFA2 GeForce RTX 4060 1-Click-OC 2X | |
| Power Consumption / The Witcher 3 ultra (external Monitor) | |
| NVIDIA GeForce RTX 4090 Founders Edition (133% PT OC, Idle: 81.25 W) | |
| NVIDIA GeForce RTX 4090 Founders Edition (100% PT, Idle: 81.25 W) | |
| AMD Radeon RX 7900 XTX (Idle: 86.5 W) | |
| Ortalama NVIDIA GeForce RTX 3090 (Idle: 464 - 597, n=18 W) | |
| Ortalama NVIDIA GeForce RTX 3080 Ti (Idle: 490 - 528, n=3 W) | |
| Ortalama NVIDIA GeForce RTX 3080 (Idle: 498 - 505, n=2 W) | |
| Gigabyte GeForce RTX 4080 Super Gaming OC (125% PT, BIOS OC, Idle: 96.2 W) | |
| Gigabyte GeForce RTX 4080 Super Gaming OC (100% PT, BIOS OC, Idle: 96.2 W) | |
| NVIDIA GeForce RTX 4080 Founders Edition (110% PT, Idle: 78.45 W) | |
| NVIDIA GeForce RTX 4080 Founders Edition (100% PT, Idle: 78.45 W) | |
| AMD Radeon RX 7900 XT (Idle: 84.6 W) | |
| AMD Radeon RX 7800 XT | |
| Sınıf ortalaması Desktop (Idle: 69 - 692, n=44, son 2 yıl W) | |
| Asus TUF Gaming GeForce RTX 4070 Ti (Perf BIOS / 110% PT, Idle: 75.4 W) | |
| Asus TUF Gaming GeForce RTX 4070 Ti (Perf BIOS / 100% PT, Idle: 75.4 W) | |
| Asus TUF Gaming GeForce RTX 4070 Ti (Quiet BIOS / 100% PT, Idle: 75.4 W) | |
| Ortalama NVIDIA GeForce RTX 4070 Ti (Idle: 404 - 434, n=9 W) | |
| Gigabyte Aorus GeForce RTX 4070 Ti Master (Silent BIOS; 100% PT, Idle: 75.5 W) | |
| Gigabyte Aorus GeForce RTX 4070 Ti Master (OC BIOS; 128% PT, Idle: 75.5 W) | |
| Gigabyte Aorus GeForce RTX 4070 Ti Master (OC BIOS; 100% PT, Idle: 75.5 W) | |
| Ortalama NVIDIA Titan RTX (Idle: 371 - 463, n=27 W) | |
| Asus TUF Gaming GeForce RTX 4070 Ti Super (110% PT, Perf. BIOS, Idle: 138 W) | |
| Asus TUF Gaming GeForce RTX 4070 Ti Super (100% PT, Perf. BIOS, Idle: 138 W) | |
| Gigabyte GeForce RTX 4070 Super Gaming OC 12G (100% PT, BIOS OC, Idle: 122.6 W) | |
| Gigabyte GeForce RTX 4070 Super Gaming OC 12G (145% PT, BIOS OC, Idle: 122.6 W) | |
| Sapphire Pulse Radeon RX 7700 XT | |
| NVIDIA GeForce RTX 4070 Super Founders Edition (109% PT, Idle: 114.9 W) | |
| NVIDIA GeForce RTX 4070 Super Founders Edition (100% PT, Idle: 114.9 W) | |
| Zotac Gaming GeForce RTX 4070 AMP Airo (120% PT, Idle: 94.4 W) | |
| Zotac Gaming GeForce RTX 4070 AMP Airo (100% PT, Idle: 94.4 W) | |
| XFX Speedster QICK 308 Radeon RX 7600 Black Edition | |
| KFA2 GeForce RTX 4060 Ti EX, 16GB GDDR6 | |
| Ortalama NVIDIA GeForce RTX 4060 Ti 8G (Idle: 288 - 321, n=4 W) | |
| KFA2 GeForce RTX 4060 1-Click-OC 2X | |
| Power Consumption / Witcher 3 ultra Efficiency (external Monitor) | |
| AMD Radeon RX 7900 XT | |
| Sınıf ortalaması Desktop (0.113 - 0.653, n=44, son 2 yıl) | |
| AMD Radeon RX 7900 XTX | |
| NVIDIA GeForce RTX 4080 Founders Edition | |
| Asus TUF Gaming GeForce RTX 4070 Ti | |
| Gigabyte GeForce RTX 4070 Super Gaming OC 12G | |
| NVIDIA GeForce RTX 4090 Founders Edition | |
| Gigabyte Aorus GeForce RTX 4070 Ti Master | |
| Asus TUF Gaming GeForce RTX 4070 Ti Super | |
| Ortalama NVIDIA GeForce RTX 4070 Ti (0.509 - 0.548, n=5) | |
| Gigabyte GeForce RTX 4080 Super Gaming OC | |
| NVIDIA GeForce RTX 4070 Super Founders Edition | |
| Zotac Gaming GeForce RTX 4070 AMP Airo | |
| Ortalama NVIDIA GeForce RTX 4060 Ti 8G (0.4243 - 0.4656, n=4) | |
| AMD Radeon RX 7800 XT | |
| Sapphire Pulse Radeon RX 7700 XT | |
| KFA2 GeForce RTX 4060 Ti EX, 16GB GDDR6 | |
| KFA2 GeForce RTX 4060 1-Click-OC 2X | |
| Ortalama NVIDIA GeForce RTX 3080 Ti (0.3496 - 0.3735, n=3) | |
| XFX Speedster QICK 308 Radeon RX 7600 Black Edition | |
| Ortalama NVIDIA GeForce RTX 3090 (0.268 - 0.3954, n=15) | |
| Ortalama NVIDIA Titan RTX (0.2926 - 0.385, n=26) | |
| Ortalama NVIDIA GeForce RTX 3080 (0.291 - 0.301, n=2) | |
| 1280x720 FurMark 1.19 GPU Stress Test (external Monitor) | |
| 1920x1080 The Witcher 3 ultra (external Monitor) | |
* ... daha küçük daha iyidir
Artılar
Eksiler
Karar: İndirimli MSRP'de tam AD103 ile artan kazançlar
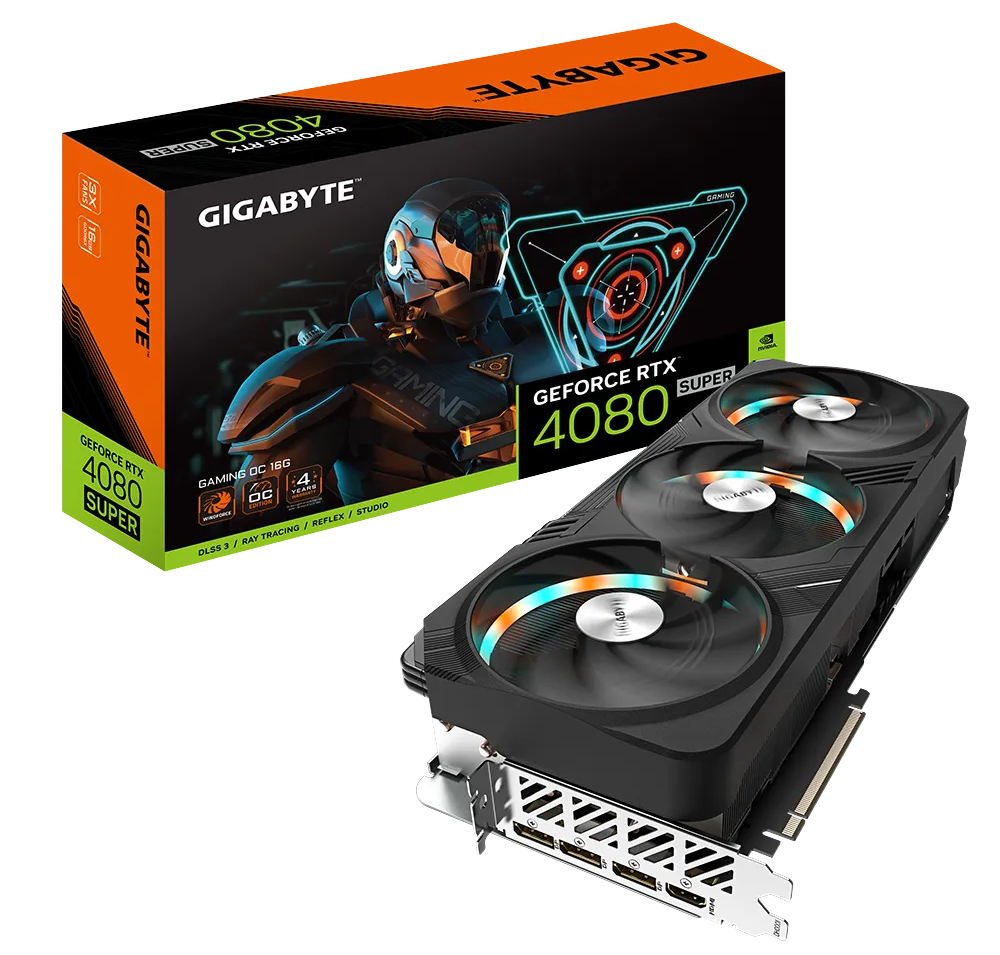

Gigabyte GeForce RTX 4080 Super Gaming OC 16G, %5 daha fazla gölgelendirici, nominal 45 MHz artış ve biraz daha hızlı bellek sunarken, RTX 4080 selefini daha düşük bir fiyatla tamamen destekliyor. Gigabyte, üç yuvalı tasarım, dokuz ısı borulu üç fanlı WindForce kurulumu ve iyi bir RGB gibi son nesil varyantın tüm tanıdık yönlerini korudu.
Genel olarak, Gigabyte'ın kartı, rakiplerinin önüne geçmeyi başarıyor RTX 4080 Founders Edition shader sayılarındaki artışa karşılık gelen sentetiklerde. Deltalar oyun testlerinde şaşırtıcı bir şekilde daha genişti, ancak kesin kazançlar, eğer varsa, oyunun kendisine ve oynadığınız çözünürlüğe bağlı olacaktır.
RTX 4090 Founders Edition (Best Buy'da 1.599 ABD Doları) hala listelerde başı çekiyor ve Kırmızı Takım amiral gemisi statükosunu bozmaya yönelik herhangi bir girişime karşı kayıtsız göründüğü için Nvidia'nın RTX 4090 Ti veya Super'i piyasaya sürmek için çok az teşviki var.
Gigabyte RTX 4080 Super Gaming OC 16G, yeni DLSS teknolojileri desteğiyle daha da iyi hale gelen harika bir 4K oyun performansı sunuyor. RTX 4080 Super FE'ye göre 50 ABD doları artış tamamen boşa gitmiyor, ancak biraz daha fazla para kazanmak istiyorsanız AMD Radeon RX 7900 XTX de aynı derecede yetkin bir teklif."
Nvidia, RTX 4080 FE'nin MSRP'sini 200 ABD doları düşürerek kartlarını doğru oynamış gibi görünüyor (kelime oyunu amaçlanmıştır). İdeal olarak bu fiyatın 2022'deki fiyat olması gerekirdi, ancak AMD Radeon RX 7900 XTX 'in (A mazon'da 926 ABD Dolarından başlayan fiyatlarla) bir rekabet görüntüsü sunması biraz zaman aldı.
Her iki kart da yüksek yenileme hızına sahip 1440p ve doğal 4K 60 fps oyunlar için harika, ancak RX 7900 XTX bu segmentte paranın karşılığını verme açısından genel olarak daha iyi bir bahis gibi görünüyor.
Bununla birlikte, RTX 4080 Super Gaming OC şu anda yalnızca Nvidia kartlarının sunabileceği avantajlarla birlikte geliyor. Bunlar arasında DLSS 3 kare üretimi ve DLSS 3.5 ışın yeniden yapılandırma teknolojileri için destekle birlikte daha iyi genel ışın izleme performansı ve büyük ölçüde geliştirilmiş güç verimliliği yer alıyor.
Gigabyte, 50 ABD doları ek ücret karşılığında oldukça yetenekli bir soğutucu, çift VBIOS anahtarı, iyi bir estetik, GPU sarkmasını önlemek için destek braketleri ve dört yıllık garanti gibi iyi bir özellik seti sunuyor.
Ancak bu noktada yeni bir GPU'ya bin dolar vermek mantıklı mı? Belki de değil. RTX 4070 Super ( Amazon'da 600 ABD Dolarından başlayan fiyatlarla), biraz yükseltme yardımıyla zaten iyi 4K oyun oynama kapasitesine sahip ve bu yılın sonlarında çıkacak olan Nvidia Blackwell ve AMD RDNA 4 GPU'larının neler sunacağını bekleyip görmek akıllıca olabilir.
Orijinal RTX 4080 non-Super resmi olarak EoL'landı, ancak yerel pazarınızda bazı büyük pazarlıklar için avlanmak kötü bir fikir değil.
Fiyat ve Bulunabilirlik
Gigabyte GeForce RTX 4080 Super Gaming OC 16G resmi olarak 1.050 ABD Doları MSRP fiyatına sahip ancak şu anda hem Amazon ABD hem de Best Buy ABD'de 1.100 ABD Dolarına satılıyor.
Kart henüz Amazon Hindistan'da listelenmemiştir, ancak yerel perakende mağazalarındaki fiyatlar ₹1,20,000 ila ₹1,28,000 arasında değişebilir.
Şeffaflık
İncelenecek cihazların seçimi editör ekibimiz tarafından yapılır. Test örneği, bu incelemenin amacı doğrultusunda üretici veya perakendeci tarafından yazara ödünç olarak sağlanmıştır. Borç verenin bu inceleme üzerinde herhangi bir etkisi olmadığı gibi, üretici de yayınlanmadan önce bu incelemenin bir kopyasını almamıştır. Bu incelemeyi yayınlama zorunluluğu yoktu. Bağımsız bir medya şirketi olarak Notebookcheck, üreticilerin, perakendecilerin veya yayıncıların otoritesine tabi değildir.
Notebookcheck bu şekilde test yapıyor
Notebookcheck, tüm sonuçların karşılaştırılabilir olmasını sağlamak için her yıl yüzlerce dizüstü bilgisayarı ve akıllı telefonu standart prosedürler kullanarak bağımsız olarak inceliyor. Yaklaşık 20 yıldır test yöntemlerimizi sürekli olarak geliştirdik ve bu süreçte endüstri standartlarını belirledik. Test laboratuvarlarımızda deneyimli teknisyenler ve editörler tarafından yüksek kaliteli ölçüm ekipmanları kullanılmaktadır. Bu testler çok aşamalı bir doğrulama sürecini içerir. Karmaşık derecelendirme sistemimiz, nesnelliği koruyan yüzlerce sağlam temellere dayanan ölçüm ve kıyaslamaya dayanmaktadır.Price comparison

