HP Pavilion x360 15 2019 Dönüştürülebilir İnceleme: Bu Yapılandırmayı Satın Alma
HP Pavilion x360 15, HP'den satın alabileceğiniz en ucuz 15,6 inç dönüştürülebilir dizüstü bilgisayardır. Buna rağmen, bazı yapılandırmalar bütçe dizüstü olması gereken için pahalı tarafında olmak 1000 $ USD ulaşabilir. Bugün sahip olduğumuz ünite, perakende satışlarda 1000 $ karşılığında Whiskey Lake-U Core i7-8565U CPU, 12 GB RAM, 512 GB NVMe SSD ve 768p dokunmatik ekrana sahip son derece yapılandırılmış bir SKU'dur. Comet Lake-U CPU'lu daha yeni SKU'lar çevrimiçi bulunabilir, bu da çeşitli satış noktalarının Whiskey Lake-U ünitemizi indirimli fiyatlarla taşıyabileceği anlamına gelir.Doğru rakipler arasında Asus VivoBook Flip 15, Lenovo IdeaPad C340 15, Dell gibi 15,6 inçlik diğer bütçeler bulunur Inspiron 15 3585 ve Acer Spin serisi.Daha fazla HP inceleme: Pavilion Gaming 15Envy x360 15Spectre x360 15EliteBook x360 1040Omen 15
Derecelendirme | Tarih | Modeli | Ağırlık | Yükseklik | Boyut | Çözünürlük | Fiyat |
|---|---|---|---|---|---|---|---|
| 72 % v7 (old) | 02/2020 | HP Pavilion x360 15-dq0065cl i7-8565U, UHD Graphics 620 | 1.9 kg | 20.6 mm | 15.60" | 1366x768 | |
| 78.9 % v6 (old) | 07/2018 | Asus VivoBook Flip 15 TP510UA-E8073T i5-8250U, UHD Graphics 620 | 2.3 kg | 18 mm | 15.60" | 1920x1080 | |
| 82.6 % v7 (old) | 12/2019 | Lenovo Ideapad C340-15IWL-81N5004QGE i5-8265U, GeForce MX230 | 2 kg | 20.5 mm | 15.60" | 1920x1080 | |
| 80.1 % v6 (old) | 04/2018 | HP Envy x360 15-bq102ng R5 2500U, Vega 8 | 2.1 kg | 19.6 mm | 15.60" | 1920x1080 | |
| 77.6 % v6 (old) | 05/2022 | Dell Inspiron 15 3585 (2300U, Vega 6) R3 2300U, Vega 6 | 1.9 kg | 20 mm | 15.60" | 1920x1080 |
Durum
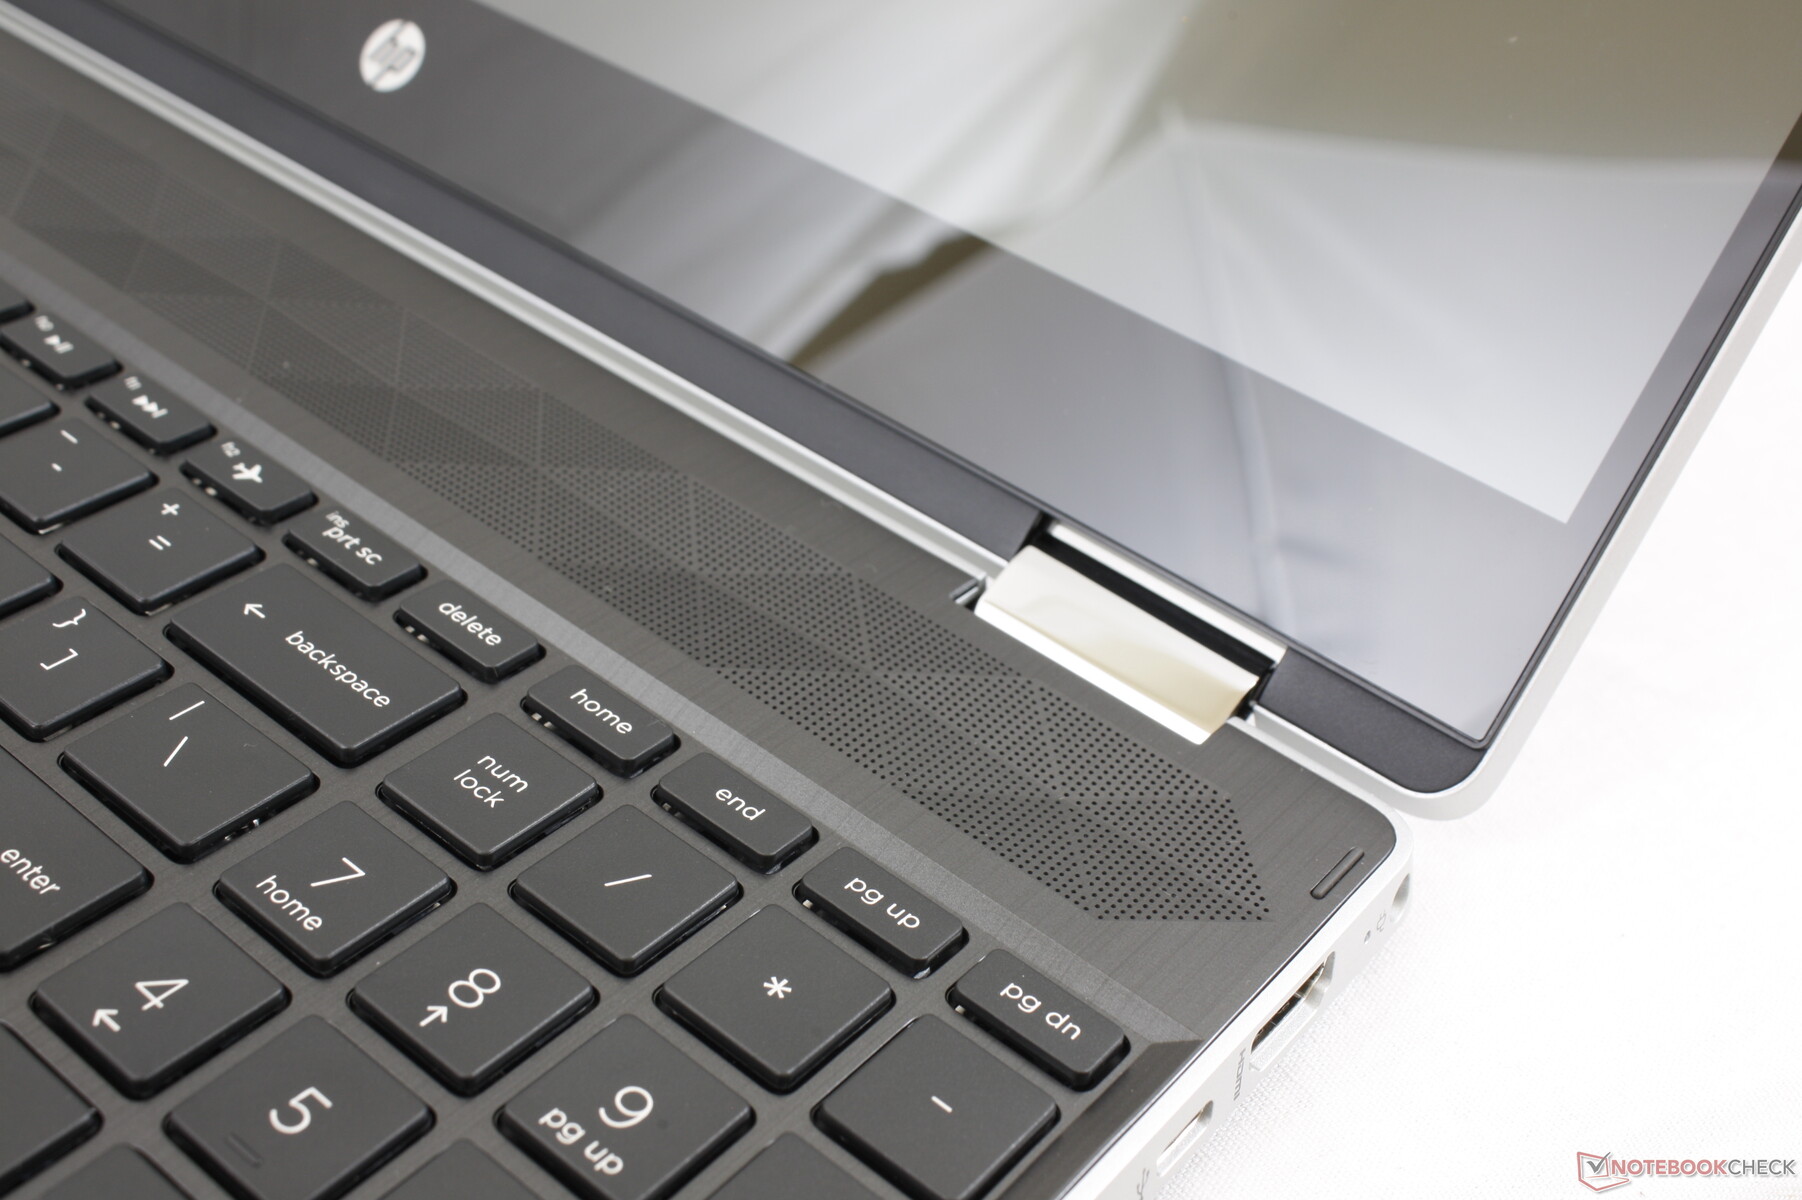
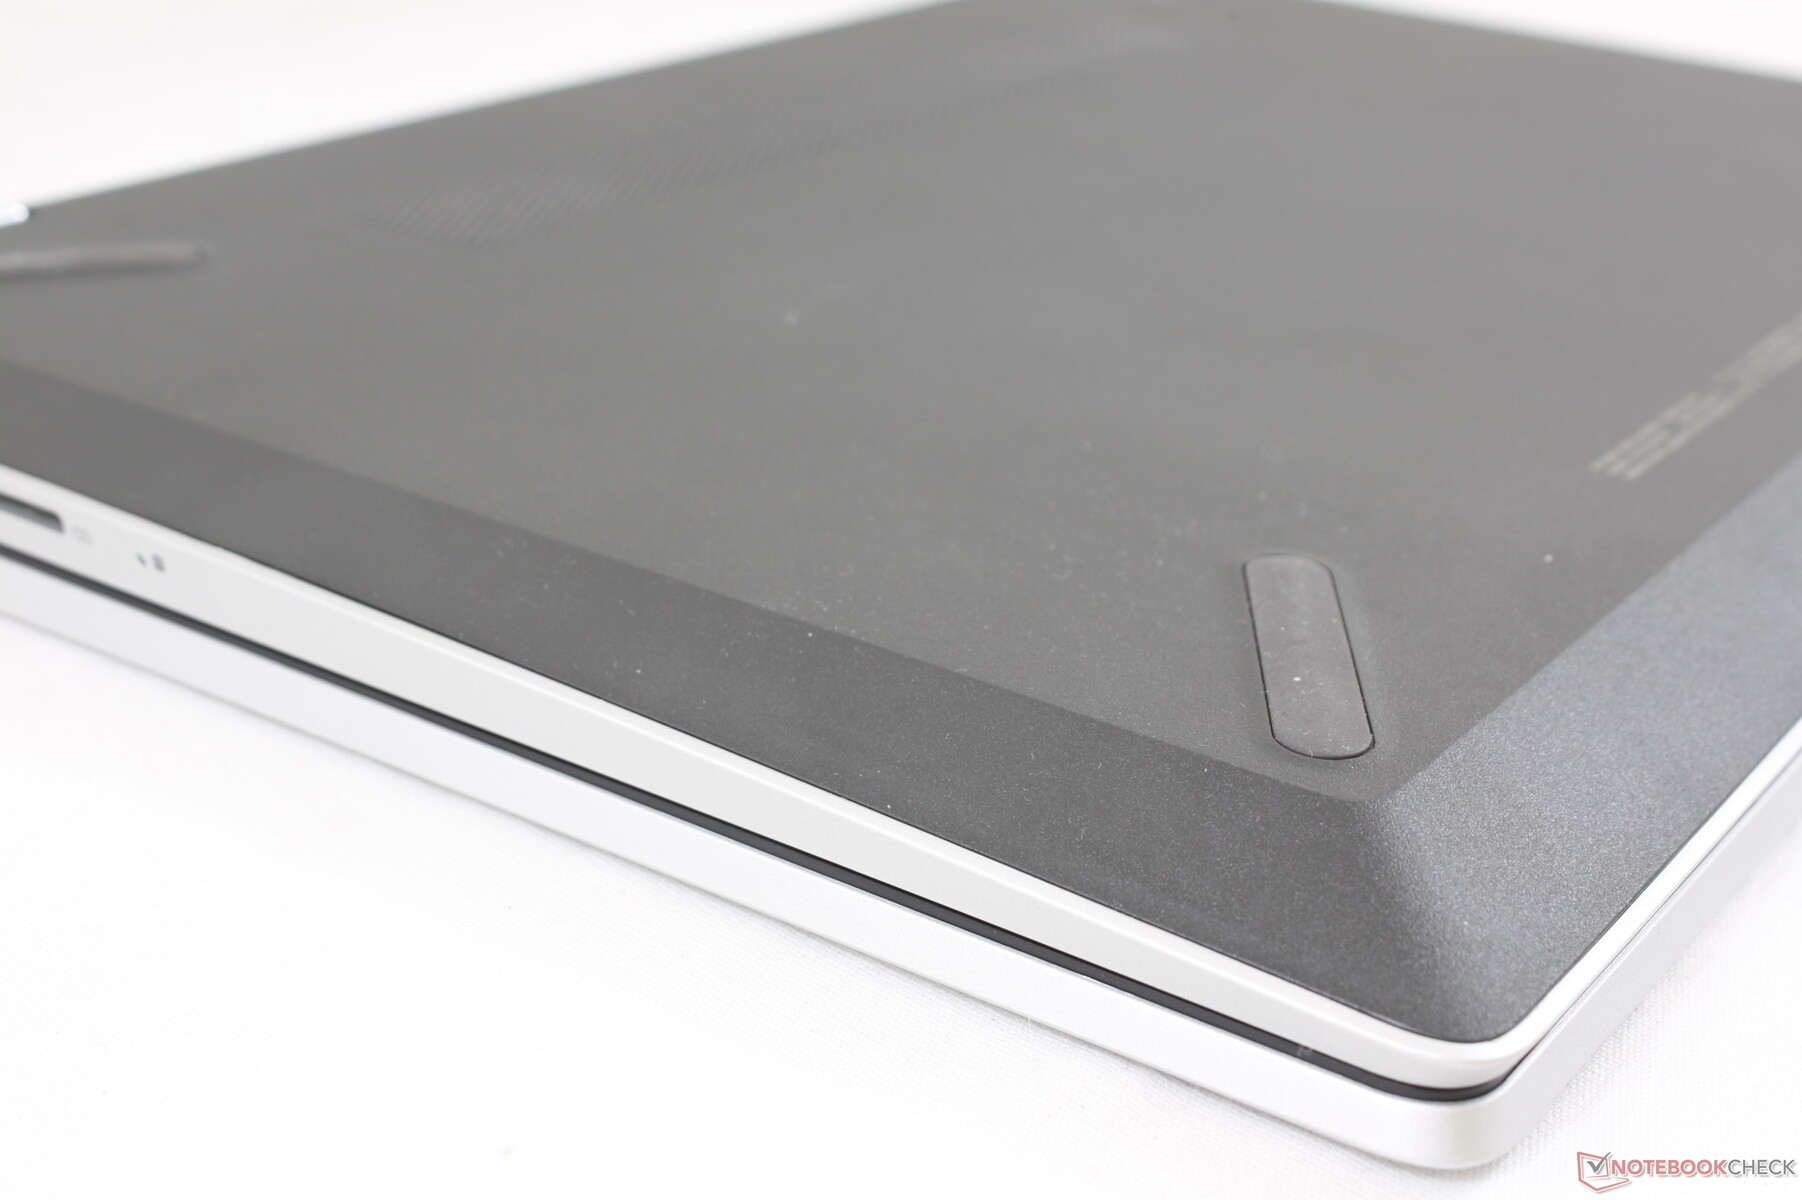
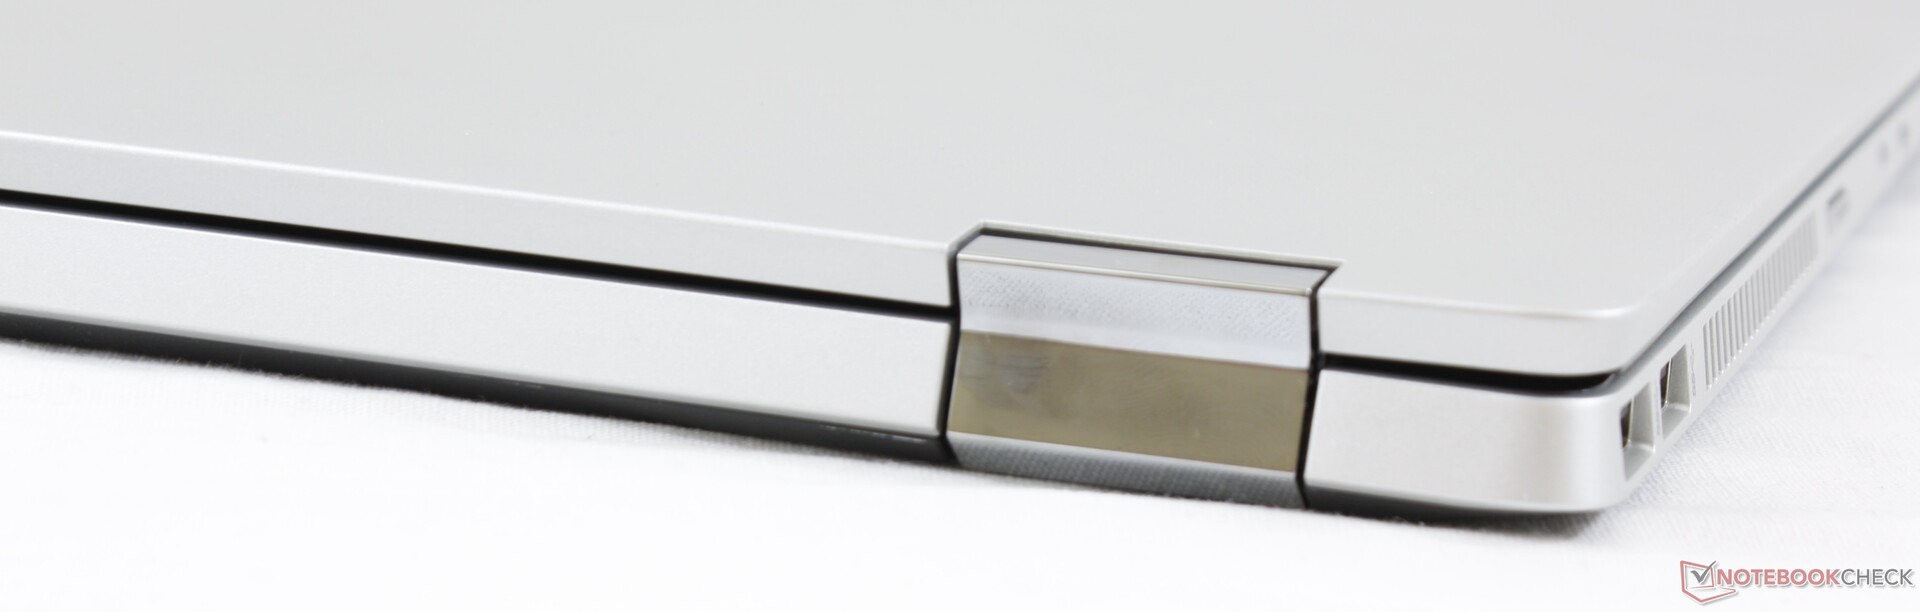
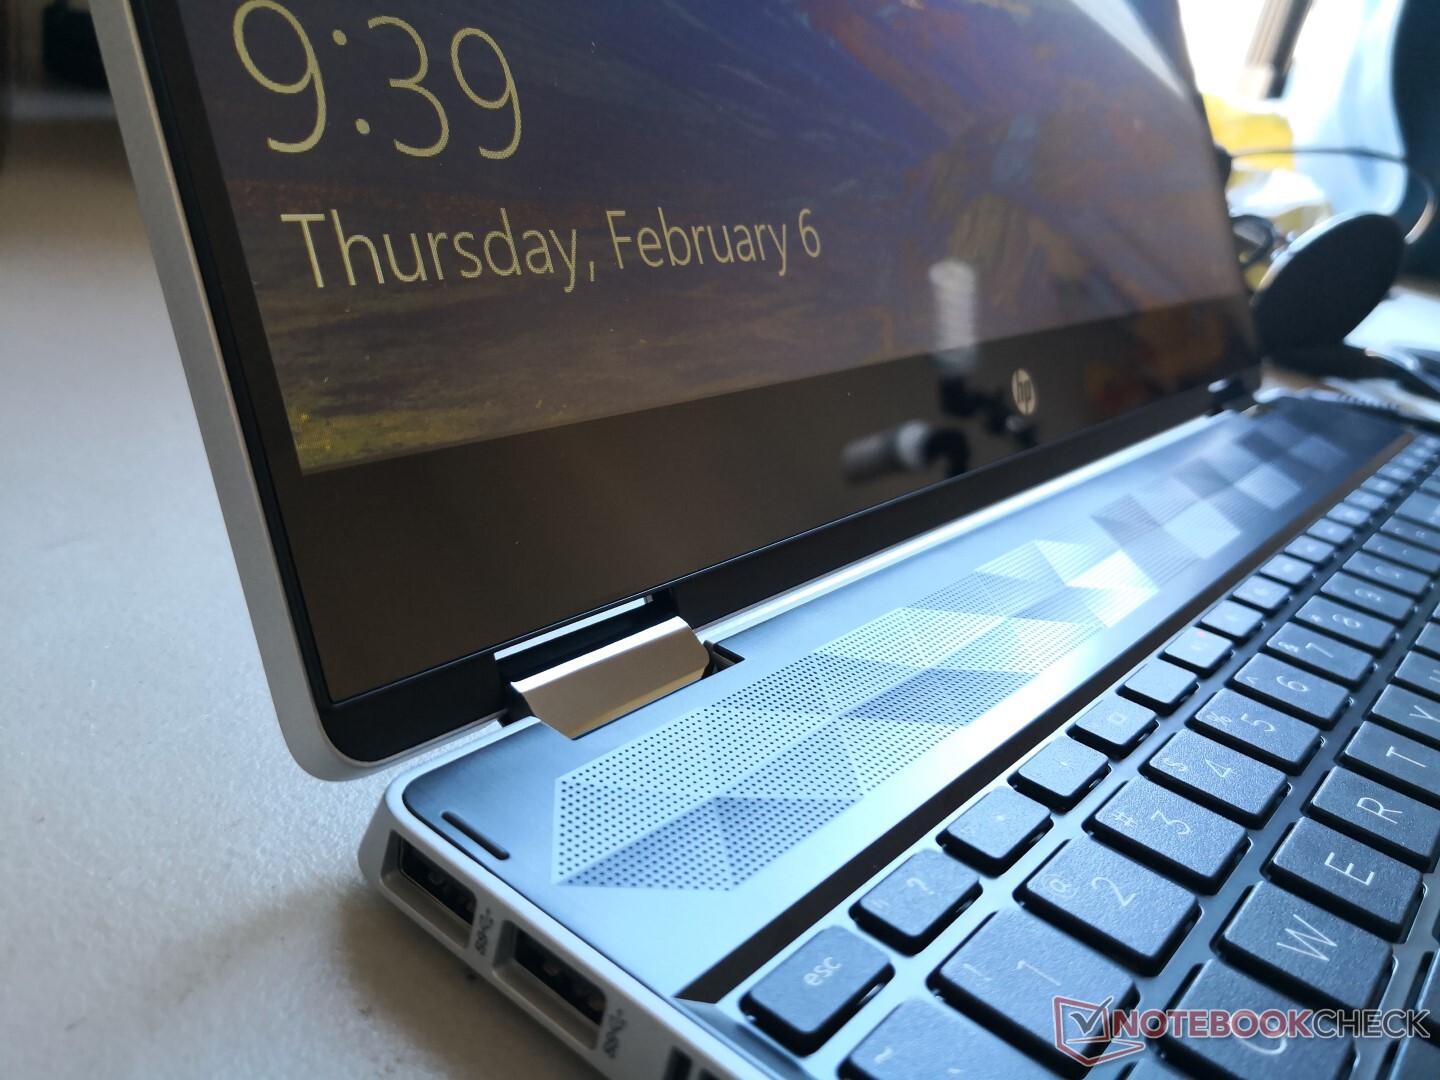
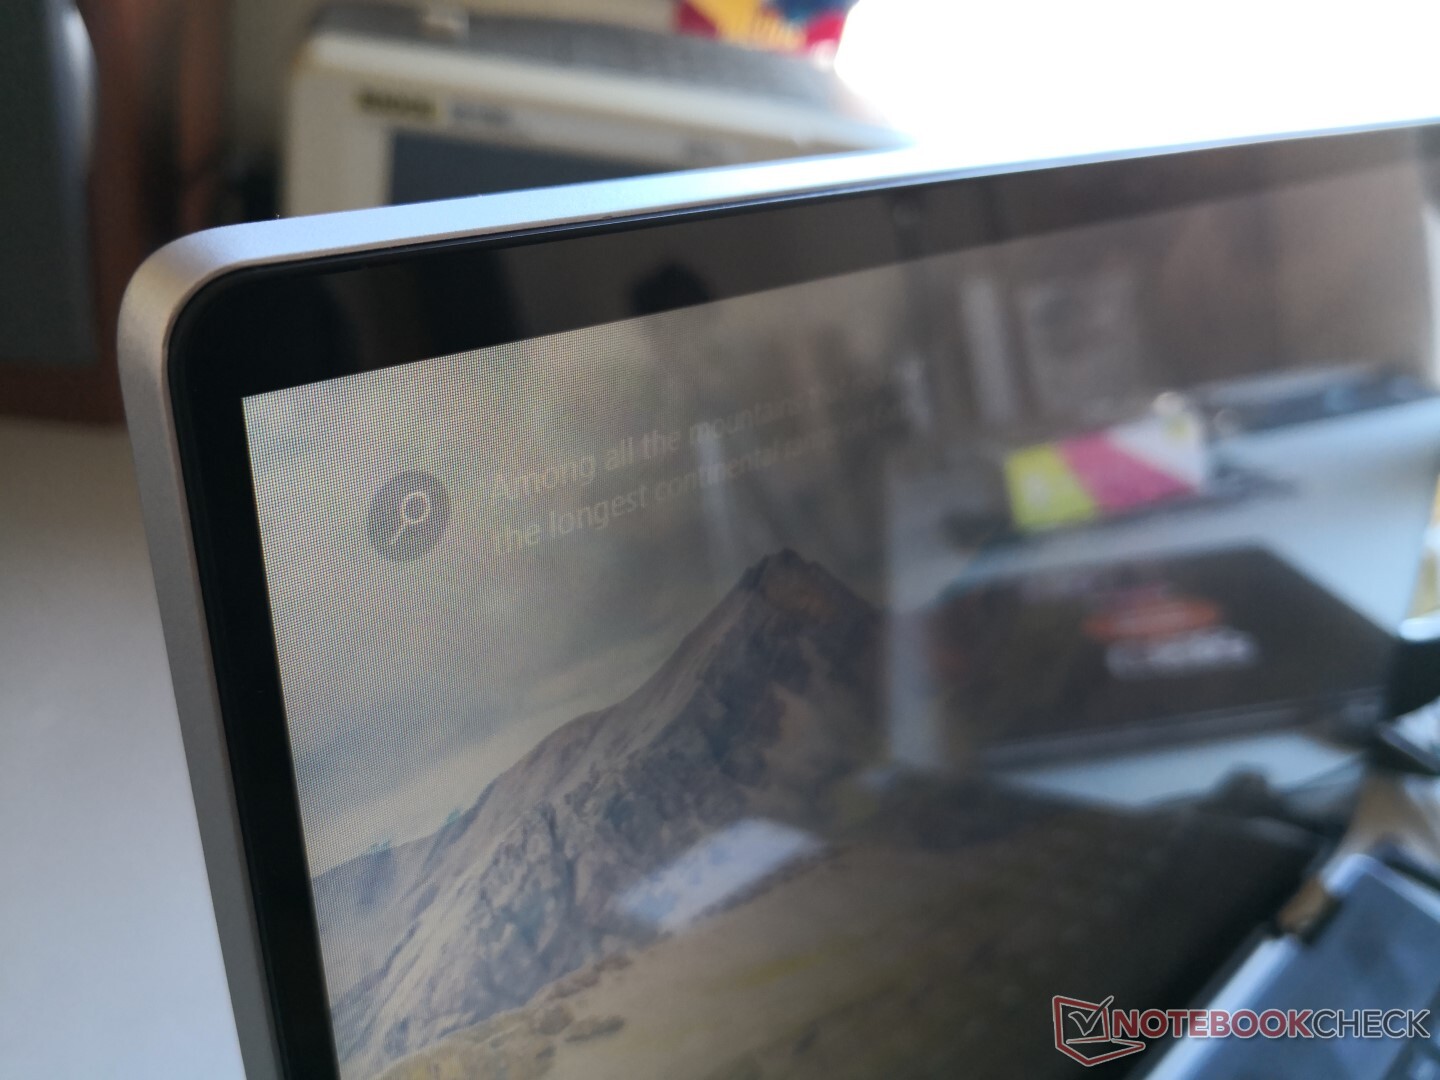
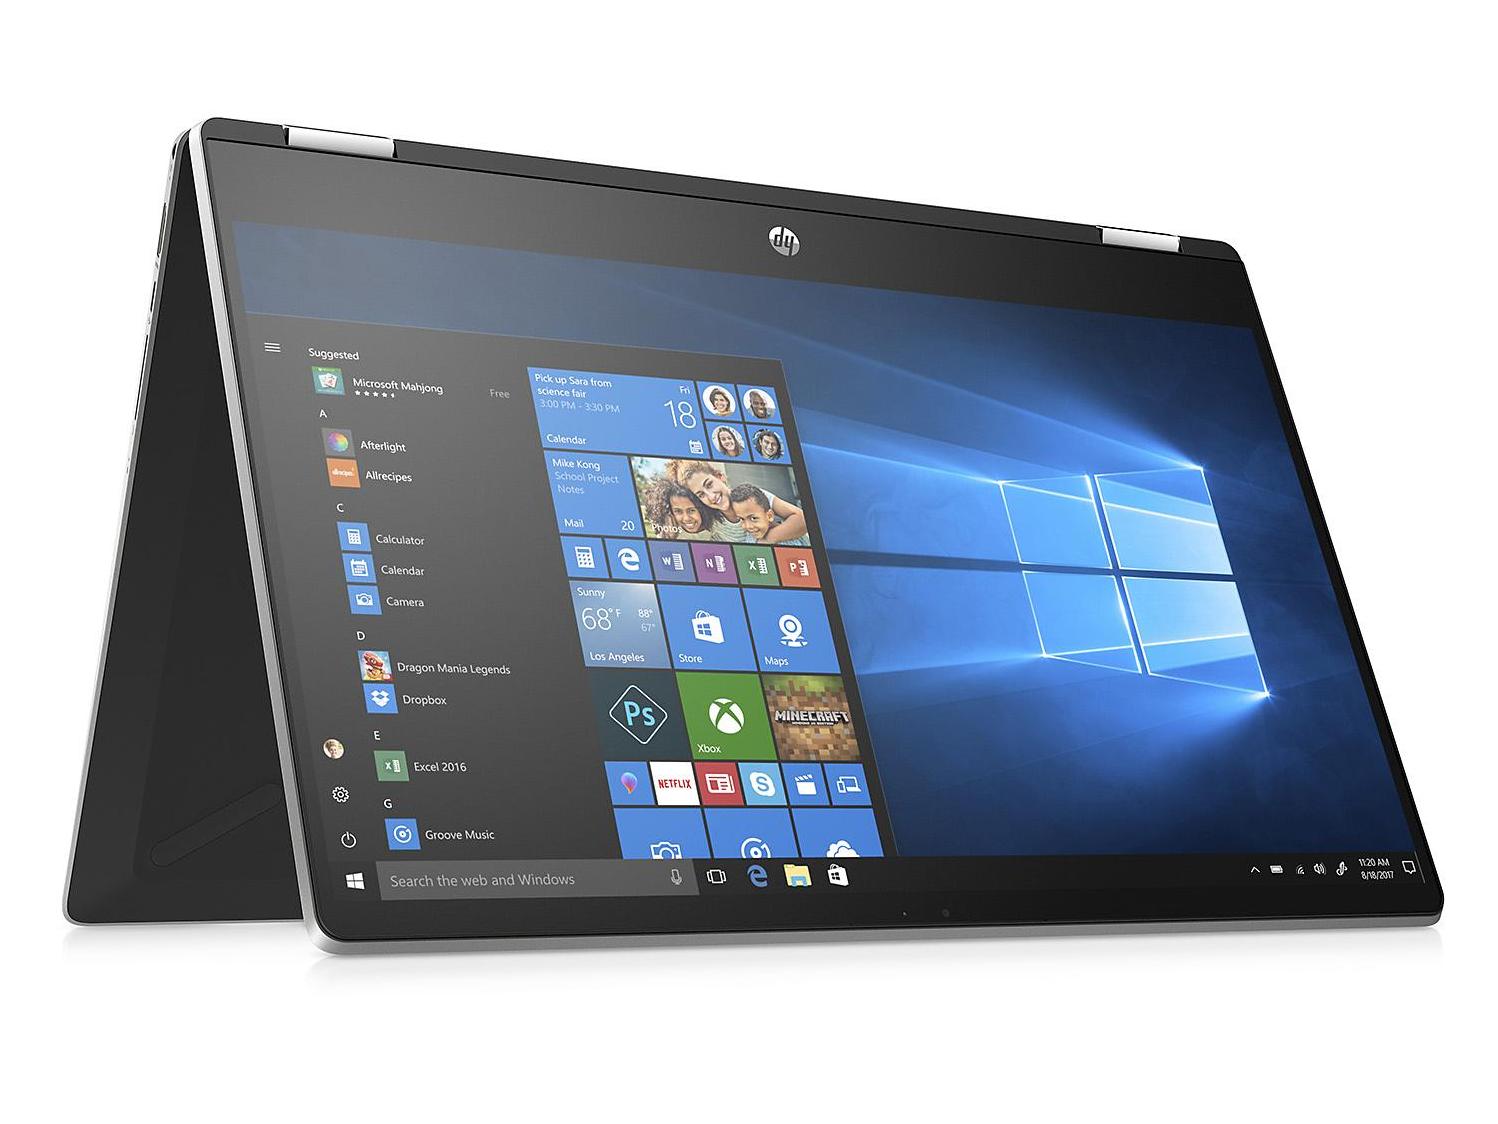
2017'de test ettiğimiz son Pavilion x360 15 ile karşılaştırıldığında, bu 2019 modeli daha modern bir görsel tasarım için dar çerçeveler içeriyor. Bununla birlikte, tüm kasa hala plastiktir, yani daha pahalı HP Envy veya Spectre dizüstü bilgisayarların lükslüğünden yoksundur. Avuç içi dayanakları ve klavye güverte, aksi takdirde düz plastik tasarımı desteklemek için sahte bir fırçalanmış alüminyum görünüme sahiptir.Şasinin kenarlarının ve köşelerinin, yanlışlıkla çarpmaların daha iyi adsorbe edilmesi için kalın plastikten yapılmış olması hoşuma gider. Buna rağmen, hem taban hem de kapak, rakip Asus VivoBook Flip veya Lenovo Ideapad C340 15'ten biraz daha sert olmakla birlikte, daha pahalı Spectre x360 15'ten daha belirgin bir şekilde esner ve gıcırdar.
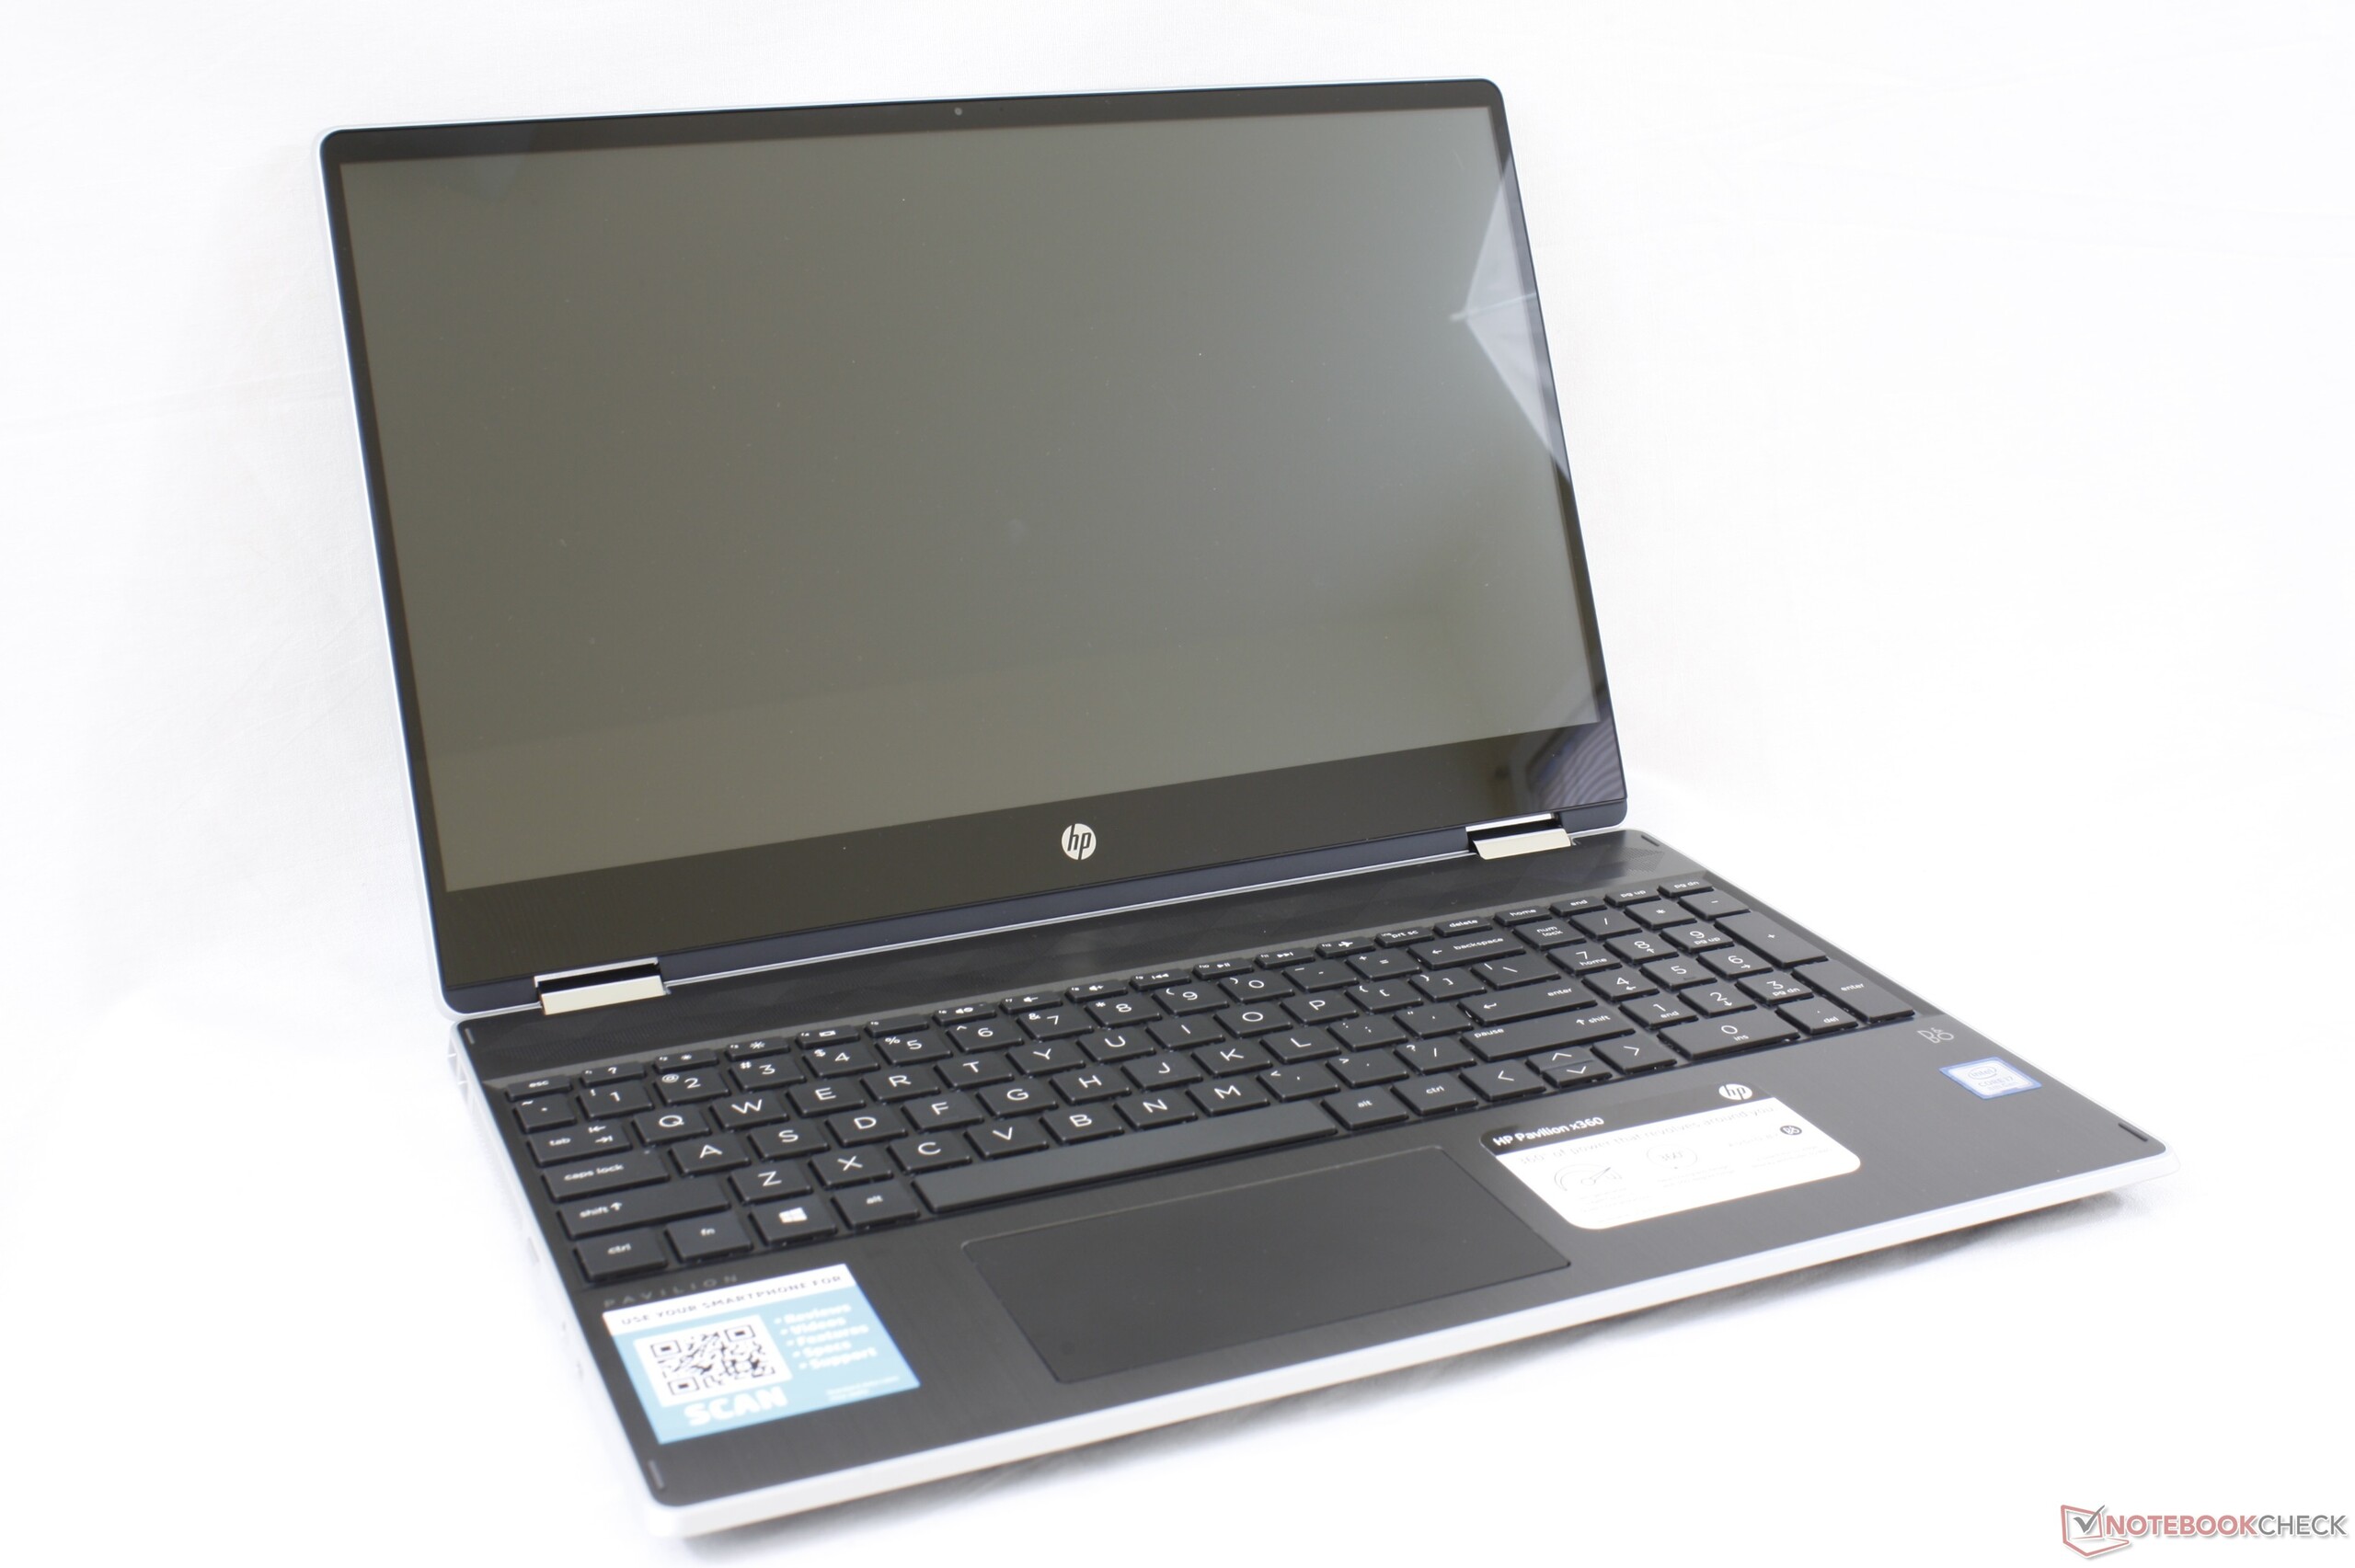
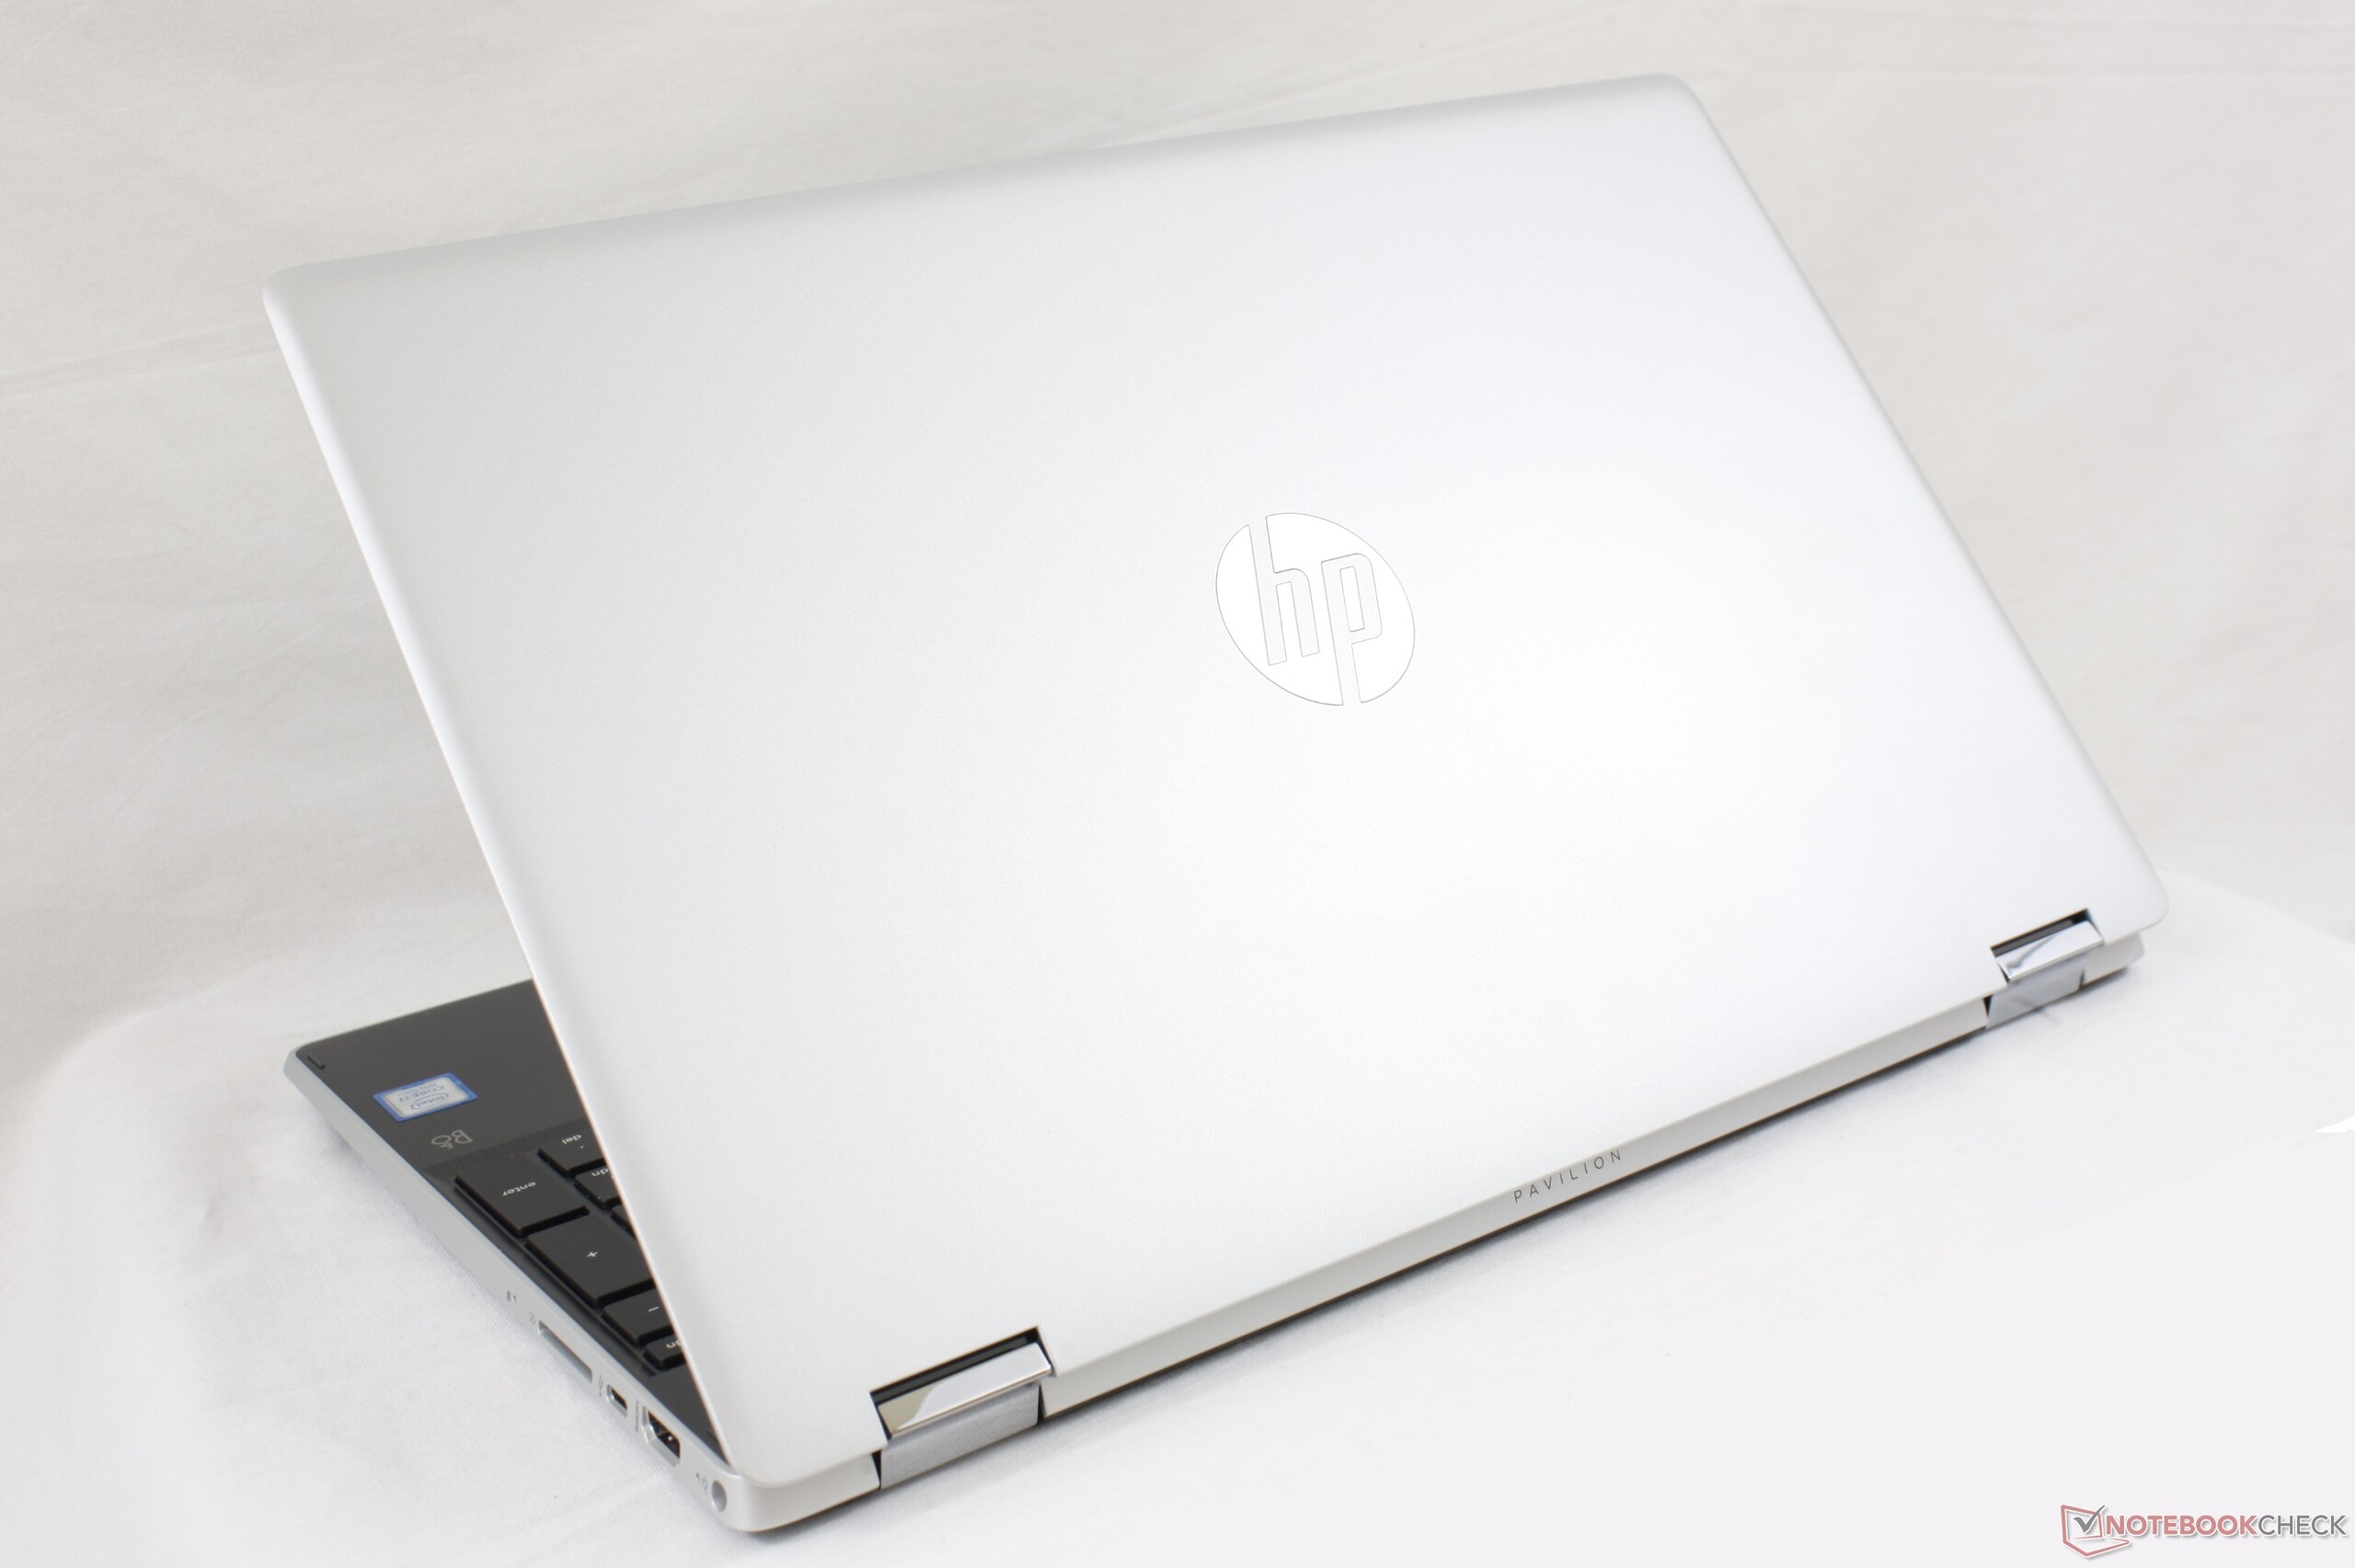
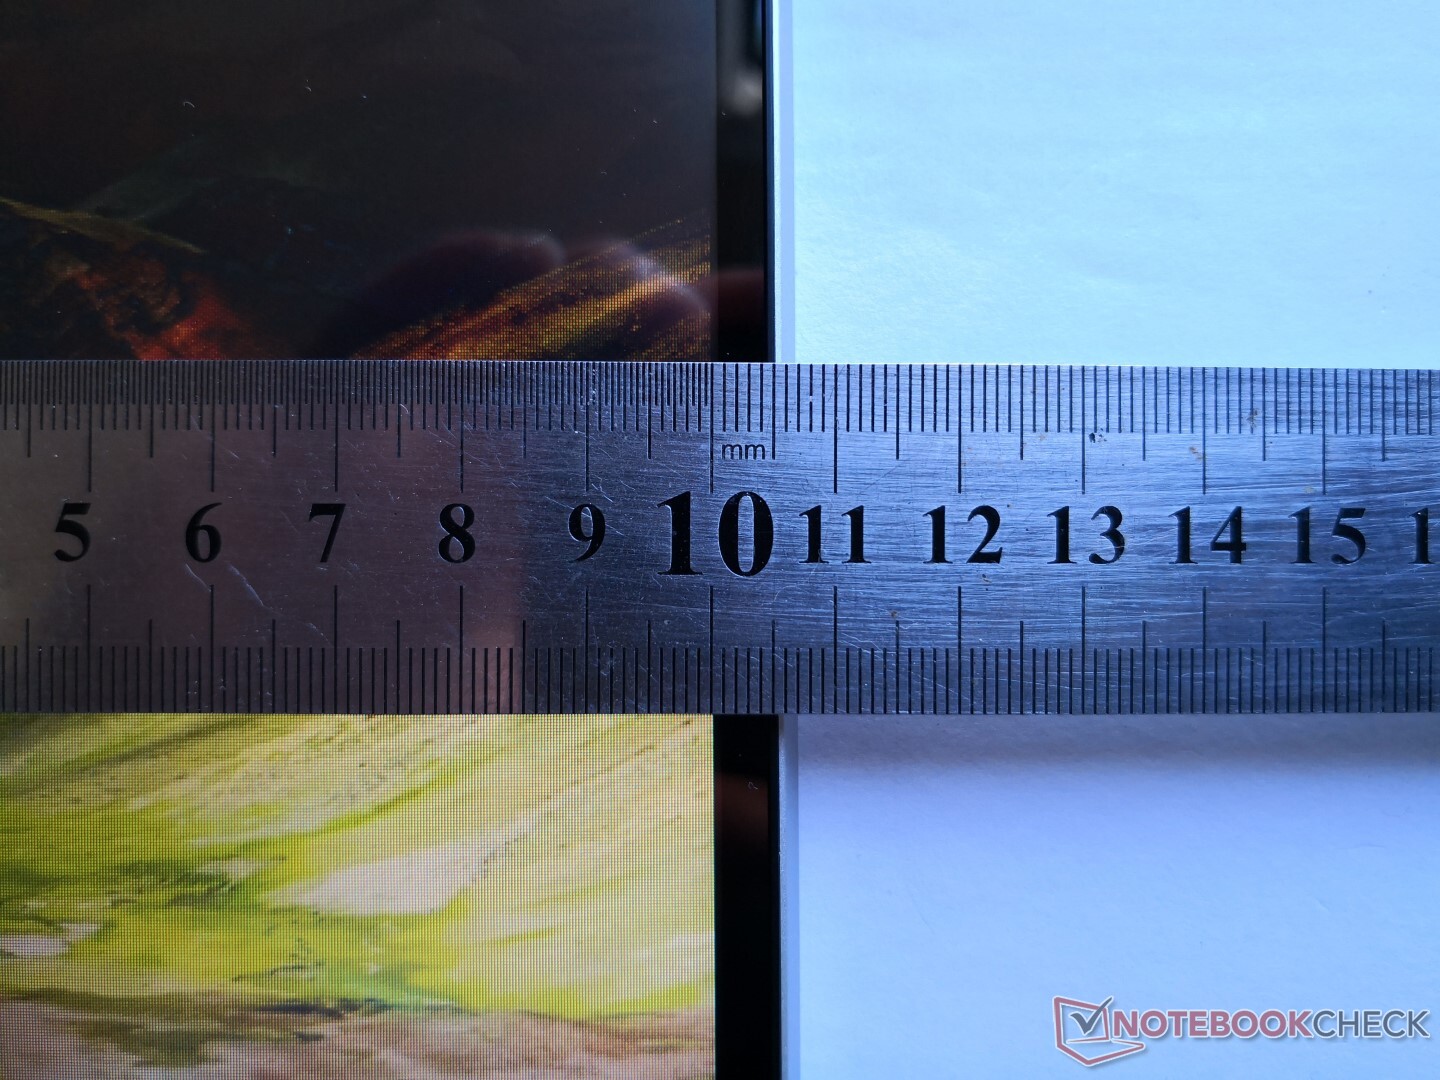
Toplam boyutlar ve ağırlık sırasıyla Envy x360 15, Ideapad C340-15 veya Asus VivoBook Flip 15 gibi alternatiflerden biraz daha küçük ve daha hafiftir. Amiral gemisi HP Spectre x360 15'ten bile daha küçük bir kaplama alanına sahiptir.
Bağlantı
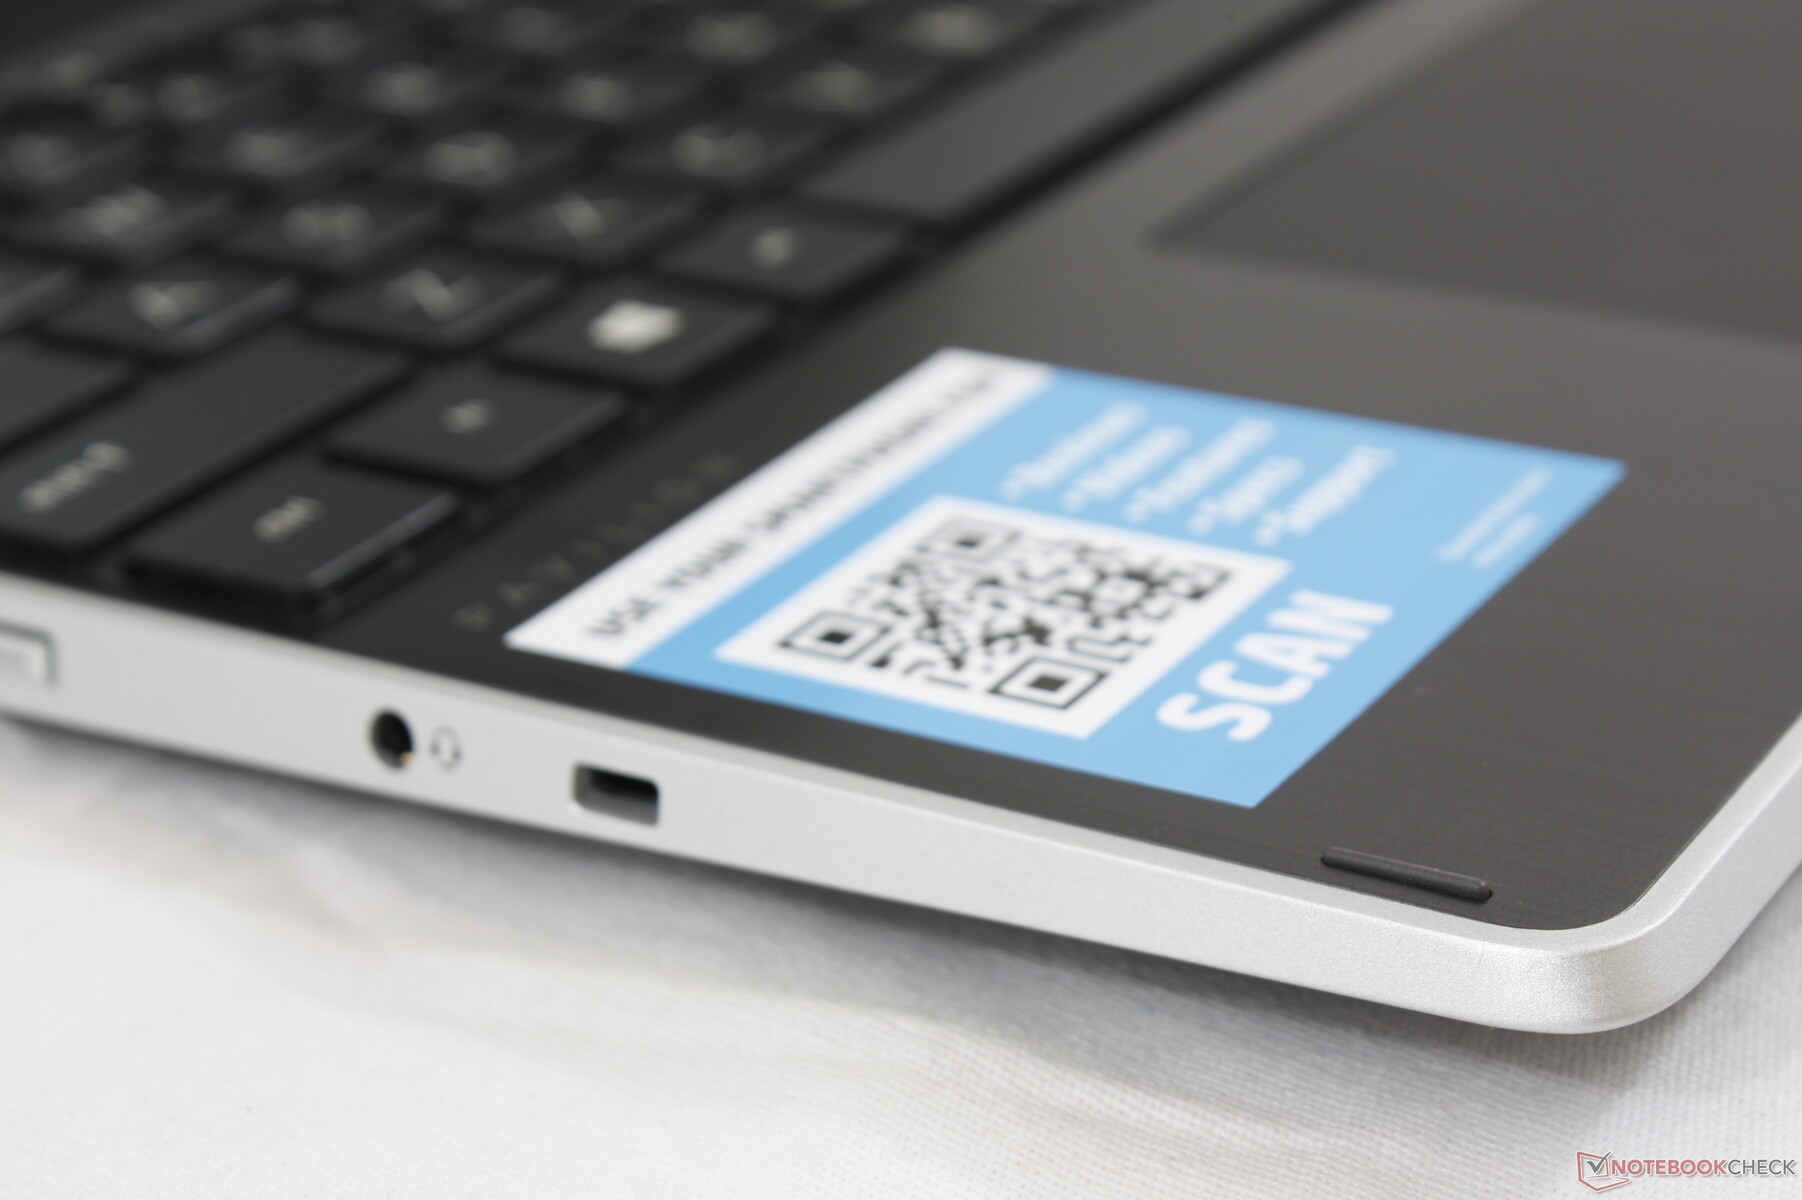
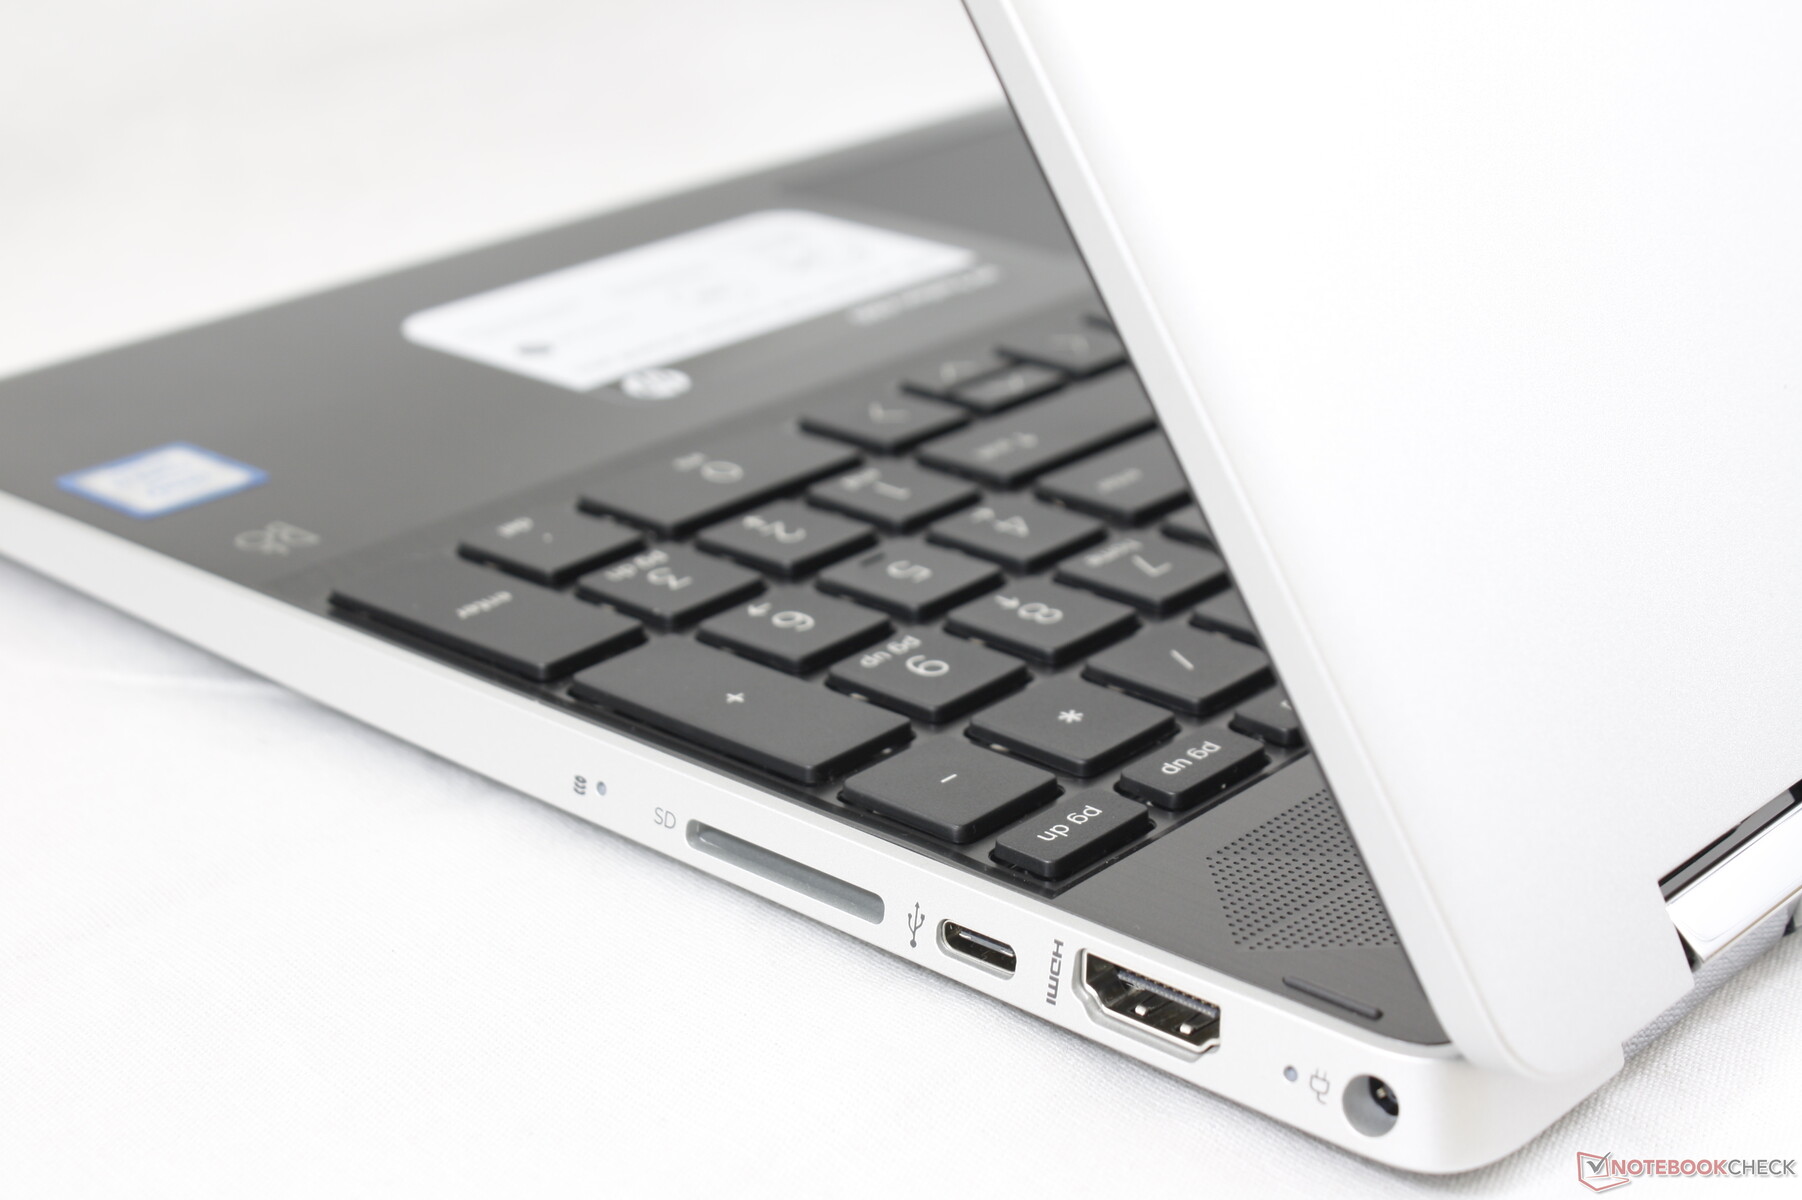
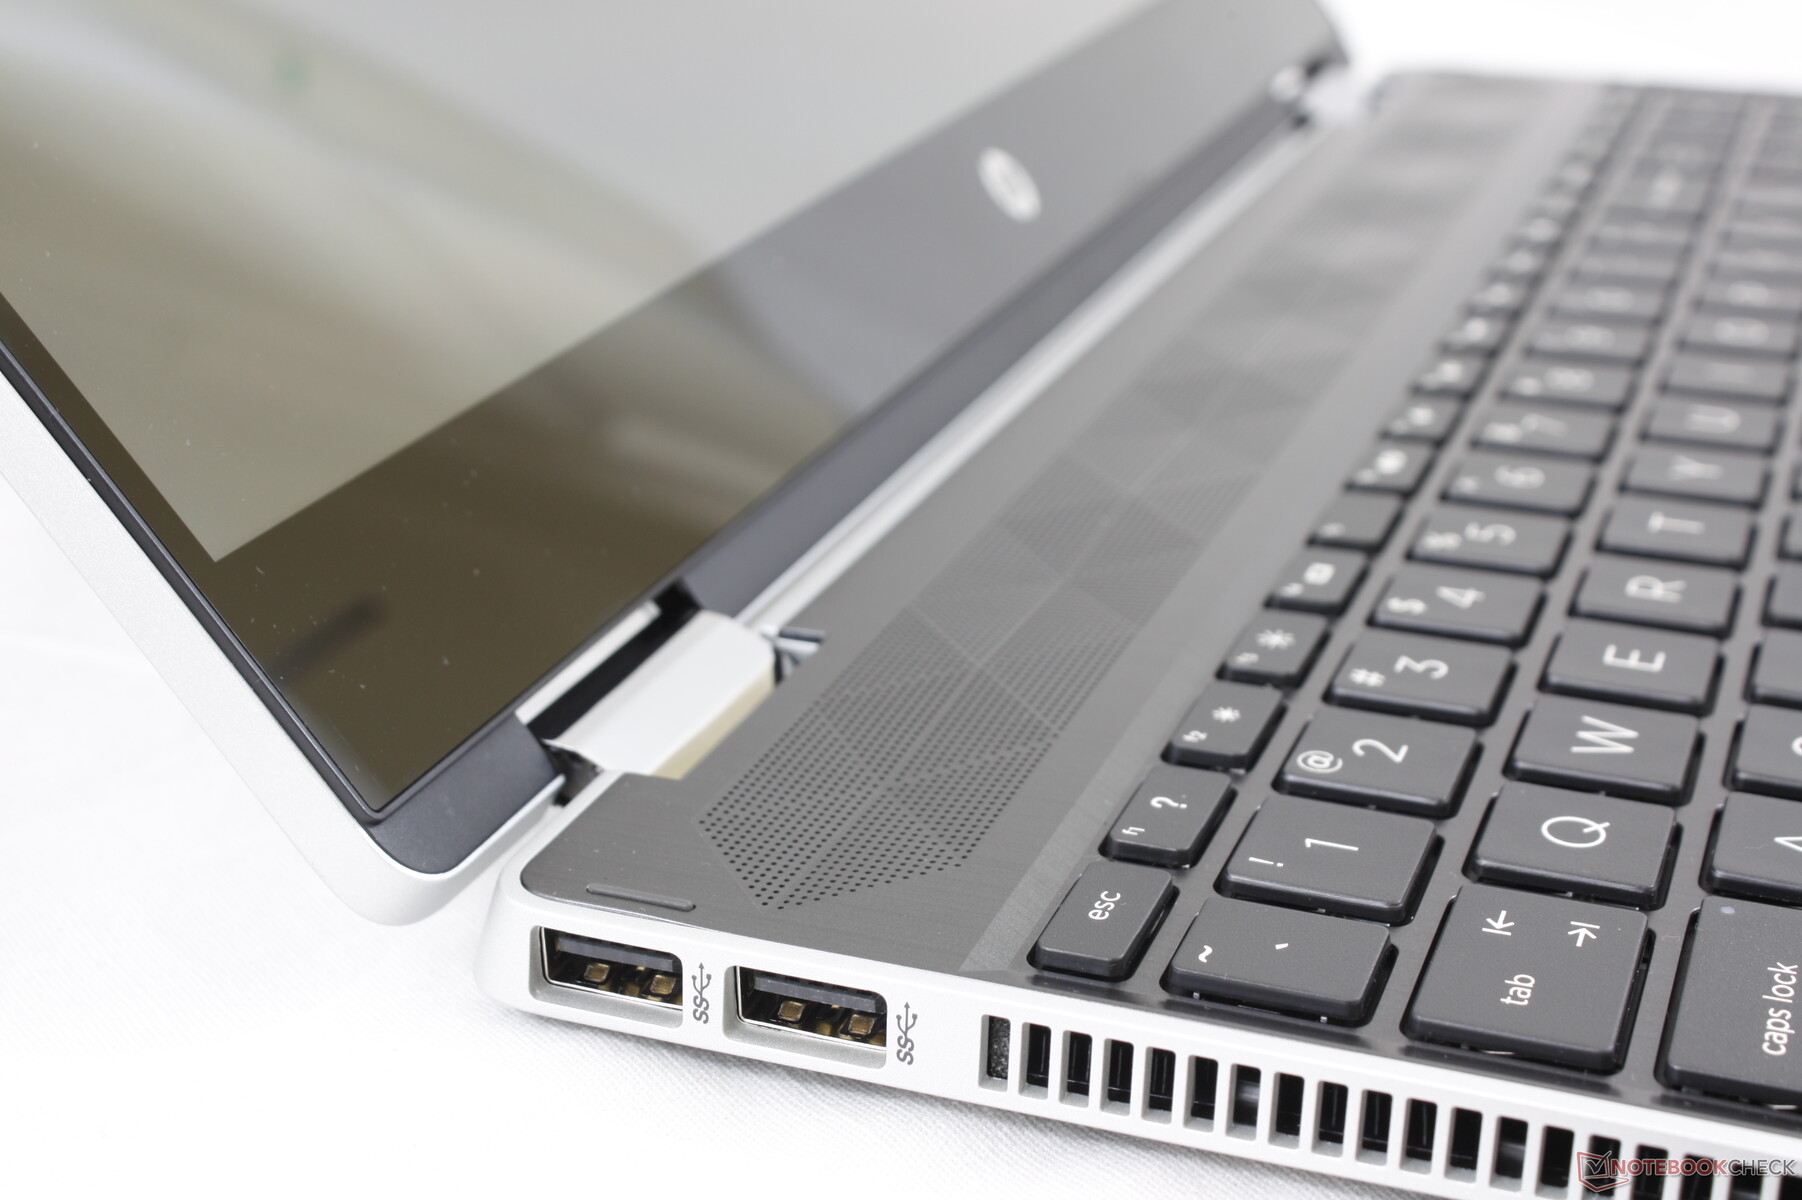
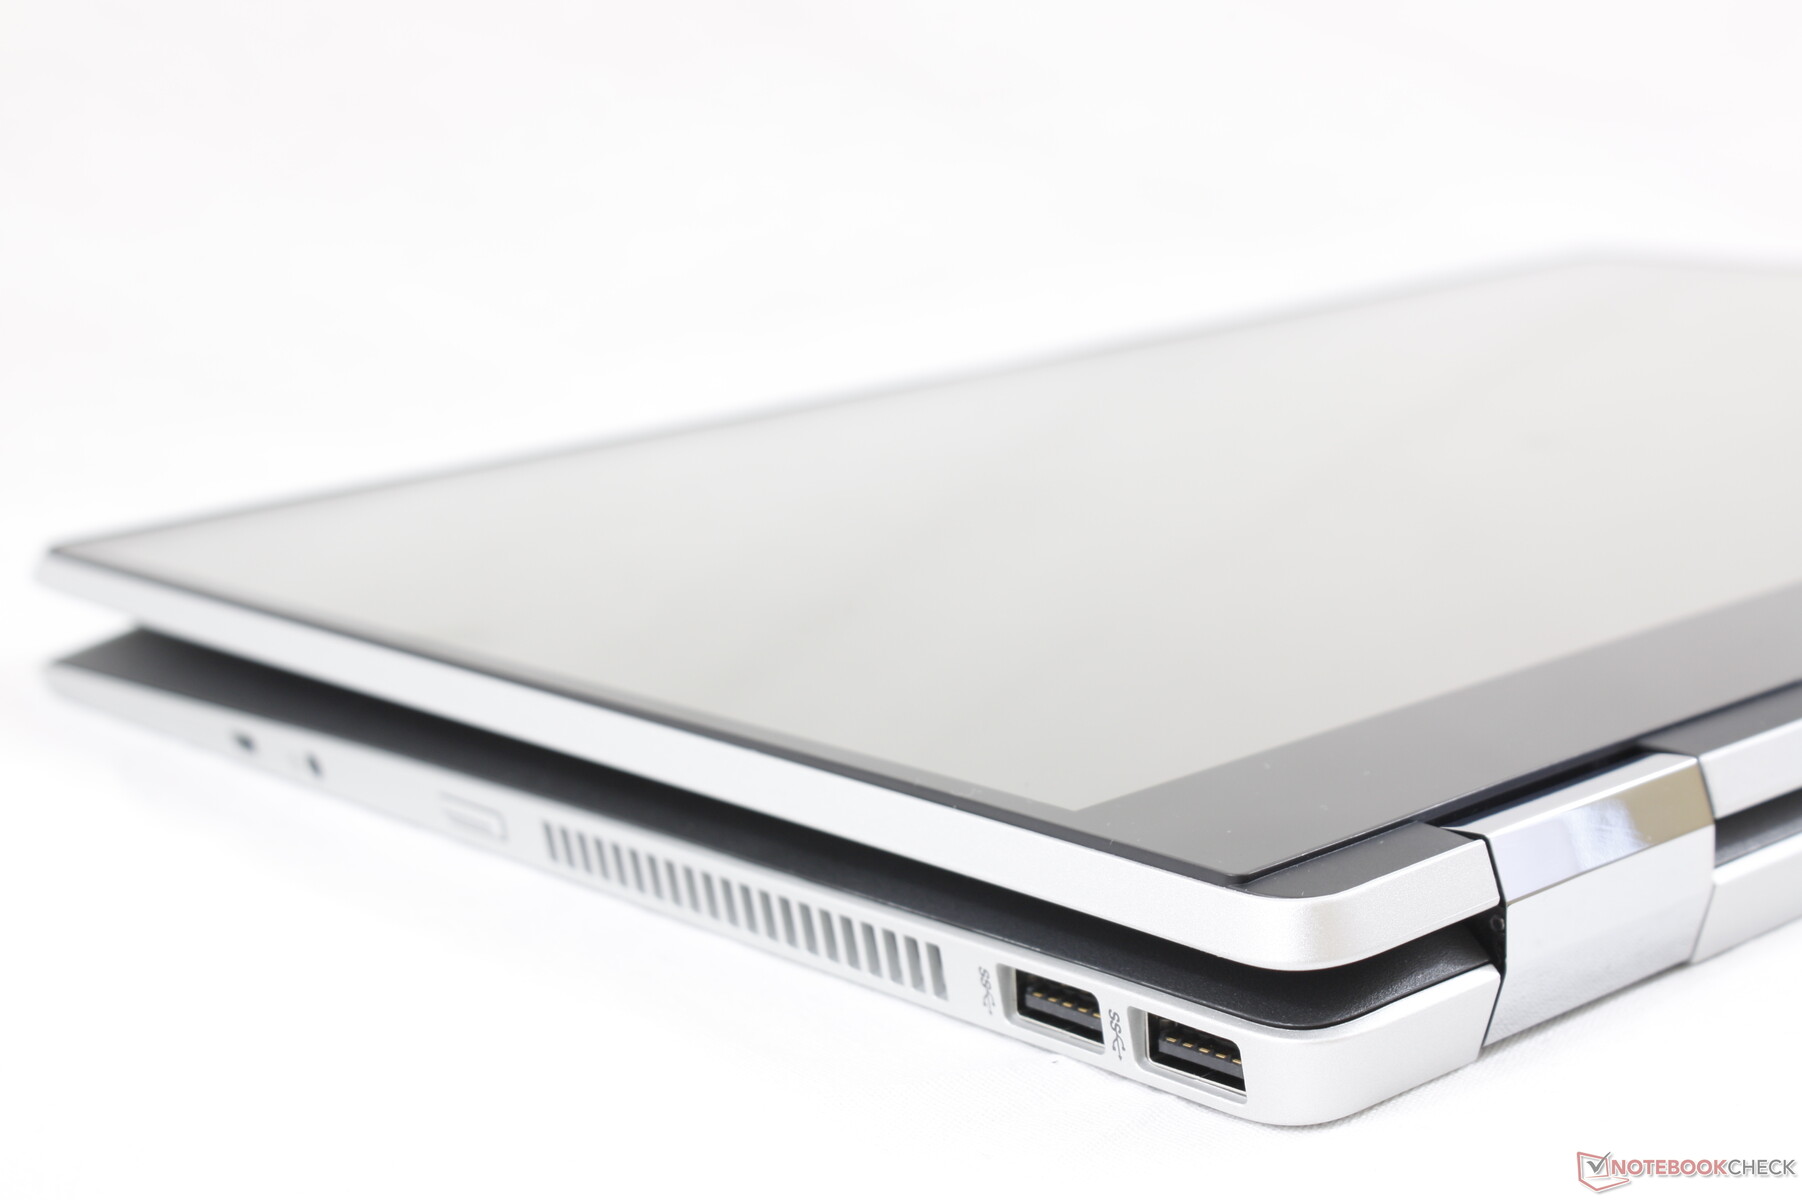
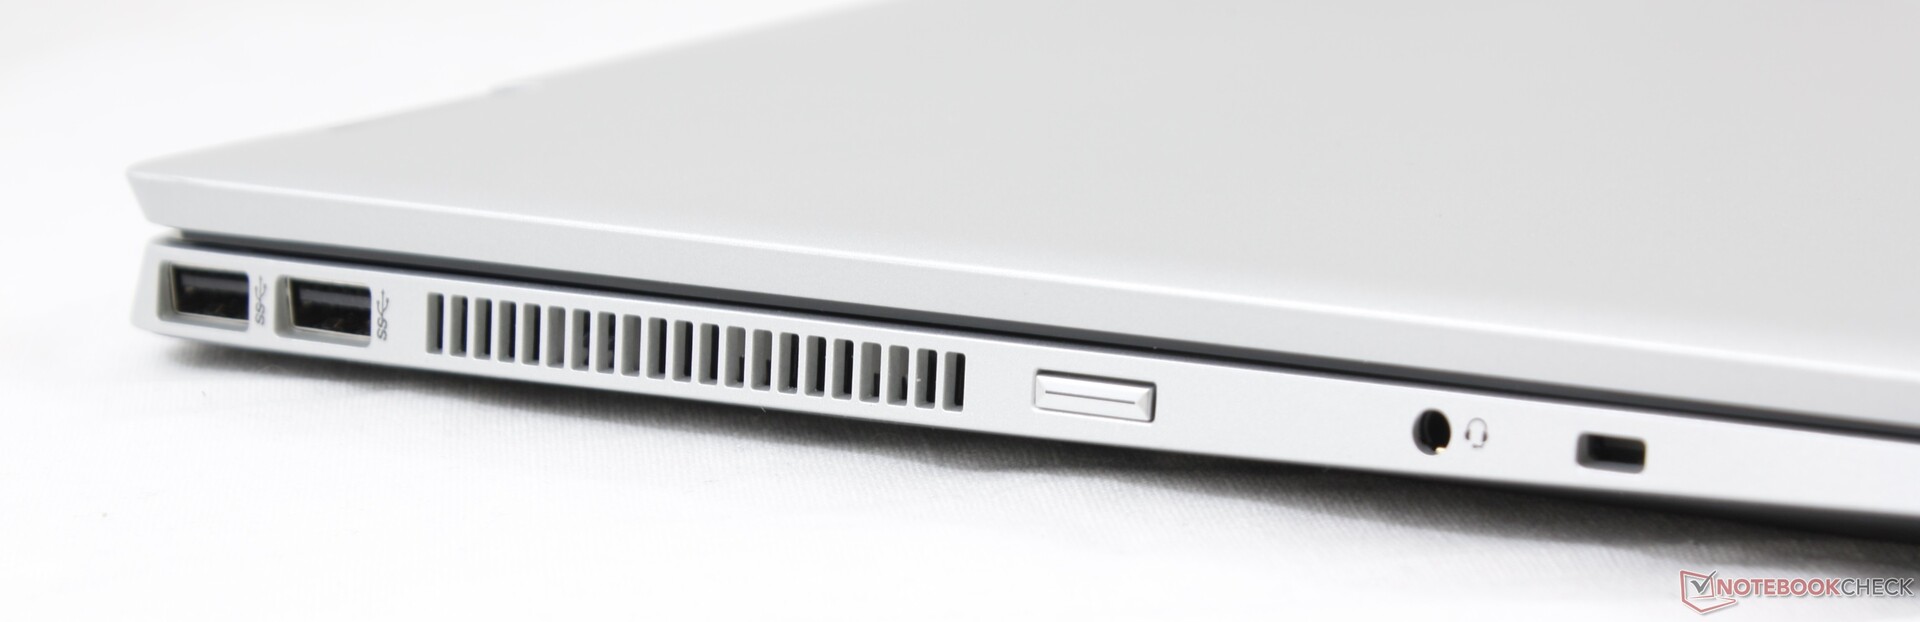
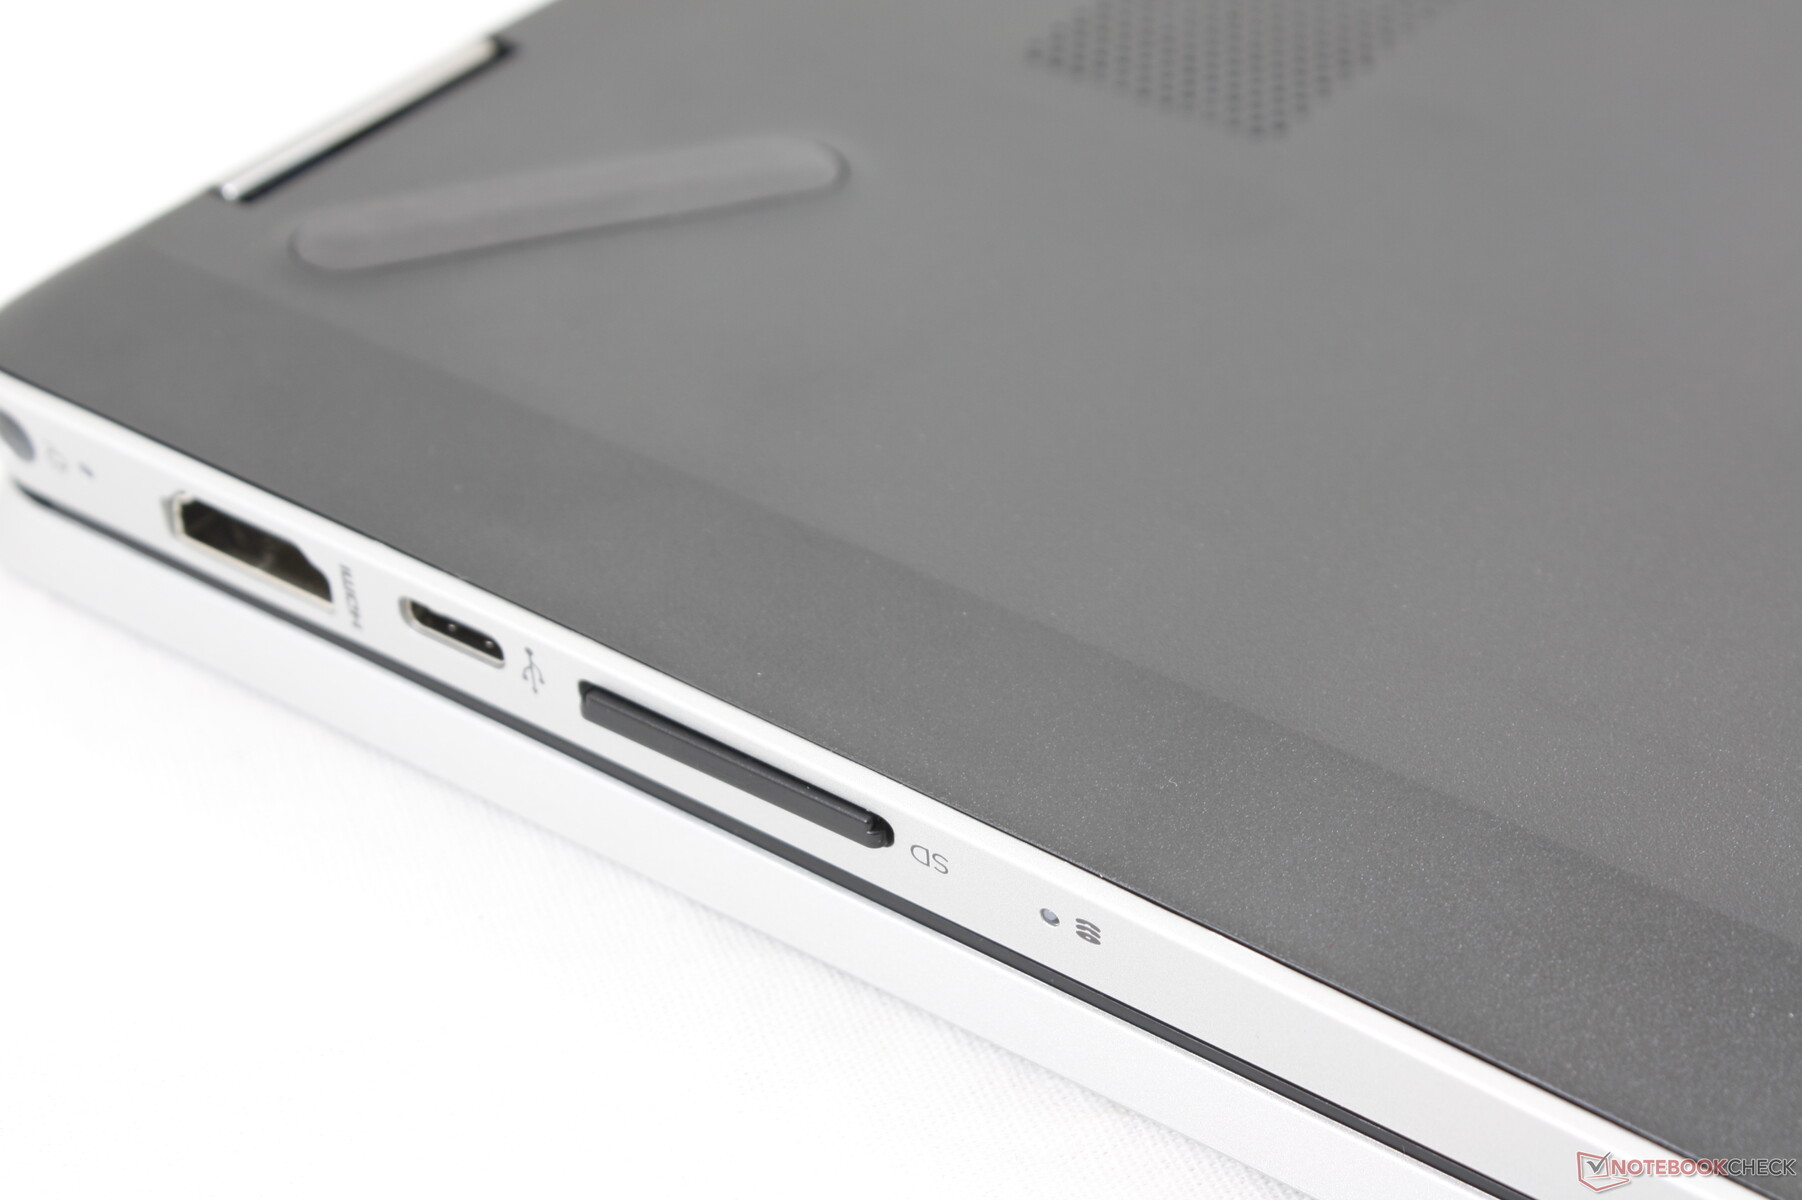
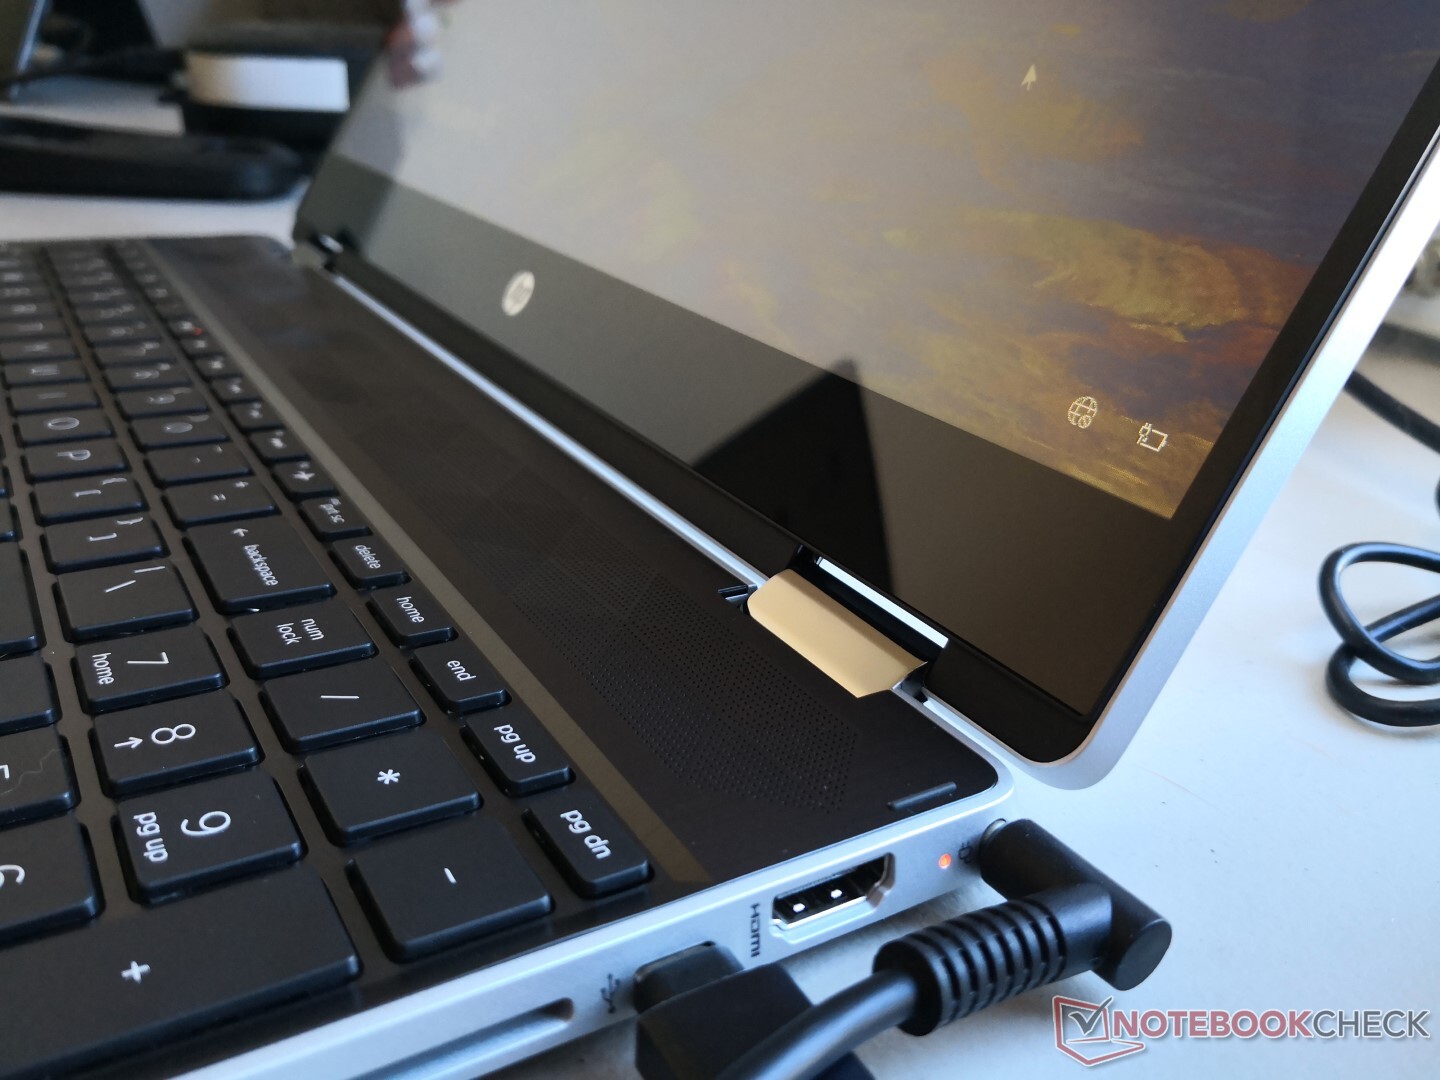
Belki de tesadüf eseri, buradaki port seçenekleri, farklı bir düzenlemede de olsa Lenovo IdeaPad C340-15'teki ile tamamen aynıdır. USB Type-A bağlantı noktaları yalnızca diğer her şey sağ kenardayken sol kenar üzerindedir. Bağlantı noktalarına ulaşmak kolaydır, ancak kalın USB aygıtları veya kabloları bitişik bağlantı noktalarını engelleyebilecek şekilde sıkıca paketlenir.
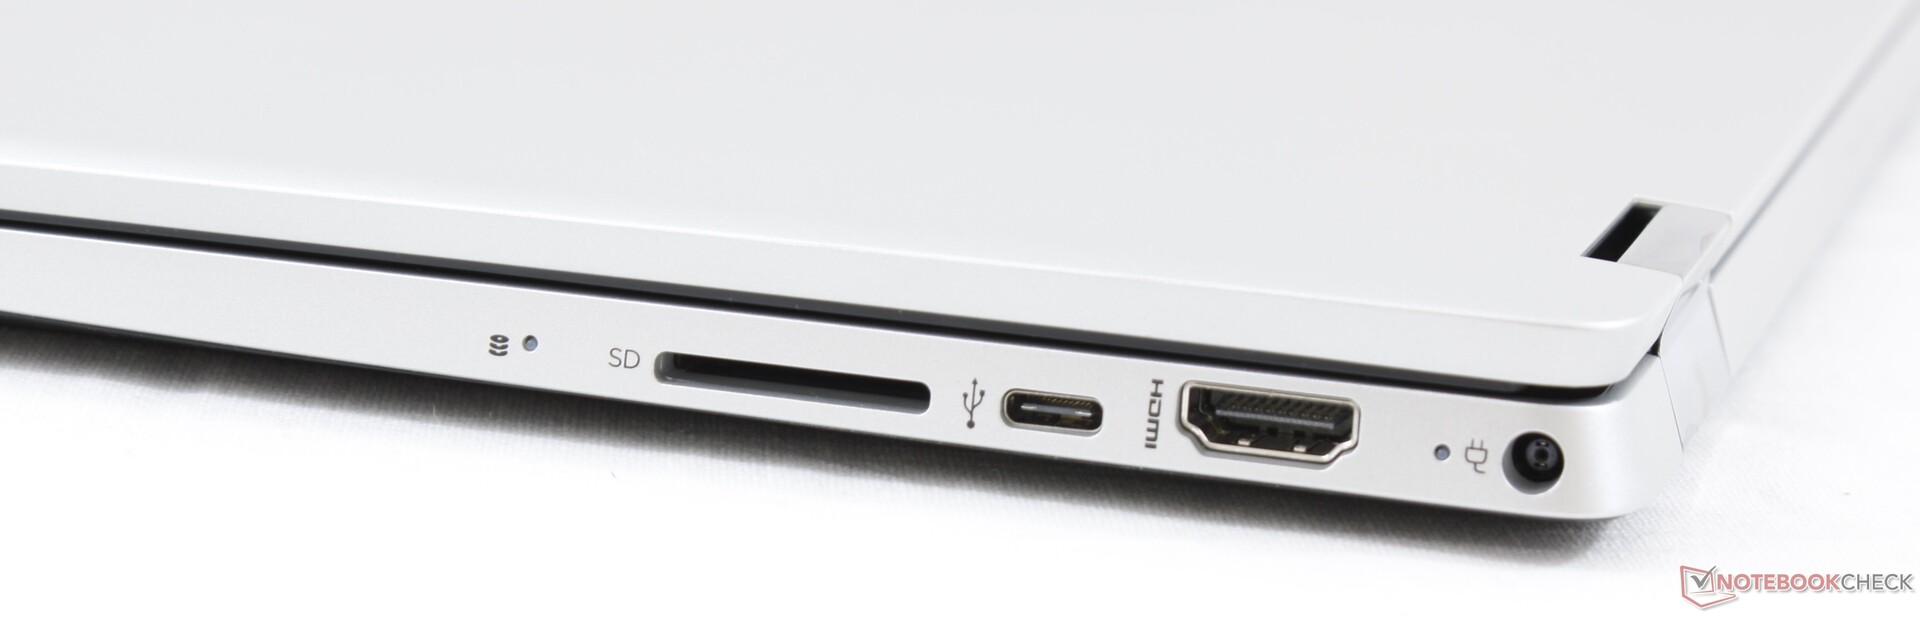
SD Kart Okuyucu
Tam boyutlu SD kart okuyucu iyi aktarım hızları sunar. UHS-II test kartımızdan masaüstüne 1 GB görüntü taşımak, Dell XPS 15'teki 6 veya 7 saniyeye kıyasla yaklaşık 14 saniye sürer.
| SD Card Reader | |
| average JPG Copy Test (av. of 3 runs) | |
| Dell XPS 15 7590 i5 iGPU FHD (Toshiba Exceria Pro SDXC 64 GB UHS-II) | |
| HP Pavilion x360 15-dq0065cl (Toshiba Exceria Pro SDXC 64 GB UHS-II) | |
| Lenovo Ideapad C340-15IWL-81N5004QGE (Toshiba Exceria Pro SDXC 64 GB UHS-II) | |
| HP Envy x360 15-bq102ng (Toshiba Exceria Pro SDXC 64 GB UHS-II) | |
| Dell Inspiron 15 3585 (2300U, Vega 6) (Toshiba Exceria Pro SDXC 64 GB UHS-II) | |
| Asus VivoBook Flip 15 TP510UA-E8073T (Toshiba Exceria Pro SDXC 64 GB UHS-II) | |
| maximum AS SSD Seq Read Test (1GB) | |
| Dell XPS 15 7590 i5 iGPU FHD (Toshiba Exceria Pro SDXC 64 GB UHS-II) | |
| Lenovo Ideapad C340-15IWL-81N5004QGE (Toshiba Exceria Pro SDXC 64 GB UHS-II) | |
| HP Envy x360 15-bq102ng (Toshiba Exceria Pro SDXC 64 GB UHS-II) | |
| HP Pavilion x360 15-dq0065cl (Toshiba Exceria Pro SDXC 64 GB UHS-II) | |
| Dell Inspiron 15 3585 (2300U, Vega 6) (Toshiba Exceria Pro SDXC 64 GB UHS-II) | |
| Asus VivoBook Flip 15 TP510UA-E8073T (Toshiba Exceria Pro SDXC 64 GB UHS-II) | |
İletişim
Realtek RTL8822BE, 2x2 802.11ac kablosuz ve entegre Bluetooth 4.2 için standart olarak gelir. Ancak Netgear RAX200 yönlendiricimiz ve 10 Gbit Ethernet sunucumuzla bile, yalnızca 1,73 Gbps teorisinin aksine yalnızca 650 Mbps civarında ortalama aktarım hızlarını kaydedebiliyoruz.
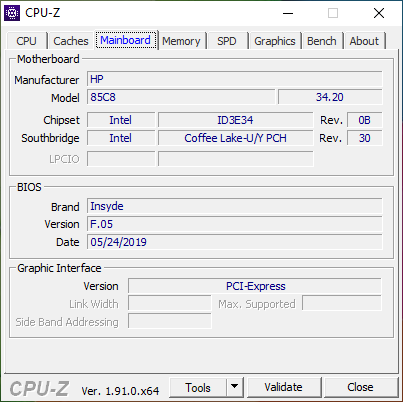
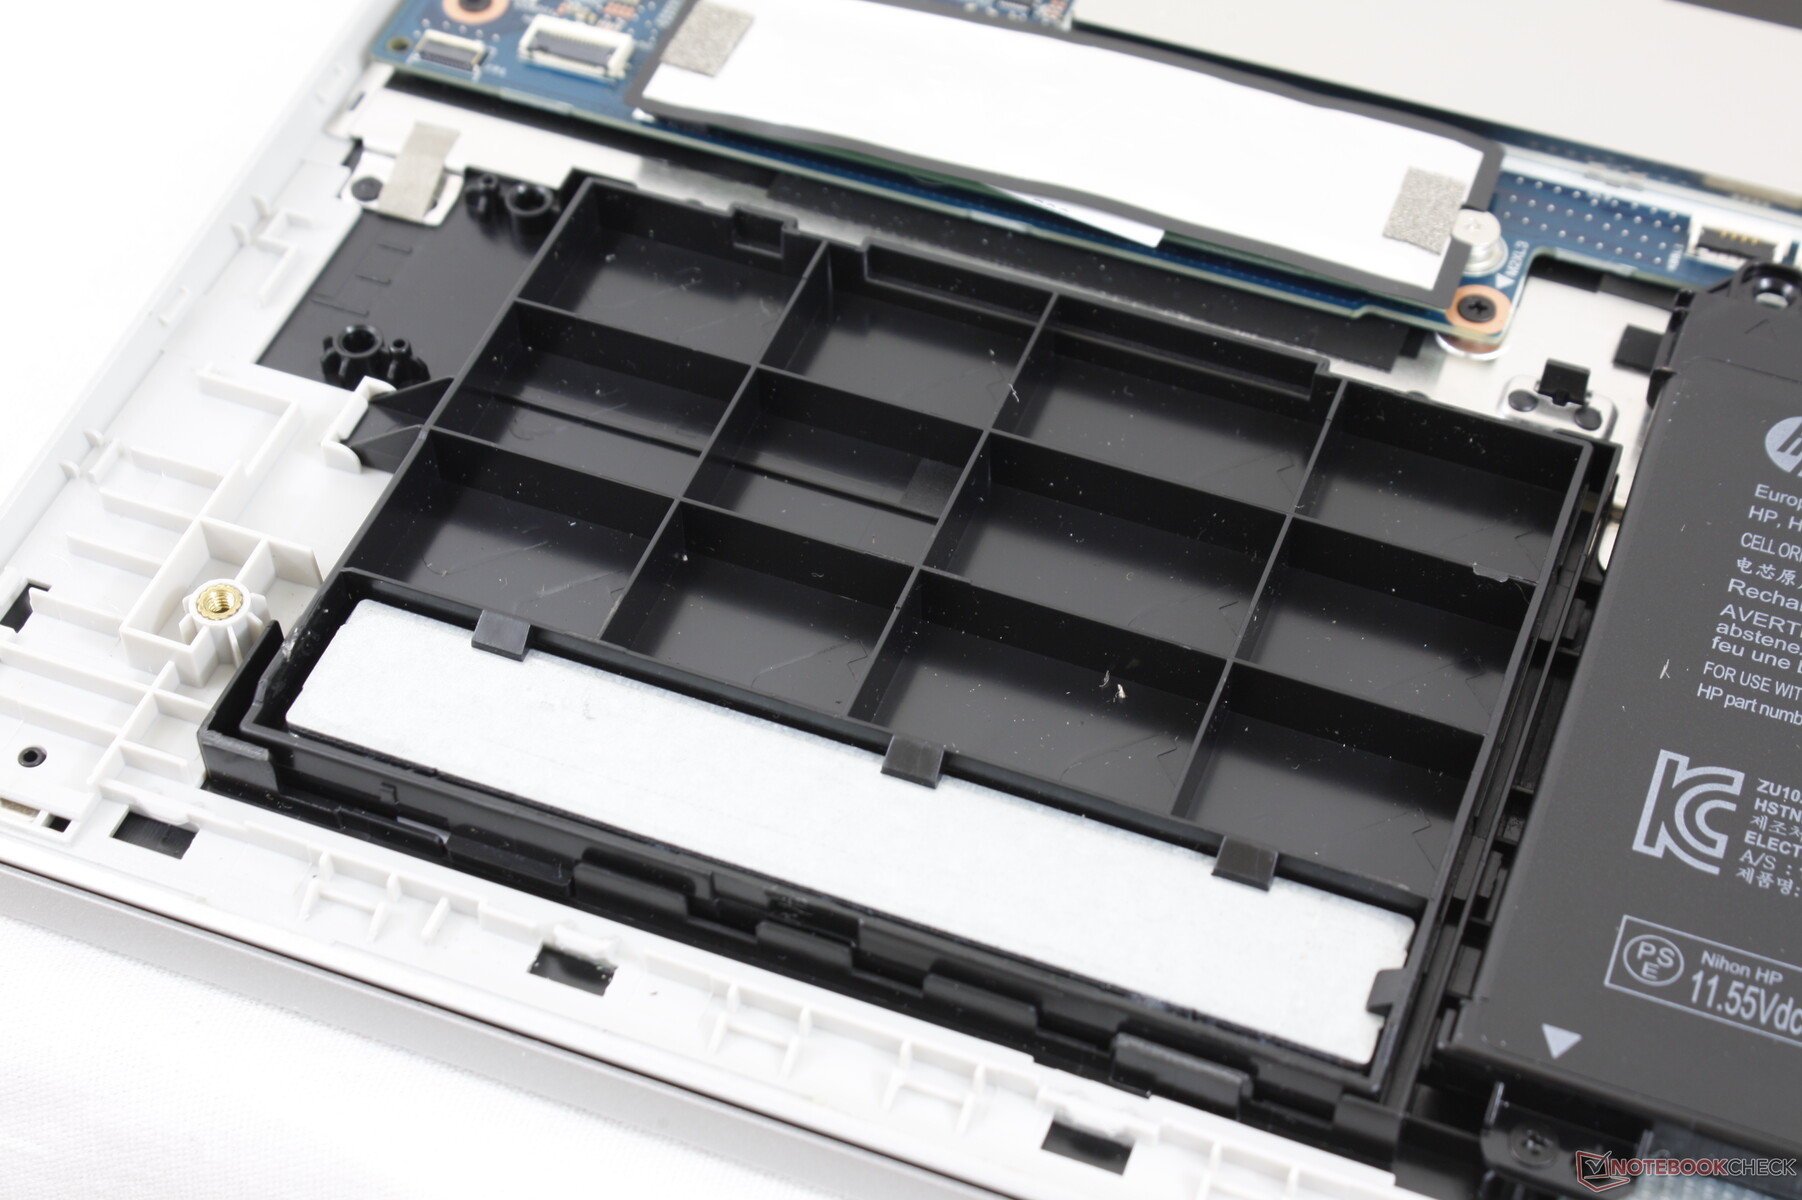
Bakım
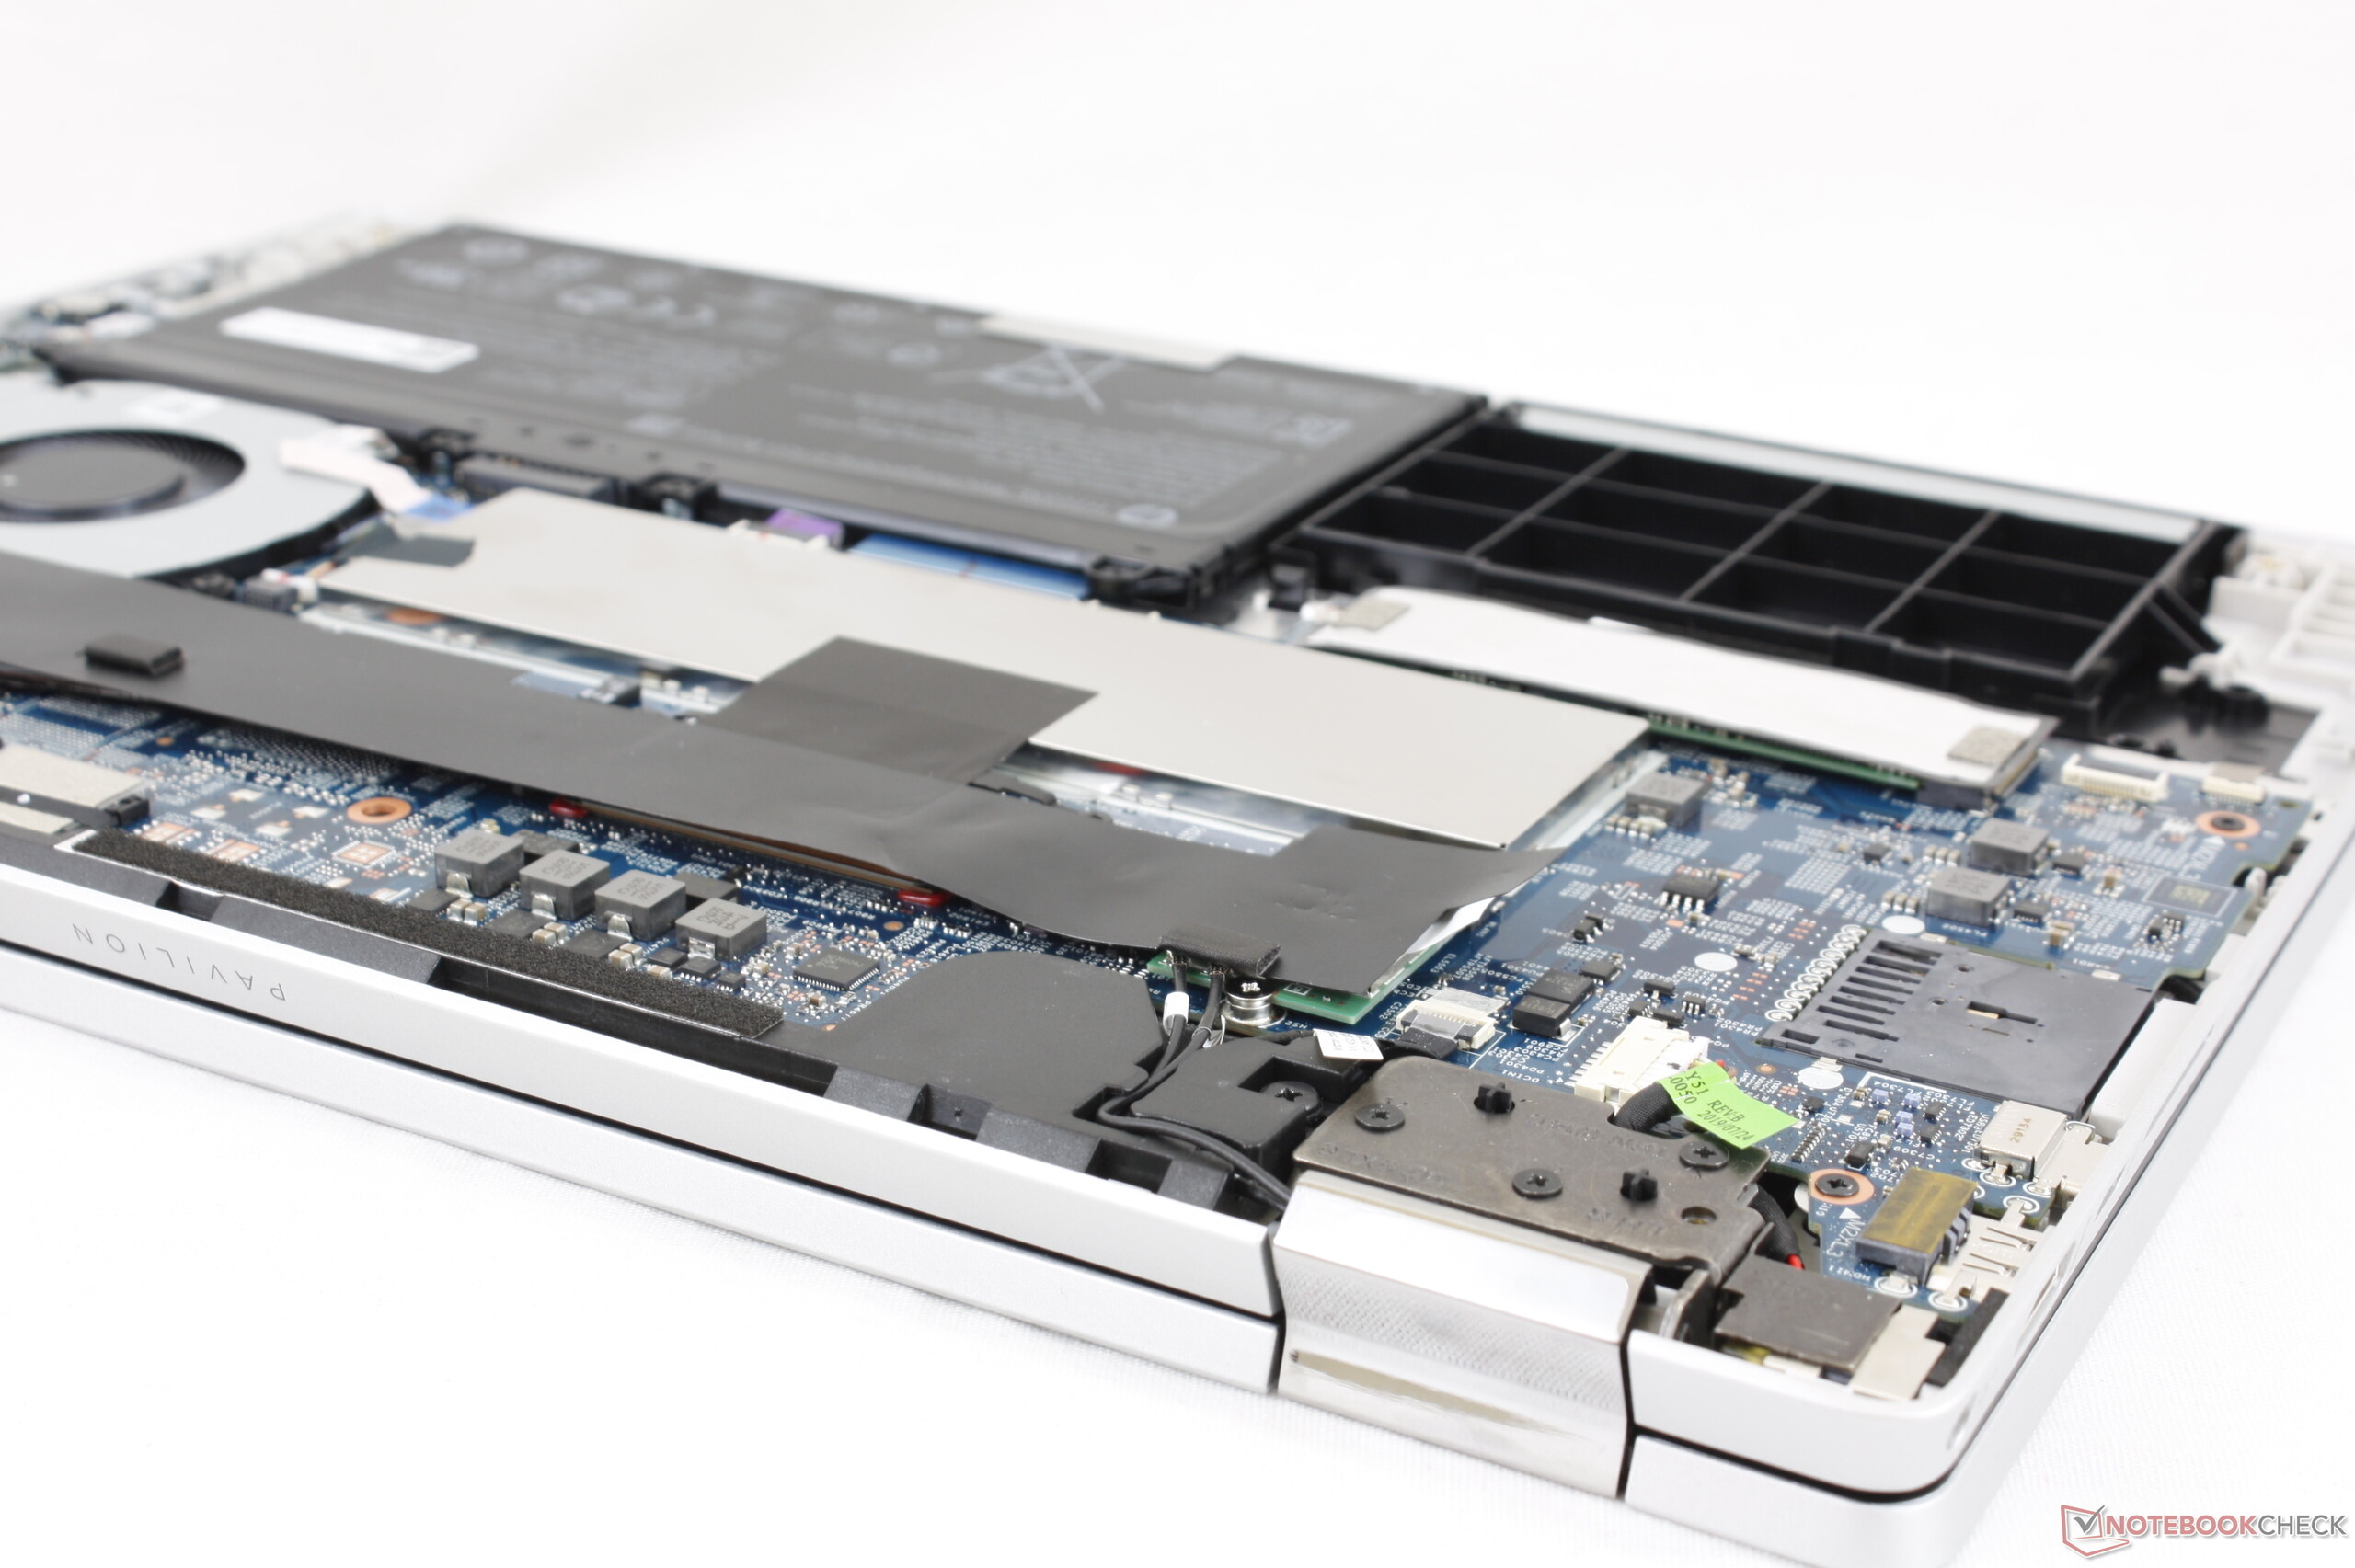
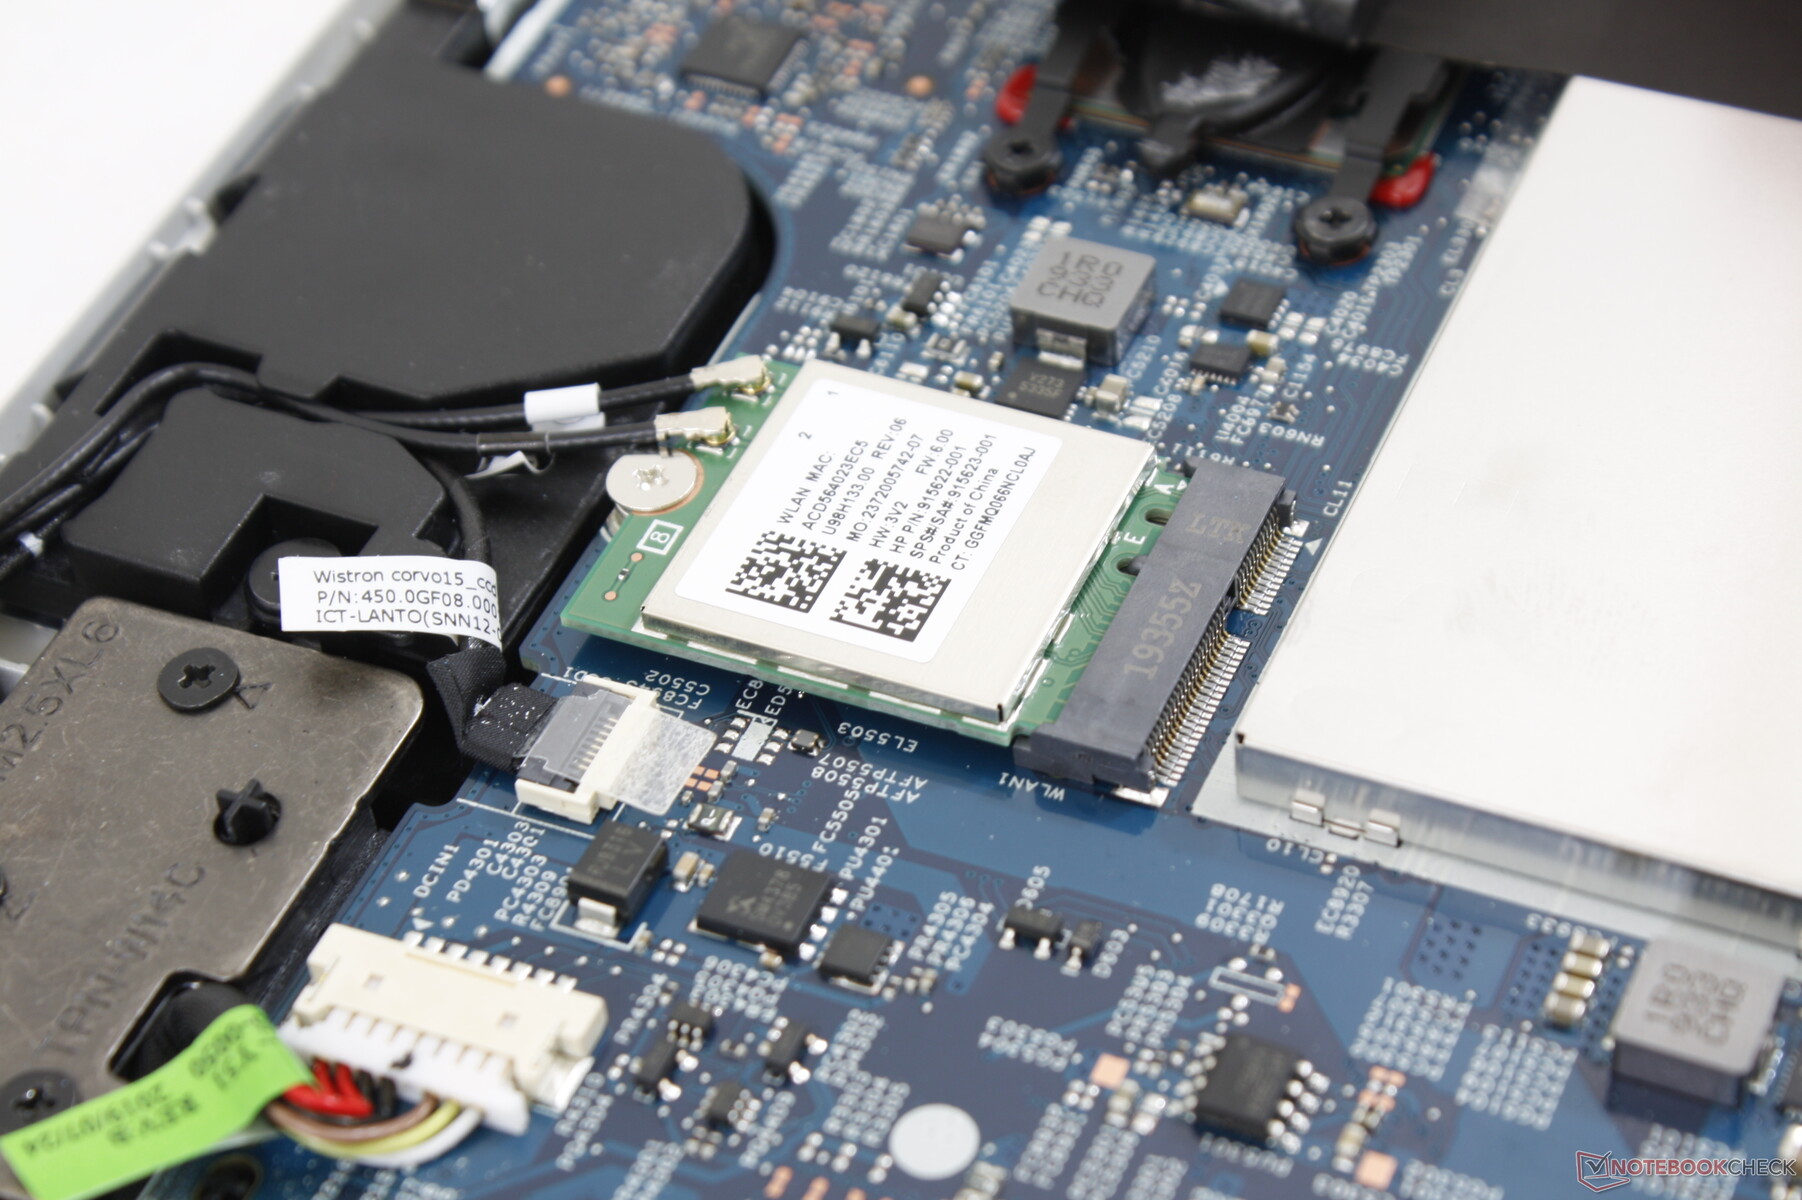
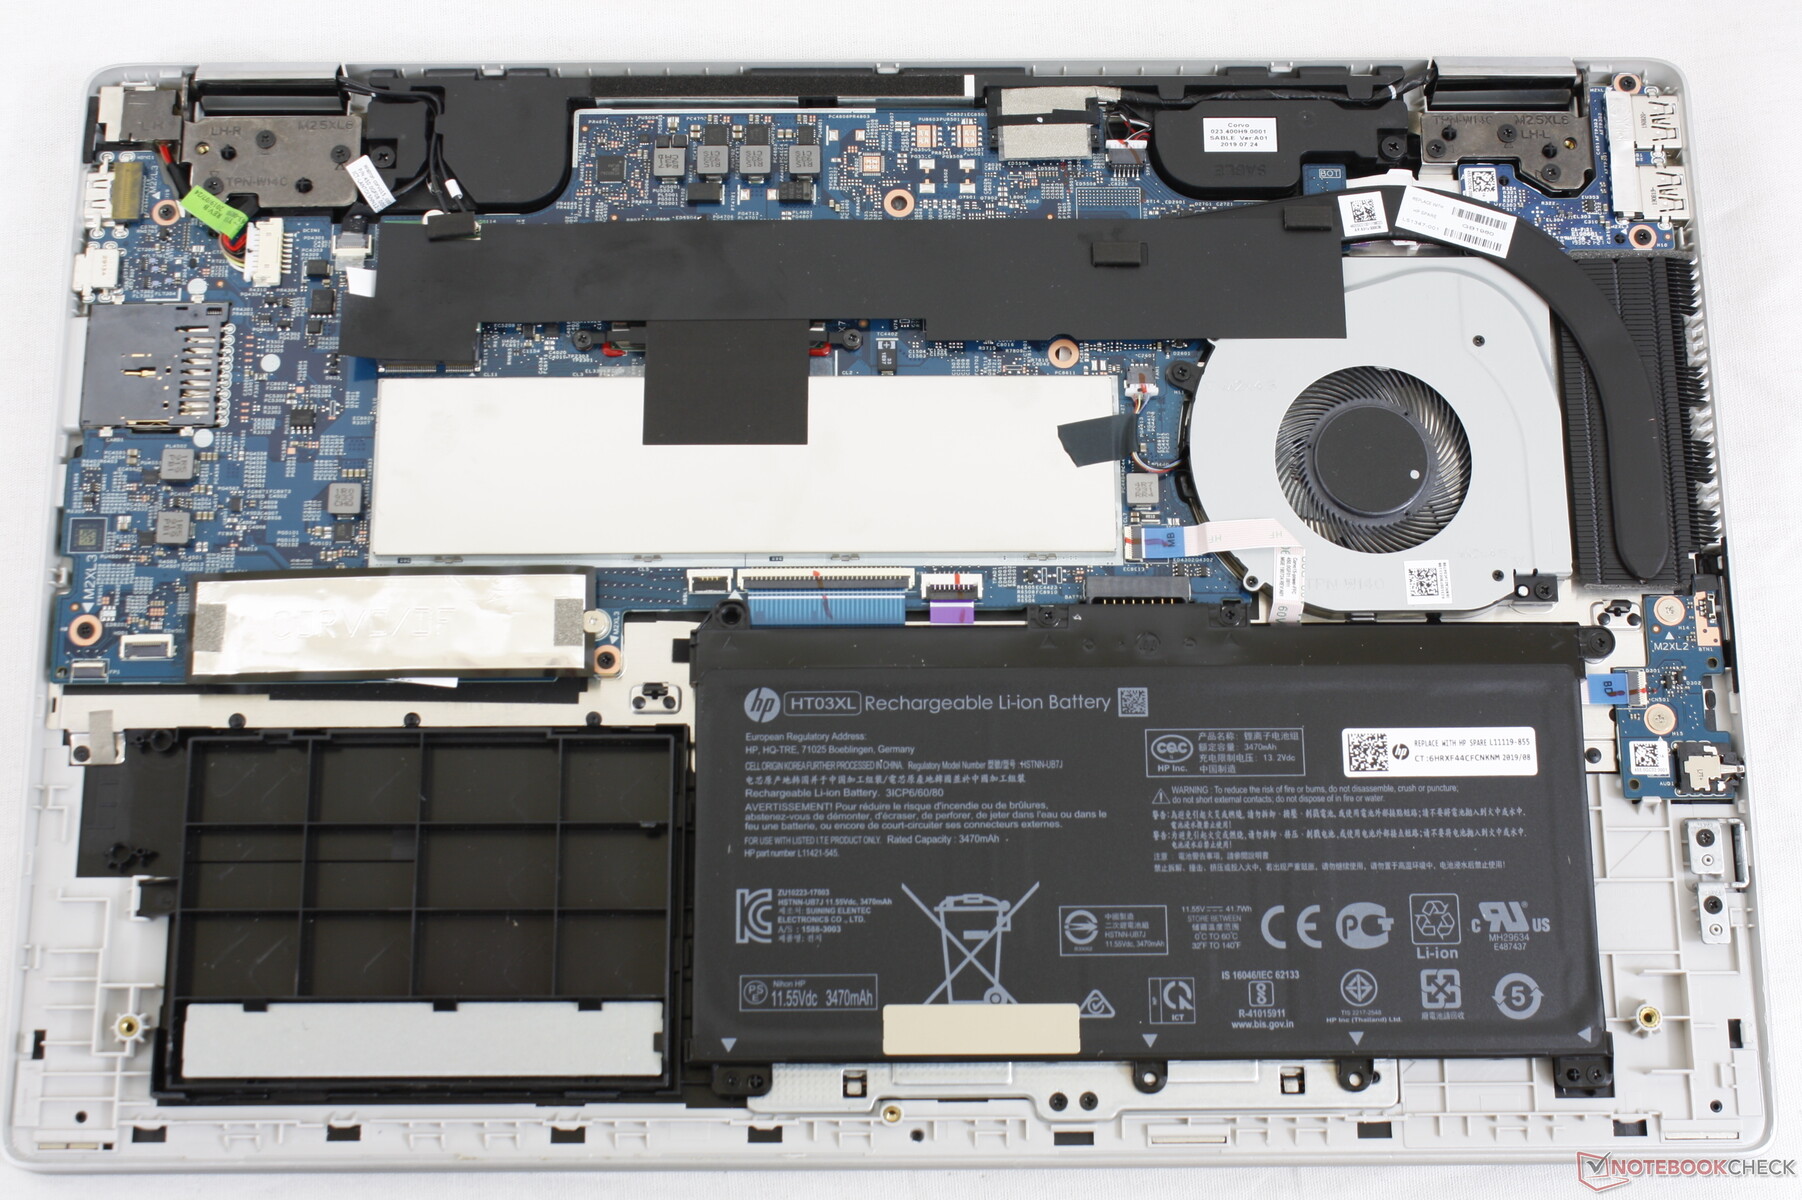
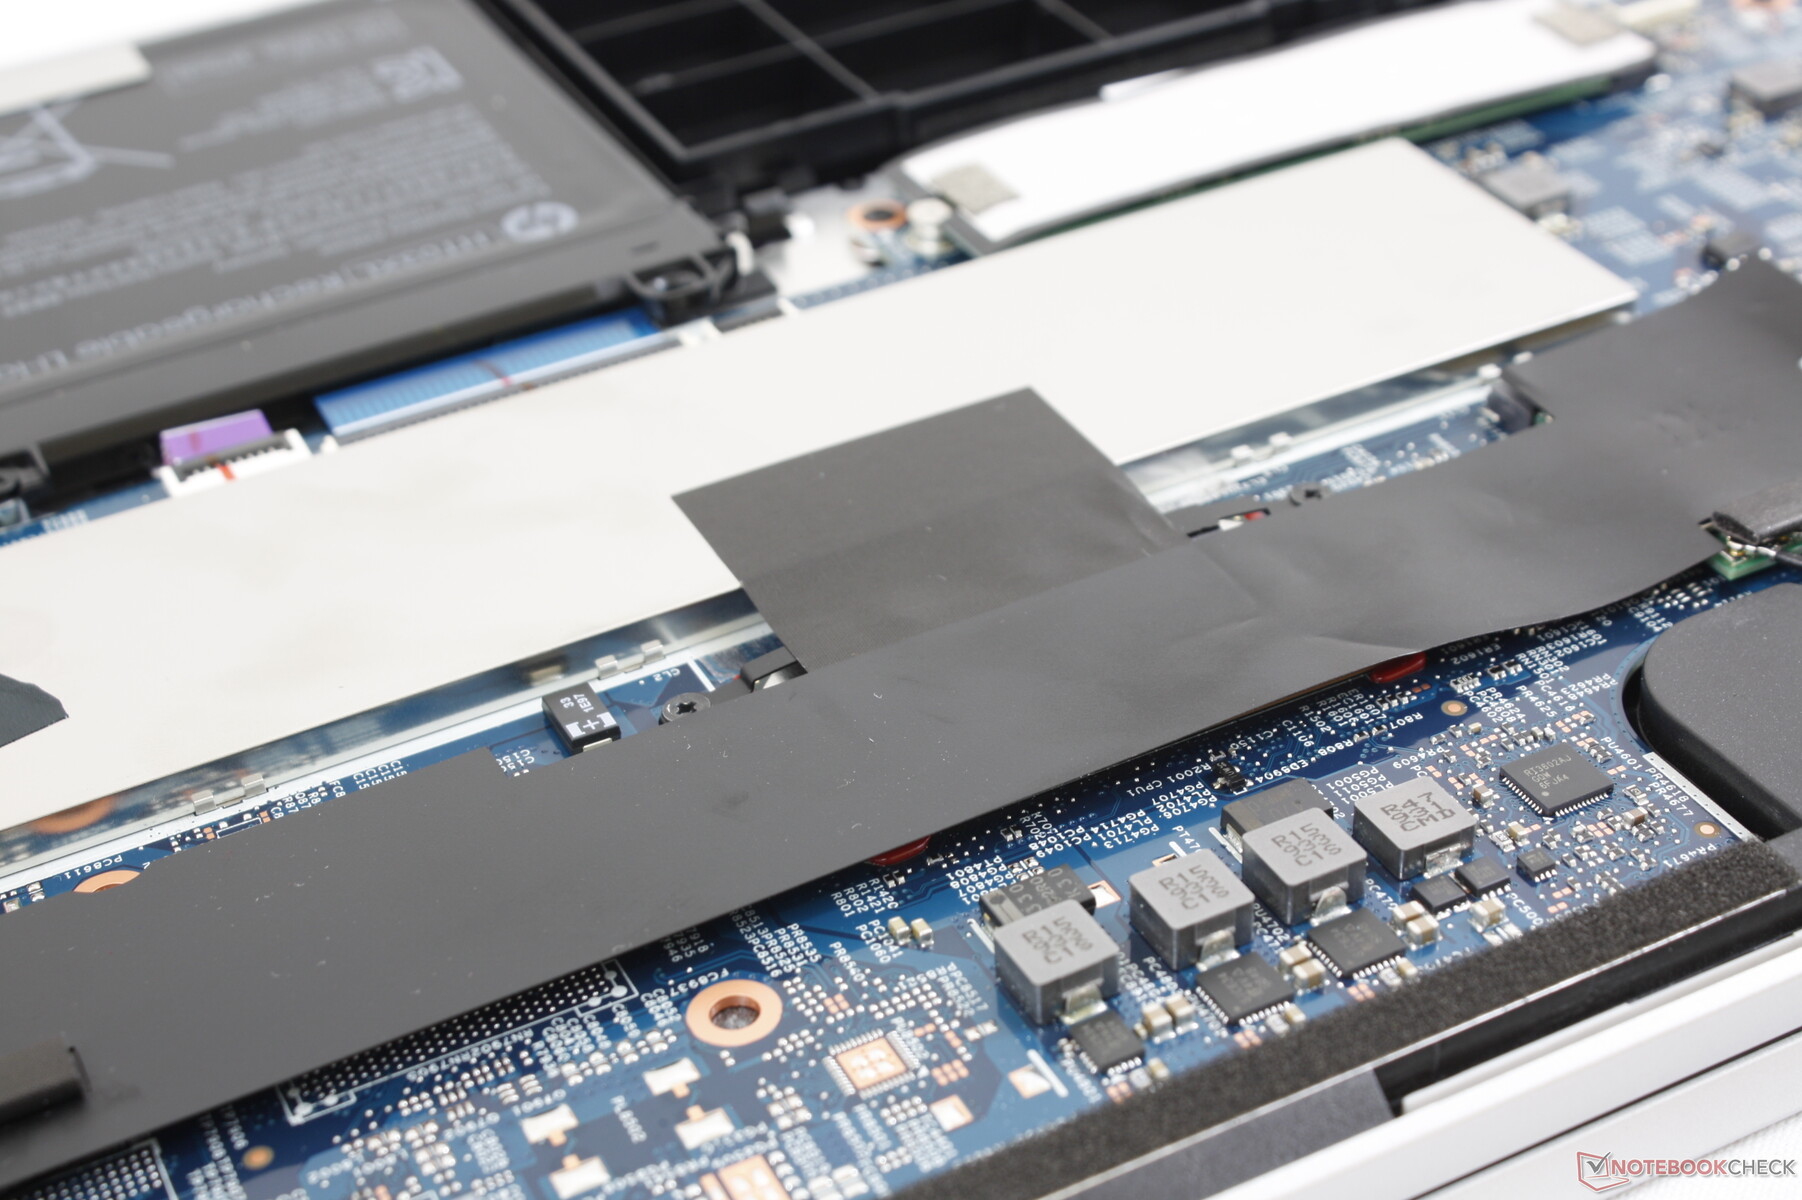
Pavilion dizüstü bilgisayarlara servis yapmak genellikle zordur ve Pavilion x360 15 farklı değildir. Alt panel, dördü kauçuk tabanın altına gizlenmiş beş Philips vida ile sabitlenmiştir. Daha sonra, plakayı dizüstü bilgisayarın geri kalanından kenarlar ve köşeler boyunca ayırmak için keskin bir kenar gerekir. 2x SODIMM yuvaları bir alüminyum plaka altında korunurken, kullanıcılar M.2 depolama yuvasına, pile ve WLAN modülüne doğrudan erişebilir.
Aksesuarlar ve Garanti
Kutuda AC adaptörü ve bazı küçük kılavuzlar dışında hiçbir ekstra yoktur. HP, dünyanın en büyük OEM'lerinden biri olduğundan, standart bir yıllık sınırlı garanti birçok ek seçenekle geçerlidir.
Giriş cihazları
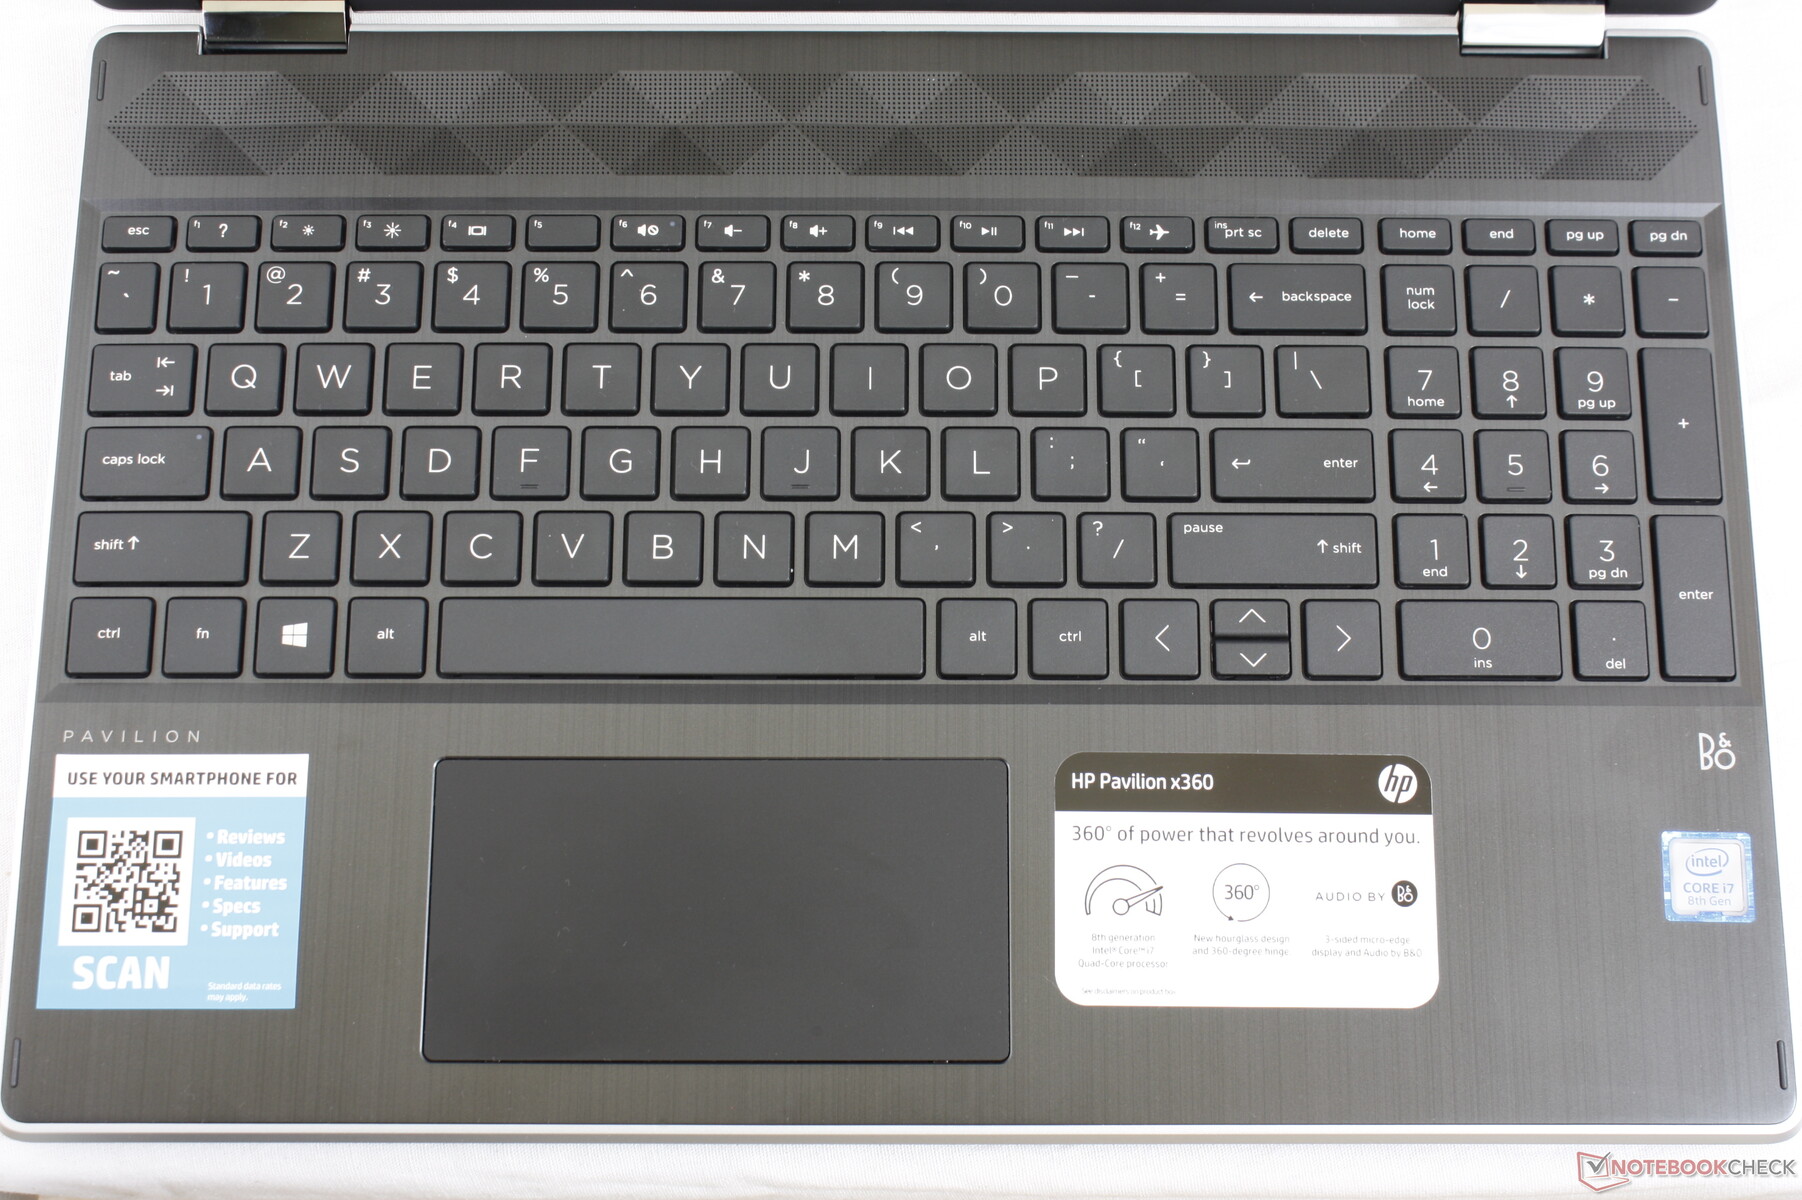
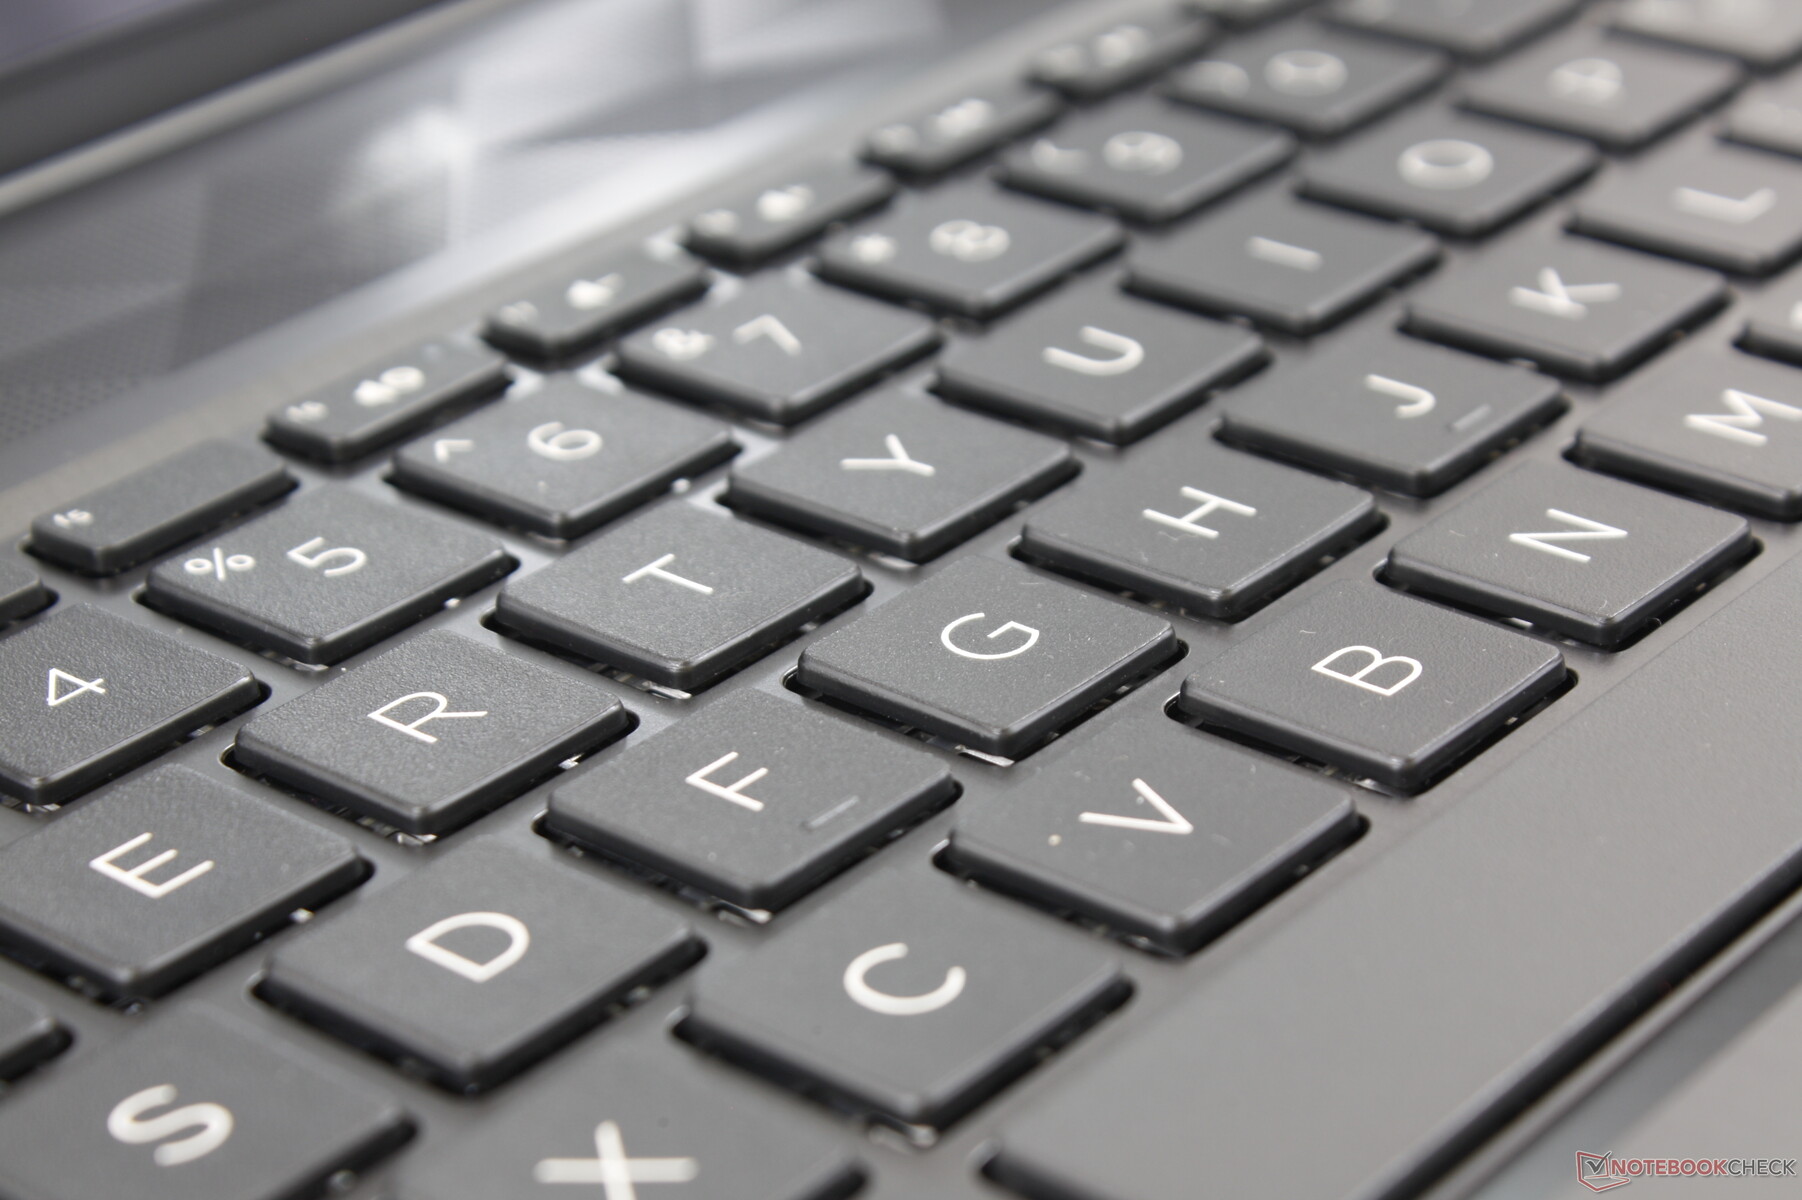
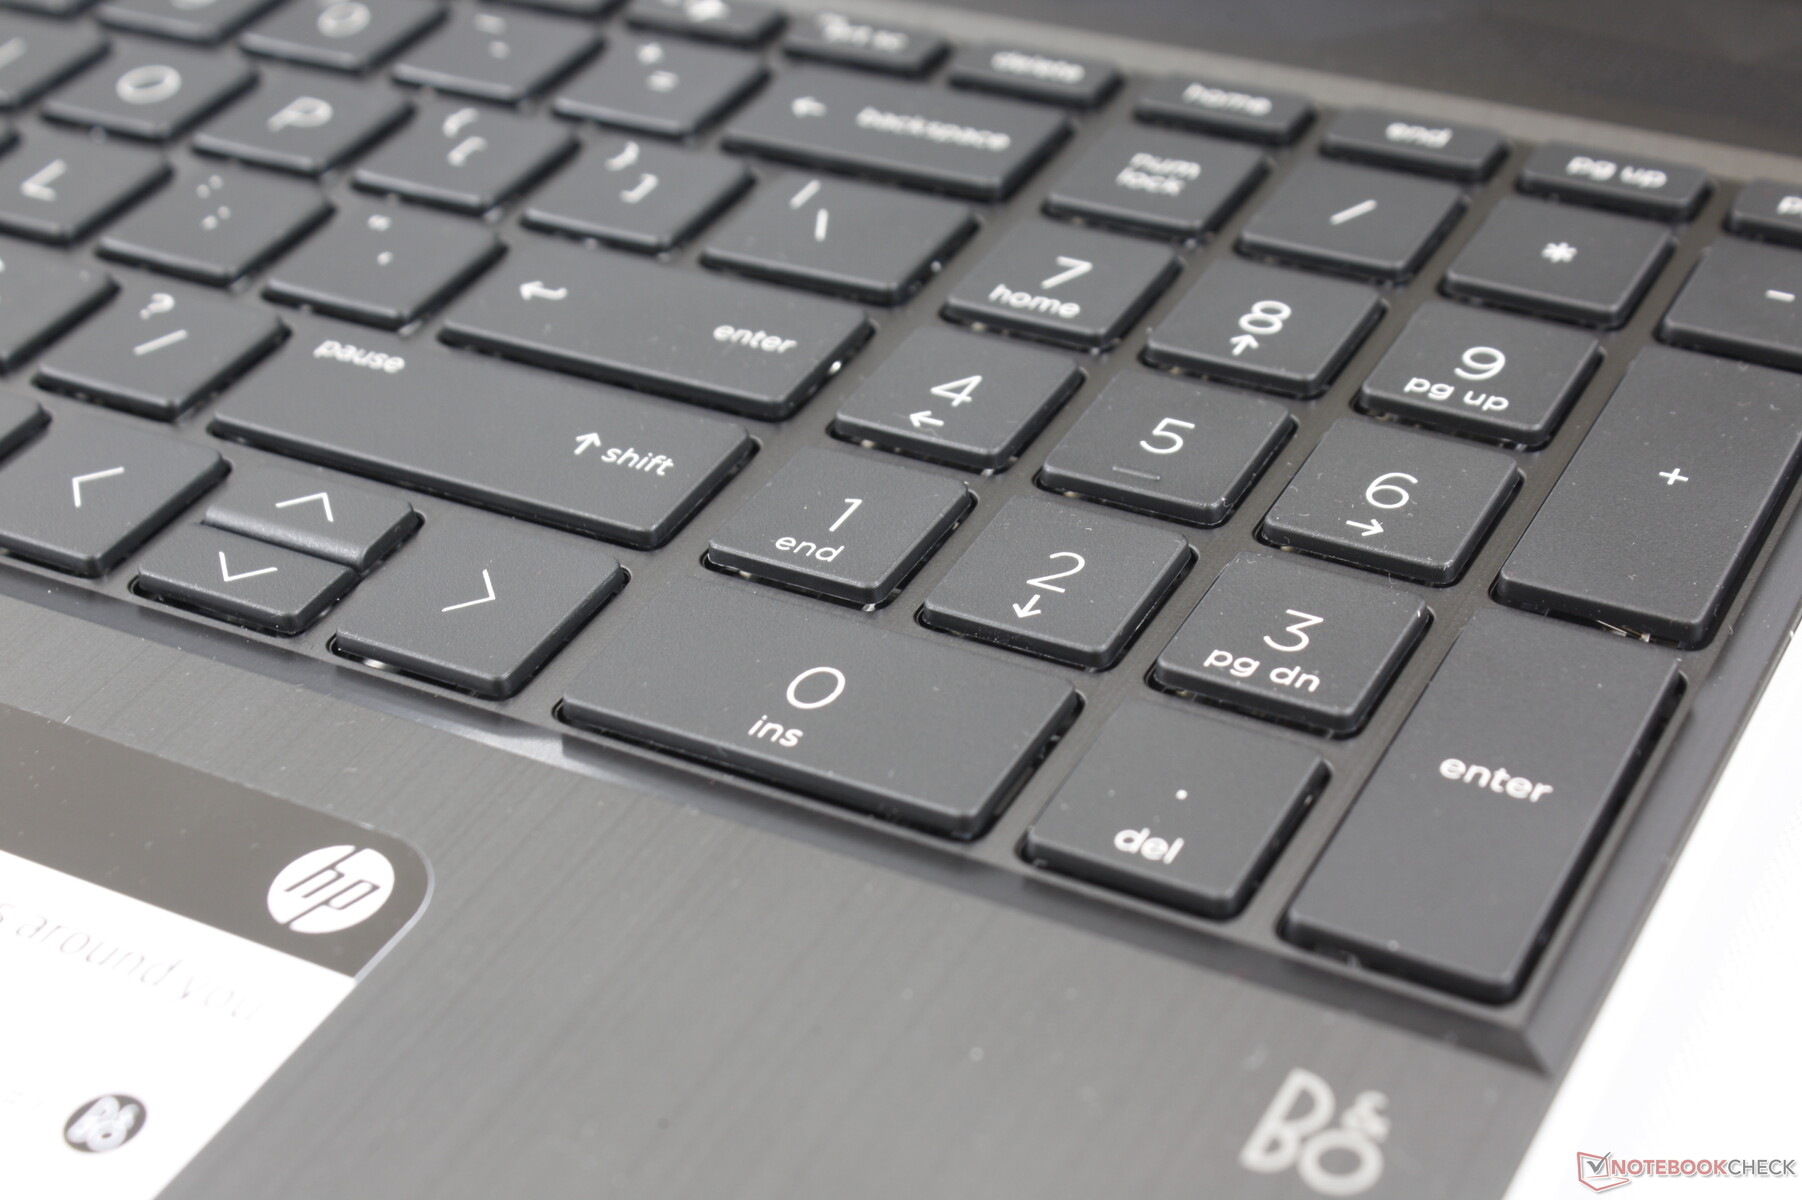
Plastik klavye tuşlarının arka ışığı yoktur ve daha pahalı HP Envy veya Spectre serilerindeki tuşlara kıyasla boyutu daha küçüktür. Bireysel anahtarlar daha fazla kıpırdama eğilimi gösterir, yani köşelerinden birine merkezine karşı bir tuşa basarsanız geri bildirim farklıdır. Bu, klavyede istenmeyen bir durumdur çünkü parmağınızın nereye ineceği önemli değil, önemli geri bildirimlerin düzgün olmasını istersiniz. Bununla birlikte, bütçe dizüstü bilgisayarlarında ucuz klavyelere alışıksanız, buradaki Pavilion klavyesi sürpriz olmamalıdır.Klavyenin en iyi kısmı belki de entegre NumPad'dir. Sayı tuşları ana QWERTY tuşları ile aynı boyuttadır, ancak diğer dizüstü bilgisayarların çoğu daha küçük NumPad anahtarlarına sahiptir veya hiç yoktur.
Dokunmatik
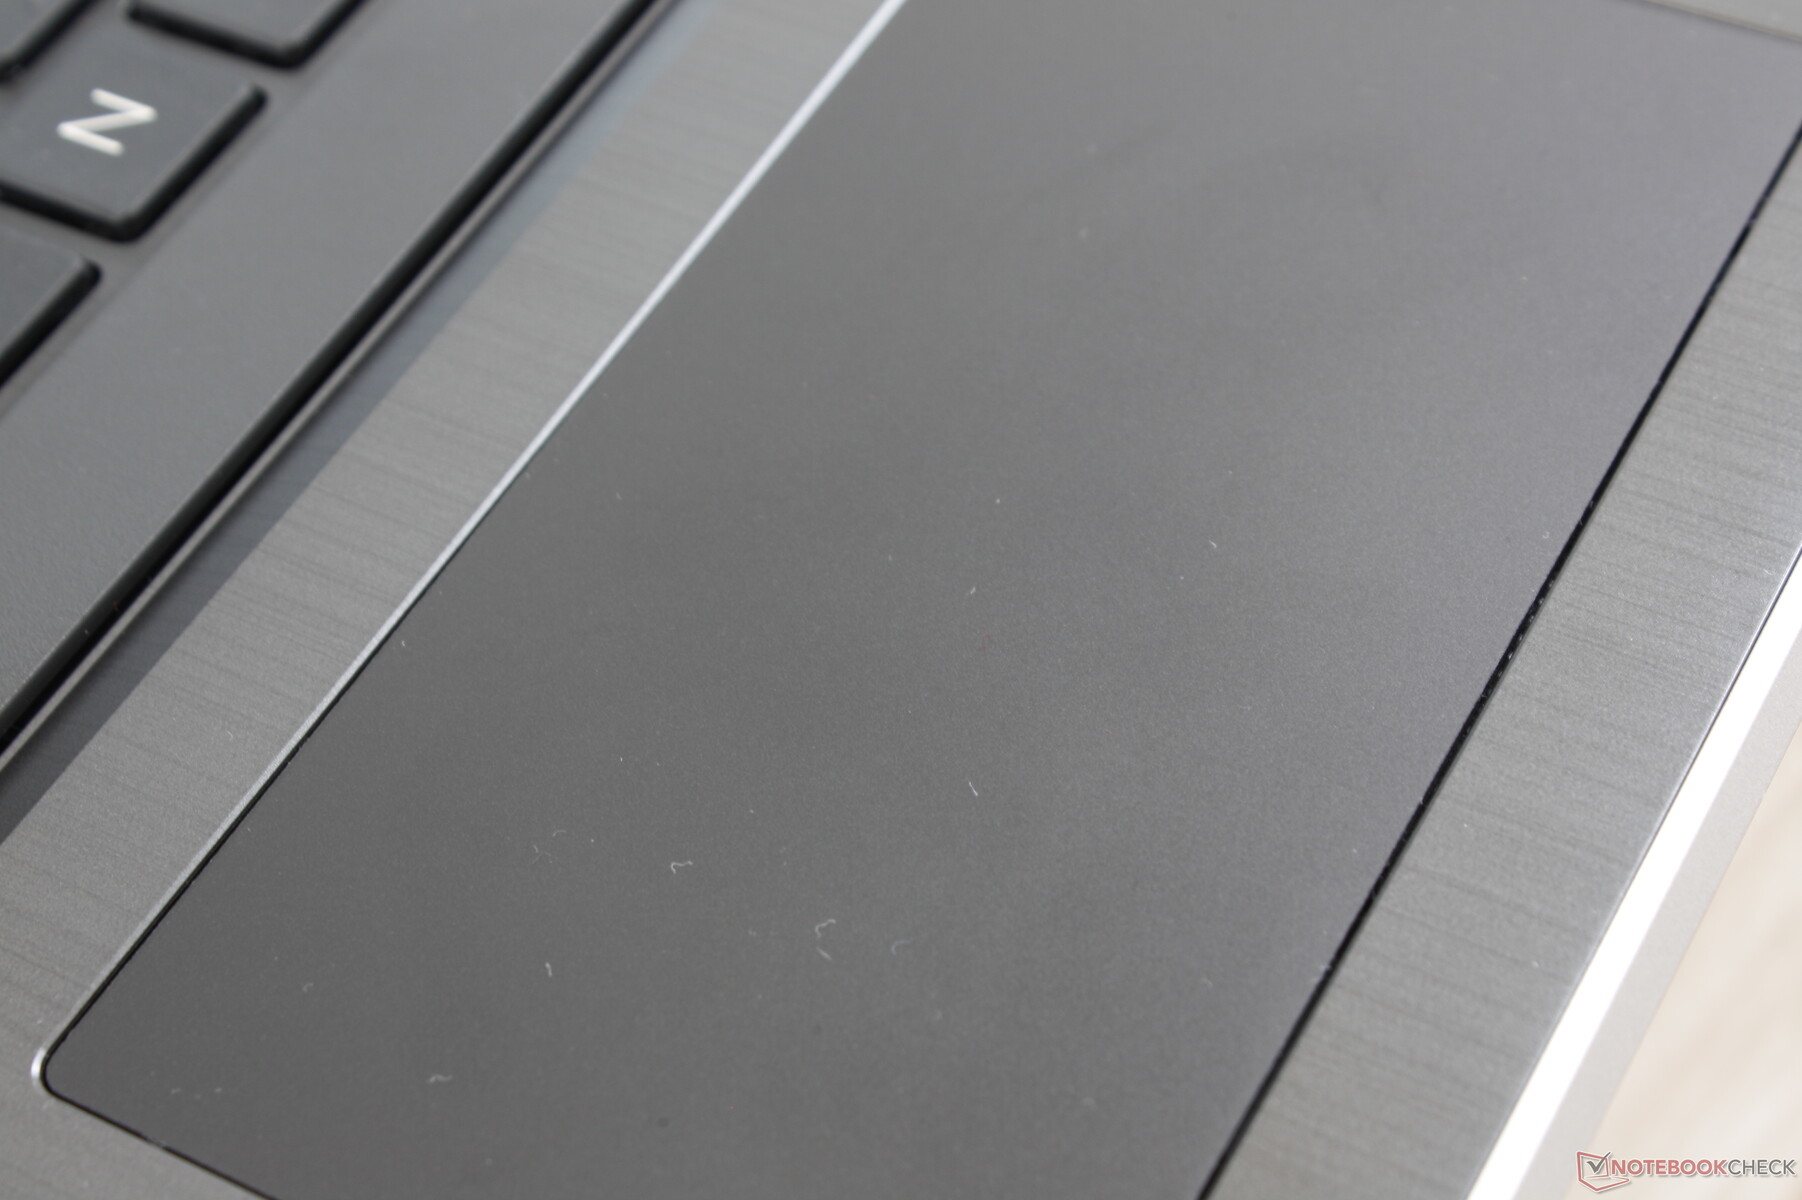
Tıklama yüzeyi (11,5 x 6 cm) 2019 Spectre x360 15 (12 x 6 cm) üzerindeki tıklama yüzeyinden biraz daha küçüktür. Aksi takdirde, çok yavaş kayma sırasında biraz yapışkanlık ile pürüzsüz ve güvenilirdir. Entegre fare tuşları, daha önce belirtilen Spectre'den farklı olmayan yumuşak ama sesli bir tıklama ile geri bildirimde de tatmin edicidir. Dikey kaydırma, tıklama yüzeyi yüzeyinin geniş en boy oranı nedeniyle sıkışık hissedilir.
Görüntüle
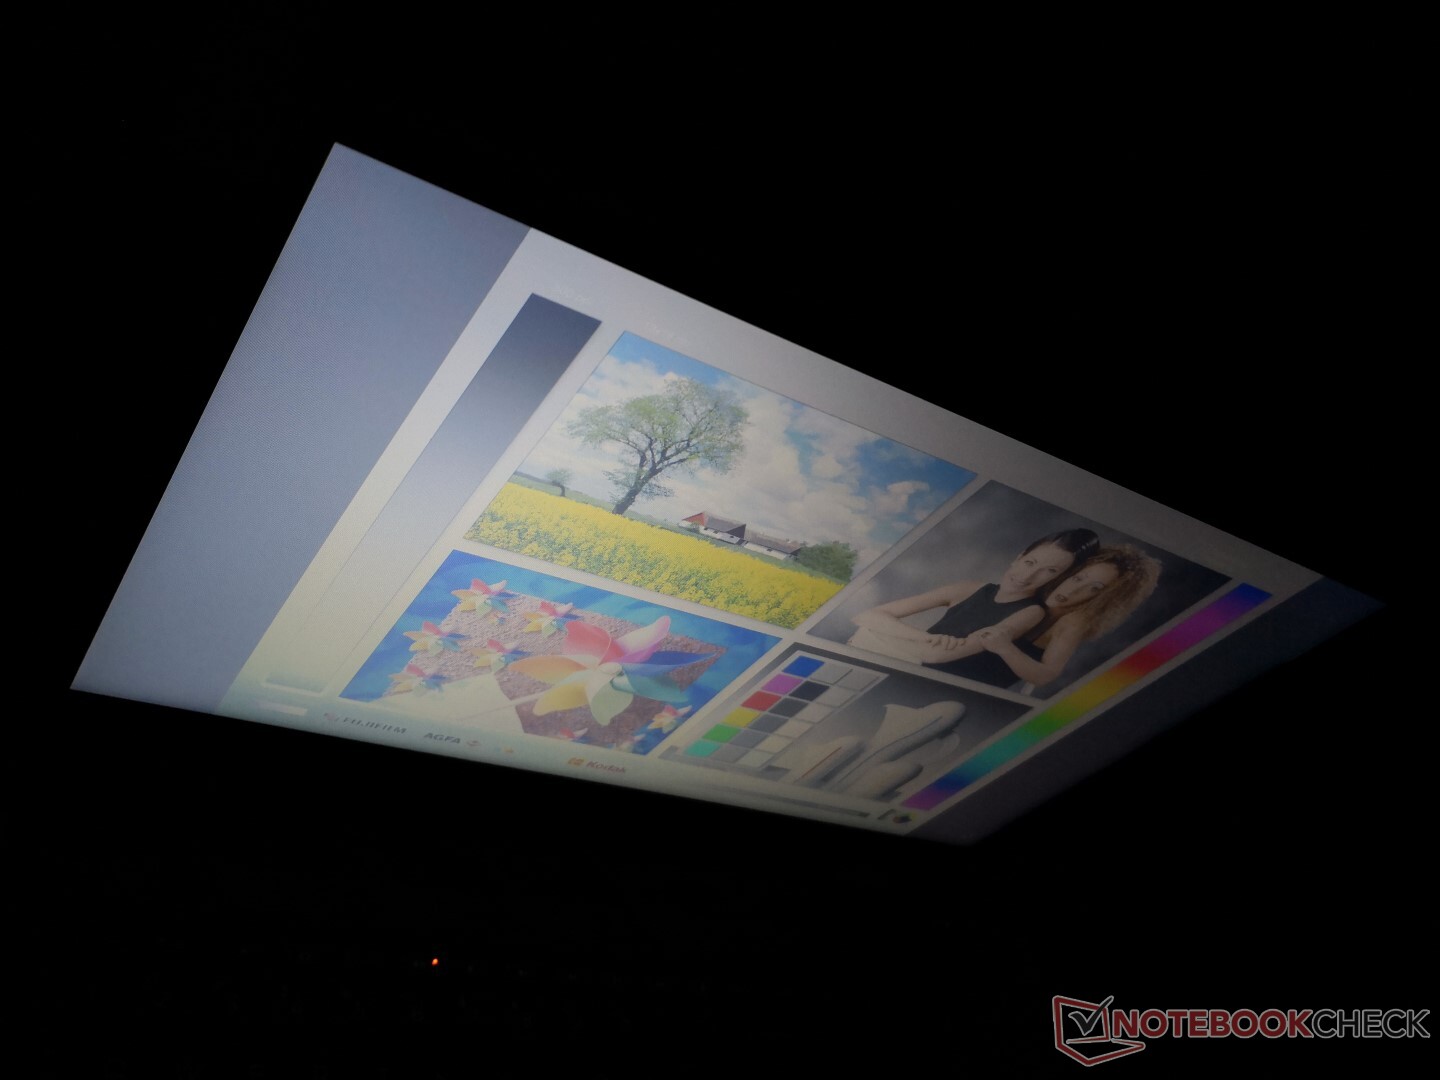
768p ekran, 2019'da yapılan bir dizüstü bilgisayarda bulabileceğiniz en kötü ekranlardan biri. Korkunç renkler ve 300: 1'in çok düşük kontrast oranı ile 200 nit'in altında loş. Titreşim ışığına duyarlı kullanıcıları etkilemek için darbe genişliği modülasyonu yüzde 99'a kadar tüm parlaklık seviyelerinde mevcuttur. En kötü suçu, metinlerin ve görüntülerin normalde net olduğu parlak bir ekran için bile grenli bir ilk izlenim için sadece 768p'nin düşük doğal çözünürlüğüdür. Yarı iyi bir görsel deneyim arıyorsanız, bunun yerine 1080p panelli diğer dizüstü bilgisayarlarda daha iyi olursunuz. Muhtemelen burada kaydettiğimizden farklı sonuçlar elde edecek olan 1080p panelli SKU'lar mevcuttur.
| |||||||||||||||||||||||||
Aydınlatma: 88 %
Batarya modunda parlaklık: 195.7 cd/m²
Kontrast: 288:1 (Siyah: 0.68 cd/m²)
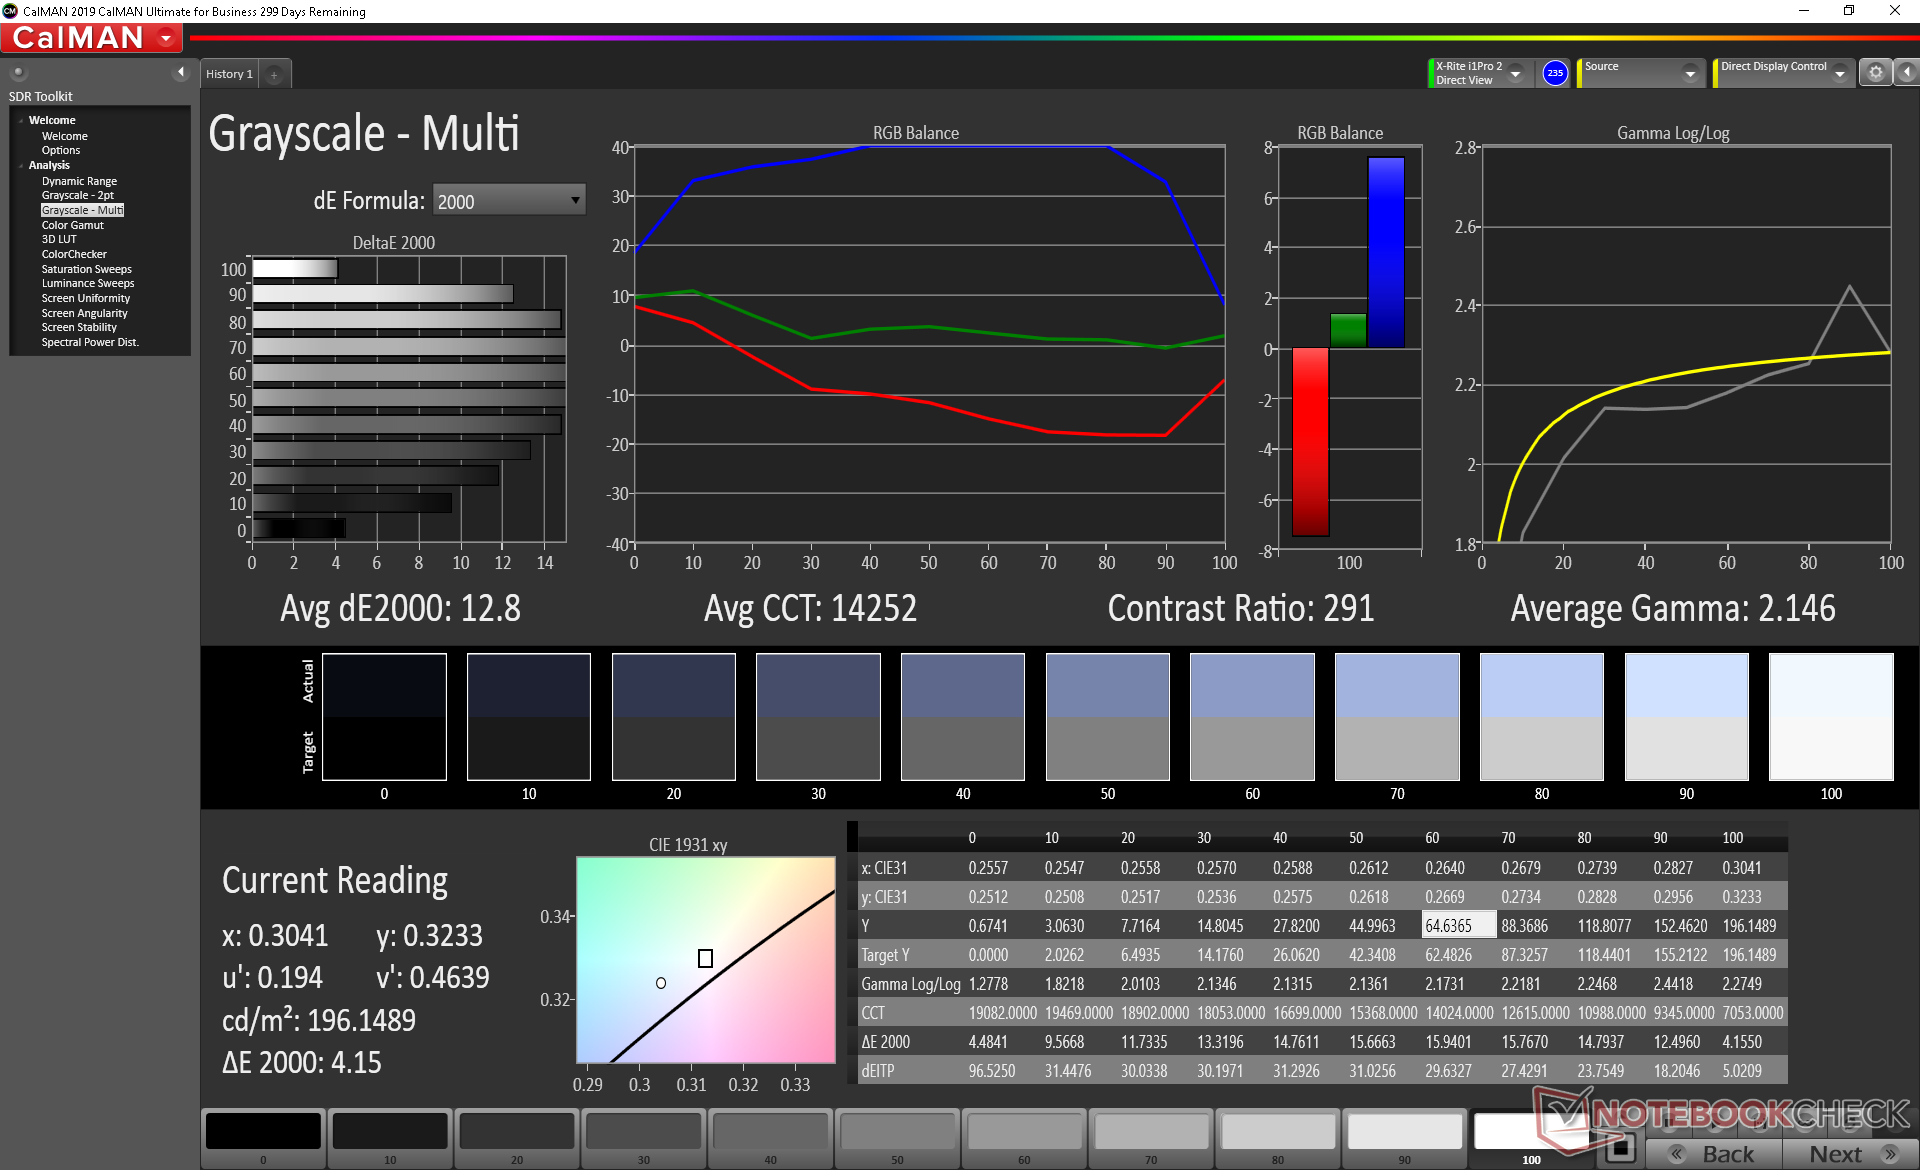
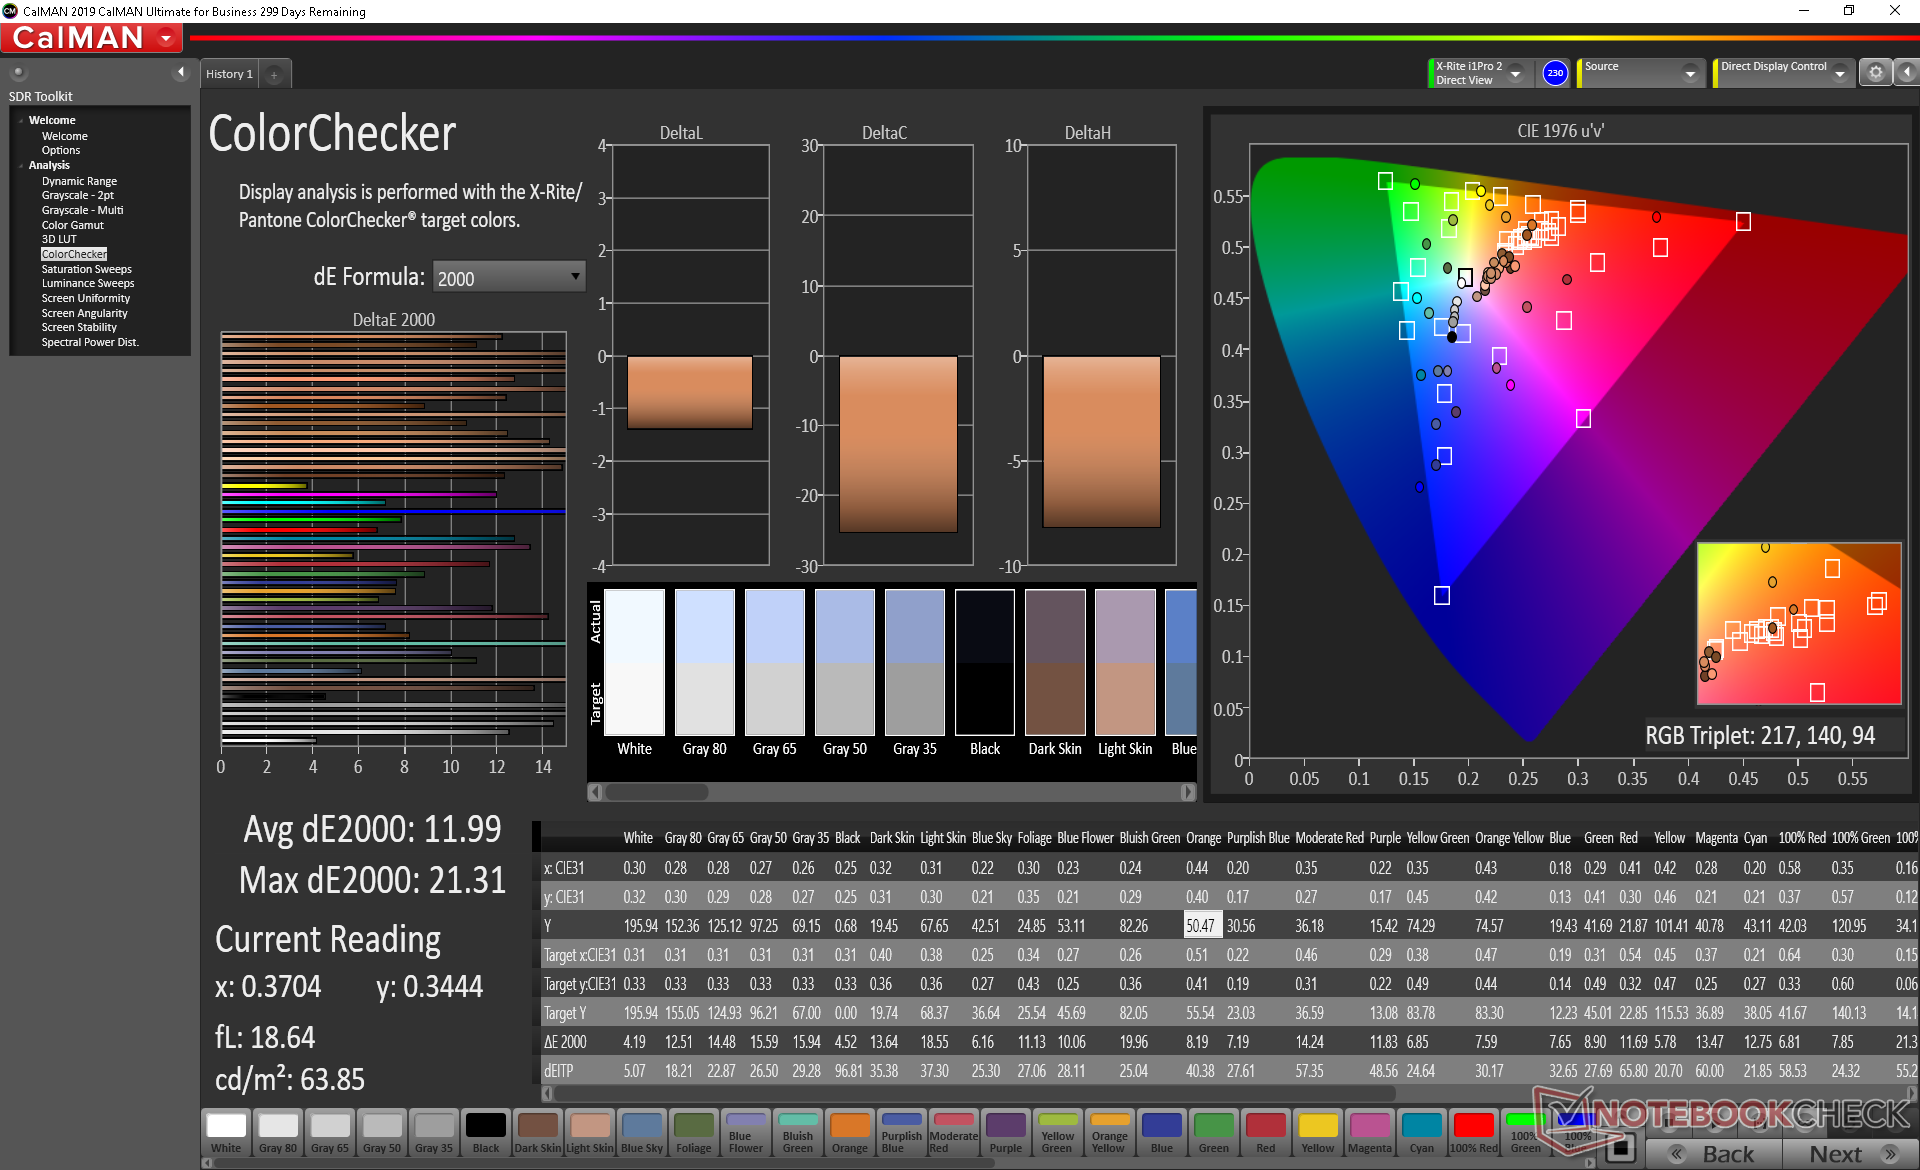
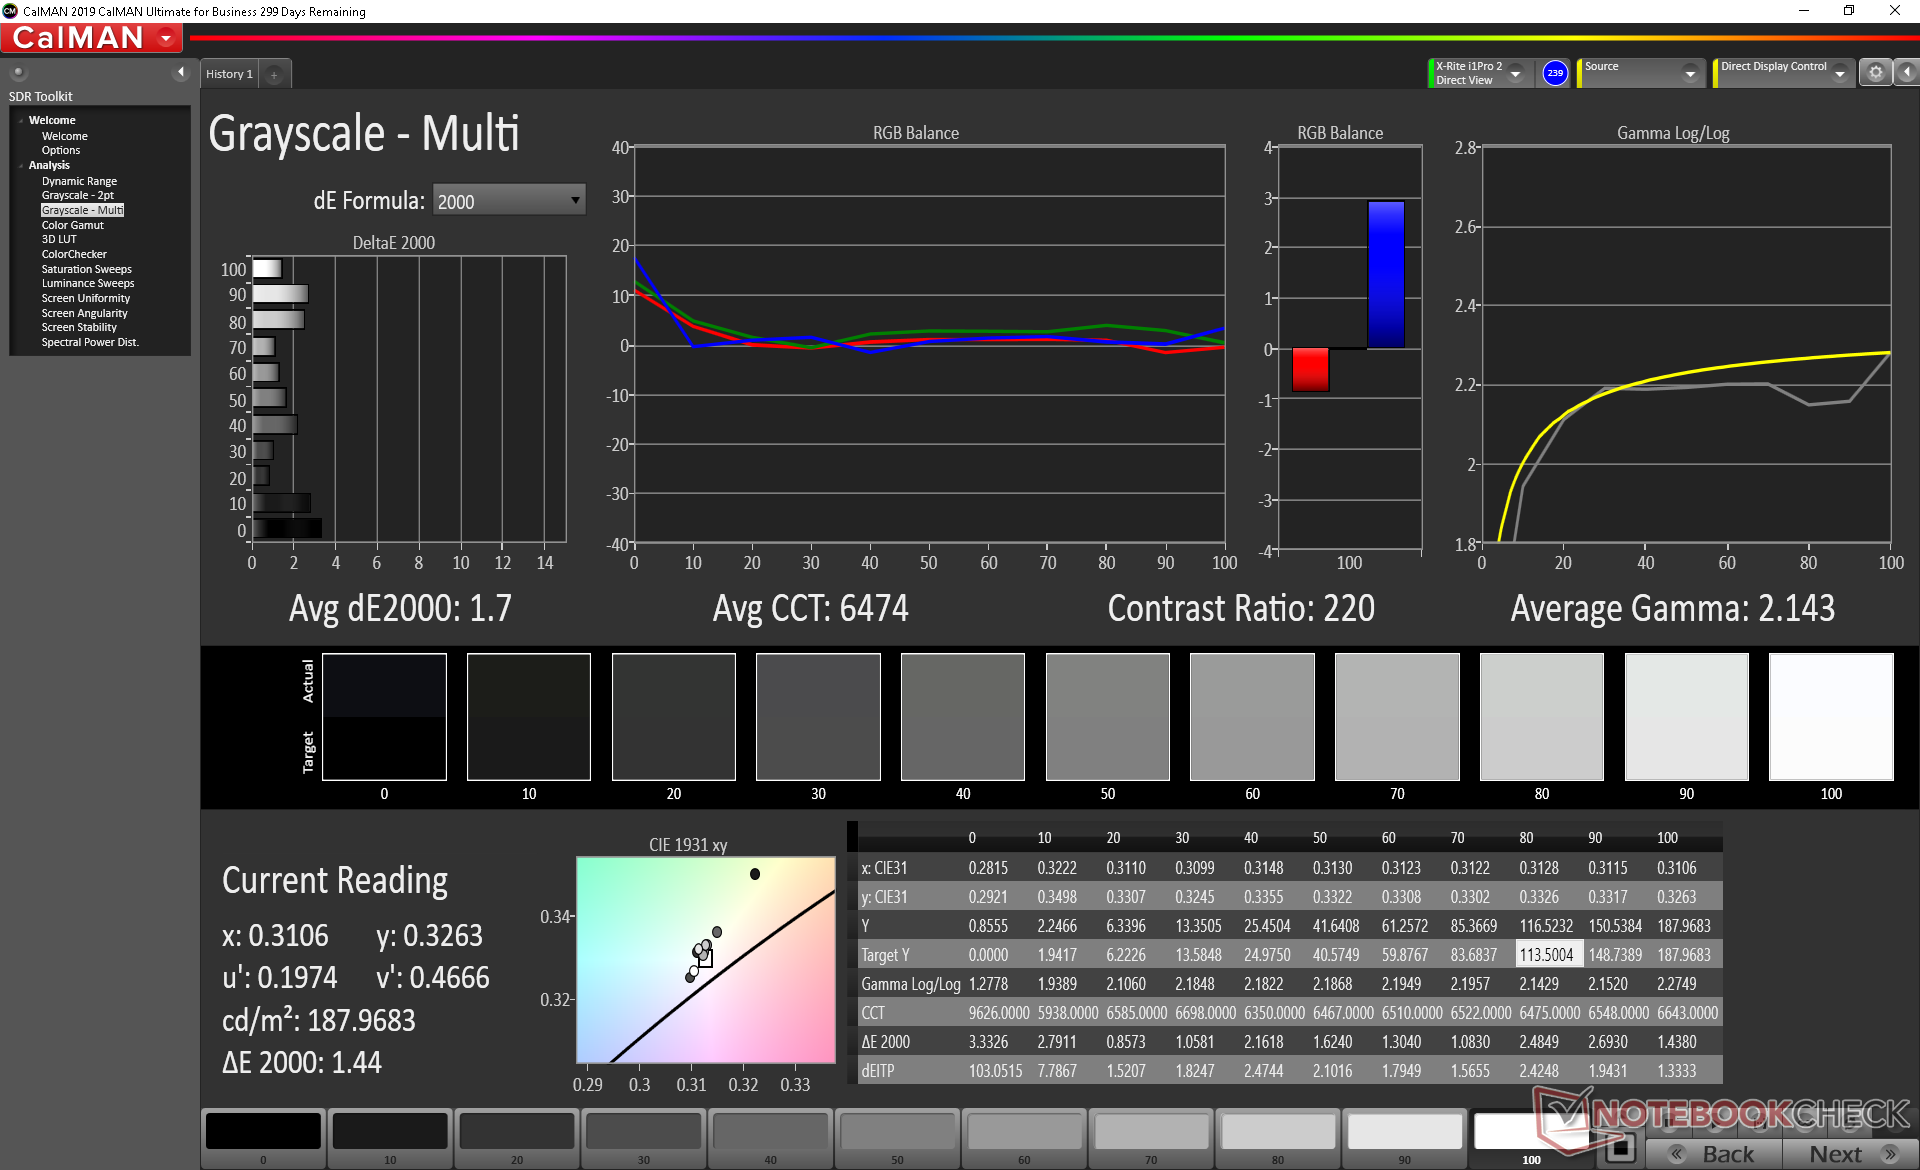
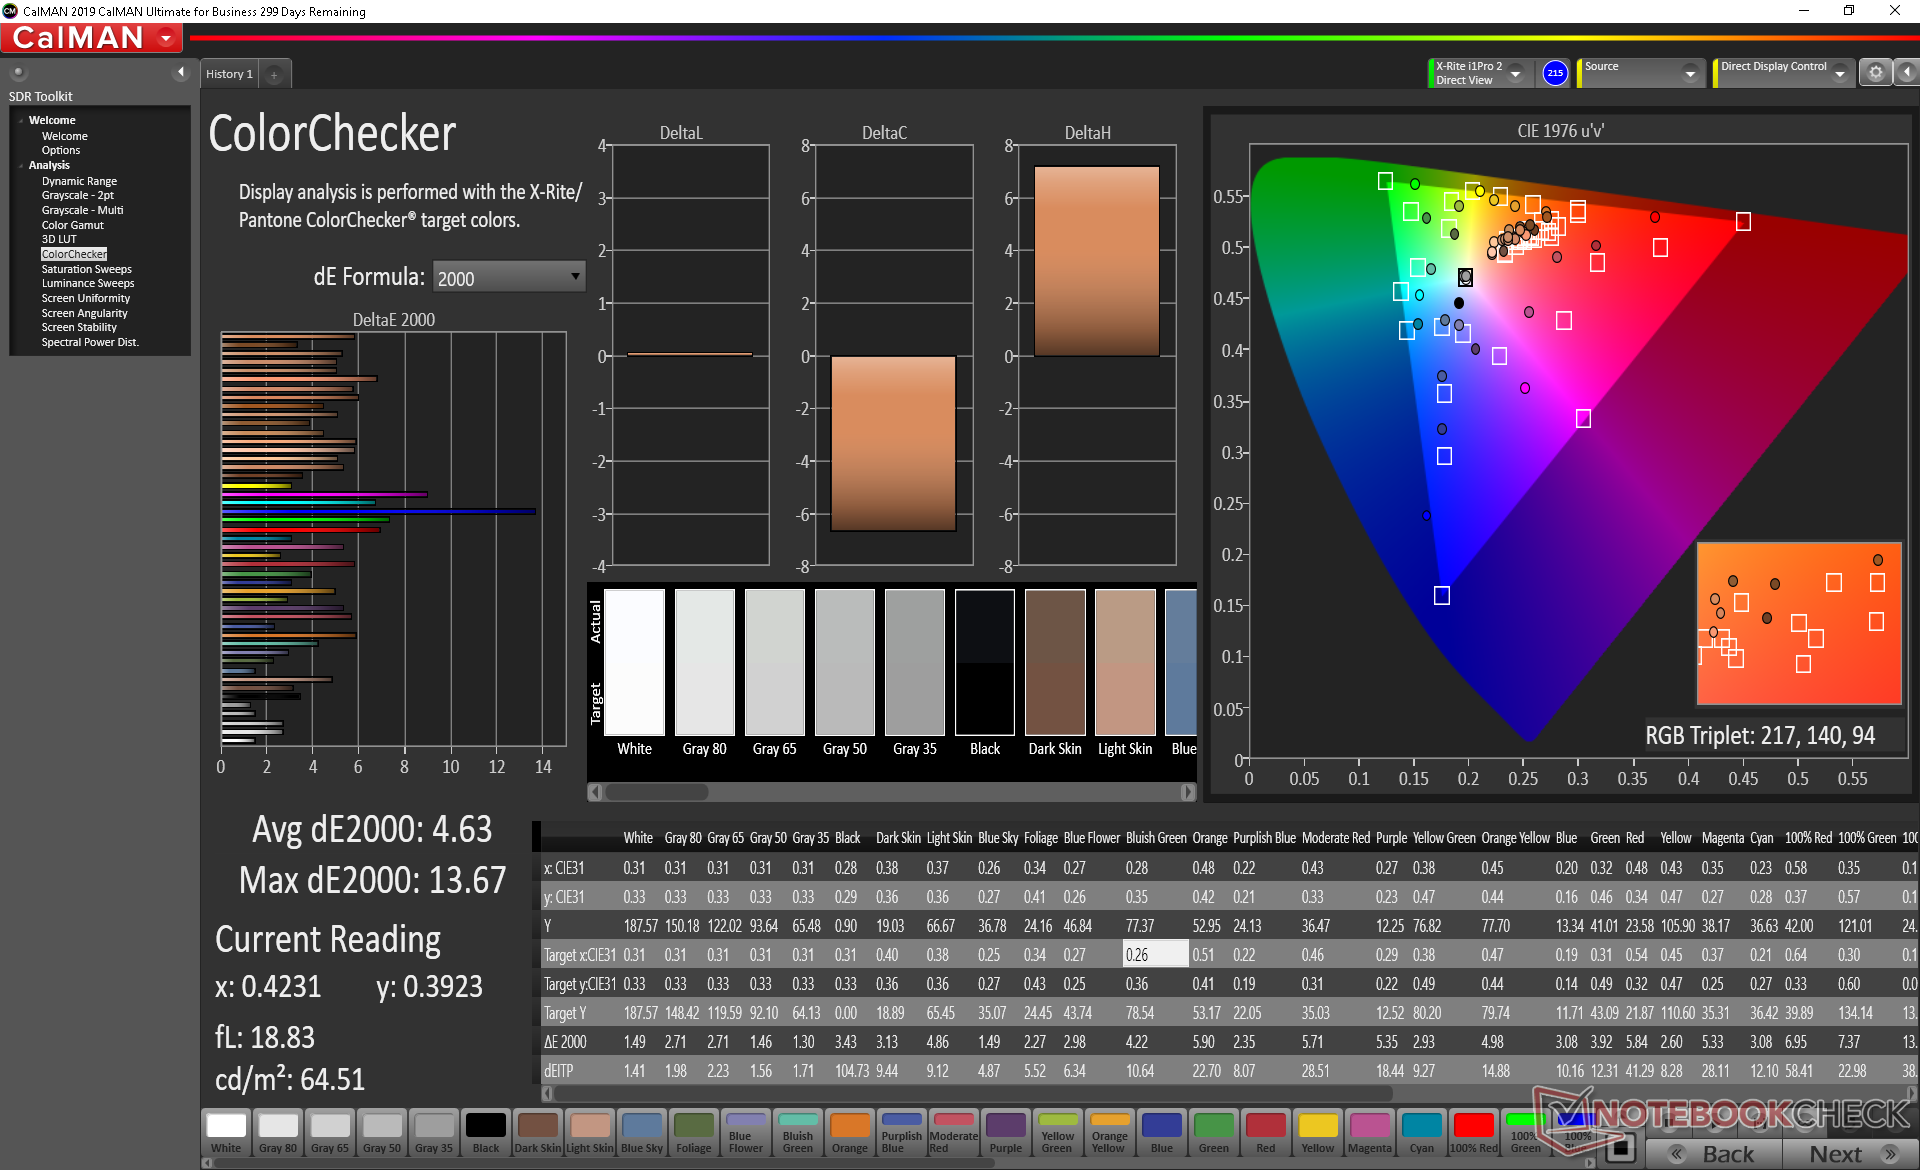
ΔE ColorChecker Calman: 11.99 | ∀{0.5-29.43 Ø4.72}
calibrated: 4.63
ΔE Greyscale Calman: 12.8 | ∀{0.09-98 Ø4.97}
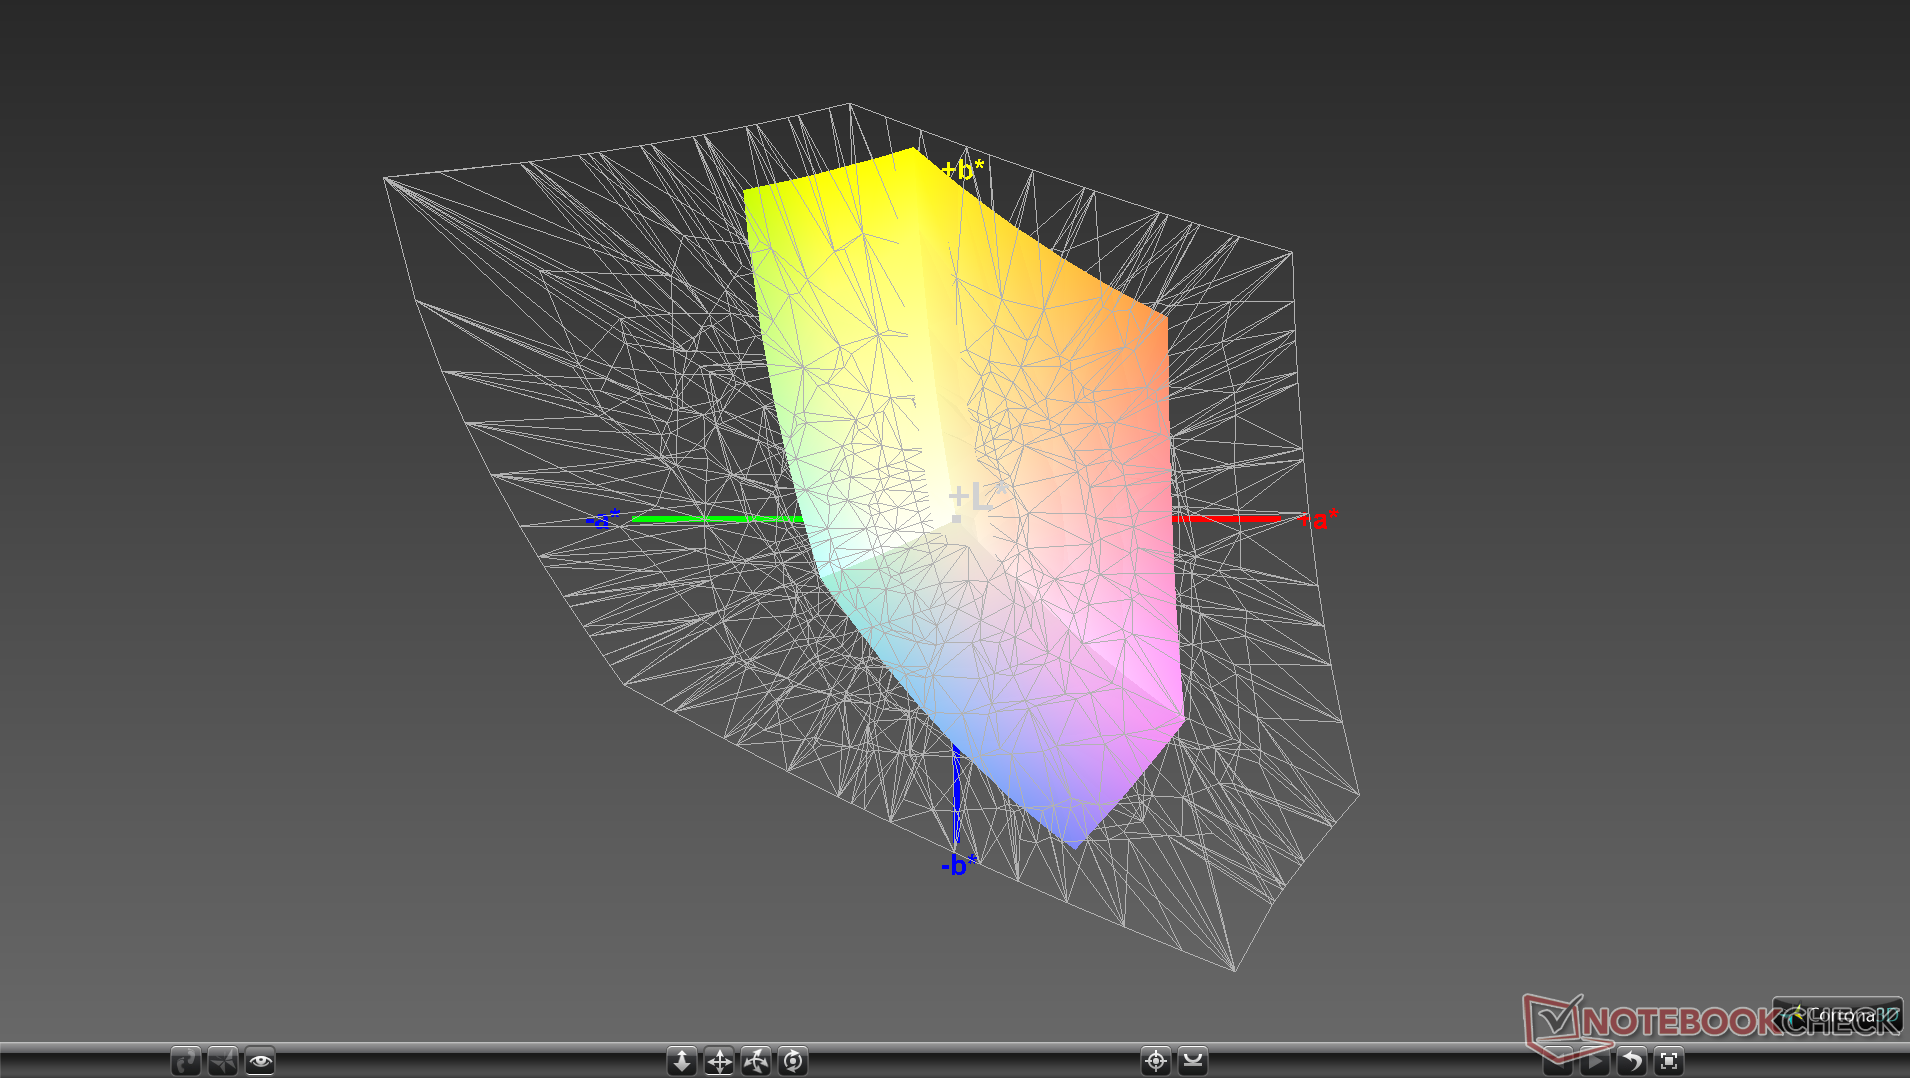
57.8% sRGB (Argyll 1.6.3 3D)
36.7% AdobeRGB 1998 (Argyll 1.6.3 3D)
39.93% AdobeRGB 1998 (Argyll 3D)
58.2% sRGB (Argyll 3D)
38.65% Display P3 (Argyll 3D)
Gamma: 2.15
CCT: 14252 K
| HP Pavilion x360 15-dq0065cl BOE076E, TN LED, 15.6", 1366x768 | Asus VivoBook Flip 15 TP510UA-E8073T AU Optronics B156HAN02.1, IPS, 15.6", 1920x1080 | Lenovo Ideapad C340-15IWL-81N5004QGE BOE CQ NV156FHM-N48, IPS, 15.6", 1920x1080 | HP Envy x360 15-bq102ng Chi Mei CM15E9, IPS, 15.6", 1920x1080 | Dell Inspiron 15 3585 (2300U, Vega 6) BOE0802, TN, 15.6", 1920x1080 | Dell XPS 15 7590 i5 iGPU FHD LQ156M1, IPS, 15.6", 1920x1080 | |
|---|---|---|---|---|---|---|
| Display | 1% | 0% | 7% | 1% | 70% | |
| Display P3 Coverage (%) | 38.65 | 39.19 1% | 39.05 1% | 41.36 7% | 39.22 1% | 66.5 72% |
| sRGB Coverage (%) | 58.2 | 58.9 1% | 57.3 -2% | 62.2 7% | 58.9 1% | 98 68% |
| AdobeRGB 1998 Coverage (%) | 39.93 | 40.49 1% | 40.35 1% | 42.74 7% | 40.52 1% | 68.4 71% |
| Response Times | -25% | -48% | -13% | 33% | -41% | |
| Response Time Grey 50% / Grey 80% * (ms) | 68.8 ? | 44 ? 36% | 57 ? 17% | 40 ? 42% | 39 ? 43% | 52.8 ? 23% |
| Response Time Black / White * (ms) | 15.6 ? | 29 ? -86% | 33 ? -112% | 26 ? -67% | 12 ? 23% | 32 ? -105% |
| PWM Frequency (Hz) | 1000 ? | 352 ? | 25000 ? | 250 ? | 1020 ? | |
| Screen | 71% | 64% | 81% | 13% | 118% | |
| Brightness middle (cd/m²) | 195.7 | 229 17% | 266 36% | 221 13% | 225 15% | 588 200% |
| Brightness (cd/m²) | 186 | 221 19% | 251 35% | 207 11% | 213 15% | 555 198% |
| Brightness Distribution (%) | 88 | 76 -14% | 81 -8% | 87 -1% | 88 0% | 89 1% |
| Black Level * (cd/m²) | 0.68 | 0.15 78% | 0.165 76% | 0.15 78% | 0.535 21% | 0.4 41% |
| Contrast (:1) | 288 | 1527 430% | 1612 460% | 1473 411% | 421 46% | 1470 410% |
| Colorchecker dE 2000 * | 11.99 | 5.03 58% | 6.33 47% | 4.35 64% | 10.37 14% | 2.5 79% |
| Colorchecker dE 2000 max. * | 21.31 | 8.89 58% | 21.03 1% | 8.98 58% | 19.75 7% | 6.3 70% |
| Colorchecker dE 2000 calibrated * | 4.63 | 5.23 -13% | 3.89 16% | 0.6 87% | ||
| Greyscale dE 2000 * | 12.8 | 5.56 57% | 3.81 70% | 3.09 76% | 12.09 6% | 4.5 65% |
| Gamma | 2.15 102% | 2.64 83% | 2.38 92% | 2.23 99% | 2.72 81% | 2.2 100% |
| CCT | 14252 46% | 7015 93% | 6057 107% | 6068 107% | 13335 49% | 6836 95% |
| Color Space (Percent of AdobeRGB 1998) (%) | 36.7 | 37 1% | 37 1% | 56 53% | 37 1% | 63.2 72% |
| Color Space (Percent of sRGB) (%) | 57.8 | 59 2% | 57 -1% | 86 49% | 59 2% | 98 70% |
| Toplam Ortalama (Program / Ayarlar) | 16% /
44% | 5% /
38% | 25% /
54% | 16% /
13% | 49% /
89% |
* ... daha küçük daha iyidir
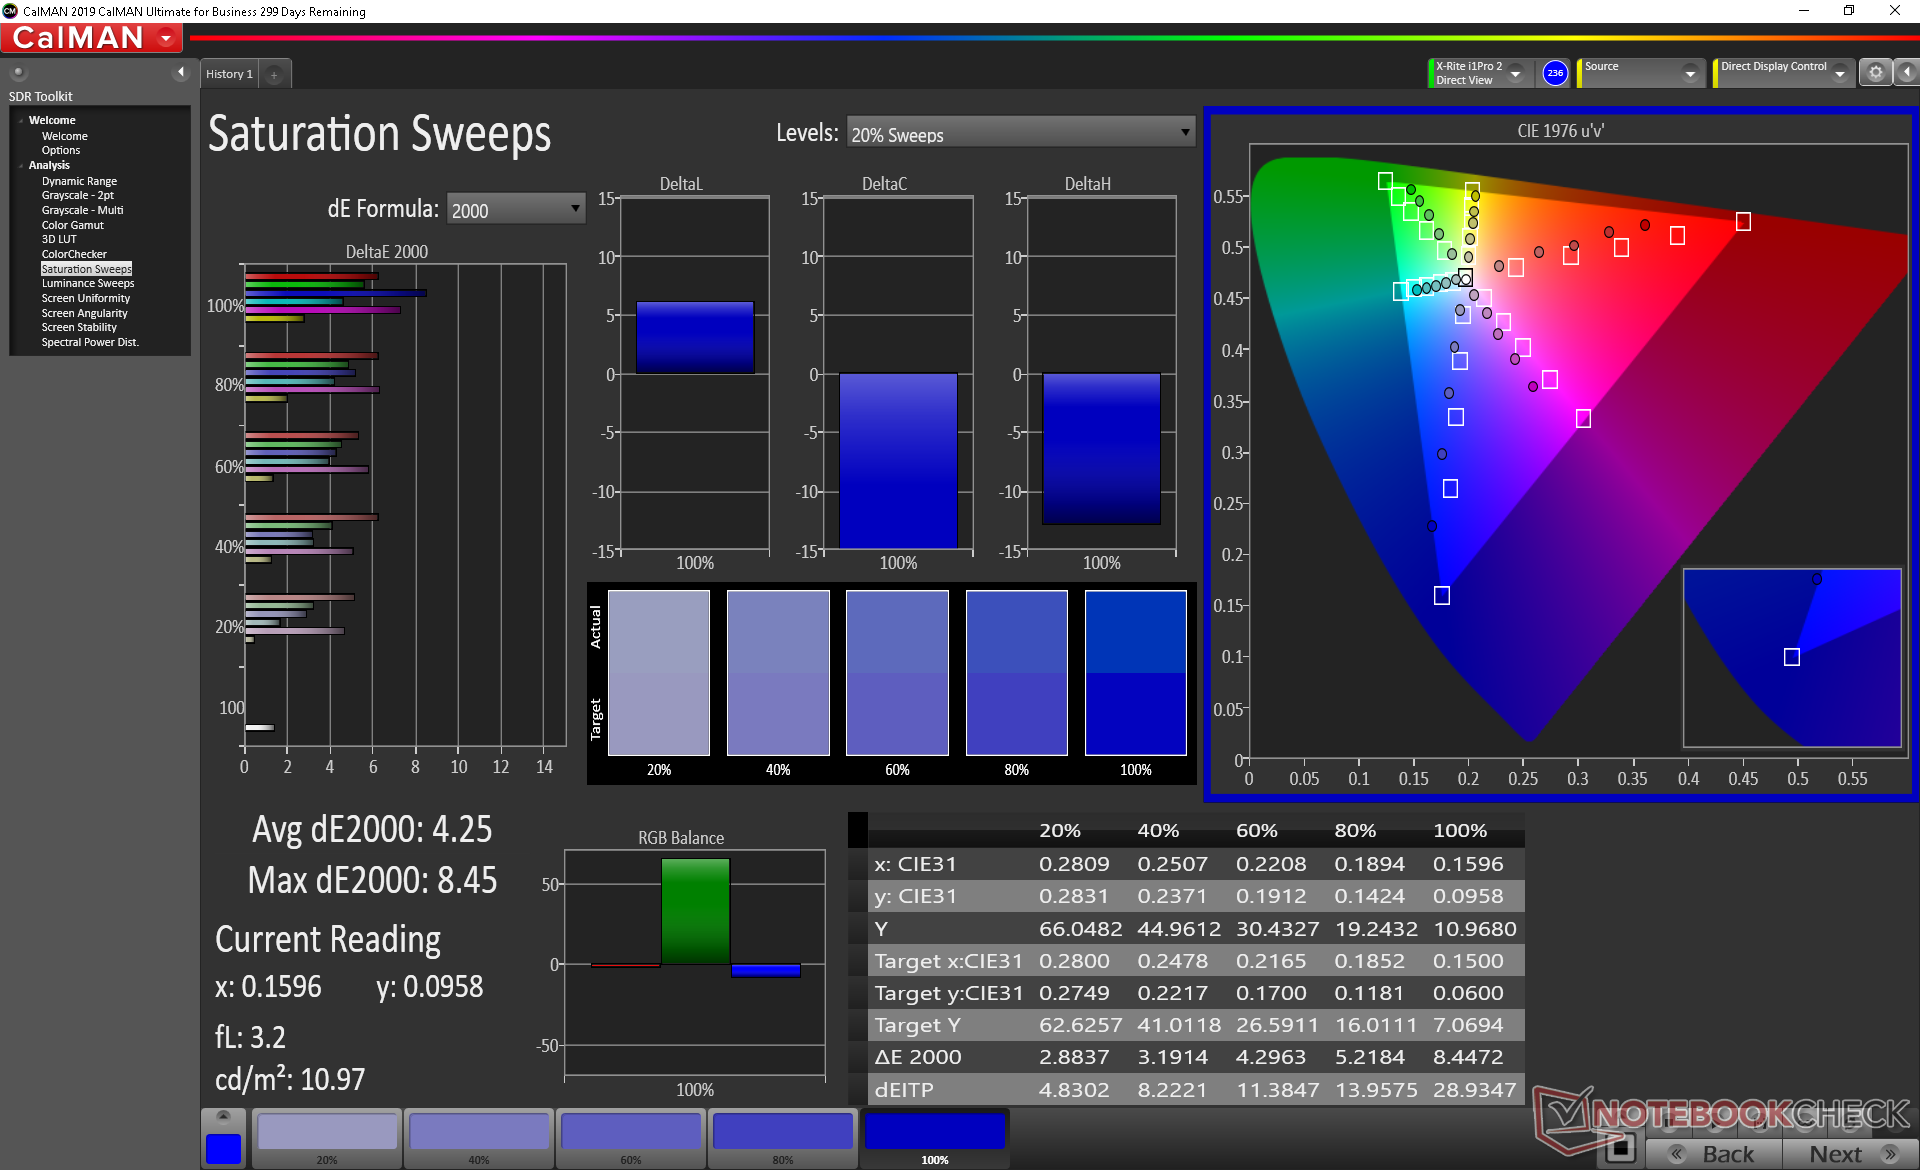
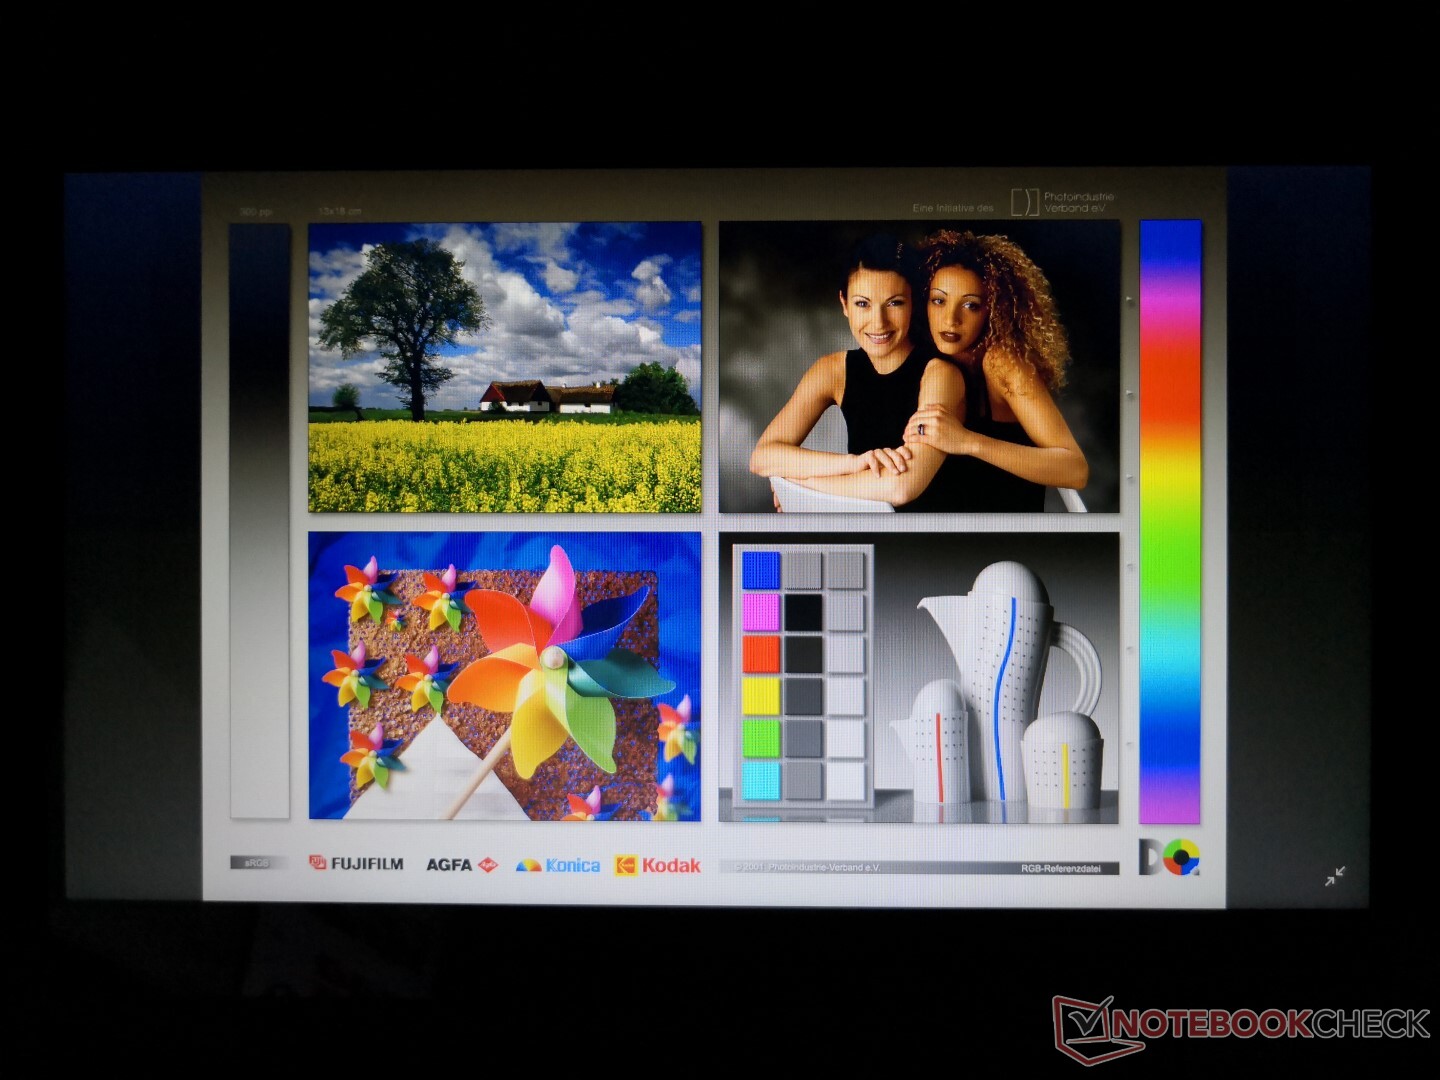
Renk alanı, bütçe panelini göstermek için sırasıyla AdobeRGB ve sRGB'nin sadece yüzde 37'sinde ve yüzde 58'inde dar. Bu sonuçlar, yukarıdaki sığ renkler hakkındaki öznel analizimizi doğrulamaktadır. Buna karşılık, neredeyse tüm üst düzey Ultrabook'lardaki ekranlar daha derin ve daha doğru renkler için tipik olarak sRGB'nin yüzde 90'ından fazlasını kaplar.
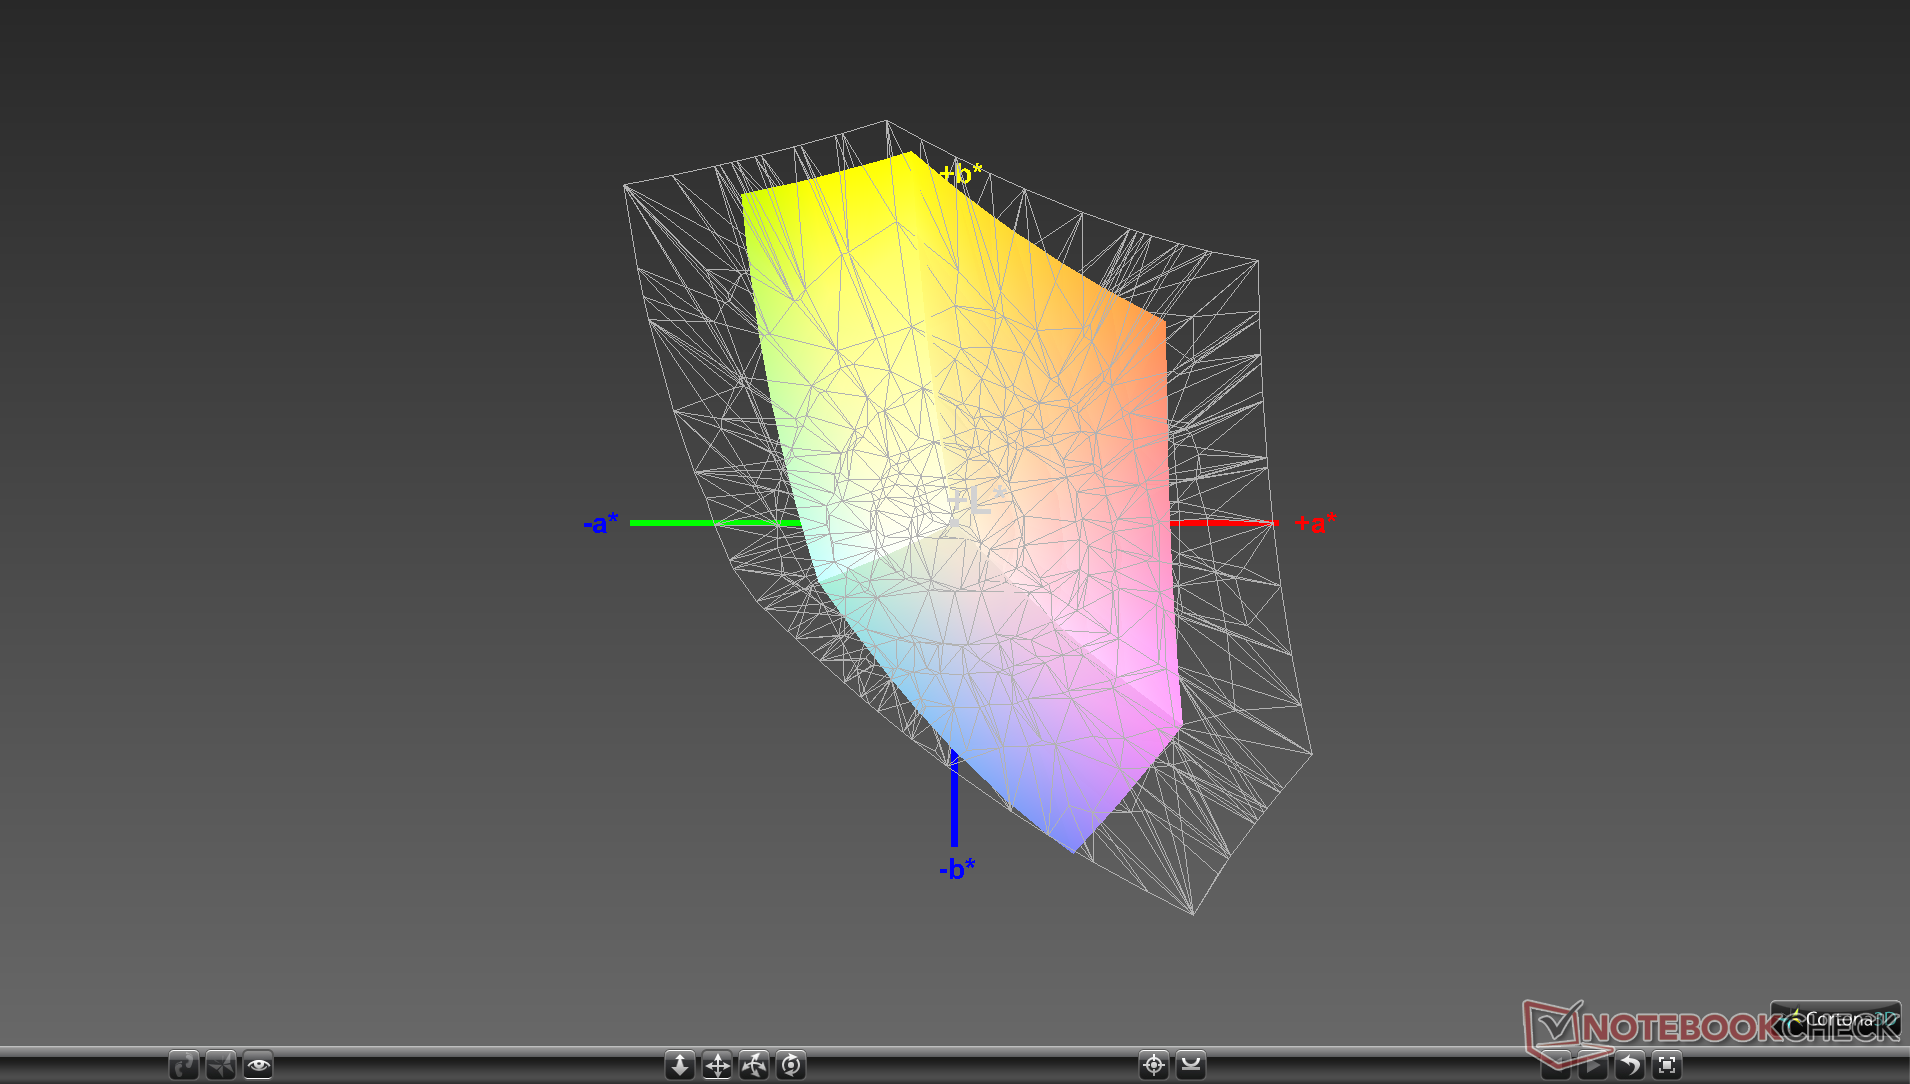
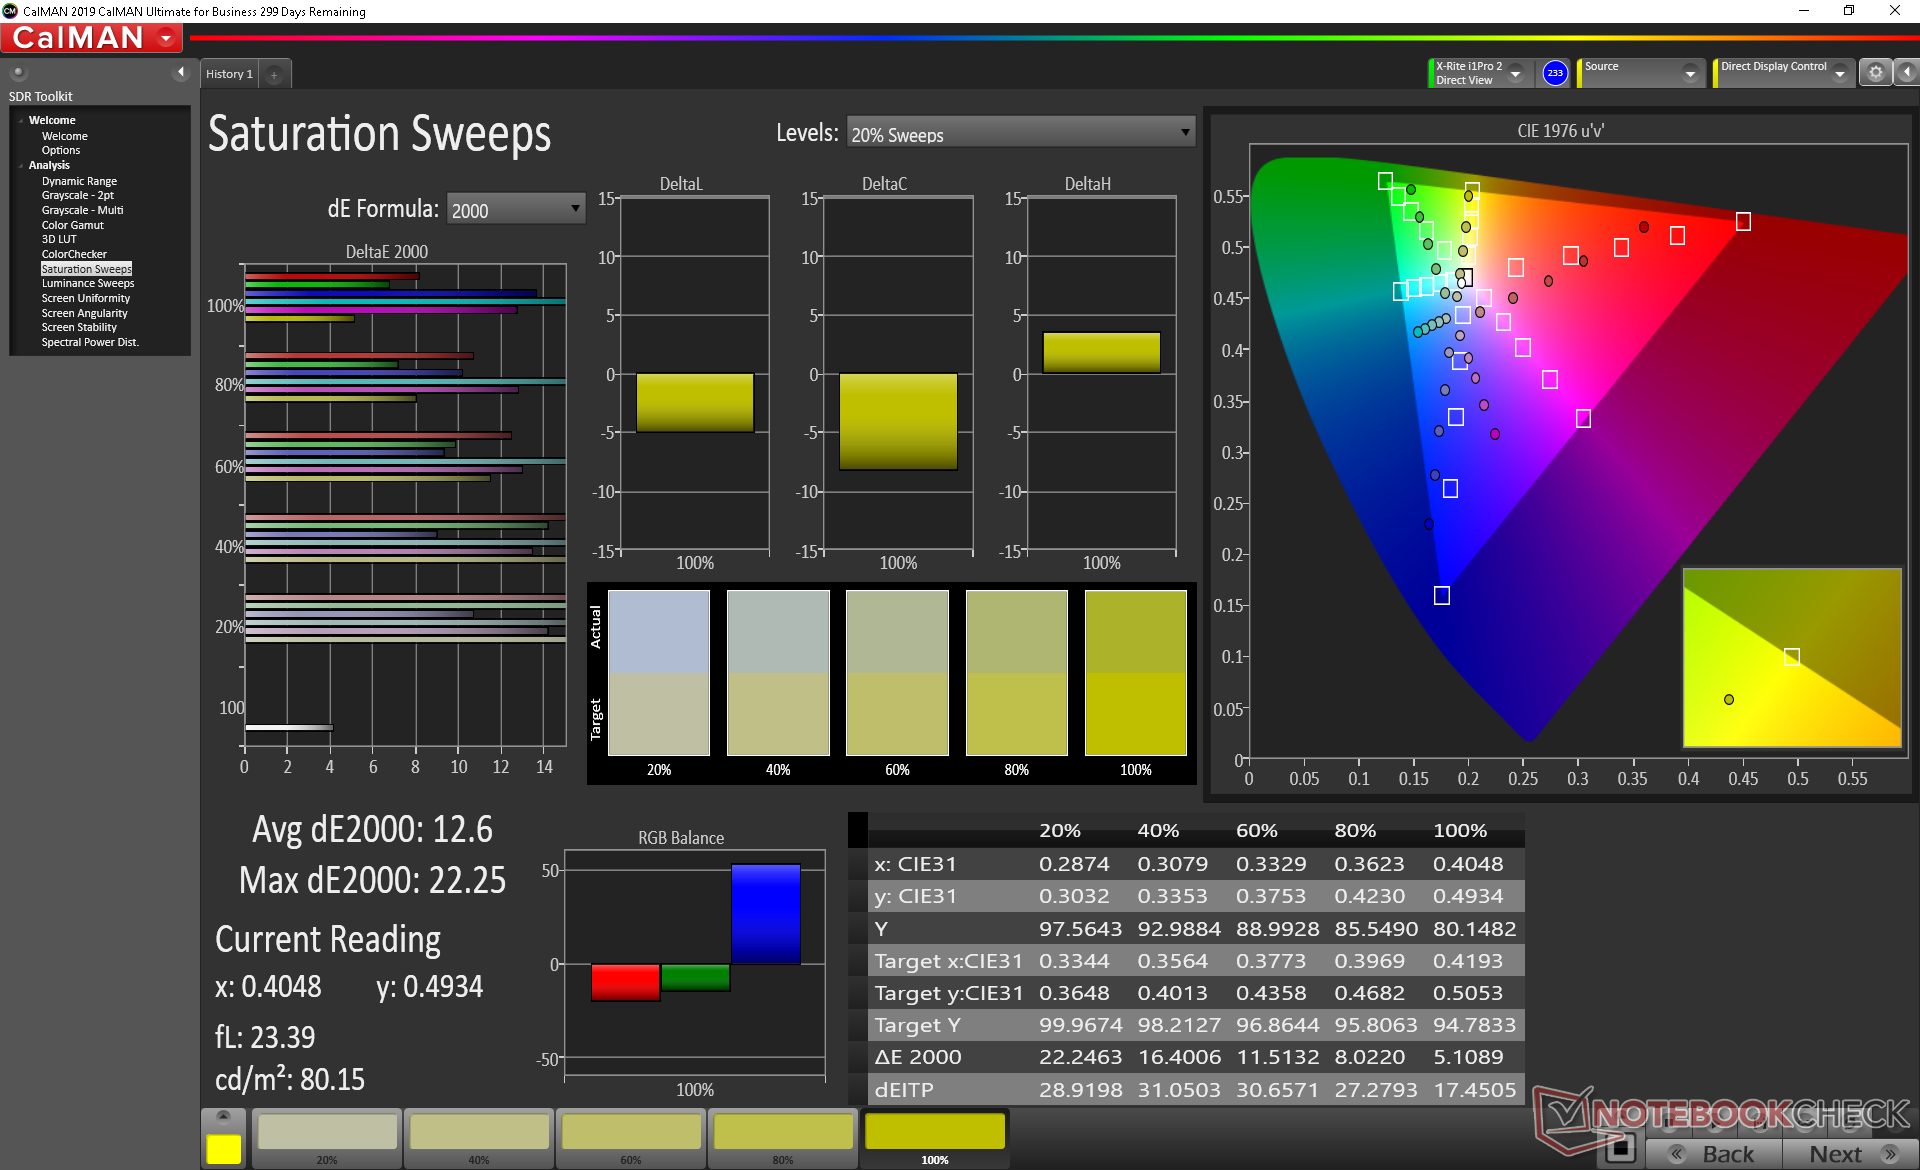
Şaşırtıcı olmayan bir şekilde, bir X-Rite kolorimetresi ile yapılan diğer ölçümler çok yanlış bir paneli ortaya çıkarır. Renk sıcaklığı çok soğuk ve bu nedenle renkler özellikle düşük doygunluk seviyelerinde çok kapalı. Panel kendimiz kalibre edildikten sonra renkler önemli ölçüde gelişir, ancak bu tür sınırlı siyah seviyeleri ve renk üretimi ile çok şey yapabilirsiniz.
Yanıt Sürelerini Görüntüle
| ↔ Tepki Süresi Siyahtan Beyaza | ||
|---|---|---|
| 15.6 ms ... yükseliş ↗ ve sonbahar↘ birleşimi | ↗ 9.2 ms yükseliş | 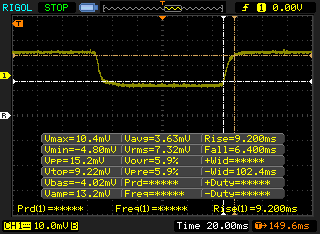 |
| ↘ 6.4 ms sonbahar | ||
| Ekran, testlerimizde iyi yanıt oranları gösteriyor ancak rekabetçi oyuncular için çok yavaş olabilir. Karşılaştırıldığında, test edilen tüm cihazlar 0.1 (minimum) ile 240 (maksimum) ms arasında değişir. » Tüm cihazların 37 %'si daha iyi. Bu, ölçülen yanıt süresinin test edilen tüm cihazların ortalamasından (19.8 ms) daha iyi olduğu anlamına gelir. | ||
| ↔ Tepki Süresi %50 Griden %80 Griye | ||
| 68.8 ms ... yükseliş ↗ ve sonbahar↘ birleşimi | ↗ 30 ms yükseliş | 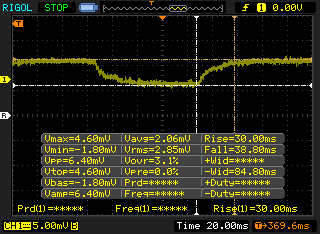 |
| ↘ 38.8 ms sonbahar | ||
| Ekran, testlerimizde yavaş yanıt oranları gösteriyor ve oyuncular için yetersiz olacaktır. Karşılaştırıldığında, test edilen tüm cihazlar 0.165 (minimum) ile 636 (maksimum) ms arasında değişir. » Tüm cihazların 98 %'si daha iyi. Bu, ölçülen yanıt süresinin test edilen tüm cihazların ortalamasından (31 ms) daha kötü olduğu anlamına gelir. | ||
Ekran Titremesi / PWM (Darbe Genişliği Modülasyonu)
| Ekran titriyor / PWM algılandı | 1000 Hz | ≤ 99 % parlaklık ayarı | 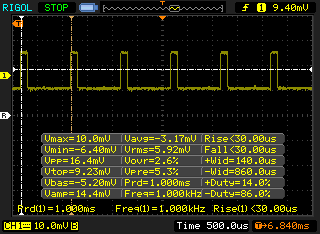 |
Ekran arka ışığı 1000 Hz'de titriyor (en kötü durum, örneğin PWM kullanılması) 99 % ve altındaki parlaklık ayarında titreme algılandı. Bu parlaklık ayarının üzerinde titreme veya PWM olmamalıdır. 1000 Hz frekansı oldukça yüksektir, bu nedenle PWM'ye duyarlı çoğu kullanıcı herhangi bir titremeyi fark etmemelidir. Karşılaştırıldığında: Test edilen tüm cihazların %52 %'si ekranı karartmak için PWM kullanmıyor. PWM tespit edilirse, ortalama 7781 (minimum: 5 - maksimum: 343500) Hz ölçüldü. | |||
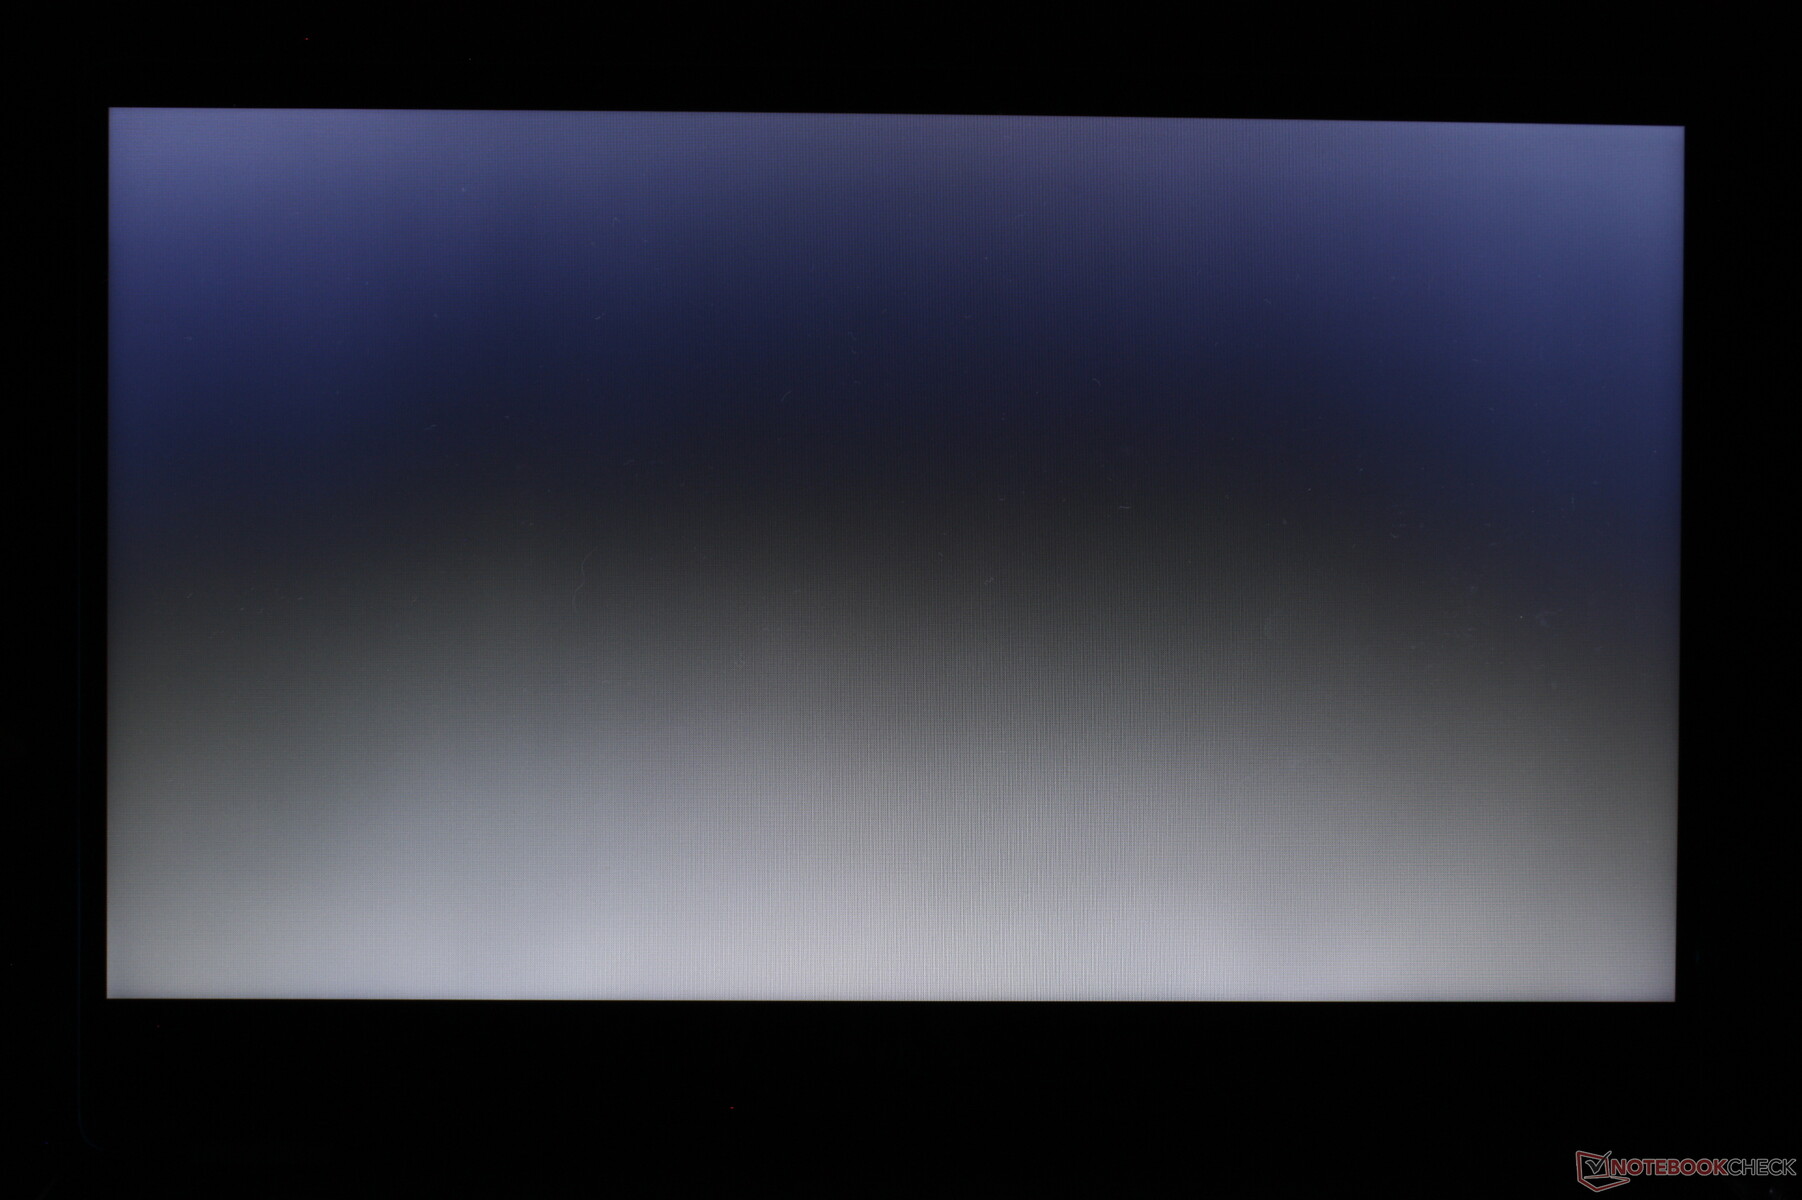
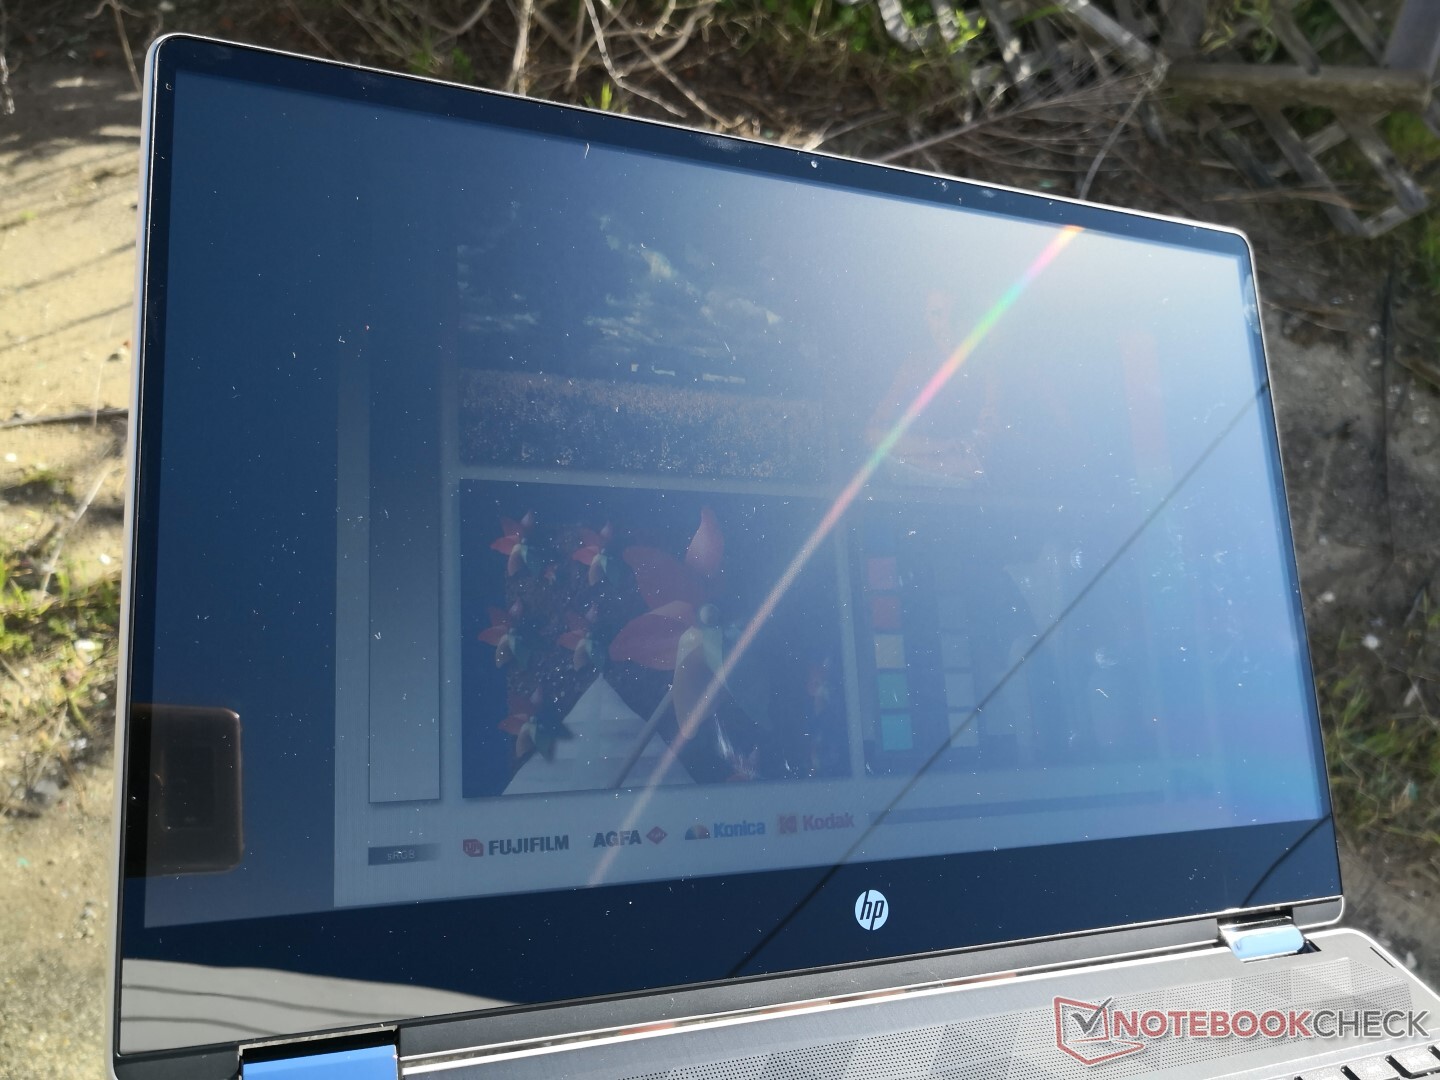
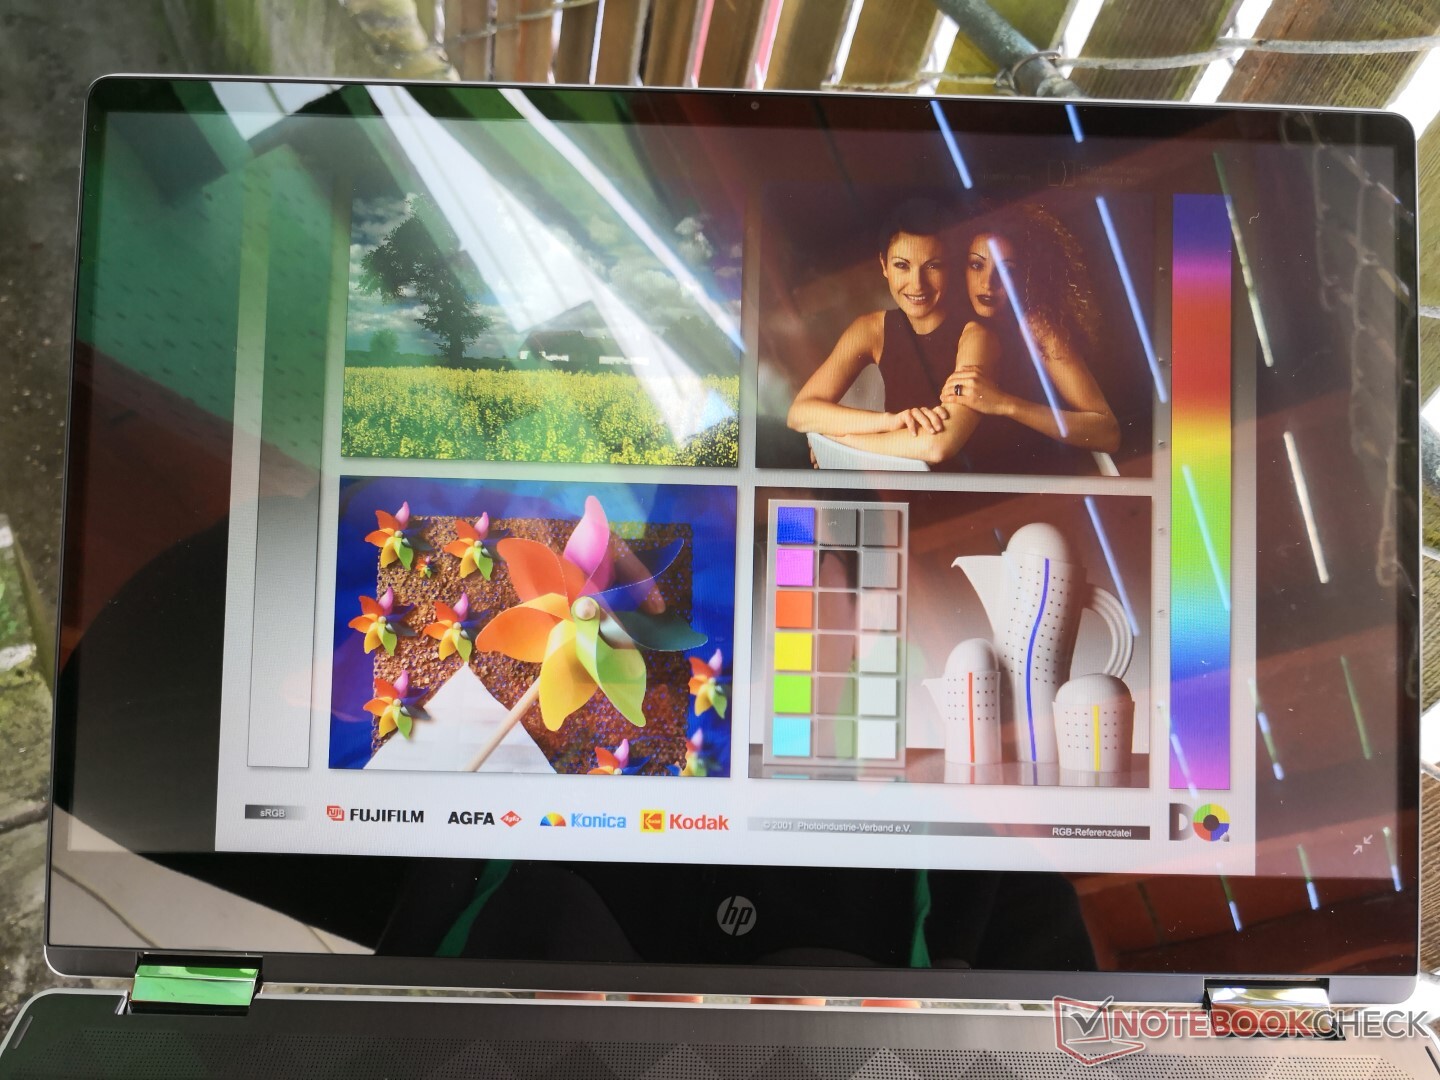
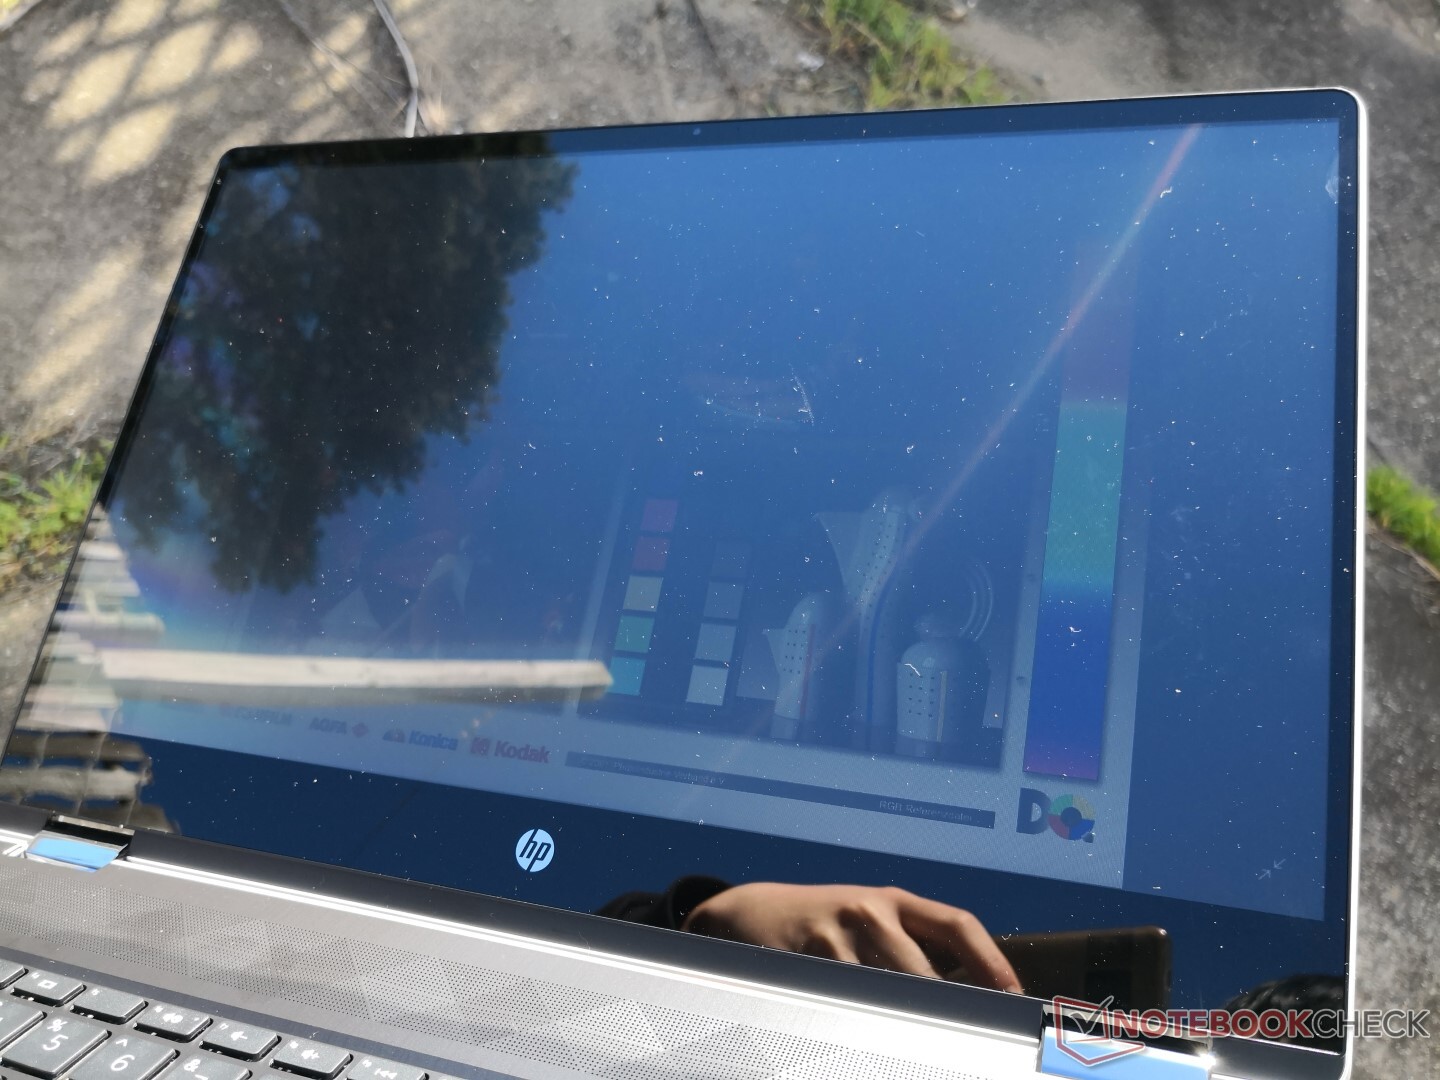
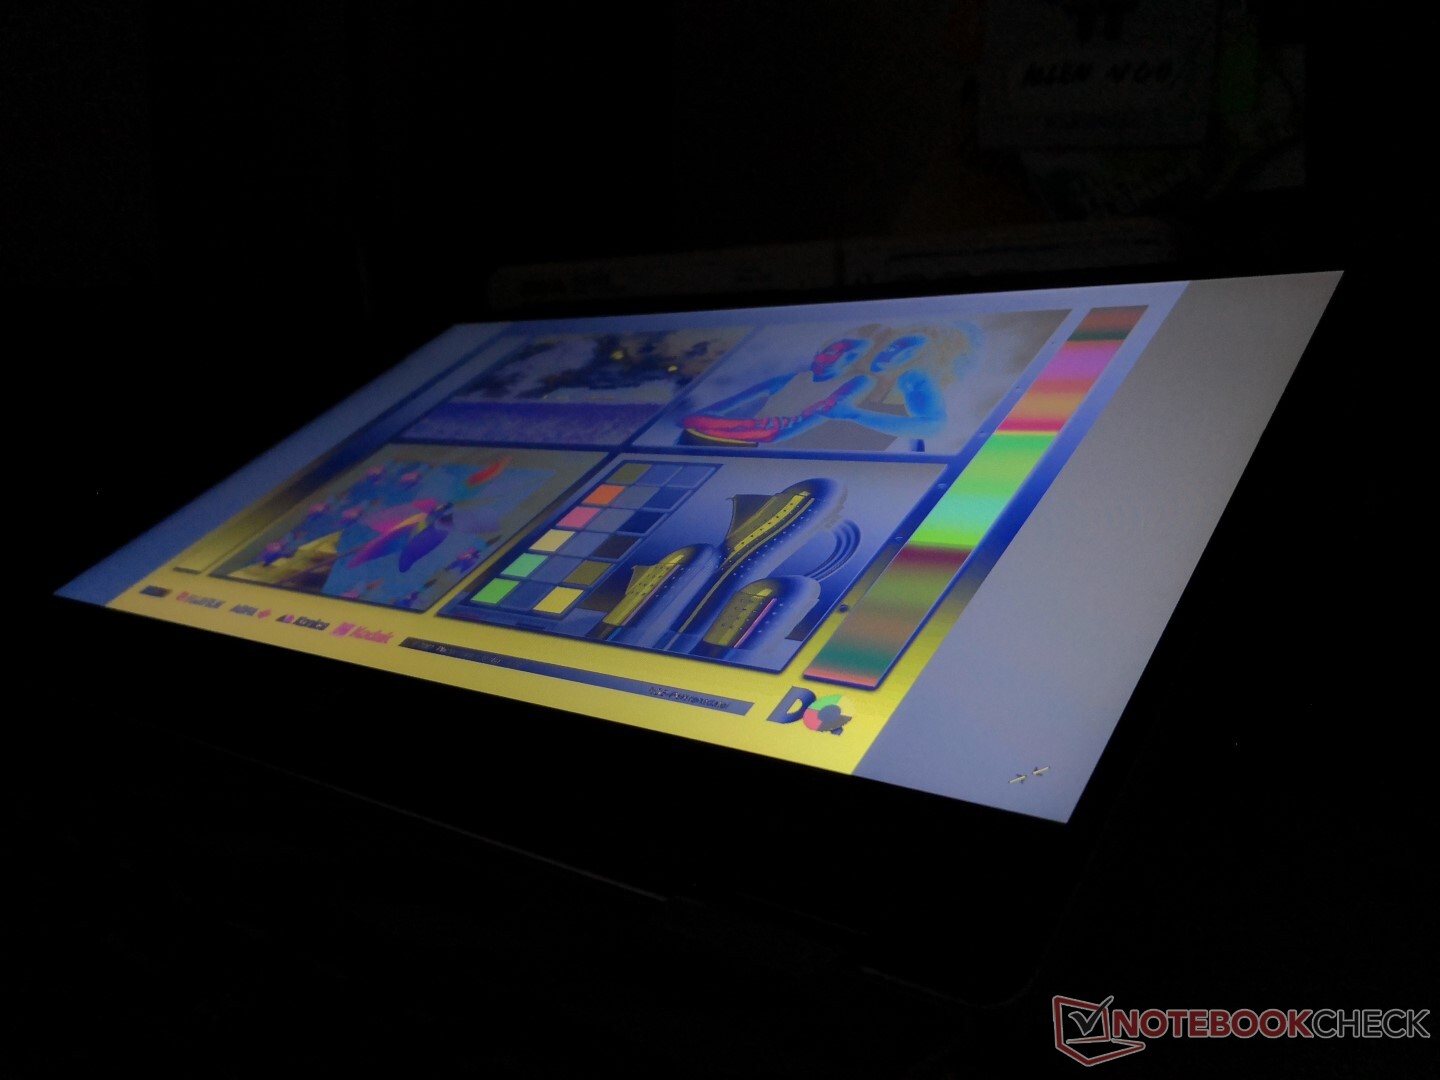
Dış mekan görünürlüğü ortalamanın çok altında. Loş bir arka ışık, parlak ekran ve zayıf TN görüntüleme açılarının kombinasyonu, gölgede bile hoş olmayan bir deneyim sağlar. 2'si 1 arada form faktörü nedeniyle bu özel dönüştürülebilir mekanı kullanmaya cazip gelebilirsiniz, ancak Pavilion serisi çoğunlukla iç mekan koşulları için tasarlanmıştır.
Verim
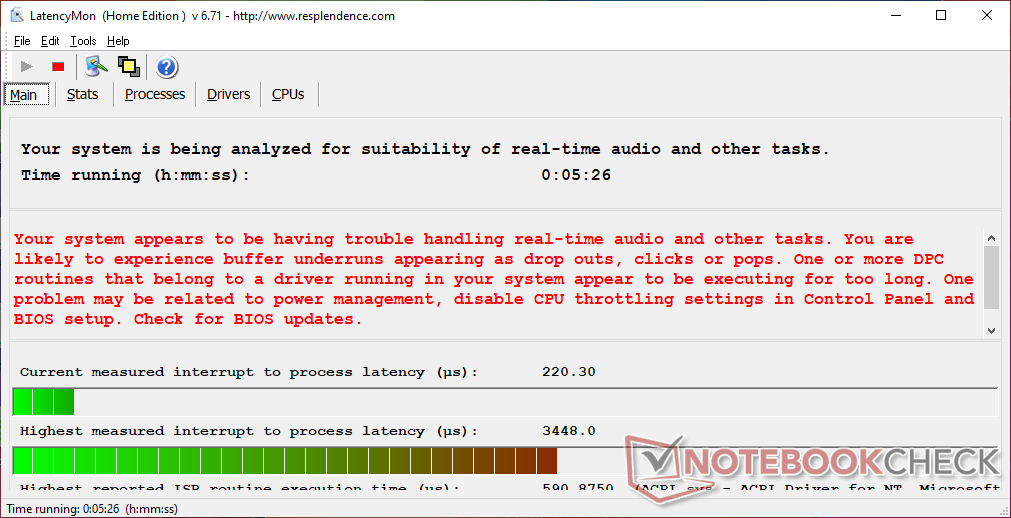
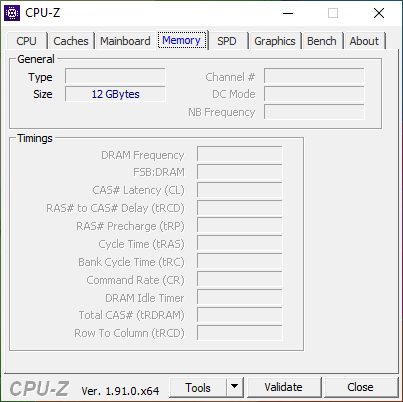
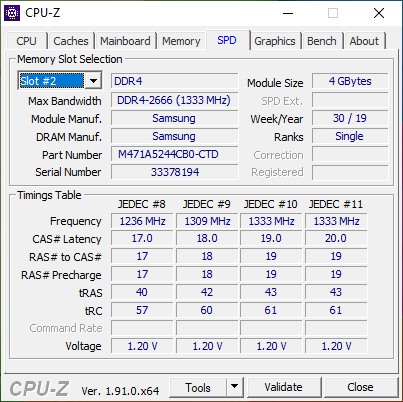
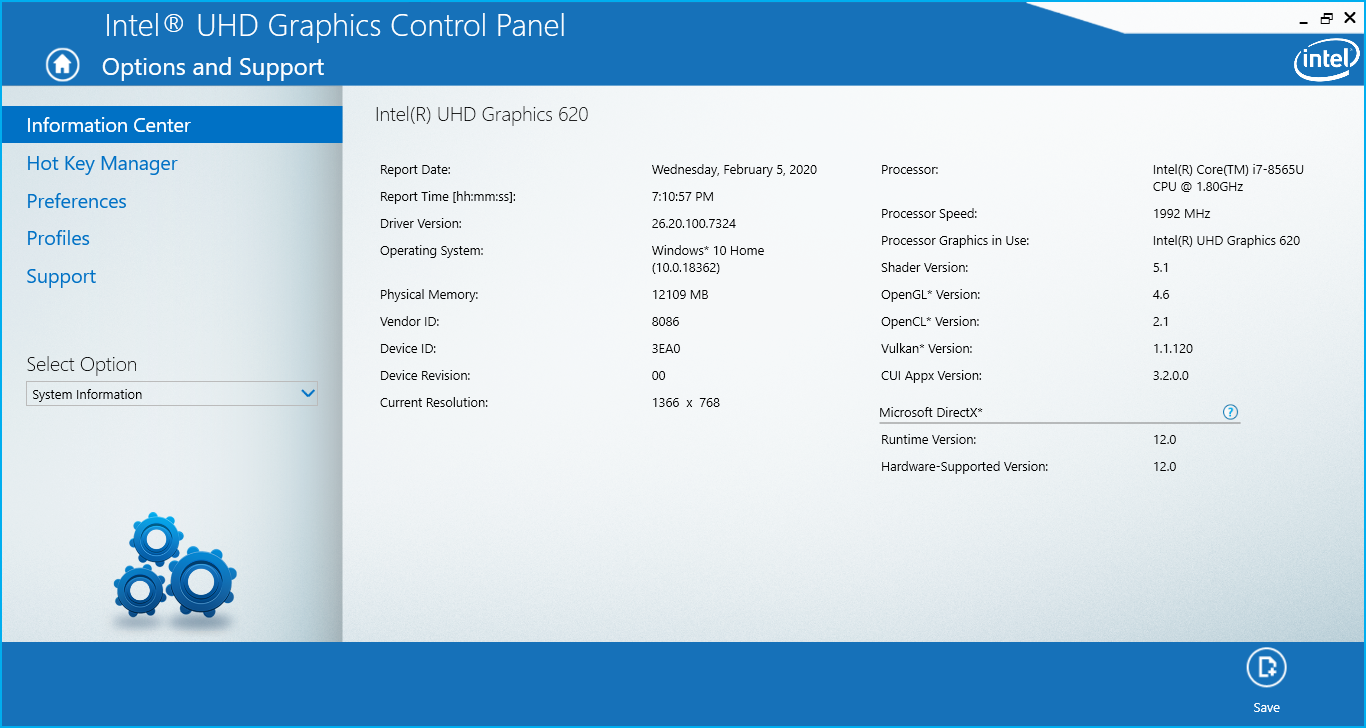
Tüm SKU'lar U sınıfı Core i3 - Core i7 CPU'larla birlikte gelir ve bazıları Radeon 535 grafikleriyle bile yapılandırılabilir. Bununla birlikte, genel performans hafif ila hafif-orta iş yüklerini ve web'de gezinme ve video akışı gibi çoklu görevleri hedefler. Aynı Core i7-8565U CPU'nun, kabaca benzer bir işlemci performansı düzeyi için HP'nin üst düzey Spectre serisinde de bulunabileceğini unutmayın.LatencyMon, kablosuz etkinleştirildiğinde bile DPC gecikme sorunlarını gösterir. RAM, iki SODIMM yuvasında 16 GB'a kadar genişletilebilir.
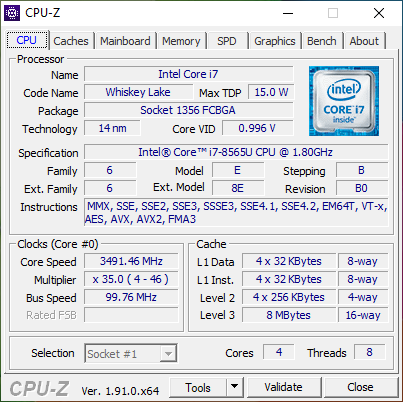
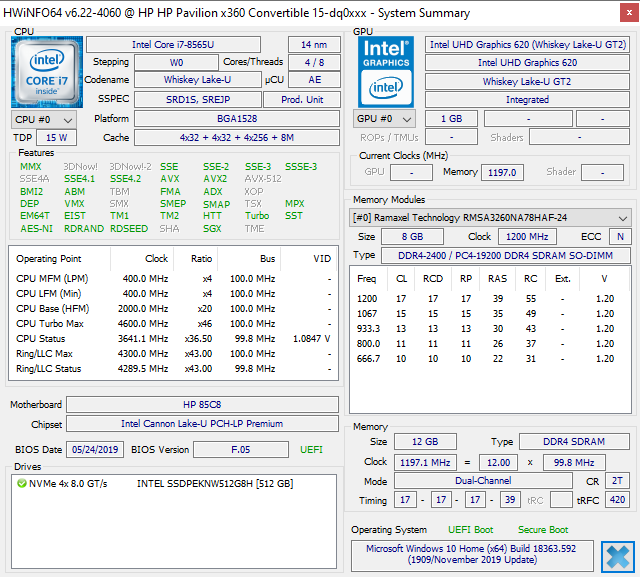
İşlemci
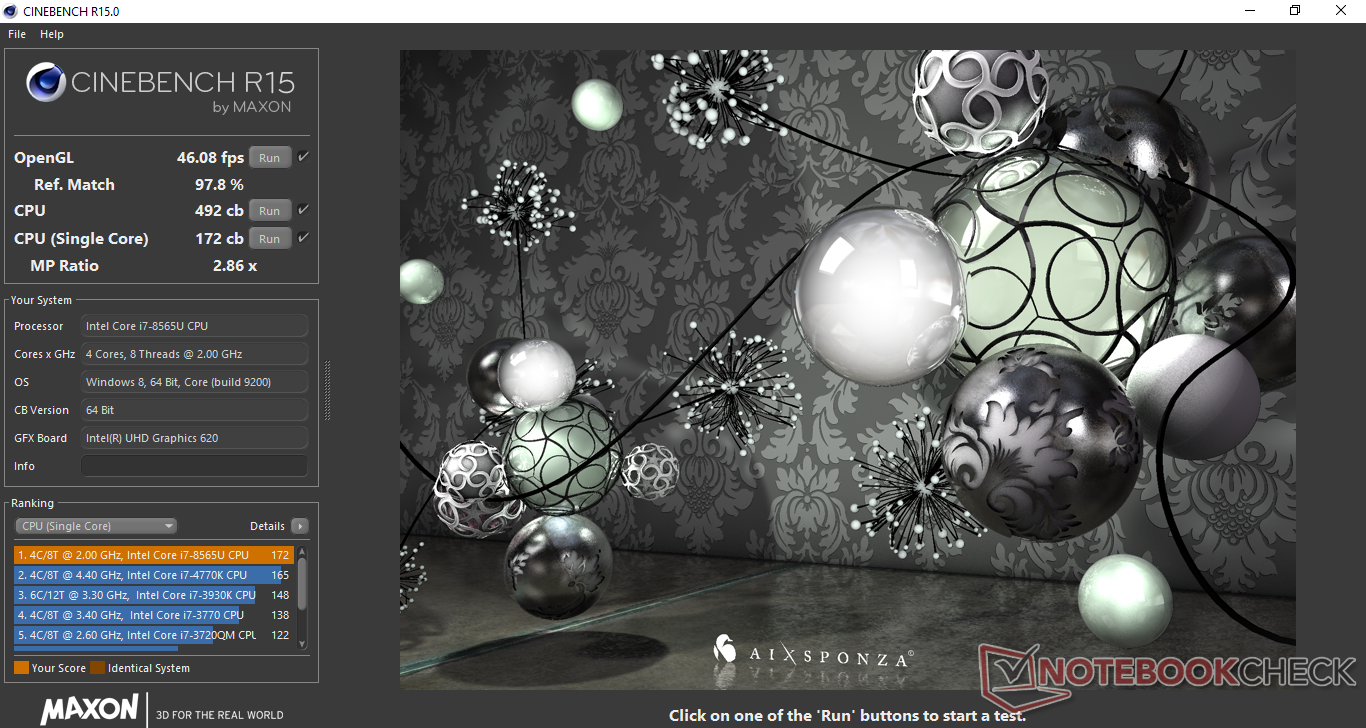
Ham çok iş parçacığı performansı, aynı işlemciye sahip diğer 50 dizüstü bilgisayardan alınan veritabanımızdaki ortalama Core i7-8565U'dan yaklaşık yüzde 9 ila 16 daha yavaştır. Spectre x360 13'teki i7-8565U, Pavilion'umuzdan daha hızlı çalışır. Açı, Pavilion Cabrio'daki CPU'nun neredeyse yok olan Turbo Boost potansiyeline kısmen atfedilebilir. Örneğin, CineBench R15 Multi-Thread'ı bir döngüde çalıştırırken, diğer tüm dizüstü bilgisayarlarda normalde göreceğimiz saat hızında başlangıç artışı olmadan son puanlar çalışma boyunca sabit kalır. Kullanıcılar, eski Kaby Lake ile aynı işlemci performansını bekleyebilirler. -R Core i7-8550U, Dell Latitude 5495'teki Ryzen 7 2700U'dan daha yavaştır.Daha fazla teknik bilgi ve karşılaştırma karşılaştırmaları için Core i7-8565U üzerindeki özel sayfamıza bakın.
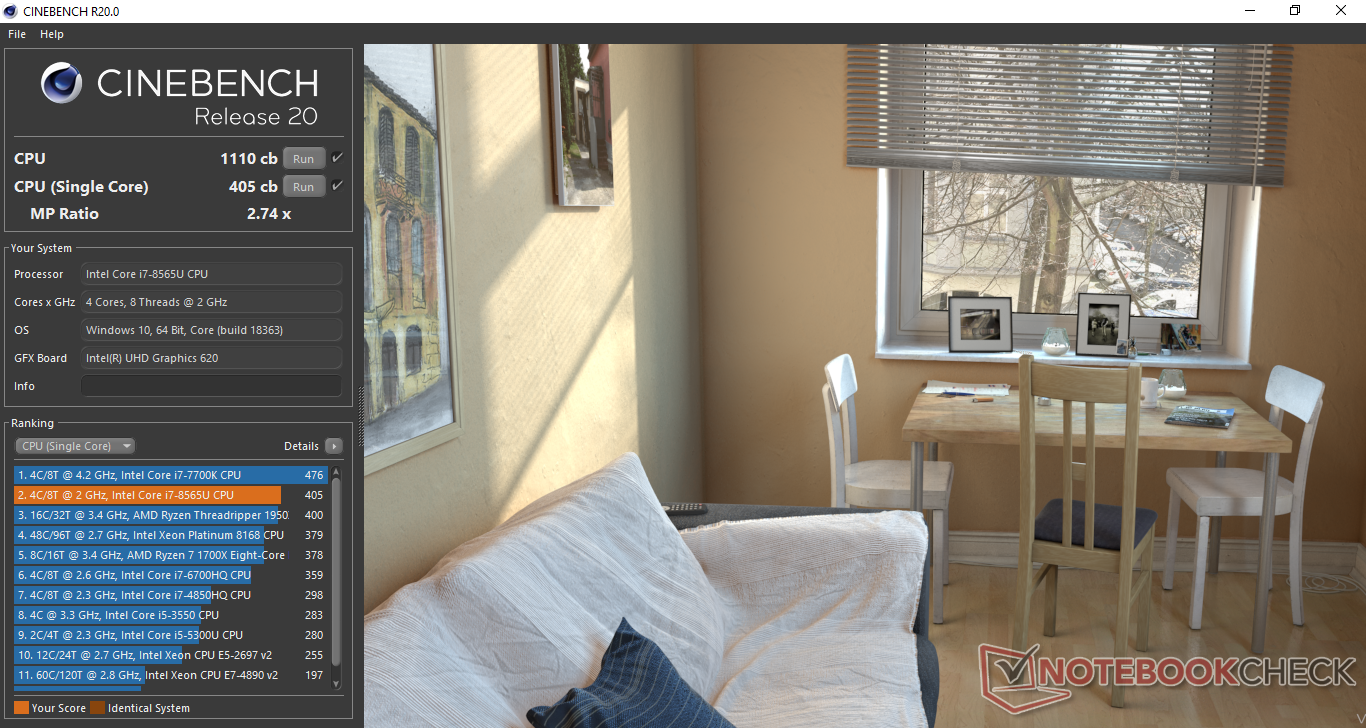
| Cinebench R20 | |
| CPU (Multi Core) | |
| Dell XPS 13 7390 Core i7-10710U | |
| MSI Modern 15 A10RB | |
| Microsoft Surface Laptop 3 15 i7-1065G7 | |
| MSI GF63 Thin 9SC | |
| Dell Inspiron 15 5000 5585 | |
| Dell Latitude 14 5495 | |
| Ortalama Intel Core i7-8565U (954 - 1645, n=20) | |
| MSI Modern 14 A10RB-459US | |
| Dynabook Portege A30-E-174 | |
| Dell Latitude 13 3390 | |
| HP Pavilion x360 15-dq0065cl | |
| CPU (Single Core) | |
| MSI Modern 15 A10RB | |
| Dell XPS 13 7390 Core i7-10710U | |
| Microsoft Surface Laptop 3 15 i7-1065G7 | |
| MSI Modern 14 A10RB-459US | |
| MSI GF63 Thin 9SC | |
| Ortalama Intel Core i7-8565U (342 - 472, n=20) | |
| HP Pavilion x360 15-dq0065cl | |
| Dynabook Portege A30-E-174 | |
| Dell Latitude 14 5495 | |
| Dell Latitude 13 3390 | |
| Dell Inspiron 15 5000 5585 | |
| Cinebench R15 | |
| CPU Single 64Bit | |
| MSI Modern 15 A10RB | |
| Microsoft Surface Laptop 3 15 i7-1065G7 | |
| Dell XPS 13 7390 Core i7-10710U | |
| MSI GF63 Thin 9SC | |
| Ortalama Intel Core i7-8565U (138.3 - 193, n=51) | |
| HP Pavilion x360 15-dq0065cl | |
| MSI Modern 14 A10RB-459US | |
| Dynabook Portege A30-E-174 | |
| Dell Latitude 14 5495 | |
| Lenovo Legion Y520-15IKBA-80WY001VGE | |
| Dell Latitude 13 3390 | |
| Dell Inspiron 15 5000 5585 | |
| CPU Multi 64Bit | |
| Dell XPS 13 7390 Core i7-10710U | |
| MSI Modern 15 A10RB | |
| MSI GF63 Thin 9SC | |
| Microsoft Surface Laptop 3 15 i7-1065G7 | |
| Dell Inspiron 15 5000 5585 | |
| Dell Latitude 14 5495 | |
| Ortalama Intel Core i7-8565U (452 - 815, n=52) | |
| MSI Modern 14 A10RB-459US | |
| Dell Latitude 13 3390 | |
| Lenovo Legion Y520-15IKBA-80WY001VGE | |
| Dynabook Portege A30-E-174 | |
| HP Pavilion x360 15-dq0065cl | |
| Cinebench R11.5 | |
| CPU Single 64Bit | |
| Dell XPS 13 7390 Core i7-10710U | |
| Ortalama Intel Core i7-8565U (0.65 - 2.16, n=11) | |
| Dell Latitude 13 3390 | |
| Dell Inspiron 15 5000 5585 | |
| CPU Multi 64Bit | |
| Dell XPS 13 7390 Core i7-10710U | |
| Dell Inspiron 15 5000 5585 | |
| Ortalama Intel Core i7-8565U (4.09 - 7.4, n=11) | |
| Dell Latitude 13 3390 | |
| Cinebench R10 | |
| Rendering Multiple CPUs 32Bit | |
| Dell XPS 13 7390 Core i7-10710U | |
| Ortalama Intel Core i7-8565U (13806 - 23118, n=16) | |
| Dynabook Portege A30-E-174 | |
| Rendering Single 32Bit | |
| Dell XPS 13 7390 Core i7-10710U | |
| Ortalama Intel Core i7-8565U (2682 - 8906, n=16) | |
| Dynabook Portege A30-E-174 | |
| wPrime 2.10 - 1024m | |
| Ortalama Intel Core i7-8565U (263 - 420, n=7) | |
| Dell XPS 13 7390 Core i7-10710U | |
* ... daha küçük daha iyidir
Sistem performansı
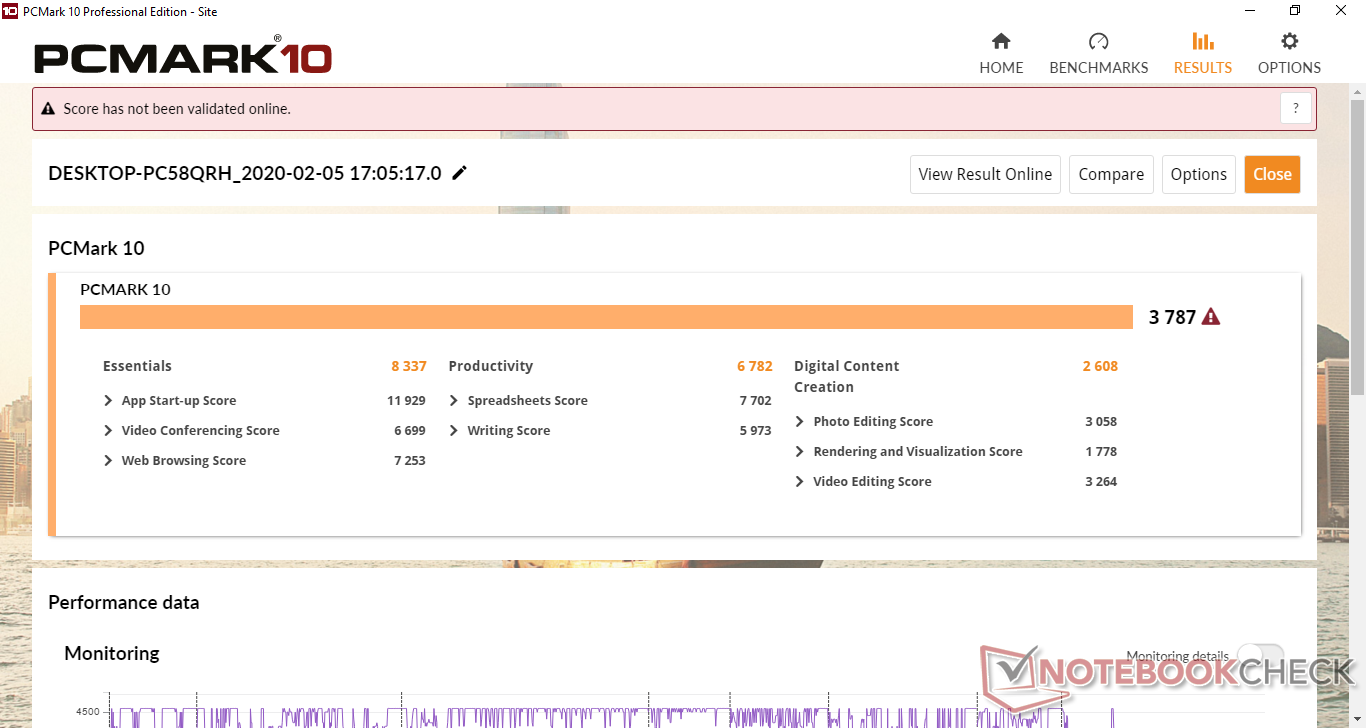
PCMark sonuçları, aynı Core i7 CPU'ya ve entegre UHD Graphics 620 GPU'ya sahip diğer dizüstü bilgisayarlarla karşılaştırıldığında olmasını beklediğimiz yerdir. Dijital İçerik Oluşturma Puanı özellikle zayıftır, çünkü bu kesinlikle herhangi bir grafik veya düzenleme işi için kullanılacak dizüstü bilgisayar değildir.
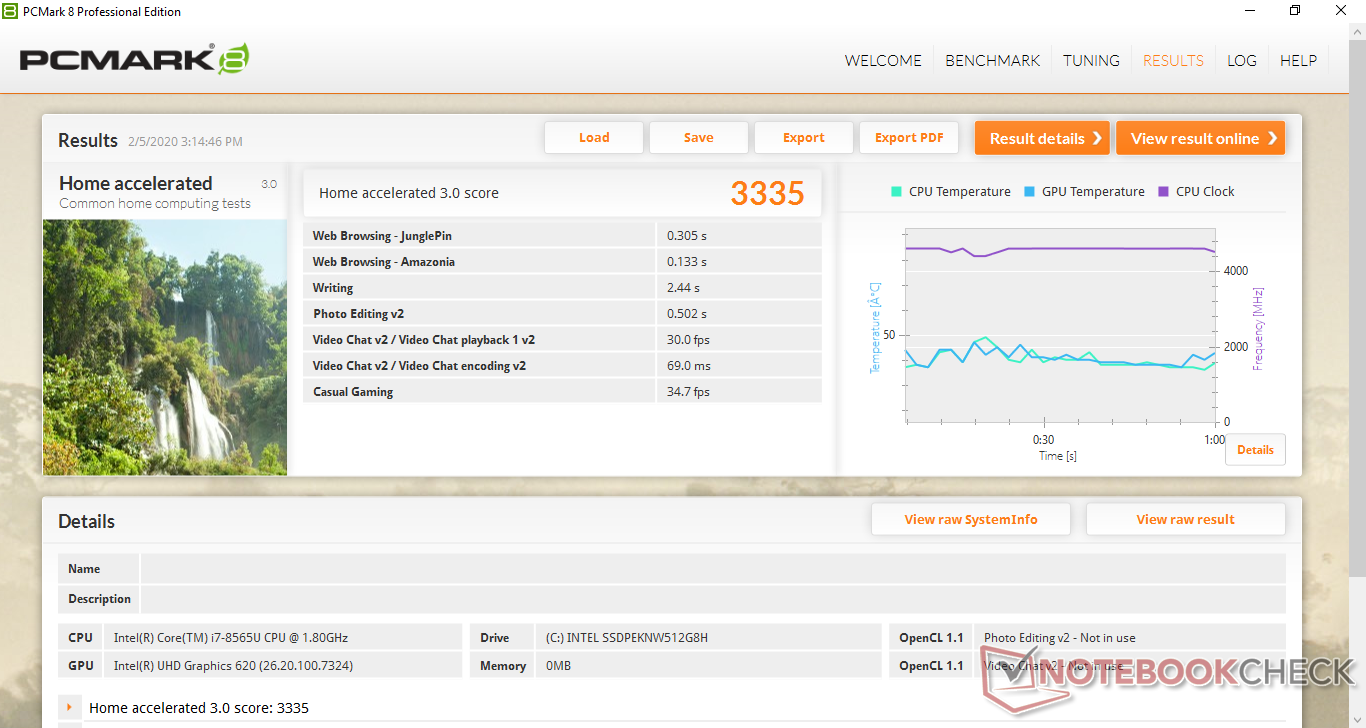
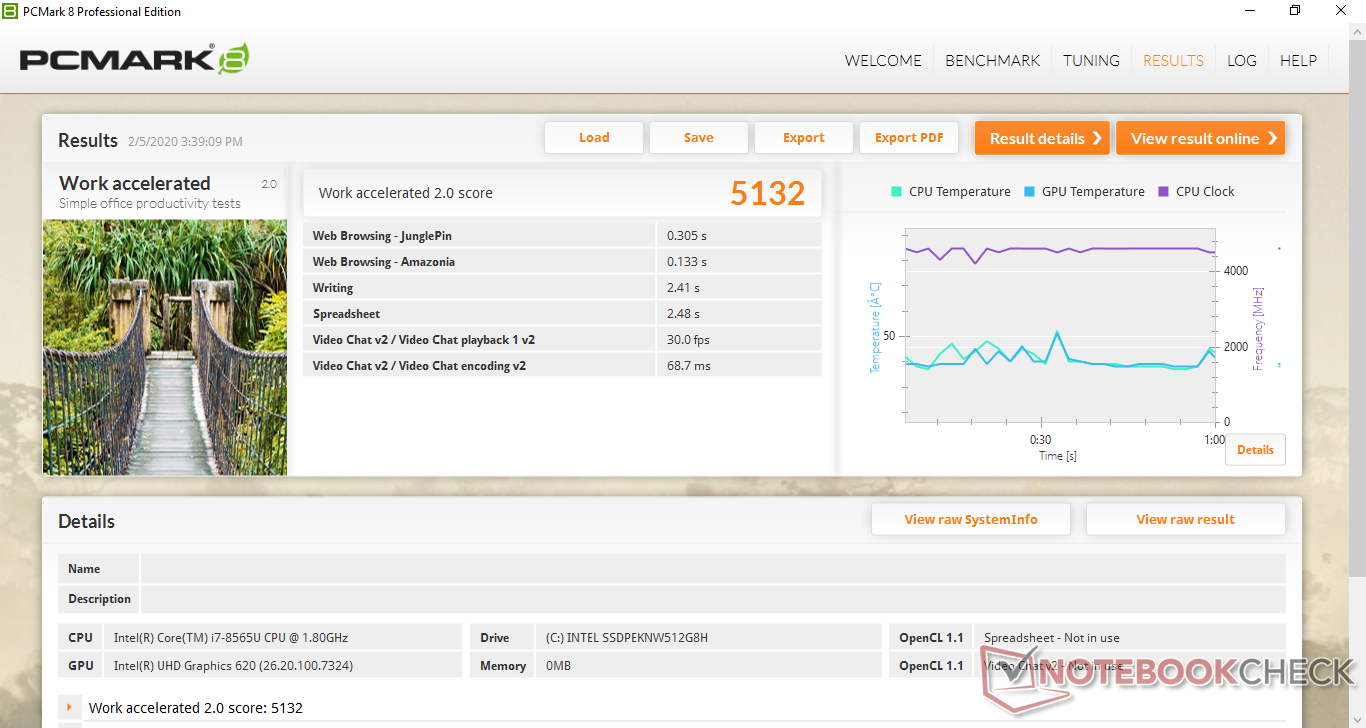
| PCMark 8 Home Score Accelerated v2 | 3335 puan | |
| PCMark 8 Work Score Accelerated v2 | 5132 puan | |
| PCMark 10 Score | 3787 puan | |
Yardım | ||
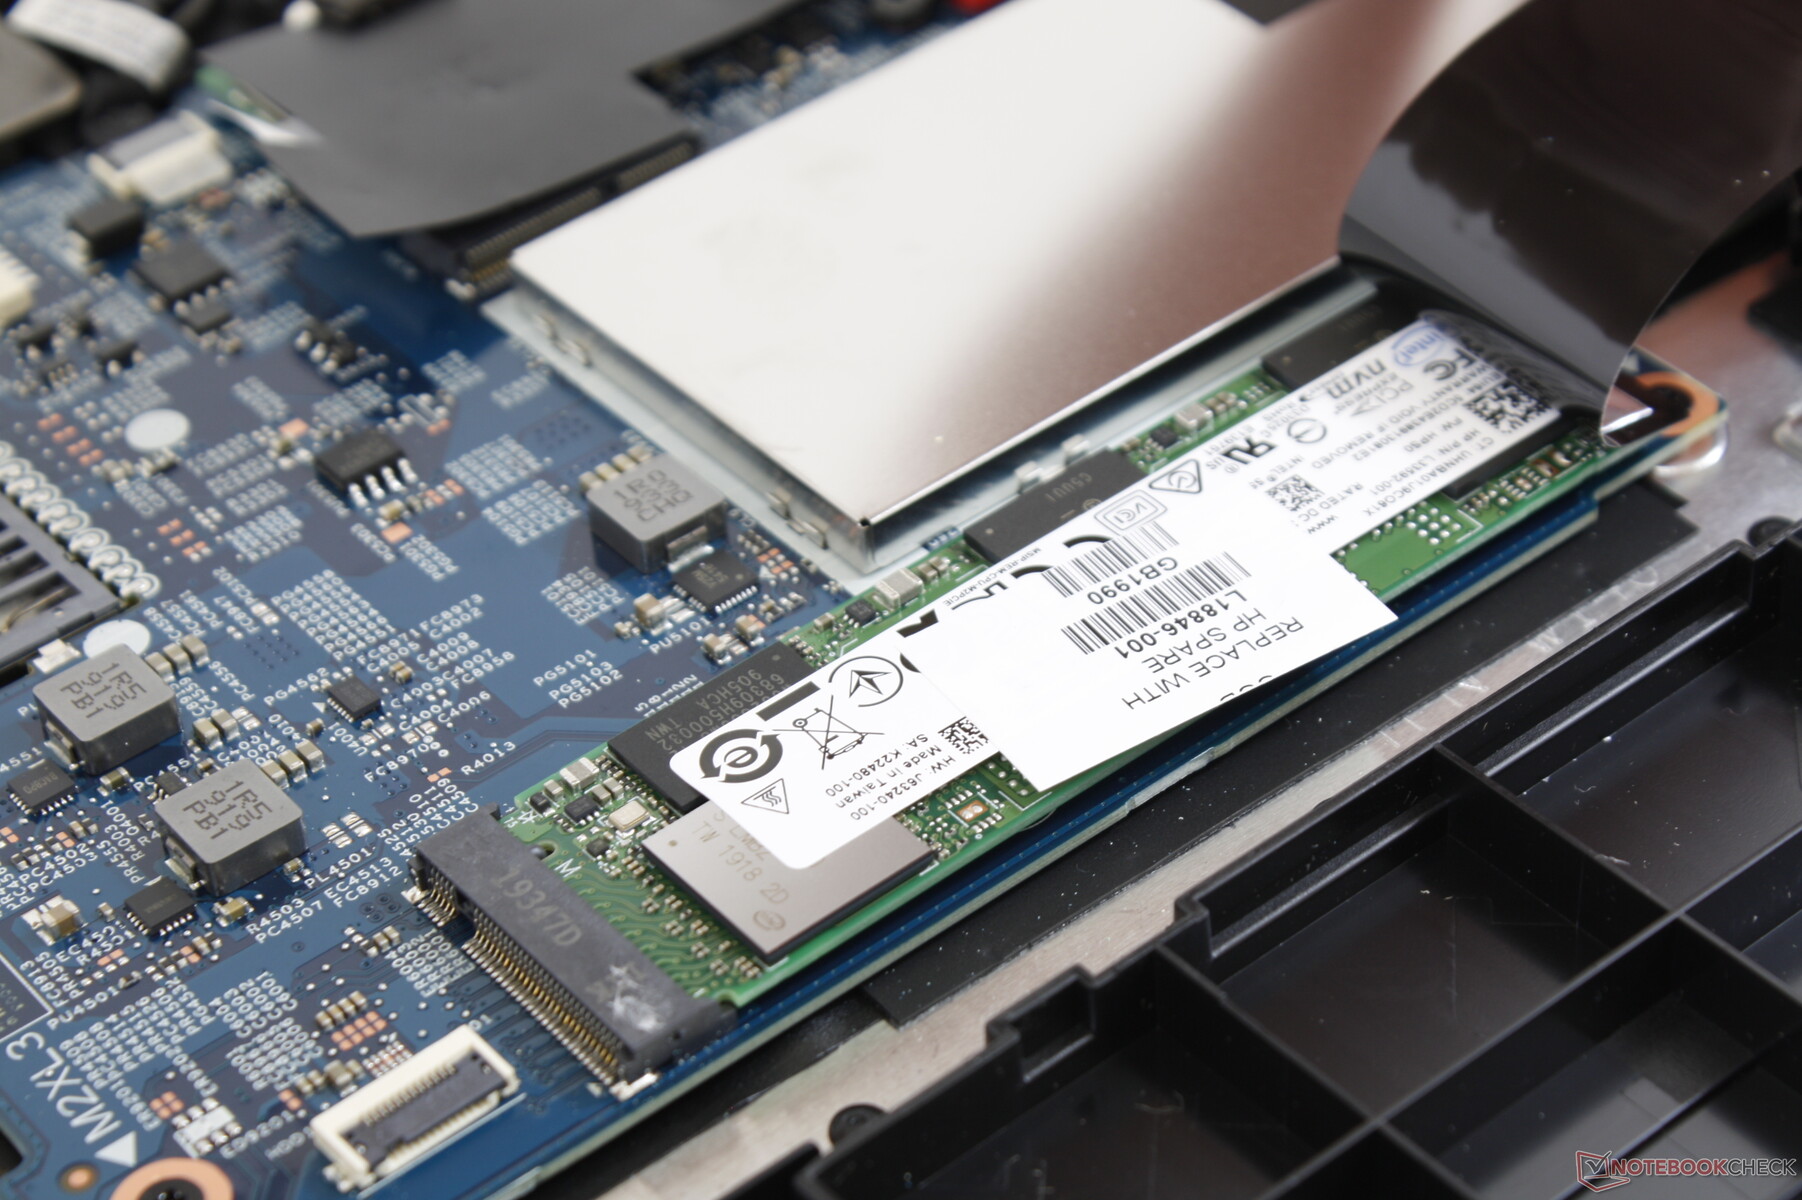
Depolama aygıtları
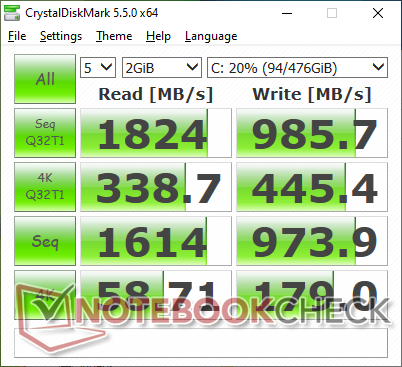
Yalnızca tek bir M.2 2280 depolama yuvası kullanılabilir. Test birimimiz orta sınıf 512 GB Intel 660p PCIe NVMe SSD ile birlikte gelirken, kullanıcılar kapasiteye ve dizüstü bilgisayarın nereden satın alındığına bağlı olarak farklı üreticilerin SSD'lerini bekleyebilirler. Sıralı okuma ve yazma hızları, Samsung PM981 serisinden veya Toshiba XG6 serisinden 1500 veya 2000 MB / s'ye kıyasla 1000 MB / s civarında seyrediyor. Daha fazla karşılaştırma karşılaştırması için HDD ve SSD tablolarımıza bakın.
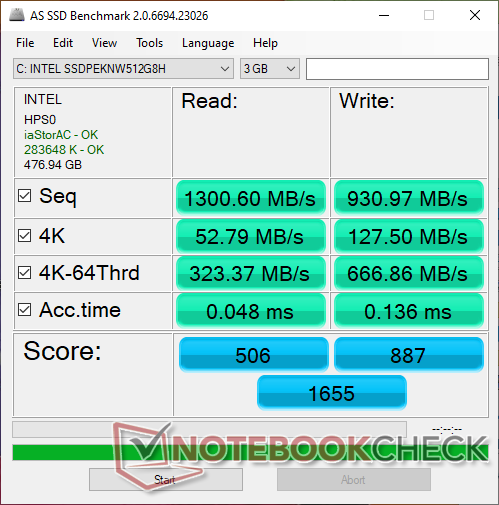
| HP Pavilion x360 15-dq0065cl Intel SSD 660p SSDPEKNW512G8 | Asus VivoBook Flip 15 TP510UA-E8073T SanDisk SD8SN8U128G1002 | Lenovo Ideapad C340-15IWL-81N5004QGE SK hynix BC501 HFM128GDJTNG-831 | HP Envy x360 15-bq102ng Samsung PM961 MZVLW256HEHP | Dell Inspiron 15 3585 (2300U, Vega 6) Toshiba BG3 KBG30ZMS256G | Dell XPS 15 7590 i5 iGPU FHD Toshiba XG6 KXG60ZNV512G | |
|---|---|---|---|---|---|---|
| AS SSD | -60% | -35% | 19% | -73% | 70% | |
| Seq Read (MB/s) | 1301 | 474.8 -64% | 1399 8% | 2465 89% | 1291 -1% | 2357 81% |
| Seq Write (MB/s) | 931 | 229.3 -75% | 369.8 -60% | 1318 42% | 688 -26% | 1235 33% |
| 4K Read (MB/s) | 52.8 | 26.42 -50% | 40 -24% | 42.97 -19% | 21.87 -59% | 43.29 -18% |
| 4K Write (MB/s) | 127.5 | 49.85 -61% | 109.2 -14% | 81.9 -36% | 35.62 -72% | 99.7 -22% |
| 4K-64 Read (MB/s) | 323.4 | 364.5 13% | 264.3 -18% | 1025 217% | 632 95% | 1020 215% |
| 4K-64 Write (MB/s) | 667 | 93.2 -86% | 181.9 -73% | 338.6 -49% | 221.2 -67% | 1502 125% |
| Access Time Read * (ms) | 0.048 | 0.13 -171% | 0.07 -46% | 0.077 -60% | 0.33 -588% | 0.07 -46% |
| Access Time Write * (ms) | 0.136 | 0.088 35% | 0.041 70% | 0.046 66% | 0.234 -72% | 0.039 71% |
| Score Read (Points) | 506 | 438 -13% | 444 -12% | 1314 160% | 783 55% | 1299 157% |
| Score Write (Points) | 887 | 166 -81% | 328 -63% | 552 -38% | 326 -63% | 1726 95% |
| Score Total (Points) | 1655 | 825 -50% | 963 -42% | 2488 50% | 1489 -10% | 3640 120% |
| Copy ISO MB/s (MB/s) | 905 | 317.8 -65% | 265.8 -71% | 700 -23% | 432.6 -52% | 2145 137% |
| Copy Program MB/s (MB/s) | 607 | 80.8 -87% | 158.7 -74% | 167.2 -72% | 95.6 -84% | 565 -7% |
| Copy Game MB/s (MB/s) | 911 | 127.1 -86% | 216.8 -76% | 370.4 -59% | 263.4 -71% | 1320 45% |
| CrystalDiskMark 5.2 / 6 | -39% | 4% | -39% | 32% | ||
| Write 4K (MB/s) | 179 | 105 -41% | 116 -35% | 87.3 -51% | 93.6 -48% | |
| Read 4K (MB/s) | 58.7 | 39.72 -32% | 42.73 -27% | 23.54 -60% | 41.87 -29% | |
| Write Seq (MB/s) | 974 | 326.9 -66% | 1222 25% | 824 -15% | 1698 74% | |
| Read Seq (MB/s) | 1614 | 1033 -36% | 1608 0% | 715 -56% | 1978 23% | |
| Write 4K Q32T1 (MB/s) | 445.4 | 269.1 -40% | 280.1 -37% | 147.8 -67% | 383.1 -14% | |
| Read 4K Q32T1 (MB/s) | 338.7 | 284.8 -16% | 333.6 -2% | 256.1 -24% | 326.9 -3% | |
| Write Seq Q32T1 (MB/s) | 986 | 321 -67% | 1291 31% | 733 -26% | 2778 182% | |
| Read Seq Q32T1 (MB/s) | 1824 | 1606 -12% | 3183 75% | 1525 -16% | 3119 71% | |
| Toplam Ortalama (Program / Ayarlar) | -60% /
-60% | -37% /
-37% | 12% /
14% | -56% /
-60% | 51% /
56% |
* ... daha küçük daha iyidir

GPU Performansı
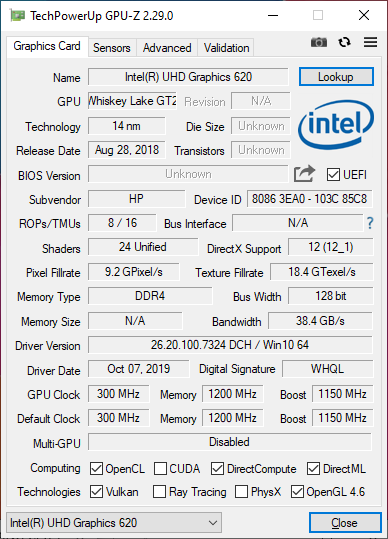
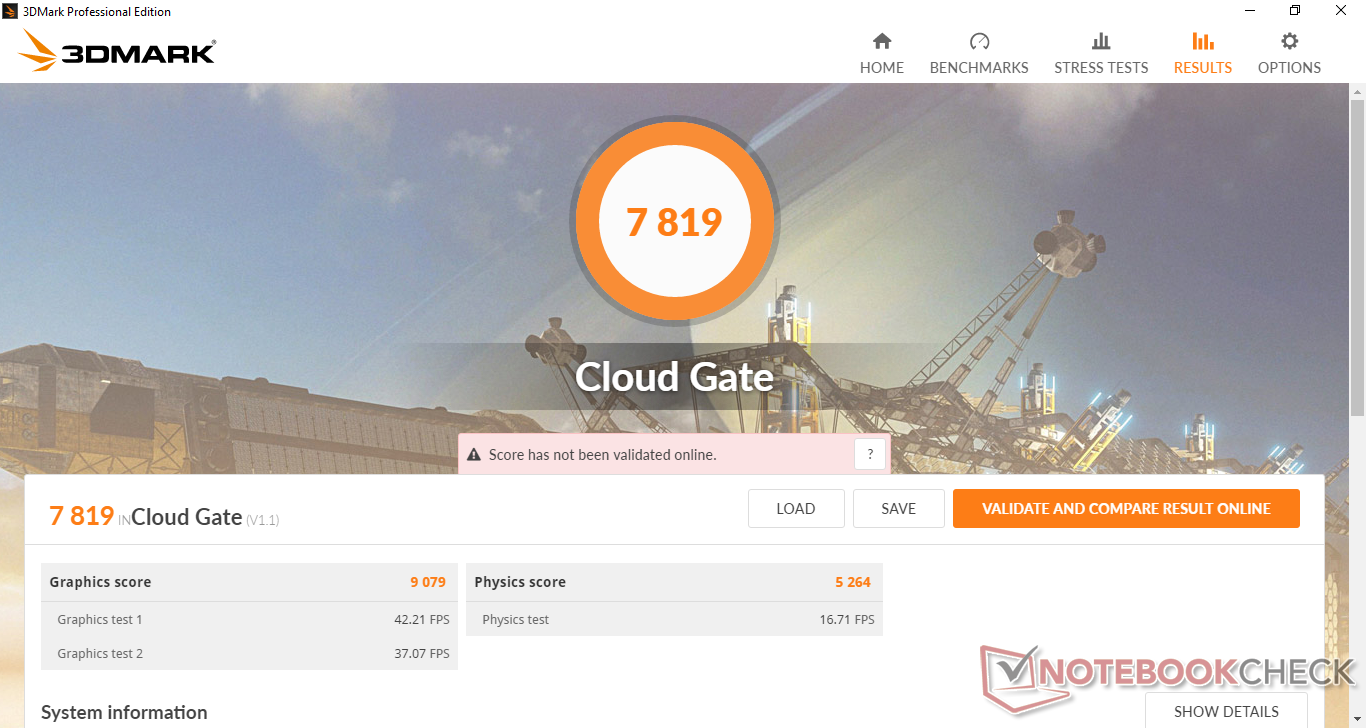
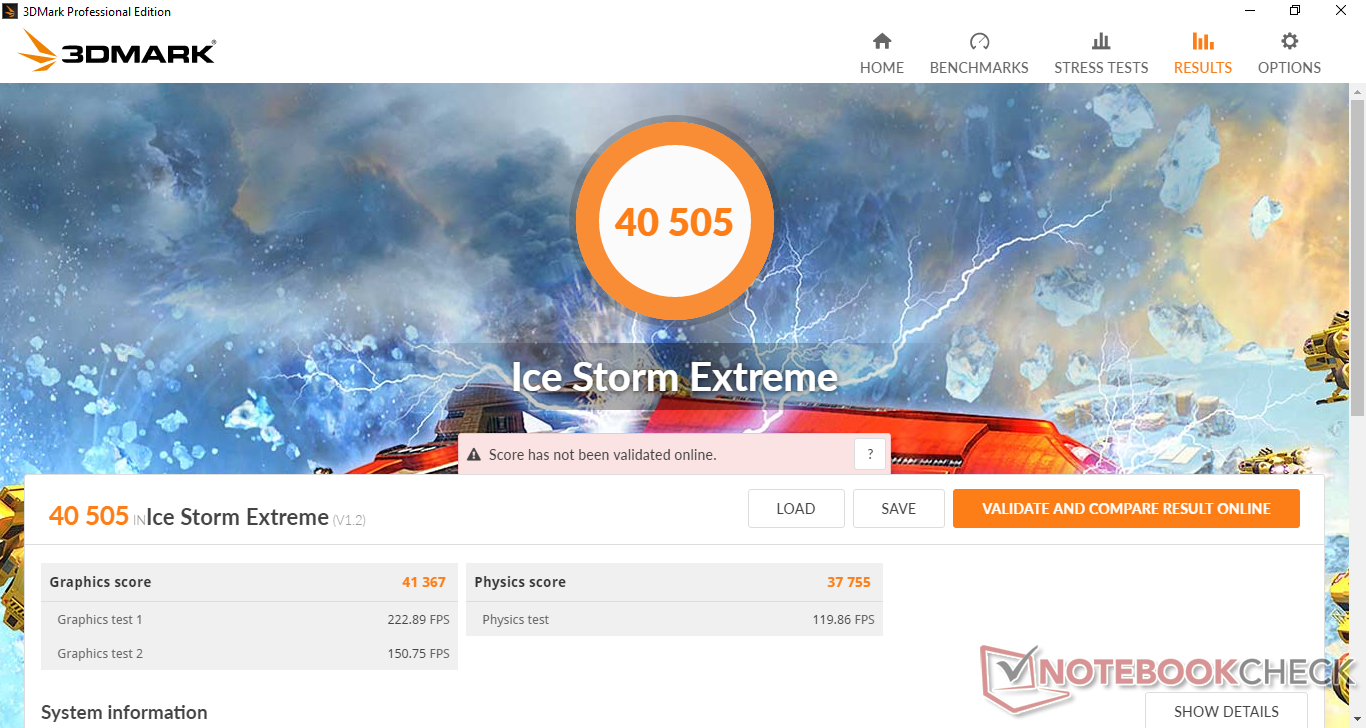
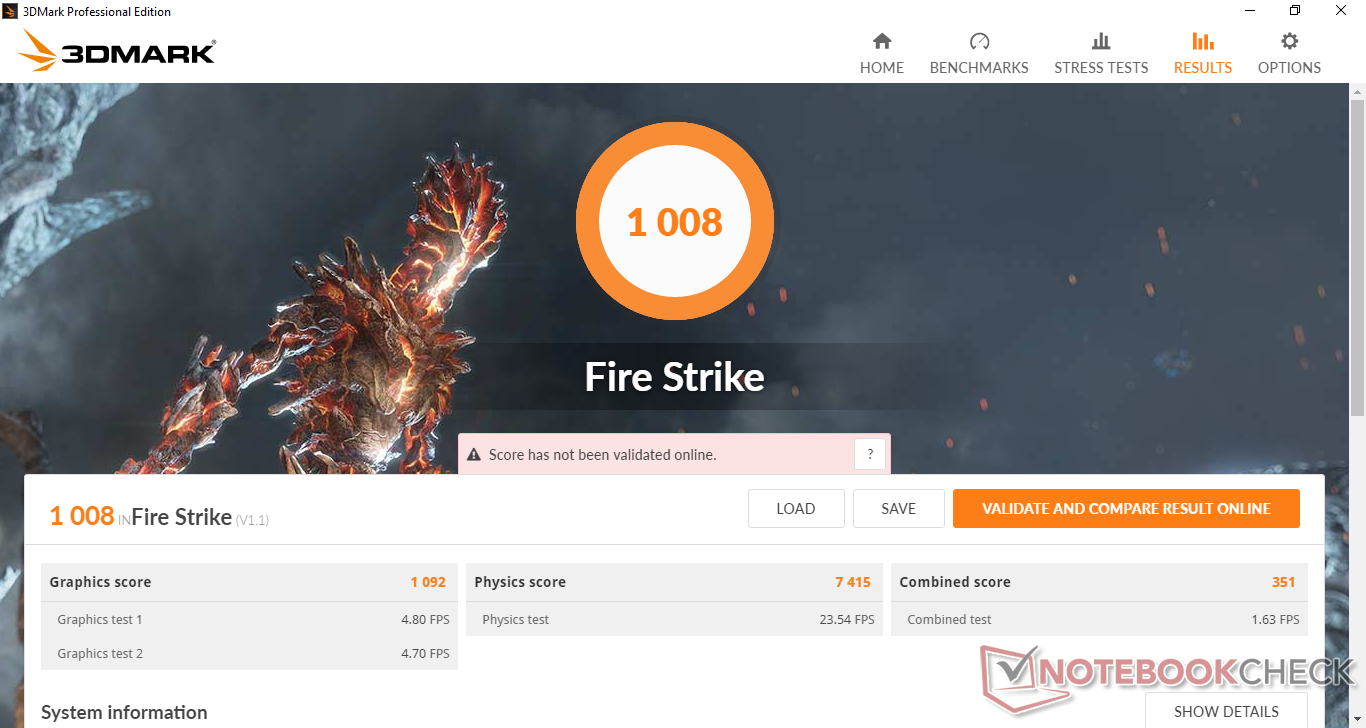
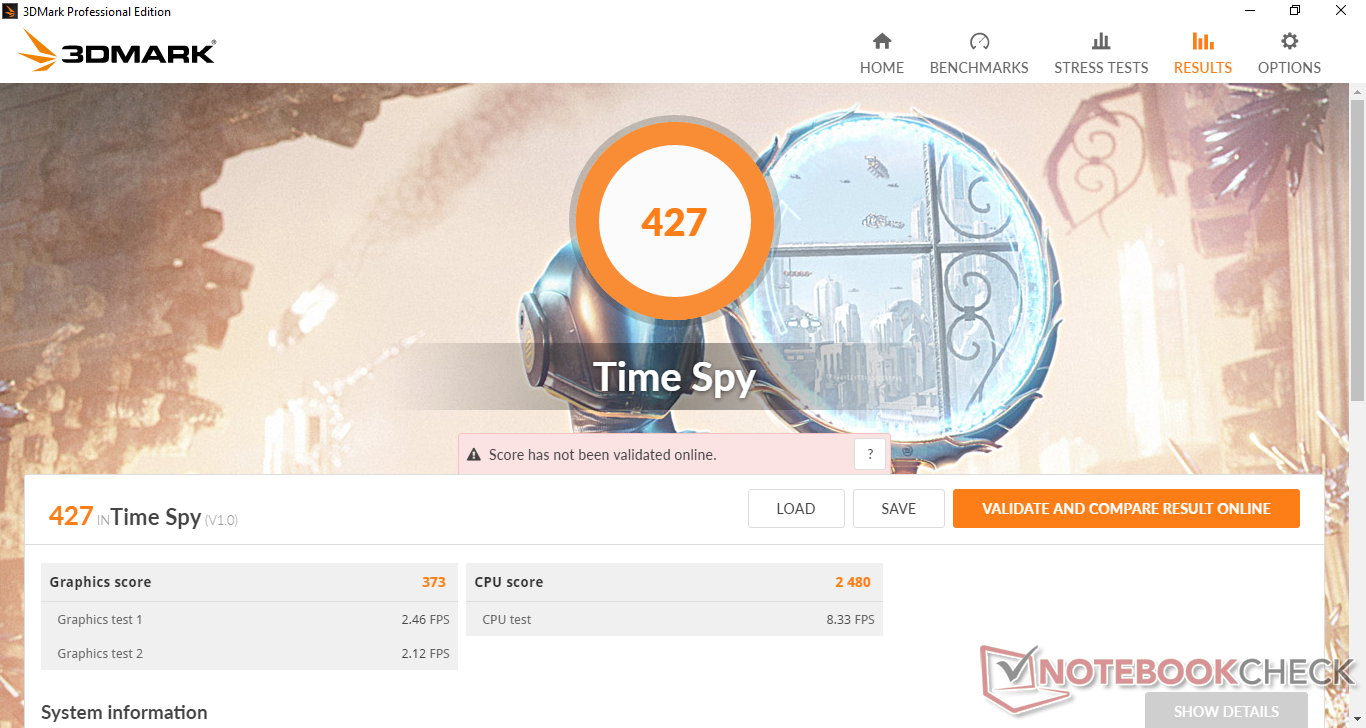
UHD Graphics 620 bu noktada oldukça eski. Video akışı ve nadiren tarayıcı oyunlarının dışında grafiksel olarak çok fazla şey yapmayı beklemeyin. Harici bir monitörünüz olması koşuluyla 4K30 oynatma sorunsuz çalışır. Daha fazla teknik bilgi ve karşılaştırma karşılaştırmaları için UHD Graphics 620'deki özel sayfamıza bakın.
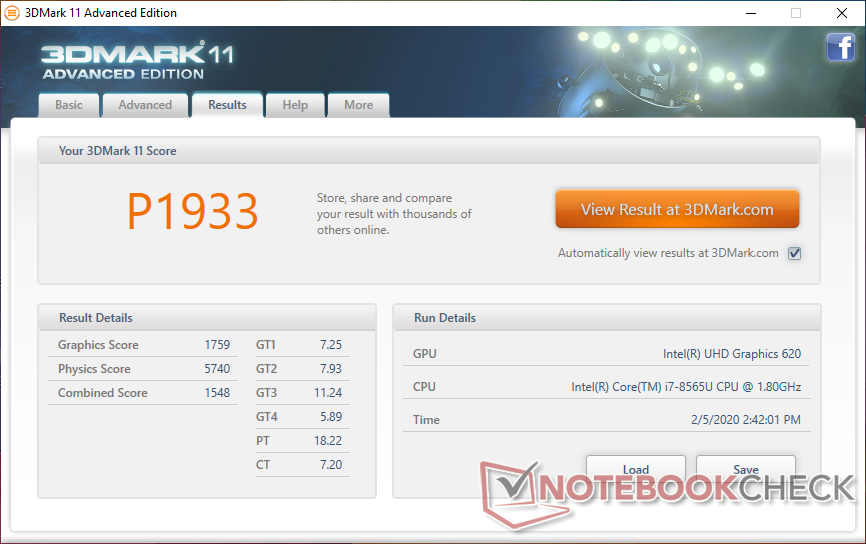
| 3DMark 11 Performance | 1933 puan | |
| 3DMark Cloud Gate Standard Score | 7819 puan | |
| 3DMark Fire Strike Score | 1008 puan | |
| 3DMark Time Spy Score | 427 puan | |
Yardım | ||
| Shadow of the Tomb Raider - 1280x720 Lowest Preset | |
| MSI Modern 14 A10RB-459US | |
| Dell Inspiron 15 5000 5585 | |
| Microsoft Surface Laptop 3 15 i7-1065G7 | |
| Dell Inspiron 15 3585 (2300U, Vega 6) | |
| Dell XPS 13 7390 Core i7-10710U | |
| Ortalama Intel UHD Graphics 620 (12 - 21.7, n=13) | |
| düşük | orta | yüksek | ultra | |
|---|---|---|---|---|
| BioShock Infinite (2013) | 49.1 | 30.5 | 24.7 | |
| The Witcher 3 (2015) | 16.8 | 10.5 | ||
| Rocket League (2017) | 62.7 |
Emisyonları
Sistem Gürültüsü
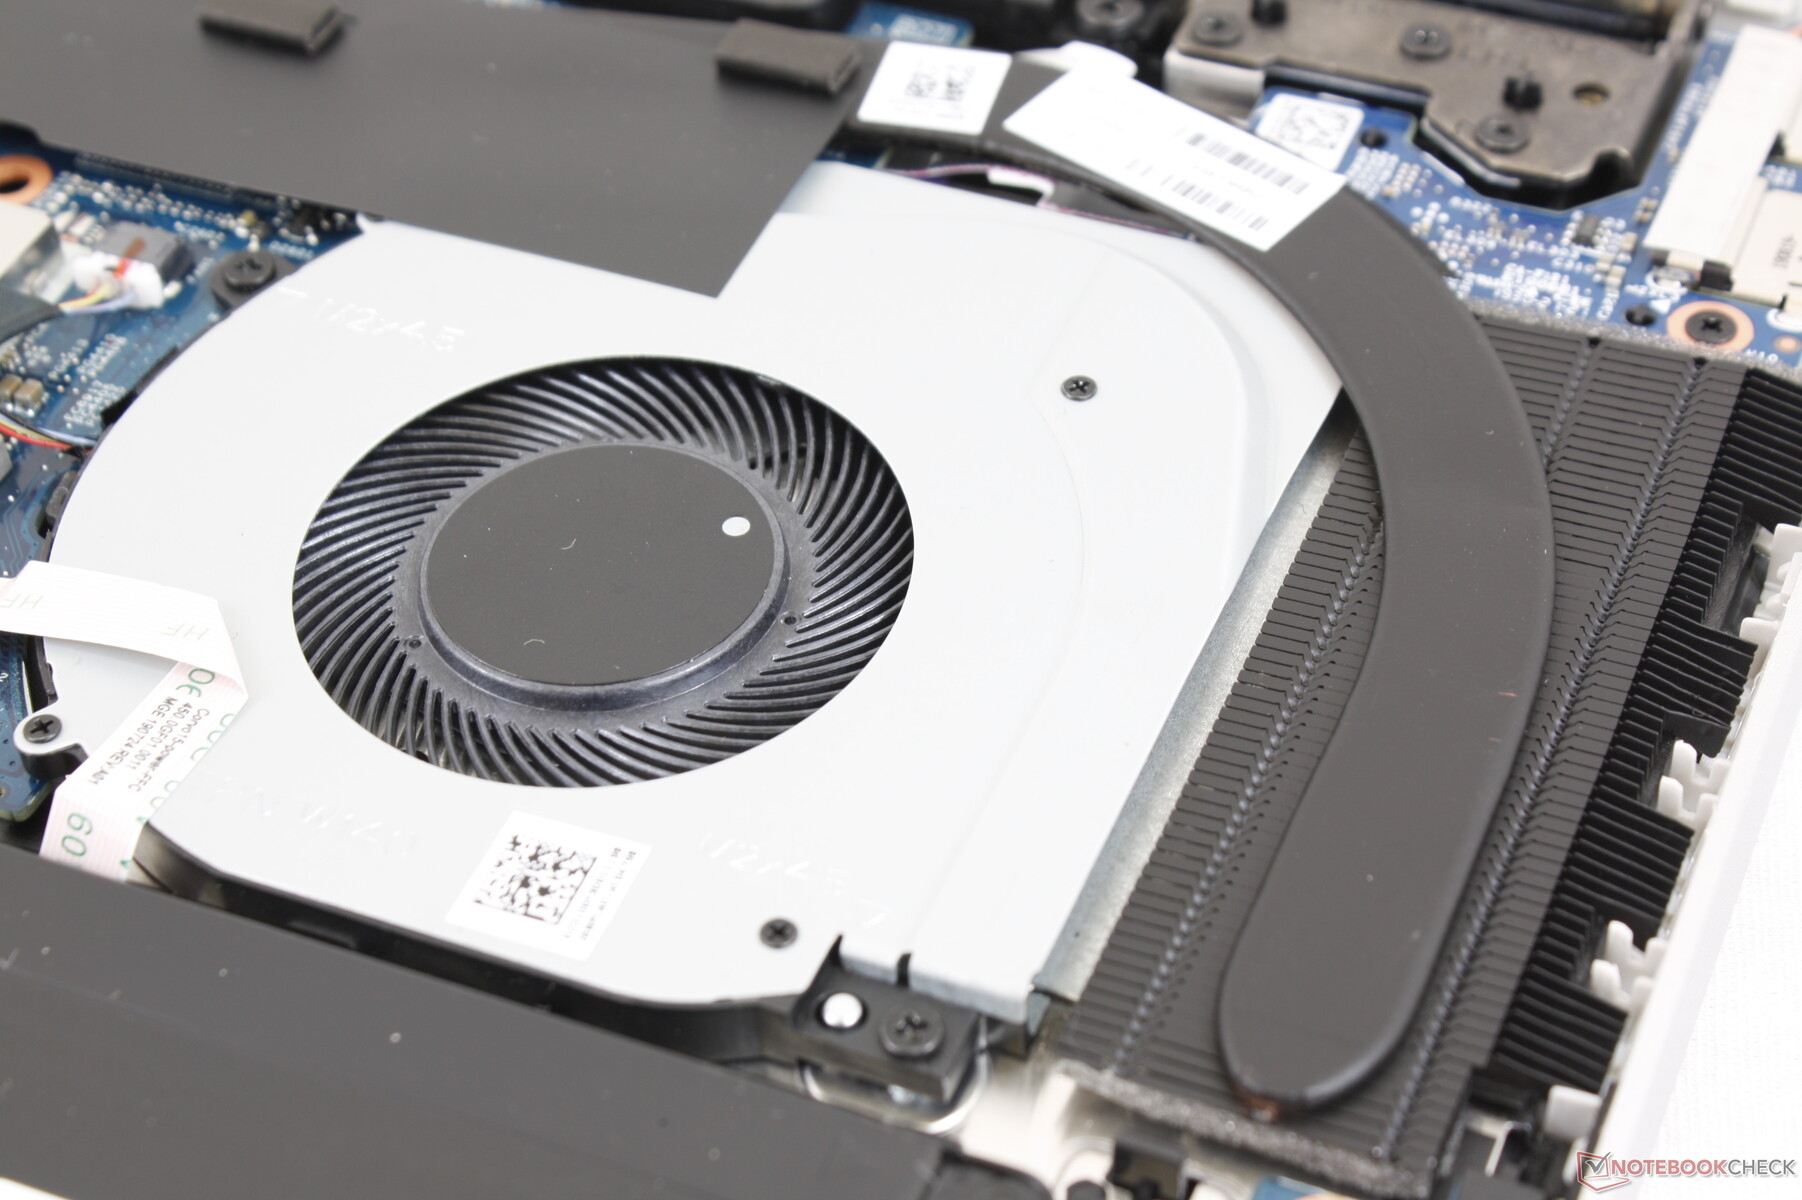
Soğutma çözeltisi tek bir fan ve bir ısı borusundan oluşur. Tamamen sessiz bir deneyim için fan, web'e göz atma veya e-posta gönderme gibi düşük yüklerde boşta kalır. En kötüsü, 3DMark 06'yı yaklaşık 90 saniye çalıştırırken sadece 31,5 dB (A) fan gürültüsü kaydedebiliyoruz. Hem Prime95 hem de FurMark'ı çalıştırmak, 37 dB (A) değerinin biraz üzerinde maksimum fan gürültüsü indükleyecektir, ancak bu aşırı bir durumdur. Genel olarak, Pavilion x360 15, rakiplerinin çoğundan daha sessizdir.Test birimimizde bobin sızlanması veya elektronik gürültü yaşamadık.
| HP Pavilion x360 15-dq0065cl UHD Graphics 620, i7-8565U, Intel SSD 660p SSDPEKNW512G8 | Asus VivoBook Flip 15 TP510UA-E8073T UHD Graphics 620, i5-8250U, SanDisk SD8SN8U128G1002 | Lenovo Ideapad C340-15IWL-81N5004QGE GeForce MX230, i5-8265U, SK hynix BC501 HFM128GDJTNG-831 | HP Envy x360 15-bq102ng Vega 8, R5 2500U, Samsung PM961 MZVLW256HEHP | Dell Inspiron 15 3585 (2300U, Vega 6) Vega 6, R3 2300U, Toshiba BG3 KBG30ZMS256G | Dell XPS 15 7590 i5 iGPU FHD UHD Graphics 630, i5-9300H, Toshiba XG6 KXG60ZNV512G | |
|---|---|---|---|---|---|---|
| Noise | -6% | -8% | -9% | -10% | -3% | |
| kapalı / ortam * (dB) | 28.4 | 30.2 -6% | 30.3 -7% | 30.13 -6% | 30.6 -8% | 29.3 -3% |
| Idle Minimum * (dB) | 28.4 | 30.9 -9% | 30.6 -8% | 30.13 -6% | 30.6 -8% | 29.3 -3% |
| Idle Average * (dB) | 28.4 | 30.9 -9% | 30.6 -8% | 30.13 -6% | 30.6 -8% | 29.3 -3% |
| Idle Maximum * (dB) | 28.4 | 30.9 -9% | 30.6 -8% | 30.13 -6% | 30.6 -8% | 29.8 -5% |
| Load Average * (dB) | 31.5 | 34.2 -9% | 36.4 -16% | 38.8 -23% | 36.7 -17% | 32.4 -3% |
| Load Maximum * (dB) | 37.4 | 34.2 9% | 36.8 2% | 38.8 -4% | 41.1 -10% | 37.2 1% |
* ... daha küçük daha iyidir
Ses yüksekliği
| Boşta |
| 28.4 / 28.4 / 28.4 dB |
| Çalışırken |
| 31.5 / 37.4 dB |
 | ||
30 dB sessiz 40 dB(A) duyulabilirlik 50 dB(A) gürültülü |
||
min: | ||
Sıcaklık
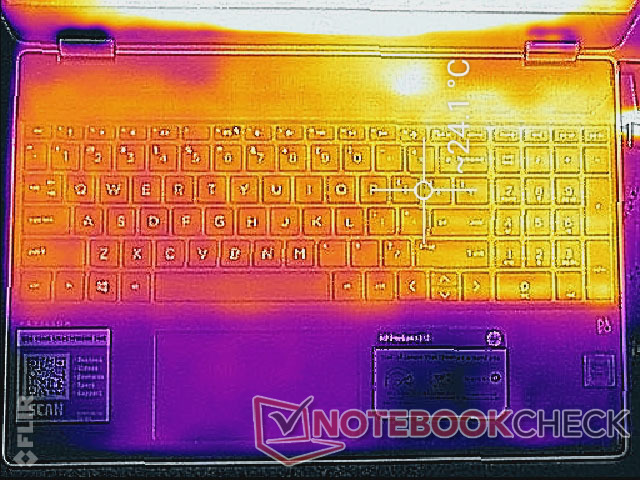
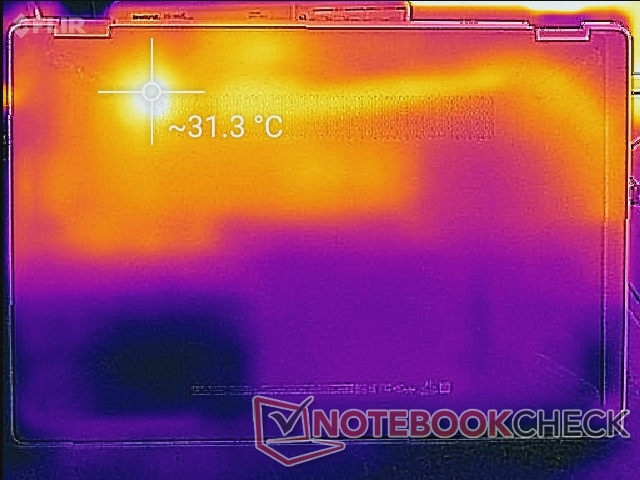
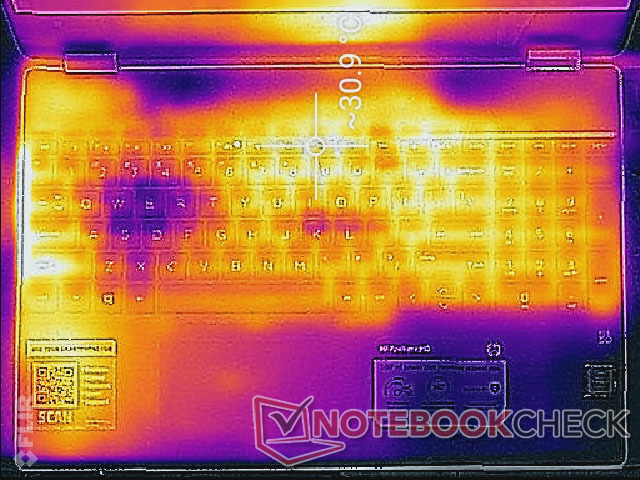
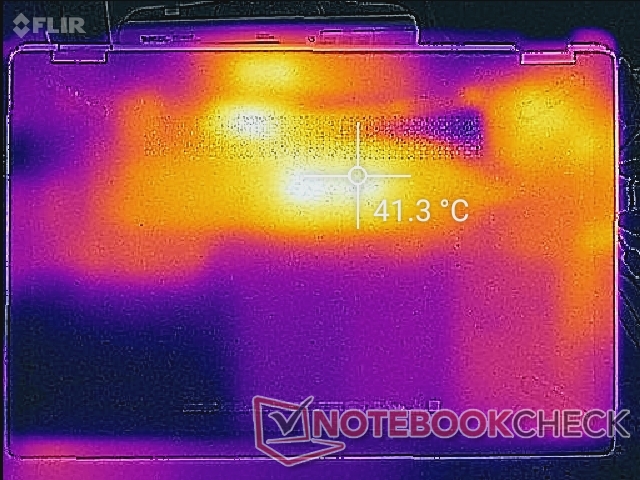
Kısmen nispeten düşük çekirdek sıcaklıkları ve özel bir GPU eksikliği nedeniyle yüzey sıcaklıkları asla rahatsız olmaz. En kötüsü, çok yüksek işlem yükleri çalıştırırken klavye desteğindeki ve altındaki en sıcak noktalar sırasıyla 31 C ve 41 C'ye ulaşabilir. Pavyon, Ryzen 5 2500U ile Envy 15'te kaydettiğimizden daha serin çalışıyor.
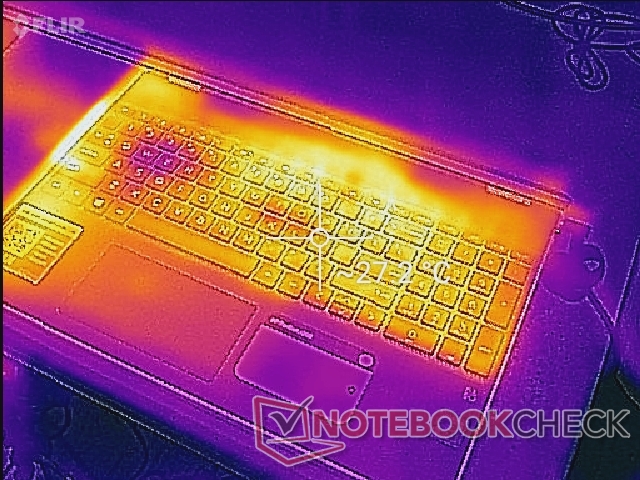
(+) Üst taraftaki maksimum sıcaklık, 36.8 °C / 98 F ortalamasına kıyasla 31.6 °C / 89 F'dir. , Multimedia sınıfı için 21 ile 71 °C arasında değişir.
(±) Alt kısım, 39.1 °C / 102 F ortalamasına kıyasla maksimum 41.6 °C / 107 F'ye kadar ısınır
(+) Boşta kullanımda, üst tarafın ortalama sıcaklığı 22.9 °C / 73 F olup, cihazın 31.3 °C / 88 F.
(+) Avuç içi dayanakları ve dokunmatik yüzey, maksimum 29.8 °C / 85.6 F ile cilt sıcaklığından daha soğuktur ve bu nedenle dokunulduğunda soğuktur.
(±) Benzer cihazların avuç içi dayanağı alanının ortalama sıcaklığı 28.7 °C / 83.7 F (-1.1 °C / -1.9 F) idi.
Stress Test
We stress the system with synthetic loads to identify for any potential throttling or stability issues. When running Prime95 to stress the CPU, clock rates would jump to the 2.1 to 2.2 GHz range and then maintain that speed indefinitely at a relatively cool core temperature of 59 C. The Core i7-8565U, however, is rated for a maximum multi-core Turbo Boost of 4.1 GHz meaning that the Pavilion system isn't exploiting the performance potential of the CPU. Results are somewhat similar to the older HP Spectre x360 15 with the Core i7-8550U as that would stabilize at 2.1 GHz and 64 C when under similar Prime95 stress conditions. Running both Prime95 and FurMark simultaneously will throttle the CPU to just 1.0 GHz while maintaining a core temperature of 59 C. There is definitely temperature overhead for faster Turbo Boost clock rates, but that is not exploited here at all.
Running on batteries will not limit performance. A 3DMark 11 run on battery power returns Physics and Graphics scores of 5511 and 1735 points, respectively, compared to 5740 and 1759 points when on mains.
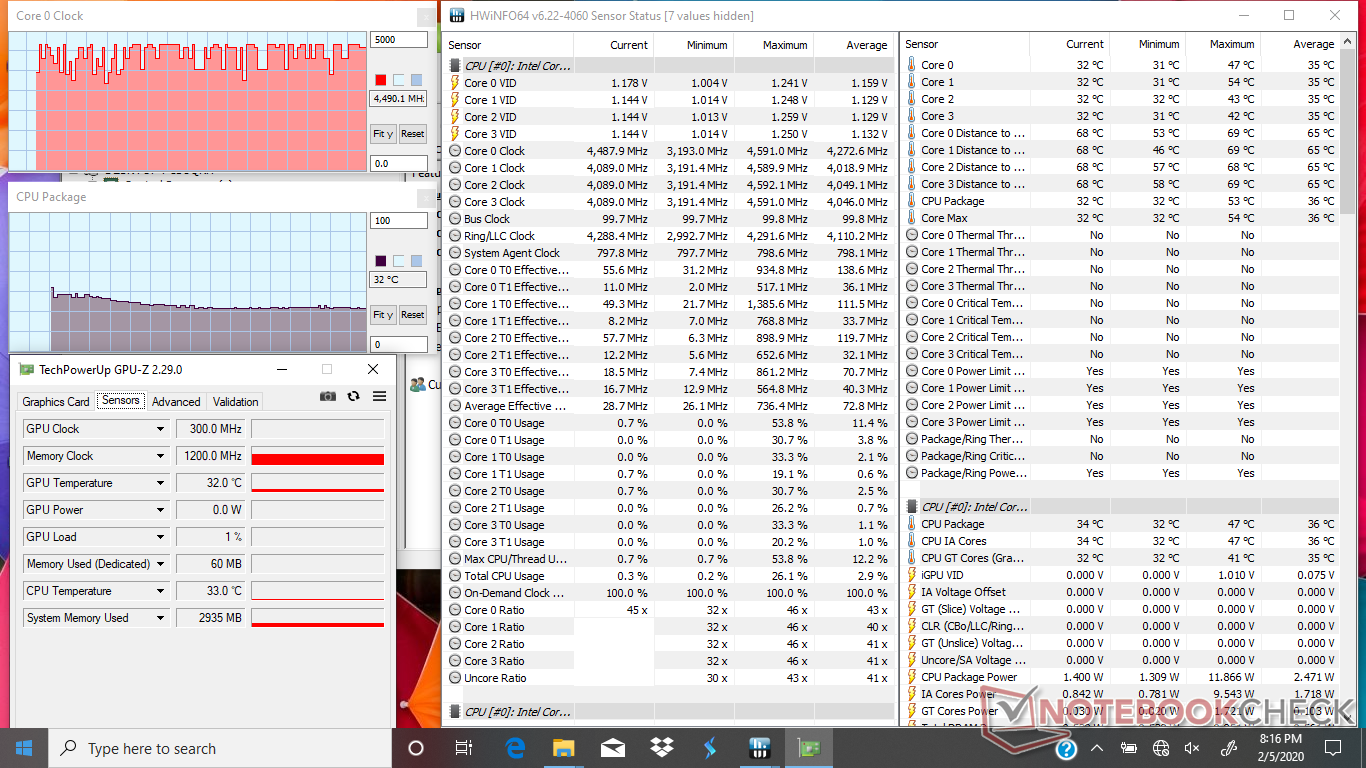
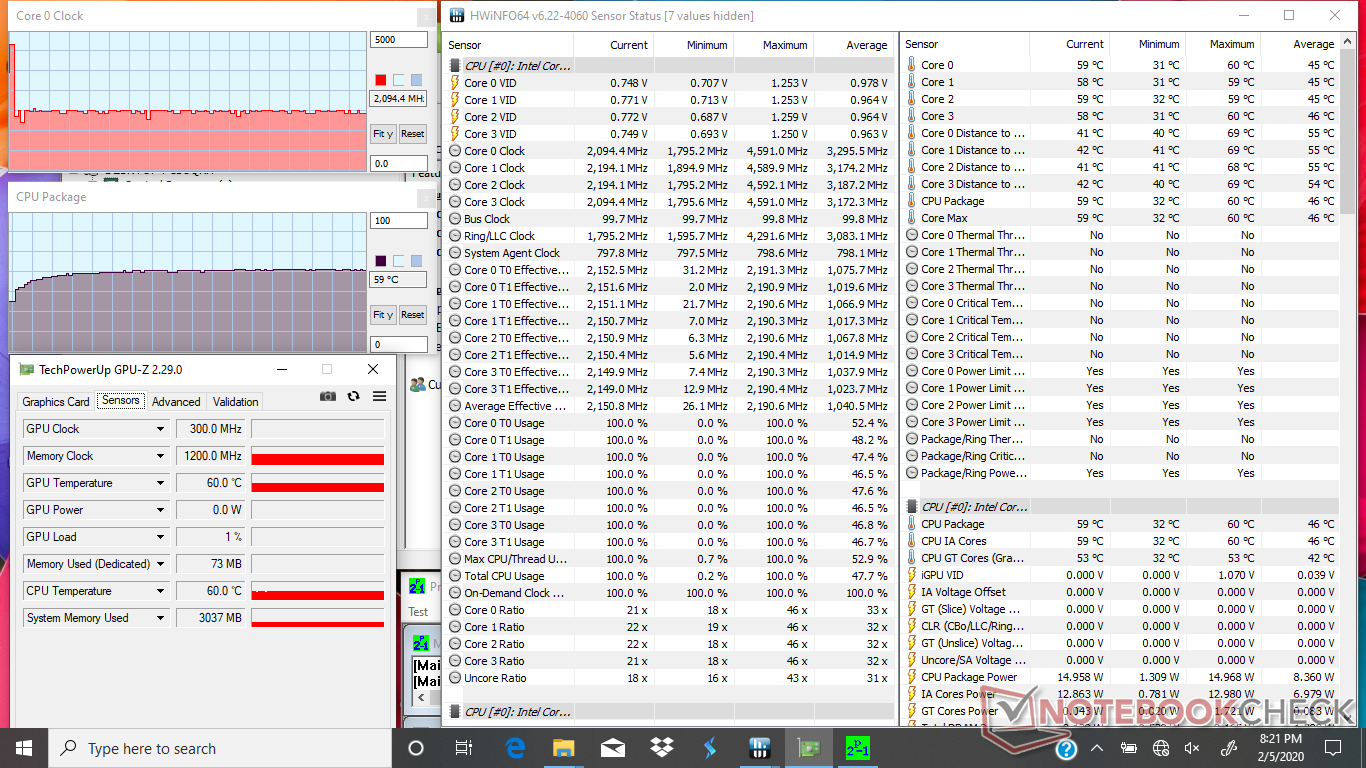
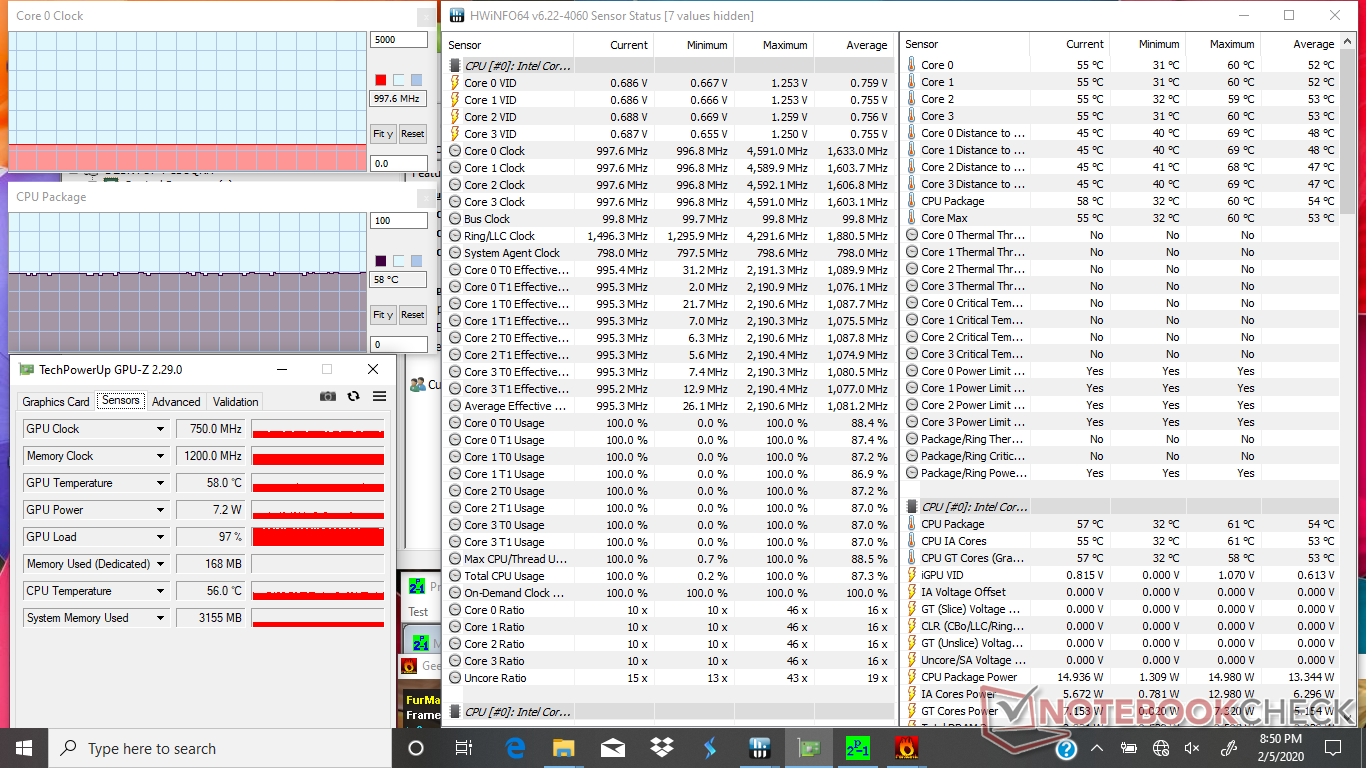
| CPU Clock (GHz) | GPU Clock (MHz) | Average CPU Temperature (°C) | |
| System Idle | -- | -- | 32 |
| Prime95 Stress | 2.1 - 2.2 | -- | 59 |
| Prime95 + FurMark Stress | 1.0 | 750 | 59 |
Speakers
Maximum volume is about the same as on the HP Spectre x360 15 (~80 dB). Pink noise measurements, however, reveal a narrower scope of frequencies and poorer bass reproduction on the Pavilion system. Maximum volume introduces no static or surface vibrations.


HP Pavilion x360 15-dq0065cl ses analizi
(±) | hoparlör ses yüksekliği ortalama ama iyi (80.3 dB)
Bas 100 - 315Hz
(±) | azaltılmış bas - ortalama olarak medyandan 12.7% daha düşük
(-) | bas doğrusal değildir (15.3% delta ile önceki frekans)
Ortalar 400 - 2000 Hz
(+) | dengeli ortalar - medyandan yalnızca 3.6% uzakta
(±) | Ortaların doğrusallığı ortalamadır (7% delta - önceki frekans)
Yüksekler 2 - 16 kHz
(+) | dengeli yüksekler - medyandan yalnızca 3.6% uzakta
(±) | Yükseklerin doğrusallığı ortalamadır (7% delta - önceki frekans)
Toplam 100 - 16.000 Hz
(±) | Genel sesin doğrusallığı ortalamadır (20.1% ortancaya göre fark)
Aynı sınıfla karşılaştırıldığında
» Bu sınıftaki tüm test edilen cihazların %67%'si daha iyi, 8% benzer, 25% daha kötüydü
» En iyisinin deltası 5% idi, ortalama 17% idi, en kötüsü 45% idi
Test edilen tüm cihazlarla karşılaştırıldığında
» Test edilen tüm cihazların %52'si daha iyi, 8 benzer, % 40 daha kötüydü
» En iyisinin deltası 4% idi, ortalama 24% idi, en kötüsü 134% idi
Apple MacBook 12 (Early 2016) 1.1 GHz ses analizi
(+) | hoparlörler nispeten yüksek sesle çalabilir (83.6 dB)
Bas 100 - 315Hz
(±) | azaltılmış bas - ortalama olarak medyandan 11.3% daha düşük
(±) | Bas doğrusallığı ortalamadır (14.2% delta - önceki frekans)
Ortalar 400 - 2000 Hz
(+) | dengeli ortalar - medyandan yalnızca 2.4% uzakta
(+) | orta frekanslar doğrusaldır (5.5% deltadan önceki frekansa)
Yüksekler 2 - 16 kHz
(+) | dengeli yüksekler - medyandan yalnızca 2% uzakta
(+) | yüksekler doğrusaldır (4.5% deltadan önceki frekansa)
Toplam 100 - 16.000 Hz
(+) | genel ses doğrusaldır (10.2% ortancaya göre fark)
Aynı sınıfla karşılaştırıldığında
» Bu sınıftaki tüm test edilen cihazların %7%'si daha iyi, 2% benzer, 91% daha kötüydü
» En iyisinin deltası 5% idi, ortalama 18% idi, en kötüsü 53% idi
Test edilen tüm cihazlarla karşılaştırıldığında
» Test edilen tüm cihazların %5'si daha iyi, 1 benzer, % 94 daha kötüydü
» En iyisinin deltası 4% idi, ortalama 24% idi, en kötüsü 134% idi
Energy Management
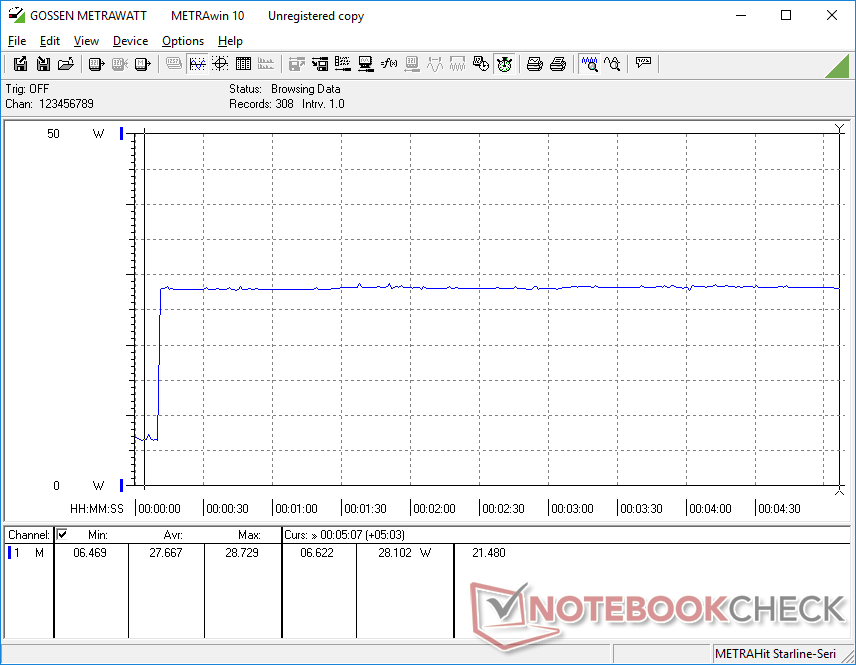
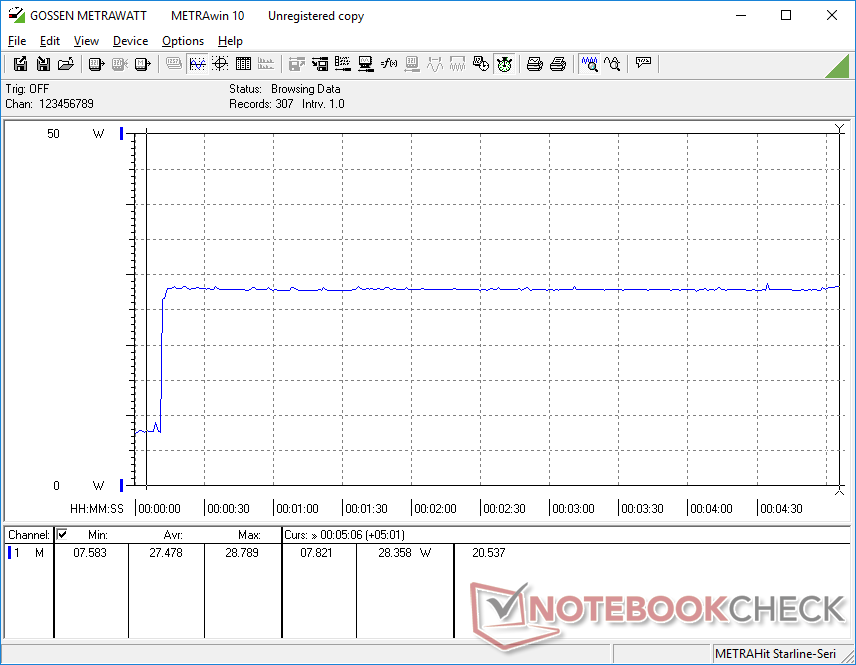
Power Consumption
Idling on desktop consumes about 3 W to 7 W depending on the power profile and brightness setting to be just slightly more power efficient than the Asus VivoBook Flip 15 or Lenovo Ideapad C340 each with higher resolution 1080p displays. Running 3DMark 06 will bump consumption to 26.7 W compared to 37 W and 38 W on the Asus VivoBook Flip 15 or Ryzen 3 2300U-powered Dell Inspiron 15 3585. The Pavilion is more efficient mostly because it doesn't benefit from any significant Turbo Boost upticks.
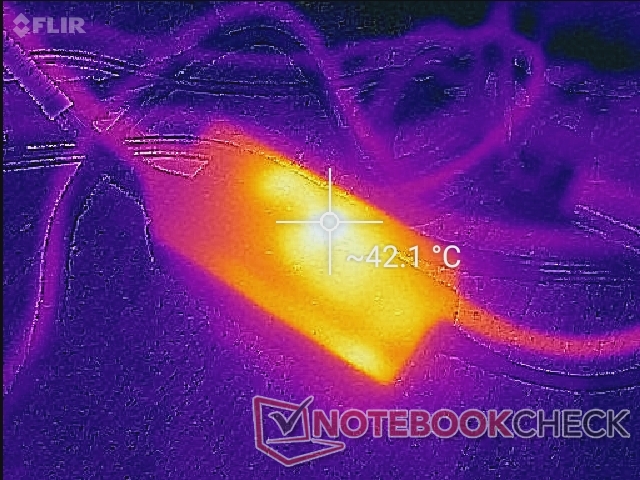
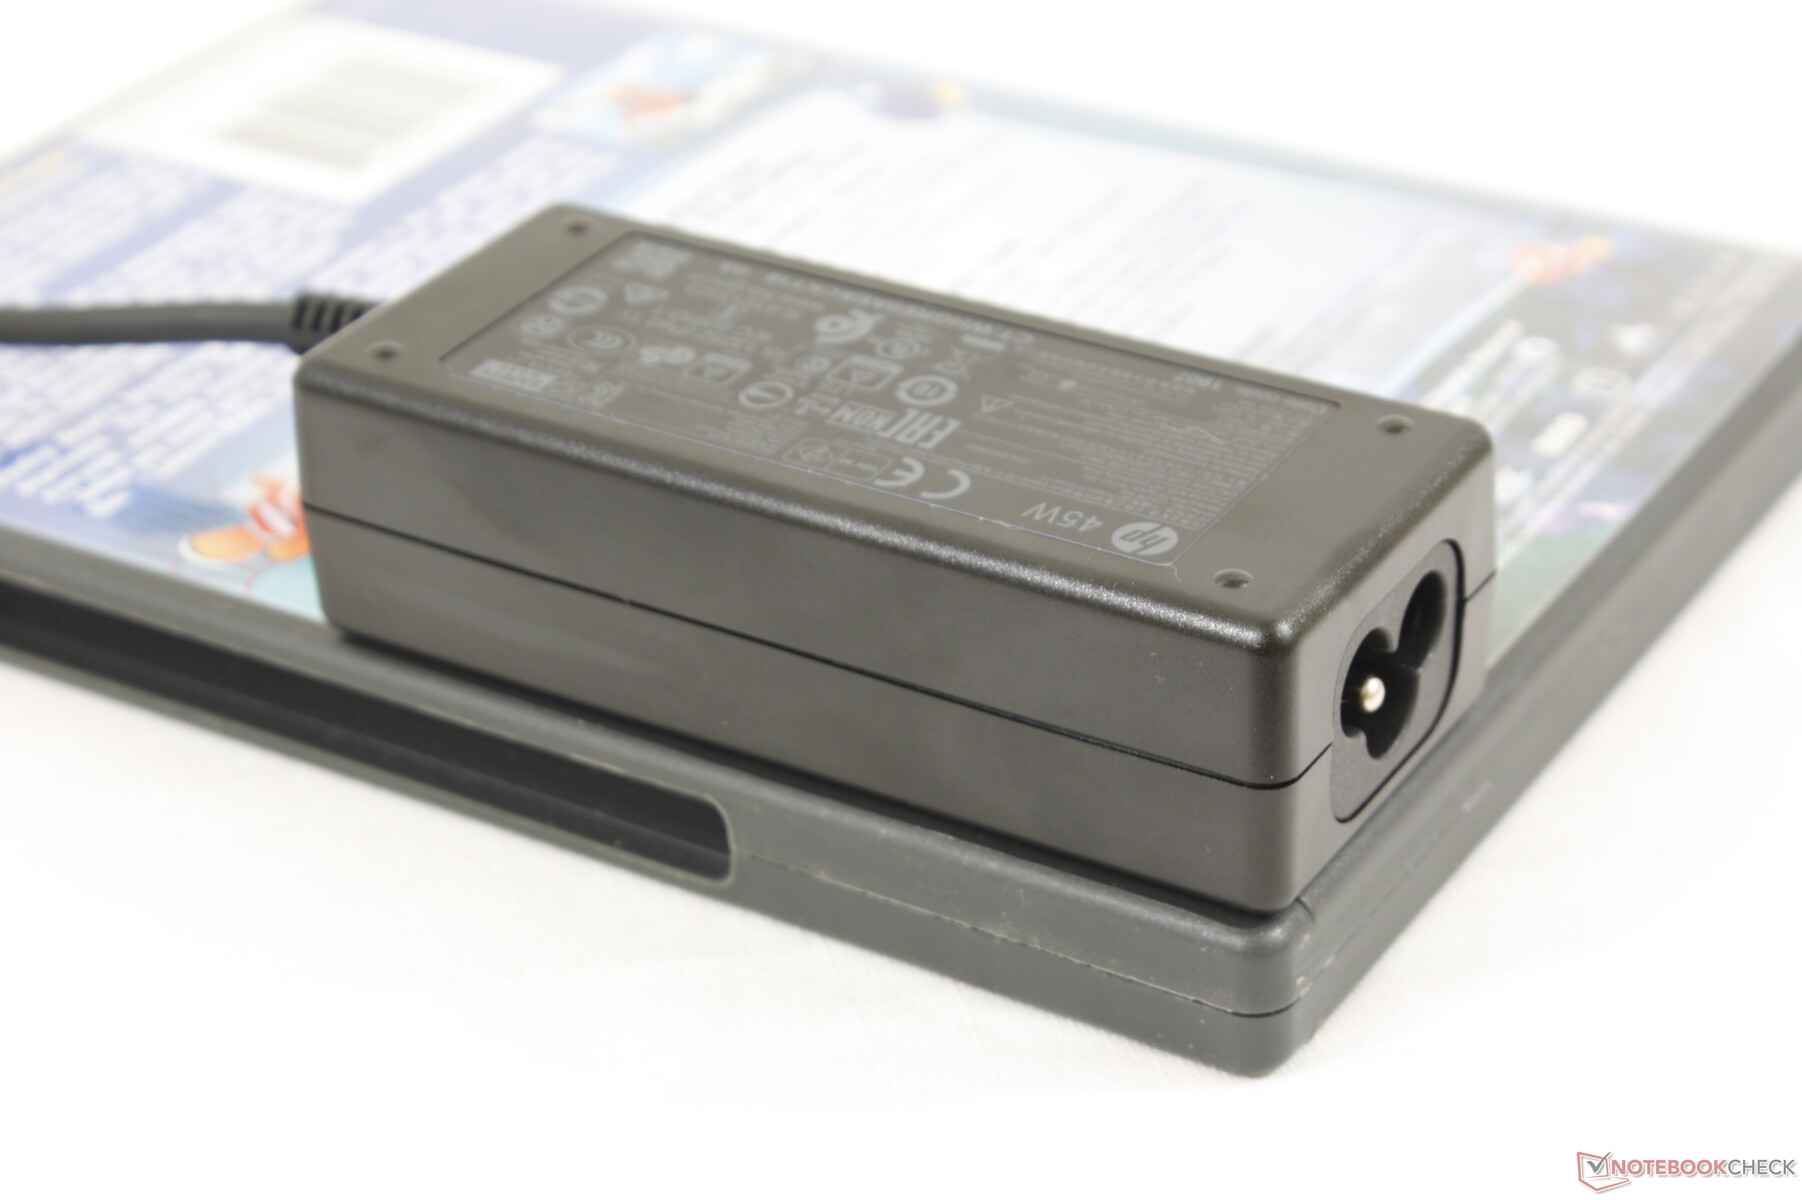
We're able to measure a maximum consumption of 28.8 W from the small (~9.4 x 3.9 x 2.7 cm) 45 W adapter. Attempting to recharge the system via USB Type-C will not work.

| Kapalı / Bekleme modu | |
| Boşta | |
| Çalışırken |
|
Key:
min: | |
| HP Pavilion x360 15-dq0065cl i7-8565U, UHD Graphics 620, Intel SSD 660p SSDPEKNW512G8, TN LED, 1366x768, 15.6" | Asus VivoBook Flip 15 TP510UA-E8073T i5-8250U, UHD Graphics 620, SanDisk SD8SN8U128G1002, IPS, 1920x1080, 15.6" | Lenovo Ideapad C340-15IWL-81N5004QGE i5-8265U, GeForce MX230, SK hynix BC501 HFM128GDJTNG-831, IPS, 1920x1080, 15.6" | HP Envy x360 15-bq102ng R5 2500U, Vega 8, Samsung PM961 MZVLW256HEHP, IPS, 1920x1080, 15.6" | Dell Inspiron 15 3585 (2300U, Vega 6) R3 2300U, Vega 6, Toshiba BG3 KBG30ZMS256G, TN, 1920x1080, 15.6" | Dell XPS 15 7590 i5 iGPU FHD i5-9300H, UHD Graphics 630, Toshiba XG6 KXG60ZNV512G, IPS, 1920x1080, 15.6" | |
|---|---|---|---|---|---|---|
| Power Consumption | -28% | -48% | -43% | -59% | -96% | |
| Idle Minimum * (Watt) | 3.6 | 3.9 -8% | 3.23 10% | 4.8 -33% | 6.3 -75% | 3.79 -5% |
| Idle Average * (Watt) | 5.4 | 7.2 -33% | 6.3 -17% | 7 -30% | 9.2 -70% | 6.9 -28% |
| Idle Maximum * (Watt) | 6.5 | 9.5 -46% | 8 -23% | 9.5 -46% | 9.6 -48% | 9.2 -42% |
| Load Average * (Watt) | 26.7 | 36.8 -38% | 47 -76% | 40.8 -53% | 38 -42% | 62 -132% |
| Load Maximum * (Watt) | 28.8 | 33.1 -15% | 67.3 -134% | 44.3 -54% | 46 -60% | 108 -275% |
* ... daha küçük daha iyidir
Battery Life
Battery capacity is small at just 41 Wh compared to 56 Wh and 84 Wh on the pricier Envy x360 15 and Spectre x360 15, respectively. Runtimes are unsurprisingly short at just over 4 hours of real-world WLAN use. Recharging from empty to full capacity takes about 1.5 hours.
| HP Pavilion x360 15-dq0065cl i7-8565U, UHD Graphics 620, 41 Wh | Asus VivoBook Flip 15 TP510UA-E8073T i5-8250U, UHD Graphics 620, 42 Wh | Lenovo Ideapad C340-15IWL-81N5004QGE i5-8265U, GeForce MX230, 52.5 Wh | HP Envy x360 15-bq102ng R5 2500U, Vega 8, 55.8 Wh | Dell Inspiron 15 3585 (2300U, Vega 6) R3 2300U, Vega 6, 42 Wh | Dell XPS 15 7590 i5 iGPU FHD i5-9300H, UHD Graphics 630, 97 Wh | |
|---|---|---|---|---|---|---|
| Pil Çalışma Süresi | 40% | 100% | 65% | 4% | 125% | |
| Reader / Idle (h) | 12.3 | 7.3 -41% | ||||
| WiFi v1.3 (h) | 4.3 | 6 40% | 8.6 100% | 7.1 65% | 5.3 23% | 14.1 228% |
| Load (h) | 1.4 | 1.8 29% | 1.7 21% |
Artılar
Eksiler
Verdict
The redeeming aspects of the 2019 Pavilion x360 15 are its narrow bezels, light weight, and small dimensions relative to other budget convertibles of this size category. Port options are respectable and fan noise is relatively quiet due to the limited Turbo Boost and good core temperatures.
Unfortunately, almost everything else falls apart. For a $1000, the Pavilion x360 15 offers short battery life, a weak chassis design and one of the worst displays you can get on any laptop with a Whiskey Lake-U CPU. The display is dim, contrast is low, colors are poor, and viewing angles are narrow because of the TN panel which almost completely negates the benefits of a 2-in-1 form factor. A configuration like this should not even exist at this price range.
Now, the actual Pavilion x360 15 model isn't bad for a budget laptop. Lower-end configurations retail for about $500 to be an easier pill to swallow. Nonetheless, we highly recommend configuring any SKU with the 1080p panel instead. If the convertible form factor is not a must-have, then the Walmart Motile could be a worthwhile alternative.
Not worth the exorbitant four-digit market price. If you're willing to spend $1000 on a new laptop, then consider the HP Envy or Spectre instead.
HP Pavilion x360 15-dq0065cl
- 02/09/2020 v7 (old)
Allen Ngo
Price comparison
