İnceleme: MSI Modern 14 A10RB Laptop, göründüğünden daha hafif
(3 Şubat 2020 güncellemesi: Core i7-10710U'lu MSI Modern 14 SKU'lar var, ancak yazma sırasında ABD'de mevcut değiller.) MSI üst düzey MSI Prestige 14, MSI ile karıştırılmamalıdır Modern 14, içerik oluşturucuları ve işletme kullanıcılarını daha sıkı bütçelerle hedefleyen daha uygun fiyatlı bir sürümdür. Prestij 14'ün GTX grafikleri, 4K UHD panelleri ve Thunderbolt 3 desteği gibi gelişmiş özelliklerinin çoğundan, tipik ofis çalışanlarının takdir edebileceği daha hafif bir sistem lehine geçer. Mevcut SKU'lar Core i5-10210U CPU ve 1080p matta sabitlenir Görüntüle. Yükseltilebilir seçenekler GPU (Intel UHD Graphics 620 veya GeForce MX250), NVMe SSD ve 32 GB'a kadar DDR4 RAM ile sınırlıdır. Burada test edilen yapılandırma Xotic PC'de 900 USD karşılığında bulunabilir. MSI Modern 14, hem Ultrabook'lar hem de Microsoft Surface Dizüstü bilgisayar serisi, Apple MacBook Pro serisi, Dell Latitude 7400 ve Lenovo ThinkPad P43 gibi iş merkezli dizüstü bilgisayarlarla rekabet ediyor.Daha fazla MSI incelemeleri: MSI Prestij 14MSI P65 CreatorMSI WE75 9TKMSI Alfa 15MSI PS63 ModernMSI GS65 Stealth
Derecelendirme | Tarih | Modeli | Ağırlık | Yükseklik | Boyut | Çözünürlük | Fiyat |
|---|---|---|---|---|---|---|---|
| 80.9 % v7 (old) | 02/2020 | MSI Modern 14 A10RB-459US i5-10210U, GeForce MX250 | 1.2 kg | 16 mm | 14.00" | 1920x1080 | |
| 88.2 % v7 (old) | 10/2019 | Lenovo Yoga C940-14IIL i7-1065G7, Iris Plus Graphics G7 (Ice Lake 64 EU) | 1.4 kg | 14.95 mm | 14.00" | 1920x1080 | |
| 89.7 % v7 (old) | 12/2019 | Apple MacBook Pro 16 2019 i9 5500M i9-9880H, Radeon Pro 5500M | 2 kg | 16.2 mm | 16.00" | 3072x1920 | |
| 83.7 % v7 (old) | 10/2019 | Asus VivoBook 14 X403FA i5-8265U, UHD Graphics 620 | 1.3 kg | 16.5 mm | 14.00" | 1920x1080 | |
| 90.1 % v7 (old) | 10/2019 | Lenovo ThinkPad X1 Carbon 2019-20QE000VGE i7-8665U, UHD Graphics 620 | 1.1 kg | 14.9 mm | 14.00" | 2560x1440 |
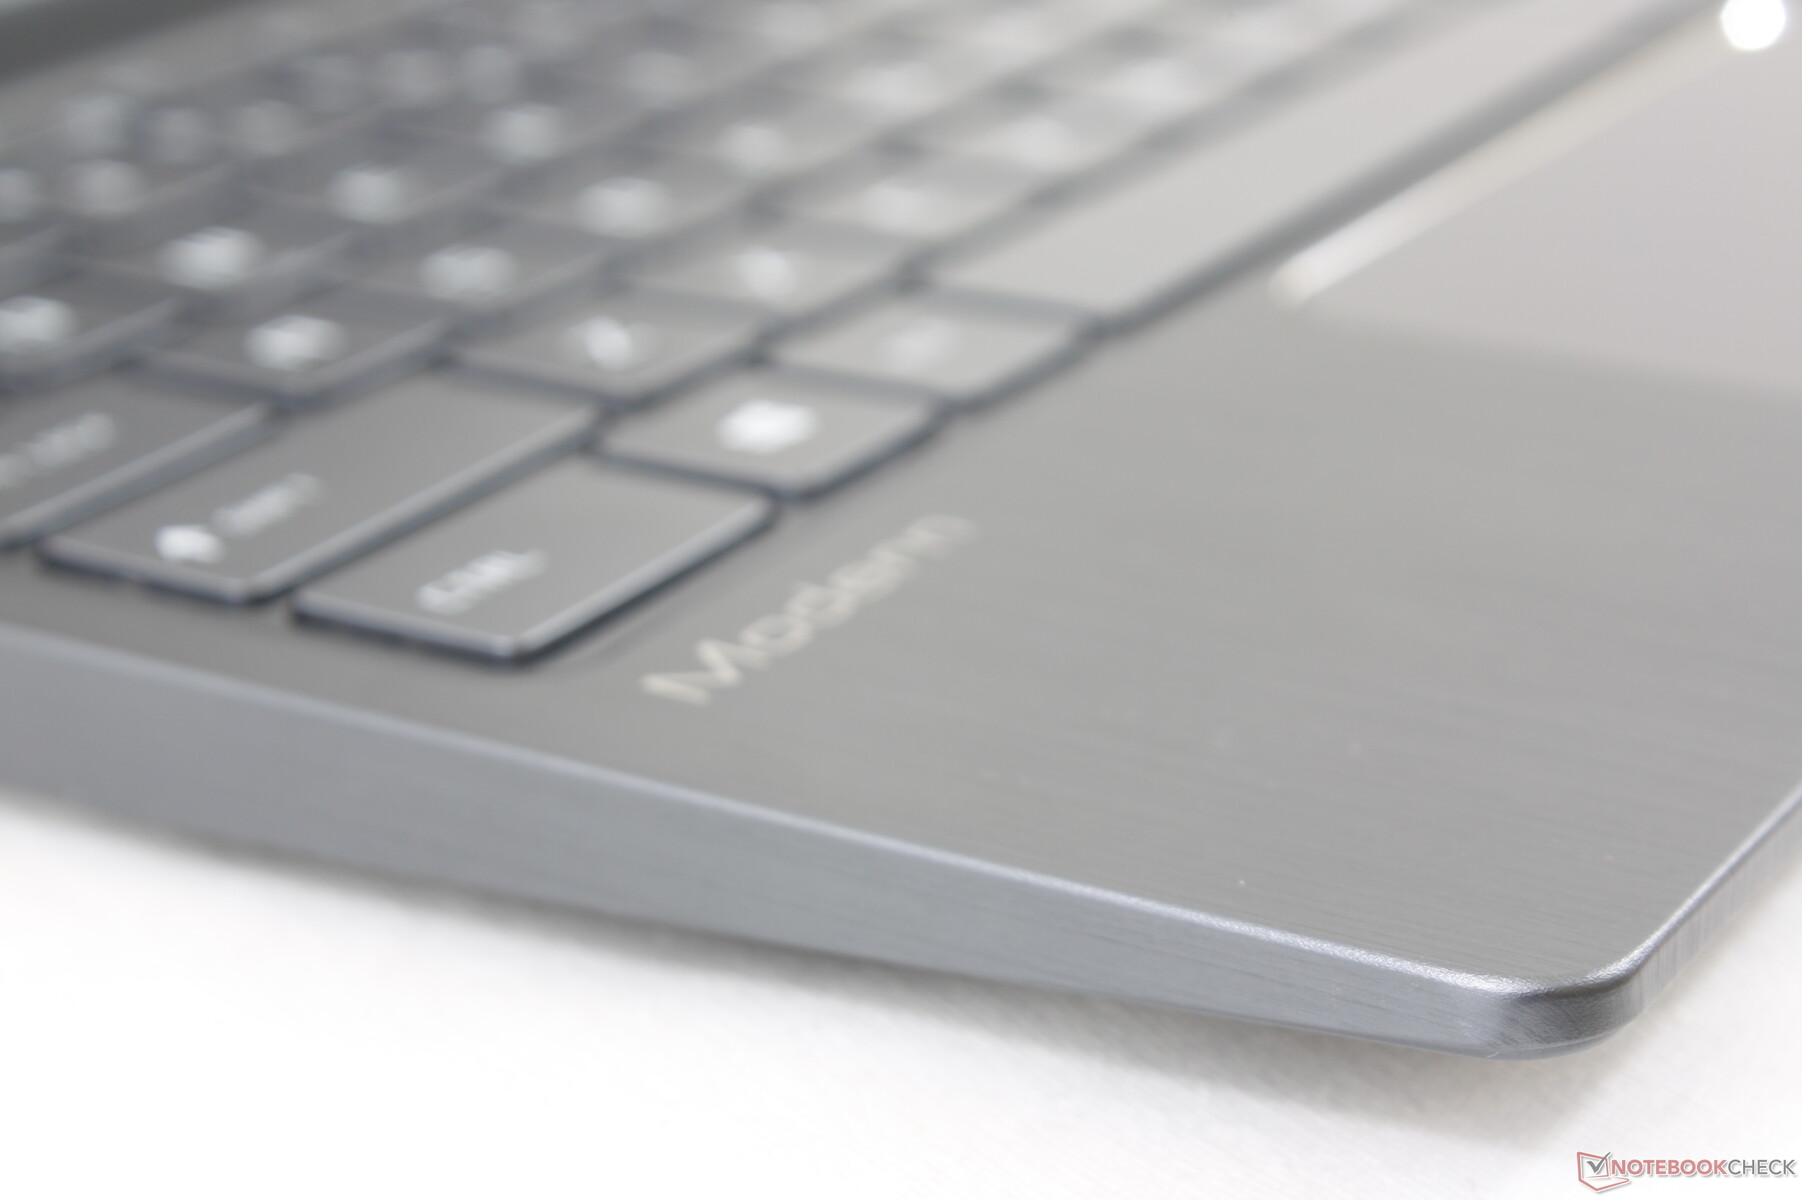
Durum
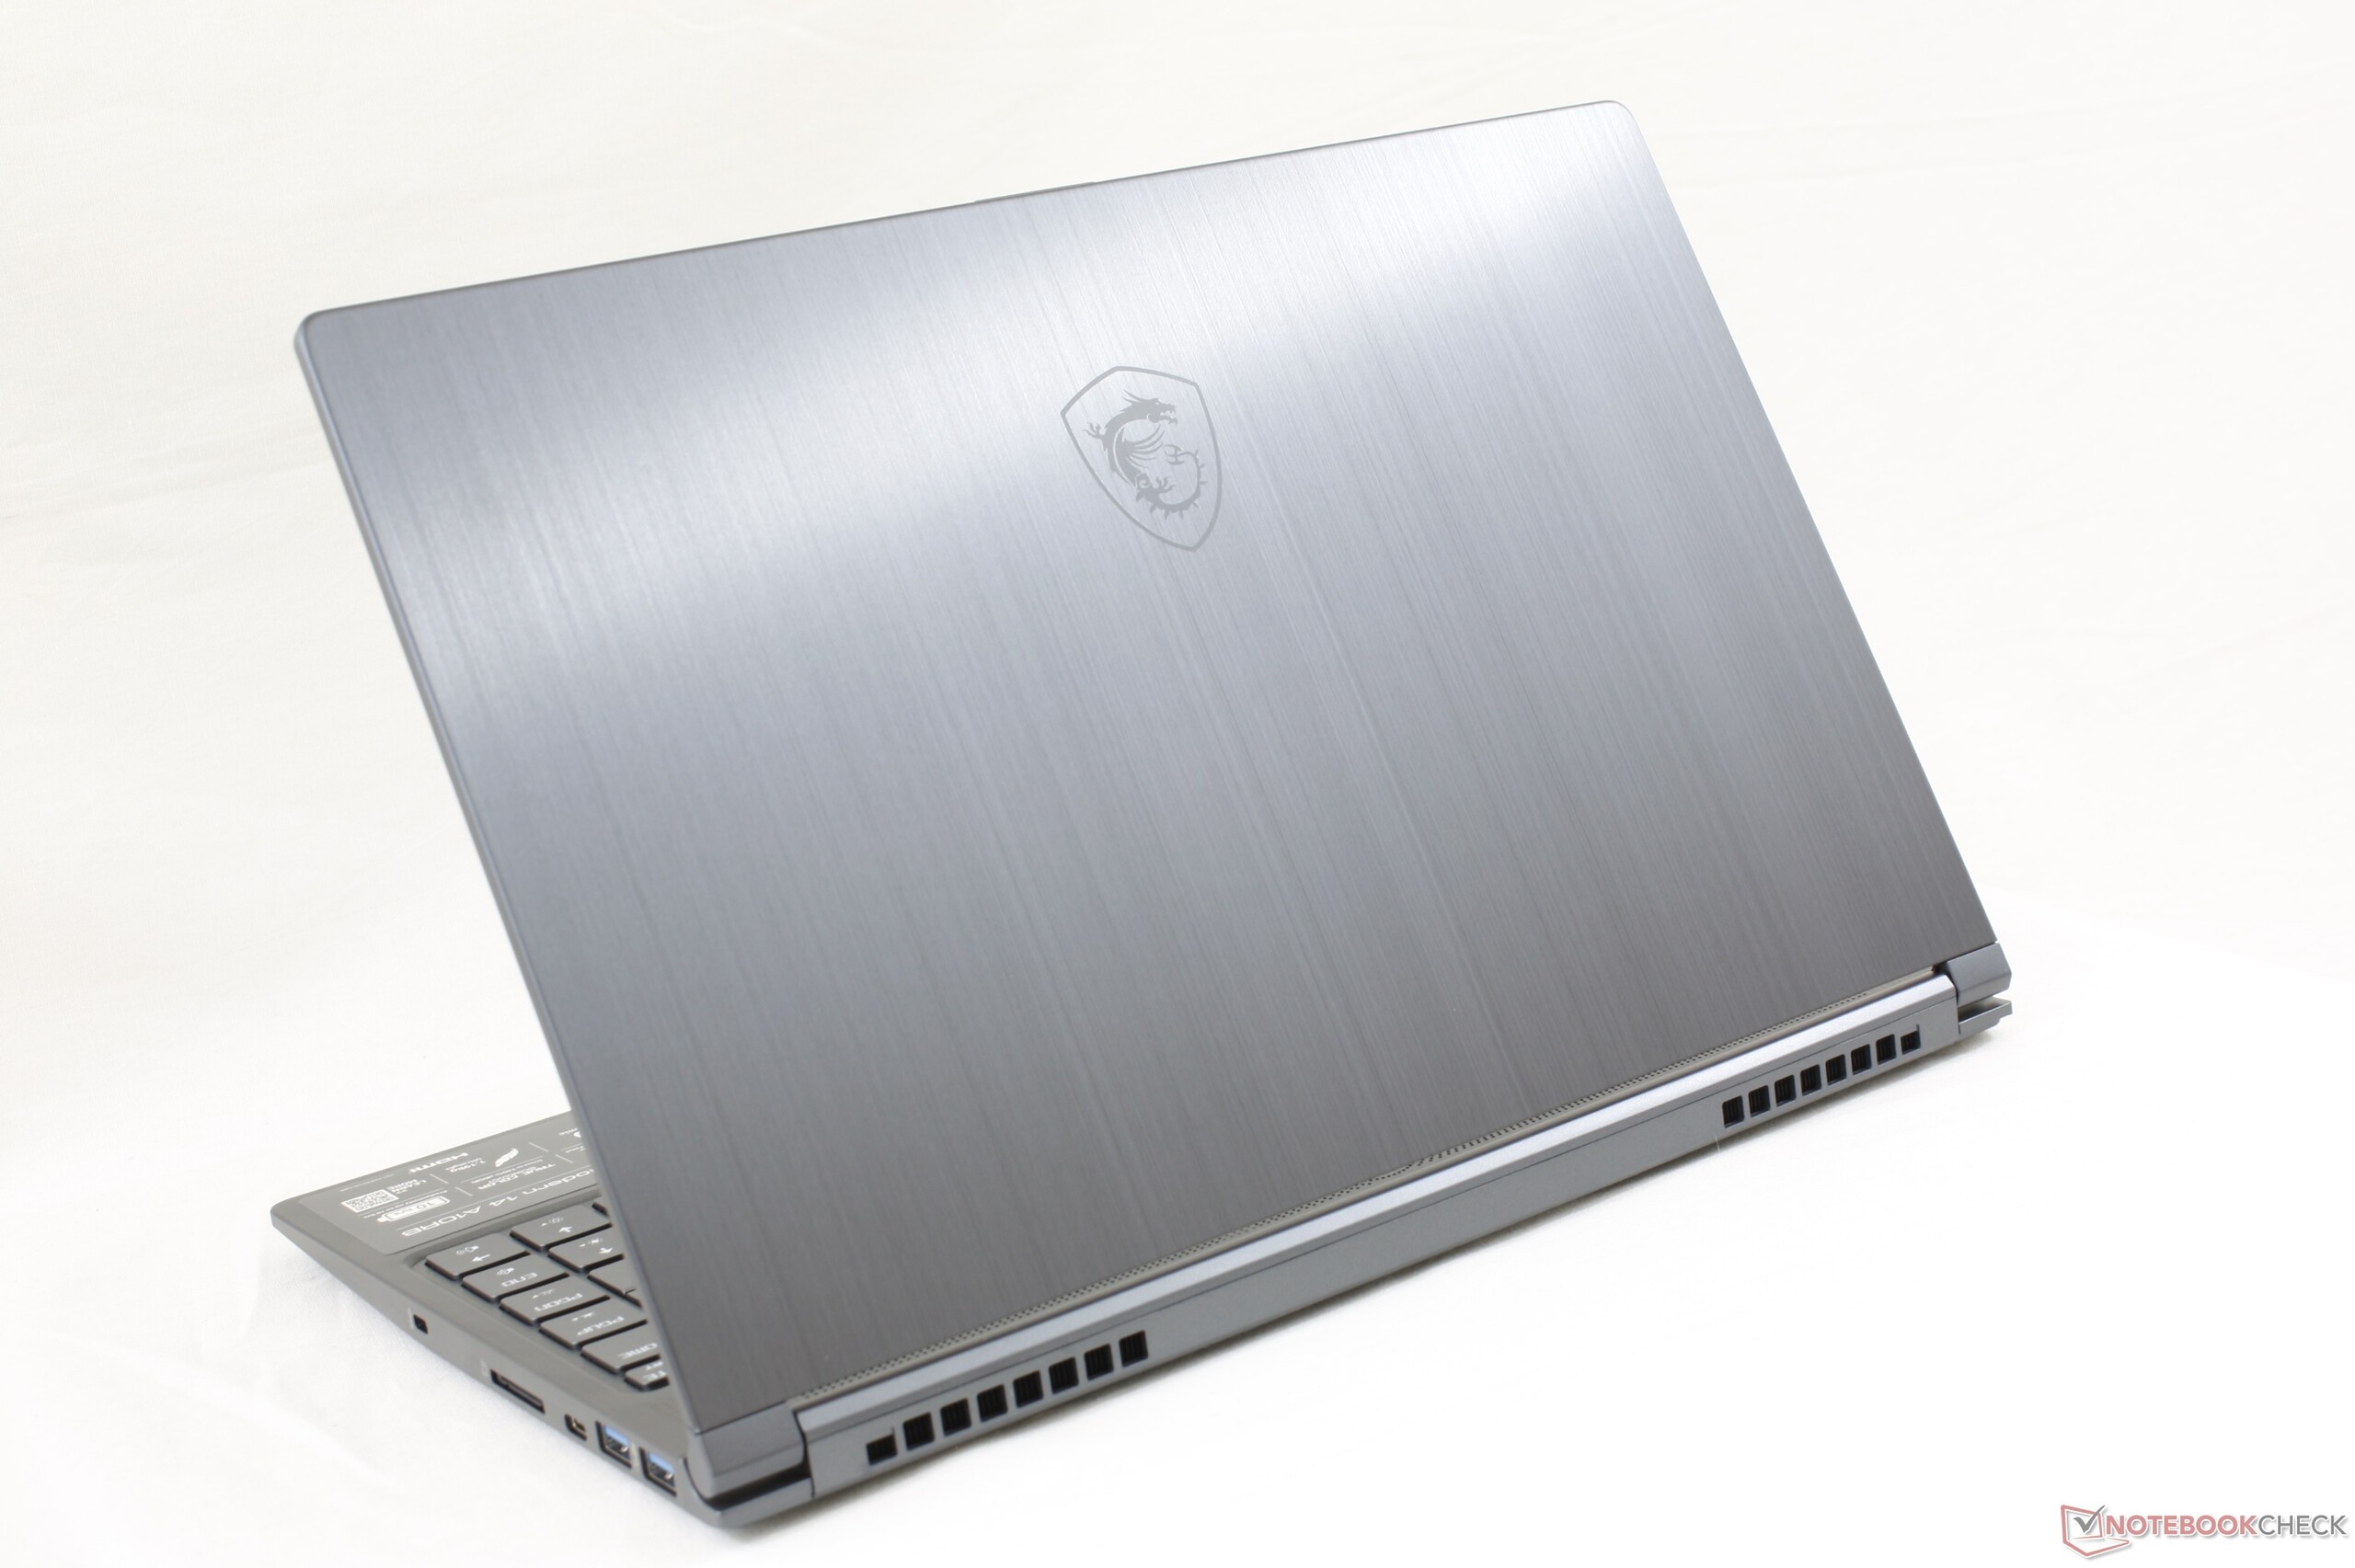
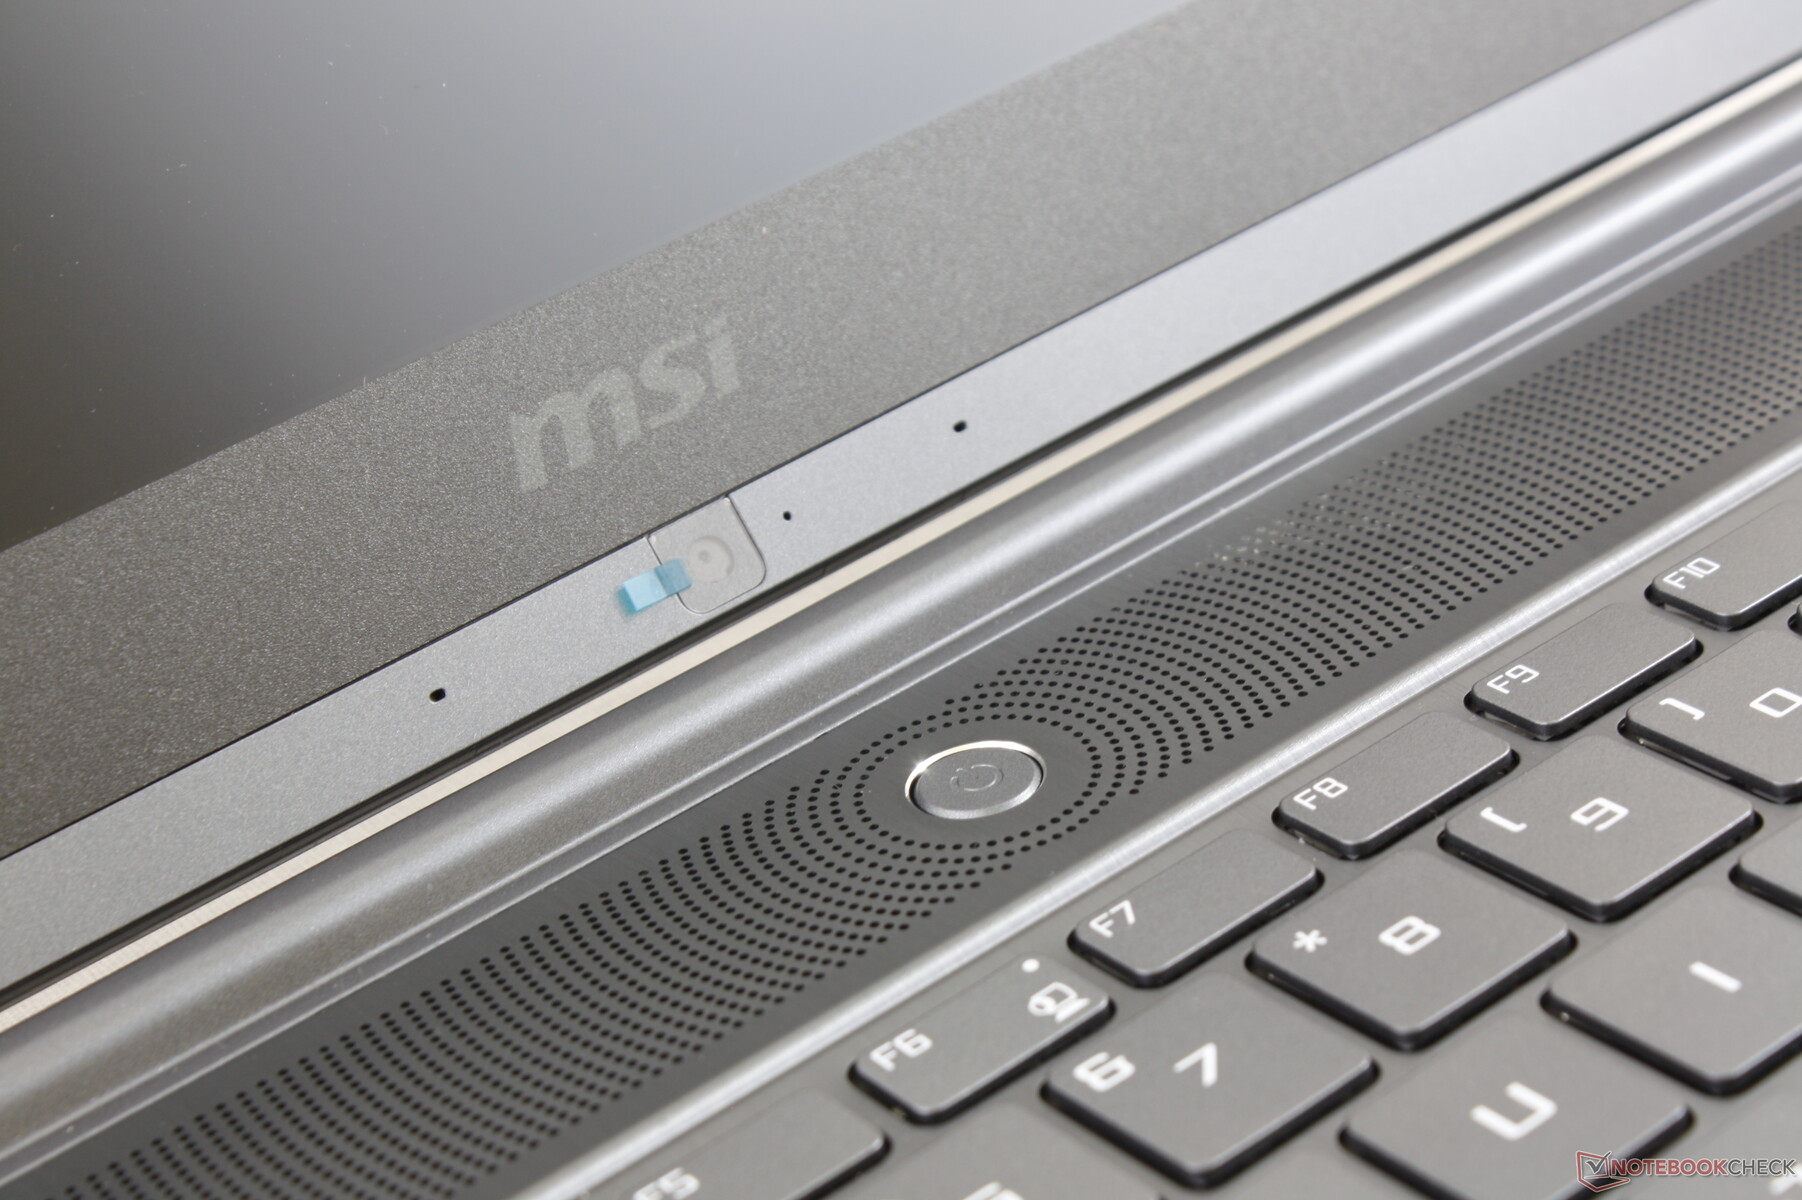
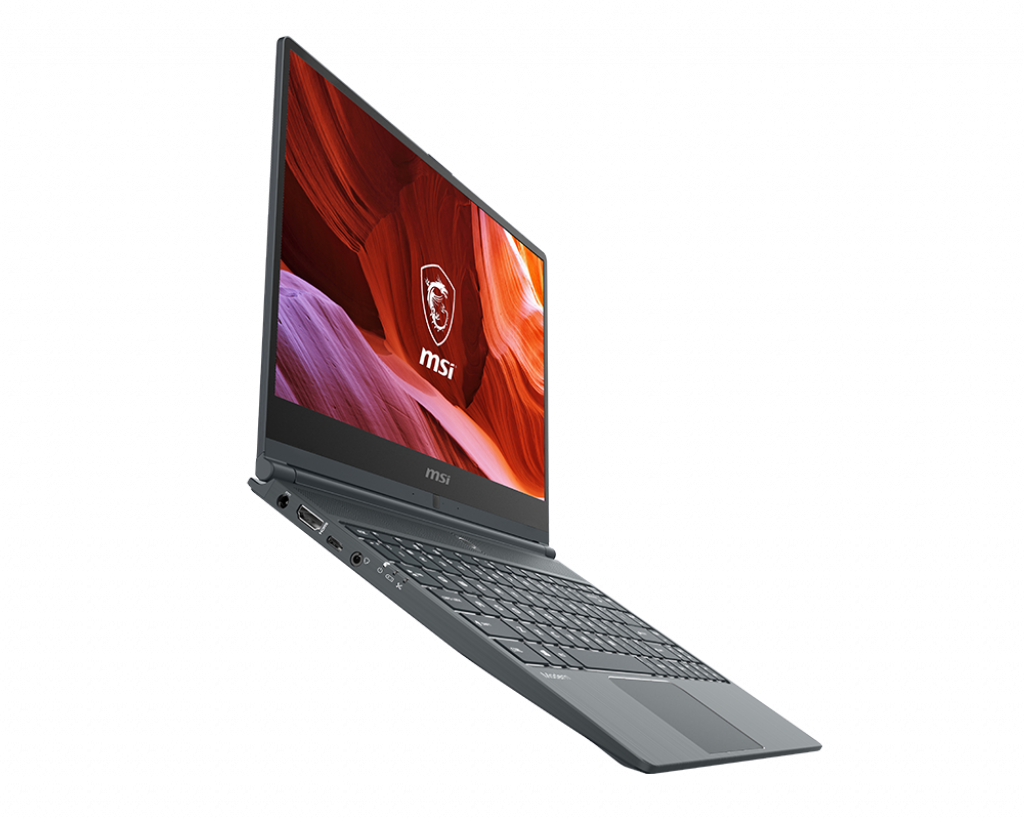
MSI'ın güçlü yönlerinden biri görsel olarak çekici bir dizüstü bilgisayar yaratmak. Modern 14'ün, benzer fırçalanmış alüminyum yüzeyleri ve dokuları paylaştıklarından, süper ince MSI GS serisi oyun dizüstü bilgisayarlarından birkaç ipucu aldığı açıktır. Her zamanki sıkıcı ofis dizüstü bilgisayarıyla karşılaştırıldığında, Modern 14 kesinlikle daha şık ve çekici.Ne yazık ki, görsel çekicilik şasi sertliği pahasına geldi. Taban, yanlarını bükmeye çalışırken bazı gıcırtılar sergiler ve genel iskelet sağlamlık hissi vermez. XPS 13, Spectre 13, EliteBook 1040, Surface Dizüstü Bilgisayar, MacBook Pro gibi alternatifler ve hatta Dell Latitude 5000 veya 7000 serisi gibi çoğu ofis dizüstü bilgisayarı daha güçlü bir şekilde üretilmiştir ve daha fazla yenilebilir.
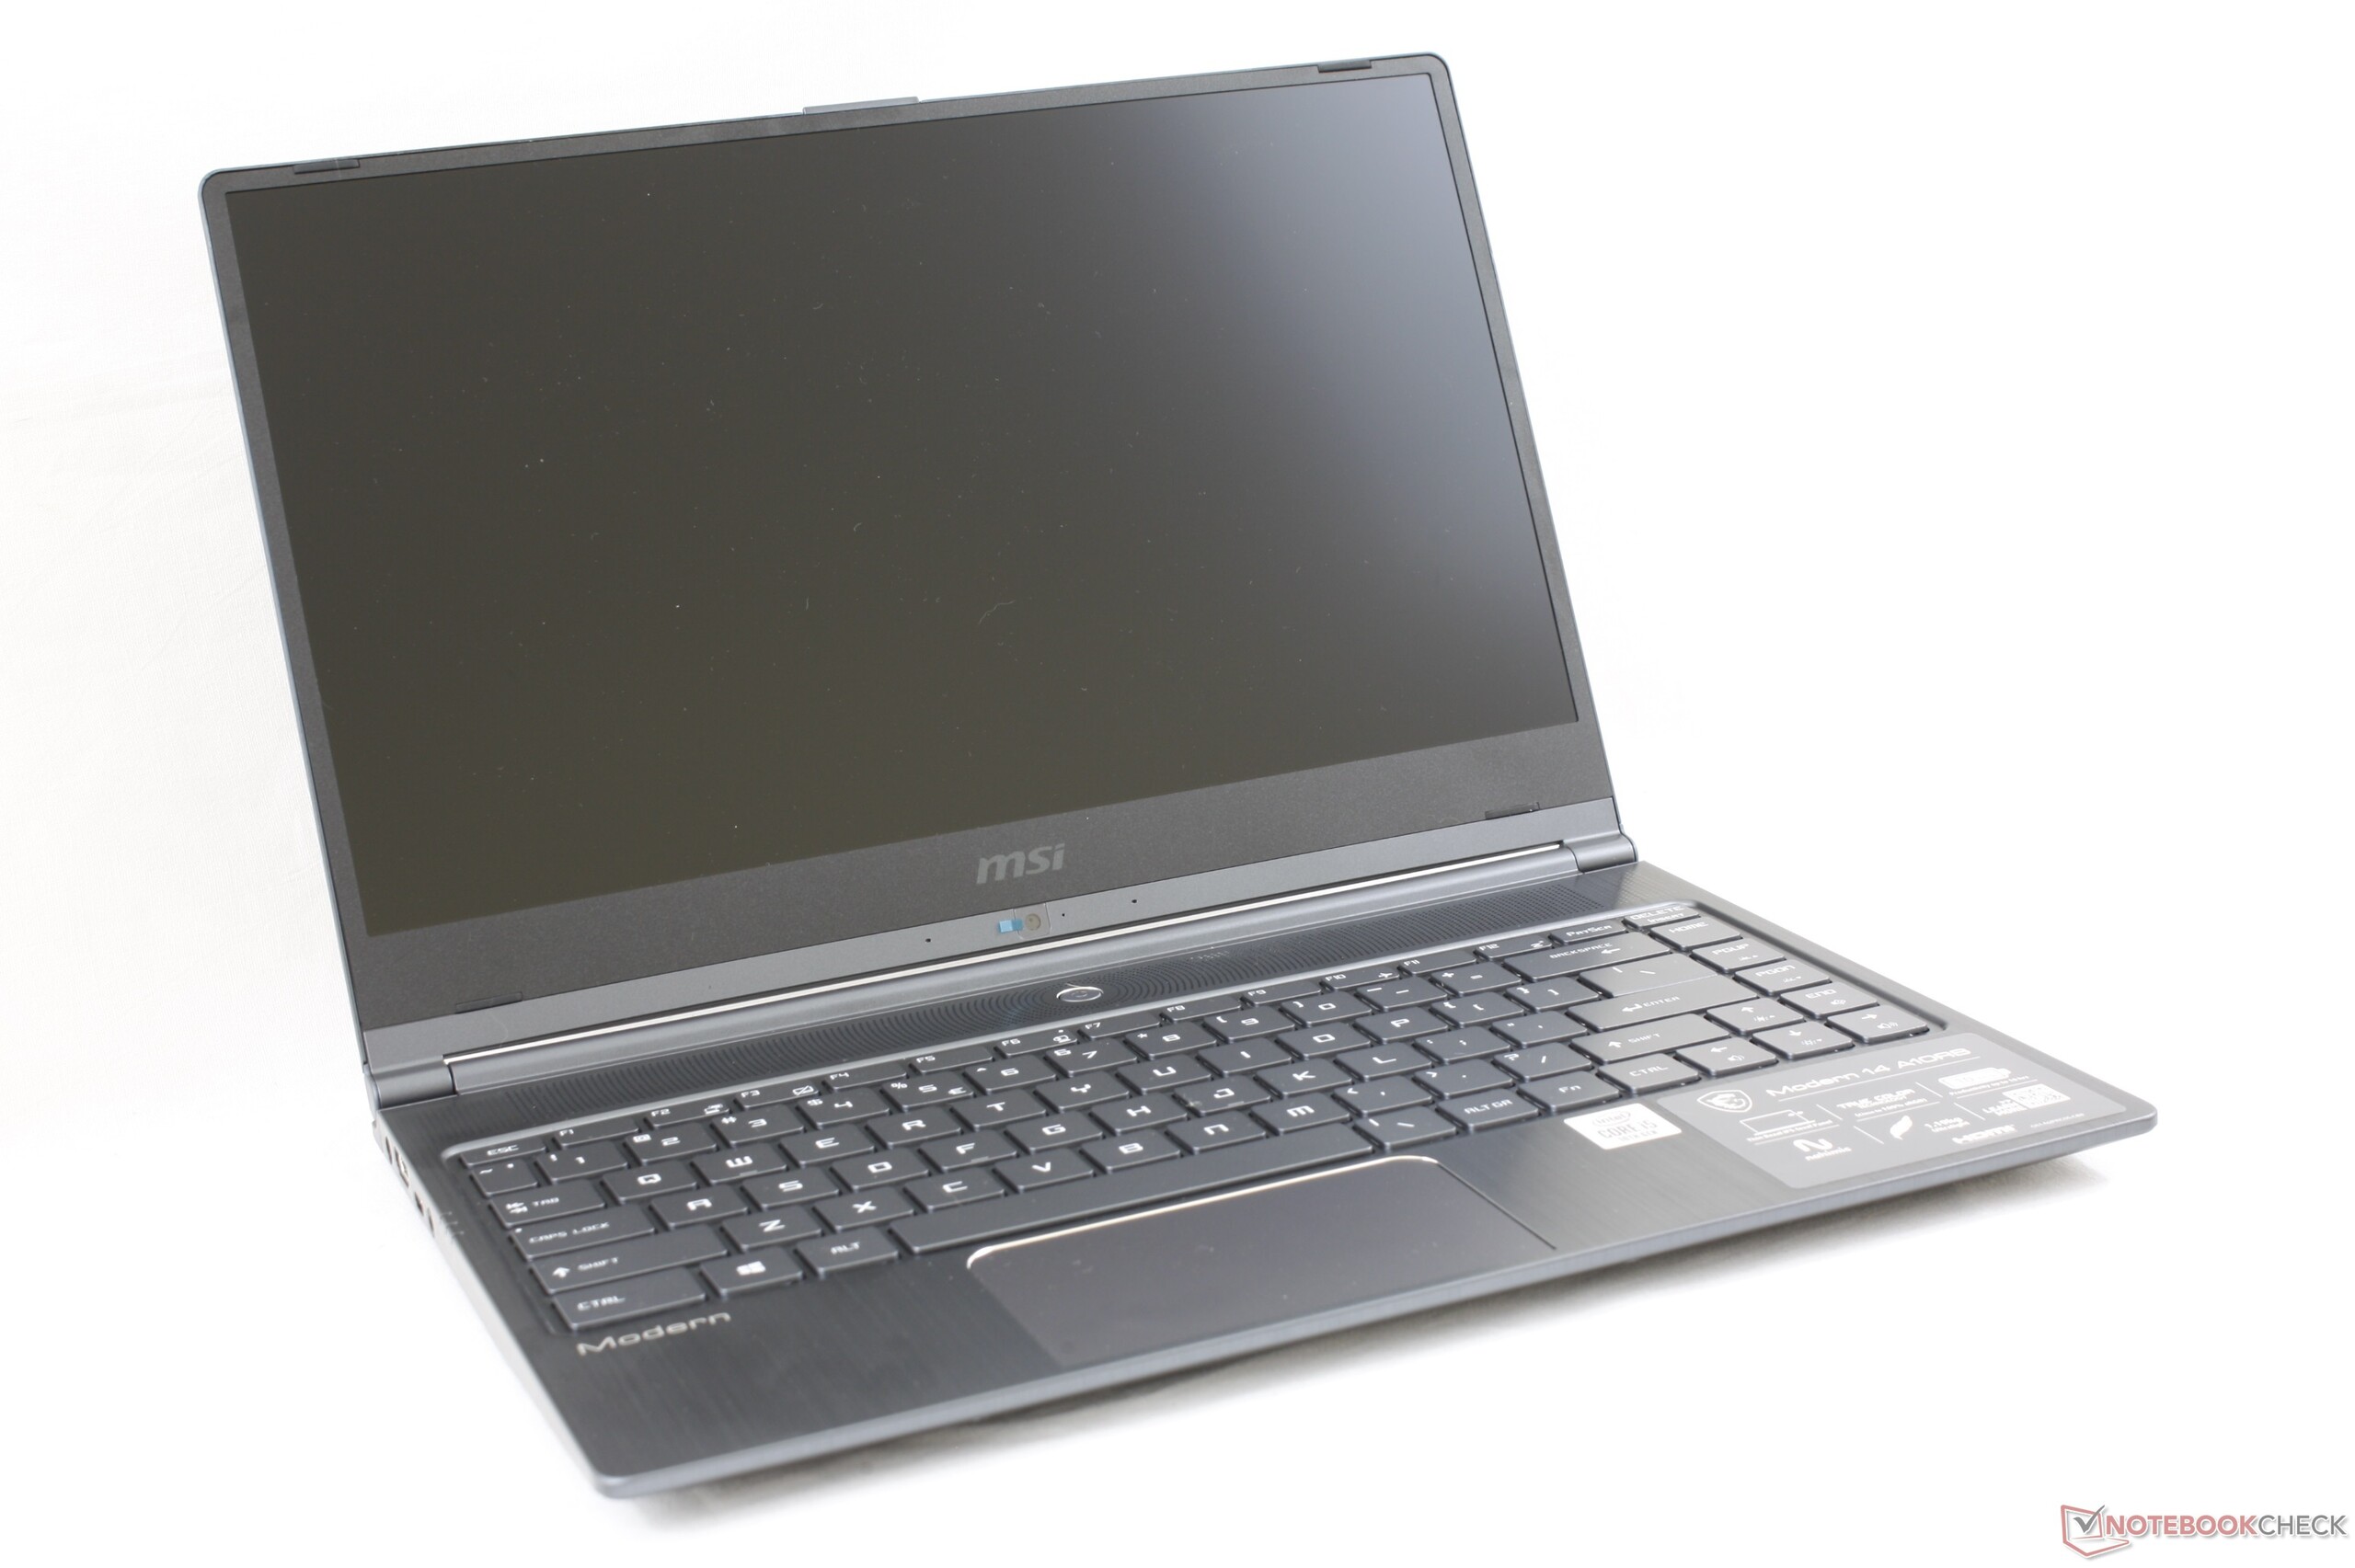
Belki de ince iskelet ve esnek yüzeylerin doğrudan bir sonucu olarak, Modern 14 sadece 1,2 kg'da birçok alternatiften çok daha hafiftir. Ağırlığı, 13,3 inç Dell XPS 13 ile neredeyse aynıdır ve daha büyük bir 14 inç ekran boyutu sağlar. Daha pahalı Yoga C940-14 ve Prestige 14, her boyutta biraz daha ağır ve daha küçüktür.
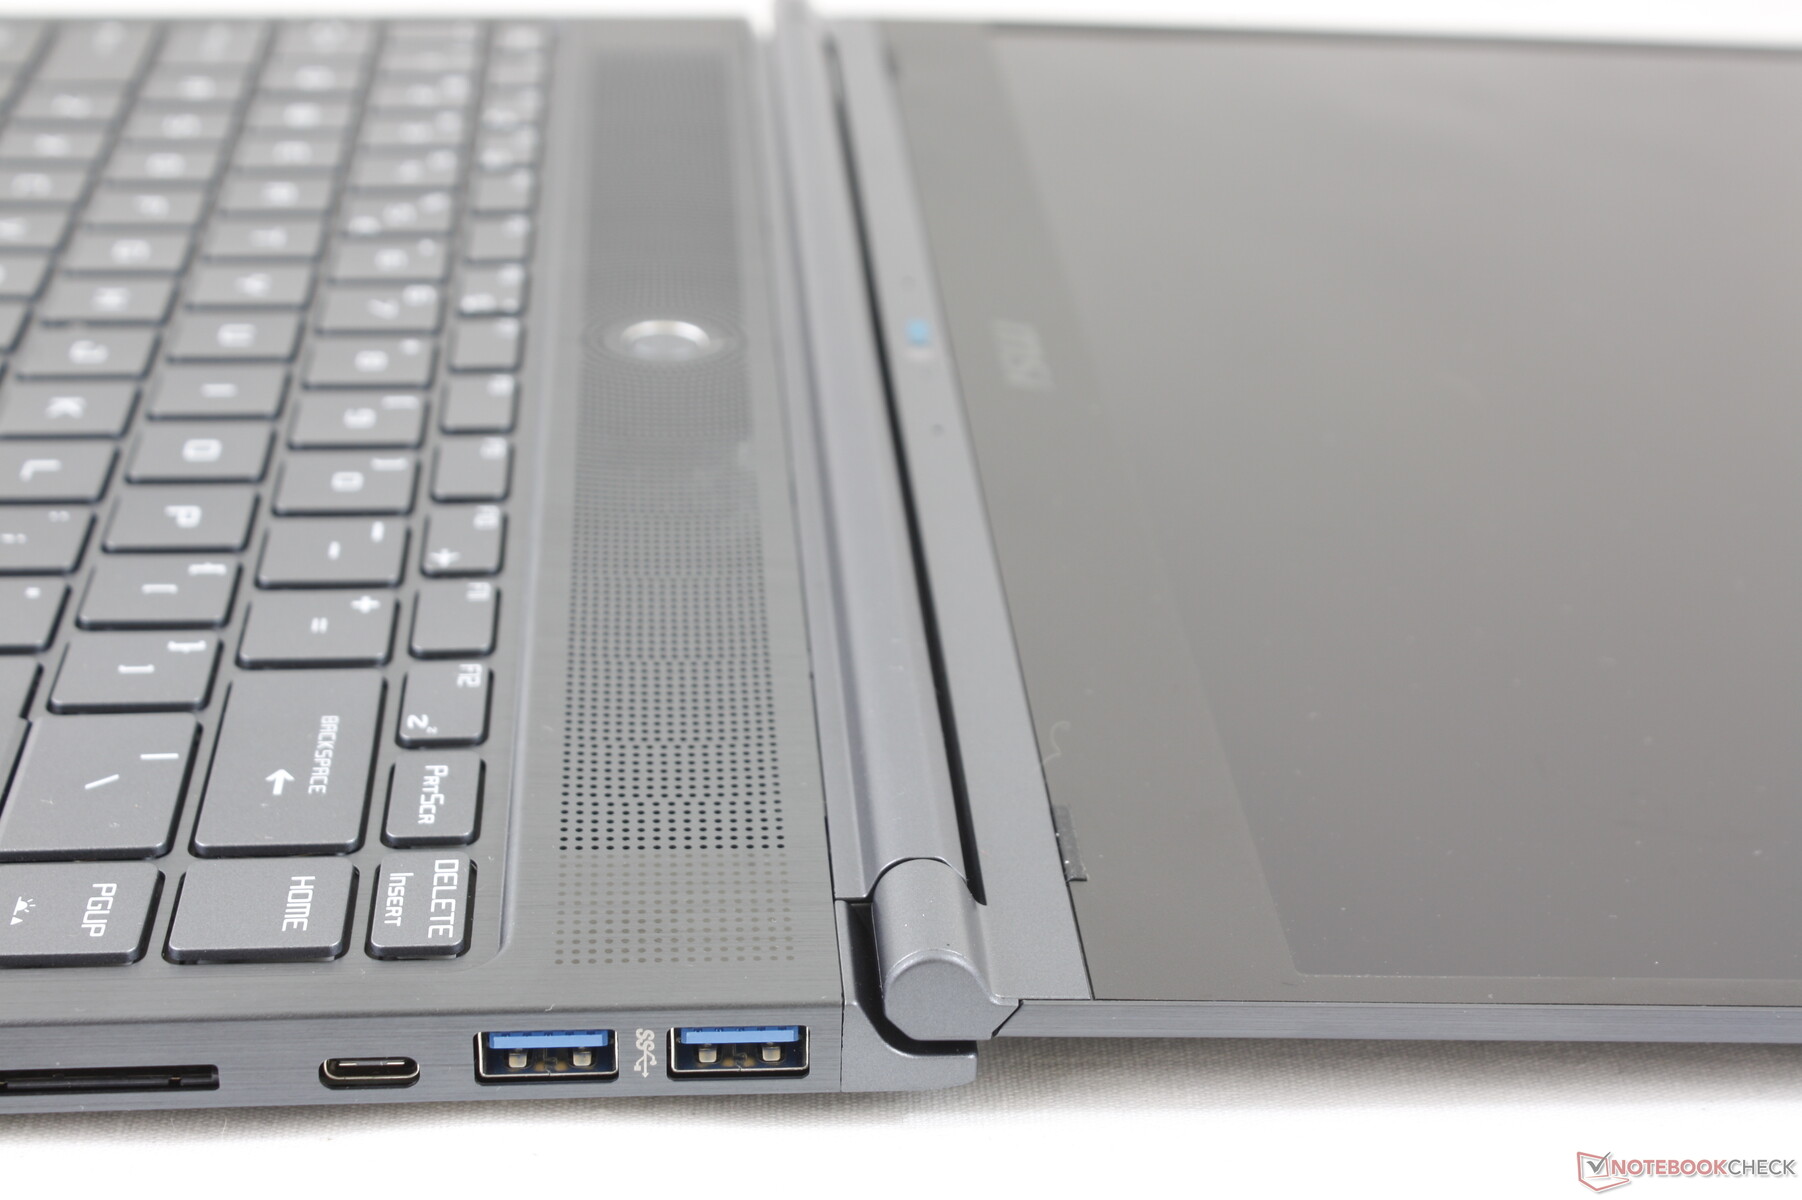
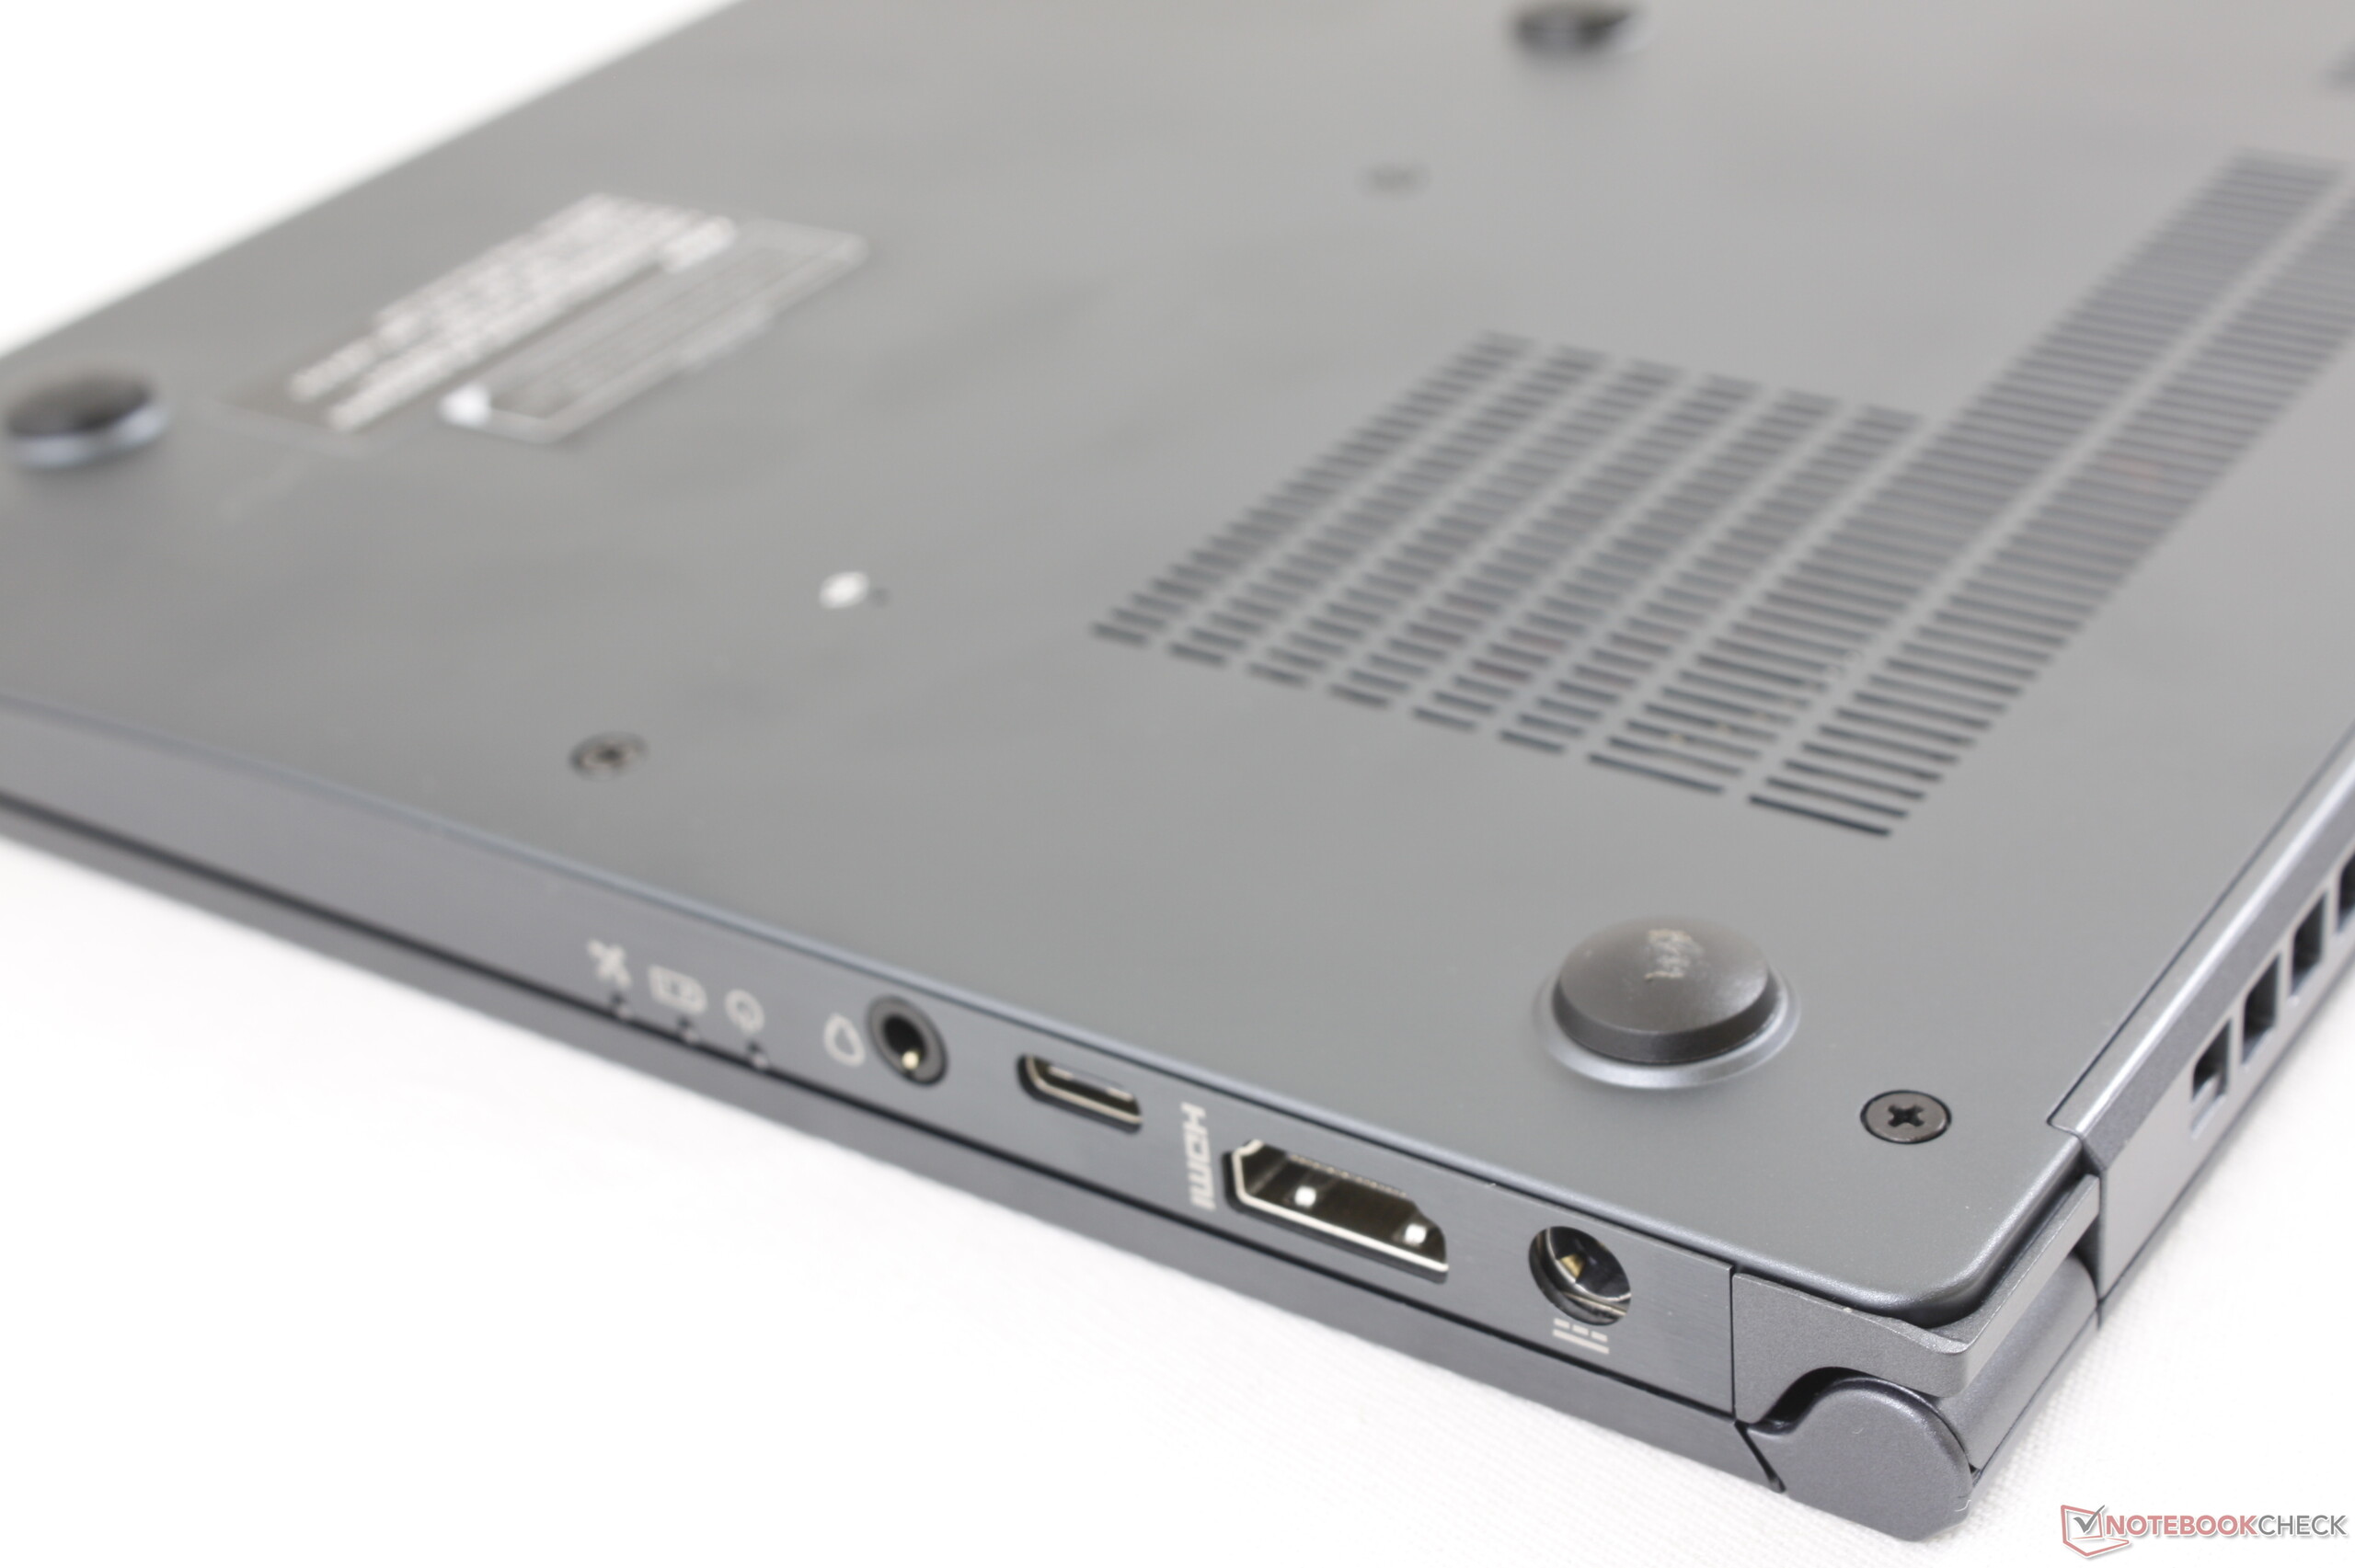
Bağlantı
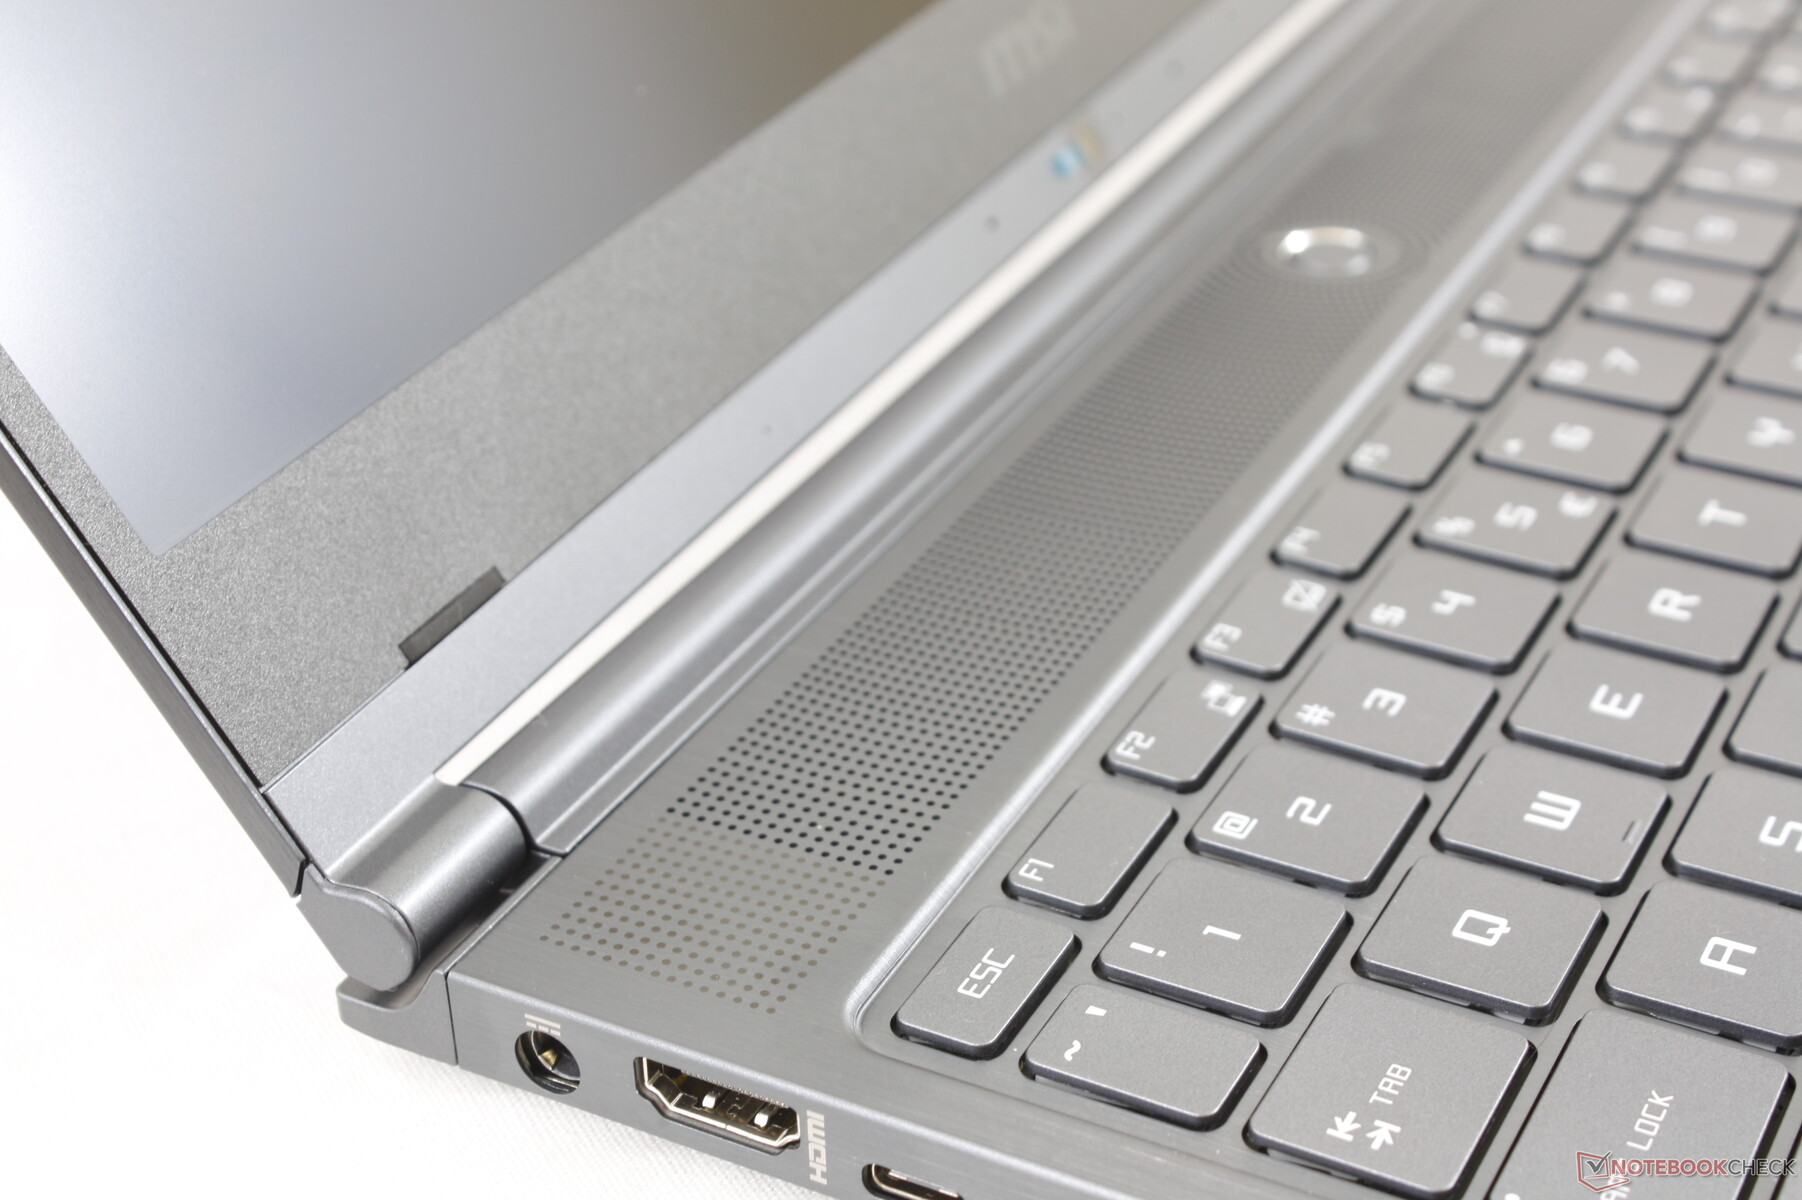
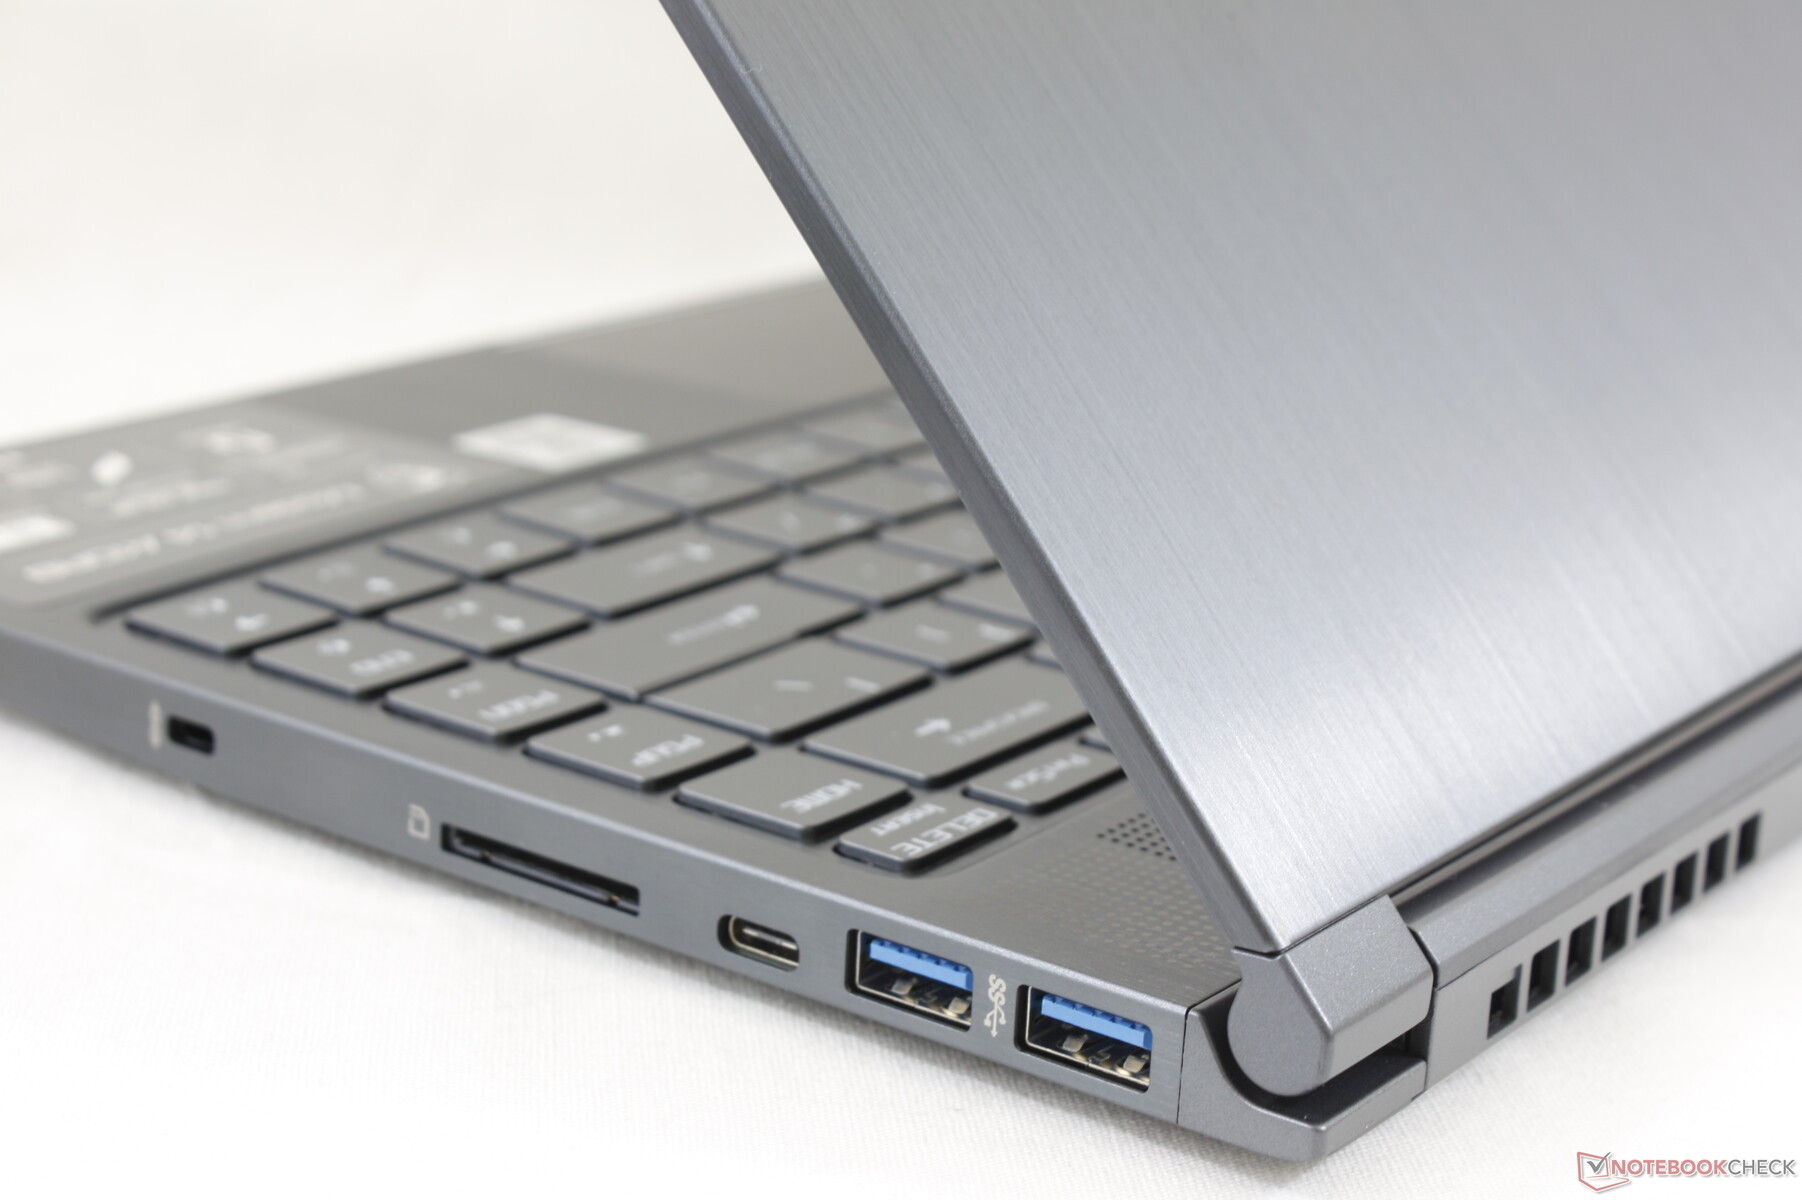
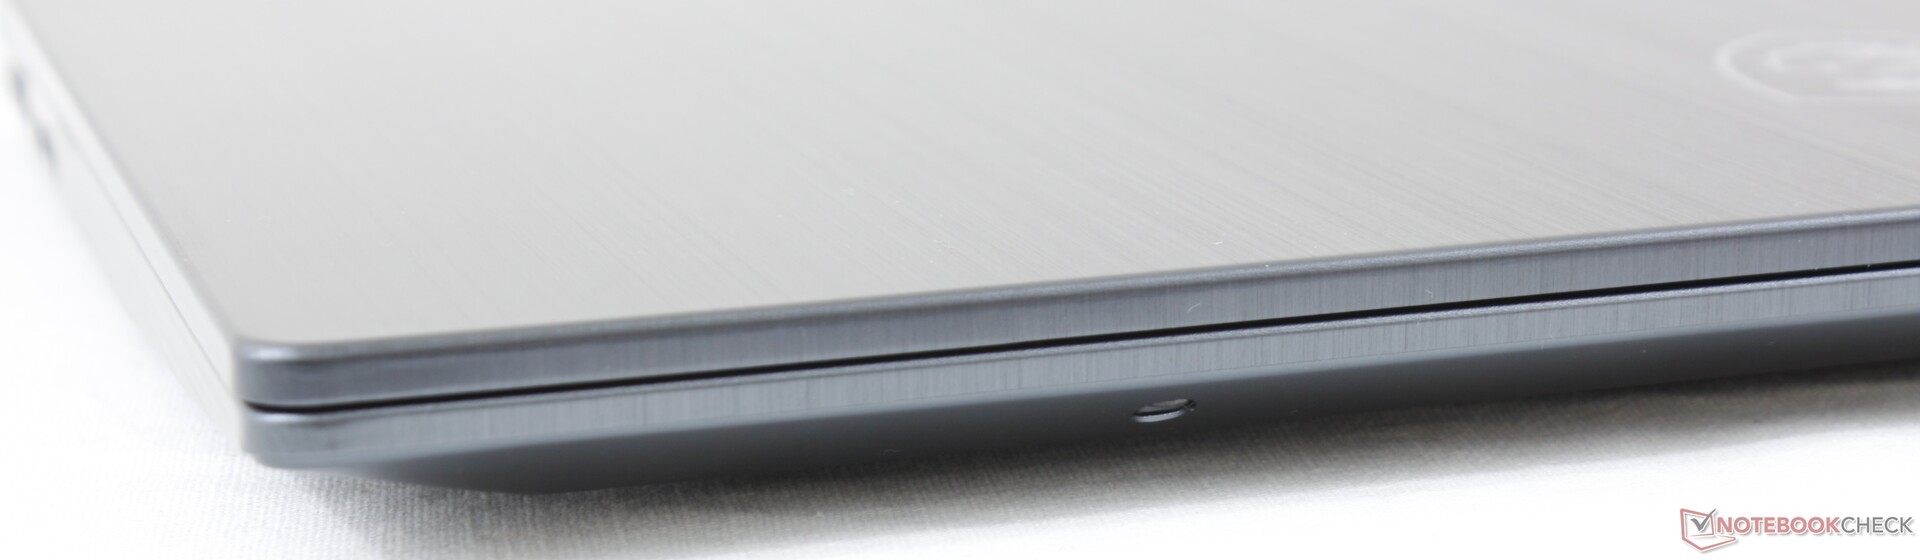
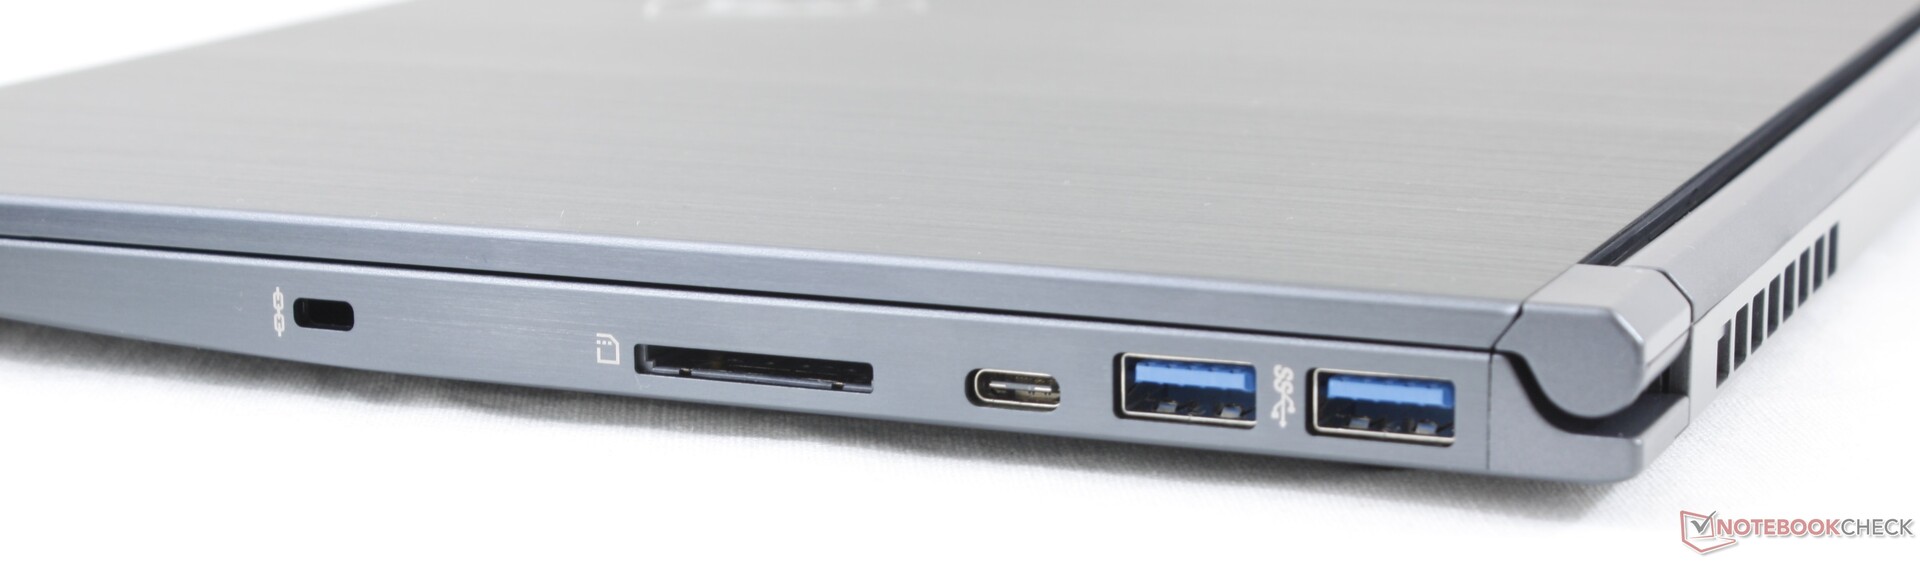
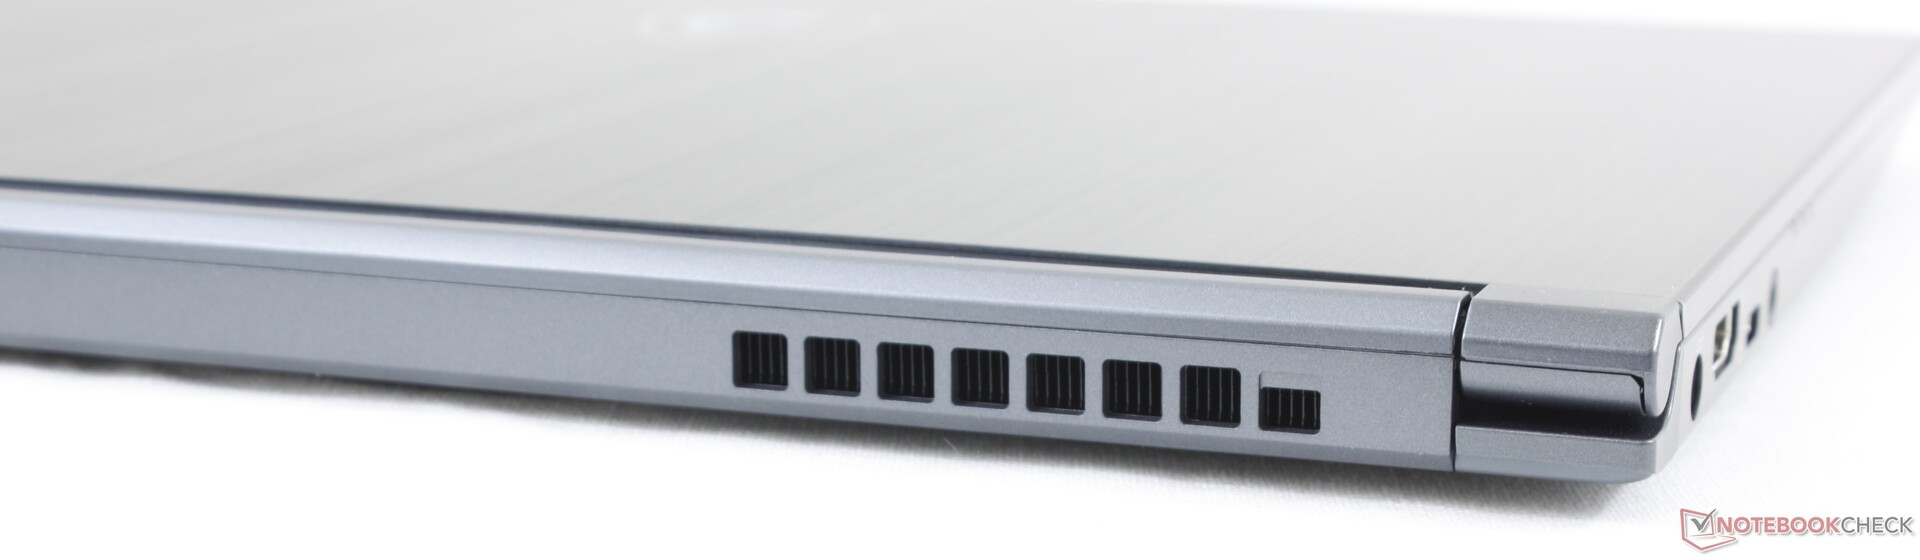
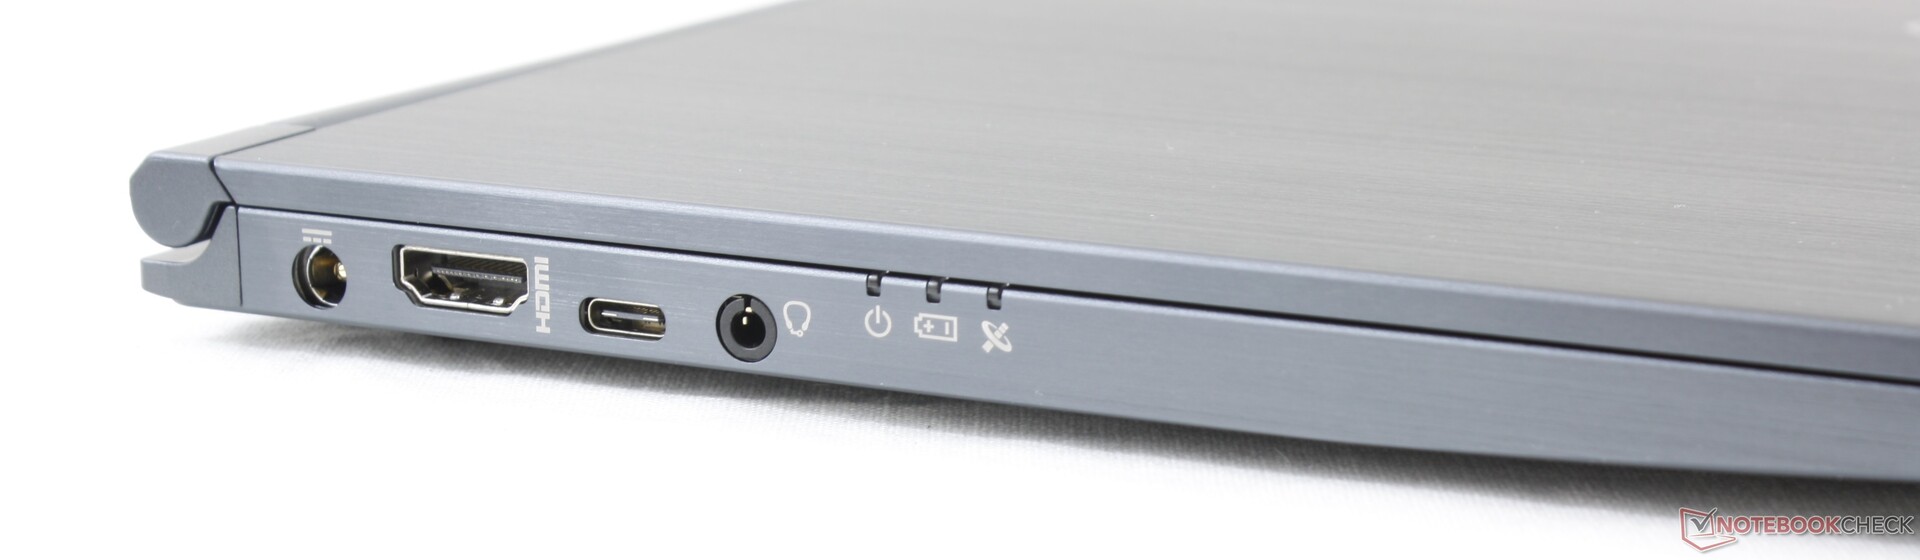
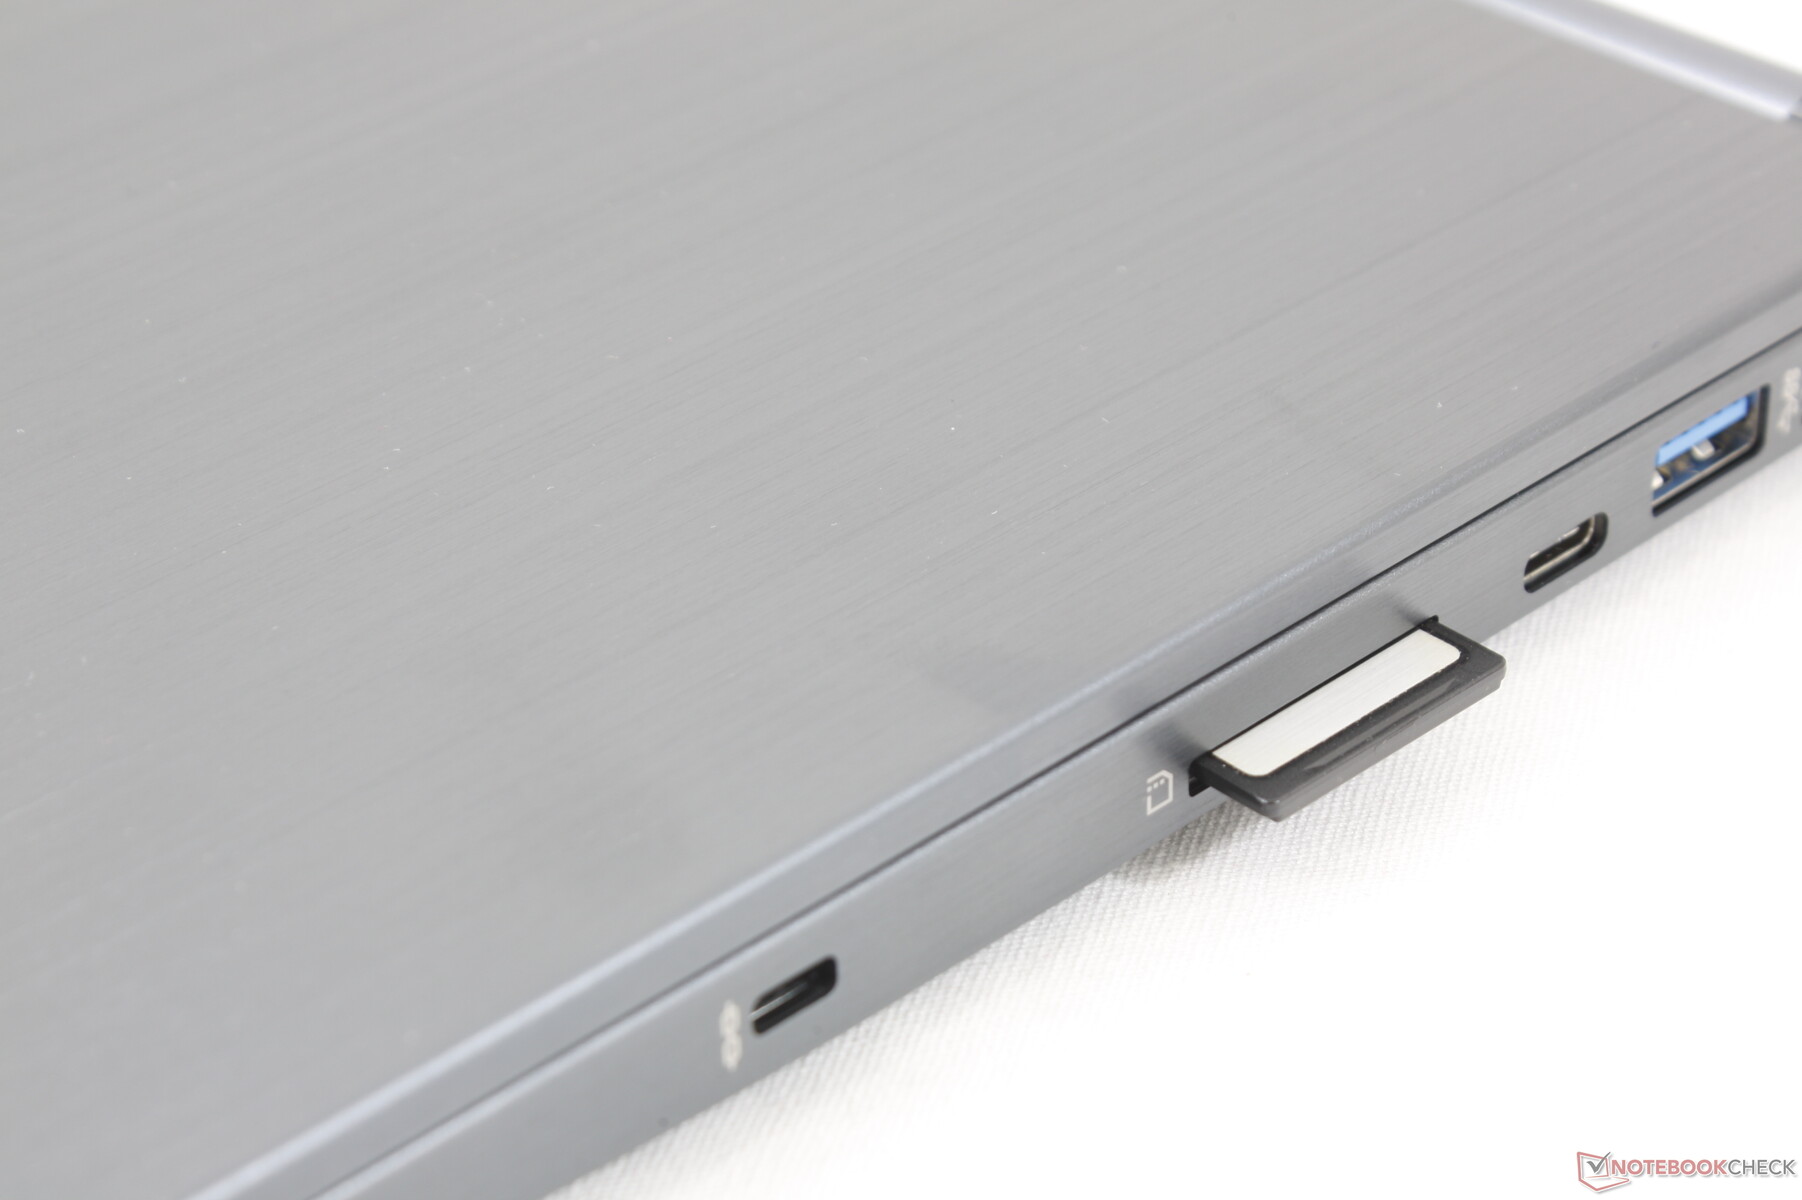
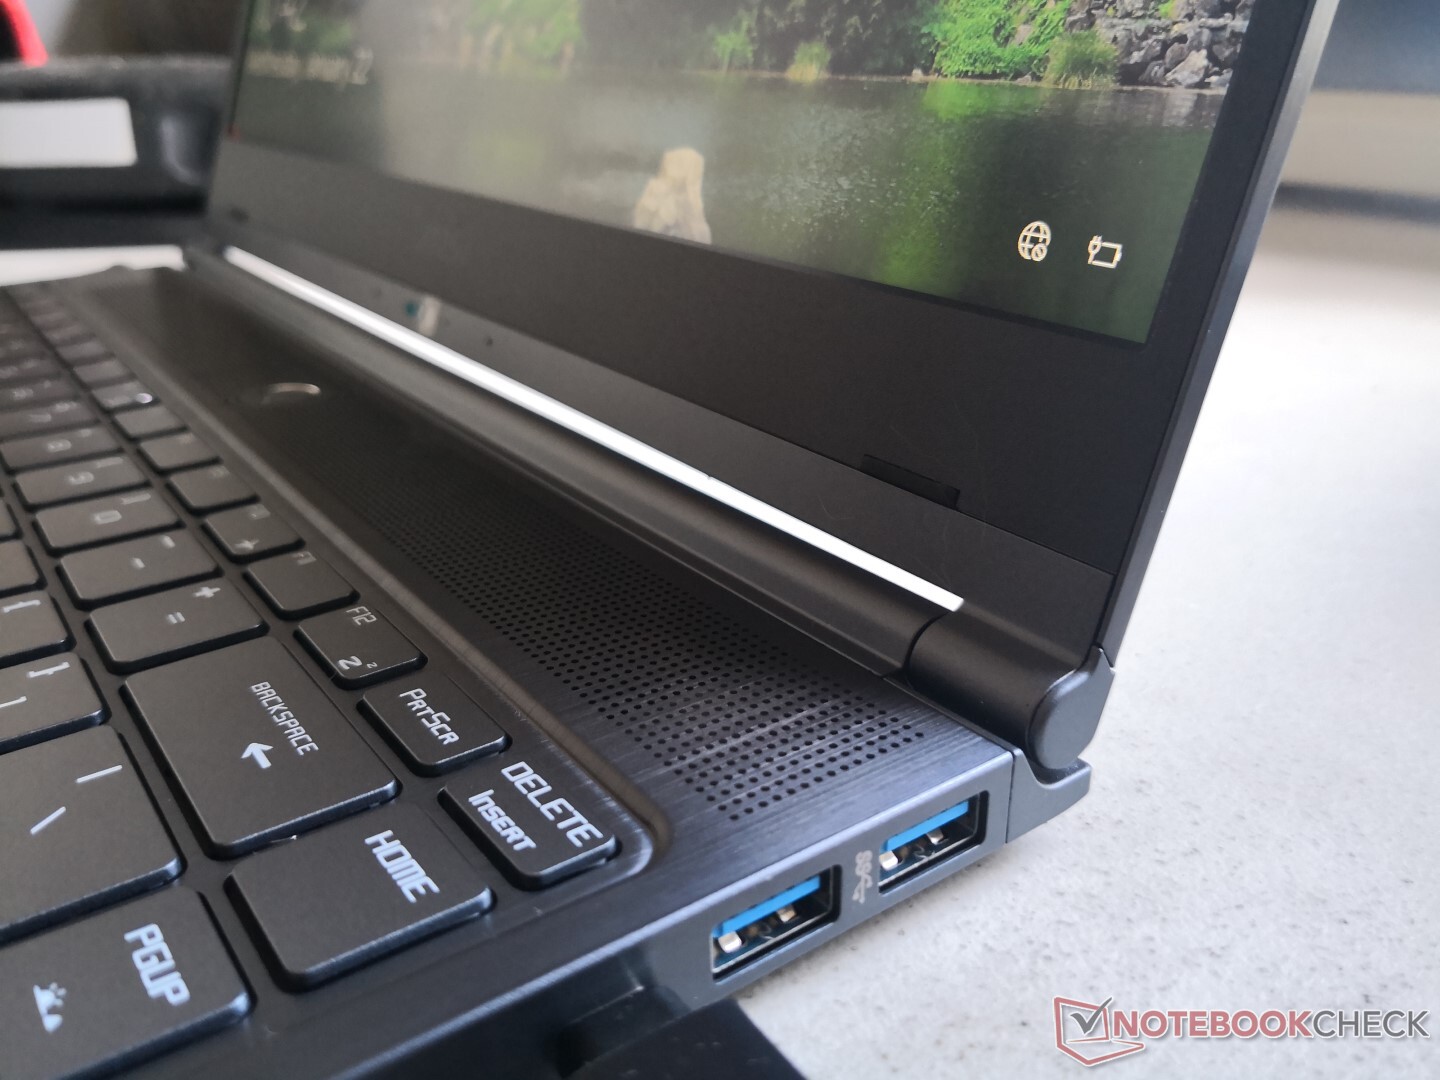
MSI, ince profil ve hafif olmasına rağmen liman seçiminde eksik değildi. Kullanıcılar burada tam boyutlu HDMI ve çoklu USB Tip A bağlantı noktaları dahil olmak üzere XPS 13 veya HP Spectre 13'e göre daha fazla seçeneğe sahip olacaklar. Ana dezavantajı, USB Type-C bağlantı noktasının Prestij 14'ten farklı olarak Thunderbolt 3'ü desteklememesidir. Bağlantı noktası konumlandırma da iyidir ancak mükemmel değildir; HDMI bağlantı noktası AC adaptör bağlantı noktasının yanında sıkışmış hissederken, her iki tarafta USB A Tipi bağlantı noktalarını görmeyi tercih ederdik.
SD Kart Okuyucu
Sistemin tam boyutlu yaylı bir SD kart okuyucuyu entegre ettiği gerçeğini takdir etsek de, aktarım hızları maalesef çok yavaş. UHS-II test kartımızdan 1 GB değerinde fotoğraf taşımak, Prestige 15 veya XPS 15'teki 7 saniyeye kıyasla yaklaşık 36 saniye sürer.
| SD Card Reader | |
| average JPG Copy Test (av. of 3 runs) | |
| Dell XPS 15 7590 9980HK GTX 1650 (Toshiba Exceria Pro SDXC 64 GB UHS-II) | |
| Asus ZenBook 15 UX534FT-DB77 (Toshiba Exceria Pro SDXC 64 GB UHS-II) | |
| MSI Modern 14 A10RB-459US (Toshiba Exceria Pro SDXC 64 GB UHS-II) | |
| maximum AS SSD Seq Read Test (1GB) | |
| Dell XPS 15 7590 9980HK GTX 1650 (Toshiba Exceria Pro SDXC 64 GB UHS-II) | |
| Asus ZenBook 15 UX534FT-DB77 (Toshiba Exceria Pro SDXC 64 GB UHS-II) | |
| MSI Modern 14 A10RB-459US (Toshiba Exceria Pro SDXC 64 GB UHS-II) | |
İletişim
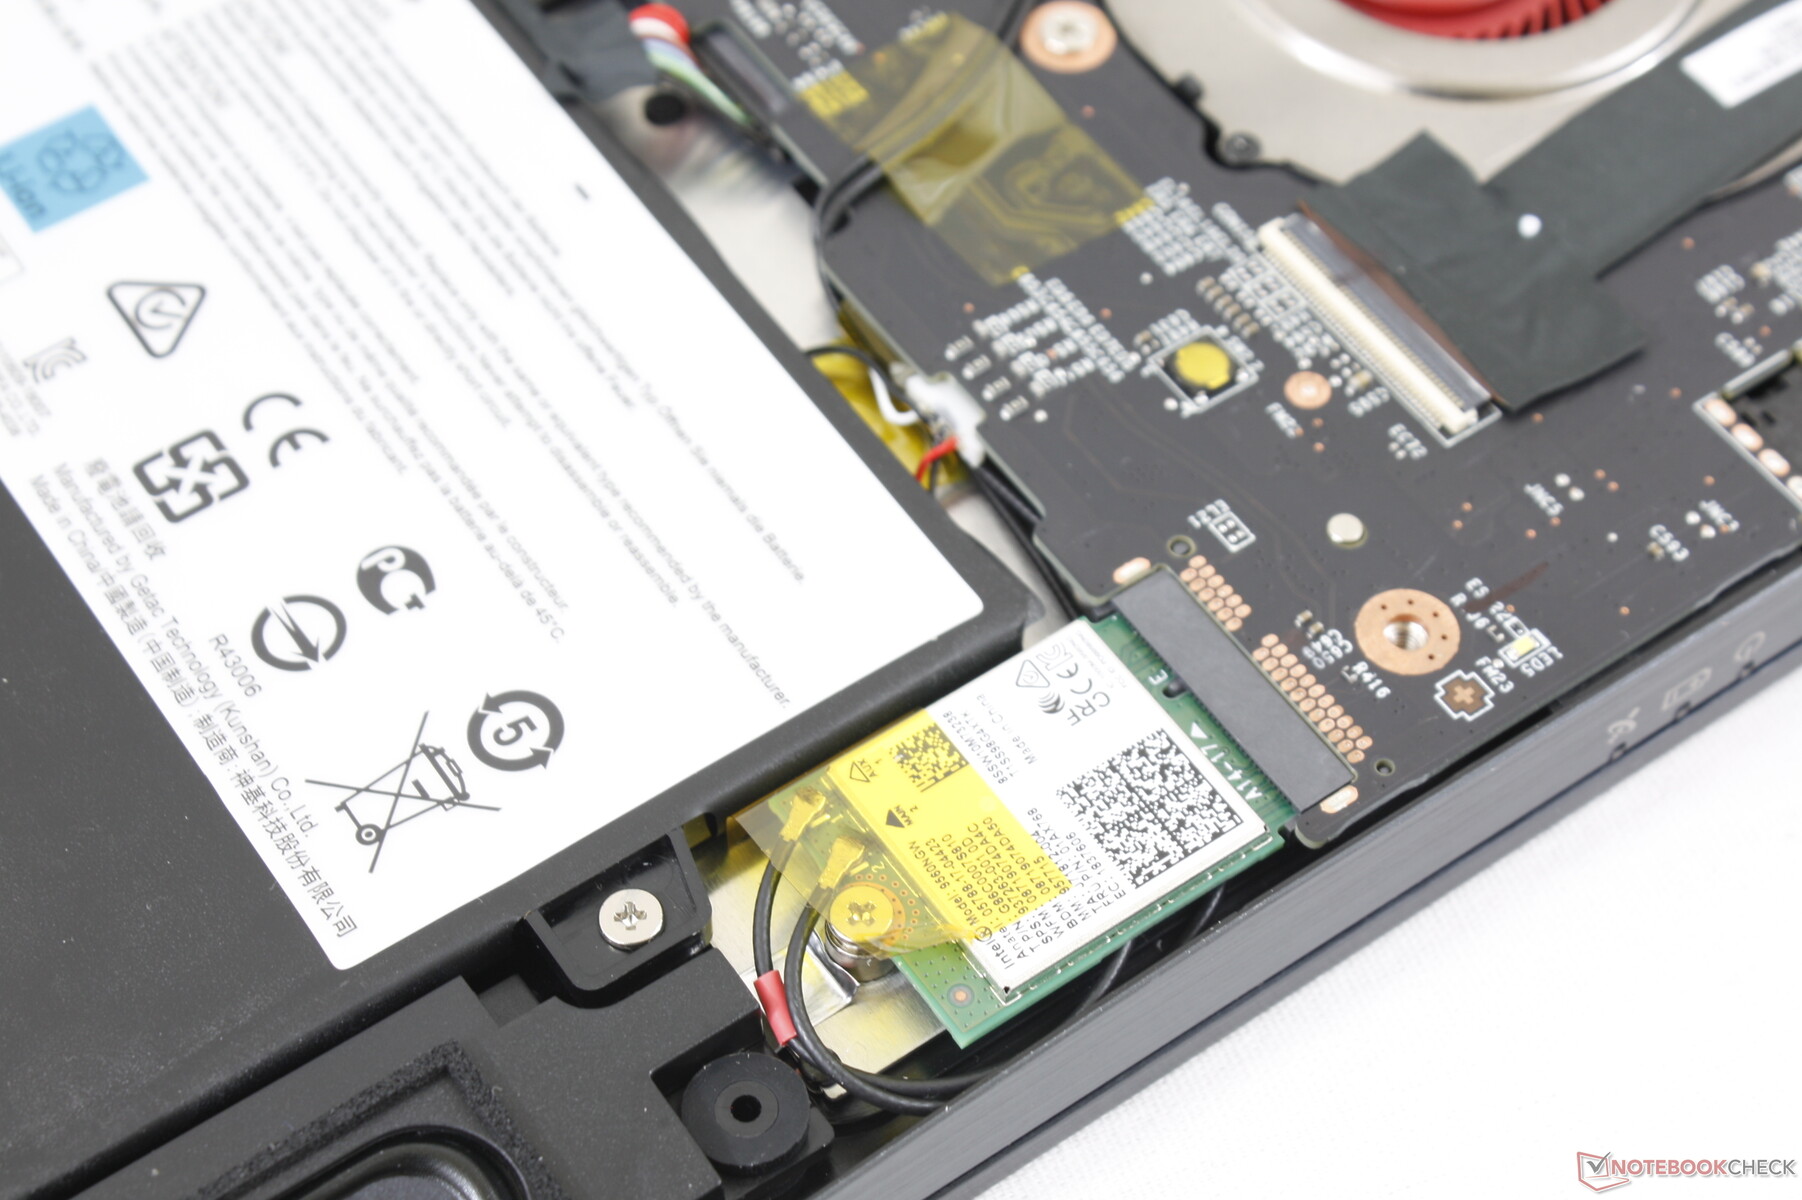
Prestij 15'teki Wi-Fi 6 uyumlu Intel AX200'ün aksine Wi-Fi 5 bağlantısı için Intel 9560 dahildir. Test birimi ile çalışma süremiz boyunca hiçbir bağlantı sorunu yaşamadık.
| Networking | |
| iperf3 transmit AX12 | |
| MSI Prestige 15 A10SC | |
| Asus ZenBook 15 UX534FT-DB77 | |
| iperf3 receive AX12 | |
| MSI Prestige 15 A10SC | |
| Asus ZenBook 15 UX534FT-DB77 | |
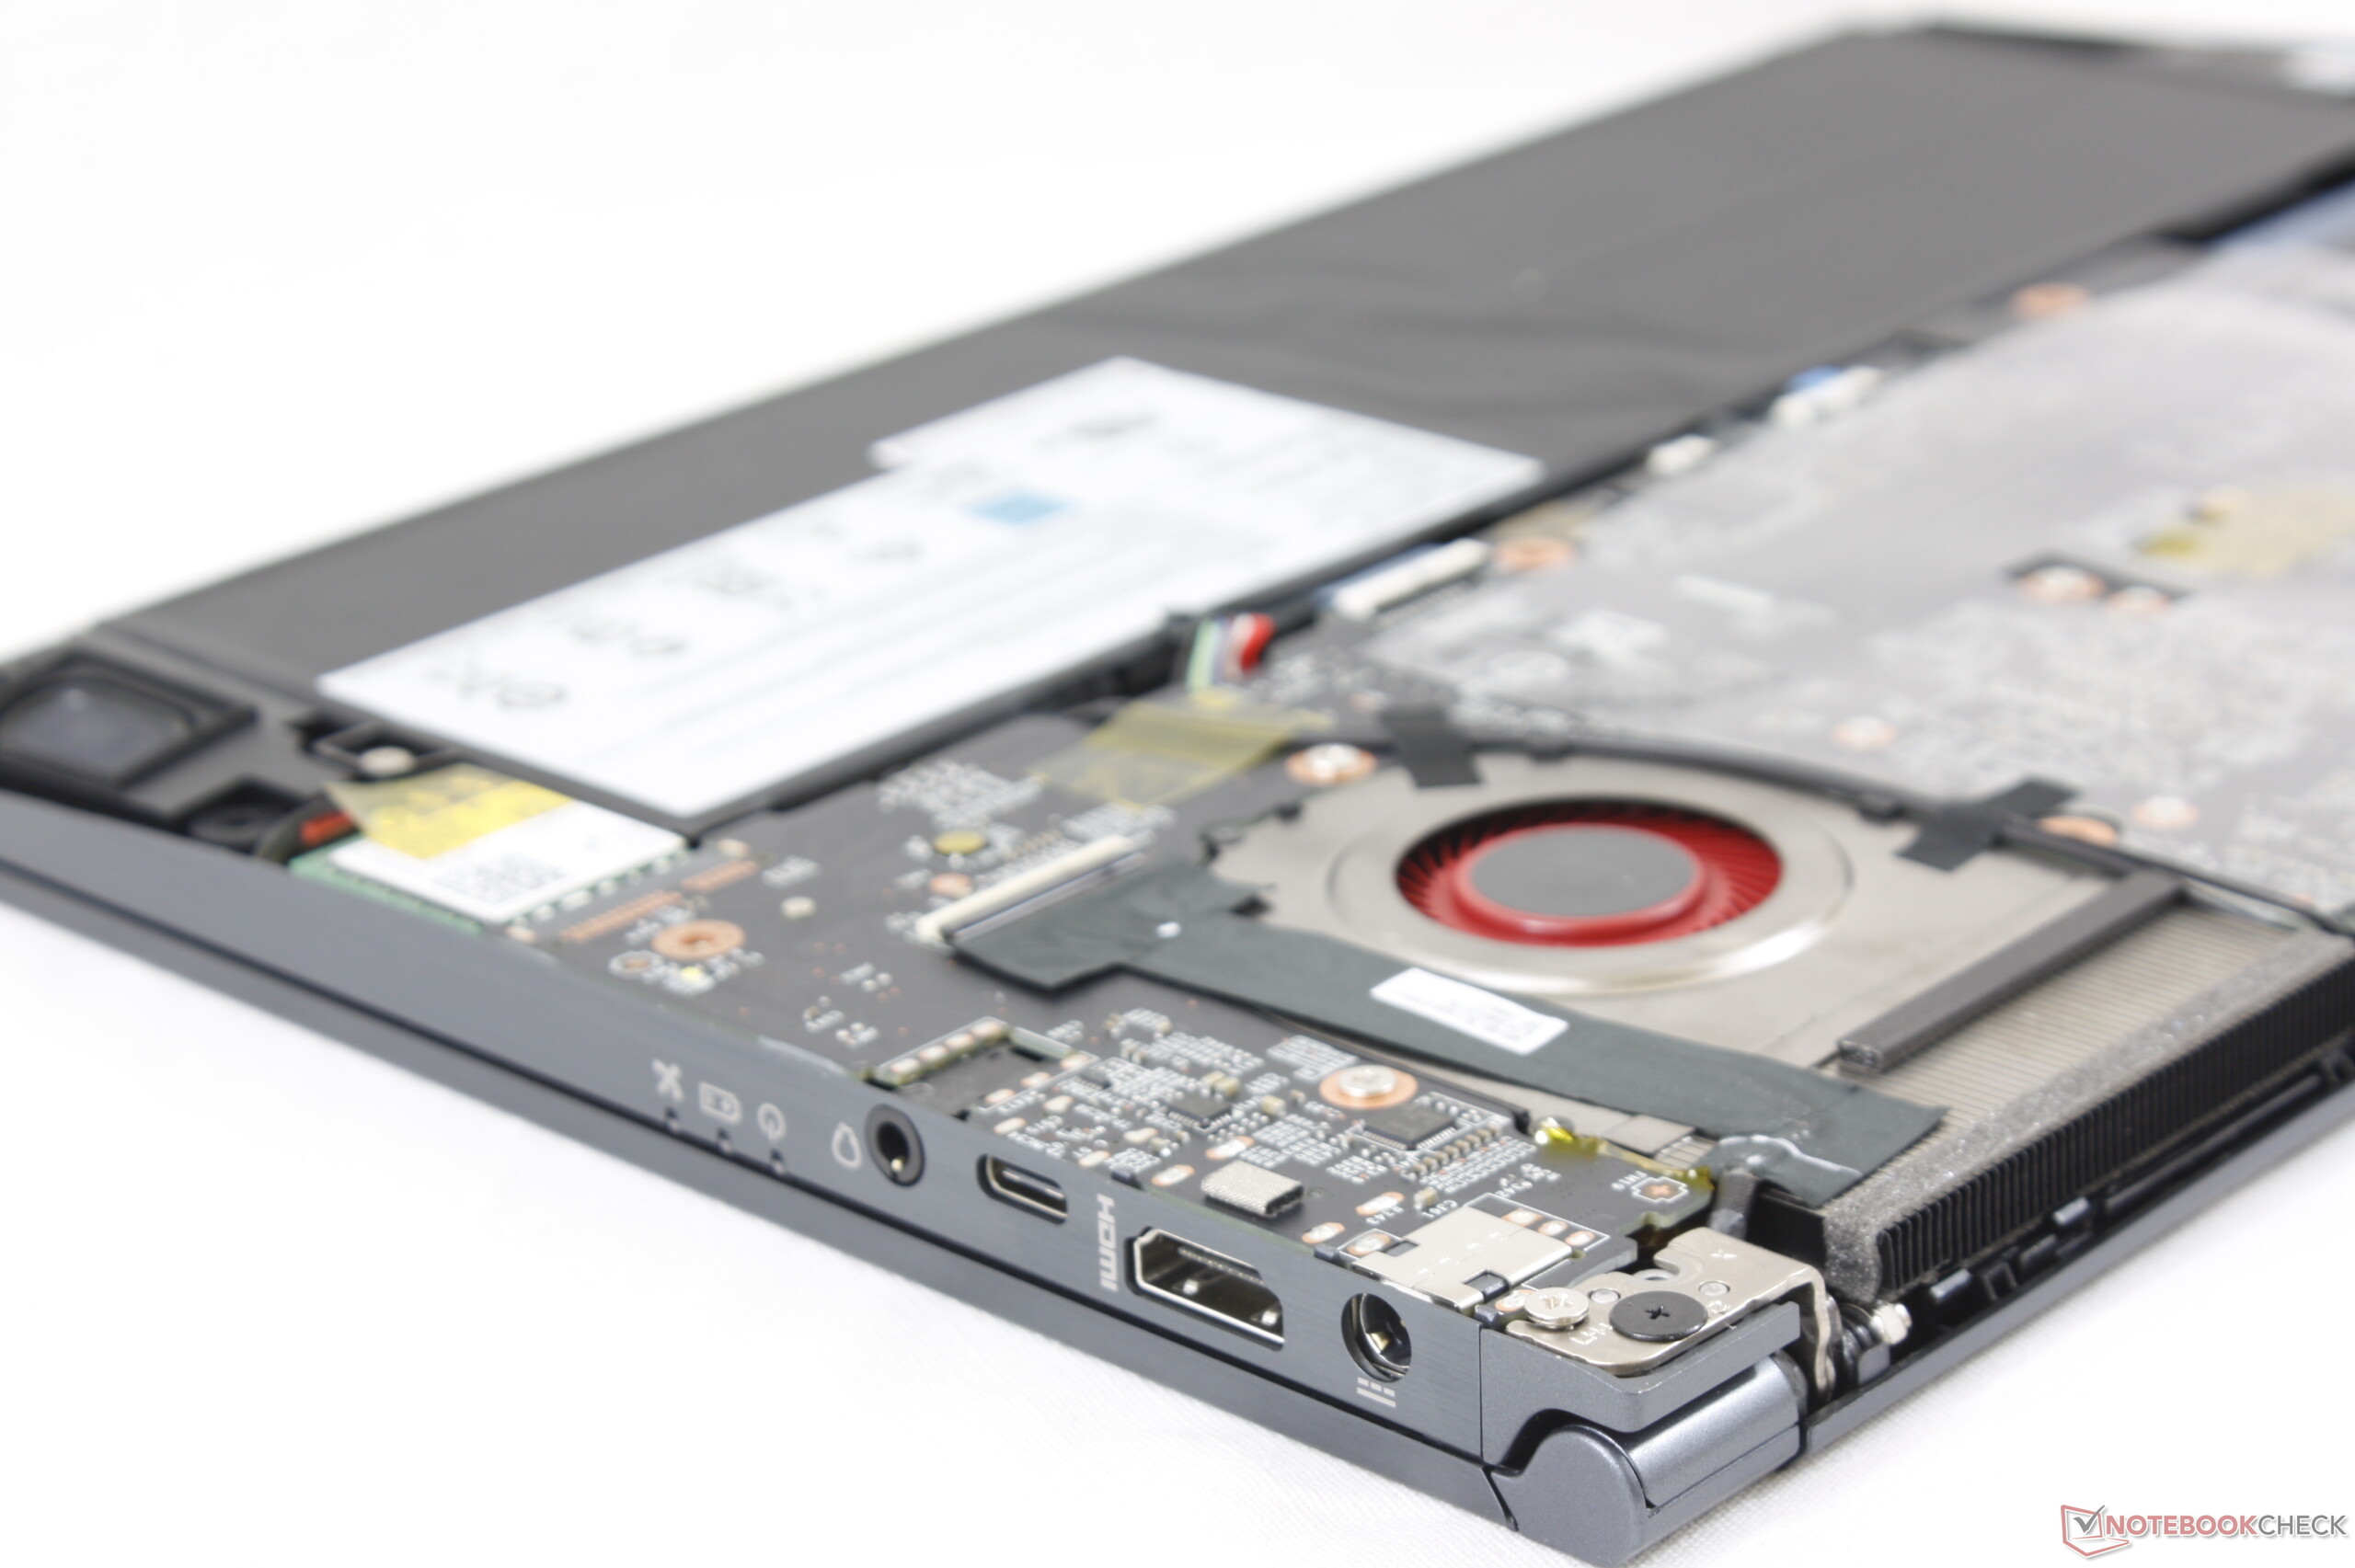
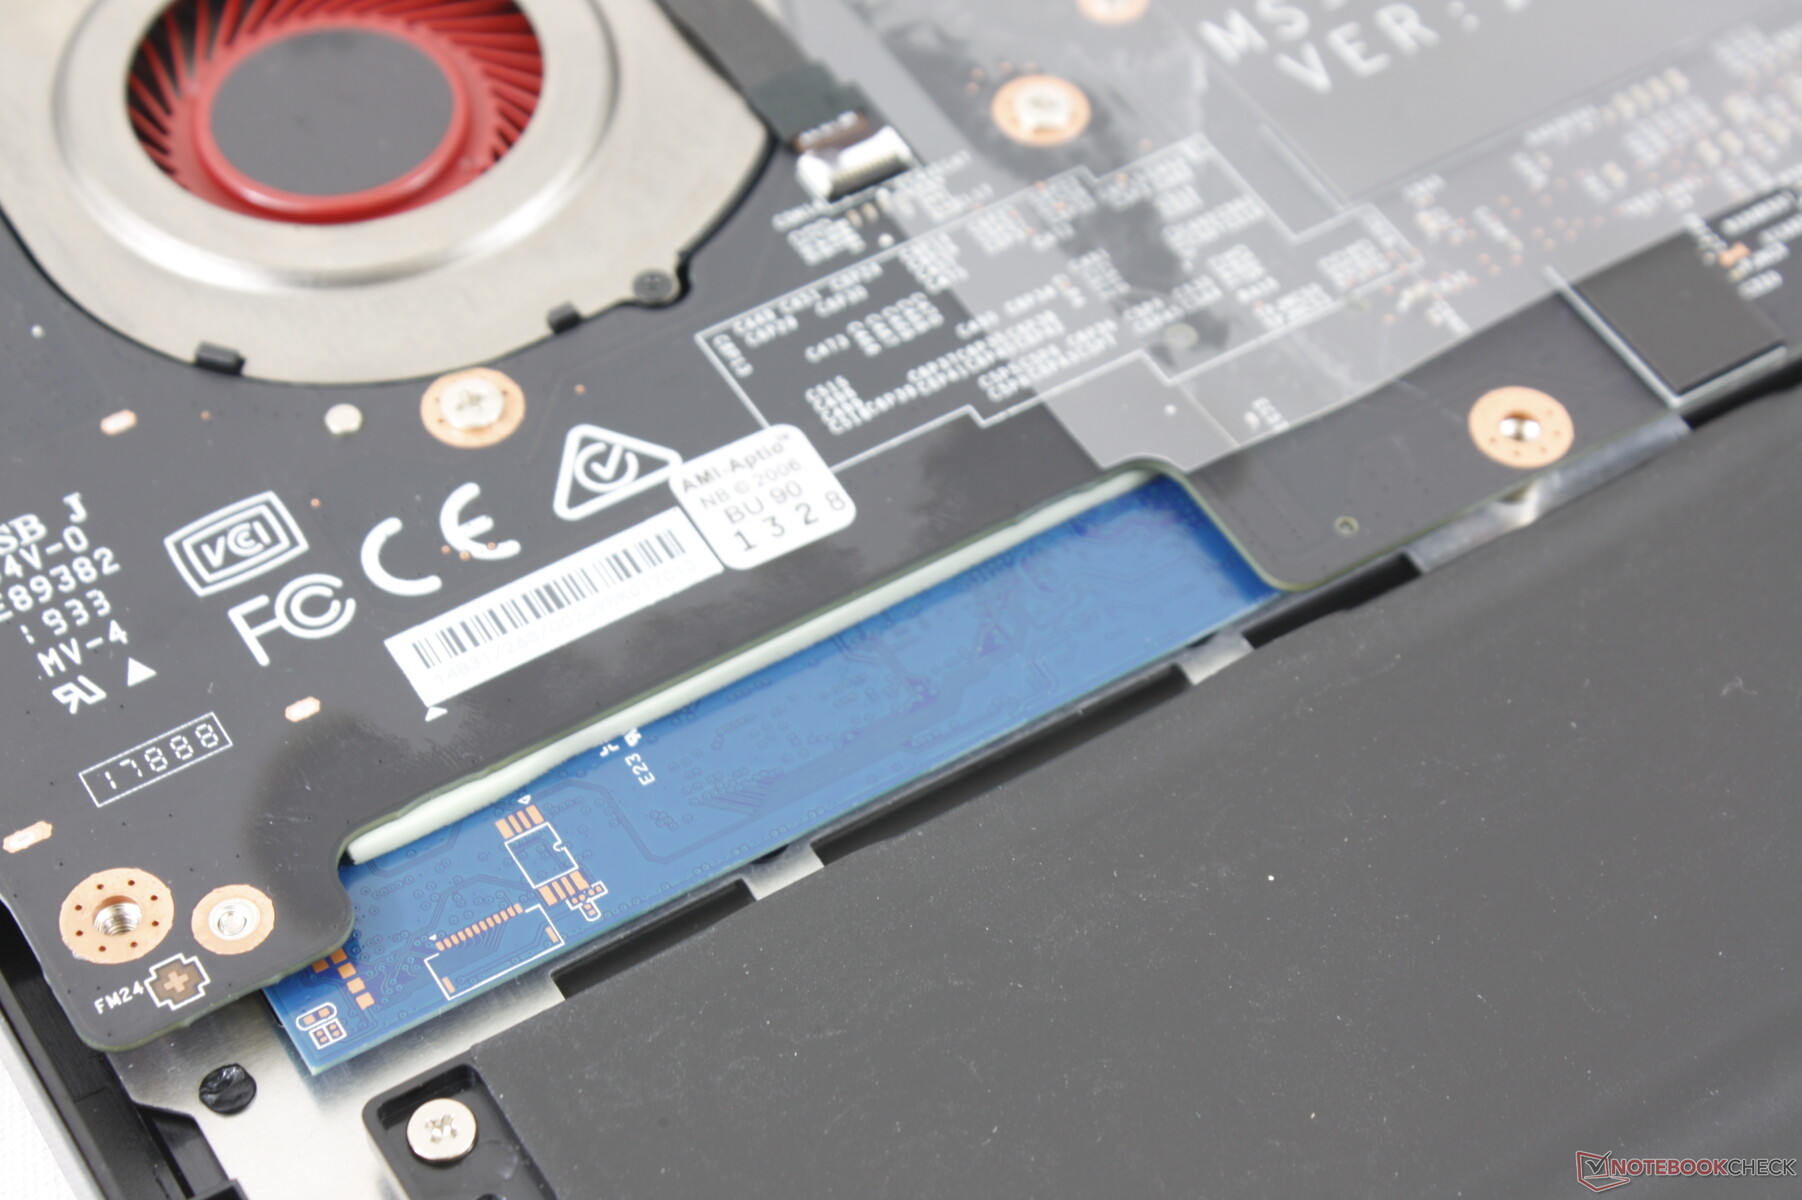
Bakım
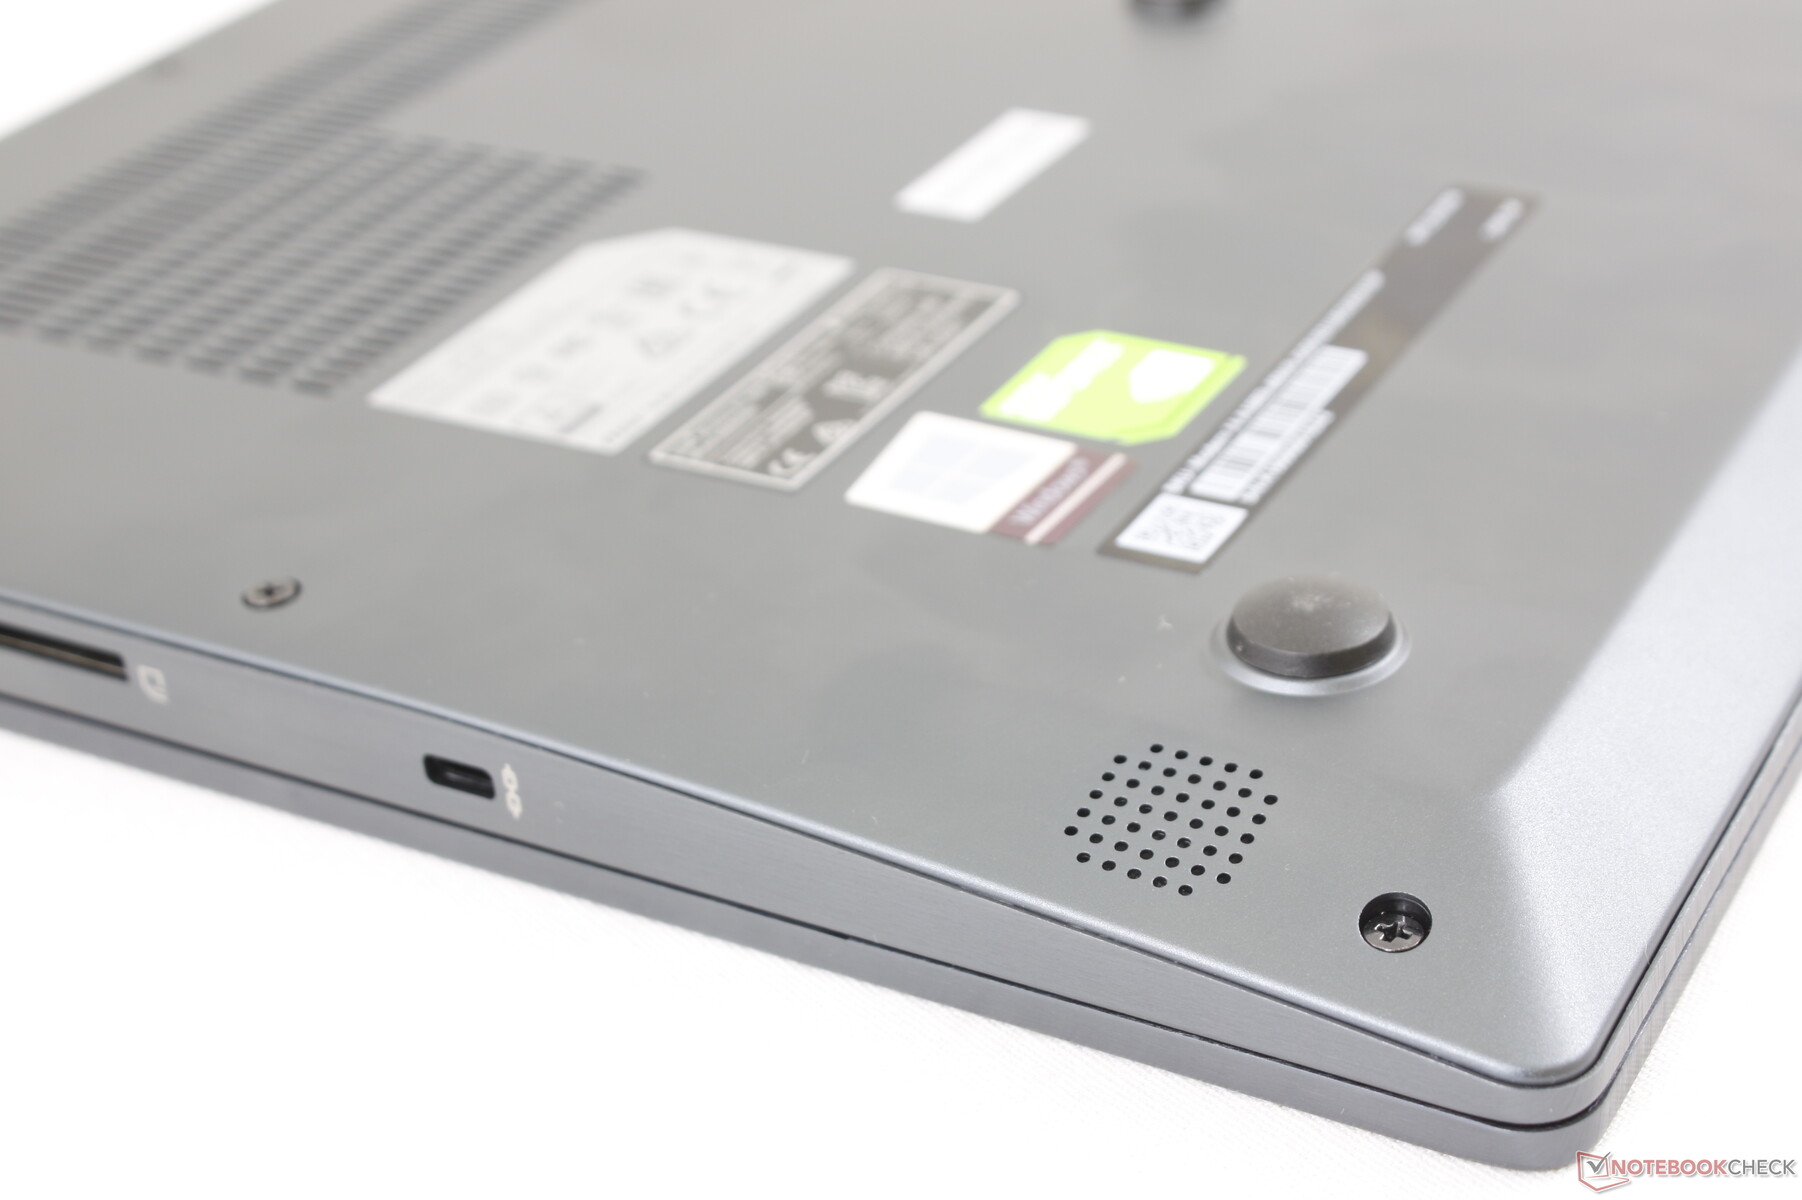
Alt panel, standart bir Philips tornavida ile nispeten kolay bir şekilde çıkar. Bununla birlikte, bir 'Fabrika Mührü' etiketinin kırılması ve M.2 WLAN modülünün veya pil takımının ötesinde daha fazla bakım yapılması için ek sökme işlemi gerekeceğini unutmayın. RAM ve M.2 depolama gibi çekirdek bileşenler, MSI GS65 veya GS75'ten farklı olarak anakartın diğer tarafında uygunsuz.
Aksesuarlar ve Garanti
Ekstralar arasında suni deri taşıma kılıfı ve USB Type-A - RJ-45 adaptörü bulunmaktadır. Bunları orta sınıf dizüstü bilgisayarlarda ücretsiz görmek nadirdir ve bu nedenle memnuniyetle karşılanırlar. Standart bir yıllık sınırlı garanti, satın aldıkları tarihten itibaren 30 gün içinde yeni dizüstü bilgisayarlarını kaydedenler için bir yıllık kazara hasar koruması için geçerlidir.
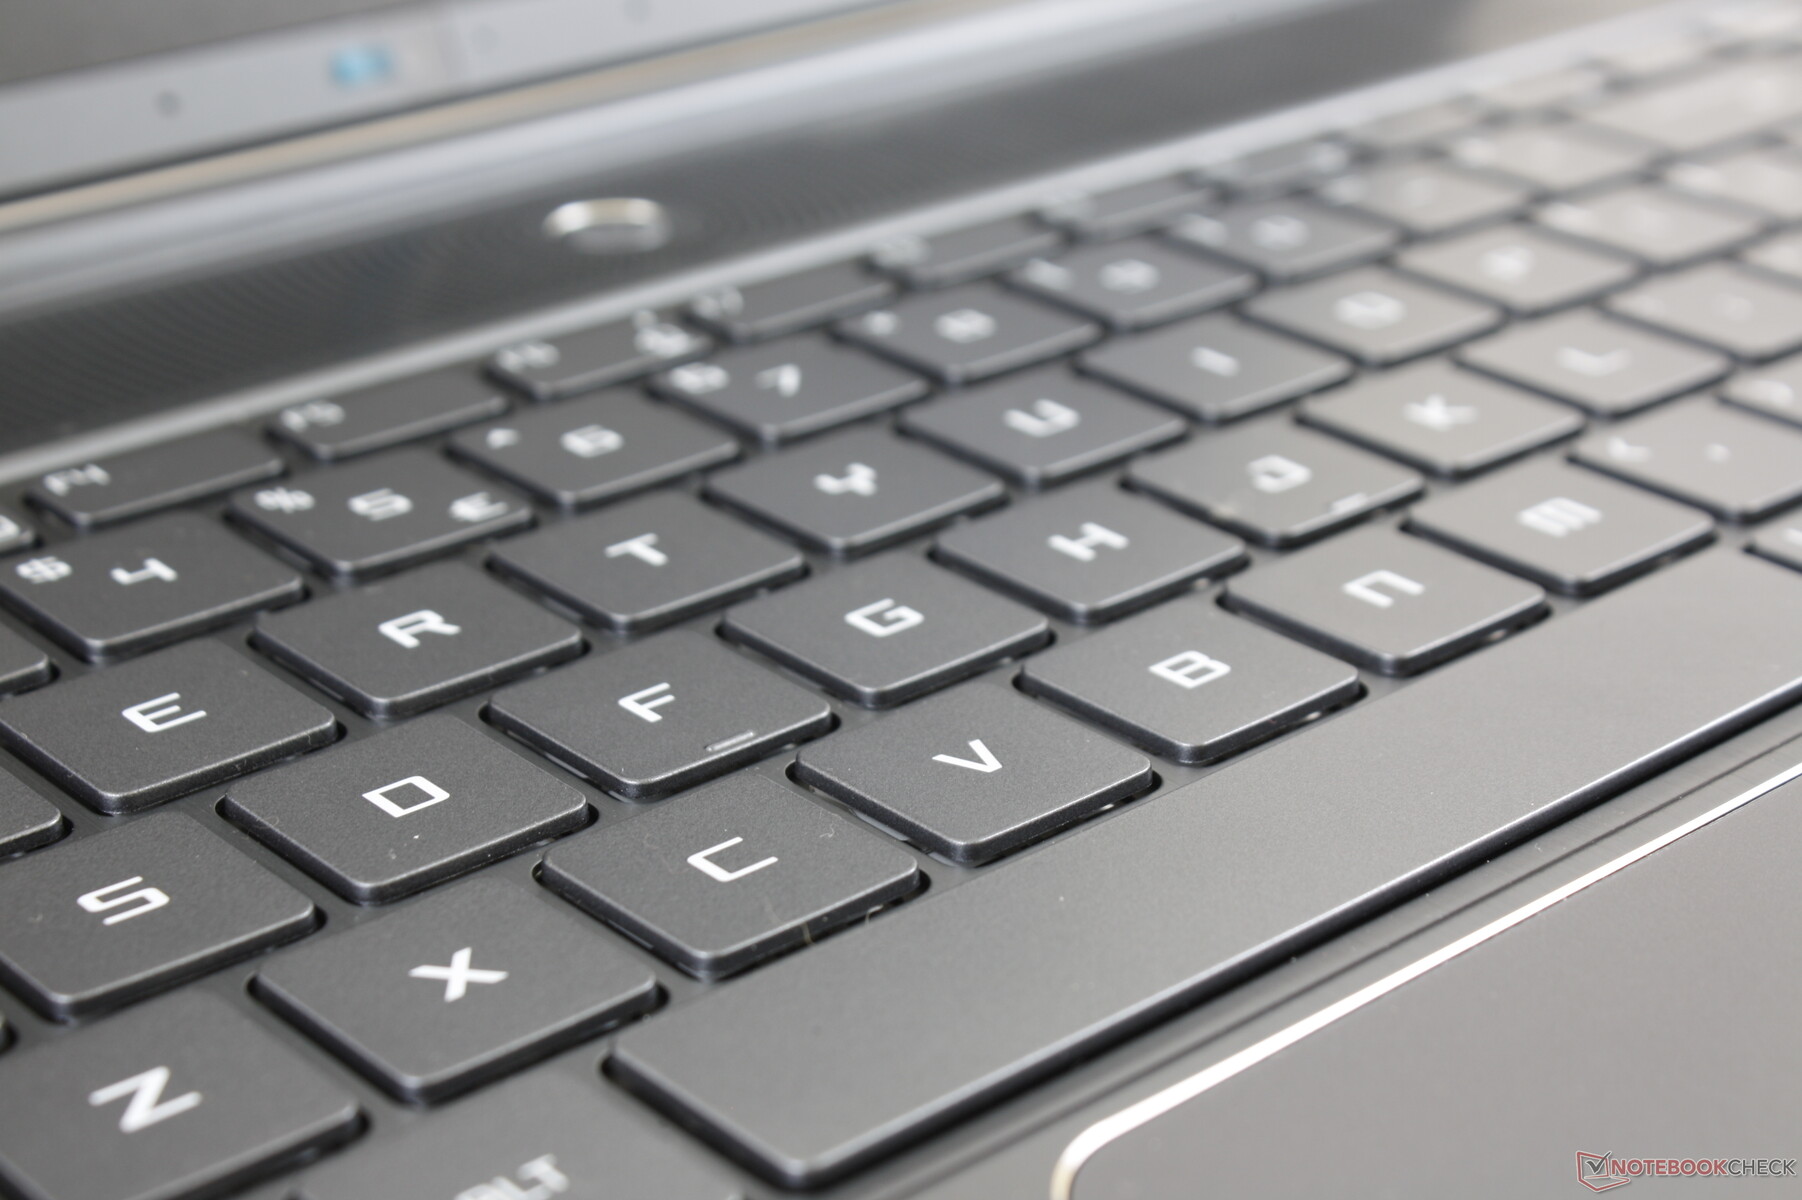
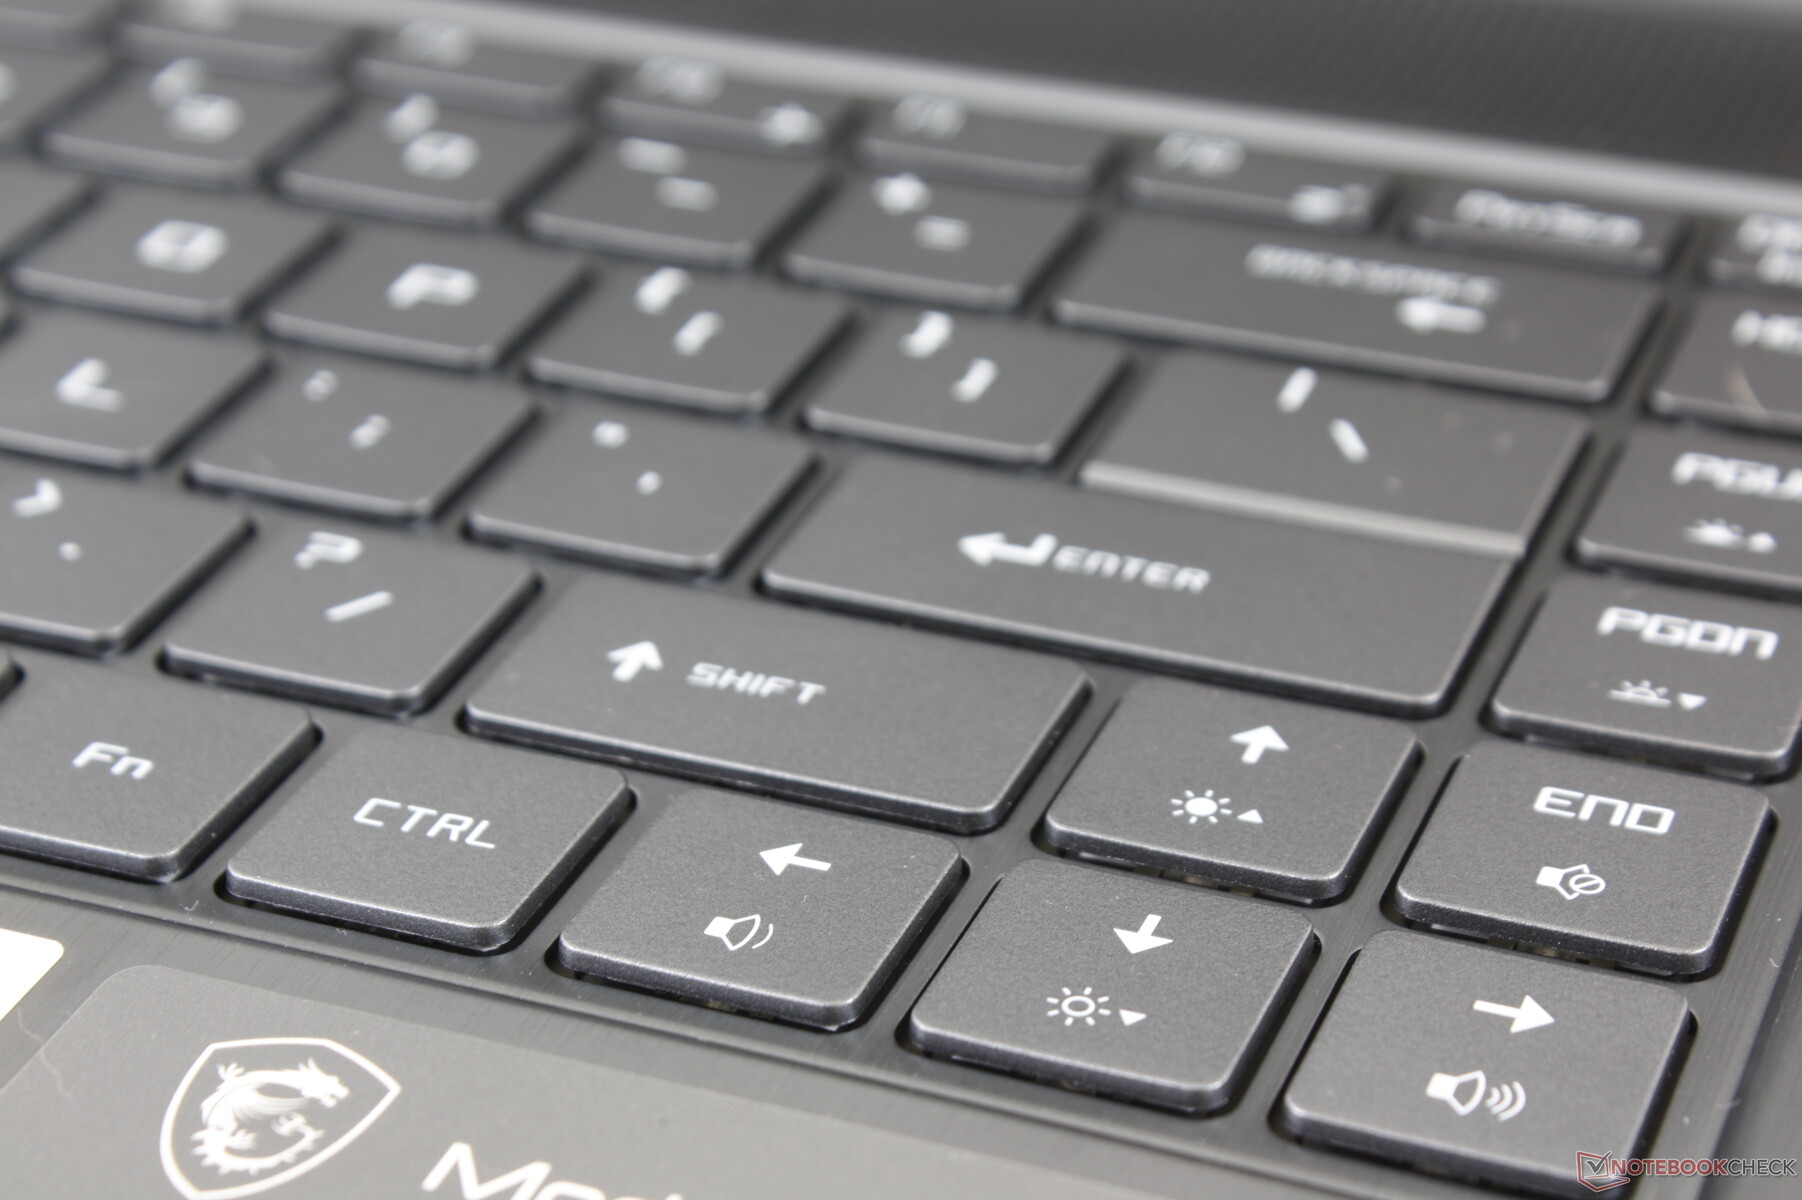
Giriş cihazları
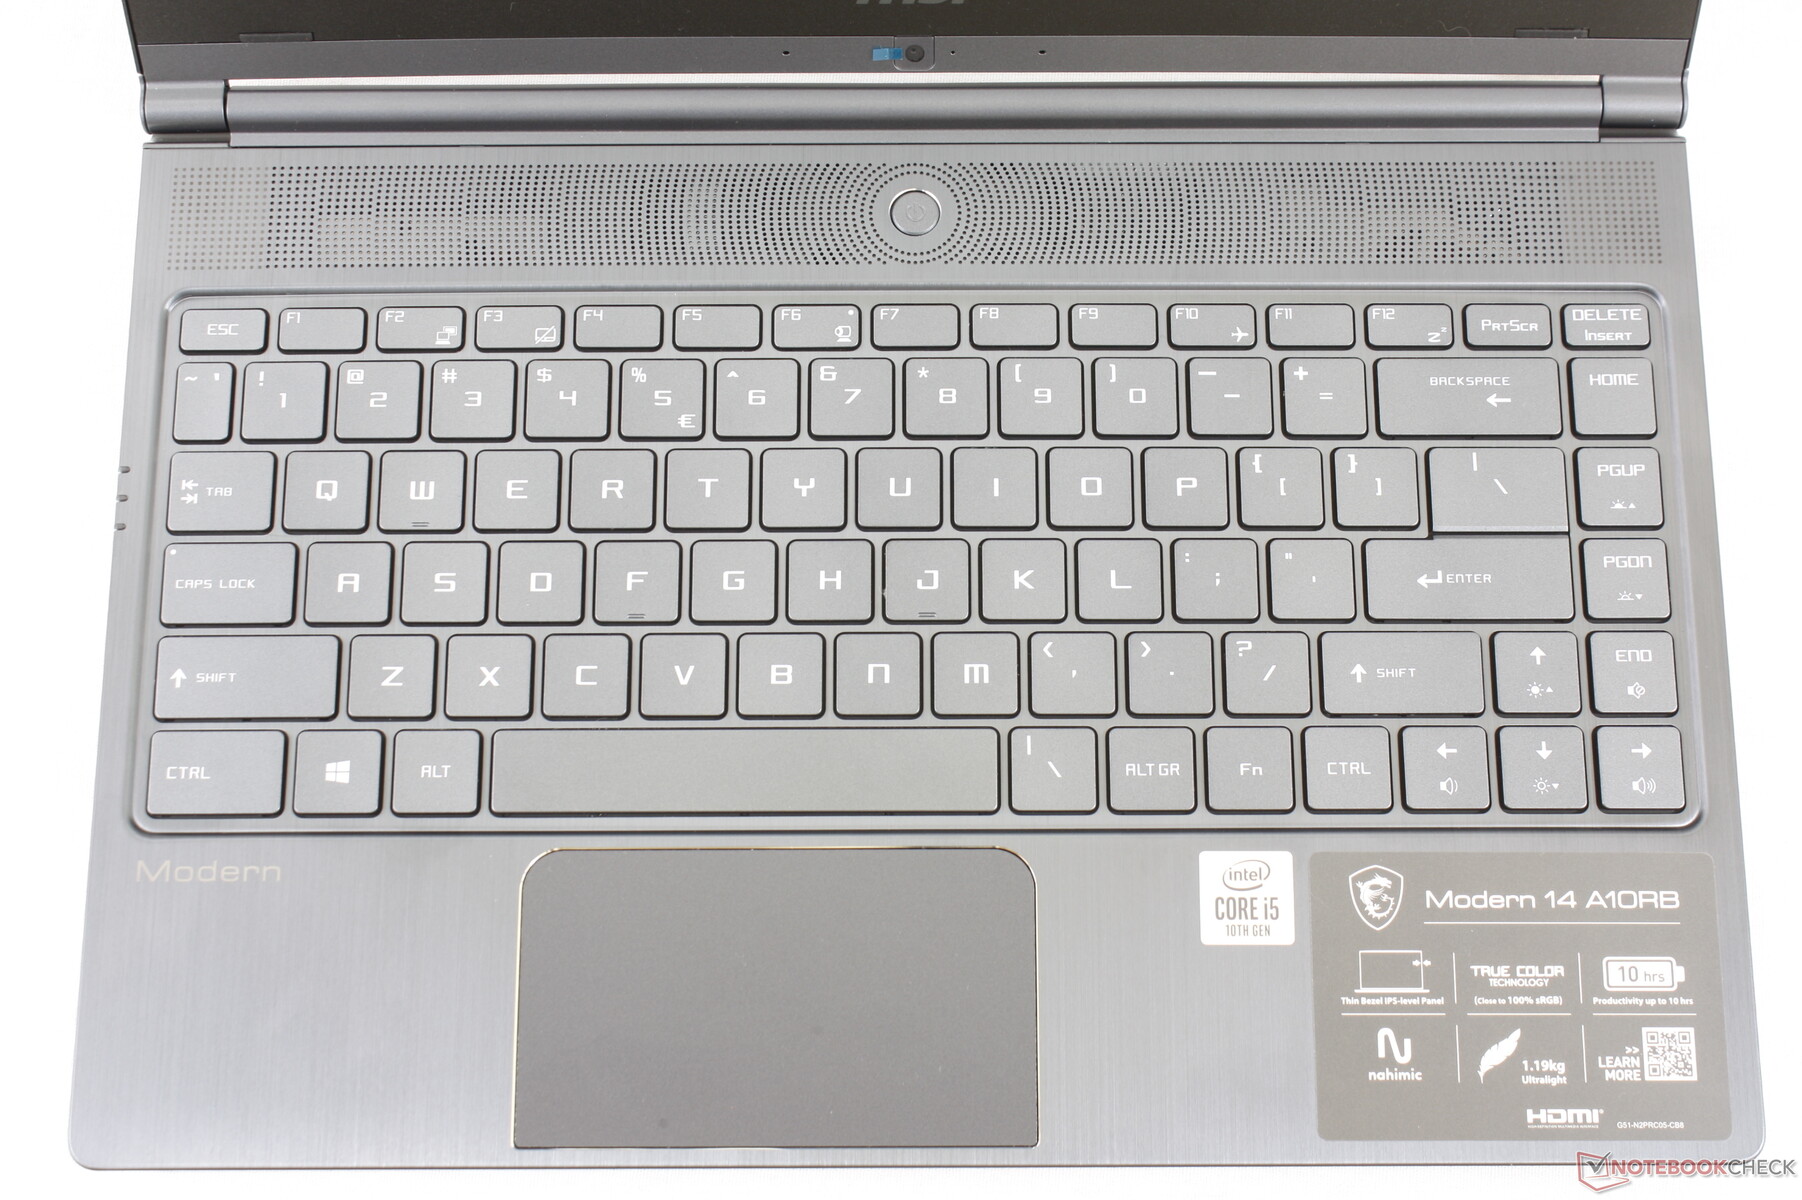
Beklendiği gibi, Modern 14, çoğu MSI G Serisi oyun dizüstü bilgisayarında bulunan SteelSteries klavyesini entegre etmiyor. Bununla birlikte, MSI'nın bunu düşünmesini isteriz, çünkü Modern 14'teki klavye daha spongier, sığ ve yazmak için daha az tatmin edici hissediyor. Microsoft Surface Laptop 3 15, Lenovo ThinkPad T serisi veya Dell Latitude serisi gibi çoğu Ultrabook ve iş dizüstü bilgisayarı, burada sahip olduğumuz MSI'dan daha net tuşlar sunar. Bununla birlikte, Asus VivoBook 14 veya Lenovo IdeaPad gibi çoğu alt uç dizüstü bilgisayarın yazılım tuşu geri bildirimlerine alışkınsanız, Modern 14'ü yazmak o kadar da farklı hissetmez.
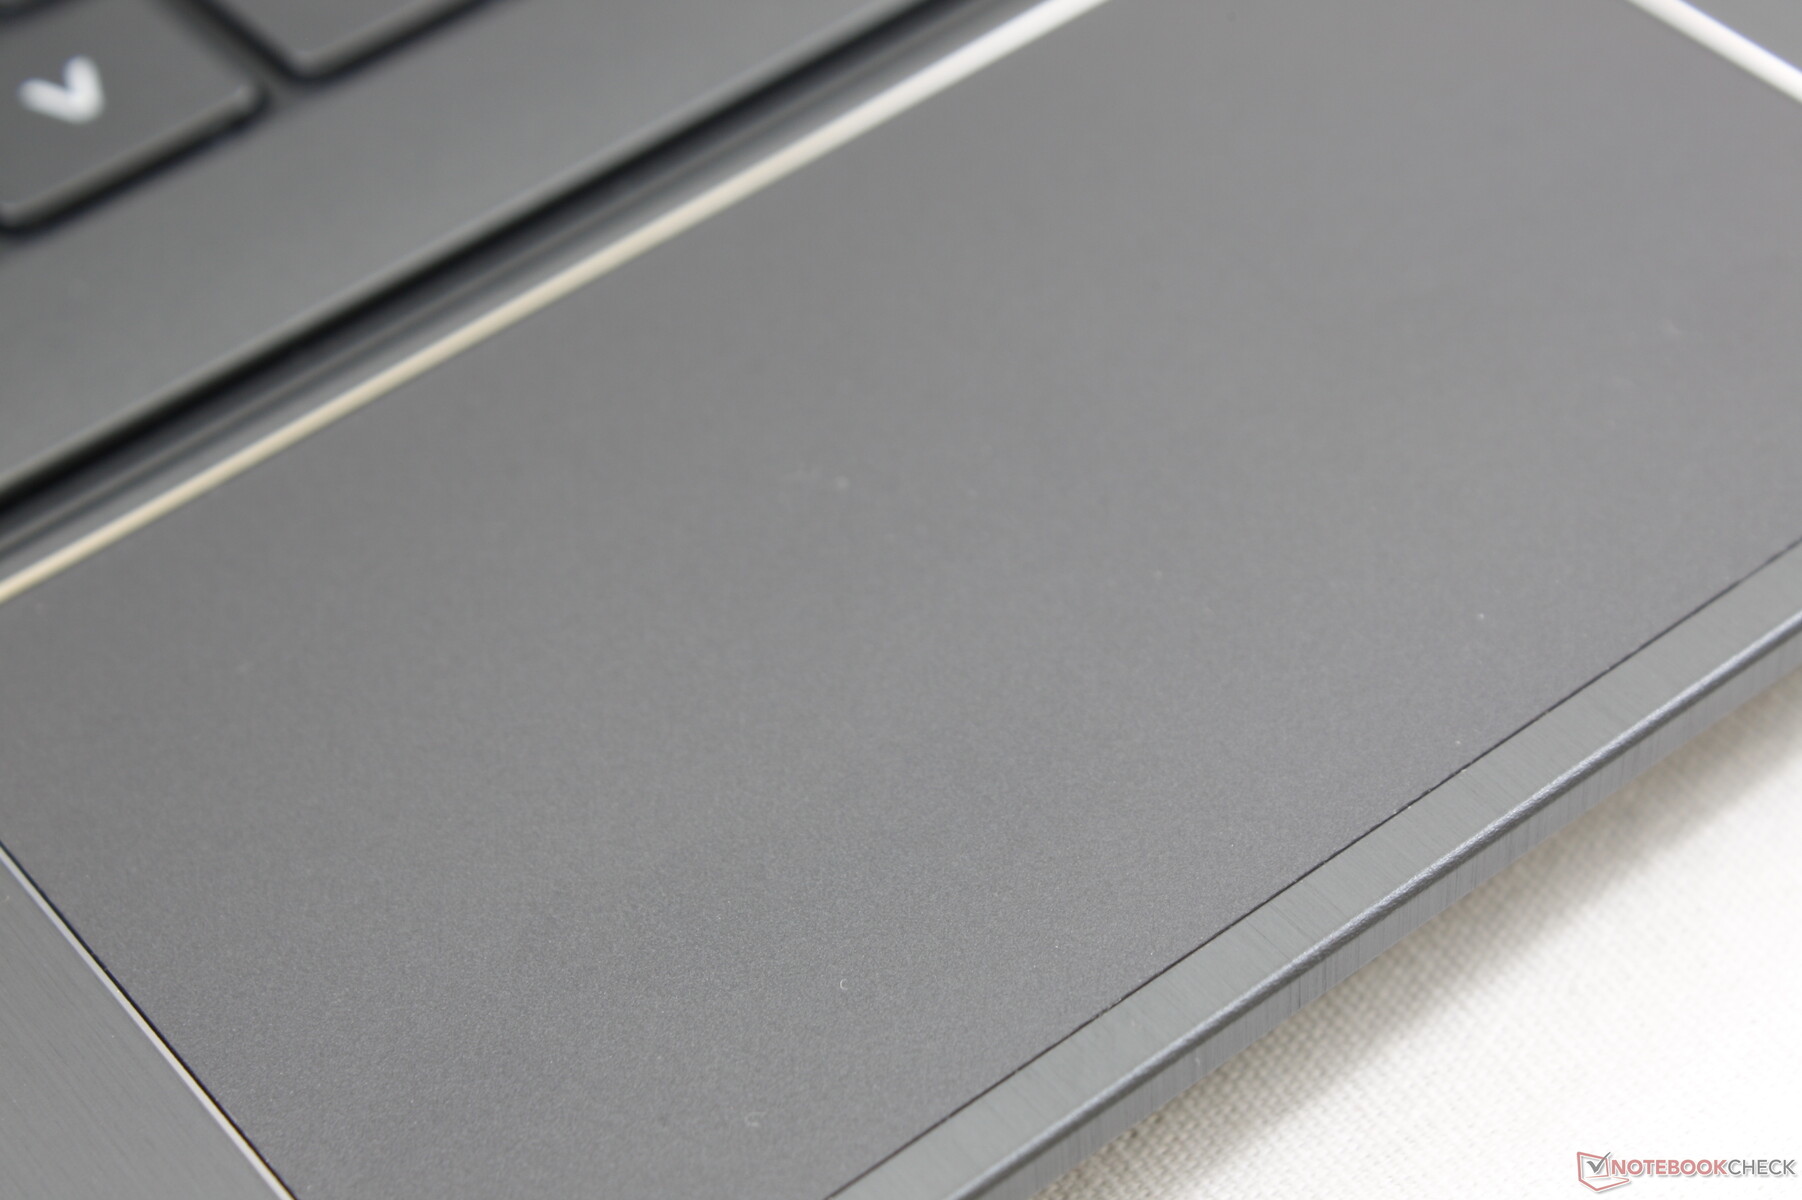
Dokunmatik
Tıklama yüzeyi (~ 10 x 5,7 cm), XPS 13 7390 2'si 1 arada (~ 11,3 x 6,8 cm) üzerindeki tıklama yüzeyinden daha küçük ve daha dardır. Sonuç olarak dikey hareketler ve iki parmak hareketleri sıkışık gelir. İmleç kontrolü, aksi takdirde yüzey boyunca yavaşça kayarken minimum yapışma ile pürüzsüzdür. Entegre fare tuşları nispeten zayıf geribildirim ile sığdır. Kısa süreler için yeterince güvenilir çalışır, ancak harici bir fare daha ergonomik ve daha az tıklama yorucu hisseder.
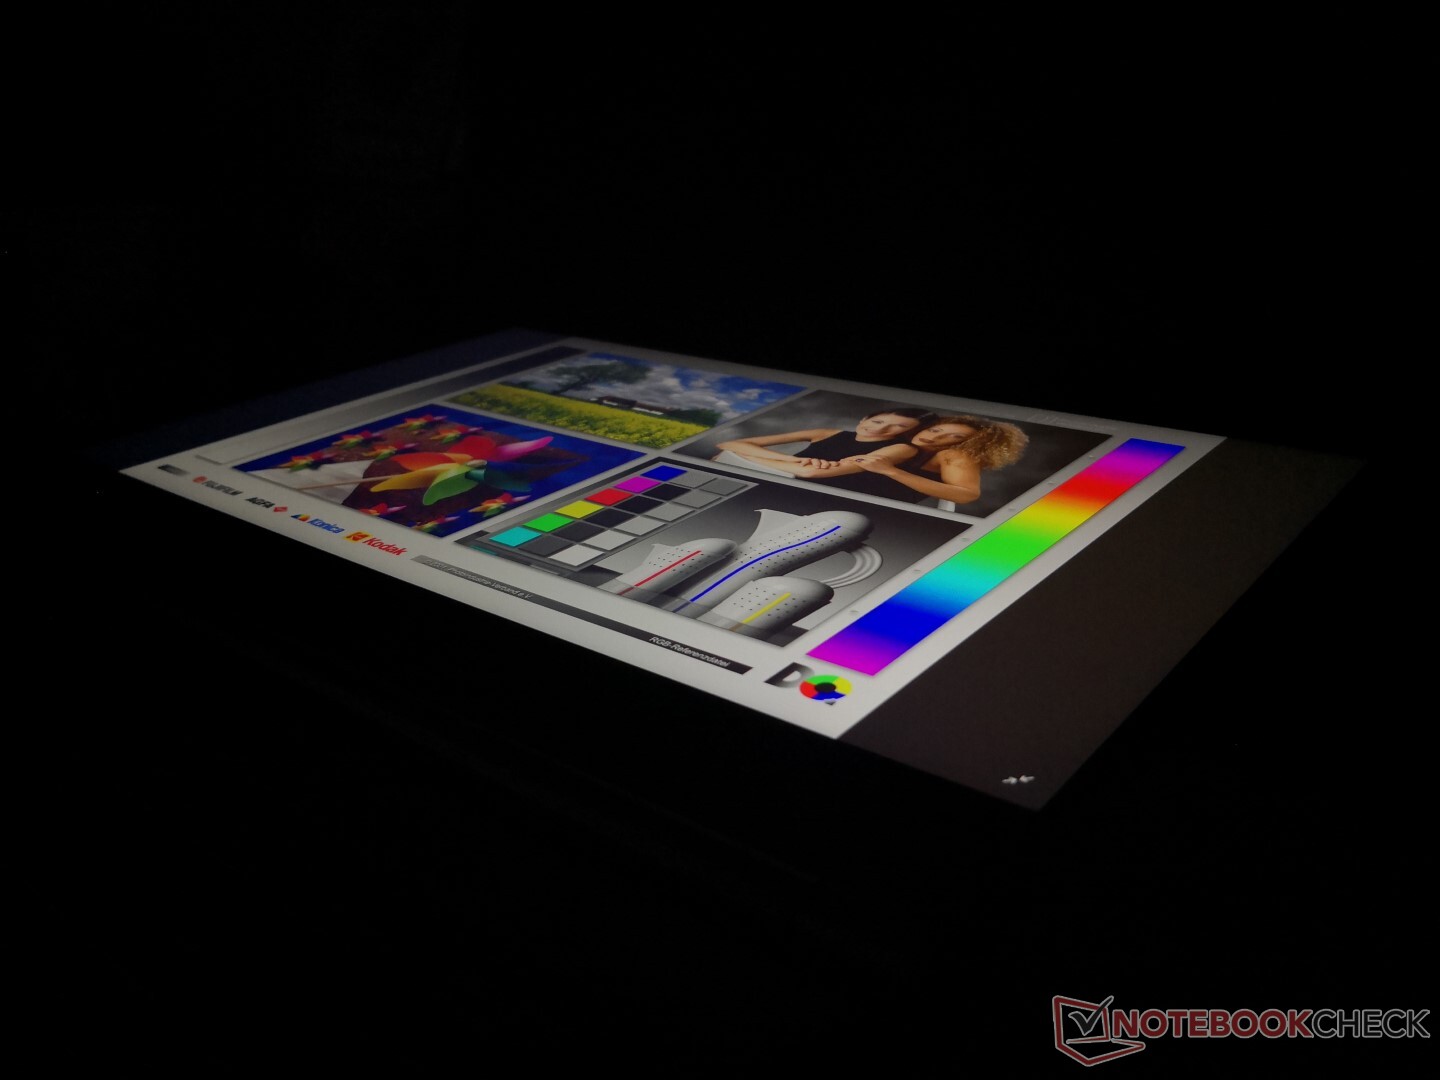
Görüntüle
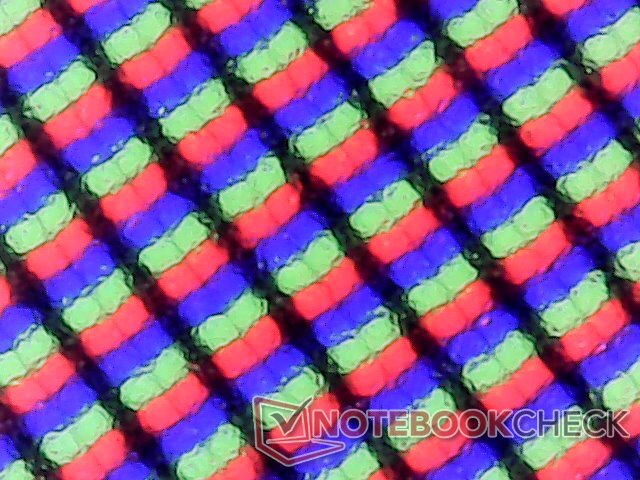
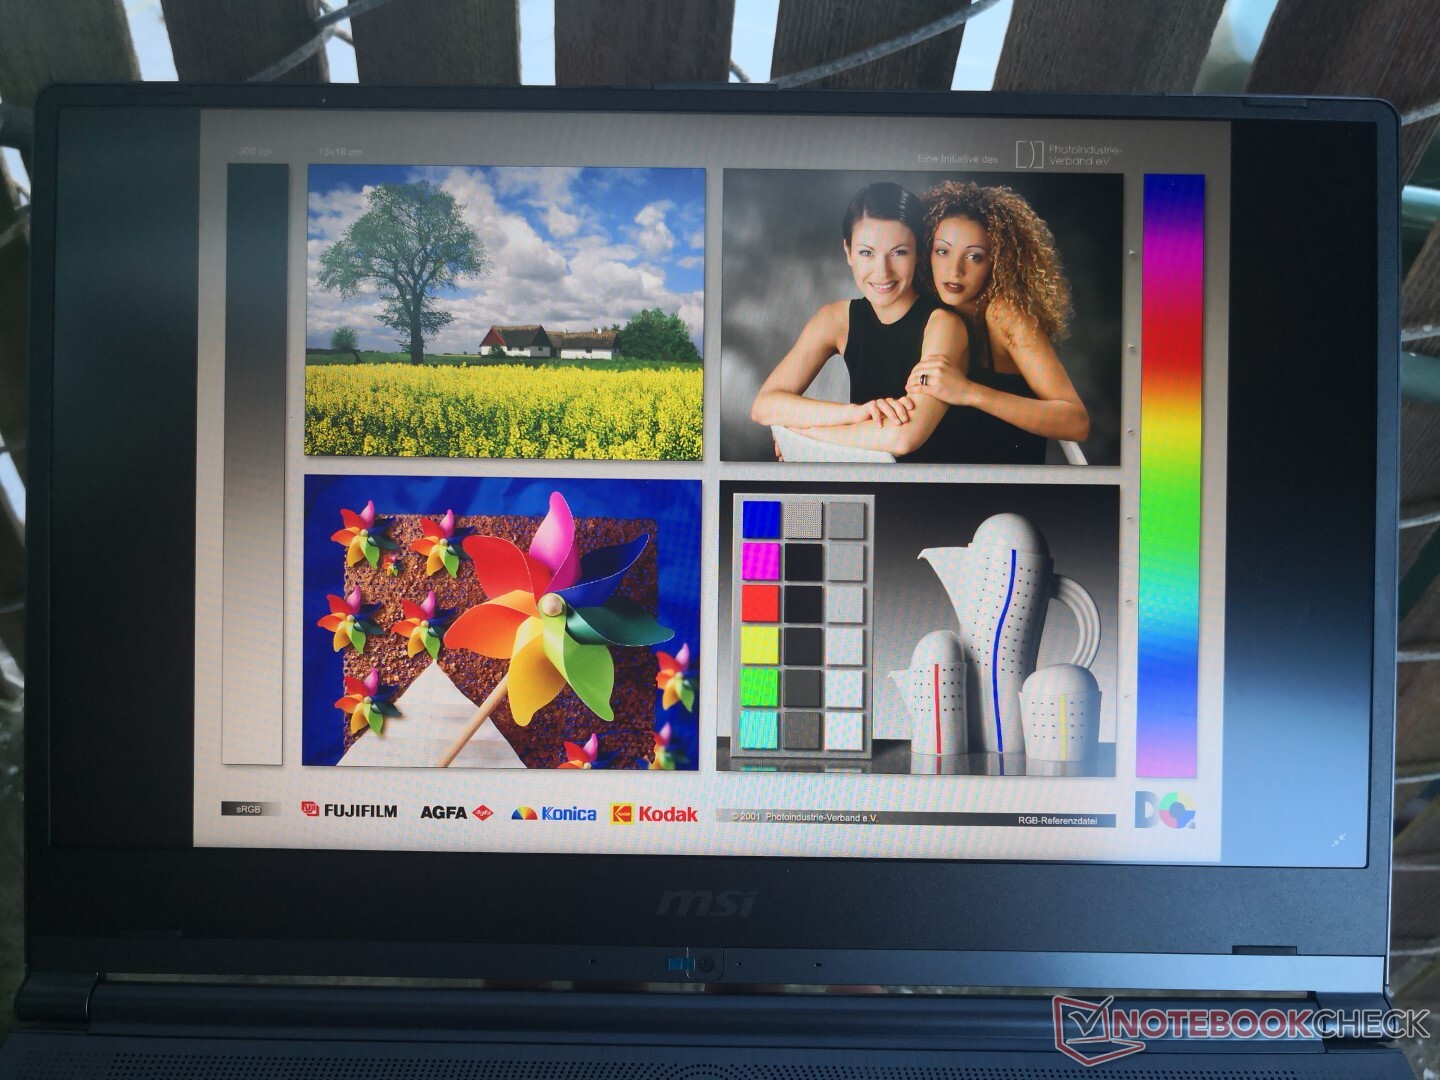
Modern 14, Acer Swift 3 SF314 ve daha eski MSI PS42'de bulunanla aynı Chi Mei N140HCE-EN2 1080p IPS panelini kullanıyor. Böylece, kontrast oranı ve nispeten yavaş tepki süreleri gibi doğuştan gelen özellikler aralarında neredeyse aynıdır. Ekranın, bunun yerine AU Optronics panelinden 4K UHD kullanan daha pahalı Prestige 14'ten yaklaşık yüzde 43 daha sönük olduğunu unutmayın.Şüphesiz, metin ve görüntüler parlak bir ekranda olduğu kadar net görünür ve çoğu mat arasında sadece küçük bir grenli katman görülür. panelleri.
| |||||||||||||||||||||||||
Aydınlatma: 87 %
Batarya modunda parlaklık: 324.1 cd/m²
Kontrast: 1473:1 (Siyah: 0.22 cd/m²)
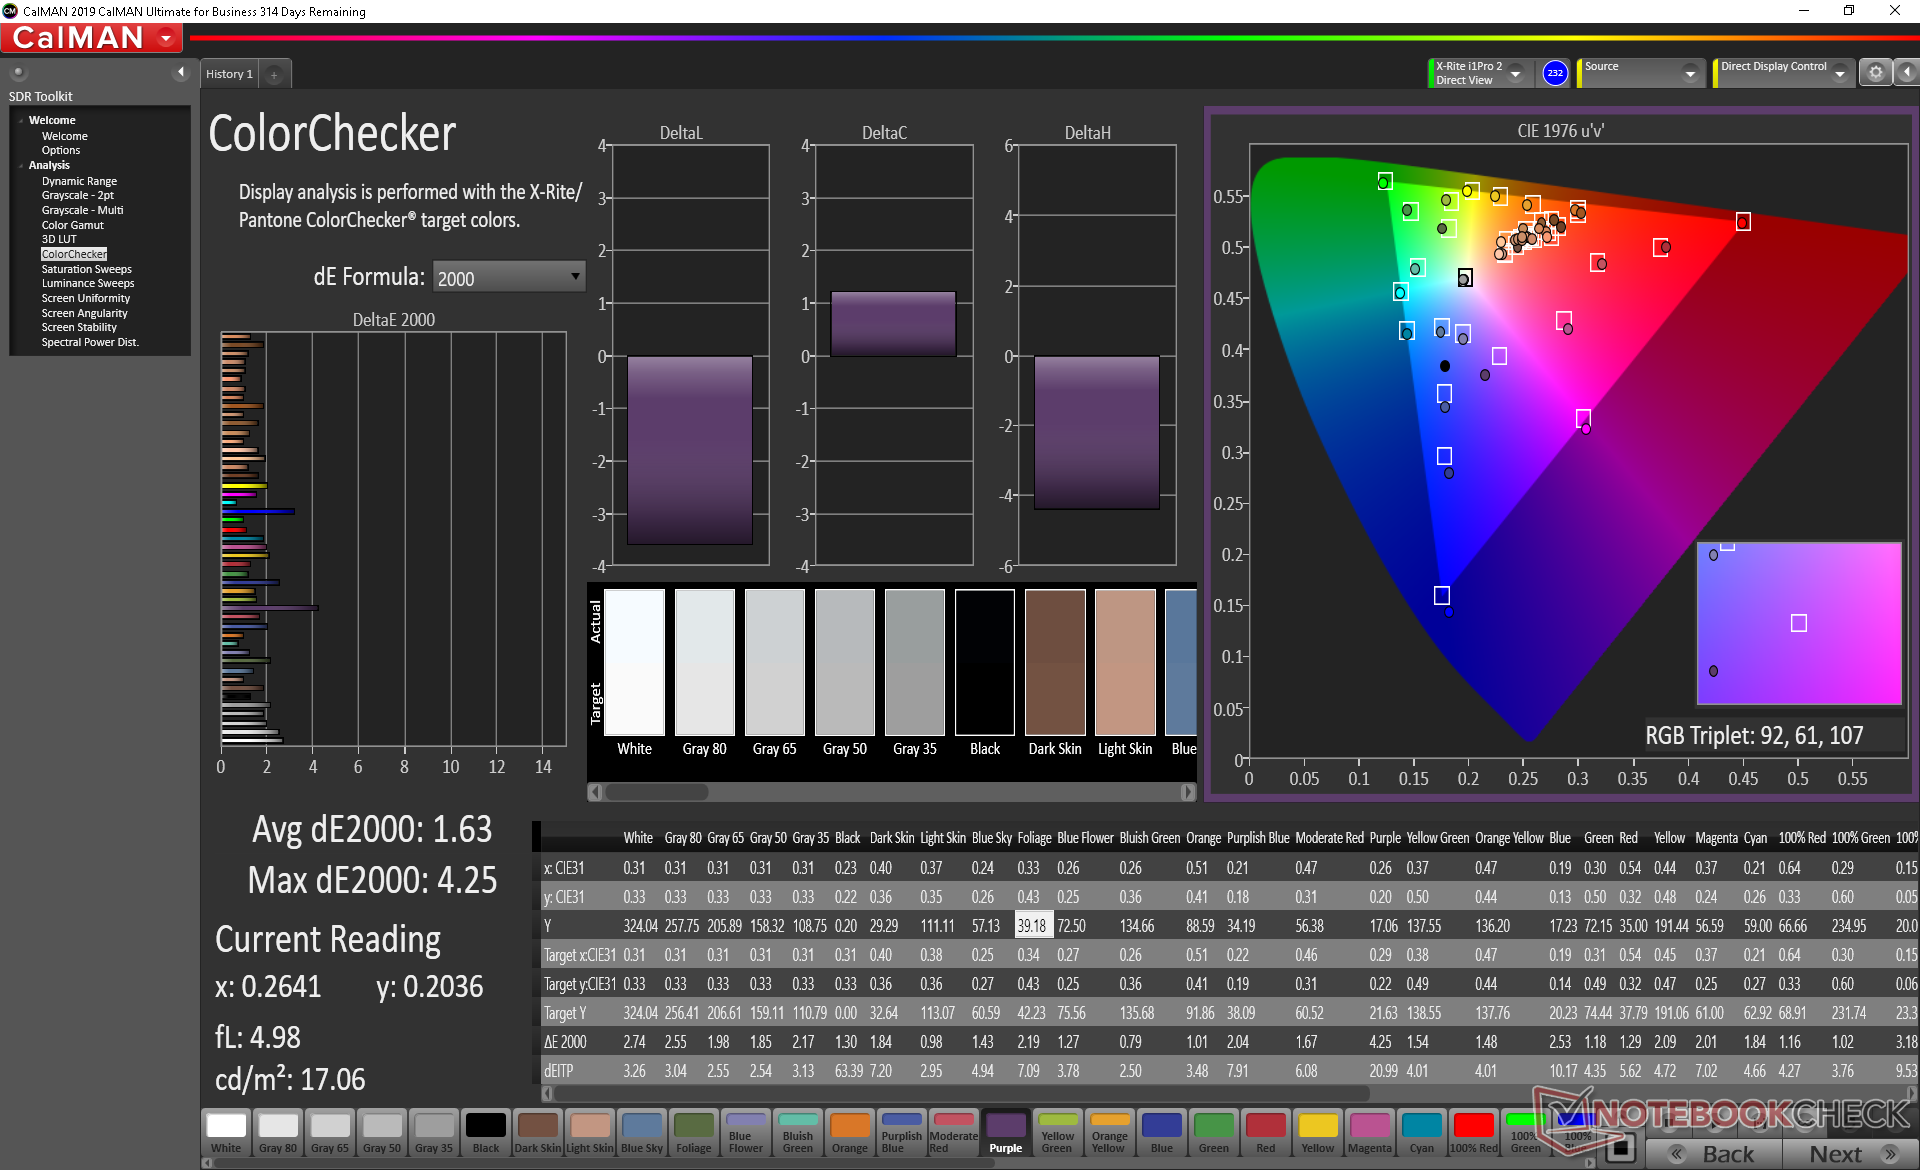
ΔE ColorChecker Calman: 1.63 | ∀{0.5-29.43 Ø4.73}
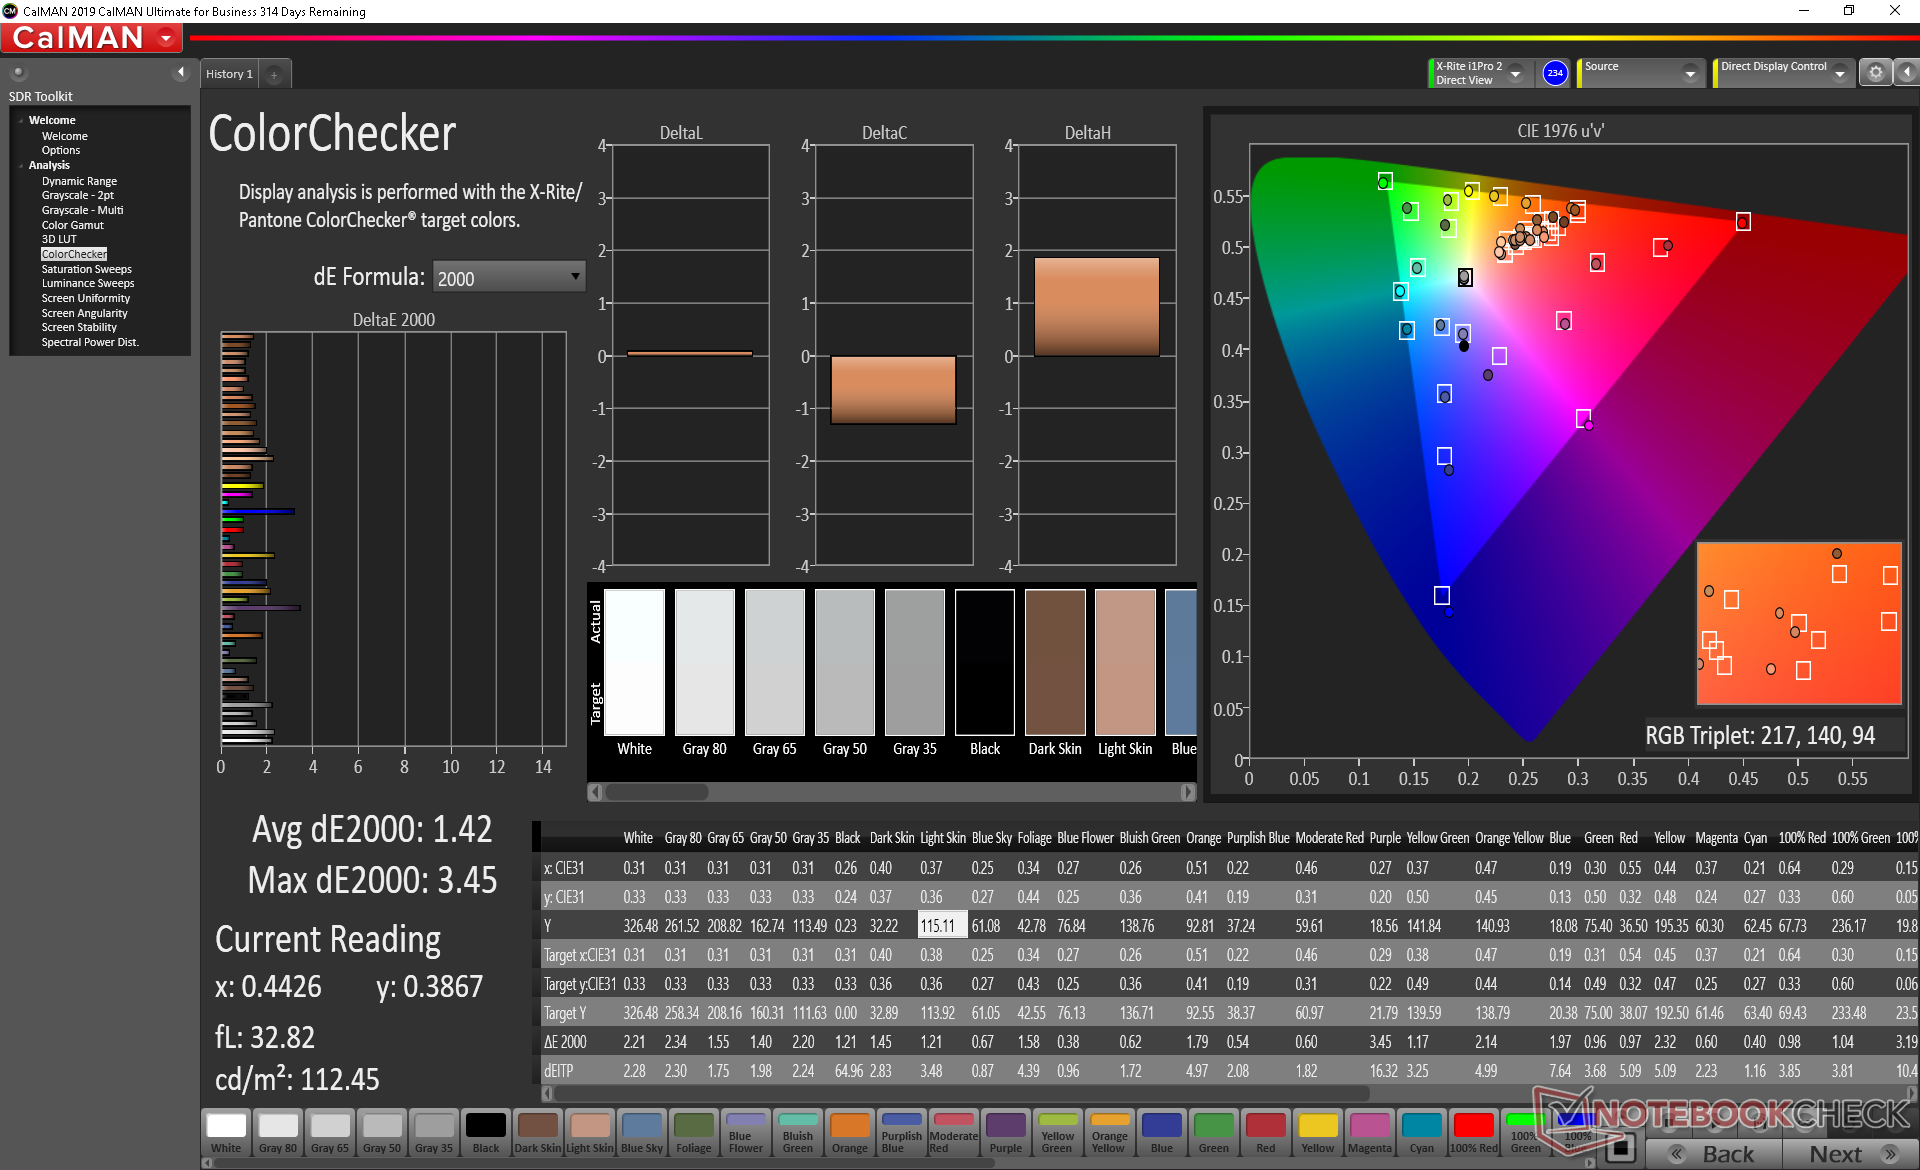
calibrated: 1.42
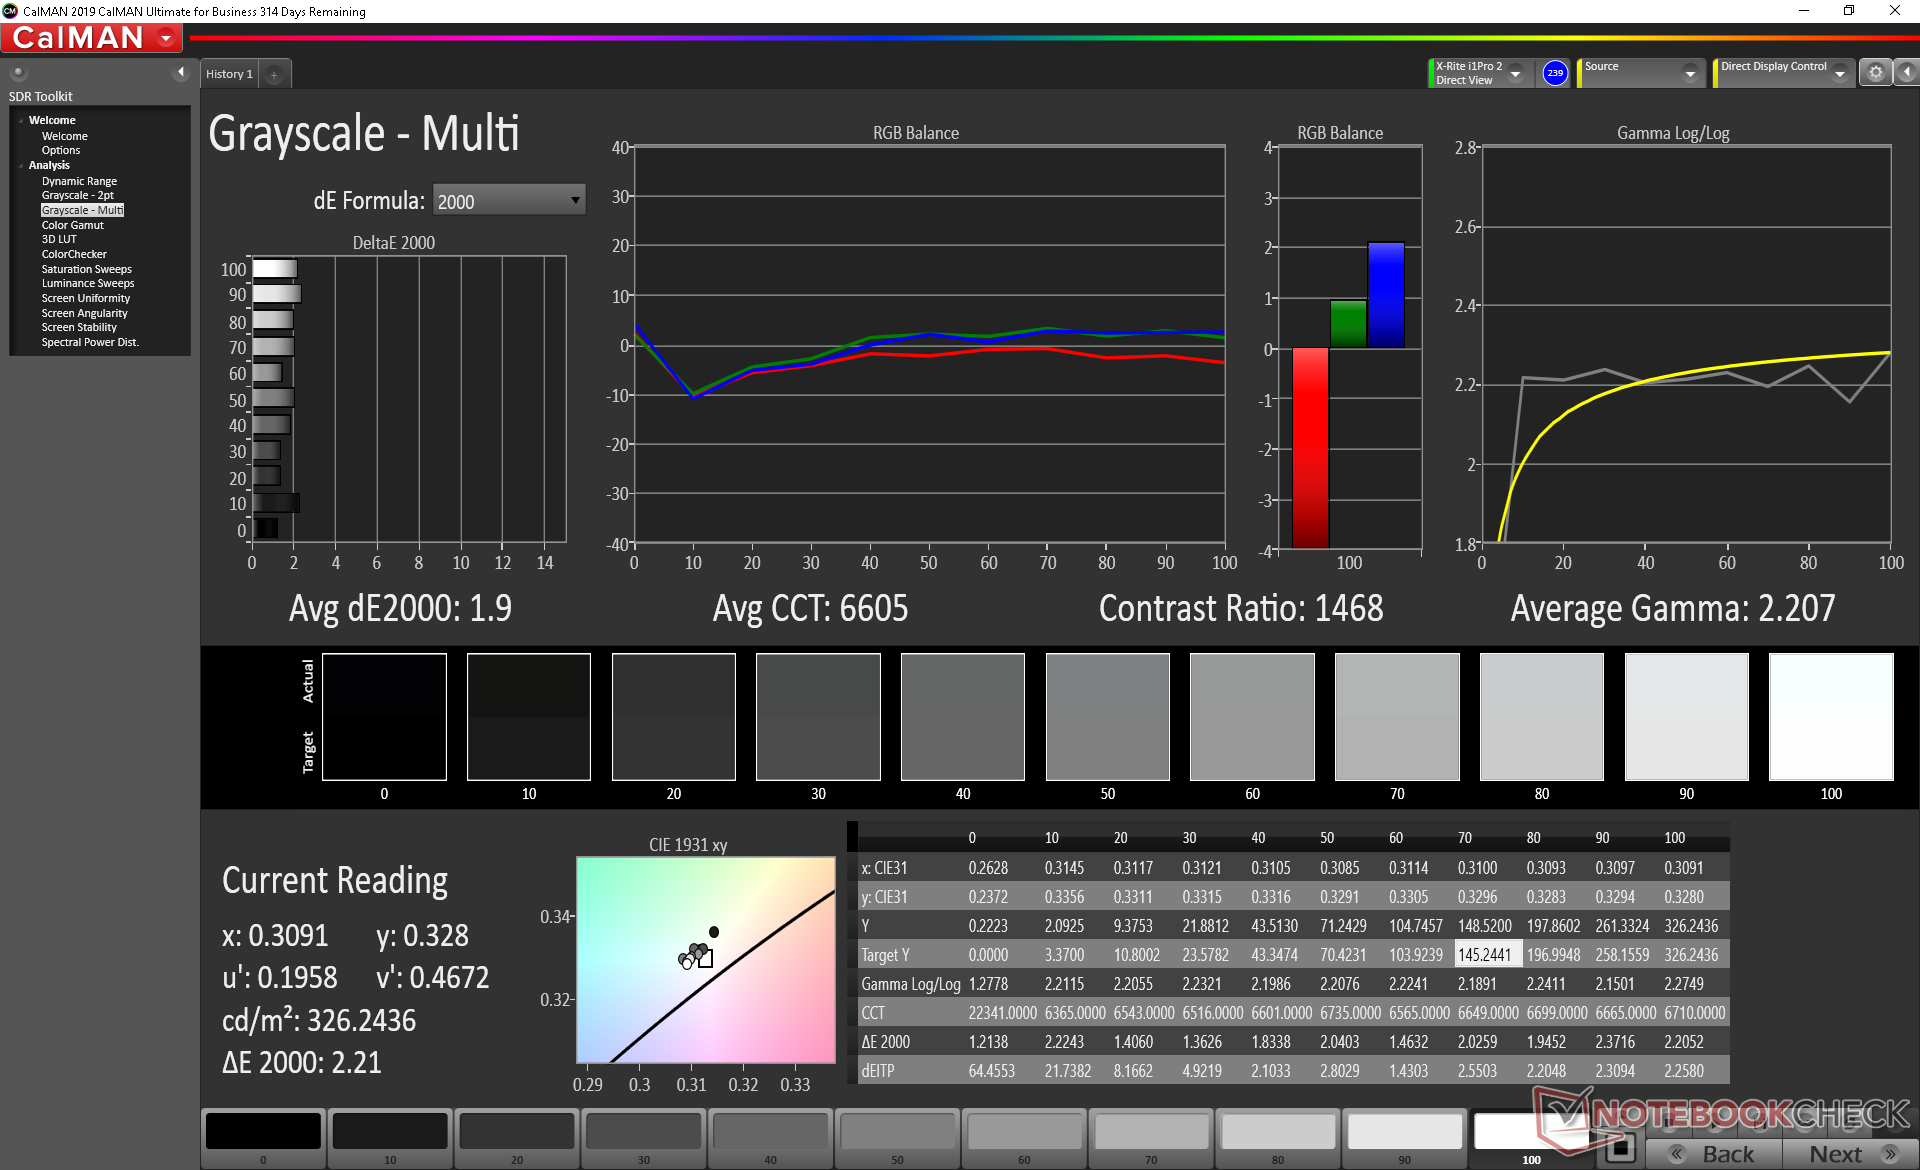
ΔE Greyscale Calman: 2.2 | ∀{0.09-98 Ø4.97}
95% sRGB (Argyll 1.6.3 3D)
60.2% AdobeRGB 1998 (Argyll 1.6.3 3D)
65.4% AdobeRGB 1998 (Argyll 3D)
94.8% sRGB (Argyll 3D)
64.2% Display P3 (Argyll 3D)
Gamma: 2.26
CCT: 6887 K
| MSI Modern 14 A10RB-459US Chi Mei N140HCE-EN2, IPS, 14", 1920x1080 | MSI Prestige 14 i7-10710U AUO123B, , 14", 3840x2160 | Asus ZenBook 15 UX534FT-DB77 BOE NV156FHM-N63, IPS, 15.6", 1920x1080 | Lenovo Yoga C940-14IIL LP140WF9-SPE2, IPS LED, 14", 1920x1080 | Dell XPS 15 7590 9980HK GTX 1650 Samsung 156WR04, SDCA029, OLED, 15.6", 3840x2160 | Apple MacBook Pro 16 2019 i9 5500M APPA044, IPS, 16", 3072x1920 | |
|---|---|---|---|---|---|---|
| Display | 26% | -2% | 3% | 27% | ||
| Display P3 Coverage (%) | 64.2 | 81.5 27% | 66.6 4% | 66 3% | 88.1 37% | |
| sRGB Coverage (%) | 94.8 | 99 4% | 87.7 -7% | 97.9 3% | 99.6 5% | |
| AdobeRGB 1998 Coverage (%) | 65.4 | 95.4 46% | 64.1 -2% | 67.3 3% | 91.8 40% | |
| Response Times | 1% | -6% | 94% | -16% | ||
| Response Time Grey 50% / Grey 80% * (ms) | 39.2 ? | 41.2 ? -5% | 49.6 ? -27% | 2.3 ? 94% | 52.4 ? -34% | |
| Response Time Black / White * (ms) | 35.6 ? | 33.2 ? 7% | 30 ? 16% | 2.4 ? 93% | 34.9 ? 2% | |
| PWM Frequency (Hz) | 25000 ? | 59.5 ? | 131700 | |||
| Screen | -5% | -70% | -9% | -45% | 6% | |
| Brightness middle (cd/m²) | 324.1 | 568 75% | 312.6 -4% | 384 18% | 421.2 30% | 519 60% |
| Brightness (cd/m²) | 301 | 513 70% | 290 -4% | 363 21% | 417 39% | 477 58% |
| Brightness Distribution (%) | 87 | 87 0% | 85 -2% | 90 3% | 94 8% | 86 -1% |
| Black Level * (cd/m²) | 0.22 | 0.28 -27% | 0.31 -41% | 0.17 23% | 0.39 -77% | |
| Contrast (:1) | 1473 | 2029 38% | 1008 -32% | 2259 53% | 1331 -10% | |
| Colorchecker dE 2000 * | 1.63 | 3.18 -95% | 5.78 -255% | 3.5 -115% | 6.06 -272% | 2.28 -40% |
| Colorchecker dE 2000 max. * | 4.25 | 7.01 -65% | 8.86 -108% | 5.5 -29% | 11.89 -180% | 6.54 -54% |
| Colorchecker dE 2000 calibrated * | 1.42 | 1.14 20% | 3.78 -166% | 1 30% | 0.86 39% | |
| Greyscale dE 2000 * | 2.2 | 4.79 -118% | 5.4 -145% | 4.6 -109% | 2.8 -27% | 0.9 59% |
| Gamma | 2.26 97% | 2.49 88% | 2.21 100% | 2.32 95% | 2.15 102% | 2145 0% |
| CCT | 6887 94% | 6488 100% | 7864 83% | 6884 94% | 6235 104% | 6572 99% |
| Color Space (Percent of AdobeRGB 1998) (%) | 60.2 | 85 41% | 57.1 -5% | 62 3% | 81 35% | 78 30% |
| Color Space (Percent of sRGB) (%) | 95 | 99 4% | 87.4 -8% | 97.7 3% | 99.6 5% | |
| Toplam Ortalama (Program / Ayarlar) | 11% /
1% | -24% /
-48% | -4% /
-6% | 25% /
-7% | -5% /
3% |
* ... daha küçük daha iyidir
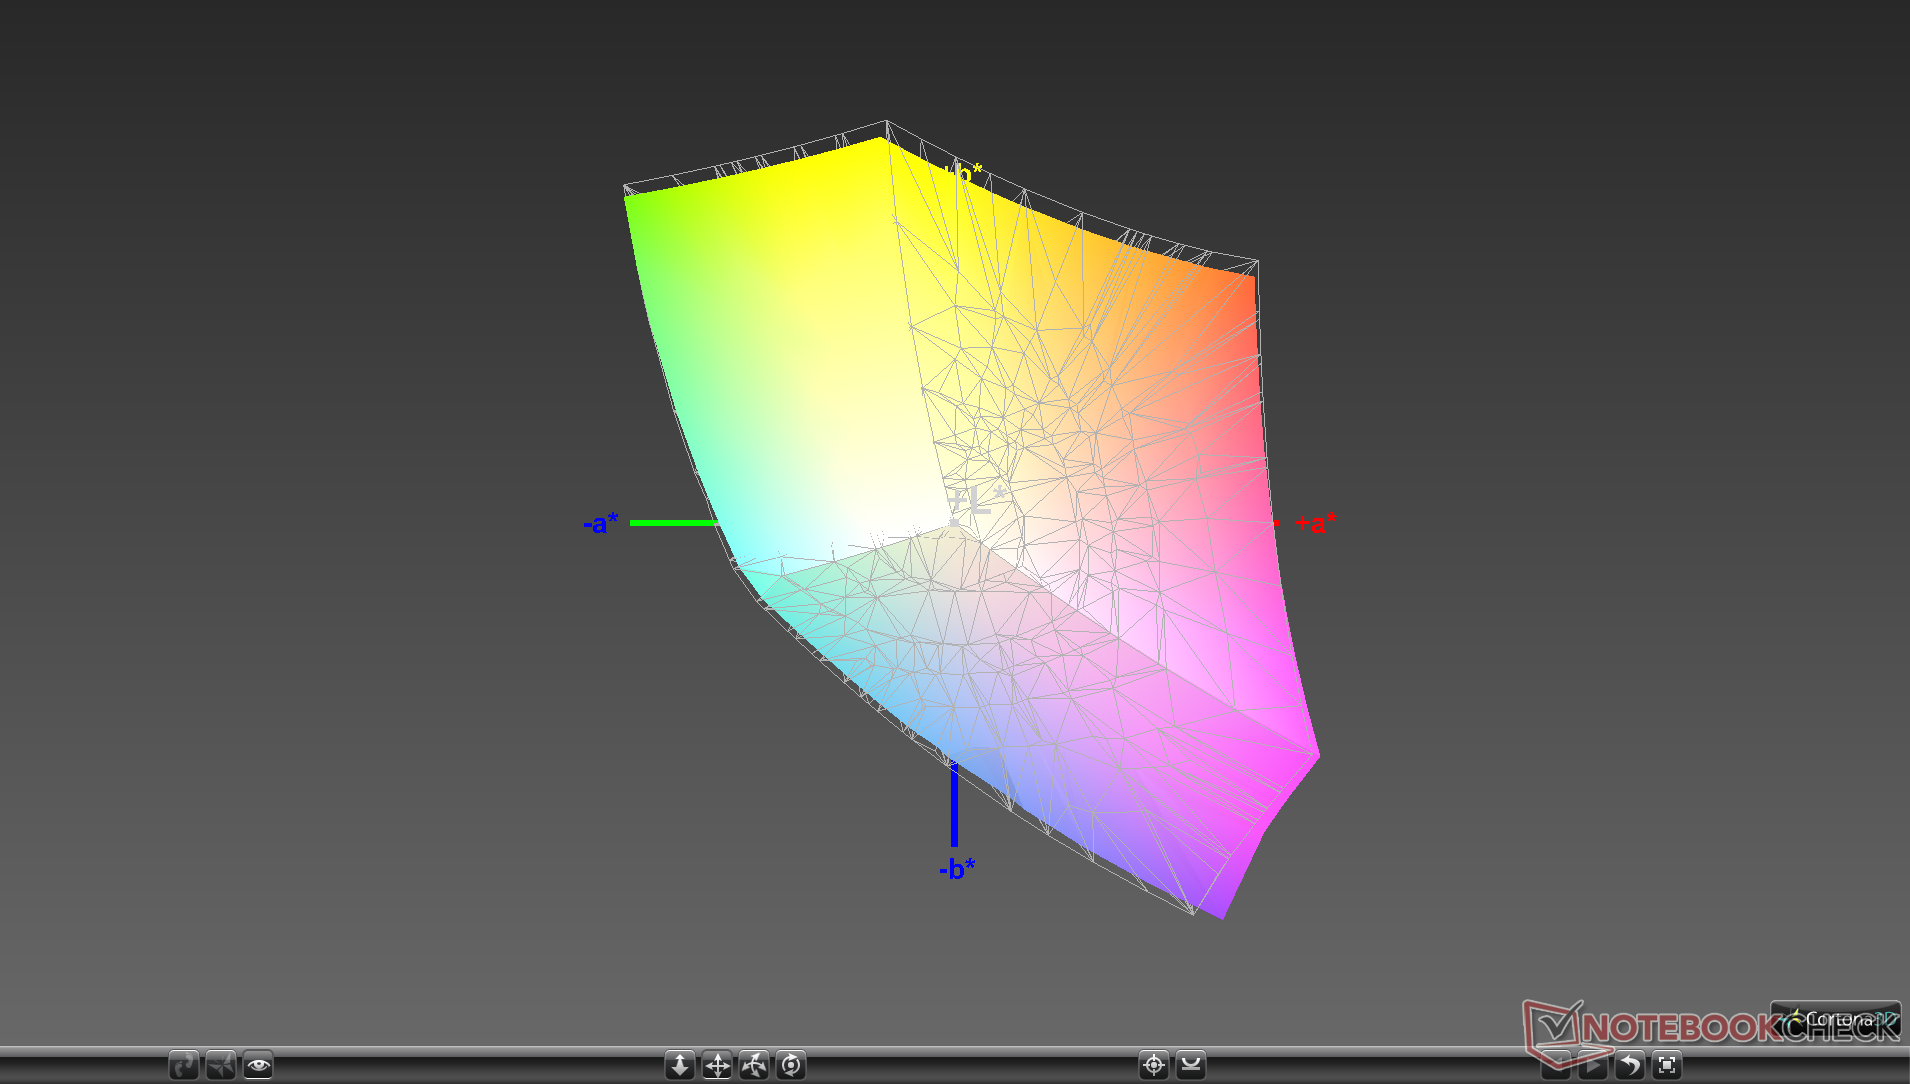
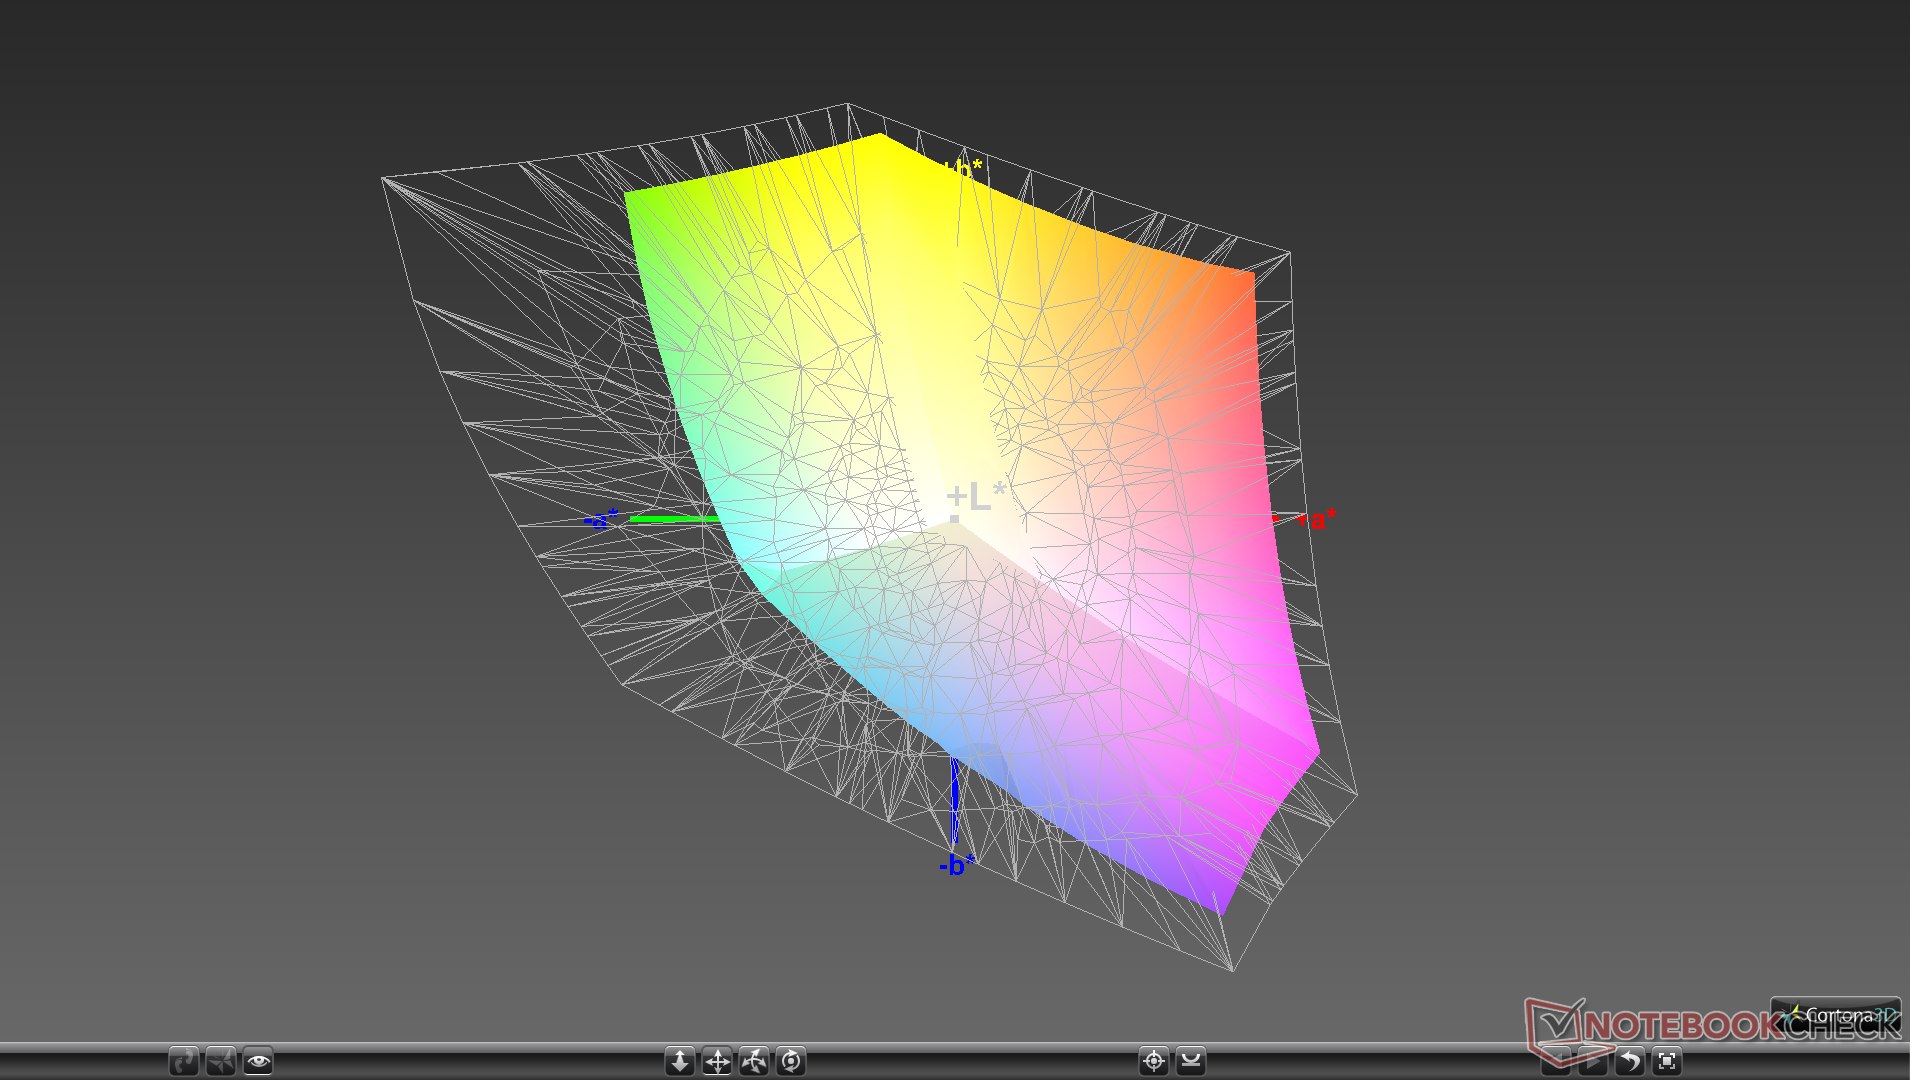
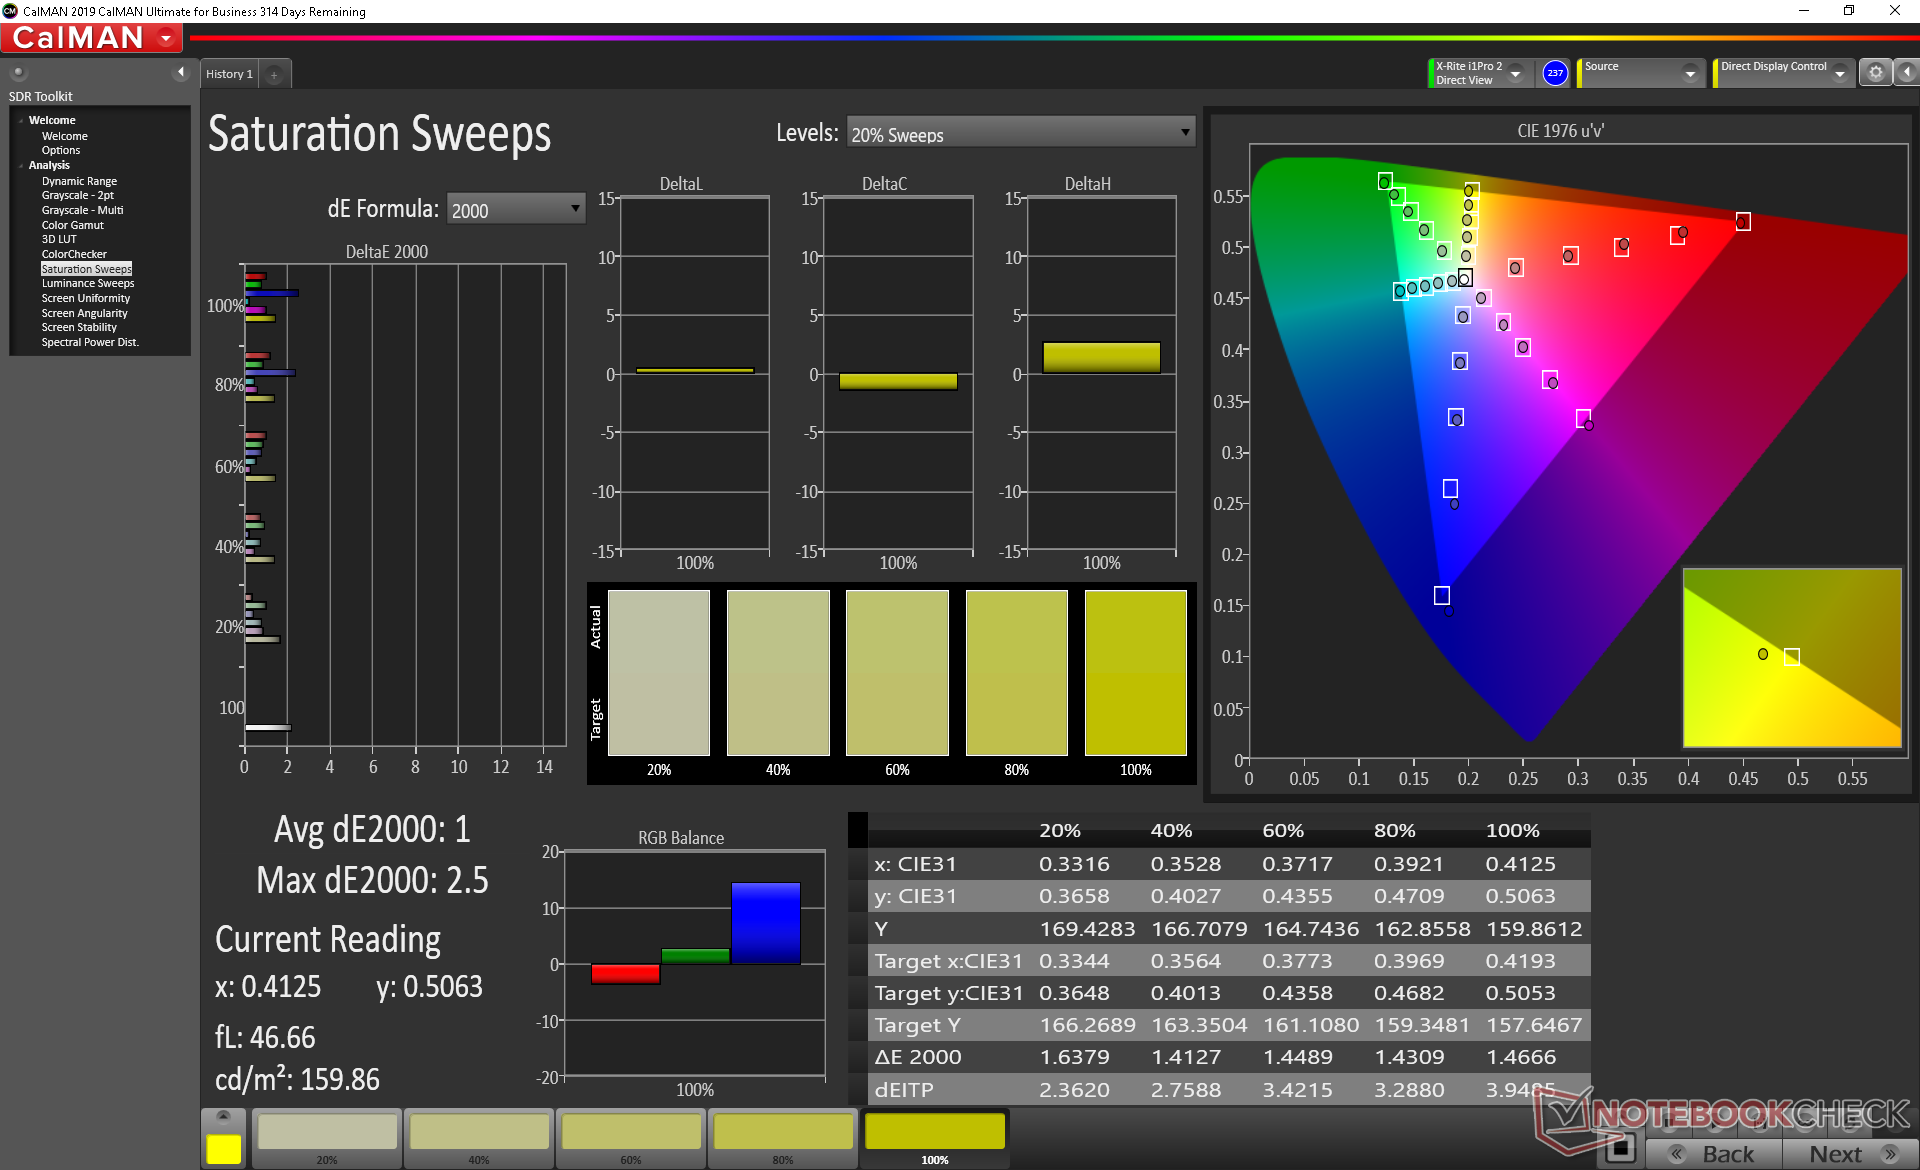
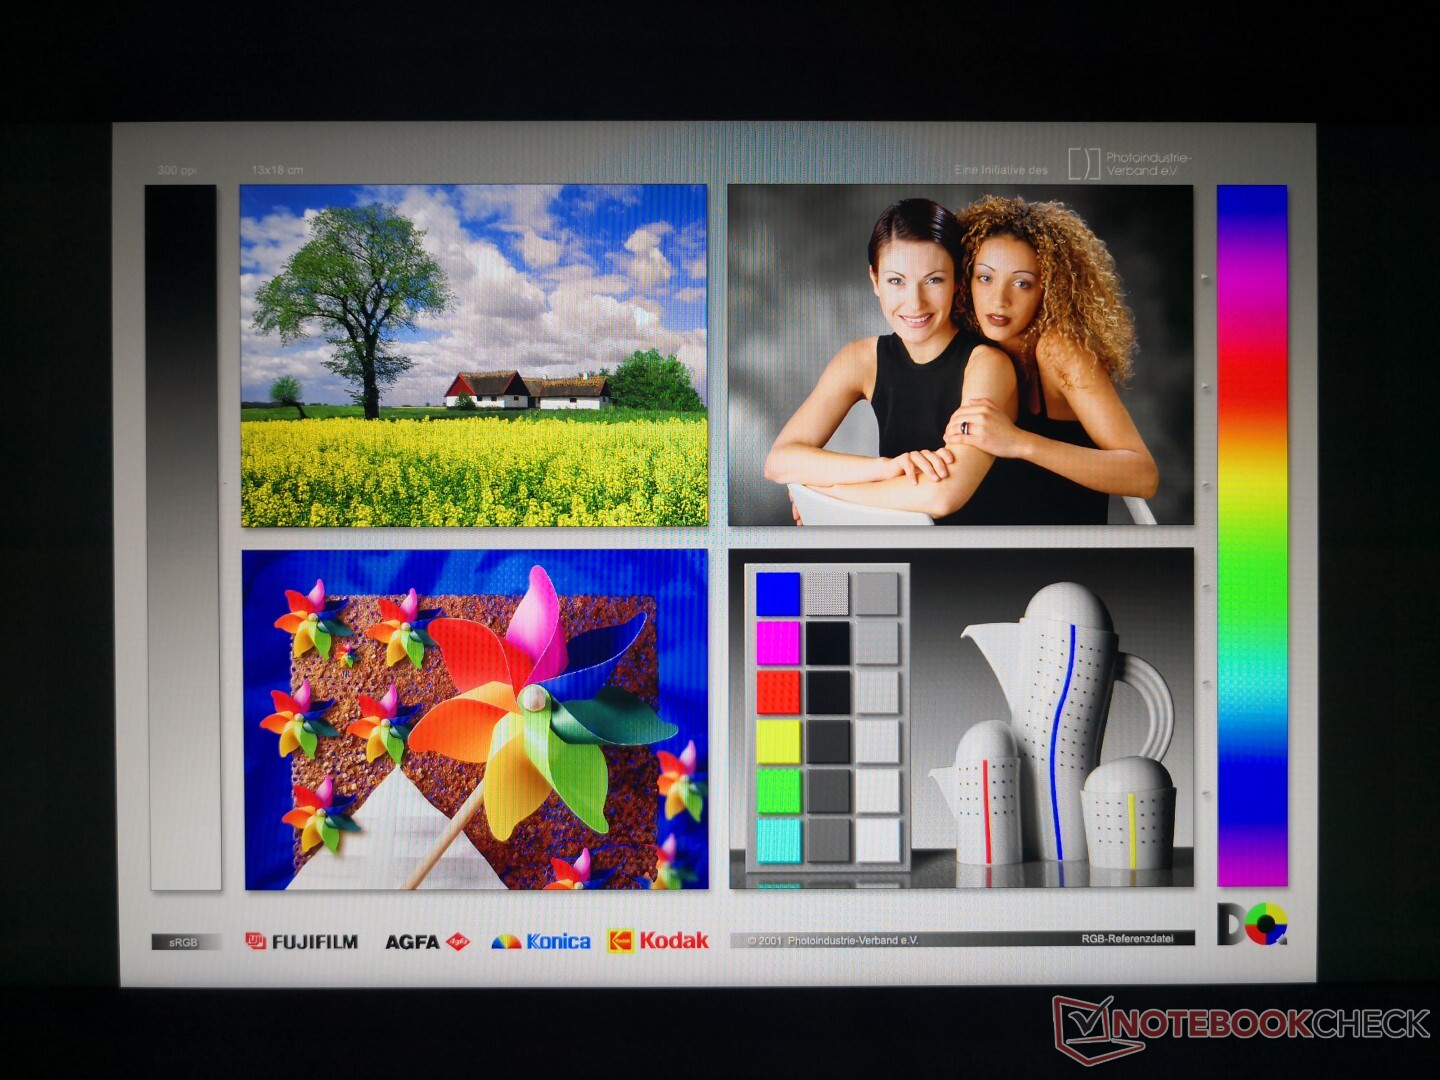
Renk alanı, orta menzilli bir paneli belirtmek için sırasıyla sRGB ve AdobeRGB standartlarının yaklaşık yüzde 95'ini ve yüzde 60'ını kapsar. Daha derin renkler arayan kullanıcılar daha pahalı Prestige 14 ve 4K UHD seçeneğini düşünmelidir.
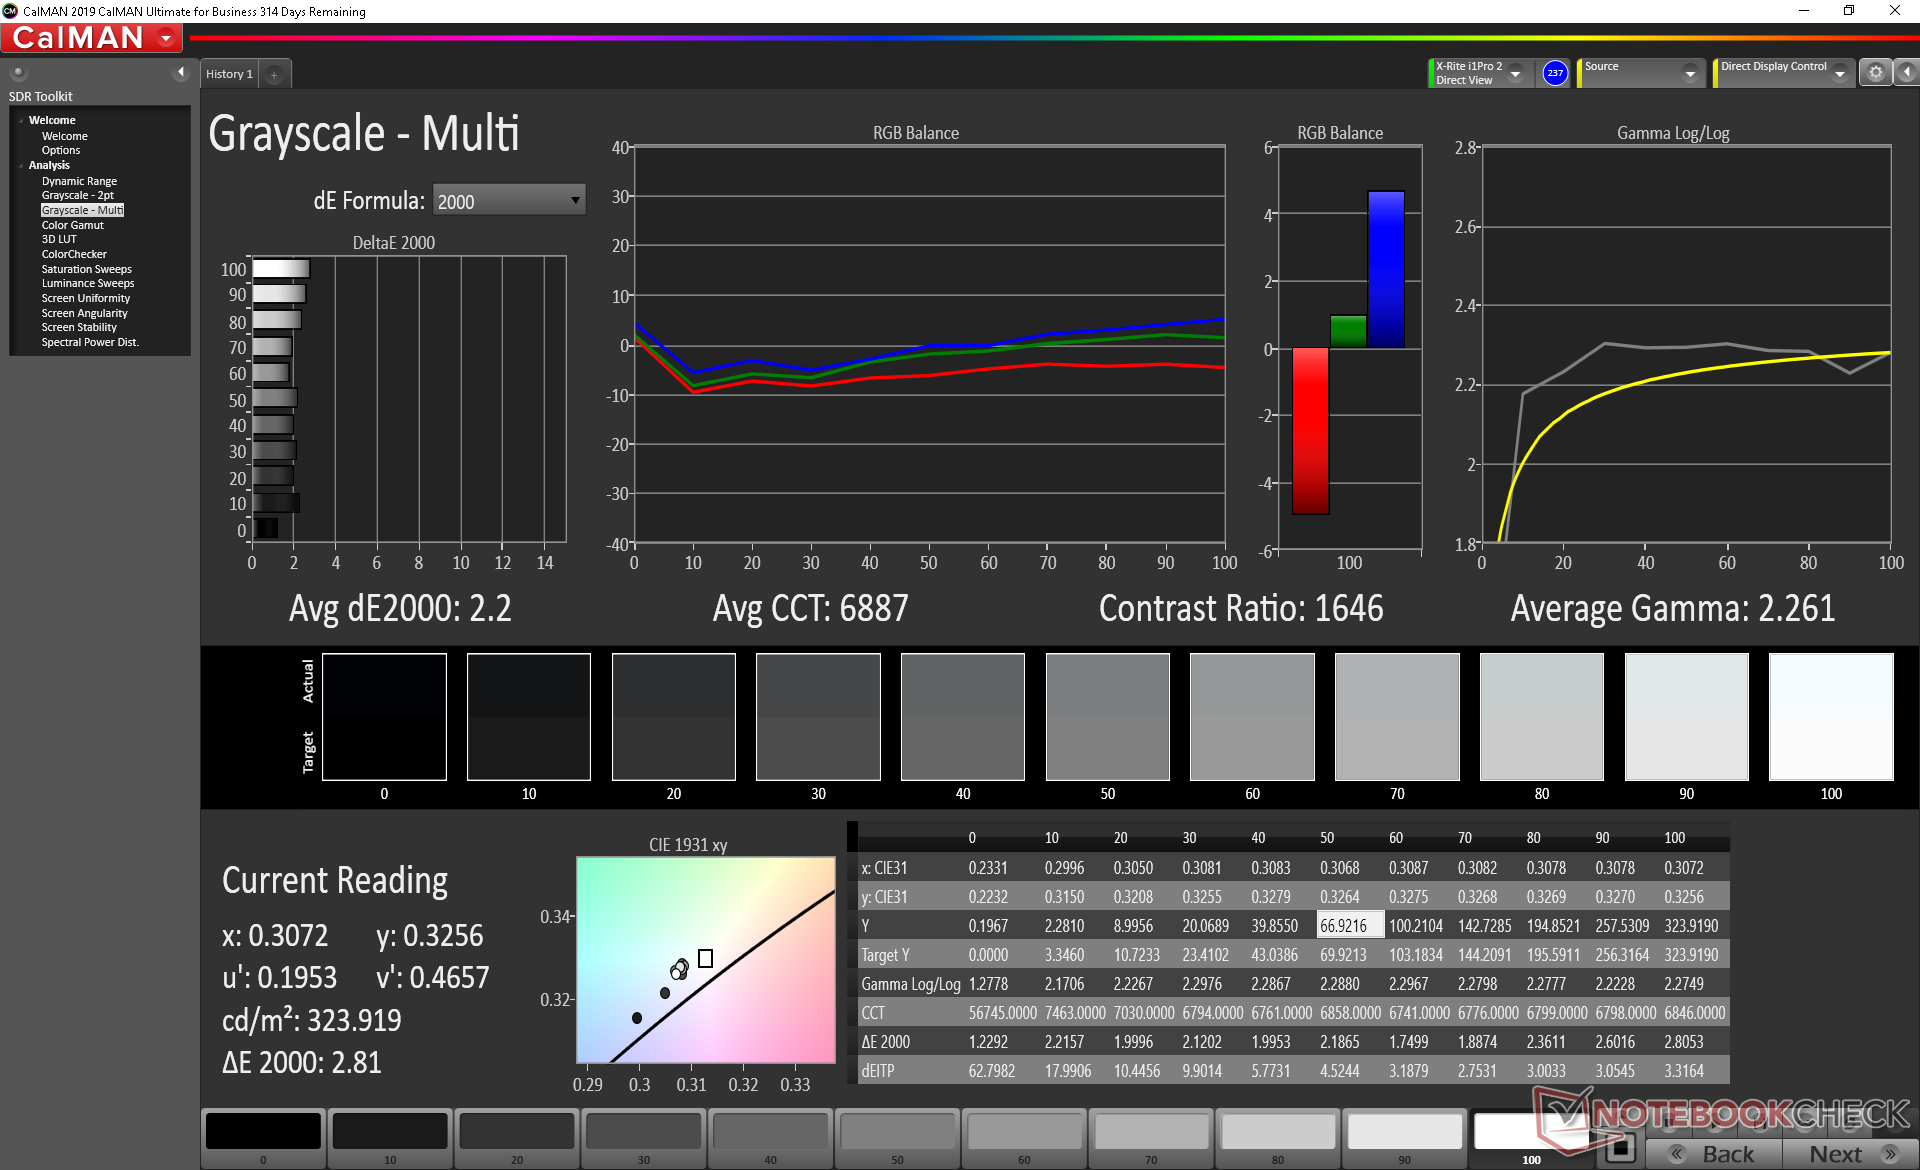
Panel, sırasıyla sadece 2.2 ve 1.44 ortalama gri tonlamalı ve renkli DeltaE değerleri ile kutudan iyi kalibre edilmiştir. Renk sıcaklığı, kendi X-Rite kalibrasyonumuzla sabitleyebildiğimiz serin tarafta her zamankinden biraz fazla. Birlikte verilen MSI True Color yazılımı, içerik oluşturucular için tek tıklamayla renk ayarlamalarını kolaylaştırır.

Yanıt Sürelerini Görüntüle
| ↔ Tepki Süresi Siyahtan Beyaza | ||
|---|---|---|
| 35.6 ms ... yükseliş ↗ ve sonbahar↘ birleşimi | ↗ 21.2 ms yükseliş | 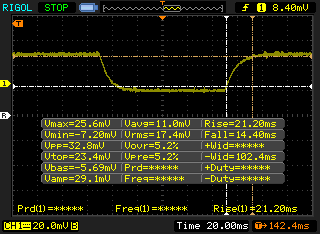 |
| ↘ 14.4 ms sonbahar | ||
| Ekran, testlerimizde yavaş yanıt oranları gösteriyor ve oyuncular için yetersiz olacaktır. Karşılaştırıldığında, test edilen tüm cihazlar 0.1 (minimum) ile 240 (maksimum) ms arasında değişir. » Tüm cihazların 93 %'si daha iyi. Bu, ölçülen yanıt süresinin test edilen tüm cihazların ortalamasından (19.9 ms) daha kötü olduğu anlamına gelir. | ||
| ↔ Tepki Süresi %50 Griden %80 Griye | ||
| 39.2 ms ... yükseliş ↗ ve sonbahar↘ birleşimi | ↗ 20.8 ms yükseliş | 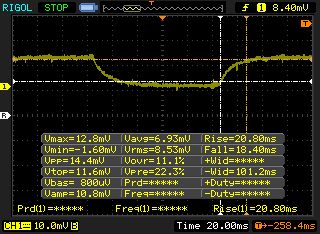 |
| ↘ 18.4 ms sonbahar | ||
| Ekran, testlerimizde yavaş yanıt oranları gösteriyor ve oyuncular için yetersiz olacaktır. Karşılaştırıldığında, test edilen tüm cihazlar 0.165 (minimum) ile 636 (maksimum) ms arasında değişir. » Tüm cihazların 60 %'si daha iyi. Bu, ölçülen yanıt süresinin test edilen tüm cihazların ortalamasından (31.1 ms) daha kötü olduğu anlamına gelir. | ||
Ekran Titremesi / PWM (Darbe Genişliği Modülasyonu)
| Ekran titriyor / PWM algılandı | 25000 Hz | ≤ 28 % parlaklık ayarı | 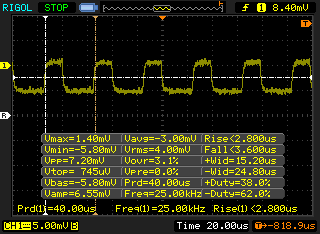 |
Ekran arka ışığı 25000 Hz'de titriyor (en kötü durum, örneğin PWM kullanılması) 28 % ve altındaki parlaklık ayarında titreme algılandı. Bu parlaklık ayarının üzerinde titreme veya PWM olmamalıdır. 25000 Hz frekansı oldukça yüksektir, bu nedenle PWM'ye duyarlı çoğu kullanıcı herhangi bir titremeyi fark etmemelidir. Karşılaştırıldığında: Test edilen tüm cihazların %52 %'si ekranı karartmak için PWM kullanmıyor. PWM tespit edilirse, ortalama 7794 (minimum: 5 - maksimum: 343500) Hz ölçüldü. | |||
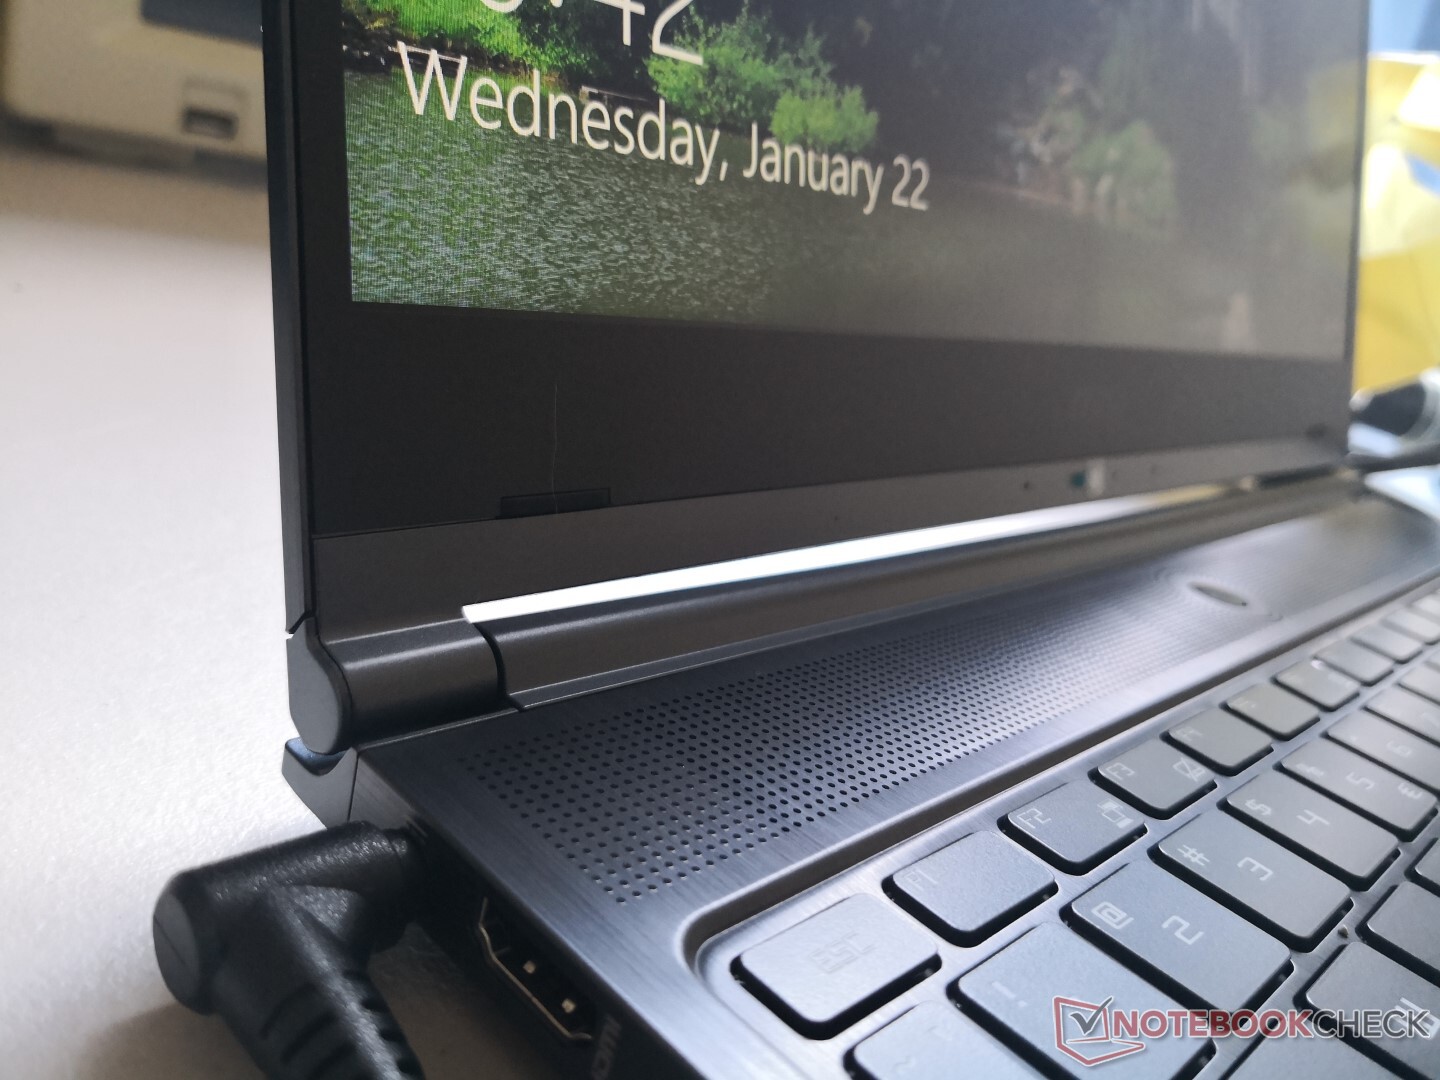
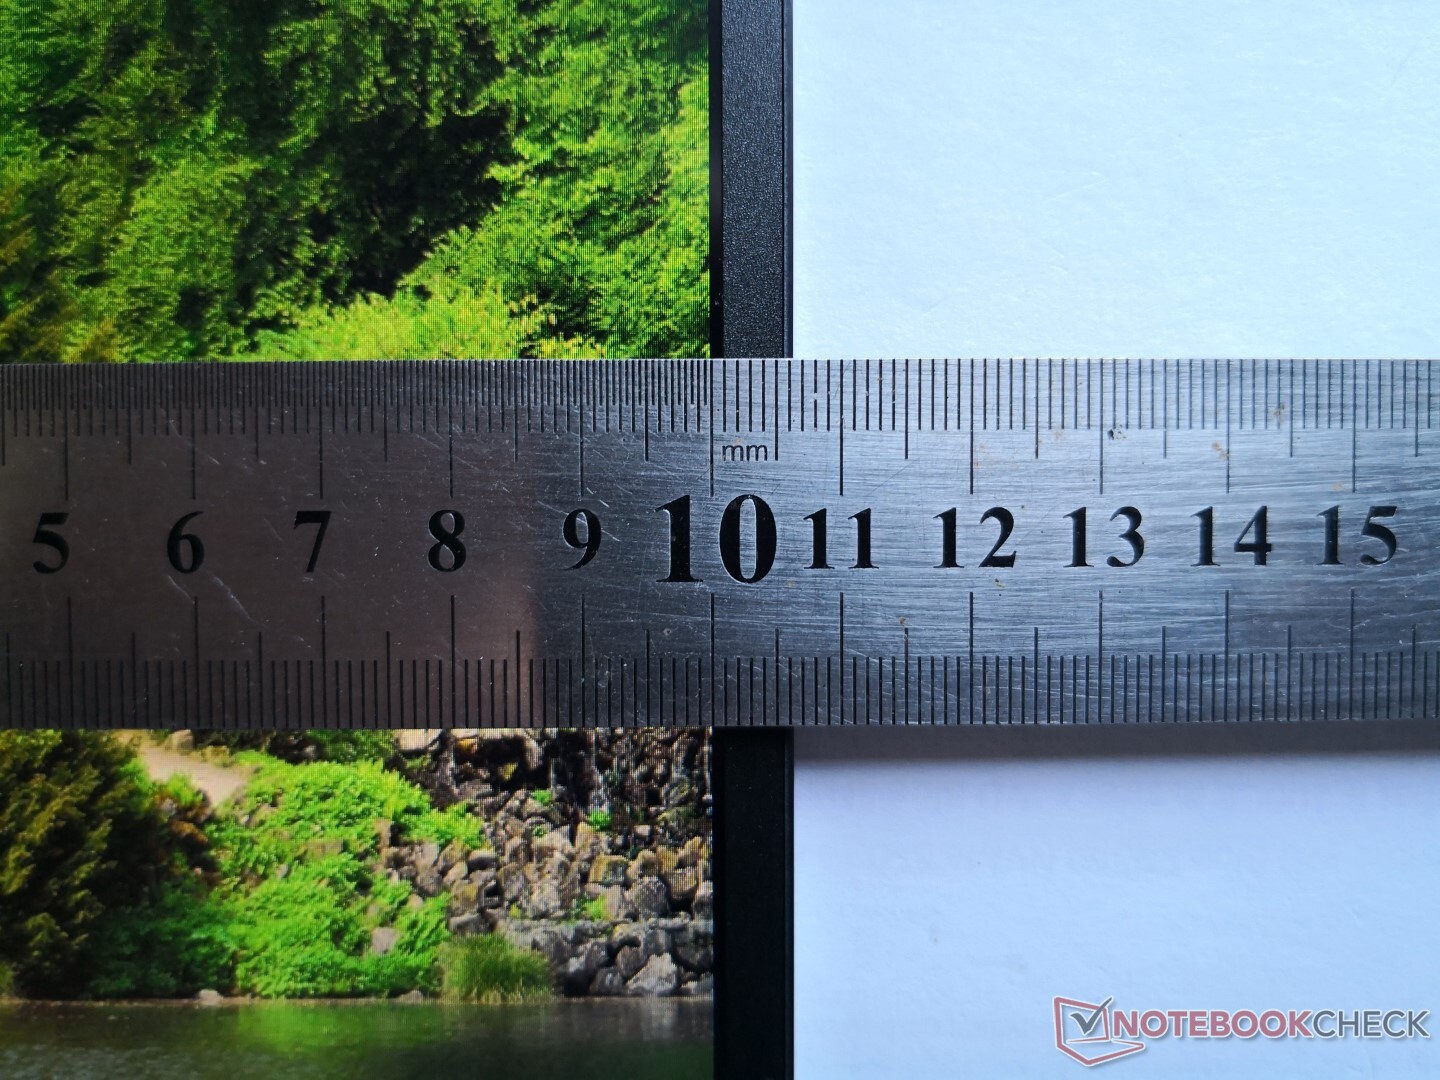
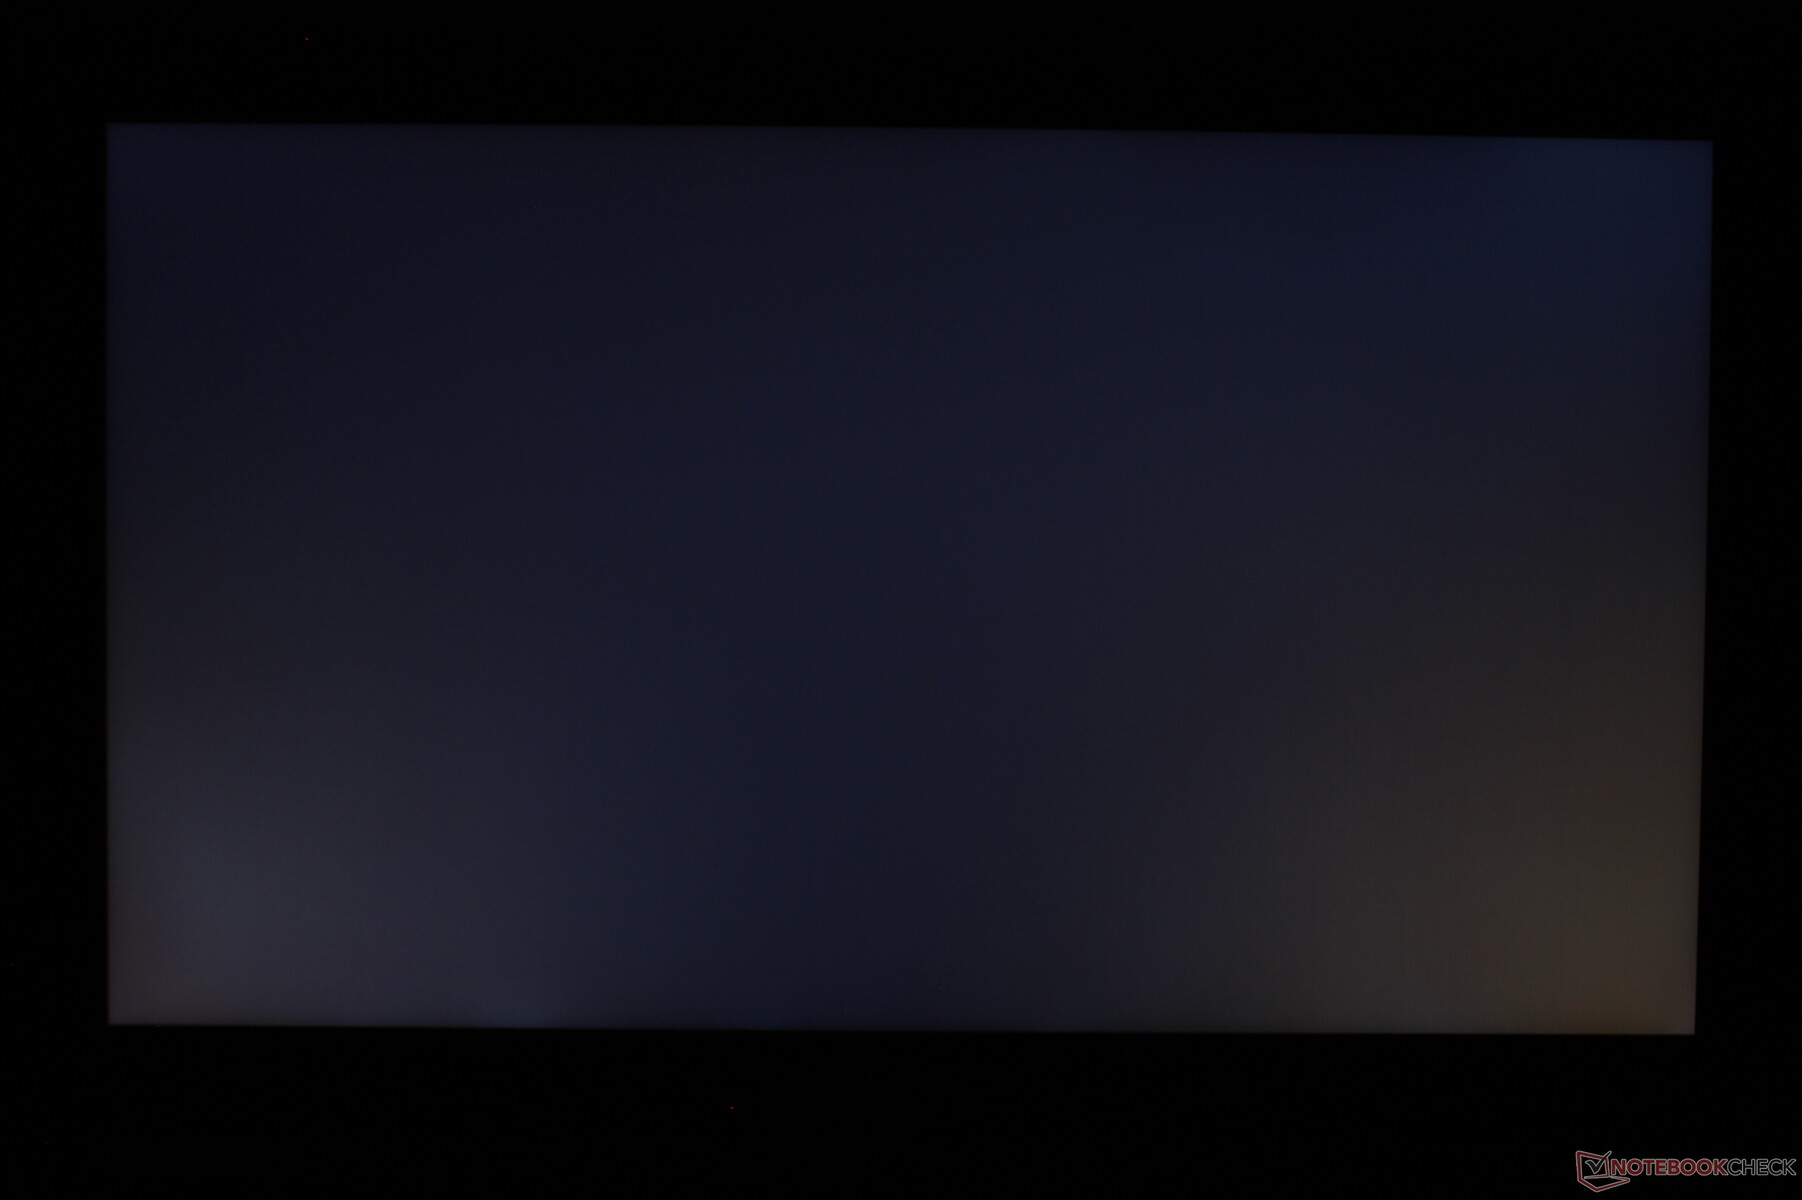
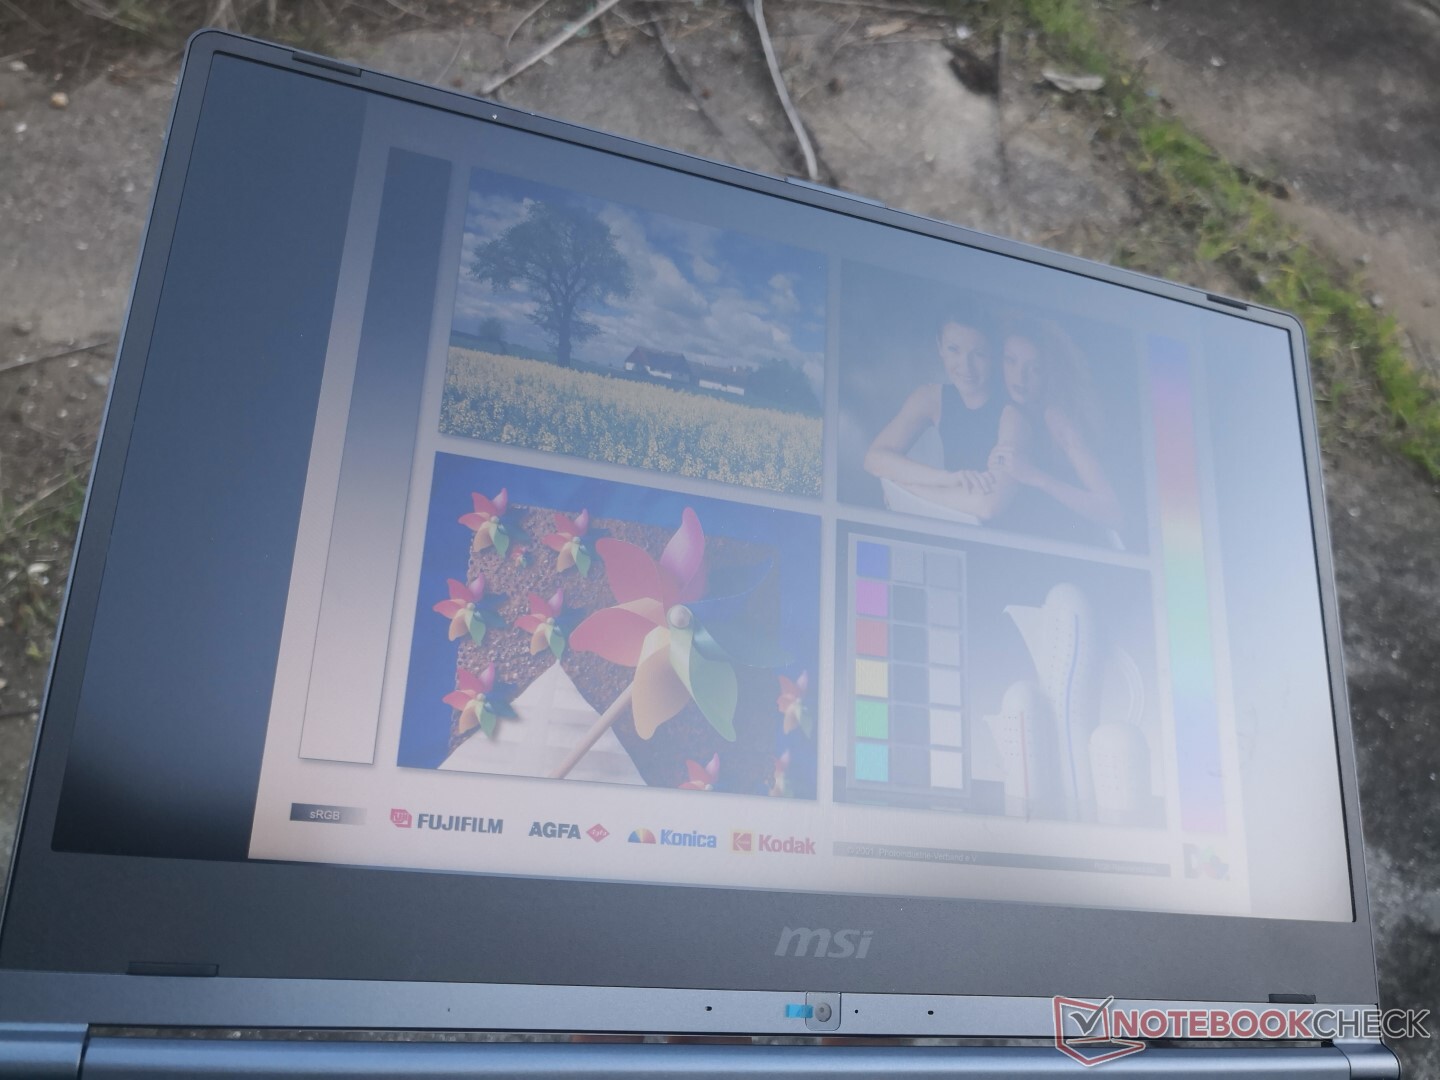
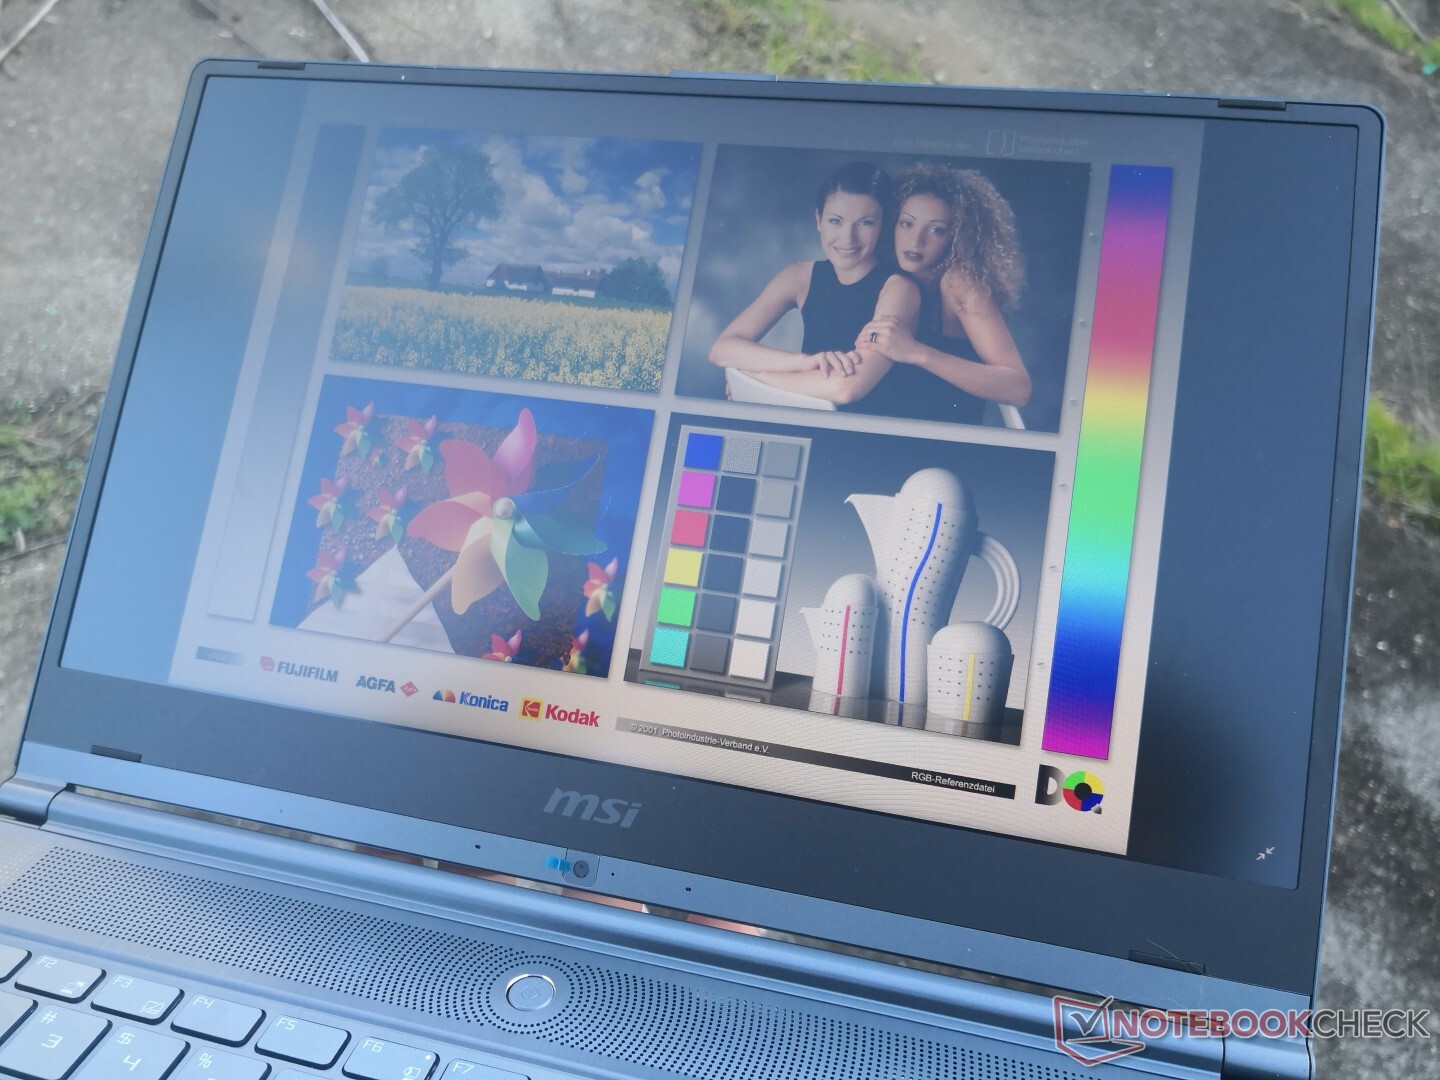
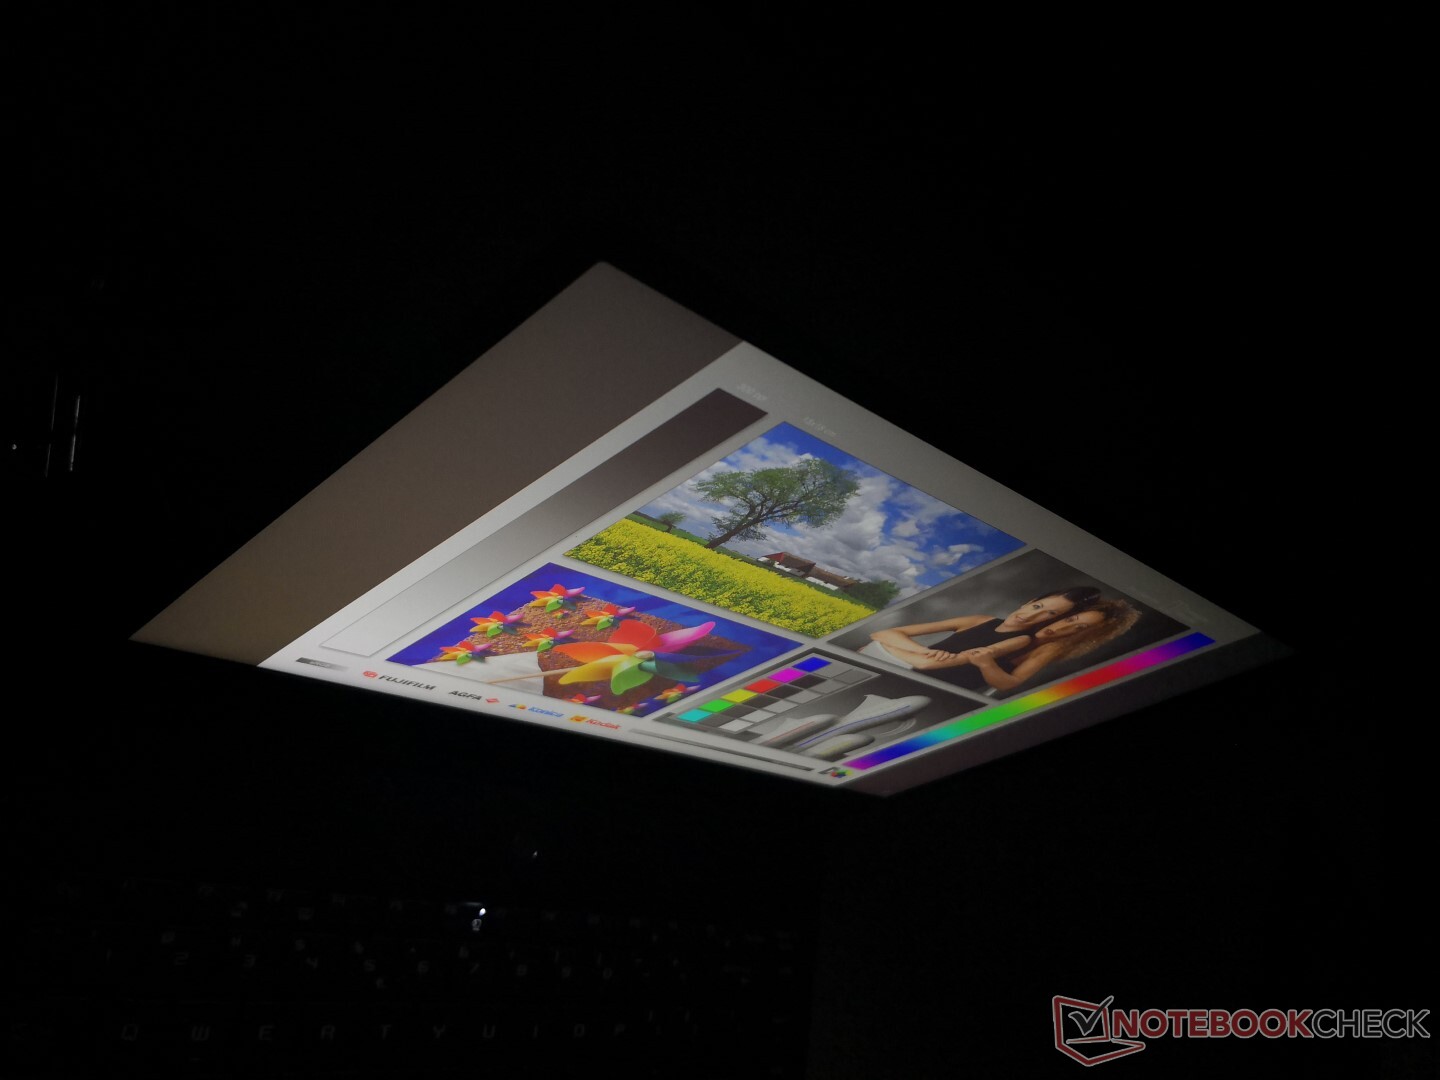
Dış mekan görünürlüğü, bir Ultrabook için ortalama değerlerdir. MacBook Pro 15 veya XPS 15 gibi daha pahalı amiral gemisi alternatifleri, dış mekanlarda daha iyi görünürlük için daha parlak ekranlara sahiptir, ancak mat MSI ekranında en azından parlama minimumdur. 180 derecelik menteşelerden daha iyi yararlanmak için görüş açıları mükemmel. Renkler ve kontrast yalnızca diğer IPS ekranların aksine aşırı açılardan izlendiğinde bozulur.
Verim
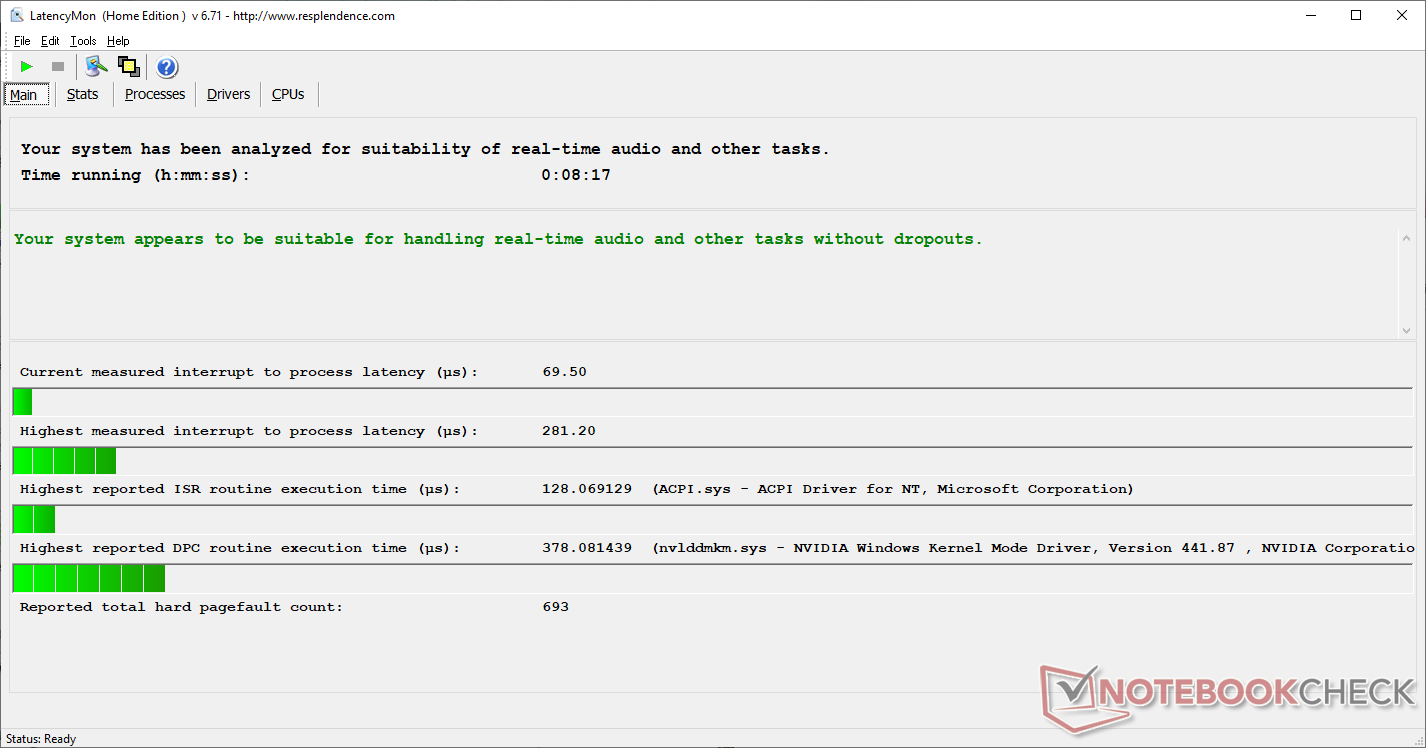
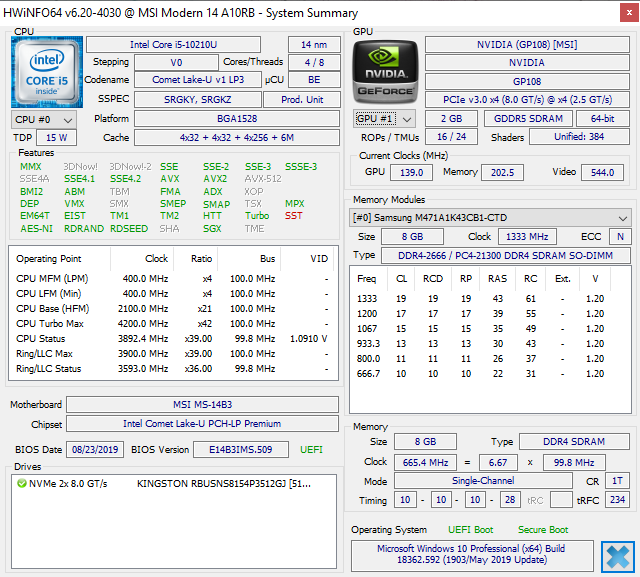
10. nesil Core i5 CPU ve GeForce MX250 GPU, aynı zamanda ince ve hafif olmakla birlikte yalnızca Intel UMA'ya özel Ultrabook'tan daha fazla grafik gücü isteyen ofis kullanıcılarını hedefliyor. Daha güçlü GTX seçeneklerine sahip dizüstü bilgisayarlar, Razer Blade Stealth ve MSI Prestige 14'ün önemli istisnaları olduğu 15 inç aralığında daha ağır ve daha büyük olma eğilimindedir. SODIMM yuvası. Özellikle bu şaside RAM yükseltmeleri zor olduğundan en az 16 GB'lık yapılandırmayı öneriyoruz.Nvidia Optimus, otomatik grafik geçişi için dahildir. LatencyMon, kablosuz etkinleştirildiğinde bile DPC gecikme sorunu göstermez.
İşlemci
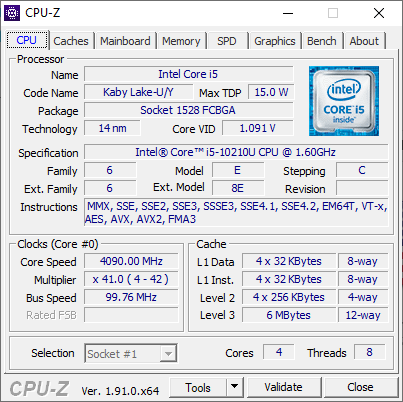
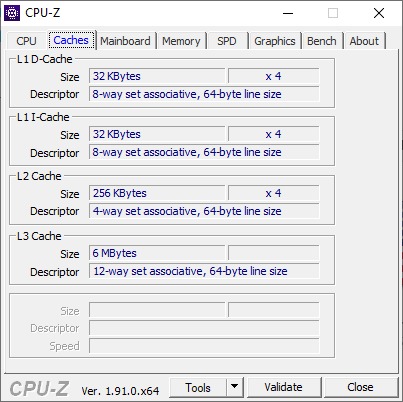
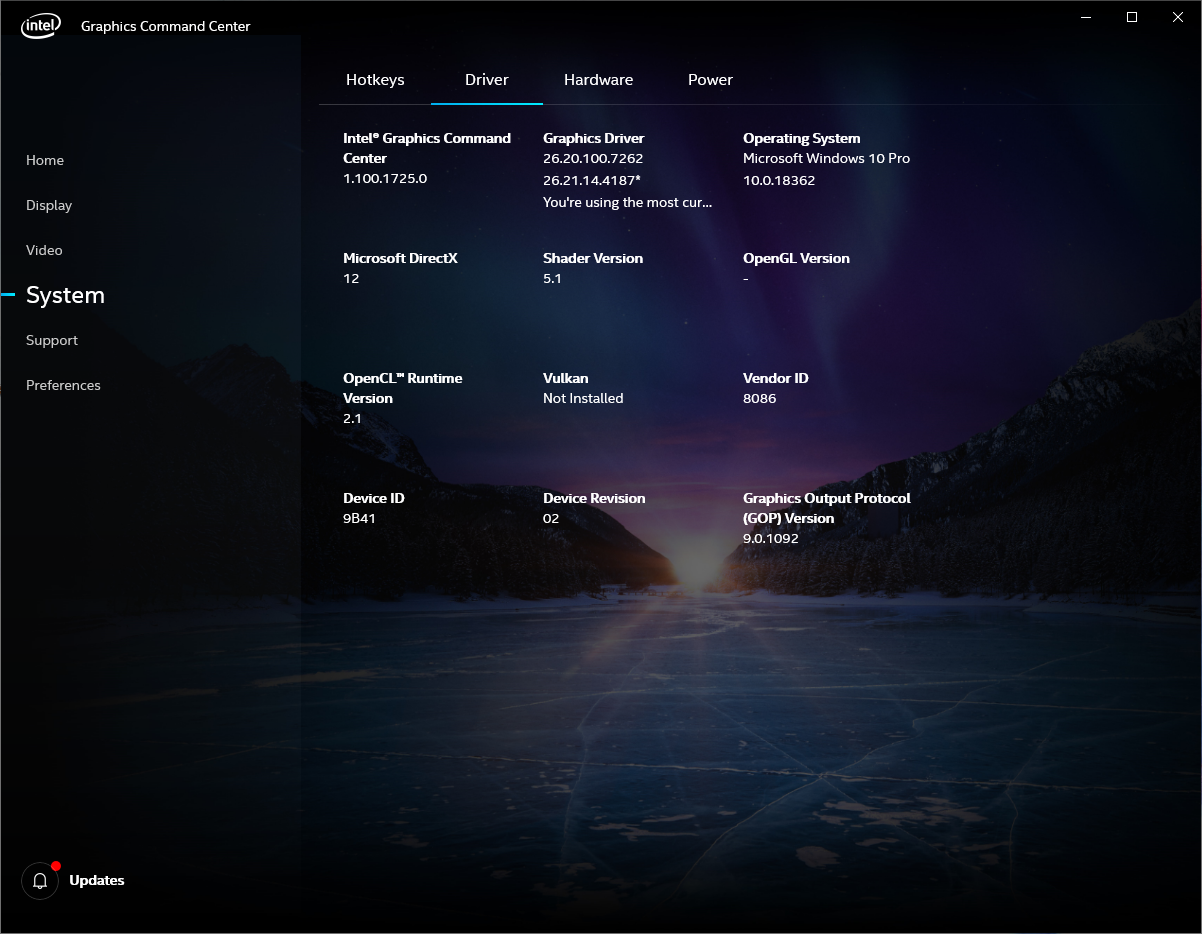
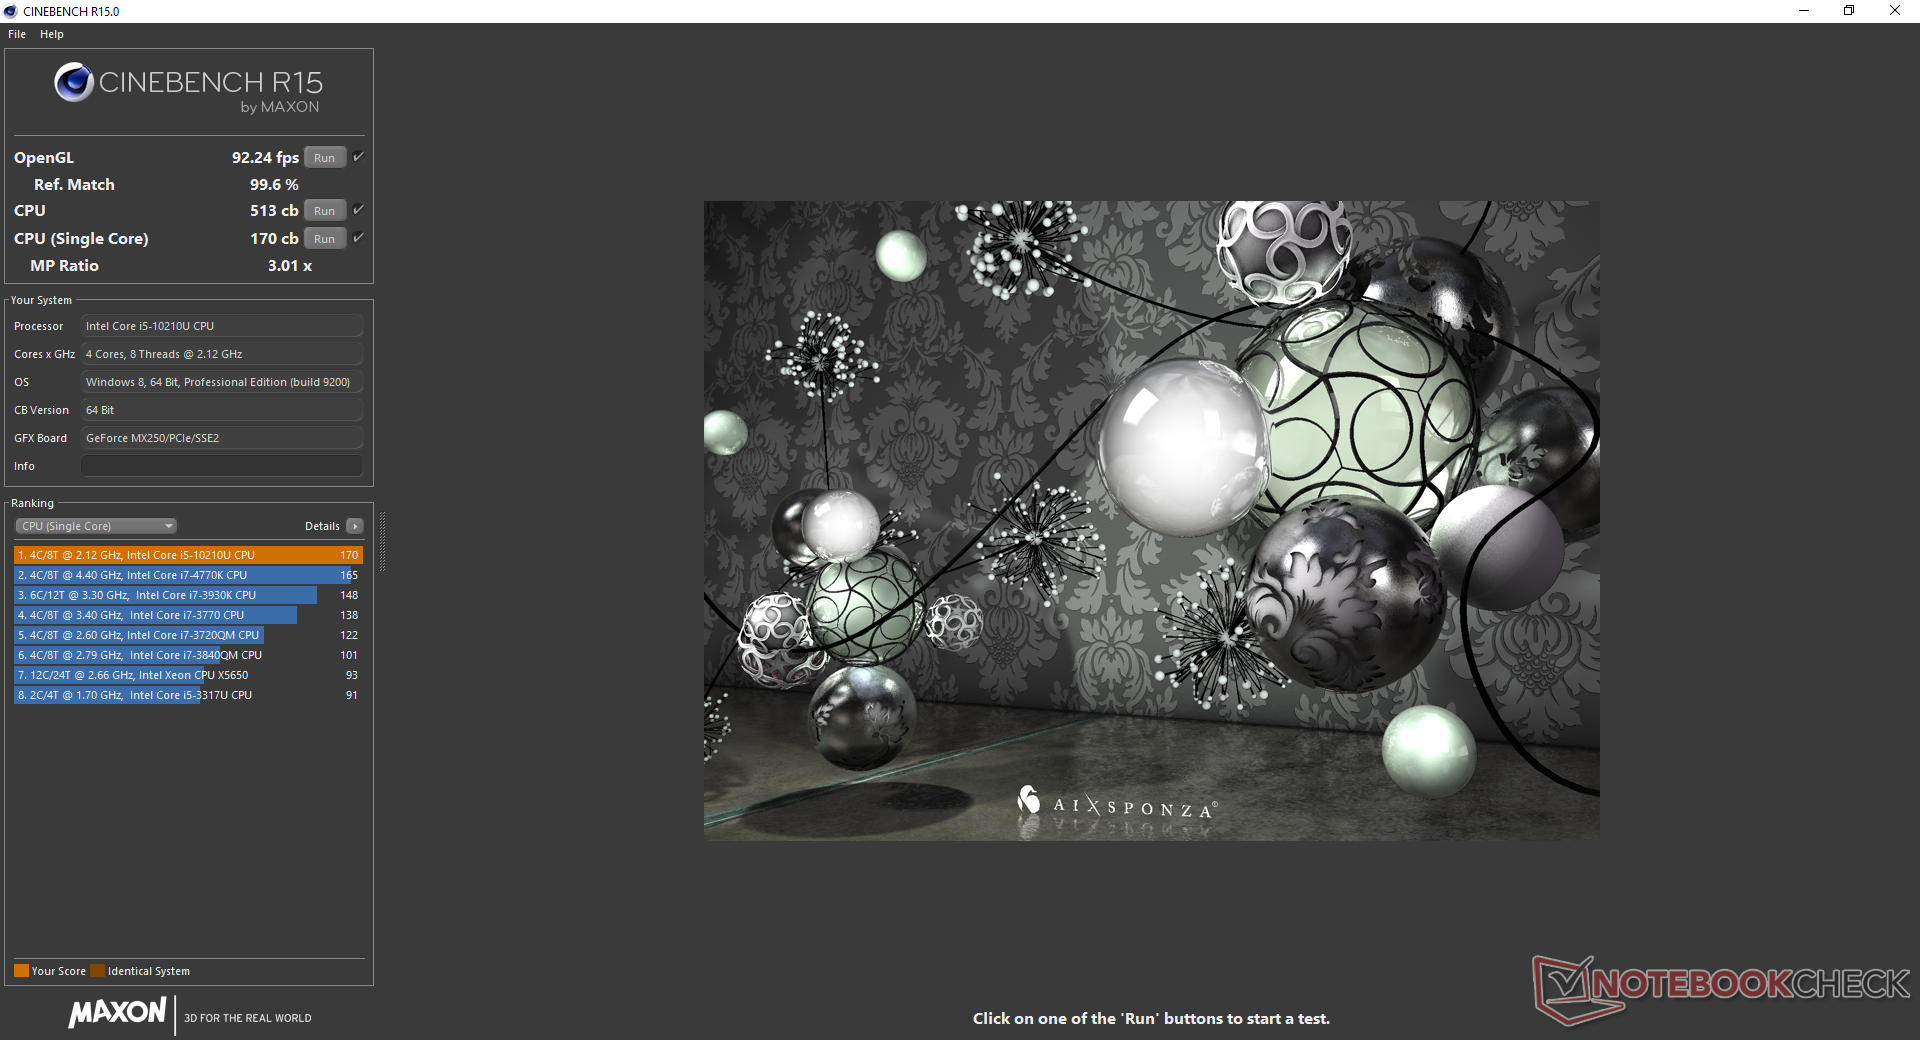
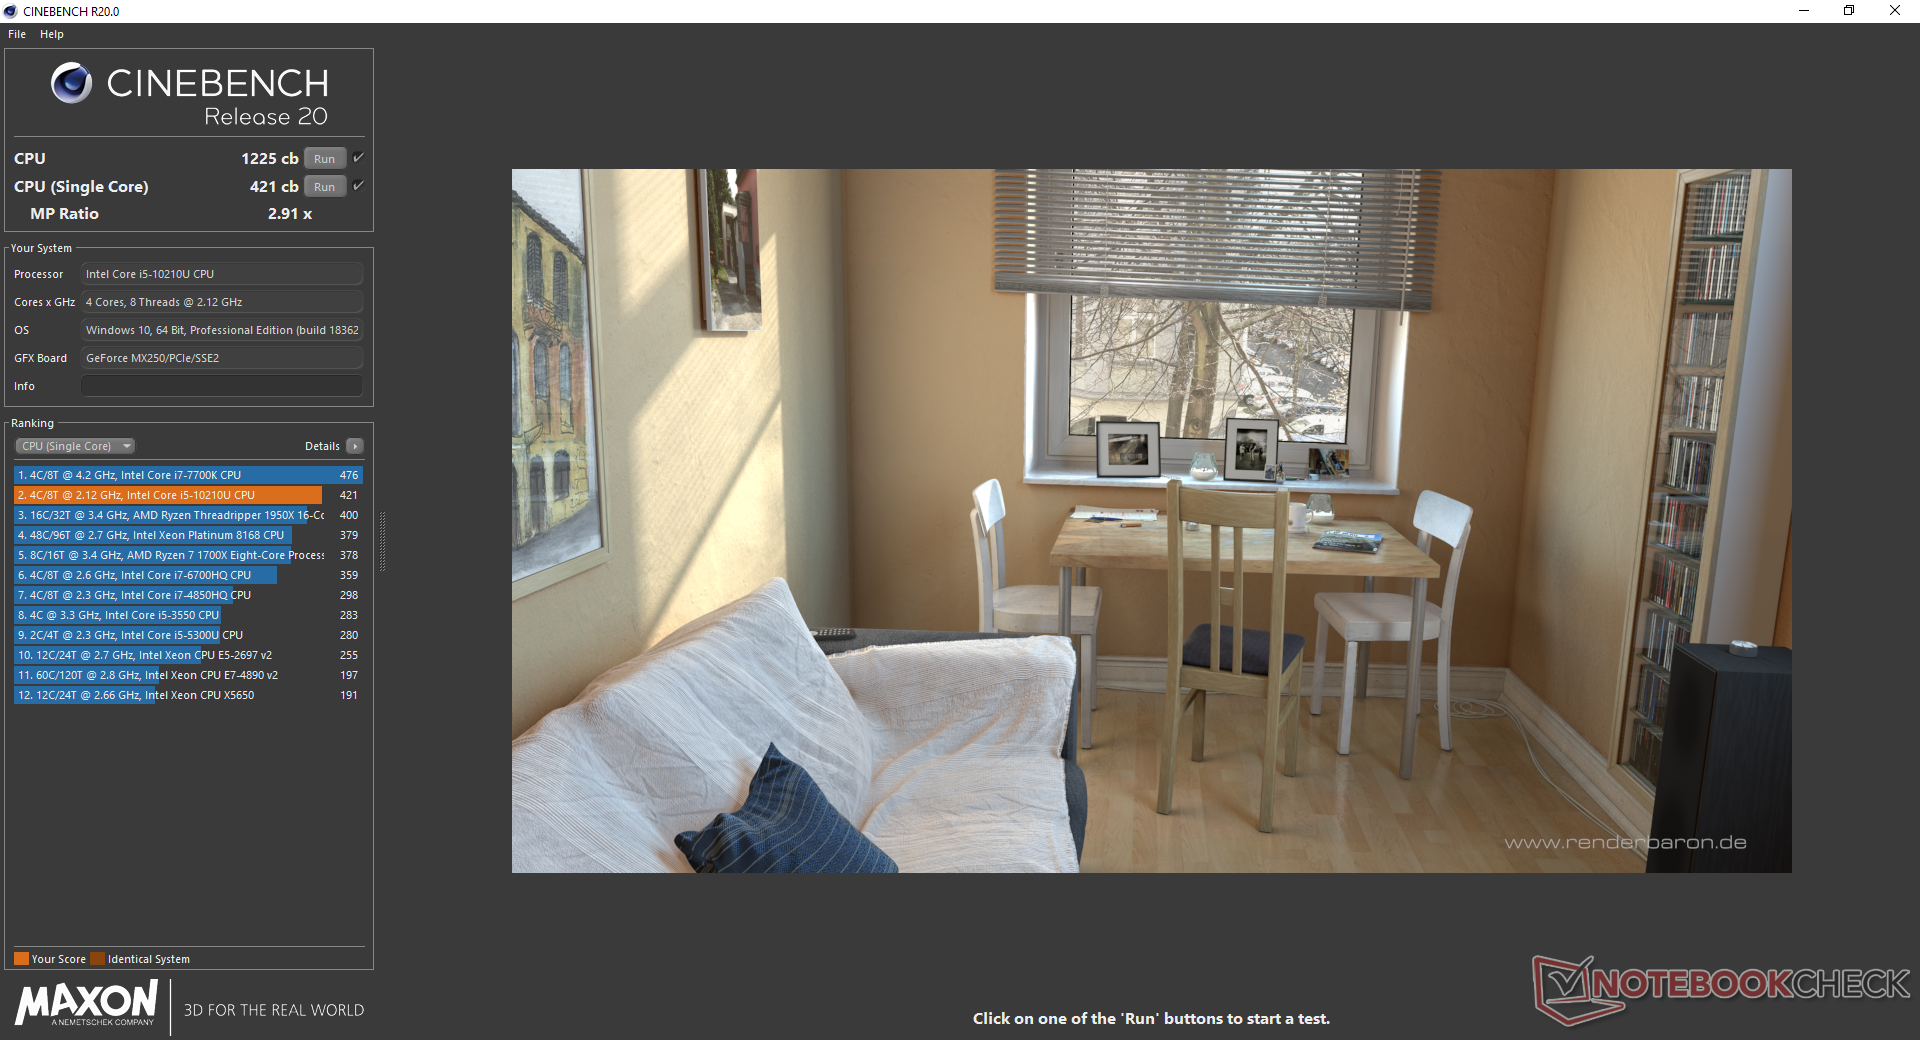
MSI'mızdaki Comet Lake-U Core i5-10210U, CineBench R15 Multi-Thread'a göre veri tabanımızdaki ortalama Core i5-10210U'dan yaklaşık yüzde 20 daha yavaş. Bu nedenle, ham performans, doğrudan yerine geçtiği iki yaşındaki Core i7-8550U'dan veya hatta Core i5-8265U'dan daha iyi değildir. Aslında, Walmart Motile dizüstü bilgisayardaki Ryzen 5 3500U bile MSI'mızdan yaklaşık yüzde 20 daha iyi performans gösterebilir. Hayal kırıklığı yaratan sonuçlar, aşağıdaki Stres Testi bölümümüzde ayrıntılı olarak açıklanan Modern 14'ün sınırlı Turbo Boost sürdürülebilirliğine atfedilebilir. Daha fazla teknik bilgi ve kıyaslama için Core i5-10210U'daki özel sayfamıza bakın.
| Cinebench R15 | |
| CPU Single 64Bit | |
| Lenovo Yoga C740-15IML | |
| Microsoft Surface Laptop 3 15 i7-1065G7 | |
| Dell XPS 13 7390 Core i7-10710U | |
| Dell G3 3590 | |
| MSI Modern 14 A10RB-459US | |
| Ortalama Intel Core i5-10210U (134 - 174, n=35) | |
| Dynabook Portege A30-E-174 | |
| Lenovo ThinkPad P43s-20RH001FGE | |
| Asus VivoBook 14 X403FA | |
| Walmart Motile M142 | |
| Dell Latitude 13 3390 | |
| Microsoft Surface Laptop 3 15 Ryzen 5 3580U | |
| CPU Multi 64Bit | |
| Dell XPS 13 7390 Core i7-10710U | |
| Dell G3 3590 | |
| Lenovo Yoga C740-15IML | |
| Microsoft Surface Laptop 3 15 i7-1065G7 | |
| Microsoft Surface Laptop 3 15 Ryzen 5 3580U | |
| Walmart Motile M142 | |
| Asus VivoBook 14 X403FA | |
| Ortalama Intel Core i5-10210U (320 - 790, n=35) | |
| MSI Modern 14 A10RB-459US | |
| Dell Latitude 13 3390 | |
| Dynabook Portege A30-E-174 | |
| Lenovo ThinkPad P43s-20RH001FGE | |
| Cinebench R11.5 | |
| CPU Single 64Bit | |
| Dell XPS 13 7390 Core i7-10710U | |
| Ortalama Intel Core i5-10210U (1.71 - 1.91, n=4) | |
| Microsoft Surface Laptop 3 15 Ryzen 5 3580U | |
| Dell Latitude 13 3390 | |
| CPU Multi 64Bit | |
| Dell XPS 13 7390 Core i7-10710U | |
| Microsoft Surface Laptop 3 15 Ryzen 5 3580U | |
| Ortalama Intel Core i5-10210U (5.69 - 8.66, n=4) | |
| Dell Latitude 13 3390 | |
| Cinebench R10 | |
| Rendering Multiple CPUs 32Bit | |
| Dell XPS 13 7390 Core i7-10710U | |
| Asus VivoBook 14 X403FA | |
| Microsoft Surface Laptop 3 15 Ryzen 5 3580U | |
| Ortalama Intel Core i5-10210U (15037 - 22164, n=3) | |
| Dynabook Portege A30-E-174 | |
| Lenovo ThinkPad P43s-20RH001FGE | |
| Rendering Single 32Bit | |
| Dell XPS 13 7390 Core i7-10710U | |
| Ortalama Intel Core i5-10210U (6410 - 6613, n=3) | |
| Dynabook Portege A30-E-174 | |
| Lenovo ThinkPad P43s-20RH001FGE | |
| Asus VivoBook 14 X403FA | |
| Microsoft Surface Laptop 3 15 Ryzen 5 3580U | |
| wPrime 2.10 - 1024m | |
| Microsoft Surface Laptop 3 15 Ryzen 5 3580U | |
| Ortalama Intel Core i5-10210U (n=1) | |
| Dell XPS 13 7390 Core i7-10710U | |
| Cinebench R20 | |
| CPU (Single Core) | |
| Lenovo Yoga C740-15IML | |
| Dell XPS 13 7390 Core i7-10710U | |
| Microsoft Surface Laptop 3 15 i7-1065G7 | |
| Dell G3 3590 | |
| MSI Modern 14 A10RB-459US | |
| Ortalama Intel Core i5-10210U (322 - 428, n=30) | |
| Asus VivoBook 14 X403FA | |
| Dynabook Portege A30-E-174 | |
| Lenovo ThinkPad P43s-20RH001FGE | |
| Walmart Motile M142 | |
| Microsoft Surface Laptop 3 15 Ryzen 5 3580U | |
| Dell Latitude 13 3390 | |
| CPU (Multi Core) | |
| Dell XPS 13 7390 Core i7-10710U | |
| Dell G3 3590 | |
| Microsoft Surface Laptop 3 15 i7-1065G7 | |
| Lenovo Yoga C740-15IML | |
| Microsoft Surface Laptop 3 15 Ryzen 5 3580U | |
| Walmart Motile M142 | |
| Asus VivoBook 14 X403FA | |
| Ortalama Intel Core i5-10210U (722 - 1820, n=30) | |
| MSI Modern 14 A10RB-459US | |
| Dynabook Portege A30-E-174 | |
| Dell Latitude 13 3390 | |
| Lenovo ThinkPad P43s-20RH001FGE | |
* ... daha küçük daha iyidir
Sistem performansı
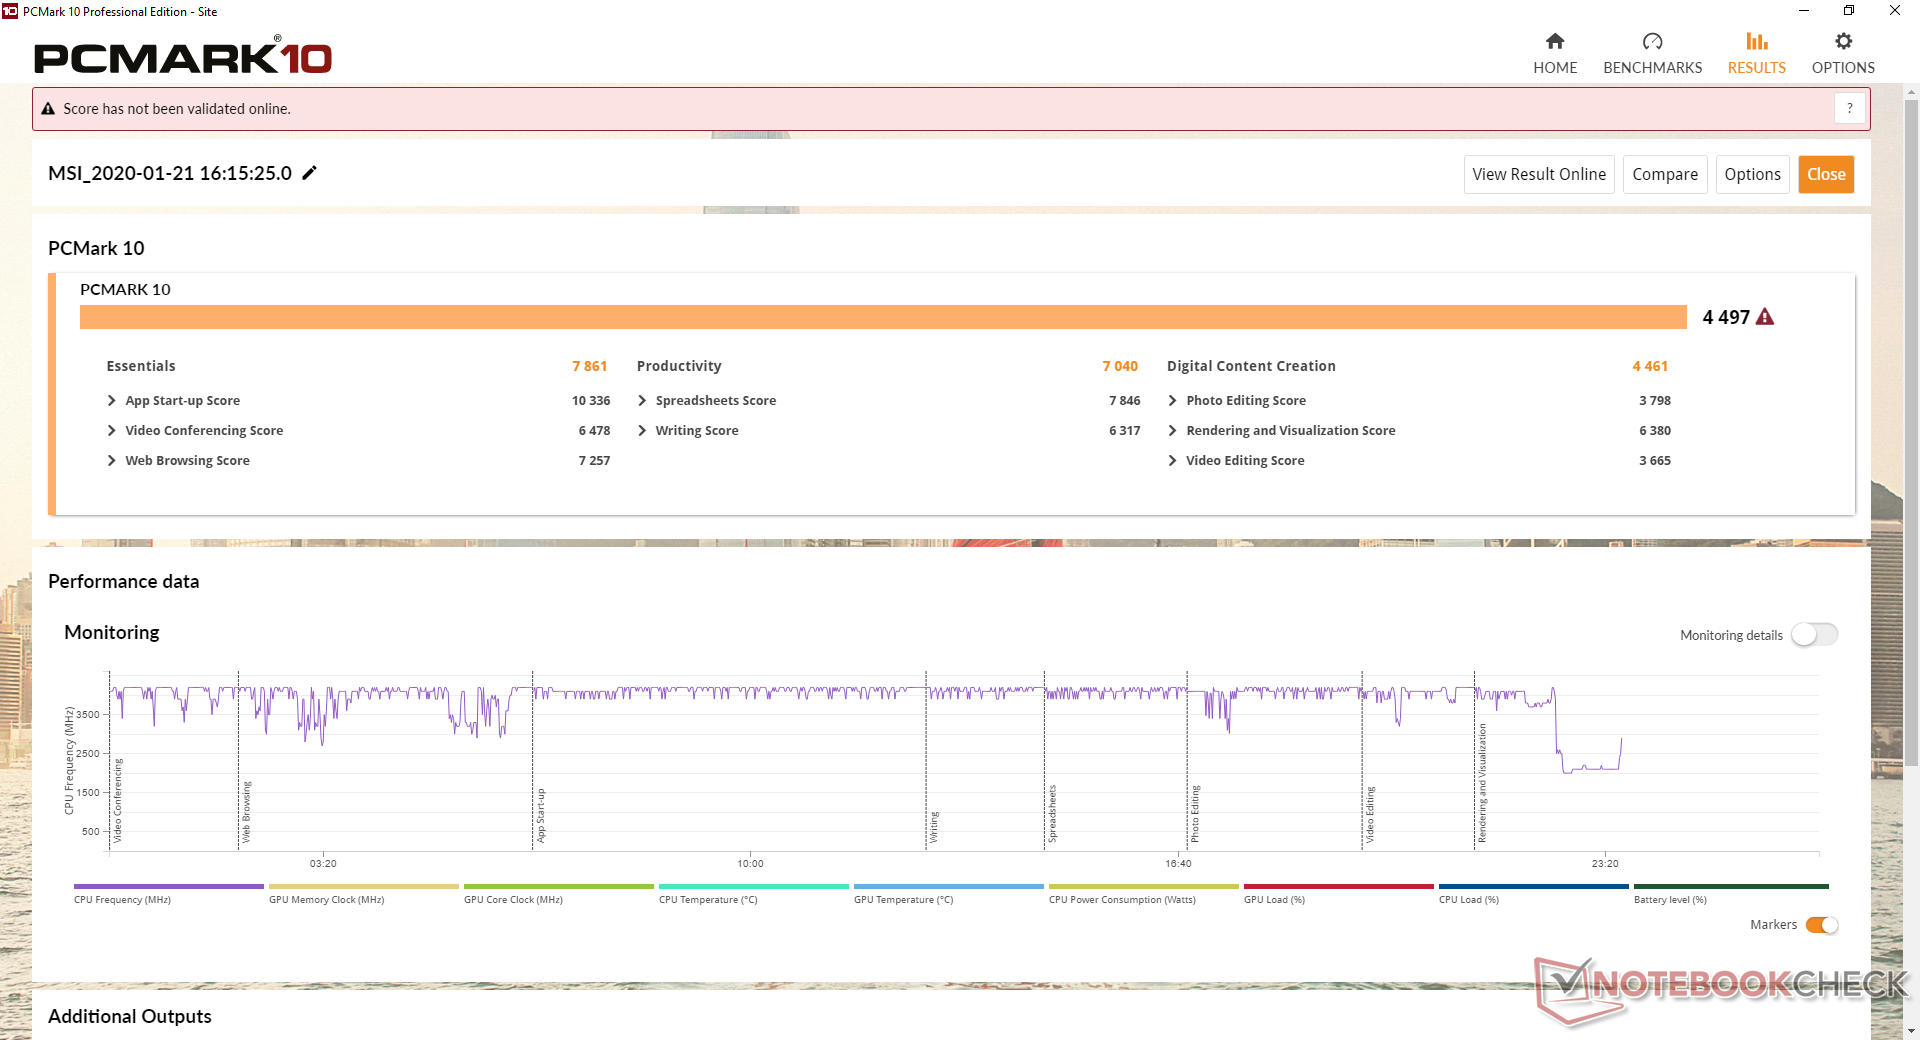
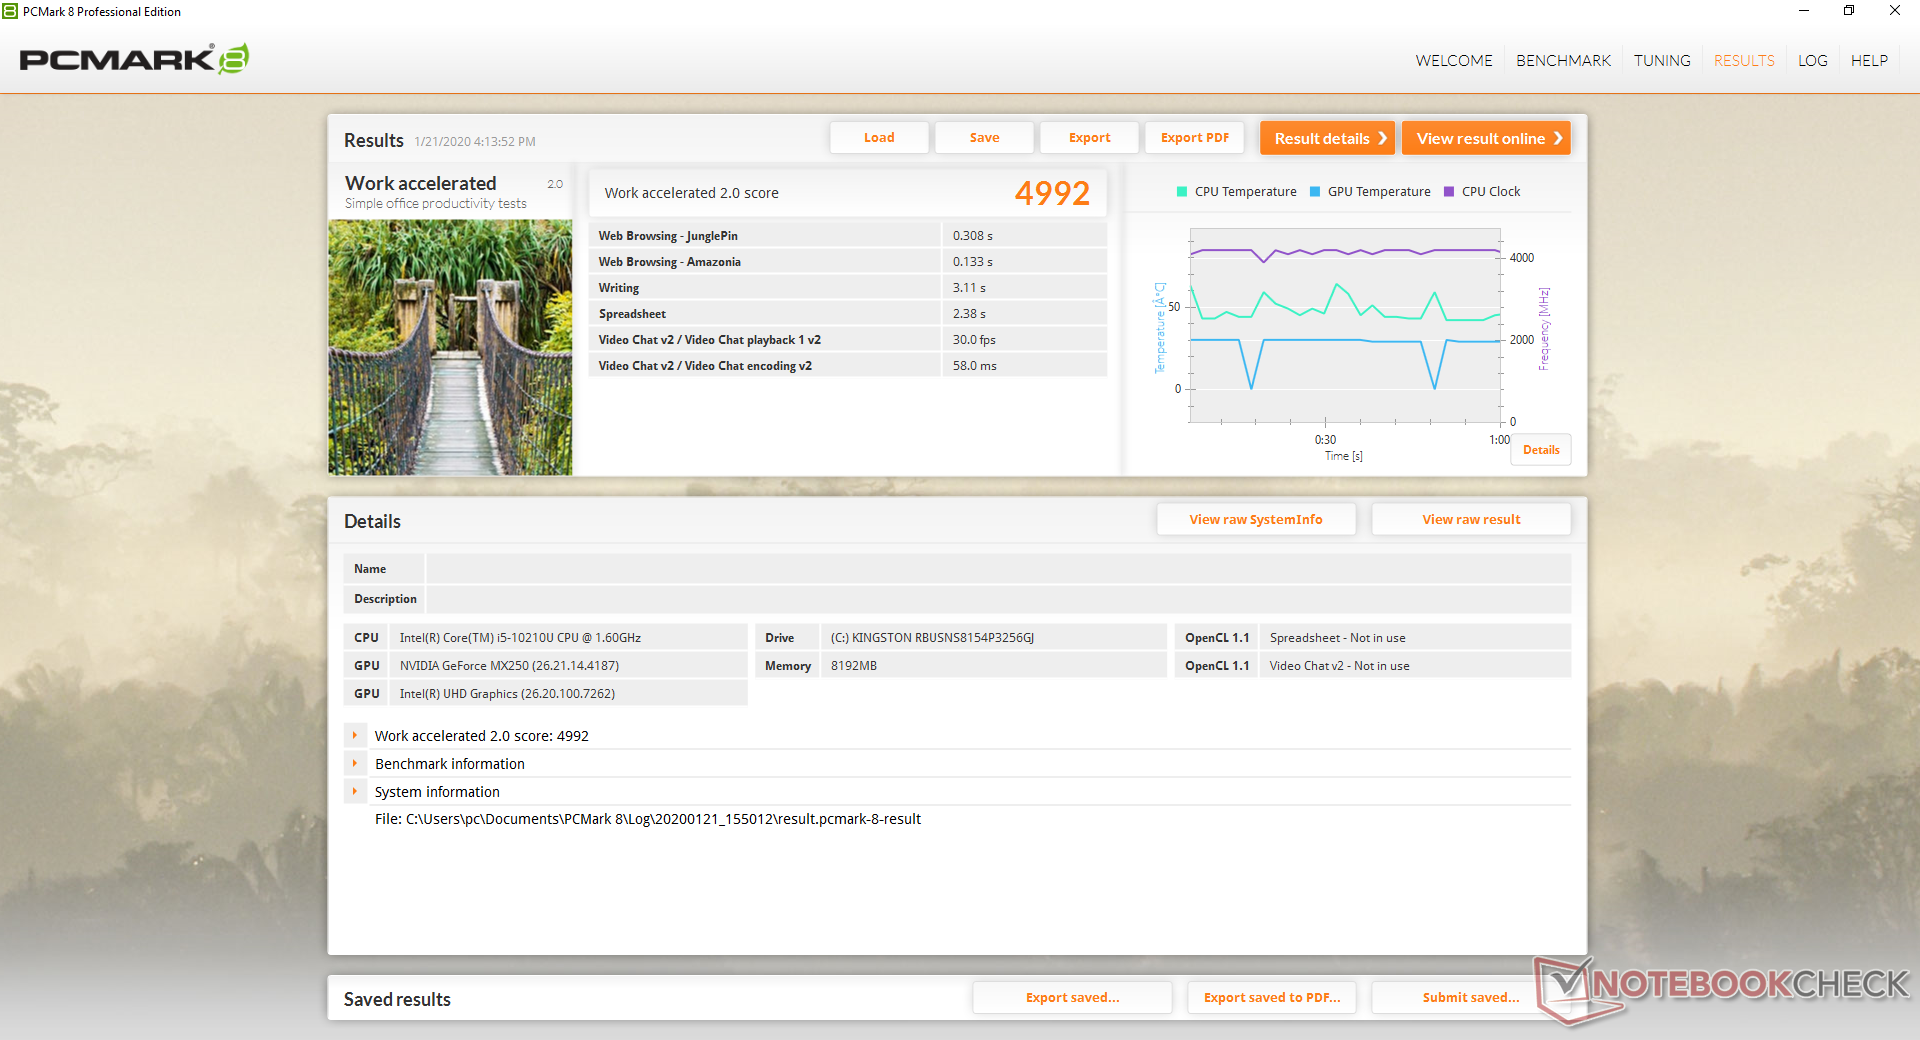
PCMark sonuçları genellikle Ice Lake'in CPU performans avantajlarının devreye girdiği Essentials karşılaştırması için bir Core i7-1065G7 dizüstü bilgisayarla karşılaştırılabilir. Test birimi ile geçirdiğimiz süre boyunca herhangi bir yazılım veya donanım sorunu yaşamadık.
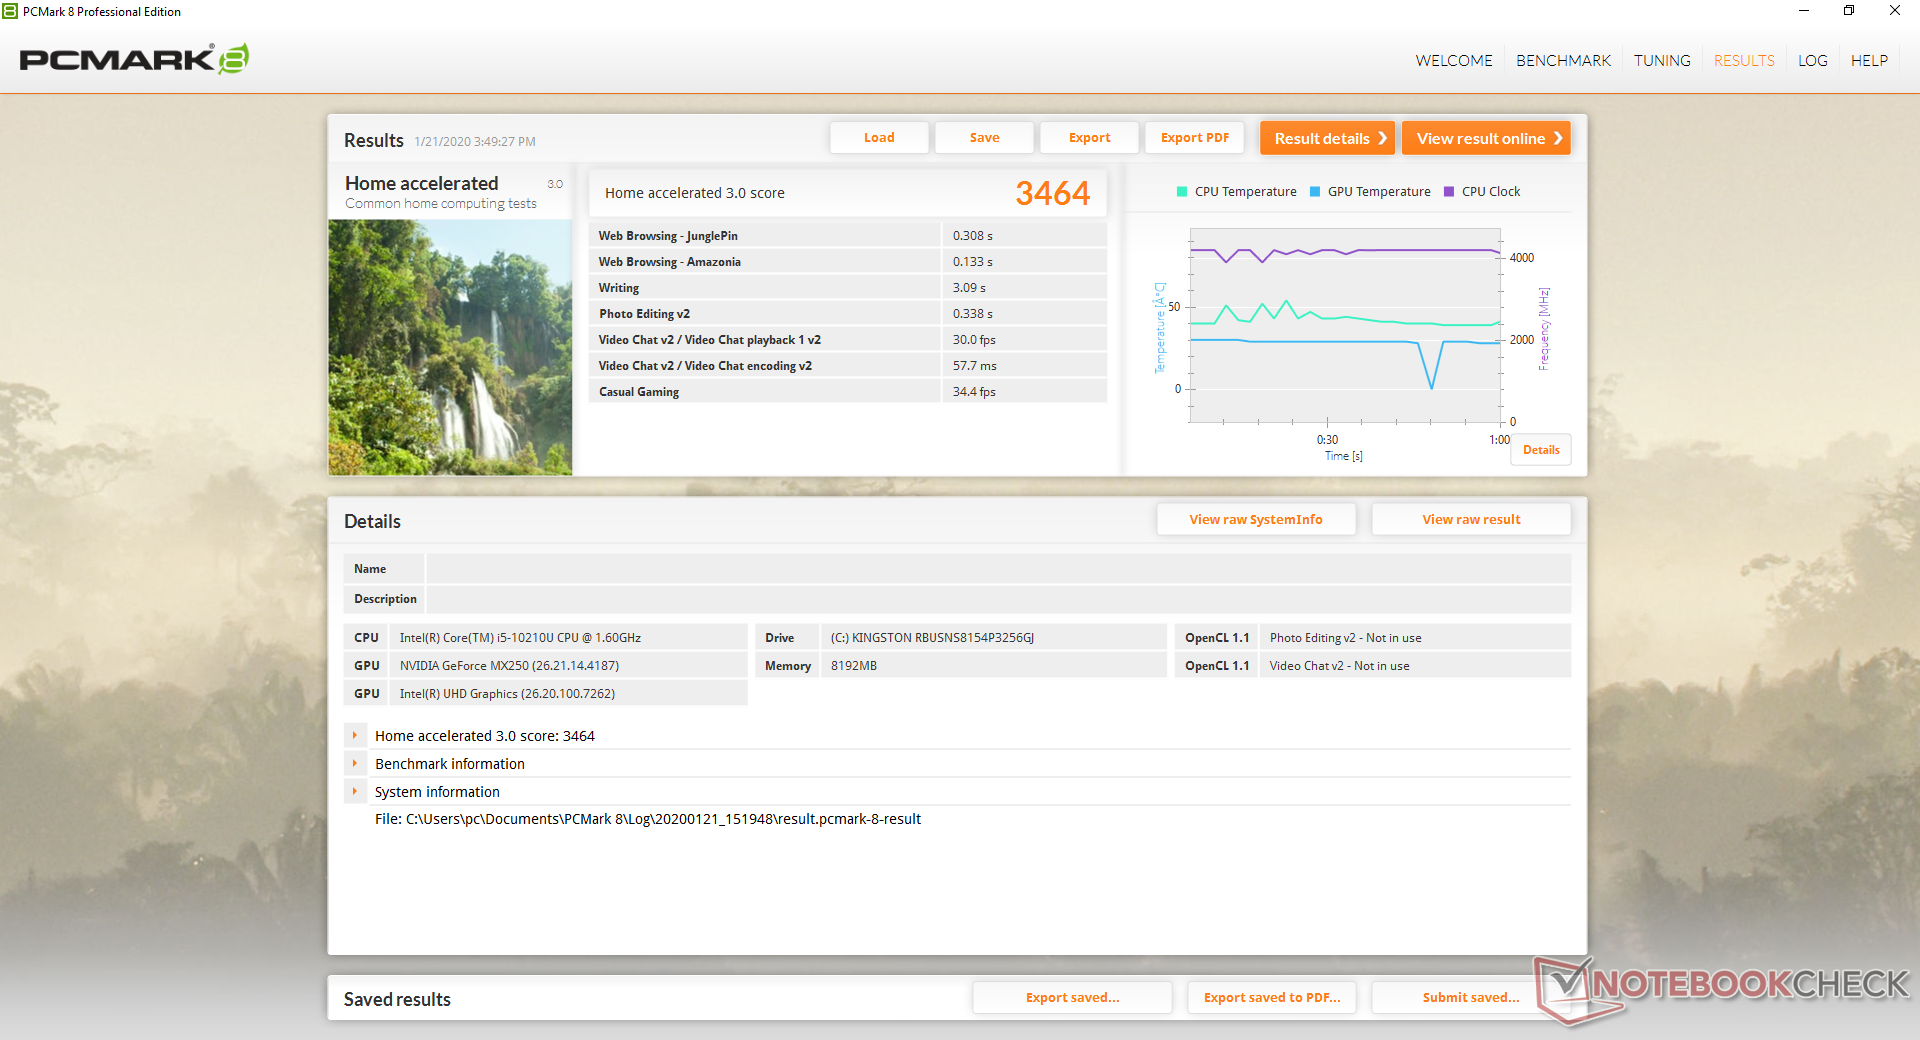
| PCMark 8 Home Score Accelerated v2 | 3464 puan | |
| PCMark 8 Work Score Accelerated v2 | 4992 puan | |
| PCMark 10 Score | 4497 puan | |
Yardım | ||
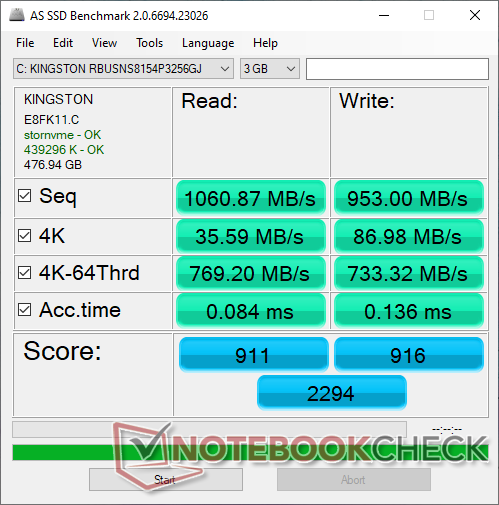
Depolama aygıtları
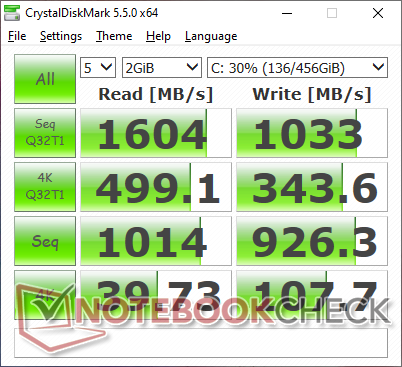
Test birimimiz 512 GB Kingston RBUSNS8154P3512GJ M.2 SSD ile birlikte gelir, ancak dizüstü bilgisayar satıcısına bağlı olarak diğer OEM'lerden sürücüler bekler. Sıralı okuma ve yazma hızlarının her biri ortalama 1000 MB / sn'dir ve giriş seviyesi NVMe SSD'yi önerir. Samsung PM981, Toshiba XG6 ve Apple AP1024, bazı durumlarda Kingston'umuzdan 2 kat daha iyi performans gösteriyor. Daha fazla karşılaştırma karşılaştırması için HDD ve SSD tablolarımıza bakın.
| MSI Modern 14 A10RB-459US Kingston RBUSNS8154P3512GJ | Asus ZenBook 15 UX534FT-DB77 Samsung SSD PM981 MZVLB1T0HALR | Lenovo Yoga C940-14IIL Samsung SSD PM981 MZVLB512HAJQ | Dell XPS 15 7590 9980HK GTX 1650 Toshiba XG6 KXG60ZNV1T02 | Apple MacBook Pro 16 2019 i9 5500M Apple SSD AP1024 7171 | |
|---|---|---|---|---|---|
| AS SSD | 51% | 64% | 73% | 57% | |
| Seq Read (MB/s) | 1061 | 1887 78% | 2525 138% | 1723 62% | 2531 139% |
| Seq Write (MB/s) | 953 | 1432 50% | 1253 31% | 1386 45% | 2289 140% |
| 4K Read (MB/s) | 35.59 | 52.3 47% | 59.1 66% | 43.25 22% | 15.85 -55% |
| 4K Write (MB/s) | 87 | 146 68% | 134.1 54% | 98.3 13% | 39.88 -54% |
| 4K-64 Read (MB/s) | 769 | 969 26% | 1010 31% | 1078 40% | 1267 65% |
| 4K-64 Write (MB/s) | 733 | 1375 88% | 1461 99% | 1456 99% | 1749 139% |
| Access Time Read * (ms) | 0.084 | 0.034 60% | 0.052 38% | 0.05 40% | 0.122 -45% |
| Access Time Write * (ms) | 0.136 | 0.075 45% | 0.029 79% | 0.039 71% | 0.095 30% |
| Score Read (Points) | 911 | 1210 33% | 1322 45% | 1294 42% | 1536 69% |
| Score Write (Points) | 916 | 1664 82% | 1721 88% | 1693 85% | 2018 120% |
| Score Total (Points) | 2294 | 3483 52% | 3670 60% | 3638 59% | 4317 88% |
| Copy ISO MB/s (MB/s) | 956 | 1375 44% | 2016 111% | 3182 233% | 1995 109% |
| Copy Program MB/s (MB/s) | 496.5 | 468 -6% | 542 9% | 984 98% | 584 18% |
| Copy Game MB/s (MB/s) | 872 | 1287 48% | 1278 47% | 1824 109% | 1135 30% |
| CrystalDiskMark 5.2 / 6 | 68% | 66% | 58% | 49% | |
| Write 4K (MB/s) | 107.7 | 141.6 31% | 128.4 19% | 104.3 -3% | 55.5 -48% |
| Read 4K (MB/s) | 39.73 | 45.28 14% | 46.37 17% | 45.23 14% | 16.21 -59% |
| Write Seq (MB/s) | 926 | 1975 113% | 1863 101% | 1729 87% | 1959 112% |
| Read Seq (MB/s) | 1014 | 2272 124% | 2340 131% | 1861 84% | 1763 74% |
| Write 4K Q32T1 (MB/s) | 343.6 | 458.6 33% | 451.1 31% | 509 48% | 398.5 16% |
| Read 4K Q32T1 (MB/s) | 499.1 | 391.4 -22% | 415.3 -17% | 388.5 -22% | 648 30% |
| Write Seq Q32T1 (MB/s) | 1033 | 2393 132% | 2985 189% | 2813 172% | 2727 164% |
| Read Seq Q32T1 (MB/s) | 1604 | 3464 116% | 2565 60% | 2906 81% | 3242 102% |
| Write 4K Q8T8 (MB/s) | 451.4 | ||||
| Read 4K Q8T8 (MB/s) | 1004 | ||||
| Toplam Ortalama (Program / Ayarlar) | 60% /
57% | 65% /
65% | 66% /
67% | 53% /
54% |
* ... daha küçük daha iyidir

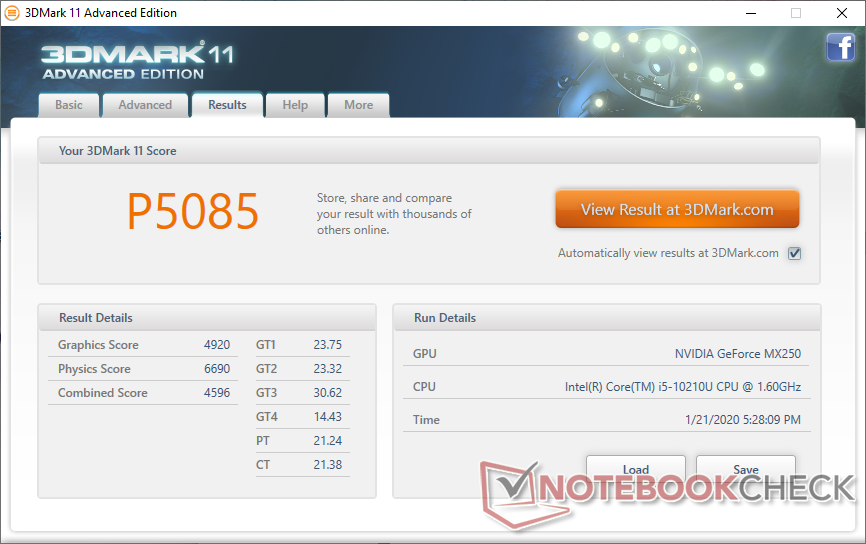
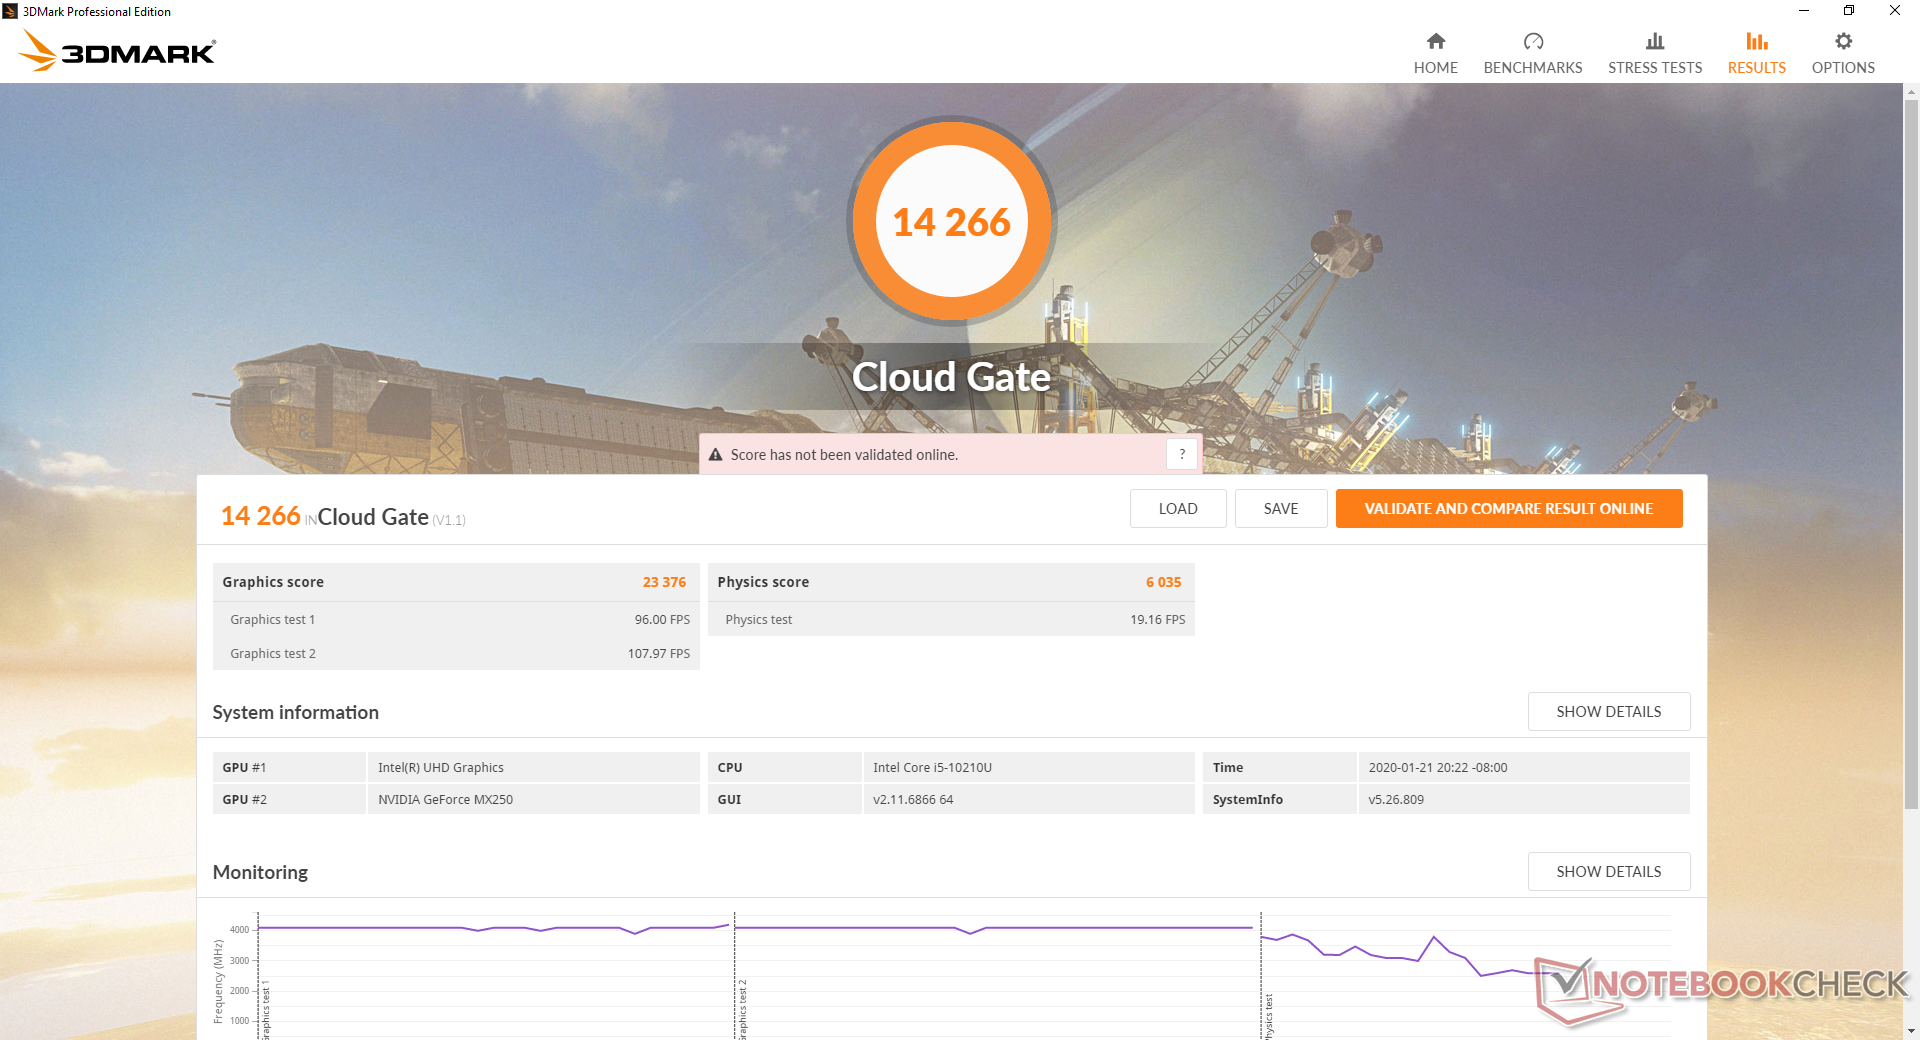
GPU Performansı
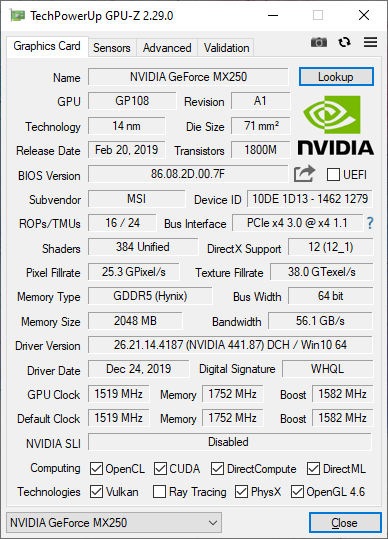
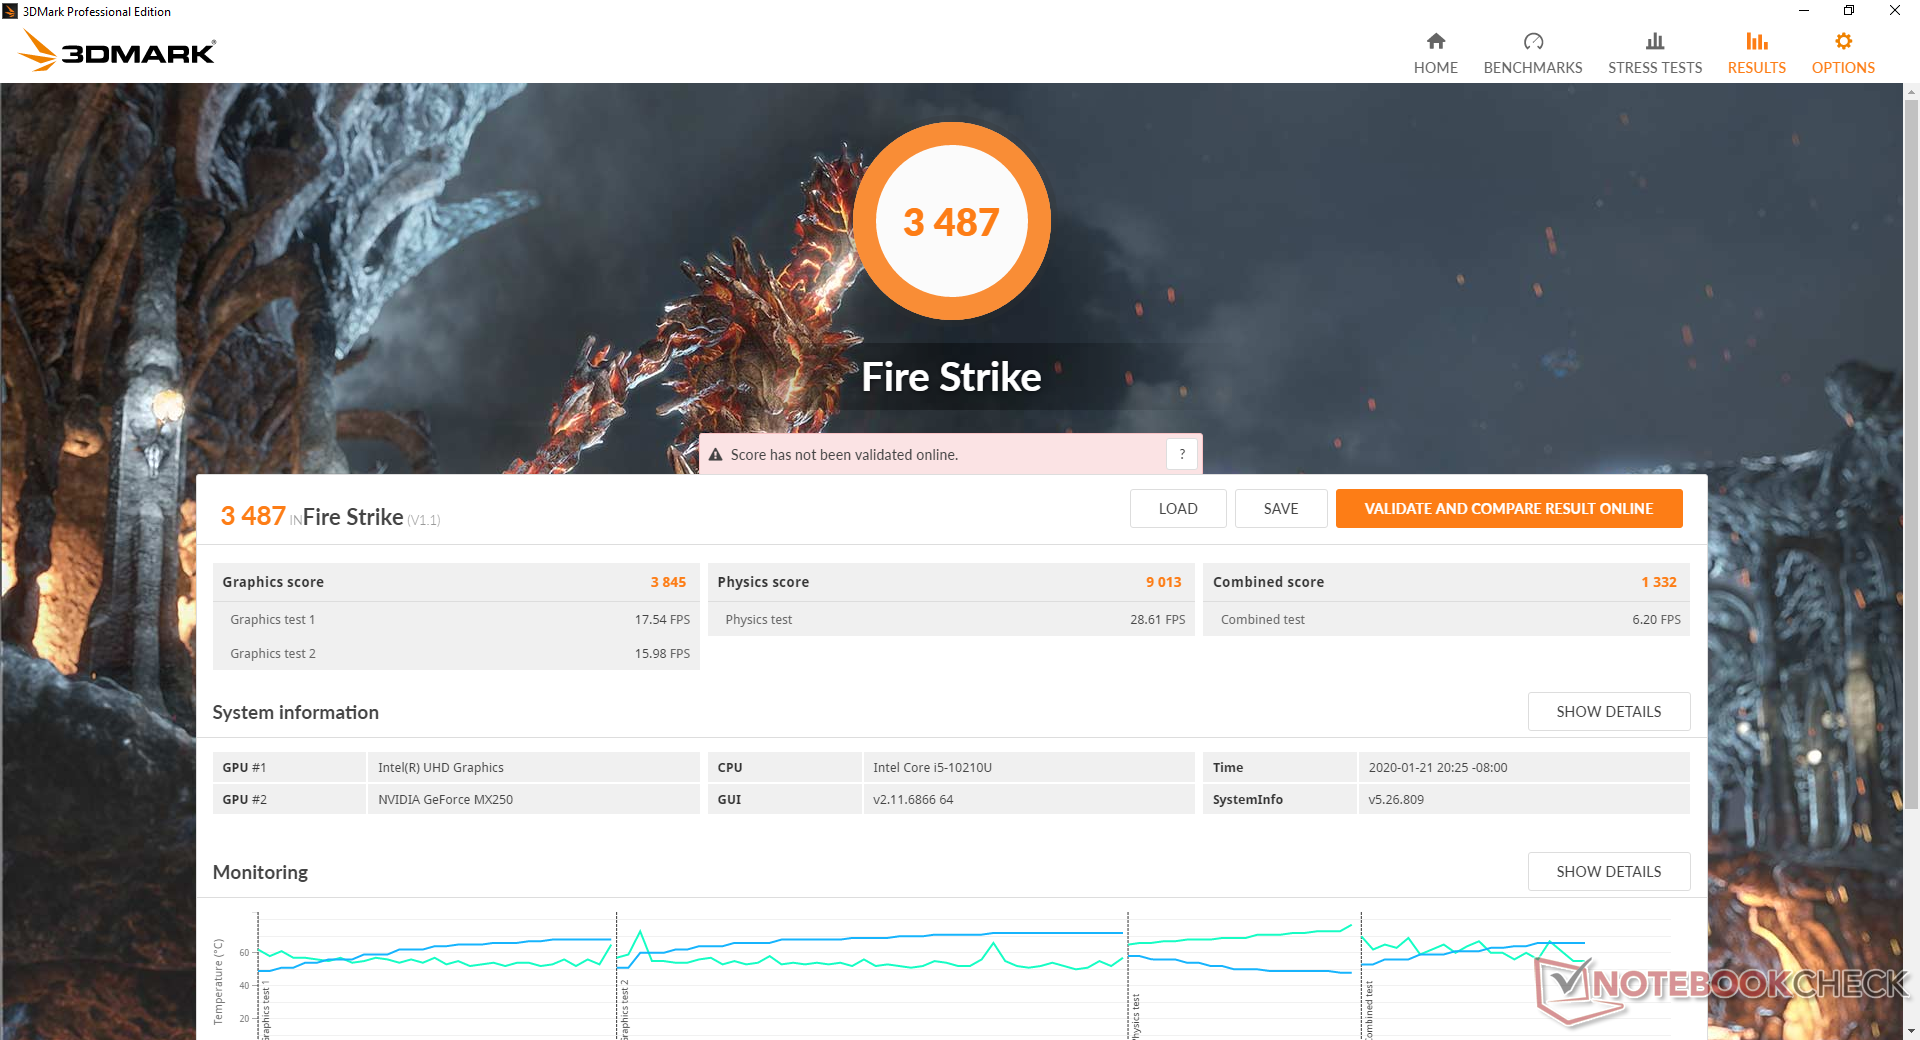
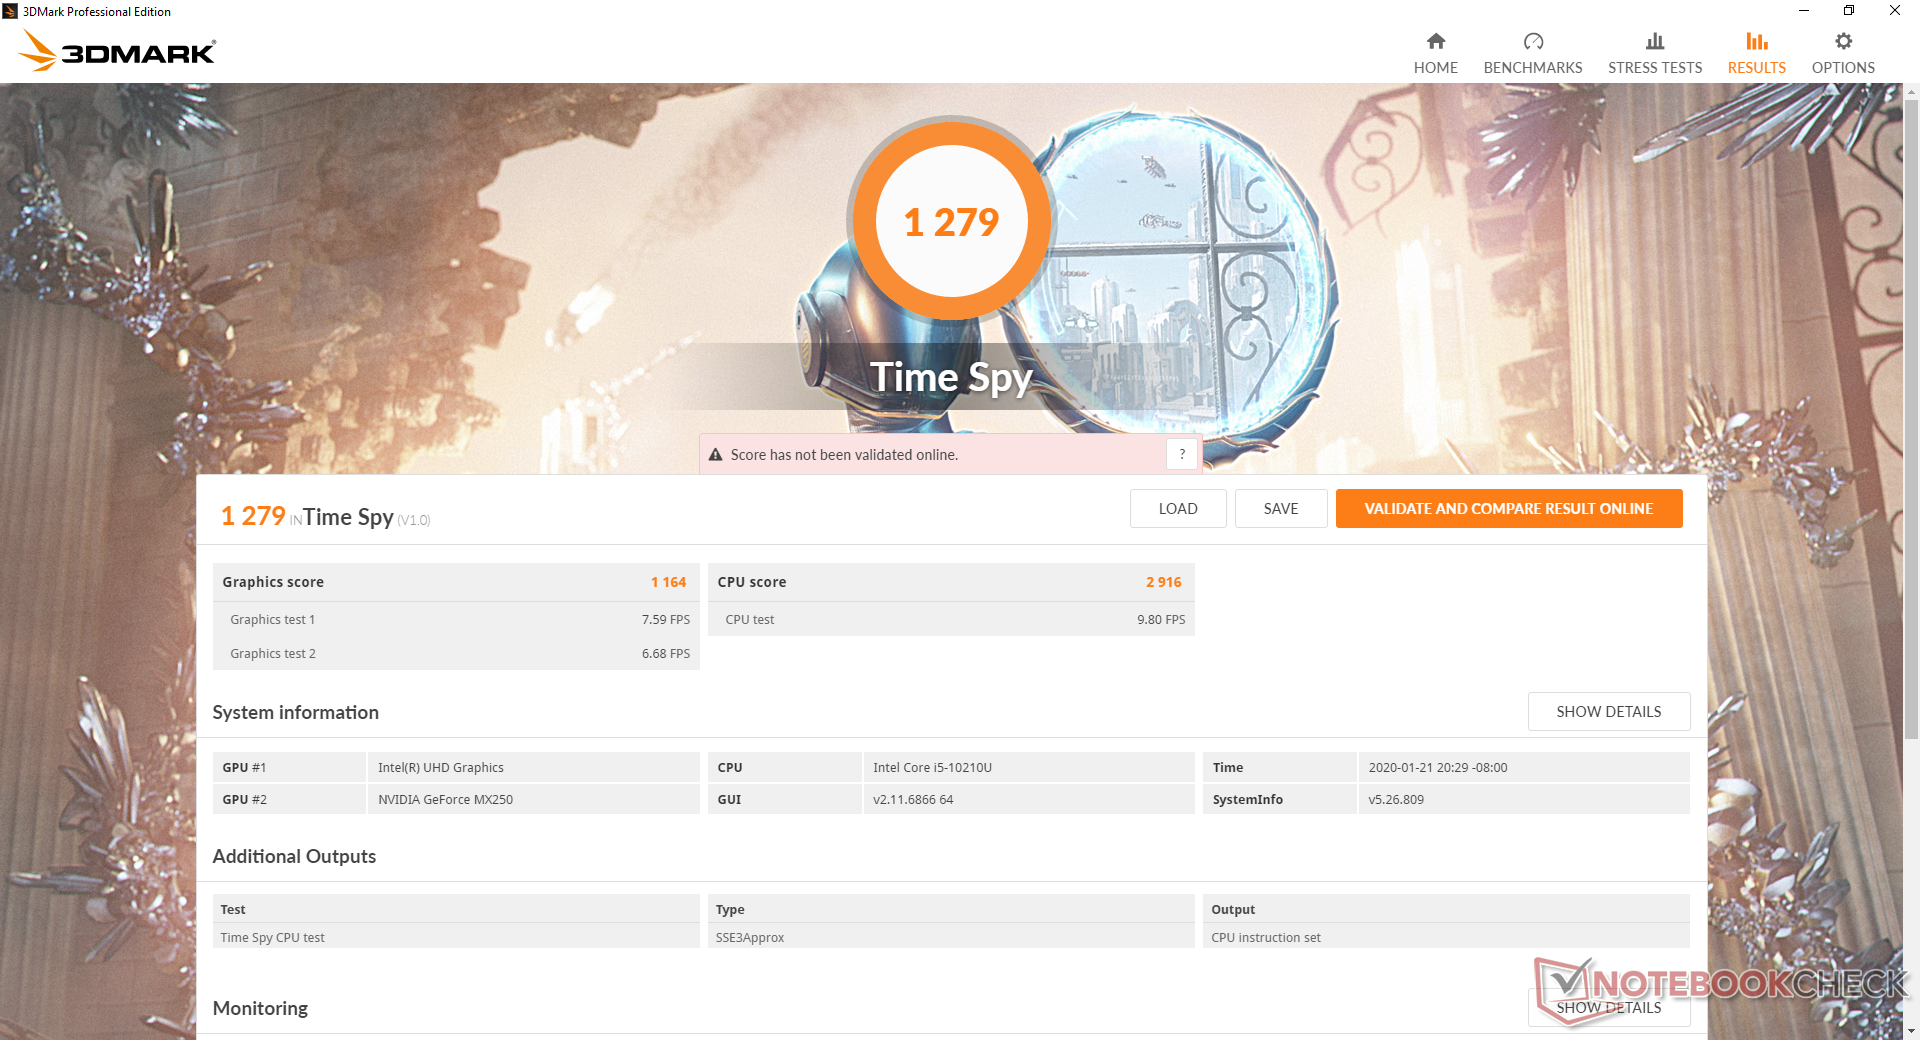
3DMark sonuçları, eski 25 W GeForce MX150 ile Razer Blade Stealth ile neredeyse aynıdır ve 10 W GeForce MX150'den yaklaşık yüzde 35 daha hızlıdır. GeForce MX250 aslında yeniden yapılandırılmış bir MX150'dir ve bu nedenle kullanıcılar aralarında önemli bir performans artışı beklememelidir. Bu arada, MX230, MX250'den yaklaşık yüzde 30 ila 35 daha yavaş. Modern 14'ün oyun yetenekleri, sistem oyunculara yönelik olmasa da, DOTA 2 veya Fortnite gibi iddiasız oyunlarda iyi. Bununla birlikte, yavaş siyah-beyaz tepki süreleri nedeniyle gözle görülür gölgelenmeye hazır olun. Witcher 3'te rölanti, oyun oynarken kesintiye uğrayan arka plan etkinliği veya azaltma davranışı olmadığını göstermek için kare hızlarında tekrarlayan düşüşler göstermez. Daha fazla teknik bilgi ve karşılaştırma karşılaştırmaları için GeForce MX250'deki özel sayfamıza bakın.
| 3DMark 11 | |
| 1280x720 Performance GPU | |
| Walmart EVOO Gaming 17 | |
| Maingear Vector 15 | |
| Asus Zephyrus S GX531GM | |
| Dell XPS 15 7590 9980HK GTX 1650 | |
| Lenovo ThinkPad X1 Extreme-20MF000XGE | |
| MSI Modern 14 A10RB-459US | |
| Microsoft Surface Laptop 3 15 i7-1065G7 | |
| Ortalama NVIDIA GeForce MX250 (3585 - 4942, n=29) | |
| Asus Zenbook 14 UX433FN-A6023T | |
| Asus VivoBook 14 X412FJ-EB023T | |
| Asus VivoBook 15 X542UF-DM143T | |
| 1280x720 Performance Combined | |
| Walmart EVOO Gaming 17 | |
| Maingear Vector 15 | |
| Dell XPS 15 7590 9980HK GTX 1650 | |
| Lenovo ThinkPad X1 Extreme-20MF000XGE | |
| Asus Zephyrus S GX531GM | |
| MSI Modern 14 A10RB-459US | |
| Ortalama NVIDIA GeForce MX250 (3532 - 4638, n=29) | |
| Microsoft Surface Laptop 3 15 i7-1065G7 | |
| Asus Zenbook 14 UX433FN-A6023T | |
| Asus VivoBook 14 X412FJ-EB023T | |
| Asus VivoBook 15 X542UF-DM143T | |
| 3DMark 11 Performance | 5085 puan | |
| 3DMark Cloud Gate Standard Score | 14266 puan | |
| 3DMark Fire Strike Score | 3487 puan | |
| 3DMark Time Spy Score | 1279 puan | |
Yardım | ||
| Shadow of the Tomb Raider | |
| 1280x720 Lowest Preset | |
| Lenovo IdeaPad S740-15IRH | |
| HP Pavilion Gaming 15-ec0017ng | |
| MSI PS63 Modern 8RC | |
| MSI Modern 14 A10RB-459US | |
| Ortalama NVIDIA GeForce MX250 (24 - 56, n=8) | |
| Asus VivoBook 14 F412FJ-EB084T | |
| Microsoft Surface Laptop 3 15 i7-1065G7 | |
| HP Envy 13-ah0003ng | |
| Microsoft Surface Laptop 3 15 Ryzen 5 3580U | |
| 1920x1080 Medium Preset | |
| Lenovo IdeaPad S740-15IRH | |
| HP Pavilion Gaming 15-ec0017ng | |
| MSI PS63 Modern 8RC | |
| MSI Modern 14 A10RB-459US | |
| Ortalama NVIDIA GeForce MX250 (7 - 19, n=8) | |
| HP Envy 13-ah0003ng | |
| Asus VivoBook 14 F412FJ-EB084T | |
| Microsoft Surface Laptop 3 15 Ryzen 5 3580U | |
| düşük | orta | yüksek | ultra | |
|---|---|---|---|---|
| BioShock Infinite (2013) | 189.7 | 117.5 | 100.5 | 37.8 |
| The Witcher 3 (2015) | 68.1 | 38 | 21.5 | 11.7 |
| Shadow of the Tomb Raider (2018) | 56 | 19 | 12 |
Emisyonları
Sistem Gürültüsü
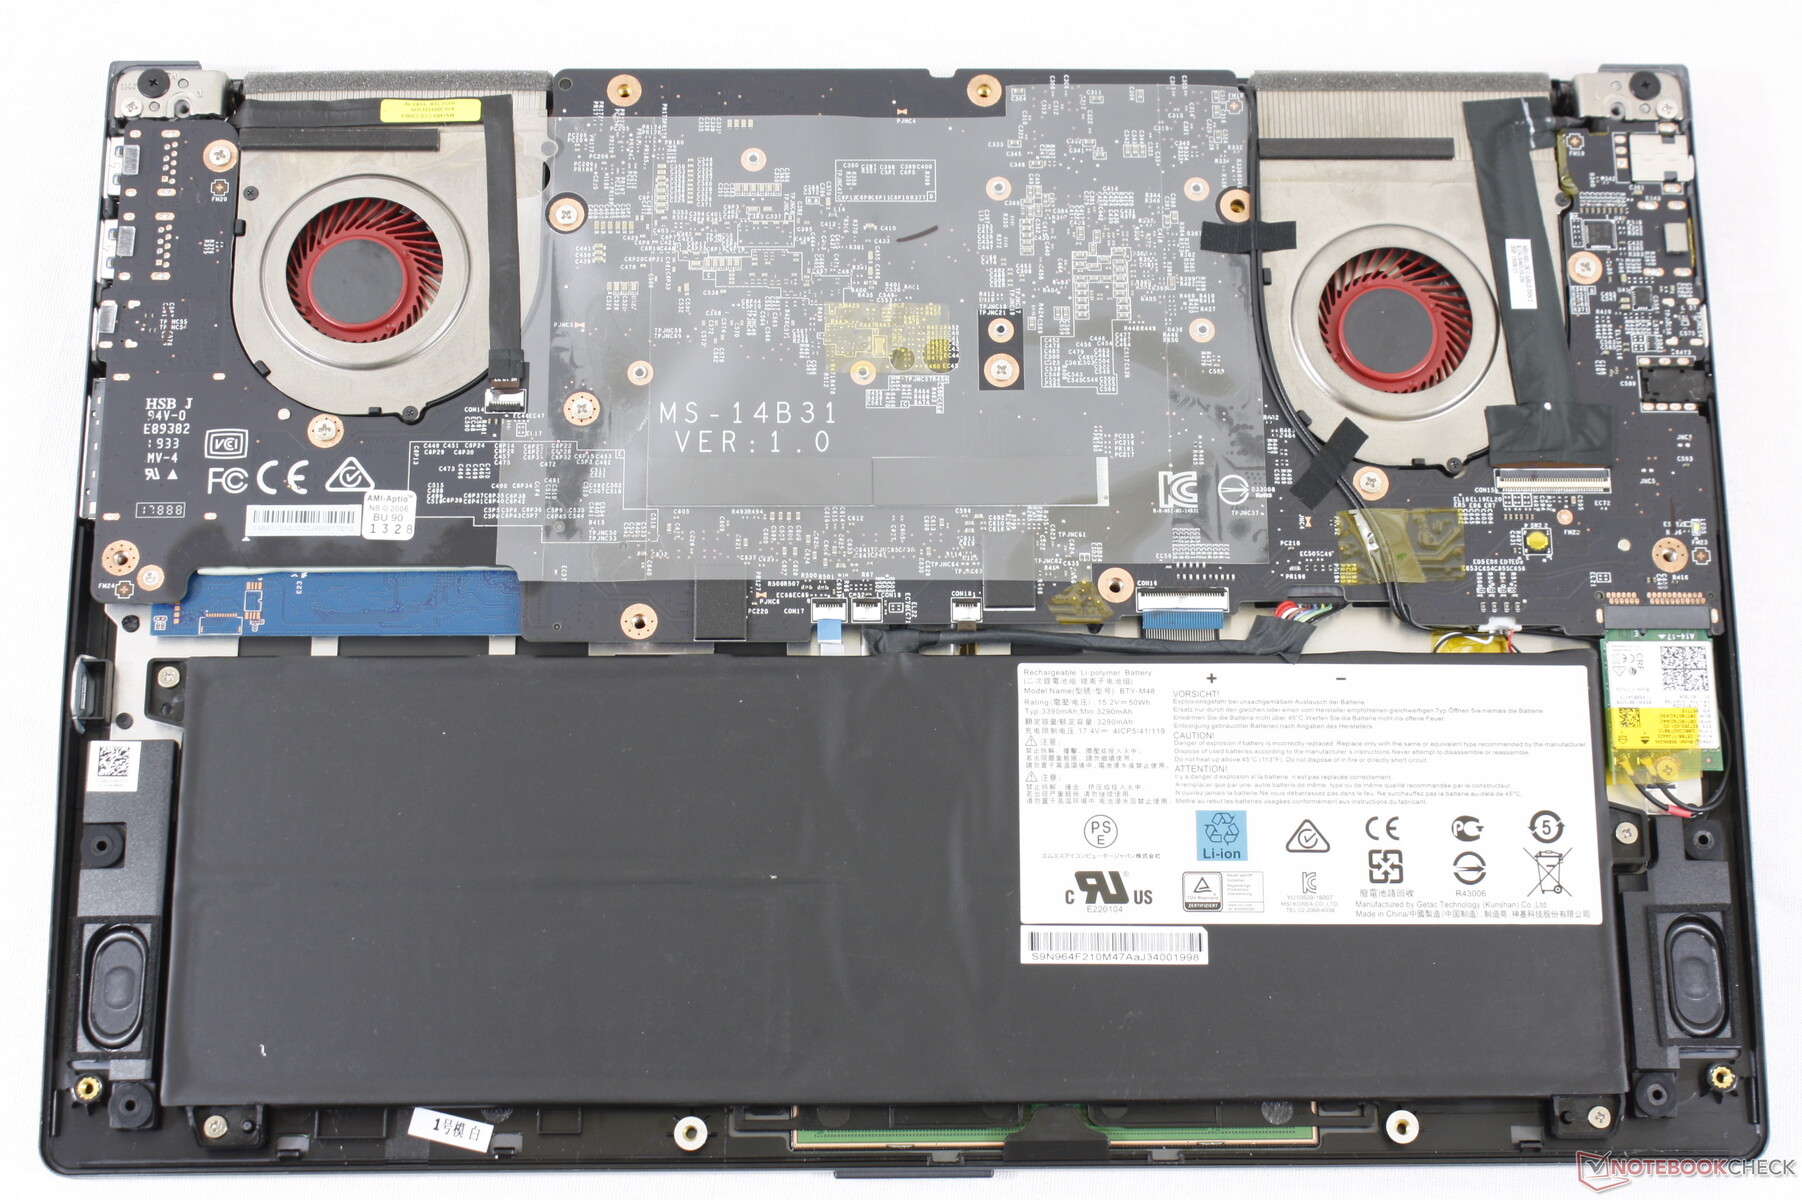
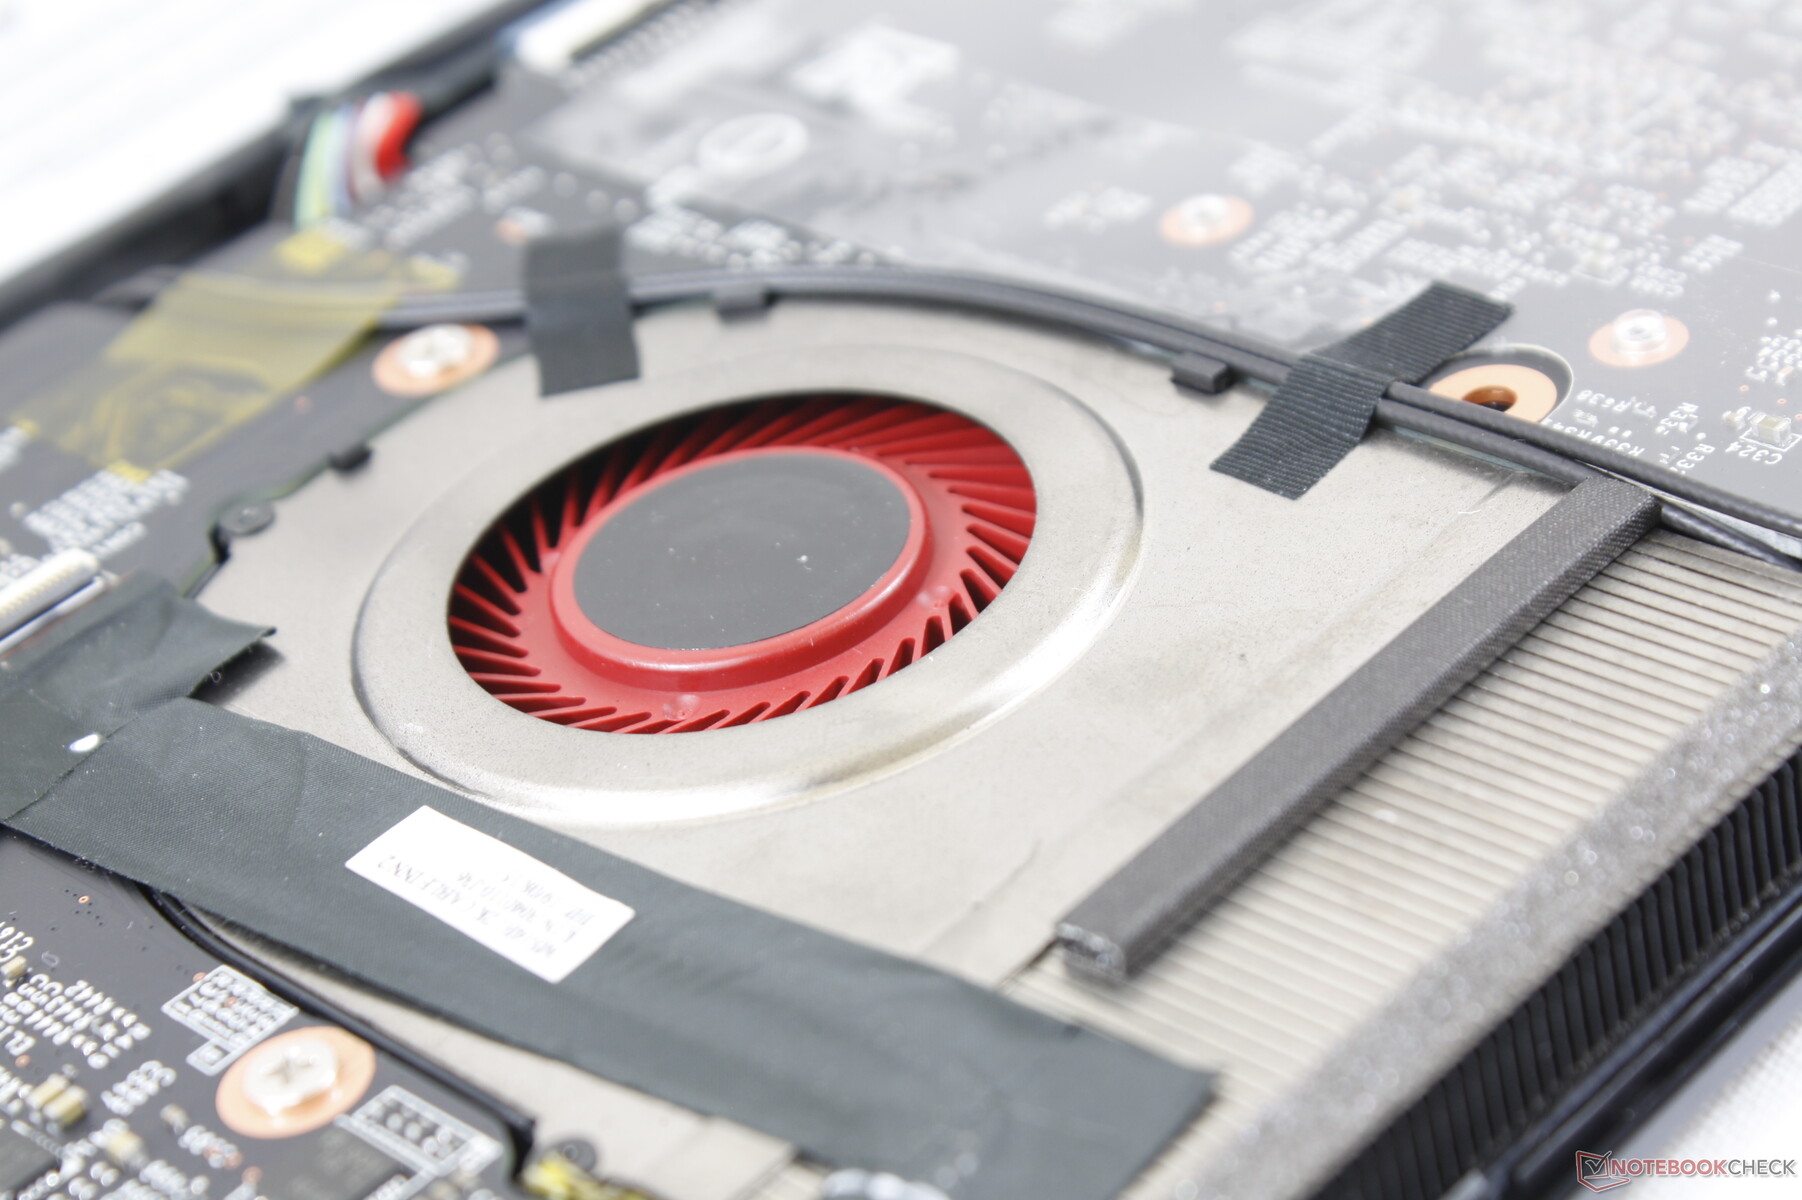
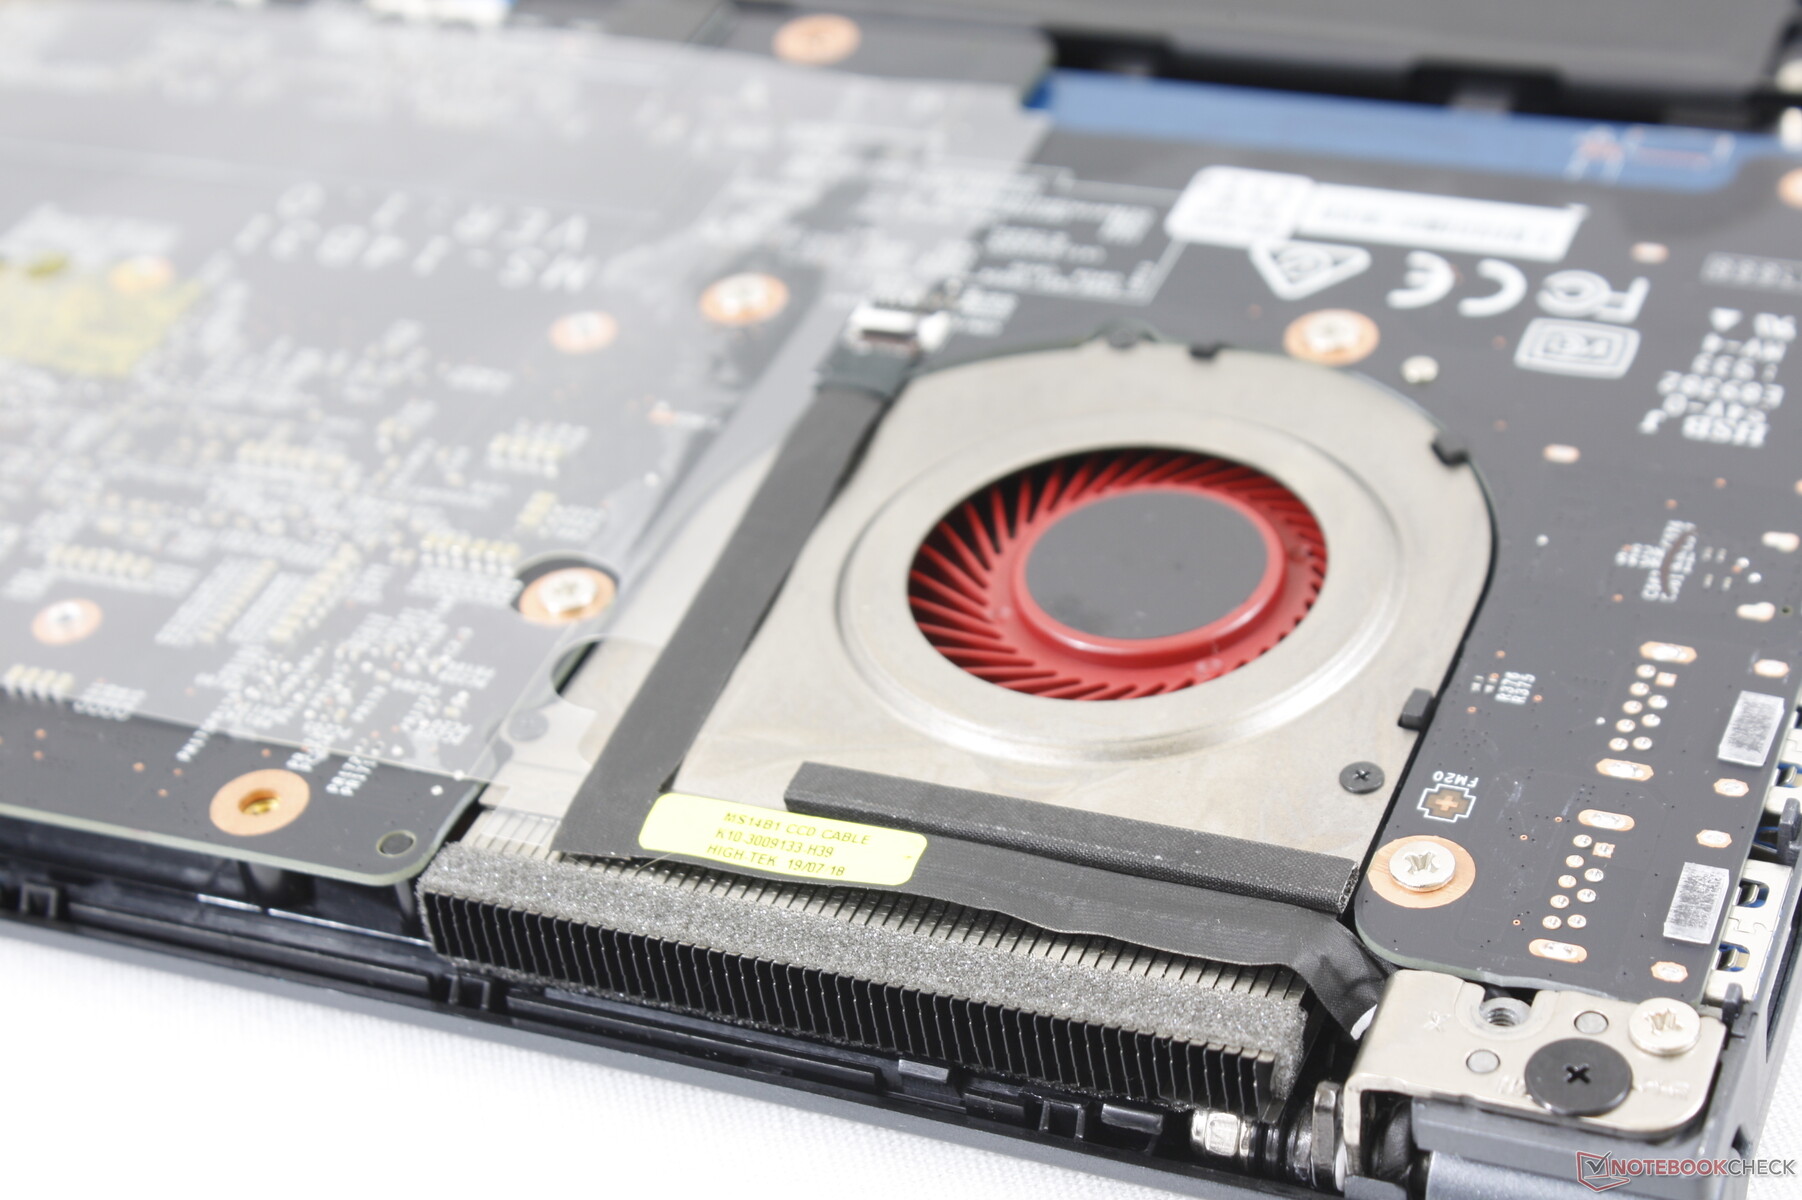
Soğutma çözümü ikiz fanlar ve aralarında üç ısı borusundan oluşur. GPU ve CPU, diğer dizüstü bilgisayarların çoğundan farklı olarak ısı borularını paylaşmaz, yani bir işlemci stres altındaysa, diğer işlemcinin sıcaklığı önemli ölçüde etkilenmez.Fan gürültüsü her zaman yaklaşık 29,5 dB (A) değerinde AC adaptöre bağlandığında arka plan 28,7 dB (A). Sistemi MSI Creator Center üzerinden Sessiz veya Yüksek Performans moduna ayarlamak minimum fan gürültüsünü değiştirmez. Sadece dizüstü bilgisayar prizden çıkarıldığında fanlar tamamen duracaktır. 3DMark 06 gibi daha yüksek yükler, Lenovo ThinkPad P43s veya Ice Lake ile çalışanlardan farklı olarak yaklaşık 33.4 dB (A) fan gürültüsüne neden olacaktır. Yoga C940 benzer koşullar altındayken. Darbe davranışı minimumda tutulur. Oyun oynuyorsanız fan gürültüsü 40,5 dB (A) değerine kadar çıkabilir. Modern 14, yüksek işleme stresi altındayken çoğu Ultrabook'tan biraz daha yüksek bir gürültü tavanına sahip sessiz bir sistemdir. Test ünitemizden elektronik gürültü veya bobin sızıntısı olmadığını fark edemeyiz.
| MSI Modern 14 A10RB-459US GeForce MX250, i5-10210U, Kingston RBUSNS8154P3512GJ | Asus ZenBook 15 UX534FT-DB77 GeForce GTX 1650 Max-Q, i7-8565U, Samsung SSD PM981 MZVLB1T0HALR | Lenovo Yoga C940-14IIL Iris Plus Graphics G7 (Ice Lake 64 EU), i7-1065G7, Samsung SSD PM981 MZVLB512HAJQ | Apple MacBook Pro 16 2019 i9 5500M Radeon Pro 5500M, i9-9880H, Apple SSD AP1024 7171 | Lenovo ThinkPad P43s-20RH001FGE Quadro P520, i7-8565U, WDC PC SN720 SDAQNTW-256G | Lenovo ThinkPad X1 Carbon 2019-20QE000VGE UHD Graphics 620, i7-8665U, WDC PC SN720 SDAQNTW-512G | |
|---|---|---|---|---|---|---|
| Noise | 1% | 3% | -10% | 3% | 6% | |
| kapalı / ortam * (dB) | 28.7 | 28.4 1% | 29.3 -2% | 29.8 -4% | 29.2 -2% | 28.4 1% |
| Idle Minimum * (dB) | 29.5 | 28.4 4% | 29.3 1% | 29.9 -1% | 29.2 1% | 28.4 4% |
| Idle Average * (dB) | 29.5 | 28.4 4% | 29.3 1% | 29.9 -1% | 29.2 1% | 28.4 4% |
| Idle Maximum * (dB) | 29.5 | 28.4 4% | 29.3 1% | 29.9 -1% | 29.2 1% | 28.6 3% |
| Load Average * (dB) | 33.4 | 33.9 -1% | 33.3 -0% | 43 -29% | 33.3 -0% | 31.5 6% |
| Witcher 3 ultra * (dB) | 37.9 | 39.8 -5% | 45.4 -20% | |||
| Load Maximum * (dB) | 40.5 | 40.2 1% | 33.3 18% | 46.1 -14% | 33.3 18% | 33.1 18% |
* ... daha küçük daha iyidir
Ses yüksekliği
| Boşta |
| 29.5 / 29.5 / 29.5 dB |
| Çalışırken |
| 33.4 / 40.5 dB |
 | ||
30 dB sessiz 40 dB(A) duyulabilirlik 50 dB(A) gürültülü |
||
min: | ||
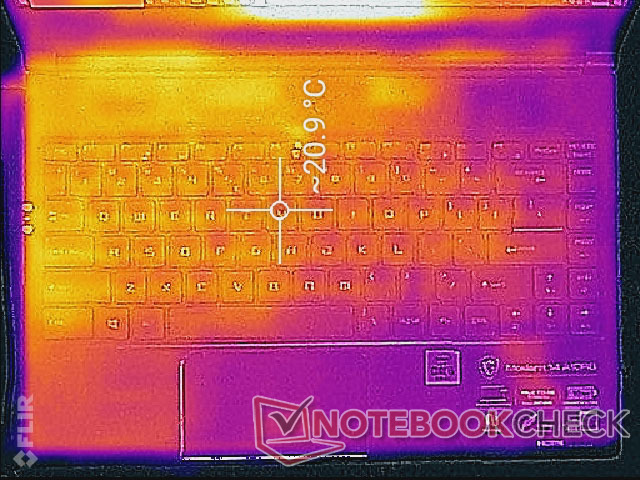
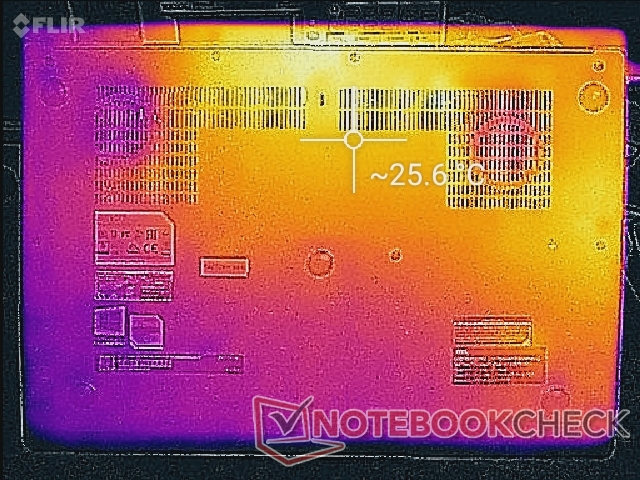
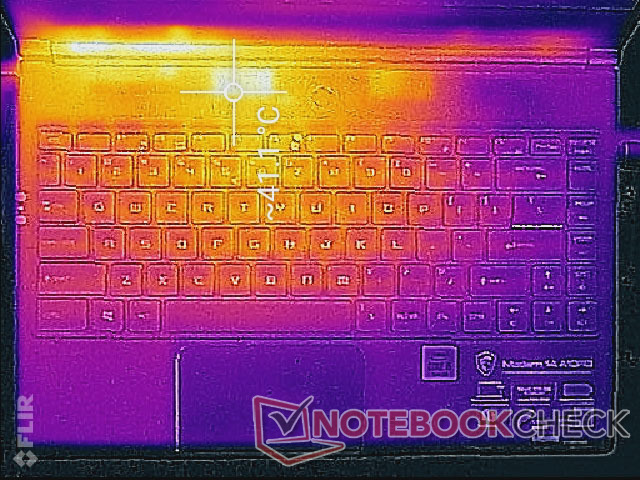
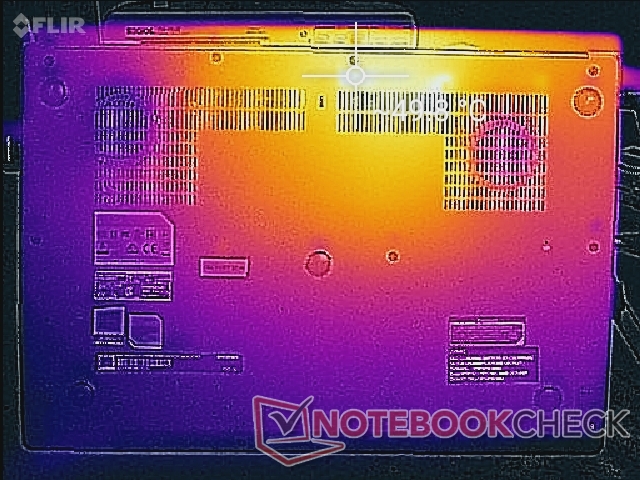
Sıcaklık
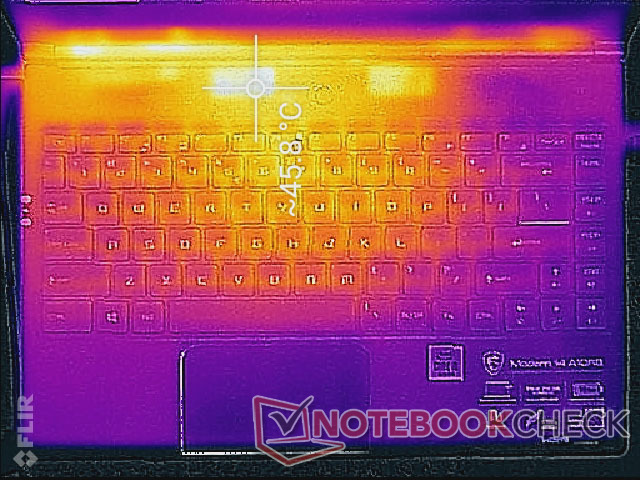
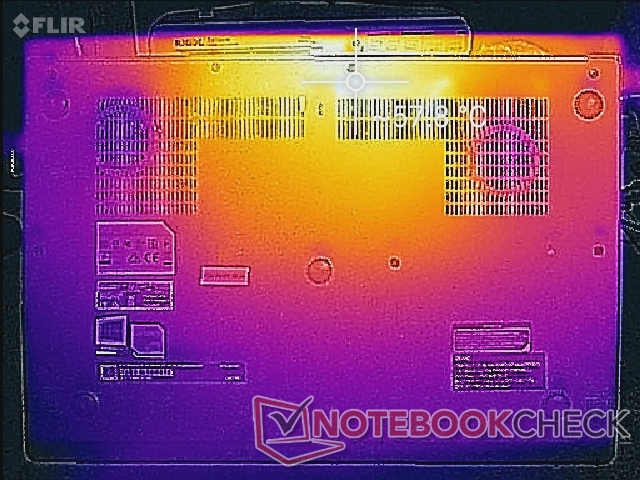
Rölantideyken yüzey sıcaklıkları her iki tarafta da düzdür ve arka taraf birkaç derece C hafifçe ısınır. Oyun oynarsa, sıcak noktalar 41 C ila 57 C'ye kadar ısınabilir. Bu noktalar şükür ki parmakların bulunduğu kasanın arkasına doğru ve avuç içlerinin aşağıdaki sıcaklık haritalarımızda gösterildiği gibi dokunma olasılığı düşüktür. Buna karşılık, Buz Gölü ile çalışan Lenovo Yoga C940-14'teki sıcak noktalar, benzer stresli koşullar altında 45 C'ye kadar biraz daha serin. MSI'nın avuç içi dayanakları ve klavye tuşları yazarken asla rahatsız olmaz.
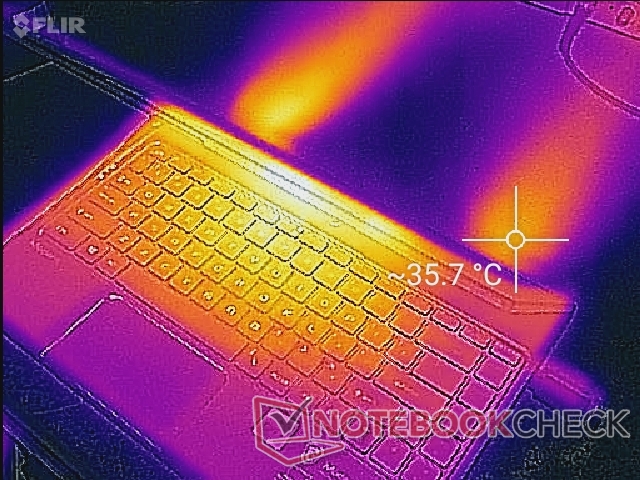
(-) Üst taraftaki maksimum sıcaklık, 34.3 °C / 94 F ortalamasına kıyasla 47.6 °C / 118 F'dir. , Office sınıfı için 21.2 ile 62.5 °C arasında değişir.
(-) Alt kısım, 36.8 °C / 98 F ortalamasına kıyasla maksimum 58.2 °C / 137 F'ye kadar ısınır
(+) Boşta kullanımda, üst tarafın ortalama sıcaklığı 20.7 °C / 69 F olup, cihazın 29.5 °C / 85 F.
(+) The Witcher 3 oynarken, üst tarafın ortalama sıcaklığı 29.1 °C / 84 F olup, cihazın 29.5 °C / 85 F.
(+) Avuç içi dayanakları ve dokunmatik yüzey, maksimum 26.8 °C / 80.2 F ile cilt sıcaklığından daha soğuktur ve bu nedenle dokunulduğunda soğuktur.
(±) Benzer cihazların avuç içi dayanağı alanının ortalama sıcaklığı 27.5 °C / 81.5 F (+0.7 °C / 1.3 F) idi.
Stres testi
Herhangi bir olası azaltma veya kararlılık sorununu belirlemek için dizüstü bilgisayarı stres altına alıyoruz. Prime95 çalıştırıldığında, CPU 70 C çekirdek sıcaklığına ulaşana kadar ilk 40 saniye boyunca 2,7 GHz ila 3 GHz aralığına yükselecektir. Daha sonra, bir çekirdek korumak için saat hızları 2,3 ila 2,5 GHz aralığına düşecektir. Bu sonuçlar, yukarıdaki CineBench R15 Multi-Thread döngü testinde ve aşağıdaki güç tüketimi okumalarında gözlemlediğimiz sonuçlara uygundur.Running Witcher 3, gerçek dünyadaki stresli yükleri daha fazla temsil eder. CPU ve GPU sıcaklıkları, aynı GeForce MX250 GPU ile donatılmış 2019 HP Spectre x360 15'teki maksimum 75 C ve 91 C ile karşılaştırıldığında, sırasıyla 58 C ve 75 C'de sabitlenecektir. Çekirdek sıcaklıkları nispeten soğuktur, yani ortalama CPU performansının altında rahat yüzey sıcaklıklarının korunmasına atfedilebilir. Pillerle ilgili bir 3DMark 11 testi, şebekedayken 6690 ve 4920 noktaya kıyasla sırasıyla 6502 ve 4345 puanlık Fizik ve Grafik puanları döndürür.
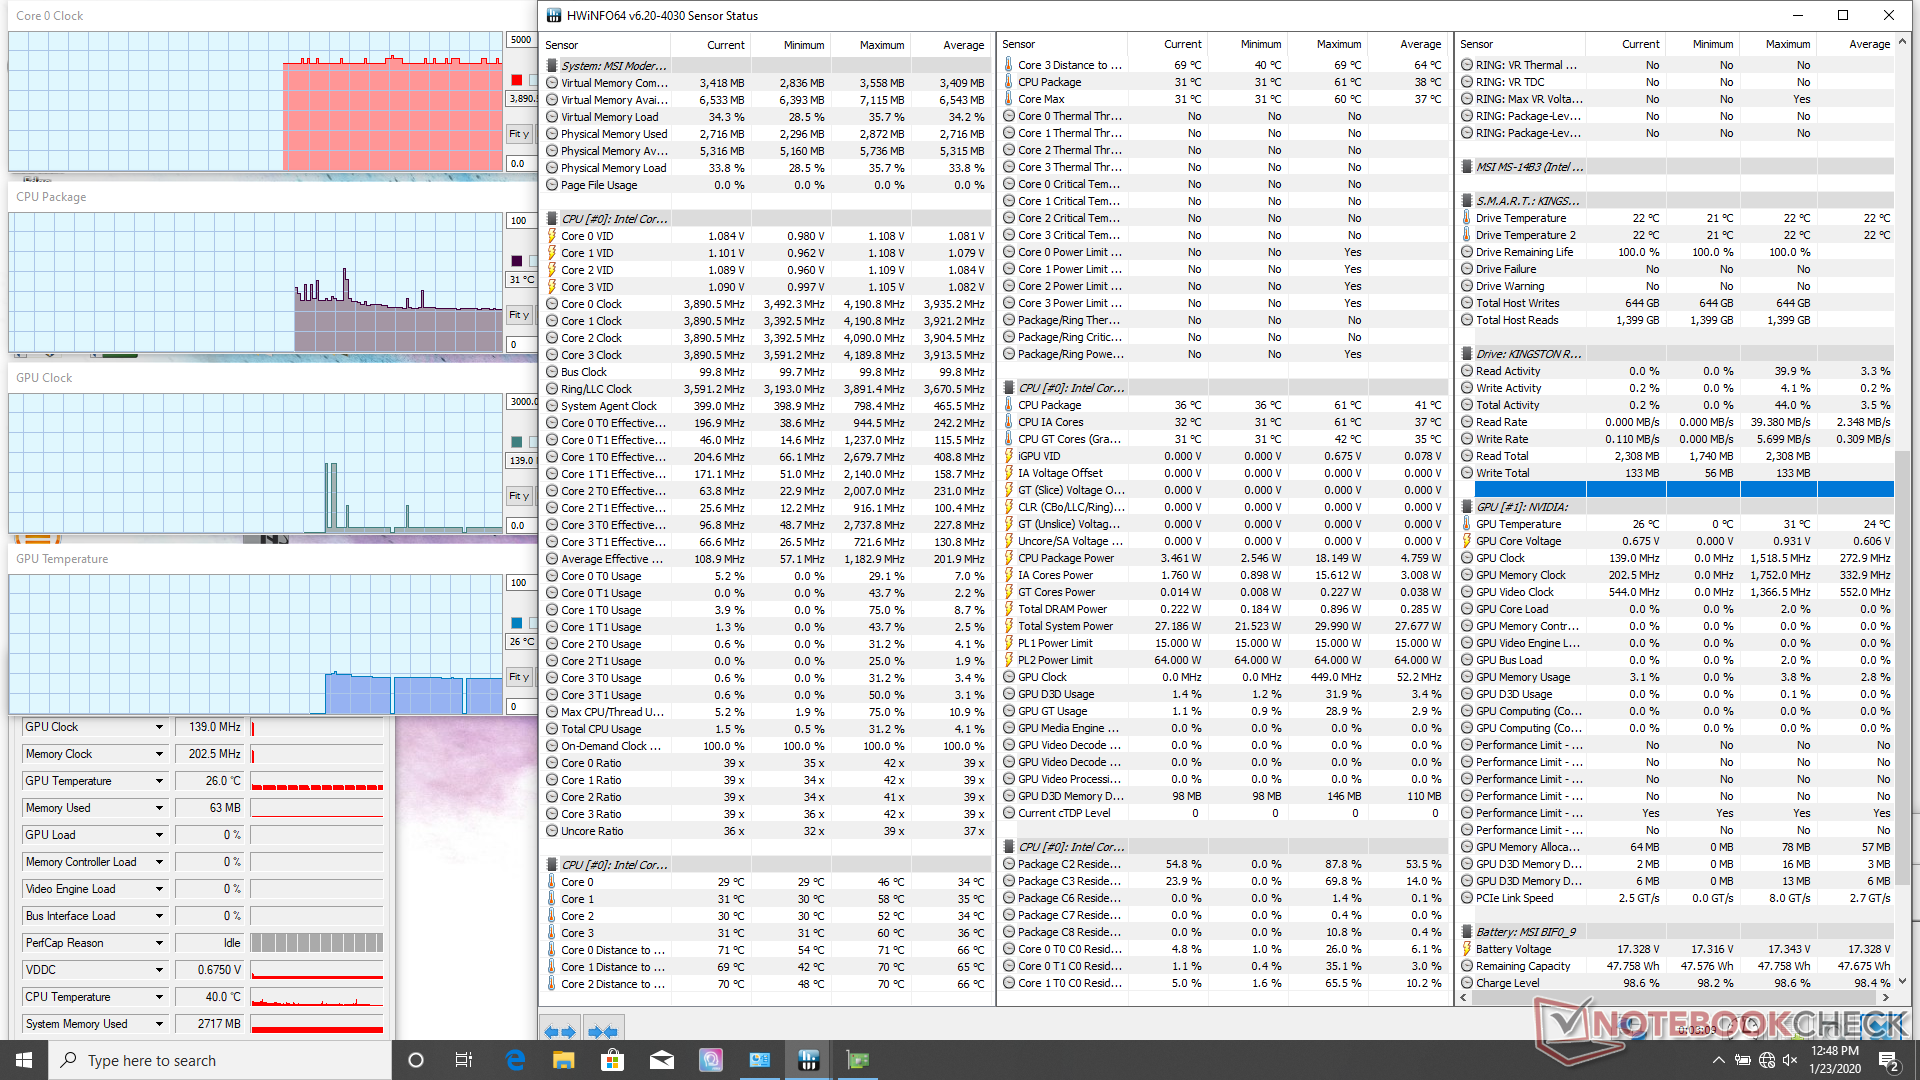
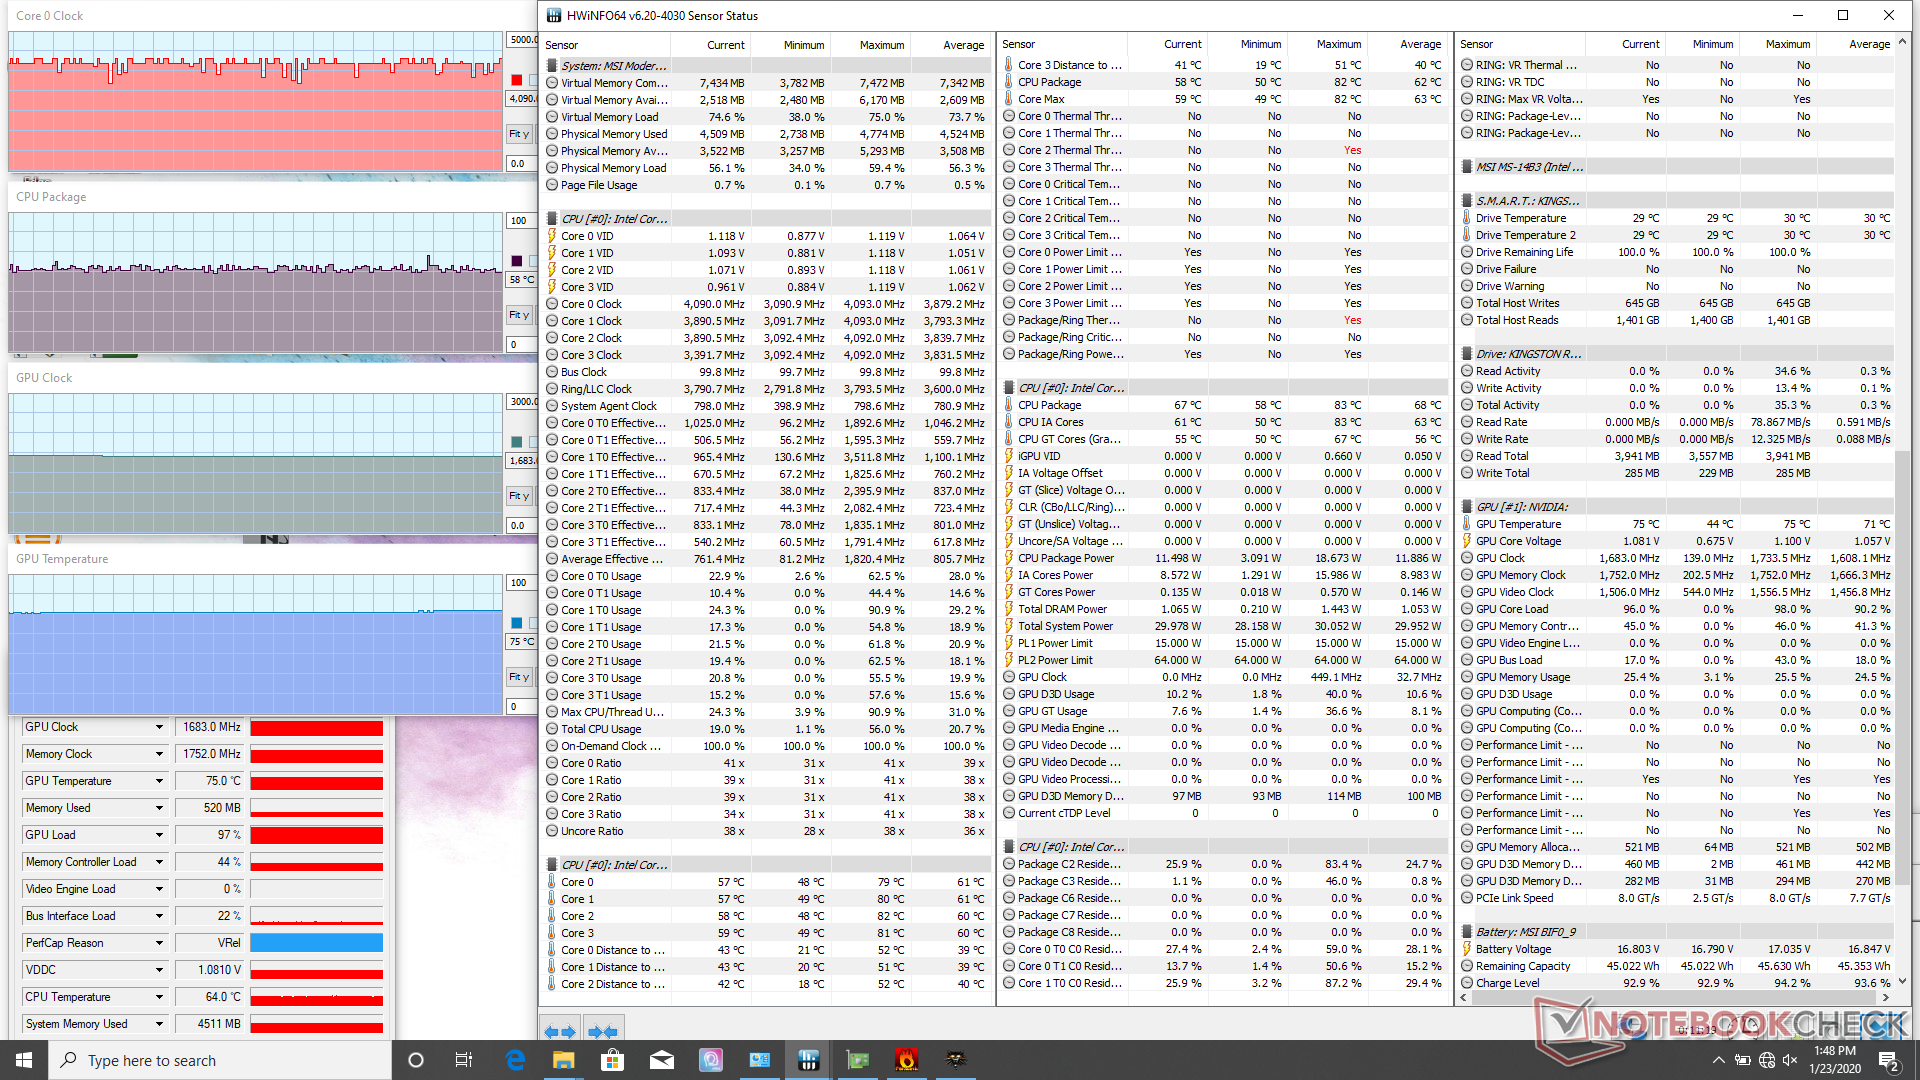
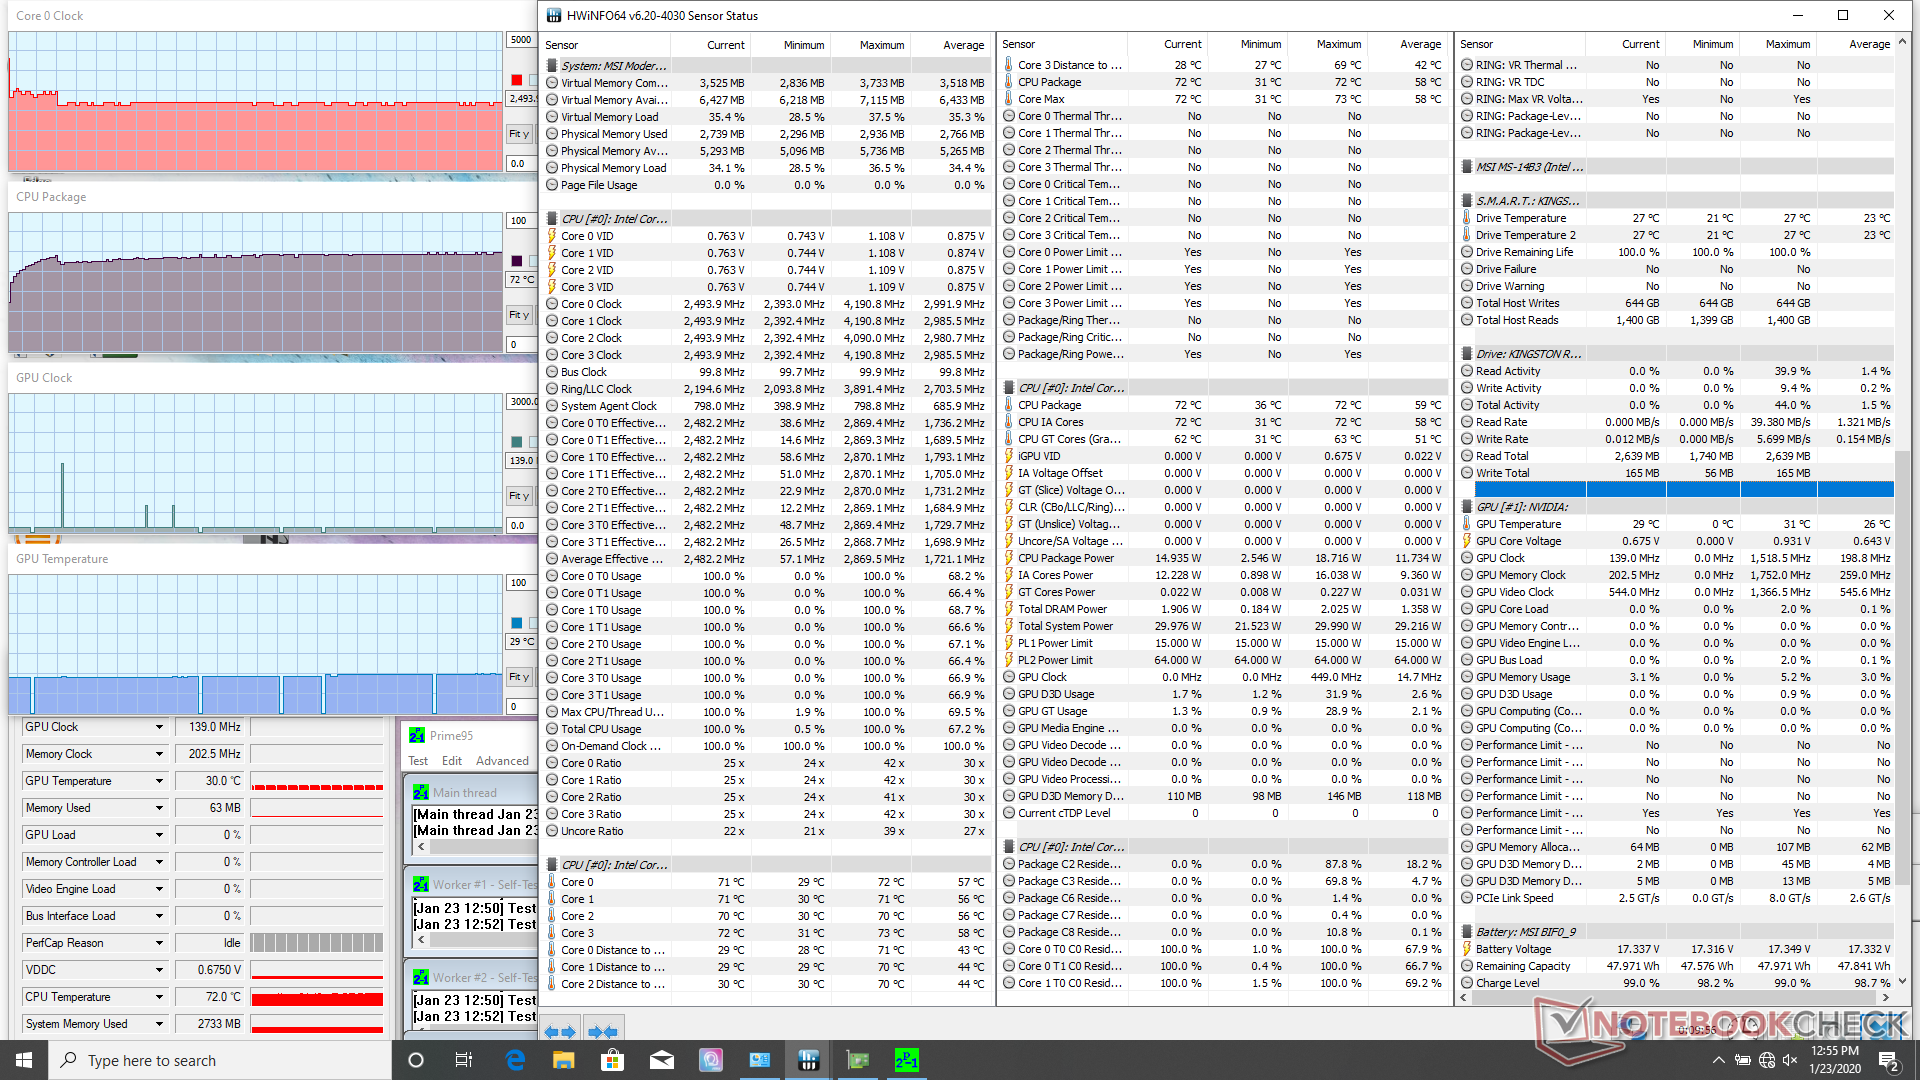
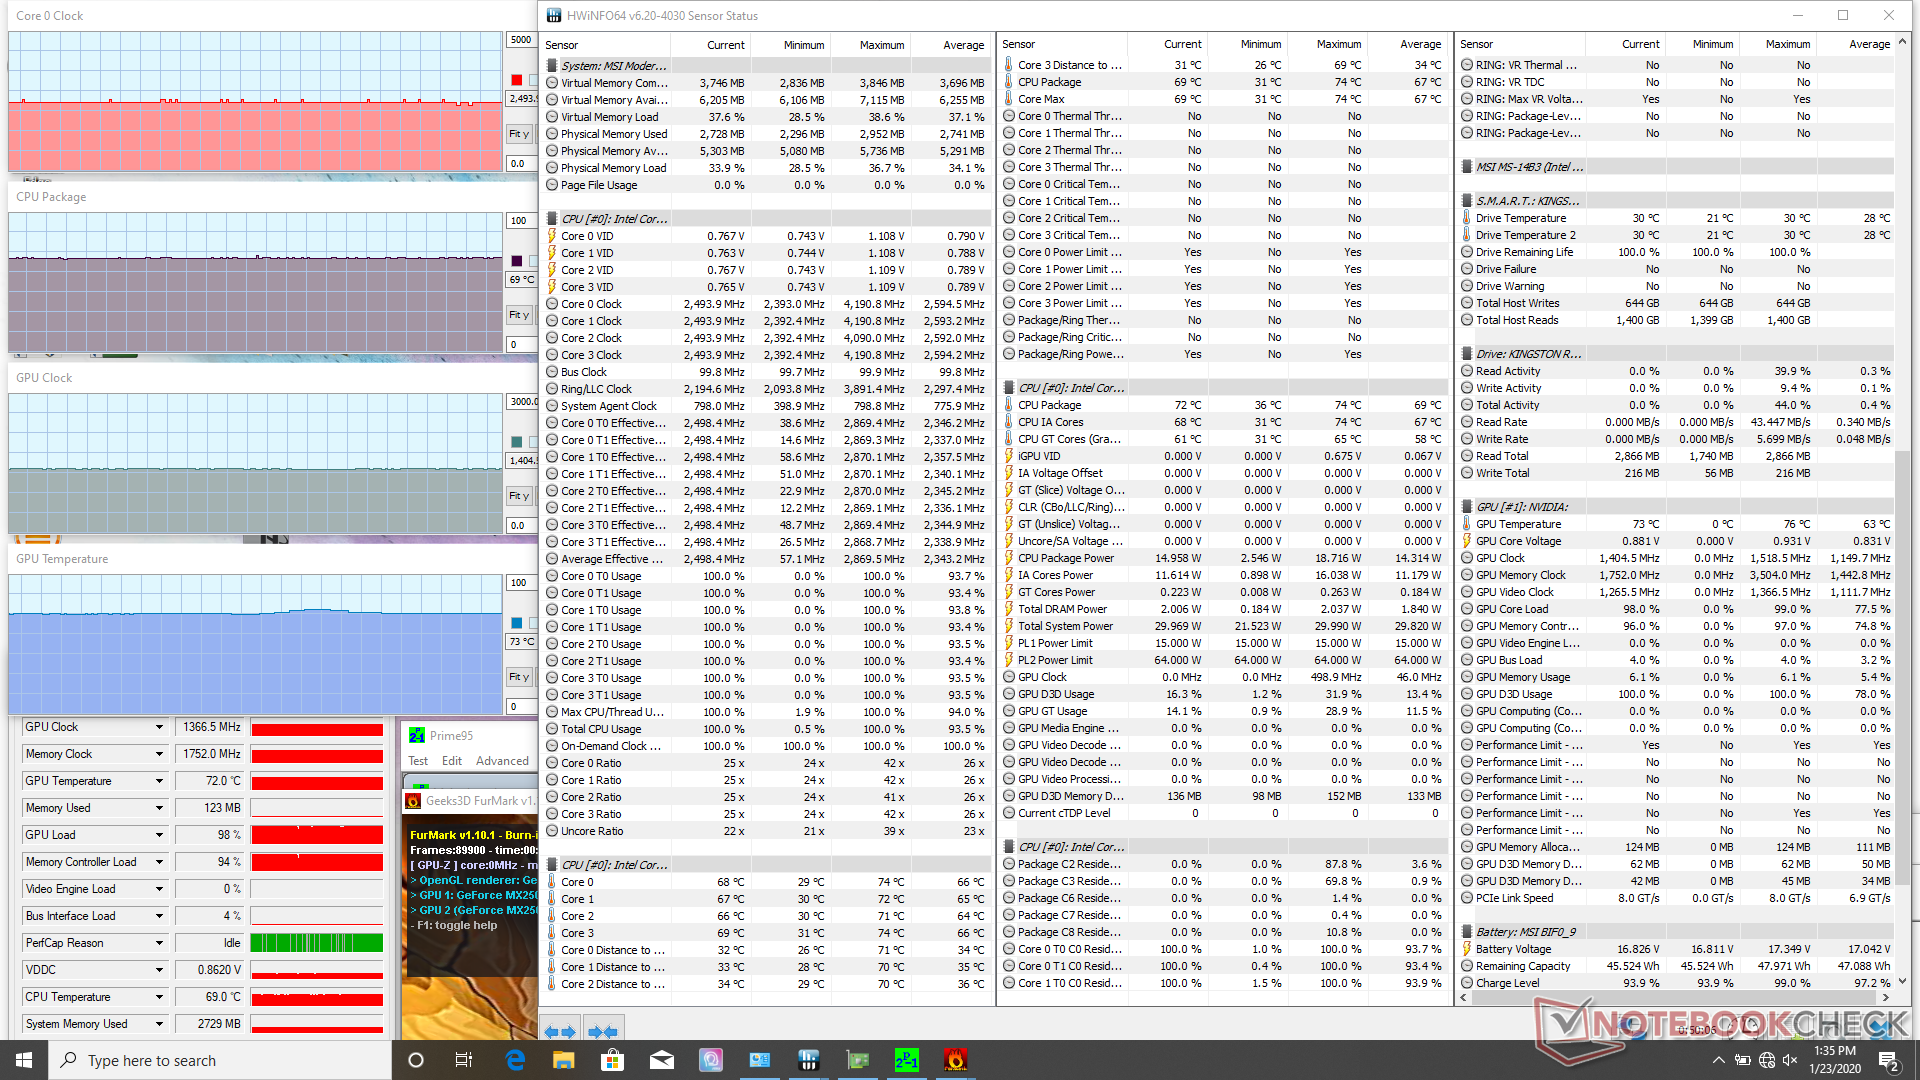
| CPU Clock (GHz) | GPU Clock (MHz) | Average CPU Temperature (°C) | Average GPU Temperature (°C) | |
| System Idle | -- | -- | 31 | 26 |
| Prime95 Stress | 2.3 - 2.5 | -- | 72 | 29 |
| Prime95 + FurMark Stress | 2.3 - 2.6 | 1404 | 69 | 73 |
| Witcher 3 Stress | ~4.0 | 1683 | ~58 | 75 |
Hoparlörler
MSI, çoğu G Serisi oyun dizüstü bilgisayarındaki güçlü hoparlörleriyle ses kalitesi konusunda yüksek standartlar belirlemiştir. Bununla birlikte, Modern 14'teki hoparlörler, ucuz ve orta sınıf bir dizüstü bilgisayar için daha tipiktir. Bas, HP Spectre x360 15 gibi birçok multimedya dizüstü bilgisayarda 250 Hz veya 500 Hz ile başlayarak 1000 Hz'de başlayarak beklenenden daha zayıftır. Hoparlörler sesli aramalar ve küçük konferans odaları için yeterince iyi çalışır, ancak müzik ve video oynatma için kulaklık. Yüksek ses seviyesi ayarları statik veya titreşim oluşturmaz.


MSI Modern 14 A10RB-459US ses analizi
(+) | hoparlörler nispeten yüksek sesle çalabilir (84.8 dB)
Bas 100 - 315Hz
(-) | neredeyse hiç bas yok - ortalama olarak medyandan 25.7% daha düşük
(±) | Bas doğrusallığı ortalamadır (11.6% delta - önceki frekans)
Ortalar 400 - 2000 Hz
(±) | daha yüksek ortalar - ortalama olarak medyandan 8.2% daha yüksek
(±) | Ortaların doğrusallığı ortalamadır (10.7% delta - önceki frekans)
Yüksekler 2 - 16 kHz
(+) | dengeli yüksekler - medyandan yalnızca 3.2% uzakta
(±) | Yükseklerin doğrusallığı ortalamadır (7.9% delta - önceki frekans)
Toplam 100 - 16.000 Hz
(-) | genel ses doğrusal değildir (30.8% ortancaya göre fark)
Aynı sınıfla karşılaştırıldığında
» Bu sınıftaki tüm test edilen cihazların %92%'si daha iyi, 3% benzer, 5% daha kötüydü
» En iyisinin deltası 7% idi, ortalama 21% idi, en kötüsü 53% idi
Test edilen tüm cihazlarla karşılaştırıldığında
» Test edilen tüm cihazların %89'si daha iyi, 3 benzer, % 8 daha kötüydü
» En iyisinin deltası 4% idi, ortalama 24% idi, en kötüsü 134% idi
Apple MacBook 12 (Early 2016) 1.1 GHz ses analizi
(+) | hoparlörler nispeten yüksek sesle çalabilir (83.6 dB)
Bas 100 - 315Hz
(±) | azaltılmış bas - ortalama olarak medyandan 11.3% daha düşük
(±) | Bas doğrusallığı ortalamadır (14.2% delta - önceki frekans)
Ortalar 400 - 2000 Hz
(+) | dengeli ortalar - medyandan yalnızca 2.4% uzakta
(+) | orta frekanslar doğrusaldır (5.5% deltadan önceki frekansa)
Yüksekler 2 - 16 kHz
(+) | dengeli yüksekler - medyandan yalnızca 2% uzakta
(+) | yüksekler doğrusaldır (4.5% deltadan önceki frekansa)
Toplam 100 - 16.000 Hz
(+) | genel ses doğrusaldır (10.2% ortancaya göre fark)
Aynı sınıfla karşılaştırıldığında
» Bu sınıftaki tüm test edilen cihazların %7%'si daha iyi, 2% benzer, 91% daha kötüydü
» En iyisinin deltası 5% idi, ortalama 18% idi, en kötüsü 53% idi
Test edilen tüm cihazlarla karşılaştırıldığında
» Test edilen tüm cihazların %5'si daha iyi, 1 benzer, % 94 daha kötüydü
» En iyisinin deltası 4% idi, ortalama 24% idi, en kötüsü 134% idi
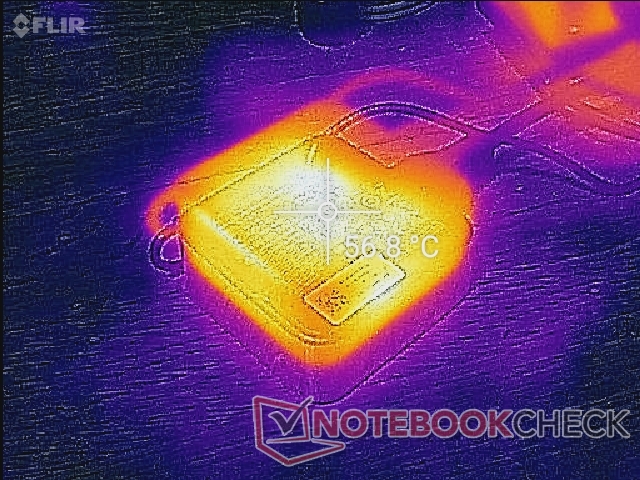
Enerji yönetimi
Güç tüketimi
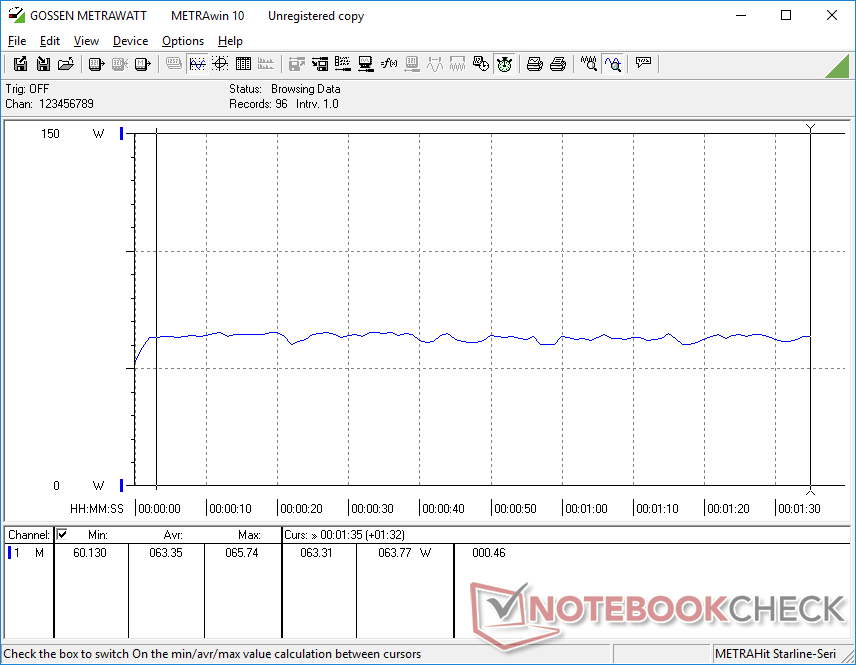
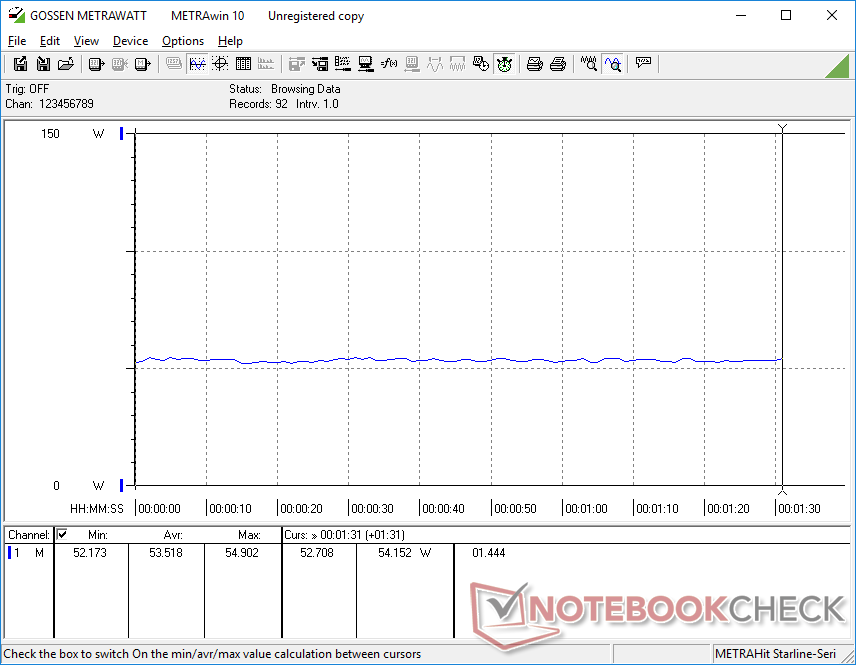
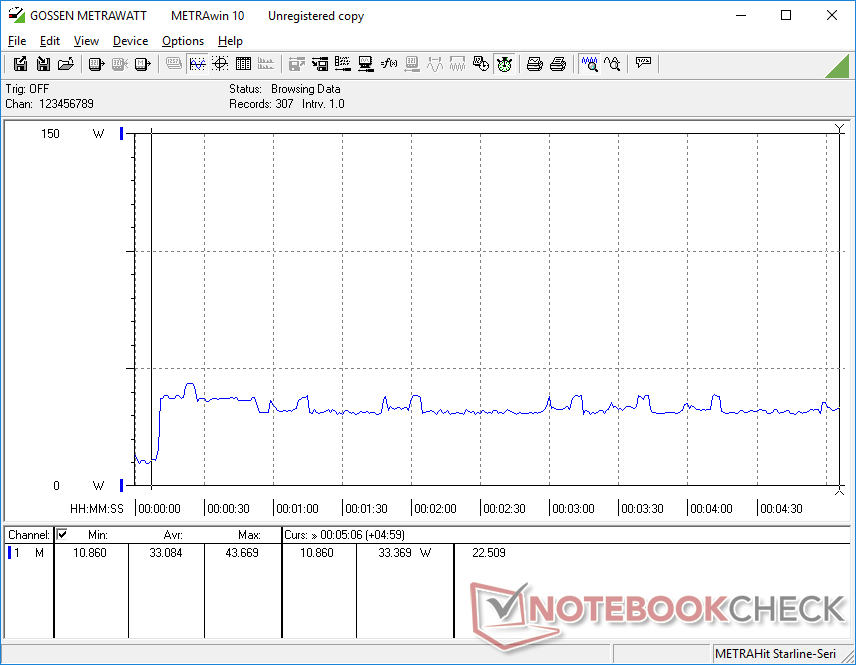
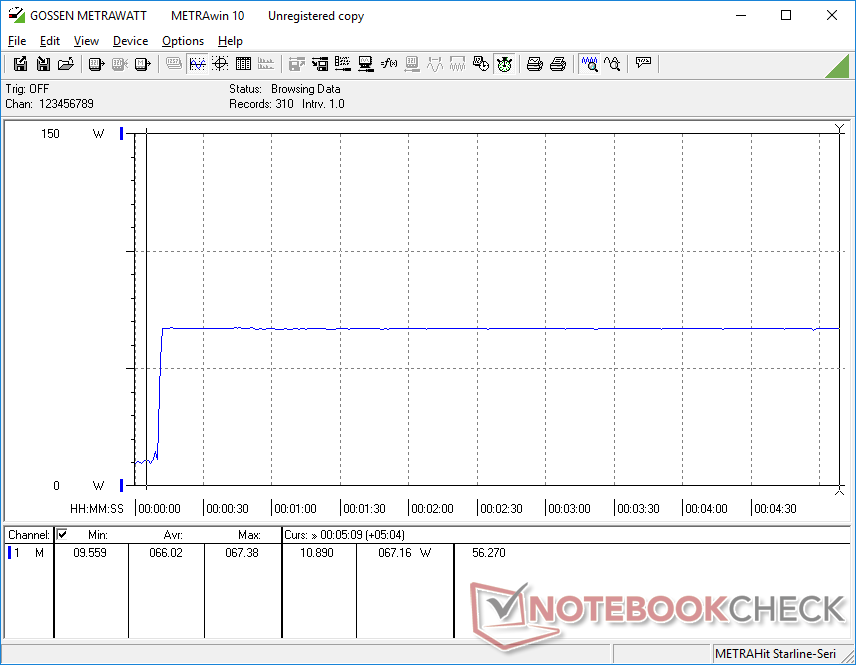
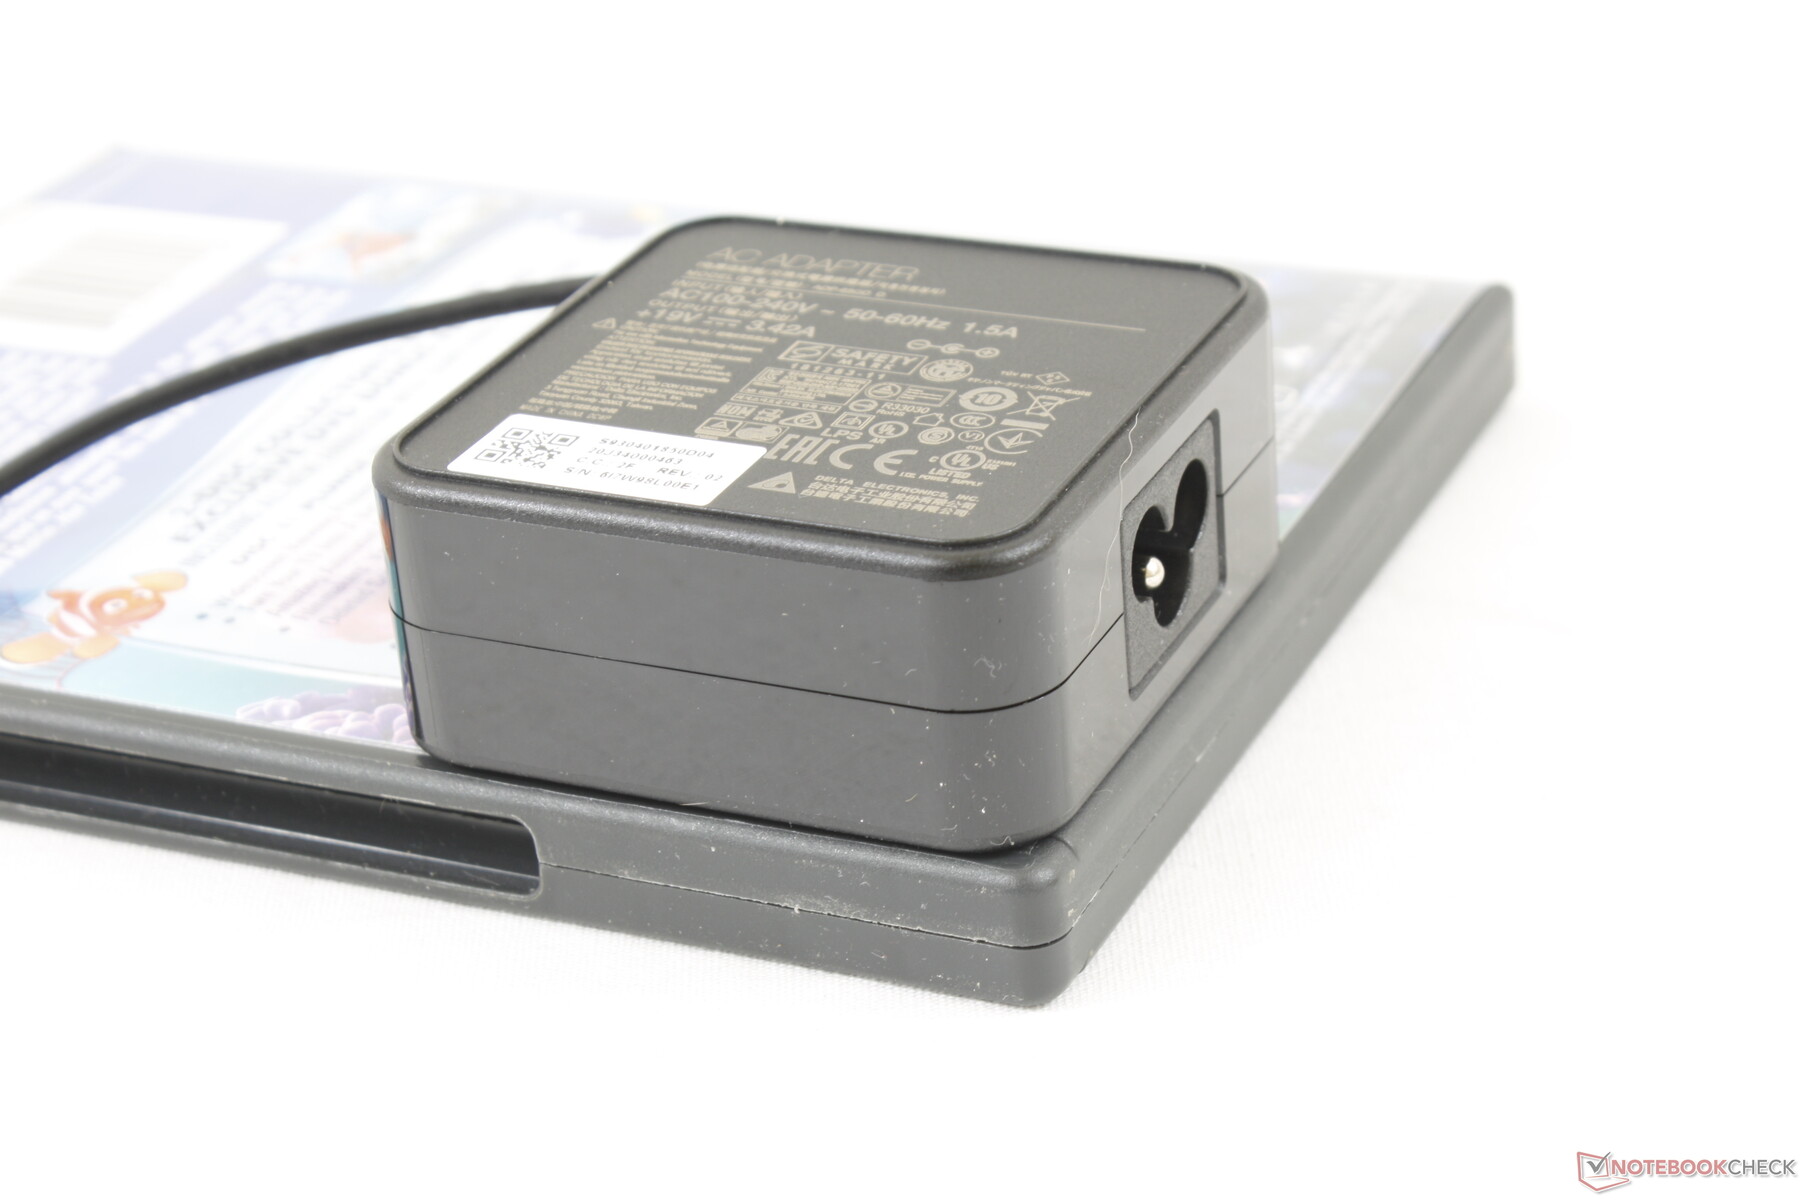
Masaüstünde rölanti, parlaklık düzeyine ve güç profiline bağlı olarak 4 W ile 8 W arasında diğer Ultrabook'lardan daha verimli olmasını gerektirir. Oyun oynuyorsanız, tüketimin 53 W ile 63 W arasında değişmesini bekleyin. Asus ZenBook 15'teki GTX 1650 Max-Q'nun güç tüketiminde sadece yüzde 19 artış için yüzde 110 ila 170 daha hızlı grafik performansı sunabileceğini unutmayın. Prime95 ve FurMark'ı aynı anda çalıştırırken küçük (~ 6,6 x 6,6 x 3 cm) 65 W AC adaptöründen maksimum 67,4 W tüketim kaydetmek için. Modern 14, ince ve hafif dizüstü bilgisayarlarda nadir görülen beş tam dakikadan sonra bile bu oranı koruyabilir.
| Kapalı / Bekleme modu | |
| Boşta | |
| Çalışırken |
|
Key:
min: | |
| MSI Modern 14 A10RB-459US i5-10210U, GeForce MX250, Kingston RBUSNS8154P3512GJ, IPS, 1920x1080, 14" | Asus ZenBook 15 UX534FT-DB77 i7-8565U, GeForce GTX 1650 Max-Q, Samsung SSD PM981 MZVLB1T0HALR, IPS, 1920x1080, 15.6" | Lenovo Yoga C940-14IIL i7-1065G7, Iris Plus Graphics G7 (Ice Lake 64 EU), Samsung SSD PM981 MZVLB512HAJQ, IPS LED, 1920x1080, 14" | Dell XPS 15 7590 9980HK GTX 1650 i9-9980HK, GeForce GTX 1650 Mobile, Toshiba XG6 KXG60ZNV1T02, OLED, 3840x2160, 15.6" | Apple MacBook Pro 16 2019 i9 5500M i9-9880H, Radeon Pro 5500M, Apple SSD AP1024 7171, IPS, 3072x1920, 16" | Lenovo ThinkPad X1 Carbon 2019-20QE000VGE i7-8665U, UHD Graphics 620, WDC PC SN720 SDAQNTW-512G, IPS, 2560x1440, 14" | |
|---|---|---|---|---|---|---|
| Power Consumption | -79% | 2% | -90% | -70% | 7% | |
| Idle Minimum * (Watt) | 4.2 | 5 -19% | 3.2 24% | 6.2 -48% | 3.7 12% | 3 29% |
| Idle Average * (Watt) | 5.9 | 13.2 -124% | 7 -19% | 9.6 -63% | 12.1 -105% | 6.3 -7% |
| Idle Maximum * (Watt) | 7.2 | 24 -233% | 8.9 -24% | 21.2 -194% | 17 -136% | 8.9 -24% |
| Load Average * (Watt) | 63.4 | 70 -10% | 47.6 25% | 104.3 -65% | 91.5 -44% | 40.8 36% |
| Witcher 3 ultra * (Watt) | 53.5 | 63.3 -18% | 91.7 -71% | 103 -93% | ||
| Load Maximum * (Watt) | 67.4 | 114 -69% | 63.1 6% | 135.3 -101% | 102.3 -52% | 67.5 -0% |
* ... daha küçük daha iyidir
Pil ömrü
Modern 14'ün daha küçük ekran boyutu nedeniyle pil kapasitesi çoğu 15.6 inçlik dizüstü bilgisayardan daha küçüktür. Çalışma zamanları, yaklaşık 8.5 saatlik gerçek dünya WLAN kullanımında çoğu Ultrabook ile hala karşılaştırılabilir. Boştan tam kapasiteye şarj etmek yaklaşık 2 saat sürer.Bir USB C Tipi şarj cihazını bağlamayı denedik, ancak dizüstü bilgisayar USB C Tipi şarjı desteklemiyor.
| MSI Modern 14 A10RB-459US i5-10210U, GeForce MX250, 50 Wh | Lenovo ThinkPad X1 Carbon 2018-20KGS5DU00 i5-8550U, UHD Graphics 620, 57 Wh | Asus ZenBook 15 UX534FT-DB77 i7-8565U, GeForce GTX 1650 Max-Q, 71 Wh | Lenovo Yoga C940-14IIL i7-1065G7, Iris Plus Graphics G7 (Ice Lake 64 EU), 60 Wh | Dell XPS 15 7590 9980HK GTX 1650 i9-9980HK, GeForce GTX 1650 Mobile, 97 Wh | Apple MacBook Pro 16 2019 i9 5500M i9-9880H, Radeon Pro 5500M, 99.8 Wh | |
|---|---|---|---|---|---|---|
| Pil Çalışma Süresi | 5% | 30% | -8% | 22% | -2% | |
| Reader / Idle (h) | 16.4 | 21.5 31% | 15.2 -7% | |||
| WiFi v1.3 (h) | 8.6 | 9 5% | 8.4 -2% | 10.6 23% | 7.8 -9% | 12 40% |
| Load (h) | 1.8 | 2.9 61% | 1.1 -39% | 3.3 83% | 1 -44% | |
| Witcher 3 ultra (h) | 0.9 |
Artılar
Eksiler
Karar

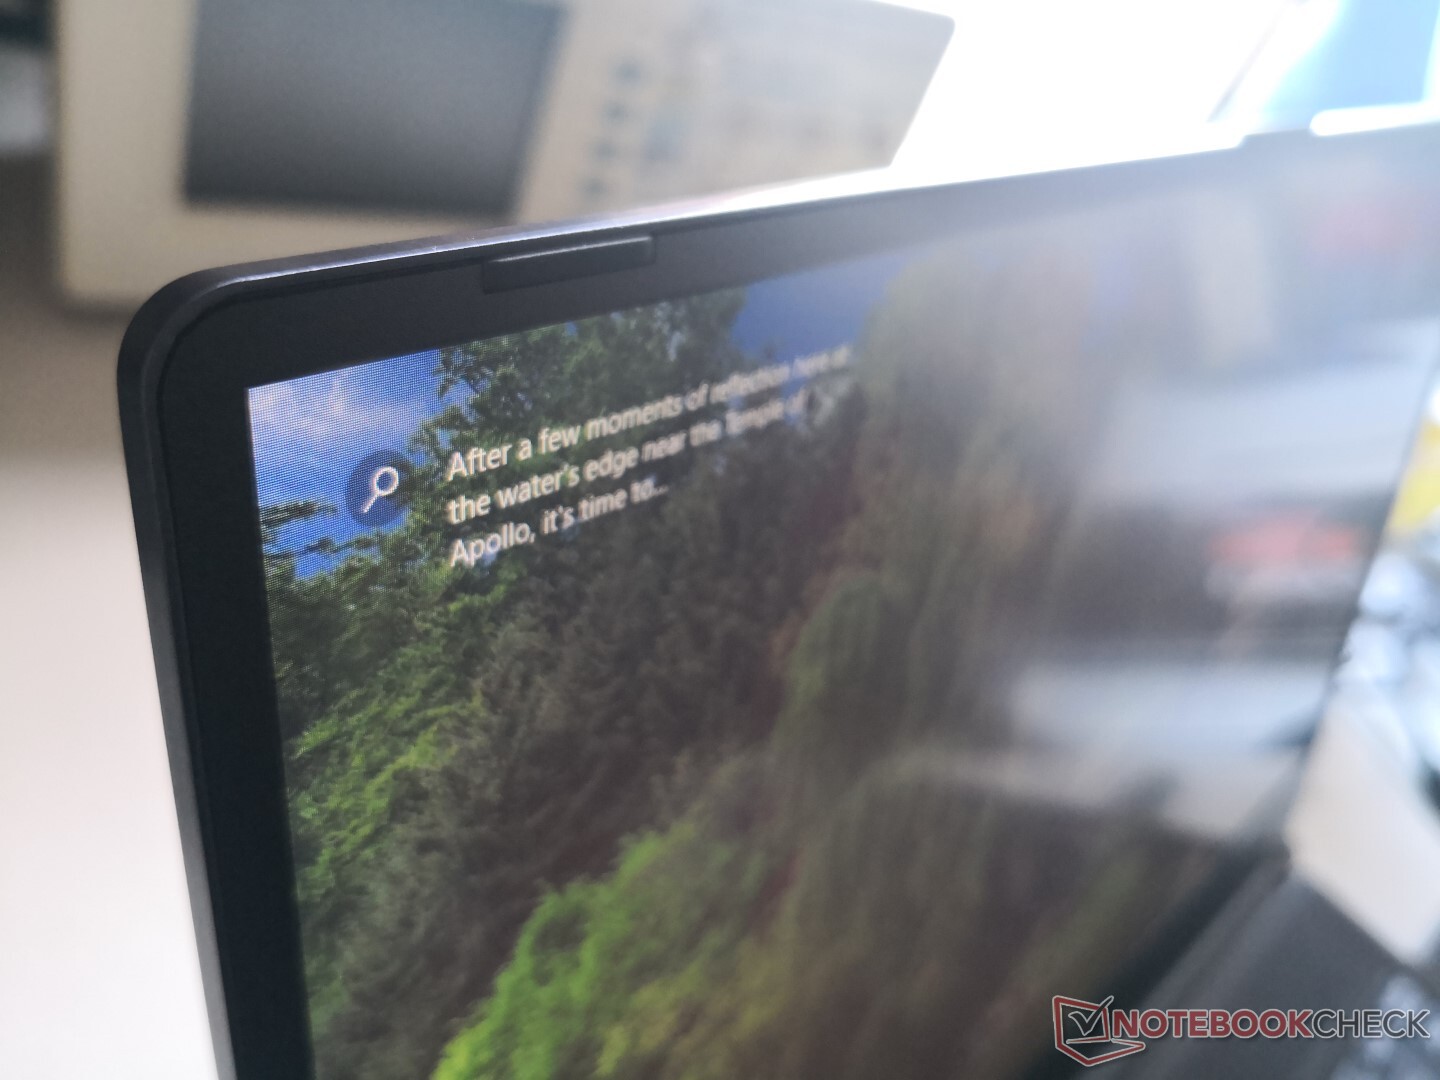
Oyun dizüstü bilgisayarlarında ve profesyonel dizüstü bilgisayarlarda bu kadar uzun süre uğraştıktan sonra MSI, Modern 14 ile uygun fiyatlı alt defter ofis pazarını kırmaya hazırdır. Modern 14'ün en iyi özellikleri çoğunlukla görseldir; 14 inçlik ekran iyi kalibre edilmiş ve kullanıma hazırken, seyahat dostu ağırlık, sağlıklı port seçimi ve isteğe bağlı GeForce MX250 grafiklerin tümü doğrudan hedef kitleye yarar sağlıyor. Modern 14'ün ana dezavantajları şasi sertliği, yükseltilebilirlik, tek kanallı RAM ve klavye geri beslemesidir. RAM veya depolama gibi yaygın yükseltmeler daha zor hale getirilirken, yüzeyler Dell, Lenovo veya HP'nin çoğu ofis dizüstü bilgisayarından daha fazla esner ve gıcırdar. Klavye tuşları yumuşak tarafta ve daktilolara daha iyi hizmet vermek için daha net geri bildirimlerden yararlanmış olabilir.Diğer sakıncalar arasında "burun kamerası" web kamerası, parmak izi okuyucu veya Thunderbolt 3 desteği, 8 GB tek kanallı RAM ve Core i5-10210U. Bununla birlikte, 900 dolardan daha az bir fiyata, sistemin güçlü ve zayıf yanlarını bildiğiniz sürece, bu uygun bir fiyat.Bu babanızın ofis dizüstü bilgisayarı değil. MSI Modern 14, Dell, HP veya Lenovo'nun orta sınıf ofis çözümlerine kıyasla görsel olarak çekici tasarımı ve çok hafif ağırlığıyla genç ofis kullanıcılarını ve içerik oluşturucuları hedefliyor.
MSI Modern 14 A10RB-459US
- 01/27/2020 v7 (old)
Allen Ngo
Price comparison
