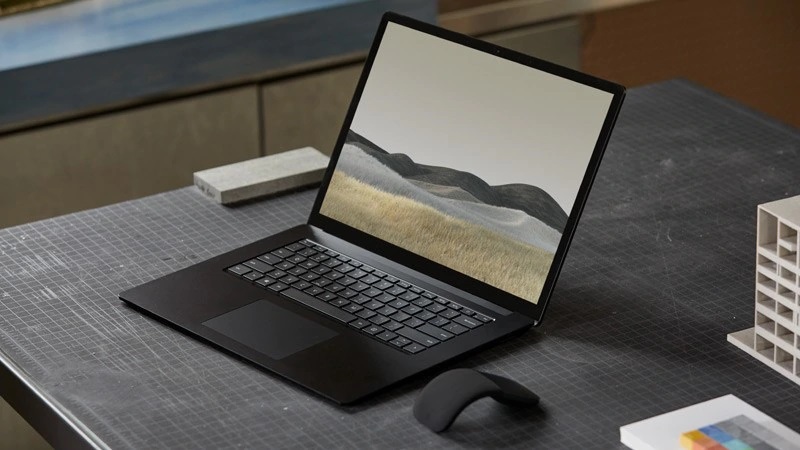
İnceleme: Microsoft Surface Laptop 3 15 inç Core i7 - Ice Lake ile daha iyi
15 inçlik Microsoft Surface Dizüstü Bilgisayarı 3, en pahalıdan en pahalıya doğru dört ana SKU'dan oluşur: Ryzen 5 3580U, Core i5-1035G7, Ryzen 7 3780U ve Core i7-1065G7. Yakın zamanda, Surface Laptop'un temel seviyede neler sunabileceğini görmek için AMD Ryzen 5 yapılandırmasını kontrol ettik. Bugün, Surface Laptop'un söz konusu en iyi durumda ne yapabileceğini görmek için Intel Core i7 SKU'yu kontrol edeceğiz.Şasi, klavye hakkında daha fazla bilgi edinmek için Surface Laptop 3 Ryzen 5 SKU'daki mevcut incelememizi kontrol etmenizi öneririz. , ekran ve diğer harici özellikler, bu özellikler Intel ve AMD modelleri arasında aynıdır. Bu inceleme bunun yerine Intel Core i7 ve AMD Ryzen 5 SKU'lar arasındaki sıcaklık, güç tüketimi, pil ömrü ve elbette performans da dahil olmak üzere tüm dahili farklılıklara odaklanacak. Core i7 SKU'yu Ryzen 7 SKU ile karşılaştırmak, daha ilginç sonuçlar elde etmek için yapılmış olurdu, ancak bu, Ryzen 7 biriminde ellerimizi alabileceğimiz gelecekteki bir tarihe kadar beklemek zorunda kalacak.Daha Microsoft yorumları: Surface Pro 7Surface Pro 6Surface Book 2Yüzey Dizüstü Bilgisayar 3 Ryzen 5Yüzey Dizüstü Bilgisayar 2
Derecelendirme | Tarih | Modeli | Ağırlık | Yükseklik | Boyut | Çözünürlük | Fiyat |
|---|---|---|---|---|---|---|---|
| 83.9 % v7 (old) | 01/2020 | Microsoft Surface Laptop 3 15 i7-1065G7 i7-1065G7, Iris Plus Graphics G7 (Ice Lake 64 EU) | 1.5 kg | 14.7 mm | 15.00" | 2496x1664 | |
| 86.3 % v7 (old) | 10/2019 | Dell XPS 15 7590 i5 iGPU FHD i5-9300H, UHD Graphics 630 | 1.9 kg | 17 mm | 15.60" | 1920x1080 | |
| 86 % v7 (old) | 03/2020 | Lenovo Yoga C940-15IRH i7-9750H, GeForce GTX 1650 Max-Q | 2 kg | 19.7 mm | 15.60" | 1920x1080 | |
| 83.9 % v7 (old) | HP Spectre x360 15-df0126ng i7-8750H, GeForce GTX 1050 Ti Max-Q | 2.2 kg | 19.3 mm | 15.60" | 3840x2160 | ||
| 89.7 % v7 (old) | 12/2019 | Apple MacBook Pro 16 2019 i9 5500M i9-9880H, Radeon Pro 5500M | 2 kg | 16.2 mm | 16.00" | 3072x1920 |
Durum
Bağlantı
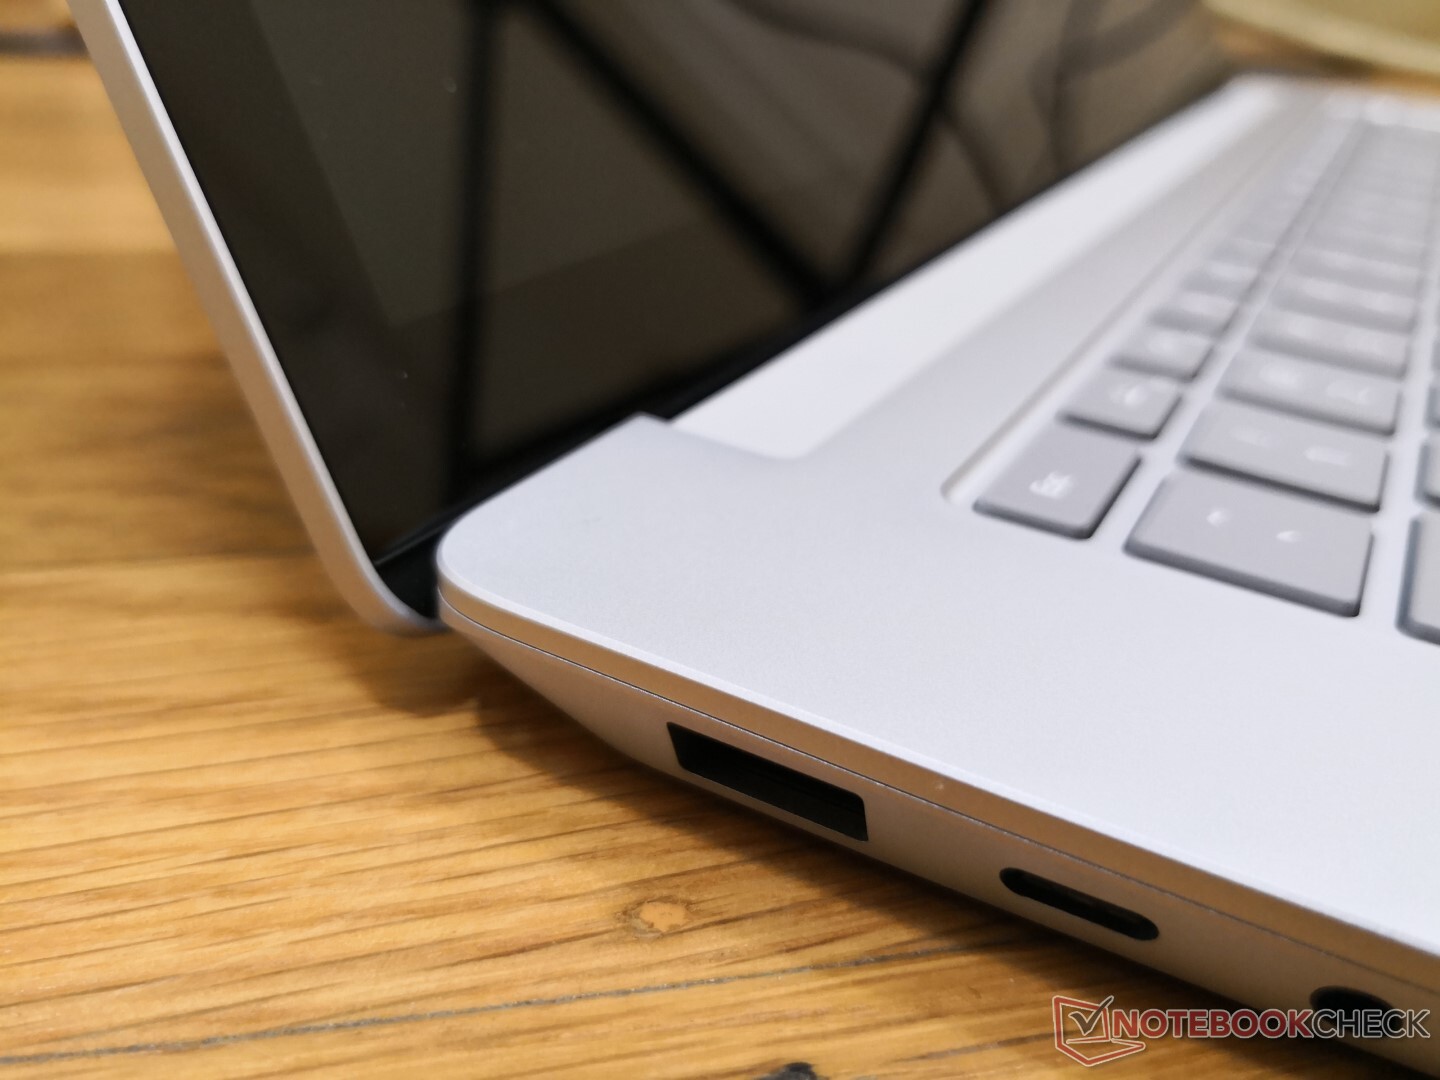
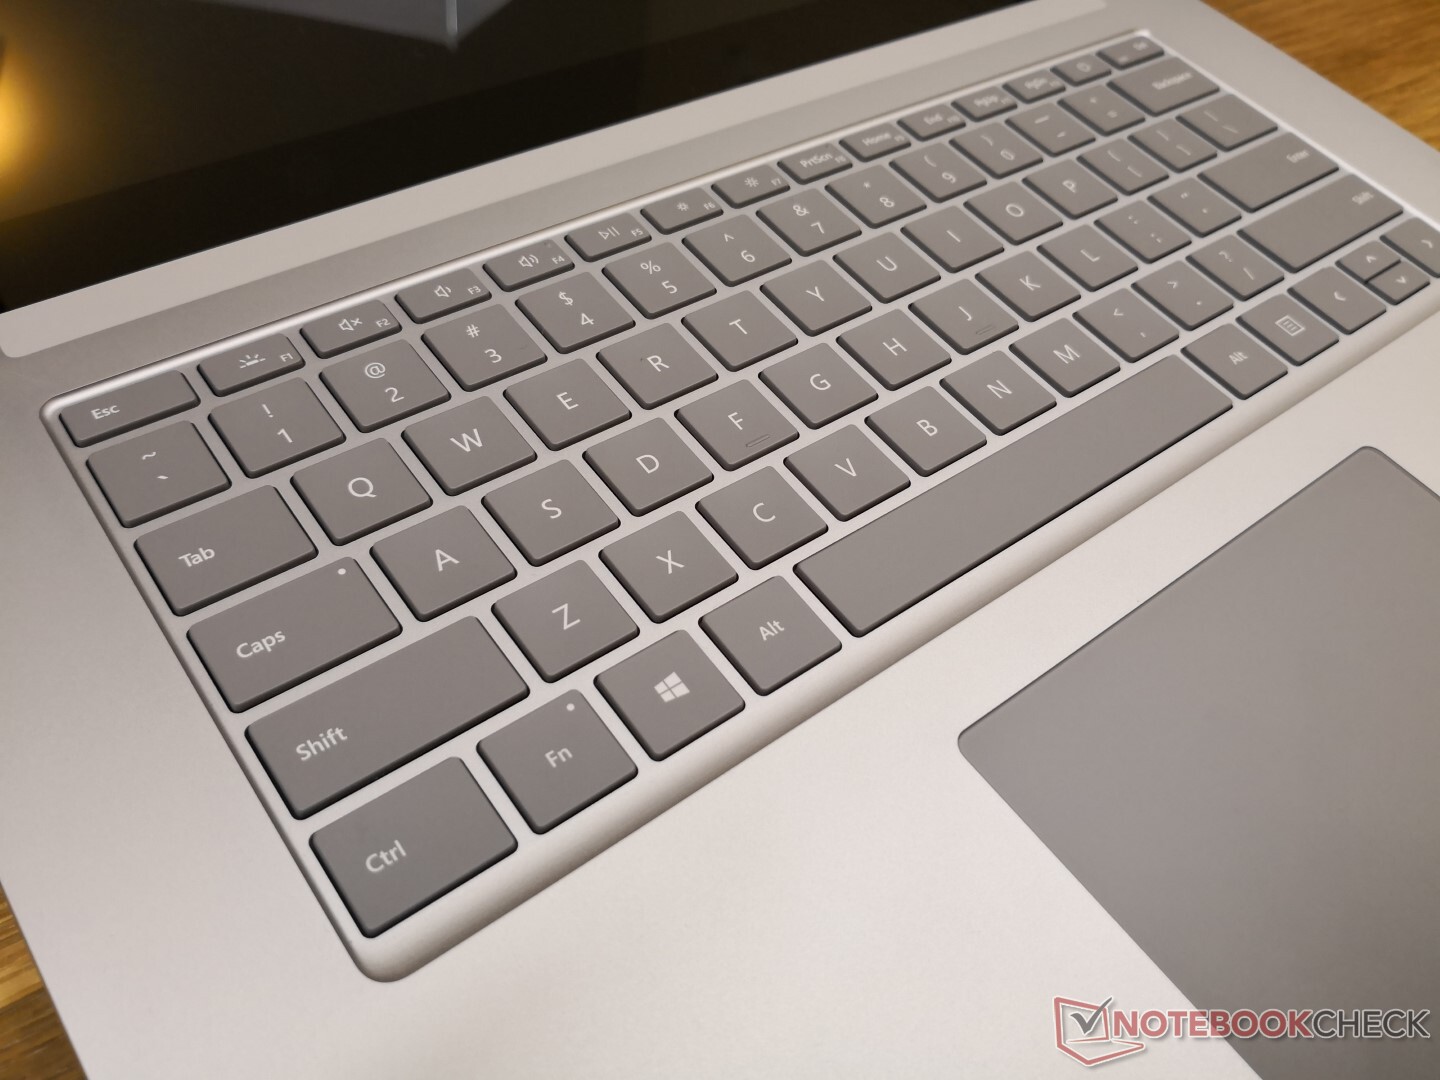
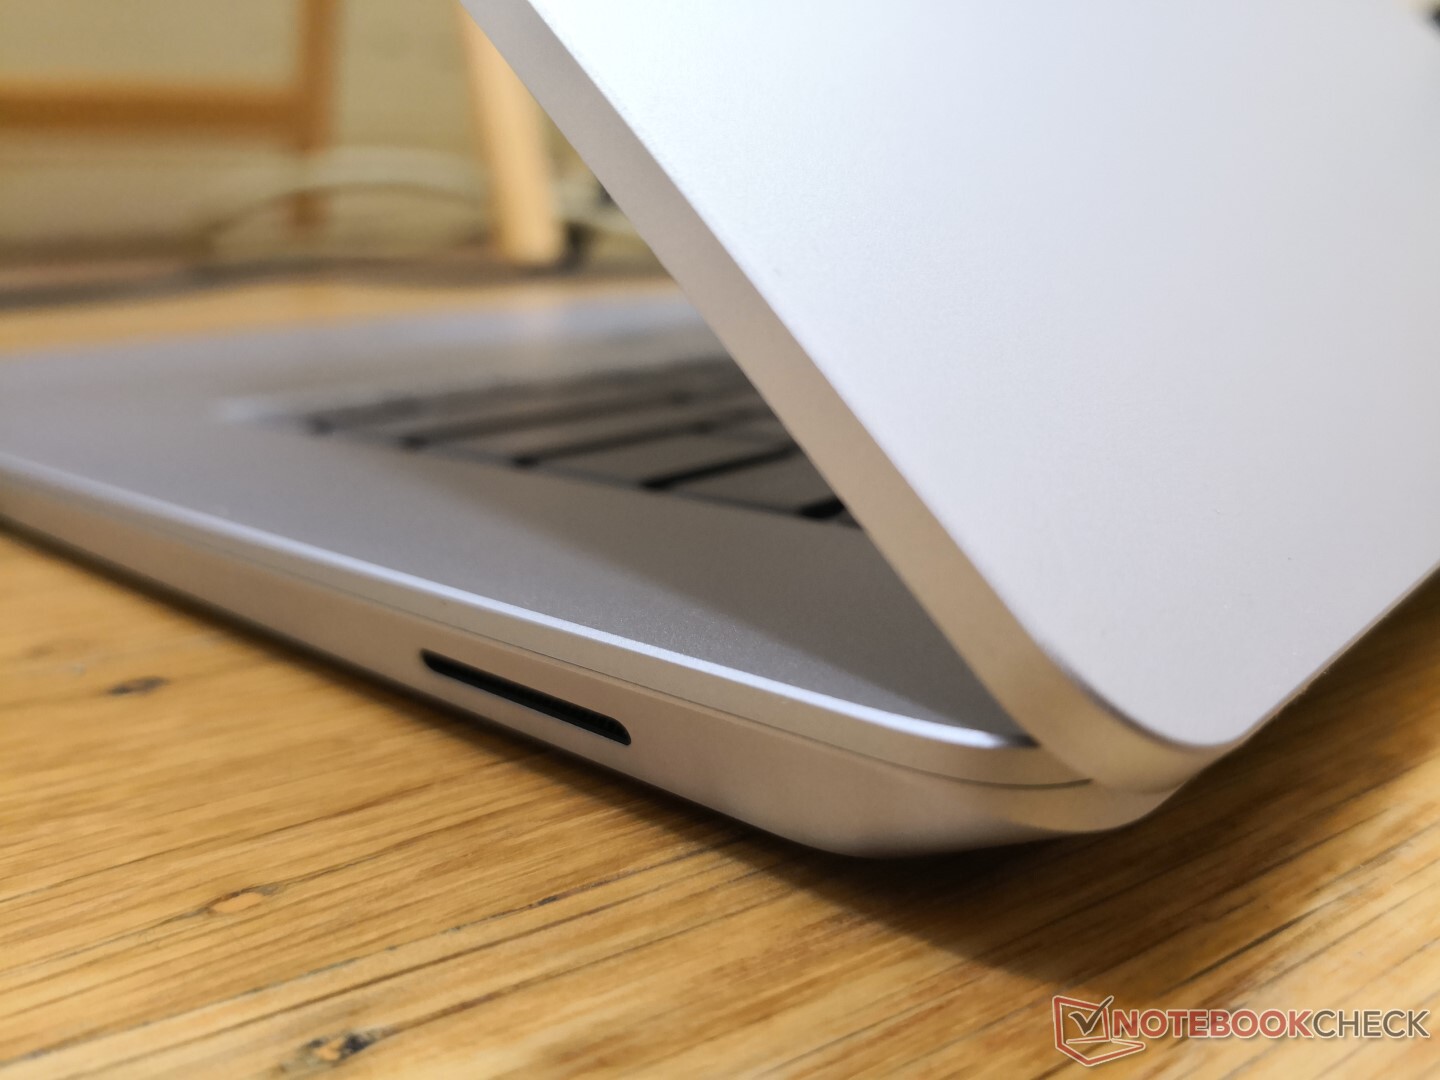
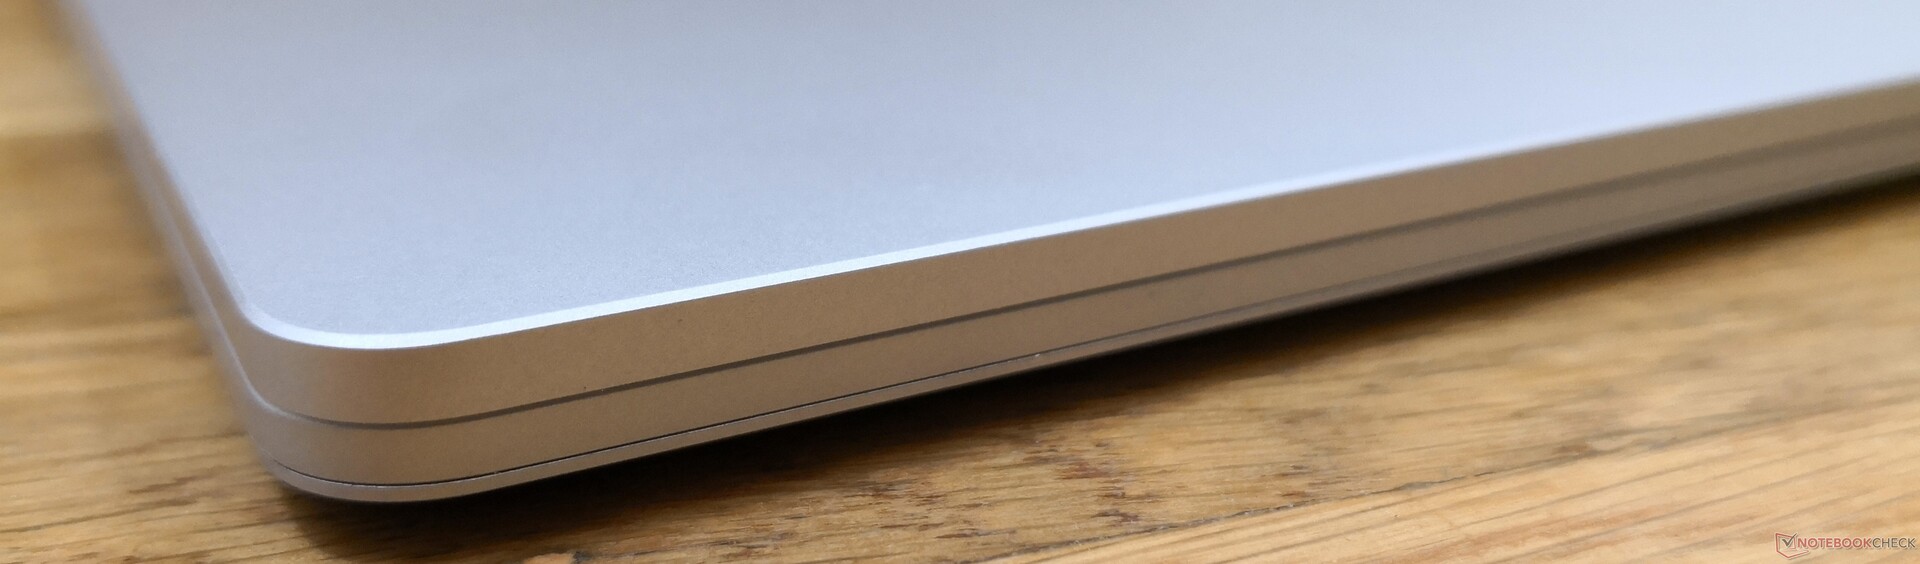
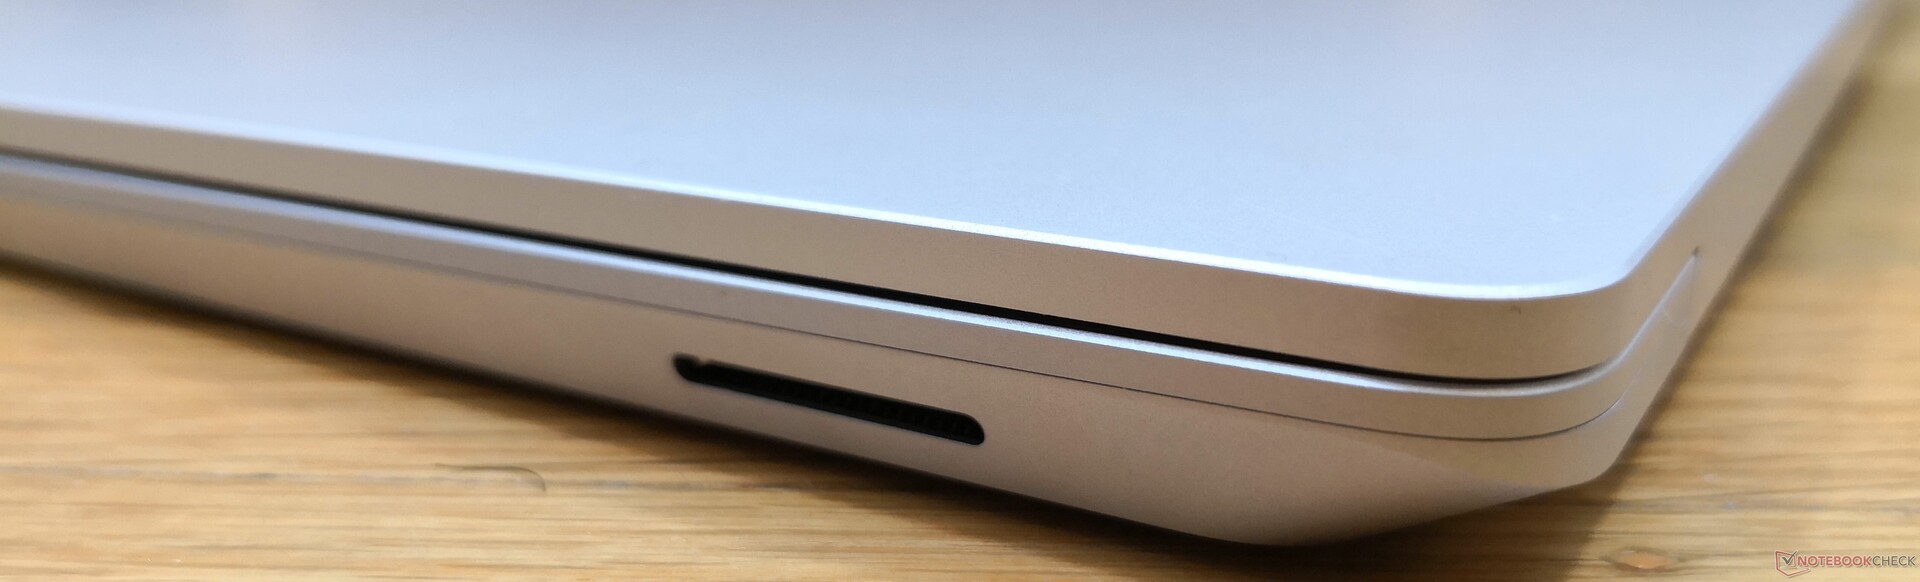
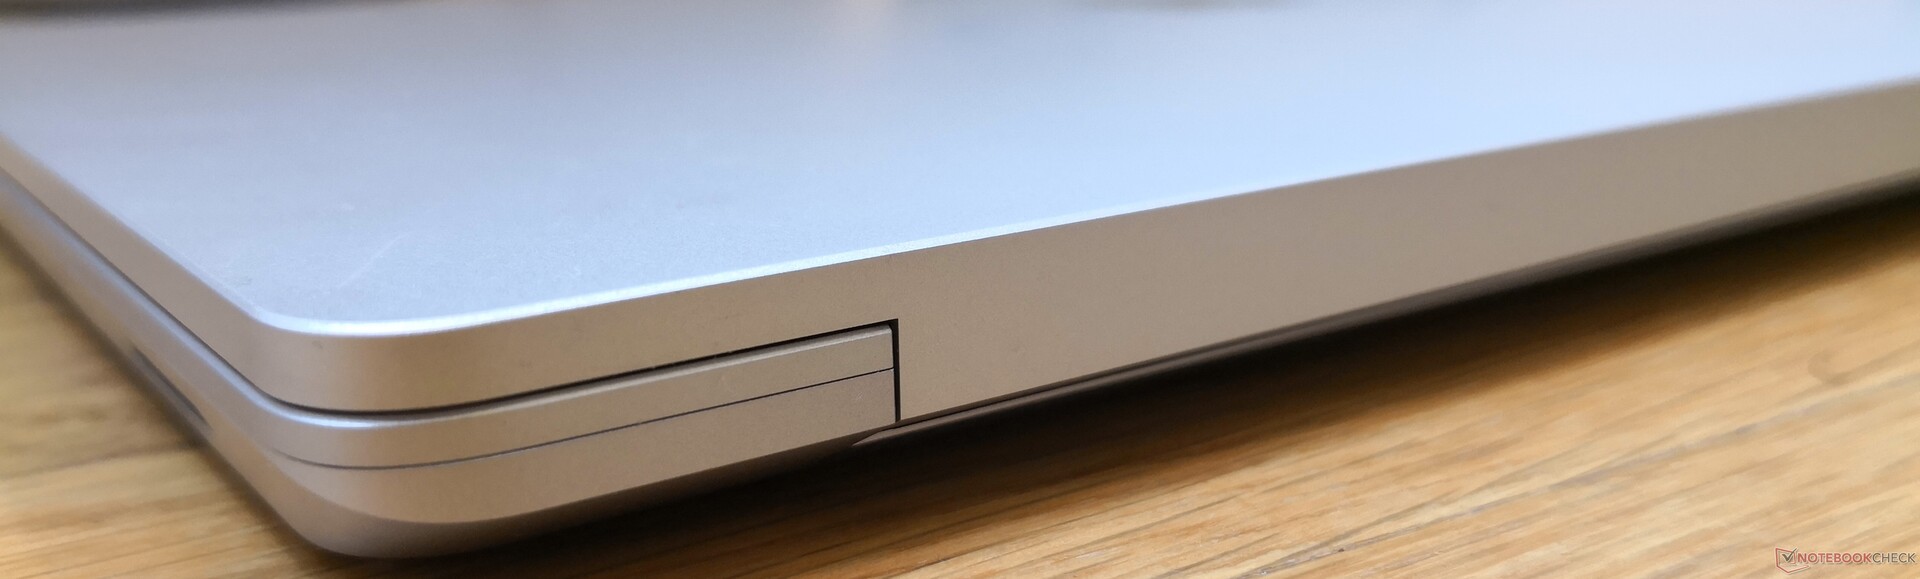
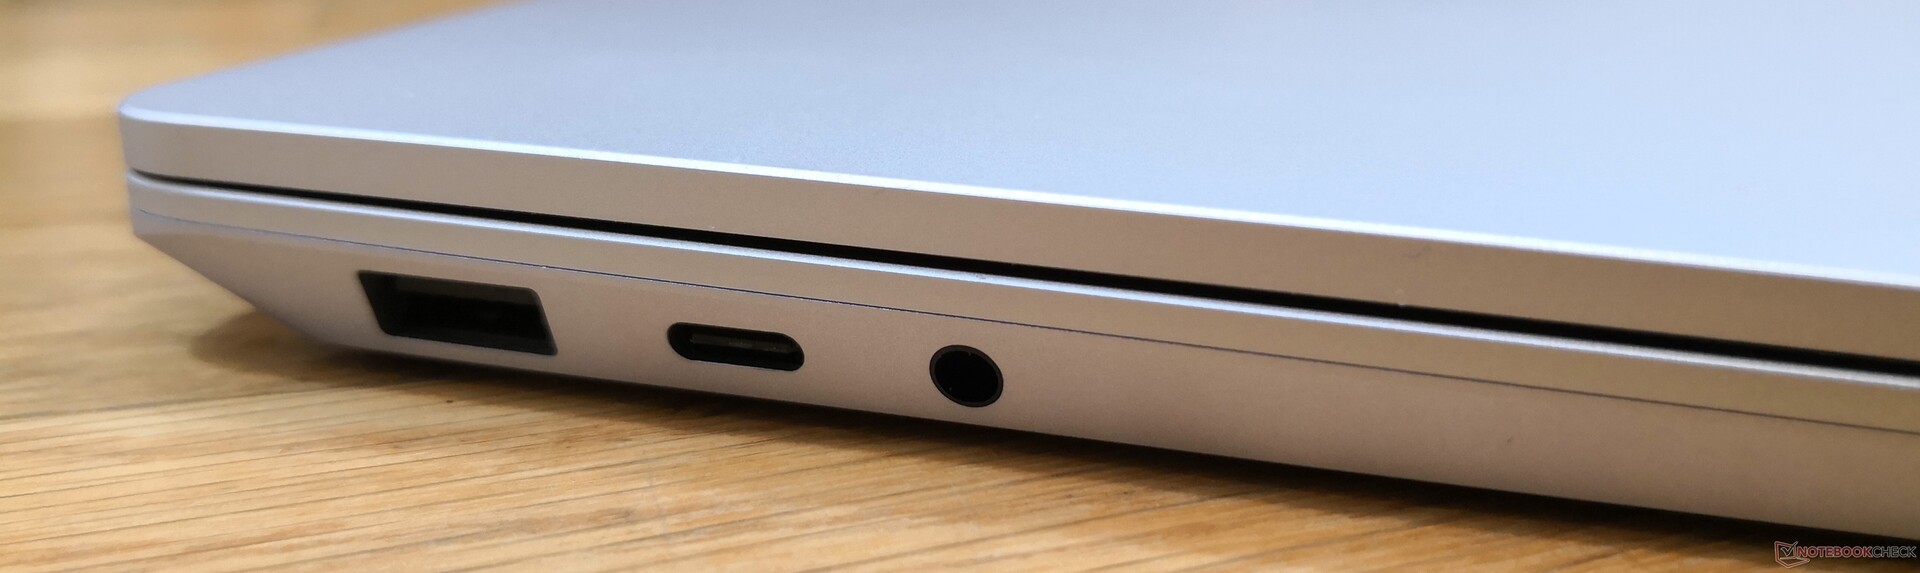
Bağlantı noktası seçenekleri 15 inçlik bir dizüstü bilgisayar için sınırlıdır. Örneğin, daha küçük Huawei MateBook X Pro, çift USB Type-C bağlantı noktası, Thunderbolt 3 ve USB Type-A bağlantı noktasıyla birlikte gelirken, Microsoft dizüstü bilgisayarda Thunderbolt uyumluluğu olmayan yalnızca bir USB Type-C bağlantı noktası bulunur. Bir SD okuyucu, özellikle içerik oluşturucuları ve hareket halindeki kullanıcılar için takdir edilecektir. Surface Laptop 3'ün yerleştirme özelliklerinden sonuna kadar yararlanmak istiyorsanız pahalı Surface Dock'u satın almanız gerekir.
İletişim
Intel SKU'lar, Wi-Fi 6 (802.11ax) bağlantısı için Intel AX201 ile standart olarak gelirken, AMD SKU'lar yalnızca Wi-Fi 5 bağlantısı için daha yavaş Atheros / Qualcomm QCA6174 ile birlikte gelir. Birincisi, yepyeni bir Wi-Fi 6 yönlendiricisine sahip birkaç kullanıcıdan biri olmanız durumunda, ikincisinin aktarım oranlarını iki katından fazla sunabilir. Aksi takdirde, Wi-Fi 6 dizüstü bilgisayara sahip olmanın ana nedeni çoğunlukla geleceğe yöneliktir çünkü WLAN performansı günlük yükler sırasında farklı hissetmeyecektir. Başlık altında bazı donanım değişiklikleri için AX201'in AX200 tasarrufuyla işlevsel olarak aynı olduğunu unutmayın.
| Networking | |
| iperf3 transmit AX12 | |
| MSI Prestige 15 A10SC | |
| Dell XPS 15 7590 i5 iGPU FHD | |
| HP Spectre x360 15-df0126ng | |
| Apple MacBook Pro 16 2019 i9 5500M | |
| iperf3 receive AX12 | |
| MSI Prestige 15 A10SC | |
| Apple MacBook Pro 16 2019 i9 5500M | |
| Dell XPS 15 7590 i5 iGPU FHD | |
| HP Spectre x360 15-df0126ng | |
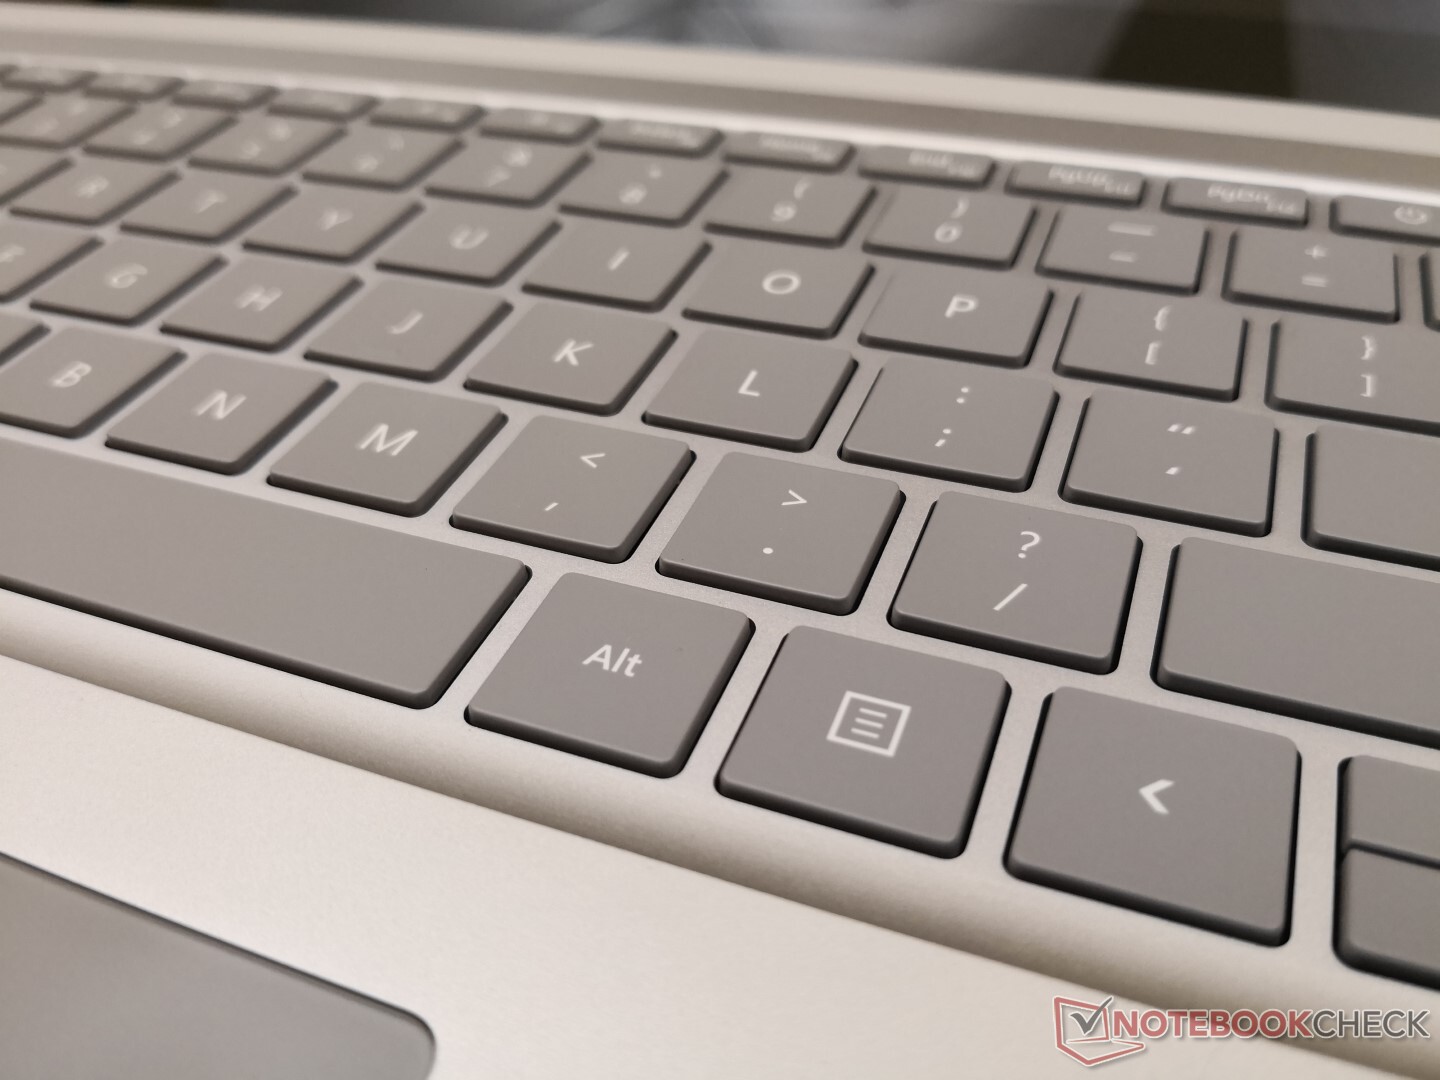
Giriş cihazları
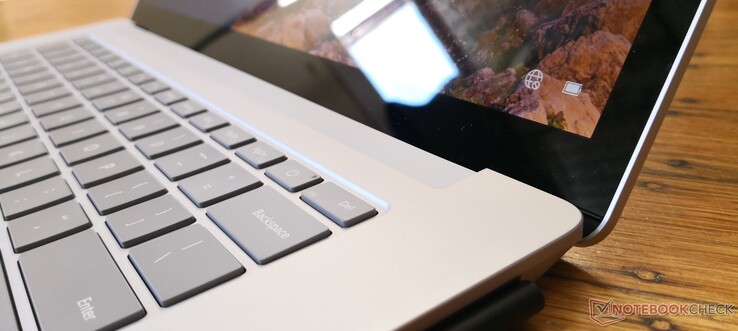
Klavye ve Dokunmatik Yüzey

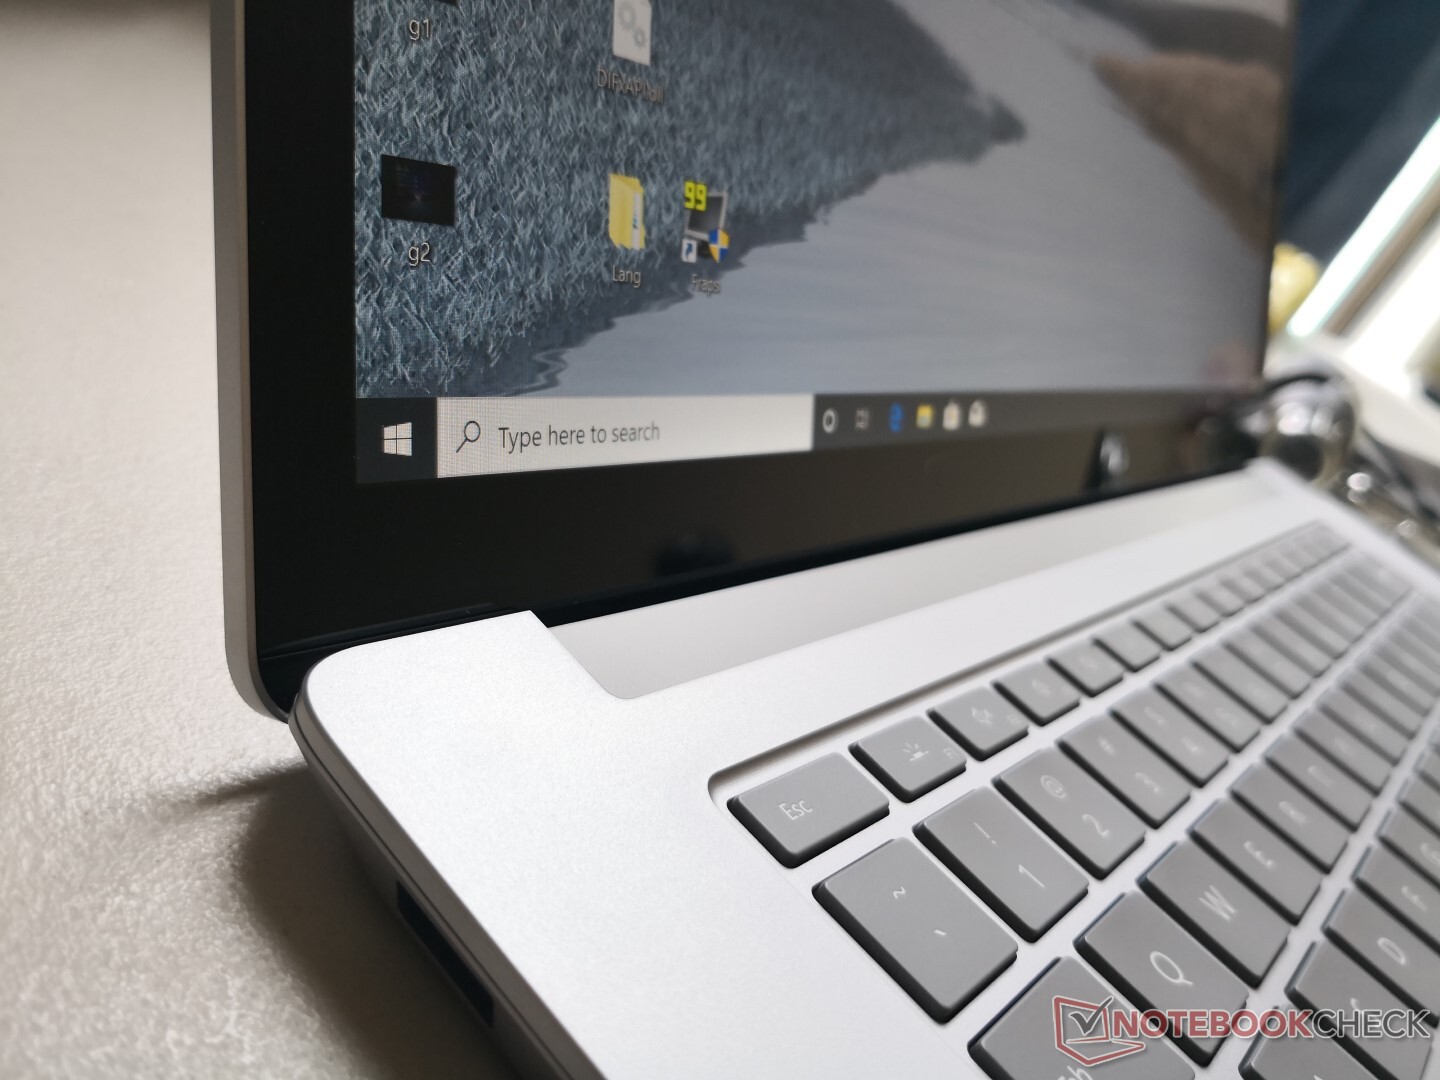
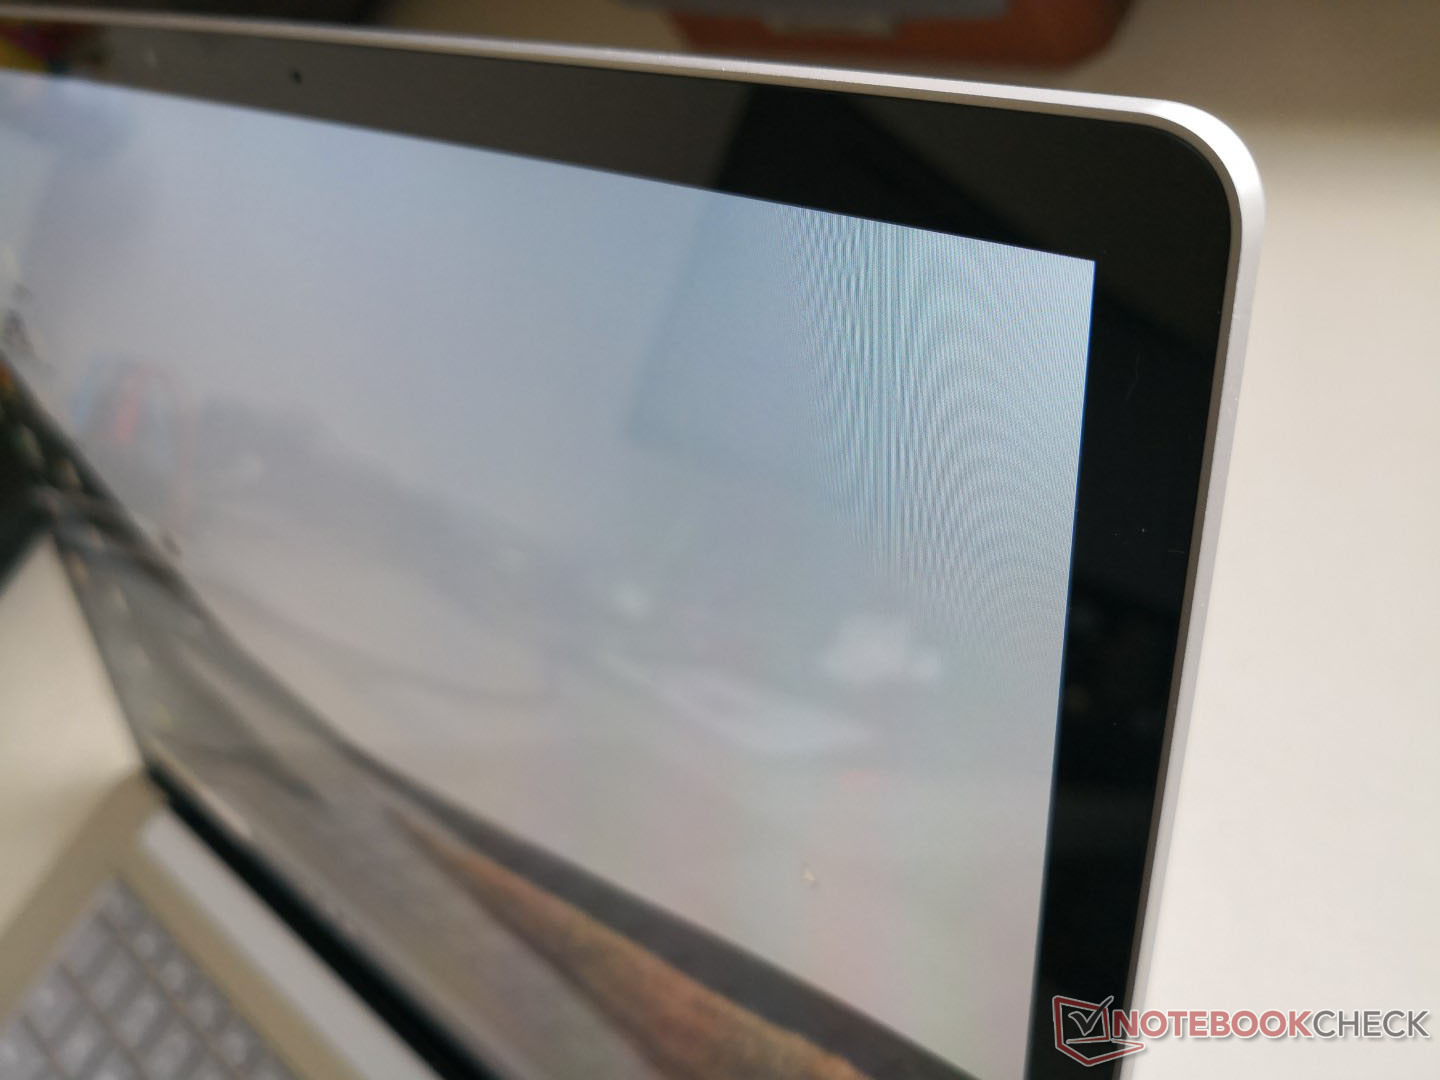
Görüntüle
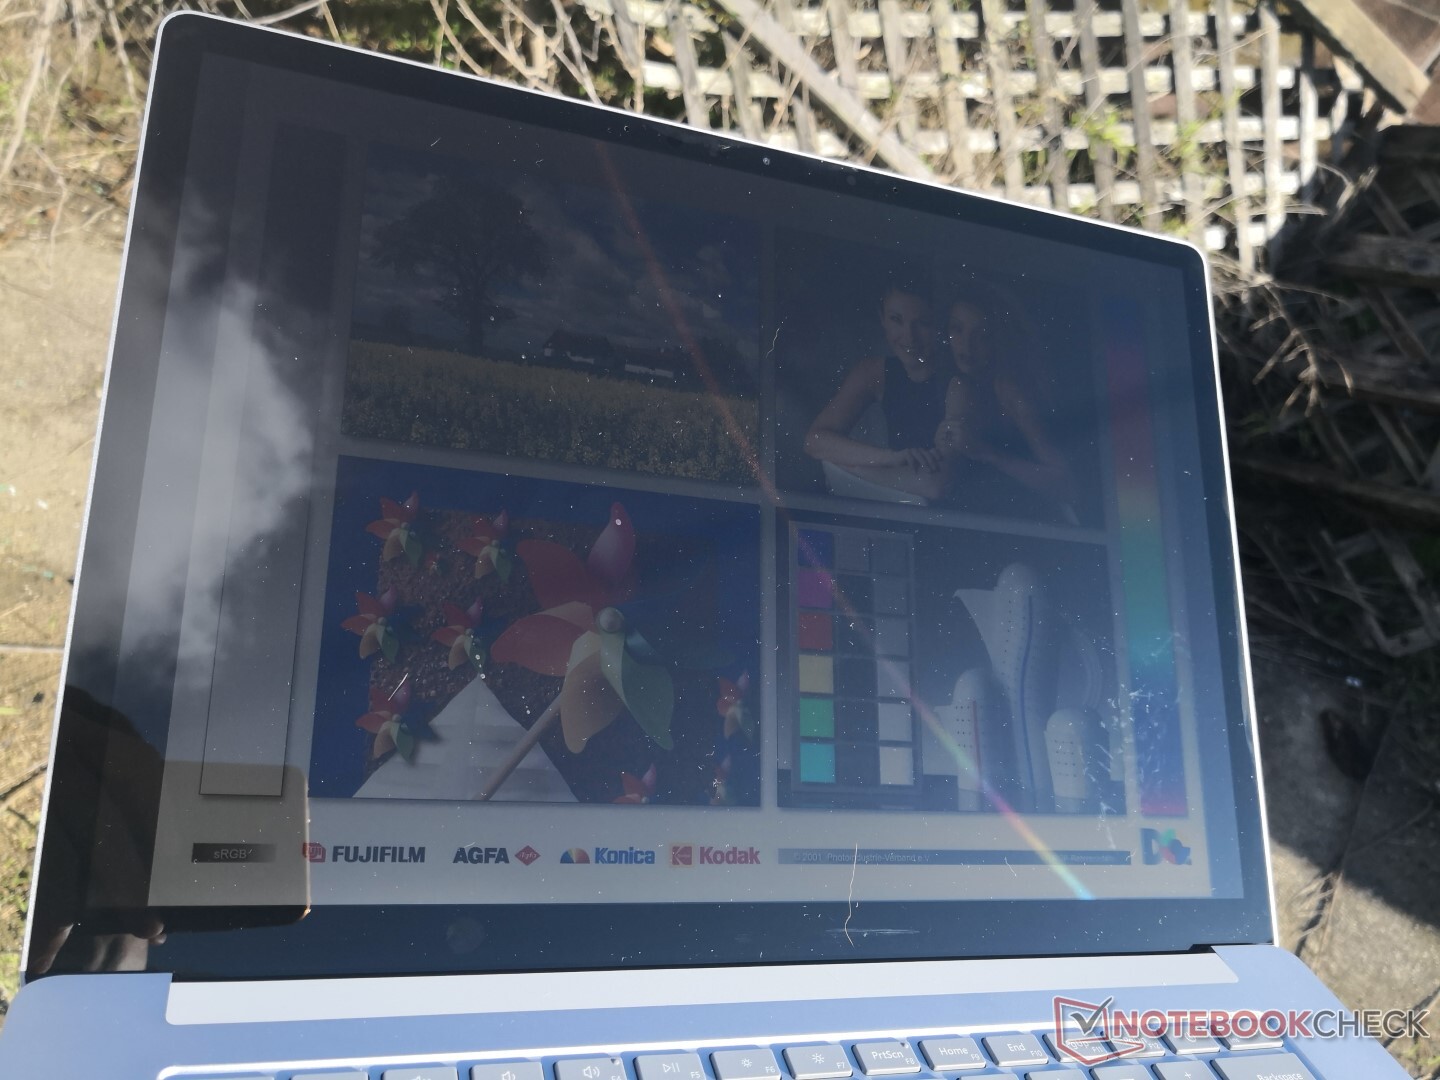
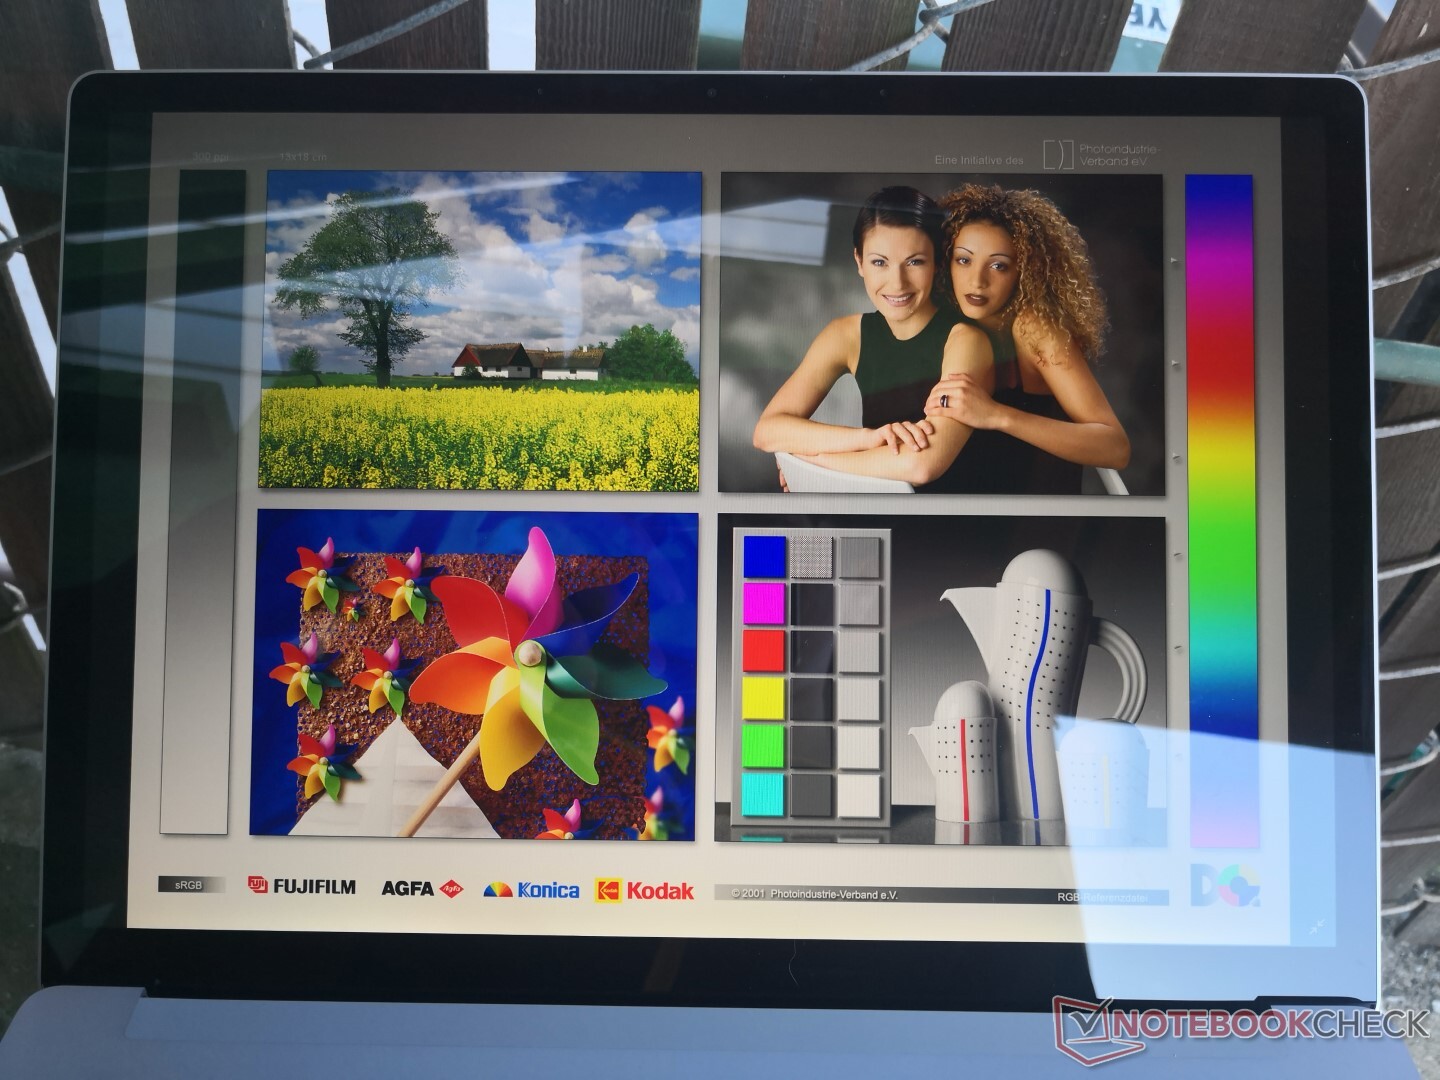
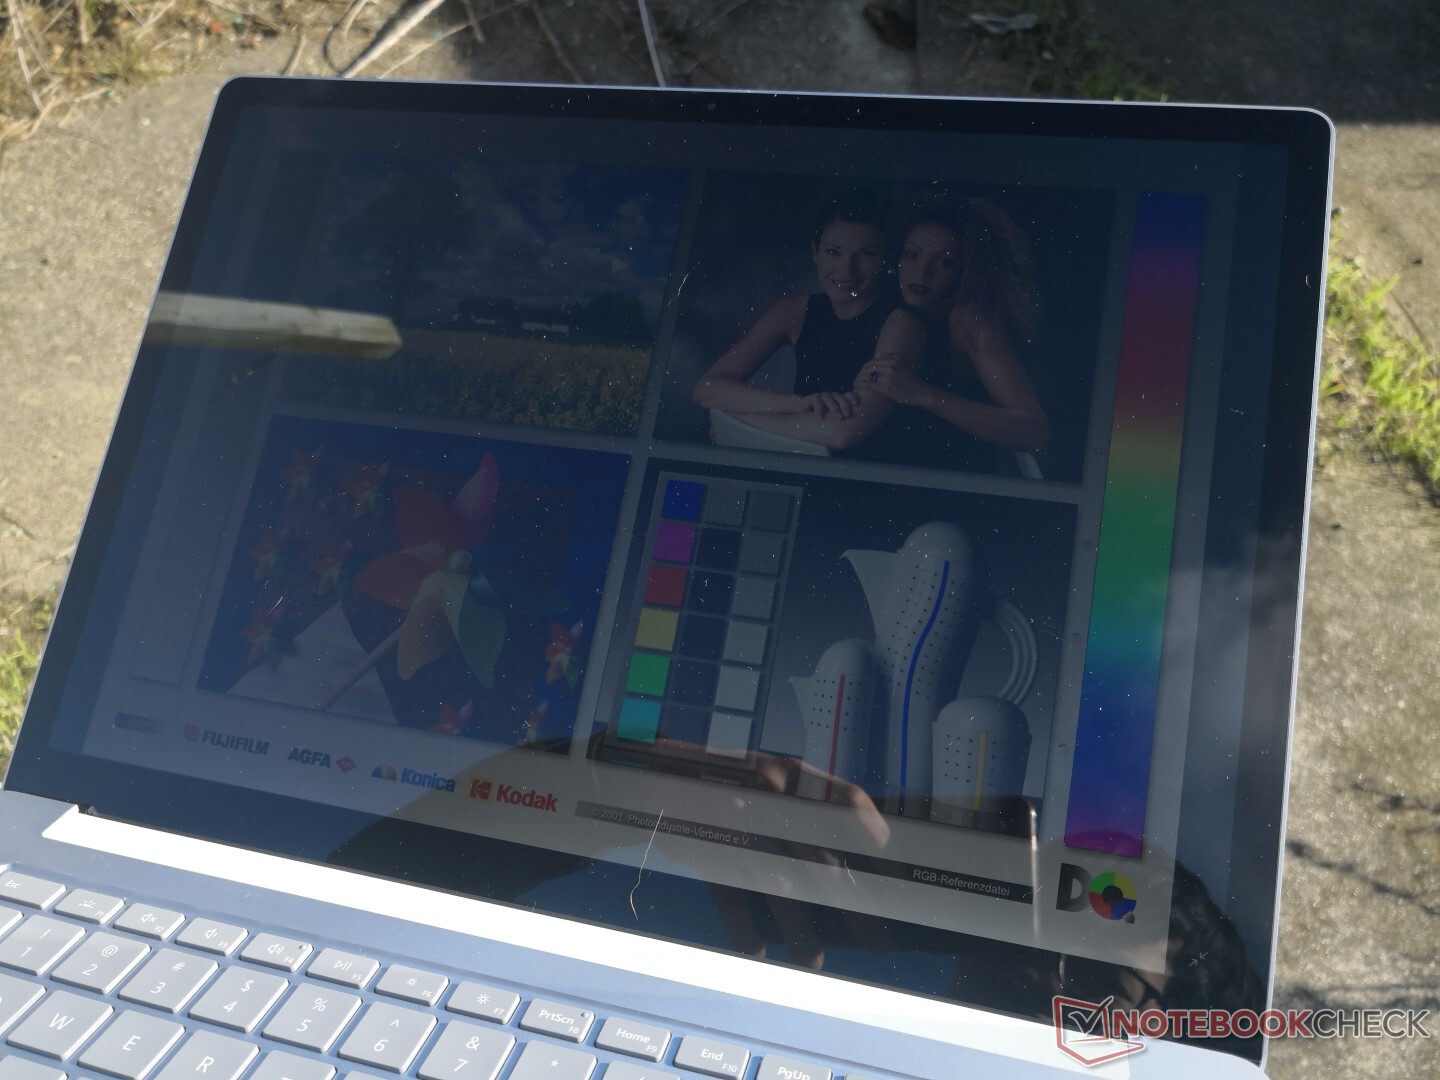
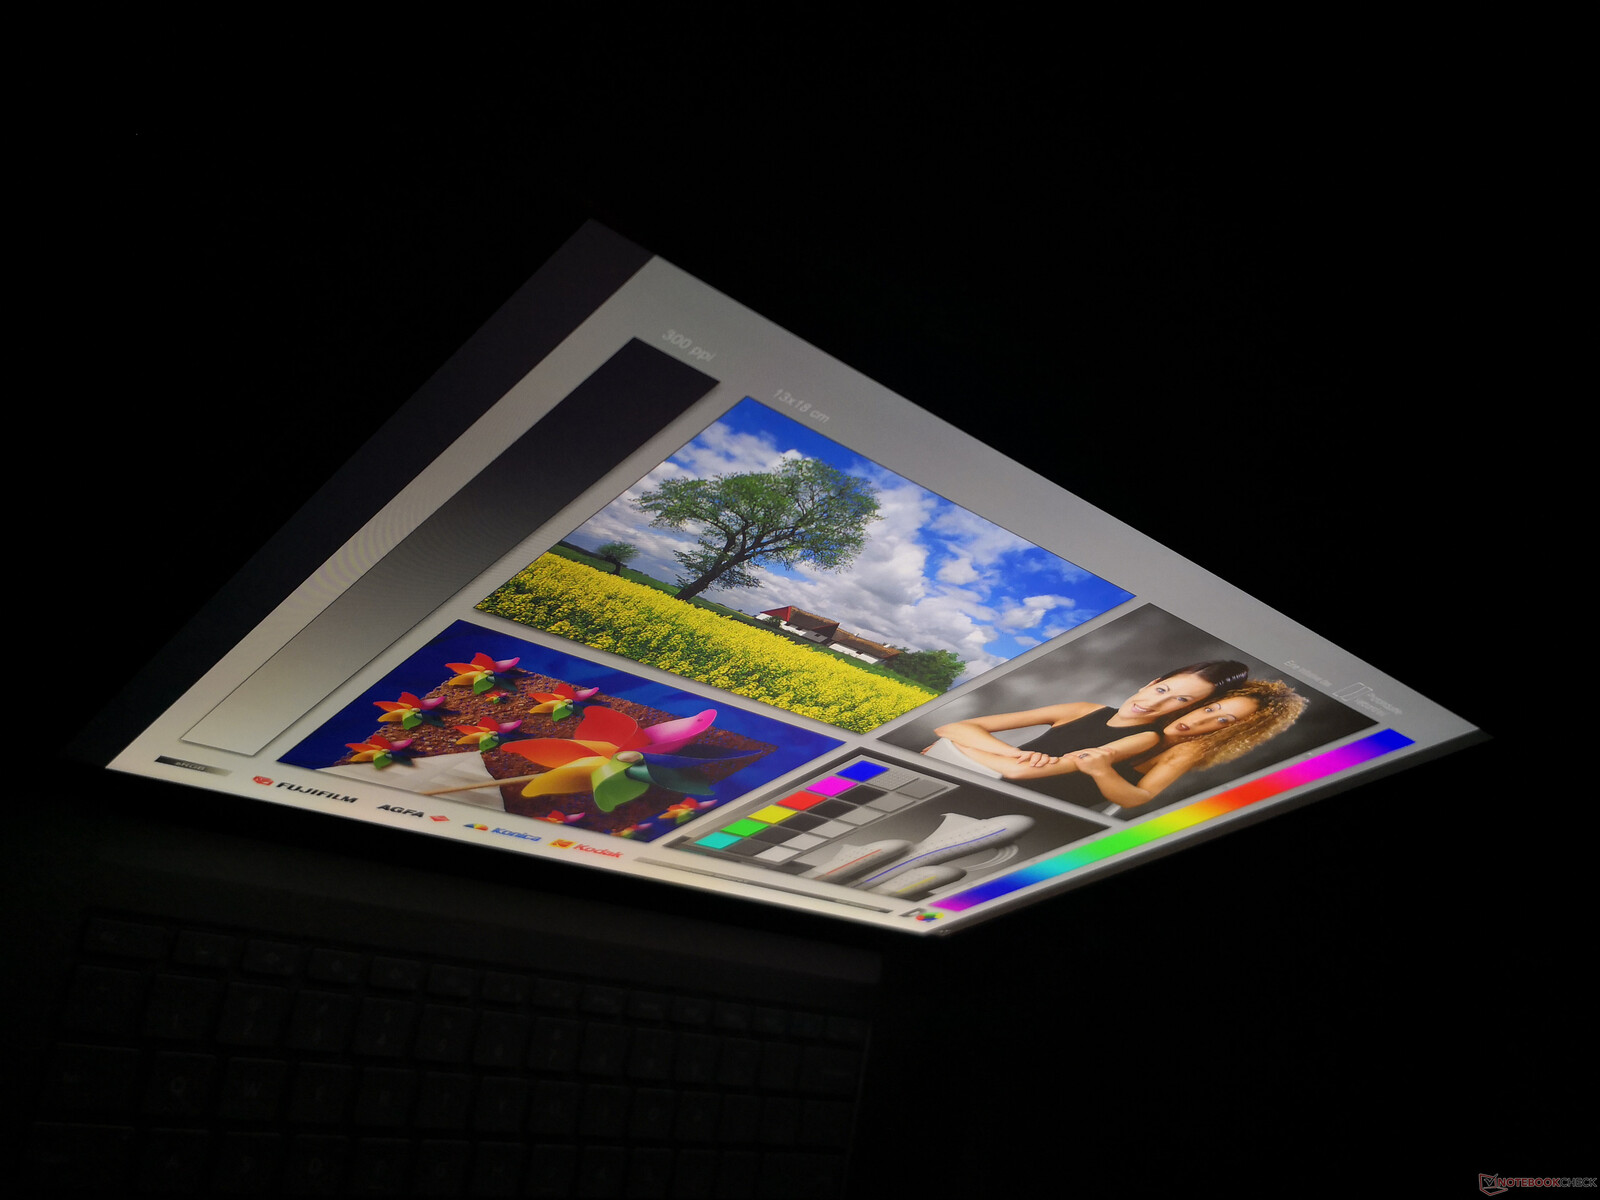
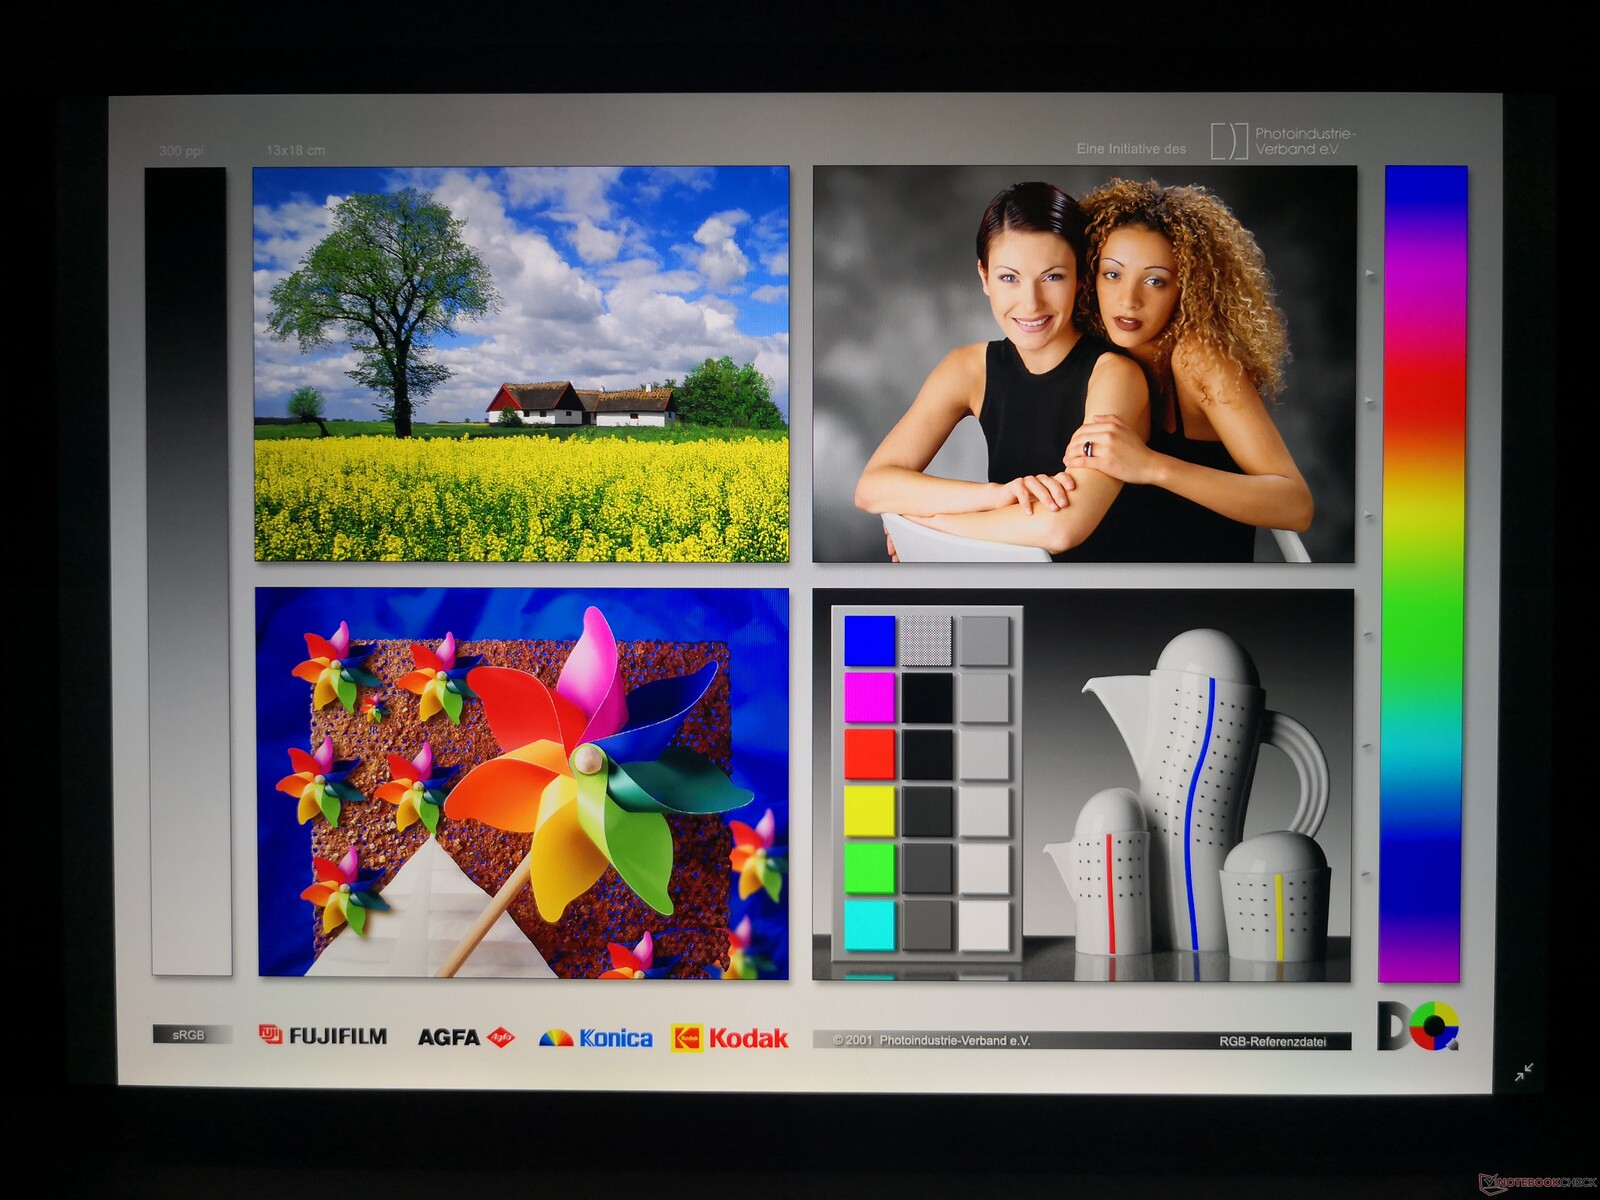
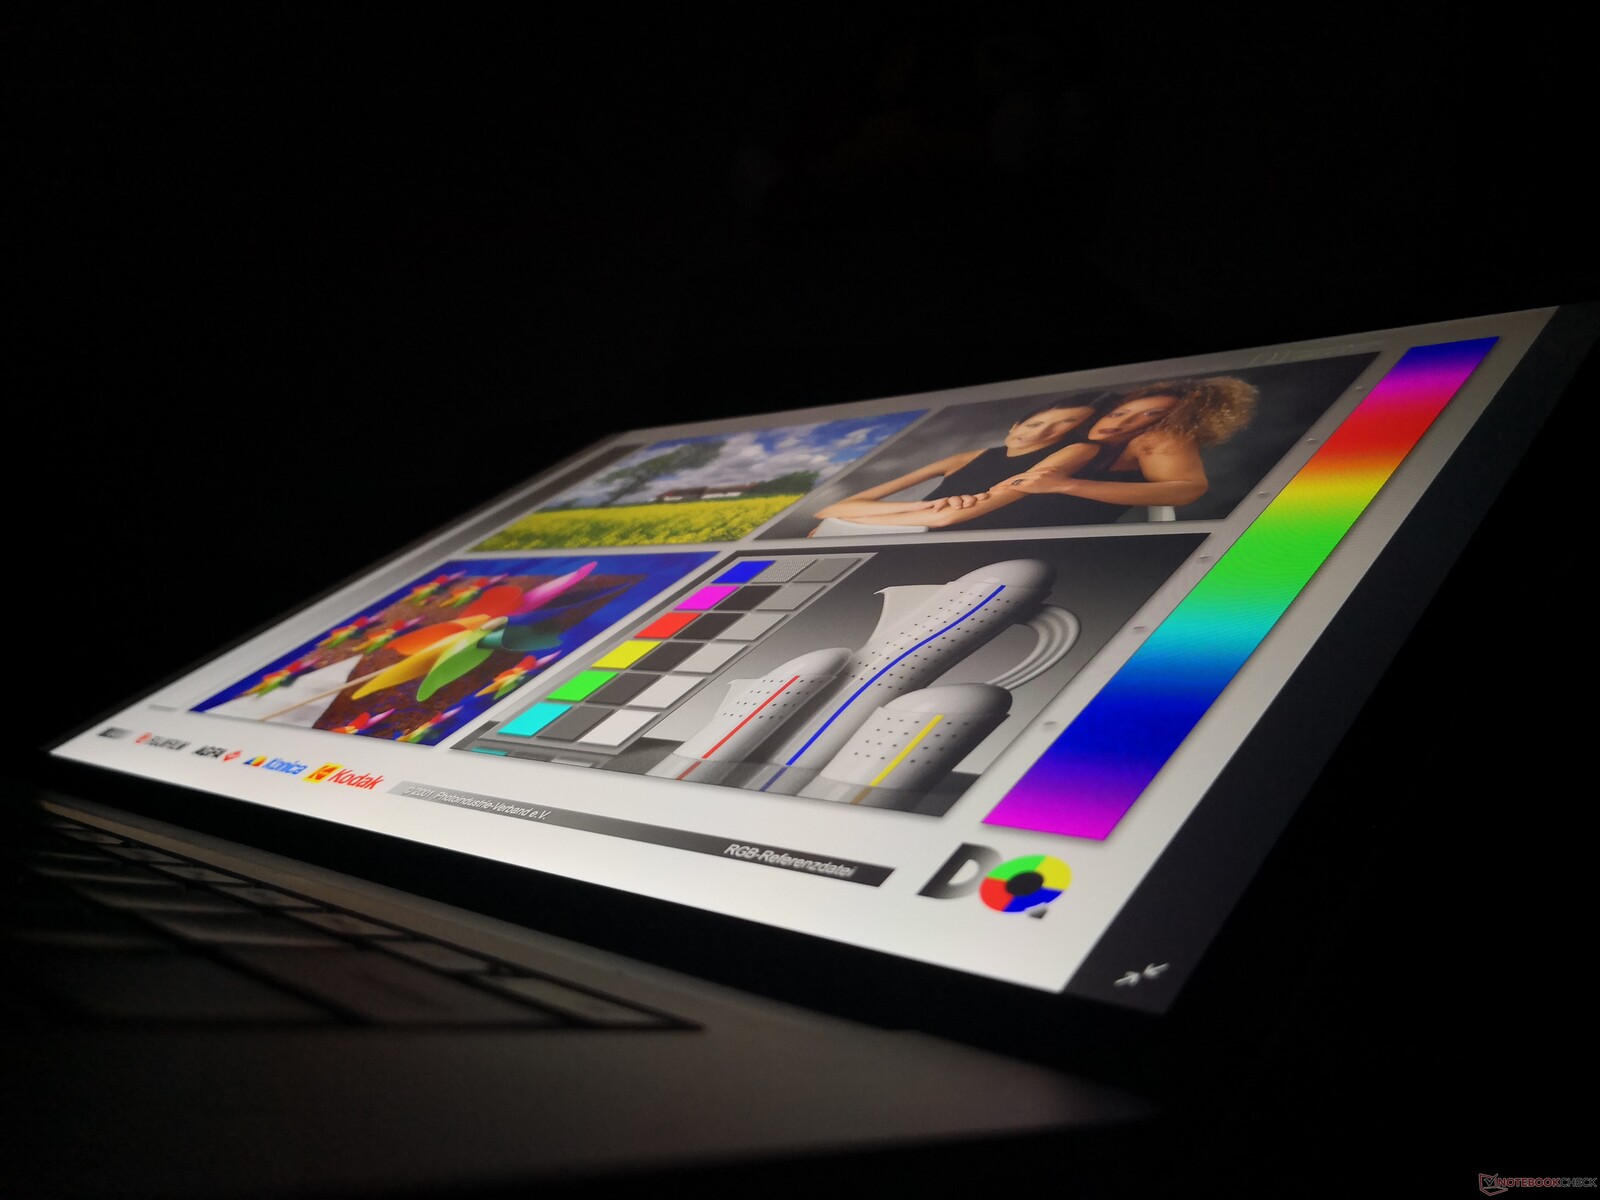
Microsoft, tüm Surface Laptop 3 SKU'larında aynı Sharp LQ150P1JX51 IPS panelini kullanmaktadır. Bağımsız ölçümlerimiz, parlaklık, kontrast, renkler, tepki süreleri ve hatta darbe genişliği modülasyon frekansı dahil olmak üzere Intel ve AMD seçenekleri arasında önemli ekran özelliklerinin aynı olduğunu göstermektedir. Rakip Apple MacBook Pro 16 ve Dell XPS 15, daha iyi dış mekan görünürlüğü için daha parlak ekranlara sahiptir.

| |||||||||||||||||||||||||
Aydınlatma: 78 %
Batarya modunda parlaklık: 412.4 cd/m²
Kontrast: 1178:1 (Siyah: 0.35 cd/m²)
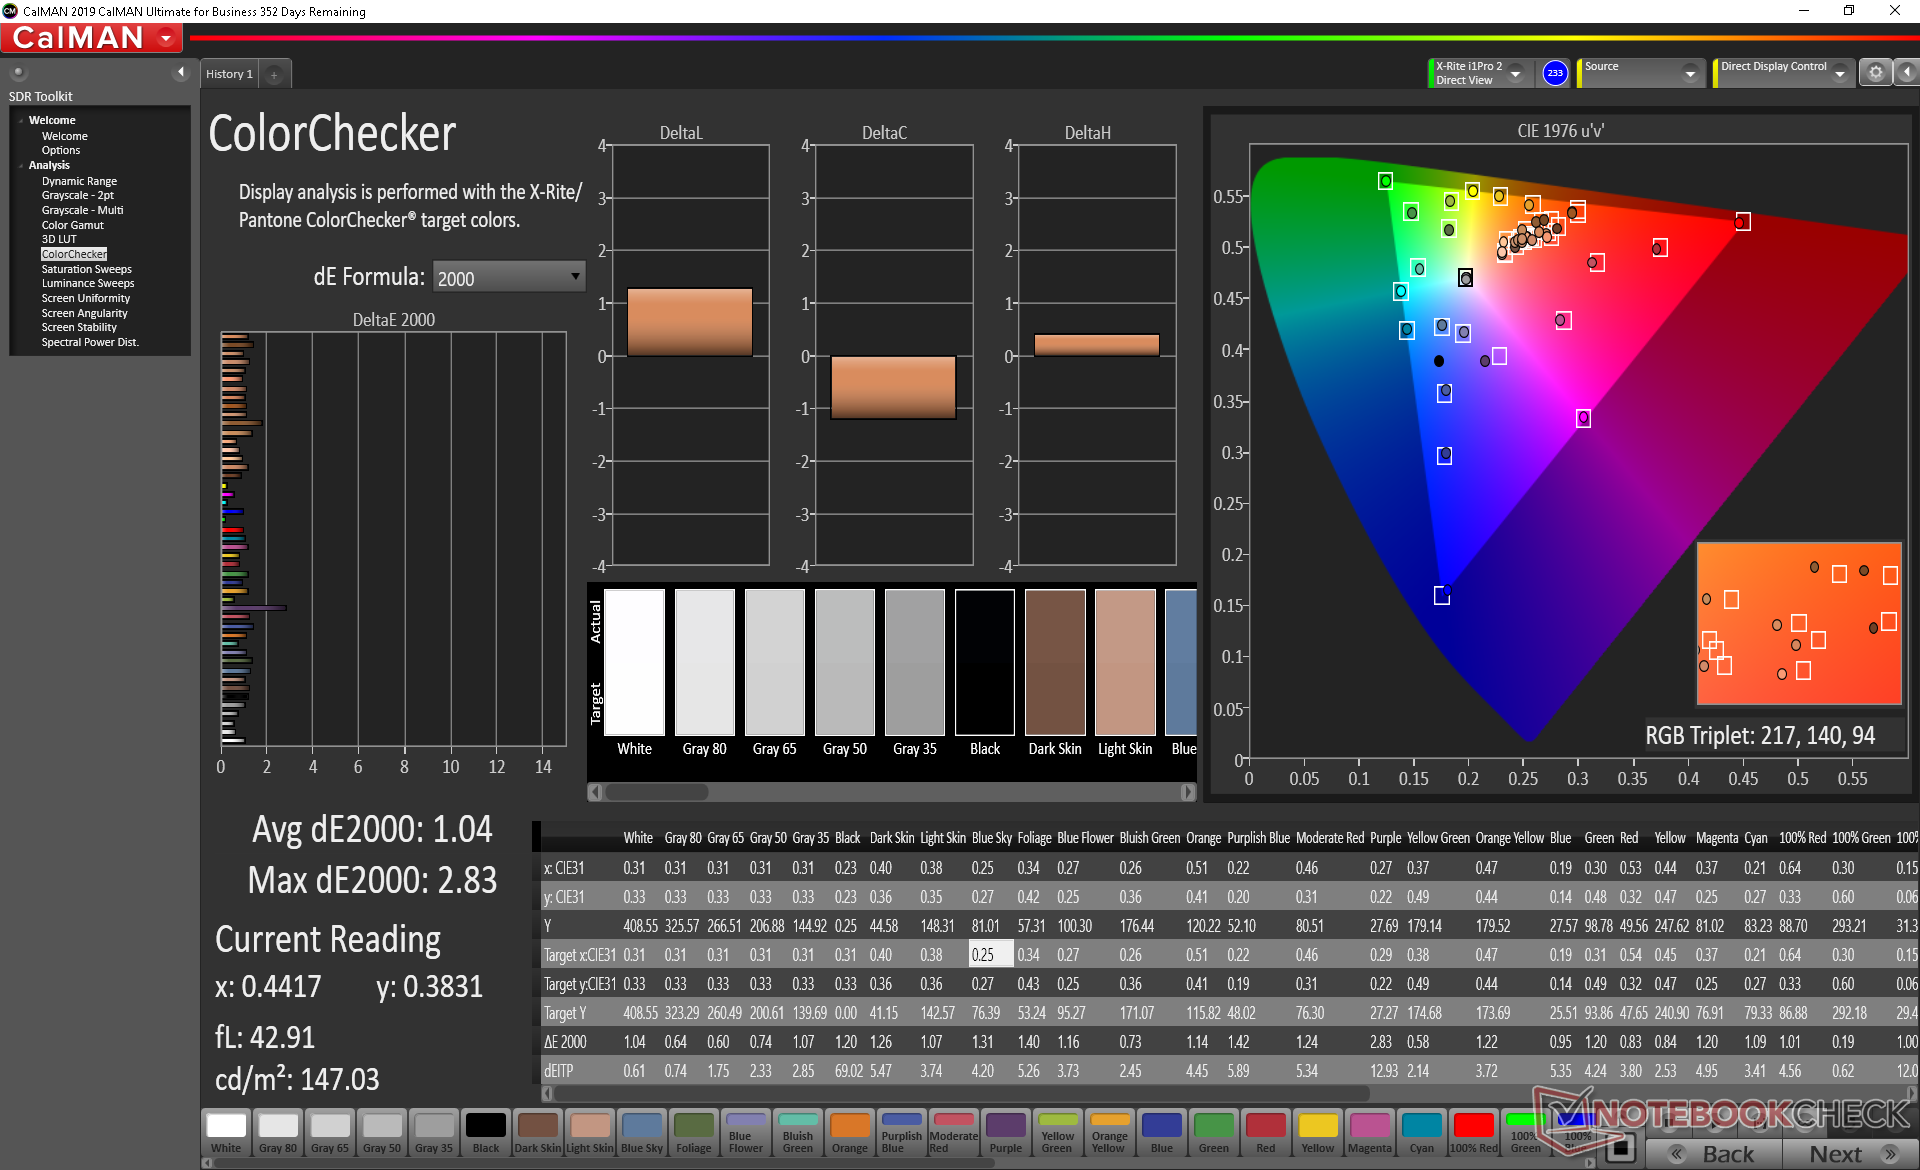
ΔE ColorChecker Calman: 1.04 | ∀{0.5-29.43 Ø4.71}
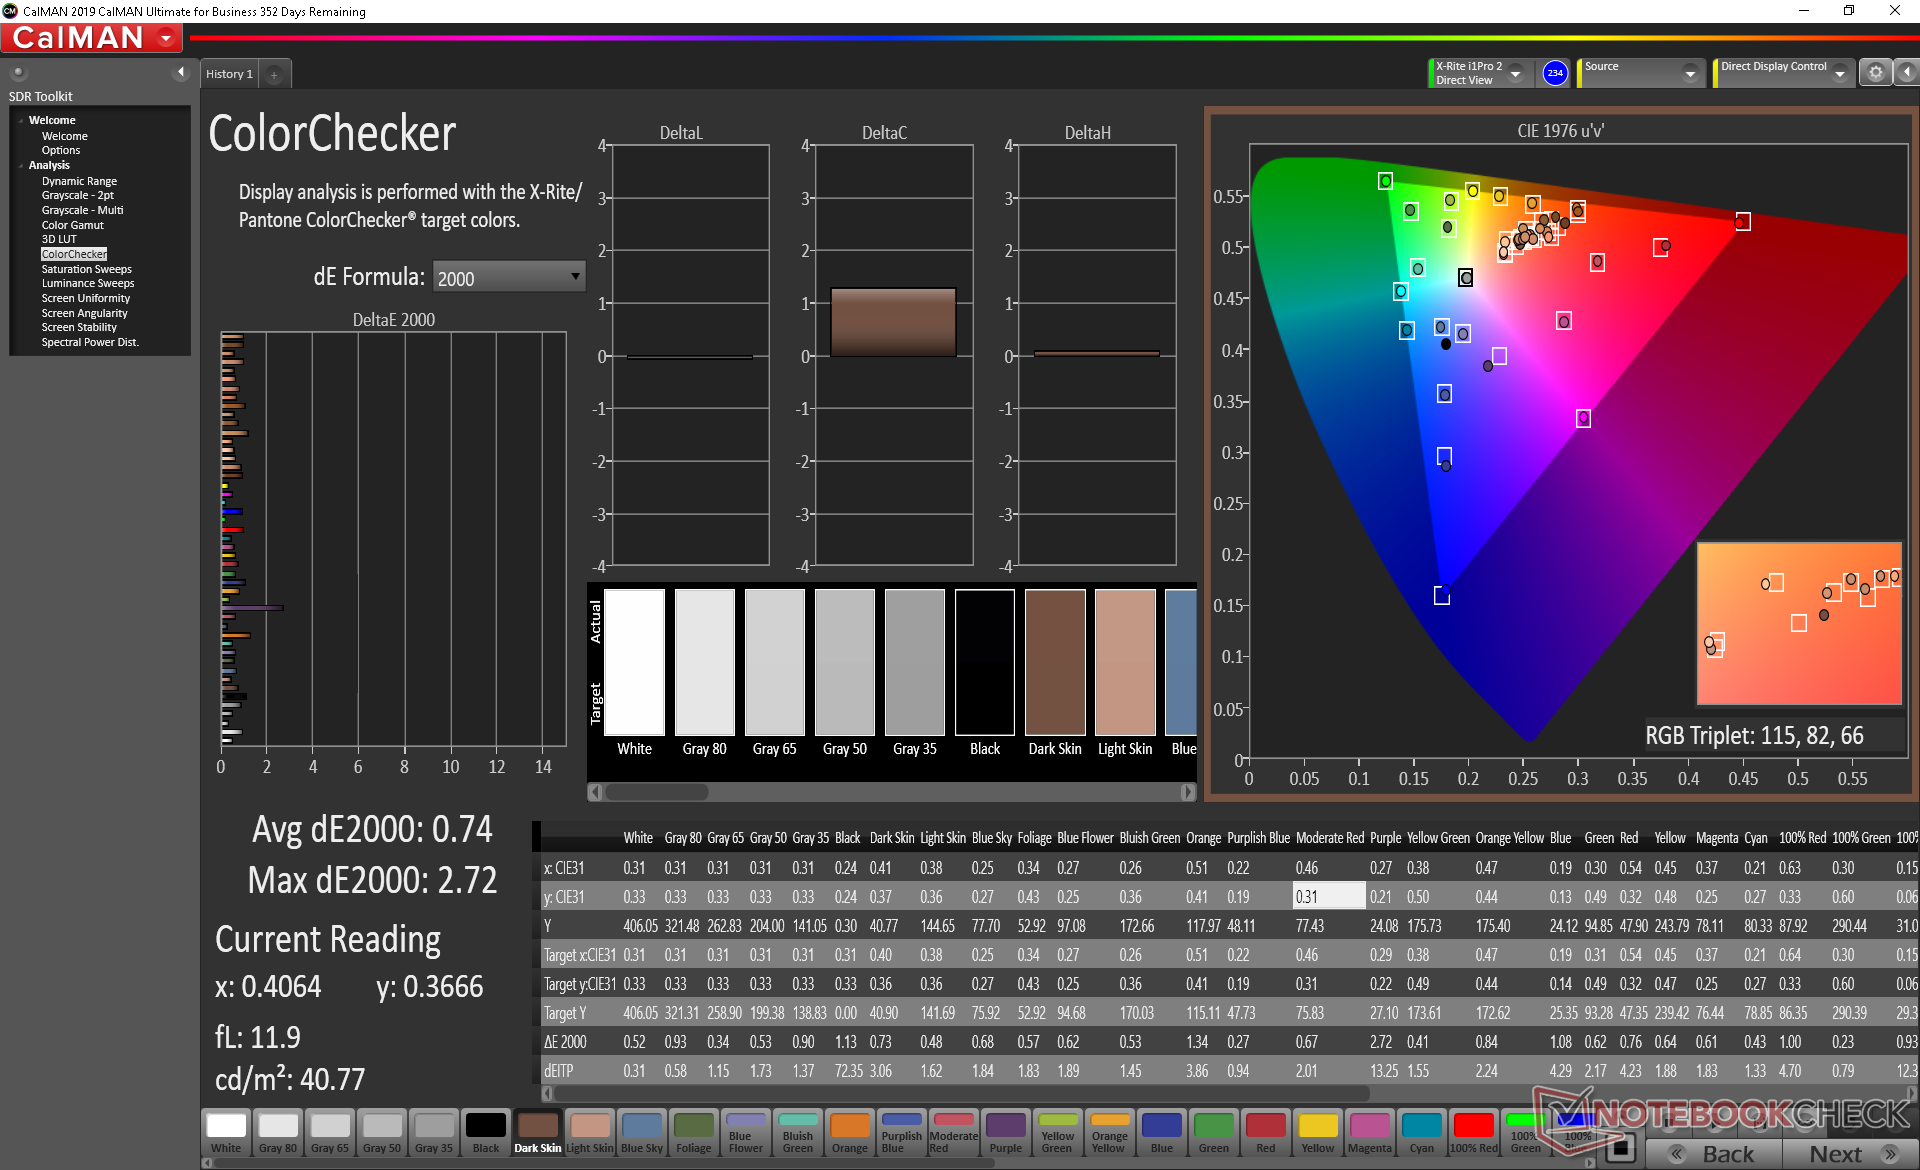
calibrated: 0.74
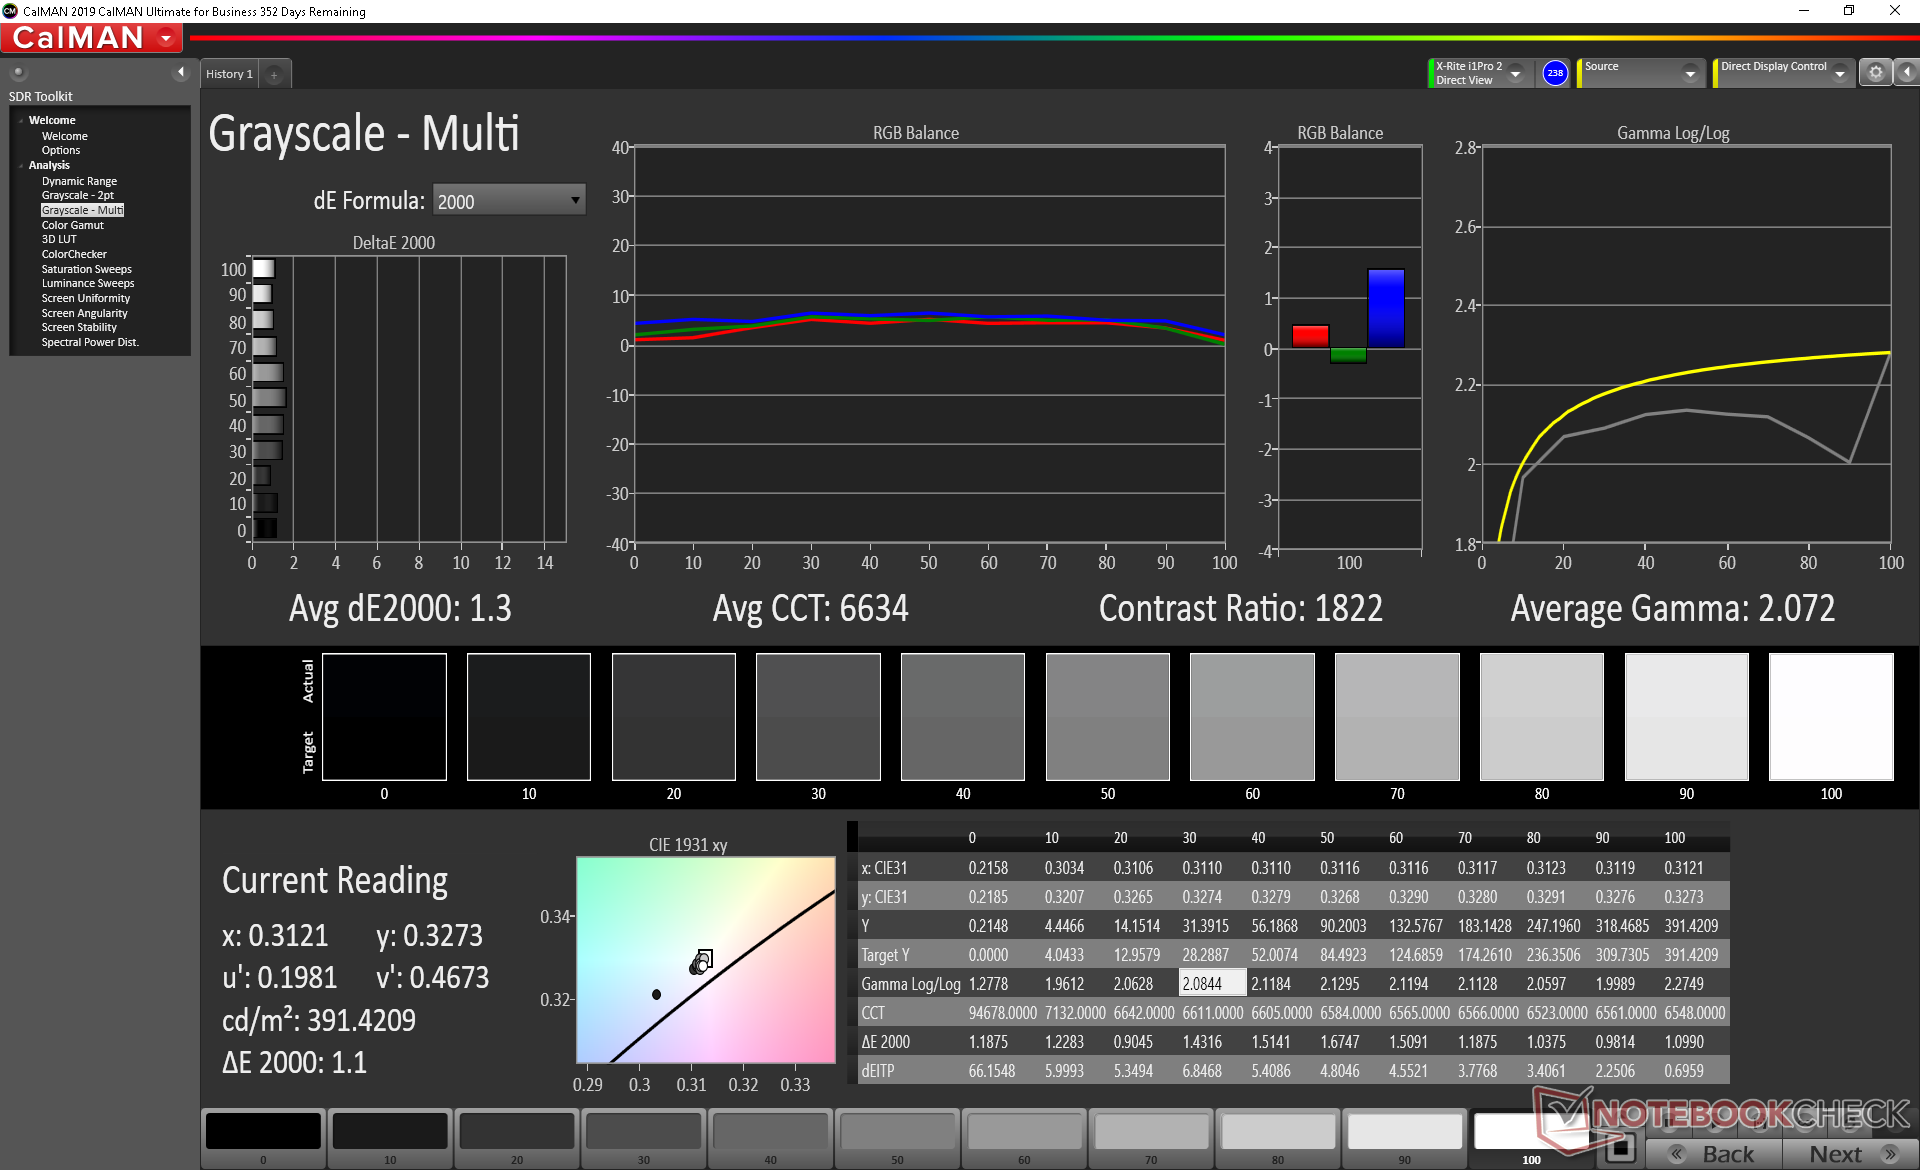
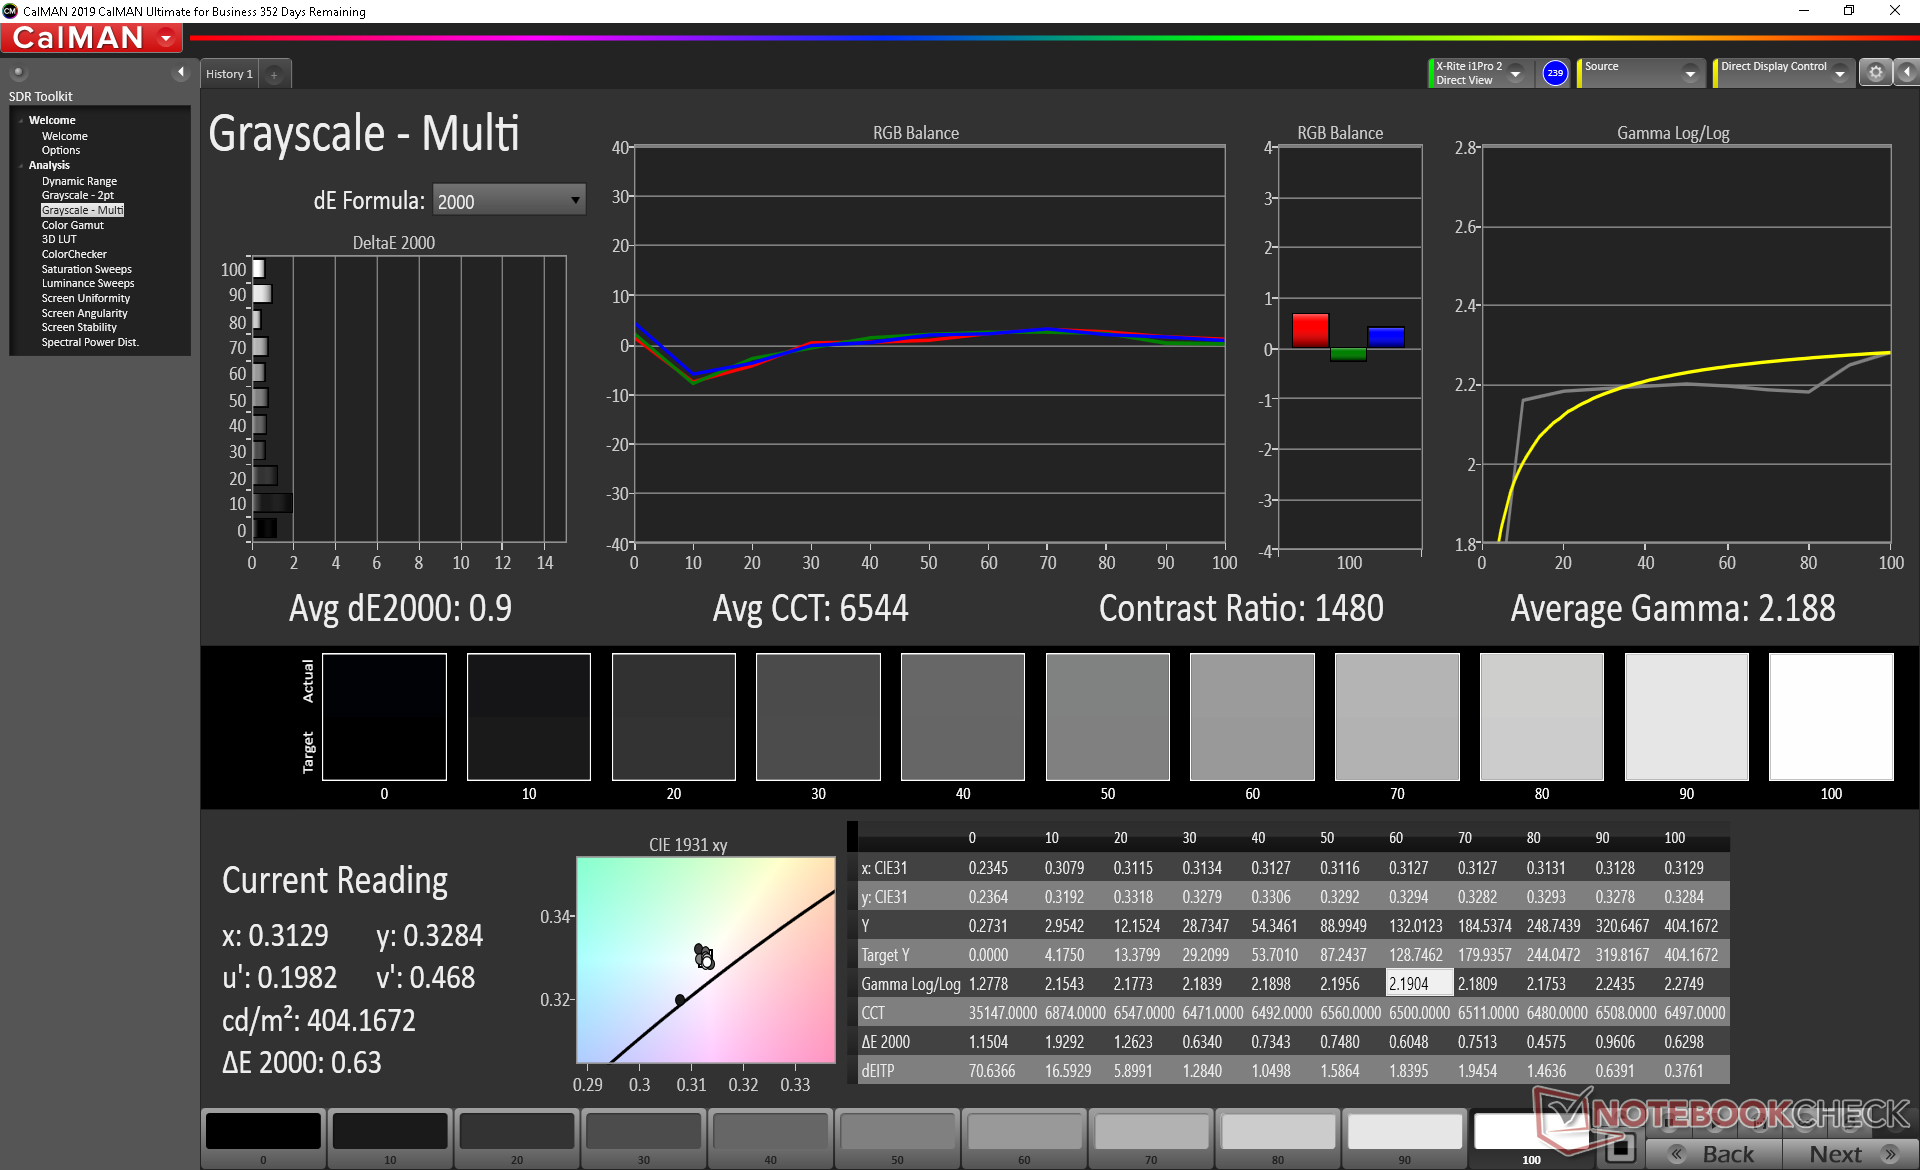
ΔE Greyscale Calman: 1.3 | ∀{0.09-98 Ø4.96}
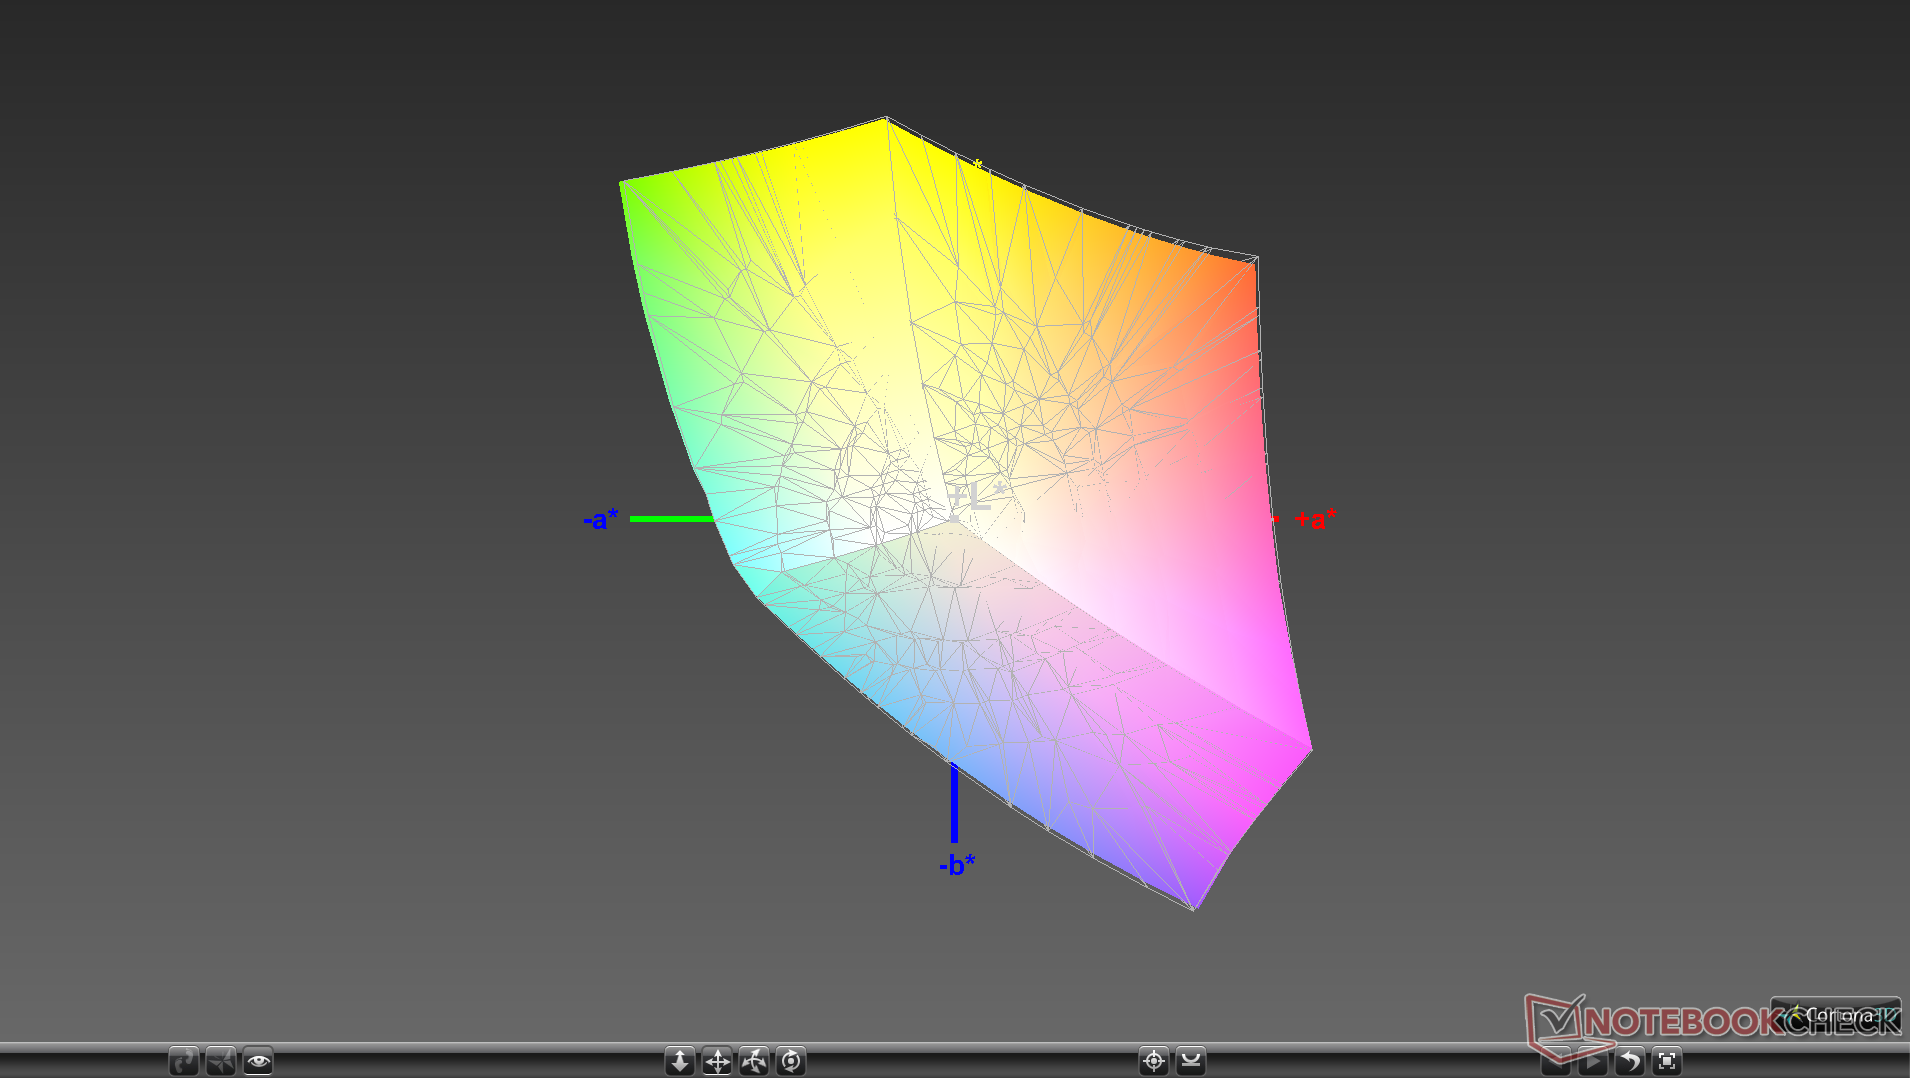
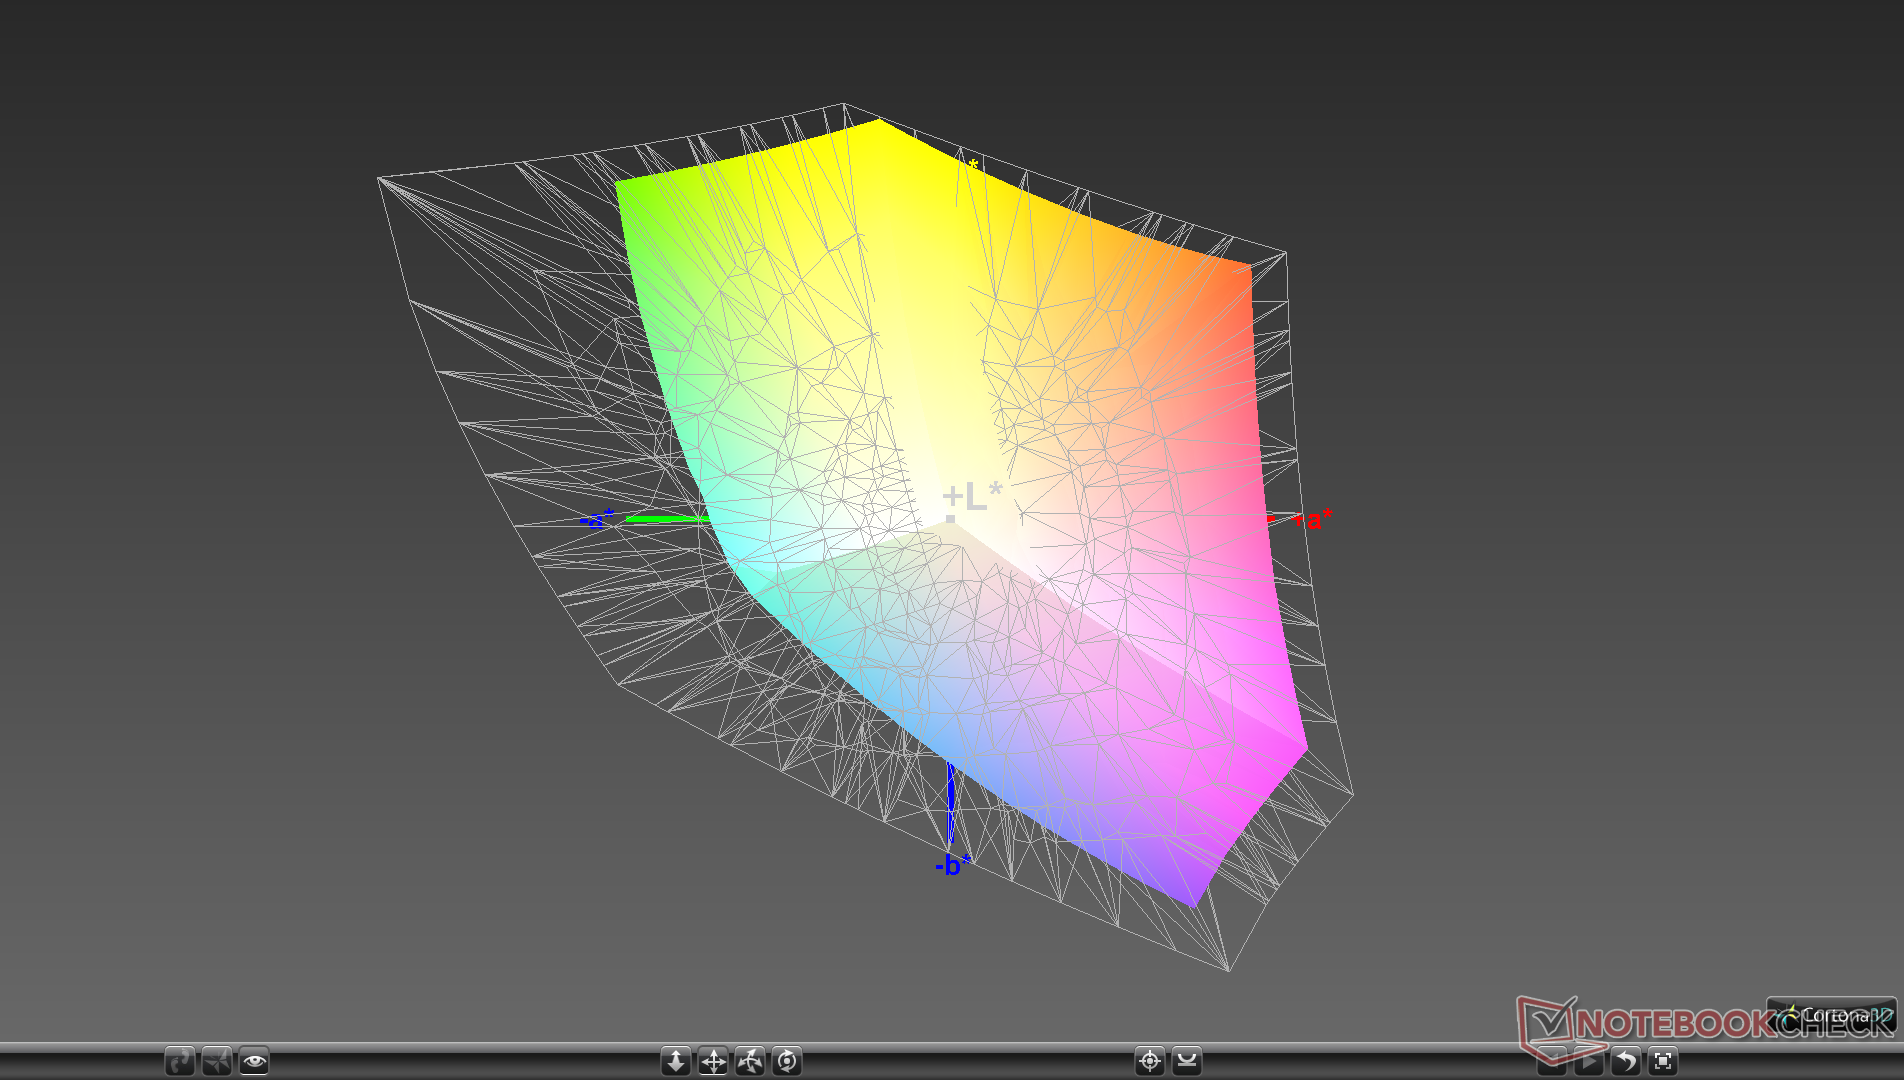
98.4% sRGB (Argyll 1.6.3 3D)
62.4% AdobeRGB 1998 (Argyll 1.6.3 3D)
67.8% AdobeRGB 1998 (Argyll 3D)
98.4% sRGB (Argyll 3D)
65.6% Display P3 (Argyll 3D)
Gamma: 2.07
CCT: 6634 K
| Microsoft Surface Laptop 3 15 i7-1065G7 Sharp LQ150P1JX51, IPS, 15", 2496x1664 | Apple MacBook Pro 16 2019 i9 5500M APPA044, IPS, 16", 3072x1920 | Dell XPS 15 7590 i5 iGPU FHD LQ156M1, IPS, 15.6", 1920x1080 | Asus ZenBook 15 UX534FT-DB77 BOE NV156FHM-N63, IPS, 15.6", 1920x1080 | MSI Prestige 15 A10SC Sharp LQ156D1JW42, IPS, 15.6", 3840x2160 | Microsoft Surface Laptop 3 15 Ryzen 5 3580U Sharp LQ150P1JX51, IPS, 15", 2496x1664 | |
|---|---|---|---|---|---|---|
| Display | 1% | -5% | 22% | -1% | ||
| Display P3 Coverage (%) | 65.6 | 66.5 1% | 66.6 2% | 82 25% | 66.9 2% | |
| sRGB Coverage (%) | 98.4 | 98 0% | 87.7 -11% | 98.3 0% | 99.3 1% | |
| AdobeRGB 1998 Coverage (%) | 67.8 | 68.4 1% | 64.1 -5% | 96.2 42% | 63.7 -6% | |
| Response Times | 7% | 11% | 20% | -8% | 10% | |
| Response Time Grey 50% / Grey 80% * (ms) | 56 ? | 52.4 ? 6% | 52.8 ? 6% | 41.2 ? 26% | 60 ? -7% | 47.2 ? 16% |
| Response Time Black / White * (ms) | 38 ? | 34.9 ? 8% | 32 ? 16% | 33.2 ? 13% | 41.2 ? -8% | 36.8 ? 3% |
| PWM Frequency (Hz) | 21370 ? | 131700 | 1020 ? | 26040 ? | 21370 ? | |
| Screen | -14% | -34% | -132% | -65% | -31% | |
| Brightness middle (cd/m²) | 412.4 | 519 26% | 588 43% | 312.6 -24% | 464.5 13% | 416.9 1% |
| Brightness (cd/m²) | 374 | 477 28% | 555 48% | 290 -22% | 451 21% | 389 4% |
| Brightness Distribution (%) | 78 | 86 10% | 89 14% | 85 9% | 92 18% | 86 10% |
| Black Level * (cd/m²) | 0.35 | 0.39 -11% | 0.4 -14% | 0.31 11% | 0.5 -43% | 0.4 -14% |
| Contrast (:1) | 1178 | 1331 13% | 1470 25% | 1008 -14% | 929 -21% | 1042 -12% |
| Colorchecker dE 2000 * | 1.04 | 2.28 -119% | 2.5 -140% | 5.78 -456% | 3.36 -223% | 2.75 -164% |
| Colorchecker dE 2000 max. * | 2.83 | 6.54 -131% | 6.3 -123% | 8.86 -213% | 7.06 -149% | 6.64 -135% |
| Colorchecker dE 2000 calibrated * | 0.74 | 0.86 -16% | 0.6 19% | 3.78 -411% | 3.42 -362% | 0.71 4% |
| Greyscale dE 2000 * | 1.3 | 0.9 31% | 4.5 -246% | 5.4 -315% | 1.3 -0% | 1.8 -38% |
| Gamma | 2.07 106% | 2145 0% | 2.2 100% | 2.21 100% | 2.14 103% | 2.09 105% |
| CCT | 6634 98% | 6572 99% | 6836 95% | 7864 83% | 6596 99% | 6646 98% |
| Color Space (Percent of AdobeRGB 1998) (%) | 62.4 | 78 25% | 63.2 1% | 57.1 -8% | 84.8 36% | 63.4 2% |
| Color Space (Percent of sRGB) (%) | 98.4 | 98 0% | 87.4 -11% | 98.3 0% | 99.4 1% | |
| Toplam Ortalama (Program / Ayarlar) | -4% /
-11% | -7% /
-22% | -39% /
-89% | -17% /
-41% | -7% /
-20% |
* ... daha küçük daha iyidir
Renk alanı sRGB'yi ve AdobeRGB standardının yaklaşık yüzde 62'sini kapsar. Tam AdobeRGB kapsamı, XPS 15, Asus ZenBook Pro 15 veya MSI Prestige 15'in aksine kullanılamaz.
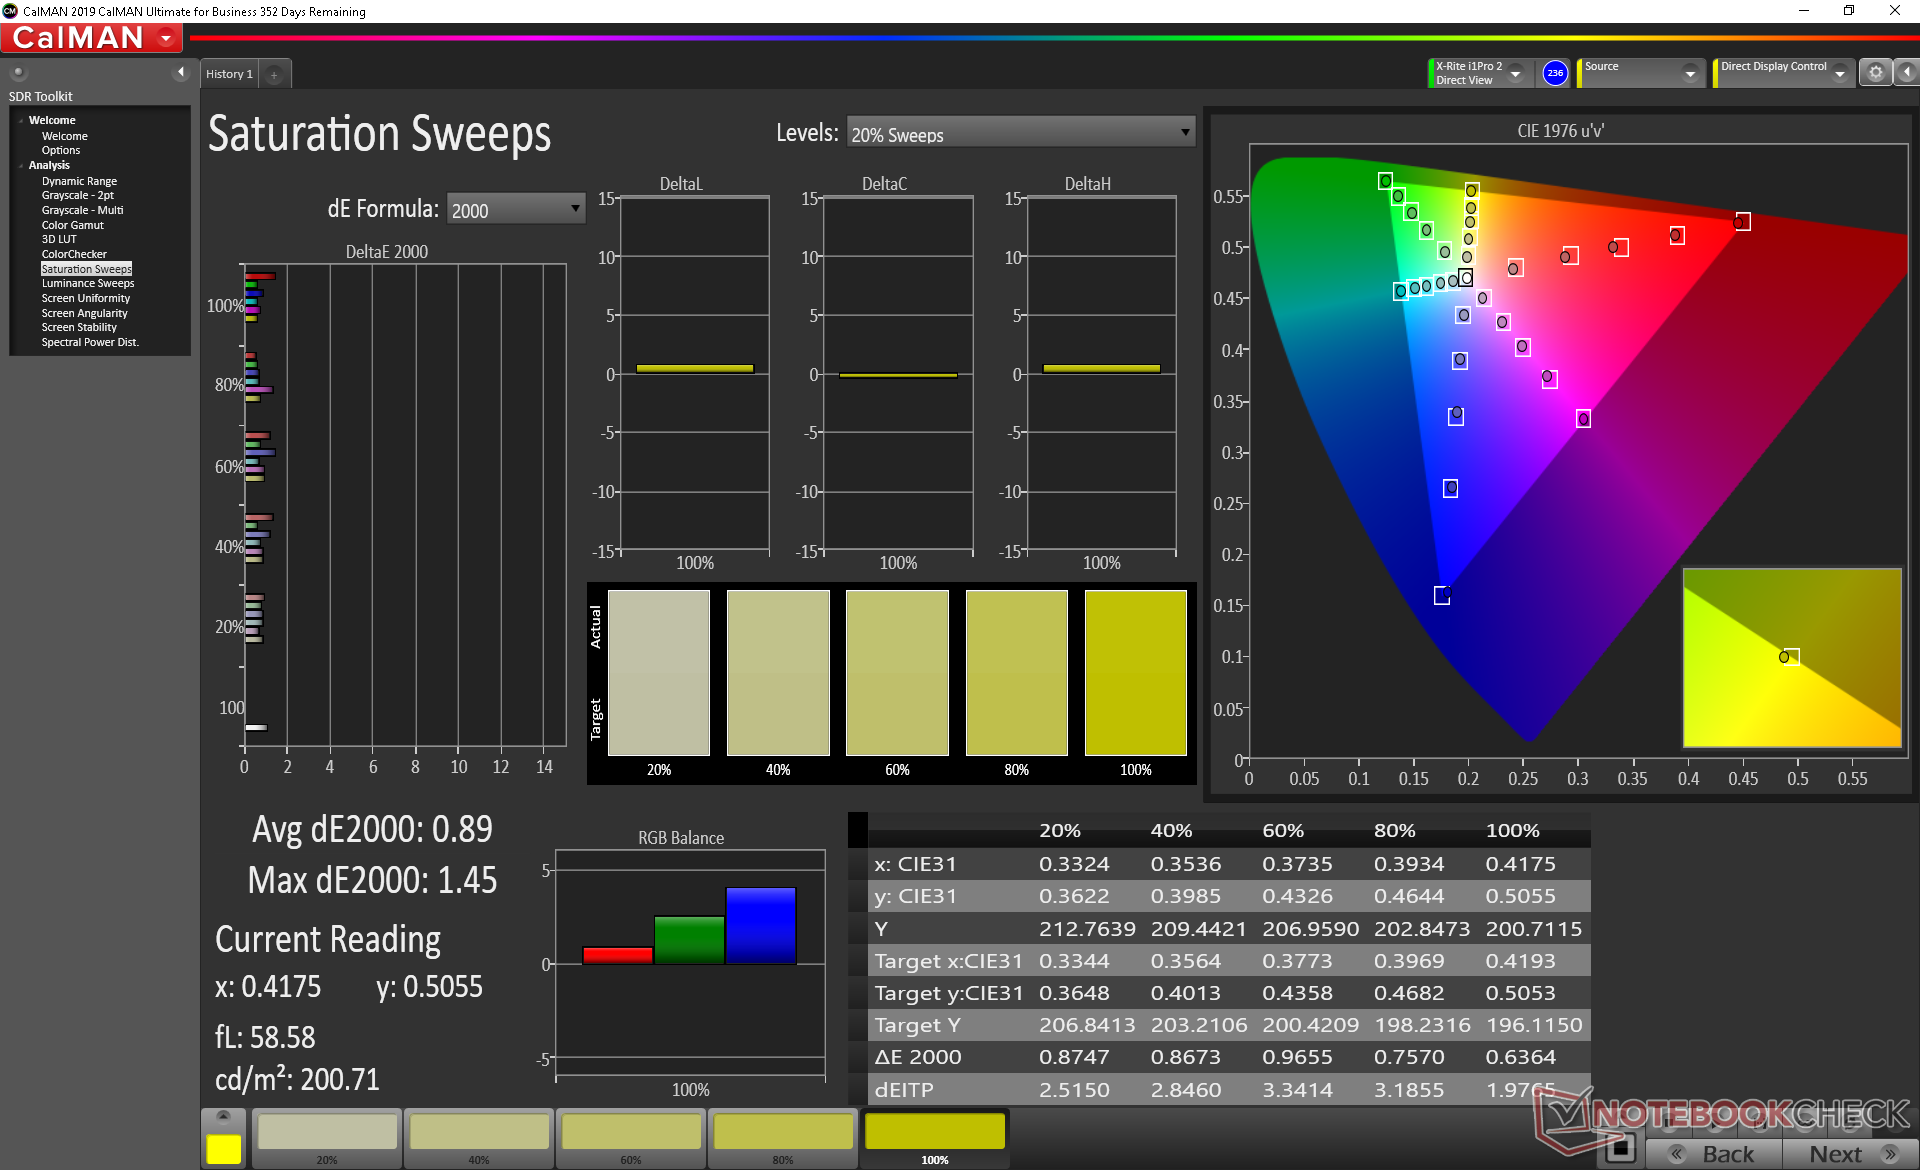
Intel birimimiz Ryzen birimimizle karşılaştırıldığında daha iyi kalibre edilmiş olarak gelir. Intel, bazı Surface Laptop 3 SKU'larının diğerlerinden daha iyi kalibre edilebileceğini önermek için testimizde hiçbir kalibrasyon sonrası işlem yapılmadığını söylüyor. Ortalama gri tonlamalı ve renkli DeltaE değerleri sırasıyla sadece 1.3 ve 0.89'da zaten düşük. Ekranı kendimiz daha da kalibre etmek bu değerleri çok az geliştirir.
Yanıt Sürelerini Görüntüle
| ↔ Tepki Süresi Siyahtan Beyaza | ||
|---|---|---|
| 38 ms ... yükseliş ↗ ve sonbahar↘ birleşimi | ↗ 21.2 ms yükseliş | 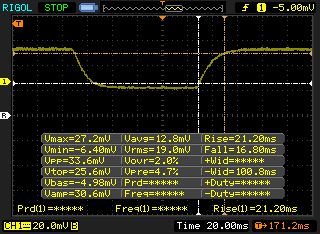 |
| ↘ 16.8 ms sonbahar | ||
| Ekran, testlerimizde yavaş yanıt oranları gösteriyor ve oyuncular için yetersiz olacaktır. Karşılaştırıldığında, test edilen tüm cihazlar 0.1 (minimum) ile 240 (maksimum) ms arasında değişir. » Tüm cihazların 96 %'si daha iyi. Bu, ölçülen yanıt süresinin test edilen tüm cihazların ortalamasından (19.8 ms) daha kötü olduğu anlamına gelir. | ||
| ↔ Tepki Süresi %50 Griden %80 Griye | ||
| 56 ms ... yükseliş ↗ ve sonbahar↘ birleşimi | ↗ 27.6 ms yükseliş | 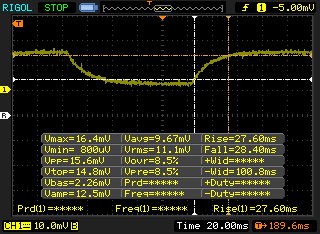 |
| ↘ 28.4 ms sonbahar | ||
| Ekran, testlerimizde yavaş yanıt oranları gösteriyor ve oyuncular için yetersiz olacaktır. Karşılaştırıldığında, test edilen tüm cihazlar 0.165 (minimum) ile 636 (maksimum) ms arasında değişir. » Tüm cihazların 93 %'si daha iyi. Bu, ölçülen yanıt süresinin test edilen tüm cihazların ortalamasından (30.9 ms) daha kötü olduğu anlamına gelir. | ||
Ekran Titremesi / PWM (Darbe Genişliği Modülasyonu)
| Ekran titriyor / PWM algılandı | 21370 Hz | ≤ 51 % parlaklık ayarı | 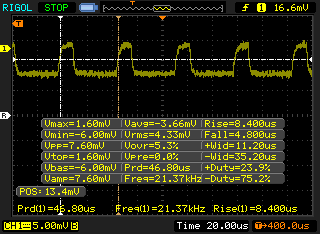 |
Ekran arka ışığı 21370 Hz'de titriyor (en kötü durum, örneğin PWM kullanılması) 51 % ve altındaki parlaklık ayarında titreme algılandı. Bu parlaklık ayarının üzerinde titreme veya PWM olmamalıdır. 21370 Hz frekansı oldukça yüksektir, bu nedenle PWM'ye duyarlı çoğu kullanıcı herhangi bir titremeyi fark etmemelidir. Karşılaştırıldığında: Test edilen tüm cihazların %52 %'si ekranı karartmak için PWM kullanmıyor. PWM tespit edilirse, ortalama 7741 (minimum: 5 - maksimum: 343500) Hz ölçüldü. | |||
Verim
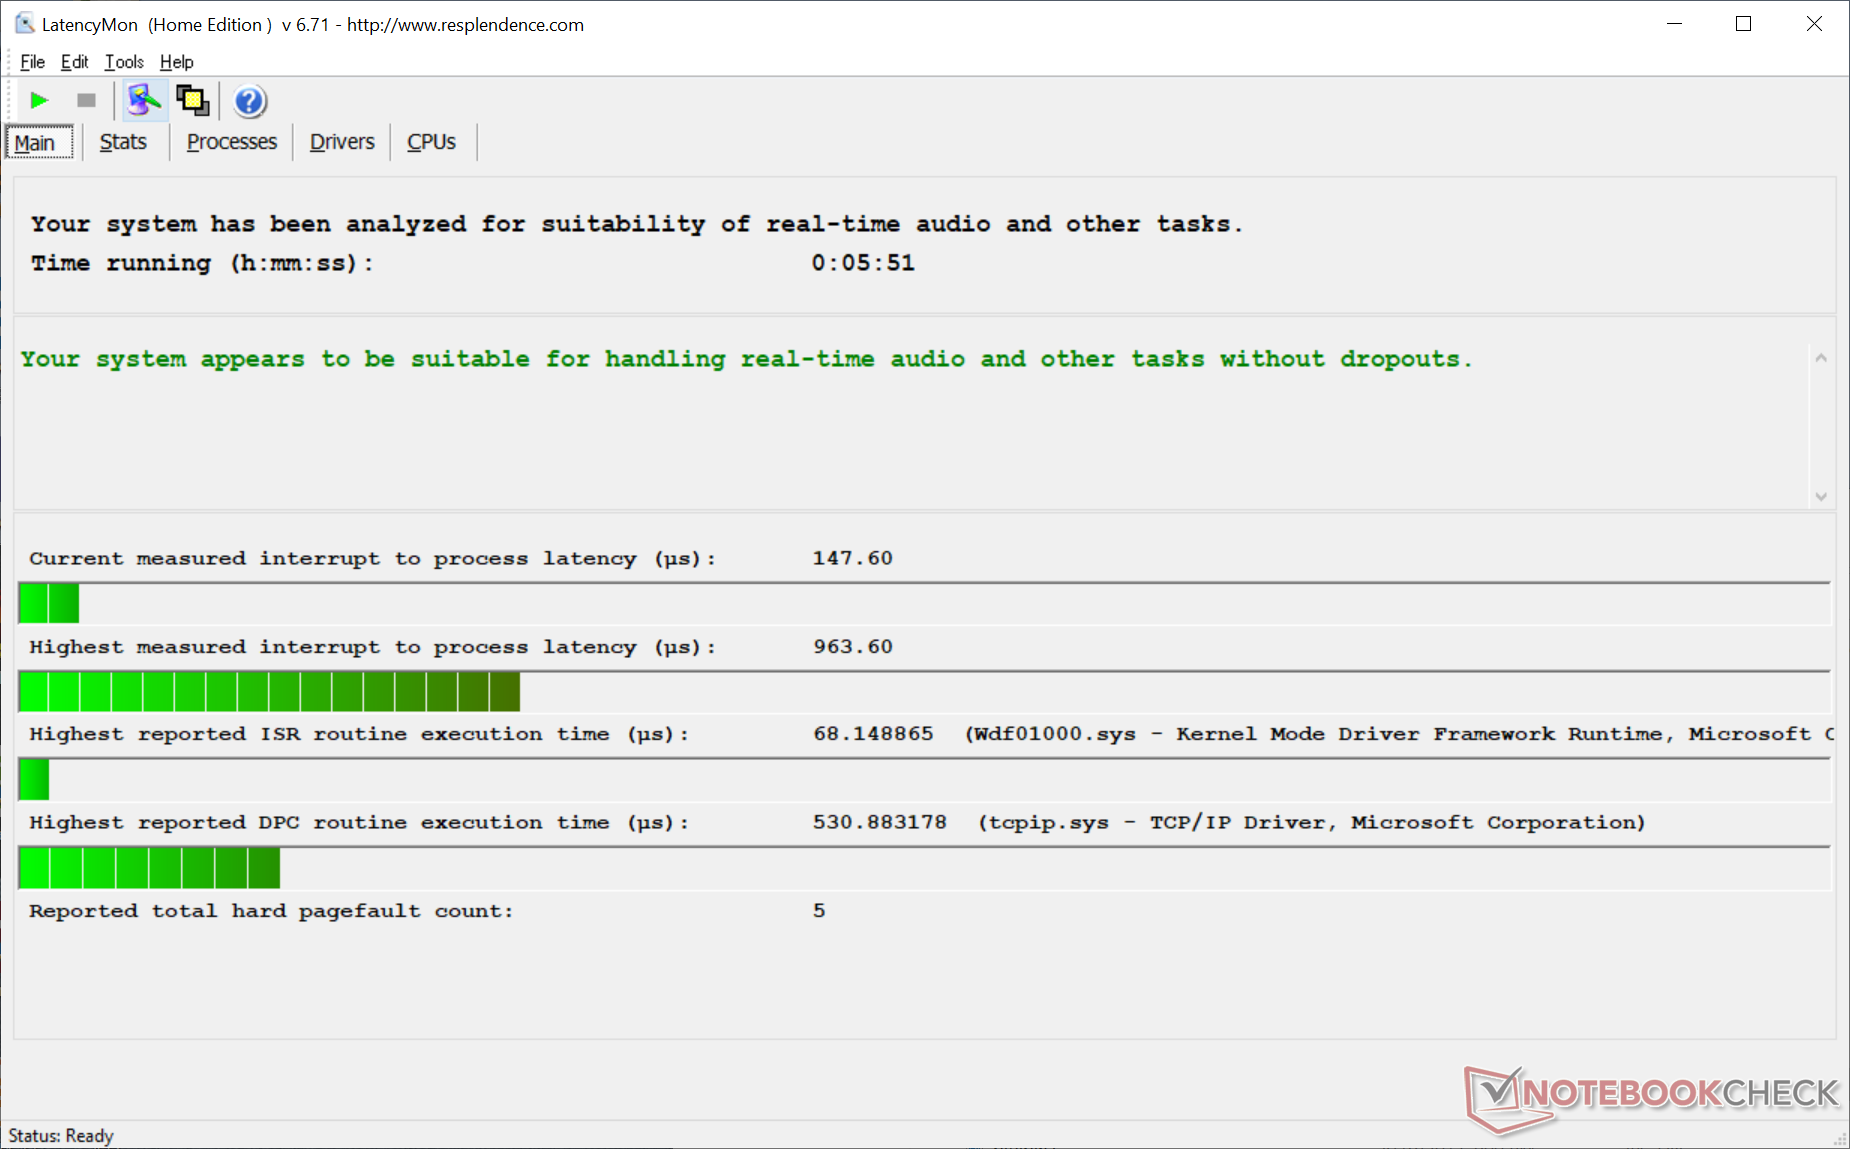
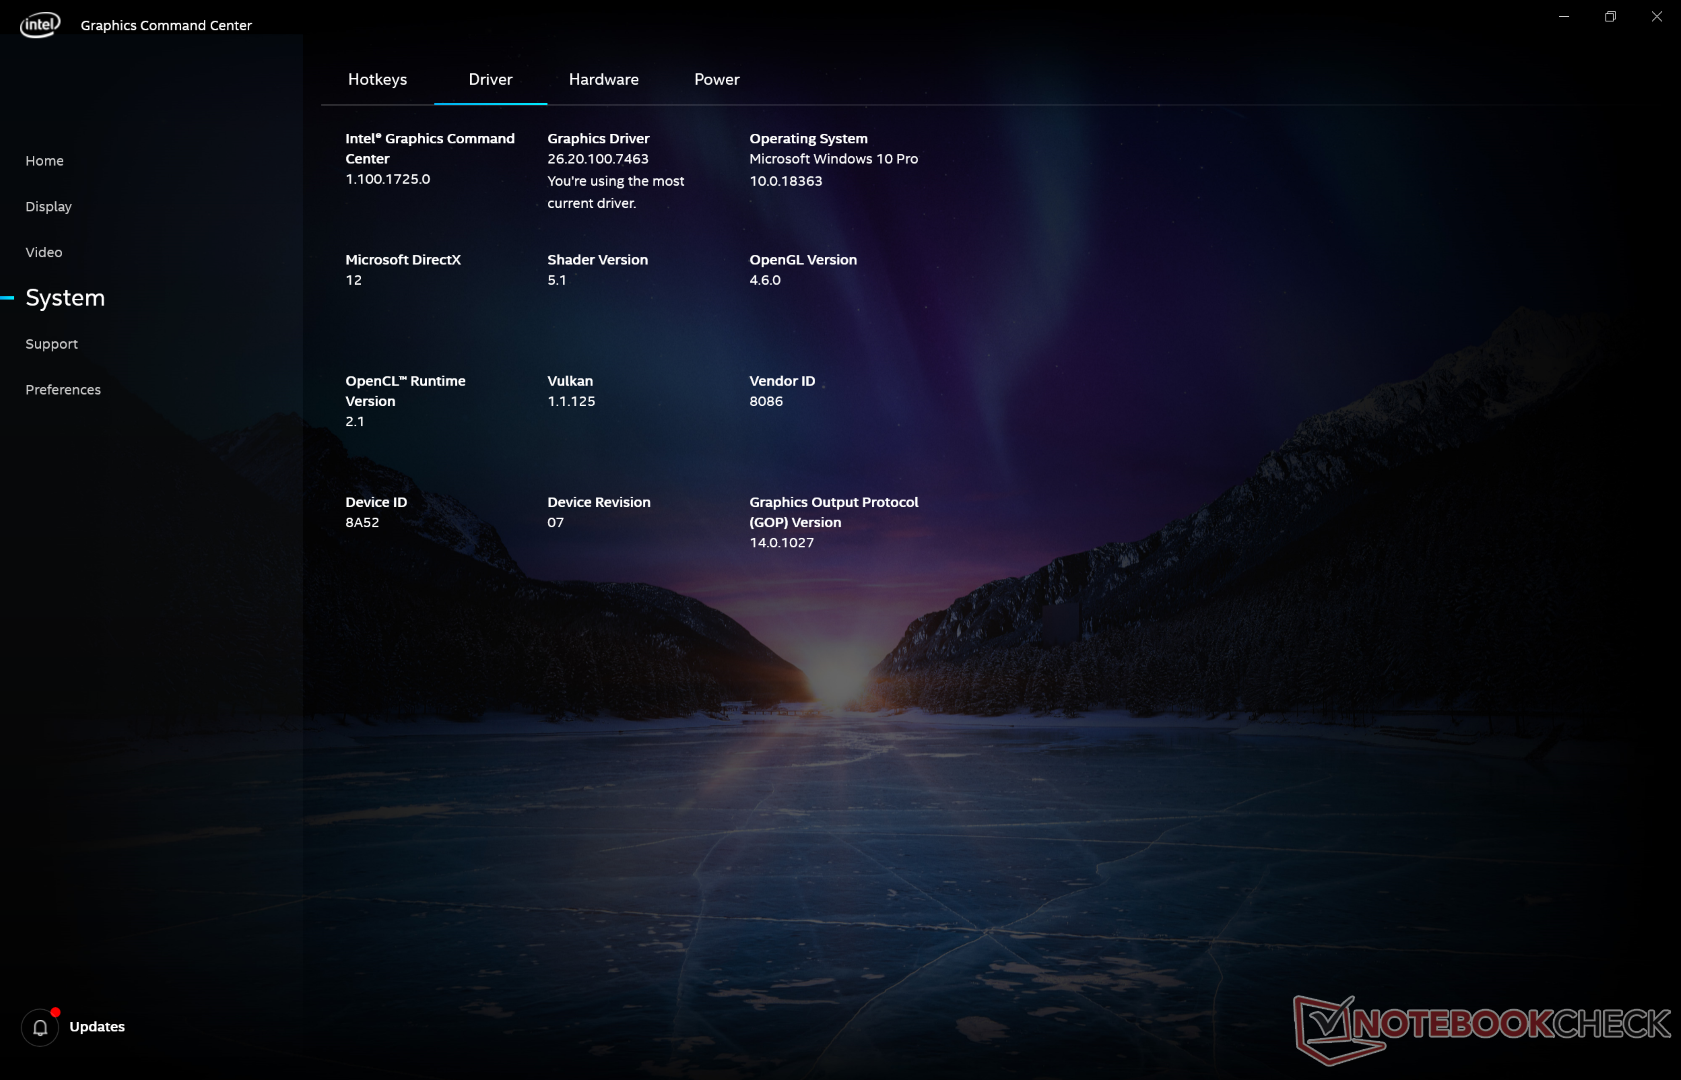
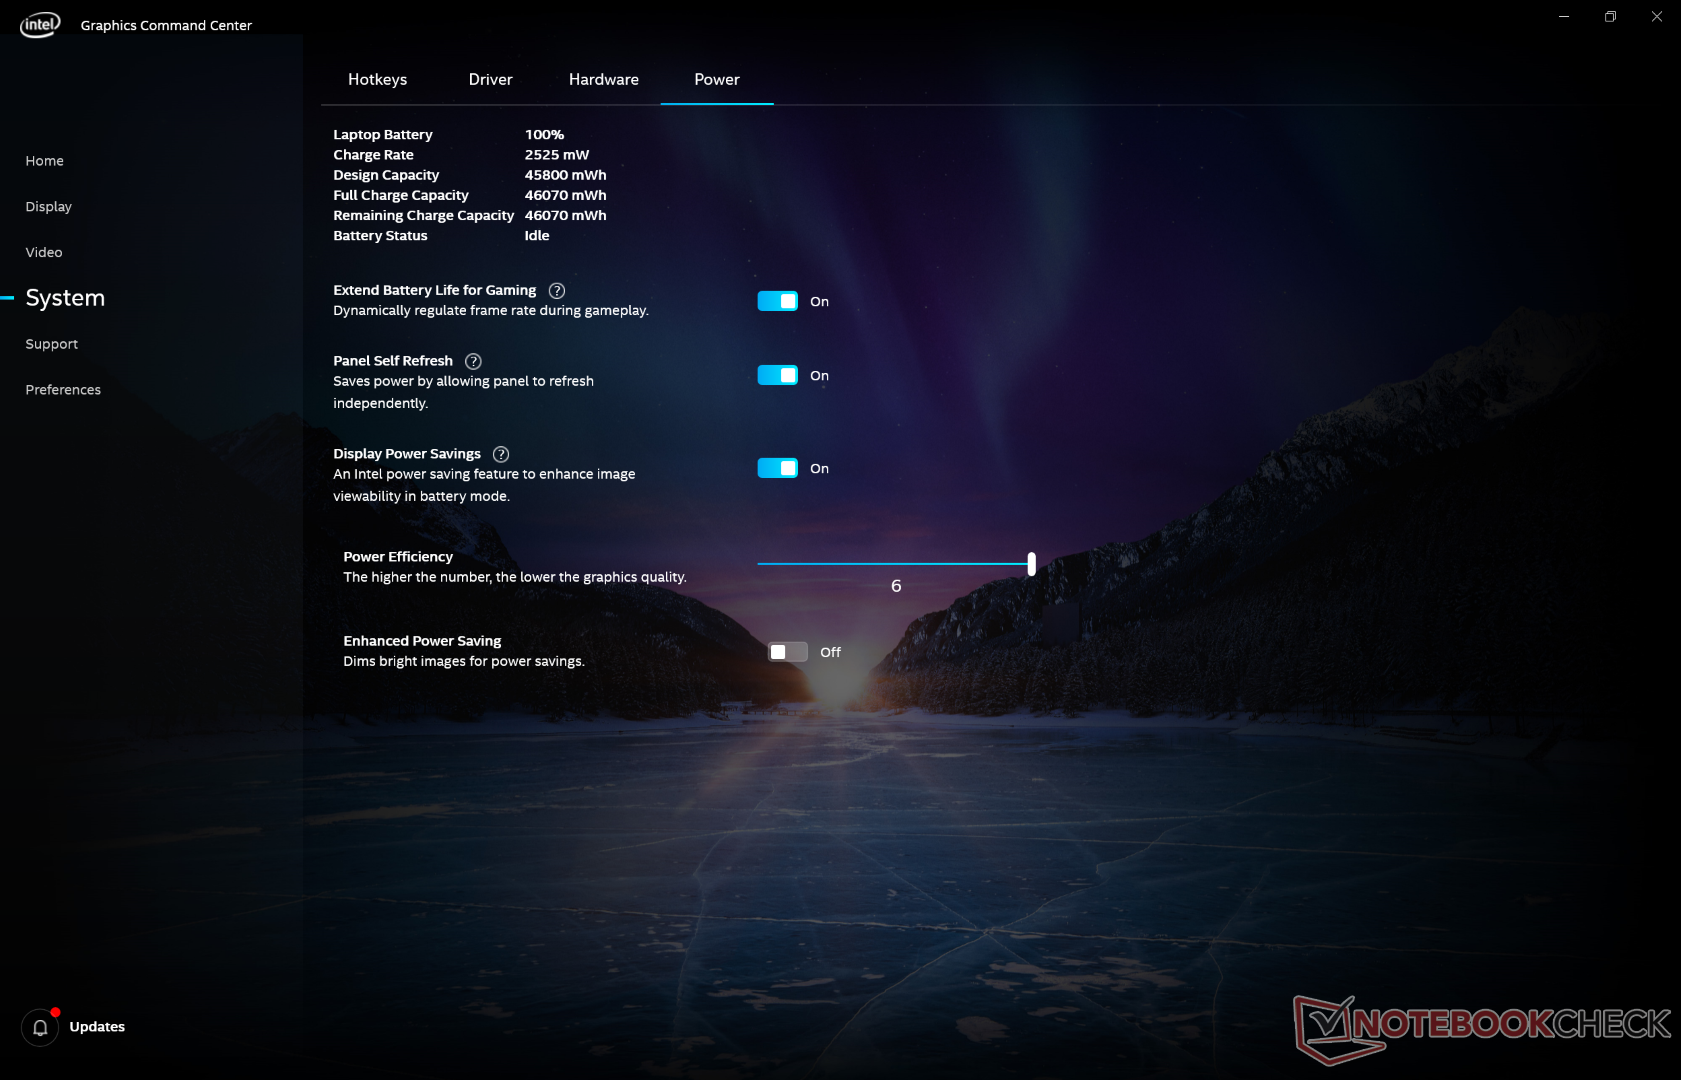
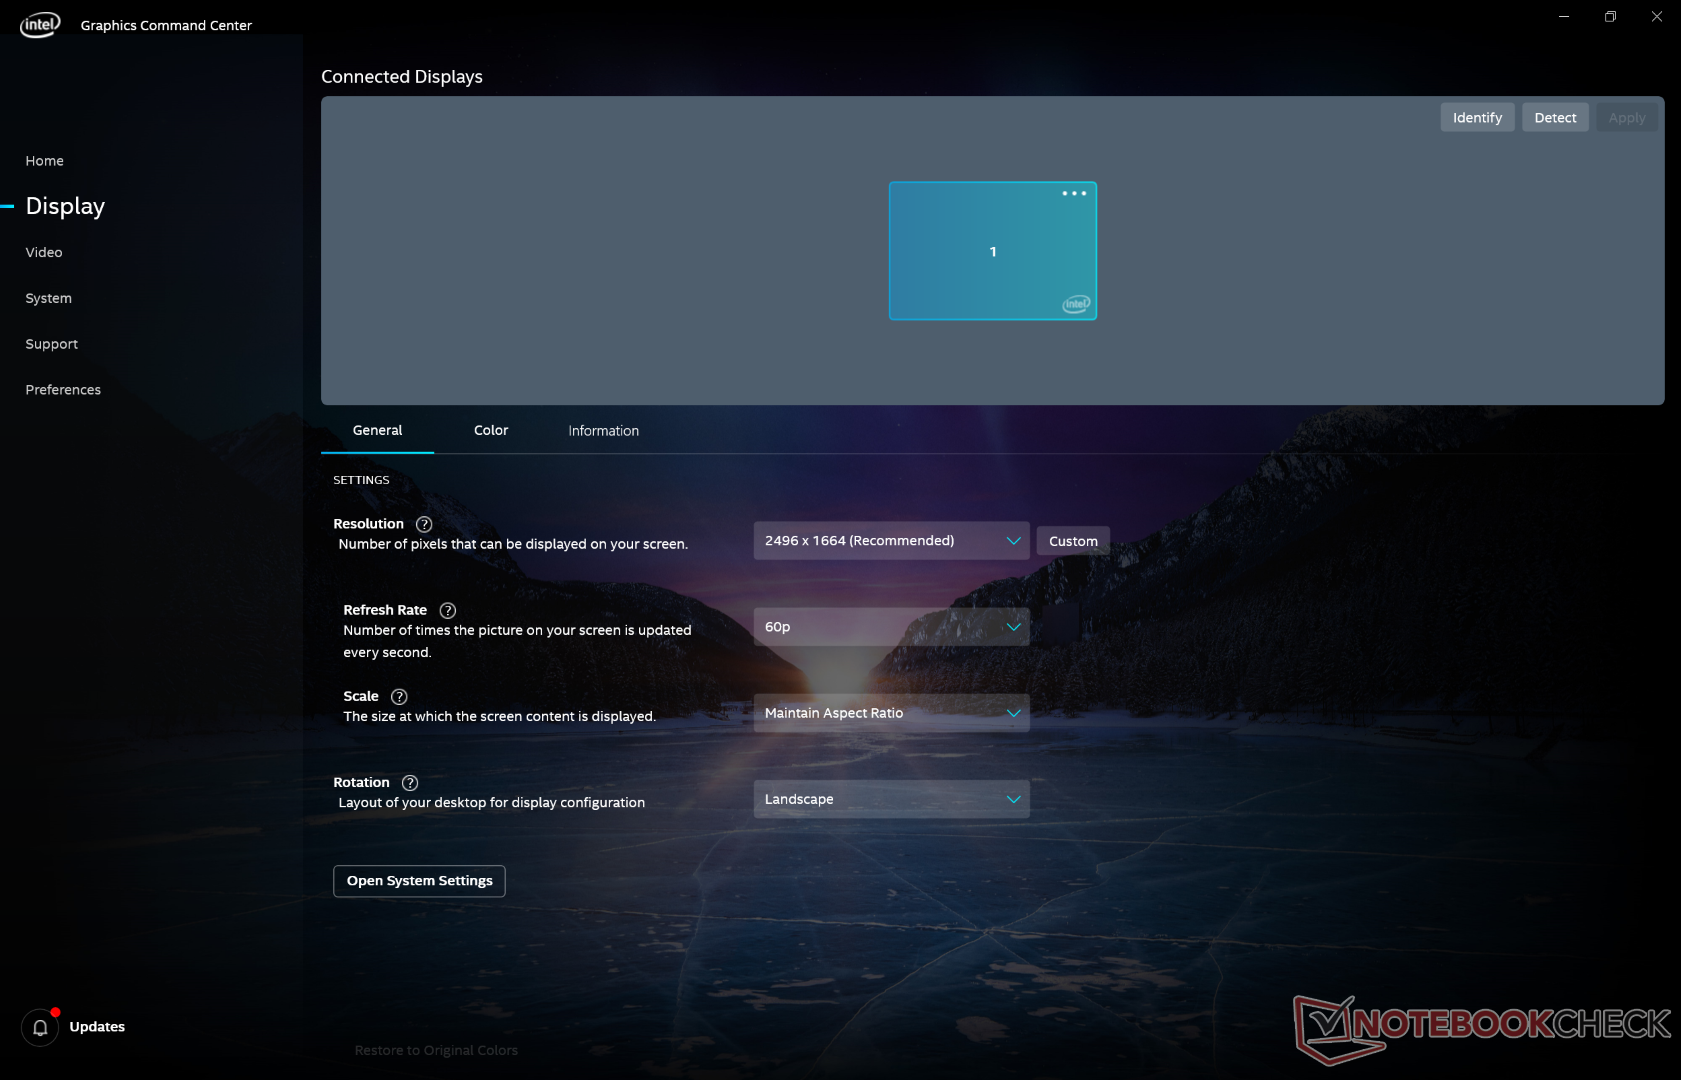
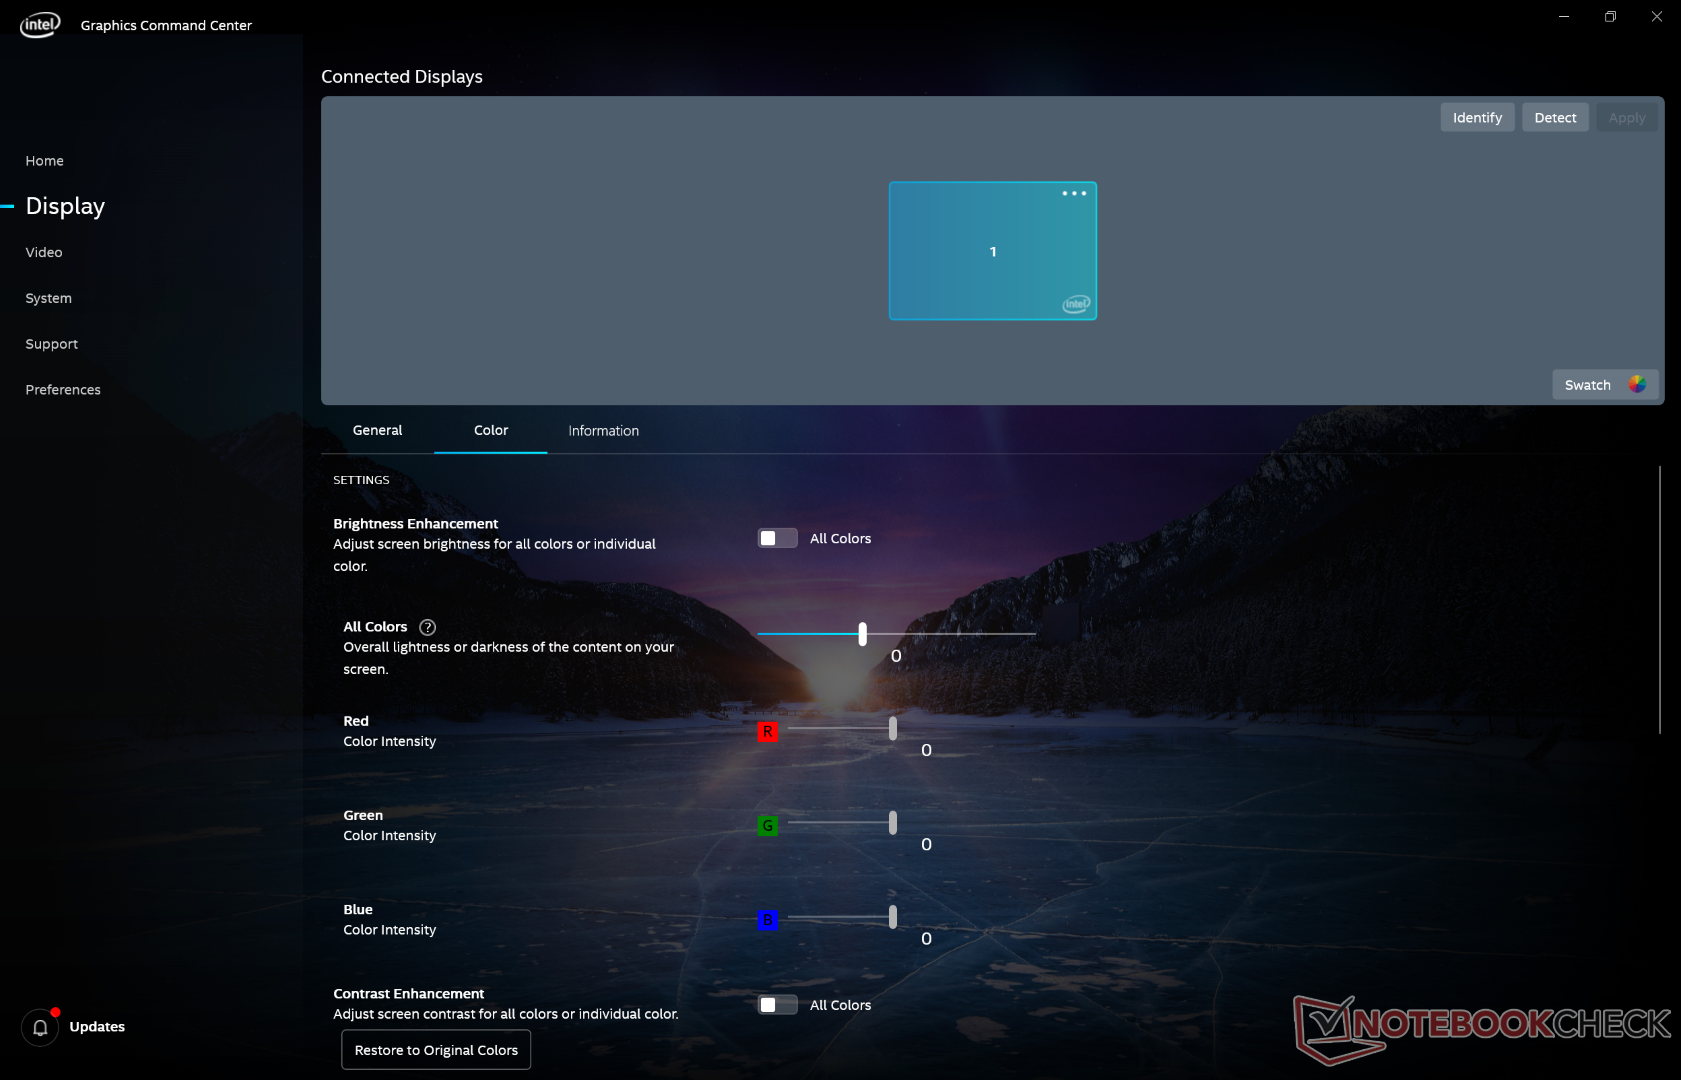
Core i7-1065G7 SKU, Microsoft'un en hızlı Surface Laptop 3 yapılandırması olarak pazarlanmaktadır. Core i5-1035G7 SKU'nun Ryzen 5 3580U ile aynı şekilde AMD Ryzen 7 3780U ile doğrudan rekabet eder. Aynı Intel Ice Lake CPU'nun en son Surface Pro 7'de de bulunabileceğini unutmayın. Oyun oynamasanız bile, entegre Iris Plus G7'nin ekstra grafik beygir gücü grafik editörleri için faydalı olmalı, video kodlamayı hızlandırmalı veya kod çözme ve daha yüksek çözünürlüklerde harici monitör desteği. Ünitemiz, eski Intel Grafik Kontrol Merkezi'nin yerini alacak şekilde önceden yüklenmiş Intel Command Center yazılımı ile birlikte gönderilir. Yeni uygulama, gözden geçirilmiş bir kullanıcı arayüzü ile daha görsel ayarlar sunar. Intel grafik destekli gelecekteki dizüstü bilgisayarların da Command Center ile birlikte gelmesi bekleniyor.LatencyMon, Ryzen ünitemizde gözlemlediğimizin aksine Wi-Fi ne olursa olsun yinelenen DPC gecikme sorunları göstermiyor.
İşlemci
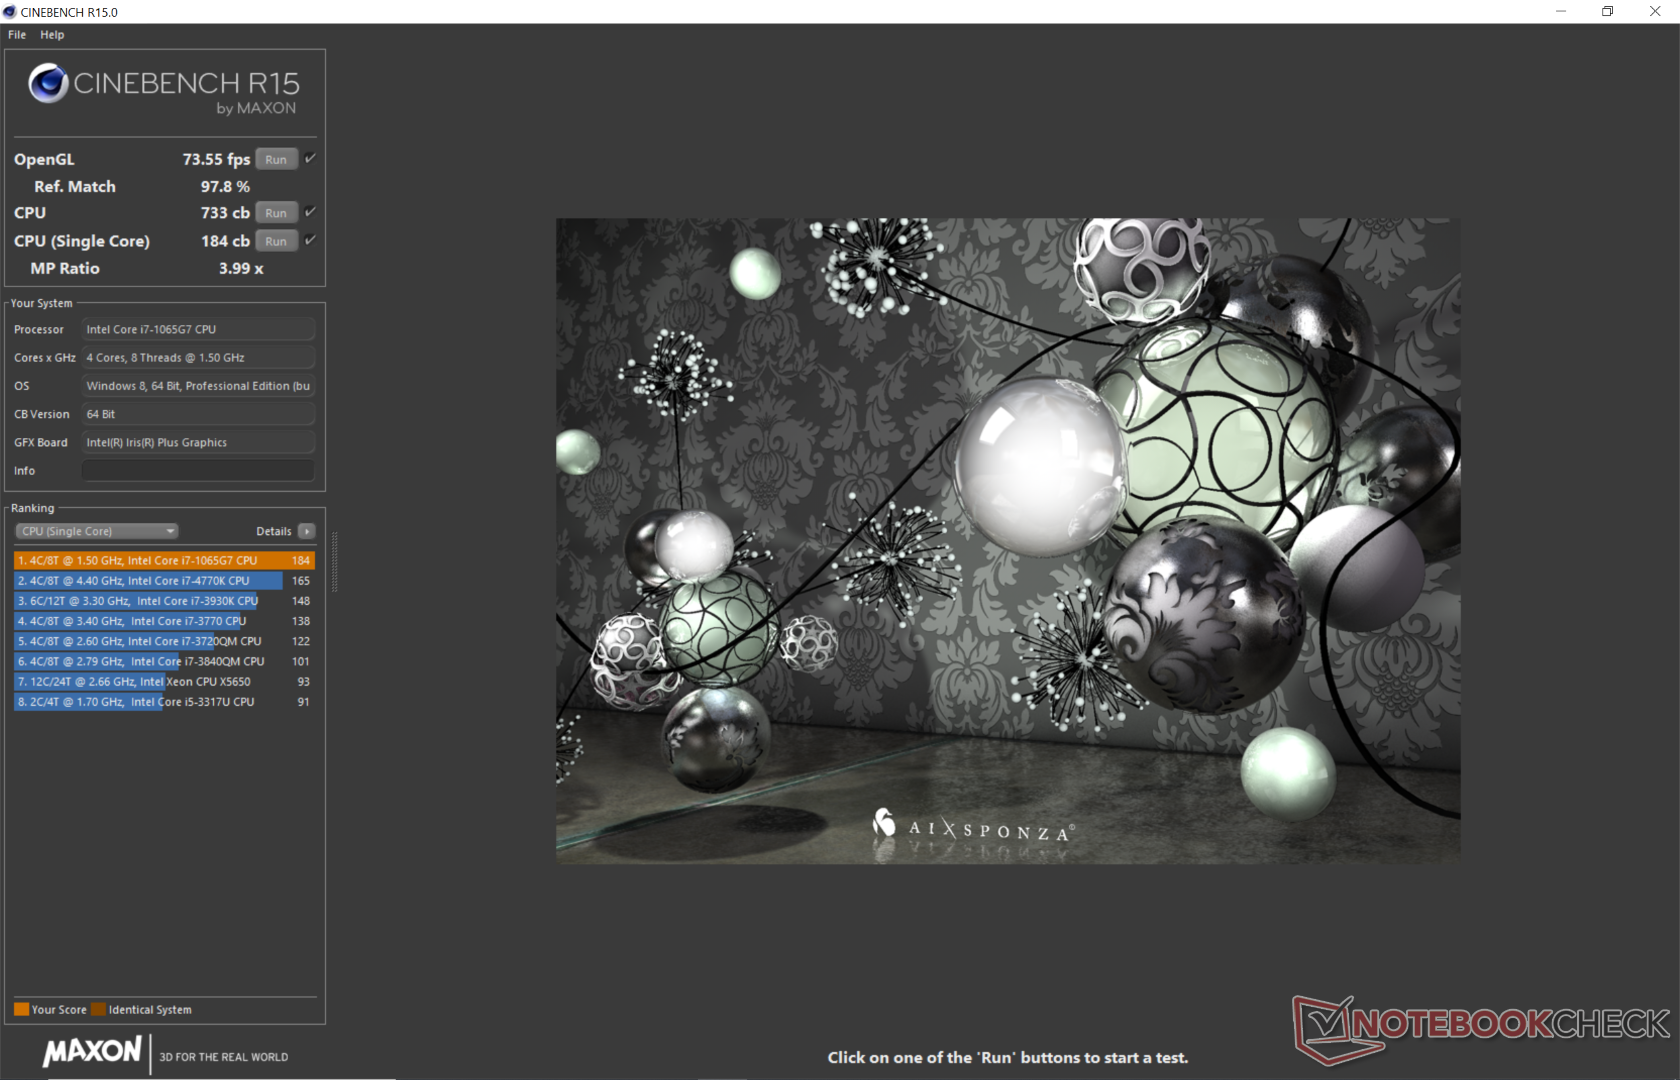
Veritabanımızdaki 9. Core i7-1065G7 girişimiz olarak, işlemcinin neler yapabileceğini görmeye başlıyoruz. Microsoft'un 25 W CPU'yu uygulaması, çok iş parçacıklı CineBench puanı ortalama i7-1065G7'den yüzde 11 daha hızlı olduğu için çoğudan daha iyi görünüyor. Ham performans böylece Ryzen 5 3580U'dan yüzde 16 daha yüksektir ve Core i5-9300H'nin sadece birkaç yüzde puanı içinde. Ortalamadan daha yüksek CPU kıyaslama puanlarını açıklayan performans sürdürülebilirliği beklenenden daha iyi. Örneğin, CineBench R15 Multi-Thread'ı bir döngüde çalıştırırken, benzer şekilde donatılmış Lenovo Yoga C940'taki yüzde 17'ye kıyasla performans zaman içinde sadece yüzde 6 ila 7 azaldı. Aşağıdaki grafikte gösterildiği gibi stresli koşullar altında da performans sabittir. AMD'ye karşı bir başka avantaj da donanım tabanlı AI hızlandırmasıdır. Sorun, çoğu uygulamanın ve hatta Windows'un kendisinin yeni ortaya çıkan teknolojiyi henüz kullanmamış olması, günlük iş yüklerinizin, eğer varsa, Buz Gölü'nün AI özelliklerinden yararlanamayacağı anlamına geliyor. Core i7'deki özel sayfamıza bakın. Daha fazla teknik bilgi ve kıyaslama karşılaştırması için -1065G7.
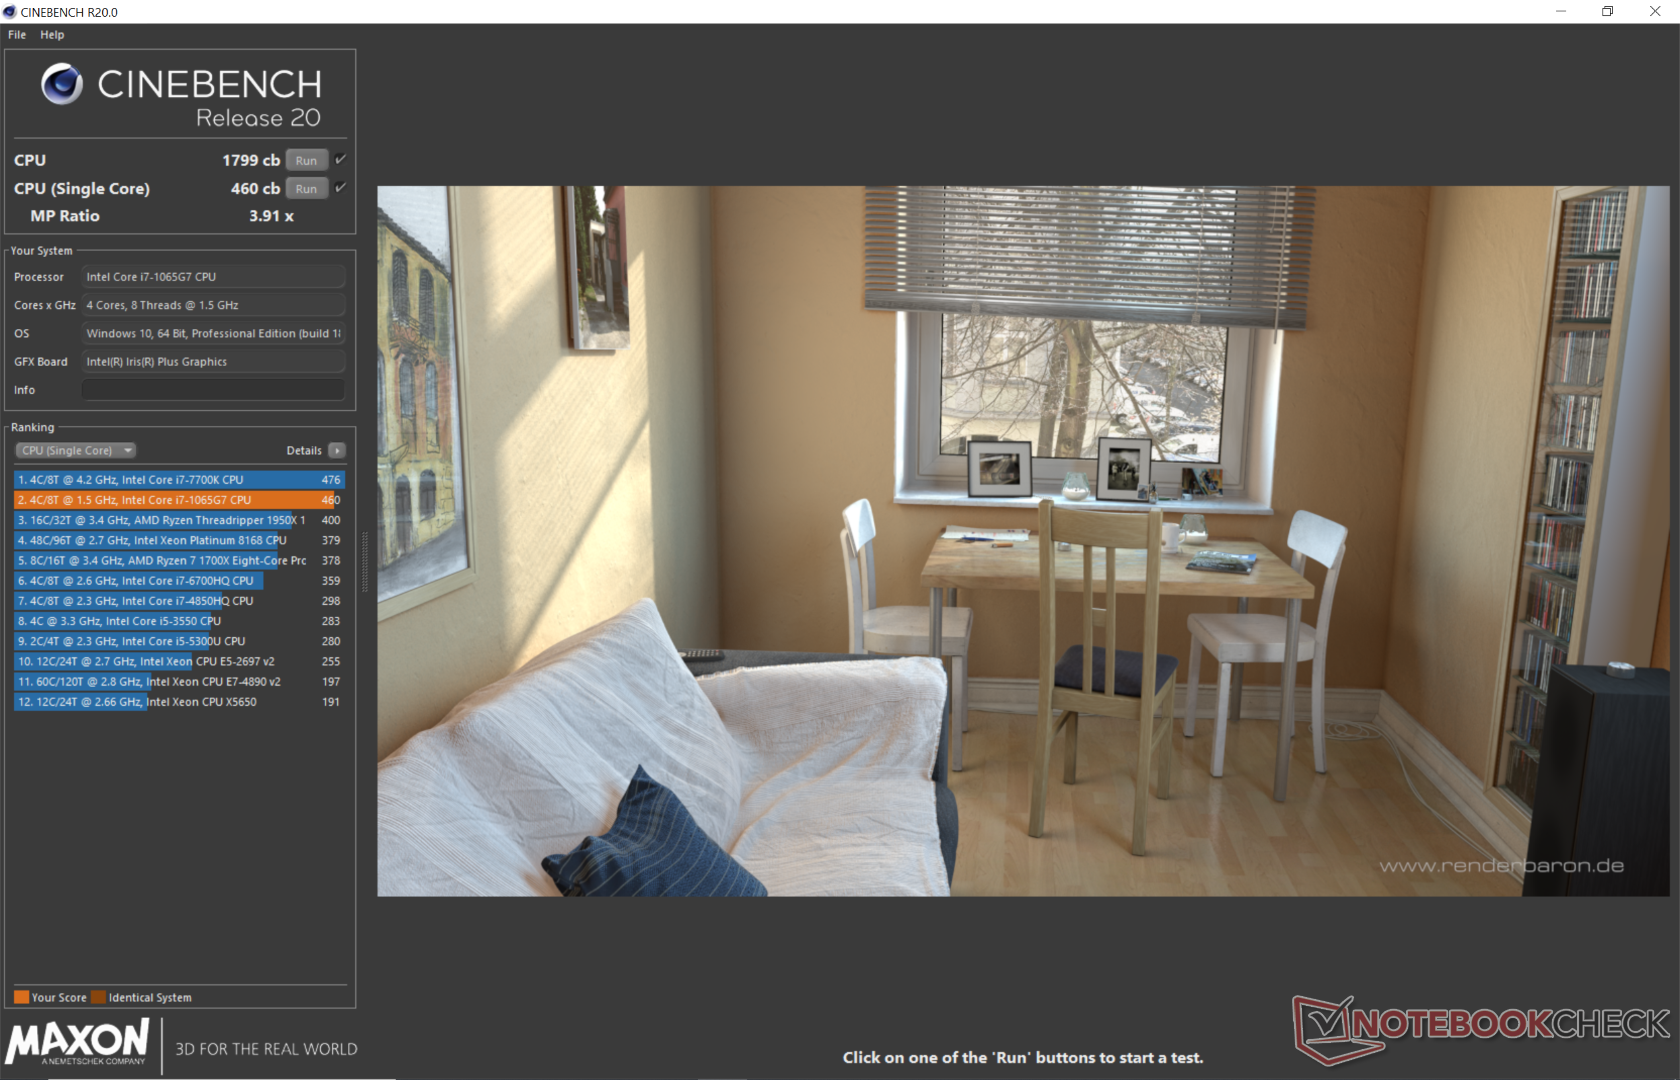
| Cinebench R20 | |
| CPU (Single Core) | |
| MSI Prestige 15 A10SC | |
| Microsoft Surface Laptop 3 15 i7-1065G7 | |
| Walmart EVOO Gaming 17 | |
| Microsoft Surface Pro 7 Core i5-1035G4 | |
| Ortalama Intel Core i7-1065G7 (358 - 474, n=31) | |
| Dell G3 3590 | |
| Dell XPS 13 7390 2-in-1 Core i3 | |
| HP EliteBook x360 830 G6 | |
| Dynabook Portege A30-E-174 | |
| Microsoft Surface Laptop 3 15 Ryzen 5 3580U | |
| Dell Latitude 13 3390 | |
| Dell Inspiron 15 5000 5585 | |
| Dell Latitude 3400 | |
| CPU (Multi Core) | |
| Walmart EVOO Gaming 17 | |
| MSI Prestige 15 A10SC | |
| Dell G3 3590 | |
| Microsoft Surface Laptop 3 15 i7-1065G7 | |
| Microsoft Surface Laptop 3 15 Ryzen 5 3580U | |
| Ortalama Intel Core i7-1065G7 (1081 - 2024, n=31) | |
| Dell Inspiron 15 5000 5585 | |
| Microsoft Surface Pro 7 Core i5-1035G4 | |
| HP EliteBook x360 830 G6 | |
| Dynabook Portege A30-E-174 | |
| Dell Latitude 13 3390 | |
| Dell XPS 13 7390 2-in-1 Core i3 | |
| Dell Latitude 3400 | |
| Cinebench R15 | |
| CPU Single 64Bit | |
| MSI Prestige 15 A10SC | |
| Microsoft Surface Laptop 3 15 i7-1065G7 | |
| Walmart EVOO Gaming 17 | |
| Ortalama Intel Core i7-1065G7 (141 - 190, n=35) | |
| Dell G3 3590 | |
| Microsoft Surface Pro 7 Core i5-1035G4 | |
| HP EliteBook x360 830 G6 | |
| Dell XPS 13 7390 2-in-1 Core i3 | |
| Dynabook Portege A30-E-174 | |
| Dell Latitude 3400 | |
| Dell Latitude 13 3390 | |
| Microsoft Surface Laptop 3 15 Ryzen 5 3580U | |
| Dell Inspiron 15 5000 5585 | |
| CPU Multi 64Bit | |
| Walmart EVOO Gaming 17 | |
| MSI Prestige 15 A10SC | |
| Dell G3 3590 | |
| Microsoft Surface Laptop 3 15 i7-1065G7 | |
| Microsoft Surface Laptop 3 15 Ryzen 5 3580U | |
| Dell Inspiron 15 5000 5585 | |
| Ortalama Intel Core i7-1065G7 (288 - 836, n=36) | |
| Microsoft Surface Pro 7 Core i5-1035G4 | |
| Dell Latitude 13 3390 | |
| HP EliteBook x360 830 G6 | |
| Dynabook Portege A30-E-174 | |
| Dell XPS 13 7390 2-in-1 Core i3 | |
| Dell Latitude 3400 | |
Sistem performansı
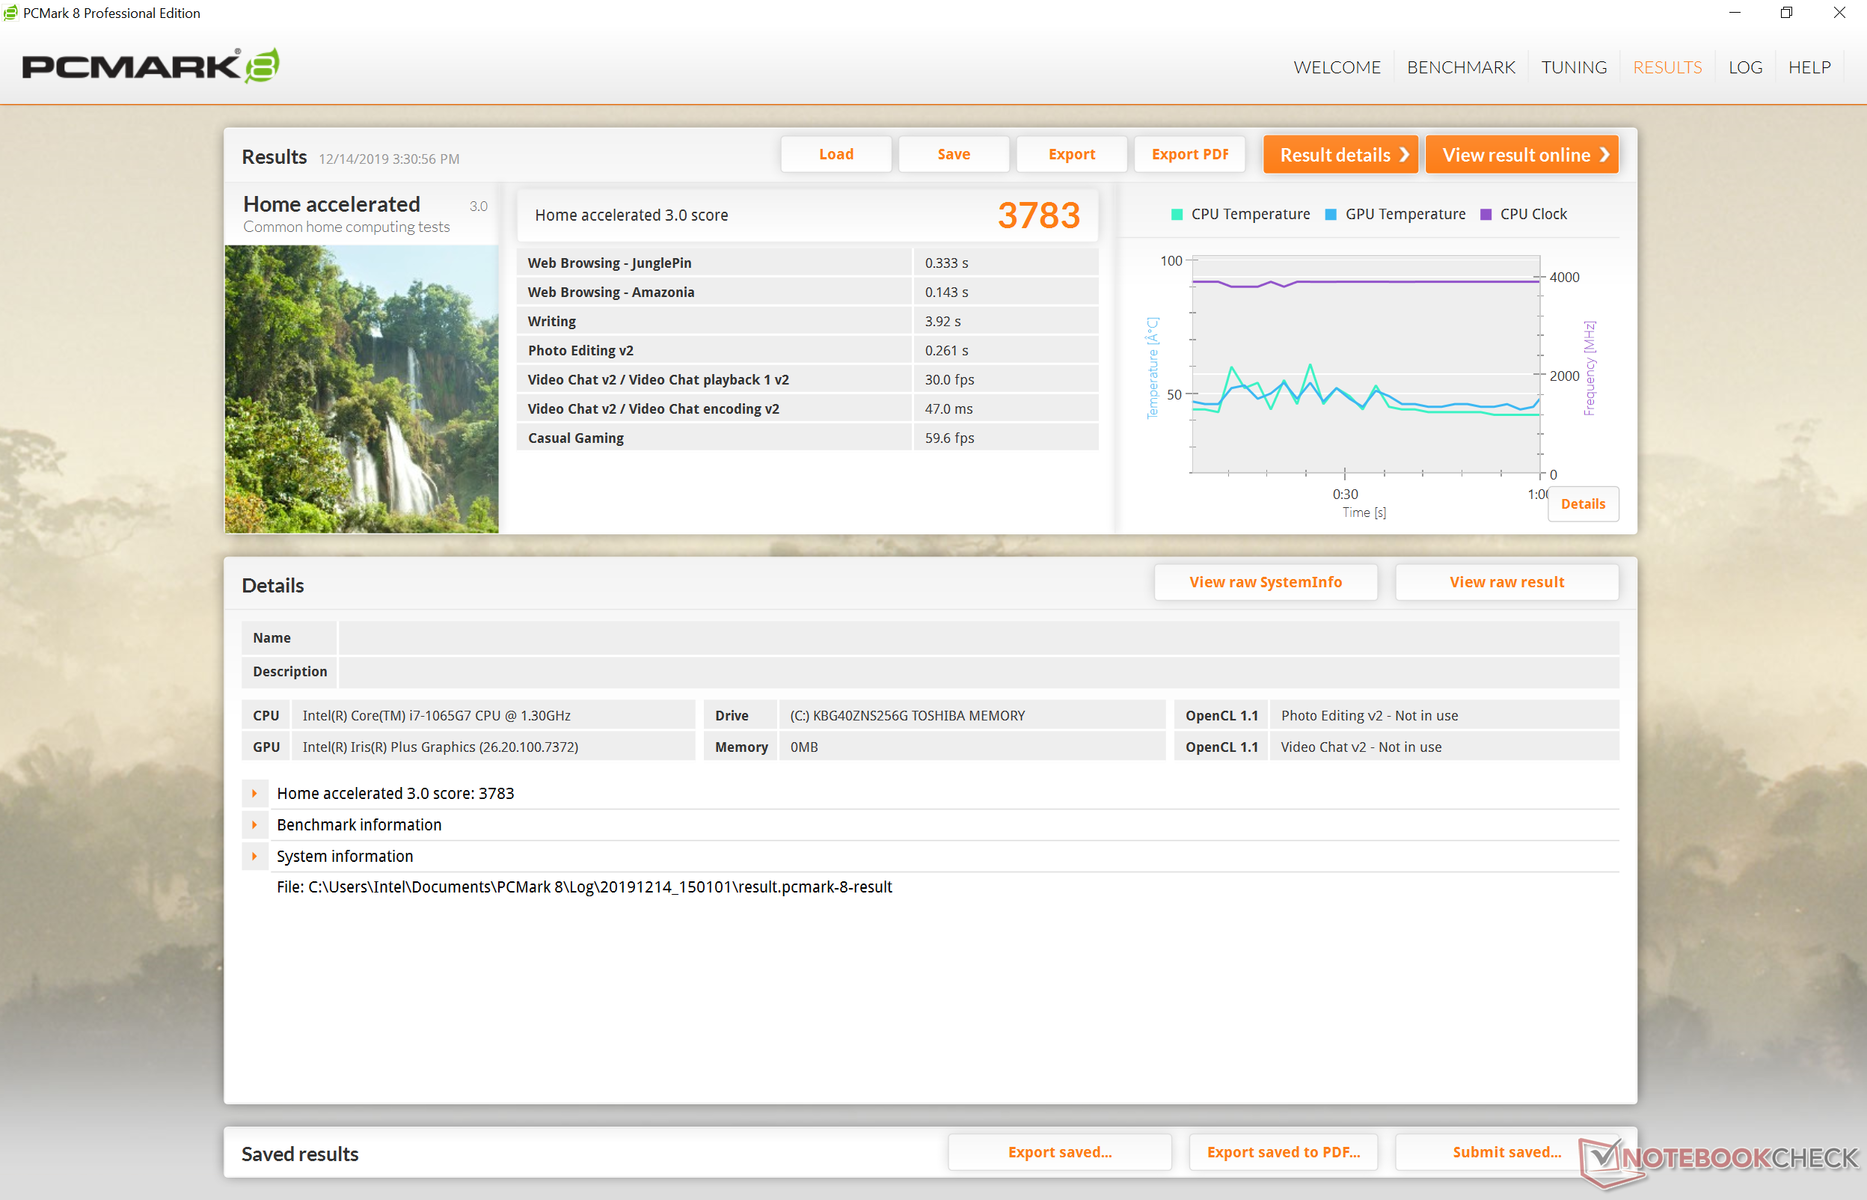
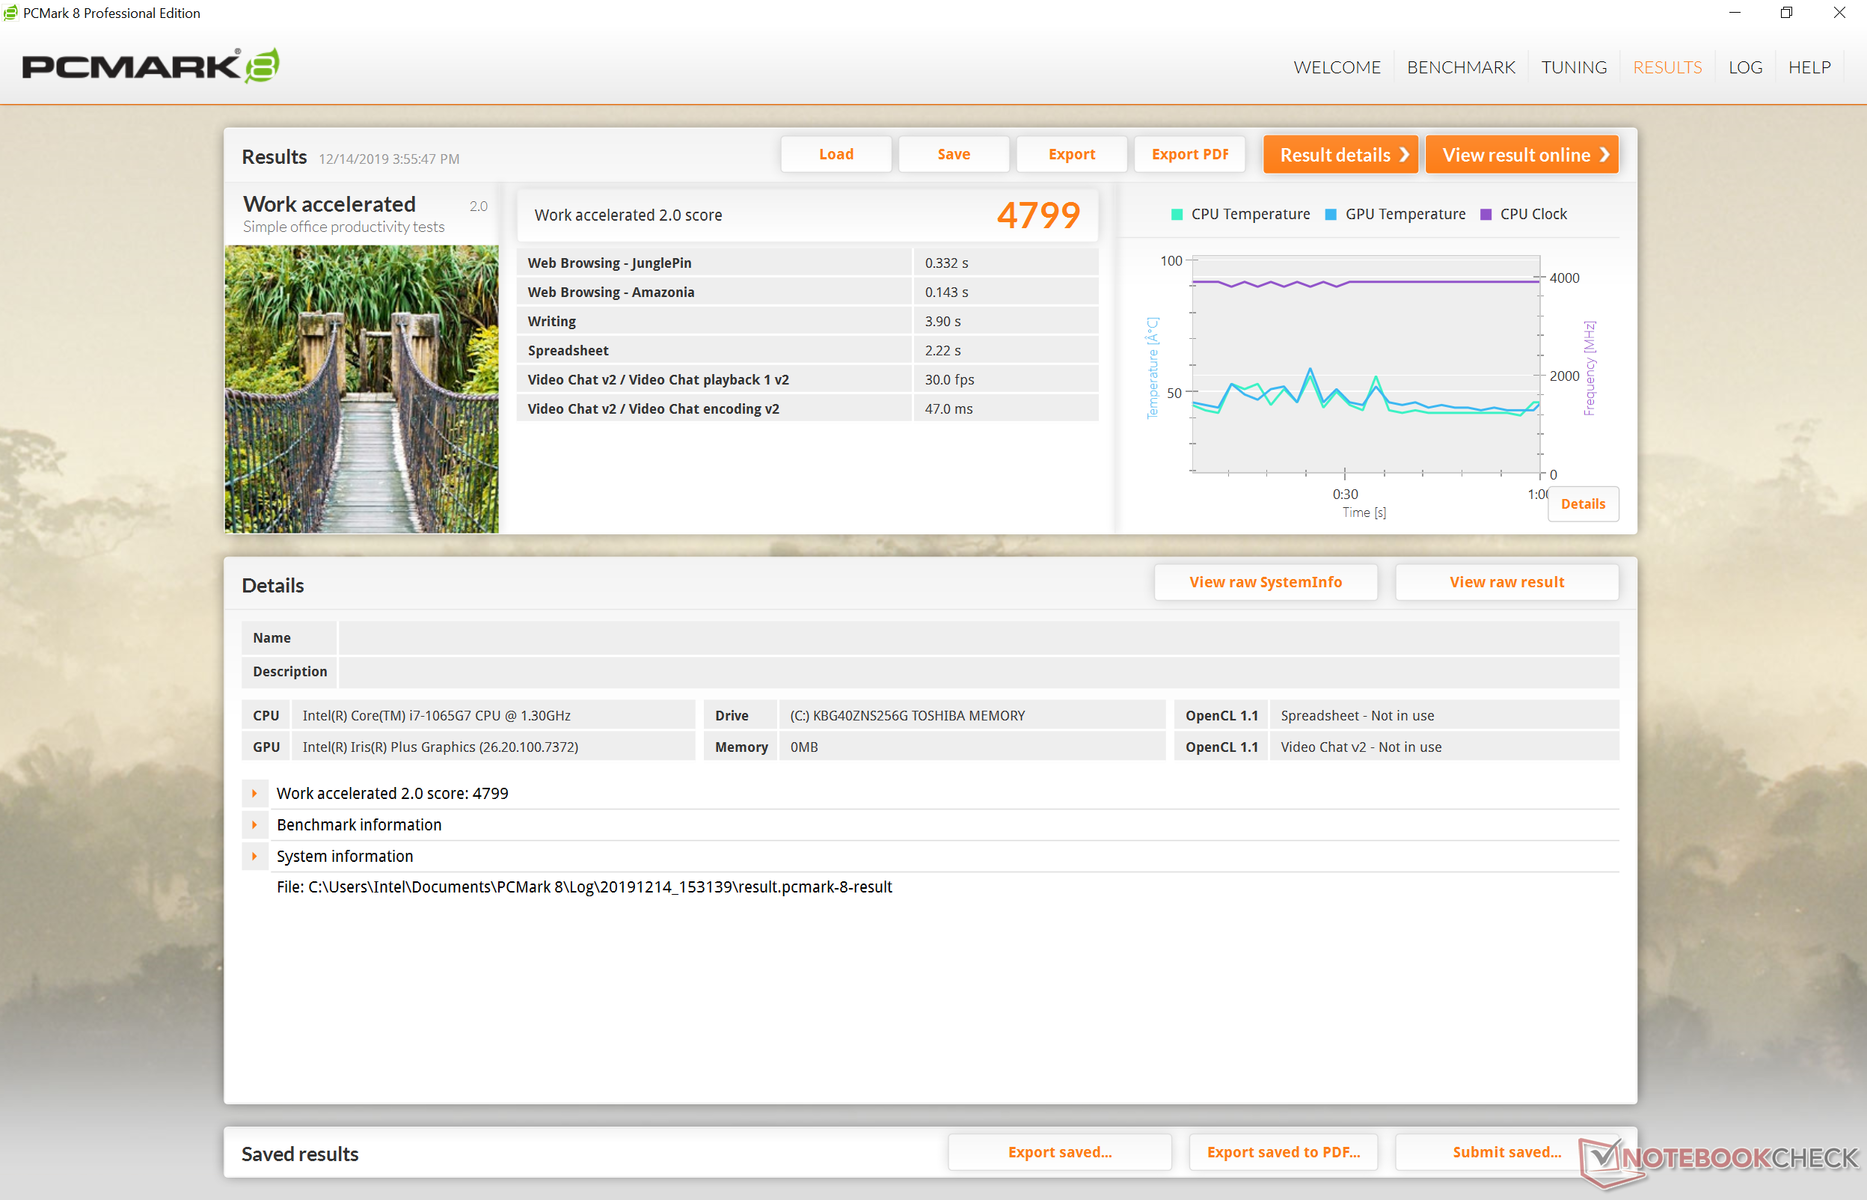
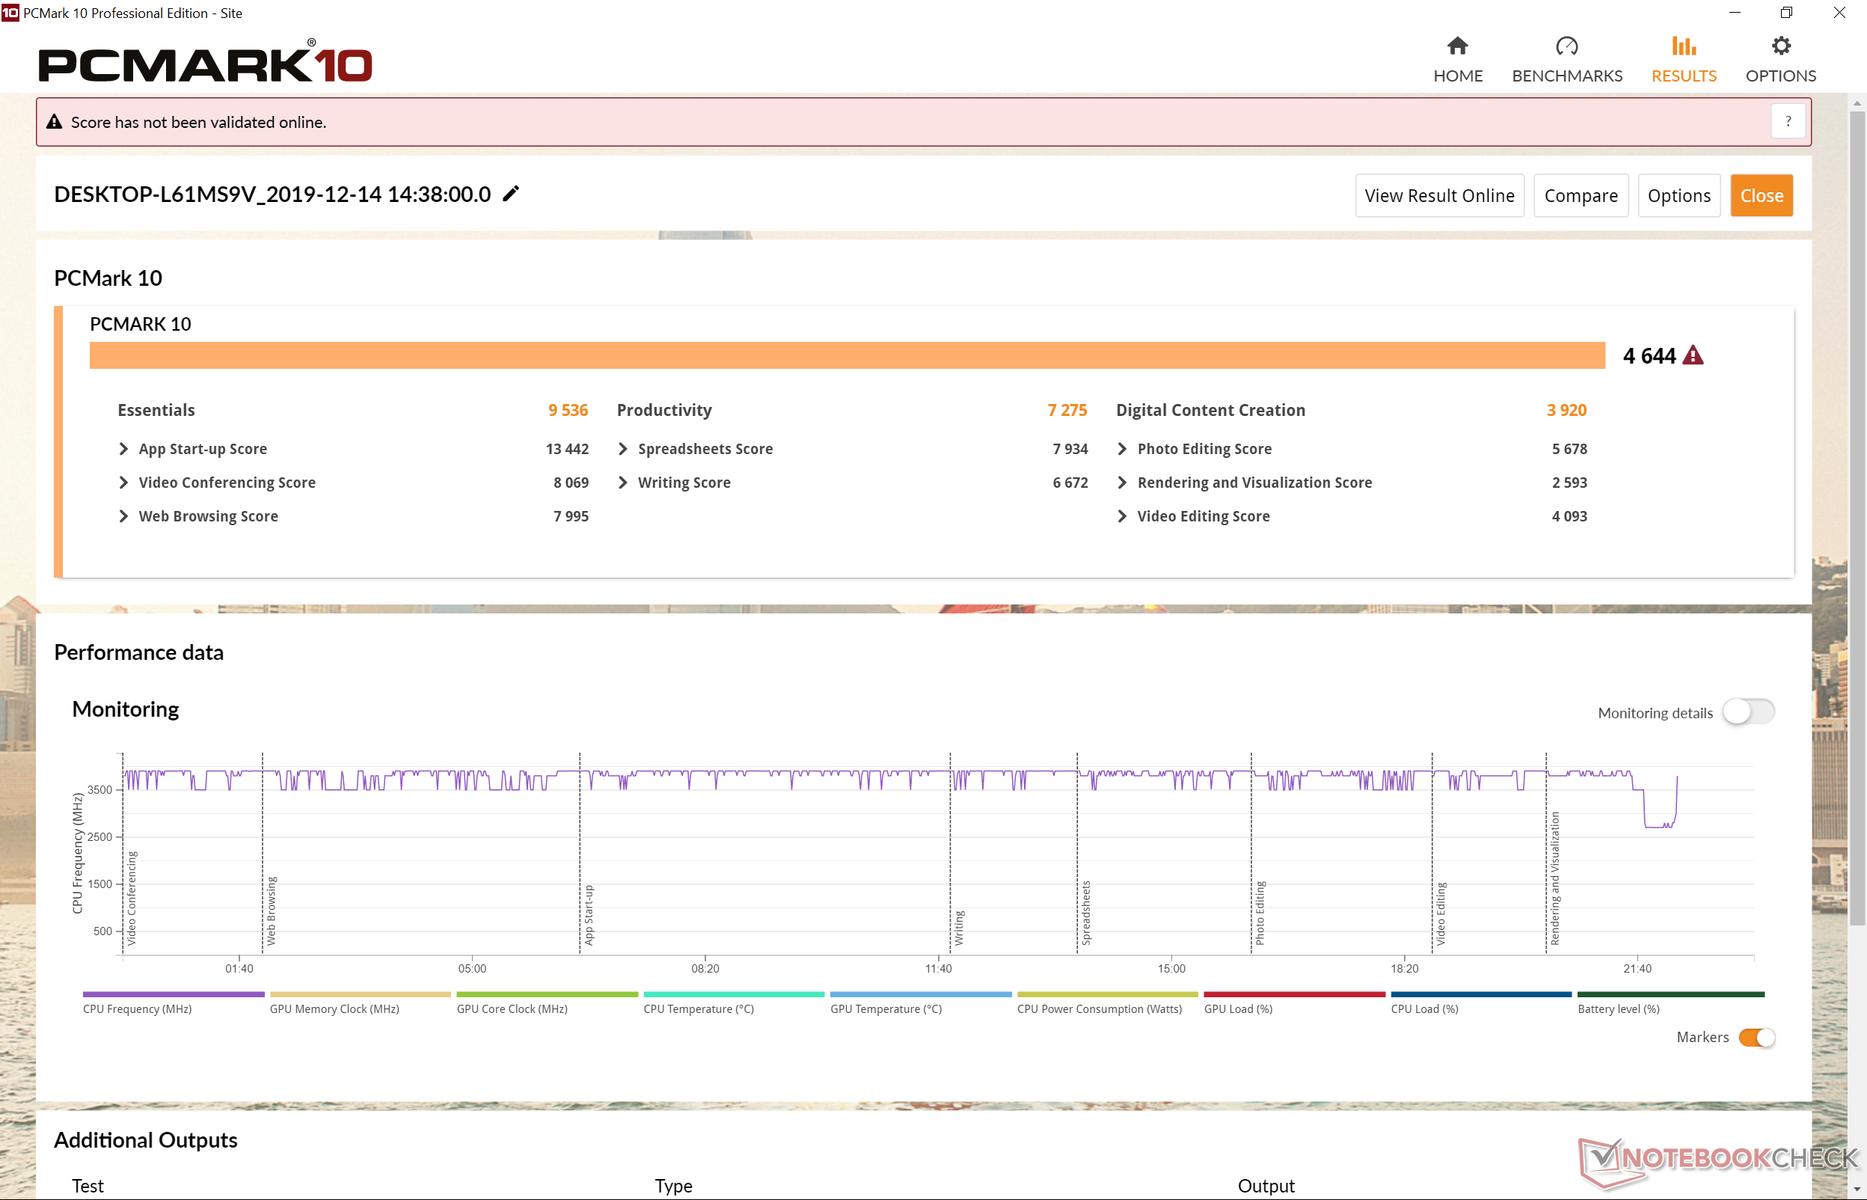
PCMark skorları, karşılaştırmaya bağlı olarak Ryzen 5 SKU'dan yüzde 4 ila yüzde 21 daha yüksektir. Örneğin, Dijital Yaratılış puanı, Iris Plus ve Vega 8/9/10/11 serisi arasındaki gerçek dünya performans farkının Intel'in sizden istediği kadar geniş olmadığını öne sürmek için AMD'den sadece yüzde 4 daha yüksek. inanıyoruz. Intel, web tarama ve başlatma uygulamaları arasında sistemin ne kadar hızlı ve sorunsuz bir şekilde çok görevli olabileceğini test eden PCMark Essentials karşılaştırmasında en büyük avantajına sahiptir. Intel yonga seti, bu tür günlük uygulamalar için muhtemelen daha iyi optimize edilmiştir.Test birimiyle zamanımız boyunca herhangi bir yazılım veya donanım sorunu yaşamadık.
| PCMark 8 | |
| Home Score Accelerated v2 | |
| Dell XPS 15 7590 i5 iGPU FHD | |
| Microsoft Surface Laptop 3 15 i7-1065G7 | |
| Ortalama Intel Core i7-1065G7, Intel Iris Plus Graphics G7 (Ice Lake 64 EU) (3305 - 4275, n=17) | |
| MSI Prestige 15 A10SC | |
| HP Spectre x360 15-df0126ng | |
| Microsoft Surface Laptop 3 15 Ryzen 5 3580U | |
| Work Score Accelerated v2 | |
| Dell XPS 15 7590 i5 iGPU FHD | |
| Microsoft Surface Laptop 3 15 i7-1065G7 | |
| MSI Prestige 15 A10SC | |
| HP Spectre x360 15-df0126ng | |
| Ortalama Intel Core i7-1065G7, Intel Iris Plus Graphics G7 (Ice Lake 64 EU) (2460 - 5291, n=17) | |
| Microsoft Surface Laptop 3 15 Ryzen 5 3580U | |
| PCMark 8 Home Score Accelerated v2 | 3783 puan | |
| PCMark 8 Work Score Accelerated v2 | 4799 puan | |
| PCMark 10 Score | 4644 puan | |
Yardım | ||
Depolama aygıtları
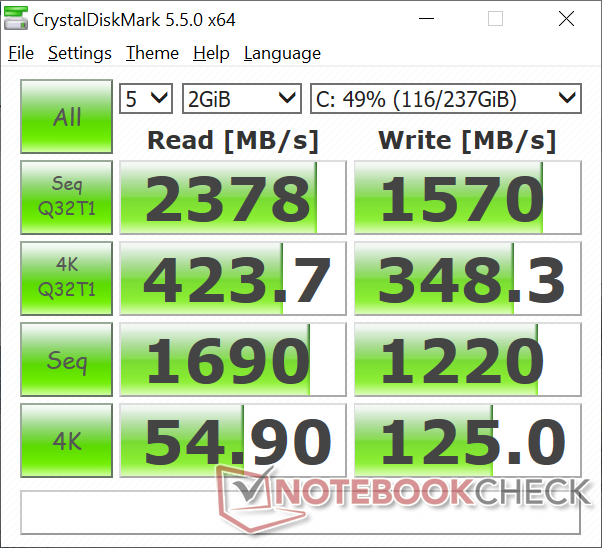
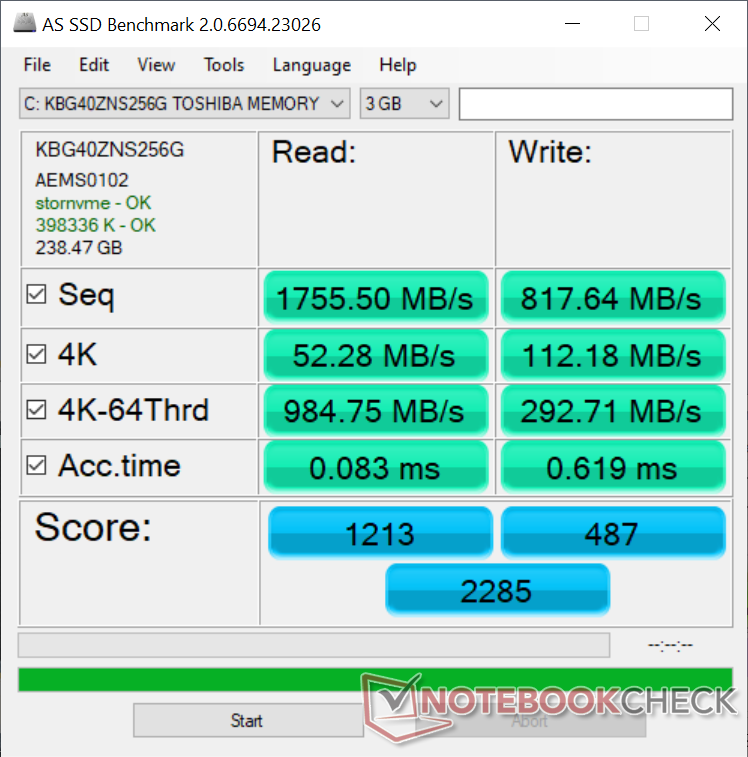
İlginçtir, Intel SKU'muz, Microsoft'un Surface Dizüstü 3 serisi için birden fazla tedarikçi tedarik ettiğini önermek için Ryzen 5 SKU'muzdaki 256 GB SK Hynix BC501'in aksine 256 GB Toshiba KBG40ZNS256G NVMe SSD ile birlikte gelir. Bu nedenle, hangi SSD'yi gerçekten satın alacağınıza dair bir kumar. Toshiba sürücüsü SK Hynix diskinden daha iyi performans gösteriyor. AS SSD, Ryzen 5 SKU'muzda sırasıyla 1122 MB / s ve 514 MB / s ile karşılaştırıldığında sırasıyla 1755 MB / s ve 818 MB / s sıralı okuma ve yazma hızlarını göstermektedir. Bir gelişme olmasına rağmen, Apple MacBook Pro 16 veya Razer Blade Stealth'de bulunan aktarım oranları yalnızca Apple SSD veya Lite-On SSD ile karşılaştırıldığında ortalama. Microsoft'un önde gelen dizüstü bilgisayar serilerinde köşeleri kestiğini görmek hayal kırıklığı yaratıyor. Daha fazla karşılaştırma karşılaştırması için HDD ve SSD tablolarımıza bakın.
| Microsoft Surface Laptop 3 15 i7-1065G7 Toshiba KBG40ZNS256G NVMe | Apple MacBook Pro 16 2019 i9 5500M Apple SSD AP1024 7171 | Asus ZenBook 15 UX534FT-DB77 Samsung SSD PM981 MZVLB1T0HALR | MSI Prestige 15 A10SC Samsung SSD PM981 MZVLB1T0HALR | Microsoft Surface Laptop 3 15 Ryzen 5 3580U SK hynix BC501 HFM256GDGTNG | Razer Blade Stealth 13, Core i7-1065G7 Lite-On CA3-8D512 | |
|---|---|---|---|---|---|---|
| AS SSD | 82% | 66% | 85% | -21% | 13% | |
| Seq Read (MB/s) | 1756 | 2531 44% | 1887 7% | 1274 -27% | 1122 -36% | 2666 52% |
| Seq Write (MB/s) | 818 | 2289 180% | 1432 75% | 1395 71% | 514 -37% | 1497 83% |
| 4K Read (MB/s) | 52.3 | 15.85 -70% | 52.3 0% | 50.3 -4% | 34.98 -33% | 53.7 3% |
| 4K Write (MB/s) | 112.2 | 39.88 -64% | 146 30% | 119.8 7% | 96.8 -14% | 133.7 19% |
| 4K-64 Read (MB/s) | 985 | 1267 29% | 969 -2% | 1599 62% | 492 -50% | 652 -34% |
| 4K-64 Write (MB/s) | 292.7 | 1749 498% | 1375 370% | 1455 397% | 339.9 16% | 272 -7% |
| Access Time Read * (ms) | 0.083 | 0.122 -47% | 0.034 59% | 0.044 47% | 0.056 33% | 0.075 10% |
| Access Time Write * (ms) | 0.619 | 0.095 85% | 0.075 88% | 0.092 85% | 0.11 82% | 0.032 95% |
| Score Read (Points) | 1213 | 1536 27% | 1210 0% | 1777 46% | 639 -47% | 972 -20% |
| Score Write (Points) | 487 | 2018 314% | 1664 242% | 1714 252% | 488 0% | 555 14% |
| Score Total (Points) | 2285 | 4317 89% | 3483 52% | 4411 93% | 1434 -37% | 1982 -13% |
| Copy ISO MB/s (MB/s) | 1192 | 1995 67% | 1375 15% | 2830 137% | 828 -31% | 1495 25% |
| Copy Program MB/s (MB/s) | 604 | 584 -3% | 468 -23% | 609 1% | 200.5 -67% | 458.4 -24% |
| Copy Game MB/s (MB/s) | 1136 | 1135 0% | 1287 13% | 1424 25% | 387.4 -66% | 964 -15% |
* ... daha küçük daha iyidir

GPU Performansı
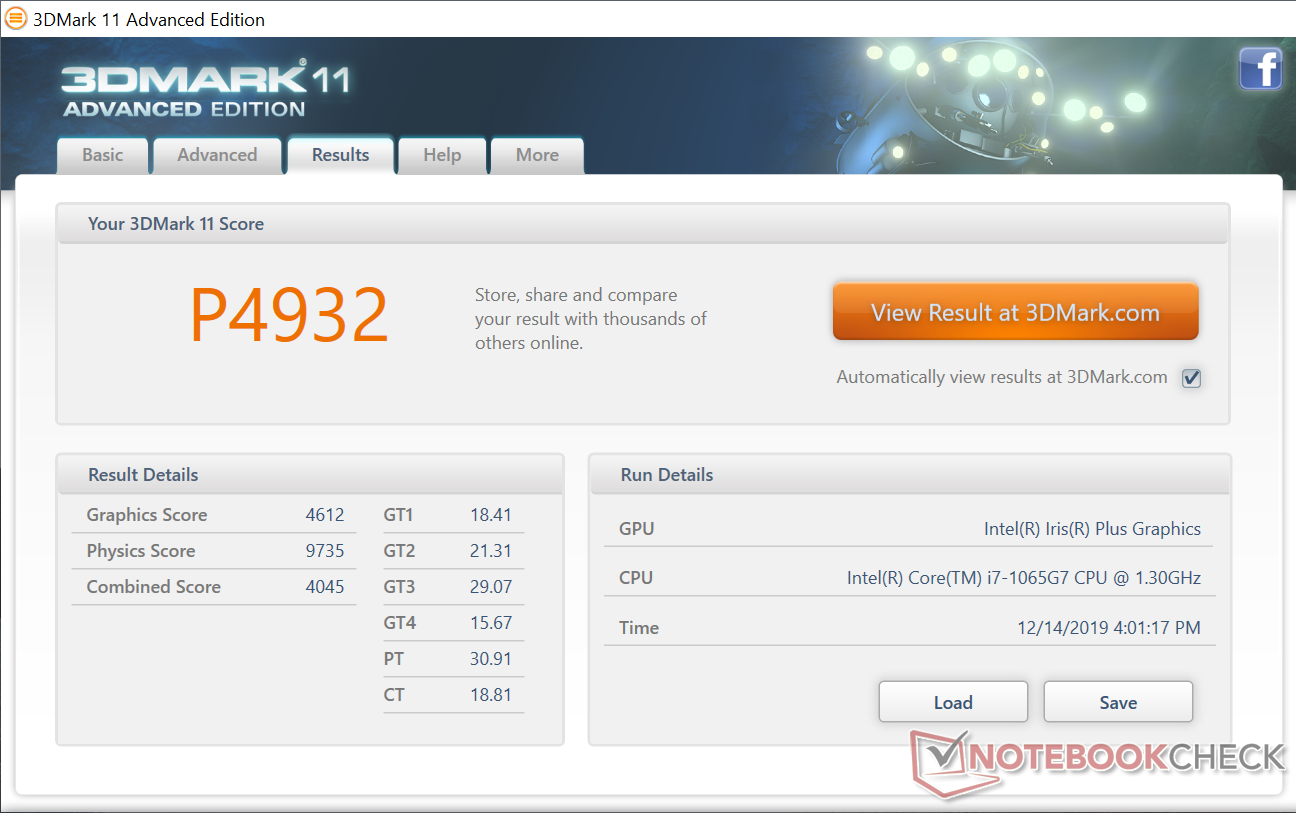
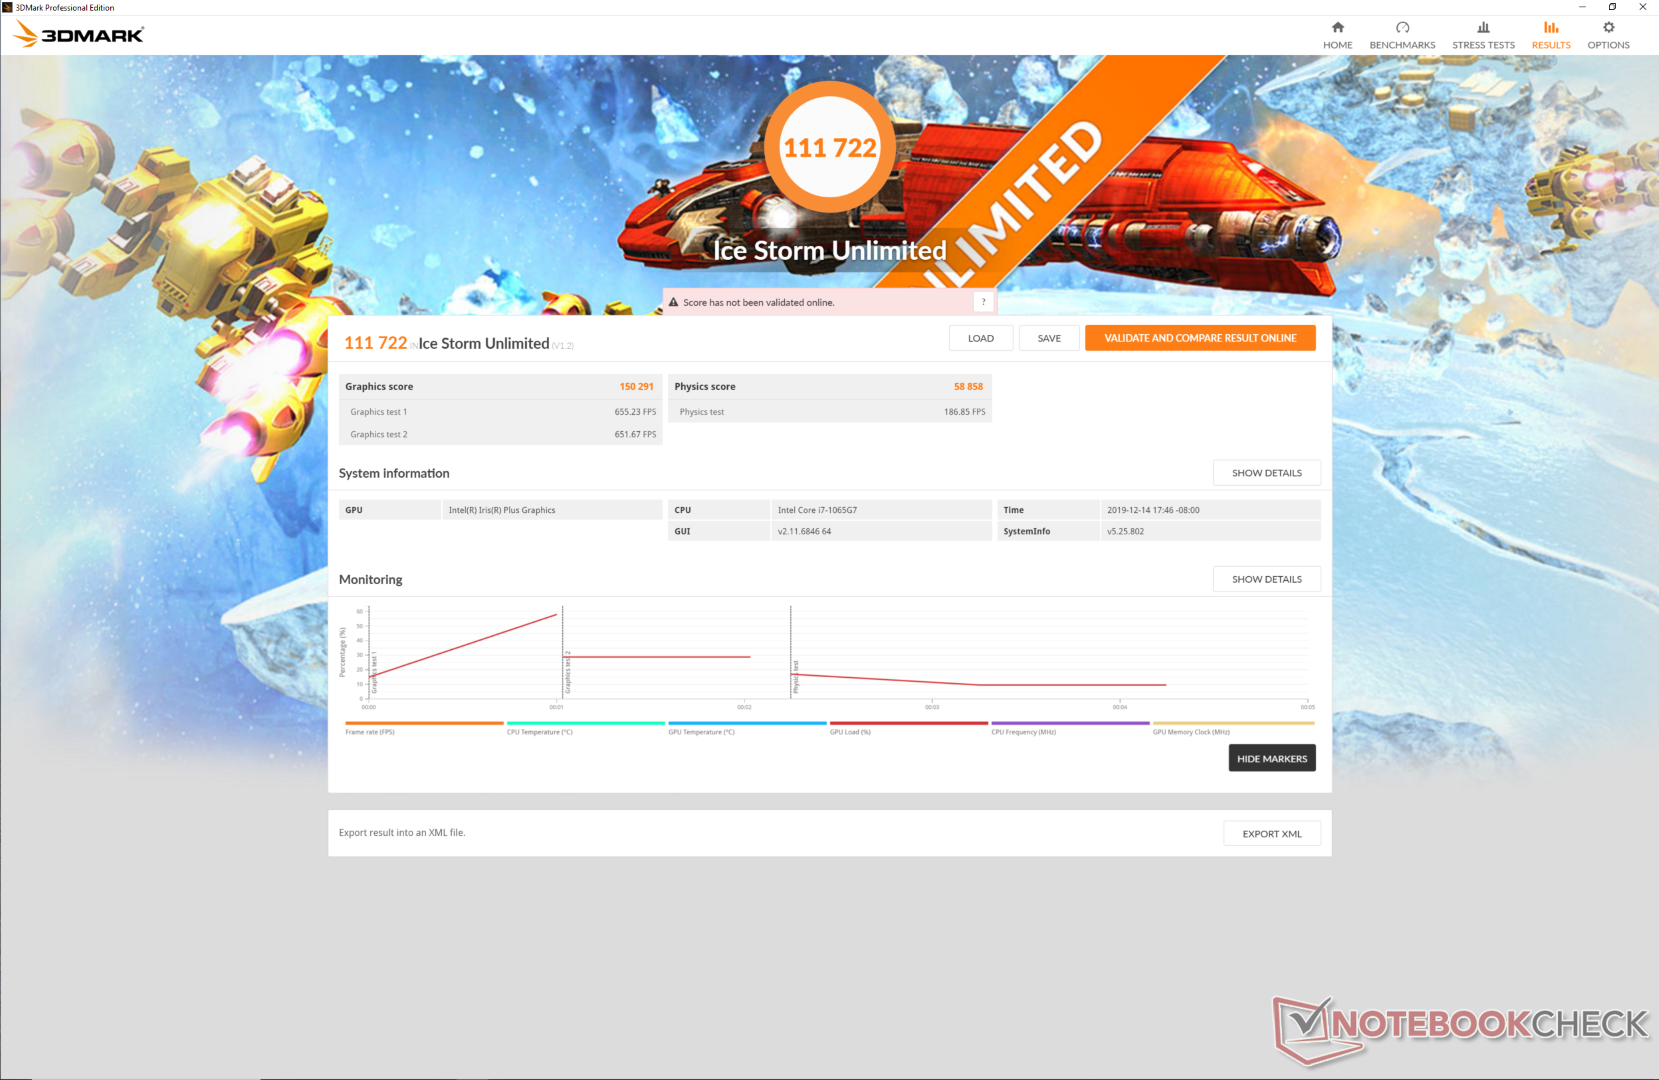
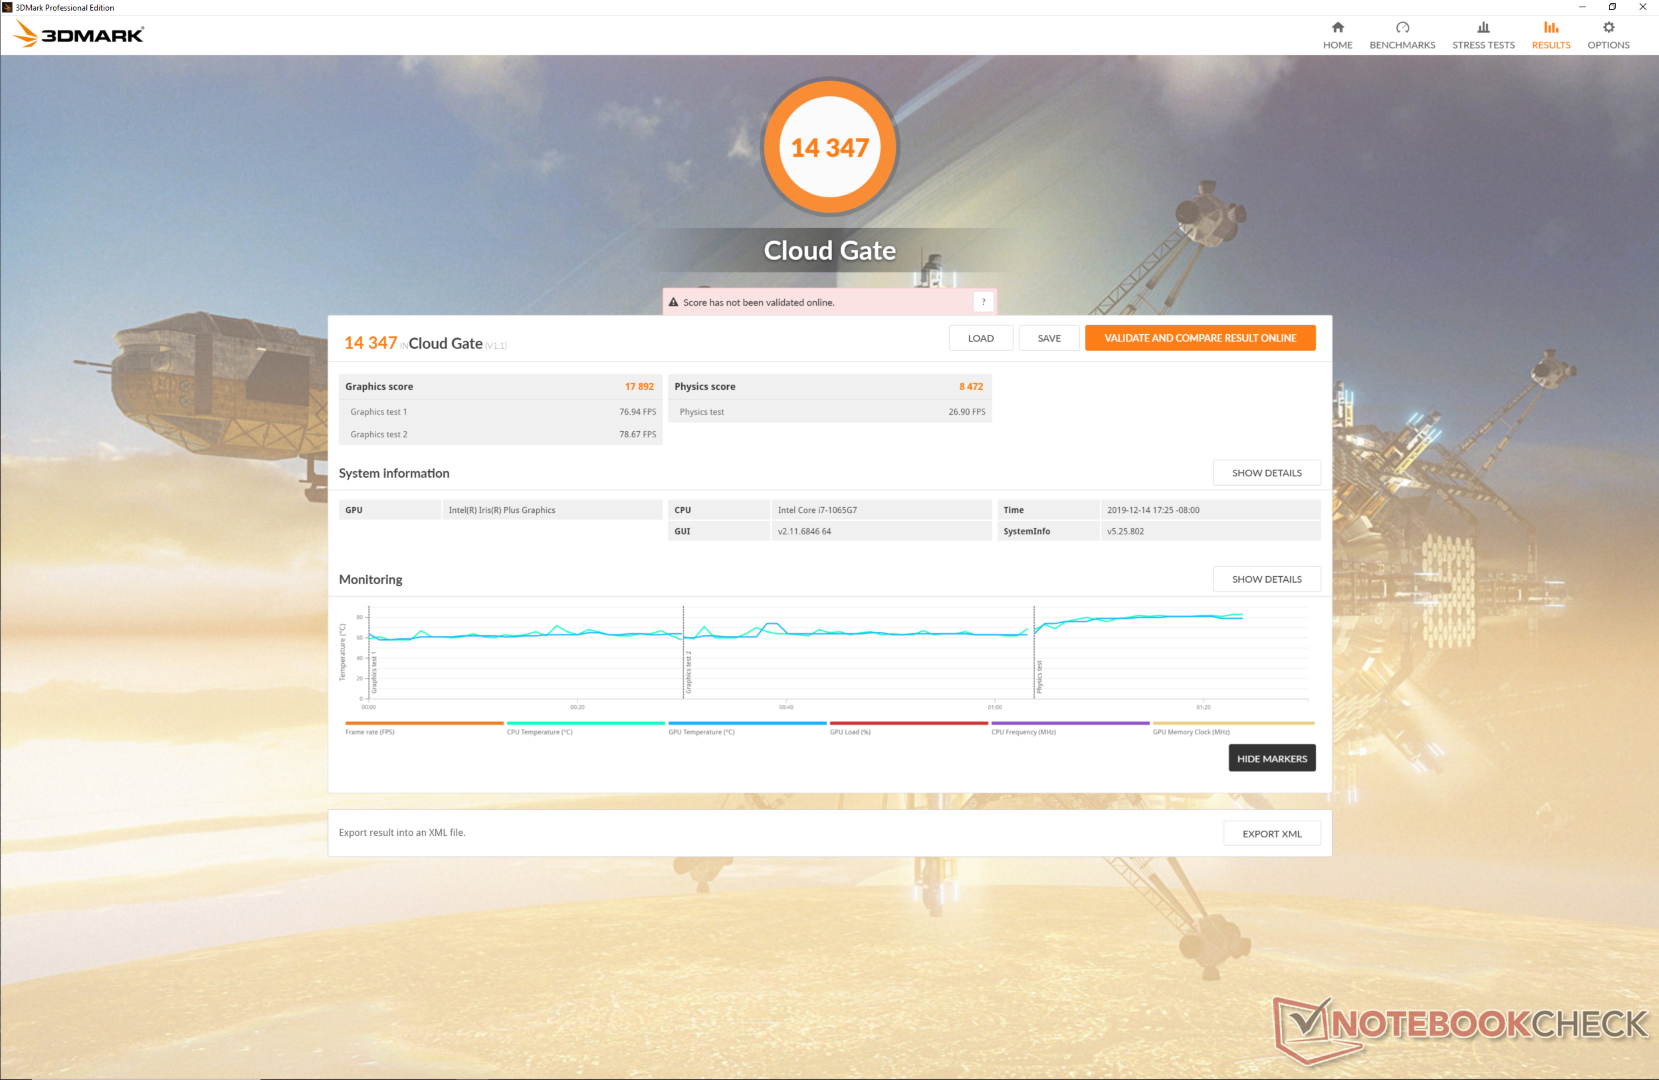
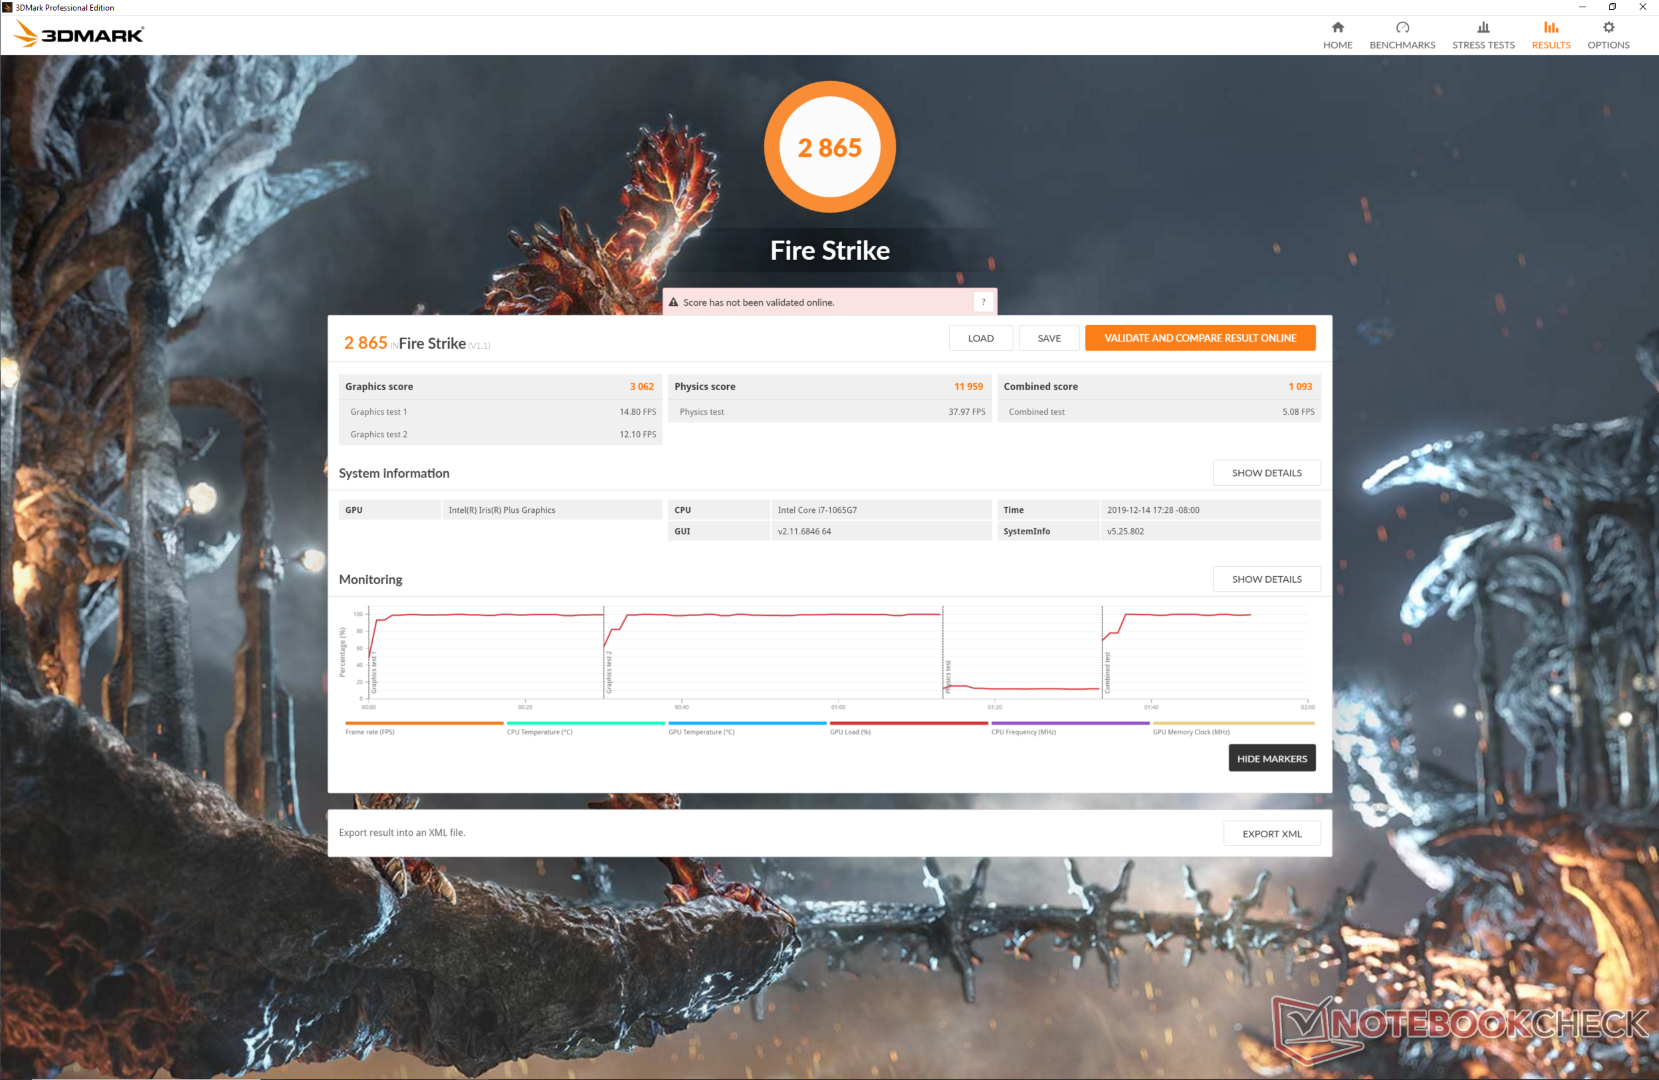
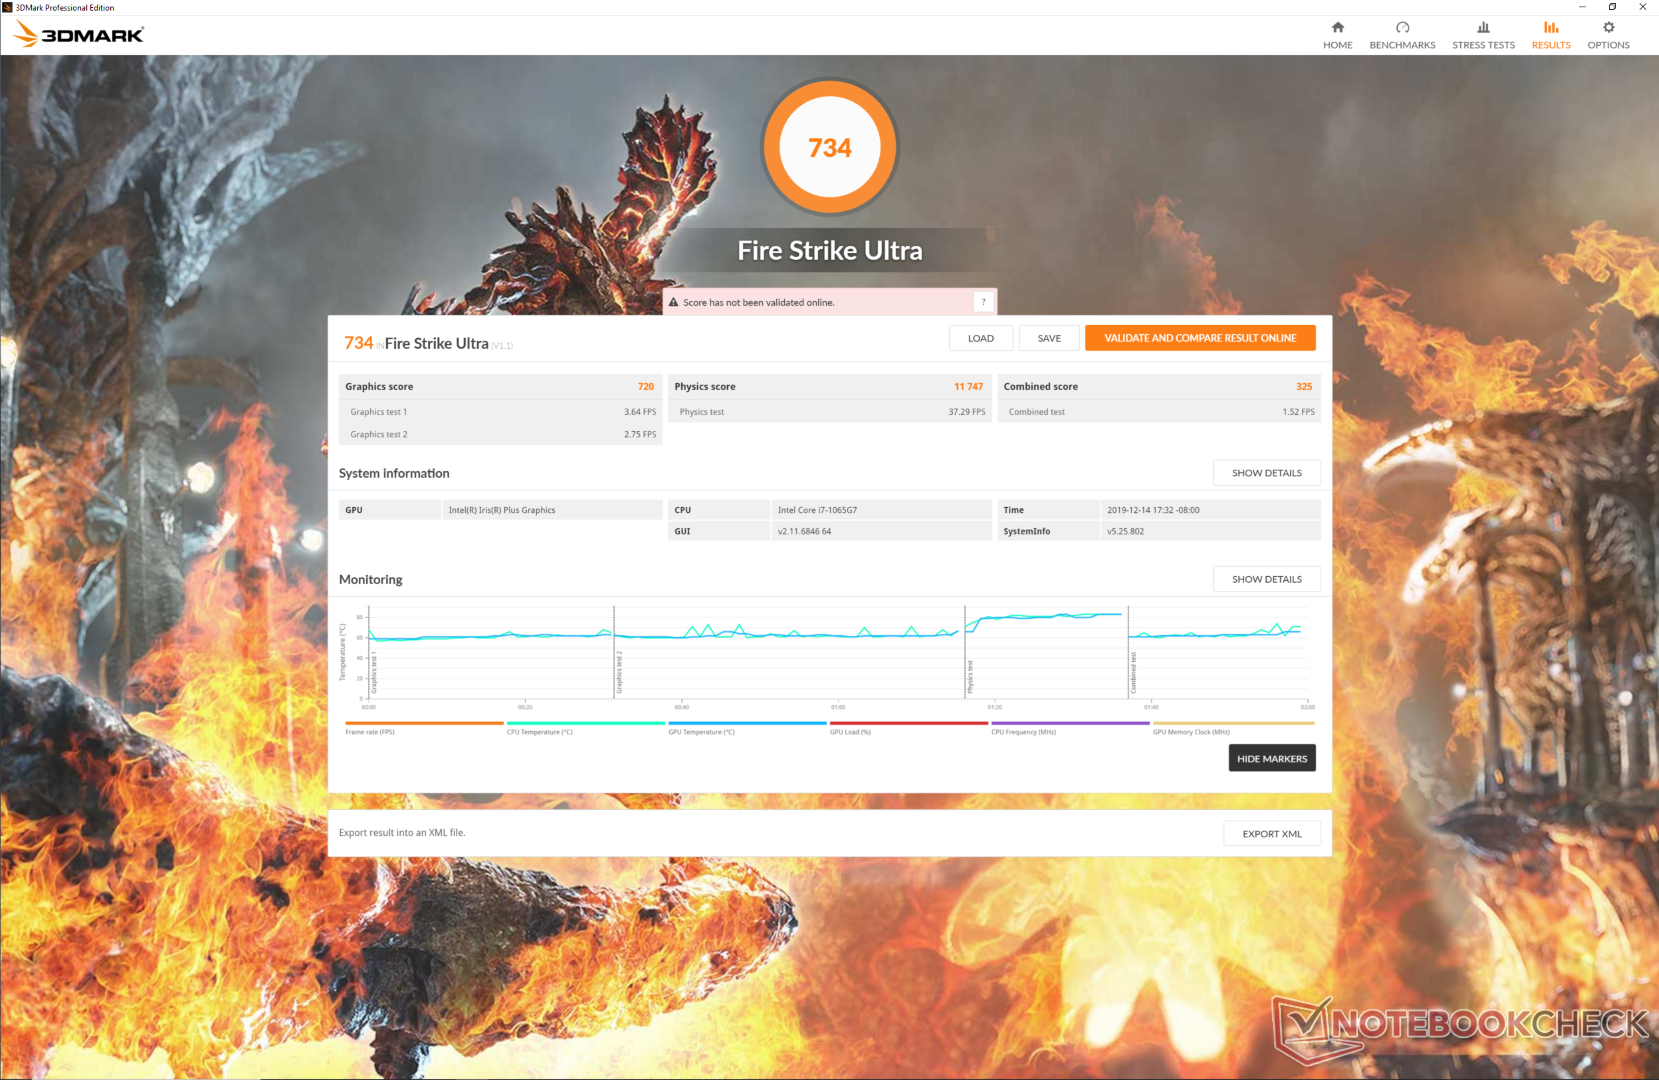
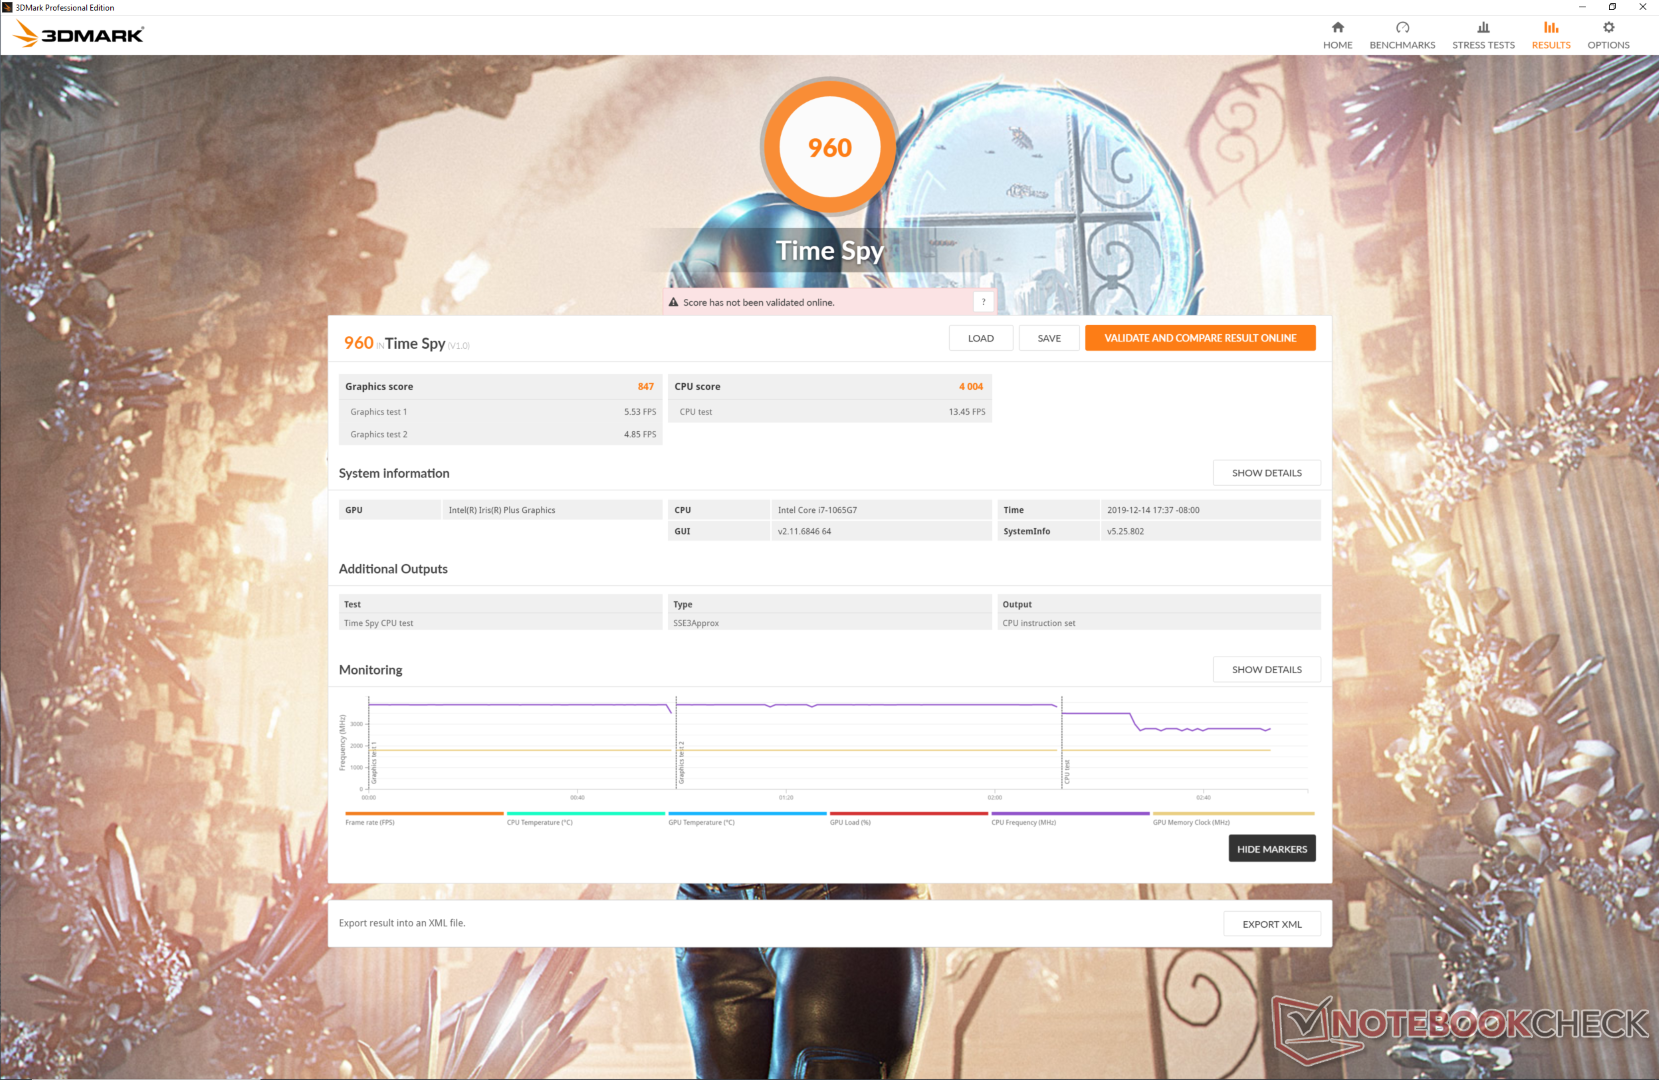
3DMark skorları, entegre Iris Plus GPU'nun Ryzen 5 3580U'daki RX Vega 9 ile en kötü veya en iyi yüzde 15 daha hızlı olduğunu gösteriyor. Ancak gerçek dünya oyun senaryolarında, Intel GPU'nun çok daha hızlı olma potansiyeli vardır. Örneğin Roket Ligi ve F1 2019'un her biri RX Vega 9'dan yüzde 40'a kadar daha hızlı çalışabilirken Overwatch ve Tomb Raider'ın Gölgesi gibi diğer oyunlar Intel ve AMD SKU'lar arasında boyunduruk yapıyor. Fortnite veya Rocket League gibi popüler oyunları oynamayı planlıyorsanız, performansı en üst düzeye çıkarmak için Intel Iris Plus seçeneklerini düşünebilirsiniz. 3DMark, Intel Iris Plus ve AMD RX Vega serisi entegre GPU'lar için gerçek dünya oyun performansının zayıf bir göstergesi olmaya devam ediyor. Ek oyun karşılaştırmaları ve karşılaştırmaları burada Iris Plus G7 sayfamızda bulunabilir.
| 3DMark 11 | |
| 1280x720 Performance GPU | |
| Lenovo Yoga C940-15IRH | |
| Microsoft Surface Laptop 3 15 i7-1065G7 | |
| Huawei MateBook 14 KLV-W29 | |
| Microsoft Surface Laptop 3 15 Ryzen 5 3580U | |
| Xiaomi Mi Notebook Pro i5 | |
| Dell Inspiron 15 5000 5585 | |
| Ortalama Intel Iris Plus Graphics G7 (Ice Lake 64 EU) (2112 - 4630, n=28) | |
| Walmart Motile M142 | |
| Microsoft Surface Pro 7 Core i5-1035G4 | |
| Microsoft Surface Laptop i7 | |
| Microsoft Surface Laptop i7 | |
| Schenker Slim 15 L19 | |
| Dell Latitude 7400-8N6DH | |
| 1280x720 Performance Combined | |
| Lenovo Yoga C940-15IRH | |
| Huawei MateBook 14 KLV-W29 | |
| Microsoft Surface Laptop 3 15 i7-1065G7 | |
| Xiaomi Mi Notebook Pro i5 | |
| Dell Inspiron 15 5000 5585 | |
| Ortalama Intel Iris Plus Graphics G7 (Ice Lake 64 EU) (1319 - 4163, n=28) | |
| Microsoft Surface Laptop 3 15 Ryzen 5 3580U | |
| Microsoft Surface Pro 7 Core i5-1035G4 | |
| Walmart Motile M142 | |
| Microsoft Surface Laptop i7 | |
| Microsoft Surface Laptop i7 | |
| Schenker Slim 15 L19 | |
| Dell Latitude 7400-8N6DH | |
| 3DMark 11 Performance | 4932 puan | |
| 3DMark Ice Storm Standard Score | 67987 puan | |
| 3DMark Cloud Gate Standard Score | 14347 puan | |
| 3DMark Fire Strike Score | 2865 puan | |
| 3DMark Time Spy Score | 960 puan | |
Yardım | ||
| Shadow of the Tomb Raider - 1280x720 Lowest Preset | |
| Acer Aspire 5 A515-52G-723L | |
| Acer Aspire 5 A515-52G-53PU | |
| Dell Inspiron 15 5000 5585 | |
| Microsoft Surface Laptop 3 15 i7-1065G7 | |
| Microsoft Surface Laptop 3 15 Ryzen 5 3580U | |
| Ortalama Intel Iris Plus Graphics G7 (Ice Lake 64 EU) (15.6 - 33, n=13) | |
| HP Pavilion 15-cw0003ng | |
| Dell XPS 13 7390 Core i7-10710U | |
| F1 2019 | |
| 1280x720 Ultra Low Preset | |
| Microsoft Surface Laptop 3 15 i7-1065G7 | |
| Microsoft Surface Laptop 3 15 Ryzen 5 3580U | |
| Ortalama Intel Iris Plus Graphics G7 (Ice Lake 64 EU) (35 - 63, n=5) | |
| 1920x1080 Medium Preset AA:T AF:16x | |
| Microsoft Surface Laptop 3 15 i7-1065G7 | |
| Ortalama Intel Iris Plus Graphics G7 (Ice Lake 64 EU) (22 - 31, n=5) | |
| Microsoft Surface Laptop 3 15 Ryzen 5 3580U | |
| 1920x1080 High Preset AA:T AF:16x | |
| Microsoft Surface Laptop 3 15 i7-1065G7 | |
| Ortalama Intel Iris Plus Graphics G7 (Ice Lake 64 EU) (19 - 27, n=4) | |
| Microsoft Surface Laptop 3 15 Ryzen 5 3580U | |
| 1920x1080 Ultra High Preset AA:T AF:16x | |
| Microsoft Surface Laptop 3 15 i7-1065G7 | |
| Ortalama Intel Iris Plus Graphics G7 (Ice Lake 64 EU) (12 - 21, n=4) | |
| Microsoft Surface Laptop 3 15 Ryzen 5 3580U | |
| Borderlands 3 | |
| 1280x720 Very Low Overall Quality (DX11) | |
| Microsoft Surface Laptop 3 15 i7-1065G7 | |
| Ortalama Intel Iris Plus Graphics G7 (Ice Lake 64 EU) (26.7 - 37, n=4) | |
| Microsoft Surface Laptop 3 15 Ryzen 5 3580U | |
| 1920x1080 Medium Overall Quality (DX11) | |
| Microsoft Surface Laptop 3 15 i7-1065G7 | |
| Ortalama Intel Iris Plus Graphics G7 (Ice Lake 64 EU) (11.7 - 16, n=3) | |
| Microsoft Surface Laptop 3 15 Ryzen 5 3580U | |
| 1920x1080 High Overall Quality (DX11) | |
| Microsoft Surface Laptop 3 15 i7-1065G7 | |
| Ortalama Intel Iris Plus Graphics G7 (Ice Lake 64 EU) (7.73 - 10, n=3) | |
| Microsoft Surface Laptop 3 15 Ryzen 5 3580U | |
| düşük | orta | yüksek | ultra | |
|---|---|---|---|---|
| StarCraft II: Heart of the Swarm (2013) | 358.2 | 100.9 | 64.8 | |
| BioShock Infinite (2013) | 109.6 | 73 | 61.5 | 22.6 |
| The Witcher 3 (2015) | 56.4 | 36.8 | 20.1 | 10 |
| Overwatch (2016) | 90 | 64 | 32.9 | 19.7 |
| Rocket League (2017) | 96.1 | 61 | 42.8 | |
| Shadow of the Tomb Raider (2018) | 31 | |||
| F1 2019 (2019) | 63 | 31 | 27 | 17 |
| Borderlands 3 (2019) | 37 | 16 | 10 |
Emisyonları
Sistem Gürültüsü
Intel ve AMD SKU'lar arasında fan gürültüsü bakımından bazı farklılıklar olacağını tahmin etmiştik, ancak durum böyle değil. 3DMark 06, Witcher 3 veya Prime95'i çalıştırırken mikrofon ölçümlerimizin tümü, geçen ay AMD yapılandırmamızla aynı sonuçlarla sonuçlandı. Surface Laptop 3, düşük ve orta yükler sırasında çoğunlukla yüksek sesle duyulur ve fan gürültüsü yalnızca uzun süreler boyunca oyun gibi daha yüksek yükler çalıştırıldığında fark edilir şekilde yükselir. Elektronik gürültü bir sorun olmayacak kadar küçüktür.
| Microsoft Surface Laptop 3 15 i7-1065G7 Iris Plus Graphics G7 (Ice Lake 64 EU), i7-1065G7, Toshiba KBG40ZNS256G NVMe | Apple MacBook Pro 16 2019 i9 5500M Radeon Pro 5500M, i9-9880H, Apple SSD AP1024 7171 | Dell XPS 15 7590 i5 iGPU FHD UHD Graphics 630, i5-9300H, Toshiba XG6 KXG60ZNV512G | Asus ZenBook 15 UX534FT-DB77 GeForce GTX 1650 Max-Q, i7-8565U, Samsung SSD PM981 MZVLB1T0HALR | Razer Blade Stealth i7-8565U GeForce MX150, i7-8565U, Lite-On CA3-8D256-Q11 | Microsoft Surface Laptop 3 15 Ryzen 5 3580U Vega 9, R5 3580U, SK hynix BC501 HFM256GDGTNG | |
|---|---|---|---|---|---|---|
| Noise | -13% | -2% | -2% | -8% | 2% | |
| kapalı / ortam * (dB) | 28.5 | 29.8 -5% | 29.3 -3% | 28.4 -0% | 28.4 -0% | 28 2% |
| Idle Minimum * (dB) | 28.5 | 29.9 -5% | 29.3 -3% | 28.4 -0% | 28.5 -0% | 28 2% |
| Idle Average * (dB) | 28.5 | 29.9 -5% | 29.3 -3% | 28.4 -0% | 29 -2% | 28 2% |
| Idle Maximum * (dB) | 28.7 | 29.9 -4% | 29.8 -4% | 28.4 1% | 29.1 -1% | 28 2% |
| Load Average * (dB) | 30 | 43 -43% | 32.4 -8% | 33.9 -13% | 42.8 -43% | 29.2 3% |
| Witcher 3 ultra * (dB) | 39.2 | 45.4 -16% | 39.8 -2% | 41.4 -6% | 39 1% | |
| Load Maximum * (dB) | 41.2 | 46.1 -12% | 37.2 10% | 40.2 2% | 41.6 -1% | 41.4 -0% |
* ... daha küçük daha iyidir
Ses yüksekliği
| Boşta |
| 28.5 / 28.5 / 28.7 dB |
| Çalışırken |
| 30 / 41.2 dB |
 | ||
30 dB sessiz 40 dB(A) duyulabilirlik 50 dB(A) gürültülü |
||
min: | ||
Sıcaklık
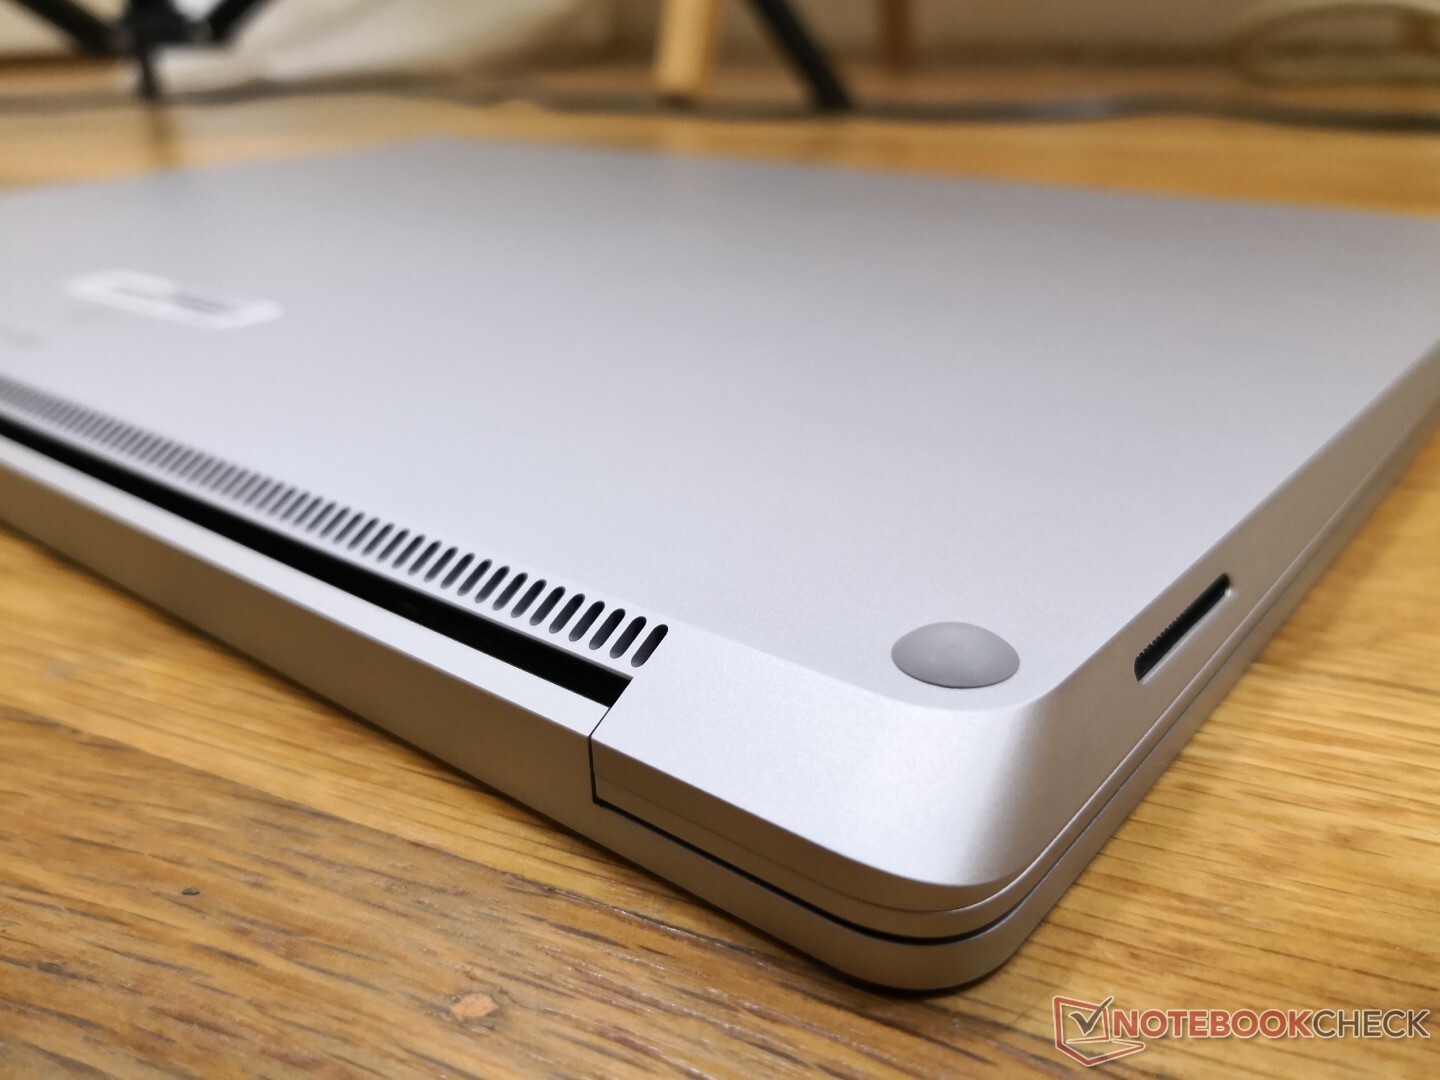
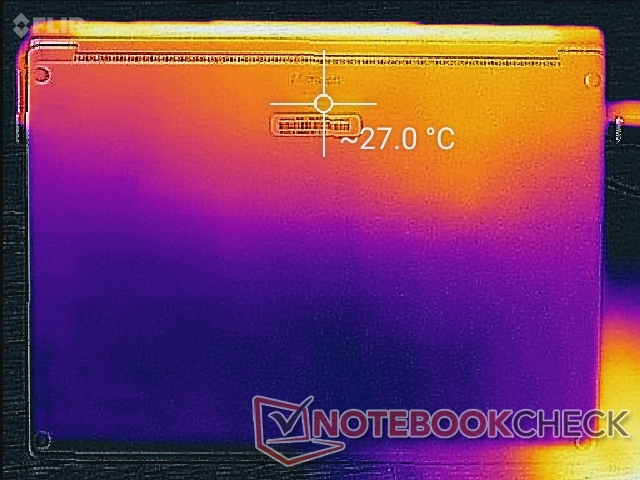
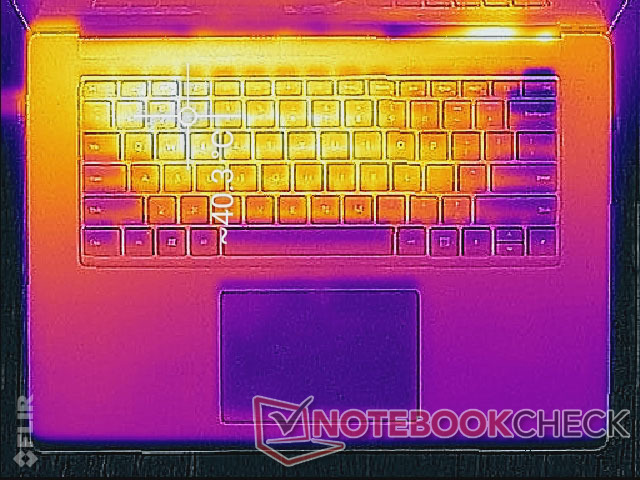
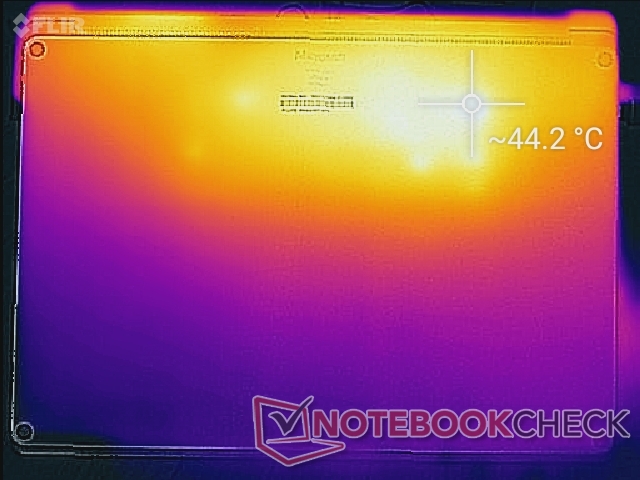
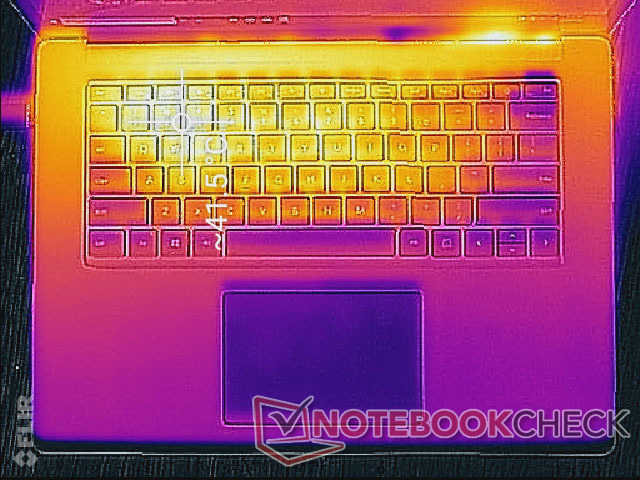
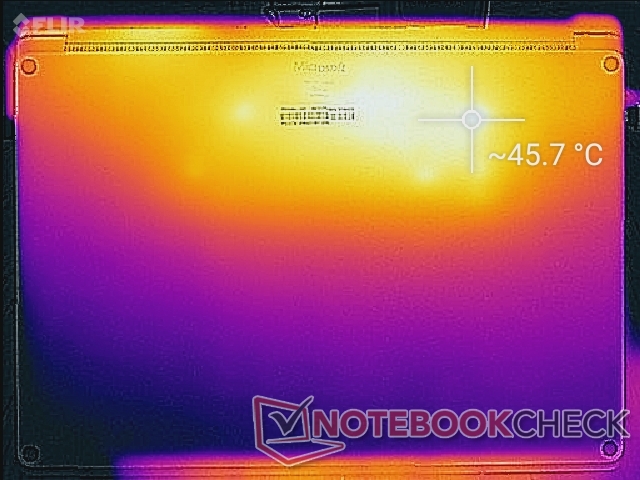
Performans farklılıklarına rağmen Intel ve AMD SKU'lar arasında yüzey sıcaklığı gelişiminde önemli bir fark yoktur. Prime95 ve FurMark'ı aynı anda çalıştırmak, Intel'de 42 C ila 50 C'ye kıyasla Intel'de 41 C ila 46 C sıcak noktalara neden olur. Çoğu oyun dizüstü bilgisayarının aksine oyun oynarken veya yüksek yükler çalıştırırken çok sıcak WASD tuşlarına hazır olun.Alt paneldeki havalandırma ızgaralarının olmaması, hava akışını engellemeden dizüstü bilgisayarınızı kucağınızda kullanabileceğiniz anlamına gelir. Öte yandan, dizüstü bilgisayarın arka yarısı normalden daha sıcak olacaktır.
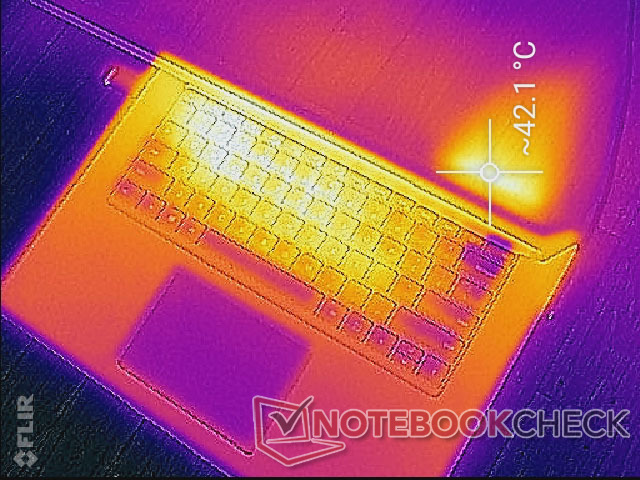
(±) Üst taraftaki maksimum sıcaklık, 34.3 °C / 94 F ortalamasına kıyasla 41.8 °C / 107 F'dir. , Office sınıfı için 21.2 ile 62.5 °C arasında değişir.
(-) Alt kısım, 36.8 °C / 98 F ortalamasına kıyasla maksimum 45.6 °C / 114 F'ye kadar ısınır
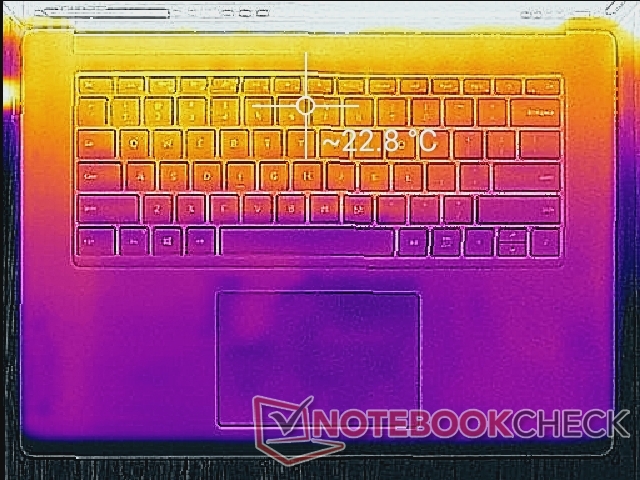
(+) Boşta kullanımda, üst tarafın ortalama sıcaklığı 21.6 °C / 71 F olup, cihazın 29.5 °C / 85 F.
(±) The Witcher 3 oynarken, üst tarafın ortalama sıcaklığı 32.2 °C / 90 F olup, cihazın 29.5 °C / 85 F.
(+) Avuç içi dayanakları ve dokunmatik yüzey, maksimum 29 °C / 84.2 F ile cilt sıcaklığından daha soğuktur ve bu nedenle dokunulduğunda soğuktur.
(±) Benzer cihazların avuç içi dayanağı alanının ortalama sıcaklığı 27.6 °C / 81.7 F (-1.4 °C / -2.5 F) idi.
Stres testi
Herhangi bir olası azaltma veya kararlılık sorununu belirlemek için sistemi sentetik yüklerle vurgularız. Prime95 çalıştırıldığında, CPU saat hızlarının ilk 20 saniye boyunca 3.5 GHz'de çalıştığı ve 85 C'lik bir çekirdek sıcaklık tavanına çarpana kadar gözlemlenebilir. Daha sonra, daha düşük bir çekirdek sıcaklığını korumak için saat hızları 2.6 - 2.7 GHz aralığına düşer. 75 C. Hem saat hızları (2,7 GHz'e karşı 2,4 GHz) hem de çekirdek sıcaklığı (77 C'a karşı 66 C Tctl / Tdie), Ryzen 5 3580U SKU'ya kıyasla Core i7'de daha yüksek değerlerde stabilize olur. HWiNFO'nun çekirdek sıcaklıkları Intel ve AMD CPU'lar arasında farklı rapor ettiğini ve bu sıcaklık farklılıklarının burada doğrudan karşılaştırılamayabileceğini unutmayın.Running Witcher 3, gerçek dünyadaki yükleri daha fazla temsil ediyor. GPU-Z'ye göre Ryzen 5 SKU'ya (1050 MHz'e 800 MHz ve 73 C'a 58 C) kıyasla hem GPU saat hızları hem de çekirdek sıcaklığı yine daha yüksek. Pil gücüyle çalışmak performansı sınırlamaz, yani AC prizinden uzakta kullanıcılar tam sistem performansı elde edebilir. Pillerdeki bir Fire Strike, şebeke başındayken 11959 ve 3062 noktalarına kıyasla sırasıyla Fizik ve Grafik puanları 12008 ve 3060 puan verir.
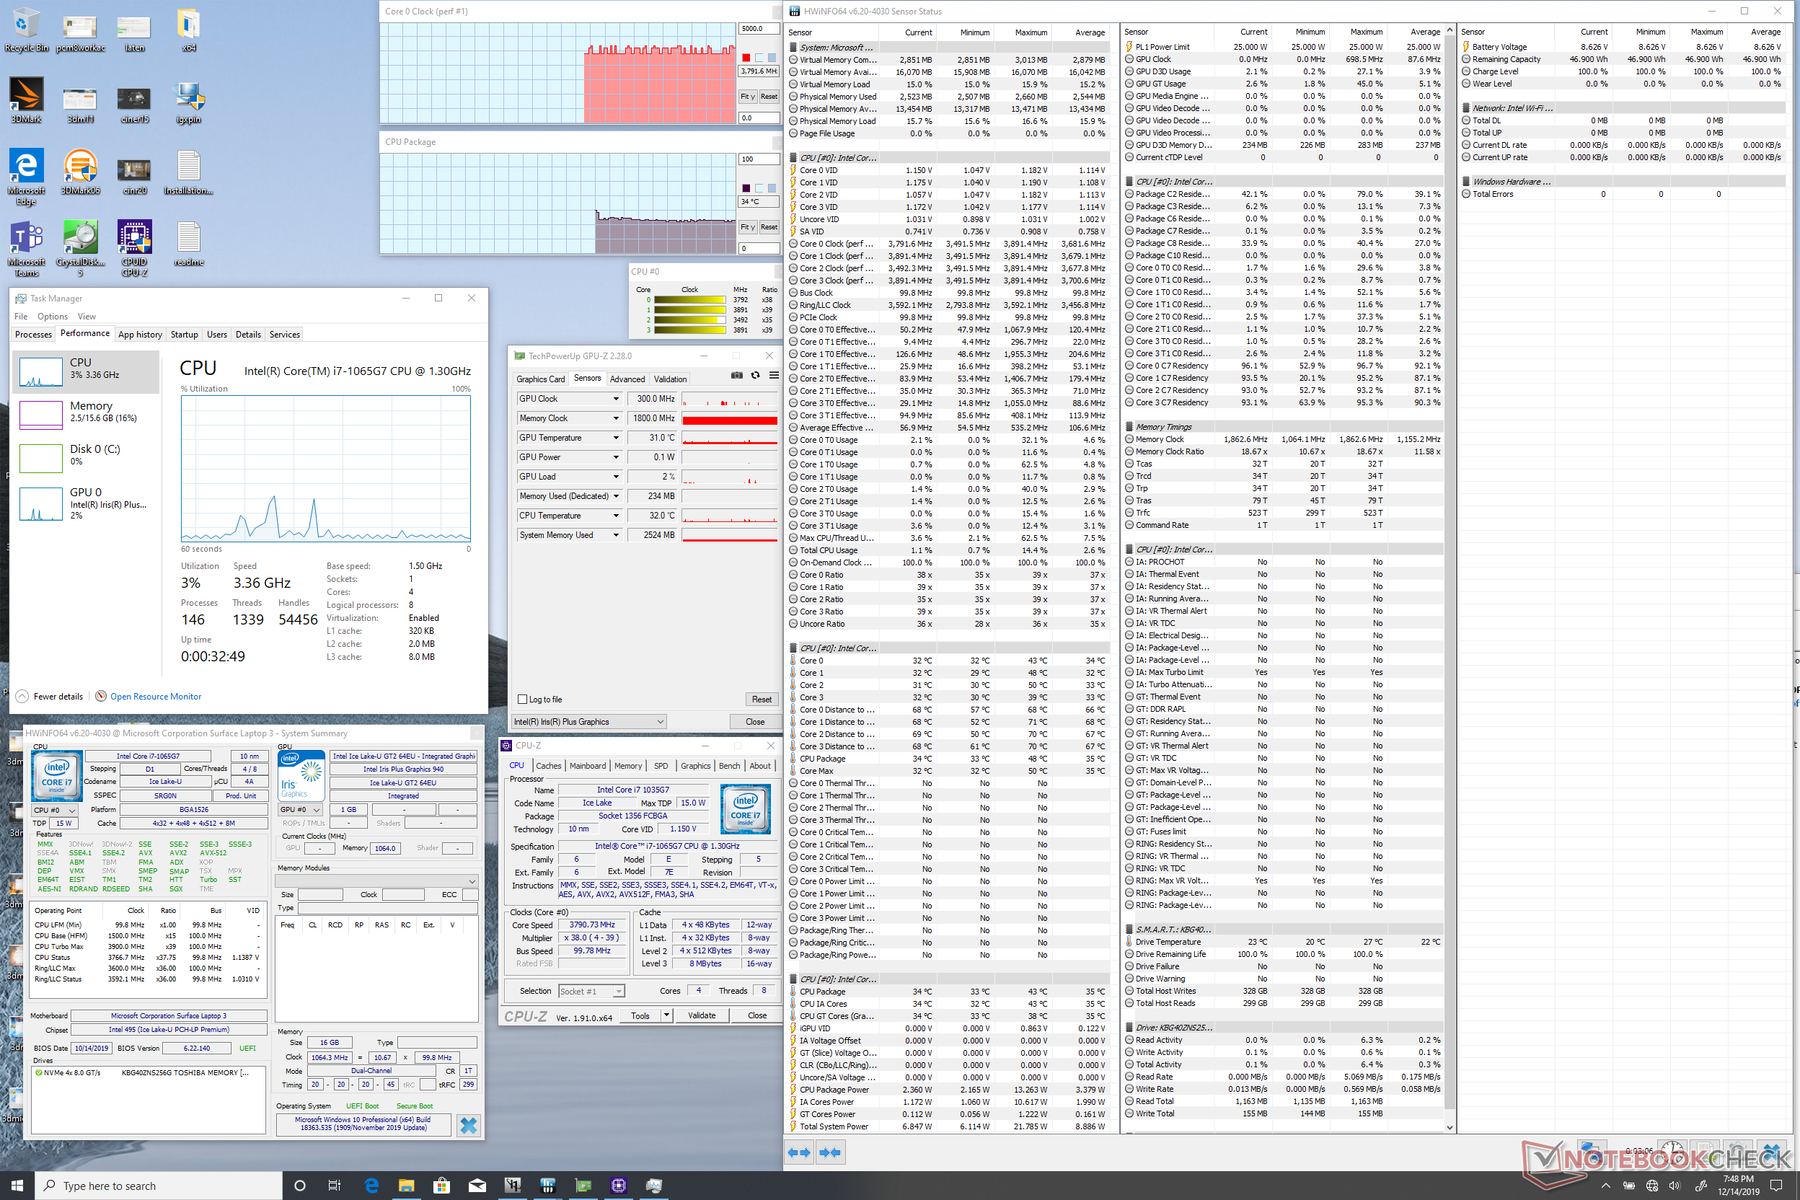
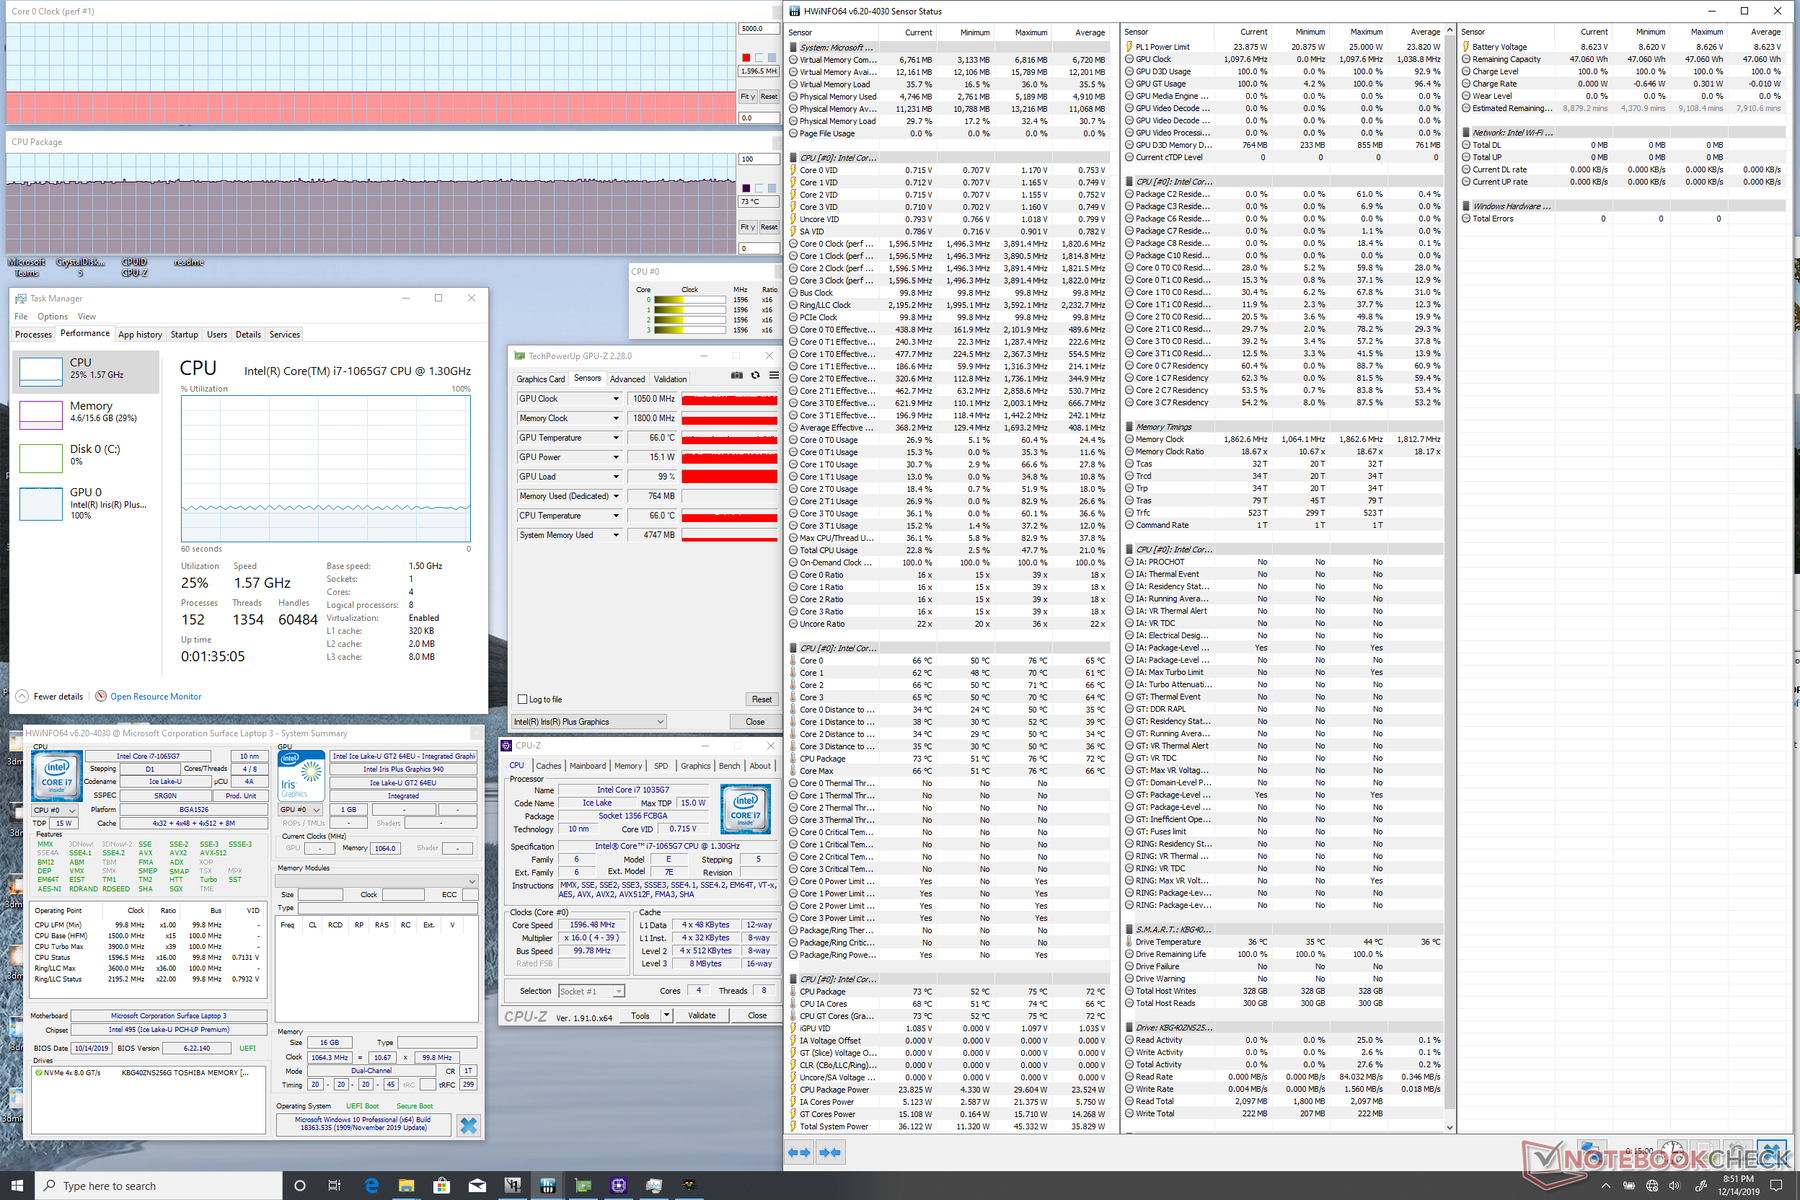
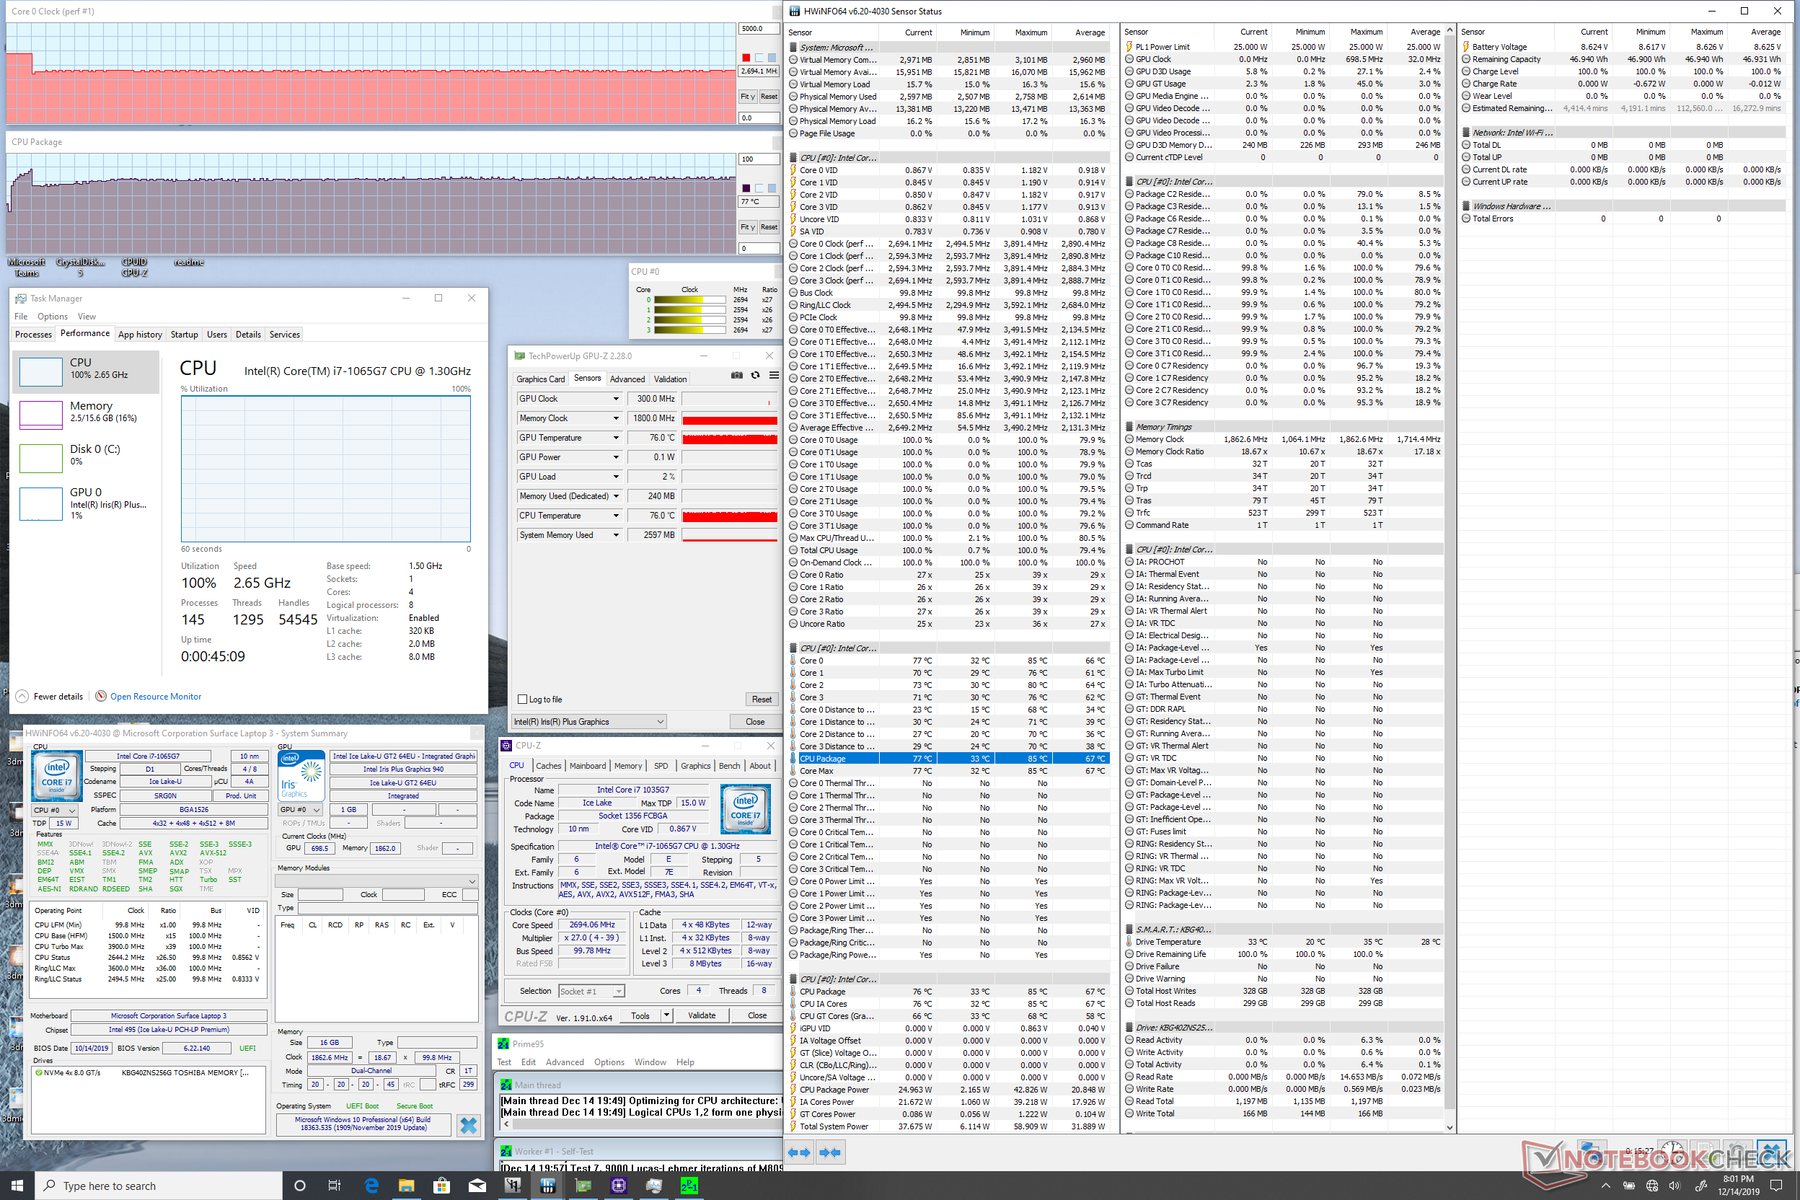
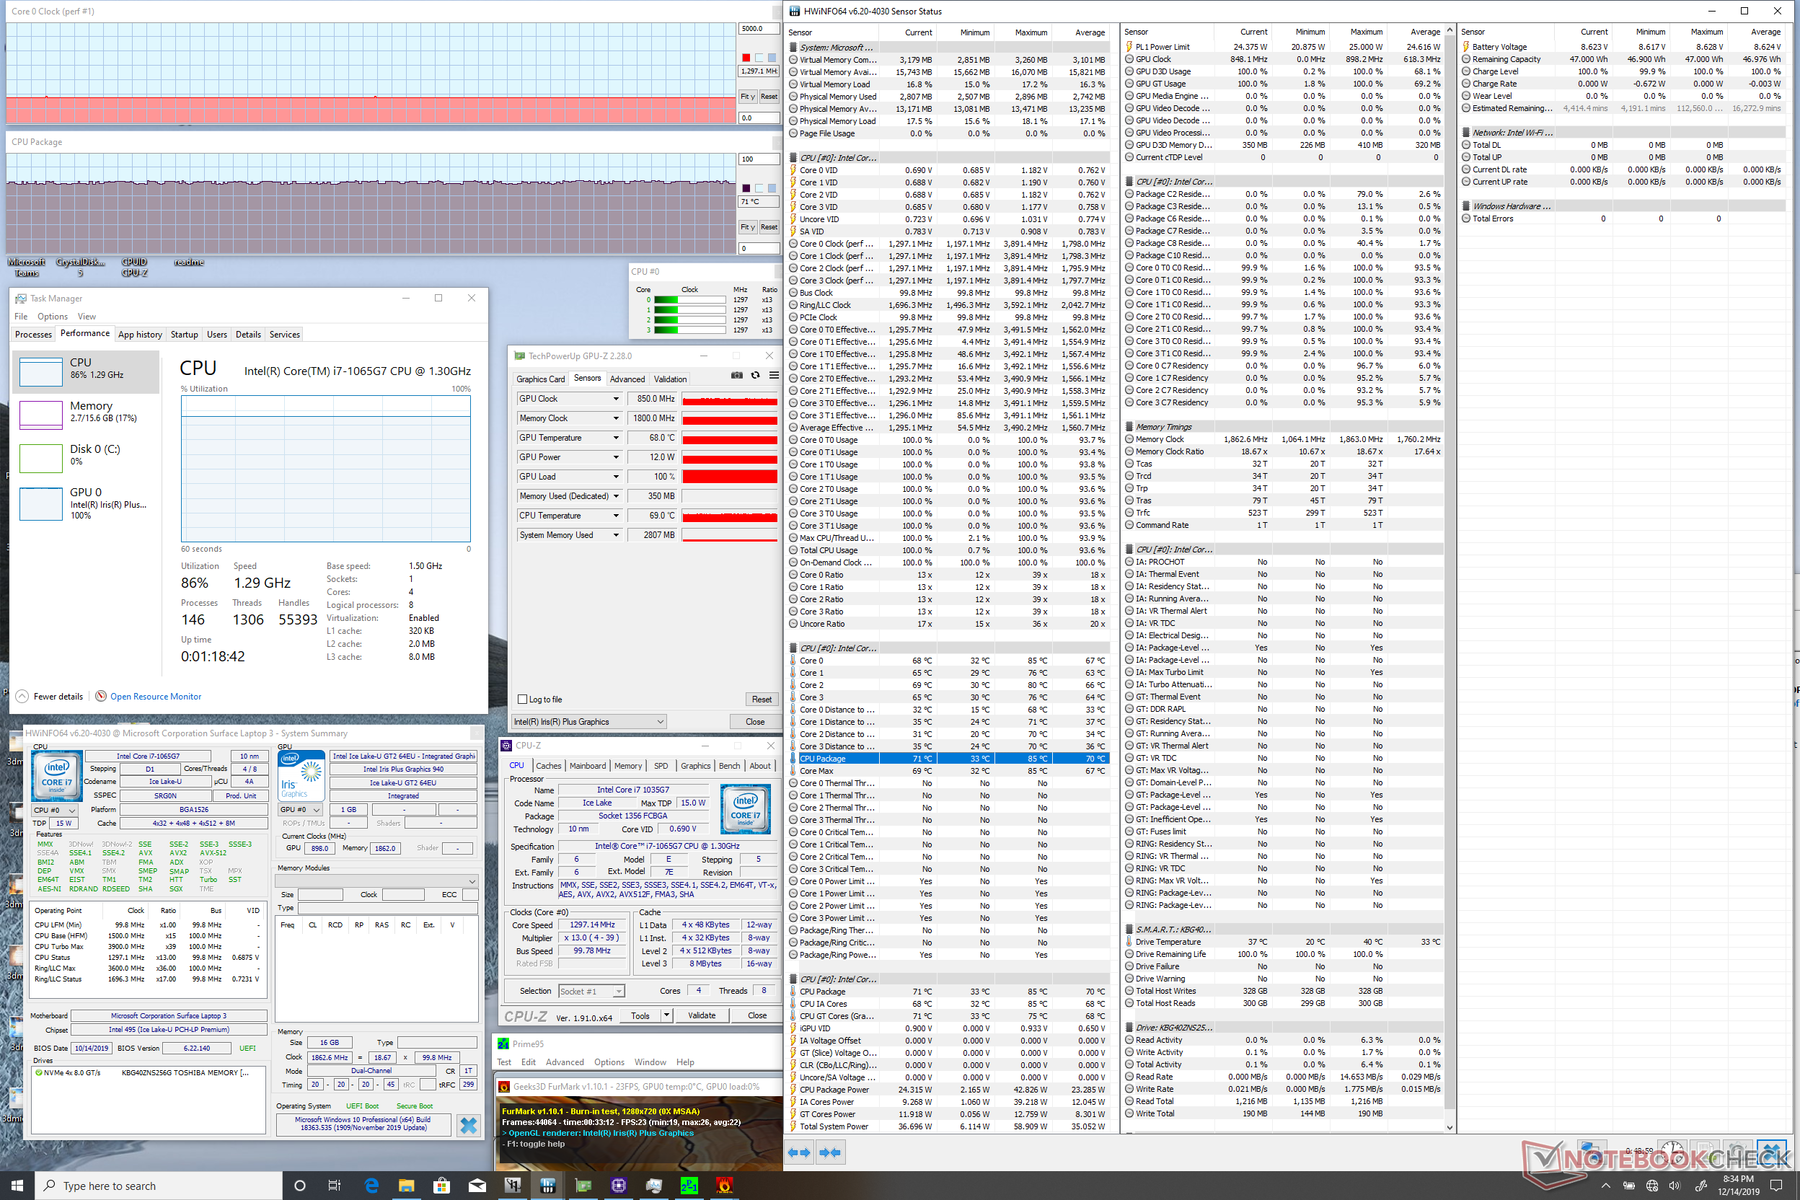
| CPU Clock (GHz) | GPU Clock (MHz) | Average CPU Temperature (°C) | |
| System Idle | -- | -- | 34 |
| Prime95 Stress | 2.6 - 2.7 | -- | 77 |
| Prime95 + FurMark Stress | 1.3 | 850 | 71 |
| Witcher 3 Stress | 1.6 | 1050 | 73 |
Hoparlörler

Microsoft Surface Laptop 3 15 i7-1065G7 ses analizi
(±) | hoparlör ses yüksekliği ortalama ama iyi (80.5 dB)
Bas 100 - 315Hz
(±) | azaltılmış bas - ortalama olarak medyandan 5.3% daha düşük
(±) | Bas doğrusallığı ortalamadır (10.3% delta - önceki frekans)
Ortalar 400 - 2000 Hz
(+) | dengeli ortalar - medyandan yalnızca 2.7% uzakta
(+) | orta frekanslar doğrusaldır (6.7% deltadan önceki frekansa)
Yüksekler 2 - 16 kHz
(+) | dengeli yüksekler - medyandan yalnızca 2.7% uzakta
(±) | Yükseklerin doğrusallığı ortalamadır (8.5% delta - önceki frekans)
Toplam 100 - 16.000 Hz
(+) | genel ses doğrusaldır (11.7% ortancaya göre fark)
Aynı sınıfla karşılaştırıldığında
» Bu sınıftaki tüm test edilen cihazların %4%'si daha iyi, 2% benzer, 95% daha kötüydü
» En iyisinin deltası 7% idi, ortalama 21% idi, en kötüsü 53% idi
Test edilen tüm cihazlarla karşılaştırıldığında
» Test edilen tüm cihazların %8'si daha iyi, 3 benzer, % 89 daha kötüydü
» En iyisinin deltası 4% idi, ortalama 23% idi, en kötüsü 134% idi
Apple MacBook 12 (Early 2016) 1.1 GHz ses analizi
(+) | hoparlörler nispeten yüksek sesle çalabilir (83.6 dB)
Bas 100 - 315Hz
(±) | azaltılmış bas - ortalama olarak medyandan 11.3% daha düşük
(±) | Bas doğrusallığı ortalamadır (14.2% delta - önceki frekans)
Ortalar 400 - 2000 Hz
(+) | dengeli ortalar - medyandan yalnızca 2.4% uzakta
(+) | orta frekanslar doğrusaldır (5.5% deltadan önceki frekansa)
Yüksekler 2 - 16 kHz
(+) | dengeli yüksekler - medyandan yalnızca 2% uzakta
(+) | yüksekler doğrusaldır (4.5% deltadan önceki frekansa)
Toplam 100 - 16.000 Hz
(+) | genel ses doğrusaldır (10.2% ortancaya göre fark)
Aynı sınıfla karşılaştırıldığında
» Bu sınıftaki tüm test edilen cihazların %7%'si daha iyi, 2% benzer, 90% daha kötüydü
» En iyisinin deltası 5% idi, ortalama 18% idi, en kötüsü 53% idi
Test edilen tüm cihazlarla karşılaştırıldığında
» Test edilen tüm cihazların %5'si daha iyi, 1 benzer, % 94 daha kötüydü
» En iyisinin deltası 4% idi, ortalama 23% idi, en kötüsü 134% idi
Enerji yönetimi
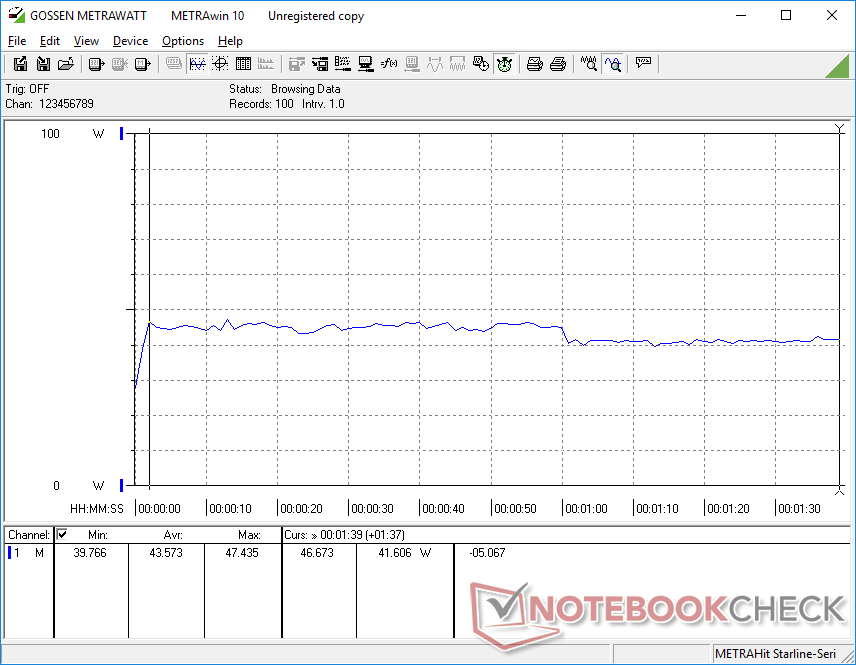
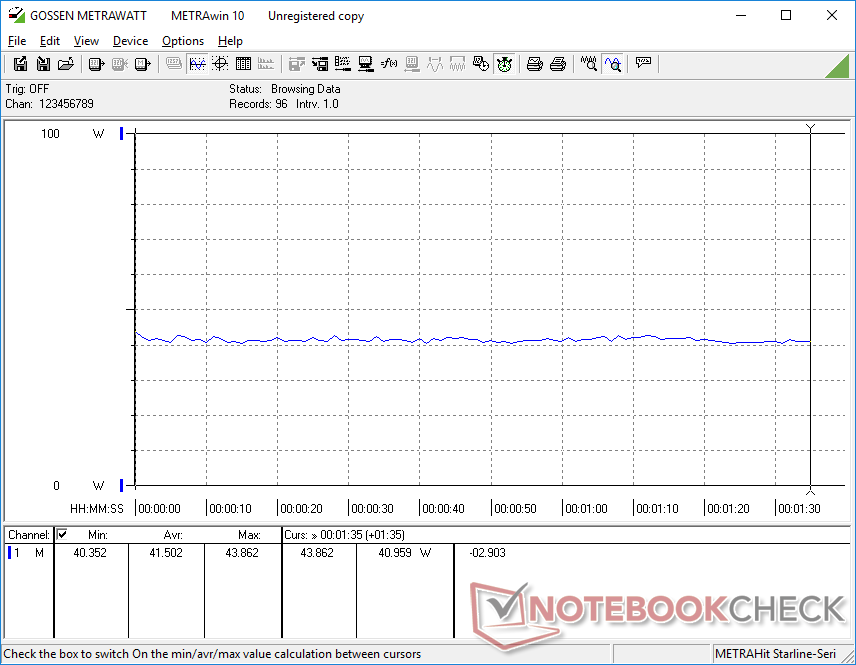
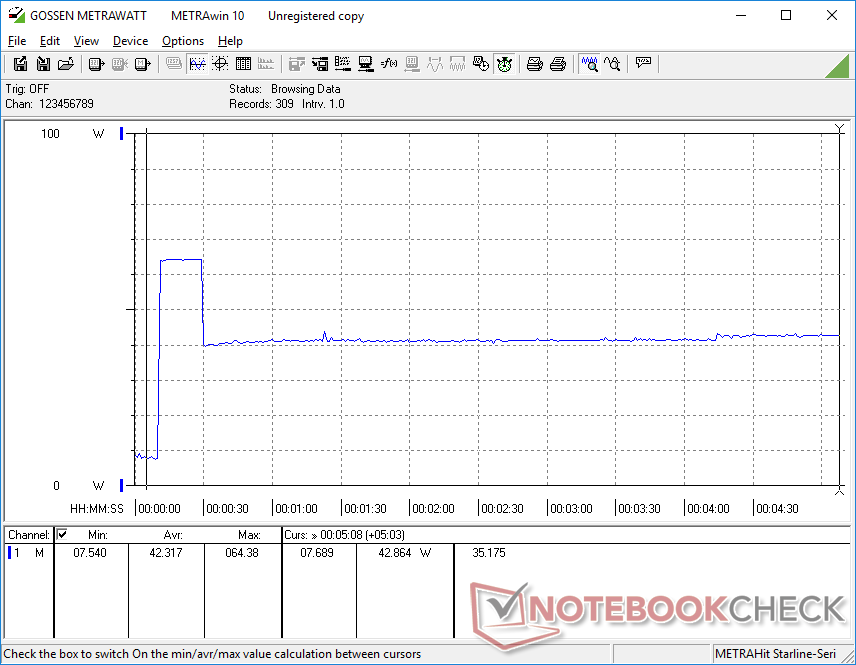
Güç tüketimi
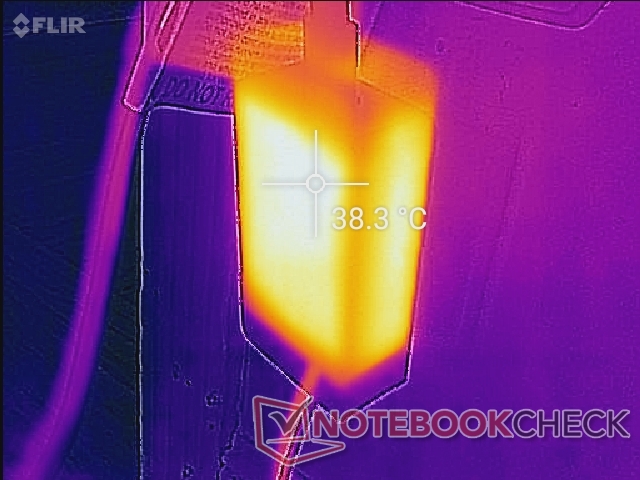
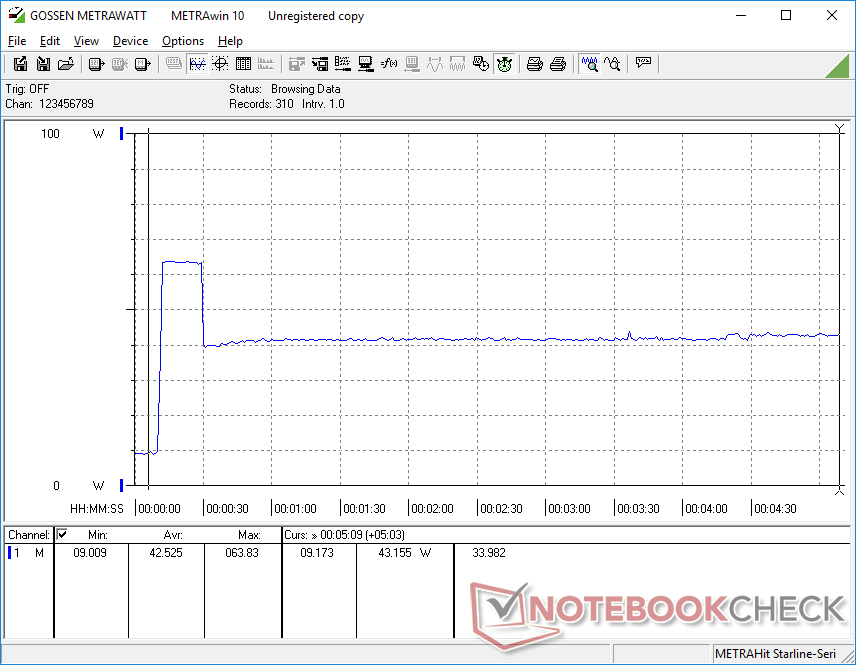
Ryzen 5 SKU'muzda 3 W ve 7 W ile karşılaştırıldığında, masaüstünde rölantide 4 W ile 8 W arasında. Bununla birlikte, özellikle bu düşük oranlarda tutarsızlıktan arka plan faaliyetlerindeki farklılıkların muhtemelen sorumlu olduğundan şüpheleniyoruz. Intel dizüstü bilgisayar her yerde daha iyi oyun performansı sunmasına rağmen, Intel dizüstü bilgisayar Ryzen 5 SKU'daki 45 W ile karşılaştırıldığında ortalama 42 W'nin biraz altında tükettiği için daha ilginç güç tüketimi rakamları geliyor. Başka bir deyişle, Intel, AMD üzerinden Watt başına üstün performansa sahiptir. Prime95 ve FurMark yüklerini çalıştırırken küçük (~ 9 x 5 x 2,5 cm) 65 W AC adaptörden maksimum 64,4 W çekebiliyoruz . Bununla birlikte, bu, tüketim nedeniyle düşmeden ve termal nedenlerden dolayı 43 W'da sabitlenmeden önce sadece 20 saniye sürer.
| Kapalı / Bekleme modu | |
| Boşta | |
| Çalışırken |
|
Key:
min: | |
| Microsoft Surface Laptop 3 15 i7-1065G7 i7-1065G7, Iris Plus Graphics G7 (Ice Lake 64 EU), Toshiba KBG40ZNS256G NVMe, IPS, 2496x1664, 15" | Dell XPS 15 7590 i5 iGPU FHD i5-9300H, UHD Graphics 630, Toshiba XG6 KXG60ZNV512G, IPS, 1920x1080, 15.6" | Asus ZenBook 15 UX534FT-DB77 i7-8565U, GeForce GTX 1650 Max-Q, Samsung SSD PM981 MZVLB1T0HALR, IPS, 1920x1080, 15.6" | MSI Prestige 15 A10SC i7-10710U, GeForce GTX 1650 Max-Q, Samsung SSD PM981 MZVLB1T0HALR, IPS, 3840x2160, 15.6" | Razer Blade Stealth i7-8565U i7-8565U, GeForce MX150, Lite-On CA3-8D256-Q11, IPS, 1920x1080, 13.3" | Microsoft Surface Laptop 3 15 Ryzen 5 3580U R5 3580U, Vega 9, SK hynix BC501 HFM256GDGTNG, IPS, 2496x1664, 15" | |
|---|---|---|---|---|---|---|
| Power Consumption | -17% | -74% | -68% | -28% | 10% | |
| Idle Minimum * (Watt) | 4.4 | 3.79 14% | 5 -14% | 6.1 -39% | 6.7 -52% | 3.3 25% |
| Idle Average * (Watt) | 8.3 | 6.9 17% | 13.2 -59% | 13.2 -59% | 8.6 -4% | 7.1 14% |
| Idle Maximum * (Watt) | 8.6 | 9.2 -7% | 24 -179% | 19.2 -123% | 9.4 -9% | 7.2 16% |
| Load Average * (Watt) | 43.6 | 62 -42% | 70 -61% | 75 -72% | 64.1 -47% | 44.8 -3% |
| Witcher 3 ultra * (Watt) | 41.5 | 63.3 -53% | 74 -78% | 63.7 -53% | 45.1 -9% | |
| Load Maximum * (Watt) | 64.4 | 108 -68% | 114 -77% | 89.7 -39% | 64.1 -0% | 53 18% |
* ... daha küçük daha iyidir
Pil ömrü
Sadece 45 Wh'de 15 inçlik bir dizüstü bilgisayar için pil kapasitesi düşüktür. Örneğin, Huawei MateBook X Pro bile daha yüksek kapasiteli 57 Wh pil ile geliyor. Çalışma zamanları, gerçek dünyadaki WLAN kullanımının 8 saatten biraz daha azında, daha yavaş Ryzen 5 SKU'dan neredeyse bir saat daha kısa olmasına rağmen dikkat çekicidir. şarj etmek gerekiyor. Gerçekçi olmayan bir senaryo olsa da, kullanıcıların gerektiğinde pili normalden daha uzun süre uzatabildiğini gösterir. Boş kapasiteden tam kapasiteye şarj etmek yaklaşık 2 saat sürer. 130 W Dell veya 65 W Lenovo AC adaptörlerimizle USB C Tipi üzerinden şarj etmek de işe yarıyor.
| Microsoft Surface Laptop 3 15 i7-1065G7 i7-1065G7, Iris Plus Graphics G7 (Ice Lake 64 EU), 45 Wh | Apple MacBook Pro 16 2019 i9 5500M i9-9880H, Radeon Pro 5500M, 99.8 Wh | Dell XPS 15 7590 i5 iGPU FHD i5-9300H, UHD Graphics 630, 97 Wh | Lenovo Yoga C940-15IRH i7-9750H, GeForce GTX 1650 Max-Q, 69 Wh | HP Spectre x360 15-df0126ng i7-8750H, GeForce GTX 1050 Ti Max-Q, 84 Wh | Asus ZenBook 15 UX534FT-DB77 i7-8565U, GeForce GTX 1650 Max-Q, 71 Wh | MSI Prestige 15 A10SC i7-10710U, GeForce GTX 1650 Max-Q, 82 Wh | Microsoft Surface Laptop 3 15 Ryzen 5 3580U R5 3580U, Vega 9, 45 Wh | |
|---|---|---|---|---|---|---|---|---|
| Pil Çalışma Süresi | -1% | 31% | -26% | -6% | 5% | -14% | -16% | |
| Reader / Idle (h) | 35 | 18.2 -48% | 18.8 -46% | 21.5 -39% | 19.1 -45% | 18.7 -47% | ||
| WiFi v1.3 (h) | 8.2 | 12 46% | 14.1 72% | 9.7 18% | 8.8 7% | 8.4 2% | 7.6 -7% | 9.1 11% |
| Load (h) | 1.9 | 1 -47% | 1.7 -11% | 1 -47% | 2.3 21% | 2.9 53% | 2.1 11% | 1.7 -11% |
| Witcher 3 ultra (h) | 0.9 |
Artılar
Eksiler
Karar
Core i7 SKU'muzun Ryzen 5 SKU'ya karşı ana avantajları arasında Wi-Fi 6 uyumluluğu, daha hızlı depolama performansı, daha hızlı CPU performansı, entegre AI hızlandırma, daha hızlı oyun performansı ve daha yüksek Watt başına performans yer alıyor. Ekran, WLAN pil ömrü, yüzey sıcaklığı ve fan gürültüsü gibi diğer özellikler ya aralarında aynı veya neredeyse aynı. Core i7 SKU'muzun daha ucuz Ryzen 5 SKU'muzdan daha iyi performans gösterebilmesi şaşırtıcı olmasa da, Ham CPU performansı, örneğin, yalnızca işlemci beygir gücüne dayalı olarak AMD'yi tercih etmemelisiniz. Oyun performansı da Intel'te daha iyi çalışan ve bazıları boyundan boya olan oyunlarla büyük ölçüde tutarsız. Bu arada, AI ivme çoğu ofis kullanıcısı için bu yazı itibariyle bir yenilik olmaya devam ediyor çünkü ortak günlük işler üzerinde doğrudan bir etkisi yok. Intel, AI alanındaki AMD'ye göre avantajlarından gerçekten yararlanabilir, ancak uygulamalar AI hızlandırmasını ilk etapta kullanmak için optimize edilmezse, tüketiciler için çok fazla bir şey ifade etmeyecektir. Surface Dizüstü Bilgisayar 3 Core i7 ve Ryzen 5 SKU'ları arasında, özellikle Microsoft'un Intel SKU'ları için aldığı fiyat primini düşündüğünüzde beklenenden daha küçük. Surface Laptop'un sunabileceği en iyisini isteyen güçlü bir kullanıcıysanız, Intel seçenekleri beyinsizdir. Aksi takdirde, iş yükünüz öncelikli olarak kelime işlemci, web'de gezinme veya video akışı içeriyorsa, Intel ve AMD Surface Laptop 3 arasındaki farkı söylemek zor olabilir.
Microsoft Surface Laptop 3 15 i7-1065G7
- 02/23/2020 v7 (old)
Allen Ngo
Price comparison
