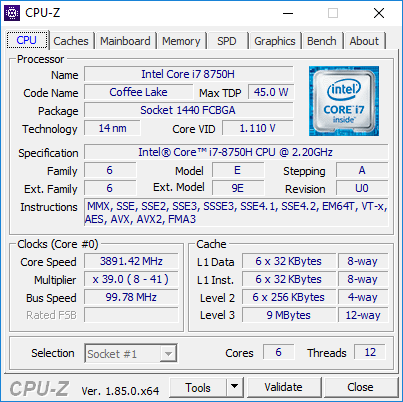
Kısa inceleme: Asus ROG GU501GM (i7-8750H, GTX 1060) Laptop


| |||||||||||||||||||||||||
Aydınlatma: 92 %
Batarya modunda parlaklık: 286.7 cd/m²
Kontrast: 735:1 (Siyah: 0.39 cd/m²)
ΔE ColorChecker Calman: 4.17 | ∀{0.5-29.43 Ø4.71}
ΔE Greyscale Calman: 2.5 | ∀{0.09-98 Ø4.96}
87% sRGB (Argyll 1.6.3 3D)
57% AdobeRGB 1998 (Argyll 1.6.3 3D)
87.7% sRGB (Argyll 3D)
63.4% Display P3 (Argyll 3D)
Gamma: 2.274
CCT: 6885 K
| Asus ROG GU501GM-BI7N8 AU Optronics AUO45ED, IPS, 15.6", 1920x1080 | MSI GS65 8RF-019DE Stealth Thin AU Optronics B156HAN08.0 (AUO80ED), IPS, 15.6", 1920x1080 | Asus Zephyrus M GM501 AUO B156HAN07.1 (AUO71ED), IPS, 15.6", 1920x1080 | Gigabyte Aero 15X v8 LGD05C0, IPS, 15.6", 1920x1080 | Aorus X5 v8 AU Optronics B156HAN07.0 (AUO70ED), IPS, 15.6", 1920x1080 | Acer Predator Triton 700 AUO B156HAN04.2 (AUO42ED), IPS, 15.6", 1920x1080 | |
|---|---|---|---|---|---|---|
| Display | 5% | 5% | 4% | 6% | 0% | |
| Display P3 Coverage (%) | 63.4 | 66.2 4% | 66.1 4% | 63.6 0% | 67.1 6% | 62.5 -1% |
| sRGB Coverage (%) | 87.7 | 92.1 5% | 92.7 6% | 93.8 7% | 93.4 6% | 88.7 1% |
| AdobeRGB 1998 Coverage (%) | 67.2 | 67.2 | 64.9 | 68.1 | 63.5 | |
| Response Times | 49% | 71% | 52% | 48% | -26% | |
| Response Time Grey 50% / Grey 80% * (ms) | 30.8 ? | 17.6 ? 43% | 6.6 ? 79% | 16.8 ? 45% | 18.8 ? 39% | 44.8 ? -45% |
| Response Time Black / White * (ms) | 27.6 ? | 12.8 ? 54% | 10.4 ? 62% | 11.2 ? 59% | 12 ? 57% | 29.6 ? -7% |
| PWM Frequency (Hz) | ||||||
| Screen | 21% | -13% | 27% | 23% | -13% | |
| Brightness middle (cd/m²) | 286.7 | 254 -11% | 307 7% | 313 9% | 271 -5% | 291 1% |
| Brightness (cd/m²) | 281 | 262 -7% | 296 5% | 300 7% | 259 -8% | 277 -1% |
| Brightness Distribution (%) | 92 | 89 -3% | 89 -3% | 78 -15% | 87 -5% | 84 -9% |
| Black Level * (cd/m²) | 0.39 | 0.22 44% | 0.25 36% | 0.33 15% | 0.27 31% | 0.22 44% |
| Contrast (:1) | 735 | 1155 57% | 1228 67% | 948 29% | 1004 37% | 1323 80% |
| Colorchecker dE 2000 * | 4.17 | 2.37 43% | 5.74 -38% | 1.29 69% | 1.81 57% | 5.52 -32% |
| Colorchecker dE 2000 max. * | 7.22 | 4.71 35% | 11.32 -57% | 2.04 72% | 3.33 54% | 10.72 -48% |
| Greyscale dE 2000 * | 2.5 | 1.58 37% | 6.44 -158% | 0.69 72% | 1.09 56% | 6.59 -164% |
| Gamma | 2.274 97% | 2.48 89% | 2.48 89% | 2.43 91% | 2.45 90% | 2.44 90% |
| CCT | 6885 94% | 6785 96% | 8395 77% | 6550 99% | 6435 101% | 7816 83% |
| Color Space (Percent of AdobeRGB 1998) (%) | 57 | 60 5% | 60 5% | 60 5% | 61 7% | 58 2% |
| Color Space (Percent of sRGB) (%) | 87 | 92 6% | 93 7% | 94 8% | 93 7% | 89 2% |
| Colorchecker dE 2000 calibrated * | 1.84 | 1.94 | ||||
| Toplam Ortalama (Program / Ayarlar) | 25% /
22% | 21% /
2% | 28% /
27% | 26% /
24% | -13% /
-13% |
* ... daha küçük daha iyidir
Yanıt Sürelerini Görüntüle
| ↔ Tepki Süresi Siyahtan Beyaza | ||
|---|---|---|
| 27.6 ms ... yükseliş ↗ ve sonbahar↘ birleşimi | ↗ 16 ms yükseliş | 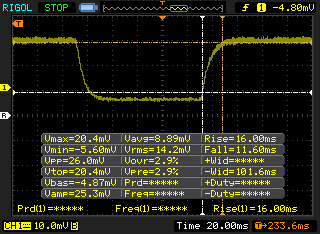 |
| ↘ 11.6 ms sonbahar | ||
| Ekran, testlerimizde nispeten yavaş yanıt oranları gösteriyor ve oyuncular için çok yavaş olabilir. Karşılaştırıldığında, test edilen tüm cihazlar 0.1 (minimum) ile 240 (maksimum) ms arasında değişir. » Tüm cihazların 70 %'si daha iyi. Bu, ölçülen yanıt süresinin test edilen tüm cihazların ortalamasından (19.8 ms) daha kötü olduğu anlamına gelir. | ||
| ↔ Tepki Süresi %50 Griden %80 Griye | ||
| 30.8 ms ... yükseliş ↗ ve sonbahar↘ birleşimi | ↗ 13.6 ms yükseliş | 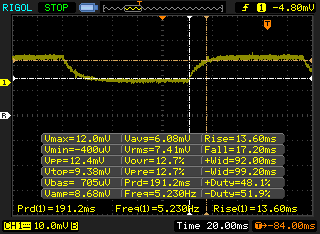 |
| ↘ 17.2 ms sonbahar | ||
| Ekran, testlerimizde yavaş yanıt oranları gösteriyor ve oyuncular için yetersiz olacaktır. Karşılaştırıldığında, test edilen tüm cihazlar 0.165 (minimum) ile 636 (maksimum) ms arasında değişir. » Tüm cihazların 41 %'si daha iyi. Bu, ölçülen yanıt süresinin test edilen tüm cihazların ortalamasına benzer olduğu anlamına gelir (30.9 ms). | ||
Ekran Titremesi / PWM (Darbe Genişliği Modülasyonu)
| Ekran titriyor / PWM algılanmadı |  | ||
Karşılaştırıldığında: Test edilen tüm cihazların %52 %'si ekranı karartmak için PWM kullanmıyor. PWM tespit edilirse, ortalama 7748 (minimum: 5 - maksimum: 343500) Hz ölçüldü. | |||
| Cinebench R10 | |
| Rendering Multiple CPUs 32Bit | |
| Sınıf ortalaması Gaming (42932 - 102066, n=9, son 2 yıl) | |
| Schenker XMG Apex 15 | |
| Aorus X5 v8 | |
| Asus ROG GU501GM-BI7N8 | |
| Ortalama Intel Core i7-8750H (29664 - 35307, n=25) | |
| Asus GL702ZC-GC104T | |
| Asus ROG Strix GL702ZC-GC204T | |
| Dell XPS 15 9575 i7-8705G | |
| Rendering Single 32Bit | |
| Sınıf ortalaması Gaming (7457 - 12575, n=9, son 2 yıl) | |
| Schenker XMG Apex 15 | |
| Aorus X5 v8 | |
| Ortalama Intel Core i7-8750H (6236 - 6645, n=25) | |
| Asus ROG GU501GM-BI7N8 | |
| Dell XPS 15 9575 i7-8705G | |
| Asus ROG Strix GL702ZC-GC204T | |
| Asus GL702ZC-GC104T | |
| wPrime 2.10 - 1024m | |
| Asus ROG Strix GL702ZC-GC204T | |
| Dell Latitude 7390 | |
| Schenker XMG Apex 15 | |
| Dell XPS 15 9575 i7-8705G | |
| Ortalama Intel Core i7-8750H (125.5 - 180.5, n=6) | |
| Asus ROG GU501GM-BI7N8 | |
| Sınıf ortalaması Gaming (33 - 210, n=6, son 2 yıl) | |
* ... daha küçük daha iyidir
| PCMark 8 Home Score Accelerated v2 | 4119 puan | |
| PCMark 8 Creative Score Accelerated v2 | 5454 puan | |
| PCMark 8 Work Score Accelerated v2 | 5111 puan | |
| PCMark 10 Score | 5092 puan | |
Yardım | ||
| Asus ROG GU501GM-BI7N8 Kingston RBUSNS8154P3128GJ | MSI GS65 8RF-019DE Stealth Thin Samsung SSD PM981 MZVLB512HAJQ | Asus Zephyrus M GM501 Samsung SM961 MZVKW512HMJP m.2 PCI-e | Gigabyte Aero 15X v8 Toshiba NVMe THNSN5512GPU7 | Aorus X5 v8 Toshiba NVMe THNSN5512GPU7 | Acer Predator Triton 700 2x SK Hynix Canvas SC300 512GB M.2 (HFS512G39MND) (RAID 0) | Ortalama Kingston RBUSNS8154P3128GJ | |
|---|---|---|---|---|---|---|---|
| AS SSD | 253% | 213% | 129% | 121% | 207% | 3% | |
| Copy Game MB/s (MB/s) | 419.3 | 369 ? -12% | |||||
| Copy Program MB/s (MB/s) | 269.2 | 209 ? -22% | |||||
| Copy ISO MB/s (MB/s) | 773 | 549 ? -29% | |||||
| Score Total (Points) | 900 | 4122 358% | 3649 305% | 2536 182% | 2515 179% | 3282 265% | 1014 ? 13% |
| Score Write (Points) | 345 | 2051 494% | 1446 319% | 939 172% | 954 177% | 1243 260% | 365 ? 6% |
| Score Read (Points) | 377 | 1346 257% | 1471 290% | 1092 190% | 1061 181% | 1350 258% | 443 ? 18% |
| Access Time Write * (ms) | 0.058 | 0.035 40% | 0.041 29% | 0.046 21% | 0.044 24% | 0.041 29% | 0.06829 ? -18% |
| Access Time Read * (ms) | 0.278 | 0.073 74% | 0.046 83% | 0.119 57% | 0.166 40% | 0.062 78% | 0.2317 ? 17% |
| 4K-64 Write (MB/s) | 237 | 1760 643% | 1198 405% | 742 213% | 773 226% | 913 285% | 259 ? 9% |
| 4K-64 Read (MB/s) | 270.3 | 1170 333% | 1218 351% | 847 213% | 856 217% | 1057 291% | 317 ? 17% |
| 4K Write (MB/s) | 67.1 | 107.2 60% | 90.2 34% | 80.4 20% | 84.5 26% | 93 39% | 65.5 ? -2% |
| 4K Read (MB/s) | 22.62 | 48.94 116% | 43.42 92% | 23.36 3% | 23.21 3% | 41.47 83% | 28.2 ? 25% |
| Seq Write (MB/s) | 404.7 | 1834 353% | 1580 290% | 1163 187% | 966 139% | 2372 486% | 404 ? 0% |
| Seq Read (MB/s) | 841 | 1266 51% | 2091 149% | 2213 163% | 1813 116% | 2517 199% | 973 ? 16% |
* ... daha küçük daha iyidir

| 3DMark | |
| 1280x720 Cloud Gate Standard Graphics | |
| Sınıf ortalaması Gaming (86886 - 223650, n=60, son 2 yıl) | |
| Aorus X5 v8 | |
| Acer Predator Triton 700 | |
| MSI GS65 8RF-019DE Stealth Thin | |
| Asus ROG GU501GM-BI7N8 | |
| Ortalama NVIDIA GeForce GTX 1060 Mobile (26770 - 86193, n=68) | |
| Asus ROG Strix GL702ZC-GC204T | |
| Acer Predator Helios 300 PH317-52-51M6 | |
| Dell XPS 15 9575 i5-8305G | |
| Asus FX504GD | |
| Lenovo Legion Y520-15IKBA-80WY001VGE | |
| 1920x1080 Fire Strike Graphics | |
| Sınıf ortalaması Gaming (12242 - 62849, n=116, son 2 yıl) | |
| Acer Predator Triton 700 | |
| Aorus X5 v8 | |
| MSI GS65 8RF-019DE Stealth Thin | |
| Asus ROG GU501GM-BI7N8 | |
| Ortalama NVIDIA GeForce GTX 1060 Mobile (10708 - 12298, n=77) | |
| Asus ROG Strix GL702ZC-GC204T | |
| Acer Predator Helios 300 PH317-52-51M6 | |
| Dell XPS 15 9575 i5-8305G | |
| Asus FX504GD | |
| Lenovo Legion Y520-15IKBA-80WY001VGE | |
| 1920x1080 Ice Storm Extreme Graphics | |
| Sınıf ortalaması Gaming (544538 - 659227, n=5, son 2 yıl) | |
| Asus FX504GD | |
| Dell XPS 15 9575 i5-8305G | |
| Ortalama NVIDIA GeForce GTX 1060 Mobile (33205 - 257260, n=33) | |
| 3DMark 06 Standard Score | 33570 puan | |
| 3DMark 11 Performance | 13082 puan | |
| 3DMark Cloud Gate Standard Score | 30938 puan | |
| 3DMark Fire Strike Score | 10370 puan | |
Yardım | ||
| Rise of the Tomb Raider - 1920x1080 Very High Preset AA:FX AF:16x (değere göre sırala) | |
| Asus ROG GU501GM-BI7N8 | |
| Ortalama NVIDIA GeForce GTX 1060 Mobile (51 - 68.8, n=37) | |
| The Witcher 3 - 1920x1080 Ultra Graphics & Postprocessing (HBAO+) (değere göre sırala) | |
| Asus ROG GU501GM-BI7N8 | |
| MSI GS65 8RF-019DE Stealth Thin | |
| Asus Zephyrus M GM501 | |
| Gigabyte Aero 15X v8 | |
| Aorus X5 v8 | |
| Acer Predator Triton 700 | |
| Ortalama NVIDIA GeForce GTX 1060 Mobile (24 - 42.3, n=60) | |
| Sınıf ortalaması Gaming (104.7 - 240, n=7, son 2 yıl) | |
| düşük | orta | yüksek | ultra | |
|---|---|---|---|---|
| BioShock Infinite (2013) | 194 | 173 | 162 | 99 |
| The Witcher 3 (2015) | 166 | 120 | 66 | 39 |
| Rise of the Tomb Raider (2016) | 163 | 120 | 71 | 57 |
| Hitman 2016 (2016) | 71 | 70 | 59 | 46 |
Ses yüksekliği
| Boşta |
| 31.4 / 31.4 / 34.2 dB |
| Çalışırken |
| 42.8 / 50.9 dB |
 | ||
30 dB sessiz 40 dB(A) duyulabilirlik 50 dB(A) gürültülü |
||
min: | ||
| Asus ROG GU501GM-BI7N8 GeForce GTX 1060 Mobile, i7-8750H, Kingston RBUSNS8154P3128GJ | MSI GS65 8RF-019DE Stealth Thin GeForce GTX 1070 Max-Q, i7-8750H, Samsung SSD PM981 MZVLB512HAJQ | Asus Zephyrus M GM501 GeForce GTX 1070 Mobile, i7-8750H, Samsung SM961 MZVKW512HMJP m.2 PCI-e | Gigabyte Aero 15X v8 GeForce GTX 1070 Max-Q, i7-8750H, Toshiba NVMe THNSN5512GPU7 | Aorus X5 v8 GeForce GTX 1070 Mobile, i7-8850H, Toshiba NVMe THNSN5512GPU7 | Acer Predator Triton 700 GeForce GTX 1080 Max-Q, i7-7700HQ, 2x SK Hynix Canvas SC300 512GB M.2 (HFS512G39MND) (RAID 0) | |
|---|---|---|---|---|---|---|
| Noise | 5% | -1% | -3% | -7% | -2% | |
| kapalı / ortam * (dB) | 28.6 | 30 -5% | 29 -1% | 29 -1% | 30 -5% | 31 -8% |
| Idle Minimum * (dB) | 31.4 | 30 4% | 30 4% | 30 4% | 33 -5% | 33 -5% |
| Idle Average * (dB) | 31.4 | 31 1% | 31 1% | 31 1% | 35 -11% | 34 -8% |
| Idle Maximum * (dB) | 34.2 | 34 1% | 33 4% | 35 -2% | 40 -17% | 40 -17% |
| Load Average * (dB) | 42.8 | 43 -0% | 49 -14% | 49 -14% | 45 -5% | 41 4% |
| Witcher 3 ultra * (dB) | 50.9 | 42 17% | 50 2% | 51 -0% | 50 2% | 43 16% |
| Load Maximum * (dB) | 50.9 | 44 14% | 52 -2% | 54 -6% | 55 -8% | 48 6% |
* ... daha küçük daha iyidir
(±) Üst taraftaki maksimum sıcaklık, 40.4 °C / 105 F ortalamasına kıyasla 43 °C / 109 F'dir. , Gaming sınıfı için 21.2 ile 68.8 °C arasında değişir.
(-) Alt kısım, 43.2 °C / 110 F ortalamasına kıyasla maksimum 46.6 °C / 116 F'ye kadar ısınır
(+) Boşta kullanımda, üst tarafın ortalama sıcaklığı 26.3 °C / 79 F olup, cihazın 33.9 °C / 93 F.
(±) The Witcher 3 oynarken, üst tarafın ortalama sıcaklığı 34.6 °C / 94 F olup, cihazın 33.9 °C / 93 F.
(+) Avuç içi dayanakları ve dokunmatik yüzey, maksimum 30.2 °C / 86.4 F ile cilt sıcaklığından daha soğuktur ve bu nedenle dokunulduğunda soğuktur.
(±) Benzer cihazların avuç içi dayanağı alanının ortalama sıcaklığı 28.8 °C / 83.8 F (-1.4 °C / -2.6 F) idi.
| Asus ROG GU501GM-BI7N8 GeForce GTX 1060 Mobile, i7-8750H, Kingston RBUSNS8154P3128GJ | MSI GS65 8RF-019DE Stealth Thin GeForce GTX 1070 Max-Q, i7-8750H, Samsung SSD PM981 MZVLB512HAJQ | Asus Zephyrus M GM501 GeForce GTX 1070 Mobile, i7-8750H, Samsung SM961 MZVKW512HMJP m.2 PCI-e | Gigabyte Aero 15X v8 GeForce GTX 1070 Max-Q, i7-8750H, Toshiba NVMe THNSN5512GPU7 | Aorus X5 v8 GeForce GTX 1070 Mobile, i7-8850H, Toshiba NVMe THNSN5512GPU7 | Acer Predator Triton 700 GeForce GTX 1080 Max-Q, i7-7700HQ, 2x SK Hynix Canvas SC300 512GB M.2 (HFS512G39MND) (RAID 0) | |
|---|---|---|---|---|---|---|
| Heat | -1% | -6% | -10% | -7% | -21% | |
| Maximum Upper Side * (°C) | 43 | 49 -14% | 52 -21% | 53 -23% | 50 -16% | 61 -42% |
| Maximum Bottom * (°C) | 46.6 | 63 -35% | 49 -5% | 65 -39% | 62 -33% | 69 -48% |
| Idle Upper Side * (°C) | 29.2 | 24 18% | 31 -6% | 26 11% | 27 8% | 29 1% |
| Idle Bottom * (°C) | 34 | 25 26% | 31 9% | 30 12% | 29 15% | 32 6% |
* ... daha küçük daha iyidir
Asus ROG GU501GM-BI7N8 ses analizi
(±) | hoparlör ses yüksekliği ortalama ama iyi (74.3 dB)
Bas 100 - 315Hz
(+) | iyi bas - medyandan yalnızca 3.8% uzakta
(±) | Bas doğrusallığı ortalamadır (10.3% delta - önceki frekans)
Ortalar 400 - 2000 Hz
(+) | dengeli ortalar - medyandan yalnızca 2.3% uzakta
(+) | orta frekanslar doğrusaldır (5.1% deltadan önceki frekansa)
Yüksekler 2 - 16 kHz
(+) | dengeli yüksekler - medyandan yalnızca 4.6% uzakta
(+) | yüksekler doğrusaldır (6.8% deltadan önceki frekansa)
Toplam 100 - 16.000 Hz
(+) | genel ses doğrusaldır (12.6% ortancaya göre fark)
Aynı sınıfla karşılaştırıldığında
» Bu sınıftaki tüm test edilen cihazların %16%'si daha iyi, 4% benzer, 81% daha kötüydü
» En iyisinin deltası 6% idi, ortalama 18% idi, en kötüsü 132% idi
Test edilen tüm cihazlarla karşılaştırıldığında
» Test edilen tüm cihazların %11'si daha iyi, 3 benzer, % 86 daha kötüydü
» En iyisinin deltası 4% idi, ortalama 23% idi, en kötüsü 134% idi
MSI GS65 8RF-019DE Stealth Thin ses analizi
(±) | hoparlör ses yüksekliği ortalama ama iyi (76 dB)
Bas 100 - 315Hz
(-) | neredeyse hiç bas yok - ortalama olarak medyandan 16.4% daha düşük
(±) | Bas doğrusallığı ortalamadır (9.7% delta - önceki frekans)
Ortalar 400 - 2000 Hz
(+) | dengeli ortalar - medyandan yalnızca 4.9% uzakta
(+) | orta frekanslar doğrusaldır (5.6% deltadan önceki frekansa)
Yüksekler 2 - 16 kHz
(+) | dengeli yüksekler - medyandan yalnızca 2.5% uzakta
(±) | Yükseklerin doğrusallığı ortalamadır (7.1% delta - önceki frekans)
Toplam 100 - 16.000 Hz
(±) | Genel sesin doğrusallığı ortalamadır (18.5% ortancaya göre fark)
Aynı sınıfla karşılaştırıldığında
» Bu sınıftaki tüm test edilen cihazların %60%'si daha iyi, 8% benzer, 32% daha kötüydü
» En iyisinin deltası 6% idi, ortalama 18% idi, en kötüsü 132% idi
Test edilen tüm cihazlarla karşılaştırıldığında
» Test edilen tüm cihazların %42'si daha iyi, 8 benzer, % 51 daha kötüydü
» En iyisinin deltası 4% idi, ortalama 23% idi, en kötüsü 134% idi
| Kapalı / Bekleme modu | |
| Boşta | |
| Çalışırken |
|
Key:
min: | |
| Asus ROG GU501GM-BI7N8 i7-8750H, GeForce GTX 1060 Mobile, Kingston RBUSNS8154P3128GJ, IPS, 1920x1080, 15.6" | Asus FX503VM-EH73 i7-7700HQ, GeForce GTX 1060 Mobile, SanDisk SD8SN8U128G1002, IPS, 1920x1080, 15.6" | MSI GS65 8RF-019DE Stealth Thin i7-8750H, GeForce GTX 1070 Max-Q, Samsung SSD PM981 MZVLB512HAJQ, IPS, 1920x1080, 15.6" | Asus Zephyrus M GM501 i7-8750H, GeForce GTX 1070 Mobile, Samsung SM961 MZVKW512HMJP m.2 PCI-e, IPS, 1920x1080, 15.6" | Gigabyte Aero 15X v8 i7-8750H, GeForce GTX 1070 Max-Q, Toshiba NVMe THNSN5512GPU7, IPS, 1920x1080, 15.6" | Aorus X5 v8 i7-8850H, GeForce GTX 1070 Mobile, Toshiba NVMe THNSN5512GPU7, IPS, 1920x1080, 15.6" | Acer Predator Triton 700 i7-7700HQ, GeForce GTX 1080 Max-Q, 2x SK Hynix Canvas SC300 512GB M.2 (HFS512G39MND) (RAID 0), IPS, 1920x1080, 15.6" | |
|---|---|---|---|---|---|---|---|
| Power Consumption | 15% | 13% | -20% | -3% | -52% | -55% | |
| Idle Minimum * (Watt) | 12.35 | 12.8 -4% | 7 43% | 16 -30% | 14 -13% | 25 -102% | 28 -127% |
| Idle Average * (Watt) | 19.98 | 15.4 23% | 11 45% | 19 5% | 18 10% | 31 -55% | 33 -65% |
| Idle Maximum * (Watt) | 25.44 | 15.9 37% | 20 21% | 26 -2% | 22 14% | 33 -30% | 41 -61% |
| Load Average * (Watt) | 94.28 | 78 17% | 98 -4% | 103 -9% | 91 3% | 102 -8% | 94 -0% |
| Witcher 3 ultra * (Watt) | 132.9 | 107.3 19% | 132 1% | 164 -23% | 142 -7% | 194 -46% | 160 -20% |
| Load Maximum * (Watt) | 140.63 | 143.4 -2% | 182 -29% | 223 -59% | 173 -23% | 239 -70% | 222 -58% |
* ... daha küçük daha iyidir
| Asus ROG GU501GM-BI7N8 i7-8750H, GeForce GTX 1060 Mobile, 55 Wh | MSI GS65 8RF-019DE Stealth Thin i7-8750H, GeForce GTX 1070 Max-Q, 82 Wh | Asus Zephyrus M GM501 i7-8750H, GeForce GTX 1070 Mobile, 55 Wh | Gigabyte Aero 15X v8 i7-8750H, GeForce GTX 1070 Max-Q, 94.24 Wh | Aorus X5 v8 i7-8850H, GeForce GTX 1070 Mobile, 92.24 Wh | Acer Predator Triton 700 i7-7700HQ, GeForce GTX 1080 Max-Q, 54 Wh | |
|---|---|---|---|---|---|---|
| Pil Çalışma Süresi | 71% | 2% | 174% | 49% | -11% | |
| Reader / Idle (h) | 4.5 | 8.5 89% | 4 -11% | 12.7 182% | 4.9 9% | 2.5 -44% |
| WiFi v1.3 (h) | 4 | 6 50% | 2.7 -32% | 8.6 115% | 2.4 -40% | |
| Load (h) | 0.8 | 1.4 75% | 1.2 50% | 2.6 225% | 1.5 88% | 1.2 50% |
Artılar
Eksiler
GU501GM, Zephyrus M serisinin en iyi özelliklerini düşük bir fiyata sunmaya çalışıyor. Çoğunlukla da başarıyor.
Ama malesef işlemci durumu biraz karıştırıyor. Artan performans çoğu iş için harika ama işlemci yoğun kullanımda tutarlılığını yitiriyor. Fan sesi ise bir diğer mesele. O kadar tizleşebiliyor ki, kulaklığı çıkarmamak daha iyi bir tercih olabiliyor. İşlemci bu durumdayken sistem çökebiliyor, ama bunun dışındaki durumlarda sorun çıkarmıyor. Farklı fan modları ile fan sesini önlemek mümkün.
Tüm bunlarla beraber GU501GM hakkında sevilmeyecek başka bir şey kalmıyor. Fiyatı düşünüldüğünde ise 1900$ etiketi bizce çok fazla. Bu fiyata daha güçlü donanımlı modeller bulmak mümkün.
Asus ROG GU501GM-BI7N8
- 07/07/2018 v6 (old)
Sam Medley
Price comparison
