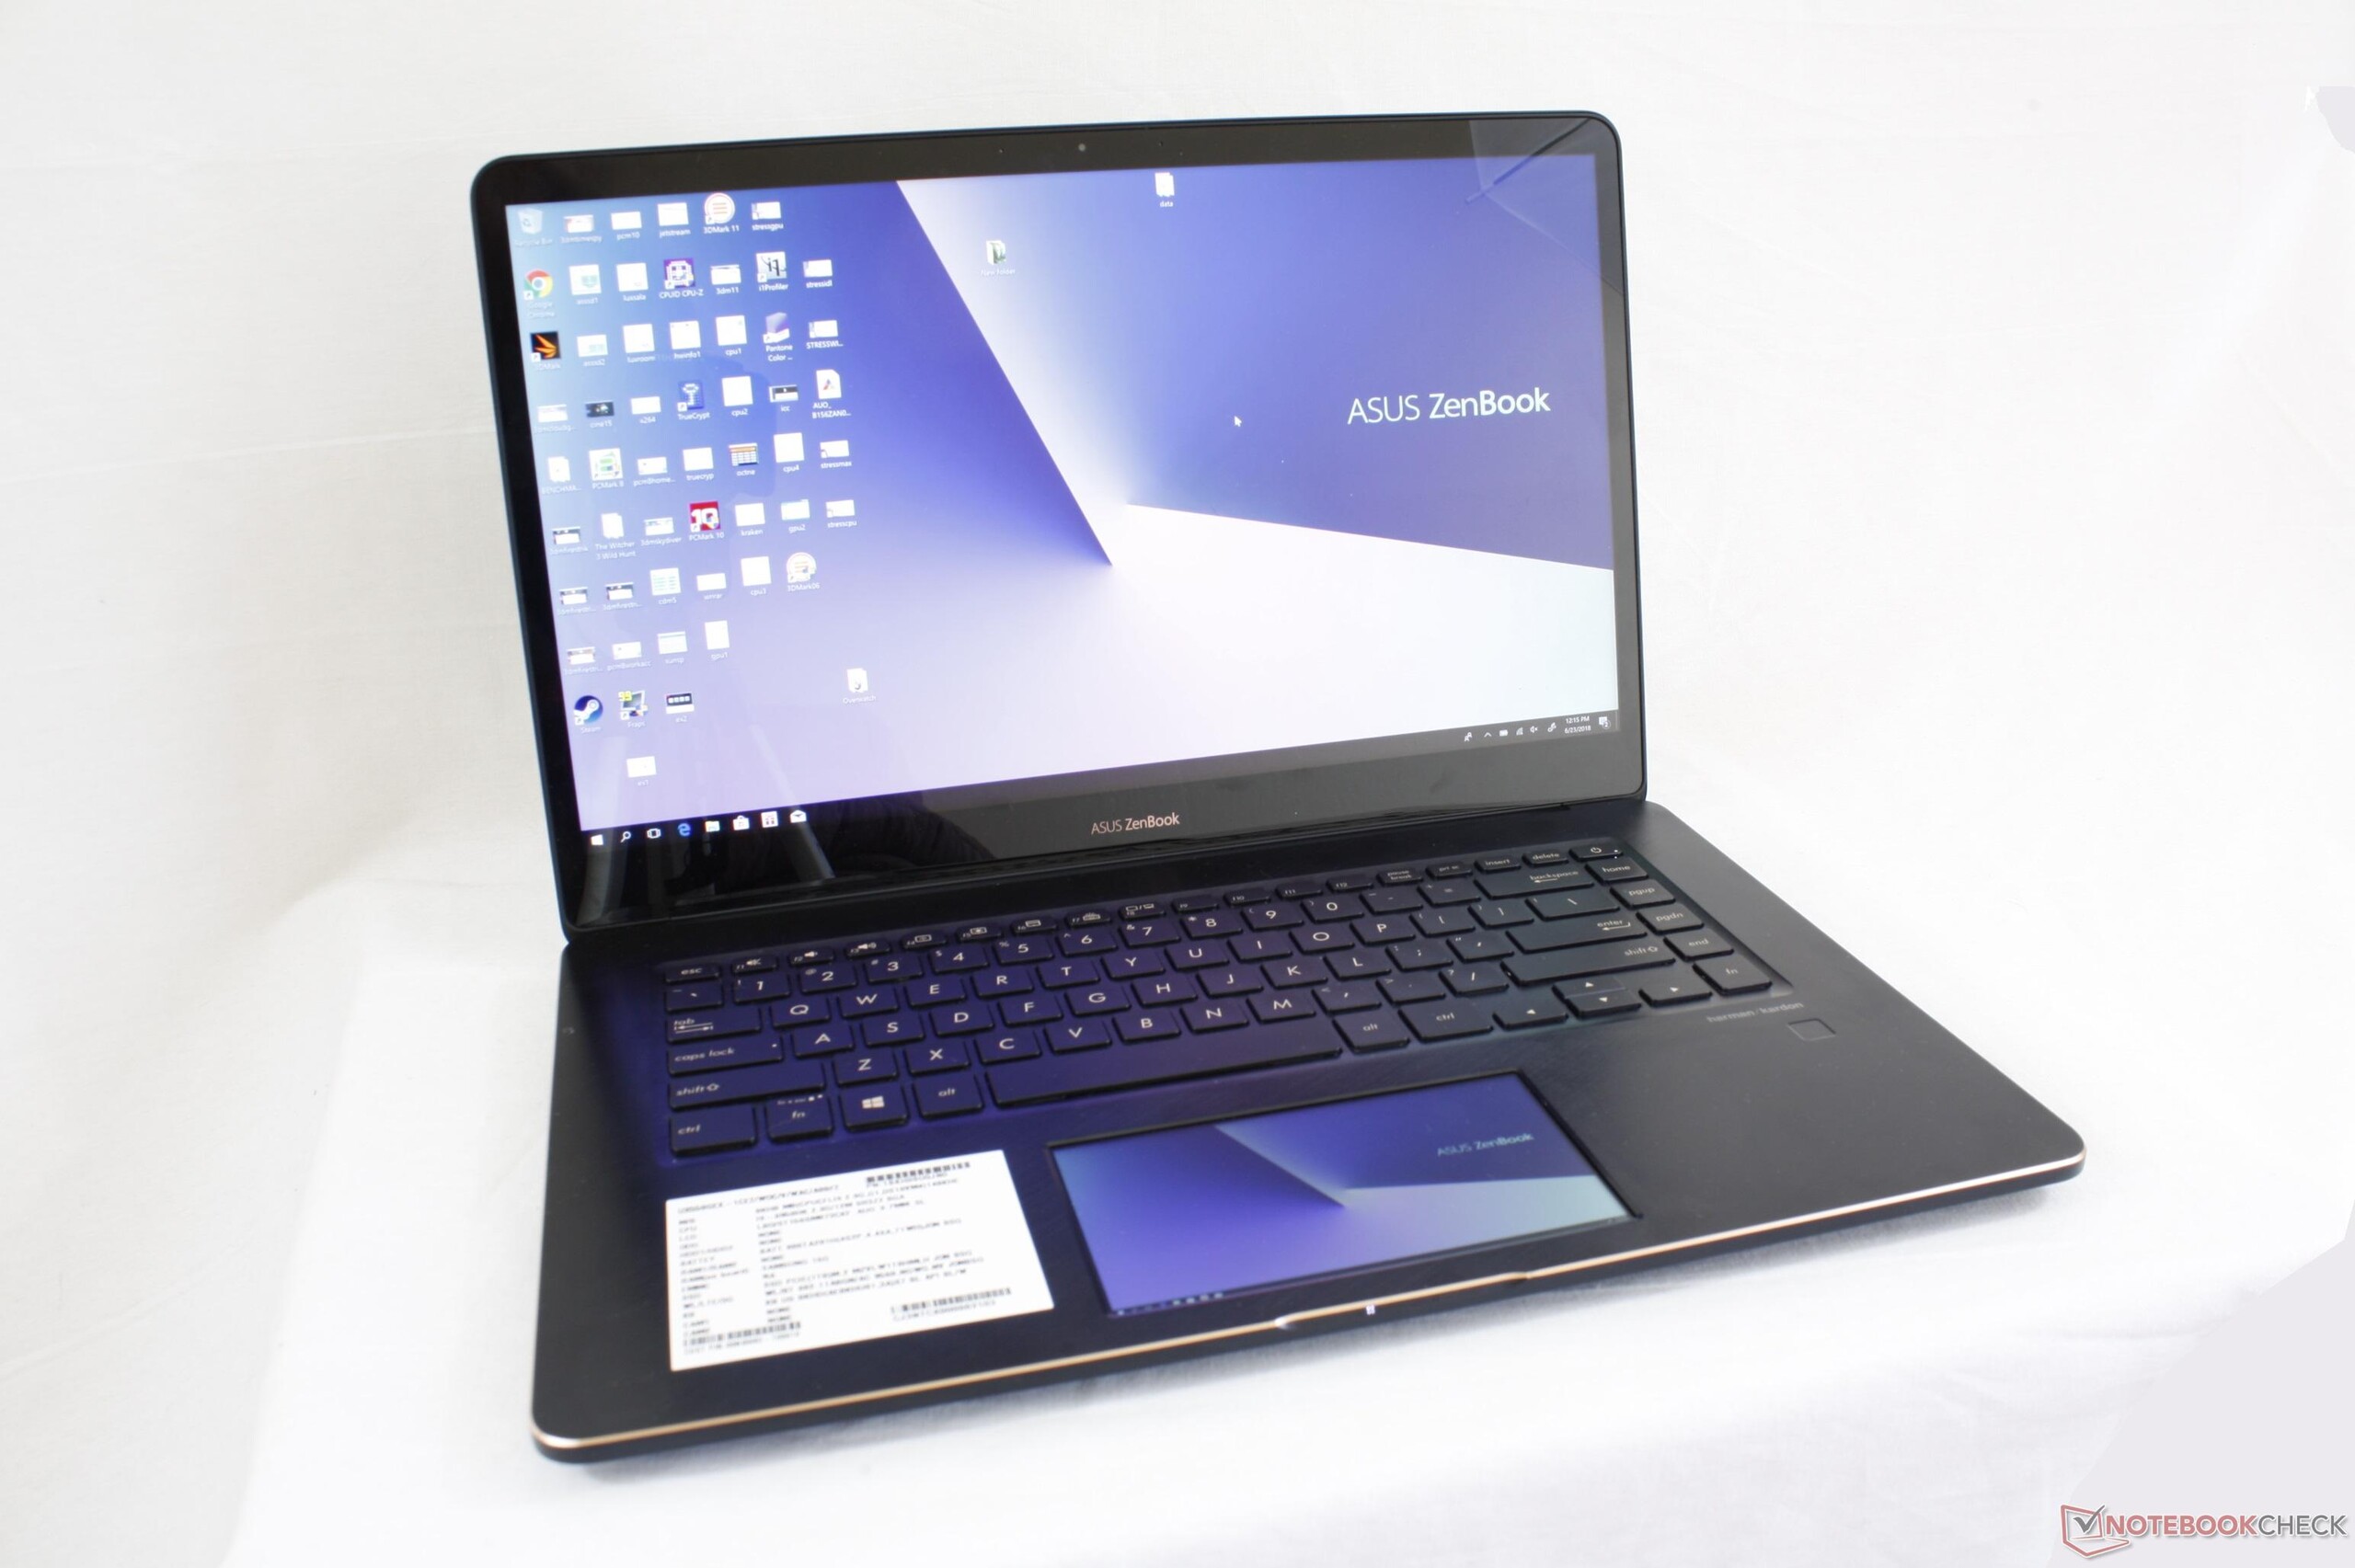
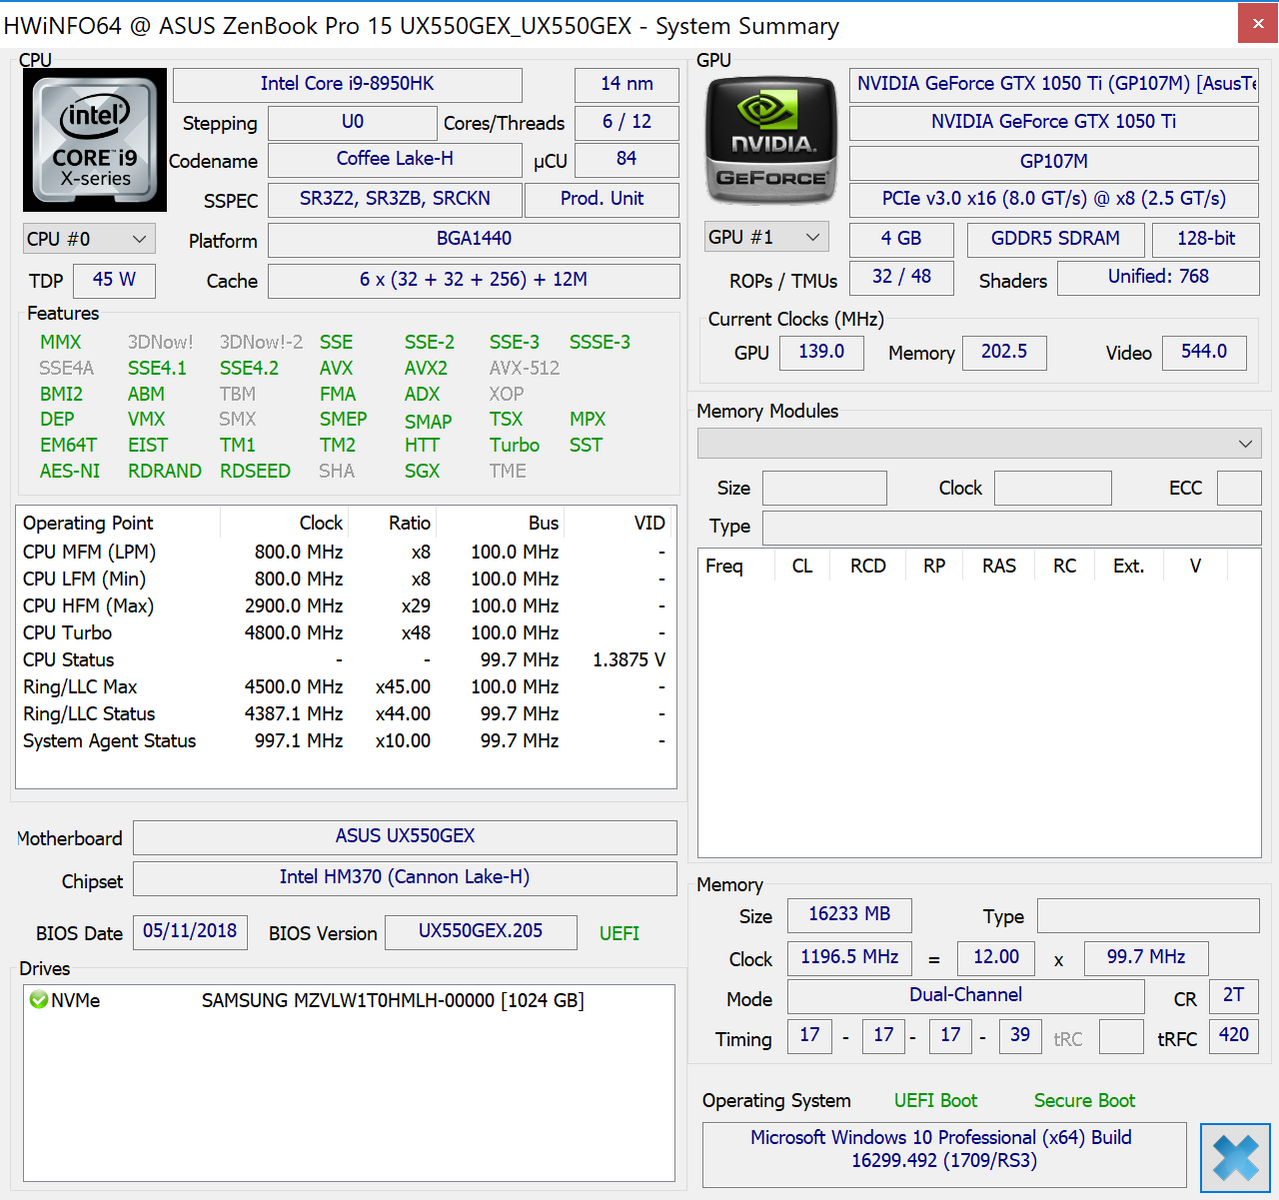
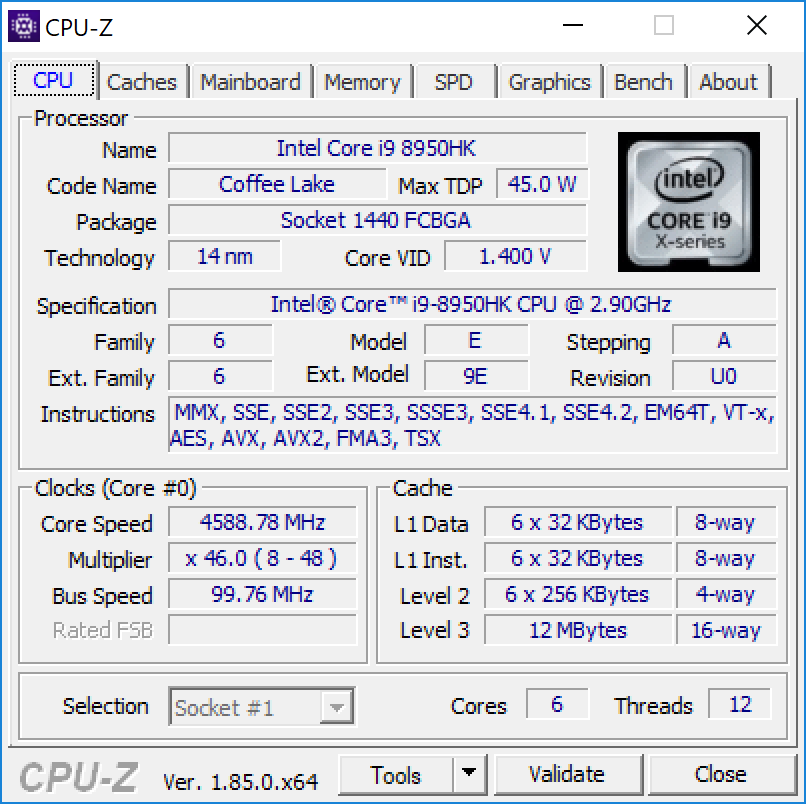
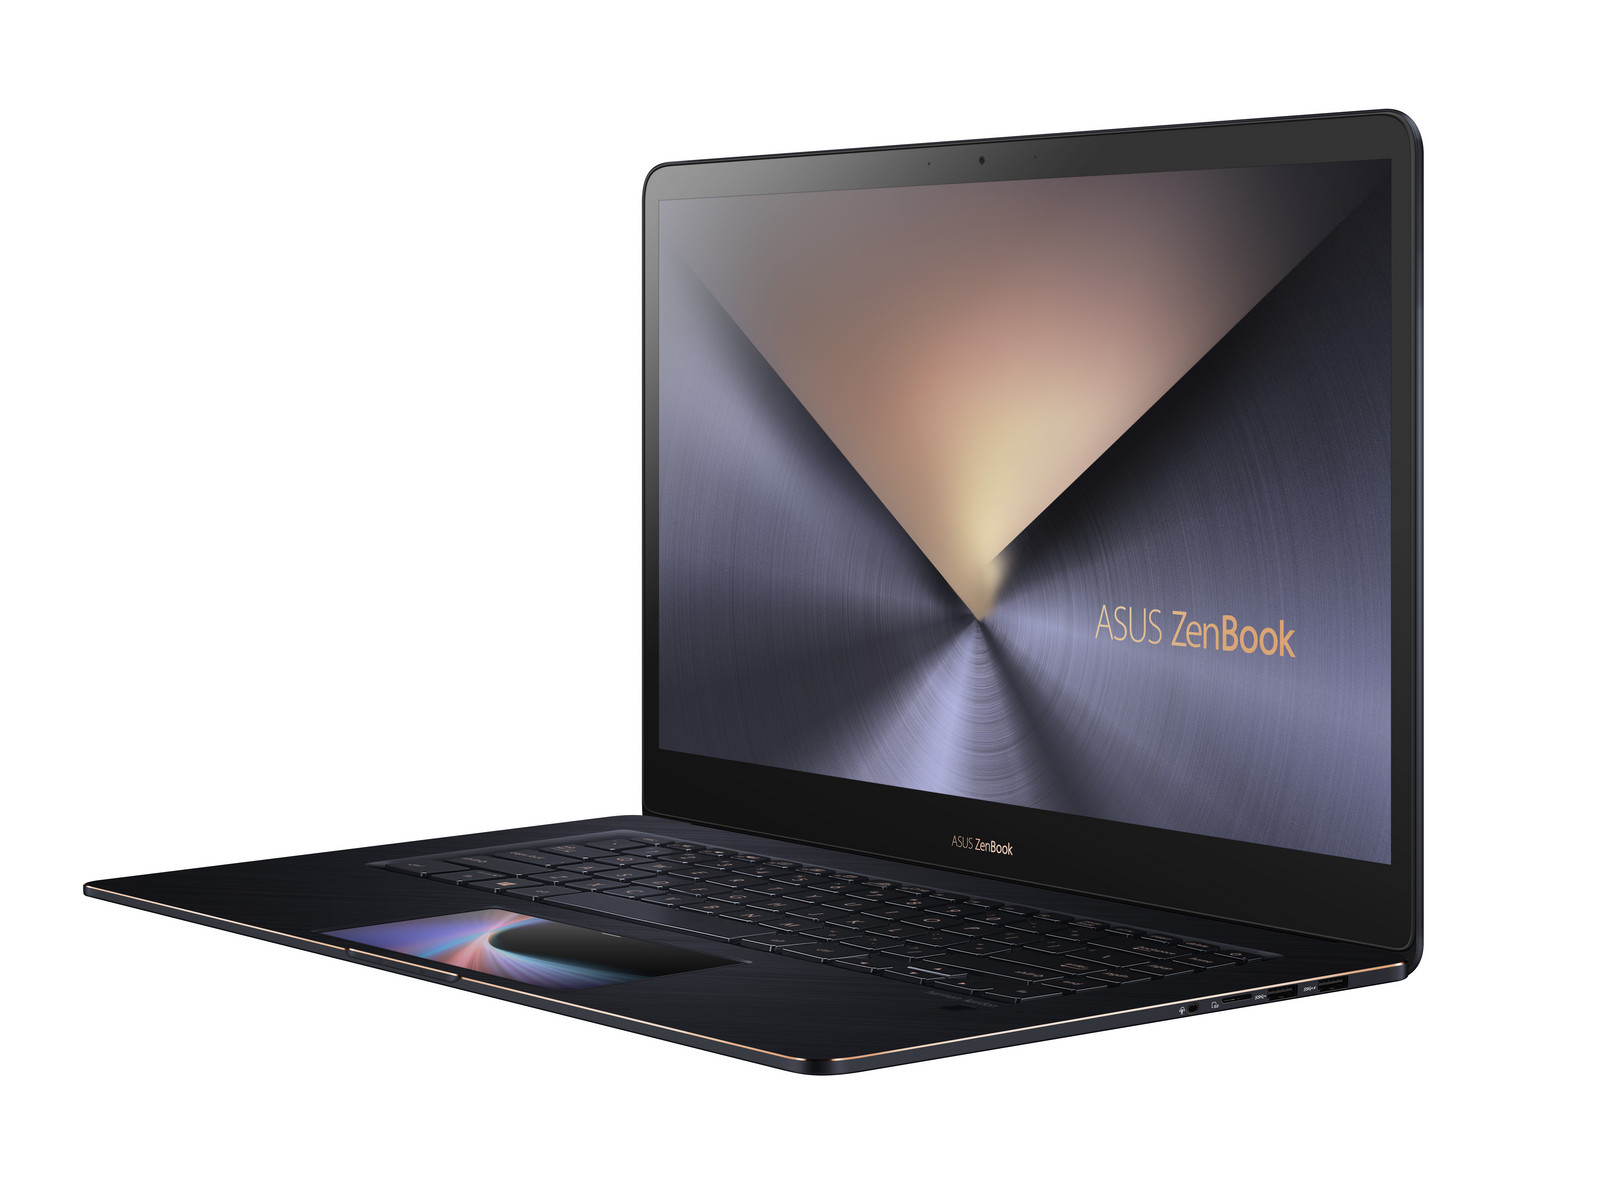
Kısa inceleme: Asus ZenBook Pro 15 UX580GE (i9-8950HK, GTX 1050 Ti, 4K UHD) Laptop
| SD Card Reader - average JPG Copy Test (av. of 3 runs) | |
| Gigabyte Aero 15X v8 (Toshiba Exceria Pro SDXC 64 GB UHS-II) | |
| Dell XPS 13 9370 i7 UHD (Toshiba Exceria Pro UHS-II) | |
| Asus ZenBook Pro 15 UX580GE (Toshiba Exceria Pro M501 UHS-II) | |
| Networking | |
| iperf3 transmit AX12 | |
| Asus ZenBook Pro 15 UX580GE | |
| Dell XPS 15 2018 i5 FHD 97Wh | |
| Gigabyte Aero 15X v8 | |
| iperf3 receive AX12 | |
| Gigabyte Aero 15X v8 | |
| Asus ZenBook Pro 15 UX580GE | |
| Dell XPS 15 2018 i5 FHD 97Wh | |
| |||||||||||||||||||||||||
Aydınlatma: 85 %
Batarya modunda parlaklık: 357.6 cd/m²
Kontrast: 1022:1 (Siyah: 0.35 cd/m²)
ΔE ColorChecker Calman: 4.12 | ∀{0.5-29.43 Ø4.72}
calibrated: 4.23
ΔE Greyscale Calman: 1.8 | ∀{0.09-98 Ø4.97}
100% sRGB (Argyll 1.6.3 3D)
87.5% AdobeRGB 1998 (Argyll 1.6.3 3D)
99.1% AdobeRGB 1998 (Argyll 3D)
100% sRGB (Argyll 3D)
85.9% Display P3 (Argyll 3D)
Gamma: 2.17
CCT: 6613 K
| Asus ZenBook Pro 15 UX580GE AU Optronics B156ZAN03.1, IPS, 15.6", 3840x2160 | Dell XPS 15 2018 i5 FHD 97Wh Sharp SHP149A LQ156M1, LED IGZO IPS InfinityEdge, 15.6", 1920x1080 | Asus ZenBook Flip 15 UX561UD B156ZAN03.1, IPS, 15.6", 3840x2160 | HP Spectre x360 15t-bl100 BOE06C3, IPS, 15.6", 3840x2160 | Gigabyte Aero 15X v8 LGD05C0, IPS, 15.6", 1920x1080 | Apple MacBook Pro 15 2017 (2.9 GHz, 560) 15.4", 2880x1800 | |
|---|---|---|---|---|---|---|
| Display | -20% | 0% | -24% | -22% | ||
| Display P3 Coverage (%) | 85.9 | 66 -23% | 86.6 1% | 66.6 -22% | 63.6 -26% | |
| sRGB Coverage (%) | 100 | 96.5 -3% | 100 0% | 86.9 -13% | 93.8 -6% | |
| AdobeRGB 1998 Coverage (%) | 99.1 | 66.7 -33% | 99.5 0% | 63.5 -36% | 64.9 -35% | |
| Response Times | -22% | -23% | -12% | 57% | -10% | |
| Response Time Grey 50% / Grey 80% * (ms) | 44 ? | 49 ? -11% | 52 ? -18% | 41.2 ? 6% | 16.8 ? 62% | 42.4 ? 4% |
| Response Time Black / White * (ms) | 22.8 ? | 30 ? -32% | 29 ? -27% | 29.6 ? -30% | 11.2 ? 51% | 28 ? -23% |
| PWM Frequency (Hz) | 961 ? | 1000 | ||||
| Screen | 13% | -2% | -22% | 14% | 25% | |
| Brightness middle (cd/m²) | 357.6 | 413 15% | 380 6% | 338.7 -5% | 313 -12% | 534 49% |
| Brightness (cd/m²) | 350 | 378 8% | 371 6% | 325 -7% | 300 -14% | 502 43% |
| Brightness Distribution (%) | 85 | 86 1% | 87 2% | 91 7% | 78 -8% | 86 1% |
| Black Level * (cd/m²) | 0.35 | 0.29 17% | 0.28 20% | 0.28 20% | 0.33 6% | 0.31 11% |
| Contrast (:1) | 1022 | 1424 39% | 1357 33% | 1210 18% | 948 -7% | 1723 69% |
| Colorchecker dE 2000 * | 4.12 | 2.44 41% | 4.38 -6% | 4.9 -19% | 1.29 69% | 1.8 56% |
| Colorchecker dE 2000 max. * | 9.91 | 4.46 55% | 7.59 23% | 8.7 12% | 2.04 79% | 3.8 62% |
| Colorchecker dE 2000 calibrated * | 4.23 | 2.48 41% | ||||
| Greyscale dE 2000 * | 1.8 | 2.48 -38% | 3.6 -100% | 5.5 -206% | 0.69 62% | 2.4 -33% |
| Gamma | 2.17 101% | 2.43 91% | 2.32 95% | 2.08 106% | 2.43 91% | 2.27 97% |
| CCT | 6613 98% | 7006 93% | 6860 95% | 7498 87% | 6550 99% | 6563 99% |
| Color Space (Percent of AdobeRGB 1998) (%) | 87.5 | 62 -29% | 88 1% | 63.5 -27% | 60 -31% | 77.92 -11% |
| Color Space (Percent of sRGB) (%) | 100 | 96 -4% | 100 0% | 86.92 -13% | 94 -6% | 99.94 0% |
| Toplam Ortalama (Program / Ayarlar) | -10% /
3% | -8% /
-4% | -19% /
-21% | 16% /
12% | 8% /
19% |
* ... daha küçük daha iyidir
Yanıt Sürelerini Görüntüle
| ↔ Tepki Süresi Siyahtan Beyaza | ||
|---|---|---|
| 22.8 ms ... yükseliş ↗ ve sonbahar↘ birleşimi | ↗ 12 ms yükseliş | 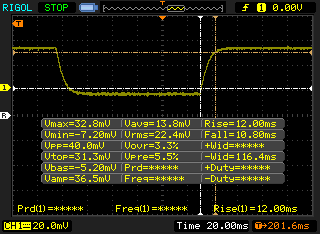 |
| ↘ 10.8 ms sonbahar | ||
| Ekran, testlerimizde iyi yanıt oranları gösteriyor ancak rekabetçi oyuncular için çok yavaş olabilir. Karşılaştırıldığında, test edilen tüm cihazlar 0.1 (minimum) ile 240 (maksimum) ms arasında değişir. » Tüm cihazların 51 %'si daha iyi. Bu, ölçülen yanıt süresinin test edilen tüm cihazların ortalamasından (19.8 ms) daha kötü olduğu anlamına gelir. | ||
| ↔ Tepki Süresi %50 Griden %80 Griye | ||
| 44 ms ... yükseliş ↗ ve sonbahar↘ birleşimi | ↗ 22 ms yükseliş | 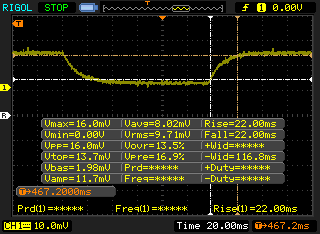 |
| ↘ 22 ms sonbahar | ||
| Ekran, testlerimizde yavaş yanıt oranları gösteriyor ve oyuncular için yetersiz olacaktır. Karşılaştırıldığında, test edilen tüm cihazlar 0.165 (minimum) ile 636 (maksimum) ms arasında değişir. » Tüm cihazların 73 %'si daha iyi. Bu, ölçülen yanıt süresinin test edilen tüm cihazların ortalamasından (31 ms) daha kötü olduğu anlamına gelir. | ||
Ekran Titremesi / PWM (Darbe Genişliği Modülasyonu)
| Ekran titriyor / PWM algılanmadı | 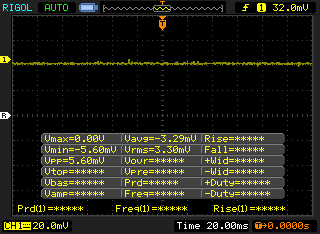 | ||
Karşılaştırıldığında: Test edilen tüm cihazların %52 %'si ekranı karartmak için PWM kullanmıyor. PWM tespit edilirse, ortalama 7753 (minimum: 5 - maksimum: 343500) Hz ölçüldü. | |||
| PCMark 10 - Score | |
| Asus ZenBook Pro 15 UX580GE | |
| Gigabyte Aero 15X v8 | |
| Dell XPS 15 2018 i5 FHD 97Wh | |
| Asus ZenBook Flip 15 UX561UD | |
| HP Spectre x360 15t-bl100 | |
| PCMark 8 Home Score Accelerated v2 | 3661 puan | |
| PCMark 8 Work Score Accelerated v2 | 4456 puan | |
| PCMark 10 Score | 5358 puan | |
Yardım | ||
| Asus ZenBook Pro 15 UX580GE Samsung SSD PM961 1TB M.2 PCIe 3.0 x4 NVMe (MZVLW1T0) | Dell XPS 15 2018 i5 FHD 97Wh Lite-On CA3-8D256-Q11 | Lenovo ThinkPad T580-20LAS01H00 Samsung SSD PM981 MZVLB512HAJQ | HP Spectre x360 15t-bl100 Samsung PM961 NVMe MZVLW512HMJP | Gigabyte Aero 15X v8 Toshiba NVMe THNSN5512GPU7 | |
|---|---|---|---|---|---|
| AS SSD | -234% | -4% | 17% | -46% | |
| Copy Game MB/s (MB/s) | 728 | 465.9 -36% | 878 21% | 1134 56% | |
| Copy Program MB/s (MB/s) | 430.9 | 117.2 -73% | 393.4 -9% | 534 24% | |
| Copy ISO MB/s (MB/s) | 1045 | 632 -40% | 1533 47% | 1936 85% | |
| Score Total (Points) | 4065 | 750 -82% | 3548 -13% | 3781 -7% | 2536 -38% |
| Score Write (Points) | 1547 | 58 -96% | 1515 -2% | 1556 1% | 939 -39% |
| Score Read (Points) | 1679 | 492 -71% | 1342 -20% | 1493 -11% | 1092 -35% |
| Access Time Write * (ms) | 0.036 | 0.889 -2369% | 0.033 8% | 0.026 28% | 0.046 -28% |
| Access Time Read * (ms) | 0.04 | 0.086 -115% | 0.059 -48% | 0.04 -0% | 0.119 -197% |
| 4K-64 Write (MB/s) | 1273 | 19.19 -98% | 1278 0% | 1262 -1% | 742 -42% |
| 4K-64 Read (MB/s) | 1431 | 301.8 -79% | 1153 -19% | 1206 -16% | 847 -41% |
| 4K Write (MB/s) | 100.9 | 5.12 -95% | 110.9 10% | 141.1 40% | 80.4 -20% |
| 4K Read (MB/s) | 37.78 | 32.5 -14% | 51.5 36% | 51.9 37% | 23.36 -38% |
| Seq Write (MB/s) | 1729 | 340.3 -80% | 1262 -27% | 1530 -12% | 1163 -33% |
| Seq Read (MB/s) | 2099 | 1574 -25% | 1373 -35% | 2342 12% | 2213 5% |
* ... daha küçük daha iyidir

| 3DMark 11 | |
| 1280x720 Performance GPU | |
| Asus ROG Strix GL702ZC-GC204T | |
| Asus ROG GU501GM-BI7N8 | |
| Intel Hades Canyon NUC8i7HVK | |
| Dell G5 15 5587 | |
| Asus Strix GL502VT-DS74 | |
| Ortalama NVIDIA GeForce GTX 1050 Ti Mobile (8304 - 10402, n=36) | |
| Asus Zenbook Pro UX550VE-DB71T | |
| Asus ZenBook Pro 15 UX580GE | |
| Asus FX504GD | |
| Asus Zenbook UX510UW-CN044T | |
| 1280x720 Performance Combined | |
| Intel Hades Canyon NUC8i7HVK | |
| Asus ROG GU501GM-BI7N8 | |
| Dell G5 15 5587 | |
| Asus ZenBook Pro 15 UX580GE | |
| Asus Zenbook Pro UX550VE-DB71T | |
| Asus Strix GL502VT-DS74 | |
| Asus ROG Strix GL702ZC-GC204T | |
| Ortalama NVIDIA GeForce GTX 1050 Ti Mobile (6104 - 9172, n=35) | |
| Asus FX504GD | |
| Asus Zenbook UX510UW-CN044T | |
| 3DMark | |
| 1280x720 Cloud Gate Standard Graphics | |
| Dell G5 15 5587 | |
| Asus ROG GU501GM-BI7N8 | |
| Asus ROG Strix GL702ZC-GC204T | |
| Intel Hades Canyon NUC8i7HVK | |
| Asus Strix GL502VT-DS74 | |
| Ortalama NVIDIA GeForce GTX 1050 Ti Mobile (43721 - 53978, n=37) | |
| Asus Zenbook Pro UX550VE-DB71T | |
| Asus ZenBook Pro 15 UX580GE | |
| Asus FX504GD | |
| Asus Zenbook UX510UW-CN044T | |
| 1920x1080 Fire Strike Graphics | |
| Asus ROG GU501GM-BI7N8 | |
| Asus ROG Strix GL702ZC-GC204T | |
| Dell G5 15 5587 | |
| Intel Hades Canyon NUC8i7HVK | |
| Ortalama NVIDIA GeForce GTX 1050 Ti Mobile (6792 - 8376, n=38) | |
| Asus Zenbook Pro UX550VE-DB71T | |
| Asus Strix GL502VT-DS74 | |
| Asus ZenBook Pro 15 UX580GE | |
| Asus FX504GD | |
| Asus Zenbook UX510UW-CN044T | |
| Fire Strike Extreme Graphics | |
| Dell G5 15 5587 | |
| Intel Hades Canyon NUC8i7HVK | |
| Ortalama NVIDIA GeForce GTX 1050 Ti Mobile (3452 - 3945, n=15) | |
| Asus Zenbook Pro UX550VE-DB71T | |
| Asus Strix GL502VT-DS74 | |
| Asus ZenBook Pro 15 UX580GE | |
| Asus FX504GD | |
| Asus Zenbook UX510UW-CN044T | |
| 3DMark 11 Performance | 8990 puan | |
| 3DMark Cloud Gate Standard Score | 24182 puan | |
| 3DMark Fire Strike Score | 6504 puan | |
| 3DMark Fire Strike Extreme Score | 3372 puan | |
| 3DMark Time Spy Score | 2281 puan | |
Yardım | ||
| BioShock Infinite - 1920x1080 Ultra Preset, DX11 (DDOF) | |
| MSI GV62 8RE-016US | |
| Gigabyte Aero 14-K7 | |
| Ortalama NVIDIA GeForce GTX 1050 Ti Mobile (61 - 97, n=23) | |
| Dell XPS 15 2018 i5 FHD 97Wh | |
| Asus ZenBook Pro 15 UX580GE | |
| Asus Zenbook UX510UW-CN044T | |
| Rise of the Tomb Raider - 1920x1080 Very High Preset AA:FX AF:16x | |
| MSI GV62 8RE-016US | |
| Ortalama NVIDIA GeForce GTX 1050 Ti Mobile (27.8 - 40.7, n=16) | |
| Asus ZenBook Pro 15 UX580GE | |
| Dell XPS 15 2018 i5 FHD 97Wh | |
| düşük | orta | yüksek | ultra | 4K | |
|---|---|---|---|---|---|
| BioShock Infinite (2013) | 270.5 | 157.4 | 149.9 | 66.5 | |
| The Witcher 3 (2015) | 88.3 | 44.6 | 24.2 | 15.8 | |
| Batman: Arkham Knight (2015) | 95 | 50 | 29 | 15 | |
| Rise of the Tomb Raider (2016) | 75.5 | 39.6 | 34.8 | 14.1 | |
| Ashes of the Singularity (2016) | 51.4 | 36.2 | 28.5 | ||
| Overwatch (2016) | 108.3 | 58.7 | 31.4 |
Ses yüksekliği
| Boşta |
| 28.6 / 29.9 / 30.5 dB |
| Çalışırken |
| 42.5 / 44.8 dB |
 | ||
30 dB sessiz 40 dB(A) duyulabilirlik 50 dB(A) gürültülü |
||
min: | ||
| Asus ZenBook Pro 15 UX580GE GeForce GTX 1050 Ti Mobile, i9-8950HK, Samsung SSD PM961 1TB M.2 PCIe 3.0 x4 NVMe (MZVLW1T0) | Dell XPS 15 2018 i5 FHD 97Wh GeForce GTX 1050 Mobile, i5-8300H, Lite-On CA3-8D256-Q11 | HP Spectre x360 15t-bl100 GeForce MX150, i5-8550U, Samsung PM961 NVMe MZVLW512HMJP | Gigabyte Aero 15X v8 GeForce GTX 1070 Max-Q, i7-8750H, Toshiba NVMe THNSN5512GPU7 | Apple MacBook Pro 15 2017 (2.9 GHz, 560) Radeon Pro 560, i7-7820HQ | Asus Zenbook Pro UX550VE-DB71T GeForce GTX 1050 Ti Mobile, i7-7700HQ, Samsung PM961 NVMe MZVLW512HMJP | |
|---|---|---|---|---|---|---|
| Noise | 1% | 6% | -11% | 2% | -3% | |
| kapalı / ortam * (dB) | 28 | 30.3 -8% | 28.4 -1% | 29 -4% | 30.8 -10% | 28.3 -1% |
| Idle Minimum * (dB) | 28.6 | 30.3 -6% | 28.4 1% | 30 -5% | 31 -8% | 30.4 -6% |
| Idle Average * (dB) | 29.9 | 30.3 -1% | 28.4 5% | 31 -4% | 31 -4% | 31 -4% |
| Idle Maximum * (dB) | 30.5 | 30.3 1% | 28.4 7% | 35 -15% | 31 -2% | 31.2 -2% |
| Load Average * (dB) | 42.5 | 37.1 13% | 41.6 2% | 49 -15% | 31.3 26% | 43.3 -2% |
| Witcher 3 ultra * (dB) | 44.8 | 43.3 3% | 36.1 19% | 51 -14% | 46.2 -3% | |
| Load Maximum * (dB) | 44.8 | 43 4% | 41.6 7% | 54 -21% | 41.8 7% | 46.2 -3% |
* ... daha küçük daha iyidir
(±) Üst taraftaki maksimum sıcaklık, 36.8 °C / 98 F ortalamasına kıyasla 42.4 °C / 108 F'dir. , Multimedia sınıfı için 21 ile 71 °C arasında değişir.
(-) Alt kısım, 39.1 °C / 102 F ortalamasına kıyasla maksimum 50.8 °C / 123 F'ye kadar ısınır
(+) Boşta kullanımda, üst tarafın ortalama sıcaklığı 29.8 °C / 86 F olup, cihazın 31.3 °C / 88 F.
(±) The Witcher 3 oynarken, üst tarafın ortalama sıcaklığı 34.6 °C / 94 F olup, cihazın 31.3 °C / 88 F.
(+) Avuç içi dayanakları ve dokunmatik yüzey, maksimum 31.8 °C / 89.2 F ile cilt sıcaklığından daha soğuktur ve bu nedenle dokunulduğunda soğuktur.
(-) Benzer cihazların avuç içi dayanağı alanının ortalama sıcaklığı 28.7 °C / 83.7 F (-3.1 °C / -5.5 F) idi.
Asus ZenBook Pro 15 UX580GE ses analizi
(±) | hoparlör ses yüksekliği ortalama ama iyi (79.9 dB)
Bas 100 - 315Hz
(-) | neredeyse hiç bas yok - ortalama olarak medyandan 22.3% daha düşük
(±) | Bas doğrusallığı ortalamadır (11.5% delta - önceki frekans)
Ortalar 400 - 2000 Hz
(+) | dengeli ortalar - medyandan yalnızca 2.4% uzakta
(±) | Ortaların doğrusallığı ortalamadır (7.5% delta - önceki frekans)
Yüksekler 2 - 16 kHz
(+) | dengeli yüksekler - medyandan yalnızca 4% uzakta
(+) | yüksekler doğrusaldır (6.2% deltadan önceki frekansa)
Toplam 100 - 16.000 Hz
(±) | Genel sesin doğrusallığı ortalamadır (17.7% ortancaya göre fark)
Aynı sınıfla karşılaştırıldığında
» Bu sınıftaki tüm test edilen cihazların %51%'si daha iyi, 7% benzer, 42% daha kötüydü
» En iyisinin deltası 5% idi, ortalama 17% idi, en kötüsü 45% idi
Test edilen tüm cihazlarla karşılaştırıldığında
» Test edilen tüm cihazların %35'si daha iyi, 8 benzer, % 57 daha kötüydü
» En iyisinin deltası 4% idi, ortalama 23% idi, en kötüsü 134% idi
Apple MacBook Pro 15 2017 (2.8 GHz, 555) ses analizi
(+) | hoparlörler nispeten yüksek sesle çalabilir (87 dB)
Bas 100 - 315Hz
(±) | azaltılmış bas - ortalama olarak medyandan 8.7% daha düşük
(±) | Bas doğrusallığı ortalamadır (11.1% delta - önceki frekans)
Ortalar 400 - 2000 Hz
(+) | dengeli ortalar - medyandan yalnızca 2.5% uzakta
(±) | Ortaların doğrusallığı ortalamadır (7.5% delta - önceki frekans)
Yüksekler 2 - 16 kHz
(+) | dengeli yüksekler - medyandan yalnızca 1.7% uzakta
(+) | yüksekler doğrusaldır (5% deltadan önceki frekansa)
Toplam 100 - 16.000 Hz
(+) | genel ses doğrusaldır (7.9% ortancaya göre fark)
Aynı sınıfla karşılaştırıldığında
» Bu sınıftaki tüm test edilen cihazların %7%'si daha iyi, 2% benzer, 91% daha kötüydü
» En iyisinin deltası 5% idi, ortalama 17% idi, en kötüsü 45% idi
Test edilen tüm cihazlarla karşılaştırıldığında
» Test edilen tüm cihazların %2'si daha iyi, 1 benzer, % 98 daha kötüydü
» En iyisinin deltası 4% idi, ortalama 23% idi, en kötüsü 134% idi
| Kapalı / Bekleme modu | |
| Boşta | |
| Çalışırken |
|
Key:
min: | |
| Asus ZenBook Pro 15 UX580GE i9-8950HK, GeForce GTX 1050 Ti Mobile, Samsung SSD PM961 1TB M.2 PCIe 3.0 x4 NVMe (MZVLW1T0), IPS, 3840x2160, 15.6" | Dell XPS 15 2018 i5 FHD 97Wh i5-8300H, GeForce GTX 1050 Mobile, Lite-On CA3-8D256-Q11, LED IGZO IPS InfinityEdge, 1920x1080, 15.6" | HP Spectre x360 15t-bl100 i5-8550U, GeForce MX150, Samsung PM961 NVMe MZVLW512HMJP, IPS, 3840x2160, 15.6" | Gigabyte Aero 15X v8 i7-8750H, GeForce GTX 1070 Max-Q, Toshiba NVMe THNSN5512GPU7, IPS, 1920x1080, 15.6" | Apple MacBook Pro 15 2017 (2.9 GHz, 560) i7-7820HQ, Radeon Pro 560, , , 2880x1800, 15.4" | Asus Zenbook Pro UX550VE-DB71T i7-7700HQ, GeForce GTX 1050 Ti Mobile, Samsung PM961 NVMe MZVLW512HMJP, IPS, 1920x1080, 15.6" | |
|---|---|---|---|---|---|---|
| Power Consumption | 42% | 28% | -17% | 32% | 32% | |
| Idle Minimum * (Watt) | 11.7 | 2.9 75% | 11.6 1% | 14 -20% | 3.7 68% | 6.3 46% |
| Idle Average * (Watt) | 18.5 | 5.8 69% | 13.8 25% | 18 3% | 16.2 12% | 7.9 57% |
| Idle Maximum * (Watt) | 22.8 | 7.5 67% | 14.2 38% | 22 4% | 18 21% | 8.1 64% |
| Load Average * (Watt) | 97.5 | 77.5 21% | 67.9 30% | 91 7% | 58.4 40% | 84.9 13% |
| Witcher 3 ultra * (Watt) | 102.9 | 84 18% | 59 43% | 142 -38% | 96.3 6% | |
| Load Maximum * (Watt) | 111.1 | 107 4% | 76.9 31% | 173 -56% | 89.6 19% | 102.4 8% |
* ... daha küçük daha iyidir
| Asus ZenBook Pro 15 UX580GE i9-8950HK, GeForce GTX 1050 Ti Mobile, 71 Wh | Dell XPS 15 2018 i5 FHD 97Wh i5-8300H, GeForce GTX 1050 Mobile, 97 Wh | HP Spectre x360 15t-bl100 i5-8550U, GeForce MX150, 79.2 Wh | Gigabyte Aero 15X v8 i7-8750H, GeForce GTX 1070 Max-Q, 94.24 Wh | Apple MacBook Pro 15 2017 (2.9 GHz, 560) i7-7820HQ, Radeon Pro 560, Wh | Asus Zenbook Pro UX550VE-DB71T i7-7700HQ, GeForce GTX 1050 Ti Mobile, 73 Wh | |
|---|---|---|---|---|---|---|
| Pil Çalışma Süresi | 98% | 41% | 43% | 32% | 18% | |
| Reader / Idle (h) | 14 | 15.6 11% | 12.7 -9% | 17.1 22% | ||
| WiFi v1.3 (h) | 6.3 | 15.7 149% | 8.5 35% | 8.6 37% | 11.3 79% | 8.9 41% |
| Load (h) | 1.3 | 1.9 46% | 2.3 77% | 2.6 100% | 1.1 -15% | 1.2 -8% |
| Witcher 3 ultra (h) | 1 | 1.3 |
Artılar
Eksiler
UX580 hakkında çok aydınlatıcı bir sonuca varmamız pek mümkün değil. Test cihazımız üretim öncesine ait ve Core i9 işlemci beklenen performansı veremiyor. Asıl incelememizi cihaz üretime hazır olduğunda vermemiz yerinde olacaktır. Ama bu incelememizde cihazın eşsiz özellikleri üzerinde durabiliriz.
Screenpad, Apple'ın Touch Bar özelliğinden daha kullanışlı. Fikrin temelinde 16:9 1080p ikinci bir ekranın kullanımı yatıyor. Alanın kullanımı için özel uygulamalara veya uygulama bazında özelleştirmeye de gerek yok. Sadece ikinci bir ekran olarak düşünmek yeterli. İki ekranlı kullanımın keyfini bilen masaüstü kullanıcıları demek istediğimi anlayacaktır. Bu yüzden UX580 en taze fikirlerden biri olarak karşımızda.
Fikrin potansiyeli olmasıyla birlikte ergonomik zorlukları da mevcut. Ekranlar arası yukarı aşağı bakmak yorucu olabilir. Ayrıca harici fare kullanılmazsa ekranın üzerinde fare kullanımı veya ikinci ekran kullanımı şeklinde sürekli değişim yapmak gerekiyor.
Son olarak ekranın yüzeyi yağlı hissi veriyor ve görüntü keskinliğini yitiriyor. Kalın mat yüzey ekran üzerinde kaydırma kullanımı için gerekli iken ekran kalitesinden ödün verilmesine sebep olmuş. Bu yüzden UX580 Screenpad ilk jenerasyon bir ürün olarak karşımızda.
Bunun dışında UX580, UX550 ile neredeyse birebir aynı. Hoparlörler daha iyi, bakımı kolay, aluminyum kasa sağlam. Batarya ömründe de iyileştirmeler beklemekle beraber, daha keskin AMOLED / OLED ekran kullanımını da bekliyoruz.
Yazının orjinali için tıklayın.
Price comparison
