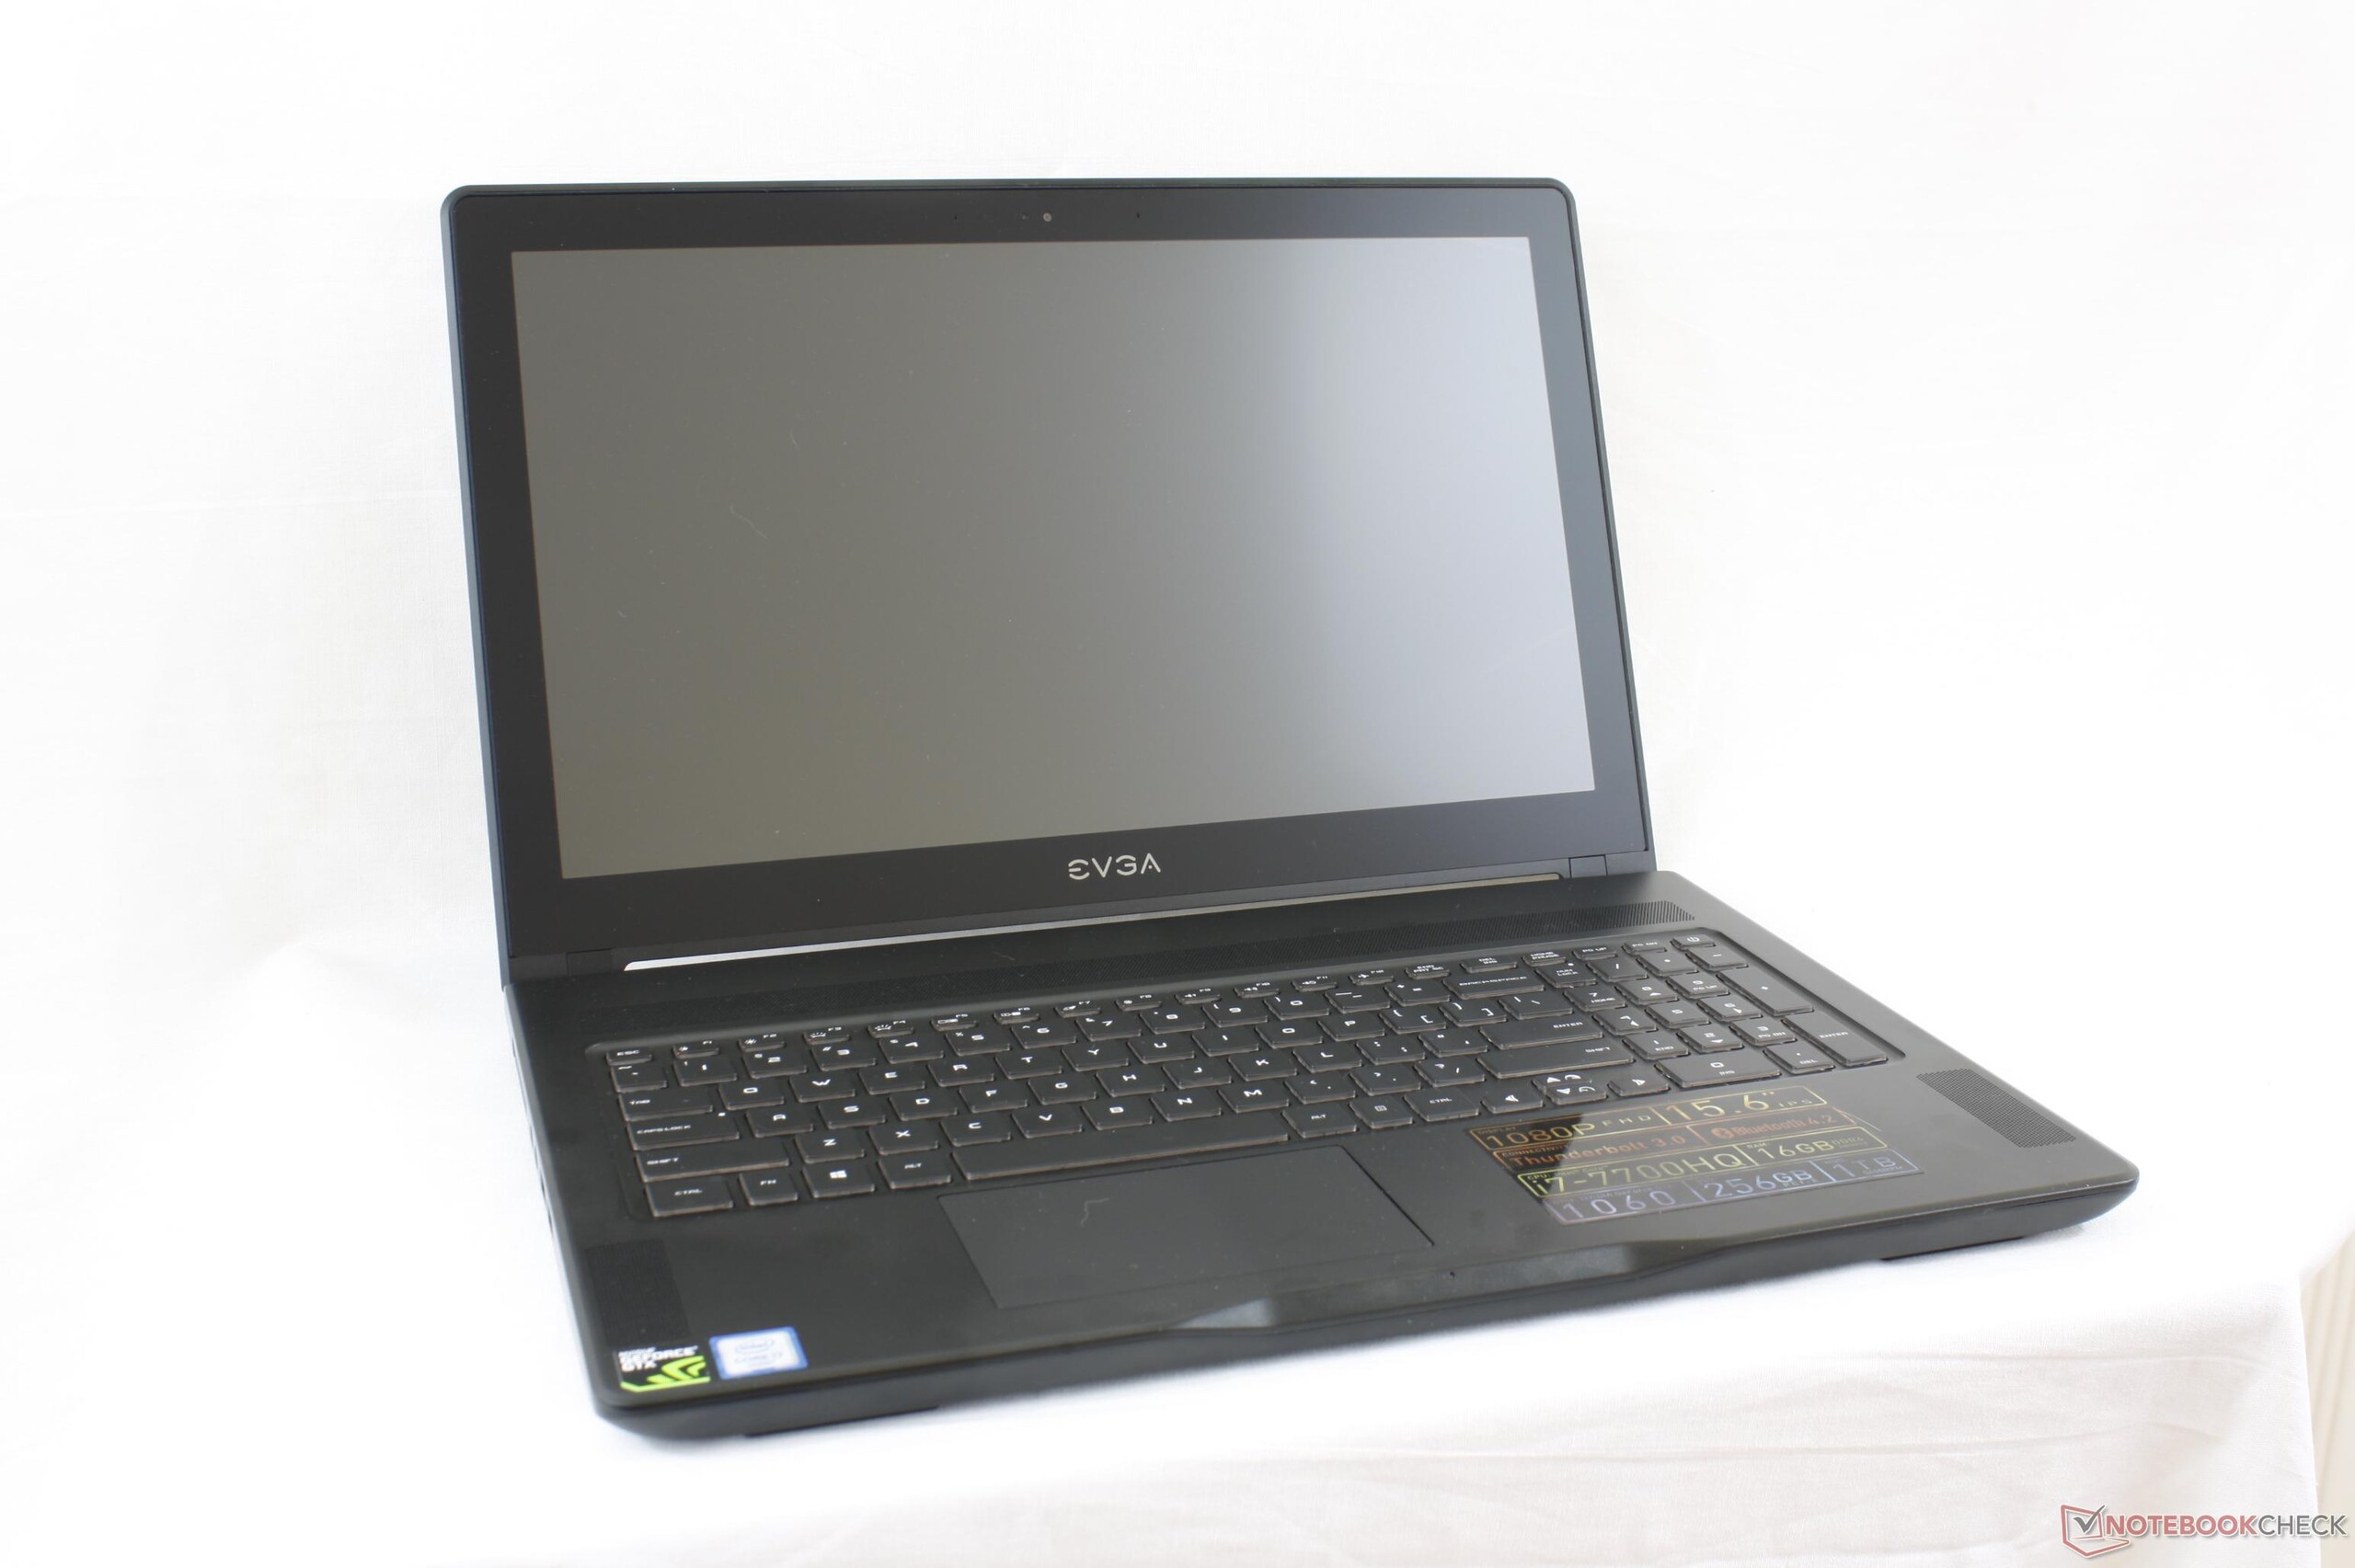
Kısa inceleme: EVGA SC15 (i7-7700HQ, GTX 1060) Laptop
| Networking | |
| iperf3 transmit AX12 | |
| MSI GS63VR 7RF-228US | |
| Dell XPS 15 9560 (i7-7700HQ, UHD) | |
| EVGA SC15 | |
| iperf3 receive AX12 | |
| MSI GS63VR 7RF-228US | |
| EVGA SC15 | |
| Dell XPS 15 9560 (i7-7700HQ, UHD) | |
| |||||||||||||||||||||||||
Aydınlatma: 73 %
Batarya modunda parlaklık: 281.5 cd/m²
Kontrast: 1043:1 (Siyah: 0.27 cd/m²)
ΔE ColorChecker Calman: 3.9 | ∀{0.5-29.43 Ø4.71}
ΔE Greyscale Calman: 3.8 | ∀{0.09-98 Ø4.96}
89.3% sRGB (Argyll 1.6.3 3D)
57.8% AdobeRGB 1998 (Argyll 1.6.3 3D)
63.6% AdobeRGB 1998 (Argyll 3D)
89.6% sRGB (Argyll 3D)
62.3% Display P3 (Argyll 3D)
Gamma: 2.27
CCT: 7322 K
| EVGA SC15 ID: AUO42ED, Name: AU Optronics B156HAN04.2, , 15.6", 1920x1080 | Asus Zephyrus GX501 AUO B156HAN04.2 (AUO42ED), IPS, 15.6", 1920x1080 | Apple MacBook Pro 15 2017 (2.8 GHz, 555) APPA031, IPS, 15.4", 2880x1800 | Gigabyte Aero 15 N156HCA-EA1 (CMN15D7), IPS, 15.6", 1920x1080 | Aorus X5 v6 IPS, 15.6", 2880x1620 | MSI GS63VR 7RF-228US IPS, 15.6", 3840x2160 | |
|---|---|---|---|---|---|---|
| Display | 3% | 34% | 4% | -2% | -21% | |
| Display P3 Coverage (%) | 62.3 | 64.8 4% | 97.9 57% | 65.2 5% | 62.5 0% | 48.21 -23% |
| sRGB Coverage (%) | 89.6 | 91.8 2% | 99.9 11% | 92.5 3% | 86.2 -4% | 72.6 -19% |
| AdobeRGB 1998 Coverage (%) | 63.6 | 65.9 4% | 85.9 35% | 66.5 5% | 62.5 -2% | 49.81 -22% |
| Response Times | 13% | -13% | -4% | 7% | 28% | |
| Response Time Grey 50% / Grey 80% * (ms) | 41.6 ? | 40.4 ? 3% | 48 ? -15% | 42.8 ? -3% | 34 ? 18% | 28 ? 33% |
| Response Time Black / White * (ms) | 30.8 ? | 24 ? 22% | 33.8 ? -10% | 32 ? -4% | 32 ? -4% | 23.6 ? 23% |
| PWM Frequency (Hz) | 119000 ? | 26000 ? | 198.4 | 1351 ? | ||
| Screen | -7% | 41% | -9% | -5% | -47% | |
| Brightness middle (cd/m²) | 281.5 | 328 17% | 545 94% | 320 14% | 280.4 0% | 274.2 -3% |
| Brightness (cd/m²) | 253 | 305 21% | 523 107% | 316 25% | 271 7% | 263 4% |
| Brightness Distribution (%) | 73 | 83 14% | 86 18% | 90 23% | 83 14% | 92 26% |
| Black Level * (cd/m²) | 0.27 | 0.25 7% | 0.44 -63% | 0.36 -33% | 0.249 8% | 0.44 -63% |
| Contrast (:1) | 1043 | 1312 26% | 1239 19% | 889 -15% | 1126 8% | 623 -40% |
| Colorchecker dE 2000 * | 3.9 | 6.02 -54% | 1.6 59% | 4.62 -18% | 4.94 -27% | 8 -105% |
| Colorchecker dE 2000 max. * | 7.1 | 10.14 -43% | 3.8 46% | 9.75 -37% | 8.13 -15% | 14.6 -106% |
| Greyscale dE 2000 * | 3.8 | 6.32 -66% | 1.9 50% | 6 -58% | 5.13 -35% | 9.1 -139% |
| Gamma | 2.27 97% | 2.28 96% | 2.26 97% | 2.46 89% | 2.26 97% | 2.24 98% |
| CCT | 7322 89% | 8194 79% | 6834 95% | 6761 96% | 7433 87% | 5020 129% |
| Color Space (Percent of AdobeRGB 1998) (%) | 57.8 | 60 4% | 60 4% | 55.9 -3% | 45.7 -21% | |
| Color Space (Percent of sRGB) (%) | 89.3 | 92 3% | 92 3% | 85.9 -4% | 72.1 -19% | |
| Toplam Ortalama (Program / Ayarlar) | 3% /
-2% | 21% /
31% | -3% /
-6% | 0% /
-3% | -13% /
-32% |
* ... daha küçük daha iyidir
Yanıt Sürelerini Görüntüle
| ↔ Tepki Süresi Siyahtan Beyaza | ||
|---|---|---|
| 30.8 ms ... yükseliş ↗ ve sonbahar↘ birleşimi | ↗ 17.6 ms yükseliş | 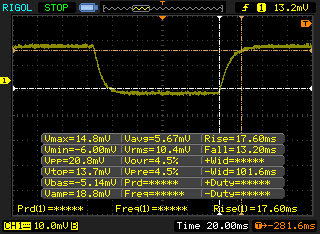 |
| ↘ 13.2 ms sonbahar | ||
| Ekran, testlerimizde yavaş yanıt oranları gösteriyor ve oyuncular için yetersiz olacaktır. Karşılaştırıldığında, test edilen tüm cihazlar 0.1 (minimum) ile 240 (maksimum) ms arasında değişir. » Tüm cihazların 83 %'si daha iyi. Bu, ölçülen yanıt süresinin test edilen tüm cihazların ortalamasından (19.8 ms) daha kötü olduğu anlamına gelir. | ||
| ↔ Tepki Süresi %50 Griden %80 Griye | ||
| 41.6 ms ... yükseliş ↗ ve sonbahar↘ birleşimi | ↗ 21.6 ms yükseliş | 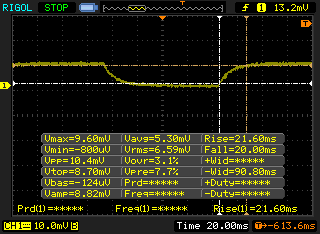 |
| ↘ 20 ms sonbahar | ||
| Ekran, testlerimizde yavaş yanıt oranları gösteriyor ve oyuncular için yetersiz olacaktır. Karşılaştırıldığında, test edilen tüm cihazlar 0.165 (minimum) ile 636 (maksimum) ms arasında değişir. » Tüm cihazların 67 %'si daha iyi. Bu, ölçülen yanıt süresinin test edilen tüm cihazların ortalamasından (30.9 ms) daha kötü olduğu anlamına gelir. | ||
Ekran Titremesi / PWM (Darbe Genişliği Modülasyonu)
| Ekran titriyor / PWM algılanmadı | 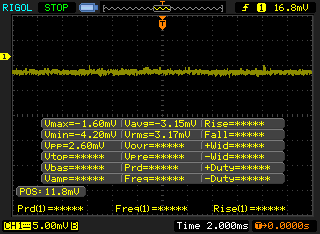 | ||
Karşılaştırıldığında: Test edilen tüm cihazların %52 %'si ekranı karartmak için PWM kullanmıyor. PWM tespit edilirse, ortalama 7741 (minimum: 5 - maksimum: 343500) Hz ölçüldü. | |||
| Cinebench R15 | |
| CPU Single 64Bit | |
| Eurocom Tornado F5 | |
| EVGA SC15 | |
| Eurocom Sky MX5 R3 | |
| Samsung Odyssey NP800G5M-X01US | |
| EVGA SC17 GTX 1070 | |
| MSI GP62-2QEi781FD | |
| Acer Aspire Nitro BE VN7-793G-5811 | |
| MSI GE72VR-6RF16H21 | |
| Toshiba Satellite S70-B-106 | |
| CPU Multi 64Bit | |
| Eurocom Tornado F5 | |
| Eurocom Sky MX5 R3 | |
| Samsung Odyssey NP800G5M-X01US | |
| EVGA SC15 | |
| EVGA SC17 GTX 1070 | |
| MSI GP62-2QEi781FD | |
| MSI GE72VR-6RF16H21 | |
| Toshiba Satellite S70-B-106 | |
| Acer Aspire Nitro BE VN7-793G-5811 | |
| Cinebench R11.5 | |
| CPU Single 64Bit | |
| Eurocom Tornado F5 | |
| Eurocom Sky MX5 R3 | |
| Samsung Odyssey NP800G5M-X01US | |
| EVGA SC15 | |
| EVGA SC17 GTX 1070 | |
| MSI GP62-2QEi781FD | |
| MSI GE72VR-6RF16H21 | |
| Toshiba Satellite S70-B-106 | |
| CPU Multi 64Bit | |
| Eurocom Tornado F5 | |
| Eurocom Sky MX5 R3 | |
| EVGA SC15 | |
| Samsung Odyssey NP800G5M-X01US | |
| EVGA SC17 GTX 1070 | |
| MSI GP62-2QEi781FD | |
| MSI GE72VR-6RF16H21 | |
| Toshiba Satellite S70-B-106 | |
| Cinebench R10 | |
| Rendering Multiple CPUs 32Bit | |
| Eurocom Tornado F5 | |
| Eurocom Sky MX5 R3 | |
| Samsung Odyssey NP800G5M-X01US | |
| EVGA SC15 | |
| EVGA SC17 GTX 1070 | |
| MSI GE72VR-6RF16H21 | |
| MSI GP62-2QEi781FD | |
| Acer Aspire Nitro BE VN7-793G-5811 | |
| Rendering Single 32Bit | |
| Eurocom Tornado F5 | |
| Eurocom Sky MX5 R3 | |
| EVGA SC15 | |
| Samsung Odyssey NP800G5M-X01US | |
| EVGA SC17 GTX 1070 | |
| Acer Aspire Nitro BE VN7-793G-5811 | |
| MSI GP62-2QEi781FD | |
| MSI GE72VR-6RF16H21 | |
| wPrime 2.10 - 1024m | |
| EVGA SC17 GTX 1070 | |
| Eurocom Sky MX5 R3 | |
| EVGA SC15 | |
| Samsung Odyssey NP800G5M-X01US | |
| MSI GP62-2QEi781FD | |
| Eurocom Tornado F5 | |
* ... daha küçük daha iyidir
| PCMark 8 | |
| Home Score Accelerated v2 | |
| EVGA SC15 | |
| Aorus X5 v6 | |
| Apple MacBook Pro 15 2017 (2.8 GHz, 555) | |
| Work Score Accelerated v2 | |
| EVGA SC15 | |
| Aorus X5 v6 | |
| Apple MacBook Pro 15 2017 (2.8 GHz, 555) | |
| Creative Score Accelerated v2 | |
| Aorus X5 v6 | |
| EVGA SC15 | |
| Apple MacBook Pro 15 2017 (2.8 GHz, 555) | |
| PCMark 8 Home Score Accelerated v2 | 5085 puan | |
| PCMark 8 Creative Score Accelerated v2 | 7505 puan | |
| PCMark 8 Work Score Accelerated v2 | 5400 puan | |
Yardım | ||
| EVGA SC15 Toshiba NVMe THNSN5256GPU7 | MSI GS63VR 7RF-228US Samsung SM961 MZVKW512HMJP m.2 PCI-e | Aorus X5 v6 Samsung SM951 MZVPV256 m.2 | Dell XPS 15 9560 (i7-7700HQ, UHD) Lite-On CX2-8B512-Q11 | Aorus X7 DT v6 Samsung SM951 MZVPV512HDGL m.2 PCI-e | |
|---|---|---|---|---|---|
| AS SSD | 37% | -56% | 9% | 17% | |
| Copy Game MB/s (MB/s) | 977 | 1082 11% | 1073 10% | 540 -45% | 1134 16% |
| Copy Program MB/s (MB/s) | 442.3 | 401.9 -9% | 351.5 -21% | 411.5 -7% | 502 13% |
| Copy ISO MB/s (MB/s) | 1071 | 1666 56% | 351.1 -67% | 1272 19% | 1482 38% |
| Score Total (Points) | 2474 | 3756 52% | 1630 -34% | 2810 14% | 2695 9% |
| Score Write (Points) | 896 | 1468 64% | 514 -43% | 1022 14% | 665 -26% |
| Score Read (Points) | 1081 | 1549 43% | 756 -30% | 1206 12% | 1353 25% |
| Access Time Write * (ms) | 0.035 | 0.029 17% | 0.025 29% | 0.034 3% | 0.025 29% |
| Access Time Read * (ms) | 0.054 | 0.041 24% | 0.367 -580% | 0.034 37% | 0.047 13% |
| 4K-64 Write (MB/s) | 706 | 1185 68% | 272.5 -61% | 789 12% | 366.9 -48% |
| 4K-64 Read (MB/s) | 822 | 1229 50% | 521 -37% | 962 17% | 1107 35% |
| 4K Write (MB/s) | 95.5 | 127.6 34% | 131.3 37% | 112.2 17% | 149.1 56% |
| 4K Read (MB/s) | 39.13 | 48.01 23% | 44.6 14% | 41.34 6% | 48.93 25% |
| Seq Write (MB/s) | 943 | 1550 64% | 1099 17% | 1207 28% | 1494 58% |
| Seq Read (MB/s) | 2203 | 2719 23% | 1904 -14% | 2026 -8% | 1971 -11% |
* ... daha küçük daha iyidir

| 3DMark | |
| 1920x1080 Fire Strike Graphics | |
| Eurocom Sky X7E2 | |
| Eurocom Sky MX5 R3 | |
| Asus Zephyrus GX501 | |
| Nvidia GeForce GTX 1060 Founders Edition 6 GB | |
| EVGA SC15 | |
| Lenovo Legion Y720 80VR002XGE | |
| Asus Strix GL502VT-DS74 | |
| HP Pavilion 15 Power 1GK62AV | |
| Asus Zenbook UX510UW-CN044T | |
| Fire Strike Extreme Graphics | |
| Eurocom Sky X7E2 | |
| Eurocom Sky MX5 R3 | |
| EVGA SC15 | |
| Asus Strix GL502VT-DS74 | |
| HP Pavilion 15 Power 1GK62AV | |
| Asus Zenbook UX510UW-CN044T | |
| 3840x2160 Fire Strike Ultra Graphics | |
| Eurocom Sky X7E2 | |
| Eurocom Sky MX5 R3 | |
| Asus Zephyrus GX501 | |
| Nvidia GeForce GTX 1060 Founders Edition 6 GB | |
| EVGA SC15 | |
| HP Pavilion 15 Power 1GK62AV | |
| 3DMark 11 | |
| 1280x720 Performance GPU | |
| Eurocom Sky X7E2 | |
| Asus Zephyrus GX501 | |
| Eurocom Sky MX5 R3 | |
| Nvidia GeForce GTX 1060 Founders Edition 6 GB | |
| EVGA SC15 | |
| Lenovo Legion Y720 80VR002XGE | |
| Asus Strix GL502VT-DS74 | |
| HP Pavilion 15 Power 1GK62AV | |
| Asus Zenbook UX510UW-CN044T | |
| 1280x720 Performance Combined | |
| Nvidia GeForce GTX 1060 Founders Edition 6 GB | |
| Eurocom Sky X7E2 | |
| Eurocom Sky MX5 R3 | |
| Asus Zephyrus GX501 | |
| EVGA SC15 | |
| Asus Strix GL502VT-DS74 | |
| HP Pavilion 15 Power 1GK62AV | |
| Asus Zenbook UX510UW-CN044T | |
| 3DMark 11 Performance | 13148 puan | |
| 3DMark Ice Storm Standard Score | 110194 puan | |
| 3DMark Cloud Gate Standard Score | 24201 puan | |
| 3DMark Fire Strike Score | 9750 puan | |
| 3DMark Fire Strike Extreme Score | 5165 puan | |
Yardım | ||
| düşük | orta | yüksek | ultra | |
|---|---|---|---|---|
| BioShock Infinite (2013) | 110 | |||
| Metro: Last Light (2013) | 82.7 | |||
| Thief (2014) | 79 | |||
| The Witcher 3 (2015) | 66 | 39.6 | ||
| Batman: Arkham Knight (2015) | 89 | 62 | ||
| Metal Gear Solid V (2015) | 60 | |||
| Dota 2 Reborn (2015) | 117.9 | |||
| Fallout 4 (2015) | 70.8 | |||
| Rise of the Tomb Raider (2016) | 66.8 | |||
| Ashes of the Singularity (2016) | 63.7 | 59.2 | ||
| Doom (2016) | 98.4 | |||
| Overwatch (2016) | 103.9 | |||
| Mafia 3 (2016) | 41 | |||
| Prey (2017) | 110.3 |
| Rise of the Tomb Raider - 1920x1080 Very High Preset AA:FX AF:16x | |
| EVGA SC17 GTX 1070 | |
| Nvidia GeForce GTX 1060 Founders Edition 6 GB | |
| Nvidia GeForce GTX 1060 Founders Edition 6 GB | |
| EVGA SC15 | |
| Aorus x3 Plus v7 | |
| EVGA SC17 | |
| Asus Strix GL502VT-DS74 | |
| HP Omen 15-ax213ng | |
| HP Pavilion 17 FHD V3A33AV | |
Ses yüksekliği
| Boşta |
| 31.9 / 32 / 32 dB |
| Çalışırken |
| 36.5 / 53.4 dB |
 | ||
30 dB sessiz 40 dB(A) duyulabilirlik 50 dB(A) gürültülü |
||
min: | ||
| EVGA SC15 GeForce GTX 1060 Mobile, i7-7700HQ, Toshiba NVMe THNSN5256GPU7 | Asus Zephyrus GX501 GeForce GTX 1080 Max-Q, i7-7700HQ, Samsung SSD SM961 1TB M.2 MZVKW1T0HMLH | Apple MacBook Pro 15 2017 (2.8 GHz, 555) Radeon Pro 555, i7-7700HQ, Apple SSD SM0256L | MSI GS63VR 7RF-228US GeForce GTX 1060 Mobile, i7-7700HQ, Samsung SM961 MZVKW512HMJP m.2 PCI-e | Gigabyte Aero 15 GeForce GTX 1060 Mobile, i7-7700HQ, Lite-On CX2-8B512-Q11 | Aorus X5 v6 GeForce GTX 1070 Mobile, 6820HK, Samsung SM951 MZVPV256 m.2 | |
|---|---|---|---|---|---|---|
| Noise | -2% | 1% | -3% | -4% | -14% | |
| kapalı / ortam * (dB) | 28 | 31 -11% | 30.9 -10% | 28.8 -3% | 31 -11% | 29.3 -5% |
| Idle Minimum * (dB) | 31.9 | 32 -0% | 31.3 2% | 33.1 -4% | 32 -0% | 33.4 -5% |
| Idle Average * (dB) | 32 | 33 -3% | 31.3 2% | 33.1 -3% | 33 -3% | 35.2 -10% |
| Idle Maximum * (dB) | 32 | 34 -6% | 31.7 1% | 34 -6% | 34 -6% | 35.2 -10% |
| Load Average * (dB) | 36.5 | 39 -7% | 39.7 -9% | 37.2 -2% | 39 -7% | 53.3 -46% |
| Witcher 3 ultra * (dB) | 40.3 | 42 -4% | 35.5 12% | 46.1 -14% | 43 -7% | |
| Load Maximum * (dB) | 53.4 | 46 14% | 48.6 9% | 47.1 12% | 50 6% | 57.6 -8% |
* ... daha küçük daha iyidir
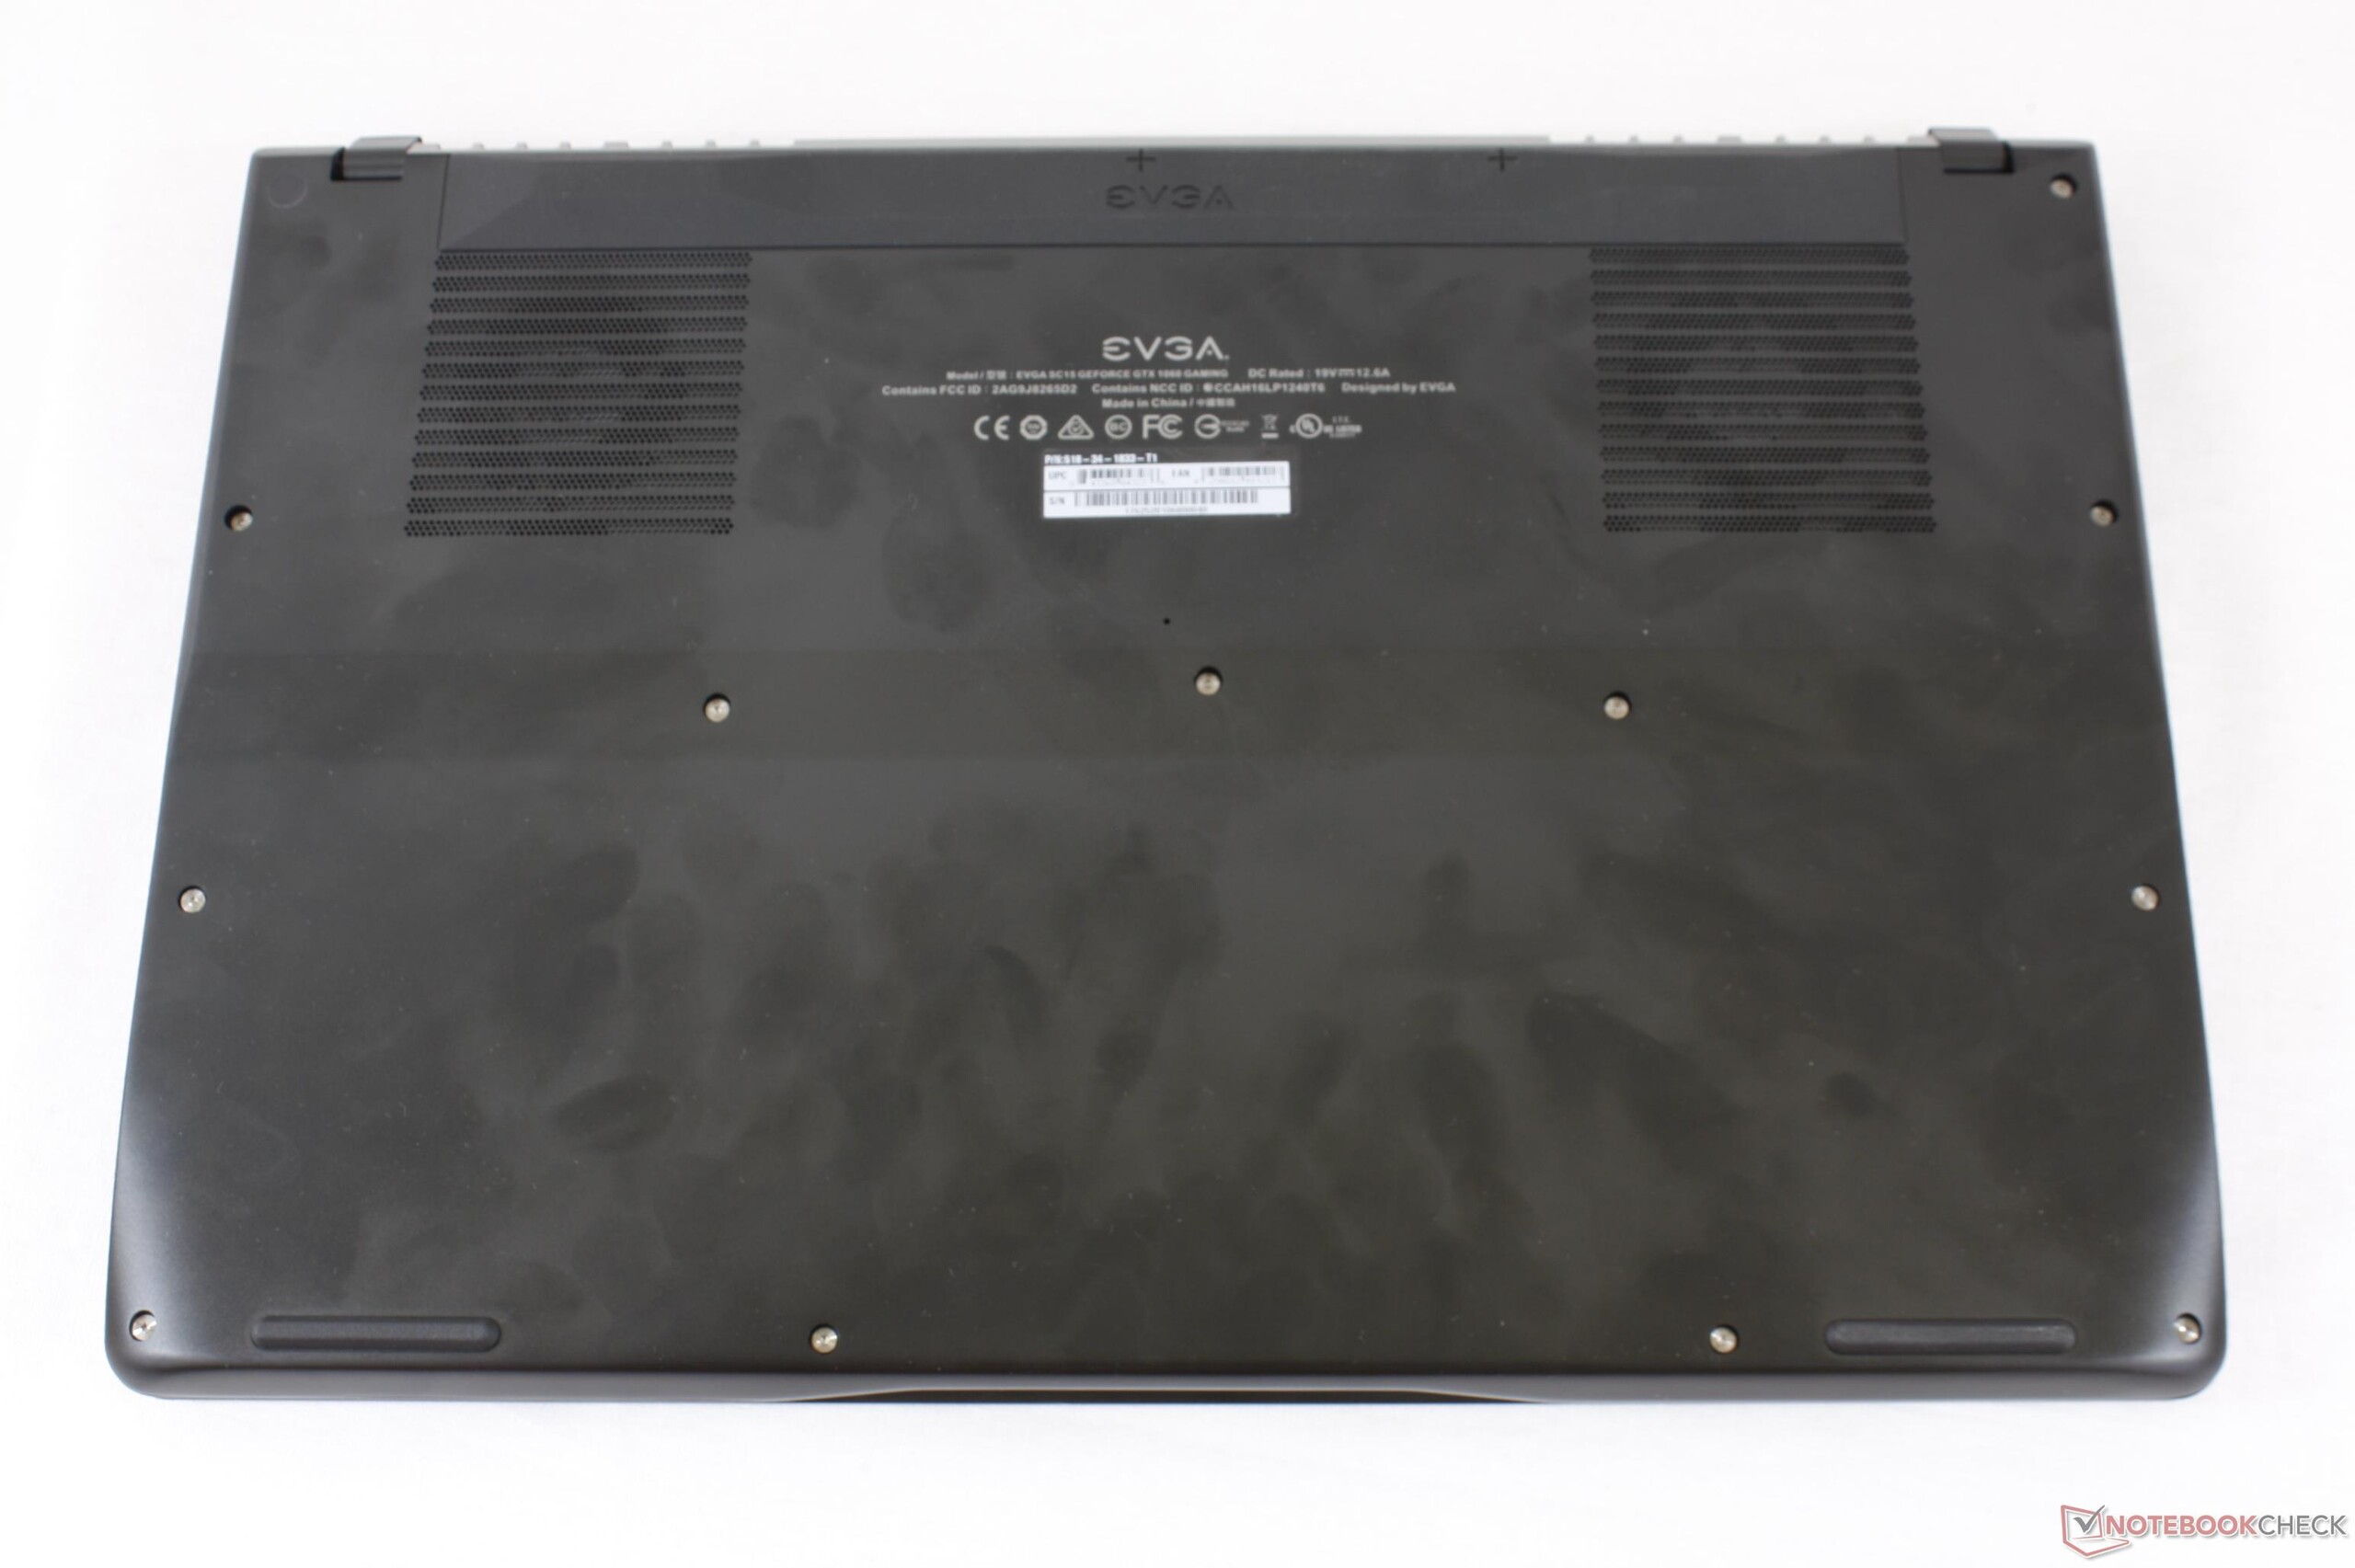
(-) Üst taraftaki maksimum sıcaklık, 40.4 °C / 105 F ortalamasına kıyasla 49.2 °C / 121 F'dir. , Gaming sınıfı için 21.2 ile 68.8 °C arasında değişir.
(-) Alt kısım, 43.2 °C / 110 F ortalamasına kıyasla maksimum 45.2 °C / 113 F'ye kadar ısınır
(+) Boşta kullanımda, üst tarafın ortalama sıcaklığı 26.8 °C / 80 F olup, cihazın 33.9 °C / 93 F.
(±) The Witcher 3 oynarken, üst tarafın ortalama sıcaklığı 32 °C / 90 F olup, cihazın 33.9 °C / 93 F.
(+) Avuç içi dayanakları ve dokunmatik yüzey, maksimum 29.8 °C / 85.6 F ile cilt sıcaklığından daha soğuktur ve bu nedenle dokunulduğunda soğuktur.
(±) Benzer cihazların avuç içi dayanağı alanının ortalama sıcaklığı 28.8 °C / 83.8 F (-1 °C / -1.8 F) idi.
EVGA SC15 ses analizi
(-) | hoparlörler çok yüksek ses çıkarmıyor (61.2 dB)
Bas 100 - 315Hz
(-) | neredeyse hiç bas yok - ortalama olarak medyandan 15.8% daha düşük
(±) | Bas doğrusallığı ortalamadır (7.3% delta - önceki frekans)
Ortalar 400 - 2000 Hz
(±) | daha yüksek ortalar - ortalama olarak medyandan 6.8% daha yüksek
(±) | Ortaların doğrusallığı ortalamadır (14.5% delta - önceki frekans)
Yüksekler 2 - 16 kHz
(+) | dengeli yüksekler - medyandan yalnızca 2.5% uzakta
(±) | Yükseklerin doğrusallığı ortalamadır (8% delta - önceki frekans)
Toplam 100 - 16.000 Hz
(-) | genel ses doğrusal değildir (34.7% ortancaya göre fark)
Aynı sınıfla karşılaştırıldığında
» Bu sınıftaki tüm test edilen cihazların %99%'si daha iyi, 1% benzer, 1% daha kötüydü
» En iyisinin deltası 6% idi, ortalama 18% idi, en kötüsü 132% idi
Test edilen tüm cihazlarla karşılaştırıldığında
» Test edilen tüm cihazların %93'si daha iyi, 1 benzer, % 6 daha kötüydü
» En iyisinin deltası 4% idi, ortalama 23% idi, en kötüsü 134% idi
Apple MacBook 12 (Early 2016) 1.1 GHz ses analizi
(+) | hoparlörler nispeten yüksek sesle çalabilir (83.6 dB)
Bas 100 - 315Hz
(±) | azaltılmış bas - ortalama olarak medyandan 11.3% daha düşük
(±) | Bas doğrusallığı ortalamadır (14.2% delta - önceki frekans)
Ortalar 400 - 2000 Hz
(+) | dengeli ortalar - medyandan yalnızca 2.4% uzakta
(+) | orta frekanslar doğrusaldır (5.5% deltadan önceki frekansa)
Yüksekler 2 - 16 kHz
(+) | dengeli yüksekler - medyandan yalnızca 2% uzakta
(+) | yüksekler doğrusaldır (4.5% deltadan önceki frekansa)
Toplam 100 - 16.000 Hz
(+) | genel ses doğrusaldır (10.2% ortancaya göre fark)
Aynı sınıfla karşılaştırıldığında
» Bu sınıftaki tüm test edilen cihazların %7%'si daha iyi, 2% benzer, 90% daha kötüydü
» En iyisinin deltası 5% idi, ortalama 18% idi, en kötüsü 53% idi
Test edilen tüm cihazlarla karşılaştırıldığında
» Test edilen tüm cihazların %5'si daha iyi, 1 benzer, % 94 daha kötüydü
» En iyisinin deltası 4% idi, ortalama 23% idi, en kötüsü 134% idi
| Kapalı / Bekleme modu | |
| Boşta | |
| Çalışırken |
|
Key:
min: | |
| EVGA SC15 i7-7700HQ, GeForce GTX 1060 Mobile, Toshiba NVMe THNSN5256GPU7, , 1920x1080, 15.6" | Asus Zephyrus GX501 i7-7700HQ, GeForce GTX 1080 Max-Q, Samsung SSD SM961 1TB M.2 MZVKW1T0HMLH, IPS, 1920x1080, 15.6" | Apple MacBook Pro 15 2017 (2.8 GHz, 555) i7-7700HQ, Radeon Pro 555, Apple SSD SM0256L, IPS, 2880x1800, 15.4" | Gigabyte Aero 15 i7-7700HQ, GeForce GTX 1060 Mobile, Lite-On CX2-8B512-Q11, IPS, 1920x1080, 15.6" | Aorus X5 v6 6820HK, GeForce GTX 1070 Mobile, Samsung SM951 MZVPV256 m.2, IPS, 2880x1620, 15.6" | |
|---|---|---|---|---|---|
| Power Consumption | -3% | 46% | 21% | -33% | |
| Idle Minimum * (Watt) | 25.8 | 18 30% | 3.4 87% | 12 53% | 25 3% |
| Idle Average * (Watt) | 26.6 | 23 14% | 13.9 48% | 15 44% | 28.9 -9% |
| Idle Maximum * (Watt) | 26.7 | 31 -16% | 17.6 34% | 20 25% | 30.1 -13% |
| Load Average * (Watt) | 80.3 | 79 2% | 71.1 11% | 82 -2% | 167.3 -108% |
| Witcher 3 ultra * (Watt) | 121.2 | 148 -22% | 57.9 52% | 111 8% | |
| Load Maximum * (Watt) | 159.3 | 196 -23% | 88.5 44% | 161 -1% | 222.6 -40% |
* ... daha küçük daha iyidir
| EVGA SC15 i7-7700HQ, GeForce GTX 1060 Mobile, 62 Wh | Asus Zephyrus GX501 i7-7700HQ, GeForce GTX 1080 Max-Q, 50 Wh | Apple MacBook Pro 15 2017 (2.8 GHz, 555) i7-7700HQ, Radeon Pro 555, 76 Wh | MSI GS63VR 7RF-228US i7-7700HQ, GeForce GTX 1060 Mobile, 65 Wh | Gigabyte Aero 15 i7-7700HQ, GeForce GTX 1060 Mobile, 94.24 Wh | Aorus X5 v6 6820HK, GeForce GTX 1070 Mobile, 94.24 Wh | |
|---|---|---|---|---|---|---|
| Pil Çalışma Süresi | -29% | 127% | 35% | 124% | 14% | |
| Reader / Idle (h) | 3.7 | 3.1 -16% | 6.4 73% | 10.6 186% | 4.2 14% | |
| WiFi v1.3 (h) | 2.8 | 2.2 -21% | 10.7 282% | 3.9 39% | 7 150% | 3 7% |
| Load (h) | 1.4 | 0.7 -50% | 1 -29% | 1.3 -7% | 1.9 36% | 1.7 21% |
| Witcher 3 ultra (h) | 1.5 |
Artılar
Eksiler
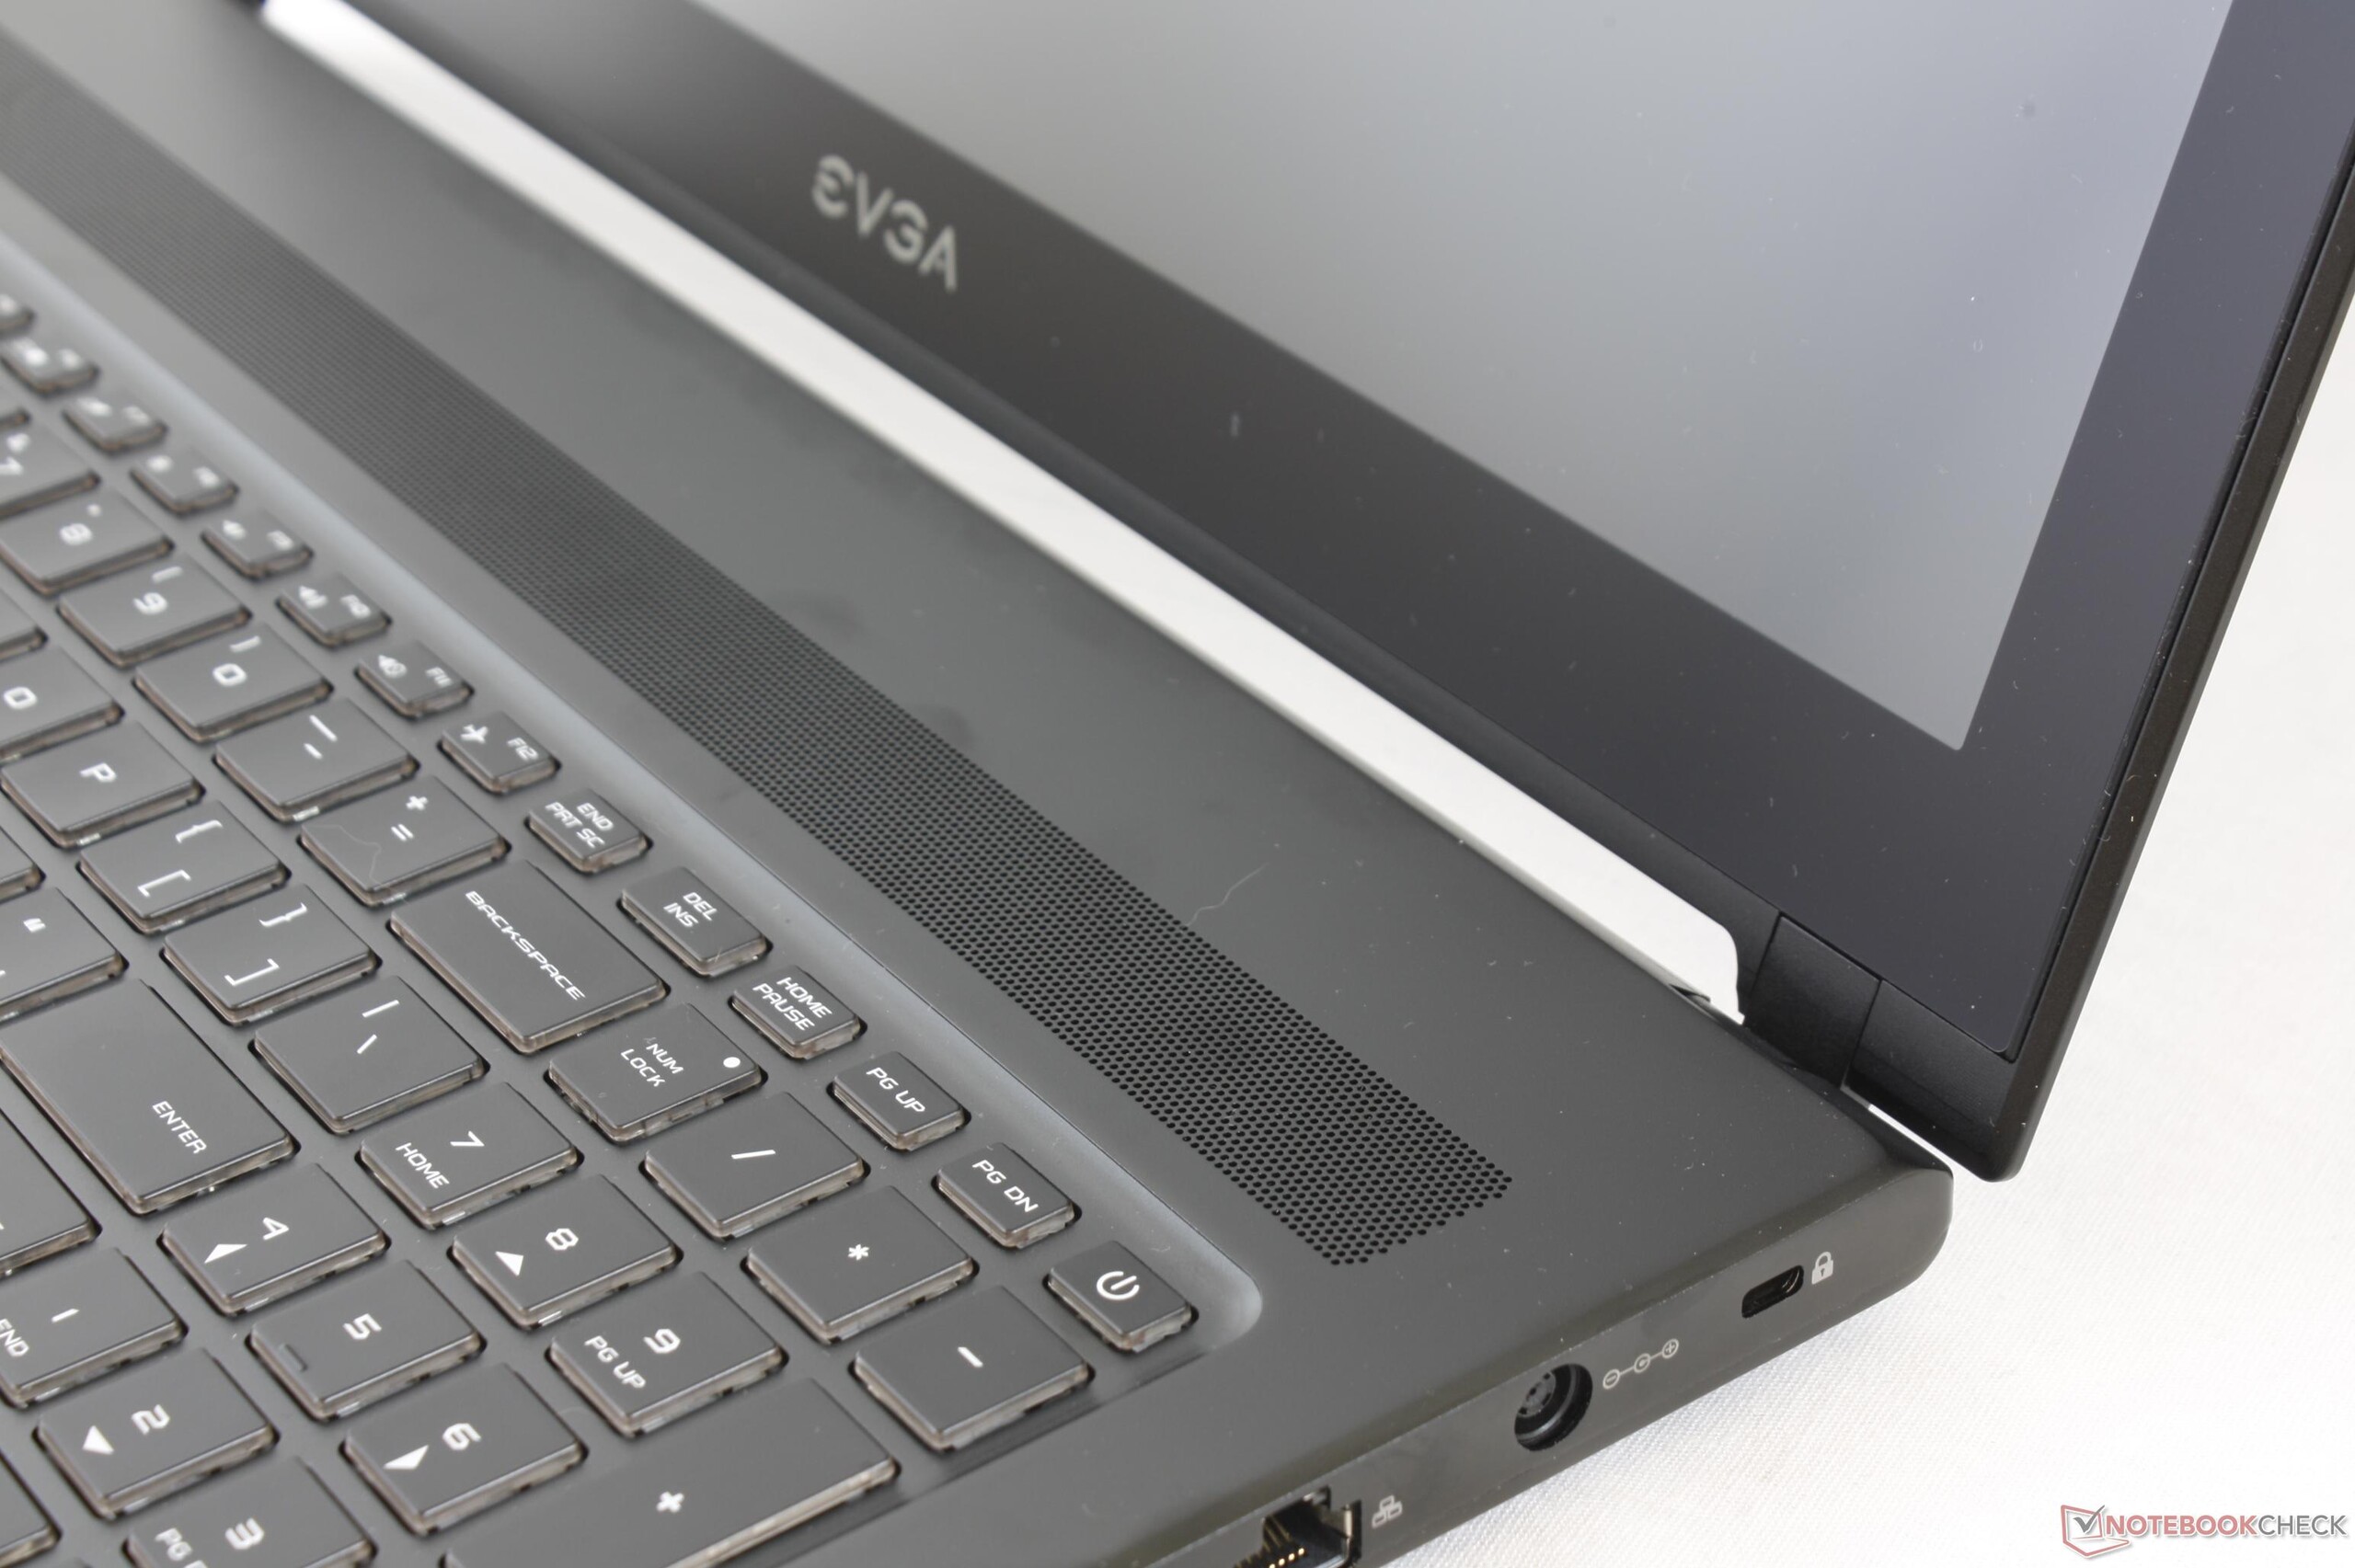
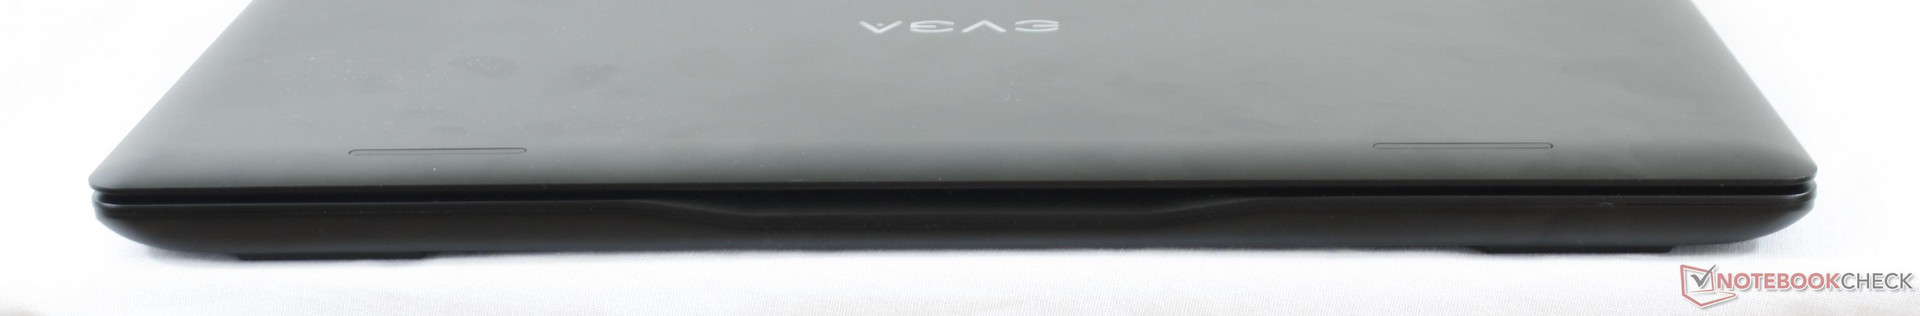
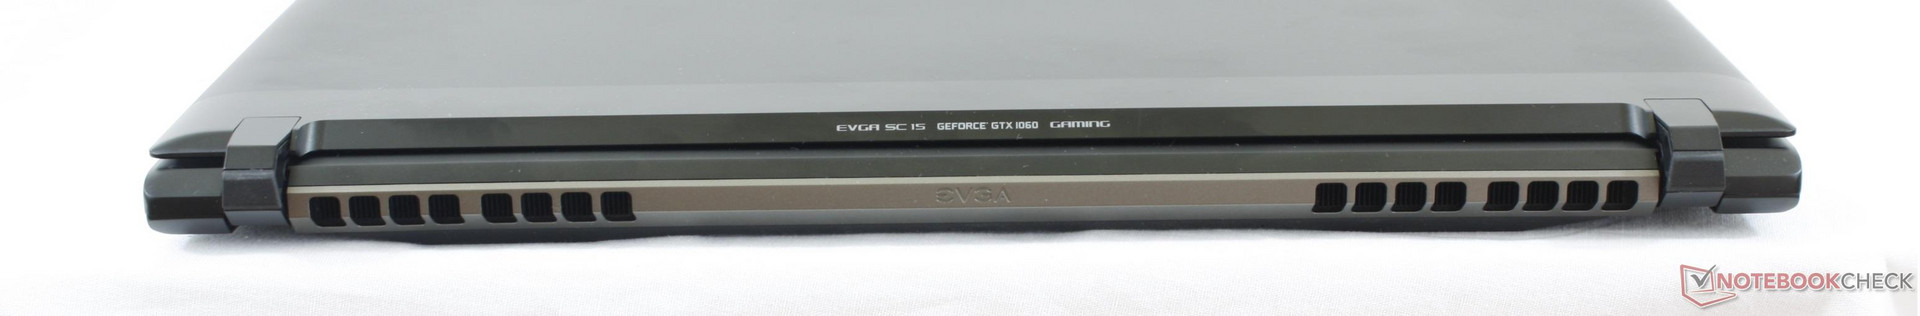
SC15, dengeli bir GTX 1060 oyun cihazından isteyebileceğiniz her şeye neredeyse sahip. Kasa harika, fan sesi çok yüksek değil, işlemci performansı tutarlı, ve G-Sync ile 120 Hz yenileme oranı standart olarak geliyor. Rakiplerine göre daha sağlam, hafif ve aynı zamanda sessiz ve serin kalabiliyor. İncelik konusunda neredeyse daha iyi bir alternatifi yok.
En iyi cihaz olabilmek adına elbette eksiklikleri var. Belki en büyük eksikliği farklı ekran seçeneklerinin olmayışı olabilir. 5ms veya 3ms seçenekleri çok büyük bir avantaj katabilirdi. Kendi ekranı ise 18ms. 120 Hz hoş olsa da yüksek cevap süresi ve daha güçlü bir ekran kartına ihtiyaç duyulması bu avantajı çok kullanışlı kılmıyor.
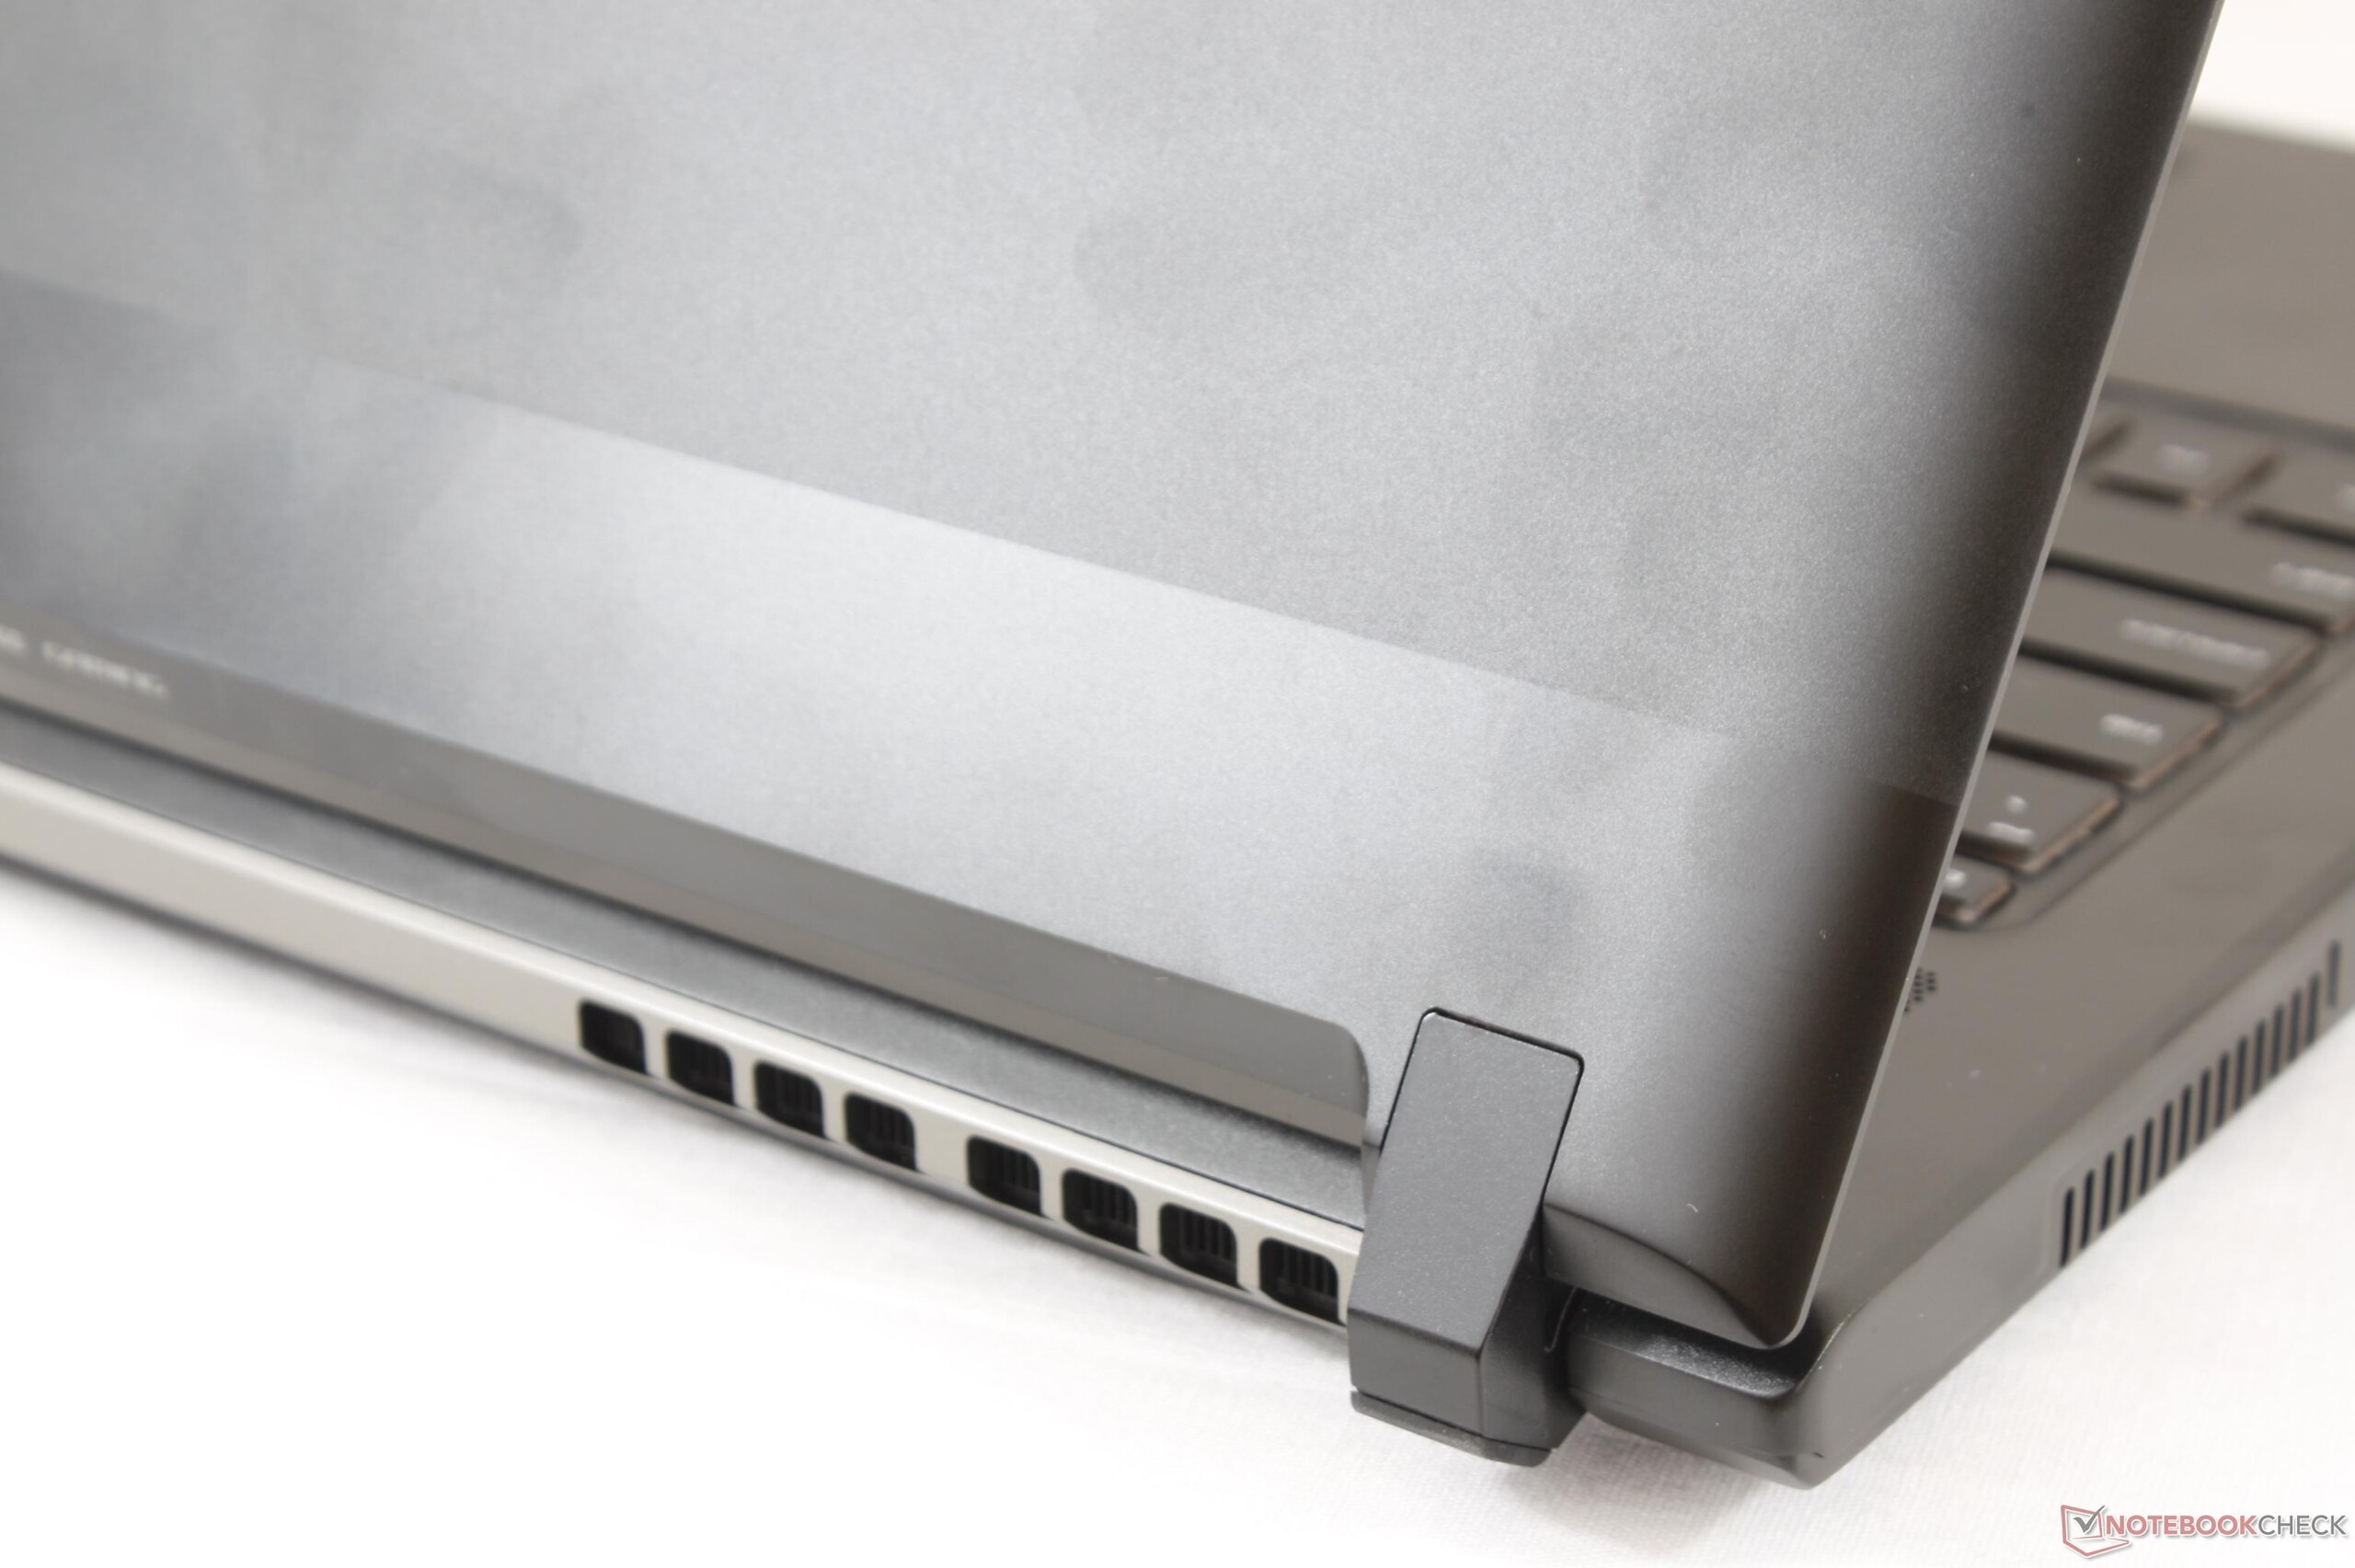
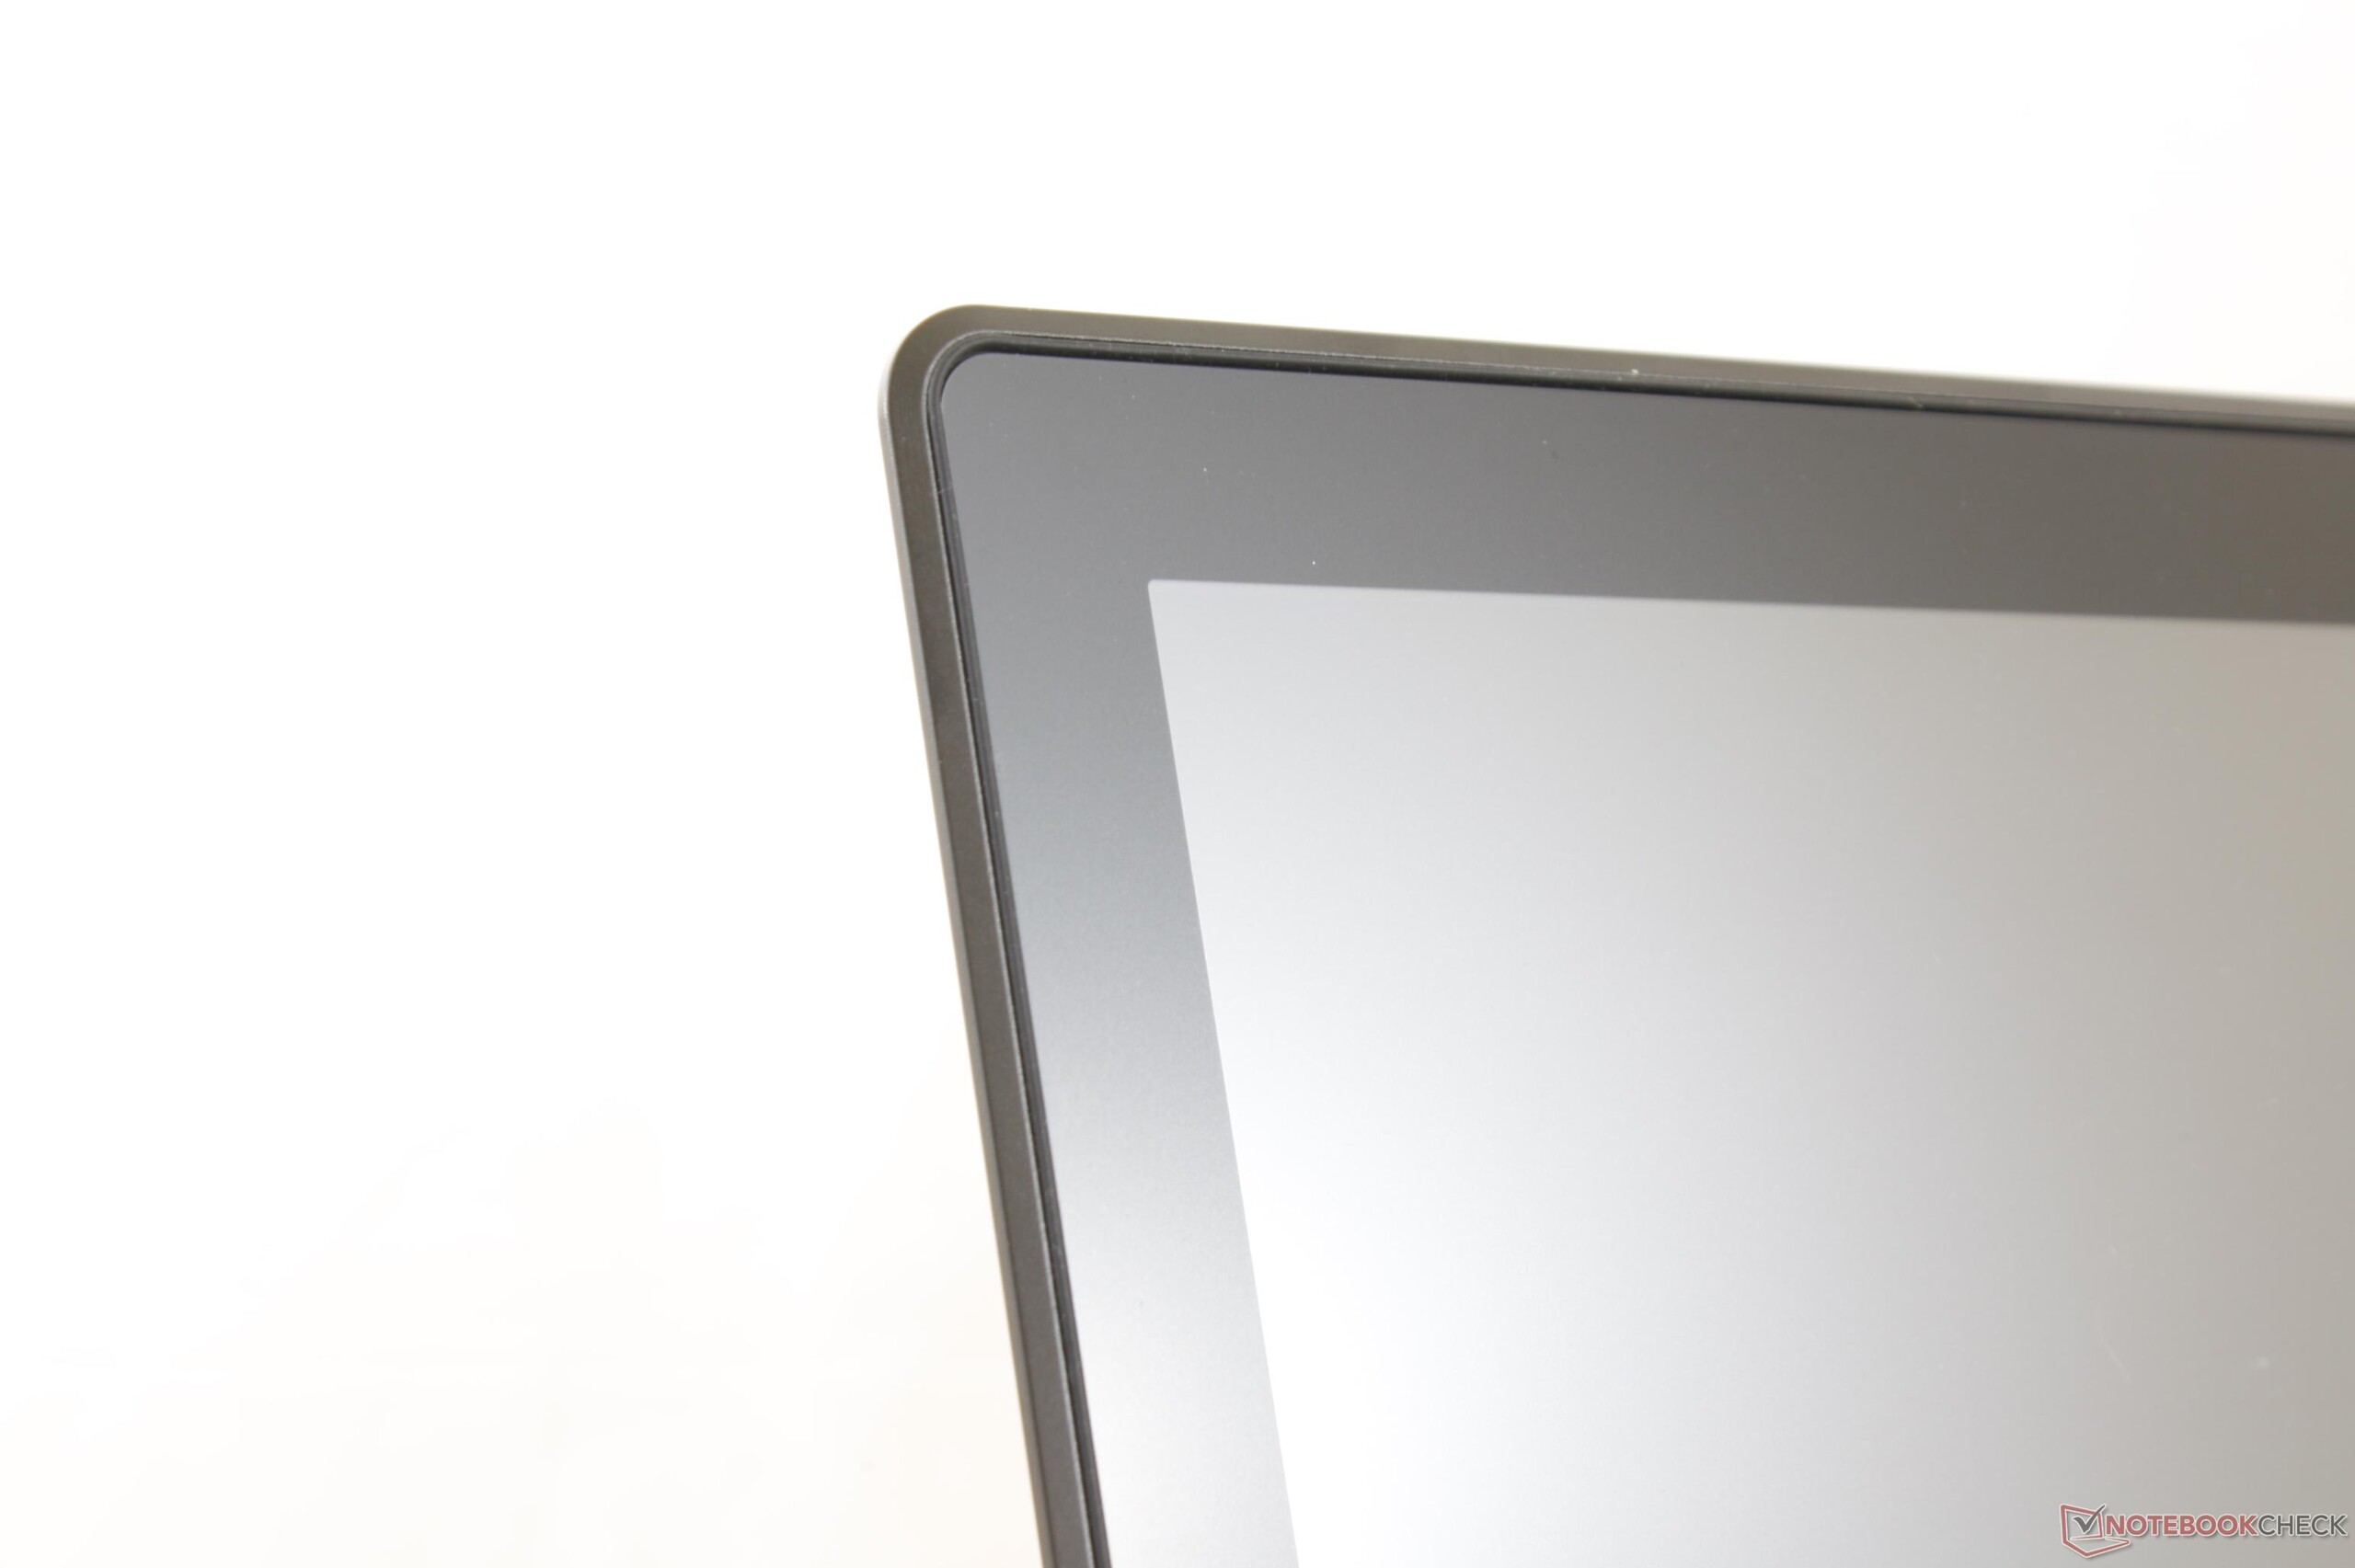
Ekran hakkında şikayetlerimiz burada bitmiyor. Mat ekran biraz kalın. Bu her ne kadar daha sağlam bir ekran kapağı sunsa da, ekran üzerinde kalın bir tabaka hissi yaratması mümkün.
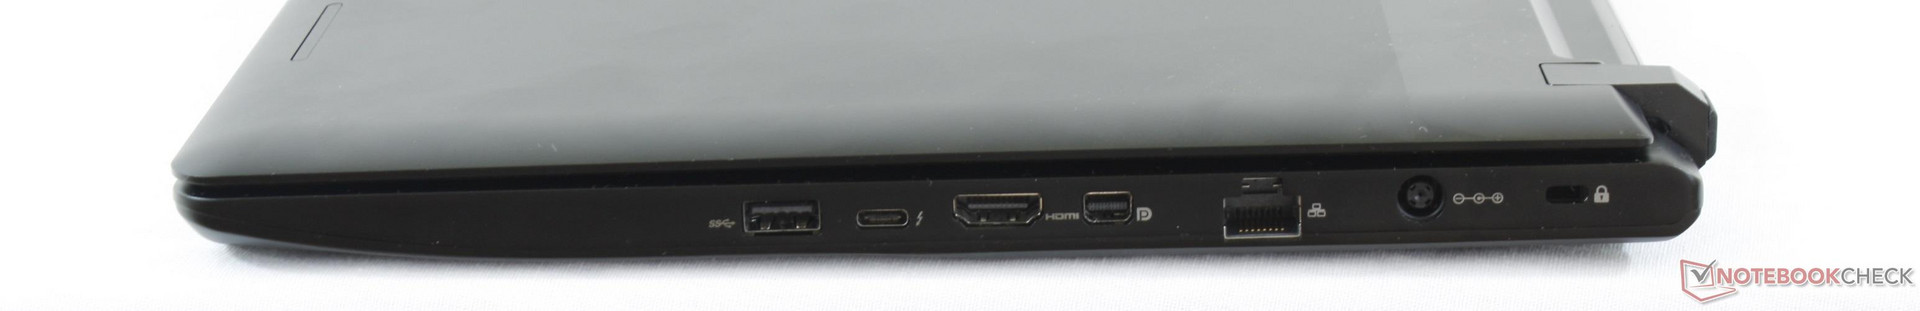
Diğer bazı eksiklikler ise toplamda öne çıkmaya başlıyor. Zayıf hoparlörler, dahili SD kart okuyucunun olmayışı, zayıf batarya ömrü, bekleme modunda yüksek güç tüketimi ve yüksek ağırlık. Apple cihazları gibi yüksek fiyat hoş özellikler demek yerine genel anlamda üst sınıf kalite için konulmuş.
SC15 sağlam, sessiz ve serin. Bu boyuttaki diğer cihazlara göre bir adım önde denebilir. Yavaş ekran cevap süresi ise bu özelliklerini bir oyun cihazı için biraz gölgelemekte.
EVGA SC15
- 07/05/2017 v6 (old)
Allen Ngo
Price comparison
