Lenovo ThinkPad X1 Extreme 2019 Dizüstü İncelemesi: Lenovo'nun önde gelen multimedya dizüstü bilgisayarının ikinci nesli daha da kötüleşti
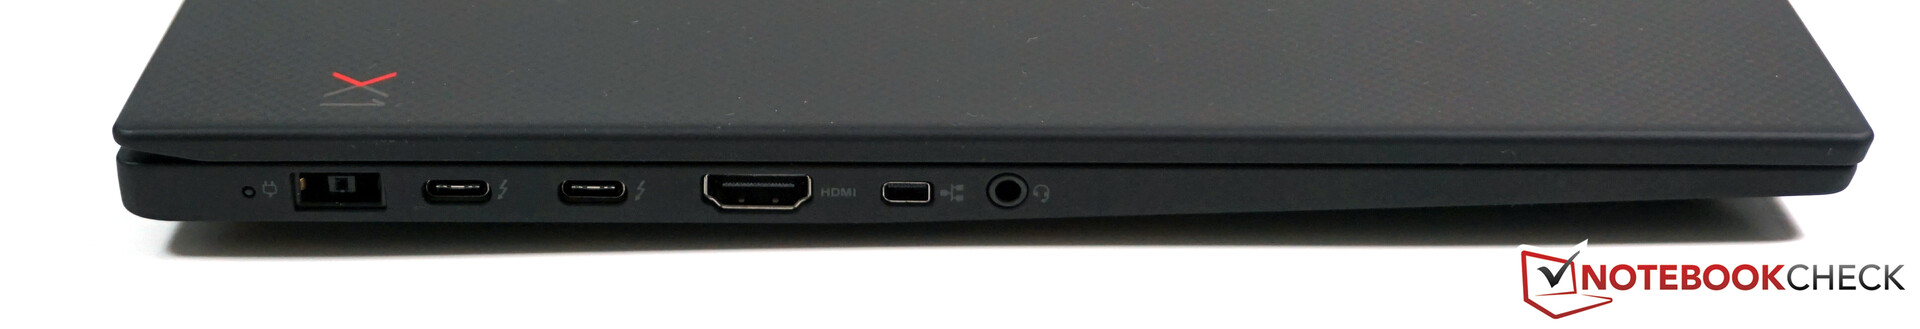
ThinkPad X1 Extreme, Dell XPS 15, HP Spectre x360 15 ve Apple MacBook Pro 15 ile yarışan Lenovo'nun premium multimedya dizüstü bilgisayar pazarına girmesinden bu yana sadece bir yıl geçti. Şirketin ilk denemesi bizi her zamanki özellikleriyle ikna etti. ThinkPads, sayısız güvenlik özelliği, cihazı hem tüketiciler hem de profesyoneller için ilginç hale getirirken, o zamandan beri Lenovo, güncellenmiş bileşenler ve yeni ekran seçenekleri ile donatılmış ikinci bir nesil yayınladı. Bu yıl neredeyse hiçbir şey görsel olarak değişmediğinden, sizi buradaki düşüncelerimiz için geçen yılın modelini incelememize yönlendireceğiz. Aynı şey X1 Extreme Gen 2'nin sunduğu bağlantı noktaları ve giriş aygıtları için de geçerlidir. Alternatif olarak, X1 Extreme'in iş istasyonu olan ThinkPad P1 2019'u da inceledik. ThinkPad P1 2019 ve X1 Extreme Gen 2, başvuru için aynı kasayı, bağlantı noktalarını ve bağlantıyı paylaşır.
Derecelendirme | Tarih | Modeli | Ağırlık | Yükseklik | Boyut | Çözünürlük | Fiyat |
|---|---|---|---|---|---|---|---|
| 87.1 % v7 (old) | 02/2020 | Lenovo ThinkPad X1 Extreme 2019 20QV000WGE i7-9750H, GeForce GTX 1650 Mobile | 1.7 kg | 18.7 mm | 15.60" | 3840x2160 | |
| 87.8 % v7 (old) | 08/2019 | Dell XPS 15 7590 9980HK GTX 1650 i9-9980HK, GeForce GTX 1650 Mobile | 2 kg | 17 mm | 15.60" | 3840x2160 | |
| 89.7 % v7 (old) | 12/2019 | Apple MacBook Pro 16 2019 i9 5500M i9-9880H, Radeon Pro 5500M | 2 kg | 16.2 mm | 16.00" | 3072x1920 | |
| 87.3 % v7 (old) | 08/2019 | Acer ConceptD 7 CN715-71-743N i7-9750H, GeForce RTX 2060 Mobile | 2.2 kg | 17.9 mm | 15.60" | 3840x2160 | |
| 86 % v7 (old) | 03/2020 | Lenovo Yoga C940-15IRH i7-9750H, GeForce GTX 1650 Max-Q | 2 kg | 19.7 mm | 15.60" | 1920x1080 | |
| 85.2 % v7 (old) | 12/2019 | MSI Prestige 15 A10SC i7-10710U, GeForce GTX 1650 Max-Q | 1.7 kg | 16 mm | 15.60" | 3840x2160 |
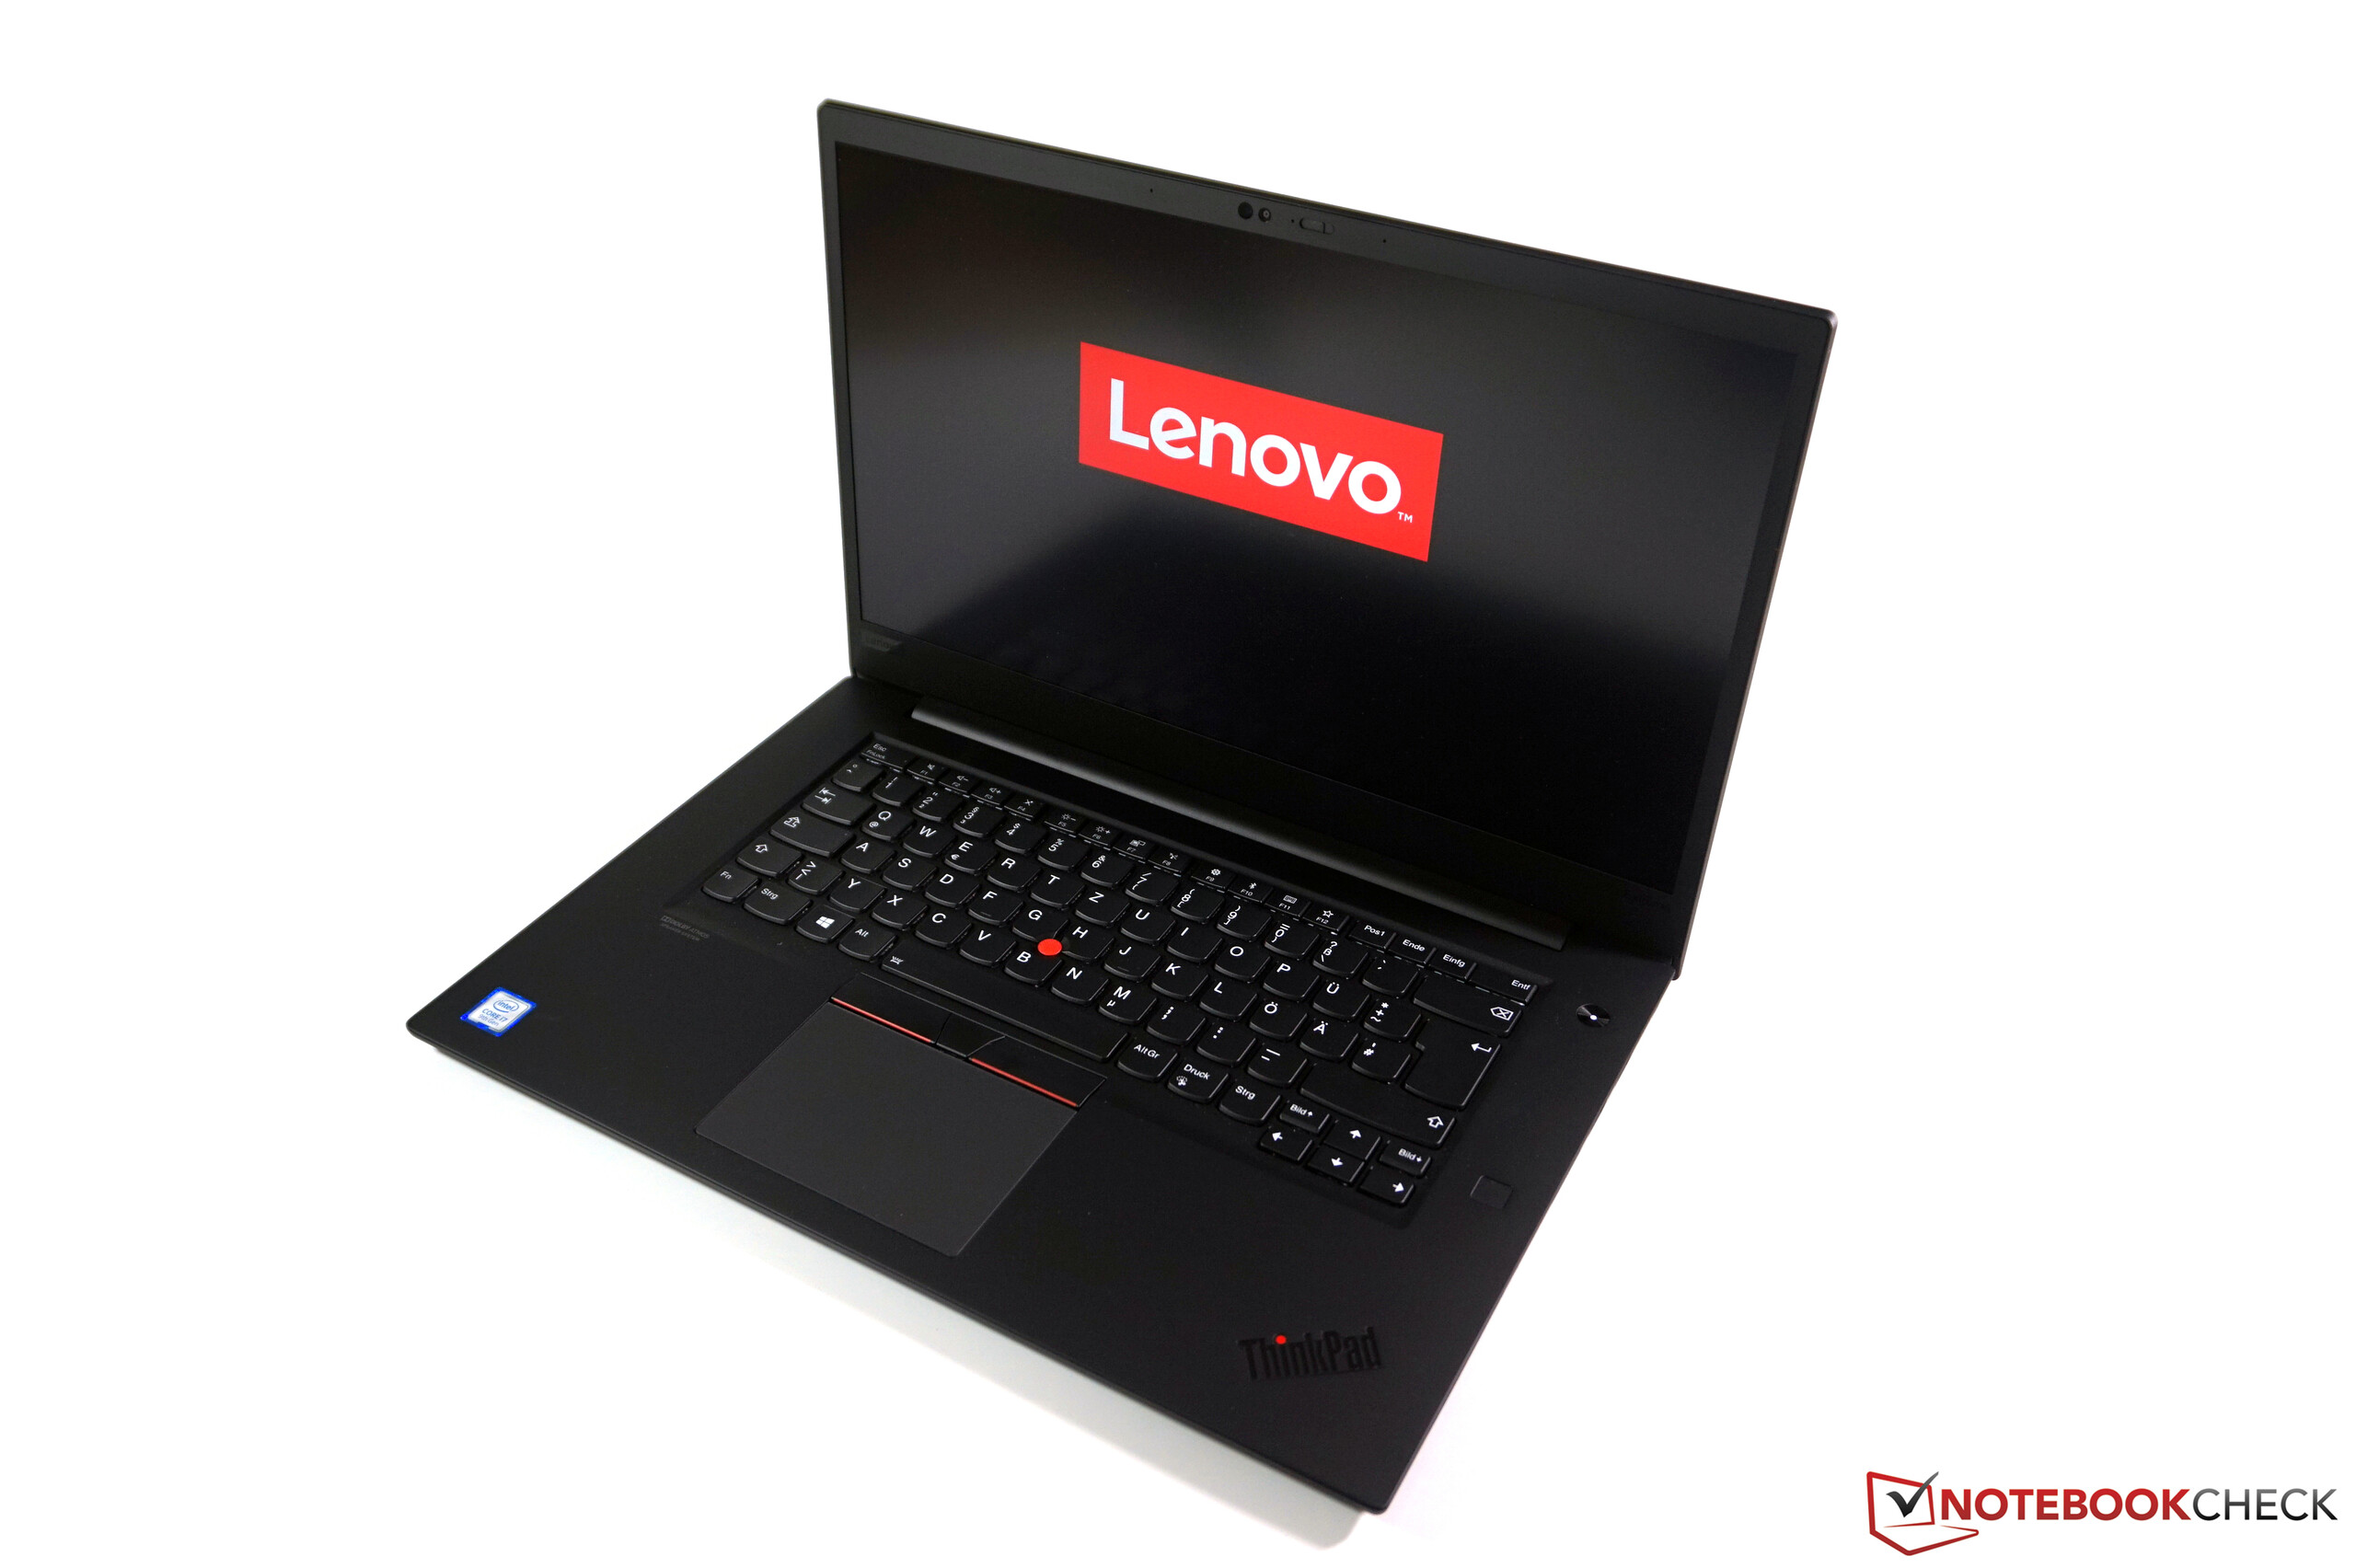
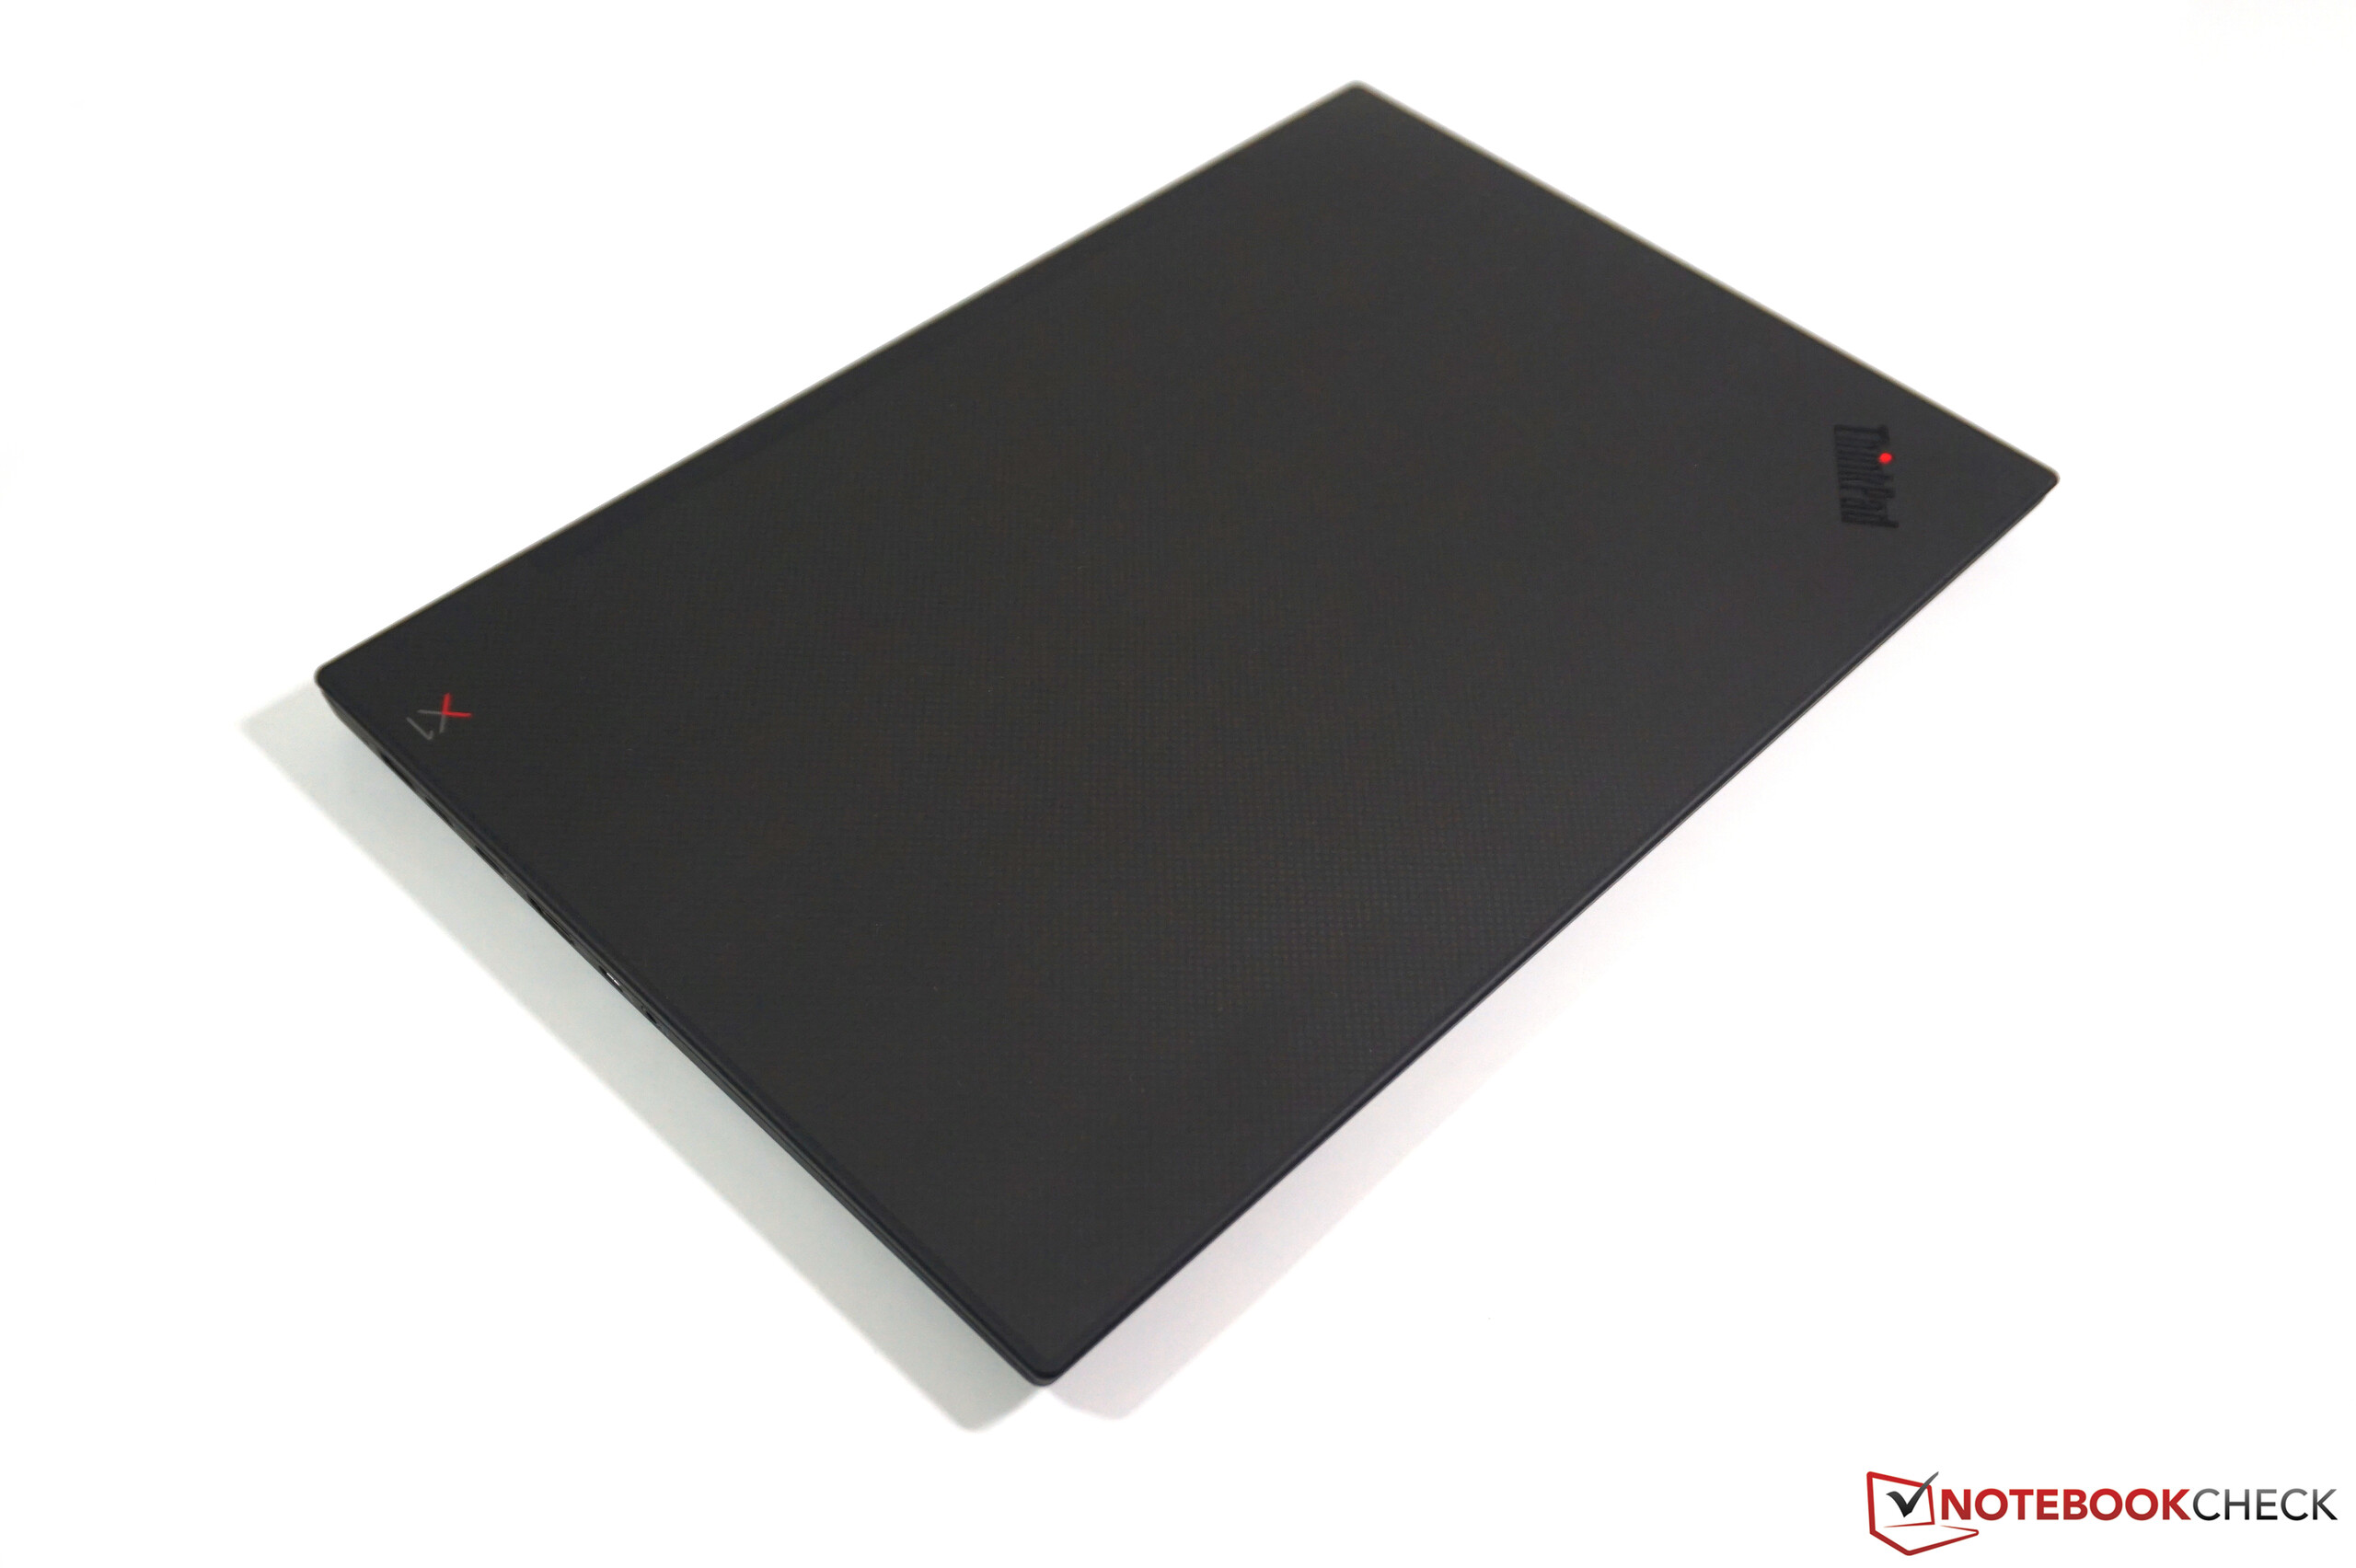
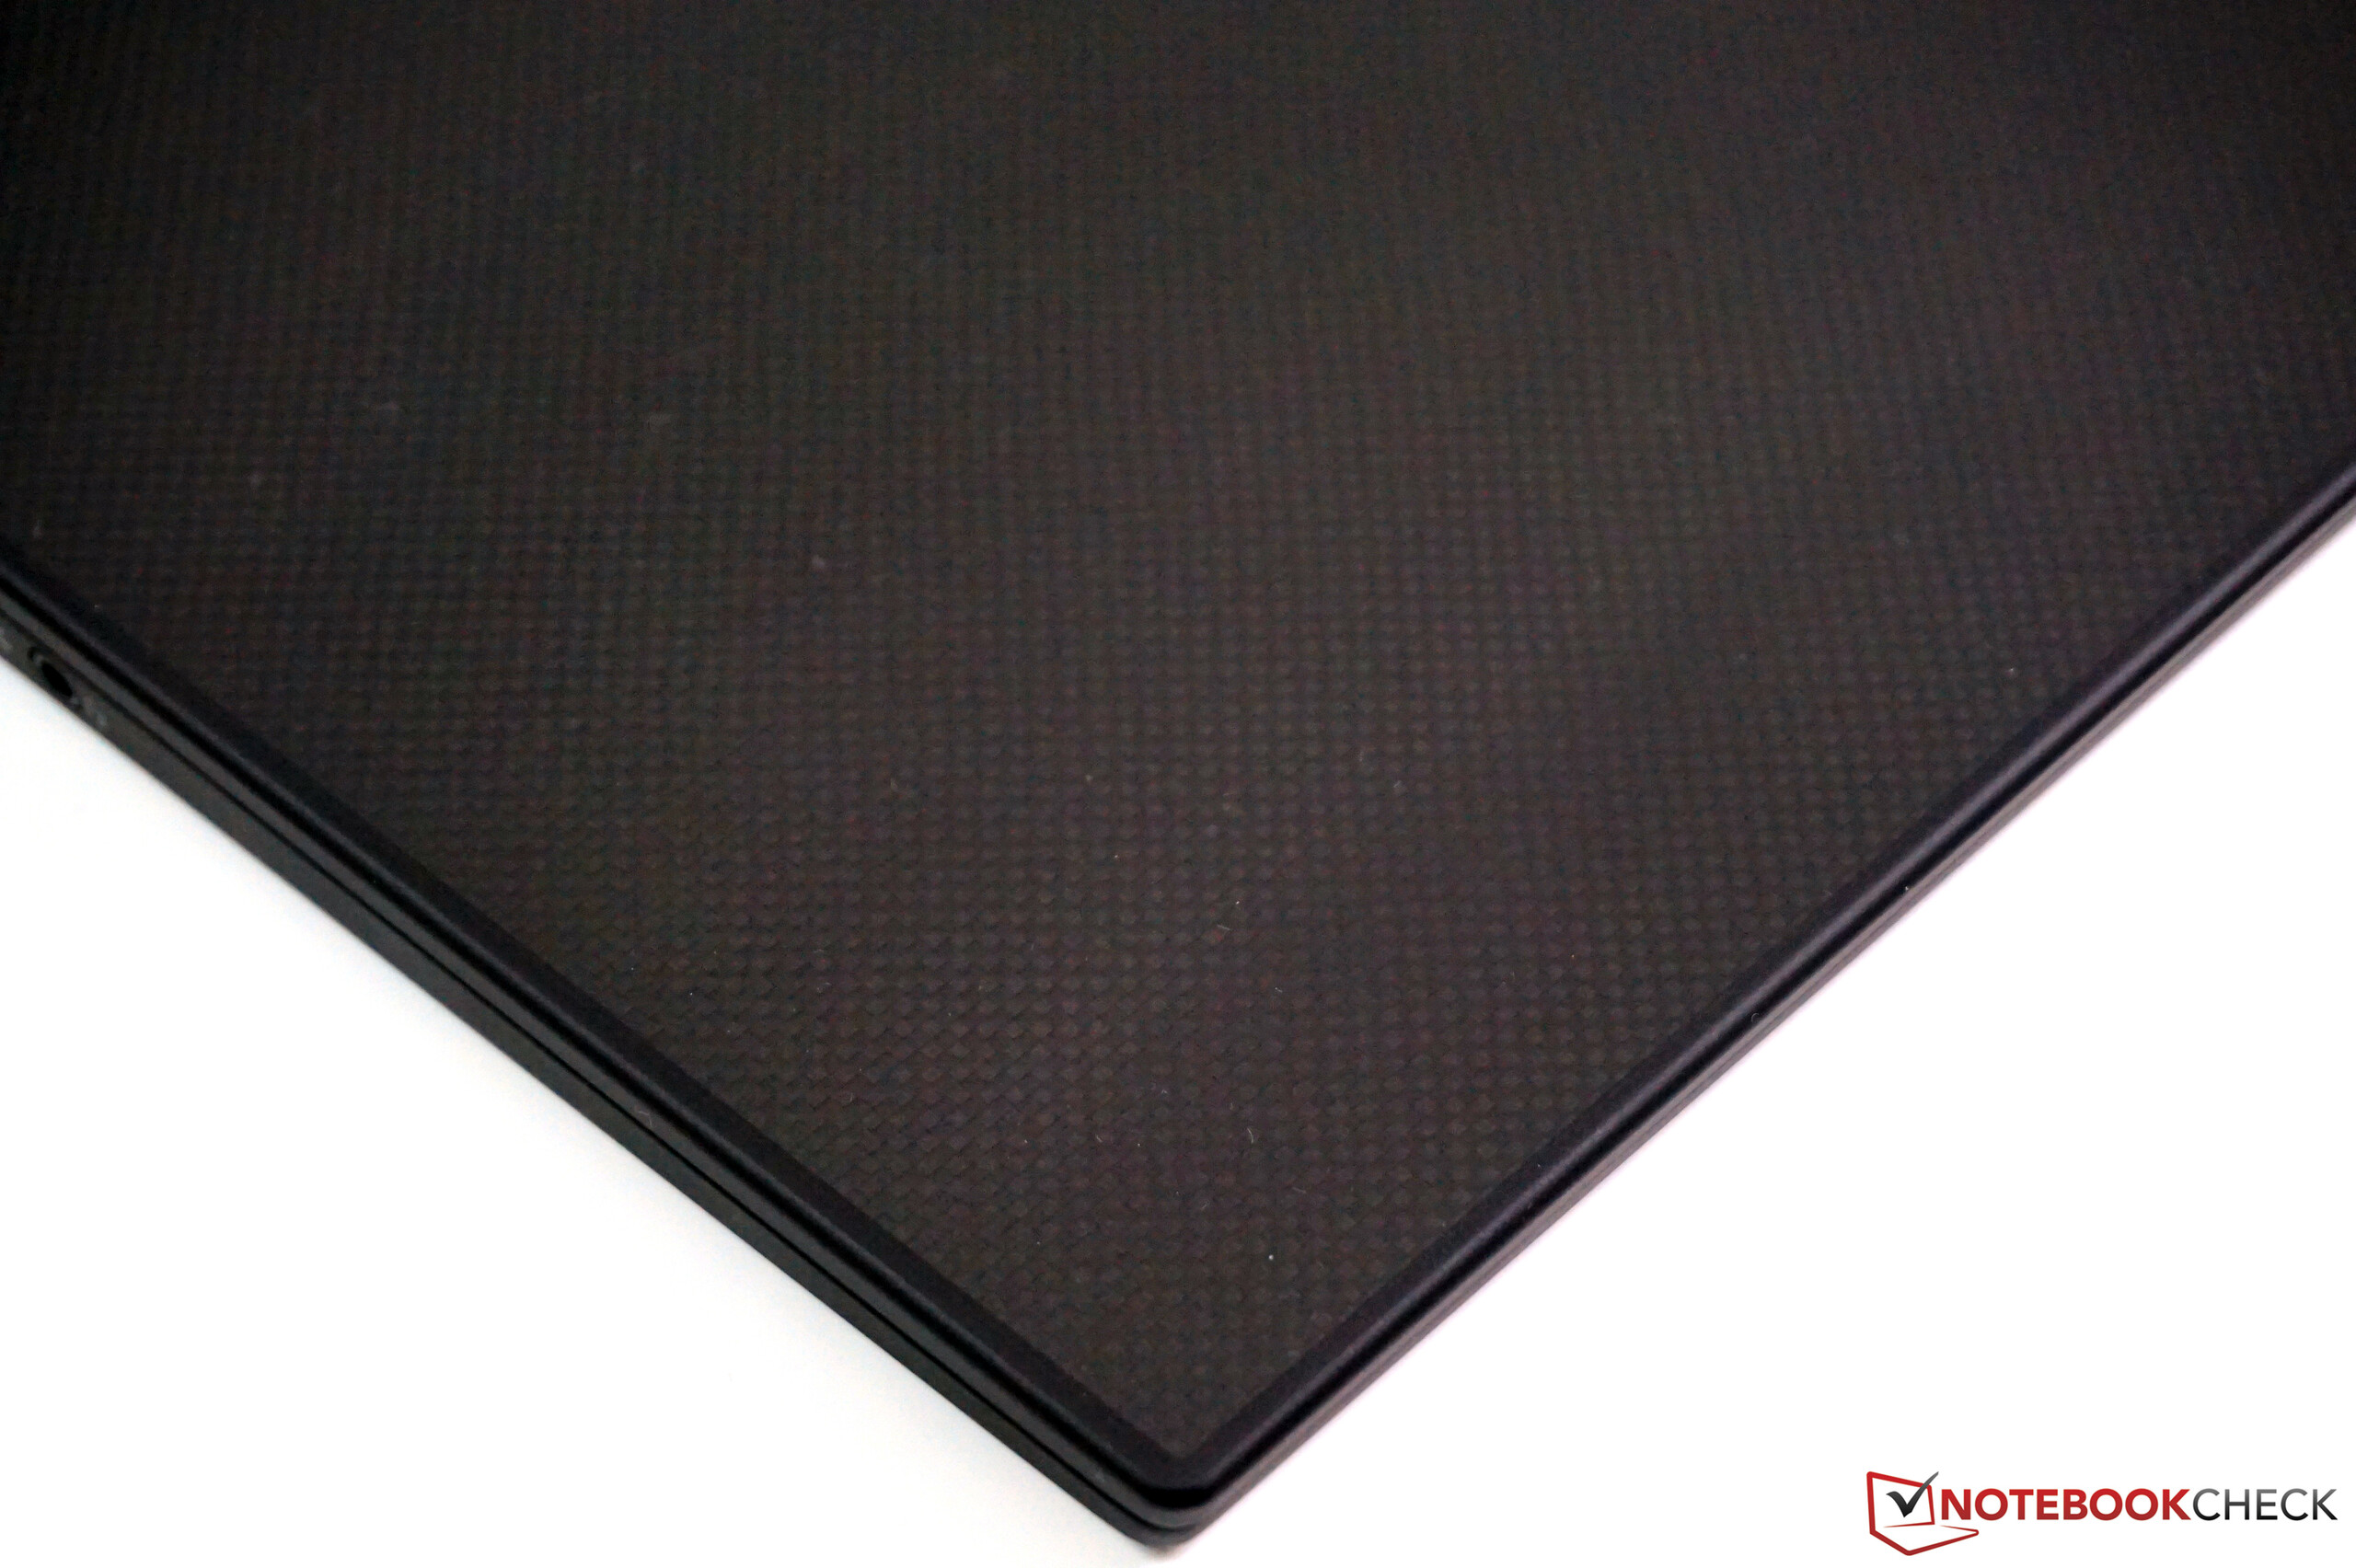
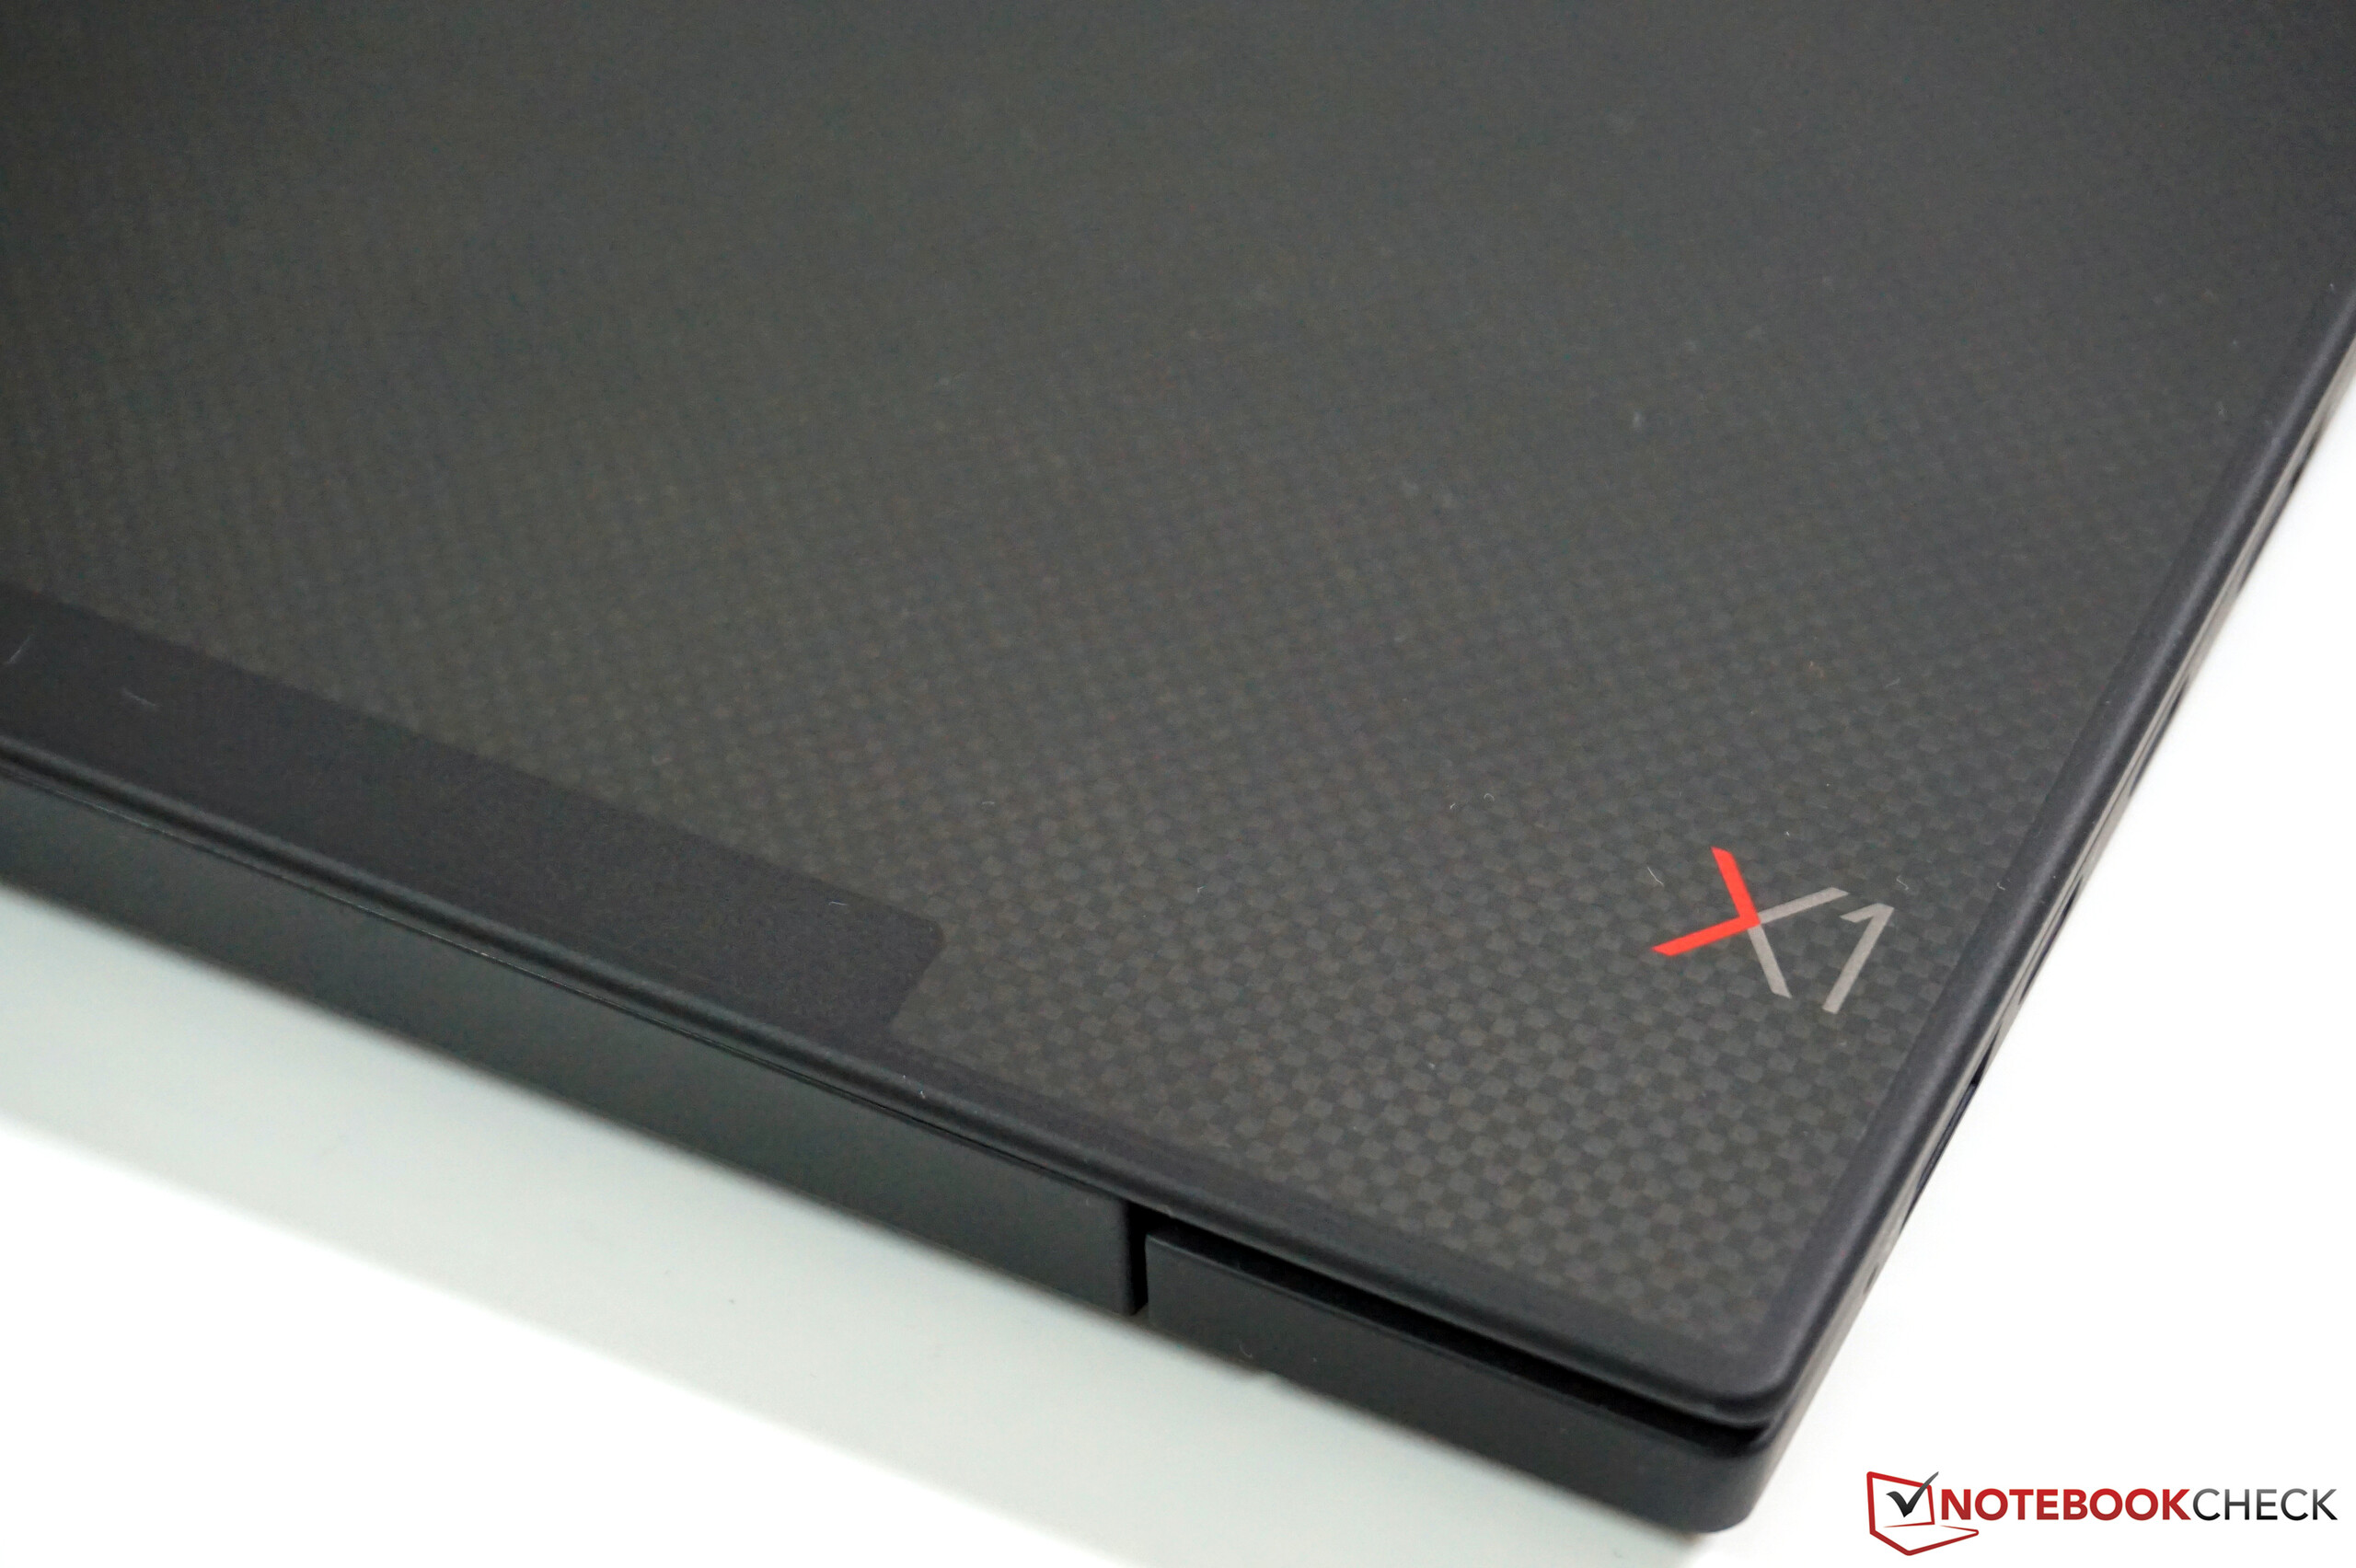
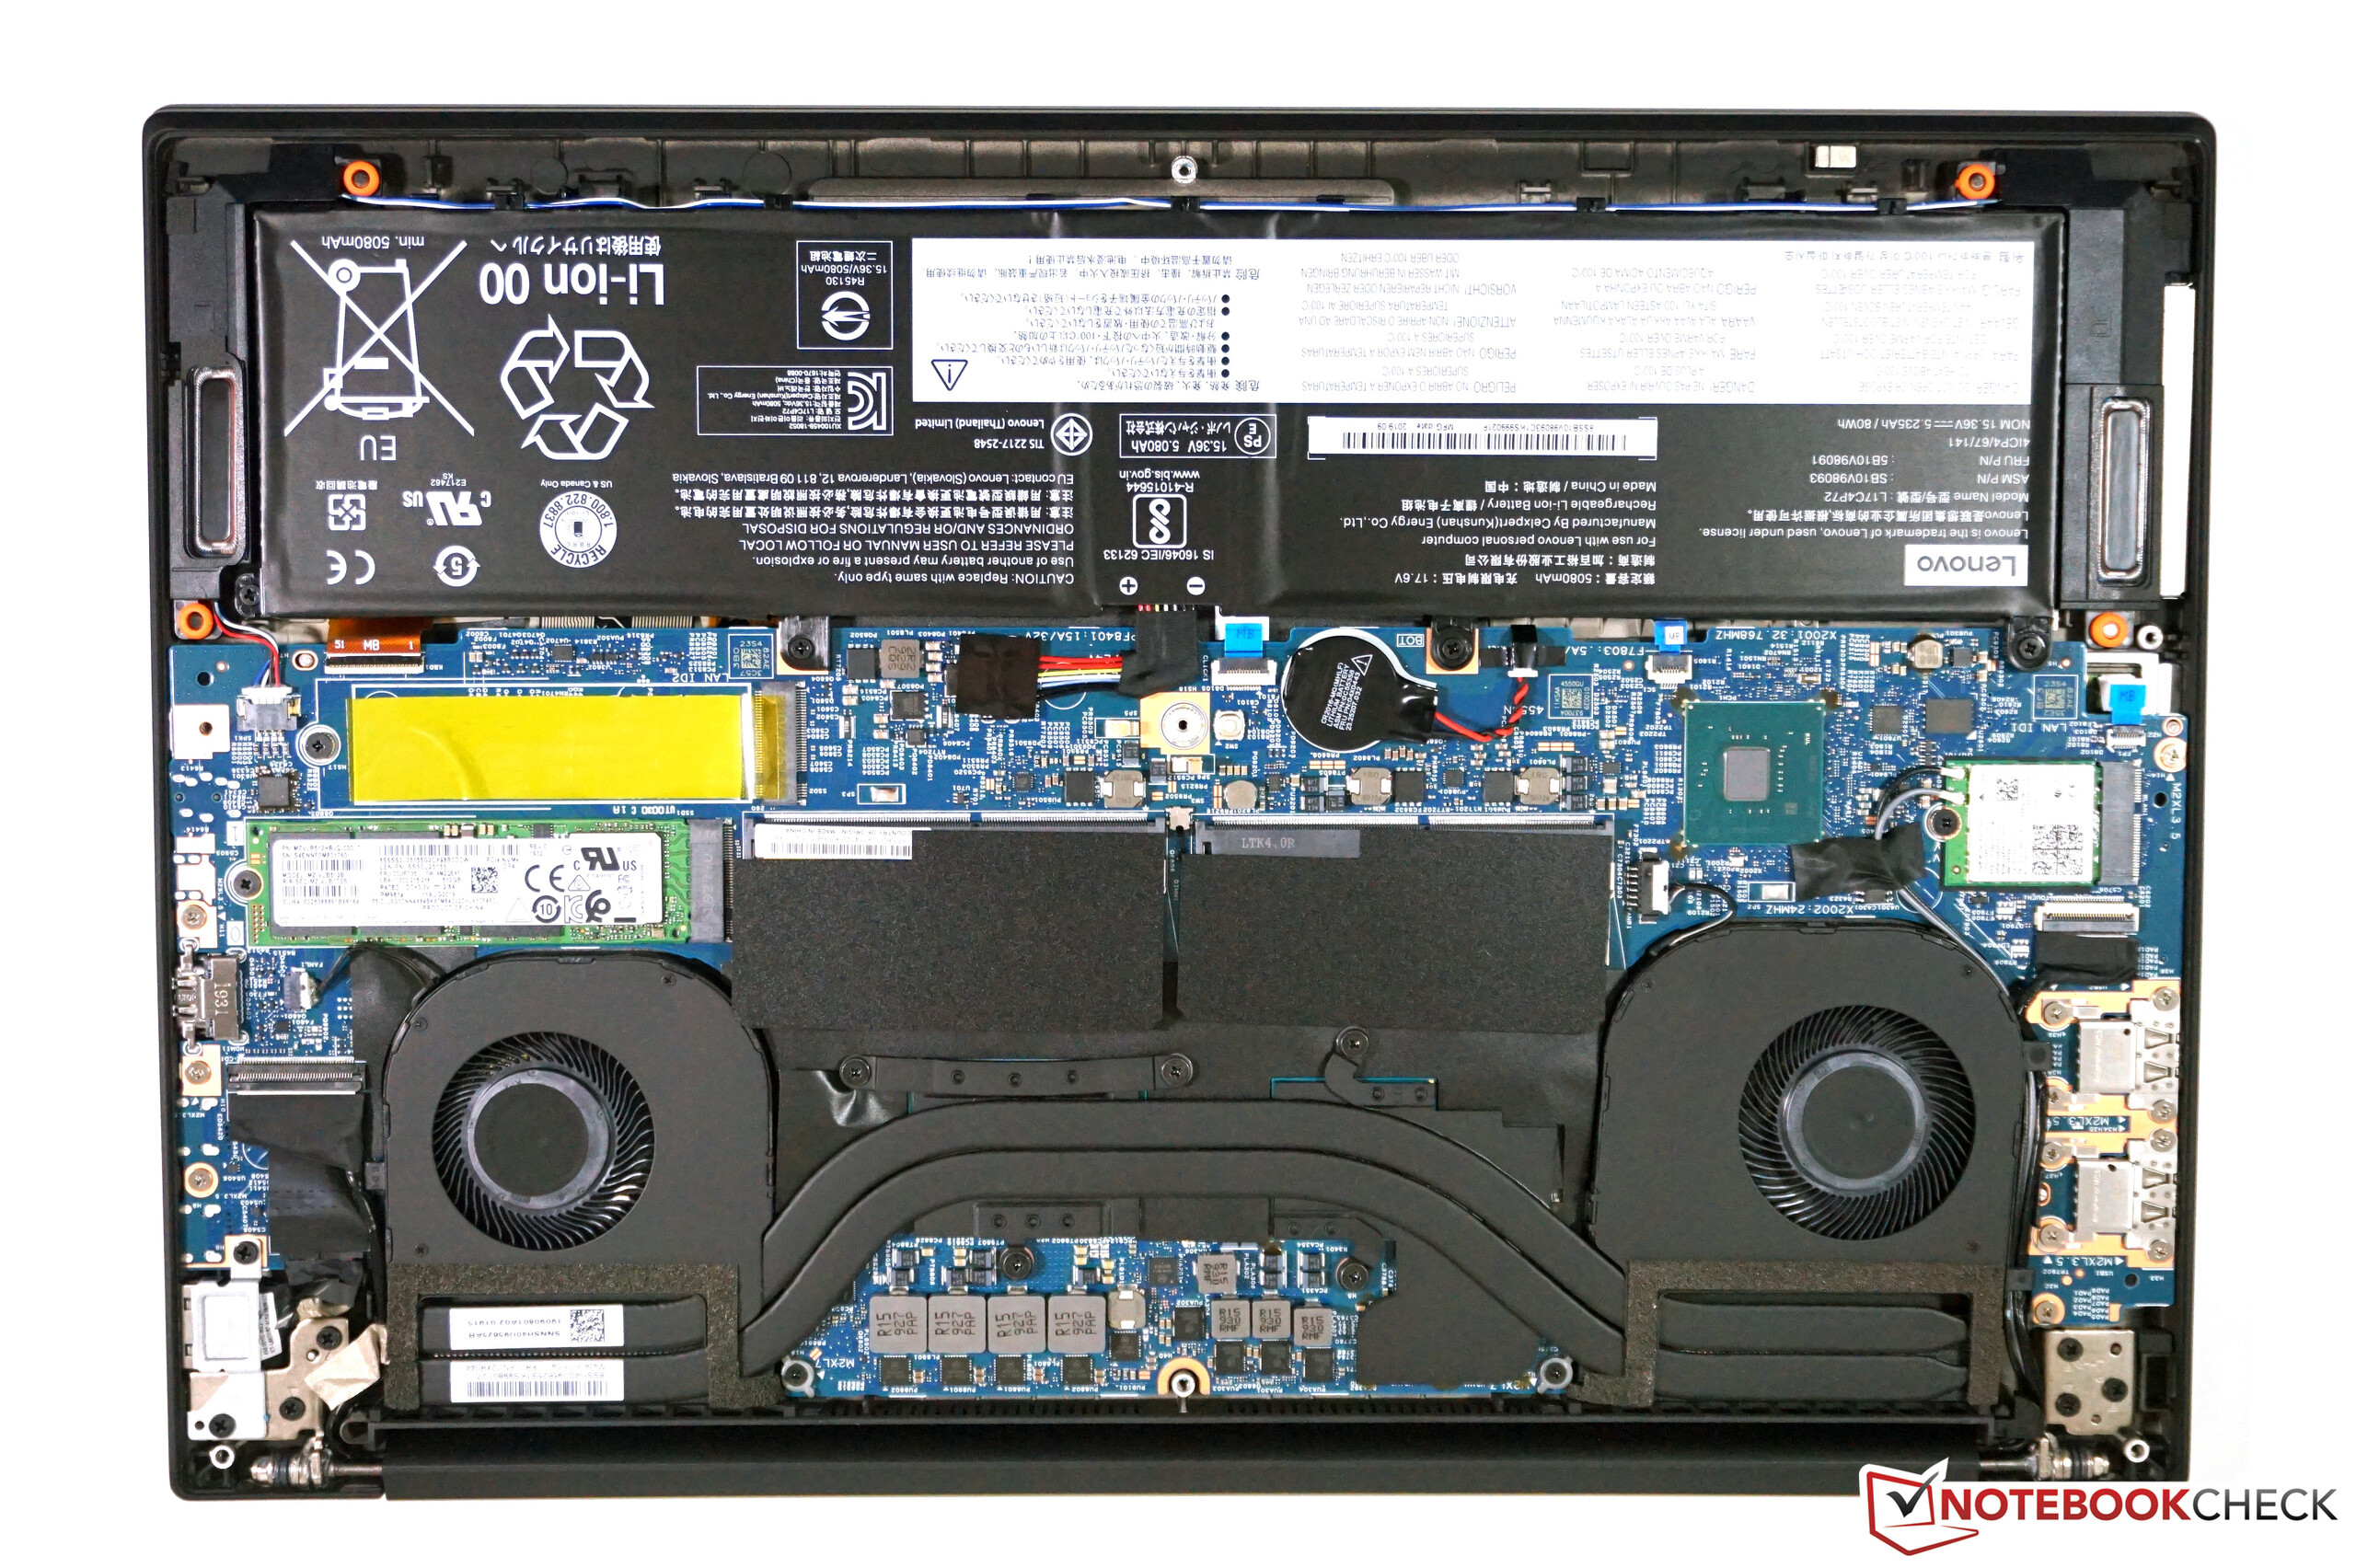
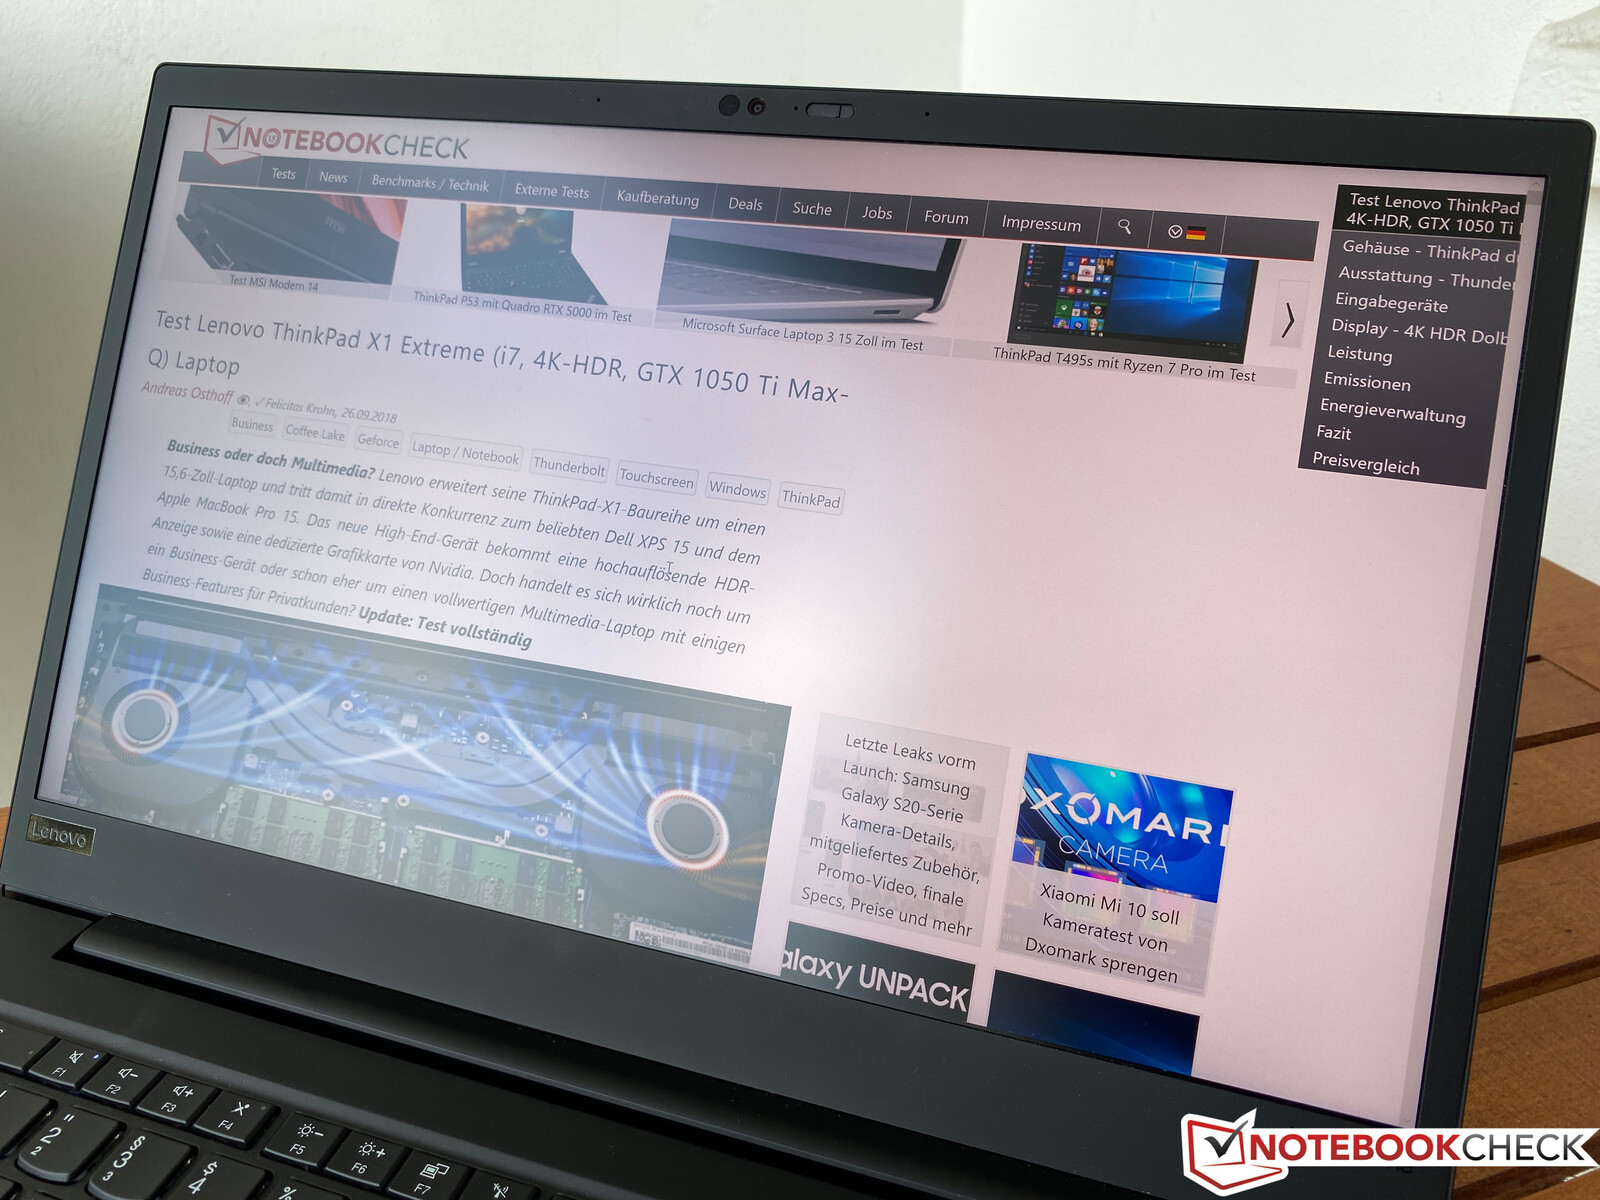
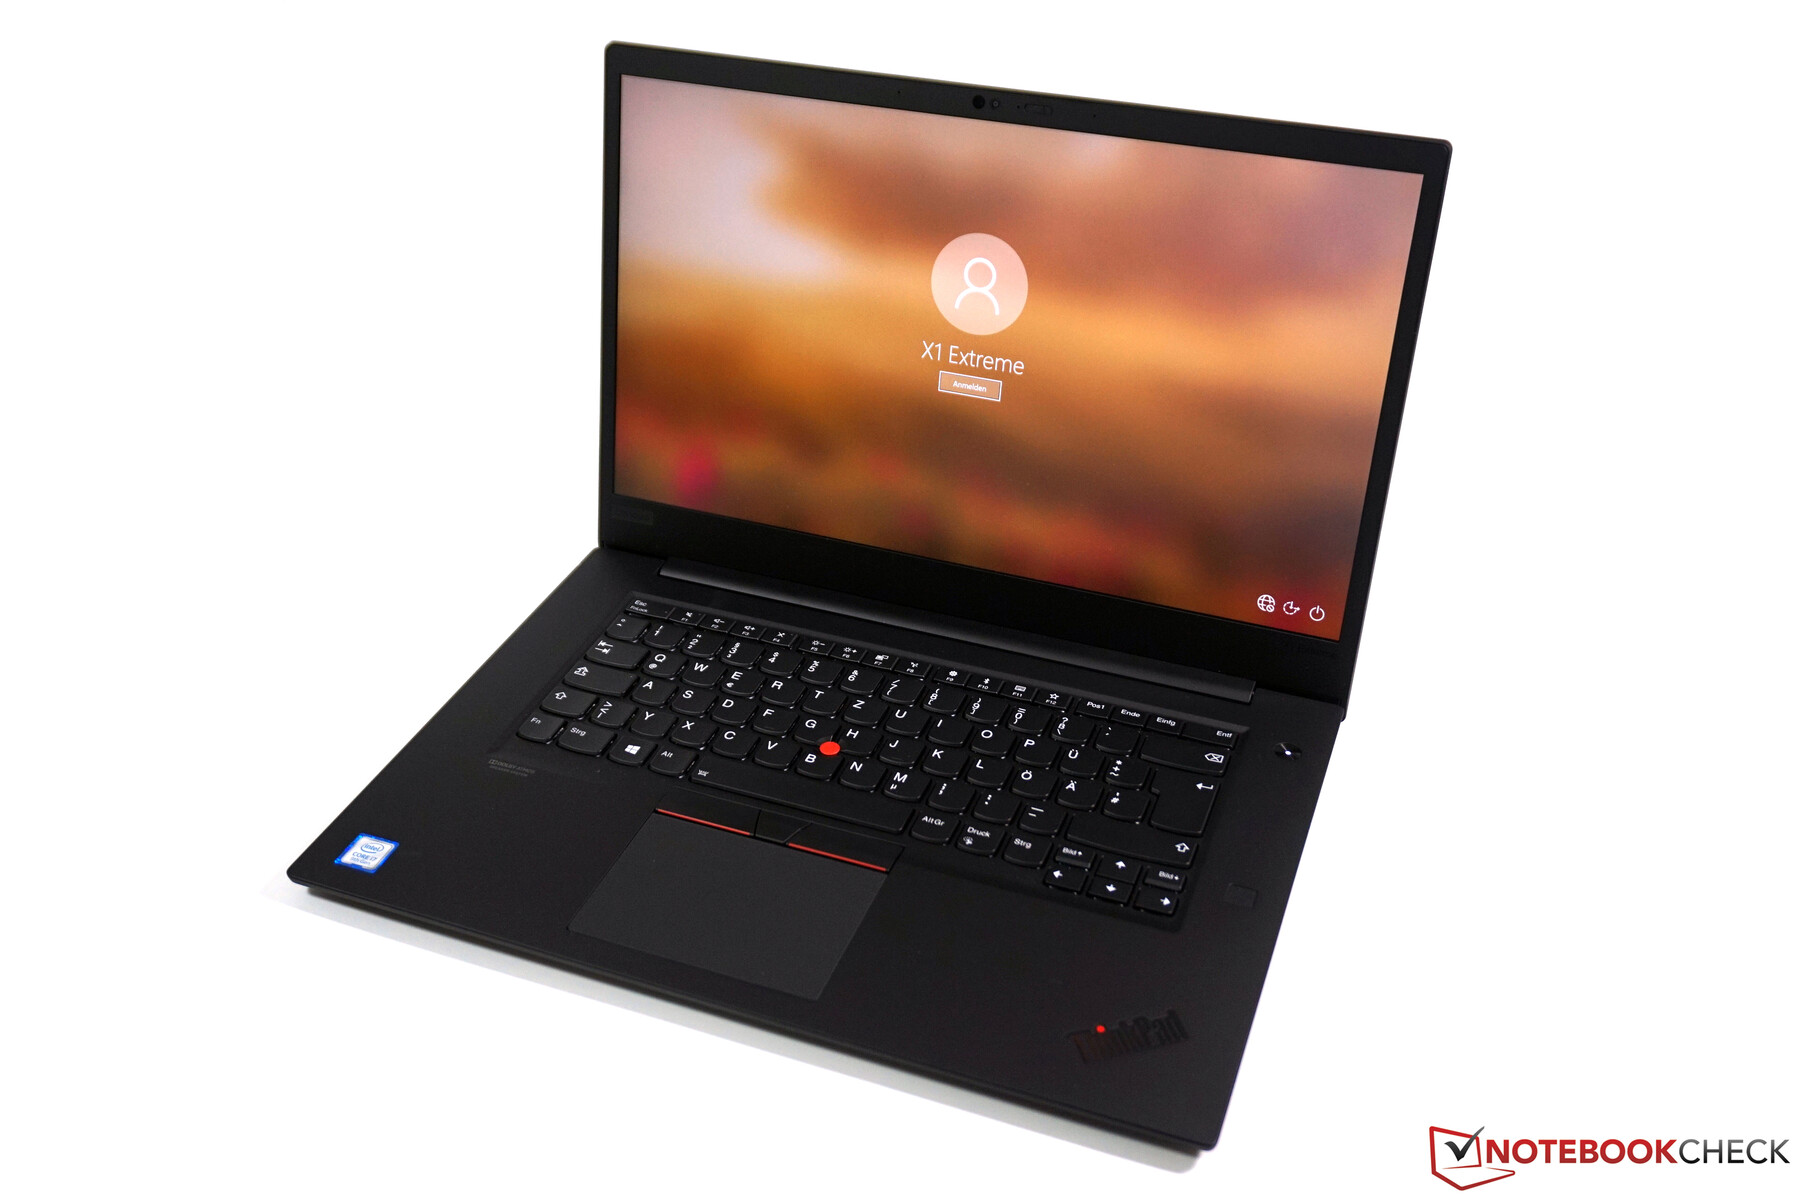
Kasa - 4K X1 Extreme, karbon fiber kaplama ile geliyor
Önceki bölümde belirtildiği gibi, geçen yılın modelinden gelen davada hiçbir şey değişmedi. Yine de küçük bir değişiklik var. Lenovo artık 4K ekranlı makineleri, ekran kapaklarına farklı bir görünüm kazandırarak ayırıyor. Daha küçük ThinkPad X1 Carbon'da olduğu gibi ekran kapağının da karbon fiber kaplaması var. Bu, örneğin Dell XPS 15'te bulunan klavye desteğine benzese de, kapağın köşeleri bu kaplamanın sadece bir etiket veya bir tür baskı olduğunu ortaya koyuyor. Tasarım kesinlikle bir zevk meselesidir, ancak en azından parmak izlerini almaya daha az duyarlıdır.

| SD Card Reader | |
| average JPG Copy Test (av. of 3 runs) | |
| Dell XPS 15 7590 9980HK GTX 1650 (Toshiba Exceria Pro SDXC 64 GB UHS-II) | |
| Lenovo ThinkPad X1 Extreme 2019 20QV000WGE (Toshiba Exceria Pro SDXC 64 GB UHS-II) | |
| MSI Prestige 15 A10SC (Toshiba Exceria Pro M501 UHS-II) | |
| Sınıf ortalaması Multimedia (23 - 531, n=43, son 2 yıl) | |
| maximum AS SSD Seq Read Test (1GB) | |
| Lenovo ThinkPad X1 Extreme 2019 20QV000WGE (Toshiba Exceria Pro SDXC 64 GB UHS-II) | |
| MSI Prestige 15 A10SC (Toshiba Exceria Pro M501 UHS-II) | |
| Dell XPS 15 7590 9980HK GTX 1650 (Toshiba Exceria Pro SDXC 64 GB UHS-II) | |
| Sınıf ortalaması Multimedia (27.9 - 1455, n=42, son 2 yıl) | |
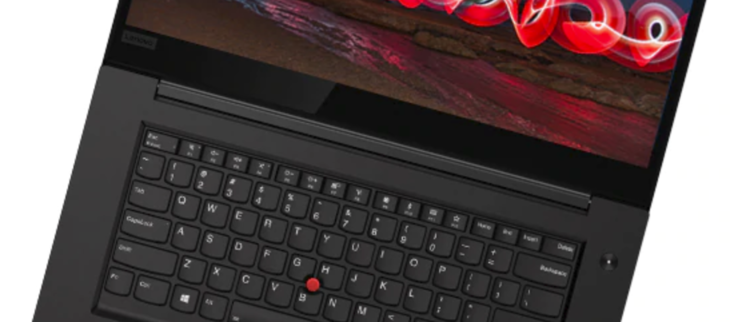
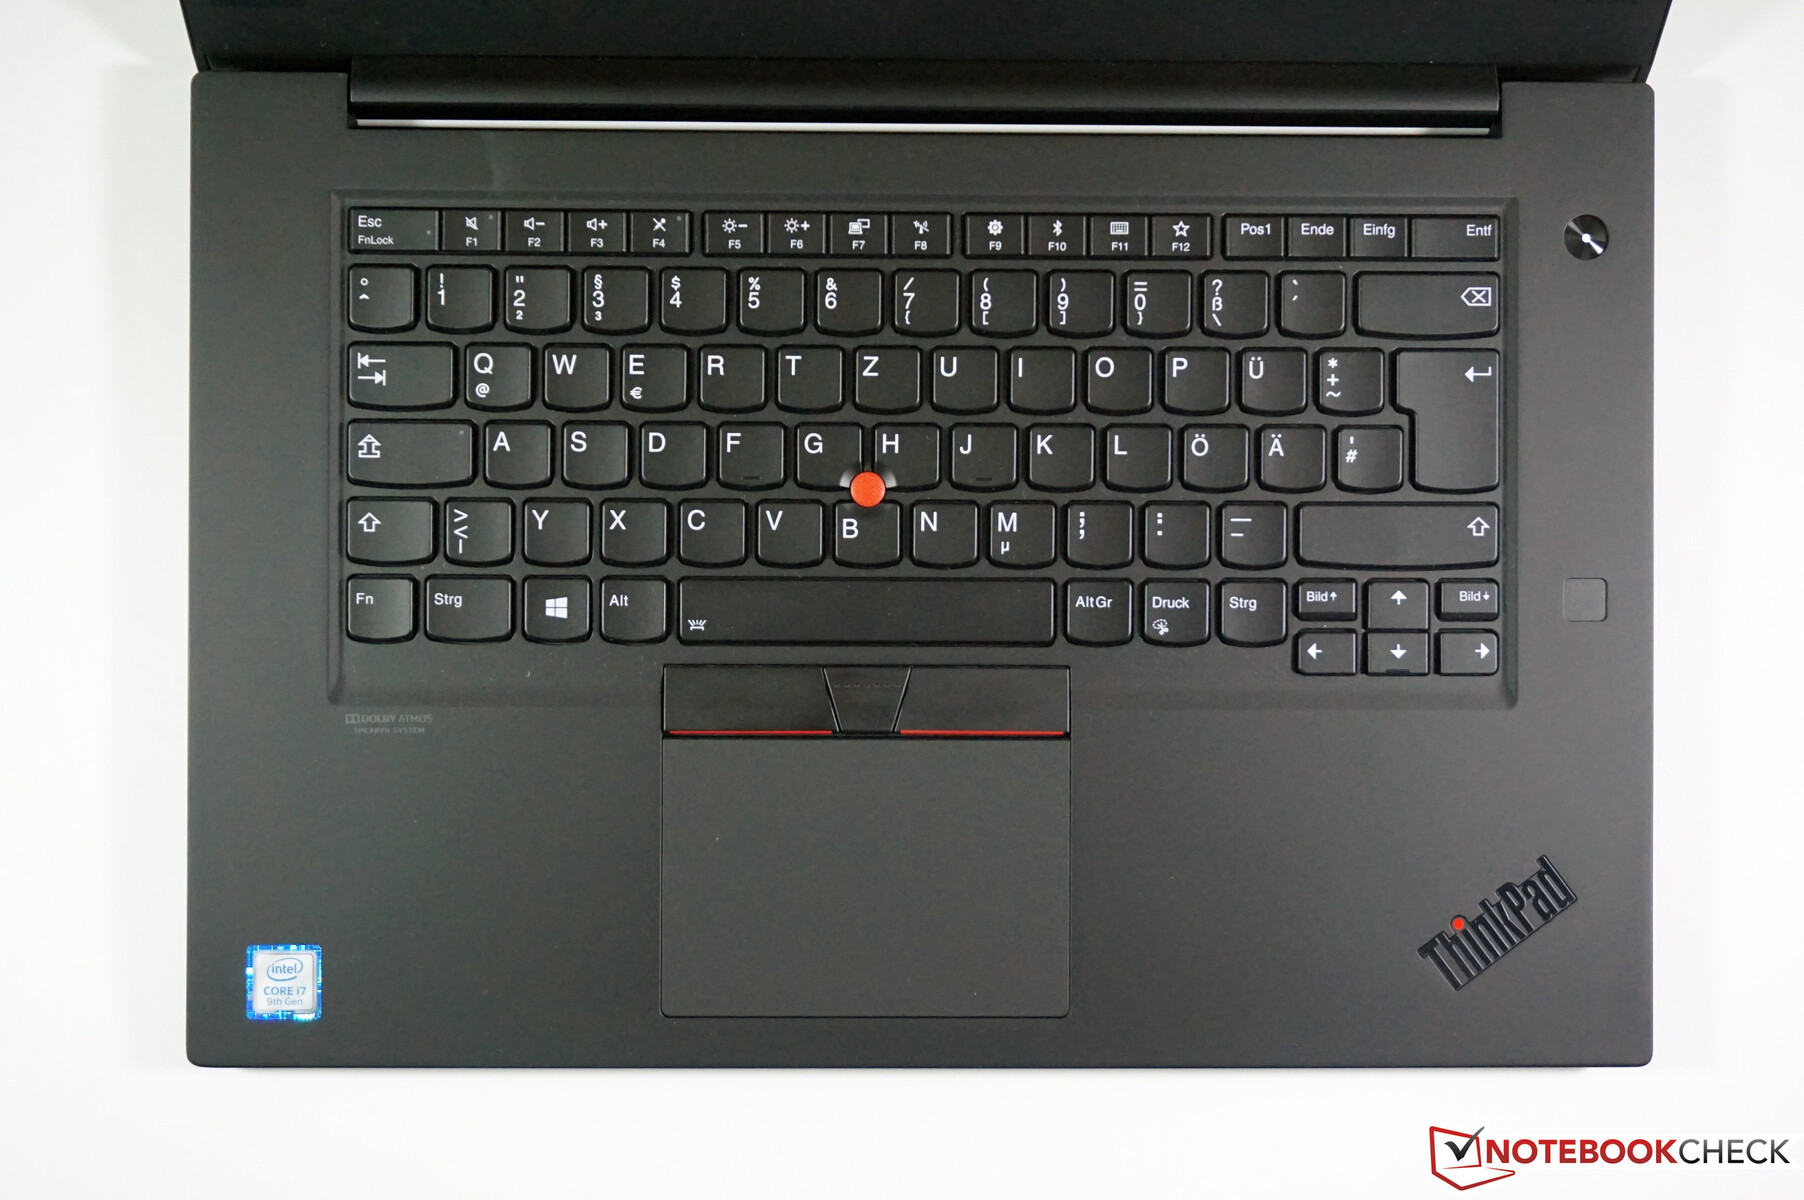
Giriş Aygıtları - İyi, ancak kesintiler var
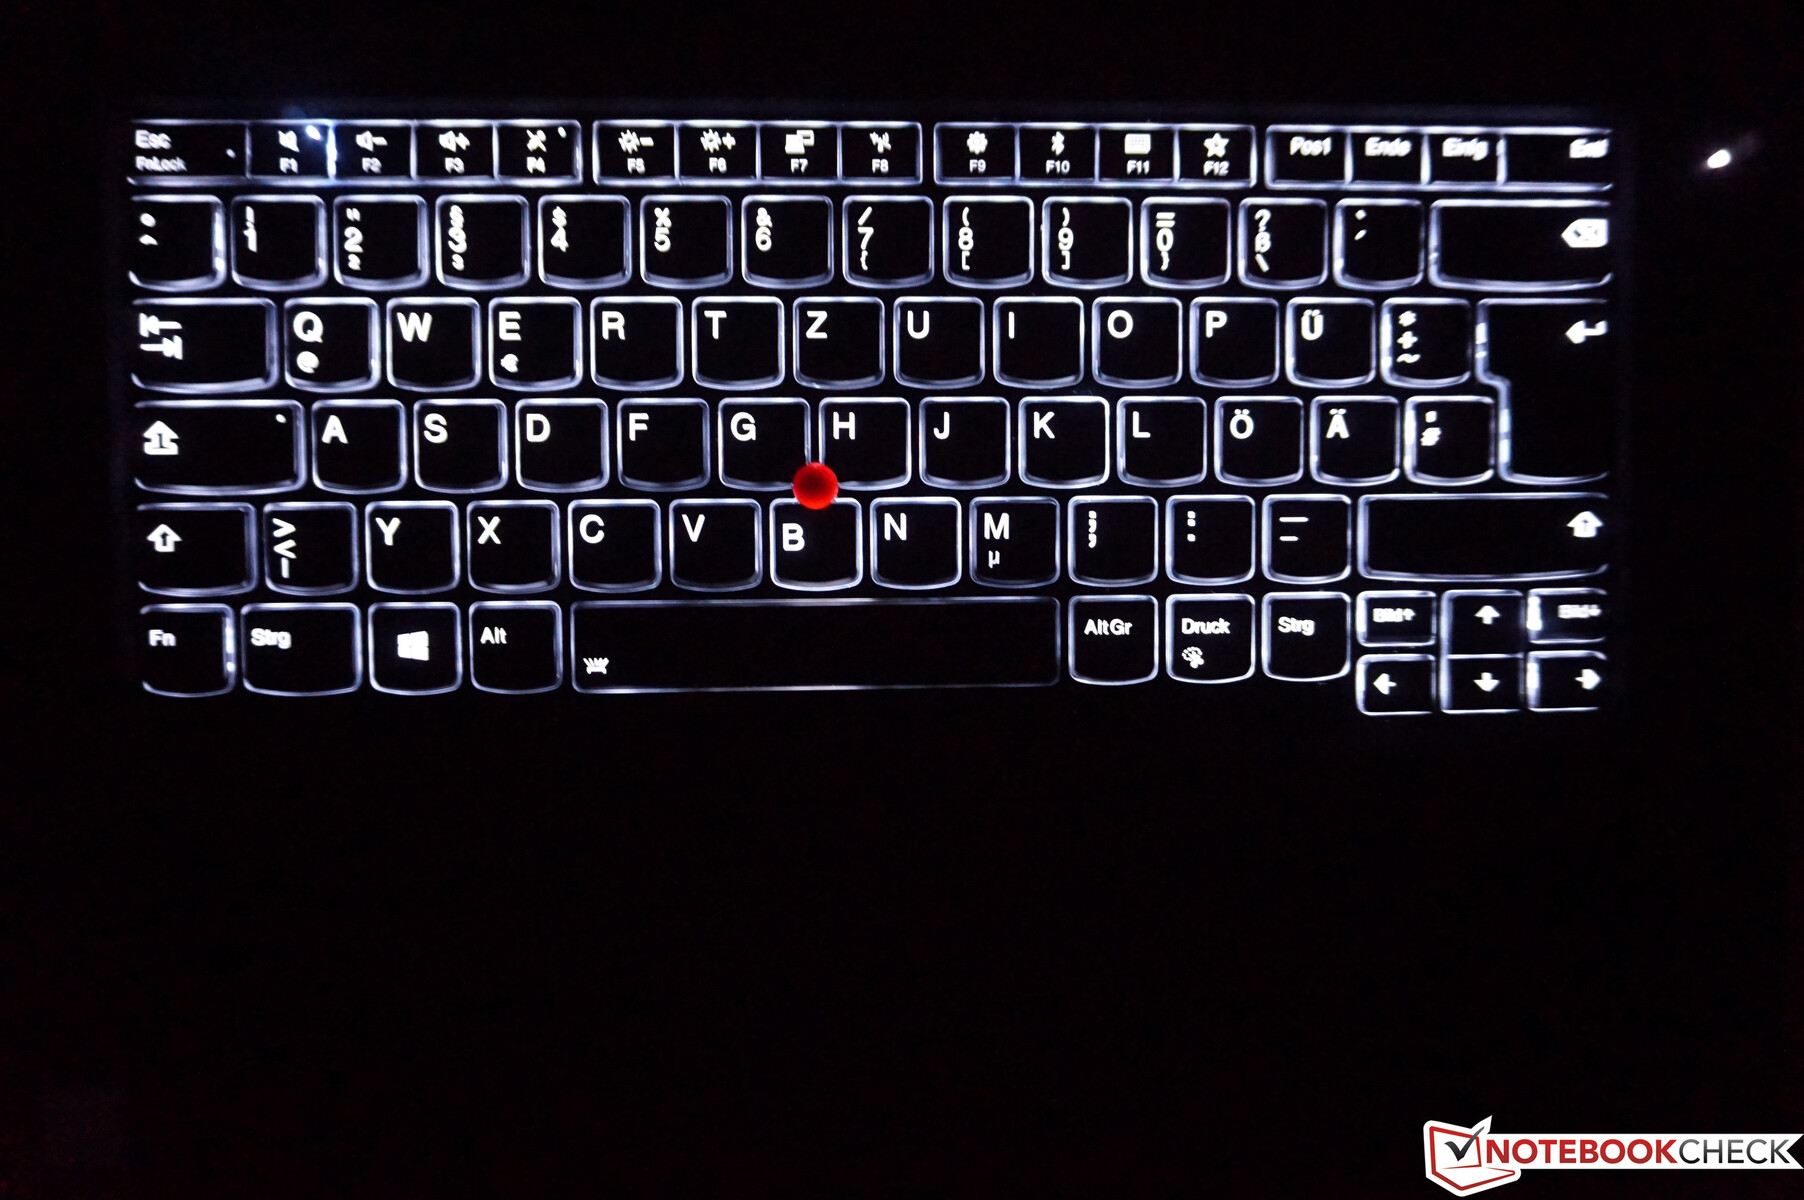
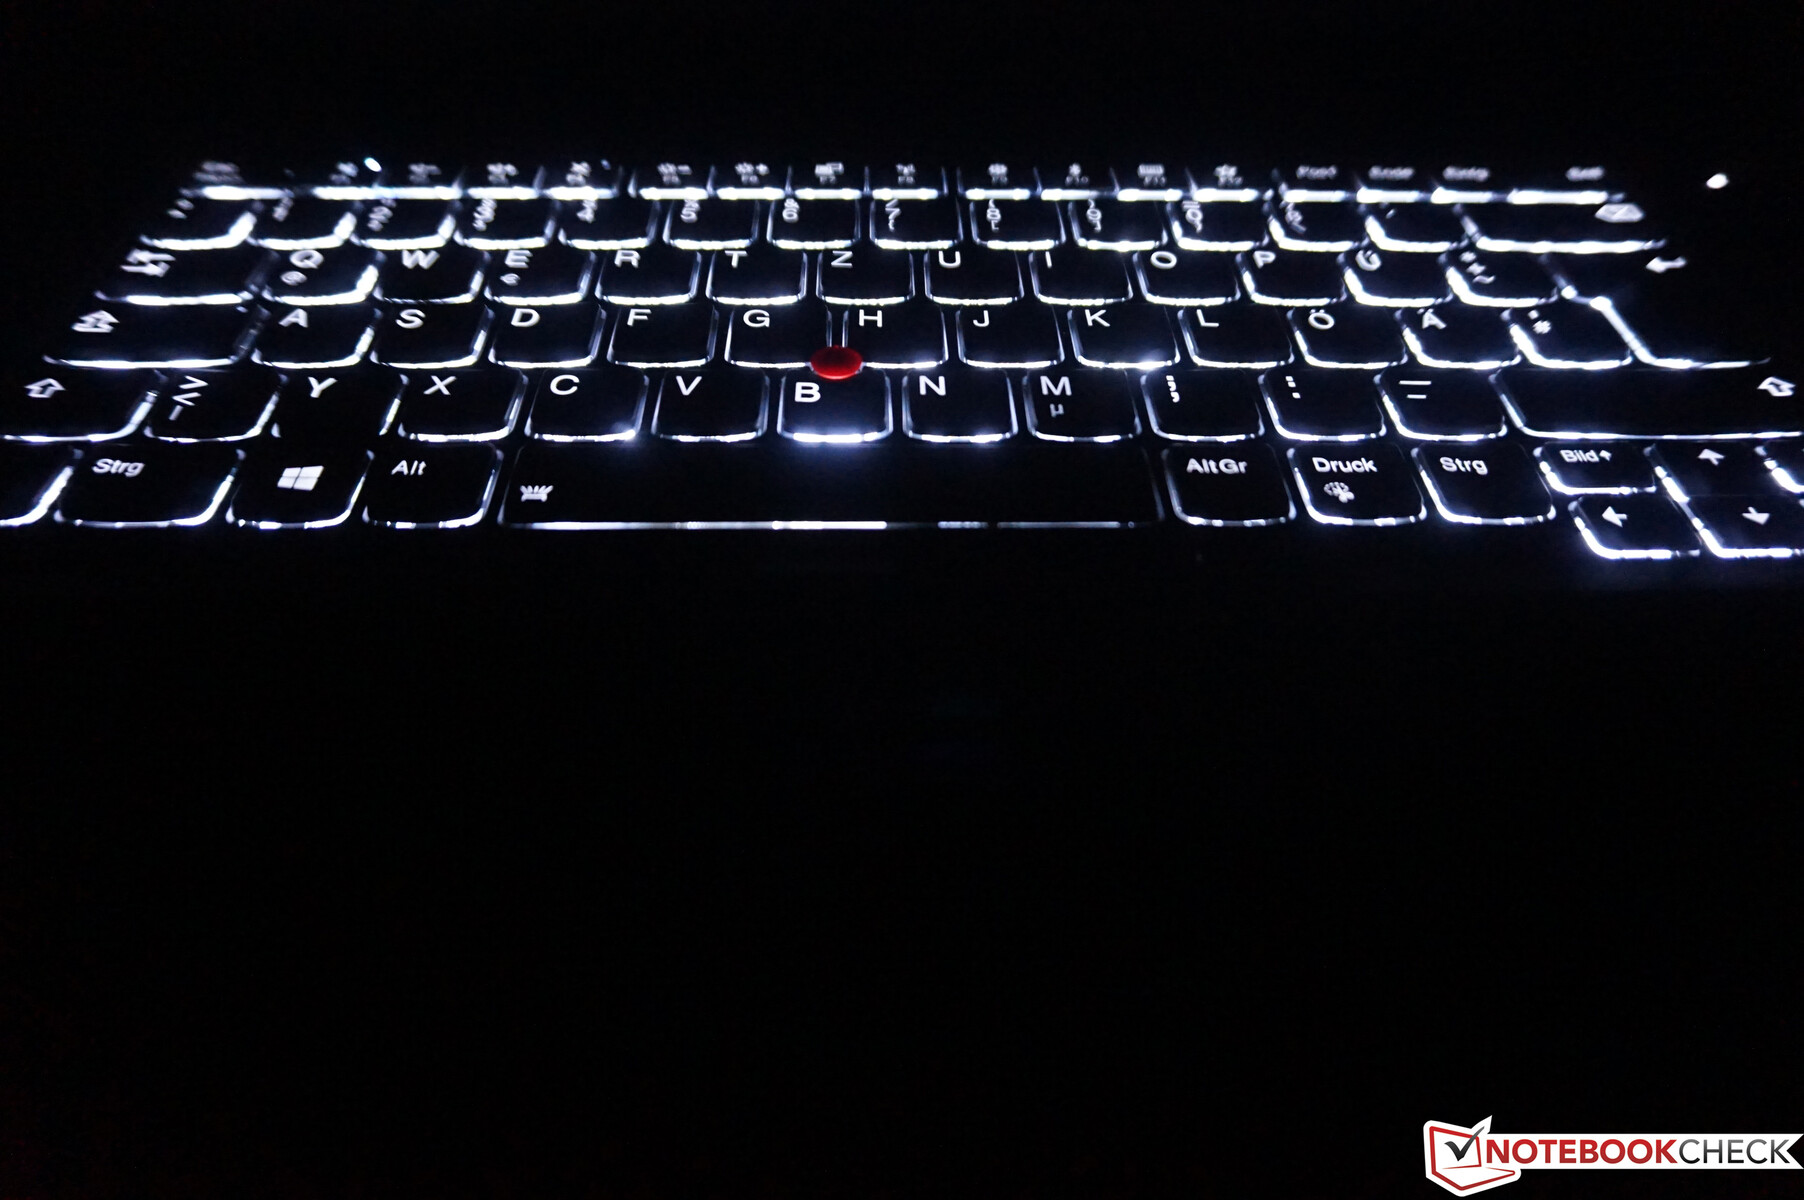
Prensip olarak, ThinkPad X1 Extreme Gen 2'deki klavye ile de hiçbir şey değişmedi, ancak yazarken bazen kesintiler bildirildi çevrimiçi. Sorunun X1 Extreme Gen 2'yi de etkilediğini doğrulayabiliriz. Ancak bu düşüşler nadirdir. Sorunun tam olarak ne olduğunu söyleyemeyiz, ancak bazı insanlar için klavyenin değiştirilmesi yardımcı oldu. Cihazınızla benzer sorunlarla karşılaşırsanız, Lenovo Hizmetiyle iletişime geçmenizi öneririz. Ancak, klavye düzgün çalışıyorsa, X1 Extreme Gen 2 bir dizüstü bilgisayardaki en iyi yazma deneyimlerinden birini sunar.
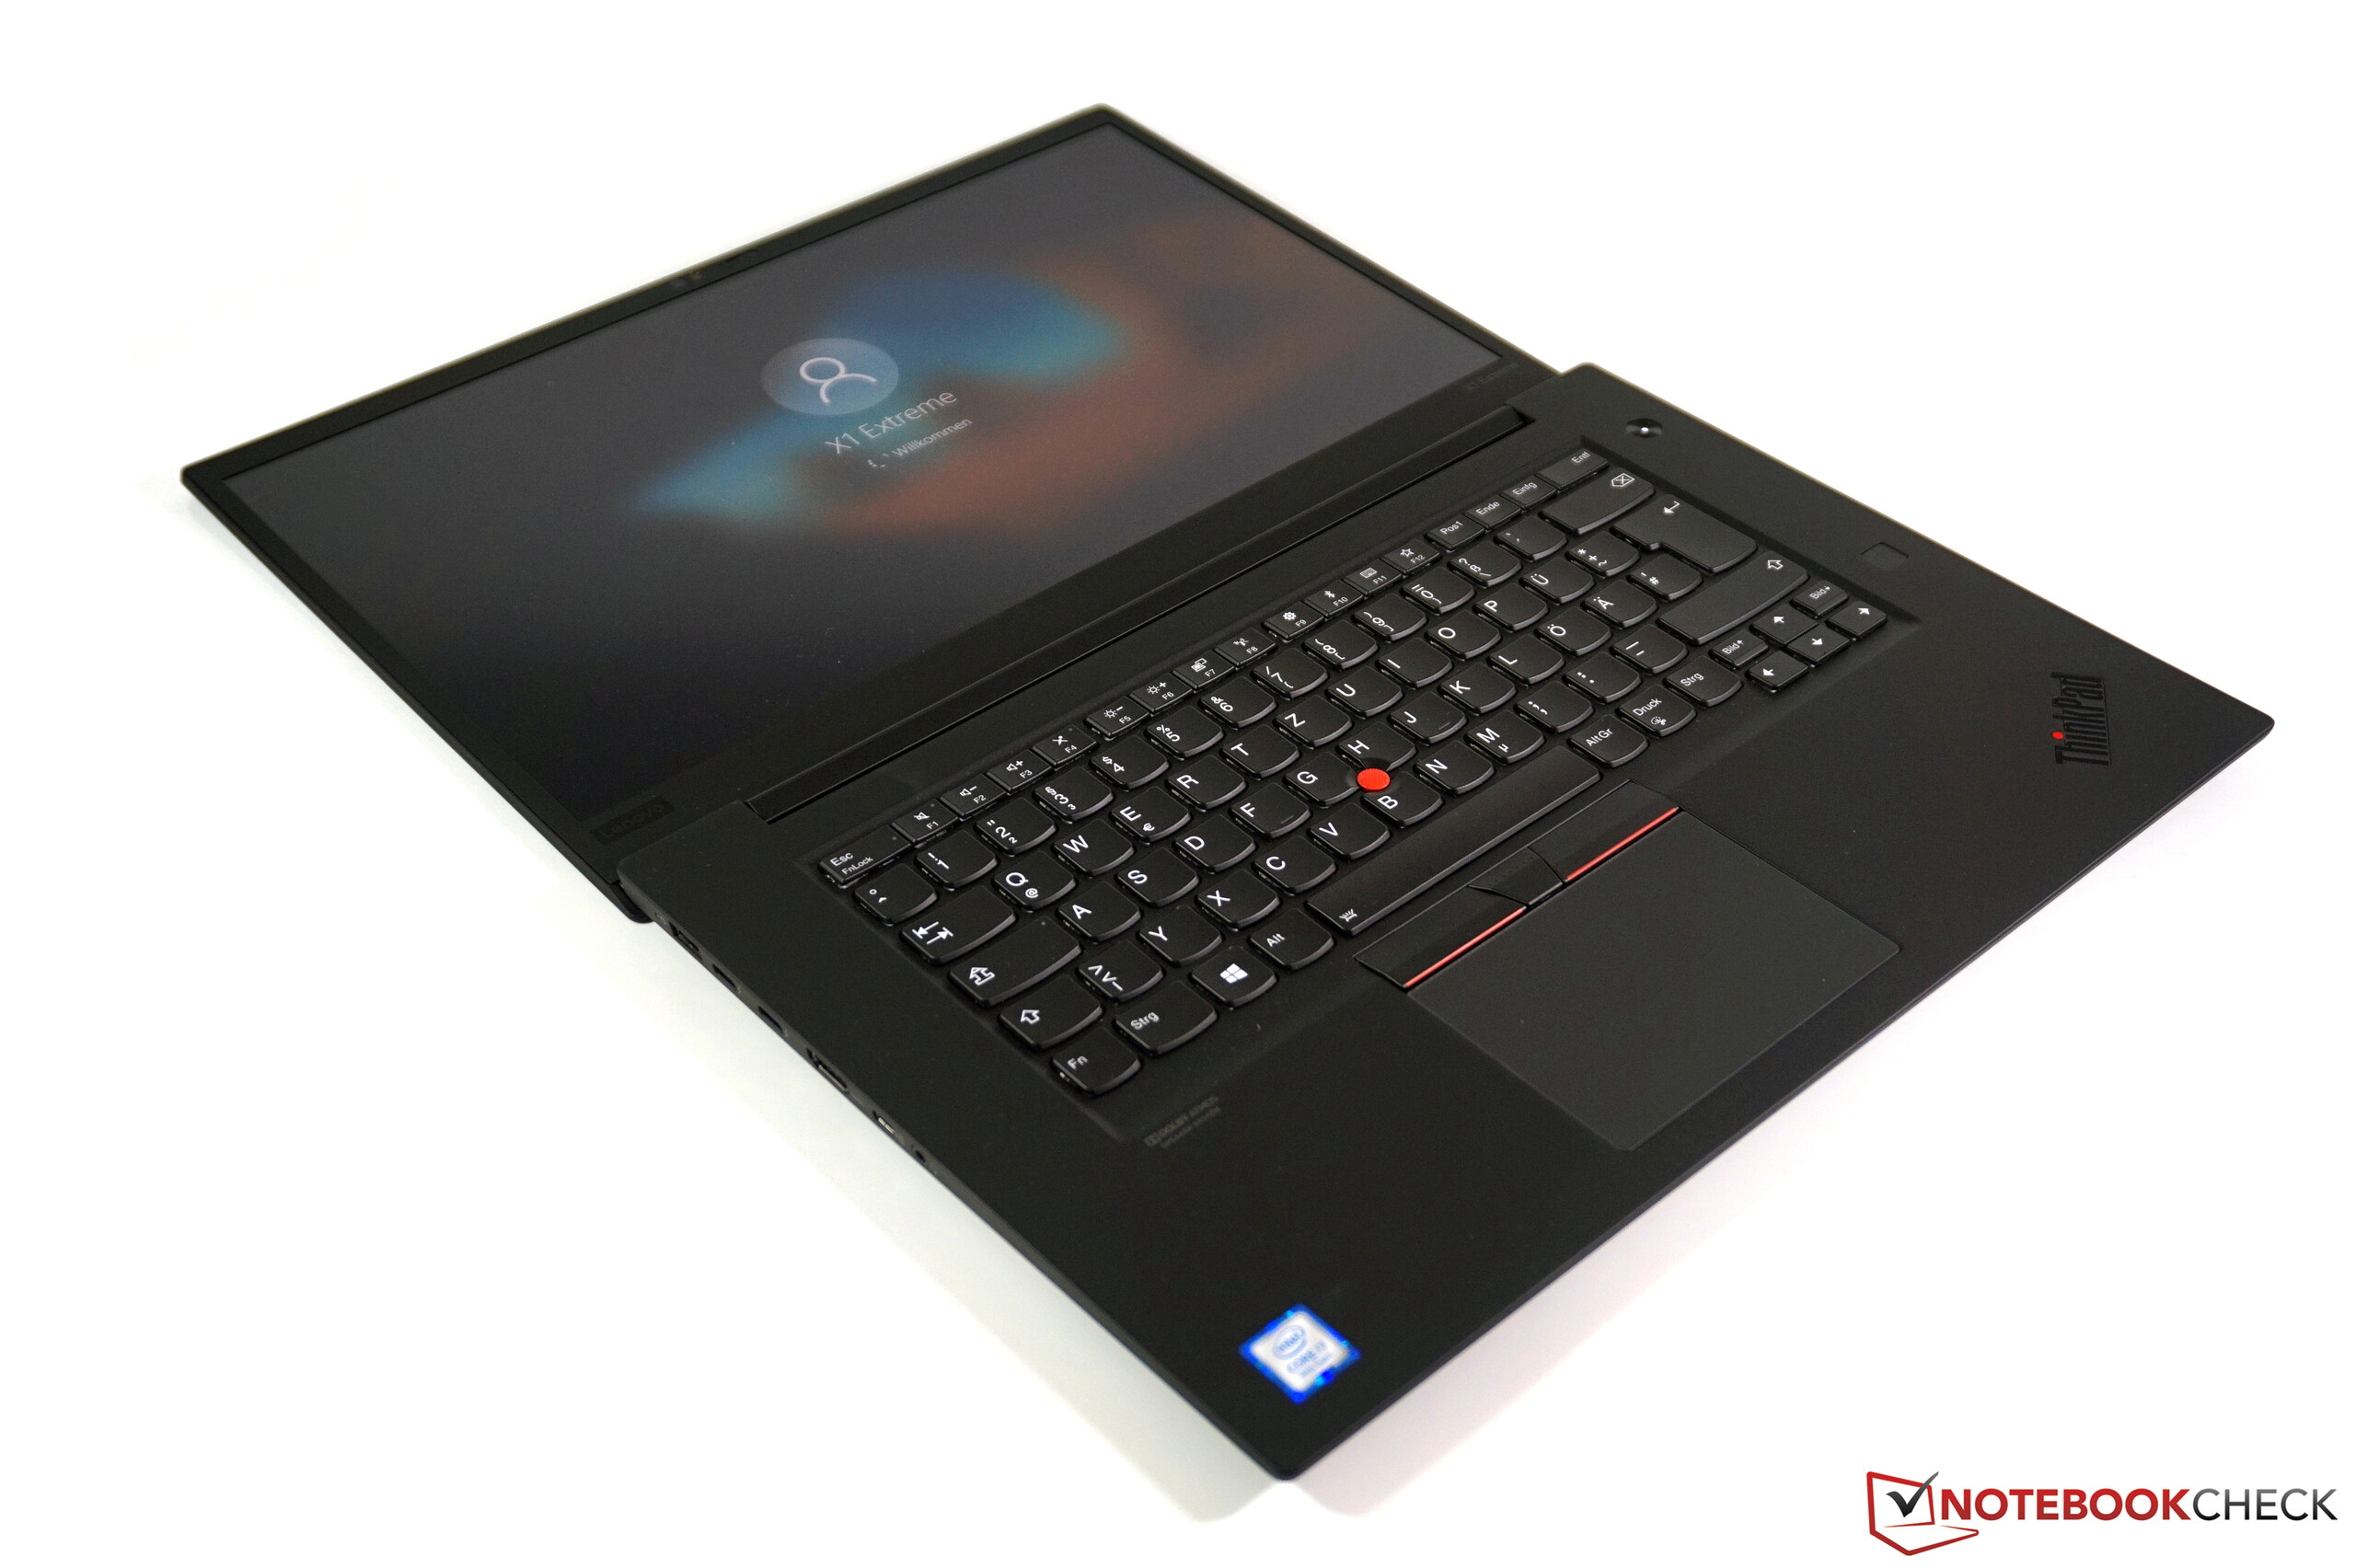
Ekran - Mat 4K panelli ThinkPad
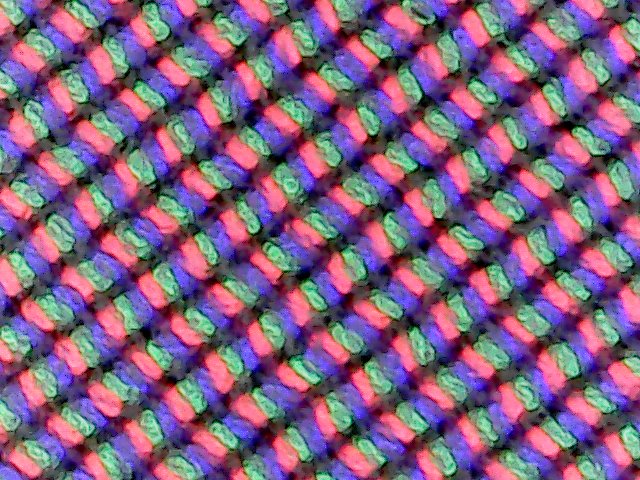
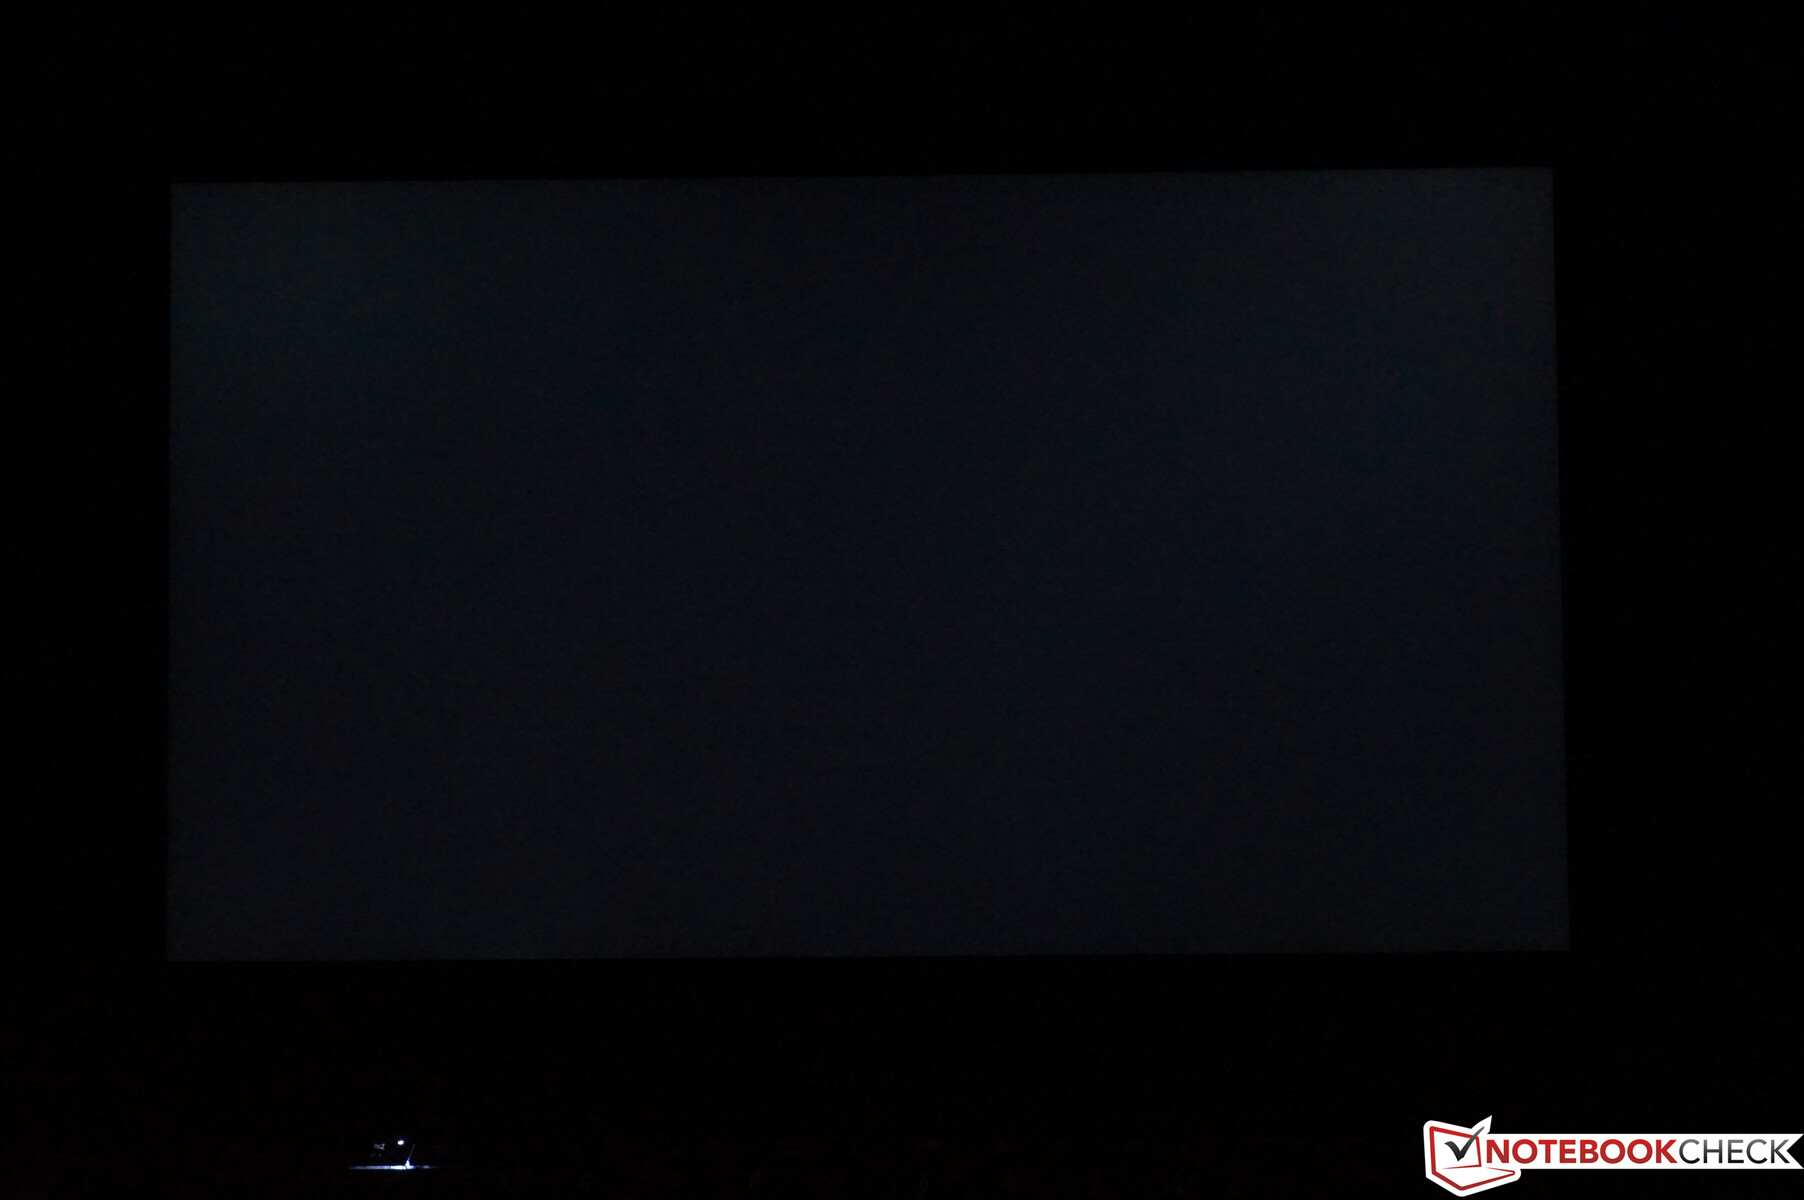
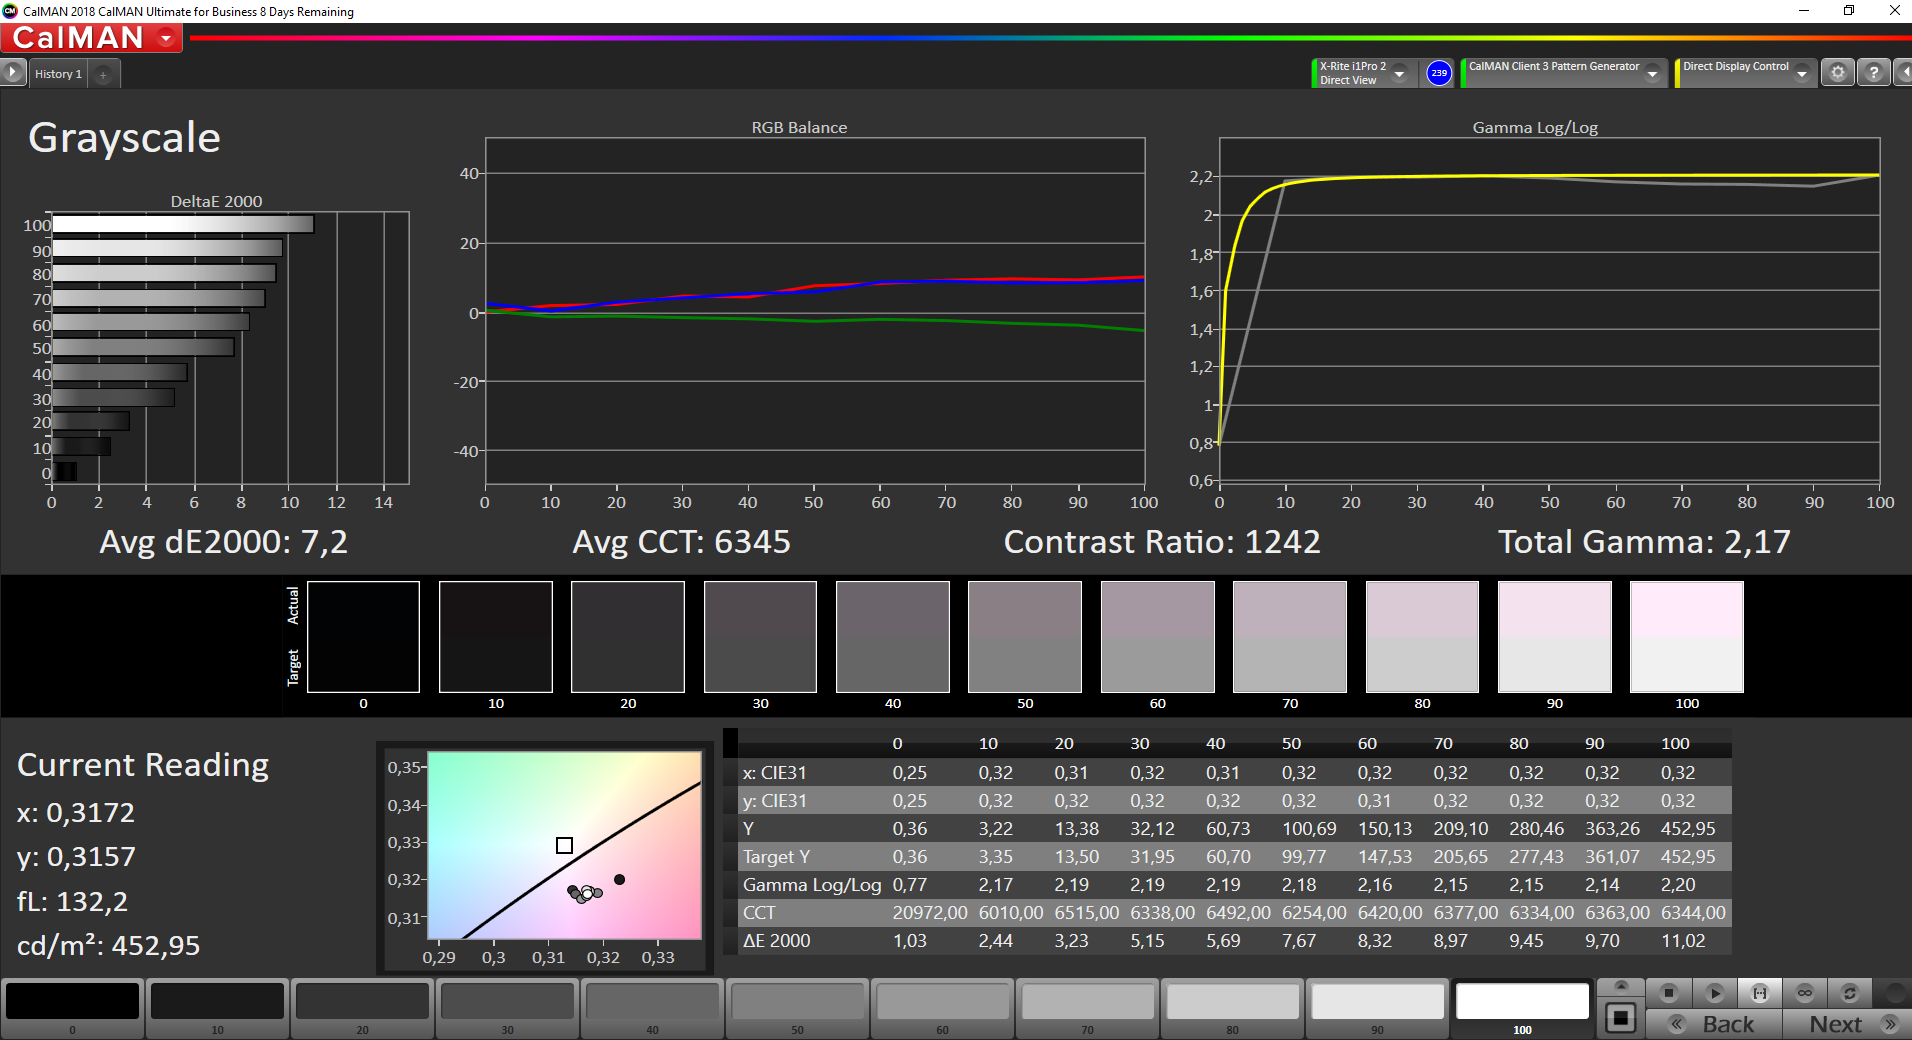
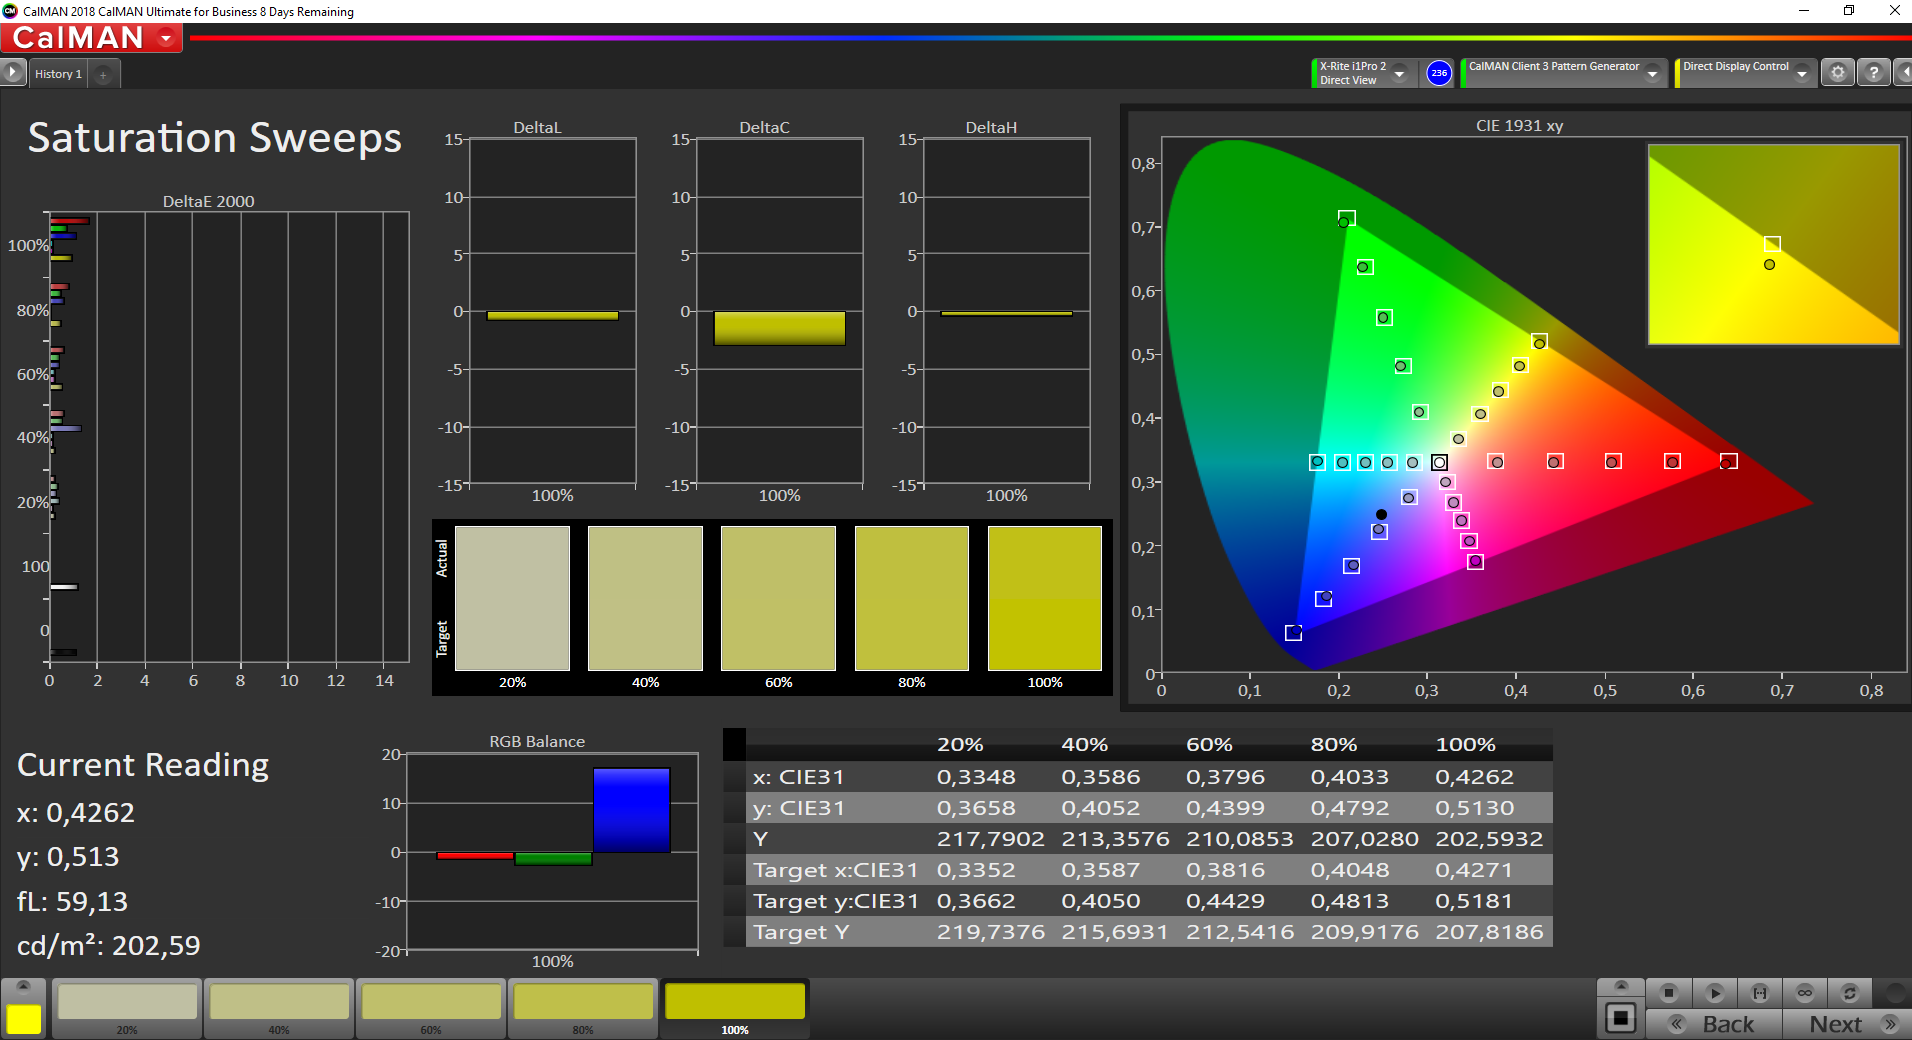
Lenovo, X1 Extreme Gen 2 ile öncekinden çok daha fazla ekran seçeneği sunuyor. İki mat FHD panele ek olarak, şirket şimdi iki 4K panel satıyor. Biri mat IPS panel, diğeri parlak bir kaplamaya sahip OLED panel. Test cihazımız, çok parlak olması gereken ve% 100 AdobeRGB kapsama alanı ile reklamı yapılan öncekine sahiptir.Özellikle X1 Extreme Gen 2, iyi görüntü kalitesi sunar, ancak içeriğin oldukça sıcak görünmesini sağlayan hafif bir kırmızı renk tonu vardır. Ayrıca, 500 nitin reklamı yapılan parlaklığını doğrulayamayız. İnceleme birimimiz 470 cd / m²'de zirveye ulaşıyor, ancak ekranın sadece bir bölgesinde, ortalaması 450 cd / m²'nin biraz altına düşüyor. Bu hala eski X1 Extreme'e göre bir gelişme. Bununla birlikte, inceleme birimimiz, selefinde ölçtüğümüzden daha yüksek bir siyah seviyesine sahiptir, bu da daha düşük bir kontrast oranı verir. Ayrıca, panelin mat kaplaması, içeriğin bazı rakiplerde olduğundan daha az keskin görünmesini sağlar. Ayrıca, görüntülerin hafif yüzeylerde biraz grenli olduğunu gördük. PWM'nin olmaması, arka ışık kanamasının olmaması gibi olumludur.
| |||||||||||||||||||||||||
Aydınlatma: 90 %
Batarya modunda parlaklık: 465 cd/m²
Kontrast: 1289:1 (Siyah: 0.36 cd/m²)
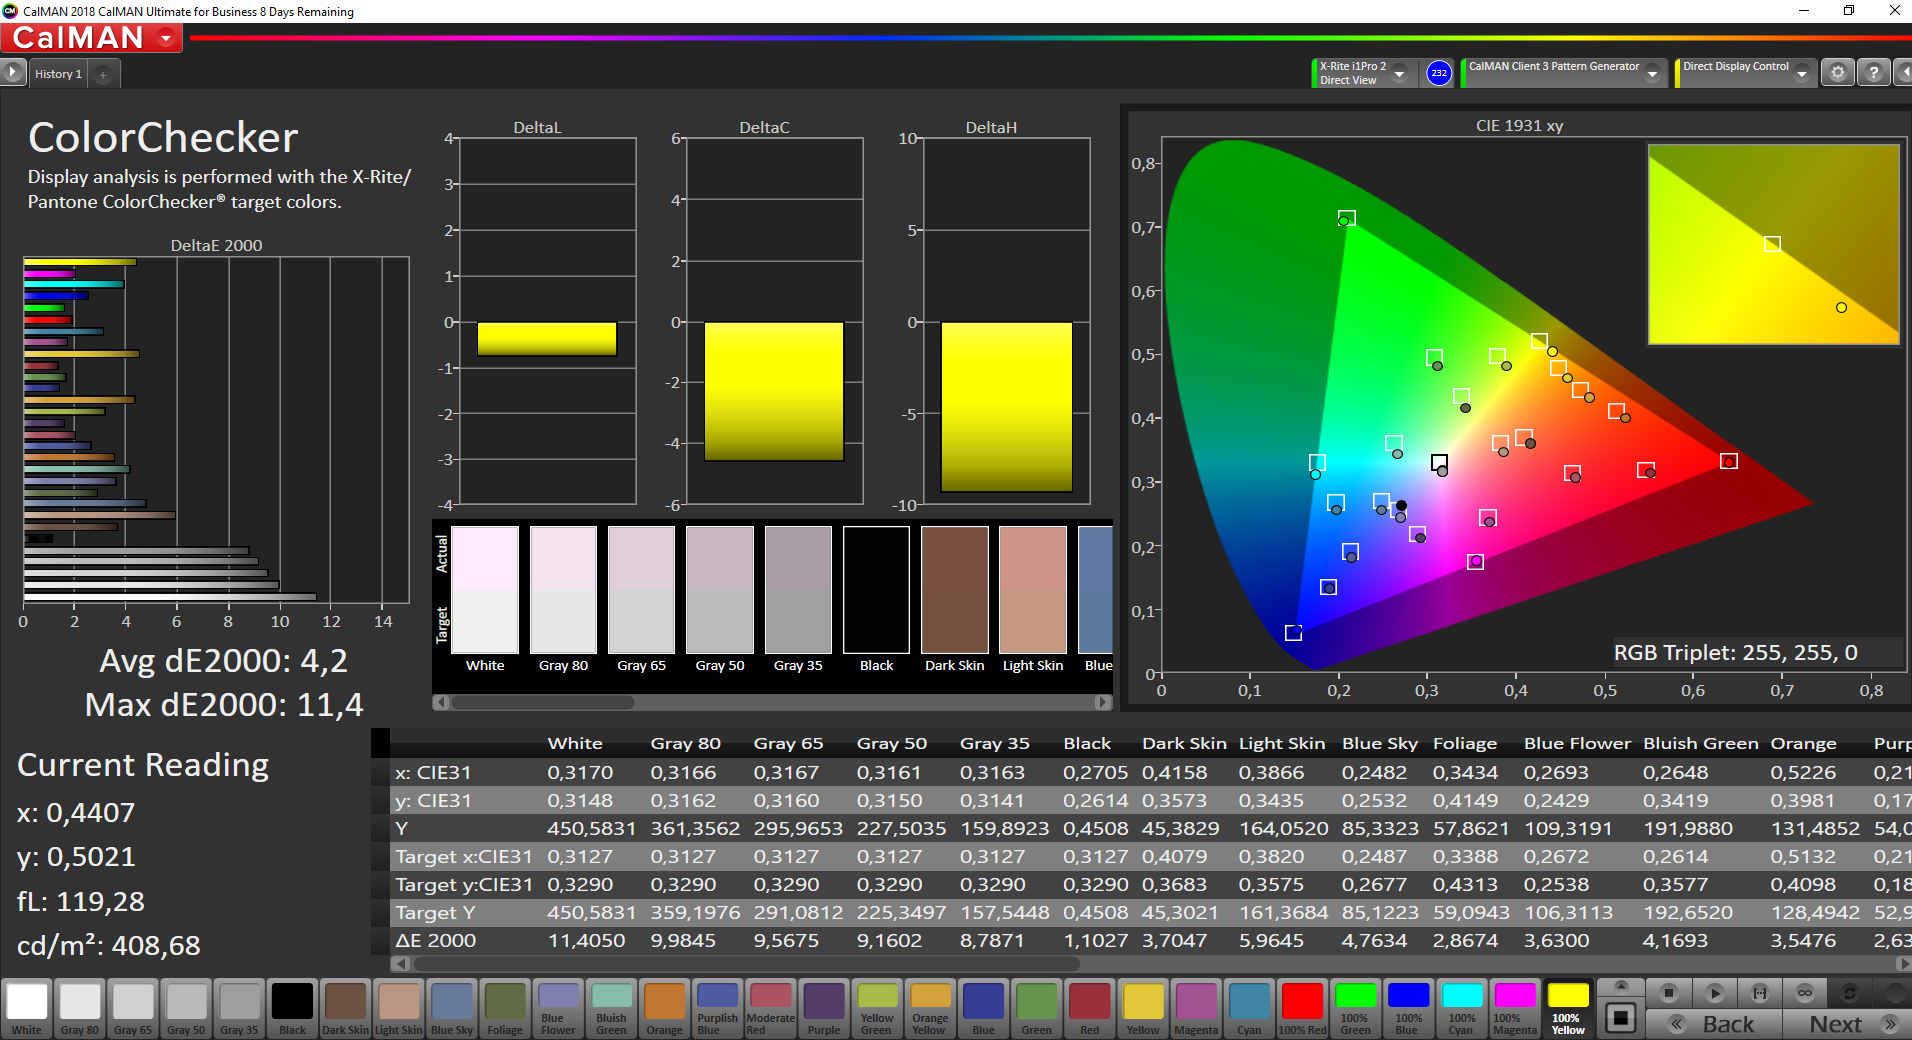
ΔE ColorChecker Calman: 4.2 | ∀{0.5-29.43 Ø4.72}
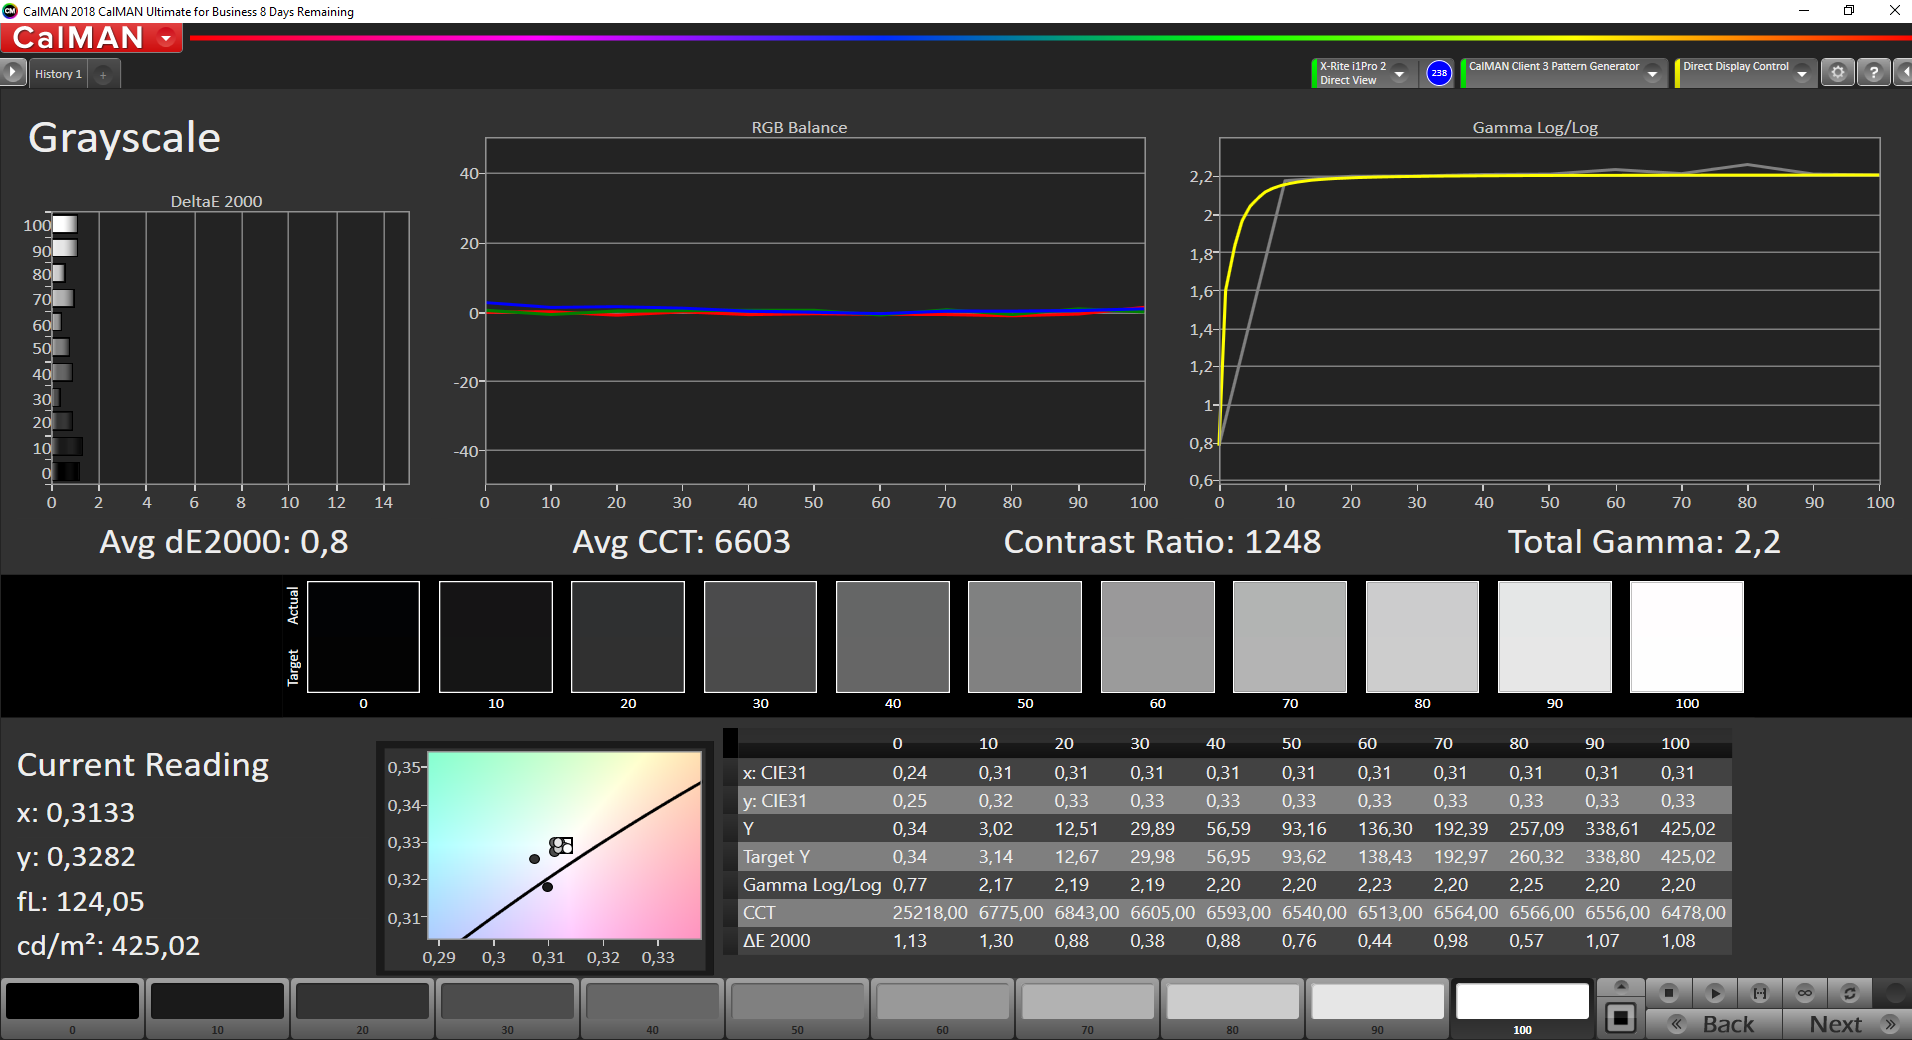
calibrated: 0.8
ΔE Greyscale Calman: 7.2 | ∀{0.09-98 Ø4.97}
99% sRGB (Argyll 1.6.3 3D)
85.2% AdobeRGB 1998 (Argyll 1.6.3 3D)
96.9% AdobeRGB 1998 (Argyll 3D)
99.1% sRGB (Argyll 3D)
82% Display P3 (Argyll 3D)
Gamma: 2.17
CCT: 6345 K
| Lenovo ThinkPad X1 Extreme 2019 20QV000WGE NE156QUM-N66, IPS, 3840x2160, 15.6" | Dell XPS 15 7590 9980HK GTX 1650 Samsung 156WR04, SDCA029, OLED, 3840x2160, 15.6" | Apple MacBook Pro 16 2019 i9 5500M APPA044, IPS, 3072x1920, 16" | Acer ConceptD 7 CN715-71-743N AU Optronics AUO31EB, IPS, 3840x2160, 15.6" | Lenovo Yoga C940-15IRH LG Philips LP156WFC-SPU1, IPS, 1920x1080, 15.6" | MSI Prestige 15 A10SC Sharp LQ156D1JW42, IPS, 3840x2160, 15.6" | Lenovo ThinkPad X1 Extreme-20MF000XGE B156ZAN03.2, IPS, 3840x2160, 15.6" | |
|---|---|---|---|---|---|---|---|
| Display | 1% | 3% | -22% | -1% | 3% | ||
| Display P3 Coverage (%) | 82 | 88.1 7% | 85.7 5% | 61.5 -25% | 82 0% | 86.3 5% | |
| sRGB Coverage (%) | 99.1 | 99.6 1% | 100 1% | 92.7 -6% | 98.3 -1% | 100 1% | |
| AdobeRGB 1998 Coverage (%) | 96.9 | 91.8 -5% | 99 2% | 63.6 -34% | 96.2 -1% | 99.4 3% | |
| Response Times | 94% | -14% | -3% | -12% | -33% | -19% | |
| Response Time Grey 50% / Grey 80% * (ms) | 46.4 ? | 2.3 ? 95% | 52.4 ? -13% | 49 ? -6% | 48.4 ? -4% | 60 ? -29% | 61.6 ? -33% |
| Response Time Black / White * (ms) | 30.4 ? | 2.4 ? 92% | 34.9 ? -15% | 30 ? 1% | 36.4 ? -20% | 41.2 ? -36% | 32 ? -5% |
| PWM Frequency (Hz) | 59.5 ? | 131700 | 26040 ? | ||||
| Screen | -0% | 17% | 18% | 3% | -23% | 4% | |
| Brightness middle (cd/m²) | 464 | 421.2 -9% | 519 12% | 365 -21% | 484.8 4% | 464.5 0% | 396 -15% |
| Brightness (cd/m²) | 448 | 417 -7% | 477 6% | 357 -20% | 463 3% | 451 1% | 380 -15% |
| Brightness Distribution (%) | 90 | 94 4% | 86 -4% | 84 -7% | 82 -9% | 92 2% | 90 0% |
| Black Level * (cd/m²) | 0.36 | 0.39 -8% | 0.275 24% | 0.26 28% | 0.5 -39% | 0.28 22% | |
| Contrast (:1) | 1289 | 1331 3% | 1327 3% | 1865 45% | 929 -28% | 1414 10% | |
| Colorchecker dE 2000 * | 4.2 | 6.06 -44% | 2.28 46% | 0.99 76% | 4.5 -7% | 3.36 20% | 4 5% |
| Colorchecker dE 2000 max. * | 11.4 | 11.89 -4% | 6.54 43% | 1.89 83% | 7.55 34% | 7.06 38% | 7.6 33% |
| Colorchecker dE 2000 calibrated * | 0.8 | 0.86 -8% | 1.01 -26% | 1.19 -49% | 3.42 -327% | 0.9 -13% | |
| Greyscale dE 2000 * | 7.2 | 2.8 61% | 0.9 87% | 1.29 82% | 5.7 21% | 1.3 82% | 6.1 15% |
| Gamma | 2.17 101% | 2.15 102% | 2145 0% | 2.2 100% | 2.45 90% | 2.14 103% | 2.25 98% |
| CCT | 6345 102% | 6235 104% | 6572 99% | 6548 99% | 6101 107% | 6596 99% | 7786 83% |
| Color Space (Percent of AdobeRGB 1998) (%) | 85.2 | 81 -5% | 78 -8% | 88 3% | 58.7 -31% | 84.8 0% | 88.5 4% |
| Color Space (Percent of sRGB) (%) | 99 | 99.6 1% | 100 1% | 92.8 -6% | 98.3 -1% | 100 1% | |
| Toplam Ortalama (Program / Ayarlar) | 32% /
14% | 2% /
12% | 6% /
13% | -10% /
-4% | -19% /
-20% | -4% /
1% |
* ... daha küçük daha iyidir
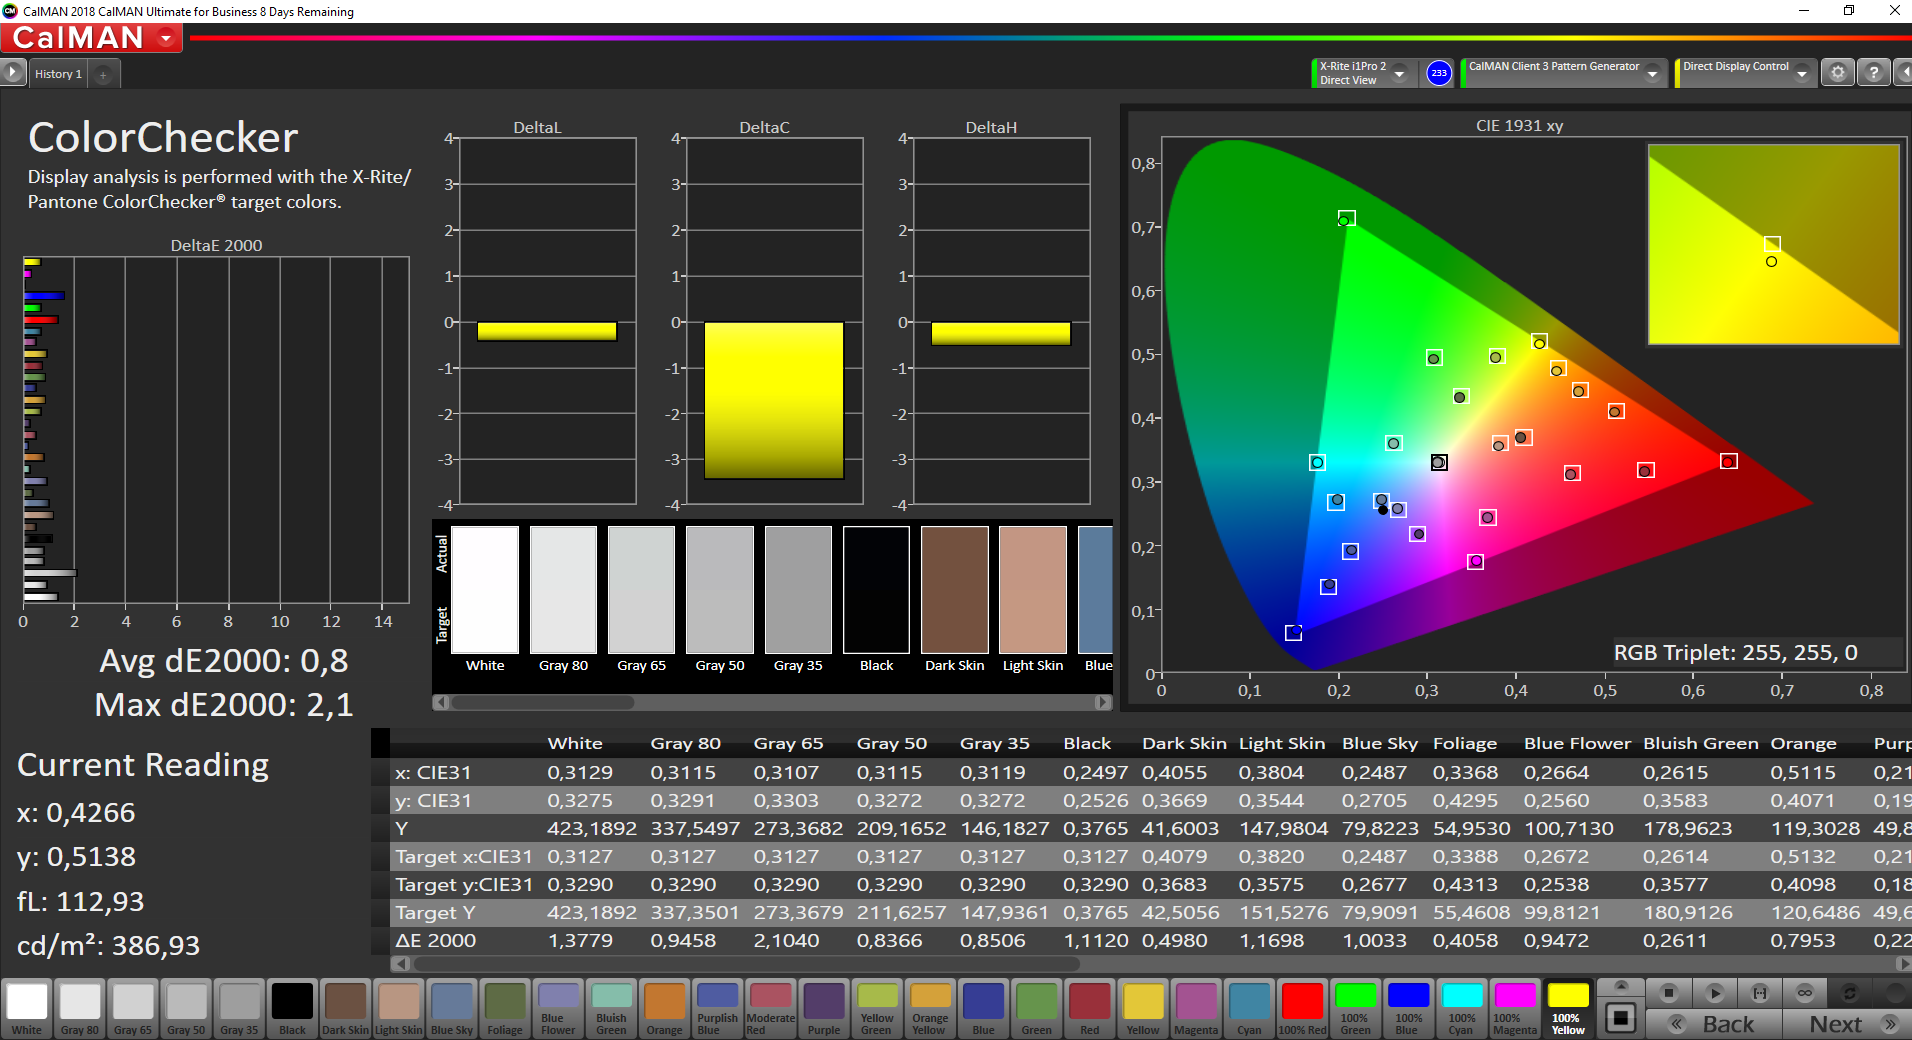
X-Rite i1 Pro 2 spektrofotometre ile bağlantılı ekran ölçümlerimiz için profesyonel CalMAN yazılımını kullandık. Daha önce fark ettiğimiz hafif kırmızı renk tonu bu testlerde tekrar ortaya çıktı, CalMAN ve spektrofotometre de gri tonlamayı etkilediğini doğruladı. Fabrika kalibrasyonu iyi bir şey olduğu için genel olarak şaşırdık. Hem gri tonlama hem de renkler için hedef değerlerden belirgin sapmalar vardır, örneğin, ek kalibrasyon ile ekranın tüm potansiyelinden yararlanmanın tek yolu. Sonuçlar da etkileyiciydi. Kısacası, NE156QUM-N66 mat 4K panelin ek kalibrasyona ihtiyacı var. Kalibre edilmiş ICC profilimizi karşılaştırma tablosumuzun üzerindeki kutudan indirebilirsiniz.
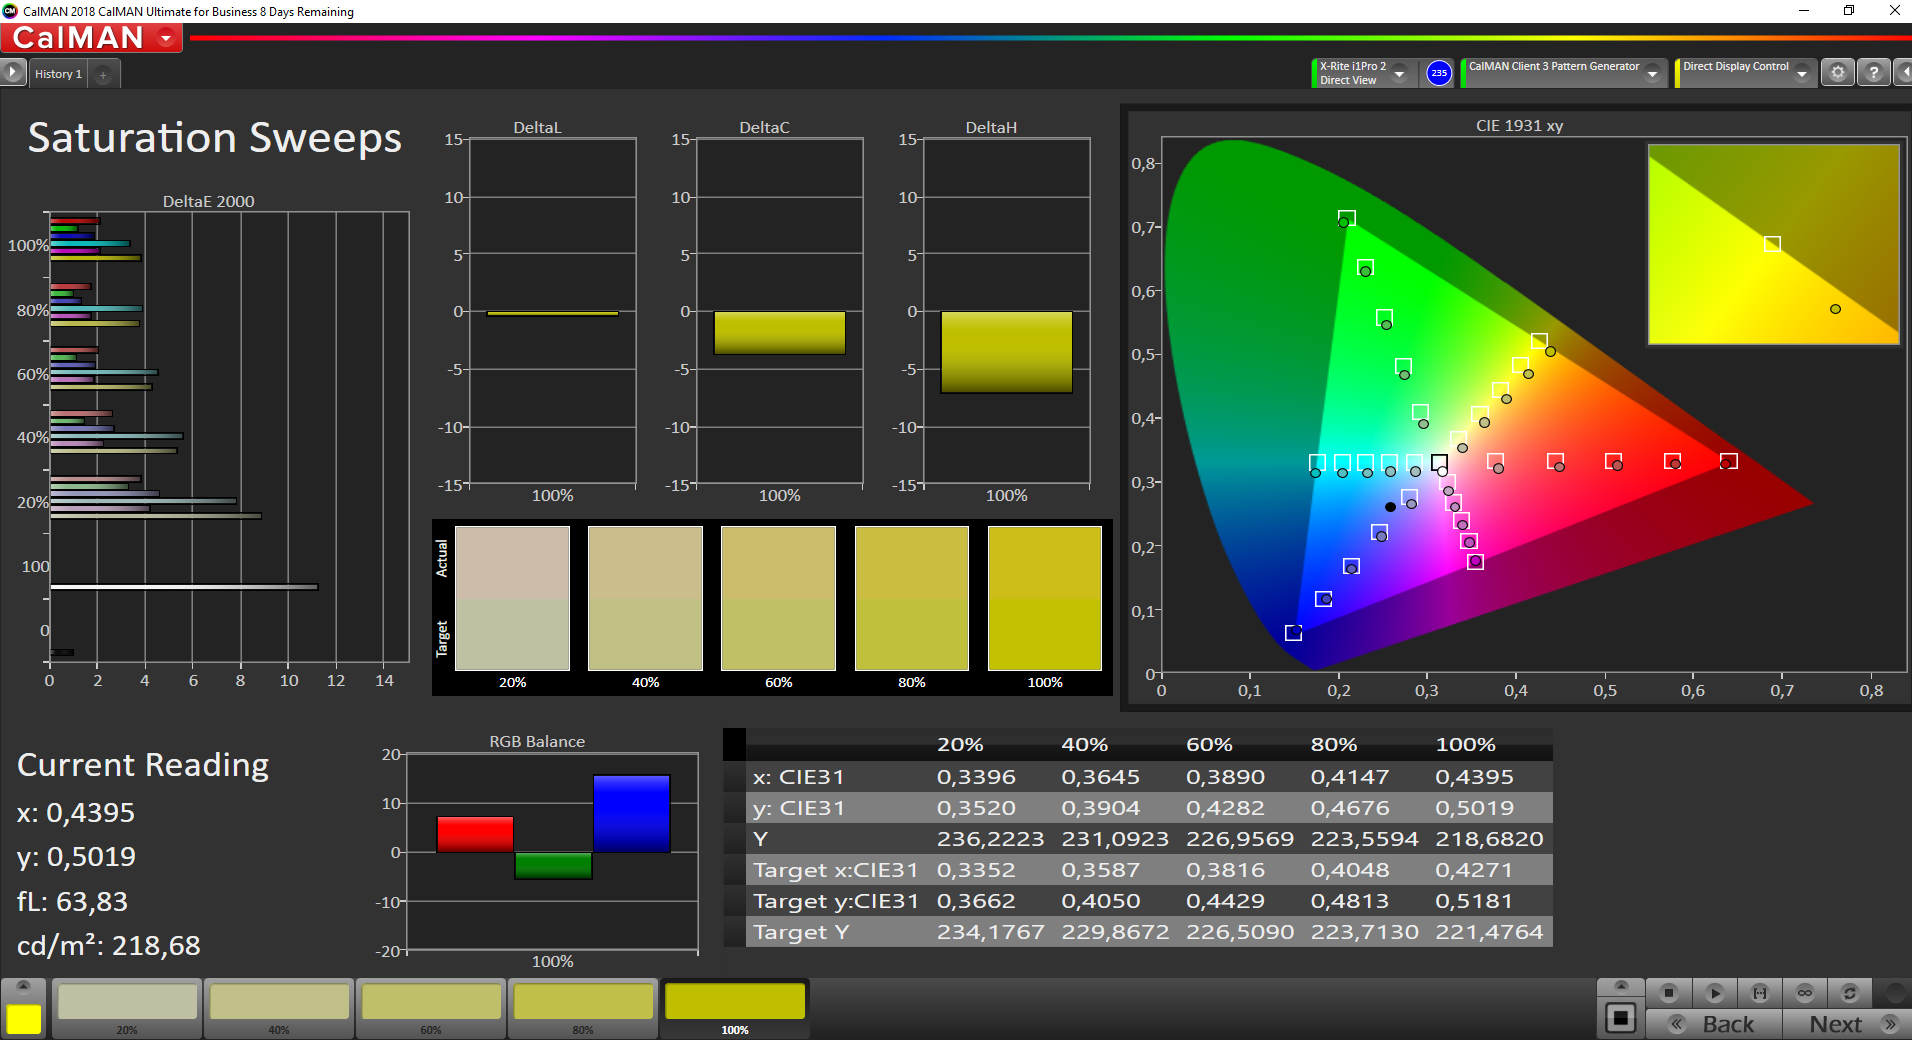
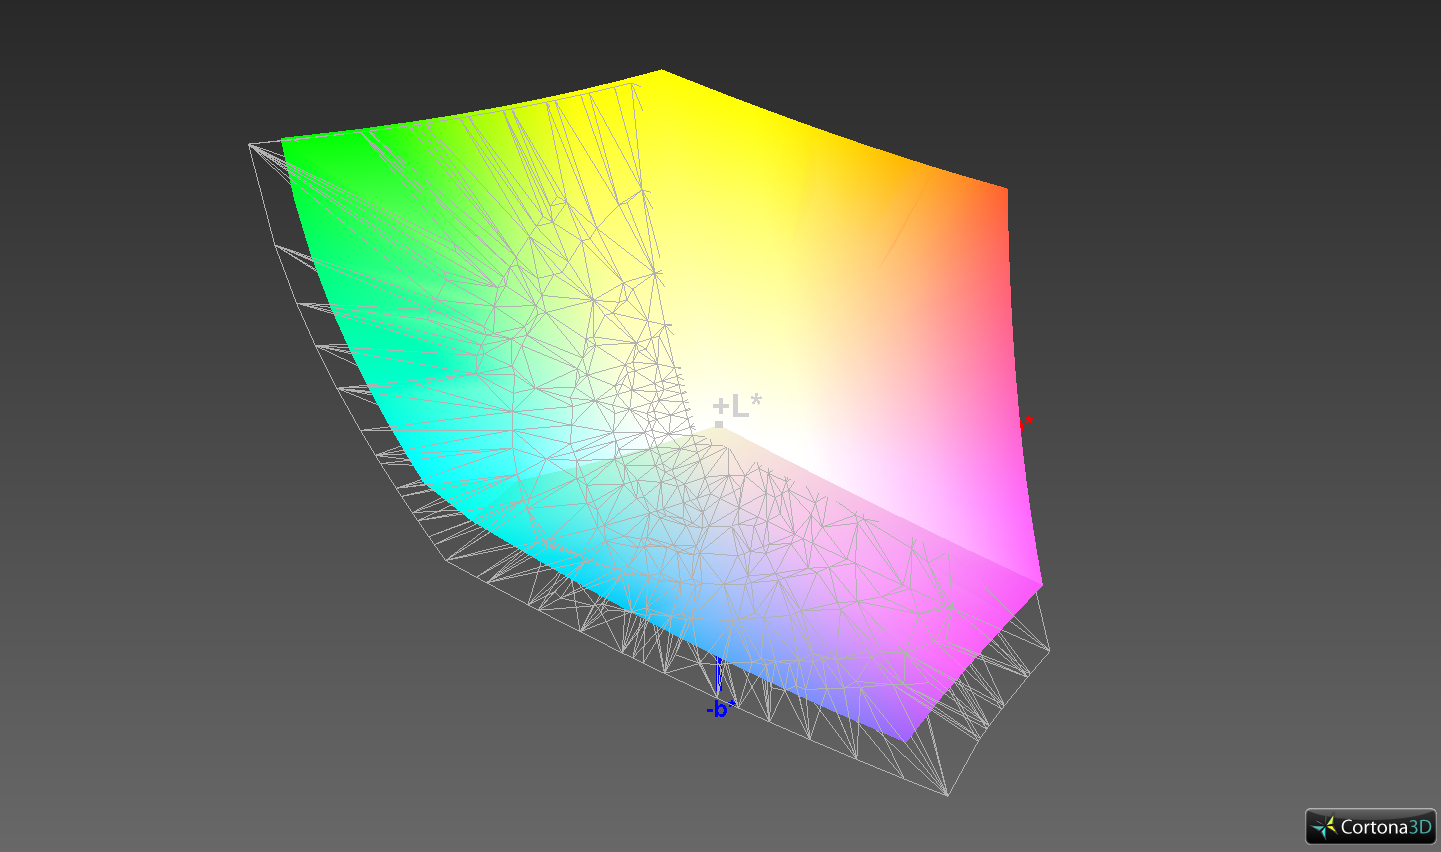
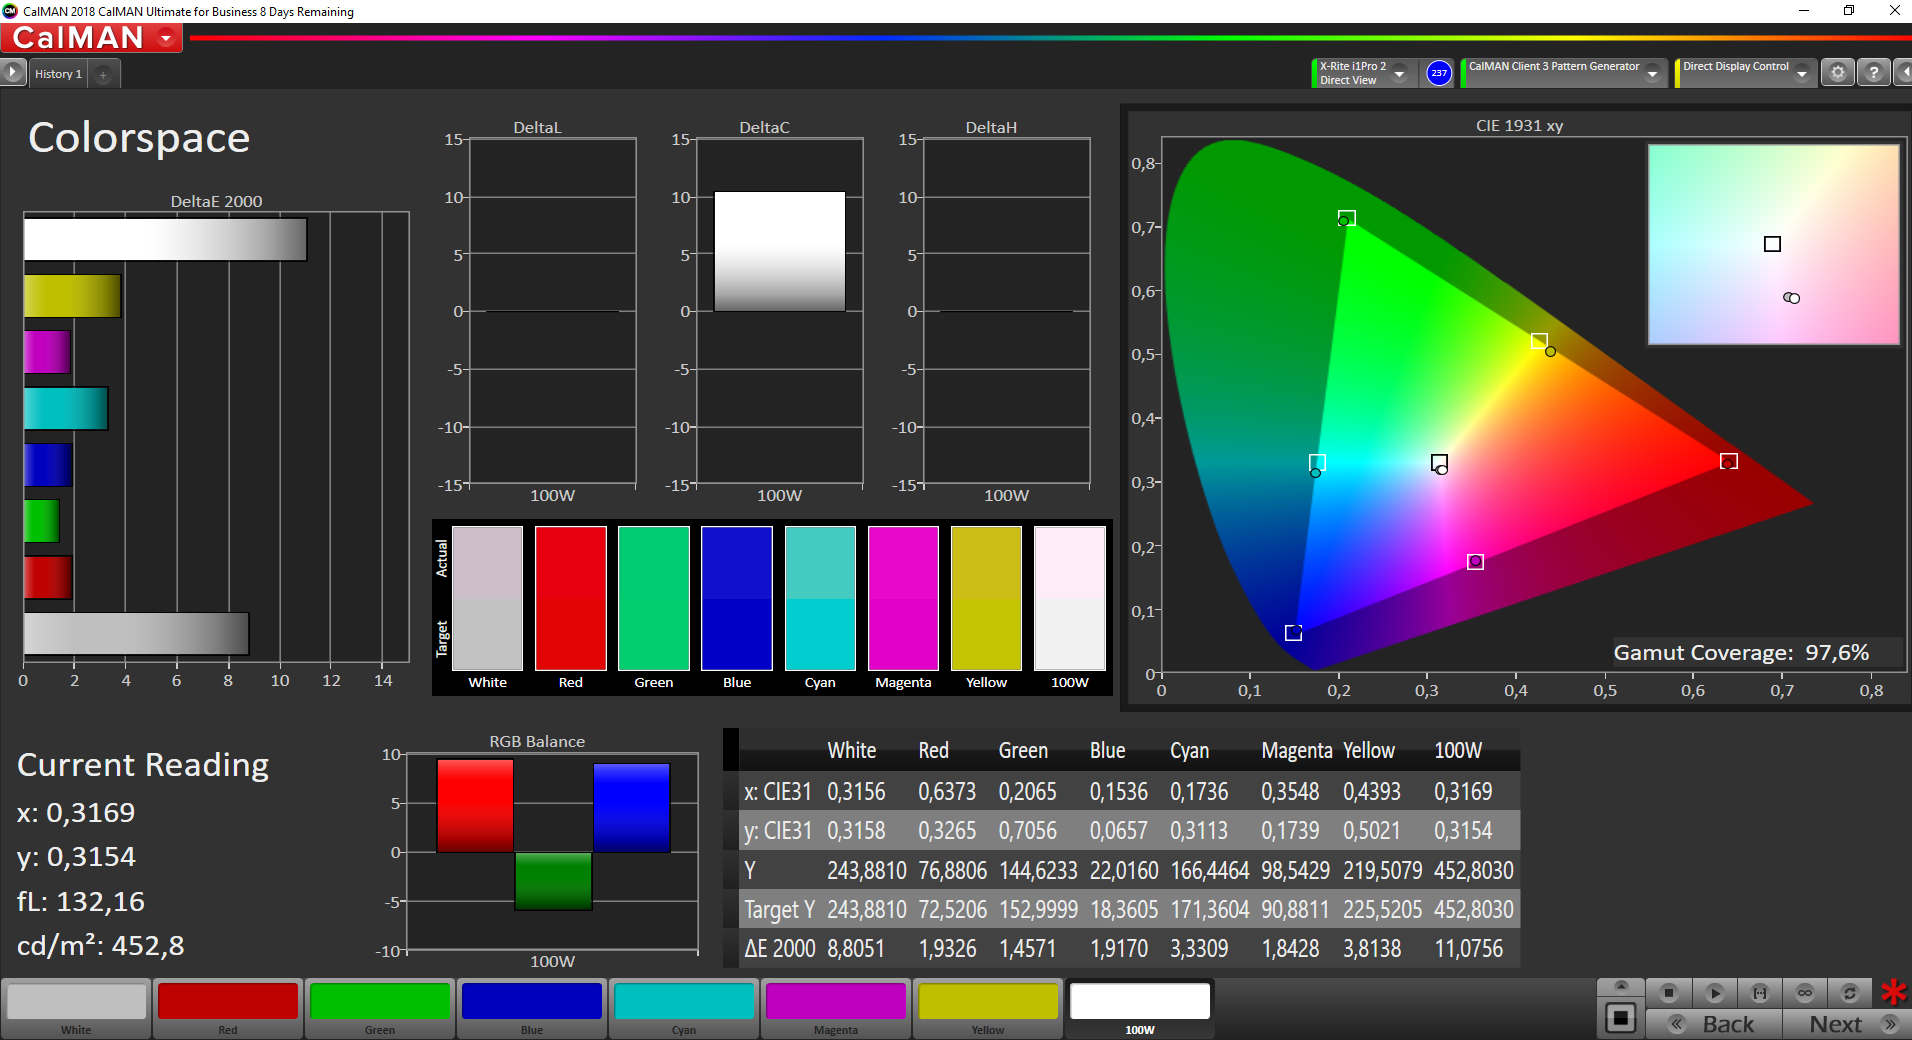
AdobeRGB renk alanını kullandığınız sürece, ekranı kalibre ettikten sonra fotoğraf düzenleme bir sorun oluşturmaz. Her zamanki gibi Lenovo, sRGB gibi ek renk uzayları için profil sunmuyor. Şirket% 100 AdobeRGB kapsamının reklamını yaparken, ne CalMAN ne de Argyll bunu onaylayamadı. Geçen yılın 4K paneli bu konuda biraz daha iyi performans gösterdi.

Yanıt Sürelerini Görüntüle
| ↔ Tepki Süresi Siyahtan Beyaza | ||
|---|---|---|
| 30.4 ms ... yükseliş ↗ ve sonbahar↘ birleşimi | ↗ 17.2 ms yükseliş | 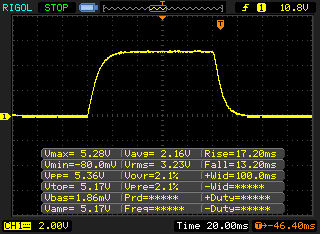 |
| ↘ 13.2 ms sonbahar | ||
| Ekran, testlerimizde yavaş yanıt oranları gösteriyor ve oyuncular için yetersiz olacaktır. Karşılaştırıldığında, test edilen tüm cihazlar 0.1 (minimum) ile 240 (maksimum) ms arasında değişir. » Tüm cihazların 82 %'si daha iyi. Bu, ölçülen yanıt süresinin test edilen tüm cihazların ortalamasından (19.8 ms) daha kötü olduğu anlamına gelir. | ||
| ↔ Tepki Süresi %50 Griden %80 Griye | ||
| 46.4 ms ... yükseliş ↗ ve sonbahar↘ birleşimi | ↗ 22 ms yükseliş | 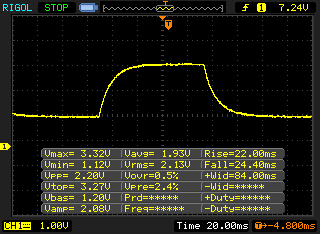 |
| ↘ 24.4 ms sonbahar | ||
| Ekran, testlerimizde yavaş yanıt oranları gösteriyor ve oyuncular için yetersiz olacaktır. Karşılaştırıldığında, test edilen tüm cihazlar 0.165 (minimum) ile 636 (maksimum) ms arasında değişir. » Tüm cihazların 80 %'si daha iyi. Bu, ölçülen yanıt süresinin test edilen tüm cihazların ortalamasından (31 ms) daha kötü olduğu anlamına gelir. | ||
Ekran Titremesi / PWM (Darbe Genişliği Modülasyonu)
| Ekran titriyor / PWM algılanmadı | 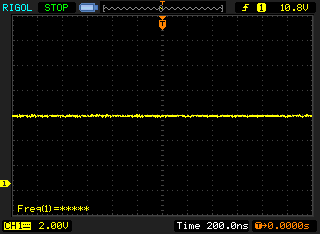 | ||
Karşılaştırıldığında: Test edilen tüm cihazların %52 %'si ekranı karartmak için PWM kullanmıyor. PWM tespit edilirse, ortalama 7763 (minimum: 5 - maksimum: 343500) Hz ölçüldü. | |||
Yine de, X1 Extreme Gen 2'yi açık havada kullanmayla ilgili herhangi bir sorunla karşılaşmadık. IPS panelinde de sabit izleme açıları vardır.

Performans - X1 Extreme Gen 2 potansiyelinin altında
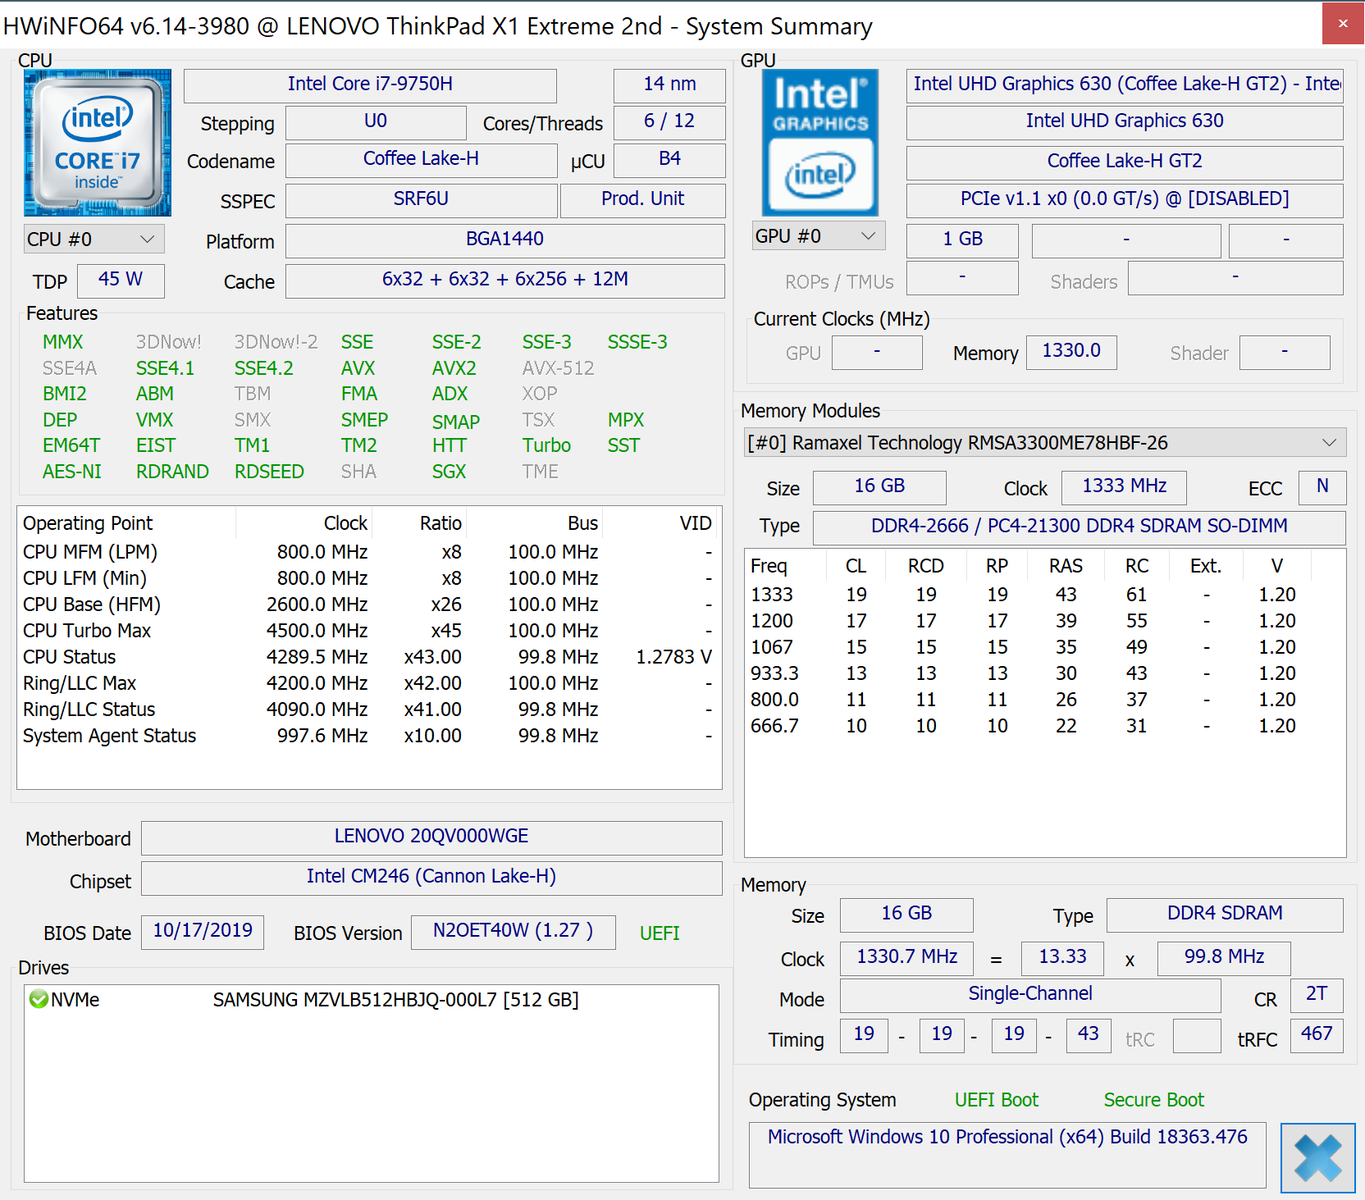

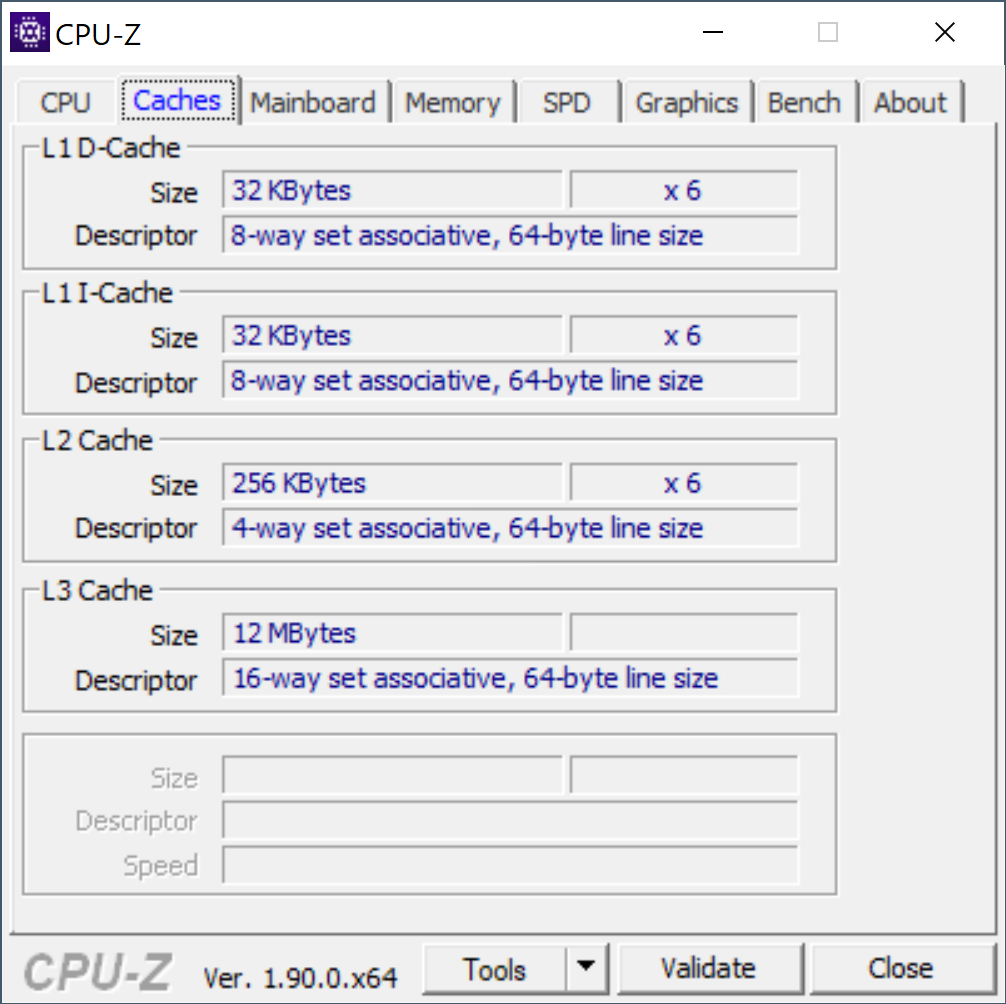
İşlemci - Core i7-9750H önceki modelden daha kötü performans gösteriyor
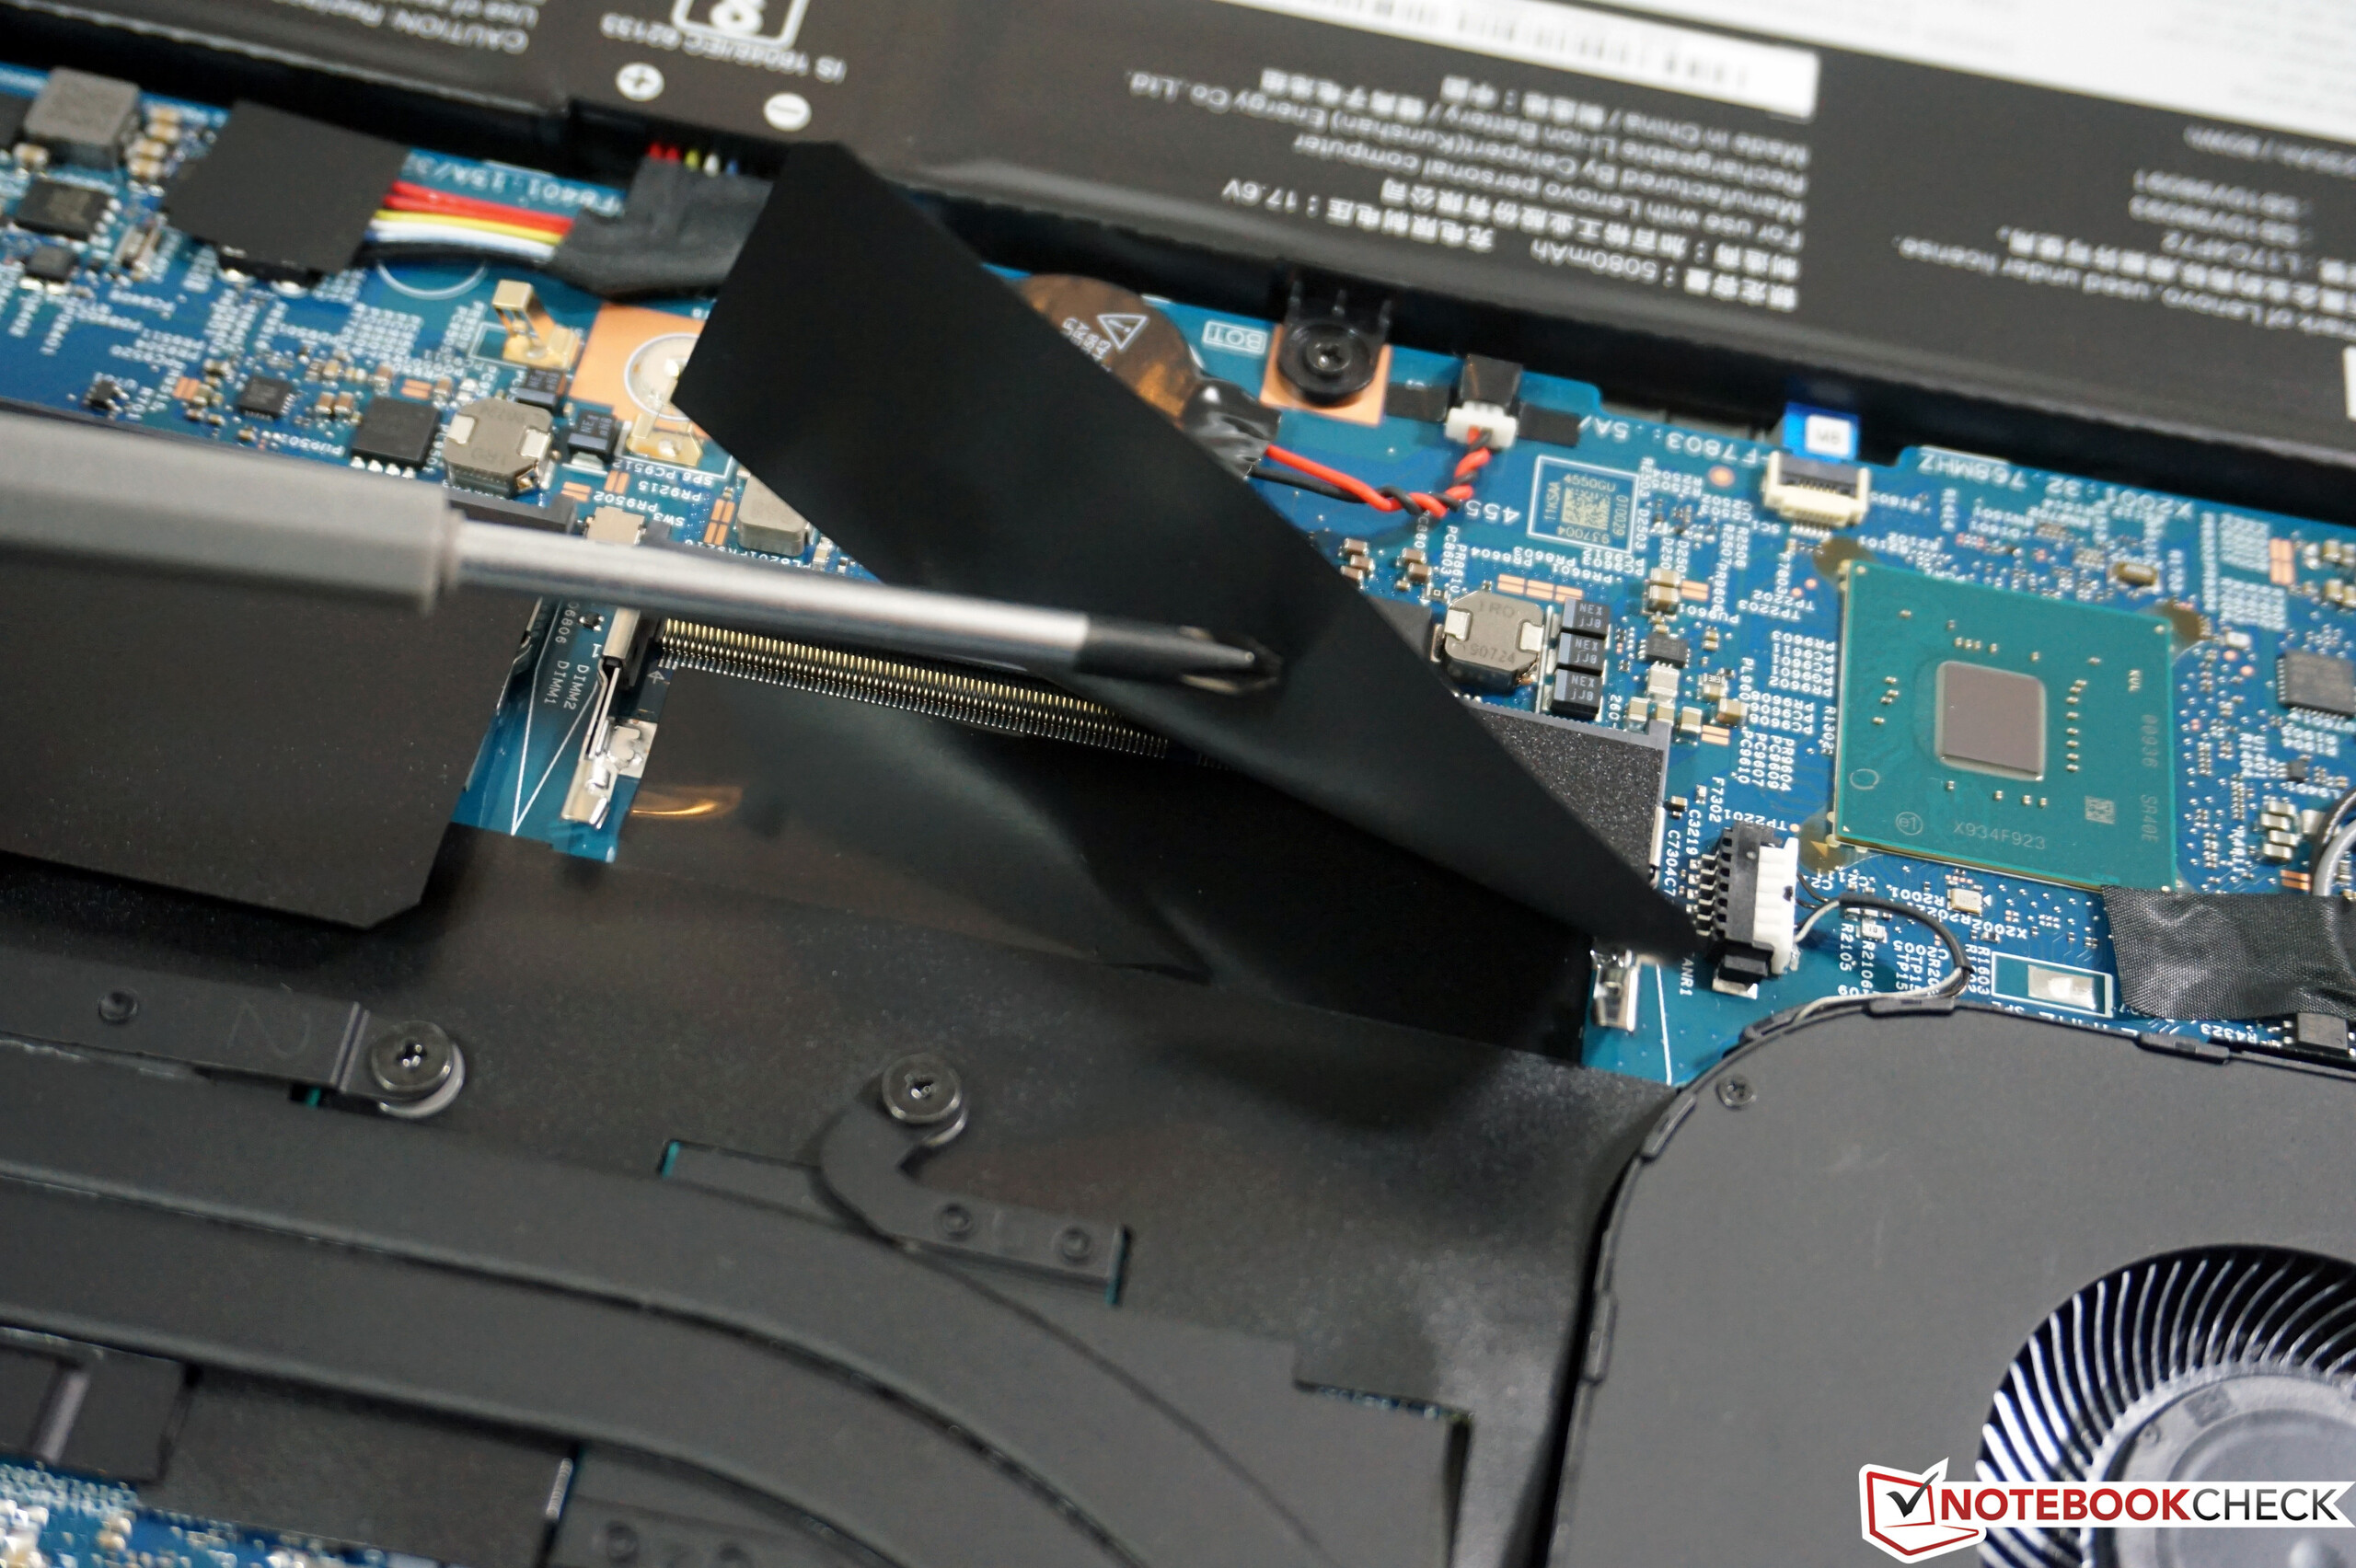
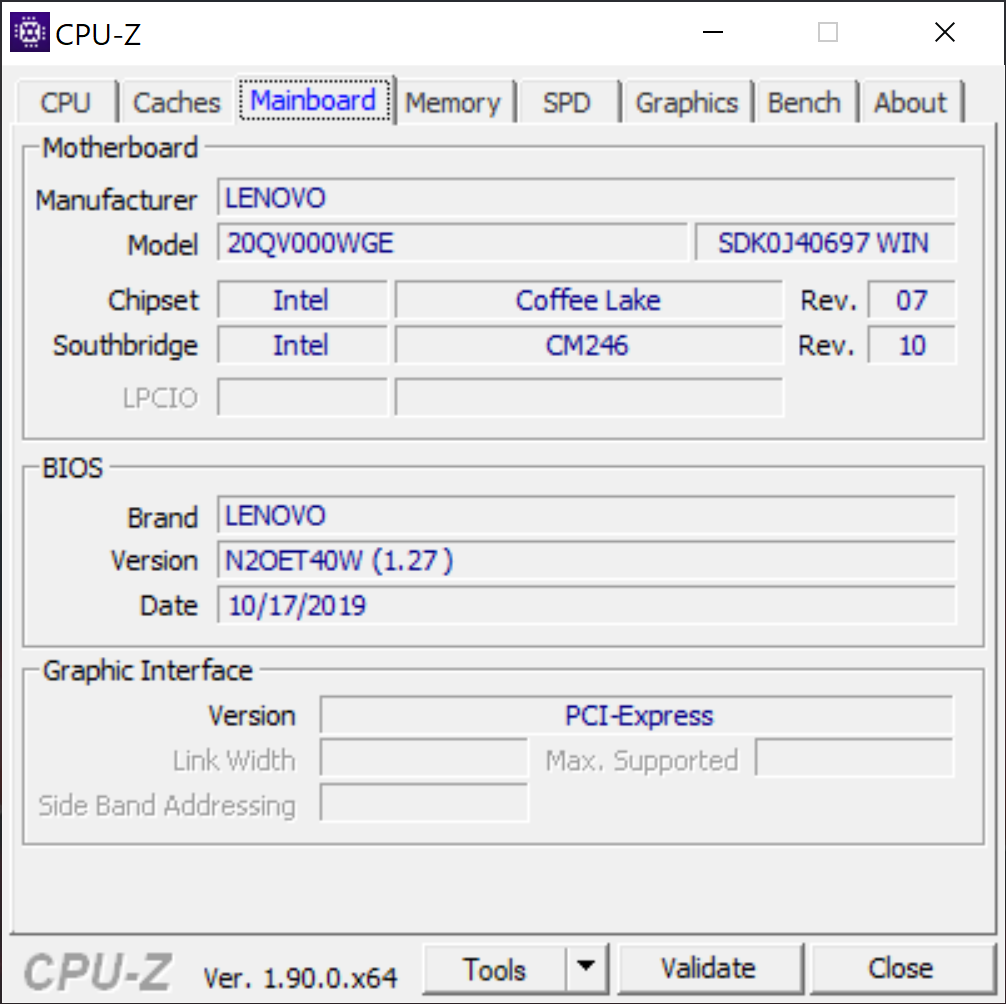
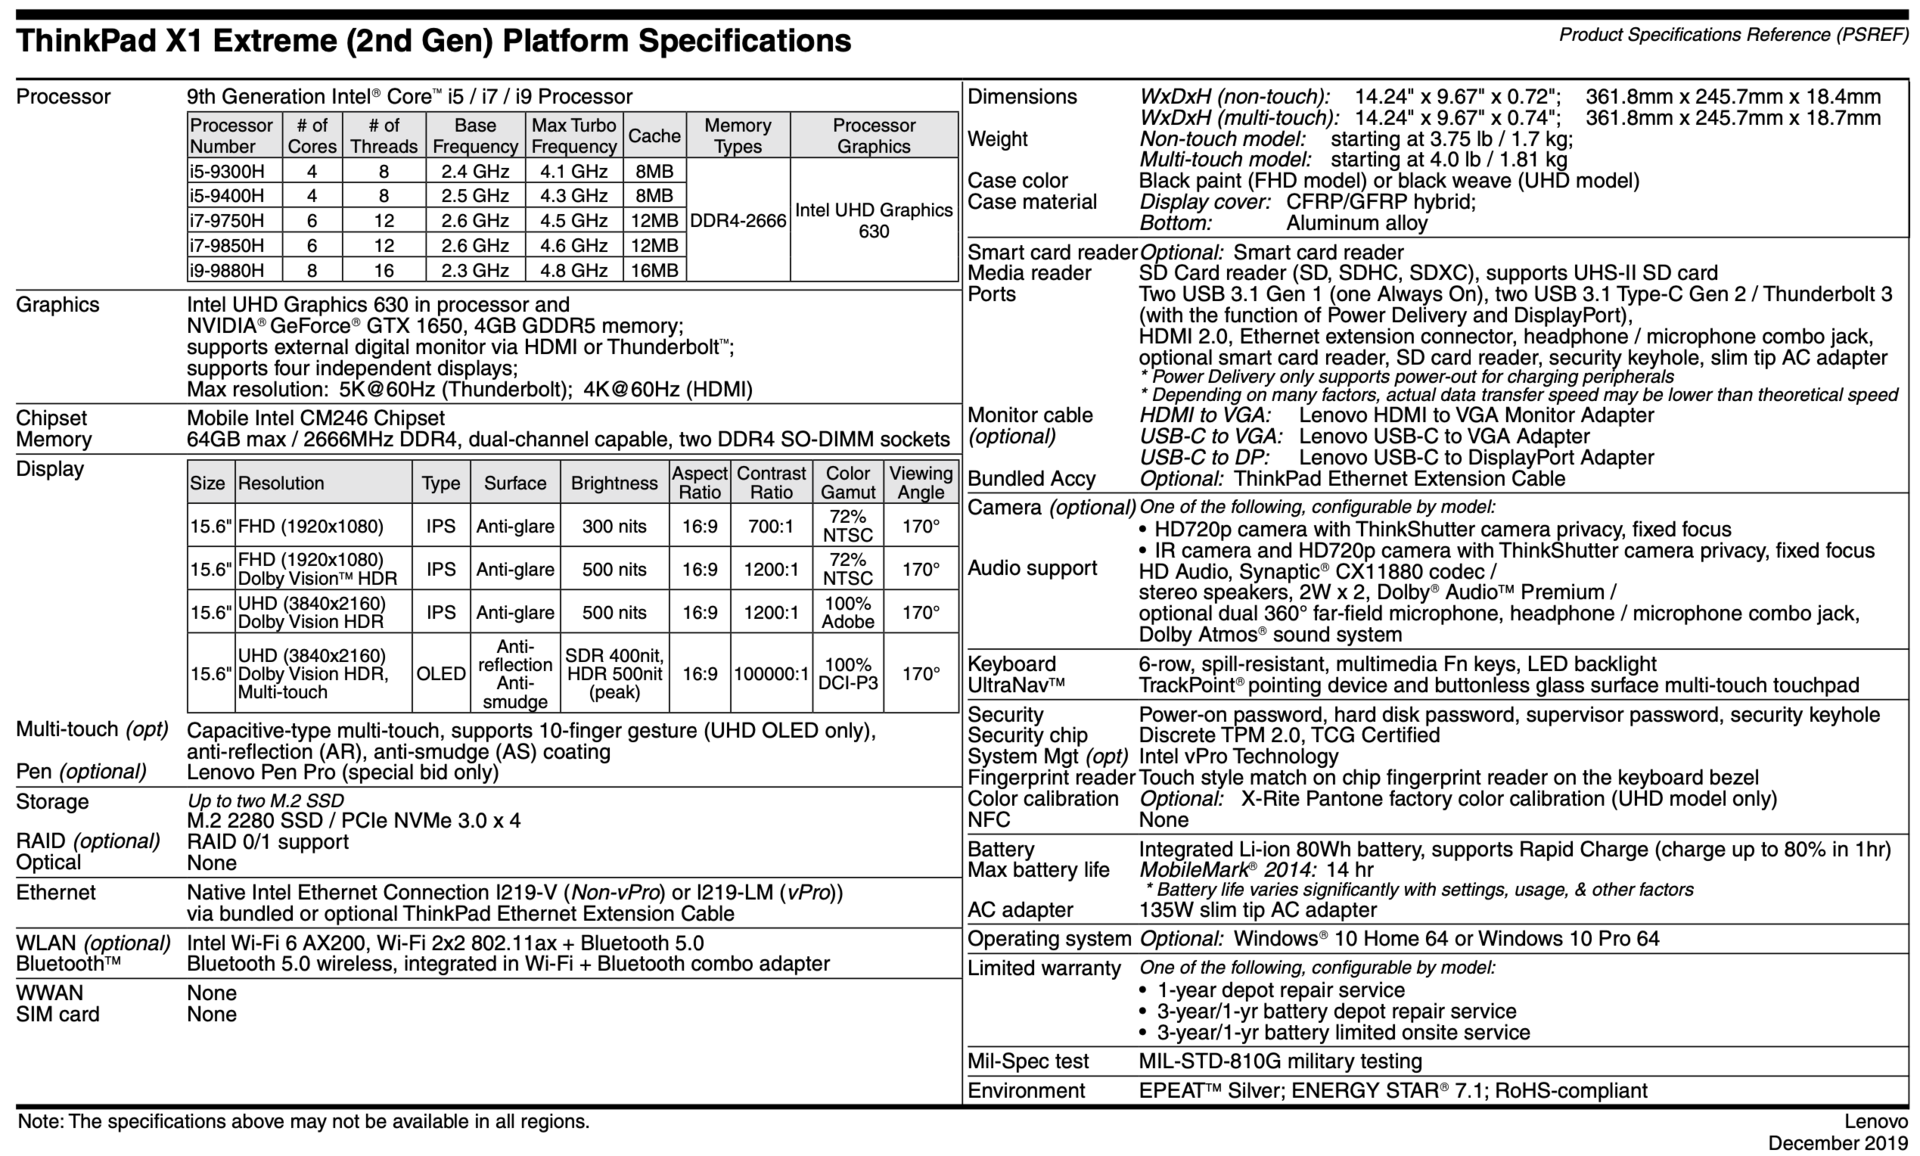
Lenovo, 4, 6 veya 8 yerel çekirdeğe sahip çeşitli Intel işlemciler sunar. Test cihazımızda 6 çekirdekli bir Coffee Lake Refresh işlemcisi olan Core i7-9750H'yi buluyoruz. Görsel olarak özdeş ThinkPad P1 2019'da olduğu gibi X1 Extreme Gen 2, CPU performansını yapay olarak kısıtlar. Kısa bir süre sonra, işlemci saf CPU yükü altında bile yalnızca 30 W tüketebilir. Pratikte bu, işlemcinin Cinebench R15 Multi 64Bit gibi kriterlerde tüm çekirdeklerde yalnızca 2.1-2.2 GHz'de çalışabileceği anlamına gelir. Bu talihsiz ve X1 Extreme Gen 2'nin selefinin altında olduğu anlamına geliyor. Örneğin, karşılaştırma grubumuzda, X1 Extreme Gen 2 yalnızca son sırada yer alabilir. Cihaz ayrıca pil gücündeki performansını da azaltır. CPU hakkında daha fazla kıyaslama ve bilgi için lütfen özel Core i7-9750H sayfamıza bakın.
Sistem Performansı - X1 Extreme Gen 2 günlük yaşamda iyi performans gösterir
Aynı şey, inceleme birimimizin genellikle karşılaştırma tablolarımızın altına yakın bittiği PCMark gibi sentetik karşılaştırmalar için de geçerlidir. Ancak, sonuçları hiçbir şekilde kötü değildir. Bu performans sorunları günlük yaşamda da göze çarpan bir kısıtlama göstermez, çünkü hızlı PCIe SSD sistemin hızlı tepki vermesine ve girdileri uygulamasına yardımcı olur.
| PCMark 8 Home Score Accelerated v2 | 3417 puan | |
| PCMark 8 Creative Score Accelerated v2 | 4836 puan | |
| PCMark 8 Work Score Accelerated v2 | 4241 puan | |
| PCMark 10 Score | 4535 puan | |
Yardım | ||

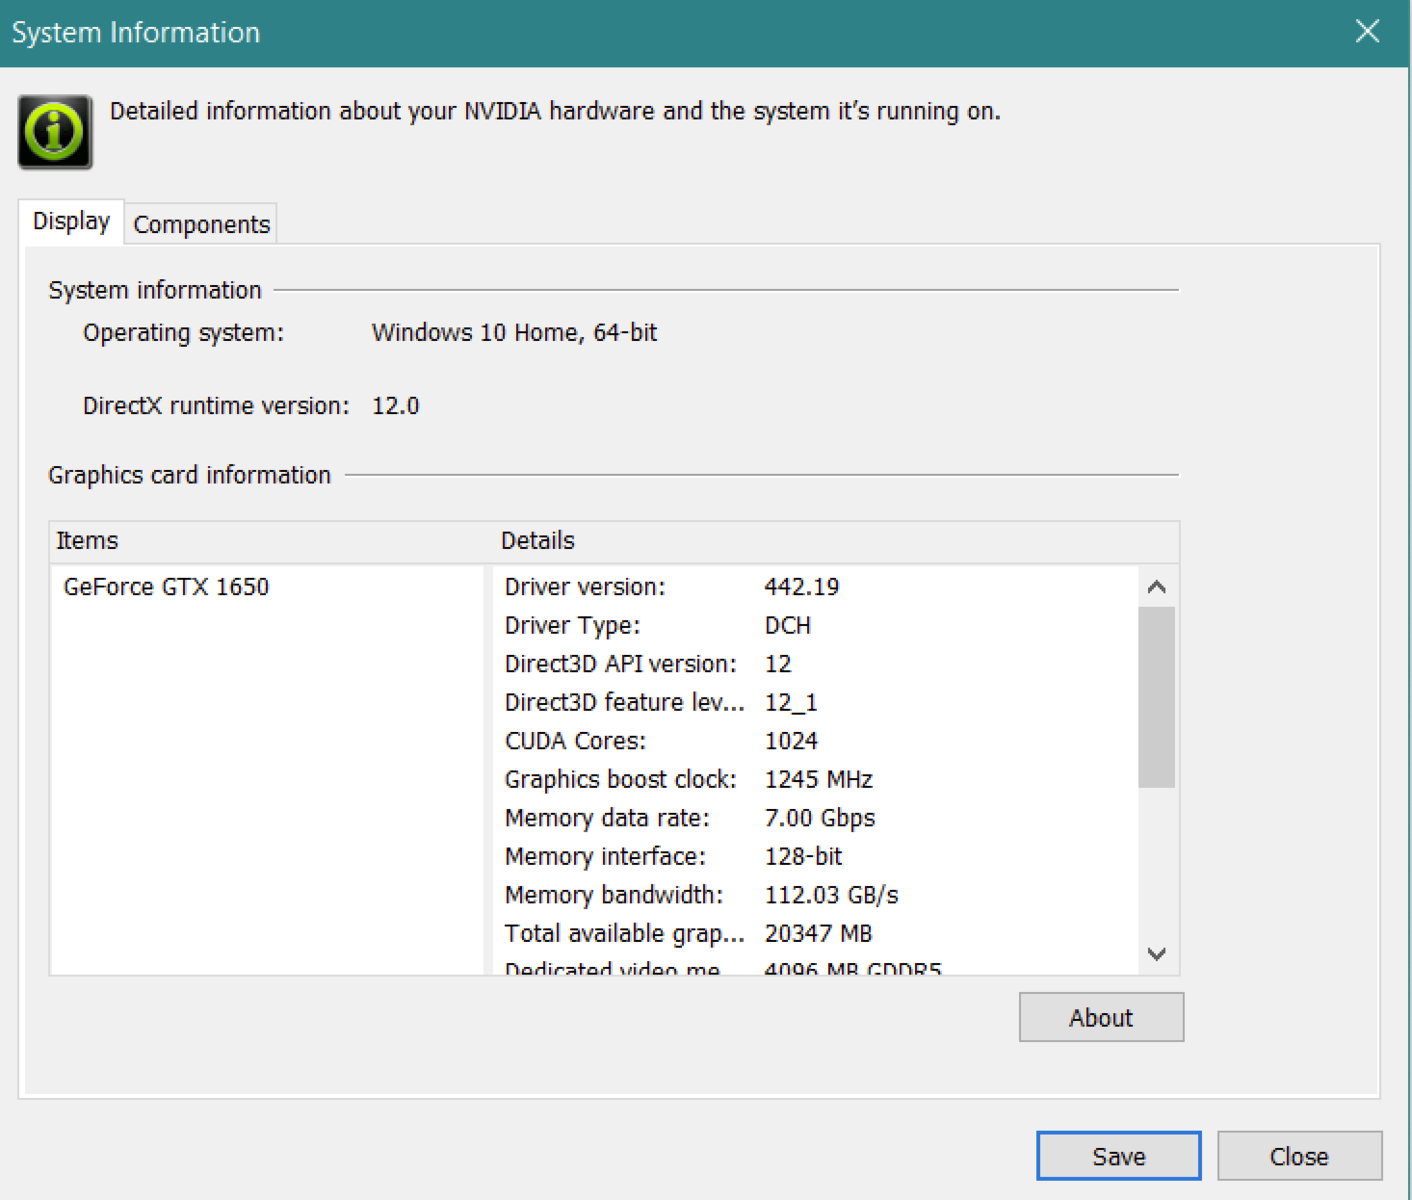
Ekran Kartı - GeForce GTX 1650 veya GTX 1650 Max-Q?
OEM'ler her zaman NVIDIA GeForce Max-Q GPU'lu dizüstü bilgisayarlara sahip olduklarını açıklamadıkları için, Lenovo'nun X1 Extreme Gen 2'de GeForce GTX 1650 veya daha yavaş GeForce GTX 1650 Max-Q'yu seçip seçmediğinden emin değildik. NVIDIA'daki irtibatlarımıza göre, sürücü bilgileri bir dizüstü bilgisayarın hangi modeline sahip olduğunu ortaya koymalıdır. Bu durumda, sürücü GeForce GTX 1650'yi rapor eder. Bu aynı zamanda selefinde bulunan GeForce GTX 1050 Ti ile karşılaştırıldığında bir yükseltmedir, ancak inceleme birimimiz de GPU'dan en iyi şekilde yararlanamaz. veritabanımızdaki diğer GeForce GTX 1650 destekli cihazlar, X1 Extreme'deki GPU yaklaşık% 15 daha yavaştır ve bunun yerine GeForce GTX 1650 Max-Q seviyesine yerleştirir. Bu nedenle önceki GeForce GTX 1050 Ti'nin selefine göre avantajı oldukça küçük. GPU, inceleme birimimizin% 99,2 ile sorunsuz bir şekilde geçtiği 3DMark Time Spy stres testi ile kanıtlandığı gibi, uzun süreli yük altında bile istikrarlı bir performans sergiliyor. Ancak, pil gücüyle çalışırken cihaz GPU performansını daraltır. Cihaz, örneğin, pil gücüyle ilgili olarak Fire Strike Graphics'te 7.045 puan kazandı. Sonuç olarak, sonuçlar pratik olarak Quadro T1000 destekli ThinkPad P1 2019 ile aynıdır.
| 3DMark 11 Performance | 10546 puan | |
| 3DMark Fire Strike Score | 6909 puan | |
| 3DMark Fire Strike Extreme Score | 3425 puan | |
| 3DMark Time Spy Score | 3080 puan | |
Yardım | ||
Oyun Performansı
Grafik performansı ile ilgili gözlemlerimiz oyun performansı için de geçerlidir. Performans açısından, X1 Extreme Gen 2, GeForce GTX 1650 Max-Q seviyesinde, normal GeForce GTX 1650'den daha fazladır. Bununla birlikte, genellikle ihtiyacınız olsa bile, 15.6 inçlik dizüstü bilgisayar en güncel oyunları oynamak için uygundur en yüksek grafik ayarlarında çalıştırmadan mücadele edin. Oyun sırasında da GPU performansı sabit kalır.
| düşük | orta | yüksek | ultra | 4K | |
|---|---|---|---|---|---|
| The Witcher 3 (2015) | 160.2 | 102.6 | 55.4 | 29.9 | 19.6 |
| Dota 2 Reborn (2015) | 121 | 109 | 94 | 89 | 43.6 |
| Rise of the Tomb Raider (2016) | 154.9 | 102.8 | 57.8 | 47.3 | 20.2 |
| X-Plane 11.11 (2018) | 90 | 68 | 59.2 | ||
| GRID 2019 (2019) | 98.2 | 67.3 | 51.7 | 34.3 | 13.5 |
Emisyonlar - X1 Extreme artık daha sessiz fanlara sahip
Fan Gürültüsü
ThinkPad P1 2019 gibi, X1 Extreme Gen 2'deki fanlar da selefinden daha sessiz çalışıyor. Genel olarak, X1 Extreme Gen 2 nispeten sessiz bir dizüstü bilgisayar, fanları genellikle kısa yük zirvelerinde bile kapalı kalıyor. X1 Extreme Gen 2 genellikle günlük yaşamda da sessizce çalışır ve test cihazımızdan yayılan bobin suyunu duyamıyoruz. Kısacası X1 Extreme Gen 2, karşılaştırma alanımızdaki en sessiz cihazlardan biridir.
Ses yüksekliği
| Boşta |
| 28.5 / 28.5 / 28.5 dB |
| Çalışırken |
| 36.3 / 36.3 dB |
 | ||
30 dB sessiz 40 dB(A) duyulabilirlik 50 dB(A) gürültülü |
||
min: | ||
| Lenovo ThinkPad X1 Extreme 2019 20QV000WGE GeForce GTX 1650 Mobile, i7-9750H, Samsung SSD PM981 MZVLB512HAJQ | Dell XPS 15 7590 9980HK GTX 1650 GeForce GTX 1650 Mobile, i9-9980HK, Toshiba XG6 KXG60ZNV1T02 | Apple MacBook Pro 16 2019 i9 5500M Radeon Pro 5500M, i9-9880H, Apple SSD AP1024 7171 | Acer ConceptD 7 CN715-71-743N GeForce RTX 2060 Mobile, i7-9750H, WDC PC SN720 SDAPNTW-512G | Lenovo Yoga C940-15IRH GeForce GTX 1650 Max-Q, i7-9750H, Intel Optane Memory H10 with Solid State Storage 32GB + 512GB HBRPEKNX0202A(L/H) | MSI Prestige 15 A10SC GeForce GTX 1650 Max-Q, i7-10710U, Samsung SSD PM981 MZVLB1T0HALR | Lenovo ThinkPad X1 Extreme-20MF000XGE GeForce GTX 1050 Ti Max-Q, i7-8750H, Samsung SSD PM981 MZVLB1T0HALR | |
|---|---|---|---|---|---|---|---|
| Noise | -12% | -13% | -13% | -11% | -6% | -3% | |
| kapalı / ortam * (dB) | 28.5 | 28.2 1% | 29.8 -5% | 30.4 -7% | 28.7 -1% | 29.3 -3% | 28.8 -1% |
| Idle Minimum * (dB) | 28.5 | 28.2 1% | 29.9 -5% | 30.6 -7% | 28.7 -1% | 30.1 -6% | 28.8 -1% |
| Idle Average * (dB) | 28.5 | 28.2 1% | 29.9 -5% | 30.6 -7% | 28.8 -1% | 30.2 -6% | 28.8 -1% |
| Idle Maximum * (dB) | 28.5 | 30.4 -7% | 29.9 -5% | 30.6 -7% | 28.8 -1% | 30.2 -6% | 31.3 -10% |
| Load Average * (dB) | 36.3 | 43.8 -21% | 43 -18% | 44 -21% | 45 -24% | 31.5 13% | 36.4 -0% |
| Witcher 3 ultra * (dB) | 36.3 | 47.2 -30% | 45.4 -25% | 43.9 -21% | 44.7 -23% | 37 -2% | 36.4 -0% |
| Load Maximum * (dB) | 36.3 | 47.2 -30% | 46.1 -27% | 44.2 -22% | 44.7 -23% | 47 -29% | 39.2 -8% |
* ... daha küçük daha iyidir
Sıcaklık
Sıcaklıklar selefine kıyasla nispeten sabit kalır. Örneğin, daha az zorlu görevlerle ilgili herhangi bir sorun yoktur. Şasi yalnızca yük altında fark edilir derecede ısınır, bu sırada cihazı uyluklarınıza bırakmamalısınız. Yazarken parmaklarımızın da ısındığını gördük, ancak burada herhangi bir kısıtlama yok.
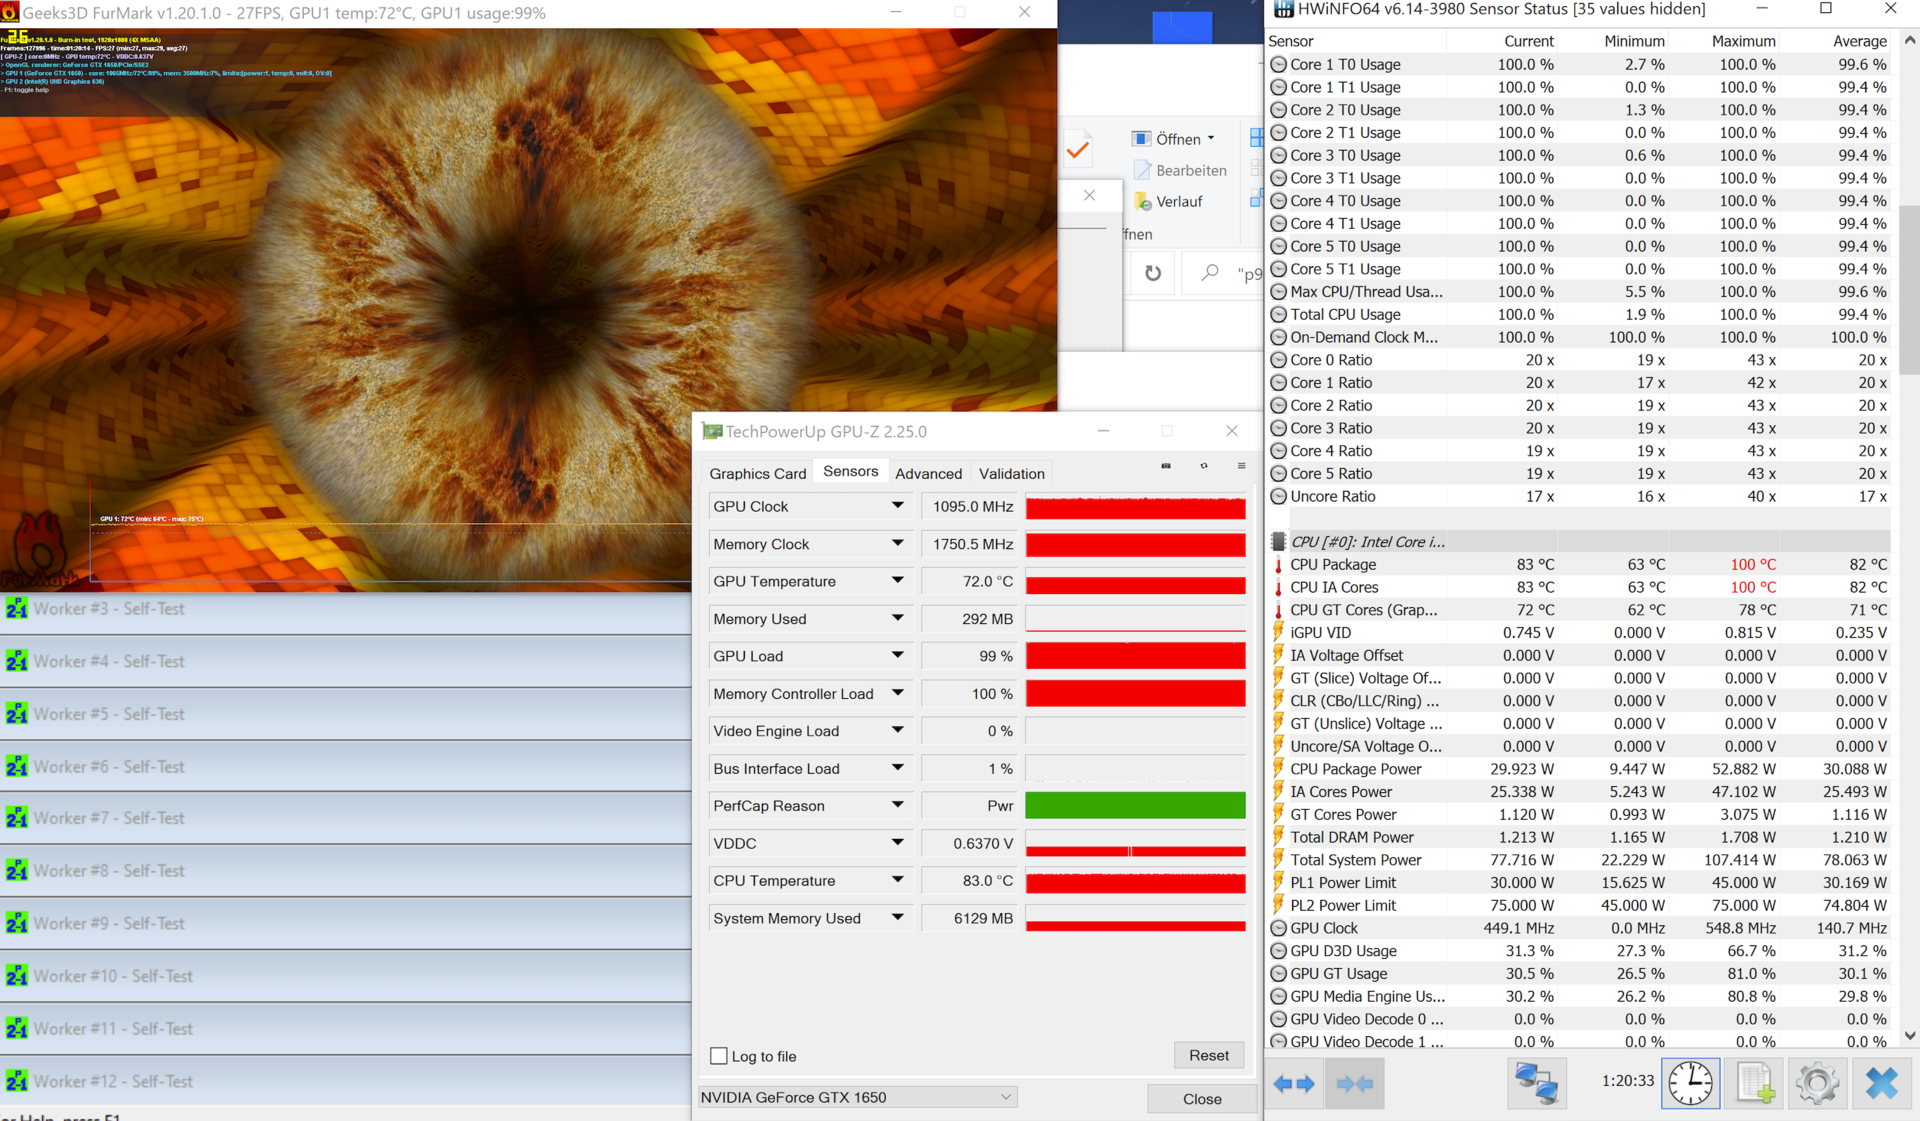
İnceleme birimimiz stres testimizde iyi performans göstermedi. Yine, CPU kısa bir süre sonra 30 W'a düşüyor ve sadece 1.9 ve 2.0 GHz arasında tüm çekirdek saat hızını koruyabiliyor. GPU ise sürekli 1.090 MHz civarında oturuyordu. Stres testinden sonra da herhangi bir kısıtlama ile karşılaşmadık.
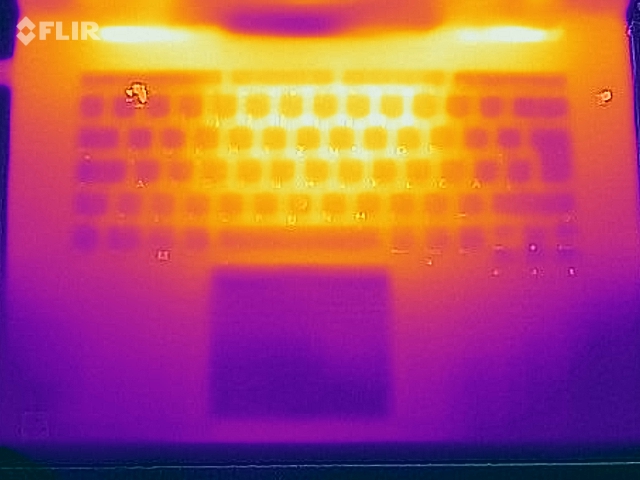
(-) Üst taraftaki maksimum sıcaklık, 36.8 °C / 98 F ortalamasına kıyasla 46.8 °C / 116 F'dir. , Multimedia sınıfı için 21 ile 71 °C arasında değişir.
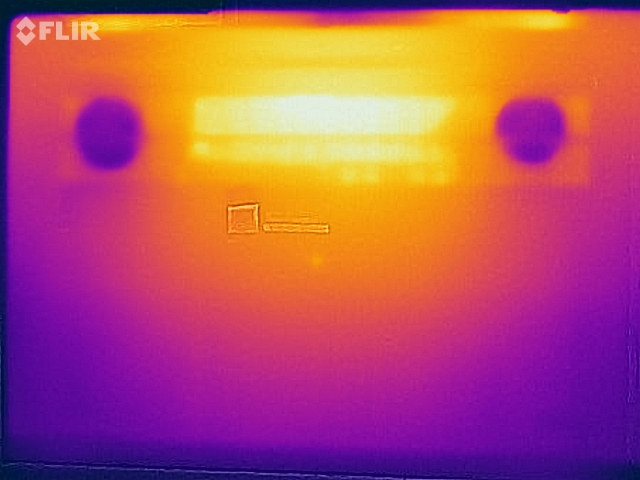
(-) Alt kısım, 39.1 °C / 102 F ortalamasına kıyasla maksimum 52.4 °C / 126 F'ye kadar ısınır
(+) Boşta kullanımda, üst tarafın ortalama sıcaklığı 24 °C / 75 F olup, cihazın 31.3 °C / 88 F.
(±) The Witcher 3 oynarken, üst tarafın ortalama sıcaklığı 37.3 °C / 99 F olup, cihazın 31.3 °C / 88 F.
(+) Avuç içi dayanakları ve dokunmatik yüzey, maksimum 31.9 °C / 89.4 F ile cilt sıcaklığından daha soğuktur ve bu nedenle dokunulduğunda soğuktur.
(-) Benzer cihazların avuç içi dayanağı alanının ortalama sıcaklığı 28.7 °C / 83.7 F (-3.2 °C / -5.7 F) idi.
Hoparlörler
Lenovo ThinkPad X1 Extreme 2019 20QV000WGE ses analizi
(±) | hoparlör ses yüksekliği ortalama ama iyi (73.1 dB)
Bas 100 - 315Hz
(±) | azaltılmış bas - ortalama olarak medyandan 8.6% daha düşük
(±) | Bas doğrusallığı ortalamadır (11.9% delta - önceki frekans)
Ortalar 400 - 2000 Hz
(±) | daha yüksek ortalar - ortalama olarak medyandan 7.7% daha yüksek
(±) | Ortaların doğrusallığı ortalamadır (7.5% delta - önceki frekans)
Yüksekler 2 - 16 kHz
(±) | azaltılmış yüksekler - ortalama olarak medyandan 6.1% daha düşük
(±) | Yükseklerin doğrusallığı ortalamadır (7.5% delta - önceki frekans)
Toplam 100 - 16.000 Hz
(±) | Genel sesin doğrusallığı ortalamadır (24.2% ortancaya göre fark)
Aynı sınıfla karşılaştırıldığında
» Bu sınıftaki tüm test edilen cihazların %85%'si daha iyi, 5% benzer, 9% daha kötüydü
» En iyisinin deltası 5% idi, ortalama 17% idi, en kötüsü 45% idi
Test edilen tüm cihazlarla karşılaştırıldığında
» Test edilen tüm cihazların %73'si daha iyi, 6 benzer, % 21 daha kötüydü
» En iyisinin deltası 4% idi, ortalama 23% idi, en kötüsü 134% idi
Dell XPS 15 7590 9980HK GTX 1650 ses analizi
(+) | hoparlörler nispeten yüksek sesle çalabilir (88.4 dB)
Bas 100 - 315Hz
(-) | neredeyse hiç bas yok - ortalama olarak medyandan 24.9% daha düşük
(±) | Bas doğrusallığı ortalamadır (14.4% delta - önceki frekans)
Ortalar 400 - 2000 Hz
(+) | dengeli ortalar - medyandan yalnızca 2.8% uzakta
(±) | Ortaların doğrusallığı ortalamadır (7.8% delta - önceki frekans)
Yüksekler 2 - 16 kHz
(+) | dengeli yüksekler - medyandan yalnızca 1.9% uzakta
(+) | yüksekler doğrusaldır (5.3% deltadan önceki frekansa)
Toplam 100 - 16.000 Hz
(±) | Genel sesin doğrusallığı ortalamadır (17.8% ortancaya göre fark)
Aynı sınıfla karşılaştırıldığında
» Bu sınıftaki tüm test edilen cihazların %52%'si daha iyi, 7% benzer, 41% daha kötüydü
» En iyisinin deltası 5% idi, ortalama 17% idi, en kötüsü 45% idi
Test edilen tüm cihazlarla karşılaştırıldığında
» Test edilen tüm cihazların %36'si daha iyi, 8 benzer, % 56 daha kötüydü
» En iyisinin deltası 4% idi, ortalama 23% idi, en kötüsü 134% idi
Apple MacBook Pro 16 2019 i9 5500M ses analizi
(+) | hoparlörler nispeten yüksek sesle çalabilir (82.3 dB)
Bas 100 - 315Hz
(+) | iyi bas - medyandan yalnızca 2.3% uzakta
(+) | bas doğrusaldır (5% delta ile önceki frekans)
Ortalar 400 - 2000 Hz
(+) | dengeli ortalar - medyandan yalnızca 2.7% uzakta
(+) | orta frekanslar doğrusaldır (3.4% deltadan önceki frekansa)
Yüksekler 2 - 16 kHz
(+) | dengeli yüksekler - medyandan yalnızca 2.1% uzakta
(+) | yüksekler doğrusaldır (2.6% deltadan önceki frekansa)
Toplam 100 - 16.000 Hz
(+) | genel ses doğrusaldır (6.9% ortancaya göre fark)
Aynı sınıfla karşılaştırıldığında
» Bu sınıftaki tüm test edilen cihazların %5%'si daha iyi, 1% benzer, 94% daha kötüydü
» En iyisinin deltası 5% idi, ortalama 17% idi, en kötüsü 45% idi
Test edilen tüm cihazlarla karşılaştırıldığında
» Test edilen tüm cihazların %1'si daha iyi, 0 benzer, % 99 daha kötüydü
» En iyisinin deltası 4% idi, ortalama 23% idi, en kötüsü 134% idi
Güç Yönetimi - 4K panel pil ömrünü etkiler
Güç tüketimi
| Kapalı / Bekleme modu | |
| Boşta | |
| Çalışırken |
|
Key:
min: | |
| Lenovo ThinkPad X1 Extreme 2019 20QV000WGE i7-9750H, GeForce GTX 1650 Mobile, Samsung SSD PM981 MZVLB512HAJQ, IPS, 3840x2160, 15.6" | Lenovo ThinkPad P1 2019-20QT000RGE i7-9850H, Quadro T1000 (Laptop), WDC PC SN720 SDAQNTW-512G, IPS LED, 1920x1080, 15.6" | Dell XPS 15 7590 9980HK GTX 1650 i9-9980HK, GeForce GTX 1650 Mobile, Toshiba XG6 KXG60ZNV1T02, OLED, 3840x2160, 15.6" | Apple MacBook Pro 16 2019 i9 5500M i9-9880H, Radeon Pro 5500M, Apple SSD AP1024 7171, IPS, 3072x1920, 16" | Acer ConceptD 7 CN715-71-743N i7-9750H, GeForce RTX 2060 Mobile, WDC PC SN720 SDAPNTW-512G, IPS, 3840x2160, 15.6" | Lenovo Yoga C940-15IRH i7-9750H, GeForce GTX 1650 Max-Q, Intel Optane Memory H10 with Solid State Storage 32GB + 512GB HBRPEKNX0202A(L/H), IPS, 1920x1080, 15.6" | MSI Prestige 15 A10SC i7-10710U, GeForce GTX 1650 Max-Q, Samsung SSD PM981 MZVLB1T0HALR, IPS, 3840x2160, 15.6" | Lenovo ThinkPad X1 Extreme-20MF000XGE i7-8750H, GeForce GTX 1050 Ti Max-Q, Samsung SSD PM981 MZVLB1T0HALR, IPS, 3840x2160, 15.6" | Ortalama NVIDIA GeForce GTX 1650 Mobile | Sınıf ortalaması Multimedia | |
|---|---|---|---|---|---|---|---|---|---|---|
| Power Consumption | -14% | 6% | 16% | -14% | 8% | 18% | 7% | 23% | 29% | |
| Idle Minimum * (Watt) | 8.5 | 13.7 -61% | 6.2 27% | 3.7 56% | 7.6 11% | 5.2 39% | 6.1 28% | 7.6 11% | 4.96 ? 42% | 5.65 ? 34% |
| Idle Average * (Watt) | 14.7 | 17.5 -19% | 9.6 35% | 12.1 18% | 13.6 7% | 10.7 27% | 13.2 10% | 14.8 -1% | 8.61 ? 41% | 10 ? 32% |
| Idle Maximum * (Watt) | 19.4 | 20.9 -8% | 21.2 -9% | 17 12% | 18.2 6% | 24.3 -25% | 19.2 1% | 17.6 9% | 14.8 ? 24% | 12.3 ? 37% |
| Load Average * (Watt) | 89.6 | 77.2 14% | 104.3 -16% | 91.5 -2% | 102 -14% | 84.4 6% | 75 16% | 86 4% | 81.7 ? 9% | 65.1 ? 27% |
| Witcher 3 ultra * (Watt) | 96.1 | 91.7 5% | 103 -7% | 144 -50% | 83.9 13% | 74 23% | 85 12% | |||
| Load Maximum * (Watt) | 129.8 | 123.7 5% | 135.3 -4% | 102.3 21% | 183 -41% | 142.8 -10% | 89.7 31% | 118.9 8% | 131.9 ? -2% | 112.5 ? 13% |
* ... daha küçük daha iyidir
Pil ömrü
Pil ömrü, en azından mat 4K paneli tercih ederseniz, X1 Extreme Gen 2'nin Aşil topuğudur. İsteğe bağlı OLED panelin 4K IPS'den daha fazla güç kullanacağını belirtmek gerekir. İnceleme birimimizin yüksek güç tüketiminden zaten tahmin edebileceğiniz gibi, pil ömrü rakiplerine göre çok daha kötü. Bu, 4K donanımlı önceki modelini bile içeriyor. Ekranı 150 cd / m² olarak ayarlayarak gerçekleştirdiğimiz normal Wi-Fi testimizde, inceleme birimimiz şarj gerektirmeden 5 saat bile yönetemiyor. Daha da kötüsü, bu değer maksimum parlaklıkta yeniden çalıştırdığımızda 4 saatin biraz üzerine düştü. Pil ömrü sizin için önemliyse, 1080p ekranı tercih etmelisiniz. Örneğin, ThinkPad P1 2019'u bir 1080p panel ile test ettik ve bu, X1 Extreme Gen 2 inceleme birimimizin neredeyse iki katı çalışma süresine ulaştı.
| Lenovo ThinkPad X1 Extreme 2019 20QV000WGE i7-9750H, GeForce GTX 1650 Mobile, 80 Wh | Dell XPS 15 7590 9980HK GTX 1650 i9-9980HK, GeForce GTX 1650 Mobile, 97 Wh | Apple MacBook Pro 16 2019 i9 5500M i9-9880H, Radeon Pro 5500M, 99.8 Wh | Acer ConceptD 7 CN715-71-743N i7-9750H, GeForce RTX 2060 Mobile, 84 Wh | Lenovo Yoga C940-15IRH i7-9750H, GeForce GTX 1650 Max-Q, 69 Wh | MSI Prestige 15 A10SC i7-10710U, GeForce GTX 1650 Max-Q, 82 Wh | Lenovo ThinkPad X1 Extreme-20MF000XGE i7-8750H, GeForce GTX 1050 Ti Max-Q, 80 Wh | Lenovo ThinkPad P1 2019-20QT000RGE i7-9850H, Quadro T1000 (Laptop), 80 Wh | Sınıf ortalaması Multimedia | |
|---|---|---|---|---|---|---|---|---|---|
| Pil Çalışma Süresi | 119% | 80% | 50% | 43% | 67% | 44% | 64% | 145% | |
| H.264 (h) | 4.7 | 9.7 106% | 6.5 38% | 6.2 32% | 9.3 98% | 16.2 ? 245% | |||
| WiFi v1.3 (h) | 4.8 | 7.8 63% | 12 150% | 8.6 79% | 9.7 102% | 7.6 58% | 6.4 33% | 8.9 85% | 12 ? 150% |
| Load (h) | 1.2 | 3.3 175% | 1 -17% | 1.6 33% | 1 -17% | 2.1 75% | 2 67% | 1.3 8% | 1.669 ? 39% |
| Reader / Idle (h) | 15.2 | 13.7 | 18.2 | 19.1 | 11.5 | 25.2 ? | |||
| Witcher 3 ultra (h) | 0.9 | 1.1 |
Artılar
Eksiler
Karar - Lenovo X1 Extreme'i daha da kötüleştirdi
İlk olarak, ThinkPad X1 Extreme Gen 2 mükemmel bir multimedya dizüstü bilgisayar olması gerektiği gibi geliyor. Selefinin şasisini daha fazla ekran seçeneği ve daha hızlı bileşenlerle birleştirmek, başarı için bir reçete olmalıdır. Bununla birlikte, pratikte değişiklikler her zaman olumlu olduğu kanıtlanmamıştır.İyi şeylerden başlayarak, mat 4K paneli ek kalibrasyon sonrası da olsa iyi görüntü kalitesi sunar. X1 Extreme Gen 2, piyasadaki en iyi giriş cihazlarından bazılarına sahiptir, ancak inceleme birimimizin de muzdarip olduğu bazı güvenilirlik sorunları vardır. X1 Extreme Gen 2 de yük altında daha sessiz çalışıyor.Ancak bundan sonra sadece kötü haberlerimiz var. Lenovo'nun aynı soğutma çözümünü korurken yeni bileşenler taktığını düşünüyoruz. Yeni işlemci, daha hızlı grafik kartı nedeniyle burada acı çekiyor, ancak ikinci işlemci de beklentilerin altında kalıyor. Sonuç, X1 Extreme Gen 2'nin öncekinden daha yavaş bir CPU'su ve sadece minimal olarak daha hızlı bir GPU'su olması. Başka bir sorun, 5 saatin altında çalışma süresi sağlayan mat 4K paneli sayesinde cihazın büyük güç tüketimi. ThinkPad X1 Extreme'in ikinci nesli bazı yerlerde daha da kötüleşti. CPU performansı, örneğin selefinin altında ve GPU potansiyeline ulaşamıyor. Mat 4K panel, görüntü kalitesi söz konusu olduğunda iyi bir seçenek olsa da, ek kalibrasyona ihtiyaç duyar ve pil ömrü üzerinde önemli bir etkiye sahiptir. İnceleme birimimizin performansı kesinlikle kendi başına kötü değildir. Örneğin günlük kullanımda sorun yaşamamalısınız. Yarışma daha fazlasını sunuyor. Ayrıca, 4K IPS ekran üzerinden isteğe bağlı 500 nit 1080p ekranın dikkate alınmasını öneririz, bu da önemli ölçüde daha az güç tüketirken çok iyi görüntü kalitesi sunar.
Lenovo ThinkPad X1 Extreme 2019 20QV000WGE
- 02/13/2020 v7 (old)
Andreas Osthoff
Price comparison
