MSI GL75 Leopard incelemede: 144 Hz ekrana sahip başarılı oyun dizüstü bilgisayarı

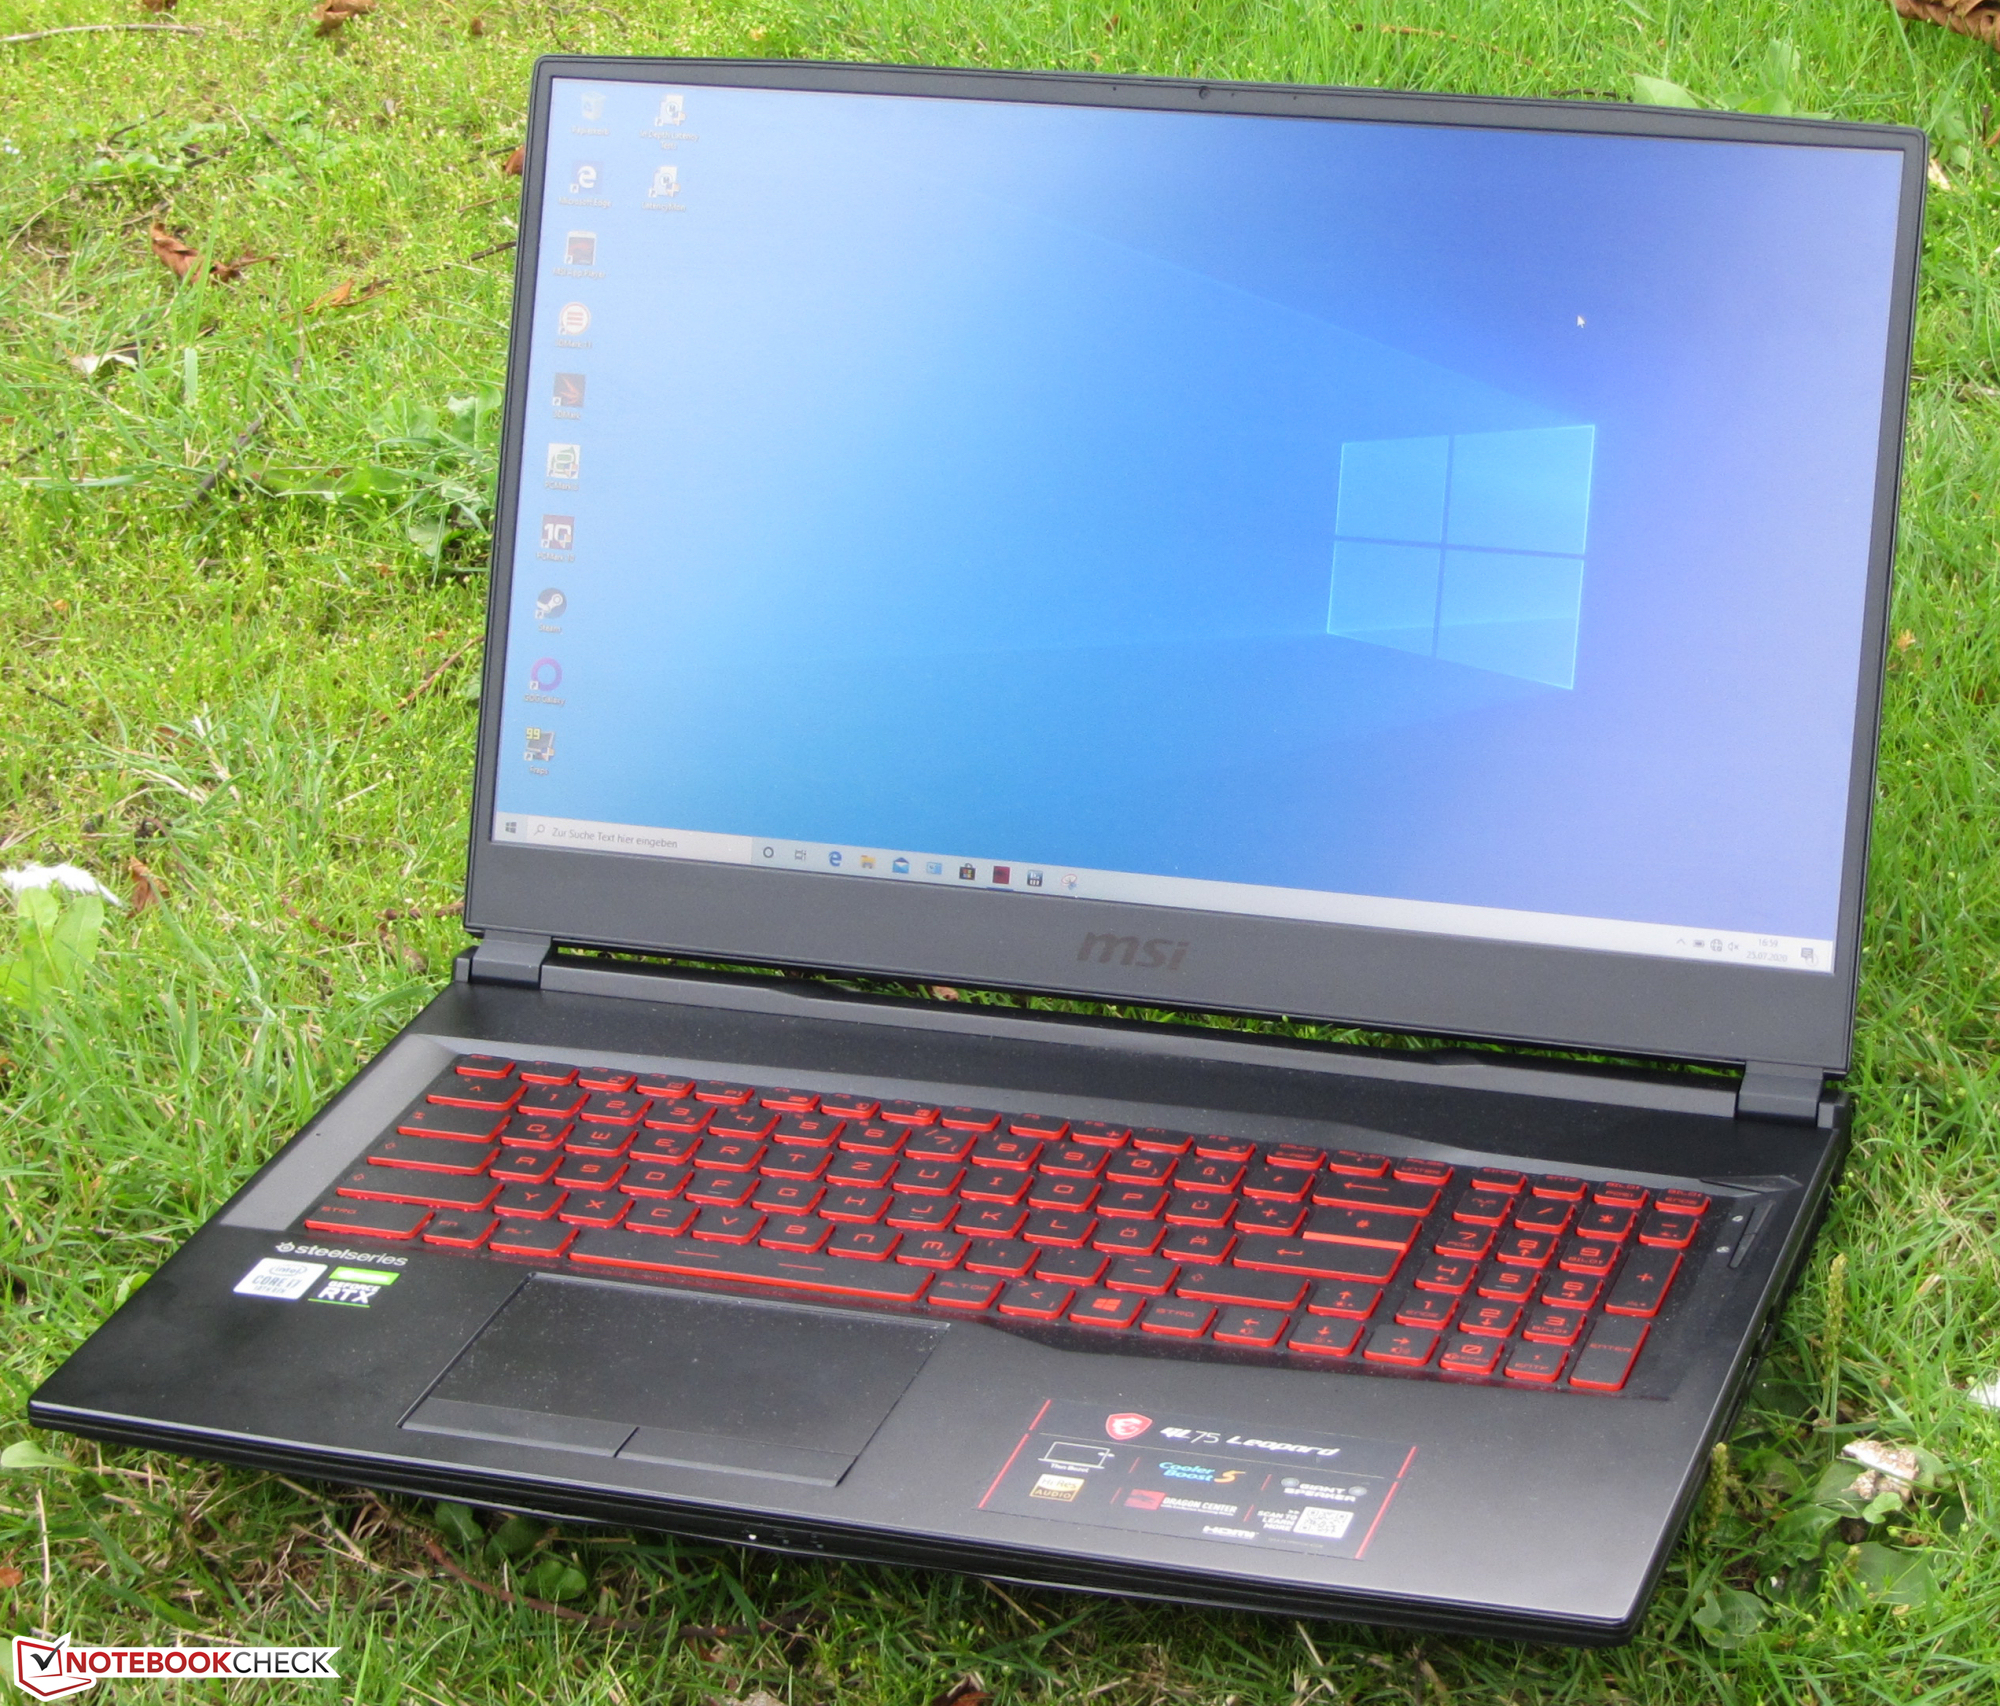
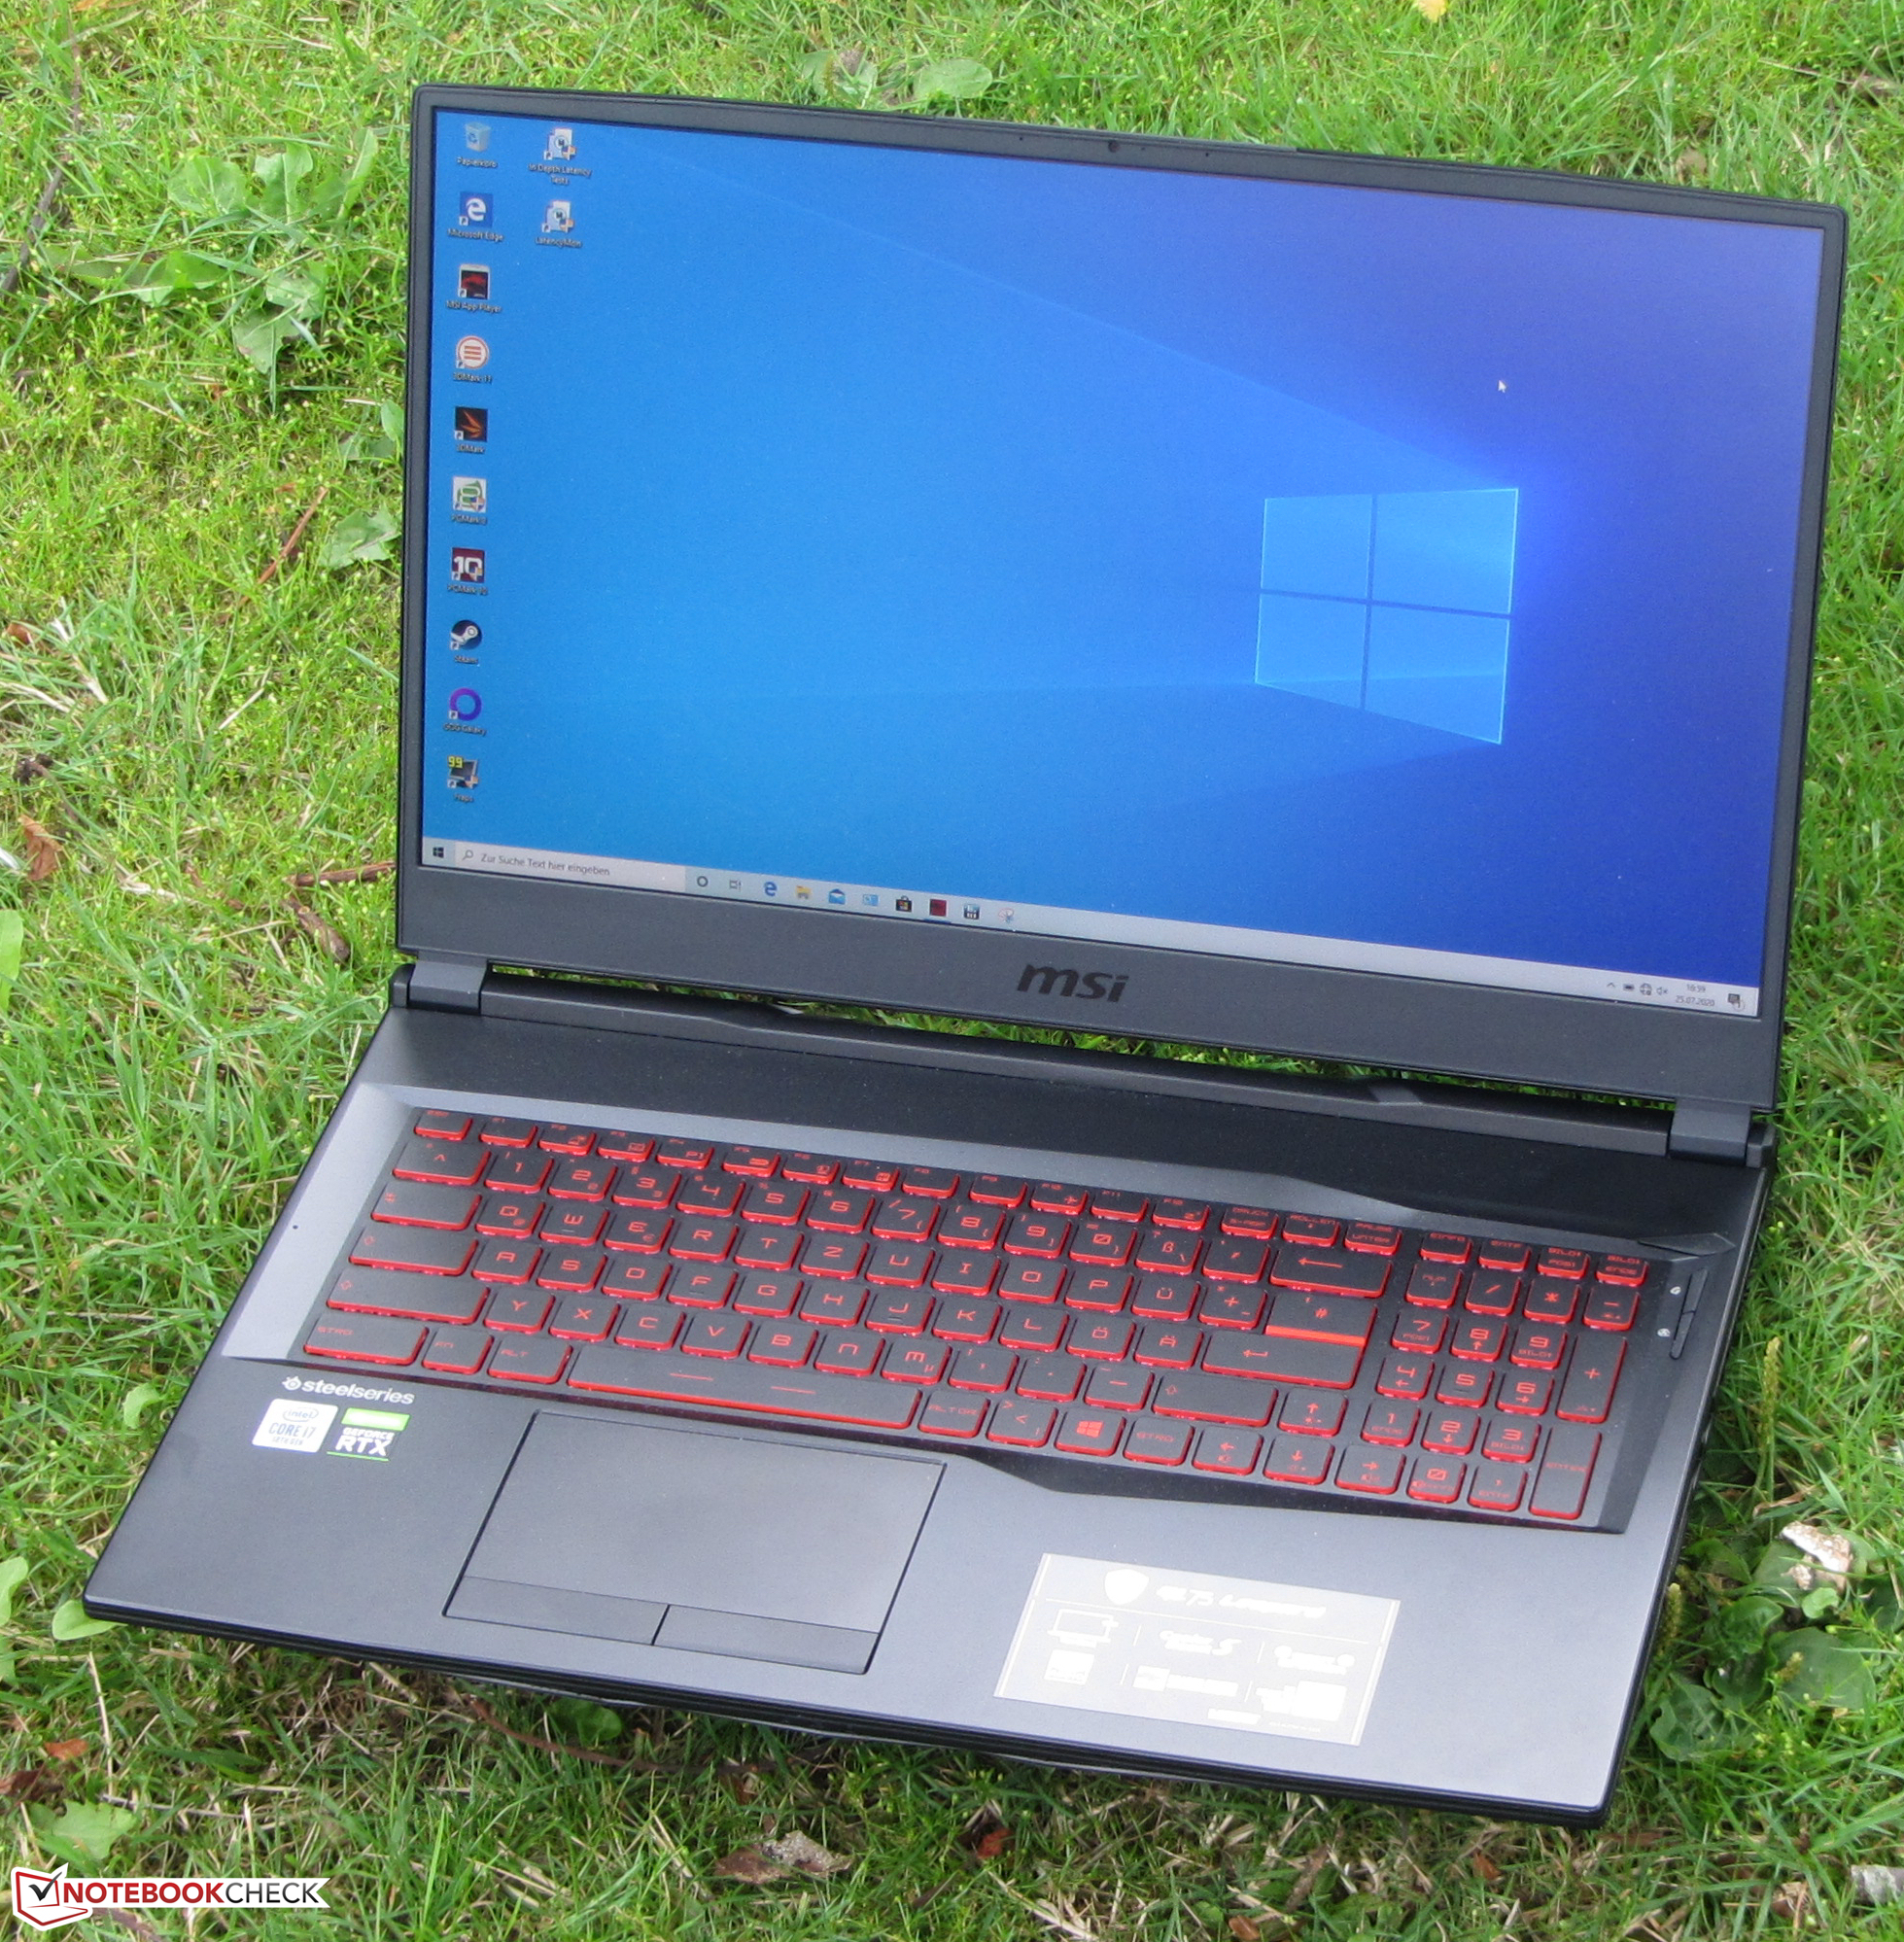
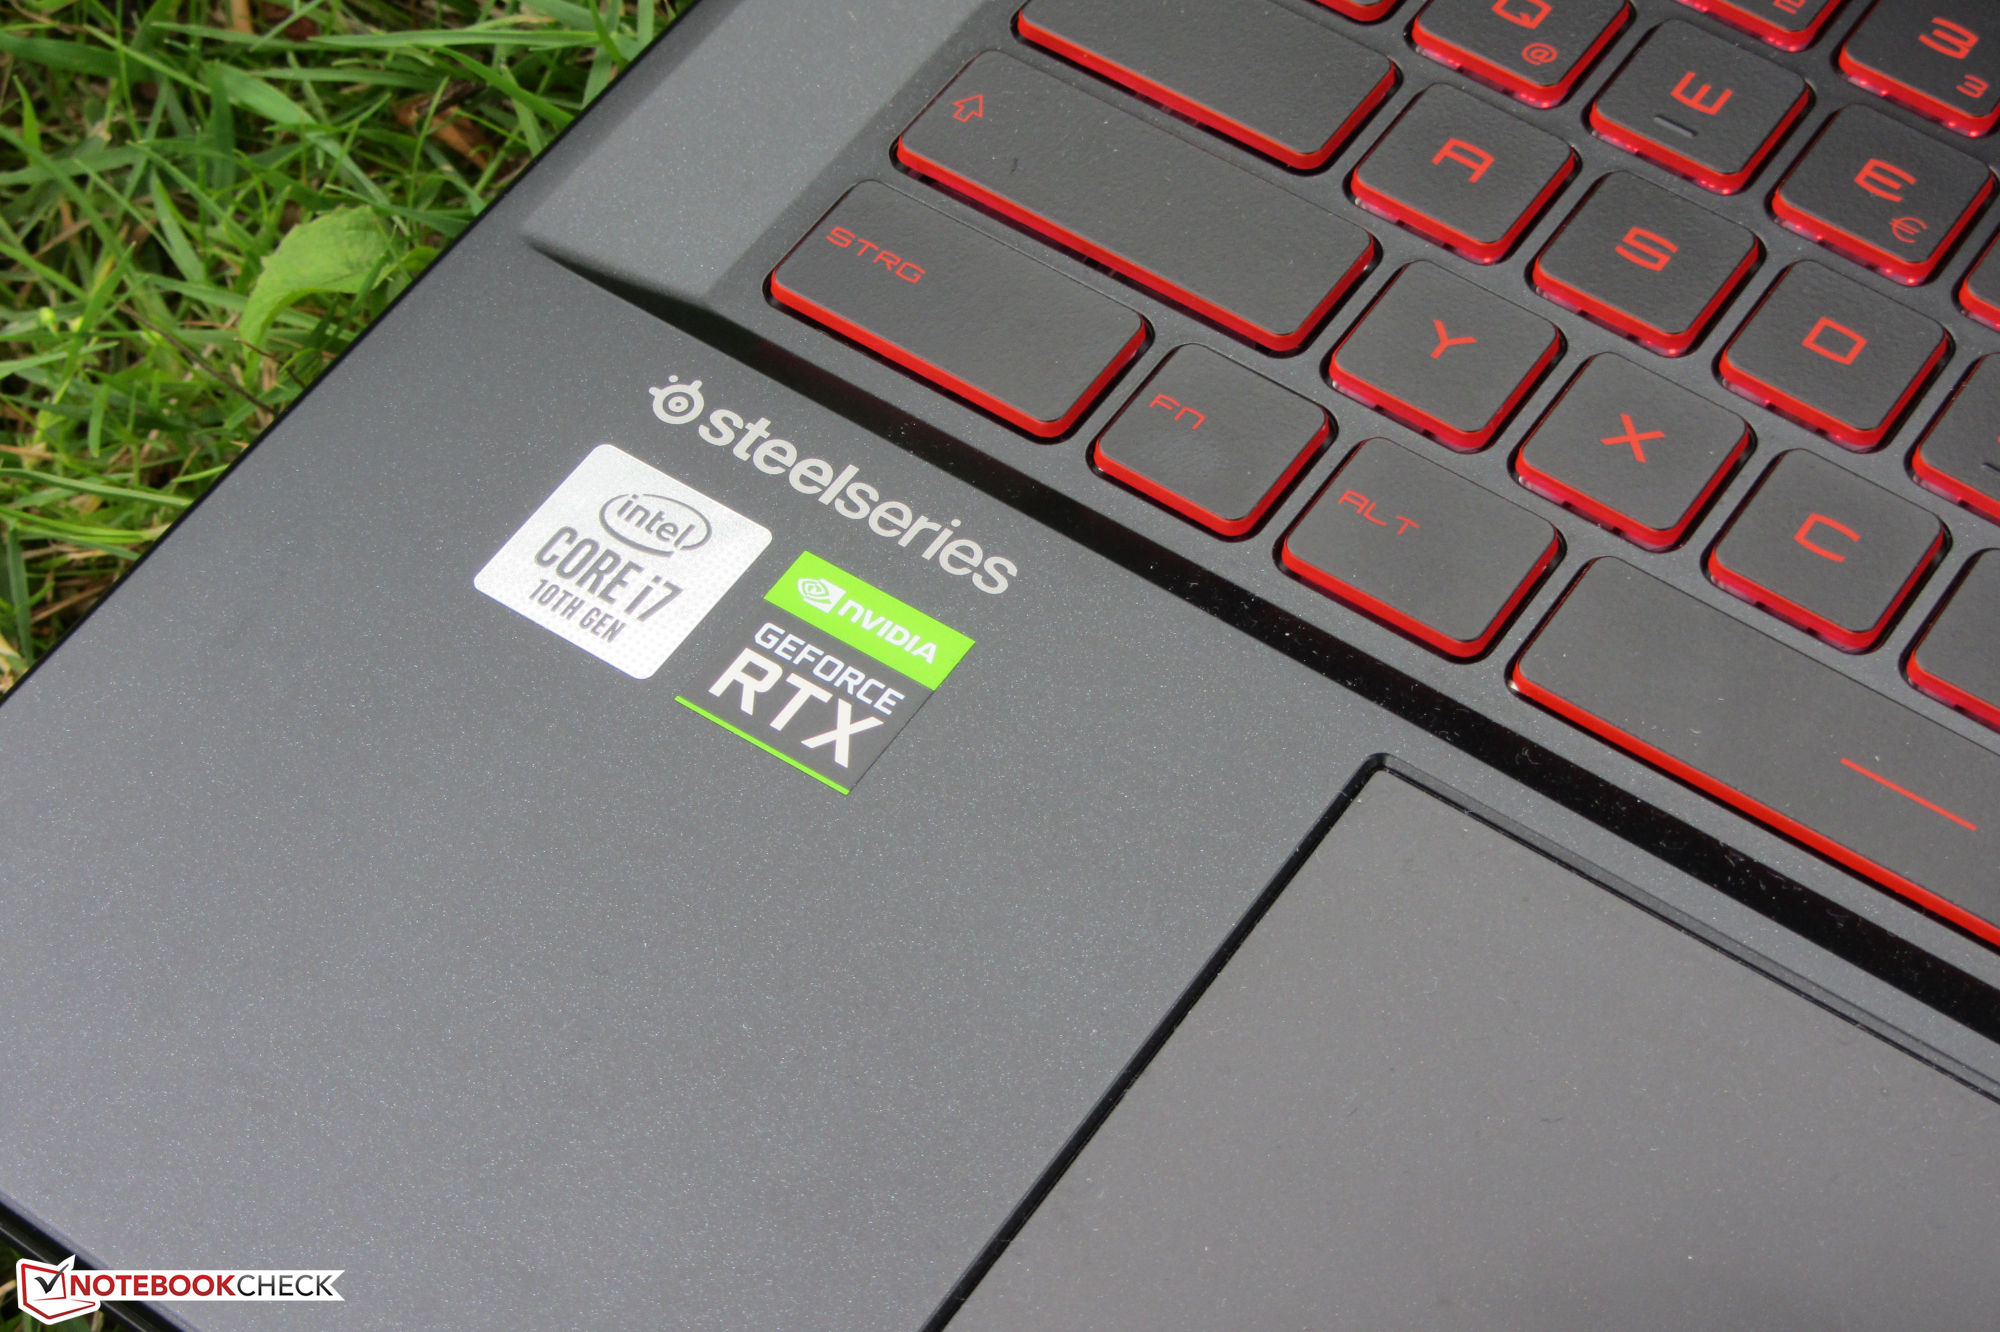
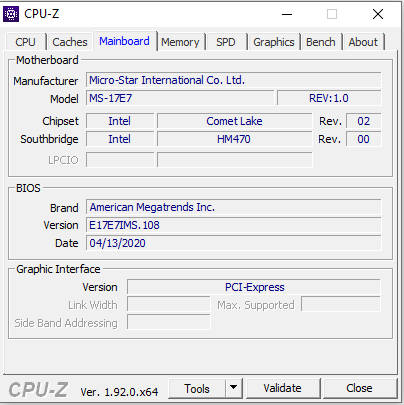
MSI GL75 Leopard, 17,3 inç formatındaki oyun dizüstü bilgisayarlarına aittir. Core i7-10750H altı çekirdekli işlemci ve GeForce RTX 2070 grafik çekirdeği tarafından desteklenmektedir. Cihaz, sırasıyla GL75 9SEK'in (büyük ölçüde) özdeş halefi ve GP75 Leopard 9SD'nin özdeş kardeş modeli olduğu için bizim için bilinmeyen bir şey değil. Rakipler arasında Acer Nitro 5 AN517-52, Schenker XMG Neo 17 ve Lenovo Legion Y740-17IRHg gibi cihazlar var. GL75 10SFR, GP75 9SD ve GL75 9SEK ile aynı yapıya sahip olduğundan, daha ileri gitmeyeceğiz kasaya, bağlantıya, giriş cihazlarına ve hoparlörlere. İlgili bilgiler GP75 9SD ve GL75 9SEK'in inceleme makalelerinde bulunabilir.
Derecelendirme | Tarih | Modeli | Ağırlık | Yükseklik | Boyut | Çözünürlük | Fiyat |
|---|---|---|---|---|---|---|---|
| 83.5 % v7 (old) | 08/2020 | MSI GL75 10SFR i7-10750H, GeForce RTX 2070 Mobile | 2.6 kg | 28 mm | 17.30" | 1920x1080 | |
| 80.6 % v7 (old) | 06/2020 | Acer Nitro 5 AN517-52-77DS i7-10750H, GeForce RTX 2060 Mobile | 2.2 kg | 24.9 mm | 17.30" | 1920x1080 | |
| 83.2 % v7 (old) | Schenker XMG Neo 17 XNE17M19 i7-9750H, GeForce RTX 2060 Mobile | 2.5 kg | 27 mm | 17.30" | 1920x1080 | ||
| 84 % v7 (old) | 05/2020 | Lenovo Legion Y740-17IRHg-81UJ001VGE i7-9750H, GeForce RTX 2080 Max-Q | 3 kg | 25.5 mm | 17.30" | 1920x1080 |
| SD Card Reader | |
| average JPG Copy Test (av. of 3 runs) | |
| Sınıf ortalaması Gaming (20.9 - 210, n=53, son 2 yıl) | |
| Schenker XMG Neo 17 (Toshiba Exceria Pro SDXC 64 GB UHS-II) | |
| Schenker XMG Neo 17 XNE17M19 (Toshiba Exceria Pro SDXC 64 GB UHS-II) | |
| MSI GP75 Leopard 9SD (Toshiba Exceria Pro SDXC 64 GB UHS-II) | |
| MSI GL75 9SEK-056US | |
| MSI GL75 10SFR (Toshiba Exceria Pro SDXC 64 GB UHS-II) | |
| maximum AS SSD Seq Read Test (1GB) | |
| Sınıf ortalaması Gaming (25.5 - 261, n=50, son 2 yıl) | |
| Schenker XMG Neo 17 (Toshiba Exceria Pro SDXC 64 GB UHS-II) | |
| Schenker XMG Neo 17 XNE17M19 (Toshiba Exceria Pro SDXC 64 GB UHS-II) | |
| MSI GL75 9SEK-056US | |
| MSI GP75 Leopard 9SD (Toshiba Exceria Pro SDXC 64 GB UHS-II) | |
| MSI GL75 10SFR (Toshiba Exceria Pro SDXC 64 GB UHS-II) | |
| Networking | |
| iperf3 transmit AX12 | |
| MSI GL75 10SFR | |
| Ortalama Intel Wi-Fi 6 AX201 (49.8 - 1775, n=324) | |
| Schenker XMG Neo 17 XNE17M19 | |
| Lenovo Legion Y740-17IRHg-81UJ001VGE | |
| MSI GP75 Leopard 9SD | |
| Schenker XMG Neo 17 | |
| Acer Nitro 5 AN517-52-77DS | |
| MSI GL75 9SEK-056US | |
| iperf3 receive AX12 | |
| Schenker XMG Neo 17 XNE17M19 | |
| Ortalama Intel Wi-Fi 6 AX201 (136 - 1743, n=324) | |
| MSI GL75 10SFR | |
| Acer Nitro 5 AN517-52-77DS | |
| MSI GL75 9SEK-056US | |
| MSI GP75 Leopard 9SD | |
| Lenovo Legion Y740-17IRHg-81UJ001VGE | |
| Schenker XMG Neo 17 | |


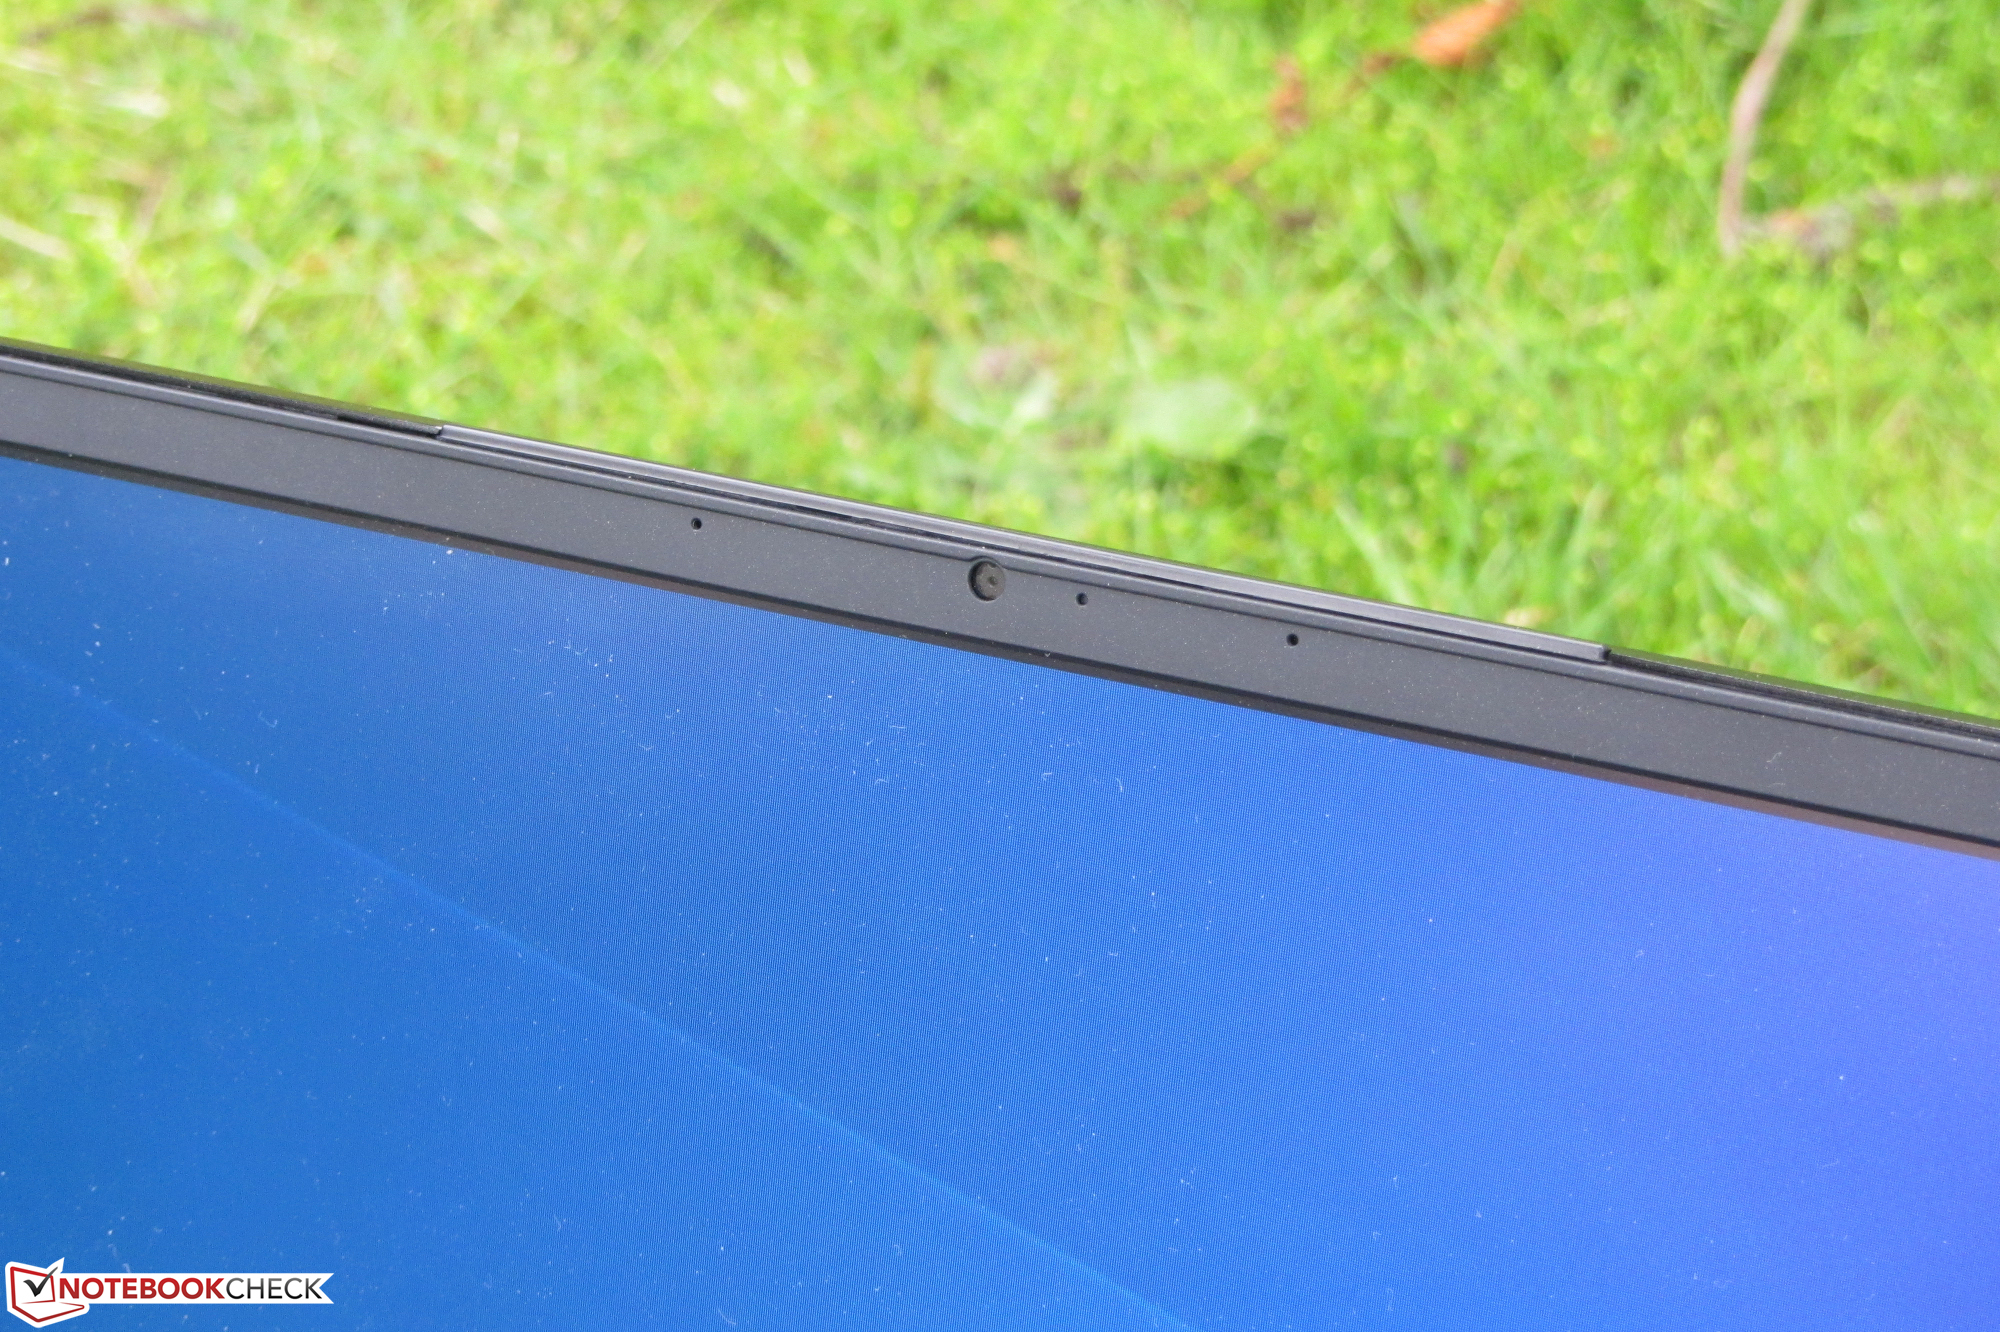
Ekran - Duyarlı, parlak, yüksek kontrastlı
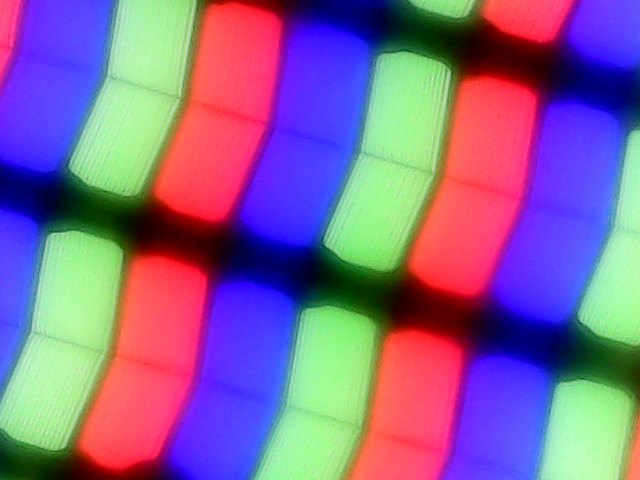
GL75'in 17,3 inçlik ekranı 1920x1080 piksellik doğal çözünürlüğe sahiptir. Parlaklık (308.7 cd / m²) ve kontrast (1.549: 1) hedef dahilinde. Ek olarak, 144 Hz panel iyi yanıt süreleri sunar. Ne yazık ki, ekran% 30 ve altındaki parlaklık seviyelerinde 208 Hz frekansta titriyor. Düşük frekans nedeniyle, hassas kullanıcılar baş ağrısı ve / veya göz sorunları yaşayabilir.
| |||||||||||||||||||||||||
Aydınlatma: 86 %
Batarya modunda parlaklık: 337 cd/m²
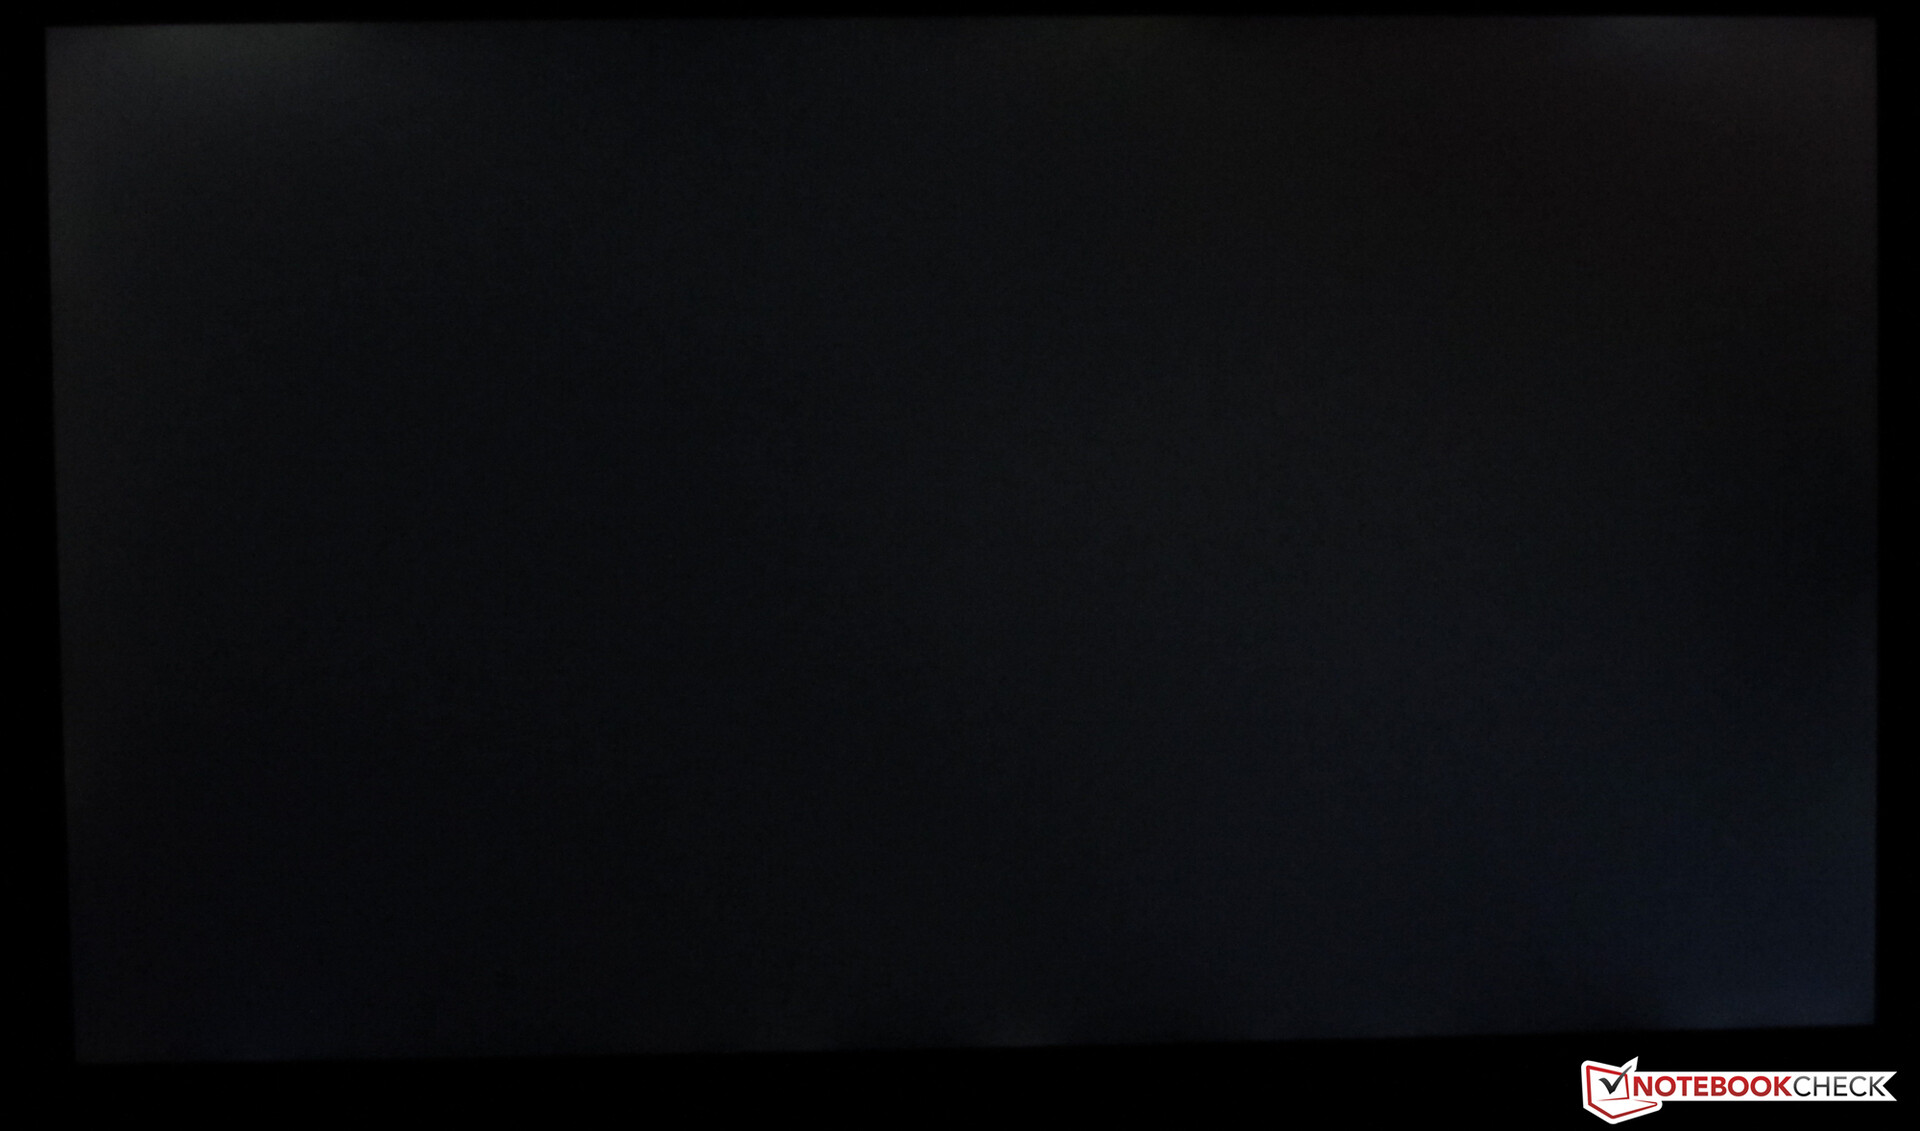
Kontrast: 1549:1 (Siyah: 0.215 cd/m²)
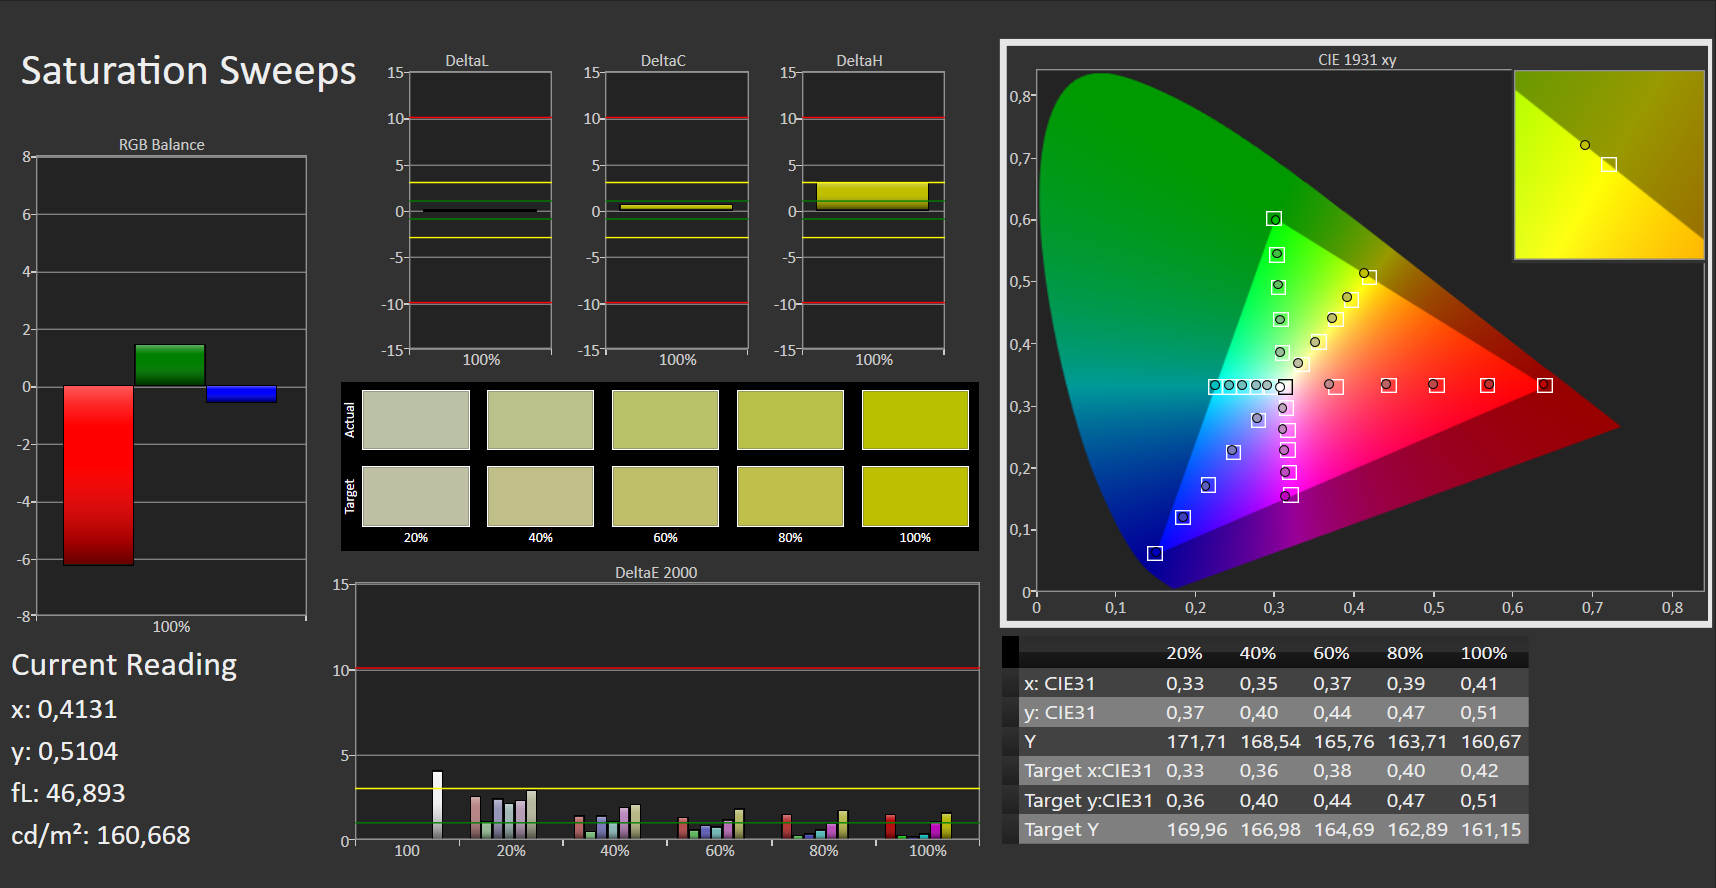
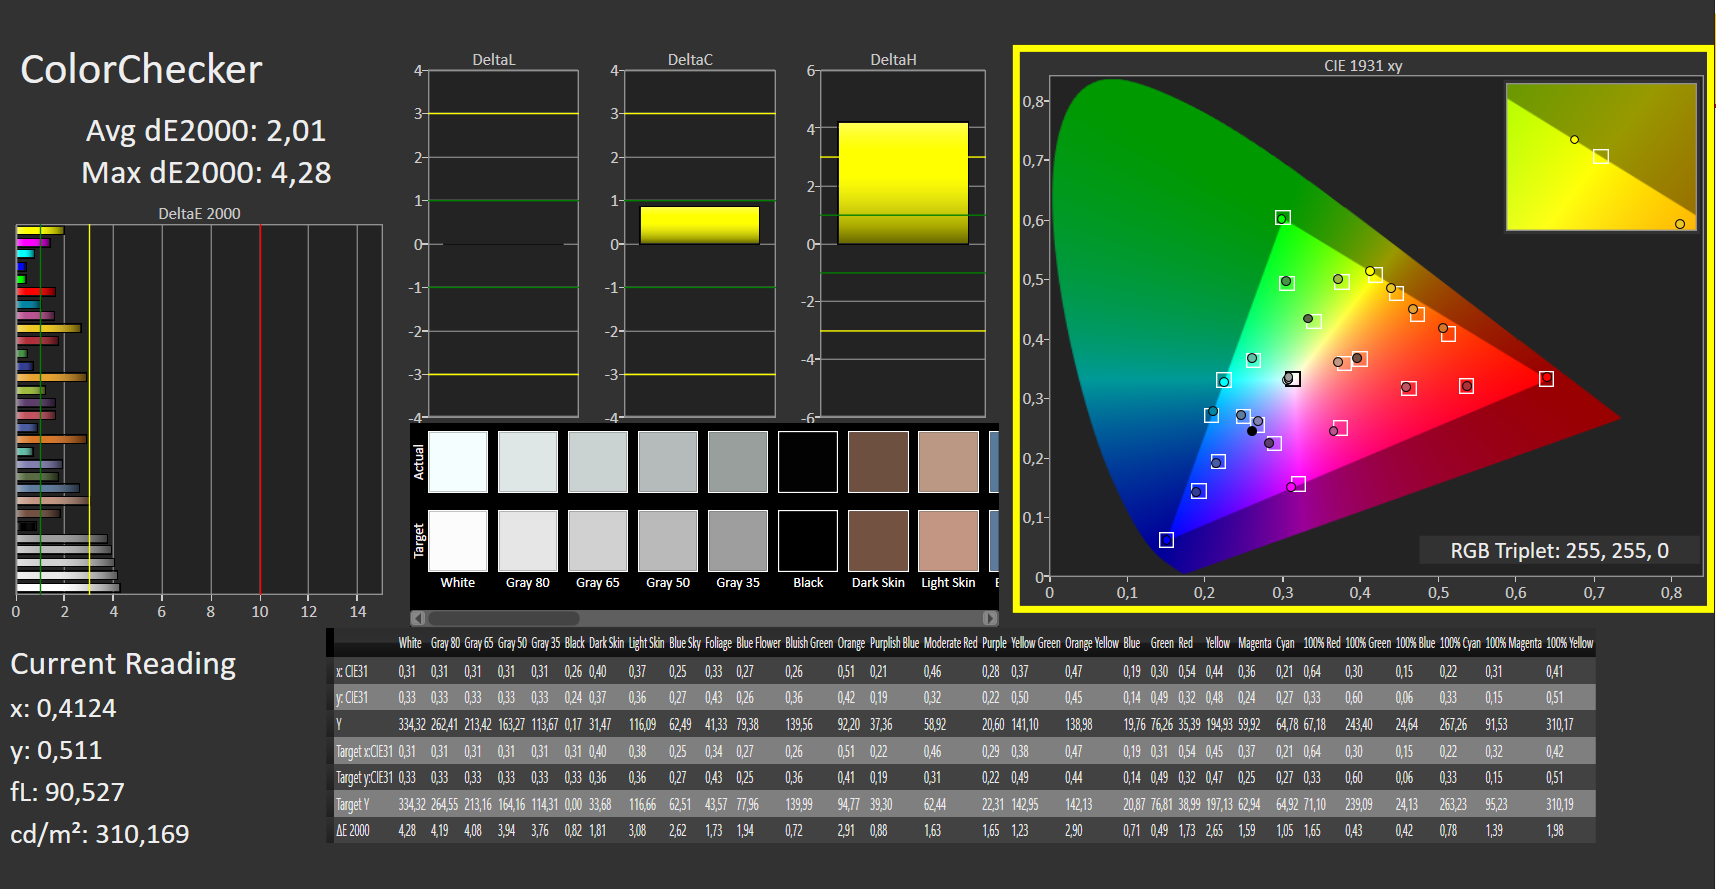
ΔE ColorChecker Calman: 1.98 | ∀{0.5-29.43 Ø4.72}
calibrated: 2.01
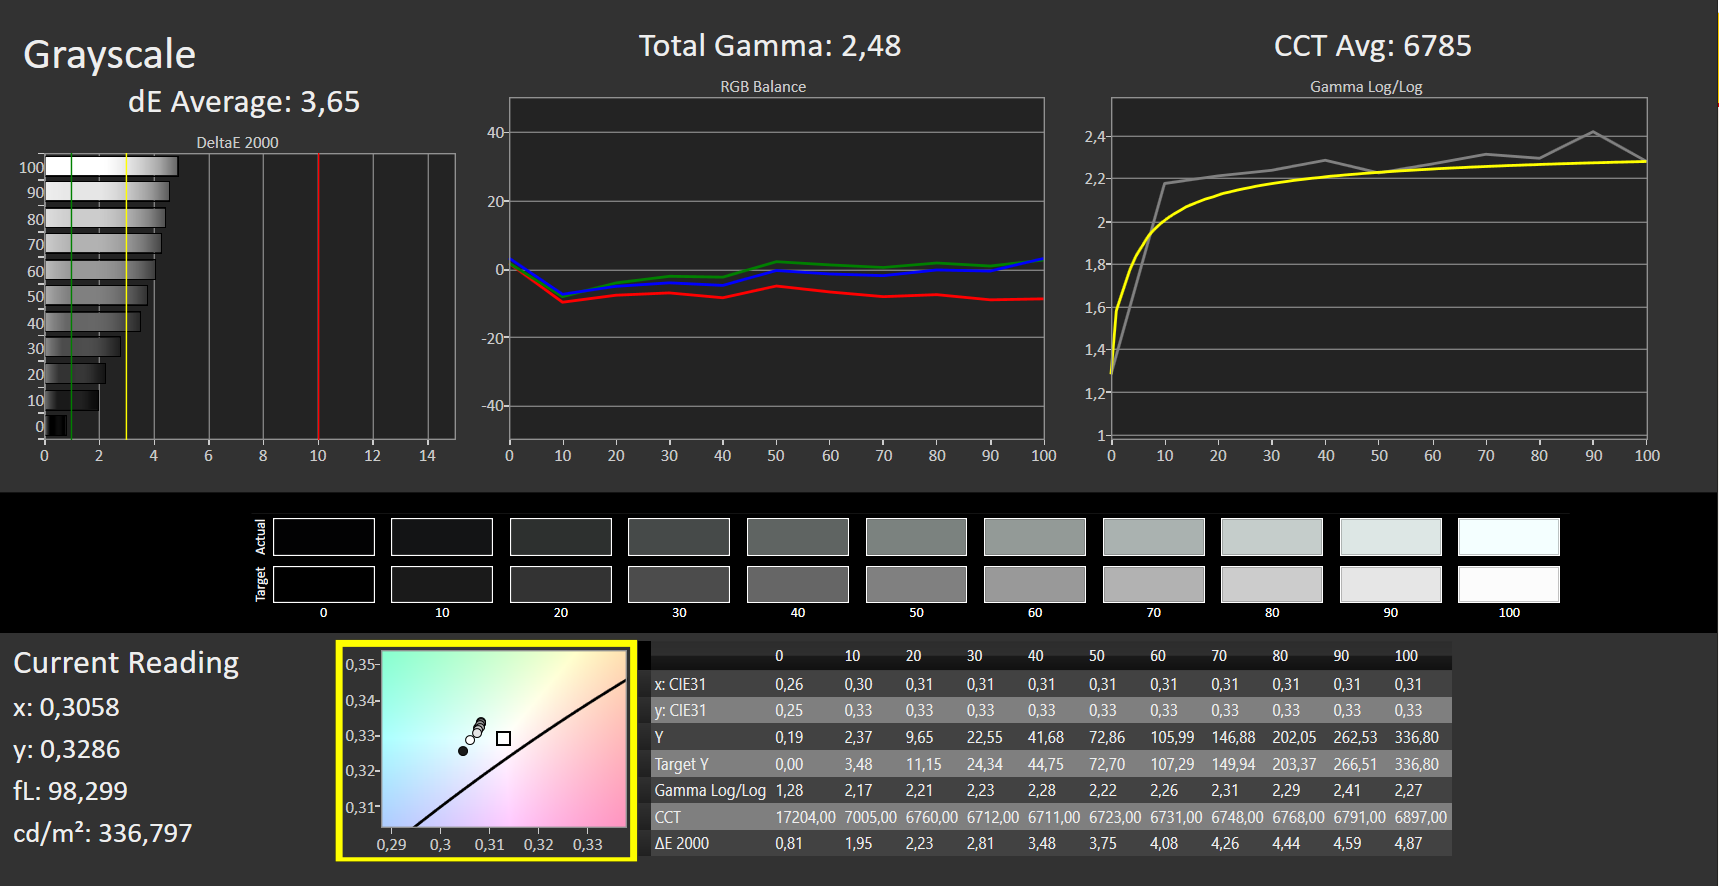
ΔE Greyscale Calman: 2.97 | ∀{0.09-98 Ø4.97}
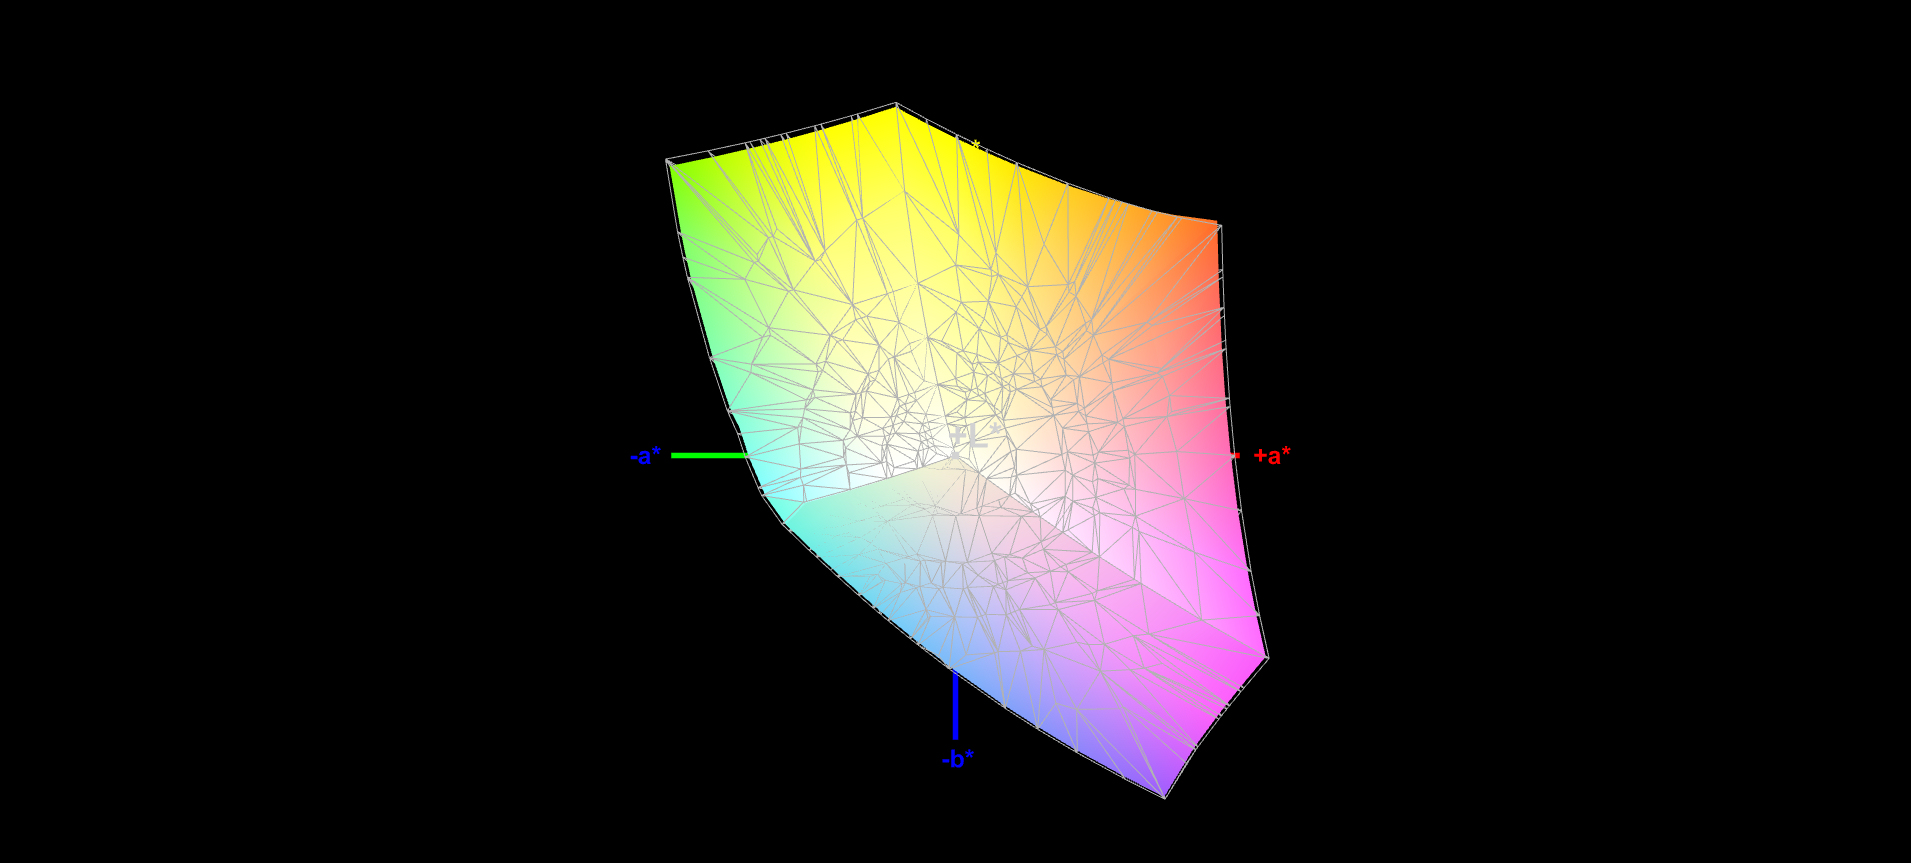
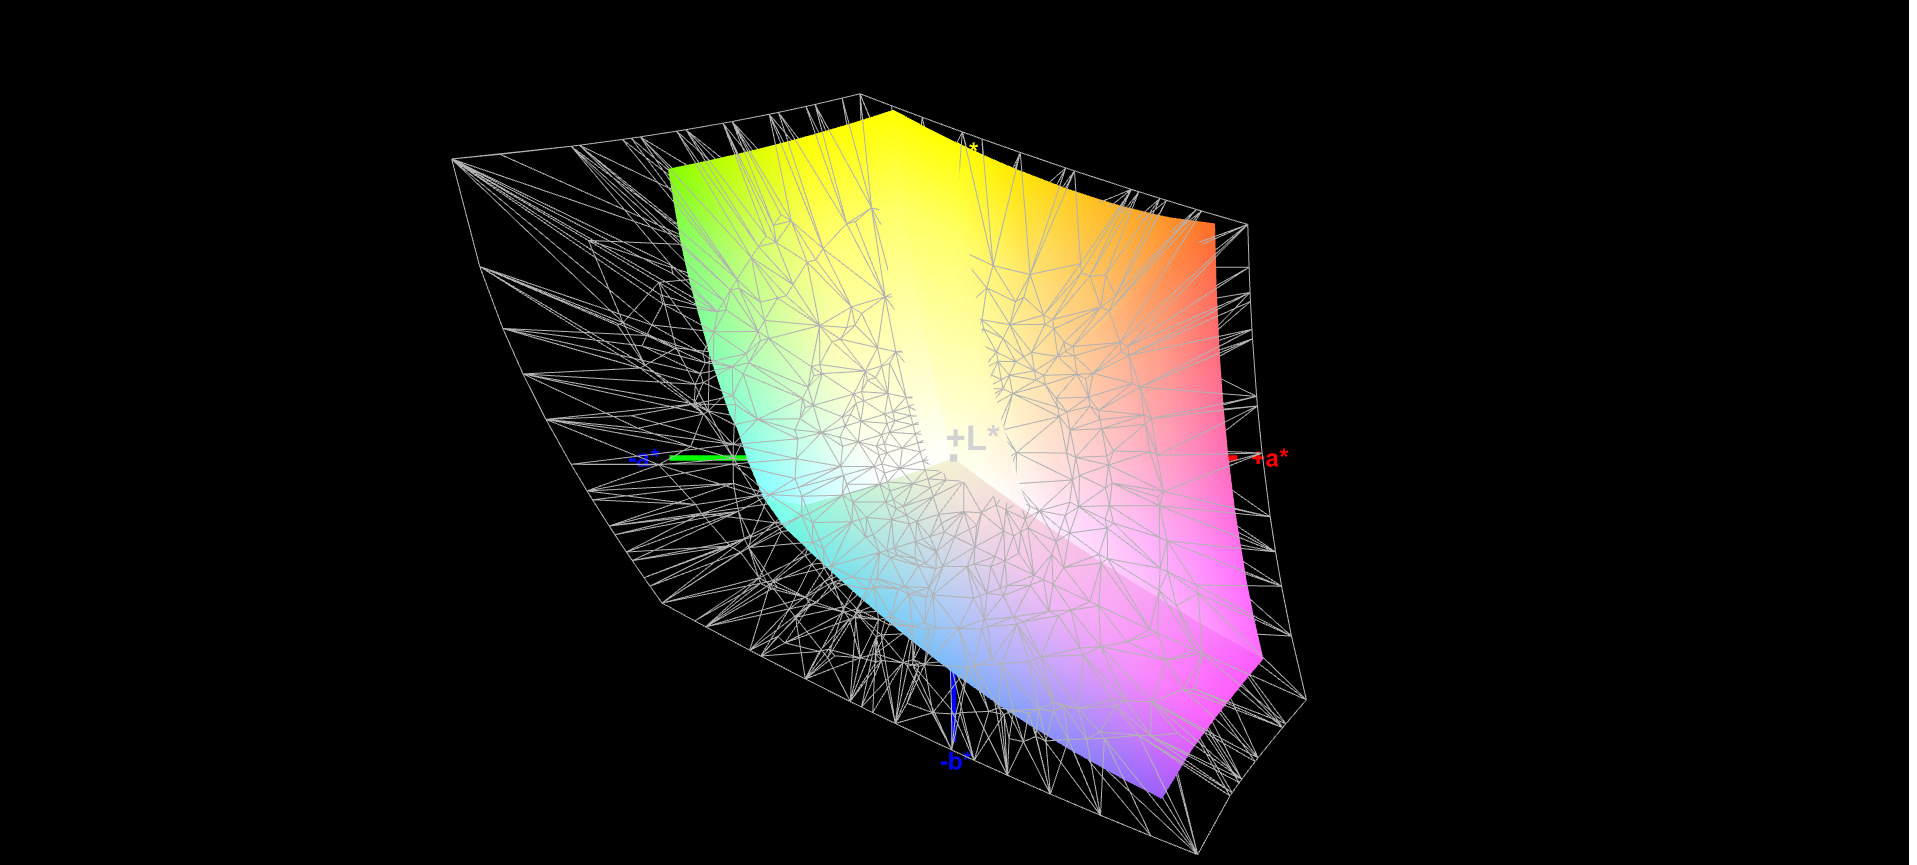
96% sRGB (Argyll 1.6.3 3D)
61% AdobeRGB 1998 (Argyll 1.6.3 3D)
66% AdobeRGB 1998 (Argyll 3D)
96.2% sRGB (Argyll 3D)
63.9% Display P3 (Argyll 3D)
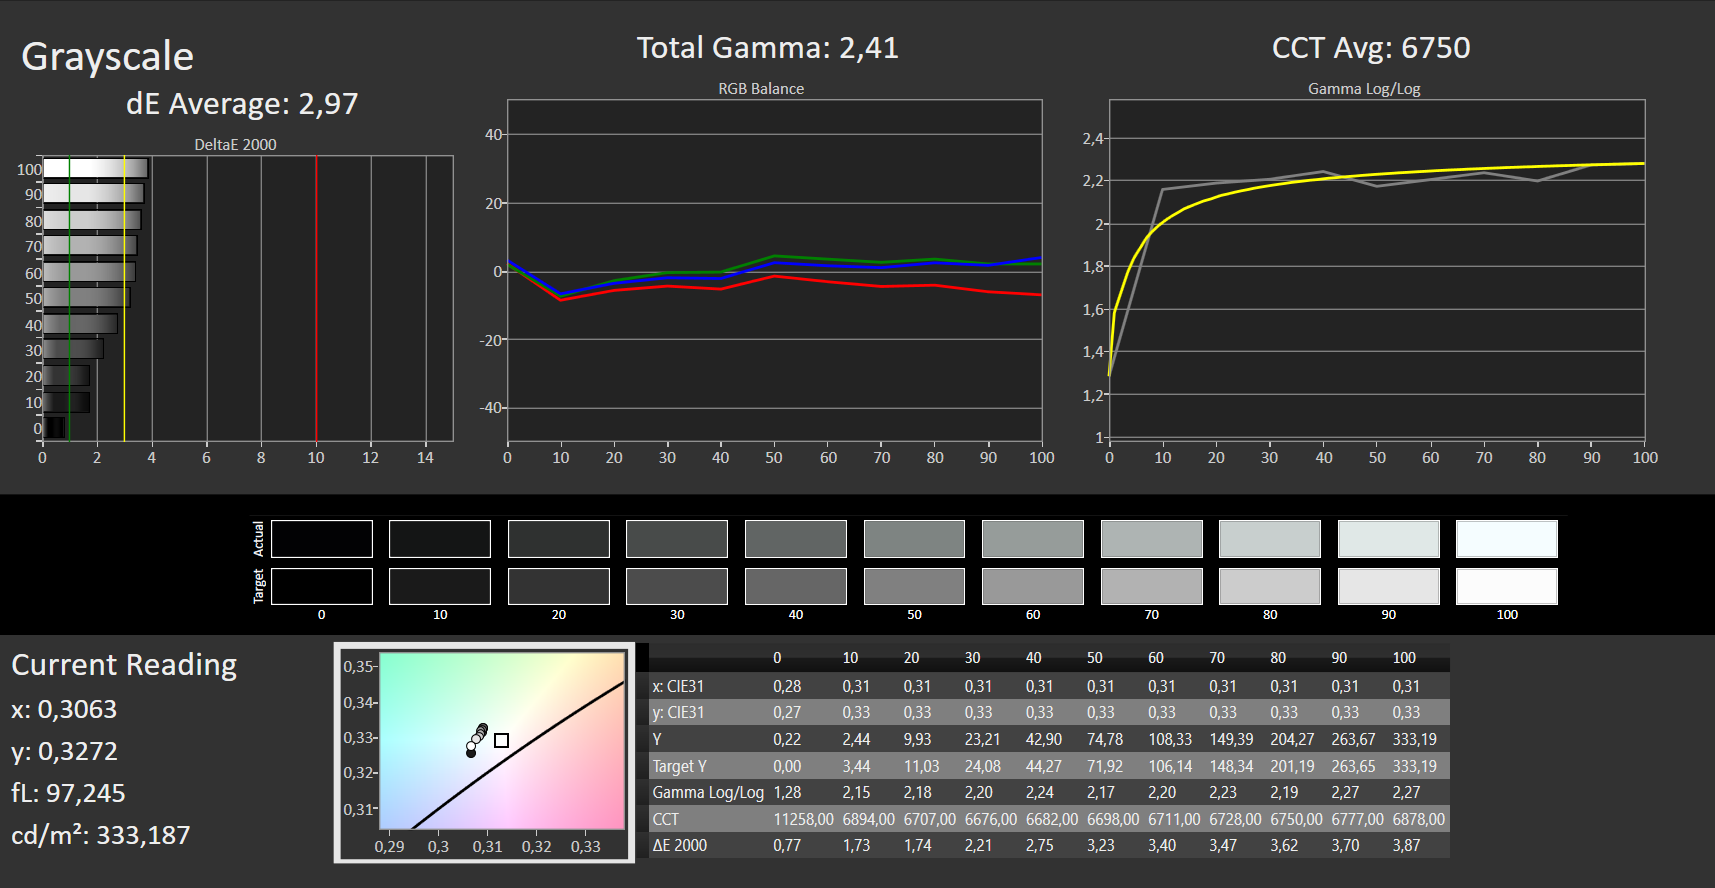
Gamma: 2.41
CCT: 6750 K
| MSI GL75 10SFR Chi Mei N173HCE-G33, IPS, 1920x1080, 17.3" | Acer Nitro 5 AN517-52-77DS AU Optronics B173HAN04.7, IPS, 1920x1080, 17.3" | Schenker XMG Neo 17 XNE17M19 LG LP173WFG-SPB1 (LGD0615), IPS, 1920x1080, 17.3" | Lenovo Legion Y740-17IRHg-81UJ001VGE AUO_B173HAN03, IPS, 1920x1080, 17.3" | MSI GL75 9SEK-056US AU Optronics AUO479D (B173HAN04.7), IPS, 1920x1080, 17.3" | MSI GP75 Leopard 9SD Chi Mei N173HCE-G33 (CMN175C), IPS, 1920x1080, 17.3" | |
|---|---|---|---|---|---|---|
| Display | -38% | -0% | -2% | -36% | -1% | |
| Display P3 Coverage (%) | 63.9 | 39.47 -38% | 64.6 1% | 63.8 0% | 41.12 -36% | 63.4 -1% |
| sRGB Coverage (%) | 96.2 | 58.9 -39% | 95.6 -1% | 92.7 -4% | 61.1 -36% | 94.9 -1% |
| AdobeRGB 1998 Coverage (%) | 66 | 40.77 -38% | 65.6 -1% | 65.3 -1% | 42.49 -36% | 65.1 -1% |
| Response Times | -191% | -30% | -28% | -144% | 18% | |
| Response Time Grey 50% / Grey 80% * (ms) | 12 ? | 35 ? -192% | 15.6 ? -30% | 16 ? -33% | 26 ? -117% | 8 ? 33% |
| Response Time Black / White * (ms) | 9 ? | 26 ? -189% | 11.6 ? -29% | 11 ? -22% | 24.4 ? -171% | 8.8 ? 2% |
| PWM Frequency (Hz) | 208 ? | 25510 ? | ||||
| Screen | -87% | -27% | -33% | -67% | -9% | |
| Brightness middle (cd/m²) | 333 | 263 -21% | 318 -5% | 310 -7% | 259.1 -22% | 420 26% |
| Brightness (cd/m²) | 309 | 246 -20% | 286 -7% | 281 -9% | 261 -16% | 393 27% |
| Brightness Distribution (%) | 86 | 85 -1% | 86 0% | 85 -1% | 93 8% | 91 6% |
| Black Level * (cd/m²) | 0.215 | 0.47 -119% | 0.23 -7% | 0.31 -44% | 0.25 -16% | 0.32 -49% |
| Contrast (:1) | 1549 | 560 -64% | 1383 -11% | 1000 -35% | 1036 -33% | 1313 -15% |
| Colorchecker dE 2000 * | 1.98 | 5.07 -156% | 3.89 -96% | 3.86 -95% | 4.23 -114% | 3.04 -54% |
| Colorchecker dE 2000 max. * | 4.34 | 20.5 -372% | 10.56 -143% | 7.8 -80% | 23.39 -439% | 7.22 -66% |
| Colorchecker dE 2000 calibrated * | 2.01 | 4.9 -144% | 1.03 49% | 3.9 -94% | 0.89 56% | |
| Greyscale dE 2000 * | 2.97 | 2.55 14% | 5.3 -78% | 4.48 -51% | 1.3 56% | 3.91 -32% |
| Gamma | 2.41 91% | 2.37 93% | 2.46 89% | 2.5 88% | 2.076 106% | 2.26 97% |
| CCT | 6750 96% | 6446 101% | 7462 87% | 7542 86% | 6542 99% | 7138 91% |
| Color Space (Percent of AdobeRGB 1998) (%) | 61 | 37 -39% | 60 -2% | 60 -2% | 39 -36% | 60 -2% |
| Color Space (Percent of sRGB) (%) | 96 | 59 -39% | 96 0% | 93 -3% | 61 -36% | 95 -1% |
| Toplam Ortalama (Program / Ayarlar) | -105% /
-91% | -19% /
-23% | -21% /
-26% | -82% /
-71% | 3% /
-5% |
* ... daha küçük daha iyidir
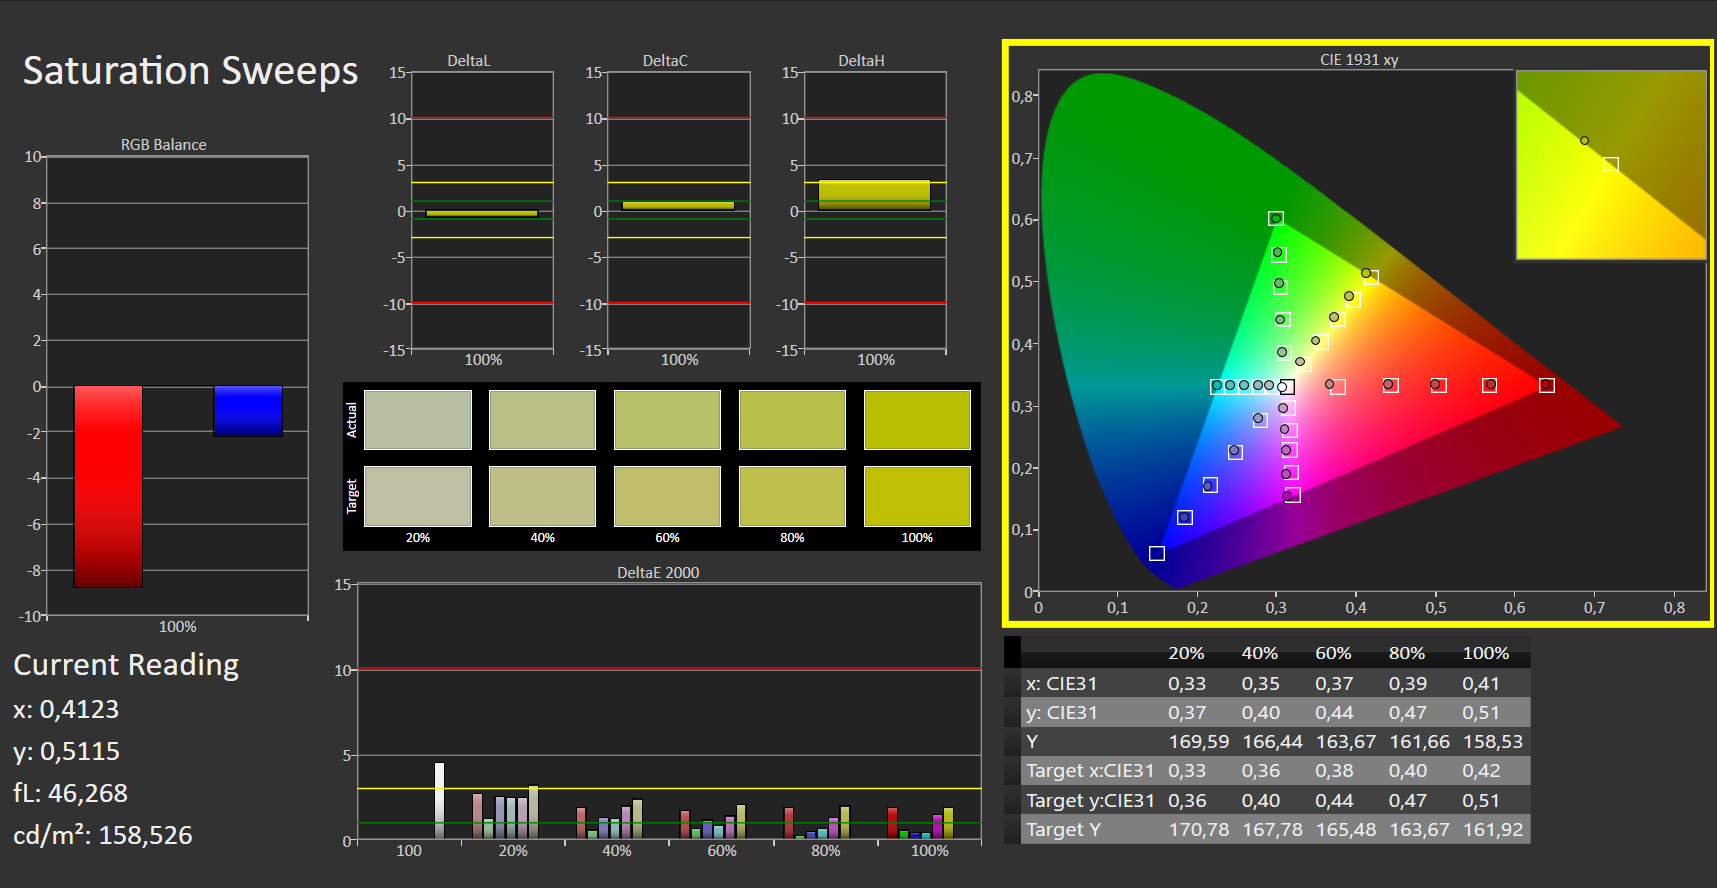
Kutunun dışında, ekran zaten iyi bir renk üretimi gösteriyor. 2'nin hemen altındaki bir DeltaE 2000 renk sapmasıyla, hedef (DeltaE 3'ten küçük) karşılanır. Ekranda mavi renk yok. Kalibrasyon, renk üretimi açısından iyileştirmelere yol açmaz. Ayrıca AdobeRGB renk alanı (% 61) tam olarak eşlenmemiştir. Durum sRGB renk alanıyla (% 96) daha iyi görünüyor.

Yanıt Sürelerini Görüntüle
| ↔ Tepki Süresi Siyahtan Beyaza | ||
|---|---|---|
| 9 ms ... yükseliş ↗ ve sonbahar↘ birleşimi | ↗ 5 ms yükseliş | 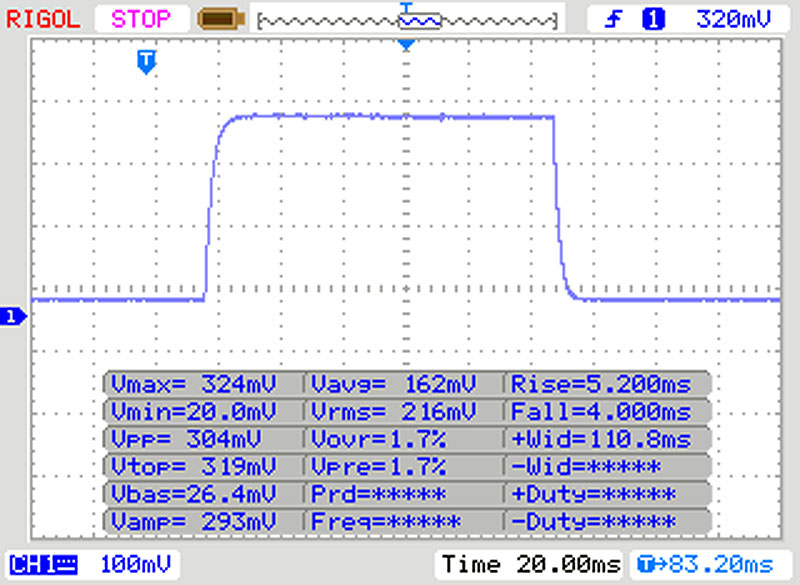 |
| ↘ 4 ms sonbahar | ||
| Ekran, testlerimizde hızlı yanıt oranları gösteriyor ve oyun oynamaya uygun olmalı. Karşılaştırıldığında, test edilen tüm cihazlar 0.1 (minimum) ile 240 (maksimum) ms arasında değişir. » Tüm cihazların 25 %'si daha iyi. Bu, ölçülen yanıt süresinin test edilen tüm cihazların ortalamasından (19.8 ms) daha iyi olduğu anlamına gelir. | ||
| ↔ Tepki Süresi %50 Griden %80 Griye | ||
| 12 ms ... yükseliş ↗ ve sonbahar↘ birleşimi | ↗ 6 ms yükseliş | 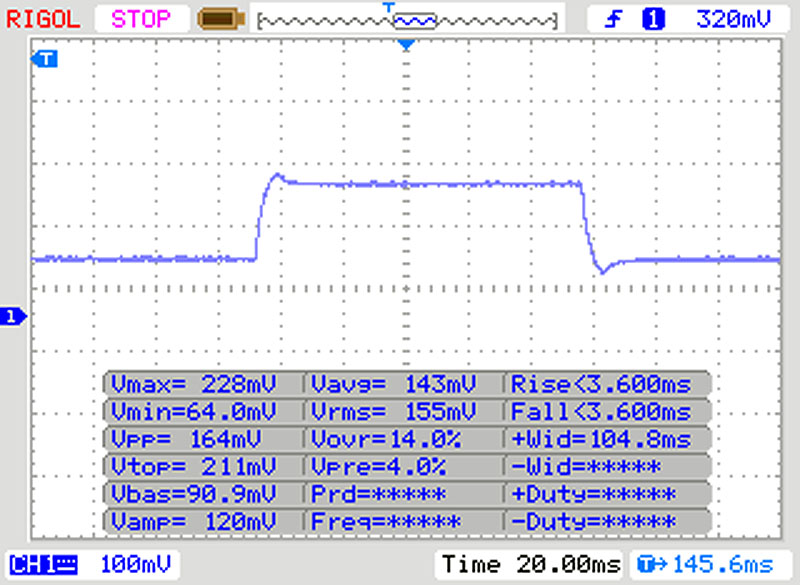 |
| ↘ 6 ms sonbahar | ||
| Ekran, testlerimizde iyi yanıt oranları gösteriyor ancak rekabetçi oyuncular için çok yavaş olabilir. Karşılaştırıldığında, test edilen tüm cihazlar 0.165 (minimum) ile 636 (maksimum) ms arasında değişir. » Tüm cihazların 25 %'si daha iyi. Bu, ölçülen yanıt süresinin test edilen tüm cihazların ortalamasından (31 ms) daha iyi olduğu anlamına gelir. | ||
Ekran Titremesi / PWM (Darbe Genişliği Modülasyonu)
| Ekran titriyor / PWM algılandı | 208 Hz | ≤ 30 % parlaklık ayarı | 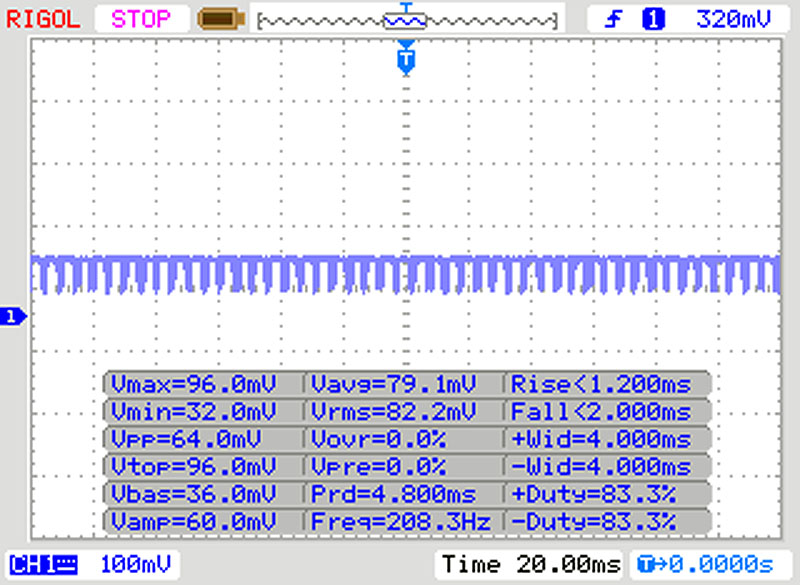 |
Ekran arka ışığı 208 Hz'de titriyor (en kötü durum, örneğin PWM kullanılması) 30 % ve altındaki parlaklık ayarında titreme algılandı. Bu parlaklık ayarının üzerinde titreme veya PWM olmamalıdır. 208 Hz frekansı nispeten düşüktür, bu nedenle hassas kullanıcılar belirtilen parlaklık ayarında ve altında muhtemelen titremeyi fark edecek ve göz yorgunluğu yaşayacaktır. Karşılaştırıldığında: Test edilen tüm cihazların %52 %'si ekranı karartmak için PWM kullanmıyor. PWM tespit edilirse, ortalama 7763 (minimum: 5 - maksimum: 343500) Hz ölçüldü. | |||
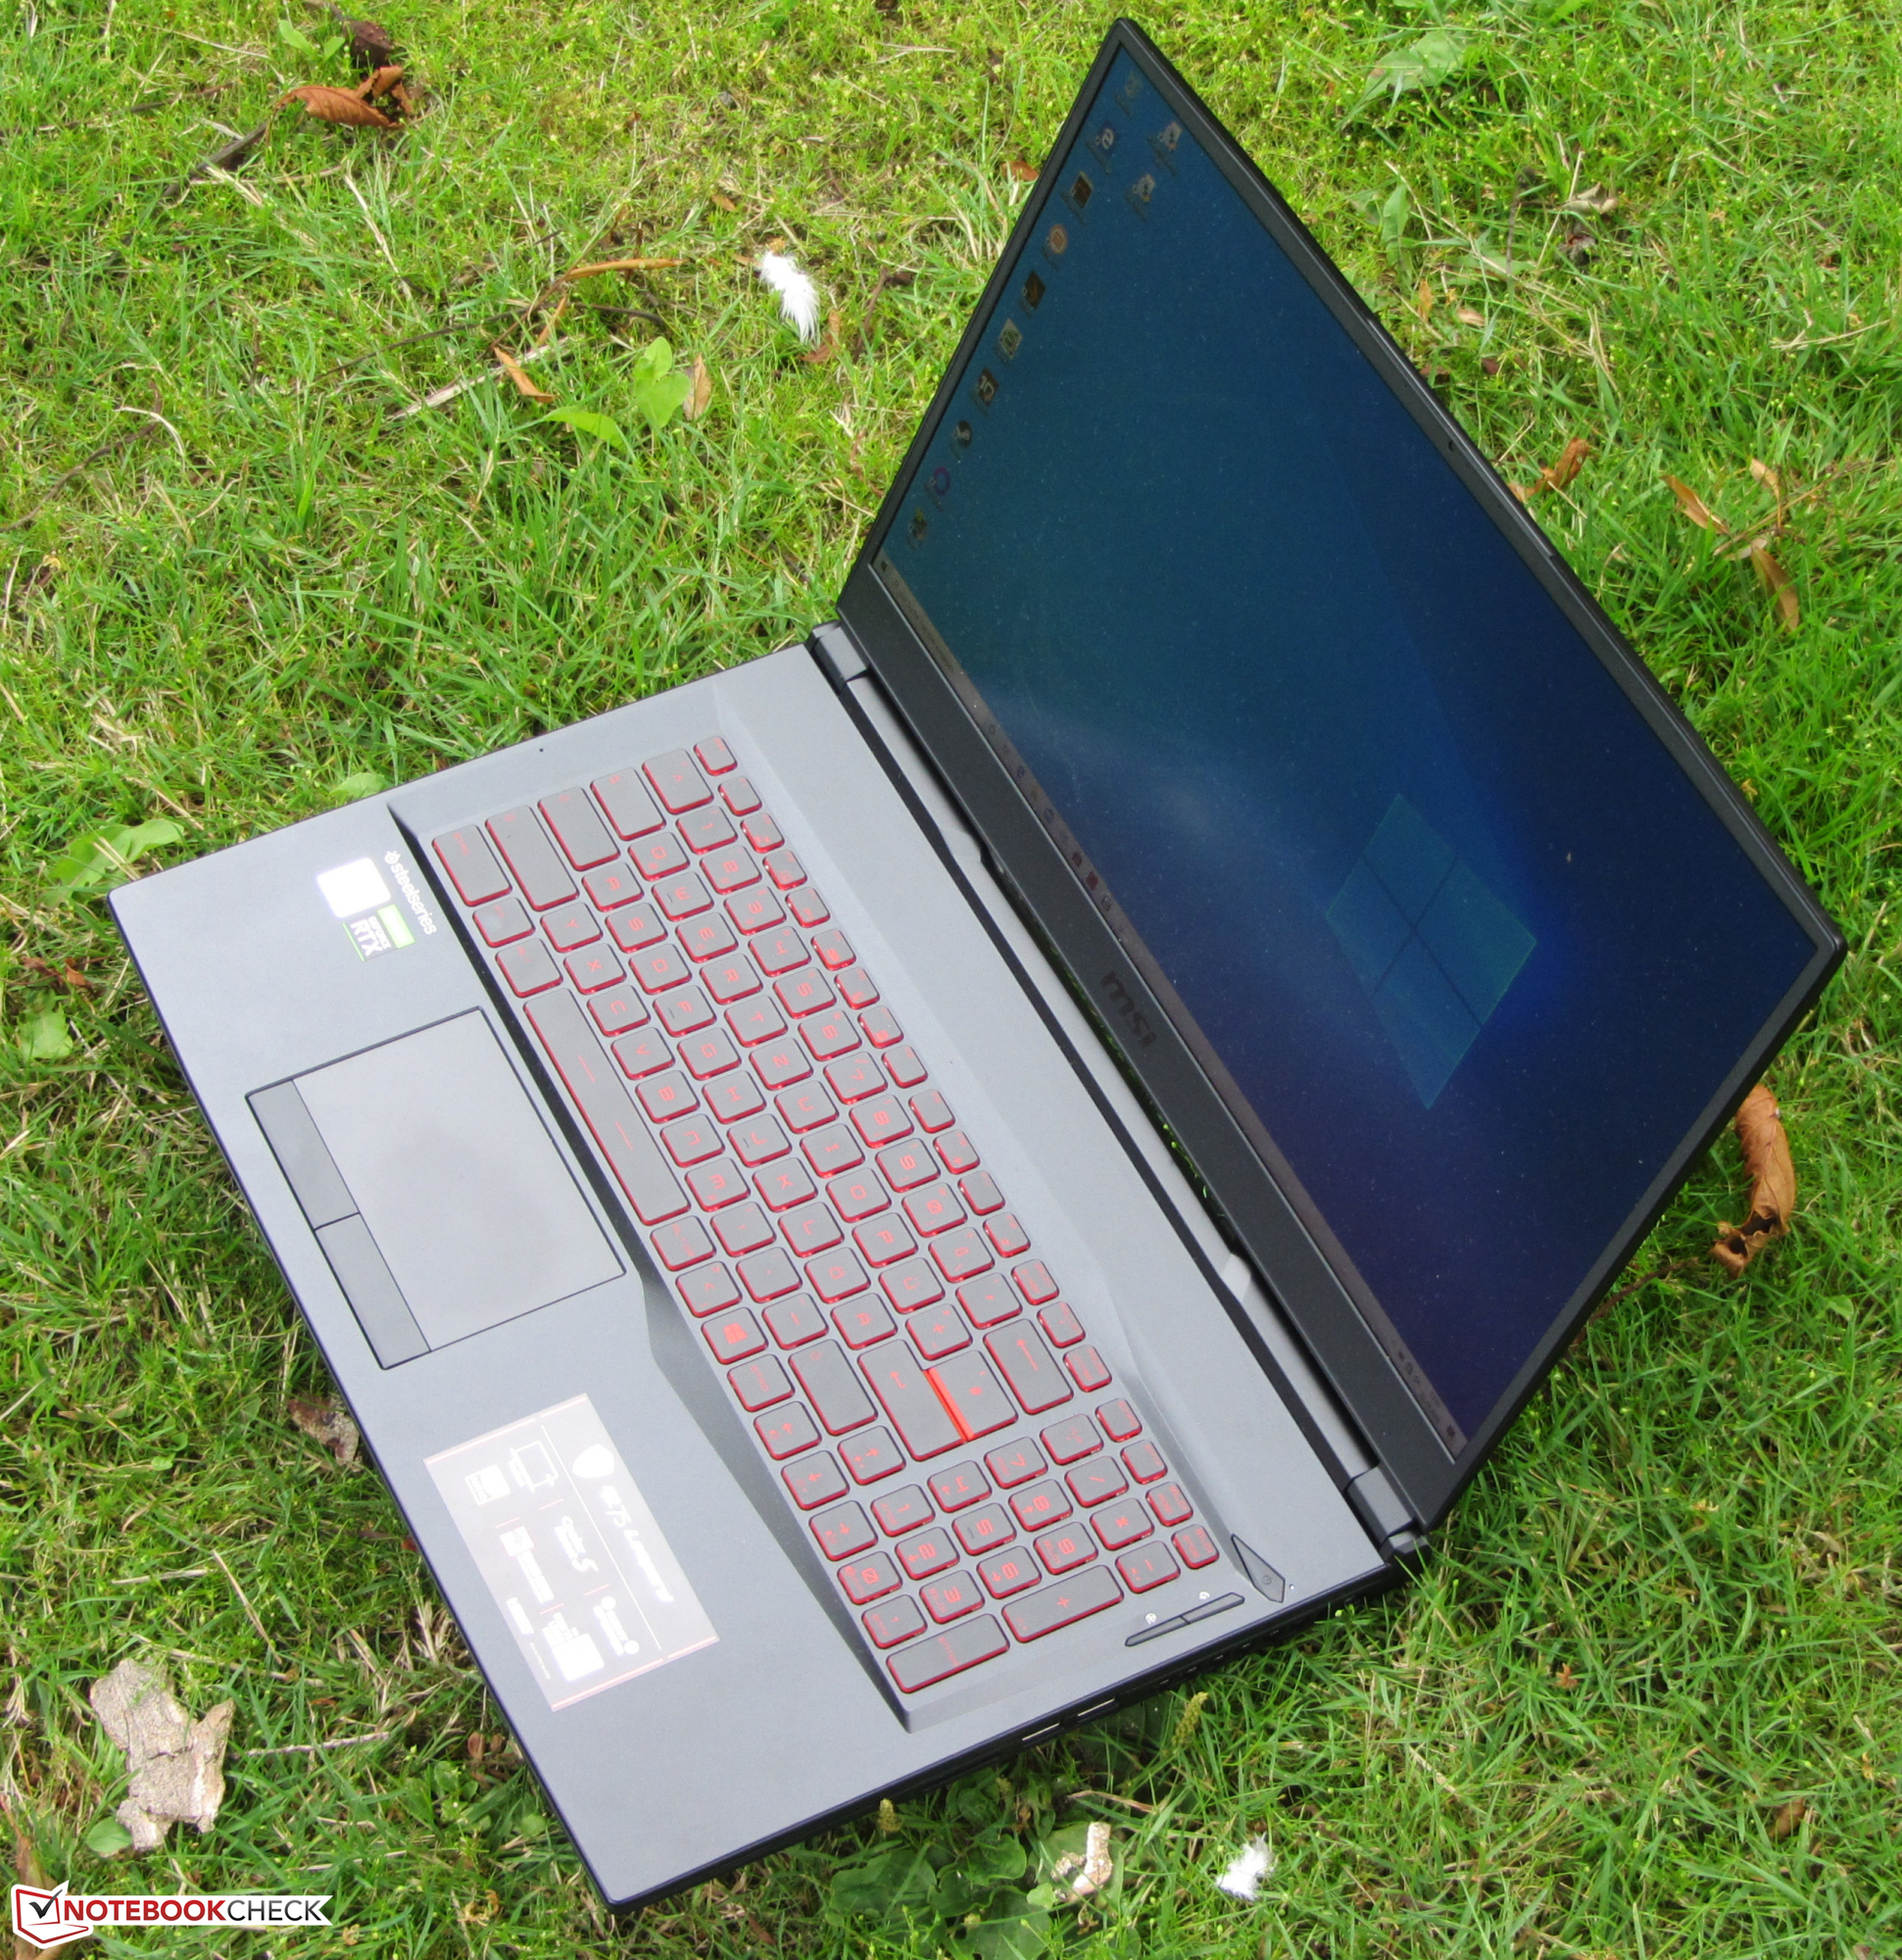
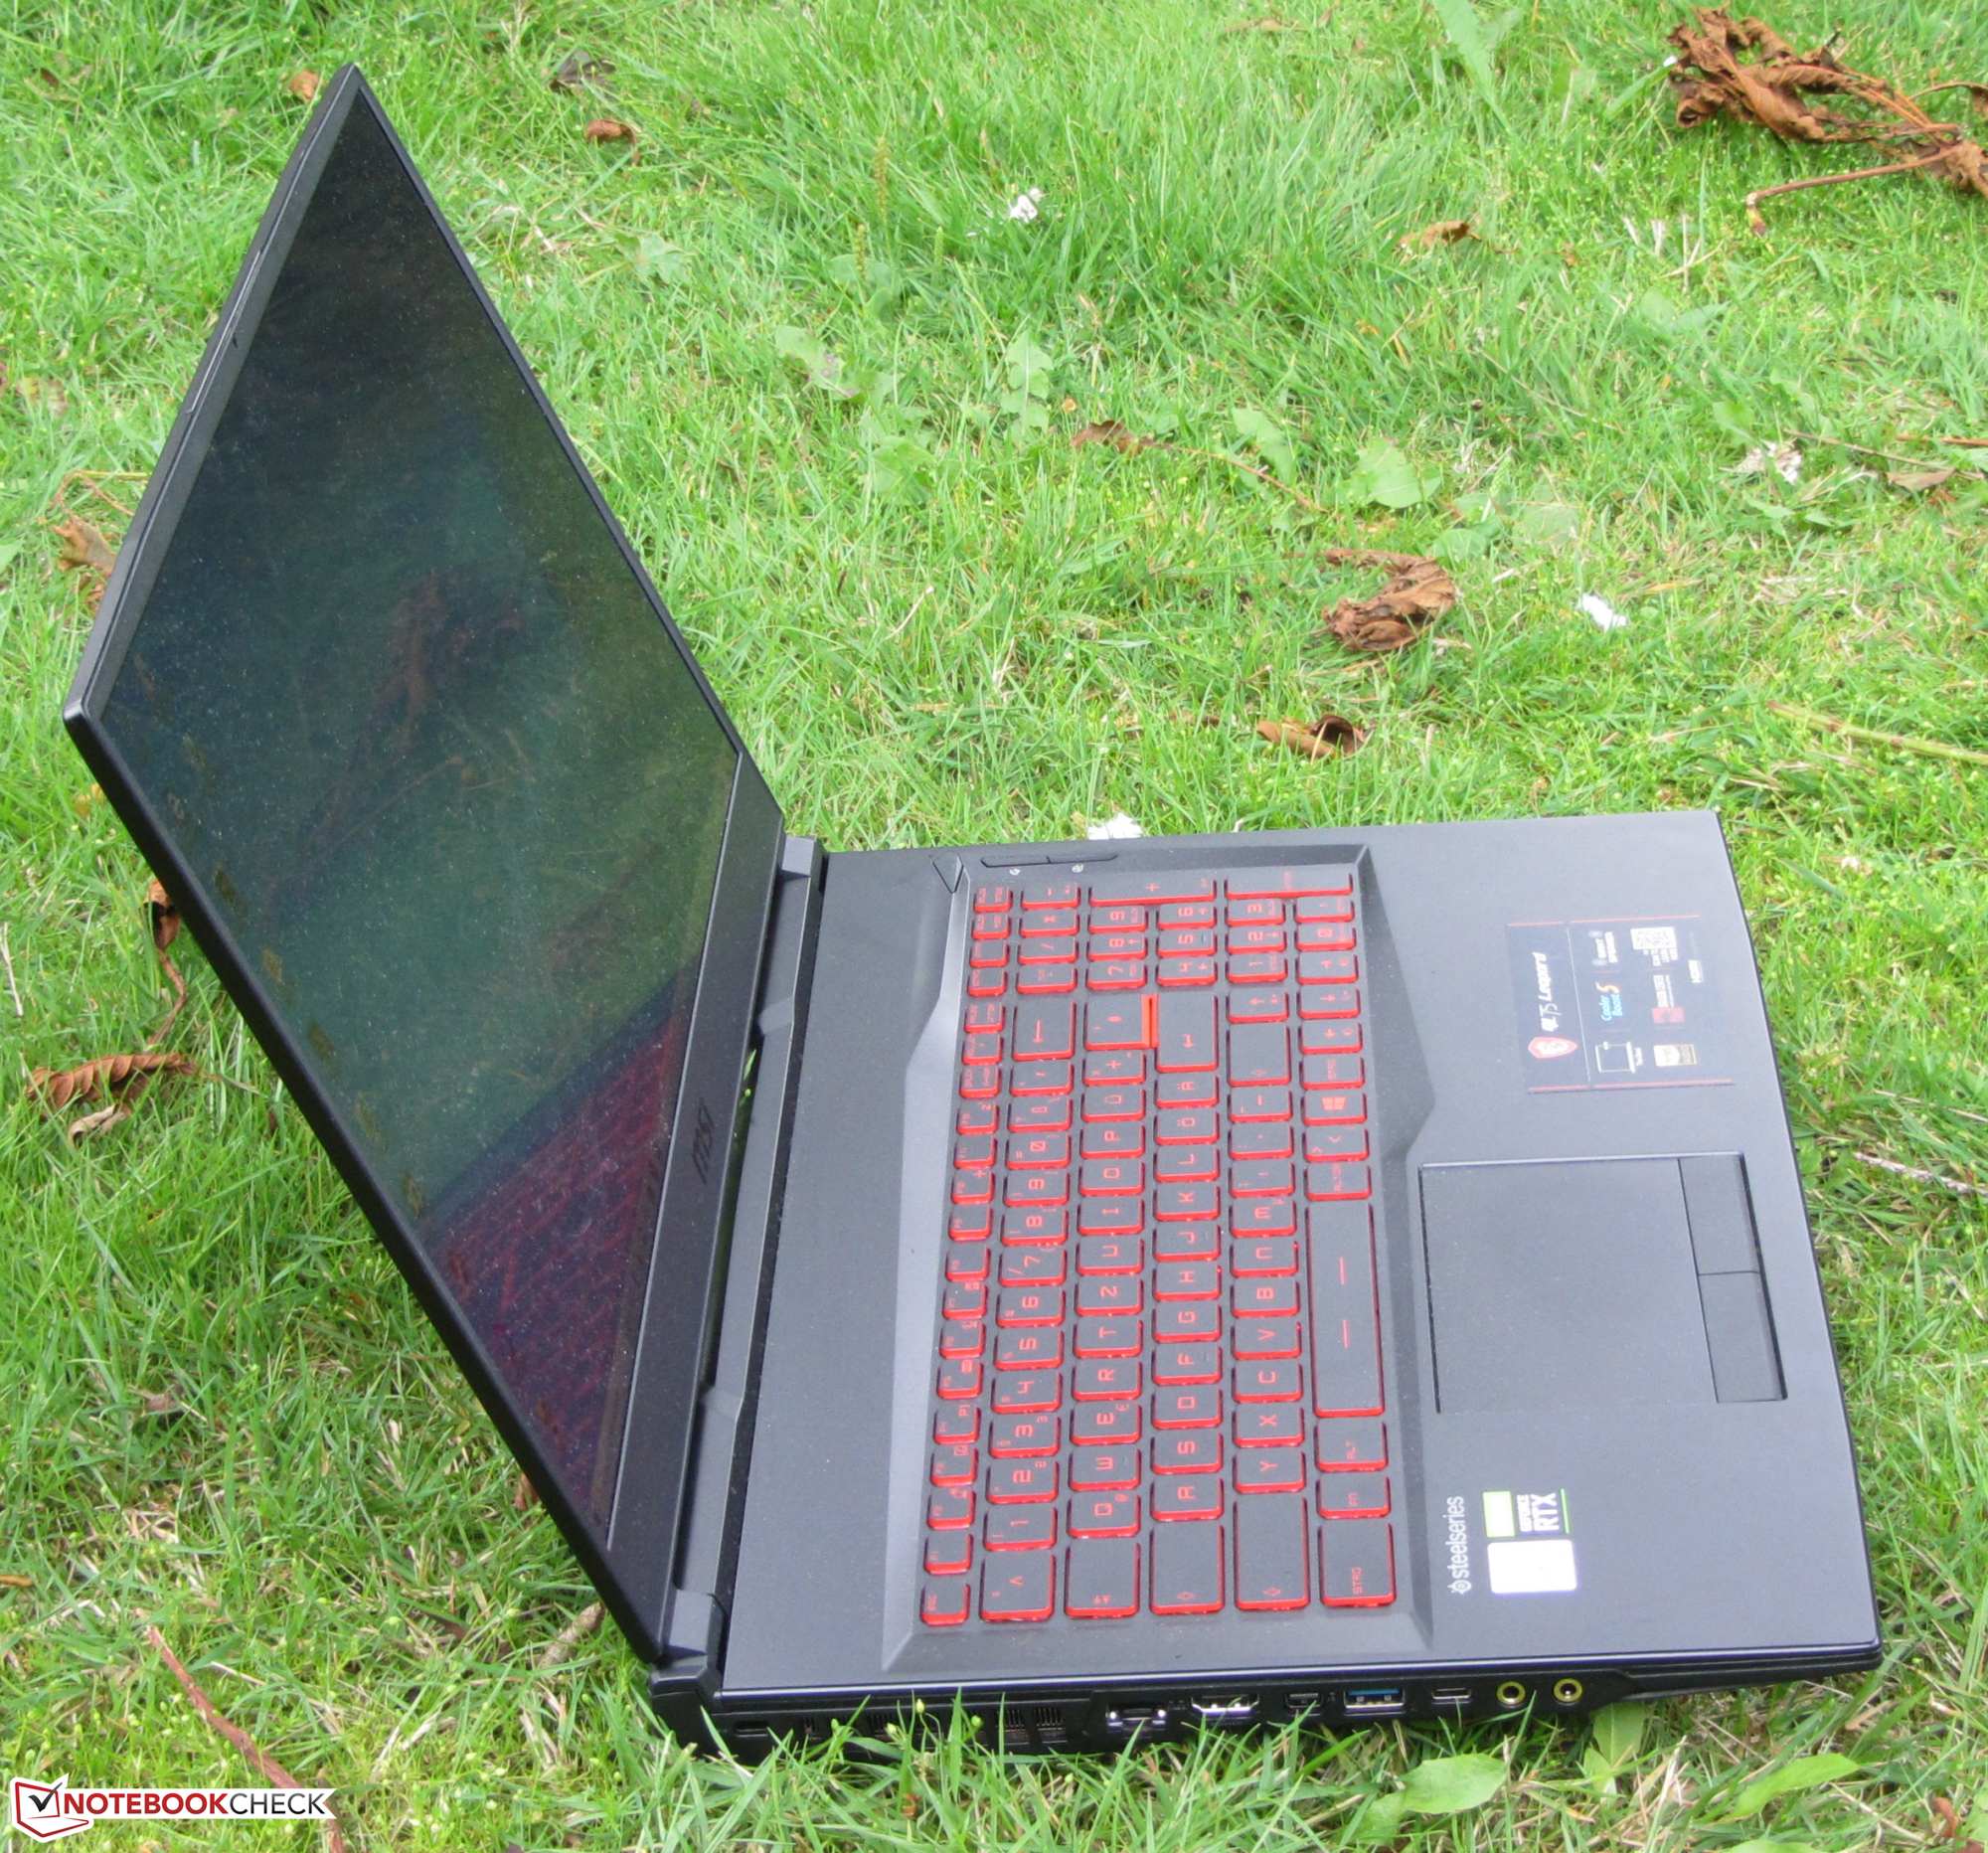
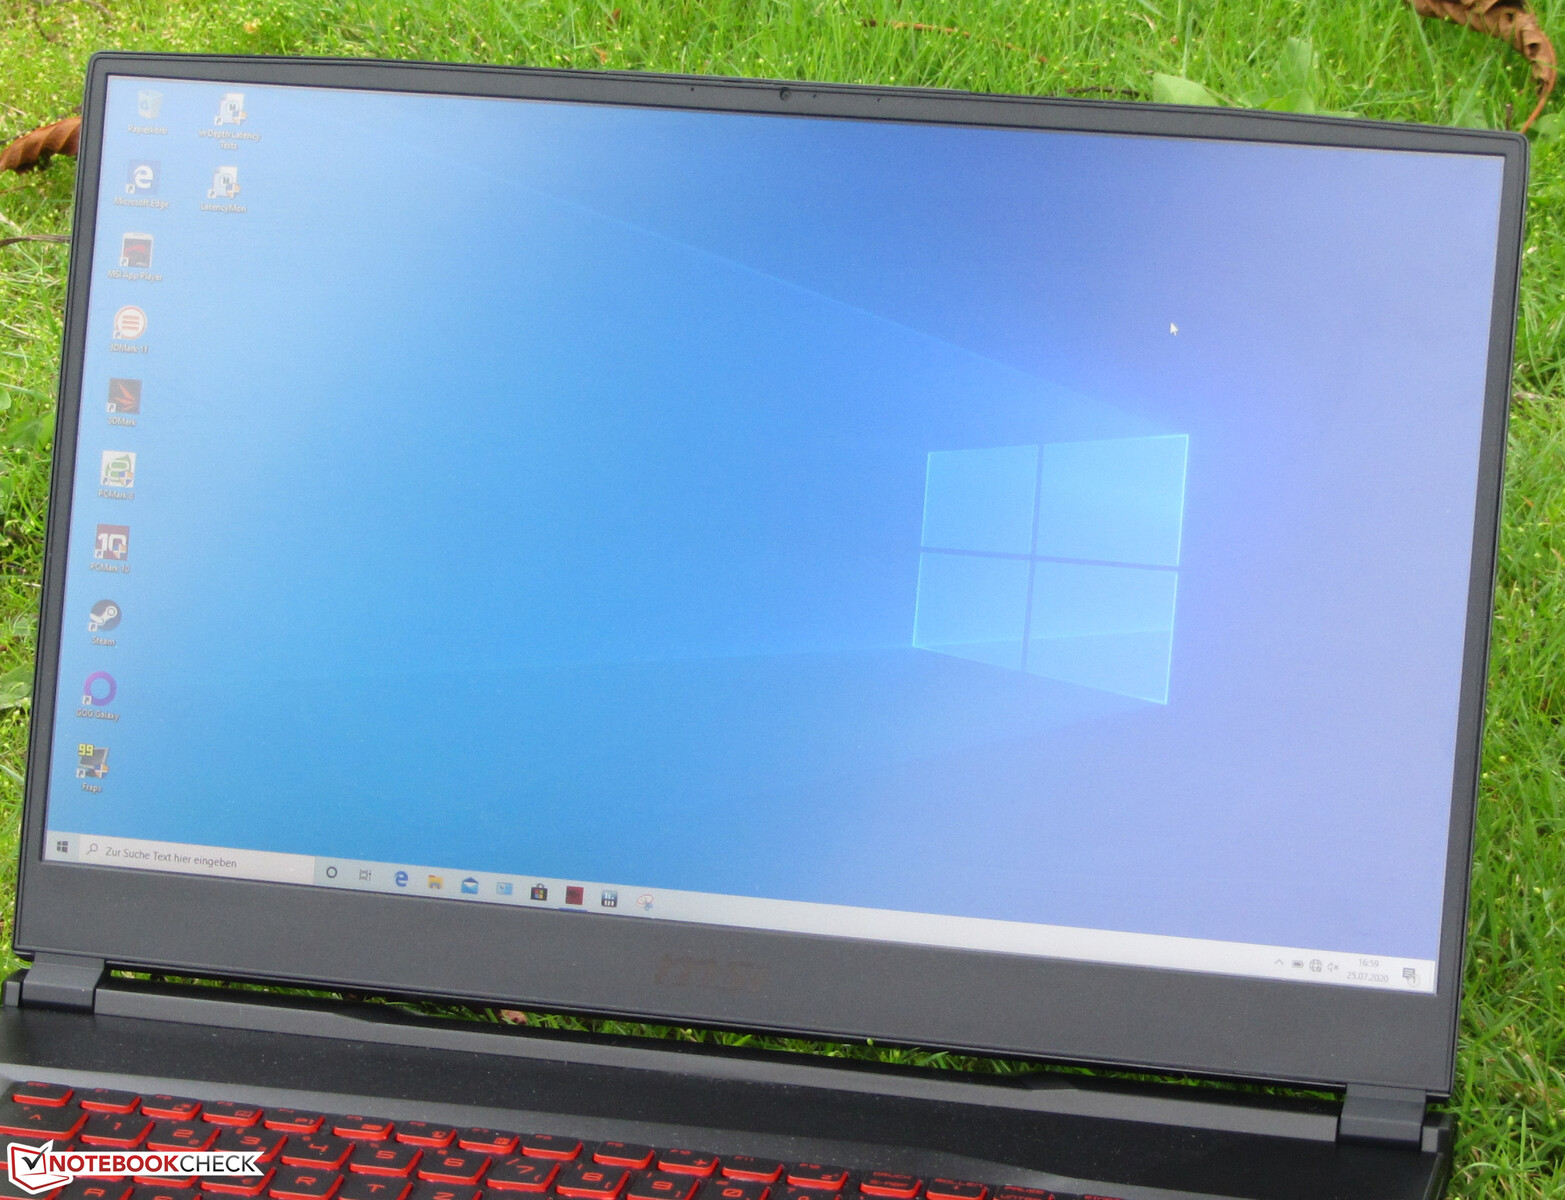
Dizüstü bilgisayar, izleme açısına sabit bir IPS paneli ile donatılmıştır. Sonuç olarak, ekran herhangi bir konumdan okunabilir. Dışarıda, güneş çok parlak olmadığında ekranı okumak mümkündür.

Performans - GL75 tüm uygulama alanları için yeterli güç sunar
MSI, GL75 Leopard 10SFR-221 ile ürün yelpazesinde 17,3 inçlik bir dizüstü oyun bilgisayarına sahip. Her modern oyunu sorunsuz bir şekilde ekrana getirir ve ayrıca diğer tüm uygulama alanlarında iyi bir figür oluşturur. Test cihazımızın maliyeti 1.800 Euro'nun (~ 2.120 $) biraz altındadır. Diğer konfigürasyon çeşitleri mevcuttur.
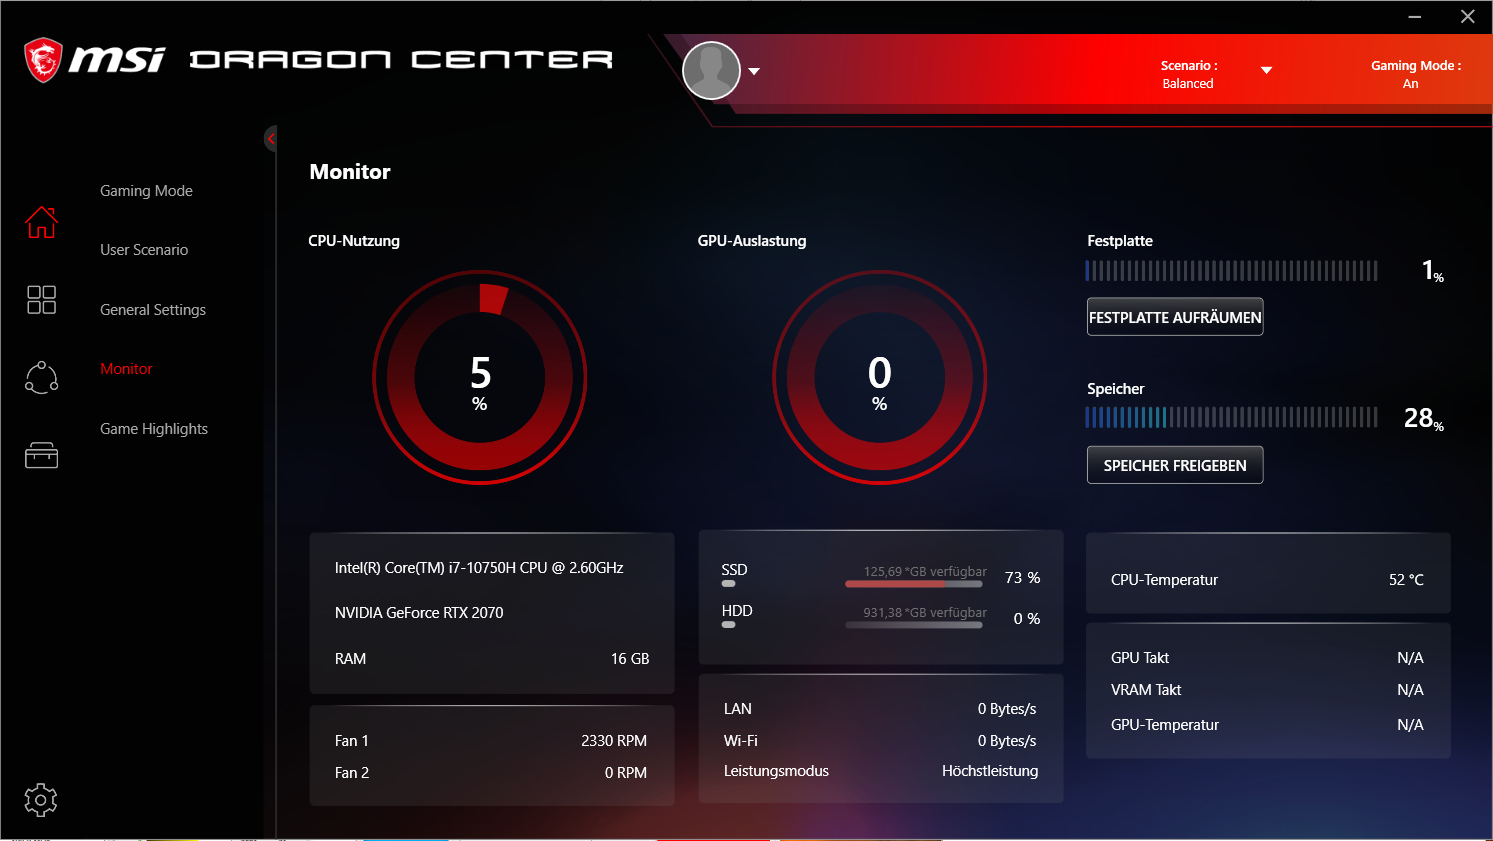
Test koşulları
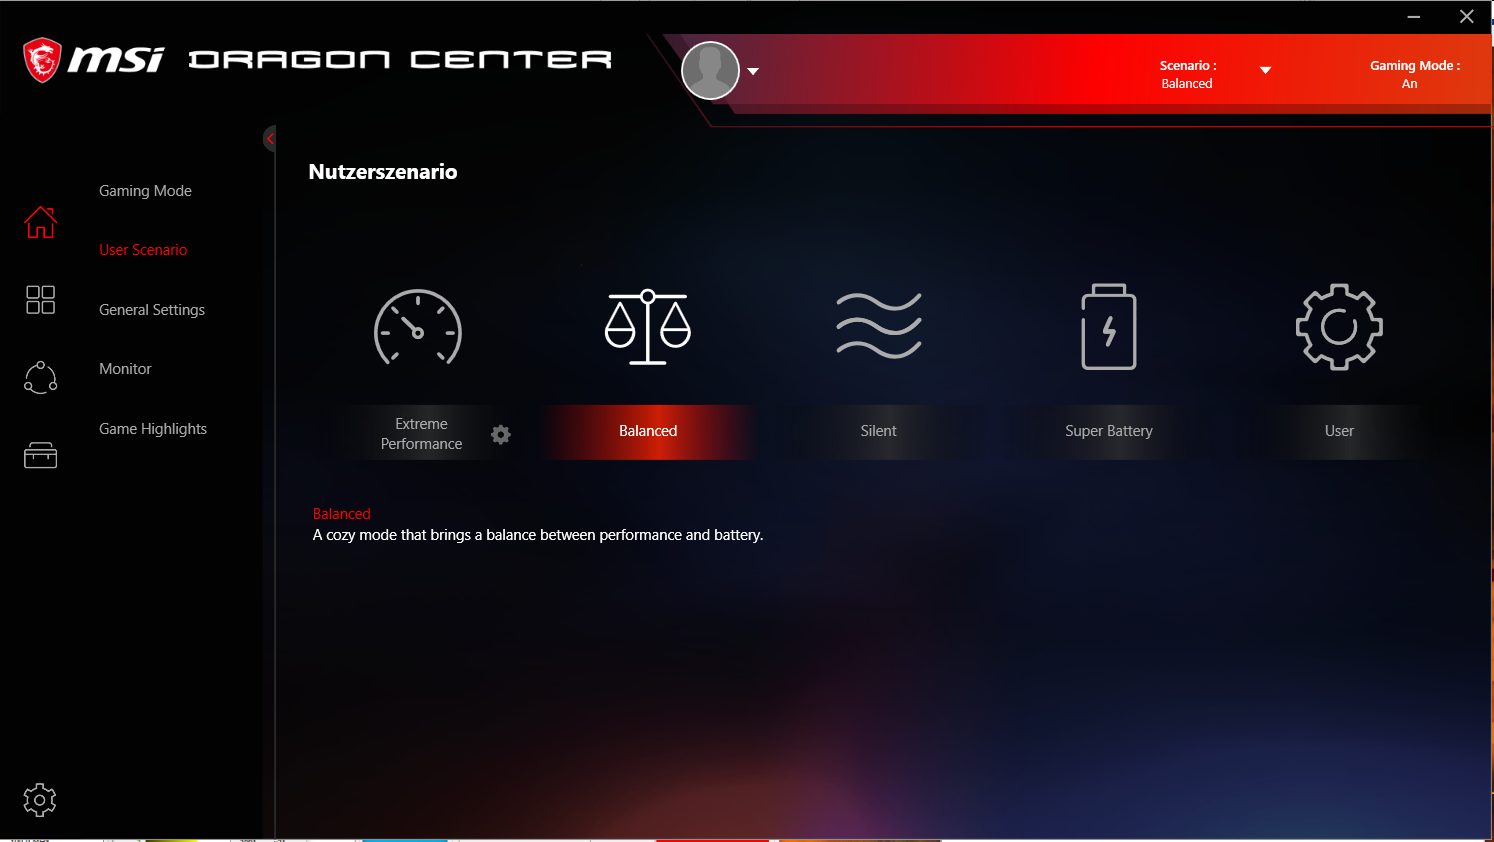
Önceden yüklenmiş Dragon Center, gürültü gelişimi ve performansı üzerinde etkisi olan çeşitli performans profilleri sunar. Tüm testleri "Dengeli" performans profili ile gerçekleştirdik. "Ekstrem Performans" profili altında bazı kıyaslamalar da yapıldı ve biz bunu uygun yerlere işaret ediyoruz.
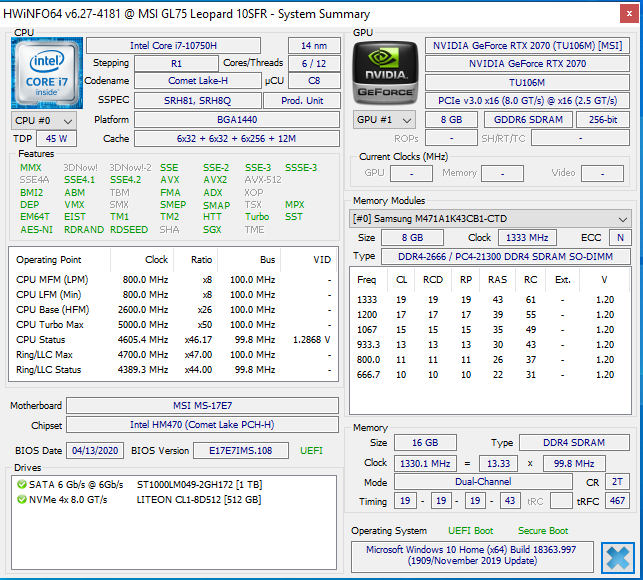
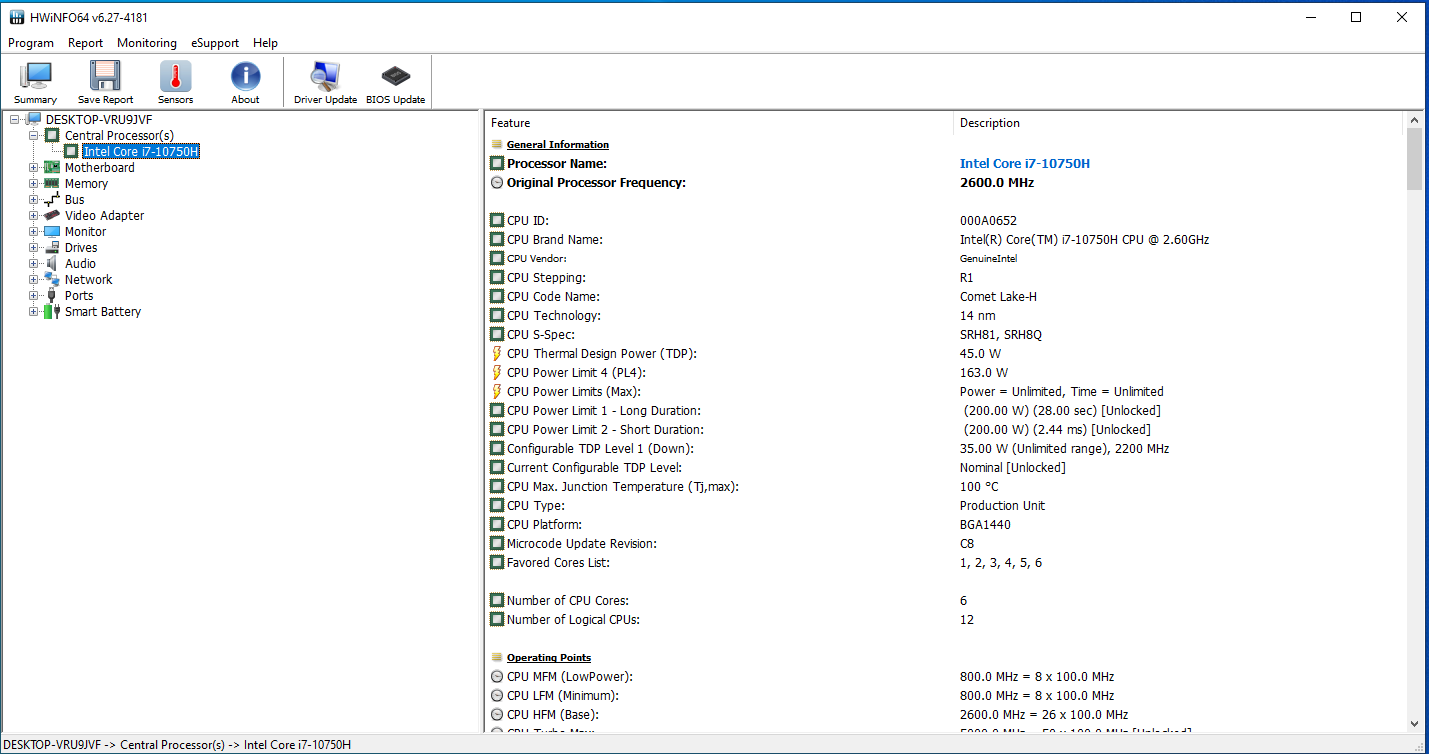
İşlemci
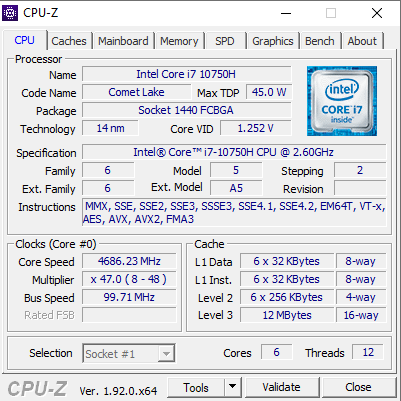
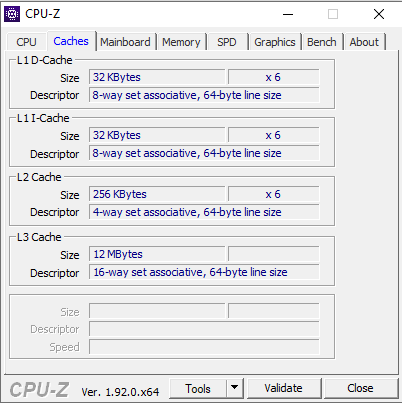
MSI, GL75'i bir Core i7-10750H hexa-core işlemci (Comet Lake) ile donatıyor. CPU, 2,6 GHz'lik bir temel hızda çalışır. Saat hızı, Turbo aracılığıyla 4,3 GHz (altı çekirdek) ve 5 GHz (bir çekirdek) aralığına yükseltilebilir. Dahası, Hyper-Threading (çekirdek başına iki iş parçacığı) desteklenir. İşlemci, Cinebench R15 benchmark'ın 3.4 ila 4.2 GHz'deki çoklu iş parçacığı testinde kısaca çalışır. Daha sonra saat hızı 3,3 ila 3,9 GHz'e düşer. Tek iplik testi 4,2 ila 4,6 GHz'de yürütülür. Pil gücünde, hızlar sırasıyla 1,6 ila 1,9 GHz (çok iş parçacıklı) ve 3,2 ila 4,6 GHz'dir (tek iş parçacıklı).
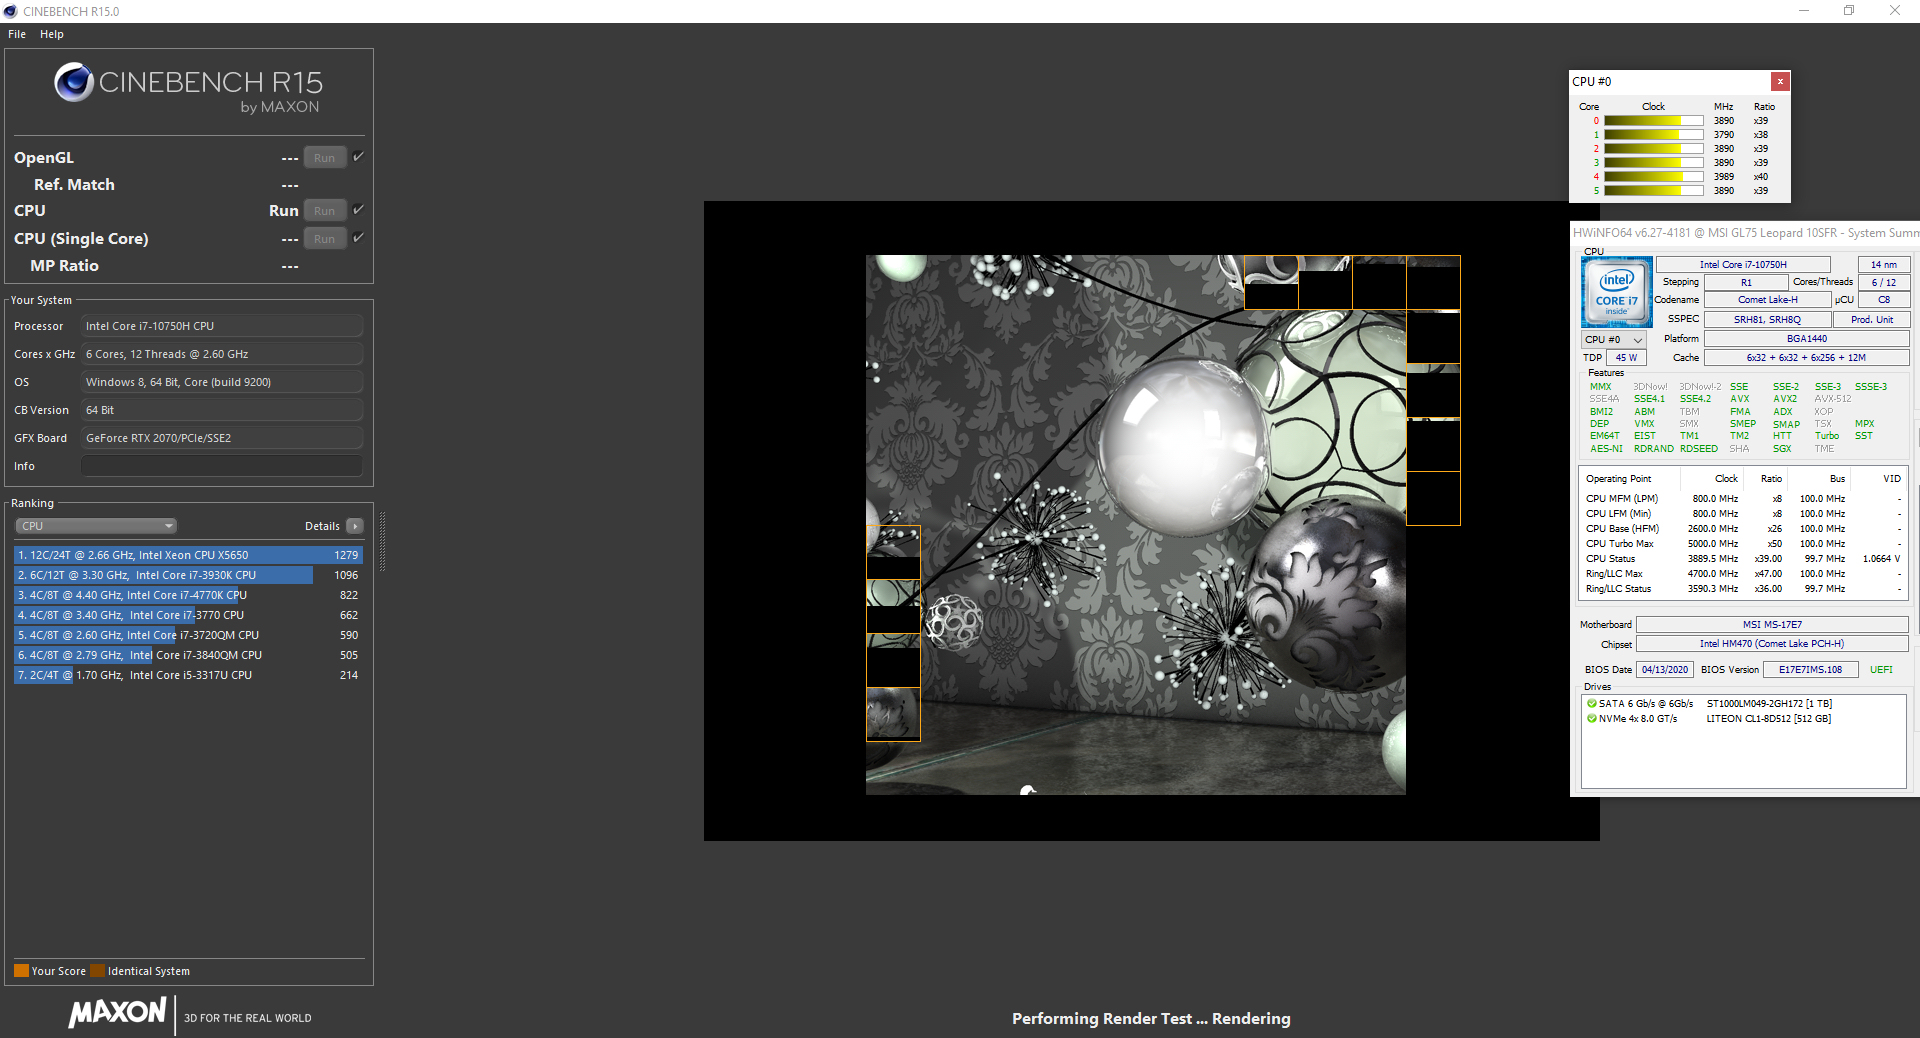
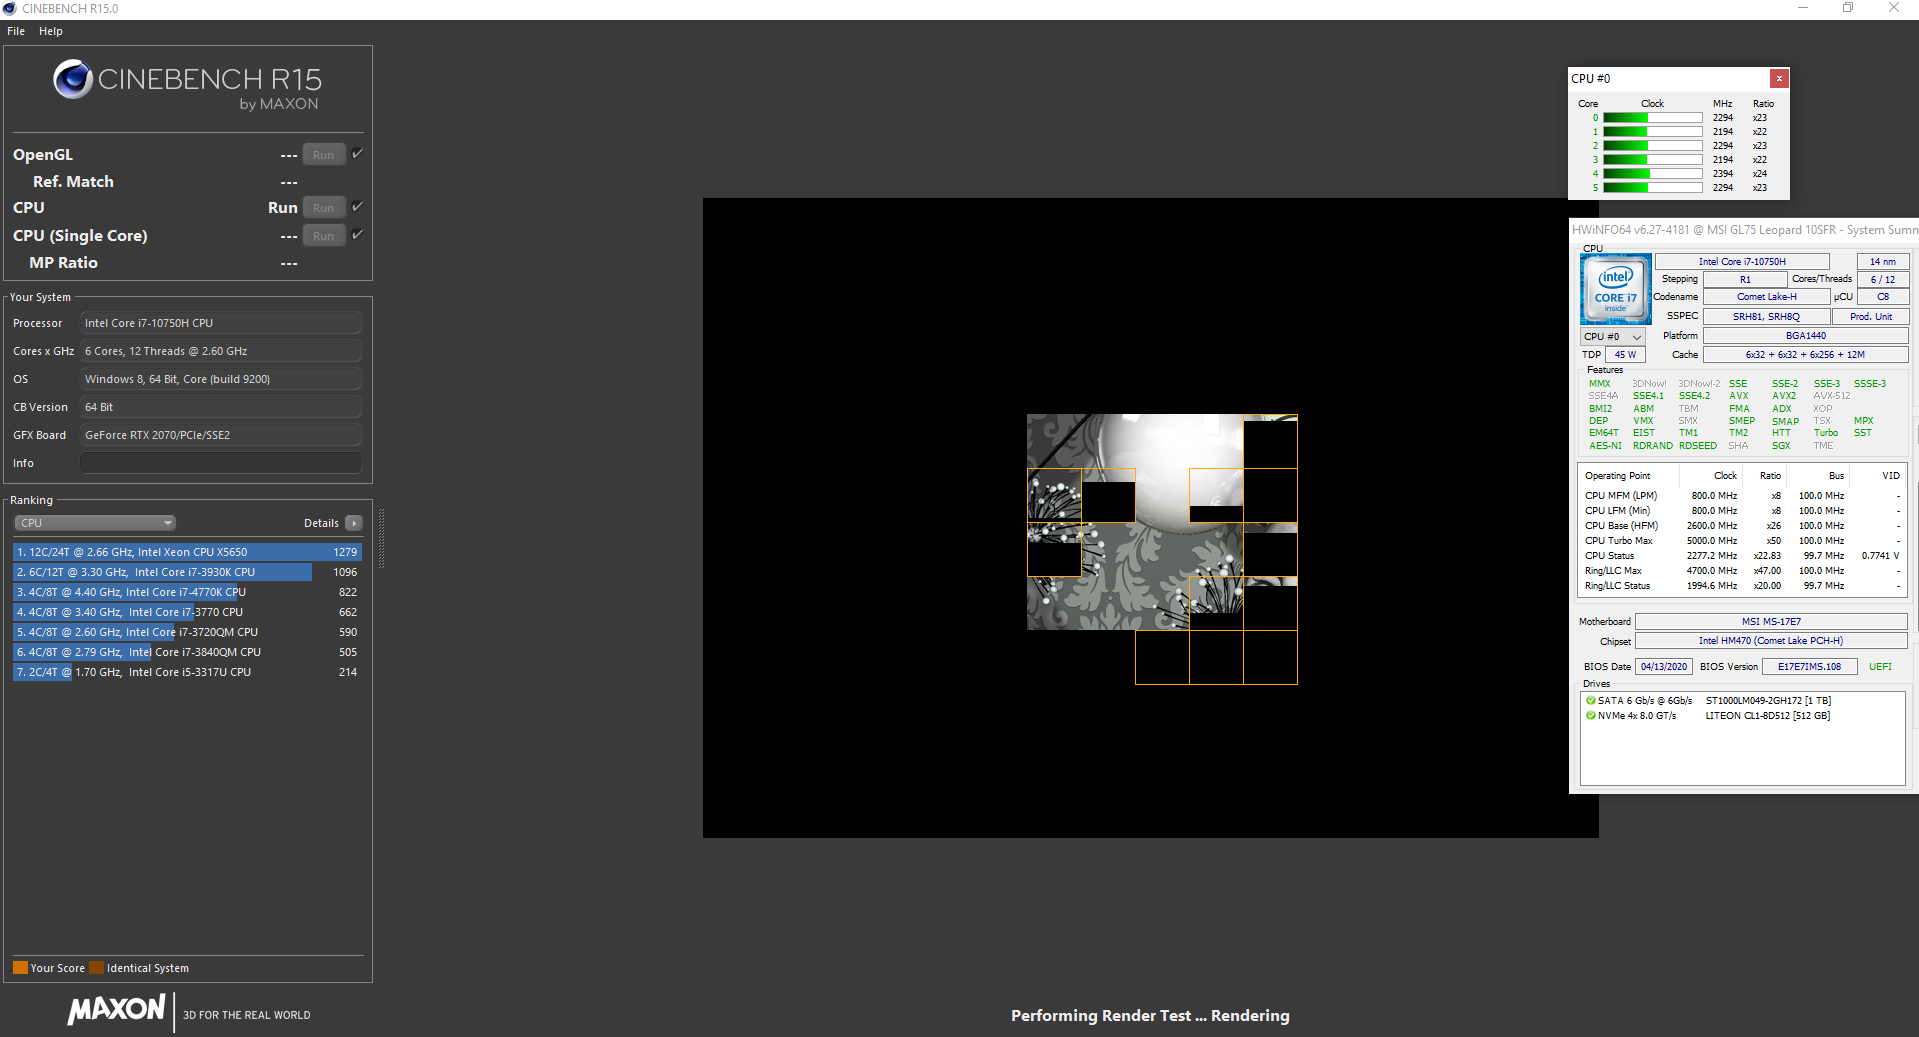
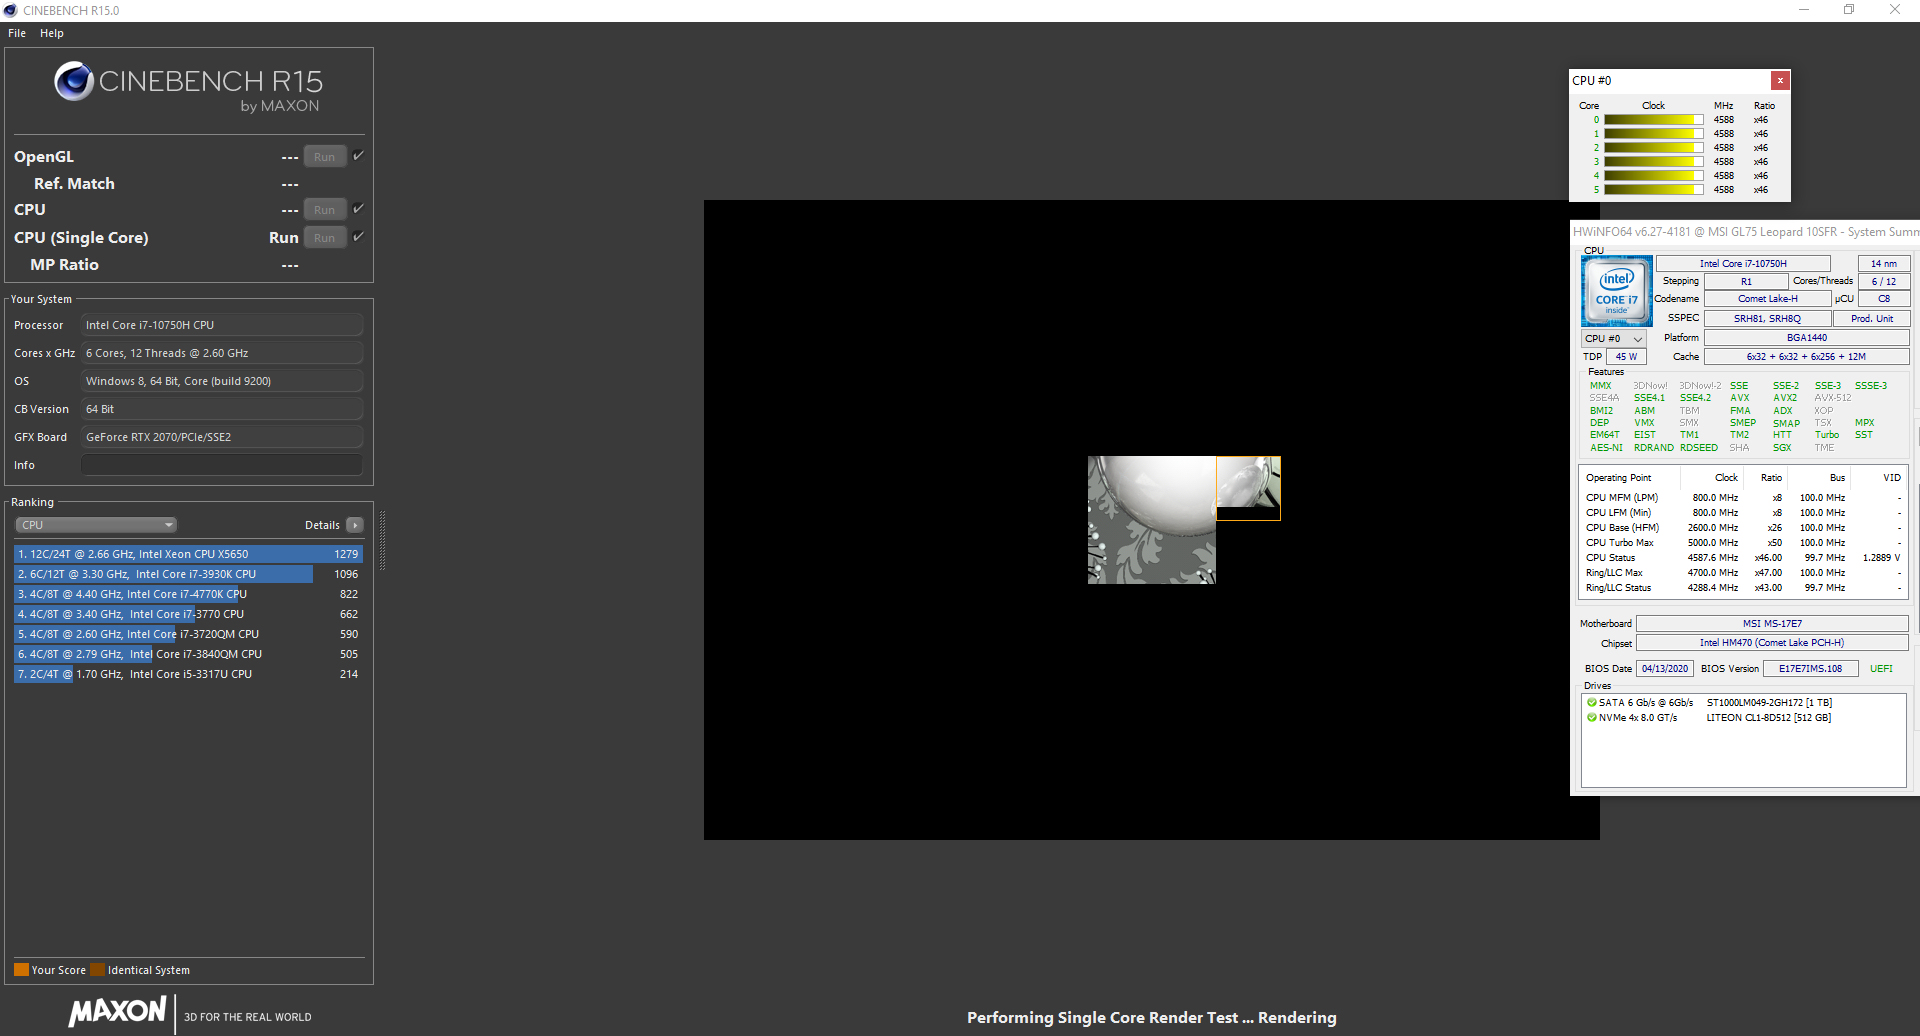
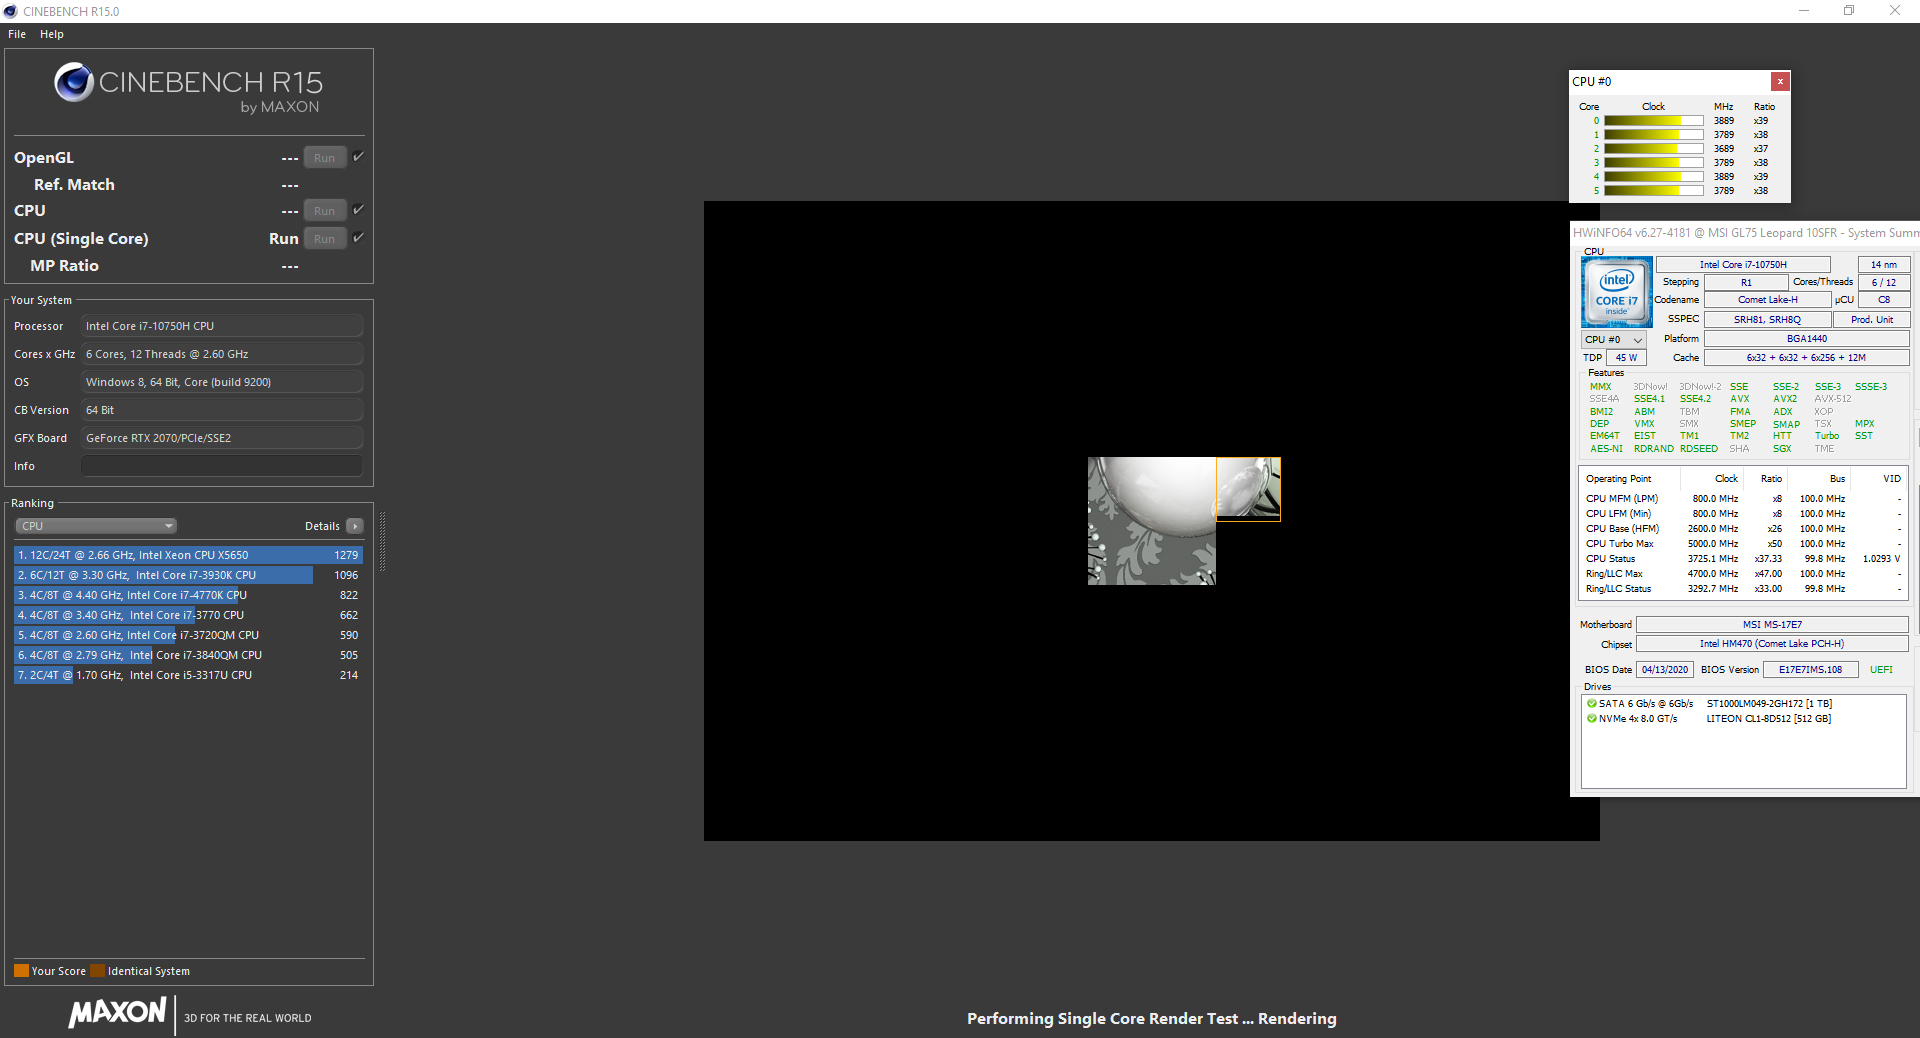
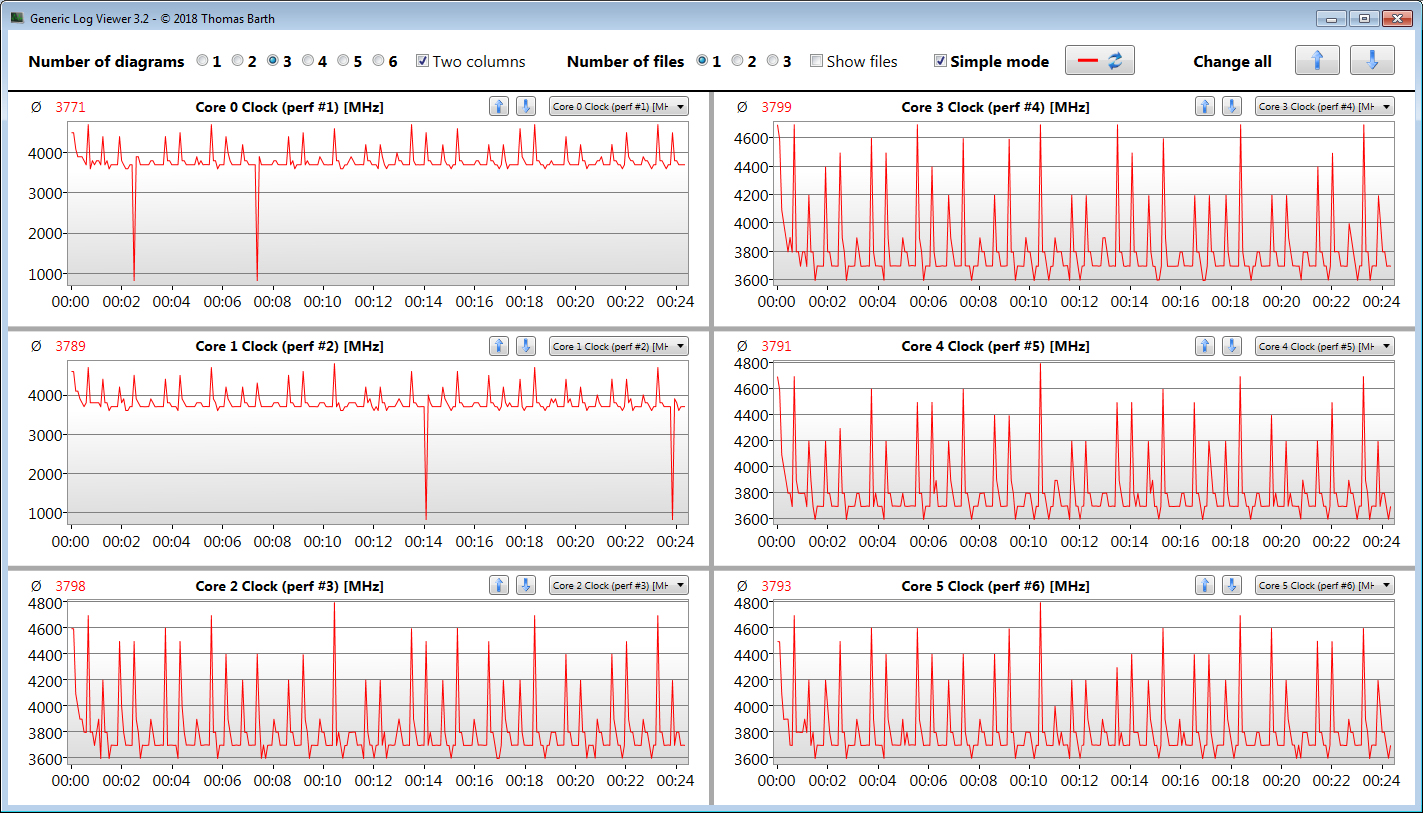
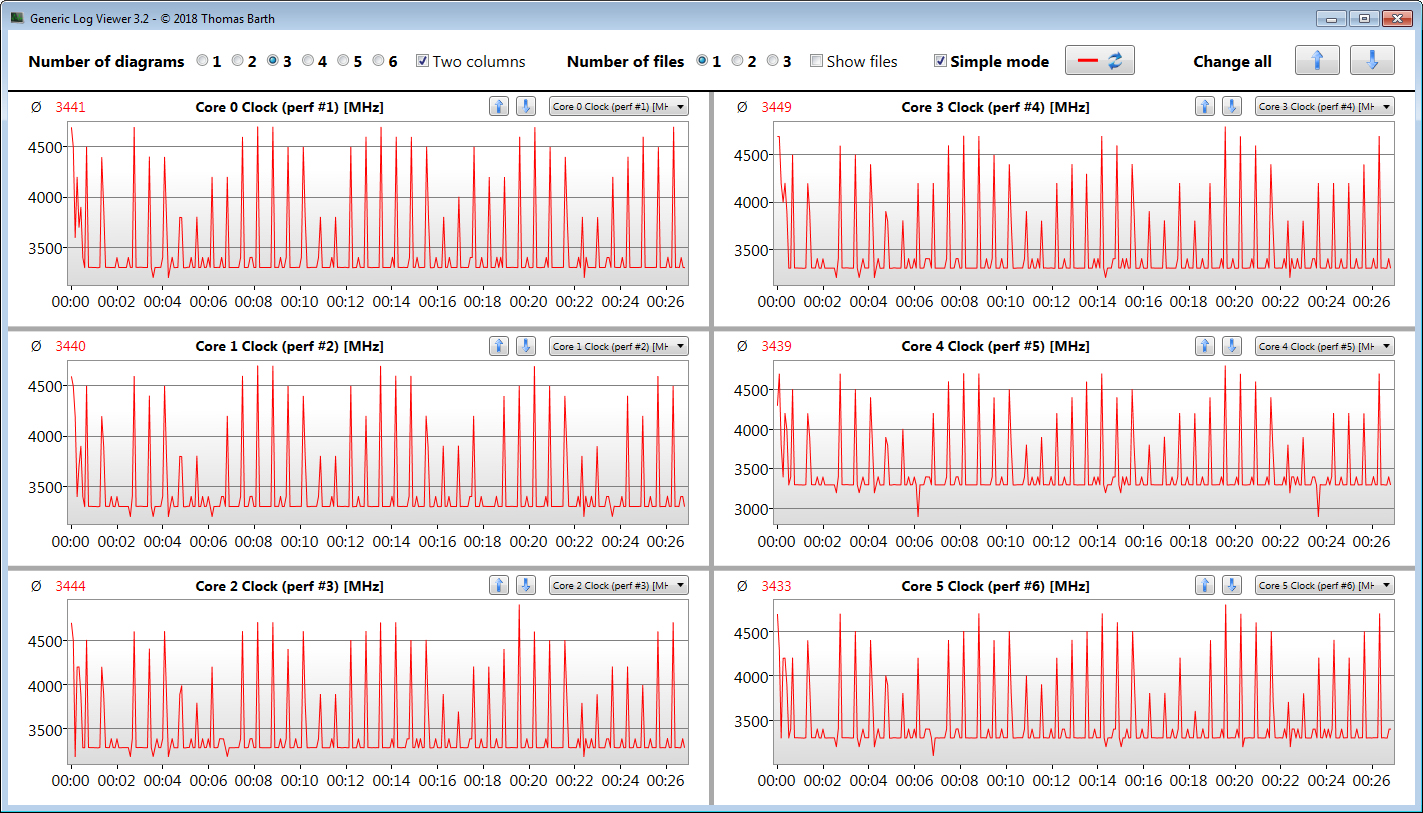
Cinebench R15 benchmark'ın multithread testini en az 30 dakika sürekli bir döngüde çalıştırarak CPU Turbo'nun da takılıyken tutarlı bir şekilde kullanılıp kullanılmadığını doğrularız. Sonuçlar birinci aşamadan ikinci aşamaya biraz düşer ve ardından sabit bir seviyede kalır. Turbo kullanılır. Dragon Center yazılımında "Aşırı Performans" profili seçilirse biraz daha yüksek sonuçlar elde edilir.
| Cinebench R15 | |
| CPU Single 64Bit | |
| Sınıf ortalaması Gaming (188.8 - 343, n=108, son 2 yıl) | |
| Ortalama Intel Core i7-10750H (184 - 213, n=45) | |
| Acer Nitro 5 AN517-52-77DS | |
| MSI GL75 10SFR (Extreme Performance) | |
| Schenker XMG Neo 17 XNE17M19 | |
| MSI GP75 Leopard 9SD | |
| MSI GL75 10SFR | |
| Asus TUF A17 FA706IU-AS76 | |
| MSI Bravo 17 A4DDR | |
| MSI GL75 9SEK-056US | |
| Lenovo Legion Y740-17IRHg-81UJ001VGE | |
| Schenker XMG Neo 17 | |
| CPU Multi 64Bit | |
| Sınıf ortalaması Gaming (1578 - 6271, n=107, son 2 yıl) | |
| MSI Bravo 17 A4DDR | |
| Asus TUF A17 FA706IU-AS76 | |
| MSI GL75 10SFR (Extreme Performance) | |
| Acer Nitro 5 AN517-52-77DS | |
| MSI GL75 9SEK-056US | |
| Ortalama Intel Core i7-10750H (804 - 1418, n=50) | |
| Lenovo Legion Y740-17IRHg-81UJ001VGE | |
| MSI GP75 Leopard 9SD | |
| MSI GL75 10SFR | |
| Schenker XMG Neo 17 XNE17M19 | |
| Schenker XMG Neo 17 | |
| Cinebench R20 | |
| CPU (Single Core) | |
| Sınıf ortalaması Gaming (442 - 895, n=108, son 2 yıl) | |
| MSI Bravo 17 A4DDR | |
| MSI GL75 10SFR | |
| Acer Nitro 5 AN517-52-77DS | |
| Asus TUF A17 FA706IU-AS76 | |
| Ortalama Intel Core i7-10750H (431 - 504, n=43) | |
| Schenker XMG Neo 17 XNE17M19 | |
| Lenovo Legion Y740-17IRHg-81UJ001VGE | |
| CPU (Multi Core) | |
| Sınıf ortalaması Gaming (4029 - 16108, n=108, son 2 yıl) | |
| MSI Bravo 17 A4DDR | |
| Asus TUF A17 FA706IU-AS76 | |
| MSI GL75 10SFR | |
| Acer Nitro 5 AN517-52-77DS | |
| Ortalama Intel Core i7-10750H (1749 - 3325, n=43) | |
| Lenovo Legion Y740-17IRHg-81UJ001VGE | |
| Schenker XMG Neo 17 XNE17M19 | |
* ... daha küçük daha iyidir
Sistem performansı
GL75'in bileşen listesine bir bakış, dizüstü bilgisayarın oyunların ötesinde uygulamalar için yeterli bilgi işlem gücüne sahip olduğunu ortaya koyuyor. Bu, PCMark kıyaslamalarındaki iyi sonuçlarla doğrulanmaktadır.
| PCMark 8 Home Score Accelerated v2 | 3372 puan | |
| PCMark 8 Creative Score Accelerated v2 | 3874 puan | |
| PCMark 8 Work Score Accelerated v2 | 5678 puan | |
| PCMark 10 Score | 5179 puan | |
Yardım | ||
DPC gecikmeleri
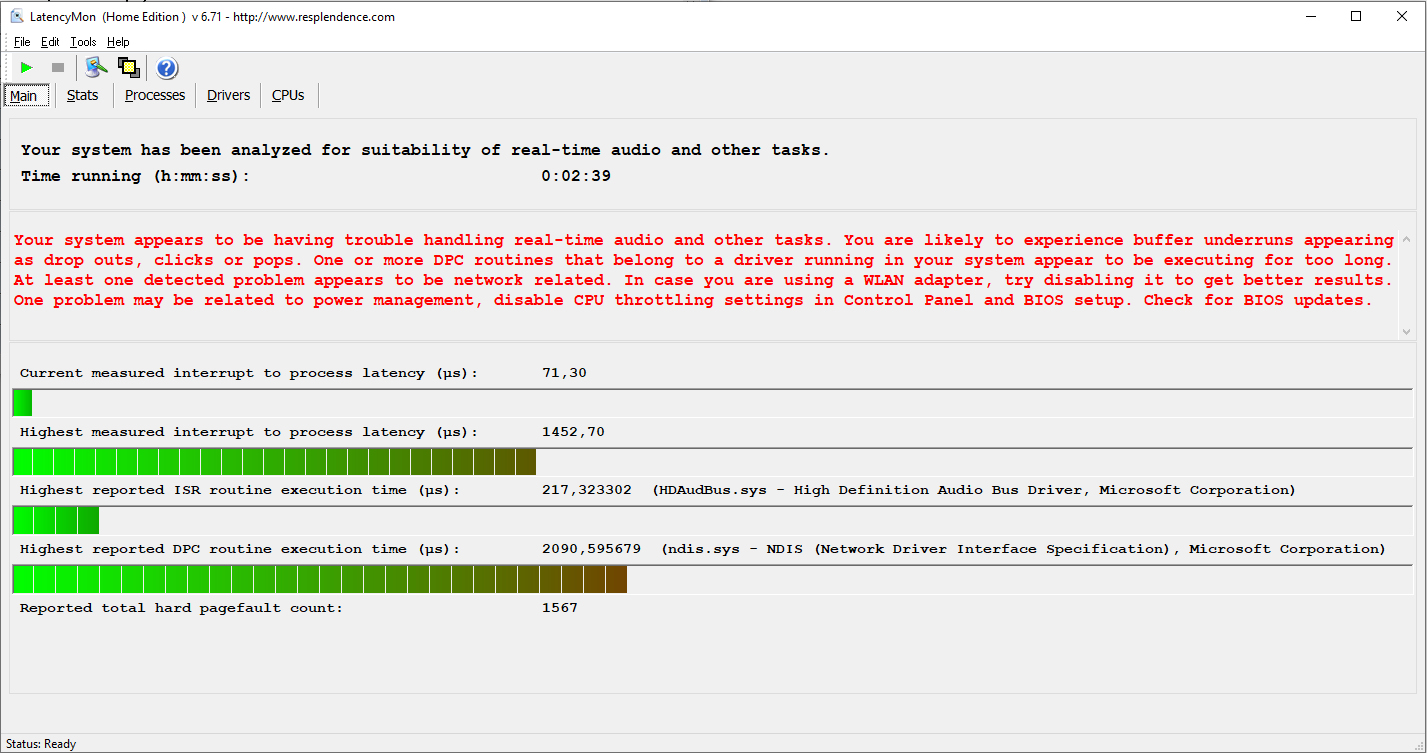
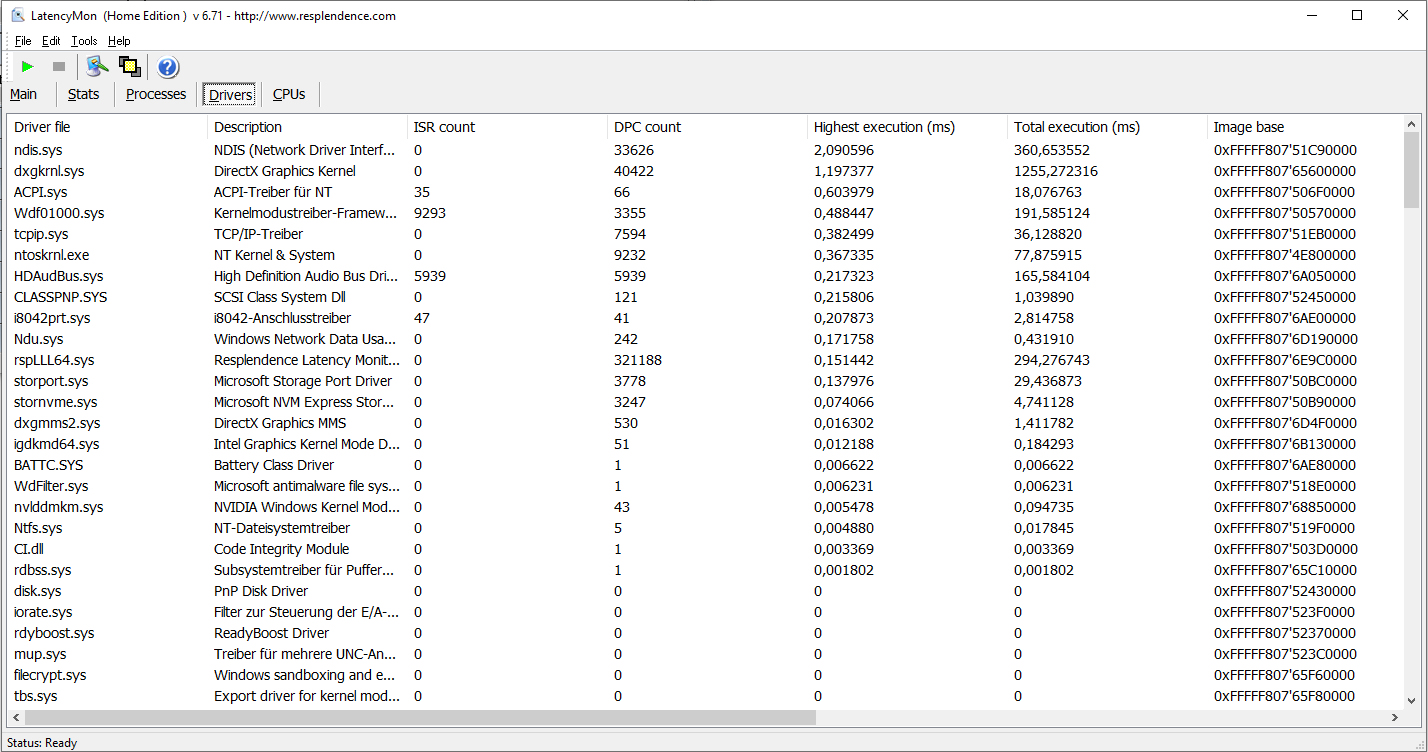
Standartlaştırılmış gecikme monitör testimizde (web sörfü, 4K video oynatma, yüksek yüklü Prime95), yüksek DPC gecikmeleri gözlemleyebildik. Sistem, gerçek zamanlı video ve ses düzenleme için uygun değildir.
| DPC Latencies / LatencyMon - interrupt to process latency (max), Web, Youtube, Prime95 | |
| Asus TUF A17 FA706IU-AS76 | |
| MSI GL75 10SFR | |
| MSI Bravo 17 A4DDR | |
| Acer Nitro 5 AN517-52-77DS | |
* ... daha küçük daha iyidir
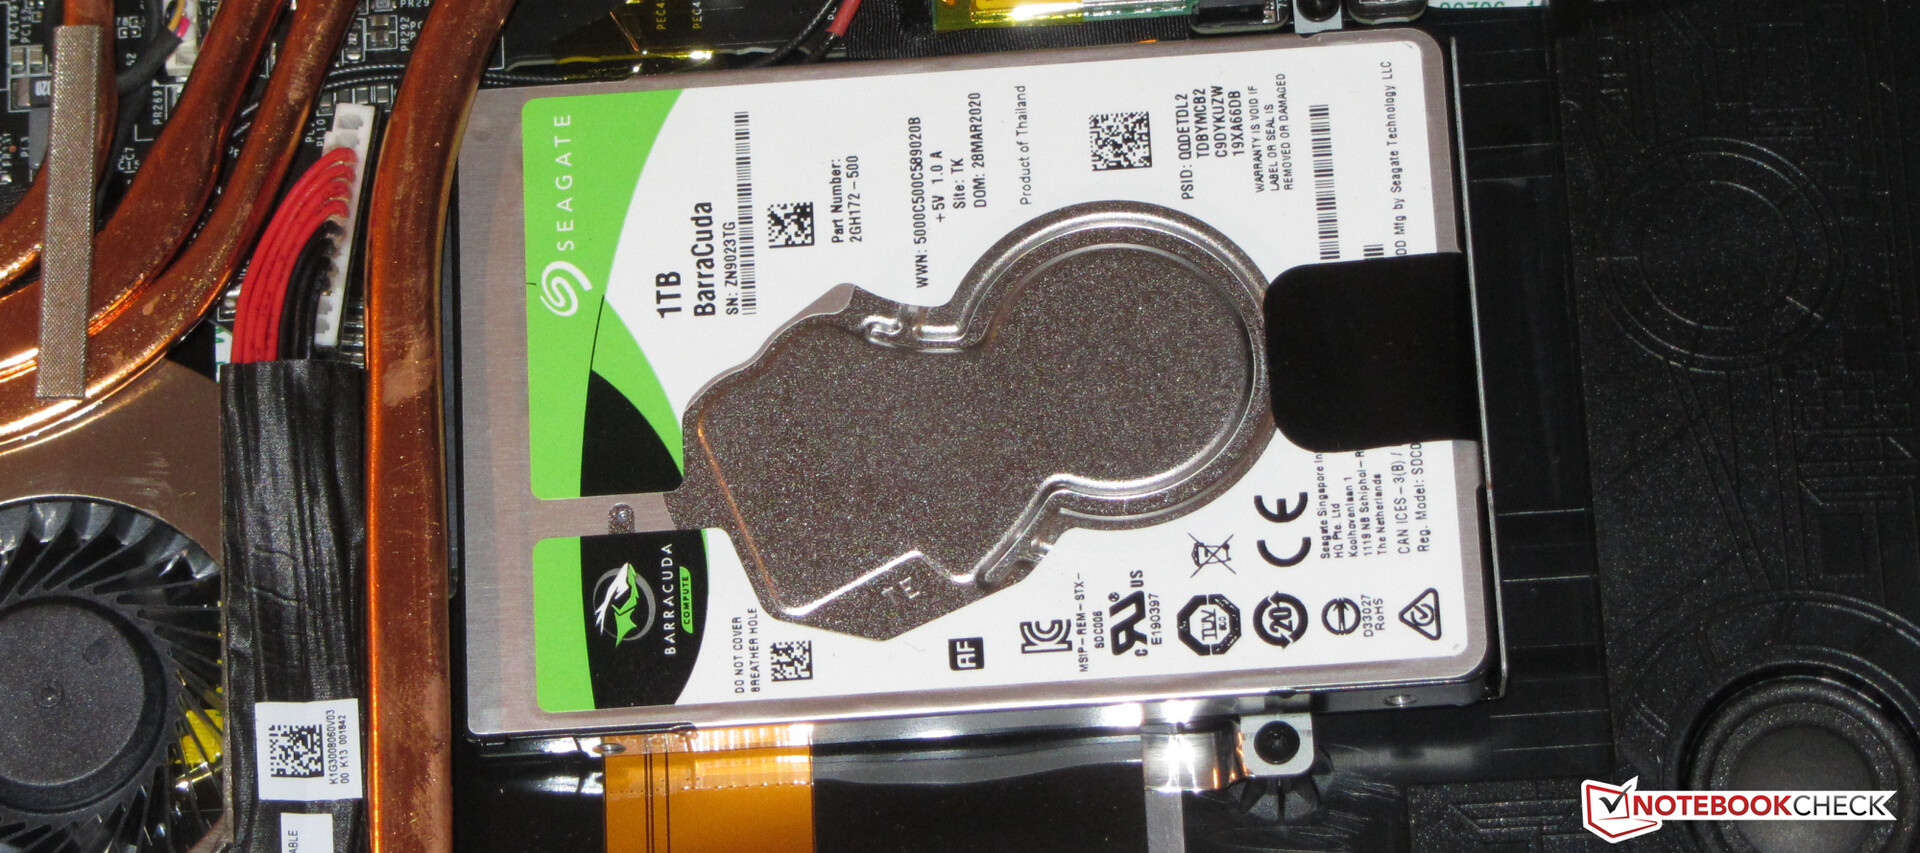
Depolama
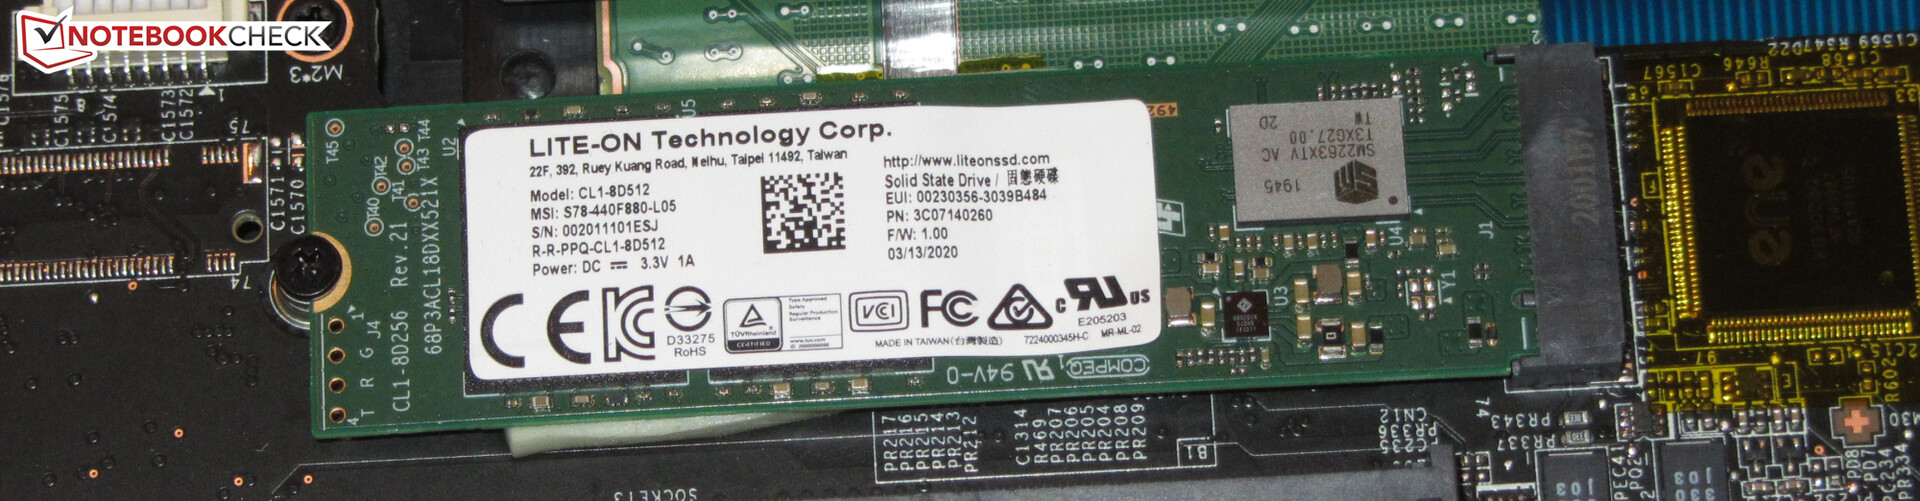
Sistem sürücüsü, Lite-On'un 512 GB depolama alanı sağlayan bir NVMe SSD'sidir (M.2 2280). SSD, genel olarak iyi aktarım hızları sunar. Dizüstü bilgisayar ayrıca 1 TB depolama alanı sağlayan ve dakikada 7.200 devirle çalışan 2,5 inçlik bir sabit sürücüyle birlikte gelir.

| MSI GL75 10SFR Lite-On CL1-8D512 | Acer Nitro 5 AN517-52-77DS WDC PC SN530 SDBPNPZ-1T00 | Schenker XMG Neo 17 XNE17M19 Samsung SSD 970 EVO Plus 500GB | Lenovo Legion Y740-17IRHg-81UJ001VGE Samsung SSD PM981 MZVLB1T0HALR | Schenker XMG Neo 17 Samsung SSD 970 EVO Plus 1TB | MSI GL75 9SEK-056US WDC PC SN520 SDAPNUW-512G | MSI GP75 Leopard 9SD Kingston RBUSNS8154P3256GJ1 | MSI Bravo 17 A4DDR Toshiba KBG30ZMV512G | Asus TUF A17 FA706IU-AS76 Intel SSD 660p 1TB SSDPEKNW010T8 | Ortalama Lite-On CL1-8D512 | |
|---|---|---|---|---|---|---|---|---|---|---|
| CrystalDiskMark 5.2 / 6 | 5% | 11% | 21% | 7% | 7% | -45% | -24% | 15% | -16% | |
| Write 4K (MB/s) | 132.2 | 140 6% | 103.2 -22% | 101.2 -23% | 92.7 -30% | 149.1 13% | 105.8 -20% | 94.6 -28% | 189.7 43% | 119 ? -10% |
| Read 4K (MB/s) | 45.62 | 49.04 7% | 42.11 -8% | 44.61 -2% | 41.4 -9% | 48.58 6% | 27.89 -39% | 47.12 3% | 62.3 37% | 35.6 ? -22% |
| Write Seq (MB/s) | 1511 | 1963 30% | 1087 -28% | 2295 52% | 1363 -10% | 270.8 -82% | 850 -44% | 1681 11% | 1099 ? -27% | |
| Read Seq (MB/s) | 1890 | 1455 -23% | 974 -48% | 2174 15% | 1259 -33% | 879 -53% | 1157 -39% | 1608 -15% | 1806 ? -4% | |
| Write 4K Q32T1 (MB/s) | 375.9 | 398.2 6% | 404.7 8% | 401.2 7% | 289.7 -23% | 462 23% | 273.3 -27% | 277.7 -26% | 468.6 25% | 390 ? 4% |
| Read 4K Q32T1 (MB/s) | 525 | 461.9 -12% | 469.8 -11% | 475.5 -9% | 337.5 -36% | 606 15% | 361.2 -31% | 546 4% | 541 3% | 371 ? -29% |
| Write Seq Q32T1 (MB/s) | 1505 | 1969 31% | 3279 118% | 2397 59% | 3332 121% | 1454 -3% | 253 -83% | 908 -40% | 1770 18% | 965 ? -36% |
| Read Seq Q32T1 (MB/s) | 2008 | 1927 -4% | 3513 75% | 3337 66% | 3477 73% | 1724 -14% | 1505 -25% | 1632 -19% | 1898 -5% | 1998 ? 0% |
| Write 4K Q8T8 (MB/s) | 1562 | 1211 | ||||||||
| Read 4K Q8T8 (MB/s) | 1373 | 1104 | ||||||||
| AS SSD | 51% | 119% | 89% | 130% | 49% | -53% | 6% | 30% | -13% | |
| Seq Read (MB/s) | 1923 | 1804 -6% | 2274 18% | 2800 46% | 2359 23% | 1296 -33% | 748 -61% | 1420 -26% | 1320 -31% | 1795 ? -7% |
| Seq Write (MB/s) | 1065 | 1922 80% | 2522 137% | 2424 128% | 2469 132% | 1391 31% | 219 -79% | 922 -13% | 1539 45% | 706 ? -34% |
| 4K Read (MB/s) | 25.43 | 38.21 50% | 49.72 96% | 42.77 68% | 53.5 110% | 29.67 17% | 25.7 1% | 48.51 91% | 56.3 121% | 24.8 ? -2% |
| 4K Write (MB/s) | 101.9 | 105 3% | 118.2 16% | 94.8 -7% | 117.6 15% | 82.4 -19% | 116.8 15% | 158.5 56% | 92.6 ? -9% | |
| 4K-64 Read (MB/s) | 477.9 | 976 104% | 1209 153% | 1406 194% | 1579 230% | 1042 118% | 259.3 -46% | 928 94% | 586 23% | 379 ? -21% |
| 4K-64 Write (MB/s) | 563 | 1150 104% | 2218 294% | 1697 201% | 2048 264% | 1284 128% | 190.2 -66% | 345.4 -39% | 820 46% | 472 ? -16% |
| Access Time Read * (ms) | 0.053 | 0.055 -4% | 0.05 6% | 0.048 9% | 0.108 -104% | 0.159 -200% | 0.089 -68% | 0.043 19% | 0.069 ? -30% | |
| Access Time Write * (ms) | 0.126 | 0.045 64% | 0.031 75% | 0.039 69% | 0.03 76% | 0.031 75% | 0.058 54% | 0.189 -50% | 0.113 10% | 0.134 ? -6% |
| Score Read (Points) | 696 | 1194 72% | 1486 114% | 1729 148% | 1869 169% | 1201 73% | 360 -48% | 1119 61% | 775 11% | 584 ? -16% |
| Score Write (Points) | 771 | 1747 127% | 2588 236% | 2034 164% | 2413 213% | 1542 100% | 294 -62% | 554 -28% | 1132 47% | 635 ? -18% |
| Score Total (Points) | 1785 | 3563 100% | 4855 172% | 4630 159% | 5248 194% | 3363 88% | 821 -54% | 2232 25% | 2333 31% | 1469 ? -18% |
| Copy ISO MB/s (MB/s) | 1710 | 1305 -24% | 2148 26% | 1736 2% | 1710 ? 0% | |||||
| Copy Program MB/s (MB/s) | 465.3 | 467.5 0% | 582 25% | 553 19% | 465 ? 0% | |||||
| Copy Game MB/s (MB/s) | 1042 | 872 -16% | 1278 23% | 1264 21% | 1042 ? 0% | |||||
| Toplam Ortalama (Program / Ayarlar) | 28% /
33% | 65% /
73% | 55% /
64% | 69% /
78% | 28% /
33% | -49% /
-49% | -9% /
-7% | 23% /
24% | -15% /
-14% |
* ... daha küçük daha iyidir
Continuous load read: DiskSpd Read Loop, Queue Depth 8
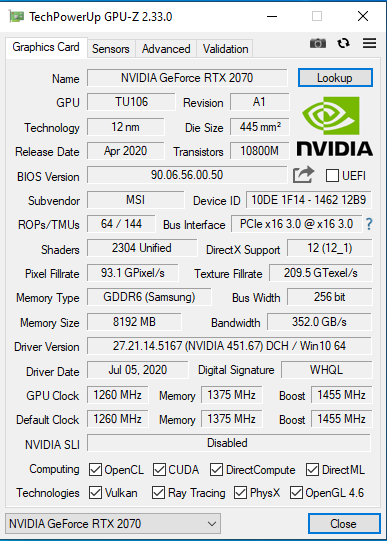
Grafik kartı
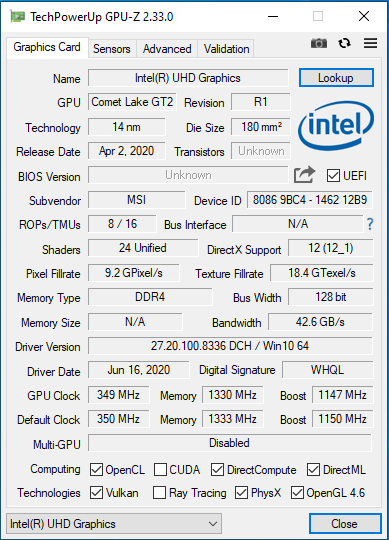
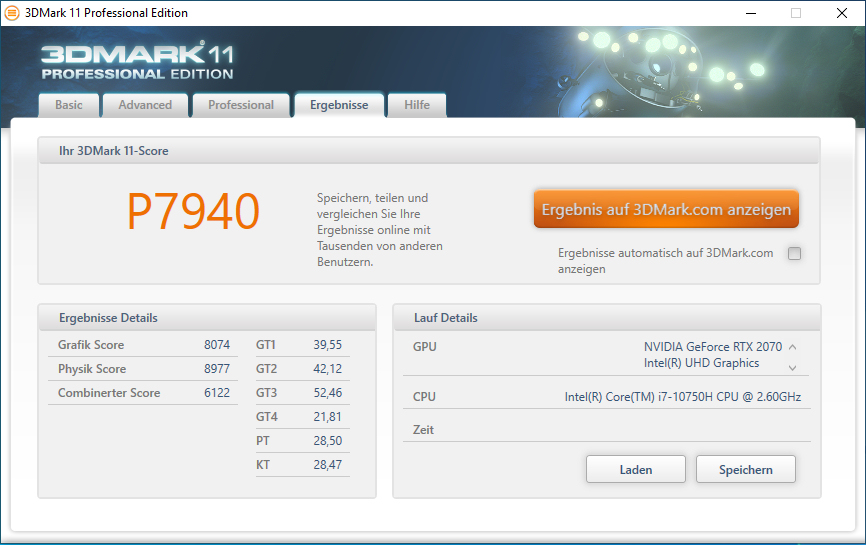
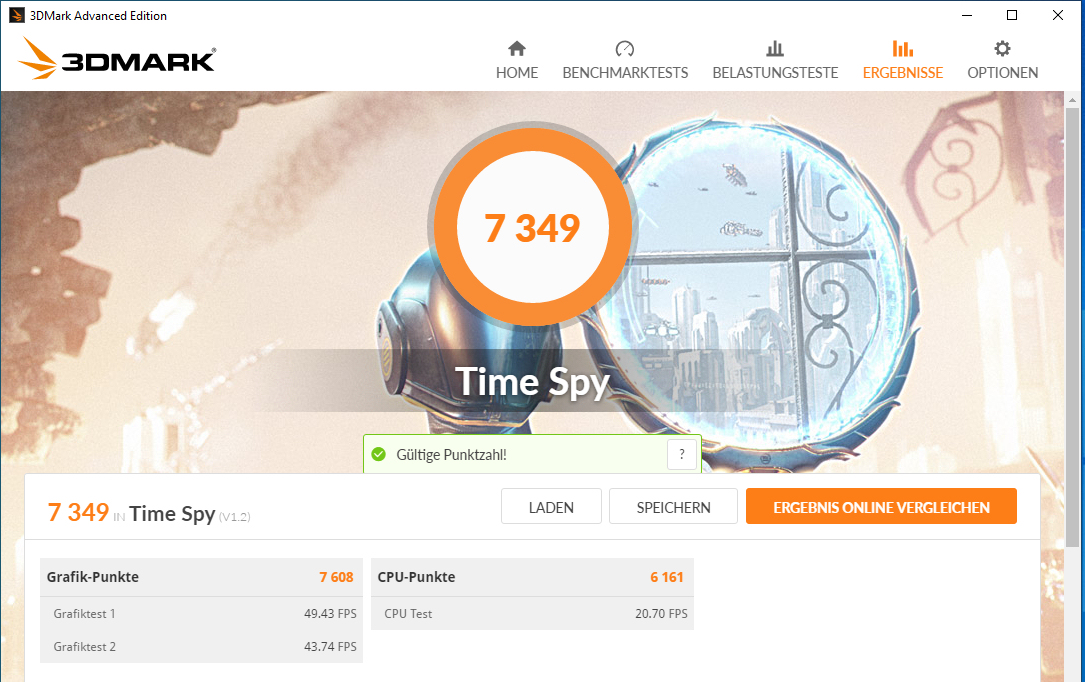
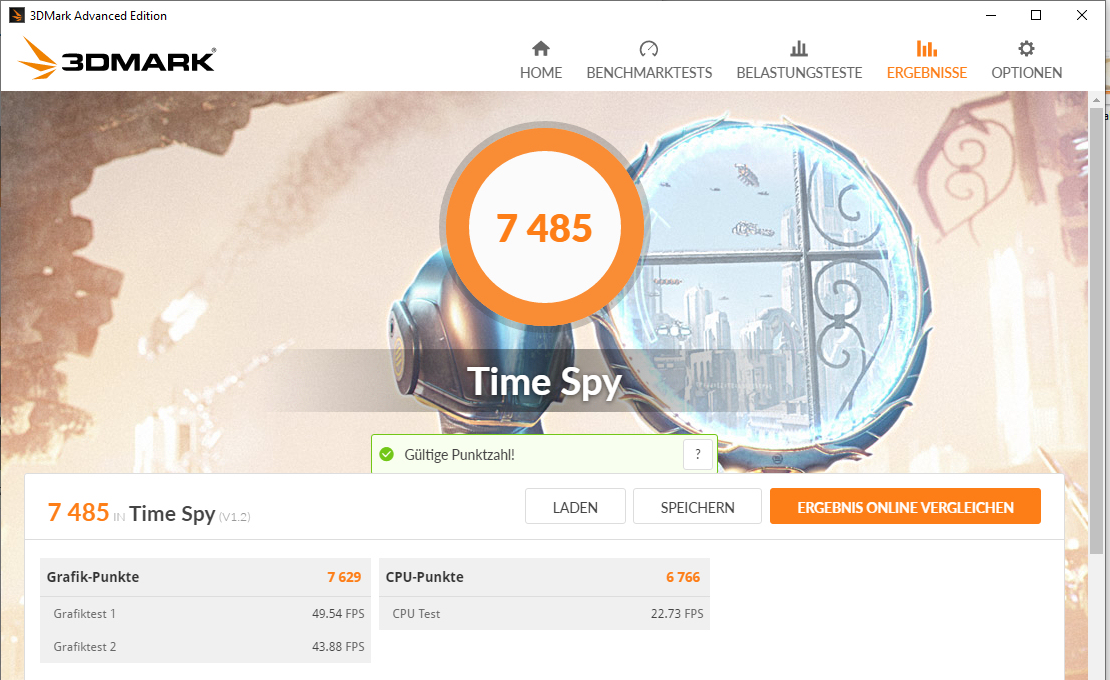
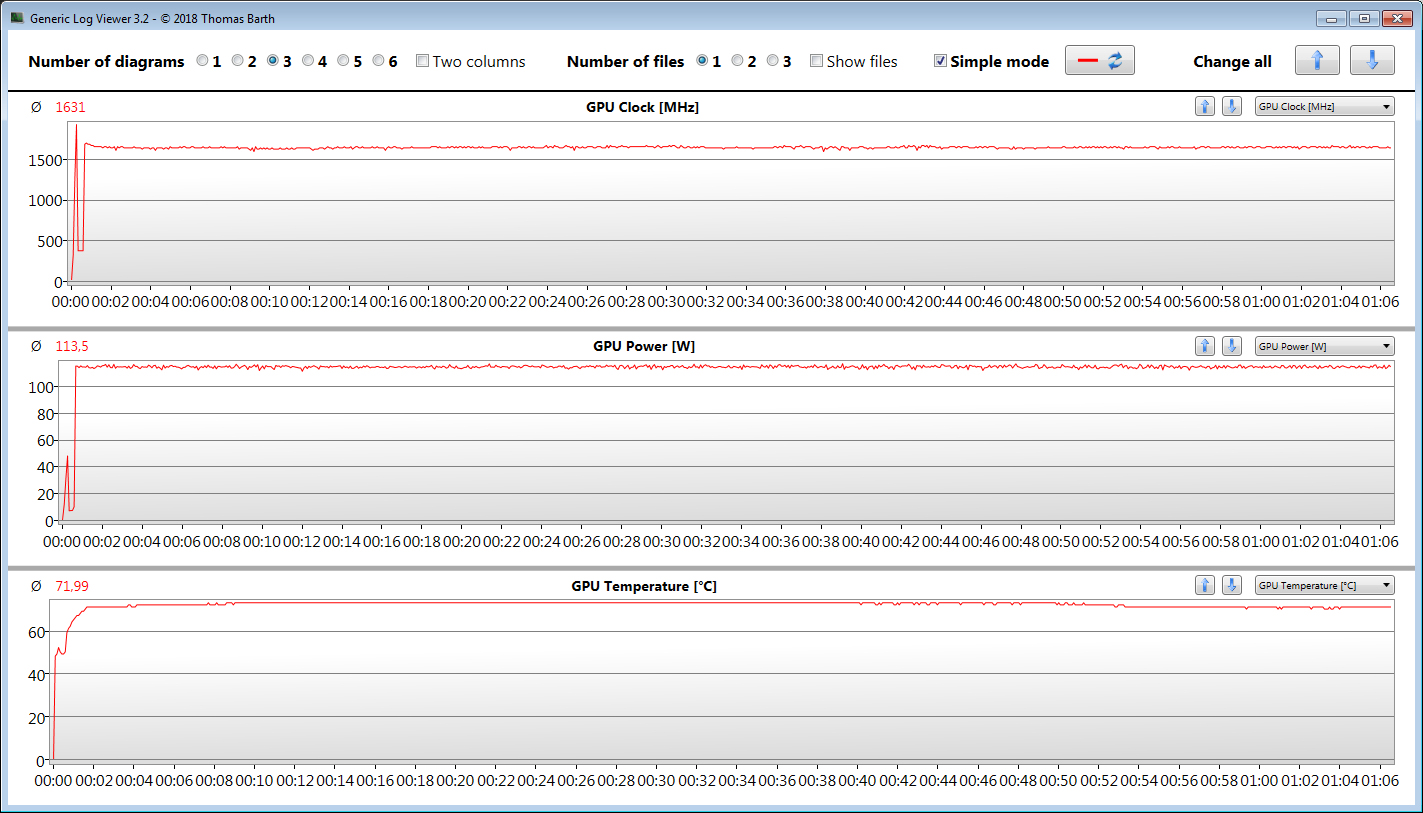
GeForce RTX 2070 grafik çekirdeği DirectX 12'yi destekler ve 1.260 MHz'lik bir temel hızda çalışır. Güçlendirildiğinde, 1.455 MHz'e kadar bir artış mümkündür. Bununla birlikte, GPU belirli bir sıcaklığa ve / veya enerji eşiğine ulaşmazsa daha yüksek hızlar da elde edilebilir. Sonuç olarak, ancak kısa bir süre için korunabilen maksimum 1.900 MHz kaydettik. GPU, The Witcher 3 testimizi ortalama 1,631 MHz hızında işler. Ayrıca, GPU hızlı GDDR6 grafik belleğine (8.192 MB) erişebilir. 3DMark testlerindeki sonuçlar, burada yüklü grafik çekirdeği için normal düzeydedir. İşlemciye entegre olan UHD Graphics 630 GPU aktif durumda ve dizüstü bilgisayar Nvidia'nın Optimus grafik değiştirme çözümü ile çalışıyor. Dragon Center yazılımı içinden seçilebilen "Extreme Performance" profilinin grafik performansı üzerinde hiçbir etkisi yoktur. 3DMark sonuçları benzerdir.
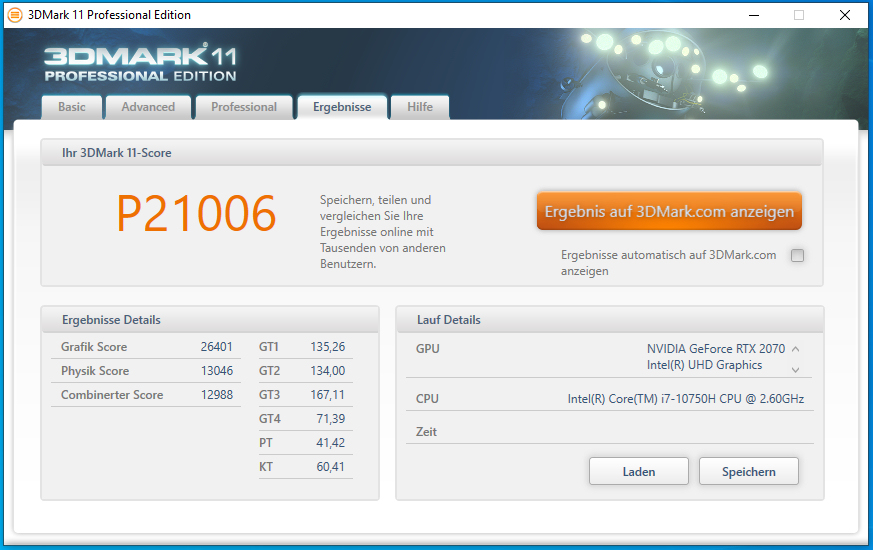
| 3DMark 11 Performance | 21006 puan | |
| 3DMark Cloud Gate Standard Score | 36210 puan | |
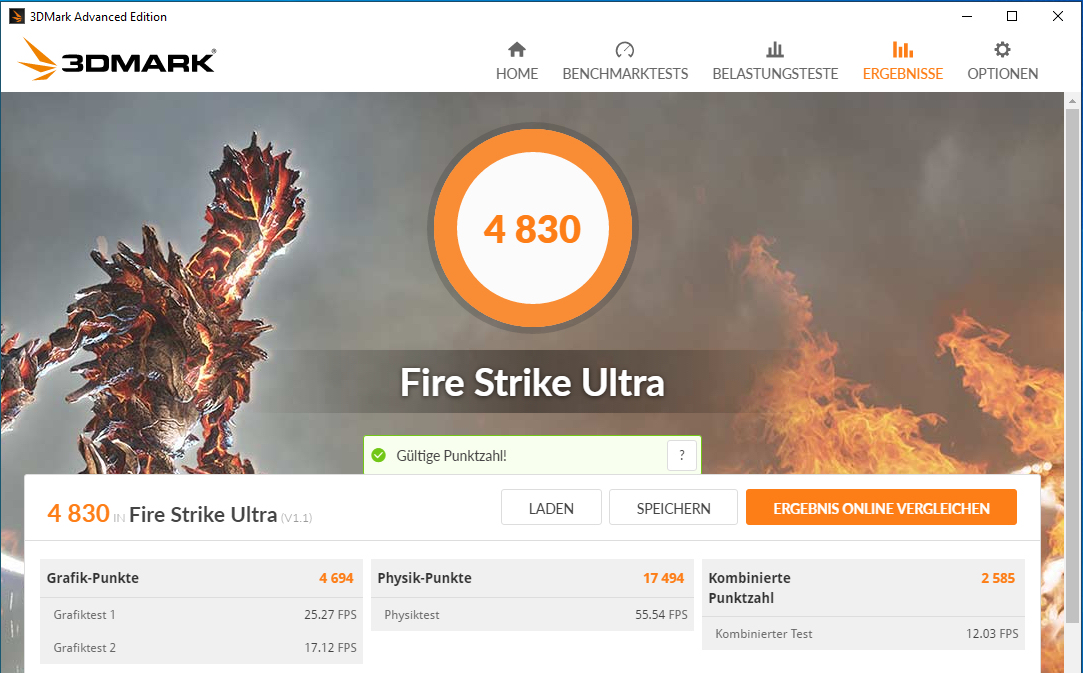
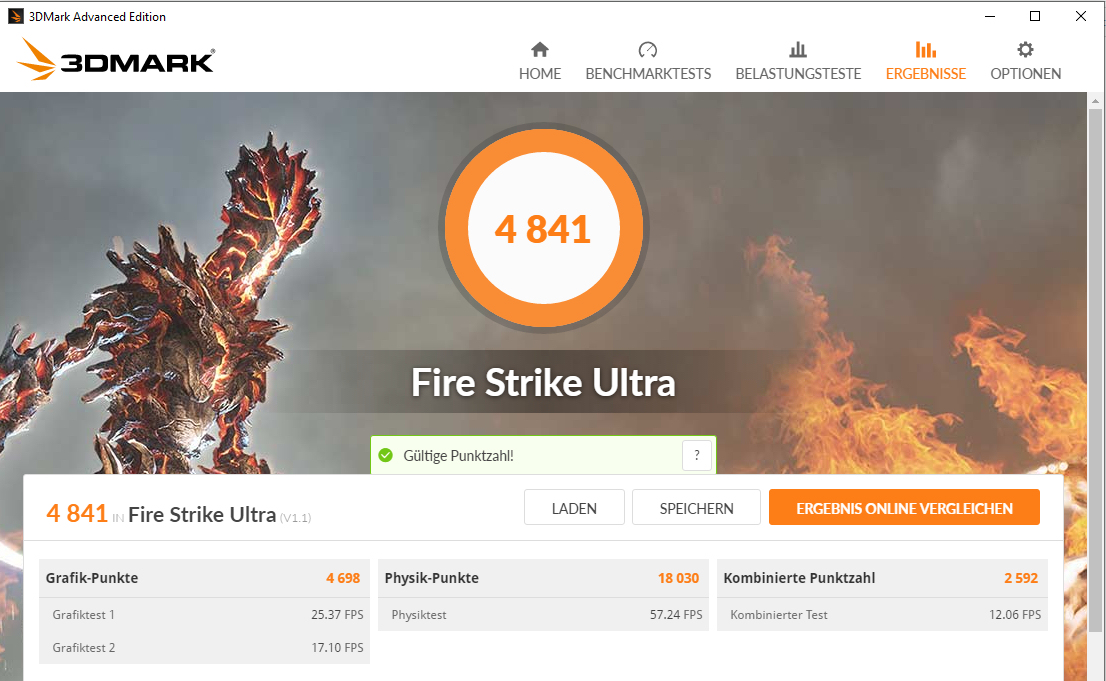
| 3DMark Fire Strike Score | 17529 puan | |
| 3DMark Time Spy Score | 7349 puan | |
Yardım | ||
| 3DMark 11 - 1280x720 Performance GPU | |
| Sınıf ortalaması Gaming (21841 - 80022, n=106, son 2 yıl) | |
| Lenovo Legion Y740-17IRHg-81UJ001VGE | |
| MSI GL75 10SFR | |
| Ortalama NVIDIA GeForce RTX 2070 Mobile (23335 - 27298, n=21) | |
| Schenker XMG Neo 17 | |
| MSI GL75 9SEK-056US | |
| Asus TUF A17 FA706IU-AS76 | |
| Acer Nitro 5 AN517-52-77DS | |
| MSI GP75 Leopard 9SD | |
| Schenker XMG Neo 17 XNE17M19 | |
| MSI Bravo 17 A4DDR | |
Oyun performansı
Yerleşik CPU-GPU kombinasyonu, tüm modern oyunları Full HD çözünürlükte ve maksimum kalite ayarlarıyla mat ekrana sorunsuz bir şekilde getirir. Full HD'nin ötesinde çözünürlükler, uygun bir monitör bağlandığında da mümkündür. Ancak, bu durumda kalite kontroller çok yüksek ayarlanmamalıdır.
| The Witcher 3 - 1920x1080 Ultra Graphics & Postprocessing (HBAO+) | |
| Sınıf ortalaması Gaming (95 - 240, n=7, son 2 yıl) | |
| Lenovo Legion Y740-17IRHg-81UJ001VGE | |
| MSI GL75 10SFR | |
| Ortalama NVIDIA GeForce RTX 2070 Mobile (64 - 82.1, n=21) | |
| Schenker XMG Neo 17 | |
| Acer Nitro 5 AN517-52-77DS | |
| MSI GL75 9SEK-056US | |
| MSI GP75 Leopard 9SD | |
| Schenker XMG Neo 17 XNE17M19 | |
| Asus TUF A17 FA706IU-AS76 | |
| MSI Bravo 17 A4DDR | |
| BioShock Infinite - 1920x1080 Ultra Preset, DX11 (DDOF) | |
| Ortalama NVIDIA GeForce RTX 2070 Mobile (136.9 - 187.8, n=9) | |
| Lenovo Legion Y740-17IRHg-81UJ001VGE | |
| MSI GL75 10SFR | |
| MSI GP75 Leopard 9SD | |
| Acer Nitro 5 AN517-52-77DS | |
| Shadow of the Tomb Raider - 1920x1080 Highest Preset AA:T | |
| Sınıf ortalaması Gaming (96 - 116, n=2, son 2 yıl) | |
| MSI GL75 10SFR | |
| Ortalama NVIDIA GeForce RTX 2070 Mobile (74.2 - 97, n=11) | |
| MSI GL75 9SEK-056US | |
| Asus TUF A17 FA706IU-AS76 | |
| Acer Nitro 5 AN517-52-77DS | |
| MSI Bravo 17 A4DDR | |
| Total War: Three Kingdoms - 1920x1080 Ultra (incl textures) | |
| MSI GL75 10SFR | |
| Ortalama NVIDIA GeForce RTX 2070 Mobile (n=1) | |
| Acer Nitro 5 AN517-52-77DS | |
| Red Dead Redemption 2 - 1920x1080 Maximum Settings | |
| MSI GL75 10SFR | |
| Ortalama NVIDIA GeForce RTX 2070 Mobile (42.4 - 43, n=3) | |
| Acer Nitro 5 AN517-52-77DS | |
| Doom Eternal - 1920x1080 Ultra Preset | |
| Ortalama NVIDIA GeForce RTX 2070 Mobile (145.1 - 157, n=3) | |
| MSI GL75 10SFR | |
| Acer Nitro 5 AN517-52-77DS | |
| MSI Bravo 17 A4DDR | |
Kare hızlarının uzun bir süre boyunca bile büyük ölçüde sabit kalıp kalmadığını doğrulamak için The Witcher 3 oyununun Full HD çözünürlükte ve maksimum kalite ayarlarında yaklaşık 60 dakika çalışmasına izin verdik. Oyuncu tarafından somutlaştırılan karakter tüm bu süre boyunca hareket etmez. Kare hızlarında bir düşüş bulunamadı.
| düşük | orta | yüksek | ultra | |
|---|---|---|---|---|
| BioShock Infinite (2013) | 332.8 | 294.5 | 276.3 | 163.7 |
| The Witcher 3 (2015) | 286.3 | 226.7 | 147.1 | 79.9 |
| Dota 2 Reborn (2015) | 147.2 | 129.4 | 121.8 | 115 |
| X-Plane 11.11 (2018) | 107 | 92.3 | 79.6 | |
| Shadow of the Tomb Raider (2018) | 118 | 104 | 100 | 93 |
| Total War: Three Kingdoms (2019) | 232.7 | 129.9 | 88.5 | 63.1 |
| Red Dead Redemption 2 (2019) | 127.9 | 97.5 | 66.4 | 43 |
| Hunt Showdown (2020) | 184.2 | 124 | 101.7 | |
| Doom Eternal (2020) | 217.6 | 162 | 148.9 | 145.1 |
| Gears Tactics (2020) | 226.5 | 169.9 | 115.2 | 90.9 |
| F1 2020 (2020) | 230 | 177 | 148 | 115 |
| Death Stranding (2020) | 149.3 | 126 | 114.6 | 112 |
Emisyonlar - MSI dizüstü bilgisayarın hayranları çok fazla gürültü çıkarır
Gürültü emisyonları
Boşta kullanımda, fanlar genellikle düşük hızlarda çalışır. O zaman gerçekten fark edilmiyorlar. Bazen sessizdirler ve sessizlik hakimdir. Ancak, fanlar yük altında ortaya çıkıyor. Sonuç olarak, stres testi sırasında 53,2 dB (A) ses basıncı seviyesi kaydediyoruz. Dragon Center yazılımında "Extreme Performance" profiline geçerseniz, ses seviyesi 54.9 dB (A) 'ya yükselir. "Sessiz" modu, hesaplama gücü pahasına, genel olarak daha düşük bir gürültü seviyesi ile sonuçlanır.
Ses yüksekliği
| Boşta |
| 32.2 / 32.2 / 32.2 dB |
| Çalışırken |
| 52.8 / 53.2 dB |
 | ||
30 dB sessiz 40 dB(A) duyulabilirlik 50 dB(A) gürültülü |
||
min: | ||
| MSI GL75 10SFR i7-10750H, GeForce RTX 2070 Mobile | Acer Nitro 5 AN517-52-77DS i7-10750H, GeForce RTX 2060 Mobile | Schenker XMG Neo 17 XNE17M19 i7-9750H, GeForce RTX 2060 Mobile | Lenovo Legion Y740-17IRHg-81UJ001VGE i7-9750H, GeForce RTX 2080 Max-Q | MSI GL75 9SEK-056US i7-9750H, GeForce RTX 2060 Mobile | MSI GP75 Leopard 9SD i7-9750H, GeForce GTX 1660 Ti Mobile | Ortalama NVIDIA GeForce RTX 2070 Mobile | Sınıf ortalaması Gaming | |
|---|---|---|---|---|---|---|---|---|
| Noise | 10% | 5% | 12% | 6% | -1% | 2% | 13% | |
| kapalı / ortam * (dB) | 30.1 | 30.2 -0% | 31 -3% | 30.3 -1% | 28.1 7% | 29 4% | 28.8 ? 4% | 24.1 ? 20% |
| Idle Minimum * (dB) | 32.2 | 30.2 6% | 31 4% | 30.3 6% | 30.9 4% | 29 10% | 30.4 ? 6% | 25.9 ? 20% |
| Idle Average * (dB) | 32.2 | 30.2 6% | 33 -2% | 30.3 6% | 30.9 4% | 34 -6% | 31.7 ? 2% | 27.4 ? 15% |
| Idle Maximum * (dB) | 32.2 | 30.2 6% | 35 -9% | 30.5 5% | 31 4% | 37 -15% | 34.9 ? -8% | 29.9 ? 7% |
| Load Average * (dB) | 52.8 | 41.5 21% | 43 19% | 40.8 23% | 39 26% | 53 -0% | 46.8 ? 11% | 43.3 ? 18% |
| Witcher 3 ultra * (dB) | 53.8 | 44.5 17% | 45 16% | 40.5 25% | 53.5 1% | 51 5% | ||
| Load Maximum * (dB) | 53.2 | 44.6 16% | 47 12% | 40.8 23% | 53.5 -1% | 55 -3% | 55.8 ? -5% | 54.2 ? -2% |
* ... daha küçük daha iyidir
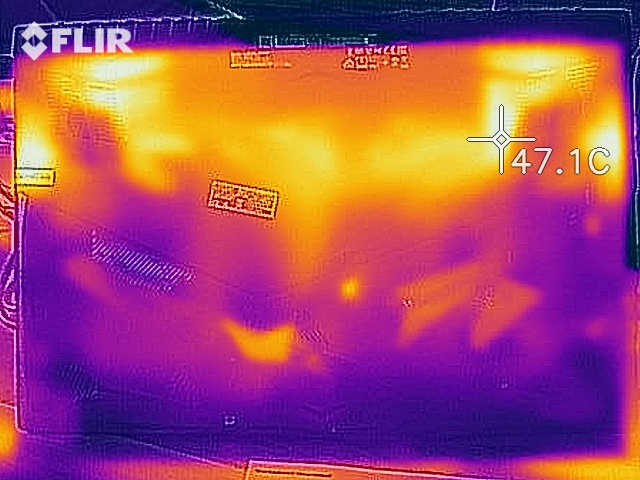
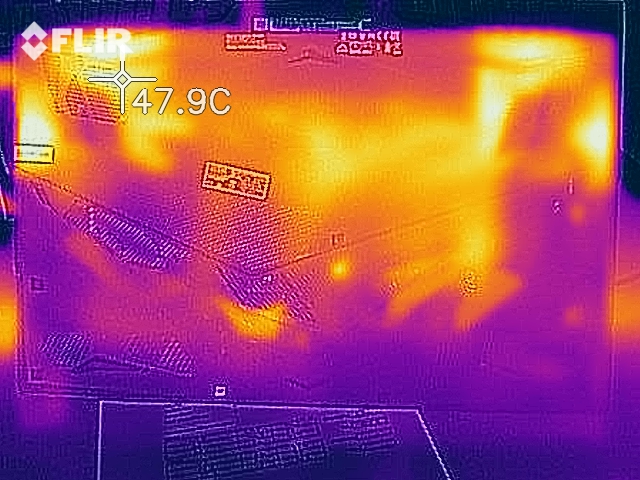
Temperature
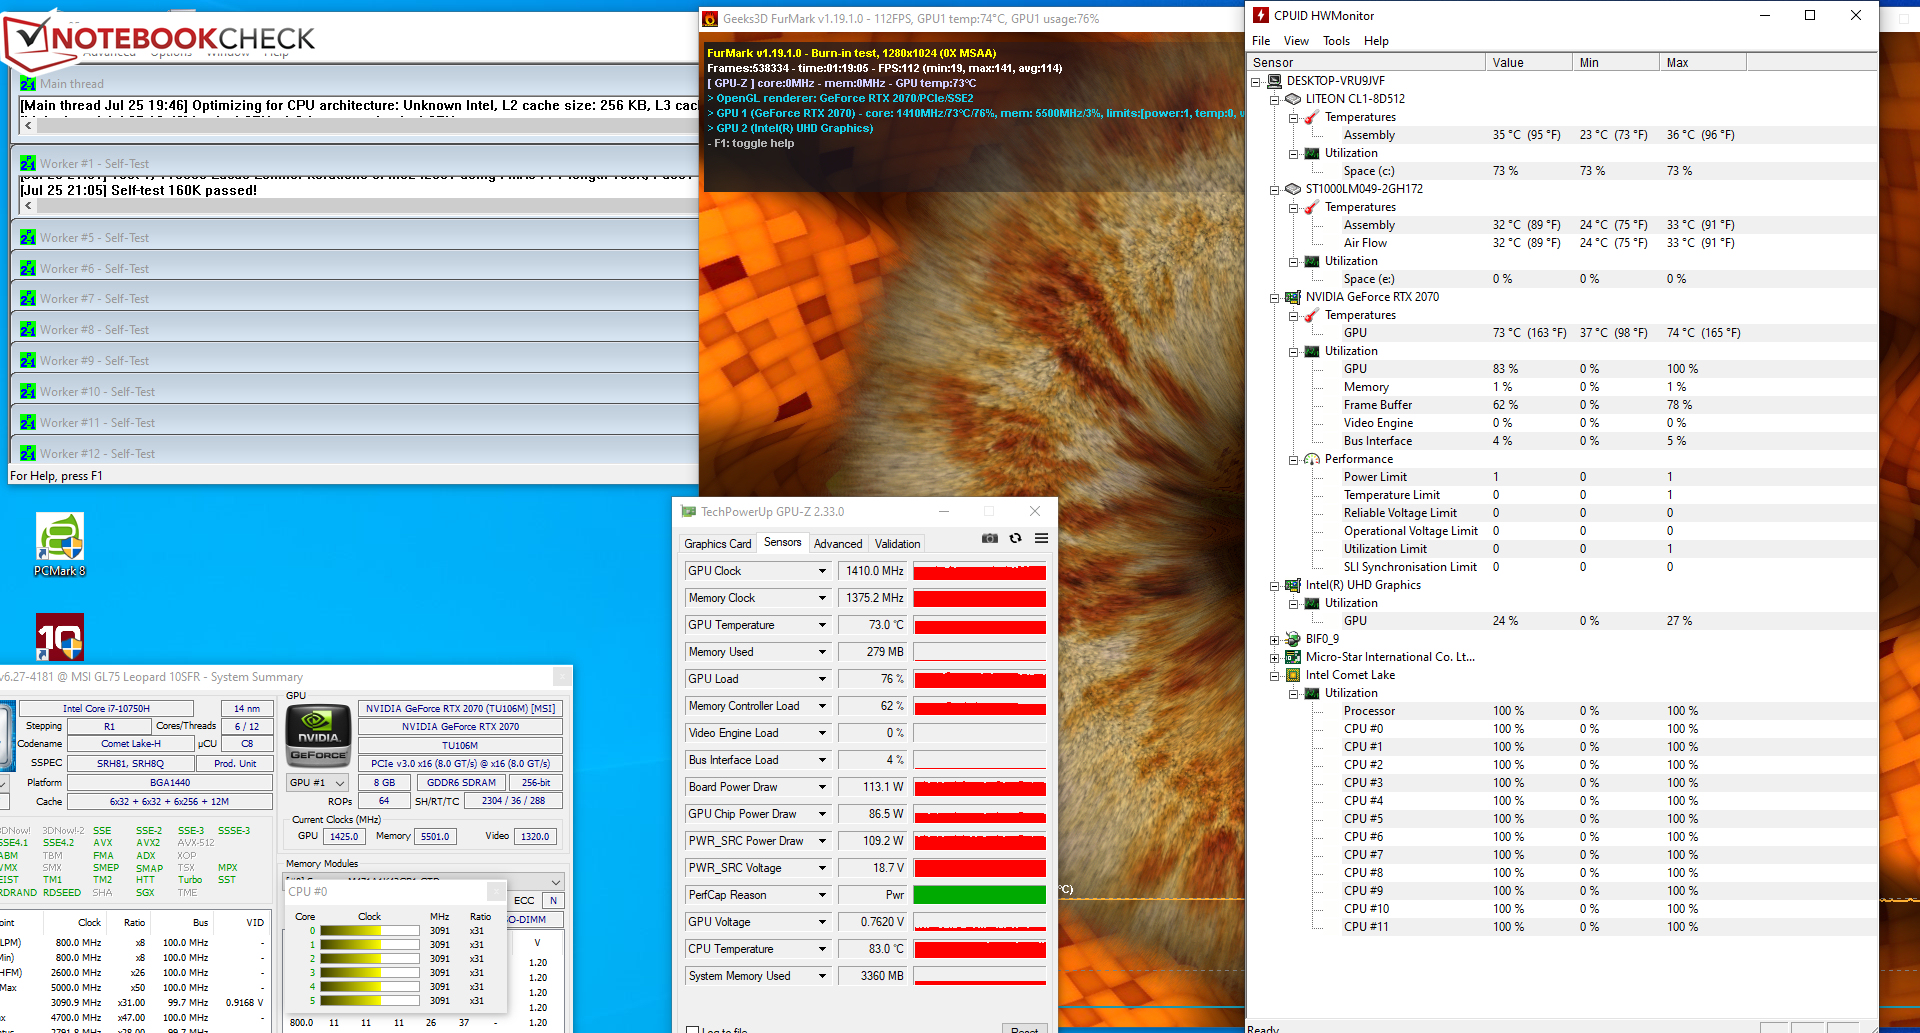
The CPU and GPU process our stress test (Prime95 and FurMark run for at least an hour) at 3.1 GHz and 1,400 to 1,450 MHz, respectively. On battery power, the clock rates are 1.6 to 1.9 GHz (CPU) and 300 MHz (GPU), respectively. The stress test represents an extreme scenario that doesn't occur in everyday life. We use this test to check if the system remains stable even under full load.
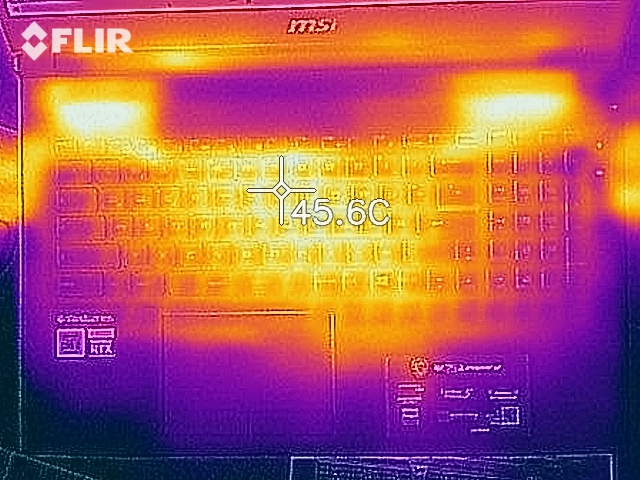
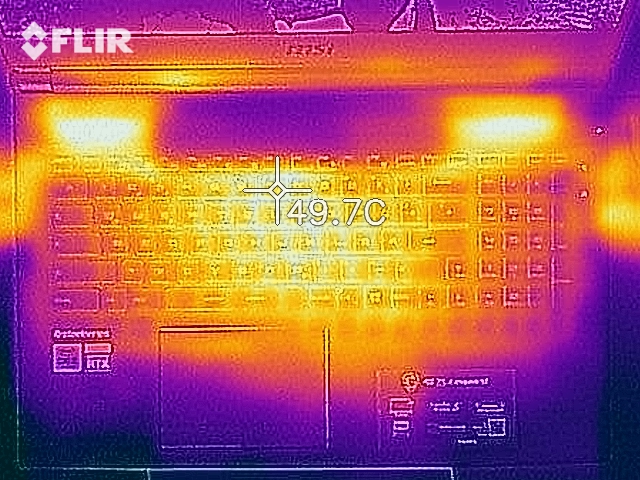
The GL75 doesn't heat up in a particularly strong way. We register temperatures slightly above 40 °C (~104 °F) at some measuring points during the stress test. Heat development is at the same level when performing our The Witcher 3 test. In everyday use, the values are in the green range.
(±) Üst taraftaki maksimum sıcaklık, 40.4 °C / 105 F ortalamasına kıyasla 44 °C / 111 F'dir. , Gaming sınıfı için 21.2 ile 68.8 °C arasında değişir.
(±) Alt kısım, 43.2 °C / 110 F ortalamasına kıyasla maksimum 42.5 °C / 109 F'ye kadar ısınır
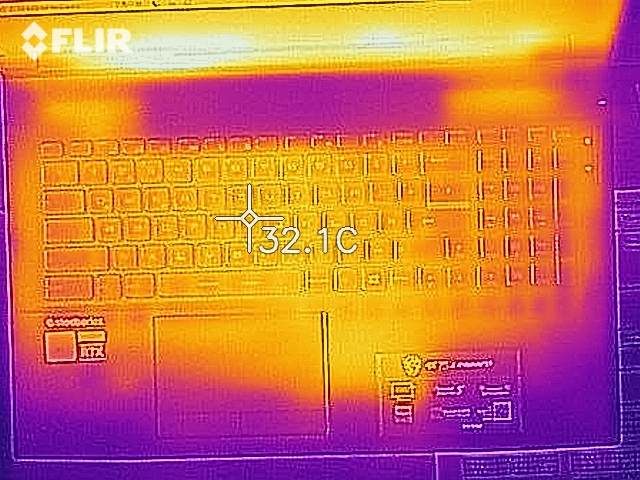
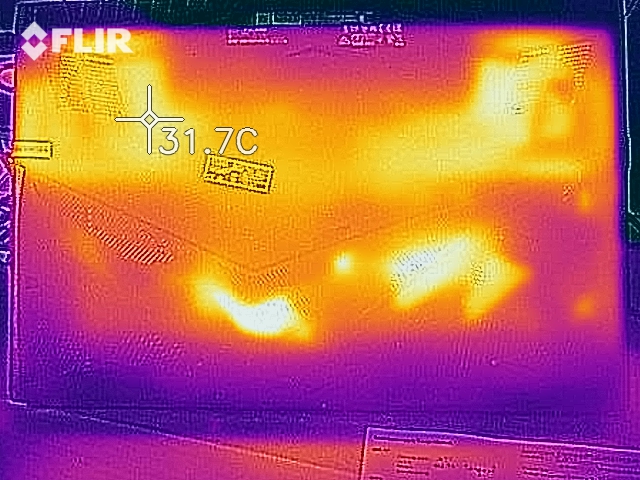
(+) Boşta kullanımda, üst tarafın ortalama sıcaklığı 27.4 °C / 81 F olup, cihazın 33.9 °C / 93 F.
(±) The Witcher 3 oynarken, üst tarafın ortalama sıcaklığı 36.4 °C / 98 F olup, cihazın 33.9 °C / 93 F.
(+) Avuç içi dayanakları ve dokunmatik yüzey maksimum (33.3 °C / 91.9 F) cilt sıcaklığına ulaşıyor ve bu nedenle sıcak değil.
(-) Benzer cihazların avuç içi dayanağı alanının ortalama sıcaklığı 28.8 °C / 83.8 F (-4.5 °C / -8.1 F) idi.
| MSI GL75 10SFR i7-10750H, GeForce RTX 2070 Mobile | Acer Nitro 5 AN517-52-77DS i7-10750H, GeForce RTX 2060 Mobile | Schenker XMG Neo 17 XNE17M19 i7-9750H, GeForce RTX 2060 Mobile | Lenovo Legion Y740-17IRHg-81UJ001VGE i7-9750H, GeForce RTX 2080 Max-Q | MSI GL75 9SEK-056US i7-9750H, GeForce RTX 2060 Mobile | MSI GP75 Leopard 9SD i7-9750H, GeForce GTX 1660 Ti Mobile | Ortalama NVIDIA GeForce RTX 2070 Mobile | Sınıf ortalaması Gaming | |
|---|---|---|---|---|---|---|---|---|
| Heat | -7% | -4% | -4% | -27% | -3% | -14% | -10% | |
| Maximum Upper Side * (°C) | 44 | 50.6 -15% | 48 -9% | 40.7 7% | 49.4 -12% | 45 -2% | 47.1 ? -7% | 45.2 ? -3% |
| Maximum Bottom * (°C) | 42.5 | 53.8 -27% | 54 -27% | 42.2 1% | 50.6 -19% | 42 1% | 51 ? -20% | 48.2 ? -13% |
| Idle Upper Side * (°C) | 29.1 | 26.6 9% | 26 11% | 31.9 -10% | 39 -34% | 30 -3% | 31.8 ? -9% | 31 ? -7% |
| Idle Bottom * (°C) | 29.5 | 27.8 6% | 27 8% | 33.9 -15% | 42 -42% | 32 -8% | 34.8 ? -18% | 34.3 ? -16% |
* ... daha küçük daha iyidir
Speakers
MSI GL75 10SFR ses analizi
(±) | hoparlör ses yüksekliği ortalama ama iyi (75.6 dB)
Bas 100 - 315Hz
(-) | neredeyse hiç bas yok - ortalama olarak medyandan 20.3% daha düşük
(±) | Bas doğrusallığı ortalamadır (13.1% delta - önceki frekans)
Ortalar 400 - 2000 Hz
(+) | dengeli ortalar - medyandan yalnızca 1.9% uzakta
(±) | Ortaların doğrusallığı ortalamadır (7% delta - önceki frekans)
Yüksekler 2 - 16 kHz
(+) | dengeli yüksekler - medyandan yalnızca 2.3% uzakta
(+) | yüksekler doğrusaldır (3.7% deltadan önceki frekansa)
Toplam 100 - 16.000 Hz
(+) | genel ses doğrusaldır (13.9% ortancaya göre fark)
Aynı sınıfla karşılaştırıldığında
» Bu sınıftaki tüm test edilen cihazların %22%'si daha iyi, 7% benzer, 71% daha kötüydü
» En iyisinin deltası 6% idi, ortalama 18% idi, en kötüsü 132% idi
Test edilen tüm cihazlarla karşılaştırıldığında
» Test edilen tüm cihazların %16'si daha iyi, 4 benzer, % 80 daha kötüydü
» En iyisinin deltası 4% idi, ortalama 23% idi, en kötüsü 134% idi
Energy management - The MSI Leopard doesn't offer long battery life
Energy consumption
In idle usage, we register a maximum power consumption of 18 watts - a high value, but it's quite normal for a device in this performance class. The stress test lets the demand increase up to 224 watts. Moreover, we measure an average power consumption of 203 watts (196 to 212 watts) during the execution of our The Witcher 3 test. The rated output of the power adapter is 230 watts.
| Kapalı / Bekleme modu | |
| Boşta | |
| Çalışırken |
|
Key:
min: | |
| MSI GL75 10SFR i7-10750H, GeForce RTX 2070 Mobile | Acer Nitro 5 AN517-52-77DS i7-10750H, GeForce RTX 2060 Mobile | Schenker XMG Neo 17 XNE17M19 i7-9750H, GeForce RTX 2060 Mobile | Lenovo Legion Y740-17IRHg-81UJ001VGE i7-9750H, GeForce RTX 2080 Max-Q | MSI GL75 9SEK-056US i7-9750H, GeForce RTX 2060 Mobile | MSI GP75 Leopard 9SD i7-9750H, GeForce GTX 1660 Ti Mobile | Ortalama NVIDIA GeForce RTX 2070 Mobile | Sınıf ortalaması Gaming | |
|---|---|---|---|---|---|---|---|---|
| Power Consumption | 34% | 14% | -18% | 15% | 11% | -42% | -9% | |
| Idle Minimum * (Watt) | 12 | 5.4 55% | 11 8% | 15.7 -31% | 10.7 11% | 10 17% | 21.4 ? -78% | 12.8 ? -7% |
| Idle Average * (Watt) | 16.6 | 9.8 41% | 14 16% | 26.3 -58% | 15.2 8% | 15 10% | 26.3 ? -58% | 18.5 ? -11% |
| Idle Maximum * (Watt) | 18 | 10.9 39% | 20 -11% | 28 -56% | 17.8 1% | 22 -22% | 32.2 ? -79% | 24 ? -33% |
| Load Average * (Watt) | 130 | 104 20% | 100 23% | 136 -5% | 88.2 32% | 92 29% | 114.8 ? 12% | 108.2 ? 17% |
| Witcher 3 ultra * (Watt) | 203 | 134.3 34% | 151 26% | 160 21% | 147.8 27% | 153 25% | ||
| Load Maximum * (Watt) | 224 | 193 14% | 174 22% | 177 21% | 206.5 8% | 216 4% | 238 ? -6% | 254 ? -13% |
* ... daha küçük daha iyidir
Battery life
The gaming laptop achieves a runtime of 3:54 h in our practical WLAN test (accessing websites using a script). In addition, the 17.3-incher ends our video test after 5:11 h. We let the short film Big Buck Bunny (H.264 encoding, 1920x1080 pixels) run in a continuous loop here. Test conditions: The energy-saving functions and the wireless modules (only during the video test) are deactivated; the display brightness is adjusted to about 150 cd/m².
| MSI GL75 10SFR i7-10750H, GeForce RTX 2070 Mobile, 51 Wh | Acer Nitro 5 AN517-52-77DS i7-10750H, GeForce RTX 2060 Mobile, 57.48 Wh | Schenker XMG Neo 17 XNE17M19 i7-9750H, GeForce RTX 2060 Mobile, 46 Wh | Lenovo Legion Y740-17IRHg-81UJ001VGE i7-9750H, GeForce RTX 2080 Max-Q, 76 Wh | MSI GL75 9SEK-056US i7-9750H, GeForce RTX 2060 Mobile, 51 Wh | MSI GP75 Leopard 9SD i7-9750H, GeForce GTX 1660 Ti Mobile, 51 Wh | Sınıf ortalaması Gaming | |
|---|---|---|---|---|---|---|---|
| Pil Çalışma Süresi | 83% | 17% | -15% | 19% | -23% | 70% | |
| Reader / Idle (h) | 6.4 | 11 72% | 6.7 5% | 3.8 -41% | 7.9 23% | 4.8 -25% | 8.71 ? 36% |
| H.264 (h) | 5.2 | 7.3 40% | 2.8 -46% | 8.9 ? 71% | |||
| WiFi v1.3 (h) | 3.9 | 6.6 69% | 4.7 21% | 3 -23% | 4.2 8% | 3.2 -18% | 7.09 ? 82% |
| Load (h) | 0.8 | 2 150% | 1 25% | 1.2 50% | 1 25% | 0.6 -25% | 1.51 ? 89% |
Artılar
Eksiler
Verdict
MSI GL75 kendisinden bekleneni yapıyor. Tüm modern oyunları sorunsuz bir şekilde ekrana getiriyor. Bunun için çözünürlük ve kalite seviyesinden ödün verilmesine gerek yoktur. Core i7-10750H hexa-core işlemci ve GeForce RTX 2070 GPU'nun kombinasyonu bunu mümkün kılıyor.
Güçlü donanımın soğutulması gerekiyor. Bu nedenle dizüstü bilgisayarın iki fanı, yük altında ağır bir şekilde ortaya çıkıyor ve çok fazla gürültü çıkarıyor. Olumlu sonuç: Dava sadece orta derecede ısınır.
MSI, GL75 Leopard 10SFR-221 ile makul bir fiyata çok yönlü bir dizüstü oyun bilgisayarı sunuyor.
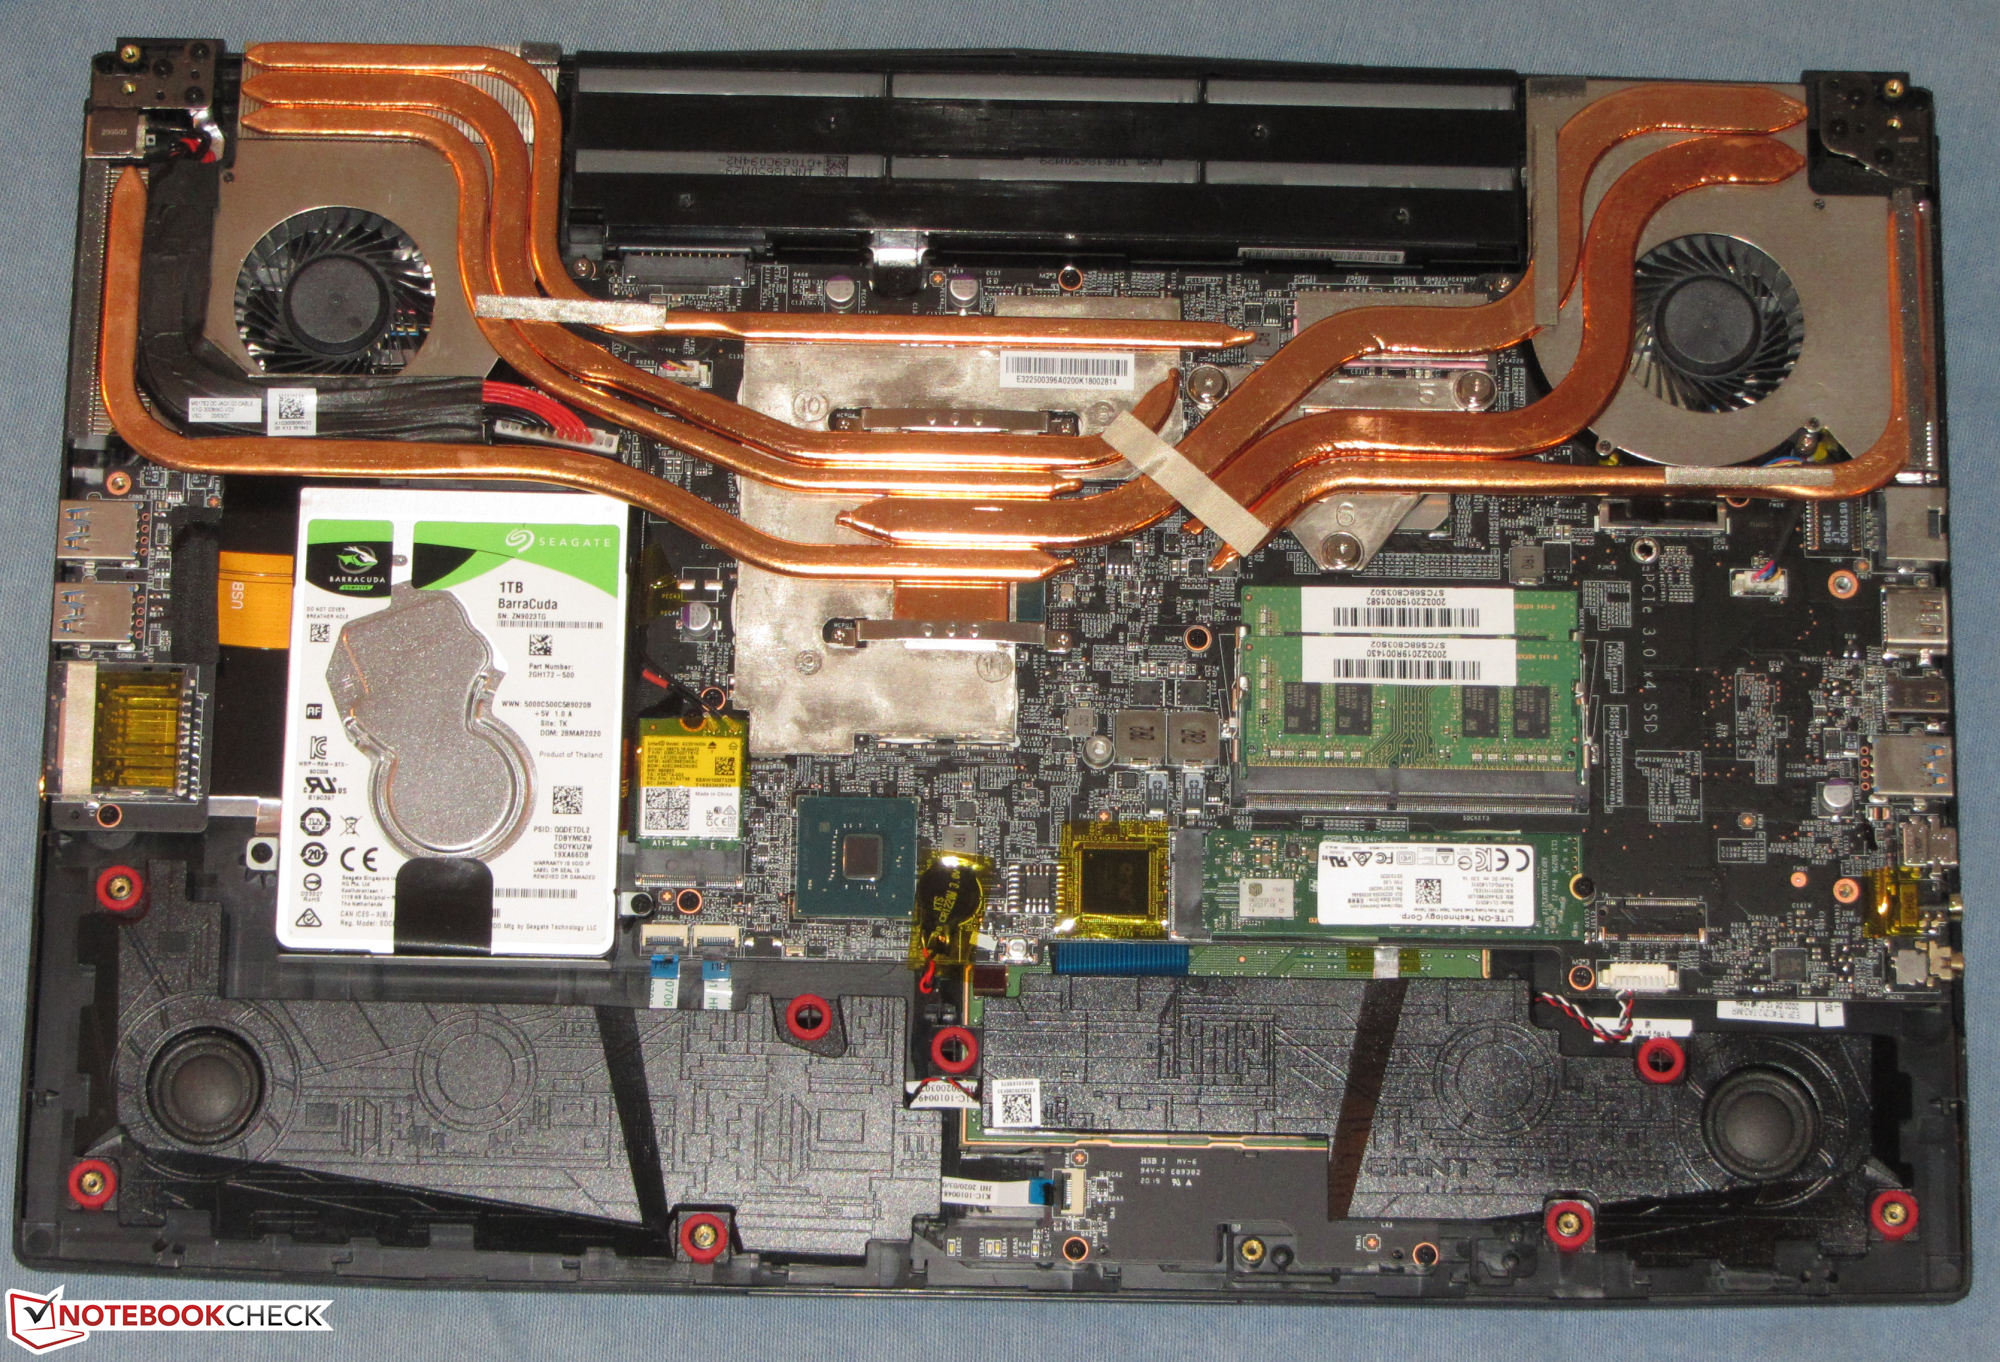
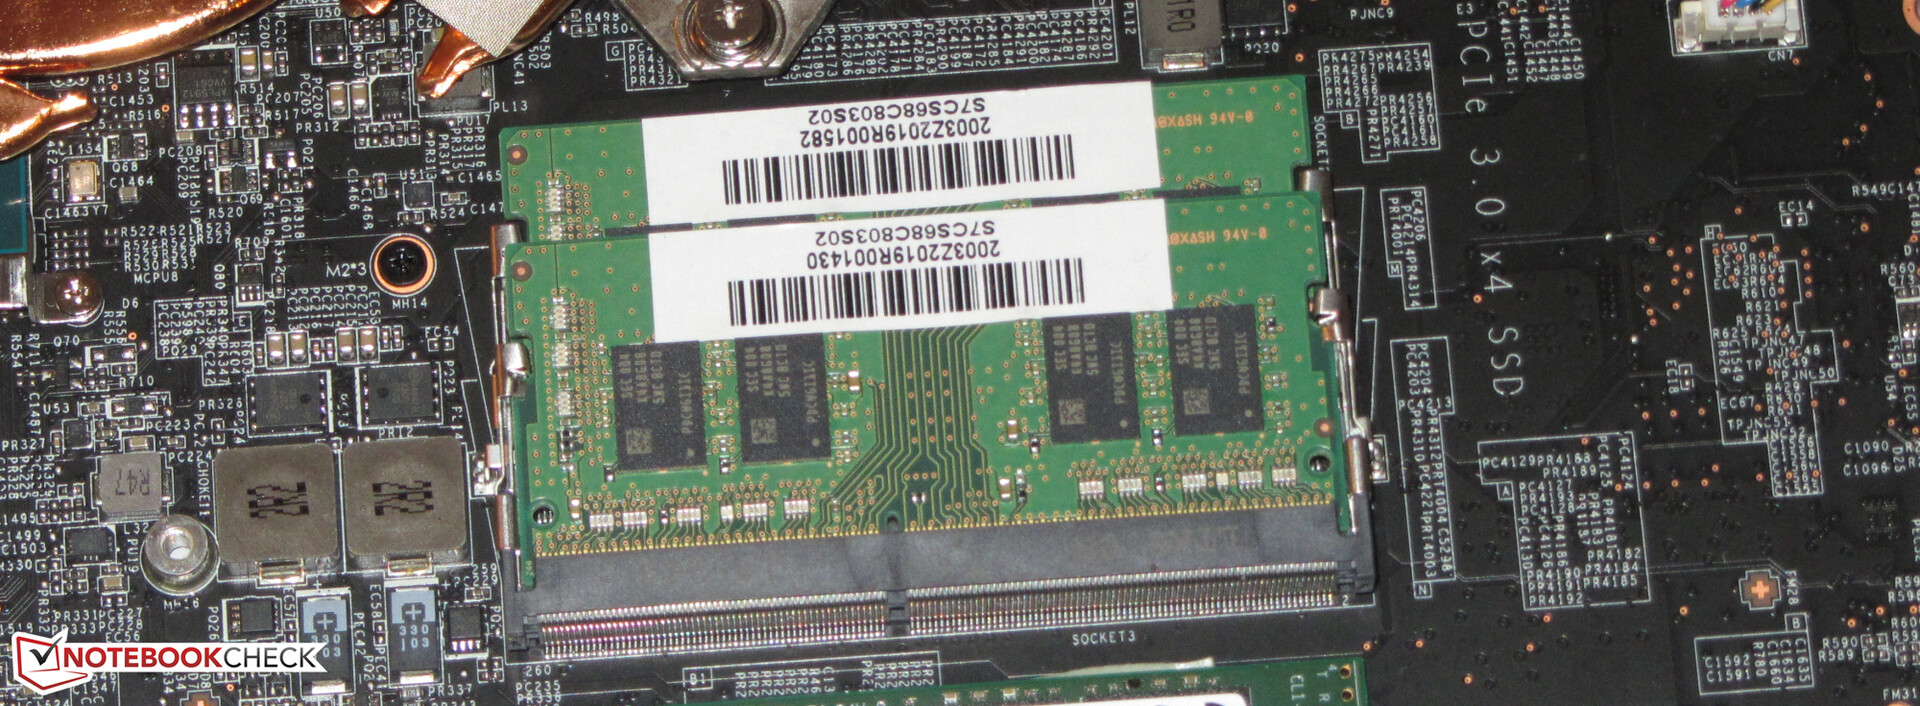
Dizüstü bilgisayar, toplam 512 GB depolama alanı sunan hızlı bir NVMe SSD ile birlikte gelir. Bir oyun dizüstü bilgisayarı asla çok fazla depolama alanına sahip olamayacağından, MSI ayrıca 1 TB sabit sürücü (7.200 rpm) içerir. Her iki depolama cihazı da değiştirilebilir. Bunu yapmak için, kasanın alt kapağının çıkarılması gerekir.
Mat 144 Hz Full HD IPS ekran, sabit görüntüleme açıları, yeterli parlaklık, iyi kontrast, kısa tepki süreleri ve mükemmel renk üretimi ile puanlar. Renk alanı kapsamı da sevindiricidir.
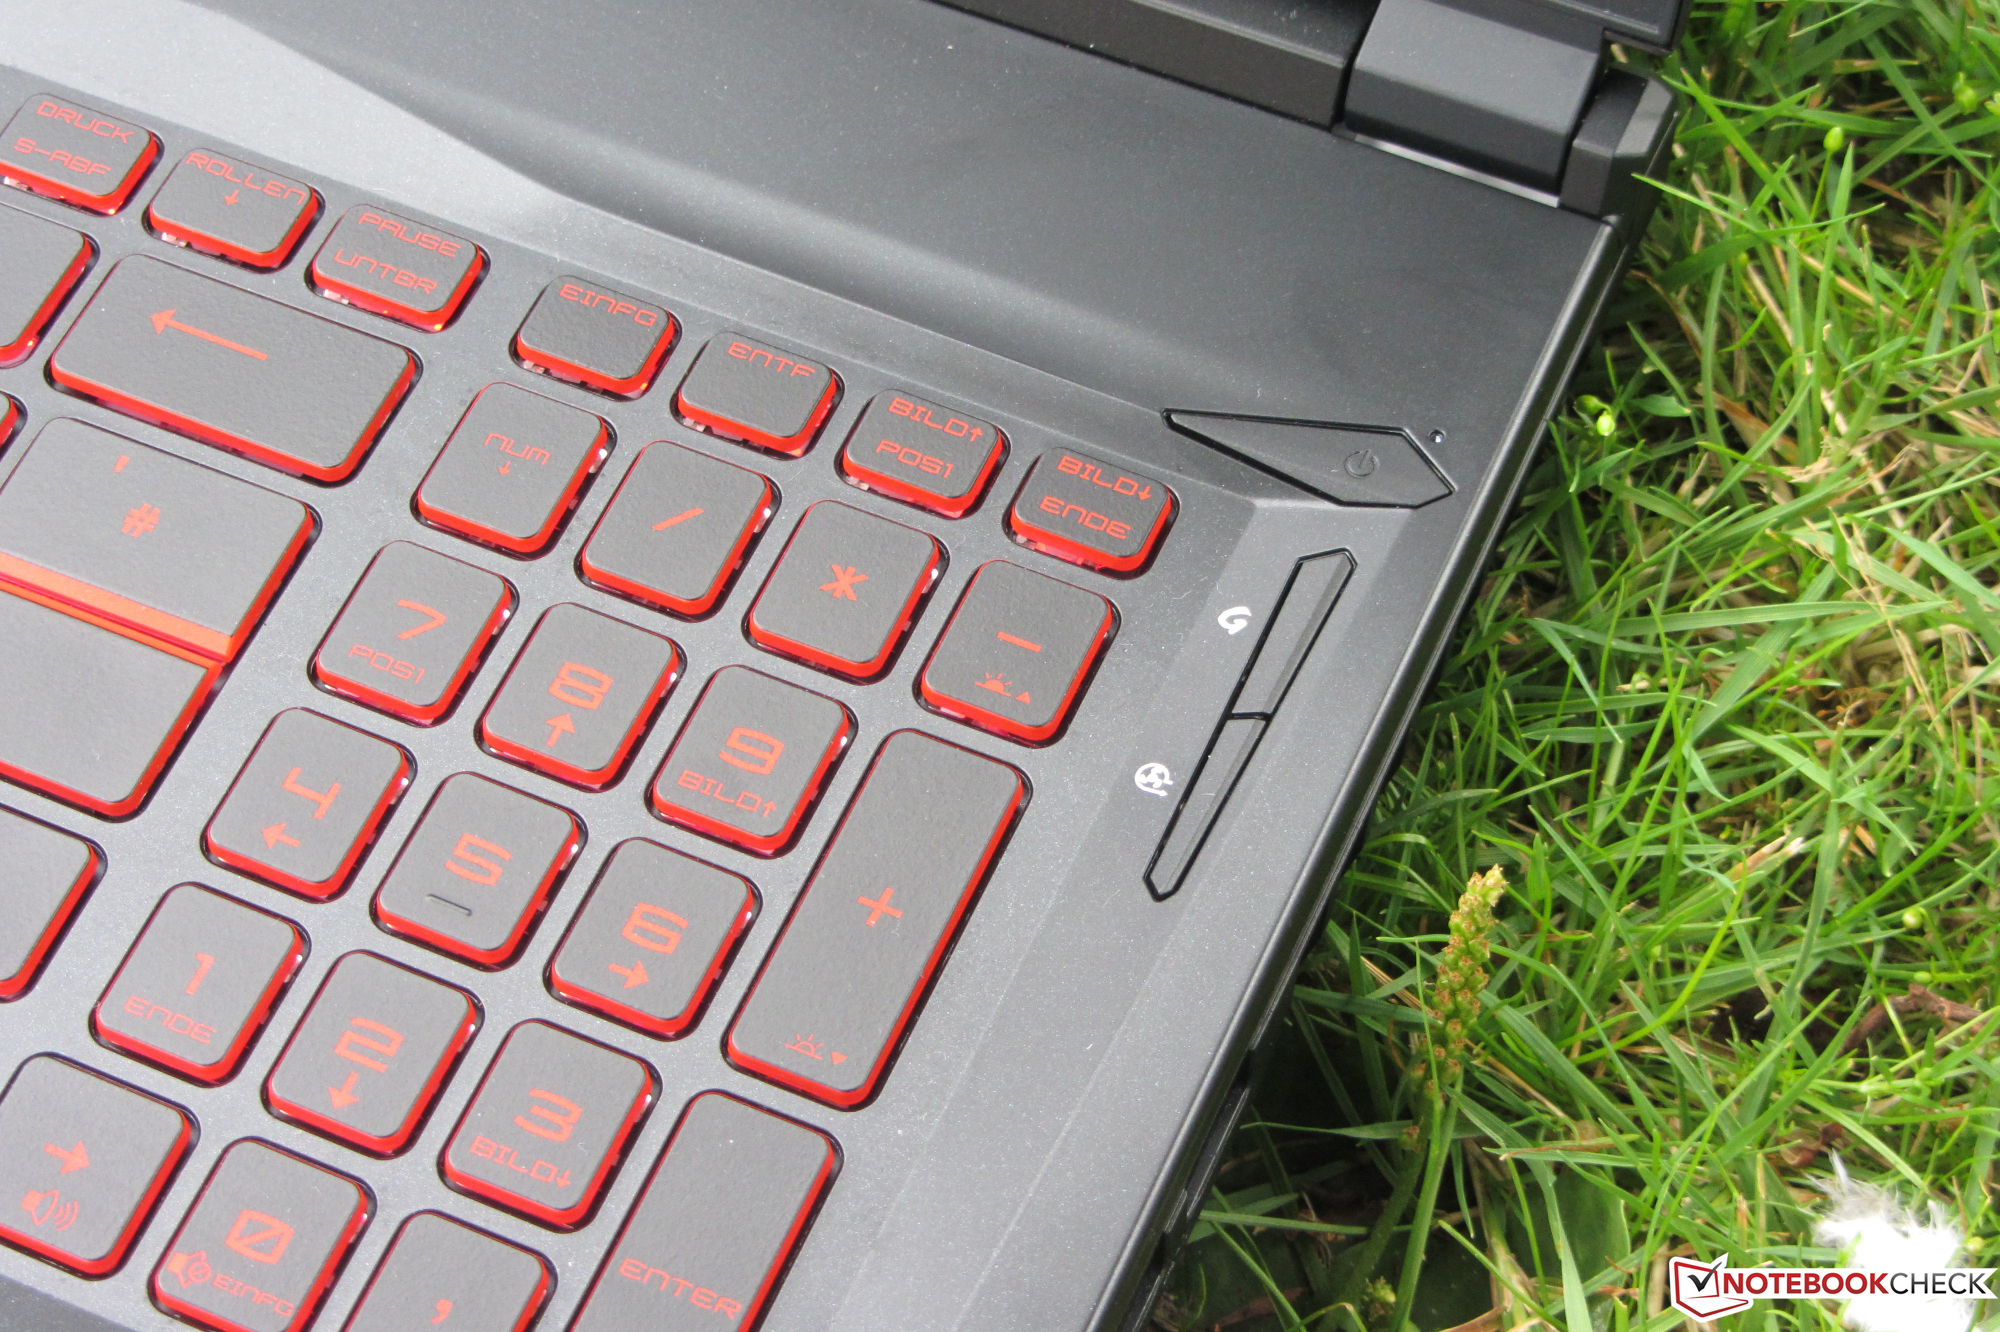
Pil çalışma süreleri kimsenin canını sıkmaz, ancak bir oyun dizüstü bilgisayarı için uygundur. Arkadan aydınlatmalı klavye günlük uygunluğunu kanıtlamıştır. Bununla birlikte, selefi ve kardeş modelin yaptığı gibi RGB aydınlatma sunmuyor, ancak yalnızca kırmızı renkte tek renkli bir aydınlatmaya sahip. Üstelik dizüstü bilgisayar Thunderbolt 3 bağlantı noktası sunmuyor. MSI, USB-C veya Güç Dağıtımı yoluyla DisplayPort'u desteklemeyen bir USB Type-C 3.2 Gen 2 bağlantı noktası kurdu.
MSI GL75 10SFR
- 07/31/2020 v7 (old)
Sascha Mölck
Price comparison

