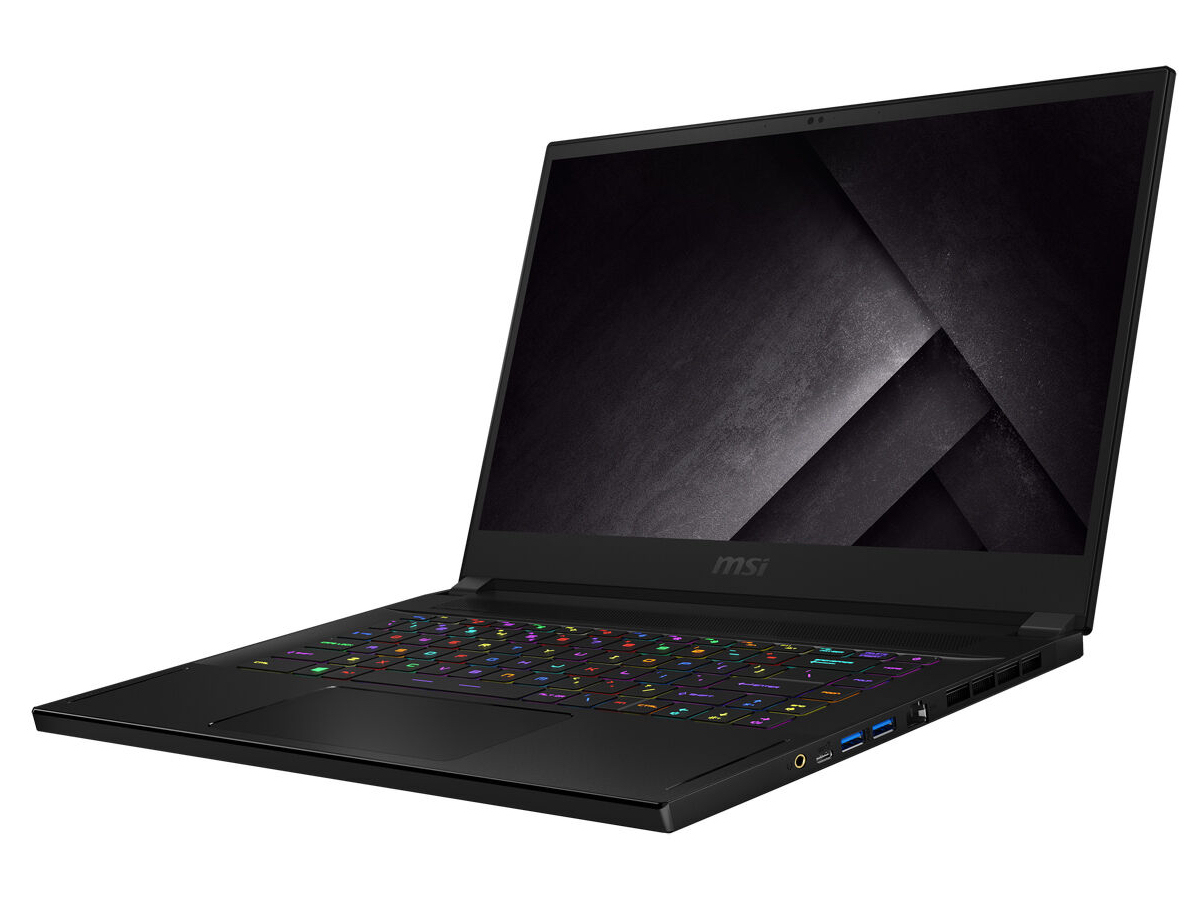
MSI GS66 Stealth 10SE incelemede: 240 Hz ekrana sahip şık dizüstü oyun bilgisayarı

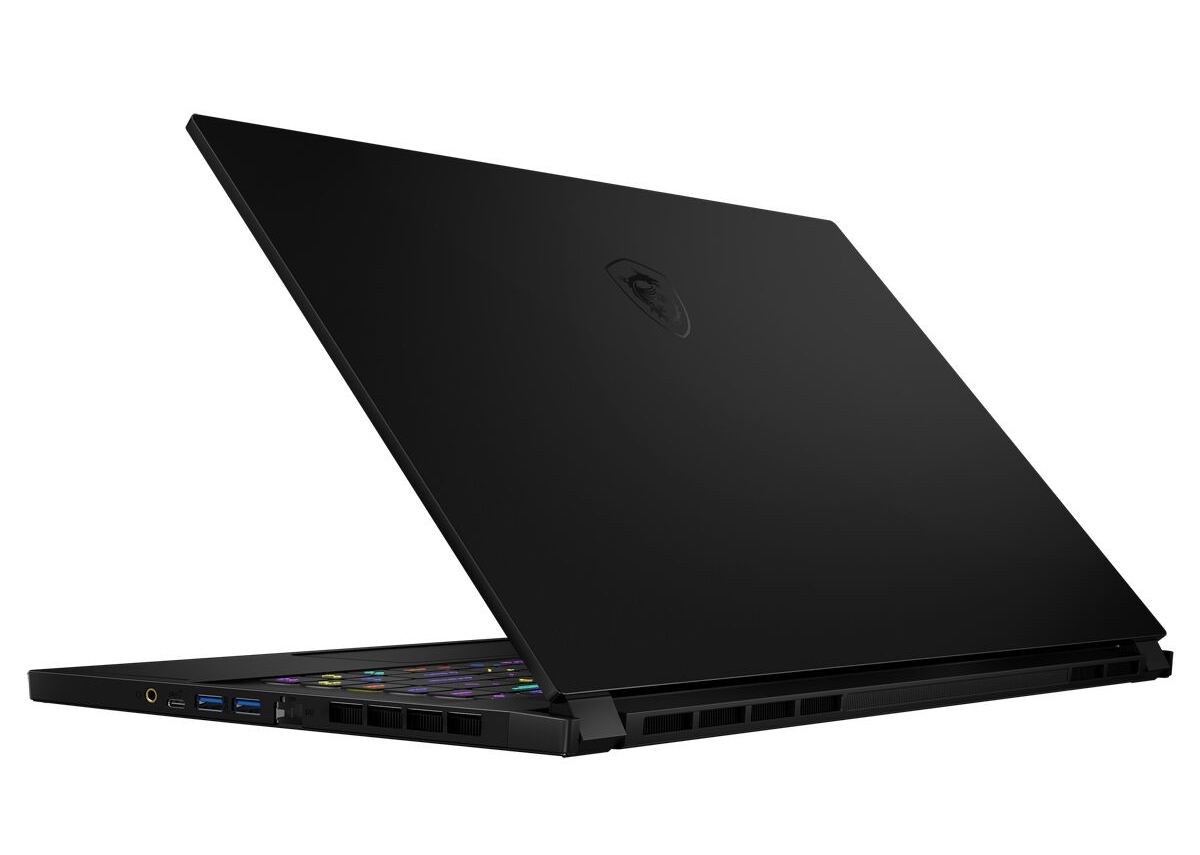
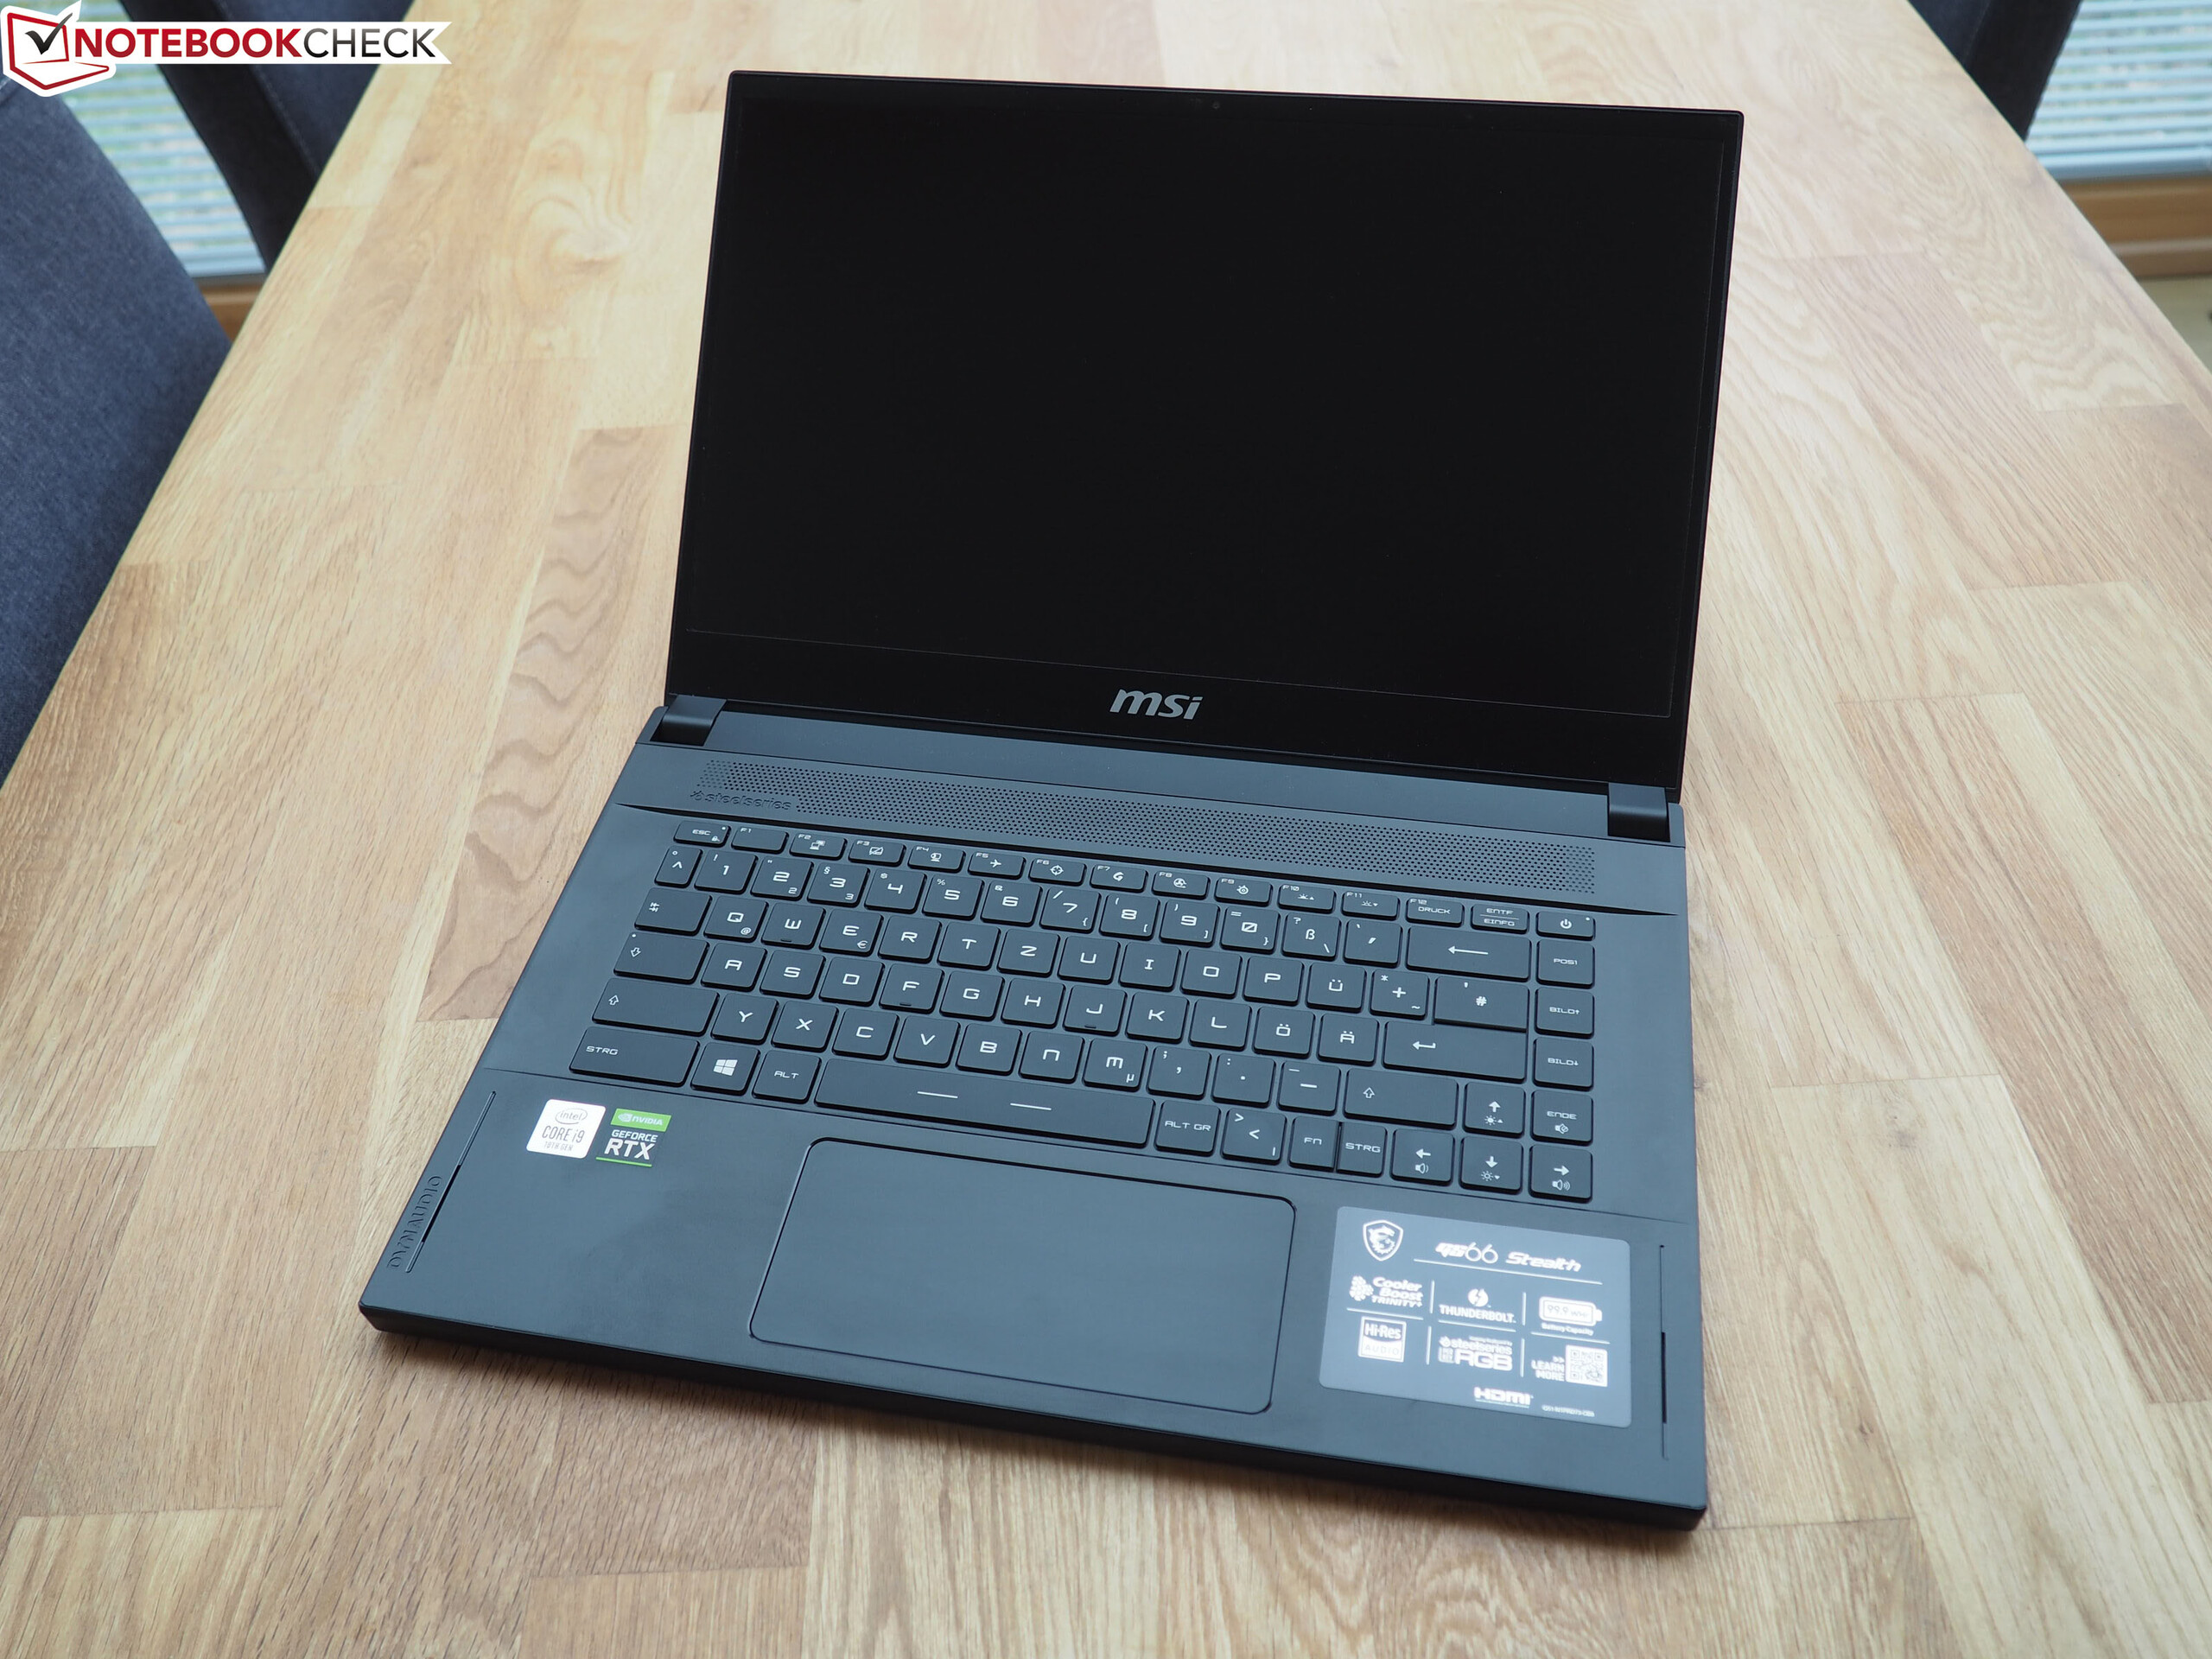
Teknik açıdan, MSI GS66 Stealth 10SE 15.6 inç oyun dizüstü bilgisayarı, daha önce incelediğimiz GS66 Stealth 10SFS'nin biraz sulandırılmış bir sürümüdür ve aynı zamanda ikincisinden daha düşük bir fiyata satılır. Bize sağlanan test cihazı, bir Core i7-10750H altı çekirdekli işlemci ve bir GeForce RTX 2060 grafik çekirdeği tarafından desteklenmektedir. Rakipler arasında Dell G5 15 SE, Lenovo Legion 5 15IMH05H, Asus TUF A15 FA506IV, Schenker XMG Core 15 GK5CP6V ve Razer Blade 15 gibi cihazlar yer alıyor. kasa, bağlantı, giriş cihazları ve hoparlörlerle ilgili daha fazla bilgi. İlgili bilgiler GS66 10SFS incelemesinde bulunabilir.
Derecelendirme | Tarih | Modeli | Ağırlık | Yükseklik | Boyut | Çözünürlük | Fiyat |
|---|---|---|---|---|---|---|---|
| 82.5 % v7 (old) | 08/2020 | MSI GS66 Stealth 10SE-045 i7-10750H, GeForce RTX 2060 Mobile | 2.2 kg | 19.8 mm | 15.60" | 1920x1080 | |
| 84.2 % v7 (old) | 03/2020 | Razer Blade 15 GTX 1660 Ti i7-9750H, GeForce GTX 1660 Ti Mobile | 2.1 kg | 19.9 mm | 15.60" | 1920x1080 | |
| 83.7 % v7 (old) | 06/2020 | Dell G5 15 SE 5505 P89F R7 4800H, Radeon RX 5600M | 2.4 kg | 21.6 mm | 15.60" | 1920x1080 | |
| 83.3 % v7 (old) | 07/2020 | Lenovo Legion 5 15IMH05H i5-10300H, GeForce RTX 2060 Mobile | 2.5 kg | 26.1 mm | 15.60" | 1920x1080 | |
| 82.7 % v7 (old) | Asus TUF Gaming A15 FA506IV-HN172 R7 4800H, GeForce RTX 2060 Mobile | 2.2 kg | 24.9 mm | 15.60" | 1920x1080 | ||
| 81.3 % v7 (old) | Schenker XMG Core 15 GK5CP6V i7-9750H, GeForce GTX 1660 Ti Mobile | 2 kg | 26 mm | 15.60" | 1920x1080 |
| Networking | |
| iperf3 transmit AX12 | |
| Dell G5 15 SE 5505 P89F | |
| MSI GS66 Stealth 10SE-045 | |
| MSI GS66 Stealth 10SFS | |
| MSI GS66 10SGS | |
| Schenker XMG Core 15 GK5CP6V | |
| Lenovo Legion 5 15IMH05H | |
| iperf3 receive AX12 | |
| Dell G5 15 SE 5505 P89F | |
| Schenker XMG Core 15 GK5CP6V | |
| MSI GS66 10SGS | |
| MSI GS66 Stealth 10SE-045 | |
| MSI GS66 Stealth 10SFS | |
| Lenovo Legion 5 15IMH05H | |


Ekran - duyarlı 240 Hz panelli GS66
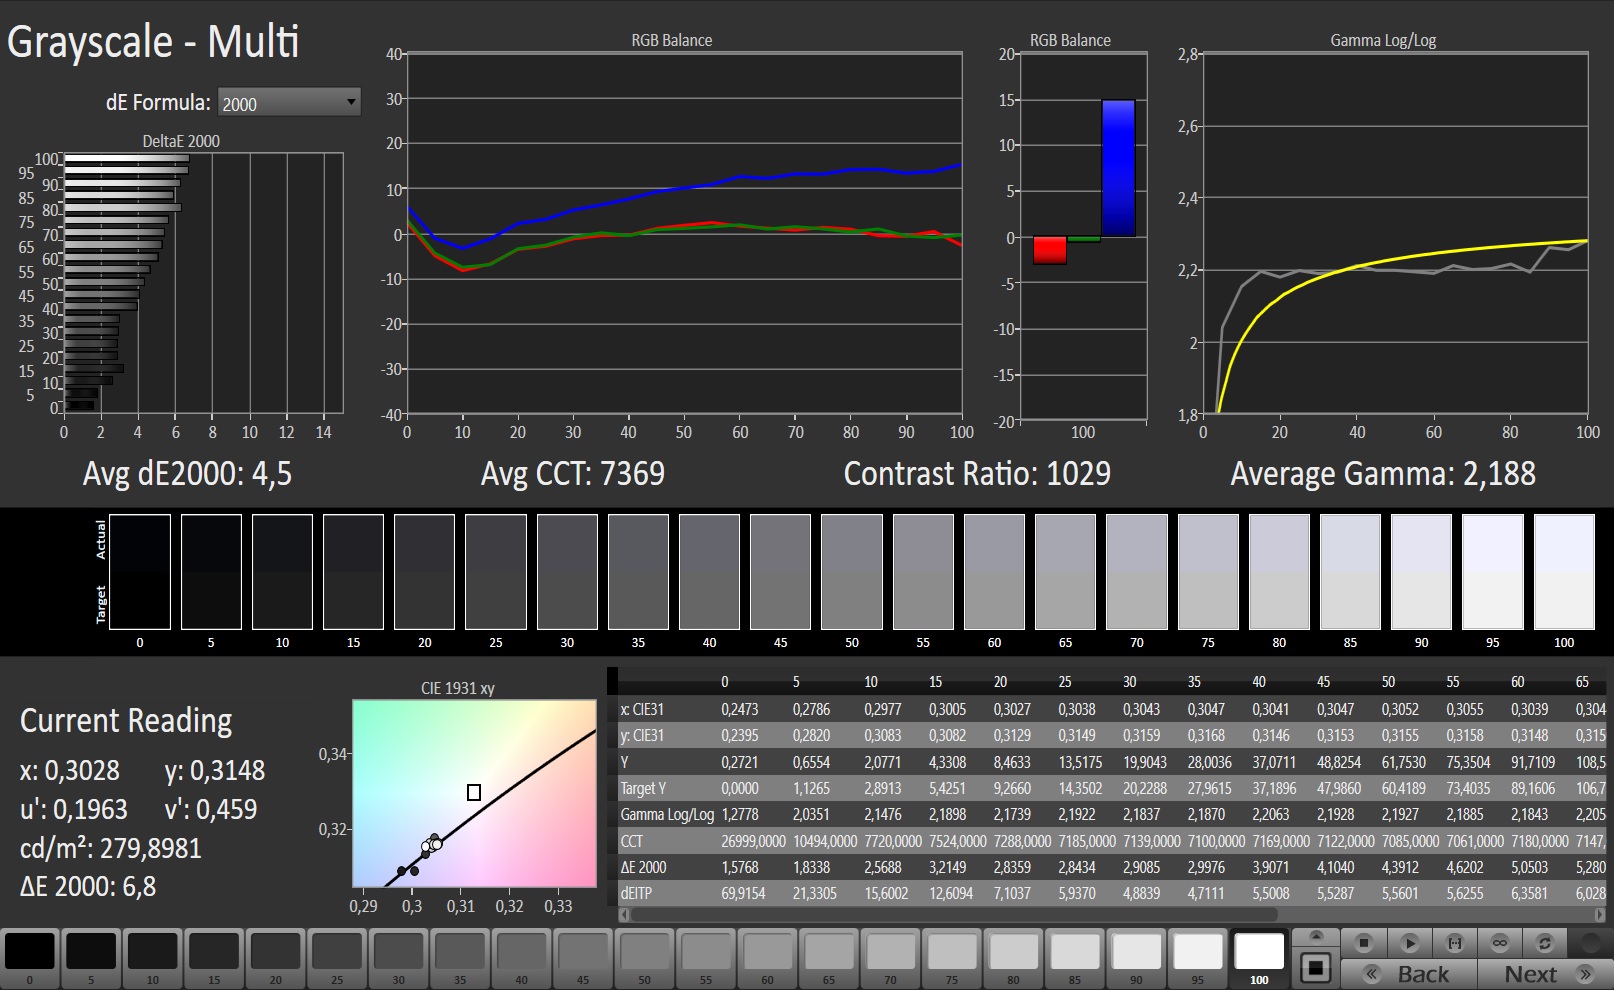
MSI, dizüstü bilgisayarı iyi yanıt süreleri sunan 15.6 inç formatında 240 Hz panel ile donatıyor. Ekranın doğal çözünürlüğü 1920x1080 pikseldir. İyi bir kontrast (1.007: 1) sunsa da, maksimum parlaklık (259 cd / m²) nispeten düşüktür. 300 cd / m²'nin üzerindeki değerlerin iyi olduğunu düşünüyoruz. Ekran% 19 ve altındaki parlaklık seviyelerinde maalesef 23.580 Hz frekansta titriyor. Bununla birlikte, hassas kullanıcılar bile yüksek frekans nedeniyle baş ağrısı ve / veya göz problemlerinden rahatsız olmamalıdır.
| |||||||||||||||||||||||||
Aydınlatma: 91 %
Batarya modunda parlaklık: 272 cd/m²
Kontrast: 1007:1 (Siyah: 0.27 cd/m²)
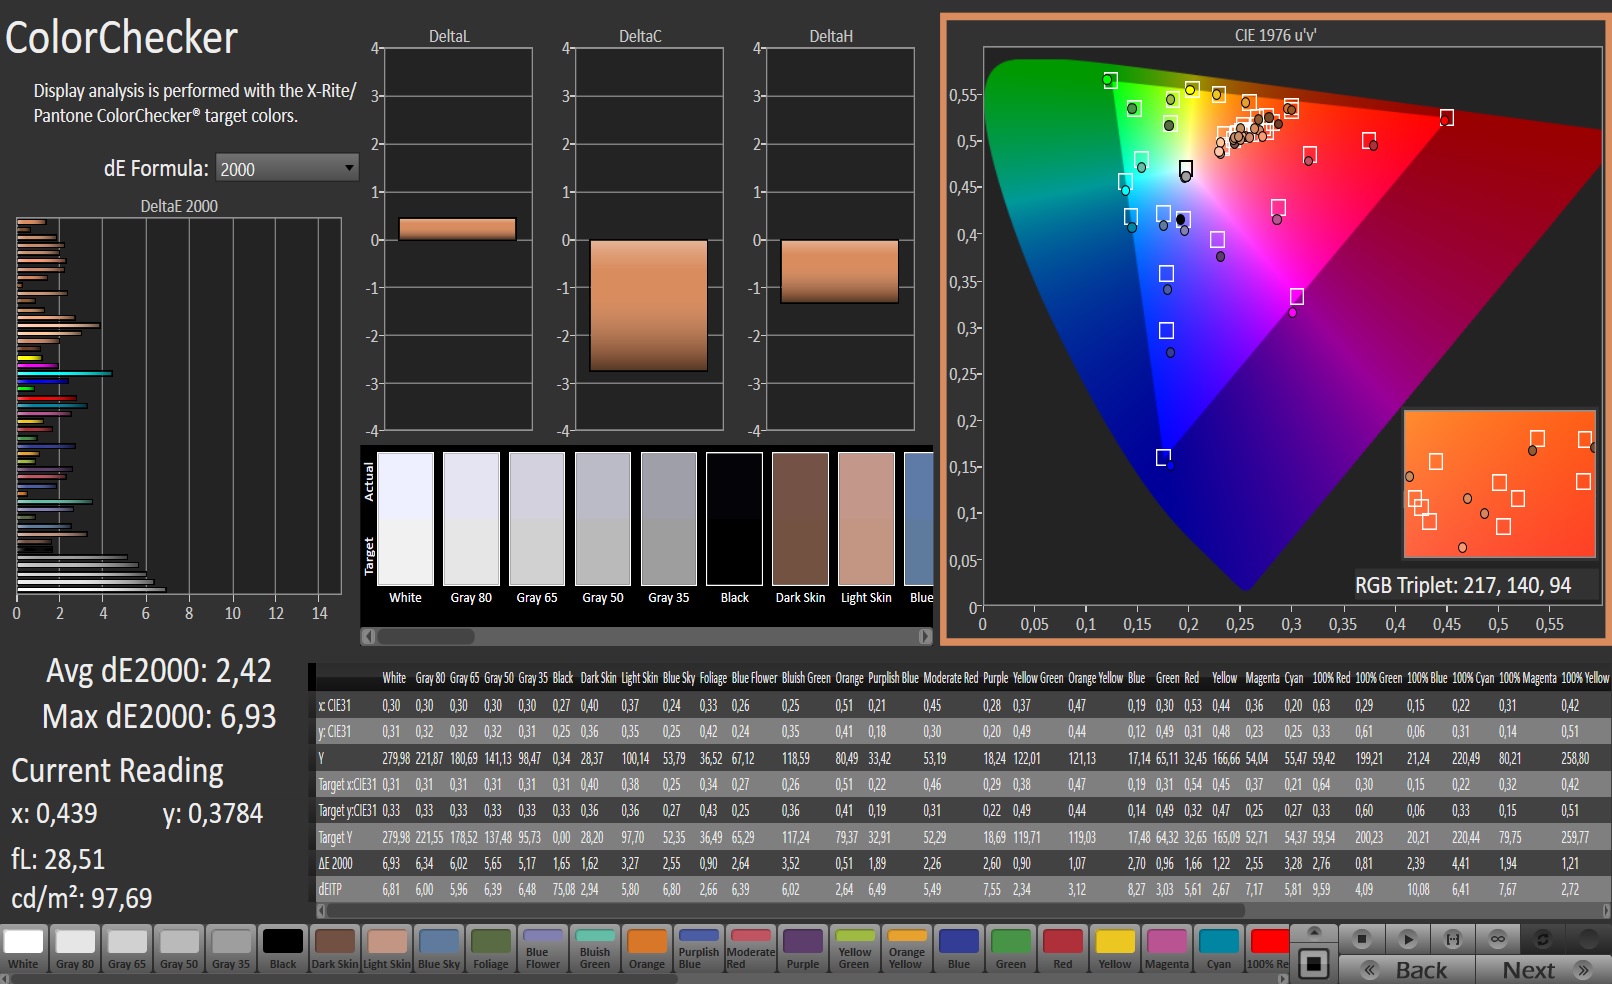
ΔE ColorChecker Calman: 2.42 | ∀{0.5-29.43 Ø4.73}
calibrated: 0.88
ΔE Greyscale Calman: 4.5 | ∀{0.09-98 Ø4.97}
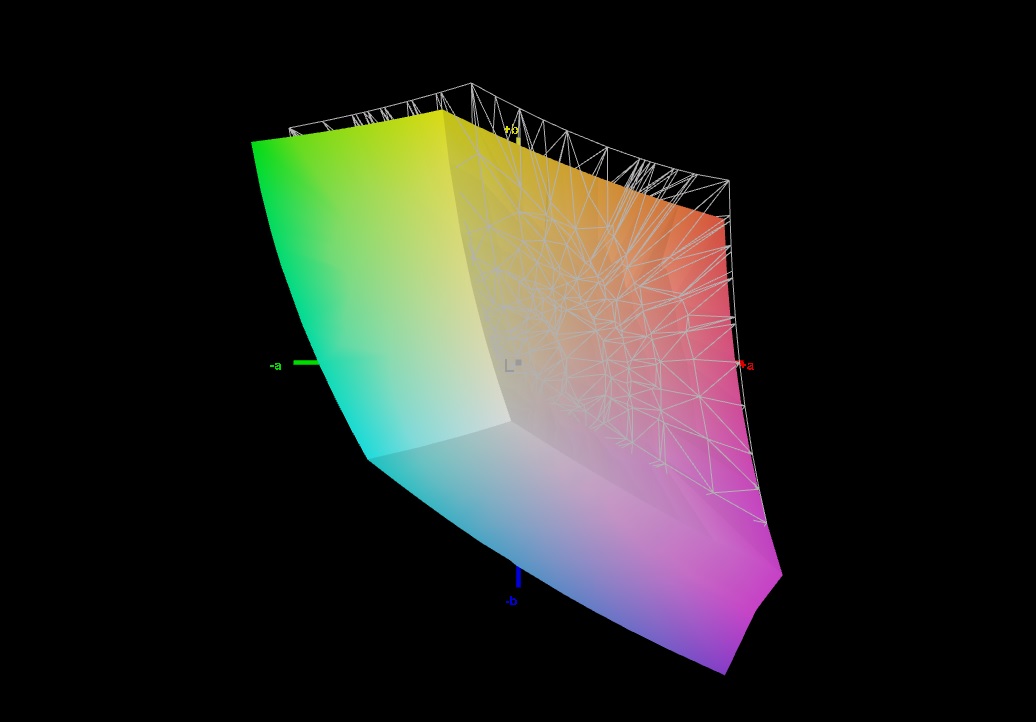
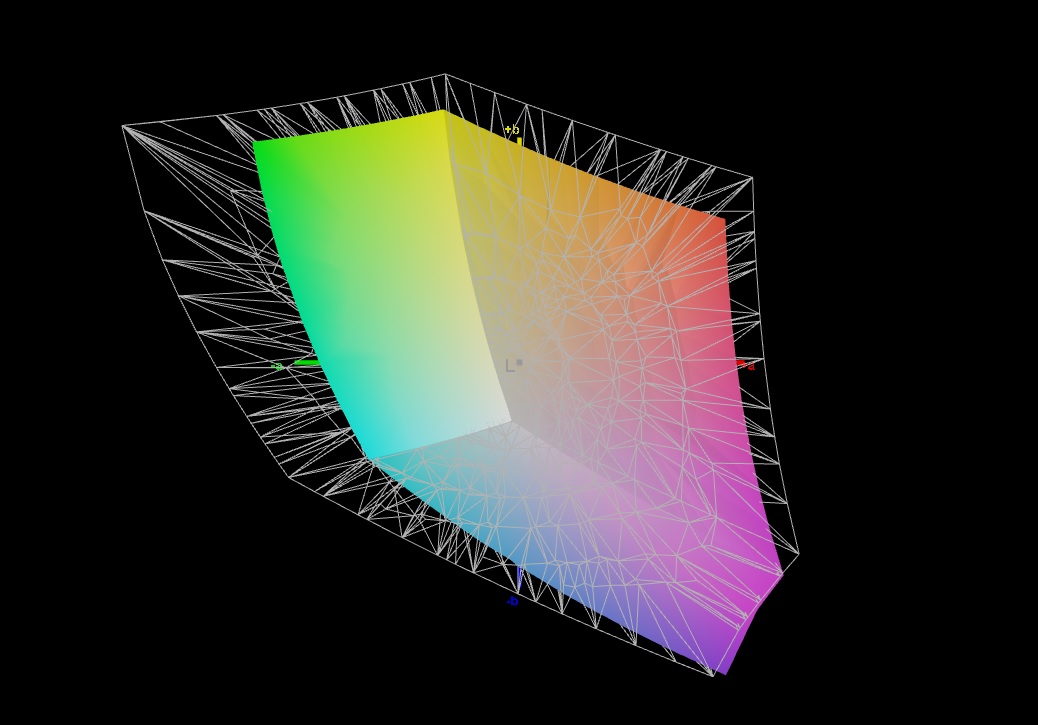
91% sRGB (Argyll 1.6.3 3D)
69% AdobeRGB 1998 (Argyll 1.6.3 3D)
68.9% AdobeRGB 1998 (Argyll 3D)
98.3% sRGB (Argyll 3D)
67.5% Display P3 (Argyll 3D)
Gamma: 2.188
CCT: 7369 K
| MSI GS66 Stealth 10SE-045 Sharp LQ156M1JW03, IPS, 1920x1080, 15.6" | MSI GS66 Stealth 10SFS AUO B156HAN12.0 (AUO328E), IPS, 1920x1080, 15.6" | Razer Blade 15 GTX 1660 Ti BOE NV156FHM-N4K, IPS, 1920x1080, 15.6" | Dell G5 15 SE 5505 P89F BOE NV156FH, WVA, 1920x1080, 15.6" | Lenovo Legion 5 15IMH05H BOE CQ NV156FHM-NX1, IPS, 1920x1080, 15.6" | Asus TUF Gaming A15 FA506IV-HN172 LM156LF-2F01, IPS, 1920x1080, 15.6" | Schenker XMG Core 15 GK5CP6V BOEhydis NV156FHM-N4G (BOE084D), IPS, 1920x1080, 15.6" | |
|---|---|---|---|---|---|---|---|
| Display | 2% | -4% | -7% | -42% | -41% | -6% | |
| Display P3 Coverage (%) | 67.5 | 69.5 3% | 65.3 -3% | 63 -7% | 38.8 -43% | 38.92 -42% | 63.3 -6% |
| sRGB Coverage (%) | 98.3 | 99.6 1% | 91.8 -7% | 90.1 -8% | 57.8 -41% | 58.5 -40% | 91.2 -7% |
| AdobeRGB 1998 Coverage (%) | 68.9 | 70.8 3% | 66.5 -3% | 64.1 -7% | 40.09 -42% | 40.22 -42% | 65 -6% |
| Response Times | -5% | -5% | -37% | -90% | -157% | 14% | |
| Response Time Grey 50% / Grey 80% * (ms) | 12 ? | 14 ? -17% | 13.6 ? -13% | 20.4 ? -70% | 26 ? -117% | 34 ? -183% | 8.8 ? 27% |
| Response Time Black / White * (ms) | 10.4 ? | 9.6 ? 8% | 10 ? 4% | 10.8 ? -4% | 17 ? -63% | 24 ? -131% | 10.4 ? -0% |
| PWM Frequency (Hz) | 23580 ? | 200 ? | 198.4 ? | ||||
| Screen | 6% | -26% | -25% | -58% | -64% | -8% | |
| Brightness middle (cd/m²) | 272 | 316 16% | 312.7 15% | 292 7% | 301 11% | 280 3% | 324 19% |
| Brightness (cd/m²) | 259 | 311 20% | 305 18% | 290 12% | 277 7% | 254 -2% | 296 14% |
| Brightness Distribution (%) | 91 | 92 1% | 90 -1% | 77 -15% | 77 -15% | 88 -3% | 88 -3% |
| Black Level * (cd/m²) | 0.27 | 0.21 22% | 0.27 -0% | 0.27 -0% | 0.26 4% | 0.15 44% | 0.27 -0% |
| Contrast (:1) | 1007 | 1505 49% | 1158 15% | 1081 7% | 1158 15% | 1867 85% | 1200 19% |
| Colorchecker dE 2000 * | 2.42 | 3.03 -25% | 4.57 -89% | 3.99 -65% | 5.12 -112% | 5.89 -143% | 4.07 -68% |
| Colorchecker dE 2000 max. * | 6.93 | 7.32 -6% | 6.81 2% | 6.11 12% | 8.86 -28% | 19 -174% | 6.39 8% |
| Colorchecker dE 2000 calibrated * | 0.88 | 1.1 -25% | 2.91 -231% | 3.02 -243% | 4.88 -455% | 4.79 -444% | 1.49 -69% |
| Greyscale dE 2000 * | 4.5 | 3.9 13% | 4.3 4% | 3.3 27% | 3.47 23% | 4.08 9% | 4.01 11% |
| Gamma | 2.188 101% | 2.42 91% | 2.29 96% | 2.25 98% | 2.37 93% | 2.33 94% | 2.6 85% |
| CCT | 7369 88% | 7439 87% | 7098 92% | 7047 92% | 7062 92% | 7303 89% | 7350 88% |
| Color Space (Percent of AdobeRGB 1998) (%) | 69 | 65 -6% | 59.4 -14% | 58.1 -16% | 37 -46% | 37 -46% | 59 -14% |
| Color Space (Percent of sRGB) (%) | 91 | 100 10% | 91.3 0% | 89.7 -1% | 57 -37% | 58 -36% | 91 0% |
| Toplam Ortalama (Program / Ayarlar) | 1% /
4% | -12% /
-19% | -23% /
-23% | -63% /
-59% | -87% /
-72% | 0% /
-5% |
* ... daha küçük daha iyidir
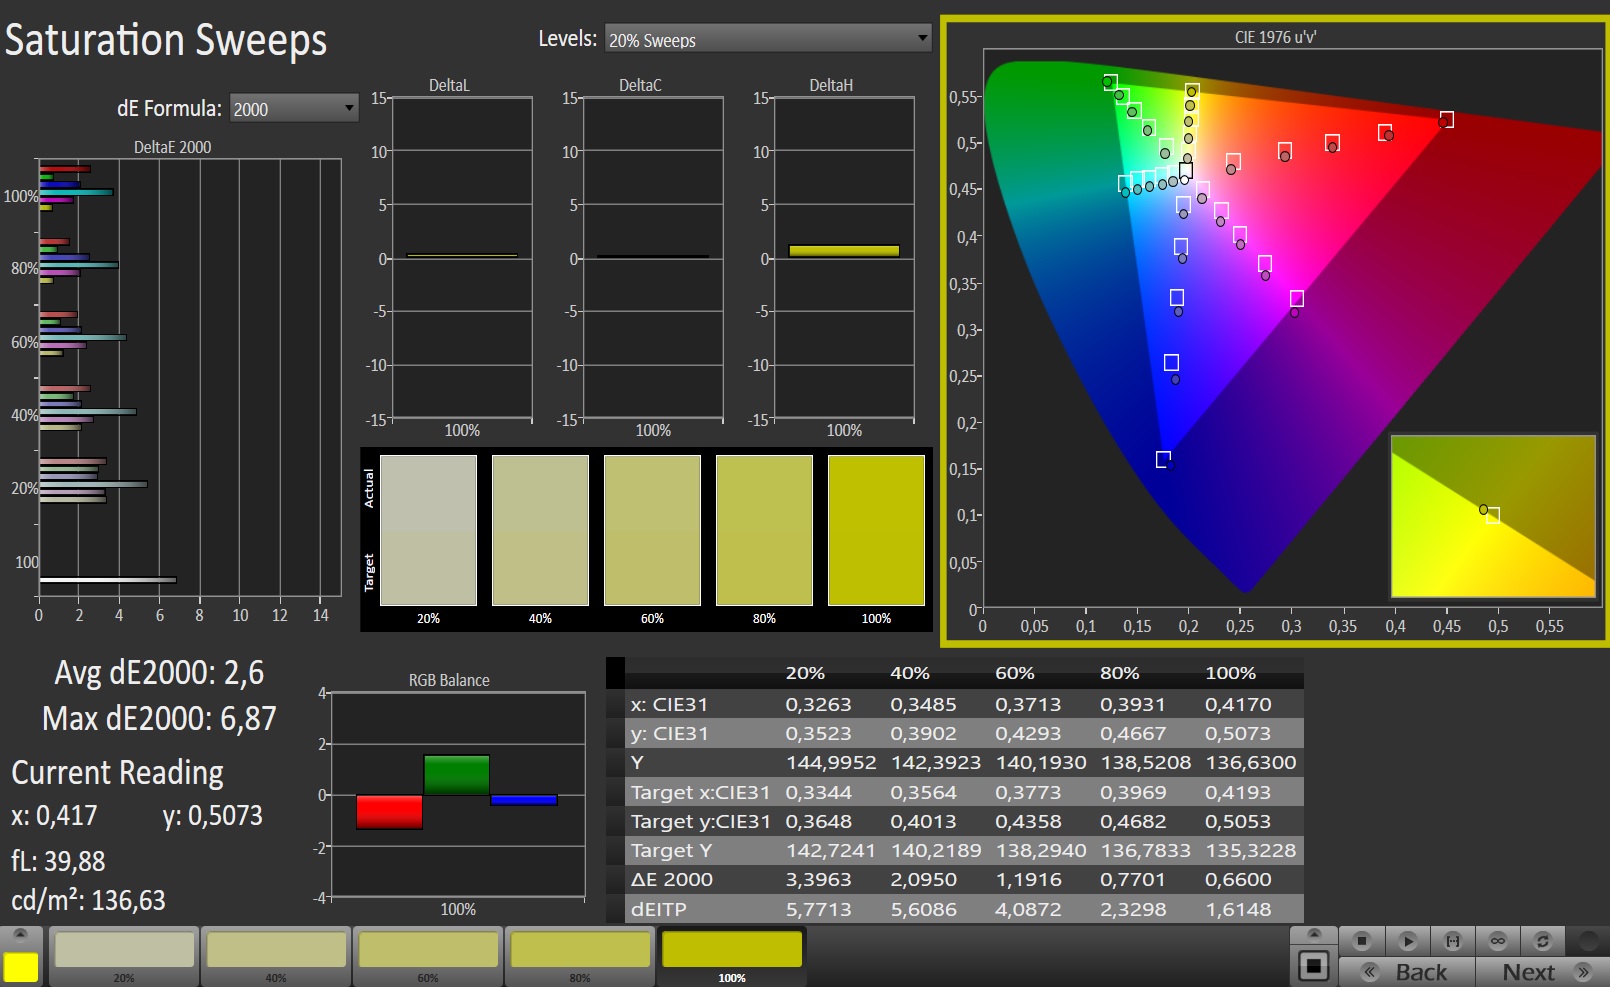
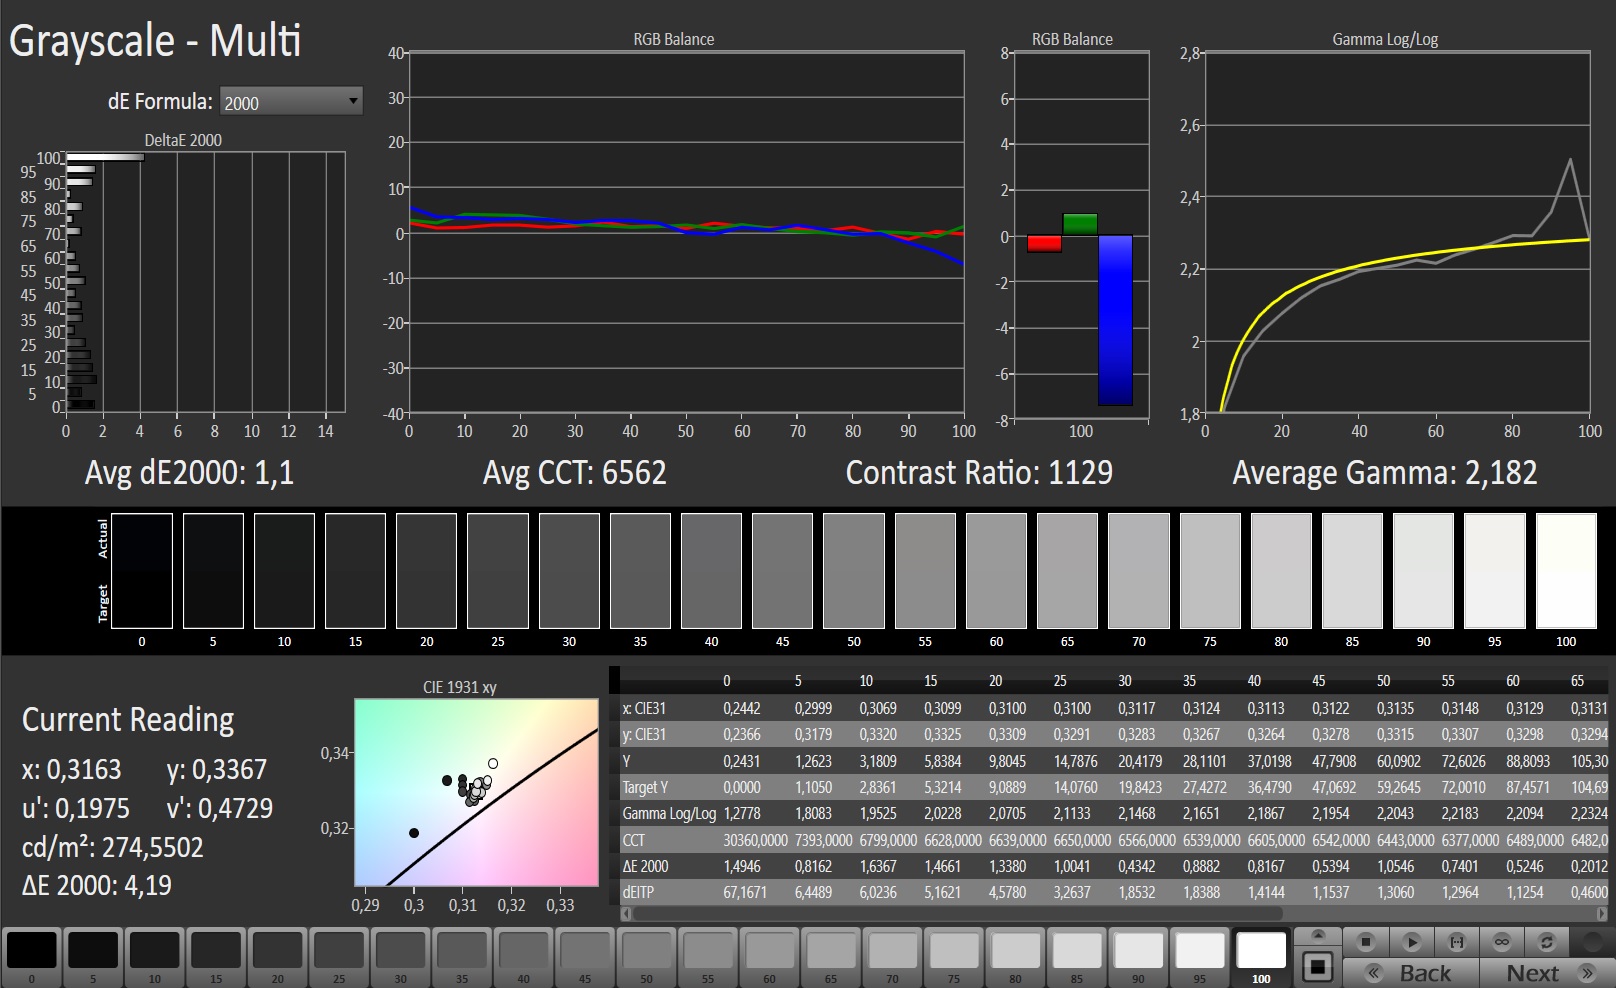
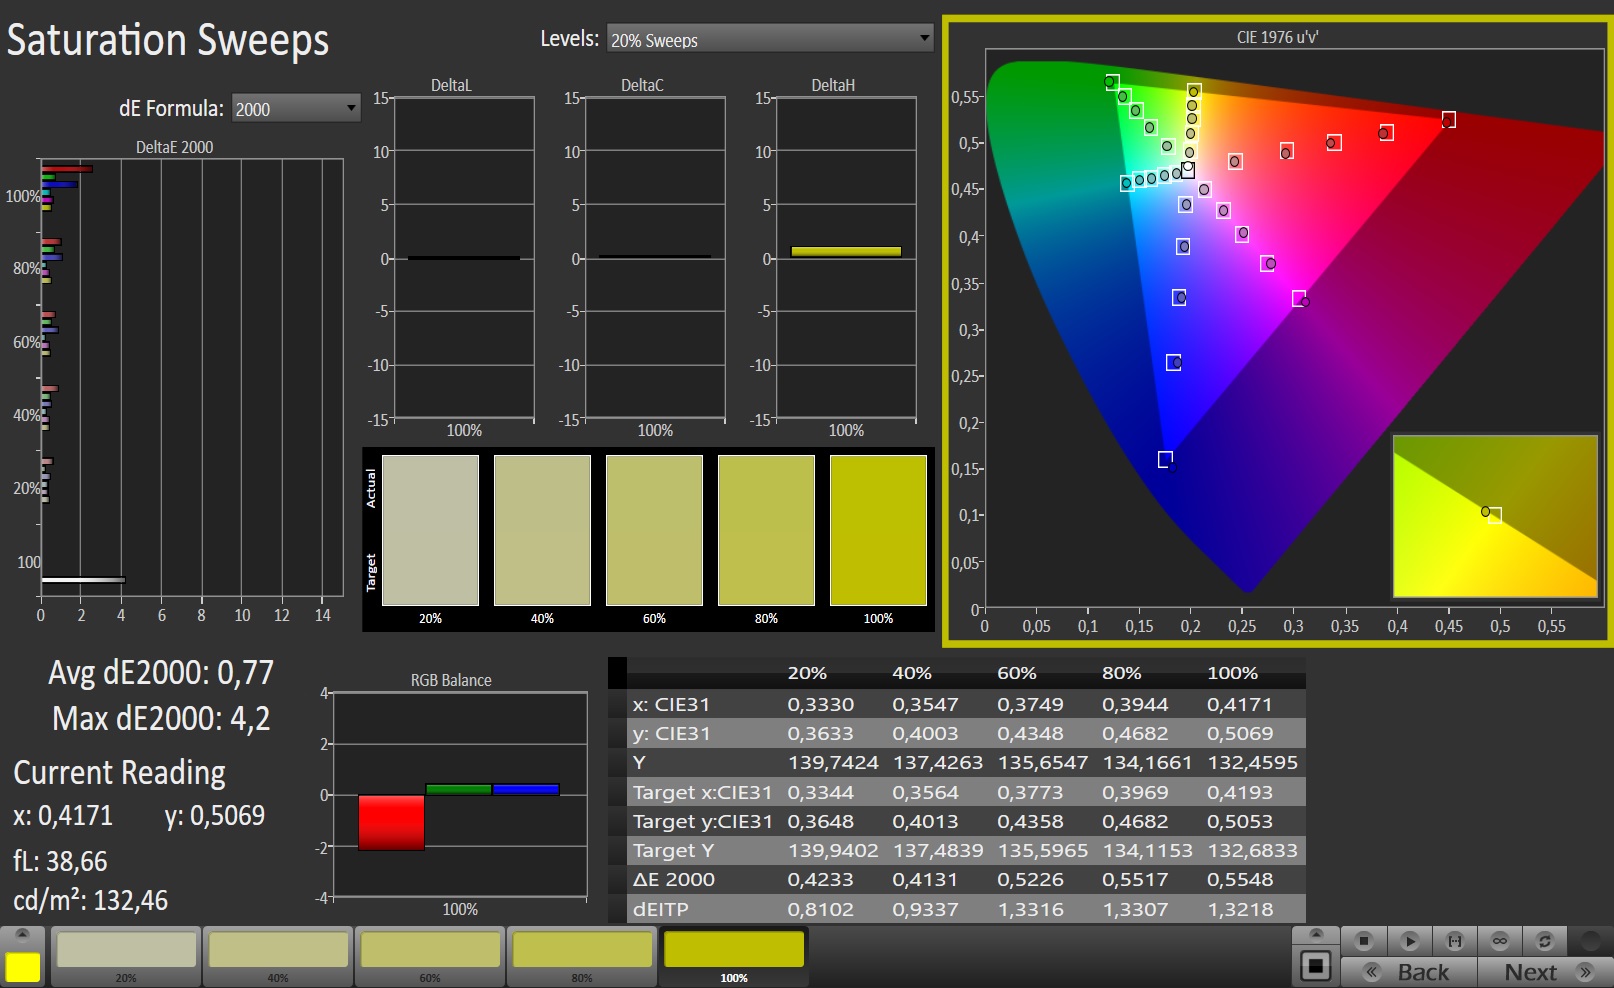
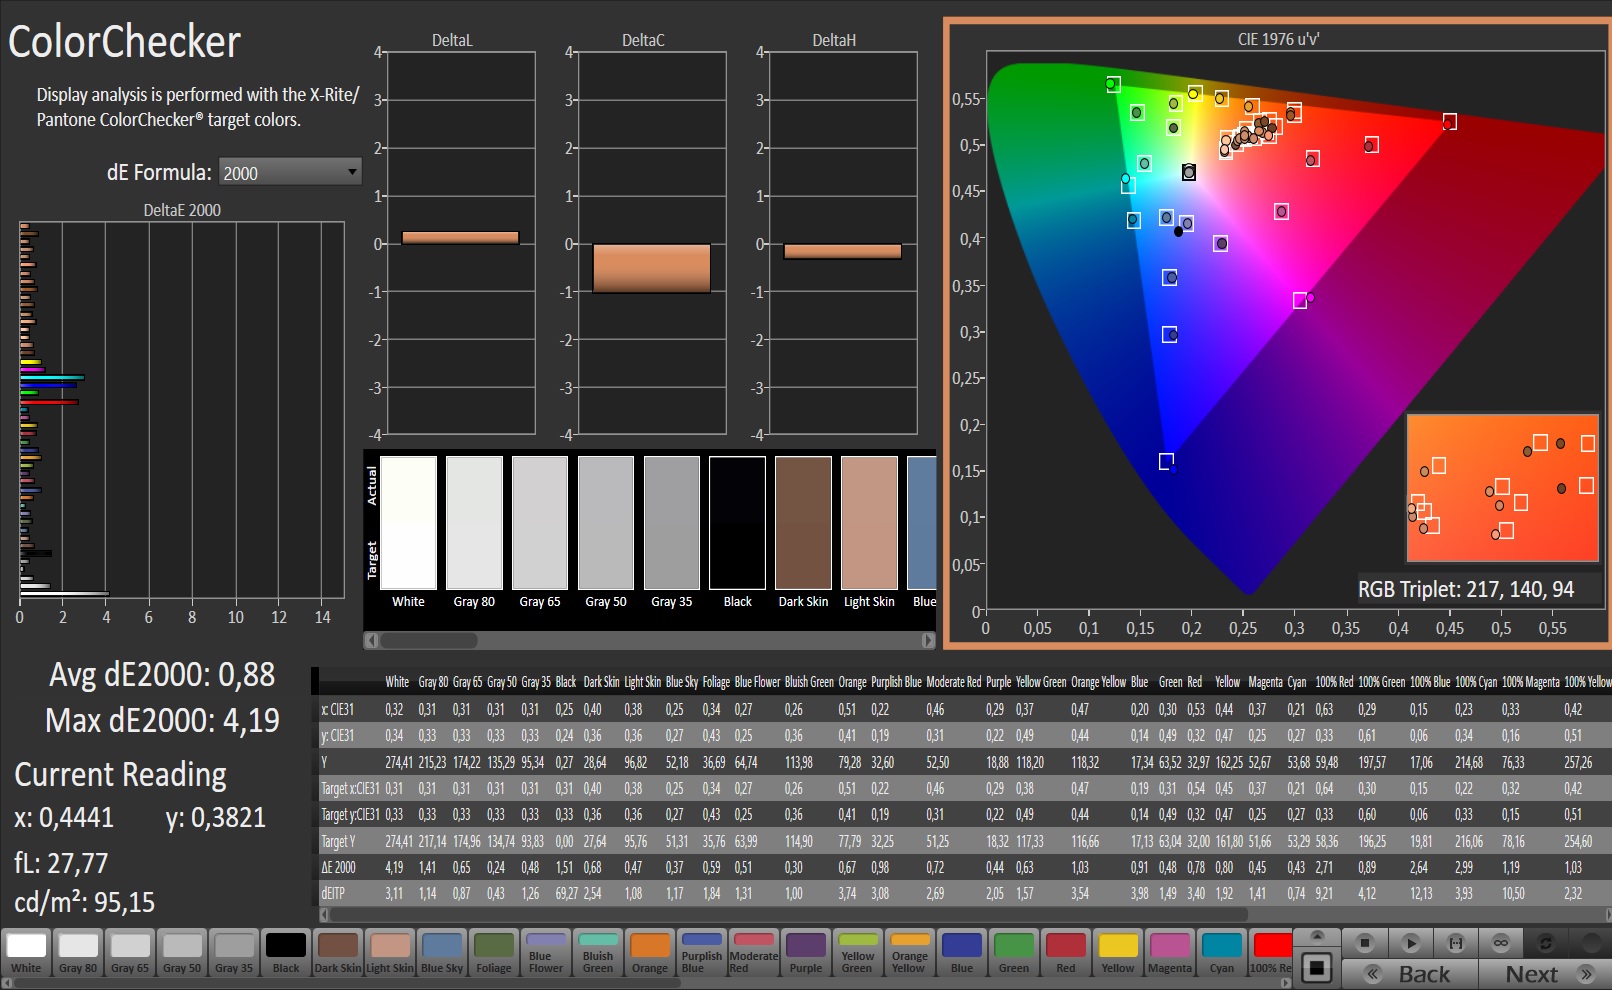
Kutunun dışında, ekran zaten harika bir renk üretimi gösteriyor. 2.42'lik bir Delta E 2000 renk sapmasıyla, hedef (Delta E 3'ten küçük) karşılanır. Ekranda mavi renk yok. Ayrıca kalibrasyon, renk üretimi açısından iyileştirmeler sağlar. Bu şekilde renk sapması 0,88'e düşürülür ve gri tonlamalar daha dengeli bir şekilde görüntülenir. AdobeRGB (% 69) ve sRGB (% 91) renk uzayları tam olarak eşlenmedi.
Yanıt Sürelerini Görüntüle
| ↔ Tepki Süresi Siyahtan Beyaza | ||
|---|---|---|
| 10.4 ms ... yükseliş ↗ ve sonbahar↘ birleşimi | ↗ 6 ms yükseliş | 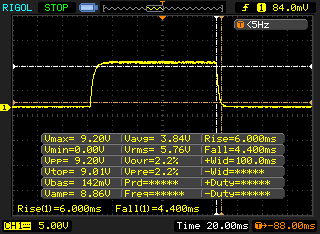 |
| ↘ 4.4 ms sonbahar | ||
| Ekran, testlerimizde iyi yanıt oranları gösteriyor ancak rekabetçi oyuncular için çok yavaş olabilir. Karşılaştırıldığında, test edilen tüm cihazlar 0.1 (minimum) ile 240 (maksimum) ms arasında değişir. » Tüm cihazların 28 %'si daha iyi. Bu, ölçülen yanıt süresinin test edilen tüm cihazların ortalamasından (19.9 ms) daha iyi olduğu anlamına gelir. | ||
| ↔ Tepki Süresi %50 Griden %80 Griye | ||
| 12 ms ... yükseliş ↗ ve sonbahar↘ birleşimi | ↗ 7.6 ms yükseliş | 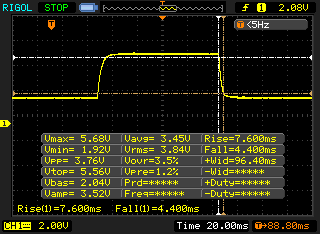 |
| ↘ 4.4 ms sonbahar | ||
| Ekran, testlerimizde iyi yanıt oranları gösteriyor ancak rekabetçi oyuncular için çok yavaş olabilir. Karşılaştırıldığında, test edilen tüm cihazlar 0.165 (minimum) ile 636 (maksimum) ms arasında değişir. » Tüm cihazların 25 %'si daha iyi. Bu, ölçülen yanıt süresinin test edilen tüm cihazların ortalamasından (31.1 ms) daha iyi olduğu anlamına gelir. | ||
Ekran Titremesi / PWM (Darbe Genişliği Modülasyonu)
| Ekran titriyor / PWM algılandı | 23580 Hz | ≤ 19 % parlaklık ayarı | 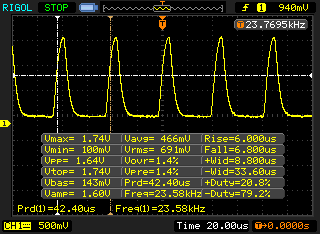 |
Ekran arka ışığı 23580 Hz'de titriyor (en kötü durum, örneğin PWM kullanılması) 19 % ve altındaki parlaklık ayarında titreme algılandı. Bu parlaklık ayarının üzerinde titreme veya PWM olmamalıdır. 23580 Hz frekansı oldukça yüksektir, bu nedenle PWM'ye duyarlı çoğu kullanıcı herhangi bir titremeyi fark etmemelidir. Karşılaştırıldığında: Test edilen tüm cihazların %52 %'si ekranı karartmak için PWM kullanmıyor. PWM tespit edilirse, ortalama 7794 (minimum: 5 - maksimum: 343500) Hz ölçüldü. | |||
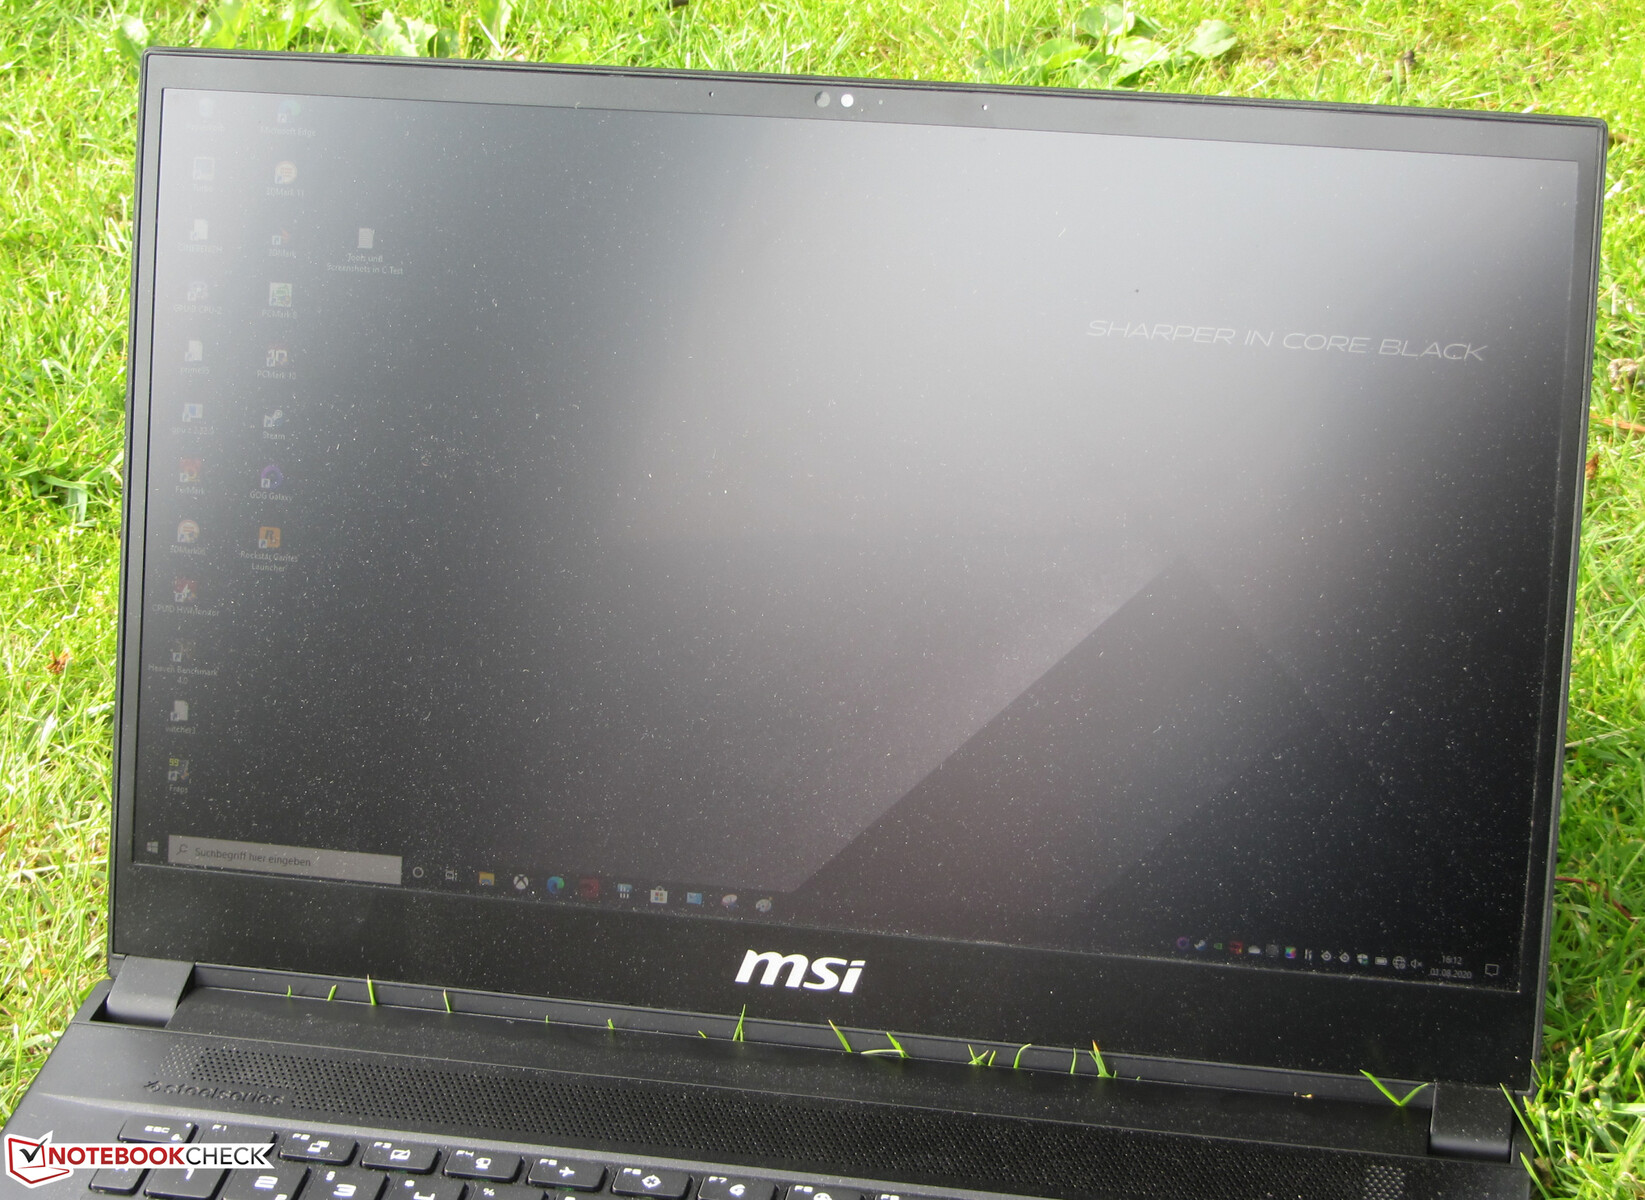
MSI, dizüstü bilgisayarı görüş açısına sahip sabit bir IPS paneli ile donatıyor. Sonuç olarak, ekran herhangi bir konumdan okunabilir. Dış mekanlarda, güneş çok parlak olmadığında ekran okunabilir.

Performans - Önümüzdeki yıllar için yeterli
MSI, GS66 Stealth 10SE ile yelpazesinde 15.6 inçlik bir dizüstü oyun bilgisayarına sahiptir. Her modern oyunu sorunsuz bir şekilde ekrana getirir ve ayrıca diğer tüm uygulama alanlarında iyi bir figür oluşturur. Test cihazımız için yaklaşık 1.900 Euro (~ 2.257 $) ödenmesi gerekiyor. Sonuç olarak, şu anda dizinin en ucuz temsilcisi. Diğer konfigürasyon çeşitleri mevcuttur.
Test koşulları
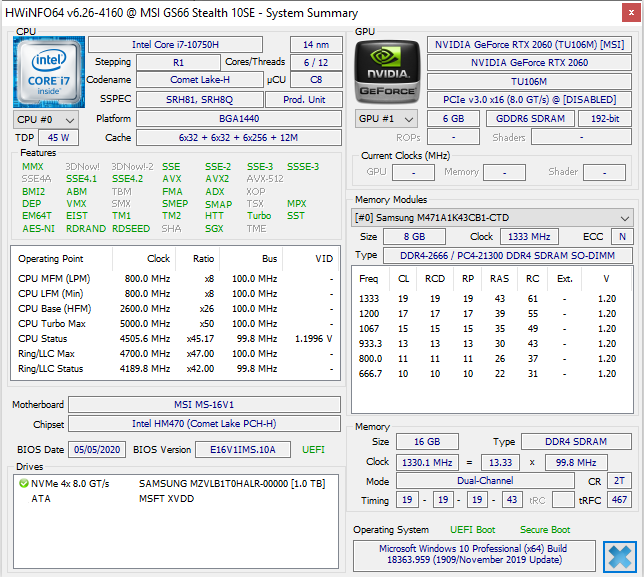
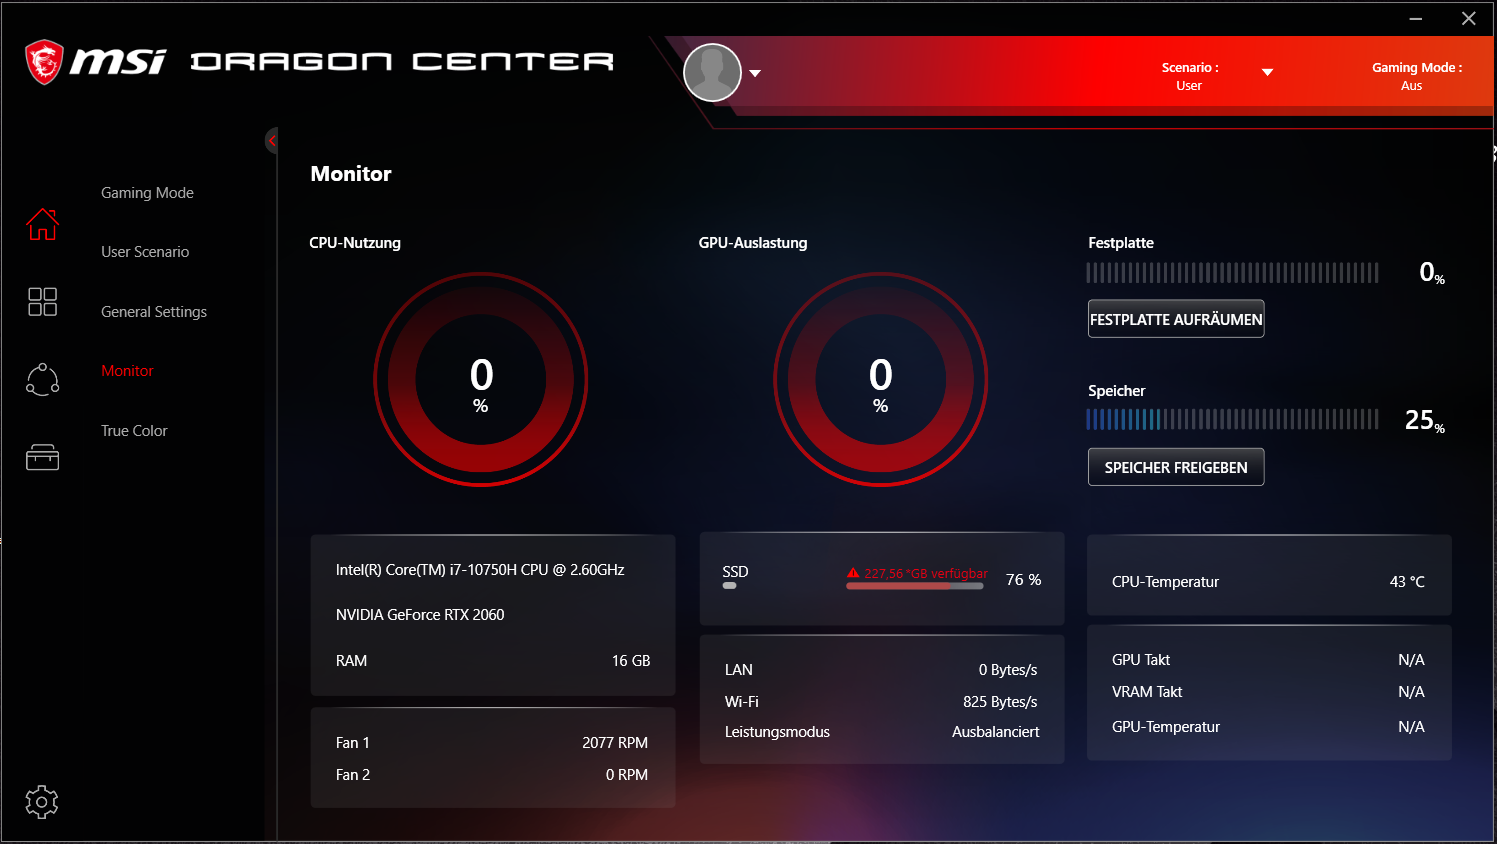
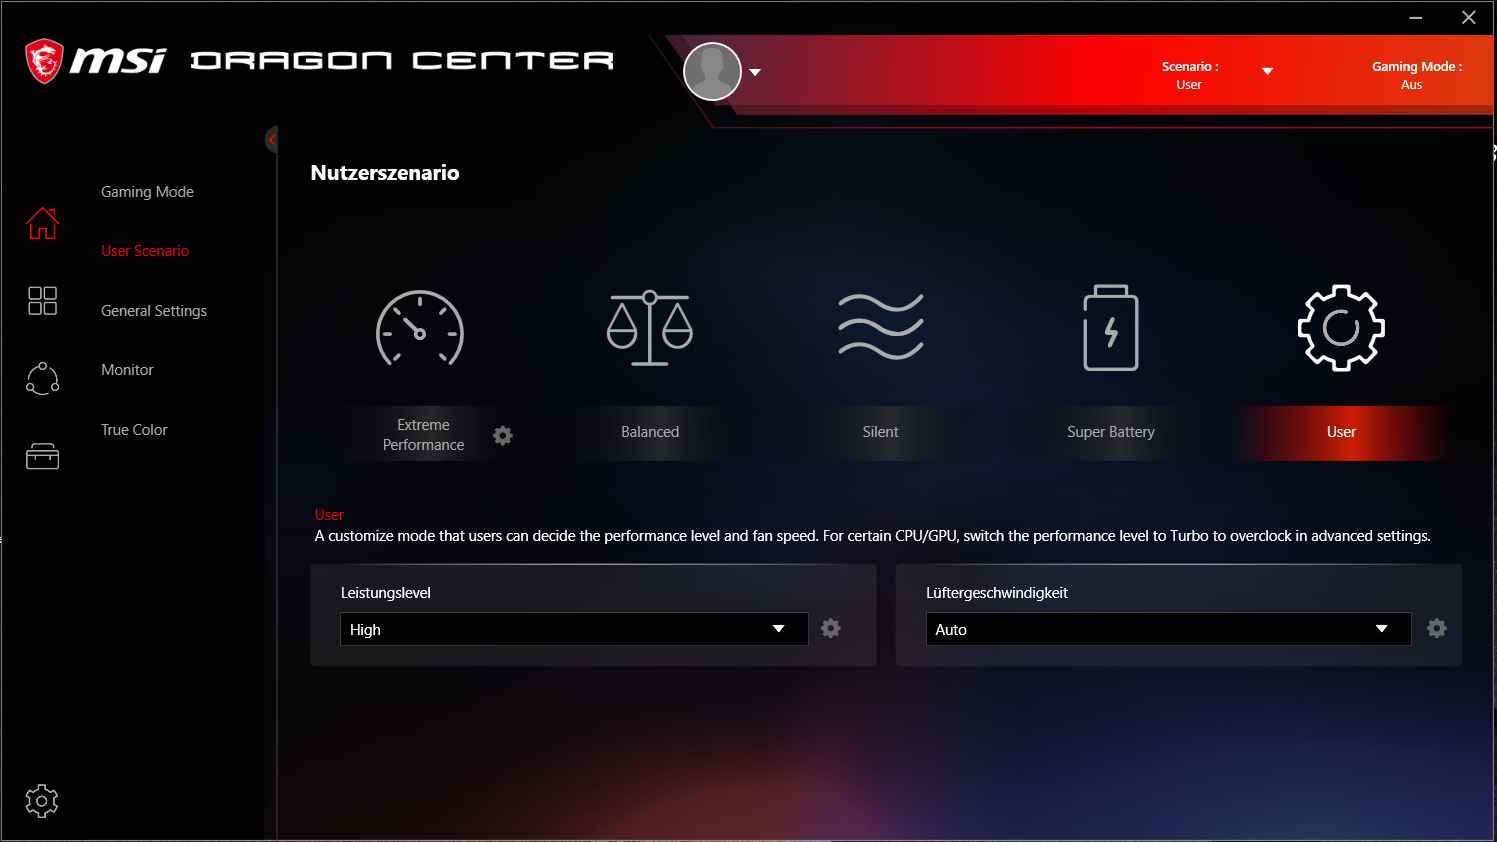
Önceden yüklenmiş Dragon Center yazılımı, gürültü ve hesaplama gücü üzerinde etkisi olan çeşitli performans profilleri sunar. Tüm testleri "Kullanıcı" performans profili ile gerçekleştirdik. "Yüksek" performans seviyesi seçildi ve otomatik fan kontrolü etkinleştirildi. Ek olarak, entegre GPU açılır.
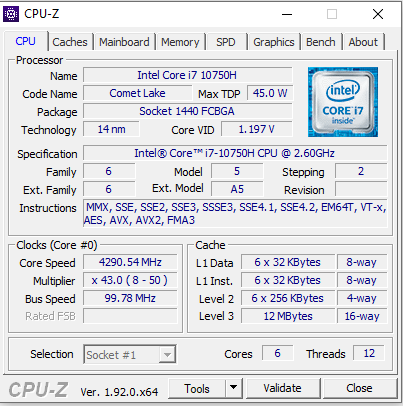
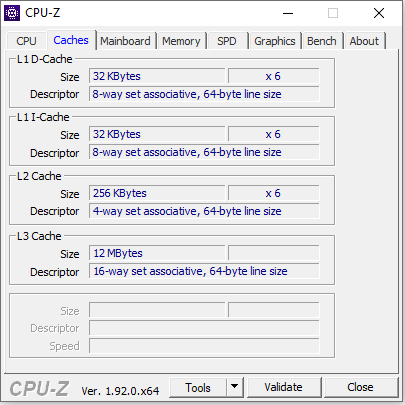
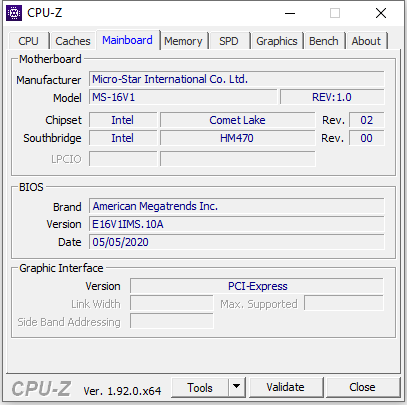
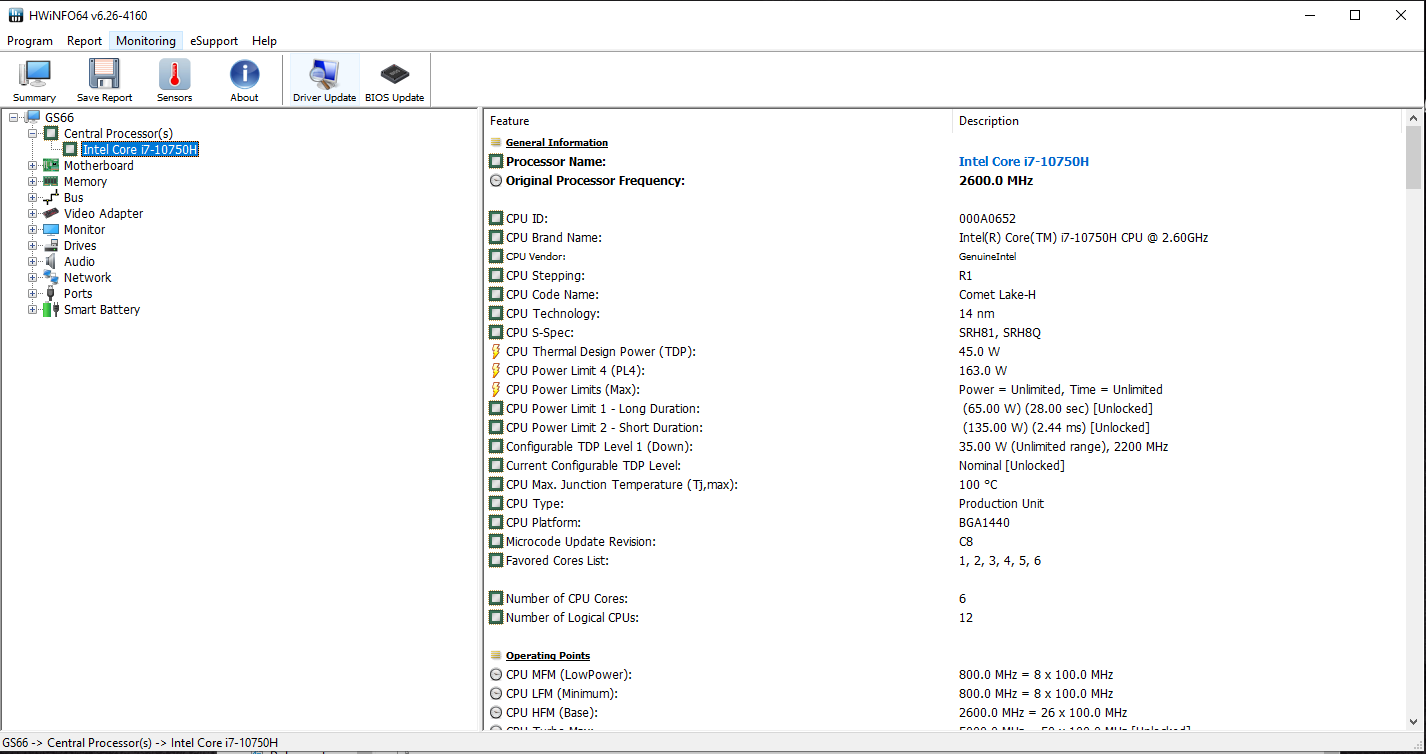
İşlemci
Yerleşik Core i7-10750H altı çekirdekli işlemci (Comet Lake) performans, güç tüketimi ve fiyat arasında iyi bir uzlaşmayı temsil eder. CPU, 2.3 GHz'lik bir temel hızda çalışır. Saat hızı, Turbo aracılığıyla 4,3 GHz (altı çekirdek) ve 5 GHz (bir çekirdek) aralığına yükseltilebilir. Dahası, Hyper-Threading (çekirdek başına iki iş parçacığı) desteklenir. İşlemci, Cinebench R15 benchmark'ın multithread testini 4 ila 4.1 GHz'de kısaca işler. Saat hızı daha sonra 3,6 ila 3,8 GHz'e düşer. Tek iplik testi 4,2 ila 4,6 GHz'de yürütülür. Pil gücünde, hızlar sırasıyla 2,6 ila 2,9 GHz (çok iş parçacıklı) ve 2,6 ila 4,2 GHz'dir (tek iş parçacıklı).
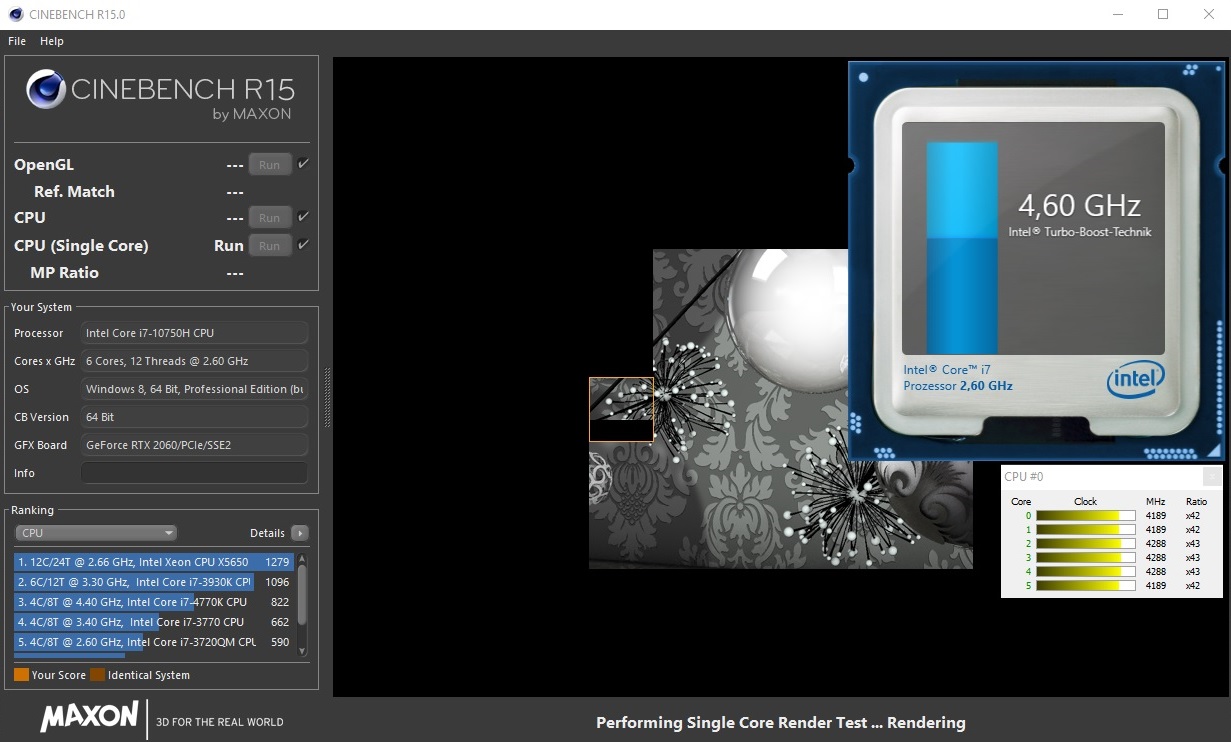
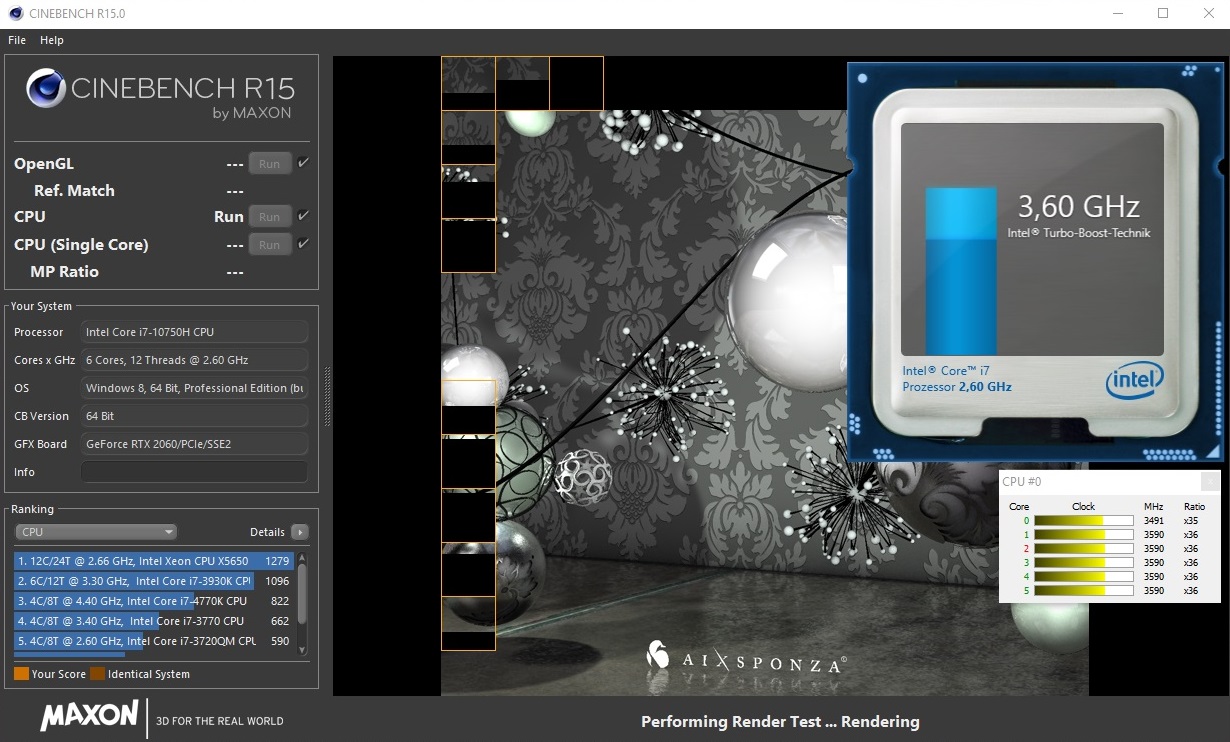
Cinebench R15 benchmark'ın multithread testini en az 30 dakika sürekli bir döngüde çalıştırarak CPU Turbo'nun da takılıyken tutarlı bir şekilde kullanılıp kullanılmadığını doğrularız. Turbo, orta düzeyde kullanılır.
| Cinebench R15 | |
| CPU Single 64Bit | |
| Sınıf ortalaması Gaming (188.8 - 343, n=111, son 2 yıl) | |
| Gigabyte Aero 15 OLED XB-8DE51B0SP | |
| MSI GS66 Stealth 10SFS | |
| Razer Blade 15 RZ09-0328 | |
| Schenker XMG Core 15 GK5CP6V | |
| MSI GS66 10SGS | |
| Dell G5 15 SE 5505 P89F | |
| MSI GS66 Stealth 10SE-045 | |
| Lenovo Legion 5 15IMH05H | |
| Asus TUF Gaming A15 FA506IV-HN172 | |
| Razer Blade 15 GTX 1660 Ti | |
| CPU Multi 64Bit | |
| Sınıf ortalaması Gaming (1578 - 6271, n=111, son 2 yıl) | |
| Dell G5 15 SE 5505 P89F | |
| Asus TUF Gaming A15 FA506IV-HN172 | |
| Gigabyte Aero 15 OLED XB-8DE51B0SP | |
| MSI GS66 Stealth 10SFS | |
| MSI GS66 10SGS | |
| MSI GS66 Stealth 10SE-045 | |
| Razer Blade 15 RZ09-0328 | |
| Schenker XMG Core 15 GK5CP6V | |
| Razer Blade 15 GTX 1660 Ti | |
| Lenovo Legion 5 15IMH05H | |
| Blender - v2.79 BMW27 CPU | |
| Lenovo Legion 5 15IMH05H | |
| Schenker XMG Core 15 GK5CP6V | |
| Razer Blade 15 RZ09-0328 | |
| MSI GS66 Stealth 10SE-045 | |
| MSI GS66 10SGS | |
| MSI GS66 Stealth 10SFS | |
| Gigabyte Aero 15 OLED XB-8DE51B0SP | |
| Dell G5 15 SE 5505 P89F | |
| Asus TUF Gaming A15 FA506IV-HN172 | |
| Sınıf ortalaması Gaming (80 - 330, n=109, son 2 yıl) | |
| 7-Zip 18.03 | |
| 7z b 4 -mmt1 | |
| Sınıf ortalaması Gaming (4199 - 7436, n=110, son 2 yıl) | |
| Gigabyte Aero 15 OLED XB-8DE51B0SP | |
| MSI GS66 Stealth 10SFS | |
| Razer Blade 15 RZ09-0328 | |
| MSI GS66 10SGS | |
| Lenovo Legion 5 15IMH05H | |
| MSI GS66 Stealth 10SE-045 | |
| Schenker XMG Core 15 GK5CP6V | |
| Asus TUF Gaming A15 FA506IV-HN172 | |
| Dell G5 15 SE 5505 P89F | |
| 7z b 4 | |
| Sınıf ortalaması Gaming (33491 - 148086, n=110, son 2 yıl) | |
| Dell G5 15 SE 5505 P89F | |
| Gigabyte Aero 15 OLED XB-8DE51B0SP | |
| Asus TUF Gaming A15 FA506IV-HN172 | |
| MSI GS66 Stealth 10SFS | |
| MSI GS66 10SGS | |
| MSI GS66 Stealth 10SE-045 | |
| Schenker XMG Core 15 GK5CP6V | |
| Razer Blade 15 RZ09-0328 | |
| Lenovo Legion 5 15IMH05H | |
| Cinebench R20 | |
| CPU (Single Core) | |
| Sınıf ortalaması Gaming (442 - 895, n=111, son 2 yıl) | |
| Gigabyte Aero 15 OLED XB-8DE51B0SP | |
| Asus TUF Gaming A15 FA506IV-HN172 | |
| Dell G5 15 SE 5505 P89F | |
| MSI GS66 Stealth 10SFS | |
| Razer Blade 15 RZ09-0328 | |
| Lenovo Legion 5 15IMH05H | |
| MSI GS66 Stealth 10SE-045 | |
| MSI GS66 10SGS | |
| Schenker XMG Core 15 GK5CP6V | |
| Razer Blade 15 GTX 1660 Ti | |
| CPU (Multi Core) | |
| Sınıf ortalaması Gaming (4029 - 16108, n=111, son 2 yıl) | |
| Dell G5 15 SE 5505 P89F | |
| Asus TUF Gaming A15 FA506IV-HN172 | |
| Gigabyte Aero 15 OLED XB-8DE51B0SP | |
| MSI GS66 Stealth 10SFS | |
| MSI GS66 10SGS | |
| MSI GS66 Stealth 10SE-045 | |
| Razer Blade 15 RZ09-0328 | |
| Lenovo Legion 5 15IMH05H | |
| Schenker XMG Core 15 GK5CP6V | |
| Razer Blade 15 GTX 1660 Ti | |
| Geekbench 5.5 | |
| Single-Core | |
| Sınıf ortalaması Gaming (986 - 2474, n=110, son 2 yıl) | |
| Gigabyte Aero 15 OLED XB-8DE51B0SP | |
| MSI GS66 Stealth 10SFS | |
| Lenovo Legion 5 15IMH05H | |
| MSI GS66 10SGS | |
| MSI GS66 Stealth 10SE-045 | |
| Asus TUF Gaming A15 FA506IV-HN172 | |
| Schenker XMG Core 15 GK5CP6V | |
| Dell G5 15 SE 5505 P89F | |
| Razer Blade 15 RZ09-0328 | |
| Multi-Core | |
| Sınıf ortalaması Gaming (6460 - 27010, n=110, son 2 yıl) | |
| Gigabyte Aero 15 OLED XB-8DE51B0SP | |
| Dell G5 15 SE 5505 P89F | |
| MSI GS66 Stealth 10SFS | |
| MSI GS66 10SGS | |
| Asus TUF Gaming A15 FA506IV-HN172 | |
| MSI GS66 Stealth 10SE-045 | |
| Razer Blade 15 RZ09-0328 | |
| Schenker XMG Core 15 GK5CP6V | |
| Lenovo Legion 5 15IMH05H | |
| HWBOT x265 Benchmark v2.2 - 4k Preset | |
| Sınıf ortalaması Gaming (11.5 - 44.3, n=110, son 2 yıl) | |
| Gigabyte Aero 15 OLED XB-8DE51B0SP | |
| Dell G5 15 SE 5505 P89F | |
| MSI GS66 Stealth 10SFS | |
| Asus TUF Gaming A15 FA506IV-HN172 | |
| MSI GS66 10SGS | |
| MSI GS66 Stealth 10SE-045 | |
| Razer Blade 15 RZ09-0328 | |
| Schenker XMG Core 15 GK5CP6V | |
| Lenovo Legion 5 15IMH05H | |
| LibreOffice - 20 Documents To PDF | |
| Dell G5 15 SE 5505 P89F | |
| MSI GS66 Stealth 10SE-045 | |
| MSI GS66 10SGS | |
| Razer Blade 15 RZ09-0328 | |
| Lenovo Legion 5 15IMH05H | |
| MSI GS66 Stealth 10SFS | |
| Gigabyte Aero 15 OLED XB-8DE51B0SP | |
| Sınıf ortalaması Gaming (19 - 88.8, n=110, son 2 yıl) | |
| Asus TUF Gaming A15 FA506IV-HN172 | |
| R Benchmark 2.5 - Overall mean | |
| MSI GS66 Stealth 10SE-045 | |
| Schenker XMG Core 15 GK5CP6V | |
| Lenovo Legion 5 15IMH05H | |
| MSI GS66 10SGS | |
| Asus TUF Gaming A15 FA506IV-HN172 | |
| MSI GS66 Stealth 10SFS | |
| Dell G5 15 SE 5505 P89F | |
| Gigabyte Aero 15 OLED XB-8DE51B0SP | |
| Sınıf ortalaması Gaming (0.3439 - 0.759, n=111, son 2 yıl) | |
* ... daha küçük daha iyidir
Sistem performansı
MSI dizüstü bilgisayar, önümüzdeki yıllarda tüm ortak uygulama alanları için yeterli bilgi işlem gücü sağlayacaktır. Güçlü bir altı çekirdekli işlemci, çift kanallı bellek ve hızlı bir NVMe SSD, hızlı ve sorunsuz bir sistem sağlar. Üstelik üst düzey GPU, tüm modern bilgisayar oyunlarını ekrana sorunsuz bir şekilde getiriyor. Buna PCMark benchmarklarında iyi sonuçlar eşlik ediyor.
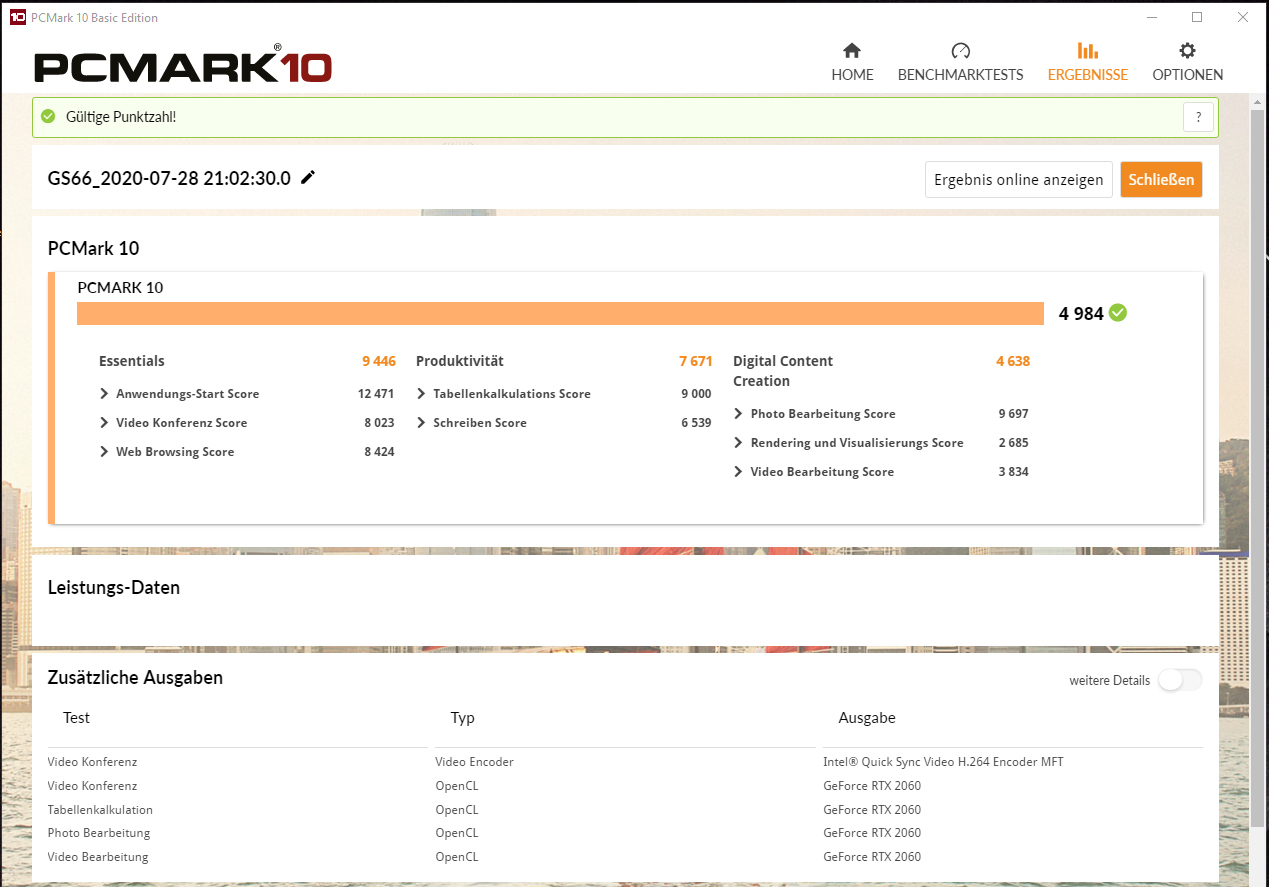
| PCMark 8 Home Score Accelerated v2 | 4539 puan | |
| PCMark 8 Creative Score Accelerated v2 | 4314 puan | |
| PCMark 8 Work Score Accelerated v2 | 5908 puan | |
| PCMark 10 Score | 4984 puan | |
Yardım | ||
| PCMark 10 - Score | |
| Sınıf ortalaması Gaming (5828 - 11574, n=95, son 2 yıl) | |
| Gigabyte Aero 15 OLED XB-8DE51B0SP | |
| MSI GS66 Stealth 10SFS | |
| MSI GS66 10SGS | |
| Dell G5 15 SE 5505 P89F | |
| Razer Blade 15 GTX 1660 Ti | |
| Razer Blade 15 RZ09-0328 | |
| Asus TUF Gaming A15 FA506IV-HN172 | |
| MSI GS66 Stealth 10SE-045 | |
| Lenovo Legion 5 15IMH05H | |
| Schenker XMG Core 15 GK5CP6V | |
| PCMark 8 | |
| Home Score Accelerated v2 | |
| Sınıf ortalaması Gaming (n=1son 2 yıl) | |
| Dell G5 15 SE 5505 P89F | |
| Asus TUF Gaming A15 FA506IV-HN172 | |
| MSI GS66 10SGS | |
| MSI GS66 Stealth 10SE-045 | |
| Razer Blade 15 GTX 1660 Ti | |
| Lenovo Legion 5 15IMH05H | |
| Razer Blade 15 RZ09-0328 | |
| Work Score Accelerated v2 | |
| MSI GS66 10SGS | |
| MSI GS66 Stealth 10SE-045 | |
| Asus TUF Gaming A15 FA506IV-HN172 | |
| Razer Blade 15 GTX 1660 Ti | |
| Dell G5 15 SE 5505 P89F | |
| Lenovo Legion 5 15IMH05H | |
| Razer Blade 15 RZ09-0328 | |
| Sınıf ortalaması Gaming (n=1son 2 yıl) | |
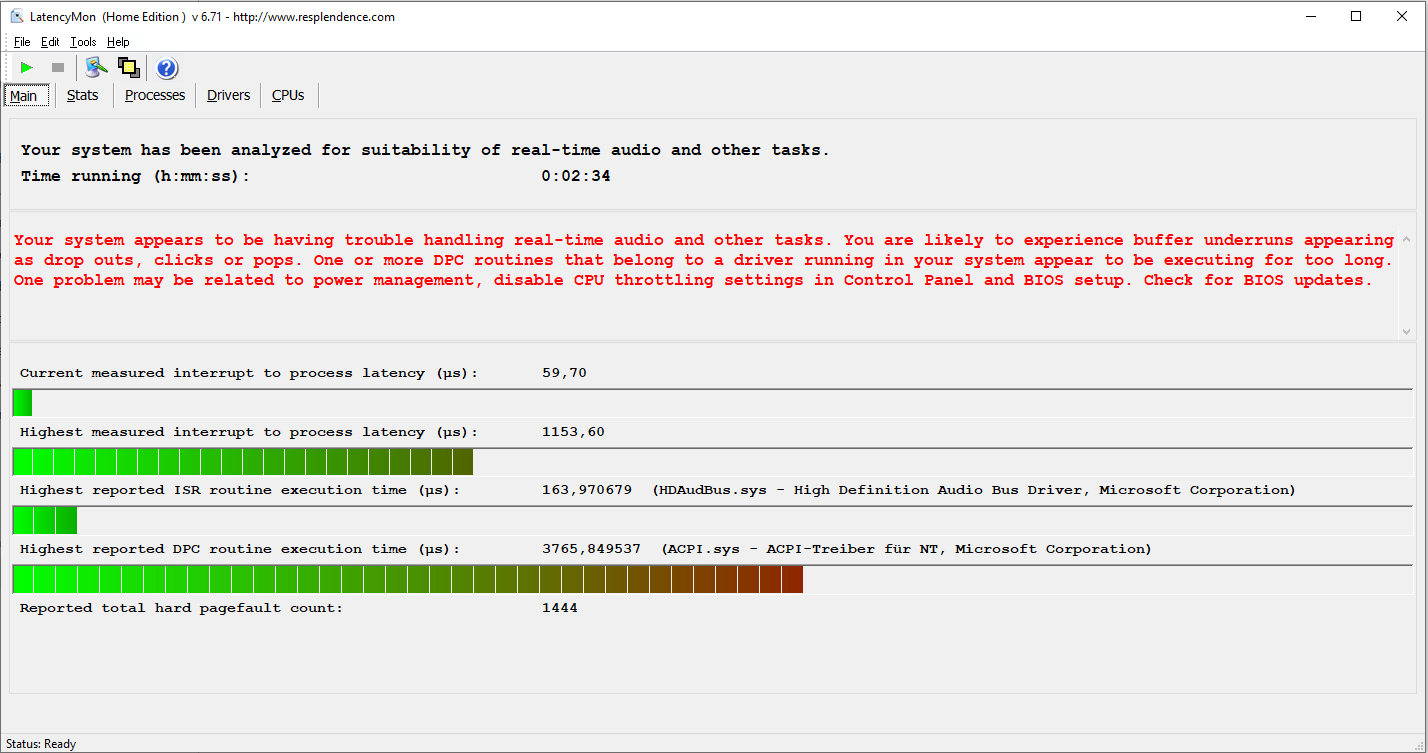
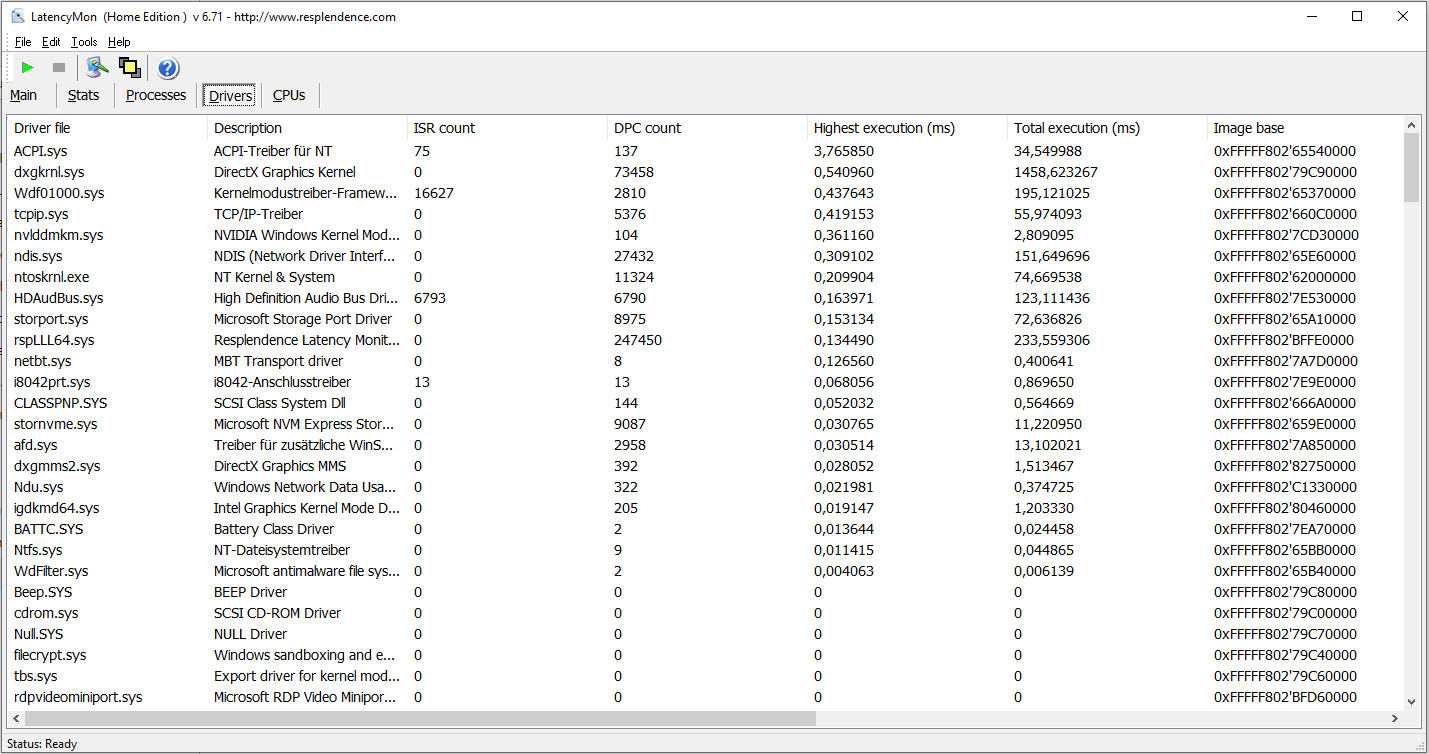
DPC gecikmeleri
Standartlaştırılmış gecikmeli monitör testimizde (web sörfü, 4K video oynatma, yüksek yüklü Prime95), DPC gecikmeleriyle ilgili sorunları gözlemleyebildik. Sistem, gerçek zamanlı video ve ses düzenleme için uygun görünmüyor.
| DPC Latencies / LatencyMon - interrupt to process latency (max), Web, Youtube, Prime95 | |
| Dell G5 15 SE 5505 P89F | |
| MSI GS66 Stealth 10SFS | |
| Gigabyte Aero 15 OLED XB-8DE51B0SP | |
| MSI GS66 10SGS | |
| MSI GS66 Stealth 10SE-045 | |
| Razer Blade 15 RZ09-0328 | |
| Asus TUF Gaming A15 FA506IV-HN172 | |
| Lenovo Legion 5 15IMH05H | |
* ... daha küçük daha iyidir
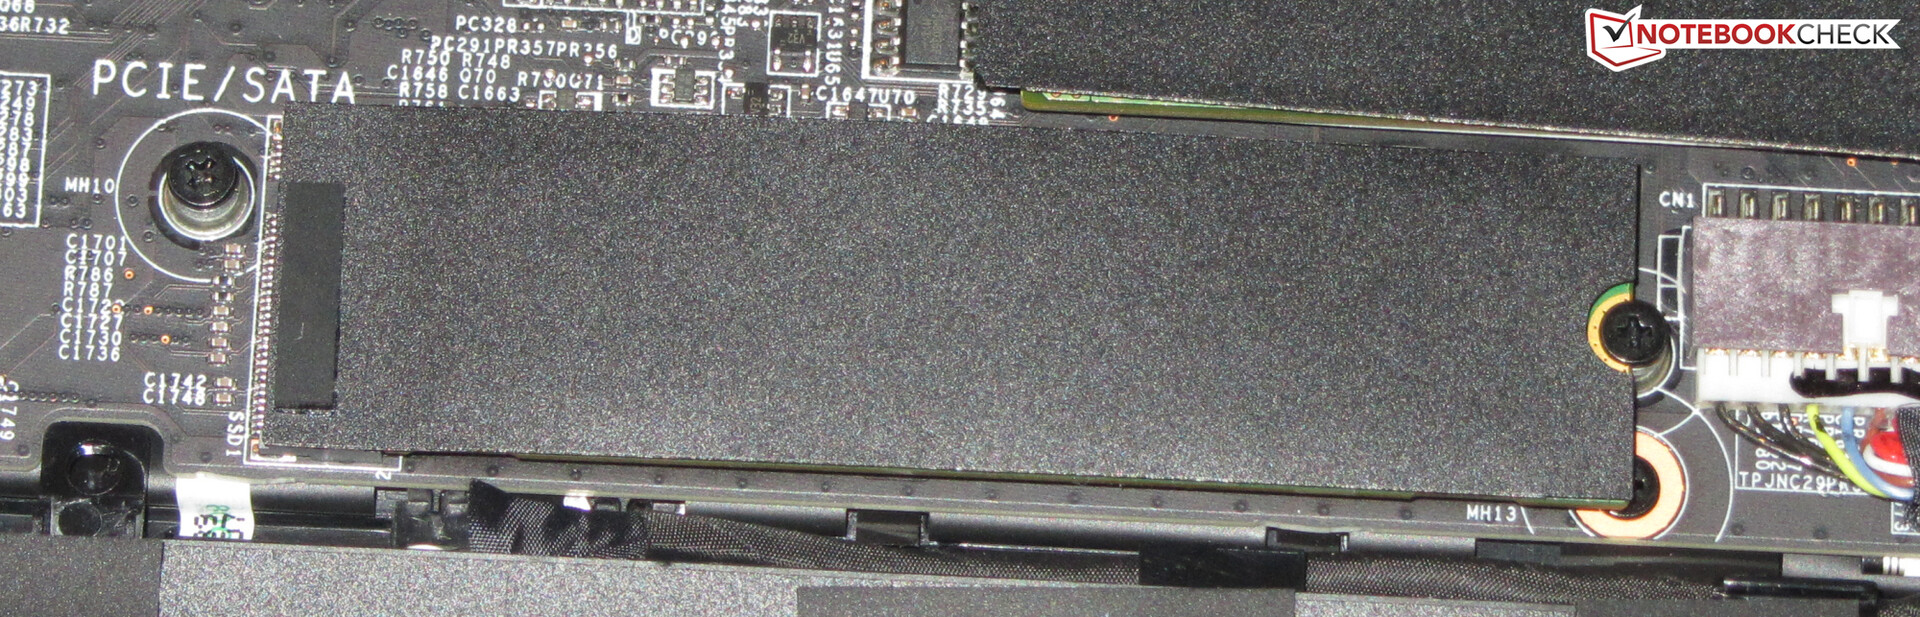
Depolama
Sistem sürücüsü, Samsung'un 1 TB depolama alanı sunan bir NVMe SSD'sidir (M.2 2280 formatı). SSD, çok iyi aktarım hızları sağlar. Dizüstü bilgisayar hala ikinci bir NVMe SSD için alan sunuyor.
| MSI GS66 Stealth 10SE-045 Samsung SSD PM981 MZVLB1T0HALR | Dell G5 15 SE 5505 P89F Samsung PM991 MZ9LQ512HALU | Lenovo Legion 5 15IMH05H Samsung PM991 MZALQ512HALU | Asus TUF Gaming A15 FA506IV-HN172 Kingston OM8PCP3512F-AB | Schenker XMG Core 15 GK5CP6V Samsung SSD 970 EVO Plus 500GB | MSI GS66 Stealth 10SFS Samsung SSD PM981 MZVLB1T0HALR | Razer Blade 15 GTX 1660 Ti Samsung SSD PM981 MZVLB256HAHQ | |
|---|---|---|---|---|---|---|---|
| CrystalDiskMark 5.2 / 6 | -20% | -21% | -18% | -14% | -4% | -14% | |
| Write 4K (MB/s) | 156.3 | 142.1 -9% | 145.4 -7% | 219.8 41% | 102 -35% | 131.3 -16% | 135 -14% |
| Read 4K (MB/s) | 47.65 | 46.43 -3% | 51.6 8% | 50.2 5% | 41.39 -13% | 45.84 -4% | 41.1 -14% |
| Write Seq (MB/s) | 2374 | 1108 -53% | 1007 -58% | 979 -59% | 1649 -31% | 2370 0% | 1427 -40% |
| Read Seq (MB/s) | 2045 | 1622 -21% | 1145 -44% | 1990 -3% | 1367 -33% | 1509 -26% | 1494 -27% |
| Write 4K Q32T1 (MB/s) | 431.3 | 467 8% | 468.4 9% | 516 20% | 379 -12% | 481.5 12% | 494.9 15% |
| Read 4K Q32T1 (MB/s) | 509 | 525 3% | 528 4% | 298.3 -41% | 401.2 -21% | 560 10% | 578 14% |
| Write Seq Q32T1 (MB/s) | 2385 | 1203 -50% | 1381 -42% | 982 -59% | 3276 37% | 2392 0% | 1417 -41% |
| Read Seq Q32T1 (MB/s) | 3505 | 2288 -35% | 2291 -35% | 1907 -46% | 3417 -3% | 3232 -8% | 3251 -7% |
| Write 4K Q8T8 (MB/s) | 981 | ||||||
| Read 4K Q8T8 (MB/s) | 300.9 | ||||||
| AS SSD | -61% | -48% | -45% | -7% | -17% | -48% | |
| Seq Read (MB/s) | 2612 | 1386 -47% | 2012 -23% | 1682 -36% | 2261 -13% | 1065 -59% | 1829 -30% |
| Seq Write (MB/s) | 2368 | 1234 -48% | 1261 -47% | 904 -62% | 2393 1% | 2360 0% | 1315 -44% |
| 4K Read (MB/s) | 51.1 | 41.32 -19% | 43.66 -15% | 60.2 18% | 54.6 7% | 48.09 -6% | 51.3 0% |
| 4K Write (MB/s) | 135.9 | 128 -6% | 109.3 -20% | 164.8 21% | 118.4 -13% | 110.7 -19% | 106 -22% |
| 4K-64 Read (MB/s) | 1635 | 854 -48% | 851 -48% | 472.5 -71% | 1376 -16% | 1635 0% | 917 -44% |
| 4K-64 Write (MB/s) | 1831 | 721 -61% | 780 -57% | 845 -54% | 2299 26% | 1829 0% | 1212 -34% |
| Access Time Read * (ms) | 0.042 | 0.098 -133% | 0.117 -179% | 0.087 -107% | 0.07 -67% | 0.071 -69% | 0.063 -50% |
| Access Time Write * (ms) | 0.028 | 0.095 -239% | 0.036 -29% | 0.02 29% | 0.031 -11% | 0.034 -21% | 0.104 -271% |
| Score Read (Points) | 1947 | 1034 -47% | 1096 -44% | 701 -64% | 1657 -15% | 1790 -8% | 1152 -41% |
| Score Write (Points) | 2204 | 973 -56% | 1016 -54% | 1101 -50% | 2657 21% | 2176 -1% | 1450 -34% |
| Score Total (Points) | 5138 | 2536 -51% | 2643 -49% | 2143 -58% | 5175 1% | 4950 -4% | 3177 -38% |
| Copy ISO MB/s (MB/s) | 2334 | 1284 -45% | 1481 -37% | 675 -71% | 1539 -34% | ||
| Copy Program MB/s (MB/s) | 569 | 401.9 -29% | 467.5 -18% | 248.4 -56% | 513 -10% | ||
| Copy Game MB/s (MB/s) | 1401 | 1013 -28% | 734 -48% | 535 -62% | 1150 -18% | ||
| Toplam Ortalama (Program / Ayarlar) | -41% /
-46% | -35% /
-38% | -32% /
-35% | -11% /
-10% | -11% /
-12% | -31% /
-36% |
* ... daha küçük daha iyidir

Continuous load read: DiskSpd Read Loop, Queue Depth 8
Grafik kartı
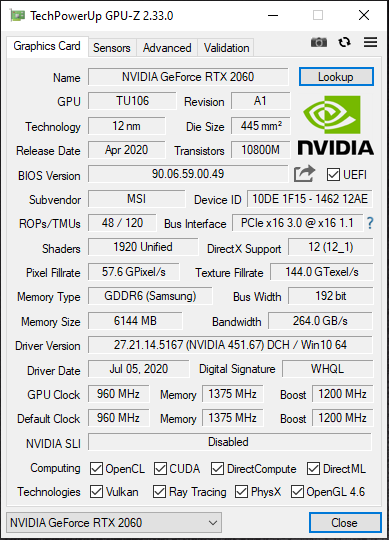
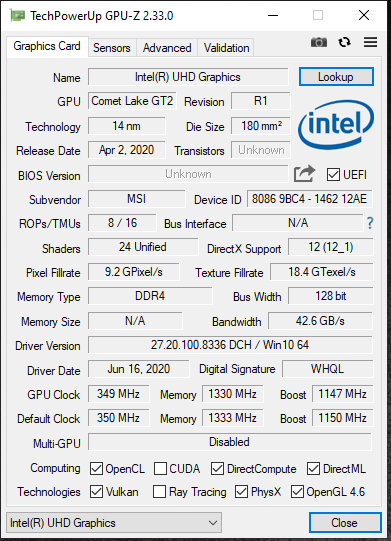
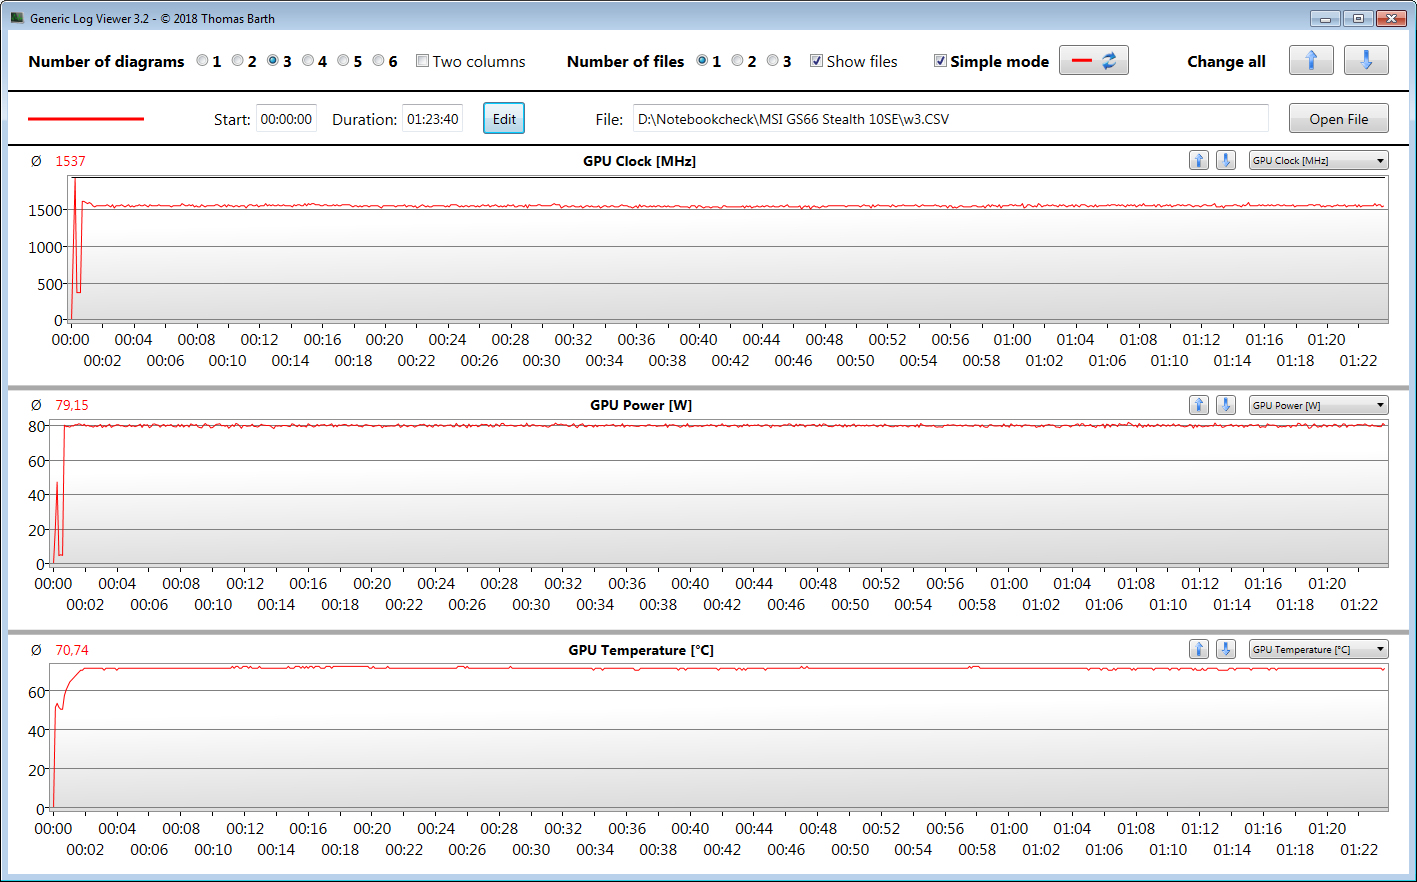
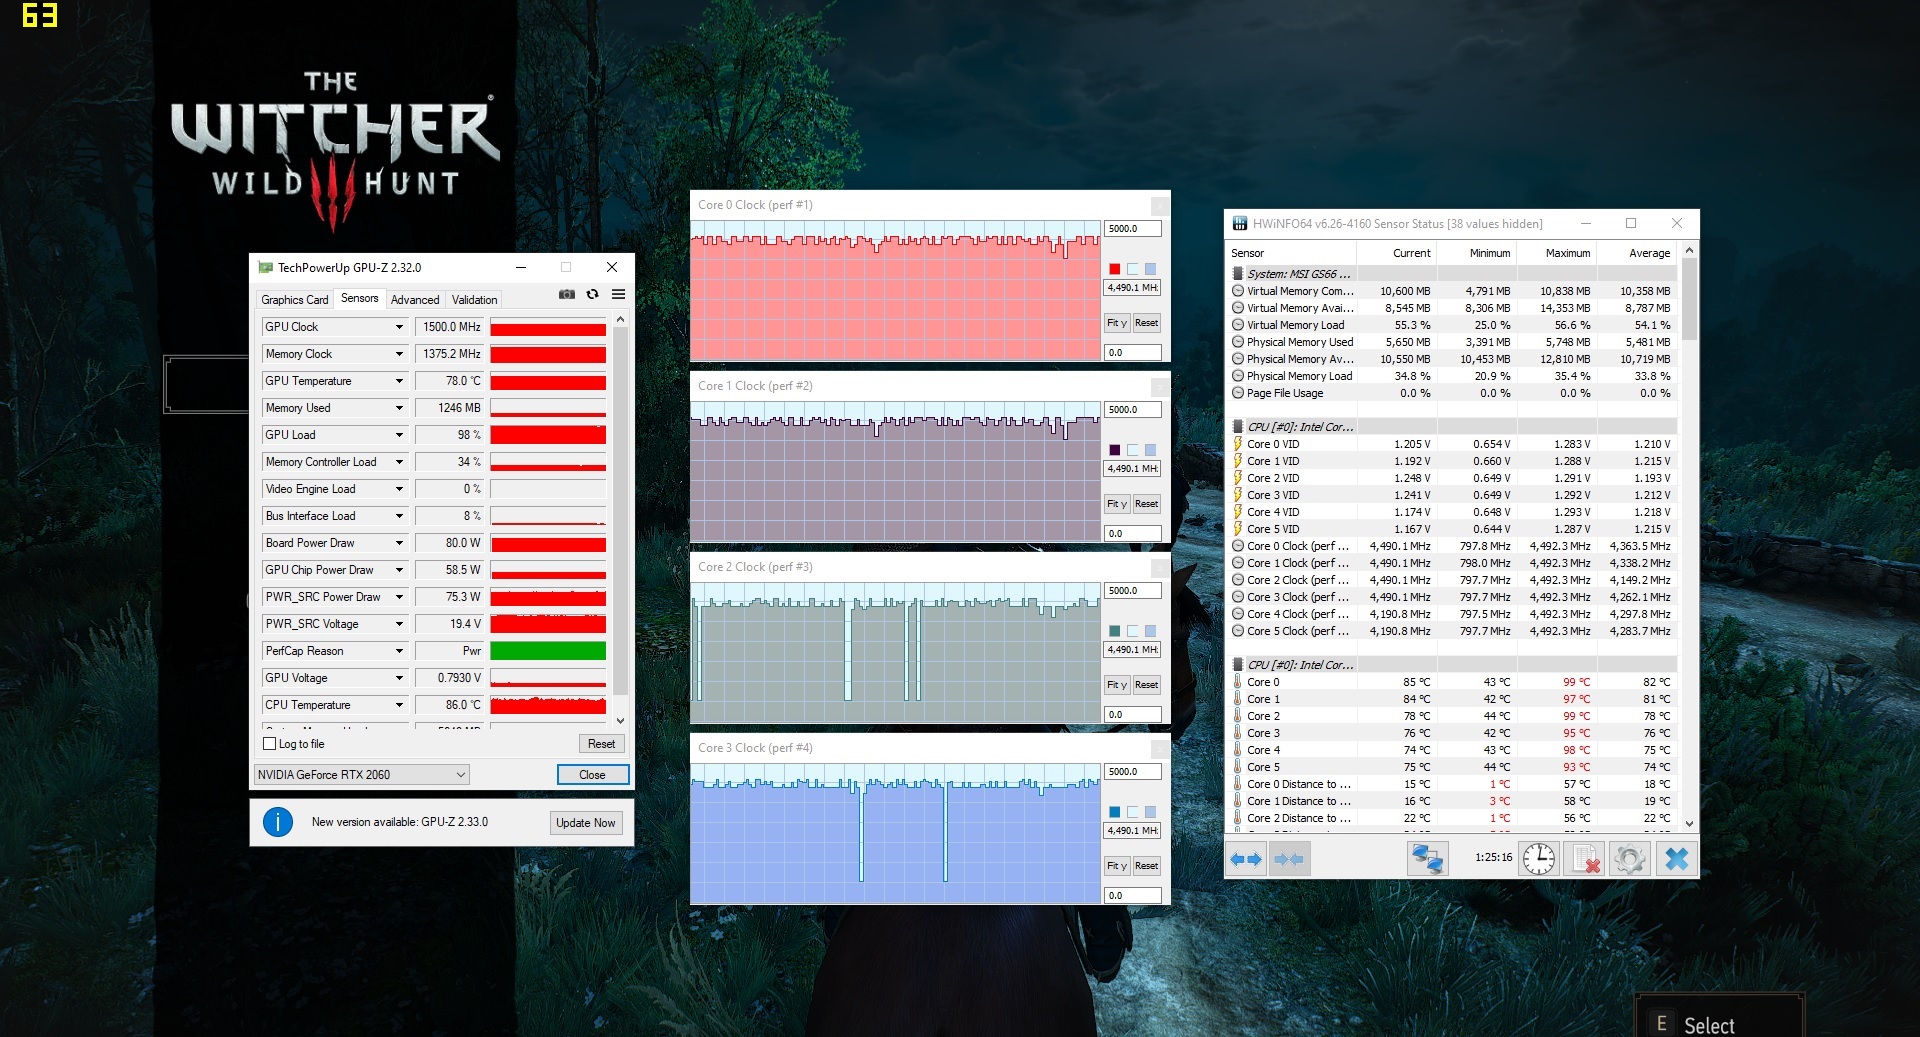
GeForce RTX 2060 grafik çekirdeği (Turing) DirectX 12'yi destekler ve 960 MHz'lik bir temel hızda çalışır. Güçlendirildiğinde 1.200 MHz'e kadar bir artış mümkündür. GPU belirli bir sıcaklığa ve / veya enerji eşiğine ulaşmazsa daha yüksek hızlar mümkündür. Bu şekilde, maksimum 1.919 MHz kaydediyoruz. The Witcher 3 testimiz ortalama 1.537 MHz hızında yürütülmektedir. Ek olarak, GPU hızlı GDDR6 grafik belleğinden (6,144 MB) yararlanabilir. 3DMark benchmarklarındaki sonuçlar, burada kurulu GPU için normal seviyededir. İşlemciye entegre olan UHD Graphics 630 GPU etkindir ve dizüstü bilgisayar, Nvidia'nın Optimus grafik değiştirme çözümüyle çalışır. Optimus, gerekirse Dragon Center yazılımından devre dışı bırakılabilir.
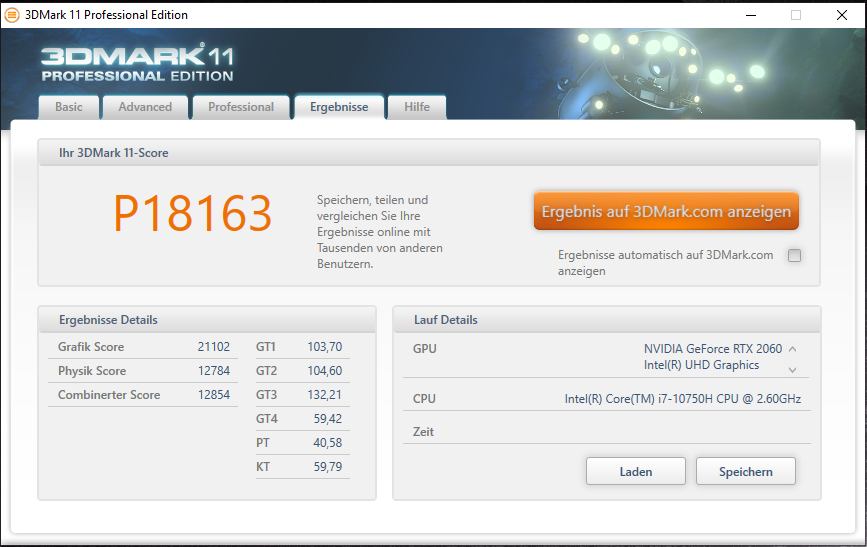

| 3DMark 11 Performance | 18163 puan | |
| 3DMark Cloud Gate Standard Score | 36138 puan | |
| 3DMark Fire Strike Score | 14290 puan | |
| 3DMark Time Spy Score | 6038 puan | |
Yardım | ||
| 3DMark 11 - 1280x720 Performance GPU | |
| Sınıf ortalaması Gaming (21841 - 80022, n=108, son 2 yıl) | |
| Gigabyte Aero 15 OLED XB-8DE51B0SP | |
| MSI GS66 10SGS | |
| Dell G5 15 SE 5505 P89F | |
| MSI GS66 Stealth 10SFS | |
| Razer Blade 15 RZ09-0328 | |
| Lenovo Legion 5 15IMH05H | |
| Asus TUF Gaming A15 FA506IV-HN172 | |
| MSI GS66 Stealth 10SE-045 | |
| Schenker XMG Core 15 GK5CP6V | |
| Razer Blade 15 GTX 1660 Ti | |
Oyun performansı
GS66'nın tüm modern bilgisayar oyunlarını ekrana sorunsuz bir şekilde getirebilmesi, güçlü donanımı göz önüne alındığında sürpriz olmamalı. Full HD çözünürlük ve yüksek ila maksimum kalite ayarları her zaman seçilebilir. GPU, Full HD'nin ötesindeki çözünürlükleri de işleyebilir (bunun için uygun bir monitörün takılması gerekir). Ancak bu durumda kalite seviyesinin düşürülmesi gerekir.
| The Witcher 3 - 1920x1080 Ultra Graphics & Postprocessing (HBAO+) | |
| Sınıf ortalaması Gaming (95 - 240, n=8, son 2 yıl) | |
| Gigabyte Aero 15 OLED XB-8DE51B0SP | |
| MSI GS66 10SGS | |
| MSI GS66 Stealth 10SFS | |
| Lenovo Legion 5 15IMH05H | |
| Dell G5 15 SE 5505 P89F | |
| MSI GS66 Stealth 10SE-045 | |
| Razer Blade 15 RZ09-0328 | |
| Asus TUF Gaming A15 FA506IV-HN172 | |
| Schenker XMG Core 15 GK5CP6V | |
| Razer Blade 15 GTX 1660 Ti | |
| BioShock Infinite - 1920x1080 Ultra Preset, DX11 (DDOF) | |
| Lenovo Legion 5 15IMH05H | |
| MSI GS66 Stealth 10SE-045 | |
| Razer Blade 15 GTX 1660 Ti | |
| Asus TUF Gaming A15 FA506IV-HN172 | |
| Shadow of the Tomb Raider - 1920x1080 Highest Preset AA:T | |
| Sınıf ortalaması Gaming (96 - 116, n=2, son 2 yıl) | |
| Gigabyte Aero 15 OLED XB-8DE51B0SP | |
| MSI GS66 10SGS | |
| MSI GS66 Stealth 10SFS | |
| Razer Blade 15 RZ09-0328 | |
| Lenovo Legion 5 15IMH05H | |
| MSI GS66 Stealth 10SE-045 | |
| Dell G5 15 SE 5505 P89F | |
| Razer Blade 15 GTX 1660 Ti | |
| Metro Exodus - 1920x1080 Ultra Quality AF:16x | |
| Gigabyte Aero 15 OLED XB-8DE51B0SP | |
| MSI GS66 10SGS | |
| Dell G5 15 SE 5505 P89F | |
| MSI GS66 Stealth 10SE-045 | |
| Far Cry 5 - 1920x1080 Ultra Preset AA:T | |
| Sınıf ortalaması Gaming (70 - 151, n=10, son 2 yıl) | |
| MSI GS66 Stealth 10SE-045 | |
| Lenovo Legion 5 15IMH05H | |
| Call of Duty Modern Warfare 2019 - 1920x1080 Maximum Settings AA:T2X Filmic SM | |
| Schenker XMG Core 15 GK5CP6V | |
| MSI GS66 Stealth 10SE-045 | |
| Red Dead Redemption 2 - 1920x1080 High Settings | |
| Gigabyte Aero 15 OLED XB-8DE51B0SP | |
| Lenovo Legion 5 15IMH05H | |
| MSI GS66 Stealth 10SE-045 | |
| Schenker XMG Core 15 GK5CP6V | |
Kare hızlarının uzun bir süre boyunca bile büyük ölçüde sabit kalıp kalmadığını doğrulamak için The Witcher 3 oyununun Full HD çözünürlükte ve maksimum kalite ayarlarında yaklaşık 60 dakika çalışmasına izin verdik. Oyuncu tarafından somutlaştırılan karakter tüm bu süre boyunca hareket etmez. Kare hızlarında bir düşüş bulunamadı.
| düşük | orta | yüksek | ultra | |
|---|---|---|---|---|
| BioShock Infinite (2013) | 336 | 290 | 268.3 | 135.8 |
| The Witcher 3 (2015) | 280.6 | 196.7 | 117.7 | 63.4 |
| Far Cry 5 (2018) | 128 | 96 | 90 | 86 |
| Shadow of the Tomb Raider (2018) | 114 | 93 | 86 | 77 |
| Metro Exodus (2019) | 140.9 | 69.9 | 53.4 | 42.2 |
| Call of Duty Modern Warfare 2019 (2019) | 143.9 | 97.3 | 80.8 | 70.7 |
| Red Dead Redemption 2 (2019) | 118.5 | 81.9 | 54.9 | 35.1 |
| Doom Eternal (2020) | 209.2 | 136.9 | 124.6 | 121.9 |
| Gears Tactics (2020) | 243.5 | 144.4 | 95.9 | 62.8 |
| F1 2020 (2020) | 230 | 150 | 131 | 93 |
| Death Stranding (2020) | 146.6 | 102 | 93.1 | 91 |
Emissions - The three fans in the MSI Stealth turn up strongly
Noise emissions
The GS66's fans can already turn up considerably in idle usage. In this way, we measure sound pressure levels of up to 40 dB(A). Nevertheless, the fans are indeed also quiet from time to time, and then silence prevails. In other words: There is no clear fan behavior. Moreover, the sound pressure levels increase even more under load. We register values of 54 dB(A) (stress test) and 48 dB(A) (The Witcher 3 test), respectively. Gaming isn't any fun without a headset here.
Ses yüksekliği
| Boşta |
| 29 / 30 / 40 dB |
| Çalışırken |
| 51 / 54 dB |
 | ||
30 dB sessiz 40 dB(A) duyulabilirlik 50 dB(A) gürültülü |
||
min: | ||
| MSI GS66 Stealth 10SE-045 i7-10750H, GeForce RTX 2060 Mobile | MSI GS66 Stealth 10SFS i9-10980HK, GeForce RTX 2070 Super Max-Q | Razer Blade 15 GTX 1660 Ti i7-9750H, GeForce GTX 1660 Ti Mobile | Dell G5 15 SE 5505 P89F R7 4800H, Radeon RX 5600M | Lenovo Legion 5 15IMH05H i5-10300H, GeForce RTX 2060 Mobile | Asus TUF Gaming A15 FA506IV-HN172 R7 4800H, GeForce RTX 2060 Mobile | Schenker XMG Core 15 GK5CP6V i7-9750H, GeForce GTX 1660 Ti Mobile | Sınıf ortalaması Gaming | |
|---|---|---|---|---|---|---|---|---|
| Noise | -6% | 4% | 11% | 4% | 4% | -0% | 11% | |
| kapalı / ortam * (dB) | 25 | 30 -20% | 28.5 -14% | 28 -12% | 30.7 -23% | 30.2 -21% | 30 -20% | 24.1 ? 4% |
| Idle Minimum * (dB) | 29 | 32 -10% | 30.3 -4% | 28 3% | 30.7 -6% | 30.2 -4% | 30 -3% | 25.8 ? 11% |
| Idle Average * (dB) | 30 | 34 -13% | 30.5 -2% | 28 7% | 30.7 -2% | 30.2 -1% | 31 -3% | 27.4 ? 9% |
| Idle Maximum * (dB) | 40 | 39 2% | 30.5 24% | 28 30% | 30.7 23% | 30.2 24% | 33 17% | 30 ? 25% |
| Load Average * (dB) | 51 | 53 -4% | 41 20% | 28 45% | 36.6 28% | 40 22% | 48 6% | 43 ? 16% |
| Witcher 3 ultra * (dB) | 48 | 48 -0% | 48 -0% | 50.6 -5% | 47 2% | 49 -2% | 51 -6% | |
| Load Maximum * (dB) | 54 | 53 2% | 51.9 4% | 50.6 6% | 50.9 6% | 49 9% | 51 6% | 54 ? -0% |
* ... daha küçük daha iyidir
Temperature
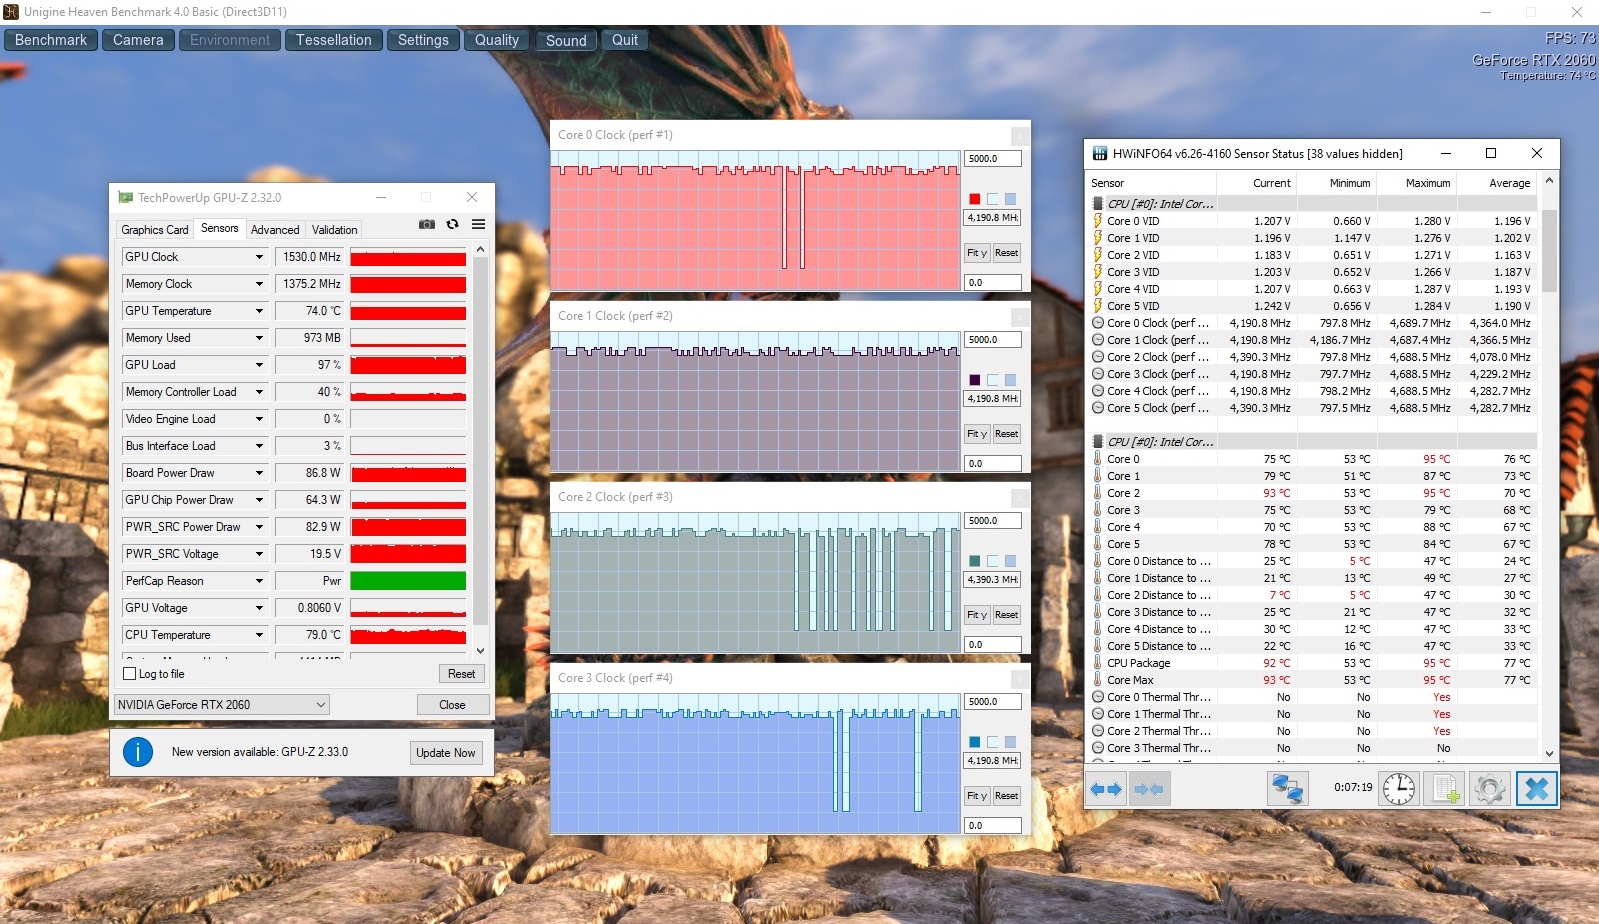
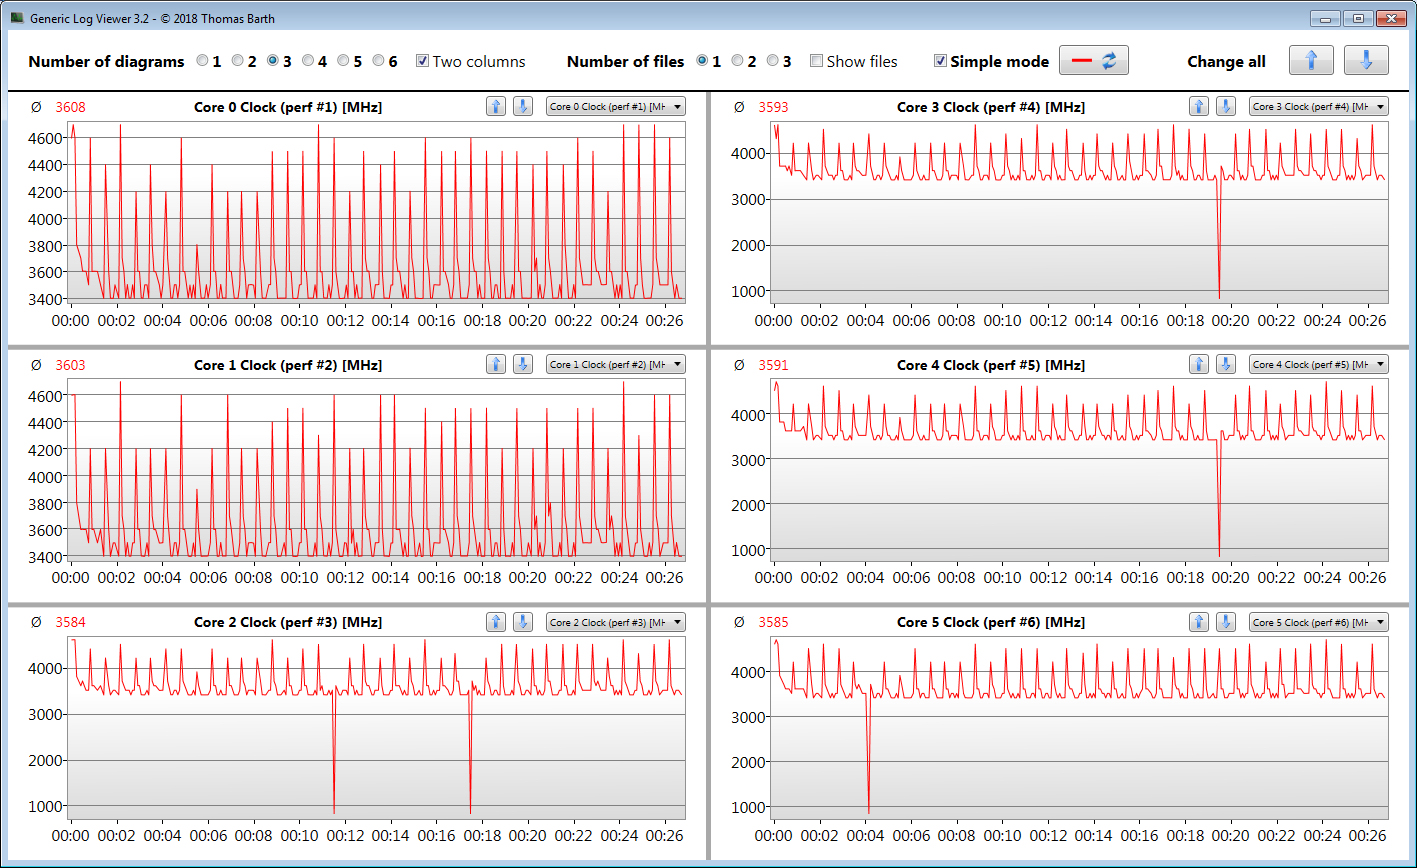
Our stress test (Prime95 and FurMark run for at least an hour) is run by the processor and graphics core at 2.5 to 2.7 GHz and 1,390 to 1,400 MHz, respectively. On battery power, the clock rates are 1.9 to 2 GHz (CPU) and 1,300 to 1,350 MHz (GPU), respectively. The stress test represents an extreme scenario that doesn't occur in everyday life. We use this test to check if the system remains stable even under full load.
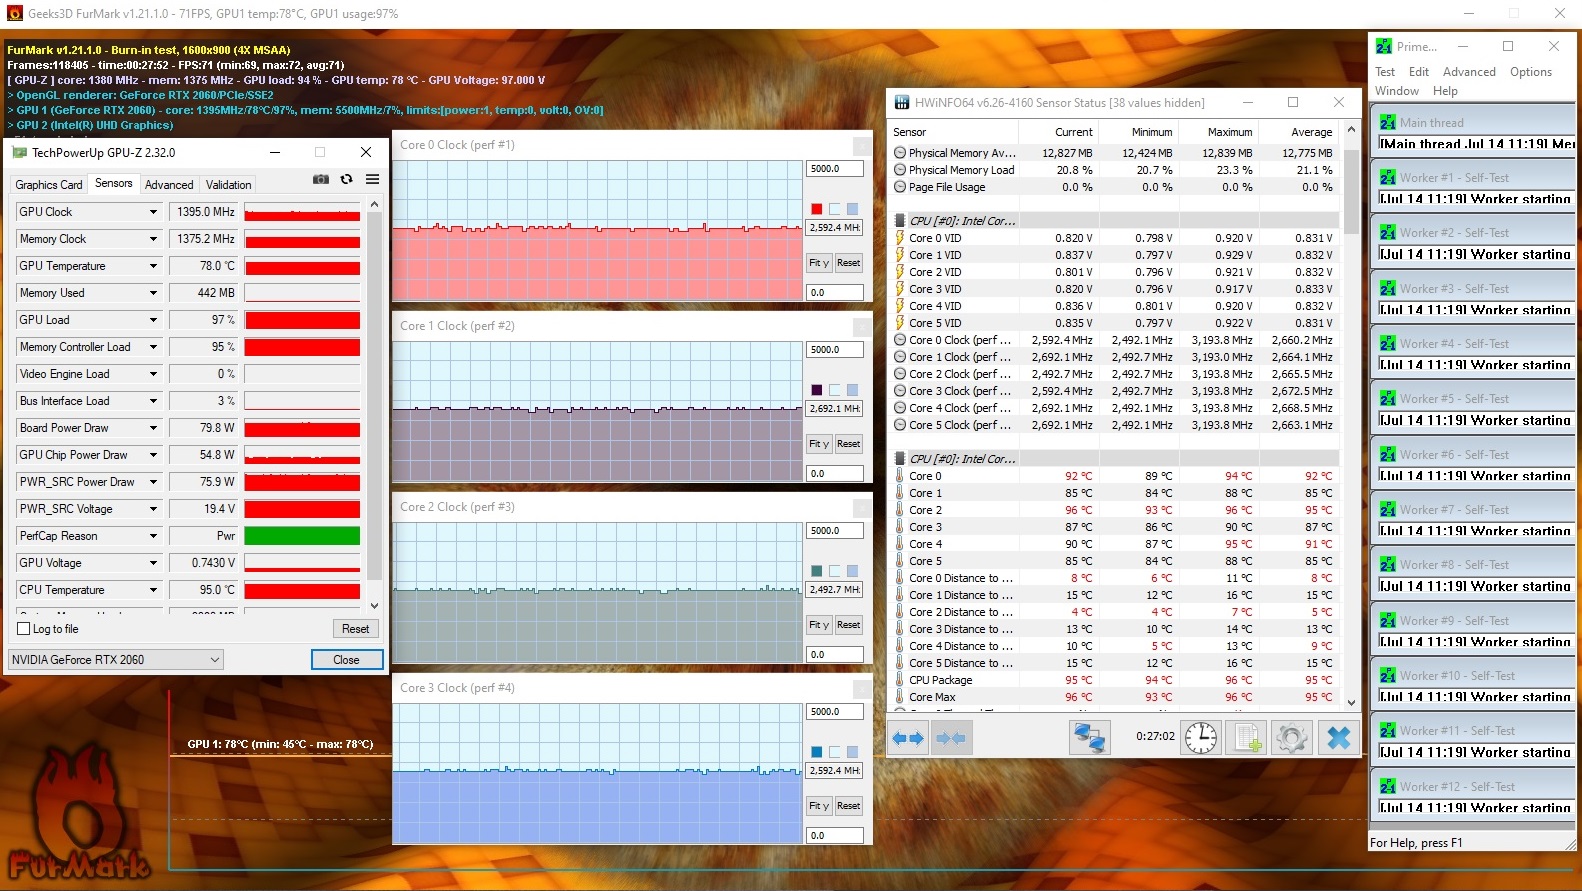
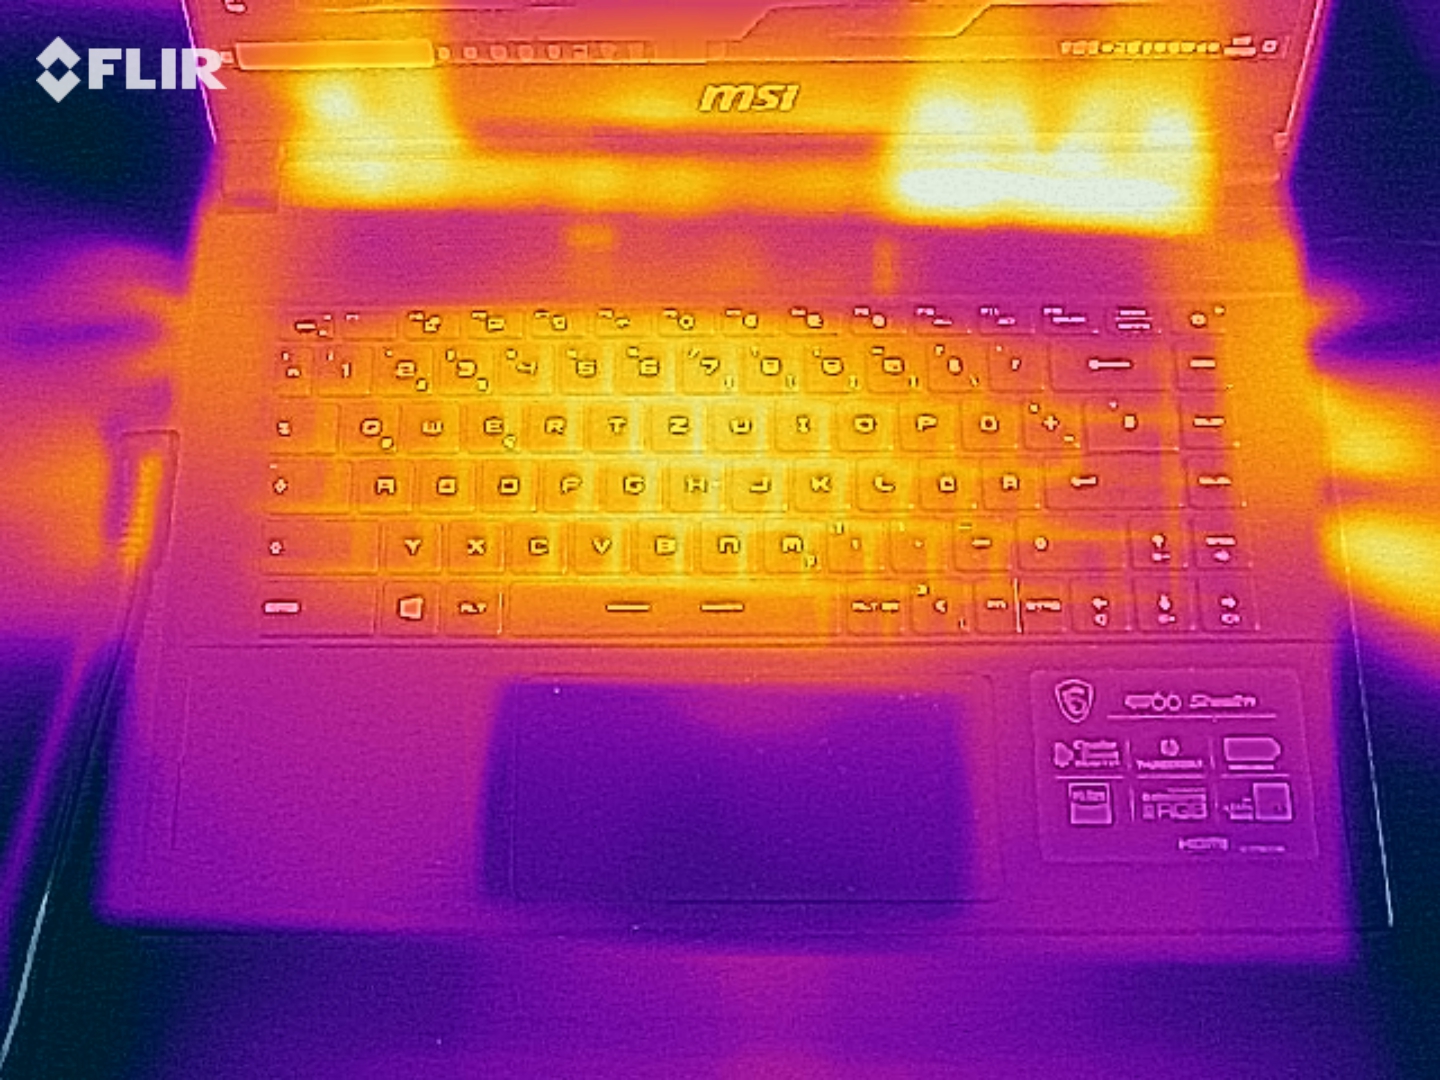
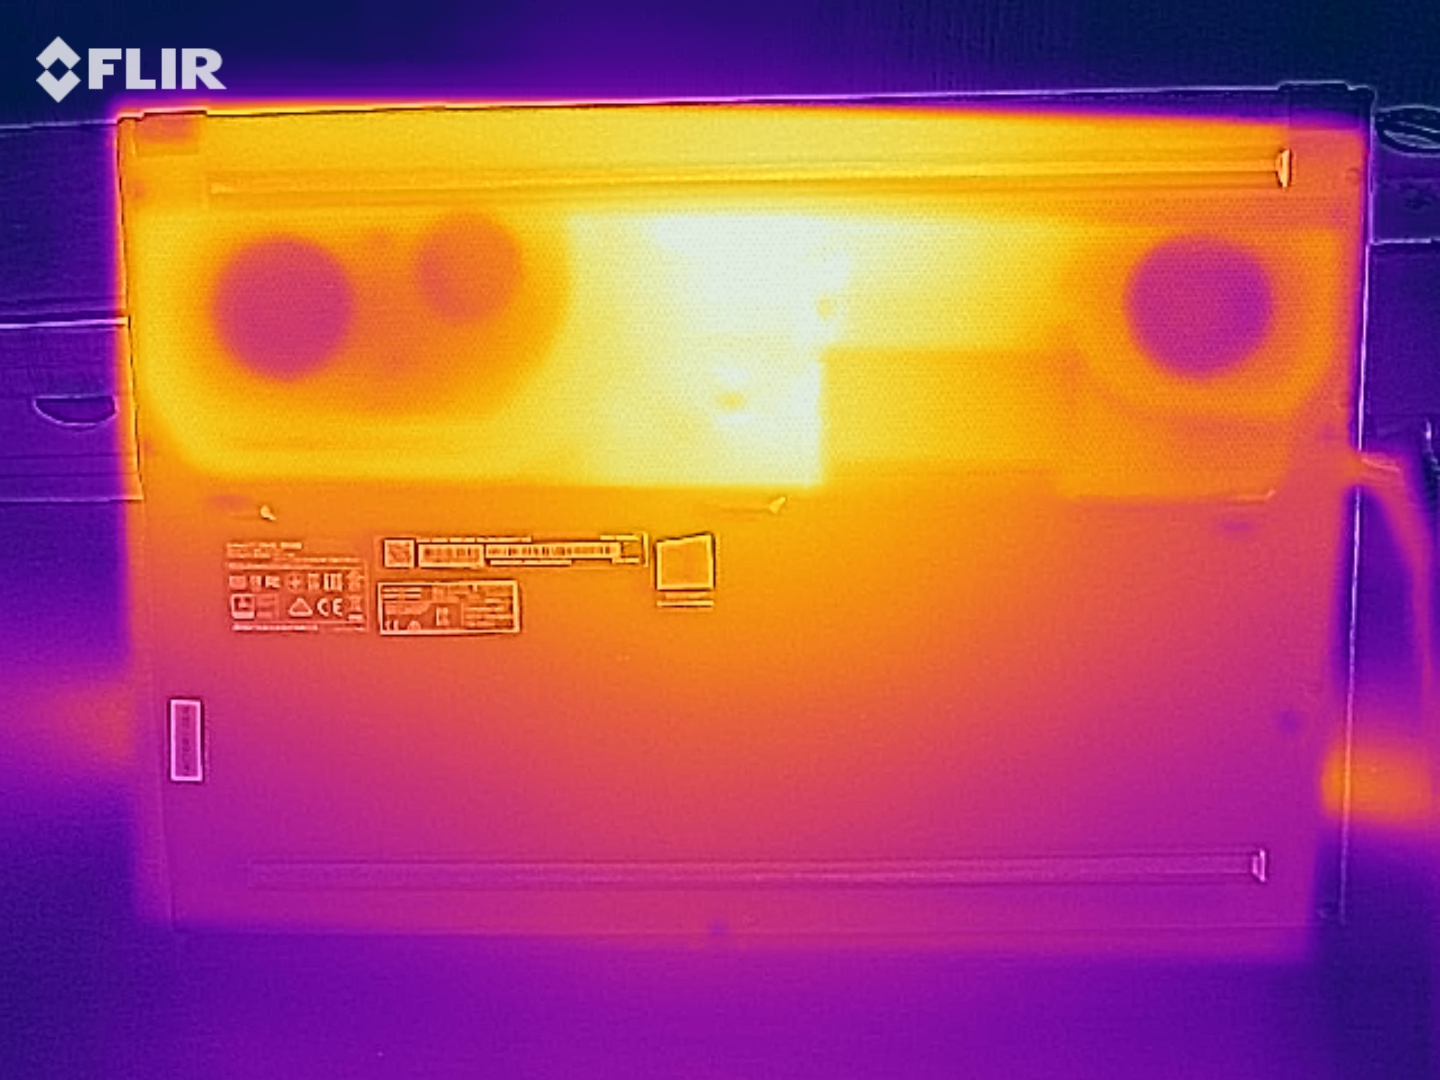
The MSI laptop warms up noticeably under load but not excessively. During the stress test, we register temperatures above 50 °C (~122 °F) at some measuring points. The heat development is a bit stronger when performing our The Witcher 3 test. As a result, the computer shouldn't be placed on the lap. In everyday use, the temperatures are in the green range.
(-) Üst taraftaki maksimum sıcaklık, 40.4 °C / 105 F ortalamasına kıyasla 53 °C / 127 F'dir. , Gaming sınıfı için 21.2 ile 68.8 °C arasında değişir.
(-) Alt kısım, 43.2 °C / 110 F ortalamasına kıyasla maksimum 53 °C / 127 F'ye kadar ısınır
(+) Boşta kullanımda, üst tarafın ortalama sıcaklığı 27.4 °C / 81 F olup, cihazın 33.9 °C / 93 F.
(-) The Witcher 3 oynarken, üst tarafın ortalama sıcaklığı 42.6 °C / 109 F olup, cihazın 33.9 °C / 93 F.
(+) Avuç içi dayanakları ve dokunmatik yüzey maksimum (35 °C / 95 F) cilt sıcaklığına ulaşıyor ve bu nedenle sıcak değil.
(-) Benzer cihazların avuç içi dayanağı alanının ortalama sıcaklığı 28.8 °C / 83.8 F (-6.2 °C / -11.2 F) idi.
| MSI GS66 Stealth 10SE-045 i7-10750H, GeForce RTX 2060 Mobile | MSI GS66 Stealth 10SFS i9-10980HK, GeForce RTX 2070 Super Max-Q | Razer Blade 15 GTX 1660 Ti i7-9750H, GeForce GTX 1660 Ti Mobile | Dell G5 15 SE 5505 P89F R7 4800H, Radeon RX 5600M | Lenovo Legion 5 15IMH05H i5-10300H, GeForce RTX 2060 Mobile | Asus TUF Gaming A15 FA506IV-HN172 R7 4800H, GeForce RTX 2060 Mobile | Schenker XMG Core 15 GK5CP6V i7-9750H, GeForce GTX 1660 Ti Mobile | Sınıf ortalaması Gaming | |
|---|---|---|---|---|---|---|---|---|
| Heat | -0% | -17% | -3% | 8% | 9% | 2% | -0% | |
| Maximum Upper Side * (°C) | 53 | 53 -0% | 52 2% | 53 -0% | 46.3 13% | 42.9 19% | 48 9% | 45.2 ? 15% |
| Maximum Bottom * (°C) | 53 | 55 -4% | 52.2 2% | 57.6 -9% | 44.4 16% | 49.9 6% | 59 -11% | 48 ? 9% |
| Idle Upper Side * (°C) | 29 | 28 3% | 38 -31% | 27.4 6% | 28.1 3% | 27.8 4% | 27 7% | 31.1 ? -7% |
| Idle Bottom * (°C) | 29 | 29 -0% | 40.4 -39% | 31 -7% | 29.4 -1% | 27 7% | 28 3% | 34.2 ? -18% |
* ... daha küçük daha iyidir
Speakers
MSI GS66 Stealth 10SE-045 ses analizi
(+) | hoparlörler nispeten yüksek sesle çalabilir (86 dB)
Bas 100 - 315Hz
(-) | neredeyse hiç bas yok - ortalama olarak medyandan 30.3% daha düşük
(±) | Bas doğrusallığı ortalamadır (8.1% delta - önceki frekans)
Ortalar 400 - 2000 Hz
(±) | daha yüksek ortalar - ortalama olarak medyandan 7.7% daha yüksek
(±) | Ortaların doğrusallığı ortalamadır (7.3% delta - önceki frekans)
Yüksekler 2 - 16 kHz
(+) | dengeli yüksekler - medyandan yalnızca 3.3% uzakta
(+) | yüksekler doğrusaldır (6% deltadan önceki frekansa)
Toplam 100 - 16.000 Hz
(±) | Genel sesin doğrusallığı ortalamadır (24% ortancaya göre fark)
Aynı sınıfla karşılaştırıldığında
» Bu sınıftaki tüm test edilen cihazların %86%'si daha iyi, 4% benzer, 9% daha kötüydü
» En iyisinin deltası 6% idi, ortalama 18% idi, en kötüsü 132% idi
Test edilen tüm cihazlarla karşılaştırıldığında
» Test edilen tüm cihazların %72'si daha iyi, 6 benzer, % 22 daha kötüydü
» En iyisinin deltası 4% idi, ortalama 24% idi, en kötüsü 134% idi
Energy management - The MSI laptop delivers solid battery life
Energy consumption
We register a maximum power consumption of 31 watts in idle usage - quite a lot for a laptop with Optimus enabled. The competition partly consumes considerably less energy. Furthermore, the stress test lets the demand increase up to 186 watts. We measure an average power consumption of 146 watts during our The Witcher 3 test. The power adapter's rated output is 180 watts.
| Kapalı / Bekleme modu | |
| Boşta | |
| Çalışırken |
|
Key:
min: | |
| MSI GS66 Stealth 10SE-045 i7-10750H, GeForce RTX 2060 Mobile | MSI GS66 Stealth 10SFS i9-10980HK, GeForce RTX 2070 Super Max-Q | Razer Blade 15 GTX 1660 Ti i7-9750H, GeForce GTX 1660 Ti Mobile | Dell G5 15 SE 5505 P89F R7 4800H, Radeon RX 5600M | Lenovo Legion 5 15IMH05H i5-10300H, GeForce RTX 2060 Mobile | Asus TUF Gaming A15 FA506IV-HN172 R7 4800H, GeForce RTX 2060 Mobile | Schenker XMG Core 15 GK5CP6V i7-9750H, GeForce GTX 1660 Ti Mobile | Sınıf ortalaması Gaming | |
|---|---|---|---|---|---|---|---|---|
| Power Consumption | -16% | -41% | 22% | 33% | 22% | 15% | -22% | |
| Idle Minimum * (Watt) | 7 | 13 -86% | 18.7 -167% | 6.5 7% | 3.2 54% | 5.4 23% | 9 -29% | 13.2 ? -89% |
| Idle Average * (Watt) | 18 | 16 11% | 30.7 -71% | 10.6 41% | 8.3 54% | 10 44% | 12 33% | 18.9 ? -5% |
| Idle Maximum * (Watt) | 31 | 27 13% | 33.9 -9% | 11 65% | 8.7 72% | 10.5 66% | 18 42% | 24.3 ? 22% |
| Load Average * (Watt) | 107 | 109 -2% | 93.4 13% | 84.1 21% | 82 23% | 135 -26% | 86 20% | 108 ? -1% |
| Witcher 3 ultra * (Watt) | 146 | 155 -6% | 158.9 -9% | 152.9 -5% | 151 -3% | 144 1% | 126 14% | |
| Load Maximum * (Watt) | 186 | 236 -27% | 195.3 -5% | 180.4 3% | 195 -5% | 147 21% | 173 7% | 254 ? -37% |
* ... daha küçük daha iyidir
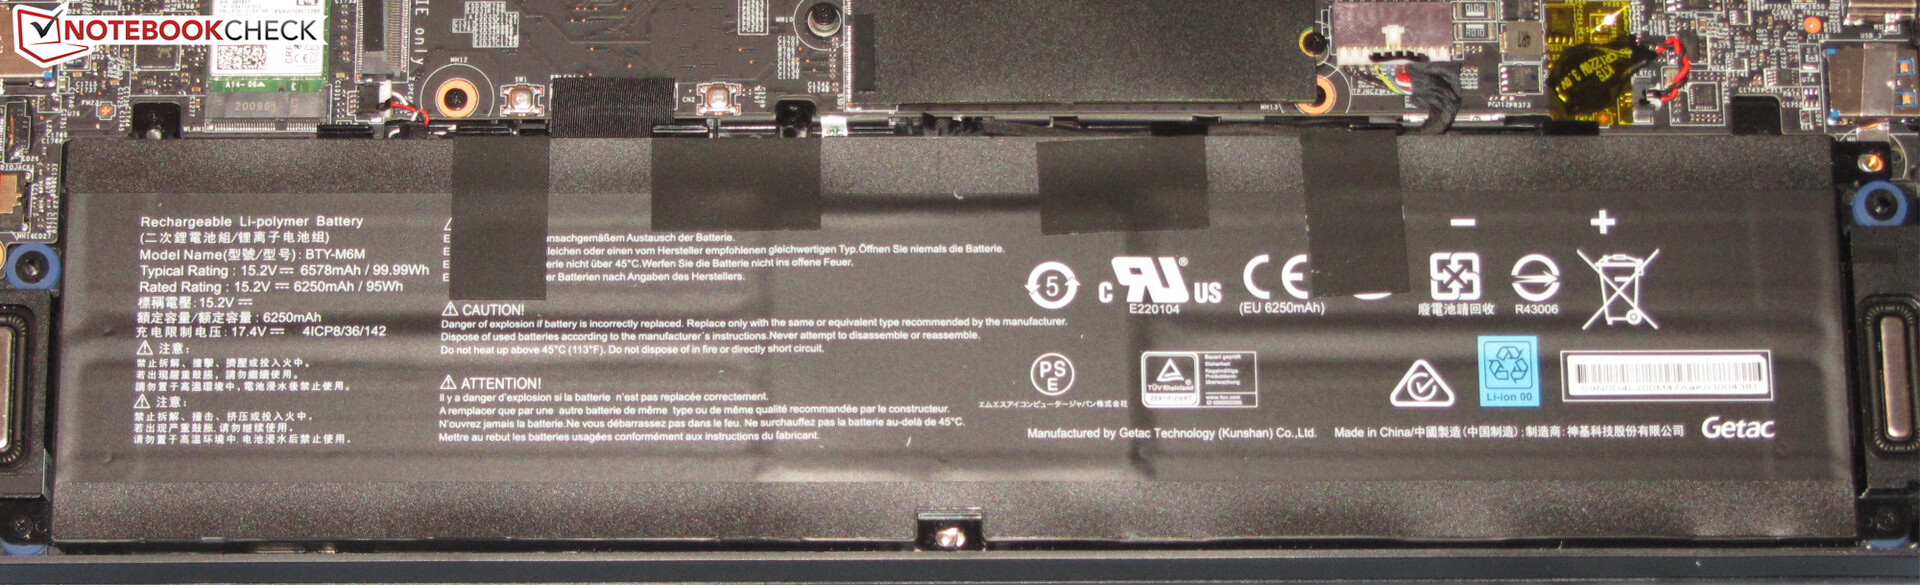
Battery life
The gaming laptop achieves a runtime of 6:21 h in our practical WLAN test (accessing websites using a script). In addition, the 15.6-incher completes our video test after 6:35 h. We let the short film Big Buck Bunny (H.264 encoding, 1920x1080 pixels) run in a continuous loop here. Test conditions: The energy-saving functions and the wireless modules (only during the video test) are deactivated, and the display brightness is regulated to about 150 cd/m².
| MSI GS66 Stealth 10SE-045 i7-10750H, GeForce RTX 2060 Mobile, 99.9 Wh | Dell G5 15 SE 5505 P89F R7 4800H, Radeon RX 5600M, 51 Wh | Lenovo Legion 5 15IMH05H i5-10300H, GeForce RTX 2060 Mobile, 60 Wh | Asus TUF Gaming A15 FA506IV-HN172 R7 4800H, GeForce RTX 2060 Mobile, 48 Wh | Schenker XMG Core 15 GK5CP6V i7-9750H, GeForce GTX 1660 Ti Mobile, 46 Wh | MSI GS66 10SGS i7-10750H, GeForce RTX 2080 Super Max-Q, 99.99 Wh | MSI GS66 Stealth 10SFS i9-10980HK, GeForce RTX 2070 Super Max-Q, 99.99 Wh | Razer Blade 15 GTX 1660 Ti i7-9750H, GeForce GTX 1660 Ti Mobile, 65 Wh | Sınıf ortalaması Gaming | |
|---|---|---|---|---|---|---|---|---|---|
| Pil Çalışma Süresi | 15% | 32% | 12% | -39% | 18% | 10% | -14% | 14% | |
| Reader / Idle (h) | 9 | 11.2 24% | 14.1 57% | 9.8 9% | 6.1 -32% | 10.2 13% | 8.4 -7% | 8.71 ? -3% | |
| H.264 (h) | 6.6 | 9.2 39% | 5.4 -18% | 8.26 ? 25% | |||||
| WiFi v1.3 (h) | 6.4 | 6.2 -3% | 7.2 13% | 6.2 -3% | 3.6 -44% | 6.9 8% | 6.1 -5% | 5.5 -14% | 7.02 ? 10% |
| Load (h) | 1.2 | 1.5 25% | 1.4 17% | 1.9 58% | 0.7 -42% | 1.6 33% | 1.7 42% | 1.47 ? 23% |
Artılar
Eksiler
Verdict
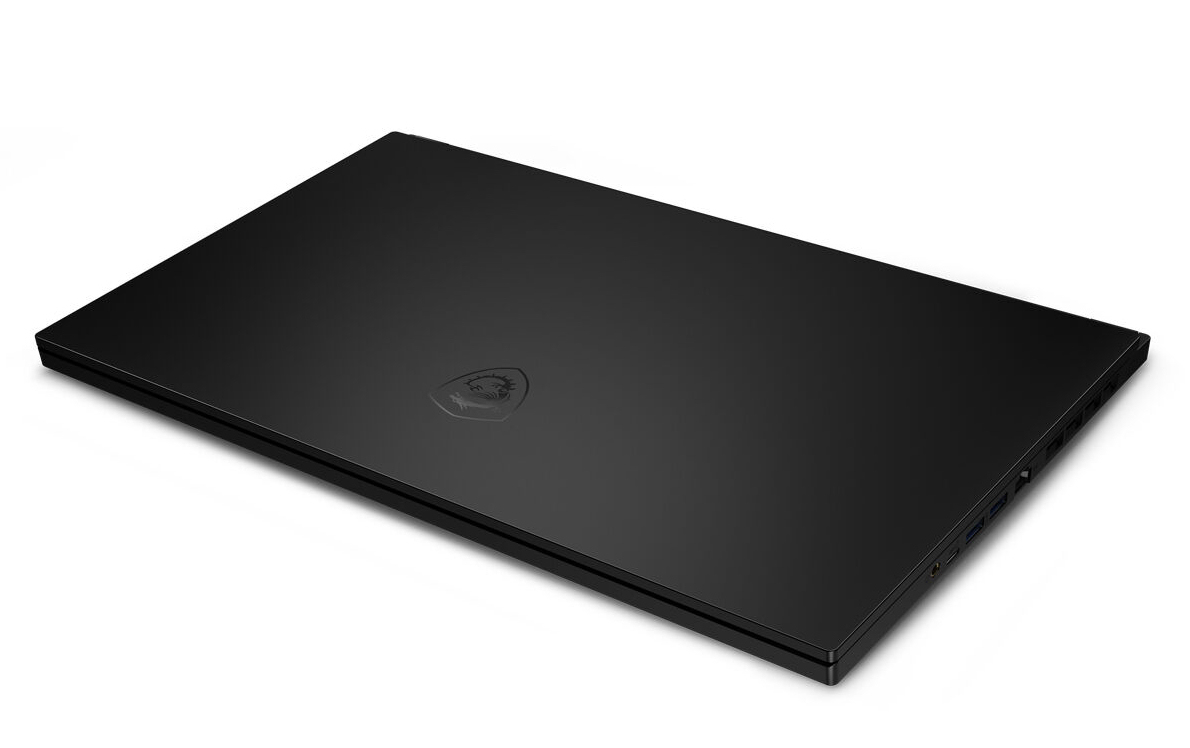
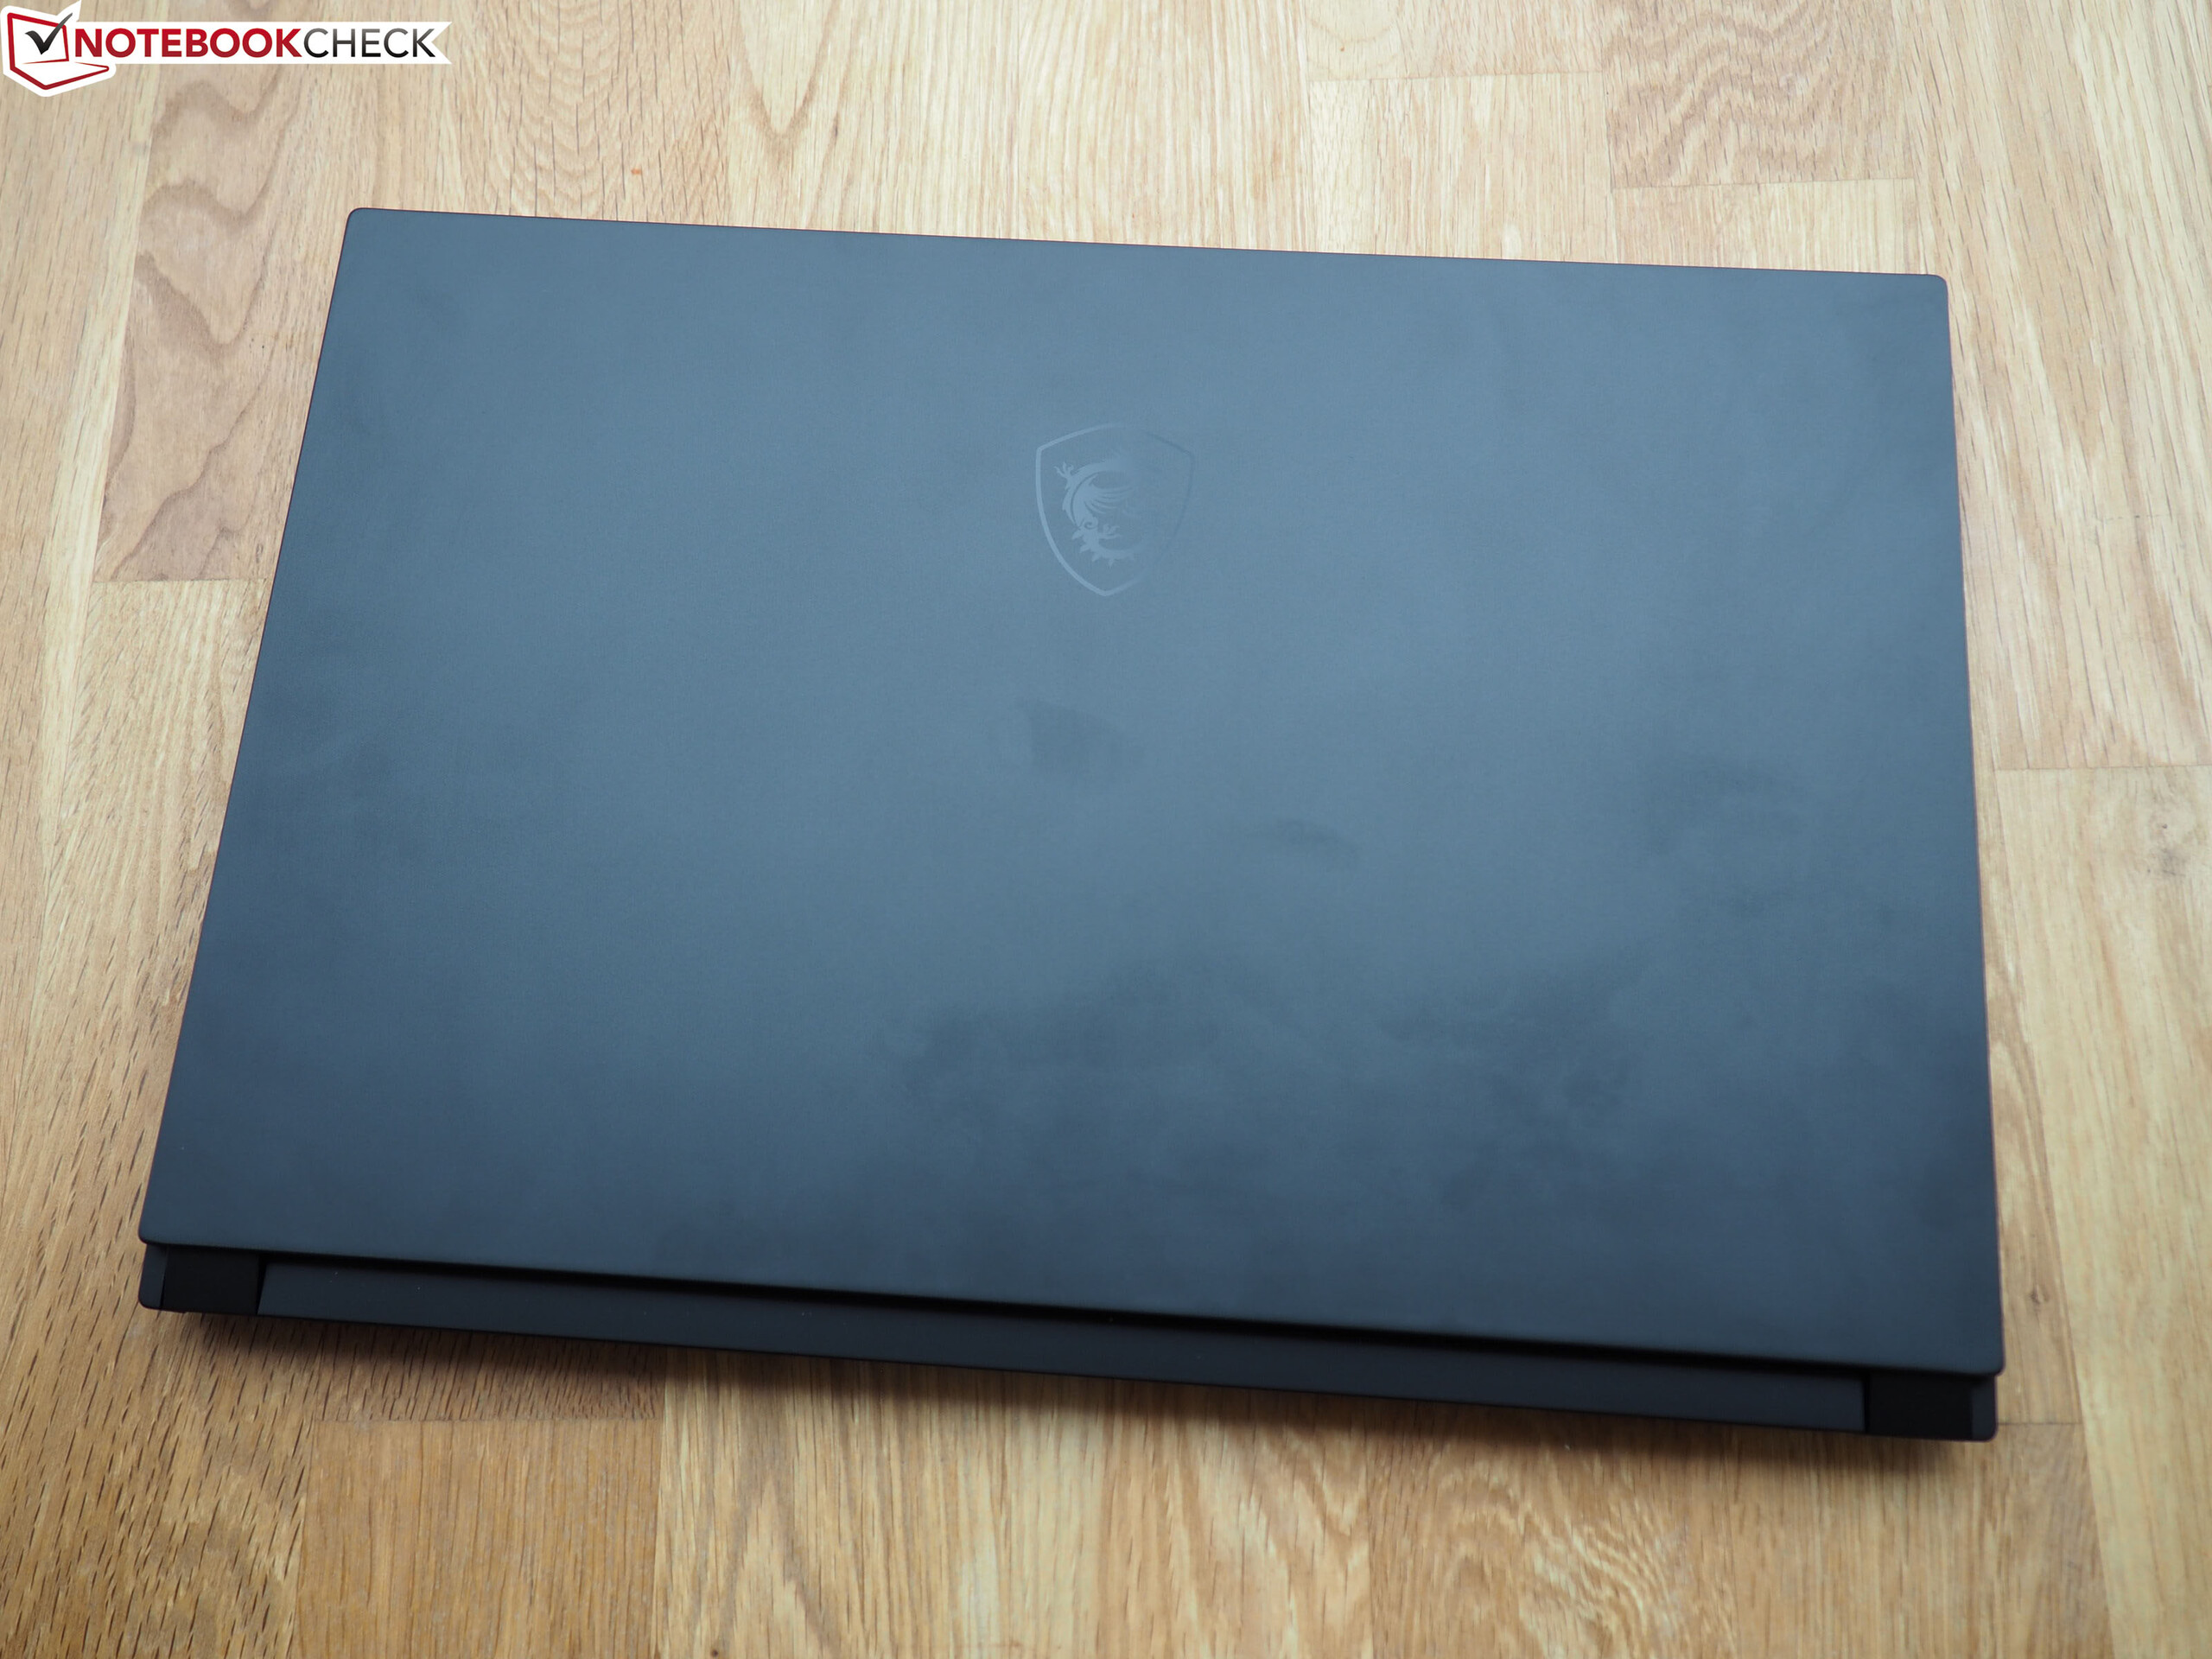
MSI GS66, parmak izlerine karşı çok hassas olduğu kanıtlanmış şık, kompakt bir metal kasaya sahiptir. Kasanın içinde bir Core i7-10750H işlemci ve bir GeForce RTX 2060 grafik çekirdeği bulunuyor ve bu da tüm modern bilgisayar oyunlarını sorunsuz bir şekilde mat Full HD ekrana getiriyor. Yüksek ila maksimum kalite ayarları her zaman seçilebilir.
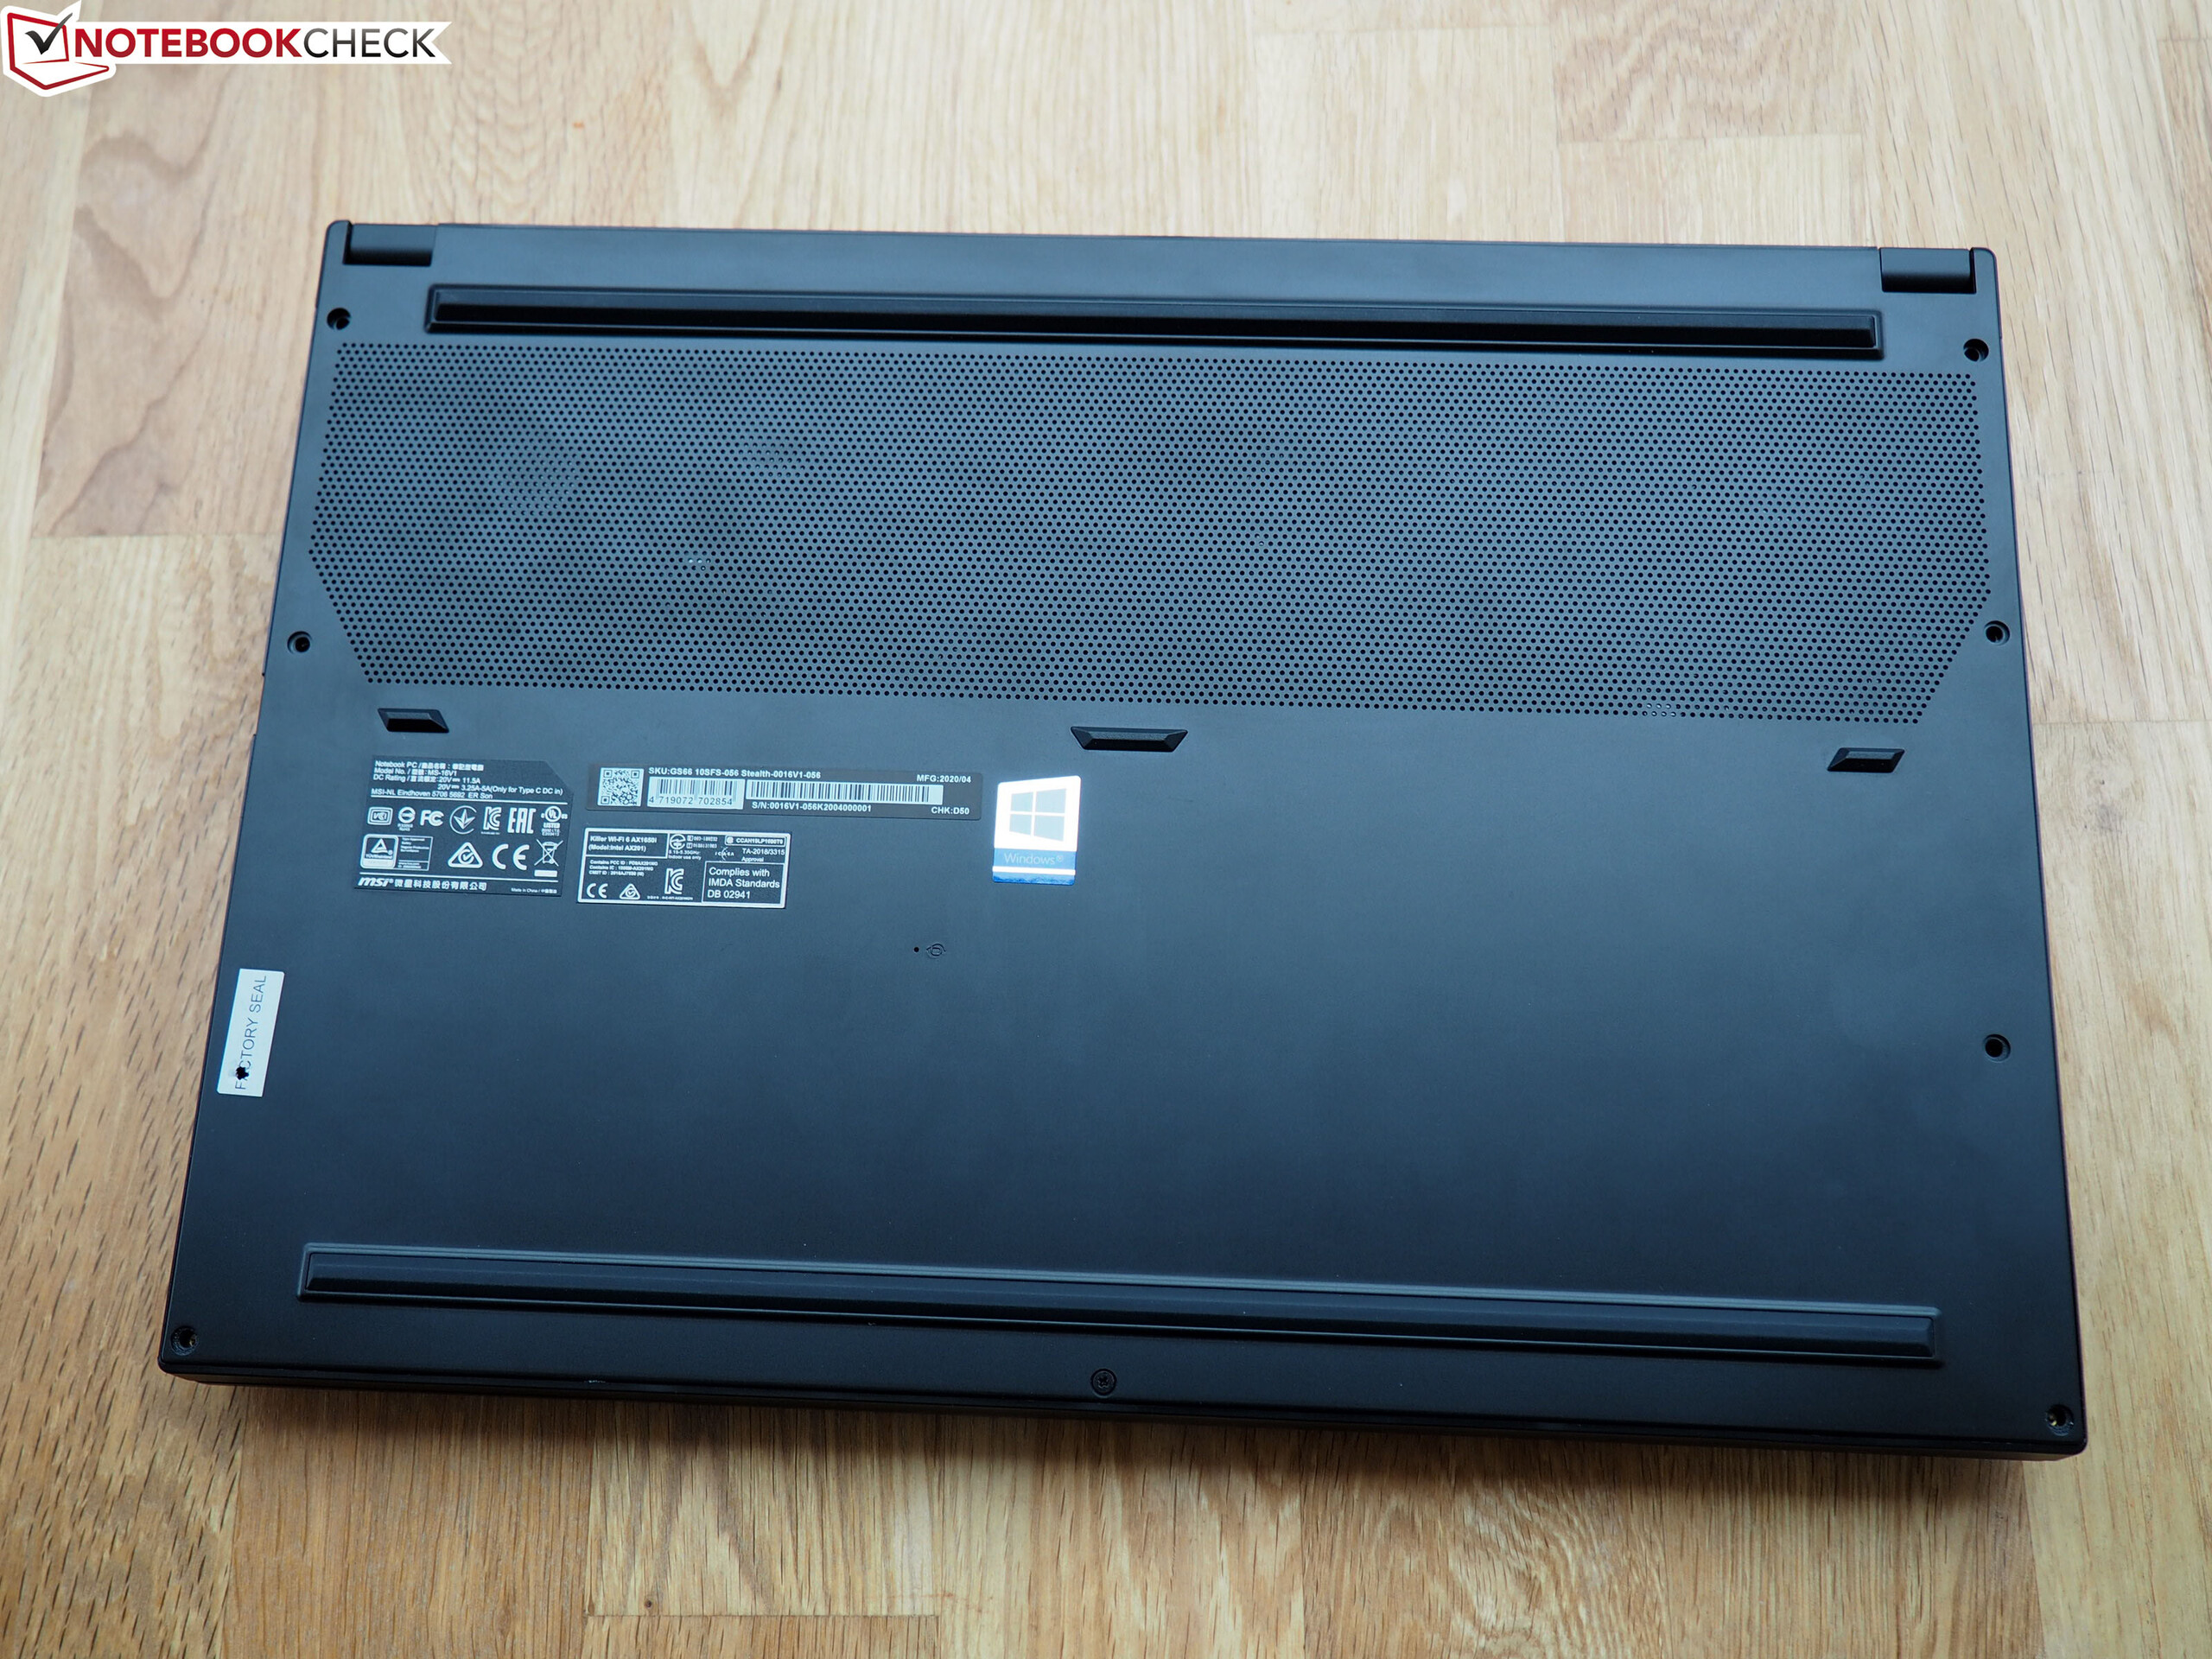
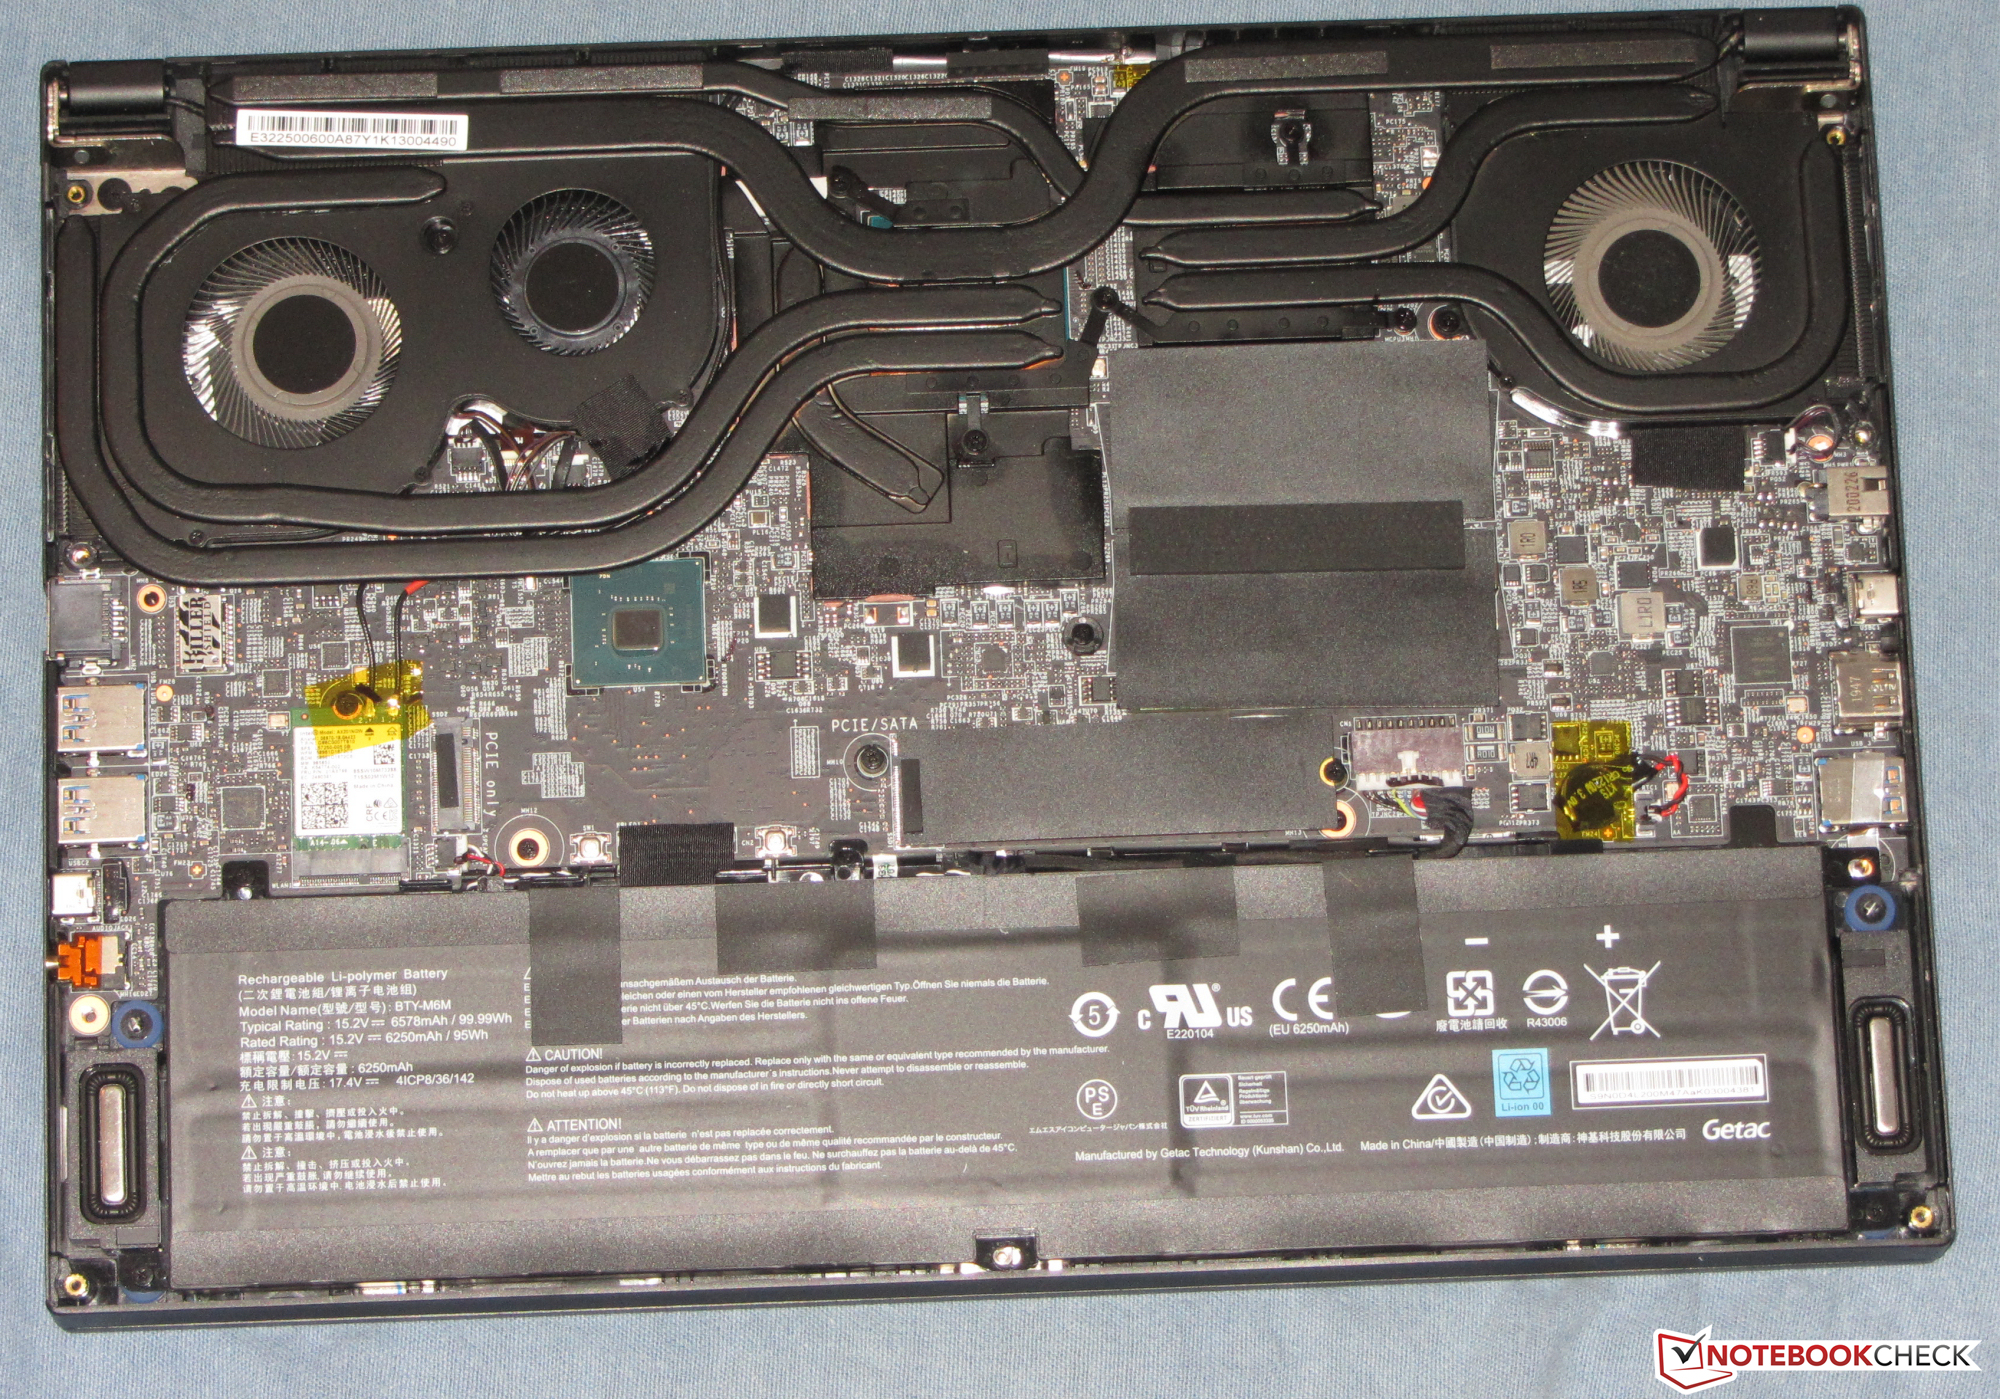
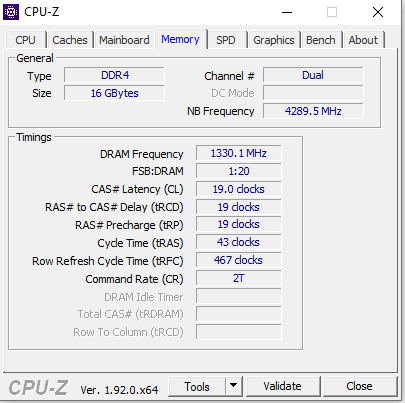
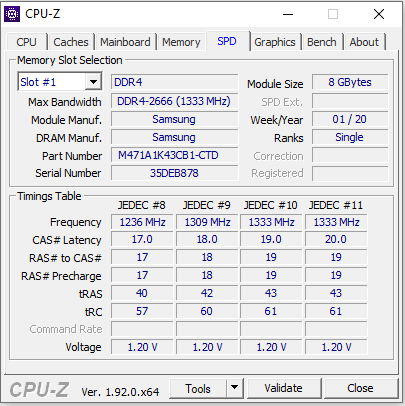
Donanımın 16 GB RAM'e (çift kanal modu) erişimi vardır. 64 GB'a kadar yükseltme yapmak mümkün olacaktır. Hızlı 1 TB NVMe SSD, gerekli depolama alanını sağlar. Depolama alanı biterse, dizüstü bilgisayar ikinci bir NVMe SSD ile genişletilebilir. Bakım / yükseltme önlemleri, kasanın alt kapağının çıkarılmasını gerektirir.
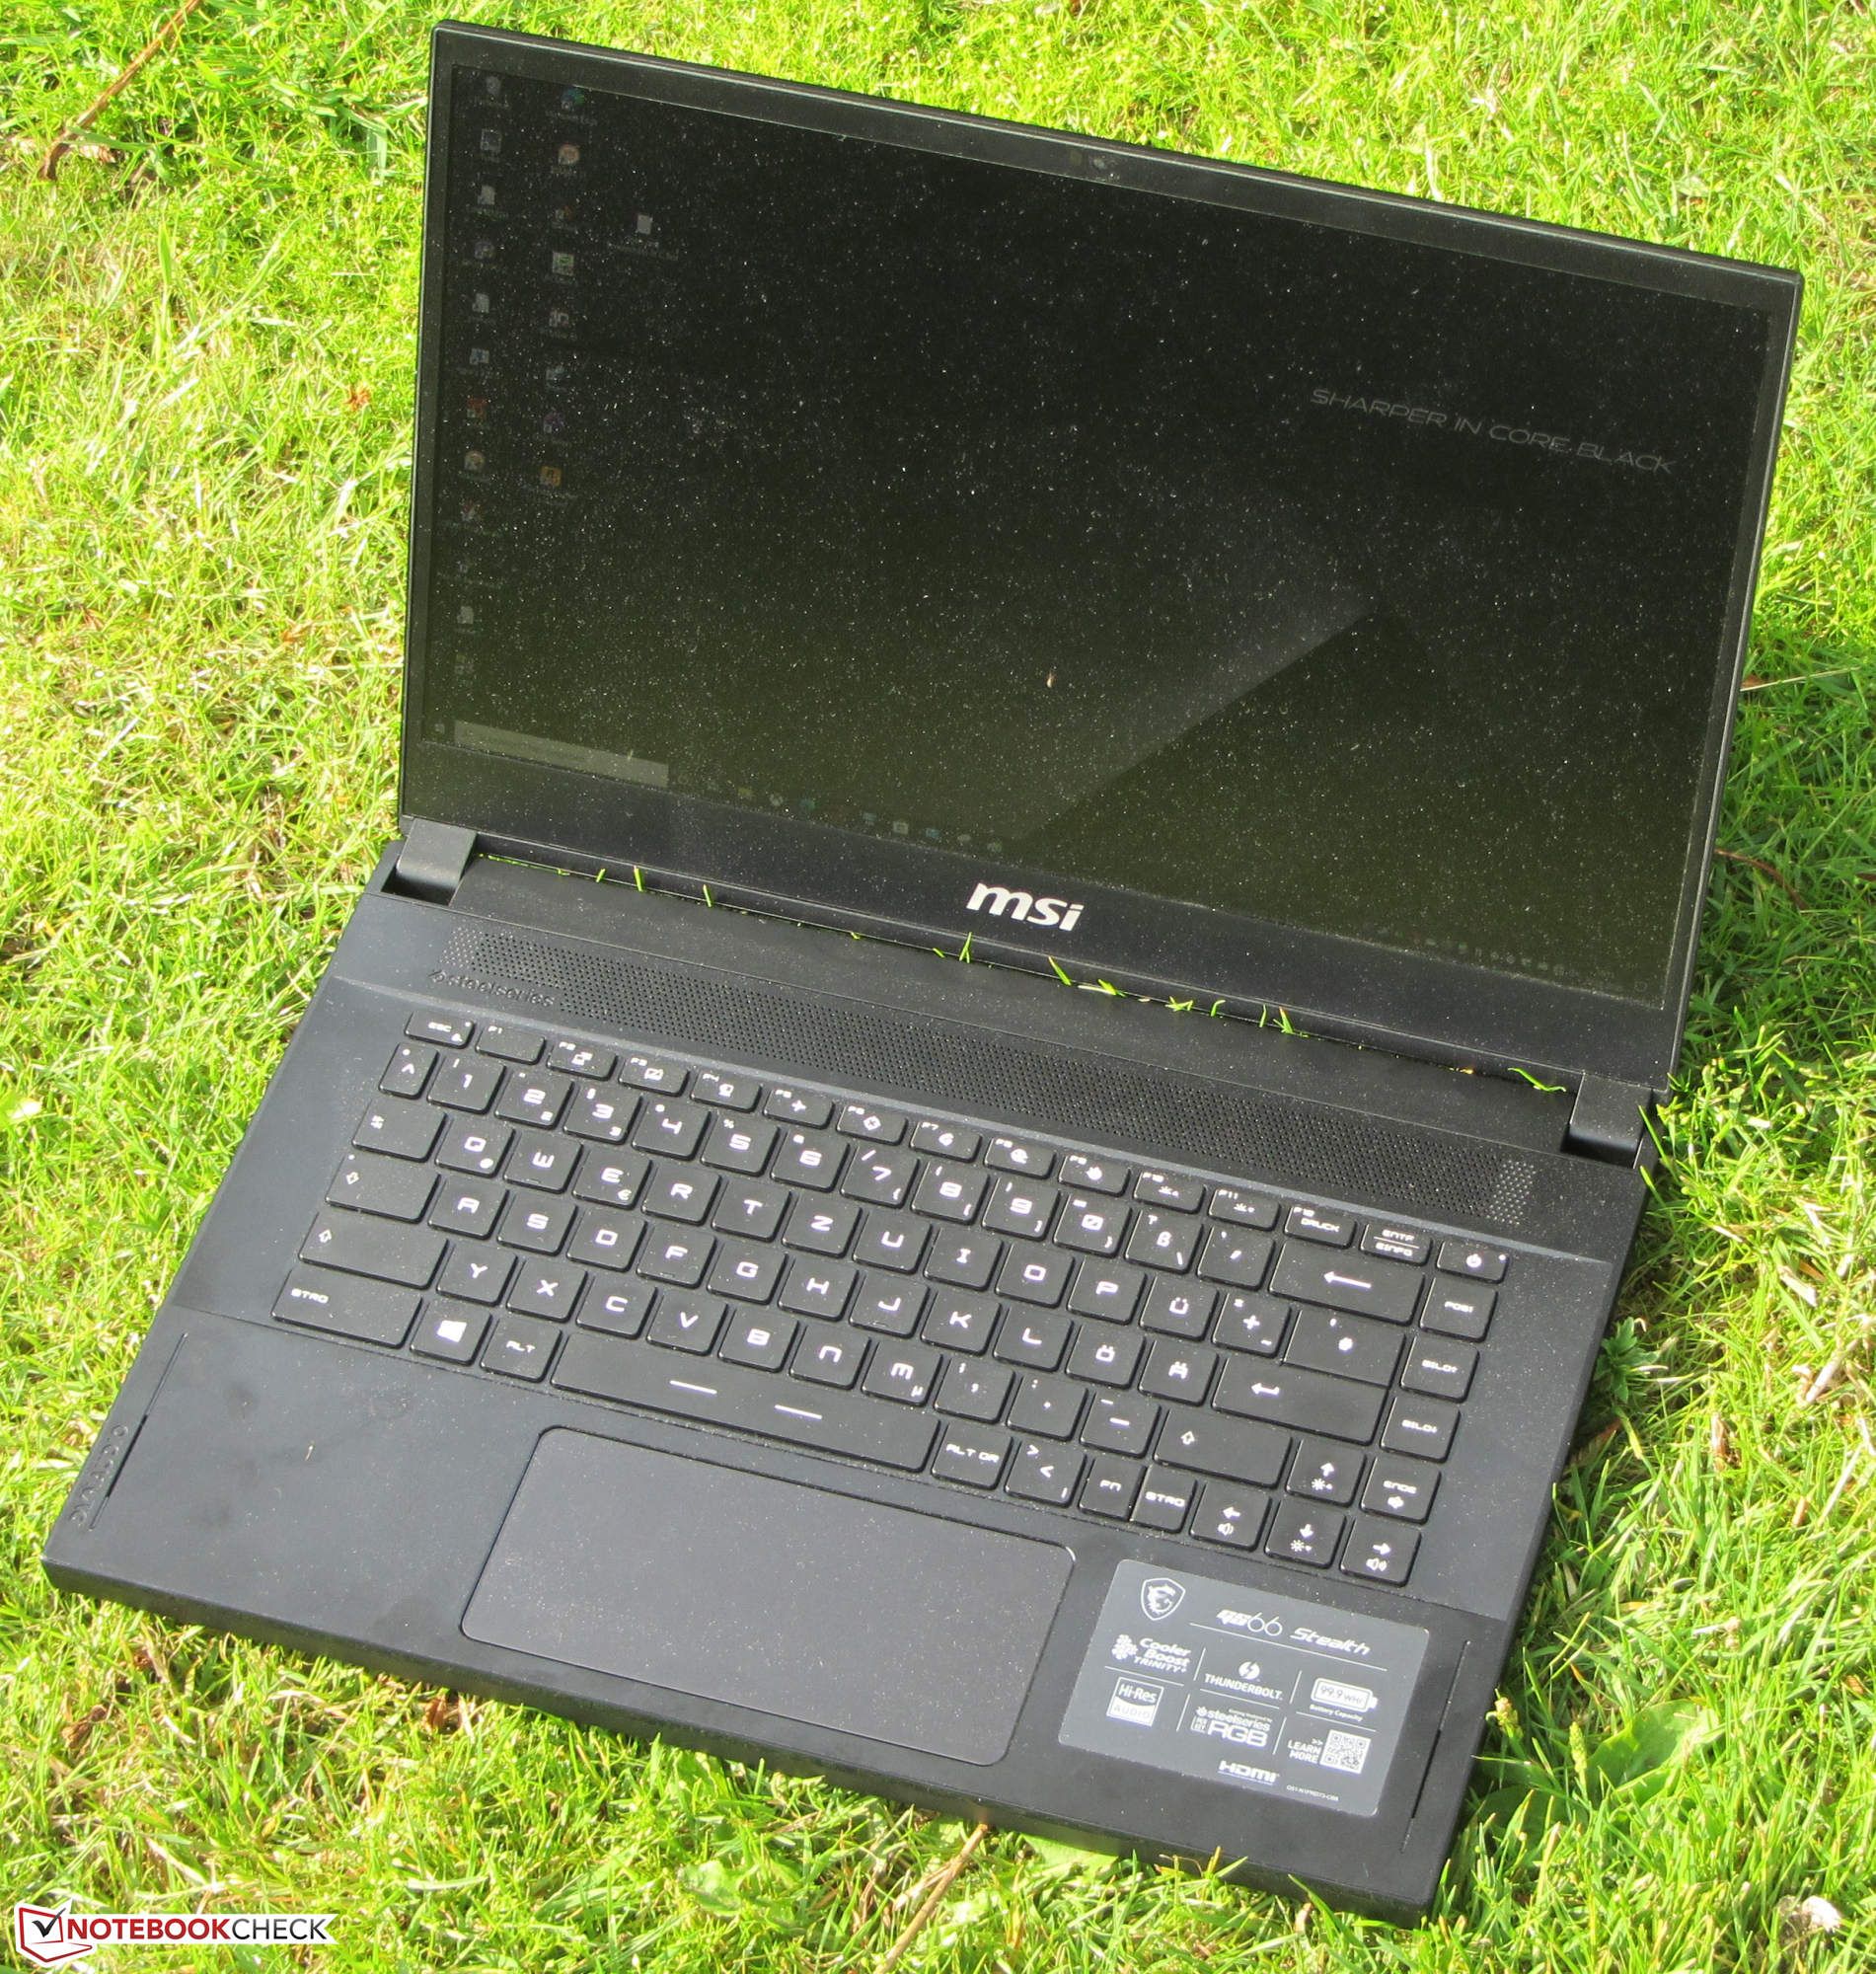
Dizüstü bilgisayarın öne çıkan özelliği 240 Hz IPS ekranıdır.
Ekran, hızlı tepki süreleri, sabit görüş açıları, iyi kontrast ve mükemmel renk üretimi ile puanlar. Öte yandan maksimum parlaklık düşüktür. Bu fiyat aralığındaki bir dizüstü bilgisayar bu konuda daha fazlasını sunmalıdır.
Prensip olarak, pil çalışma süreleri bir oyun dizüstü bilgisayarı için fazlasıyla yeterli. Ancak bunları pil kapasitesi (99,9 Wh) ile ilişkili olarak görürseniz, işler farklı görünür. Rakipler, GS66'nın pilinin yalnızca yarısı kadar kapasiteye sahip pillerden benzer veya kısmen daha iyi çalışma süreleri elde ediyor. Boşta kullanımda ve düşük yük altında yüksek enerji tüketimi burada fark edilir.
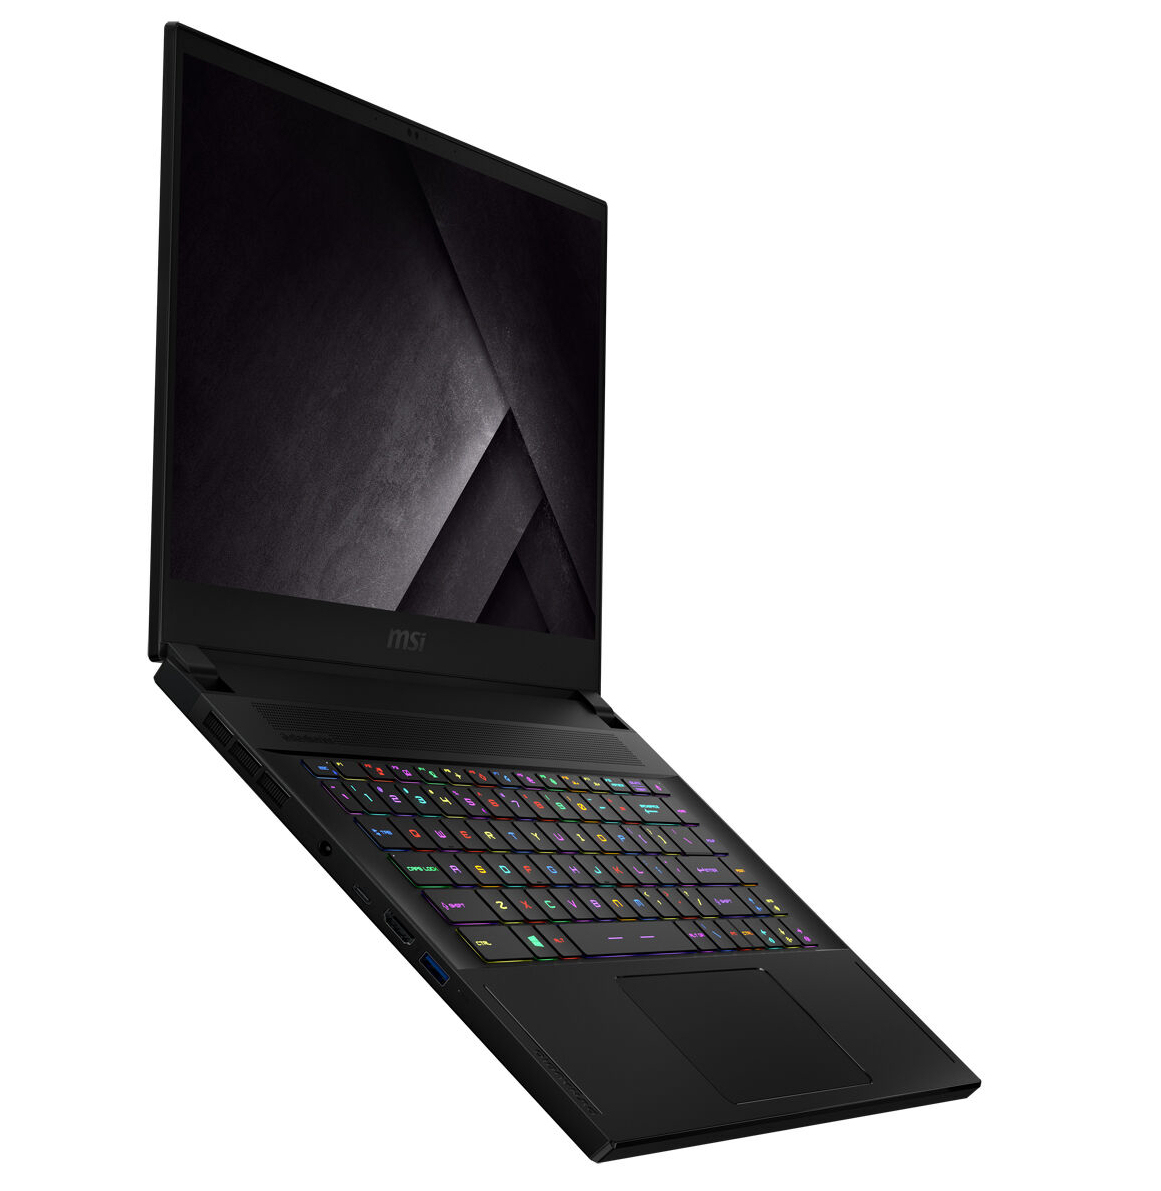
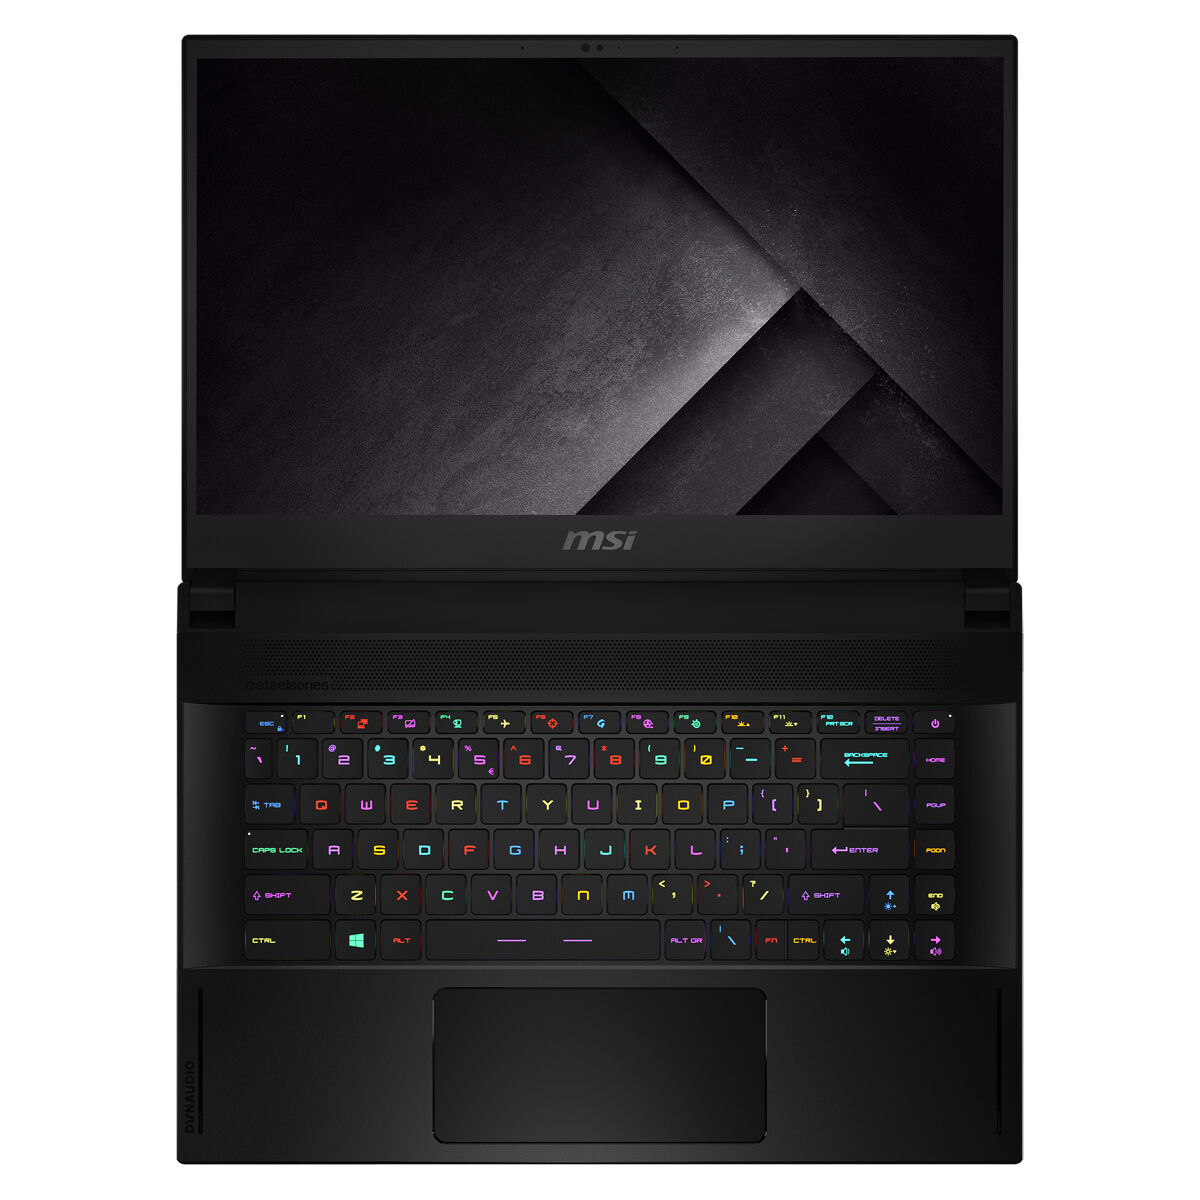
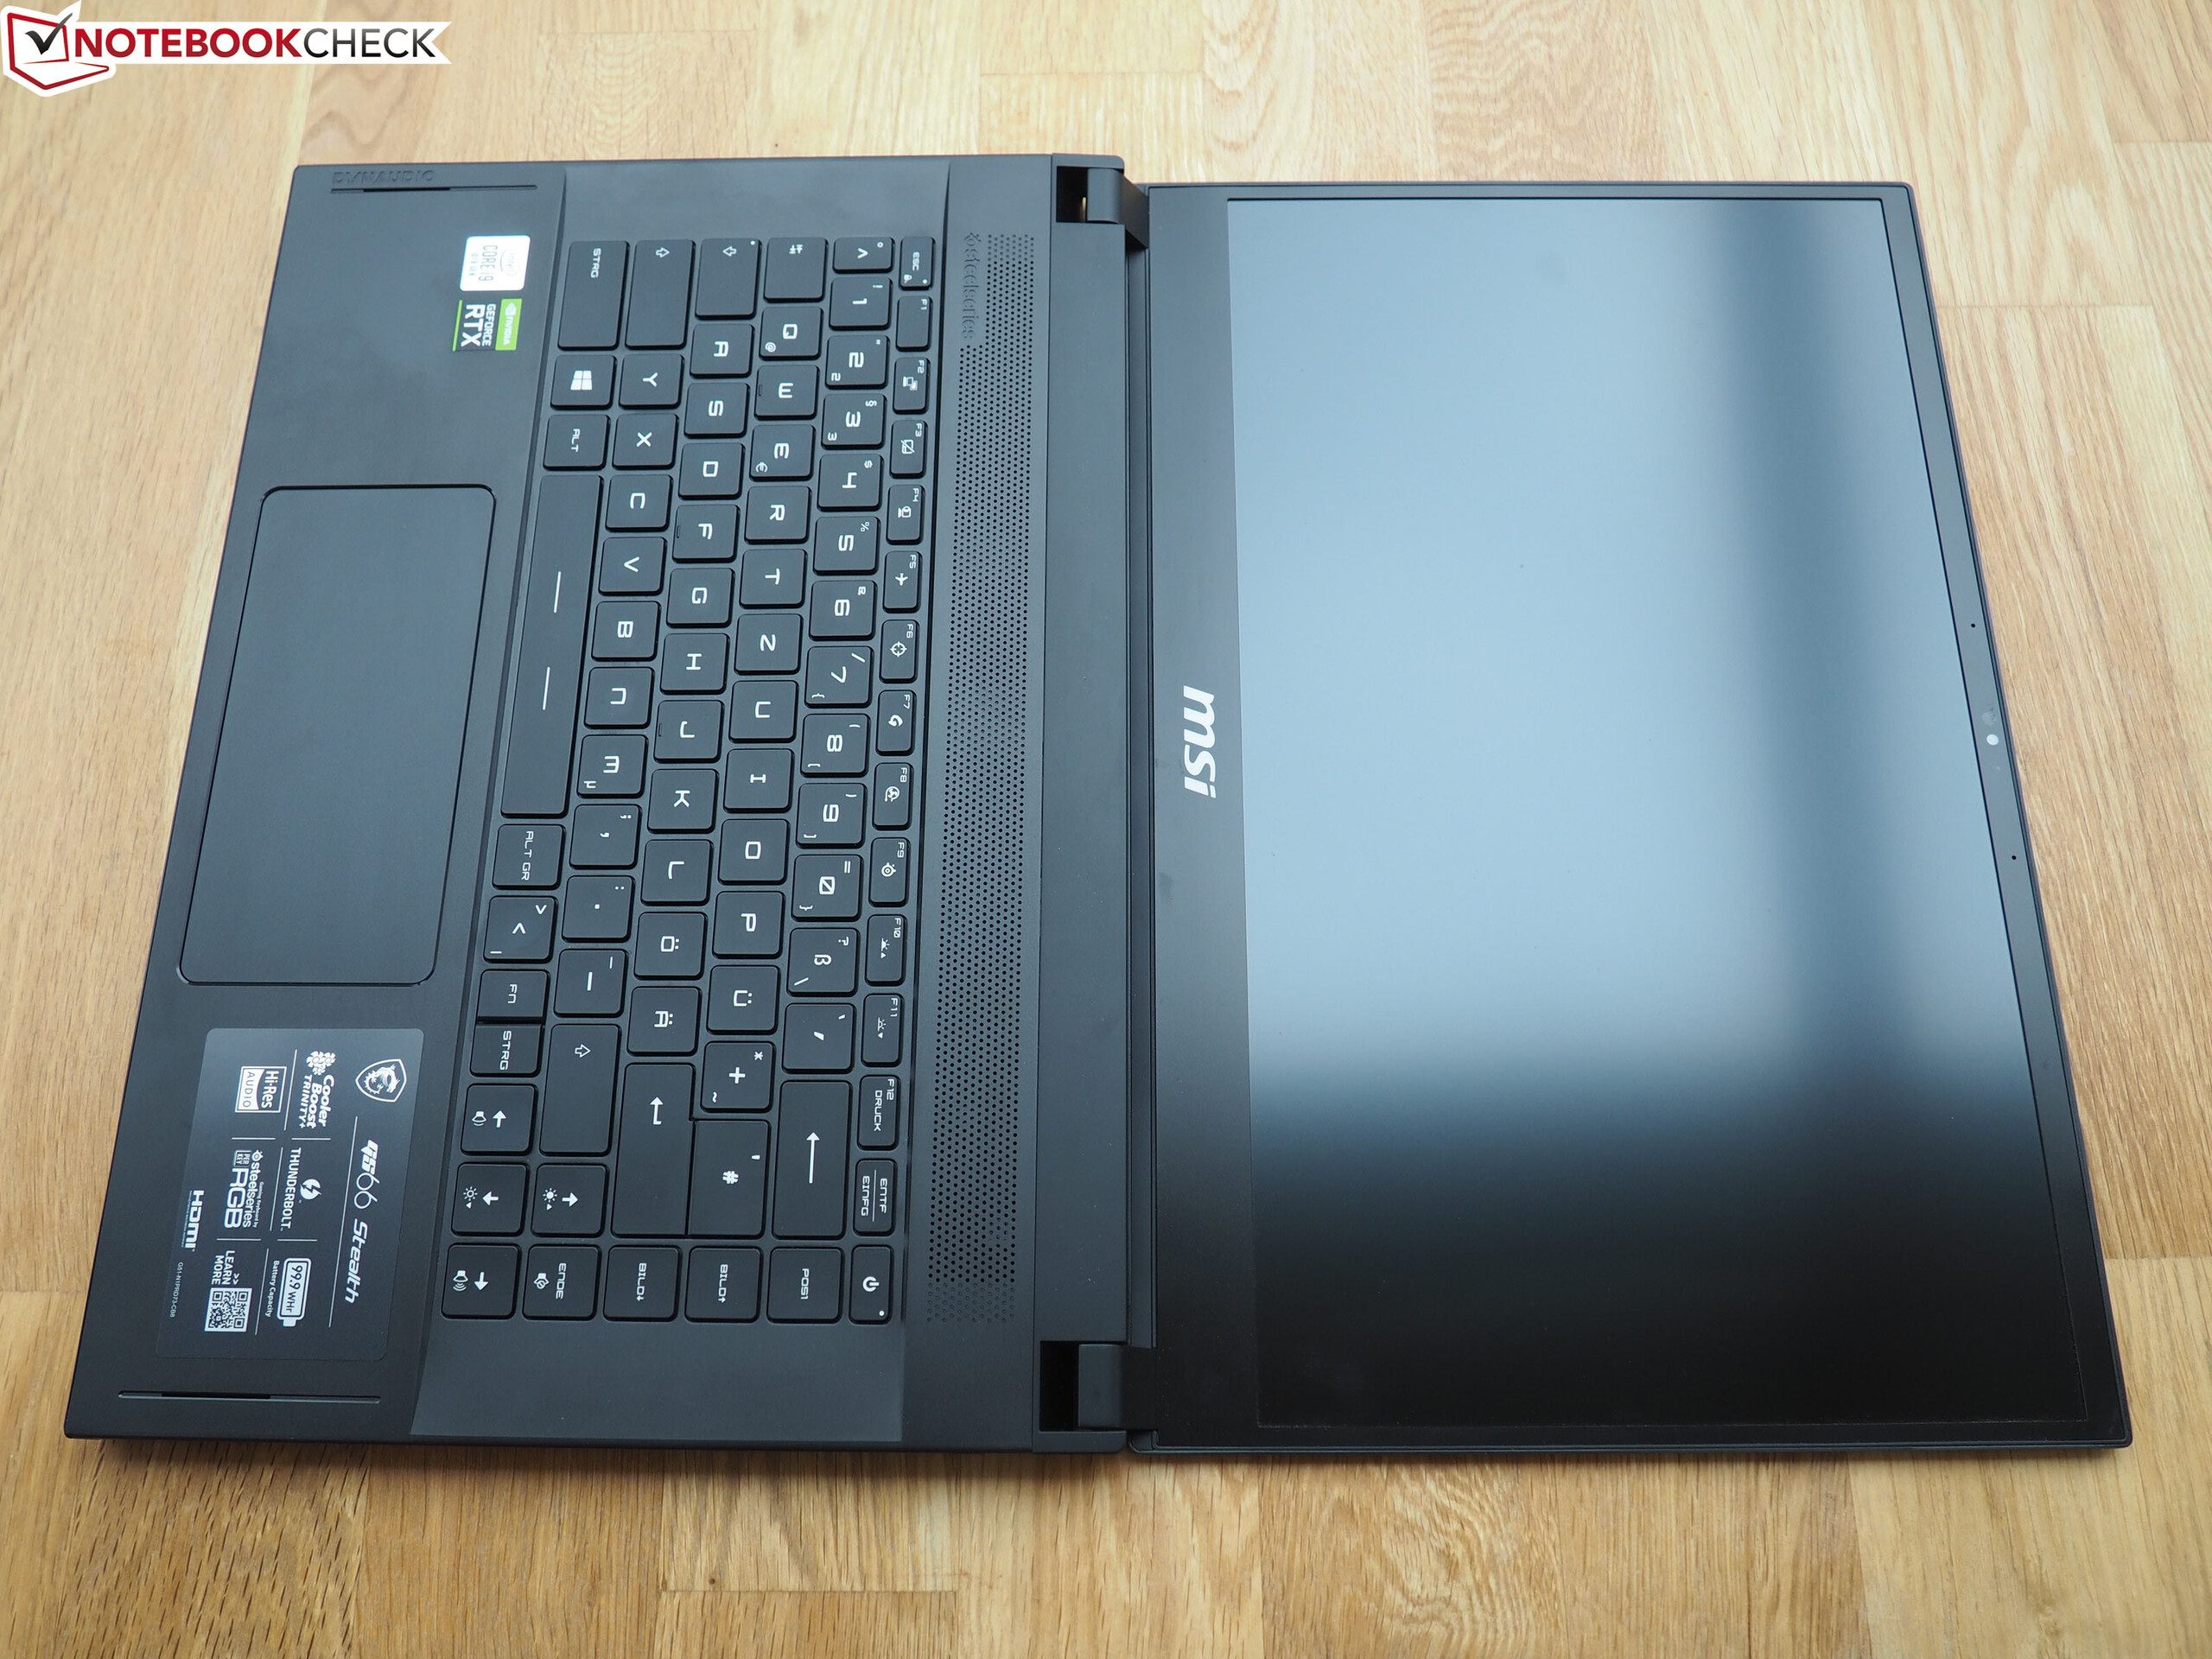
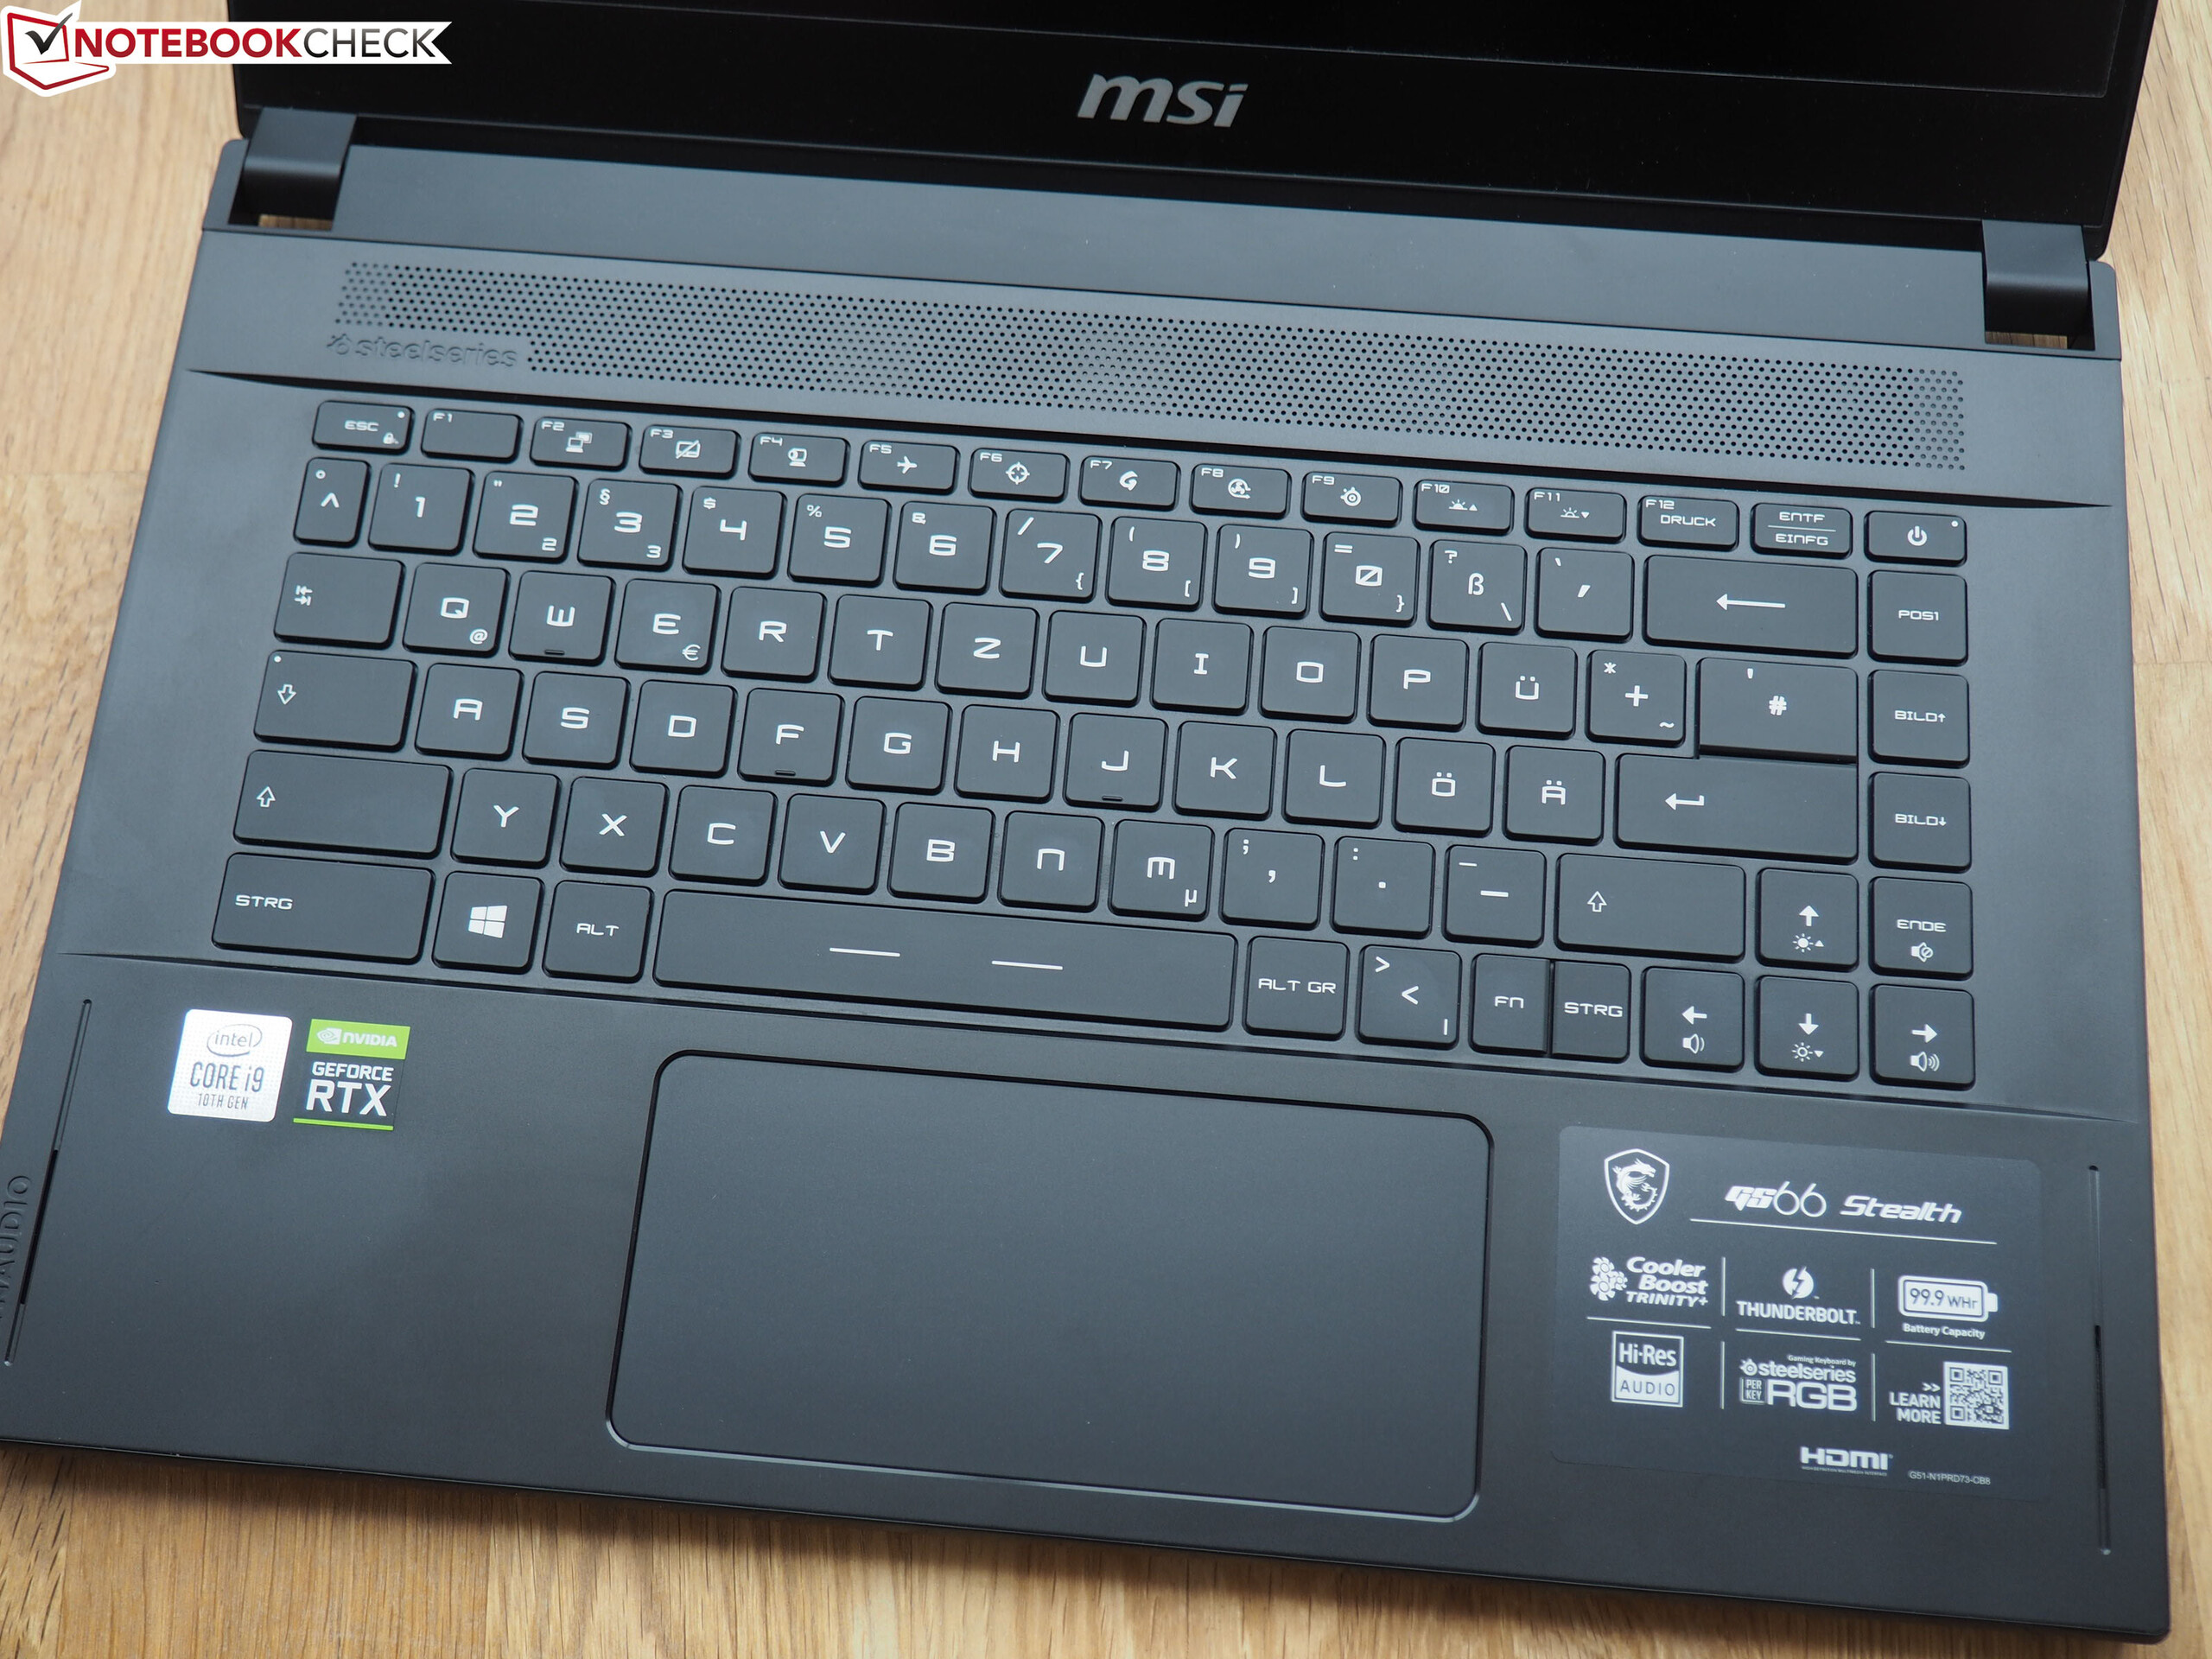
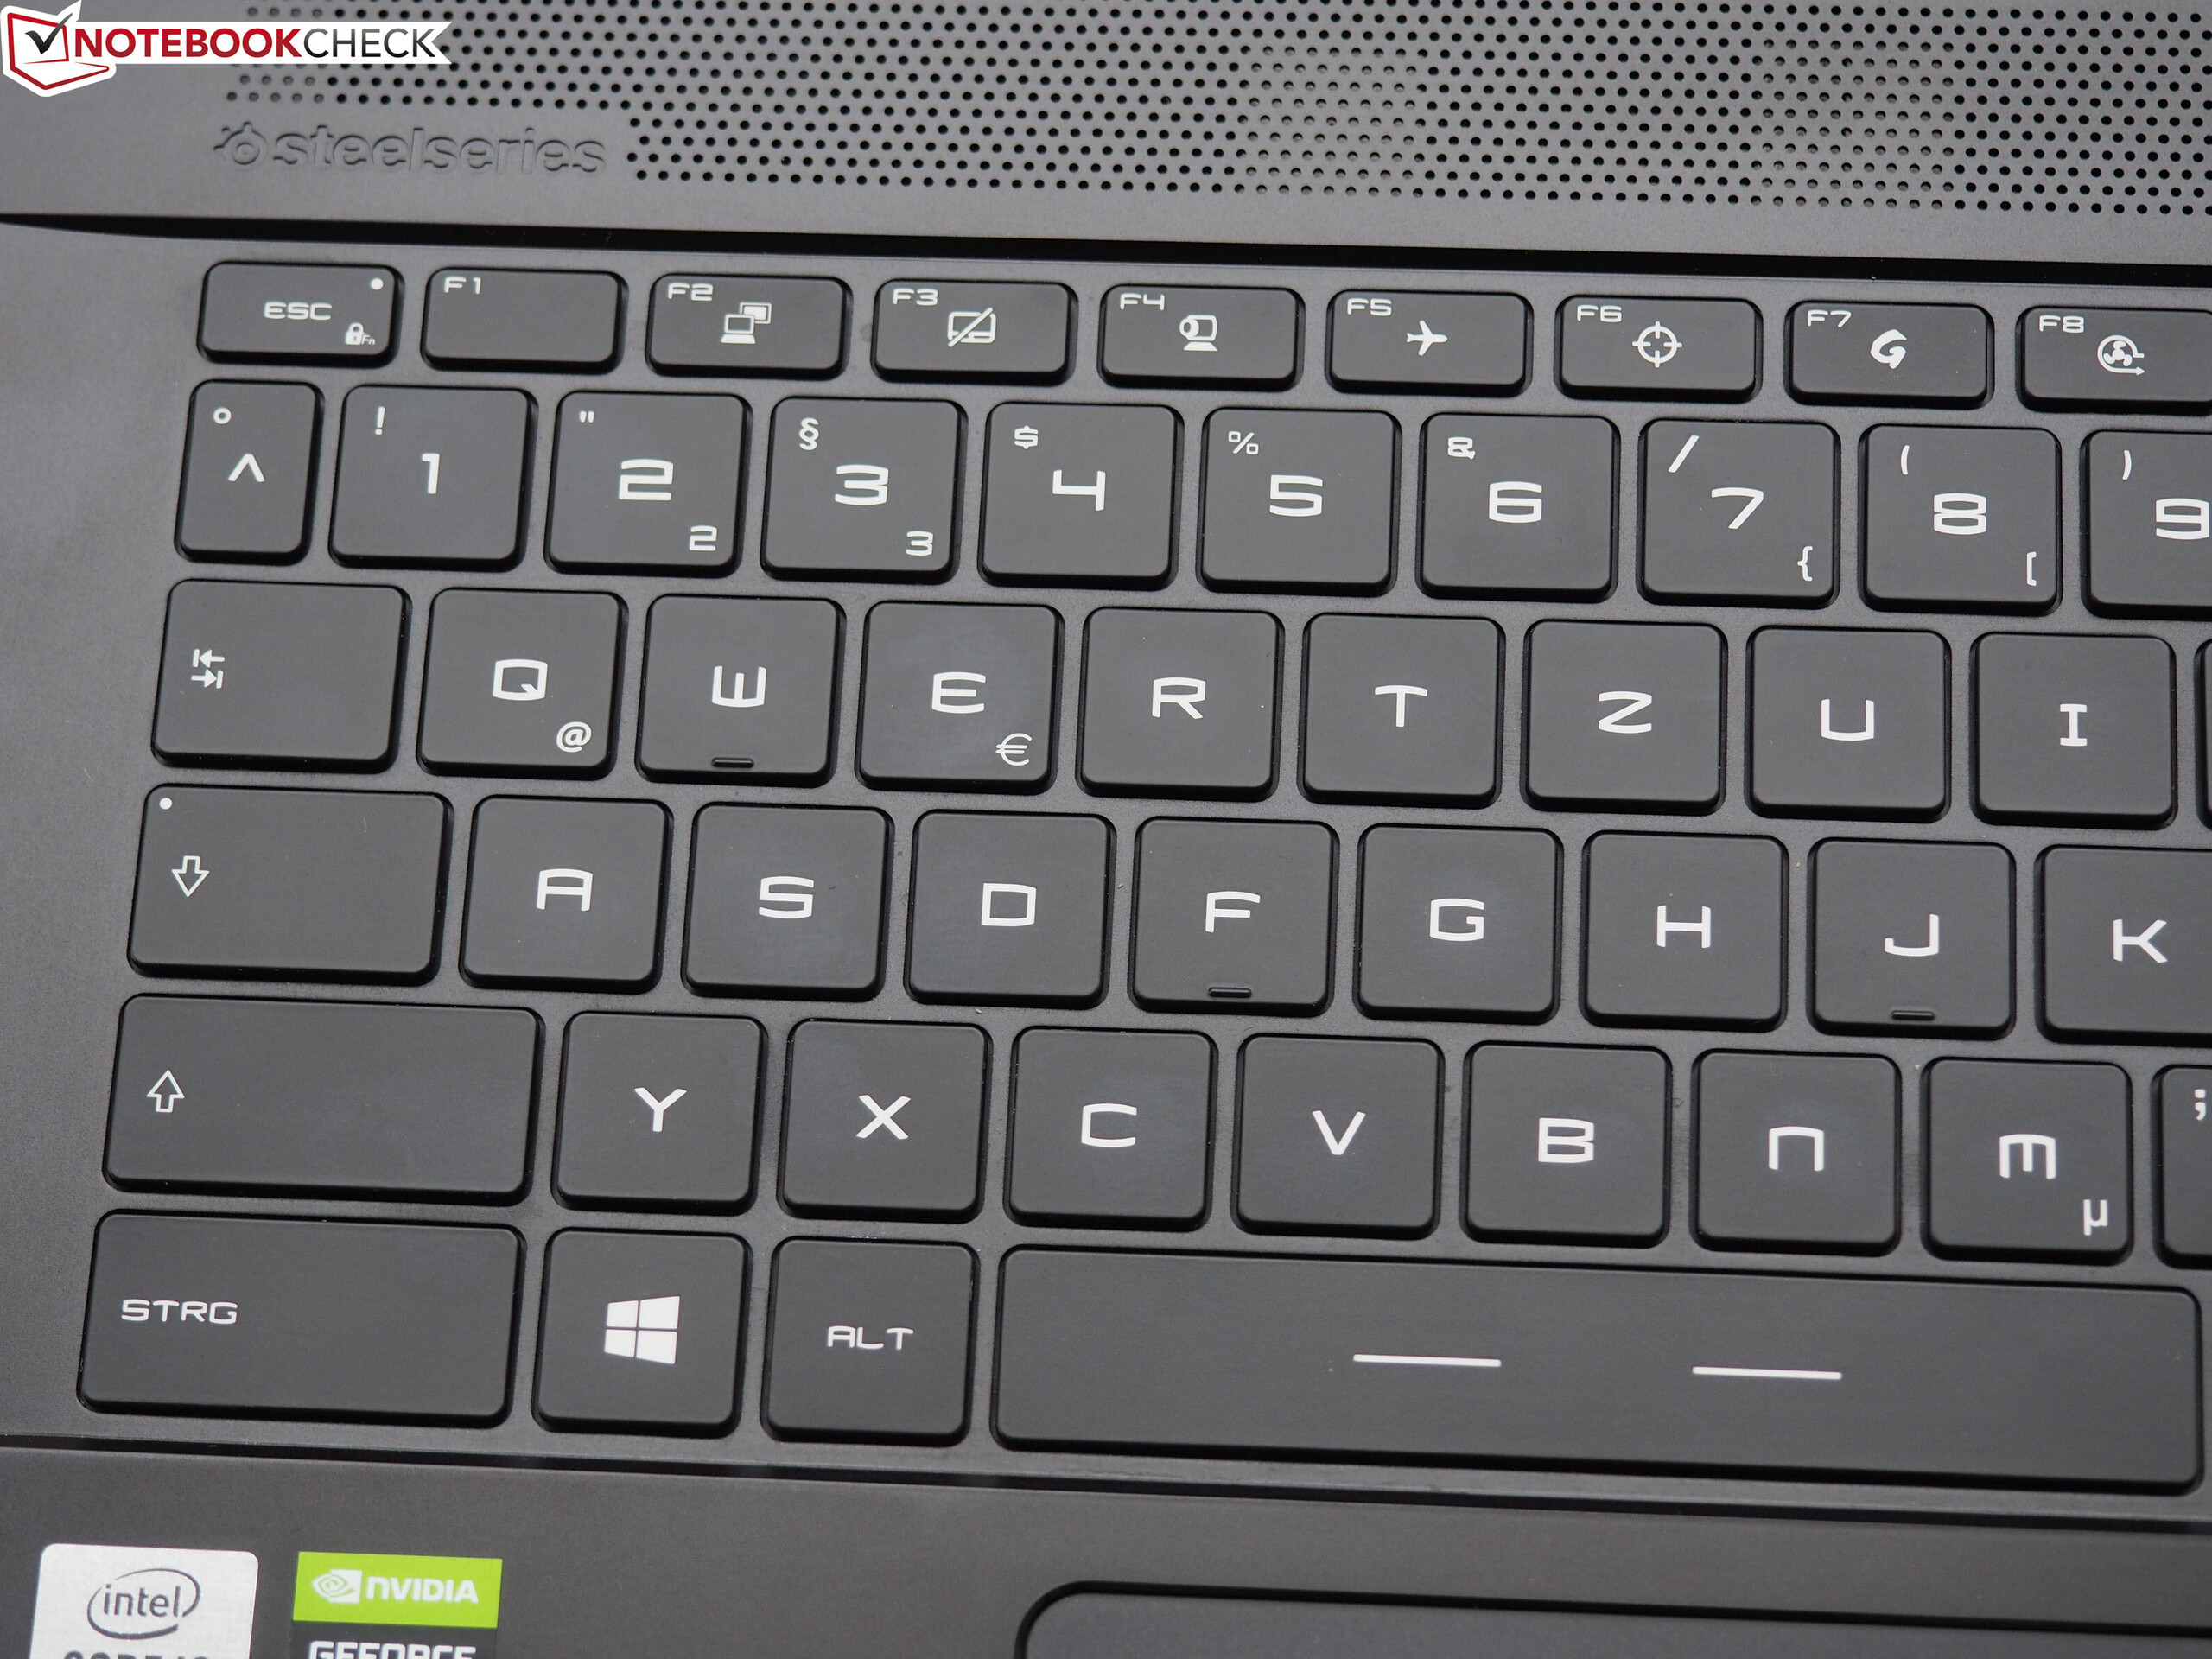
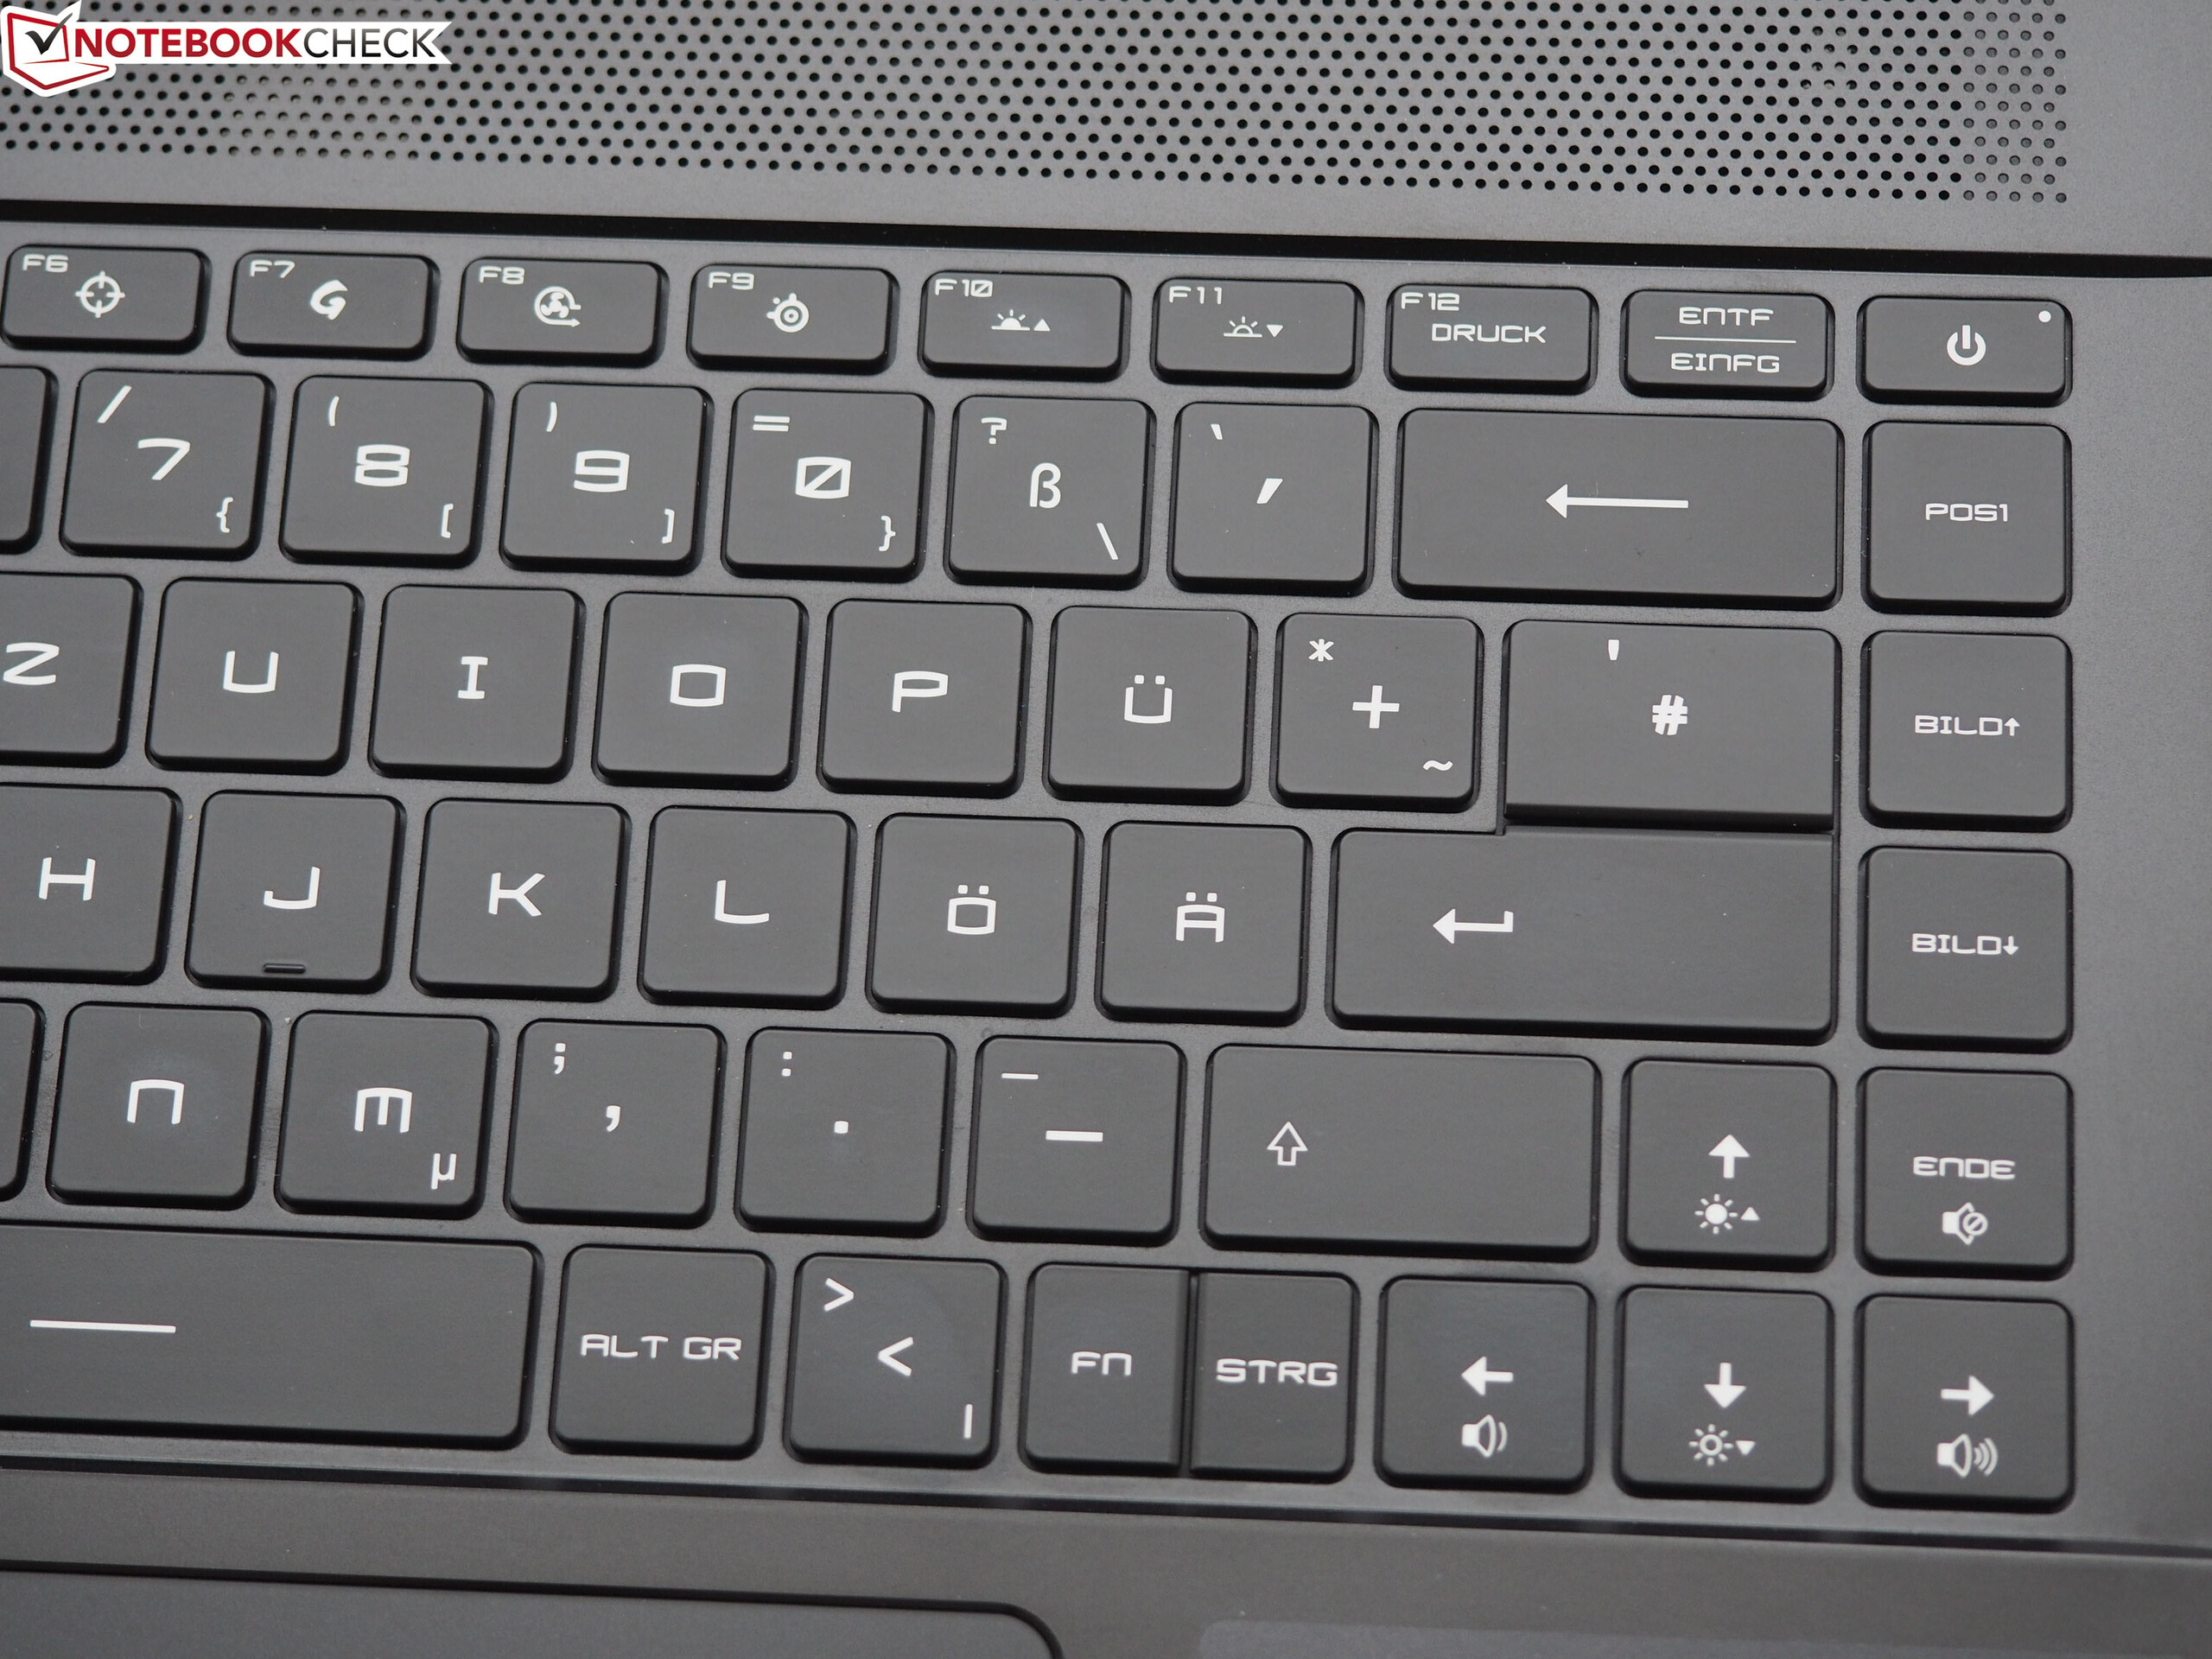
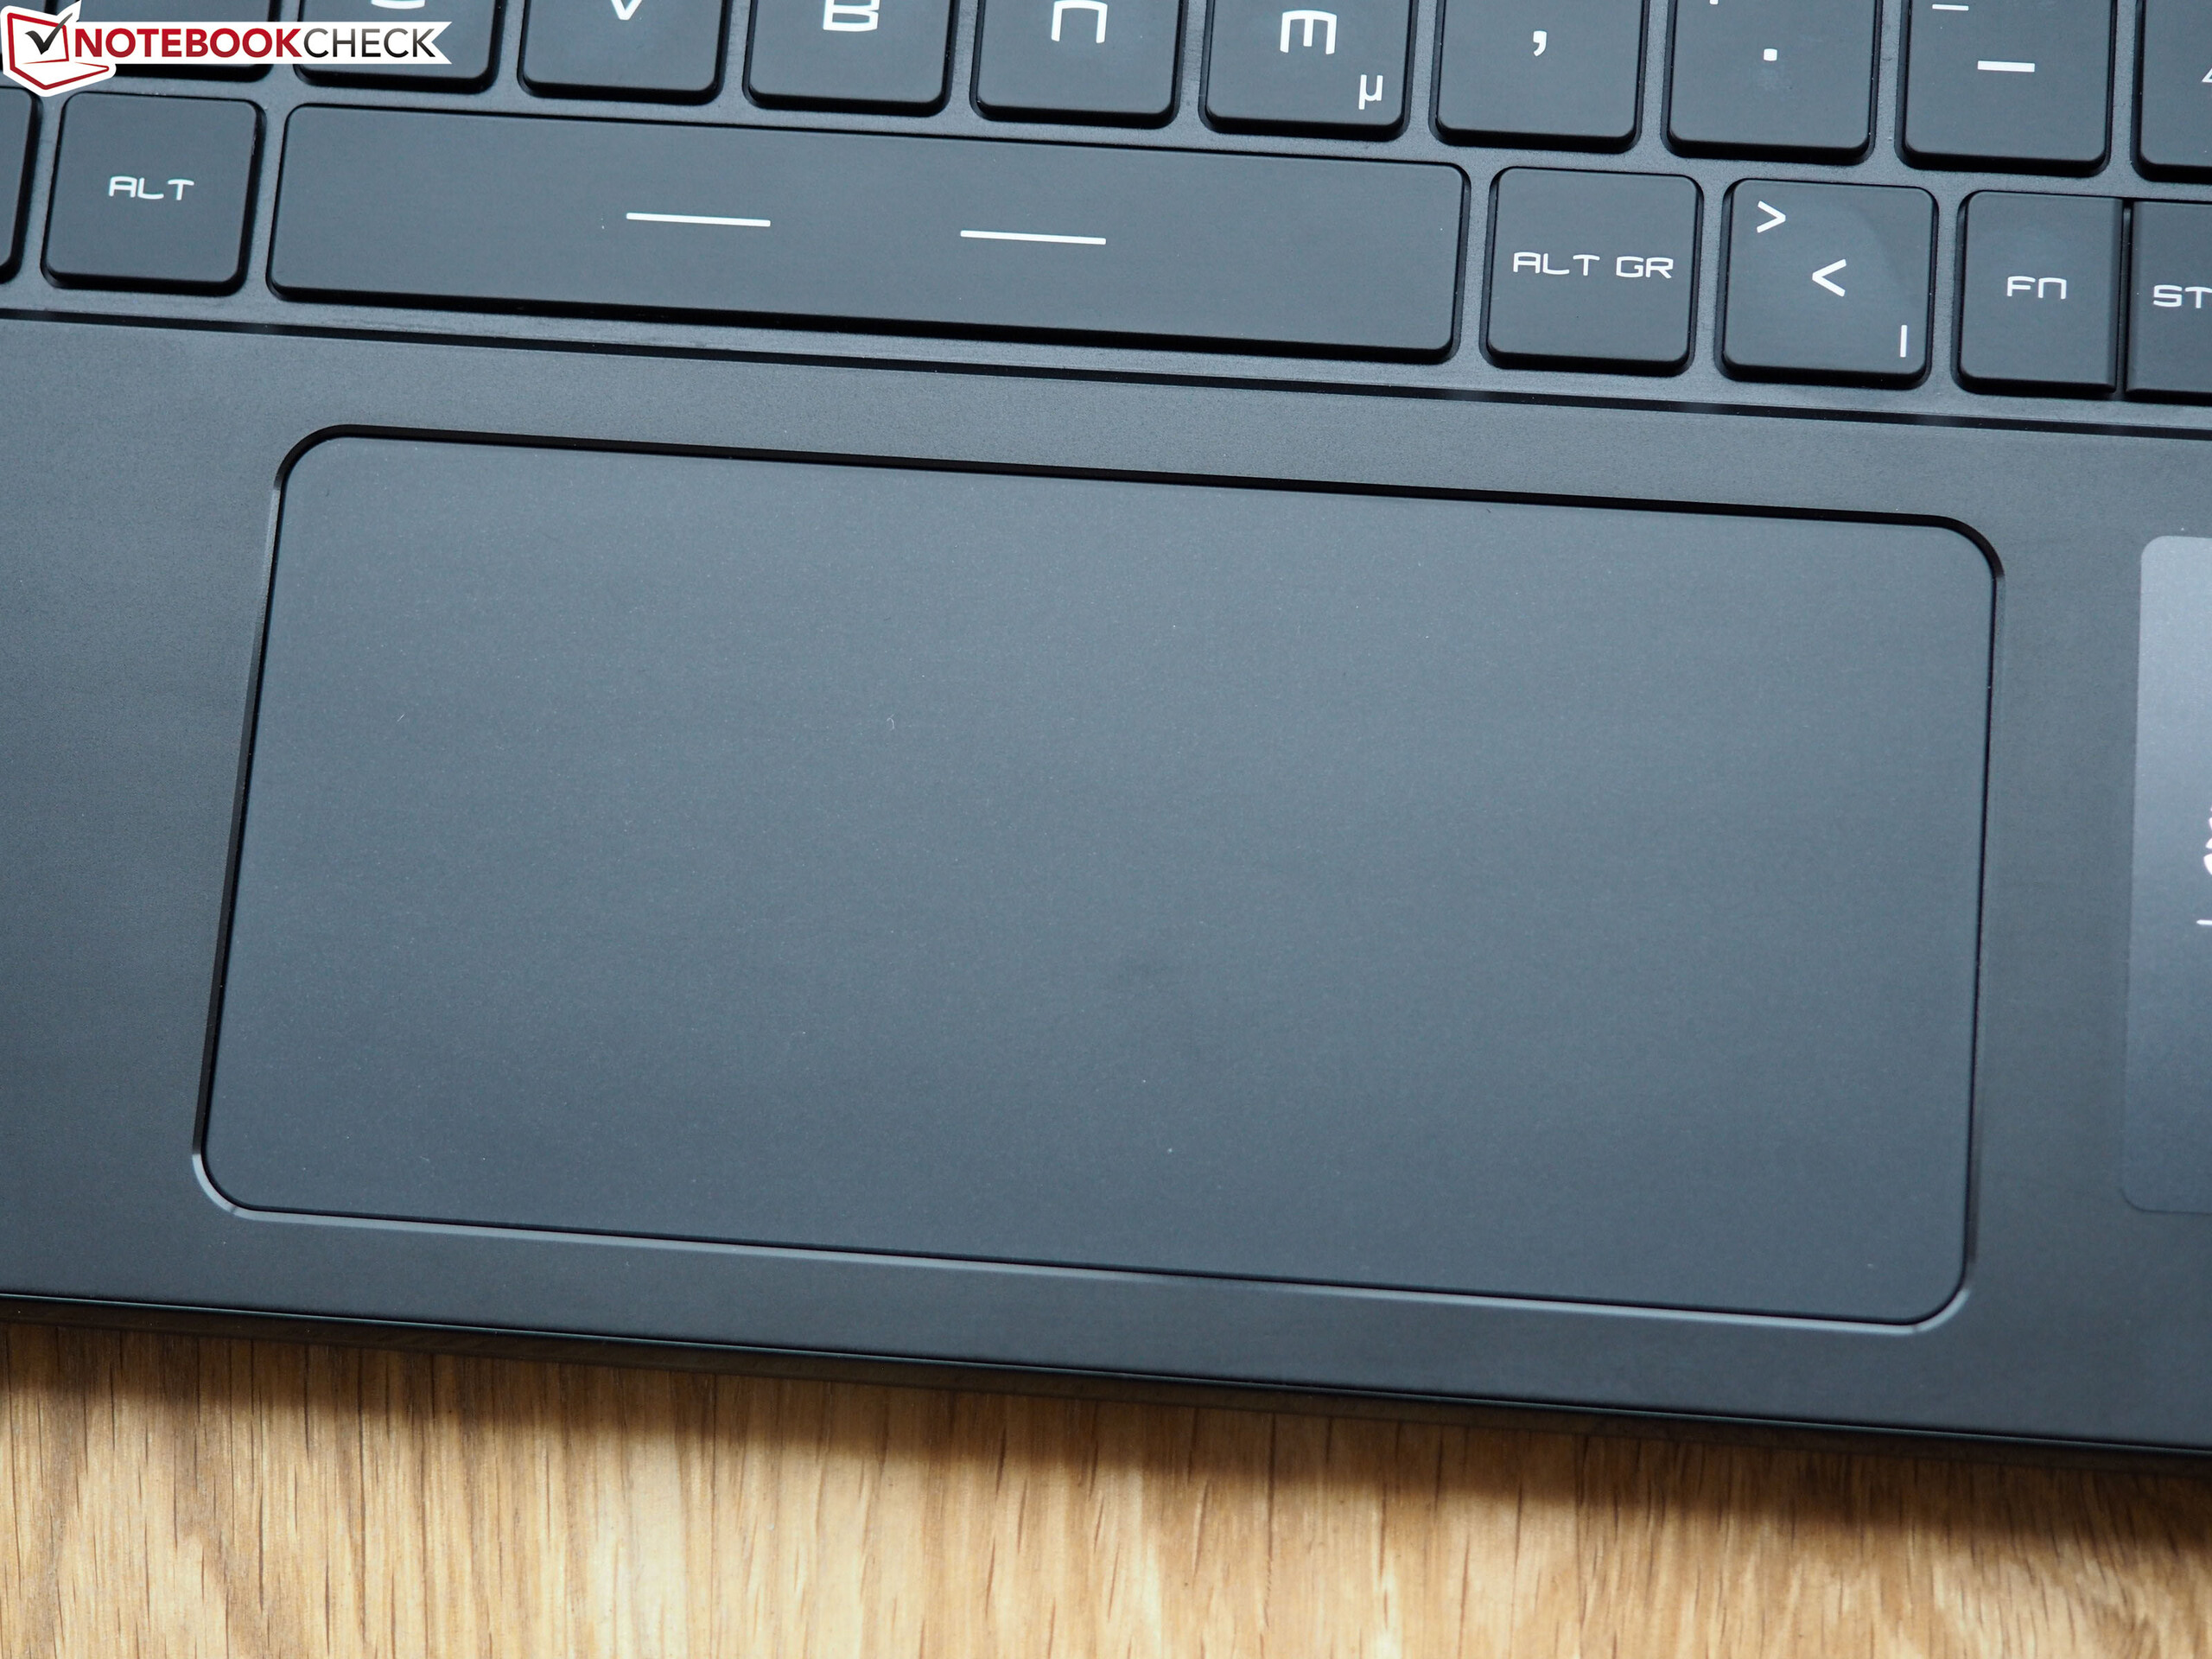
Chiclet klavyenin (RGB aydınlatma) günlük kullanım için uygun olduğu kanıtlanmıştır. Dahası, çok yönlü bağlantı noktası yapılandırması, diğer şeylerin yanı sıra, kapsamlı yerleştirme çözümlerinin veya harici bir GPU'nun bağlanmasına izin veren bir Thunderbolt 3 bağlantı noktası içerir. Pil, Thunderbolt 3 veya USB Type-C 3.2 Gen 2 bağlantı noktaları üzerinden şarj edilemez. 45 watt'lık bir güç adaptörünü taktık, ancak bununla bir şarj işlemini tetikleyemedik.
MSI GS66 Stealth 10SE-045
- 08/05/2020 v7 (old)
Sascha Mölck
Price comparison

