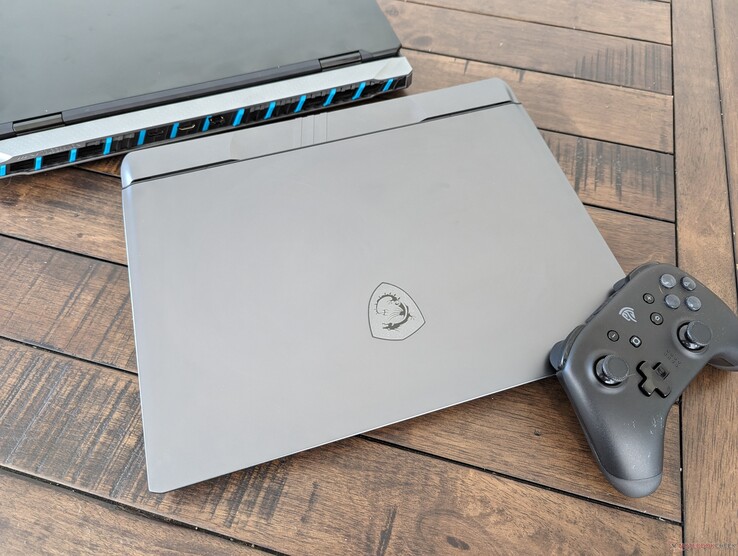
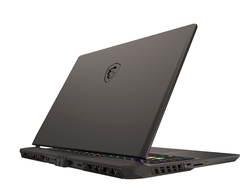
MSI Vector 16 HX dizüstü bilgisayar incelemesi: Titan fiyatı olmadan Titan performansı
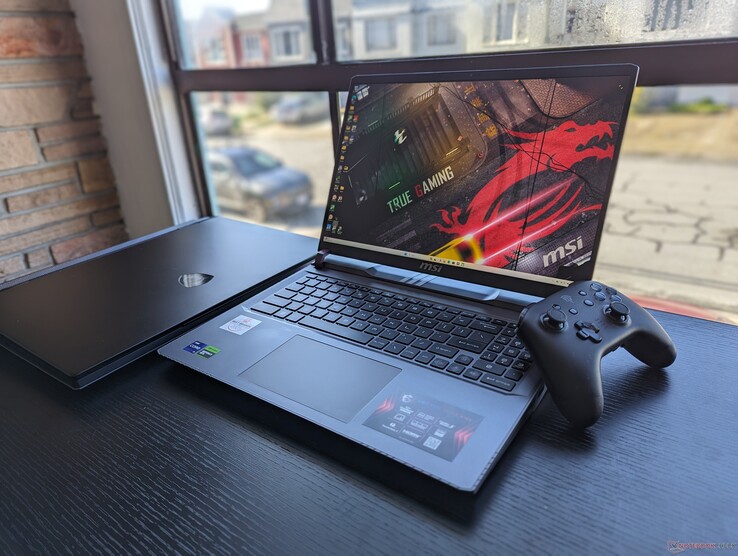
Ölen Maingear Vector ile karıştırılmaması gereken MSI Vector 16 HX, yeni 14. nesil Intel Raptor Lake-HX CPU seçenekleri ve eskiyen 15,6 inç GP66 üzerine revize edilmiş bir kasa tasarımı sunarak geçen yılki GP68'in yerini alıyor. Model bu yılın başlarında CES 2024'te MSI Claw ve Titan 18 HX gibi bir dizi başka duyuruyla birlikte görücüye çıktı.
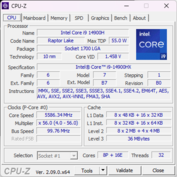
İnceleme birimimiz Core i9-14900HX CPU, 175
GeForce RTX 4080 GPU ve 1600p 240 Hz IPS ekran ile yaklaşık 2700 USD perakende satış fiyatına sahip üst düzey bir yapılandırmadır. Diğer konfigürasyonlar RTX 4090, 4070 veya 4060 grafikler ve 1200p 144 Hz ekran ile bulunabilir, ancak şu anda tüm seçenekler aynı Core i9-14900HX CPU'yu içeriyor.Vector 16 HX'in alternatifleri arasında diğer orta ve üst seviye 16 inç oyun dizüstü bilgisayarları yer alıyor Lenovo Legion 5i 16,Asus TUF Gaming A16 , Alienware m16 R1veya HP Omen 16.
Daha fazla MSI incelemesi:
Karşılaştırmalı olarak olası rakipler
Derecelendirme | Tarih | Modeli | Ağırlık | Yükseklik | Boyut | Çözünürlük | Fiyat |
|---|---|---|---|---|---|---|---|
| 88 % v7 (old) | 02/2024 | MSI Vector 16 HX A14V i9-14900HX, GeForce RTX 4080 Laptop GPU | 2.7 kg | 28.55 mm | 16.00" | 2560x1600 | |
| 86.9 % v7 (old) | MSI Vector GP66 12UGS i9-12900H, GeForce RTX 3070 Ti Laptop GPU | 2.3 kg | 23.4 mm | 15.60" | 1920x1080 | ||
| 89.1 % v7 (old) | 02/2024 | Lenovo Legion 5 16IRX G9 i7-14650HX, GeForce RTX 4060 Laptop GPU | 2.4 kg | 25.2 mm | 16.00" | 2560x1600 | |
| 85.1 % v7 (old) | 09/2023 | HP Victus 16-r0077ng i7-13700H, GeForce RTX 4070 Laptop GPU | 2.4 kg | 24 mm | 16.10" | 1920x1080 | |
| 86.9 % v7 (old) | 06/2023 | Asus TUF Gaming A16 FA617XS R9 7940HS, Radeon RX 7600S | 2.2 kg | 22.1 mm | 16.00" | 1920x1200 | |
| 86.1 % v7 (old) | 01/2023 | Dell G16 7620 i7-12700H, GeForce RTX 3060 Laptop GPU | 2.6 kg | 26.9 mm | 16.00" | 2560x1600 |
Kasa - Güçlü, Ama Gösterişli Değil
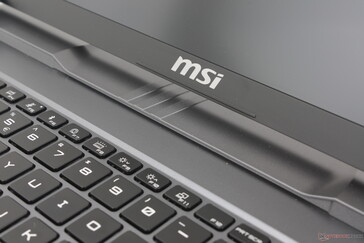
Metal alaşımlı dış kapağın yanı sıra, tabanın çoğu daha pahalı Titan HX ile karşılaştırıldığında daha az lüks bir deneyim için plastiktir. Vector serisinin en üst seviye olması beklenmiyor, ancak yine de ~2000$'lık fiyatı göz önüne alındığında biraz daha fazlasını bekliyoruz. Klavyesi ve alt paneli Razer Blade 16 ya da Titan HX gibi alternatiflerin premium hissinden yoksun Alienware m16 R1.
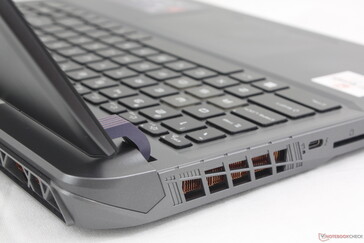
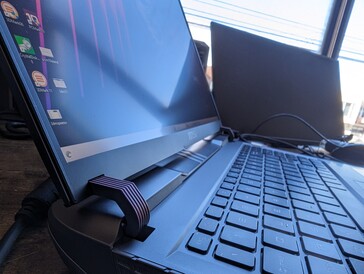
Neyse ki, kasa sertliği diğer dizüstü bilgisayarlarda belirgin şekilde daha zayıf olma eğiliminde olan kapak da dahil olmak üzere yukarıdan aşağıya mükemmel. Özellikle yeniden tasarlanan menteşeler, artık eskisinden çok daha büyük ve daha sağlam ve dizüstü bilgisayardaki menteşeleri anımsatıyor Asus Strix Scar 17. Ancak eğrilikleri, ekranı açabileceğiniz maksimum açıyı yalnızca 130 derece ile sınırlar.
Top 10
» Top 10 Multimedia Notebook listesi
» Top 10 oyun notebooku
» Top 10 bütçeye uygun Ofis/İş Notebook Listesi
» Top 10 Premium Ofis/İş notebookları
» Top 10 Çalışma istasyonu laptopları
» Top 10 Subnotebook listesi
» Top 10 Ultrabooklar
» En iyi 10 dönüştürülebilir modeli
» Seçimi en iyi 10 tablet
» Notebookcheck Top 10 Windows Tabletleri
» Top 10 Subnotebook listesi
» NotebookCheck tarafından incelenen en iyi Notebook ekranları
» Notebookcheck'in 500 Euro altındaki en iyi 10 Notebook listesi
» NotebookCheck tarafından seçilen 300 Euro altındaki en iyi 10 Notebook
» Notebookcheck'in 500 Euro altındaki en iyi 10 Notebook listesi
» Notebookcheck'in Top 10 akıllı telefon listesi
» Notebookcheck'in Top 10 hafif oyun notebookları
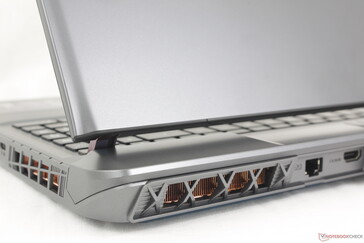
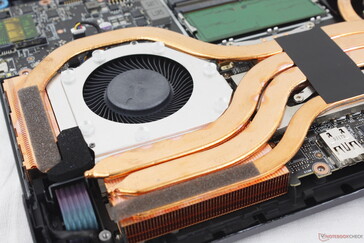
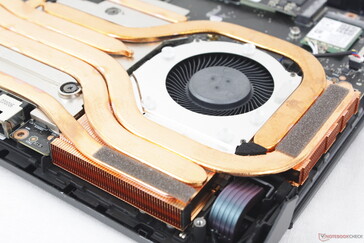
Vector 16 HX büyük bir dizüstü bilgisayar ve bundan kaçış yok. İddialı 175 W TGP hedefi (veya CPU ile birleştirildiğinde 240 W), diğer 16 inçlik modellerin çoğundan daha güçlü bir soğutma çözümü ve daha büyük kasa tasarımı gerektiriyor. MSI, geçen yılki modelden bile daha büyük ve ağır Dell G16 7620 ki zaten oldukça büyüktü. Neyse ki 18 inçlik Razer Blade 18 kadar ağır değil veya Asus ROG Strix Scar 18ama tam olarak taşınabilir de değil.
Bağlanabilirlik
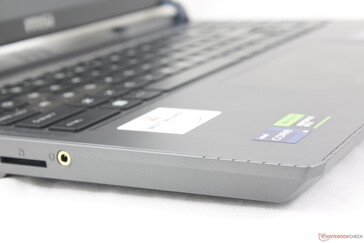
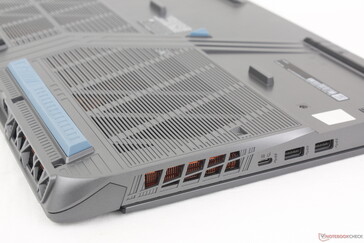
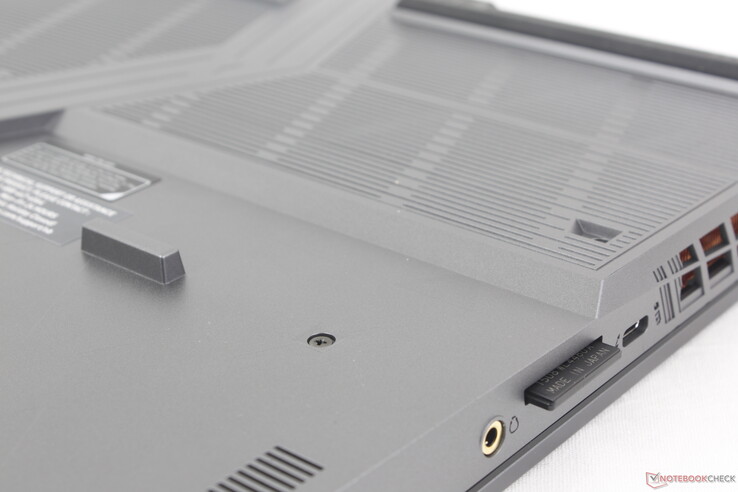
MSI, GP66 ile karşılaştırıldığında bağlantı noktalarını revize etti. Vector 16 HX'in yenilikleri arasında SD kart okuyucu ve uygun Thunderbolt desteğine sahip ek USB-C bağlantı noktaları yer alıyor. Buna karşılık, yeni modelde daha az USB-A bağlantı noktası var ve özel mini-DisplayPort'u bırakmış. Bu hala Dell G16 veya Asus TUF Gaming A16 daha az USB-C bağlantı noktasına sahip olan veya SD kart okuyucusu olmayan.
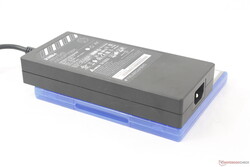
AC adaptör boyutları farklı olsa da AC adaptör bağlantı noktasının Titan 18 HX'teki ile aynı olduğunu unutmayın.
SD Kart Okuyucu
Entegre SD kart okuyucusundan aktarım hızları, yeni SD kart okuyucusunda bulunan kart okuyucusundan 2 ila 3 kat daha hızlı olacak şekilde yaklaşık 90 MB/sn'dir Lenovo Legion 5 16. Bununla birlikte, MSI üzerindeki okuyucu yaylı değildir ve bu nedenle takılan bir SD kartı büyük parmaklarla çıkarmak zor olabilir.
| SD Card Reader | |
| average JPG Copy Test (av. of 3 runs) | |
| MSI Vector 16 HX A14V (Toshiba Exceria Pro SDXC 64 GB UHS-II) | |
| Lenovo Legion 5 16IRX G9 | |
| maximum AS SSD Seq Read Test (1GB) | |
| MSI Vector 16 HX A14V (Toshiba Exceria Pro SDXC 64 GB UHS-II) | |
| Lenovo Legion 5 16IRX G9 | |
İletişim
Wi-Fi 7 yönlendiriciler henüz yaygınlaşmamış olsa da Killer BE1750x, Wi-Fi 7 ve Bluetooth 5.4 ile uyumludur. Bu nedenle, günümüzde çoğu kullanıcı Wi-Fi 7 yönlendiricisine sahip olmadığından, dahil edilmesi daha çok geleceğe yöneliktir. Yine de Asus AXE11000 Wi-Fi 6E test yönlendiricimizle eşleştirildiğinde aktarım hızları istikrarlı ve güvenilirdir.
| Networking | |
| iperf3 transmit AX12 | |
| MSI Vector GP66 12UGS | |
| iperf3 receive AX12 | |
| MSI Vector GP66 12UGS | |
| iperf3 transmit AXE11000 | |
| Lenovo Legion 5 16IRX G9 | |
| MSI Vector 16 HX A14V | |
| Dell G16 7620 | |
| Asus TUF Gaming A16 FA617XS | |
| HP Victus 16-r0077ng | |
| iperf3 receive AXE11000 | |
| Lenovo Legion 5 16IRX G9 | |
| MSI Vector 16 HX A14V | |
| Dell G16 7620 | |
| Asus TUF Gaming A16 FA617XS | |
| HP Victus 16-r0077ng | |
| iperf3 transmit AXE11000 6GHz | |
| MSI Vector 16 HX A14V | |
| iperf3 receive AXE11000 6GHz | |
| MSI Vector 16 HX A14V | |
Web kamerası
Vector sık sık video konferans yapmak için tasarlanmadığından entegre web kamerası 1 MP gibi düşük bir değere sahip. IR de desteklenmiyor, ancak en azından gizlilik amacıyla fiziksel bir deklanşör içeriyor.
Bakım
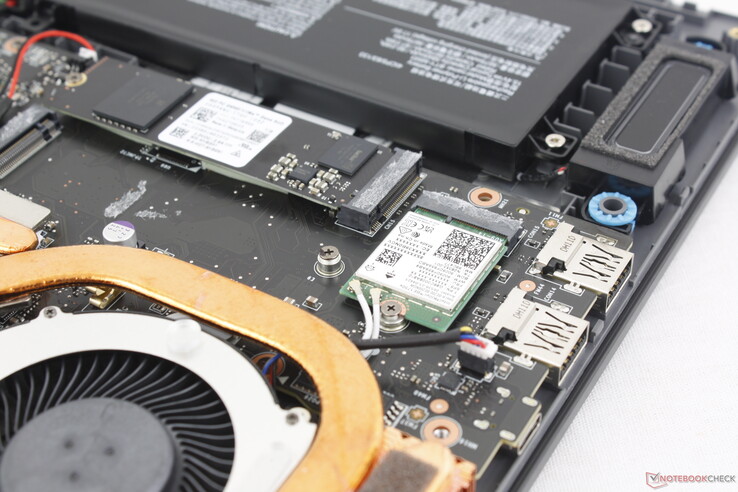
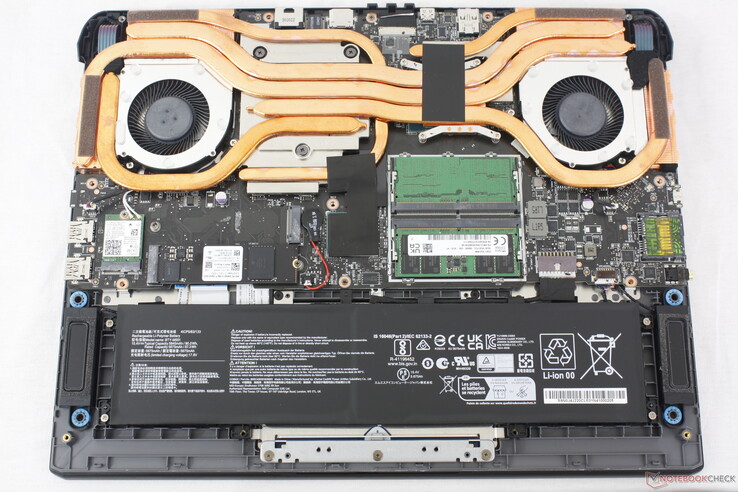
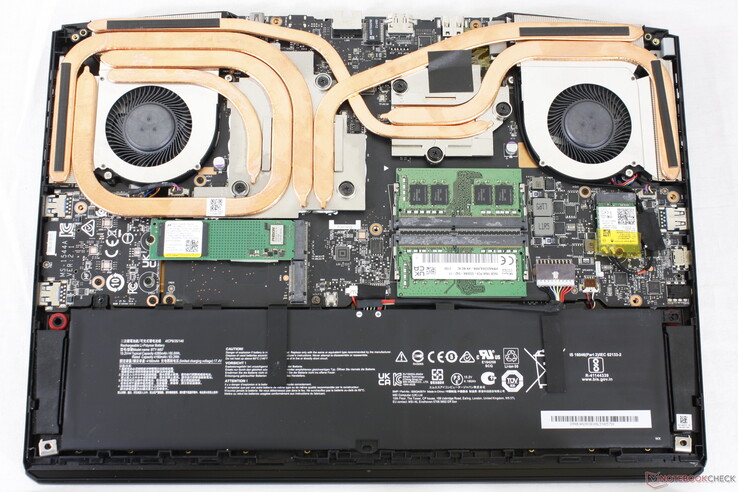
Alt panel 13 Phillips vida ile sabitlenmiştir. Ne yazık ki, kenar ve köşeler işlemi olması gerekenden daha zahmetli hale getirecek önemli kıvrımlara sahip olduğundan paneli çıkarmak zor olabilir. Karşılaştırmak gerekirse, alt panel Razer Blade 16 çok daha düzdür ve daha kolay çıkarılması için daha az mandal içerir. Vector 16 HX'e bakım yaparken düz bir kenar kullanılması tavsiye edilir.
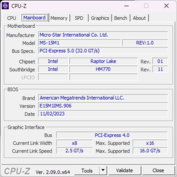
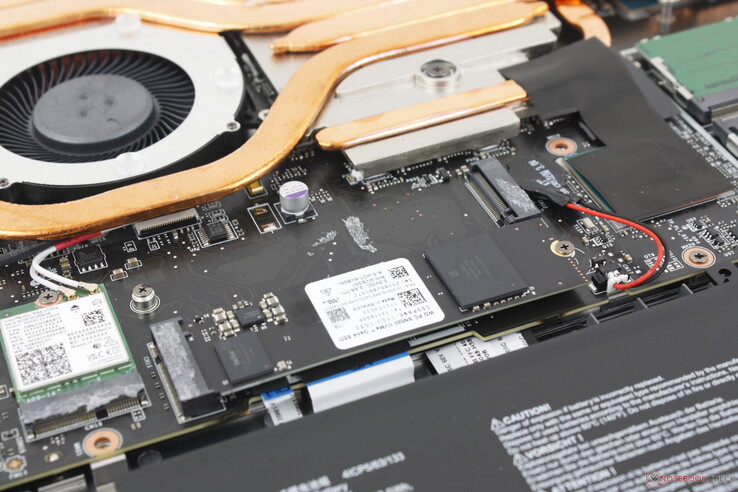
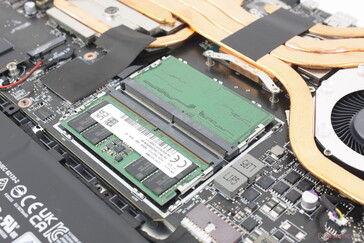
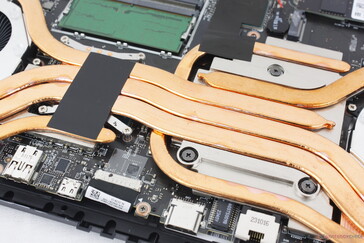
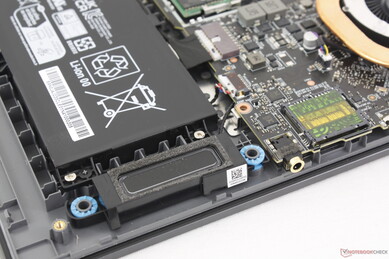
Kullanıcılar içeriye girdiklerinde tıpkı eski Vector GP66 tasarımında olduğu gibi 2x M.2 depolama yuvasına, 2x SODIMM yuvasına, bataryaya ve WLAN modülüne erişebilecekler.
Aksesuarlar ve Garanti
Kutuda AC adaptörü ve evraklar dışında herhangi bir ekstra ürün bulunmamaktadır. ABD'de satın alındıysa normal bir yıllık sınırlı üretici garantisi geçerlidir.
Giriş Aygıtları - Basit ve İşlevsel
Klavye
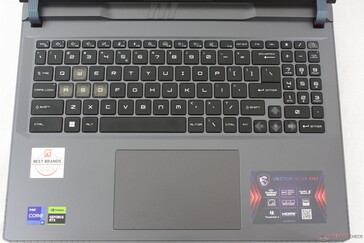
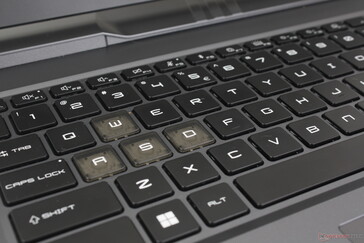
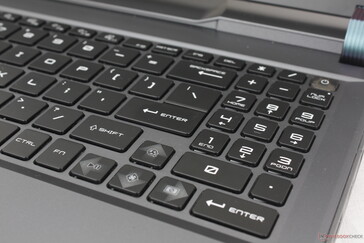
MSI, eski modellere kıyasla klavye düzenini yeniledi Vektör GP66 tasarım. GP66'daki garip Fn/Ctrl tuşları artık düzgün bir şekilde ayrılmıştır ve diğer birçok oyun dizüstü bilgisayarı tipik olarak numpad'i tamamen atlarken yeni bir numpad de vardır. Ne yazık ki, Ok tuşları eskisinden daha küçük ve dar numpad tuşlarının kullanımı çok rahat değil. Bu nedenle, daha büyük ve daha rahat QWERTY tuşlarıyla karşılaştırıldığında sonradan düşünülmüş gibi hissettiriyorlar.
Tuş başına RGB aydınlatma, tüm tuşları ve sembolleri aydınlatmak için standart olarak geliyor.
Dokunmatik yüzey
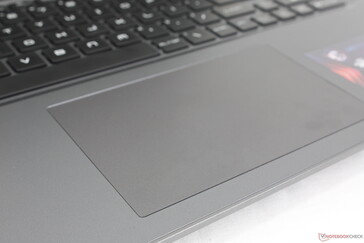
Yaklaşık 13,2 x 8,2 cm boyutlarındaki clickpad, Dell G16 7620 (10,5 x 6 cm) ve eski Vector GP66'ya (10,5 x 6,5 cm) kıyasla daha geniş. Çekiş çok yumuşak ve düşük hızlarda kayarken sadece çok hafif bir takılma oluyor. Aşağı bastırırken geri bildirim de nispeten sessiz takırtıya rağmen oldukça sağlam. Oyun dizüstü bilgisayarlarında tıklama pedleri genellikle vasatın altındadır, ancak Vector 16 HX'te oldukça büyük ve yarı iyi bir tane görmekten memnunuz.
Ekran - G-Sync'siz Tüm IPS
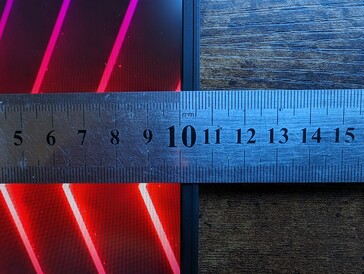
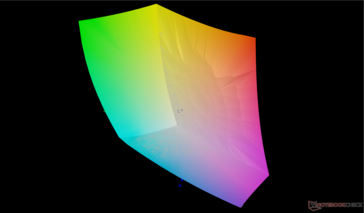
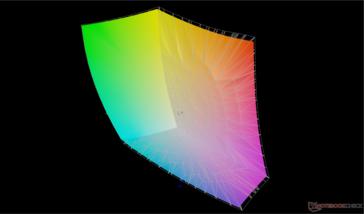
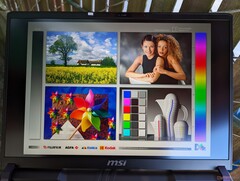
Bu, veritabanımızda üst düzey Chi Mei N160GME-GTB panel ile gönderilen ilk sistemdir. Özellikleri, yakın zamanda piyasaya sürülen NE160QDM-NZ3'e çok benziyor Lenovo Legion 5 16 ancak kayda değer bir gelişme var: sadece sRGB yerine tam DCI-P3 kapsamı. Bunun dışında kullanıcılar Lenovo makinede olduğu gibi aynı 240 Hz doğal yenileme hızı, ~1300:1 kontrast oranı ve hızlı tepki süreleri bekleyebilirler.
Vector 16 HX'in mevcut tüm konfigürasyonlarında G-Sync'in bulunmaması dikkat çekiyor. Yenileme hızı da 60 Hz veya 240 Hz'de sabitken, değişken yenileme hızına sahip paneller yaygınlaşıyor.
Daha ucuz olan 1200p 144 Hz yapılandırmasının parlaklık, renkler ve daha fazlası açısından 1600p 240 Hz yapılandırmamızdan muhtemelen farklı özelliklere sahip olacağını unutmayın.
| |||||||||||||||||||||||||
Aydınlatma: 83 %
Batarya modunda parlaklık: 557.2 cd/m²
Kontrast: 1359:1 (Siyah: 0.41 cd/m²)
ΔE ColorChecker Calman: 2.91 | ∀{0.5-29.43 Ø4.77}
calibrated: 1.63
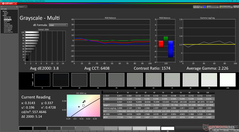
ΔE Greyscale Calman: 3.8 | ∀{0.09-98 Ø5}
85.4% AdobeRGB 1998 (Argyll 3D)
99.7% sRGB (Argyll 3D)
95.4% Display P3 (Argyll 3D)
Gamma: 2.23
CCT: 6408 K
| MSI Vector 16 HX A14V Chi Mei N160GME-GTB, IPS, 2560x1600, 16" | MSI Vector GP66 12UGS BOE NE156FHM-NZ3, IPS, 1920x1080, 15.6" | Lenovo Legion 5 16IRX G9 NE160QDM-NZ3, IPS, 2560x1600, 16" | HP Victus 16-r0077ng CMN162D, IPS, 1920x1080, 16.1" | Asus TUF Gaming A16 FA617XS BOE NE160WUM-NX2, IPS, 1920x1200, 16" | Dell G16 7620 BOE NE16QDM, IPS, 2560x1600, 16" | |
|---|---|---|---|---|---|---|
| Display | -14% | -12% | -17% | -15% | -16% | |
| Display P3 Coverage (%) | 95.4 | 70.1 -27% | 72.4 -24% | 66.7 -30% | 69.3 -27% | 68.3 -28% |
| sRGB Coverage (%) | 99.7 | 99.5 0% | 100 0% | 98 -2% | 97.3 -2% | 98 -2% |
| AdobeRGB 1998 Coverage (%) | 85.4 | 72.1 -16% | 74.1 -13% | 69 -19% | 70.7 -17% | 70.5 -17% |
| Response Times | 7% | -48% | -53% | -81% | -21% | |
| Response Time Grey 50% / Grey 80% * (ms) | 5.7 ? | 5.8 ? -2% | 12.5 ? -119% | 13.3 ? -133% | 15.6 ? -174% | 8.6 ? -51% |
| Response Time Black / White * (ms) | 11.4 ? | 9.6 ? 16% | 8.7 ? 24% | 8.2 ? 28% | 10 ? 12% | 10.4 ? 9% |
| PWM Frequency (Hz) | ||||||
| Screen | -3% | 29% | 17% | 13% | 5% | |
| Brightness middle (cd/m²) | 557.2 | 353.1 -37% | 526 -6% | 308 -45% | 301 -46% | 369.4 -34% |
| Brightness (cd/m²) | 506 | 325 -36% | 500 -1% | 285 -44% | 294 -42% | 348 -31% |
| Brightness Distribution (%) | 83 | 85 2% | 87 5% | 85 2% | 94 13% | 83 0% |
| Black Level * (cd/m²) | 0.41 | 0.38 7% | 0.33 20% | 0.25 39% | 0.21 49% | 0.32 22% |
| Contrast (:1) | 1359 | 929 -32% | 1594 17% | 1232 -9% | 1433 5% | 1154 -15% |
| Colorchecker dE 2000 * | 2.91 | 2.24 23% | 1.2 59% | 1.3 55% | 1.79 38% | 1.78 39% |
| Colorchecker dE 2000 max. * | 5.94 | 5 16% | 2.1 65% | 2.76 54% | 3.48 41% | 4.41 26% |
| Colorchecker dE 2000 calibrated * | 1.63 | 1.02 37% | 1 39% | 0.92 44% | 1.2 26% | 1.22 25% |
| Greyscale dE 2000 * | 3.8 | 4 -5% | 1.3 66% | 1.7 55% | 2.5 34% | 3.2 16% |
| Gamma | 2.23 99% | 2.24 98% | 2.23 99% | 2.167 102% | 2.265 97% | 2.2 100% |
| CCT | 6408 101% | 6864 95% | 6391 102% | 6767 96% | 6157 106% | 6750 96% |
| Toplam Ortalama (Program / Ayarlar) | -3% /
-4% | -10% /
9% | -18% /
-0% | -28% /
-6% | -11% /
-3% |
* ... daha küçük daha iyidir
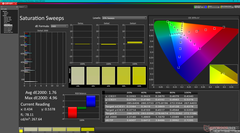
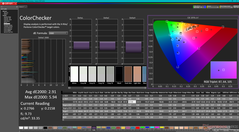
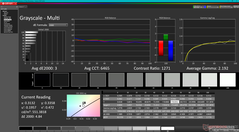
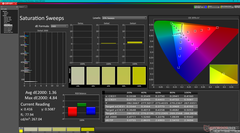
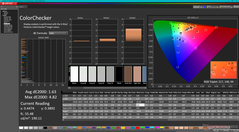
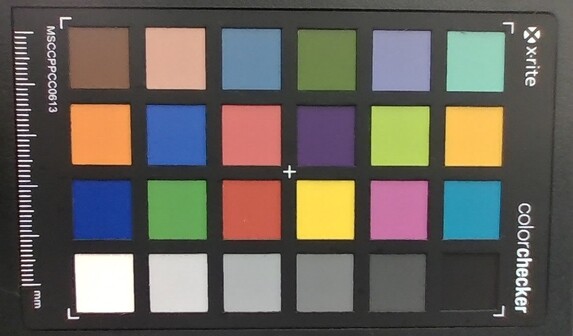
Ekran önceden kalibre edilmemiş olsa da, renkleri zaten nispeten doğru. Ortalama gri tonlama ve renk deltaE değerleri P3 standardına göre sırasıyla yalnızca 3,8 ve 2,91'dir. Kalibre edilmiş ICM profilimiz, deltaE <2 standardına daha yakın doğruluğu artırmak için yukarıda ücretsiz olarak mevcuttur.
Yanıt Sürelerini Görüntüle
| ↔ Tepki Süresi Siyahtan Beyaza | ||
|---|---|---|
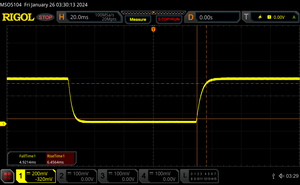
| 11.4 ms ... yükseliş ↗ ve sonbahar↘ birleşimi | ↗ 6.5 ms yükseliş | |
| ↘ 4.9 ms sonbahar | ||
| Ekran, testlerimizde iyi yanıt oranları gösteriyor ancak rekabetçi oyuncular için çok yavaş olabilir. Karşılaştırıldığında, test edilen tüm cihazlar 0.1 (minimum) ile 240 (maksimum) ms arasında değişir. » Tüm cihazların 30 %'si daha iyi. Bu, ölçülen yanıt süresinin test edilen tüm cihazların ortalamasından (20.1 ms) daha iyi olduğu anlamına gelir. | ||
| ↔ Tepki Süresi %50 Griden %80 Griye | ||
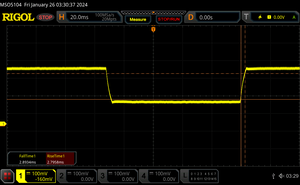
| 5.7 ms ... yükseliş ↗ ve sonbahar↘ birleşimi | ↗ 2.8 ms yükseliş | |
| ↘ 2.9 ms sonbahar | ||
| Ekran, testlerimizde çok hızlı yanıt oranları gösteriyor ve hızlı oyun oynamaya çok uygun olmalı. Karşılaştırıldığında, test edilen tüm cihazlar 0.165 (minimum) ile 636 (maksimum) ms arasında değişir. » Tüm cihazların 17 %'si daha iyi. Bu, ölçülen yanıt süresinin test edilen tüm cihazların ortalamasından (31.5 ms) daha iyi olduğu anlamına gelir. | ||
Ekran Titremesi / PWM (Darbe Genişliği Modülasyonu)
| Ekran titriyor / PWM algılanmadı | |||
Karşılaştırıldığında: Test edilen tüm cihazların %53 %'si ekranı karartmak için PWM kullanmıyor. PWM tespit edilirse, ortalama 8042 (minimum: 5 - maksimum: 343500) Hz ölçüldü. | |||
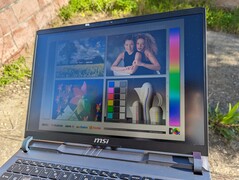
Mat ekran, bir IPS panel için yaklaşık 550 nit ile nispeten parlaktır HP Victus 16 veya Asus TUF Gaming A16. Gölge altındayken görüntülenebilirlik tolere edilebilir, ancak daha parlak dış mekan koşullarında ekran hala çok loş.
Performans
Test Koşulları
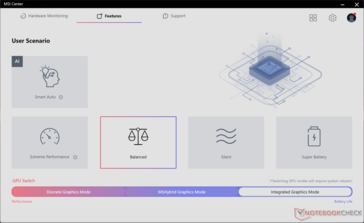
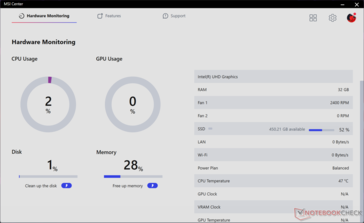
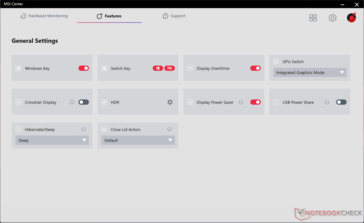
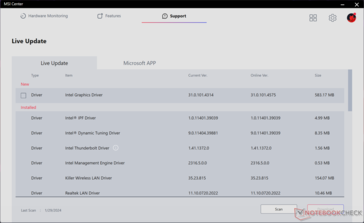
Aşağıdaki kıyaslamaları çalıştırmadan önce ünitemizi Cooler Boost aktifken dGPU moduna ve Extreme Performance moduna ayarladık. Sistem sahipleri önceden yüklenmiş MSI Center yazılımına aşina olmalıdır çünkü bu yazılım sistem güncellemeleri, sistem değerleri, özelliklerin değiştirilmesi ve MUX ayarları ile güç profillerinin ayarlanması için bir merkezdir. DGPU ve iGPU modları arasında geçiş yapmak için yeniden başlatma gerekir ve bu da normal bir soğuk başlatmadan daha uzun sürebilir.
İşlemci
Titan 18 HX'te keşfettiklerimize çok benzer şekilde Core i9-14900HX geçen nesle göre sadece küçük bir artış Core i9-13980HX yüzde 10'a varan oranda azalmıştır. Bu nedenle, özellikle 14. nesil Raptor Lake-HX yenileme serisi 14. nesil Meteor Lake serisinde bulunan yeni özel NPU'dan yoksun olduğu için yıldan yıla faydalar yalnızca marjinaldir. Elbette, Core i9-13980HX 2023'ün en hızlı mobil CPU'larından biriydi ve bu nedenle Core i9-14900HX kesinlikle yetersiz değil. 12. nesil veya daha eski Intel oyun dizüstü bilgisayarlarından yükseltme yapan kullanıcılar yine de önemli performans artışları görmelidir.
Cinebench R15 Multi Loop
Cinebench R23: Multi Core | Single Core
Cinebench R20: CPU (Multi Core) | CPU (Single Core)
Cinebench R15: CPU Multi 64Bit | CPU Single 64Bit
Blender: v2.79 BMW27 CPU
7-Zip 18.03: 7z b 4 | 7z b 4 -mmt1
Geekbench 6.5: Multi-Core | Single-Core
Geekbench 5.5: Multi-Core | Single-Core
HWBOT x265 Benchmark v2.2: 4k Preset
LibreOffice : 20 Documents To PDF
R Benchmark 2.5: Overall mean
| CPU Performance rating | |
| MSI Vector 16 HX A14V | |
| Asus Zephyrus Duo 16 GX650PY-NM006W -2! | |
| Ortalama Intel Core i9-14900HX | |
| Alienware m16 R1 AMD | |
| Lenovo Legion 5 16IRX G9 | |
| Alienware m16 R1 Intel | |
| Lenovo Legion Pro 5 16ARX8 -2! | |
| Asus TUF Gaming A16 FA617XS -2! | |
| MSI Vector GP66 12UGS -2! | |
| Lenovo Legion Slim 7 16APH8 | |
| Lenovo LOQ 16IRH8 | |
| Dell G16 7620 -2! | |
| HP Victus 16-r0077ng | |
| Cinebench R23 / Multi Core | |
| Asus Zephyrus Duo 16 GX650PY-NM006W | |
| MSI Vector 16 HX A14V | |
| Ortalama Intel Core i9-14900HX (17078 - 36249, n=37) | |
| Alienware m16 R1 AMD | |
| Lenovo Legion 5 16IRX G9 | |
| Alienware m16 R1 Intel | |
| Lenovo Legion Pro 5 16ARX8 | |
| Dell G16 7620 | |
| Asus TUF Gaming A16 FA617XS | |
| MSI Vector GP66 12UGS | |
| Lenovo Legion Slim 7 16APH8 | |
| HP Victus 16-r0077ng | |
| Lenovo LOQ 16IRH8 | |
| Cinebench R23 / Single Core | |
| MSI Vector 16 HX A14V | |
| Ortalama Intel Core i9-14900HX (1720 - 2245, n=37) | |
| Lenovo Legion 5 16IRX G9 | |
| Asus Zephyrus Duo 16 GX650PY-NM006W | |
| Alienware m16 R1 Intel | |
| MSI Vector GP66 12UGS | |
| Lenovo LOQ 16IRH8 | |
| Alienware m16 R1 AMD | |
| Lenovo Legion Pro 5 16ARX8 | |
| Asus TUF Gaming A16 FA617XS | |
| Lenovo Legion Slim 7 16APH8 | |
| Dell G16 7620 | |
| HP Victus 16-r0077ng | |
| Cinebench R20 / CPU (Multi Core) | |
| Asus Zephyrus Duo 16 GX650PY-NM006W | |
| MSI Vector 16 HX A14V | |
| Ortalama Intel Core i9-14900HX (6579 - 13832, n=37) | |
| Alienware m16 R1 AMD | |
| Lenovo Legion 5 16IRX G9 | |
| Alienware m16 R1 Intel | |
| Lenovo Legion Pro 5 16ARX8 | |
| MSI Vector GP66 12UGS | |
| Dell G16 7620 | |
| Asus TUF Gaming A16 FA617XS | |
| Lenovo Legion Slim 7 16APH8 | |
| HP Victus 16-r0077ng | |
| Lenovo LOQ 16IRH8 | |
| Cinebench R20 / CPU (Single Core) | |
| MSI Vector 16 HX A14V | |
| Ortalama Intel Core i9-14900HX (657 - 859, n=37) | |
| Asus Zephyrus Duo 16 GX650PY-NM006W | |
| Lenovo Legion 5 16IRX G9 | |
| Alienware m16 R1 Intel | |
| MSI Vector GP66 12UGS | |
| Alienware m16 R1 AMD | |
| Lenovo Legion Pro 5 16ARX8 | |
| Lenovo LOQ 16IRH8 | |
| Asus TUF Gaming A16 FA617XS | |
| Lenovo Legion Slim 7 16APH8 | |
| Dell G16 7620 | |
| HP Victus 16-r0077ng | |
| Cinebench R15 / CPU Multi 64Bit | |
| Asus Zephyrus Duo 16 GX650PY-NM006W | |
| MSI Vector 16 HX A14V | |
| Ortalama Intel Core i9-14900HX (3263 - 5589, n=38) | |
| Alienware m16 R1 AMD | |
| Lenovo Legion 5 16IRX G9 | |
| Alienware m16 R1 Intel | |
| Lenovo Legion Pro 5 16ARX8 | |
| Asus TUF Gaming A16 FA617XS | |
| Dell G16 7620 | |
| Lenovo Legion Slim 7 16APH8 | |
| Lenovo LOQ 16IRH8 | |
| MSI Vector GP66 12UGS | |
| HP Victus 16-r0077ng | |
| Cinebench R15 / CPU Single 64Bit | |
| MSI Vector 16 HX A14V | |
| Asus Zephyrus Duo 16 GX650PY-NM006W | |
| Ortalama Intel Core i9-14900HX (247 - 323, n=37) | |
| Alienware m16 R1 AMD | |
| Lenovo Legion Pro 5 16ARX8 | |
| Lenovo Legion 5 16IRX G9 | |
| Asus TUF Gaming A16 FA617XS | |
| Alienware m16 R1 Intel | |
| MSI Vector GP66 12UGS | |
| Lenovo Legion Slim 7 16APH8 | |
| Lenovo LOQ 16IRH8 | |
| Dell G16 7620 | |
| HP Victus 16-r0077ng | |
| Blender / v2.79 BMW27 CPU | |
| Lenovo LOQ 16IRH8 | |
| HP Victus 16-r0077ng | |
| MSI Vector GP66 12UGS | |
| Lenovo Legion Slim 7 16APH8 | |
| Asus TUF Gaming A16 FA617XS | |
| Dell G16 7620 | |
| Lenovo Legion Pro 5 16ARX8 | |
| Alienware m16 R1 Intel | |
| Lenovo Legion 5 16IRX G9 | |
| Ortalama Intel Core i9-14900HX (91 - 206, n=37) | |
| Alienware m16 R1 AMD | |
| MSI Vector 16 HX A14V | |
| Asus Zephyrus Duo 16 GX650PY-NM006W | |
| 7-Zip 18.03 / 7z b 4 | |
| Asus Zephyrus Duo 16 GX650PY-NM006W | |
| MSI Vector 16 HX A14V | |
| Ortalama Intel Core i9-14900HX (66769 - 136645, n=37) | |
| Alienware m16 R1 AMD | |
| Lenovo Legion 5 16IRX G9 | |
| Alienware m16 R1 Intel | |
| Lenovo Legion Pro 5 16ARX8 | |
| Lenovo Legion Slim 7 16APH8 | |
| Asus TUF Gaming A16 FA617XS | |
| MSI Vector GP66 12UGS | |
| HP Victus 16-r0077ng | |
| Dell G16 7620 | |
| Lenovo LOQ 16IRH8 | |
| 7-Zip 18.03 / 7z b 4 -mmt1 | |
| Asus Zephyrus Duo 16 GX650PY-NM006W | |
| Lenovo Legion Pro 5 16ARX8 | |
| MSI Vector 16 HX A14V | |
| Ortalama Intel Core i9-14900HX (5452 - 7545, n=37) | |
| Alienware m16 R1 AMD | |
| Lenovo Legion 5 16IRX G9 | |
| Asus TUF Gaming A16 FA617XS | |
| Lenovo Legion Slim 7 16APH8 | |
| Alienware m16 R1 Intel | |
| MSI Vector GP66 12UGS | |
| Lenovo LOQ 16IRH8 | |
| HP Victus 16-r0077ng | |
| Dell G16 7620 | |
| Geekbench 6.5 / Multi-Core | |
| MSI Vector 16 HX A14V | |
| Ortalama Intel Core i9-14900HX (13158 - 19665, n=37) | |
| Lenovo Legion 5 16IRX G9 | |
| Alienware m16 R1 Intel | |
| Lenovo LOQ 16IRH8 | |
| Lenovo Legion Slim 7 16APH8 | |
| Alienware m16 R1 AMD | |
| HP Victus 16-r0077ng | |
| Geekbench 6.5 / Single-Core | |
| MSI Vector 16 HX A14V | |
| Ortalama Intel Core i9-14900HX (2419 - 3129, n=37) | |
| Lenovo Legion 5 16IRX G9 | |
| Alienware m16 R1 AMD | |
| Alienware m16 R1 Intel | |
| Lenovo Legion Slim 7 16APH8 | |
| Lenovo LOQ 16IRH8 | |
| HP Victus 16-r0077ng | |
| Geekbench 5.5 / Multi-Core | |
| MSI Vector 16 HX A14V | |
| Asus Zephyrus Duo 16 GX650PY-NM006W | |
| Ortalama Intel Core i9-14900HX (8618 - 23194, n=37) | |
| Lenovo Legion 5 16IRX G9 | |
| Alienware m16 R1 AMD | |
| Alienware m16 R1 Intel | |
| MSI Vector GP66 12UGS | |
| Lenovo Legion Pro 5 16ARX8 | |
| Lenovo LOQ 16IRH8 | |
| Asus TUF Gaming A16 FA617XS | |
| Lenovo Legion Slim 7 16APH8 | |
| Dell G16 7620 | |
| HP Victus 16-r0077ng | |
| Geekbench 5.5 / Single-Core | |
| Asus Zephyrus Duo 16 GX650PY-NM006W | |
| MSI Vector 16 HX A14V | |
| Ortalama Intel Core i9-14900HX (1669 - 2210, n=37) | |
| Lenovo Legion Pro 5 16ARX8 | |
| Asus TUF Gaming A16 FA617XS | |
| Alienware m16 R1 AMD | |
| Lenovo Legion Slim 7 16APH8 | |
| Lenovo Legion 5 16IRX G9 | |
| MSI Vector GP66 12UGS | |
| Alienware m16 R1 Intel | |
| Lenovo LOQ 16IRH8 | |
| HP Victus 16-r0077ng | |
| Dell G16 7620 | |
| HWBOT x265 Benchmark v2.2 / 4k Preset | |
| Asus Zephyrus Duo 16 GX650PY-NM006W | |
| MSI Vector 16 HX A14V | |
| Alienware m16 R1 AMD | |
| Ortalama Intel Core i9-14900HX (16.8 - 38.9, n=37) | |
| Lenovo Legion 5 16IRX G9 | |
| Lenovo Legion Pro 5 16ARX8 | |
| Alienware m16 R1 Intel | |
| Asus TUF Gaming A16 FA617XS | |
| Lenovo Legion Slim 7 16APH8 | |
| MSI Vector GP66 12UGS | |
| Dell G16 7620 | |
| Lenovo LOQ 16IRH8 | |
| HP Victus 16-r0077ng | |
| LibreOffice / 20 Documents To PDF | |
| Lenovo Legion Slim 7 16APH8 | |
| HP Victus 16-r0077ng | |
| Asus Zephyrus Duo 16 GX650PY-NM006W | |
| Dell G16 7620 | |
| MSI Vector 16 HX A14V | |
| Lenovo LOQ 16IRH8 | |
| Alienware m16 R1 Intel | |
| Lenovo Legion 5 16IRX G9 | |
| Ortalama Intel Core i9-14900HX (19 - 85.1, n=37) | |
| Asus TUF Gaming A16 FA617XS | |
| MSI Vector GP66 12UGS | |
| Alienware m16 R1 AMD | |
| Lenovo Legion Pro 5 16ARX8 | |
| R Benchmark 2.5 / Overall mean | |
| Dell G16 7620 | |
| HP Victus 16-r0077ng | |
| Lenovo LOQ 16IRH8 | |
| Lenovo Legion Slim 7 16APH8 | |
| Alienware m16 R1 Intel | |
| Alienware m16 R1 AMD | |
| Asus TUF Gaming A16 FA617XS | |
| MSI Vector GP66 12UGS | |
| Lenovo Legion Pro 5 16ARX8 | |
| Lenovo Legion 5 16IRX G9 | |
| Asus Zephyrus Duo 16 GX650PY-NM006W | |
| Ortalama Intel Core i9-14900HX (0.3604 - 0.4859, n=37) | |
| MSI Vector 16 HX A14V | |
Cinebench R23: Multi Core | Single Core
Cinebench R20: CPU (Multi Core) | CPU (Single Core)
Cinebench R15: CPU Multi 64Bit | CPU Single 64Bit
Blender: v2.79 BMW27 CPU
7-Zip 18.03: 7z b 4 | 7z b 4 -mmt1
Geekbench 6.5: Multi-Core | Single-Core
Geekbench 5.5: Multi-Core | Single-Core
HWBOT x265 Benchmark v2.2: 4k Preset
LibreOffice : 20 Documents To PDF
R Benchmark 2.5: Overall mean
* ... daha küçük daha iyidir
AIDA64: FP32 Ray-Trace | FPU Julia | CPU SHA3 | CPU Queen | FPU SinJulia | FPU Mandel | CPU AES | CPU ZLib | FP64 Ray-Trace | CPU PhotoWorxx
| Performance rating | |
| MSI Vector 16 HX A14V | |
| Ortalama Intel Core i9-14900HX | |
| Asus TUF Gaming A16 FA617XS | |
| Lenovo Legion 5 16IRX G9 | |
| Dell G16 7620 | |
| HP Victus 16-r0077ng | |
| MSI Vector GP66 12UGS | |
| AIDA64 / FP32 Ray-Trace | |
| MSI Vector 16 HX A14V | |
| Asus TUF Gaming A16 FA617XS | |
| Ortalama Intel Core i9-14900HX (13098 - 33474, n=36) | |
| Lenovo Legion 5 16IRX G9 | |
| Dell G16 7620 | |
| HP Victus 16-r0077ng | |
| MSI Vector GP66 12UGS | |
| AIDA64 / FPU Julia | |
| MSI Vector 16 HX A14V | |
| Ortalama Intel Core i9-14900HX (67573 - 166040, n=36) | |
| Asus TUF Gaming A16 FA617XS | |
| Lenovo Legion 5 16IRX G9 | |
| Dell G16 7620 | |
| HP Victus 16-r0077ng | |
| MSI Vector GP66 12UGS | |
| AIDA64 / CPU SHA3 | |
| MSI Vector 16 HX A14V | |
| Ortalama Intel Core i9-14900HX (3589 - 7979, n=36) | |
| Asus TUF Gaming A16 FA617XS | |
| Lenovo Legion 5 16IRX G9 | |
| Dell G16 7620 | |
| HP Victus 16-r0077ng | |
| MSI Vector GP66 12UGS | |
| AIDA64 / CPU Queen | |
| MSI Vector 16 HX A14V | |
| Ortalama Intel Core i9-14900HX (118405 - 148966, n=36) | |
| Asus TUF Gaming A16 FA617XS | |
| MSI Vector GP66 12UGS | |
| Dell G16 7620 | |
| Lenovo Legion 5 16IRX G9 | |
| HP Victus 16-r0077ng | |
| AIDA64 / FPU SinJulia | |
| MSI Vector 16 HX A14V | |
| Asus TUF Gaming A16 FA617XS | |
| Ortalama Intel Core i9-14900HX (10475 - 18517, n=36) | |
| Lenovo Legion 5 16IRX G9 | |
| Dell G16 7620 | |
| MSI Vector GP66 12UGS | |
| HP Victus 16-r0077ng | |
| AIDA64 / FPU Mandel | |
| MSI Vector 16 HX A14V | |
| Asus TUF Gaming A16 FA617XS | |
| Ortalama Intel Core i9-14900HX (32543 - 83662, n=36) | |
| Lenovo Legion 5 16IRX G9 | |
| HP Victus 16-r0077ng | |
| Dell G16 7620 | |
| MSI Vector GP66 12UGS | |
| AIDA64 / CPU AES | |
| Ortalama Intel Core i9-14900HX (86964 - 241777, n=36) | |
| MSI Vector 16 HX A14V | |
| MSI Vector GP66 12UGS | |
| Lenovo Legion 5 16IRX G9 | |
| Asus TUF Gaming A16 FA617XS | |
| Dell G16 7620 | |
| HP Victus 16-r0077ng | |
| AIDA64 / CPU ZLib | |
| MSI Vector 16 HX A14V | |
| Ortalama Intel Core i9-14900HX (1054 - 2292, n=36) | |
| Lenovo Legion 5 16IRX G9 | |
| Asus TUF Gaming A16 FA617XS | |
| MSI Vector GP66 12UGS | |
| Dell G16 7620 | |
| HP Victus 16-r0077ng | |
| AIDA64 / FP64 Ray-Trace | |
| MSI Vector 16 HX A14V | |
| Asus TUF Gaming A16 FA617XS | |
| Ortalama Intel Core i9-14900HX (6809 - 18349, n=36) | |
| Lenovo Legion 5 16IRX G9 | |
| Dell G16 7620 | |
| HP Victus 16-r0077ng | |
| MSI Vector GP66 12UGS | |
| AIDA64 / CPU PhotoWorxx | |
| MSI Vector 16 HX A14V | |
| Ortalama Intel Core i9-14900HX (23903 - 54702, n=36) | |
| HP Victus 16-r0077ng | |
| Dell G16 7620 | |
| Lenovo Legion 5 16IRX G9 | |
| Asus TUF Gaming A16 FA617XS | |
| MSI Vector GP66 12UGS | |
Sistem Performansı
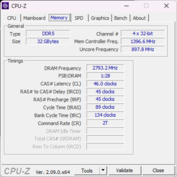
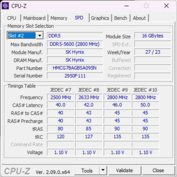
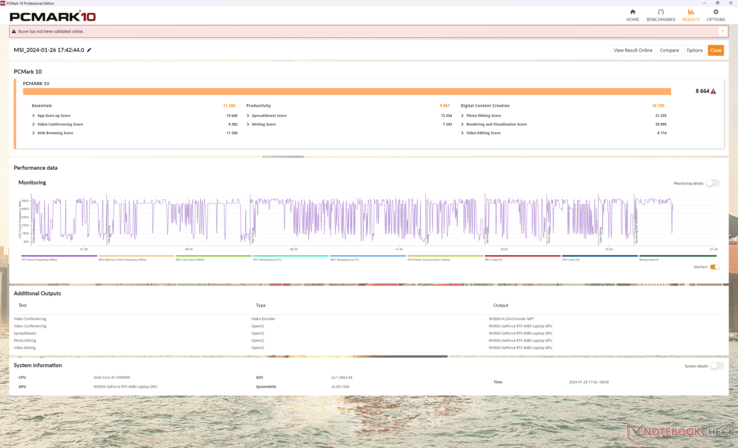
PCMark sonuçları, yeni 14. nesil CPU ve tam güçlü 175 W GeForce RTX 4080 GPU sayesinde herhangi bir üst orta seviye oyun dizüstü bilgisayarının en yüksek sonuçlarından bazılarıdır. RAM performansı da eski Vector GP66 tasarımına göre yaklaşık yüzde 70 daha yüksek okuma ve yazma hızlarıyla beklenenden daha hızlı.
CrossMark: Overall | Productivity | Creativity | Responsiveness
WebXPRT 3: Overall
WebXPRT 4: Overall
Mozilla Kraken 1.1: Total
| PCMark 10 / Score | |
| Ortalama Intel Core i9-14900HX, NVIDIA GeForce RTX 4080 Laptop GPU (7703 - 9223, n=7) | |
| MSI Vector 16 HX A14V | |
| MSI Vector GP66 12UGS | |
| Asus TUF Gaming A16 FA617XS | |
| Lenovo Legion 5 16IRX G9 | |
| Dell G16 7620 | |
| HP Victus 16-r0077ng | |
| PCMark 10 / Essentials | |
| Ortalama Intel Core i9-14900HX, NVIDIA GeForce RTX 4080 Laptop GPU (11255 - 12600, n=7) | |
| MSI Vector 16 HX A14V | |
| MSI Vector GP66 12UGS | |
| Asus TUF Gaming A16 FA617XS | |
| Lenovo Legion 5 16IRX G9 | |
| HP Victus 16-r0077ng | |
| Dell G16 7620 | |
| PCMark 10 / Productivity | |
| Asus TUF Gaming A16 FA617XS | |
| Ortalama Intel Core i9-14900HX, NVIDIA GeForce RTX 4080 Laptop GPU (6662 - 11410, n=7) | |
| MSI Vector GP66 12UGS | |
| MSI Vector 16 HX A14V | |
| Lenovo Legion 5 16IRX G9 | |
| HP Victus 16-r0077ng | |
| Dell G16 7620 | |
| PCMark 10 / Digital Content Creation | |
| MSI Vector 16 HX A14V | |
| Ortalama Intel Core i9-14900HX, NVIDIA GeForce RTX 4080 Laptop GPU (14211 - 16246, n=7) | |
| MSI Vector GP66 12UGS | |
| Lenovo Legion 5 16IRX G9 | |
| Asus TUF Gaming A16 FA617XS | |
| Dell G16 7620 | |
| HP Victus 16-r0077ng | |
| CrossMark / Overall | |
| MSI Vector 16 HX A14V | |
| Ortalama Intel Core i9-14900HX, NVIDIA GeForce RTX 4080 Laptop GPU (1992 - 2334, n=7) | |
| Lenovo Legion 5 16IRX G9 | |
| Dell G16 7620 | |
| Asus TUF Gaming A16 FA617XS | |
| CrossMark / Productivity | |
| MSI Vector 16 HX A14V | |
| Ortalama Intel Core i9-14900HX, NVIDIA GeForce RTX 4080 Laptop GPU (1812 - 2204, n=7) | |
| Lenovo Legion 5 16IRX G9 | |
| Asus TUF Gaming A16 FA617XS | |
| Dell G16 7620 | |
| CrossMark / Creativity | |
| MSI Vector 16 HX A14V | |
| Ortalama Intel Core i9-14900HX, NVIDIA GeForce RTX 4080 Laptop GPU (2327 - 2500, n=7) | |
| Lenovo Legion 5 16IRX G9 | |
| Asus TUF Gaming A16 FA617XS | |
| Dell G16 7620 | |
| CrossMark / Responsiveness | |
| MSI Vector 16 HX A14V | |
| Ortalama Intel Core i9-14900HX, NVIDIA GeForce RTX 4080 Laptop GPU (1520 - 2254, n=7) | |
| Lenovo Legion 5 16IRX G9 | |
| Dell G16 7620 | |
| Asus TUF Gaming A16 FA617XS | |
| WebXPRT 3 / Overall | |
| Ortalama Intel Core i9-14900HX, NVIDIA GeForce RTX 4080 Laptop GPU (310 - 345, n=7) | |
| MSI Vector 16 HX A14V | |
| Lenovo Legion 5 16IRX G9 | |
| MSI Vector GP66 12UGS | |
| HP Victus 16-r0077ng | |
| HP Victus 16-r0077ng | |
| Dell G16 7620 | |
| WebXPRT 4 / Overall | |
| Ortalama Intel Core i9-14900HX, NVIDIA GeForce RTX 4080 Laptop GPU (300 - 321, n=7) | |
| MSI Vector 16 HX A14V | |
| Lenovo Legion 5 16IRX G9 | |
| Asus TUF Gaming A16 FA617XS | |
| Dell G16 7620 | |
| HP Victus 16-r0077ng | |
| HP Victus 16-r0077ng | |
| Mozilla Kraken 1.1 / Total | |
| Dell G16 7620 | |
| HP Victus 16-r0077ng | |
| HP Victus 16-r0077ng | |
| MSI Vector GP66 12UGS | |
| Asus TUF Gaming A16 FA617XS | |
| Lenovo Legion 5 16IRX G9 | |
| MSI Vector 16 HX A14V | |
| Ortalama Intel Core i9-14900HX, NVIDIA GeForce RTX 4080 Laptop GPU (437 - 446, n=7) | |
* ... daha küçük daha iyidir
| PCMark 10 Score | 8664 puan | |
Yardım | ||
| AIDA64 / Memory Copy | |
| MSI Vector 16 HX A14V | |
| Ortalama Intel Core i9-14900HX (38028 - 83392, n=36) | |
| HP Victus 16-r0077ng | |
| Lenovo Legion 5 16IRX G9 | |
| Asus TUF Gaming A16 FA617XS | |
| Dell G16 7620 | |
| MSI Vector GP66 12UGS | |
| AIDA64 / Memory Read | |
| MSI Vector 16 HX A14V | |
| Ortalama Intel Core i9-14900HX (43306 - 87568, n=36) | |
| Lenovo Legion 5 16IRX G9 | |
| HP Victus 16-r0077ng | |
| Dell G16 7620 | |
| Asus TUF Gaming A16 FA617XS | |
| MSI Vector GP66 12UGS | |
| AIDA64 / Memory Write | |
| MSI Vector 16 HX A14V | |
| Asus TUF Gaming A16 FA617XS | |
| Ortalama Intel Core i9-14900HX (37146 - 80589, n=36) | |
| HP Victus 16-r0077ng | |
| Dell G16 7620 | |
| Lenovo Legion 5 16IRX G9 | |
| MSI Vector GP66 12UGS | |
| AIDA64 / Memory Latency | |
| Dell G16 7620 | |
| HP Victus 16-r0077ng | |
| MSI Vector GP66 12UGS | |
| Asus TUF Gaming A16 FA617XS | |
| Lenovo Legion 5 16IRX G9 | |
| Ortalama Intel Core i9-14900HX (76.1 - 105, n=36) | |
| MSI Vector 16 HX A14V | |
* ... daha küçük daha iyidir
DPC Gecikme Süresi
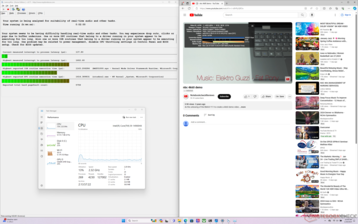
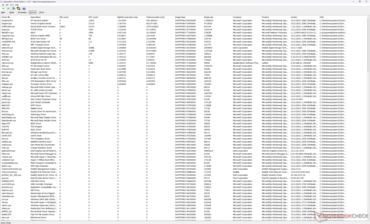
LatencyMon, ana sayfamızın birden fazla sekmesini açarken DPC sorunlarının yanı sıra bir dakika uzunluğundaki 4K60 test videosu sırasında 8 karenin düştüğünü ortaya koyuyor. Düşen kareler neredeyse düzenli aralıklarla gerçekleşiyor ve bu da arka plan etkinliği veya altta yatan bir sürücü ile ilgili bir sorun olduğunu gösteriyor.
| DPC Latencies / LatencyMon - interrupt to process latency (max), Web, Youtube, Prime95 | |
| MSI Vector GP66 12UGS | |
| Lenovo Legion 5 16IRX G9 | |
| HP Victus 16-r0077ng | |
| MSI Vector 16 HX A14V | |
| Asus TUF Gaming A16 FA617XS | |
| Dell G16 7620 | |
* ... daha küçük daha iyidir
Depolama Cihazları
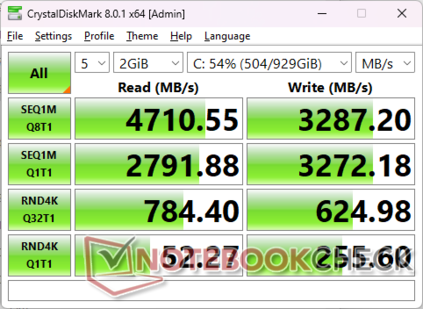
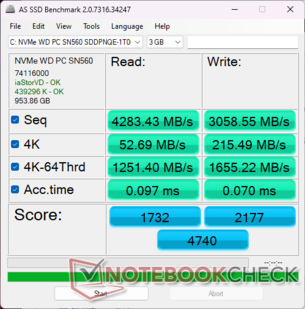
Test ünitemiz orta seviye 1 TB ile yapılandırılmış olarak geliyor Western Digital PC SN560 PCIe4 x4 NVMe SSD, stres altındayken bile yaklaşık 4900 MB/sn'lik sabit aktarım hızları sağlar. Model, daha büyük Titan 18 HX'de olduğu gibi PCIe5 x4 SSD'leri de desteklemektedir, ancak PCIe5 SSD'lerin düşük kullanılabilirliği, şu anda vahşi doğadaki yapılandırmaların büyük çoğunluğunun yalnızca PCIe4 sürücülerle gönderildiği anlamına gelmektedir.
| Drive Performance rating - Percent | |
| Lenovo Legion 5 16IRX G9 | |
| Dell G16 7620 | |
| MSI Vector GP66 12UGS | |
| HP Victus 16-r0077ng | |
| MSI Vector 16 HX A14V | |
| Asus TUF Gaming A16 FA617XS | |
* ... daha küçük daha iyidir
Disk Throttling: DiskSpd Read Loop, Queue Depth 8
GPU Performansı - Vektörün Parladığı Yer
Diğer oyun dizüstü bilgisayarlarının çoğu, GP66 da dahil olmak üzere daha düşük TGP değerlerini hedeflerken, Vector 16 HX daha hızlı performans için maksimum 175 W'ı hedefliyor. Sonuç olarak, MSI sistemimiz, veritabanımızdaki ortalama dizüstü bilgisayardan yaklaşık yüzde 8 ila 10 daha hızlıdır aynı mobil GeForce RTX 4080 GPU. Bu çok büyük bir fark değil, ancak makinelerinden mümkün olduğunca fazla GPU performansı elde etmek isteyen güçlü kullanıcılar ve oyuncular, Vector 16 HX'i aynı grafik seçeneklerine sahip alternatiflere göre değerlendirmek isteyeceklerdir HP Omen 16.
Yükseltme RTX 4090 yapılandırmasının grafik performansını yaklaşık yüzde 10 artırması beklenirken, RTX 4070 ve RTX 4060'a düşmenin performansı sırasıyla yaklaşık yüzde 30 ila 35 ve yüzde 40 ila 45 oranında düşürmesi bekleniyor.
| Güç Profili | Fizik Puanı | Grafik Puanı | Birleşik Puan |
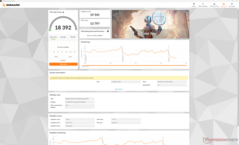
| Olağanüstü Performans (Cooler Boost açıkken) | 13797 | 19541 | 18392 |
| Aşırı Performans (Soğutucu Takviyesi kapalıyken) | 14118 (-0%) | 19471 (-0%) | 18423 (-0%) |
| Dengeli Mod | 13858 (-0%) | 16466 (-16%) | 16013 (-13%) |
| Akü Gücü | 8307 (-40%) | 8955 (-54%) | 8851 (-52%) |
Cooler Boost'a sahip diğer MSI oyun dizüstü bilgisayarlarında olduğu gibi, yukarıdaki tabloda yer alan Time Spy puanlarımıza göre Extreme Performance modunda olduğunuz sürece performans bu özellikten etkilenmiyor gibi görünüyor. Ancak Dengeli moda geçmek grafik performansını yaklaşık yüzde 16 oranında düşürecektir.
| 3DMark Performance rating - Percent | |
| KFA2 GeForce RTX 4080 SG | |
| Asus Zephyrus Duo 16 GX650PY-NM006W -1! | |
| Alienware m18 R1 AMD -1! | |
| MSI Vector 16 HX A14V | |
| Alienware m16 R1 AMD | |
| Ortalama NVIDIA GeForce RTX 4080 Laptop GPU | |
| Lenovo Legion Pro 5 16ARX8 | |
| MSI Vector GP66 12UGS -1! | |
| Lenovo Legion 5 16IRX G9 -1! | |
| Alienware m16 R1 Intel -1! | |
| Framework Laptop 16 | |
| Asus TUF Gaming A16 FA617XS -1! | |
| Dell G16 7620 -1! | |
| Lenovo ThinkPad Z16 Gen 2 -1! | |
| 3DMark 11 - 1280x720 Performance GPU | |
| KFA2 GeForce RTX 4080 SG | |
| Asus Zephyrus Duo 16 GX650PY-NM006W | |
| MSI Vector 16 HX A14V | |
| Alienware m18 R1 AMD | |
| Ortalama NVIDIA GeForce RTX 4080 Laptop GPU (45199 - 63128, n=24) | |
| Alienware m16 R1 AMD | |
| Lenovo Legion Pro 5 16ARX8 | |
| MSI Vector GP66 12UGS | |
| Framework Laptop 16 | |
| Alienware m16 R1 Intel | |
| Lenovo Legion 5 16IRX G9 | |
| Asus TUF Gaming A16 FA617XS | |
| Dell G16 7620 | |
| Lenovo ThinkPad Z16 Gen 2 | |
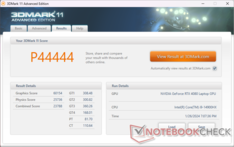
| 3DMark 11 Performance | 44444 puan | |
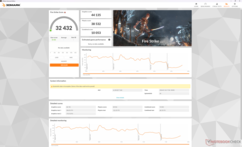
| 3DMark Fire Strike Score | 32432 puan | |
| 3DMark Time Spy Score | 18392 puan | |
Yardım | ||
* ... daha küçük daha iyidir
Oyun Performansı
Mevcut tüm oyunlar, çoğu ayar maksimumdayken doğal 1600p ekran çözünürlüğünde sorunsuz çalışır. Ancak, G-Sync'in olmaması nedeniyle v-sync'i etkinleştirmeyi veya kare hızını 120 ile sınırlamayı düşünebilirsiniz. Örneğin Baldur's Gate, 1440p'de ortalama 129 FPS'dir ve kare hızlarının kilidi açılırsa 240 Hz ekranda ekran yırtılmasına neden olabilir.
Mobil RTX 4080, mobil RTX 4080'den önemli ölçüde daha zayıf olduğu için 4K'da oyun oynuyorsanız DLSS önerilir masaüstü muadili. Cyberpunk 2077, doğal 4K Ultra RT ayarlarında sadece 18,5 FPS ortalamasına sahiptir, ancak hem DLSS Auto hem de kare oluşturmayı etkinleştirmek ortalamayı 75,8 FPS'ye çıkarır.
| Performance rating - Percent | |
| MSI Vector 16 HX A14V | |
| Lenovo Legion 5 16IRX G9 | |
| MSI Vector GP66 12UGS | |
| HP Victus 16-r0077ng | |
| Dell G16 7620 | |
| Asus TUF Gaming A16 FA617XS | |
| The Witcher 3 - 1920x1080 Ultra Graphics & Postprocessing (HBAO+) | |
| MSI Vector 16 HX A14V | |
| MSI Vector GP66 12UGS | |
| HP Victus 16-r0077ng | |
| Asus TUF Gaming A16 FA617XS | |
| Lenovo Legion 5 16IRX G9 | |
| Dell G16 7620 | |
| GTA V - 1920x1080 Highest AA:4xMSAA + FX AF:16x | |
| MSI Vector 16 HX A14V | |
| MSI Vector GP66 12UGS | |
| Lenovo Legion 5 16IRX G9 | |
| HP Victus 16-r0077ng | |
| Dell G16 7620 | |
| Asus TUF Gaming A16 FA617XS | |
| Final Fantasy XV Benchmark - 1920x1080 High Quality | |
| MSI Vector 16 HX A14V | |
| MSI Vector GP66 12UGS | |
| HP Victus 16-r0077ng | |
| Lenovo Legion 5 16IRX G9 | |
| Dell G16 7620 | |
| Asus TUF Gaming A16 FA617XS | |
| Strange Brigade - 1920x1080 ultra AA:ultra AF:16 | |
| MSI Vector 16 HX A14V | |
| MSI Vector GP66 12UGS | |
| Lenovo Legion 5 16IRX G9 | |
| HP Victus 16-r0077ng | |
| Asus TUF Gaming A16 FA617XS | |
| Dell G16 7620 | |
| Dota 2 Reborn - 1920x1080 ultra (3/3) best looking | |
| MSI Vector 16 HX A14V | |
| Lenovo Legion 5 16IRX G9 | |
| MSI Vector GP66 12UGS | |
| Dell G16 7620 | |
| HP Victus 16-r0077ng | |
| Asus TUF Gaming A16 FA617XS | |
| X-Plane 11.11 - 1920x1080 high (fps_test=3) | |
| MSI Vector 16 HX A14V | |
| Lenovo Legion 5 16IRX G9 | |
| MSI Vector GP66 12UGS | |
| Dell G16 7620 | |
| HP Victus 16-r0077ng | |
| Asus TUF Gaming A16 FA617XS | |
| Baldur's Gate 3 | |
| 1920x1080 High Preset AA:T | |
| MSI Vector 16 HX A14V | |
| Ortalama NVIDIA GeForce RTX 4080 Laptop GPU (122.2 - 183.5, n=4) | |
| Framework Laptop 16 | |
| Lenovo ThinkPad Z16 Gen 2 | |
| 1920x1080 Ultra Preset AA:T | |
| MSI Vector 16 HX A14V | |
| Ortalama NVIDIA GeForce RTX 4080 Laptop GPU (111.8 - 181.2, n=7) | |
| Framework Laptop 16 | |
| Lenovo ThinkPad Z16 Gen 2 | |
| 2560x1440 Ultra Preset AA:T | |
| MSI Vector 16 HX A14V | |
| Ortalama NVIDIA GeForce RTX 4080 Laptop GPU (88.3 - 129.3, n=7) | |
| Framework Laptop 16 | |
| Lenovo ThinkPad Z16 Gen 2 | |
| 3840x2160 Ultra Preset AA:T | |
| MSI Vector 16 HX A14V | |
| Ortalama NVIDIA GeForce RTX 4080 Laptop GPU (48.8 - 68.4, n=5) | |
| Framework Laptop 16 | |
| Final Fantasy XV Benchmark | |
| 1920x1080 High Quality | |
| KFA2 GeForce RTX 4080 SG | |
| MSI Vector 16 HX A14V | |
| Asus Zephyrus Duo 16 GX650PY-NM006W | |
| Alienware m16 R1 AMD | |
| Ortalama NVIDIA GeForce RTX 4080 Laptop GPU (129 - 182.1, n=23) | |
| Lenovo Legion Pro 5 16ARX8 | |
| MSI Vector GP66 12UGS | |
| Lenovo Legion 5 16IRX G9 | |
| Alienware m16 R1 Intel | |
| Dell G16 7620 | |
| Asus TUF Gaming A16 FA617XS | |
| Framework Laptop 16 | |
| Lenovo ThinkPad Z16 Gen 2 | |
| 2560x1440 High Quality | |
| KFA2 GeForce RTX 4080 SG | |
| Asus Zephyrus Duo 16 GX650PY-NM006W | |
| MSI Vector 16 HX A14V | |
| Alienware m16 R1 AMD | |
| Ortalama NVIDIA GeForce RTX 4080 Laptop GPU (98 - 142, n=22) | |
| Lenovo Legion Pro 5 16ARX8 | |
| Lenovo Legion 5 16IRX G9 | |
| Alienware m16 R1 Intel | |
| Dell G16 7620 | |
| Framework Laptop 16 | |
| Lenovo ThinkPad Z16 Gen 2 | |
| 3840x2160 High Quality | |
| KFA2 GeForce RTX 4080 SG | |
| MSI Vector 16 HX A14V | |
| Alienware m16 R1 AMD | |
| Ortalama NVIDIA GeForce RTX 4080 Laptop GPU (60.8 - 79.5, n=13) | |
| Lenovo Legion Pro 5 16ARX8 | |
| Framework Laptop 16 | |
| X-Plane 11.11 | |
| 1920x1080 high (fps_test=3) | |
| KFA2 GeForce RTX 4080 SG | |
| MSI Vector 16 HX A14V | |
| Lenovo Legion 5 16IRX G9 | |
| Ortalama NVIDIA GeForce RTX 4080 Laptop GPU (89.3 - 143.5, n=25) | |
| Alienware m16 R1 Intel | |
| Asus Zephyrus Duo 16 GX650PY-NM006W | |
| Lenovo Legion Pro 5 16ARX8 | |
| Alienware m16 R1 AMD | |
| MSI Vector GP66 12UGS | |
| Dell G16 7620 | |
| Framework Laptop 16 | |
| Asus TUF Gaming A16 FA617XS | |
| Lenovo ThinkPad Z16 Gen 2 | |
| 3840x2160 high (fps_test=3) | |
| KFA2 GeForce RTX 4080 SG | |
| MSI Vector 16 HX A14V | |
| Ortalama NVIDIA GeForce RTX 4080 Laptop GPU (78 - 143.7, n=13) | |
| Lenovo Legion Pro 5 16ARX8 | |
| Alienware m16 R1 AMD | |
| Framework Laptop 16 | |
| Far Cry 5 | |
| 1920x1080 Ultra Preset AA:T | |
| KFA2 GeForce RTX 4080 SG | |
| MSI Vector 16 HX A14V | |
| Lenovo Legion 5 16IRX G9 | |
| Alienware m16 R1 Intel | |
| Ortalama NVIDIA GeForce RTX 4080 Laptop GPU (114 - 162, n=11) | |
| MSI Vector GP66 12UGS | |
| Alienware m16 R1 AMD | |
| Framework Laptop 16 | |
| Asus TUF Gaming A16 FA617XS | |
| Lenovo ThinkPad Z16 Gen 2 | |
| 2560x1440 Ultra Preset AA:T | |
| KFA2 GeForce RTX 4080 SG | |
| MSI Vector 16 HX A14V | |
| Ortalama NVIDIA GeForce RTX 4080 Laptop GPU (114 - 157, n=10) | |
| Alienware m16 R1 AMD | |
| Lenovo Legion 5 16IRX G9 | |
| Alienware m16 R1 Intel | |
| Framework Laptop 16 | |
| 3840x2160 Ultra Preset AA:T | |
| KFA2 GeForce RTX 4080 SG | |
| MSI Vector 16 HX A14V | |
| Alienware m16 R1 AMD | |
| Ortalama NVIDIA GeForce RTX 4080 Laptop GPU (71 - 97, n=6) | |
| Framework Laptop 16 | |
| Dota 2 Reborn | |
| 1920x1080 ultra (3/3) best looking | |
| KFA2 GeForce RTX 4080 SG | |
| Lenovo Legion Pro 5 16ARX8 | |
| Asus Zephyrus Duo 16 GX650PY-NM006W | |
| MSI Vector 16 HX A14V | |
| Lenovo Legion 5 16IRX G9 | |
| Alienware m16 R1 AMD | |
| Ortalama NVIDIA GeForce RTX 4080 Laptop GPU (133 - 194.7, n=23) | |
| MSI Vector GP66 12UGS | |
| Alienware m16 R1 Intel | |
| Dell G16 7620 | |
| Framework Laptop 16 | |
| Asus TUF Gaming A16 FA617XS | |
| Lenovo ThinkPad Z16 Gen 2 | |
| 3840x2160 ultra (3/3) best looking | |
| KFA2 GeForce RTX 4080 SG | |
| MSI Vector 16 HX A14V | |
| Alienware m16 R1 AMD | |
| Lenovo Legion Pro 5 16ARX8 | |
| Ortalama NVIDIA GeForce RTX 4080 Laptop GPU (116.7 - 182.6, n=14) | |
| Framework Laptop 16 | |
| Strange Brigade | |
| 1920x1080 ultra AA:ultra AF:16 | |
| KFA2 GeForce RTX 4080 SG | |
| Alienware m16 R1 AMD | |
| MSI Vector 16 HX A14V | |
| Asus Zephyrus Duo 16 GX650PY-NM006W | |
| Ortalama NVIDIA GeForce RTX 4080 Laptop GPU (239 - 357, n=22) | |
| Lenovo Legion Pro 5 16ARX8 | |
| MSI Vector GP66 12UGS | |
| Lenovo Legion 5 16IRX G9 | |
| Alienware m16 R1 Intel | |
| Asus TUF Gaming A16 FA617XS | |
| Dell G16 7620 | |
| Framework Laptop 16 | |
| Lenovo ThinkPad Z16 Gen 2 | |
| 2560x1440 ultra AA:ultra AF:16 | |
| KFA2 GeForce RTX 4080 SG | |
| Asus Zephyrus Duo 16 GX650PY-NM006W | |
| Alienware m16 R1 AMD | |
| MSI Vector 16 HX A14V | |
| Ortalama NVIDIA GeForce RTX 4080 Laptop GPU (179.5 - 248, n=21) | |
| Lenovo Legion Pro 5 16ARX8 | |
| Lenovo Legion 5 16IRX G9 | |
| Alienware m16 R1 Intel | |
| Dell G16 7620 | |
| Framework Laptop 16 | |
| 3840x2160 ultra AA:ultra AF:16 | |
| KFA2 GeForce RTX 4080 SG | |
| MSI Vector 16 HX A14V | |
| Alienware m16 R1 AMD | |
| Ortalama NVIDIA GeForce RTX 4080 Laptop GPU (100.9 - 144.3, n=12) | |
| Lenovo Legion Pro 5 16ARX8 | |
| Framework Laptop 16 | |
Witcher 3 FPS Chart
| düşük | orta | yüksek | ultra | QHD | 4K | |
|---|---|---|---|---|---|---|
| GTA V (2015) | 187.1 | 185.7 | 181.9 | 136.5 | 128.8 | 158.6 |
| The Witcher 3 (2015) | 640 | 513.3 | 384.6 | 183.3 | 121.2 | |
| Dota 2 Reborn (2015) | 217 | 194.8 | 186.7 | 175 | 168.4 | |
| Final Fantasy XV Benchmark (2018) | 232 | 219 | 178.8 | 142 | 79.5 | |
| X-Plane 11.11 (2018) | 204 | 177.4 | 137.7 | 118.1 | ||
| Far Cry 5 (2018) | 180 | 167 | 161 | 154 | 97 | |
| Strange Brigade (2018) | 505 | 405 | 378 | 349 | 248 | 123.2 |
| Tiny Tina's Wonderlands (2022) | 344 | 297.1 | 212.8 | 167.1 | 114.8 | 60.3 |
| F1 22 (2022) | 339 | 324 | 297 | 81.2 | 76.9 | 39.6 |
| Baldur's Gate 3 (2023) | 228.5 | 204.3 | 183.5 | 181.2 | 129.3 | 68.4 |
| Cyberpunk 2077 (2023) | 143.4 | 135.3 | 127.1 | 118.6 | 79.4 | 36.6 |
Emisyonlar - Yüksek Sesle ve Gururla
Sistem Gürültüsü
Sistem, Dengeli veya Sessiz güç profillerinde masaüstünde rölantide çalışırken bile oldukça gürültülüdür. Çalışırken fan gürültüsü Witcher 3 aşırı Performans modunda Cooler Boost ayarından bağımsız olarak 62 dB(A) değerine ulaşır. 60+ dB(A) aralığı, daha iyi bir oyun deneyimi için kulaklıkların önerildiği noktaya kadar veritabanımızdaki en gürültülü dizüstü bilgisayarlardan bazılarına ev sahipliği yapmaktadır.
Dengeli modda oyun oynamak fan gürültüsü tavanını önemli ölçüde 54 dB(A) aralığına düşürecektir. Hala yüksek olsa da, Aşırı Performans modundaki kadar kötü değildir. Bu nedenle kullanıcılar, yukarıda belirtildiği gibi GPU performansında yüzde 16'lık bir düşüşe neden olsa da, Aşırı Performans modu yerine Dengeli modda oyun oynamak isteyebilir.
Ses yüksekliği
| Boşta |
| 33.5 / 33.5 / 33.5 dB |
| Çalışırken |
| 52.1 / 62 dB |
 | ||
30 dB sessiz 40 dB(A) duyulabilirlik 50 dB(A) gürültülü |
||
min: | ||
| MSI Vector 16 HX A14V GeForce RTX 4080 Laptop GPU, i9-14900HX, WD PC SN560 SDDPNQE-1T00 | MSI Vector GP66 12UGS GeForce RTX 3070 Ti Laptop GPU, i9-12900H | Lenovo Legion 5 16IRX G9 GeForce RTX 4060 Laptop GPU, i7-14650HX, Samsung PM9A1 MZVL21T0HCLR | HP Victus 16-r0077ng GeForce RTX 4070 Laptop GPU, i7-13700H, Kioxia XG8 KXG80ZNV1T02 | Asus TUF Gaming A16 FA617XS Radeon RX 7600S, R9 7940HS, Micron 2400 MTFDKBA512QFM | Dell G16 7620 GeForce RTX 3060 Laptop GPU, i7-12700H, WDC PC SN810 512GB | |
|---|---|---|---|---|---|---|
| Noise | 17% | 11% | 14% | 15% | 18% | |
| kapalı / ortam * (dB) | 23.2 | 22.9 1% | 24 -3% | 25 -8% | 25 -8% | 23.2 -0% |
| Idle Minimum * (dB) | 33.5 | 23.4 30% | 24 28% | 28 16% | 25 25% | 28.3 16% |
| Idle Average * (dB) | 33.5 | 23.4 30% | 28.8 14% | 29 13% | 26 22% | 28.8 14% |
| Idle Maximum * (dB) | 33.5 | 27.4 18% | 32 4% | 30 10% | 28 16% | 28.9 14% |
| Load Average * (dB) | 52.1 | 36 31% | 45.5 13% | 43 17% | 43 17% | 32.4 38% |
| Witcher 3 ultra * (dB) | 62 | 58.2 6% | 53.1 14% | 46 26% | 51 18% | 48.3 22% |
| Load Maximum * (dB) | 62 | 58 6% | 55.7 10% | 48 23% | 53 15% | 48.1 22% |
* ... daha küçük daha iyidir
Sıcaklık
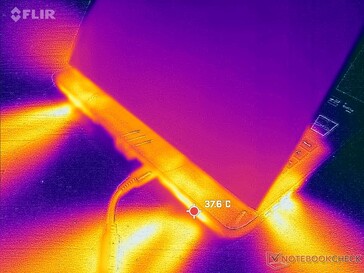
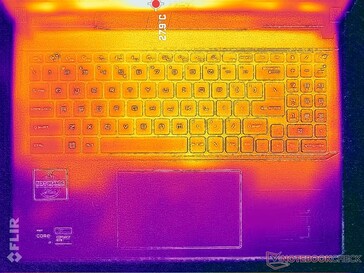
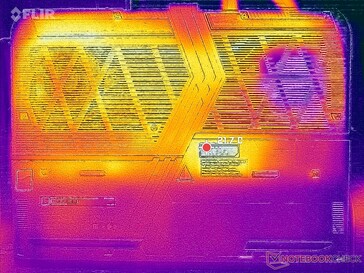
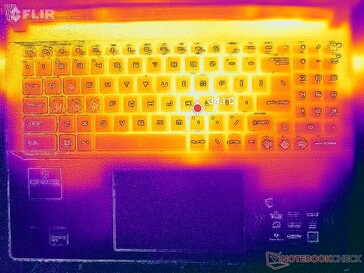
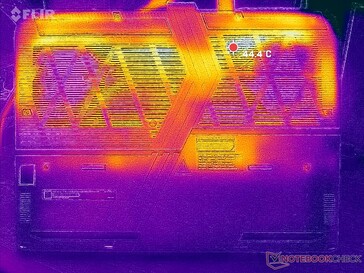
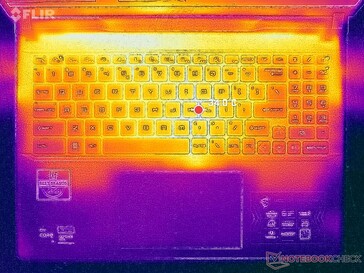
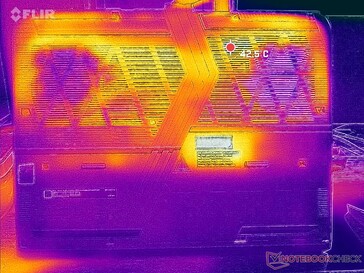
Plastik taban, geniş havalandırma ızgaraları ve kalın kasa tasarımı sayesinde yüzey sıcaklıkları diğer oyun dizüstü bilgisayarlarının çoğundan daha soğuk. Aslında bu, RTX 4080 ile test ettiğimiz en soğuk oyun dizüstü bilgisayarlarından biri. Çalıştırırken Witcher 3klavye merkezindeki sıcak nokta, Legion 5i 16 G9 veya daha eski modellerde 39 C'ye kıyasla yalnızca 34 C'ye ulaşır Vektör GP66.
(+) Üst taraftaki maksimum sıcaklık, 40.4 °C / 105 F ortalamasına kıyasla 36.4 °C / 98 F'dir. , Gaming sınıfı için 21.2 ile 68.8 °C arasında değişir.
(+) Alt kısım, 43.3 °C / 110 F ortalamasına kıyasla maksimum 35.6 °C / 96 F'ye kadar ısınır
(+) Boşta kullanımda, üst tarafın ortalama sıcaklığı 24.5 °C / 76 F olup, cihazın 33.9 °C / 93 F.
(+) The Witcher 3 oynarken, üst tarafın ortalama sıcaklığı 30.4 °C / 87 F olup, cihazın 33.9 °C / 93 F.
(+) Avuç içi dayanakları ve dokunmatik yüzey, maksimum 24 °C / 75.2 F ile cilt sıcaklığından daha soğuktur ve bu nedenle dokunulduğunda soğuktur.
(+) Benzer cihazların avuç içi dayanağı alanının ortalama sıcaklığı 28.8 °C / 83.8 F (+4.8 °C / 8.6 F) idi.
| MSI Vector 16 HX A14V Intel Core i9-14900HX, NVIDIA GeForce RTX 4080 Laptop GPU | MSI Vector GP66 12UGS Intel Core i9-12900H, NVIDIA GeForce RTX 3070 Ti Laptop GPU | Lenovo Legion 5 16IRX G9 Intel Core i7-14650HX, NVIDIA GeForce RTX 4060 Laptop GPU | HP Victus 16-r0077ng Intel Core i7-13700H, NVIDIA GeForce RTX 4070 Laptop GPU | Asus TUF Gaming A16 FA617XS AMD Ryzen 9 7940HS, AMD Radeon RX 7600S | Dell G16 7620 Intel Core i7-12700H, NVIDIA GeForce RTX 3060 Laptop GPU | |
|---|---|---|---|---|---|---|
| Heat | -25% | -20% | -35% | -26% | -15% | |
| Maximum Upper Side * (°C) | 36.4 | 40.2 -10% | 40.4 -11% | 51 -40% | 53 -46% | 47.6 -31% |
| Maximum Bottom * (°C) | 35.6 | 43.8 -23% | 43.8 -23% | 54 -52% | 48 -35% | 54 -52% |
| Idle Upper Side * (°C) | 26.6 | 34.8 -31% | 30.3 -14% | 37 -39% | 30 -13% | 23 14% |
| Idle Bottom * (°C) | 27 | 37 -37% | 35.3 -31% | 29 -7% | 30 -11% | 24.6 9% |
* ... daha küçük daha iyidir
Stres Testi
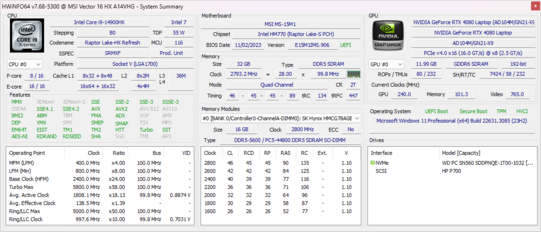
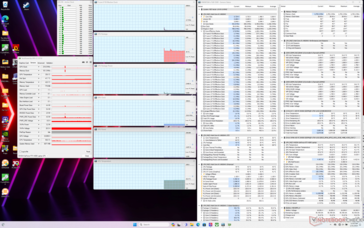
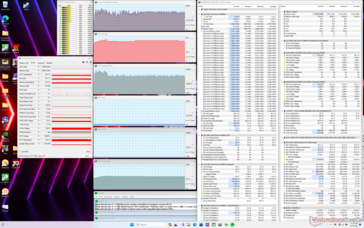
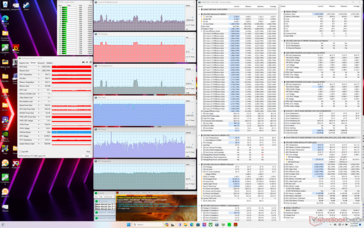
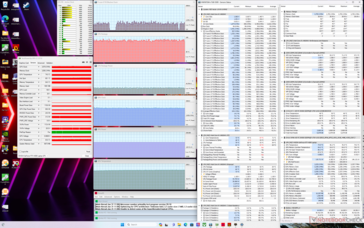
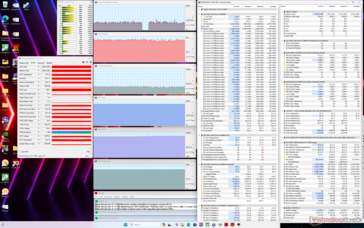
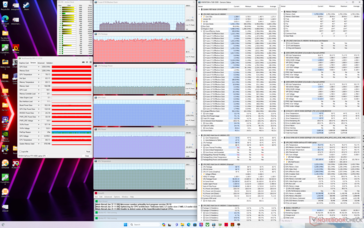
Prime95 stresini başlatırken CPU, çekirdek sıcaklığı yaklaşık bir dakika sonra 87 C'ye ulaşana kadar 4,2 GHz ve 180 W'a yükselir. Daha sonra, ~3,3 GHz, 140 W ve 82 C'ye düşecektir. Cooler Boost etkinleştirilse bile sonuçlar aynı kalacaktır.
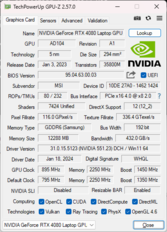
Tipik oyun yüklerini temsil etmek için Witcher 3 adresini Extreme Performance modunda çalıştırmak, HWiNFO'ya göre 2535 MHz saat, 77 C çekirdek sıcaklığı ve 165 W kart güç çekimi sabit GPU değerleriyle sonuçlanacaktır. Sonuçlar Cooler Boost ayarından bağımsız olarak neredeyse aynı kalacaktır. Ancak daha sessiz olan Dengeli moda geçildiğinde GPU saati ve kart güç çekişi sırasıyla sadece 2055 MHz ve 120 W'a düşecektir ki bu da yukarıdaki GPU Performansı bölümümüzde bahsedilen kayda değer performans düşüşünü yansıtmaktadır.
| CPU Saati (GHz) | GPU Saati (MHz) | Ortalama CPU Sıcaklığı (°C) | Ortalama GPU Sıcaklığı (°C) | |
| Sistem Boşta | -- | -- | 44 | 36 |
| Prime95 Stres | 3.3 | -- | 82 | 50 |
| Prime95 + FurMark Stress (Cooler Boost açıkken Aşırı Performans) | ~1.7 | 2535 | 67 | 65 |
| Witcher 3 Stres (Dengeli mod) | ~1,5 | 2055 | 81 | 75 |
| Witcher 3 Stres (Cooler Boost kapalı iken Aşırı Performans) | ~1,5 | 2535 | 83 | 77 |
| Witcher 3 Stres (Cooler Boost açıkken Aşırı Performans) | ~1,5 | 2535 | 85 | 77 |
Konuşmacılar
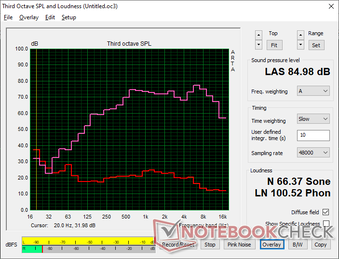
MSI Vector 16 HX A14V ses analizi
(+) | hoparlörler nispeten yüksek sesle çalabilir (85 dB)
Bas 100 - 315Hz
(±) | azaltılmış bas - ortalama olarak medyandan 12.7% daha düşük
(+) | bas doğrusaldır (6.8% delta ile önceki frekans)
Ortalar 400 - 2000 Hz
(+) | dengeli ortalar - medyandan yalnızca 3% uzakta
(+) | orta frekanslar doğrusaldır (3.6% deltadan önceki frekansa)
Yüksekler 2 - 16 kHz
(+) | dengeli yüksekler - medyandan yalnızca 3.1% uzakta
(+) | yüksekler doğrusaldır (6.7% deltadan önceki frekansa)
Toplam 100 - 16.000 Hz
(+) | genel ses doğrusaldır (12.6% ortancaya göre fark)
Aynı sınıfla karşılaştırıldığında
» Bu sınıftaki tüm test edilen cihazların %15%'si daha iyi, 3% benzer, 81% daha kötüydü
» En iyisinin deltası 6% idi, ortalama 18% idi, en kötüsü 132% idi
Test edilen tüm cihazlarla karşılaştırıldığında
» Test edilen tüm cihazların %11'si daha iyi, 2 benzer, % 87 daha kötüydü
» En iyisinin deltası 4% idi, ortalama 24% idi, en kötüsü 134% idi
Apple MacBook Pro 16 2021 M1 Pro ses analizi
(+) | hoparlörler nispeten yüksek sesle çalabilir (84.7 dB)
Bas 100 - 315Hz
(+) | iyi bas - medyandan yalnızca 3.8% uzakta
(+) | bas doğrusaldır (5.2% delta ile önceki frekans)
Ortalar 400 - 2000 Hz
(+) | dengeli ortalar - medyandan yalnızca 1.3% uzakta
(+) | orta frekanslar doğrusaldır (2.1% deltadan önceki frekansa)
Yüksekler 2 - 16 kHz
(+) | dengeli yüksekler - medyandan yalnızca 1.9% uzakta
(+) | yüksekler doğrusaldır (2.7% deltadan önceki frekansa)
Toplam 100 - 16.000 Hz
(+) | genel ses doğrusaldır (4.6% ortancaya göre fark)
Aynı sınıfla karşılaştırıldığında
» Bu sınıftaki tüm test edilen cihazların %0%'si daha iyi, 0% benzer, 100% daha kötüydü
» En iyisinin deltası 5% idi, ortalama 17% idi, en kötüsü 45% idi
Test edilen tüm cihazlarla karşılaştırıldığında
» Test edilen tüm cihazların %0'si daha iyi, 0 benzer, % 100 daha kötüydü
» En iyisinin deltası 4% idi, ortalama 24% idi, en kötüsü 134% idi
Enerji Yönetimi
Güç Tüketimi
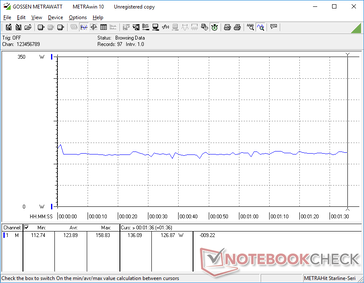
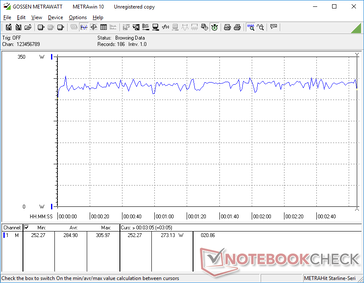
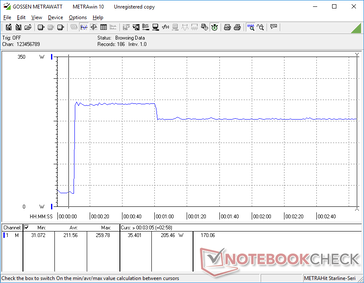
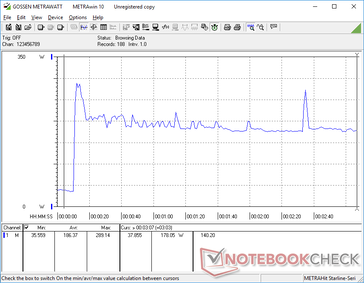
Vector 16 HX, eski Vector GP66'dan daha hızlı olabilir, ancak aynı zamanda çok daha fazla güç tüketiyor. Çalışıyor Witcher 3 ve Prime95, eski modele kıyasla sırasıyla yüzde 27 ve yüzde 58 daha fazla güç talep ediyor. Buna rağmen, performans kazançları, watt başına daha yüksek performans için güç kazançlarından çok daha fazladır.
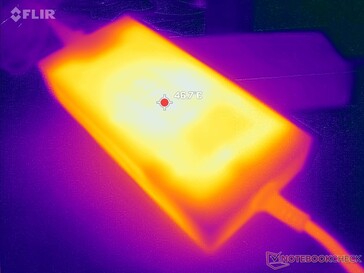
Sistem, yapılandırmaya bağlı olarak 280 W veya 330 W AC adaptörle birlikte gönderilir. Yeni 330 W AC adaptörü ~18,5 x 8,5 x 3,2 cm boyutlarında nispeten ince olup eski GP66'nın ~18 x 8,5 x 3,5 cm boyutlarındaki 280 W AC adaptörü ile hemen hemen aynı boyuttadır.
| Kapalı / Bekleme modu | |
| Boşta | |
| Çalışırken |
|
Key:
min: | |
| MSI Vector 16 HX A14V i9-14900HX, GeForce RTX 4080 Laptop GPU, WD PC SN560 SDDPNQE-1T00, IPS, 2560x1600, 16" | MSI Vector GP66 12UGS i9-12900H, GeForce RTX 3070 Ti Laptop GPU, , IPS, 1920x1080, 15.6" | Lenovo Legion 5 16IRX G9 i7-14650HX, GeForce RTX 4060 Laptop GPU, Samsung PM9A1 MZVL21T0HCLR, IPS, 2560x1600, 16" | HP Victus 16-r0077ng i7-13700H, GeForce RTX 4070 Laptop GPU, Kioxia XG8 KXG80ZNV1T02, IPS, 1920x1080, 16.1" | Asus TUF Gaming A16 FA617XS R9 7940HS, Radeon RX 7600S, Micron 2400 MTFDKBA512QFM, IPS, 1920x1200, 16" | Dell G16 7620 i7-12700H, GeForce RTX 3060 Laptop GPU, WDC PC SN810 512GB, IPS, 2560x1600, 16" | |
|---|---|---|---|---|---|---|
| Power Consumption | -2% | 20% | 38% | 47% | 18% | |
| Idle Minimum * (Watt) | 15.8 | 17.5 -11% | 15.4 3% | 8 49% | 7 56% | 14.4 9% |
| Idle Average * (Watt) | 23.3 | 20.1 14% | 19.7 15% | 13 44% | 10 57% | 17.8 24% |
| Idle Maximum * (Watt) | 30 | 47.3 -58% | 20.7 31% | 22 27% | 15 50% | 31.5 -5% |
| Load Average * (Watt) | 123.9 | 107.3 13% | 102.6 17% | 86 31% | 86 31% | 101.2 18% |
| Witcher 3 ultra * (Watt) | 285 | 225 21% | 191.3 33% | 141.8 50% | 160.6 44% | 176.9 38% |
| Load Maximum * (Watt) | 306 | 277.7 9% | 246.6 19% | 233 24% | 172 44% | 242.9 21% |
* ... daha küçük daha iyidir
Power Consumption Witcher 3 / Stresstest
Power Consumption external Monitor
Pil Ömrü
Pil kapasitesi eski Vector GP66 tasarımına göre 65 Wh'den 90 Wh'ye önemli ölçüde artmış olsa da, gerçek çalışma süreleri artmamıştır. Dengeli güç profilinde iGPU aktifken WLAN'da gezinme, otomatik kapanmadan önce hala yaklaşık 5,5 saat sürüyor. Lenovo Legion 5 16 gibi diğer 16 inçlik sistemler veya HP Victus 16 karşılaştırıldığında her biri birkaç saat daha uzun süre dayanabiliyor.
Ürünle birlikte verilen AC adaptörü ile boş kapasiteden tam kapasiteye şarj etmek neredeyse 2,5 saat sürüyor. Sistem, sağ kenardaki bağlantı noktası aracılığıyla USB-C üzerinden şarj edilebiliyor.
| MSI Vector 16 HX A14V i9-14900HX, GeForce RTX 4080 Laptop GPU, 90 Wh | MSI Vector GP66 12UGS i9-12900H, GeForce RTX 3070 Ti Laptop GPU, 65 Wh | Lenovo Legion 5 16IRX G9 i7-14650HX, GeForce RTX 4060 Laptop GPU, 80 Wh | HP Victus 16-r0077ng i7-13700H, GeForce RTX 4070 Laptop GPU, 83 Wh | Asus TUF Gaming A16 FA617XS R9 7940HS, Radeon RX 7600S, 90 Wh | Dell G16 7620 i7-12700H, GeForce RTX 3060 Laptop GPU, 84 Wh | |
|---|---|---|---|---|---|---|
| Pil Çalışma Süresi | -17% | -4% | 29% | 60% | -31% | |
| Reader / Idle (h) | 10.7 | 7.9 -26% | 20.3 90% | 7.1 -34% | ||
| WiFi v1.3 (h) | 5.5 | 5.7 4% | 7.4 35% | 7.1 29% | 12.4 125% | 5 -9% |
| Load (h) | 1.4 | 1 -29% | 0.8 -43% | 0.9 -36% | 0.7 -50% | |
| H.264 (h) | 9.6 | 12.4 |
Artılar
Eksiler
Karar - Hızlı ve Chonky
Oyun dizüstü bilgisayarları, taşınabilirlik ve performans arasında ince bir çizgide yürüyor ve mevcut eğilim taşınabilirliğe doğru eğiliyor. MSI Vector 16 HX, daha kalın, daha büyük ve daha gürültülü bir sistem anlamına gelse bile hiç çekinmeden performansı tercih ediyor. Gerçekten de, şu anda piyasada bulunan en büyük ve en gürültülü 16 inç oyun dizüstü bilgisayarlarından biri.
MSI Vector 16 HX, fan gürültüsü veya boyut söz konusu olduğunda utangaç değildir. Buna karşılık, performans açısından aynı GeForce RTX 4080 veya 4090 GPU'ya sahip diğer oyun dizüstü bilgisayarlarını geride bırakıyor.
Büyük boyut ve gürültülü fanlar boşuna değil, çünkü model performans söz konusu olduğunda mükemmel. 175 W GeForce RTX 4080 GPU rTX 4090'a sahip bazı dizüstü bilgisayarlarla bile başa baş olmak için ortalamadan yaklaşık yüzde 10 daha hızlıdır. Tek başına bu gerçek bile, ekstra beygir gücü için taşınabilirlikten biraz ödün vermeyi düşünmeyen performans avcılarını cezbedecektir. Kalın kasa aynı zamanda sert ve güçlü bir kapağa sahip ki bu, daha ince birçok alternatif için söyleyebileceğimiz bir şey değil.
Birkaç yönü kesinlikle daha iyi olabilirdi. MSI büyük bir tasarıma bağlı kalmak istiyorsa, servis kolaylığı daha kolay hale getirilmeli ve fan gürültüsünü azaltmak için sıvı soğutma veya buhar odası düşünülmelidir. Numpad ya da en azından ok tuşları, MSI'daki ok tuşları gibi daha büyük yapılmalıdır Lenovo Legion 5 16.
Fiyat ve Bulunabilirlik
MSI Vector 16 HX A14V
- 02/03/2024 v7 (old)
Allen Ngo
Şeffaflık
İncelenecek cihazların seçimi editör ekibimiz tarafından yapılır. Test örneği, bu incelemenin amacı doğrultusunda üretici veya perakendeci tarafından yazara ödünç olarak sağlanmıştır. Borç verenin bu inceleme üzerinde herhangi bir etkisi olmadığı gibi, üretici de yayınlanmadan önce bu incelemenin bir kopyasını almamıştır. Bu incelemeyi yayınlama zorunluluğu yoktu. Bağımsız bir medya şirketi olarak Notebookcheck, üreticilerin, perakendecilerin veya yayıncıların otoritesine tabi değildir.
Notebookcheck bu şekilde test yapıyor
Notebookcheck, tüm sonuçların karşılaştırılabilir olmasını sağlamak için her yıl yüzlerce dizüstü bilgisayarı ve akıllı telefonu standart prosedürler kullanarak bağımsız olarak inceliyor. Yaklaşık 20 yıldır test yöntemlerimizi sürekli olarak geliştirdik ve bu süreçte endüstri standartlarını belirledik. Test laboratuvarlarımızda deneyimli teknisyenler ve editörler tarafından yüksek kaliteli ölçüm ekipmanları kullanılmaktadır. Bu testler çok aşamalı bir doğrulama sürecini içerir. Karmaşık derecelendirme sistemimiz, nesnelliği koruyan yüzlerce sağlam temellere dayanan ölçüm ve kıyaslamaya dayanmaktadır.

