XMG Fusion 15 (Early 24) incelemesi: Oyuncular ve içerik üreticiler için kompakt bir RTX 4070 dizüstü bilgisayar
Oyuncular ve içerik oluşturucular için 15,3 inçlik bir dizüstü bilgisayar olan XMG Fusion 15 (Early 24), üretici Tongfang'ın barebone (GM5IX7A) modelini temel alıyor. Raptor Lake, Ada Lovelace ve 32 GB RAM, dizüstü bilgisayarı akış, işleme ve oyun için donatıyor. Mevcut varyant yaklaşık 2.500 ABD Doları karşılığında satın alınabilir. Rakipler arasında aşağıdaki gibi cihazlar bulunmaktadır Aorus 16X (2024), Alienware m16 R2, HP Omen Transcend 16 ve Lenovo Legion Pro 5 16IRX9.
Karşılaştırmalı olarak olası rakipler
Derecelendirme | Tarih | Modeli | Ağırlık | Yükseklik | Boyut | Çözünürlük | Fiyat |
|---|---|---|---|---|---|---|---|
| 88.9 % v7 (old) | 05/2024 | Schenker XMG Fusion 15 (Early 24) i9-14900HX, GeForce RTX 4070 Laptop GPU | 2.1 kg | 21.9 mm | 15.30" | 2560x1600 | |
| 87.4 % v7 (old) | 04/2024 | Aorus 16X 2024 i9-14900HX, GeForce RTX 4070 Laptop GPU | 2.3 kg | 20 mm | 16.00" | 2560x1600 | |
| 90.2 % v7 (old) | 03/2024 | Alienware m16 R2 Ultra 7 155H, GeForce RTX 4070 Laptop GPU | 2.5 kg | 23.5 mm | 16.00" | 2560x1600 | |
| 88.4 % v7 (old) | 02/2024 | HP Omen Transcend 16-u1095ng i9-14900HX, GeForce RTX 4070 Laptop GPU | 2.3 kg | 20 mm | 16.00" | 2560x1600 | |
| 89.3 % v7 (old) | 04/2024 | Lenovo Legion Pro 5 16IRX9 i9-14900HX, GeForce RTX 4070 Laptop GPU | 2.5 kg | 26.95 mm | 16.00" | 2560x1600 |
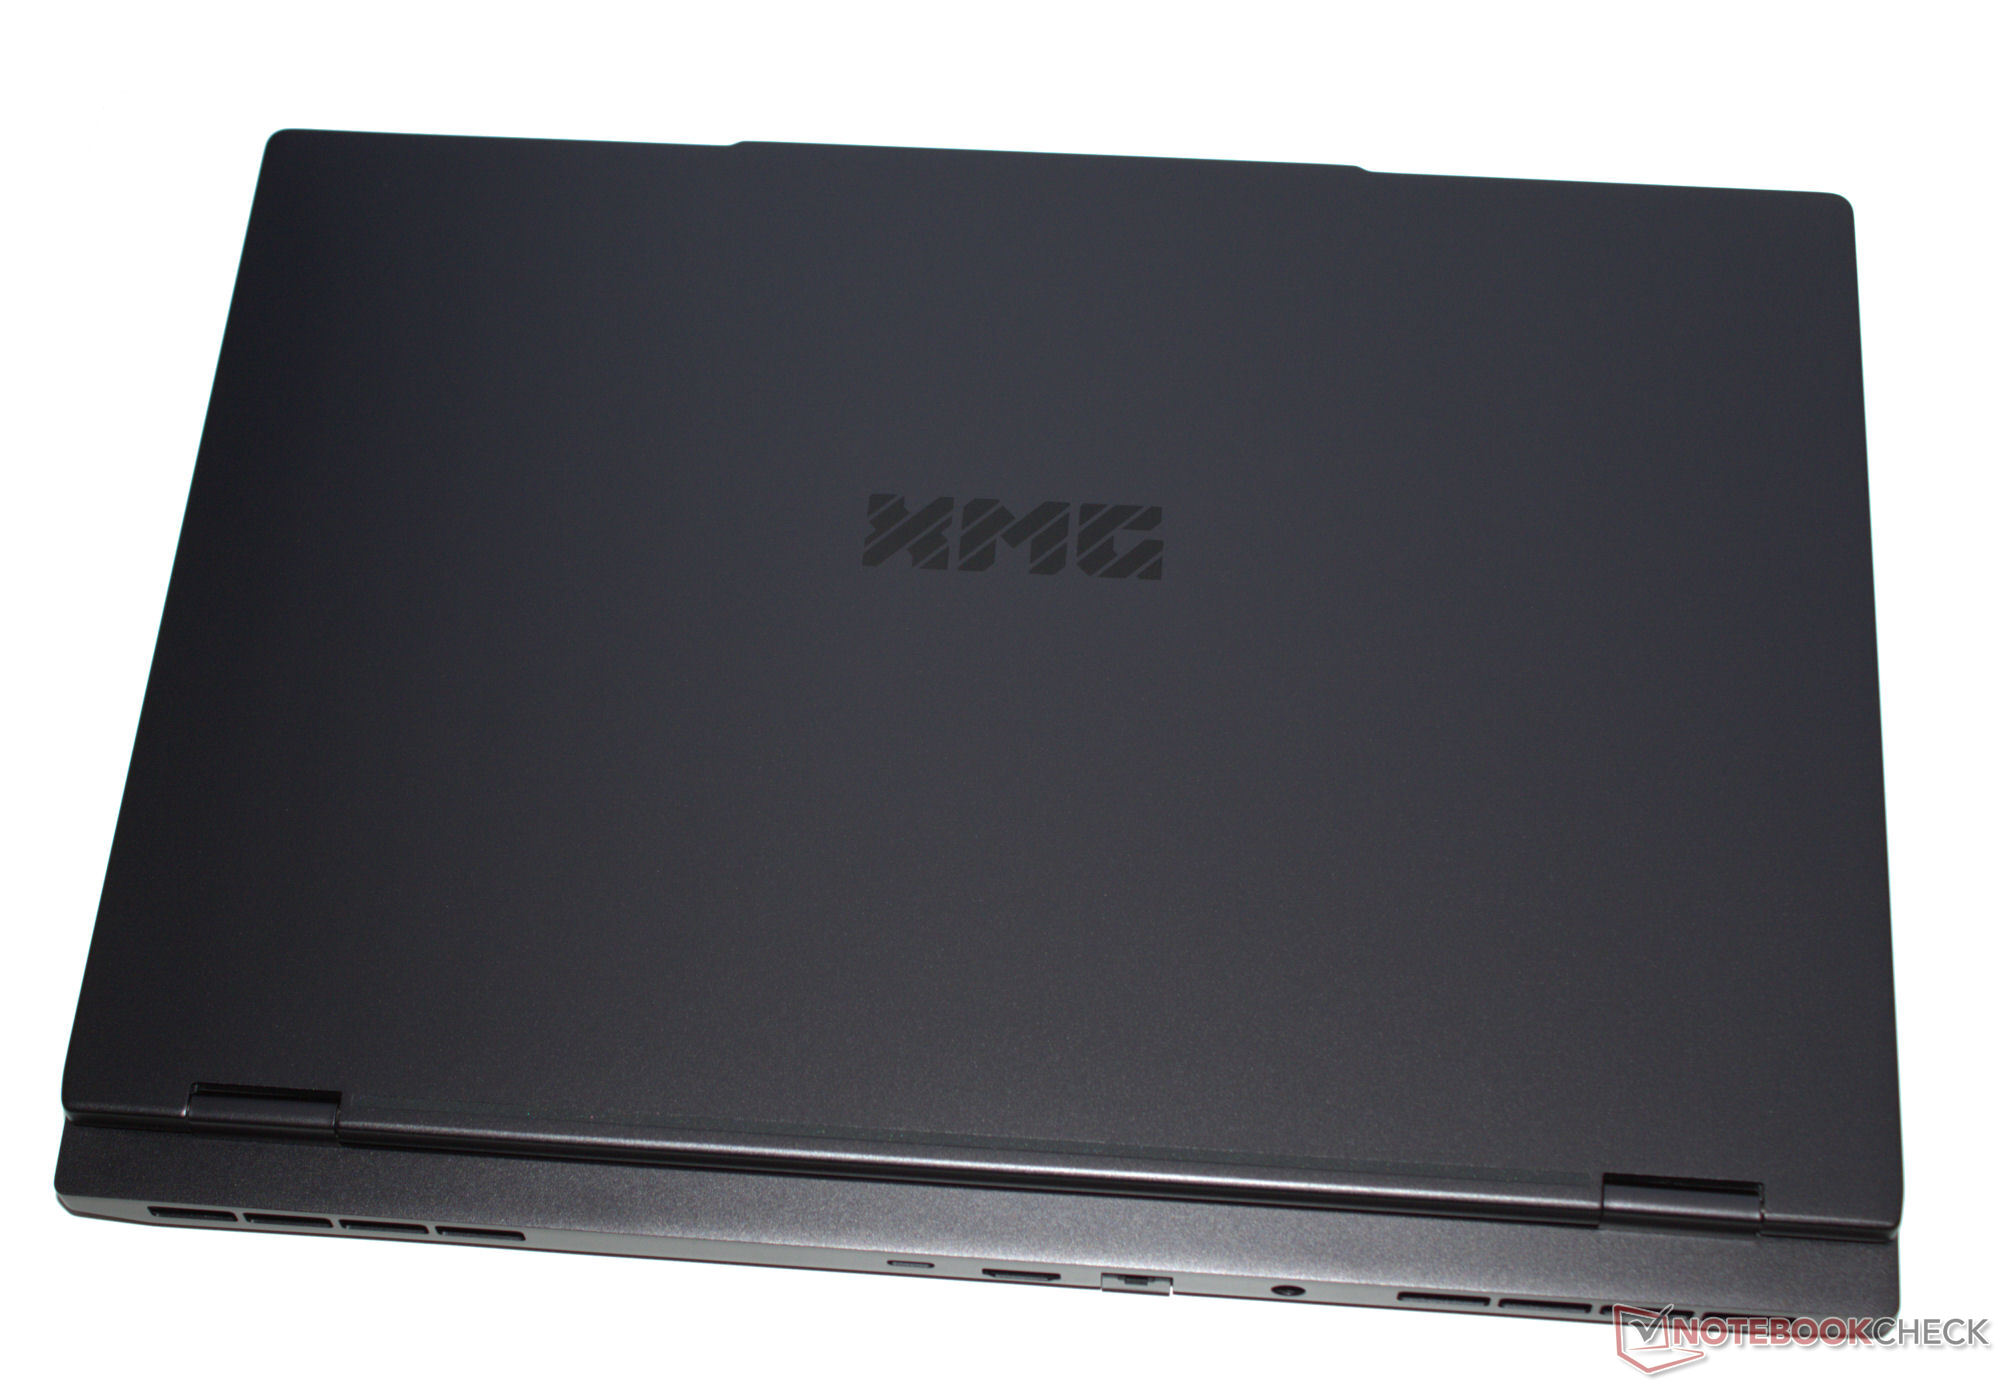
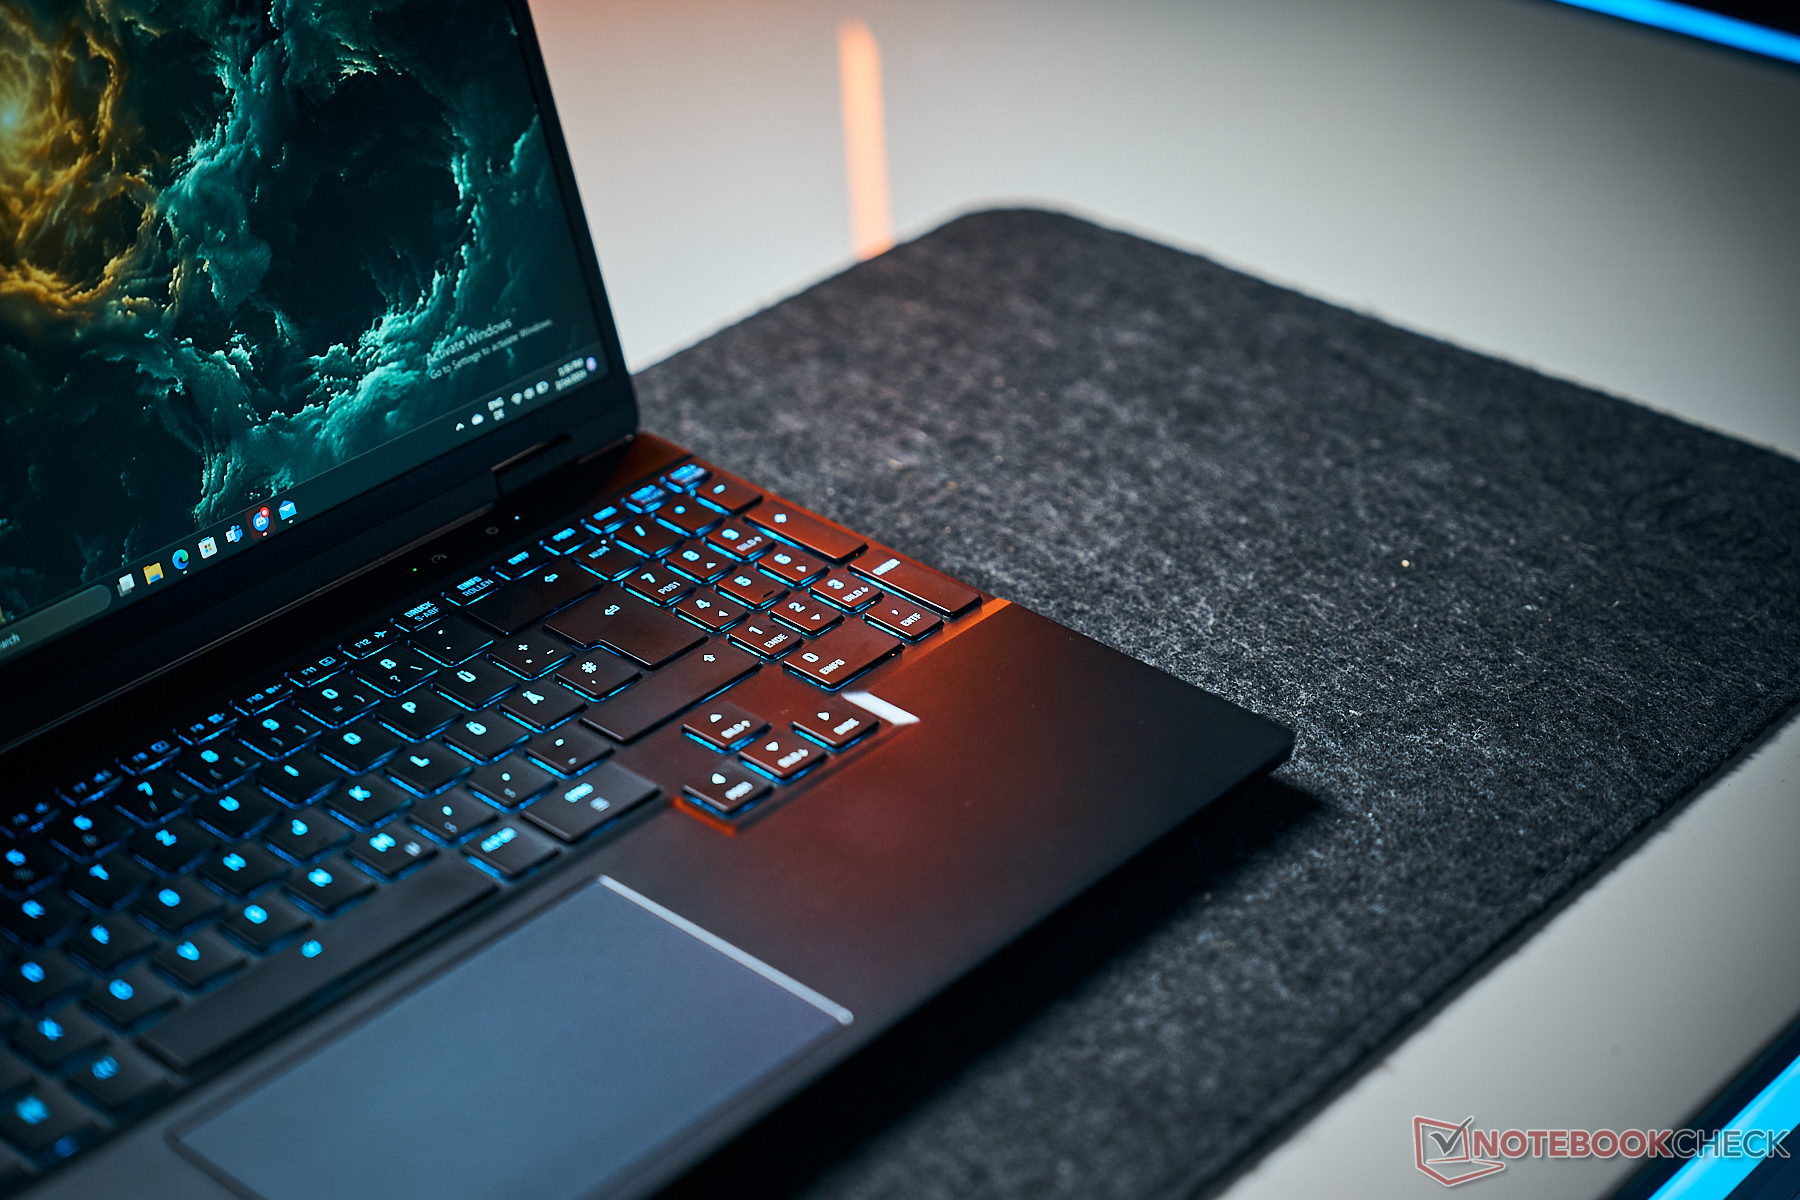
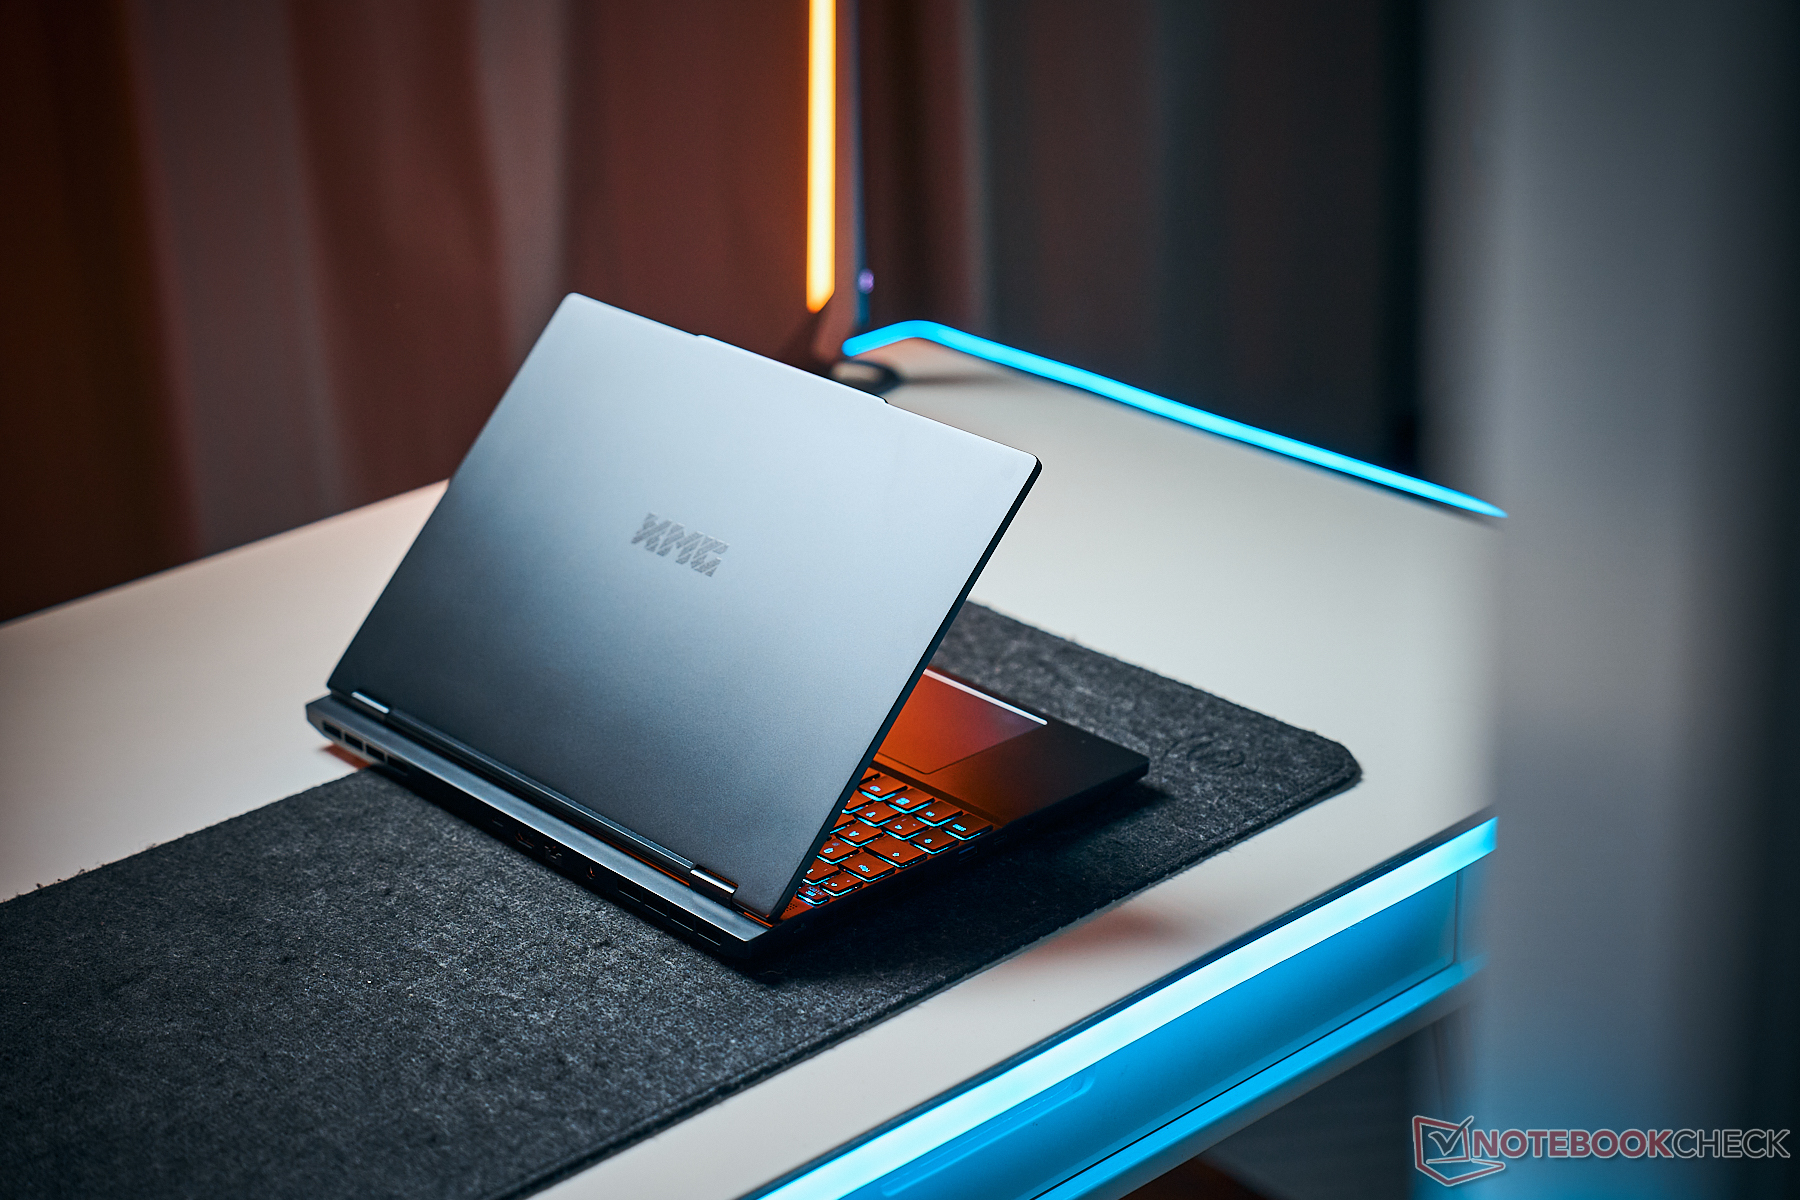
Kasa - Alüminyum kasalı XMG dizüstü bilgisayar
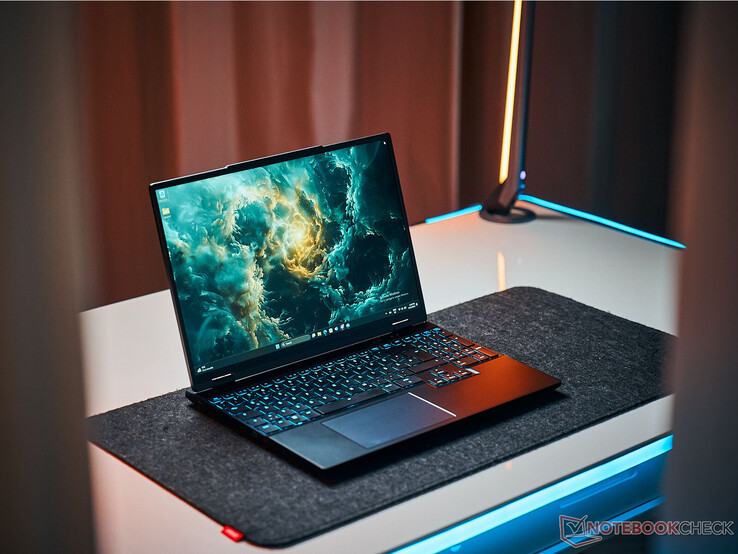
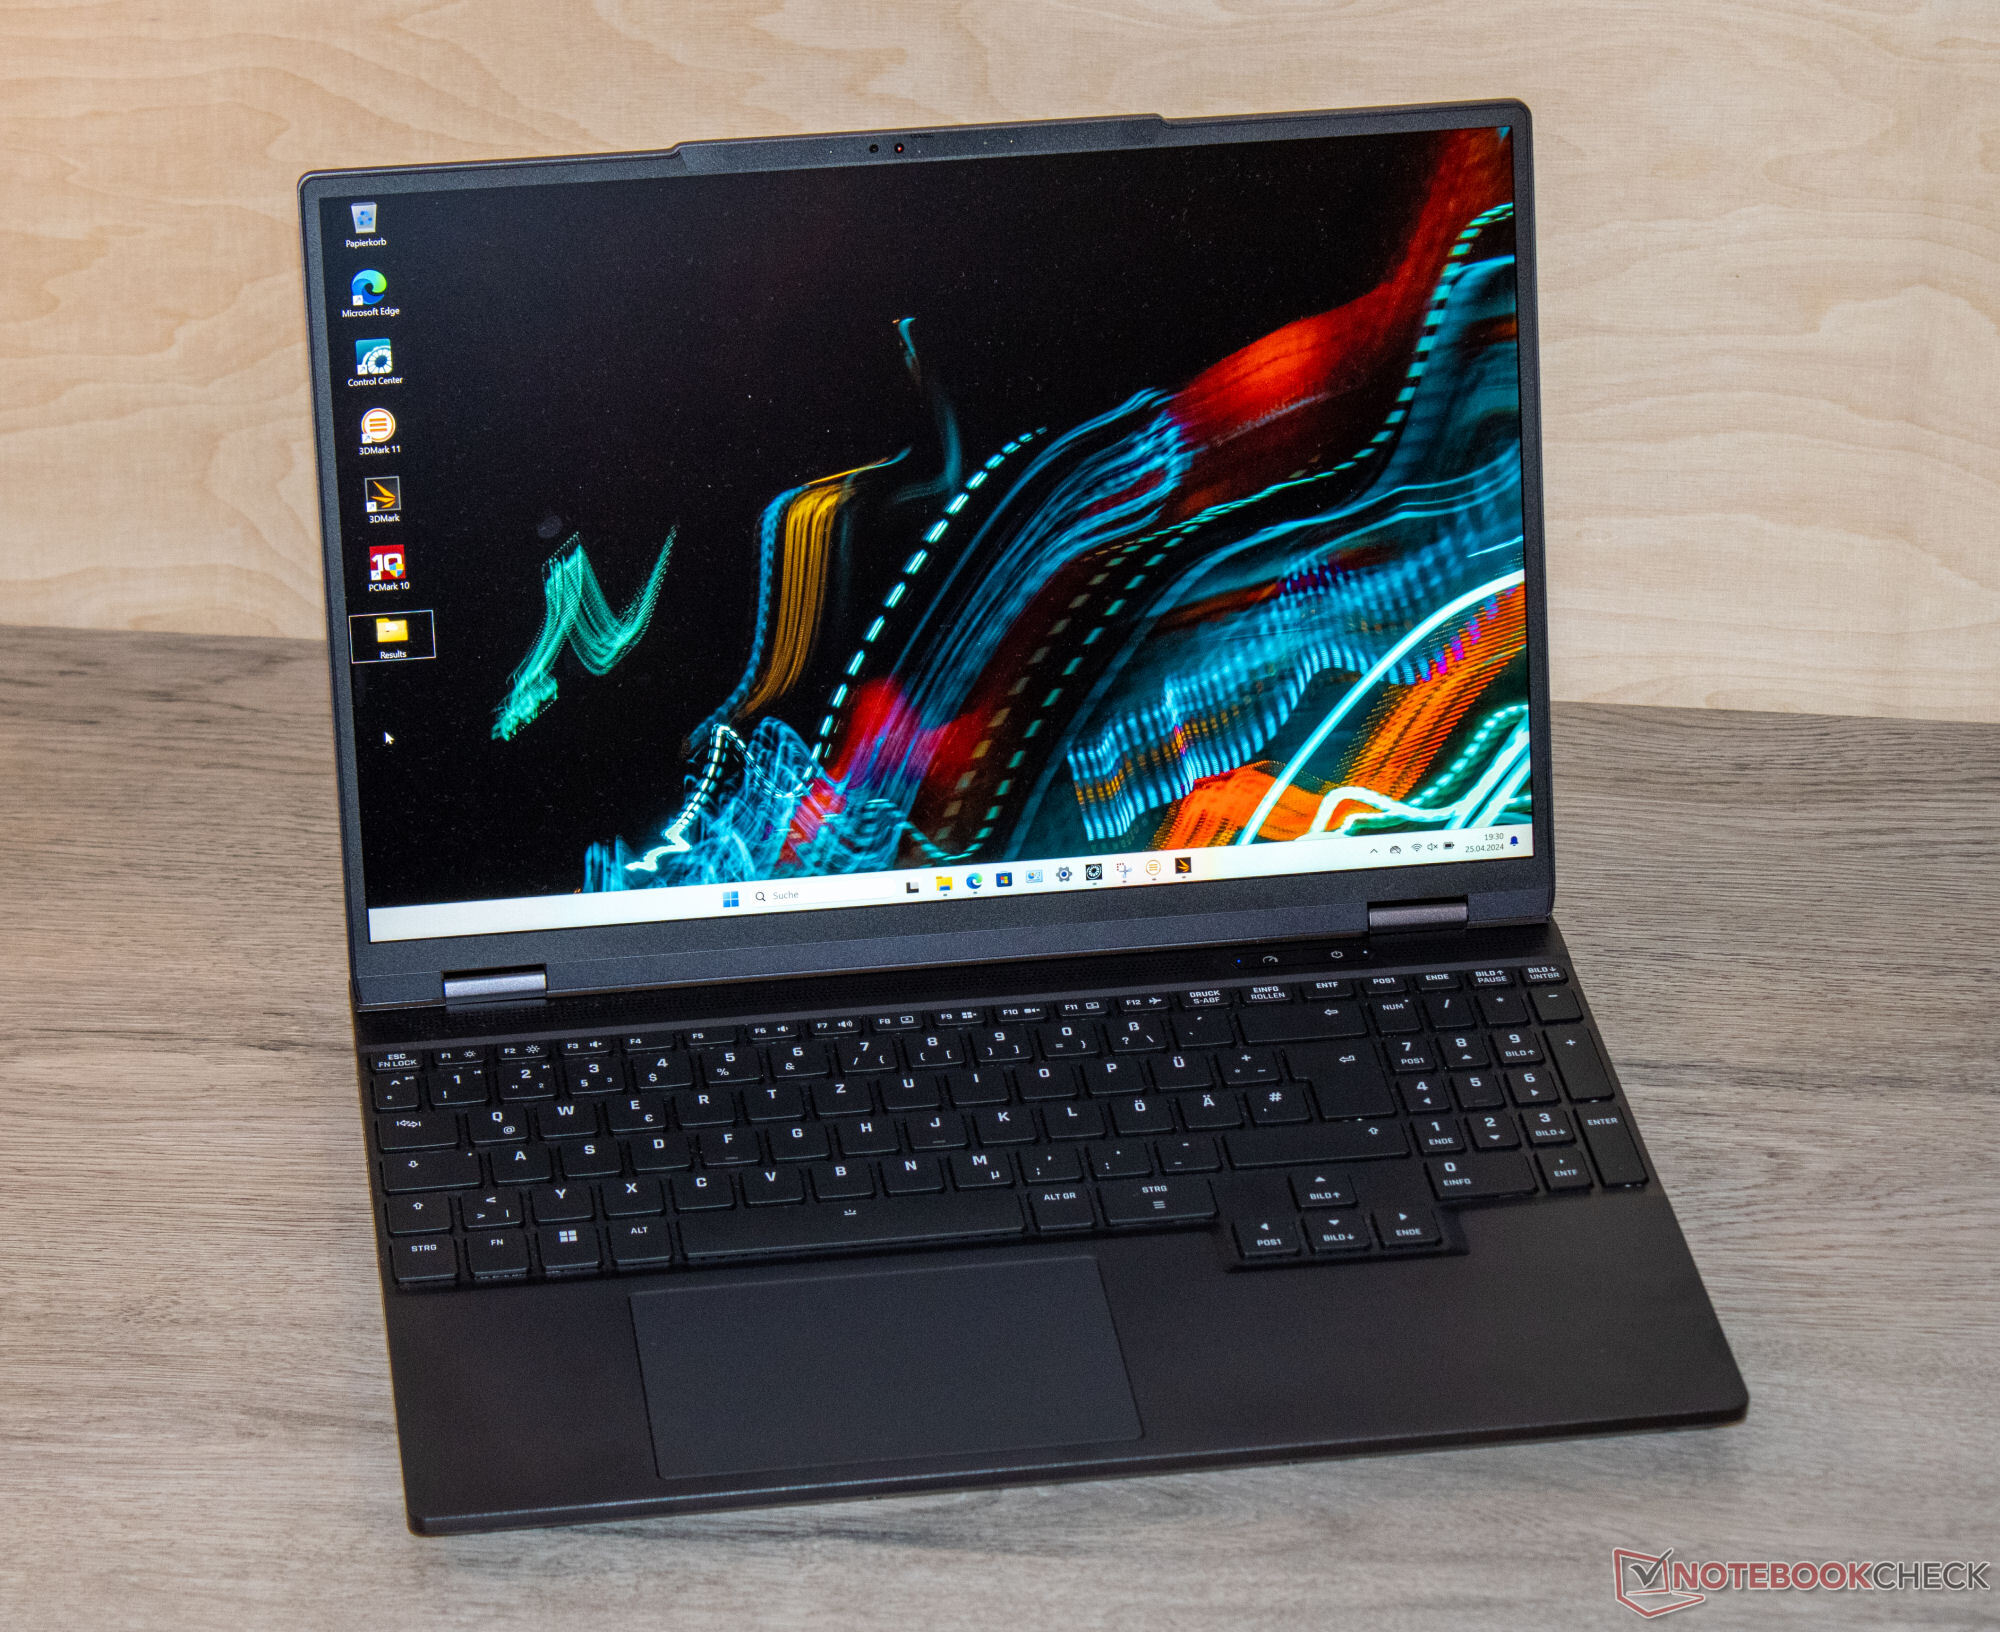
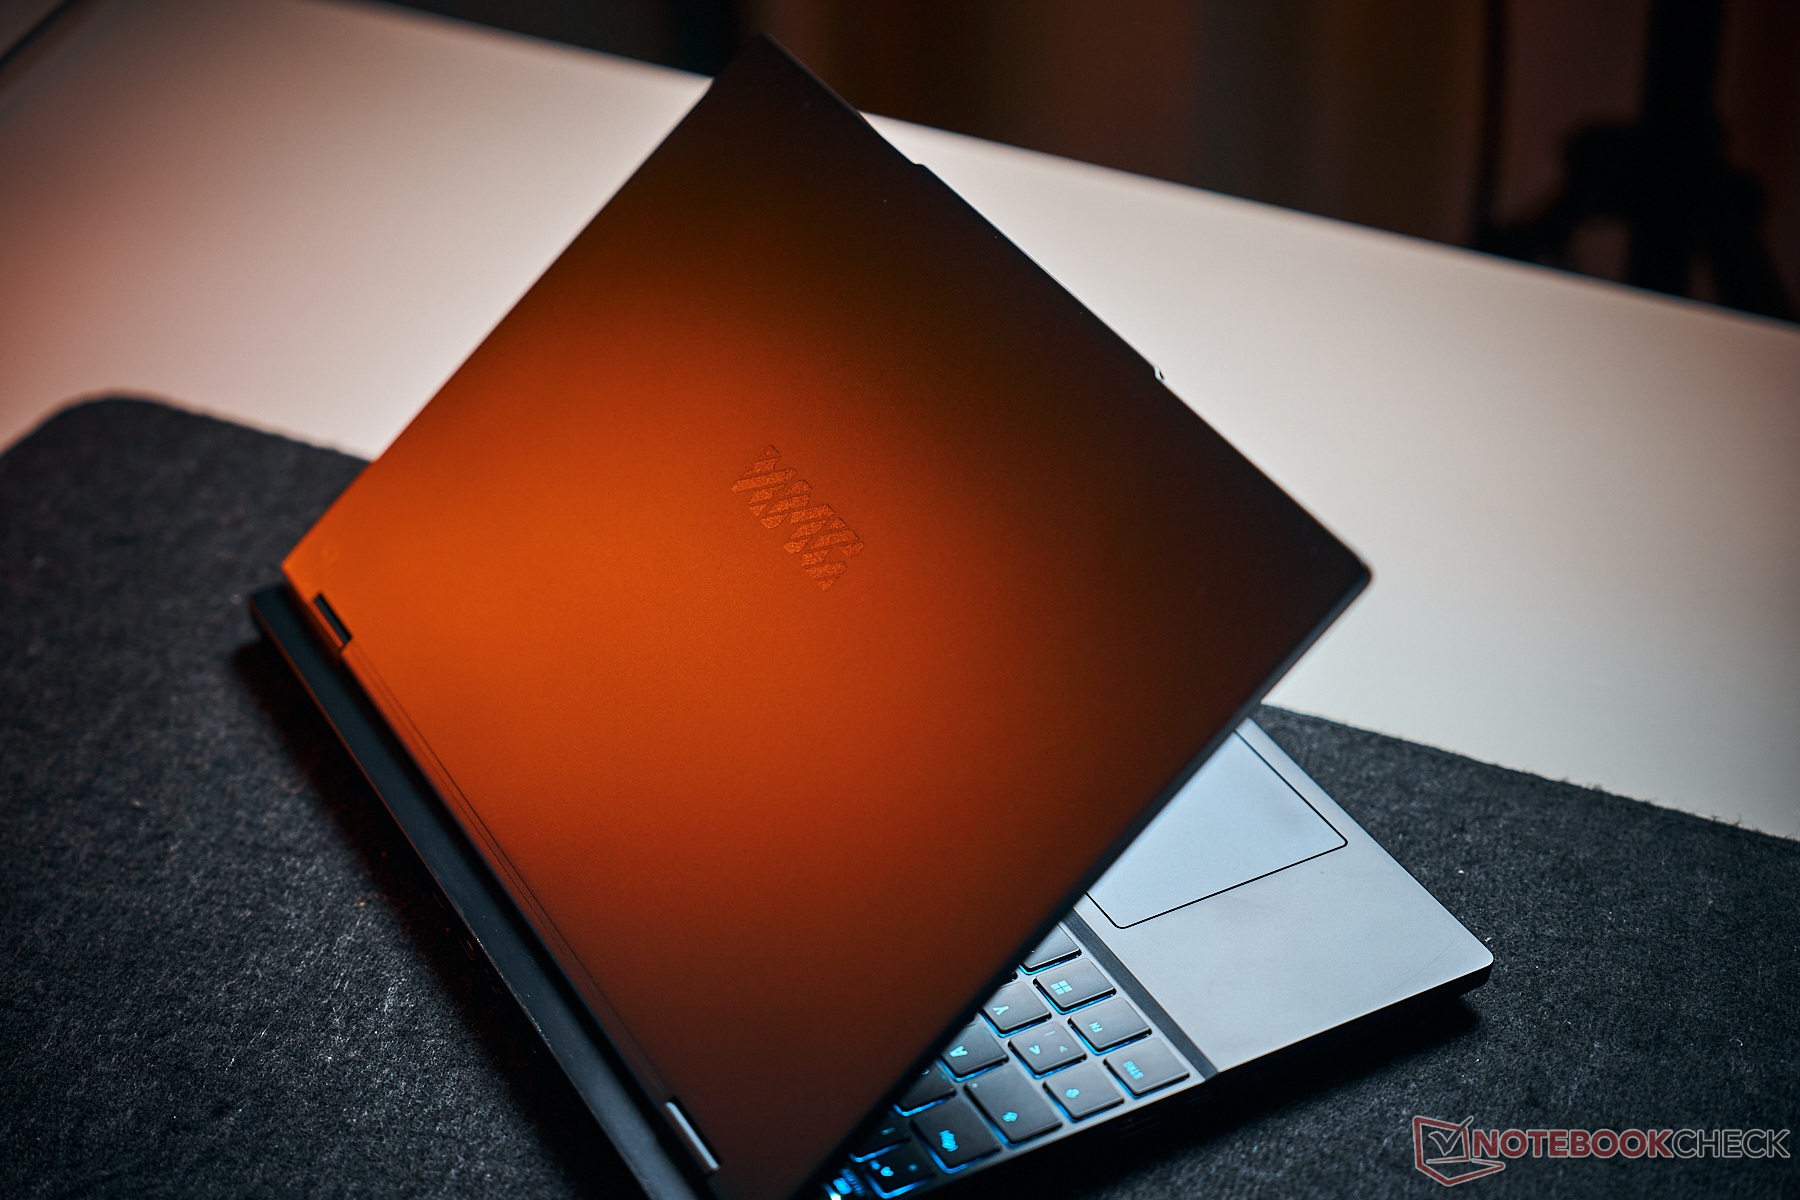
Schenker, pürüzsüz yüzeylere sahip şık, mat siyah alüminyum bir kasa tercih etmiş. Dizüstü bilgisayarda göz alıcı tasarım öğeleri veya LED şeritler bulunmuyor; yalnızca klavye arka aydınlatması (RGB) cihaza biraz renk katıyor. Dizüstü bilgisayar profesyonel ortamlarda neredeyse hiç göze çarpmayacaktır.
Hiçbir malzeme çıkıntısı olmadığını ve tüm boşlukların mükemmel bir şekilde hizalandığını fark ettik. Ana ünite ve kapak hafifçe bükülebilir, ancak bu olağan dışı bir şey değildir. Kapağın arkasına bastırmak herhangi bir görüntü değişikliğine yol açmıyor. Sert menteşeler maksimum 180 derecelik bir açılma açısına izin veriyor. Tek elle açmak mümkündür.
Hiç şaşırtıcı değil: Karşılaştırma alanında Fusion en kompakt cihazdır - en küçük ekrana sahiptir. Aynı zamanda içlerinde en hafif olanıdır.
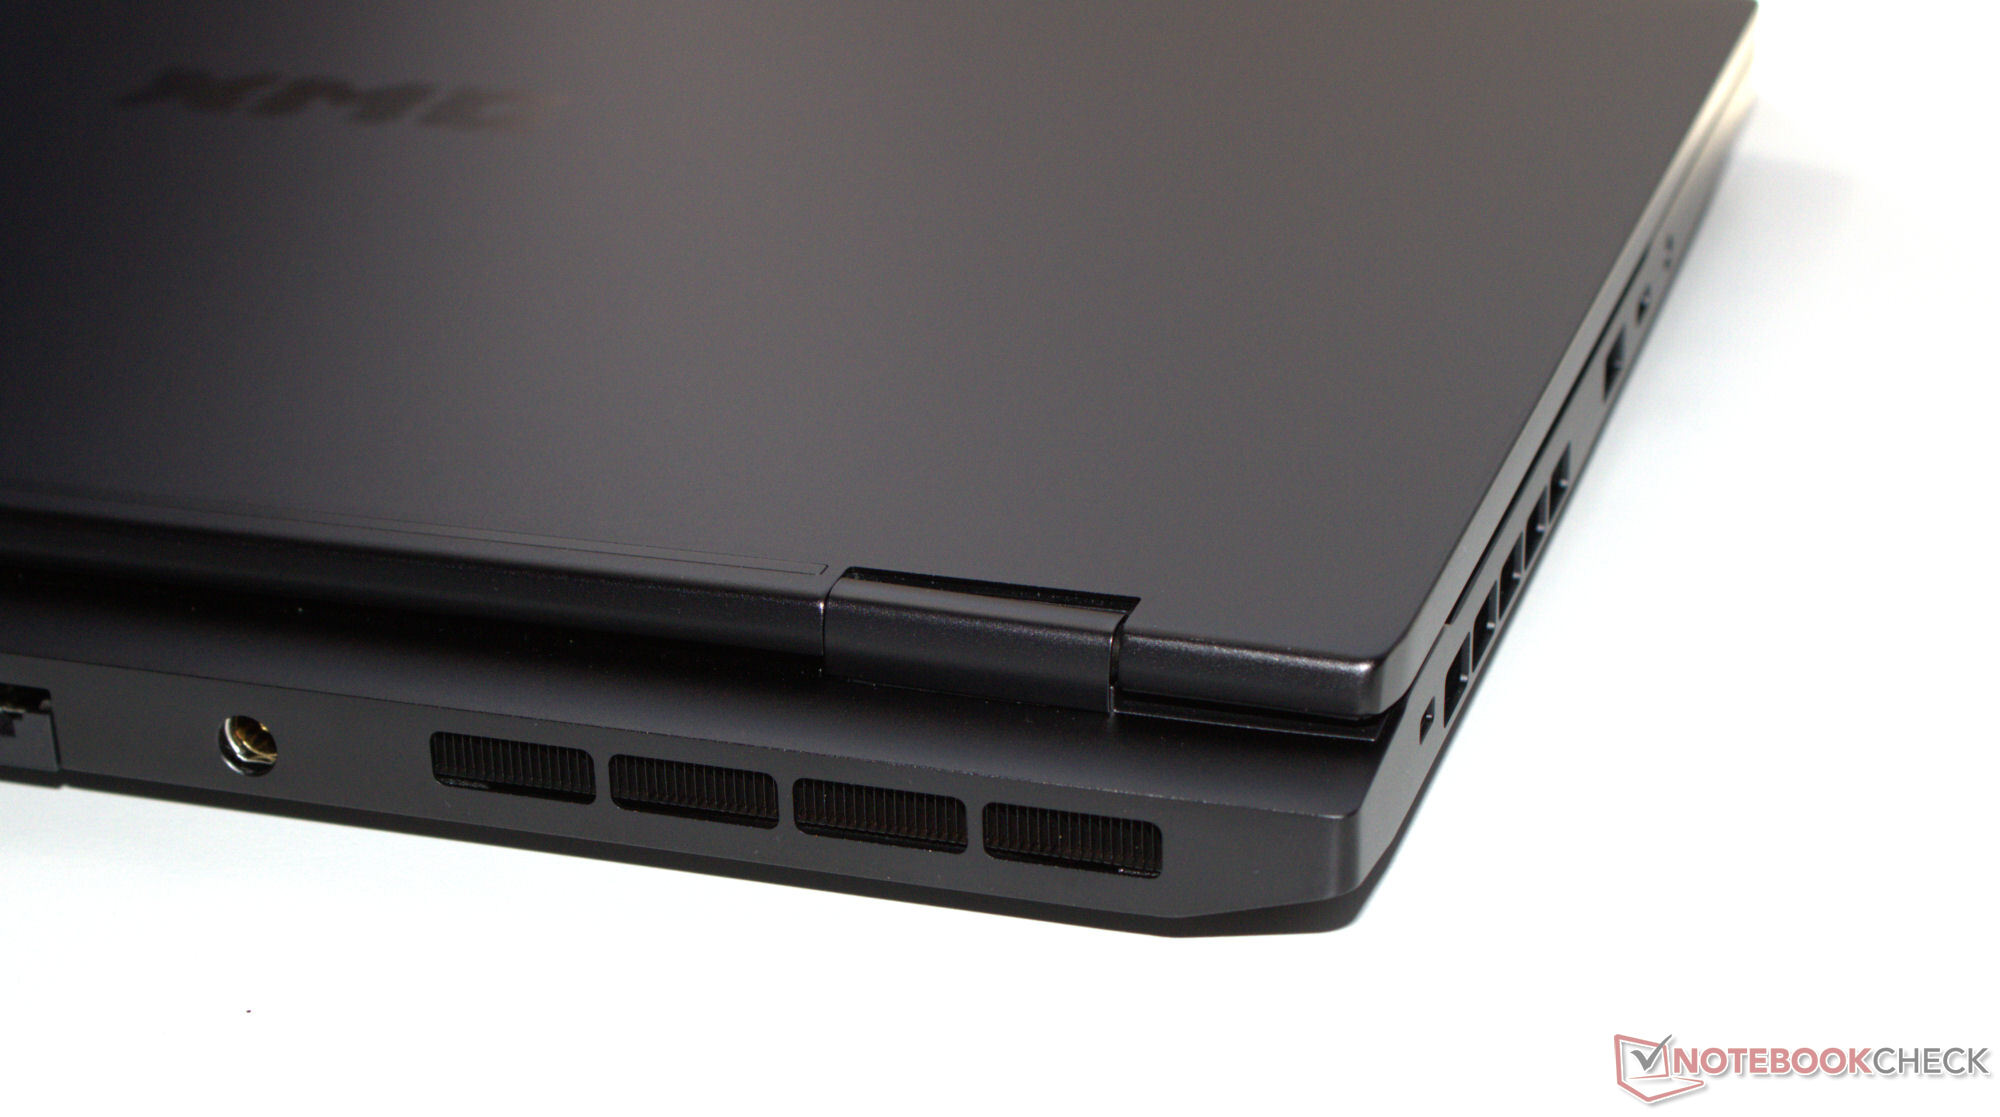
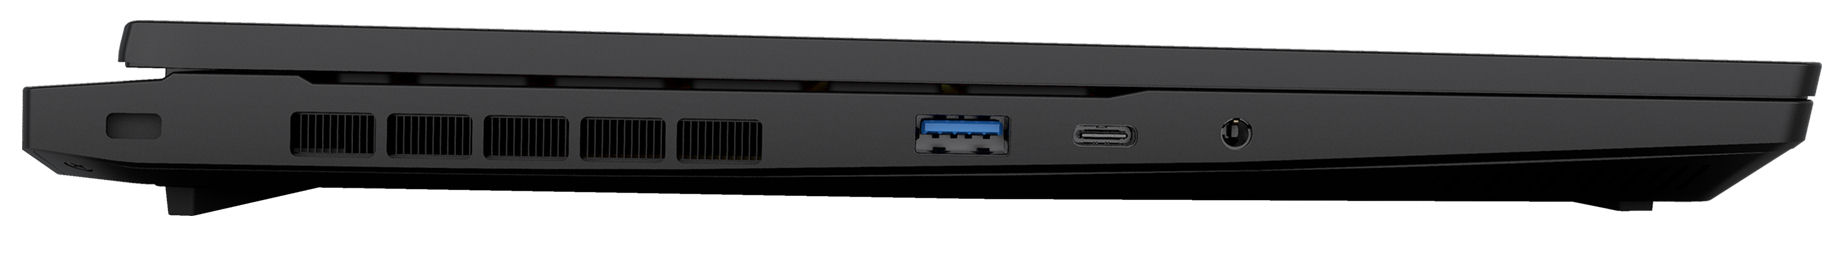
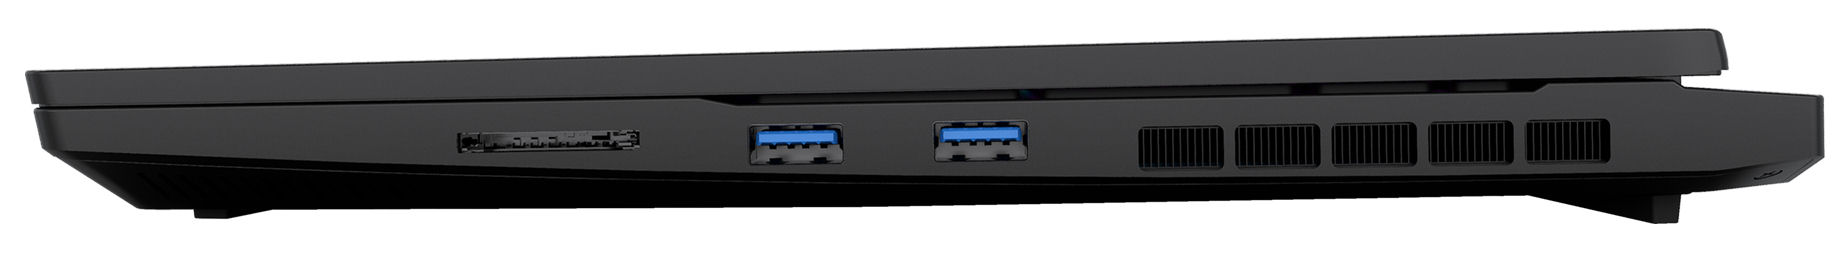
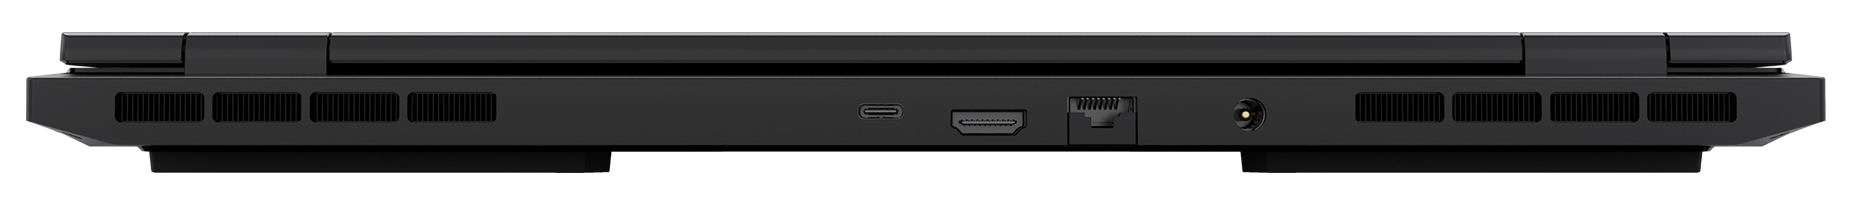
Bağlanabilirlik - Thunderbolt 4 özellikli Fusion 15
Fusion'da üç USB-A bağlantı noktası (USB 3.2 Gen 1) ve iki USB-C bağlantı noktası (1x USB 3.2 Gen 1, 1x Thunderbolt 4) bulunmaktadır. TB4 bağlantı noktası Güç Dağıtımını destekler ve bir DisplayPort sinyali çıkışı sağlayabilir. Dizüstü bilgisayarın toplamda iki video çıkışı (1x HDMI, 1x DP) vardır. Bir ses jakı ve bir Gigabit Ethernet portu bağlantı seçeneklerini tamamlıyor. Video çıkışları ve güç bağlantısı cihazın arkasında yer alıyor. İlgili kablolar arkadan çıkar, böylece yolunuza çıkmazlar.
SD kart okuyucu
SD kart okuyucu (referans kart: AV PRO microSD 128 GB V60) 81 MB/s (her biri 5 MB boyutunda 250 jpg görüntü aktarma) ve 82 MB/s (büyük veri bloklarını kopyalama) aktarım hızlarıyla ortalama bir hıza sahiptir. Rekabet büyük ölçüde daha hızlı okuyucular sunuyor.
| SD Card Reader | |
| average JPG Copy Test (av. of 3 runs) | |
| Aorus 16X 2024 (AV PRO microSD 128 GB V60) | |
| Sınıf ortalaması Gaming (20.9 - 210, n=54, son 2 yıl) | |
| Schenker XMG Fusion 15 (Early 24) (AV PRO microSD 128 GB V60) | |
| Alienware m16 R2 (AV PRO microSD 128 GB V60) | |
| maximum AS SSD Seq Read Test (1GB) | |
| Alienware m16 R2 (AV PRO microSD 128 GB V60) | |
| Aorus 16X 2024 (AV PRO microSD 128 GB V60) | |
| Sınıf ortalaması Gaming (25.5 - 261, n=51, son 2 yıl) | |
| Schenker XMG Fusion 15 (Early 24) (AV PRO microSD 128 GB V60) | |
İletişim
Fusion, en iyi senaryoda (yakın çevrede WiFi cihazı yok, dizüstü bilgisayar ile sunucu arasında kısa mesafe) çok iyi veri hızlarına ulaşan bir WiFi 6E çipi (Intel AX211) kullanıyor. Kablolu bağlantılar, daha önce karşılaşmadığımız bir üretici olan Motorcomm'un Gigabit Ethernet denetleyicisi (YT6801) tarafından gerçekleştiriliyor.
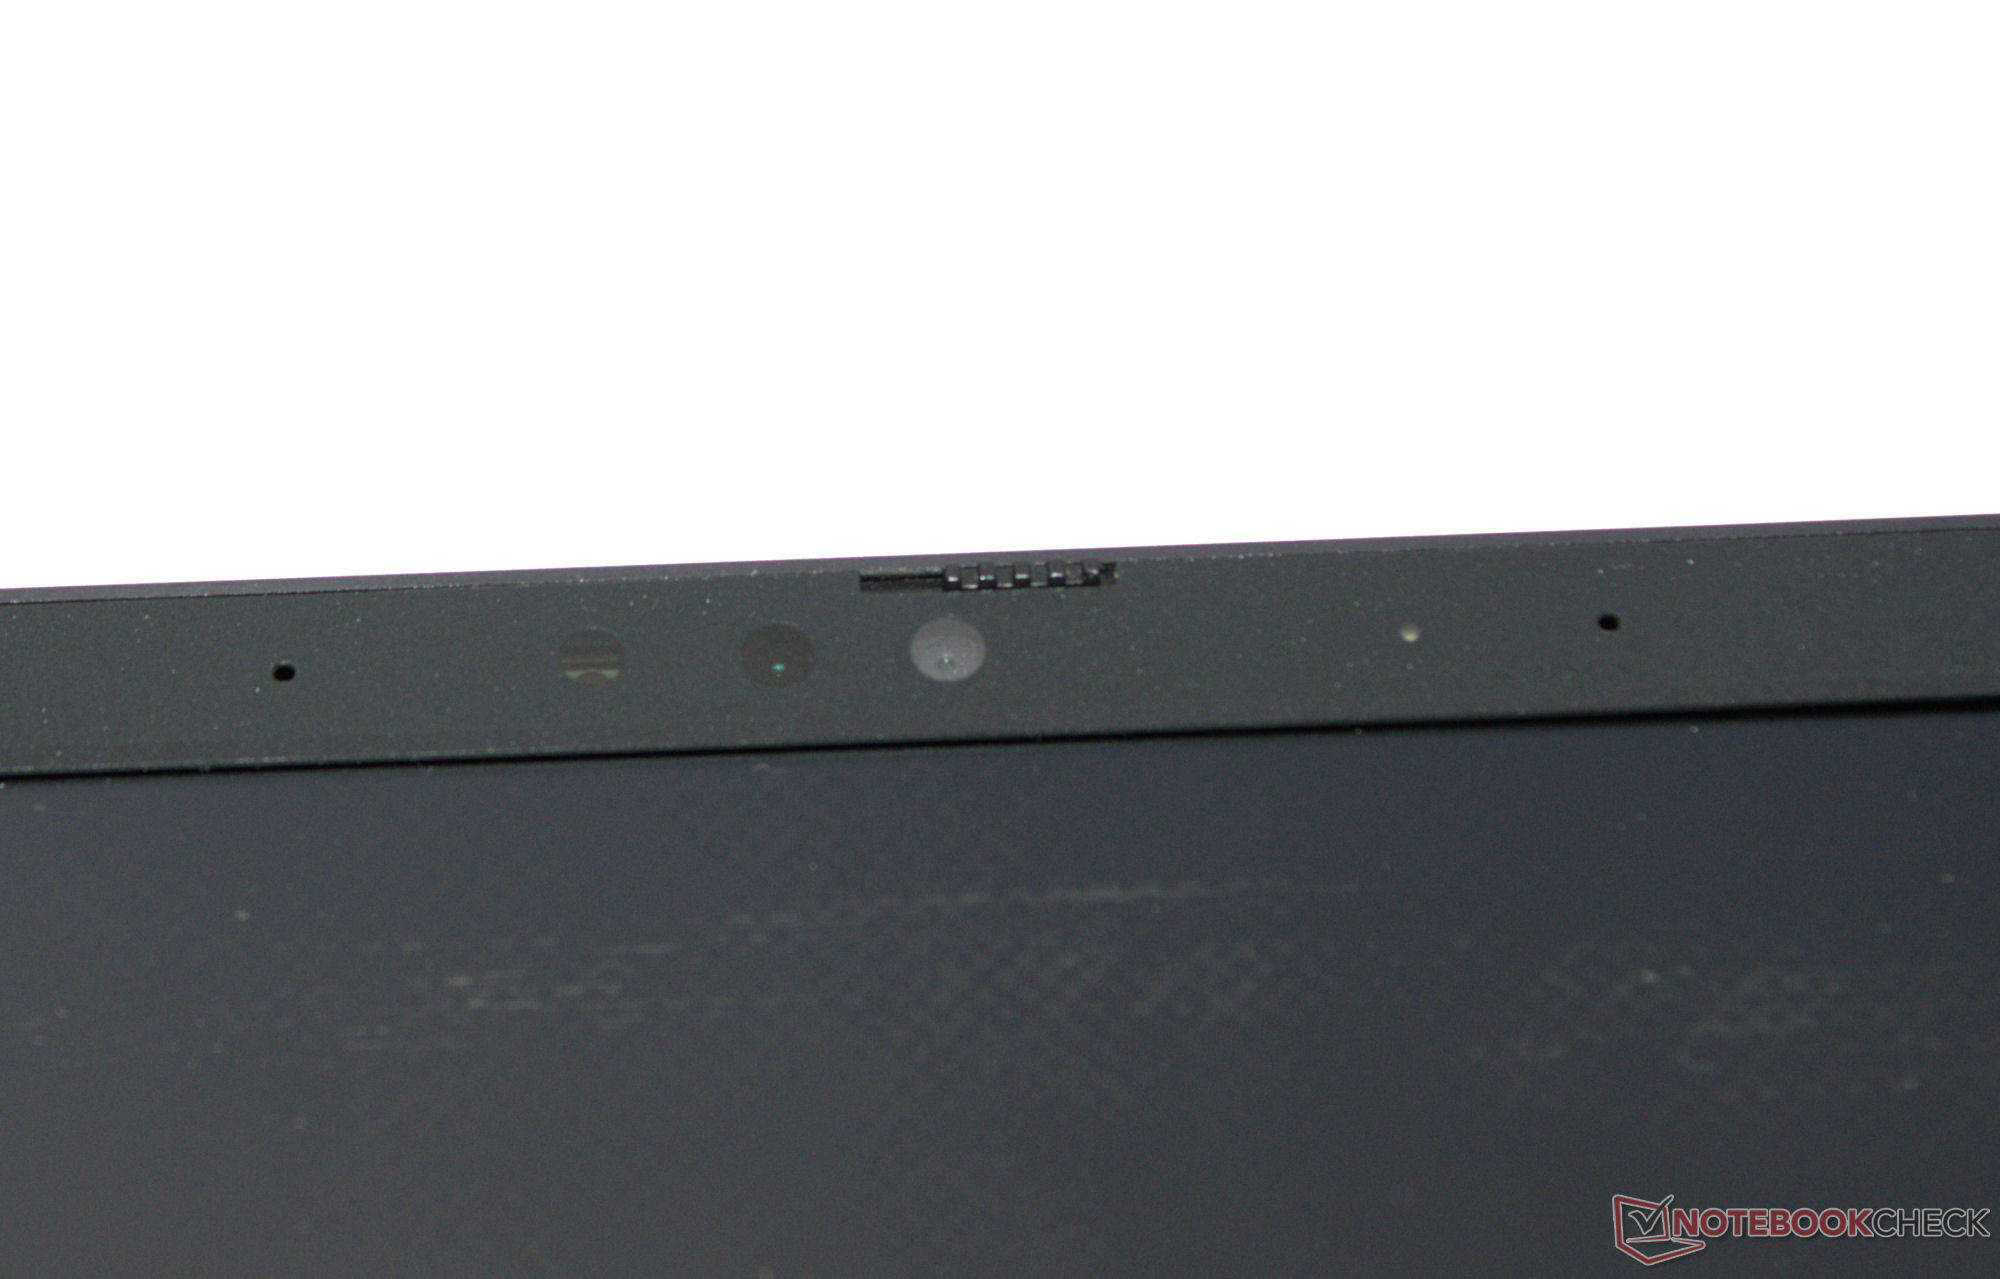
Web kamerası
Web kamerası (2,1 MP) ortalama kalitede. Renk doğruluğu söz konusu olduğunda başarısızdır: Yaklaşık 9 sapma ile hedef değer (DeltaE<3) kaçırılmıştır. Bununla birlikte, Windows Hello'yu desteklemektedir. Ayrıca, mekanik bir kapak ile donatılmıştır.

 GeForce RTX 4070 Laptop GPU, i9-14900HX, Samsung 990 Pro 1 TB")
 GeForce RTX 4070 Laptop GPU, i9-14900HX, Samsung 990 Pro 1 TB")
Aksesuarlar
Dizüstü bilgisayar bir USB bellek (sürücü, kılavuzlar), çıkartmalar ve bir mousepad ile birlikte teslim edilir.
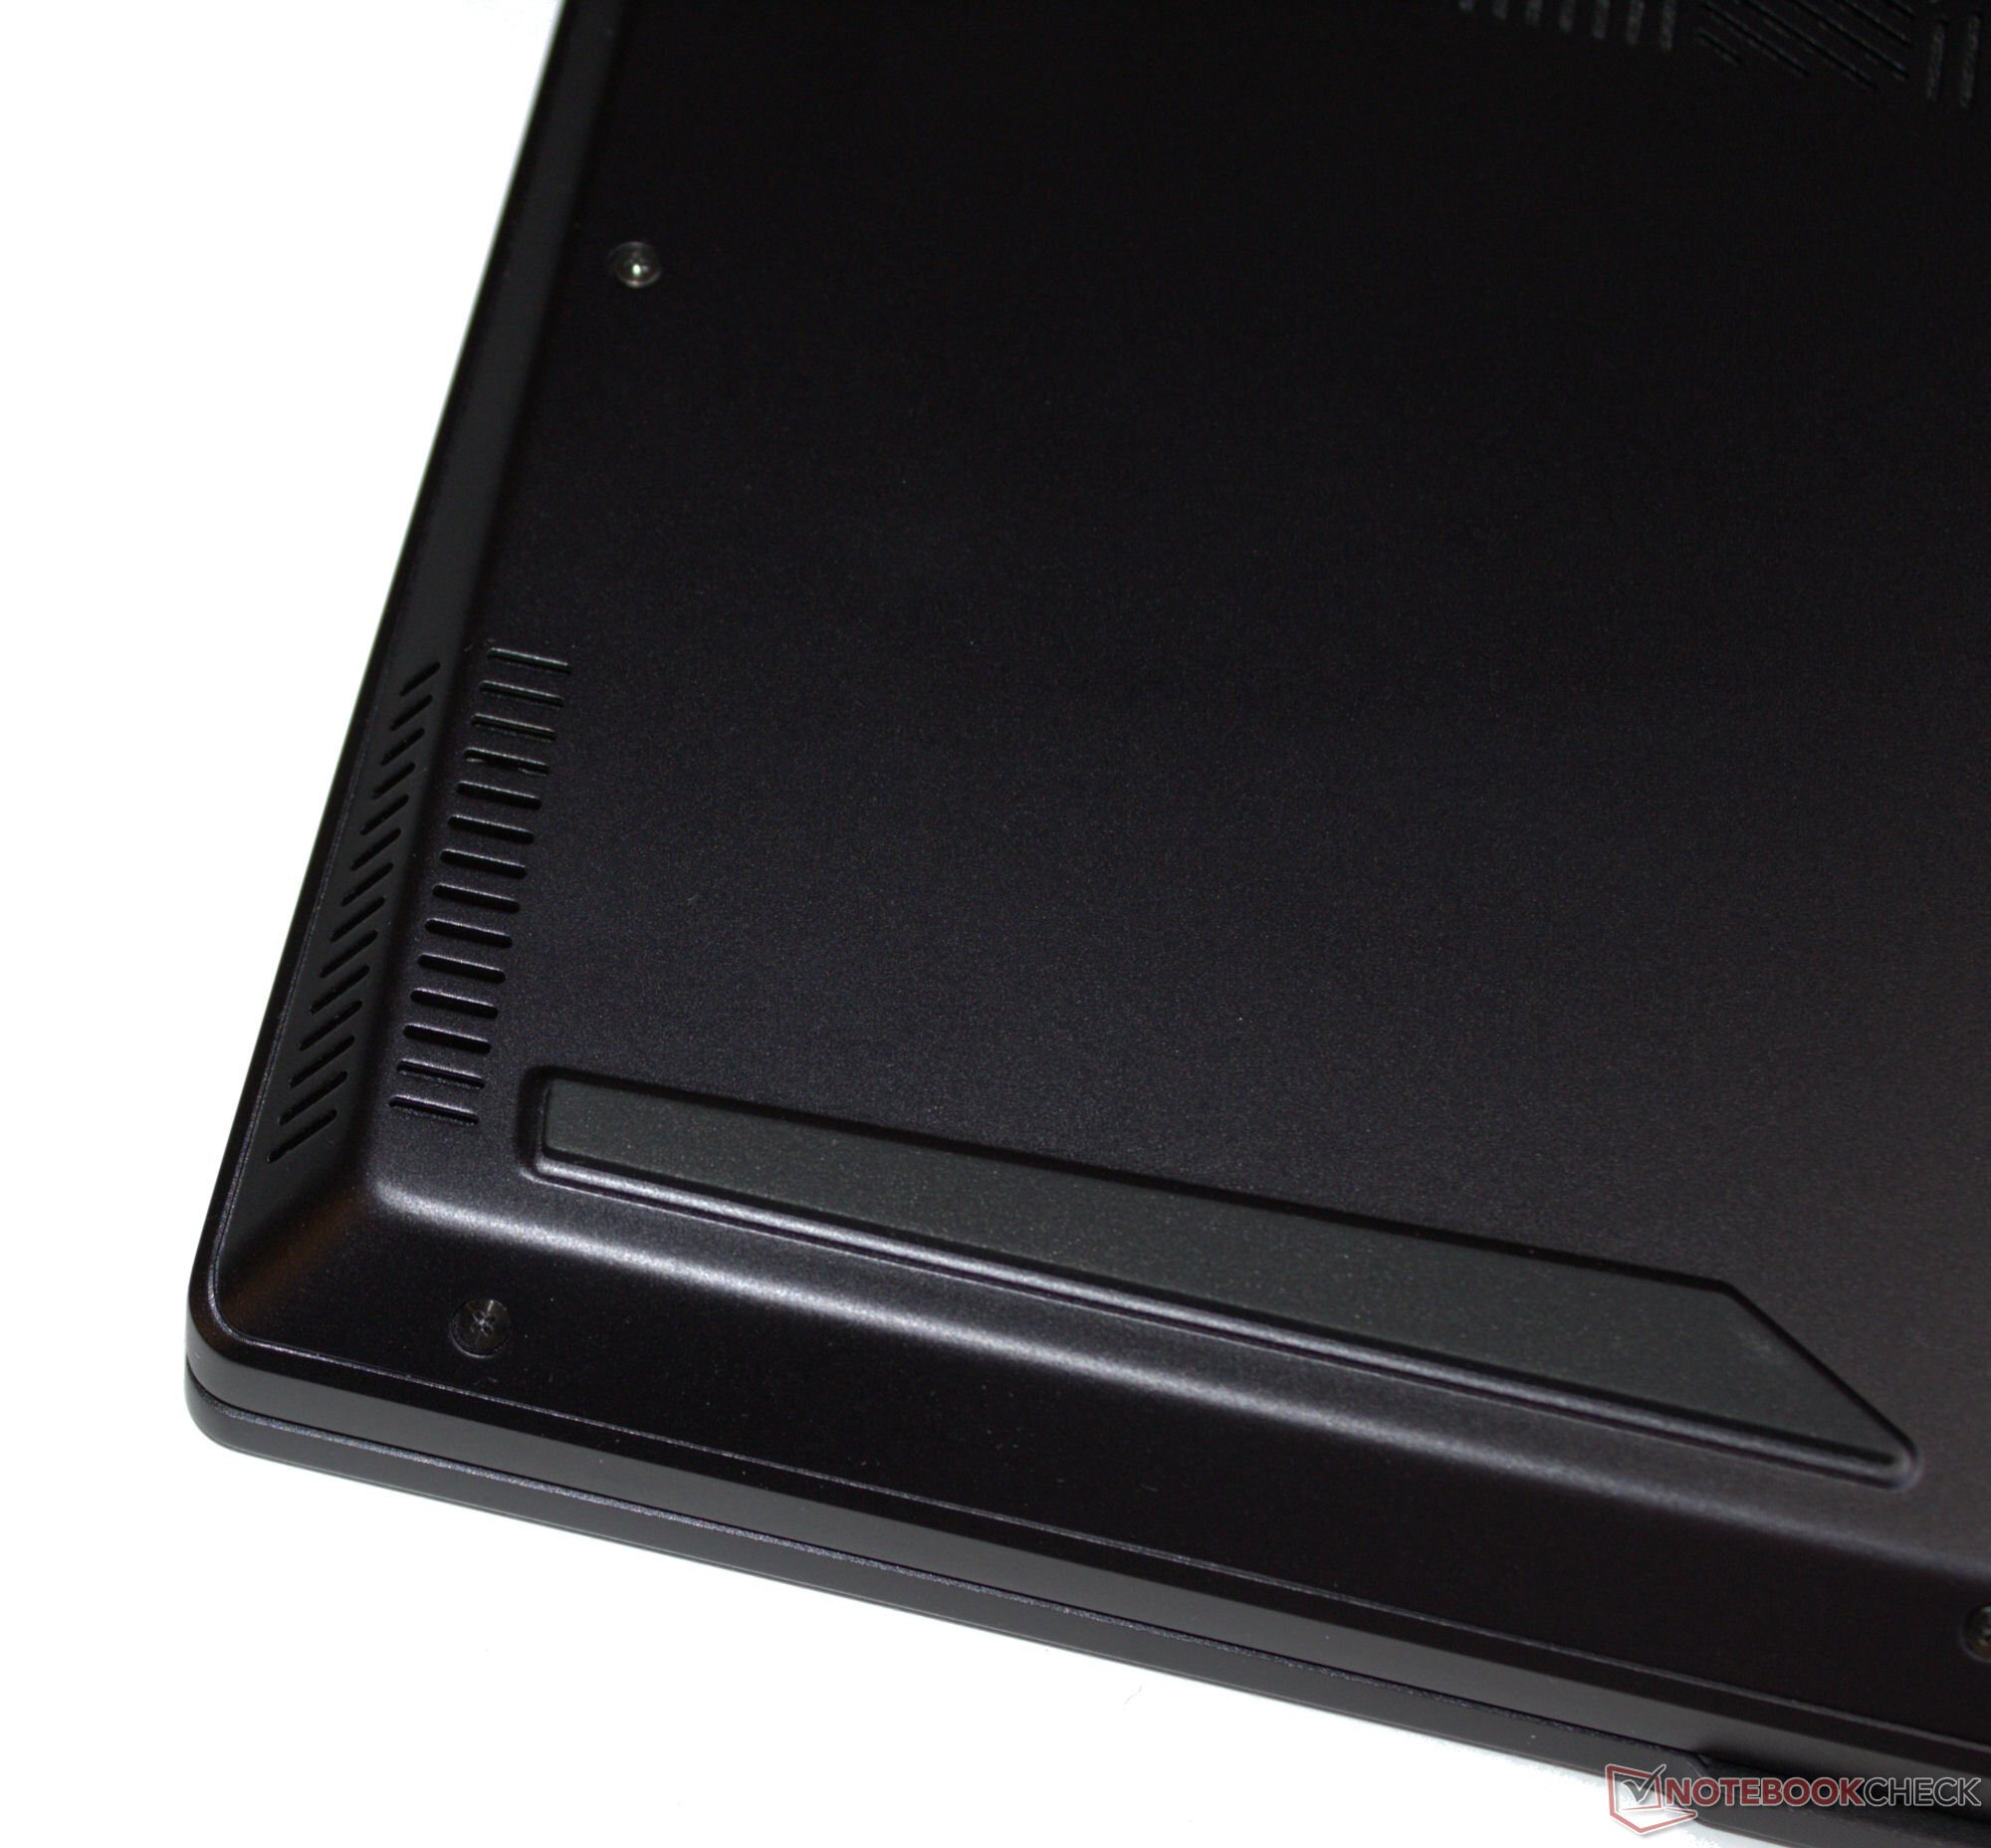
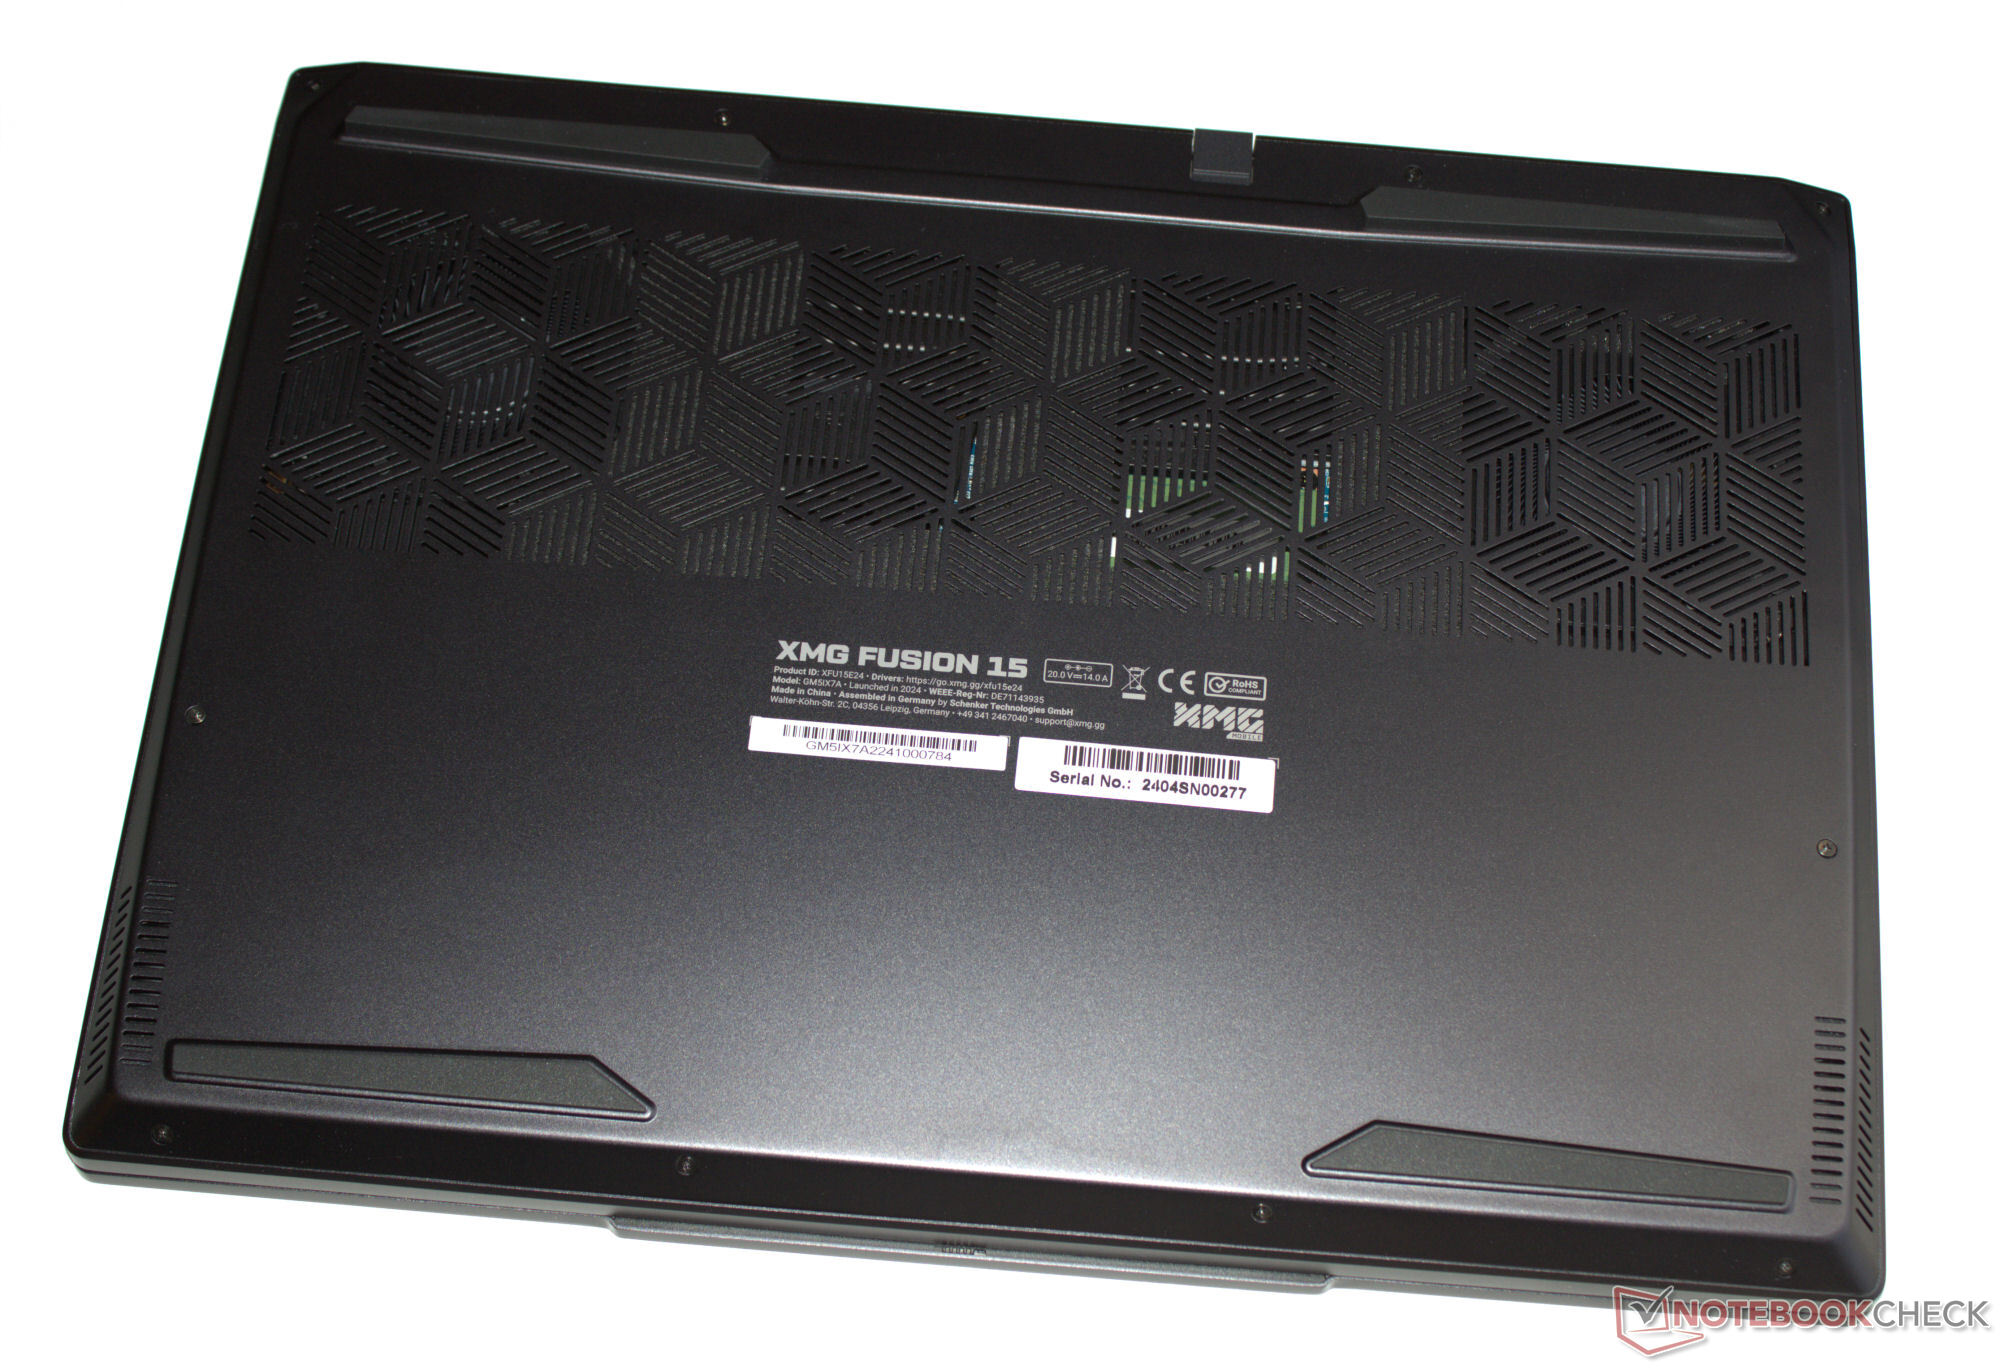
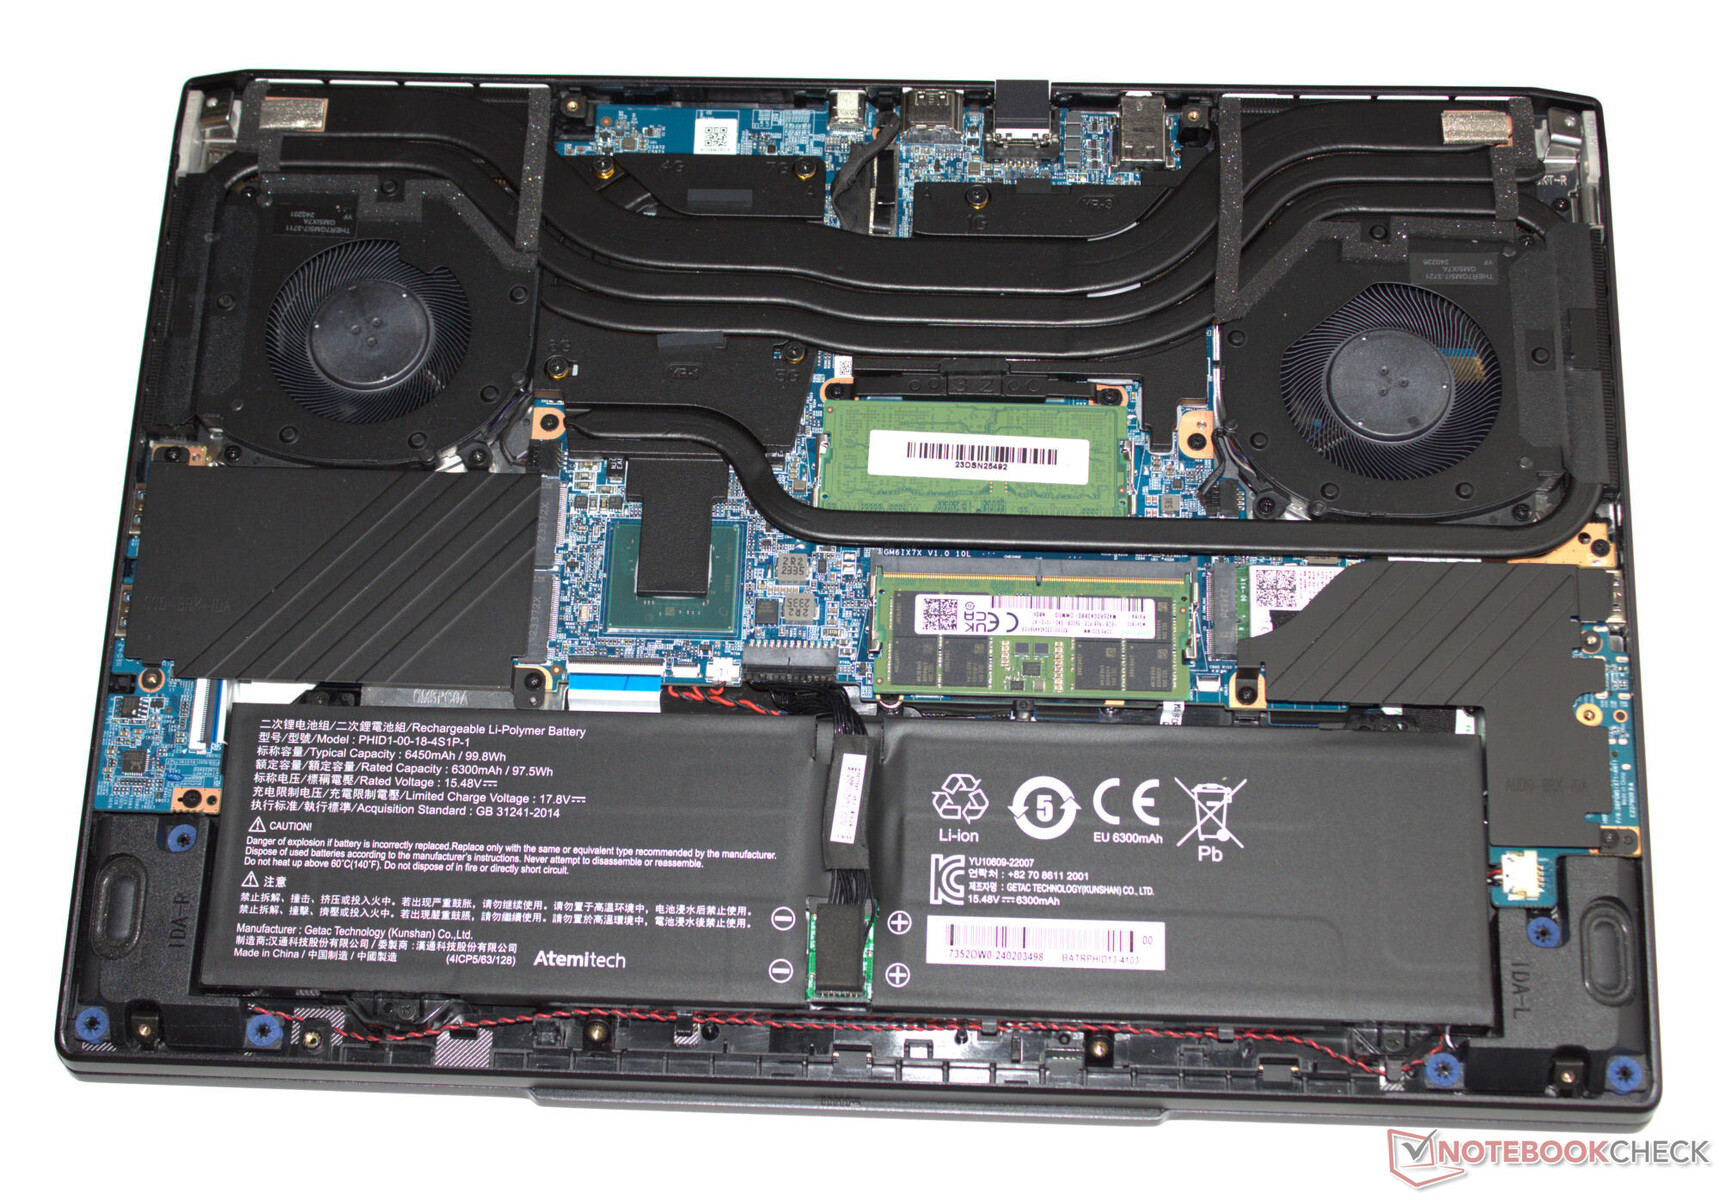
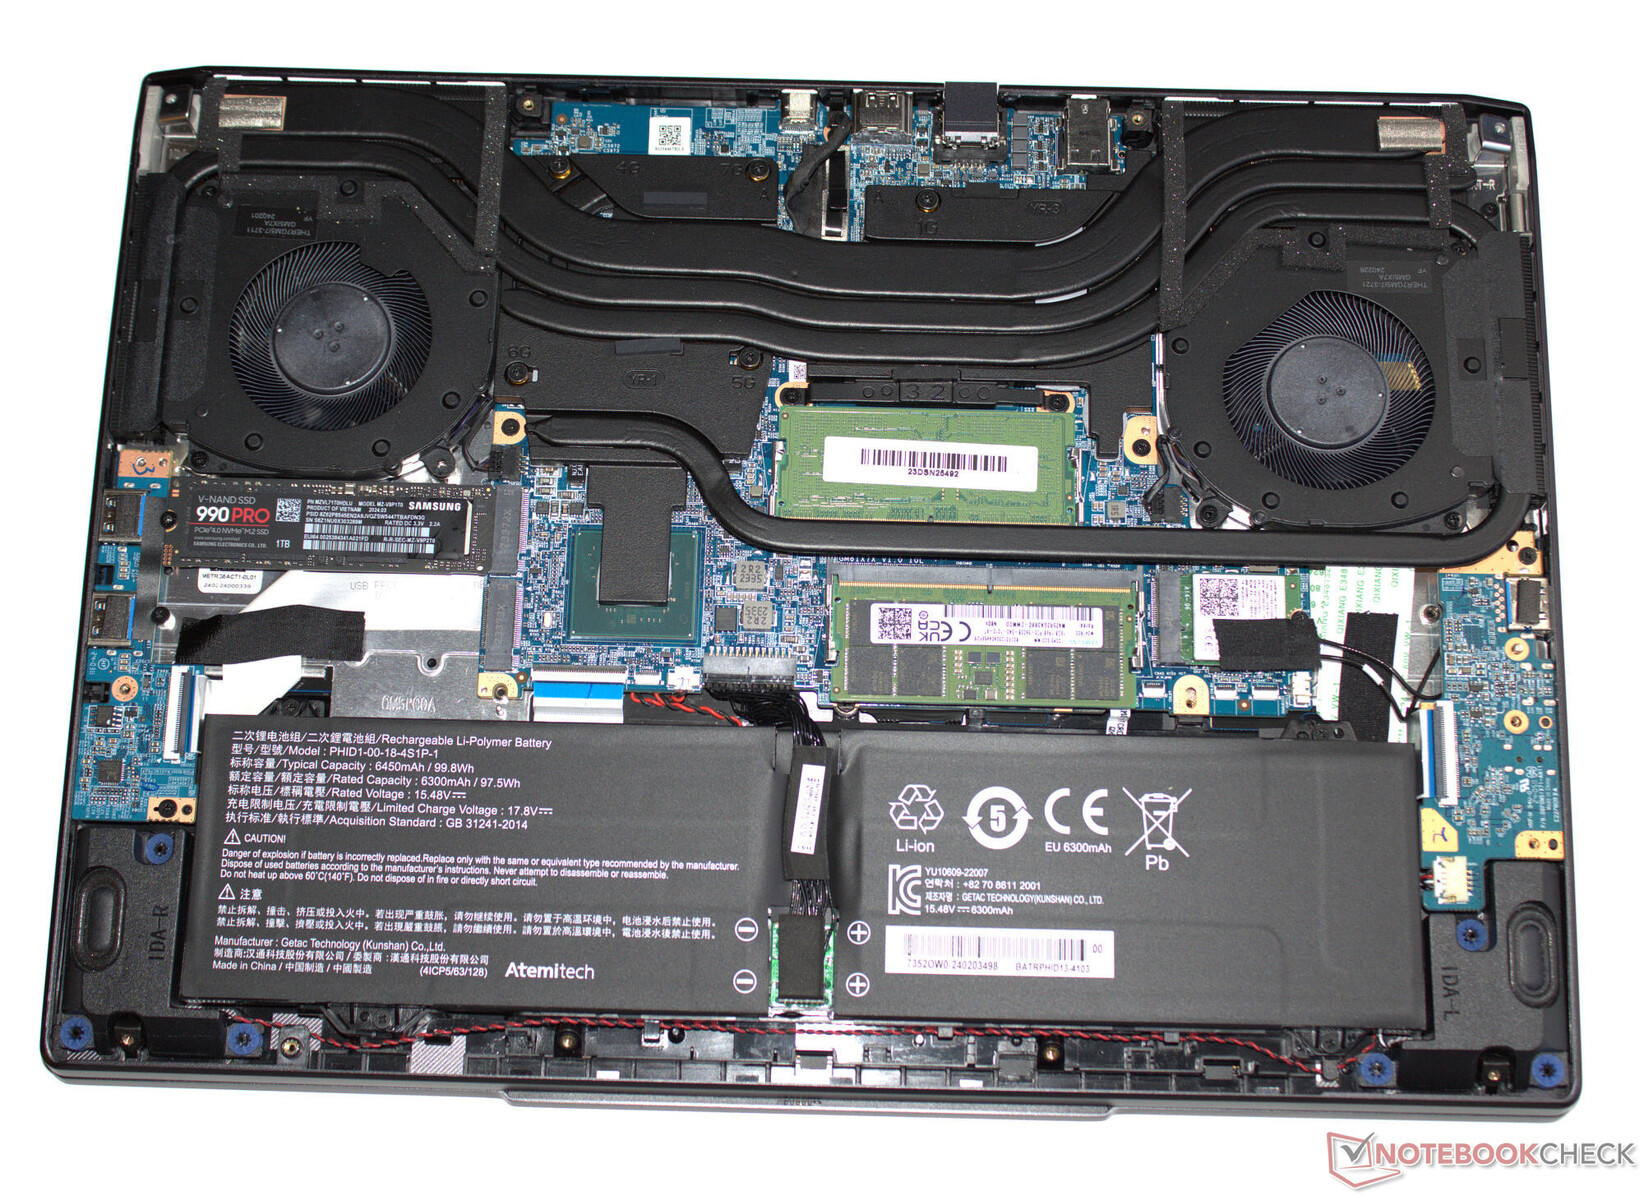
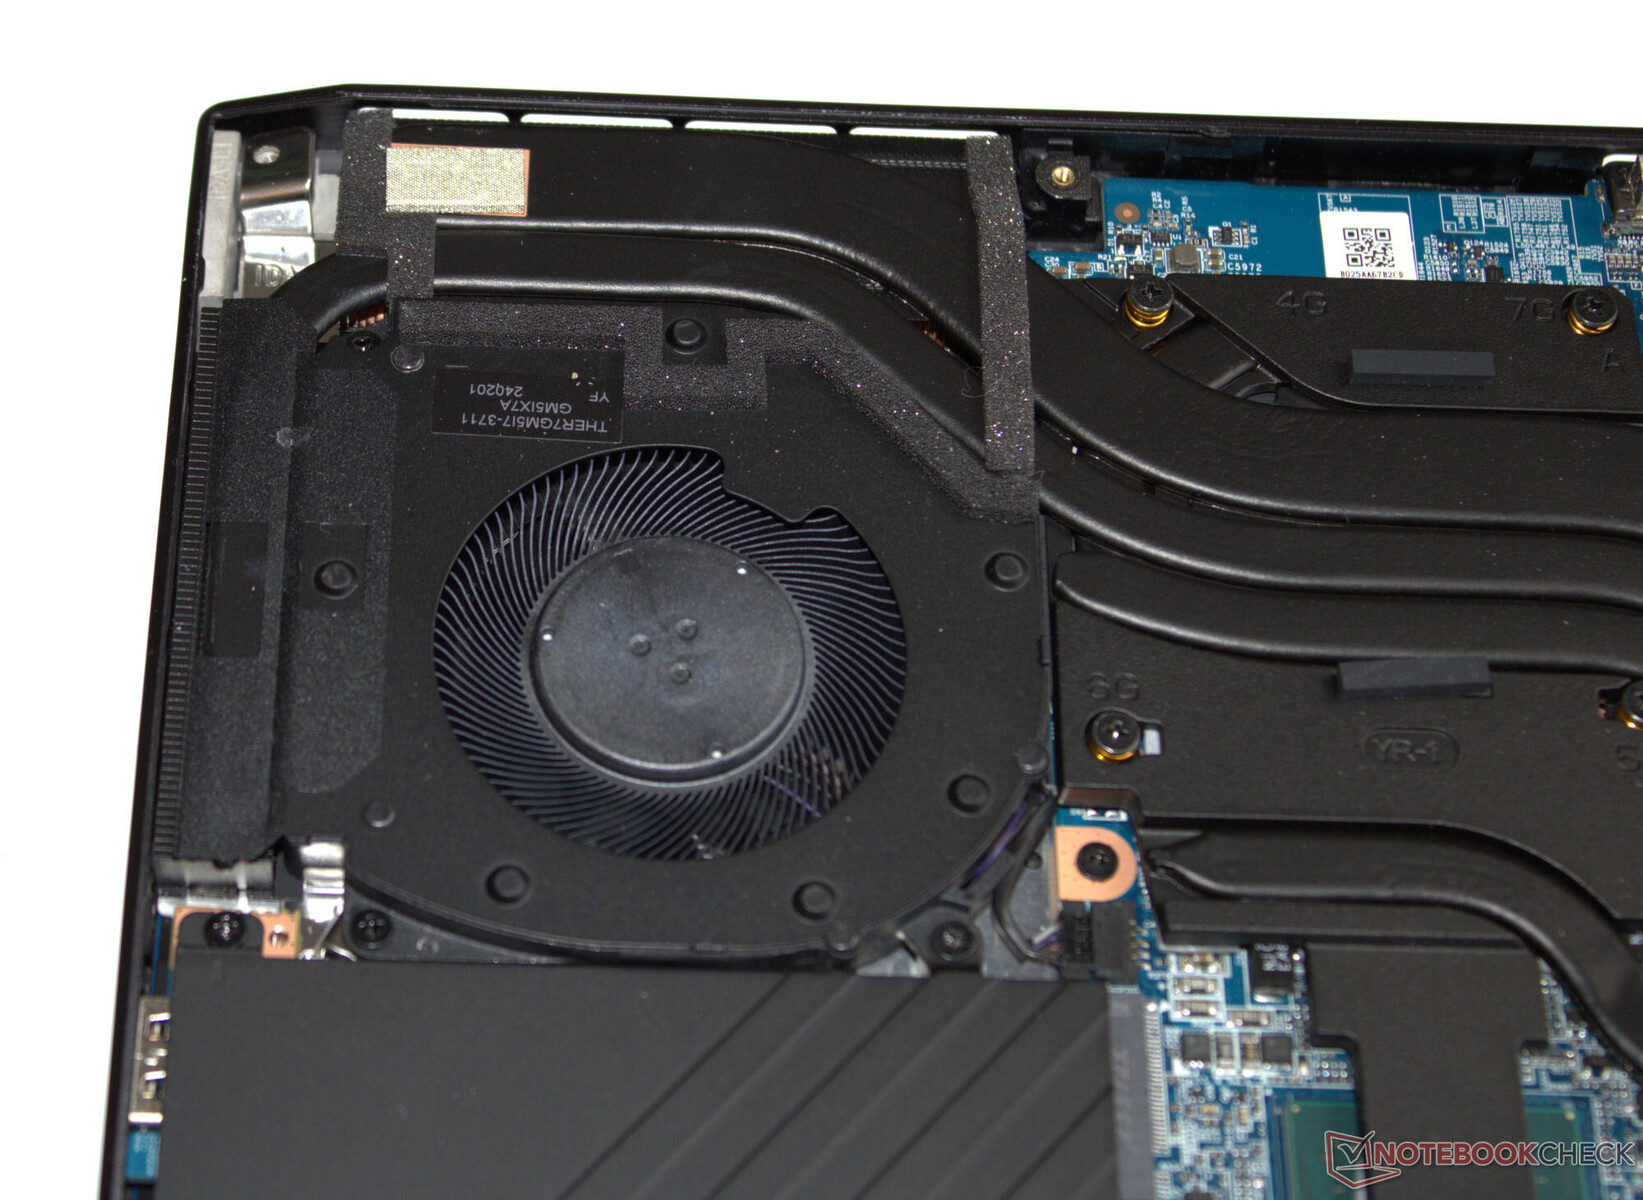
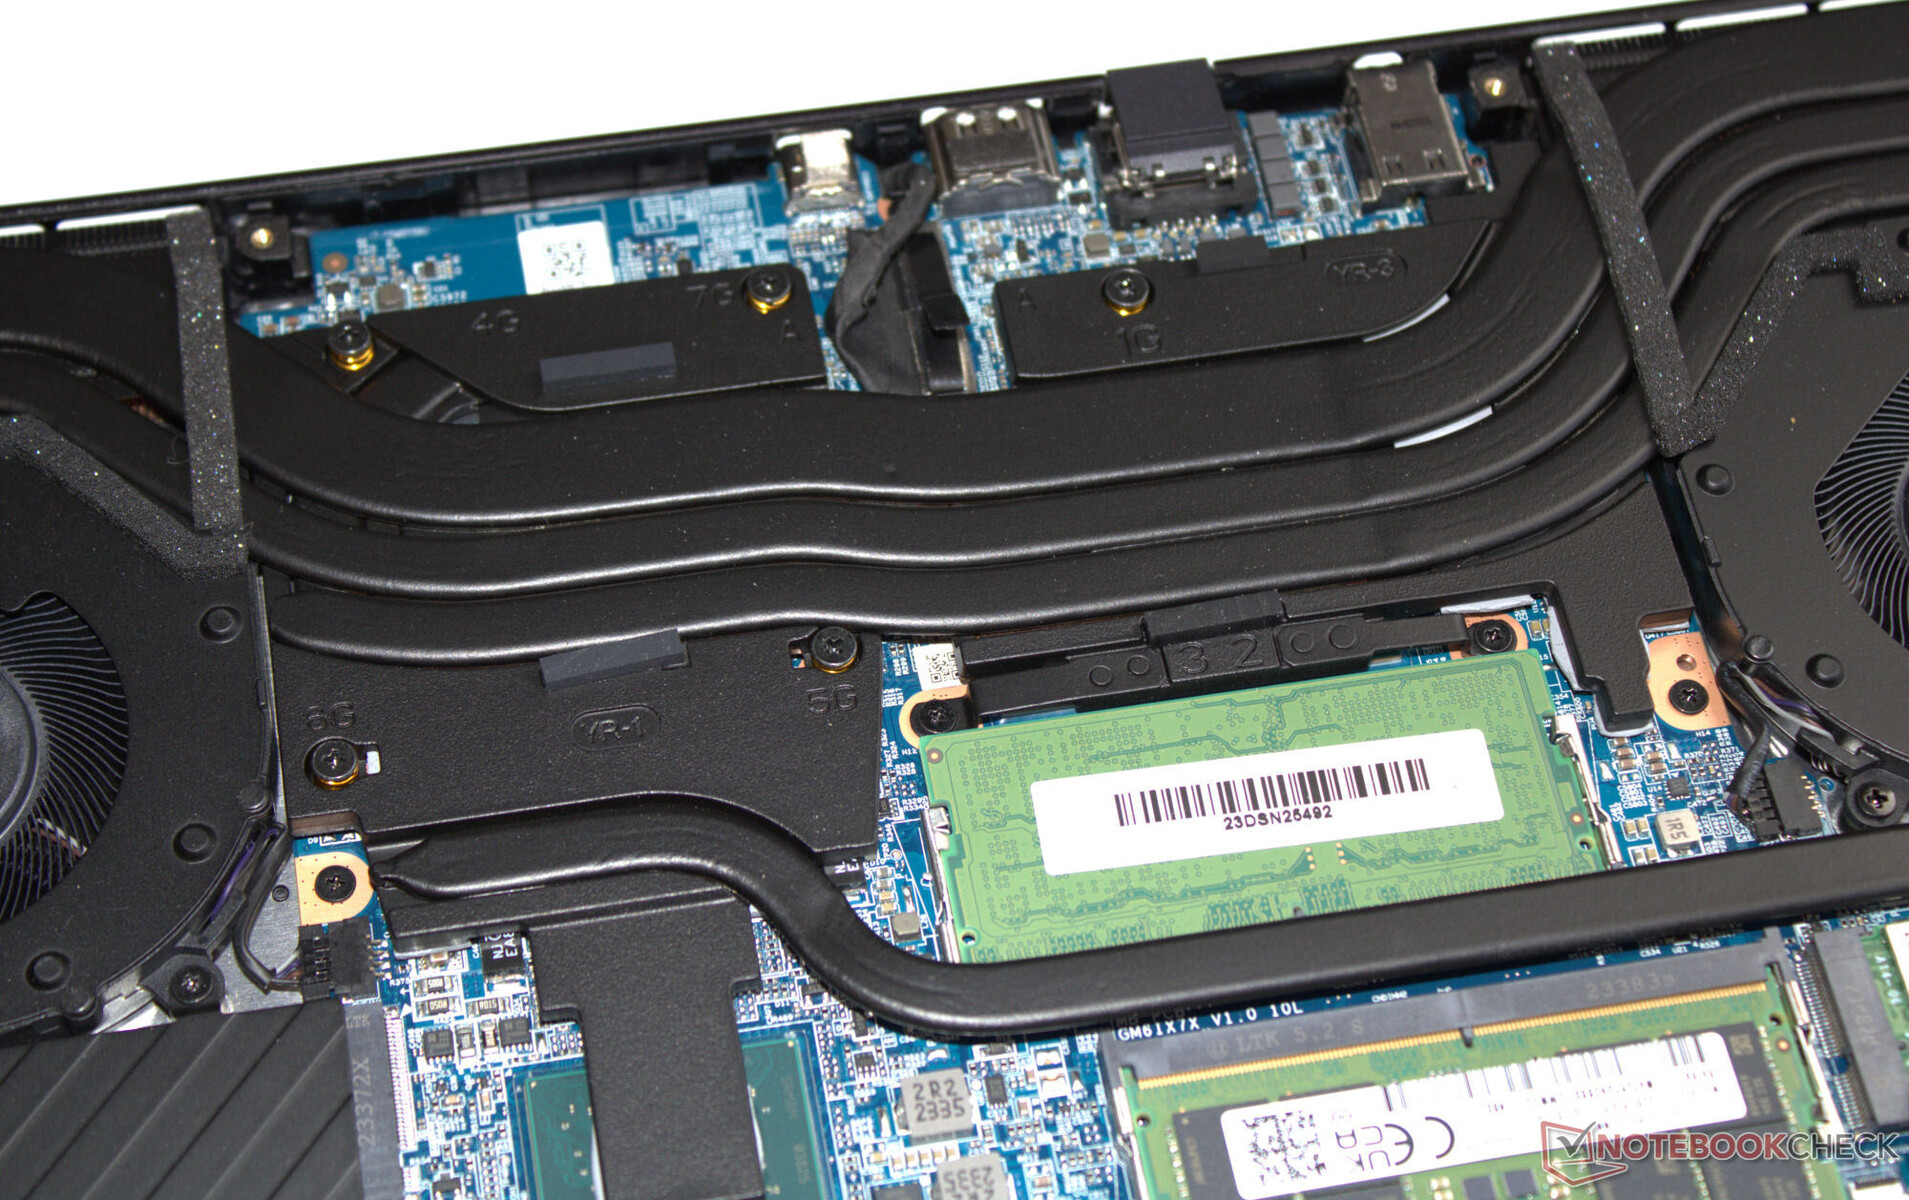
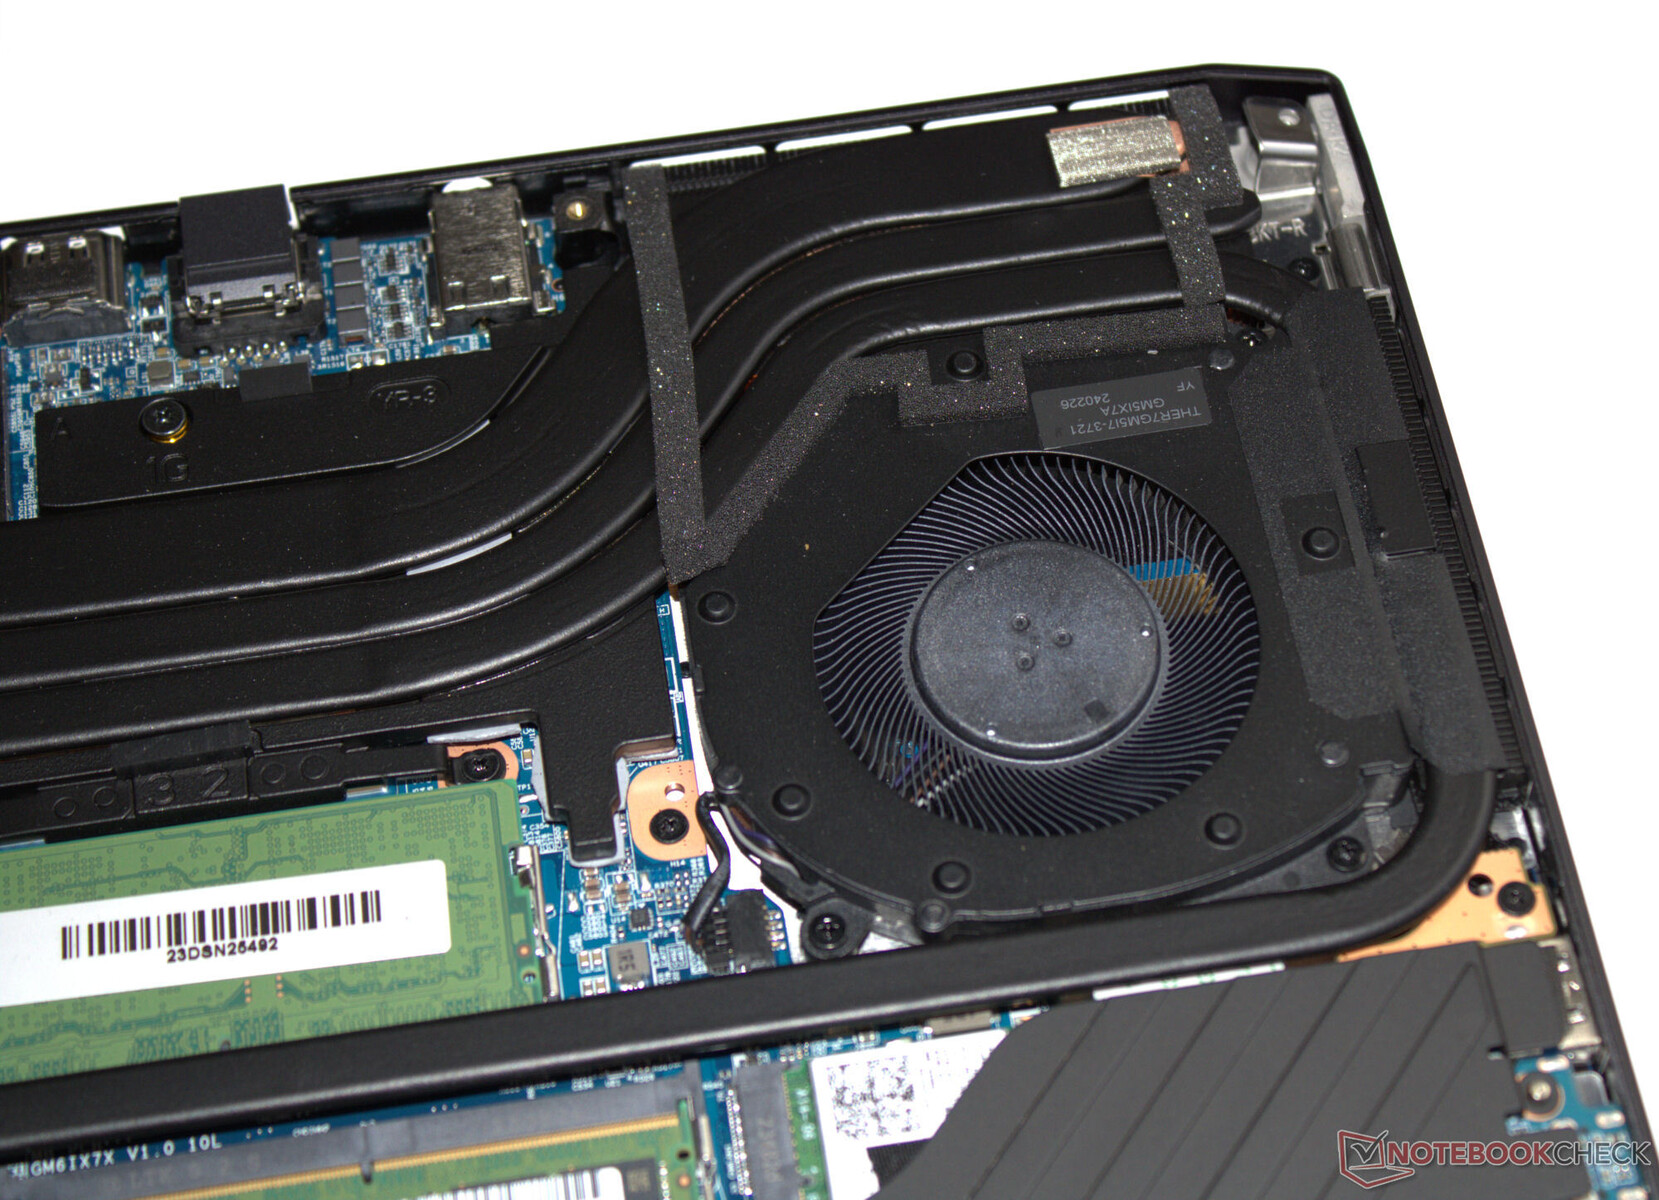
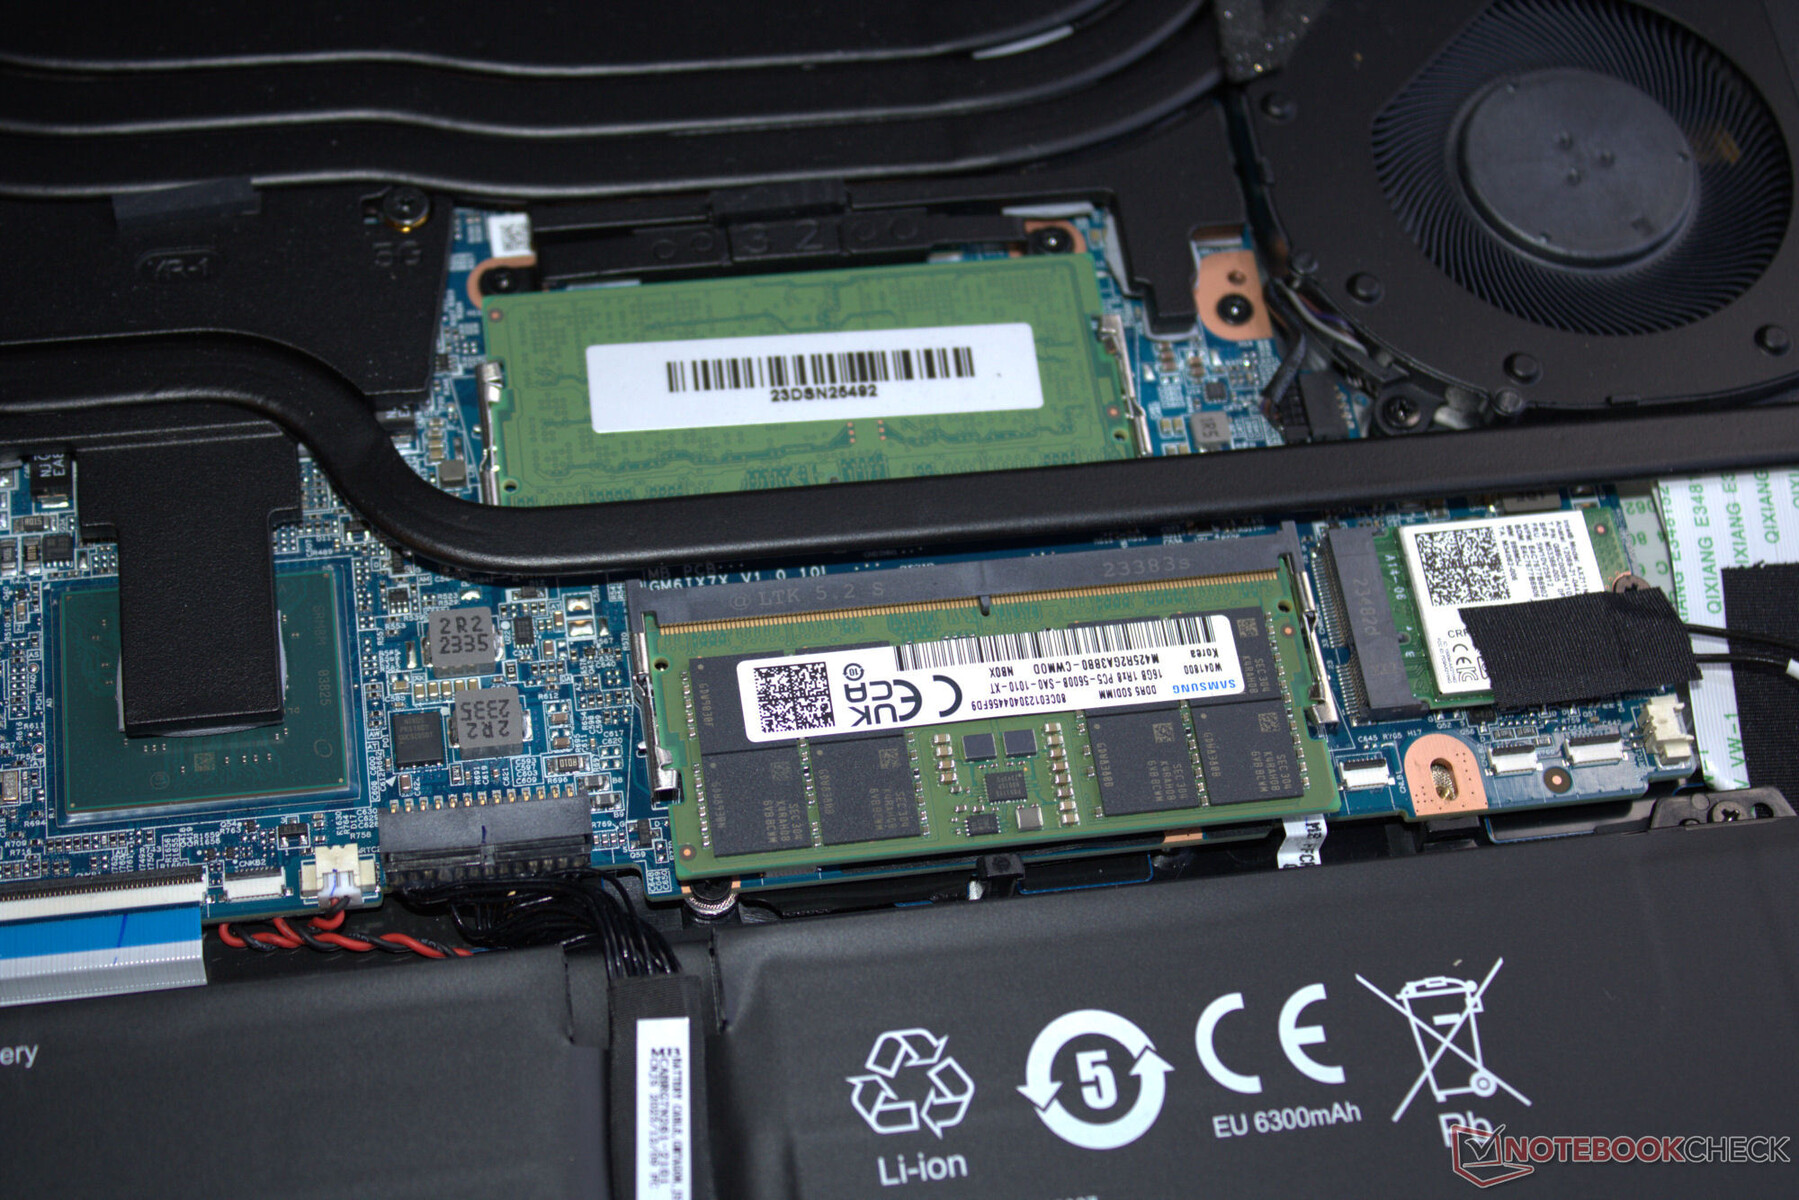
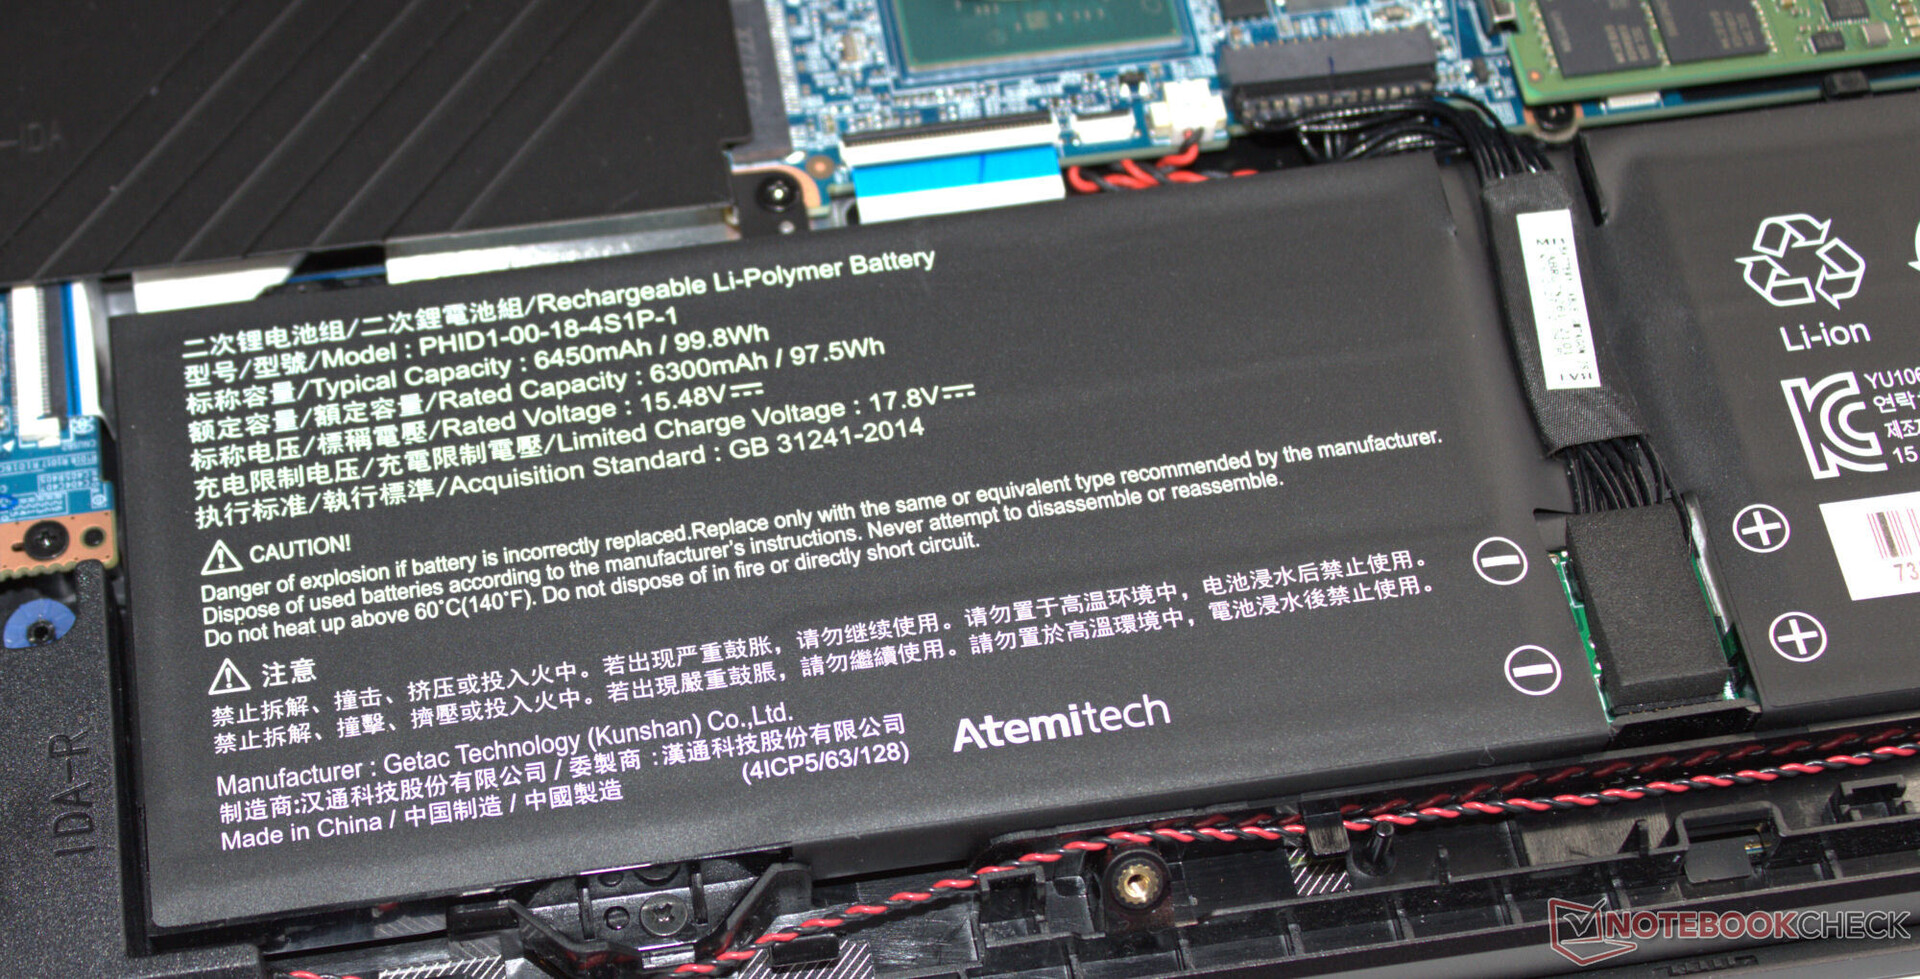
Bakım
Cihazın altındaki tüm vidaları söktükten sonra, alt kasa kısmı oldukça kolay bir şekilde çıkarılabilir - bu konuda yardımcı olması için sadece bir mızrap veya düz bir spatulaya ihtiyacınız olabilir. Daha sonra RAM yuvalarına (her ikisi de dolu), SSD'ye (PCIe 4, M.2-2280), ikinci SSD yuvasına (PCIe 4, M.2-2280), WLAN modülüne, fanlara, BIOS piline ve dizüstü bilgisayarın piline erişebilirsiniz.
Garanti
Cihaz, iki yıl süren temel garanti kapsamındadır; buna teslim alma hizmeti ve 6 aylık hızlı onarım hizmeti (48 saat içinde onarım) dahildir. Bu garantiyi ücret karşılığında 36 aya kadar uzatabilirsiniz.
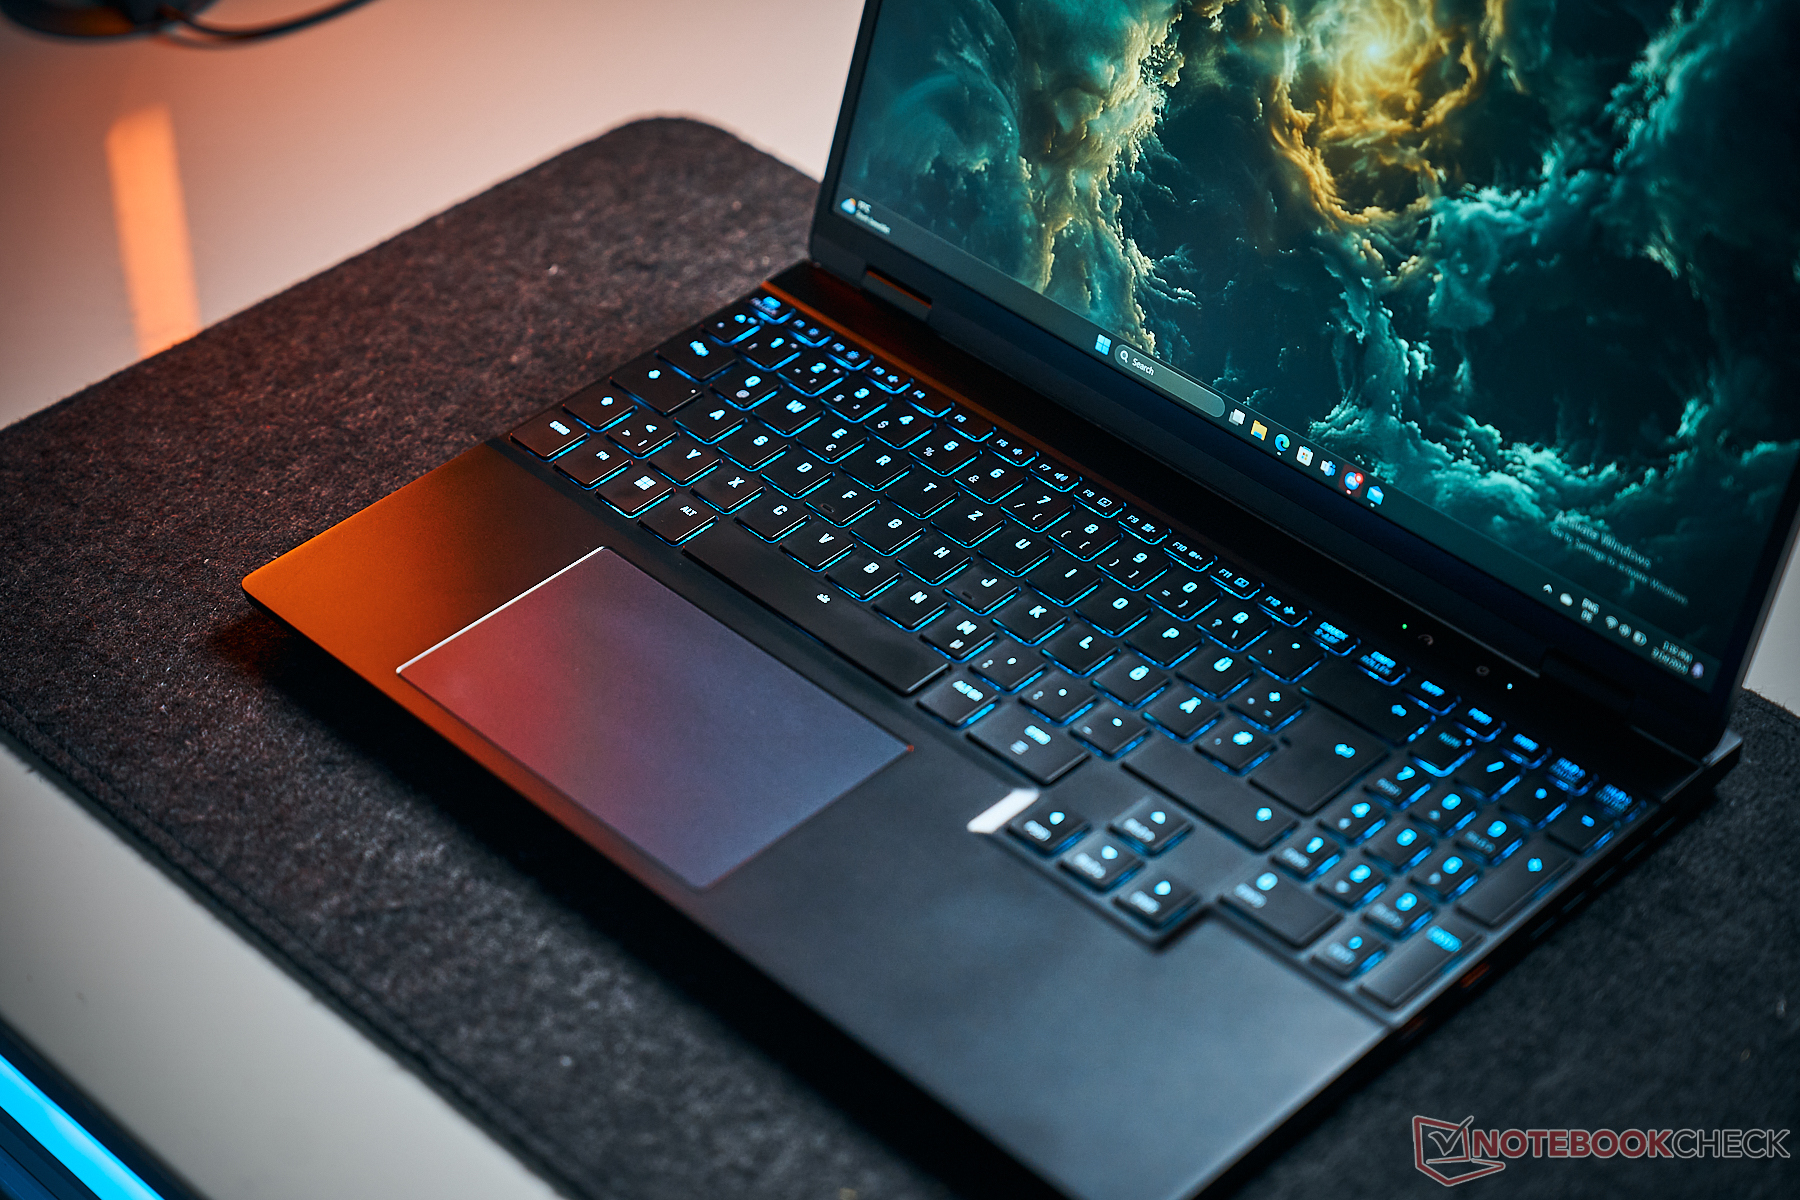
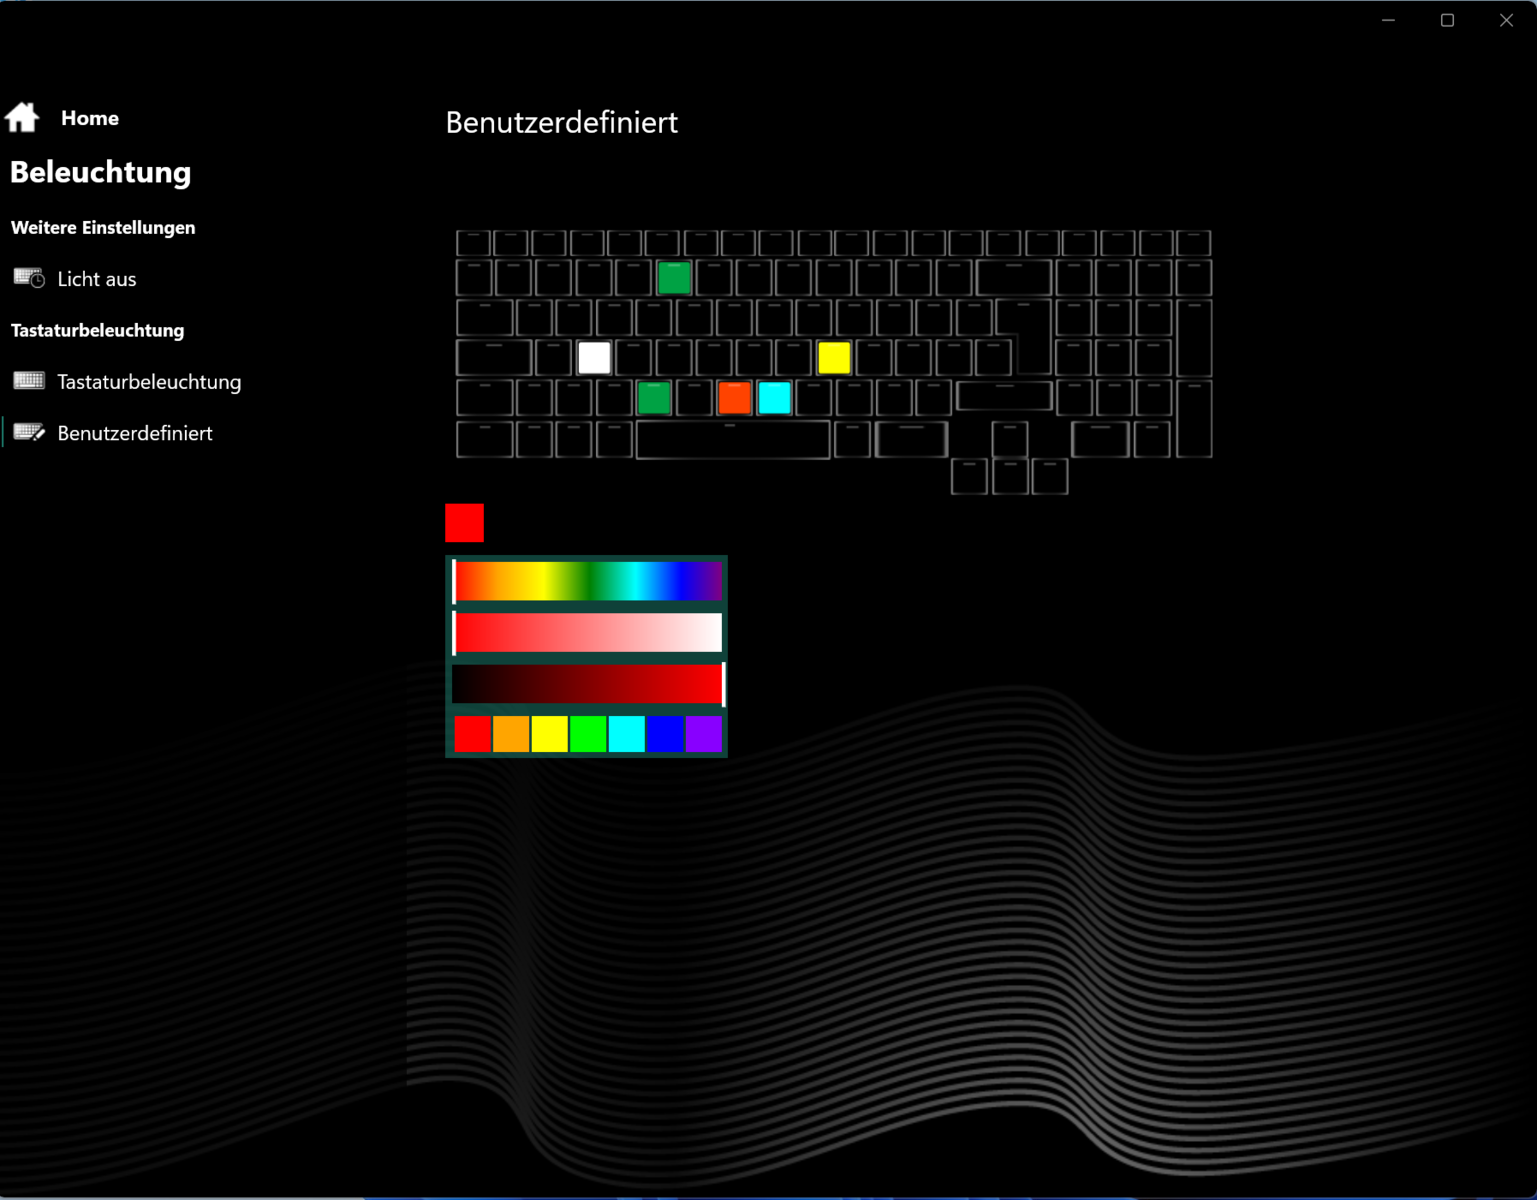
Giriş aygıtları - Tek tuşlu RGB arka aydınlatma
Klavye
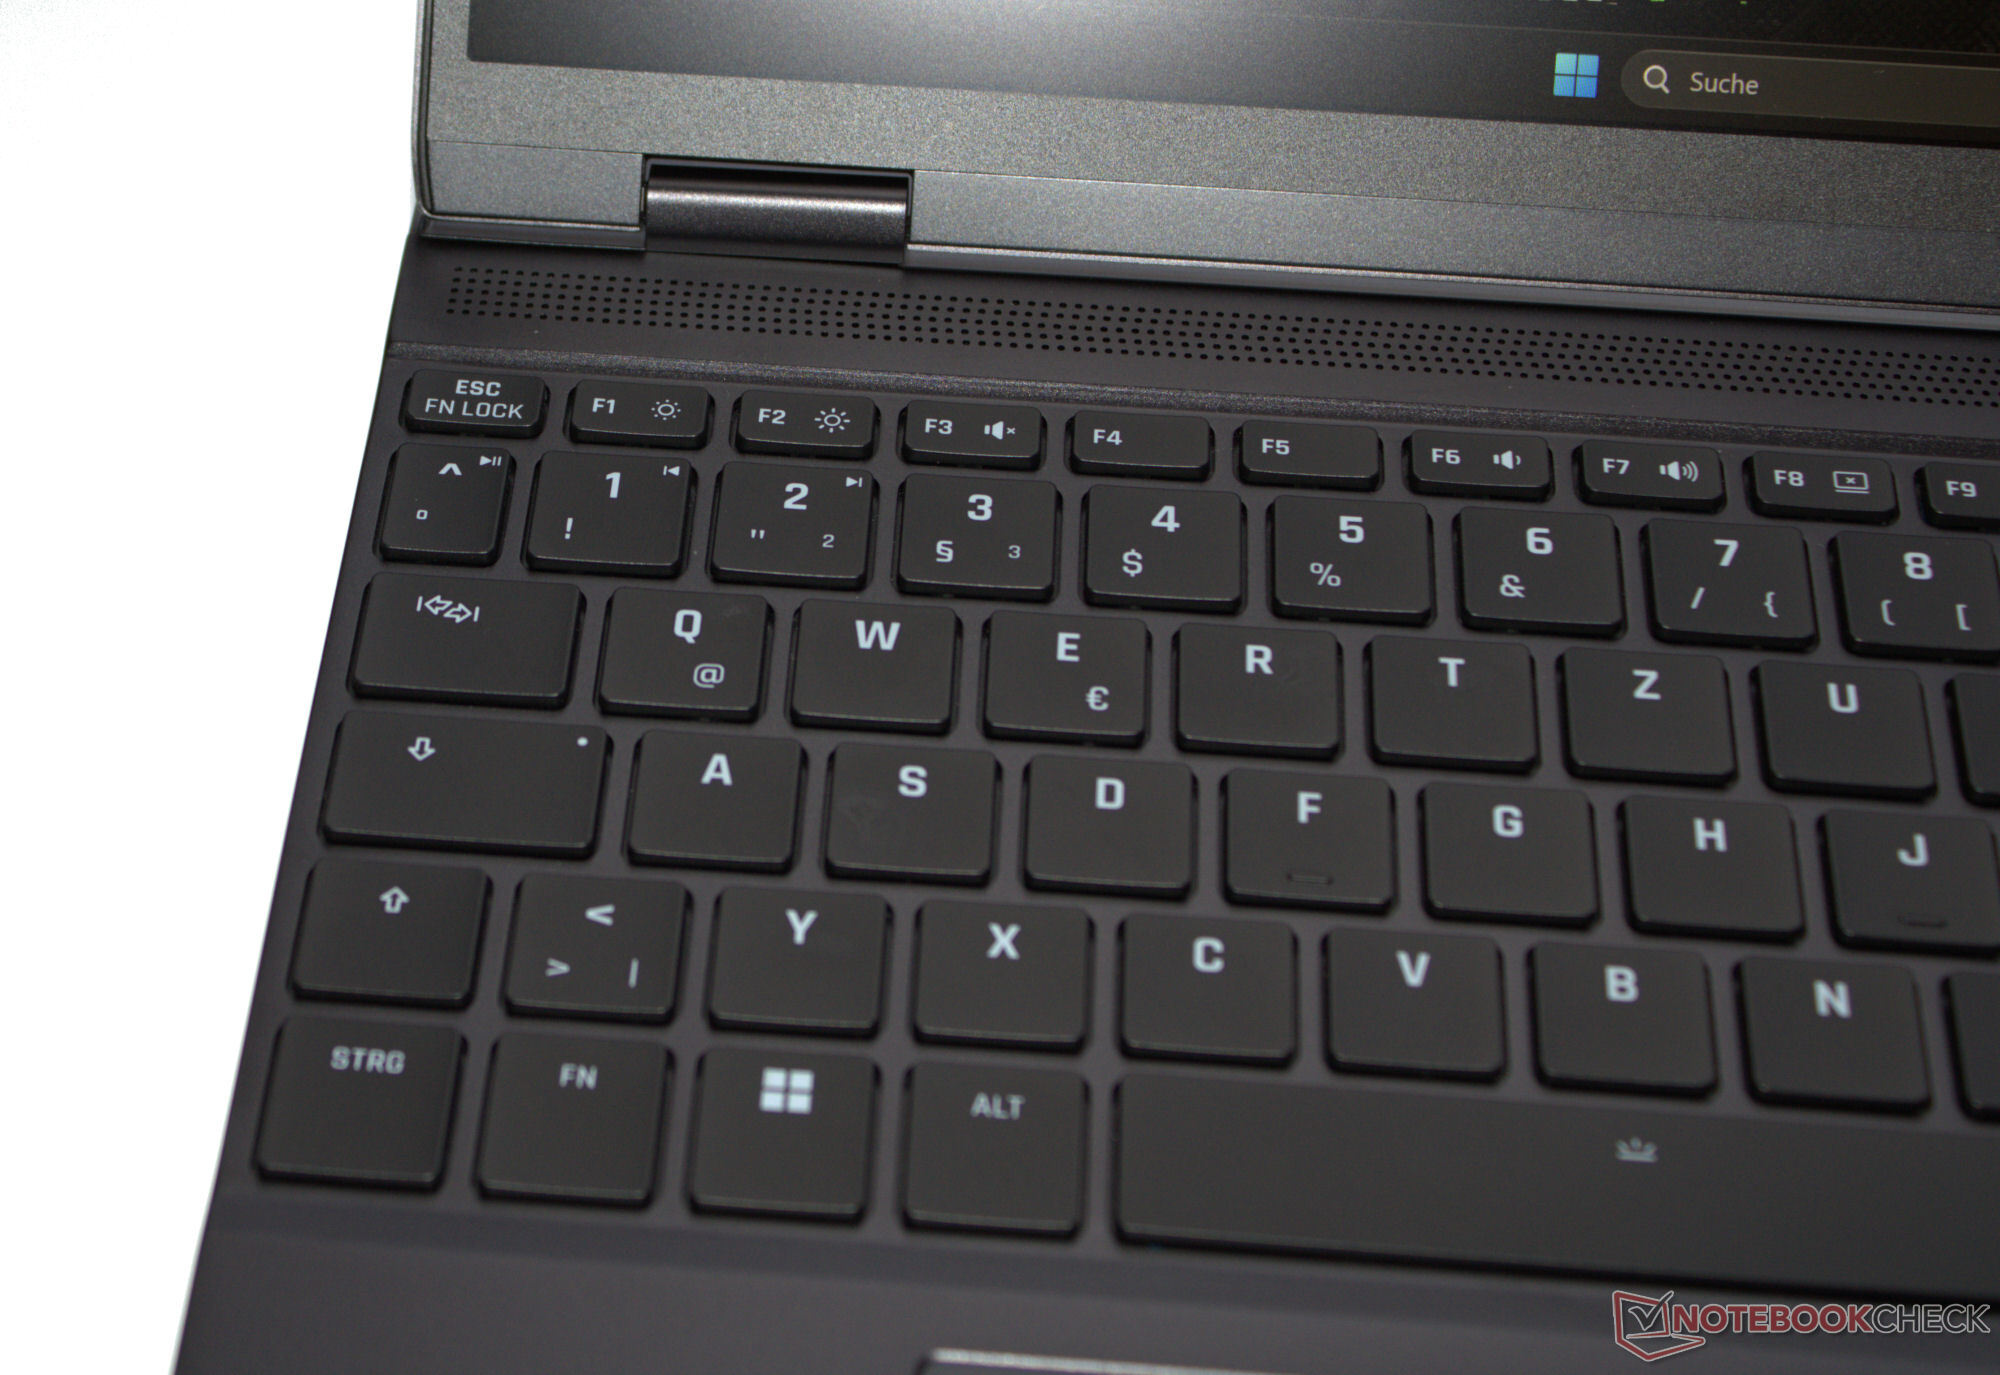
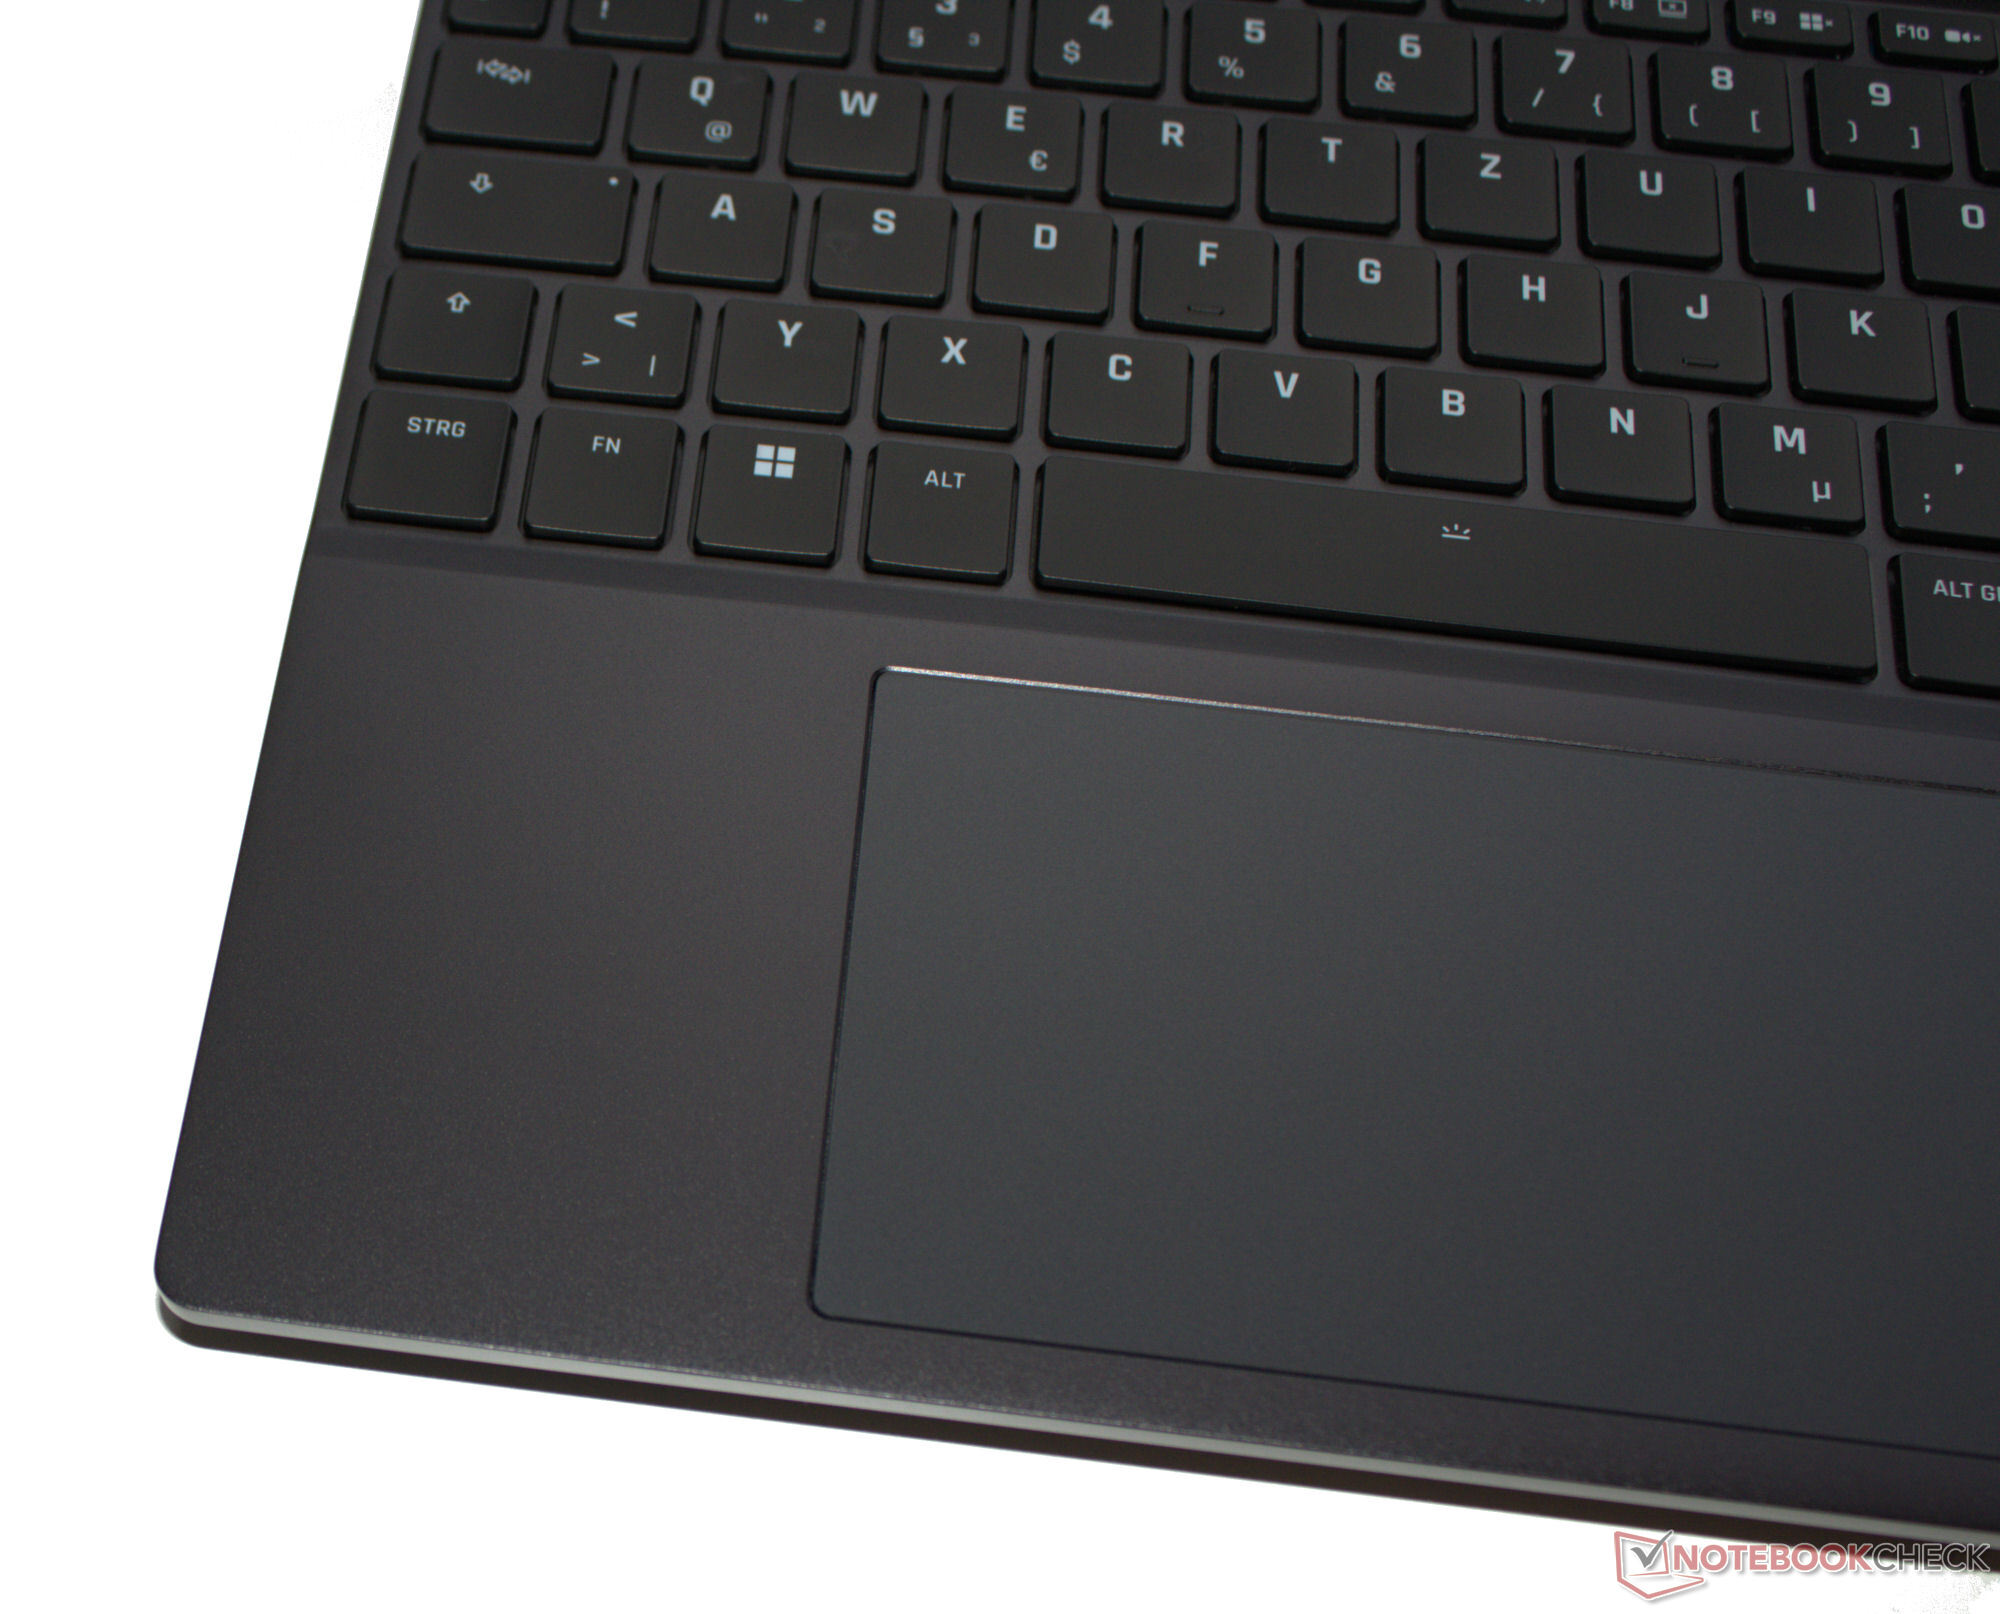
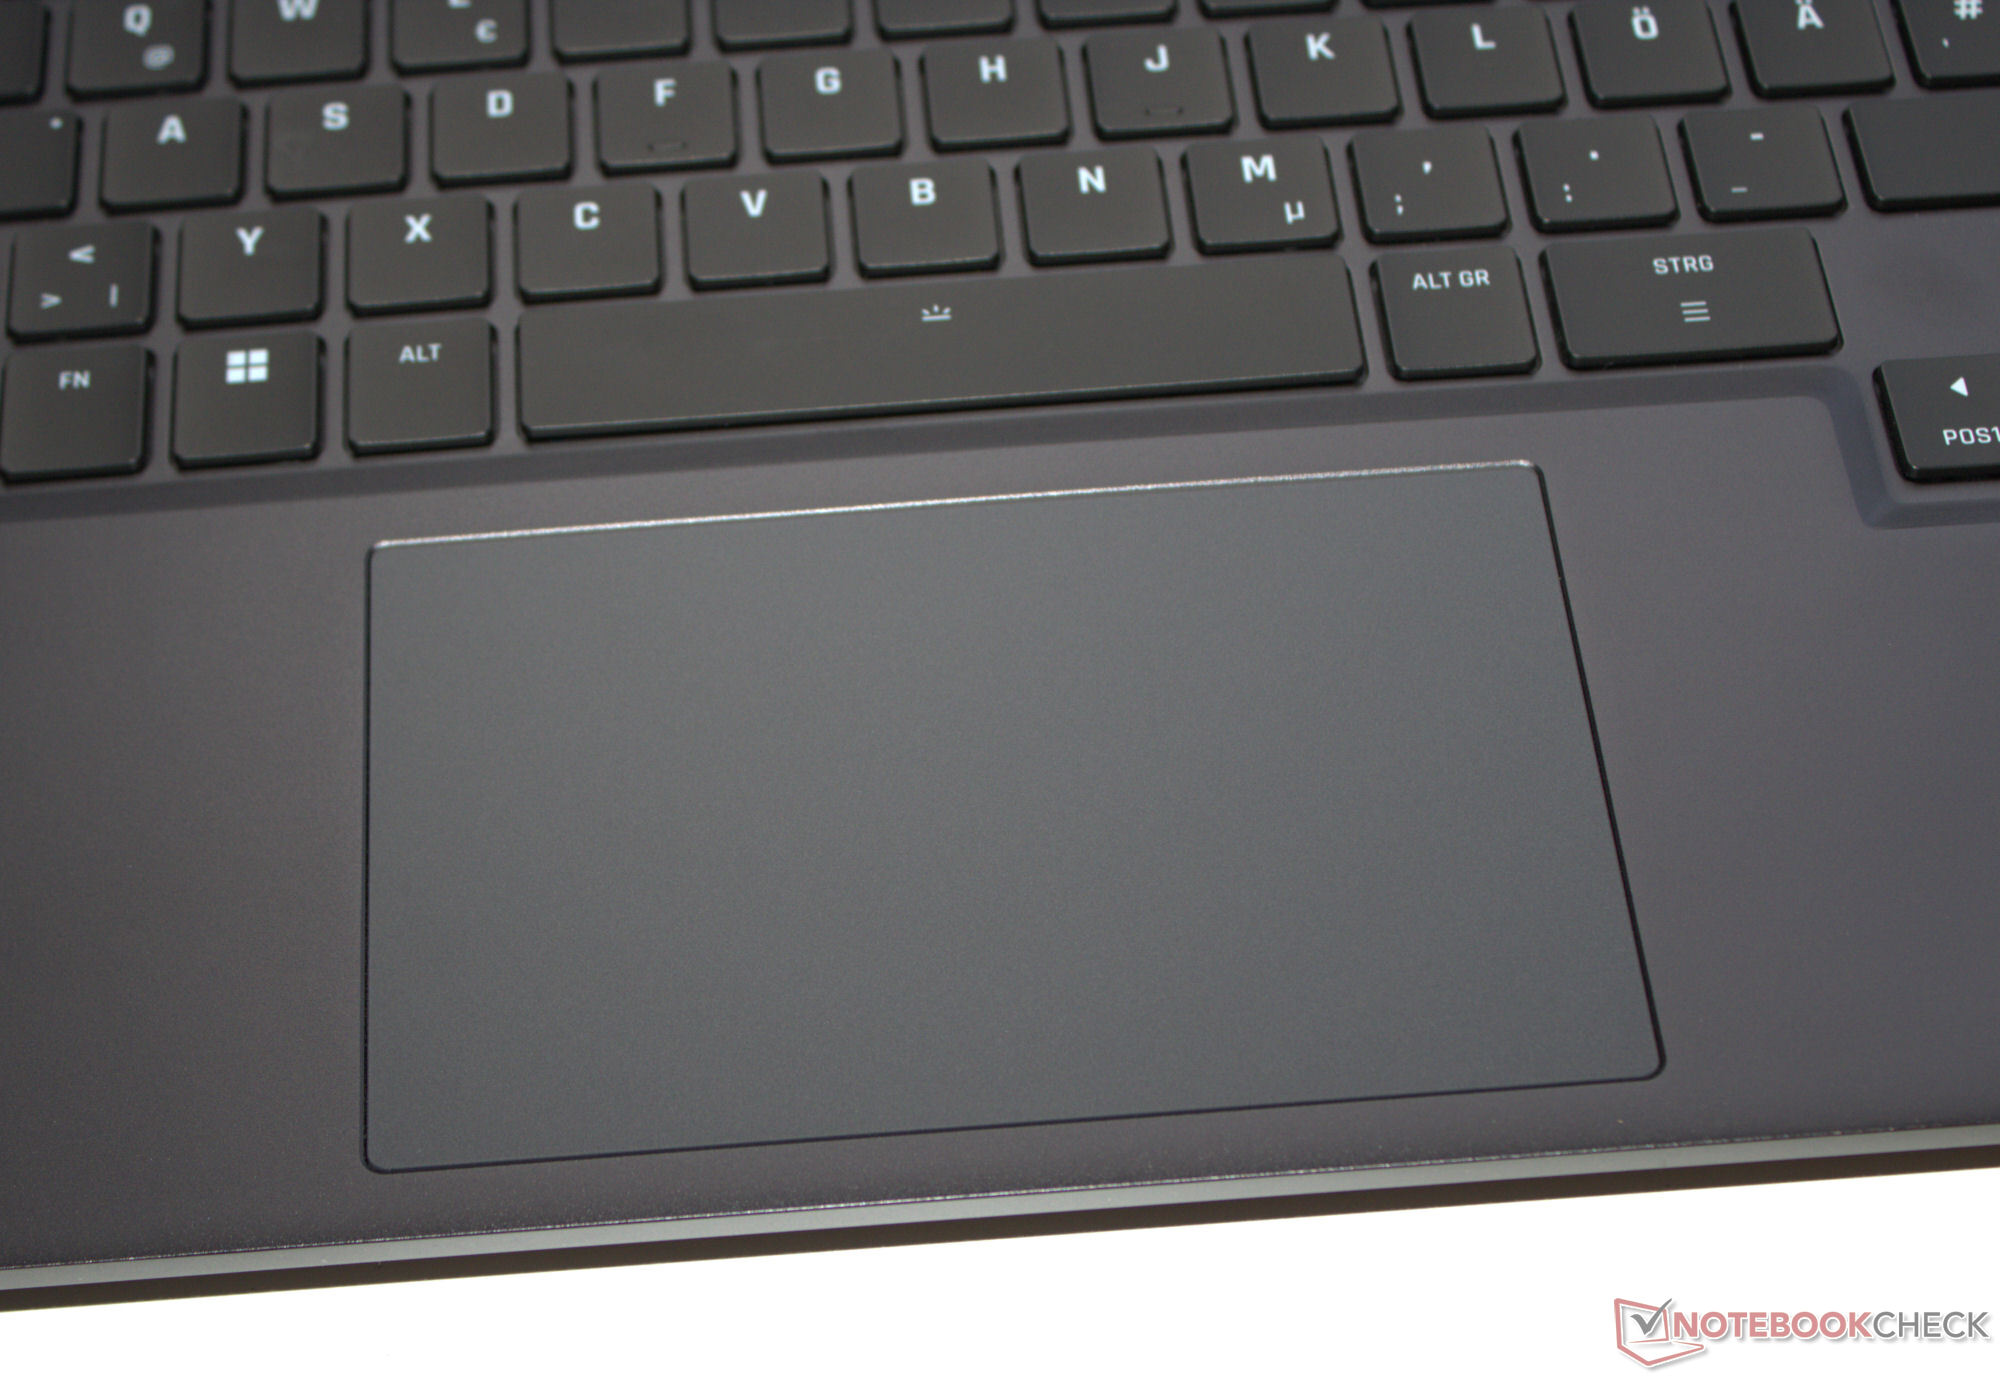
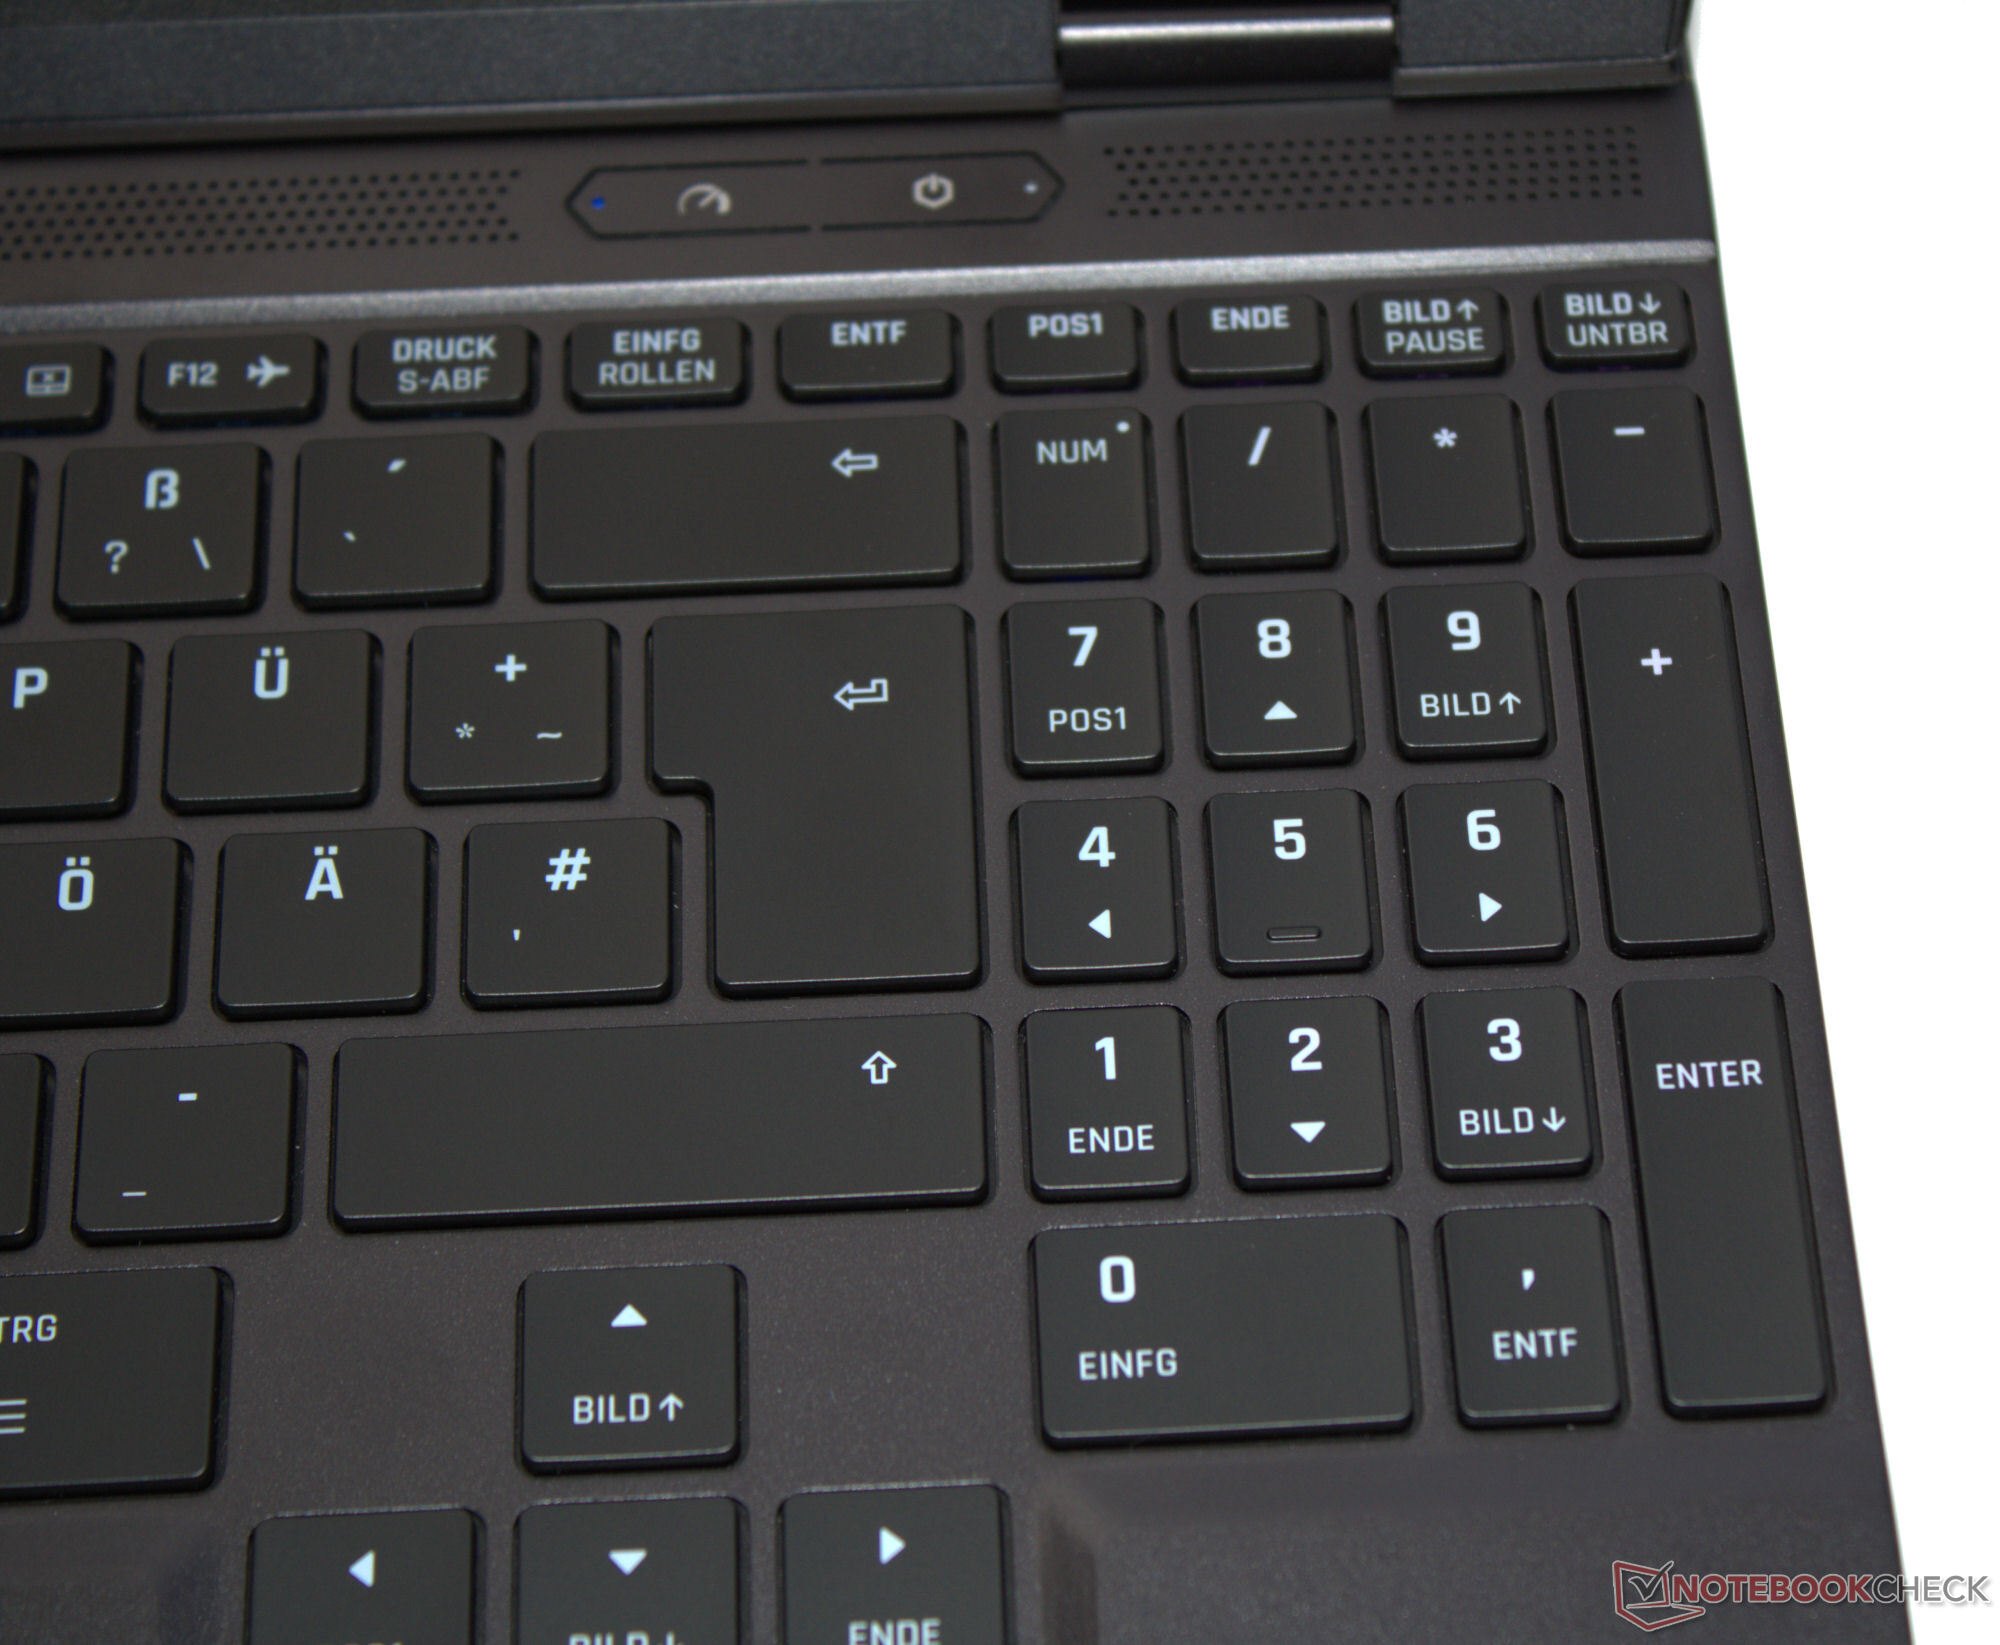
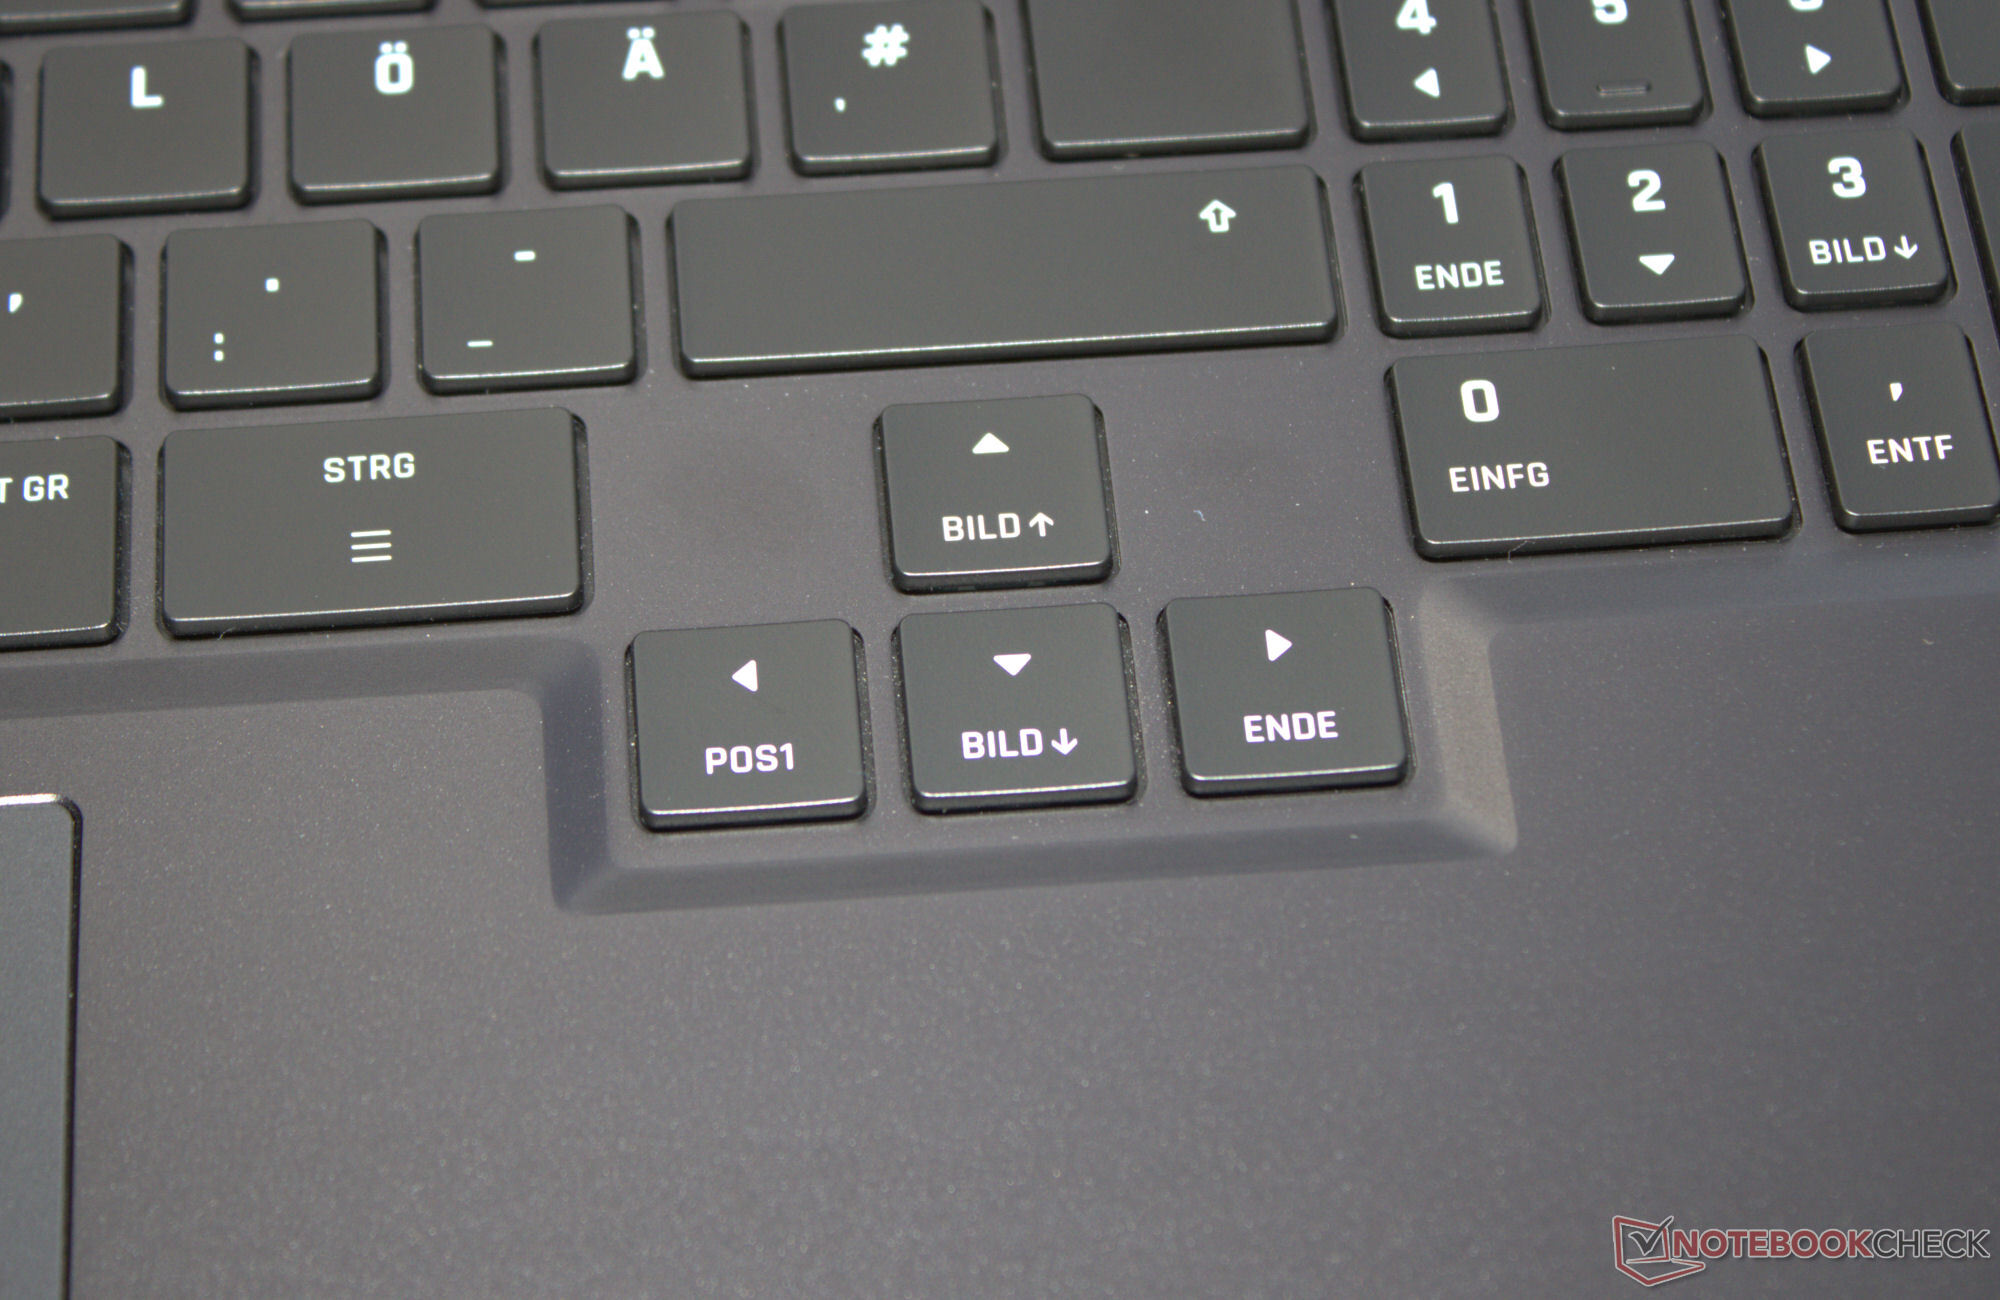
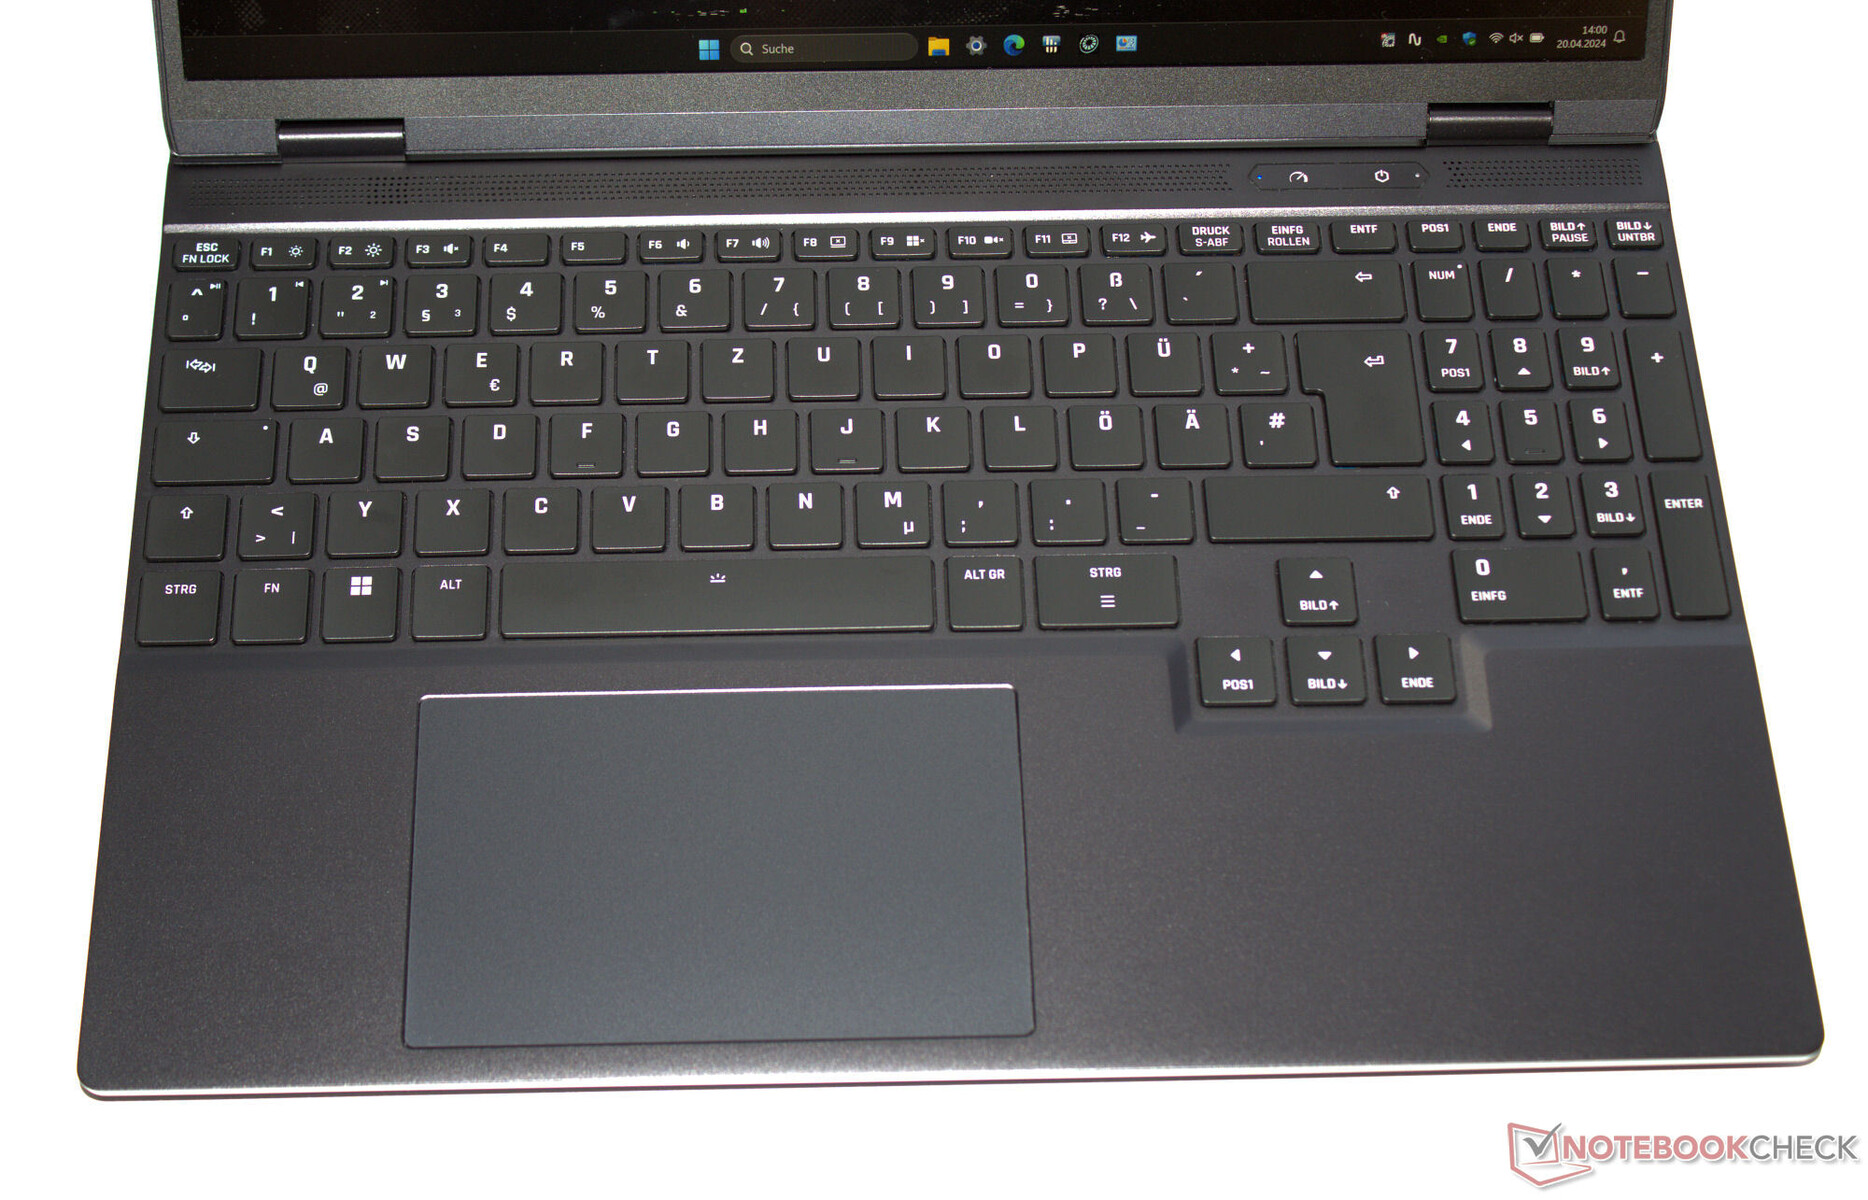
Chiclet klavyenin tuşları (dört seviyeli RGB arka aydınlatma) orta bir kaldırma ve net bir basınç noktasına sahiptir. Dirençleri biraz daha keskin olabilirdi ama bu bir zevk meselesi. Klavye yazarken minimum düzeyde eğiliyor, ancak testimiz sırasında rahatsız edici olmadı. Pozitif: Dört ok tuşu sadece tam boyutta değil, aynı zamanda diğer tuşlardan da ayrılmış.
Dokunmatik yüzey
Çoklu dokunmatik clickpad (yaklaşık 12,3 x 7,8 cm) fare ihtiyacının yerini alır ve pürüzsüz yüzeyi parmakların üzerinde kaymasını kolaylaştırır. Kısa bir kaldırma ve net bir basınç noktasına sahiptir.
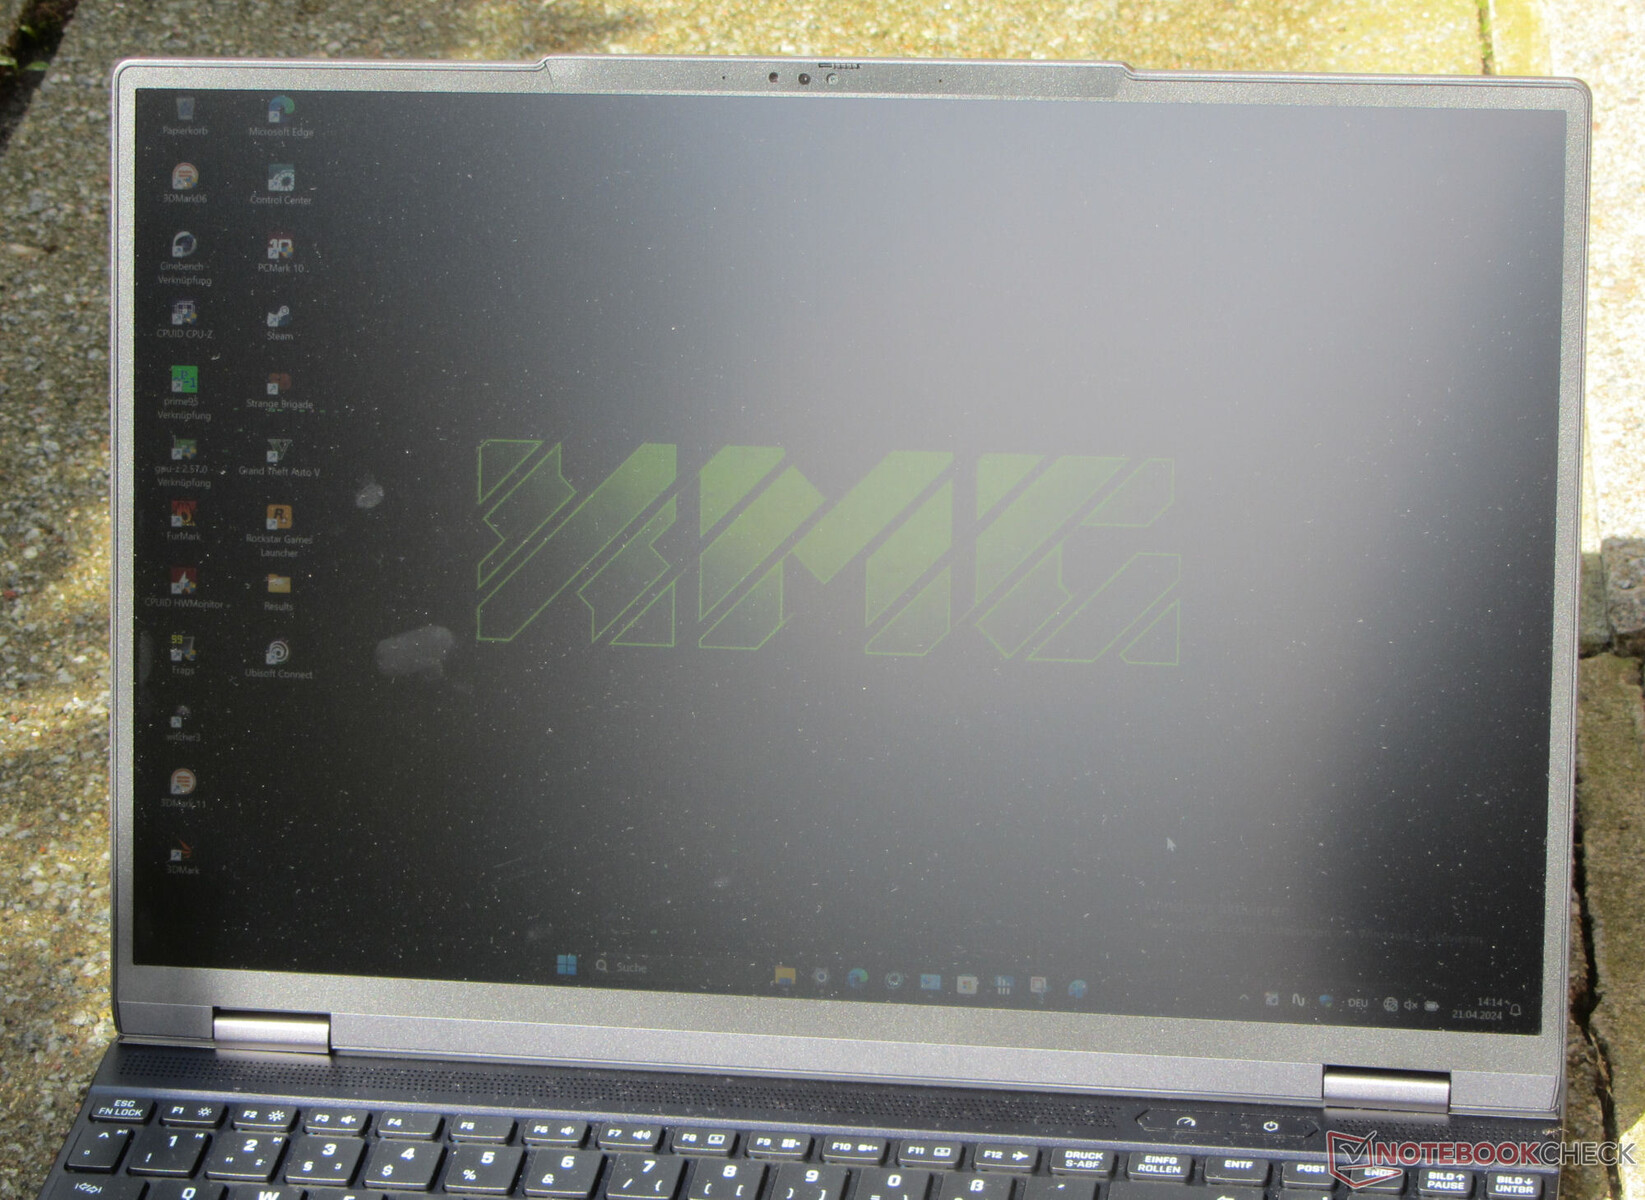
Ekran - sRGB kapsama alanına sahip parlak panel
Schenker, Fusion'ı 16:10 en boy oranına sahip 15,3 inç ekranla (2.560 x 1.600 piksel) donattı. Mat 240 Hz panel Adaptive Sync, PWM titremesi yok, kısa tepki süreleri ve mükemmel parlaklık sunuyor. Alternatif ekranlar mevcut değildir.
| |||||||||||||||||||||||||
Aydınlatma: 89 %
Batarya modunda parlaklık: 491 cd/m²
Kontrast: 1045:1 (Siyah: 0.47 cd/m²)
ΔE ColorChecker Calman: 2.16 | ∀{0.5-29.43 Ø4.73}
calibrated: 1.14
ΔE Greyscale Calman: 3.3 | ∀{0.09-98 Ø4.97}
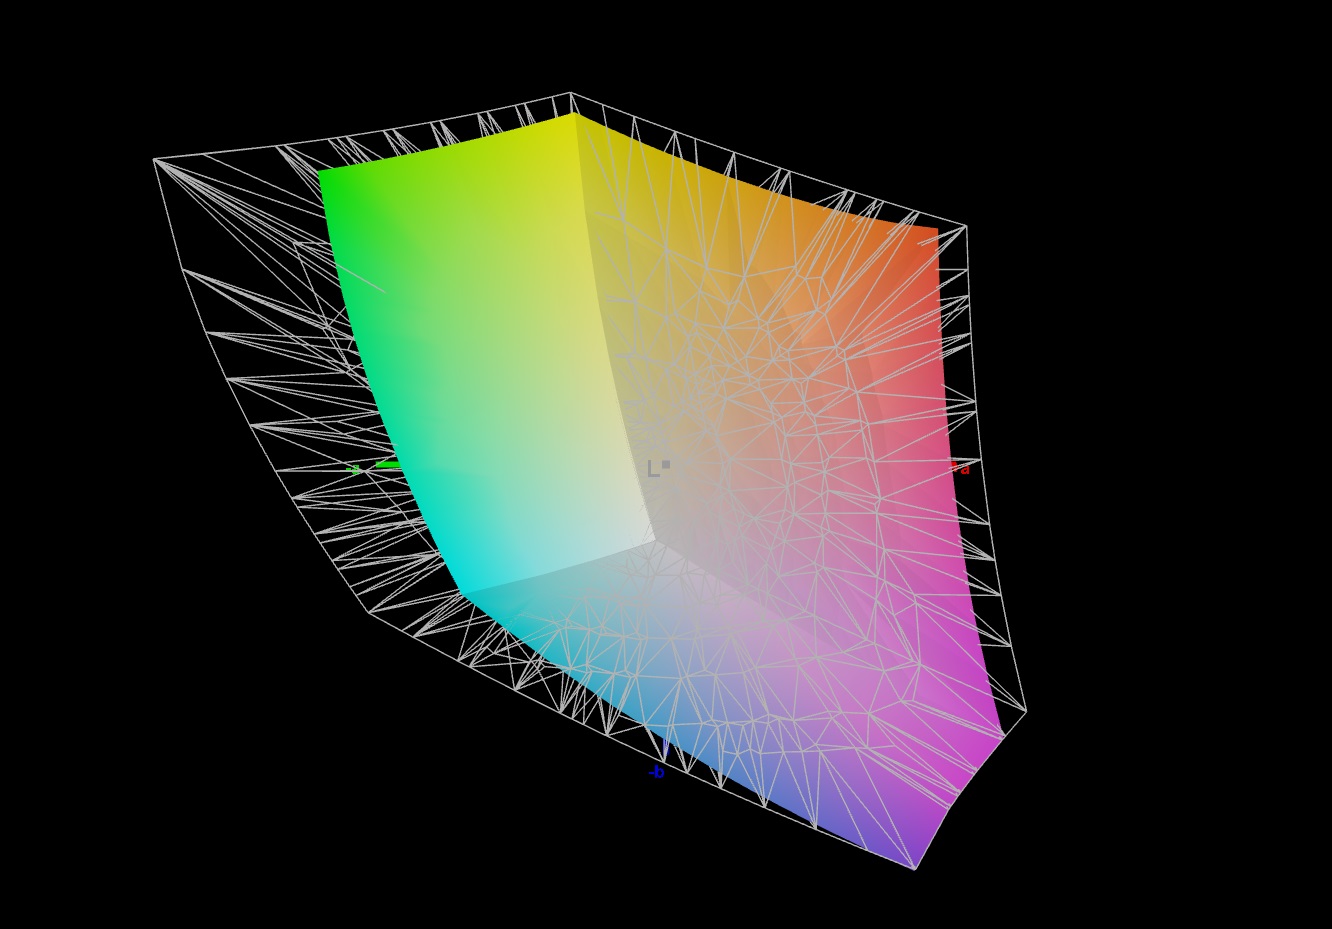
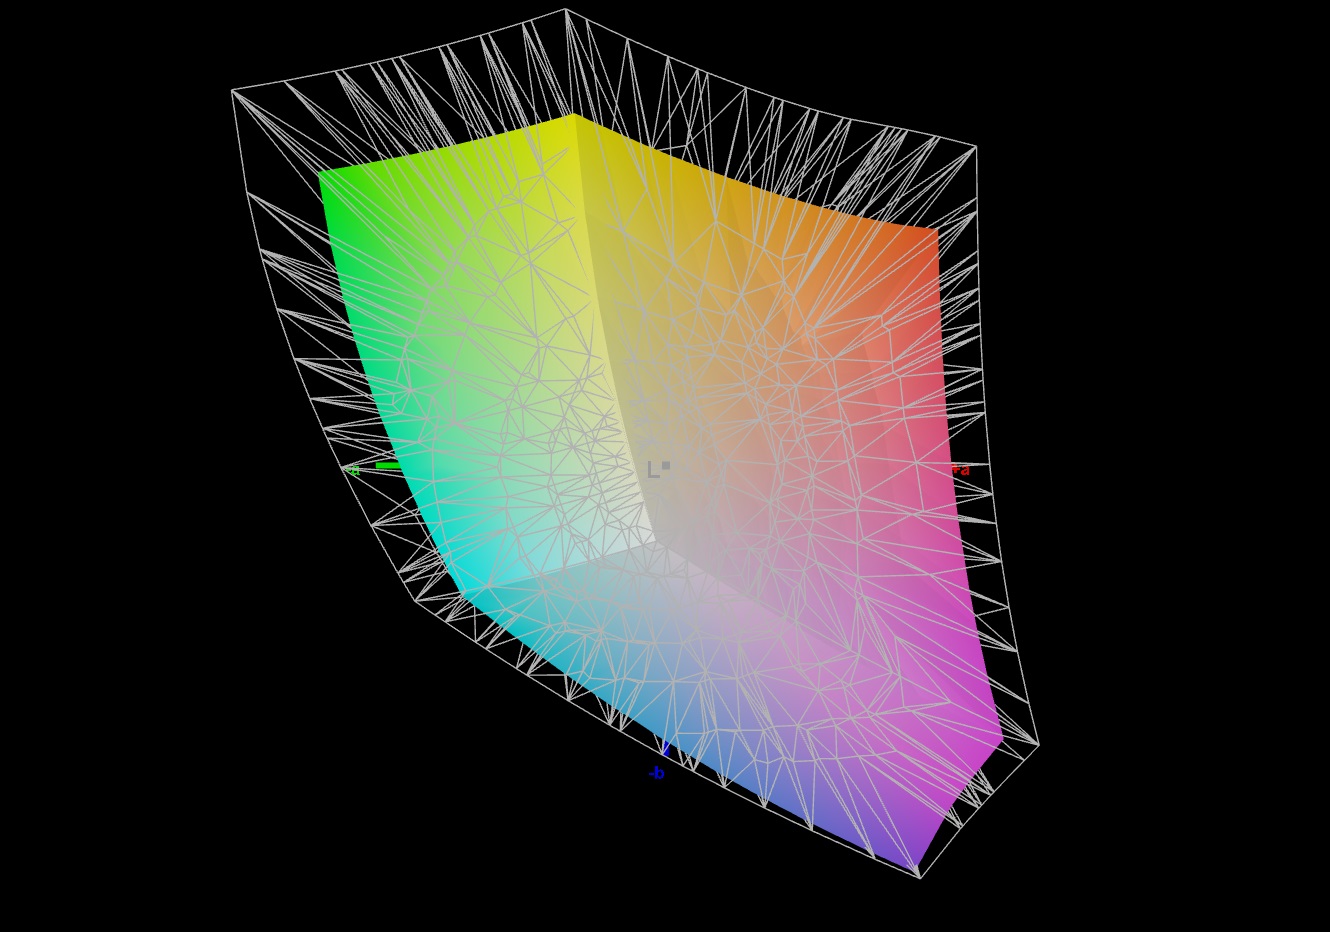
75% AdobeRGB 1998 (Argyll 3D)
100% sRGB (Argyll 3D)
73.5% Display P3 (Argyll 3D)
Gamma: 2.204
CCT: 6286 K
| Schenker XMG Fusion 15 (Early 24) BOE NJ NE153QDM-NZ1, IPS, 2560x1600, 15.3" | Aorus 16X 2024 BOE CQ NE160QDM-NY1, IPS, 2560x1600, 16" | Alienware m16 R2 BOE NE16NYH, IPS, 2560x1600, 16" | HP Omen Transcend 16-u1095ng ATNA60DL02-0 (SDC41A4), OLED, 2560x1600, 16" | Lenovo Legion Pro 5 16IRX9 BOE NE160QDM-NYC, IPS, 2560x1600, 16" | |
|---|---|---|---|---|---|
| Display | -7% | -3% | 22% | -5% | |
| Display P3 Coverage (%) | 73.5 | 67.2 -9% | 71 -3% | 99.8 36% | 69.3 -6% |
| sRGB Coverage (%) | 100 | 96.7 -3% | 100 0% | 100 0% | 99.4 -1% |
| AdobeRGB 1998 Coverage (%) | 75 | 69.3 -8% | 71.4 -5% | 97 29% | 70.1 -7% |
| Response Times | -27% | -41% | 96% | -105% | |
| Response Time Grey 50% / Grey 80% * (ms) | 5 ? | 7.5 ? -50% | 5.7 ? -14% | 0.2 ? 96% | 11.9 ? -138% |
| Response Time Black / White * (ms) | 5.2 ? | 5.4 ? -4% | 8.7 ? -67% | 0.2 ? 96% | 8.9 ? -71% |
| PWM Frequency (Hz) | 120 ? | ||||
| Screen | -1% | 11% | 182% | 17% | |
| Brightness middle (cd/m²) | 491 | 542 10% | 345.8 -30% | 390 -21% | 384 -22% |
| Brightness (cd/m²) | 460 | 504 10% | 337 -27% | 392 -15% | 366 -20% |
| Brightness Distribution (%) | 89 | 86 -3% | 87 -2% | 98 10% | 91 2% |
| Black Level * (cd/m²) | 0.47 | 0.45 4% | 0.3 36% | 0.02 96% | 0.35 26% |
| Contrast (:1) | 1045 | 1204 15% | 1153 10% | 19500 1766% | 1097 5% |
| Colorchecker dE 2000 * | 2.16 | 2.73 -26% | 1.99 8% | 1.94 10% | 0.97 55% |
| Colorchecker dE 2000 max. * | 4.44 | 5.29 -19% | 3.52 21% | 4.26 4% | 3.57 20% |
| Colorchecker dE 2000 calibrated * | 1.14 | 1.32 -16% | 0.62 46% | 4.21 -269% | 0.77 32% |
| Greyscale dE 2000 * | 3.3 | 2.9 12% | 2.1 36% | 1.5 55% | 1.5 55% |
| Gamma | 2.204 100% | 2.192 100% | 2.32 95% | 2.221 99% | 2.24 98% |
| CCT | 6286 103% | 6173 105% | 6369 102% | 6395 102% | 6709 97% |
| Toplam Ortalama (Program / Ayarlar) | -12% /
-6% | -11% /
1% | 100% /
135% | -31% /
-5% |
* ... daha küçük daha iyidir
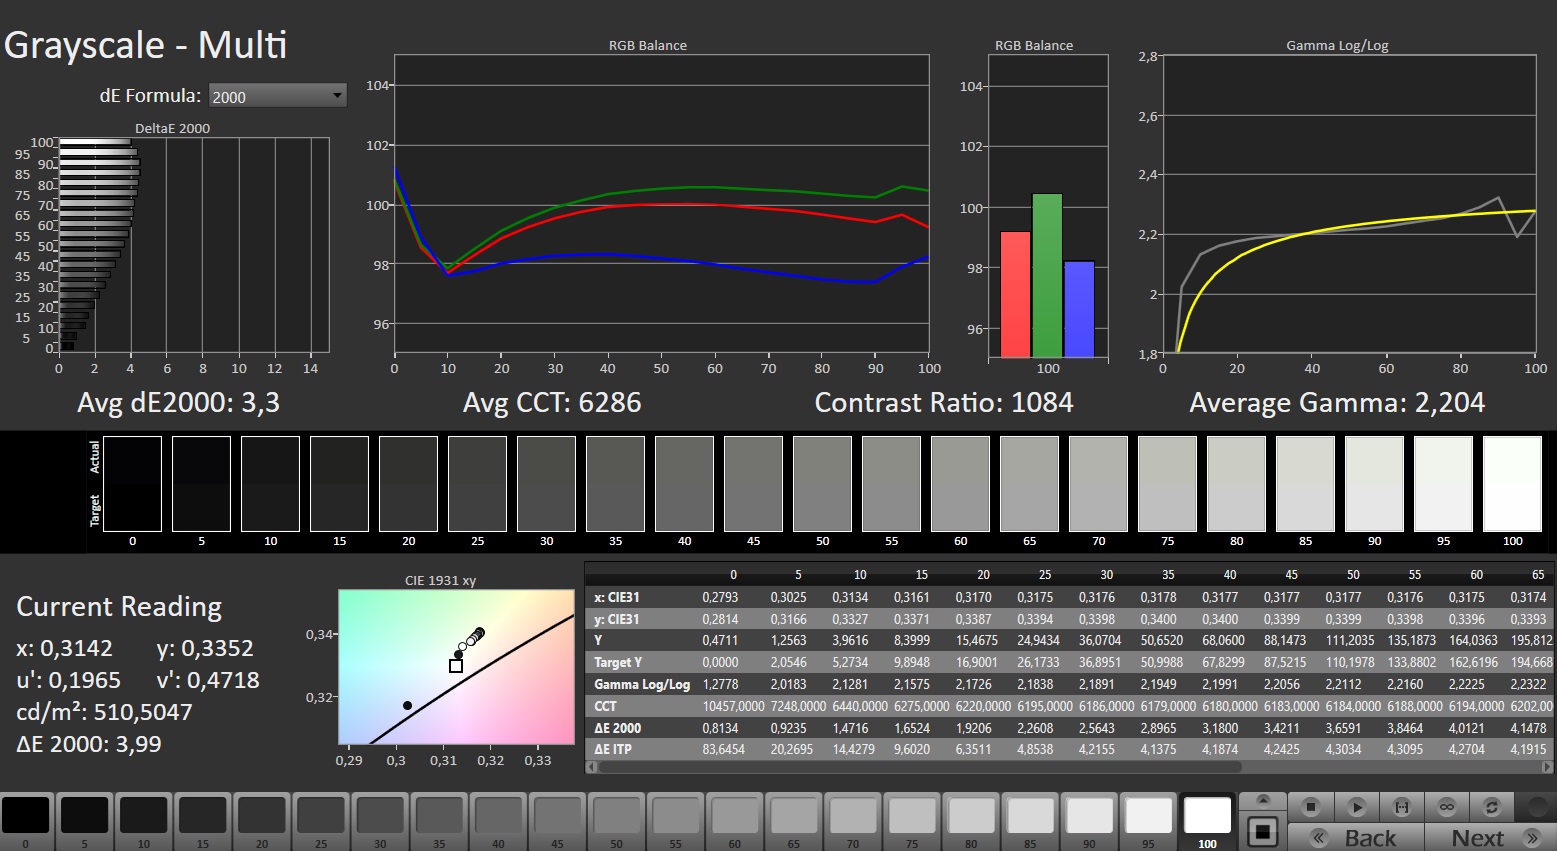
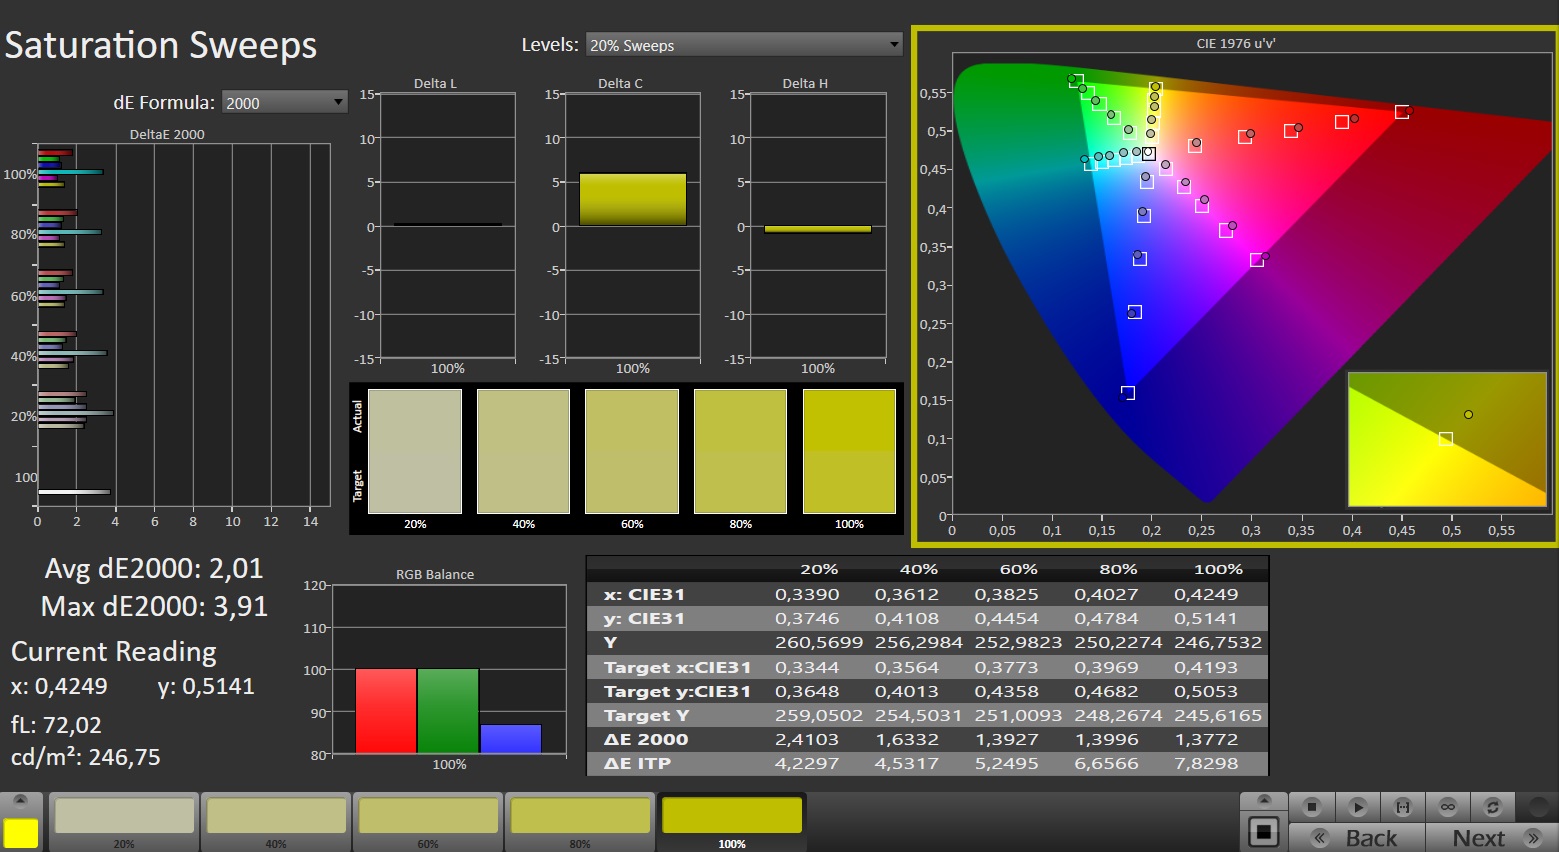
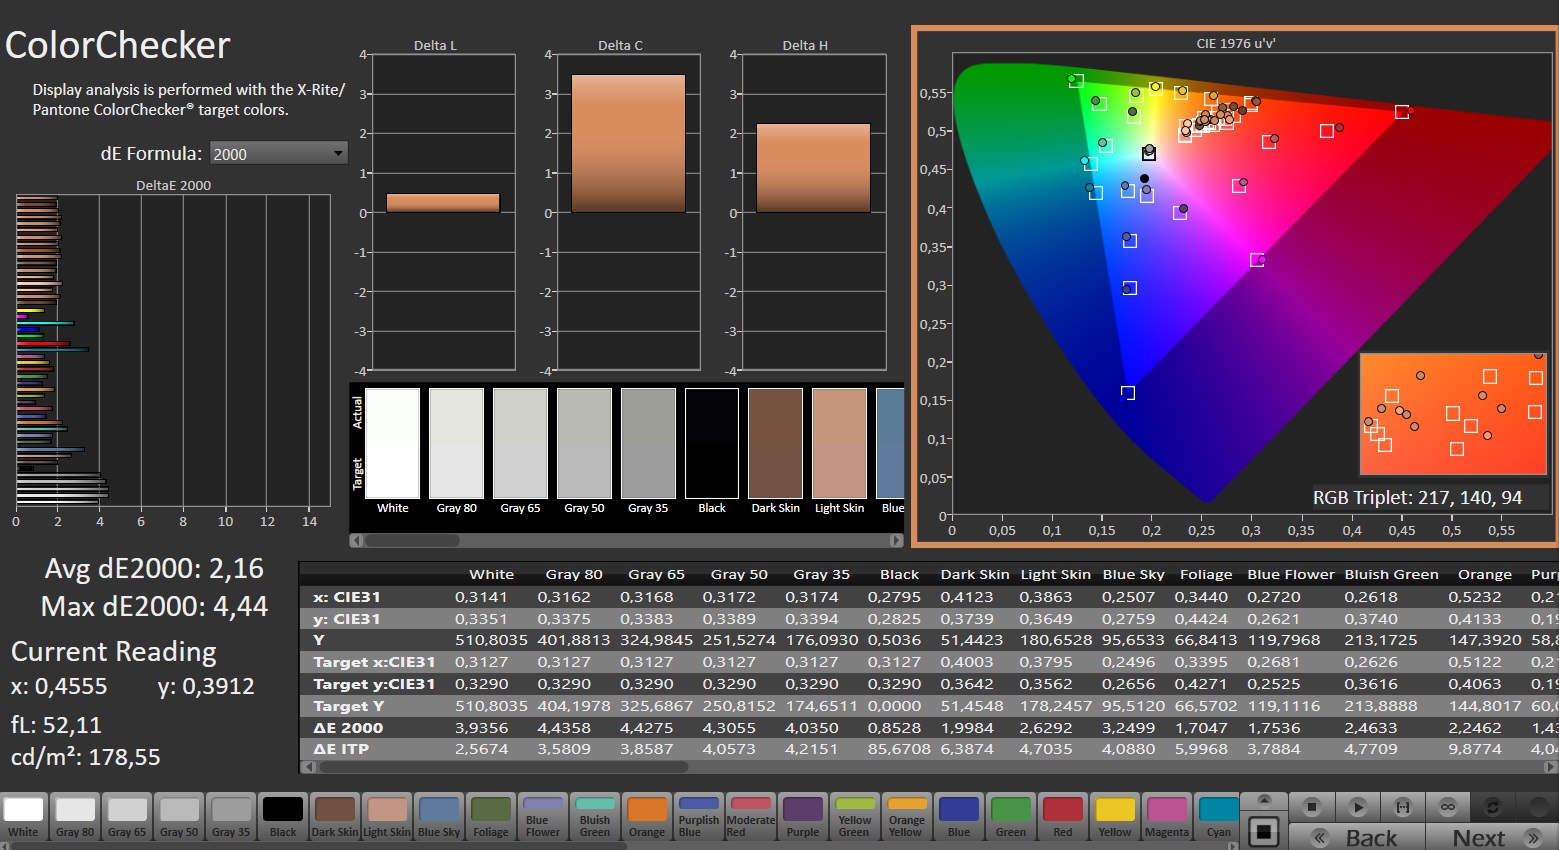
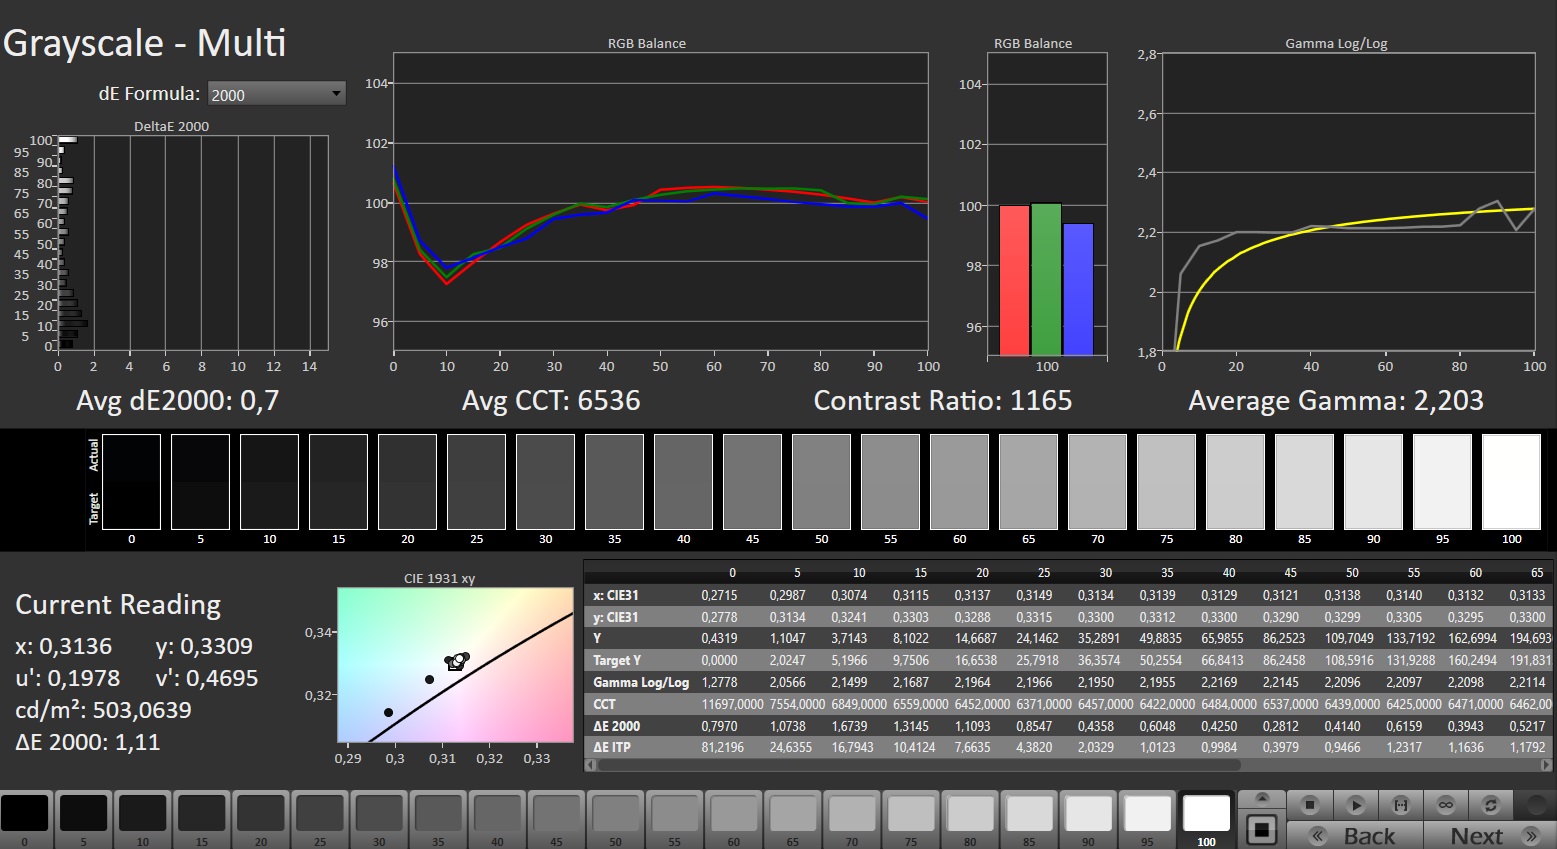
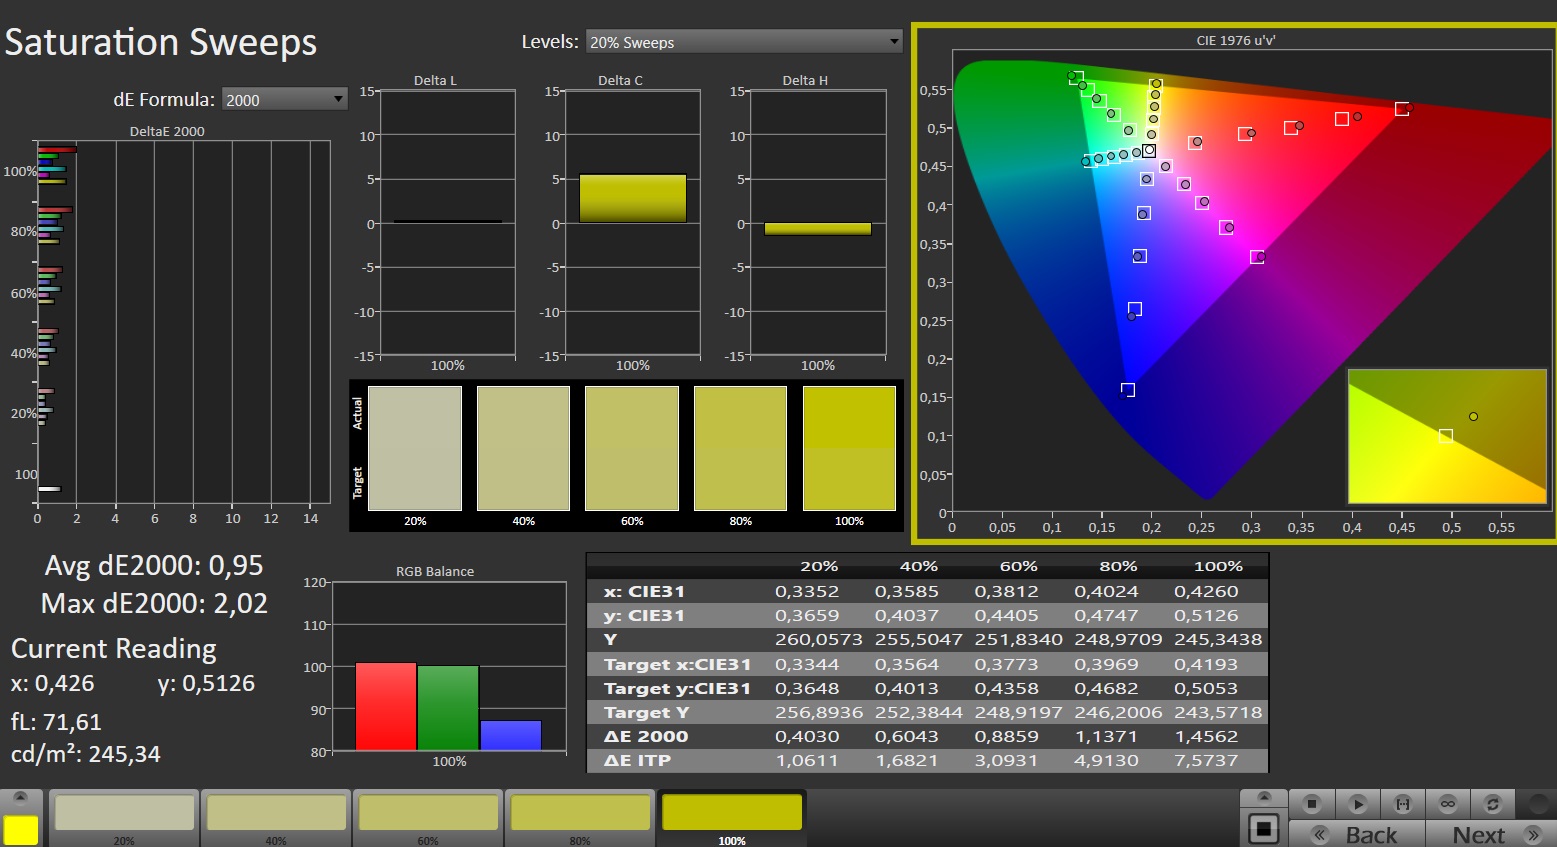
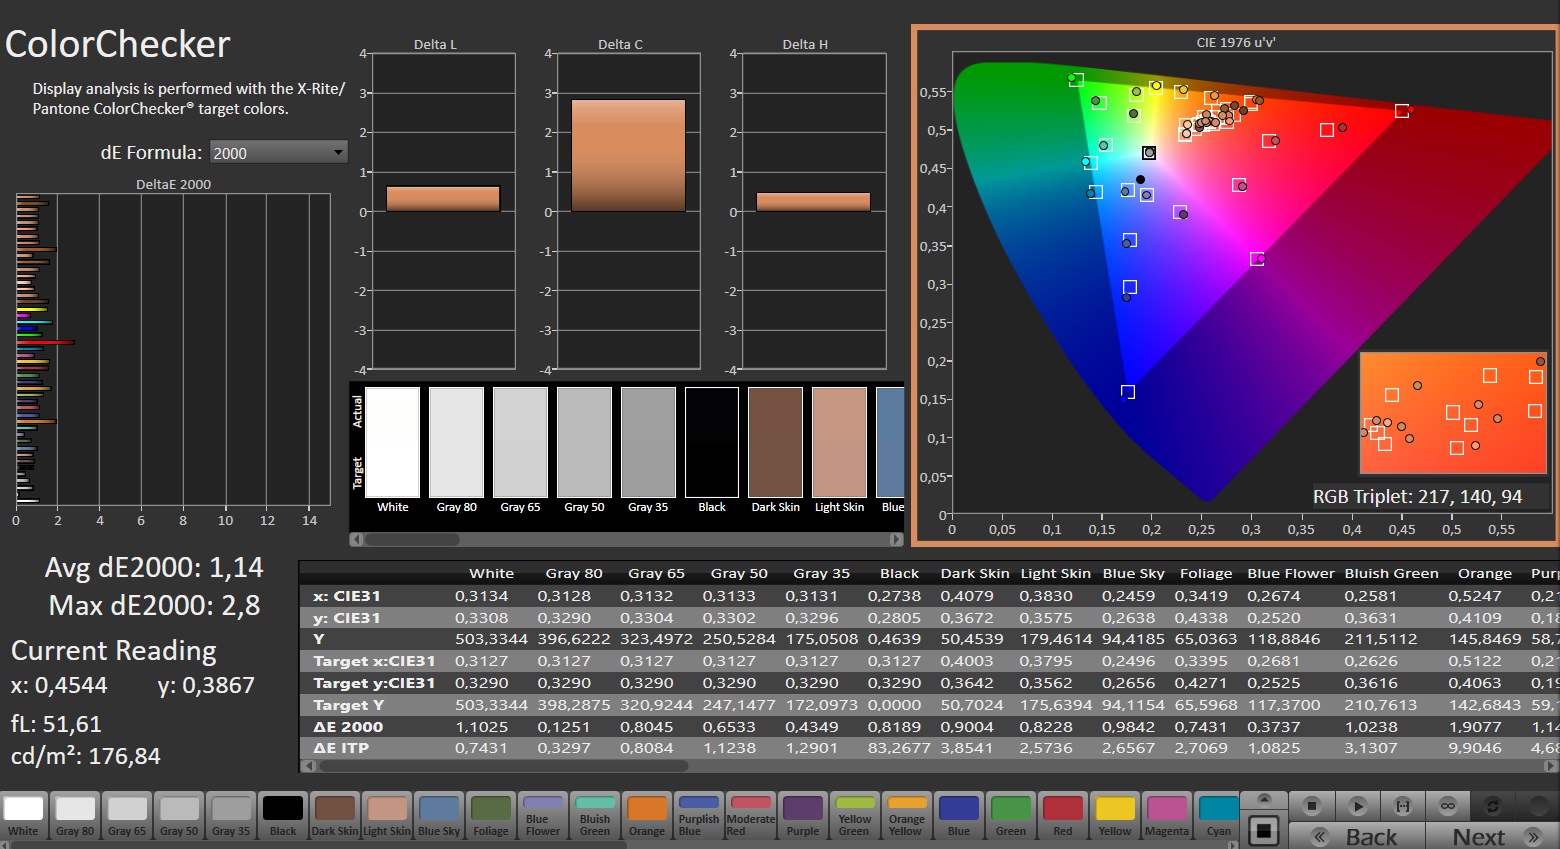
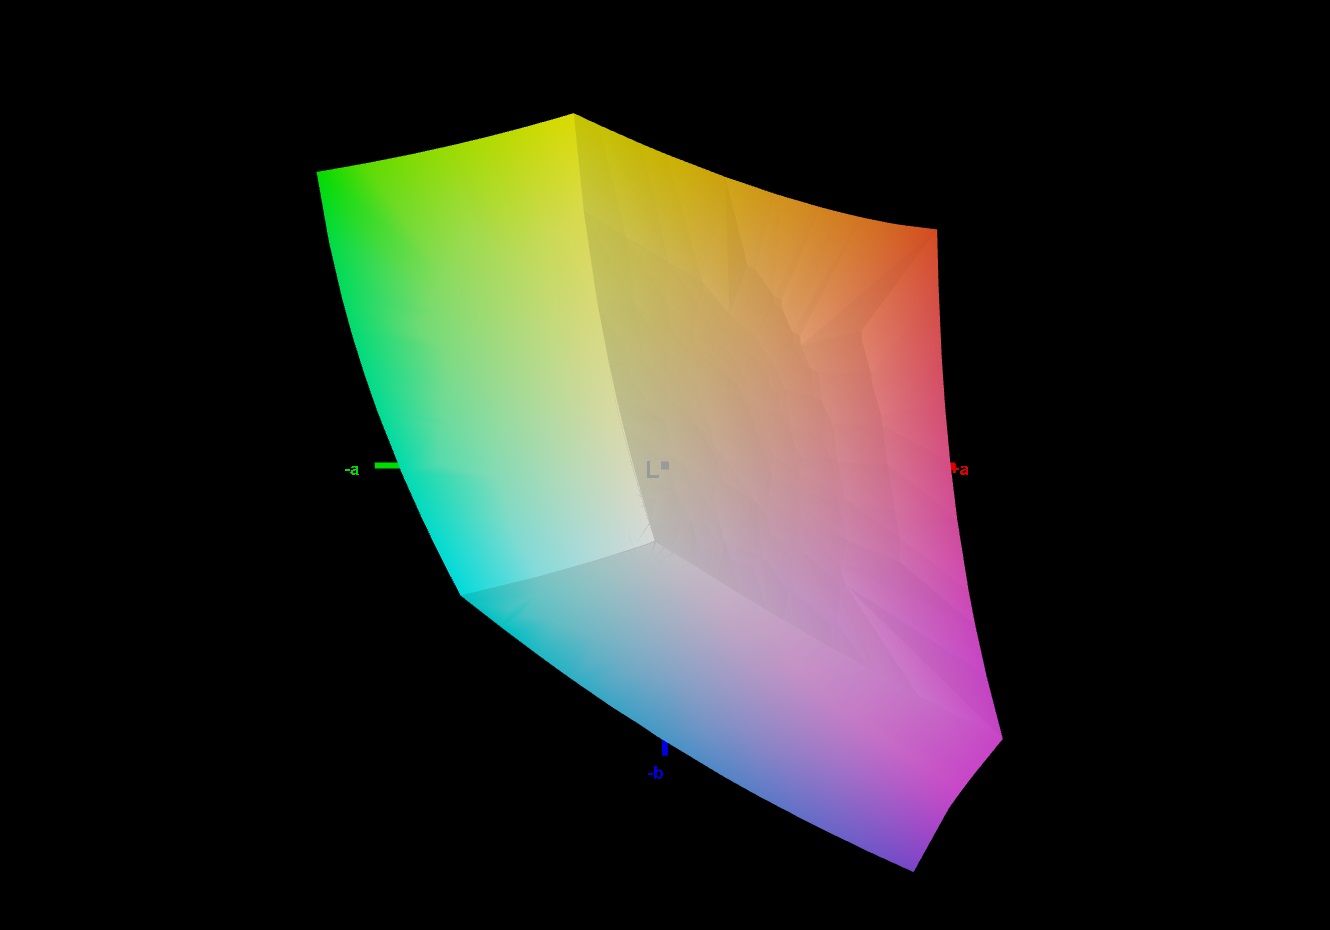
Ekran, kutudan çıkar çıkmaz iyi bir renk gösterimi sergiledi: Yaklaşık 2,2'lik bir sapma ile hedef değere (DeltaE < 3) ulaşıldı. Ekranın kalibre edilmesi sapmayı 1,14'e düşürüyor ve daha dengeli gri tonlar elde edilmesini sağlıyor. Panel, sRGB renk alanını tamamen kapsayabiliyor ancak AdobeRGB veya DCI P3 renk alanlarını kapsayamıyor. Rakiplerinin çoğunun ekranlarında da durum farklı değil.
Yanıt Sürelerini Görüntüle
| ↔ Tepki Süresi Siyahtan Beyaza | ||
|---|---|---|
| 5.2 ms ... yükseliş ↗ ve sonbahar↘ birleşimi | ↗ 1.5 ms yükseliş | 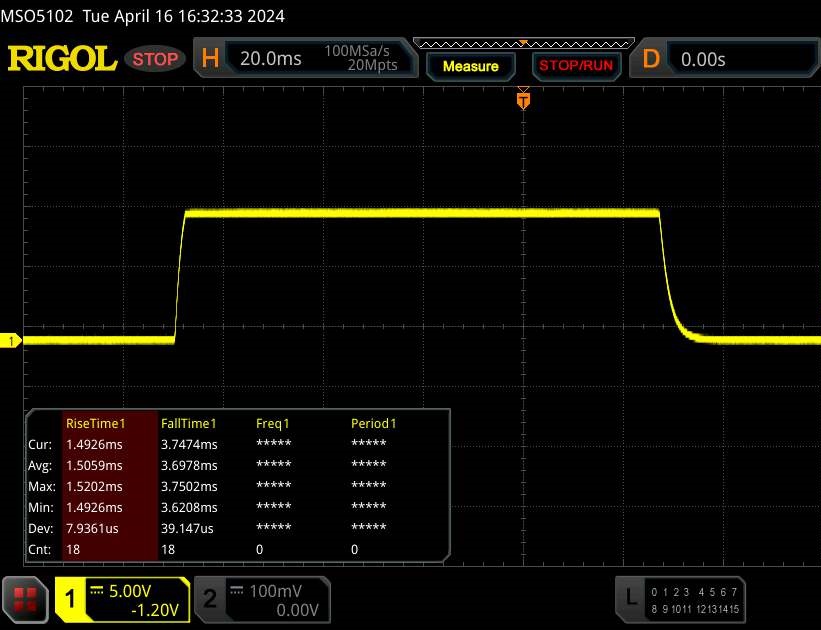 |
| ↘ 3.7 ms sonbahar | ||
| Ekran, testlerimizde çok hızlı yanıt oranları gösteriyor ve hızlı oyun oynamaya çok uygun olmalı. Karşılaştırıldığında, test edilen tüm cihazlar 0.1 (minimum) ile 240 (maksimum) ms arasında değişir. » Tüm cihazların 18 %'si daha iyi. Bu, ölçülen yanıt süresinin test edilen tüm cihazların ortalamasından (19.9 ms) daha iyi olduğu anlamına gelir. | ||
| ↔ Tepki Süresi %50 Griden %80 Griye | ||
| 5 ms ... yükseliş ↗ ve sonbahar↘ birleşimi | ↗ 2.3 ms yükseliş | 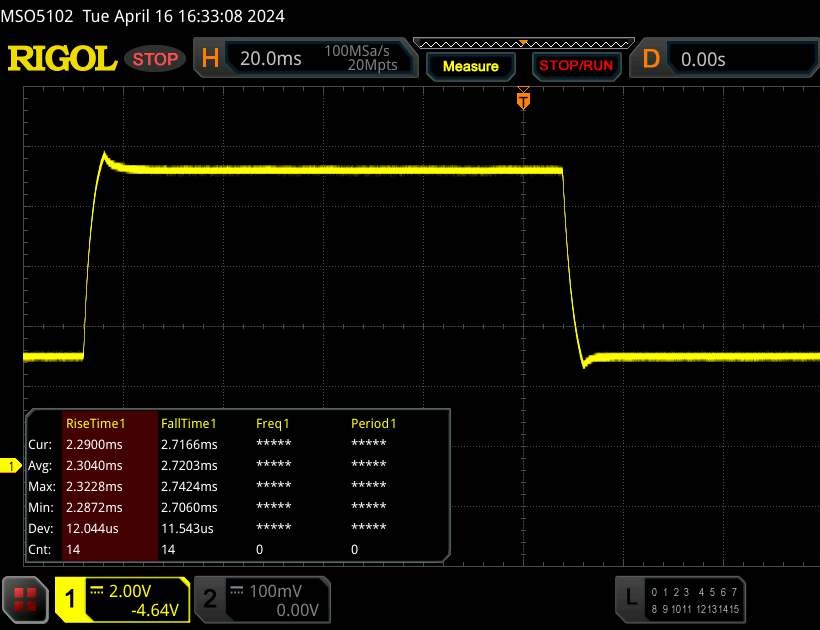 |
| ↘ 2.7 ms sonbahar | ||
| Ekran, testlerimizde çok hızlı yanıt oranları gösteriyor ve hızlı oyun oynamaya çok uygun olmalı. Karşılaştırıldığında, test edilen tüm cihazlar 0.165 (minimum) ile 636 (maksimum) ms arasında değişir. » Tüm cihazların 17 %'si daha iyi. Bu, ölçülen yanıt süresinin test edilen tüm cihazların ortalamasından (31.1 ms) daha iyi olduğu anlamına gelir. | ||
Ekran Titremesi / PWM (Darbe Genişliği Modülasyonu)
| Ekran titriyor / PWM algılanmadı |  | ||
Karşılaştırıldığında: Test edilen tüm cihazların %52 %'si ekranı karartmak için PWM kullanmıyor. PWM tespit edilirse, ortalama 7798 (minimum: 5 - maksimum: 343500) Hz ölçüldü. | |||
Cihazın görüş açısı sabit IPS paneli her açıdan okunaklı kalır. Dışarıda, güneş çok parlak olmadığı sürece ekrandan okuyabilirsiniz.

Performans - Raptor Lake ve Ada Lovelace dizüstü bilgisayara güç veriyor
Güçlü, kompakt XMG Fusion 15 (Early 24) oyunculara ve yaratıcılara yöneliktir. Raptor Lake ve Ada Lovelace gerekli performansı sağlar. Dizüstü bilgisayar Schenker online mağazası üzerinden bireysel olarak yapılandırılabilir. Mevcut varyantın maliyeti yaklaşık 2.500 ABD Dolarıdır. Daha ucuz modeller yaklaşık 1.700 ABD Dolarından başlamaktadır.
Test koşulları
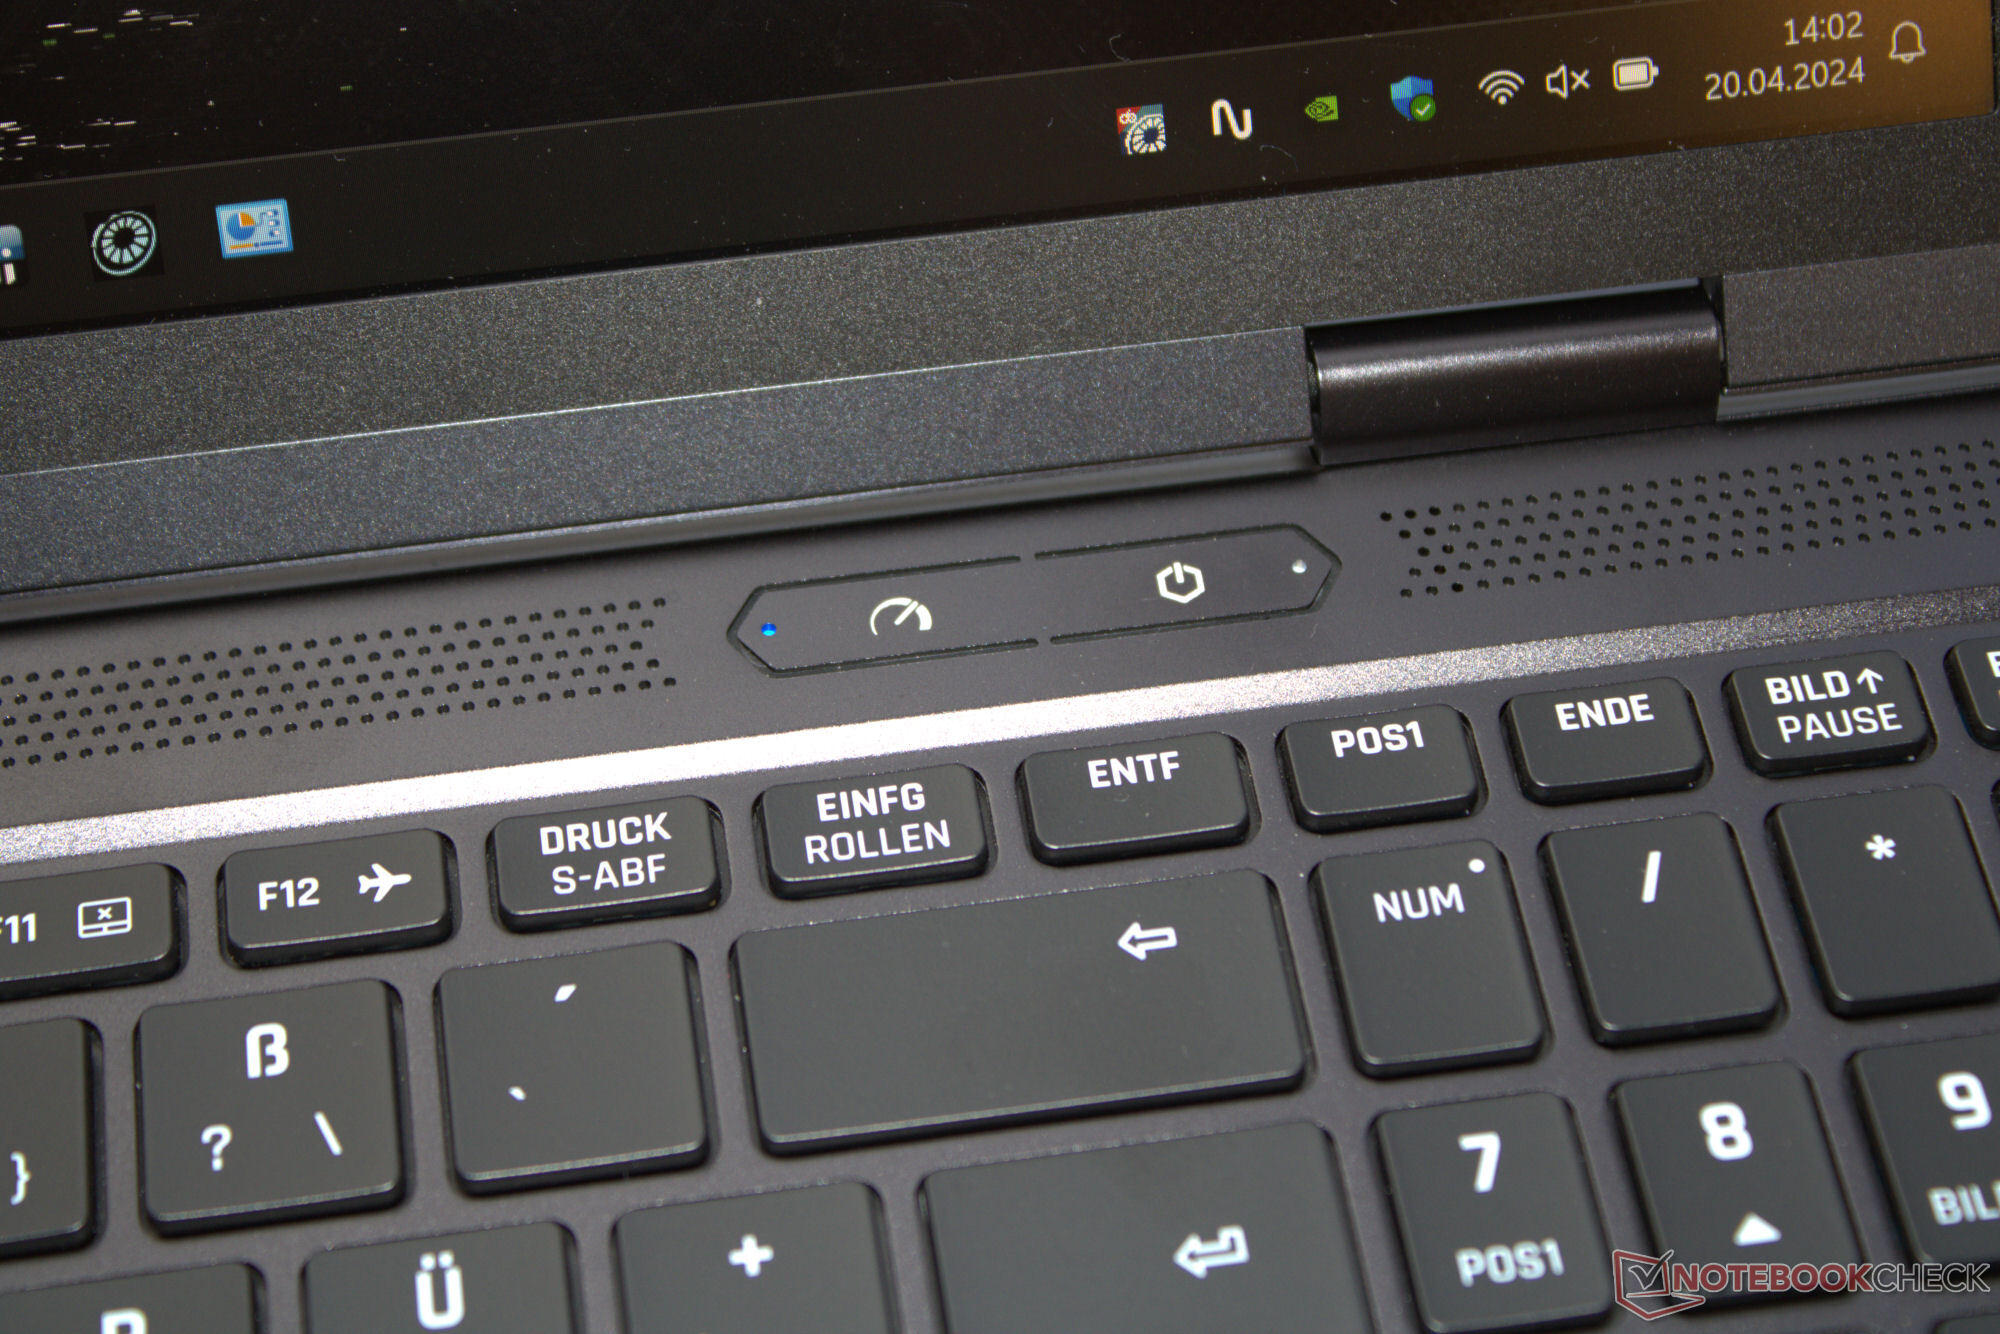
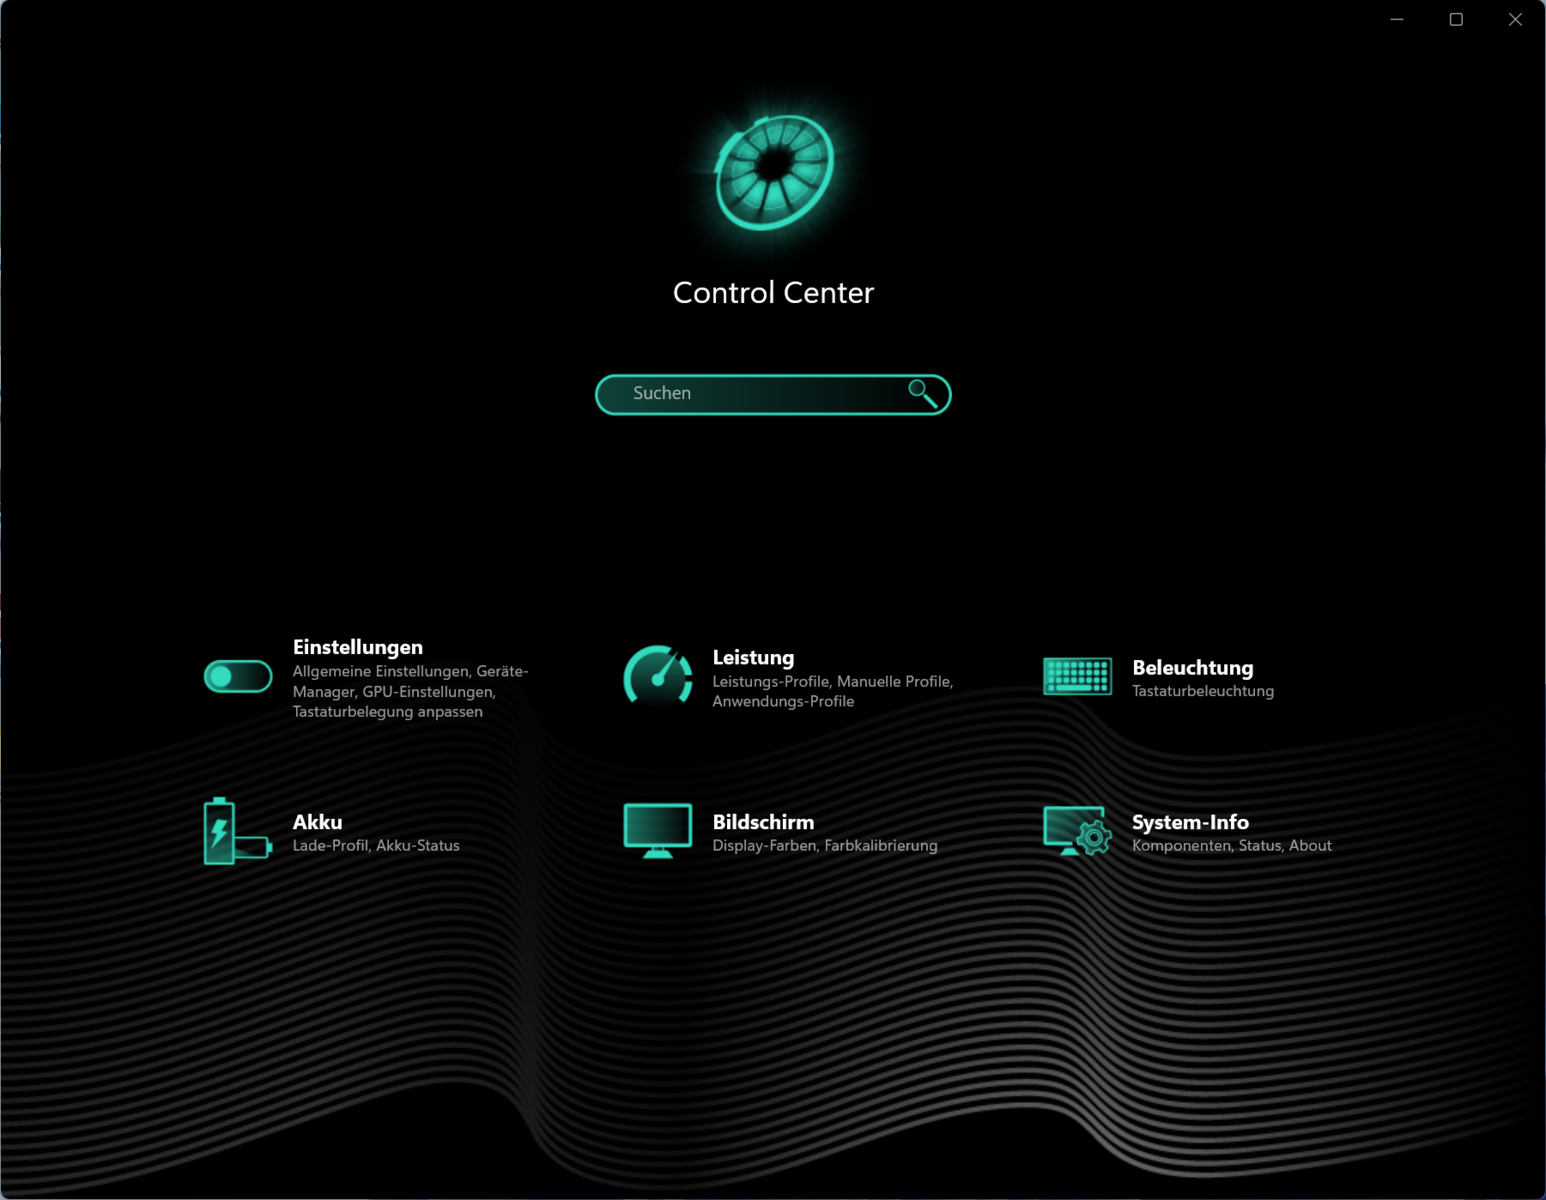
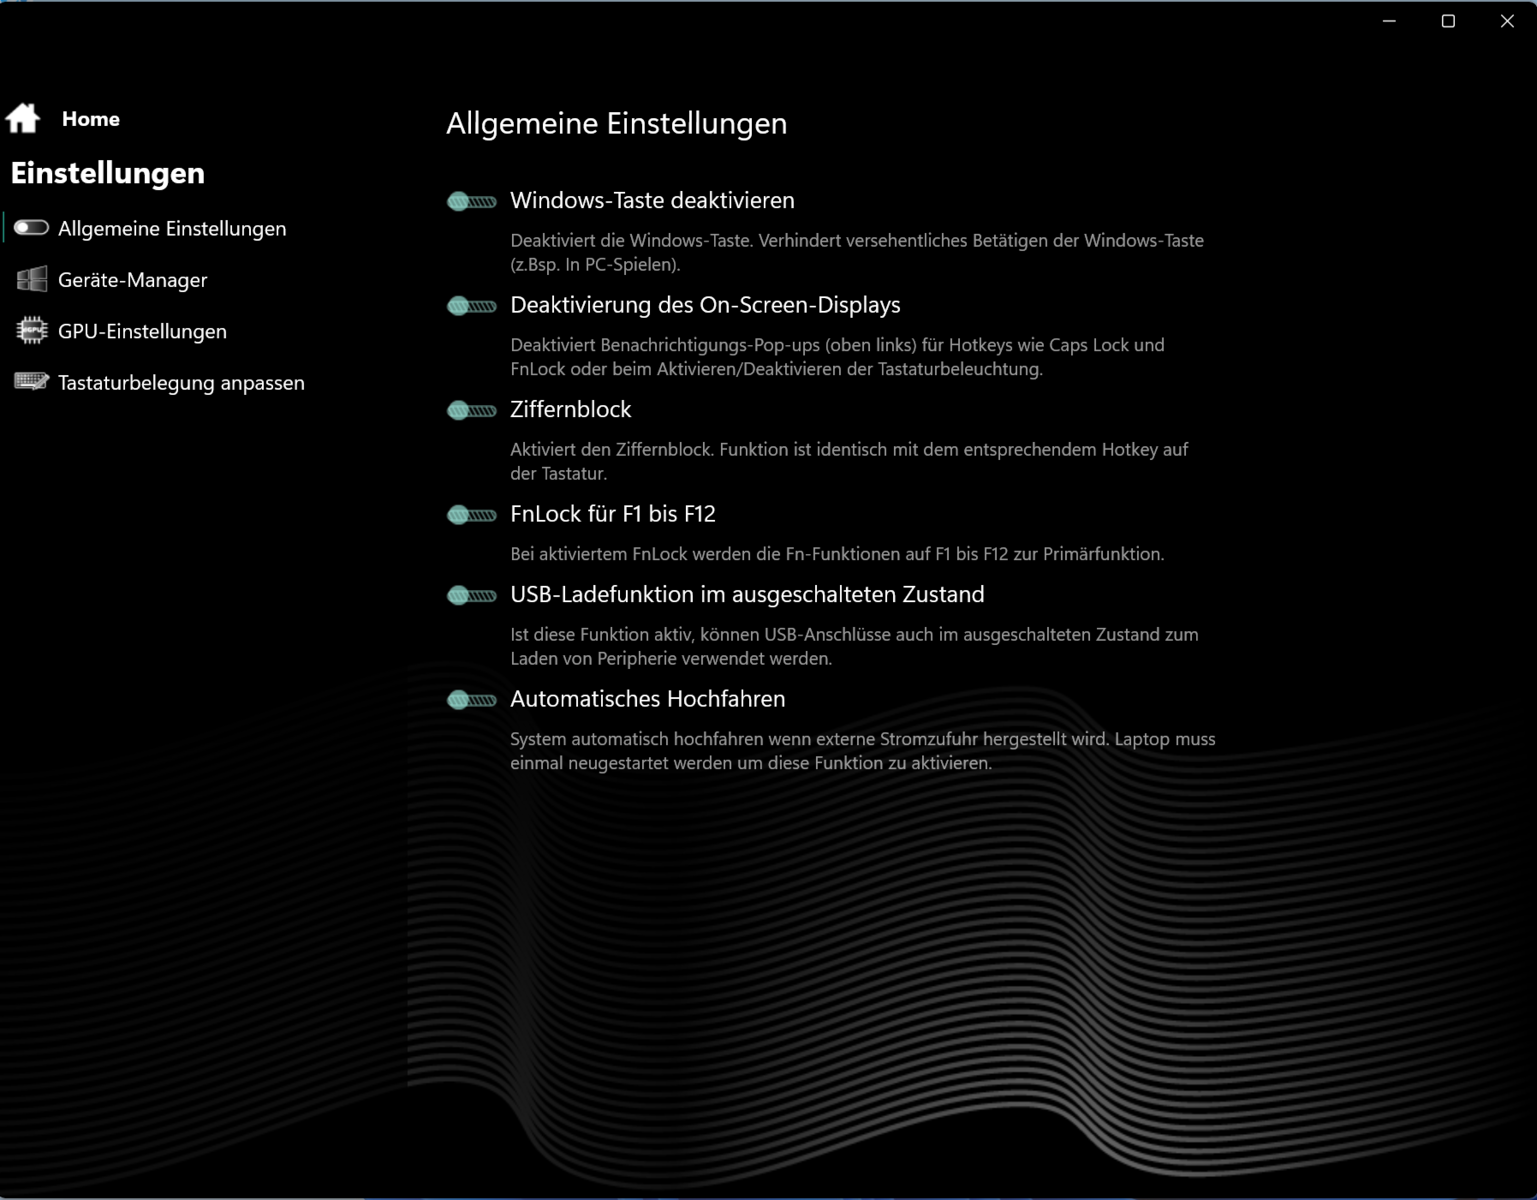
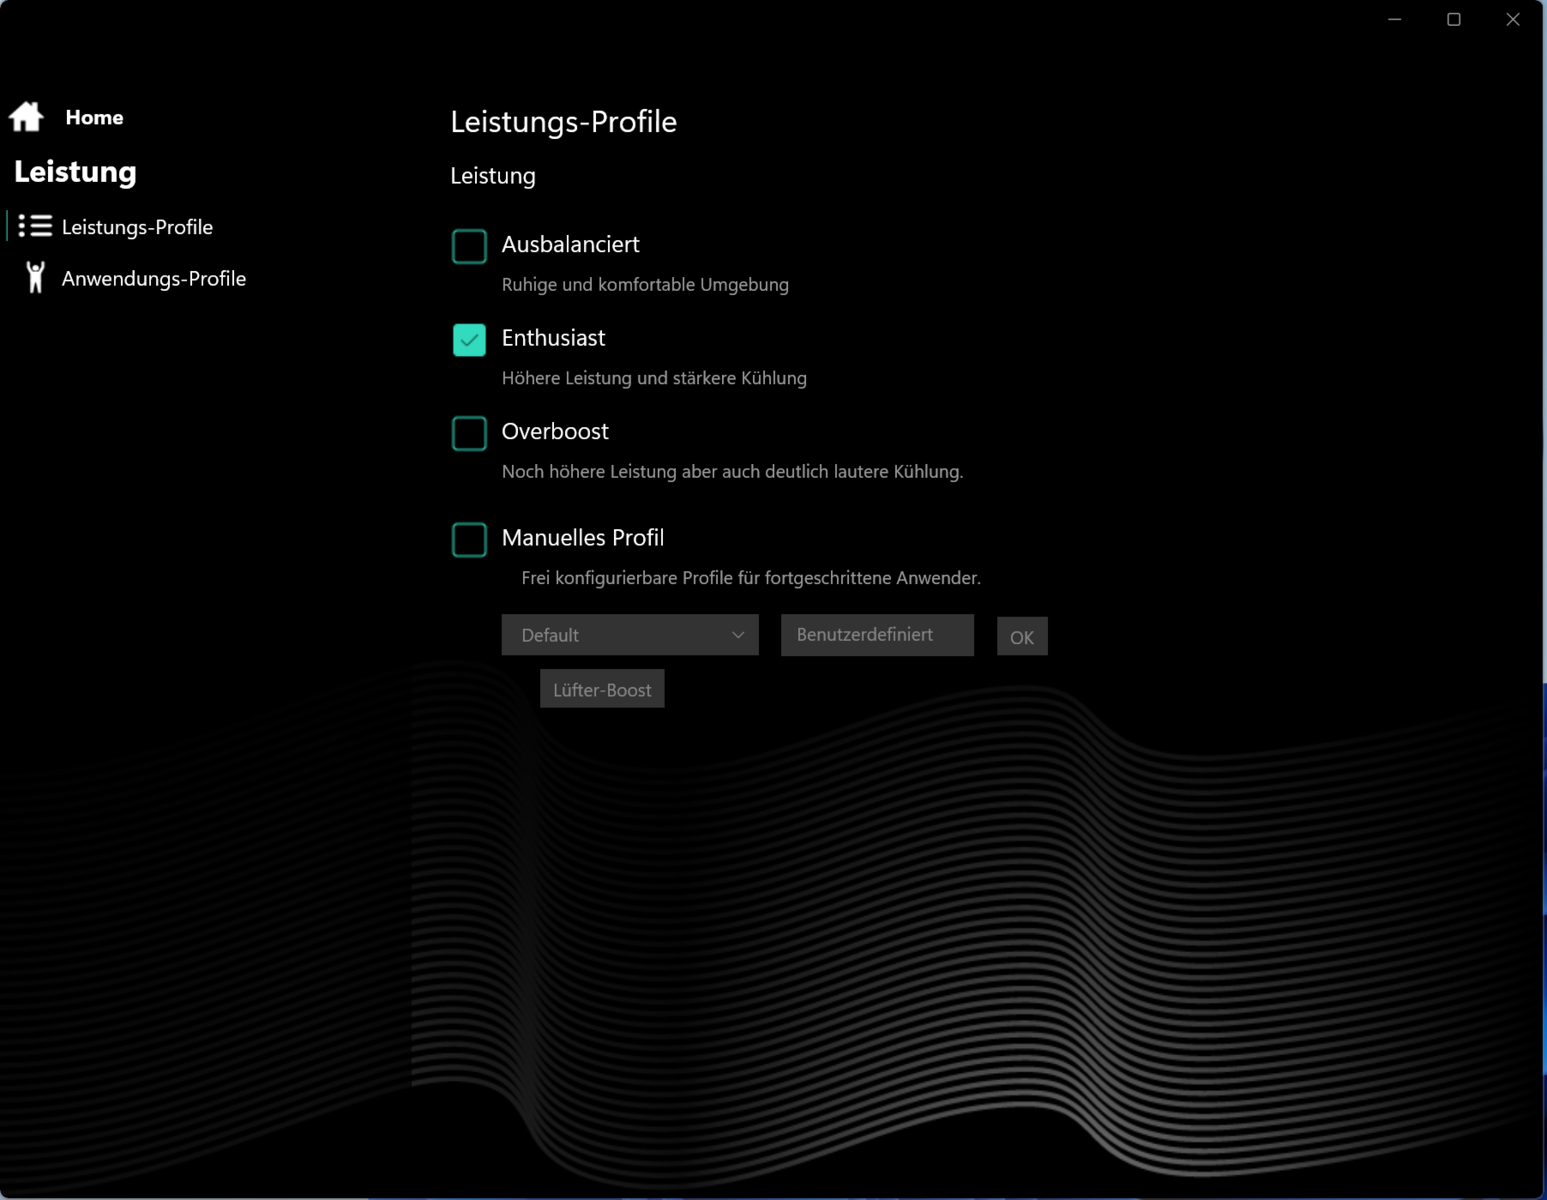
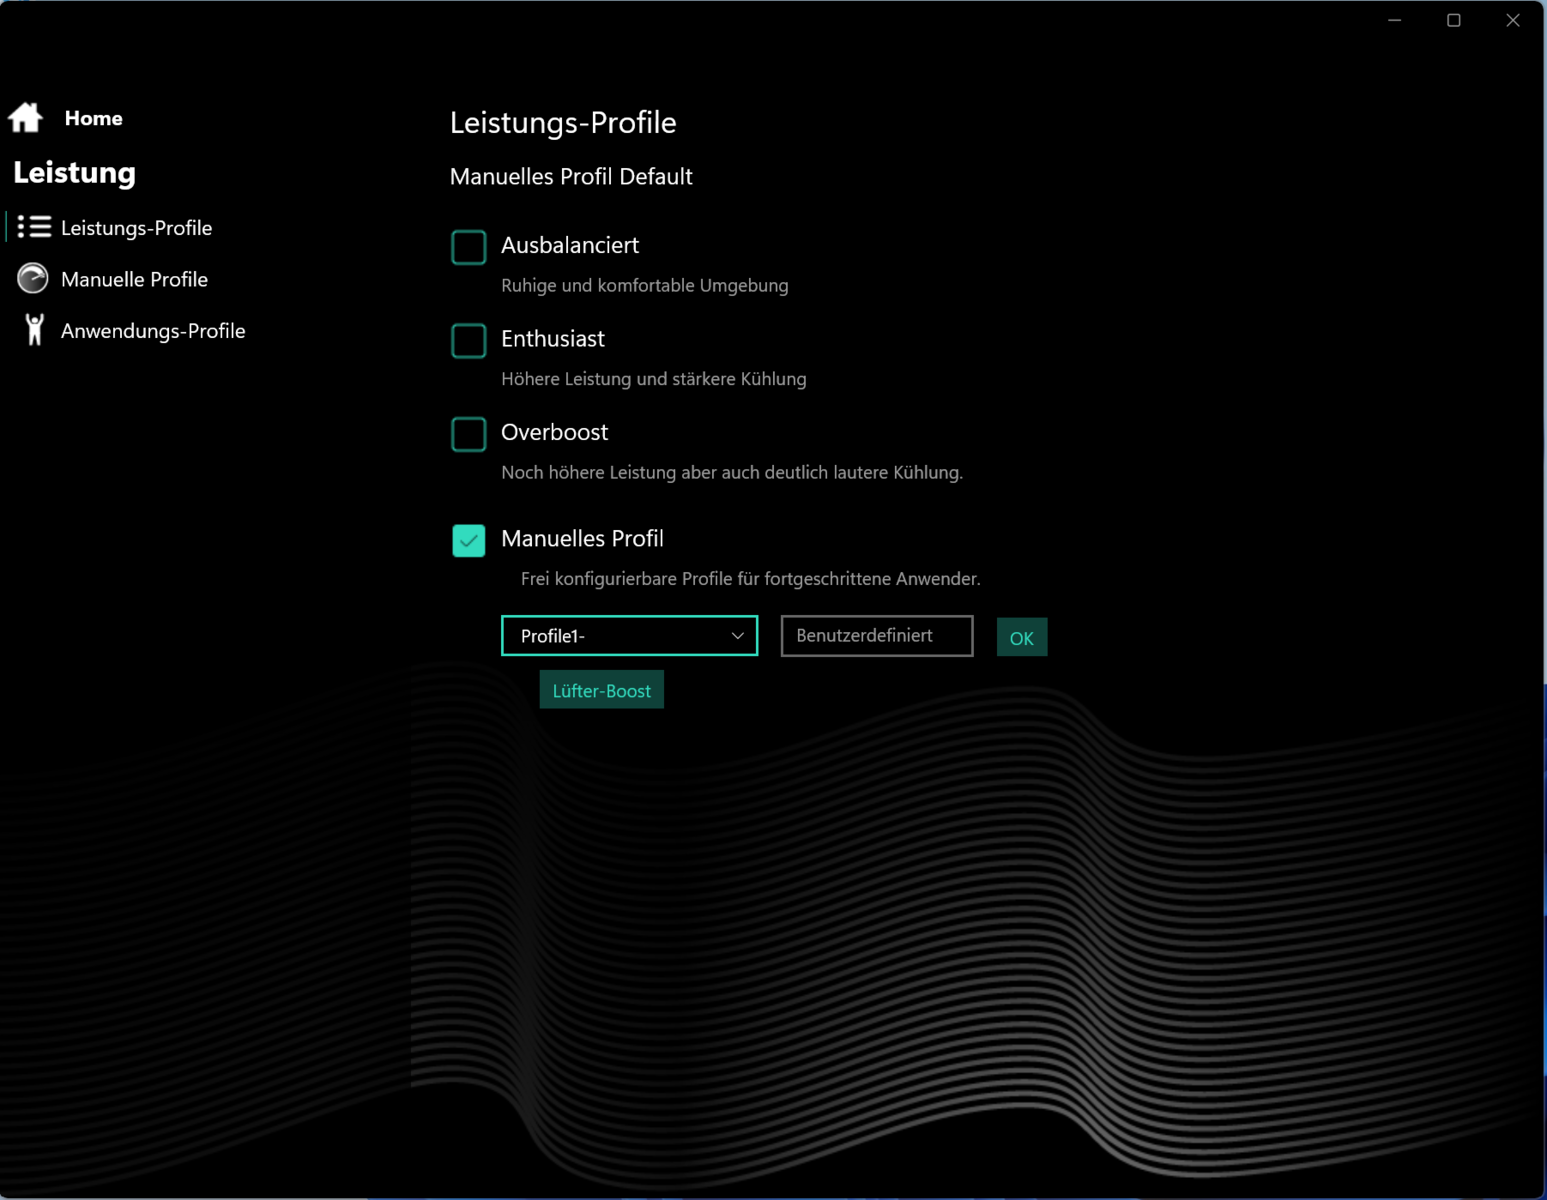
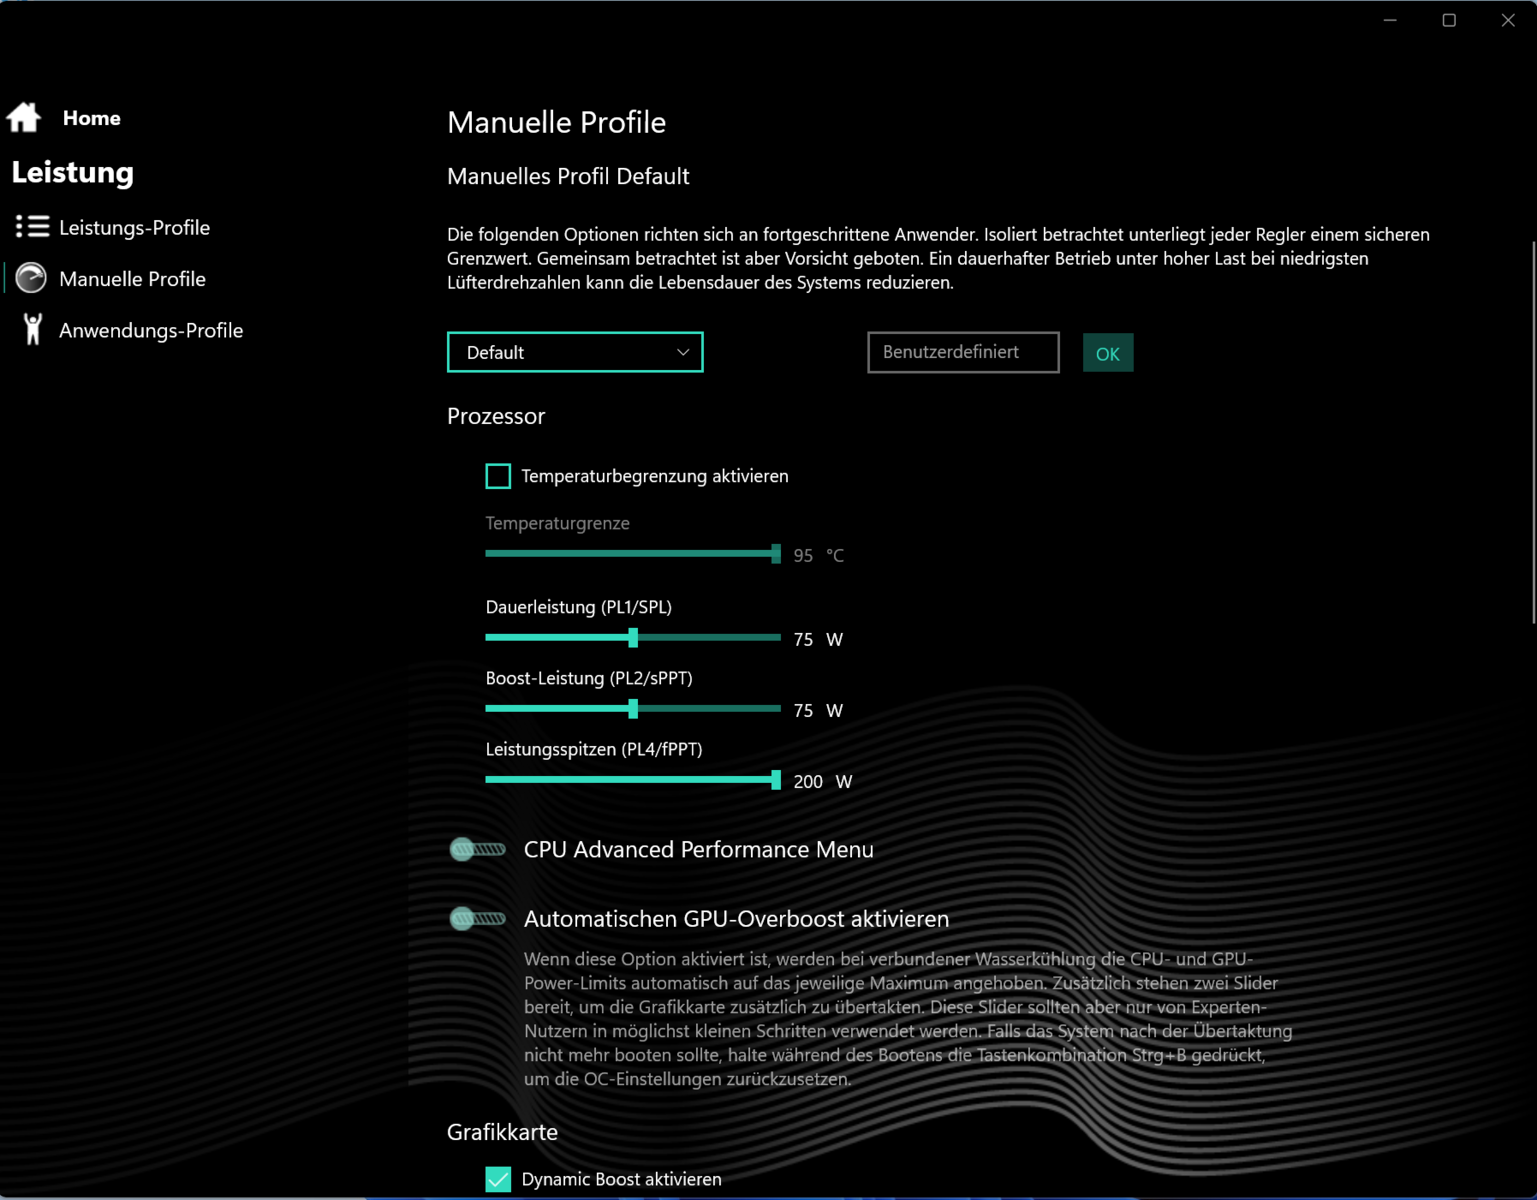
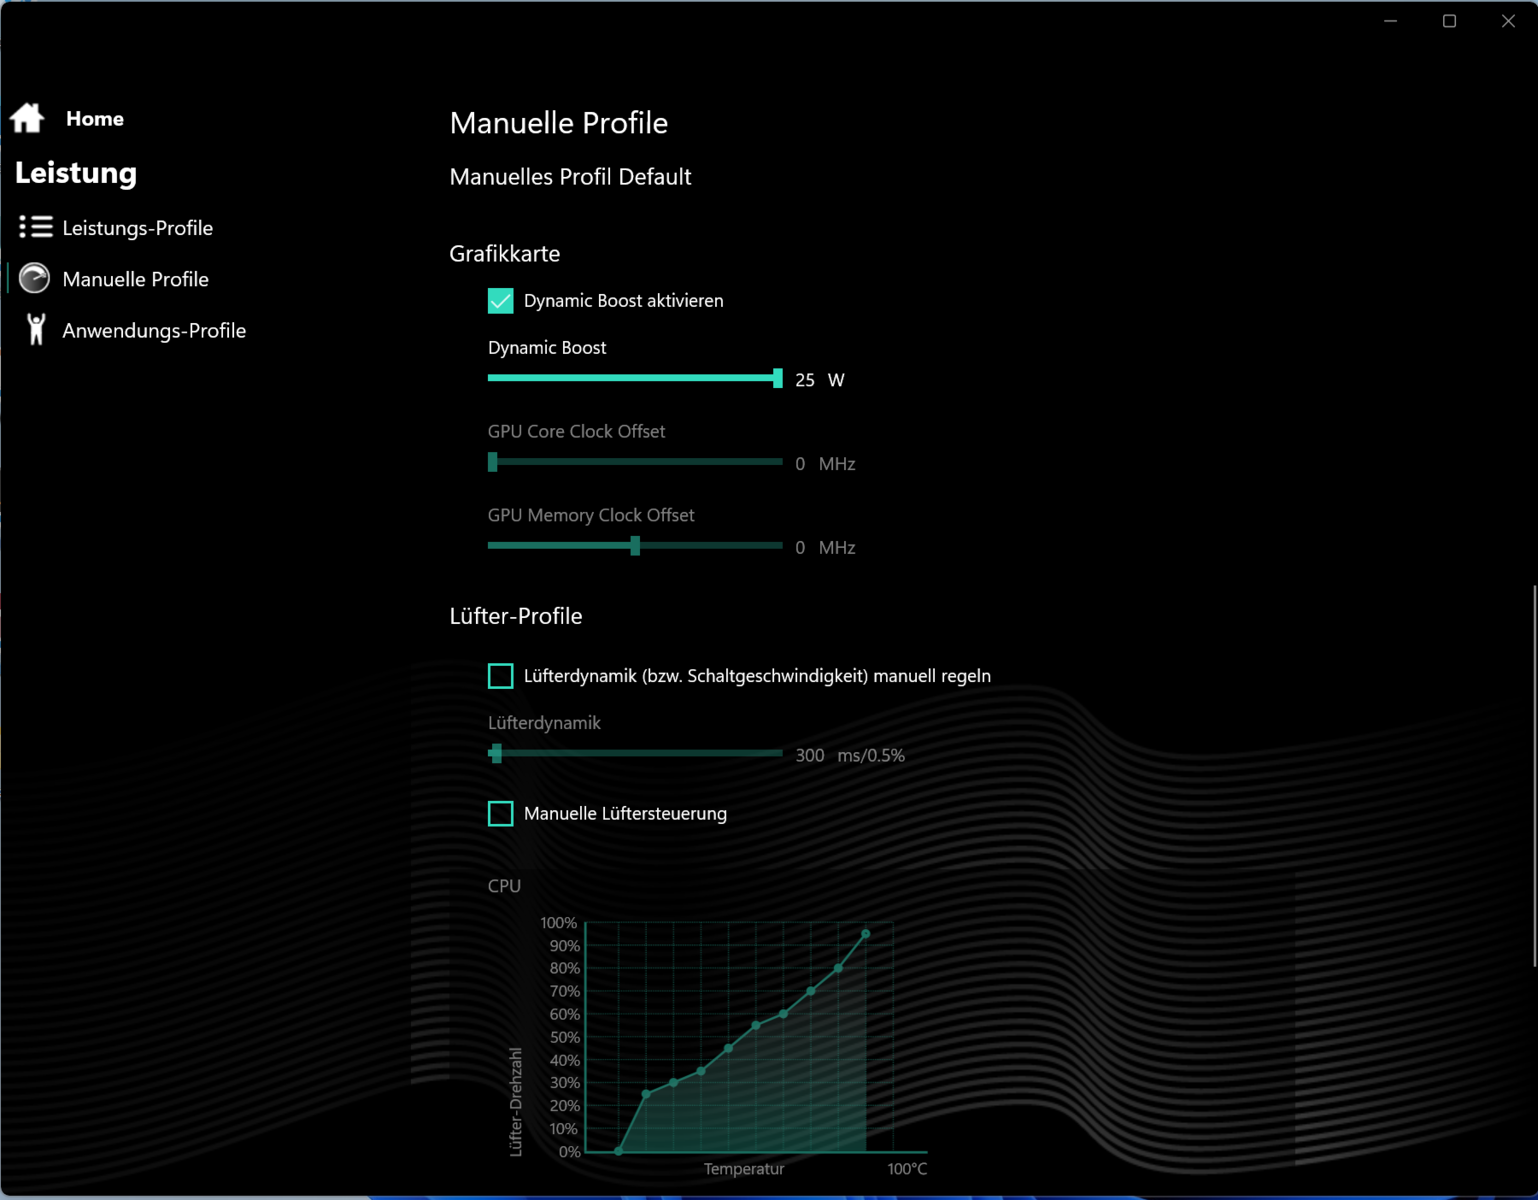
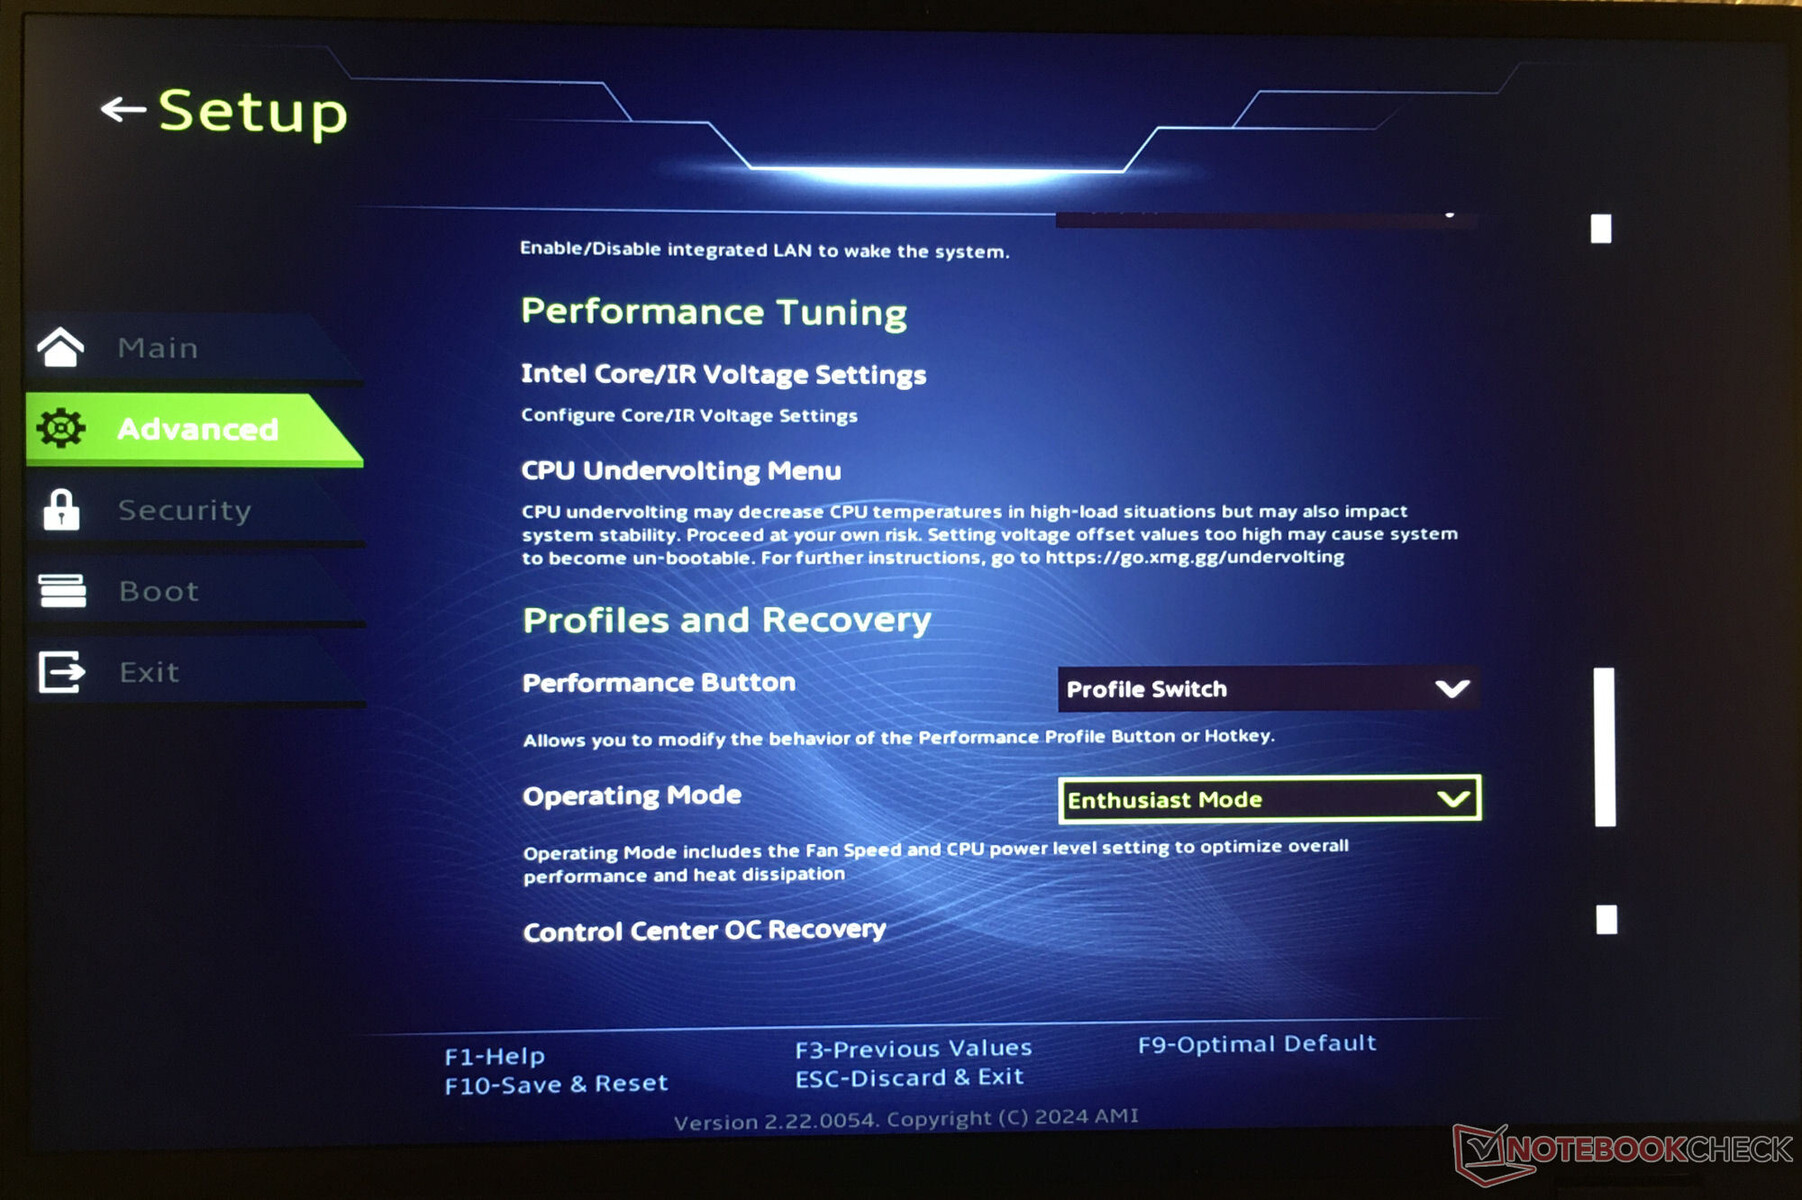
Dizüstü bilgisayar, ayrı bir düğme (güç düğmesinin yanında) kullanılarak aralarında hızlıca geçiş yapılabilen, üreticiye özel üç performans modu (tabloya bakın) sunar. Önceden yüklenmiş Kontrol Merkezi yazılımı kullanılarak bireysel profiller oluşturulabilir. Örneğin, CPU'nun güç sınırları, GPU'nun TGP'si ve/veya cihazın üst sıcaklık sınırları ayarlanabilir.
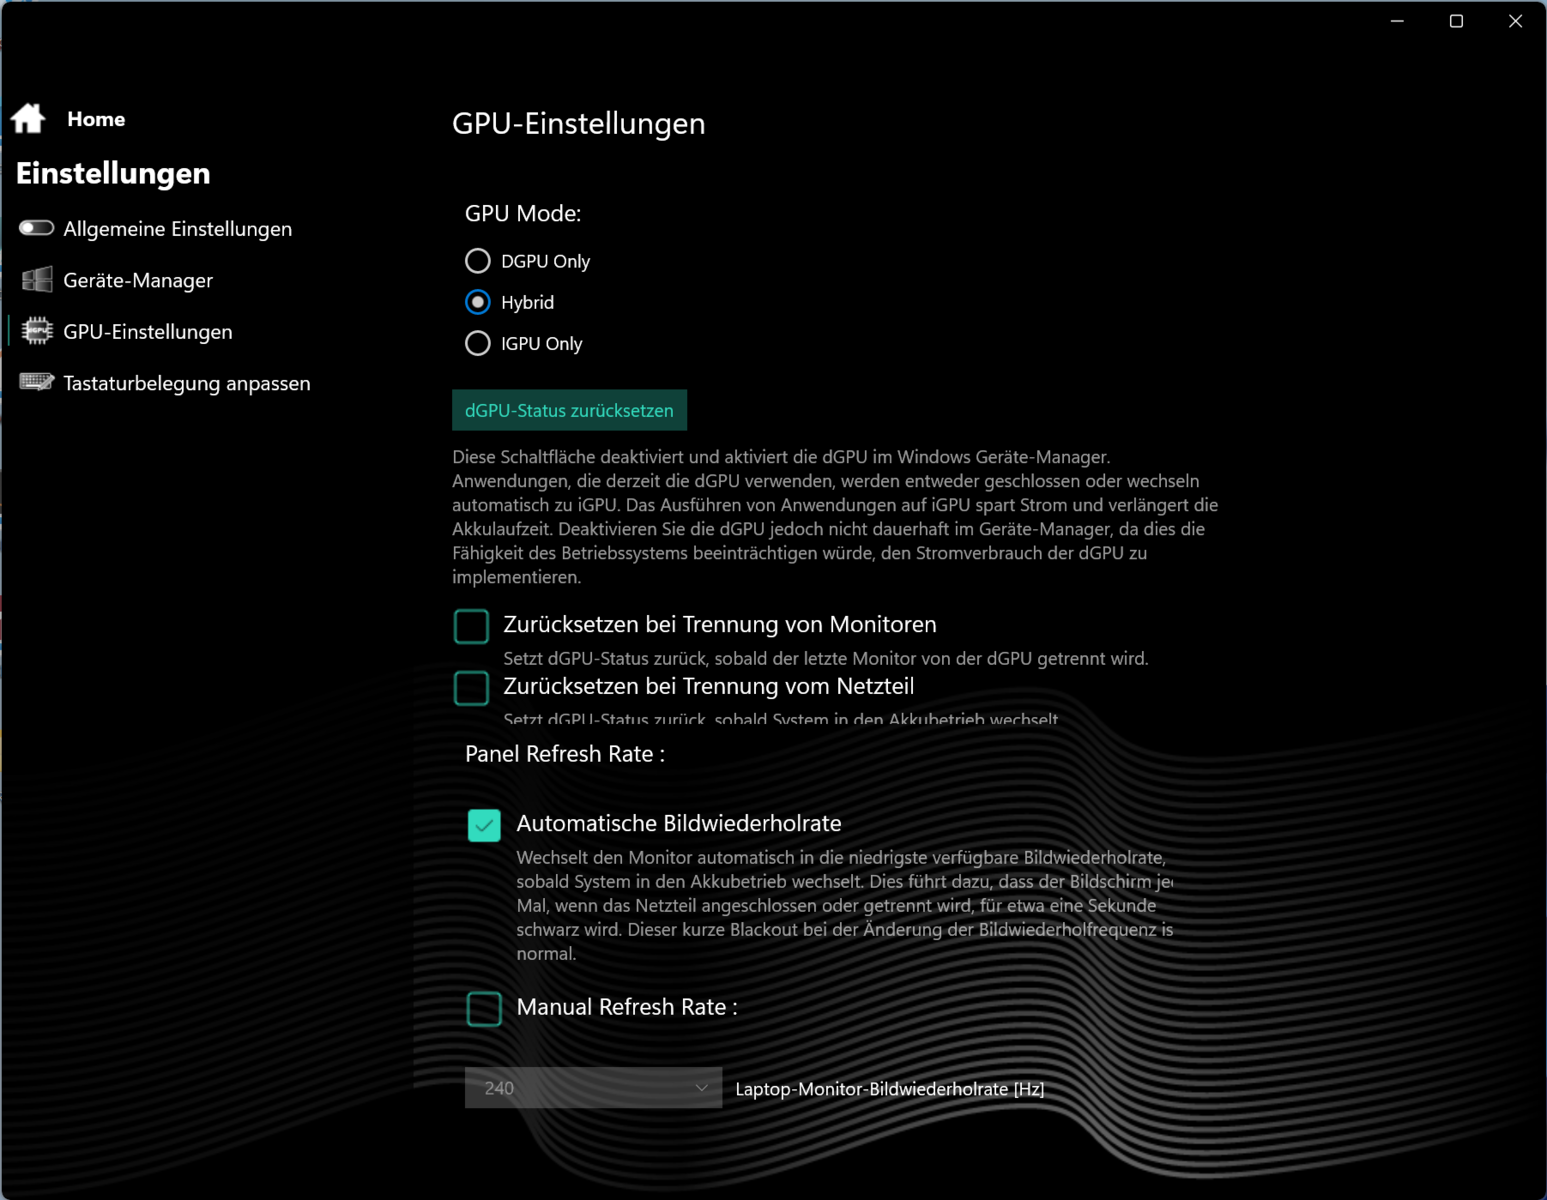
Testimiz sırasında Enthusiast (kıyaslamalar) ve Balanced (pil testleri) modları kullanıldı. GPU modu Hybrid (= Optimus) olarak ayarlanmıştır.
| Meraklısı | Overboost | Dengeli | |
|---|---|---|---|
| Güç Sınırı 1 (HWInfo) | 160 watt | 160 watt | 160 watt |
| Güç Sınırı 2 (HWInfo) | 170 watt | 170 watt | 170 watt |
| Gürültü (Witcher 3) | 51 dB(A) | 53 dB(A) | 39 dB(A) |
| Performans (Witcher 3) | 128 fps | 130 fps | 14-128 fps |


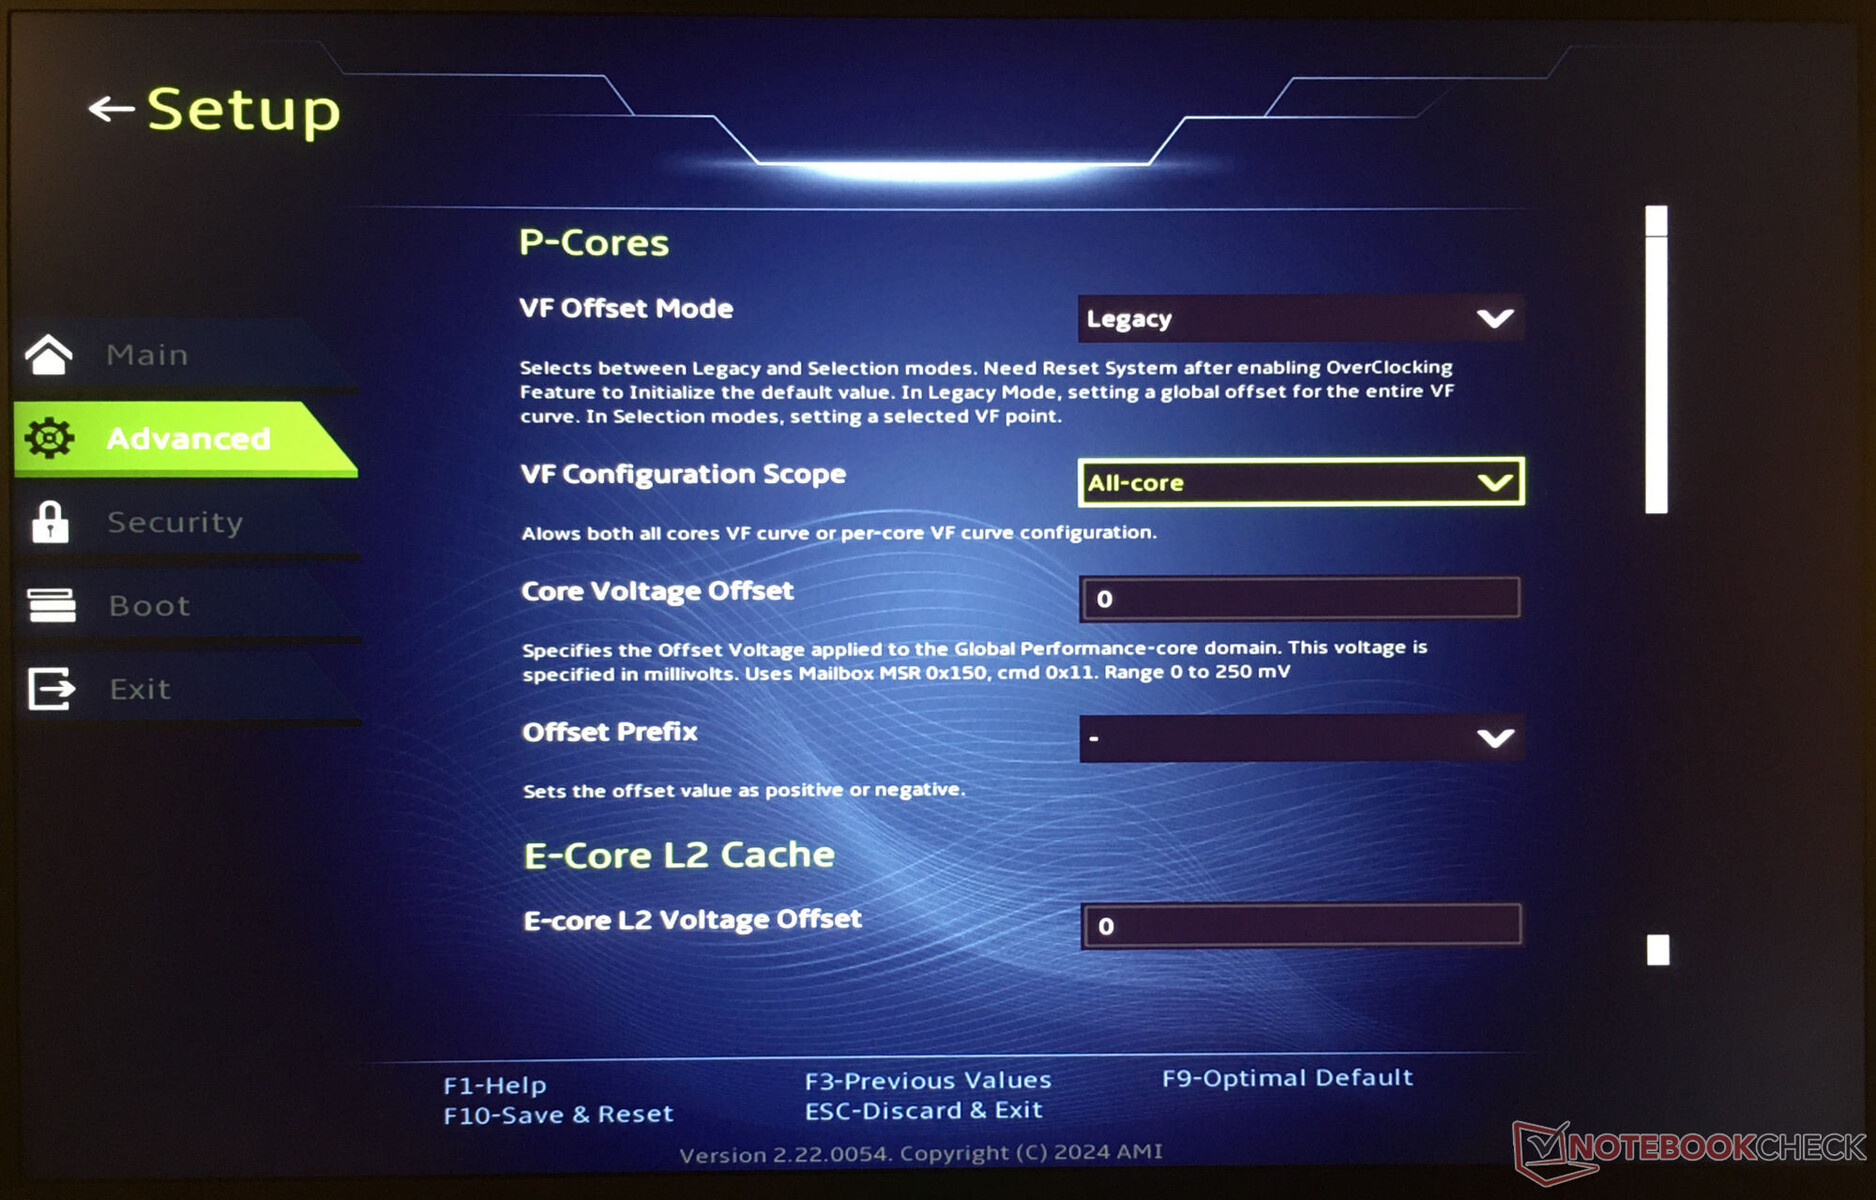
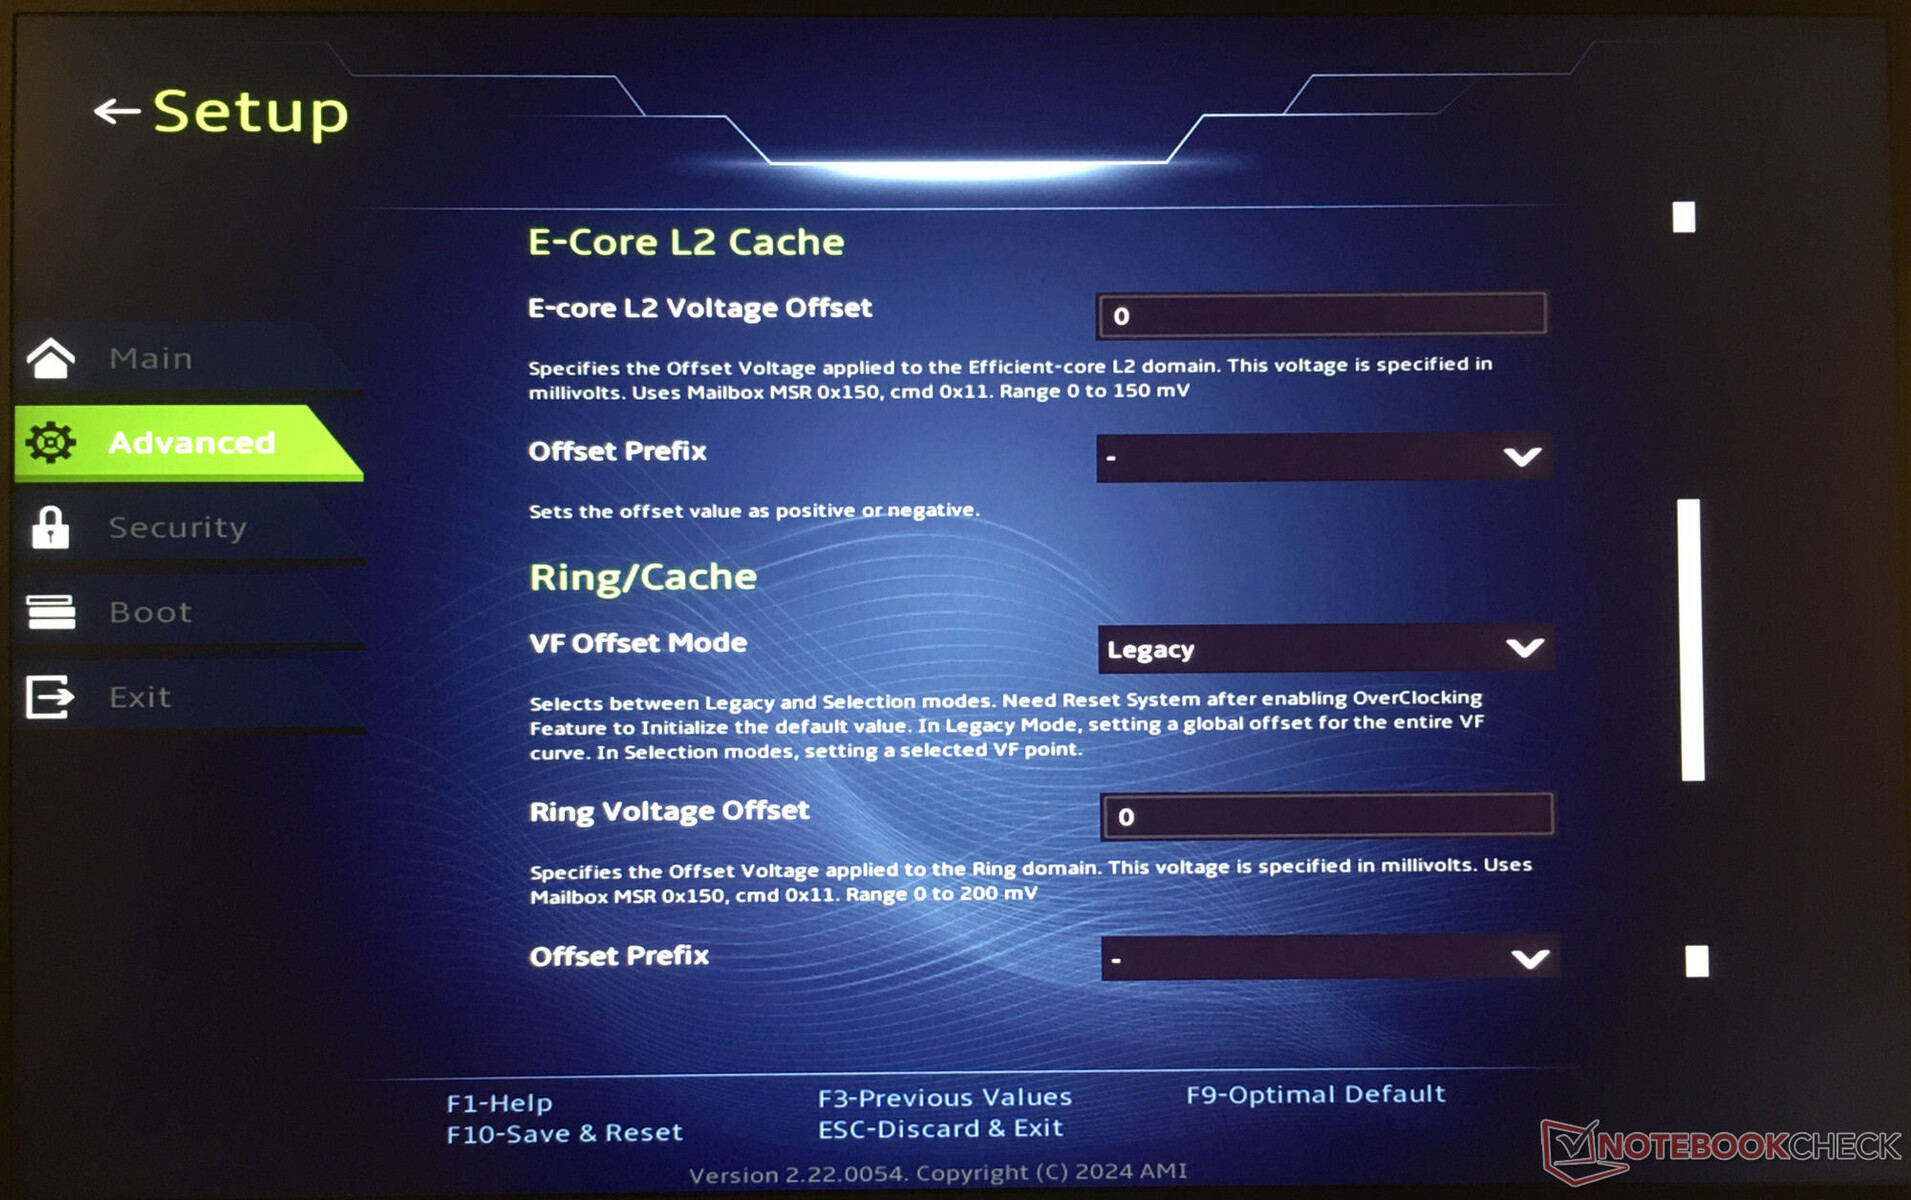
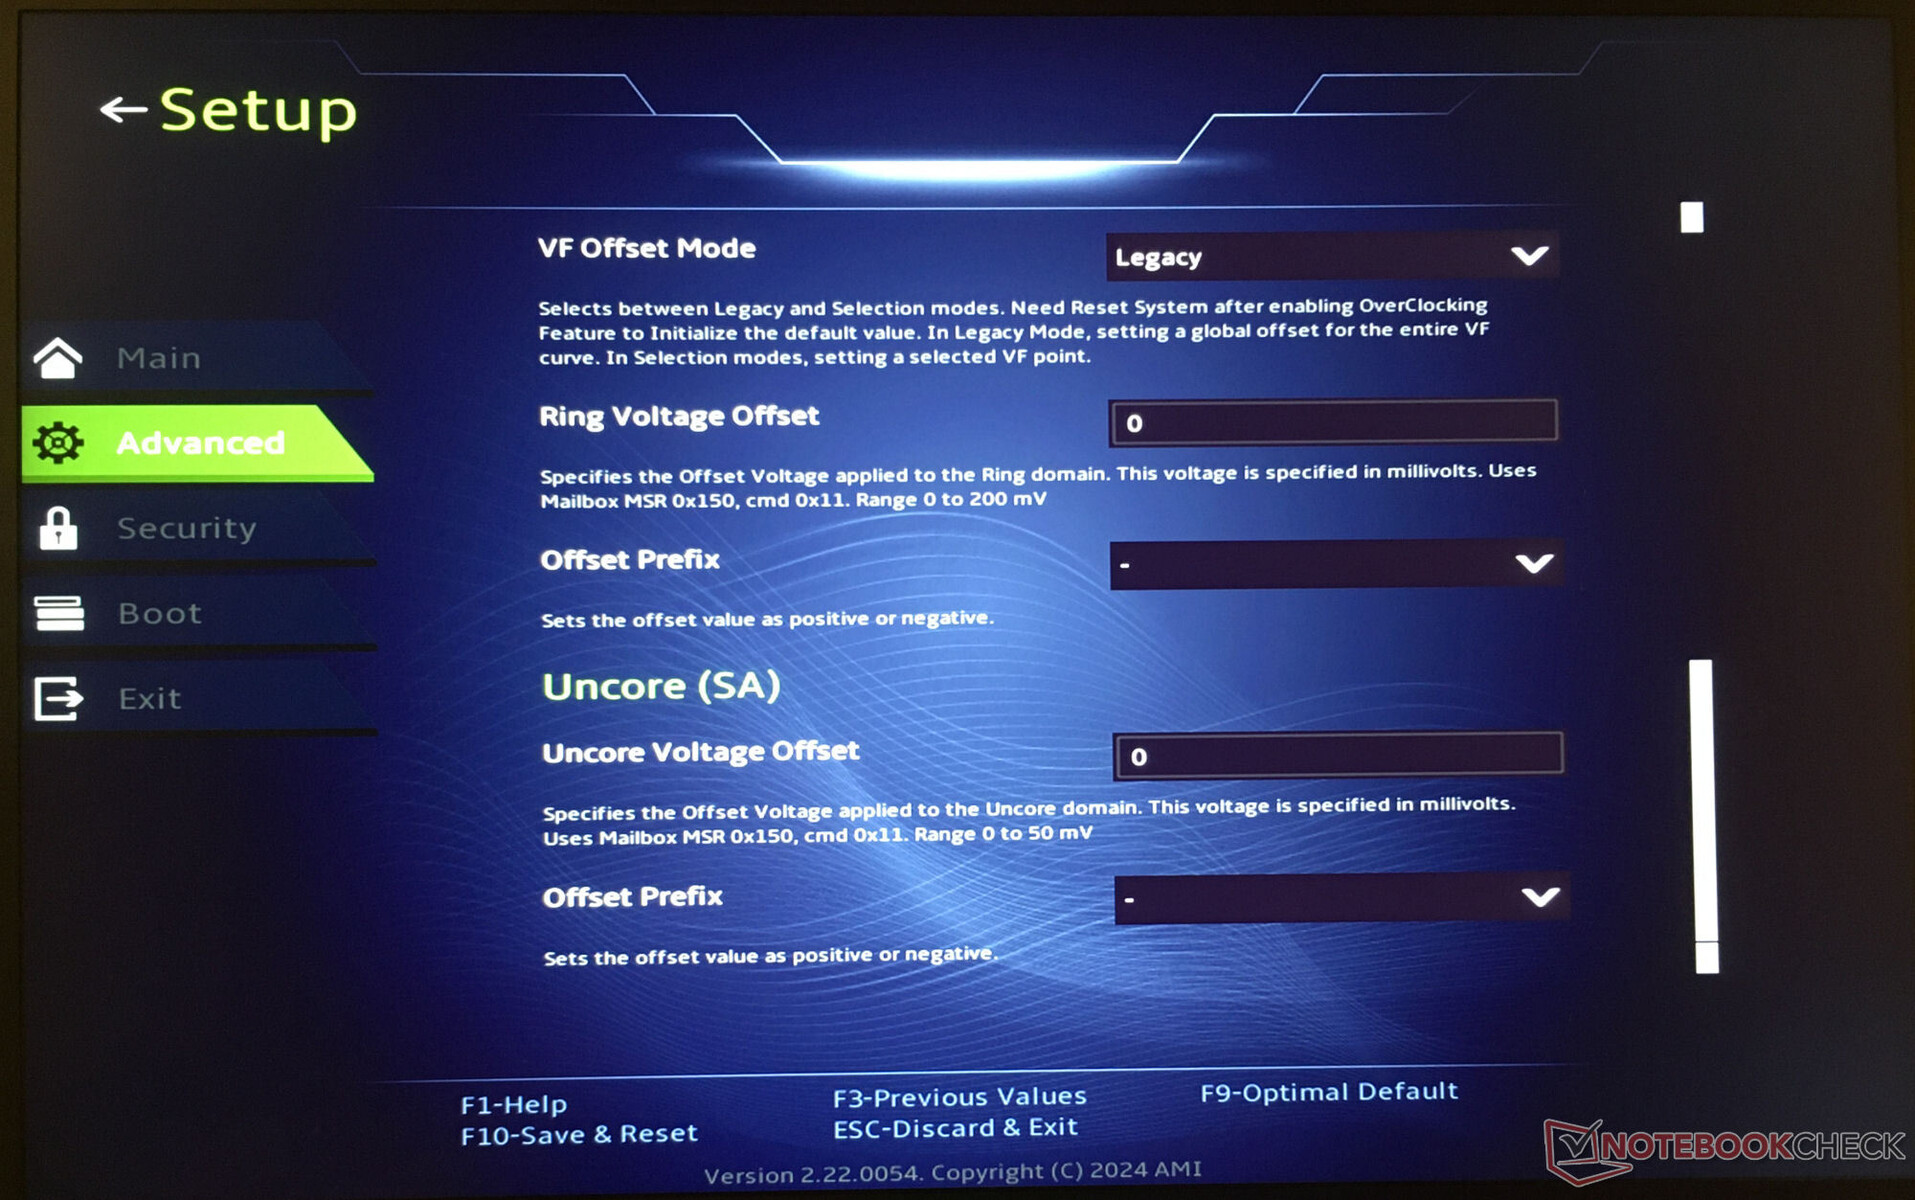
Düşük Voltaj
İşlemci, üretici tarafından öngörülenden daha düşük voltajlarla çalıştırılabilir (undervolting). Sonuç olarak, cihazın güç tüketimi ve ısı emisyonları azalır. Ancak dikkatli olun: Voltajı çok fazla düşürmek kararsız veya hatalı bir sisteme yol açabilir. Bu durumda, değişiklikler tersine çevrilmelidir-gerilim düşürme işlemi kendi sorumluluğunuzda gerçekleştirilmelidir.
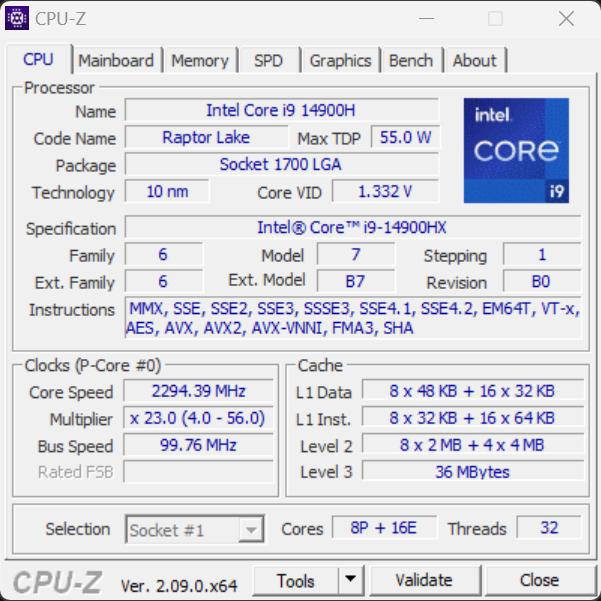
İşlemci
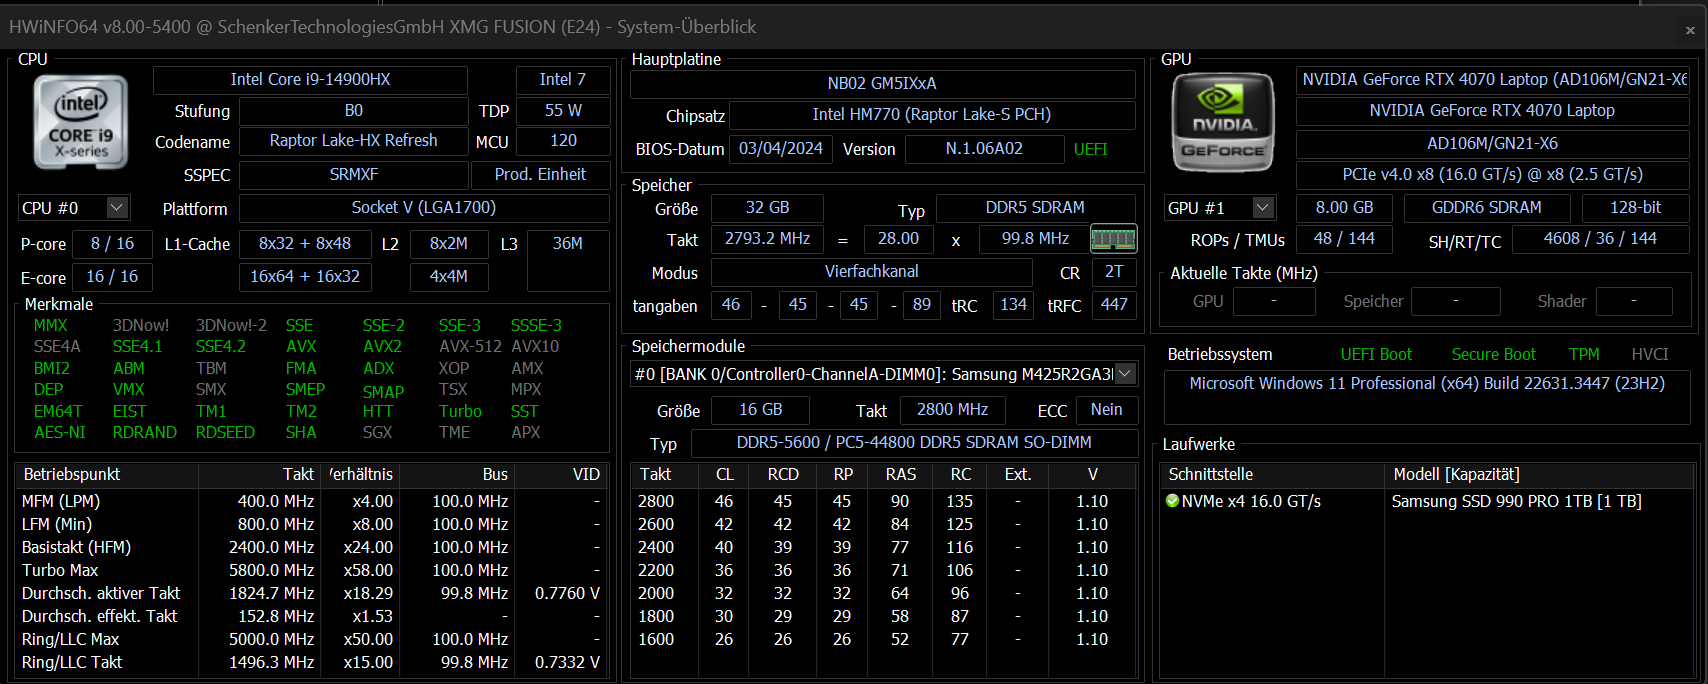
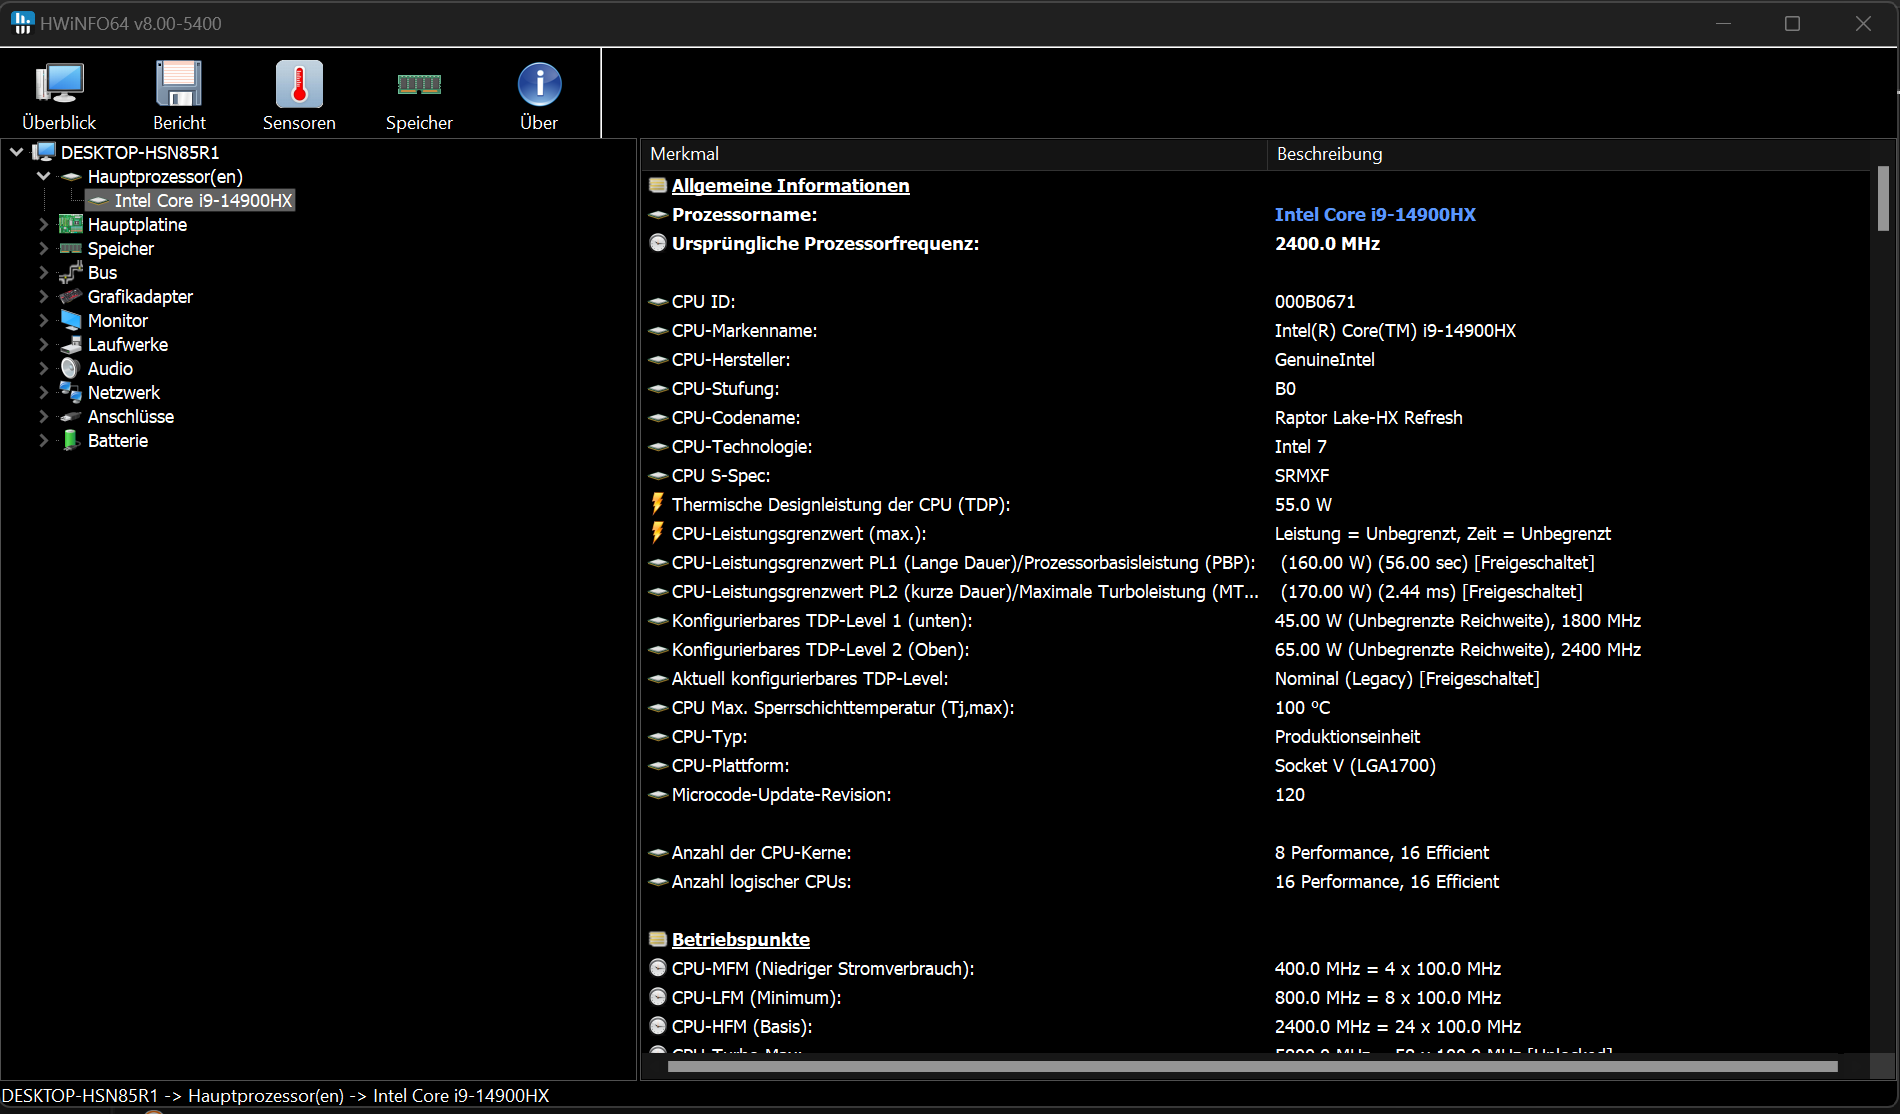
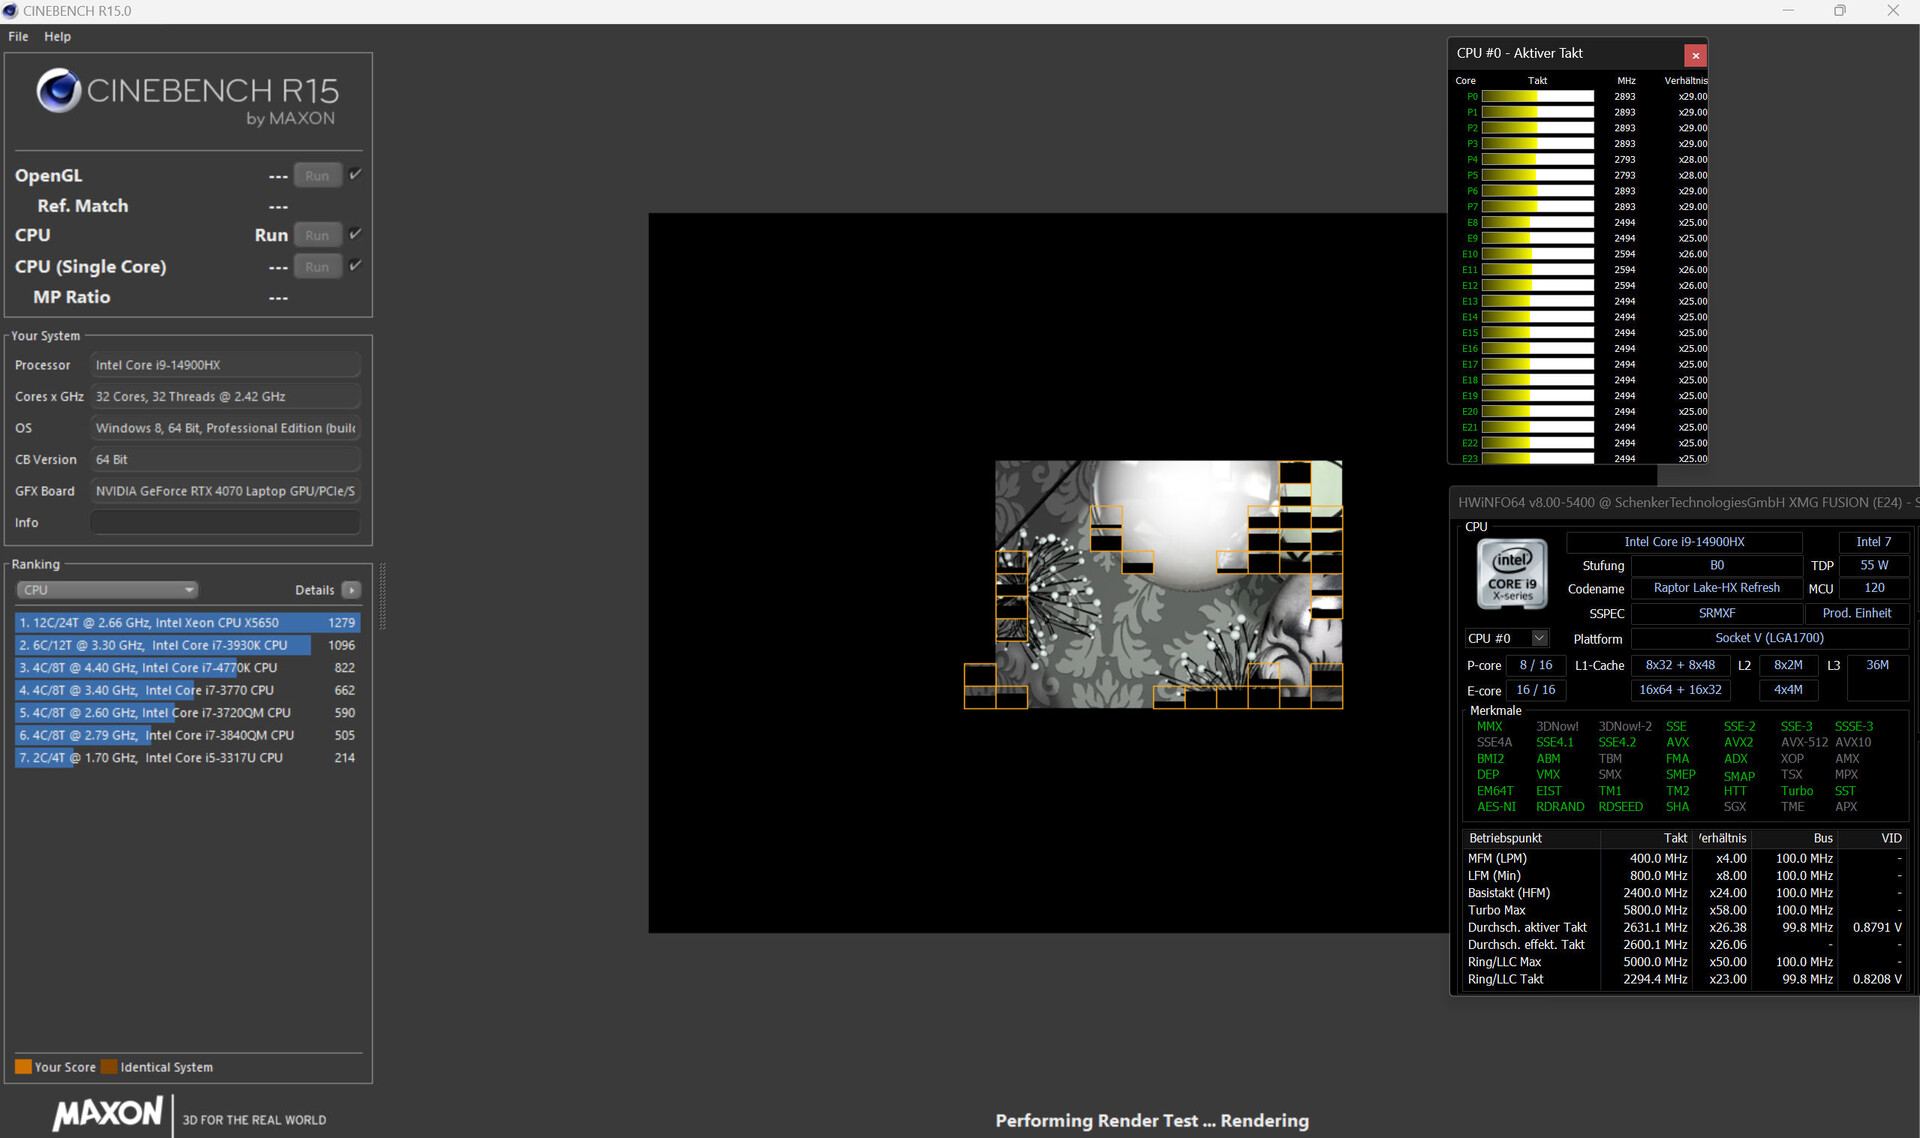
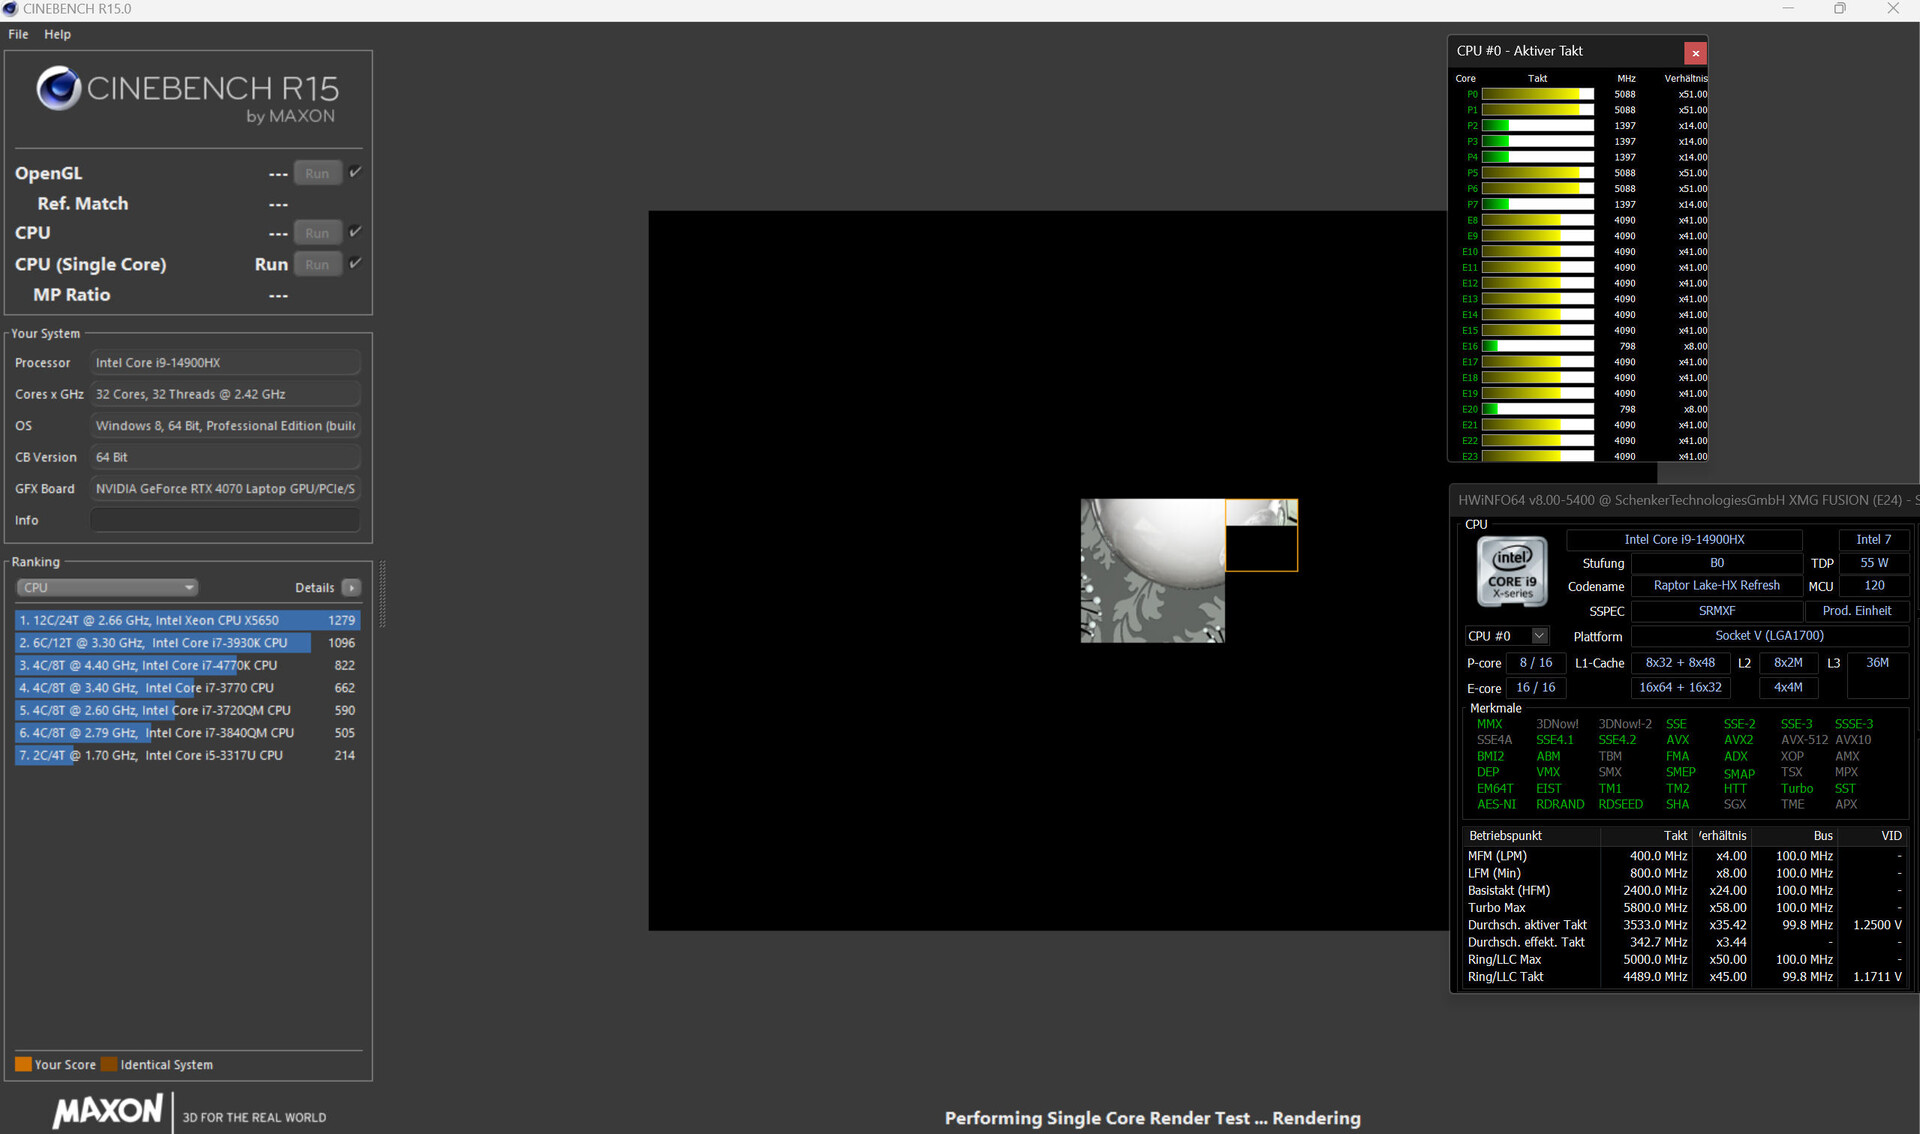
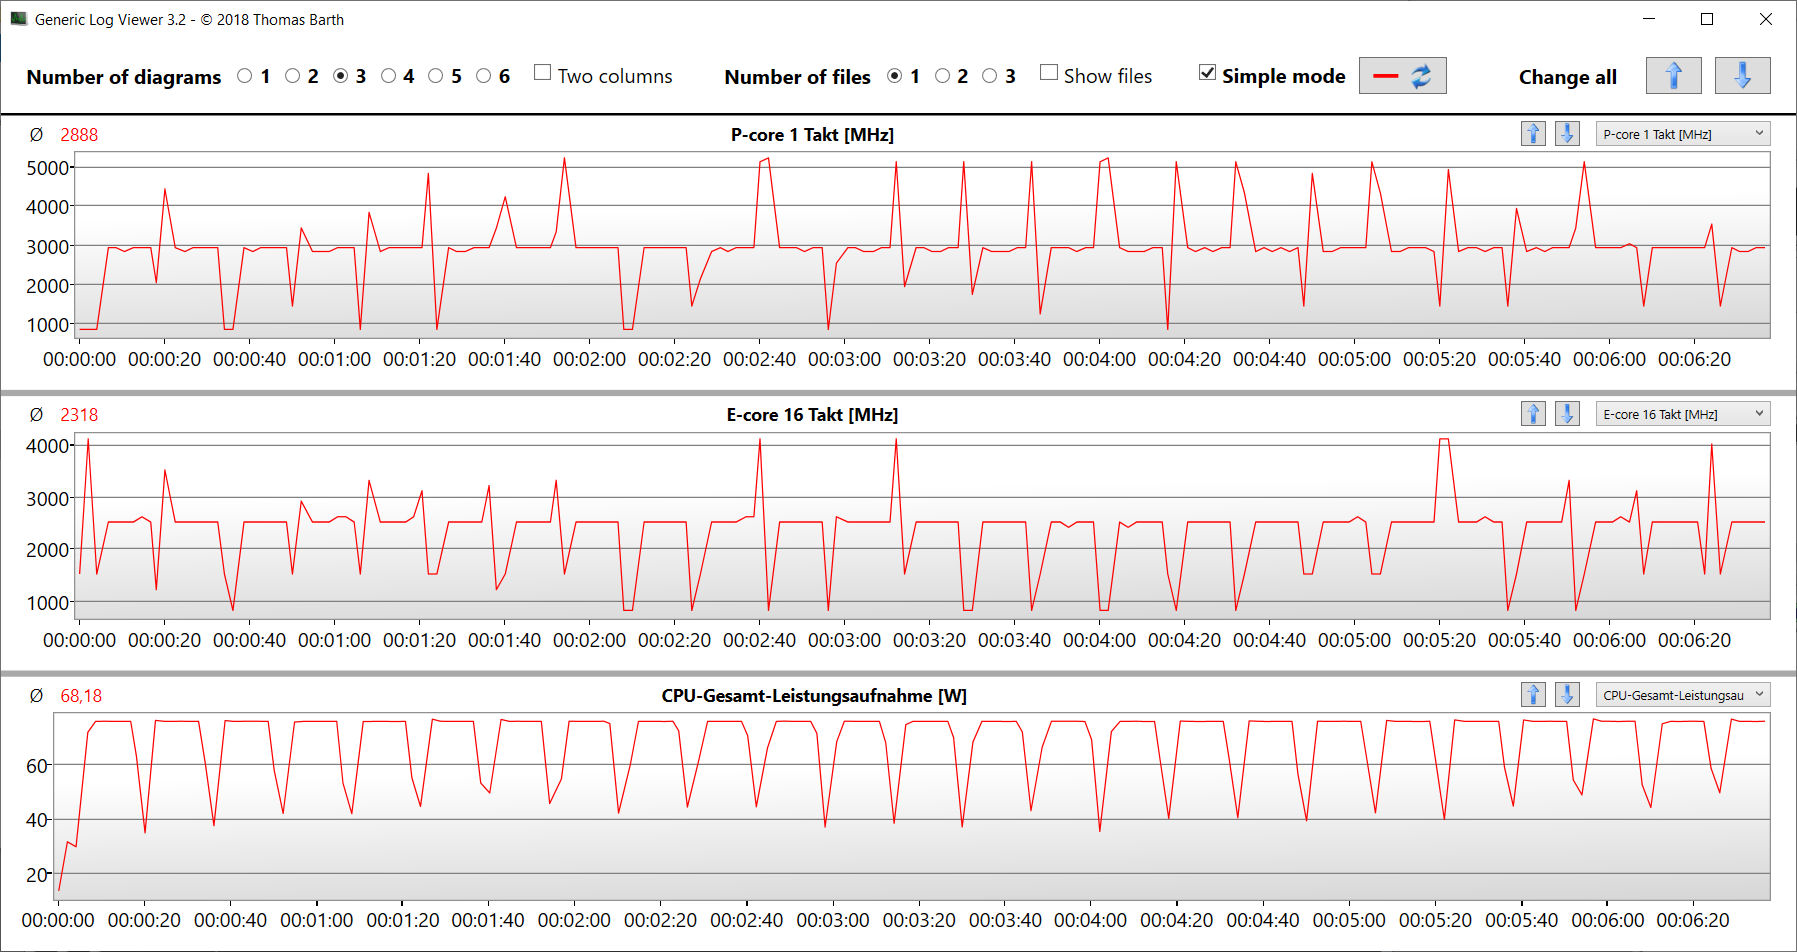
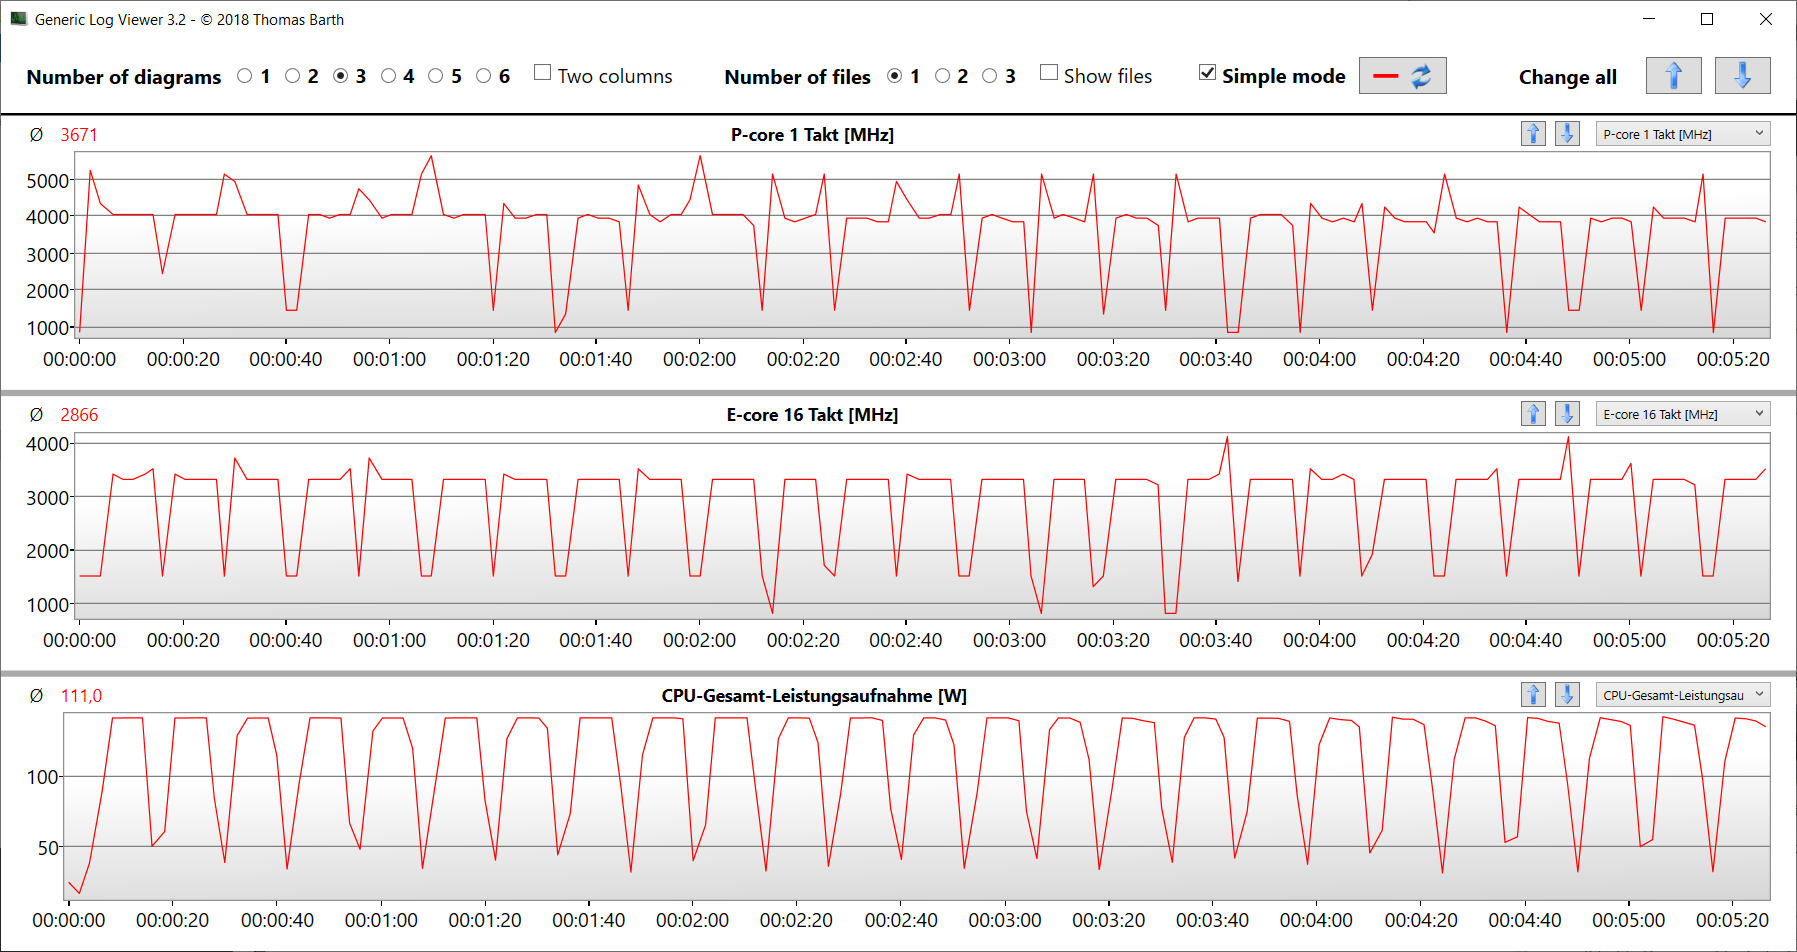
Bu Core i9-14900HX (Raptor Lake)'in 24 CPU çekirdeği (8P + 16E = 32 iş parçacığı) 5,8 GHz (P) ve 4,1 GHz (E) maksimum saat hızlarına ulaşır. Kalıcı çoklu iş parçacığı yükü (CB15 Döngüsü) sabit saat hızlarıyla sonuçlanır; bu seviye seçilen güç moduna bağlıdır.
Enthusiast, CPU ortalamasının altında kıyaslama değerleri sunarken, Overboost bunları ortalamanın önemli ölçüde üzerine çıkarır; bu öncelikle dizüstü bilgisayarın çoklu iş parçacığı performansı için geçerlidir. Tek iş parçacığı performansı, her üç profil de kullanıldığında yüksek ve çok benzer bir seviyede değişir.
Core i9 hakkında daha fazla bilgiyi analiz makalemizde bulabilirsiniz.
Cinebench R15 Multi continuous test
| CPU Performance rating - Percent | |
| Schenker XMG Fusion 15 (Early 24) | |
| Lenovo Legion Pro 5 16IRX9 | |
| Aorus 16X 2024 | |
| Ortalama Intel Core i9-14900HX | |
| Schenker XMG Fusion 15 (Early 24) | |
| Sınıf ortalaması Gaming | |
| HP Omen Transcend 16-u1095ng | |
| Alienware m16 R2 -1! | |
| Cinebench R23 | |
| Multi Core | |
| Schenker XMG Fusion 15 (Early 24) (Overboost) | |
| Lenovo Legion Pro 5 16IRX9 | |
| Ortalama Intel Core i9-14900HX (17078 - 36249, n=37) | |
| Aorus 16X 2024 | |
| Sınıf ortalaması Gaming (10488 - 40970, n=112, son 2 yıl) | |
| Schenker XMG Fusion 15 (Early 24) | |
| HP Omen Transcend 16-u1095ng | |
| Alienware m16 R2 | |
| Single Core | |
| Schenker XMG Fusion 15 (Early 24) (Overboost) | |
| Aorus 16X 2024 | |
| HP Omen Transcend 16-u1095ng | |
| Ortalama Intel Core i9-14900HX (1720 - 2245, n=37) | |
| Lenovo Legion Pro 5 16IRX9 | |
| Schenker XMG Fusion 15 (Early 24) | |
| Sınıf ortalaması Gaming (1166 - 2356, n=112, son 2 yıl) | |
| Alienware m16 R2 | |
| Cinebench R20 | |
| CPU (Multi Core) | |
| Schenker XMG Fusion 15 (Early 24) (Overboost) | |
| Lenovo Legion Pro 5 16IRX9 | |
| Ortalama Intel Core i9-14900HX (6579 - 13832, n=37) | |
| Aorus 16X 2024 | |
| Sınıf ortalaması Gaming (4029 - 16108, n=111, son 2 yıl) | |
| Schenker XMG Fusion 15 (Early 24) | |
| HP Omen Transcend 16-u1095ng | |
| Alienware m16 R2 | |
| CPU (Single Core) | |
| Schenker XMG Fusion 15 (Early 24) (Overboost) | |
| Aorus 16X 2024 | |
| HP Omen Transcend 16-u1095ng | |
| Ortalama Intel Core i9-14900HX (657 - 859, n=37) | |
| Lenovo Legion Pro 5 16IRX9 | |
| Schenker XMG Fusion 15 (Early 24) | |
| Sınıf ortalaması Gaming (442 - 895, n=111, son 2 yıl) | |
| Alienware m16 R2 | |
| Cinebench R15 | |
| CPU Multi 64Bit | |
| Lenovo Legion Pro 5 16IRX9 | |
| Schenker XMG Fusion 15 (Early 24) (Overboost) | |
| Ortalama Intel Core i9-14900HX (3263 - 5589, n=38) | |
| Aorus 16X 2024 | |
| Sınıf ortalaması Gaming (1578 - 6271, n=111, son 2 yıl) | |
| HP Omen Transcend 16-u1095ng | |
| Schenker XMG Fusion 15 (Early 24) | |
| Alienware m16 R2 | |
| CPU Single 64Bit | |
| Aorus 16X 2024 | |
| Schenker XMG Fusion 15 (Early 24) (Overboost) | |
| Ortalama Intel Core i9-14900HX (247 - 323, n=37) | |
| Lenovo Legion Pro 5 16IRX9 | |
| HP Omen Transcend 16-u1095ng | |
| Sınıf ortalaması Gaming (188.8 - 343, n=111, son 2 yıl) | |
| Schenker XMG Fusion 15 (Early 24) | |
| Alienware m16 R2 | |
| Blender - v2.79 BMW27 CPU | |
| HP Omen Transcend 16-u1095ng | |
| Sınıf ortalaması Gaming (80 - 330, n=109, son 2 yıl) | |
| Schenker XMG Fusion 15 (Early 24) | |
| Aorus 16X 2024 | |
| Ortalama Intel Core i9-14900HX (91 - 206, n=37) | |
| Lenovo Legion Pro 5 16IRX9 | |
| Schenker XMG Fusion 15 (Early 24) (Overboost) | |
| 7-Zip 18.03 | |
| 7z b 4 | |
| Schenker XMG Fusion 15 (Early 24) (Overboost) | |
| Lenovo Legion Pro 5 16IRX9 | |
| Ortalama Intel Core i9-14900HX (66769 - 136645, n=37) | |
| Aorus 16X 2024 | |
| Schenker XMG Fusion 15 (Early 24) | |
| Sınıf ortalaması Gaming (33491 - 148086, n=110, son 2 yıl) | |
| HP Omen Transcend 16-u1095ng | |
| Alienware m16 R2 | |
| 7z b 4 -mmt1 | |
| Schenker XMG Fusion 15 (Early 24) | |
| Schenker XMG Fusion 15 (Early 24) (Overboost) | |
| Aorus 16X 2024 | |
| HP Omen Transcend 16-u1095ng | |
| Ortalama Intel Core i9-14900HX (5452 - 7545, n=37) | |
| Lenovo Legion Pro 5 16IRX9 | |
| Sınıf ortalaması Gaming (4199 - 7436, n=110, son 2 yıl) | |
| Alienware m16 R2 | |
| Geekbench 6.7 | |
| Multi-Core | |
| Lenovo Legion Pro 5 16IRX9 (6.2.1) | |
| Schenker XMG Fusion 15 (Early 24) (6.2.1, Overboost) | |
| Aorus 16X 2024 (6.2.1) | |
| Ortalama Intel Core i9-14900HX (13158 - 19665, n=37) | |
| Schenker XMG Fusion 15 (Early 24) (6.2.1) | |
| HP Omen Transcend 16-u1095ng (6.2.1) | |
| Sınıf ortalaması Gaming (6625 - 22104, n=111, son 2 yıl) | |
| Alienware m16 R2 (6.2.1) | |
| Single-Core | |
| Schenker XMG Fusion 15 (Early 24) (6.2.1) | |
| Aorus 16X 2024 (6.2.1) | |
| Schenker XMG Fusion 15 (Early 24) (6.2.1, Overboost) | |
| Ortalama Intel Core i9-14900HX (2419 - 3129, n=37) | |
| Lenovo Legion Pro 5 16IRX9 (6.2.1) | |
| Sınıf ortalaması Gaming (1490 - 3259, n=111, son 2 yıl) | |
| HP Omen Transcend 16-u1095ng (6.2.1) | |
| Alienware m16 R2 (6.2.1) | |
| Geekbench 5.5 | |
| Multi-Core | |
| Lenovo Legion Pro 5 16IRX9 | |
| Schenker XMG Fusion 15 (Early 24) (Overboost) | |
| Aorus 16X 2024 | |
| Ortalama Intel Core i9-14900HX (8618 - 23194, n=37) | |
| HP Omen Transcend 16-u1095ng | |
| Schenker XMG Fusion 15 (Early 24) | |
| Sınıf ortalaması Gaming (6460 - 27010, n=110, son 2 yıl) | |
| Alienware m16 R2 | |
| Single-Core | |
| Aorus 16X 2024 | |
| Schenker XMG Fusion 15 (Early 24) (Overboost) | |
| Schenker XMG Fusion 15 (Early 24) | |
| Ortalama Intel Core i9-14900HX (1669 - 2210, n=37) | |
| HP Omen Transcend 16-u1095ng | |
| Lenovo Legion Pro 5 16IRX9 | |
| Sınıf ortalaması Gaming (986 - 2474, n=110, son 2 yıl) | |
| Alienware m16 R2 | |
| HWBOT x265 Benchmark v2.2 - 4k Preset | |
| Schenker XMG Fusion 15 (Early 24) (Overboost) | |
| Lenovo Legion Pro 5 16IRX9 | |
| Ortalama Intel Core i9-14900HX (16.8 - 38.9, n=37) | |
| Sınıf ortalaması Gaming (11.5 - 44.3, n=110, son 2 yıl) | |
| Aorus 16X 2024 | |
| Schenker XMG Fusion 15 (Early 24) | |
| HP Omen Transcend 16-u1095ng | |
| Alienware m16 R2 | |
| LibreOffice - 20 Documents To PDF | |
| HP Omen Transcend 16-u1095ng (6.3.4.2) | |
| Alienware m16 R2 (6.3.4.2) | |
| Sınıf ortalaması Gaming (19 - 88.8, n=110, son 2 yıl) | |
| Ortalama Intel Core i9-14900HX (19 - 85.1, n=37) | |
| Lenovo Legion Pro 5 16IRX9 (6.3.4.2) | |
| Schenker XMG Fusion 15 (Early 24) (6.3.4.2) | |
| Aorus 16X 2024 (6.3.4.2) | |
| Schenker XMG Fusion 15 (Early 24) (6.3.4.2, Overboost) | |
| R Benchmark 2.5 - Overall mean | |
| Alienware m16 R2 | |
| Sınıf ortalaması Gaming (0.3439 - 0.759, n=111, son 2 yıl) | |
| HP Omen Transcend 16-u1095ng | |
| Lenovo Legion Pro 5 16IRX9 | |
| Ortalama Intel Core i9-14900HX (0.3604 - 0.4859, n=37) | |
| Aorus 16X 2024 | |
| Schenker XMG Fusion 15 (Early 24) (Overboost) | |
| Schenker XMG Fusion 15 (Early 24) | |
* ... daha küçük daha iyidir
AIDA64: FP32 Ray-Trace | FPU Julia | CPU SHA3 | CPU Queen | FPU SinJulia | FPU Mandel | CPU AES | CPU ZLib | FP64 Ray-Trace | CPU PhotoWorxx
| Performance rating | |
| Schenker XMG Fusion 15 (Early 24) | |
| Lenovo Legion Pro 5 16IRX9 | |
| Sınıf ortalaması Gaming | |
| Ortalama Intel Core i9-14900HX | |
| Aorus 16X 2024 | |
| Schenker XMG Fusion 15 (Early 24) | |
| HP Omen Transcend 16-u1095ng | |
| Alienware m16 R2 | |
| AIDA64 / FP32 Ray-Trace | |
| Sınıf ortalaması Gaming (10227 - 85542, n=109, son 2 yıl) | |
| Schenker XMG Fusion 15 (Early 24) (v6.92.6600, Overboost) | |
| Lenovo Legion Pro 5 16IRX9 (v6.92.6600) | |
| Ortalama Intel Core i9-14900HX (13098 - 33474, n=36) | |
| Aorus 16X 2024 (v6.92.6600) | |
| Schenker XMG Fusion 15 (Early 24) (v6.92.6600) | |
| Alienware m16 R2 (v6.92.6600) | |
| HP Omen Transcend 16-u1095ng (v6.92.6600) | |
| AIDA64 / FPU Julia | |
| Schenker XMG Fusion 15 (Early 24) (v6.92.6600, Overboost) | |
| Sınıf ortalaması Gaming (51376 - 238426, n=109, son 2 yıl) | |
| Lenovo Legion Pro 5 16IRX9 (v6.92.6600) | |
| Ortalama Intel Core i9-14900HX (67573 - 166040, n=36) | |
| Aorus 16X 2024 (v6.92.6600) | |
| Schenker XMG Fusion 15 (Early 24) (v6.92.6600) | |
| Alienware m16 R2 (v6.92.6600) | |
| HP Omen Transcend 16-u1095ng (v6.92.6600) | |
| AIDA64 / CPU SHA3 | |
| Schenker XMG Fusion 15 (Early 24) (v6.92.6600, Overboost) | |
| Lenovo Legion Pro 5 16IRX9 (v6.92.6600) | |
| Ortalama Intel Core i9-14900HX (3589 - 7979, n=36) | |
| Sınıf ortalaması Gaming (2180 - 9817, n=109, son 2 yıl) | |
| Aorus 16X 2024 (v6.92.6600) | |
| Schenker XMG Fusion 15 (Early 24) (v6.92.6600) | |
| HP Omen Transcend 16-u1095ng (v6.92.6600) | |
| Alienware m16 R2 (v6.92.6600) | |
| AIDA64 / CPU Queen | |
| Lenovo Legion Pro 5 16IRX9 (v6.92.6600) | |
| Schenker XMG Fusion 15 (Early 24) (v6.92.6600, Overboost) | |
| Aorus 16X 2024 (v6.92.6600) | |
| Ortalama Intel Core i9-14900HX (118405 - 148966, n=36) | |
| Schenker XMG Fusion 15 (Early 24) (v6.92.6600) | |
| HP Omen Transcend 16-u1095ng (v6.92.6600) | |
| Sınıf ortalaması Gaming (49785 - 173351, n=100, son 2 yıl) | |
| Alienware m16 R2 (v6.92.6600) | |
| AIDA64 / FPU SinJulia | |
| Schenker XMG Fusion 15 (Early 24) (v6.92.6600, Overboost) | |
| Lenovo Legion Pro 5 16IRX9 (v6.92.6600) | |
| Ortalama Intel Core i9-14900HX (10475 - 18517, n=36) | |
| Aorus 16X 2024 (v6.92.6600) | |
| Sınıf ortalaması Gaming (4424 - 33636, n=109, son 2 yıl) | |
| Schenker XMG Fusion 15 (Early 24) (v6.92.6600) | |
| HP Omen Transcend 16-u1095ng (v6.92.6600) | |
| Alienware m16 R2 (v6.92.6600) | |
| AIDA64 / FPU Mandel | |
| Sınıf ortalaması Gaming (25115 - 128721, n=109, son 2 yıl) | |
| Schenker XMG Fusion 15 (Early 24) (v6.92.6600, Overboost) | |
| Lenovo Legion Pro 5 16IRX9 (v6.92.6600) | |
| Ortalama Intel Core i9-14900HX (32543 - 83662, n=36) | |
| Aorus 16X 2024 (v6.92.6600) | |
| Schenker XMG Fusion 15 (Early 24) (v6.92.6600) | |
| Alienware m16 R2 (v6.92.6600) | |
| HP Omen Transcend 16-u1095ng (v6.92.6600) | |
| AIDA64 / CPU AES | |
| Schenker XMG Fusion 15 (Early 24) (v6.92.6600, Overboost) | |
| Schenker XMG Fusion 15 (Early 24) (v6.92.6600) | |
| Ortalama Intel Core i9-14900HX (86964 - 241777, n=36) | |
| Lenovo Legion Pro 5 16IRX9 (v6.92.6600) | |
| Aorus 16X 2024 (v6.92.6600) | |
| Sınıf ortalaması Gaming (39258 - 247074, n=109, son 2 yıl) | |
| HP Omen Transcend 16-u1095ng (v6.92.6600) | |
| Alienware m16 R2 (v6.92.6600) | |
| AIDA64 / CPU ZLib | |
| Schenker XMG Fusion 15 (Early 24) (v6.92.6600, Overboost) | |
| Lenovo Legion Pro 5 16IRX9 (v6.92.6600) | |
| Ortalama Intel Core i9-14900HX (1054 - 2292, n=36) | |
| Aorus 16X 2024 (v6.92.6600) | |
| Sınıf ortalaması Gaming (574 - 2531, n=109, son 2 yıl) | |
| Schenker XMG Fusion 15 (Early 24) (v6.92.6600) | |
| HP Omen Transcend 16-u1095ng (v6.92.6600) | |
| Alienware m16 R2 (v6.92.6600) | |
| AIDA64 / FP64 Ray-Trace | |
| Sınıf ortalaması Gaming (5509 - 45446, n=109, son 2 yıl) | |
| Schenker XMG Fusion 15 (Early 24) (v6.92.6600, Overboost) | |
| Lenovo Legion Pro 5 16IRX9 (v6.92.6600) | |
| Ortalama Intel Core i9-14900HX (6809 - 18349, n=36) | |
| Aorus 16X 2024 (v6.92.6600) | |
| Schenker XMG Fusion 15 (Early 24) (v6.92.6600) | |
| Alienware m16 R2 (v6.92.6600) | |
| HP Omen Transcend 16-u1095ng (v6.92.6600) | |
| AIDA64 / CPU PhotoWorxx | |
| Lenovo Legion Pro 5 16IRX9 (v6.92.6600) | |
| HP Omen Transcend 16-u1095ng (v6.92.6600) | |
| Aorus 16X 2024 (v6.92.6600) | |
| Schenker XMG Fusion 15 (Early 24) (v6.92.6600, Overboost) | |
| Schenker XMG Fusion 15 (Early 24) (v6.92.6600) | |
| Ortalama Intel Core i9-14900HX (23903 - 54702, n=36) | |
| Sınıf ortalaması Gaming (12271 - 89891, n=109, son 2 yıl) | |
| Alienware m16 R2 (v6.92.6600) | |
Sistem performansı
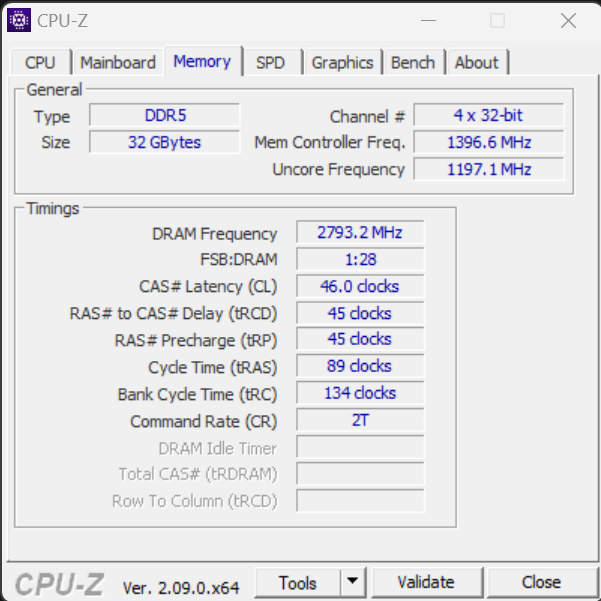
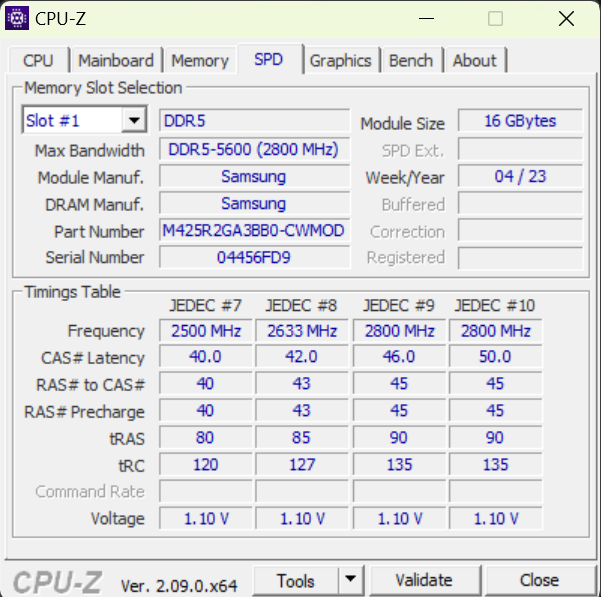
Sorunsuz çalışan sistem, bilgi işlem gücünden yoksun değildir. Oyun, yayın ve render işlemleri dizüstü bilgisayar için büyük zorluklar teşkil etmiyor. RAM'in aktarım hızları DDR5-5600 RAM için normal bir seviyede. PCMark sonuçları da iyi.
CrossMark: Overall | Productivity | Creativity | Responsiveness
WebXPRT 3: Overall
WebXPRT 4: Overall
Mozilla Kraken 1.1: Total
| PCMark 10 / Score | |
| Lenovo Legion Pro 5 16IRX9 | |
| Schenker XMG Fusion 15 (Early 24) | |
| Aorus 16X 2024 | |
| Sınıf ortalaması Gaming (5828 - 11574, n=95, son 2 yıl) | |
| Ortalama Intel Core i9-14900HX, NVIDIA GeForce RTX 4070 Laptop GPU (7768 - 8550, n=8) | |
| HP Omen Transcend 16-u1095ng | |
| Alienware m16 R2 | |
| PCMark 10 / Essentials | |
| Schenker XMG Fusion 15 (Early 24) | |
| Lenovo Legion Pro 5 16IRX9 | |
| Aorus 16X 2024 | |
| Ortalama Intel Core i9-14900HX, NVIDIA GeForce RTX 4070 Laptop GPU (10104 - 11815, n=8) | |
| Sınıf ortalaması Gaming (8810 - 12600, n=99, son 2 yıl) | |
| HP Omen Transcend 16-u1095ng | |
| Alienware m16 R2 | |
| PCMark 10 / Productivity | |
| Aorus 16X 2024 | |
| Schenker XMG Fusion 15 (Early 24) | |
| Sınıf ortalaması Gaming (6845 - 18766, n=97, son 2 yıl) | |
| Ortalama Intel Core i9-14900HX, NVIDIA GeForce RTX 4070 Laptop GPU (9577 - 11103, n=8) | |
| HP Omen Transcend 16-u1095ng | |
| Lenovo Legion Pro 5 16IRX9 | |
| Alienware m16 R2 | |
| PCMark 10 / Digital Content Creation | |
| Lenovo Legion Pro 5 16IRX9 | |
| Sınıf ortalaması Gaming (7602 - 19657, n=97, son 2 yıl) | |
| Schenker XMG Fusion 15 (Early 24) | |
| Ortalama Intel Core i9-14900HX, NVIDIA GeForce RTX 4070 Laptop GPU (12114 - 14827, n=8) | |
| Aorus 16X 2024 | |
| Alienware m16 R2 | |
| HP Omen Transcend 16-u1095ng | |
| CrossMark / Overall | |
| Aorus 16X 2024 | |
| Schenker XMG Fusion 15 (Early 24) | |
| Ortalama Intel Core i9-14900HX, NVIDIA GeForce RTX 4070 Laptop GPU (2002 - 2312, n=7) | |
| Lenovo Legion Pro 5 16IRX9 | |
| Sınıf ortalaması Gaming (1366 - 2409, n=97, son 2 yıl) | |
| Alienware m16 R2 | |
| CrossMark / Productivity | |
| Aorus 16X 2024 | |
| Schenker XMG Fusion 15 (Early 24) | |
| Ortalama Intel Core i9-14900HX, NVIDIA GeForce RTX 4070 Laptop GPU (1827 - 2191, n=7) | |
| Sınıf ortalaması Gaming (1386 - 2254, n=97, son 2 yıl) | |
| Lenovo Legion Pro 5 16IRX9 | |
| Alienware m16 R2 | |
| CrossMark / Creativity | |
| Aorus 16X 2024 | |
| Ortalama Intel Core i9-14900HX, NVIDIA GeForce RTX 4070 Laptop GPU (2258 - 2458, n=7) | |
| Schenker XMG Fusion 15 (Early 24) | |
| Lenovo Legion Pro 5 16IRX9 | |
| Sınıf ortalaması Gaming (1343 - 2729, n=97, son 2 yıl) | |
| Alienware m16 R2 | |
| CrossMark / Responsiveness | |
| Aorus 16X 2024 | |
| Ortalama Intel Core i9-14900HX, NVIDIA GeForce RTX 4070 Laptop GPU (1734 - 2330, n=7) | |
| Schenker XMG Fusion 15 (Early 24) | |
| Lenovo Legion Pro 5 16IRX9 | |
| Sınıf ortalaması Gaming (1226 - 2334, n=97, son 2 yıl) | |
| Alienware m16 R2 | |
| WebXPRT 3 / Overall | |
| HP Omen Transcend 16-u1095ng | |
| Schenker XMG Fusion 15 (Early 24) | |
| Aorus 16X 2024 | |
| Lenovo Legion Pro 5 16IRX9 | |
| Ortalama Intel Core i9-14900HX, NVIDIA GeForce RTX 4070 Laptop GPU (269 - 342, n=8) | |
| Sınıf ortalaması Gaming (242 - 532, n=100, son 2 yıl) | |
| Alienware m16 R2 | |
| WebXPRT 4 / Overall | |
| Schenker XMG Fusion 15 (Early 24) | |
| Ortalama Intel Core i9-14900HX, NVIDIA GeForce RTX 4070 Laptop GPU (291 - 304, n=6) | |
| Lenovo Legion Pro 5 16IRX9 | |
| Sınıf ortalaması Gaming (176.4 - 354, n=100, son 2 yıl) | |
| Alienware m16 R2 | |
| Mozilla Kraken 1.1 / Total | |
| Alienware m16 R2 | |
| Sınıf ortalaması Gaming (391 - 590, n=105, son 2 yıl) | |
| Lenovo Legion Pro 5 16IRX9 | |
| Ortalama Intel Core i9-14900HX, NVIDIA GeForce RTX 4070 Laptop GPU (431 - 469, n=8) | |
| HP Omen Transcend 16-u1095ng | |
| Aorus 16X 2024 | |
| Schenker XMG Fusion 15 (Early 24) | |
* ... daha küçük daha iyidir
| PCMark 10 Score | 8522 puan | |
Yardım | ||
| AIDA64 / Memory Copy | |
| Lenovo Legion Pro 5 16IRX9 | |
| Aorus 16X 2024 | |
| HP Omen Transcend 16-u1095ng | |
| Schenker XMG Fusion 15 (Early 24) | |
| Ortalama Intel Core i9-14900HX (38028 - 83392, n=36) | |
| Sınıf ortalaması Gaming (21750 - 129946, n=109, son 2 yıl) | |
| Alienware m16 R2 | |
| AIDA64 / Memory Read | |
| Aorus 16X 2024 | |
| Lenovo Legion Pro 5 16IRX9 | |
| Schenker XMG Fusion 15 (Early 24) | |
| HP Omen Transcend 16-u1095ng | |
| Ortalama Intel Core i9-14900HX (43306 - 87568, n=36) | |
| Alienware m16 R2 | |
| Sınıf ortalaması Gaming (22956 - 118858, n=109, son 2 yıl) | |
| AIDA64 / Memory Write | |
| HP Omen Transcend 16-u1095ng | |
| Aorus 16X 2024 | |
| Lenovo Legion Pro 5 16IRX9 | |
| Sınıf ortalaması Gaming (22297 - 135096, n=109, son 2 yıl) | |
| Ortalama Intel Core i9-14900HX (37146 - 80589, n=36) | |
| Schenker XMG Fusion 15 (Early 24) | |
| Alienware m16 R2 | |
| AIDA64 / Memory Latency | |
| Alienware m16 R2 | |
| Sınıf ortalaması Gaming (75.3 - 259, n=109, son 2 yıl) | |
| HP Omen Transcend 16-u1095ng | |
| Ortalama Intel Core i9-14900HX (76.1 - 105, n=36) | |
| Lenovo Legion Pro 5 16IRX9 | |
| Schenker XMG Fusion 15 (Early 24) | |
| Aorus 16X 2024 | |
* ... daha küçük daha iyidir
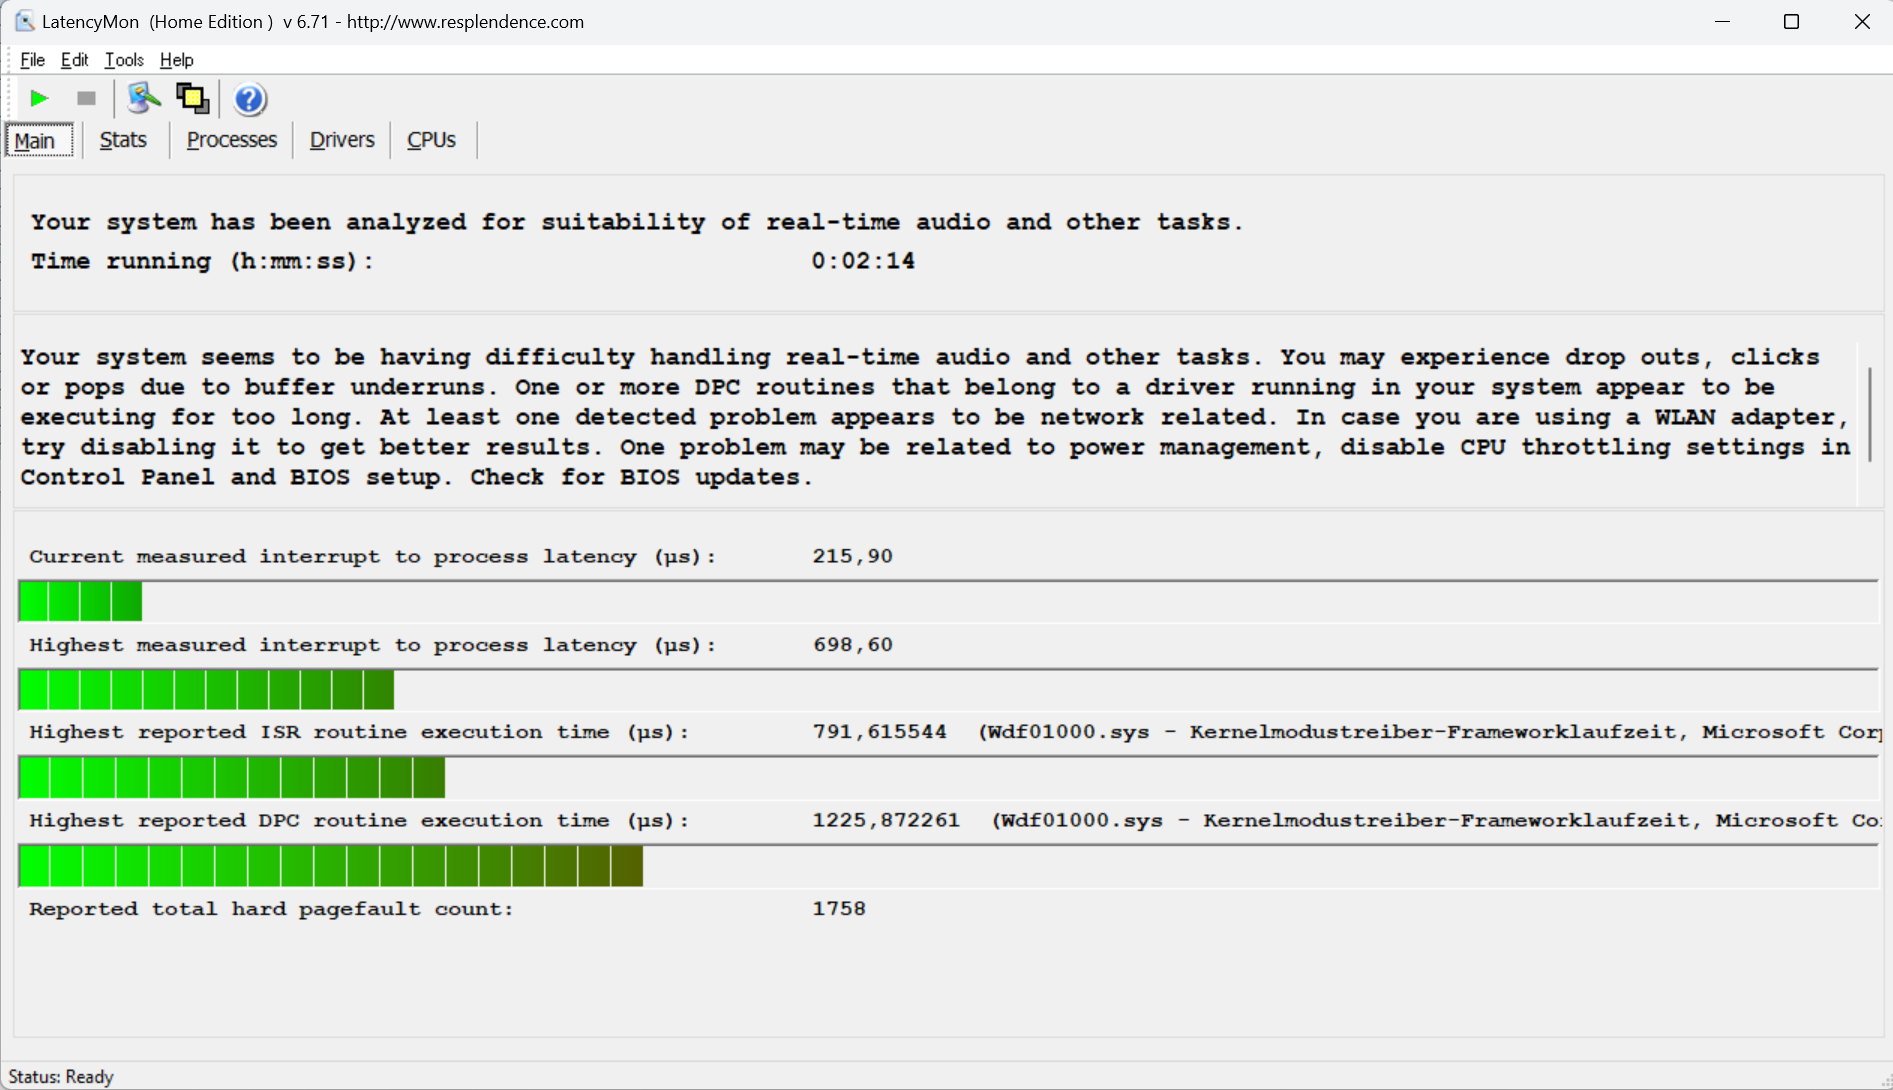
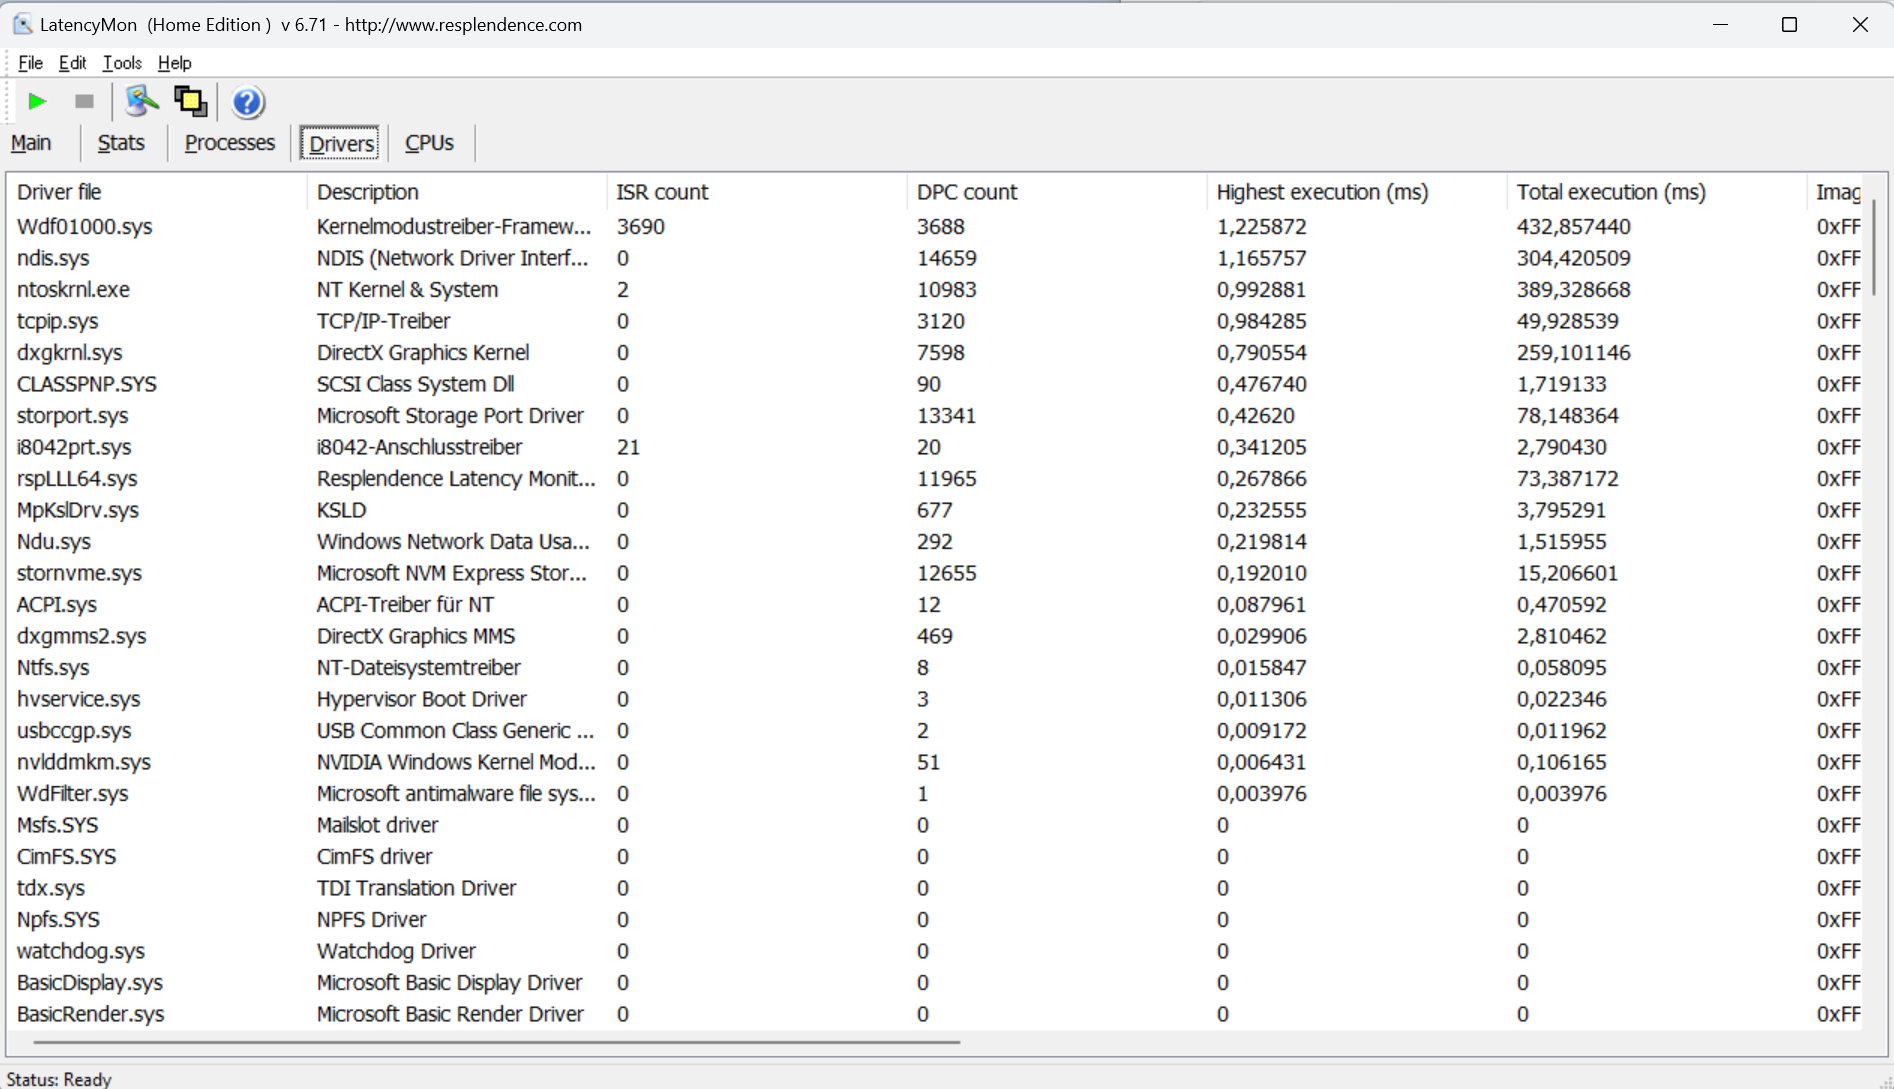
DPC gecikme süreleri
Standartlaştırılmış gecikme monitör testi (web'de gezinme, 4k video oynatma, Prime95 yüksek yük) bazı anormallikler ortaya çıkardı. Sistem gerçek zamanlı video ve ses düzenleme için uygun görünmüyor. Gelecekteki yazılım güncellemeleri iyileştirmelere ve hatta kötüleşmelere yol açabilir.
| DPC Latencies / LatencyMon - interrupt to process latency (max), Web, Youtube, Prime95 | |
| Alienware m16 R2 | |
| HP Omen Transcend 16-u1095ng | |
| Aorus 16X 2024 | |
| Lenovo Legion Pro 5 16IRX9 | |
| Schenker XMG Fusion 15 (Early 24) | |
* ... daha küçük daha iyidir
Depolama cihazları
Fusion, toplam iki adet M.2-2280 formatlı PCIe-4 SSD'yi barındırabilir. RAID-0/1 desteklenmektedir. Test cihazımızdaki Samsung SSD (1TB) mükemmel veri hızları sağladı. Olumlu: Herhangi bir termal daralma gözlemlemedik.


* ... daha küçük daha iyidir
Reading continuous performance: DiskSpd Read Loop, Queue Depth 8
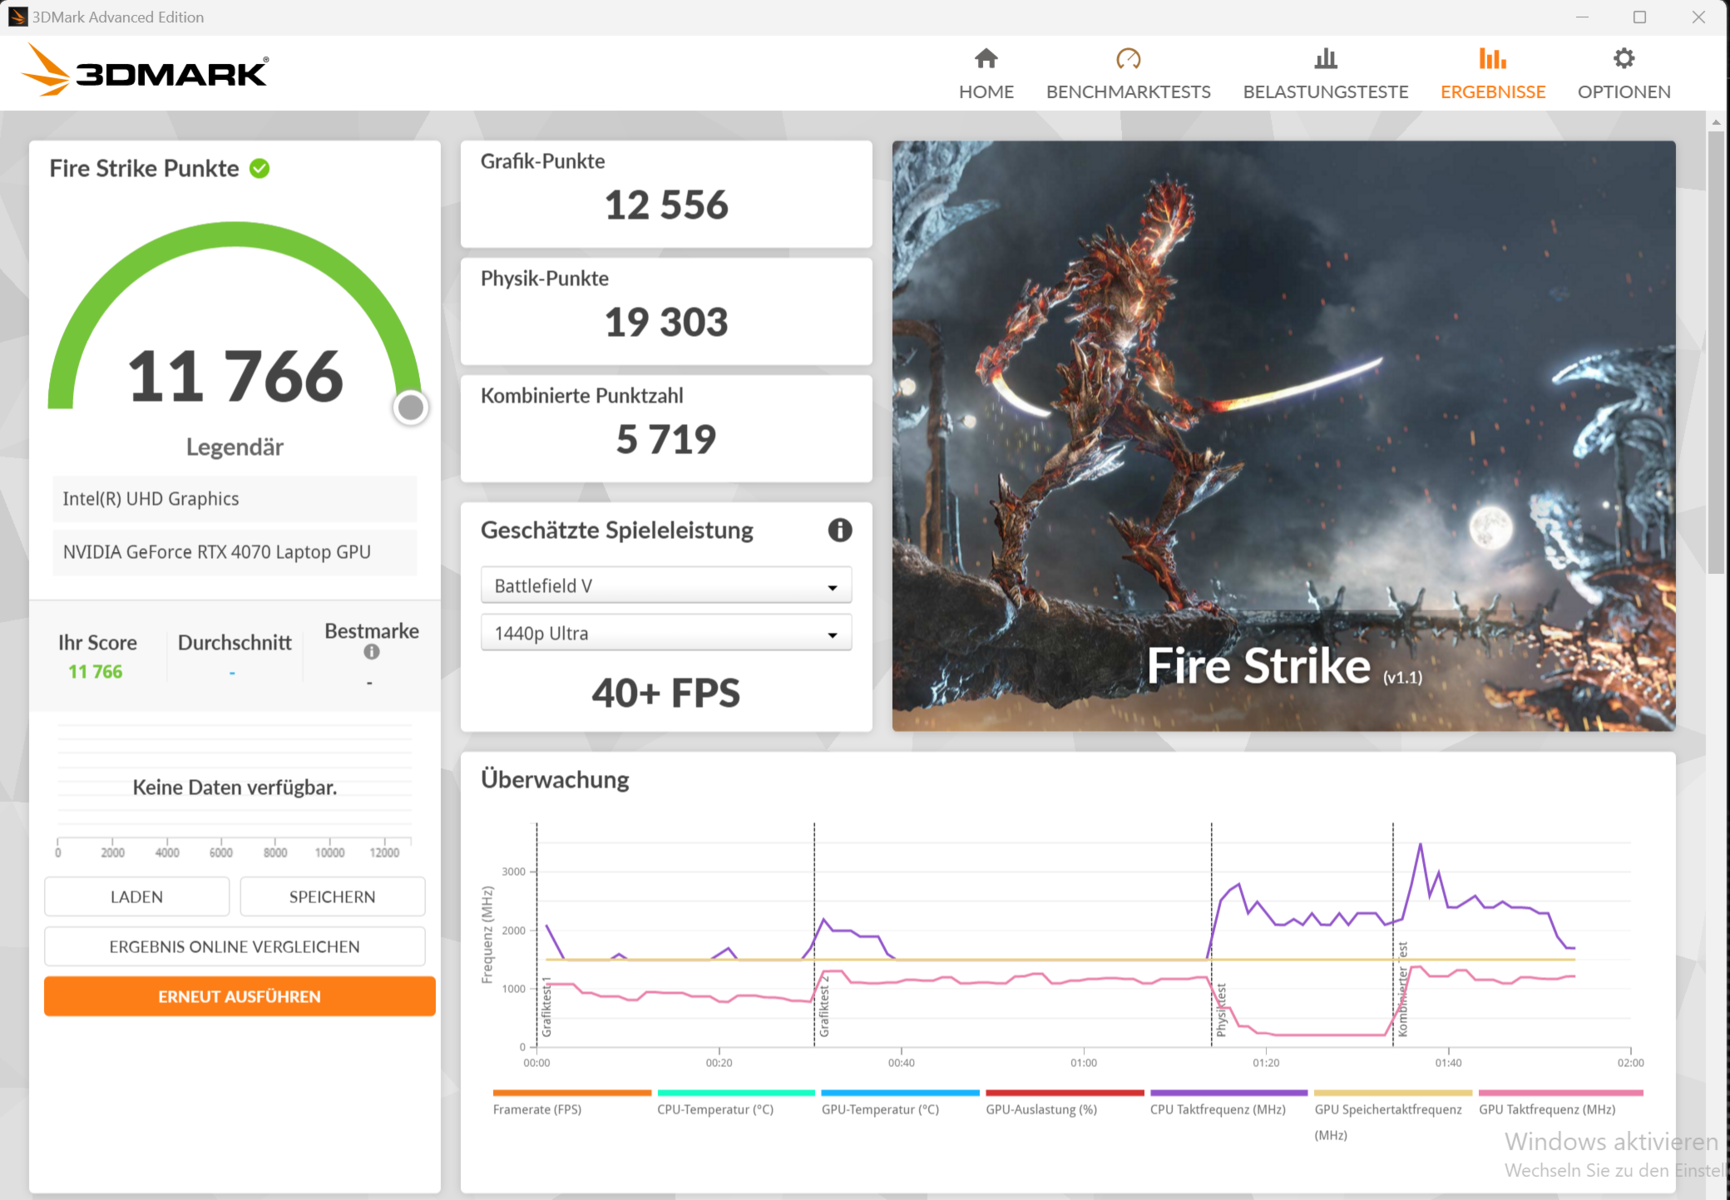
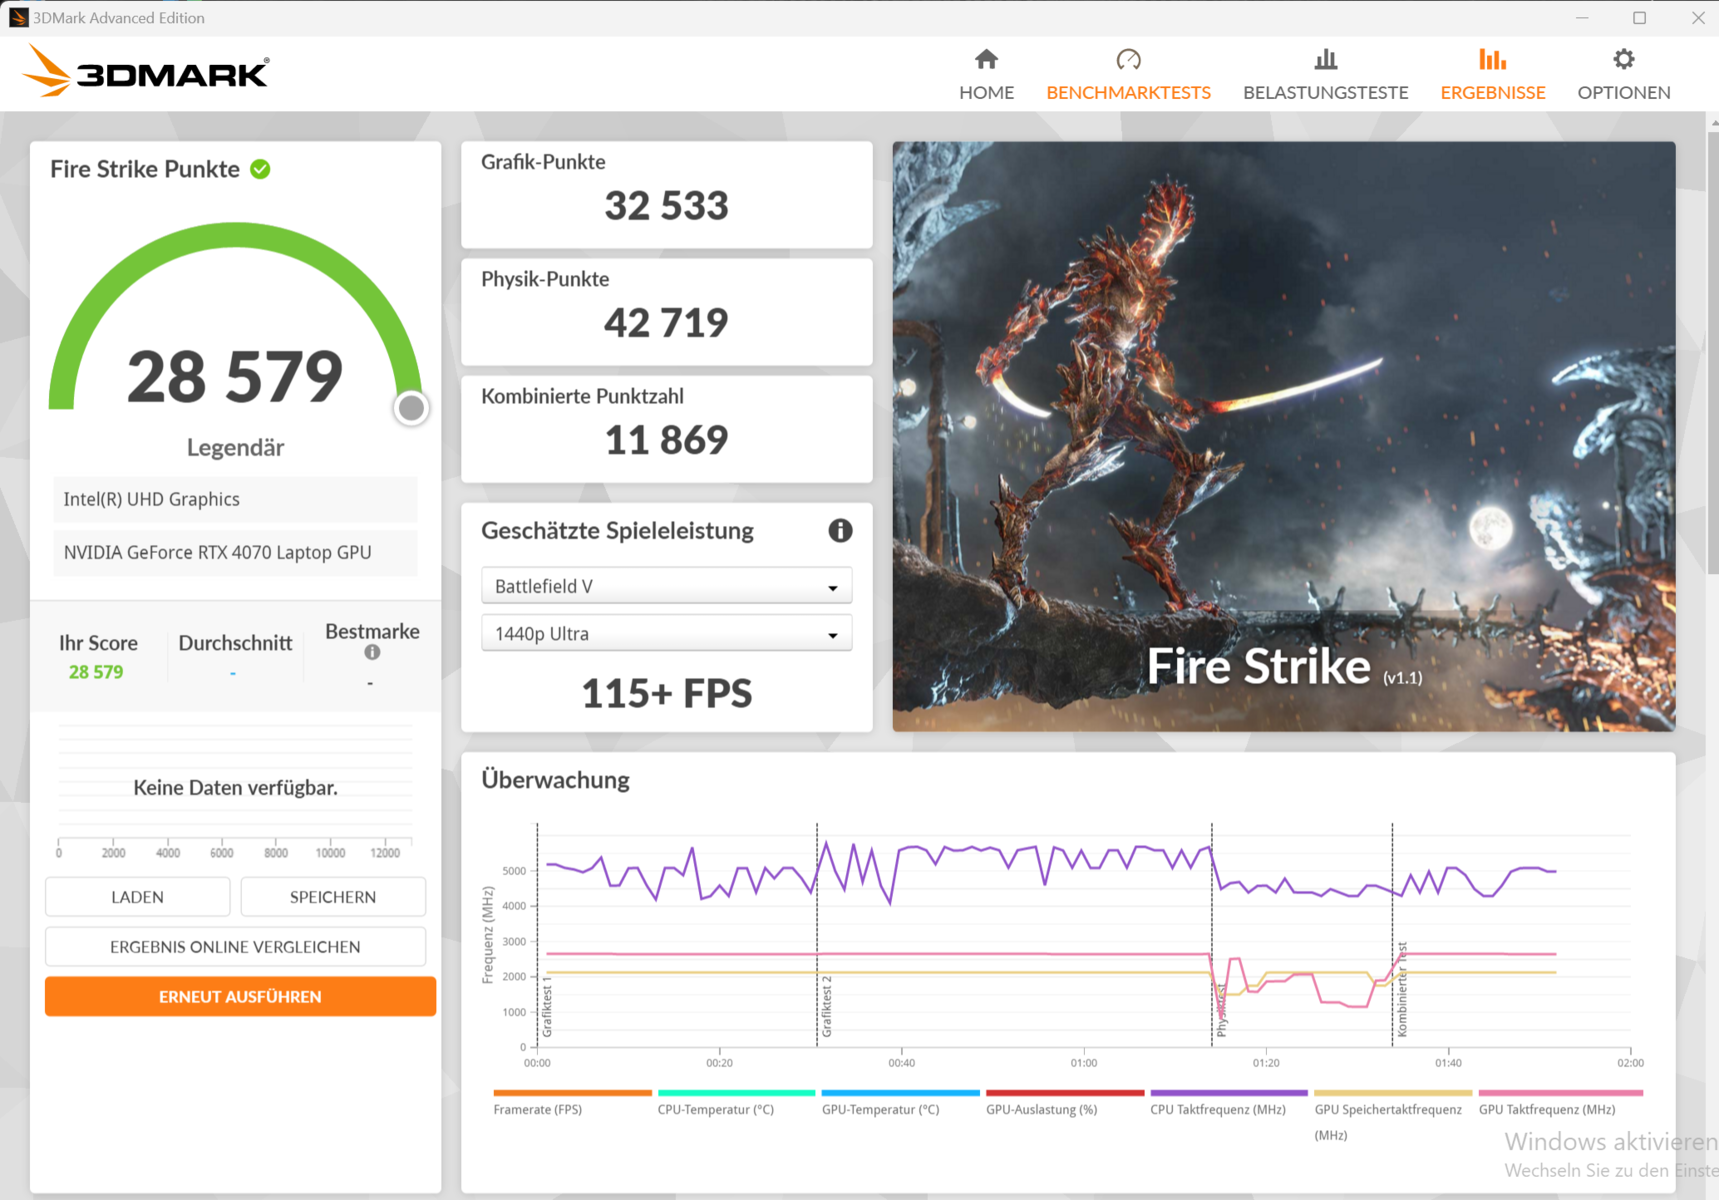
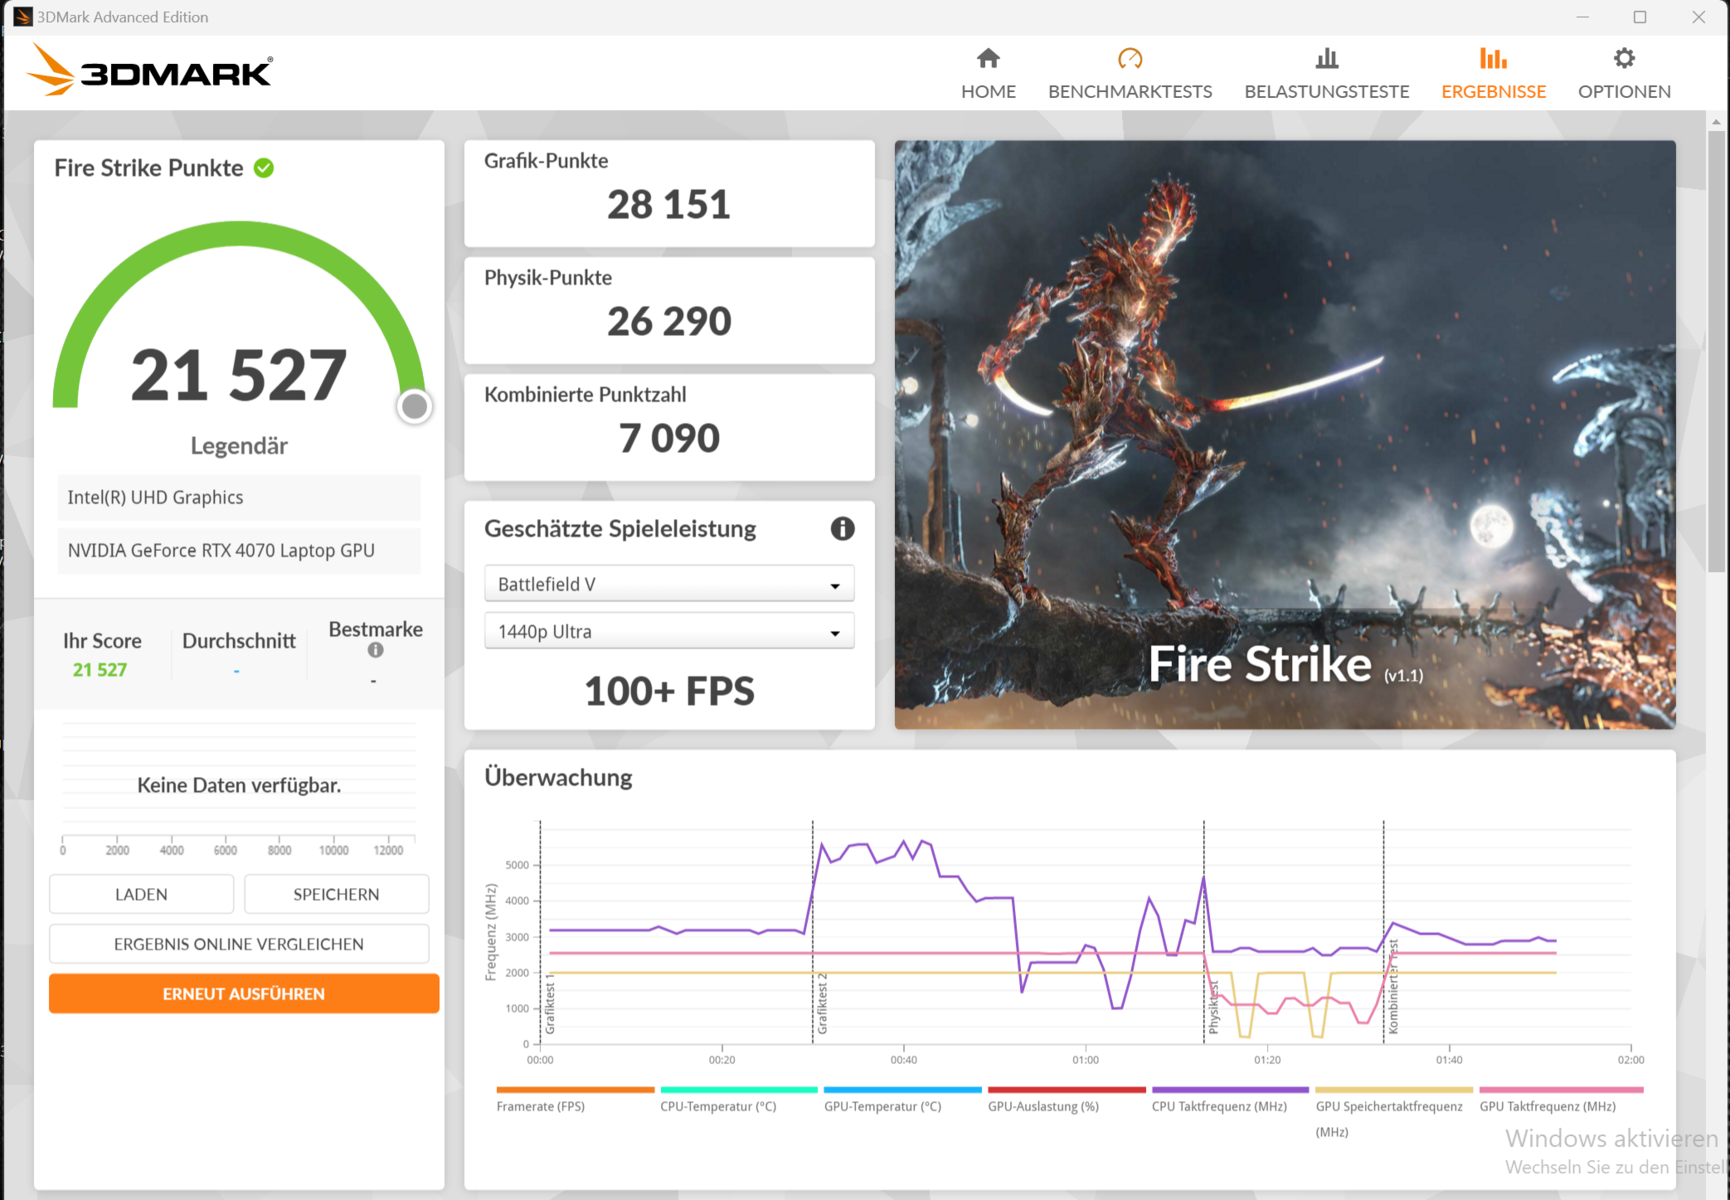
Grafik kartı
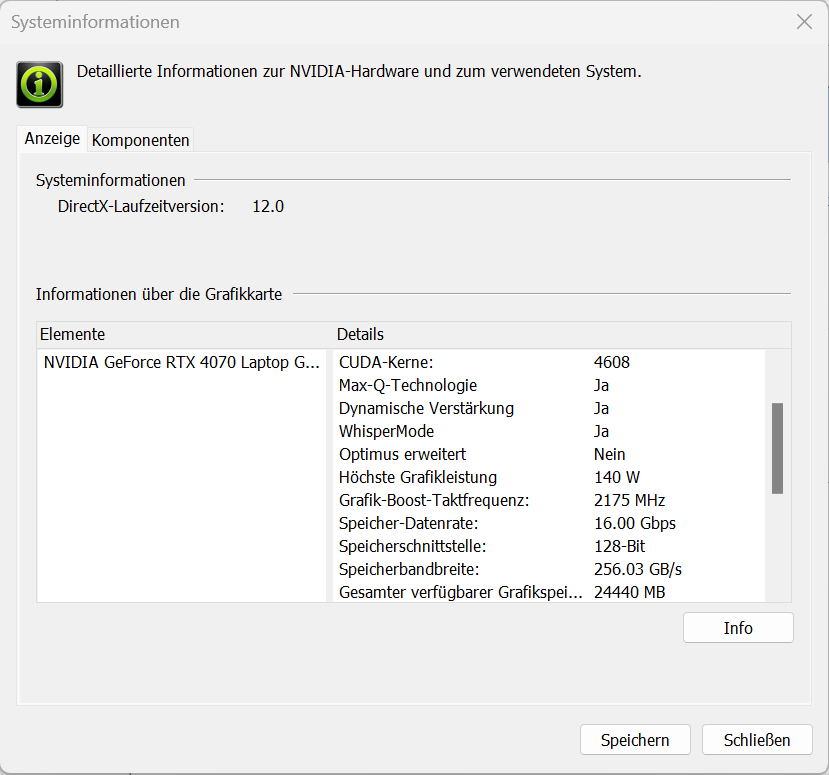
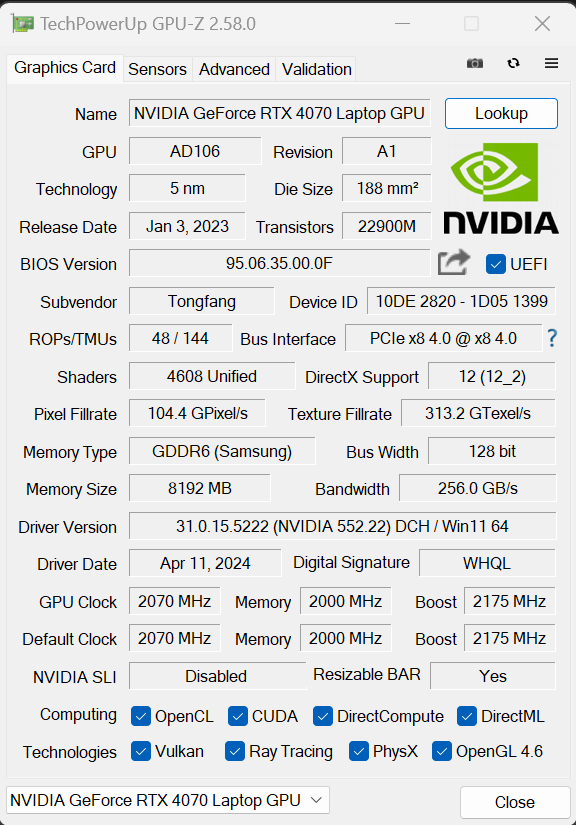
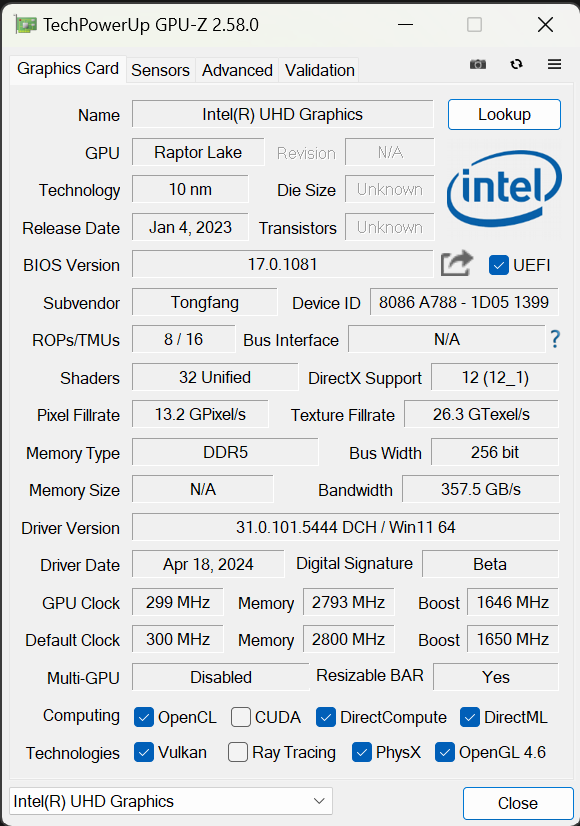
Schenker, dizüstü bilgisayarın GeForce RTX 4070 maksimum 140 watt TGP (115 watt + 25 watt Dynamic Boost) - daha fazlası Nvidia tarafından önerilmemektedir. GPU'nun 8 GB VRAM'e (GDDR6) erişimi var - günümüz talepleri için biraz düşük bir değer. Karşılaştırmalar RTX-4070 ortalamasının(Enthusiast) üzerinde sonuçlar verdi ve Overboost yalnızca küçük bir avantaj sağladı. DGPU ve Optimus arasında geçiş yapmak için yeniden başlatma gerekiyor.

| 3DMark Performance rating - Percent | |
| Sınıf ortalaması Gaming | |
| Schenker XMG Fusion 15 (Early 24) | |
| Lenovo Legion Pro 5 16IRX9 | |
| Schenker XMG Fusion 15 (Early 24) | |
| Alienware m16 R2 | |
| Aorus 16X 2024 | |
| Ortalama NVIDIA GeForce RTX 4070 Laptop GPU | |
| HP Omen Transcend 16-u1095ng | |
| 3DMark 11 - 1280x720 Performance GPU | |
| Sınıf ortalaması Gaming (21841 - 80022, n=108, son 2 yıl) | |
| Schenker XMG Fusion 15 (Early 24) (Overboost) | |
| Schenker XMG Fusion 15 (Early 24) | |
| Lenovo Legion Pro 5 16IRX9 | |
| Alienware m16 R2 | |
| Aorus 16X 2024 | |
| Ortalama NVIDIA GeForce RTX 4070 Laptop GPU (24229 - 46434, n=67) | |
| HP Omen Transcend 16-u1095ng | |
| 3DMark | |
| 1920x1080 Fire Strike Graphics | |
| Sınıf ortalaması Gaming (12242 - 62849, n=120, son 2 yıl) | |
| Schenker XMG Fusion 15 (Early 24) (Overboost) | |
| Schenker XMG Fusion 15 (Early 24) | |
| Lenovo Legion Pro 5 16IRX9 | |
| Alienware m16 R2 | |
| Aorus 16X 2024 | |
| Ortalama NVIDIA GeForce RTX 4070 Laptop GPU (12242 - 33451, n=71) | |
| HP Omen Transcend 16-u1095ng | |
| 2560x1440 Time Spy Graphics | |
| Sınıf ortalaması Gaming (5012 - 26212, n=119, son 2 yıl) | |
| Schenker XMG Fusion 15 (Early 24) (Overboost) | |
| Lenovo Legion Pro 5 16IRX9 | |
| Alienware m16 R2 | |
| Schenker XMG Fusion 15 (Early 24) | |
| Aorus 16X 2024 | |
| Ortalama NVIDIA GeForce RTX 4070 Laptop GPU (5012 - 13391, n=70) | |
| HP Omen Transcend 16-u1095ng | |
| 3DMark 06 Standard Score | 63892 puan | |
| 3DMark 11 Performance | 36008 puan | |
| 3DMark Fire Strike Score | 26661 puan | |
| 3DMark Time Spy Score | 13067 puan | |
Yardım | ||
| Geekbench 5.5 | |
| OpenCL Score | |
| Sınıf ortalaması Gaming (80702 - 277970, n=107, son 2 yıl) | |
| Schenker XMG Fusion 15 (Early 24) | |
| Schenker XMG Fusion 15 (Early 24) (Overboost) | |
| Aorus 16X 2024 | |
| HP Omen Transcend 16-u1095ng | |
| Ortalama NVIDIA GeForce RTX 4070 Laptop GPU (17391 - 132836, n=68) | |
| Lenovo Legion Pro 5 16IRX9 | |
| Alienware m16 R2 | |
| Vulkan Score 5.5 | |
| Sınıf ortalaması Gaming (9296 - 246759, n=83, son 2 yıl) | |
| Schenker XMG Fusion 15 (Early 24) (Overboost) | |
| Aorus 16X 2024 | |
| Schenker XMG Fusion 15 (Early 24) | |
| Ortalama NVIDIA GeForce RTX 4070 Laptop GPU (28158 - 102618, n=37) | |
| Alienware m16 R2 | |
| Lenovo Legion Pro 5 16IRX9 | |
| Geekbench 6.7 | |
| GPU OpenCL | |
| Sınıf ortalaması Gaming (67235 - 253130, n=108, son 2 yıl) | |
| Schenker XMG Fusion 15 (Early 24) (6.2.1) | |
| Schenker XMG Fusion 15 (Early 24) (6.2.1, Overboost) | |
| HP Omen Transcend 16-u1095ng (6.2.1) | |
| Aorus 16X 2024 (6.2.1) | |
| Lenovo Legion Pro 5 16IRX9 (6.2.1) | |
| Ortalama NVIDIA GeForce RTX 4070 Laptop GPU (85488 - 129836, n=45) | |
| Alienware m16 R2 (6.2.1) | |
| GPU Vulkan | |
| Schenker XMG Fusion 15 (Early 24) (6.2.1, Overboost) | |
| Sınıf ortalaması Gaming (20128 - 231659, n=60, son 2 yıl) | |
| Alienware m16 R2 (6.2.1) | |
| Lenovo Legion Pro 5 16IRX9 (6.2.1) | |
| Ortalama NVIDIA GeForce RTX 4070 Laptop GPU (89638 - 120033, n=24) | |
| Schenker XMG Fusion 15 (Early 24) (6.2.1) | |
| Aorus 16X 2024 (6.2.1) | |
| V-Ray 5 Benchmark | |
| GPU RTX | |
| Sınıf ortalaması Gaming (1146 - 4363, n=37, son 2 yıl) | |
| Lenovo Legion Pro 5 16IRX9 (5.0.1) | |
| Schenker XMG Fusion 15 (Early 24) (5.0.1, Overboost) | |
| Schenker XMG Fusion 15 (Early 24) (5.0.1) | |
| Alienware m16 R2 (5.0.1) | |
| Aorus 16X 2024 (5.0.1) | |
| Ortalama NVIDIA GeForce RTX 4070 Laptop GPU (171 - 1872, n=39) | |
| GPU CUDA | |
| Sınıf ortalaması Gaming (887 - 3288, n=37, son 2 yıl) | |
| Lenovo Legion Pro 5 16IRX9 (5.0.1) | |
| Schenker XMG Fusion 15 (Early 24) (5.0.1, Overboost) | |
| Schenker XMG Fusion 15 (Early 24) (5.0.1) | |
| Alienware m16 R2 (5.0.1) | |
| Aorus 16X 2024 (5.0.1) | |
| Ortalama NVIDIA GeForce RTX 4070 Laptop GPU (120 - 1356, n=39) | |
| CPU | |
| Schenker XMG Fusion 15 (Early 24) (5.0.1, Overboost) | |
| Lenovo Legion Pro 5 16IRX9 (5.0.1) | |
| Sınıf ortalaması Gaming (5864 - 30302, n=36, son 2 yıl) | |
| Aorus 16X 2024 (5.0.1) | |
| Schenker XMG Fusion 15 (Early 24) (5.0.1) | |
| Ortalama NVIDIA GeForce RTX 4070 Laptop GPU (9339 - 20388, n=38) | |
| Alienware m16 R2 (5.0.1) | |
| V-Ray Benchmark Next 4.10 | |
| GPU | |
| Sınıf ortalaması Gaming (427 - 1333, n=105, son 2 yıl) | |
| Lenovo Legion Pro 5 16IRX9 (v4.10.07 ) | |
| Schenker XMG Fusion 15 (Early 24) (v4.10.07, Overboost) | |
| Ortalama NVIDIA GeForce RTX 4070 Laptop GPU (434 - 686, n=52) | |
| Schenker XMG Fusion 15 (Early 24) (v4.10.07 ) | |
| HP Omen Transcend 16-u1095ng (v4.10.07 ) | |
| Aorus 16X 2024 (v4.10.07 ) | |
| CPU | |
| Schenker XMG Fusion 15 (Early 24) (v4.10.07, Overboost) | |
| Lenovo Legion Pro 5 16IRX9 (v4.10.07 ) | |
| Aorus 16X 2024 (v4.10.07 ) | |
| Sınıf ortalaması Gaming (10048 - 45327, n=104, son 2 yıl) | |
| Schenker XMG Fusion 15 (Early 24) (v4.10.07 ) | |
| HP Omen Transcend 16-u1095ng (v4.10.07 ) | |
| Ortalama NVIDIA GeForce RTX 4070 Laptop GPU (12638 - 35173, n=52) | |
* ... daha küçük daha iyidir
Oyun performansı
Donanım, yüksek ila maksimum ayarlarda QHD oyun oynamak için tasarlanmıştır. DLSS 3 ve Frame Generation kullanarak, ışın izleme dahil olmak üzere daha yüksek çözünürlüklerde ve maksimum ayarlarda oyun oynayabilirsiniz, ancak yalnızca bu işlevleri destekleyen oyunlarla. RTX-4070 ortalamasının(Enthusiast) ve Overboost 'un üzerinde kare hızlarının küçük bir avantaj sağladığını gördük.
| Performance rating - Percent | |
| Schenker XMG Fusion 15 (Early 24) | |
| Sınıf ortalaması Gaming | |
| Lenovo Legion Pro 5 16IRX9 | |
| Schenker XMG Fusion 15 (Early 24) | |
| Aorus 16X 2024 | |
| HP Omen Transcend 16-u1095ng | |
| Alienware m16 R2 -1! | |
| Ortalama NVIDIA GeForce RTX 4070 Laptop GPU | |
| The Witcher 3 - 1920x1080 Ultra Graphics & Postprocessing (HBAO+) | |
| Sınıf ortalaması Gaming (95 - 240, n=8, son 2 yıl) | |
| Lenovo Legion Pro 5 16IRX9 | |
| Schenker XMG Fusion 15 (Early 24) (Overboost) | |
| Schenker XMG Fusion 15 (Early 24) | |
| Aorus 16X 2024 | |
| Alienware m16 R2 | |
| HP Omen Transcend 16-u1095ng | |
| Ortalama NVIDIA GeForce RTX 4070 Laptop GPU (69.8 - 133.7, n=57) | |
| GTA V - 1920x1080 Highest AA:4xMSAA + FX AF:16x | |
| Schenker XMG Fusion 15 (Early 24) (Overboost) | |
| Schenker XMG Fusion 15 (Early 24) | |
| Sınıf ortalaması Gaming (48.3 - 186.9, n=102, son 2 yıl) | |
| Lenovo Legion Pro 5 16IRX9 | |
| HP Omen Transcend 16-u1095ng | |
| Ortalama NVIDIA GeForce RTX 4070 Laptop GPU (48.3 - 141.6, n=63) | |
| Aorus 16X 2024 | |
| Final Fantasy XV Benchmark - 1920x1080 High Quality | |
| Sınıf ortalaması Gaming (41 - 215, n=103, son 2 yıl) | |
| Schenker XMG Fusion 15 (Early 24) (1.3, Overboost) | |
| Lenovo Legion Pro 5 16IRX9 (1.3) | |
| Schenker XMG Fusion 15 (Early 24) (1.3) | |
| Alienware m16 R2 (1.3) | |
| Aorus 16X 2024 (1.3) | |
| Ortalama NVIDIA GeForce RTX 4070 Laptop GPU (41 - 131.9, n=65) | |
| HP Omen Transcend 16-u1095ng (1.3) | |
| Strange Brigade - 1920x1080 ultra AA:ultra AF:16 | |
| Sınıf ortalaması Gaming (76.3 - 456, n=93, son 2 yıl) | |
| Lenovo Legion Pro 5 16IRX9 (1.47.22.14 D3D12) | |
| Schenker XMG Fusion 15 (Early 24) (1.47.22.14 D3D12, Overboost) | |
| Alienware m16 R2 (1.47.22.14 D3D12) | |
| Schenker XMG Fusion 15 (Early 24) (1.47.22.14 D3D12) | |
| Aorus 16X 2024 (1.47.22.14 D3D12) | |
| Ortalama NVIDIA GeForce RTX 4070 Laptop GPU (76.3 - 234, n=63) | |
| HP Omen Transcend 16-u1095ng (1.47.22.14 D3D12) | |
| Dota 2 Reborn - 1920x1080 ultra (3/3) best looking | |
| Schenker XMG Fusion 15 (Early 24) (Overboost) | |
| Lenovo Legion Pro 5 16IRX9 | |
| Schenker XMG Fusion 15 (Early 24) | |
| Aorus 16X 2024 | |
| HP Omen Transcend 16-u1095ng | |
| Sınıf ortalaması Gaming (84.8 - 248, n=112, son 2 yıl) | |
| Ortalama NVIDIA GeForce RTX 4070 Laptop GPU (89.7 - 191.2, n=67) | |
| Alienware m16 R2 | |
| X-Plane 11.11 - 1920x1080 high (fps_test=3) | |
| Schenker XMG Fusion 15 (Early 24) (Overboost) | |
| Lenovo Legion Pro 5 16IRX9 | |
| Schenker XMG Fusion 15 (Early 24) | |
| Aorus 16X 2024 | |
| HP Omen Transcend 16-u1095ng | |
| Ortalama NVIDIA GeForce RTX 4070 Laptop GPU (52.1 - 147.9, n=69) | |
| Sınıf ortalaması Gaming (52.1 - 143.5, n=115, son 2 yıl) | |
| Alienware m16 R2 | |
| Cyberpunk 2077 | |
| 1920x1080 Ultra Preset (FSR off) | |
| Sınıf ortalaması Gaming (17.7 - 169.9, n=120, son 2 yıl) | |
| Schenker XMG Fusion 15 (Early 24) (2.02, Overboost) | |
| Lenovo Legion Pro 5 16IRX9 (2.02) | |
| Schenker XMG Fusion 15 (Early 24) (2.02) | |
| Alienware m16 R2 (2.02) | |
| Ortalama NVIDIA GeForce RTX 4070 Laptop GPU (30.7 - 90.7, n=40) | |
| Aorus 16X 2024 (2.02) | |
| 2560x1440 Ultra Preset (FSR off) | |
| Sınıf ortalaması Gaming (24.8 - 122.8, n=93, son 2 yıl) | |
| Schenker XMG Fusion 15 (Early 24) (2.02, Overboost) | |
| Lenovo Legion Pro 5 16IRX9 (2.02) | |
| Alienware m16 R2 (2.02) | |
| Schenker XMG Fusion 15 (Early 24) (2.02) | |
| Aorus 16X 2024 (2.02) | |
| Ortalama NVIDIA GeForce RTX 4070 Laptop GPU (24.8 - 57.1, n=37) | |
| 1920x1080 Ray Tracing Ultra Preset (DLSS off) | |
| Sınıf ortalaması Gaming (19.1 - 84.9, n=43, son 2 yıl) | |
| Schenker XMG Fusion 15 (Early 24) (2.02, Overboost) | |
| Lenovo Legion Pro 5 16IRX9 (2.02) | |
| Schenker XMG Fusion 15 (Early 24) (2.02) | |
| Alienware m16 R2 (2.02) | |
| Aorus 16X 2024 (2.02) | |
| Ortalama NVIDIA GeForce RTX 4070 Laptop GPU (19.1 - 46.8, n=23) | |
| Dragon's Dogma 2 | |
| 1920x1080 High Preset | |
| Schenker XMG Fusion 15 (Early 24) | |
| Sınıf ortalaması Gaming (59.9 - 99.3, n=8, son 2 yıl) | |
| Ortalama NVIDIA GeForce RTX 4070 Laptop GPU (61.3 - 80, n=5) | |
| 2560x1440 High Preset | |
| Sınıf ortalaması Gaming (51.6 - 93.4, n=6, son 2 yıl) | |
| Schenker XMG Fusion 15 (Early 24) | |
| Ortalama NVIDIA GeForce RTX 4070 Laptop GPU (47.7 - 61.3, n=5) | |
| Alone in the Dark | |
| 1920x1080 Cinematic Preset | |
| Sınıf ortalaması Gaming (n=1son 2 yıl) | |
| Schenker XMG Fusion 15 (Early 24) | |
| Aorus 16X 2024 | |
| Ortalama NVIDIA GeForce RTX 4070 Laptop GPU (105.5 - 126, n=5) | |
| 2560x1440 Cinematic Preset | |
| Schenker XMG Fusion 15 (Early 24) | |
| Ortalama NVIDIA GeForce RTX 4070 Laptop GPU (37.4 - 76.6, n=5) | |
| Aorus 16X 2024 | |
| The Witcher 3 v4 | |
| 1920x1080 Ultra Preset / On AA:FX | |
| Schenker XMG Fusion 15 (Early 24) | |
| Ortalama NVIDIA GeForce RTX 4070 Laptop GPU (85 - 86.5, n=2) | |
| 1920x1080 RT Ultra Preset / On AA:FX | |
| Schenker XMG Fusion 15 (Early 24) | |
| Ortalama NVIDIA GeForce RTX 4070 Laptop GPU (36 - 40.4, n=2) | |
Kare hızlarının daha uzun bir süre boyunca sabit kalıp kalmadığını test etmek için, The Witcher 3 oyununu Full HD'de ve ayarlar maksimumda olacak şekilde yaklaşık 60 dakika boyunca çalıştırdık. Oyun karakterini hareket ettirmedik. Kare hızında bir düşüş fark etmedik, ancak yaklaşık 50 dakika sonra yüzde birkaç oranında düştüler(Enthusiast). Profil Overboost etkinleştirildiğinde bu davranış gerçekleşmedi.
Witcher 3 FPS diagram
| düşük | orta | yüksek | ultra | QHD | |
|---|---|---|---|---|---|
| GTA V (2015) | 187.8 | 187 | 186.4 | 137.6 | 98.2 |
| The Witcher 3 (2015) | 603.3 | 418.4 | 246.2 | 128 | 92.2 |
| Dota 2 Reborn (2015) | 234 | 207 | 196.5 | 182.1 | |
| Final Fantasy XV Benchmark (2018) | 226 | 175.5 | 124.6 | 90.5 | |
| X-Plane 11.11 (2018) | 205 | 173.3 | 136.9 | ||
| Far Cry 5 (2018) | 204 | 176 | 166 | 157 | 124 |
| Strange Brigade (2018) | 558 | 313 | 245 | 214 | 139.2 |
| The Witcher 3 v4 (2023) | 271 | 215 | 176.2 | 86.5 | |
| Baldur's Gate 3 (2023) | 157.2 | 121.2 | 106.1 | 105 | 82.1 |
| Cyberpunk 2077 (2023) | 156.6 | 124.5 | 103.6 | 87 | 52.6 |
| Alan Wake 2 (2023) | 74.3 | 71.4 | 70.1 | 42.8 | |
| Alone in the Dark (2024) | 222 | 209 | 196.5 | 126 | 76.6 |
| Dragon's Dogma 2 (2024) | 83.9 | 80 | 61.3 |
Emisyonlar - Schenker dizüstü bilgisayar oldukça ısınıyor
Gürültü emisyonları
Günlük kullanımda ve rölantideyken dizüstü bilgisayar çok sessiz çalışıyor. Fanlar sürekli devrede olsa da (BIOS üzerinden devre dışı bırakılabilirler), sadece çok sessiz ortamlarda duyulabilirler. Yük altında işler hızla değişiyor: Burun emisyonlarının 53 dB(A)'ya(Enthusiast) kadar çıktığını tespit ettik. Overboost modu daha da yüksek değerlerle sonuçlandı. Cihaz, Dengelimodu kullanıldığında -bir miktar performans kaybı pahasına- önemli ölçüde daha sessiz çalışıyor.
Ses yüksekliği
| Boşta |
| 27 / 28 / 33 dB |
| Çalışırken |
| 52 / 53 dB |
 | ||
30 dB sessiz 40 dB(A) duyulabilirlik 50 dB(A) gürültülü |
||
min: | ||
| Schenker XMG Fusion 15 (Early 24) i9-14900HX, GeForce RTX 4070 Laptop GPU | Aorus 16X 2024 i9-14900HX, GeForce RTX 4070 Laptop GPU | Alienware m16 R2 Ultra 7 155H, GeForce RTX 4070 Laptop GPU | HP Omen Transcend 16-u1095ng i9-14900HX, GeForce RTX 4070 Laptop GPU | Lenovo Legion Pro 5 16IRX9 i9-14900HX, GeForce RTX 4070 Laptop GPU | |
|---|---|---|---|---|---|
| Noise | -5% | 8% | 5% | 6% | |
| kapalı / ortam * (dB) | 25 | 26 -4% | 24.7 1% | 24 4% | 23.9 4% |
| Idle Minimum * (dB) | 27 | 26 4% | 25.3 6% | 29 -7% | 24.3 10% |
| Idle Average * (dB) | 28 | 32 -14% | 25.3 10% | 30 -7% | 24.3 13% |
| Idle Maximum * (dB) | 33 | 38 -15% | 25.3 23% | 31 6% | 28.9 12% |
| Load Average * (dB) | 52 | 54 -4% | 31.7 39% | 45 13% | 45.8 12% |
| Witcher 3 ultra * (dB) | 51 | 50 2% | 53.8 -5% | 44 14% | 51 -0% |
| Load Maximum * (dB) | 53 | 55 -4% | 62 -17% | 47 11% | 56.6 -7% |
* ... daha küçük daha iyidir
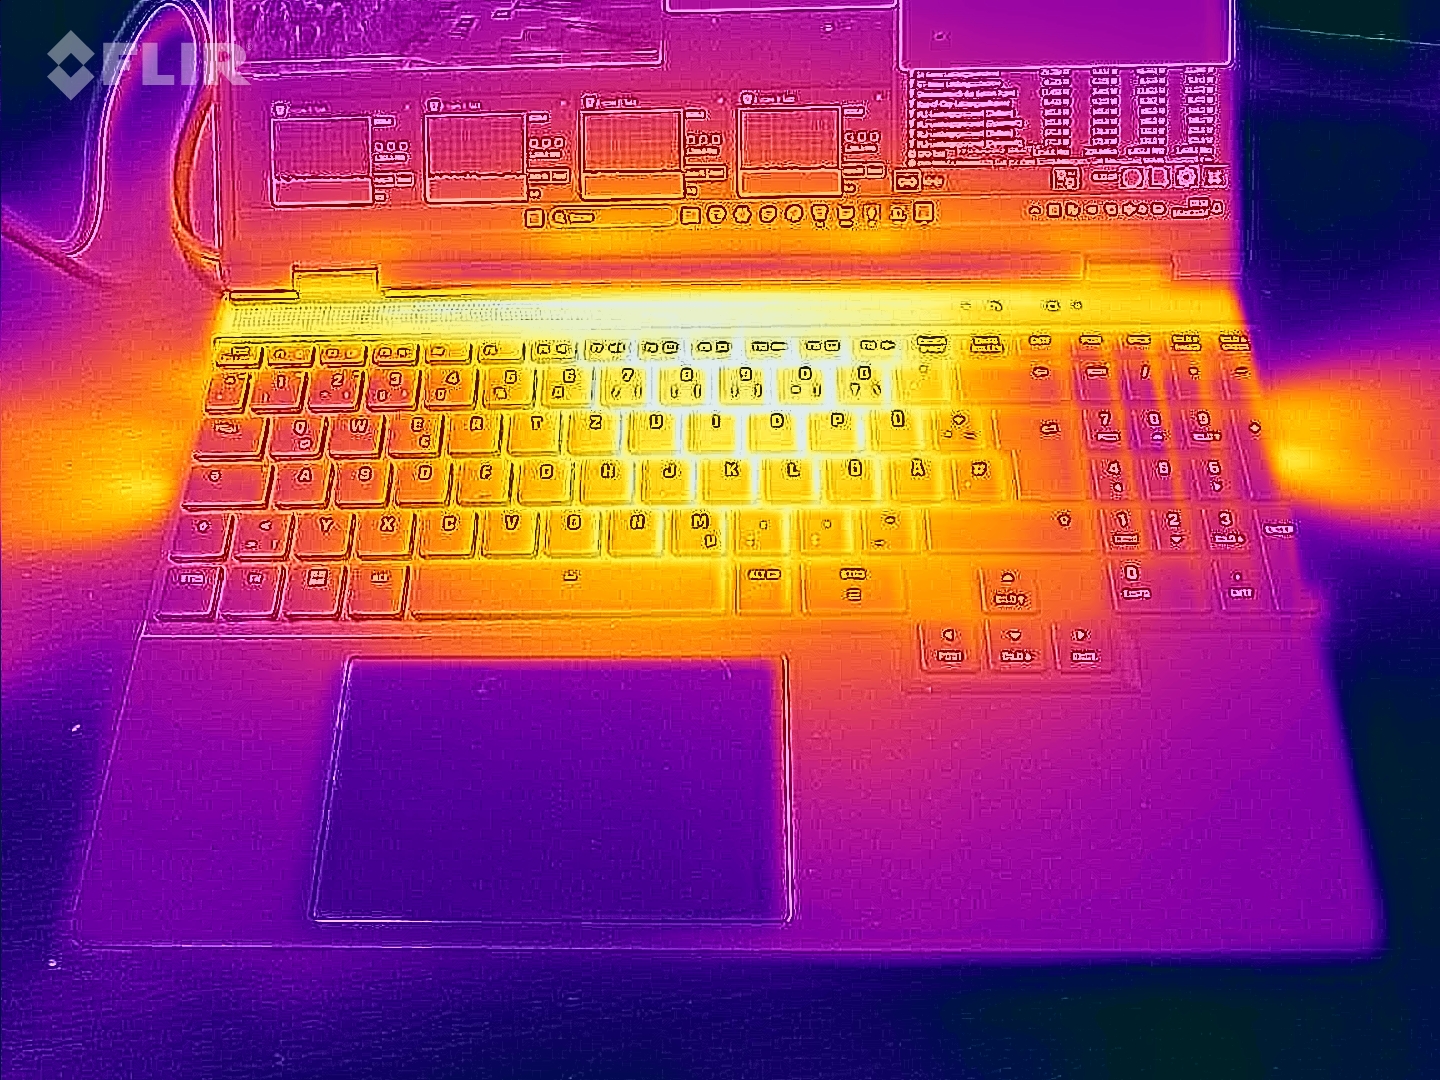
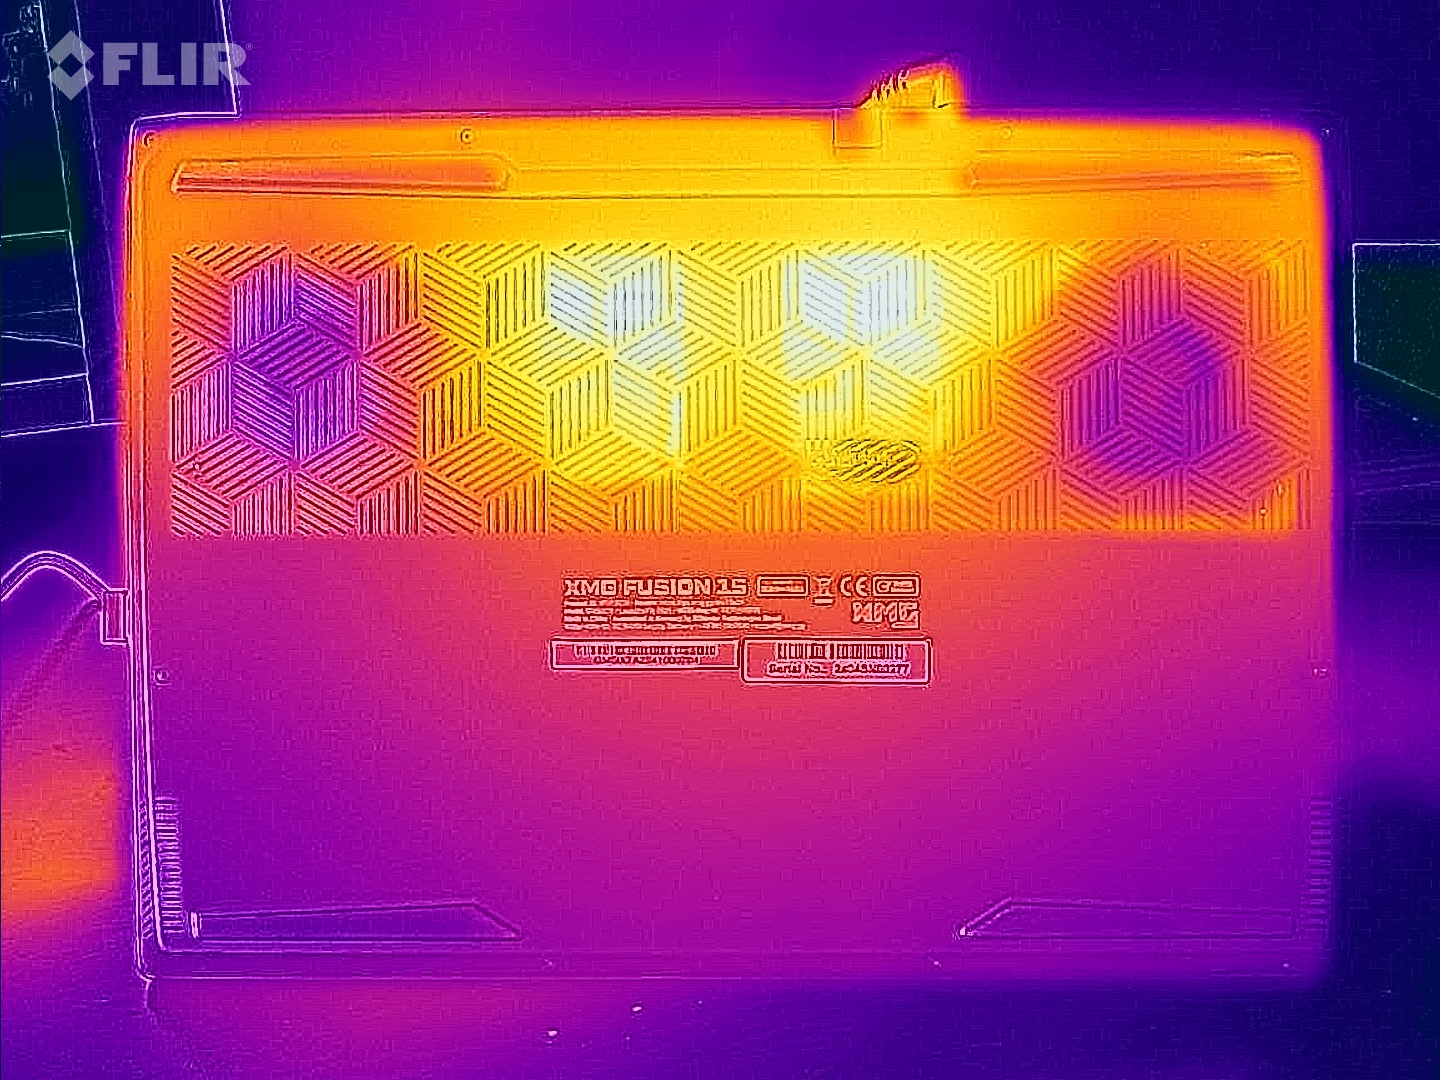
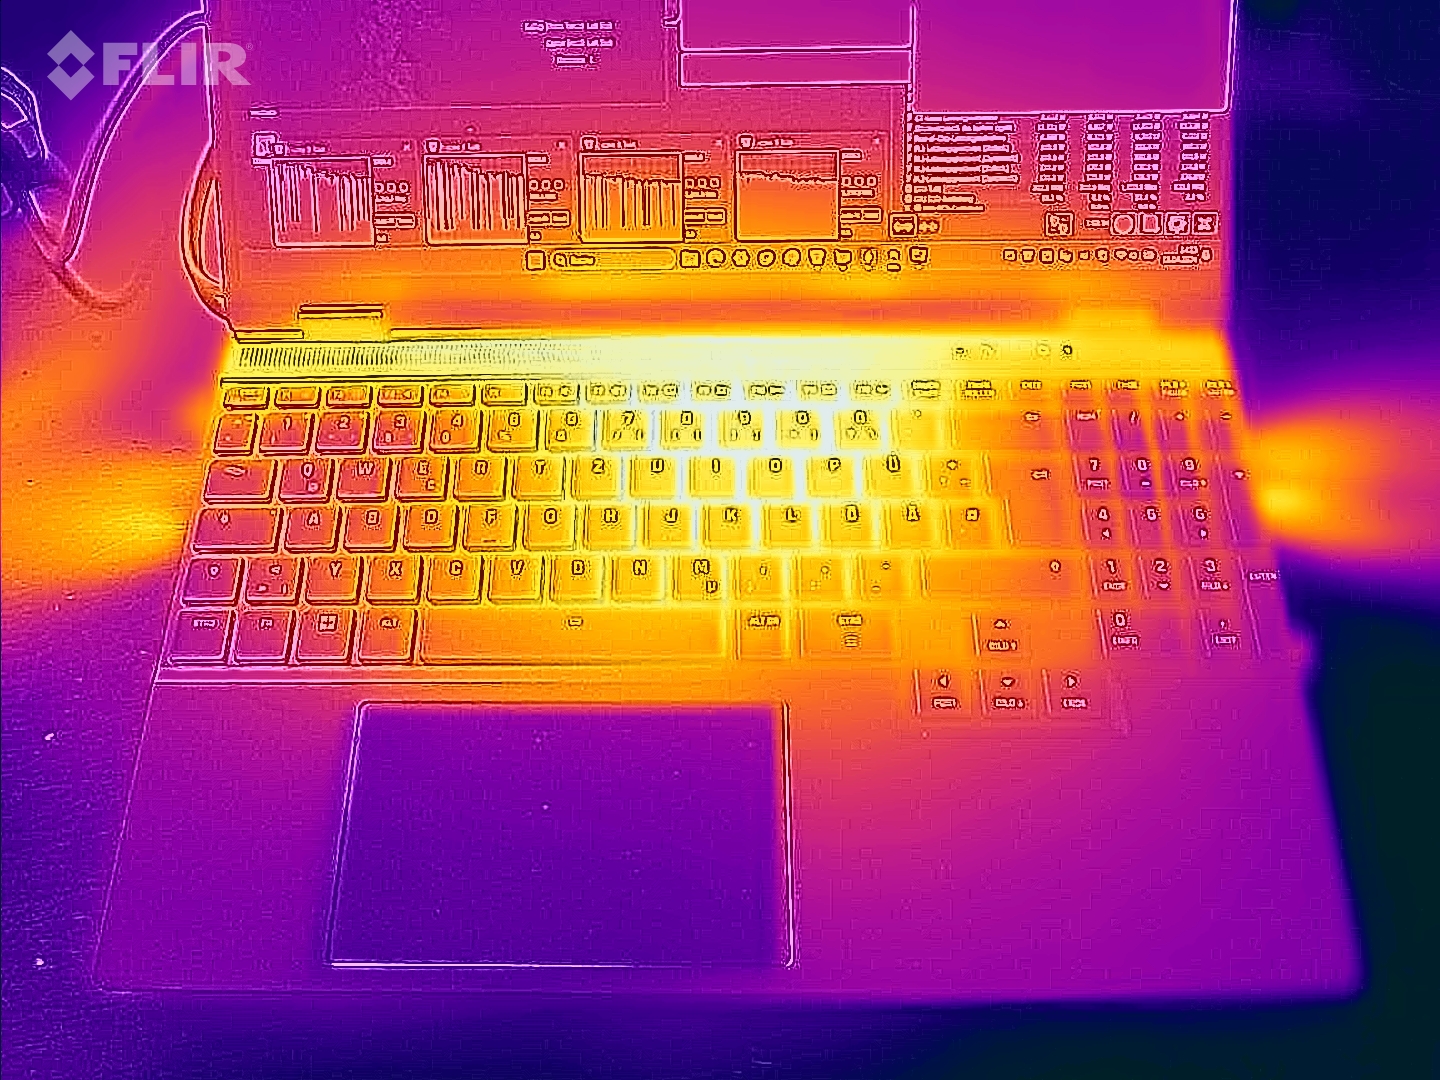
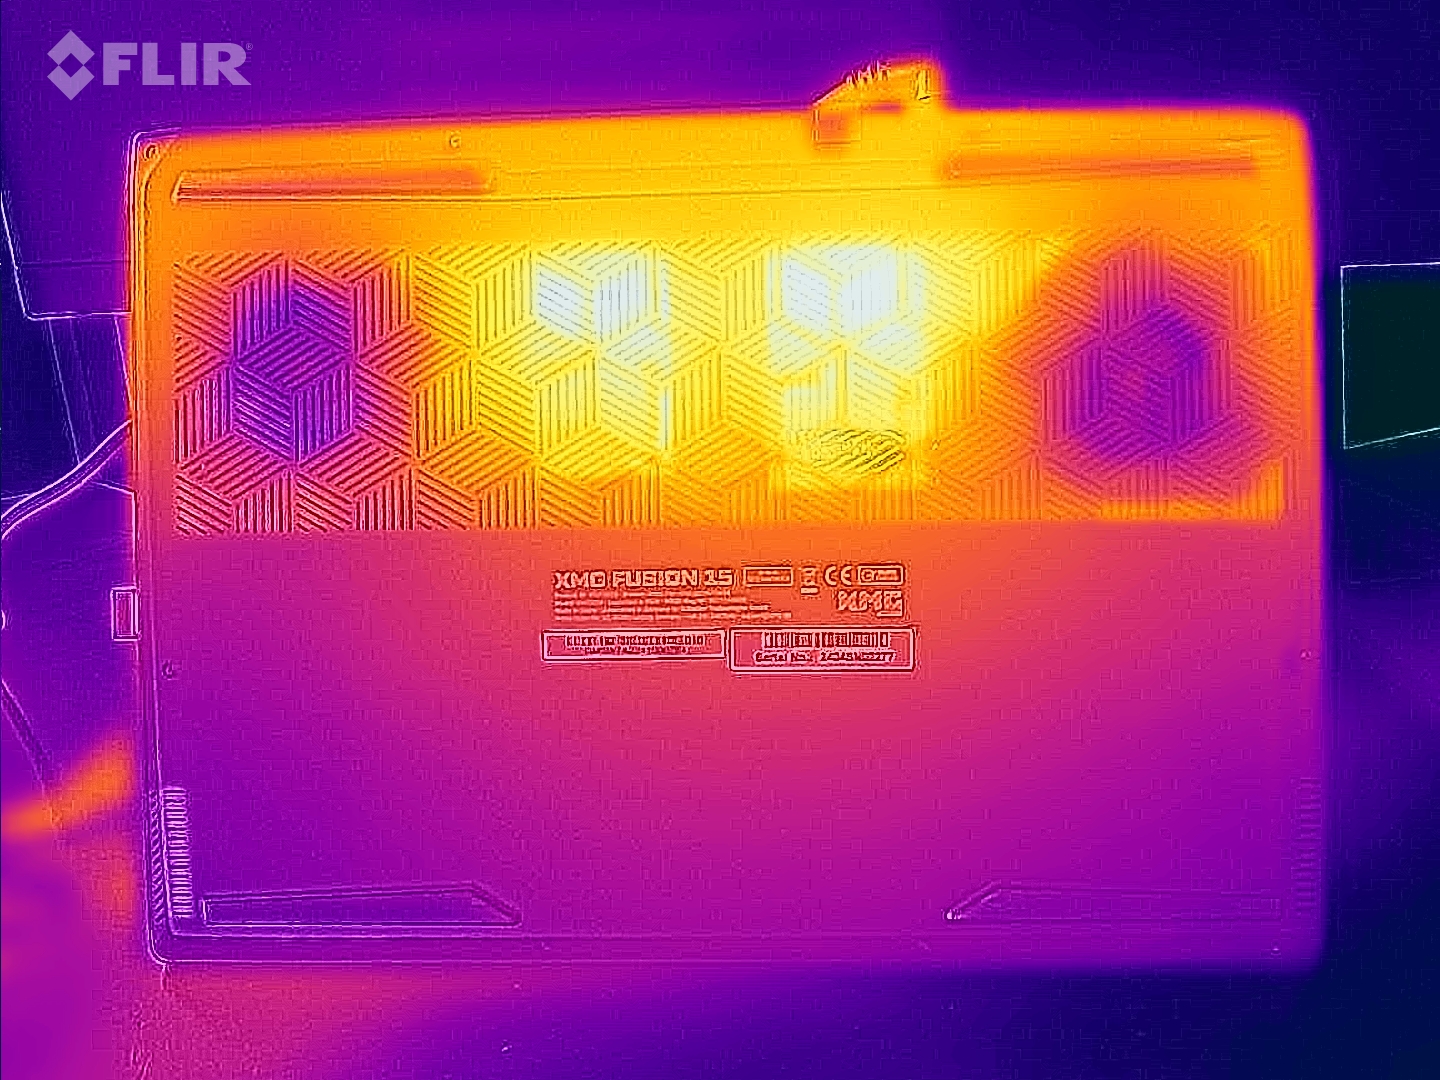
Sıcaklık
Stres testi ve Witcher 3 test dizüstü bilgisayarın önemli ölçüde ısınmasına neden oldu. Zaman zaman üst 50 derece-Celcius aralığındaki değerlere ulaştı. Günlük kullanımda (ofis, internet) değerler genellikle yeşil bölgede kalıyor.
(-) Üst taraftaki maksimum sıcaklık, 40.4 °C / 105 F ortalamasına kıyasla 48 °C / 118 F'dir. , Gaming sınıfı için 21.2 ile 68.8 °C arasında değişir.
(-) Alt kısım, 43.2 °C / 110 F ortalamasına kıyasla maksimum 56 °C / 133 F'ye kadar ısınır
(+) Boşta kullanımda, üst tarafın ortalama sıcaklığı 26.6 °C / 80 F olup, cihazın 33.9 °C / 93 F.
(-) The Witcher 3 oynarken, üst tarafın ortalama sıcaklığı 40.4 °C / 105 F olup, cihazın 33.9 °C / 93 F.
(+) Avuç içi dayanakları ve dokunmatik yüzey maksimum (34 °C / 93.2 F) cilt sıcaklığına ulaşıyor ve bu nedenle sıcak değil.
(-) Benzer cihazların avuç içi dayanağı alanının ortalama sıcaklığı 28.8 °C / 83.8 F (-5.2 °C / -9.4 F) idi.
| Schenker XMG Fusion 15 (Early 24) Intel Core i9-14900HX, NVIDIA GeForce RTX 4070 Laptop GPU | Aorus 16X 2024 Intel Core i9-14900HX, NVIDIA GeForce RTX 4070 Laptop GPU | Alienware m16 R2 Intel Core Ultra 7 155H, NVIDIA GeForce RTX 4070 Laptop GPU | HP Omen Transcend 16-u1095ng Intel Core i9-14900HX, NVIDIA GeForce RTX 4070 Laptop GPU | Lenovo Legion Pro 5 16IRX9 Intel Core i9-14900HX, NVIDIA GeForce RTX 4070 Laptop GPU | |
|---|---|---|---|---|---|
| Heat | -5% | -14% | -6% | -8% | |
| Maximum Upper Side * (°C) | 48 | 41 15% | 44.8 7% | 49 -2% | 43.8 9% |
| Maximum Bottom * (°C) | 56 | 41 27% | 48 14% | 63 -13% | 55.4 1% |
| Idle Upper Side * (°C) | 28 | 37 -32% | 37.2 -33% | 30 -7% | 32.8 -17% |
| Idle Bottom * (°C) | 29 | 38 -31% | 42 -45% | 29 -0% | 36 -24% |
* ... daha küçük daha iyidir
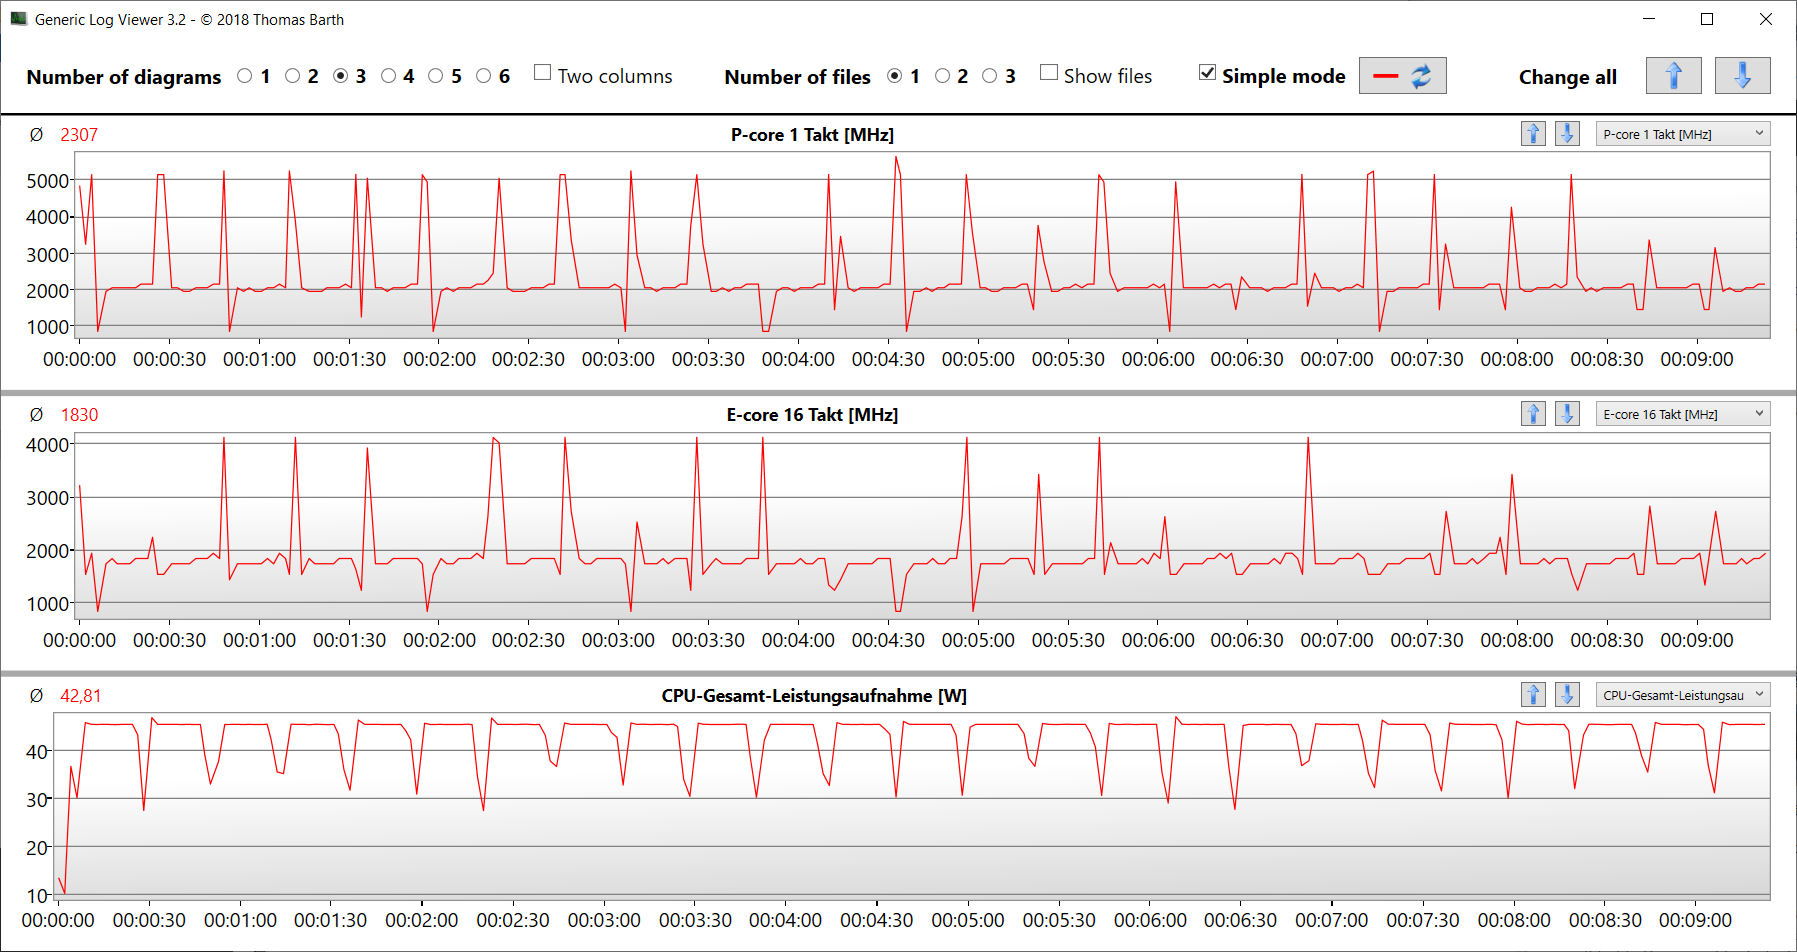
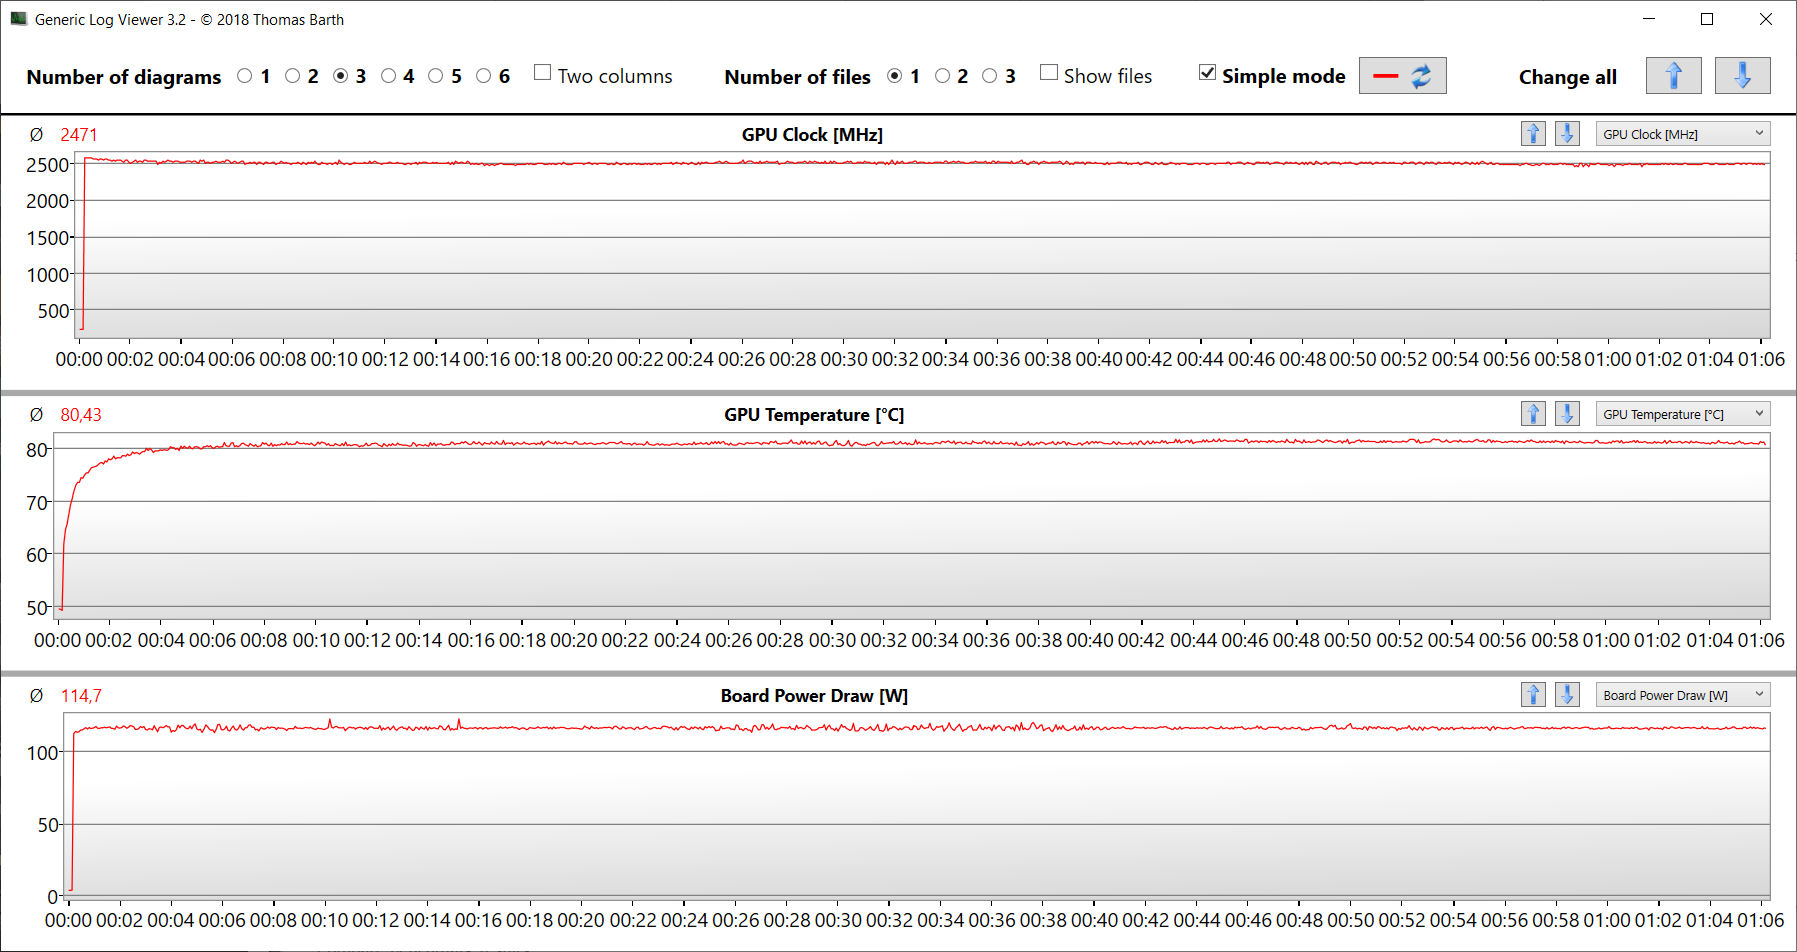
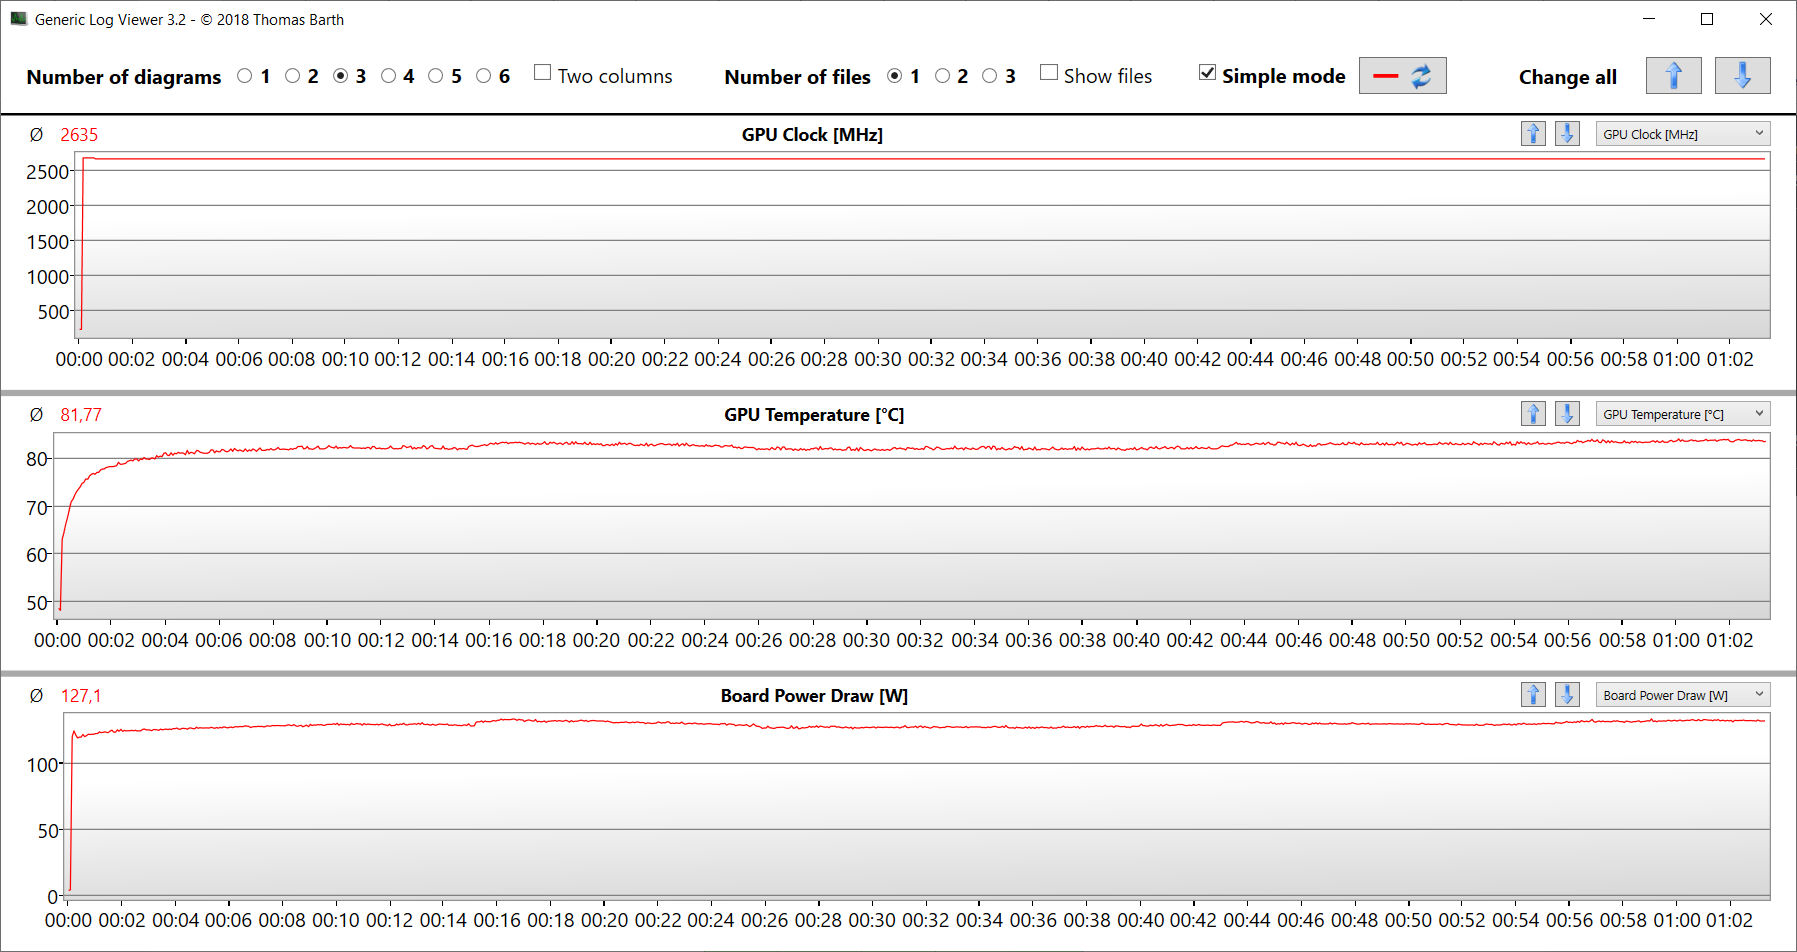
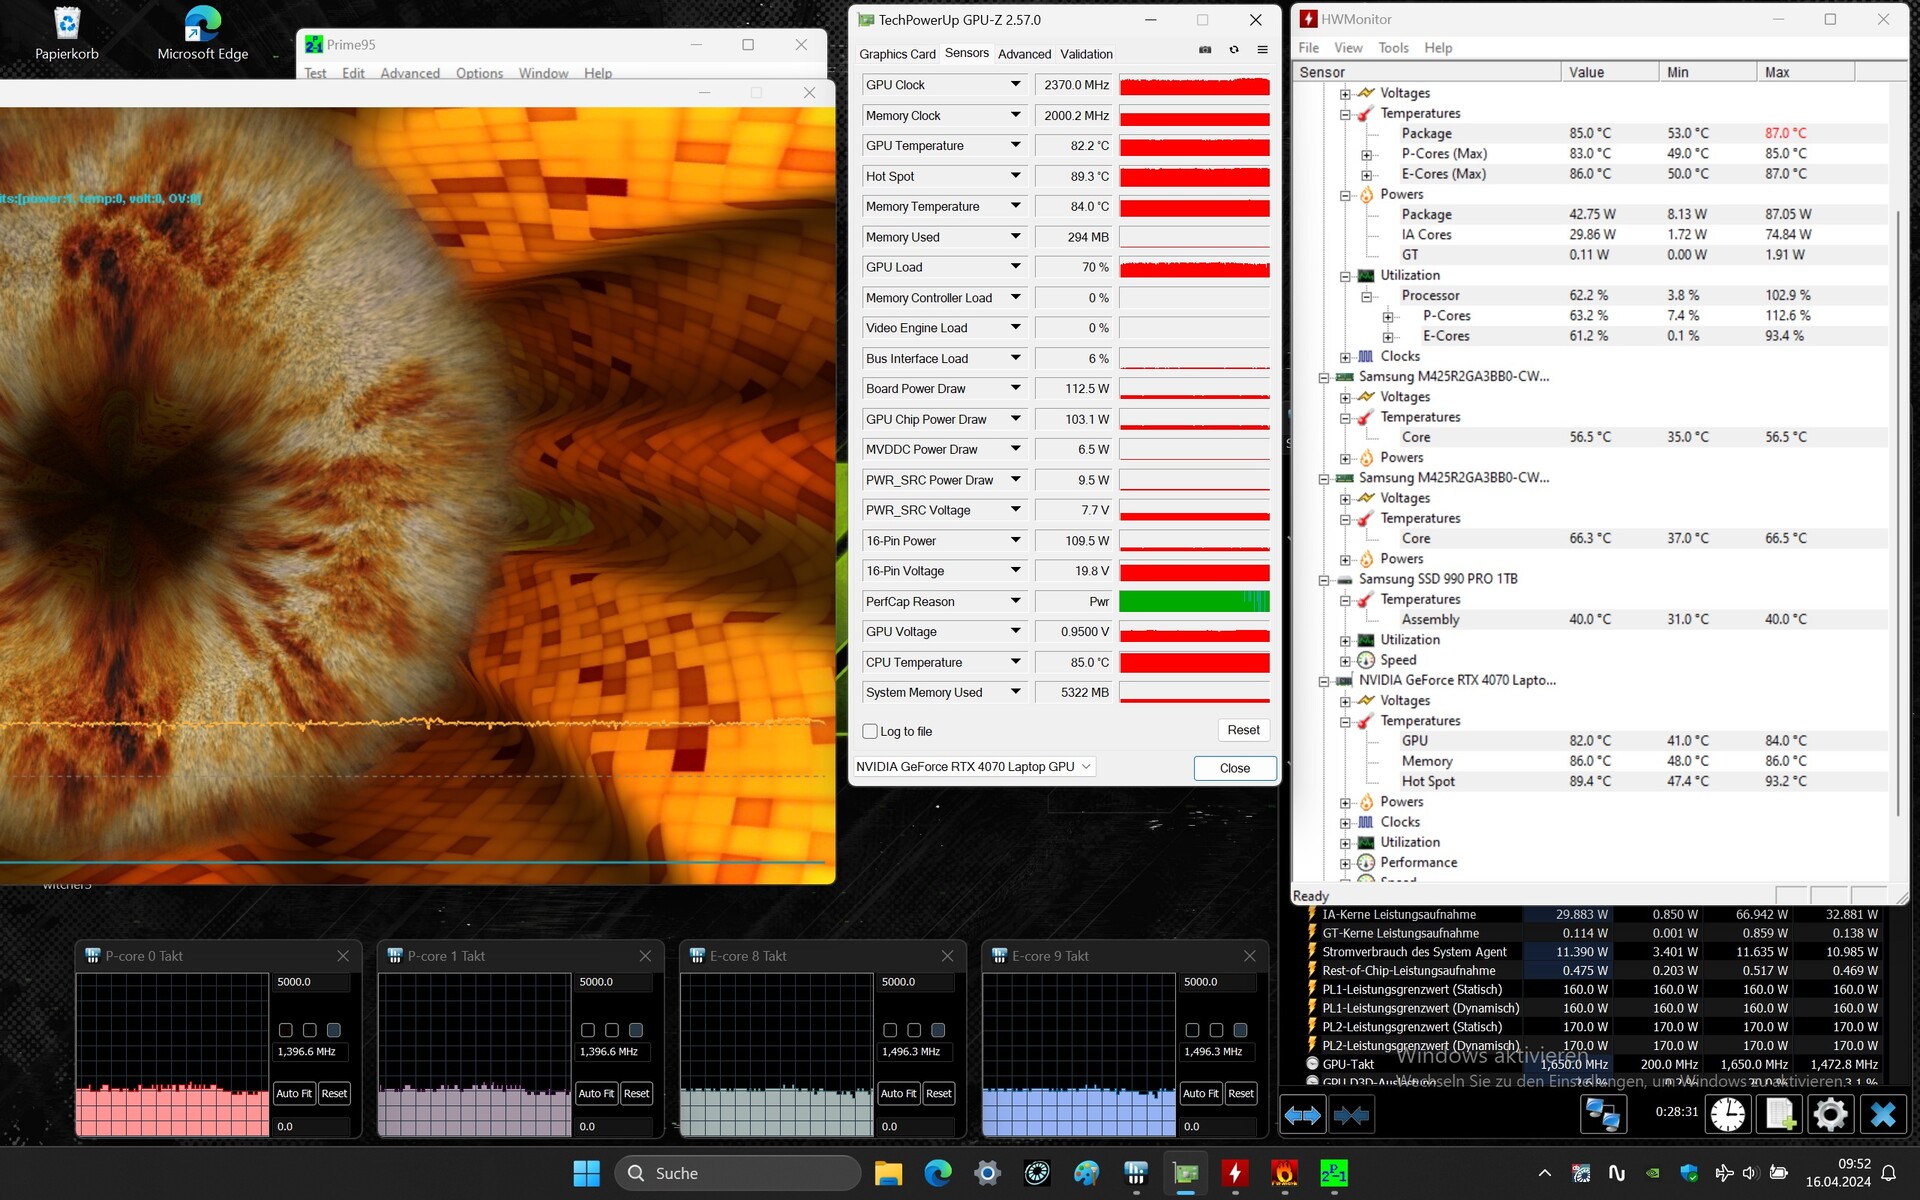
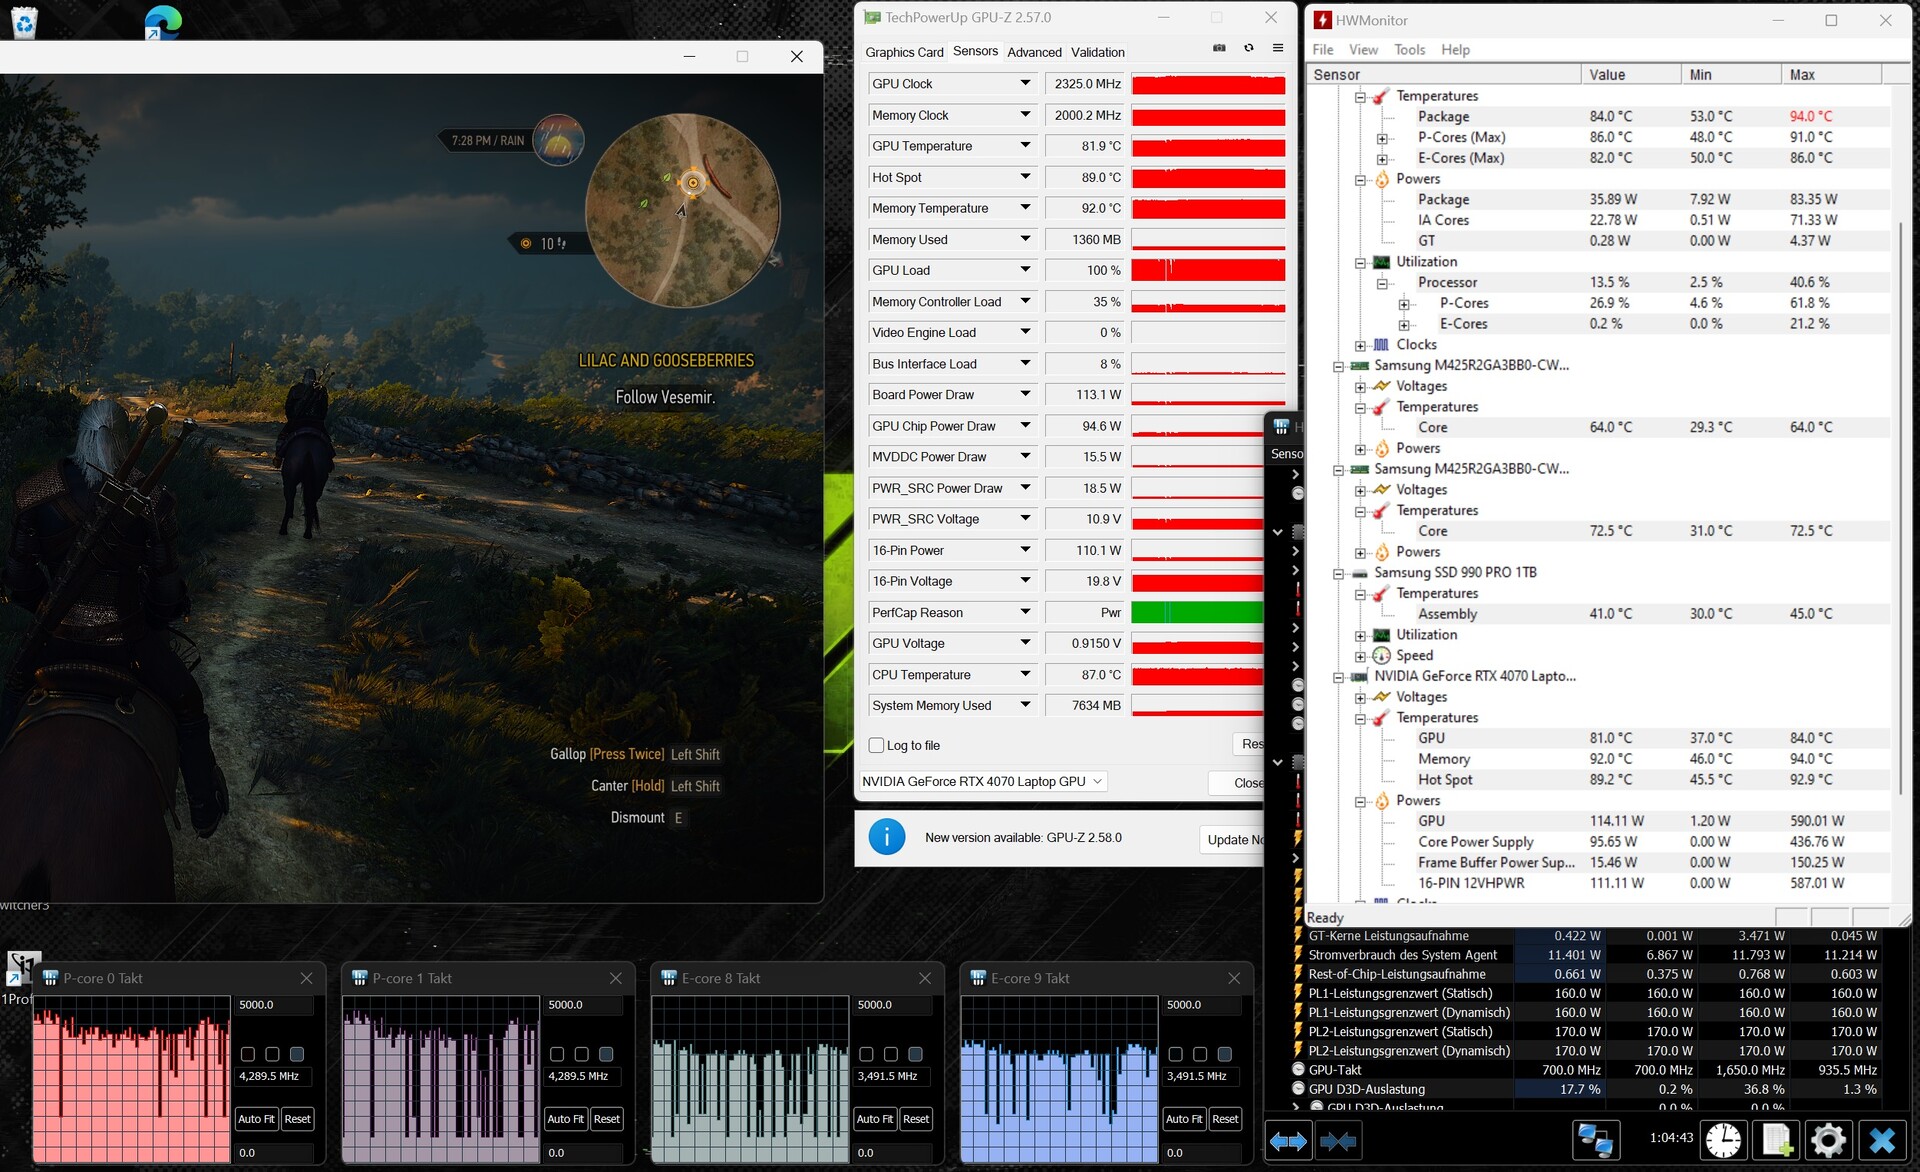
Stres testi
Stres testi tarafından simüle edilen aşırı senaryo (Prime95 ve Furmark sürekli çalışmada) sistemin tam yük altındaki kararlılığını kontrol eder. CPU saati, temel saat hızının biraz üzerindeki değerlerden altındaki değerlere doğru yavaşça ve sürekli olarak düştü. Grafik çekirdeği baştan sona yüksek hızlarda çalıştı.
Konuşmacılar
Dizüstü bilgisayarın stereo hoparlörleri iyi bir ses üretir, ancak basları eksiktir. Kulaklık veya harici hoparlör bağlayarak daha iyi bir ses deneyimi elde edilebilir.
Schenker XMG Fusion 15 (Early 24) ses analizi
(+) | hoparlörler nispeten yüksek sesle çalabilir (85 dB)
Bas 100 - 315Hz
(-) | neredeyse hiç bas yok - ortalama olarak medyandan 15.8% daha düşük
(±) | Bas doğrusallığı ortalamadır (12.5% delta - önceki frekans)
Ortalar 400 - 2000 Hz
(+) | dengeli ortalar - medyandan yalnızca 4.4% uzakta
(+) | orta frekanslar doğrusaldır (5.9% deltadan önceki frekansa)
Yüksekler 2 - 16 kHz
(+) | dengeli yüksekler - medyandan yalnızca 2% uzakta
(+) | yüksekler doğrusaldır (4.8% deltadan önceki frekansa)
Toplam 100 - 16.000 Hz
(+) | genel ses doğrusaldır (11.5% ortancaya göre fark)
Aynı sınıfla karşılaştırıldığında
» Bu sınıftaki tüm test edilen cihazların %10%'si daha iyi, 3% benzer, 87% daha kötüydü
» En iyisinin deltası 6% idi, ortalama 18% idi, en kötüsü 132% idi
Test edilen tüm cihazlarla karşılaştırıldığında
» Test edilen tüm cihazların %8'si daha iyi, 2 benzer, % 90 daha kötüydü
» En iyisinin deltası 4% idi, ortalama 24% idi, en kötüsü 134% idi
Aorus 16X 2024 ses analizi
(+) | hoparlörler nispeten yüksek sesle çalabilir (85 dB)
Bas 100 - 315Hz
(±) | azaltılmış bas - ortalama olarak medyandan 8.5% daha düşük
(±) | Bas doğrusallığı ortalamadır (8.3% delta - önceki frekans)
Ortalar 400 - 2000 Hz
(+) | dengeli ortalar - medyandan yalnızca 3.1% uzakta
(+) | orta frekanslar doğrusaldır (5.8% deltadan önceki frekansa)
Yüksekler 2 - 16 kHz
(+) | dengeli yüksekler - medyandan yalnızca 2.5% uzakta
(±) | Yükseklerin doğrusallığı ortalamadır (7% delta - önceki frekans)
Toplam 100 - 16.000 Hz
(+) | genel ses doğrusaldır (8.4% ortancaya göre fark)
Aynı sınıfla karşılaştırıldığında
» Bu sınıftaki tüm test edilen cihazların %2%'si daha iyi, 1% benzer, 97% daha kötüydü
» En iyisinin deltası 6% idi, ortalama 18% idi, en kötüsü 132% idi
Test edilen tüm cihazlarla karşılaştırıldığında
» Test edilen tüm cihazların %2'si daha iyi, 1 benzer, % 97 daha kötüydü
» En iyisinin deltası 4% idi, ortalama 24% idi, en kötüsü 134% idi
Güç yönetimi - Fusion 15 çok iyi çalışma süreleri sunar
Güç tüketimi
Güç gereksinimi, kurulu donanım için büyük ölçüde normaldir. İstisna: Tamamen şarj edilmiş bir bataryaya rağmen, dizüstü bilgisayar kapalıyken yaklaşık 20 watt'lık bir güç tüketimi değeri ölçtük. Bu muhtemelen bir hatadır. Güç tüketimi Witcher 3 testi ve stres testi biraz düşen güç tüketimi değerleriyle çalıştı. Güç kaynağı (280 watt) güç olarak yeterlidir.
| Boşta | |
| Çalışırken |
|
Key:
min: | |
| Schenker XMG Fusion 15 (Early 24) i9-14900HX, GeForce RTX 4070 Laptop GPU | Aorus 16X 2024 i9-14900HX, GeForce RTX 4070 Laptop GPU | Alienware m16 R2 Ultra 7 155H, GeForce RTX 4070 Laptop GPU | HP Omen Transcend 16-u1095ng i9-14900HX, GeForce RTX 4070 Laptop GPU | Sınıf ortalaması Gaming | |
|---|---|---|---|---|---|
| Power Consumption | -21% | -3% | -10% | -18% | |
| Idle Minimum * (Watt) | 8 | 13 -63% | 8.1 -1% | 10 -25% | 13.2 ? -65% |
| Idle Average * (Watt) | 14 | 18 -29% | 13 7% | 18 -29% | 18.9 ? -35% |
| Idle Maximum * (Watt) | 26 | 35 -35% | 40.3 -55% | 32 -23% | 24.3 ? 7% |
| Load Average * (Watt) | 118 | 138 -17% | 79 33% | 128 -8% | 108 ? 8% |
| Witcher 3 ultra * (Watt) | 192.7 | 172.6 10% | 188.1 2% | 148.4 23% | |
| Load Maximum * (Watt) | 244 | 222 9% | 254.9 -4% | 242 1% | 254 ? -4% |
* ... daha küçük daha iyidir
Power consumption Witcher 3 / stress test
Power consumption with external monitor
Çalışma Zamanları
WiFi testimiz (bir komut dosyası aracılığıyla web sitelerini yükleme) ve video testimiz (bir döngüde kısa film Big Buck Bunny (H.264 kodlama, FHD)) sırasında sırasıyla 8:00 saat ve 10:02 saat çalışma süreleri ölçtük. Bunlar çok iyi değerler.
| Schenker XMG Fusion 15 (Early 24) i9-14900HX, GeForce RTX 4070 Laptop GPU, 99.8 Wh | Aorus 16X 2024 i9-14900HX, GeForce RTX 4070 Laptop GPU, 99 Wh | Alienware m16 R2 Ultra 7 155H, GeForce RTX 4070 Laptop GPU, 90 Wh | HP Omen Transcend 16-u1095ng i9-14900HX, GeForce RTX 4070 Laptop GPU, 97 Wh | Lenovo Legion Pro 5 16IRX9 i9-14900HX, GeForce RTX 4070 Laptop GPU, 80 Wh | Sınıf ortalaması Gaming | |
|---|---|---|---|---|---|---|
| Pil Çalışma Süresi | -16% | -26% | -39% | -52% | -30% | |
| Reader / Idle (h) | 15.2 | 12.6 -17% | 12.6 -17% | 6.7 -56% | 8.71 ? -43% | |
| H.264 (h) | 10 | 9 -10% | 8.26 ? -17% | |||
| WiFi v1.3 (h) | 8 | 8 0% | 8.1 1% | 4.9 -39% | 4.8 -40% | 7.02 ? -12% |
| Load (h) | 2.7 | 1.7 -37% | 1 -63% | 1.1 -59% | 1.47 ? -46% |
Artılar
Eksiler
Karar - Taşınabilir, güçlü, azimli
Kompakt boyutlar ve düşük ağırlık (yaklaşık 2,1 kg), donanım performansının düşmesine neden olmaz. Bu Çekirdek i9 işlemci ve GeForce RTX 4070 sürekli olarak yüksek saat hızlarında çalışabilmektedir. Dizüstü bilgisayarın performans ve taşınabilirlik birleşimi bir başarı olarak sınıflandırılabilir.
XMG Fusion 15 (Erken 24)-oyuncular ve yaratıcılar için güçlü, taşınabilir bir dizüstü bilgisayar.
Dizüstü bilgisayar yük altında oldukça ısınıyor ve bunu yaparken biraz gürültü üretiyor. Daha ılımlı emisyonlar, bir miktar bilgi işlem gücünden ödün vermeyi gerektirir. 16:10 en boy oranına sahip 15,3 inç ekranı (2.560 x 1.600 piksel, IPS, 240 Hz, Adaptive Sync) genel olarak etkileyici. Yüksek parlaklığı dikkat çekicidir.
Bir tam şarj (99,8 Wh), yaklaşık 8 - 10 saatlik pratik çalışma süreleri için yeterlidir - çok iyi değerler. Pozitif: Pil, bir USB-C güç kaynağı (min. 100 watt, 20 V) aracılığıyla şarj edilebilir - dizüstü bilgisayarın TB4 bağlantı noktası Power Delivery'yi destekler. Sonuç olarak, özel güç kaynağını (280 watt) her zaman yanınızda taşımak zorunda değilsiniz.
Bir alternatif de şu olabilir Aorus 16X (2024). Bu dizüstü bilgisayar, karşılaştırılabilir bilgi işlem gücünün yanı sıra benzer şekilde iyi çalışma süreleri sunar.
Fiyat ve bulunabilirlik
XMG Fusion 15 (Early 24) doğrudan Schenker'in çevrimiçi mağazası üzerinden yapılandırılabilir ve sipariş edilebilir. Mevcut test cihazının maliyeti yaklaşık 2.500 ABD Dolarıdır. Fiyatlar yaklaşık 1.700 ABD Dolarından başlamaktadır.
Schenker XMG Fusion 15 (Early 24)
- 05/01/2024 v7 (old)
Sascha Mölck
Şeffaflık
İncelenecek cihazların seçimi editör ekibimiz tarafından yapılır. Test örneği, bu incelemenin amacı doğrultusunda üretici veya perakendeci tarafından yazara ödünç olarak sağlanmıştır. Borç verenin bu inceleme üzerinde herhangi bir etkisi olmadığı gibi, üretici de yayınlanmadan önce bu incelemenin bir kopyasını almamıştır. Bu incelemeyi yayınlama zorunluluğu yoktu. Bağımsız bir medya şirketi olarak Notebookcheck, üreticilerin, perakendecilerin veya yayıncıların otoritesine tabi değildir.
Notebookcheck bu şekilde test yapıyor
Notebookcheck, tüm sonuçların karşılaştırılabilir olmasını sağlamak için her yıl yüzlerce dizüstü bilgisayarı ve akıllı telefonu standart prosedürler kullanarak bağımsız olarak inceliyor. Yaklaşık 20 yıldır test yöntemlerimizi sürekli olarak geliştirdik ve bu süreçte endüstri standartlarını belirledik. Test laboratuvarlarımızda deneyimli teknisyenler ve editörler tarafından yüksek kaliteli ölçüm ekipmanları kullanılmaktadır. Bu testler çok aşamalı bir doğrulama sürecini içerir. Karmaşık derecelendirme sistemimiz, nesnelliği koruyan yüzlerce sağlam temellere dayanan ölçüm ve kıyaslamaya dayanmaktadır.Price comparison

