Alienware m16 R2 dizüstü bilgisayar incelemesi: Büyük ve riskli değişiklikler

Alienware m16 R2 m16 R1ama beklediğiniz şekilde değil. Yeni model, diğer Alienware ürünleri hardcore oyunculara hitap ederken, hem oyuncuları hem de genel kullanıcıları çekmek amacıyla m16 serisinin tamamen yeniden tasarlanması ve yeniden düşünülmesidir. Tek başına bu bile m16 R2'yi son yılların en ilginç Alienware dizüstü bilgisayarlarından biri yapıyor çünkü m16 R1'de mevcut olan bazı üst düzey CPU ve GPU seçeneklerini daha küçük bir tasarım lehine feda ediyor.
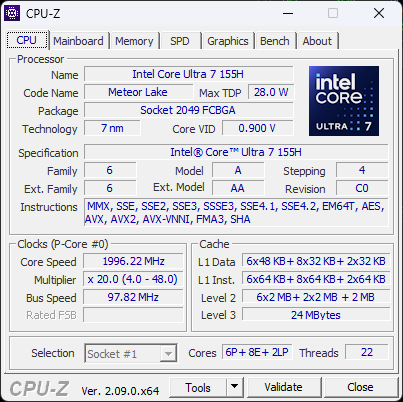
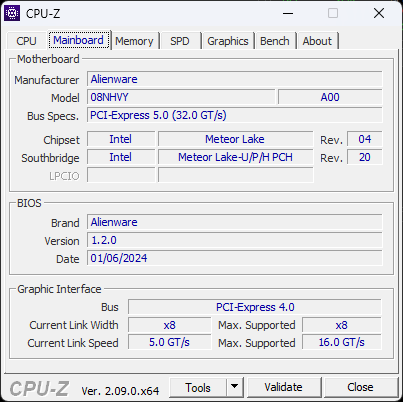
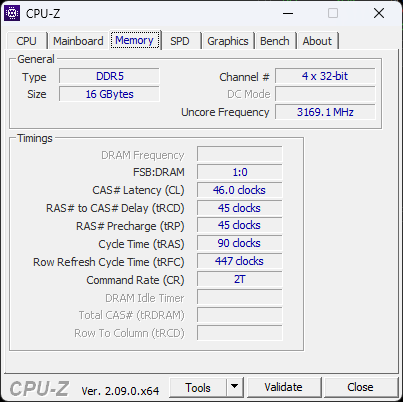
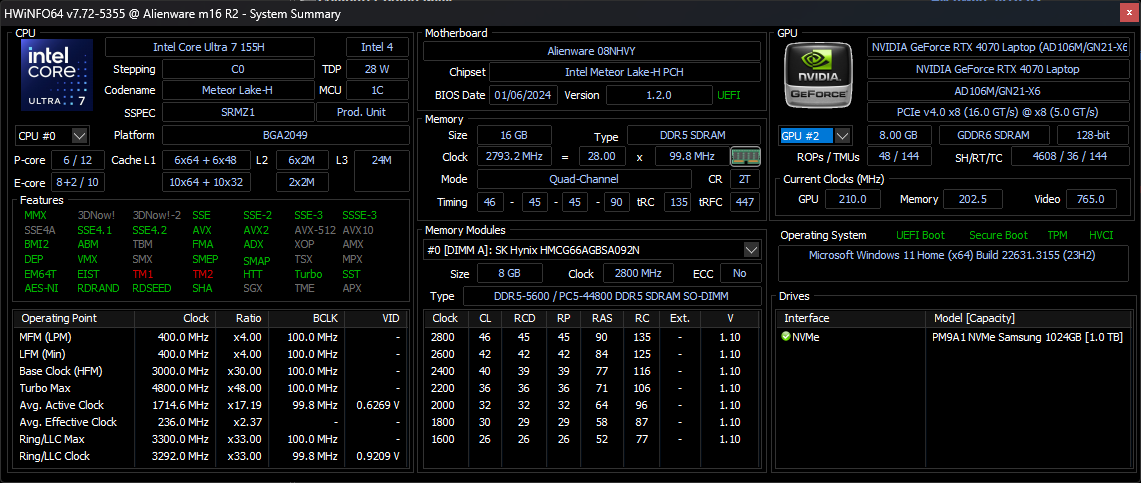
İnceleme birimimiz, Meteor Lake-H Core Ultra 7 155H CPU, GeForce RTX 4070 GPU ve 1600p 240 Hz IPS ekran ile yaklaşık 1850 USD karşılığında üst düzey yapılandırmadır. Alt uç SKU'lar bunun yerine RTX 4050 veya 4060 ile yapılandırılabilir ve üst uç SKU'lar Core Ultra 9'u içerir, ancak tüm yapılandırmalar aksi takdirde aynı 1600p240 IPS ekranla ve yalnızca RTX 4070'e kadar sınırlıdır.
Alienware m16 R2'nin alternatifleri arasında diğer yüksek performanslı 16 inç dizüstü bilgisayarlar da yer alıyor Razer Blade 16, HP Omen Transcend 16, Asus ROG Zephyrus G16veya Lenovo Legion Slim 7 16.
Daha fazla Alienware incelemesi:
Karşılaştırmalı olarak olası rakipler
Derecelendirme | Tarih | Modeli | Ağırlık | Yükseklik | Boyut | Çözünürlük | Fiyat |
|---|---|---|---|---|---|---|---|
| 90.2 % v7 (old) | 03/2024 | Alienware m16 R2 Ultra 7 155H, GeForce RTX 4070 Laptop GPU | 2.5 kg | 23.5 mm | 16.00" | 2560x1600 | |
| 88.3 % v7 (old) | 07/2023 | Alienware m16 R1 Intel i7-13700HX, GeForce RTX 4060 Laptop GPU | 3 kg | 25.4 mm | 16.00" | 2560x1600 | |
| 88.4 % v7 (old) | 07/2023 | Alienware x16 R1 i9-13900HK, GeForce RTX 4080 Laptop GPU | 2.6 kg | 18.57 mm | 16.00" | 2560x1600 | |
| 88.4 % v7 (old) | 02/2024 | HP Omen Transcend 16-u1095ng i9-14900HX, GeForce RTX 4070 Laptop GPU | 2.3 kg | 20 mm | 16.00" | 2560x1600 | |
| 92.3 % v7 (old) | 02/2024 | Asus ROG Zephyrus G16 2024 GU605M Ultra 7 155H, GeForce RTX 4070 Laptop GPU | 1.8 kg | 16.4 mm | 16.00" | 2560x1600 | |
| 90.4 % v7 (old) | 11/2023 | Lenovo Legion Slim 7 16APH8 R7 7840HS, GeForce RTX 4060 Laptop GPU | 2.1 kg | 20 mm | 16.00" | 2560x1600 |
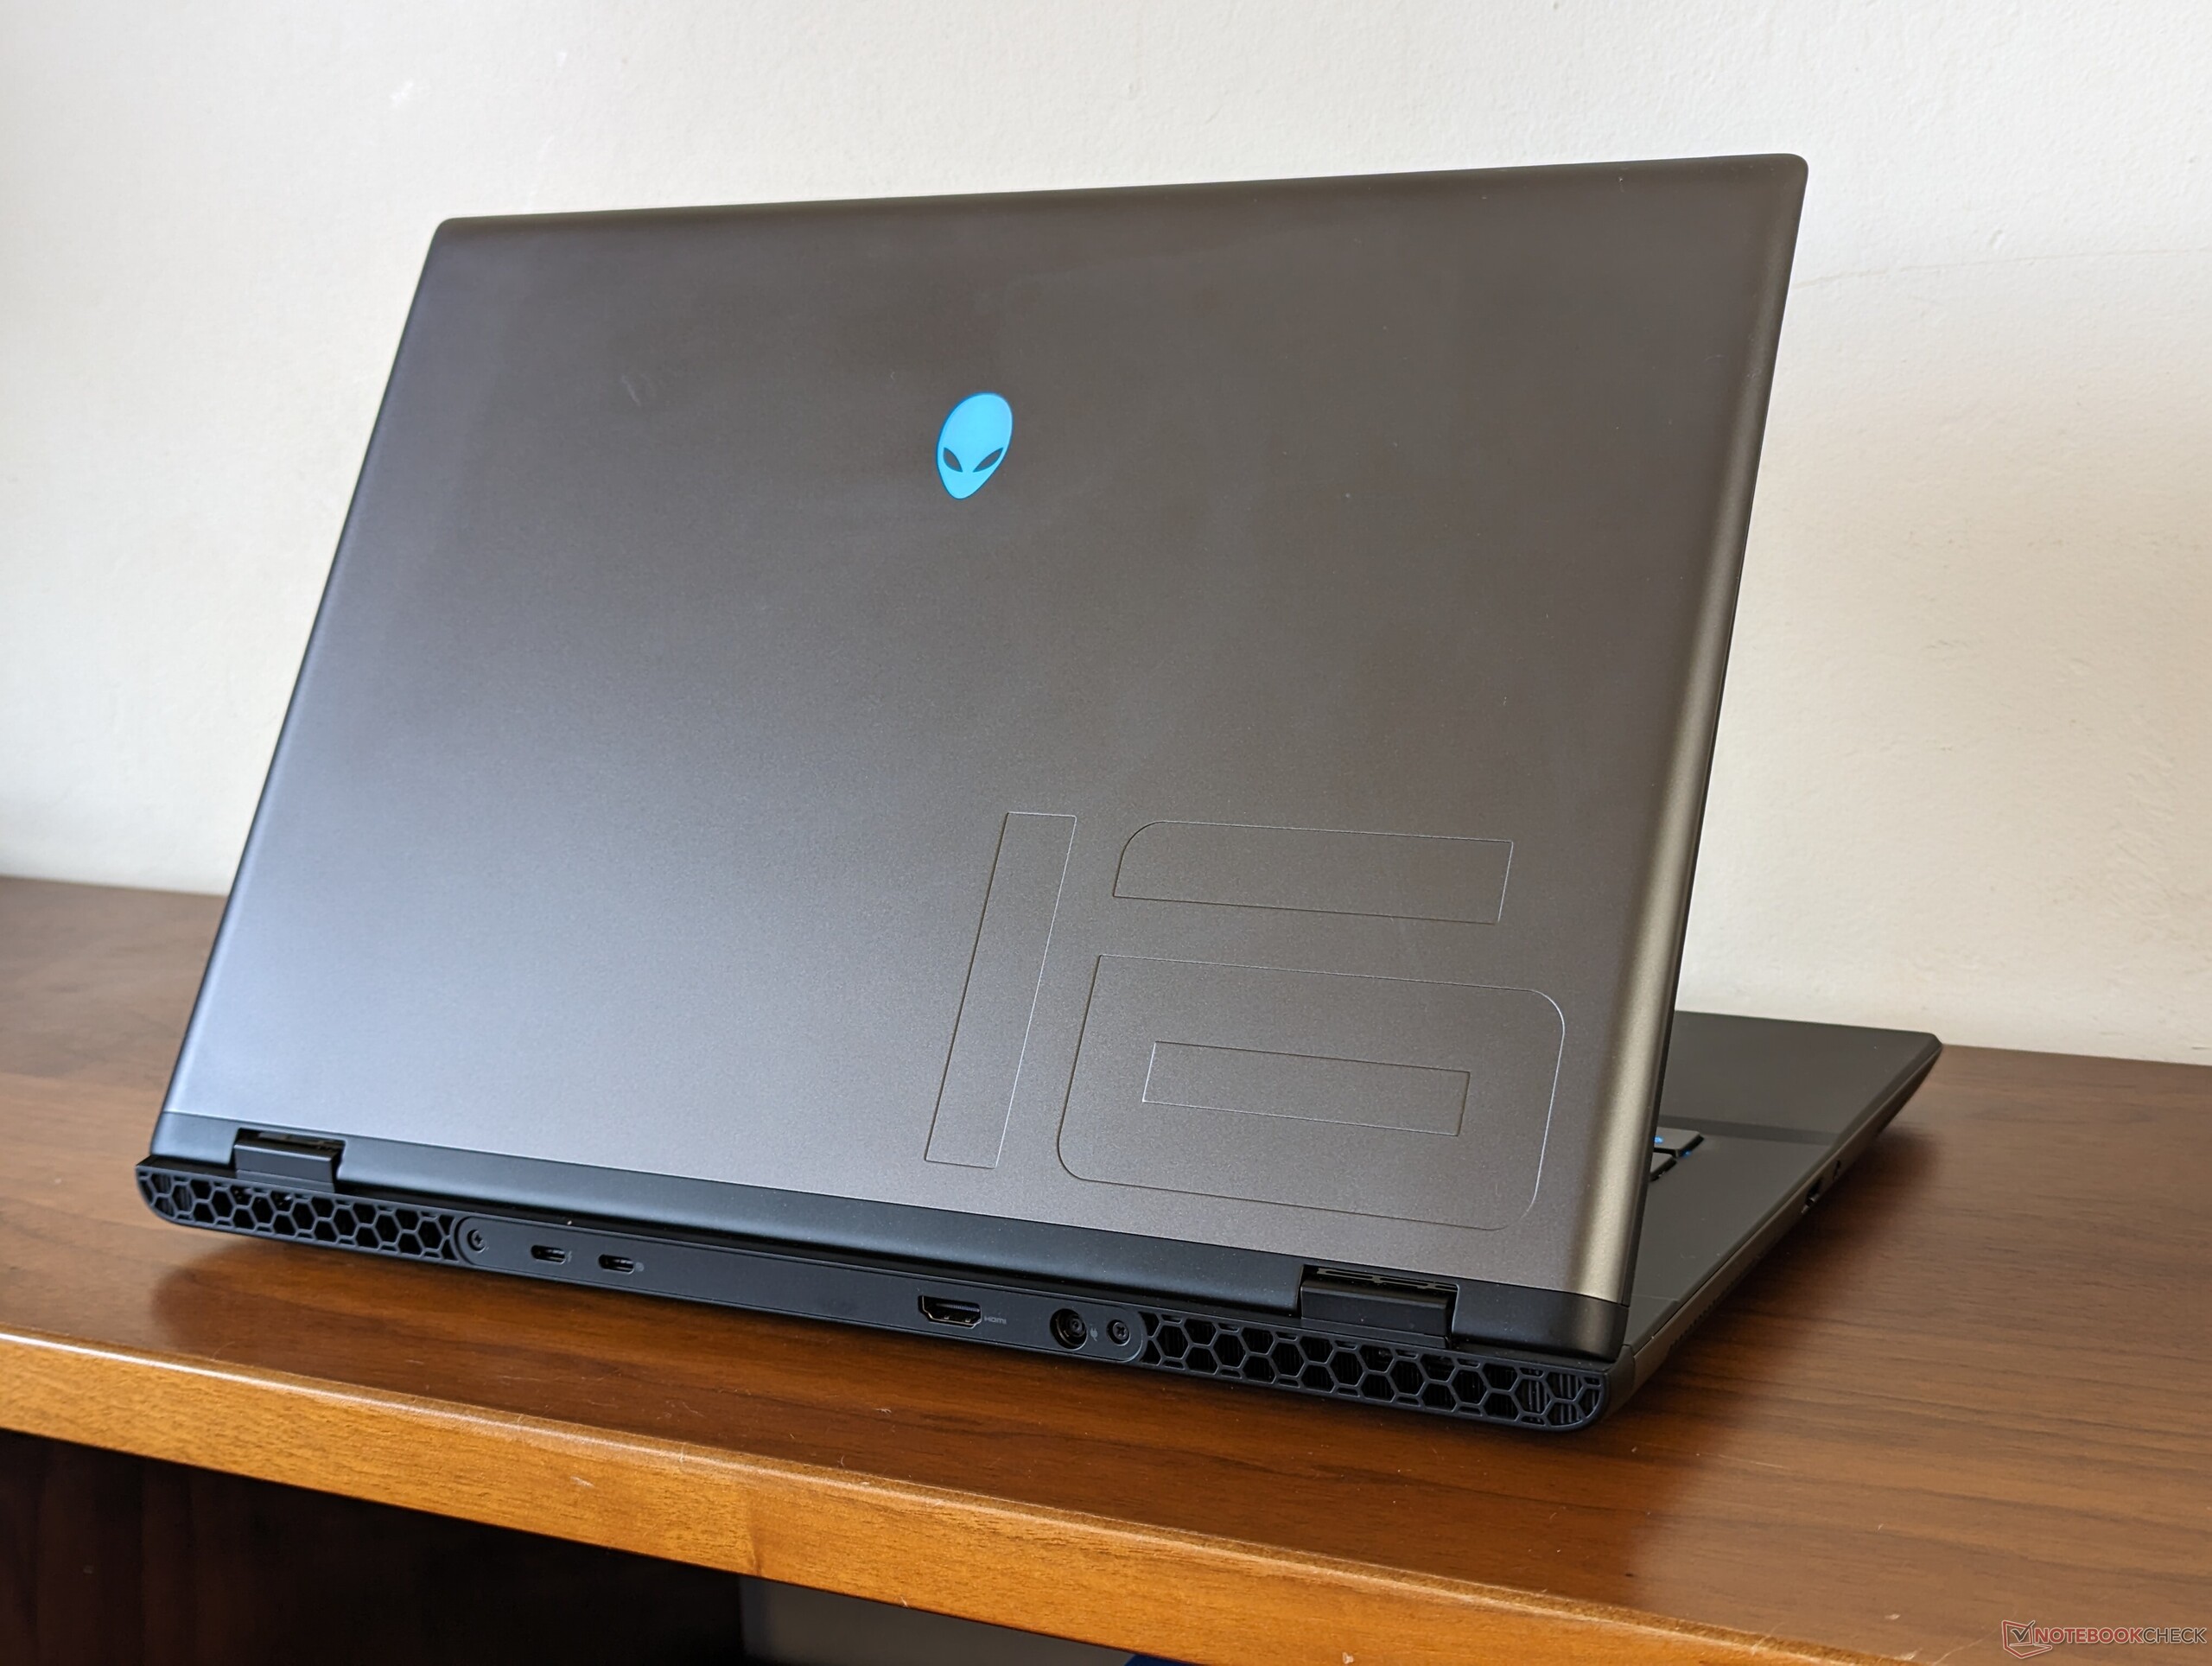
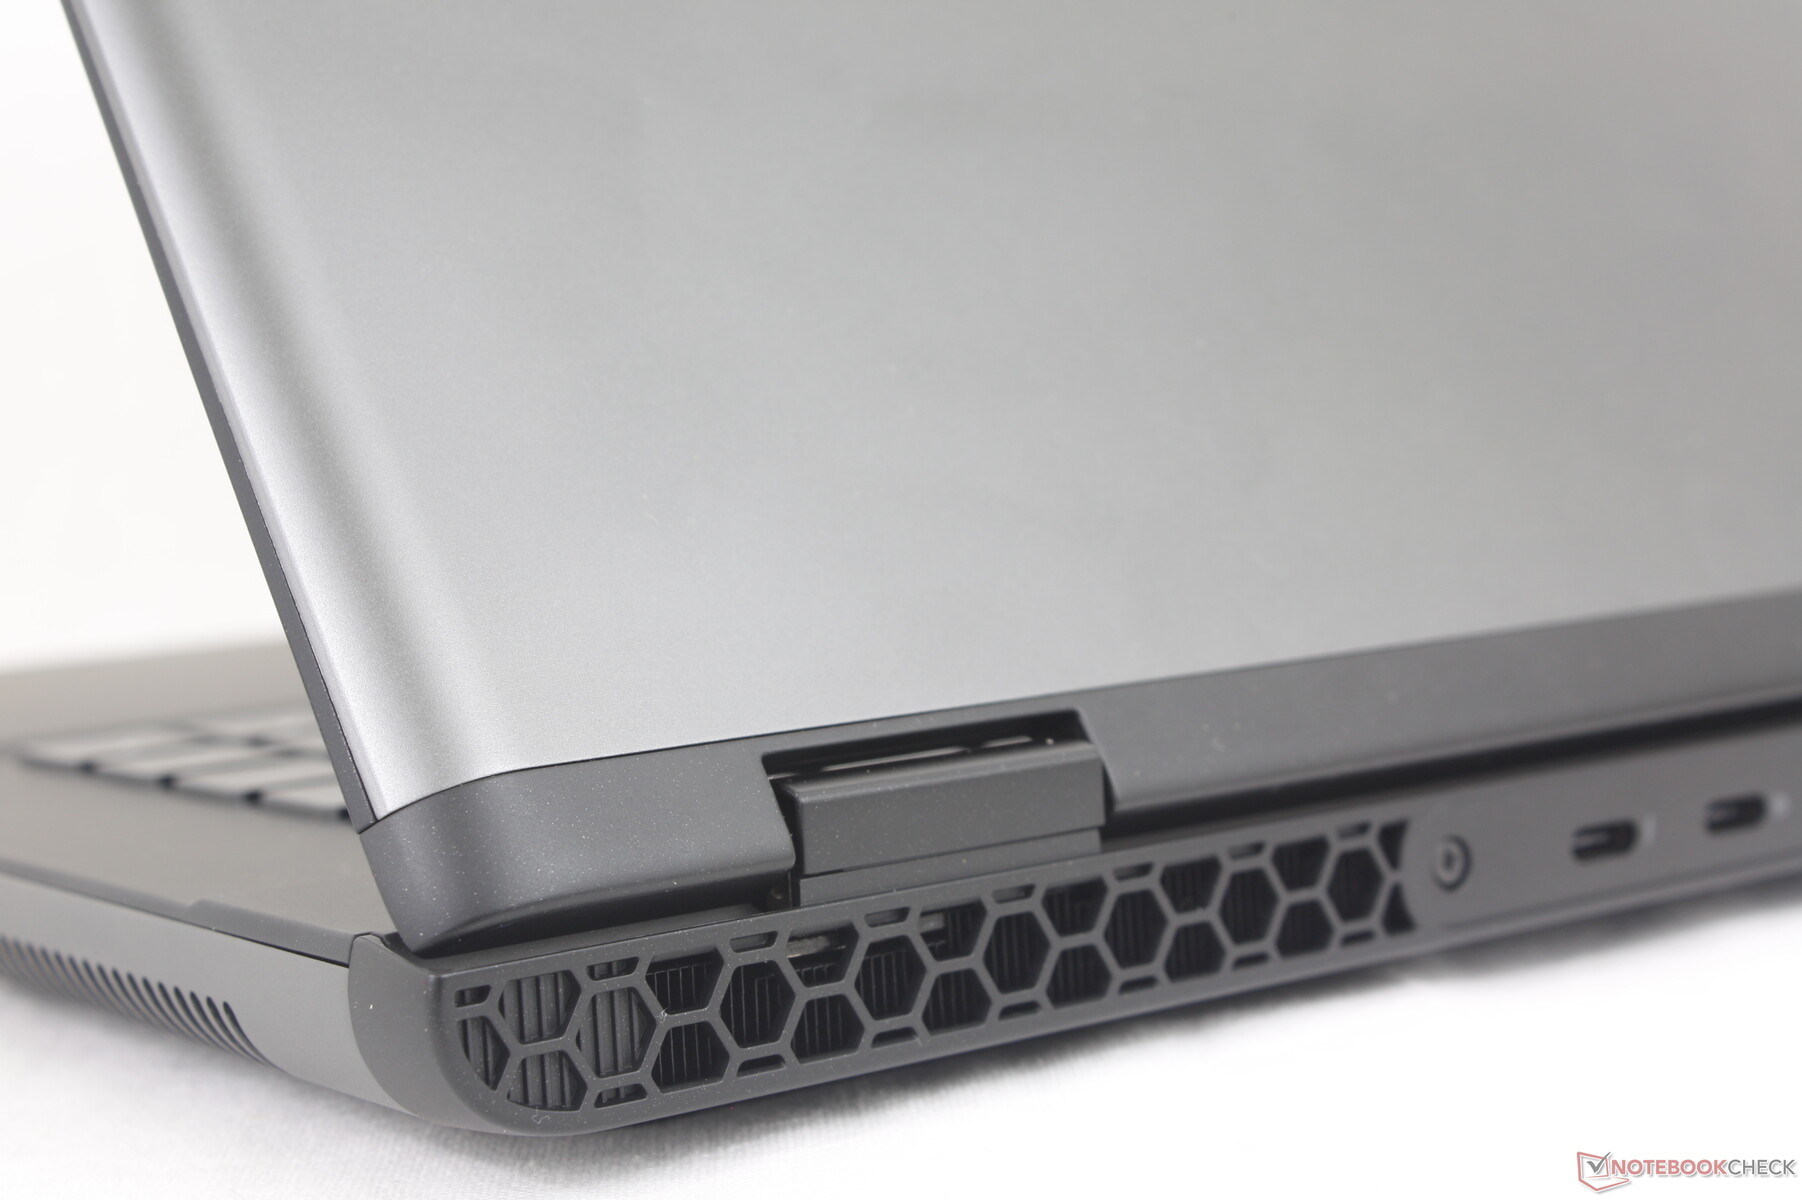
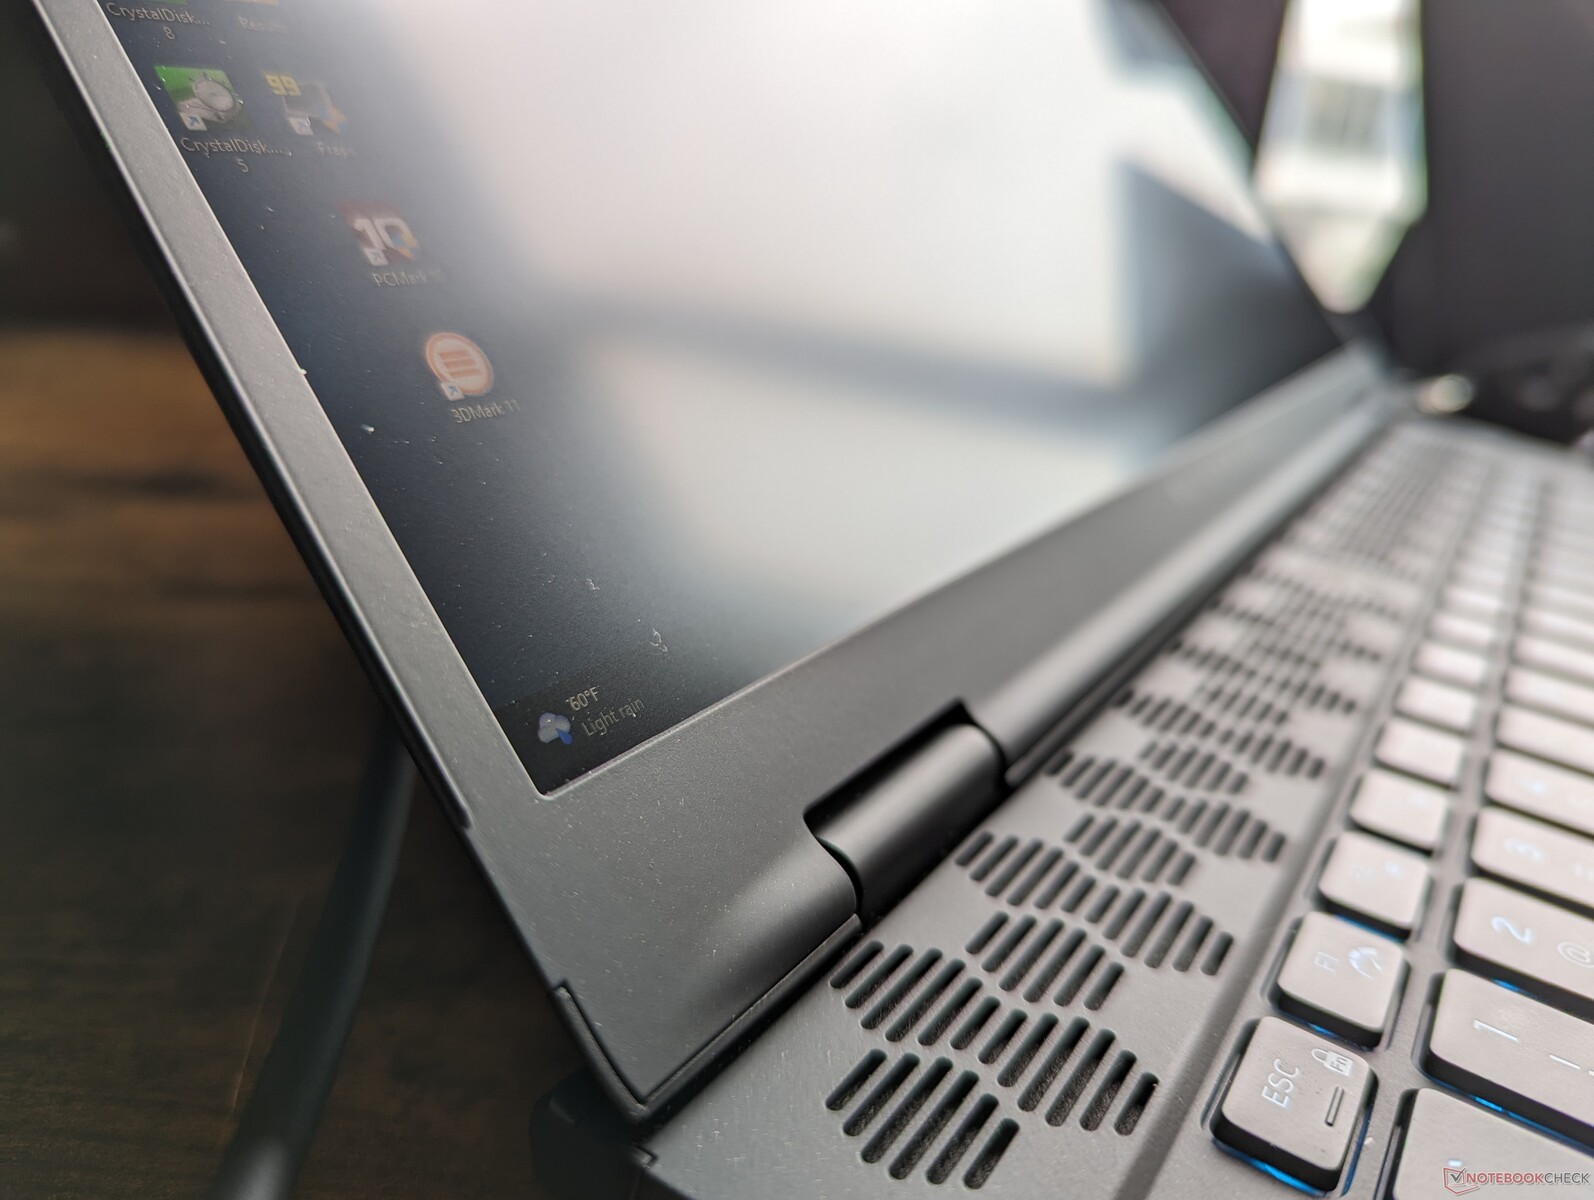
Case - Legend 3.0 Yeniden Tanımlandı
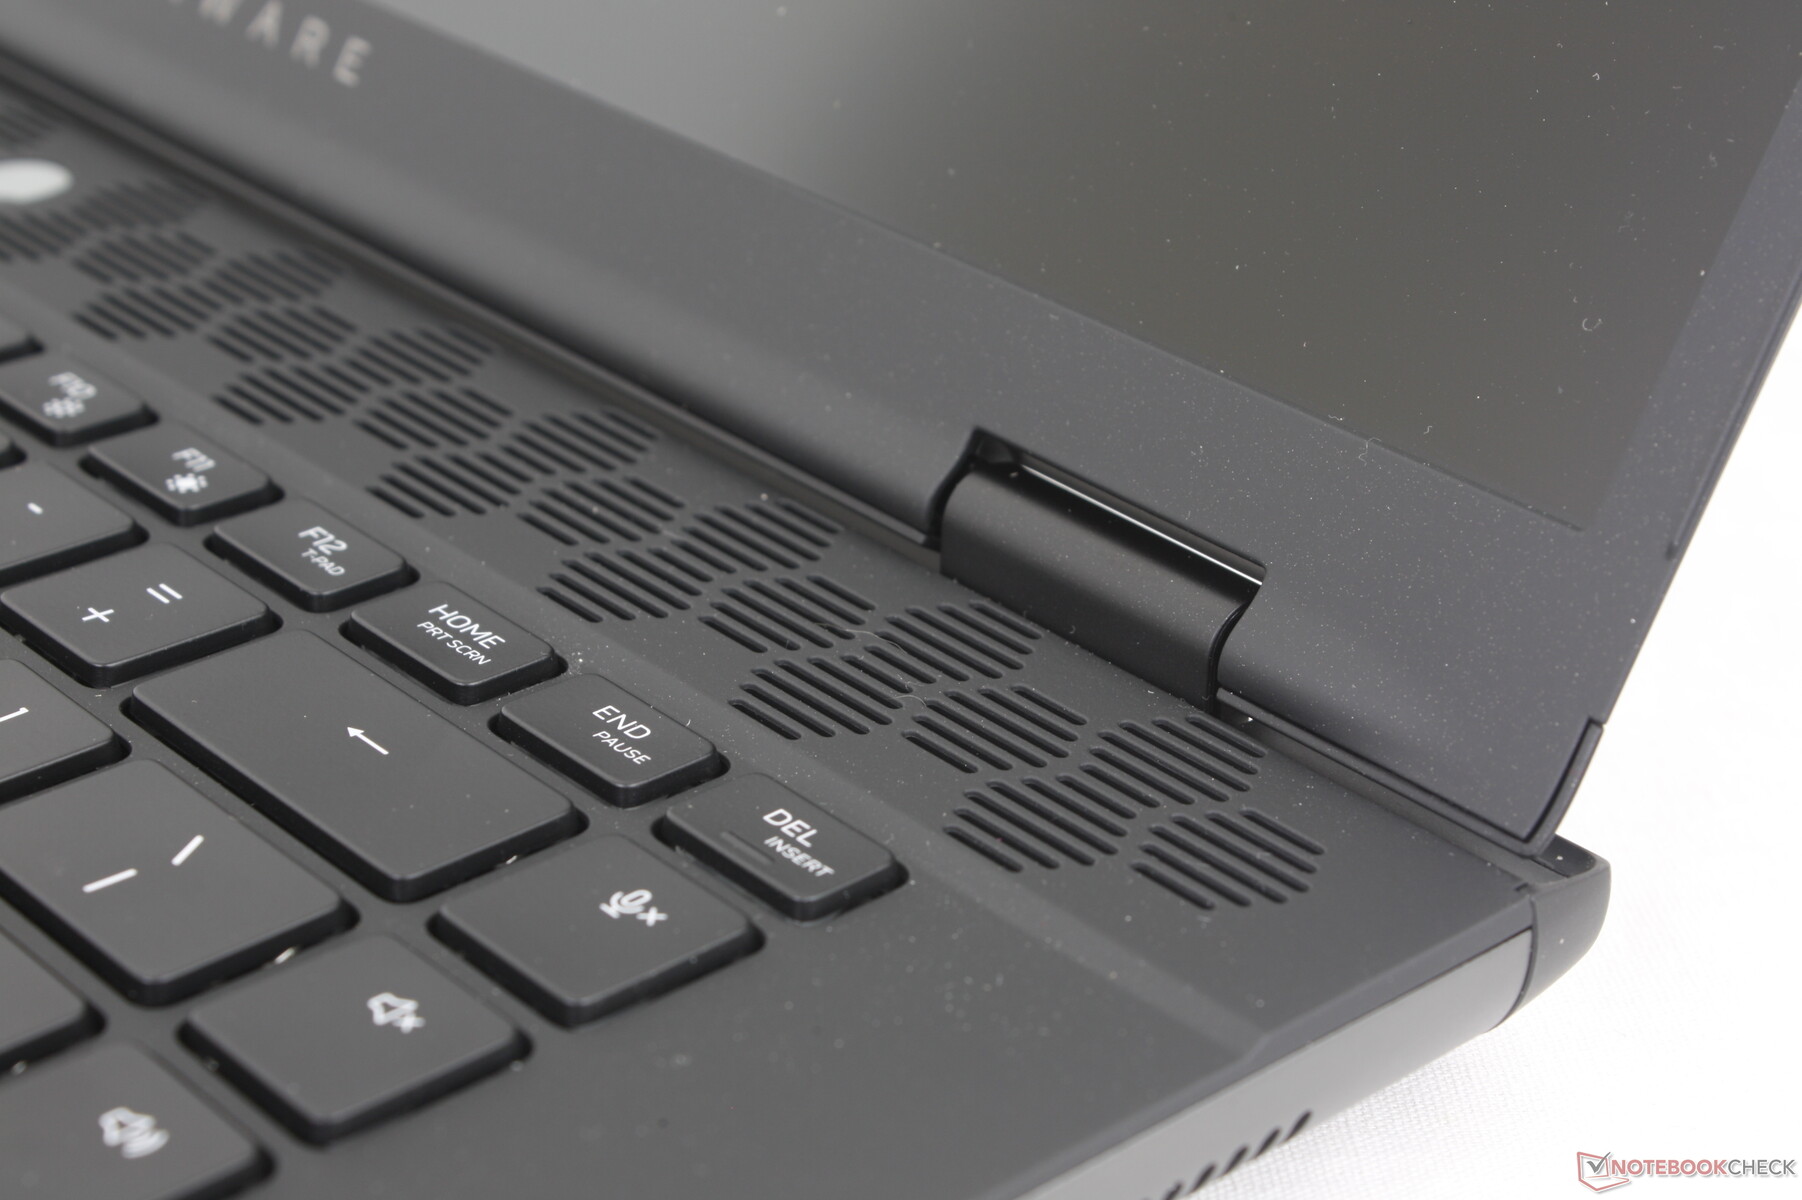
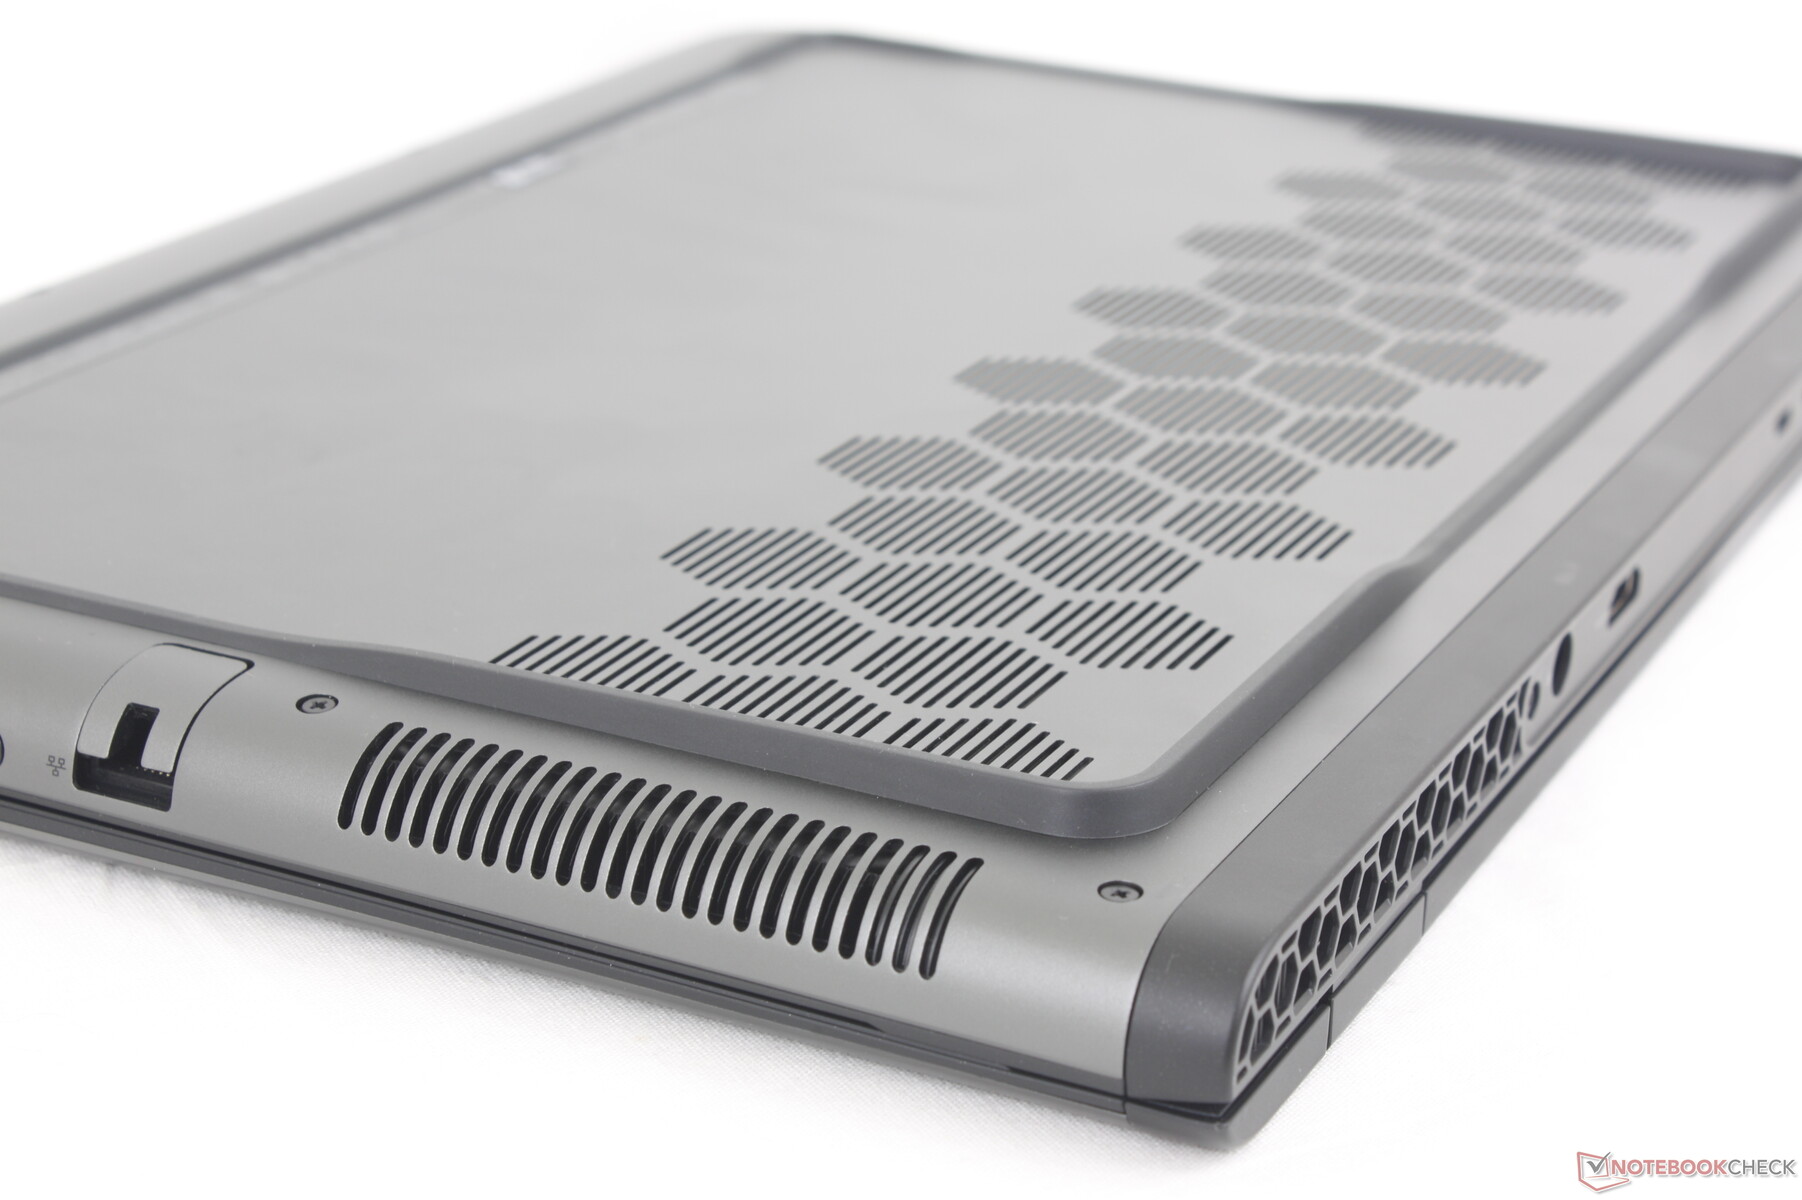
Bu Alienware m16 R1 henüz bir yaşında bile değil ve Dell şimdiden m16 R2 ile revize edilmiş bir kasa tasarımı sunuyor. En dikkat çekici değişiklik, eskisinden çok daha küçük bir ayak izi için arka taraftaki çıkıntılı termal güvertenin çıkarılmasını içeriyor. Arkadaki RGB LED halkası artık yok ve klavye hem daha büyük avuç içi dayanaklarına hem de daha büyük bir tıklama yüzeyine yer açmak için yukarı doğru itildi.
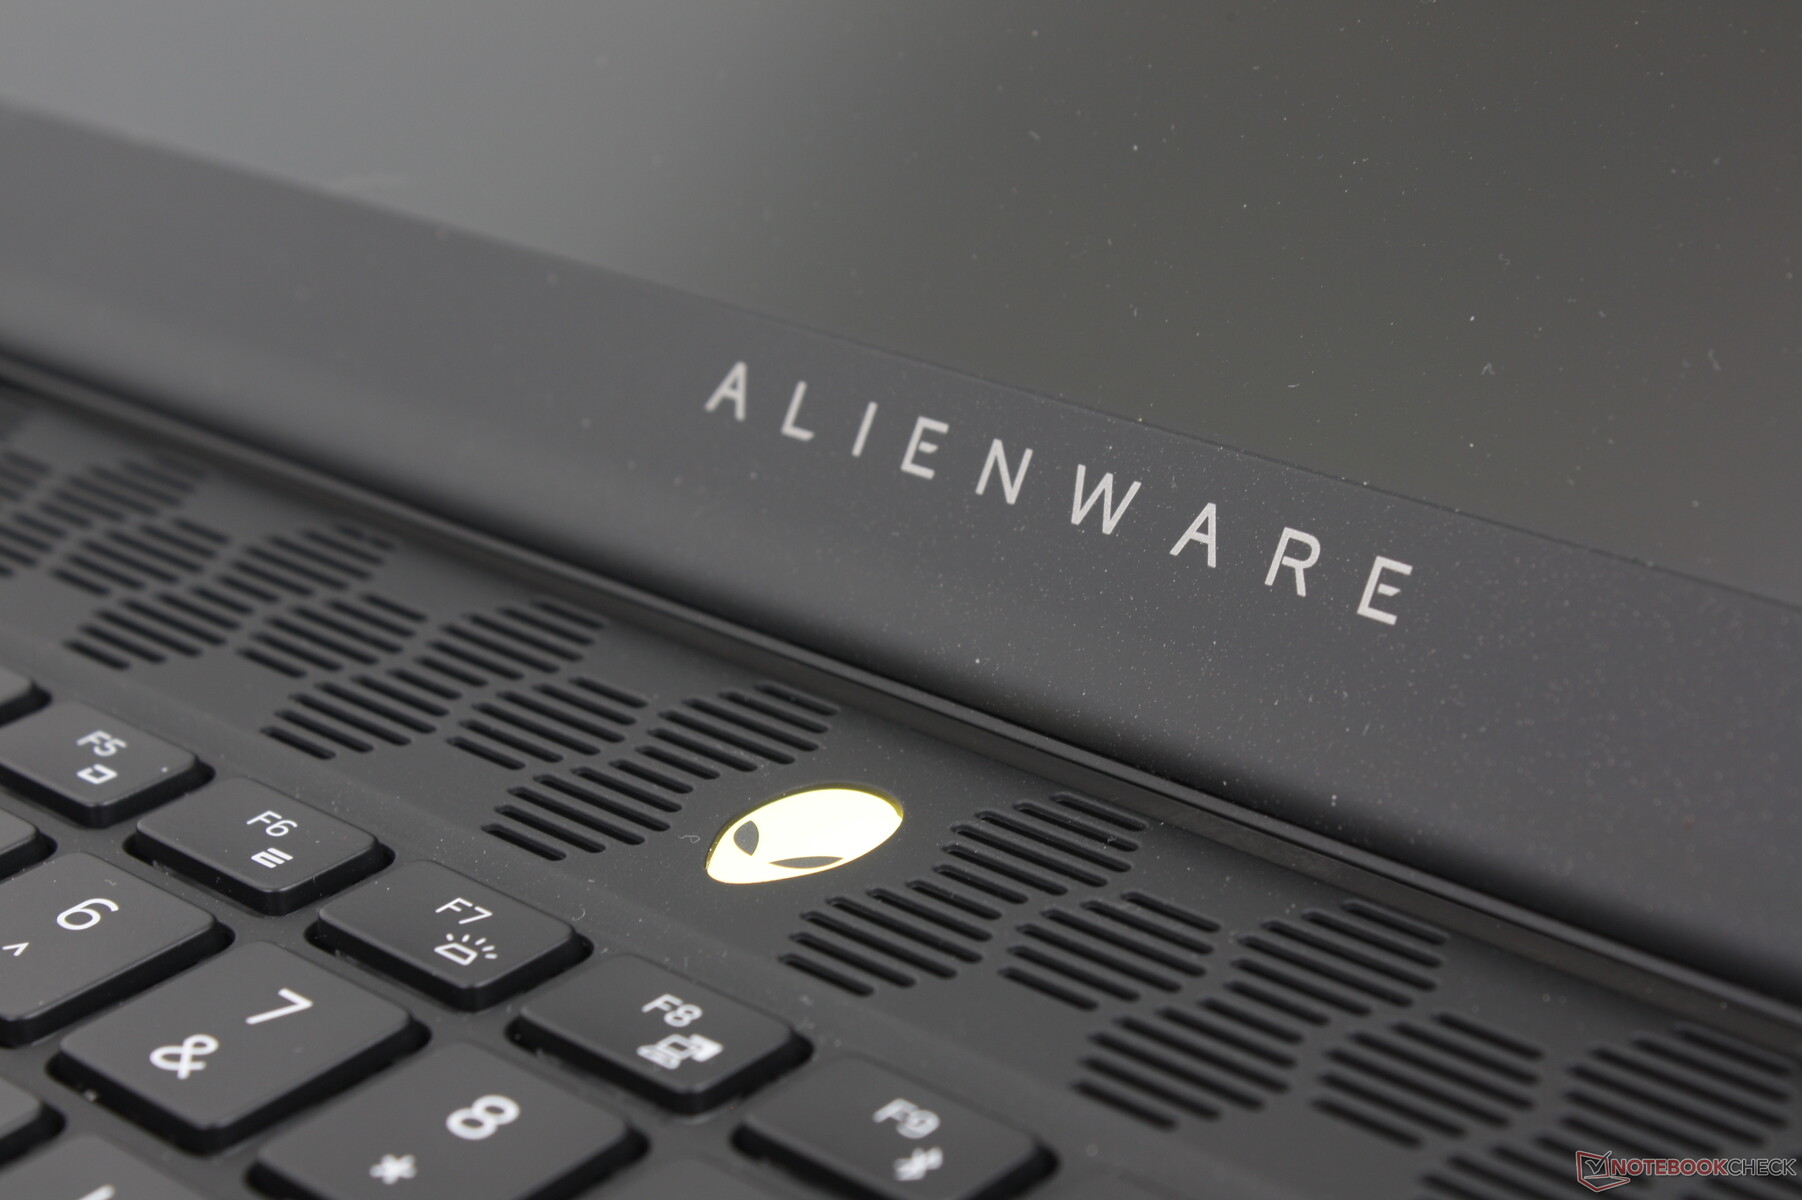
Kasa malzemeleri benzer dokular ve izlenimler için eskisi ile aynı. Sertlik kayda değer ölçüde değişmedi ve bu nedenle ünite, büyük bir gıcırtı veya belirgin zayıf noktalar olmadan yukarıdan aşağıya oldukça güçlü hissettiriyor.
Önemli şasi değişiklikleri, hem ağırlık hem de boyutlarda önemli kesintilerle sonuçlanmıştır. M16 R2, daha iyi taşınabilirlik için m16 R1'den yaklaşık yüzde 17 daha hafif ve yüzde 22 daha küçüktür. Orijinal m16 R1'in daha geniş boyutları daha büyük çantalar gerektirdiğinden, daha küçük ayak izi de sistemin daha küçük sırt çantalarına sığmasına yardımcı olur.
Boyut küçültme, m16 R2'yi kategorisinin en küçüğü yapmak için yeterli değildir, çünkü hem Razer Blade 16 ve Asus Zephyrus G16 hala daha hafif ve küçüktür.
Bağlanabilirlik - Tüm Temel Bilgiler Burada
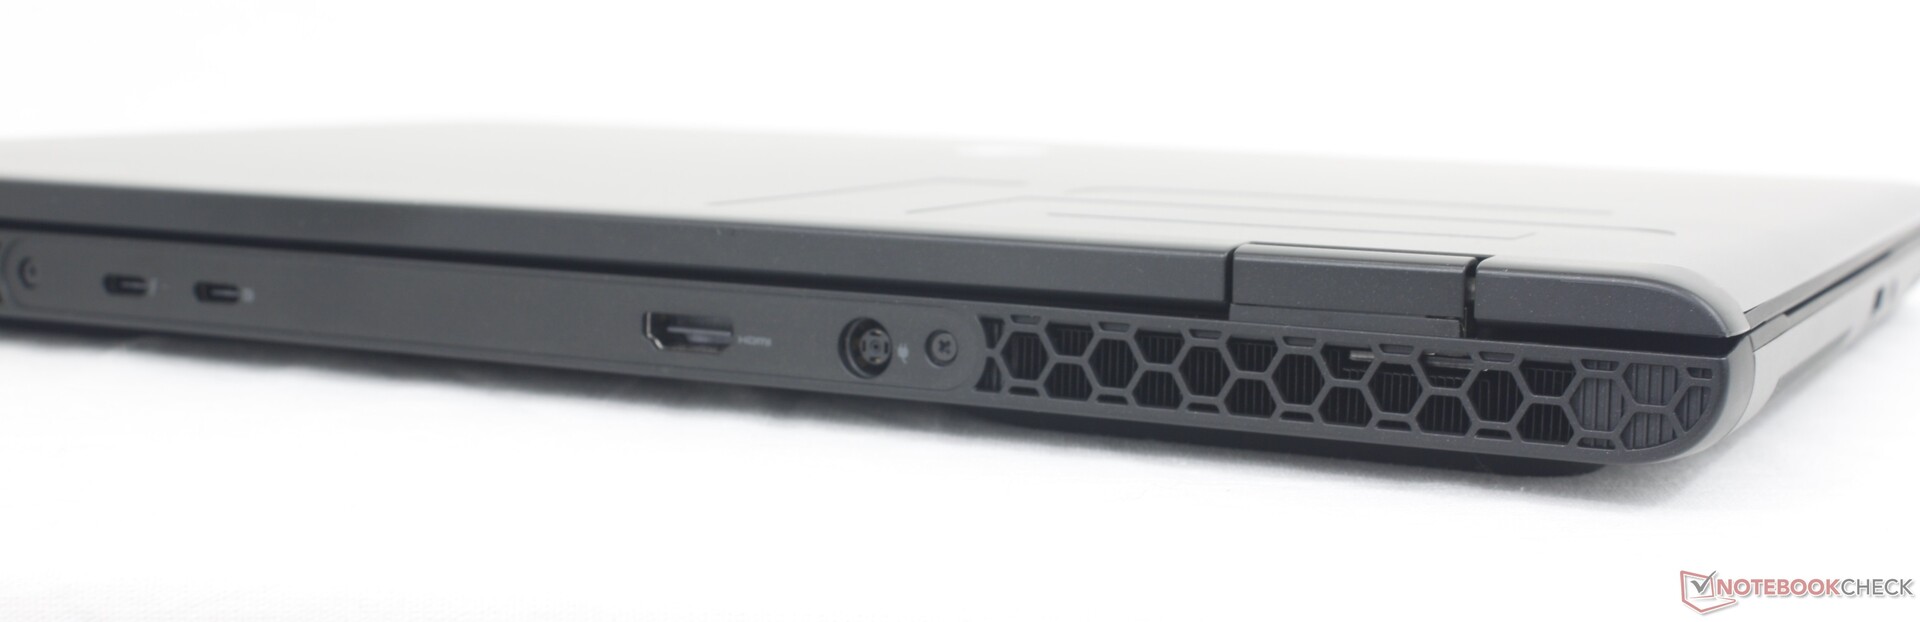
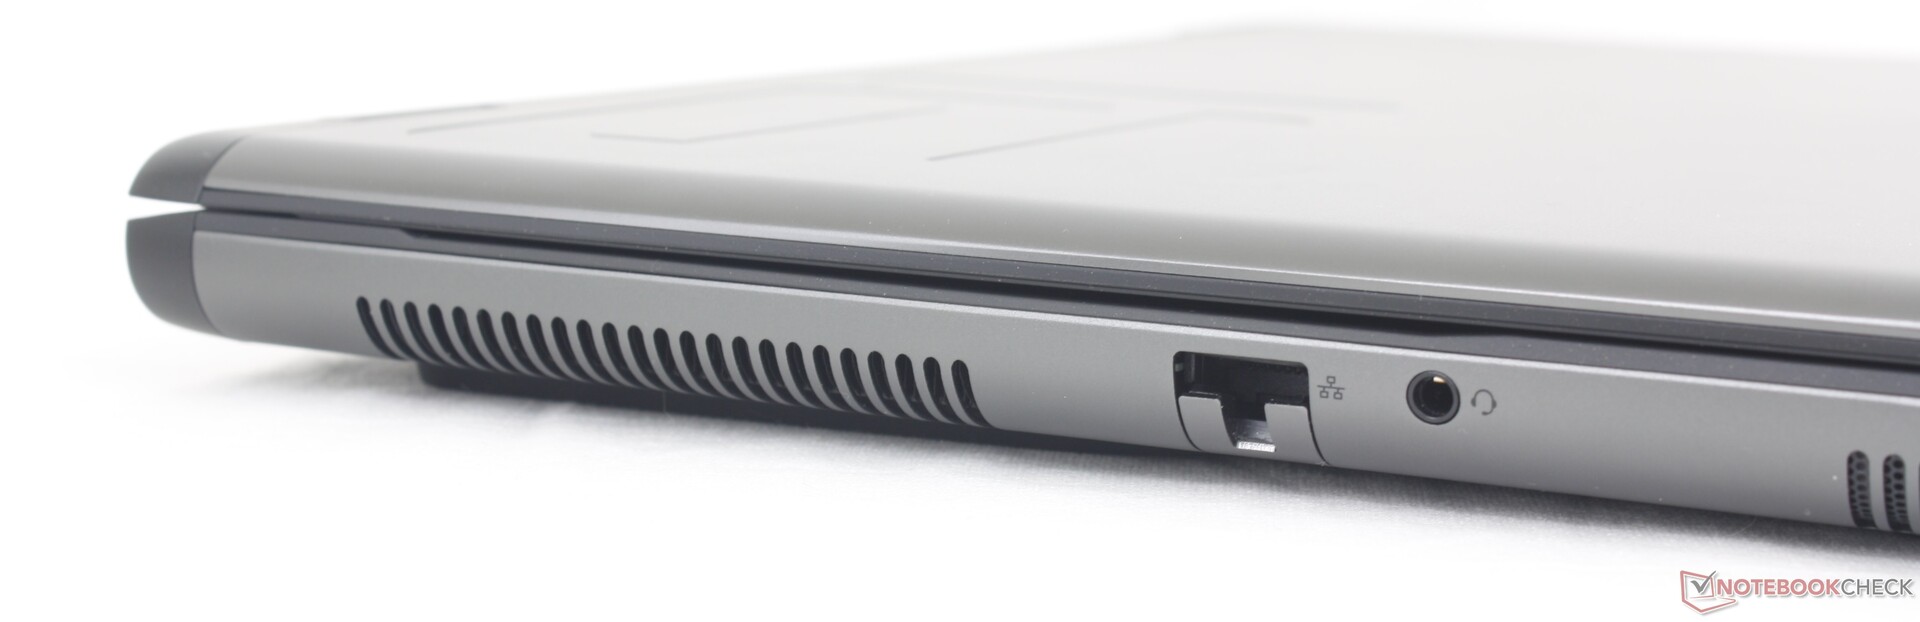
Geçen yılki m16 R1'in tüm bağlantı noktaları mini-DisplayPort hariç geri döndü. Port konumlandırması RJ-45 ile değişti ve ses jakı sol kenara taşındı, oysa m16 R1'deki portların çoğu rahatsız edici bir şekilde arka taraftaydı.
İki USB-C bağlantı noktasından yalnızca birinin Güç Dağıtımı'nı desteklediğini unutmayın. Bunun dışında her ikisi de harici monitörlerle uyumludur.
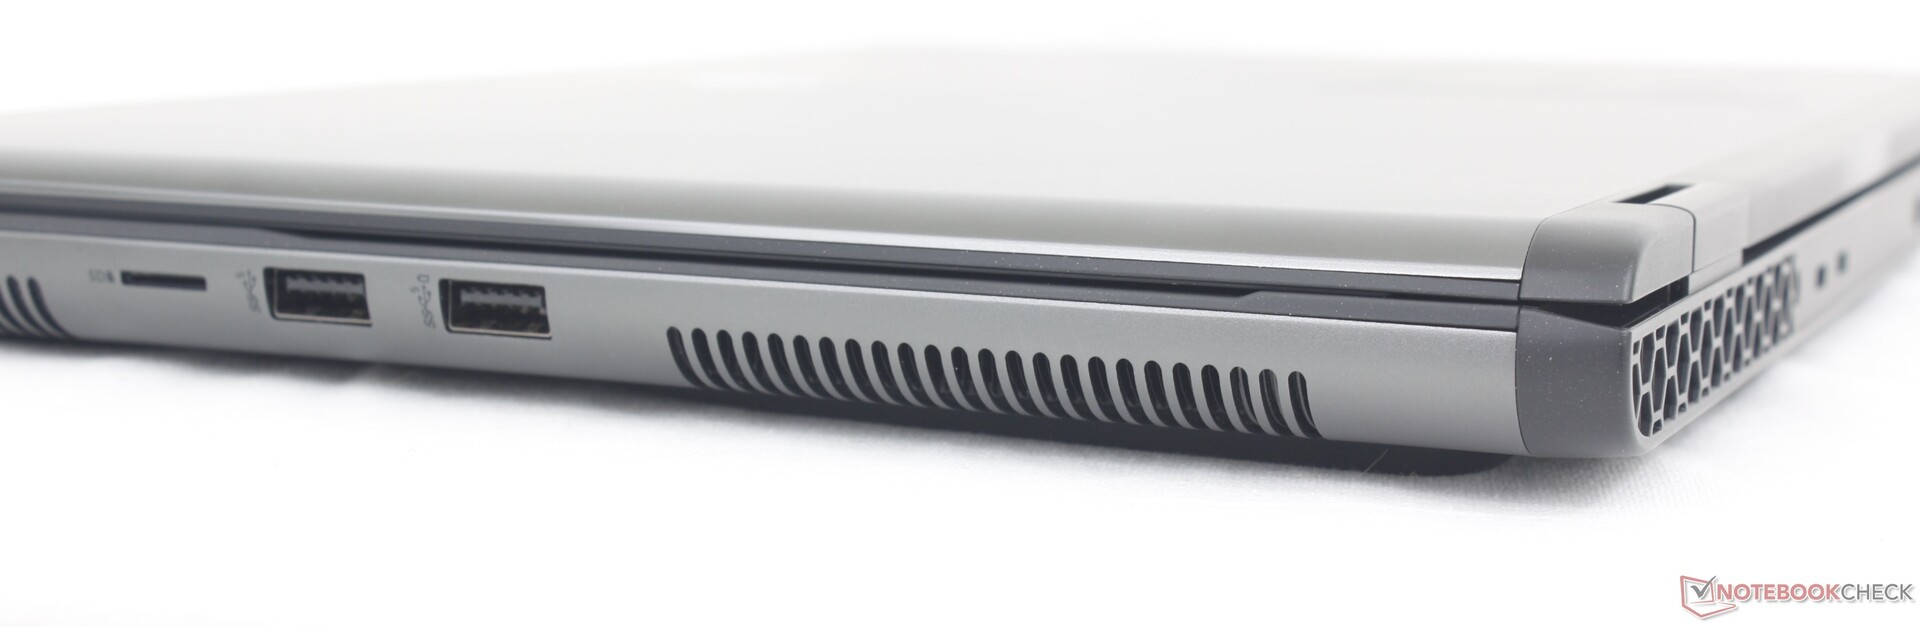
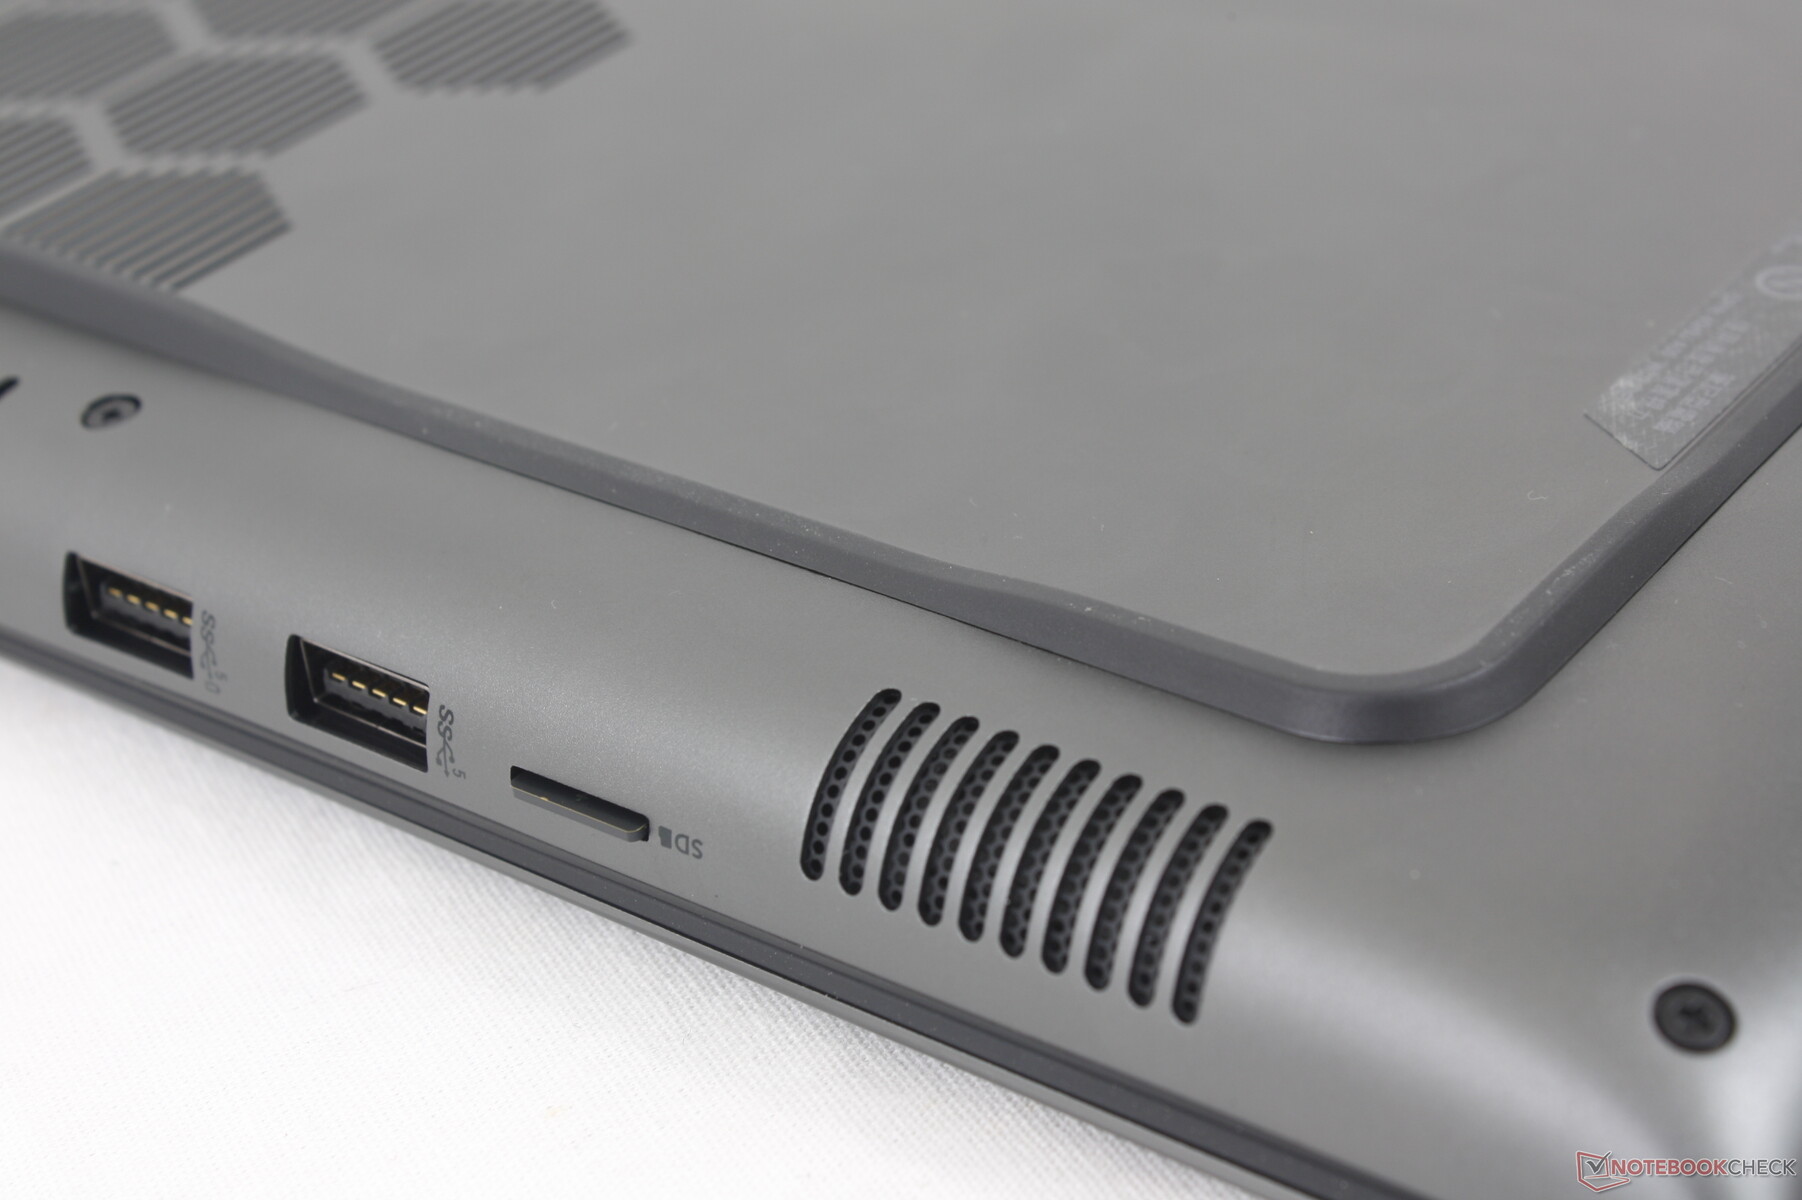
SD Kart Okuyucu
M16 R1 tam boyutlu bir SD okuyucuya sahipken, m16 R2 ne yazık ki bunun yerine bazı içerik oluşturucuları rahatsız edebilecek bir MicroSD okuyucuya geri çekildi. MicroSD'ye geçilmesine rağmen aktarım hızları m16 R1'de kaydettiklerimizle hemen hemen aynı.
| SD Card Reader | |
| average JPG Copy Test (av. of 3 runs) | |
| Alienware m16 R1 Intel (AV PRO microSD 128 GB V60) | |
| Lenovo Legion Slim 7 16APH8 (AV PRO microSD 128 GB V60) | |
| Asus ROG Zephyrus G16 2024 GU605M | |
| Alienware m16 R2 (AV PRO microSD 128 GB V60) | |
| Alienware x16 R1 (AV PRO microSD 128 GB V60) | |
| maximum AS SSD Seq Read Test (1GB) | |
| Alienware x16 R1 (AV PRO microSD 128 GB V60) | |
| Alienware m16 R2 (AV PRO microSD 128 GB V60) | |
| Alienware m16 R1 Intel (AV PRO microSD 128 GB V60) | |
| Asus ROG Zephyrus G16 2024 GU605M | |
| Lenovo Legion Slim 7 16APH8 (AV PRO microSD 128 GB V60) | |
İletişim
Intel Killer AX1675, Wi-Fi 7 uyumluluğu için BE202'ye yükseltme seçeneğiyle birlikte Wi-Fi 6E bağlantısı için standart olarak gelir. Asus AXE11000 test yönlendiricimizle eşleştirdiğimizde hiçbir sorun yaşamadık.
| Networking | |
| iperf3 transmit AXE11000 | |
| Asus ROG Zephyrus G16 2024 GU605M | |
| HP Omen Transcend 16-u1095ng | |
| Alienware m16 R1 Intel | |
| Alienware m16 R2 | |
| Alienware x16 R1 | |
| Lenovo Legion Slim 7 16APH8 | |
| iperf3 receive AXE11000 | |
| Lenovo Legion Slim 7 16APH8 | |
| HP Omen Transcend 16-u1095ng | |
| Alienware m16 R1 Intel | |
| Asus ROG Zephyrus G16 2024 GU605M | |
| Alienware x16 R1 | |
| Alienware m16 R2 | |
| iperf3 transmit AXE11000 6GHz | |
| Alienware m16 R2 | |
| Alienware x16 R1 | |
| iperf3 receive AXE11000 6GHz | |
| Alienware m16 R2 | |
| Alienware x16 R1 | |
Web kamerası
2 MP web kamerası, Windows Hello desteği için IR ile standart olarak gelir. Entegre gizlilik deklanşörü yoktur.


Bakım
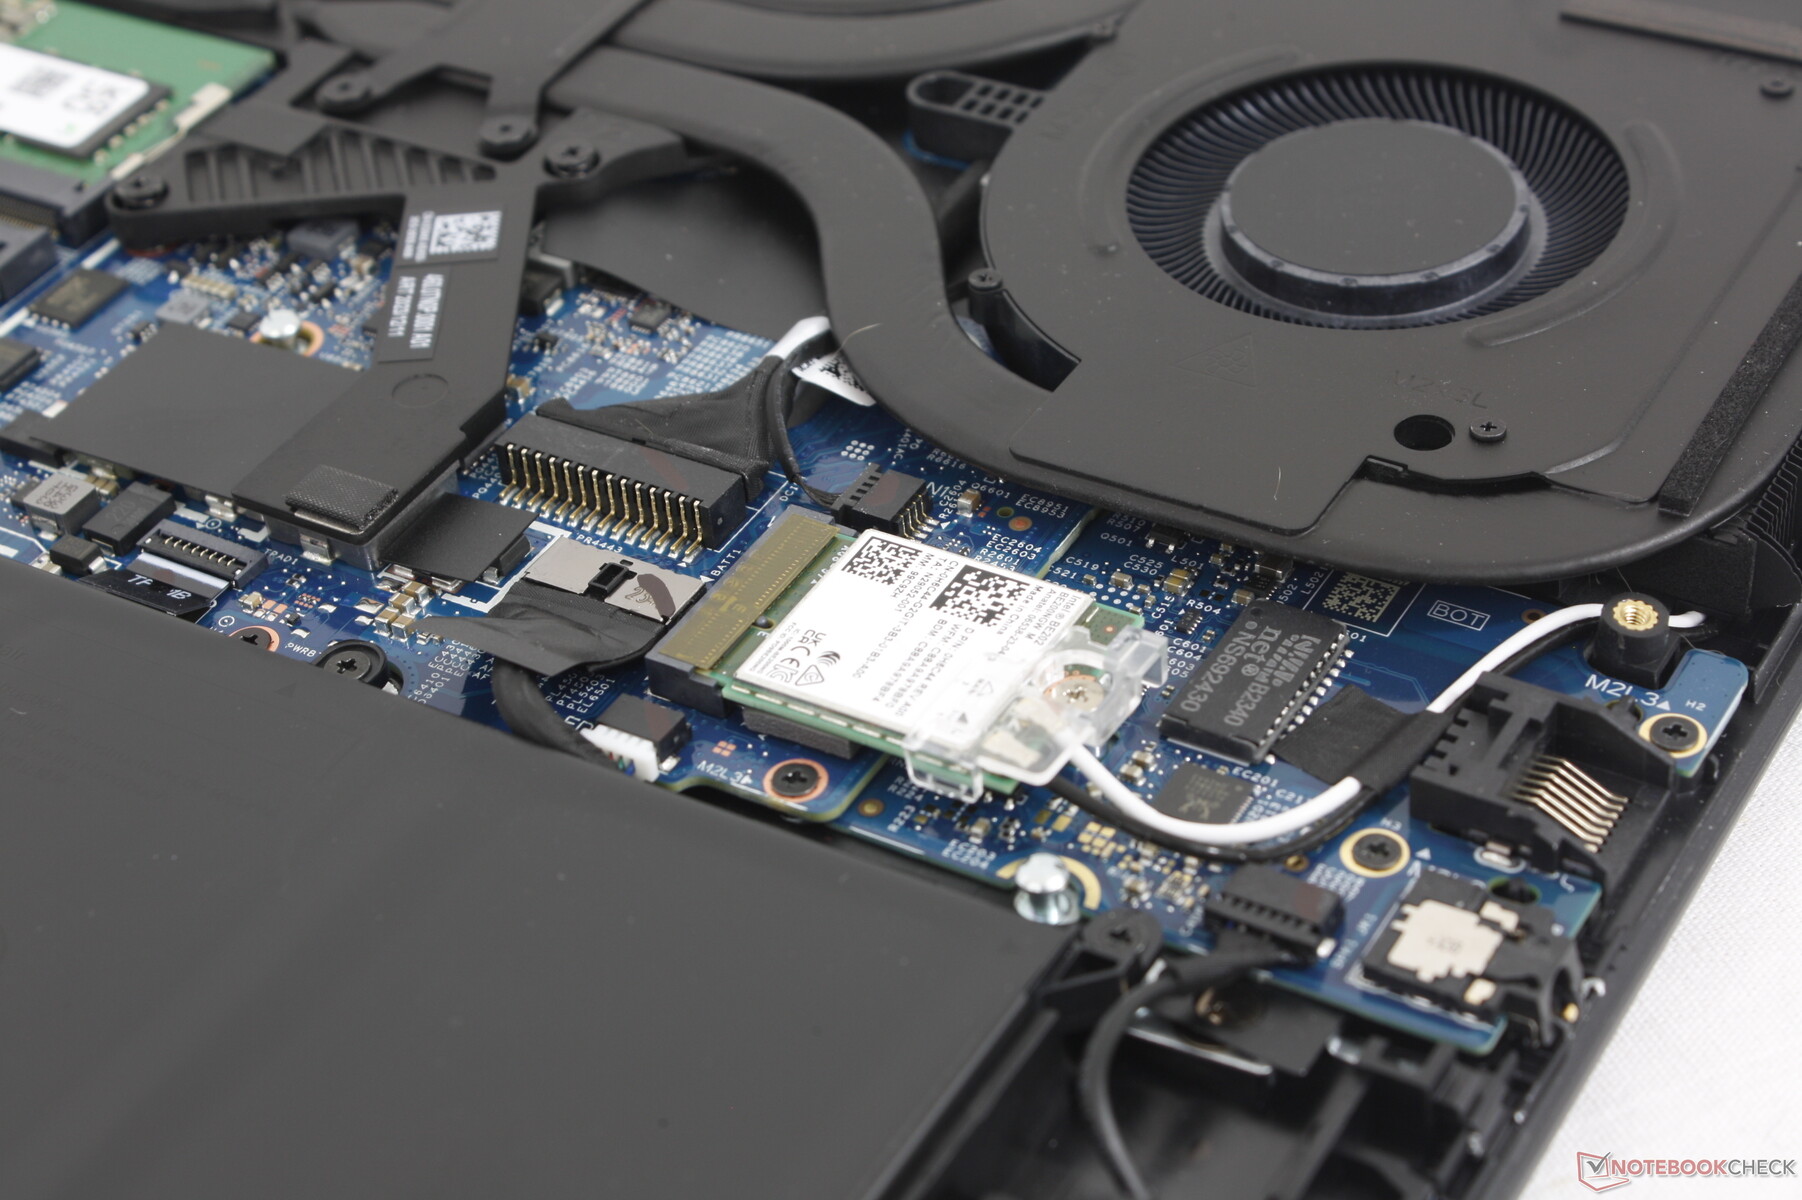
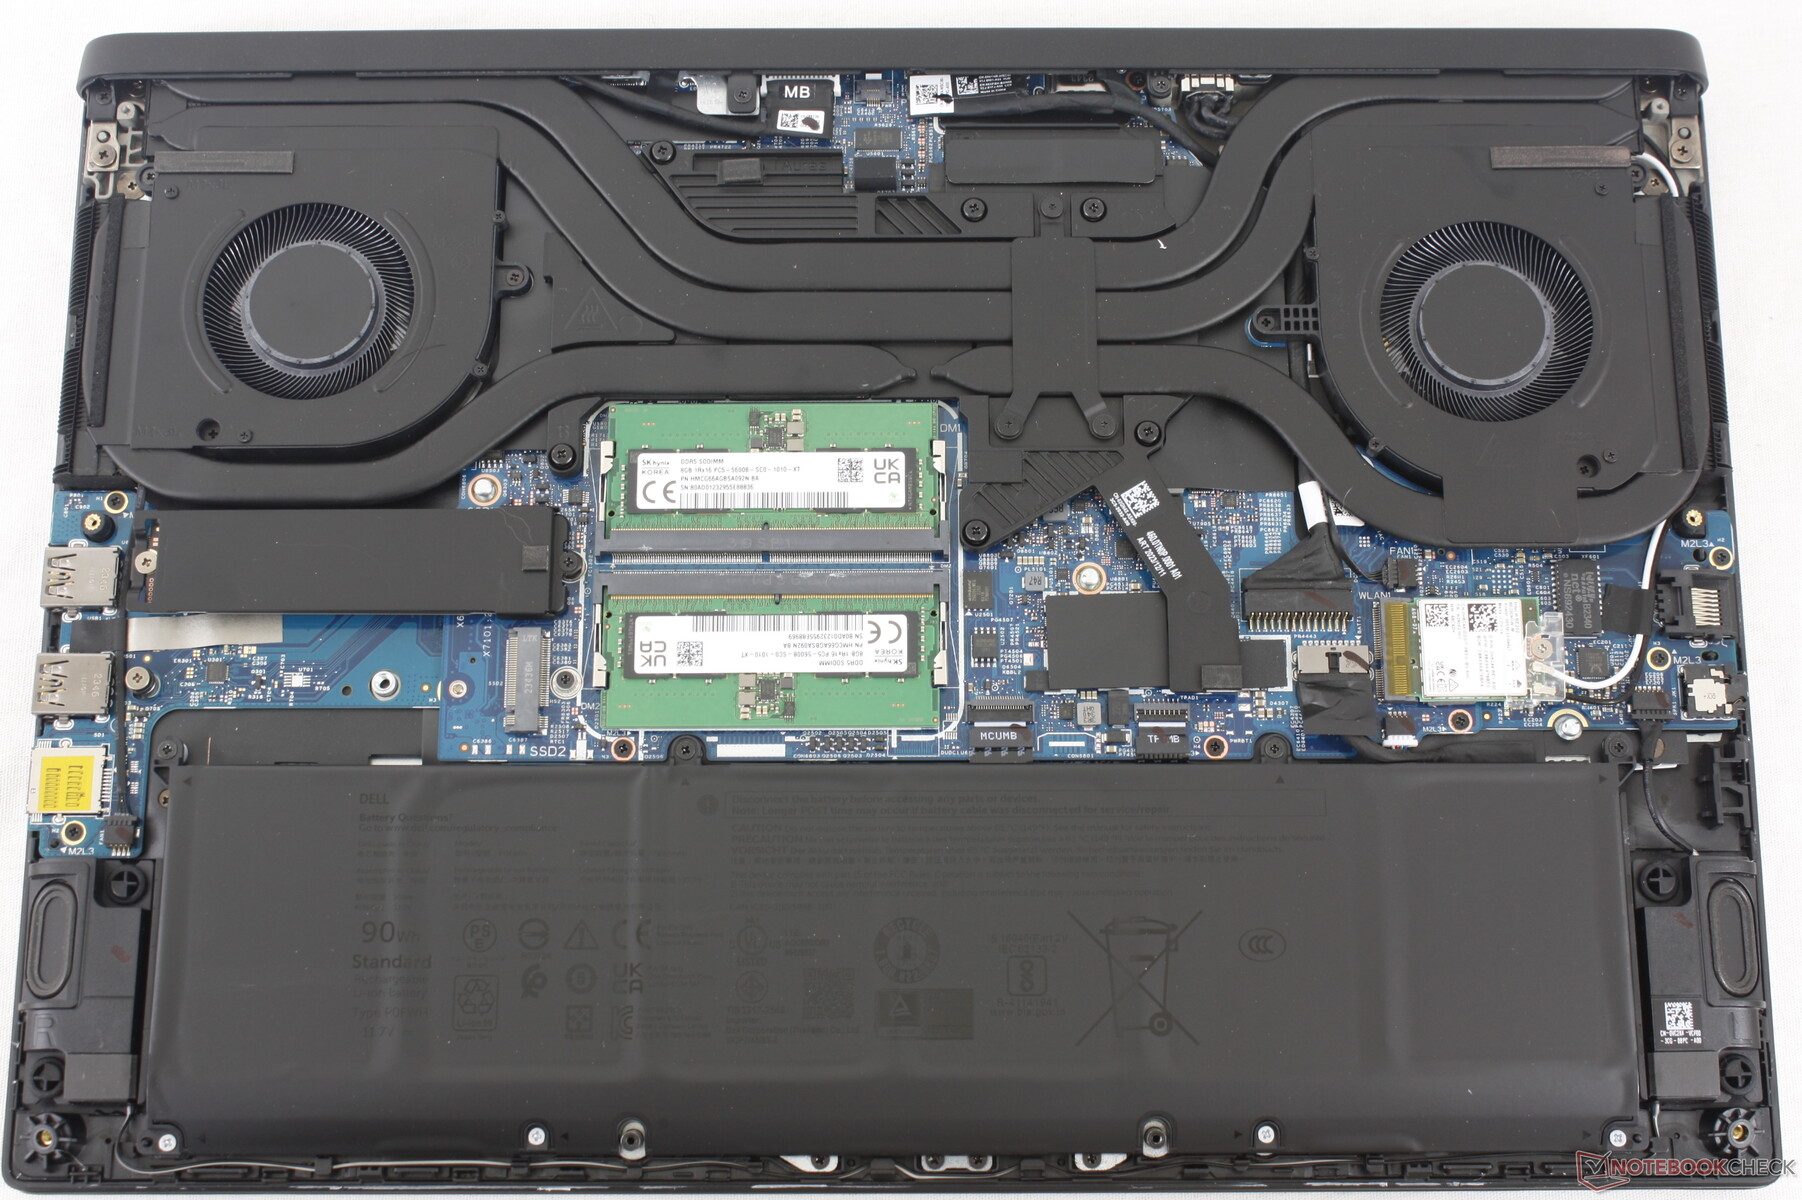
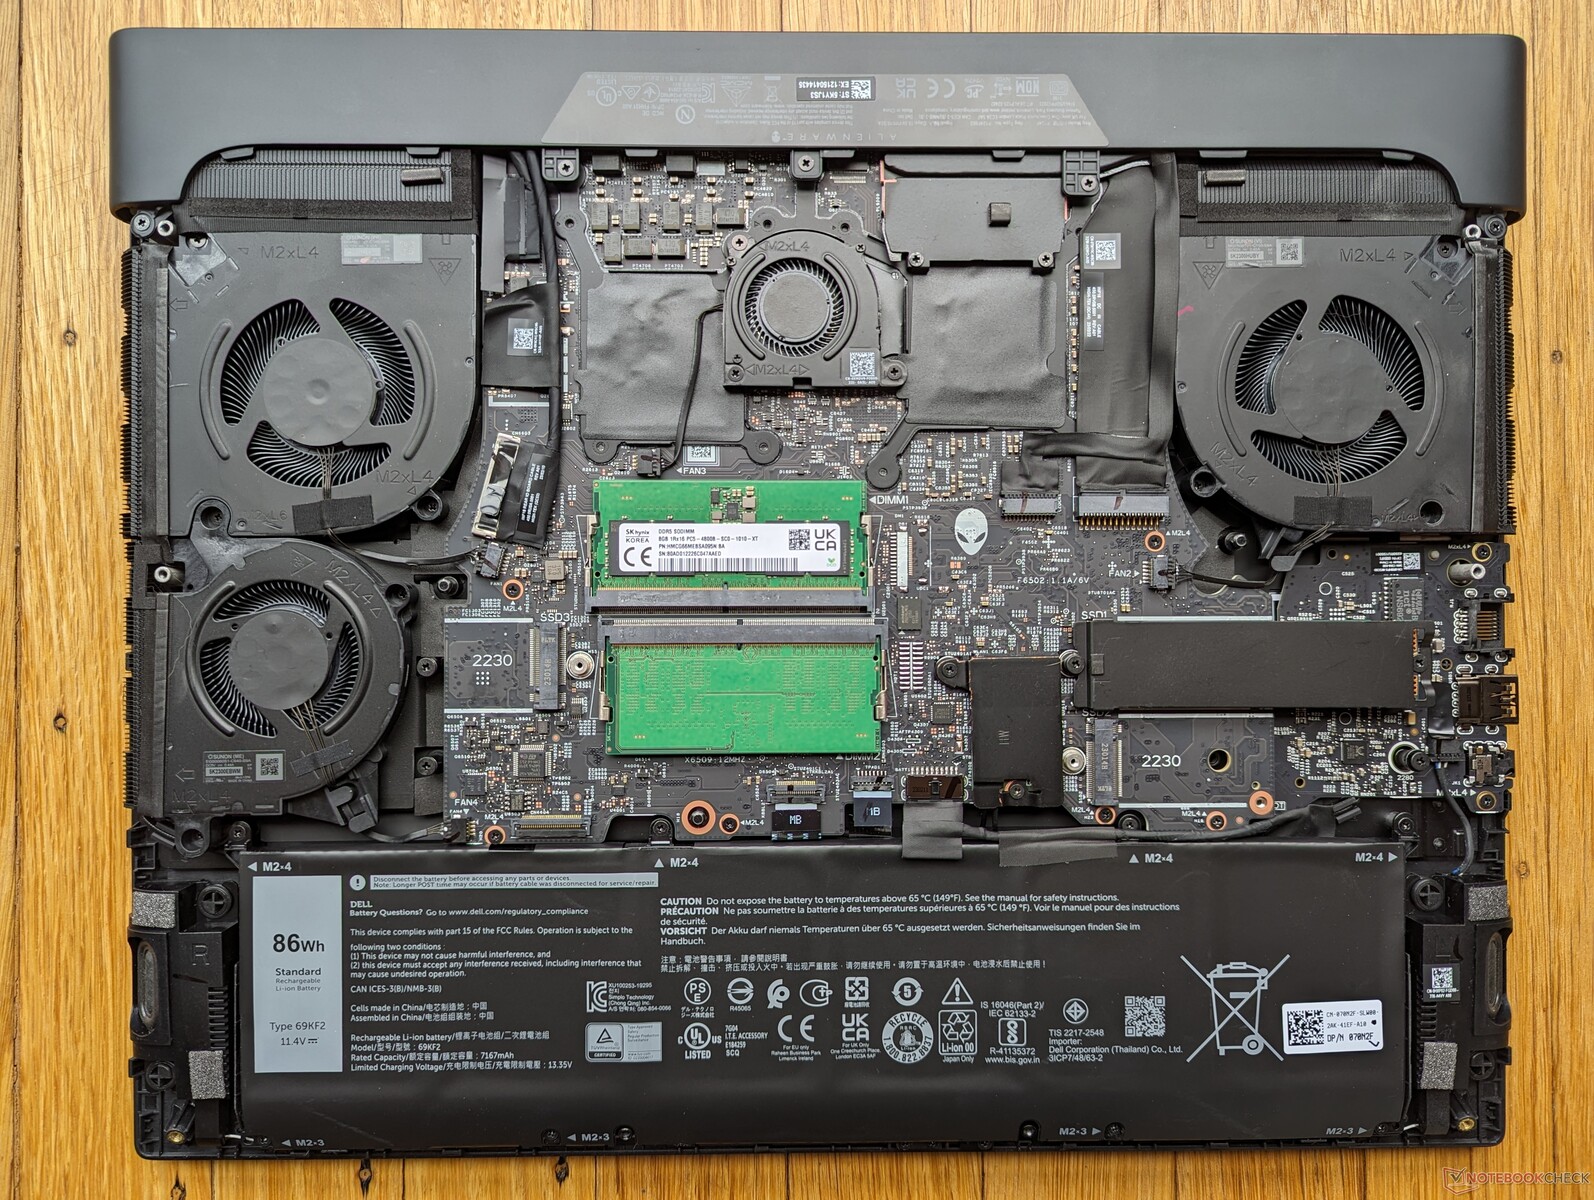
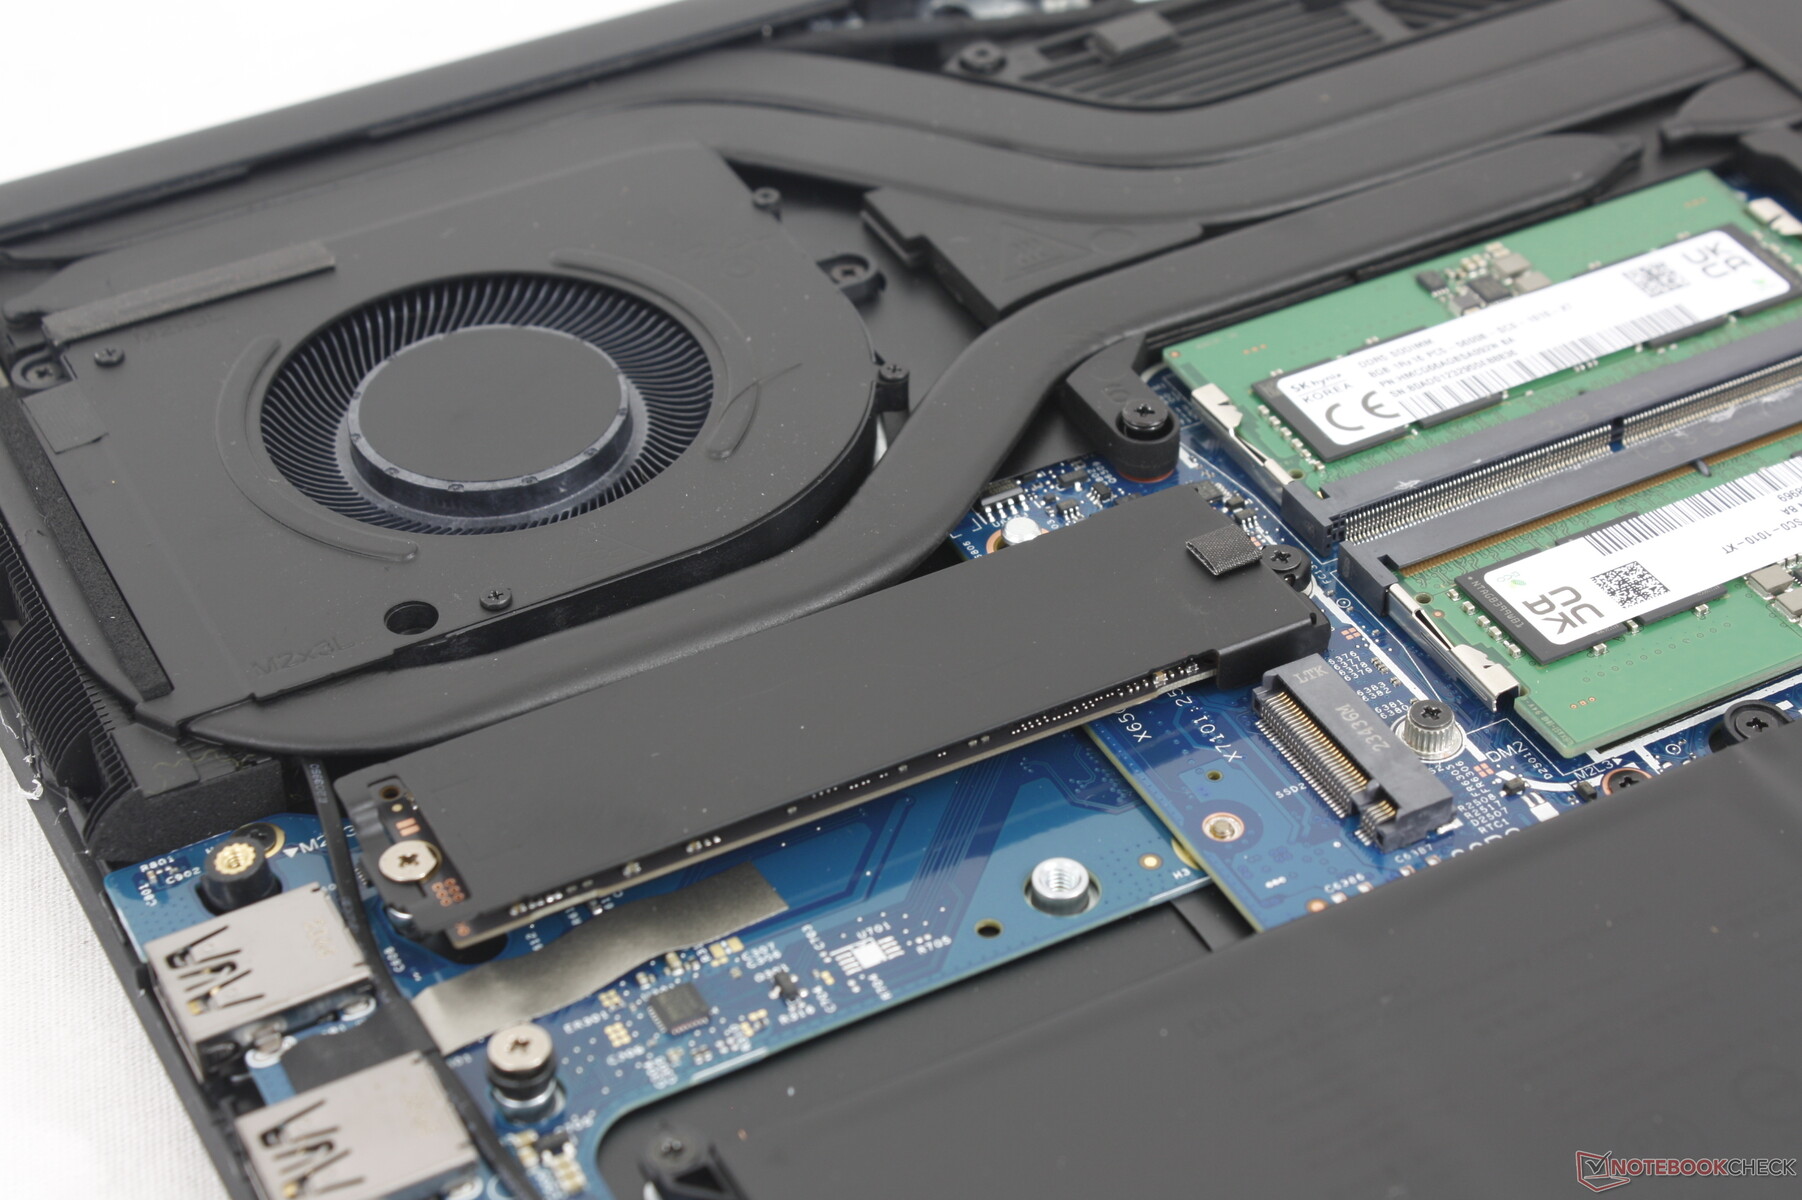
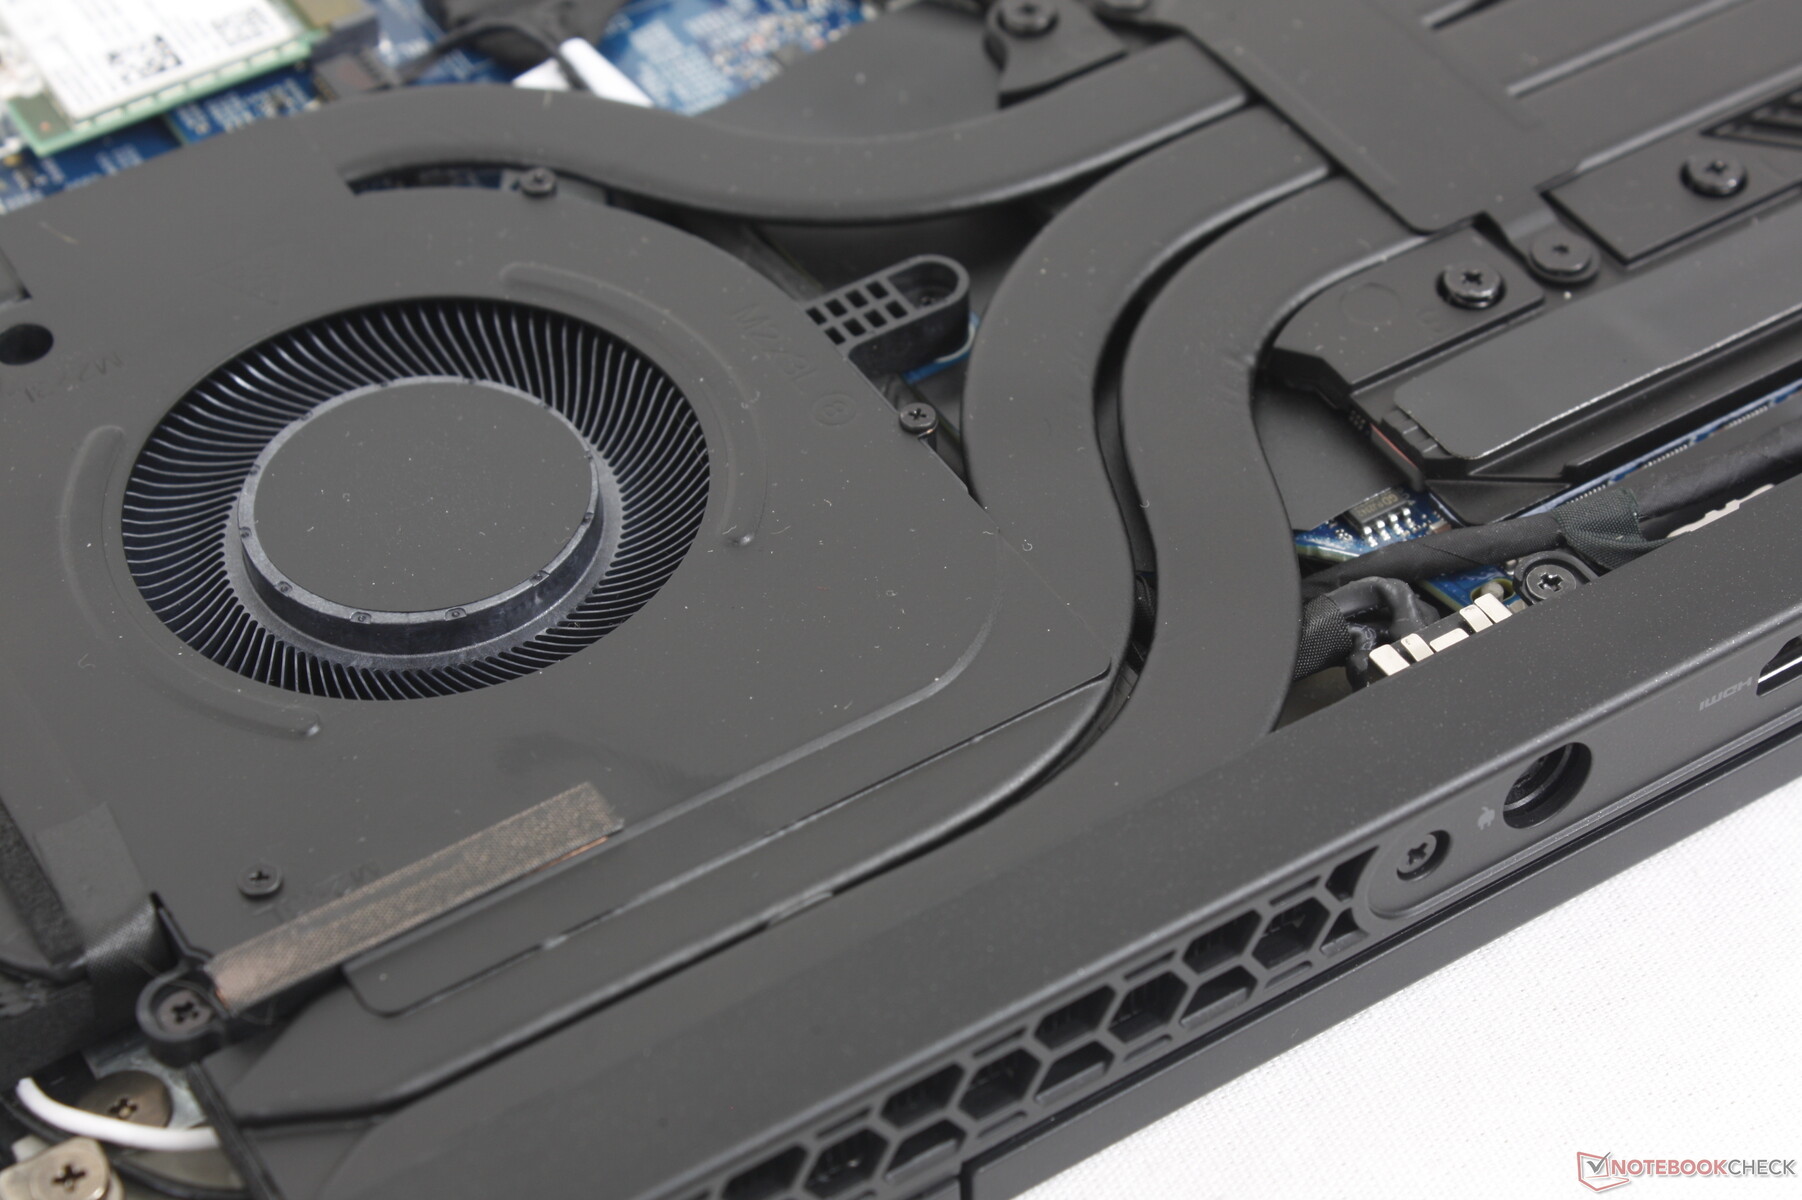
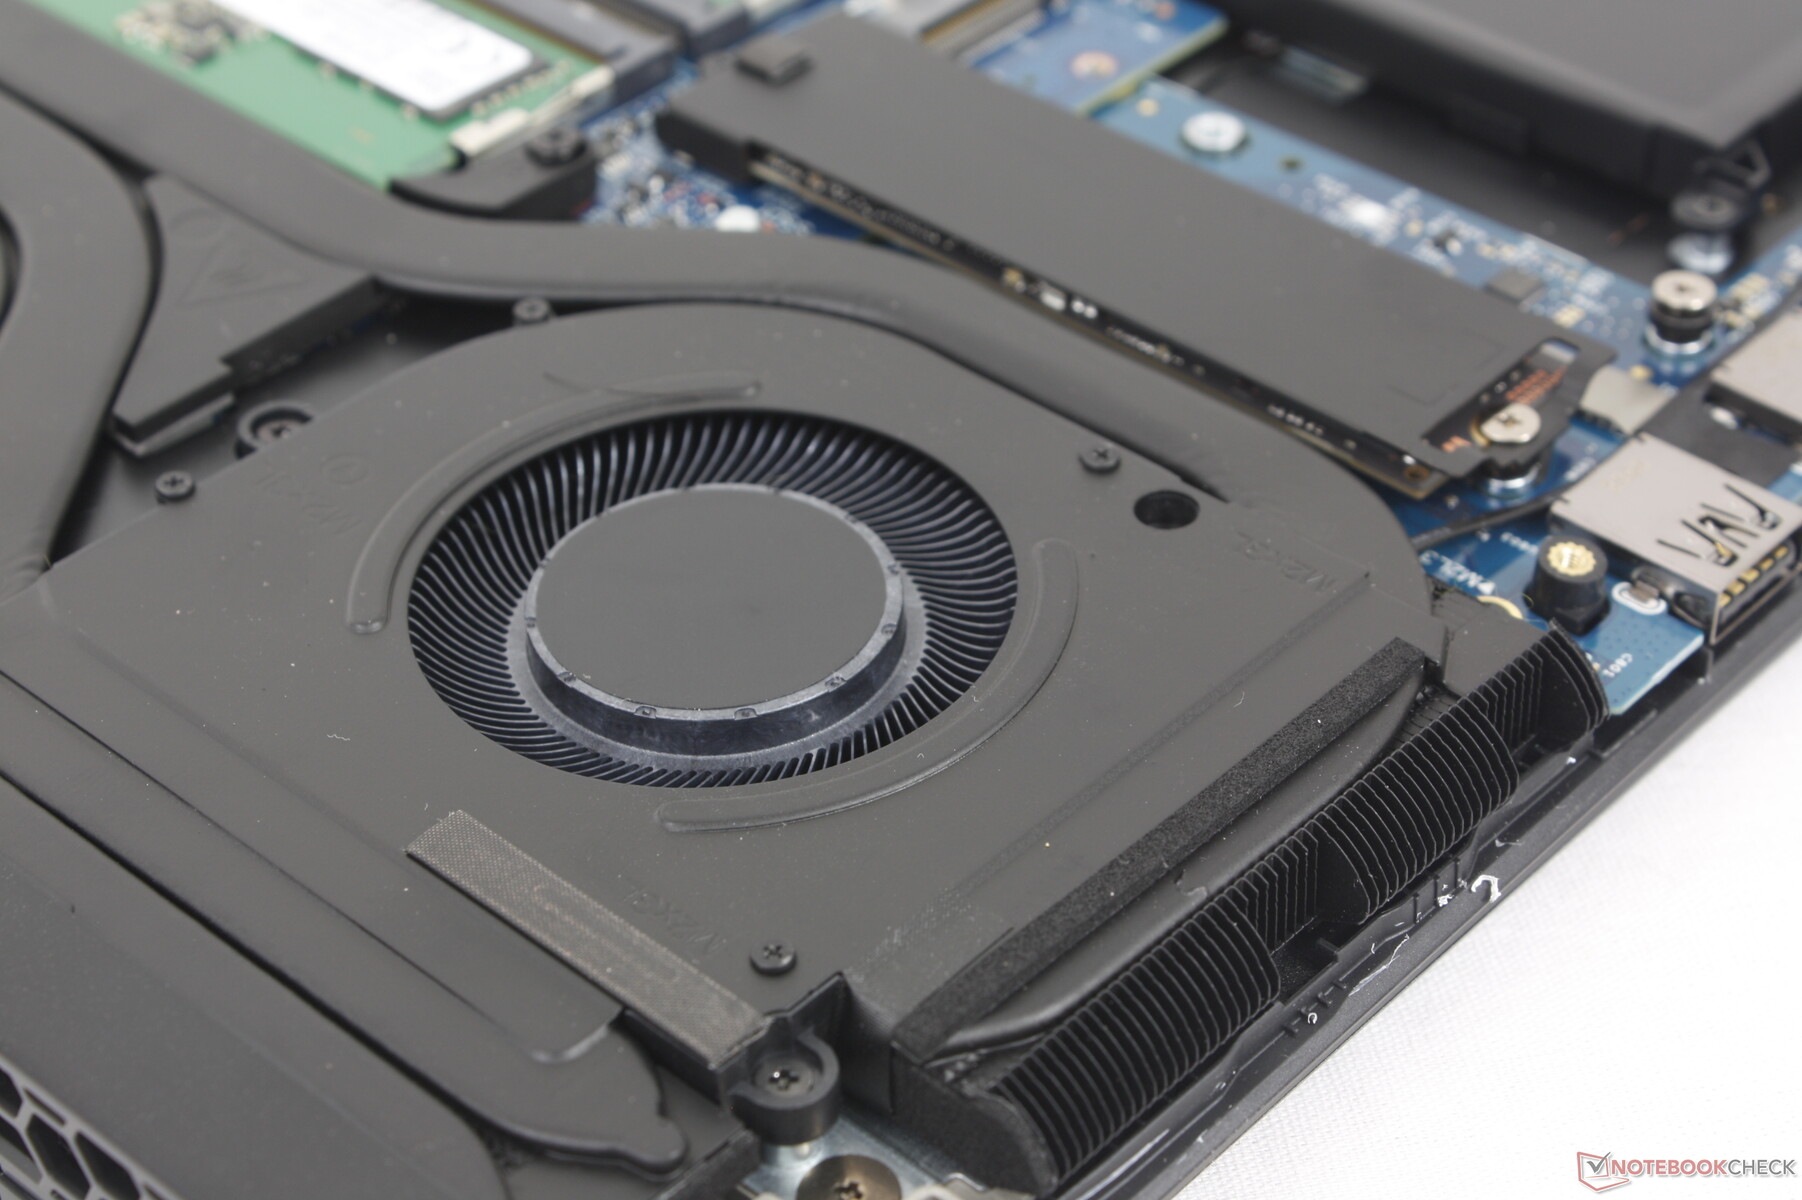
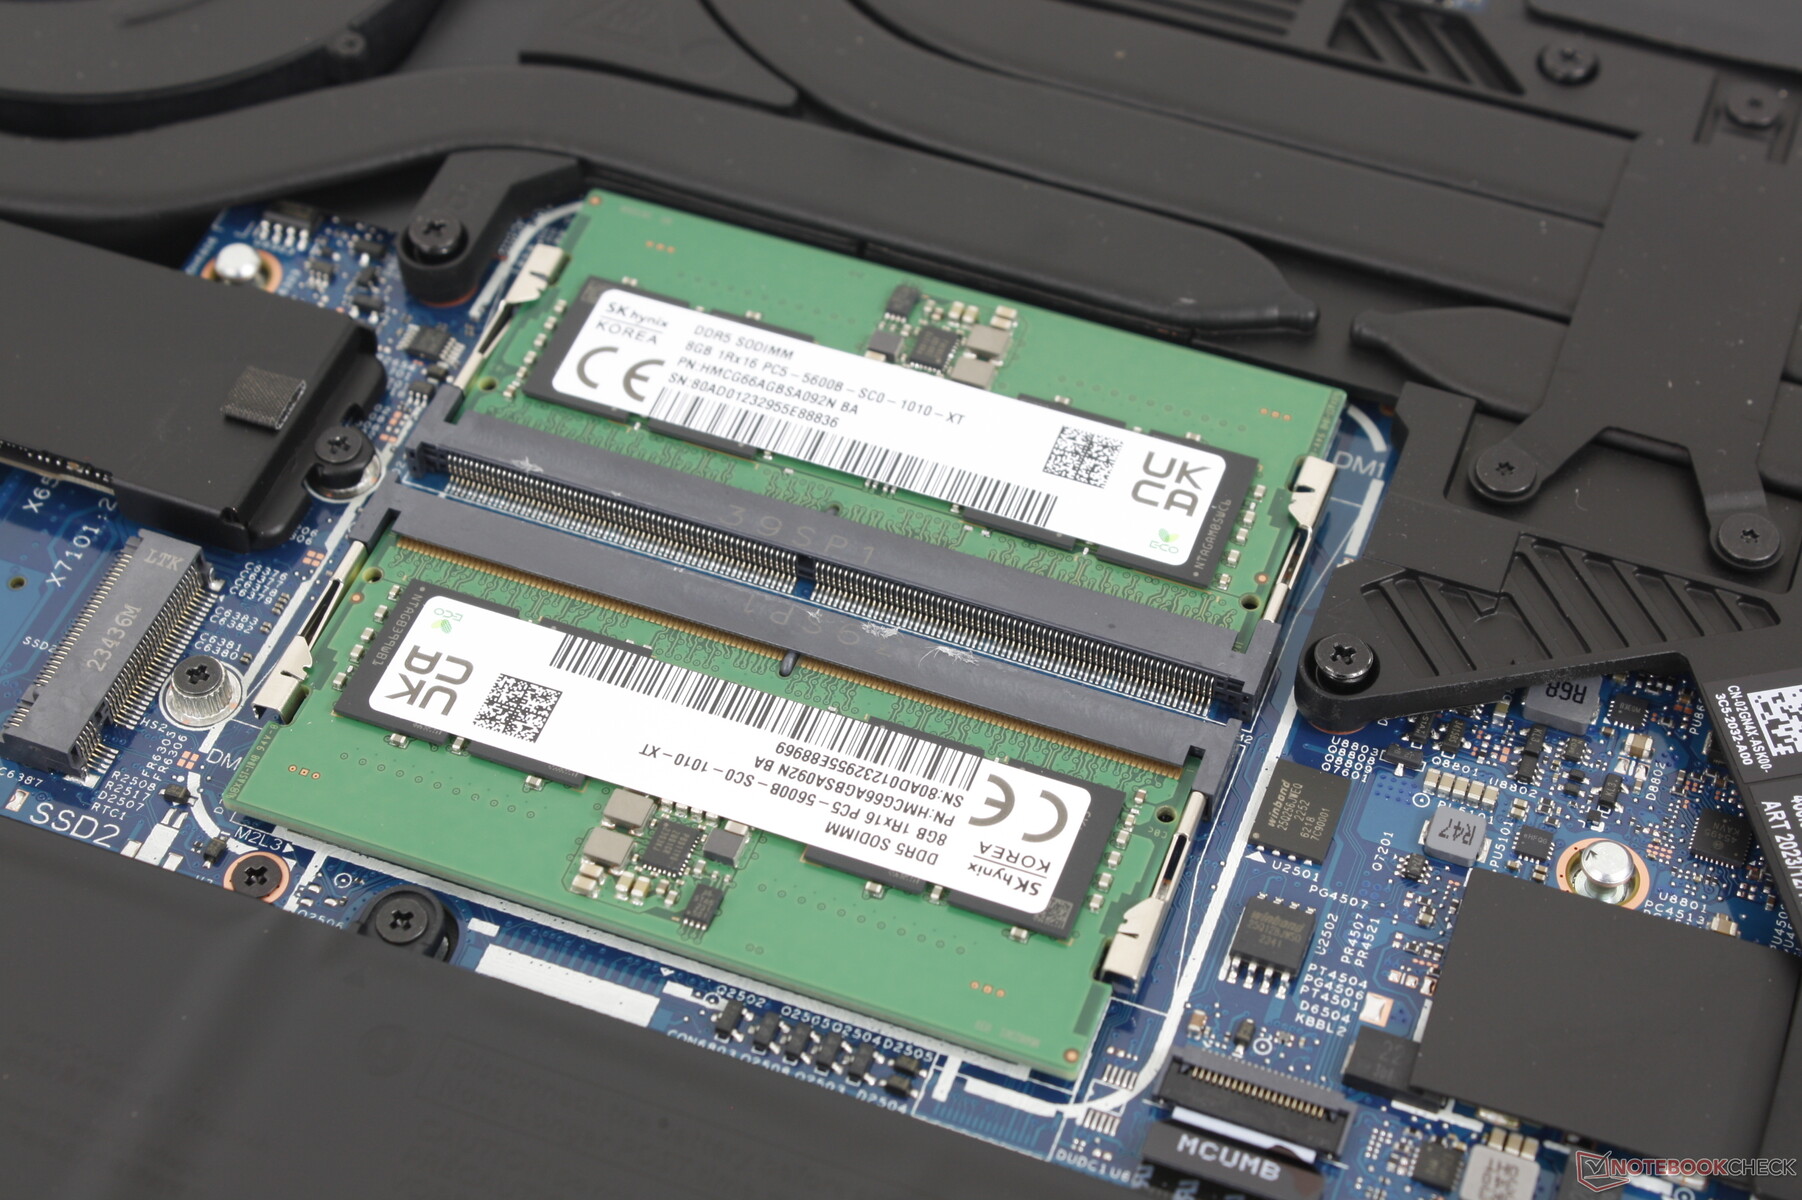
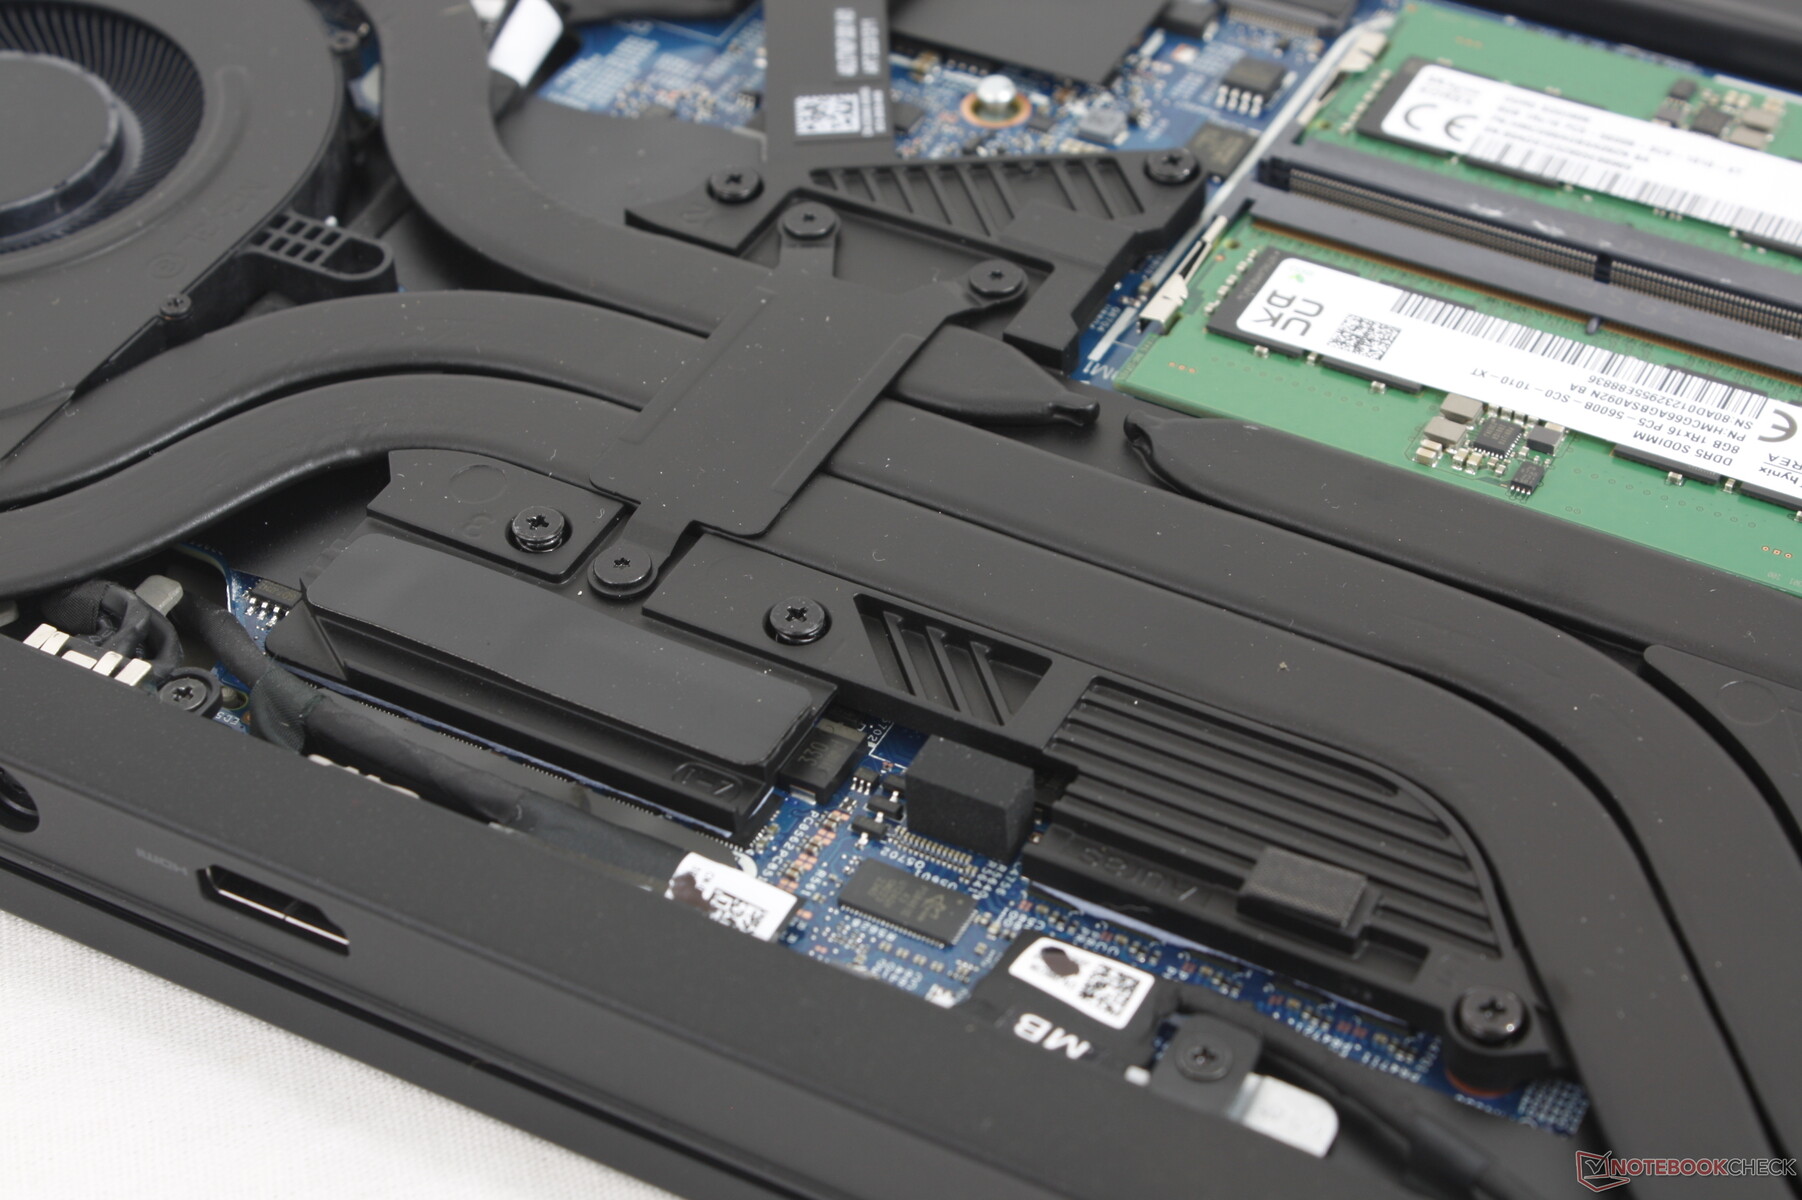
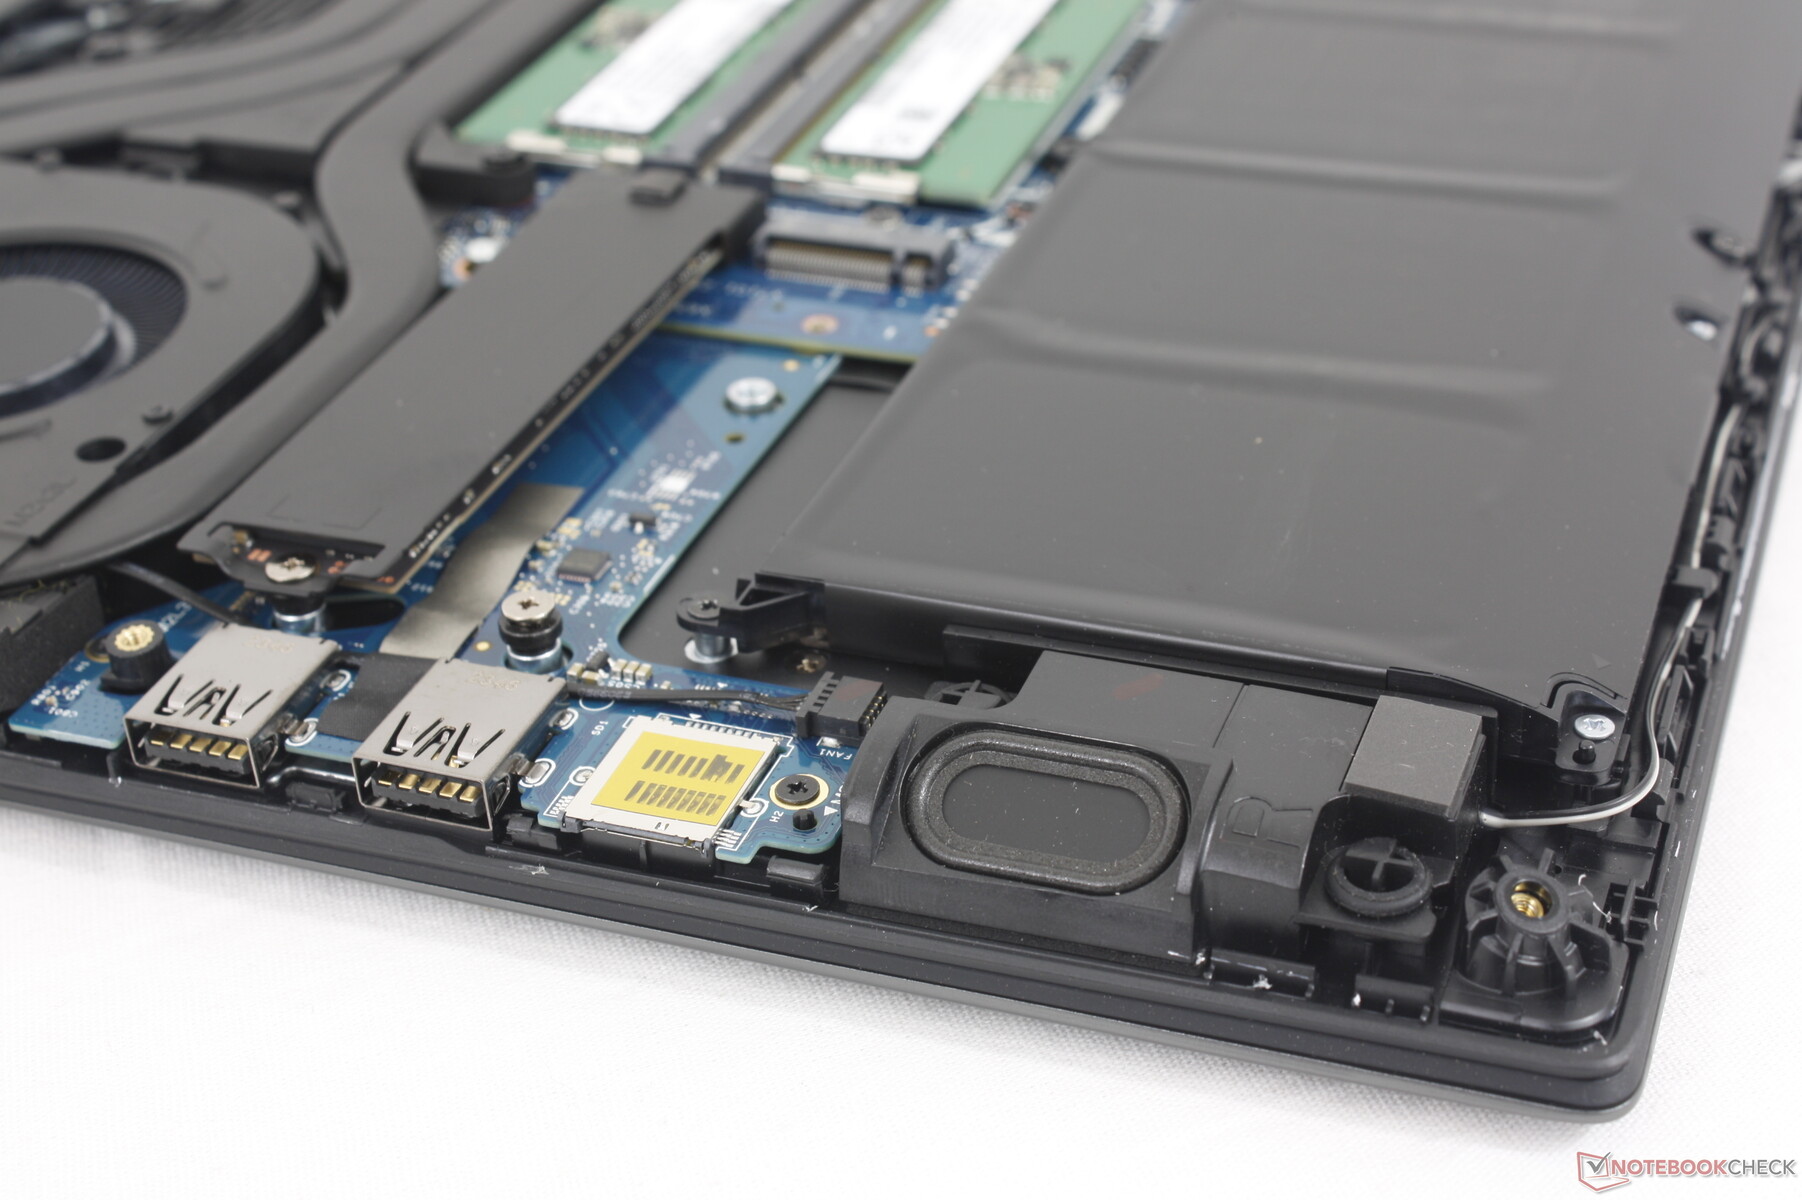
Alt panel, kolay servis için 8 Phillips vida ile sabitlenmiştir. RAM ve WLAN çıkarılabilir olmaya devam ediyor, ancak depolama yapılandırması değişti; sistem artık geçen yılki tasarımdaki bir M.2 2280 ve iki M.2 2230 SSD yerine iki M.2 2280 SSD'yi destekliyor.
Aksesuarlar ve Garanti
Perakende kutusunda her zamanki AC adaptörü ve evrakların yanı sıra birkaç Alienware logolu çıkartma yer alıyor. ABD'de satın alındığında standart olarak bir yıllık sınırlı üretici garantisi verilmektedir.
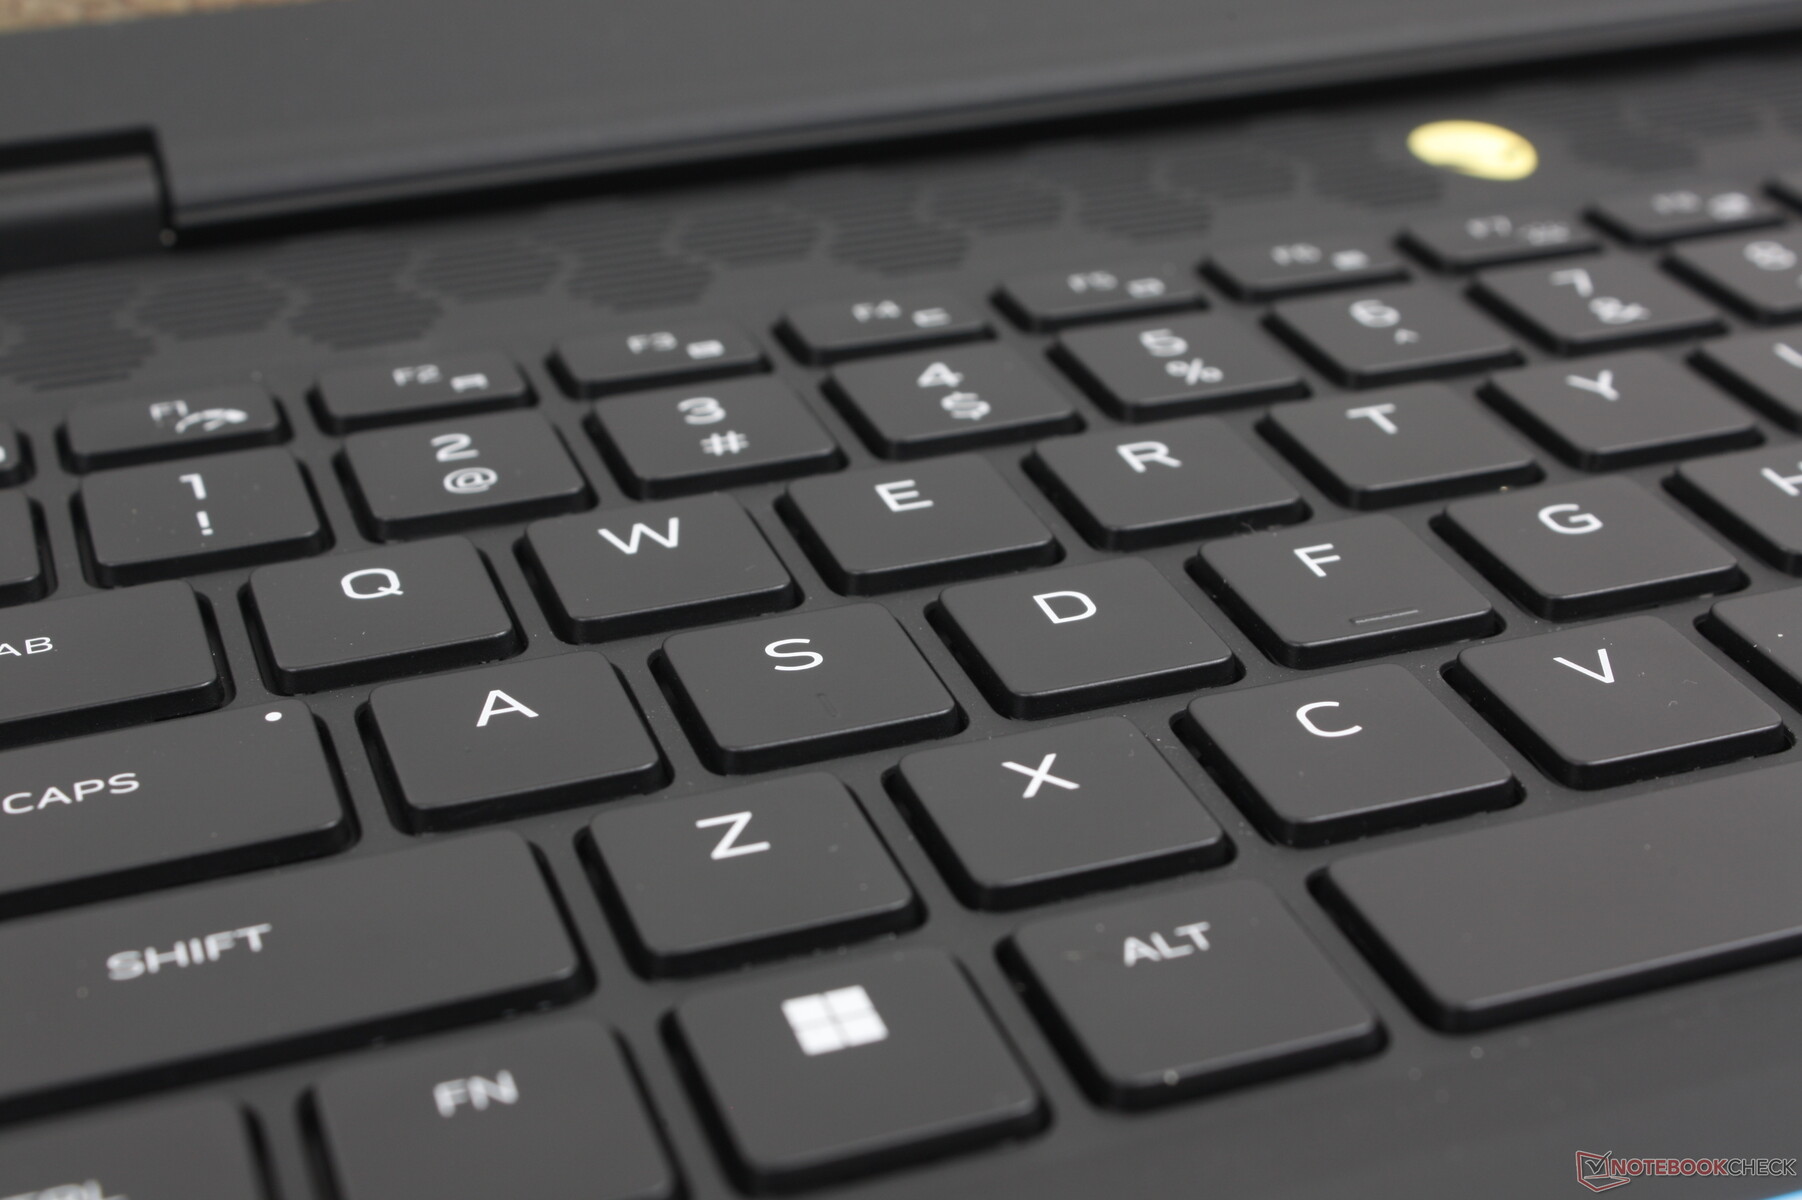
Giriş Cihazları - Mekaniğe Gerek Yok
Klavye
Sistem, ağırlığı düşük tutmak ve oyuncuların ötesinde daha geniş kitlelere hitap etmek için 1,8 mm hareket mesafesine sahip membran tabanlı tuşlar kullanıyor ve daha fazla mekanik seçenek sunmuyor. Yine de bu klavyeler, diğer oyun dizüstü bilgisayarlarındaki klavyelerle karşılaştırıldığında beklenenden daha rahat ve tıklamalı MSI Raider GE68 veya HP Omen Transcend 16. Özellikle Space ve Enter tuşları, basıldığında ana QWERTY tuşlarından çok daha yüksek ve keskin bir ses çıkarır.
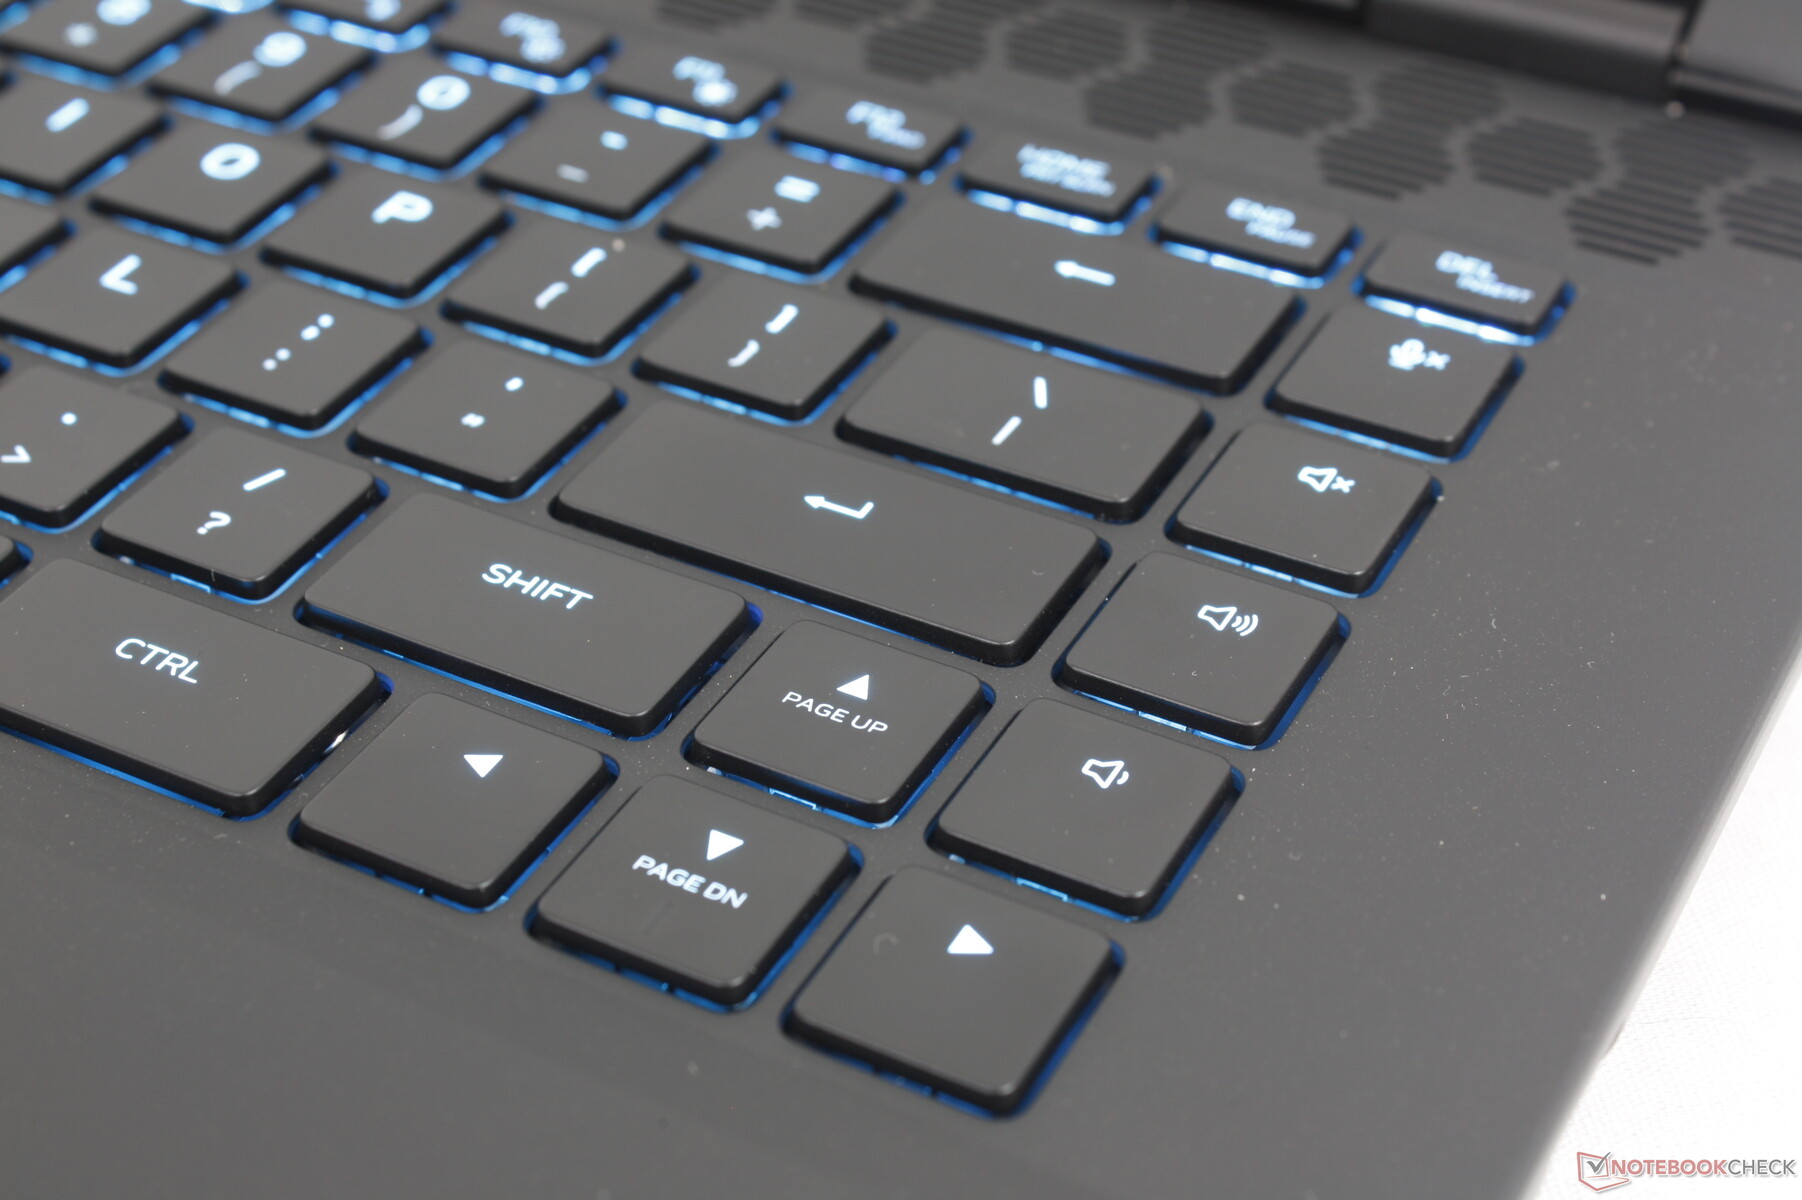
Bu yıl klavyeye eklenen yeni bir özellik de F2 tuşuna bağlı olan ve Alienware Command Center'ı başlatmaya gerek kalmadan sistemi Sessiz moda geçiren kullanışlı bir "Stealth mode" özelliği. Bunun dışında, klavye düzeni orijinal m16 R1'de olduğu gibi aynı kalıyor.
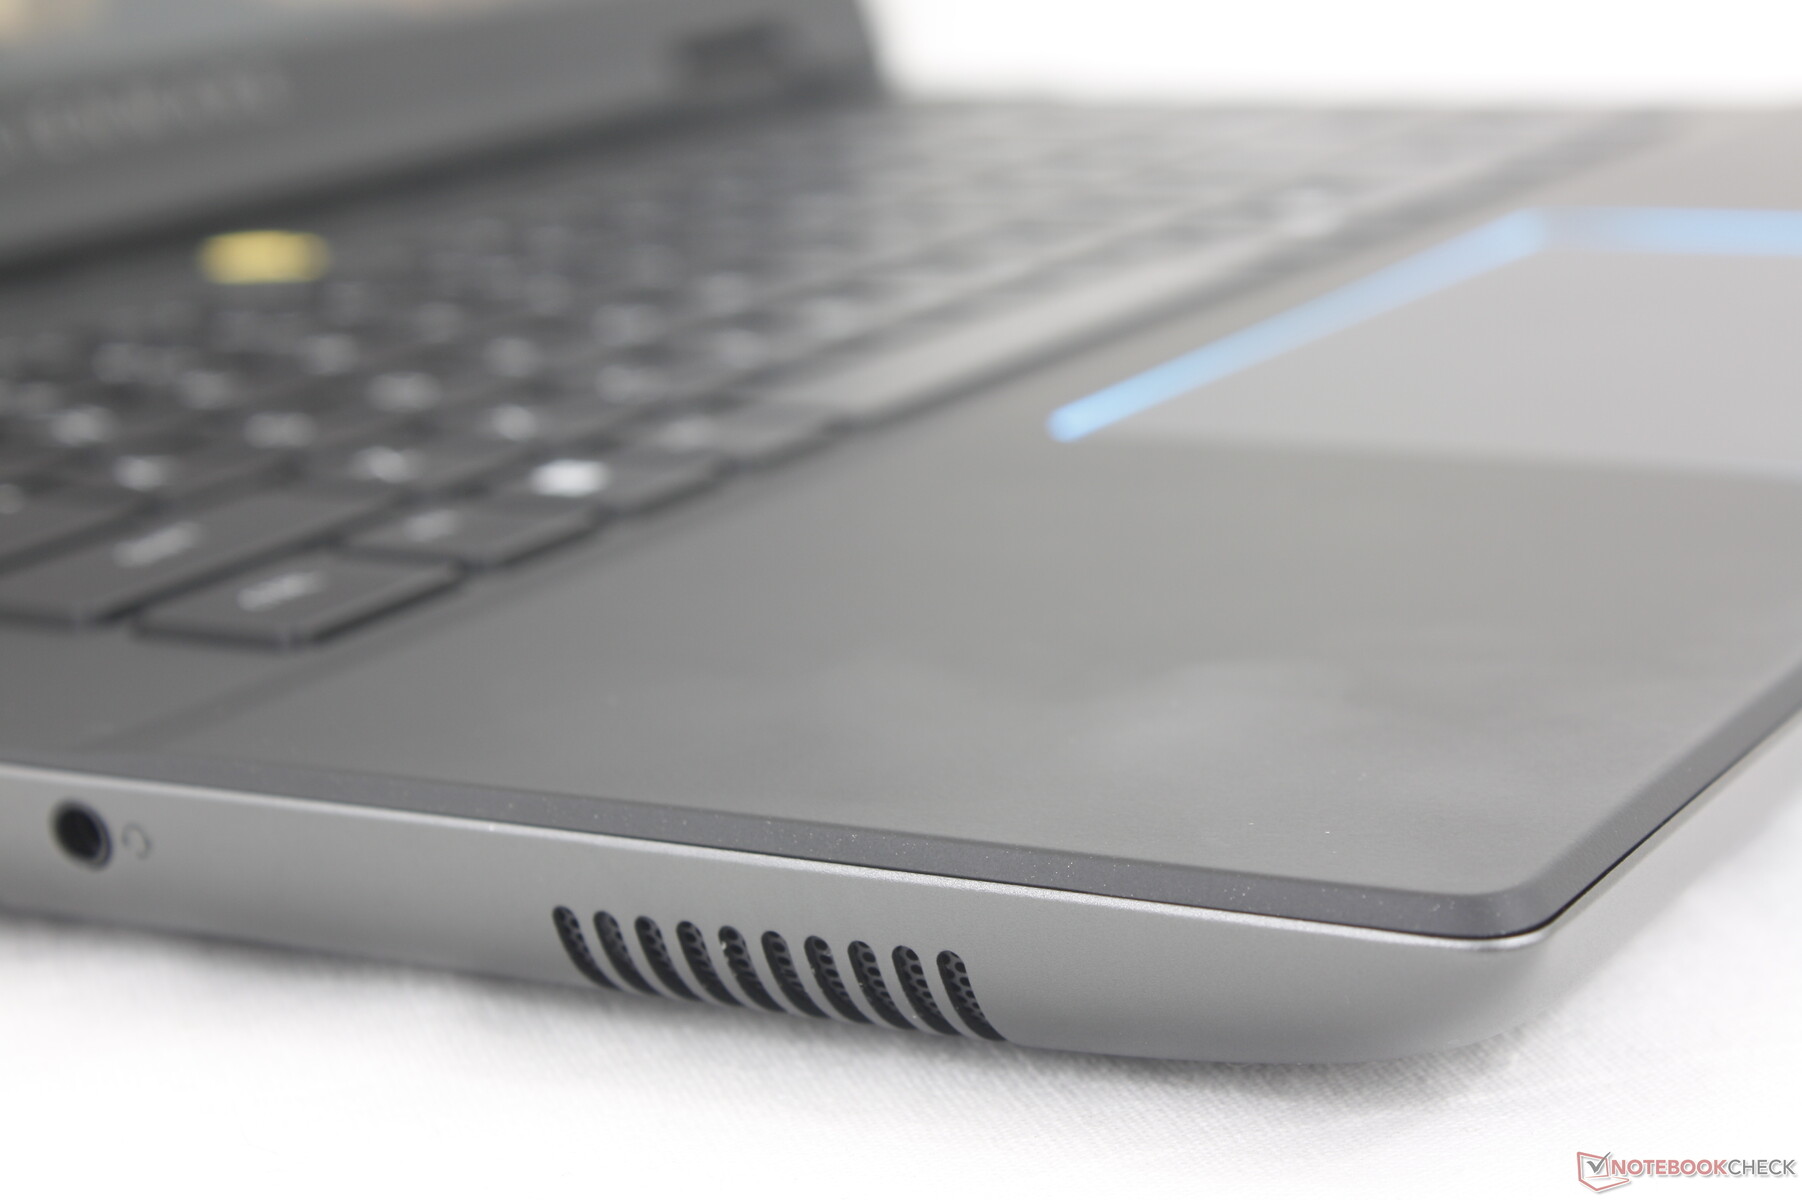
Dokunmatik yüzey
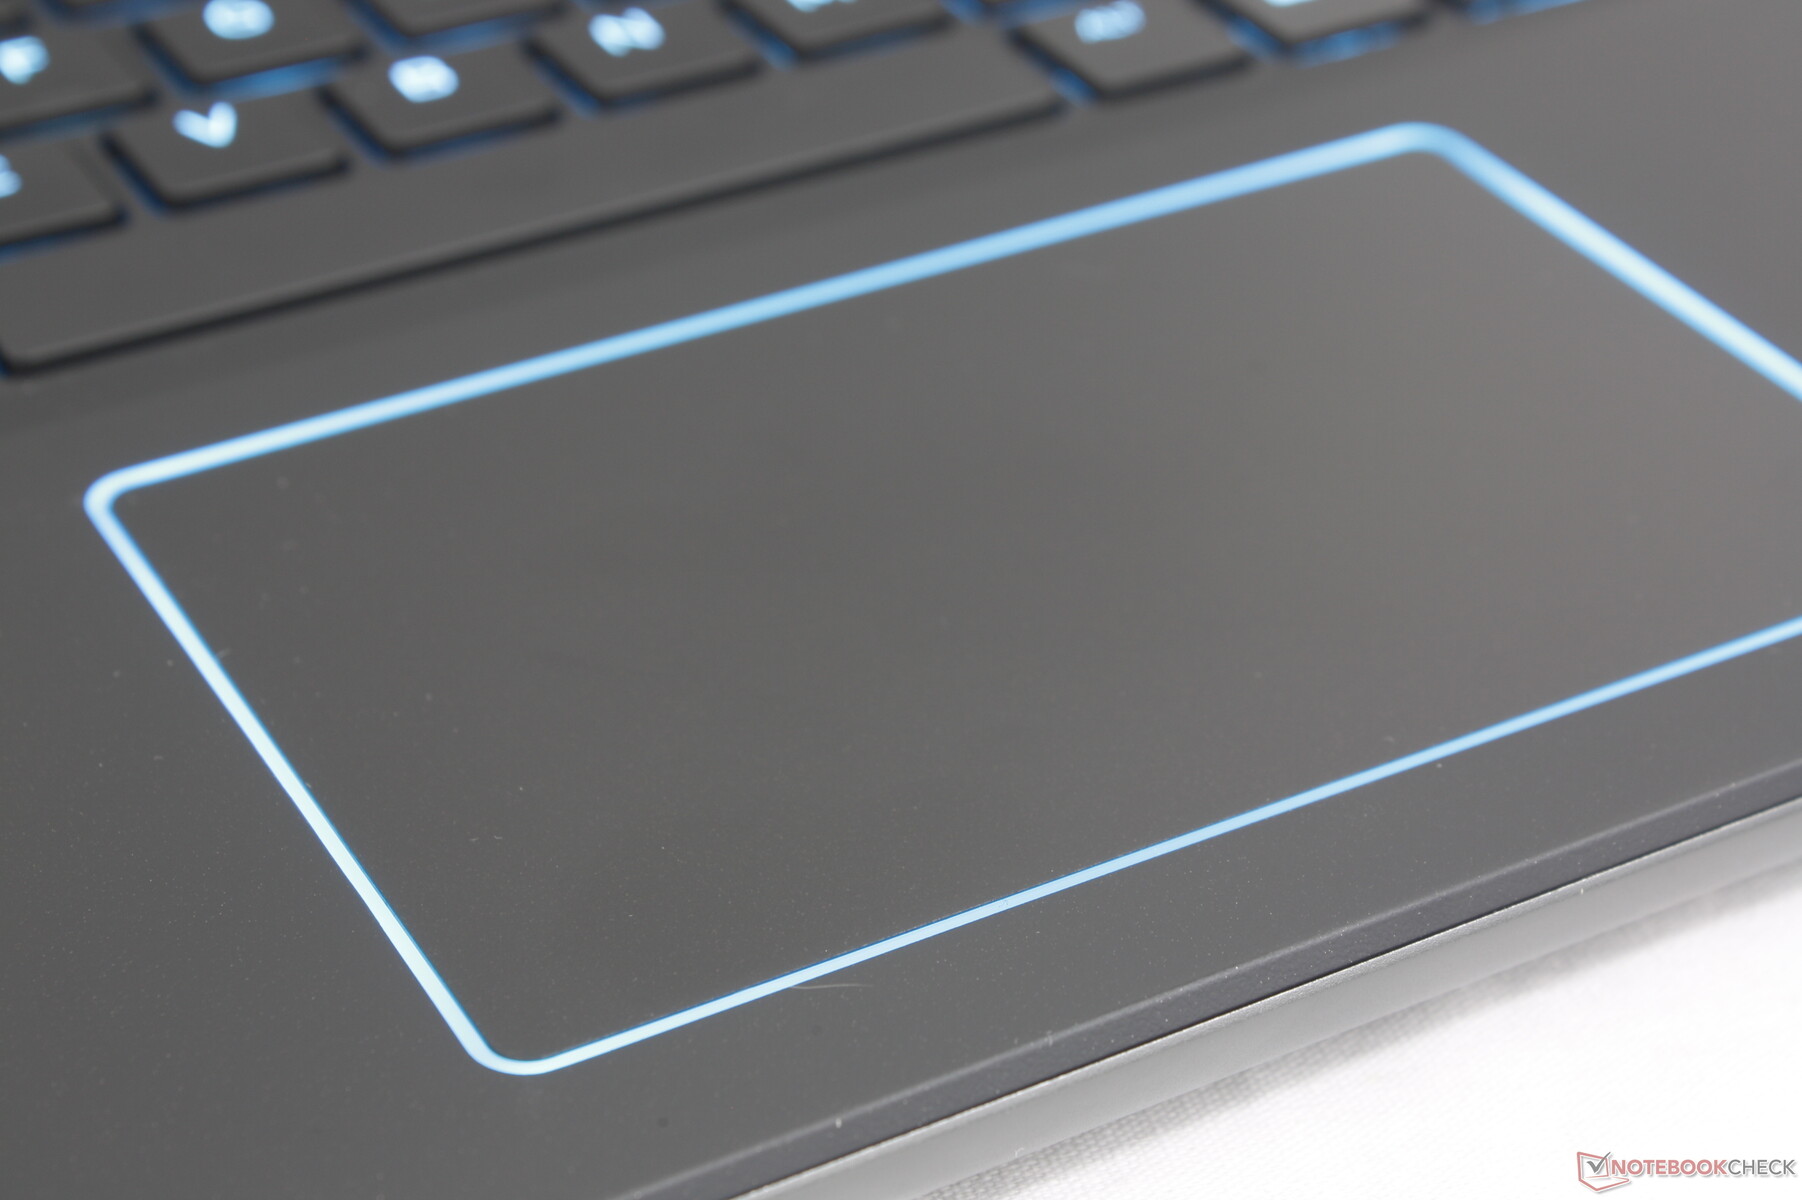
Tıklama yüzeyi geçen yılki modele göre biraz daha büyük (11,3 x 6,6 cm'ye karşılık 11,5 x 7 cm) ve çevresinde yeni RGB aydınlatma bulunuyor. Ancak, tıklama sırasında geri bildirim süngerimsi ve çok sığ olmaya devam ediyor ve tatmin edici bir his vermiyor. Temel işaretleme ve tıklama için yeterince güvenilir bir şekilde çalışıyor, ancak sürükleme ve bırakma gibi daha sıkı eylemler için hala bir fare önerilir.
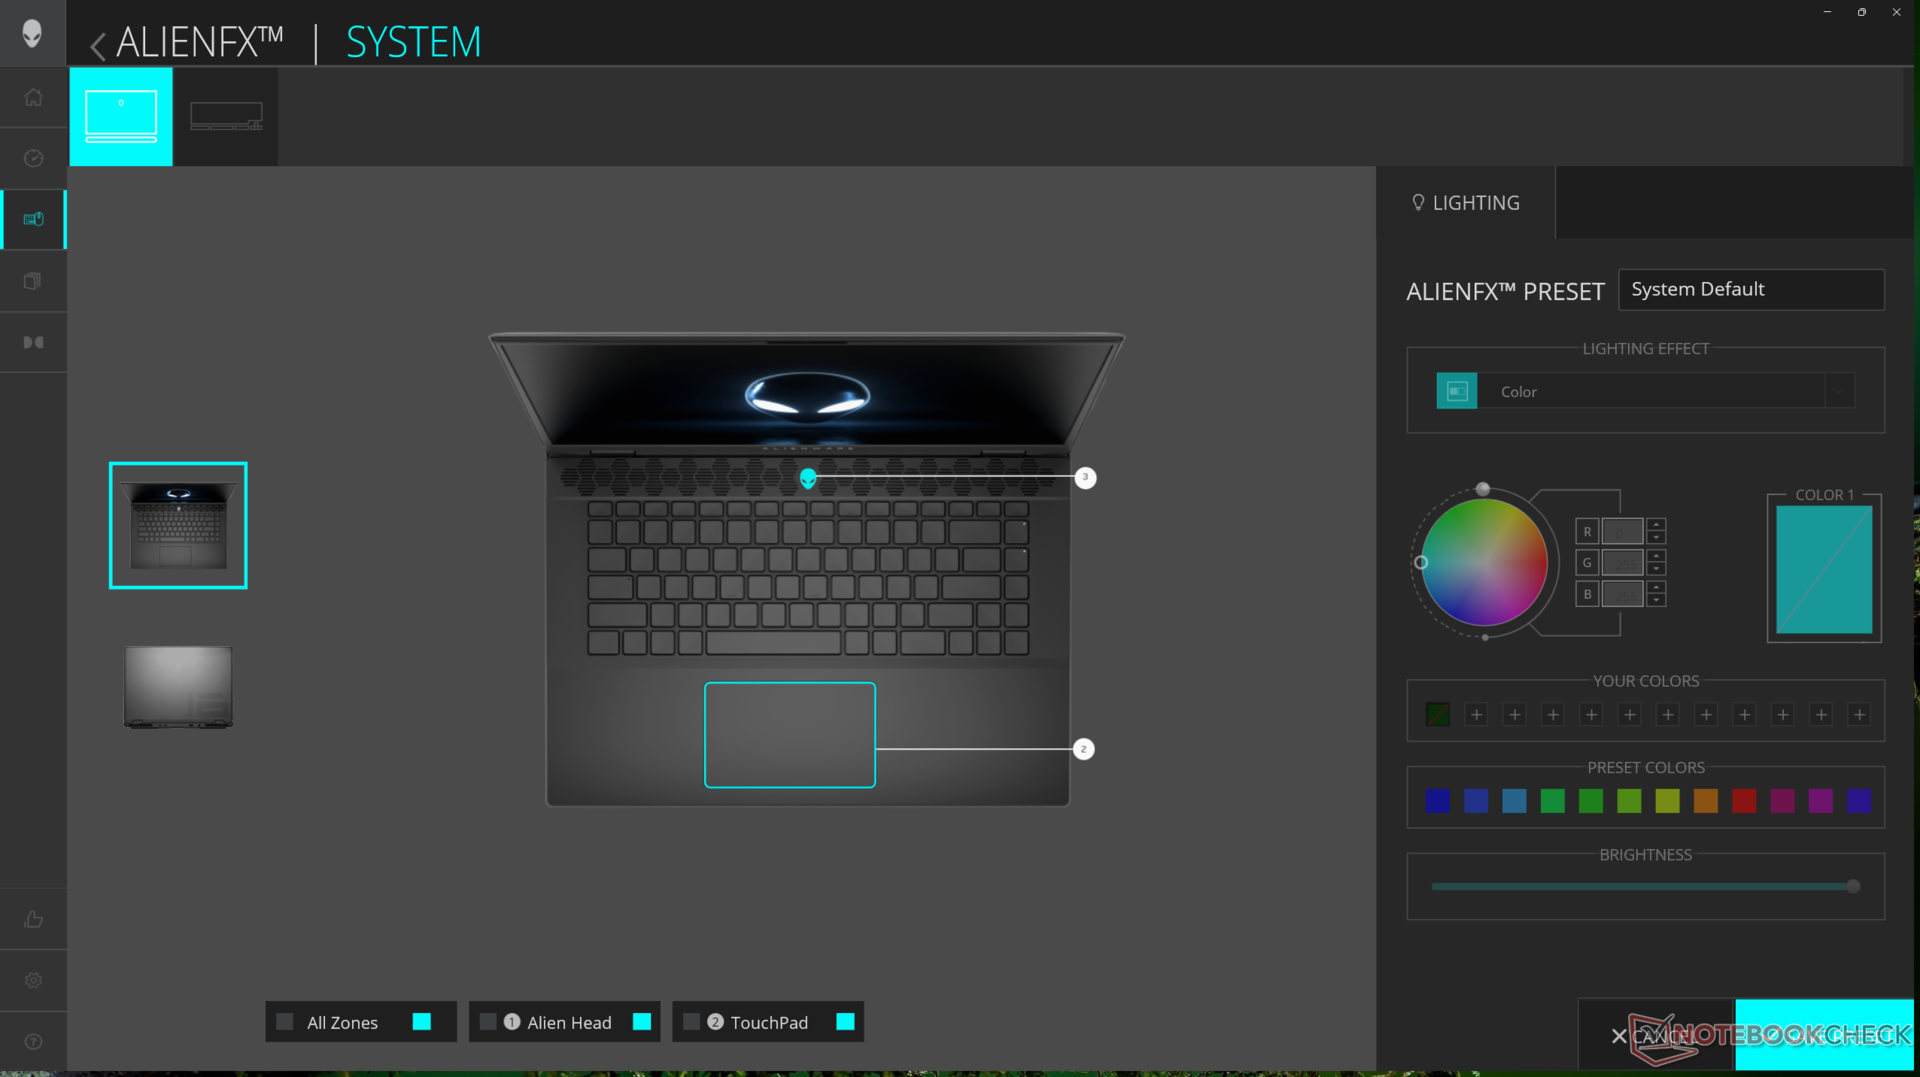
Can sıkıcı bir şekilde, RGB aydınlatma yalnızca Alienware Komuta Merkezi aracılığıyla etkinleştirilebilir veya devre dışı bırakılabilir, çünkü bunu değiştirmek için bir kısayol tuşu yoktur. RGB tuşlarının parlaklığını ayarlamak, tıklama yüzeyinin etrafındaki aydınlatmayı etkilemiyor.

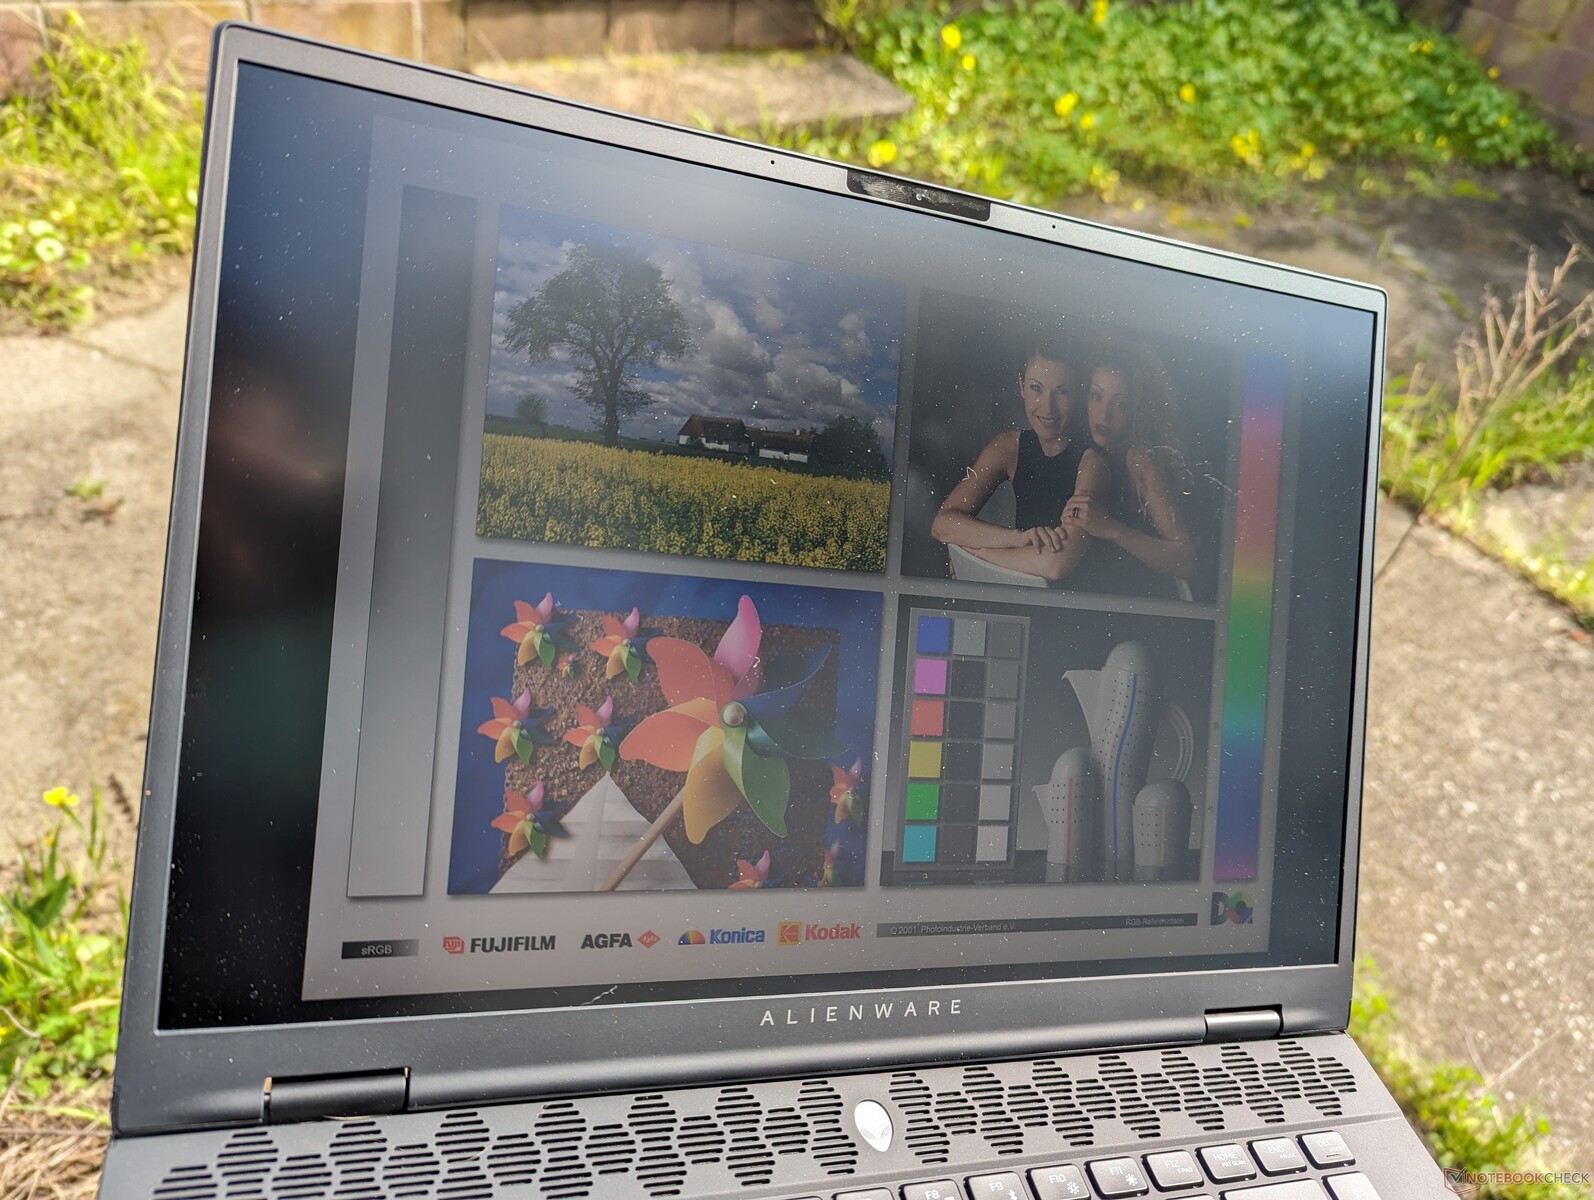
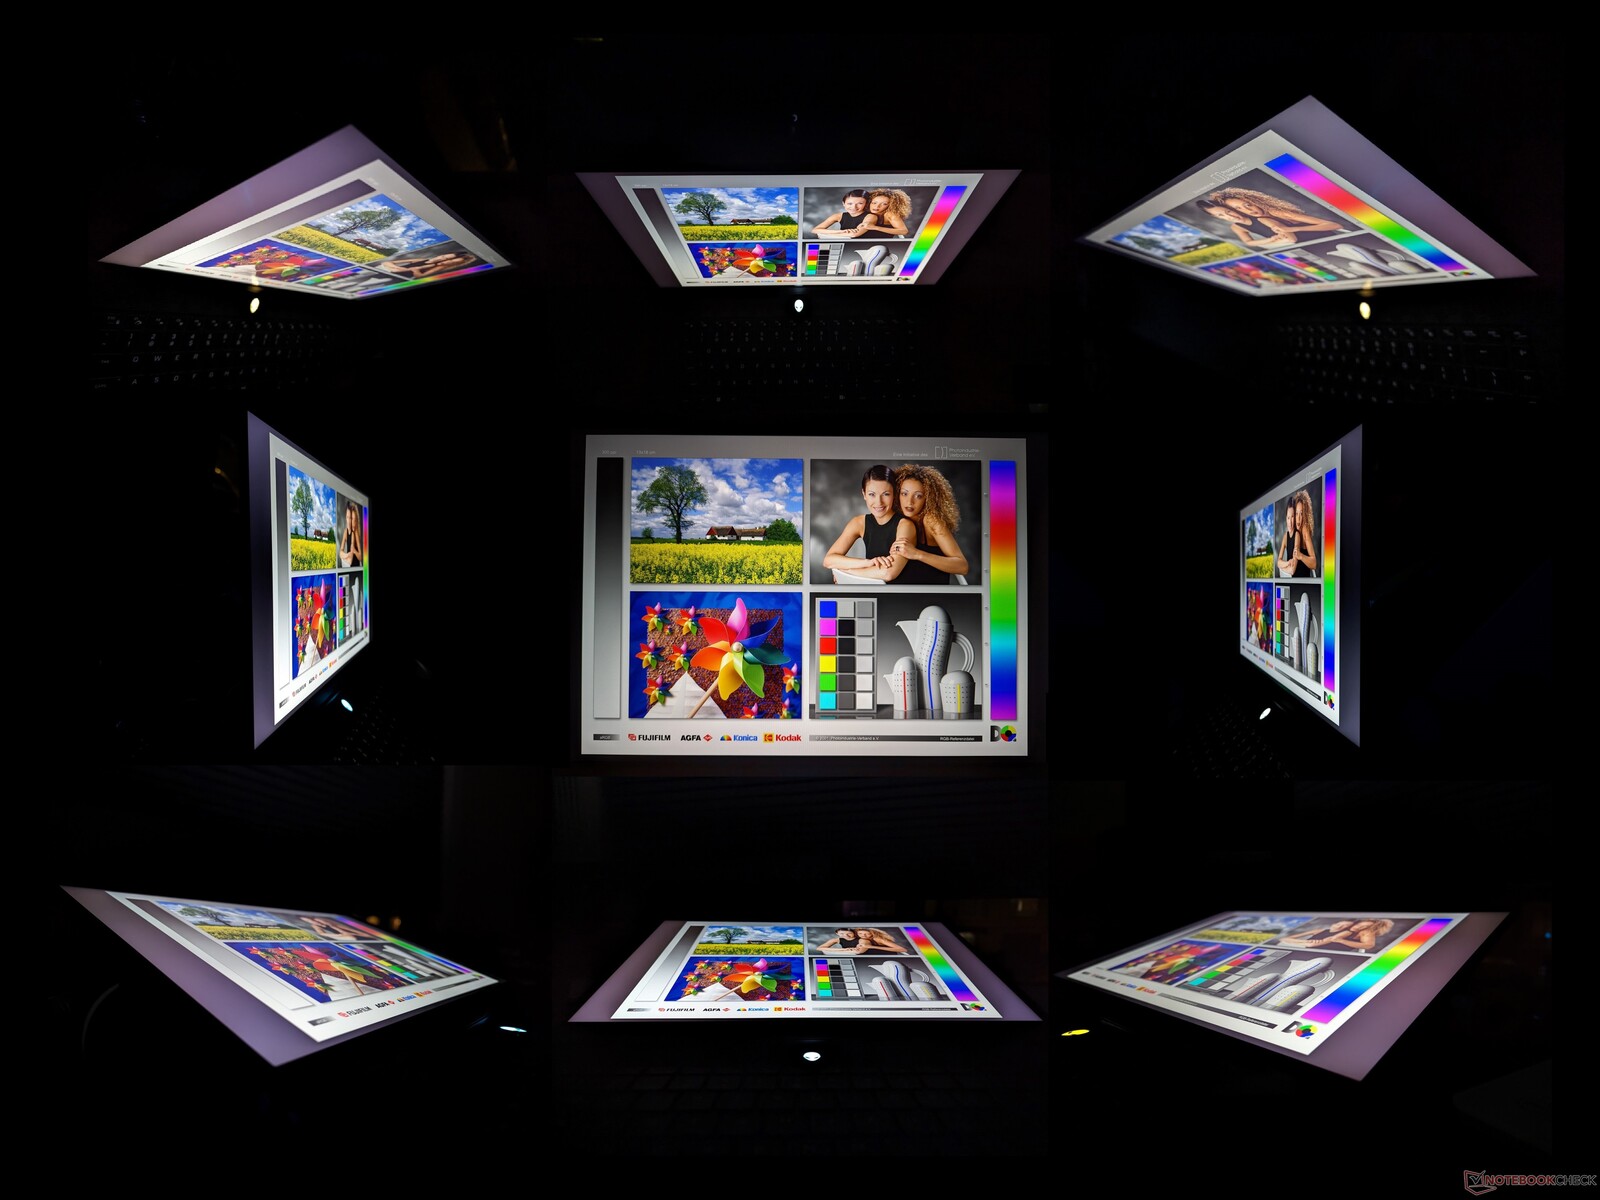
Ekran - 240 Hz ve Tam sRGB Artık Standart
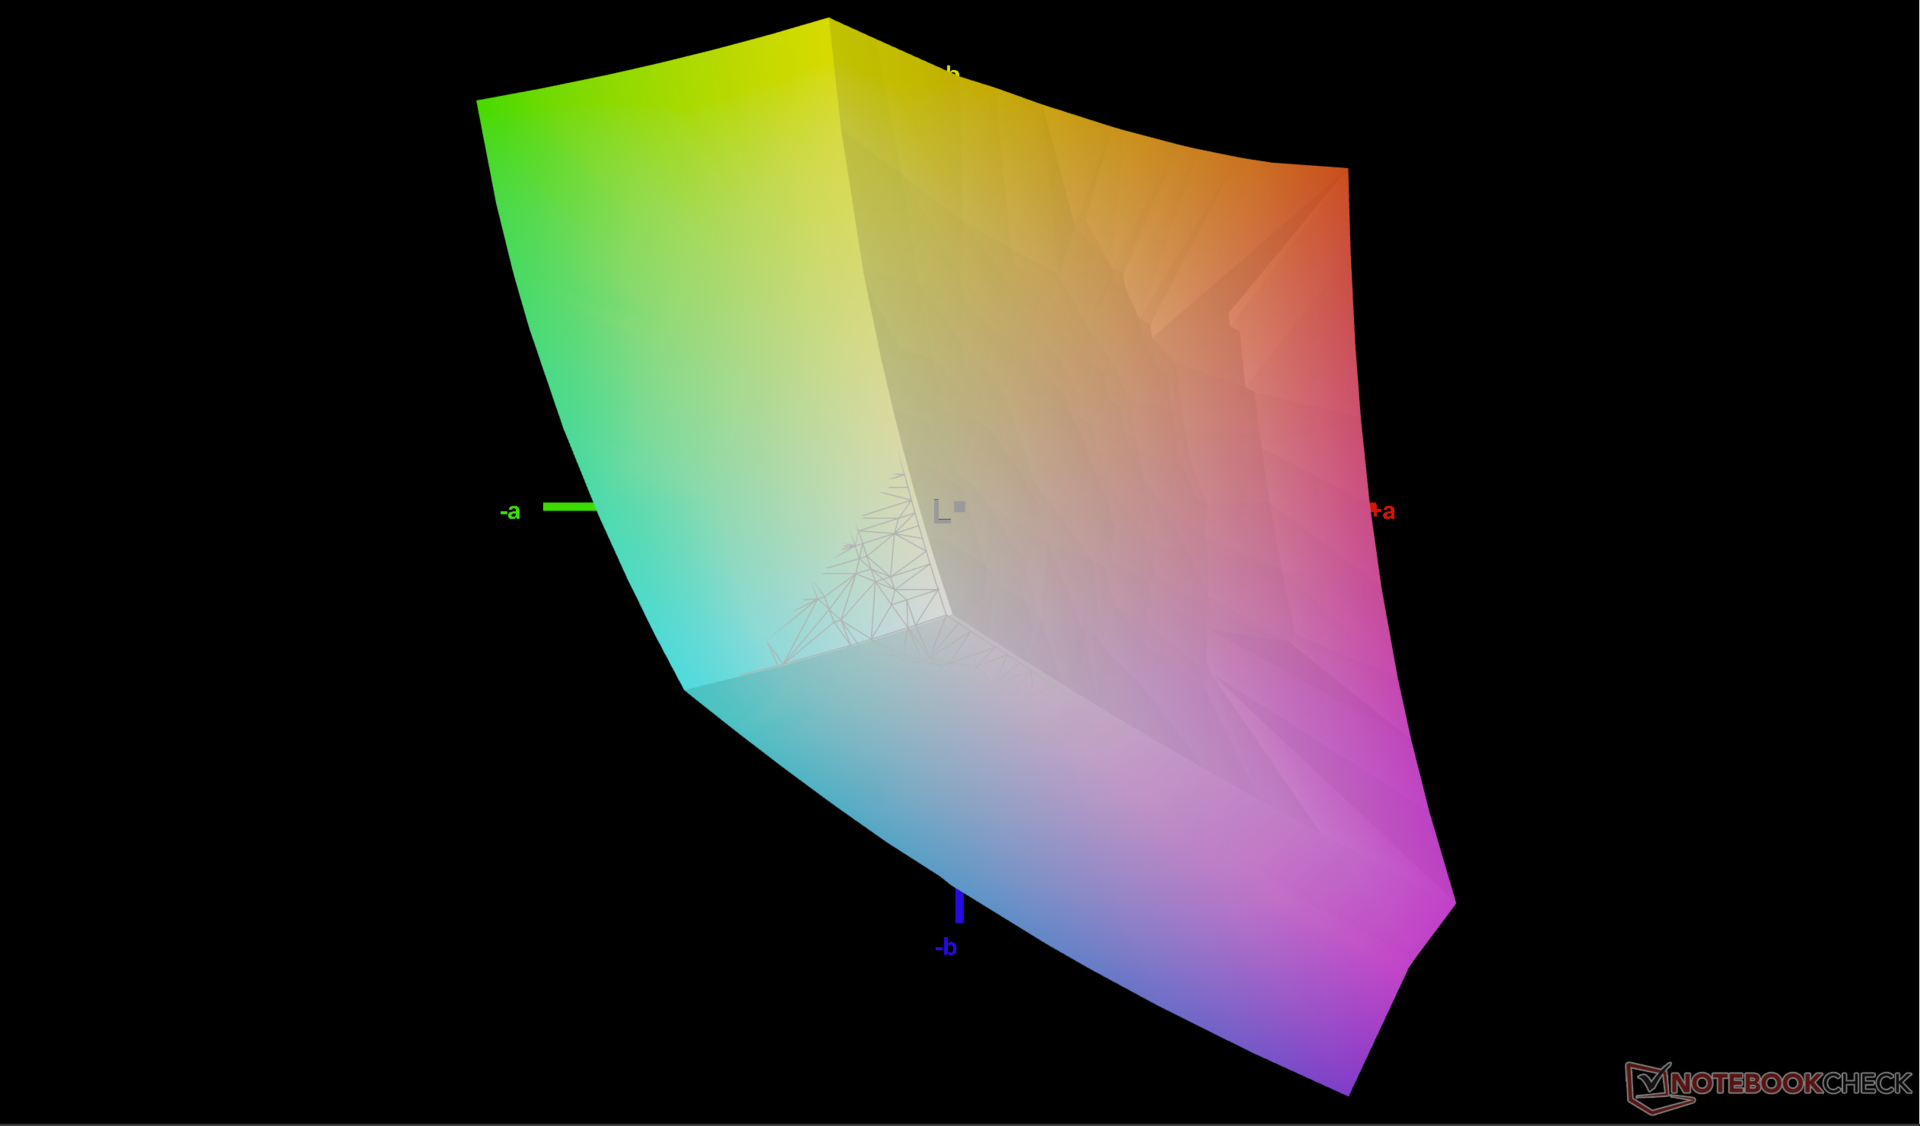
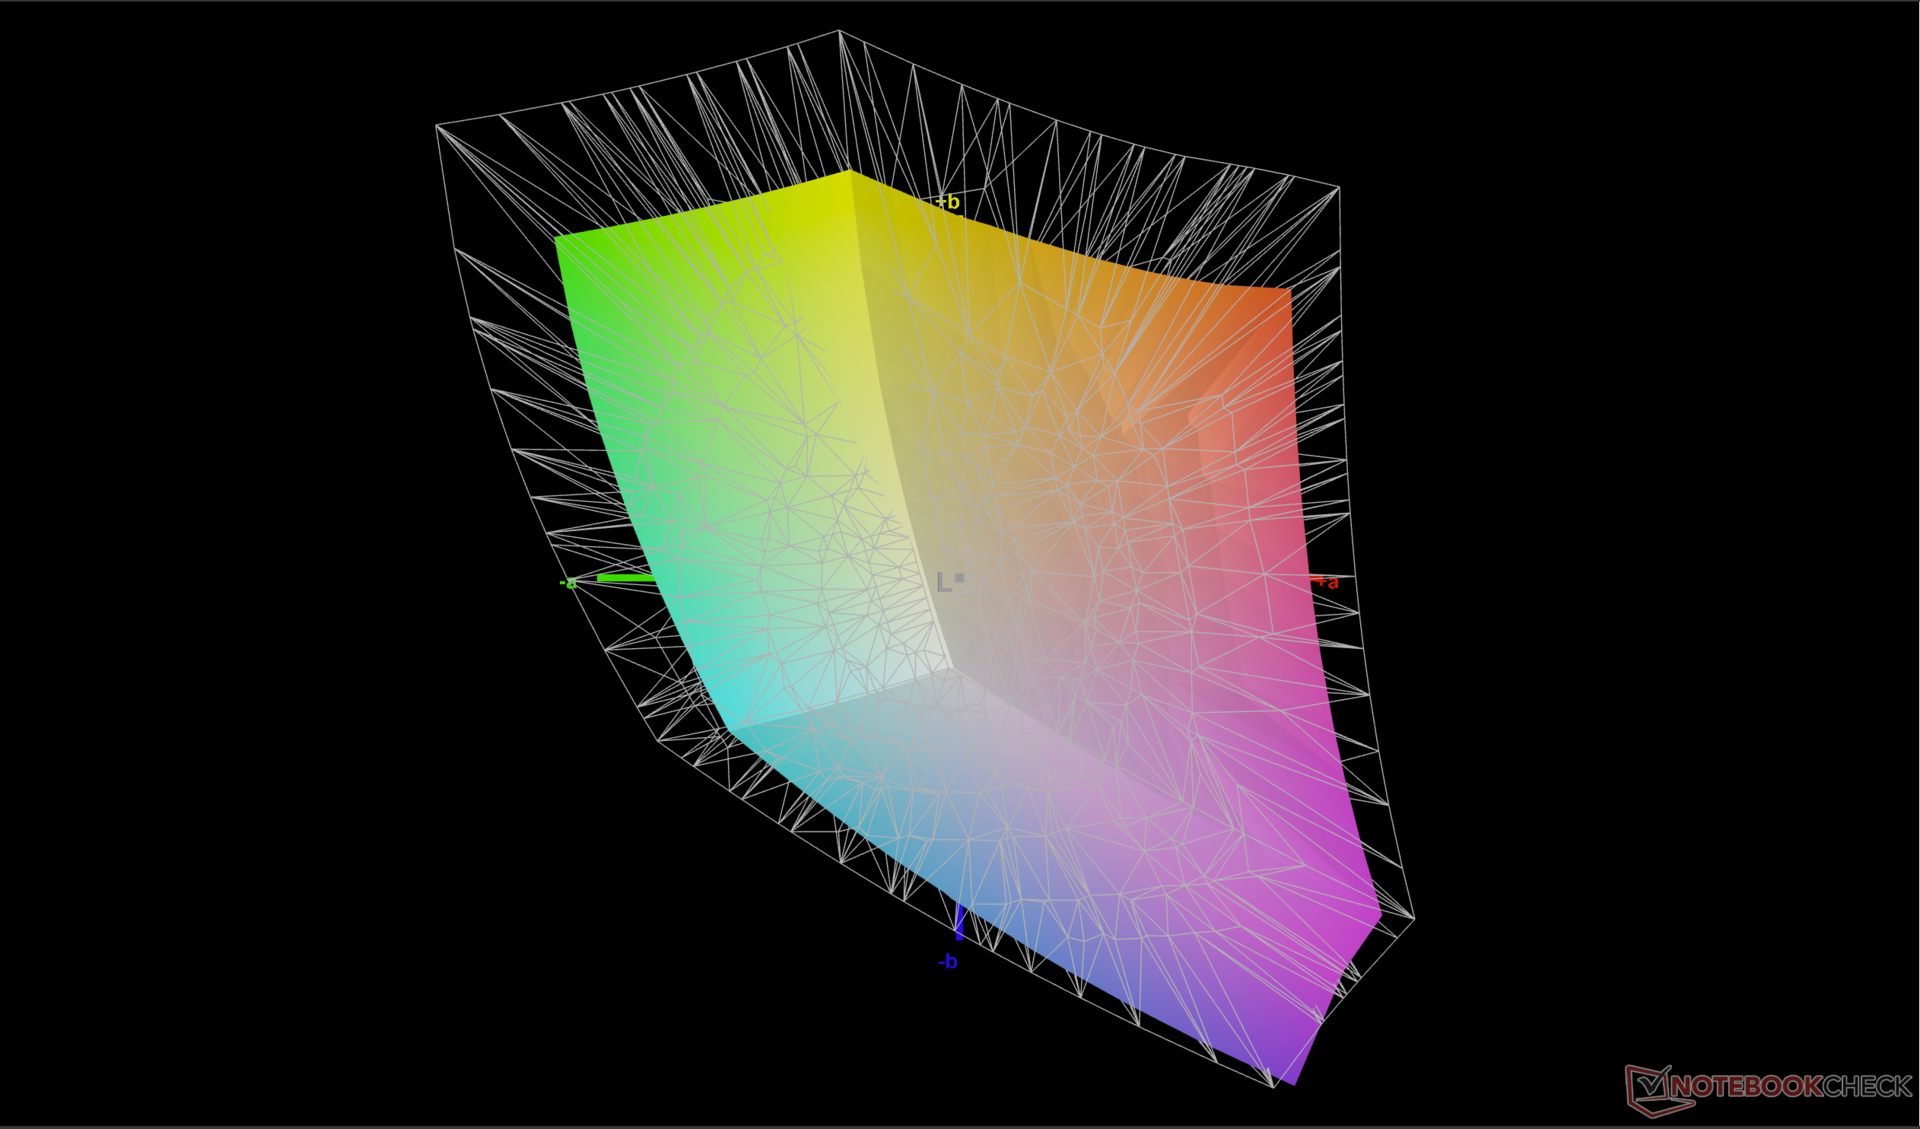
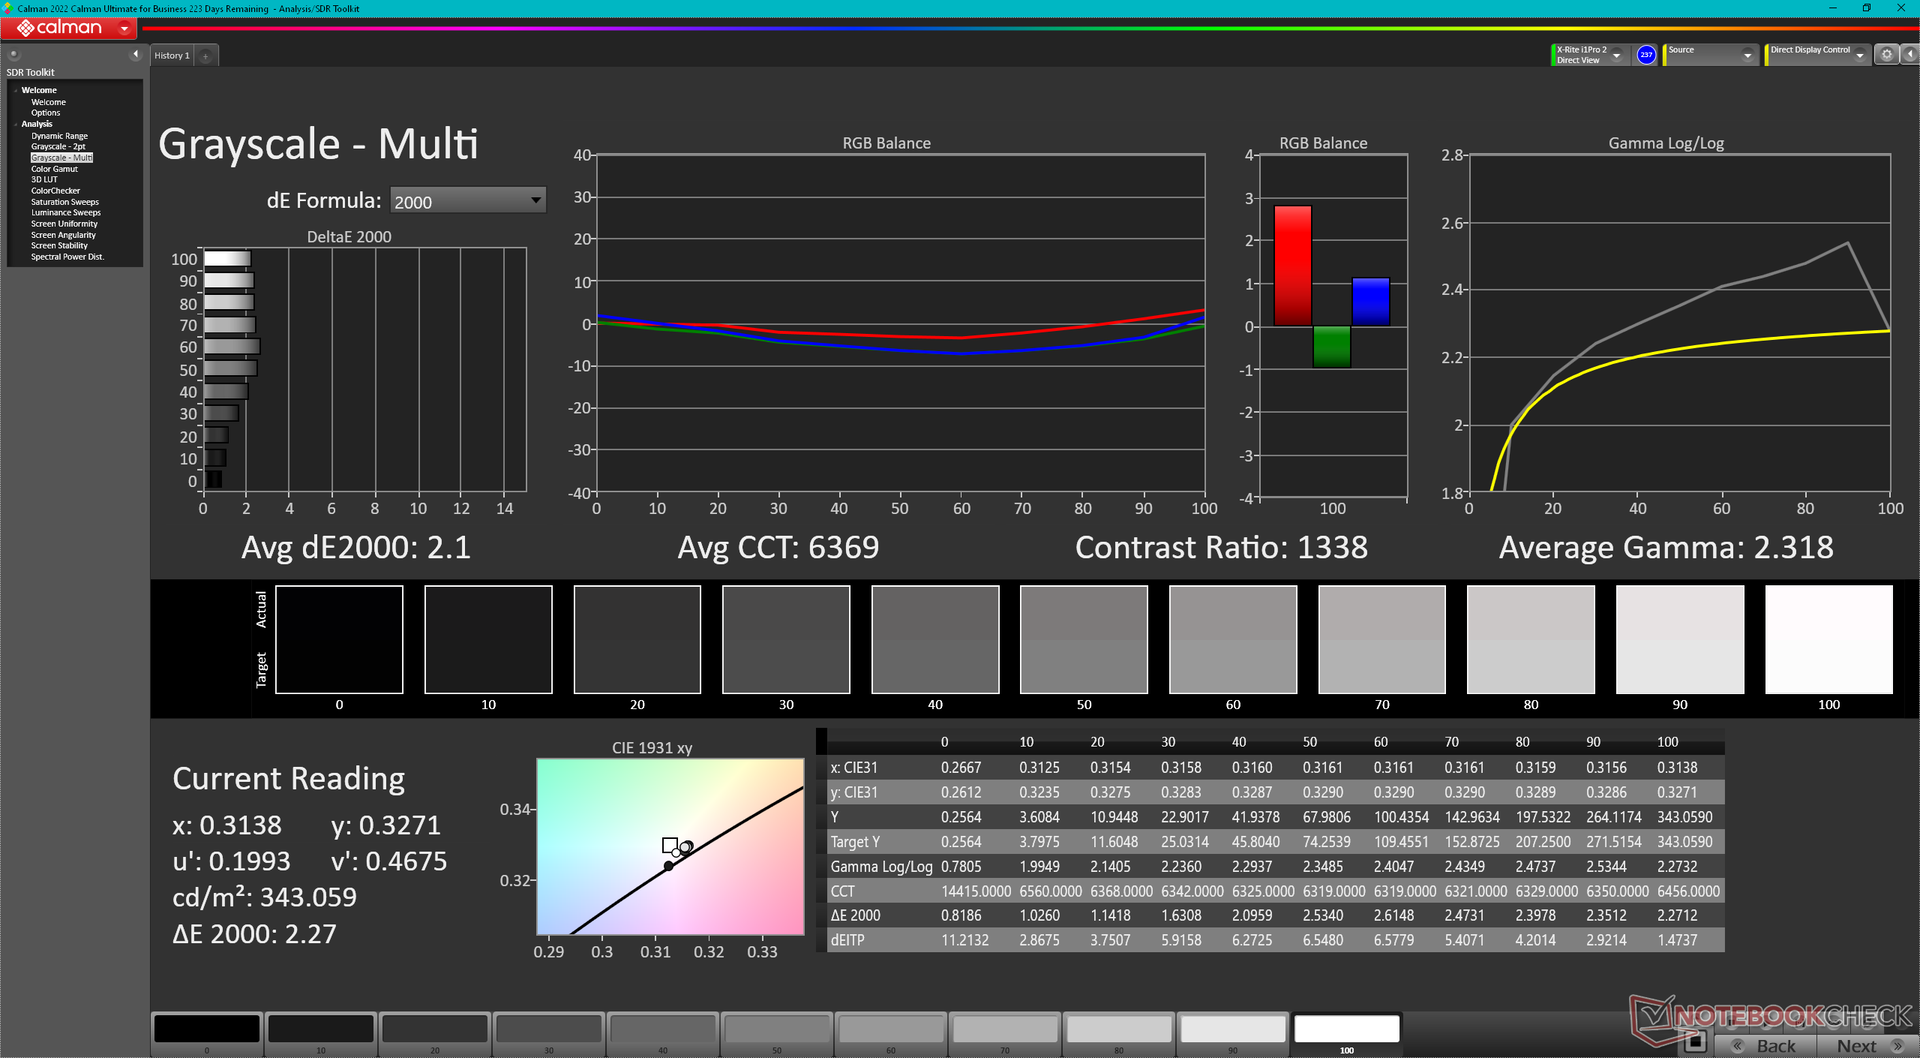
Model, geçen yılki m16 R1'deki BOE NE16NYB'nin aksine bir BOE NE16NYH panel kullanıyor. Yeni panel daha hızlı bir doğal yenileme hızına (240 Hz'e karşı 165 Hz) sahipken, hızlı siyah-beyaz tepki süreleri, ~1000:1 kontrast oranı, tam sRGB kapsamı ve 300 ila 350 nit maksimum parlaklık dahil olmak üzere diğer tüm özellikler temelde aynı kalıyor. Ekran hem oyun hem de amatör düzenleme amaçları için uygundur.
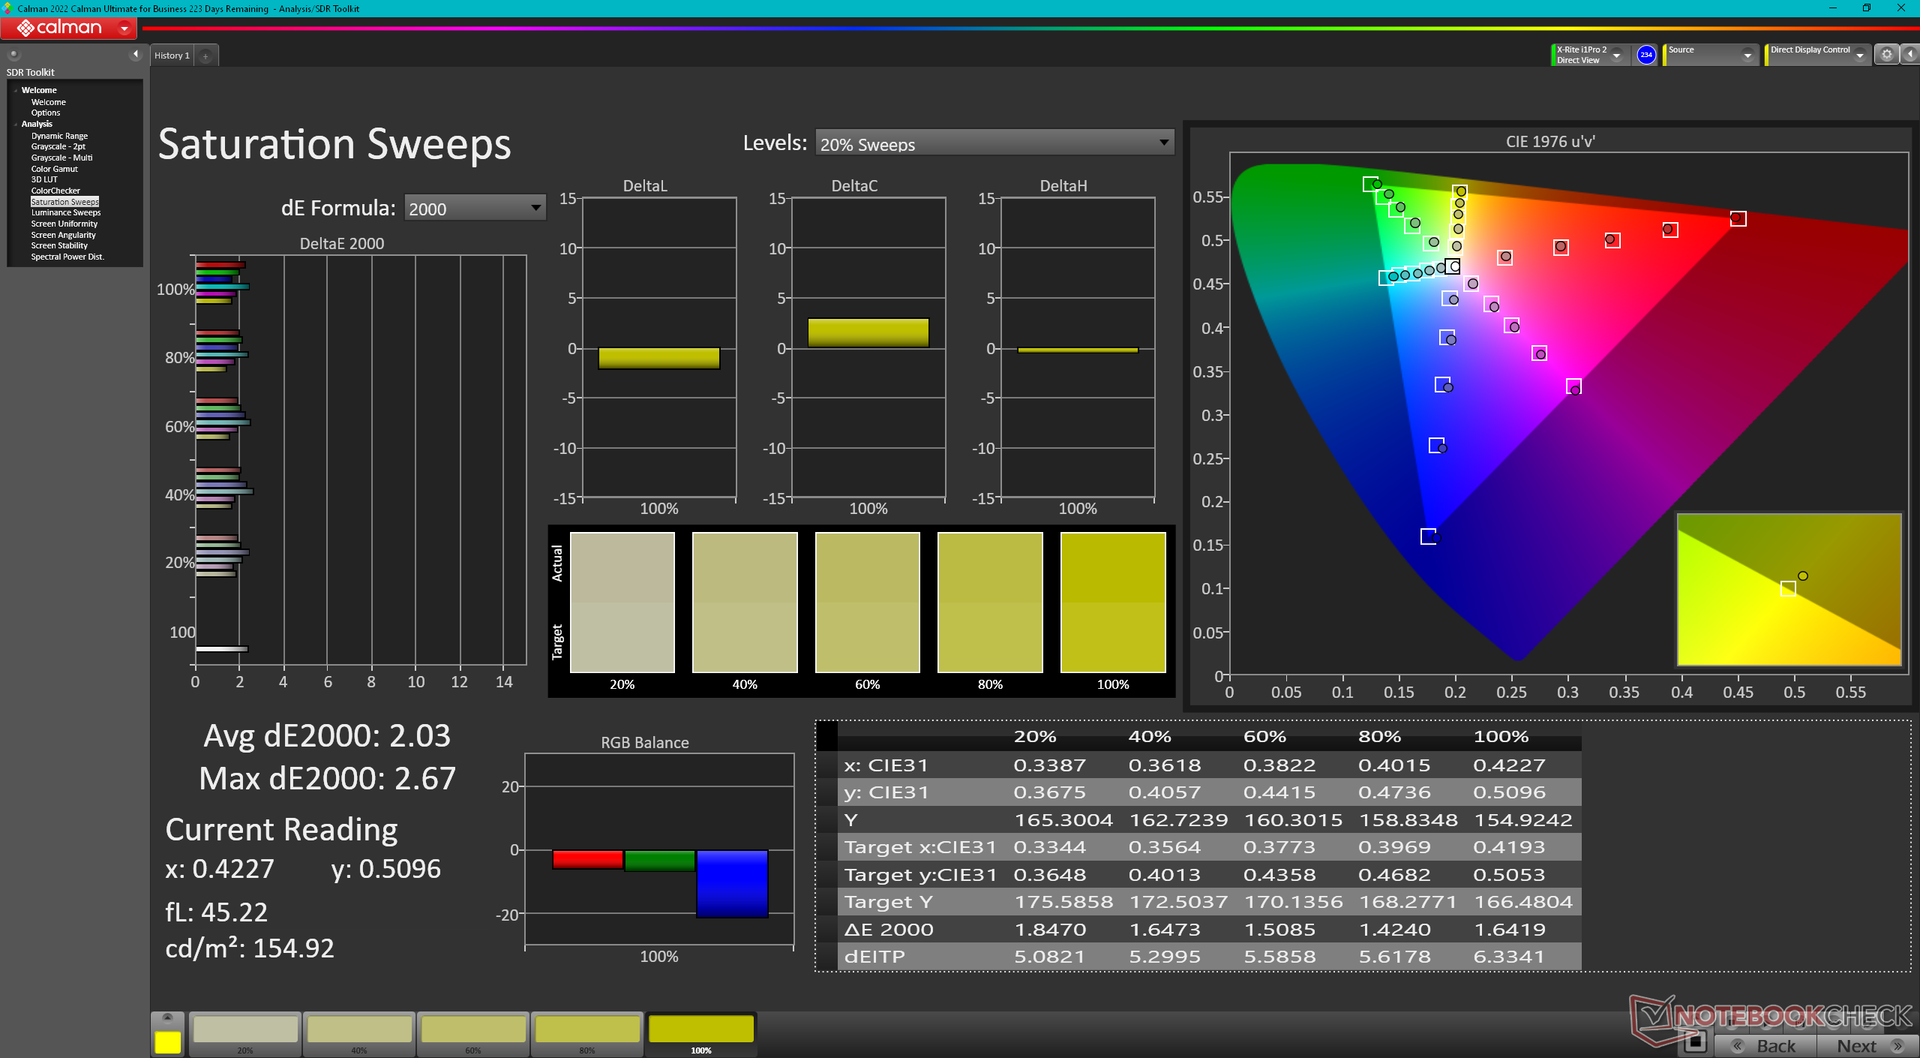
Yeni panel her ne kadar pürüzsüz olsa da DCI-P3 renkleri ve Windows değişken yenileme hızından yoksundur. Bunlardan ilki daha profesyonel grafik editörlerine hitap ederken, ikincisi pil ömrünü iyileştirebilirdi. Tam DCI-P3 renkleri x16 R1, HP Omen Transcend 16 ve Asus ROG Zephyrus G16. Ekran HDR400+ önkoşullarını karşılayacak kadar parlak olmadığı için HDR de desteklenmiyor.
| |||||||||||||||||||||||||
Aydınlatma: 87 %
Batarya modunda parlaklık: 345.8 cd/m²
Kontrast: 1153:1 (Siyah: 0.3 cd/m²)
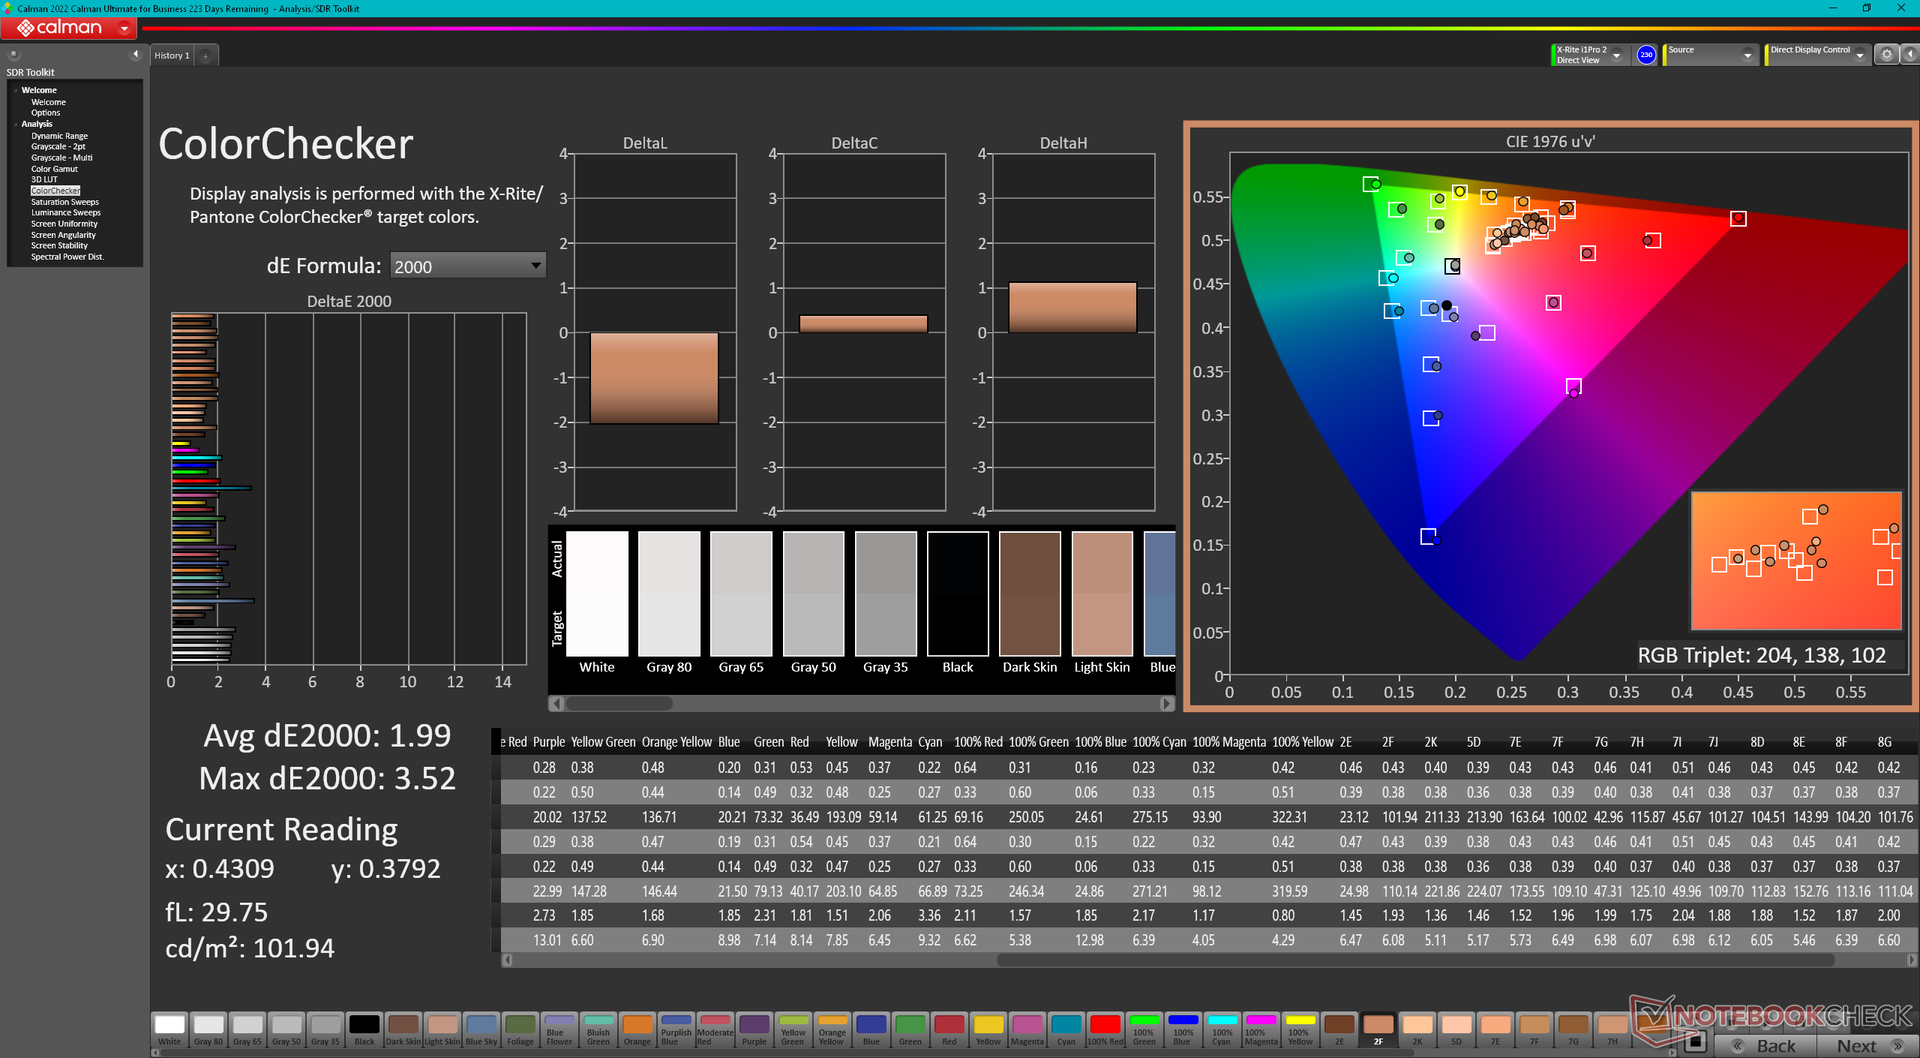
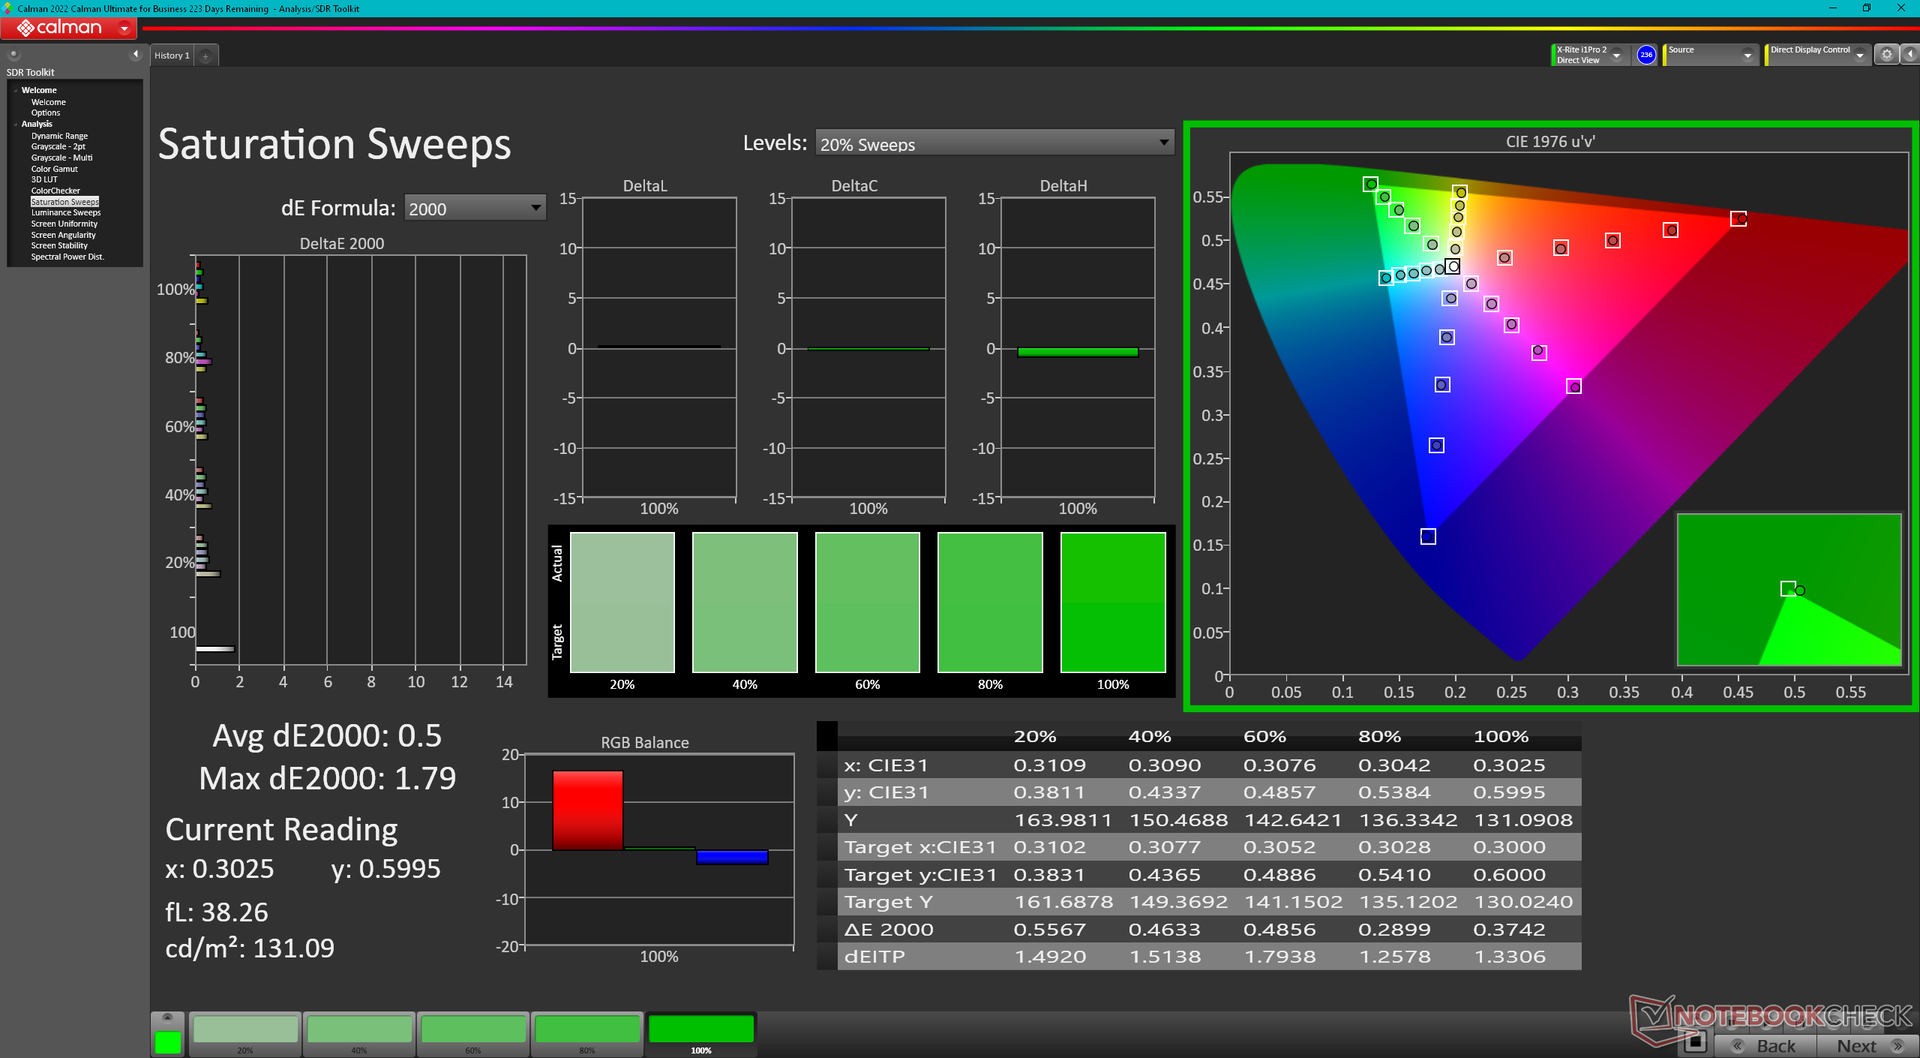
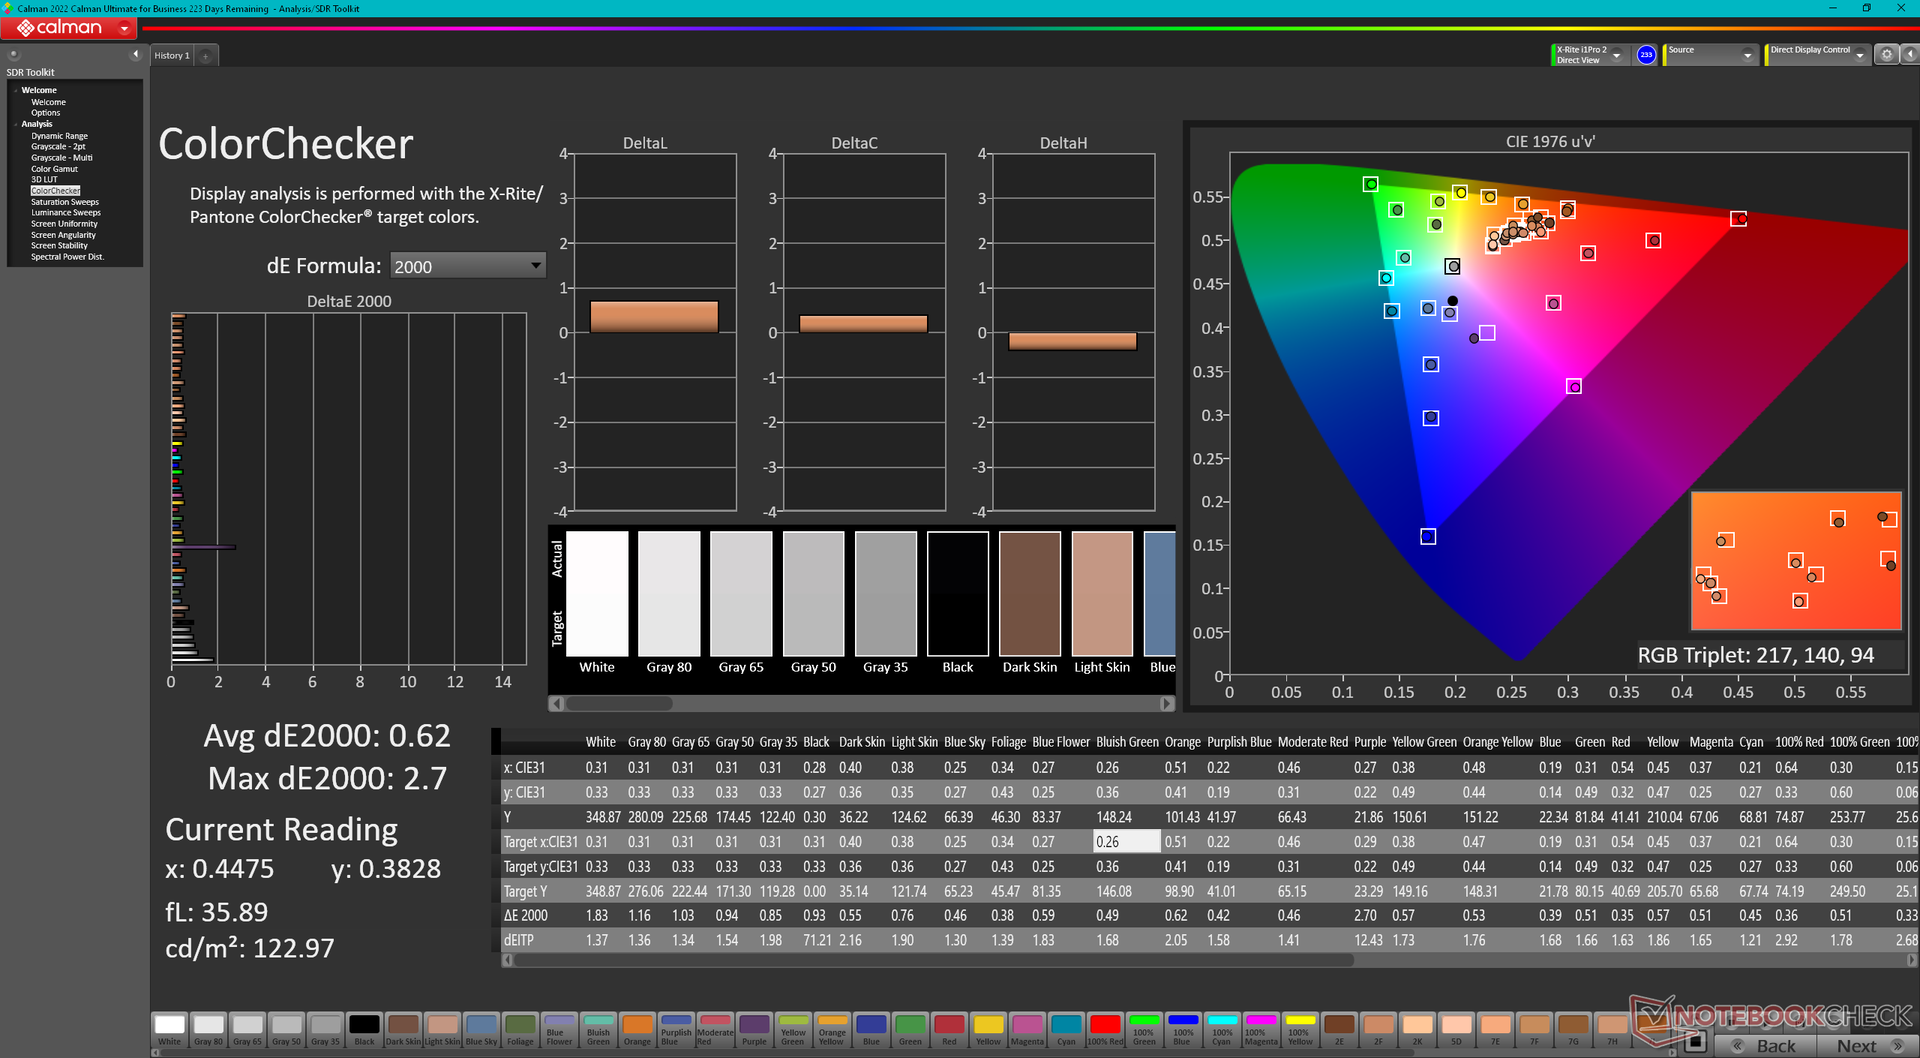
ΔE ColorChecker Calman: 1.99 | ∀{0.5-29.43 Ø4.71}
calibrated: 0.62
ΔE Greyscale Calman: 2.1 | ∀{0.09-98 Ø4.96}
71.4% AdobeRGB 1998 (Argyll 3D)
100% sRGB (Argyll 3D)
71% Display P3 (Argyll 3D)
Gamma: 2.32
CCT: 6369 K
| Alienware m16 R2 BOE NE16NYH, IPS, 2560x1600, 16" | Alienware m16 R1 Intel BOE NE16NYB, IPS, 2560x1600, 16" | Alienware x16 R1 BOE NE16NZ4, IPS, 2560x1600, 16" | HP Omen Transcend 16-u1095ng ATNA60DL02-0 (SDC41A4), OLED, 2560x1600, 16" | Asus ROG Zephyrus G16 2024 GU605M ATNA60DL01-0, OLED, 2560x1600, 16" | Lenovo Legion Slim 7 16APH8 BOE NE160QDM-NZ3, IPS, 2560x1600, 16" | |
|---|---|---|---|---|---|---|
| Display | -3% | 21% | 26% | 26% | 0% | |
| Display P3 Coverage (%) | 71 | 67.7 -5% | 99.2 40% | 99.8 41% | 99.9 41% | 70.3 -1% |
| sRGB Coverage (%) | 100 | 97.2 -3% | 100 0% | 100 0% | 100 0% | 99.6 0% |
| AdobeRGB 1998 Coverage (%) | 71.4 | 70 -2% | 88.6 24% | 97 36% | 96.9 36% | 72.4 1% |
| Response Times | 23% | -4% | 97% | 97% | -45% | |
| Response Time Grey 50% / Grey 80% * (ms) | 5.7 ? | 4 ? 30% | 5.1 ? 11% | 0.2 ? 96% | 0.22 ? 96% | 12.6 ? -121% |
| Response Time Black / White * (ms) | 8.7 ? | 7.3 ? 16% | 10.3 ? -18% | 0.2 ? 98% | 0.25 ? 97% | 5.9 ? 32% |
| PWM Frequency (Hz) | 120 ? | 960 ? | ||||
| Screen | -20% | -13% | 129% | 14% | 5% | |
| Brightness middle (cd/m²) | 345.8 | 306 -12% | 302.2 -13% | 390 13% | 416 20% | 545 58% |
| Brightness (cd/m²) | 337 | 302 -10% | 285 -15% | 392 16% | 418 24% | 502 49% |
| Brightness Distribution (%) | 87 | 89 2% | 89 2% | 98 13% | 96 10% | 82 -6% |
| Black Level * (cd/m²) | 0.3 | 0.3 -0% | 0.26 13% | 0.02 93% | 0.48 -60% | |
| Contrast (:1) | 1153 | 1020 -12% | 1162 1% | 19500 1591% | 1135 -2% | |
| Colorchecker dE 2000 * | 1.99 | 2.57 -29% | 1.63 18% | 1.94 3% | 1.6 20% | 1.36 32% |
| Colorchecker dE 2000 max. * | 3.52 | 4.26 -21% | 4.13 -17% | 4.26 -21% | 2.1 40% | 3.11 12% |
| Colorchecker dE 2000 calibrated * | 0.62 | 0.85 -37% | 1.17 -89% | 4.21 -579% | 1.04 -68% | |
| Greyscale dE 2000 * | 2.1 | 3.3 -57% | 2.5 -19% | 1.5 29% | 2.7 -29% | 1.4 33% |
| Gamma | 2.32 95% | 1.997 110% | 2.23 99% | 2.221 99% | 2.16 102% | 2.253 98% |
| CCT | 6369 102% | 6895 94% | 6590 99% | 6395 102% | 6331 103% | 6631 98% |
| Toplam Ortalama (Program / Ayarlar) | 0% /
-10% | 1% /
-4% | 84% /
102% | 46% /
32% | -13% /
-3% |
* ... daha küçük daha iyidir
Ekran, ortalama gri tonlama ve renk deltaE değerleri sırasıyla sadece 2,1 ve 1,99 ile kutudan iyi kalibre edilmiş olarak çıkıyor. X-Rite renk ölçerimizle daha fazla kalibre edildiğinde sonuçlar daha da iyileşerek her biri <1'e düşecektir, ancak çoğu kullanıcı için bu gerekli olmayacaktır. Kalibre edilmiş ICM profilimiz yukarıda ücretsiz olarak indirilebilir.
Yanıt Sürelerini Görüntüle
| ↔ Tepki Süresi Siyahtan Beyaza | ||
|---|---|---|
| 8.7 ms ... yükseliş ↗ ve sonbahar↘ birleşimi | ↗ 4.6 ms yükseliş | 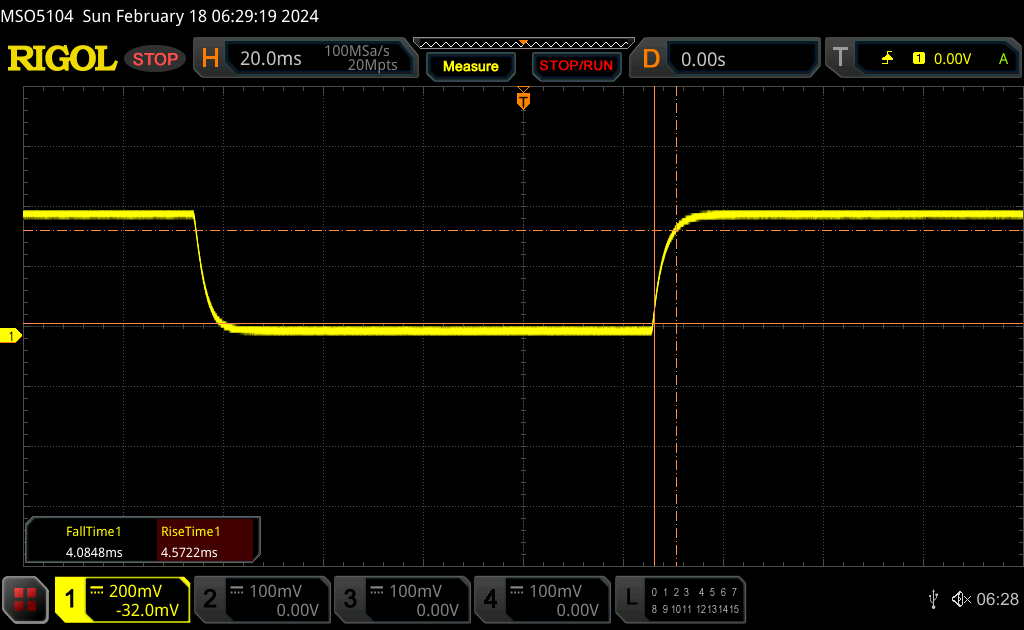 |
| ↘ 4.1 ms sonbahar | ||
| Ekran, testlerimizde hızlı yanıt oranları gösteriyor ve oyun oynamaya uygun olmalı. Karşılaştırıldığında, test edilen tüm cihazlar 0.1 (minimum) ile 240 (maksimum) ms arasında değişir. » Tüm cihazların 24 %'si daha iyi. Bu, ölçülen yanıt süresinin test edilen tüm cihazların ortalamasından (19.8 ms) daha iyi olduğu anlamına gelir. | ||
| ↔ Tepki Süresi %50 Griden %80 Griye | ||
| 5.7 ms ... yükseliş ↗ ve sonbahar↘ birleşimi | ↗ 2.6 ms yükseliş | 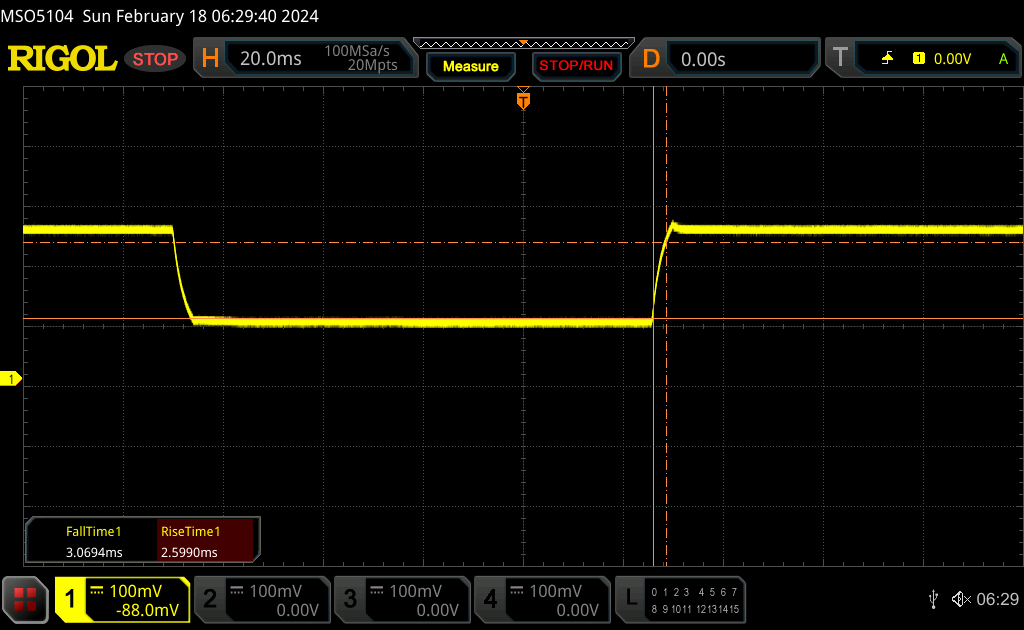 |
| ↘ 3.1 ms sonbahar | ||
| Ekran, testlerimizde çok hızlı yanıt oranları gösteriyor ve hızlı oyun oynamaya çok uygun olmalı. Karşılaştırıldığında, test edilen tüm cihazlar 0.165 (minimum) ile 636 (maksimum) ms arasında değişir. » Tüm cihazların 18 %'si daha iyi. Bu, ölçülen yanıt süresinin test edilen tüm cihazların ortalamasından (31 ms) daha iyi olduğu anlamına gelir. | ||
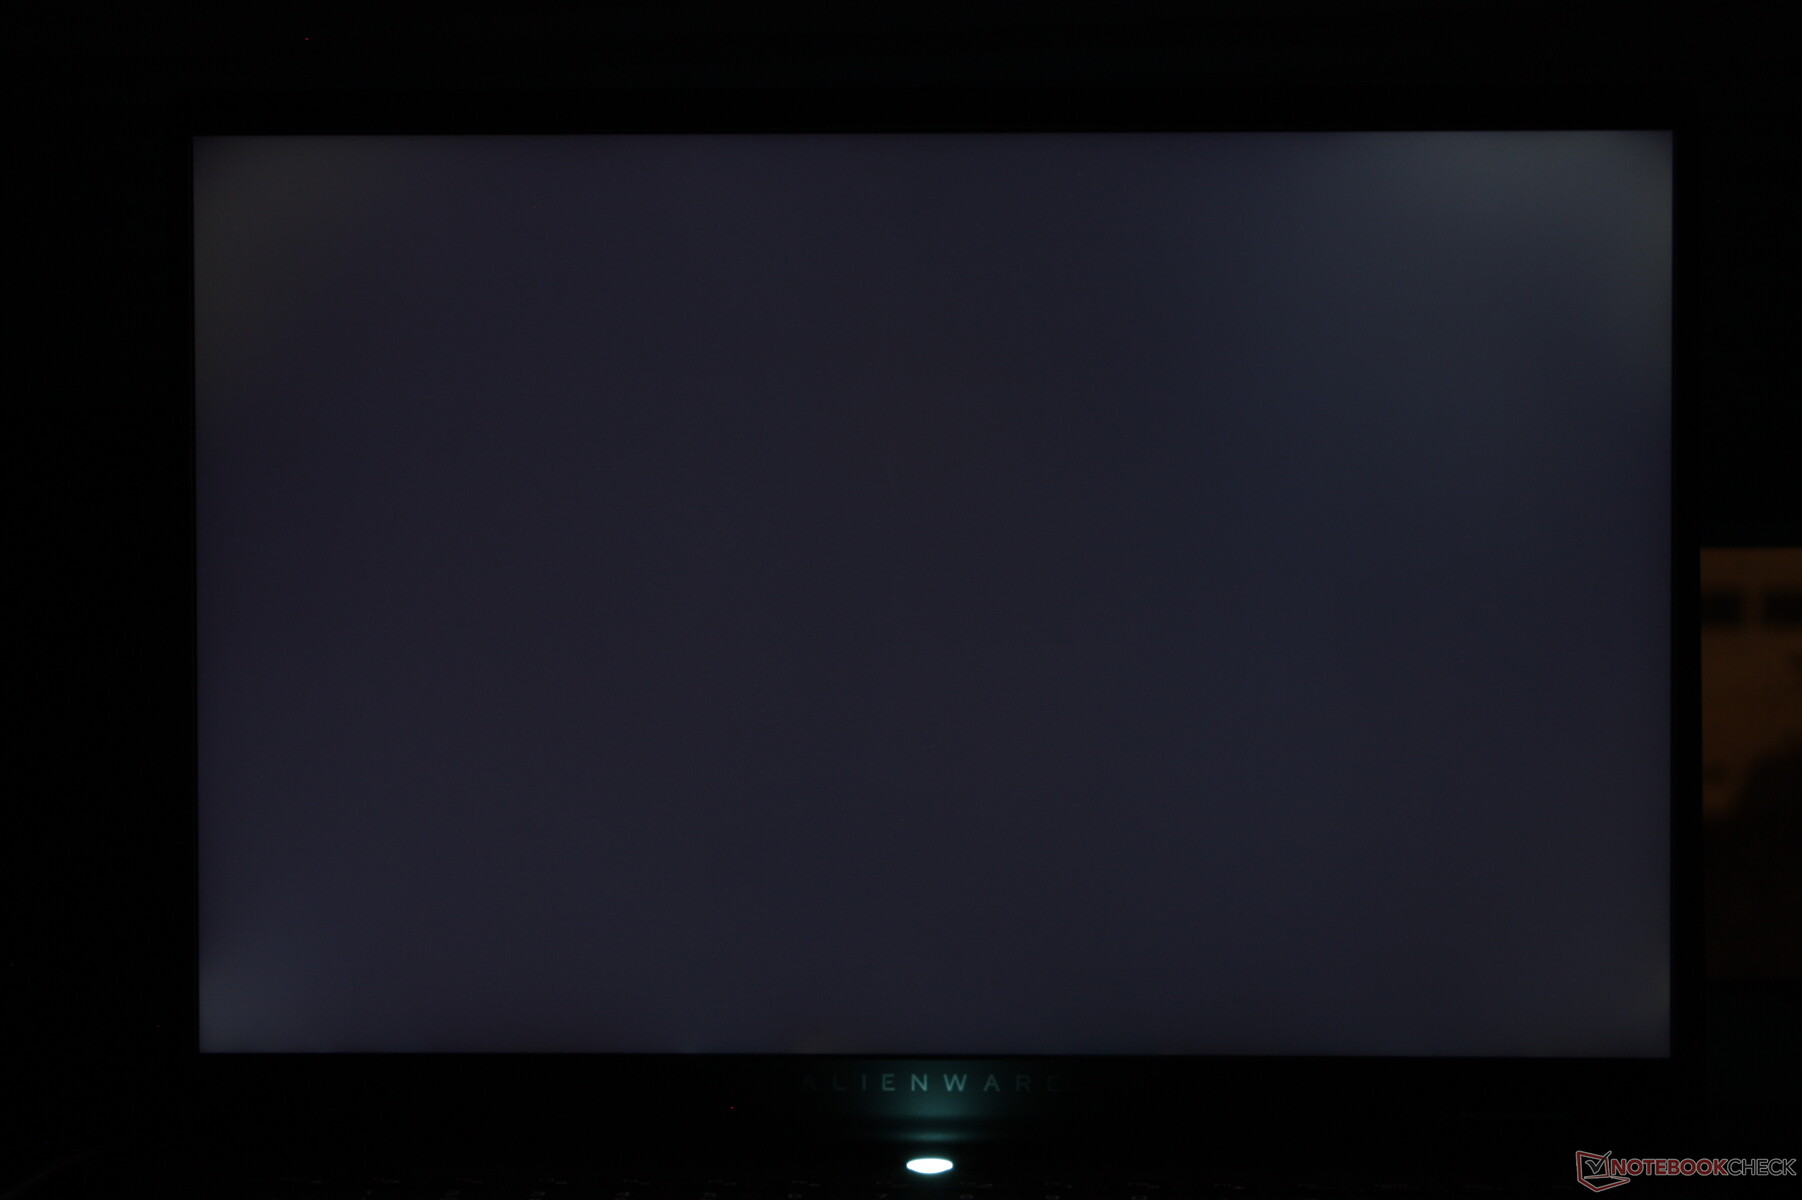
Ekran Titremesi / PWM (Darbe Genişliği Modülasyonu)
| Ekran titriyor / PWM algılanmadı | 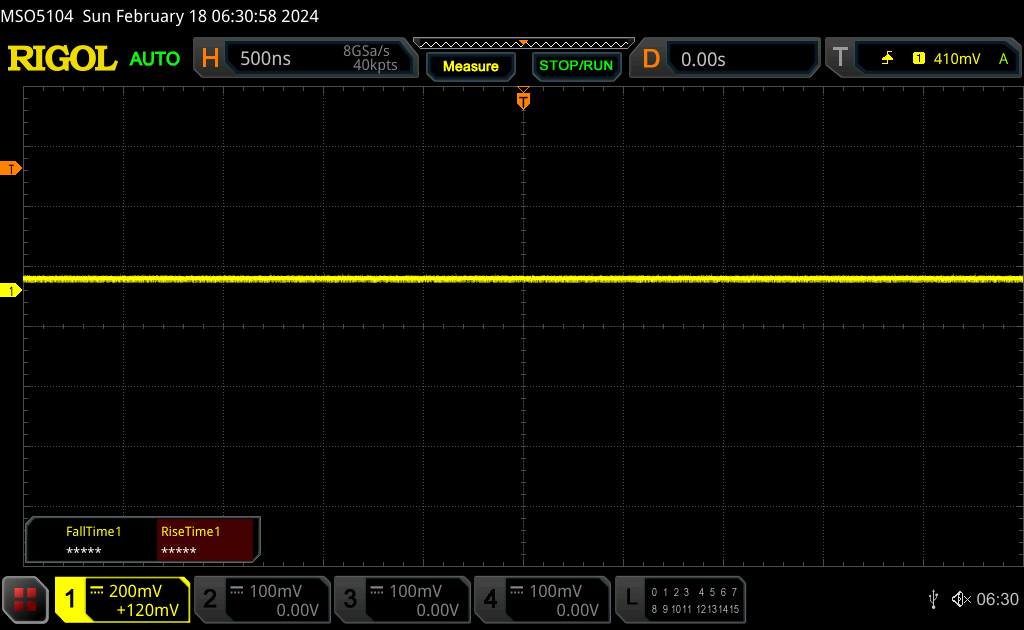 | ||
Karşılaştırıldığında: Test edilen tüm cihazların %52 %'si ekranı karartmak için PWM kullanmıyor. PWM tespit edilirse, ortalama 7757 (minimum: 5 - maksimum: 343500) Hz ölçüldü. | |||
Dış mekan görünürlüğü eskisi ile hemen hemen aynıdır ve bu nedenle parlamayı azaltmak ve renkleri korumak için mümkün olduğunca gölgede kalmanız önerilir. Yine de daha hafif ve daha küçük boyut, sistemin kullanımını kolaylaştırıyor.
Performans - Raptor Lake-HX'ten Meteor Lake-H'ye
Test Koşulları
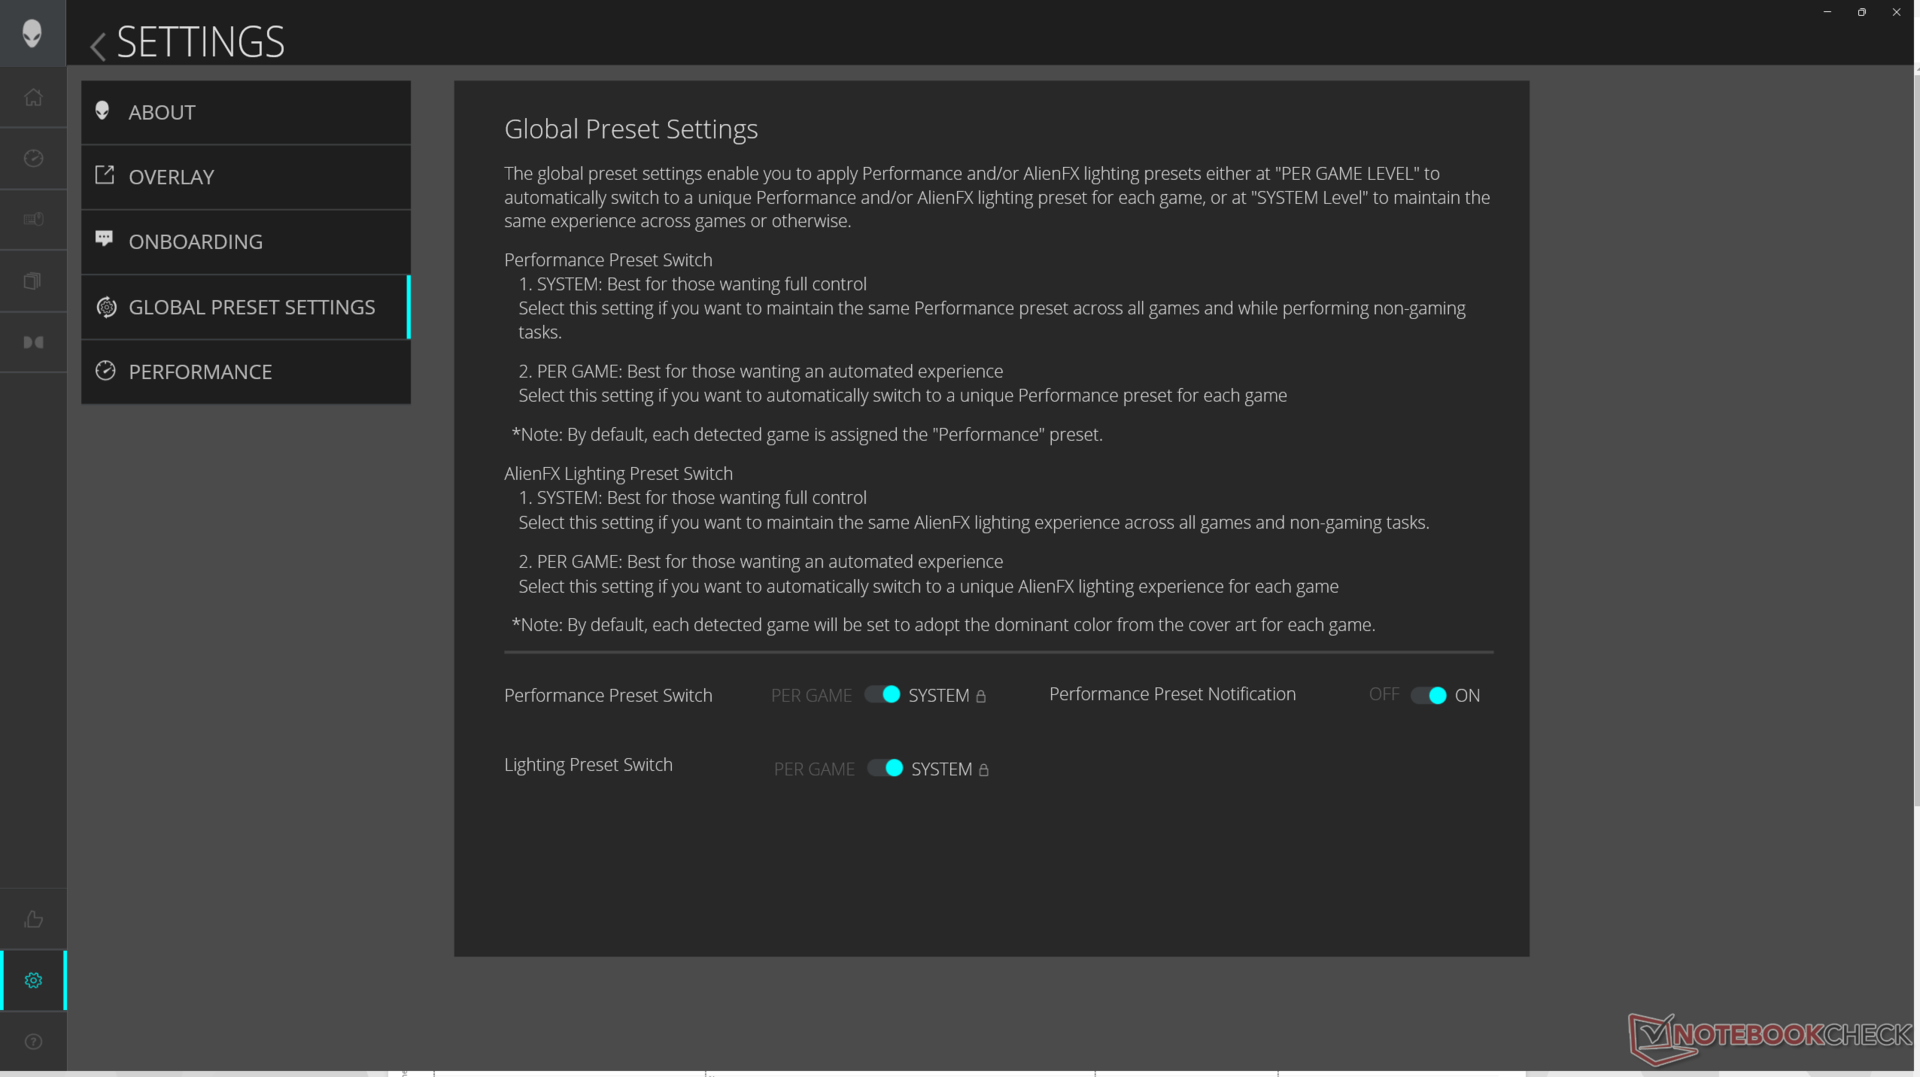
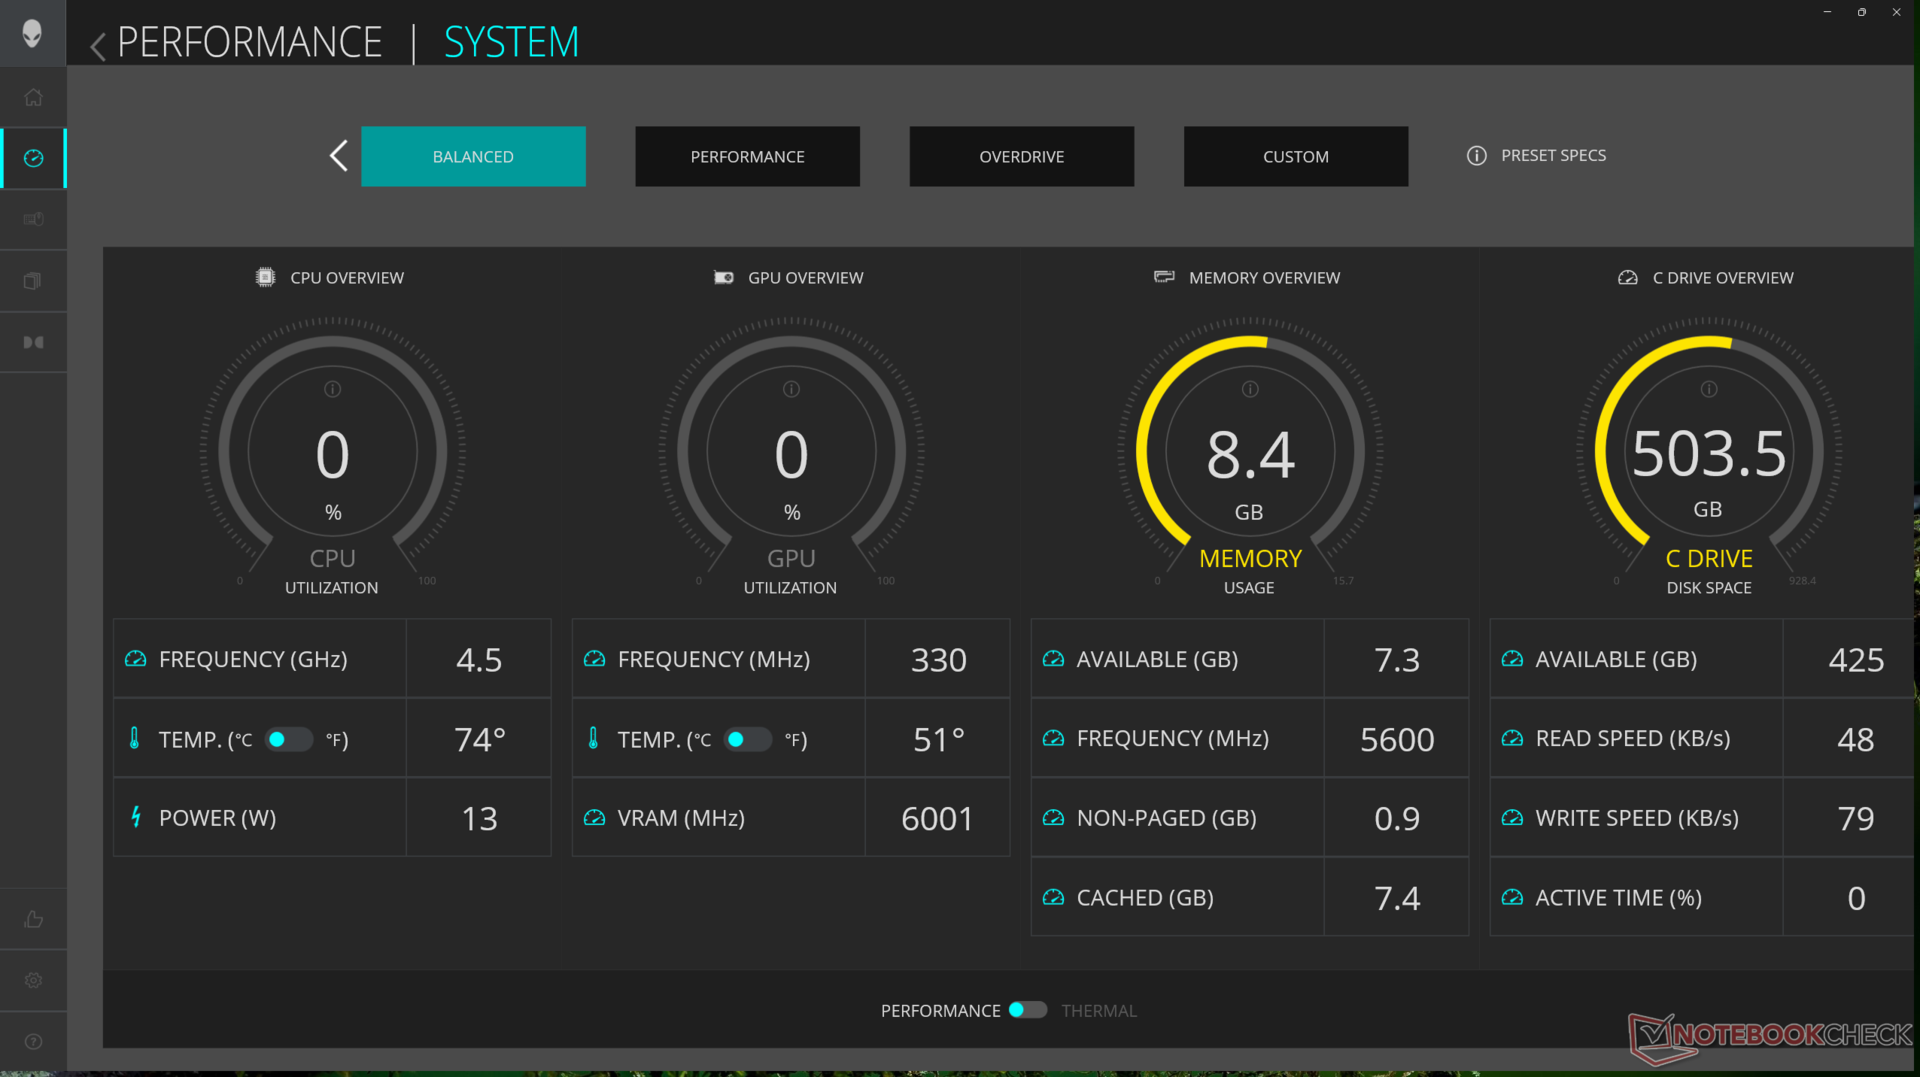
Aşağıdaki kıyaslamaları çalıştırmadan önce Alienware Command Center'ı (ACC) Overdrive moduna ve Nvidia Control Panel'i dGPU moduna ayarladık. ACC, m16 R1'de yaşadığımız birçok sorun olmadan çok daha sorunsuz çalışacak şekilde güncellendi. Örneğin, artık fan profili modları ve AlienFX RGB aydınlatma artık kullanıcıyı bilgilendirmeden otomatik olarak değişmezken, açılışta neredeyse hemen başlatılıyor.
Bununla birlikte, Windows Güç ayarlarını iki kez kontrol ettikten sonra bile kapak kapatıldığında sistemin bazen Uyku moduna doğru şekilde girmediği bir hata yaşadık. Bu da çok sıcak bir dizüstü bilgisayara ve birkaç saat sonra tamamen boşalmış bir pile yol açıyordu.
Hem Advanced Optimus hem de G-Sync desteklenmektedir, yani kullanıcılar yazılımsal yeniden başlatma olmadan iGPU ve dGPU modları arasında geçiş yapabilirler. G-Sync'in çalışması için sistemin dGPU moduna ayarlanması gerektiğini unutmayın.
İşlemci
Bizim Core Ultra 7 155H 'den yaklaşık yüzde 10 ila 15 daha yavaştır Core i7-13700HX hem tek hem de çok iş parçacıklı işlemlerde geçen yılki m16 R1'e göre daha iyi. Esasen son çıkan Ryzen 9 8945HS. Diğer Meteor Lake CPU'larda olduğu gibi Core Ultra 7 155H, Microsoft Co-Pilot gibi yapay zeka görevlerini hızlandırmak için bir NPU entegre ediyor. Ancak şu anda çoğu yapay zeka uygulaması bulut tabanlı ve yerel olarak çalıştırma seçeneği yok ve bu nedenle yeni CPU'nun entegre yapay zeka yetenekleri şu anda çok sınırlı.
Core i7-13700HX karşısındaki performans eksikliğine rağmen m16 R2, Core Ultra 7 155H'yi aynı işlemciye sahip diğer dizüstü bilgisayarlardan belirgin şekilde daha hızlı çalıştırabiliyor. Örneğin, yakın tarihli Core Ultra 7 155H MSI Prestige 16 neredeyse yüzde 20 daha yavaş çalışır.
Dell, yakın gelecekte Core i7-13700HX'e karşı performans farkını azaltmaya yardımcı olacak bir Ultra 9 185H SKU sunmayı planladığını söylüyor. Daha zorlu Core i7-14700HX veya Core i9-14900HX termal sınırlamalar nedeniyle sunulmuyor; Dell CPU TDP yerine GPU TGP'yi en üst düzeye çıkarmaya öncelik verdi.
Cinebench R15 Multi Loop
Cinebench R23: Multi Core | Single Core
Cinebench R20: CPU (Multi Core) | CPU (Single Core)
Cinebench R15: CPU Multi 64Bit | CPU Single 64Bit
Blender: v2.79 BMW27 CPU
7-Zip 18.03: 7z b 4 | 7z b 4 -mmt1
Geekbench 6.7: Multi-Core | Single-Core
Geekbench 5.5: Multi-Core | Single-Core
HWBOT x265 Benchmark v2.2: 4k Preset
LibreOffice : 20 Documents To PDF
R Benchmark 2.5: Overall mean
| CPU Performance rating | |
| Lenovo Legion 9 16IRX8 | |
| Lenovo Legion Pro 7 16IRX8H -2! | |
| Alienware m16 R1 AMD | |
| HP Omen Transcend 16-u1095ng | |
| Alienware m16 R1 Intel | |
| Alienware x16 R1 -3! | |
| Lenovo Legion Slim 7i 16 Gen 8 -3! | |
| Razer Blade 14 RZ09-0508 | |
| Framework Laptop 16 | |
| Alienware m16 R2 -1! | |
| Asus ROG Zephyrus G16 2024 GU605M | |
| Lenovo Legion Slim 7 16APH8 | |
| Ortalama Intel Core Ultra 7 155H | |
| Lenovo Legion S7 16ARHA7 -2! | |
| Asus ROG Zephyrus M16 GU603H -4! | |
| Geekbench 6.7 / Multi-Core | |
| Lenovo Legion 9 16IRX8 | |
| HP Omen Transcend 16-u1095ng | |
| Alienware m16 R1 Intel | |
| Razer Blade 14 RZ09-0508 | |
| Asus ROG Zephyrus G16 2024 GU605M | |
| Framework Laptop 16 | |
| Lenovo Legion Slim 7 16APH8 | |
| Alienware m16 R2 | |
| Alienware m16 R1 AMD | |
| Ortalama Intel Core Ultra 7 155H (7732 - 13656, n=55) | |
| Geekbench 6.7 / Single-Core | |
| Lenovo Legion 9 16IRX8 | |
| HP Omen Transcend 16-u1095ng | |
| Alienware m16 R1 AMD | |
| Razer Blade 14 RZ09-0508 | |
| Alienware m16 R1 Intel | |
| Framework Laptop 16 | |
| Lenovo Legion Slim 7 16APH8 | |
| Asus ROG Zephyrus G16 2024 GU605M | |
| Alienware m16 R2 | |
| Ortalama Intel Core Ultra 7 155H (1901 - 2473, n=52) | |
Cinebench R23: Multi Core | Single Core
Cinebench R20: CPU (Multi Core) | CPU (Single Core)
Cinebench R15: CPU Multi 64Bit | CPU Single 64Bit
Blender: v2.79 BMW27 CPU
7-Zip 18.03: 7z b 4 | 7z b 4 -mmt1
Geekbench 6.7: Multi-Core | Single-Core
Geekbench 5.5: Multi-Core | Single-Core
HWBOT x265 Benchmark v2.2: 4k Preset
LibreOffice : 20 Documents To PDF
R Benchmark 2.5: Overall mean
* ... daha küçük daha iyidir
AIDA64: FP32 Ray-Trace | FPU Julia | CPU SHA3 | CPU Queen | FPU SinJulia | FPU Mandel | CPU AES | CPU ZLib | FP64 Ray-Trace | CPU PhotoWorxx
| Performance rating | |
| Lenovo Legion Slim 7 16APH8 | |
| Alienware m16 R1 Intel | |
| Alienware x16 R1 | |
| HP Omen Transcend 16-u1095ng | |
| Alienware m16 R2 | |
| Asus ROG Zephyrus G16 2024 GU605M | |
| Ortalama Intel Core Ultra 7 155H | |
| AIDA64 / FP32 Ray-Trace | |
| Lenovo Legion Slim 7 16APH8 | |
| Alienware m16 R1 Intel | |
| Alienware m16 R2 | |
| Alienware x16 R1 | |
| HP Omen Transcend 16-u1095ng | |
| Asus ROG Zephyrus G16 2024 GU605M | |
| Ortalama Intel Core Ultra 7 155H (6670 - 18470, n=50) | |
| AIDA64 / FPU Julia | |
| Lenovo Legion Slim 7 16APH8 | |
| Alienware m16 R1 Intel | |
| Alienware m16 R2 | |
| Alienware x16 R1 | |
| HP Omen Transcend 16-u1095ng | |
| Asus ROG Zephyrus G16 2024 GU605M | |
| Ortalama Intel Core Ultra 7 155H (40905 - 93181, n=50) | |
| AIDA64 / CPU SHA3 | |
| Alienware m16 R1 Intel | |
| Lenovo Legion Slim 7 16APH8 | |
| HP Omen Transcend 16-u1095ng | |
| Alienware m16 R2 | |
| Alienware x16 R1 | |
| Asus ROG Zephyrus G16 2024 GU605M | |
| Ortalama Intel Core Ultra 7 155H (1940 - 4436, n=50) | |
| AIDA64 / CPU Queen | |
| HP Omen Transcend 16-u1095ng | |
| Alienware x16 R1 | |
| Lenovo Legion Slim 7 16APH8 | |
| Alienware m16 R1 Intel | |
| Asus ROG Zephyrus G16 2024 GU605M | |
| Alienware m16 R2 | |
| Ortalama Intel Core Ultra 7 155H (64698 - 94181, n=50) | |
| AIDA64 / FPU SinJulia | |
| Lenovo Legion Slim 7 16APH8 | |
| Alienware m16 R1 Intel | |
| HP Omen Transcend 16-u1095ng | |
| Alienware x16 R1 | |
| Asus ROG Zephyrus G16 2024 GU605M | |
| Alienware m16 R2 | |
| Ortalama Intel Core Ultra 7 155H (5639 - 10647, n=50) | |
| AIDA64 / FPU Mandel | |
| Lenovo Legion Slim 7 16APH8 | |
| Alienware m16 R1 Intel | |
| Alienware m16 R2 | |
| Alienware x16 R1 | |
| HP Omen Transcend 16-u1095ng | |
| Asus ROG Zephyrus G16 2024 GU605M | |
| Ortalama Intel Core Ultra 7 155H (18236 - 47685, n=50) | |
| AIDA64 / CPU AES | |
| Alienware m16 R1 Intel | |
| HP Omen Transcend 16-u1095ng | |
| Alienware m16 R2 | |
| Alienware x16 R1 | |
| Asus ROG Zephyrus G16 2024 GU605M | |
| Ortalama Intel Core Ultra 7 155H (45713 - 152179, n=50) | |
| Lenovo Legion Slim 7 16APH8 | |
| AIDA64 / CPU ZLib | |
| Alienware m16 R1 Intel | |
| HP Omen Transcend 16-u1095ng | |
| Alienware x16 R1 | |
| Alienware m16 R2 | |
| Asus ROG Zephyrus G16 2024 GU605M | |
| Lenovo Legion Slim 7 16APH8 | |
| Ortalama Intel Core Ultra 7 155H (557 - 1250, n=50) | |
| AIDA64 / FP64 Ray-Trace | |
| Lenovo Legion Slim 7 16APH8 | |
| Alienware m16 R1 Intel | |
| Alienware x16 R1 | |
| Alienware m16 R2 | |
| HP Omen Transcend 16-u1095ng | |
| Asus ROG Zephyrus G16 2024 GU605M | |
| Ortalama Intel Core Ultra 7 155H (3569 - 9802, n=50) | |
| AIDA64 / CPU PhotoWorxx | |
| Alienware x16 R1 | |
| HP Omen Transcend 16-u1095ng | |
| Asus ROG Zephyrus G16 2024 GU605M | |
| Ortalama Intel Core Ultra 7 155H (32719 - 54223, n=50) | |
| Lenovo Legion Slim 7 16APH8 | |
| Alienware m16 R2 | |
| Alienware m16 R1 Intel | |
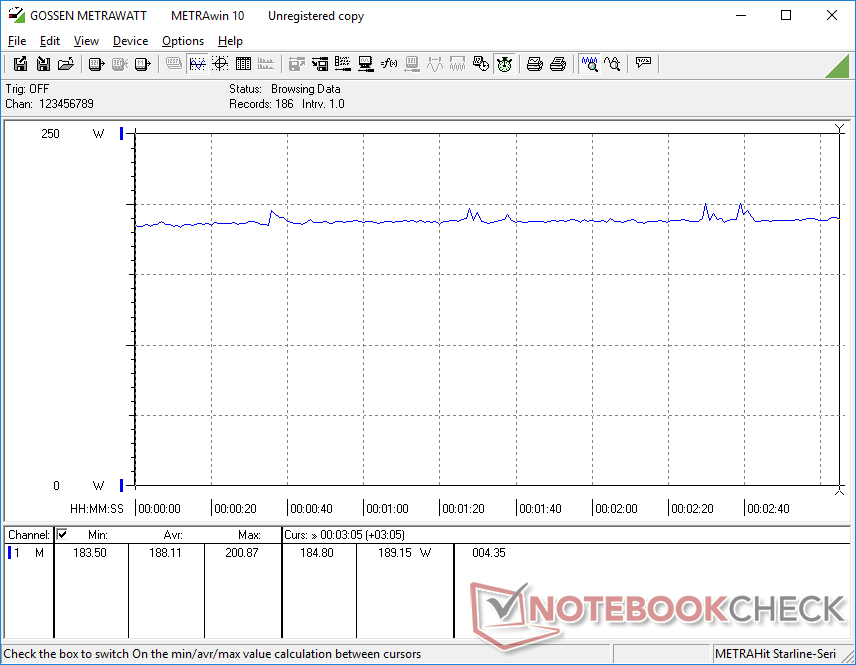
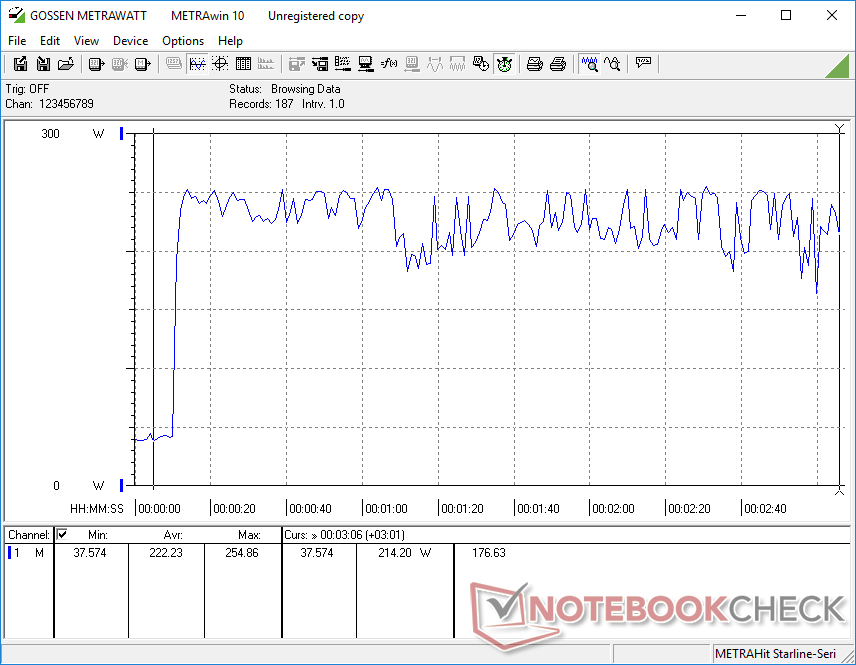
Stres Testi
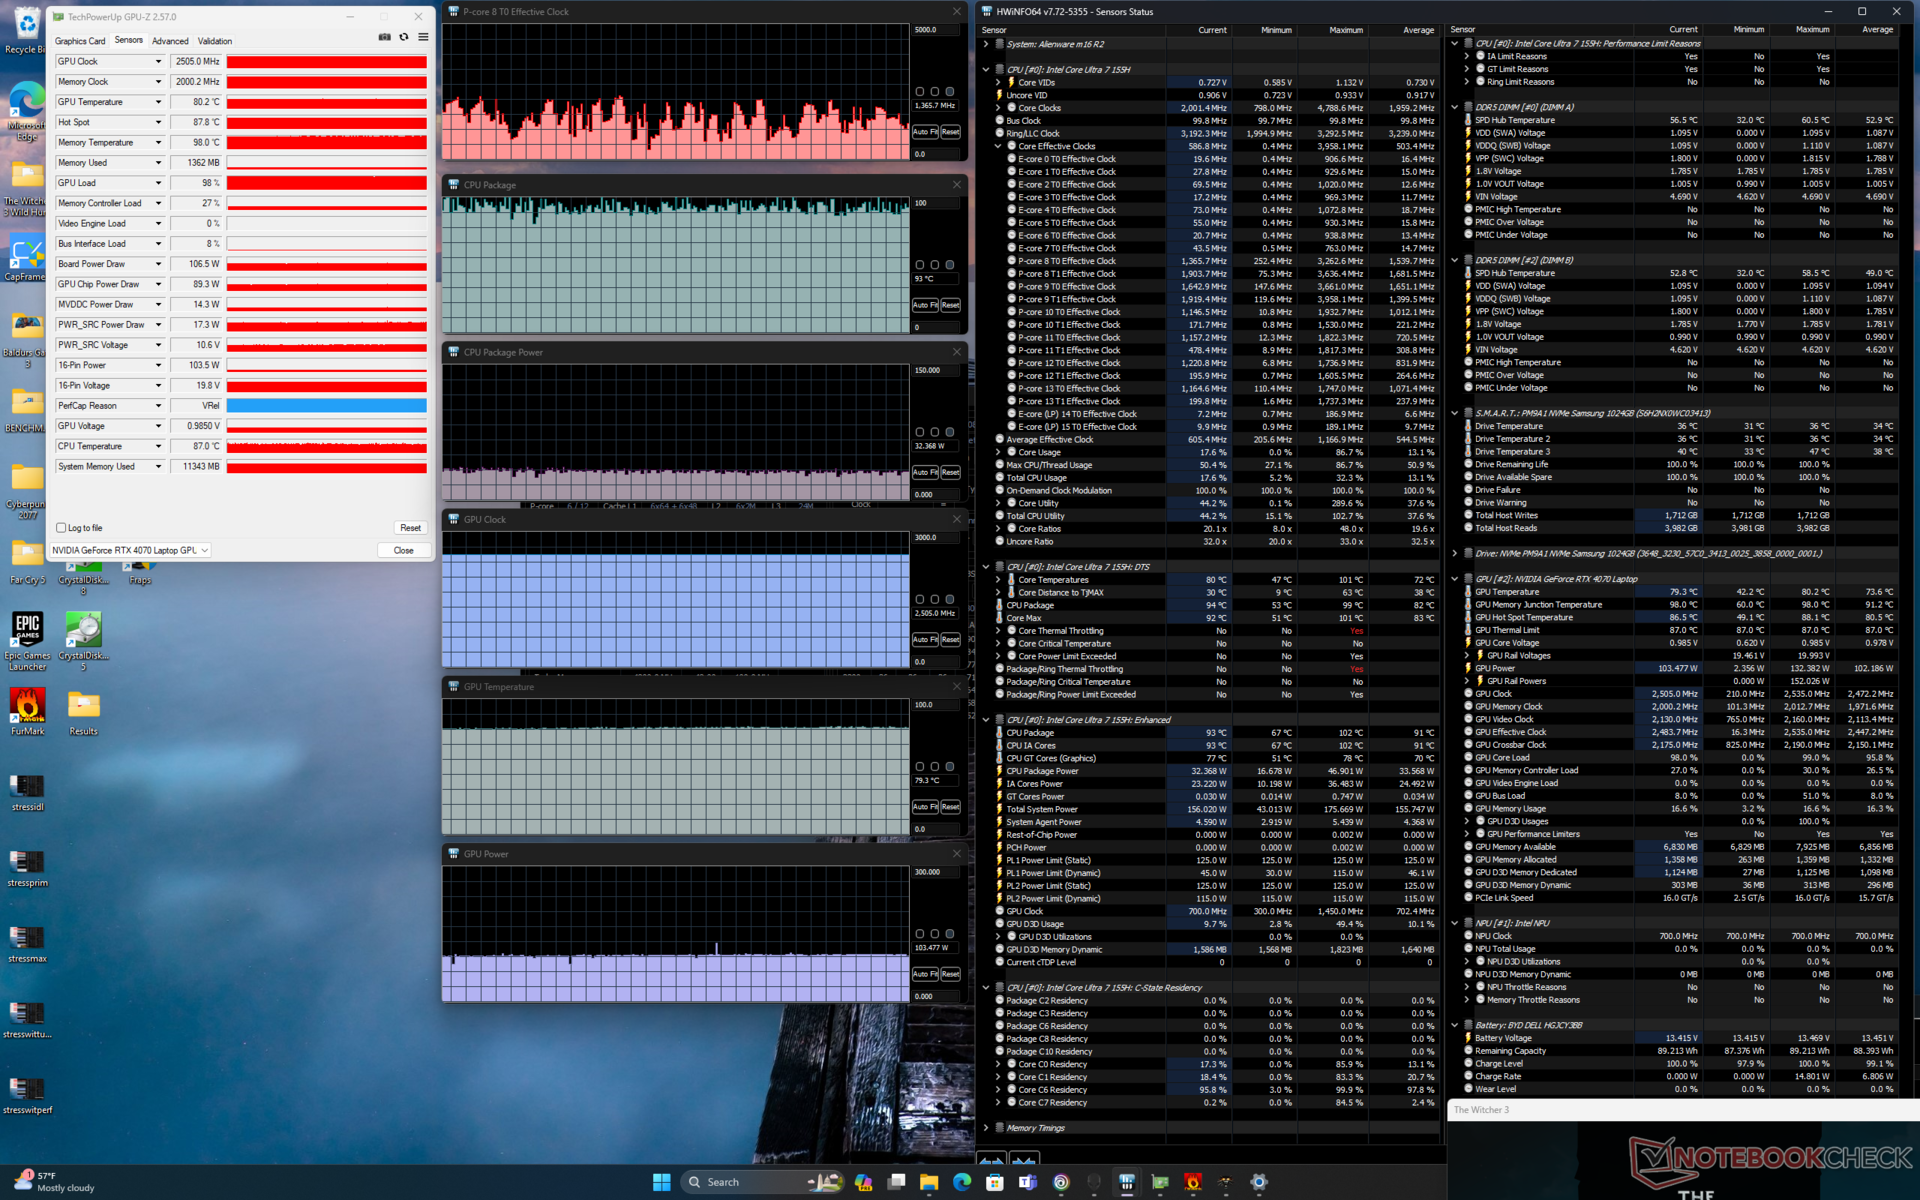
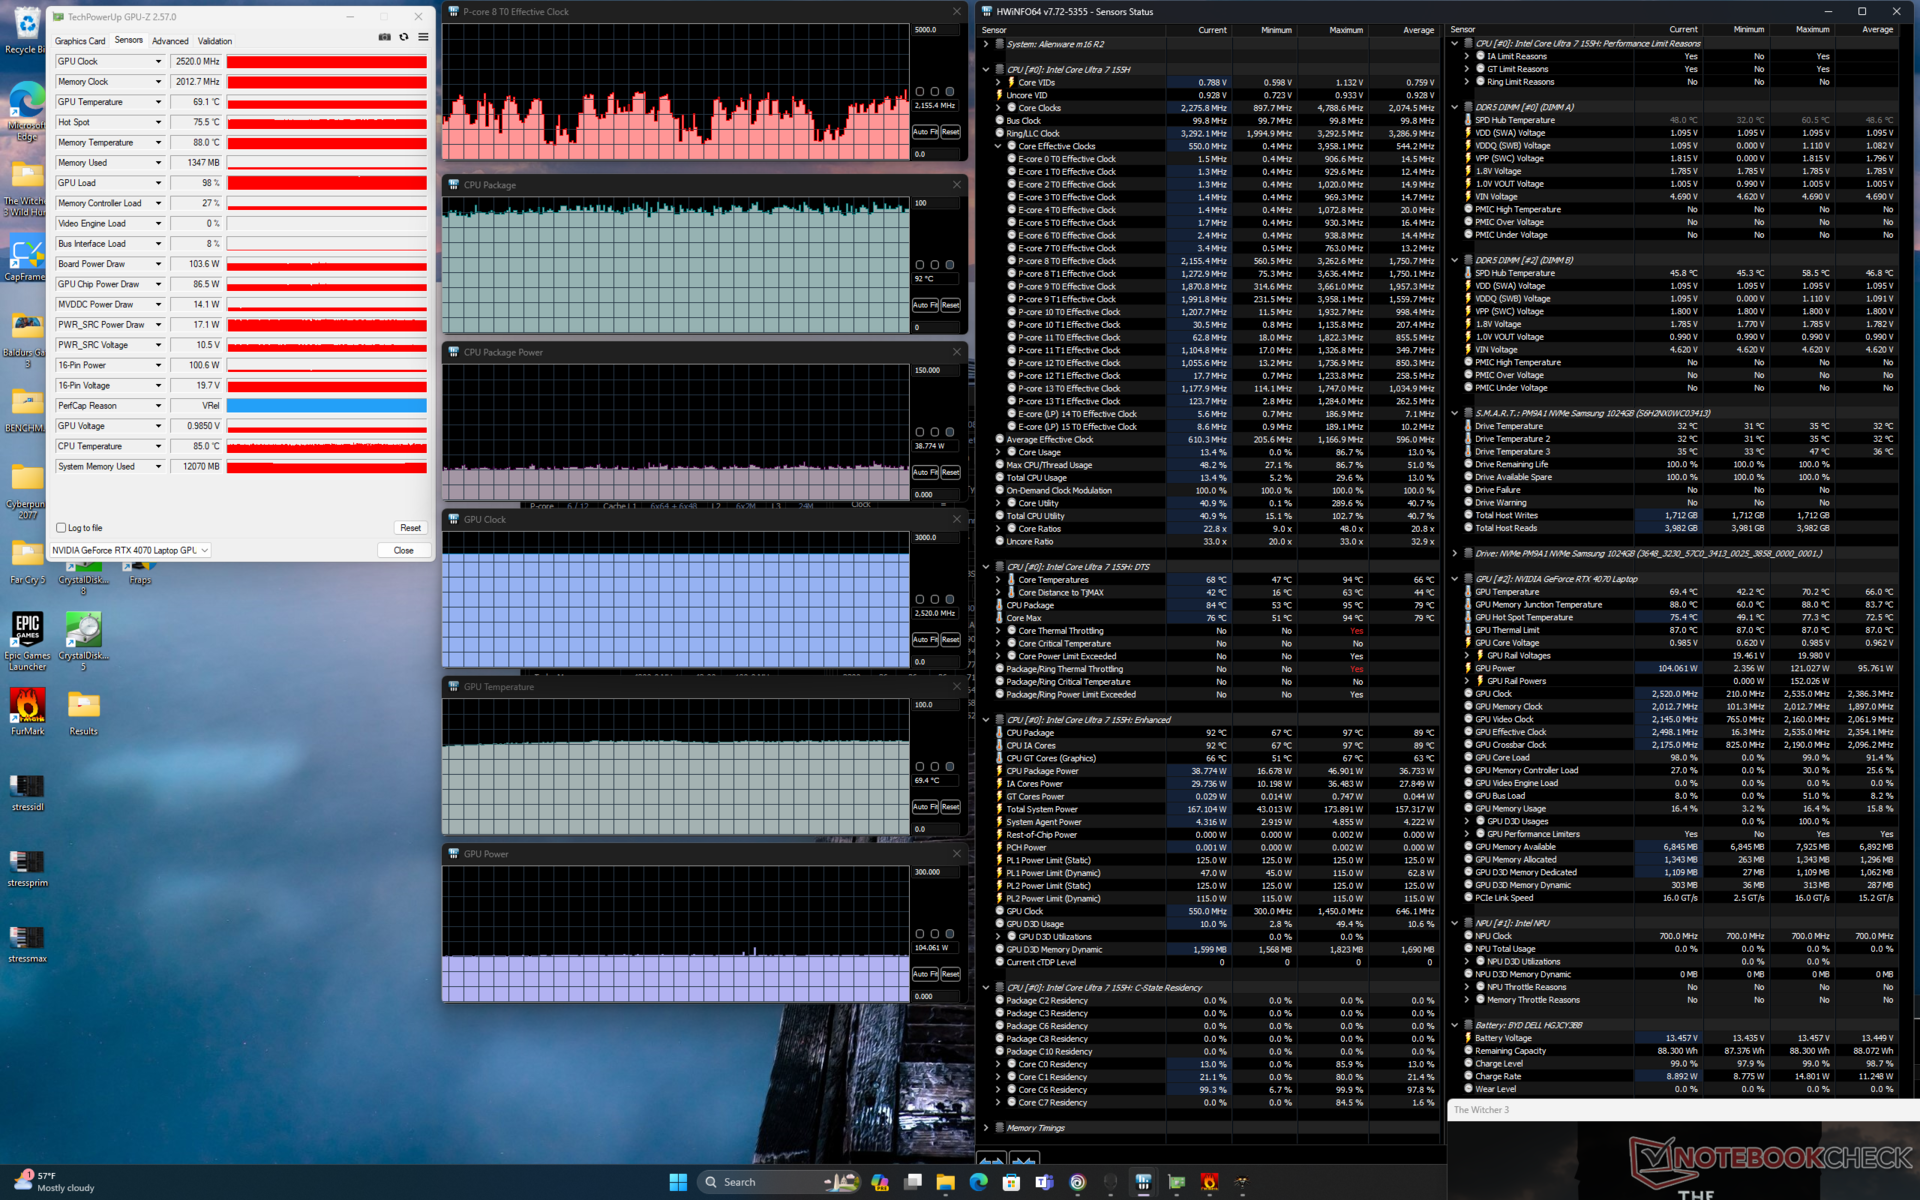
Overdrive modunda Prime95 stresini çalıştırırken, CPU sürekli olarak düşmeden ve sonunda 3,4 GHz ve 102 W'da sabitlenmeden önce birkaç saniye boyunca 4,6 GHz ve 115 W'a yükselir. Bununla birlikte, çekirdek sıcaklığı, CPU'nun soğutma çözümünün sınırlarını zaten zorladığını göstermek için 100 C'de aşırı derecede sıcak olacaktır.
İlginç bir şekilde, GPU saat hızlarında veya kart güç çekişinde neredeyse hiç değişiklik yok Witcher 3 dengeli, Performans veya Overdrive modlarında, aşağıdaki GPU Performansı bölümündeki bulgularımızla ilişkilidir. Bunun yerine, GPU sıcaklığı Performans veya Overdrive modundayken, bu modlardaki daha yüksek fan tavanları nedeniyle düşme eğilimindedir. Başka bir deyişle, fan gürültüsü değişirken saat hızları ve gerçek zamanlı TGP sabit kalacaktır. Modlar arasında CPU performansında bazı küçük değişiklikler olabilir, ancak çoğu oyun zaten CPU'ya bağlı değildir.
Nvidia Kontrol Paneli'ne göre GPU 140 W TGP olarak derecelendirilmiş olsa da, oyun oynarken 106 W'da stabilize olma eğiliminde olduğunu belirtmek gerekir. Geçici olarak maksimum 121 W'a ulaşabiliyoruz.
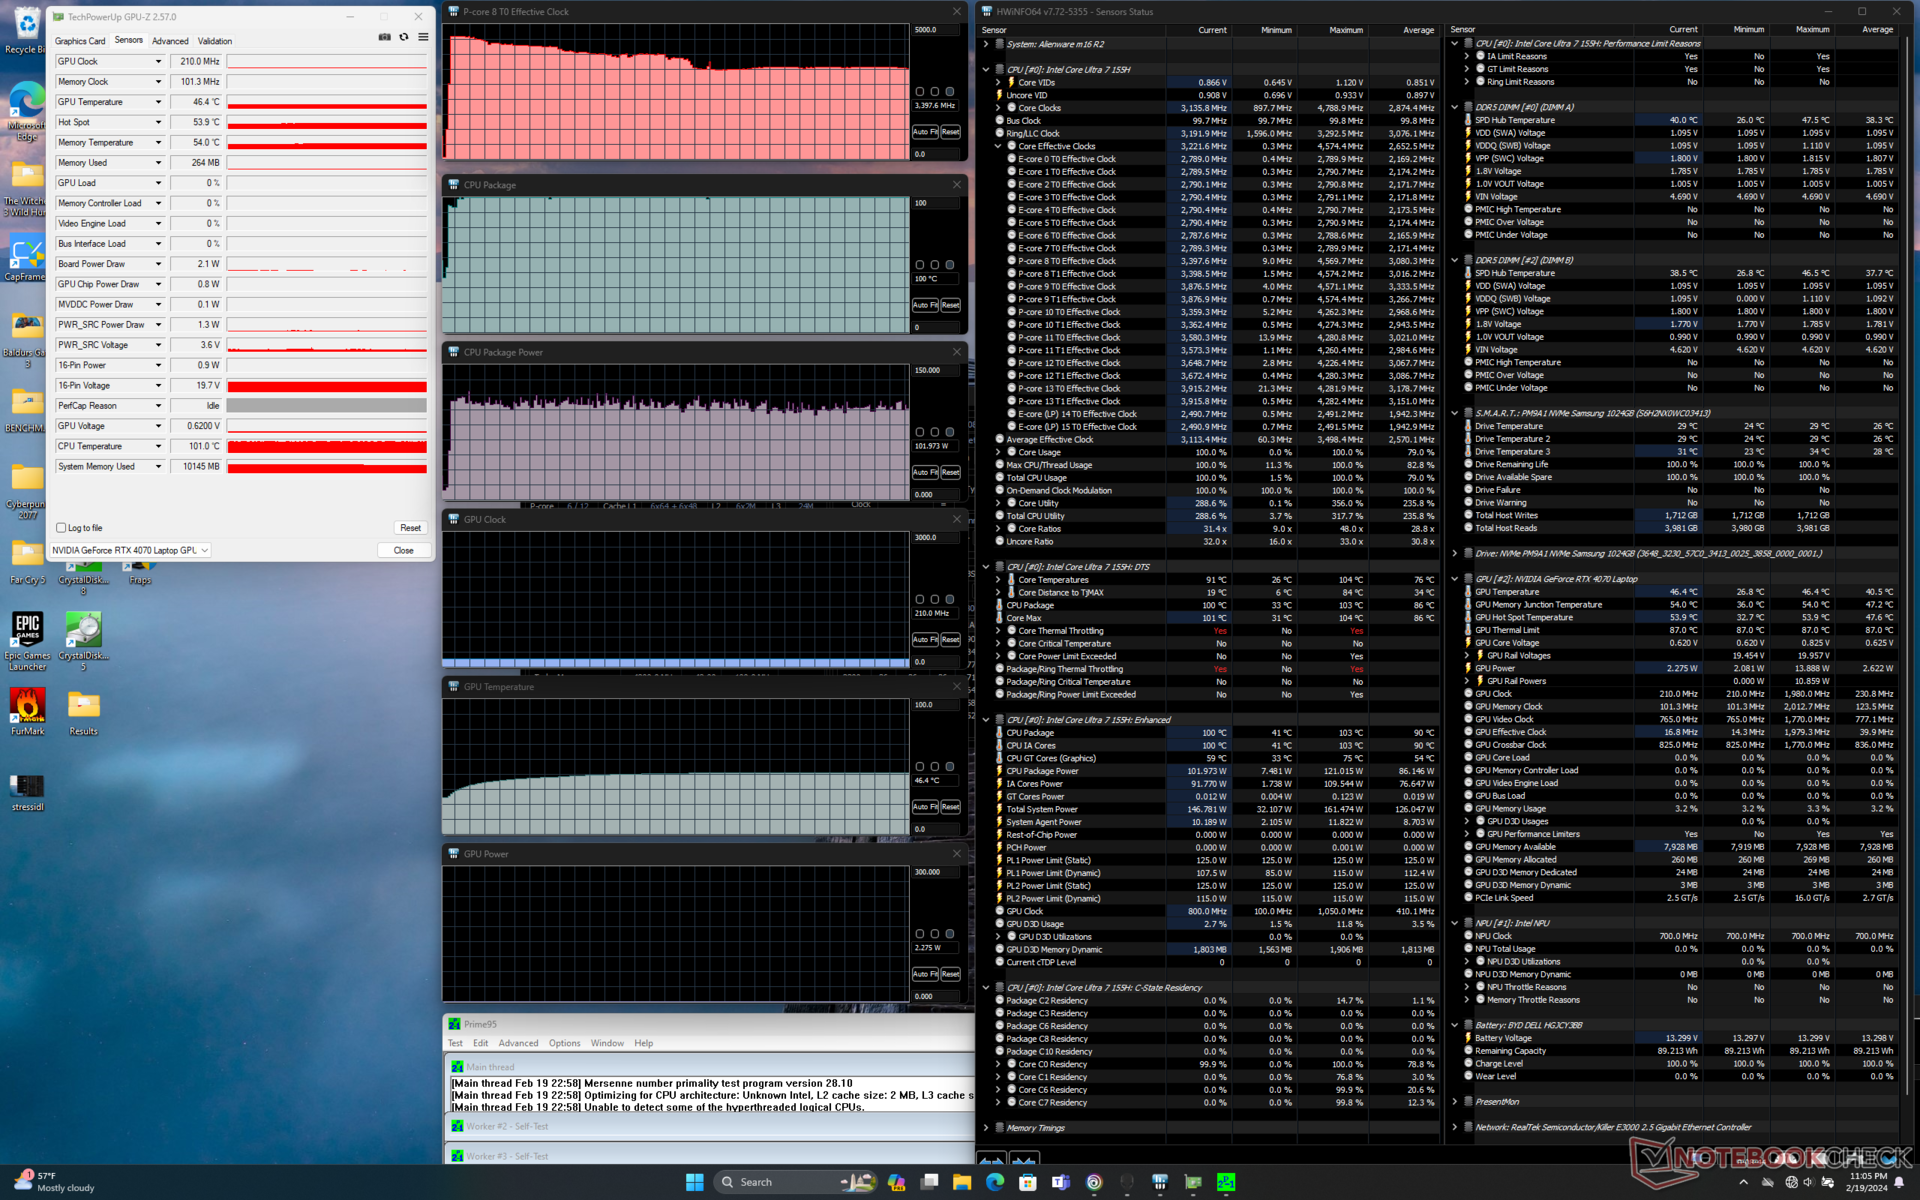
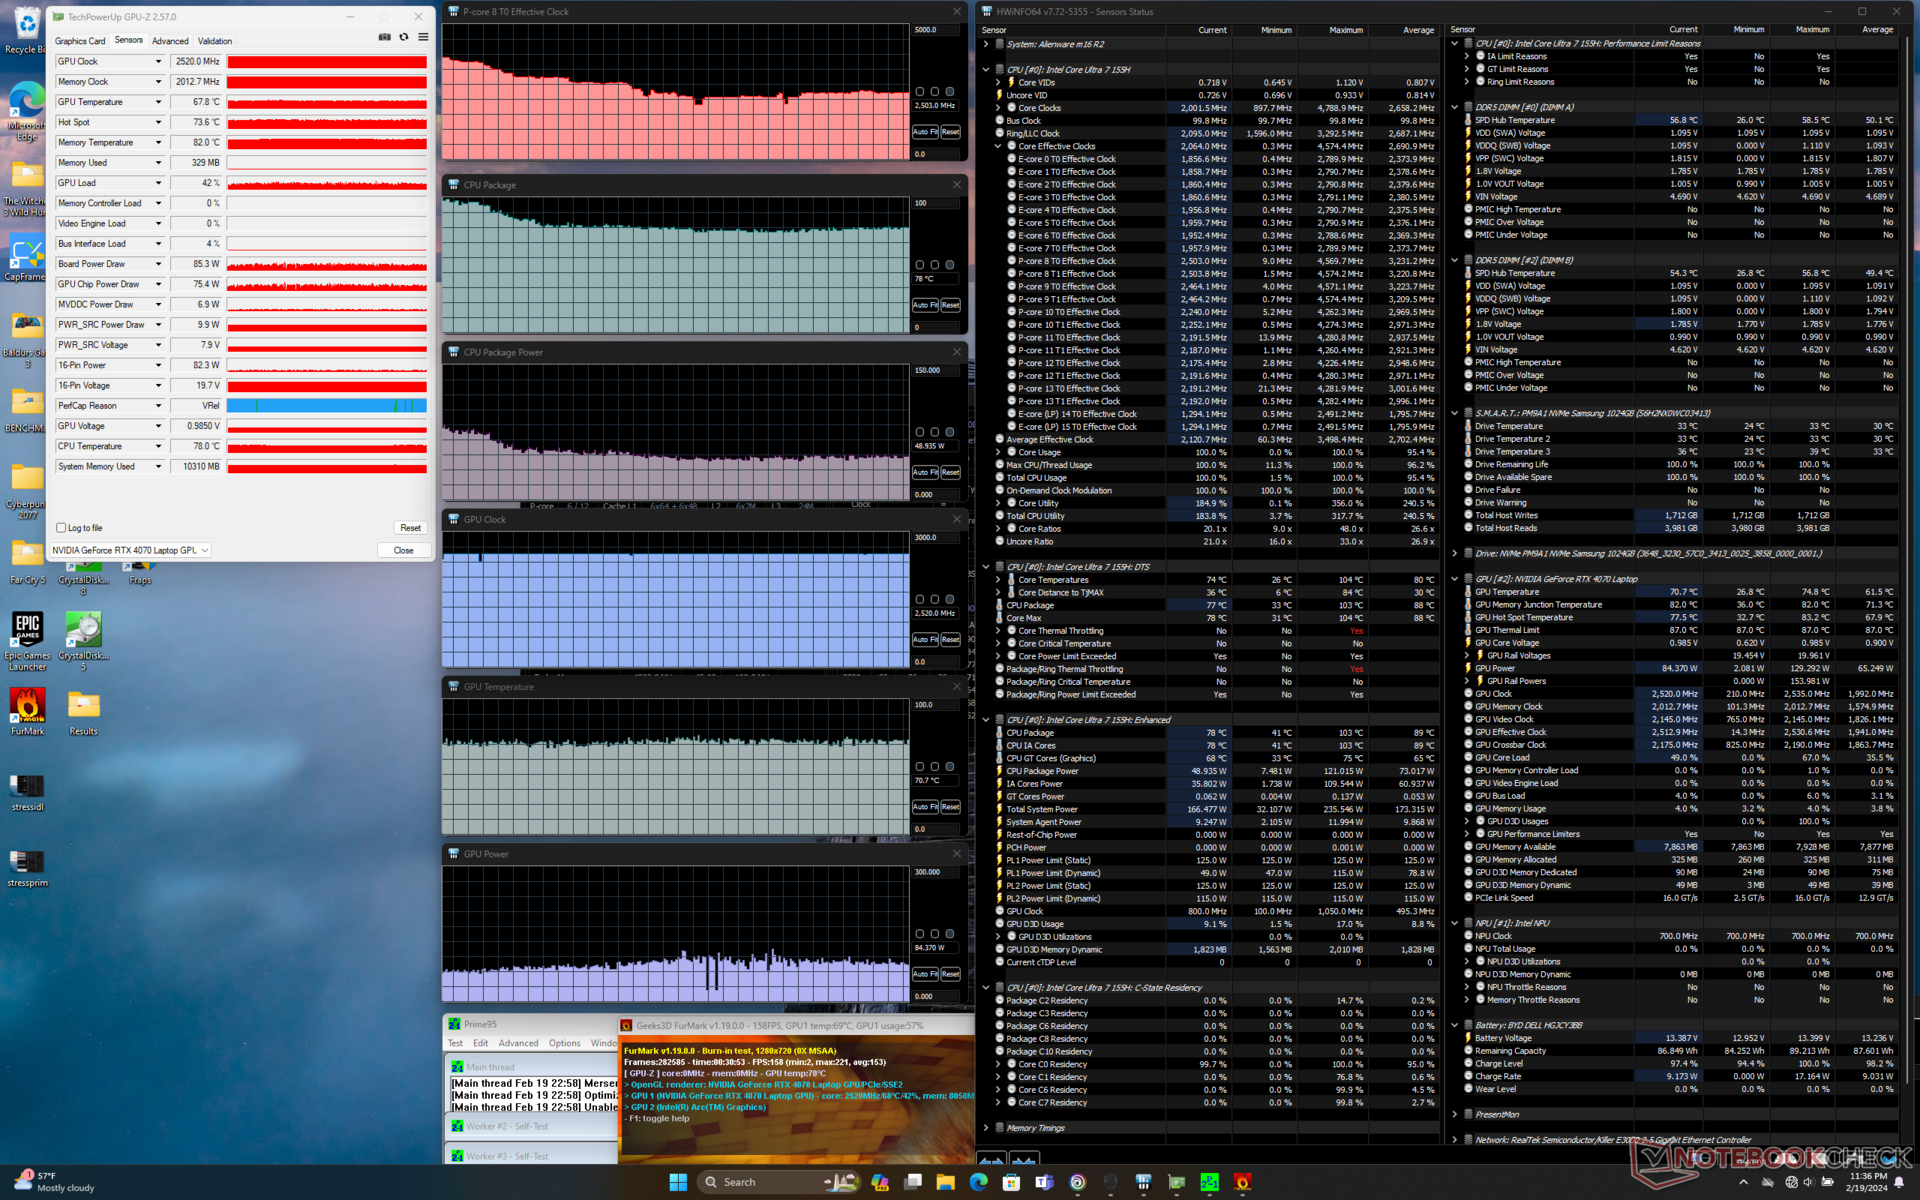

| CPU Saati (GHz) | GPU Saati (MHz) | Ortalama CPU Sıcaklığı (°C) | Ortalama GPU Sıcaklığı (°C) | |
| Sistem Boşta | -- | -- | 46 | 27 |
| Prime95 Stres | 3,4 | -- | 100 | 47 |
| Prime95 + FurMark Stres | 2.5 | 2520 | 78 | 71 |
| Witcher 3 Stres (Dengeli mod) | ~1.8 | 2502 | 93 | 80 |
| Witcher 3 Stres (Performans modu) | ~1.8 | 2520 | 91 | 77 |
| Witcher 3 Stres (Overdrive modu) | ~2.0 | 2520 | 92 | 69 |
Sistem Performansı
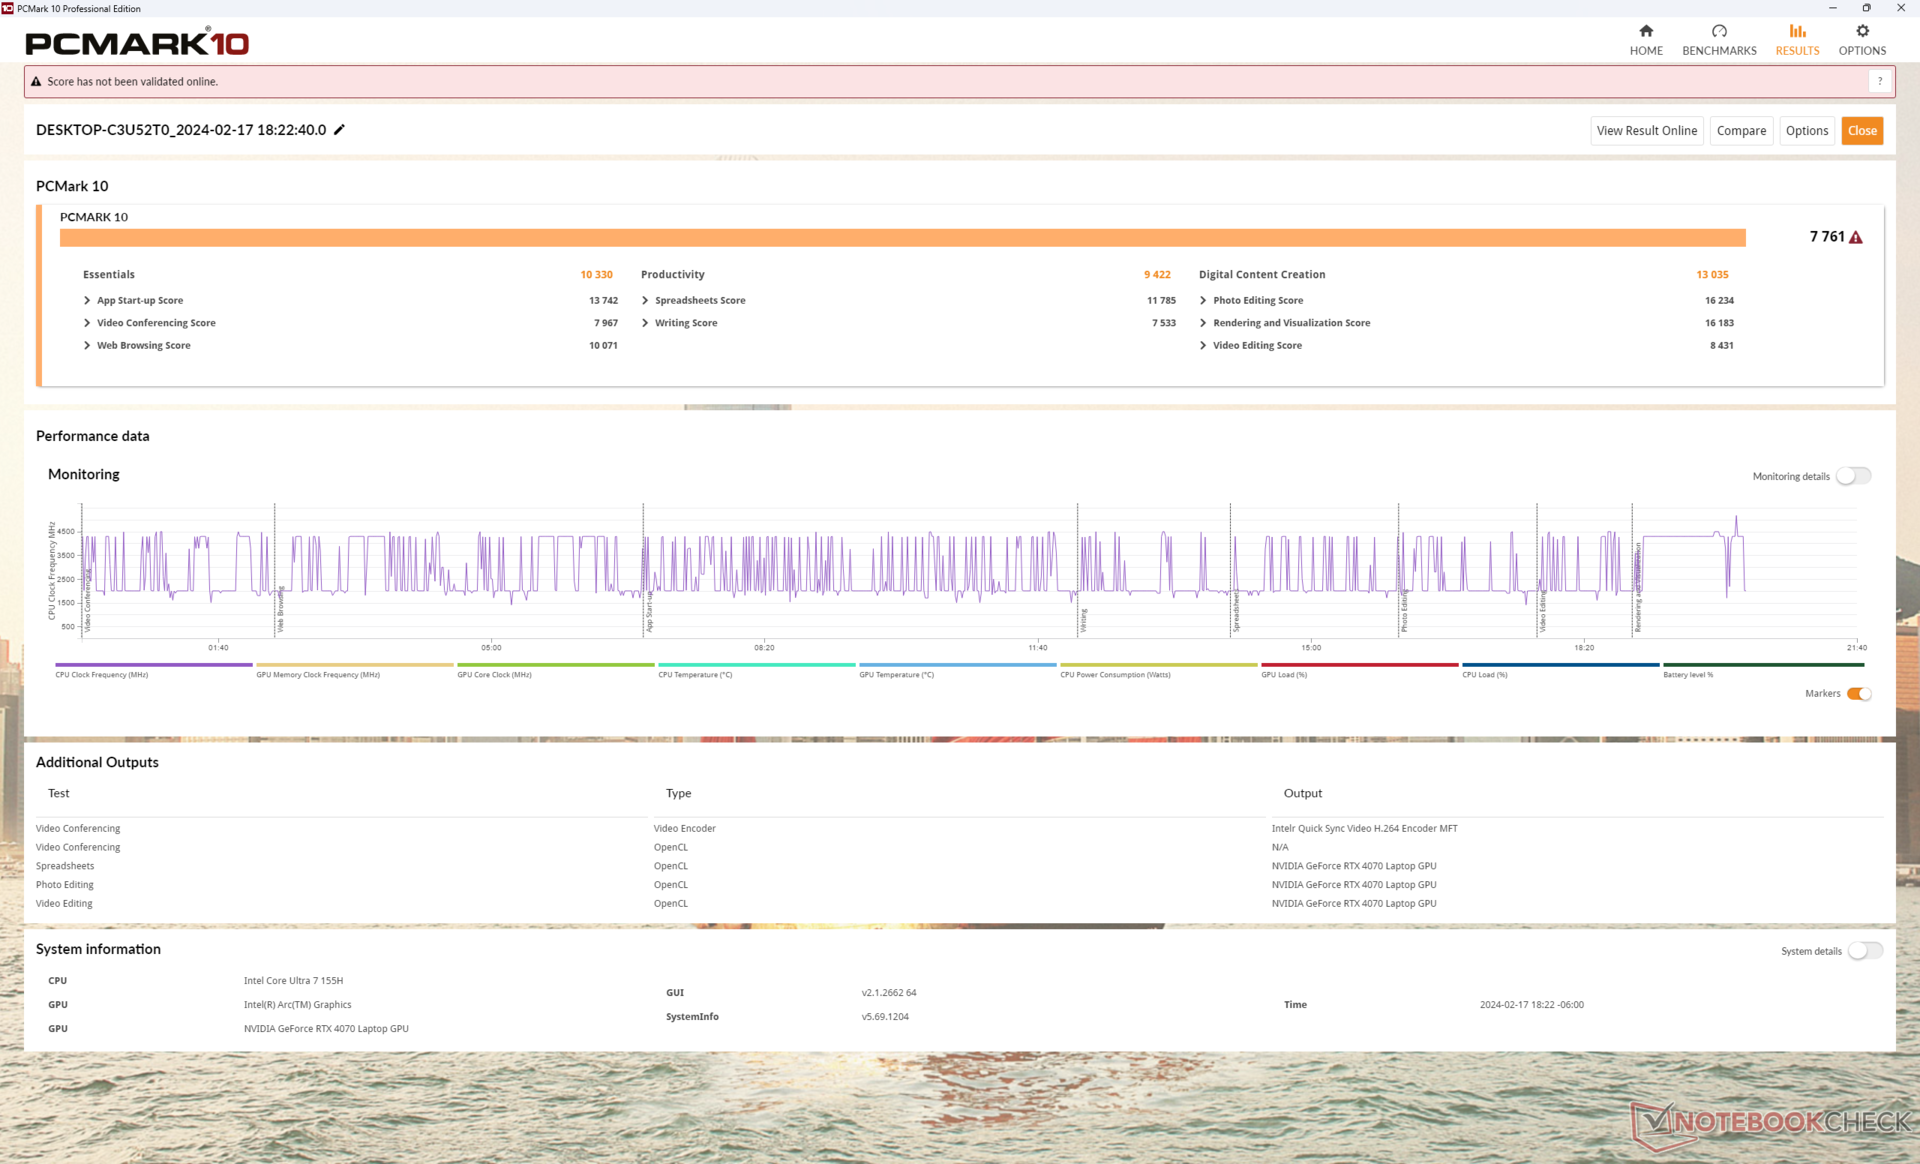
PCMark 10 sonuçları, m16 R2 daha yavaş RTX 4070 ile donatıldığı için daha düşük Dijital İçerik Oluşturma alt test puanımız dışında m16 R1 ile karşılaştırılabilir. Sistem performansı, daha yeni nesil CPU'ya rağmen çoğu günlük yükte önemli bir kazanç göstermeyecek şekilde çok benzerdir.
CrossMark: Overall | Productivity | Creativity | Responsiveness
WebXPRT 3: Overall
WebXPRT 4: Overall
Mozilla Kraken 1.1: Total
| PCMark 10 / Score | |
| Alienware x16 R1 | |
| HP Omen Transcend 16-u1095ng | |
| Alienware m16 R2 | |
| Lenovo Legion Slim 7 16APH8 | |
| Ortalama Intel Core Ultra 7 155H, NVIDIA GeForce RTX 4070 Laptop GPU (7084 - 7761, n=4) | |
| Alienware m16 R1 Intel | |
| Asus ROG Zephyrus G16 2024 GU605M | |
| PCMark 10 / Essentials | |
| Alienware x16 R1 | |
| Alienware m16 R1 Intel | |
| HP Omen Transcend 16-u1095ng | |
| Lenovo Legion Slim 7 16APH8 | |
| Alienware m16 R2 | |
| Ortalama Intel Core Ultra 7 155H, NVIDIA GeForce RTX 4070 Laptop GPU (10038 - 10393, n=4) | |
| Asus ROG Zephyrus G16 2024 GU605M | |
| PCMark 10 / Productivity | |
| HP Omen Transcend 16-u1095ng | |
| Alienware x16 R1 | |
| Lenovo Legion Slim 7 16APH8 | |
| Alienware m16 R1 Intel | |
| Alienware m16 R2 | |
| Ortalama Intel Core Ultra 7 155H, NVIDIA GeForce RTX 4070 Laptop GPU (9192 - 9518, n=4) | |
| Asus ROG Zephyrus G16 2024 GU605M | |
| PCMark 10 / Digital Content Creation | |
| Alienware x16 R1 | |
| Alienware m16 R2 | |
| HP Omen Transcend 16-u1095ng | |
| Ortalama Intel Core Ultra 7 155H, NVIDIA GeForce RTX 4070 Laptop GPU (10100 - 13035, n=4) | |
| Lenovo Legion Slim 7 16APH8 | |
| Asus ROG Zephyrus G16 2024 GU605M | |
| Alienware m16 R1 Intel | |
| CrossMark / Overall | |
| Alienware m16 R1 Intel | |
| Alienware x16 R1 | |
| Alienware m16 R2 | |
| Ortalama Intel Core Ultra 7 155H, NVIDIA GeForce RTX 4070 Laptop GPU (1687 - 1848, n=4) | |
| Asus ROG Zephyrus G16 2024 GU605M | |
| CrossMark / Productivity | |
| Alienware m16 R1 Intel | |
| Alienware x16 R1 | |
| Alienware m16 R2 | |
| Ortalama Intel Core Ultra 7 155H, NVIDIA GeForce RTX 4070 Laptop GPU (1589 - 1750, n=4) | |
| Asus ROG Zephyrus G16 2024 GU605M | |
| CrossMark / Creativity | |
| Alienware m16 R1 Intel | |
| Alienware x16 R1 | |
| Asus ROG Zephyrus G16 2024 GU605M | |
| Ortalama Intel Core Ultra 7 155H, NVIDIA GeForce RTX 4070 Laptop GPU (1860 - 2014, n=4) | |
| Alienware m16 R2 | |
| CrossMark / Responsiveness | |
| Alienware x16 R1 | |
| Alienware m16 R1 Intel | |
| Alienware m16 R2 | |
| Ortalama Intel Core Ultra 7 155H, NVIDIA GeForce RTX 4070 Laptop GPU (1424 - 1683, n=4) | |
| Asus ROG Zephyrus G16 2024 GU605M | |
| WebXPRT 3 / Overall | |
| HP Omen Transcend 16-u1095ng | |
| Alienware m16 R1 Intel | |
| Alienware x16 R1 | |
| Alienware m16 R2 | |
| Asus ROG Zephyrus G16 2024 GU605M | |
| Ortalama Intel Core Ultra 7 155H, NVIDIA GeForce RTX 4070 Laptop GPU (264 - 294, n=4) | |
| WebXPRT 4 / Overall | |
| Alienware m16 R1 Intel | |
| Alienware x16 R1 | |
| Alienware m16 R2 | |
| Asus ROG Zephyrus G16 2024 GU605M | |
| Ortalama Intel Core Ultra 7 155H, NVIDIA GeForce RTX 4070 Laptop GPU (247 - 257, n=4) | |
| Mozilla Kraken 1.1 / Total | |
| Ortalama Intel Core Ultra 7 155H, NVIDIA GeForce RTX 4070 Laptop GPU (546 - 568, n=3) | |
| Asus ROG Zephyrus G16 2024 GU605M | |
| Alienware m16 R2 | |
| Alienware m16 R1 Intel | |
| Alienware x16 R1 | |
| HP Omen Transcend 16-u1095ng | |
* ... daha küçük daha iyidir
| PCMark 10 Score | 7761 puan | |
Yardım | ||
| AIDA64 / Memory Copy | |
| Asus ROG Zephyrus G16 2024 GU605M | |
| Ortalama Intel Core Ultra 7 155H (62397 - 96791, n=50) | |
| HP Omen Transcend 16-u1095ng | |
| Alienware x16 R1 | |
| Lenovo Legion Slim 7 16APH8 | |
| Alienware m16 R2 | |
| Alienware m16 R1 Intel | |
| AIDA64 / Memory Read | |
| Asus ROG Zephyrus G16 2024 GU605M | |
| HP Omen Transcend 16-u1095ng | |
| Ortalama Intel Core Ultra 7 155H (60544 - 90647, n=50) | |
| Alienware m16 R2 | |
| Alienware x16 R1 | |
| Alienware m16 R1 Intel | |
| Lenovo Legion Slim 7 16APH8 | |
| AIDA64 / Memory Write | |
| Lenovo Legion Slim 7 16APH8 | |
| Alienware x16 R1 | |
| HP Omen Transcend 16-u1095ng | |
| Asus ROG Zephyrus G16 2024 GU605M | |
| Ortalama Intel Core Ultra 7 155H (58692 - 93451, n=50) | |
| Alienware m16 R2 | |
| Alienware m16 R1 Intel | |
| AIDA64 / Memory Latency | |
| Ortalama Intel Core Ultra 7 155H (116.2 - 233, n=50) | |
| Asus ROG Zephyrus G16 2024 GU605M | |
| Alienware m16 R2 | |
| Alienware x16 R1 | |
| Lenovo Legion Slim 7 16APH8 | |
| Alienware m16 R1 Intel | |
| HP Omen Transcend 16-u1095ng | |
* ... daha küçük daha iyidir
DPC Gecikme Süresi
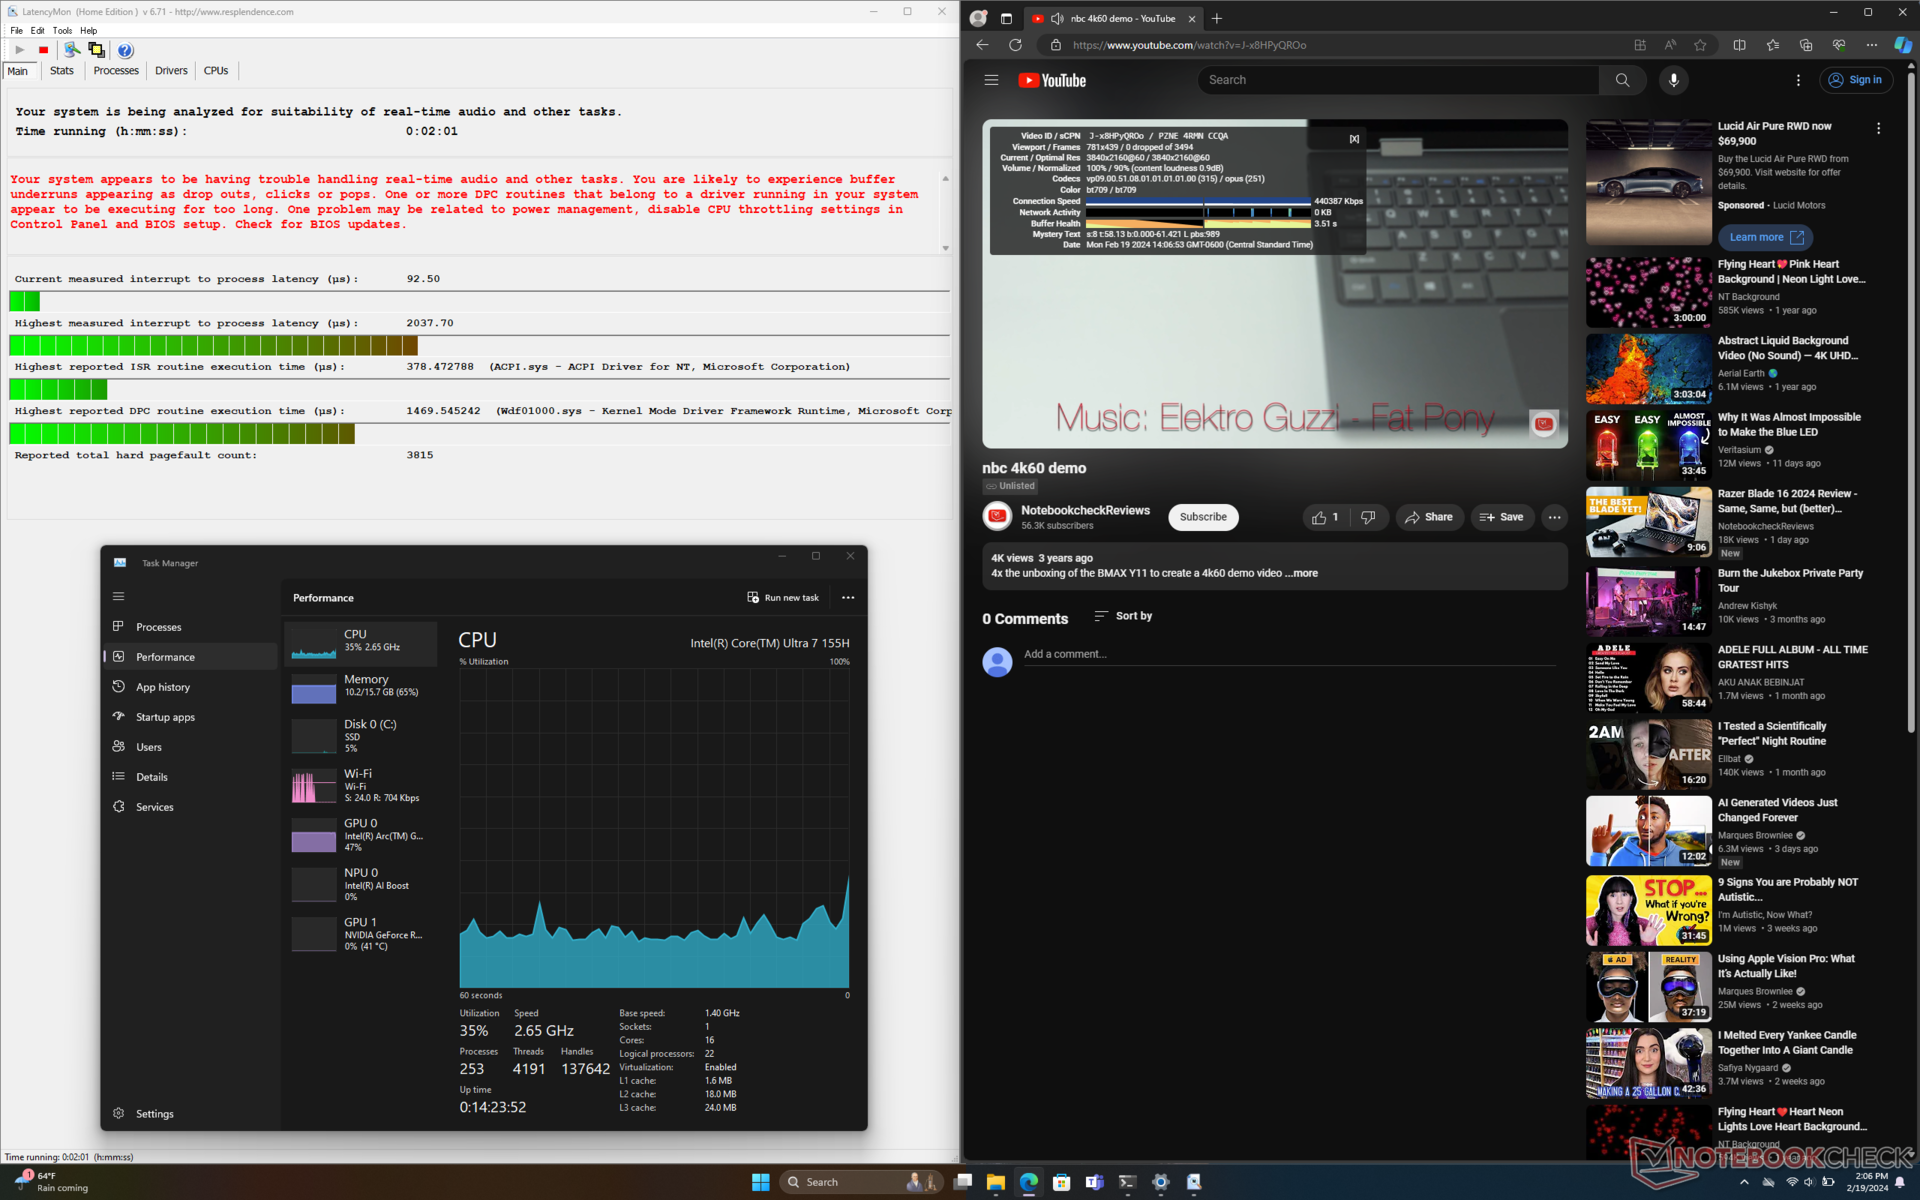
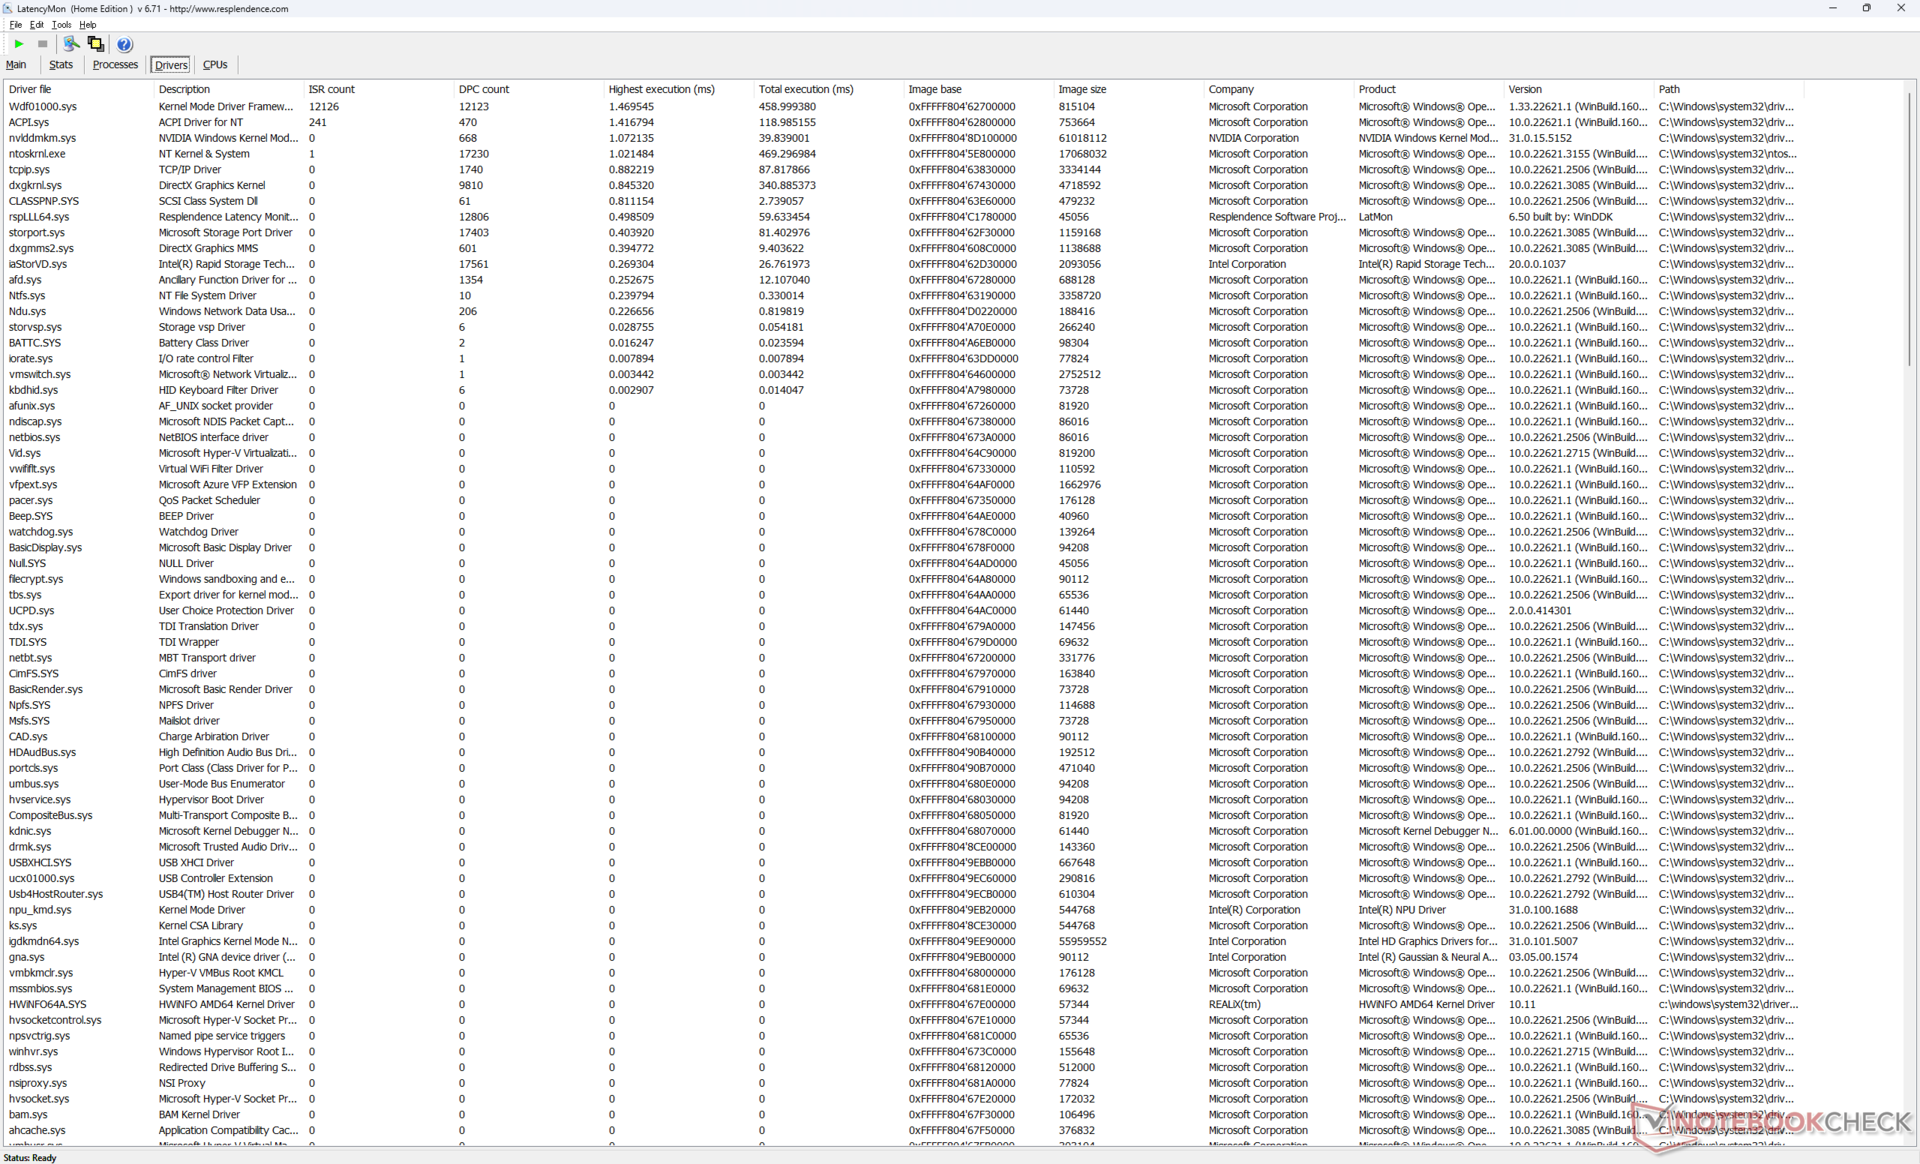
LatencyMon, ana sayfamızın birden fazla sekmesini açarken DPC sorunlarını ortaya çıkarıyor. 60 FPS'de 4K video oynatma, kaydedilen hiçbir kare düşmesi olmadan mükemmeldir.
| DPC Latencies / LatencyMon - interrupt to process latency (max), Web, Youtube, Prime95 | |
| Alienware m16 R1 Intel | |
| Asus ROG Zephyrus G16 2024 GU605M | |
| Alienware m16 R2 | |
| HP Omen Transcend 16-u1095ng | |
| Alienware x16 R1 | |
| Lenovo Legion Slim 7 16APH8 | |
* ... daha küçük daha iyidir
Depolama Cihazları
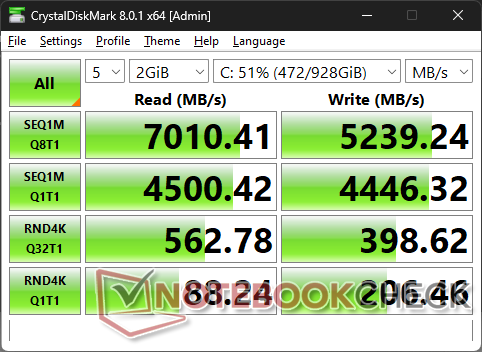
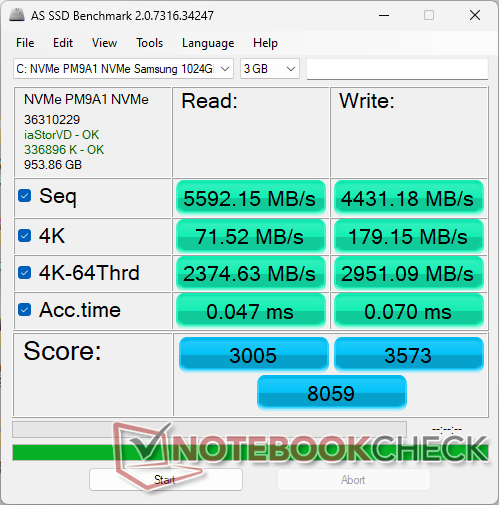
Ünitemiz aşağıdakilerle birlikte gönderilir Samsung PM9A1 Geçen yılki m16 R1'deki Kioxia yerine PCIe4 x4 NVMe SSD. Sürücü, 7000 MB/s'lik maksimum aktarım hızını uzun süreler boyunca korumakta herhangi bir sorun yaşamayacaktır. İki M.2 2280 yuvasının her biri için bir ısı dağıtıcı bulunmaktadır.

| Drive Performance rating - Percent | |
| Alienware x16 R1 | |
| Alienware m16 R2 | |
| Alienware m16 R1 Intel | |
| Lenovo Legion Slim 7 16APH8 | |
| HP Omen Transcend 16-u1095ng | |
| Asus ROG Zephyrus G16 2024 GU605M | |
* ... daha küçük daha iyidir
Disk Throttling: DiskSpd Read Loop, Queue Depth 8
GPU Performansı
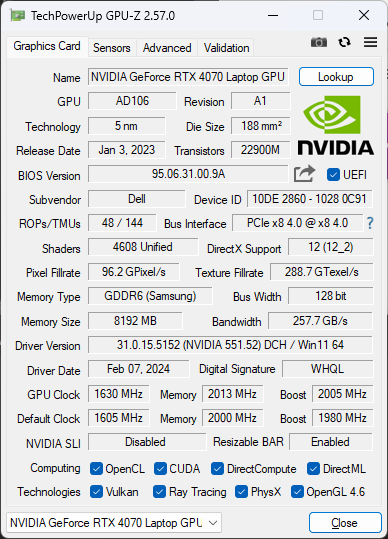
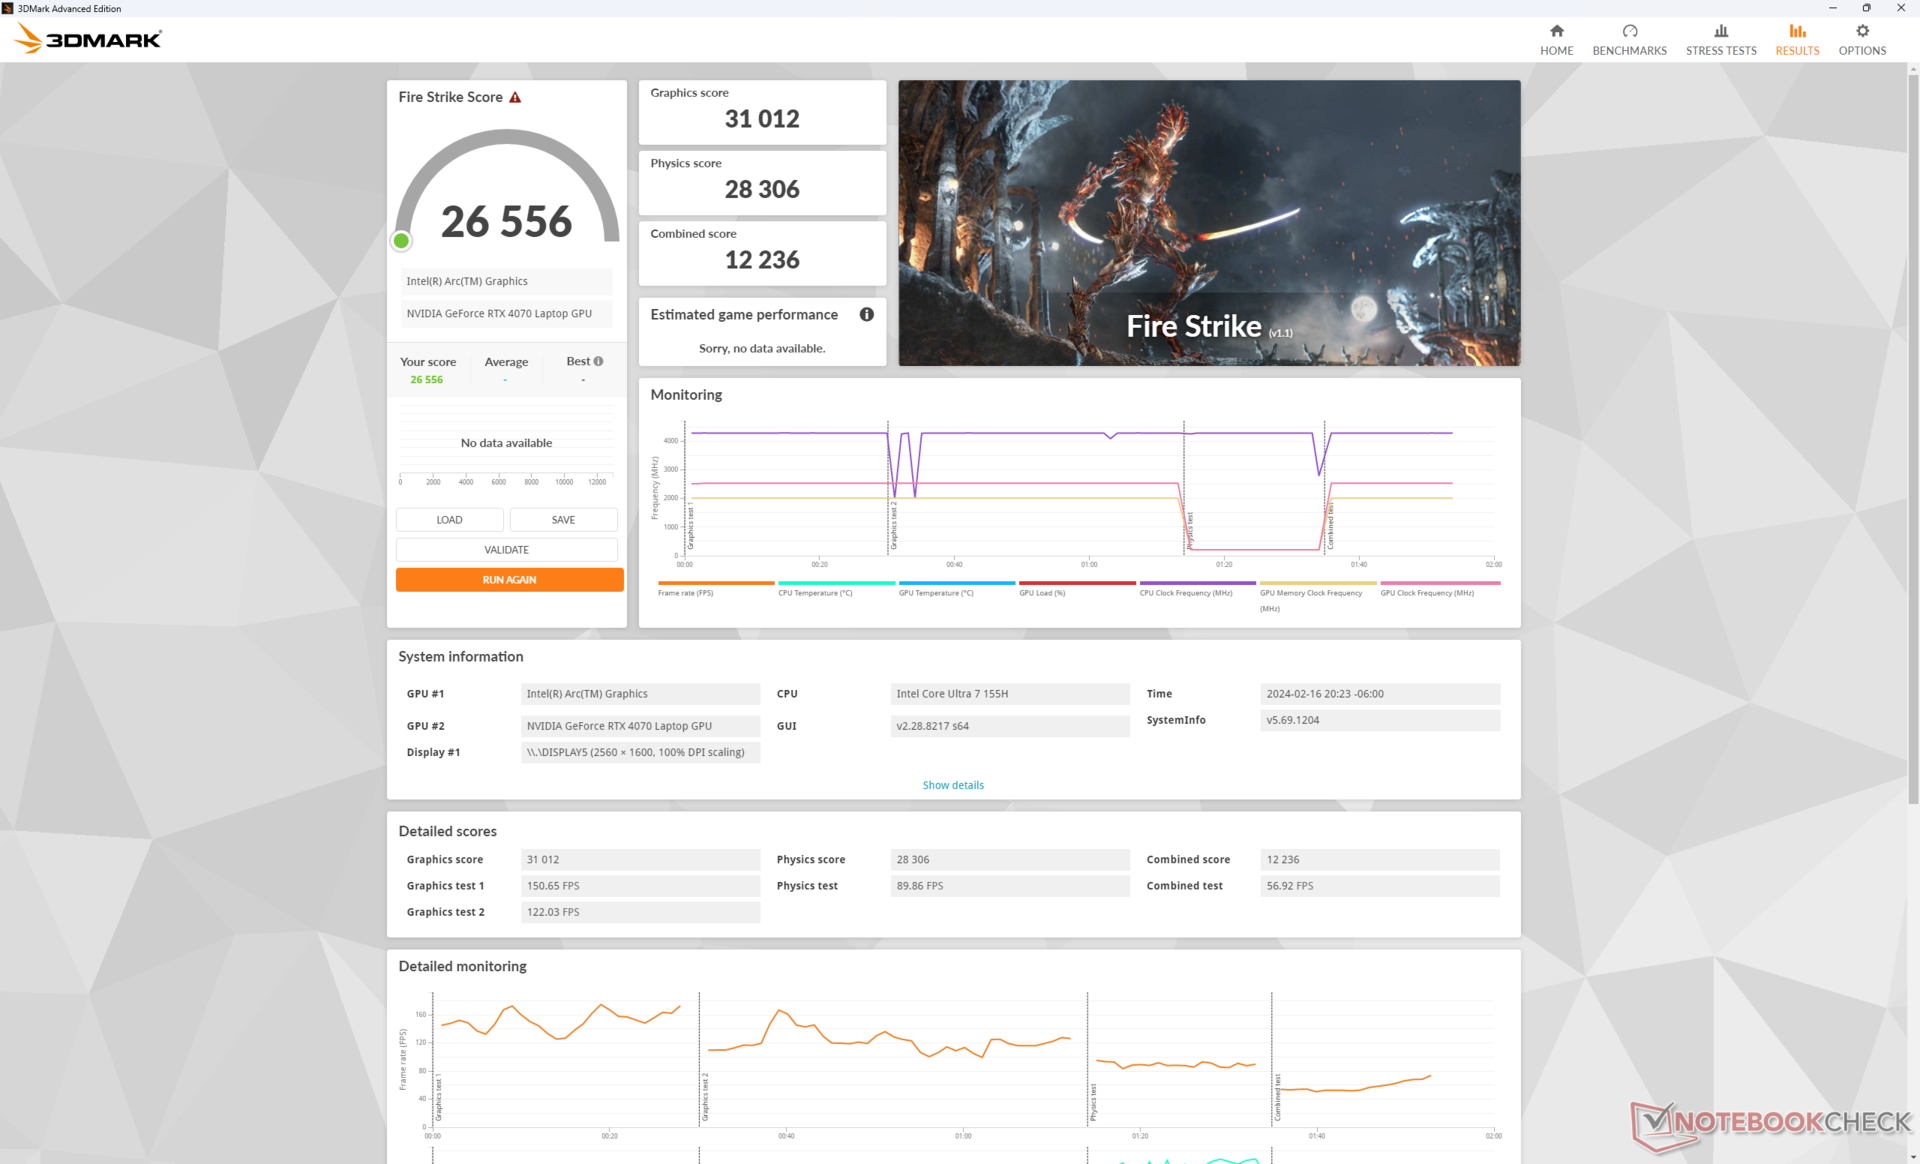
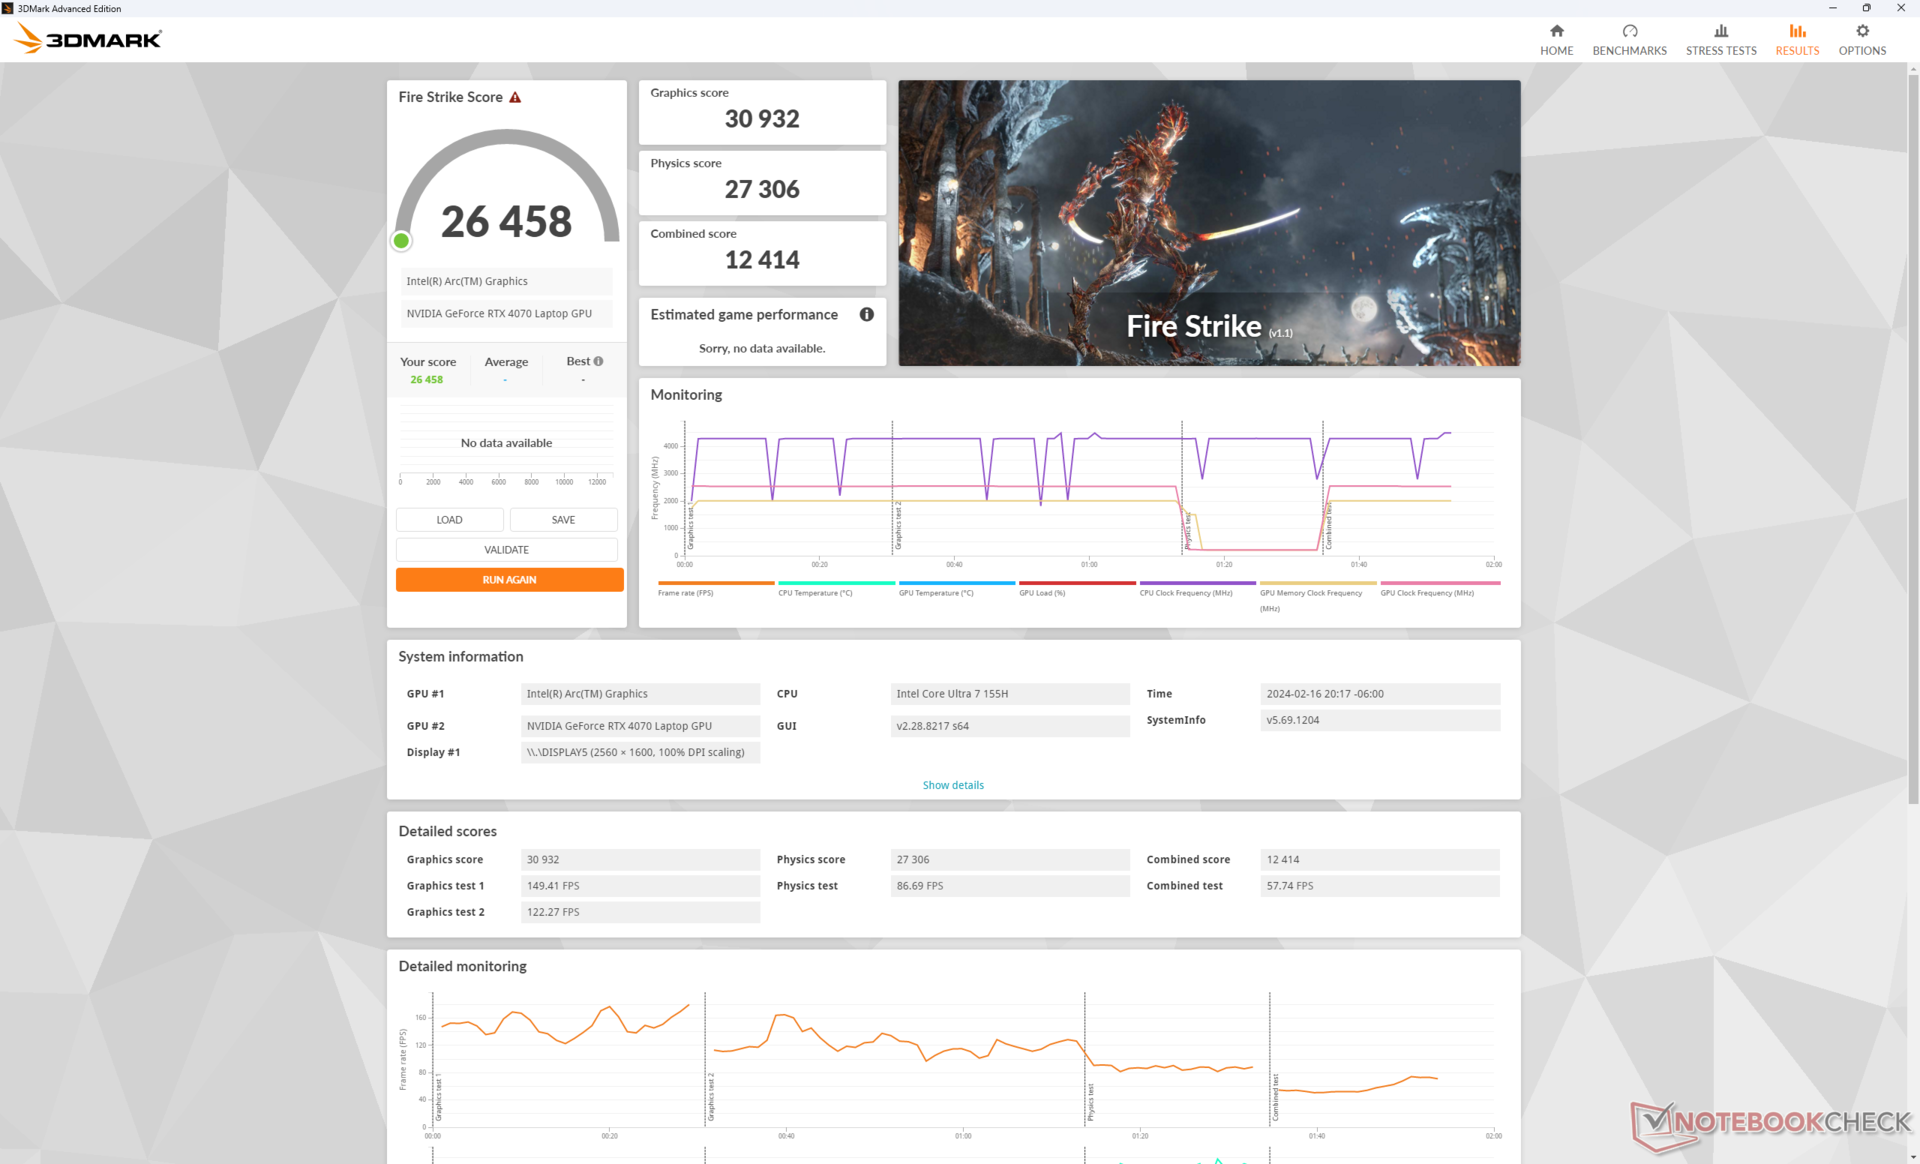
140 W GeForce RTX 4070 grafik performansı, aynı GPU ile donatılmış veritabanımızdaki ortalama dizüstü bilgisayardan yaklaşık yüzde 10 daha hızlıdır. RTX 4080 veya 4090 seçeneklerinin olmaması nedeniyle m16 R1'den yüzde 30 ila 45'e varan bir düşüş olsa da, en azından RTX 4070'in beklenenden daha iyi performans gösterdiğini görmek güzel. RTX 4080 veya 4090 isteyen kullanıcılar bunun yerine daha eski m16 R1 veya daha pahalı olan Alienware x16 serisi 'u düşünmek zorunda kalacaklar.
İlginç bir şekilde, Overdrive, Performance ve Balanced modları arasındaki performans farkları en iyi ihtimalle küçüktür. Bu şaşırtıcıdır çünkü Dengeli moda geçmek diğer oyun dizüstü bilgisayarlarının çoğunda tipik olarak yüzde 10 ila 30 performans kaybına neden olur, ancak Fire Strike puanları Alienware m16 R2'de neredeyse sabit kalır. Dell, bu modelin geliştirilmesi sırasında fan gürültü profillerini ve buna bağlı performans davranışlarını kesinlikle değiştirmiştir.
| Güç Profili | Grafik Puanı | Fizik Puanı | Birleşik Puan |
| Overdrive Modu | 30932 | 27306 | 12414 |
| Performans Modu | 31012 (-0%) | 28306 (-0%) | 12236 (-0%) |
| Dengeli Mod | 30603 (-0%) | 28281 (-0%) | 12448 (-0%) |
| Akü Gücü | 24398 (-21%) | 24684 (-10%) | 10088 (-19%) |
Sınıf düşürme RTX 4060 yapılandırmasının performansı yüzde 10 ila 15 oranında etkilemesi beklenmektedir.
| 3DMark Performance rating - Percent | |
| Lenovo Legion 9 16IRX8 | |
| Alienware m16 R1 AMD | |
| Lenovo Legion 7 16IAX7-82TD004SGE -2! | |
| Alienware m16 R2 | |
| HP Omen Transcend 16-u1095ng -2! | |
| Ortalama NVIDIA GeForce RTX 4070 Laptop GPU | |
| Lenovo Legion 5 16IRX G9 | |
| Asus ROG Zephyrus M16 GU603Z -2! | |
| Framework Laptop 16 | |
| Lenovo Legion S7 16ARHA7 -1! | |
| HP Victus 16-r0076TX -1! | |
| Dell G16 7620 -1! | |
| Asus ROG Zephyrus M16 GU603H -2! | |
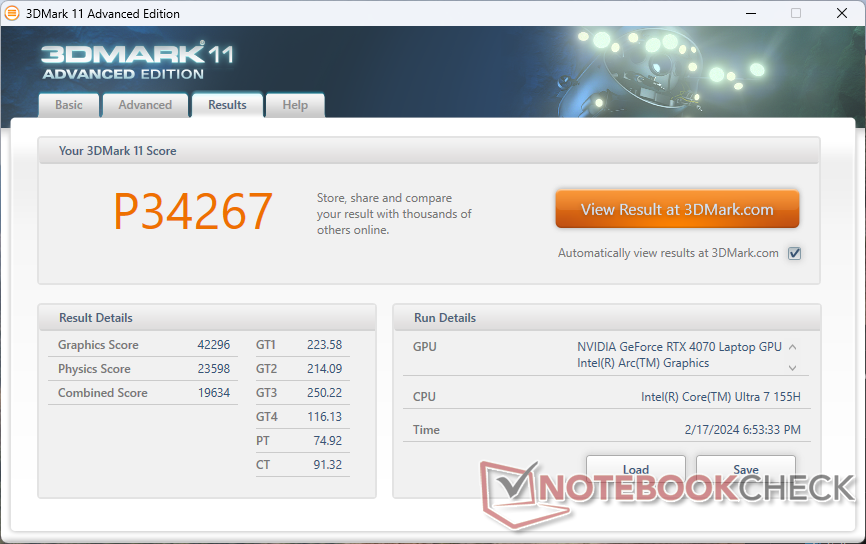
| 3DMark 11 Performance | 34267 puan | |
| 3DMark Fire Strike Score | 26458 puan | |
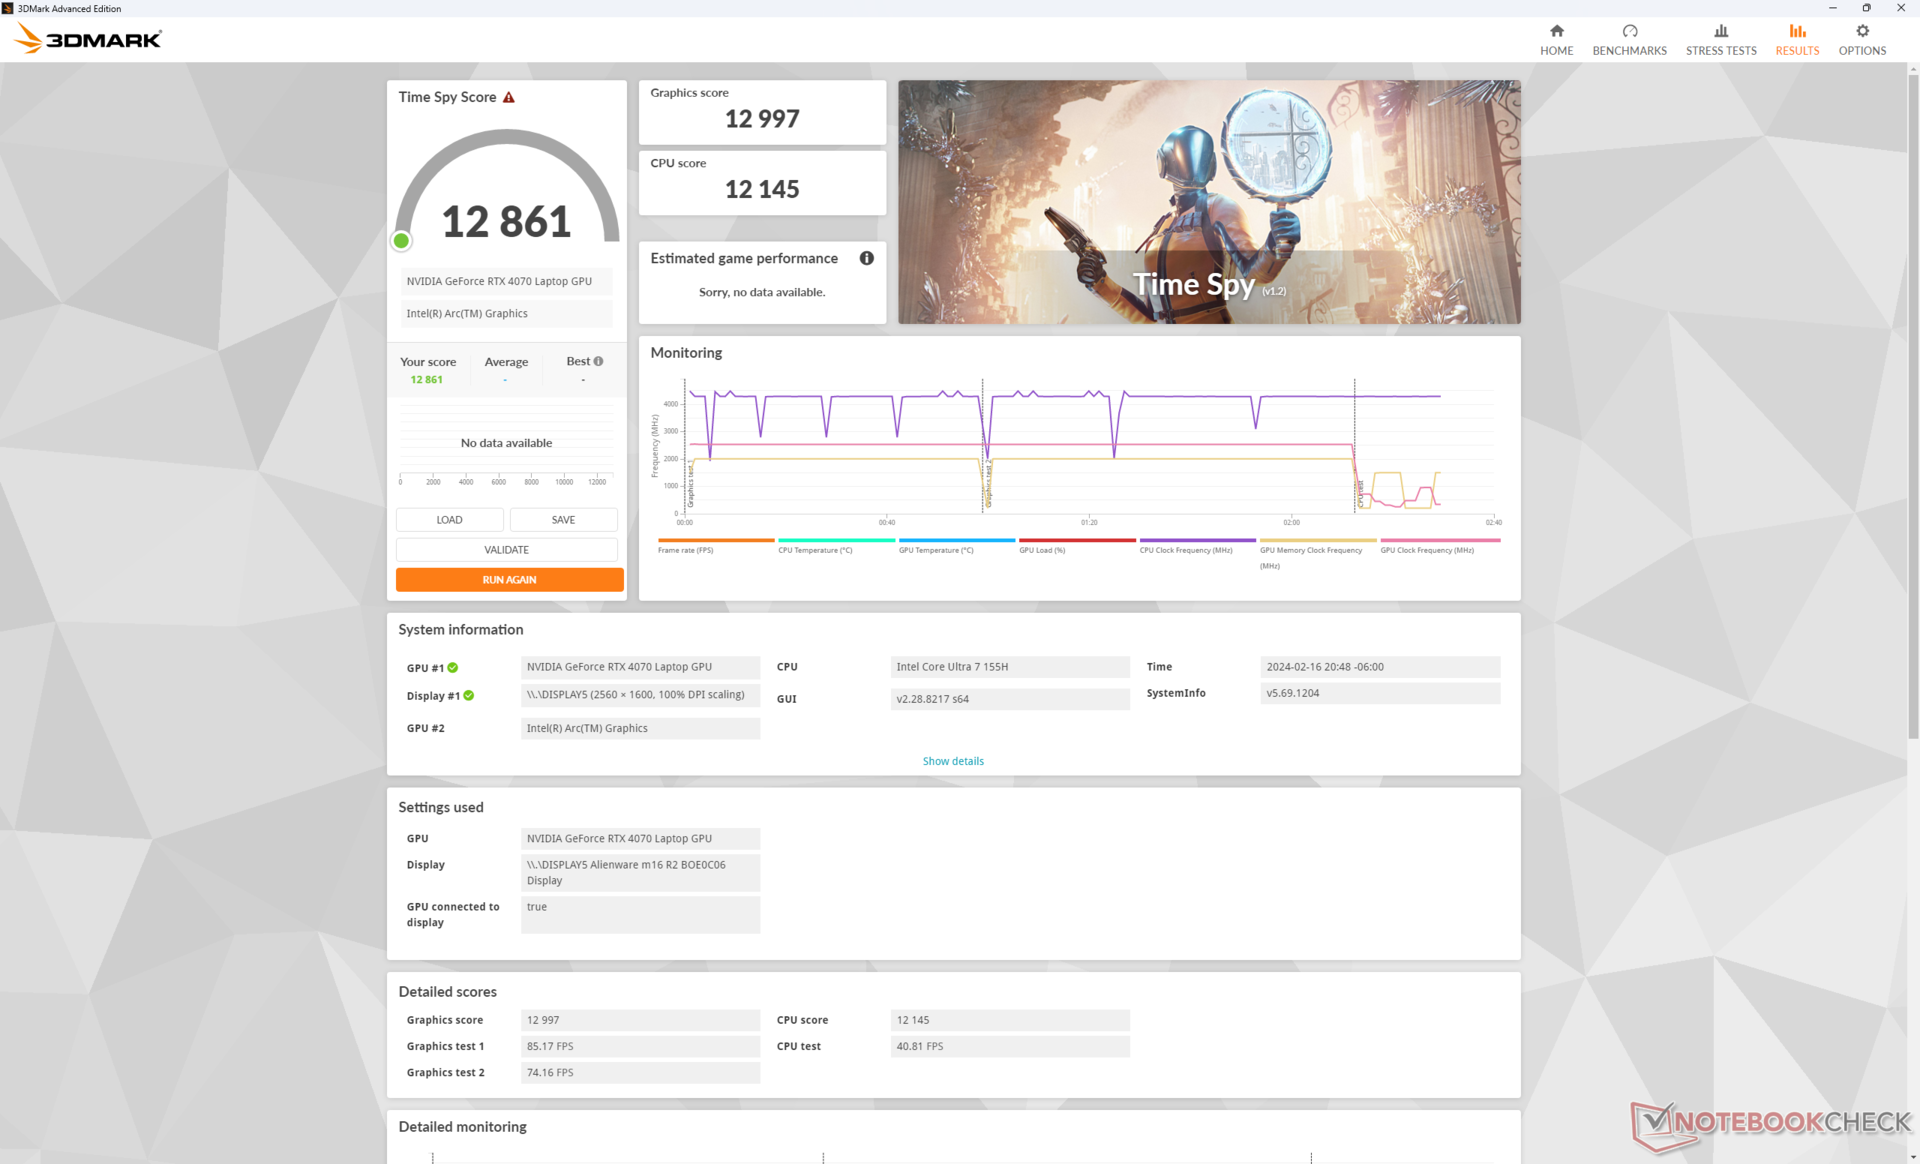
| 3DMark Time Spy Score | 12861 puan | |
Yardım | ||
* ... daha küçük daha iyidir
| Performance rating - Percent | |
| Lenovo Legion 9 16IRX8 | |
| Alienware m16 R1 AMD -1! | |
| Lenovo Legion 5 16IRX G9 | |
| Lenovo Legion 7 16IAX7-82TD004SGE | |
| HP Omen Transcend 16-u1095ng | |
| Alienware m16 R2 -1! | |
| Asus ROG Zephyrus M16 GU603Z | |
| Dell G16 7620 | |
| HP Victus 16-r0076TX -1! | |
| Framework Laptop 16 | |
| Asus ROG Zephyrus M16 GU603H | |
| Lenovo Legion S7 16ARHA7 | |
| The Witcher 3 - 1920x1080 Ultra Graphics & Postprocessing (HBAO+) | |
| Lenovo Legion 9 16IRX8 | |
| Alienware m16 R1 AMD | |
| Alienware m16 R2 | |
| Lenovo Legion 7 16IAX7-82TD004SGE | |
| HP Omen Transcend 16-u1095ng | |
| Asus ROG Zephyrus M16 GU603Z | |
| Lenovo Legion 5 16IRX G9 | |
| HP Victus 16-r0076TX | |
| Lenovo Legion S7 16ARHA7 | |
| Asus ROG Zephyrus M16 GU603H | |
| Dell G16 7620 | |
| Framework Laptop 16 | |
| GTA V - 1920x1080 Highest AA:4xMSAA + FX AF:16x | |
| Lenovo Legion 9 16IRX8 | |
| Lenovo Legion 5 16IRX G9 | |
| HP Omen Transcend 16-u1095ng | |
| Lenovo Legion 7 16IAX7-82TD004SGE | |
| Dell G16 7620 | |
| Asus ROG Zephyrus M16 GU603Z | |
| Framework Laptop 16 | |
| Lenovo Legion S7 16ARHA7 | |
| Asus ROG Zephyrus M16 GU603H | |
| Final Fantasy XV Benchmark - 1920x1080 High Quality | |
| Lenovo Legion 9 16IRX8 | |
| Alienware m16 R1 AMD | |
| Lenovo Legion 7 16IAX7-82TD004SGE | |
| Alienware m16 R2 | |
| HP Omen Transcend 16-u1095ng | |
| Lenovo Legion 5 16IRX G9 | |
| Asus ROG Zephyrus M16 GU603Z | |
| Dell G16 7620 | |
| Lenovo Legion S7 16ARHA7 | |
| HP Victus 16-r0076TX | |
| Framework Laptop 16 | |
| Asus ROG Zephyrus M16 GU603H | |
| Strange Brigade - 1920x1080 ultra AA:ultra AF:16 | |
| Lenovo Legion 9 16IRX8 | |
| Alienware m16 R1 AMD | |
| Alienware m16 R2 | |
| Lenovo Legion 5 16IRX G9 | |
| HP Omen Transcend 16-u1095ng | |
| Lenovo Legion S7 16ARHA7 | |
| Asus ROG Zephyrus M16 GU603Z | |
| Dell G16 7620 | |
| HP Victus 16-r0076TX | |
| Framework Laptop 16 | |
| Lenovo Legion 7 16IAX7-82TD004SGE | |
| Asus ROG Zephyrus M16 GU603H | |
| Dota 2 Reborn - 1920x1080 ultra (3/3) best looking | |
| Lenovo Legion 9 16IRX8 | |
| Lenovo Legion 5 16IRX G9 | |
| Lenovo Legion 7 16IAX7-82TD004SGE | |
| Alienware m16 R1 AMD | |
| Asus ROG Zephyrus M16 GU603Z | |
| HP Omen Transcend 16-u1095ng | |
| Dell G16 7620 | |
| HP Victus 16-r0076TX | |
| Alienware m16 R2 | |
| Asus ROG Zephyrus M16 GU603H | |
| Framework Laptop 16 | |
| Lenovo Legion S7 16ARHA7 | |
| X-Plane 11.11 - 1920x1080 high (fps_test=3) | |
| Lenovo Legion 9 16IRX8 | |
| Lenovo Legion 5 16IRX G9 | |
| Lenovo Legion 7 16IAX7-82TD004SGE | |
| Asus ROG Zephyrus M16 GU603Z | |
| HP Omen Transcend 16-u1095ng | |
| Alienware m16 R1 AMD | |
| HP Victus 16-r0076TX | |
| Dell G16 7620 | |
| Alienware m16 R2 | |
| Asus ROG Zephyrus M16 GU603H | |
| Framework Laptop 16 | |
| Lenovo Legion S7 16ARHA7 | |
| F1 22 | |
| 1920x1080 Ultra High Preset AA:T AF:16x | |
| Lenovo Legion 9 16IRX8 | |
| Alienware m16 R1 AMD | |
| Alienware m16 R2 | |
| Ortalama NVIDIA GeForce RTX 4070 Laptop GPU (39.2 - 88.7, n=32) | |
| Lenovo Legion 5 16IRX G9 | |
| HP Victus 16-r0076TX | |
| Framework Laptop 16 | |
| 2560x1440 Ultra High Preset AA:T AF:16x | |
| Lenovo Legion 9 16IRX8 | |
| Alienware m16 R1 AMD | |
| Alienware m16 R2 | |
| Ortalama NVIDIA GeForce RTX 4070 Laptop GPU (10.6 - 58.8, n=30) | |
| Lenovo Legion 5 16IRX G9 | |
| Framework Laptop 16 | |
| 3840x2160 Ultra High Preset AA:T AF:16x | |
| Alienware m16 R1 AMD | |
| Alienware m16 R2 | |
| Ortalama NVIDIA GeForce RTX 4070 Laptop GPU (4.7 - 27.6, n=15) | |
| Framework Laptop 16 | |
| The Witcher 3 | |
| 1920x1080 Ultra Graphics & Postprocessing (HBAO+) | |
| Lenovo Legion 9 16IRX8 | |
| Alienware m16 R1 AMD | |
| Alienware m16 R2 | |
| Lenovo Legion 7 16IAX7-82TD004SGE | |
| HP Omen Transcend 16-u1095ng | |
| Ortalama NVIDIA GeForce RTX 4070 Laptop GPU (69.8 - 133.7, n=57) | |
| Asus ROG Zephyrus M16 GU603Z | |
| Lenovo Legion 5 16IRX G9 | |
| HP Victus 16-r0076TX | |
| Lenovo Legion S7 16ARHA7 | |
| Asus ROG Zephyrus M16 GU603H | |
| Dell G16 7620 | |
| Framework Laptop 16 | |
| 3840x2160 High Graphics & Postprocessing (Nvidia HairWorks Off) | |
| Alienware m16 R1 AMD | |
| Alienware m16 R2 | |
| Ortalama NVIDIA GeForce RTX 4070 Laptop GPU (26.5 - 83.5, n=16) | |
| Framework Laptop 16 | |
| Dota 2 Reborn | |
| 1920x1080 ultra (3/3) best looking | |
| Lenovo Legion 9 16IRX8 | |
| Lenovo Legion 5 16IRX G9 | |
| Lenovo Legion 7 16IAX7-82TD004SGE | |
| Alienware m16 R1 AMD | |
| Asus ROG Zephyrus M16 GU603Z | |
| HP Omen Transcend 16-u1095ng | |
| Ortalama NVIDIA GeForce RTX 4070 Laptop GPU (89.7 - 191.2, n=67) | |
| Dell G16 7620 | |
| HP Victus 16-r0076TX | |
| Alienware m16 R2 | |
| Asus ROG Zephyrus M16 GU603H | |
| Framework Laptop 16 | |
| Lenovo Legion S7 16ARHA7 | |
| 3840x2160 ultra (3/3) best looking | |
| Alienware m16 R1 AMD | |
| Alienware m16 R2 | |
| Ortalama NVIDIA GeForce RTX 4070 Laptop GPU (88.4 - 153.3, n=26) | |
| Framework Laptop 16 | |
| Final Fantasy XV Benchmark | |
| 1920x1080 High Quality | |
| Lenovo Legion 9 16IRX8 | |
| Alienware m16 R1 AMD | |
| Lenovo Legion 7 16IAX7-82TD004SGE | |
| Alienware m16 R2 | |
| Ortalama NVIDIA GeForce RTX 4070 Laptop GPU (41 - 131.9, n=65) | |
| HP Omen Transcend 16-u1095ng | |
| Lenovo Legion 5 16IRX G9 | |
| Asus ROG Zephyrus M16 GU603Z | |
| Dell G16 7620 | |
| Lenovo Legion S7 16ARHA7 | |
| HP Victus 16-r0076TX | |
| Framework Laptop 16 | |
| Asus ROG Zephyrus M16 GU603H | |
| 2560x1440 High Quality | |
| Lenovo Legion 9 16IRX8 | |
| Alienware m16 R1 AMD | |
| Lenovo Legion 7 16IAX7-82TD004SGE | |
| Alienware m16 R2 | |
| Ortalama NVIDIA GeForce RTX 4070 Laptop GPU (32.5 - 119.9, n=57) | |
| Lenovo Legion 5 16IRX G9 | |
| Asus ROG Zephyrus M16 GU603Z | |
| Dell G16 7620 | |
| Lenovo Legion S7 16ARHA7 | |
| Framework Laptop 16 | |
| Asus ROG Zephyrus M16 GU603H | |
| 3840x2160 High Quality | |
| Alienware m16 R1 AMD | |
| Alienware m16 R2 | |
| Ortalama NVIDIA GeForce RTX 4070 Laptop GPU (26.6 - 52.8, n=23) | |
| Asus ROG Zephyrus M16 GU603Z | |
| Framework Laptop 16 | |
| Tiny Tina's Wonderlands | |
| 1920x1080 Badass Preset (DX12) | |
| Lenovo Legion 9 16IRX8 | |
| Alienware m16 R1 AMD | |
| Alienware m16 R2 | |
| Ortalama NVIDIA GeForce RTX 4070 Laptop GPU (58.6 - 115.9, n=18) | |
| Framework Laptop 16 | |
| 2560x1440 Badass Preset (DX12) | |
| Lenovo Legion 9 16IRX8 | |
| Alienware m16 R1 AMD | |
| Alienware m16 R2 | |
| Ortalama NVIDIA GeForce RTX 4070 Laptop GPU (49.8 - 79.5, n=17) | |
| Framework Laptop 16 | |
| 3840x2160 Badass Preset (DX12) | |
| Alienware m16 R1 AMD | |
| Ortalama NVIDIA GeForce RTX 4070 Laptop GPU (28.3 - 39.7, n=13) | |
| Alienware m16 R2 | |
| Framework Laptop 16 | |
| Baldur's Gate 3 | |
| 1920x1080 Ultra Preset AA:T | |
| Alienware m16 R2 | |
| Ortalama NVIDIA GeForce RTX 4070 Laptop GPU (66.7 - 128.5, n=30) | |
| Framework Laptop 16 | |
| 2560x1440 Ultra Preset AA:T | |
| Alienware m16 R2 | |
| Ortalama NVIDIA GeForce RTX 4070 Laptop GPU (54.4 - 89.6, n=25) | |
| Framework Laptop 16 | |
| 3840x2160 Ultra Preset AA:T | |
| Alienware m16 R2 | |
| Ortalama NVIDIA GeForce RTX 4070 Laptop GPU (33.4 - 45.2, n=12) | |
| Framework Laptop 16 | |
| Cyberpunk 2077 | |
| 1920x1080 Ultra Preset (FSR off) | |
| Lenovo Legion 9 16IRX8 | |
| Alienware m16 R2 | |
| Lenovo Legion 5 16IRX G9 | |
| Ortalama NVIDIA GeForce RTX 4070 Laptop GPU (30.7 - 90.7, n=40) | |
| Framework Laptop 16 | |
| 2560x1440 Ultra Preset (FSR off) | |
| Lenovo Legion 9 16IRX8 | |
| Alienware m16 R2 | |
| Lenovo Legion 5 16IRX G9 | |
| Ortalama NVIDIA GeForce RTX 4070 Laptop GPU (24.8 - 57.1, n=37) | |
| Framework Laptop 16 | |
| 3840x2160 Ultra Preset (FSR off) | |
| Ortalama NVIDIA GeForce RTX 4070 Laptop GPU (20.2 - 24, n=13) | |
| Alienware m16 R2 | |
| Framework Laptop 16 | |
Witcher 3 FPS Chart
| düşük | orta | yüksek | ultra | QHD | 4K | |
|---|---|---|---|---|---|---|
| The Witcher 3 (2015) | 399.6 | 344.6 | 240.5 | 121.3 | 72 | |
| Dota 2 Reborn (2015) | 166.8 | 149 | 149.5 | 139.7 | 130.6 | |
| Final Fantasy XV Benchmark (2018) | 184.6 | 165.1 | 119.3 | 85.2 | 48.5 | |
| X-Plane 11.11 (2018) | 132.3 | 116 | 90.8 | 78.2 | ||
| Far Cry 5 (2018) | 146 | 134 | 123 | 115 | 61 | |
| Strange Brigade (2018) | 427 | 308 | 255 | 219 | 141.7 | 73.8 |
| Tiny Tina's Wonderlands (2022) | 244 | 202.8 | 138.3 | 107.6 | 74.6 | 34.8 |
| F1 22 (2022) | 235 | 225 | 217 | 83.6 | 52.9 | 26.6 |
| Baldur's Gate 3 (2023) | 168.7 | 148.9 | 129.3 | 128.5 | 88.3 | 44.3 |
| Cyberpunk 2077 (2023) | 125.7 | 114.1 | 95.6 | 83.1 | 52.7 | 21 |
Emisyonlar
Sistem Gürültüsü
Fan gürültüsü davranışı m16 R1'e göre önemli ölçüde iyileşmiştir. Örneğin 3DMark 06 'yı Dengeli modda çalıştırırken, m16 R2 32 dB(A) ile daha uzun süre daha sessiz kalırken, m16 R1 ilk kıyaslama sahnesi boyunca 52 dB(A) gibi gereksiz derecede yüksek bir ses çıkarıyordu. Bu, m16 R2'yi aşağıdaki gibi rakiplerle daha karşılaştırılabilir hale getirir Lenovo Legion Slim 7 benzer koşullar altındayken.
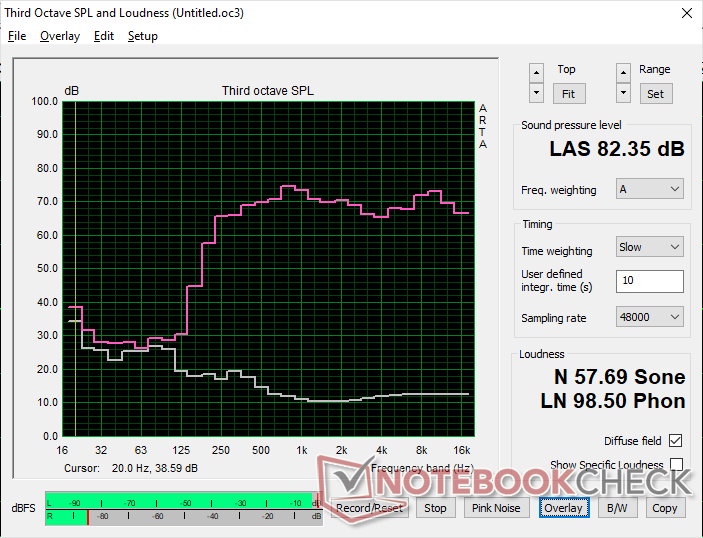
Oyun oynarken fan gürültüsü, seçilen güç profiline yakından bağlıdır. Örneğin, fan gürültüsü oyun oynarken 52 dB(A), 54 dB(A) ve 62 dB(A)'da sabitlenir Witcher 3 sırasıyla Dengeli modda, Performans modunda ve Overdrive modunda. Bu üç mod arasındaki performans farkları yukarıda belirtildiği gibi çok küçük olduğundan, çoğu senaryo için Performans modunda oyun oynamanızı ve Overdrive modundan kaçınmanızı öneririz. Maksimum 62 dB(A), daha güçlü Alienware x16 R1'de bile kaydettiğimizden çok daha yüksektir, ancak bu mod öncelikle son kullanıcı hız aşırtma amaçlıdır; Performans modu stok ayarları için yeterlidir.
Ses yüksekliği
| Boşta |
| 25.3 / 25.3 / 25.3 dB |
| Çalışırken |
| 31.7 / 62 dB |
 | ||
30 dB sessiz 40 dB(A) duyulabilirlik 50 dB(A) gürültülü |
||
min: | ||
| Alienware m16 R2 GeForce RTX 4070 Laptop GPU, Ultra 7 155H, Samsung PM9A1 MZVL21T0HCLR | Alienware m16 R1 Intel GeForce RTX 4060 Laptop GPU, i7-13700HX, Kioxia KXG70ZNV512G | Alienware x16 R1 GeForce RTX 4080 Laptop GPU, i9-13900HK, SK hynix PC801 HFS001TEJ9X101N | HP Omen Transcend 16-u1095ng GeForce RTX 4070 Laptop GPU, i9-14900HX, Kioxia XG8 KXG80ZNV1T02 | Asus ROG Zephyrus G16 2024 GU605M GeForce RTX 4070 Laptop GPU, Ultra 7 155H, WD PC SN560 SDDPNQE-1T00 | Lenovo Legion Slim 7 16APH8 GeForce RTX 4060 Laptop GPU, R7 7840HS, WDC PC SN810 1TB | |
|---|---|---|---|---|---|---|
| Noise | -8% | 1% | -8% | 2% | 0% | |
| kapalı / ortam * (dB) | 24.7 | 25 -1% | 22.7 8% | 24 3% | 23.9 3% | 24 3% |
| Idle Minimum * (dB) | 25.3 | 25 1% | 23.1 9% | 29 -15% | 23.9 6% | 25 1% |
| Idle Average * (dB) | 25.3 | 26 -3% | 25.8 -2% | 30 -19% | 27.8 -10% | 28 -11% |
| Idle Maximum * (dB) | 25.3 | 27 -7% | 25.8 -2% | 31 -23% | 30.1 -19% | 31 -23% |
| Load Average * (dB) | 31.7 | 52 -64% | 39.3 -24% | 45 -42% | 34.2 -8% | 33 -4% |
| Witcher 3 ultra * (dB) | 53.8 | 51 5% | 49.9 7% | 44 18% | 46.4 14% | 47 13% |
| Load Maximum * (dB) | 62 | 53 15% | 54.8 12% | 47 24% | 46.4 25% | 49 21% |
* ... daha küçük daha iyidir
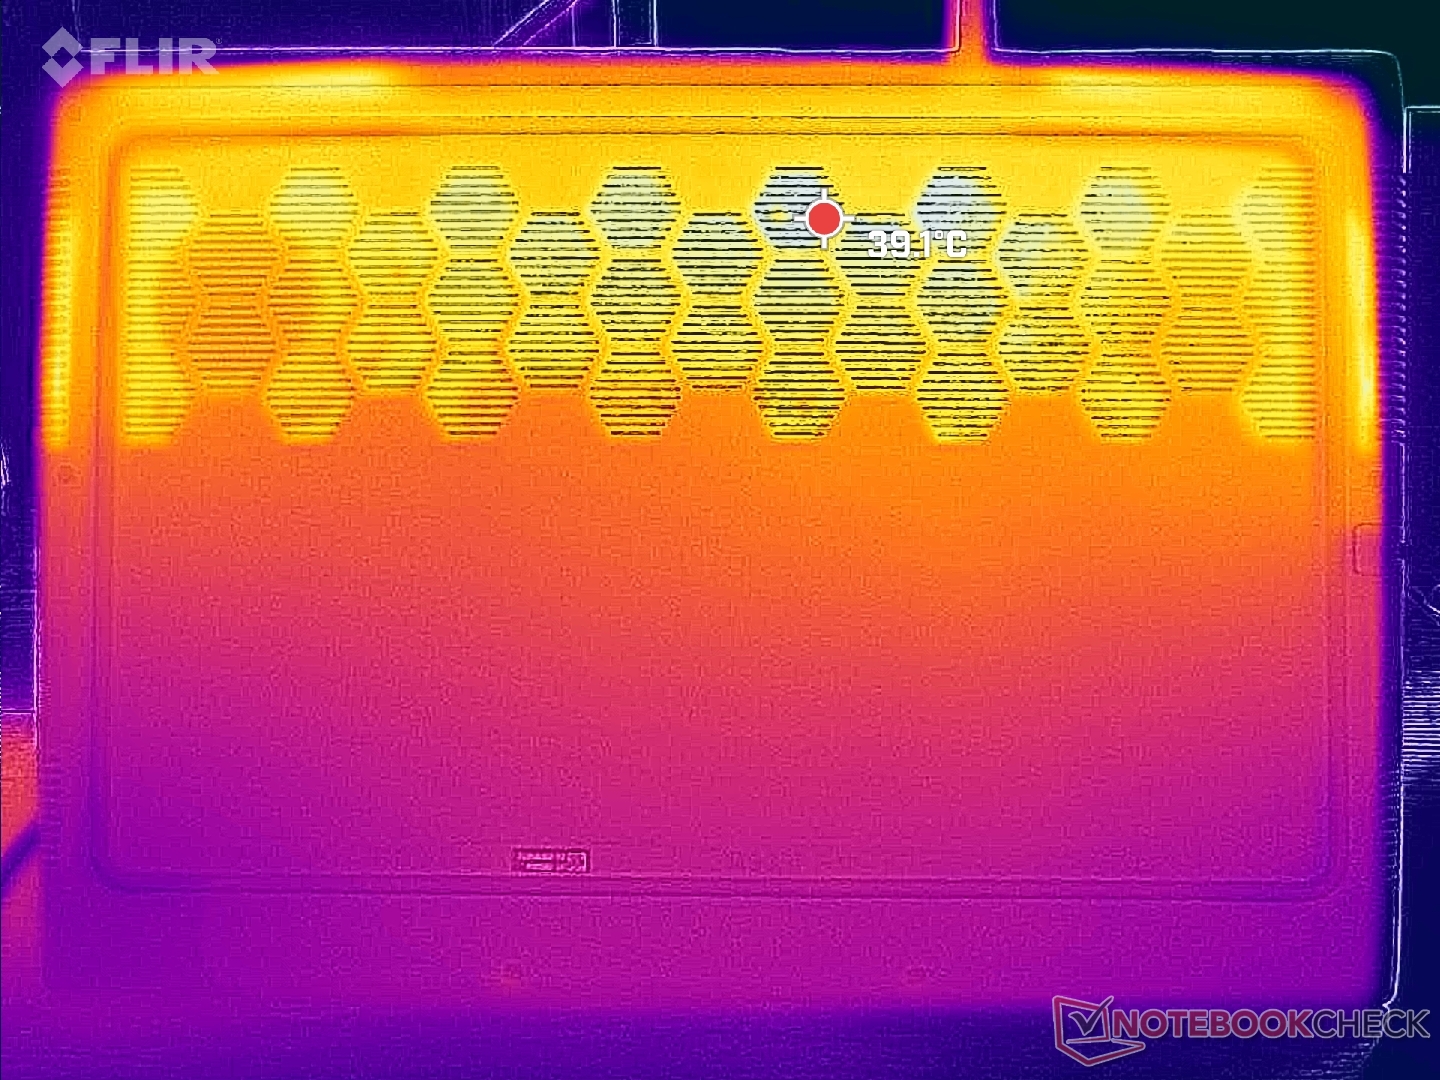
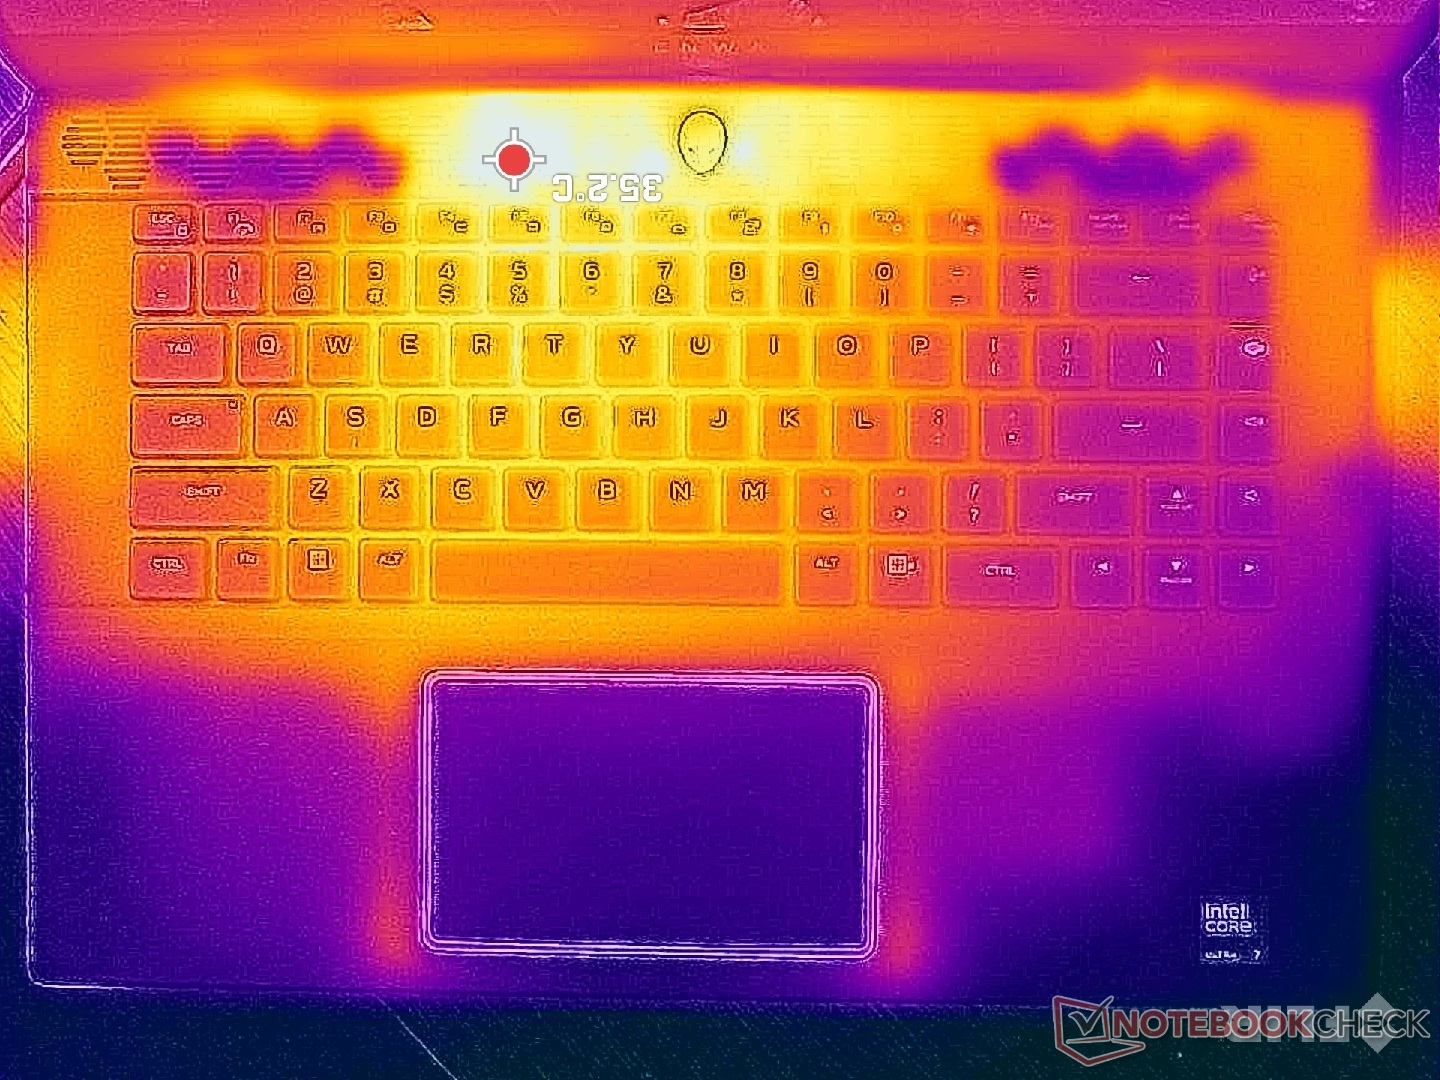
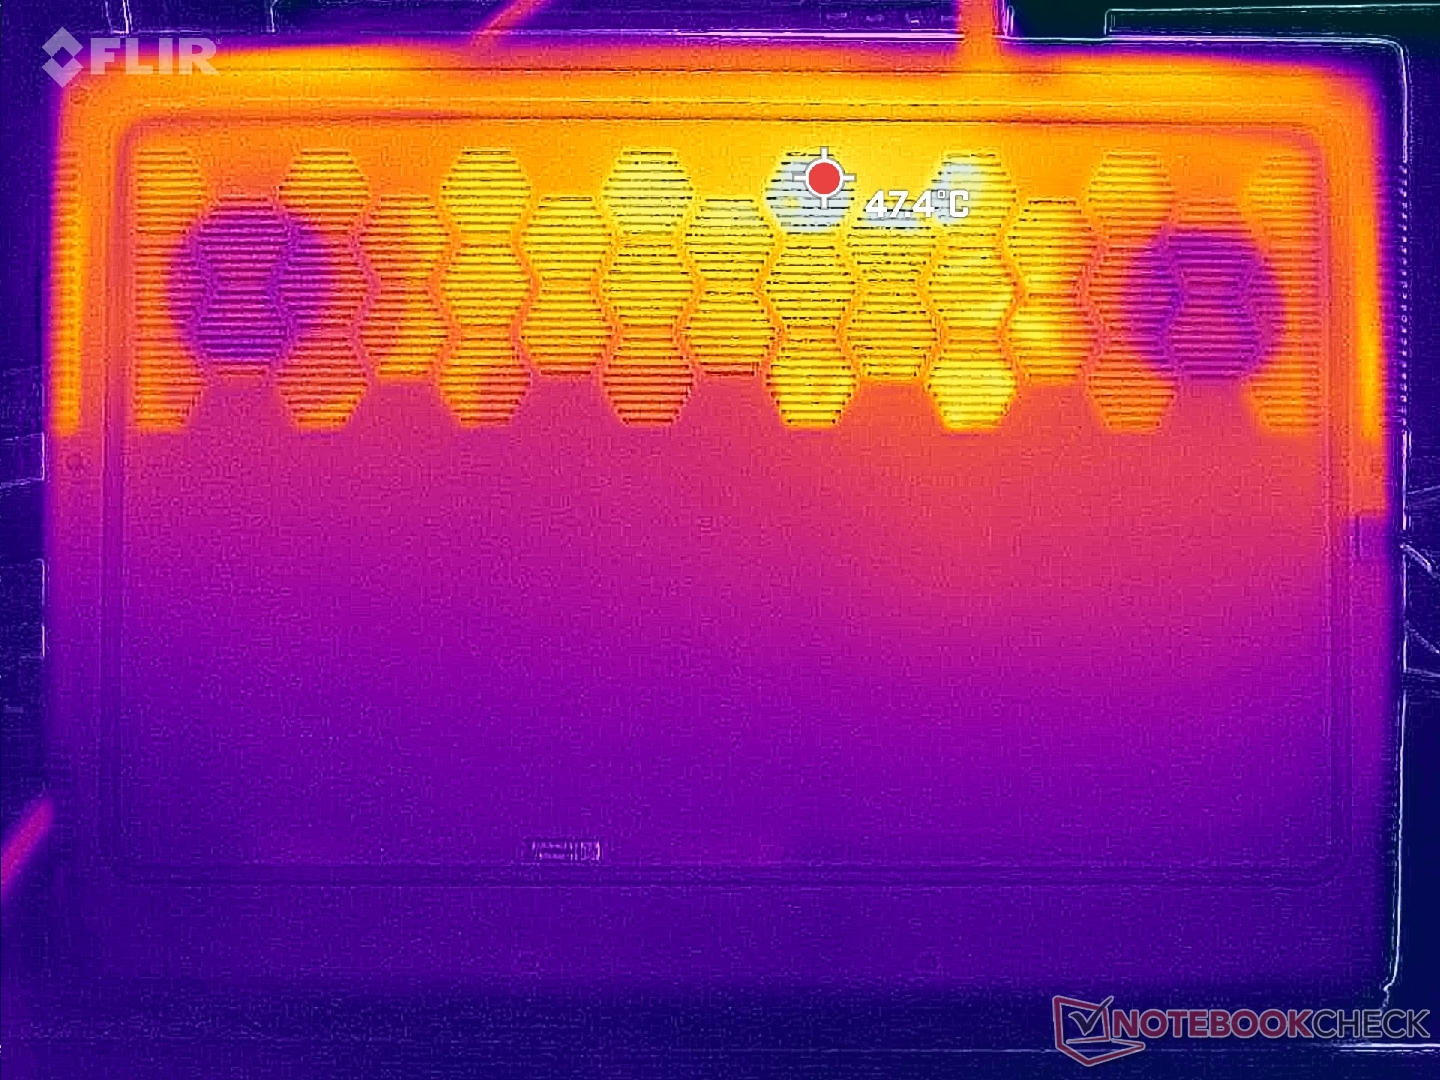
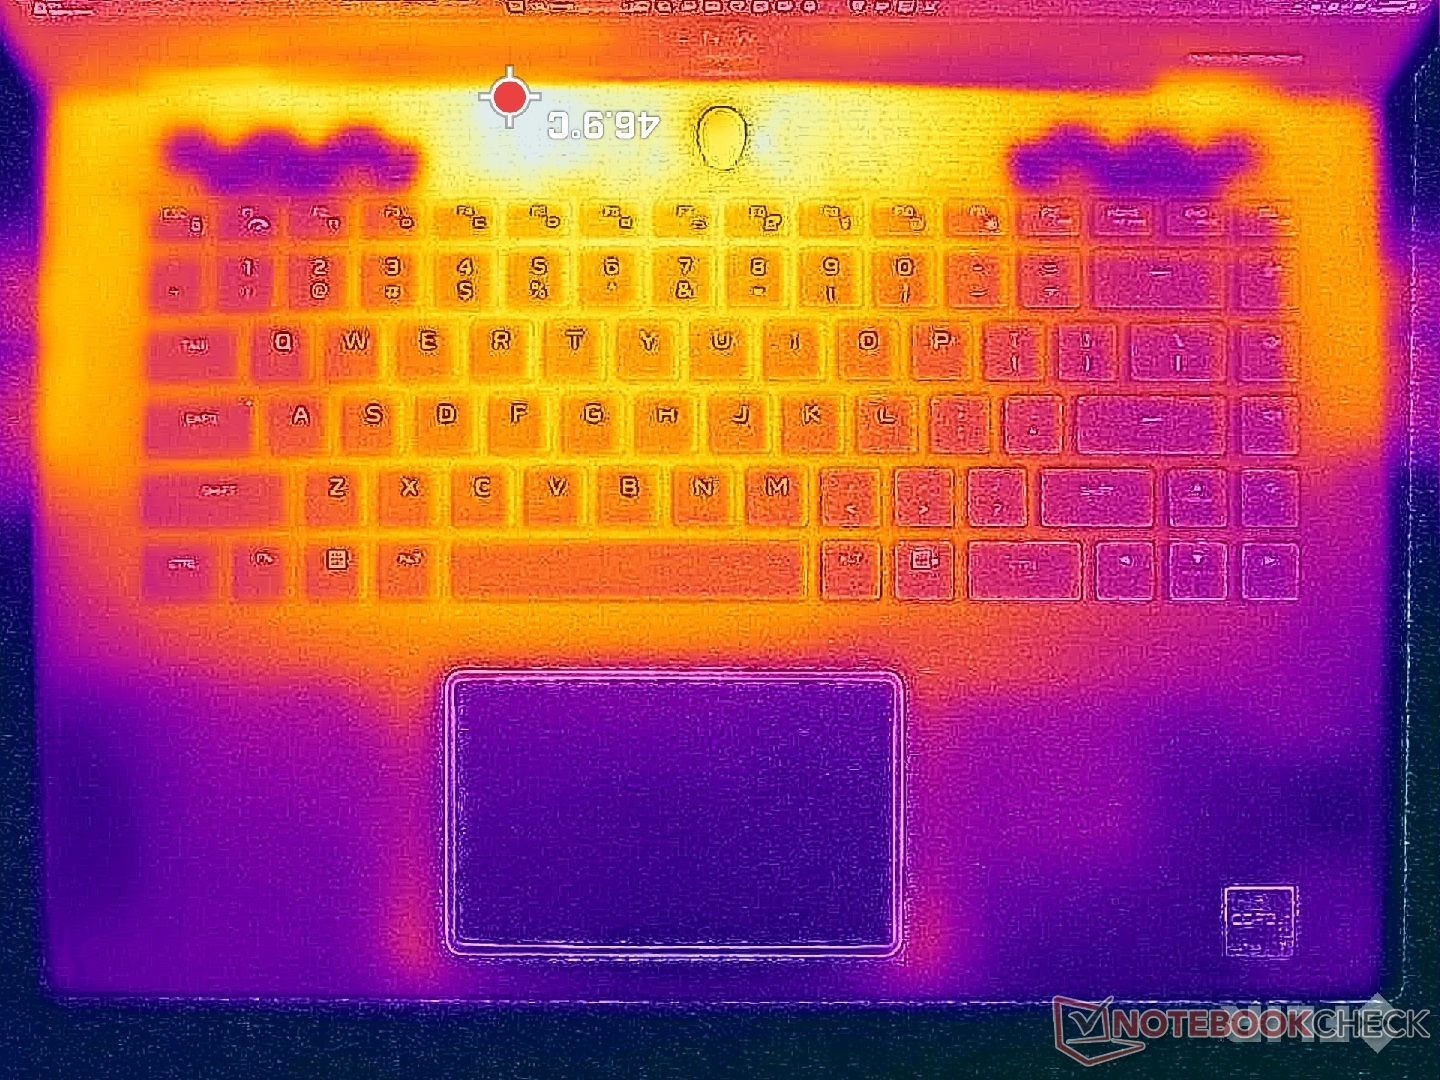
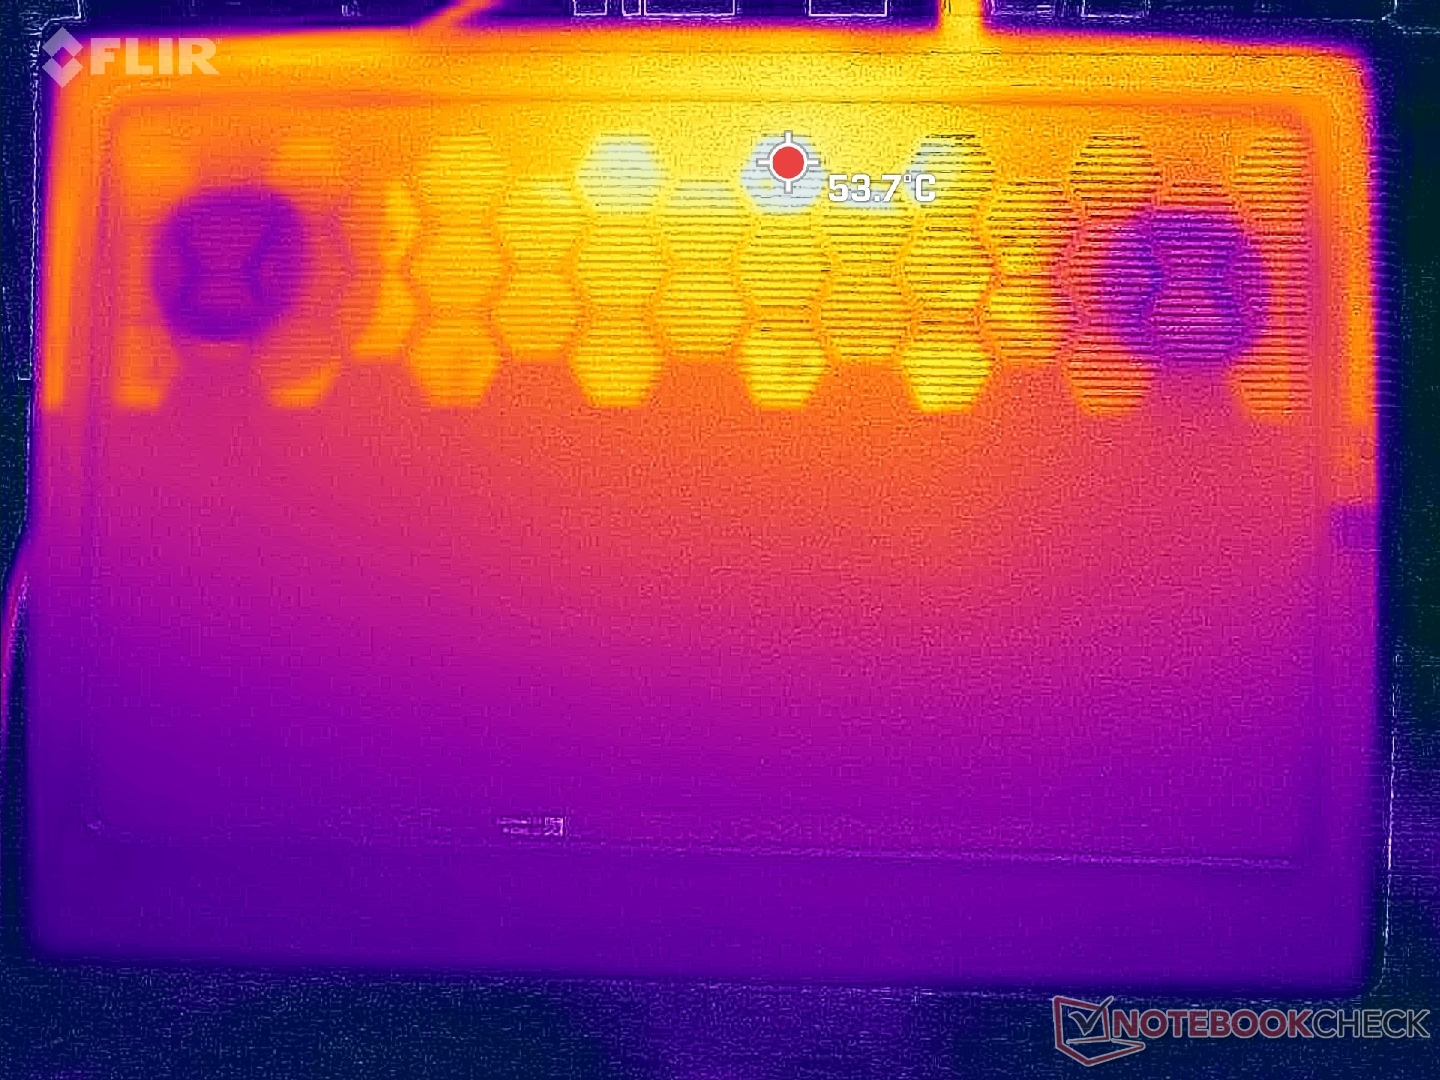
Sıcaklık
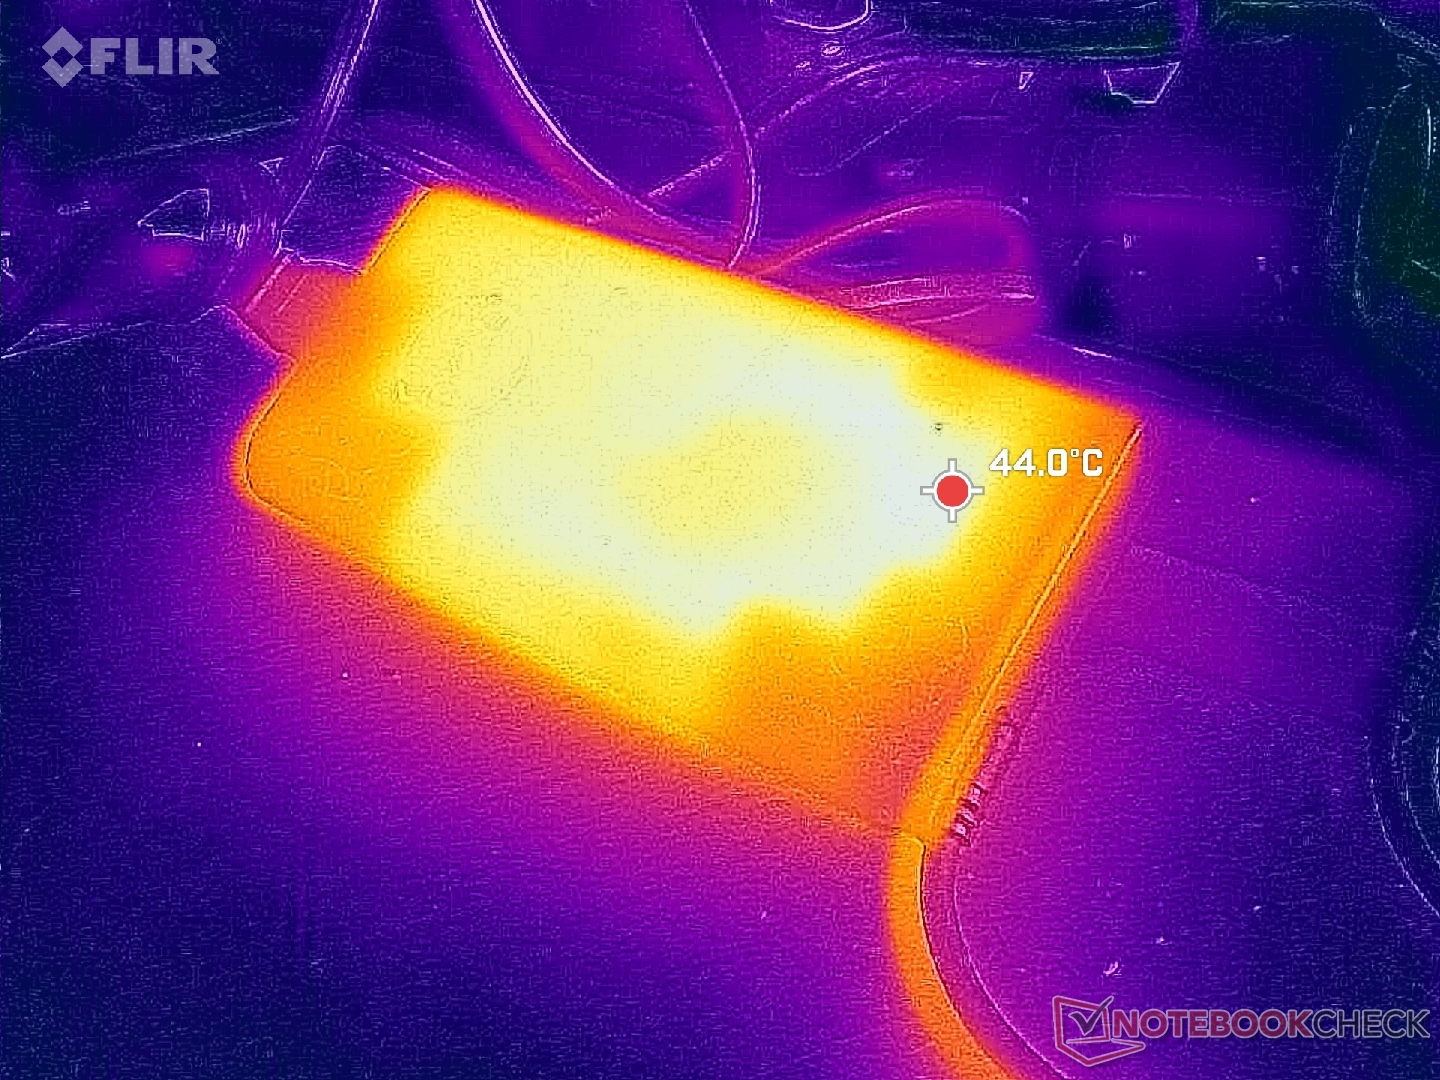
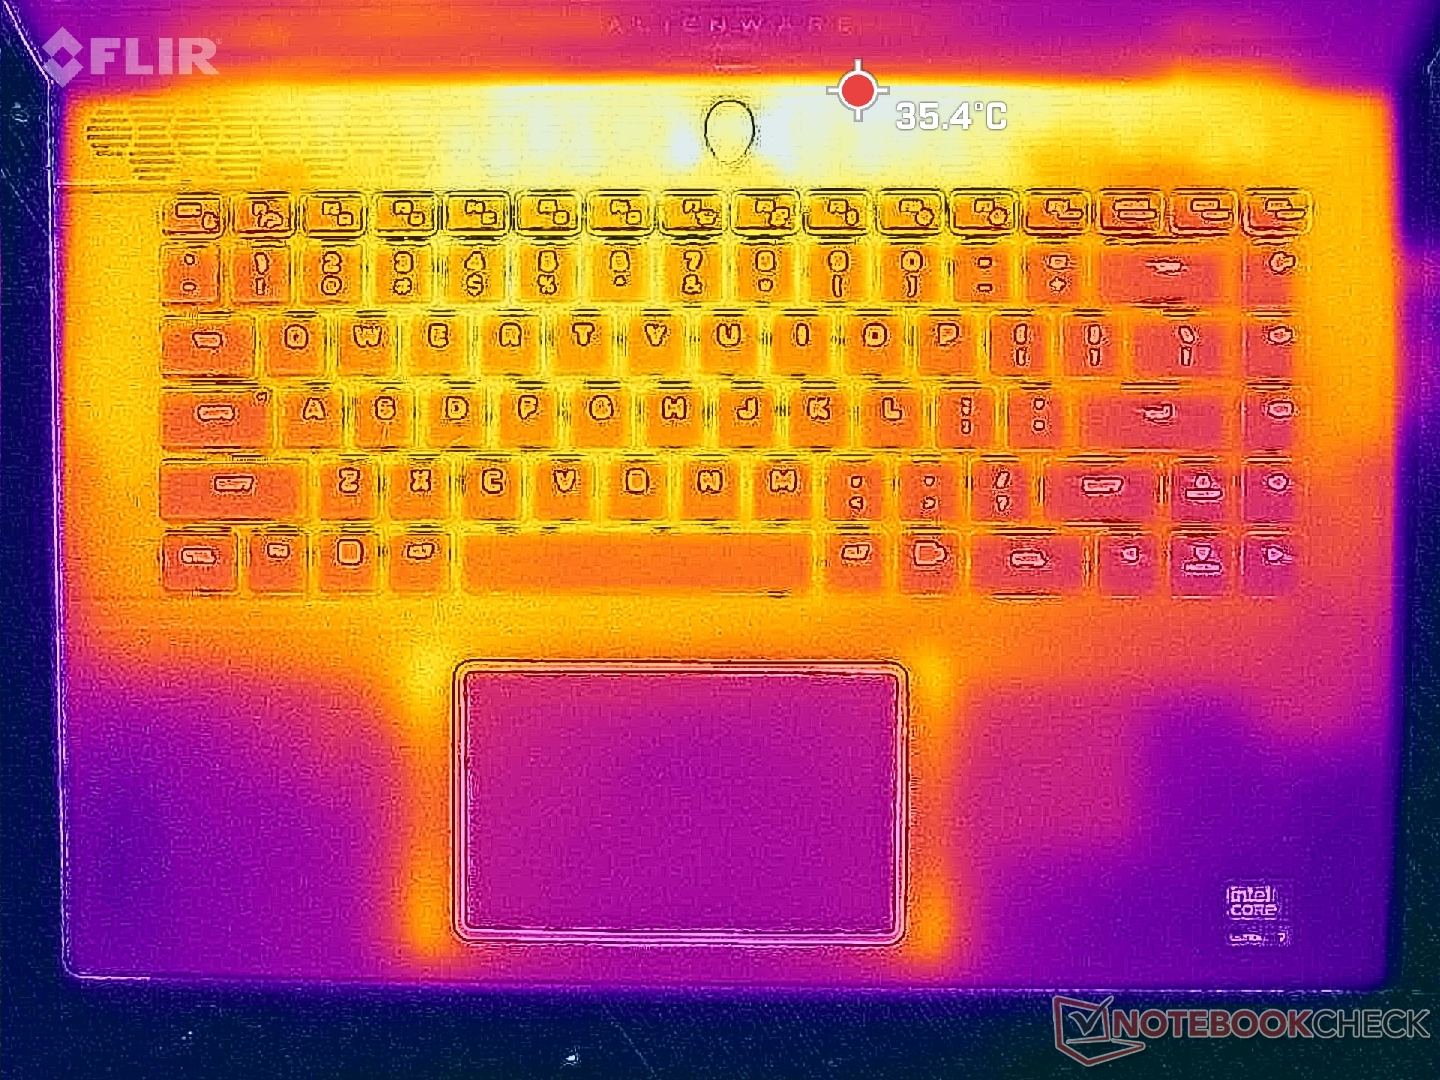
Oyunlar gibi zorlu yükleri çalıştırırken oluşan sıcak noktalar, kasanın arkasına doğru, ellerin temas etmesinin pek mümkün olmadığı yerlerde yoğunlaşıyor. Avuç içi dayanakları ve klavye sırasıyla orta 20 C ve 30 C aralığında makul derecede serin kalırken, arka kısım 50 C'ye yaklaşabilir Bıçak 16 ama yine de daha serin HP Omen Transcend 16 bazı bölgelerde sıcaklık 60 C'nin üzerine çıkabilir.
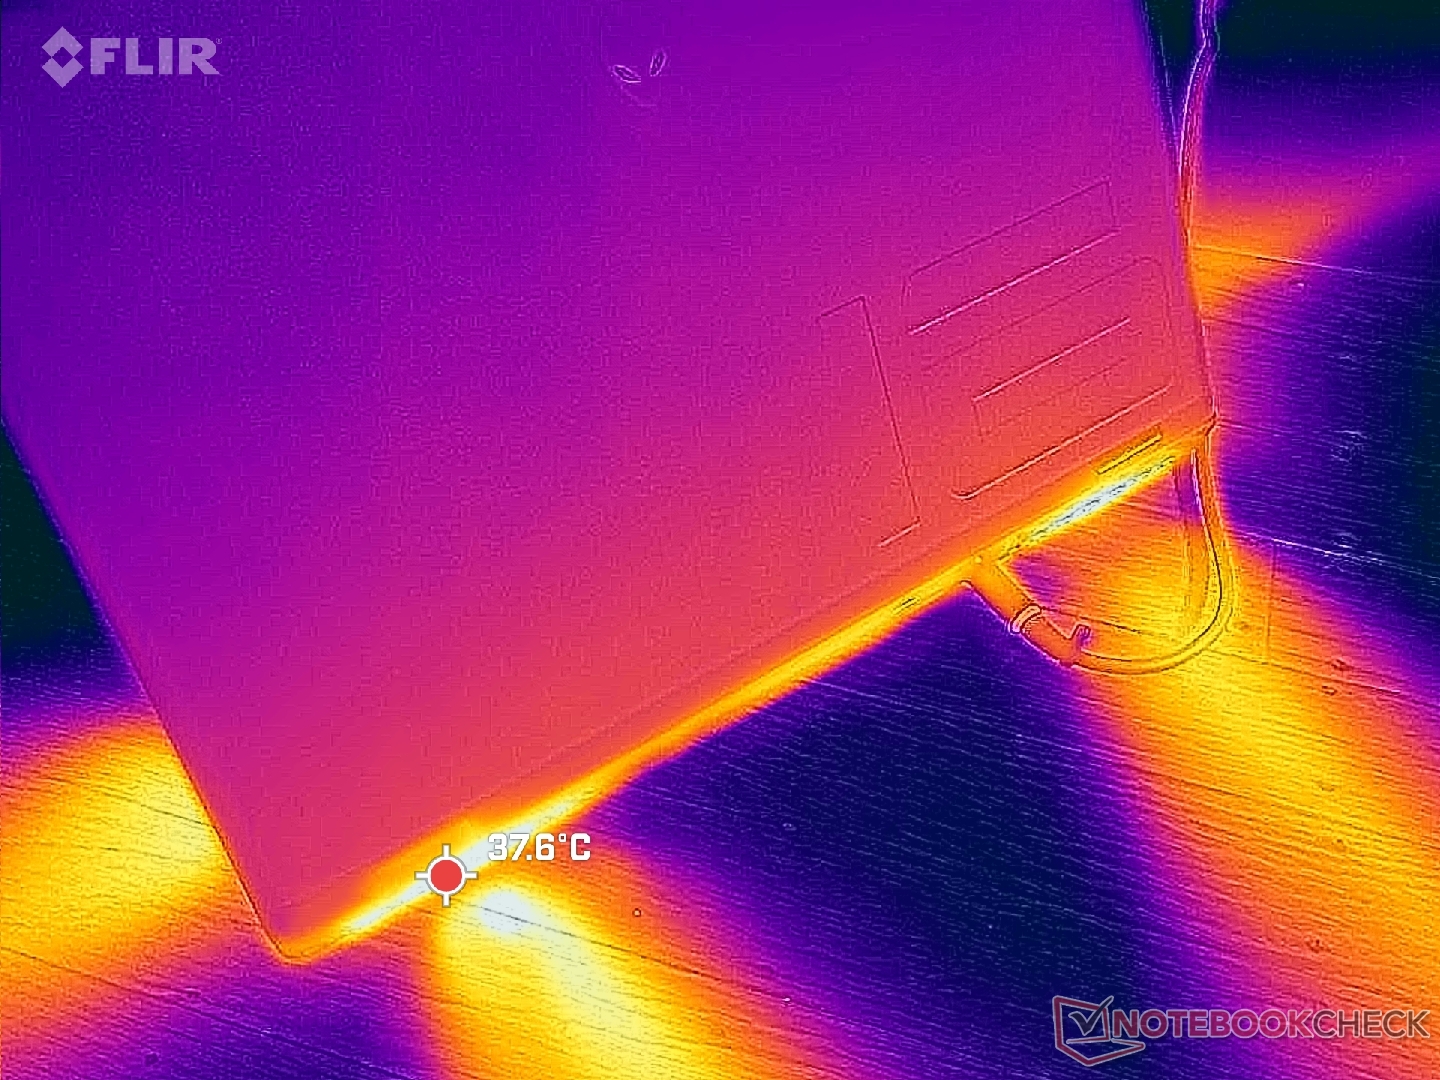
(±) Üst taraftaki maksimum sıcaklık, 40.4 °C / 105 F ortalamasına kıyasla 44.8 °C / 113 F'dir. , Gaming sınıfı için 21.2 ile 68.8 °C arasında değişir.
(-) Alt kısım, 43.2 °C / 110 F ortalamasına kıyasla maksimum 48 °C / 118 F'ye kadar ısınır
(+) Boşta kullanımda, üst tarafın ortalama sıcaklığı 30.9 °C / 88 F olup, cihazın 33.9 °C / 93 F.
(+) The Witcher 3 oynarken, üst tarafın ortalama sıcaklığı 28.7 °C / 84 F olup, cihazın 33.9 °C / 93 F.
(+) Avuç içi dayanakları ve dokunmatik yüzey, maksimum 27.2 °C / 81 F ile cilt sıcaklığından daha soğuktur ve bu nedenle dokunulduğunda soğuktur.
(±) Benzer cihazların avuç içi dayanağı alanının ortalama sıcaklığı 28.8 °C / 83.8 F (+1.6 °C / 2.8 F) idi.
| Alienware m16 R2 Intel Core Ultra 7 155H, NVIDIA GeForce RTX 4070 Laptop GPU | Alienware m16 R1 Intel Intel Core i7-13700HX, NVIDIA GeForce RTX 4060 Laptop GPU | Alienware x16 R1 Intel Core i9-13900HK, NVIDIA GeForce RTX 4080 Laptop GPU | HP Omen Transcend 16-u1095ng Intel Core i9-14900HX, NVIDIA GeForce RTX 4070 Laptop GPU | Asus ROG Zephyrus G16 2024 GU605M Intel Core Ultra 7 155H, NVIDIA GeForce RTX 4070 Laptop GPU | Lenovo Legion Slim 7 16APH8 AMD Ryzen 7 7840HS, NVIDIA GeForce RTX 4060 Laptop GPU | |
|---|---|---|---|---|---|---|
| Heat | -3% | 3% | 3% | 10% | 8% | |
| Maximum Upper Side * (°C) | 44.8 | 49 -9% | 47.2 -5% | 49 -9% | 50.3 -12% | 46 -3% |
| Maximum Bottom * (°C) | 48 | 48 -0% | 47.8 -0% | 63 -31% | 48 -0% | 46 4% |
| Idle Upper Side * (°C) | 37.2 | 40 -8% | 36.8 1% | 30 19% | 28.8 23% | 33 11% |
| Idle Bottom * (°C) | 42 | 39 7% | 35.8 15% | 29 31% | 29.8 29% | 34 19% |
* ... daha küçük daha iyidir
Konuşmacılar
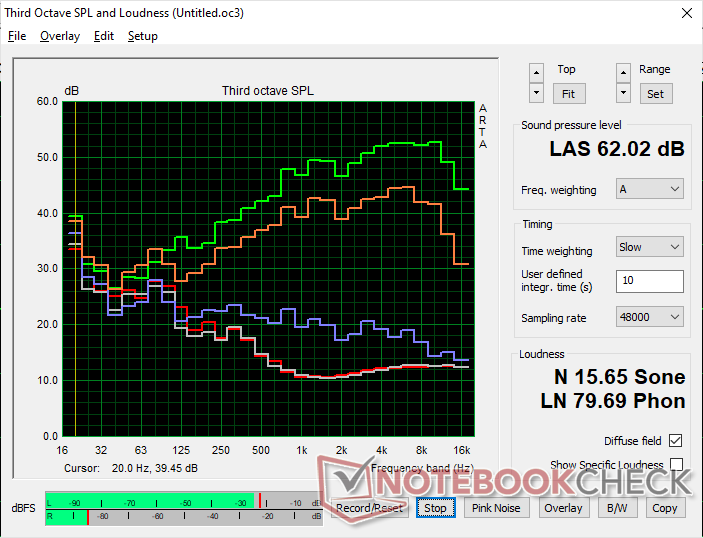
Alienware m16 R2 ses analizi
(+) | hoparlörler nispeten yüksek sesle çalabilir (82.4 dB)
Bas 100 - 315Hz
(-) | neredeyse hiç bas yok - ortalama olarak medyandan 20.1% daha düşük
(±) | Bas doğrusallığı ortalamadır (11.1% delta - önceki frekans)
Ortalar 400 - 2000 Hz
(+) | dengeli ortalar - medyandan yalnızca 2.2% uzakta
(+) | orta frekanslar doğrusaldır (3.1% deltadan önceki frekansa)
Yüksekler 2 - 16 kHz
(+) | dengeli yüksekler - medyandan yalnızca 2.2% uzakta
(+) | yüksekler doğrusaldır (3.5% deltadan önceki frekansa)
Toplam 100 - 16.000 Hz
(+) | genel ses doğrusaldır (12.9% ortancaya göre fark)
Aynı sınıfla karşılaştırıldığında
» Bu sınıftaki tüm test edilen cihazların %17%'si daha iyi, 4% benzer, 79% daha kötüydü
» En iyisinin deltası 6% idi, ortalama 18% idi, en kötüsü 132% idi
Test edilen tüm cihazlarla karşılaştırıldığında
» Test edilen tüm cihazların %12'si daha iyi, 3 benzer, % 85 daha kötüydü
» En iyisinin deltası 4% idi, ortalama 23% idi, en kötüsü 134% idi
Apple MacBook Pro 16 2021 M1 Pro ses analizi
(+) | hoparlörler nispeten yüksek sesle çalabilir (84.7 dB)
Bas 100 - 315Hz
(+) | iyi bas - medyandan yalnızca 3.8% uzakta
(+) | bas doğrusaldır (5.2% delta ile önceki frekans)
Ortalar 400 - 2000 Hz
(+) | dengeli ortalar - medyandan yalnızca 1.3% uzakta
(+) | orta frekanslar doğrusaldır (2.1% deltadan önceki frekansa)
Yüksekler 2 - 16 kHz
(+) | dengeli yüksekler - medyandan yalnızca 1.9% uzakta
(+) | yüksekler doğrusaldır (2.7% deltadan önceki frekansa)
Toplam 100 - 16.000 Hz
(+) | genel ses doğrusaldır (4.6% ortancaya göre fark)
Aynı sınıfla karşılaştırıldığında
» Bu sınıftaki tüm test edilen cihazların %0%'si daha iyi, 0% benzer, 100% daha kötüydü
» En iyisinin deltası 5% idi, ortalama 17% idi, en kötüsü 45% idi
Test edilen tüm cihazlarla karşılaştırıldığında
» Test edilen tüm cihazların %0'si daha iyi, 0 benzer, % 100 daha kötüydü
» En iyisinin deltası 4% idi, ortalama 23% idi, en kötüsü 134% idi
Enerji Yönetimi - Daha Yalın ve Daha Az Güç Tüketen
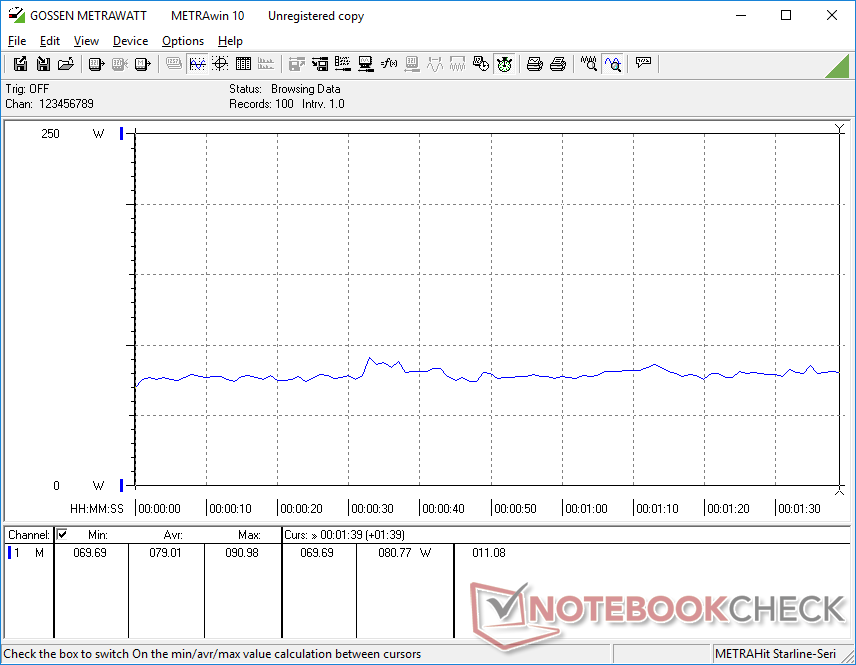
Güç Tüketimi
Masaüstünde rölanti, Sessiz modda ve iGPU modunda minimum parlaklığa ayarlandığında 8 W kadar düşük olabilir veya Overdrive modunda ve dGPU modunda maksimum parlaklığa ayarlandığında 40 W'a kadar çıkabilir. Bir sonraki bölümde gösterildiği gibi pil ömrünü uzatmak için ekstra beygir gücüne ihtiyaç duyulmadığında Dengeli modda ve iGPU modunda olmak isteyeceksiniz.
Oyun oynarken veya CPU ağırlıklı yükler çalıştırırken, genel tüketim, watt başına biraz daha yüksek performans için RTX 4060 destekli m16 R1'de kaydettiğimizle yaklaşık aynı olur.
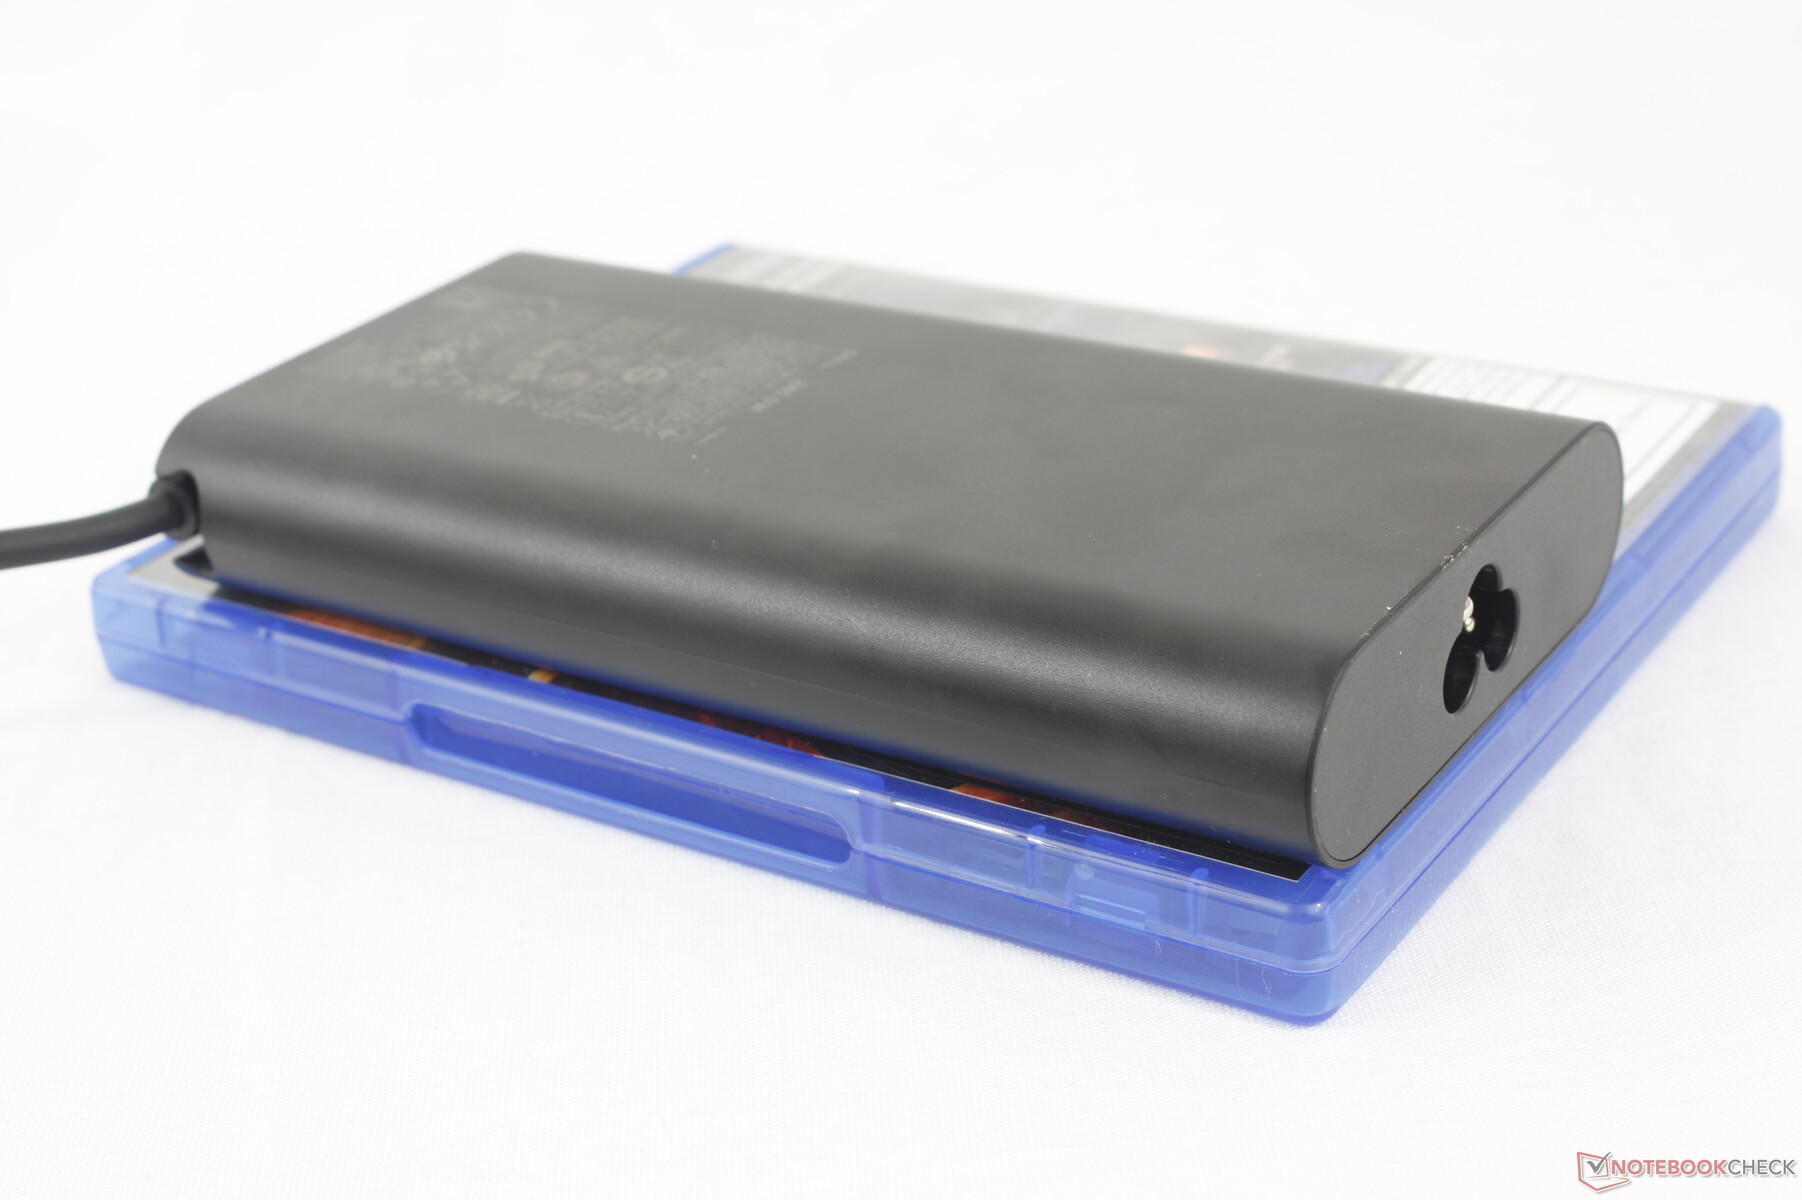
M16 R2, küçük (~15,2 x 7,7 x 2,3 cm) 240 W GaN AC adaptörle gönderilecek şekilde yapılandırılabilirken m16 R1, RTX 4080 ve 4090 yapılandırmalarına uyum sağlamak için daha büyük (~20 x 10 x 4,5 cm) 330 W adaptörle gönderilir. Bizimki gibi bazı SKU'lar bunun yerine 280 W AC adaptörle gönderilebilir.

| Kapalı / Bekleme modu | |
| Boşta | |
| Çalışırken |
|
Key:
min: | |
| Alienware m16 R2 Ultra 7 155H, GeForce RTX 4070 Laptop GPU, Samsung PM9A1 MZVL21T0HCLR, IPS, 2560x1600, 16" | Alienware m16 R1 Intel i7-13700HX, GeForce RTX 4060 Laptop GPU, Kioxia KXG70ZNV512G, IPS, 2560x1600, 16" | Alienware x16 R1 i9-13900HK, GeForce RTX 4080 Laptop GPU, SK hynix PC801 HFS001TEJ9X101N, IPS, 2560x1600, 16" | HP Omen Transcend 16-u1095ng i9-14900HX, GeForce RTX 4070 Laptop GPU, Kioxia XG8 KXG80ZNV1T02, OLED, 2560x1600, 16" | Asus ROG Zephyrus G16 2024 GU605M Ultra 7 155H, GeForce RTX 4070 Laptop GPU, WD PC SN560 SDDPNQE-1T00, OLED, 2560x1600, 16" | Lenovo Legion Slim 7 16APH8 R7 7840HS, GeForce RTX 4060 Laptop GPU, WDC PC SN810 1TB, IPS, 2560x1600, 16" | |
|---|---|---|---|---|---|---|
| Power Consumption | -10% | -77% | -13% | 24% | -67% | |
| Idle Minimum * (Watt) | 8.1 | 10 -23% | 25.2 -211% | 10 -23% | 8.3 -2% | 33 -307% |
| Idle Average * (Watt) | 13 | 14 -8% | 29.9 -130% | 18 -38% | 12.5 4% | 35 -169% |
| Idle Maximum * (Watt) | 40.3 | 21 48% | 49.8 -24% | 32 21% | 12.8 68% | 45 -12% |
| Load Average * (Watt) | 79 | 119 -51% | 105.4 -33% | 128 -62% | 71.3 10% | 59 25% |
| Witcher 3 ultra * (Watt) | 188.1 | 186.7 1% | 263 -40% | 148.4 21% | 127.5 32% | 131 30% |
| Load Maximum * (Watt) | 254.9 | 323 -27% | 313.8 -23% | 242 5% | 169.1 34% | 177 31% |
* ... daha küçük daha iyidir
Power Consumption Witcher 3 / Stresstest
Power Consumption external Monitor
Pil Ömrü
Daha küçük kasa tasarımına rağmen pil kapasitesi bu yıl 90 Wh ile biraz daha büyük. Dell'in eski Alienware dizüstü bilgisayarlarda yaşadığımız pil ömrü sorunlarını da çözdüğü görülüyor; Dengeli ve Optimus modunda web'de gezinme, Alienware m16 R1'de bunun neredeyse yarısına kıyasla 8 saat sürüyordu. Sistem, en yeni dizüstü bilgisayarlardan bile daha uzun süre dayanabiliyor Asus ROG Zephyrus G16 GU605M neredeyse bir saat farkla.
Boş durumdan tam kapasiteye şarj etmek yaklaşık 90 dakika sürer. Alternatif olarak, yüzde 85'e kadar şarj etmek 40 dakikanın biraz altında sürer. Model, çok daha yavaş olsa da genel USB-C adaptörleri ile de şarj edilebiliyor.
| Alienware m16 R2 Ultra 7 155H, GeForce RTX 4070 Laptop GPU, 90 Wh | Alienware m16 R1 Intel i7-13700HX, GeForce RTX 4060 Laptop GPU, 86 Wh | Alienware x16 R1 i9-13900HK, GeForce RTX 4080 Laptop GPU, 90 Wh | HP Omen Transcend 16-u1095ng i9-14900HX, GeForce RTX 4070 Laptop GPU, 97 Wh | Asus ROG Zephyrus G16 2024 GU605M Ultra 7 155H, GeForce RTX 4070 Laptop GPU, 90 Wh | Lenovo Legion Slim 7 16APH8 R7 7840HS, GeForce RTX 4060 Laptop GPU, 99.9 Wh | |
|---|---|---|---|---|---|---|
| Pil Çalışma Süresi | -30% | -47% | -40% | 5% | -12% | |
| Reader / Idle (h) | 12.6 | 6.4 -49% | 7.3 -42% | |||
| WiFi v1.3 (h) | 8.1 | 4.8 -41% | 2.5 -69% | 4.9 -40% | 7.3 -10% | 7.1 -12% |
| Load (h) | 1 | 1 0% | 0.7 -30% | 1.2 20% | ||
| H.264 (h) | 5.6 | 11.2 |
Artılar
Eksiler
Karar - Oyun ve Hibrit Çalışma Arasında Yeni Bir Denge Kurmak
Alienware m16 R2, akılda tutulan net bir hedefle oluşturuldu: daha küçük olmak Alienware m16 R1 performanstan ödün vermek anlamına gelse bile. Model kesinlikle eskisinden çok daha taşınabilir ancak kullanıcılar bu süreçte GeForce RTX 4080/4090 grafiklerinden, Core HX CPU'lardan ve mekanik tuşlardan mahrum kalıyor. Dell, daha küçük bir tasarım lehine bu hevesli düzeydeki özellikleri kaldırarak, daha yalın m16 R2'nin daha "sert" ve daha az seyahat dostu m16 R1'i atlamış olabilecek daha geniş bir hibrit çalışan, öğrenci ve ana akım oyuncu kitlesini çekebileceğini umuyor x16 R1.
Sonuç olarak, m16 R1 neredeyse tamamen ağırlık ve çalışma süreleri pahasına performansa odaklanırken, performanstan pil ömrüne ve taşınabilirliğe kadar tüm cepheleri son derece iyi dengeleyen bir sistem ortaya çıktı. Fan gürültü seviyeleri ve davranışları bile ekstra beygir gücüne ihtiyaç duyulmayan sınıf veya ofis ortamlarında daha uygun olacak şekilde iyileştirilmiştir. Bu, tüm donanım ve yazılım değişiklikleri nedeniyle kesinlikle test ettiğimiz en çok yönlü Alienware dizüstü bilgisayar.
GeForce RTX 4060 veya 4070 grafikleriyle yetiniyorsanız, Alienware m16 R2 seride seçebileceğiniz en iyi her işe yarayan seçenektir. Daha fazla güce ihtiyacınız varsa ve taşınabilirliği korumak istiyorsanız, daha pahalı olan Blade 16 hala gitmeniz gereken yoldur.
Etkileyici ve çoğu zaman şaşırtıcı olsa da, m16 R2 hala 16 inç kategorisinde sıkı bir rekabetle karşı karşıya. Bu rakipler Razer Blade 16örneğin, m16 R2'den daha hafif, daha küçük ve daha hızlıdır ve daha derin DCI-P3 renklerine sahiptir. Fotoğraf makinesi Asus ROG Zephyrus G16 benzer şekilde daha hafif ve daha fazla ekran seçeneğine sahip, ancak GPU performansı biraz geride. Bu senaryoda Dell, Alienware m16 R2'yi hem Razer hem de Asus sistemlerinden daha ucuz olacak şekilde fiyatlandırmıştır.
Fiyat ve Bulunabilirlik
Dell, Alienware m16 R2'yi RTX 4060 için 1650$'dan başlayan fiyatlarla veya RTX 4070 konfigürasyonu için 1850$+ fiyatlarla satışa sunuyor. Giriş seviyesi RTX 4050 konfigürasyonu da 1500$'dan satışa sunuluyor.
Alienware m16 R2
- 02/24/2024 v7 (old)
Allen Ngo
Şeffaflık
İncelenecek cihazların seçimi editör ekibimiz tarafından yapılır. Test örneği, bu incelemenin amacı doğrultusunda üretici veya perakendeci tarafından yazara ödünç olarak sağlanmıştır. Borç verenin bu inceleme üzerinde herhangi bir etkisi olmadığı gibi, üretici de yayınlanmadan önce bu incelemenin bir kopyasını almamıştır. Bu incelemeyi yayınlama zorunluluğu yoktu. Bağımsız bir medya şirketi olarak Notebookcheck, üreticilerin, perakendecilerin veya yayıncıların otoritesine tabi değildir.
Notebookcheck bu şekilde test yapıyor
Notebookcheck, tüm sonuçların karşılaştırılabilir olmasını sağlamak için her yıl yüzlerce dizüstü bilgisayarı ve akıllı telefonu standart prosedürler kullanarak bağımsız olarak inceliyor. Yaklaşık 20 yıldır test yöntemlerimizi sürekli olarak geliştirdik ve bu süreçte endüstri standartlarını belirledik. Test laboratuvarlarımızda deneyimli teknisyenler ve editörler tarafından yüksek kaliteli ölçüm ekipmanları kullanılmaktadır. Bu testler çok aşamalı bir doğrulama sürecini içerir. Karmaşık derecelendirme sistemimiz, nesnelliği koruyan yüzlerce sağlam temellere dayanan ölçüm ve kıyaslamaya dayanmaktadır.Price comparison

