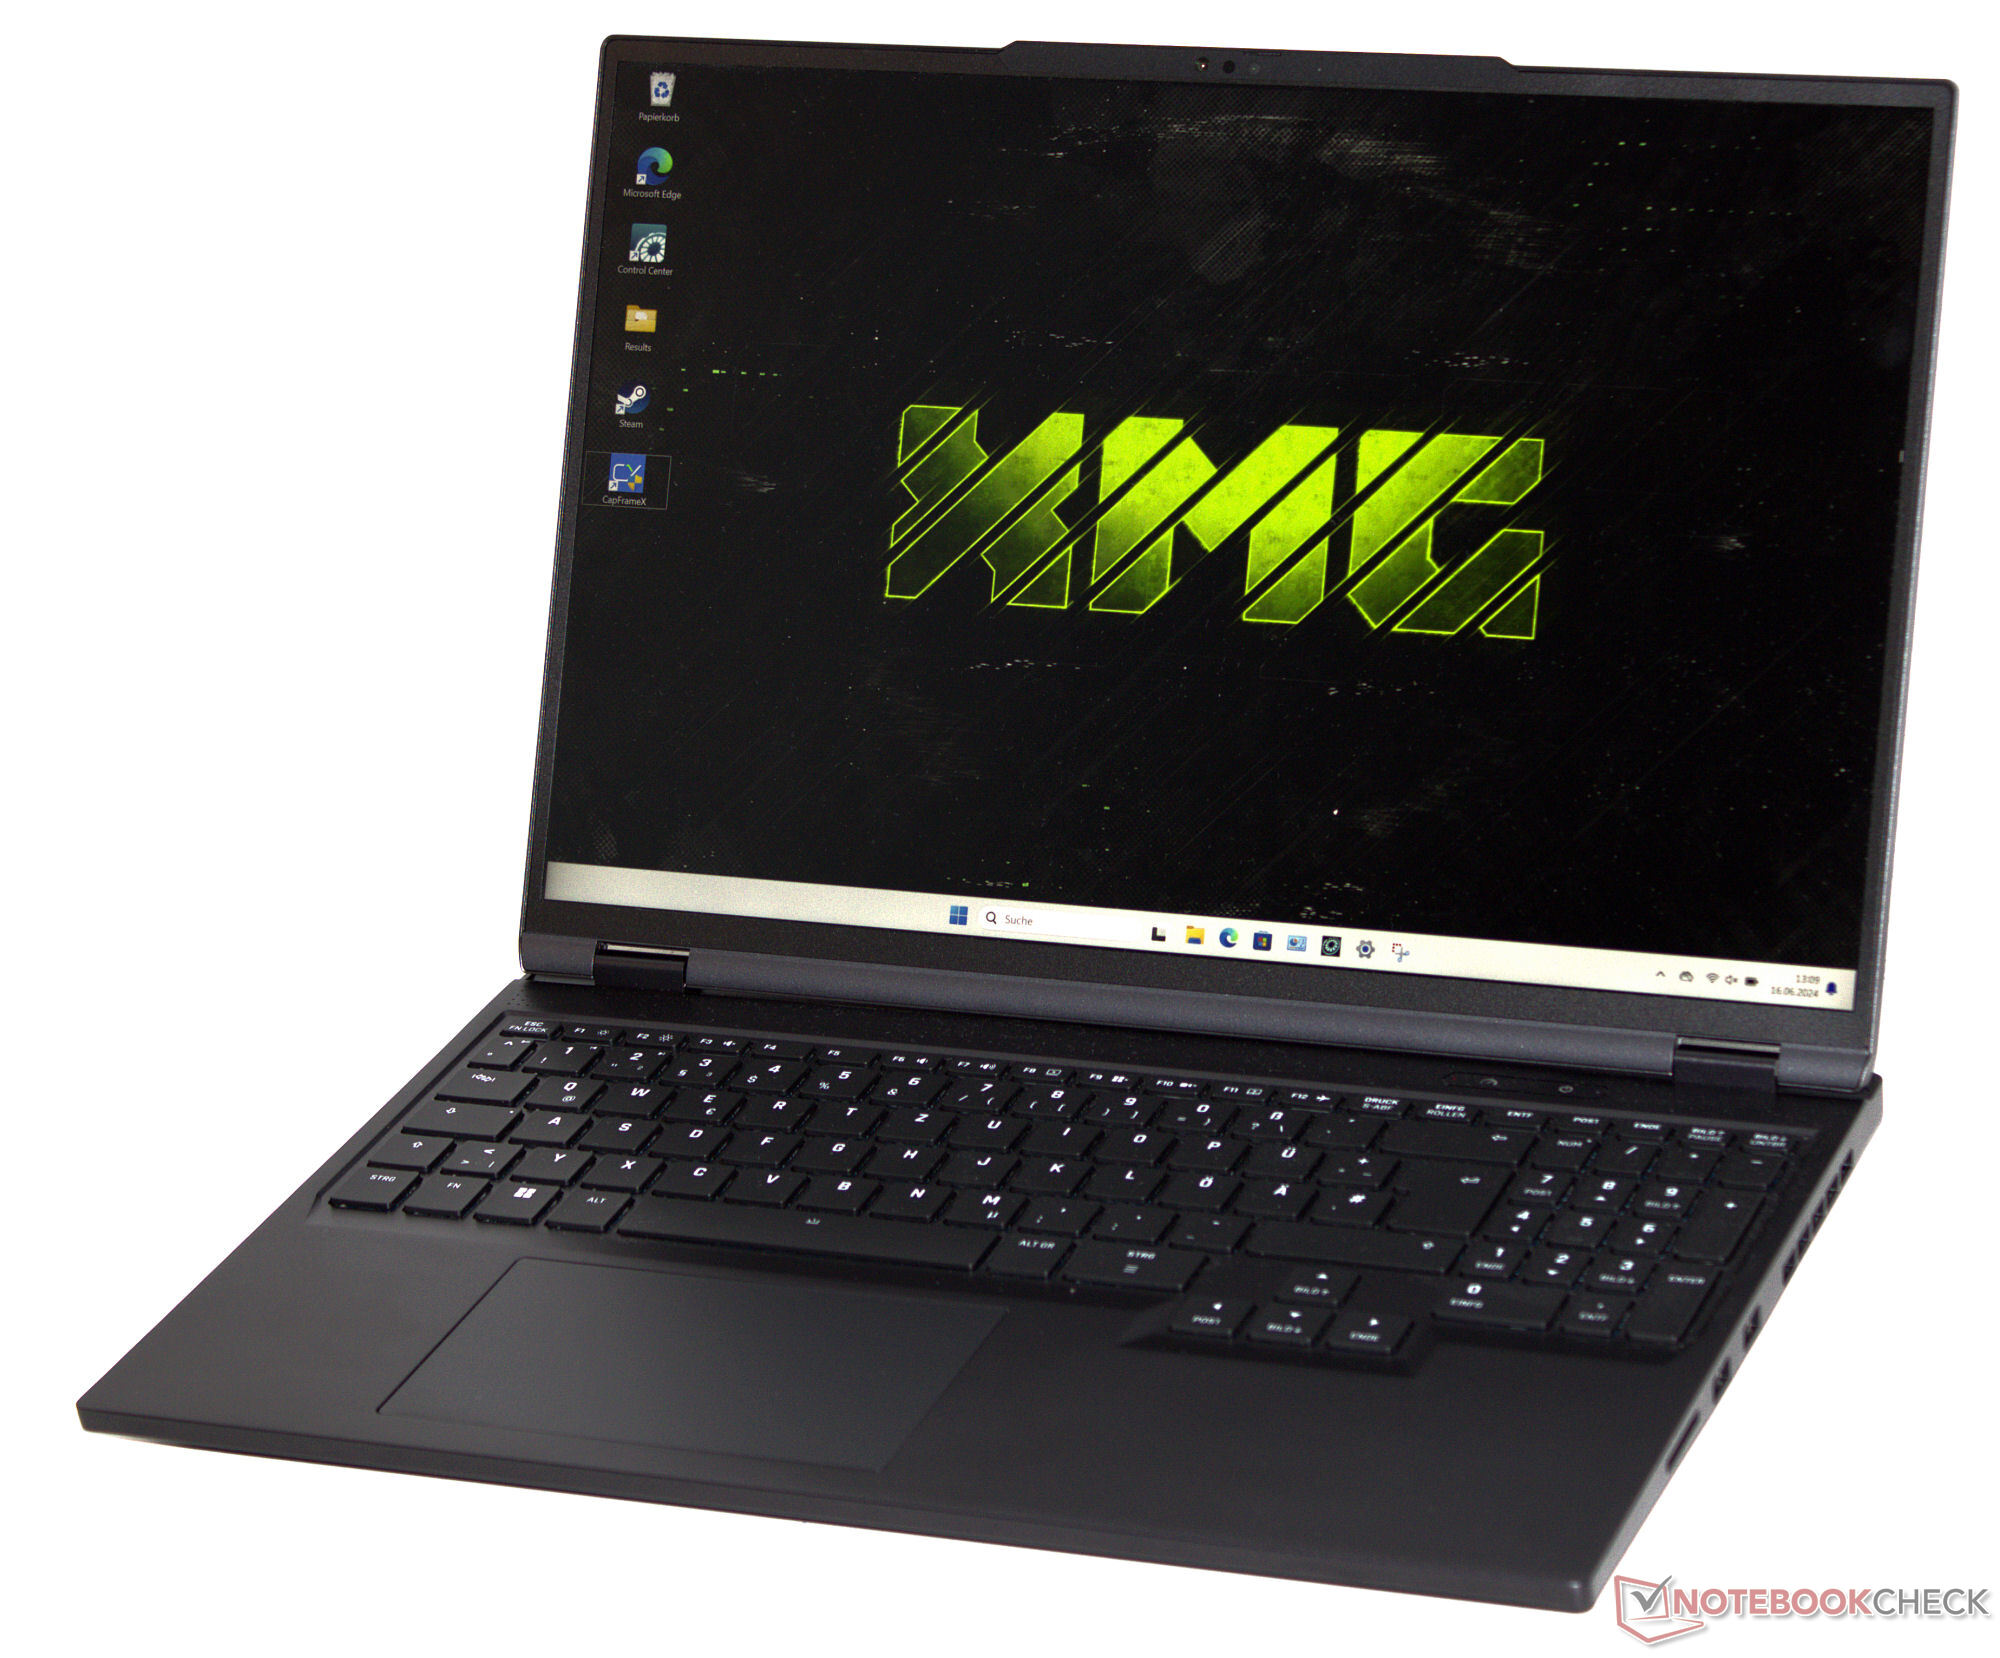
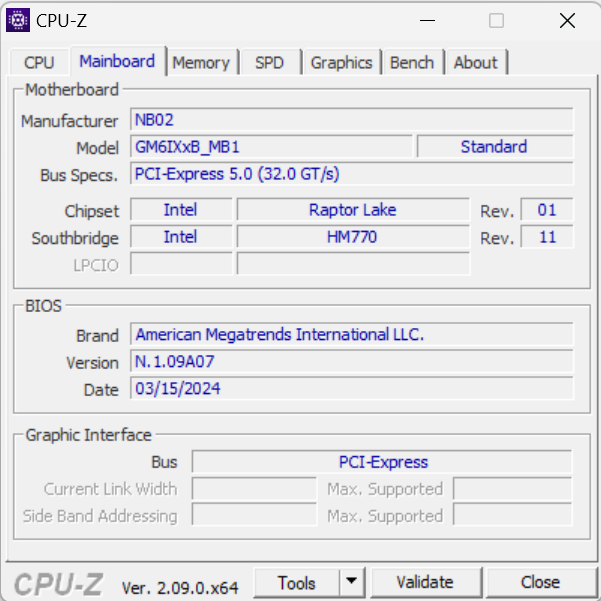
XMG Neo 16 (Early 24) incelemesi: Kompakt bir oyun dizüstü bilgisayarında tam RTX 4090 gücü

Neo 16 ile Schenker üst düzey segmente hizmet ediyor ve buna göre yarım önlem yok: Core i9, GeForce RTX 4090 ve 32 GB RAM, dizüstü bilgisayarı zorlu uygulama senaryoları (akış, render, oyun) için donatıyor. Ancak bunun bir bedeli var: İnceleme modeli için yaklaşık 4.000 $ (mevcut dolar / euro döviz kuru) ödemeniz gerekecek, ancak daha ucuz varyantlar da 2.000 $ 'dan alınabilir. Temel, Tongfang barebone (GM6IX9B) tarafından sağlanmaktadır. Rakipler, örneğin şu şekilde geliyor Razer Blade 16, the Medion Erazer Beast X40 ve Asus ROG Strix Scar 17.
Cihaz 2023 modeline benziyor ancak bazı yeni özelliklere sahip: Daha parlak bir ekran, elden geçirilmiş bir soğutma sistemi ve daha geniş bir açılma açısı. Önceki modelde bulunan (isteğe bağlı) mekanik klavye, 2024 modelinin sunduklarının bir parçası değil.
Karşılaştırmalı olarak olası rakipler
Derecelendirme | Sürüm | Tarih | Modeli | Ağırlık | Yükseklik | Boyut | Çözünürlük | Fiyat |
|---|---|---|---|---|---|---|---|---|
| 85.5 % | v8 | 06/2024 | Schenker XMG Neo 16 (Early 24) i9-14900HX, GeForce RTX 4090 Laptop GPU | 2.5 kg | 26.6 mm | 16.00" | 2560x1600 | |
| 91.1 % v7 (old) | v7 (old) | 02/2024 | Razer Blade 16 2024, RTX 4090 i9-14900HX, GeForce RTX 4090 Laptop GPU | 2.5 kg | 22 mm | 16.00" | 2560x1600 | |
| 89.2 % v7 (old) | v7 (old) | 02/2024 | Medion Erazer Beast X40 2024 i9-14900HX, GeForce RTX 4090 Laptop GPU | 2.9 kg | 36 mm | 17.00" | 2560x1600 | |
| 87.2 % v7 (old) | v7 (old) | Asus ROG Strix Scar 17 G733PYV-LL053X R9 7945HX3D, GeForce RTX 4090 Laptop GPU | 2.9 kg | 28.3 mm | 17.30" | 2560x1440 |
Kasa - XMG dizüstü bilgisayar alüminyum bir kasaya sahiptir
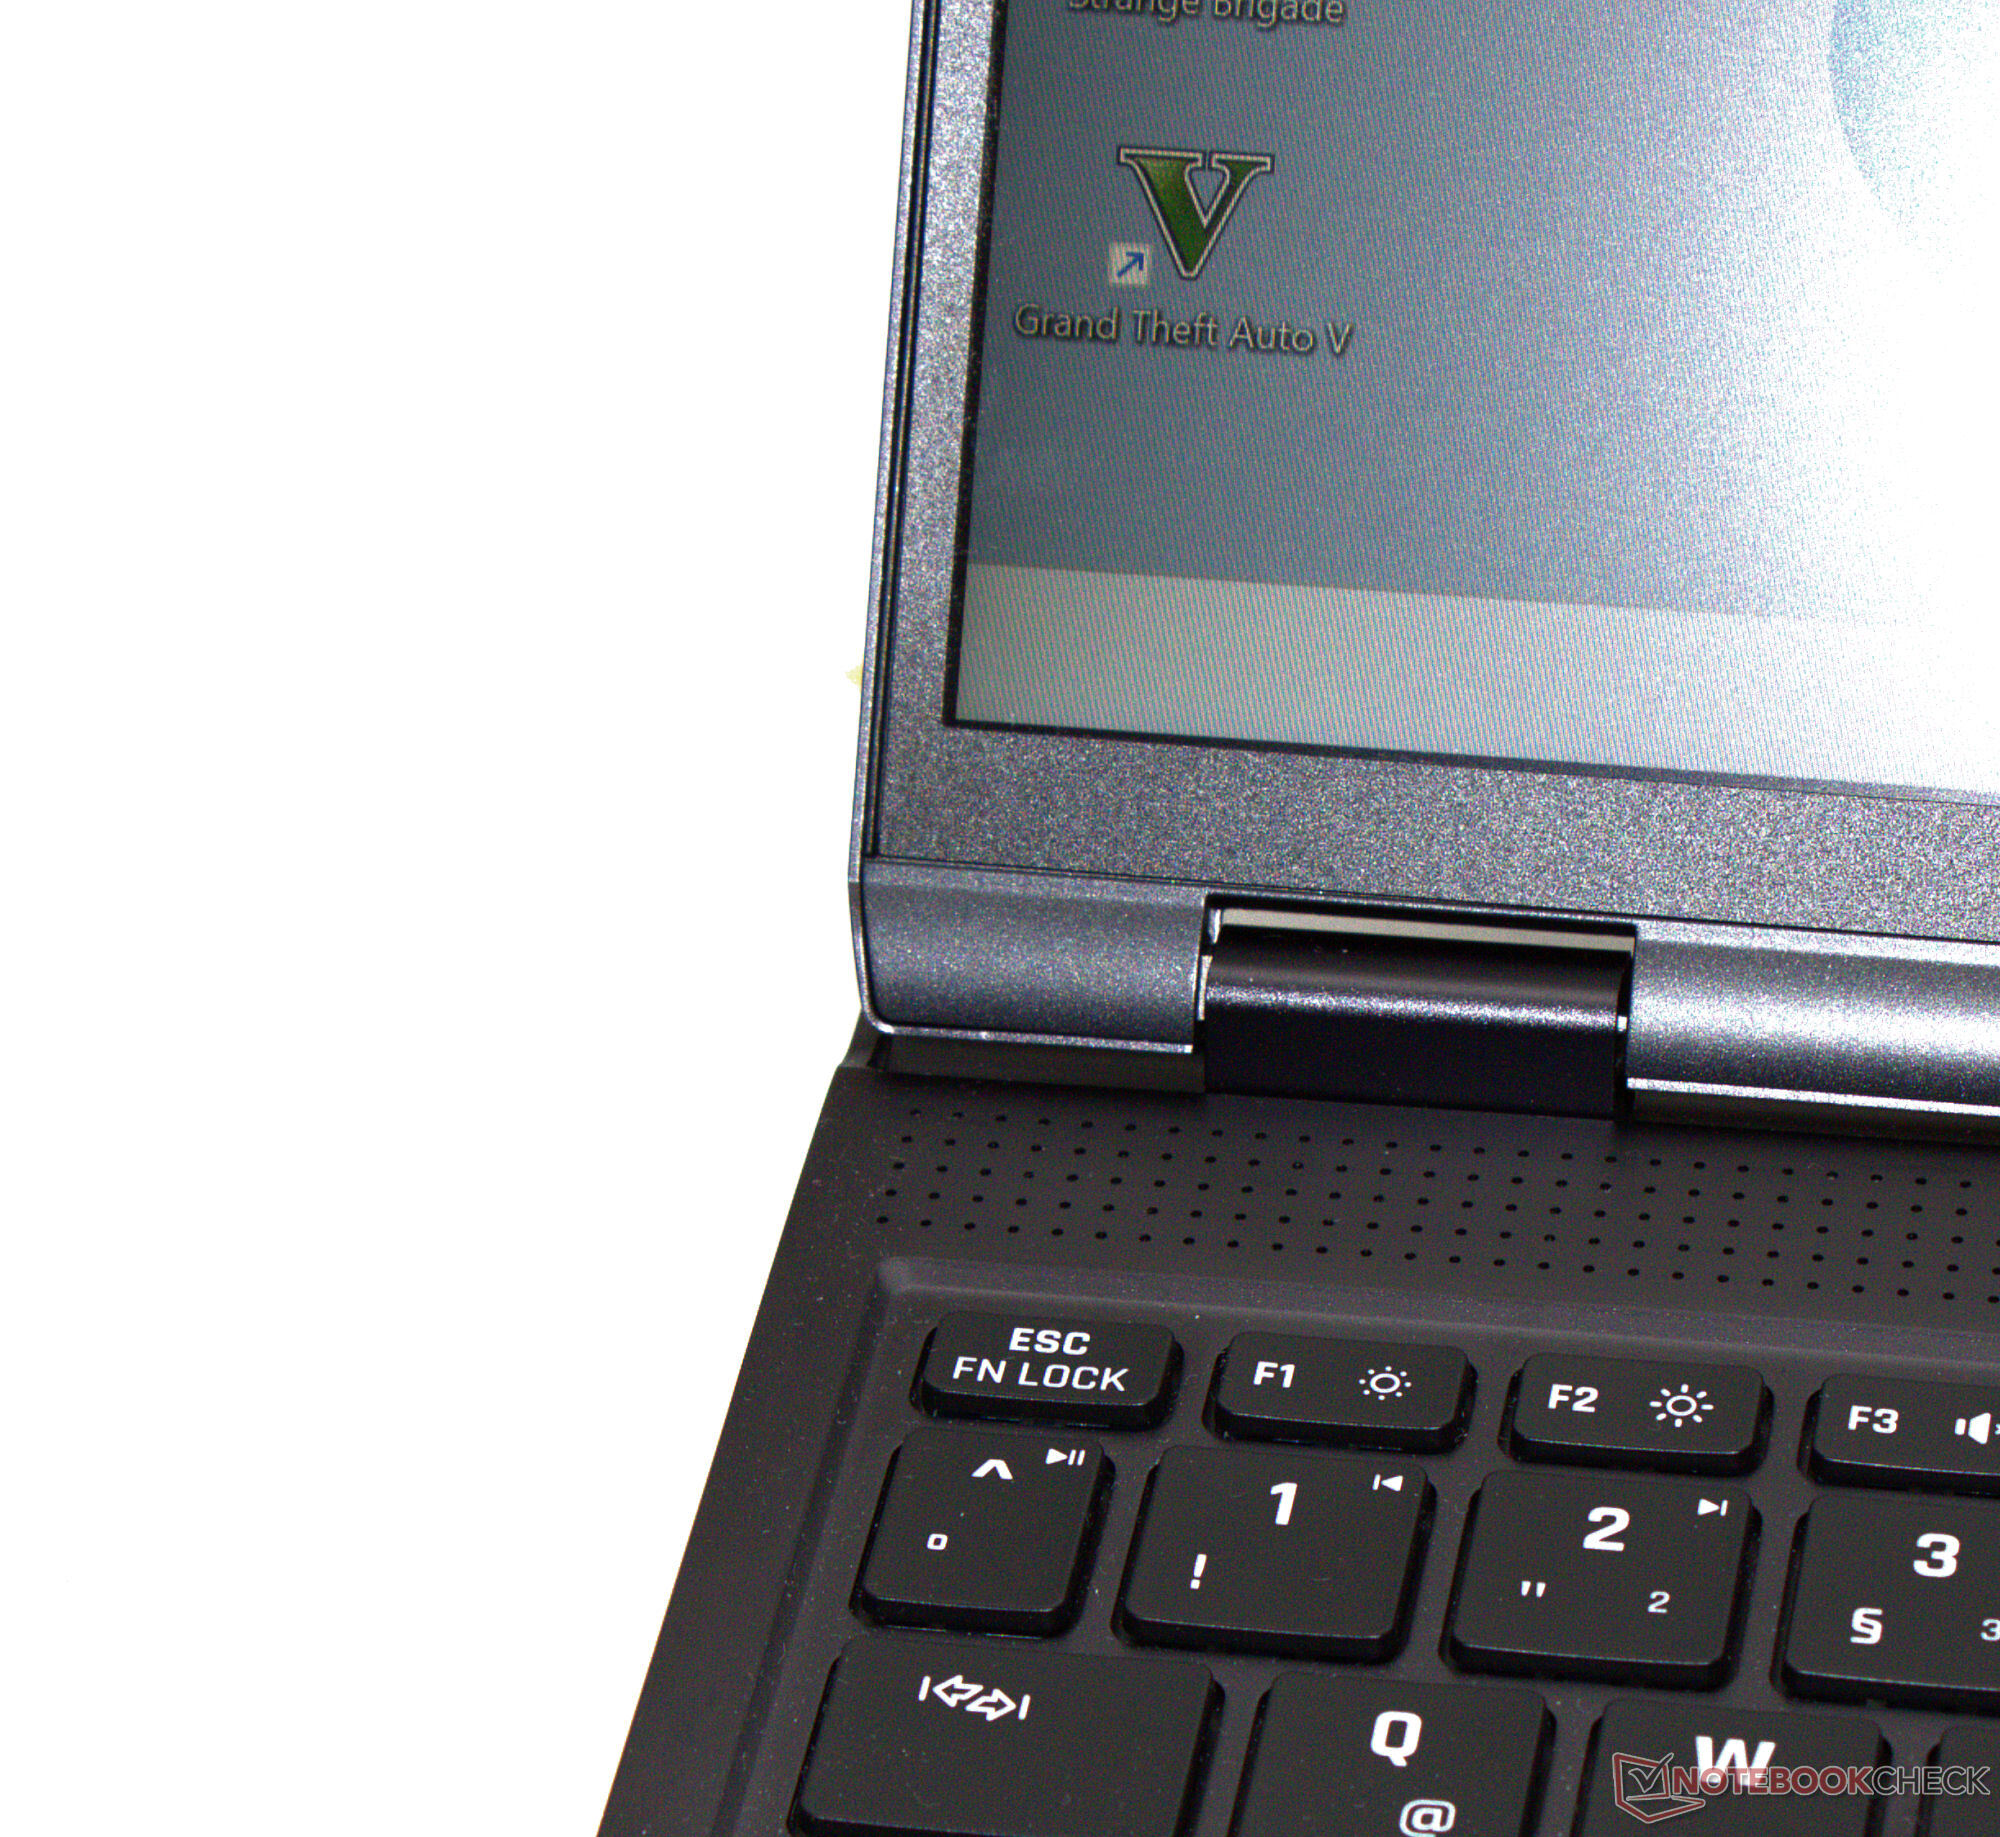
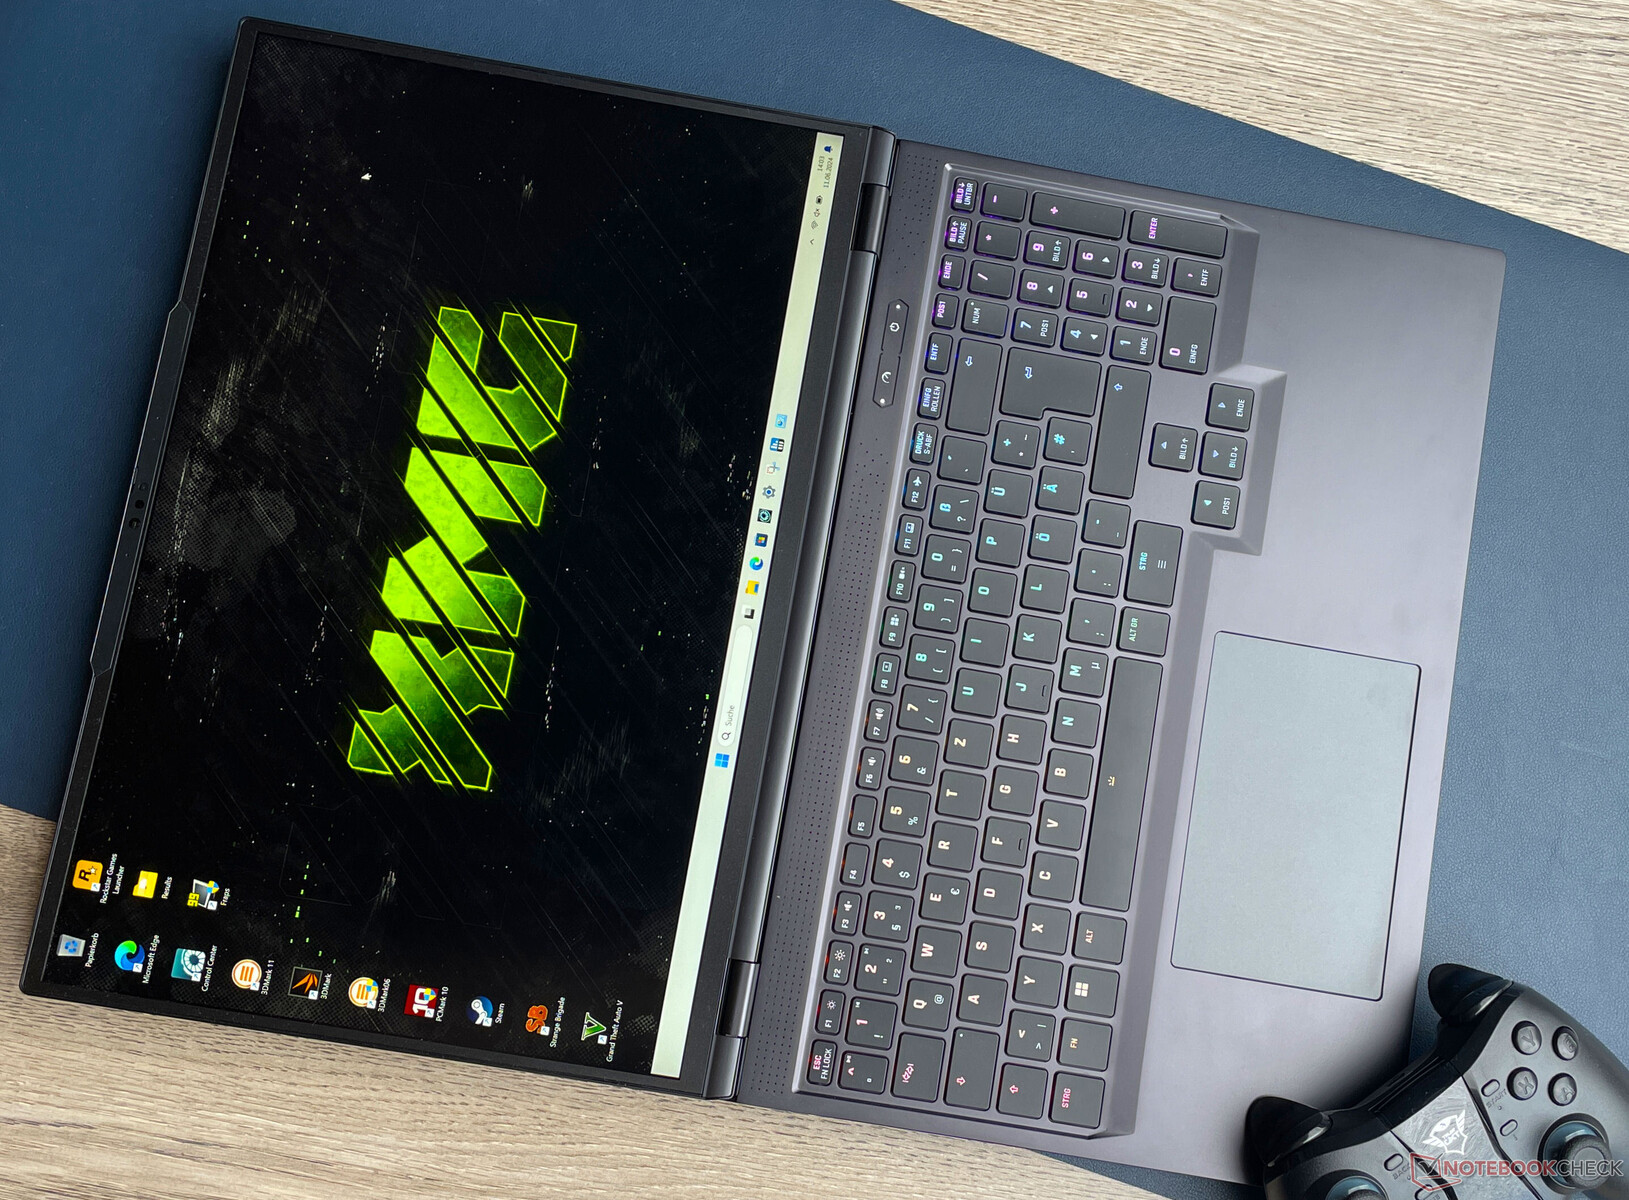
2023 modelinin kasası mevcut Neo modelinde kullanılmıyor. Yeni kapak, en son XMG dizüstü bilgisayarlarda görülen kasa ile daha fazla ortak noktaya sahip - doğru yönde atılmış bir adım: Üretici, plastik ve metal karışımı yerine tamamen metalden yapılmış bir kasa tercih etti (İstisna: Ekran çerçeveleri plastikten yapılmıştır). Kasa beklediğiniz kadar sağlam. Ana ünite ve kapak sadece hafifçe bükülebilir. Kapak 180 dereceye kadar açılma açısına izin verir (2023 modeli: 135 derece). Bu, birkaç kişi varken içeriği görüntülemeyi kolaylaştırır. Sıkı menteşeler kapağı güvenli bir şekilde yerinde ve neredeyse her açıda tutar. Cihazı tek elle açmak mümkündür.
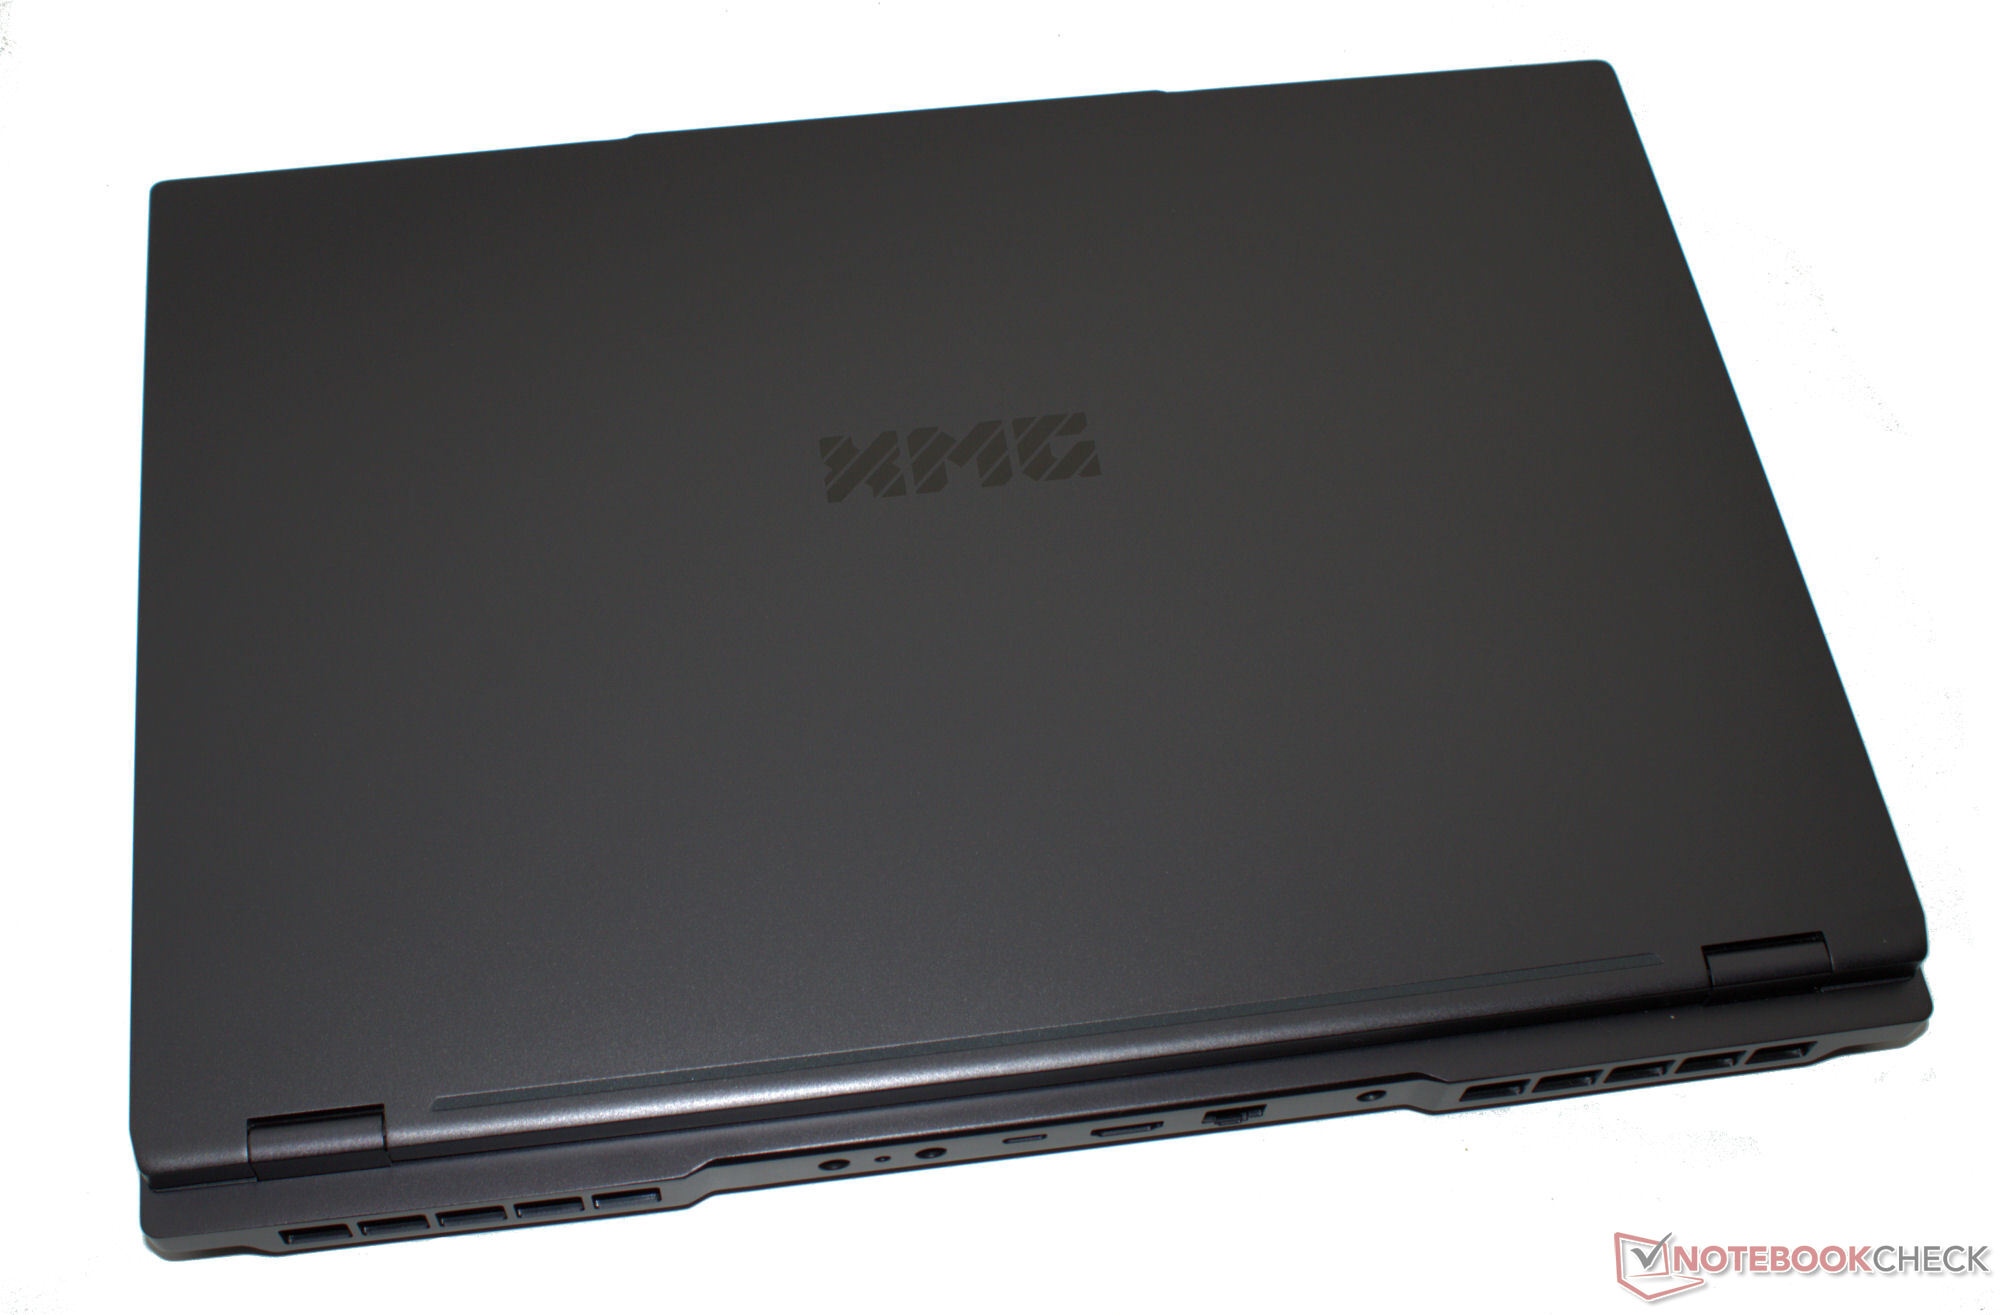
Göz alıcı tasarım öğeleri hiçbir yerde görülmez, yani mat siyah bilgisayar oldukça ciddi bir figür oluşturur. Renkli ışık, arkadan aydınlatmalı tuşlara (RGB) ek olarak kullanıcı tarafından tanımlanan, ayrı ayrı özelleştirilebilen bir LED şerit ile sağlanır.
En yeni Neo 16 bir öncekinden biraz daha kompakt görünüyor, ancak ağırlıkları açısından dizüstü bilgisayarlar birbirinden ayırt edilemiyor. Sadece Bıçak 16 daha fazla kompaktlık sunuyor - ve neredeyse aynı ağırlıkta.
Özellikler - USB 4 yerleşiktir
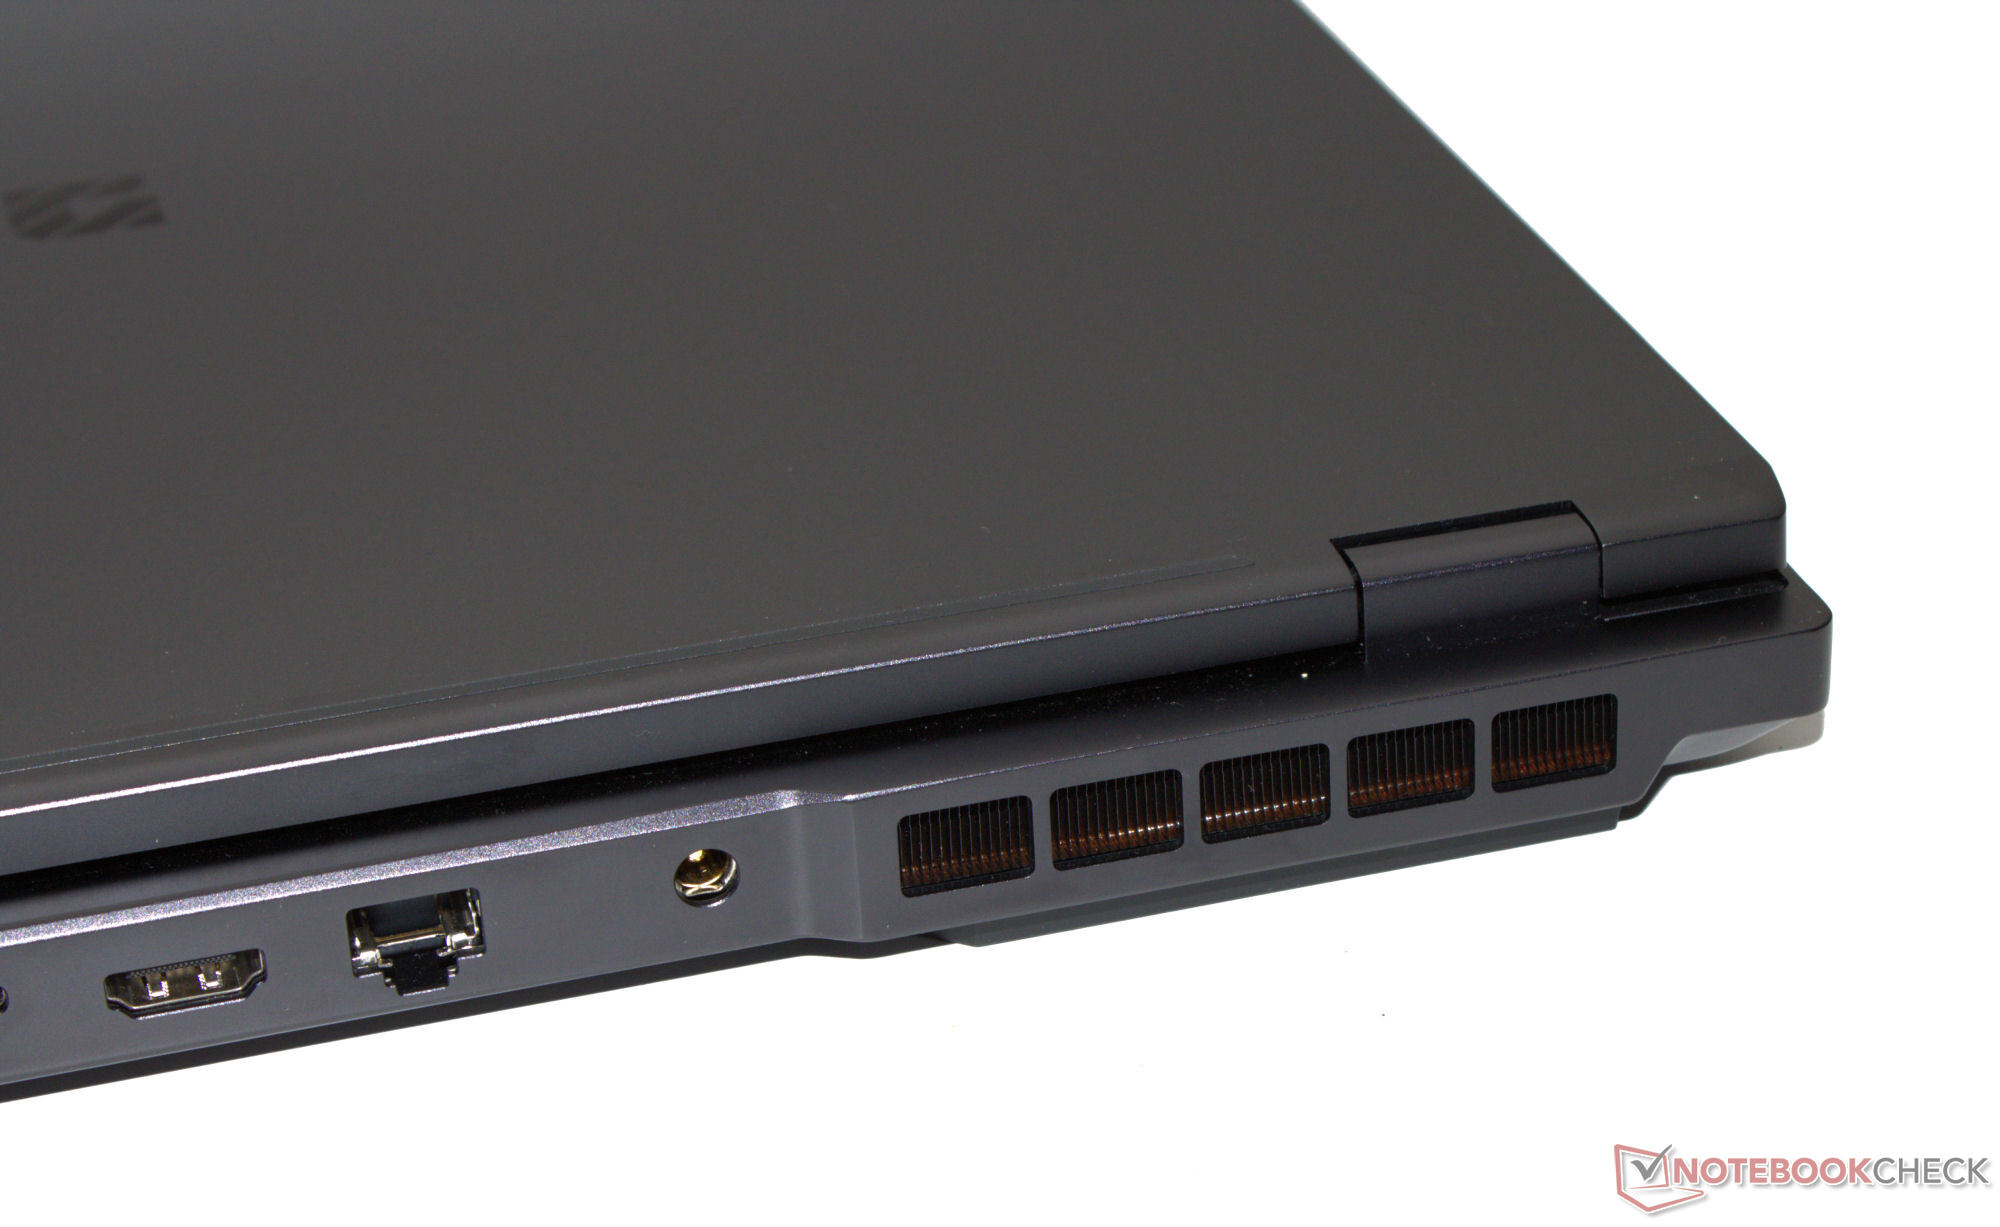
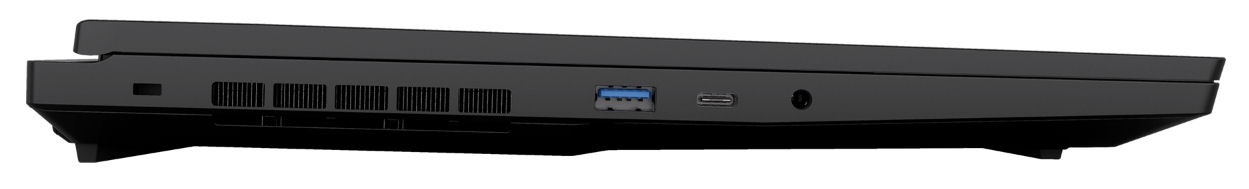
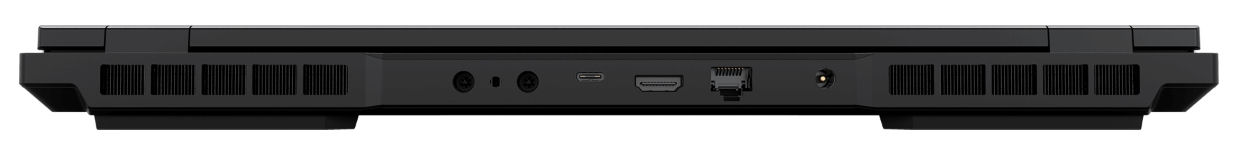
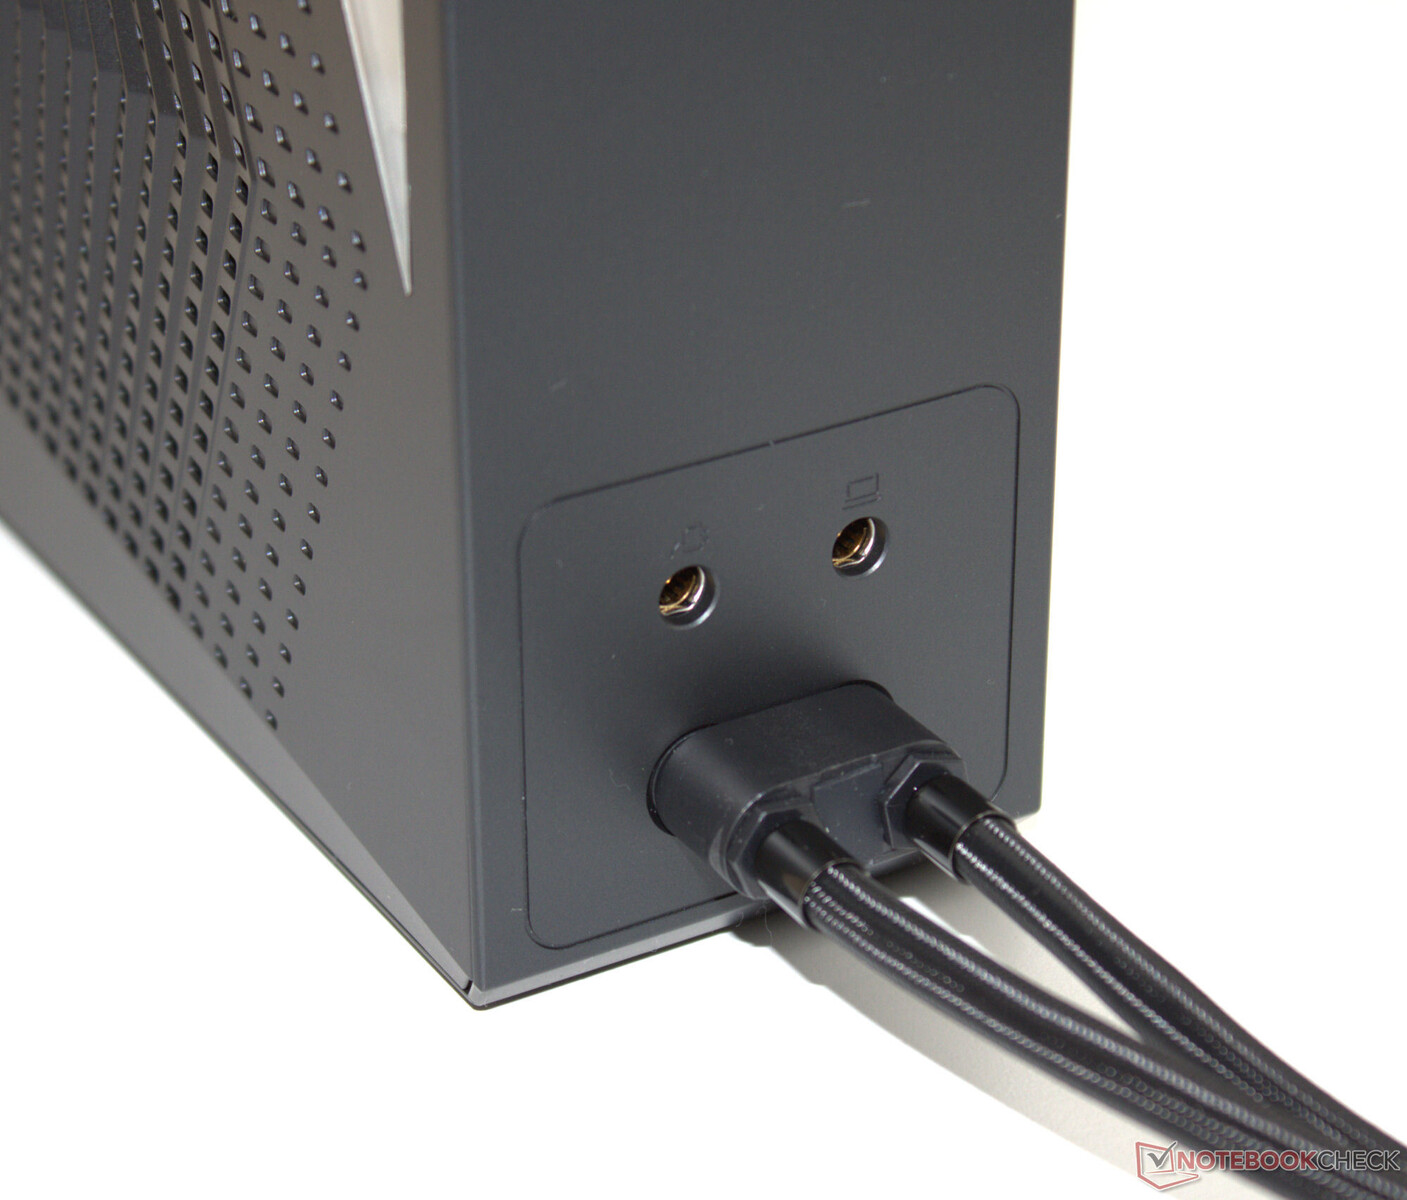
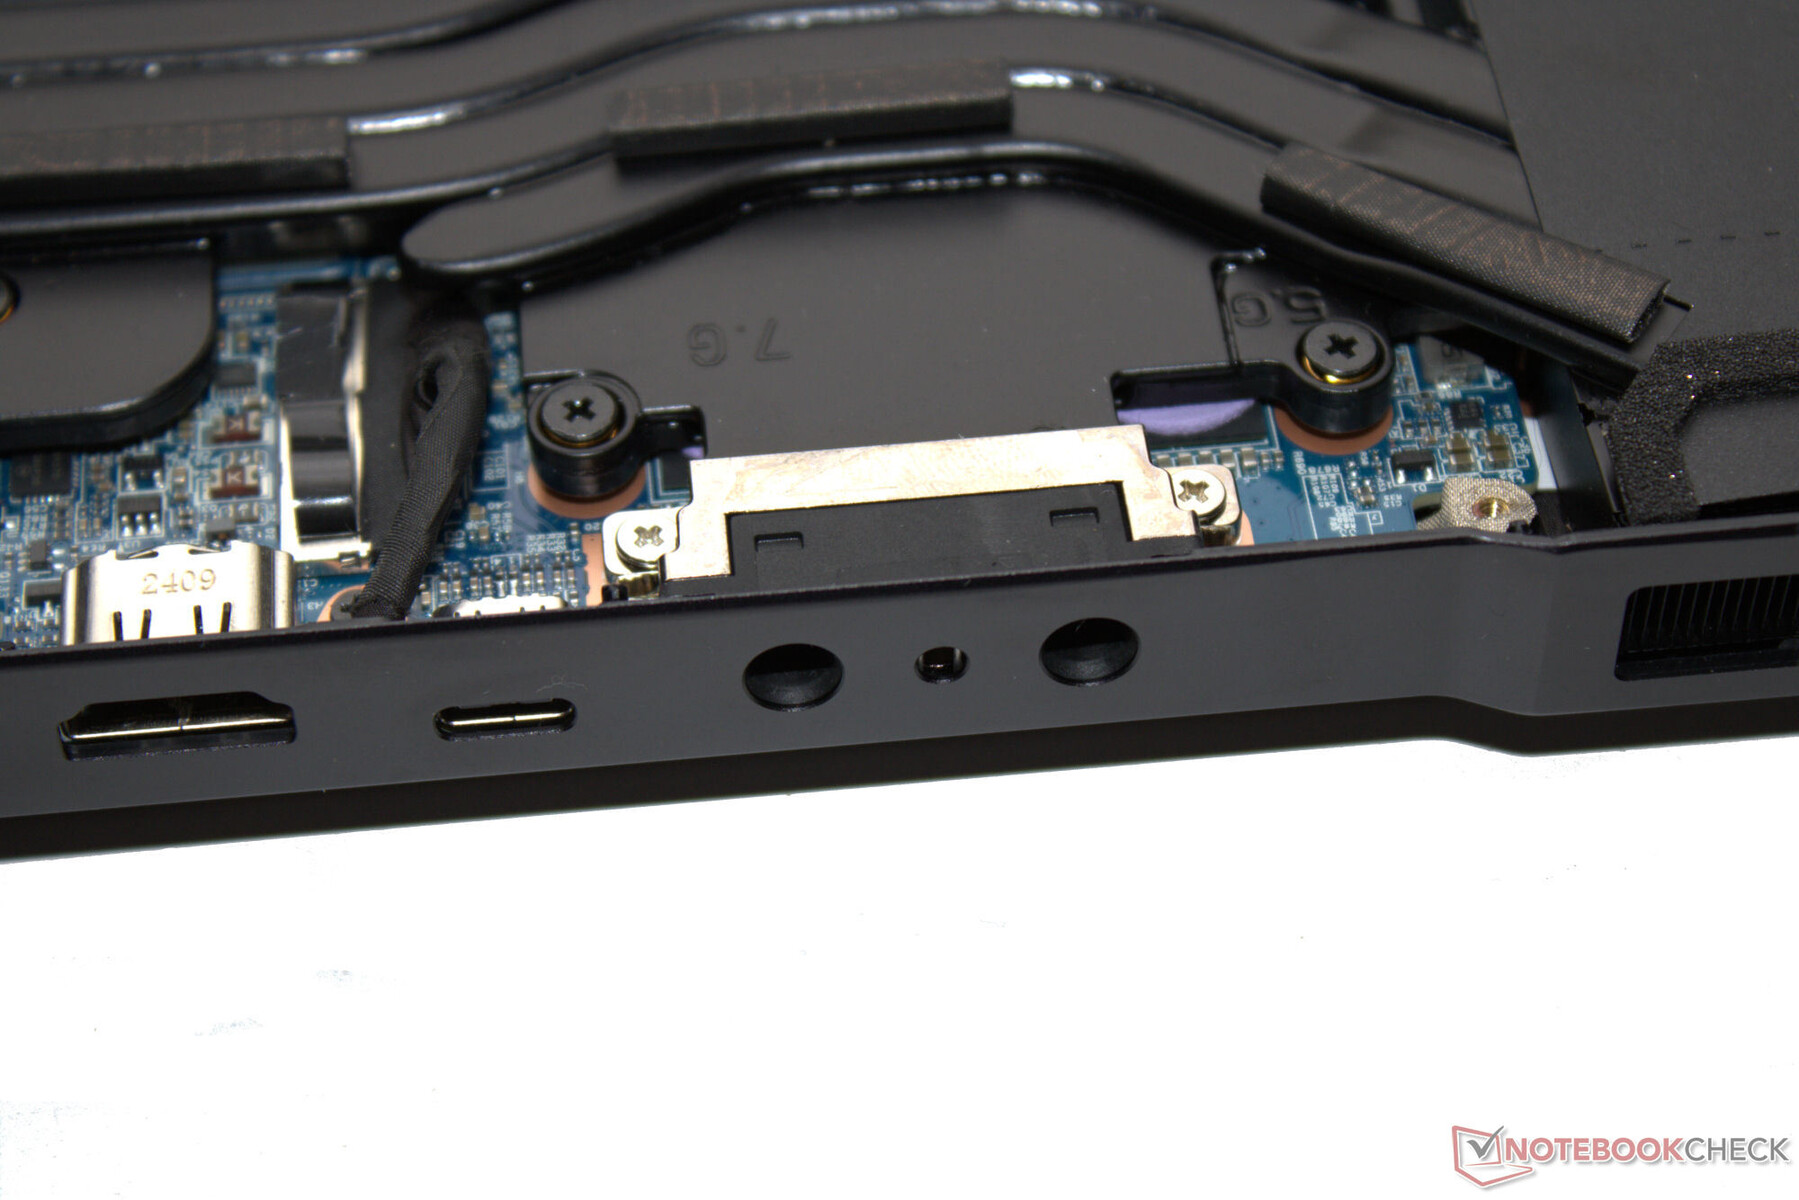
Neo 16'nın beş USB portundan dördü (3x USB-A, 2x USB-C) USB 3.2 Gen 1 standardına göre çalışır. Yalnızca arkadaki USB-C bağlantı noktası, Güç Dağıtımı ve Ekran Alt modu desteği de dahil olmak üzere Thunderbolt 4'ü (USB 4) masaya getiriyor. Toplam iki video çıkışı mevcuttur (1x HDMI, 1x DP). Bir ses jakı ve bir Gigabit Ethernet portu (2,5 GBit/s) teklifi tamamlıyor.
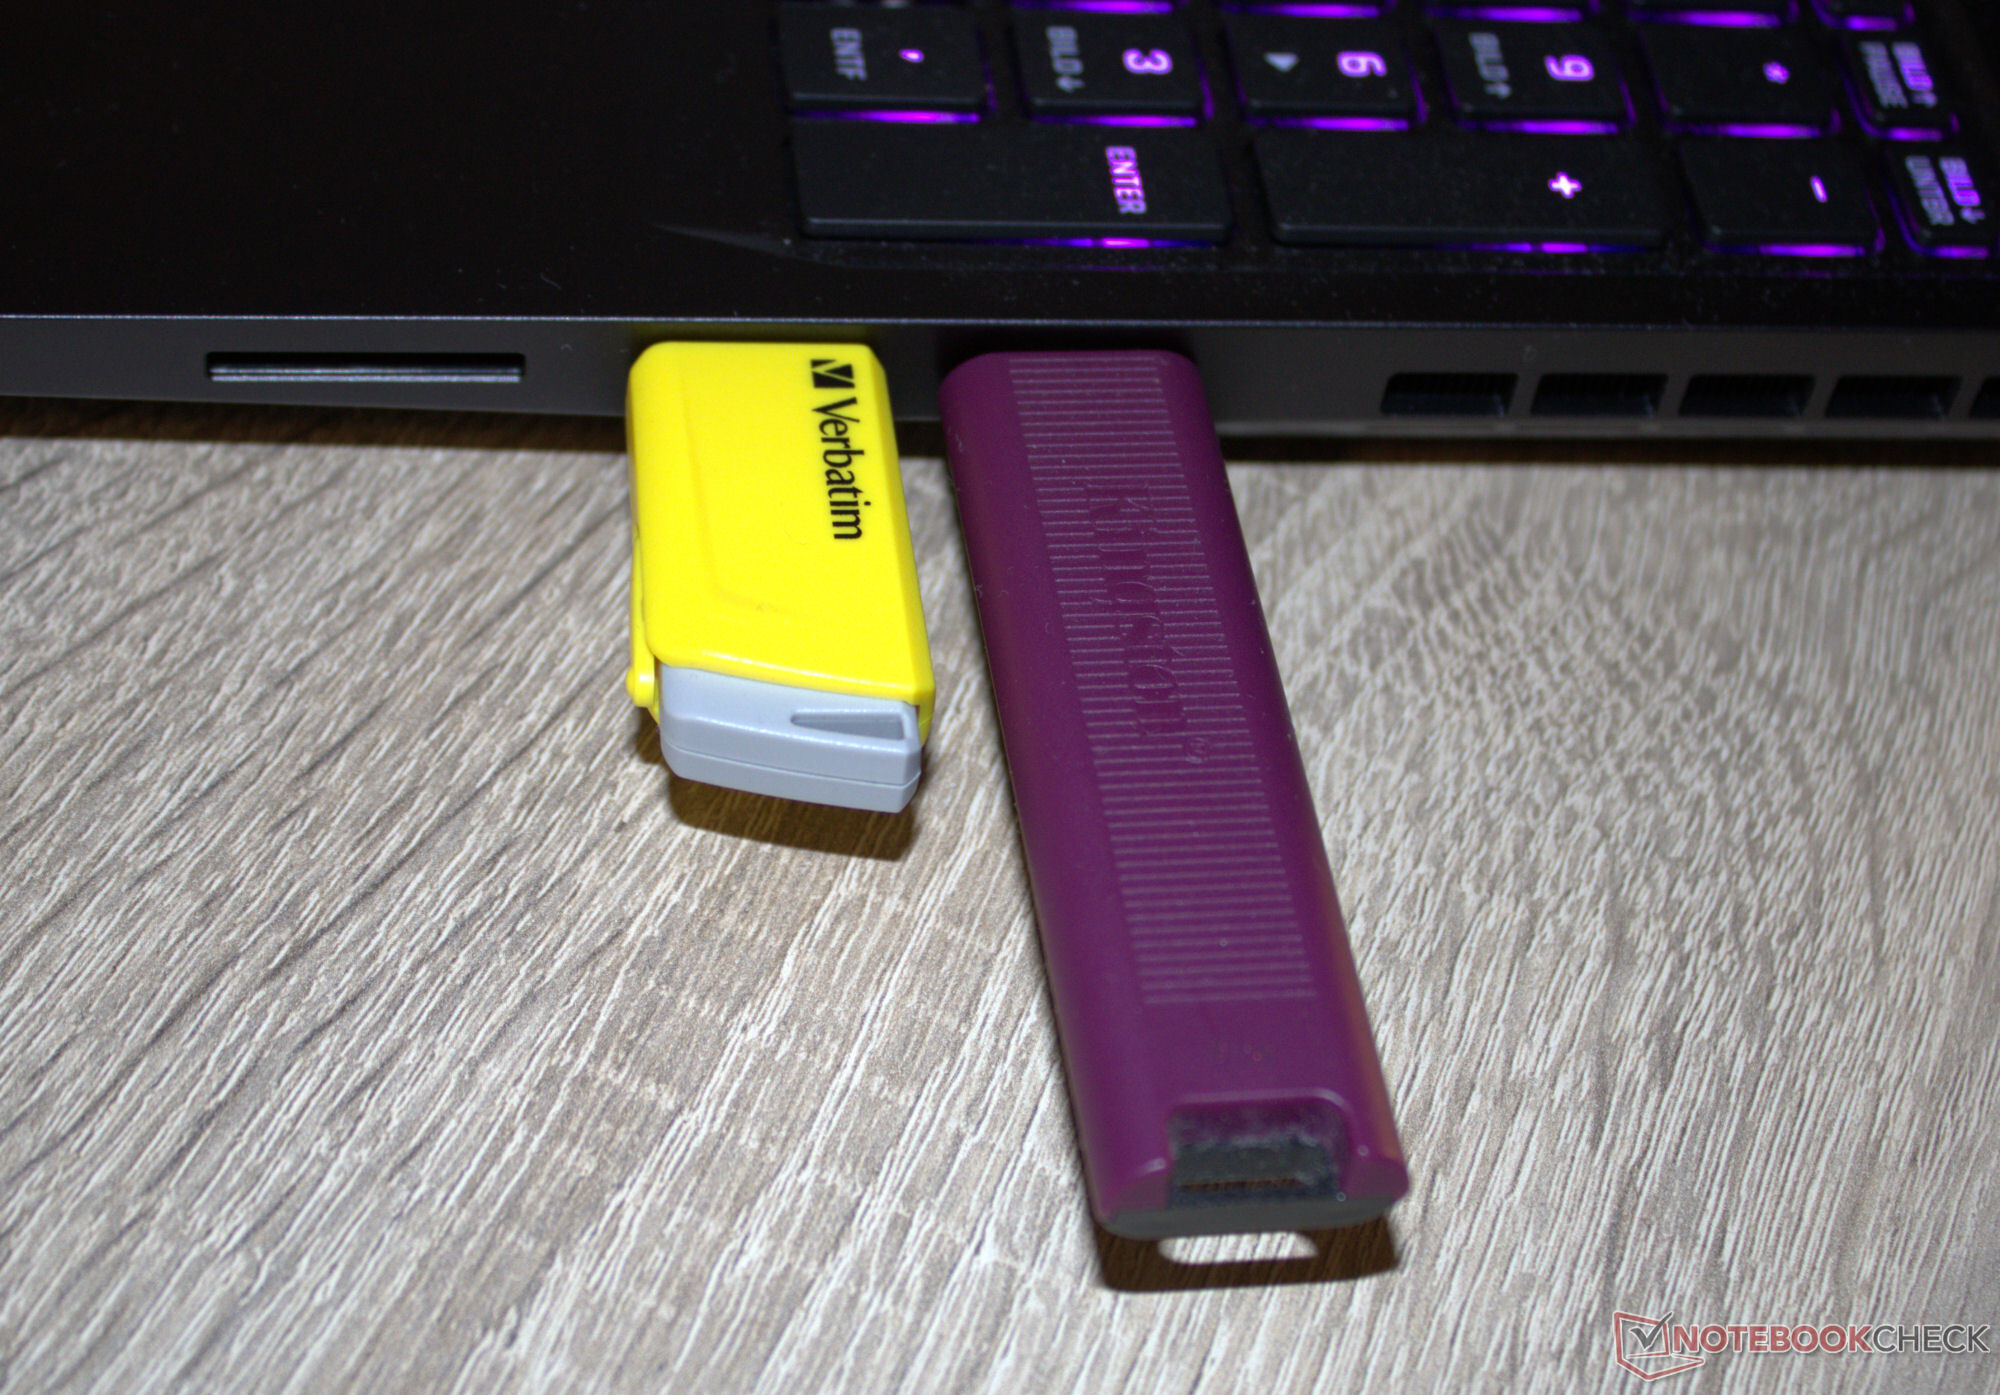
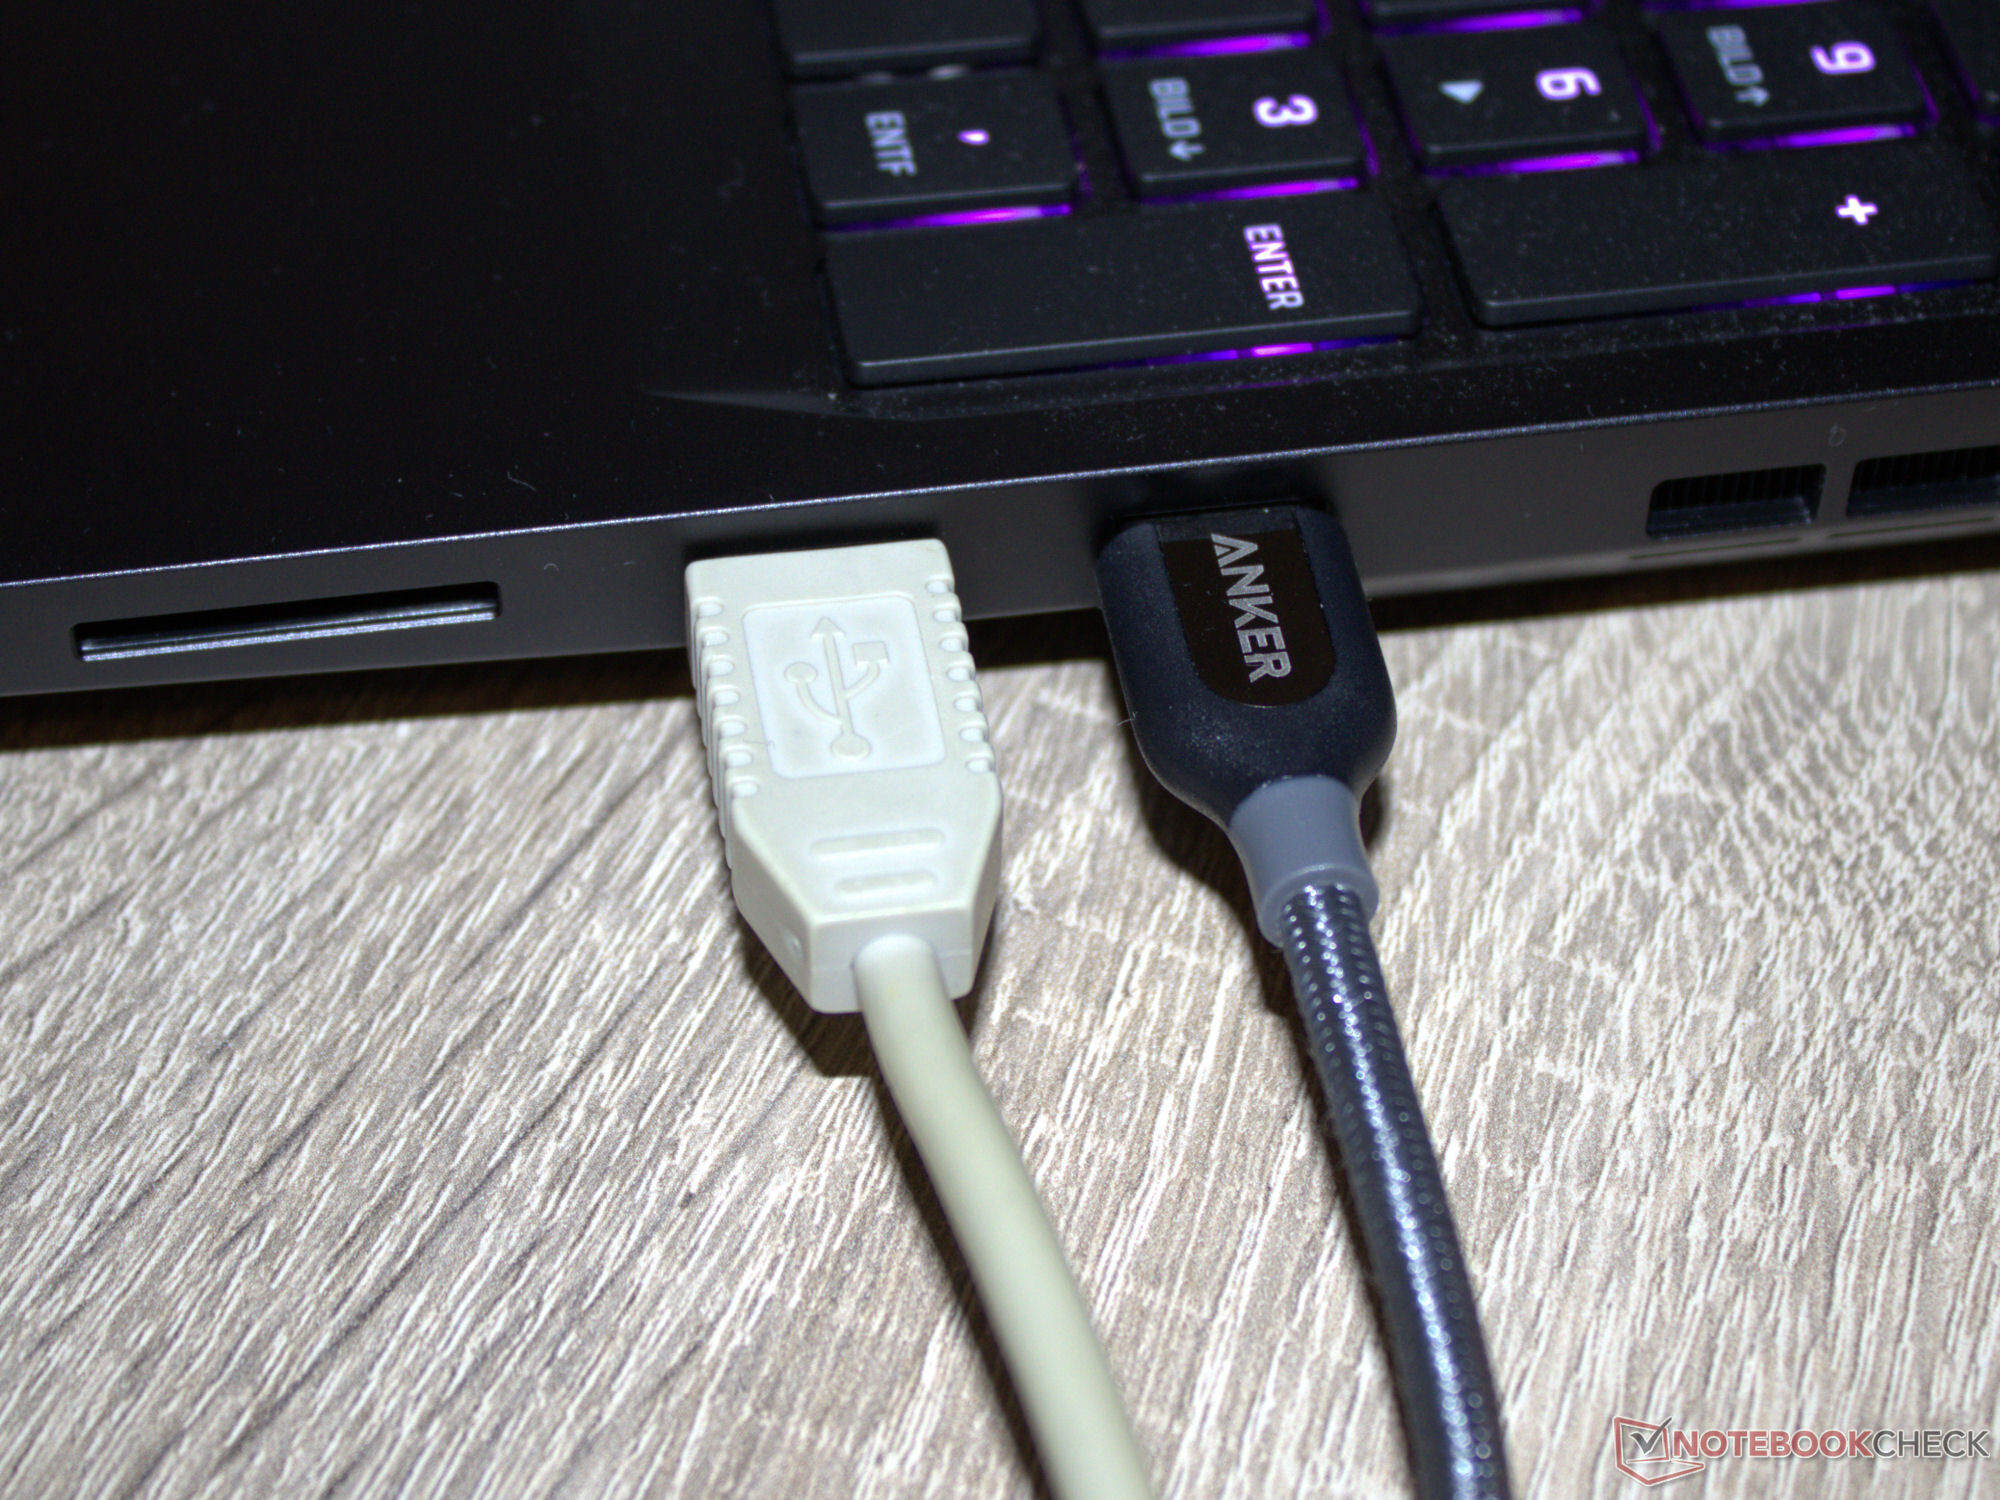
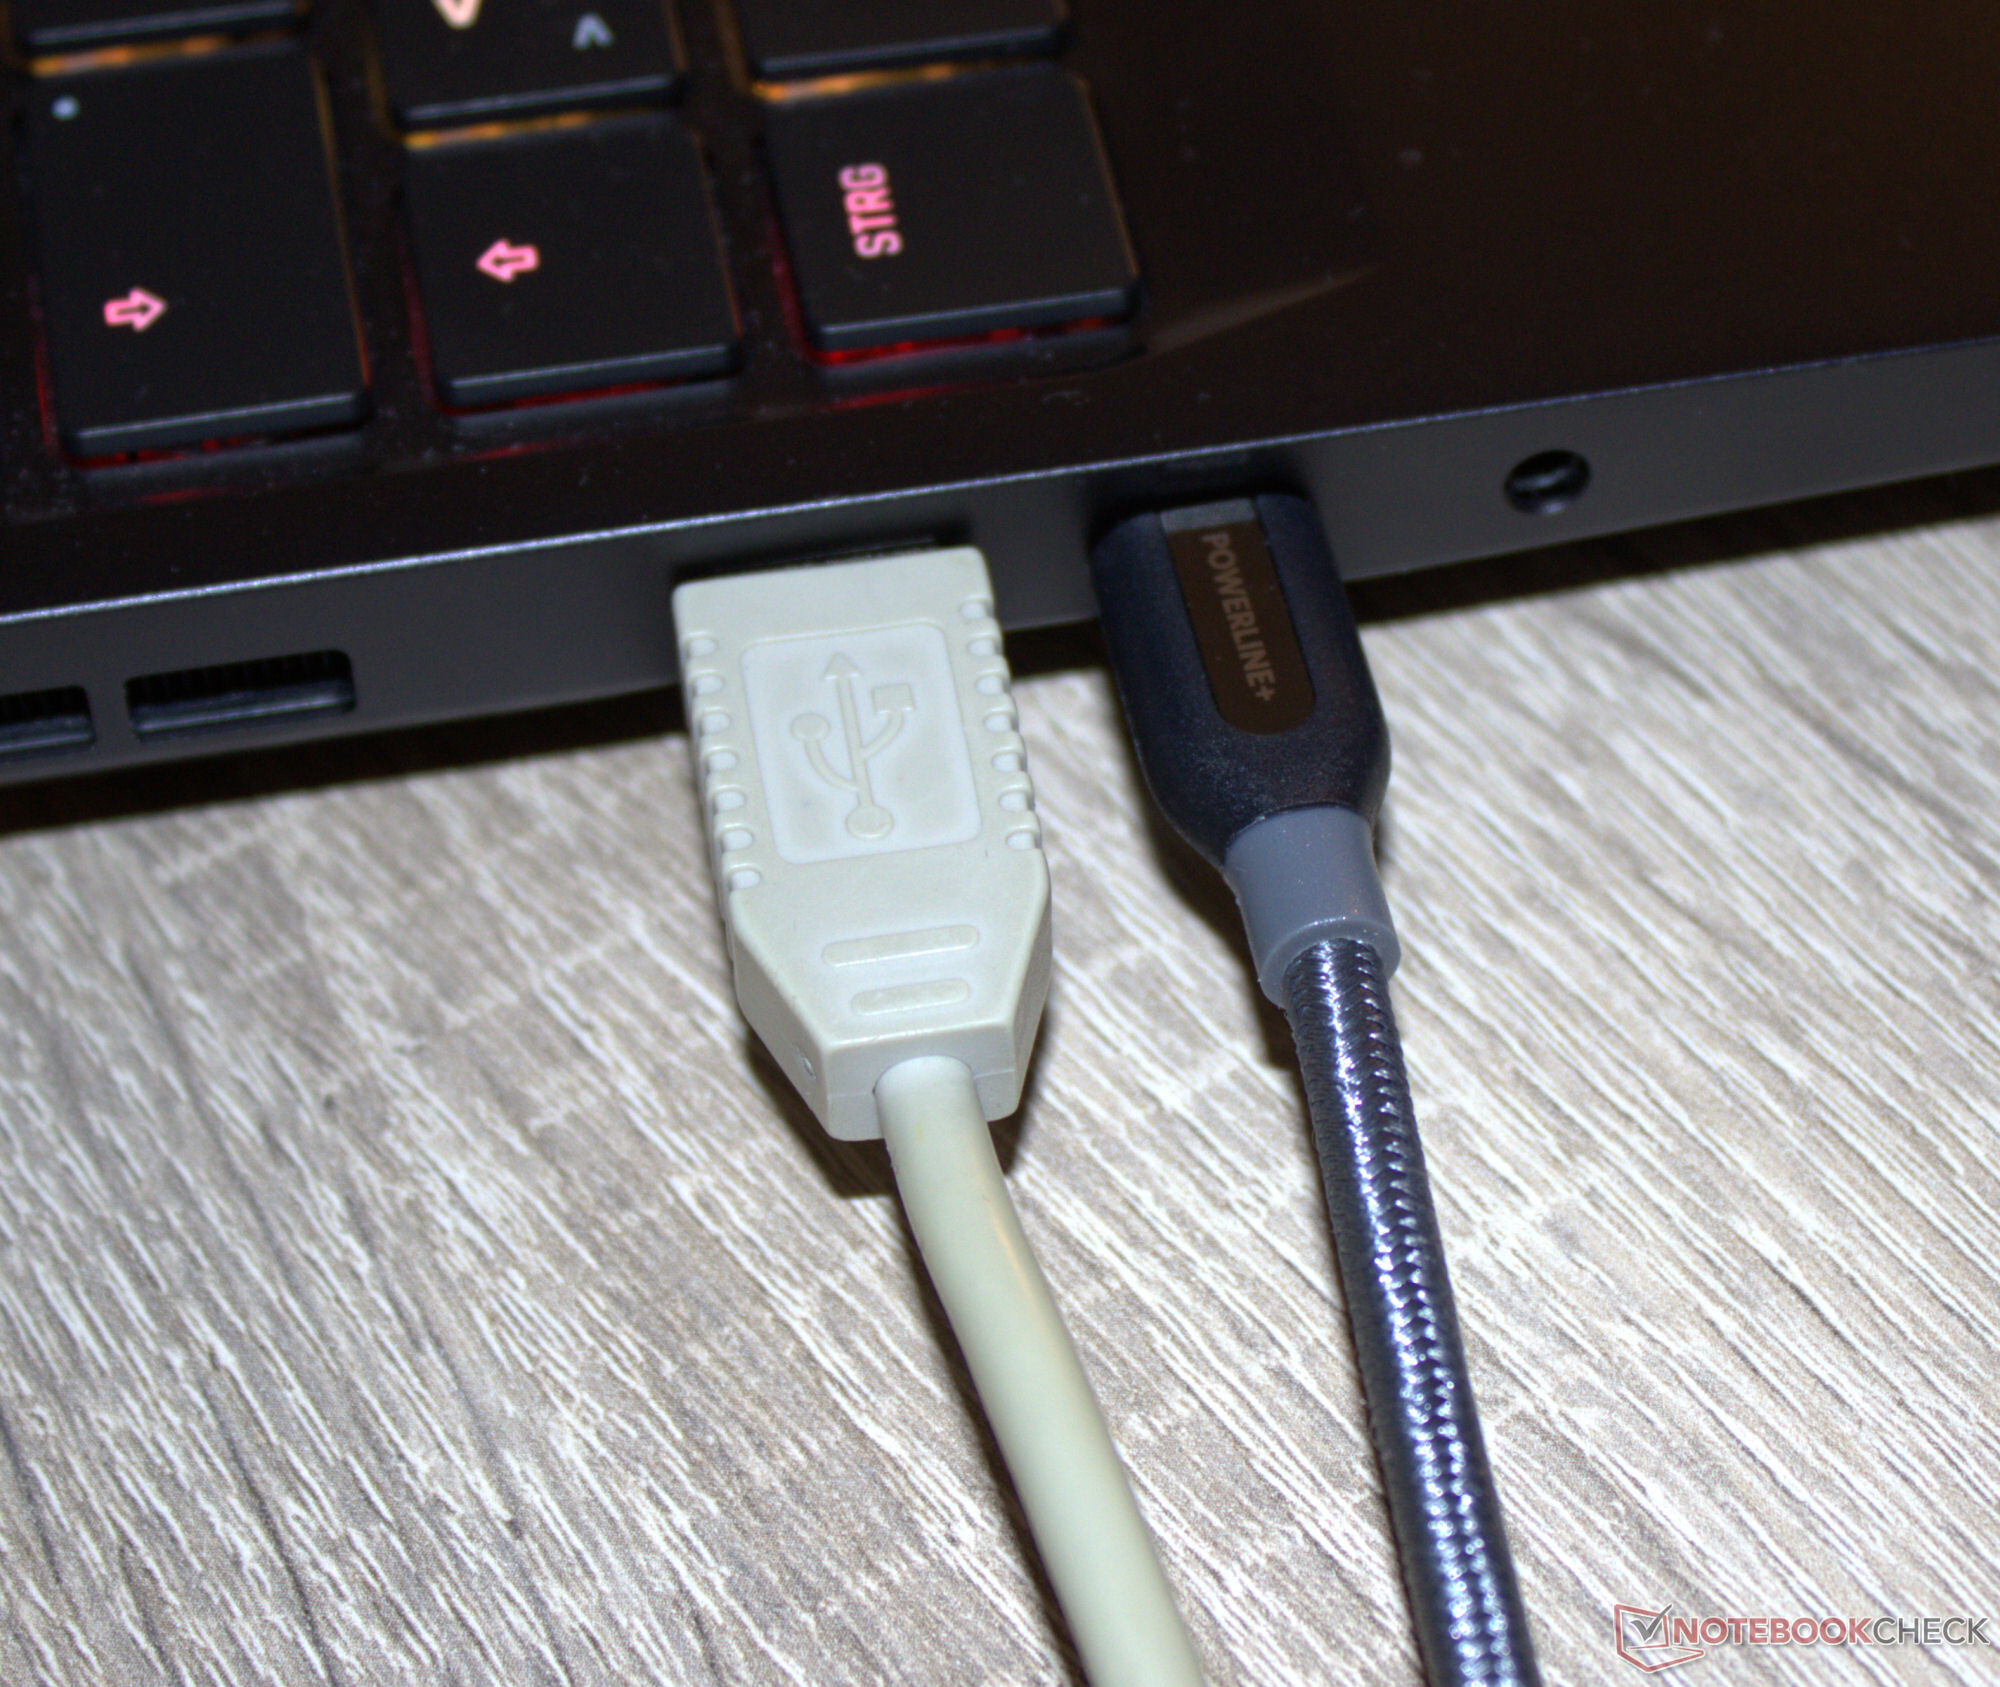
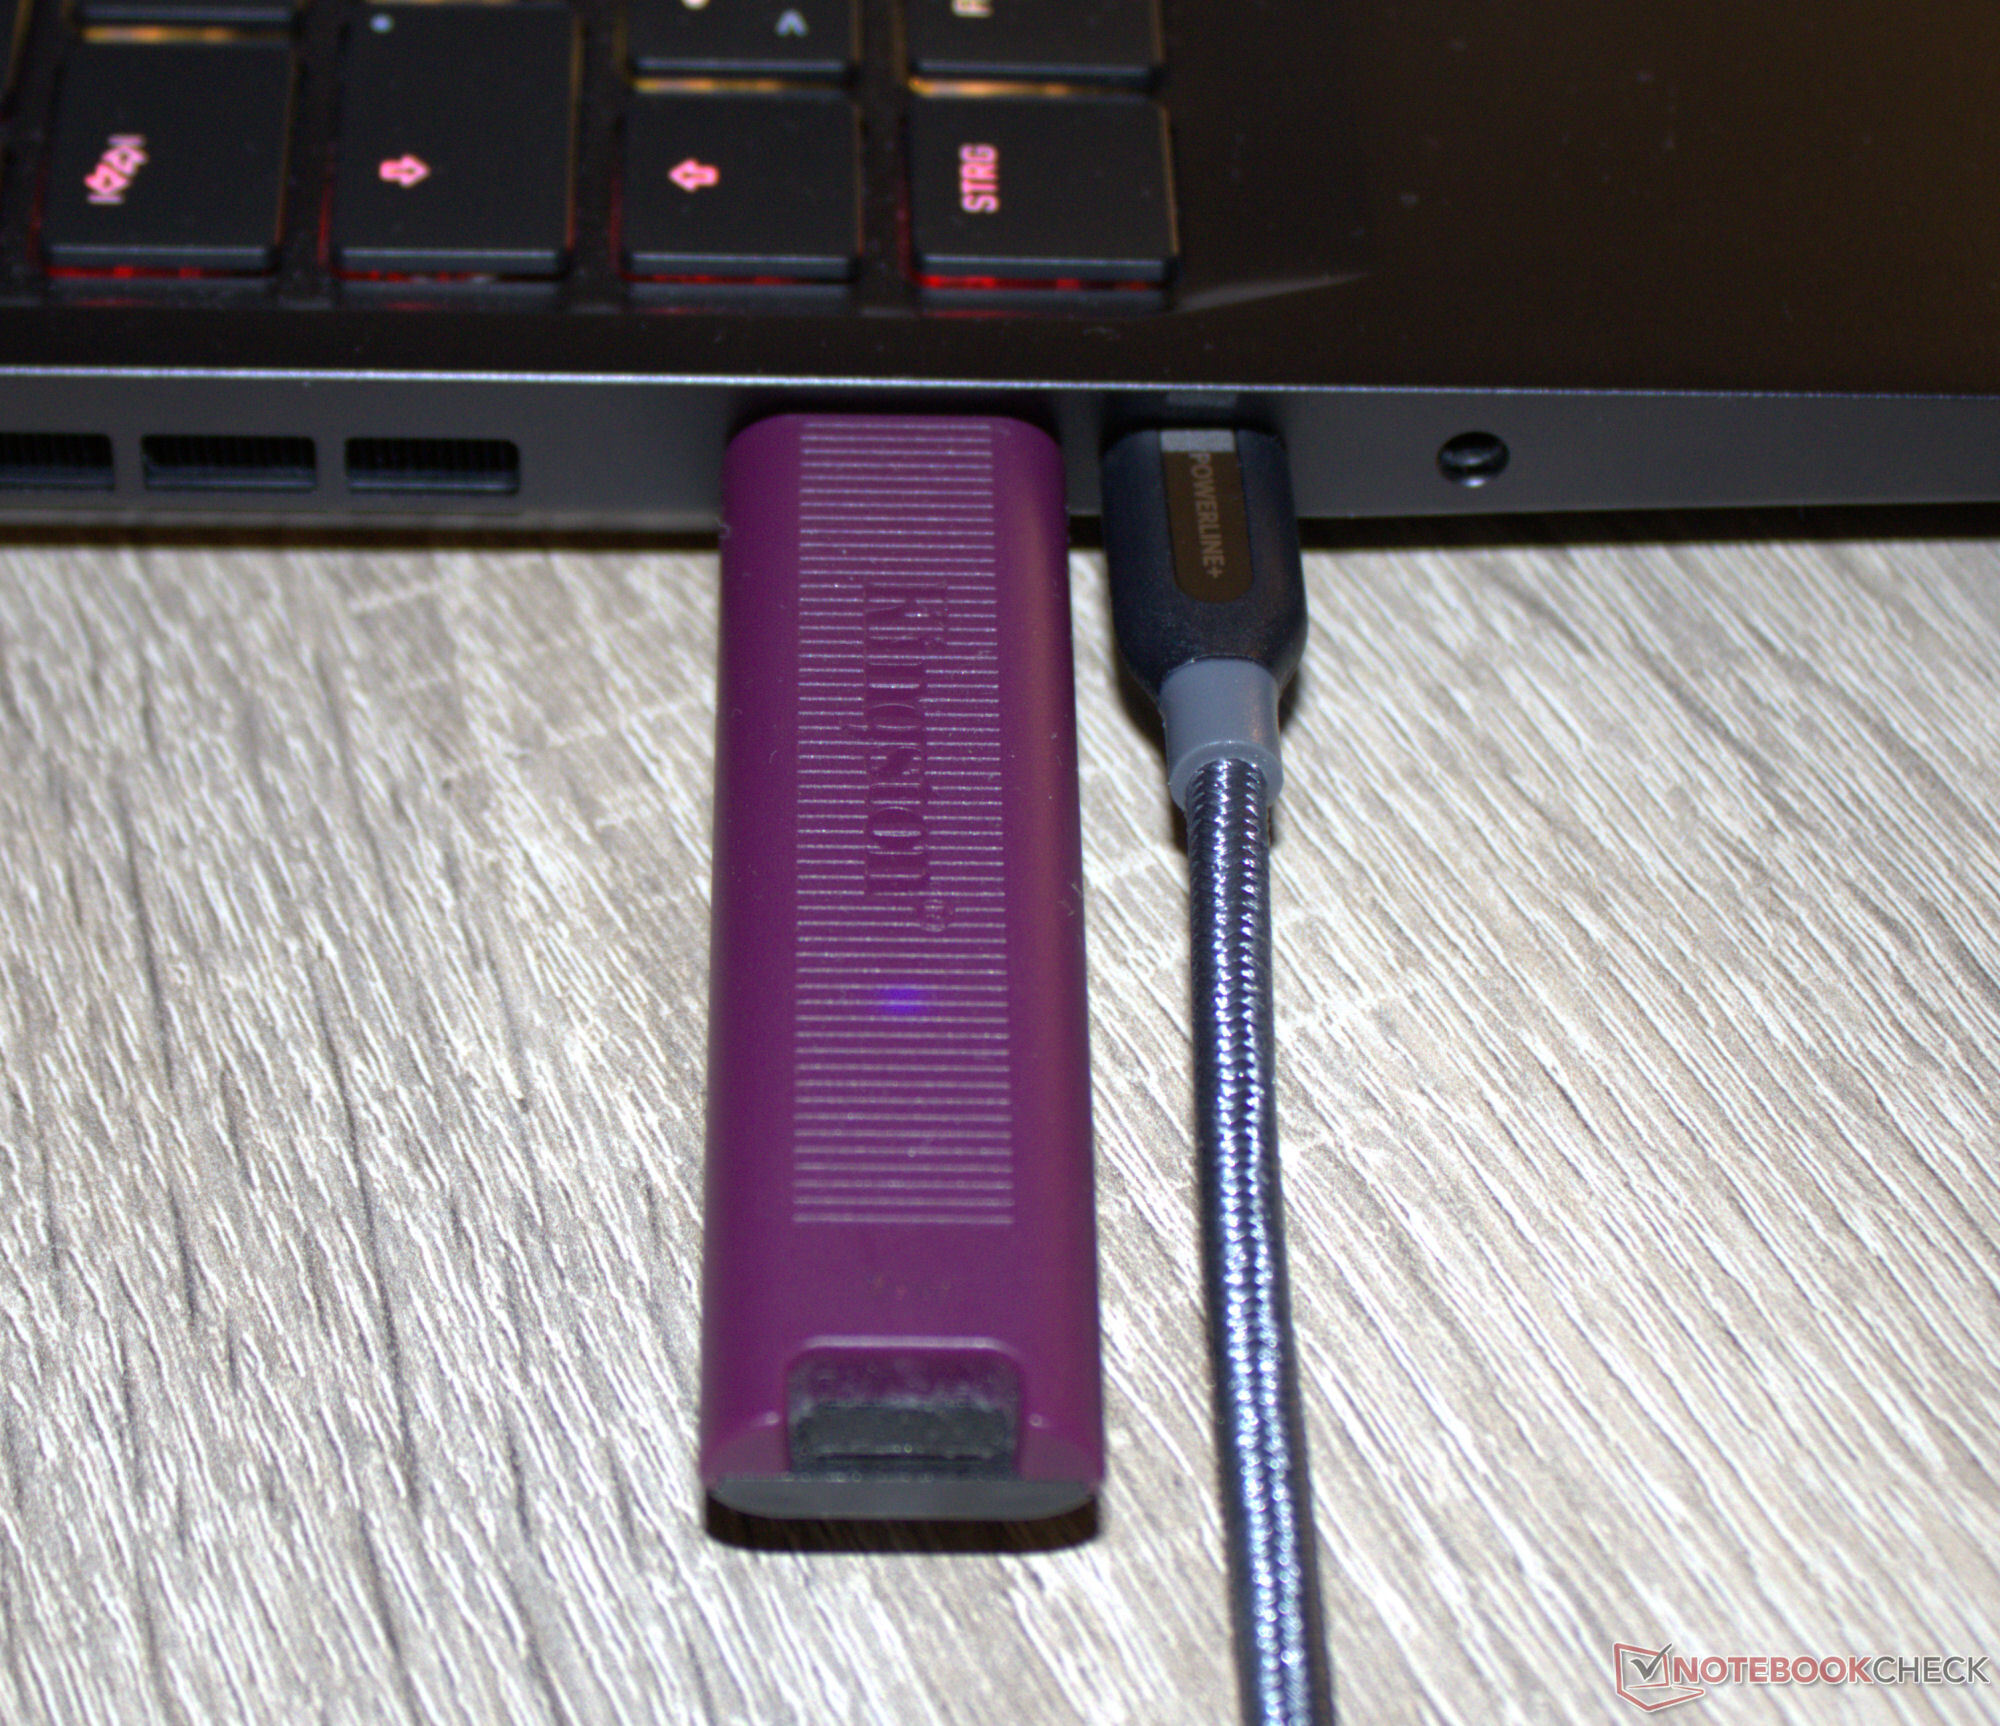
USB portları arasındaki mesafe (sağ taraf: 12 mm, sol taraf: 8 mm) uygun bir şekilde orantılı görünüyor: İki tipik büyüklükteki bellek (konektör) aynı anda takılabiliyor (galeri resimlerine bakın). Video çıkışları ve güç konektörleri cihazın arkasında bulunabilir. İlgili kablolar arkaya doğru uzanır ve bu nedenle araya girmez.
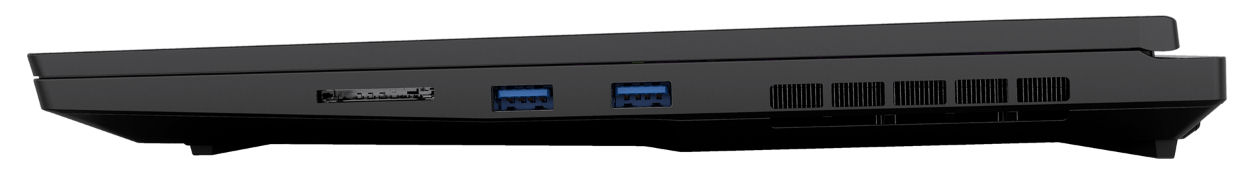
SD Kart Okuyucu
SD kart okuyucu (referans: AV PRO microSD 128 GB V60) orta hızlı modellerden biridir: Aktarım hızları 76 MB/s (250 jpg görüntünün aktarımı, dosya başına 5 MB) ve 87 MB/s (büyük veri bloklarının kopyalanması) kabul edilebilir olarak tanımlanabilir. Bu Razer Blade 16 önemli ölçüde daha yüksek rakamların mümkün olduğunu göstermektedir.
| SD Card Reader | |
| average JPG Copy Test (av. of 3 runs) | |
| Razer Blade 16 2024, RTX 4090 | |
| Sınıf ortalaması Gaming (20.9 - 210, n=54, son 2 yıl) | |
| Medion Erazer Beast X40 2024 (AV PRO microSD 128 GB V60) | |
| Schenker XMG Neo 16 (Early 24) (AV PRO microSD 128 GB V60) | |
| Schenker XMG Neo 16 E23 (AV PRO microSD 128 GB V60) | |
| maximum AS SSD Seq Read Test (1GB) | |
| Razer Blade 16 2024, RTX 4090 | |
| Sınıf ortalaması Gaming (25.5 - 261, n=51, son 2 yıl) | |
| Medion Erazer Beast X40 2024 (AV PRO microSD 128 GB V60) | |
| Schenker XMG Neo 16 (Early 24) (AV PRO microSD 128 GB V60) | |
| Schenker XMG Neo 16 E23 (AV PRO microSD 128 GB V60) | |
İletişim
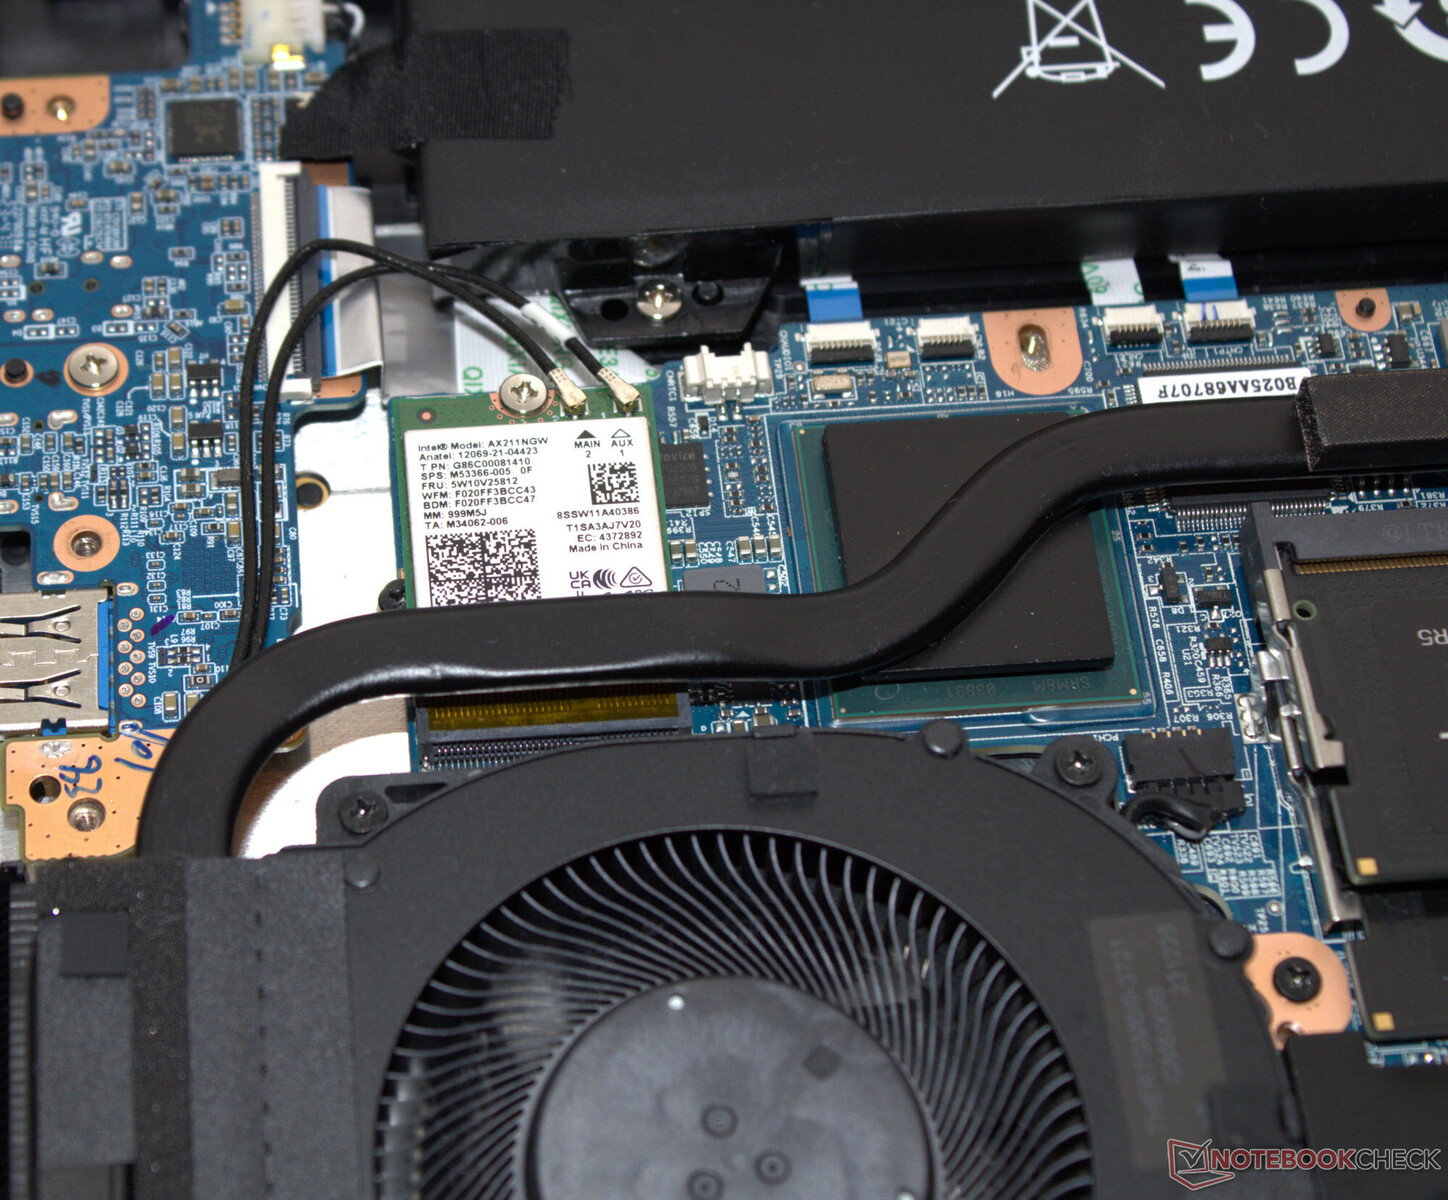
Optimum koşullar altında (yakınlarda Wi-Fi cihazı yok, dizüstü bilgisayar ile sunucu bilgisayar arasında kısa mesafe) iyi ila mükemmel veri hızlarına ulaşılabilir - bir WiFi 6E çipi (Intel AX211) bunu mümkün kılar. Kablolu bağlantılar bir Realtek Gigabit Ethernet denetleyicisi (RTL8125, 2,5 GBit/s) tarafından gerçekleştirilir.
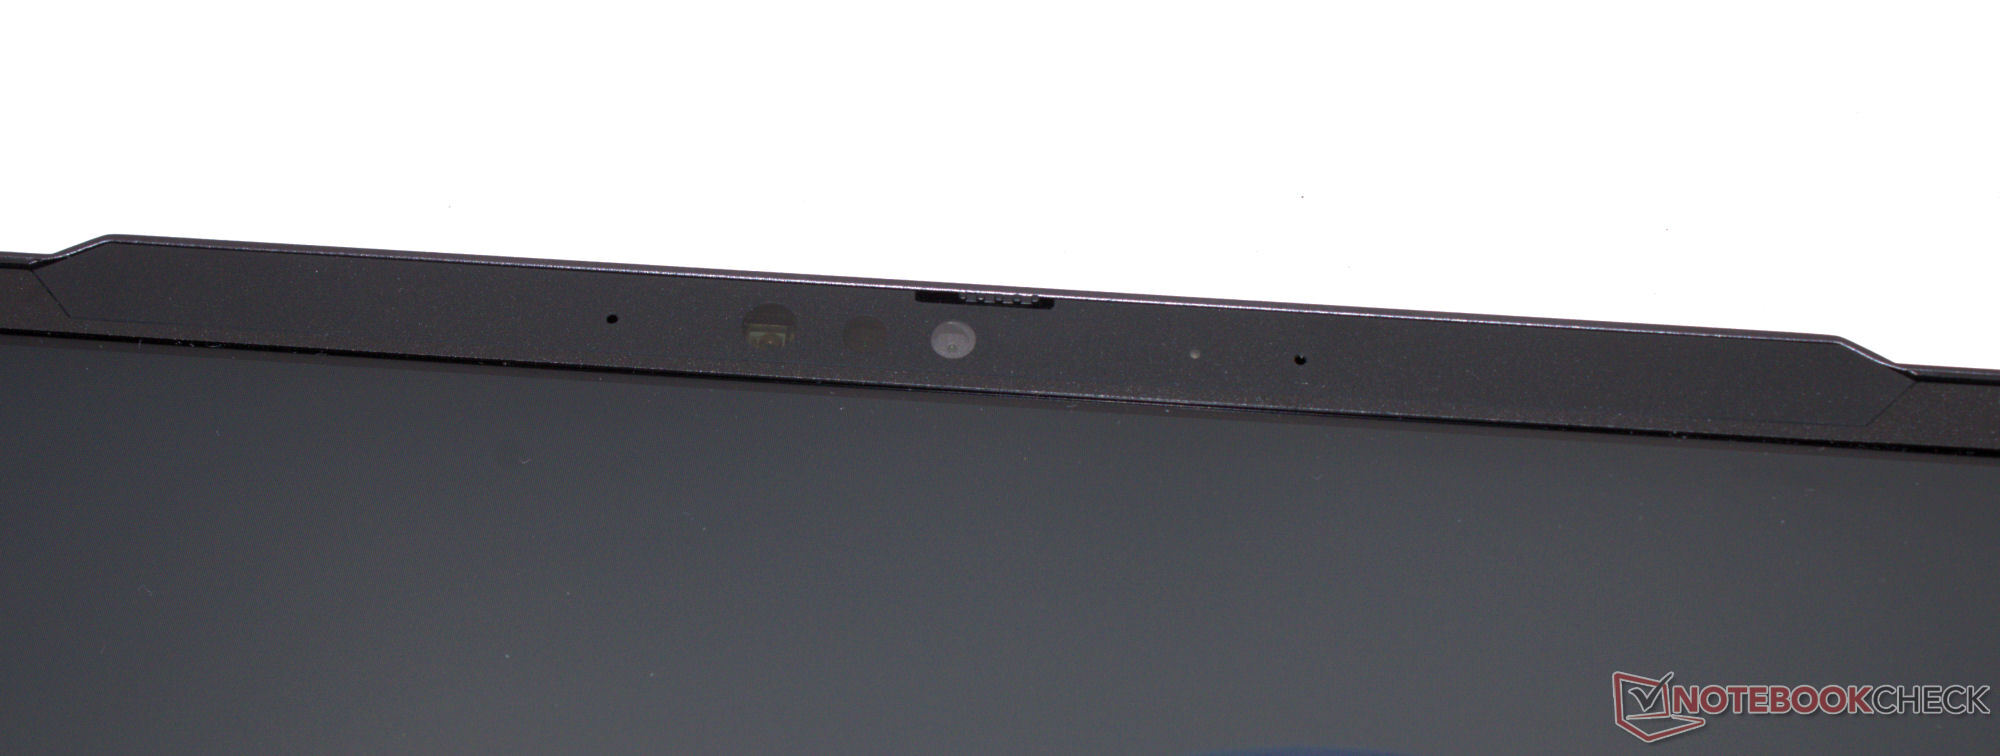
Web kamerası
Web kamerası (2,1 MP) ortalama kalite sunar ve Windows Hello desteği sağlanır. Bunun da ötesinde, mekanik bir deklanşör var.

 GeForce RTX 4090 Laptop GPU, i9-14900HX, Samsung 990 Pro 1 TB")
 GeForce RTX 4090 Laptop GPU, i9-14900HX, Samsung 990 Pro 1 TB")
Aksesuarlar
Dizüstü bilgisayar bir USB bellek (sürücüler, talimatlar), çıkartmalar ve bir mousepad ile birlikte geliyor. İsteğe bağlı bir aksesuar olarak harici su soğutma ($230).

Bakım
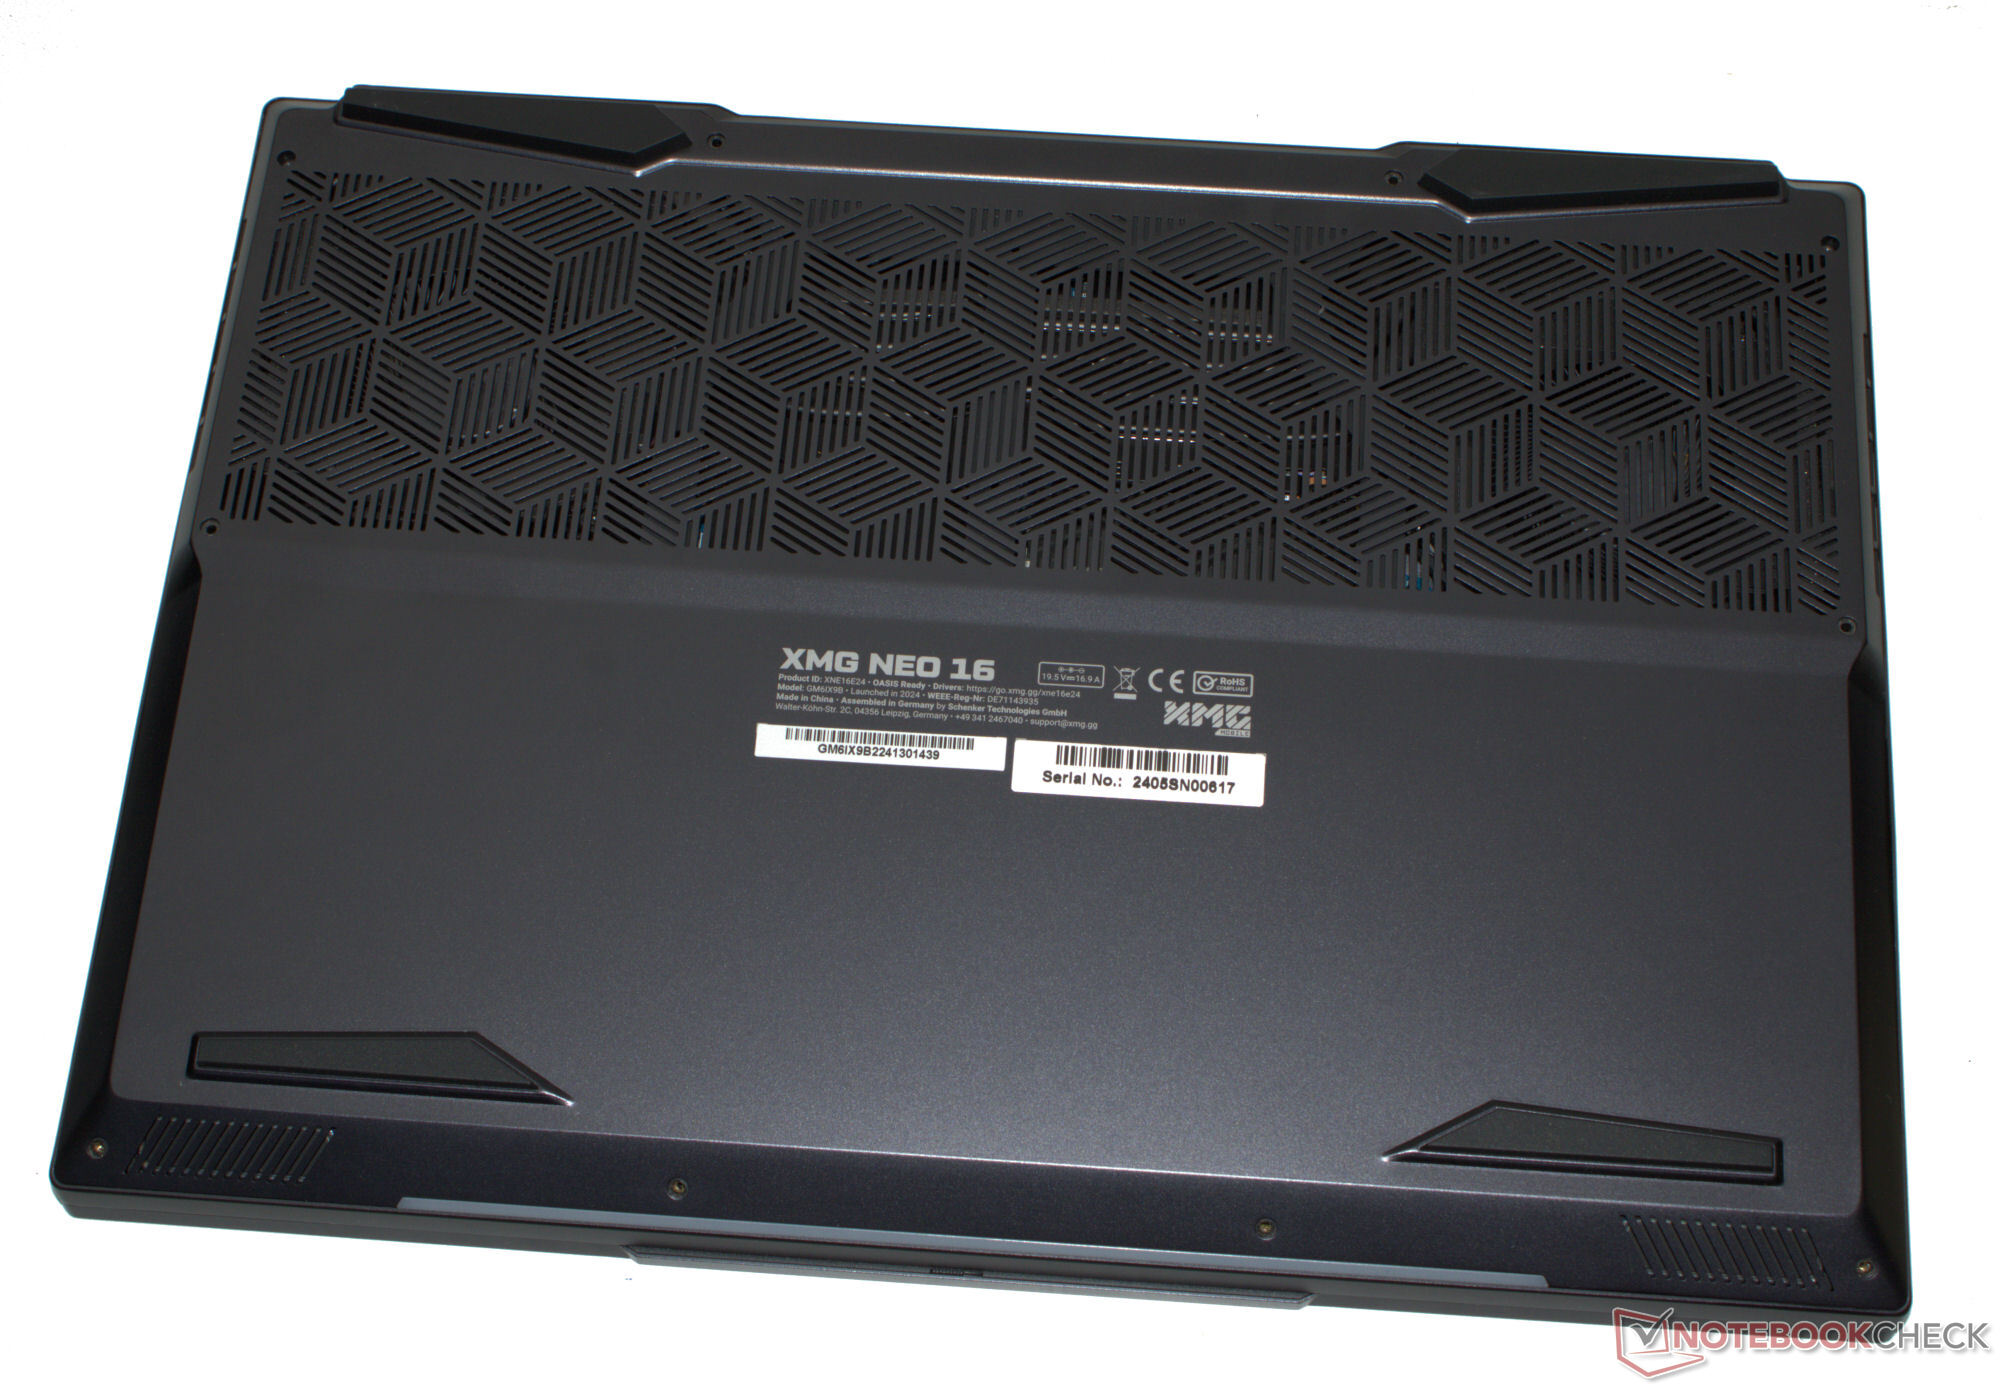
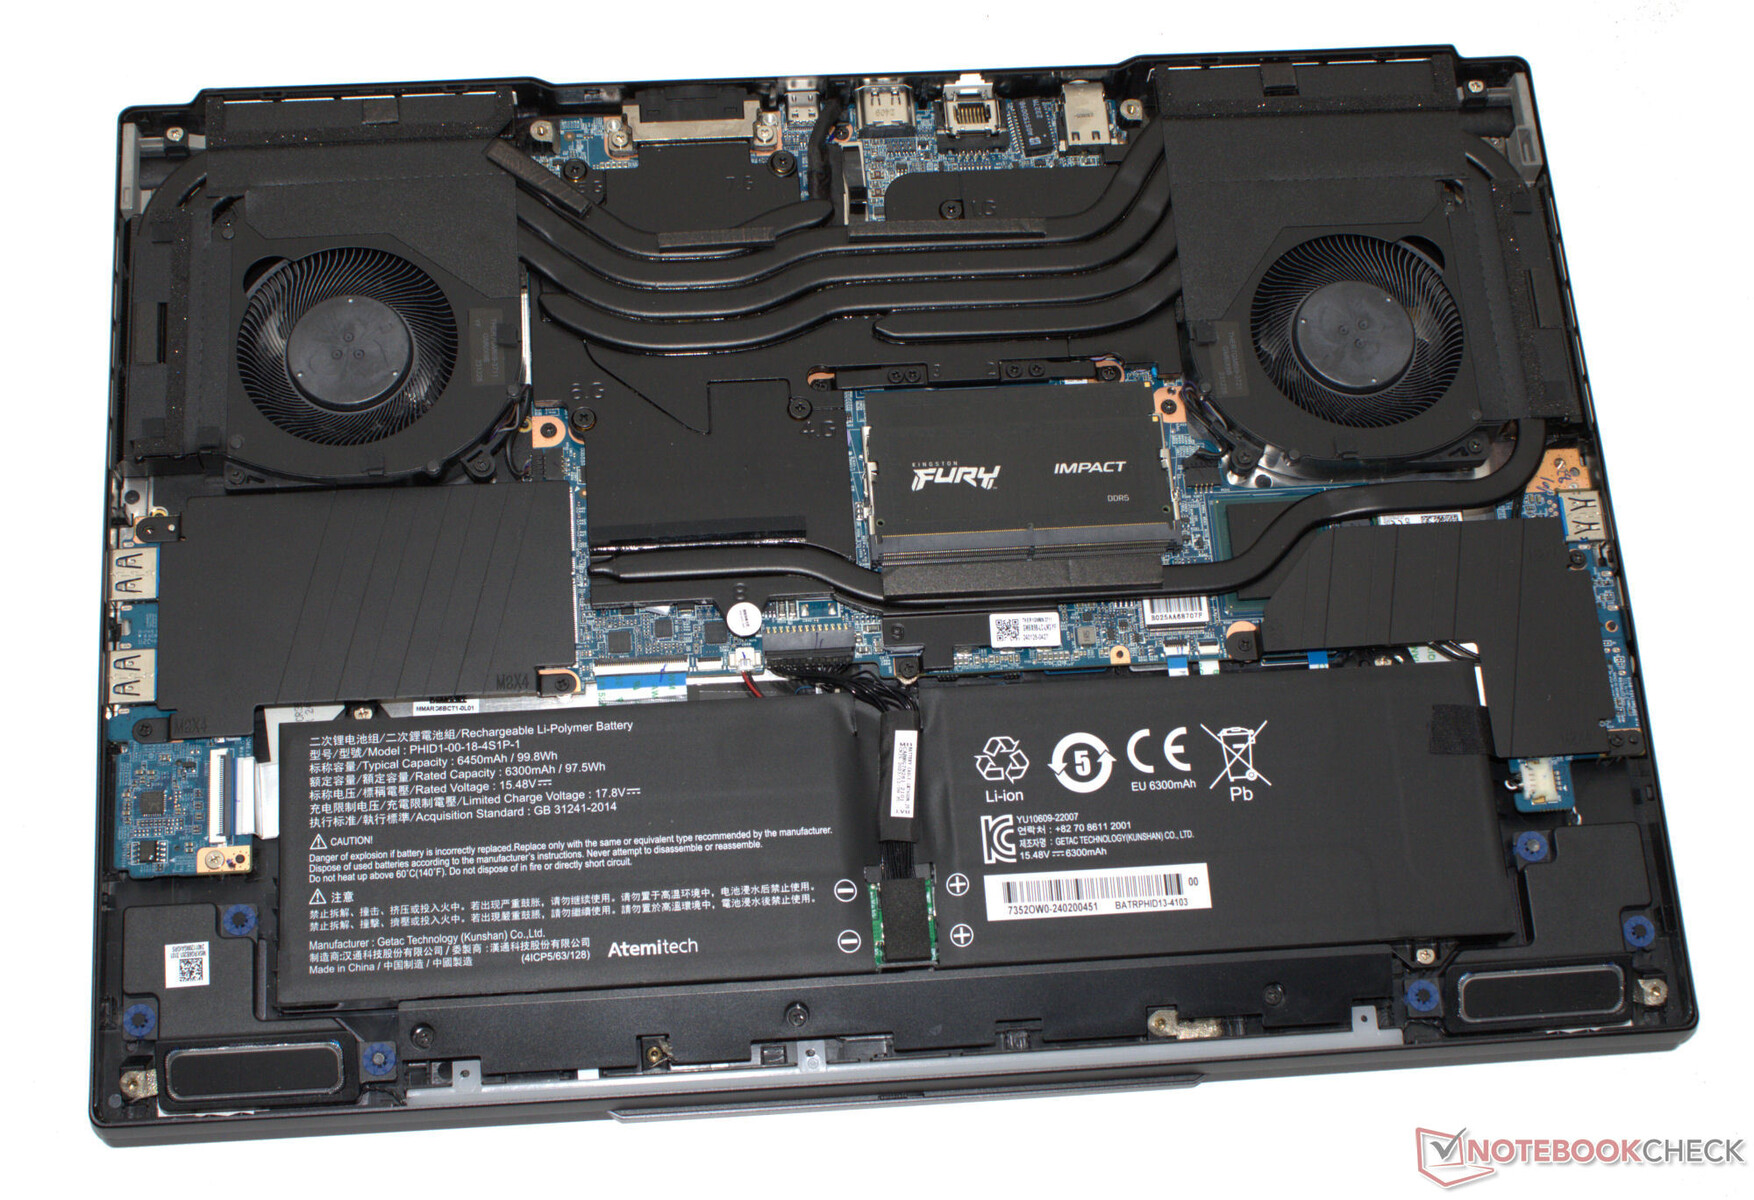
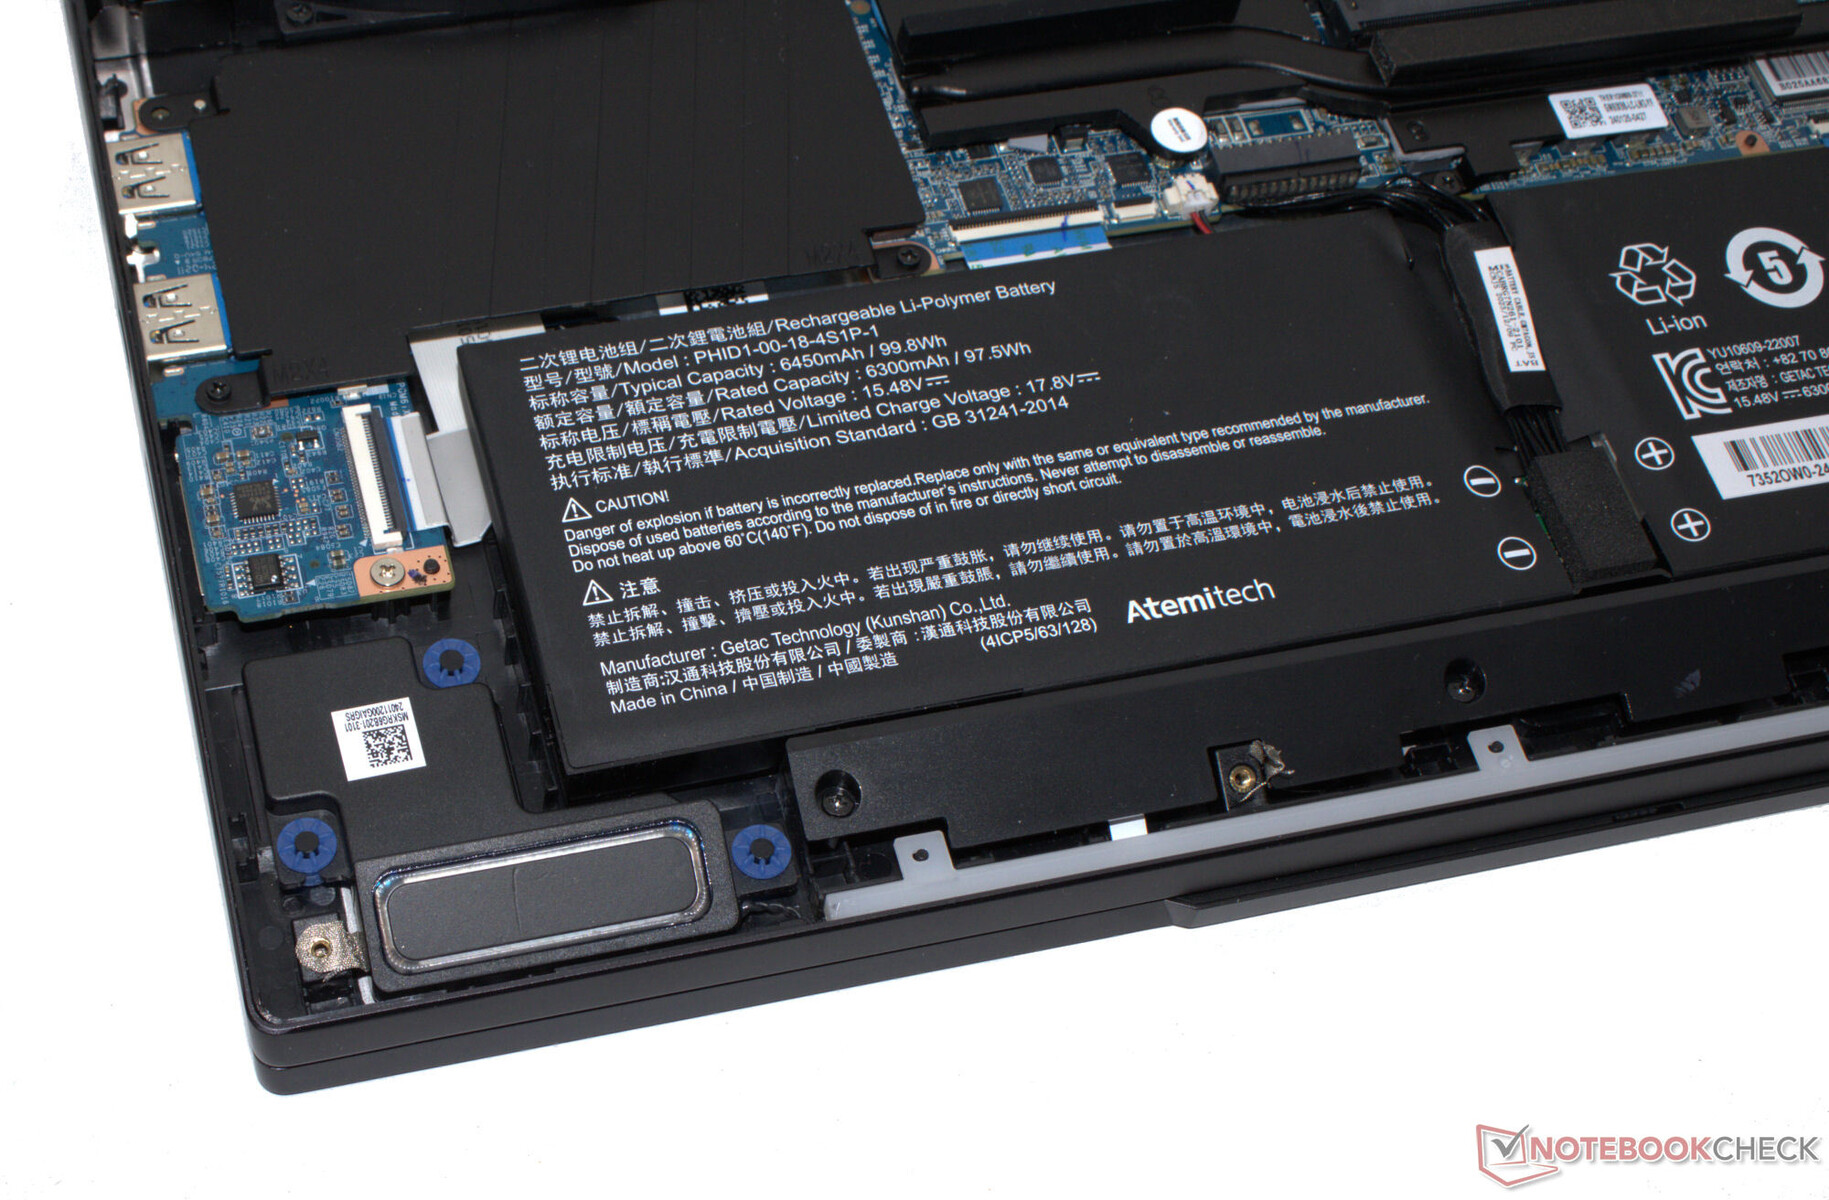
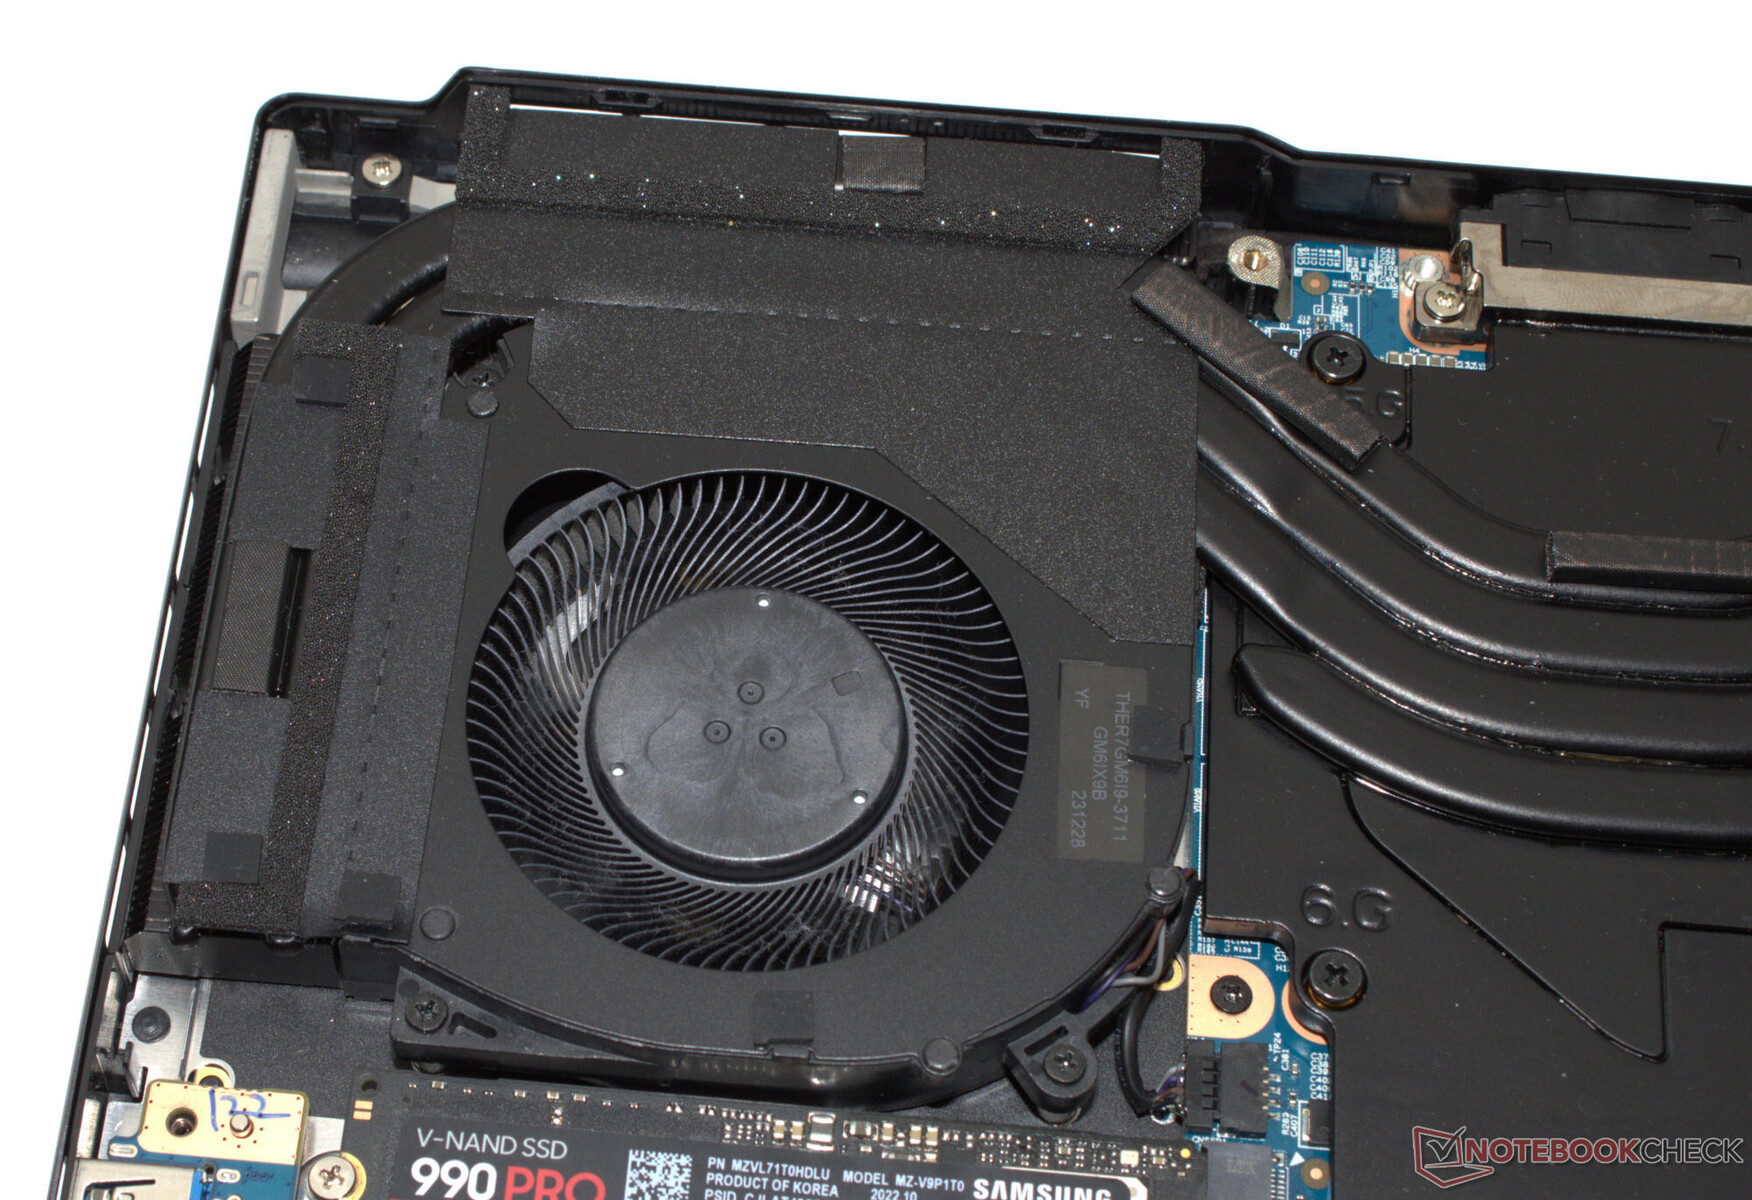
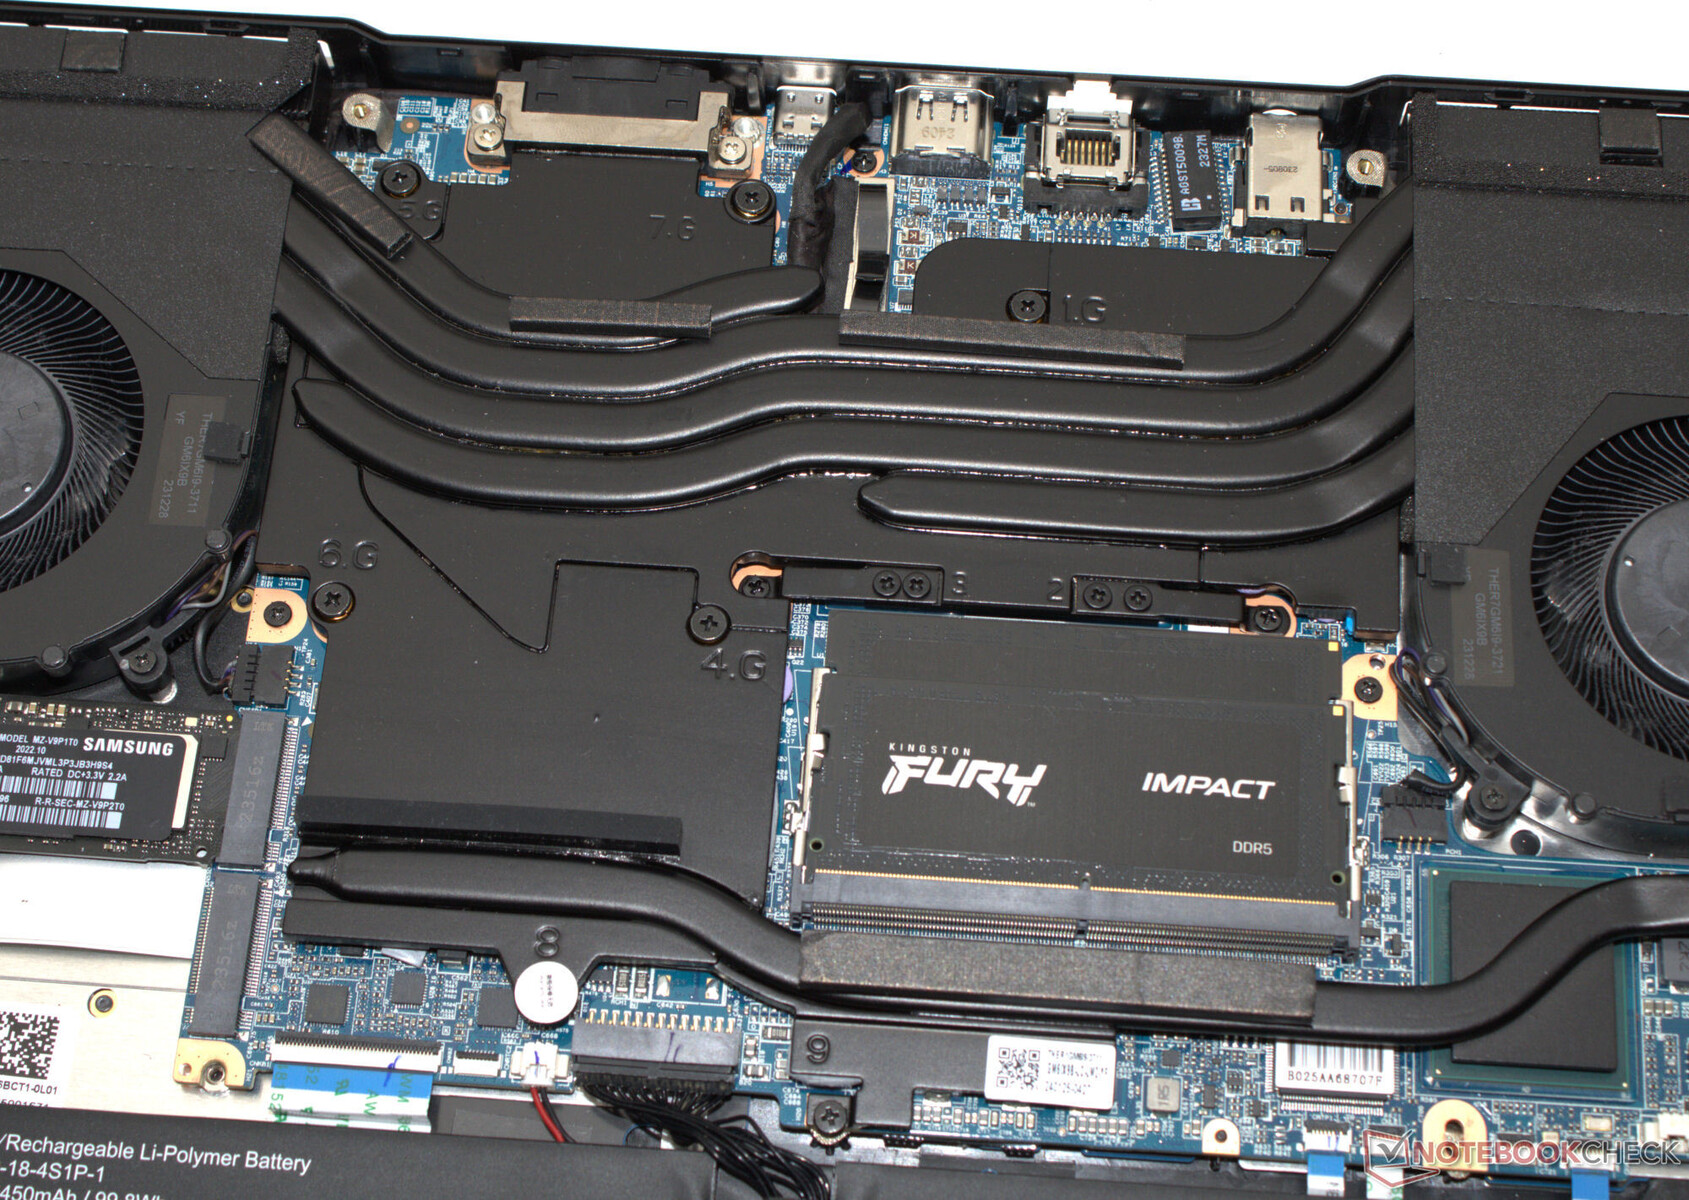
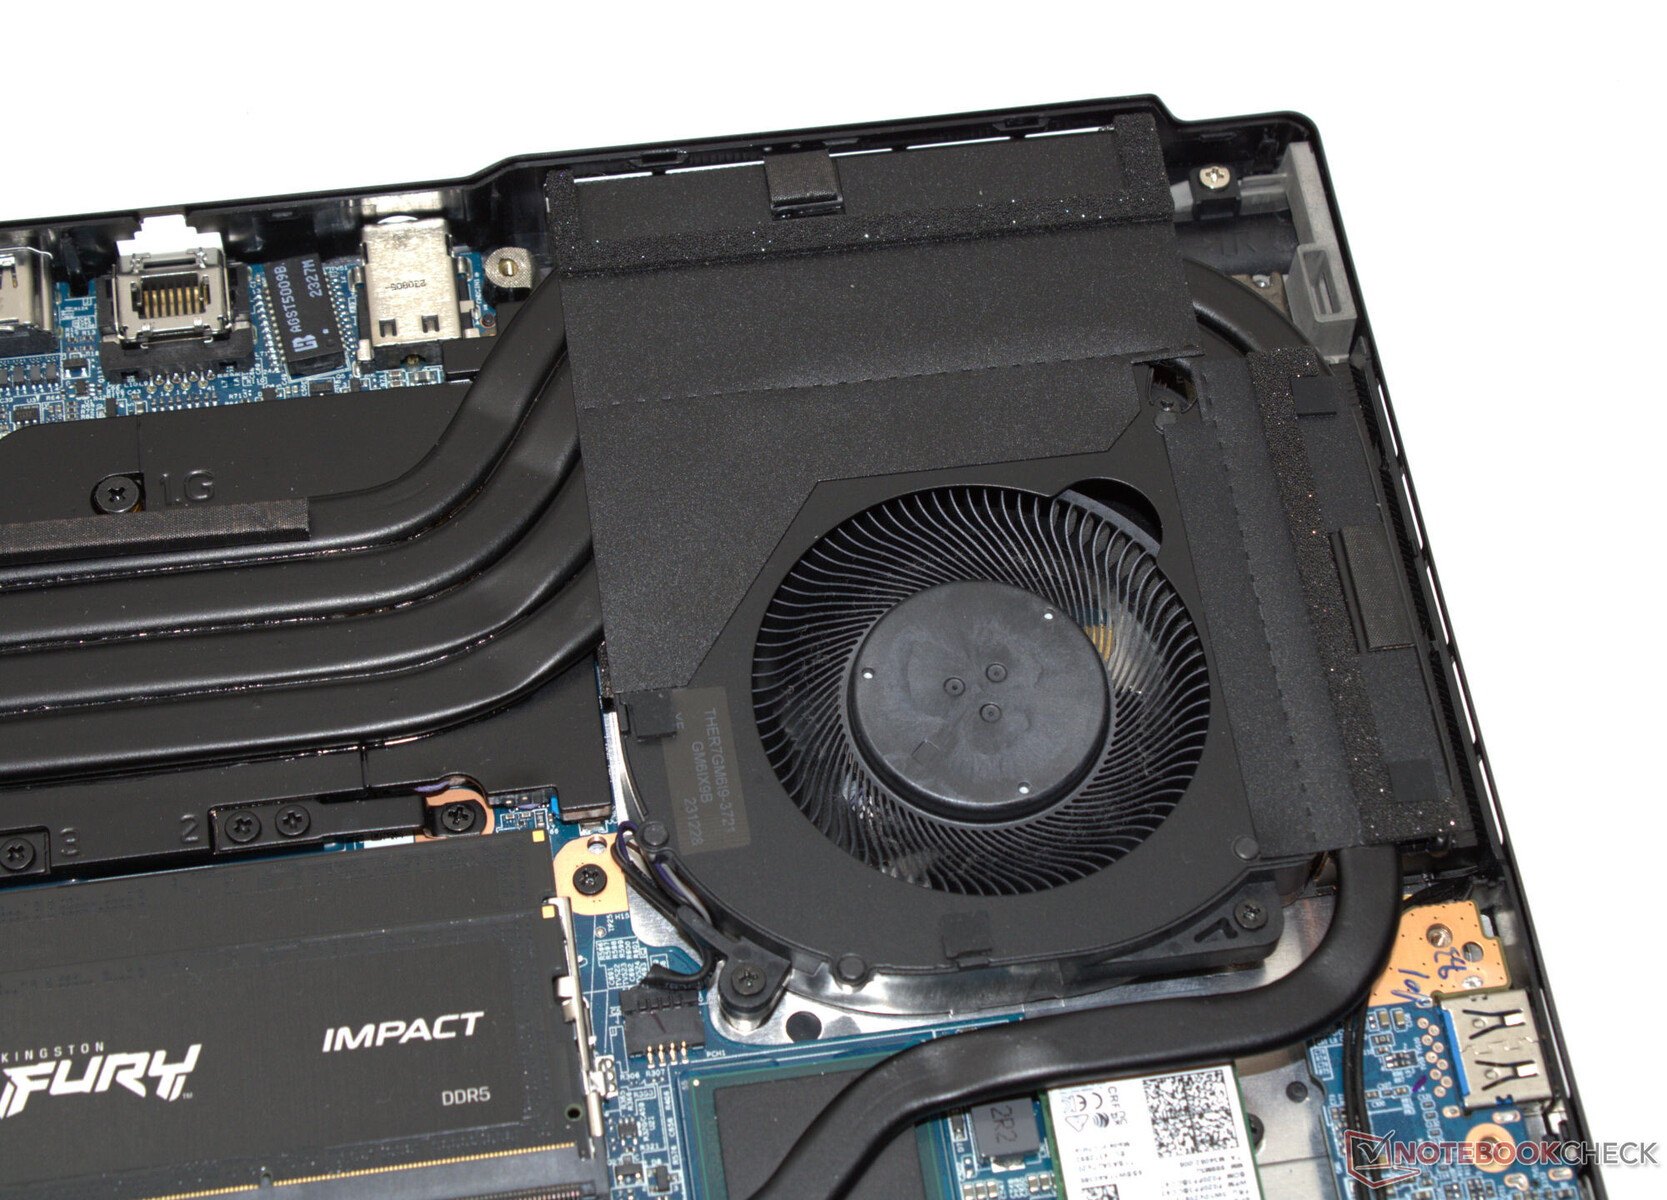
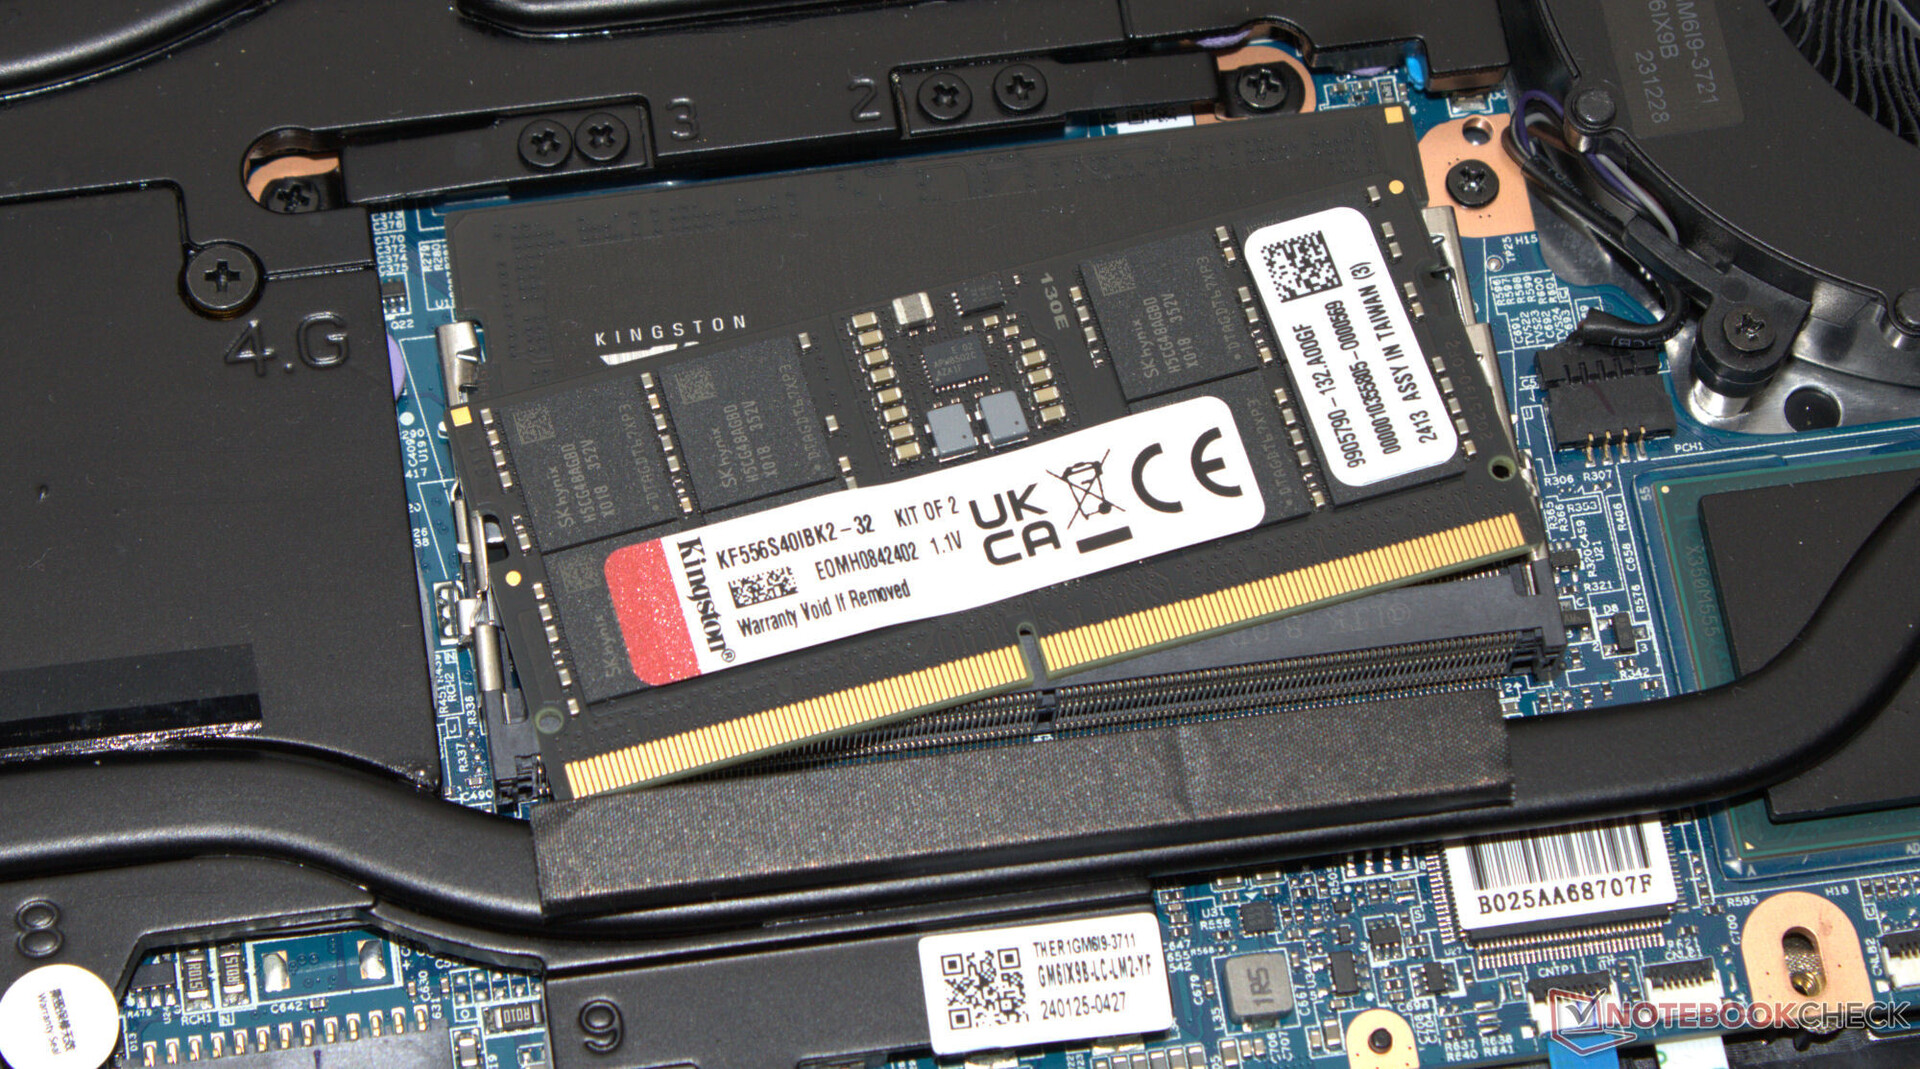
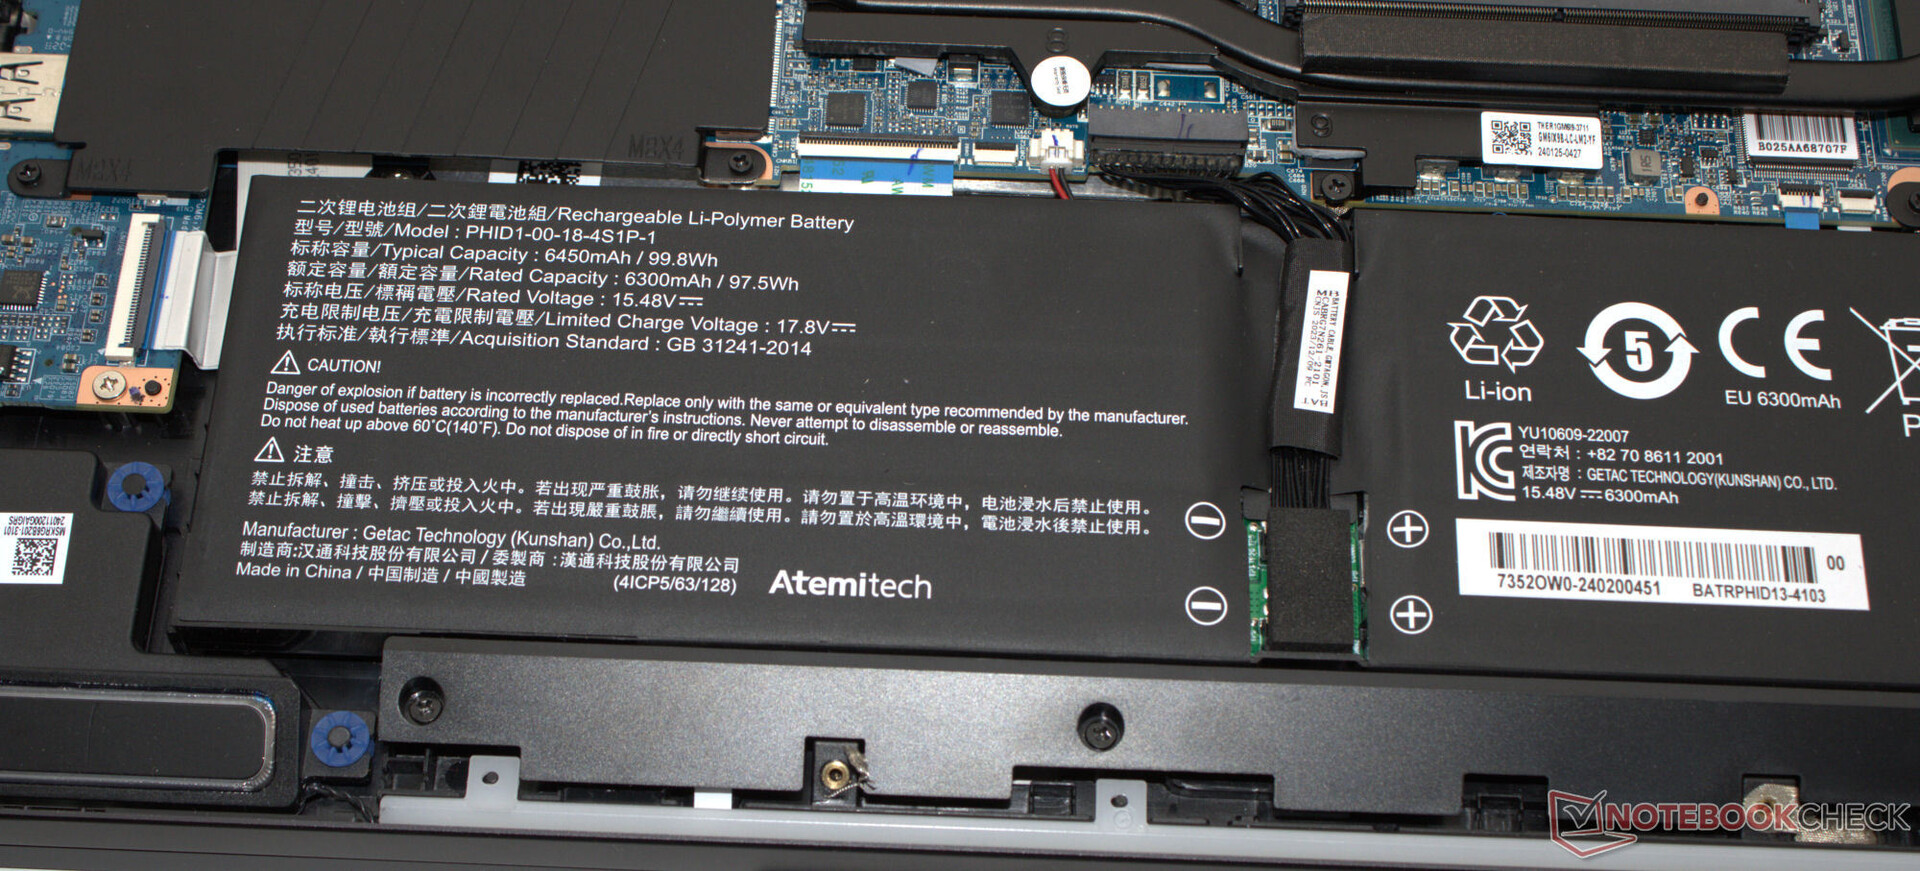
Cihazın tabanındaki tüm vidaları çıkardıktan sonra, taban kapağı bir mızrap ya da düz bir spatula yardımıyla ayrılabilir. Bu sayede RAM yuvalarına (her ikisi de dolu), fanlara ve bataryaya erişebilirsiniz. SSD ve SSD yuvaları (PCIe 4, M.2 2280) ve Wi-Fi modülü ek, vidalı plakalarla kaplıdır.

Garanti
AB'de Schenker, teslim alma hizmeti ve 6 aylık hızlı onarım hizmeti (48 saat içinde onarım) dahil olmak üzere iki yıllık temel garanti sunmaktadır. 36 aylık bir garanti, seçilen hızlı onarım süresine bağlı olarak size yaklaşık 100 ila 160 dolar arasında bir maliyet getirecektir.
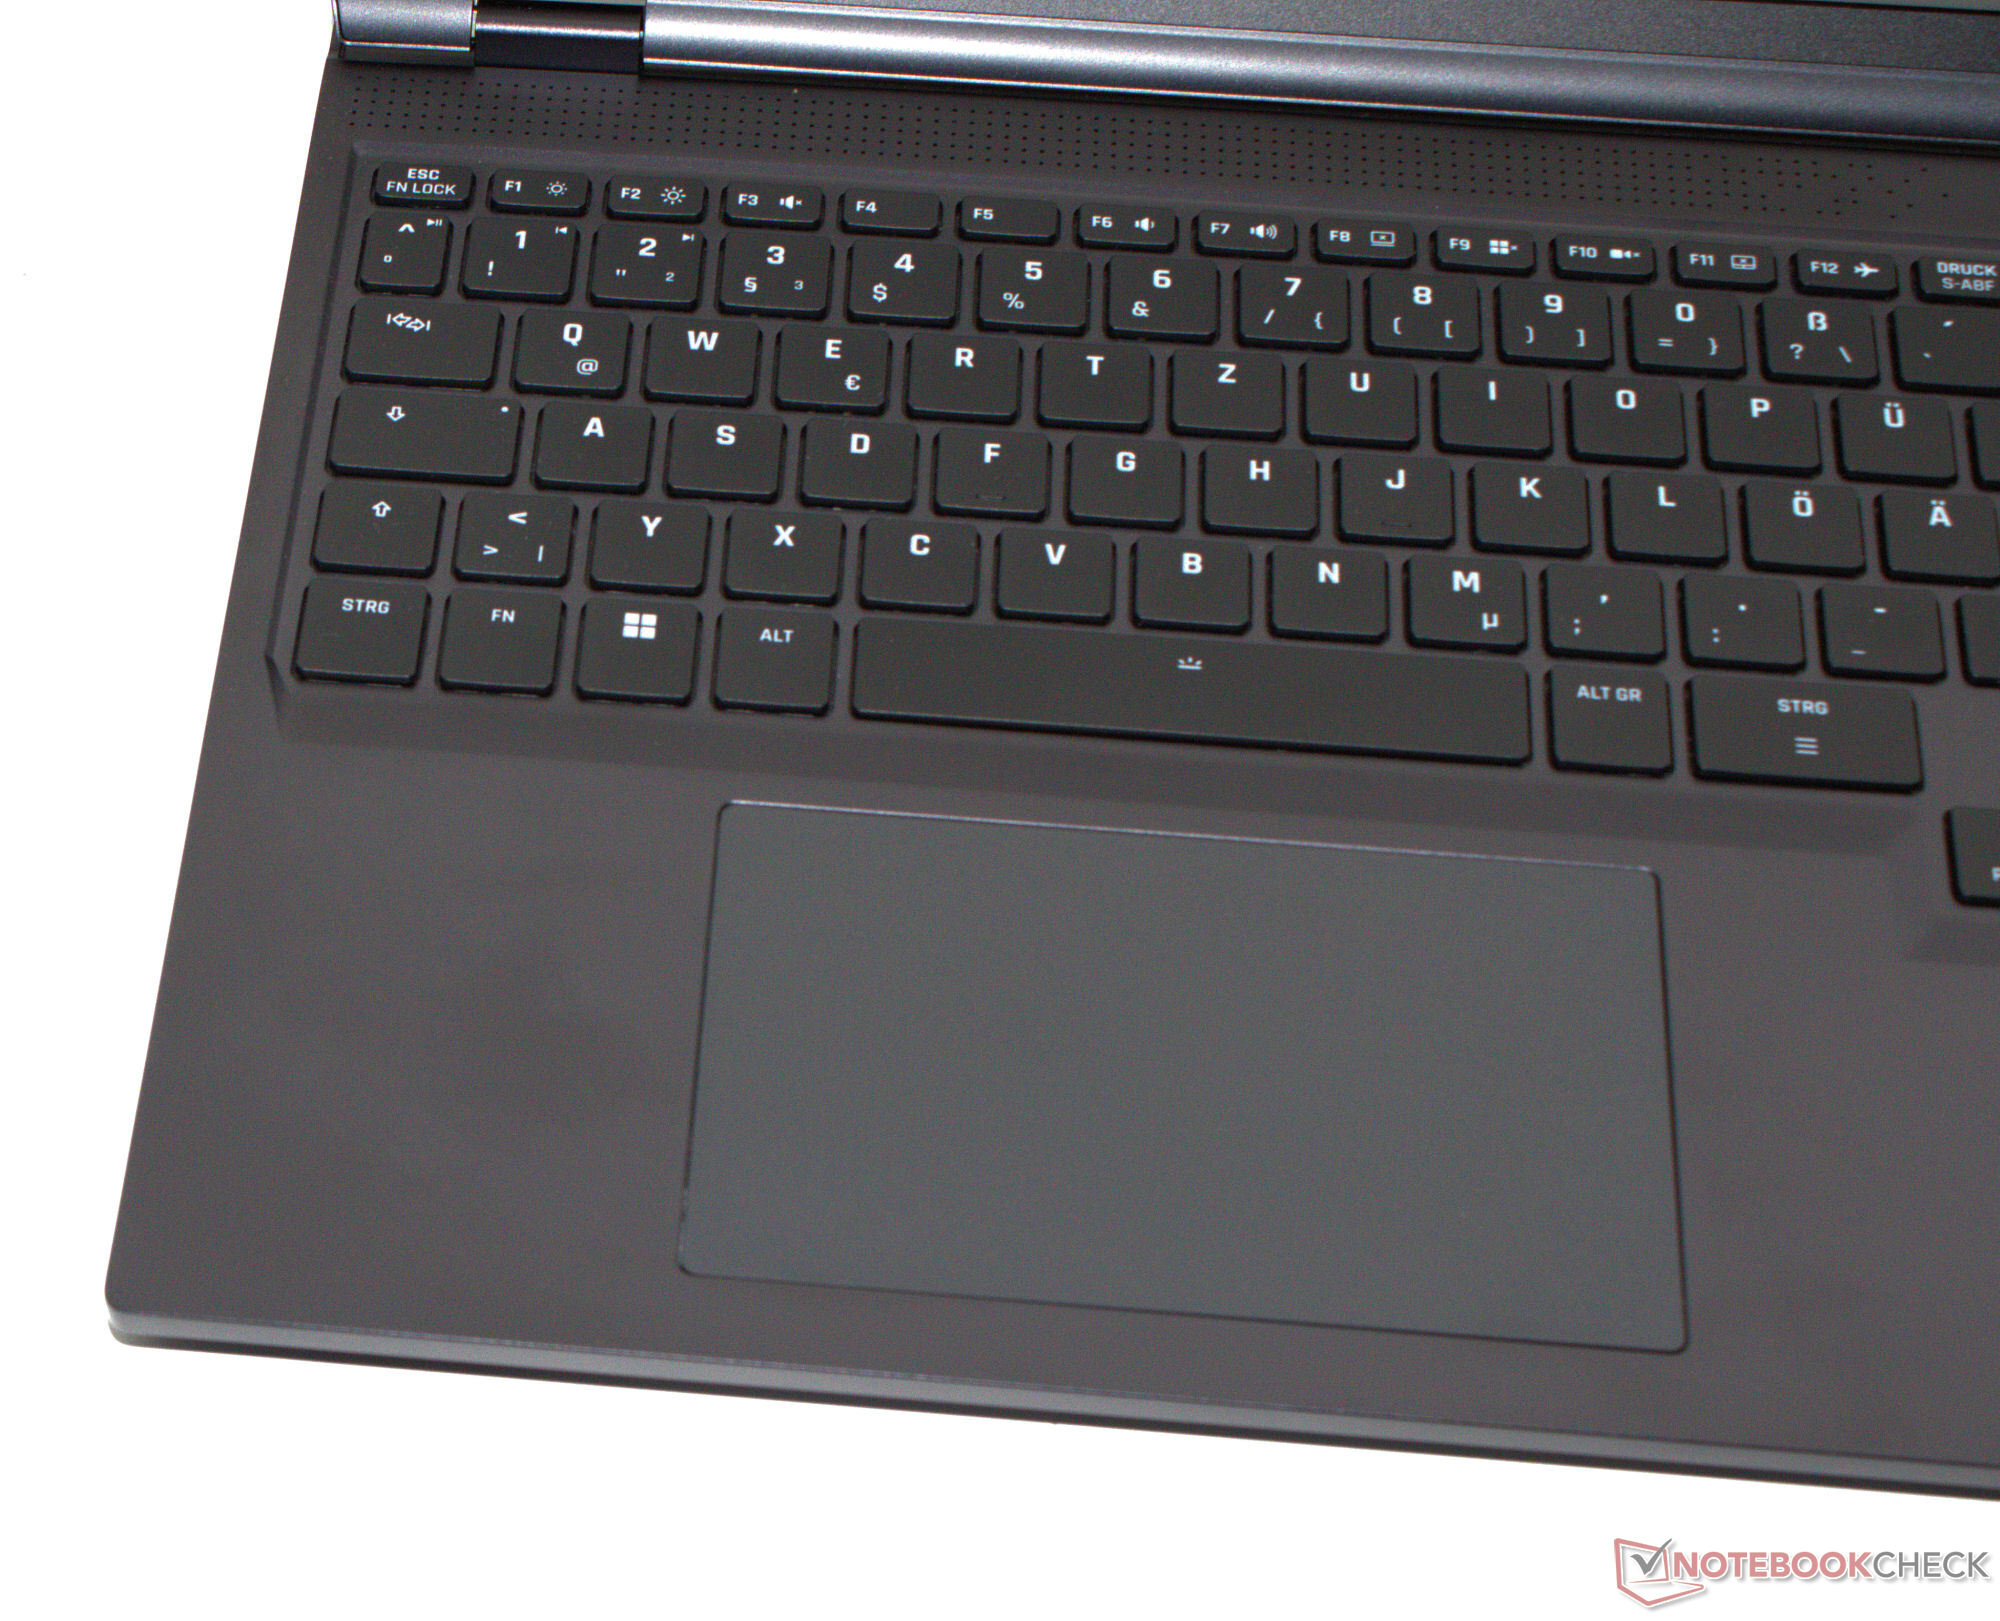
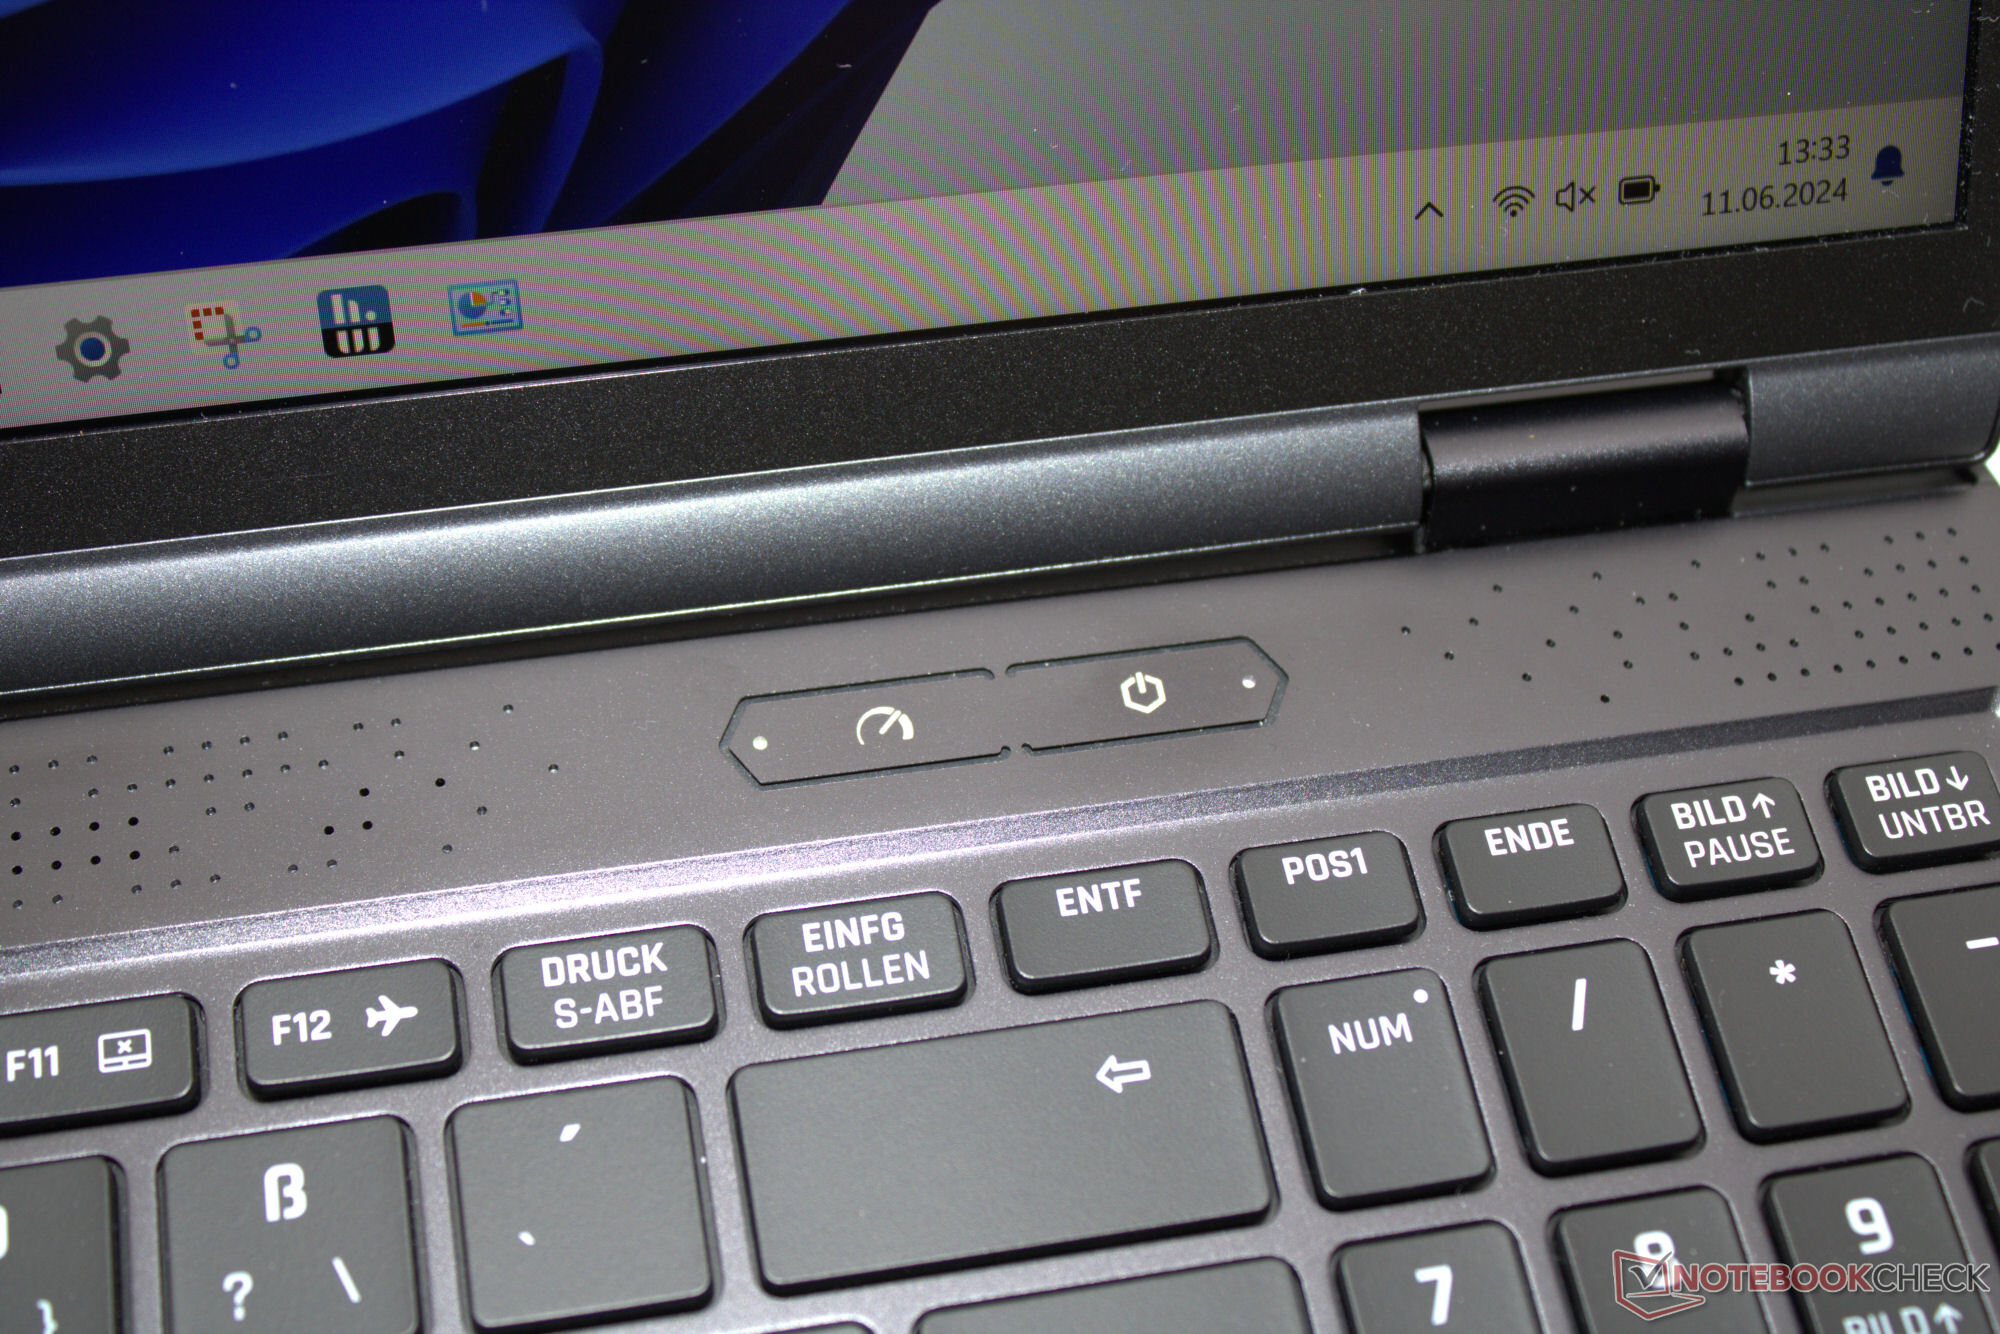
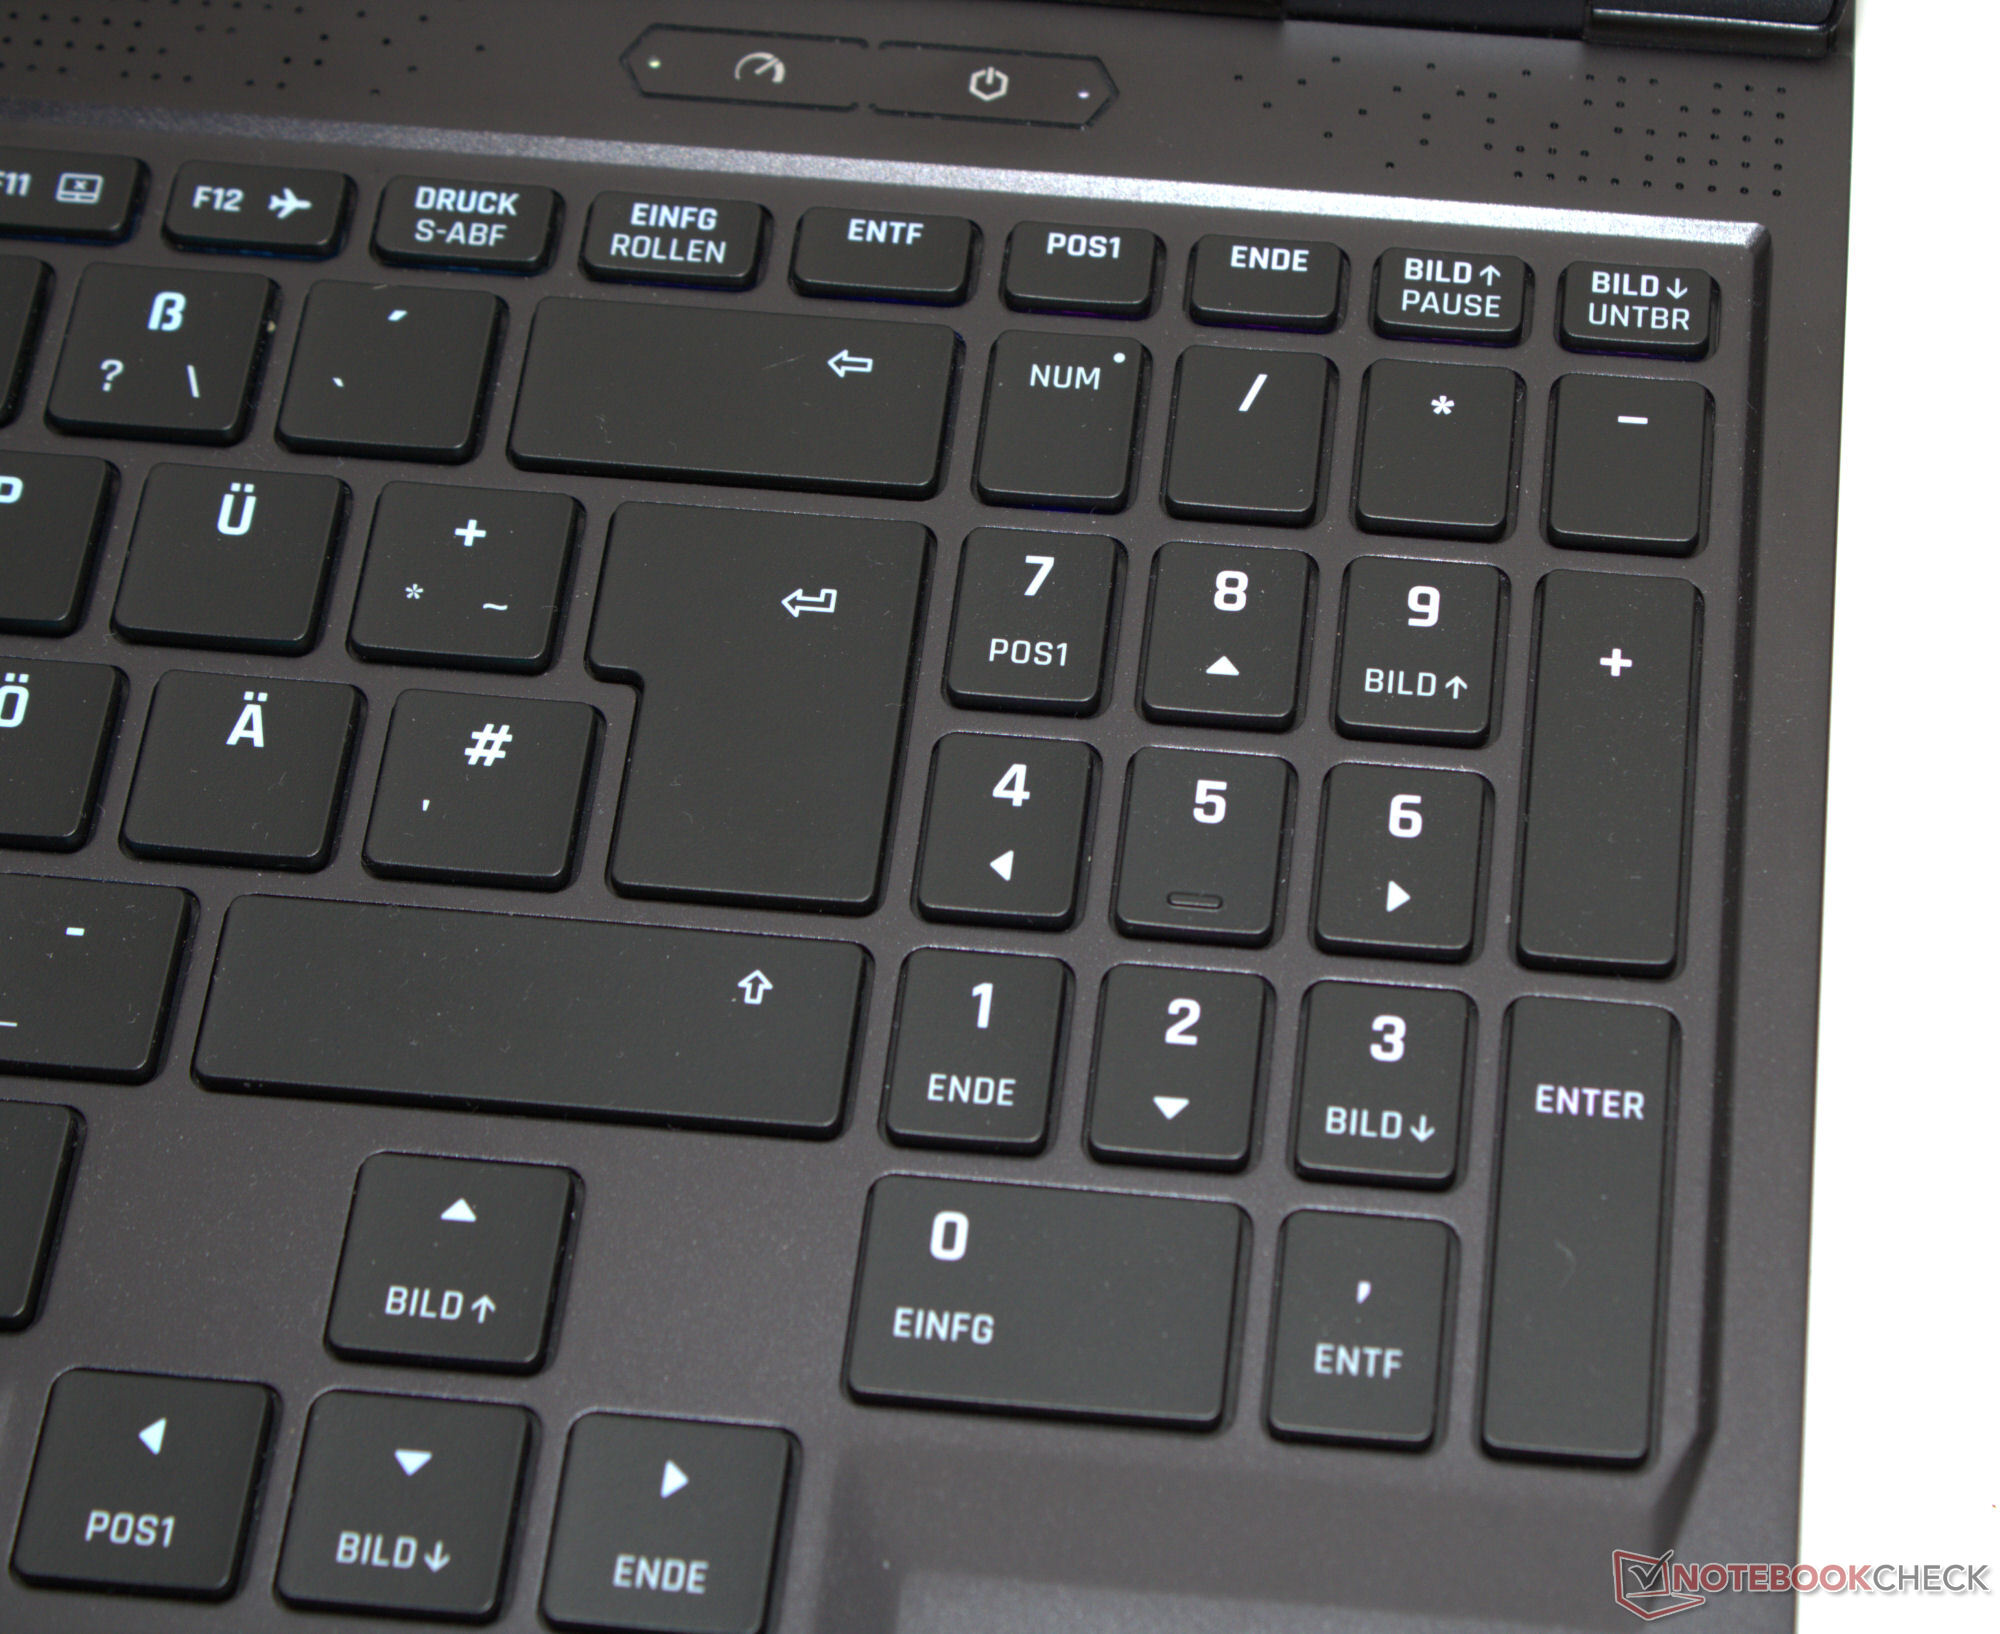
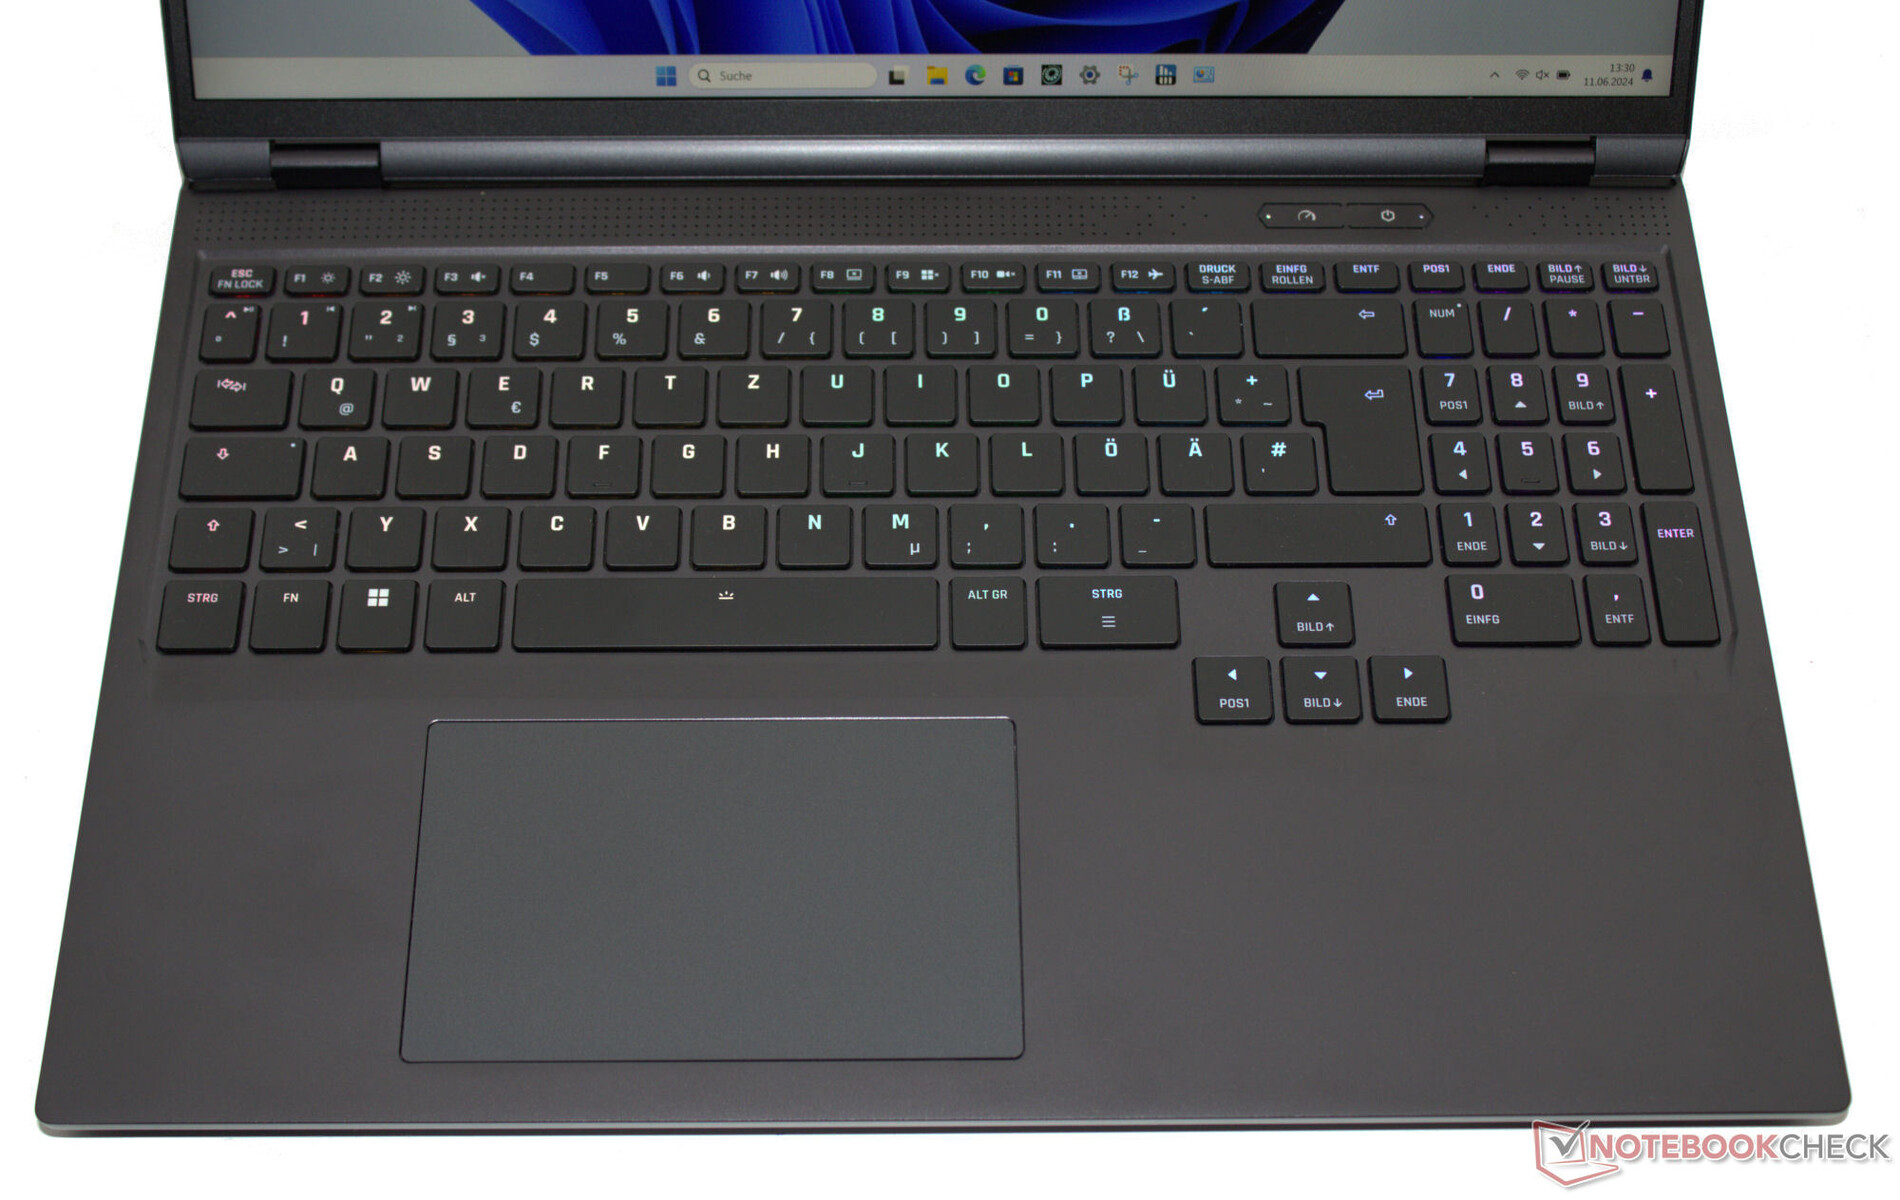
Giriş cihazları - Ayrı tuş aydınlatmasına sahip bir klavye
Klavye
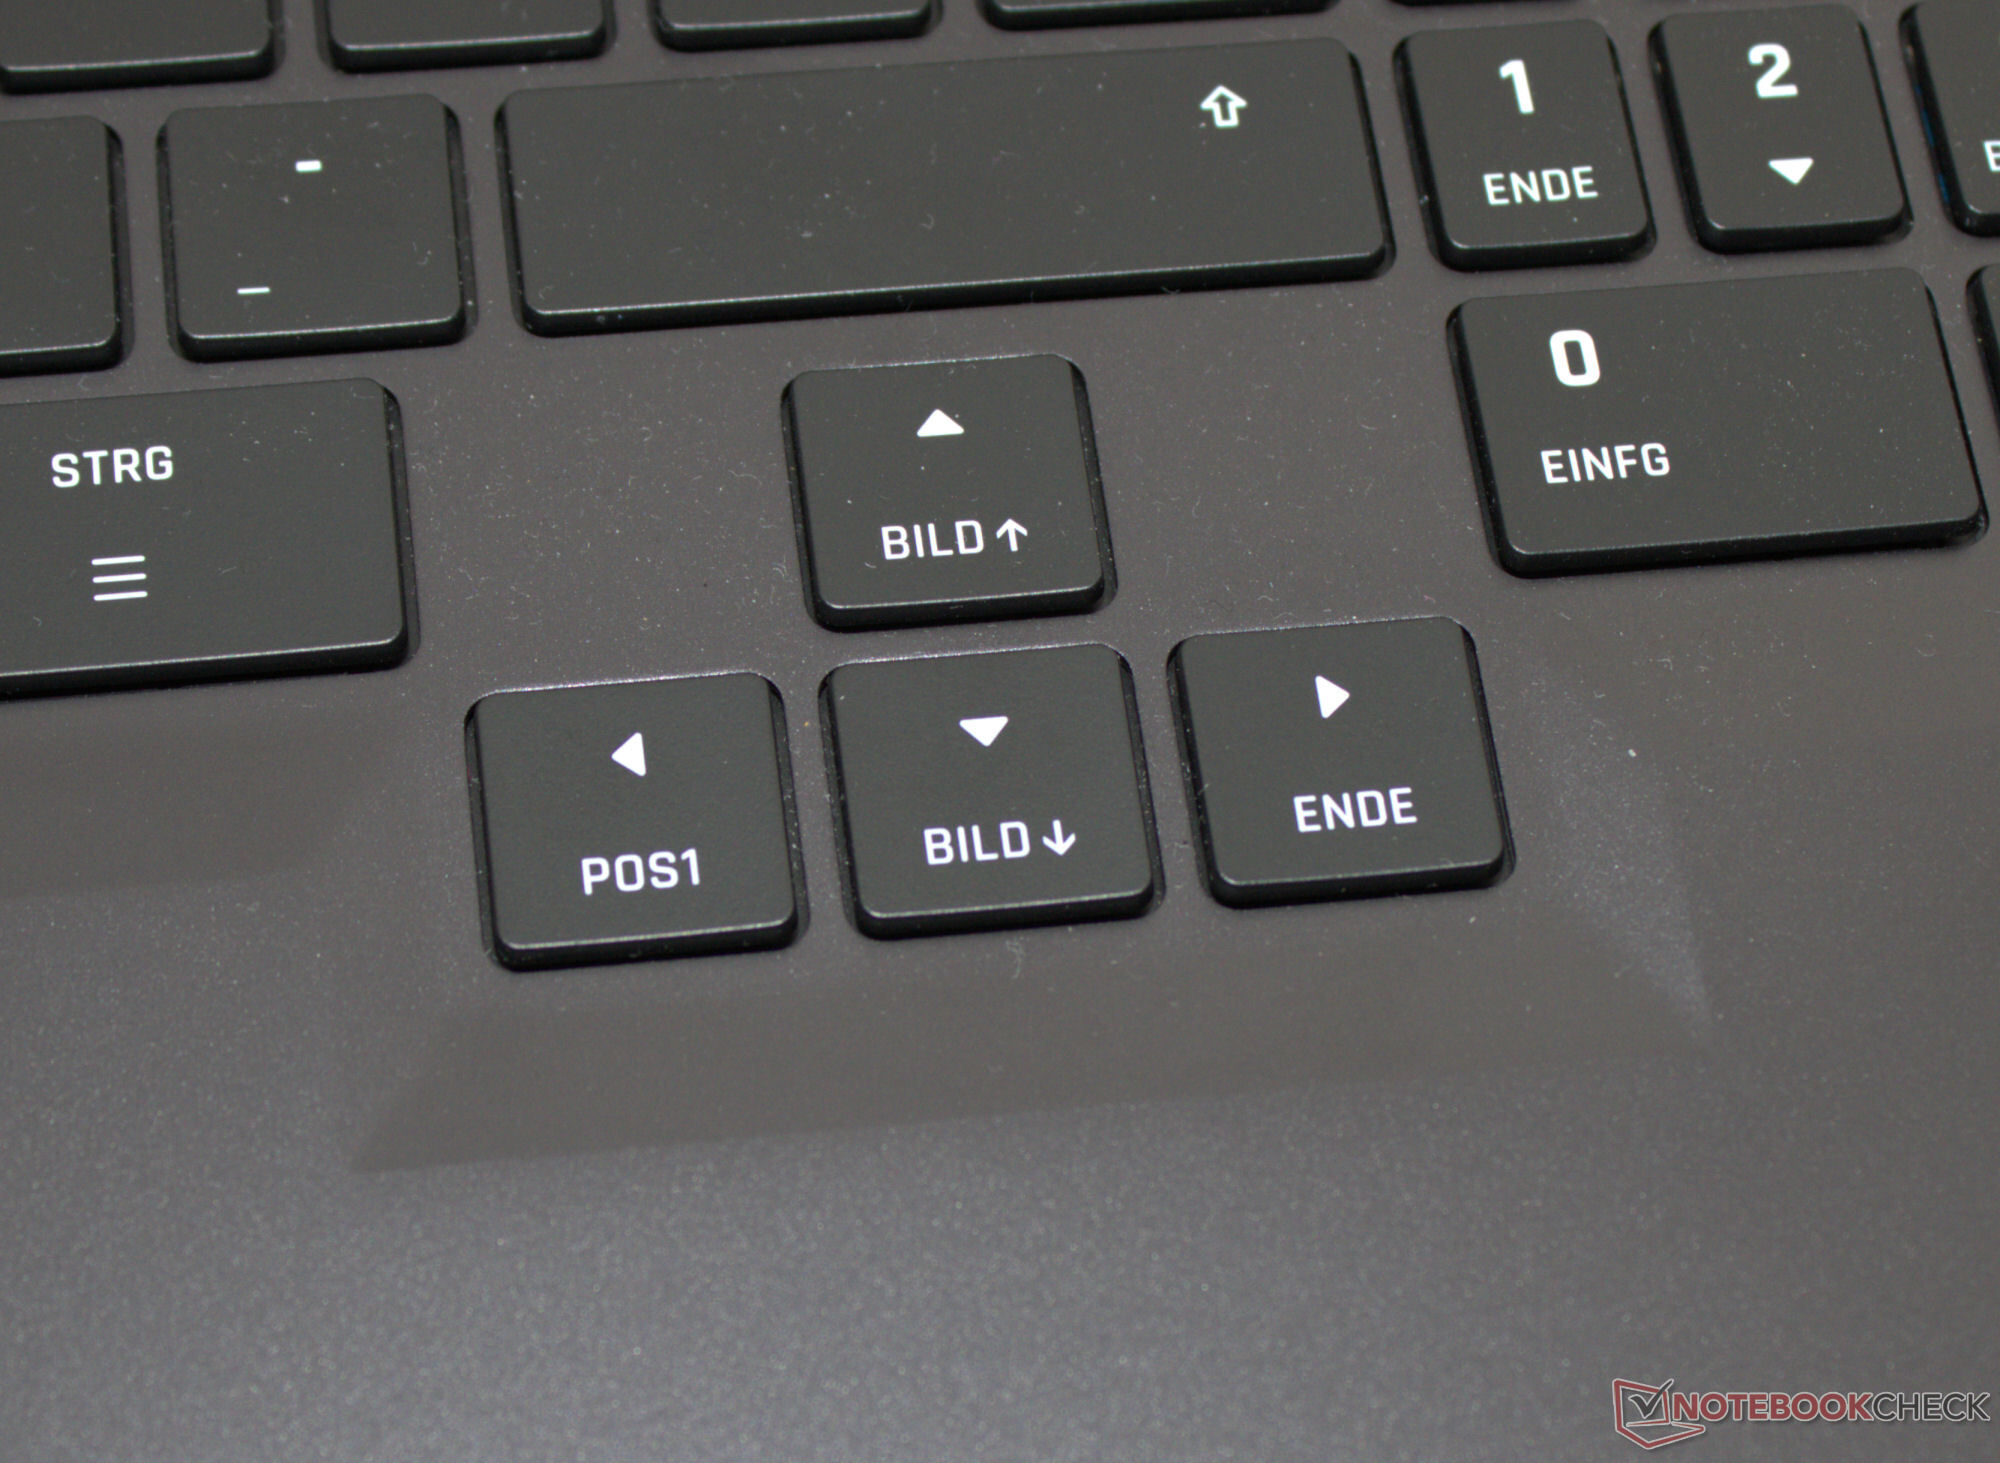
Geçen yılki Neo 16'yı isteğe bağlı bir mekanik klavye ile sipariş edebiliyordunuz, ancak mevcut modelde yalnızca chiclet klavye var. Klavye dizüstü bilgisayarın tüm genişliğini kaplıyor ve bir sayısal tuş takımı ve bireysel tuş aydınlatması (RGB) da mevcut. İçbükey, kavisli tuşlar orta hareket mesafesi, iyi tanımlanmış bir basınç noktası ve çok hoş bir direnç sunuyor. Klavye yazı yazarken esnemiyor. Dikkat çekici olan, merkezden uzak, tam boyutlu ok tuşlarının kullanımının ne kadar rahat olduğudur - geçen yılki modele göre bir gelişme.
Dokunmatik yüzey
Fare alternatifi olarak, pürüzsüz yüzeyleri kaydırma hareketlerini olabildiğince kolay hale getiren çoklu dokunma özellikli bir clickpad (yaklaşık 12,3 x 7,7 cm) sunuluyor. Kısa hareket mesafesi ve belirgin bir basınç noktası sunuyor.
Ekran - Schenker parlak bir IPS panel tercih etti
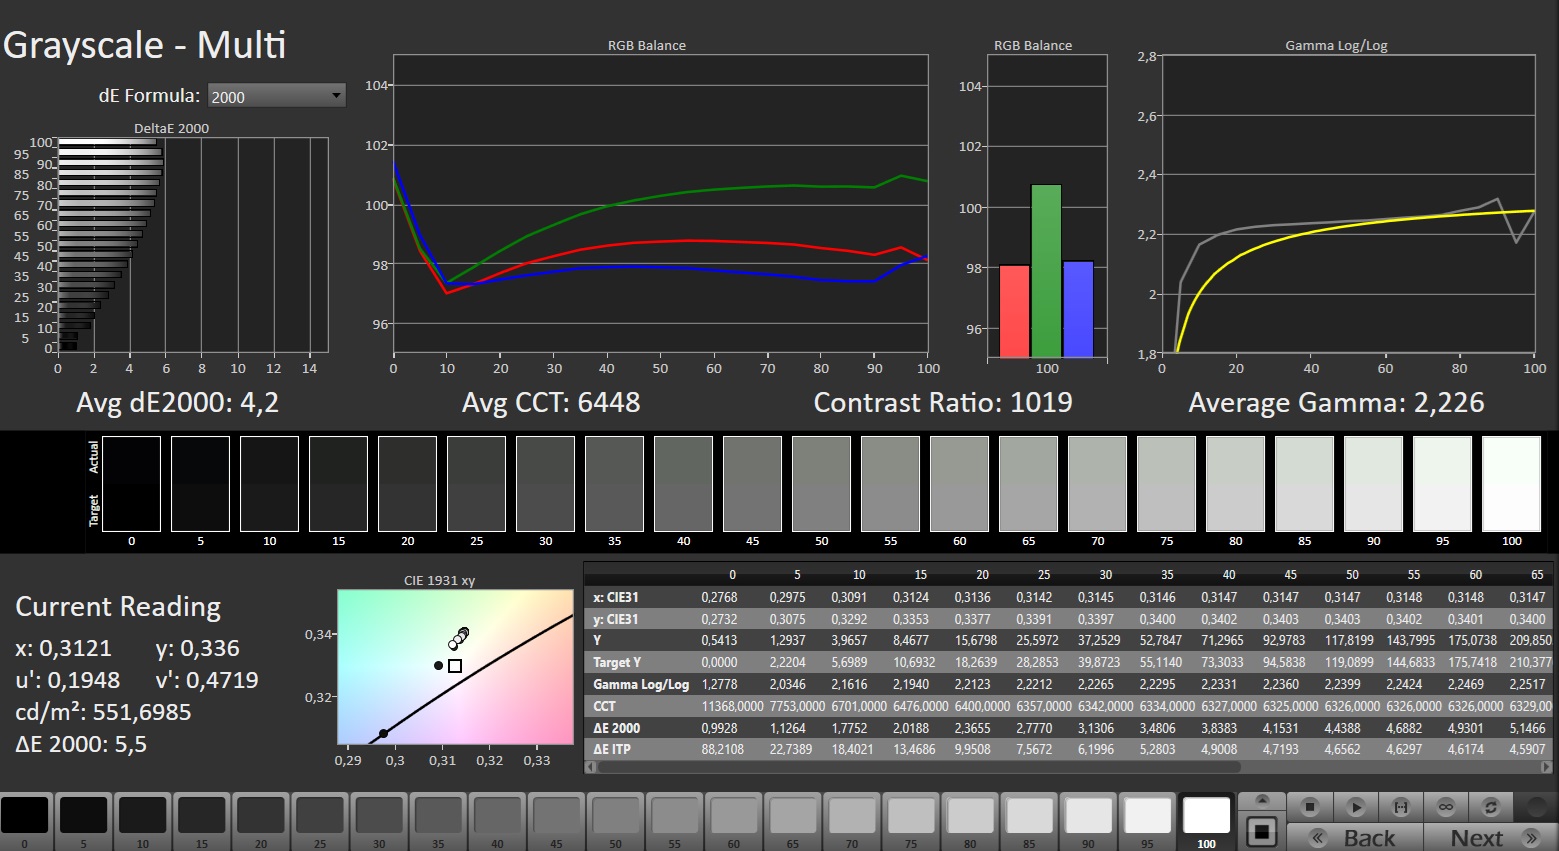
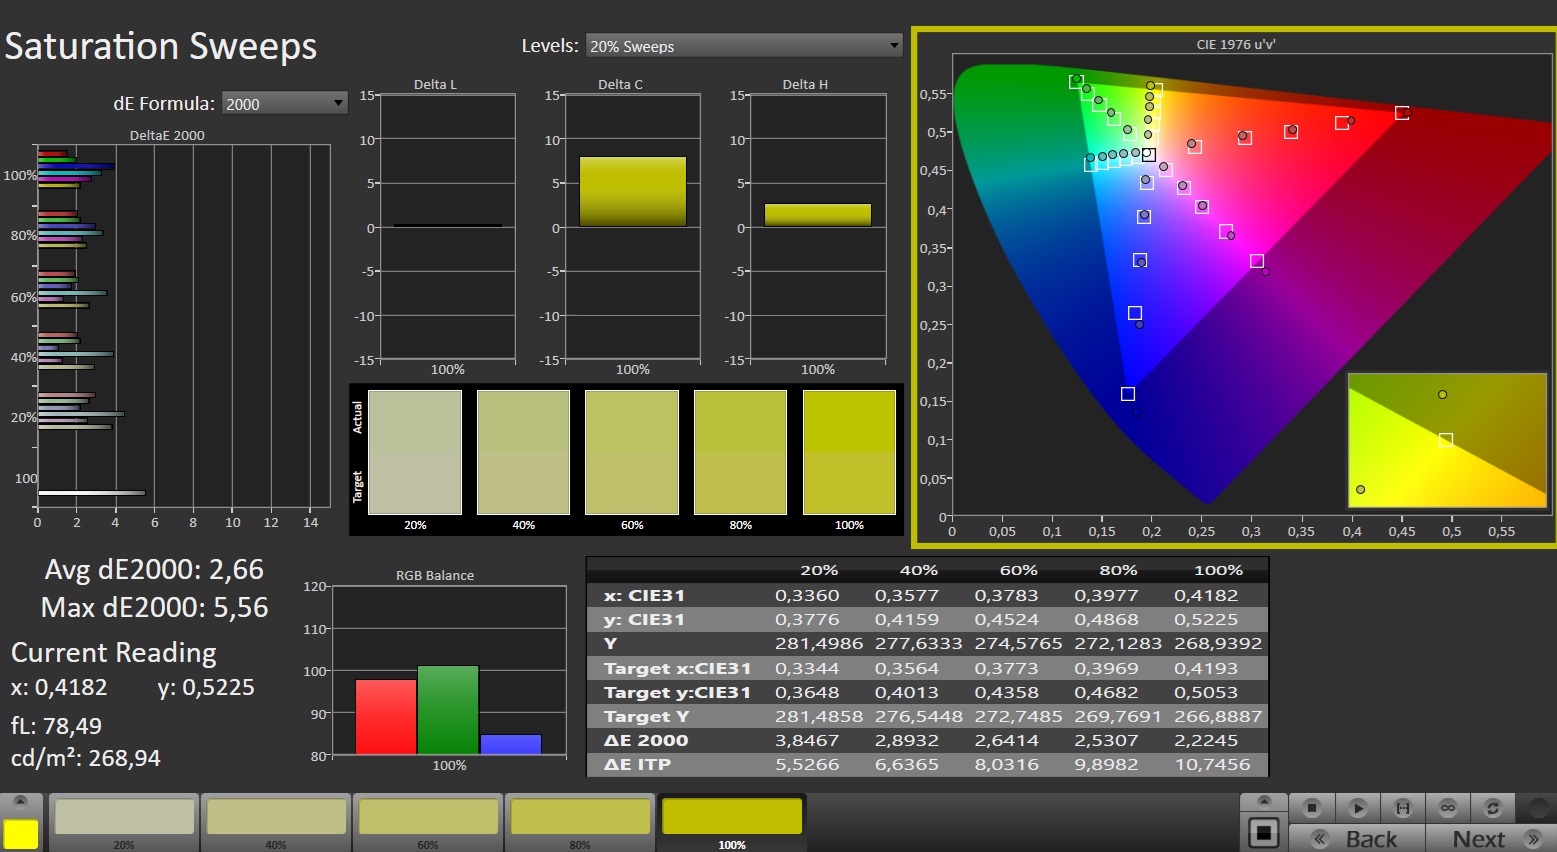
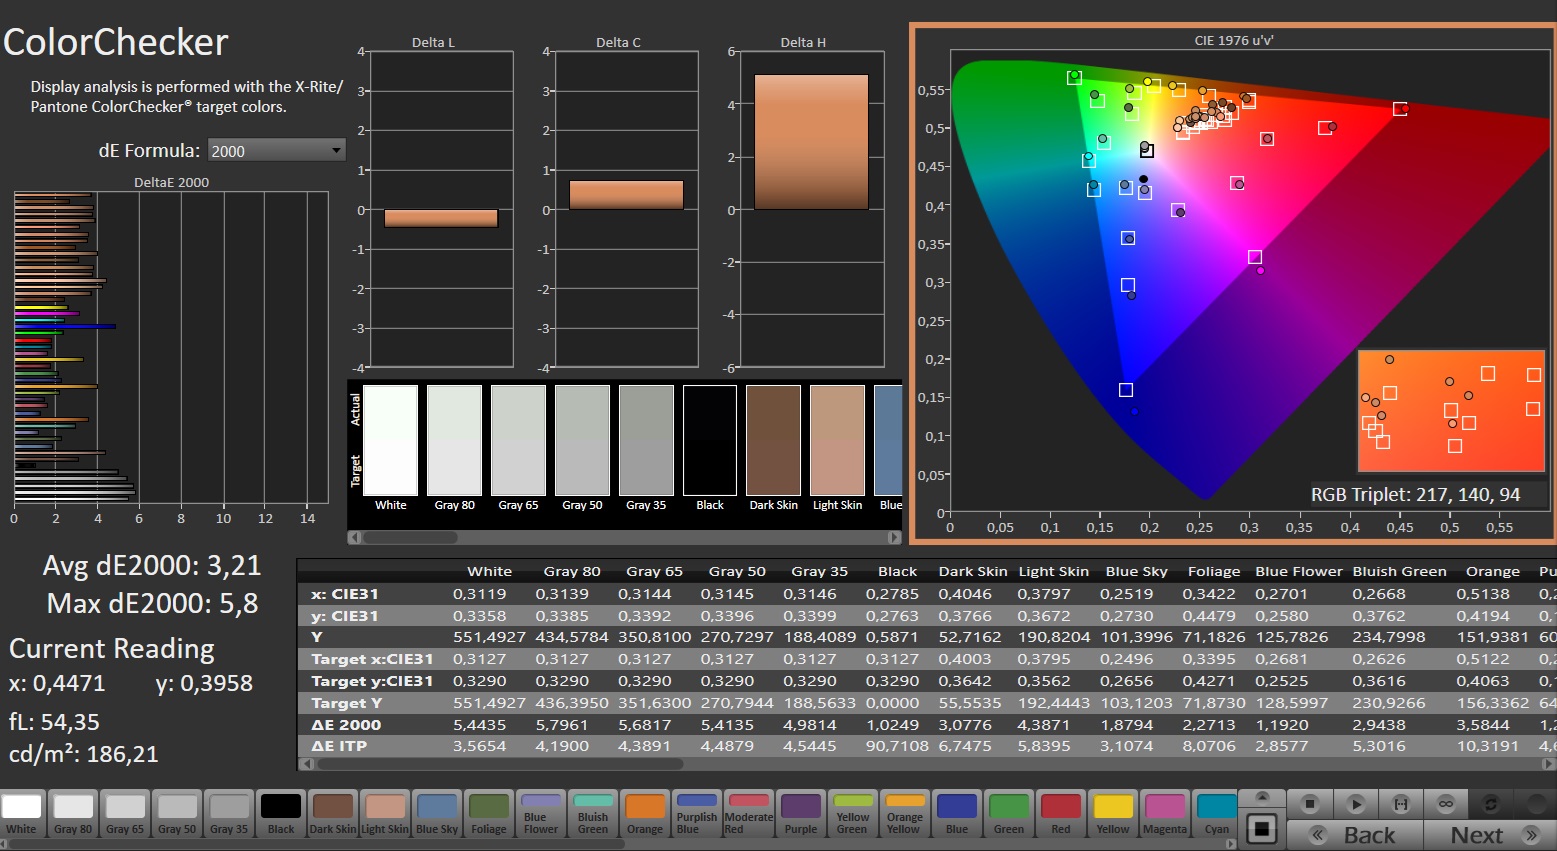
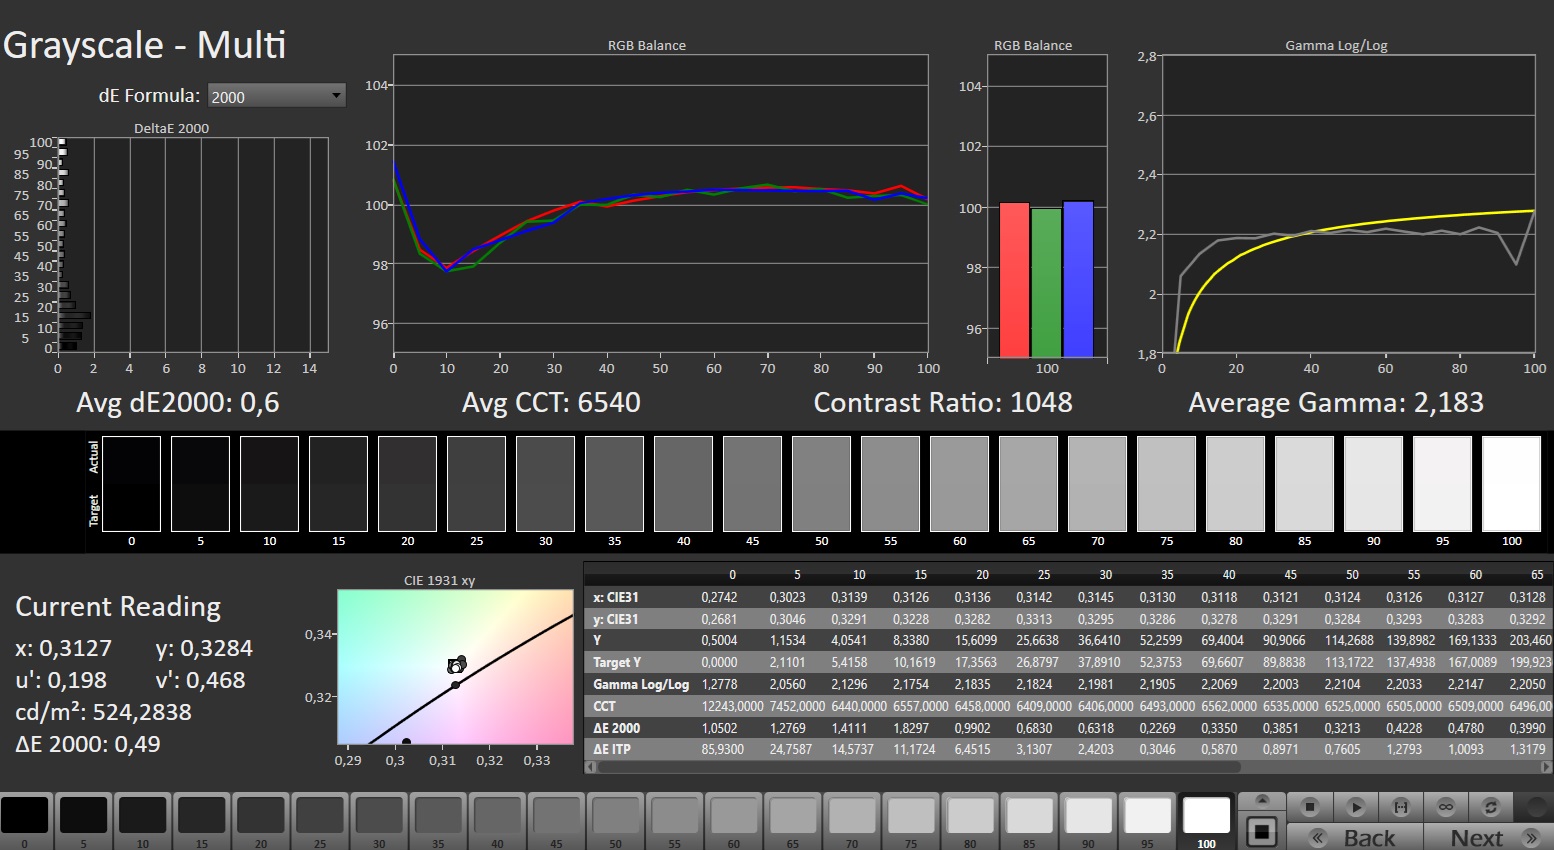
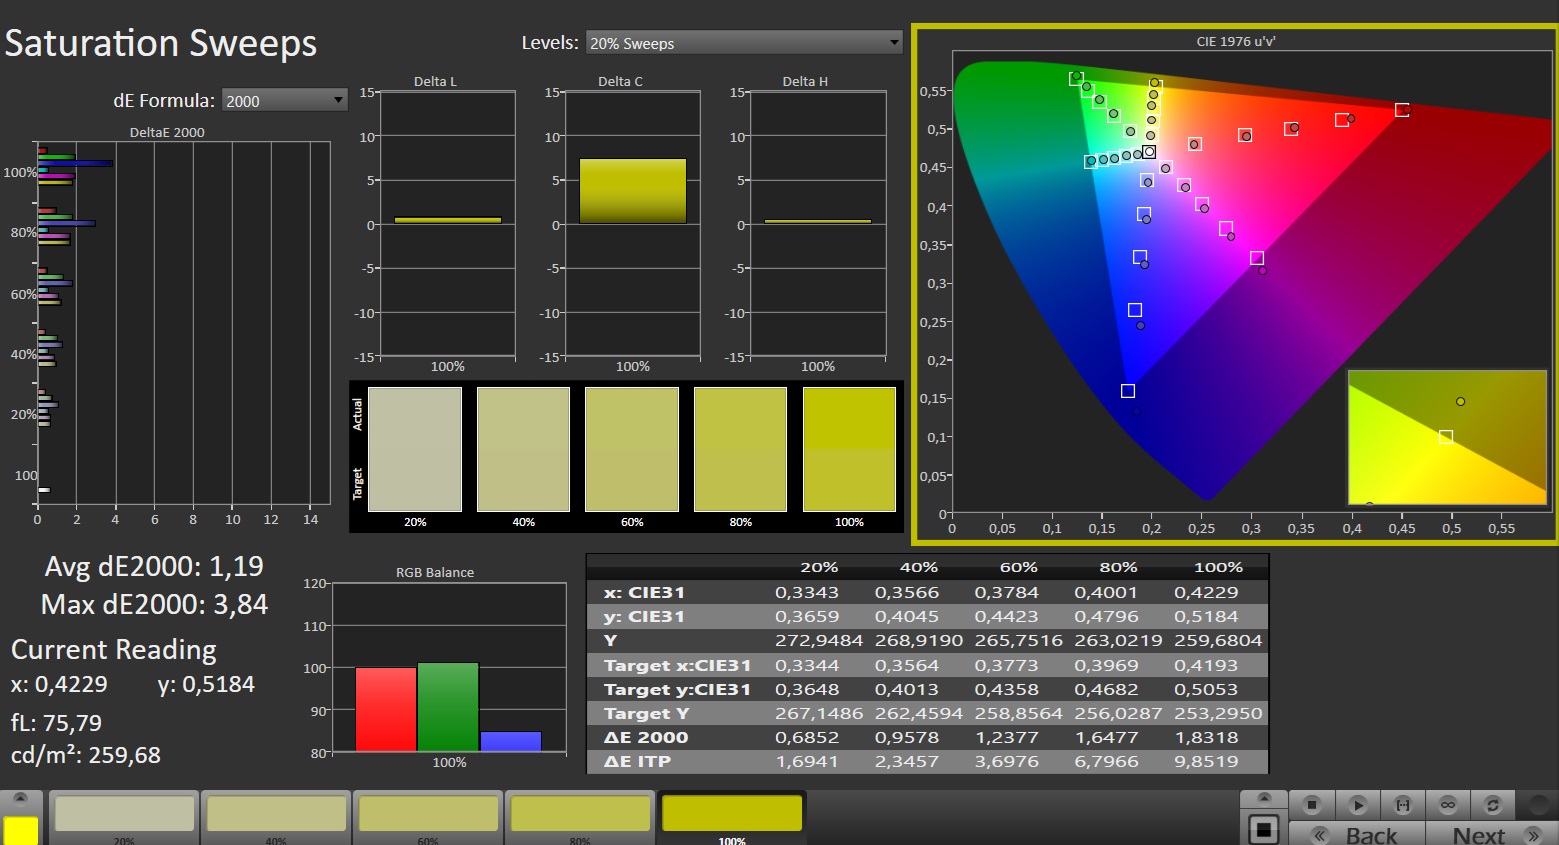
Kurulu 16 inç ekran (2.560 x 1.600 piksel) parlaklık (~ 500 cd/m²) açısından hiçbir eksiklik göstermiyor ancak kontrast (1.000:1) daha yüksek olabilirdi. Bu alanla ilgili olarak Bıçak 16'lar OLED panel daha iyi bir genel paket sunuyor - tasarımı sayesinde harika siyah değerler ve kontrast sağlıyor. Genel olarak, Neo 16 tarafından elde edilen rakamlar, cihazı iç mekanda kullanabilmek için fazlasıyla yeterli. Dışarıda ise güneş çok parlak olmadığı sürece ekran okunabilir. Son derece duyarlı, görüş açısı dengeli 16:10, 240 Hz panelin (IPS, G-Sync) parlaklık ayarından bağımsız olarak herhangi bir PWM titremesi belirtisi göstermemesi bazı olumlu yönleridir. Alternatif ekran seçenekleri mevcut değil.

| |||||||||||||||||||||||||
Aydınlatma: 85 %
Batarya modunda parlaklık: 530 cd/m²
Kontrast: 1000:1 (Siyah: 0.53 cd/m²)
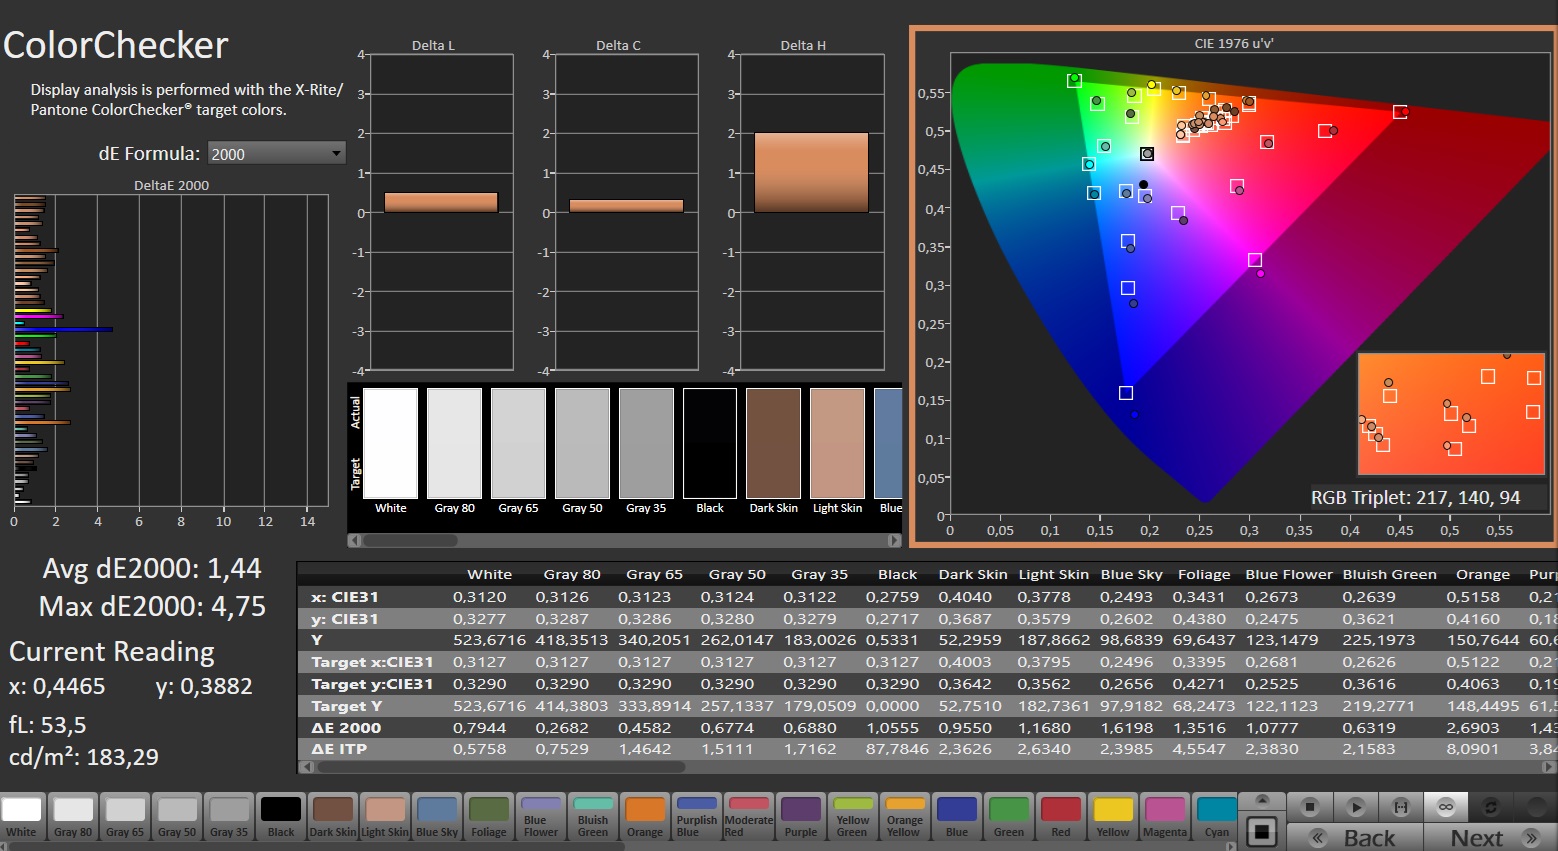
ΔE ColorChecker Calman: 3.21 | ∀{0.5-29.43 Ø4.73}
calibrated: 1.44
ΔE Greyscale Calman: 4.2 | ∀{0.09-98 Ø4.97}
70.6% AdobeRGB 1998 (Argyll 3D)
98% sRGB (Argyll 3D)
70.2% Display P3 (Argyll 3D)
Gamma: 2.226
CCT: 6448 K
| Schenker XMG Neo 16 (Early 24) BOE NE160QDM-NZA, IPS, 2560x1600, 16" | Razer Blade 16 2024, RTX 4090 Samsung SDC41AB (ATNA60DL03-0), OLED, 2560x1600, 16" | Medion Erazer Beast X40 2024 BOE NE170QDM-NZ1, IPS, 2560x1600, 17" | Schenker XMG Neo 16 E23 BOE0AF0 NE160QDM-NZ1, IPS, 2560x1600, 16" | |
|---|---|---|---|---|
| Display | 26% | -1% | -2% | |
| Display P3 Coverage (%) | 70.2 | 99.1 41% | 68.1 -3% | 67.3 -4% |
| sRGB Coverage (%) | 98 | 99.9 2% | 99.5 2% | 96.7 -1% |
| AdobeRGB 1998 Coverage (%) | 70.6 | 95.6 35% | 69 -2% | 68.9 -2% |
| Response Times | 95% | -20% | -49% | |
| Response Time Grey 50% / Grey 80% * (ms) | 11.2 ? | 0.24 ? 98% | 11.7 ? -4% | 14.5 ? -29% |
| Response Time Black / White * (ms) | 5.1 ? | 0.4 ? 92% | 6.9 ? -35% | 8.6 ? -69% |
| PWM Frequency (Hz) | 960 | |||
| Screen | 251% | 25% | 15% | |
| Brightness middle (cd/m²) | 530 | 418 -21% | 422 -20% | 372 -30% |
| Brightness (cd/m²) | 497 | 420 -15% | 388 -22% | 349 -30% |
| Brightness Distribution (%) | 85 | 98 15% | 87 2% | 88 4% |
| Black Level * (cd/m²) | 0.53 | 0.02 96% | 0.42 21% | 0.32 40% |
| Contrast (:1) | 1000 | 20900 1990% | 1005 0% | 1163 16% |
| Colorchecker dE 2000 * | 3.21 | 1.07 67% | 1.42 56% | 2.06 36% |
| Colorchecker dE 2000 max. * | 5.8 | 4.04 30% | 1.97 66% | 3 48% |
| Colorchecker dE 2000 calibrated * | 1.44 | 1.07 26% | 0.7 51% | 1.5 -4% |
| Greyscale dE 2000 * | 4.2 | 1.12 73% | 1.2 71% | 1.9 55% |
| Gamma | 2.226 99% | 2.29 96% | 2.078 106% | 2.312 95% |
| CCT | 6448 101% | 6417 101% | 6581 99% | 6747 96% |
| Toplam Ortalama (Program / Ayarlar) | 124% /
181% | 1% /
13% | -12% /
2% |
* ... daha küçük daha iyidir
Kutudan çıktığı haliyle ekran iyi bir renk üretimi sunuyor: DeltaE 3,2 ile sapma hedef değeri (DeltaE < 3) biraz ıskalıyor. Kalibrasyon bunu 1,44'e düşürüyor - iyi bir rakam. Tüm standart renk alanlarında (AdobeRGB, sRGB, DCI P3) panel - tıpkı Erazer Beast X40'lar ekran - yalnızca sRGB alanını neredeyse tamamen görüntüleyebilir. Her üç renk alanını da görüntülemek, aşağıdakilerde bulunan OLED panel için ayrılmıştır Bıçak 16.
Oluşturduğumuz renk profili ücretsiz olarak indirilebilir ve kullanılabilir. Ekranın bilgi kutusunda bir bağlantı bulunabilir.
Yanıt Sürelerini Görüntüle
| ↔ Tepki Süresi Siyahtan Beyaza | ||
|---|---|---|
| 5.1 ms ... yükseliş ↗ ve sonbahar↘ birleşimi | ↗ 1.6 ms yükseliş | 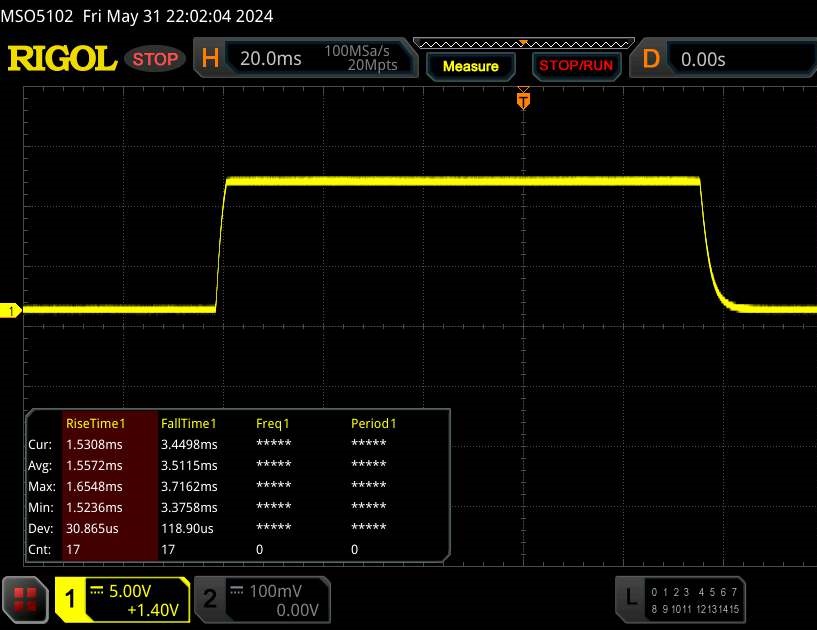 |
| ↘ 3.5 ms sonbahar | ||
| Ekran, testlerimizde çok hızlı yanıt oranları gösteriyor ve hızlı oyun oynamaya çok uygun olmalı. Karşılaştırıldığında, test edilen tüm cihazlar 0.1 (minimum) ile 240 (maksimum) ms arasında değişir. » Tüm cihazların 18 %'si daha iyi. Bu, ölçülen yanıt süresinin test edilen tüm cihazların ortalamasından (19.9 ms) daha iyi olduğu anlamına gelir. | ||
| ↔ Tepki Süresi %50 Griden %80 Griye | ||
| 11.2 ms ... yükseliş ↗ ve sonbahar↘ birleşimi | ↗ 5.2 ms yükseliş | 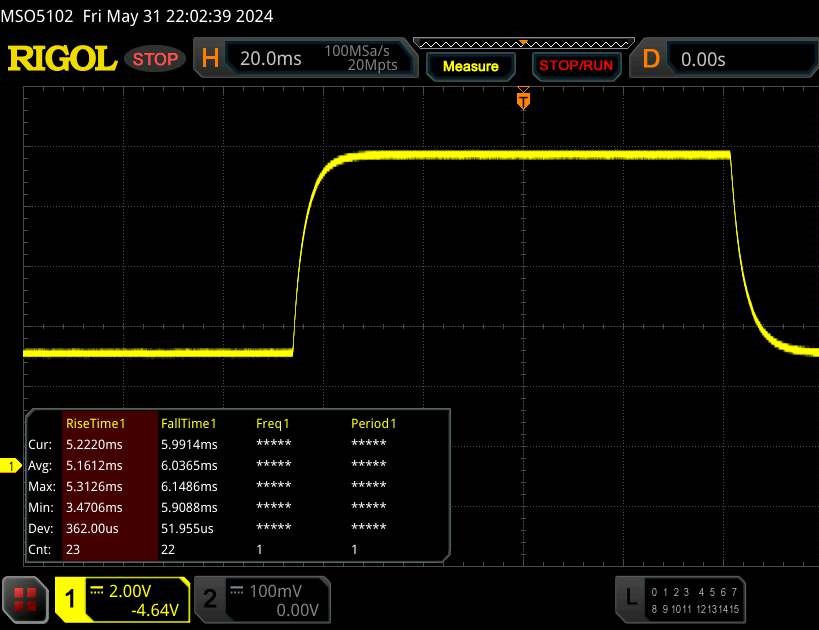 |
| ↘ 6 ms sonbahar | ||
| Ekran, testlerimizde iyi yanıt oranları gösteriyor ancak rekabetçi oyuncular için çok yavaş olabilir. Karşılaştırıldığında, test edilen tüm cihazlar 0.165 (minimum) ile 636 (maksimum) ms arasında değişir. » Tüm cihazların 25 %'si daha iyi. Bu, ölçülen yanıt süresinin test edilen tüm cihazların ortalamasından (31.1 ms) daha iyi olduğu anlamına gelir. | ||
Ekran Titremesi / PWM (Darbe Genişliği Modülasyonu)
| Ekran titriyor / PWM algılanmadı |  | ||
Karşılaştırıldığında: Test edilen tüm cihazların %52 %'si ekranı karartmak için PWM kullanmıyor. PWM tespit edilirse, ortalama 7791 (minimum: 5 - maksimum: 343500) Hz ölçüldü. | |||
Performans - Raptor Lake ve Ada Lovelace bir ton güç sağlıyor
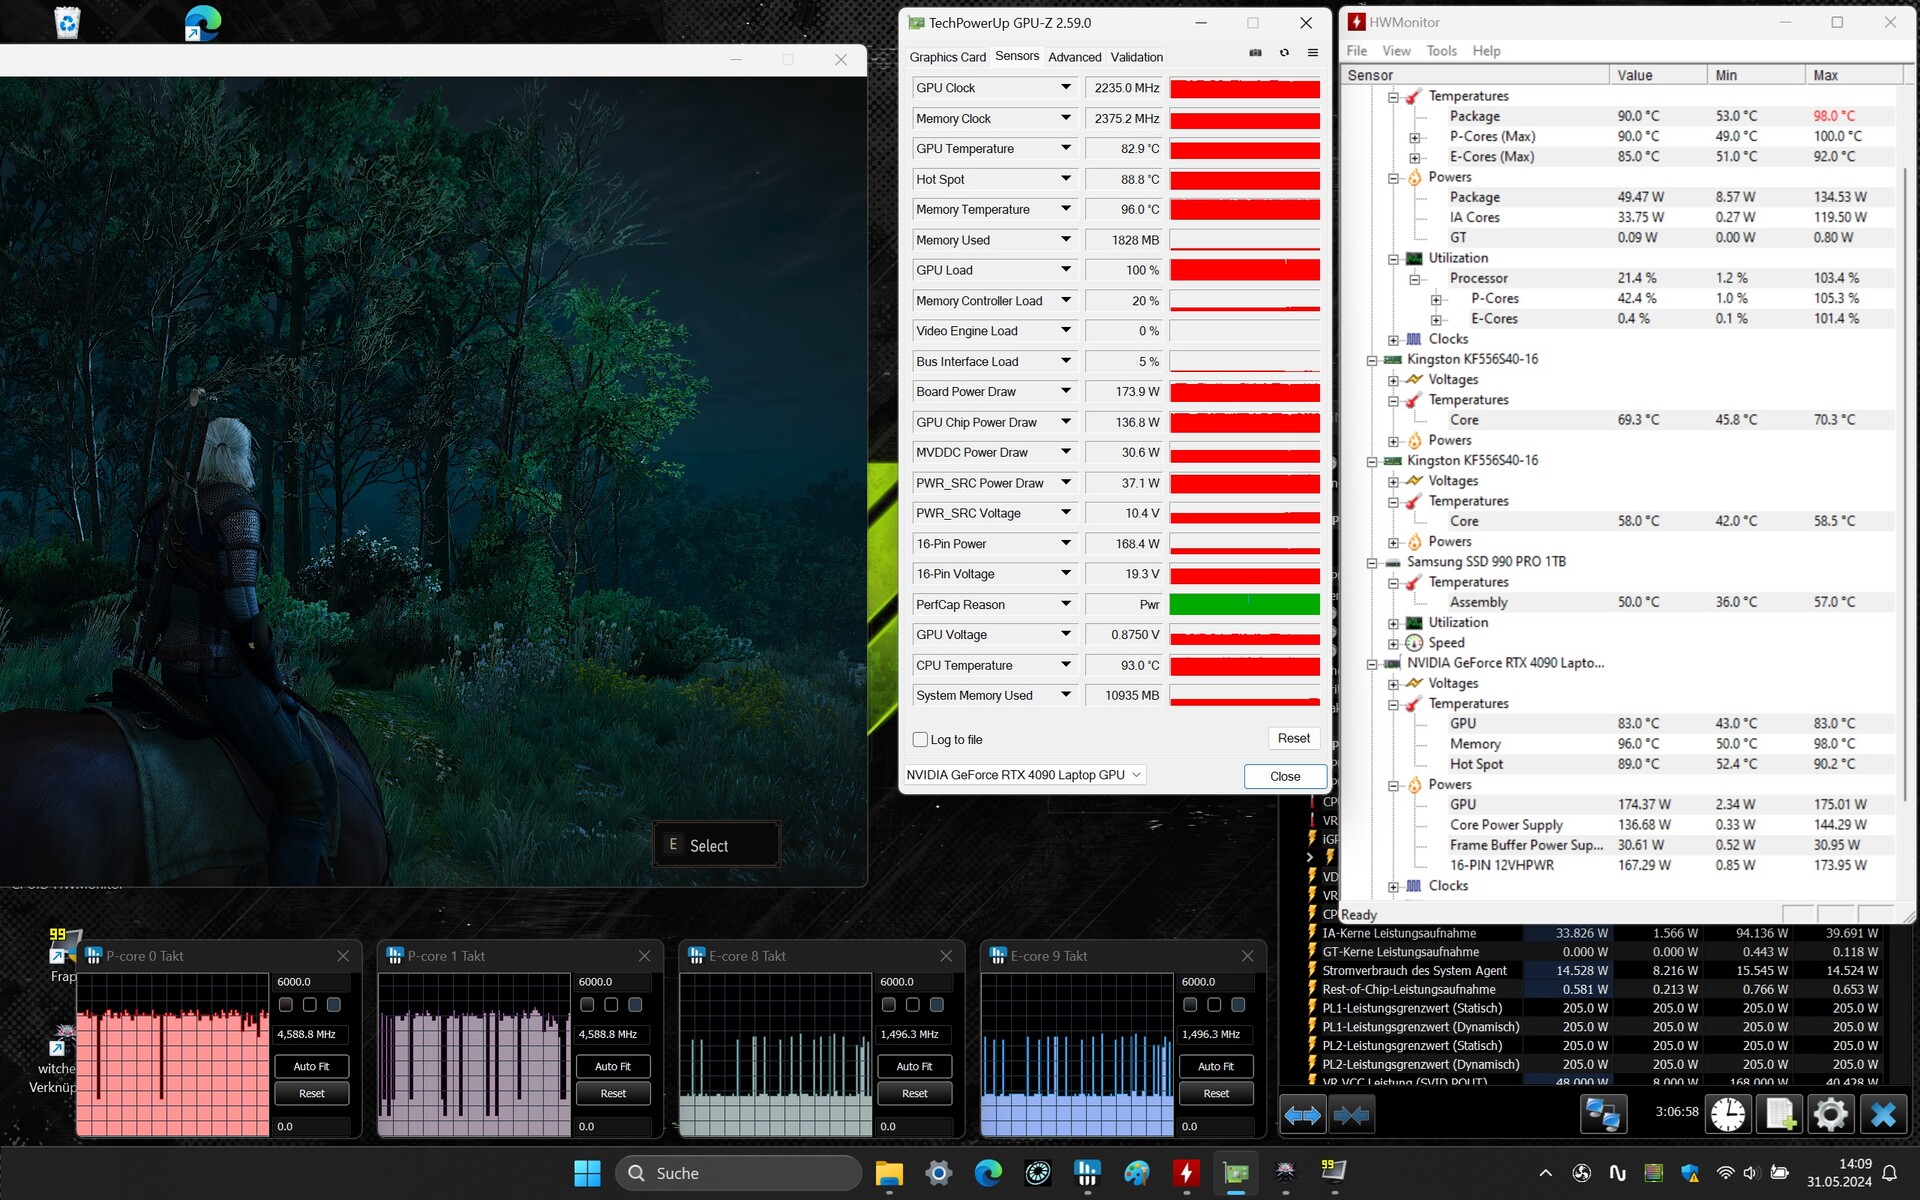
Neo 16 (Early 24) oyunculara, yaratıcılara ve genel olarak çok fazla güce ihtiyaç duyan tüm kullanıcı gruplarına yöneliktir. Her özellik varyantı bir Core i9 14900HX ile donatılmıştır ve GPU paleti RTX 4060 ile RTX 4090 arasında değişmektedir - modelimiz bir RTX 4090'dır. Bireysel konfigürasyonlar ve dizüstü bilgisayarı satın almak Bestware.com (Almanca) üzerinden mümkündür. Elimizdeki inceleme cihazı yaklaşık 4.000 $'a alınabilirken giriş seviyesi model (RTX 4060) yaklaşık 2.000 $'a mal oluyor. İsteğe bağlı olarak sunulan su soğutma (Oasis MK2) RTX 4080 veya RTX 4090 Neo 16 modellerine dahildir.
Test koşulları
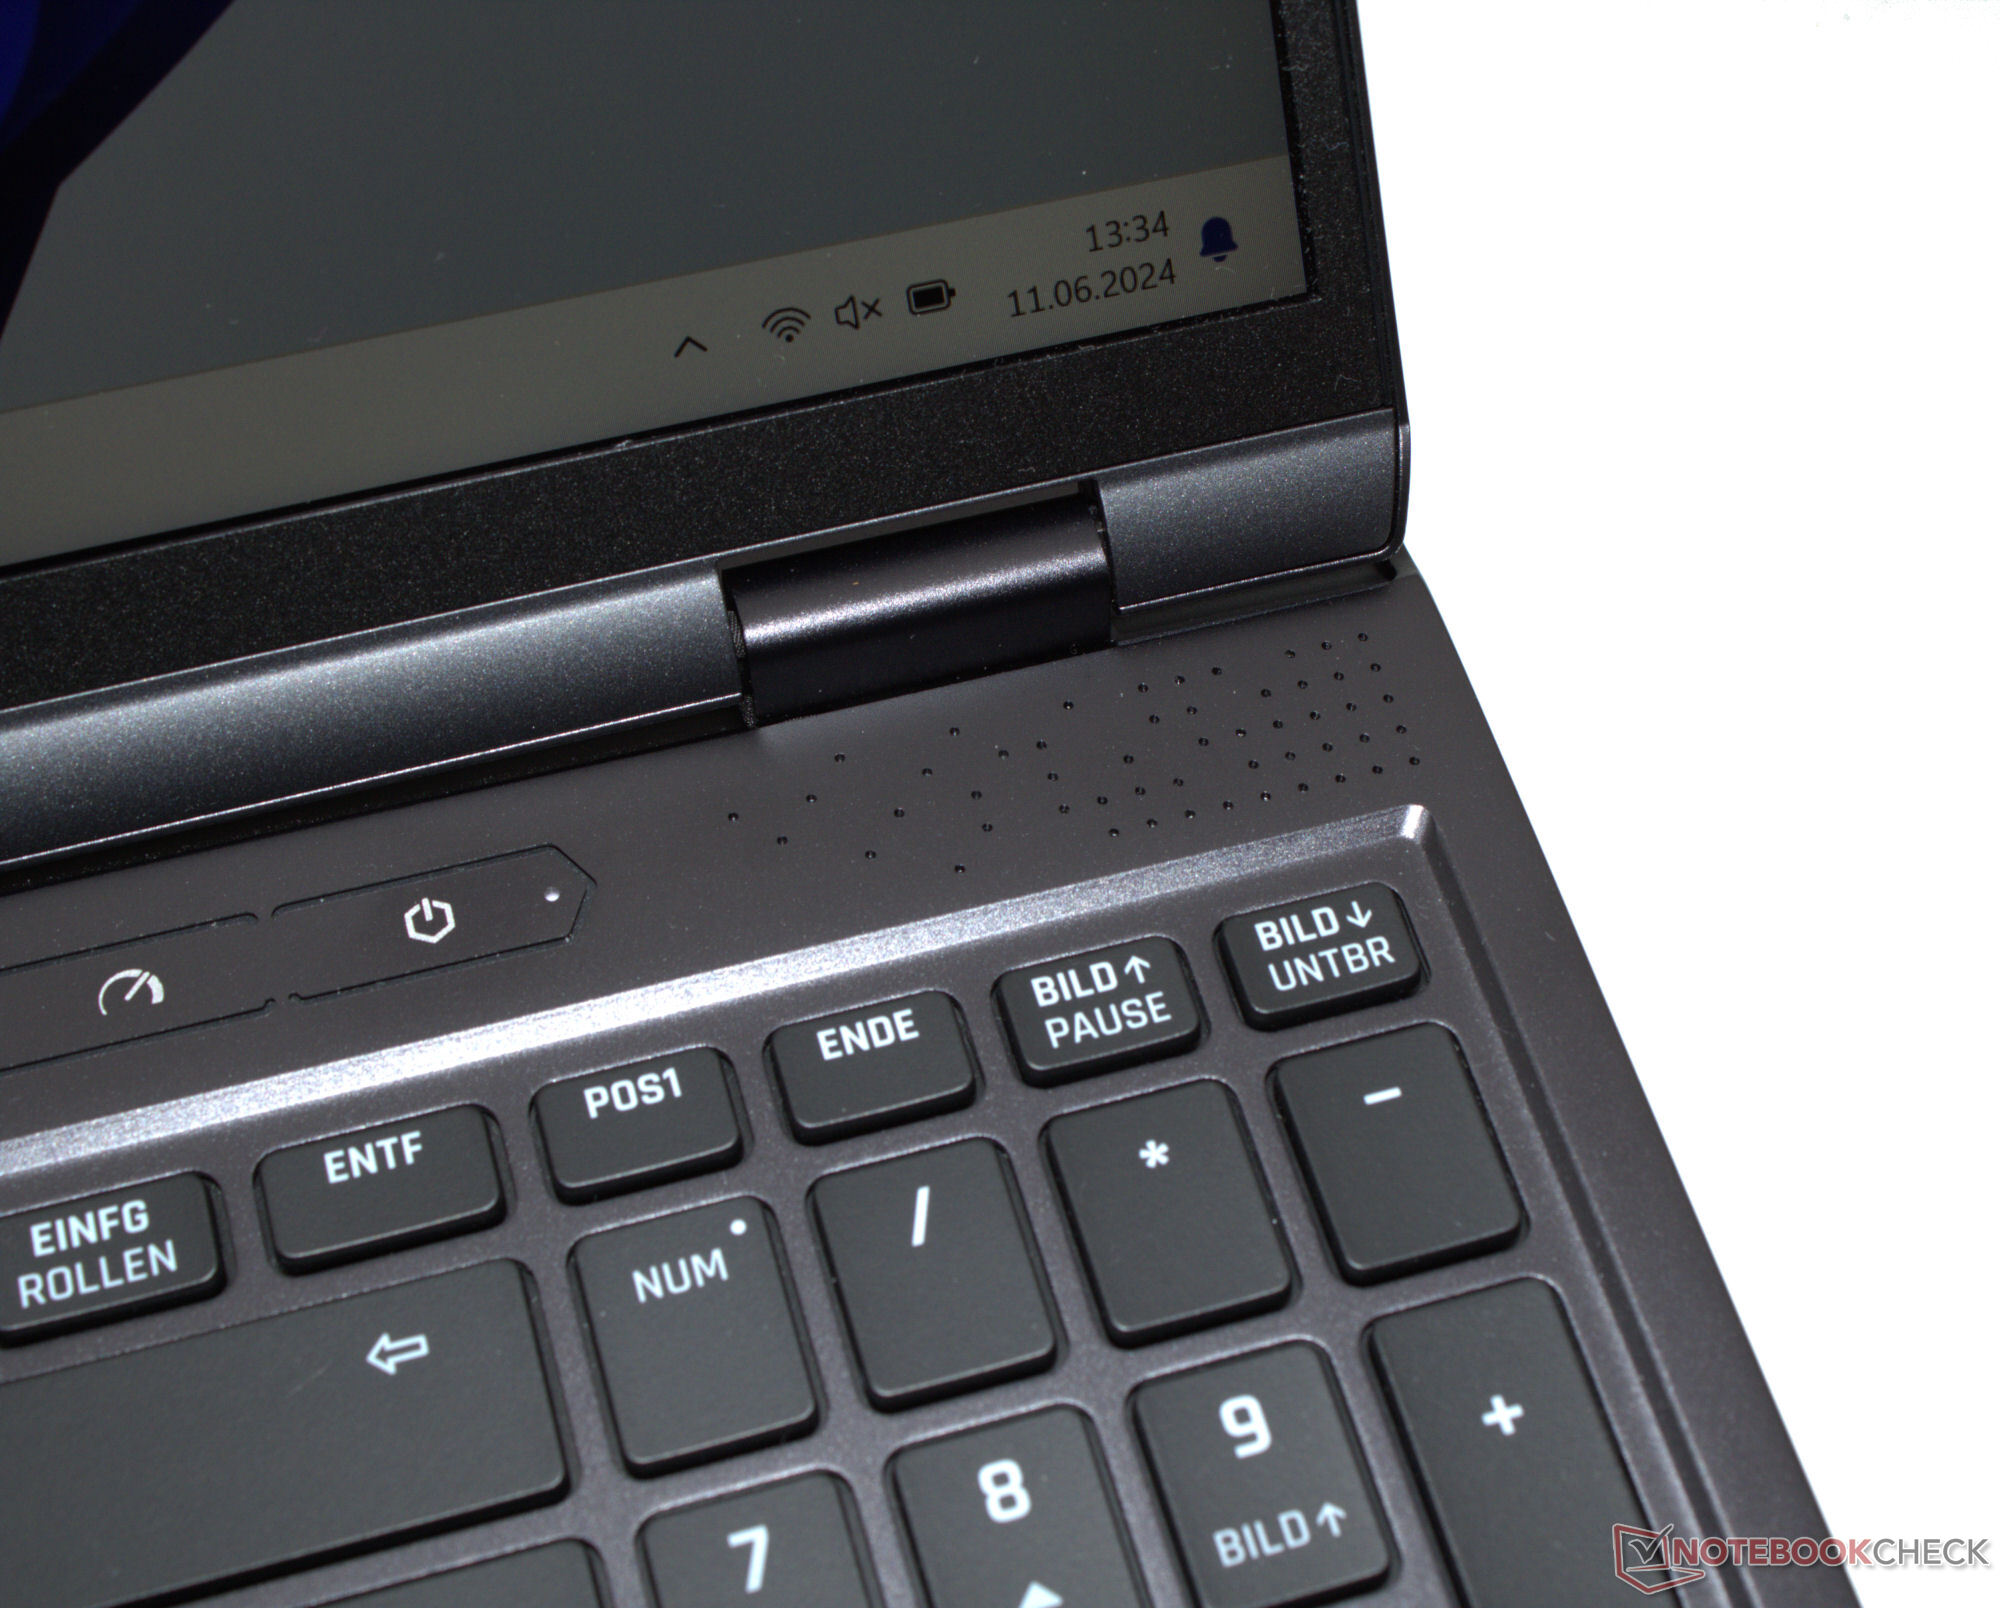
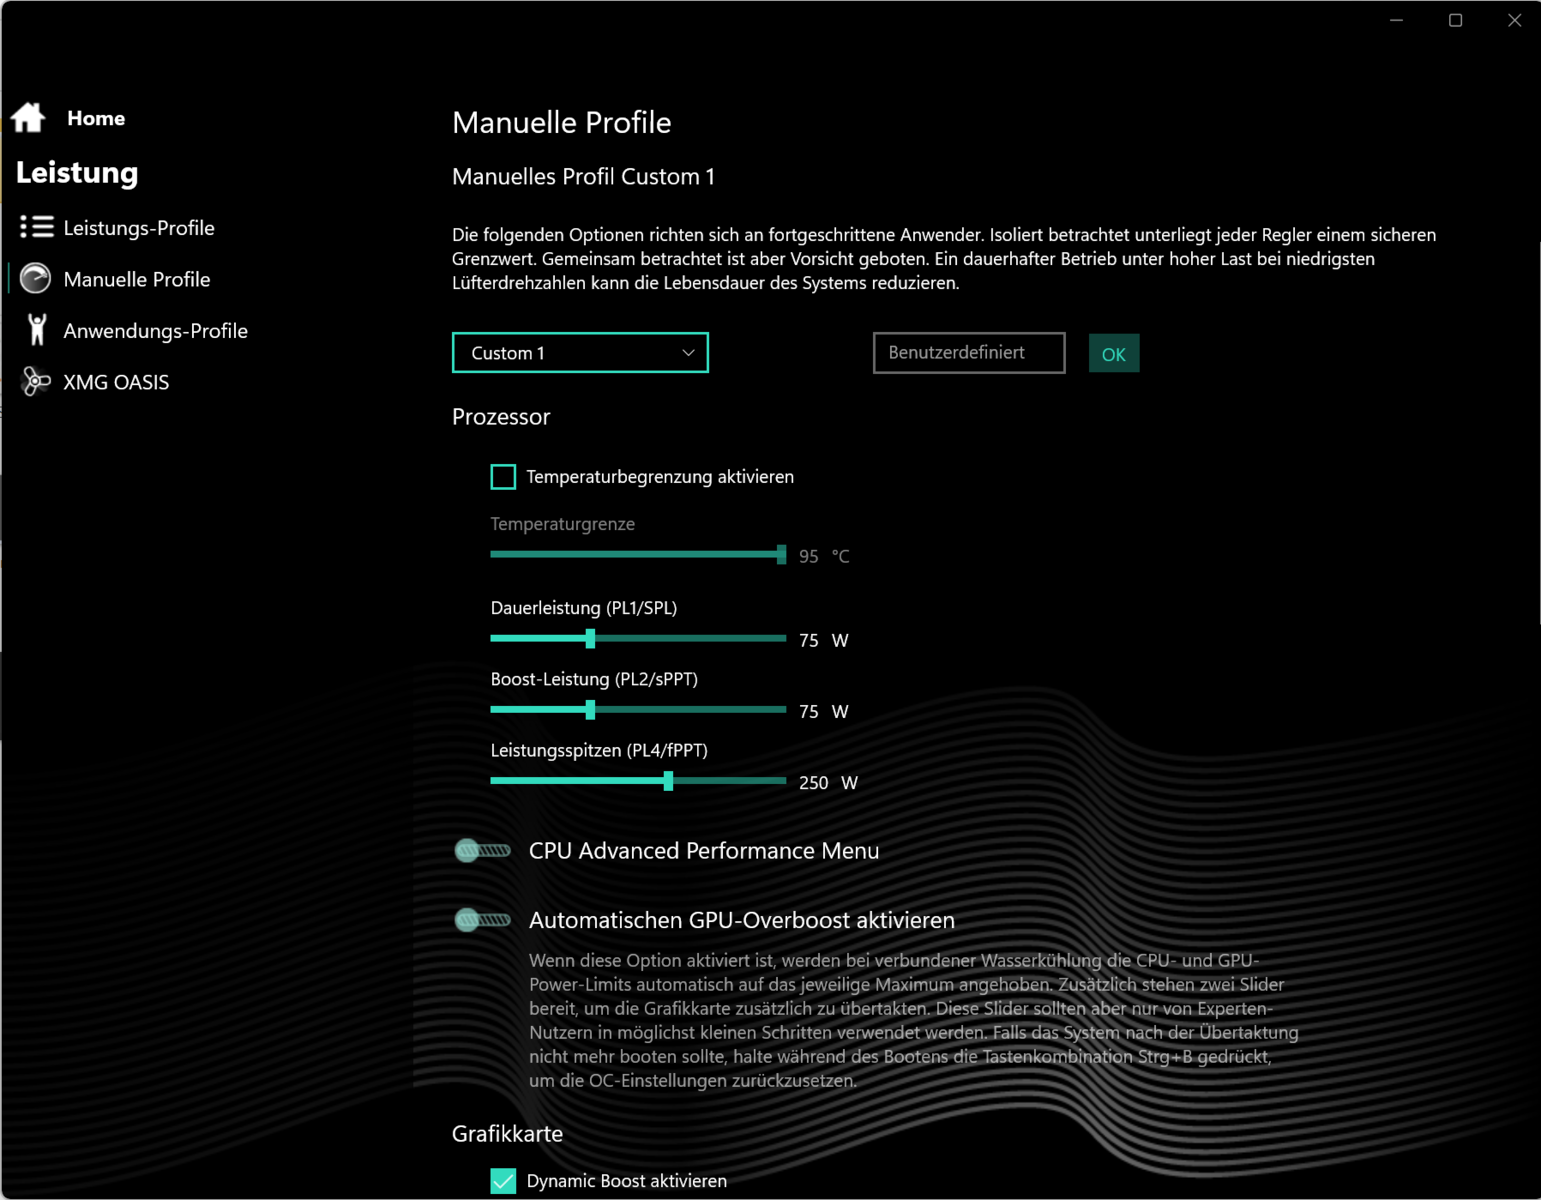
Üreticiye özel üç performans modundan birini seçebilirsiniz (tabloya bakın). Test sırasında "Overboost" (kıyaslamalar) ve "Balanced" (pil testi) modlarını kullandık. GPU modu "Hybrid" (= Optimus) olarak ayarlanmıştı. Bireysel profilleri Kontrol Merkezi üzerinden yönetebilirsiniz. Bu, CPU Güç Limitini, GPU'nun TGP'sini ve/veya sıcaklık üst limitini ayarlayabileceğiniz anlamına gelir. Ayrı bir tuş (güç düğmesinin yanında) modlar arasında hızlı geçiş yapılmasını sağlar.
İsteğe bağlı olarak sunulan harici su soğutması (Oasis Mk2) elimizin altındaydı ancak test sırasında kullanmadık. Bununla birlikte, resmi testlerden bağımsız olarak bazı ölçümler yaptık (karşılaştırma tablosuna bakın).
| Overboost | Enthusiast | Balanced | |
|---|---|---|---|
| Güç Sınırı 1 (HWInfo) | 205 Watt | 205 Watt | 205 Watt |
| Güç Sınırı 2 (HWInfo) | 205 Watt | 205 Watt | 205 Watt |
| Gürültü (Witcher 3) | 54 dB(A) | 51 dB(A) | 32 dB(A) |
| Performans (Witcher 3) | 214fps | 198fps | 30fps (kilit) |

İşlemci
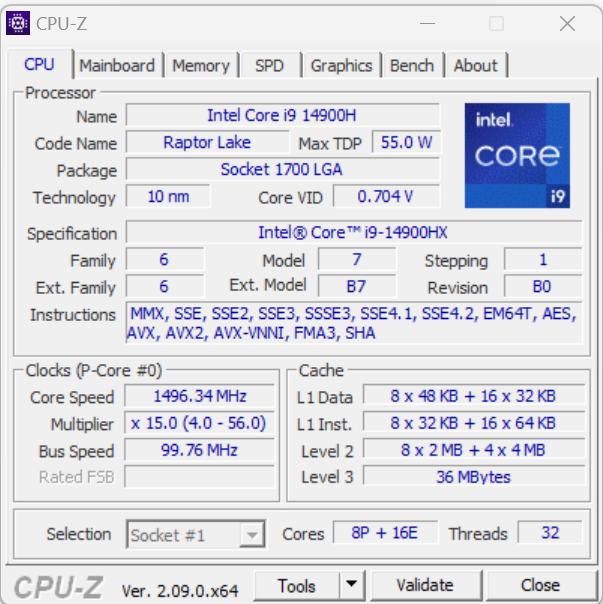
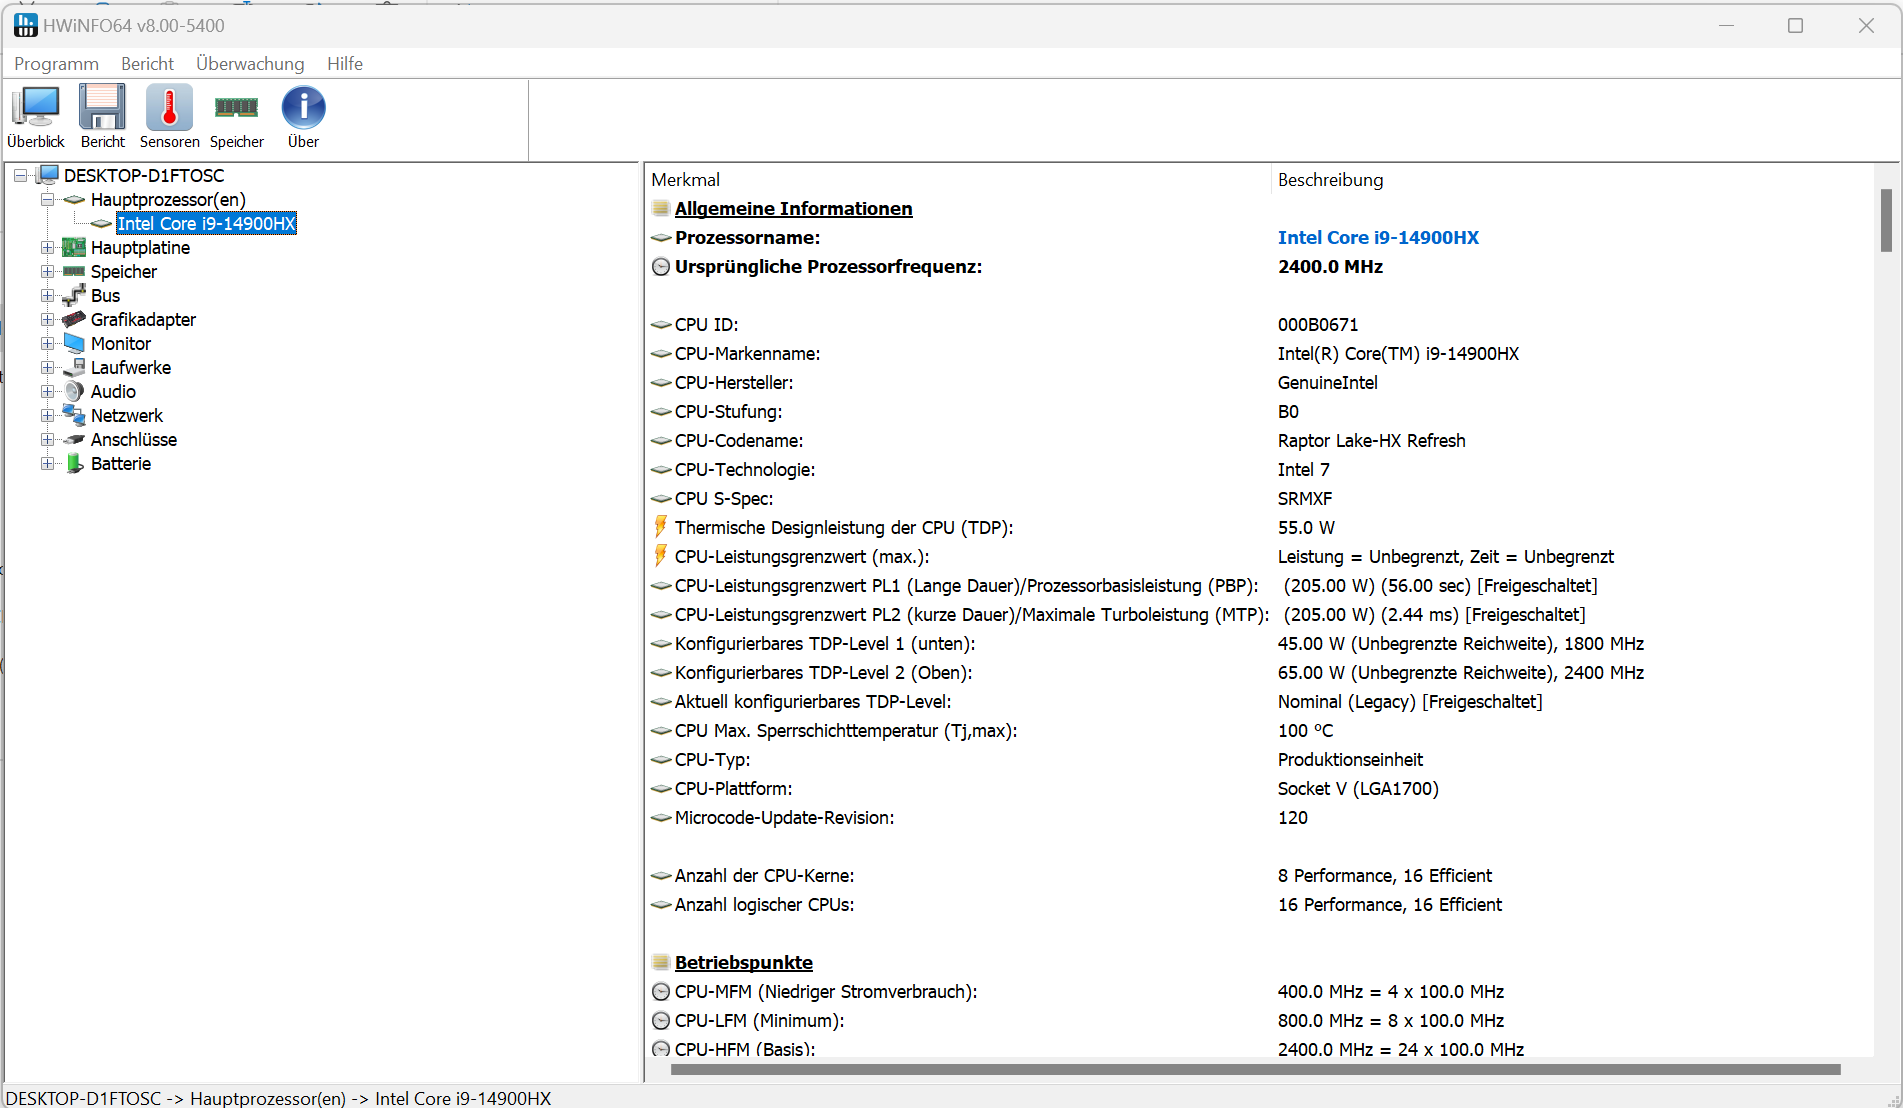
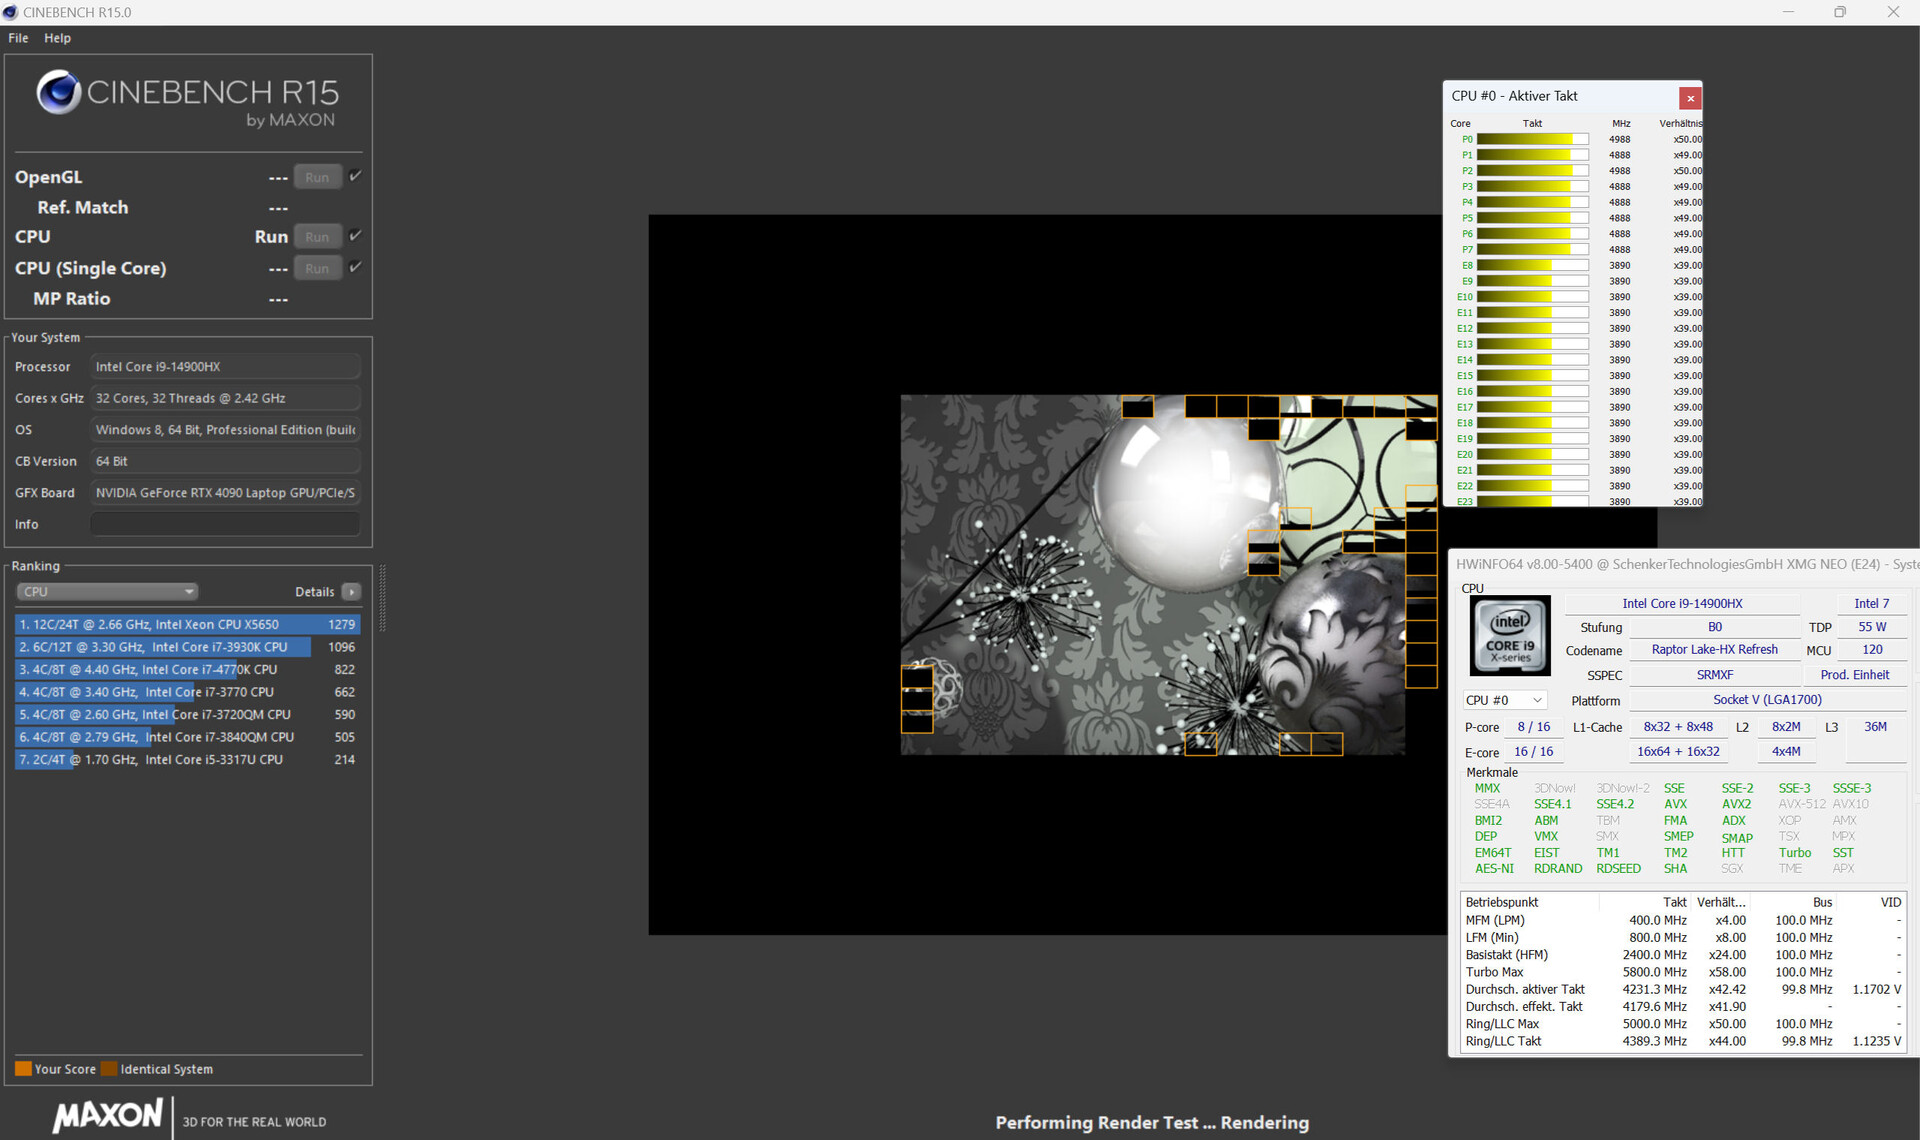
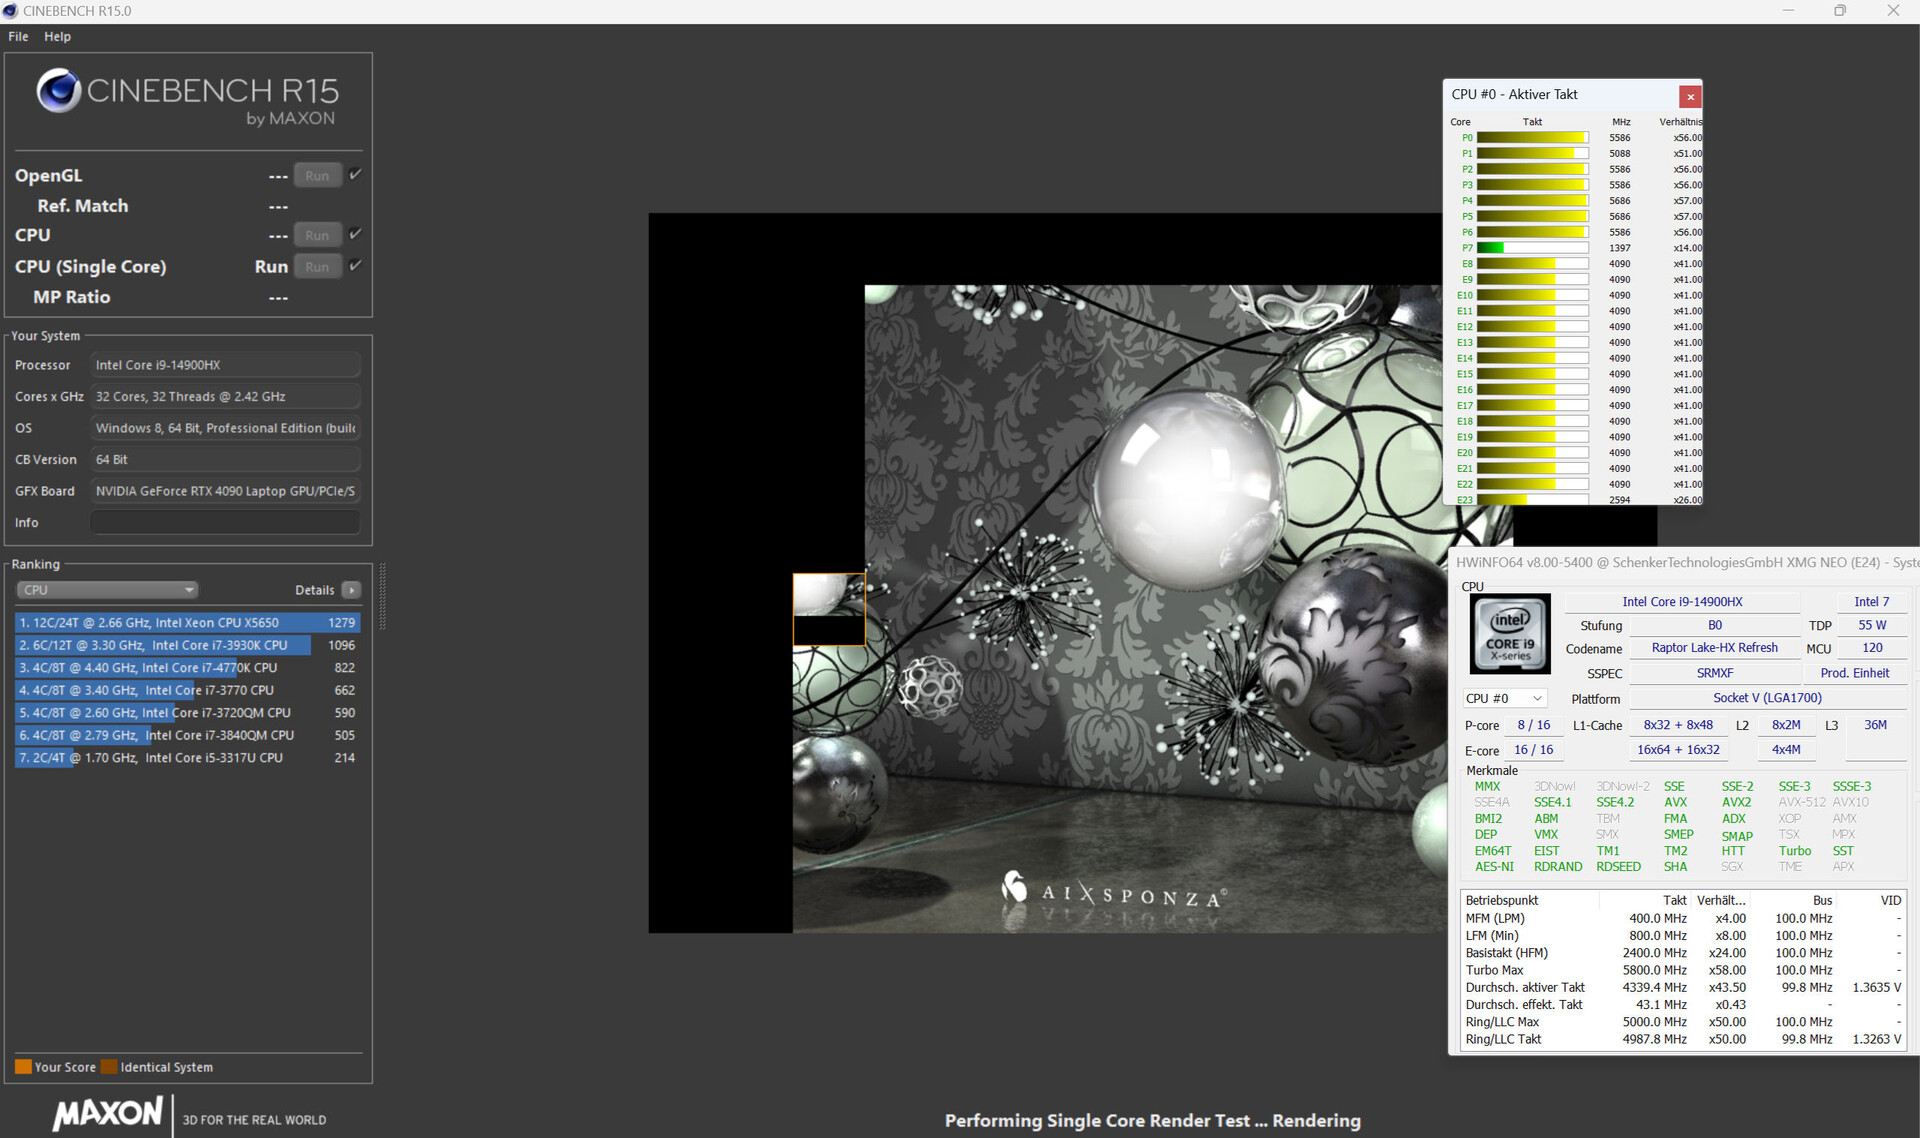
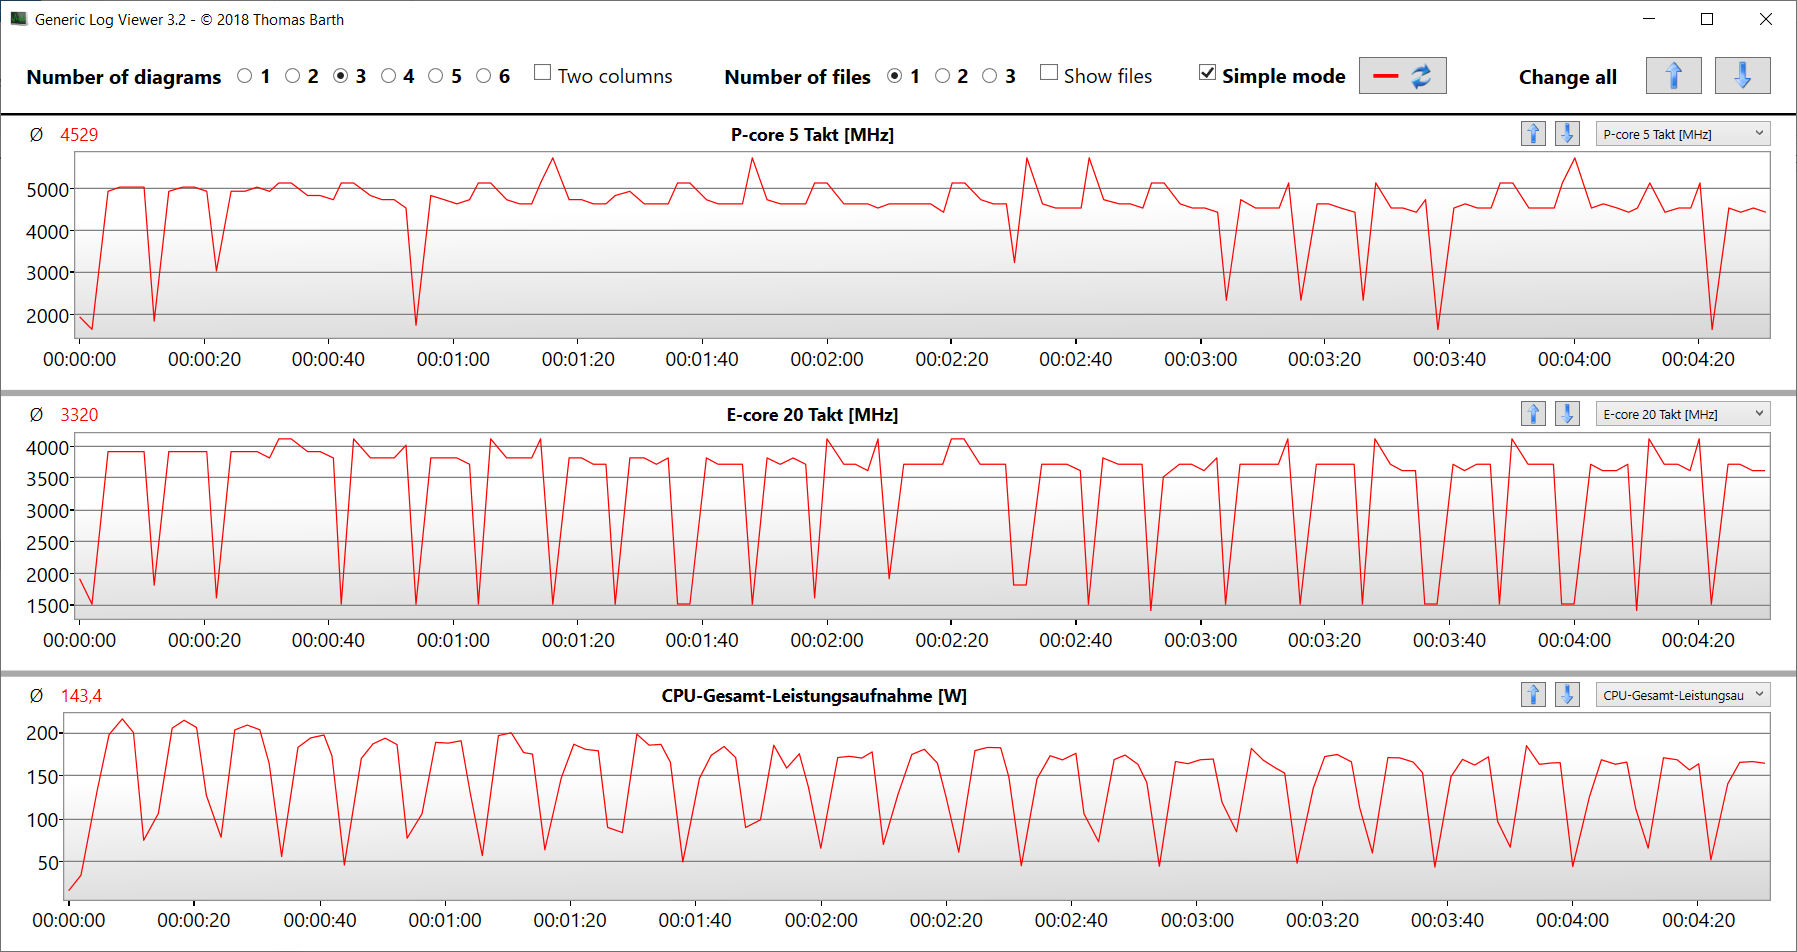
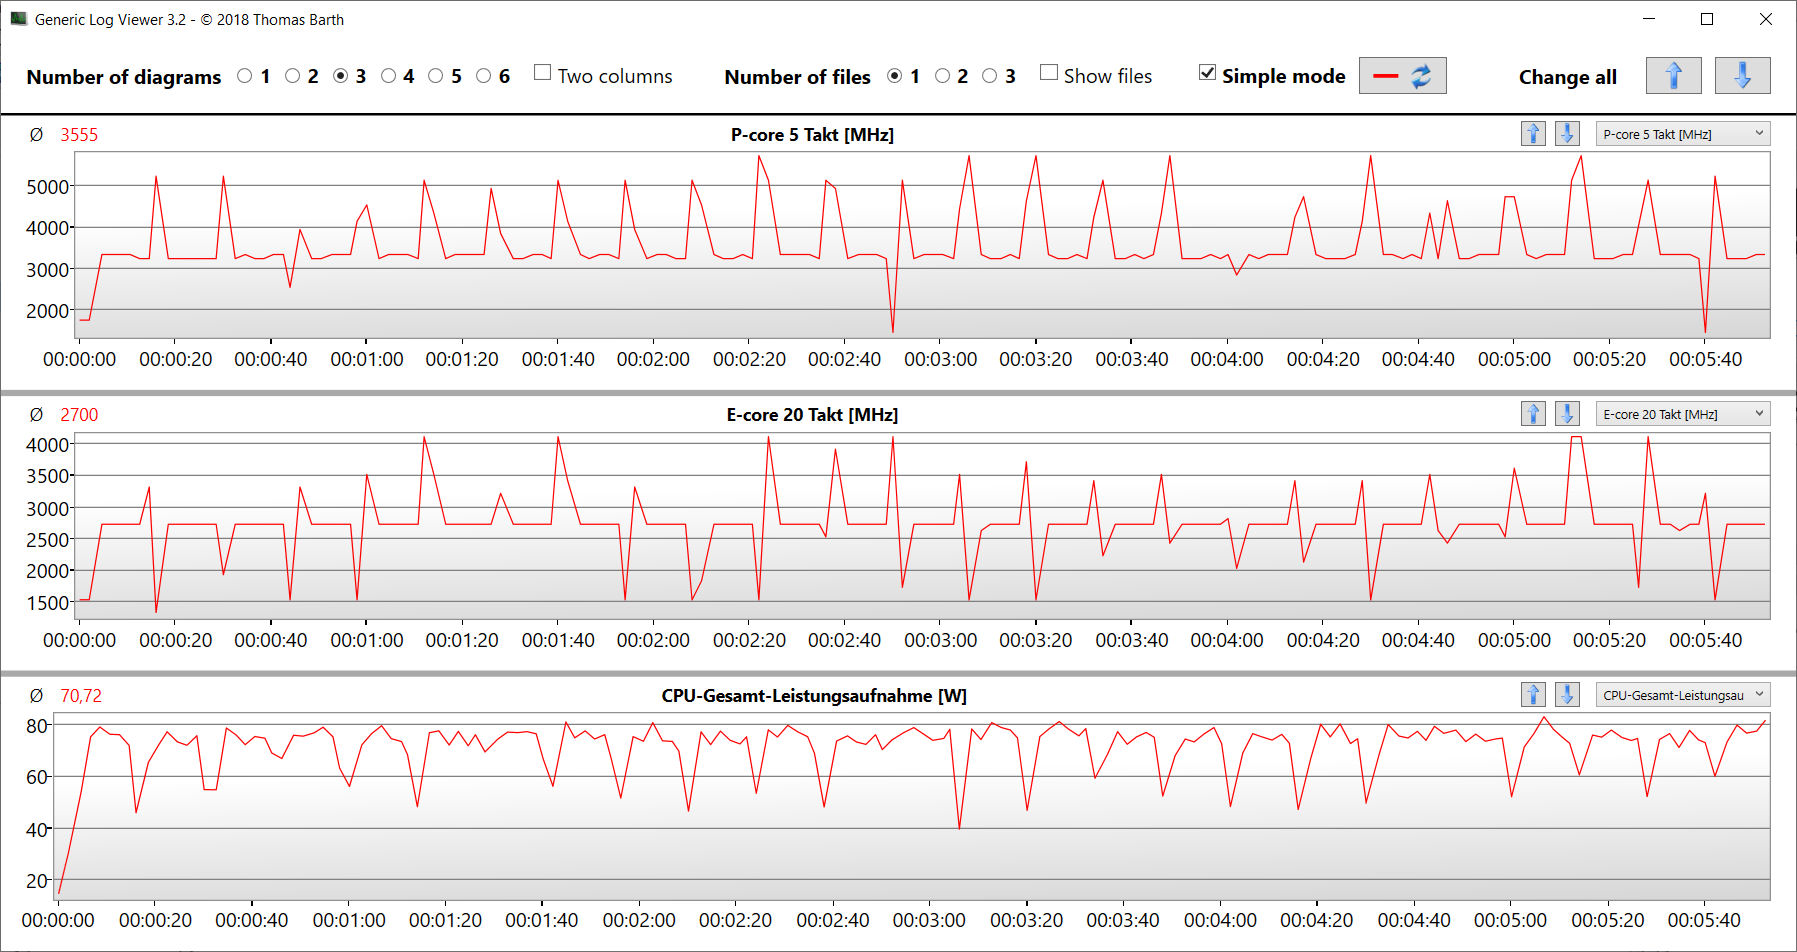
Dizüstü bilgisayar bir Core i9 14900HX (Raptor Lake) - diğer CPU'lar mevcut değildir. Core i9, maksimum 5,8 GHz (P) ve 4,1 GHz (E) hızında tam 24 çekirdek (8P + 16E = 32 iş parçacığı) sunar. Sürekli çoklu iş parçacığı yükü (CB15 döngüsü), sürekli ancak hafifçe azalan performansla (Overboost) sonuçlanır - Oasis su soğutmasının kullanılması bu etkiye karşı koyar. Diğer iki güç modu, su soğut ması olmadan da tutarlı performans sağlar - tabii ki düşük seviyede.
"Overboost" ortalamanın üzerinde CPU rakamları sunarken "Enthusiast" ortalamanın biraz altındadır - bu çoğunlukla çoklu iş parçacığı performansı için geçerlidir. Üç profilin her birinde, tek iş parçacığı performansı benzer şekilde yüksek seviyededir. İsteğe bağlı su soğutma (Oasis) küçük bir performans artışına neden olur.
Cinebench R15 Multi Continuous Test
| CPU Performance rating - Percent | |
| Schenker XMG Neo 16 (Early 24) | |
| Schenker XMG Neo 16 (Early 24) | |
| Asus ROG Strix Scar 17 G733PYV-LL053X | |
| Asus ROG Strix Scar 16 G634JZR | |
| Razer Blade 16 2024, RTX 4090 | |
| Ortalama Intel Core i9-14900HX | |
| Lenovo Legion Pro 7 RTX4090 -2! | |
| Schenker XMG Neo 16 E23 -2! | |
| Medion Erazer Beast X40 2024 | |
| Lenovo Legion 9 16IRX9, RTX 4090 | |
| Sınıf ortalaması Gaming | |
| Alienware x16 R2 P120F | |
| Cinebench R23 | |
| Multi Core | |
| Schenker XMG Neo 16 (Early 24) | |
| Schenker XMG Neo 16 (Early 24) (Overboost, Oasis) | |
| Asus ROG Strix Scar 17 G733PYV-LL053X | |
| Lenovo Legion 9 16IRX9, RTX 4090 | |
| Lenovo Legion Pro 7 RTX4090 | |
| Asus ROG Strix Scar 16 G634JZR | |
| Schenker XMG Neo 16 E23 | |
| Razer Blade 16 2024, RTX 4090 | |
| Ortalama Intel Core i9-14900HX (17078 - 36249, n=37) | |
| Sınıf ortalaması Gaming (10488 - 40970, n=110, son 2 yıl) | |
| Medion Erazer Beast X40 2024 | |
| Alienware x16 R2 P120F | |
| Single Core | |
| Medion Erazer Beast X40 2024 | |
| Schenker XMG Neo 16 (Early 24) | |
| Schenker XMG Neo 16 (Early 24) (Overboost, Oasis) | |
| Asus ROG Strix Scar 16 G634JZR | |
| Ortalama Intel Core i9-14900HX (1720 - 2245, n=37) | |
| Razer Blade 16 2024, RTX 4090 | |
| Schenker XMG Neo 16 E23 | |
| Lenovo Legion Pro 7 RTX4090 | |
| Sınıf ortalaması Gaming (1166 - 2356, n=110, son 2 yıl) | |
| Asus ROG Strix Scar 17 G733PYV-LL053X | |
| Lenovo Legion 9 16IRX9, RTX 4090 | |
| Alienware x16 R2 P120F | |
| Cinebench R20 | |
| CPU (Multi Core) | |
| Schenker XMG Neo 16 (Early 24) (Overboost, Oasis, Overboost, Oasis) | |
| Schenker XMG Neo 16 (Early 24) | |
| Asus ROG Strix Scar 17 G733PYV-LL053X | |
| Lenovo Legion 9 16IRX9, RTX 4090 | |
| Lenovo Legion Pro 7 RTX4090 | |
| Asus ROG Strix Scar 16 G634JZR | |
| Schenker XMG Neo 16 E23 | |
| Ortalama Intel Core i9-14900HX (6579 - 13832, n=37) | |
| Razer Blade 16 2024, RTX 4090 | |
| Sınıf ortalaması Gaming (4029 - 16108, n=109, son 2 yıl) | |
| Medion Erazer Beast X40 2024 | |
| Alienware x16 R2 P120F | |
| CPU (Single Core) | |
| Medion Erazer Beast X40 2024 | |
| Schenker XMG Neo 16 (Early 24) (Overboost, Oasis, Overboost, Oasis) | |
| Schenker XMG Neo 16 (Early 24) | |
| Asus ROG Strix Scar 16 G634JZR | |
| Ortalama Intel Core i9-14900HX (657 - 859, n=37) | |
| Razer Blade 16 2024, RTX 4090 | |
| Schenker XMG Neo 16 E23 | |
| Lenovo Legion Pro 7 RTX4090 | |
| Sınıf ortalaması Gaming (442 - 895, n=109, son 2 yıl) | |
| Asus ROG Strix Scar 17 G733PYV-LL053X | |
| Lenovo Legion 9 16IRX9, RTX 4090 | |
| Alienware x16 R2 P120F | |
| Cinebench R15 | |
| CPU Multi 64Bit | |
| Asus ROG Strix Scar 17 G733PYV-LL053X | |
| Schenker XMG Neo 16 (Early 24) (Overboost, Oasis) | |
| Schenker XMG Neo 16 (Early 24) | |
| Lenovo Legion 9 16IRX9, RTX 4090 | |
| Asus ROG Strix Scar 16 G634JZR | |
| Lenovo Legion Pro 7 RTX4090 | |
| Schenker XMG Neo 16 E23 | |
| Razer Blade 16 2024, RTX 4090 | |
| Ortalama Intel Core i9-14900HX (3263 - 5589, n=38) | |
| Sınıf ortalaması Gaming (1578 - 6271, n=109, son 2 yıl) | |
| Medion Erazer Beast X40 2024 | |
| Alienware x16 R2 P120F | |
| CPU Single 64Bit | |
| Schenker XMG Neo 16 (Early 24) (Overboost, Oasis) | |
| Asus ROG Strix Scar 16 G634JZR | |
| Medion Erazer Beast X40 2024 | |
| Asus ROG Strix Scar 17 G733PYV-LL053X | |
| Razer Blade 16 2024, RTX 4090 | |
| Schenker XMG Neo 16 (Early 24) | |
| Ortalama Intel Core i9-14900HX (247 - 323, n=37) | |
| Schenker XMG Neo 16 E23 | |
| Sınıf ortalaması Gaming (188.8 - 343, n=109, son 2 yıl) | |
| Lenovo Legion Pro 7 RTX4090 | |
| Lenovo Legion 9 16IRX9, RTX 4090 | |
| Alienware x16 R2 P120F | |
| Blender - v2.79 BMW27 CPU | |
| Alienware x16 R2 P120F | |
| Sınıf ortalaması Gaming (80 - 330, n=107, son 2 yıl) | |
| Medion Erazer Beast X40 2024 | |
| Ortalama Intel Core i9-14900HX (91 - 206, n=37) | |
| Schenker XMG Neo 16 E23 | |
| Razer Blade 16 2024, RTX 4090 | |
| Asus ROG Strix Scar 16 G634JZR | |
| Lenovo Legion 9 16IRX9, RTX 4090 | |
| Lenovo Legion Pro 7 RTX4090 | |
| Asus ROG Strix Scar 17 G733PYV-LL053X | |
| Schenker XMG Neo 16 (Early 24) | |
| Schenker XMG Neo 16 (Early 24) (Overboost, Oasis) | |
| 7-Zip 18.03 | |
| 7z b 4 | |
| Schenker XMG Neo 16 (Early 24) (Overboost, Oasis) | |
| Asus ROG Strix Scar 17 G733PYV-LL053X | |
| Schenker XMG Neo 16 (Early 24) | |
| Lenovo Legion 9 16IRX9, RTX 4090 | |
| Lenovo Legion Pro 7 RTX4090 | |
| Asus ROG Strix Scar 16 G634JZR | |
| Razer Blade 16 2024, RTX 4090 | |
| Schenker XMG Neo 16 E23 | |
| Ortalama Intel Core i9-14900HX (66769 - 136645, n=37) | |
| Medion Erazer Beast X40 2024 | |
| Sınıf ortalaması Gaming (33491 - 148086, n=108, son 2 yıl) | |
| Alienware x16 R2 P120F | |
| 7z b 4 -mmt1 | |
| Asus ROG Strix Scar 17 G733PYV-LL053X | |
| Asus ROG Strix Scar 16 G634JZR | |
| Schenker XMG Neo 16 (Early 24) (Overboost, Oasis) | |
| Schenker XMG Neo 16 (Early 24) | |
| Medion Erazer Beast X40 2024 | |
| Schenker XMG Neo 16 E23 | |
| Ortalama Intel Core i9-14900HX (5452 - 7545, n=37) | |
| Razer Blade 16 2024, RTX 4090 | |
| Lenovo Legion Pro 7 RTX4090 | |
| Sınıf ortalaması Gaming (4199 - 7436, n=108, son 2 yıl) | |
| Lenovo Legion 9 16IRX9, RTX 4090 | |
| Alienware x16 R2 P120F | |
| Geekbench 6.7 | |
| Multi-Core | |
| Schenker XMG Neo 16 (Early 24) (6.2.1, Overboost, Oasis) | |
| Schenker XMG Neo 16 (Early 24) (6.2.1) | |
| Asus ROG Strix Scar 16 G634JZR (6.2.1) | |
| Razer Blade 16 2024, RTX 4090 (6.2.1) | |
| Lenovo Legion 9 16IRX9, RTX 4090 (6.2.1) | |
| Ortalama Intel Core i9-14900HX (13158 - 19665, n=37) | |
| Asus ROG Strix Scar 17 G733PYV-LL053X | |
| Medion Erazer Beast X40 2024 (6.2.1) | |
| Sınıf ortalaması Gaming (6625 - 22104, n=109, son 2 yıl) | |
| Alienware x16 R2 P120F (6.2.1) | |
| Single-Core | |
| Schenker XMG Neo 16 (Early 24) (6.2.1) | |
| Schenker XMG Neo 16 (Early 24) (6.2.1, Overboost, Oasis) | |
| Medion Erazer Beast X40 2024 (6.2.1) | |
| Asus ROG Strix Scar 16 G634JZR (6.2.1) | |
| Ortalama Intel Core i9-14900HX (2419 - 3129, n=37) | |
| Razer Blade 16 2024, RTX 4090 (6.2.1) | |
| Asus ROG Strix Scar 17 G733PYV-LL053X | |
| Sınıf ortalaması Gaming (1490 - 3259, n=109, son 2 yıl) | |
| Lenovo Legion 9 16IRX9, RTX 4090 (6.2.1) | |
| Alienware x16 R2 P120F (6.2.1) | |
| Geekbench 5.5 | |
| Multi-Core | |
| Schenker XMG Neo 16 (Early 24) (Overboost, Oasis) | |
| Schenker XMG Neo 16 (Early 24) | |
| Lenovo Legion 9 16IRX9, RTX 4090 | |
| Asus ROG Strix Scar 16 G634JZR | |
| Schenker XMG Neo 16 E23 | |
| Lenovo Legion Pro 7 RTX4090 | |
| Asus ROG Strix Scar 17 G733PYV-LL053X | |
| Ortalama Intel Core i9-14900HX (8618 - 23194, n=37) | |
| Razer Blade 16 2024, RTX 4090 | |
| Medion Erazer Beast X40 2024 | |
| Sınıf ortalaması Gaming (6460 - 27010, n=108, son 2 yıl) | |
| Alienware x16 R2 P120F | |
| Single-Core | |
| Asus ROG Strix Scar 16 G634JZR | |
| Schenker XMG Neo 16 (Early 24) (Overboost, Oasis) | |
| Schenker XMG Neo 16 (Early 24) | |
| Medion Erazer Beast X40 2024 | |
| Asus ROG Strix Scar 17 G733PYV-LL053X | |
| Razer Blade 16 2024, RTX 4090 | |
| Ortalama Intel Core i9-14900HX (1669 - 2210, n=37) | |
| Sınıf ortalaması Gaming (986 - 2474, n=108, son 2 yıl) | |
| Schenker XMG Neo 16 E23 | |
| Lenovo Legion Pro 7 RTX4090 | |
| Lenovo Legion 9 16IRX9, RTX 4090 | |
| Alienware x16 R2 P120F | |
| HWBOT x265 Benchmark v2.2 - 4k Preset | |
| Schenker XMG Neo 16 (Early 24) (Overboost, Oasis) | |
| Asus ROG Strix Scar 17 G733PYV-LL053X | |
| Schenker XMG Neo 16 (Early 24) | |
| Lenovo Legion Pro 7 RTX4090 | |
| Asus ROG Strix Scar 16 G634JZR | |
| Schenker XMG Neo 16 E23 | |
| Lenovo Legion 9 16IRX9, RTX 4090 | |
| Razer Blade 16 2024, RTX 4090 | |
| Ortalama Intel Core i9-14900HX (16.8 - 38.9, n=37) | |
| Sınıf ortalaması Gaming (11.5 - 44.3, n=108, son 2 yıl) | |
| Medion Erazer Beast X40 2024 | |
| Alienware x16 R2 P120F | |
| LibreOffice - 20 Documents To PDF | |
| Lenovo Legion 9 16IRX9, RTX 4090 (6.3.4.2) | |
| Sınıf ortalaması Gaming (19 - 88.8, n=108, son 2 yıl) | |
| Asus ROG Strix Scar 16 G634JZR (6.3.4.2) | |
| Razer Blade 16 2024, RTX 4090 (6.3.4.2) | |
| Alienware x16 R2 P120F (6.3.4.2) | |
| Medion Erazer Beast X40 2024 (6.3.4.2) | |
| Ortalama Intel Core i9-14900HX (19 - 85.1, n=37) | |
| Lenovo Legion Pro 7 RTX4090 | |
| Asus ROG Strix Scar 17 G733PYV-LL053X | |
| Schenker XMG Neo 16 E23 | |
| Schenker XMG Neo 16 (Early 24) (6.3.4.2) | |
| Schenker XMG Neo 16 (Early 24) (6.3.4.2, Overboost, Oasis) | |
| R Benchmark 2.5 - Overall mean | |
| Alienware x16 R2 P120F | |
| Lenovo Legion 9 16IRX9, RTX 4090 | |
| Sınıf ortalaması Gaming (0.3439 - 0.759, n=109, son 2 yıl) | |
| Asus ROG Strix Scar 17 G733PYV-LL053X | |
| Lenovo Legion Pro 7 RTX4090 | |
| Ortalama Intel Core i9-14900HX (0.3604 - 0.4859, n=37) | |
| Schenker XMG Neo 16 (Early 24) (Overboost, Oasis, Overboost, Oasis) | |
| Razer Blade 16 2024, RTX 4090 | |
| Schenker XMG Neo 16 E23 | |
| Medion Erazer Beast X40 2024 | |
| Asus ROG Strix Scar 16 G634JZR | |
| Schenker XMG Neo 16 (Early 24) | |
* ... daha küçük daha iyidir
AIDA64: FP32 Ray-Trace | FPU Julia | CPU SHA3 | CPU Queen | FPU SinJulia | FPU Mandel | CPU AES | CPU ZLib | FP64 Ray-Trace | CPU PhotoWorxx
| Performance rating | |
| Asus ROG Strix Scar 17 G733PYV-LL053X | |
| Schenker XMG Neo 16 (Early 24) | |
| Schenker XMG Neo 16 (Early 24) | |
| Asus ROG Strix Scar 16 G634JZR | |
| Lenovo Legion 9 16IRX9, RTX 4090 | |
| Lenovo Legion Pro 7 RTX4090 | |
| Razer Blade 16 2024, RTX 4090 | |
| Schenker XMG Neo 16 E23 | |
| Ortalama Intel Core i9-14900HX | |
| Sınıf ortalaması Gaming | |
| Medion Erazer Beast X40 2024 | |
| Alienware x16 R2 P120F | |
| AIDA64 / FP32 Ray-Trace | |
| Asus ROG Strix Scar 17 G733PYV-LL053X (v6.88.6413 Beta) | |
| Schenker XMG Neo 16 (Early 24) (v6.92.6600, Overboost, Oasis) | |
| Sınıf ortalaması Gaming (10227 - 85542, n=107, son 2 yıl) | |
| Schenker XMG Neo 16 (Early 24) (v6.92.6600) | |
| Lenovo Legion 9 16IRX9, RTX 4090 (v6.92.6600) | |
| Lenovo Legion Pro 7 RTX4090 (v6.85.6300) | |
| Asus ROG Strix Scar 16 G634JZR (v6.92.6600) | |
| Razer Blade 16 2024, RTX 4090 (v6.92.6600) | |
| Ortalama Intel Core i9-14900HX (13098 - 33474, n=36) | |
| Schenker XMG Neo 16 E23 (v6.75.6100) | |
| Medion Erazer Beast X40 2024 (v6.92.6600) | |
| Alienware x16 R2 P120F (v6.92.6600) | |
| AIDA64 / FPU Julia | |
| Asus ROG Strix Scar 17 G733PYV-LL053X (v6.88.6413 Beta) | |
| Schenker XMG Neo 16 (Early 24) (v6.92.6600, Overboost, Oasis) | |
| Schenker XMG Neo 16 (Early 24) (v6.92.6600) | |
| Lenovo Legion 9 16IRX9, RTX 4090 (v6.92.6600) | |
| Sınıf ortalaması Gaming (51376 - 238426, n=107, son 2 yıl) | |
| Lenovo Legion Pro 7 RTX4090 (v6.85.6300) | |
| Razer Blade 16 2024, RTX 4090 (v6.92.6600) | |
| Asus ROG Strix Scar 16 G634JZR (v6.92.6600) | |
| Ortalama Intel Core i9-14900HX (67573 - 166040, n=36) | |
| Schenker XMG Neo 16 E23 (v6.75.6100) | |
| Medion Erazer Beast X40 2024 (v6.92.6600) | |
| Alienware x16 R2 P120F (v6.92.6600) | |
| AIDA64 / CPU SHA3 | |
| Asus ROG Strix Scar 17 G733PYV-LL053X (v6.88.6413 Beta) | |
| Schenker XMG Neo 16 (Early 24) (v6.92.6600, Overboost, Oasis) | |
| Schenker XMG Neo 16 (Early 24) (v6.92.6600) | |
| Lenovo Legion 9 16IRX9, RTX 4090 (v6.92.6600) | |
| Lenovo Legion Pro 7 RTX4090 (v6.85.6300) | |
| Asus ROG Strix Scar 16 G634JZR (v6.92.6600) | |
| Razer Blade 16 2024, RTX 4090 (v6.92.6600) | |
| Sınıf ortalaması Gaming (2180 - 9817, n=107, son 2 yıl) | |
| Ortalama Intel Core i9-14900HX (3589 - 7979, n=36) | |
| Schenker XMG Neo 16 E23 (v6.75.6100) | |
| Medion Erazer Beast X40 2024 (v6.92.6600) | |
| Alienware x16 R2 P120F (v6.92.6600) | |
| AIDA64 / CPU Queen | |
| Asus ROG Strix Scar 17 G733PYV-LL053X (v6.88.6413 Beta) | |
| Schenker XMG Neo 16 (Early 24) (v6.92.6600) | |
| Schenker XMG Neo 16 (Early 24) (v6.92.6600, Overboost, Oasis) | |
| Asus ROG Strix Scar 16 G634JZR (v6.92.6600) | |
| Razer Blade 16 2024, RTX 4090 (v6.92.6600) | |
| Ortalama Intel Core i9-14900HX (118405 - 148966, n=36) | |
| Schenker XMG Neo 16 E23 (v6.75.6100) | |
| Lenovo Legion Pro 7 RTX4090 (v6.85.6300) | |
| Medion Erazer Beast X40 2024 (v6.92.6600) | |
| Lenovo Legion 9 16IRX9, RTX 4090 (v6.92.6600) | |
| Sınıf ortalaması Gaming (49785 - 173351, n=98, son 2 yıl) | |
| Alienware x16 R2 P120F (v6.92.6600) | |
| AIDA64 / FPU SinJulia | |
| Asus ROG Strix Scar 17 G733PYV-LL053X (v6.88.6413 Beta) | |
| Schenker XMG Neo 16 (Early 24) (v6.92.6600, Overboost, Oasis) | |
| Schenker XMG Neo 16 (Early 24) (v6.92.6600) | |
| Lenovo Legion 9 16IRX9, RTX 4090 (v6.92.6600) | |
| Asus ROG Strix Scar 16 G634JZR (v6.92.6600) | |
| Razer Blade 16 2024, RTX 4090 (v6.92.6600) | |
| Lenovo Legion Pro 7 RTX4090 (v6.85.6300) | |
| Ortalama Intel Core i9-14900HX (10475 - 18517, n=36) | |
| Schenker XMG Neo 16 E23 (v6.75.6100) | |
| Sınıf ortalaması Gaming (4424 - 33636, n=107, son 2 yıl) | |
| Medion Erazer Beast X40 2024 (v6.92.6600) | |
| Alienware x16 R2 P120F (v6.92.6600) | |
| AIDA64 / FPU Mandel | |
| Asus ROG Strix Scar 17 G733PYV-LL053X (v6.88.6413 Beta) | |
| Schenker XMG Neo 16 (Early 24) (v6.92.6600, Overboost, Oasis) | |
| Schenker XMG Neo 16 (Early 24) (v6.92.6600) | |
| Sınıf ortalaması Gaming (25115 - 128721, n=107, son 2 yıl) | |
| Lenovo Legion 9 16IRX9, RTX 4090 (v6.92.6600) | |
| Lenovo Legion Pro 7 RTX4090 (v6.85.6300) | |
| Asus ROG Strix Scar 16 G634JZR (v6.92.6600) | |
| Razer Blade 16 2024, RTX 4090 (v6.92.6600) | |
| Ortalama Intel Core i9-14900HX (32543 - 83662, n=36) | |
| Schenker XMG Neo 16 E23 (v6.75.6100) | |
| Medion Erazer Beast X40 2024 | |
| Alienware x16 R2 P120F (v6.92.6600) | |
| AIDA64 / CPU AES | |
| Asus ROG Strix Scar 17 G733PYV-LL053X (v6.88.6413 Beta) | |
| Asus ROG Strix Scar 16 G634JZR (v6.92.6600) | |
| Schenker XMG Neo 16 E23 (v6.75.6100) | |
| Schenker XMG Neo 16 (Early 24) (v6.92.6600, Overboost, Oasis) | |
| Schenker XMG Neo 16 (Early 24) (v6.92.6600) | |
| Ortalama Intel Core i9-14900HX (86964 - 241777, n=36) | |
| Lenovo Legion 9 16IRX9, RTX 4090 (v6.92.6600) | |
| Lenovo Legion Pro 7 RTX4090 (v6.85.6300) | |
| Razer Blade 16 2024, RTX 4090 (v6.92.6600) | |
| Sınıf ortalaması Gaming (39258 - 247074, n=107, son 2 yıl) | |
| Medion Erazer Beast X40 2024 (v6.92.6600) | |
| Alienware x16 R2 P120F (v6.92.6600) | |
| AIDA64 / CPU ZLib | |
| Schenker XMG Neo 16 (Early 24) (v6.92.6600, Overboost, Oasis) | |
| Schenker XMG Neo 16 (Early 24) (v6.92.6600) | |
| Asus ROG Strix Scar 17 G733PYV-LL053X (v6.88.6413 Beta) | |
| Lenovo Legion 9 16IRX9, RTX 4090 (v6.92.6600) | |
| Lenovo Legion Pro 7 RTX4090 (v6.85.6300) | |
| Razer Blade 16 2024, RTX 4090 (v6.92.6600) | |
| Asus ROG Strix Scar 16 G634JZR (v6.92.6600) | |
| Ortalama Intel Core i9-14900HX (1054 - 2292, n=36) | |
| Schenker XMG Neo 16 E23 (v6.75.6100) | |
| Sınıf ortalaması Gaming (574 - 2531, n=107, son 2 yıl) | |
| Medion Erazer Beast X40 2024 (v6.92.6600) | |
| Alienware x16 R2 P120F (v6.92.6600) | |
| AIDA64 / FP64 Ray-Trace | |
| Asus ROG Strix Scar 17 G733PYV-LL053X (v6.88.6413 Beta) | |
| Schenker XMG Neo 16 (Early 24) (v6.92.6600, Overboost, Oasis) | |
| Sınıf ortalaması Gaming (5509 - 45446, n=107, son 2 yıl) | |
| Schenker XMG Neo 16 (Early 24) (v6.92.6600) | |
| Lenovo Legion 9 16IRX9, RTX 4090 (v6.92.6600) | |
| Lenovo Legion Pro 7 RTX4090 (v6.85.6300) | |
| Asus ROG Strix Scar 16 G634JZR (v6.92.6600) | |
| Razer Blade 16 2024, RTX 4090 (v6.92.6600) | |
| Ortalama Intel Core i9-14900HX (6809 - 18349, n=36) | |
| Schenker XMG Neo 16 E23 (v6.75.6100) | |
| Medion Erazer Beast X40 2024 (v6.92.6600) | |
| Alienware x16 R2 P120F (v6.92.6600) | |
| AIDA64 / CPU PhotoWorxx | |
| Lenovo Legion 9 16IRX9, RTX 4090 (v6.92.6600) | |
| Alienware x16 R2 P120F (v6.92.6600) | |
| Lenovo Legion Pro 7 RTX4090 (v6.85.6300) | |
| Asus ROG Strix Scar 16 G634JZR (v6.92.6600) | |
| Razer Blade 16 2024, RTX 4090 (v6.92.6600) | |
| Schenker XMG Neo 16 (Early 24) (v6.92.6600, Overboost, Oasis) | |
| Schenker XMG Neo 16 (Early 24) (v6.92.6600) | |
| Medion Erazer Beast X40 2024 (v6.92.6600) | |
| Schenker XMG Neo 16 E23 (v6.75.6100) | |
| Ortalama Intel Core i9-14900HX (23903 - 54702, n=36) | |
| Sınıf ortalaması Gaming (12271 - 89891, n=107, son 2 yıl) | |
| Asus ROG Strix Scar 17 G733PYV-LL053X (v6.88.6413 Beta) | |
Sistem performansı
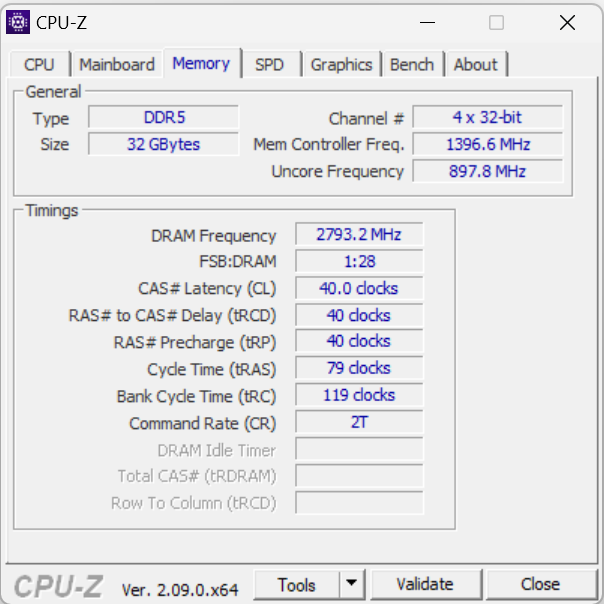
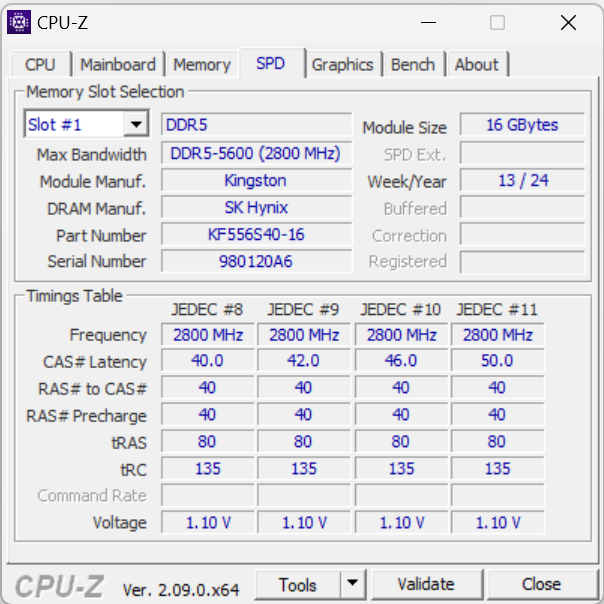
Özellikler listesi zaten onu ele veriyor: Bilgi işlem gücü konusunda hiçbir sıkıntı yok - en azından PCMark skorlarının çok iyi olması bunu doğruluyor. Oyun, yayın ve render işlemleri bu hızlı bilgisayarın ana çalışma alanları olmalı. RAM'in aktarım hızları DDR5 5600 RAM için normal seviyede.
CrossMark: Overall | Productivity | Creativity | Responsiveness
WebXPRT 3: Overall
WebXPRT 4: Overall
Mozilla Kraken 1.1: Total
| PCMark 10 / Score | |
| Asus ROG Strix Scar 17 G733PYV-LL053X | |
| Schenker XMG Neo 16 (Early 24) | |
| Medion Erazer Beast X40 2024 | |
| Ortalama Intel Core i9-14900HX, NVIDIA GeForce RTX 4090 Laptop GPU (8230 - 9234, n=13) | |
| Razer Blade 16 2024, RTX 4090 | |
| Schenker XMG Neo 16 E23 | |
| Sınıf ortalaması Gaming (5828 - 11574, n=94, son 2 yıl) | |
| Lenovo Legion 9 16IRX9, RTX 4090 | |
| Lenovo Legion Pro 7 RTX4090 | |
| Asus ROG Strix Scar 16 G634JZR | |
| Alienware x16 R2 P120F | |
| PCMark 10 / Essentials | |
| Asus ROG Strix Scar 16 G634JZR | |
| Asus ROG Strix Scar 17 G733PYV-LL053X | |
| Ortalama Intel Core i9-14900HX, NVIDIA GeForce RTX 4090 Laptop GPU (10778 - 11628, n=13) | |
| Lenovo Legion Pro 7 RTX4090 | |
| Schenker XMG Neo 16 (Early 24) | |
| Lenovo Legion 9 16IRX9, RTX 4090 | |
| Schenker XMG Neo 16 E23 | |
| Razer Blade 16 2024, RTX 4090 | |
| Medion Erazer Beast X40 2024 | |
| Sınıf ortalaması Gaming (8810 - 12600, n=98, son 2 yıl) | |
| Alienware x16 R2 P120F | |
| PCMark 10 / Productivity | |
| Medion Erazer Beast X40 2024 | |
| Schenker XMG Neo 16 (Early 24) | |
| Razer Blade 16 2024, RTX 4090 | |
| Asus ROG Strix Scar 17 G733PYV-LL053X | |
| Sınıf ortalaması Gaming (6845 - 18766, n=96, son 2 yıl) | |
| Ortalama Intel Core i9-14900HX, NVIDIA GeForce RTX 4090 Laptop GPU (9458 - 11759, n=13) | |
| Lenovo Legion 9 16IRX9, RTX 4090 | |
| Schenker XMG Neo 16 E23 | |
| Lenovo Legion Pro 7 RTX4090 | |
| Alienware x16 R2 P120F | |
| Asus ROG Strix Scar 16 G634JZR | |
| PCMark 10 / Digital Content Creation | |
| Asus ROG Strix Scar 17 G733PYV-LL053X | |
| Asus ROG Strix Scar 16 G634JZR | |
| Schenker XMG Neo 16 (Early 24) | |
| Medion Erazer Beast X40 2024 | |
| Ortalama Intel Core i9-14900HX, NVIDIA GeForce RTX 4090 Laptop GPU (13219 - 16462, n=13) | |
| Schenker XMG Neo 16 E23 | |
| Lenovo Legion Pro 7 RTX4090 | |
| Sınıf ortalaması Gaming (7602 - 19657, n=96, son 2 yıl) | |
| Lenovo Legion 9 16IRX9, RTX 4090 | |
| Razer Blade 16 2024, RTX 4090 | |
| Alienware x16 R2 P120F | |
| CrossMark / Overall | |
| Schenker XMG Neo 16 (Early 24) | |
| Razer Blade 16 2024, RTX 4090 | |
| Medion Erazer Beast X40 2024 | |
| Ortalama Intel Core i9-14900HX, NVIDIA GeForce RTX 4090 Laptop GPU (1877 - 2344, n=10) | |
| Schenker XMG Neo 16 E23 | |
| Asus ROG Strix Scar 17 G733PYV-LL053X | |
| Asus ROG Strix Scar 16 G634JZR | |
| Sınıf ortalaması Gaming (1366 - 2409, n=96, son 2 yıl) | |
| Lenovo Legion 9 16IRX9, RTX 4090 | |
| Alienware x16 R2 P120F | |
| CrossMark / Productivity | |
| Schenker XMG Neo 16 (Early 24) | |
| Medion Erazer Beast X40 2024 | |
| Razer Blade 16 2024, RTX 4090 | |
| Ortalama Intel Core i9-14900HX, NVIDIA GeForce RTX 4090 Laptop GPU (1738 - 2162, n=10) | |
| Schenker XMG Neo 16 E23 | |
| Asus ROG Strix Scar 17 G733PYV-LL053X | |
| Asus ROG Strix Scar 16 G634JZR | |
| Sınıf ortalaması Gaming (1386 - 2254, n=96, son 2 yıl) | |
| Lenovo Legion 9 16IRX9, RTX 4090 | |
| Alienware x16 R2 P120F | |
| CrossMark / Creativity | |
| Schenker XMG Neo 16 (Early 24) | |
| Schenker XMG Neo 16 E23 | |
| Razer Blade 16 2024, RTX 4090 | |
| Asus ROG Strix Scar 17 G733PYV-LL053X | |
| Ortalama Intel Core i9-14900HX, NVIDIA GeForce RTX 4090 Laptop GPU (2195 - 2660, n=10) | |
| Asus ROG Strix Scar 16 G634JZR | |
| Medion Erazer Beast X40 2024 | |
| Sınıf ortalaması Gaming (1343 - 2729, n=96, son 2 yıl) | |
| Lenovo Legion 9 16IRX9, RTX 4090 | |
| Alienware x16 R2 P120F | |
| CrossMark / Responsiveness | |
| Schenker XMG Neo 16 (Early 24) | |
| Medion Erazer Beast X40 2024 | |
| Ortalama Intel Core i9-14900HX, NVIDIA GeForce RTX 4090 Laptop GPU (1478 - 2327, n=10) | |
| Razer Blade 16 2024, RTX 4090 | |
| Lenovo Legion 9 16IRX9, RTX 4090 | |
| Asus ROG Strix Scar 16 G634JZR | |
| Schenker XMG Neo 16 E23 | |
| Sınıf ortalaması Gaming (1226 - 2334, n=96, son 2 yıl) | |
| Asus ROG Strix Scar 17 G733PYV-LL053X | |
| Alienware x16 R2 P120F | |
| WebXPRT 3 / Overall | |
| Asus ROG Strix Scar 17 G733PYV-LL053X | |
| Schenker XMG Neo 16 (Early 24) | |
| Schenker XMG Neo 16 E23 | |
| Razer Blade 16 2024, RTX 4090 | |
| Medion Erazer Beast X40 2024 | |
| Ortalama Intel Core i9-14900HX, NVIDIA GeForce RTX 4090 Laptop GPU (279 - 339, n=10) | |
| Sınıf ortalaması Gaming (242 - 532, n=99, son 2 yıl) | |
| Asus ROG Strix Scar 16 G634JZR | |
| Lenovo Legion 9 16IRX9, RTX 4090 | |
| Lenovo Legion Pro 7 RTX4090 | |
| Alienware x16 R2 P120F | |
| WebXPRT 4 / Overall | |
| Asus ROG Strix Scar 17 G733PYV-LL053X | |
| Asus ROG Strix Scar 16 G634JZR | |
| Schenker XMG Neo 16 (Early 24) | |
| Schenker XMG Neo 16 E23 | |
| Medion Erazer Beast X40 2024 | |
| Ortalama Intel Core i9-14900HX, NVIDIA GeForce RTX 4090 Laptop GPU (246 - 309, n=8) | |
| Sınıf ortalaması Gaming (176.4 - 354, n=99, son 2 yıl) | |
| Lenovo Legion Pro 7 RTX4090 | |
| Lenovo Legion 9 16IRX9, RTX 4090 | |
| Alienware x16 R2 P120F | |
| Mozilla Kraken 1.1 / Total | |
| Alienware x16 R2 P120F | |
| Lenovo Legion 9 16IRX9, RTX 4090 | |
| Lenovo Legion Pro 7 RTX4090 | |
| Sınıf ortalaması Gaming (391 - 590, n=104, son 2 yıl) | |
| Ortalama Intel Core i9-14900HX, NVIDIA GeForce RTX 4090 Laptop GPU (428 - 535, n=11) | |
| Schenker XMG Neo 16 E23 | |
| Razer Blade 16 2024, RTX 4090 | |
| Asus ROG Strix Scar 16 G634JZR | |
| Medion Erazer Beast X40 2024 | |
| Schenker XMG Neo 16 (Early 24) | |
| Asus ROG Strix Scar 17 G733PYV-LL053X | |
* ... daha küçük daha iyidir
| PCMark 10 Score | 9017 puan | |
Yardım | ||
| AIDA64 / Memory Copy | |
| Alienware x16 R2 P120F | |
| Lenovo Legion 9 16IRX9, RTX 4090 | |
| Schenker XMG Neo 16 (Early 24) | |
| Asus ROG Strix Scar 16 G634JZR | |
| Razer Blade 16 2024, RTX 4090 | |
| Schenker XMG Neo 16 (Early 24) | |
| Lenovo Legion Pro 7 RTX4090 | |
| Medion Erazer Beast X40 2024 | |
| Schenker XMG Neo 16 E23 | |
| Ortalama Intel Core i9-14900HX (38028 - 83392, n=36) | |
| Sınıf ortalaması Gaming (21750 - 129946, n=107, son 2 yıl) | |
| Asus ROG Strix Scar 17 G733PYV-LL053X | |
| AIDA64 / Memory Read | |
| Asus ROG Strix Scar 16 G634JZR | |
| Schenker XMG Neo 16 (Early 24) | |
| Lenovo Legion Pro 7 RTX4090 | |
| Schenker XMG Neo 16 (Early 24) | |
| Razer Blade 16 2024, RTX 4090 | |
| Medion Erazer Beast X40 2024 | |
| Alienware x16 R2 P120F | |
| Schenker XMG Neo 16 E23 | |
| Lenovo Legion 9 16IRX9, RTX 4090 | |
| Ortalama Intel Core i9-14900HX (43306 - 87568, n=36) | |
| Sınıf ortalaması Gaming (22956 - 118858, n=107, son 2 yıl) | |
| Asus ROG Strix Scar 17 G733PYV-LL053X | |
| AIDA64 / Memory Write | |
| Lenovo Legion 9 16IRX9, RTX 4090 | |
| Schenker XMG Neo 16 (Early 24) | |
| Schenker XMG Neo 16 (Early 24) | |
| Asus ROG Strix Scar 16 G634JZR | |
| Medion Erazer Beast X40 2024 | |
| Lenovo Legion Pro 7 RTX4090 | |
| Sınıf ortalaması Gaming (22297 - 135096, n=107, son 2 yıl) | |
| Razer Blade 16 2024, RTX 4090 | |
| Alienware x16 R2 P120F | |
| Ortalama Intel Core i9-14900HX (37146 - 80589, n=36) | |
| Schenker XMG Neo 16 E23 | |
| Asus ROG Strix Scar 17 G733PYV-LL053X | |
| AIDA64 / Memory Latency | |
| Alienware x16 R2 P120F | |
| Sınıf ortalaması Gaming (75.3 - 259, n=107, son 2 yıl) | |
| Lenovo Legion 9 16IRX9, RTX 4090 | |
| Asus ROG Strix Scar 17 G733PYV-LL053X | |
| Schenker XMG Neo 16 E23 | |
| Lenovo Legion Pro 7 RTX4090 | |
| Ortalama Intel Core i9-14900HX (76.1 - 105, n=36) | |
| Razer Blade 16 2024, RTX 4090 | |
| Medion Erazer Beast X40 2024 | |
| Asus ROG Strix Scar 16 G634JZR | |
| Schenker XMG Neo 16 (Early 24) | |
| Schenker XMG Neo 16 (Early 24) | |
* ... daha küçük daha iyidir
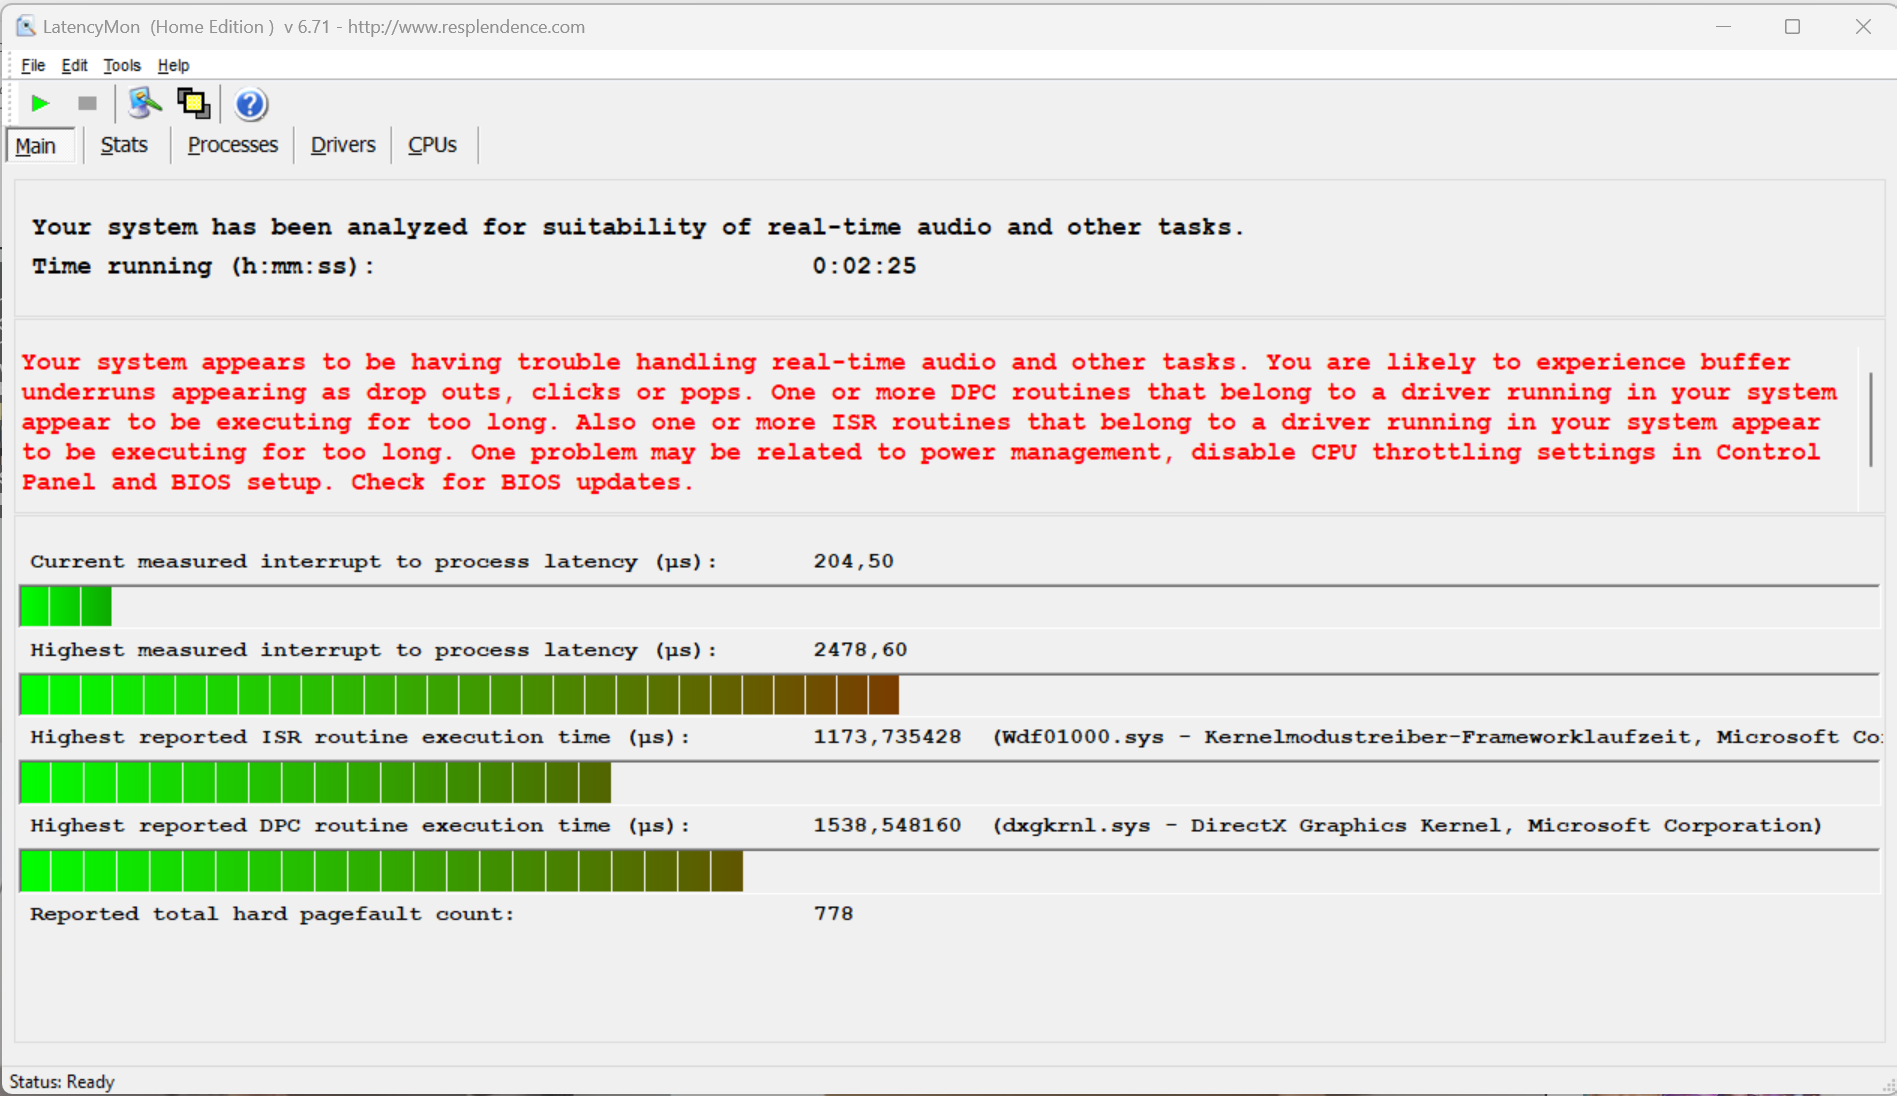
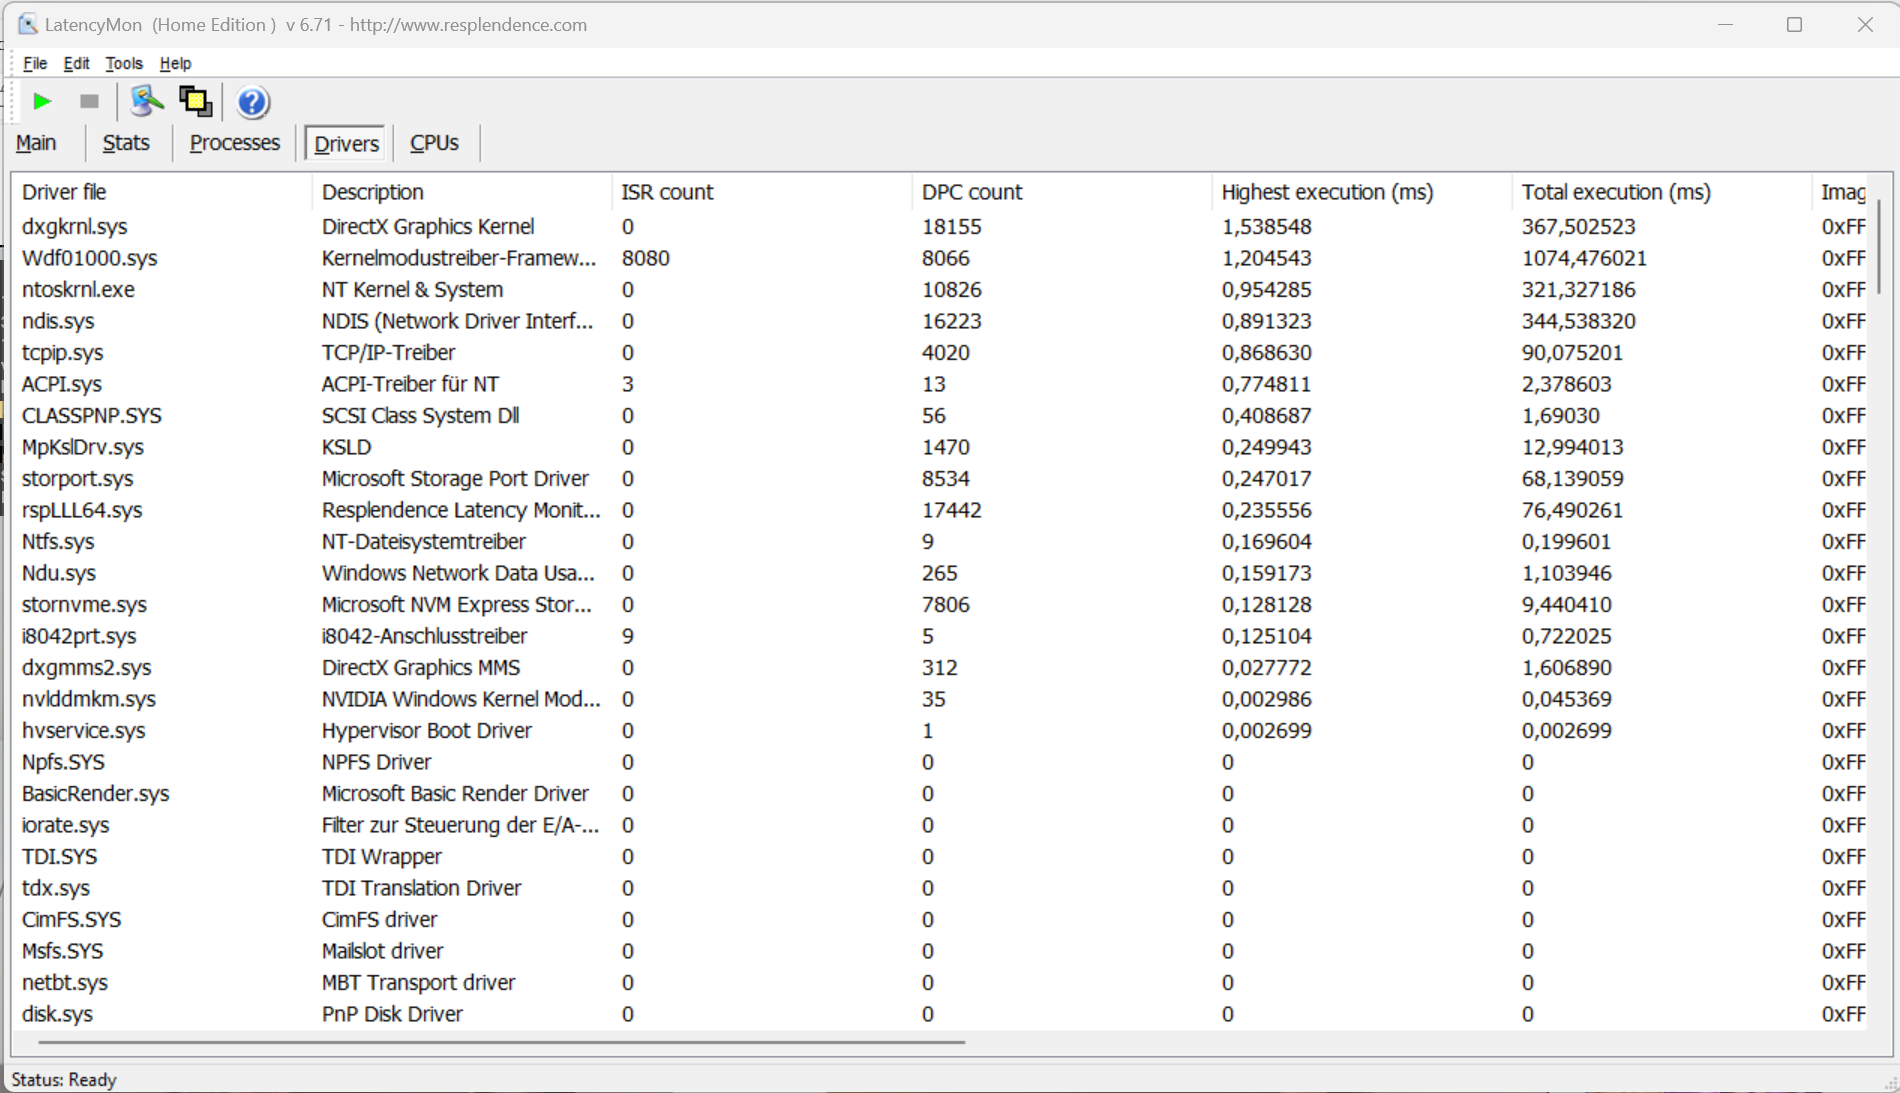
DPC gecikme süreleri
Standartlaştırılmış Latency Monitor testi (internette gezinme, 4k video oynatma, Prime95 yüksek yük) bazı anormallikler ortaya çıkardı. Sistem gerçek zamanlı video ve ses düzenleme için uygun görünmüyor. Gelecekteki yazılım güncellemeleri bunu etkileyebilir.
| DPC Latencies / LatencyMon - interrupt to process latency (max), Web, Youtube, Prime95 | |
| Schenker XMG Neo 16 E23 | |
| Schenker XMG Neo 16 (Early 24) | |
| Razer Blade 16 2024, RTX 4090 | |
| Medion Erazer Beast X40 2024 | |
| Asus ROG Strix Scar 17 G733PYV-LL053X | |
* ... daha küçük daha iyidir
Yığın depolama
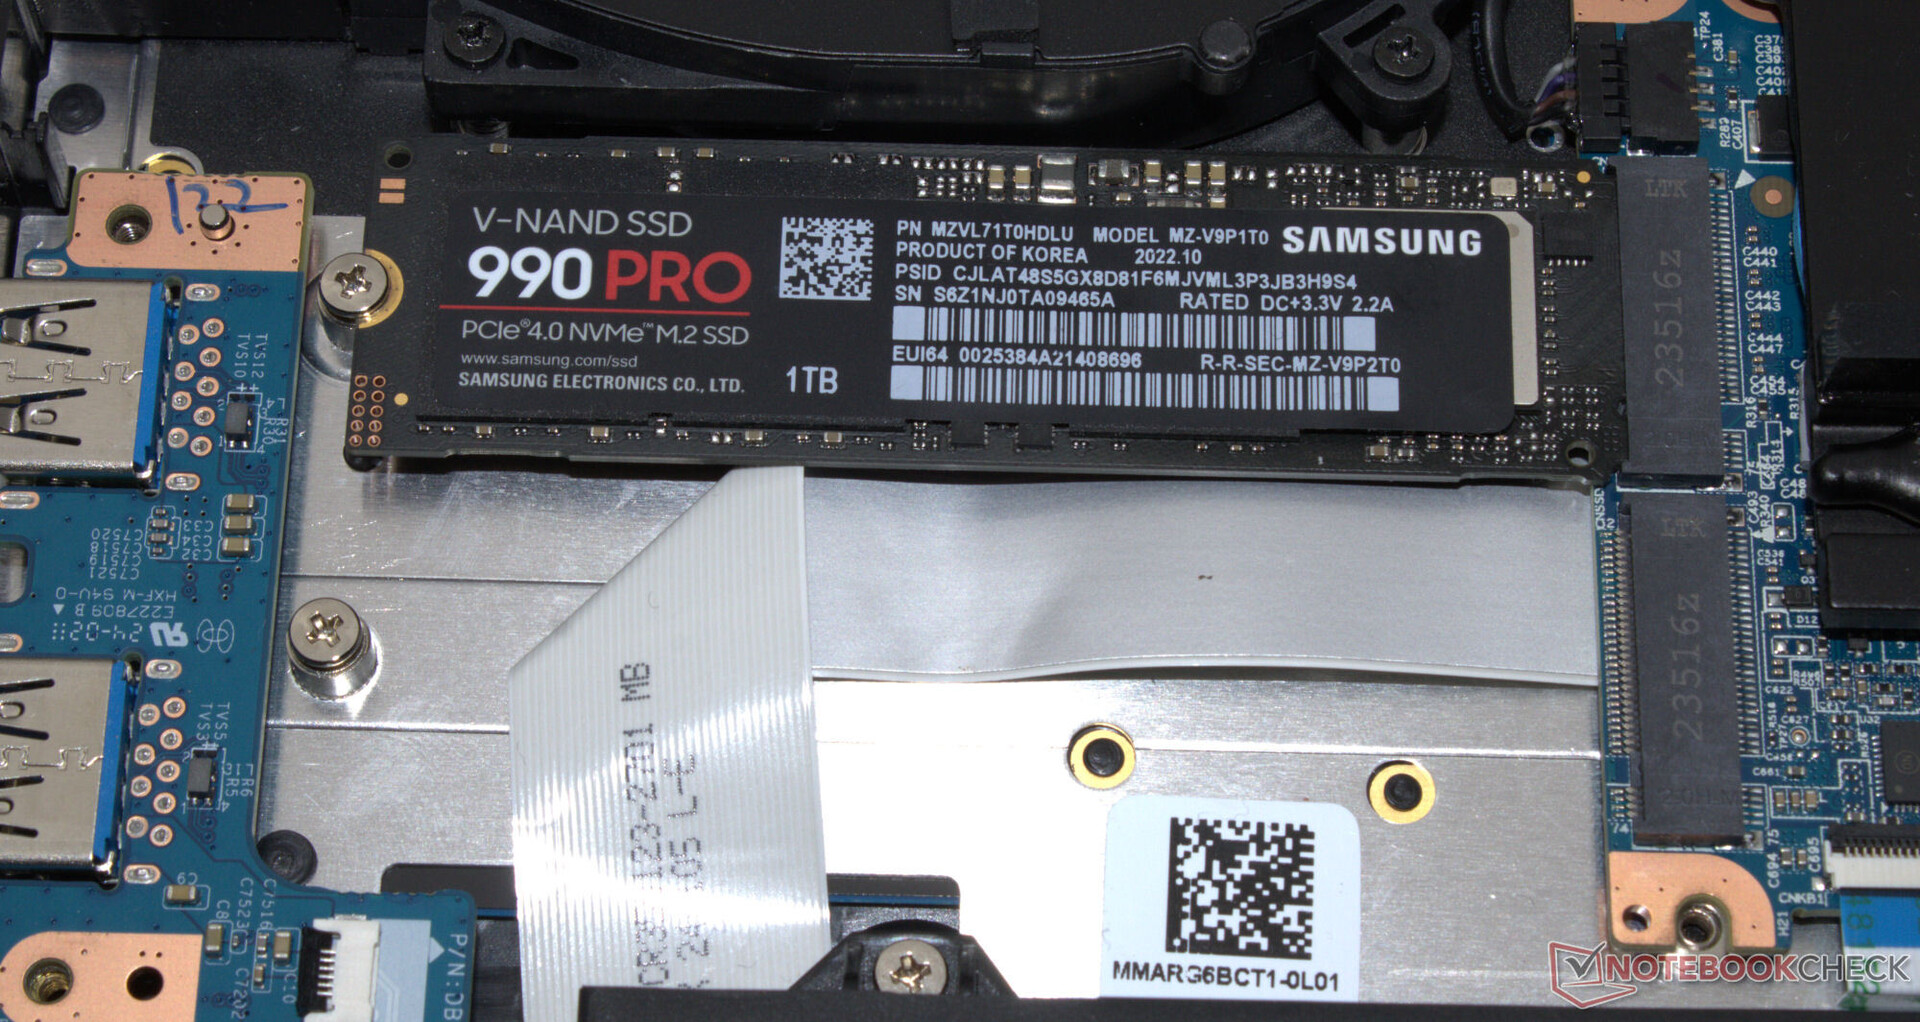
Her zamanki gibi Schenker, müşterilerine çevrimiçi mağazasında geniş bir SSD yelpazesi sunuyor - Neo'nun içinde iki tane için yer var. RAID 0/1 desteği de sunulmaktadır. İnceleme cihazının Samsung SSD'si (1 TB, PCIe 4, M.2 2280) iyi aktarım hızları sunuyor. Olumlu bir özellik de termal azaltmanın olmaması.

| Drive Performance rating - Percent | |
| Schenker XMG Neo 16 (Early 24) | |
| Medion Erazer Beast X40 2024 | |
| Ortalama Samsung 990 Pro 1 TB | |
| Razer Blade 16 2024, RTX 4090 | |
| Sınıf ortalaması Gaming | |
| Asus ROG Strix Scar 17 G733PYV-LL053X | |
| Schenker XMG Neo 16 E23 | |
* ... daha küçük daha iyidir
Continuous Performance: DiskSpd Read Loop, Queue Depth 8
Grafik kartı
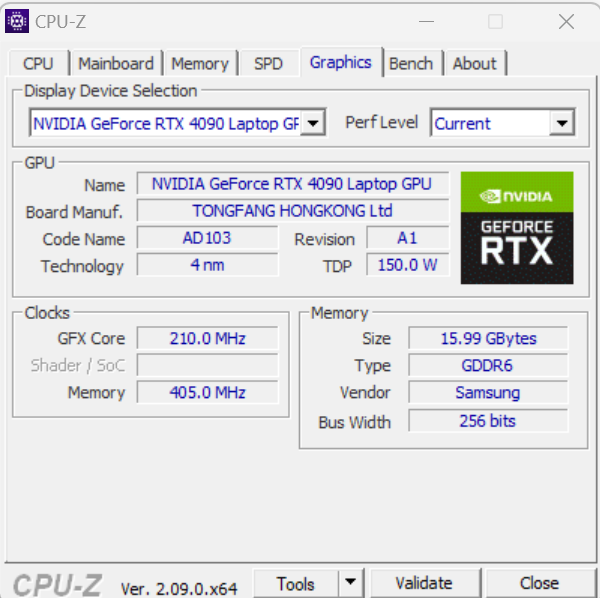
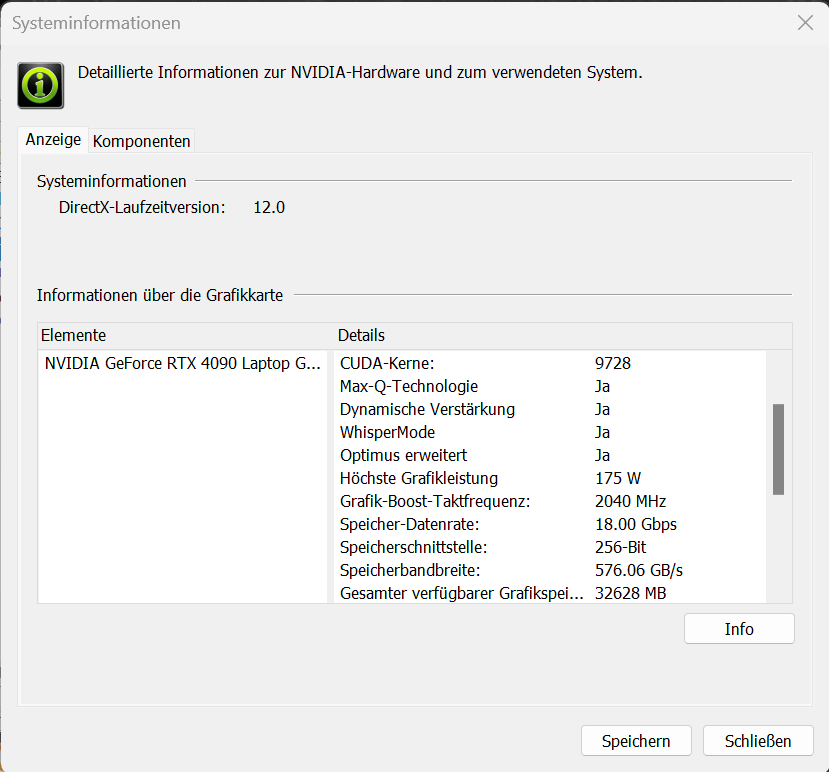
Şu anda GeForce RTX 4090 nvidia'nın mobil GPU'ları arasında en yüksek performansı sunar. 9.728 shader, 256-bit veri yolu ve hızlı GDDR6 RAM (16.384 MB) piksel hızlandırıcıyı karakterize eder. Maksimum TGP 175 watt (150 watt + 25 watt Dynamic Boost) - daha fazlası mümkün değil.
Kıyaslama sonuçları şimdiye kadarki RTX 4090 ortalamasının üstünde (Overboost) ve altında (Enthusiast, Balanced). Oasis su soğutması performansta küçük bir artış elde edilmesine yardımcı oluyor. Her durumda, ana rakip olan Bıçak 16kol mesafesinde tutulur. DGPU ve Optimus arasında geçiş yapmak için yeniden başlatma gerekmez: Gelişmiş Optimus desteklenmektedir.
| 3DMark Performance rating - Percent | |
| Schenker XMG Neo 16 (Early 24) | |
| Schenker XMG Neo 16 (Early 24) | |
| Schenker XMG Neo 16 E23 | |
| Asus ROG Strix Scar 17 G733PYV-LL053X | |
| Ortalama NVIDIA GeForce RTX 4090 Laptop GPU | |
| Lenovo Legion Pro 7 RTX4090 | |
| Razer Blade 16 2024, RTX 4090 | |
| Medion Erazer Beast X40 2024 | |
| Lenovo Legion 9 16IRX9, RTX 4090 | |
| Asus ROG Strix Scar 16 G634JZR | |
| Alienware x16 R2 P120F | |
| Sınıf ortalaması Gaming | |
| 3DMark 11 - 1280x720 Performance GPU | |
| Schenker XMG Neo 16 (Early 24) (Overboost, Oasis) | |
| Schenker XMG Neo 16 E23 | |
| Schenker XMG Neo 16 (Early 24) | |
| Razer Blade 16 2024, RTX 4090 | |
| Ortalama NVIDIA GeForce RTX 4090 Laptop GPU (54073 - 73027, n=42) | |
| Medion Erazer Beast X40 2024 | |
| Lenovo Legion 9 16IRX9, RTX 4090 | |
| Asus ROG Strix Scar 17 G733PYV-LL053X | |
| Lenovo Legion Pro 7 RTX4090 | |
| Asus ROG Strix Scar 16 G634JZR | |
| Alienware x16 R2 P120F | |
| Sınıf ortalaması Gaming (21841 - 80022, n=106, son 2 yıl) | |
| 3DMark | |
| 1920x1080 Fire Strike Graphics | |
| Schenker XMG Neo 16 (Early 24) | |
| Schenker XMG Neo 16 (Early 24) (Overboost, Oasis) | |
| Asus ROG Strix Scar 17 G733PYV-LL053X | |
| Schenker XMG Neo 16 E23 | |
| Razer Blade 16 2024, RTX 4090 | |
| Ortalama NVIDIA GeForce RTX 4090 Laptop GPU (40259 - 53059, n=41) | |
| Lenovo Legion Pro 7 RTX4090 | |
| Medion Erazer Beast X40 2024 | |
| Lenovo Legion 9 16IRX9, RTX 4090 | |
| Alienware x16 R2 P120F | |
| Asus ROG Strix Scar 16 G634JZR | |
| Sınıf ortalaması Gaming (12242 - 62849, n=118, son 2 yıl) | |
| 2560x1440 Time Spy Graphics | |
| Schenker XMG Neo 16 (Early 24) (Overboost, Oasis) | |
| Schenker XMG Neo 16 E23 | |
| Schenker XMG Neo 16 (Early 24) | |
| Asus ROG Strix Scar 17 G733PYV-LL053X | |
| Lenovo Legion Pro 7 RTX4090 | |
| Ortalama NVIDIA GeForce RTX 4090 Laptop GPU (16950 - 23292, n=43) | |
| Medion Erazer Beast X40 2024 | |
| Lenovo Legion 9 16IRX9, RTX 4090 | |
| Razer Blade 16 2024, RTX 4090 | |
| Asus ROG Strix Scar 16 G634JZR | |
| Alienware x16 R2 P120F | |
| Sınıf ortalaması Gaming (5012 - 26212, n=117, son 2 yıl) | |
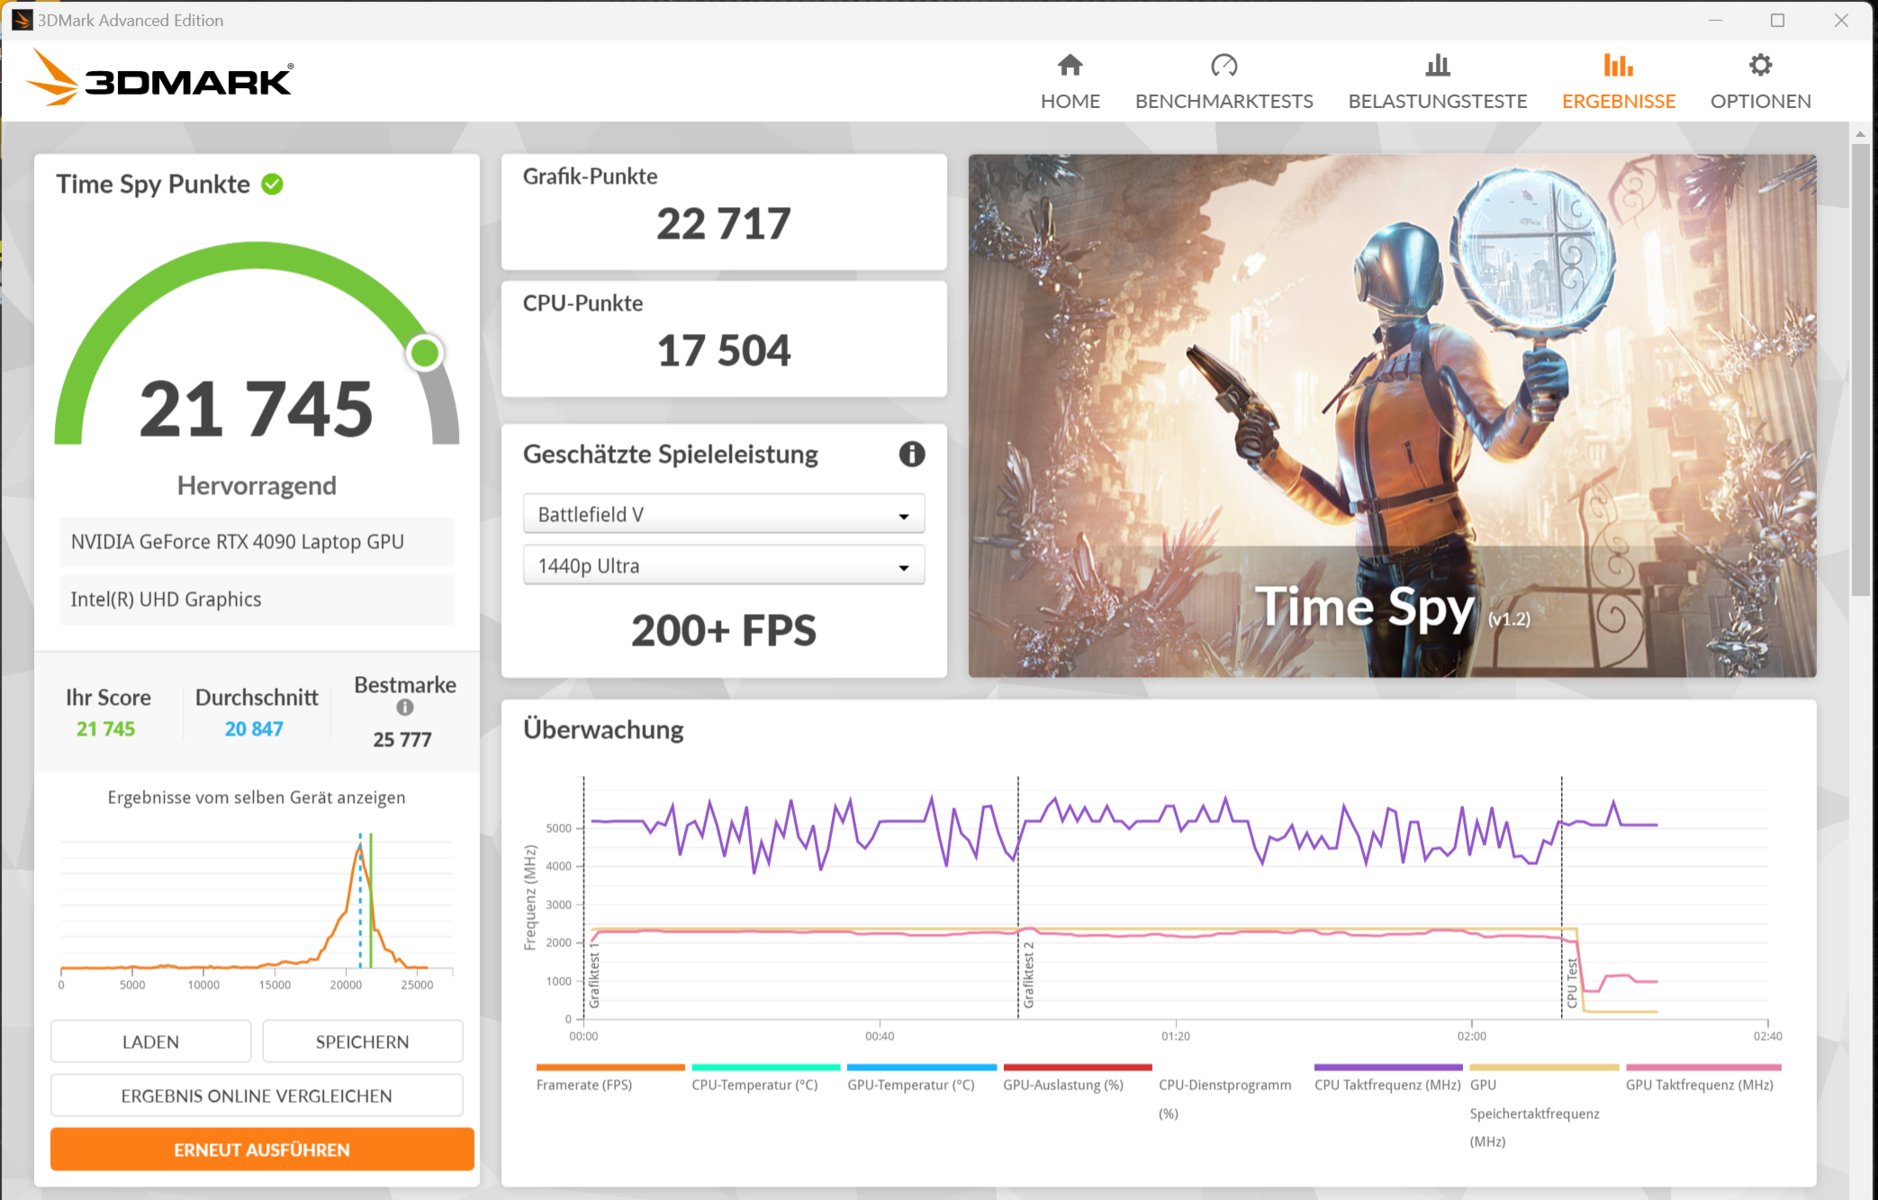
| 3DMark 06 Standard Score | 62889 puan | |
| 3DMark 11 Performance | 43829 puan | |
| 3DMark Fire Strike Score | 38597 puan | |
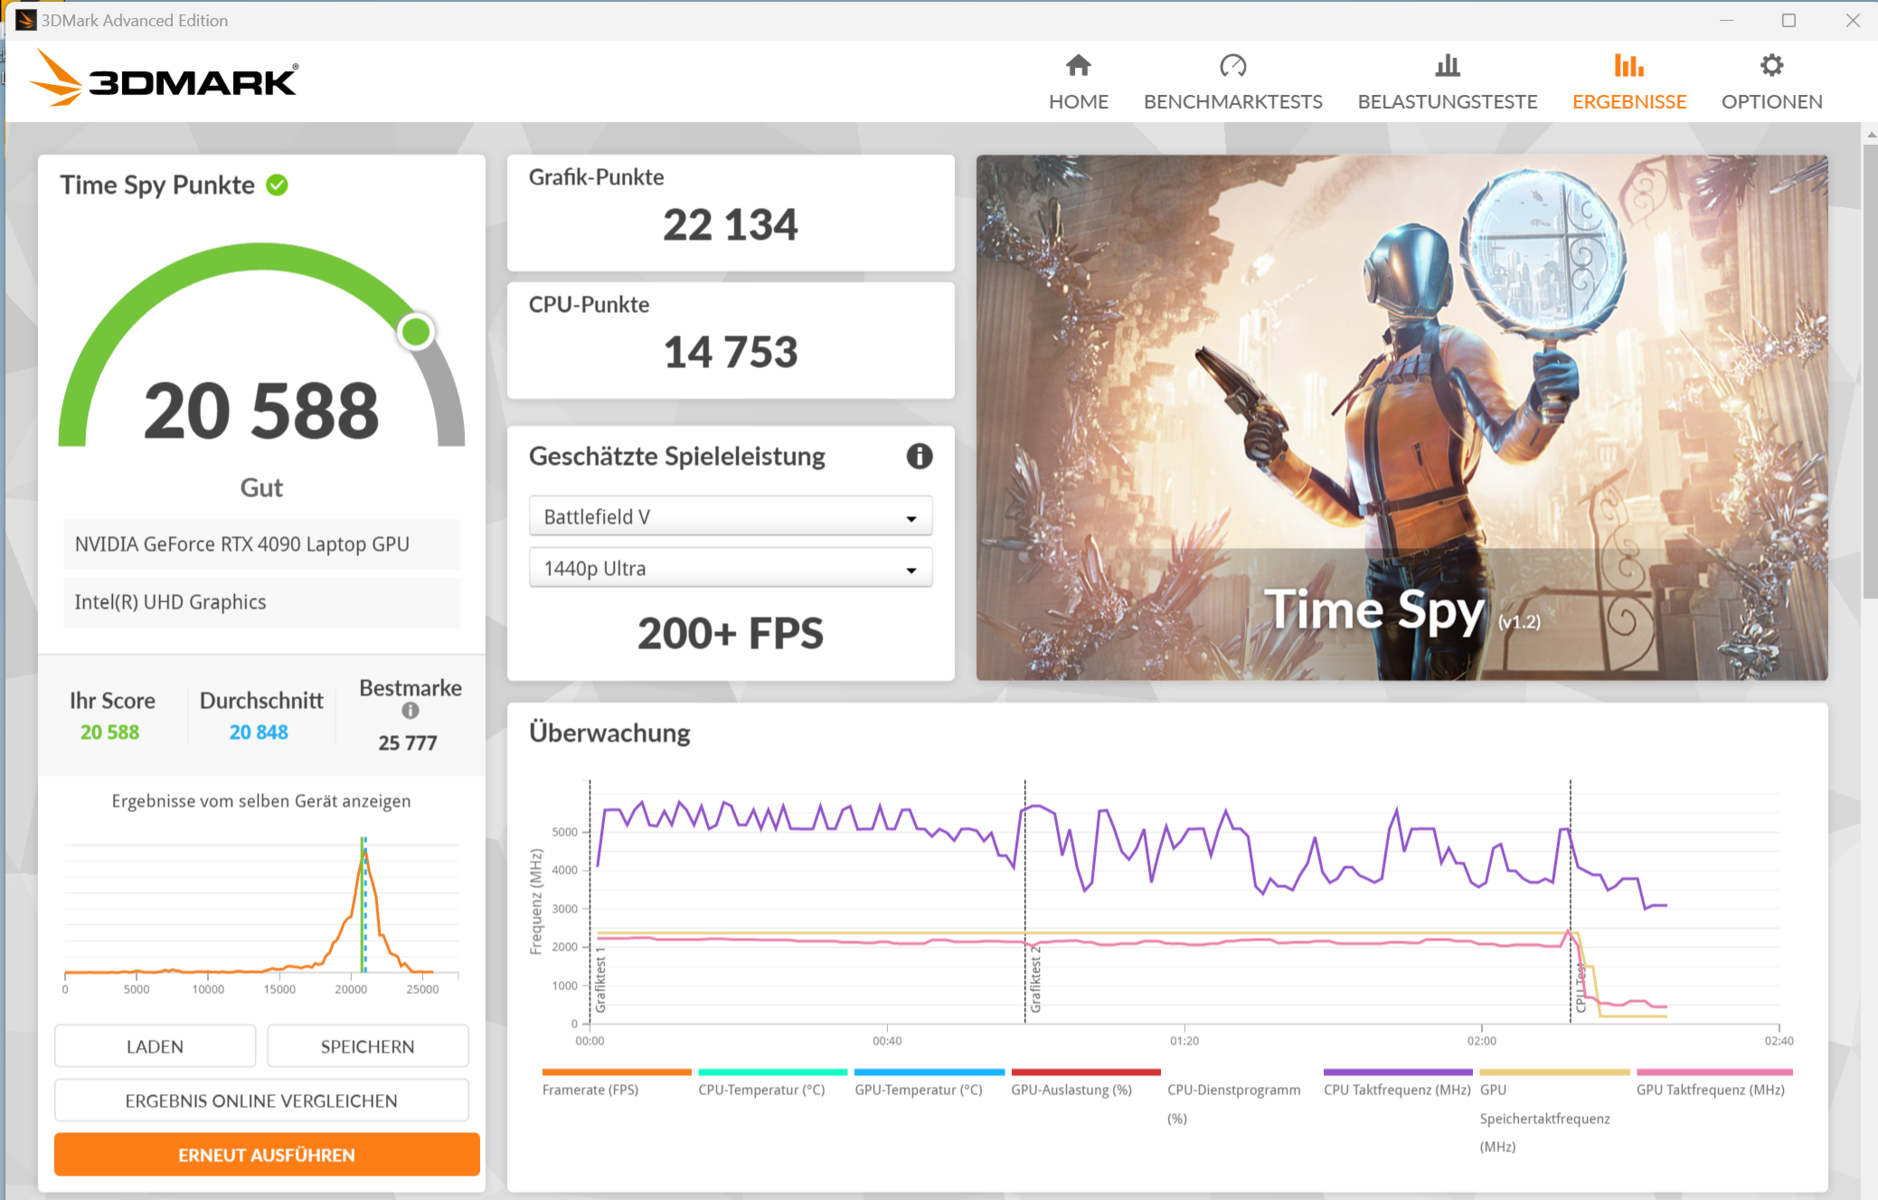
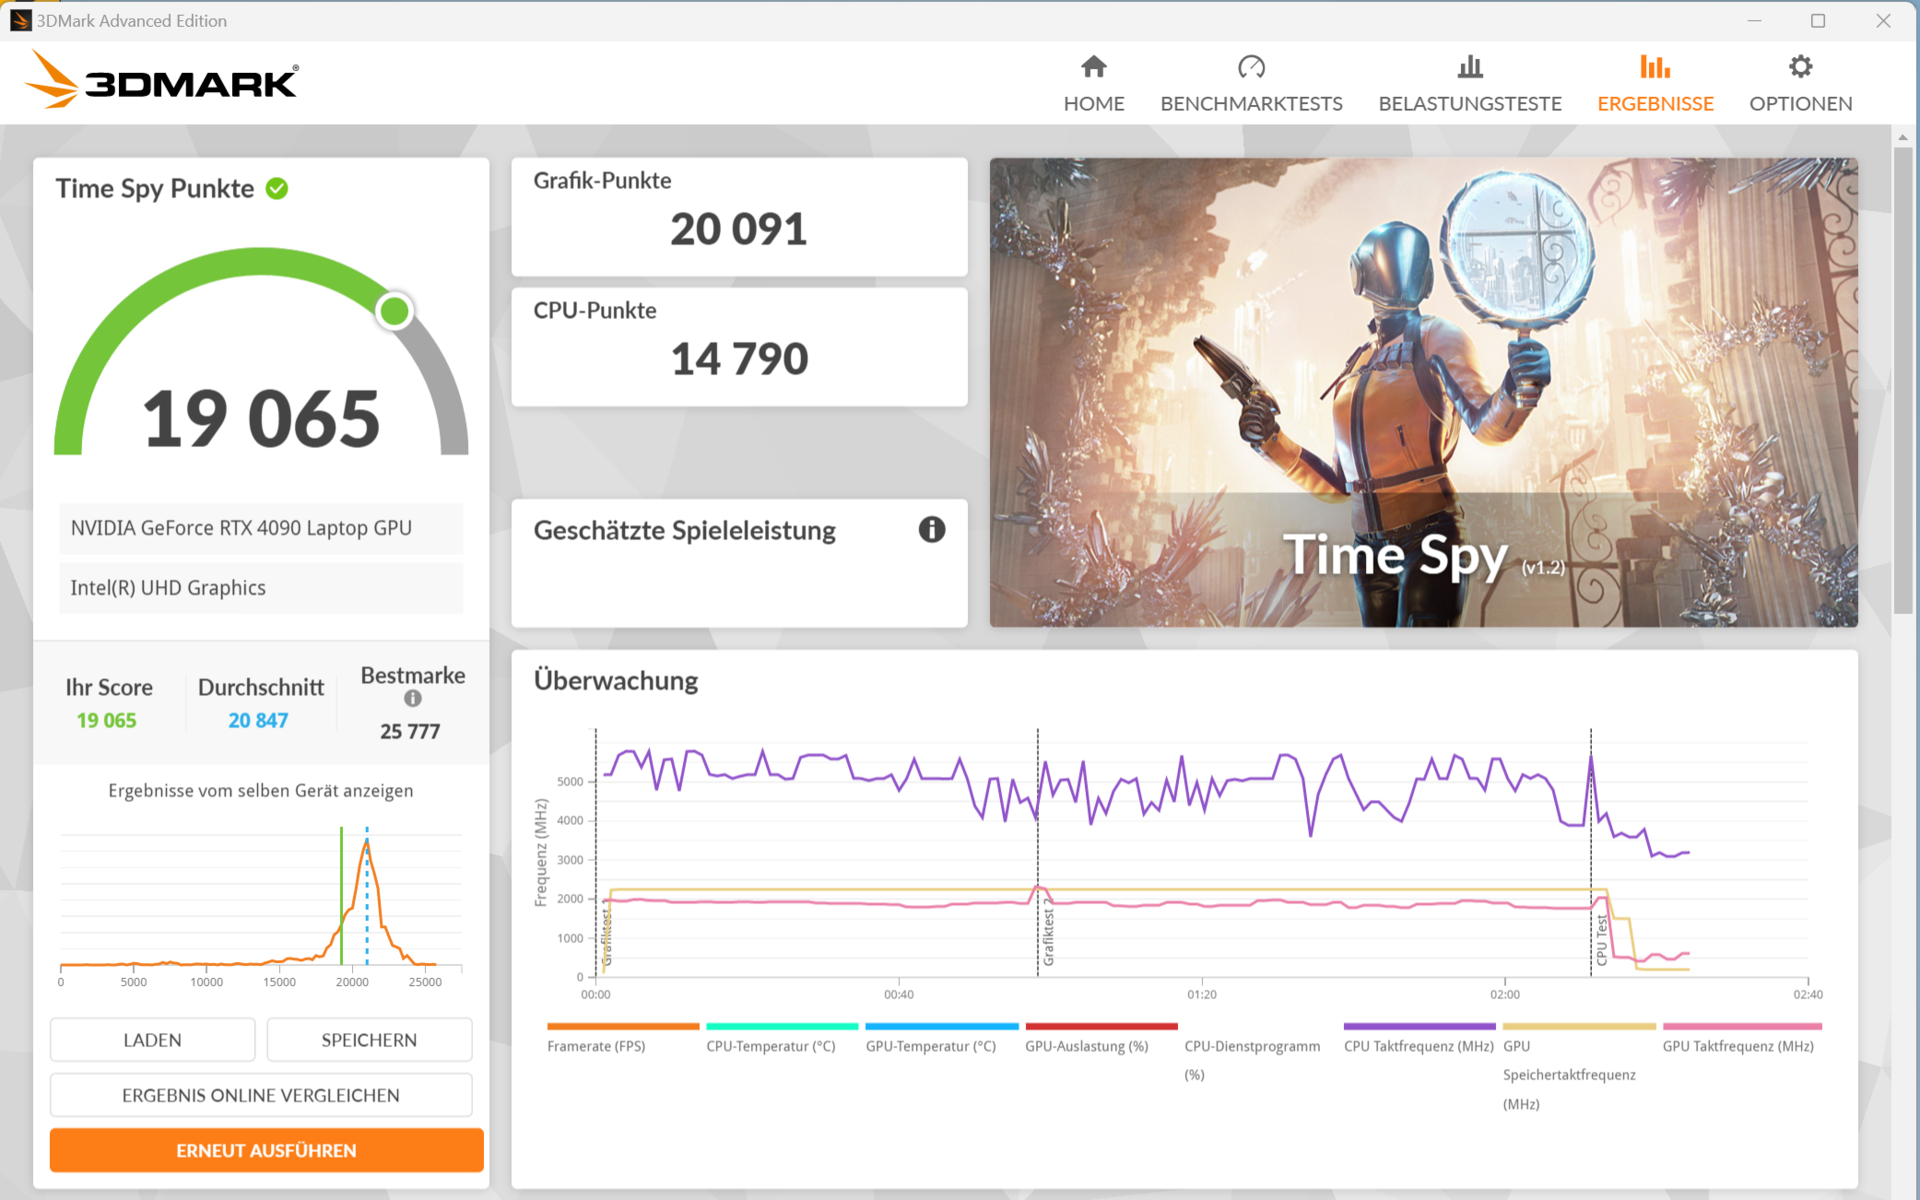
| 3DMark Time Spy Score | 20588 puan | |
| 3DMark Steel Nomad Score | 5102 puan | |
Yardım | ||
| Geekbench 5.5 | |
| OpenCL Score | |
| Schenker XMG Neo 16 (Early 24) (Overboost, Oasis) | |
| Schenker XMG Neo 16 (Early 24) | |
| Schenker XMG Neo 16 E23 | |
| Asus ROG Strix Scar 17 G733PYV-LL053X | |
| Medion Erazer Beast X40 2024 | |
| Ortalama NVIDIA GeForce RTX 4090 Laptop GPU (6841 - 237138, n=39) | |
| Razer Blade 16 2024, RTX 4090 | |
| Lenovo Legion 9 16IRX9, RTX 4090 | |
| Lenovo Legion Pro 7 RTX4090 | |
| Asus ROG Strix Scar 16 G634JZR | |
| Sınıf ortalaması Gaming (80702 - 277970, n=105, son 2 yıl) | |
| Alienware x16 R2 P120F | |
| Vulkan Score 5.5 | |
| Schenker XMG Neo 16 (Early 24) | |
| Medion Erazer Beast X40 2024 | |
| Razer Blade 16 2024, RTX 4090 | |
| Lenovo Legion 9 16IRX9, RTX 4090 | |
| Asus ROG Strix Scar 17 G733PYV-LL053X | |
| Schenker XMG Neo 16 (Early 24) (Overboost, Oasis) | |
| Sınıf ortalaması Gaming (9296 - 246759, n=81, son 2 yıl) | |
| Ortalama NVIDIA GeForce RTX 4090 Laptop GPU (49663 - 163089, n=28) | |
| Alienware x16 R2 P120F | |
| Lenovo Legion Pro 7 RTX4090 | |
| Asus ROG Strix Scar 16 G634JZR | |
| Geekbench 6.7 | |
| GPU Vulkan | |
| Razer Blade 16 2024, RTX 4090 (6.2.1) | |
| Medion Erazer Beast X40 2024 (6.2.1) | |
| Schenker XMG Neo 16 (Early 24) (6.2.1) | |
| Asus ROG Strix Scar 17 G733PYV-LL053X | |
| Ortalama NVIDIA GeForce RTX 4090 Laptop GPU (128748 - 196201, n=16) | |
| Schenker XMG Neo 16 (Early 24) (6.2.1, Overboost, Oasis) | |
| Lenovo Legion 9 16IRX9, RTX 4090 (6.2.1) | |
| Sınıf ortalaması Gaming (20128 - 231659, n=58, son 2 yıl) | |
| Alienware x16 R2 P120F (6.2.1) | |
| Asus ROG Strix Scar 16 G634JZR (6.2.1) | |
| GPU OpenCL | |
| Medion Erazer Beast X40 2024 (6.2.1) | |
| Schenker XMG Neo 16 (Early 24) (6.2.1, Overboost, Oasis) | |
| Asus ROG Strix Scar 17 G733PYV-LL053X | |
| Schenker XMG Neo 16 (Early 24) (6.2.1) | |
| Lenovo Legion 9 16IRX9, RTX 4090 (6.2.1) | |
| Ortalama NVIDIA GeForce RTX 4090 Laptop GPU (159127 - 209521, n=20) | |
| Razer Blade 16 2024, RTX 4090 (6.2.1) | |
| Asus ROG Strix Scar 16 G634JZR (6.2.1) | |
| Alienware x16 R2 P120F (6.2.1) | |
| Sınıf ortalaması Gaming (67235 - 253130, n=106, son 2 yıl) | |
* ... daha küçük daha iyidir
Oyun performansı
XMG bilgisayar, maksimum ayarlarda QHD oyun deneyimi için tasarlanmıştır. Kare hızları RTX 4090 (Overboost) için ortalamanın üzerinde ve su soğutması performansı biraz artırıyor. GPU işlevleri, Frame Generation ve DLSS 3, yalnızca bu özellikleri sunan oyunlarda olsa da, maksimum ayarlarda ve ışın izleme ile daha yüksek çözünürlüklere izin verecektir.
| Performance rating - Percent | |
| Asus ROG Strix Scar 17 G733PYV-LL053X | |
| Schenker XMG Neo 16 (Early 24) | |
| Schenker XMG Neo 16 (Early 24) | |
| Schenker XMG Neo 16 E23 | |
| Medion Erazer Beast X40 2024 | |
| Lenovo Legion Pro 7 RTX4090 | |
| Ortalama NVIDIA GeForce RTX 4090 Laptop GPU | |
| Asus ROG Strix Scar 16 G634JZR | |
| Razer Blade 16 2024, RTX 4090 | |
| Lenovo Legion 9 16IRX9, RTX 4090 | |
| Sınıf ortalaması Gaming | |
| Alienware x16 R2 P120F -1! | |
| The Witcher 3 - 1920x1080 Ultra Graphics & Postprocessing (HBAO+) | |
| Schenker XMG Neo 16 (Early 24) | |
| Schenker XMG Neo 16 (Early 24) (Overboost, Oasis) | |
| Schenker XMG Neo 16 E23 | |
| Asus ROG Strix Scar 17 G733PYV-LL053X | |
| Medion Erazer Beast X40 2024 | |
| Lenovo Legion 9 16IRX9, RTX 4090 | |
| Lenovo Legion Pro 7 RTX4090 | |
| Razer Blade 16 2024, RTX 4090 | |
| Ortalama NVIDIA GeForce RTX 4090 Laptop GPU (139.2 - 216, n=35) | |
| Asus ROG Strix Scar 16 G634JZR | |
| Sınıf ortalaması Gaming (95 - 240, n=8, son 2 yıl) | |
| Alienware x16 R2 P120F | |
| GTA V - 1920x1080 Highest AA:4xMSAA + FX AF:16x | |
| Asus ROG Strix Scar 17 G733PYV-LL053X | |
| Schenker XMG Neo 16 (Early 24) (Overboost, Oasis) | |
| Schenker XMG Neo 16 (Early 24) | |
| Schenker XMG Neo 16 E23 | |
| Lenovo Legion Pro 7 RTX4090 | |
| Medion Erazer Beast X40 2024 | |
| Asus ROG Strix Scar 16 G634JZR | |
| Ortalama NVIDIA GeForce RTX 4090 Laptop GPU (91.1 - 167.7, n=40) | |
| Razer Blade 16 2024, RTX 4090 | |
| Lenovo Legion 9 16IRX9, RTX 4090 | |
| Sınıf ortalaması Gaming (48.3 - 186.9, n=100, son 2 yıl) | |
| Final Fantasy XV Benchmark - 1920x1080 High Quality | |
| Schenker XMG Neo 16 (Early 24) (1.3, Overboost, Oasis) | |
| Schenker XMG Neo 16 (Early 24) (1.3) | |
| Schenker XMG Neo 16 E23 (1.3) | |
| Lenovo Legion Pro 7 RTX4090 (1.3) | |
| Medion Erazer Beast X40 2024 (1.3) | |
| Asus ROG Strix Scar 17 G733PYV-LL053X (1.3) | |
| Asus ROG Strix Scar 16 G634JZR (1.3) | |
| Ortalama NVIDIA GeForce RTX 4090 Laptop GPU (122.2 - 201, n=40) | |
| Lenovo Legion 9 16IRX9, RTX 4090 (1.3) | |
| Sınıf ortalaması Gaming (41 - 215, n=101, son 2 yıl) | |
| Alienware x16 R2 P120F (1.3) | |
| Razer Blade 16 2024, RTX 4090 (1.3) | |
| Strange Brigade - 1920x1080 ultra AA:ultra AF:16 | |
| Asus ROG Strix Scar 17 G733PYV-LL053X (1.47.22.14 D3D12) | |
| Schenker XMG Neo 16 (Early 24) (1.47.22.14 D3D12, Overboost, Oasis) | |
| Schenker XMG Neo 16 (Early 24) (1.47.22.14 D3D12) | |
| Schenker XMG Neo 16 E23 (1.47.22.14 D3D12) | |
| Medion Erazer Beast X40 2024 (1.47.22.14 D3D12) | |
| Lenovo Legion 9 16IRX9, RTX 4090 (1.47.22.14 D3D12) | |
| Razer Blade 16 2024, RTX 4090 (1.47.22.14 D3D12) | |
| Ortalama NVIDIA GeForce RTX 4090 Laptop GPU (233 - 421, n=39) | |
| Lenovo Legion Pro 7 RTX4090 (1.47.22.14 D3D12) | |
| Asus ROG Strix Scar 16 G634JZR (1.47.22.14 D3D12) | |
| Alienware x16 R2 P120F (1.47.22.14 D3D12) | |
| Sınıf ortalaması Gaming (76.3 - 456, n=91, son 2 yıl) | |
| Dota 2 Reborn - 1920x1080 ultra (3/3) best looking | |
| Asus ROG Strix Scar 17 G733PYV-LL053X | |
| Schenker XMG Neo 16 (Early 24) | |
| Schenker XMG Neo 16 (Early 24) (Overboost, Oasis) | |
| Medion Erazer Beast X40 2024 | |
| Razer Blade 16 2024, RTX 4090 | |
| Schenker XMG Neo 16 E23 | |
| Lenovo Legion Pro 7 RTX4090 | |
| Asus ROG Strix Scar 16 G634JZR | |
| Ortalama NVIDIA GeForce RTX 4090 Laptop GPU (115.7 - 220, n=42) | |
| Lenovo Legion 9 16IRX9, RTX 4090 | |
| Sınıf ortalaması Gaming (84.8 - 248, n=110, son 2 yıl) | |
| Alienware x16 R2 P120F | |
| X-Plane 11.11 - 1920x1080 high (fps_test=3) | |
| Asus ROG Strix Scar 17 G733PYV-LL053X | |
| Razer Blade 16 2024, RTX 4090 | |
| Schenker XMG Neo 16 (Early 24) | |
| Medion Erazer Beast X40 2024 | |
| Asus ROG Strix Scar 16 G634JZR | |
| Schenker XMG Neo 16 (Early 24) (v6.92.6600, Overboost, Oasis) | |
| Lenovo Legion Pro 7 RTX4090 | |
| Schenker XMG Neo 16 E23 | |
| Ortalama NVIDIA GeForce RTX 4090 Laptop GPU (77.8 - 166.2, n=46) | |
| Lenovo Legion 9 16IRX9, RTX 4090 | |
| Sınıf ortalaması Gaming (52.1 - 143.5, n=113, son 2 yıl) | |
| Alienware x16 R2 P120F | |
| F1 24 | |
| 1920x1080 Ultra High Preset AA:T AF:16x | |
| Asus ROG Strix Scar 17 G733PYV-LL053X (1222678) | |
| Schenker XMG Neo 16 (Early 24) (1119215) | |
| XMG Neo 16 E23 | |
| Ortalama NVIDIA GeForce RTX 4090 Laptop GPU (88 - 144.9, n=5) | |
| Lenovo Legion 9 16IRX9, RTX 4090 (1118244) | |
| Sınıf ortalaması Gaming (46.1 - 157.8, n=59, son 2 yıl) | |
| 2560x1440 Ultra High Preset AA:T AF:16x | |
| Asus ROG Strix Scar 17 G733PYV-LL053X (1222678) | |
| Schenker XMG Neo 16 (Early 24) (1119215) | |
| XMG Neo 16 E23 | |
| Ortalama NVIDIA GeForce RTX 4090 Laptop GPU (58.5 - 96.8, n=5) | |
| Lenovo Legion 9 16IRX9, RTX 4090 (1118244) | |
| Sınıf ortalaması Gaming (29.8 - 106.9, n=59, son 2 yıl) | |
| 2560x1440 Ultra High Preset + Quality DLSS AF:16x | |
| Asus ROG Strix Scar 17 G733PYV-LL053X (1222678) | |
| Schenker XMG Neo 16 (Early 24) (1119215) | |
| Ortalama NVIDIA GeForce RTX 4090 Laptop GPU (88.3 - 150.4, n=3) | |
| Sınıf ortalaması Gaming (14.3 - 159.3, n=49, son 2 yıl) | |
| Senua's Saga Hellblade 2 | |
| 1920x1080 High Preset | |
| Schenker XMG Neo 16 (Early 24) | |
| Ortalama NVIDIA GeForce RTX 4090 Laptop GPU (74 - 78.8, n=2) | |
| XMG Neo 16 E23 | |
| Sınıf ortalaması Gaming (33.9 - 86.1, n=14, son 2 yıl) | |
| 2560x1440 High Preset | |
| Schenker XMG Neo 16 (Early 24) | |
| Ortalama NVIDIA GeForce RTX 4090 Laptop GPU (51.8 - 57.3, n=2) | |
| XMG Neo 16 E23 | |
| Sınıf ortalaması Gaming (24.2 - 63.1, n=11, son 2 yıl) | |
| 2560x1440 High Preset + Quality DLSS | |
| Schenker XMG Neo 16 (Early 24) | |
| Ortalama NVIDIA GeForce RTX 4090 Laptop GPU (n=1) | |
| Sınıf ortalaması Gaming (39.6 - 81.9, n=9, son 2 yıl) | |
| Horizon Forbidden West | |
| 1920x1080 Very High Preset AA:T | |
| Schenker XMG Neo 16 (Early 24) | |
| Ortalama NVIDIA GeForce RTX 4090 Laptop GPU (81 - 125.2, n=3) | |
| Sınıf ortalaması Gaming (14.7 - 140.3, n=13, son 2 yıl) | |
| 2560x1440 Very High Preset AA:T | |
| Schenker XMG Neo 16 (Early 24) | |
| Ortalama NVIDIA GeForce RTX 4090 Laptop GPU (66 - 98, n=3) | |
| Sınıf ortalaması Gaming (39.6 - 100.9, n=10, son 2 yıl) | |
| Alone in the Dark | |
| 1920x1080 Cinematic Preset | |
| Schenker XMG Neo 16 (Early 24) | |
| Ortalama NVIDIA GeForce RTX 4090 Laptop GPU (141 - 189.9, n=2) | |
| Sınıf ortalaması Gaming (n=1son 2 yıl) | |
| 2560x1440 Cinematic Preset | |
| Schenker XMG Neo 16 (Early 24) | |
| Ortalama NVIDIA GeForce RTX 4090 Laptop GPU (99 - 133.6, n=2) | |
| Alan Wake 2 | |
| 1920x1080 High Preset | |
| Schenker XMG Neo 16 (Early 24) | |
| Ortalama NVIDIA GeForce RTX 4090 Laptop GPU (108.6 - 124.7, n=7) | |
| Asus ROG Strix Scar 17 G733PYV-LL053X | |
| Razer Blade 16 2024, RTX 4090 | |
| Sınıf ortalaması Gaming (54.6 - 133.2, n=31, son 2 yıl) | |
| 2560x1440 High Preset | |
| Schenker XMG Neo 16 (Early 24) | |
| Ortalama NVIDIA GeForce RTX 4090 Laptop GPU (78.4 - 87.1, n=7) | |
| Asus ROG Strix Scar 17 G733PYV-LL053X | |
| Razer Blade 16 2024, RTX 4090 | |
| Sınıf ortalaması Gaming (31.2 - 93.1, n=33, son 2 yıl) | |
| 1920x1080 High Preset + High Ray Tracing | |
| Ortalama NVIDIA GeForce RTX 4090 Laptop GPU (60.3 - 70.3, n=2) | |
| Schenker XMG Neo 16 (Early 24) | |
| Sınıf ortalaması Gaming (24.3 - 72, n=12, son 2 yıl) | |
Kare hızı kararlılığını kontrol etmek için Witcher 3 adresini kullandık: Oyun (maksimum ayarlar, FHD) yaklaşık 1 saat boyunca çalıştı, oyun karakteri hareket etmedi ve kare hızında herhangi bir düşüş gözlemlemedik.
Witcher 3 FPS diagram
| düşük | orta | yüksek | ultra | QHD DLSS | QHD FSR | QHD | 4K DLSS | 4K | |
|---|---|---|---|---|---|---|---|---|---|
| GTA V (2015) | 187.6 | 187.4 | 185.7 | 159.3 | 156 | ||||
| The Witcher 3 (2015) | 643 | 562.3 | 412.7 | 214 | 169.4 | ||||
| Dota 2 Reborn (2015) | 248 | 221 | 210 | 194.6 | |||||
| Final Fantasy XV Benchmark (2018) | 233 | 225 | 196.9 | 162.5 | |||||
| X-Plane 11.11 (2018) | 208 | 184.2 | 144.5 | ||||||
| Far Cry 5 (2018) | 194 | 184 | 172 | 156 | |||||
| Strange Brigade (2018) | 579 | 444 | 397 | 403 | 305 | ||||
| Baldur's Gate 3 (2023) | 253 | 215.5 | 188 | 187 | 133.2 | 114 | 73.1 | ||
| Cyberpunk 2077 (2023) | 168.5 | 157.8 | 138 | 131.5 | 93.8 | ||||
| Alan Wake 2 (2023) | 128.5 | 128 | 123.3 | 87.1 | |||||
| Alone in the Dark (2024) | 219 | 217 | 216 | 189.9 | 133.6 | ||||
| Horizon Forbidden West (2024) | 165.4 | 160.5 | 126.2 | 125.2 | 98 | ||||
| Senua's Saga Hellblade 2 (2024) | 122.3 | 103.3 | 78.8 | 83.1 | 82.1 | 57.3 | |||
| F1 24 (2024) | 346 | 369 | 302 | 127 | 129.5 | 127.1 | 84.7 |
Emisyonlar - XMG dizüstü bilgisayar sınıfa özgü emisyonlara sahiptir
Gürültü emisyonları
56 dB(A)'ya kadar gürültü seviyeleri mümkündür ancak oyun oynarken bu rakam biraz daha düşüktür (Overboost). "Balanced" kullanılarak önemli ölçüde daha düşük bir gürültü seviyesi elde edilebilir - performans pahasına. Oyun oynamak mümkün olacaktır. Günlük kullanımda (ofis, internet) ve boşta çalışırken, bilgisayar aktif performans modundan bağımsız olarak genellikle sessiz çalışır.
Harici su soğutmanın kullanılması bir miktar gürültü üretimine neden olur: Pompa çok sessiz çalışır ve fanlar çok daha belirgindir. Öznel olarak baktığımızda, harici su soğutması kullanıldığında gürültü seviyesinin daha hoş olduğunu ancak daha sessiz olmadığını düşünüyoruz.
Arada sırada, örneğin Diskspd testi sırasında dizüstü bilgisayarın içinden elektronik çatırtılar geliyor. Muhtemelen bunun nedeni SSD'dir.
Ses yüksekliği
| Boşta |
| 28 / 29 / 31 dB |
| Çalışırken |
| 51 / 56 dB |
 | ||
30 dB sessiz 40 dB(A) duyulabilirlik 50 dB(A) gürültülü |
||
min: | ||
| Schenker XMG Neo 16 (Early 24) GeForce RTX 4090 Laptop GPU, i9-14900HX, Samsung 990 Pro 1 TB | Razer Blade 16 2024, RTX 4090 GeForce RTX 4090 Laptop GPU, i9-14900HX, Samsung PM9A1 MZVL22T0HBLB | Medion Erazer Beast X40 2024 GeForce RTX 4090 Laptop GPU, i9-14900HX, Phison E18-1TB-PHISON-SSD-BICS5 | Asus ROG Strix Scar 17 G733PYV-LL053X GeForce RTX 4090 Laptop GPU, R9 7945HX3D, SK hynix PC801 HFS001TEJ9X101N | Schenker XMG Neo 16 E23 GeForce RTX 4090 Laptop GPU, i9-13900HX, Crucial P5 Plus 1TB CT1000P5PSSD8 | |
|---|---|---|---|---|---|
| Noise | 14% | 3% | 3% | -12% | |
| kapalı / ortam * (dB) | 26 | 23 12% | 25 4% | 23 12% | 25 4% |
| Idle Minimum * (dB) | 28 | 23 18% | 28 -0% | 23 18% | 31 -11% |
| Idle Average * (dB) | 29 | 23 21% | 29 -0% | 27.7 4% | 33 -14% |
| Idle Maximum * (dB) | 31 | 27.66 11% | 32 -3% | 34.7 -12% | 42 -35% |
| Load Average * (dB) | 51 | 43.76 14% | 48 6% | 53.4 -5% | 58 -14% |
| Witcher 3 ultra * (dB) | 54 | 46.81 13% | 50 7% | 53.4 1% | 57 -6% |
| Load Maximum * (dB) | 56 | 50.37 10% | 52 7% | 53.4 5% | 59 -5% |
* ... daha küçük daha iyidir
Sıcaklık
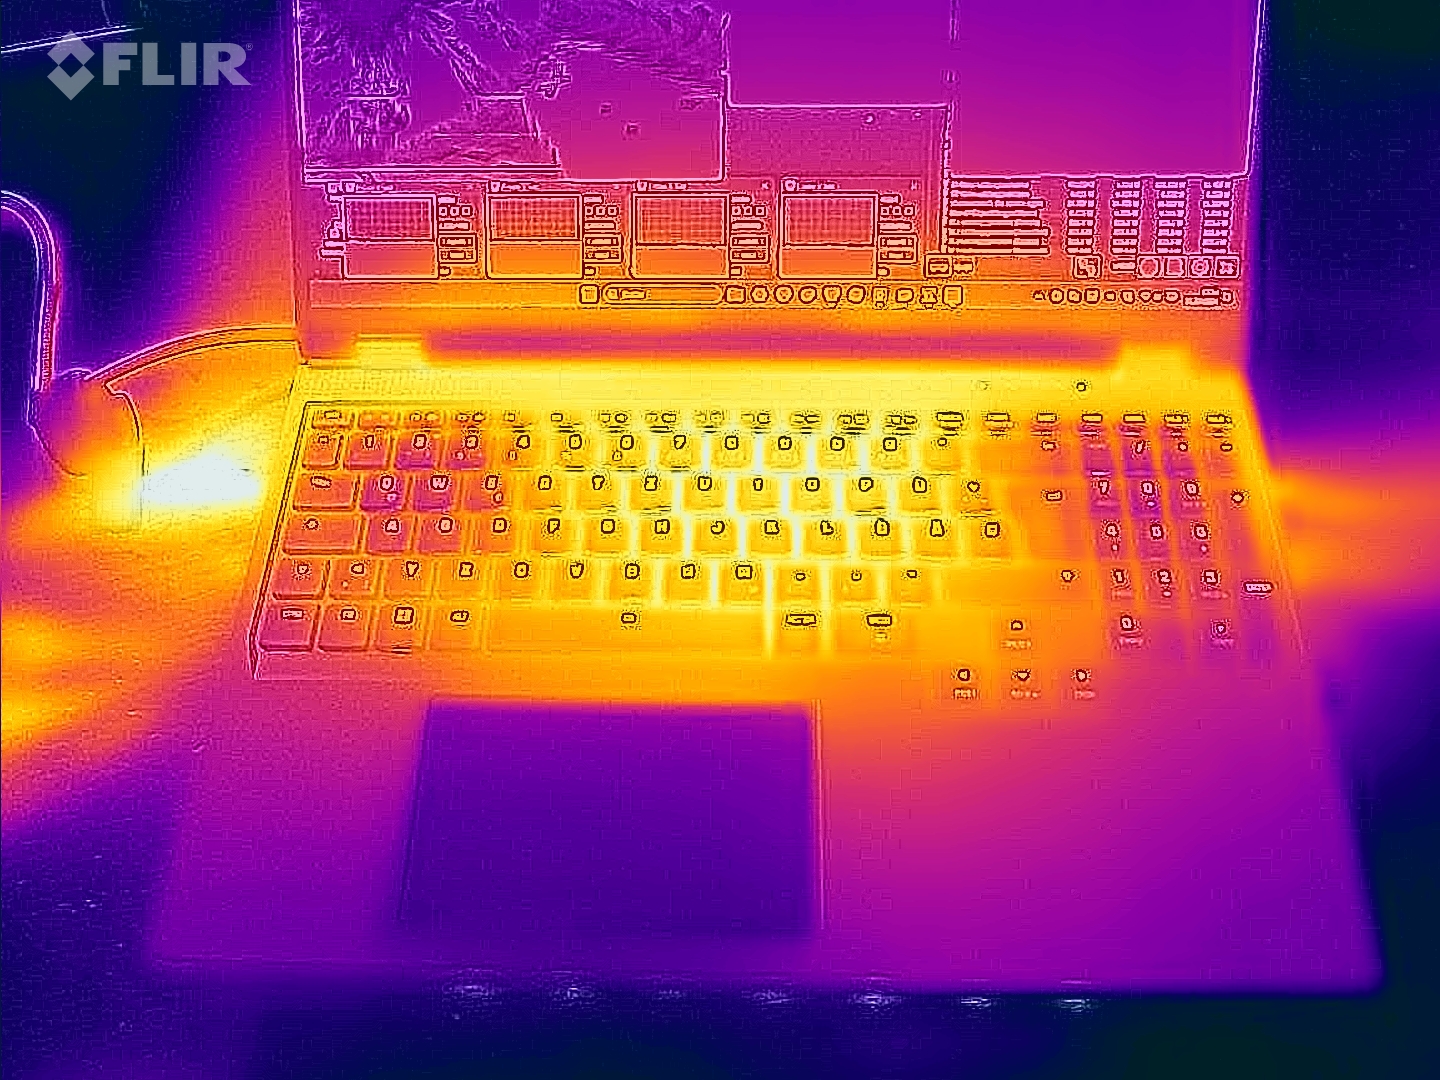
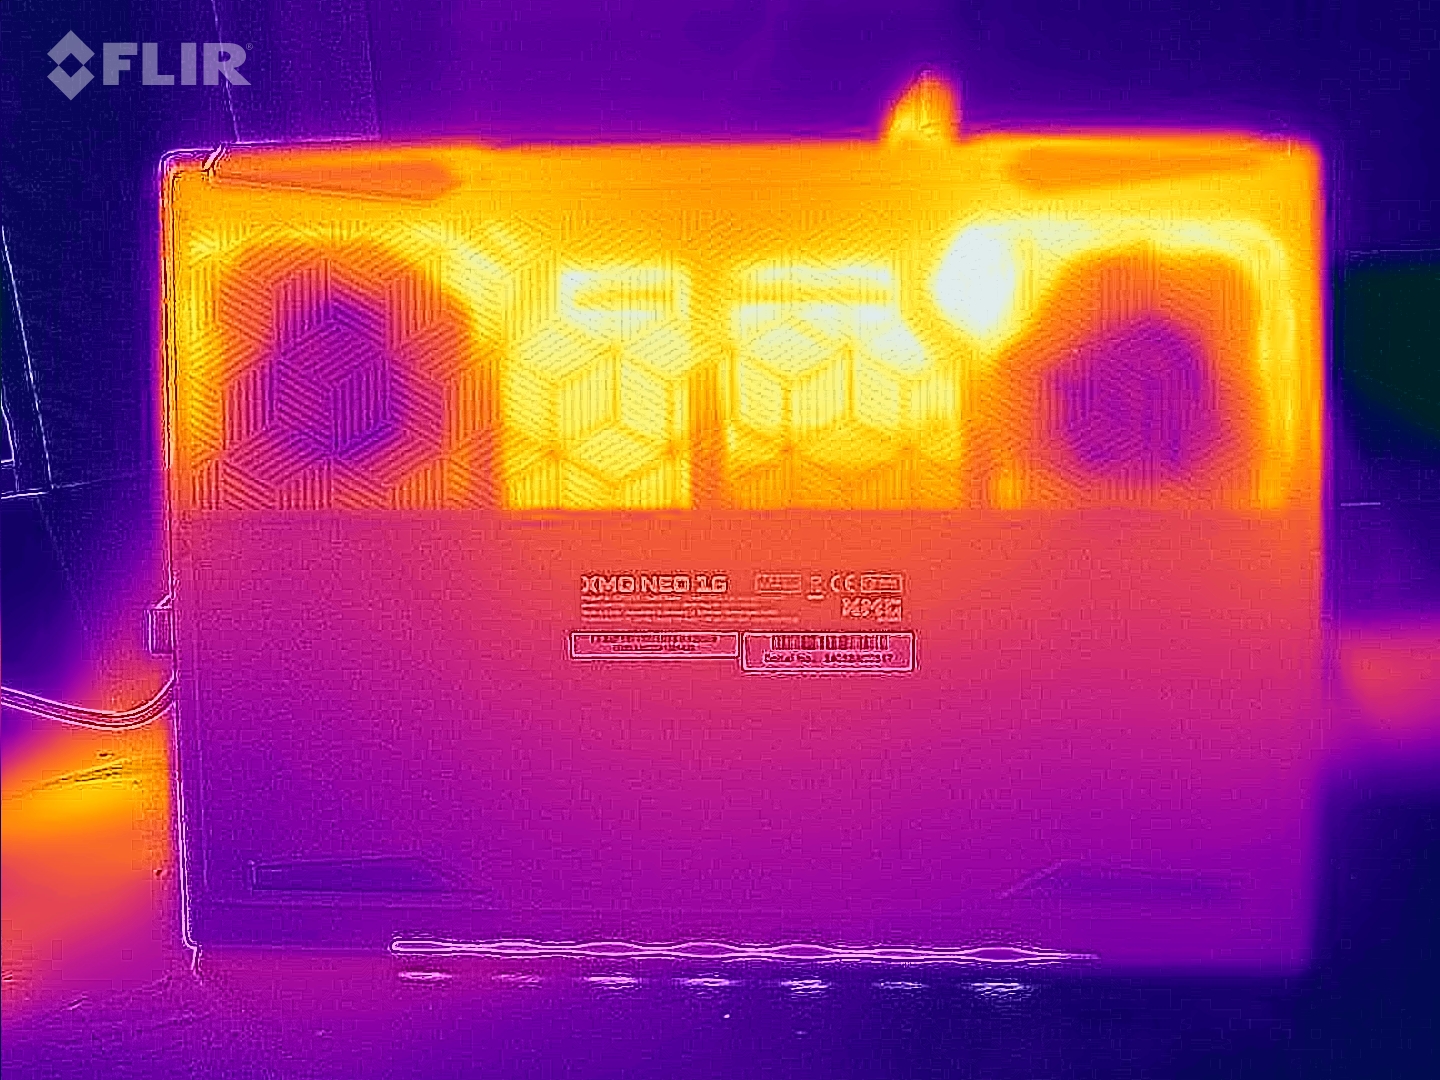
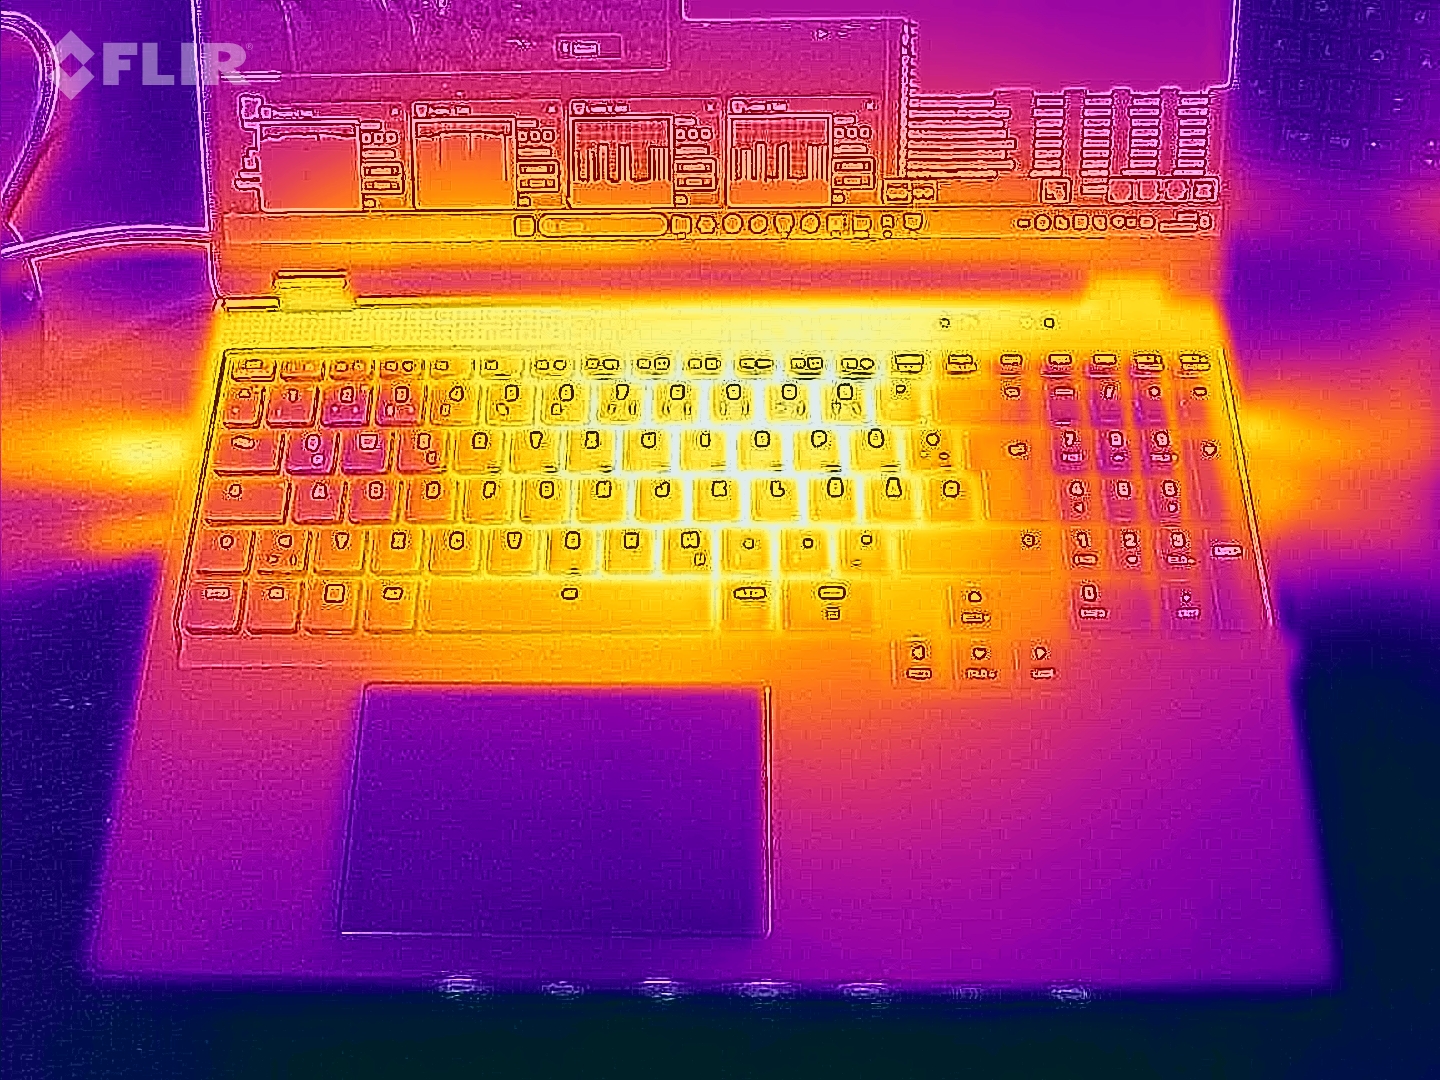
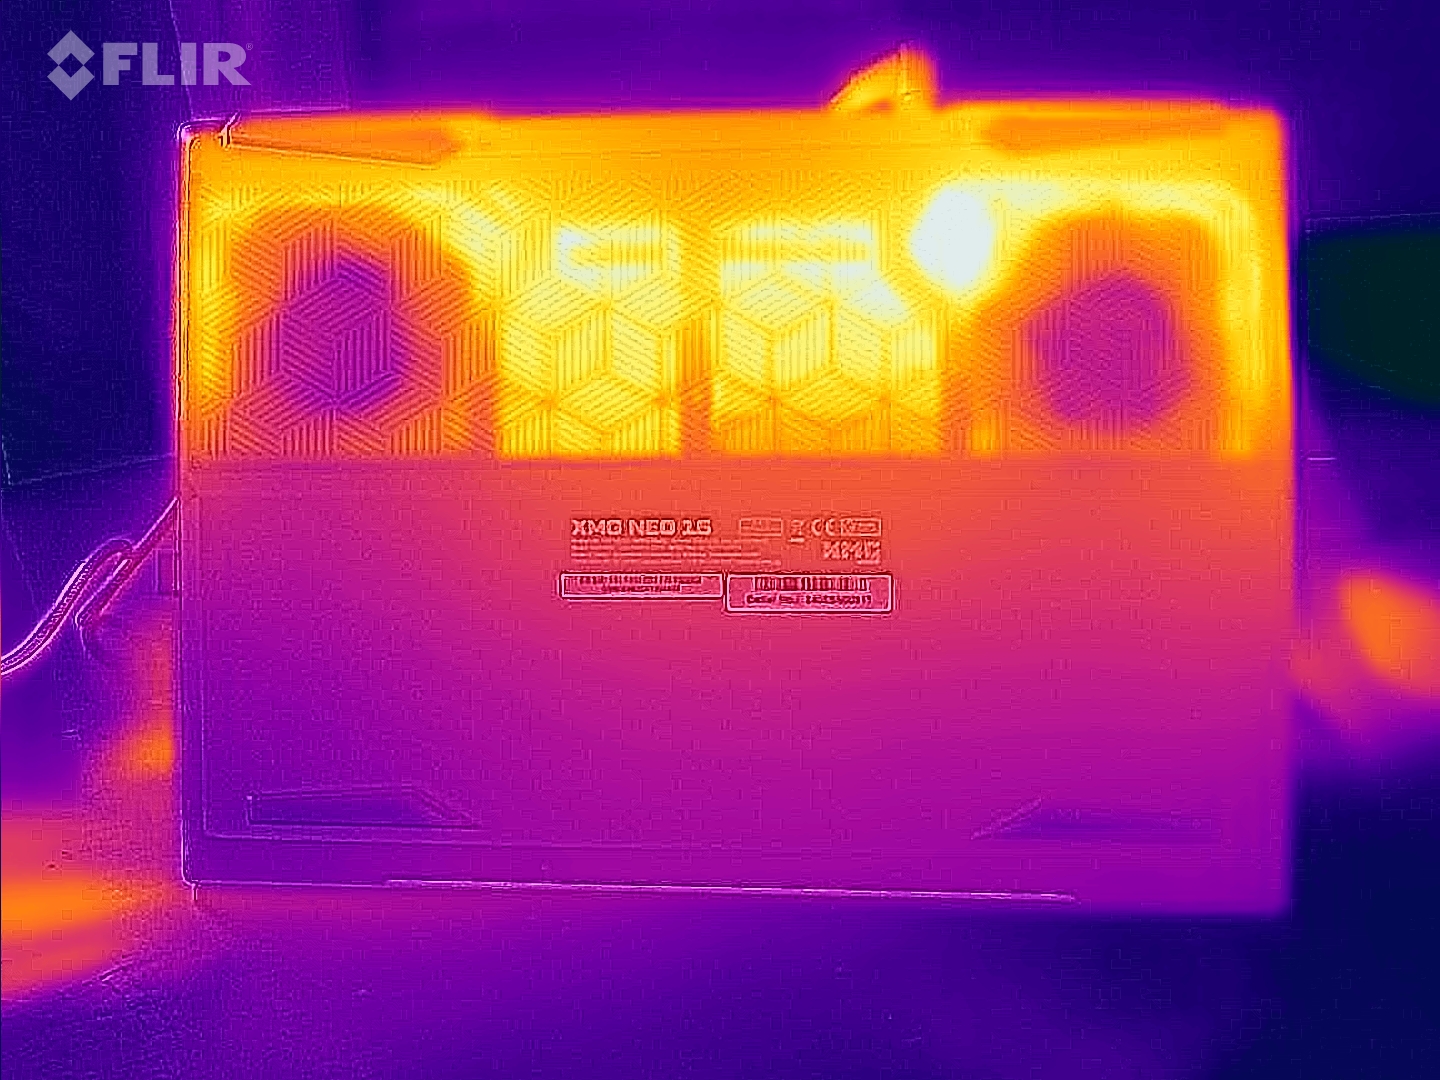
Dizüstü bilgisayar yük altında belirgin şekilde ısınıyor (stres testi ve Witcher 3 testi): Bazı bölgelerde sıcaklık bazen 50 °C'nin üzerine çıkıyor. Bununla birlikte, avuç içi dayanağında sıcaklıklar orta seviyede kalıyor. Günlük kullanımda (ofis, internet), rakamlar yeşil bölgede yer alıyor.
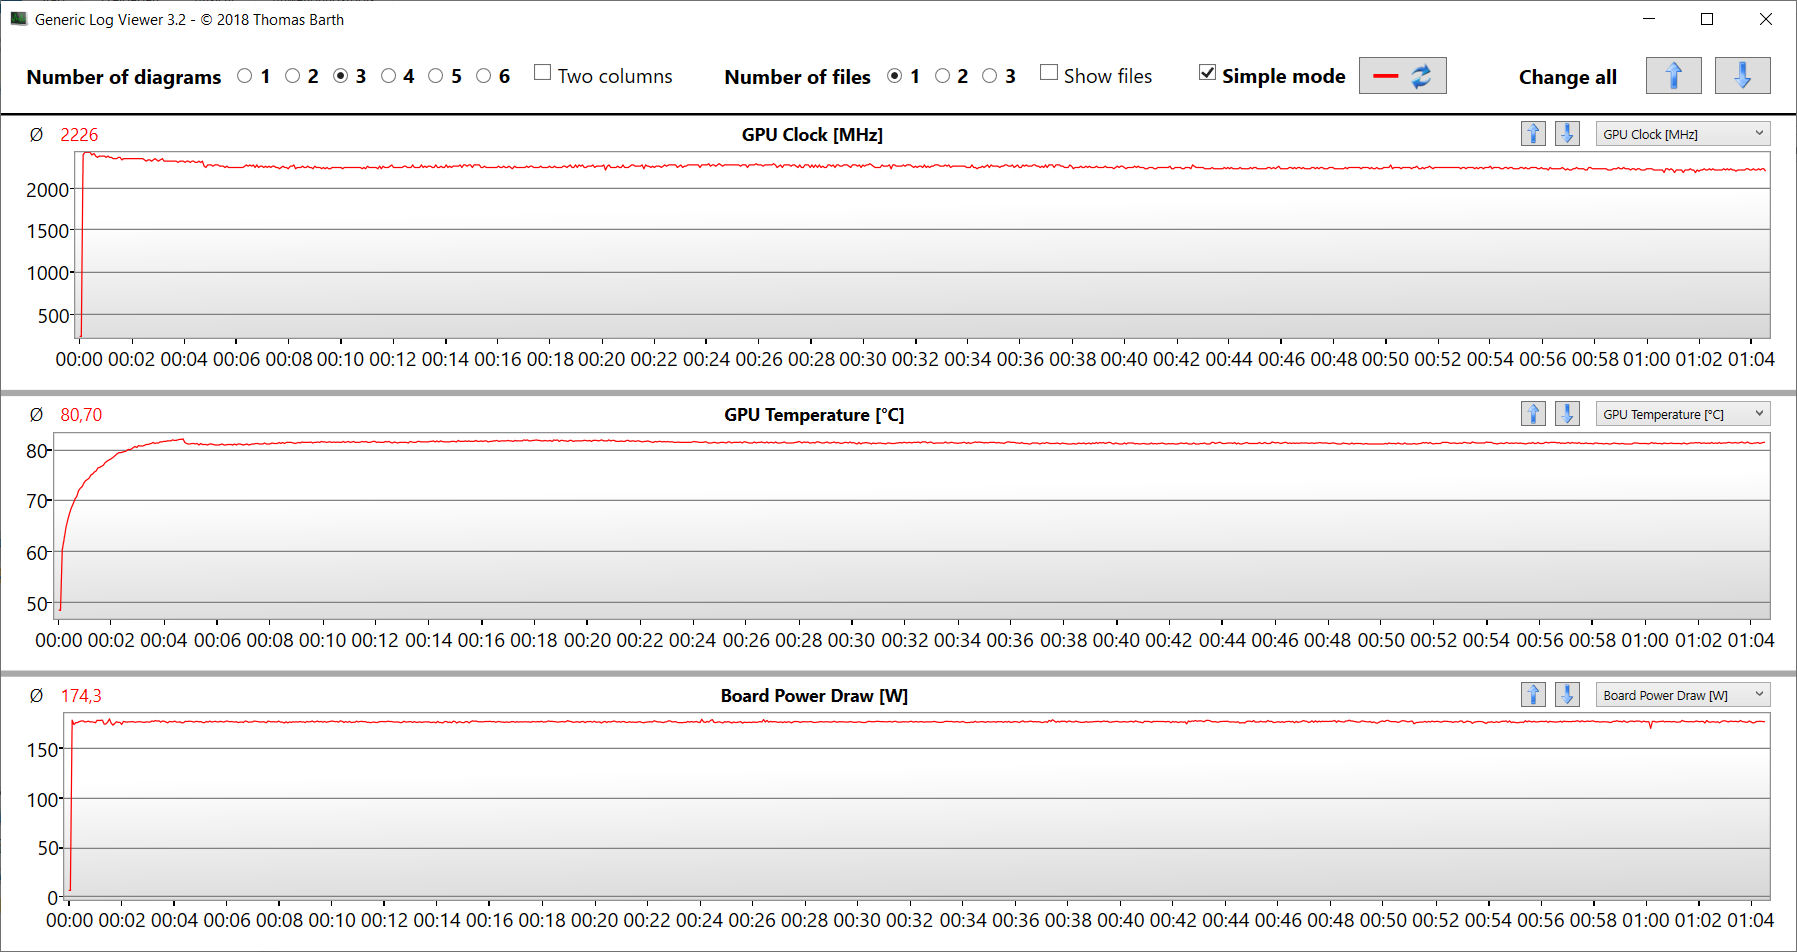
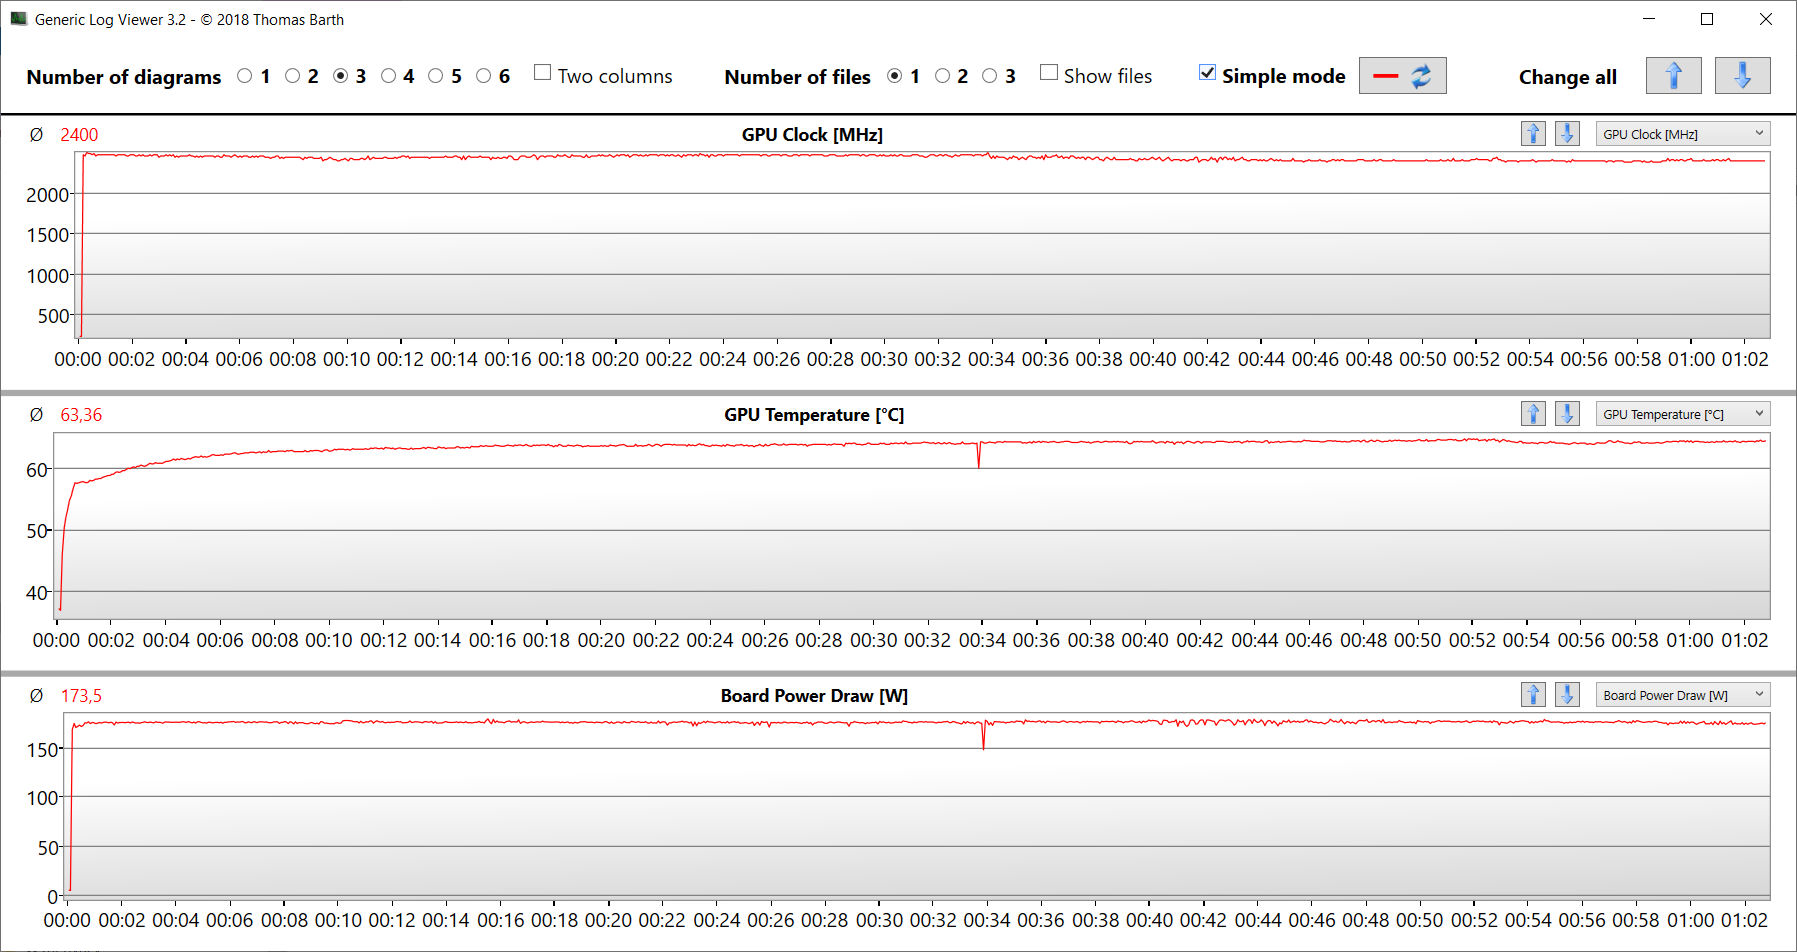
Witcher 3 testi, isteğe bağlı su soğutmanın etkisini vurgulamaktadır: GPU sıcaklığı yaklaşık 17 °C farklılık gösteriyor (80,7 °C'ye karşı 63,4 °C).
(-) Üst taraftaki maksimum sıcaklık, 40.4 °C / 105 F ortalamasına kıyasla 47 °C / 117 F'dir. , Gaming sınıfı için 21.2 ile 68.8 °C arasında değişir.
(-) Alt kısım, 43.2 °C / 110 F ortalamasına kıyasla maksimum 56 °C / 133 F'ye kadar ısınır
(+) Boşta kullanımda, üst tarafın ortalama sıcaklığı 26 °C / 79 F olup, cihazın 33.9 °C / 93 F.
(-) The Witcher 3 oynarken, üst tarafın ortalama sıcaklığı 42.4 °C / 108 F olup, cihazın 33.9 °C / 93 F.
(+) Avuç içi dayanakları ve dokunmatik yüzey maksimum (35 °C / 95 F) cilt sıcaklığına ulaşıyor ve bu nedenle sıcak değil.
(-) Benzer cihazların avuç içi dayanağı alanının ortalama sıcaklığı 28.8 °C / 83.8 F (-6.2 °C / -11.2 F) idi.
| Schenker XMG Neo 16 (Early 24) Intel Core i9-14900HX, NVIDIA GeForce RTX 4090 Laptop GPU | Razer Blade 16 2024, RTX 4090 Intel Core i9-14900HX, NVIDIA GeForce RTX 4090 Laptop GPU | Medion Erazer Beast X40 2024 Intel Core i9-14900HX, NVIDIA GeForce RTX 4090 Laptop GPU | Asus ROG Strix Scar 17 G733PYV-LL053X AMD Ryzen 9 7945HX3D, NVIDIA GeForce RTX 4090 Laptop GPU | Schenker XMG Neo 16 E23 Intel Core i9-13900HX, NVIDIA GeForce RTX 4090 Laptop GPU | |
|---|---|---|---|---|---|
| Heat | 2% | -7% | 8% | 1% | |
| Maximum Upper Side * (°C) | 47 | 45 4% | 47 -0% | 40.1 15% | 50 -6% |
| Maximum Bottom * (°C) | 56 | 45 20% | 54 4% | 46.7 17% | 51 9% |
| Idle Upper Side * (°C) | 27 | 29 -7% | 30 -11% | 26.5 2% | 28 -4% |
| Idle Bottom * (°C) | 27 | 30 -11% | 32 -19% | 27.7 -3% | 26 4% |
* ... daha küçük daha iyidir
Stres testi
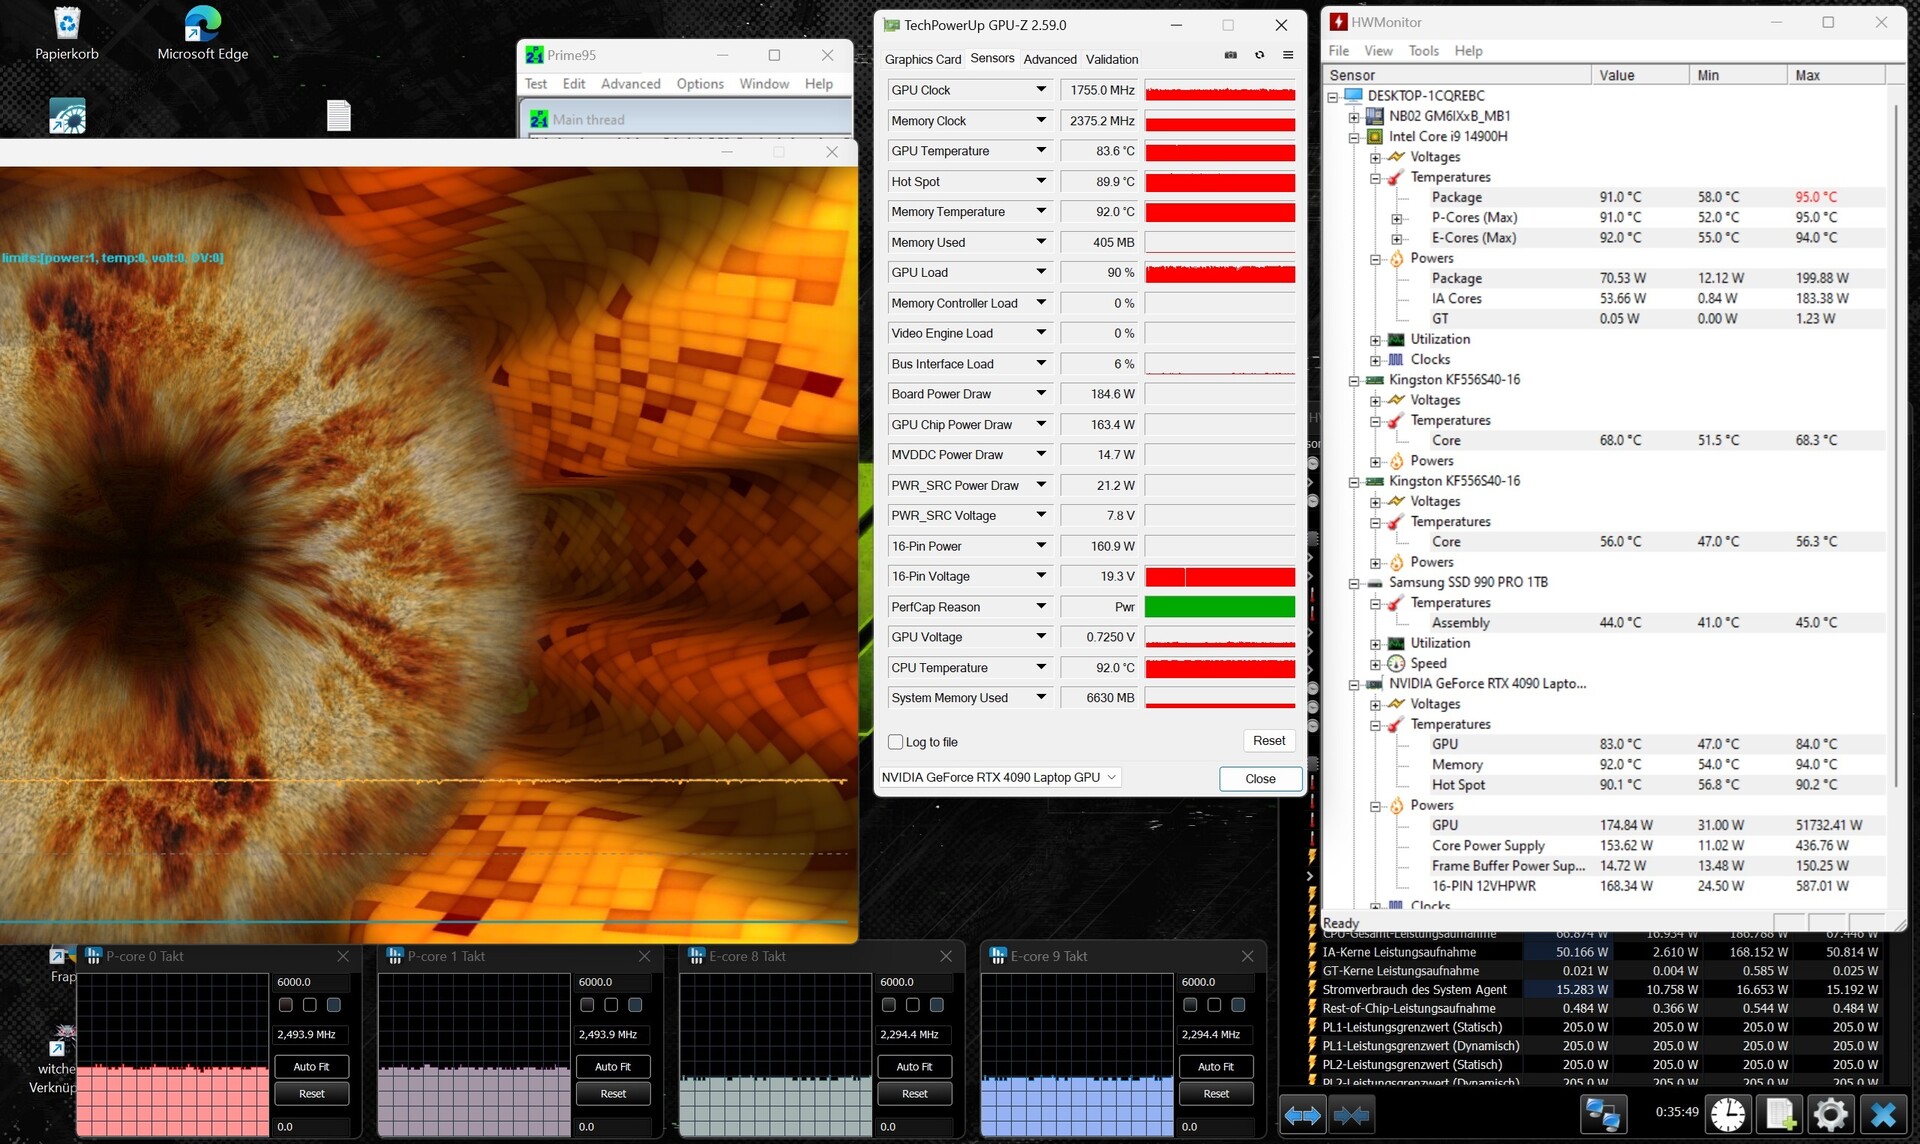
Stres testi aşırı senaryosu (Prime95 ve Furmark sürekli çalışmada) tam yük altında sistem kararlılığını kontrol eder. CPU hızı testin ilk dakikasında yaklaşık 4,3 ila 4,5 GHz (P) ve 3,5 ila 3,6 GHz'den (E) 2,5 GHz (P) ve 2,3 GHz'e (E) düşer. Aynı zamanda GPU hızı 1.600 MHz'lik başlangıç noktasından 2.000 MHz'in üzerine çıkmaktadır.
Konuşmacılar
Stereo hoparlörler bas seslerden yoksundur. Bunun dışında, çoğunlukla iyi ses üretirler. Kulaklık veya harici hoparlör kullanarak daha iyi kalite elde edilebilir.
Schenker XMG Neo 16 (Early 24) ses analizi
(+) | hoparlörler nispeten yüksek sesle çalabilir (86 dB)
Bas 100 - 315Hz
(-) | neredeyse hiç bas yok - ortalama olarak medyandan 16.3% daha düşük
(±) | Bas doğrusallığı ortalamadır (8.6% delta - önceki frekans)
Ortalar 400 - 2000 Hz
(+) | dengeli ortalar - medyandan yalnızca 3% uzakta
(+) | orta frekanslar doğrusaldır (3.6% deltadan önceki frekansa)
Yüksekler 2 - 16 kHz
(+) | dengeli yüksekler - medyandan yalnızca 2.5% uzakta
(+) | yüksekler doğrusaldır (4.9% deltadan önceki frekansa)
Toplam 100 - 16.000 Hz
(+) | genel ses doğrusaldır (12.4% ortancaya göre fark)
Aynı sınıfla karşılaştırıldığında
» Bu sınıftaki tüm test edilen cihazların %15%'si daha iyi, 3% benzer, 82% daha kötüydü
» En iyisinin deltası 6% idi, ortalama 18% idi, en kötüsü 132% idi
Test edilen tüm cihazlarla karşılaştırıldığında
» Test edilen tüm cihazların %11'si daha iyi, 2 benzer, % 87 daha kötüydü
» En iyisinin deltası 4% idi, ortalama 24% idi, en kötüsü 134% idi
Razer Blade 16 2024, RTX 4090 ses analizi
(±) | hoparlör ses yüksekliği ortalama ama iyi (81.16 dB)
Bas 100 - 315Hz
(±) | azaltılmış bas - ortalama olarak medyandan 8.2% daha düşük
(±) | Bas doğrusallığı ortalamadır (7.4% delta - önceki frekans)
Ortalar 400 - 2000 Hz
(+) | dengeli ortalar - medyandan yalnızca 3.3% uzakta
(+) | orta frekanslar doğrusaldır (5.9% deltadan önceki frekansa)
Yüksekler 2 - 16 kHz
(+) | dengeli yüksekler - medyandan yalnızca 1.6% uzakta
(+) | yüksekler doğrusaldır (3.1% deltadan önceki frekansa)
Toplam 100 - 16.000 Hz
(+) | genel ses doğrusaldır (9.2% ortancaya göre fark)
Aynı sınıfla karşılaştırıldığında
» Bu sınıftaki tüm test edilen cihazların %3%'si daha iyi, 1% benzer, 95% daha kötüydü
» En iyisinin deltası 6% idi, ortalama 18% idi, en kötüsü 132% idi
Test edilen tüm cihazlarla karşılaştırıldığında
» Test edilen tüm cihazların %3'si daha iyi, 1 benzer, % 96 daha kötüydü
» En iyisinin deltası 4% idi, ortalama 24% idi, en kötüsü 134% idi
Enerji yönetimi - Schenker Neo iyi bir pil ömrü sunar
Güç tüketimi
Güç tüketimi, elimizdeki kurulu donanım için normal bir seviyede. Witcher 3 testi ve stres testi biraz azalan güç tüketimi ile çalıştı. PSU (330 watt) uygun büyüklükte.
| Kapalı / Bekleme modu | |
| Boşta | |
| Çalışırken |
|
Key:
min: | |
| Schenker XMG Neo 16 (Early 24) i9-14900HX, GeForce RTX 4090 Laptop GPU, Samsung 990 Pro 1 TB, IPS, 2560x1600, 16" | Razer Blade 16 2024, RTX 4090 i9-14900HX, GeForce RTX 4090 Laptop GPU, Samsung PM9A1 MZVL22T0HBLB, OLED, 2560x1600, 16" | Medion Erazer Beast X40 2024 i9-14900HX, GeForce RTX 4090 Laptop GPU, Phison E18-1TB-PHISON-SSD-BICS5, IPS, 2560x1600, 17" | Asus ROG Strix Scar 17 G733PYV-LL053X R9 7945HX3D, GeForce RTX 4090 Laptop GPU, SK hynix PC801 HFS001TEJ9X101N, IPS, 2560x1440, 17.3" | Schenker XMG Neo 16 E23 i9-13900HX, GeForce RTX 4090 Laptop GPU, Crucial P5 Plus 1TB CT1000P5PSSD8, IPS, 2560x1600, 16" | Sınıf ortalaması Gaming | |
|---|---|---|---|---|---|---|
| Power Consumption | -22% | -1% | -23% | -9% | -16% | |
| Idle Minimum * (Watt) | 6 | 16.9 -182% | 7 -17% | 15.4 -157% | 8 -33% | 13.2 ? -120% |
| Idle Average * (Watt) | 16 | 17.8 -11% | 15 6% | 21.6 -35% | 18 -13% | 18.9 ? -18% |
| Idle Maximum * (Watt) | 28 | 19.6 30% | 33 -18% | 22.2 21% | 28 -0% | 24.3 ? 13% |
| Load Average * (Watt) | 130 | 128 2% | 134 -3% | 116.7 10% | 133 -2% | 108.3 ? 17% |
| Witcher 3 ultra * (Watt) | 302 | 243 20% | 280 7% | 262 13% | 294 3% | |
| Load Maximum * (Watt) | 361 | 328 9% | 294 19% | 327.1 9% | 399 -11% | 254 ? 30% |
| Cyberpunk 2077 ultra external monitor * (Watt) | 272 |
* ... daha küçük daha iyidir
Power consumption Witcher 3 / stress test
Power consumption with an external monitor
Pil ömrü
Wi-Fi ve video testlerinde (bir komut dosyası yardımıyla web sitelerinin yüklenmesi ve bir döngüde kısa Big Buck Bunny (H.264 kodlama, FHD) videosu), 16 inçlik makine 5 saat 50 dakika ve 6 saat 58 dakikalık çalışma süreleri elde etti. Sonuç olarak, bunlar iyi rakamlar.
| Schenker XMG Neo 16 (Early 24) i9-14900HX, GeForce RTX 4090 Laptop GPU, 99.8 Wh | Razer Blade 16 2024, RTX 4090 i9-14900HX, GeForce RTX 4090 Laptop GPU, 95.2 Wh | Medion Erazer Beast X40 2024 i9-14900HX, GeForce RTX 4090 Laptop GPU, 99.8 Wh | Asus ROG Strix Scar 17 G733PYV-LL053X R9 7945HX3D, GeForce RTX 4090 Laptop GPU, 90 Wh | Schenker XMG Neo 16 E23 i9-13900HX, GeForce RTX 4090 Laptop GPU, 99 Wh | Sınıf ortalaması Gaming | |
|---|---|---|---|---|---|---|
| Pil Çalışma Süresi | -10% | 7% | -34% | -1% | 0% | |
| Reader / Idle (h) | 10 | 8.71 ? -13% | ||||
| H.264 (h) | 7 | 7.6 9% | 5 -29% | 5.8 -17% | 8.26 ? 18% | |
| WiFi v1.3 (h) | 5.8 | 5.5 -5% | 6.2 7% | 4.8 -17% | 6.7 16% | 7.04 ? 21% |
| Load (h) | 2 | 1.3 -35% | 0.9 -55% | 1.47 ? -26% | ||
| Witcher 3 ultra (h) | 1.4 |
Artılar
Eksiler
Karar - Üst düzey bir ateş topu
Neo 16 vaat ettiklerini yerine getiriyor: Performans ölçeğinin üst ucundaki donanım (Core i9, RTX 4090) video düzenleme, işleme, akış ve elbette QHD oyun oynamaya olanak tanır. Beklenen yüksek emisyonlar, uygun performans modu seçilerek daha ılımlı bir seviyeye düşürülebilir.
XMG Neo 16 (Early 24) ile Schenker, kompakt bir form faktöründe çok fazla güç sunuyor.
Ödün vermeyen bir çözüm arayanlar, isteğe bağlı olarak temin edilebilen harici su soğutmaya (230 $) başvurmak zorunda kalacaklar: Bu, küçük bir performans artışı ve daha düşük emisyon elde edilmesine yardımcı olur. Bunu söyledikten sonra, dizüstü bilgisayar sabit bir yere bağlanır.
Mat, 16 inç, 16:10 ekran (2.560 x 1.600 piksel, sRGB, IPS, 240 Hz), özellikle hoş bir nokta olan yüksek parlaklığı ile büyük ölçüde iyi bir izlenim bıraktı. Renk alanı kapsamının yanı sıra kontrast söz konusu olduğunda iyileştirme için biraz yer var. RAID 0/1 desteği de dahil olmak üzere iki SSD yuvası (PCIe 4), tonlarca depolama alanı ve kısa yükleme süreleri sağlar.
Tek bir pil şarjı (99,8 Wh), gerçek hayatta yaklaşık 6 ila 7 saatlik çalışma süreleri için yeterlidir - iyi rakamlar. Pozitif: Batarya bir USB-C şarj cihazı (100 watt, 20 V, 5 A) ile şarj edilebilir - TB4 portu Güç Dağıtımını destekler, yani PSU (330 watt) teorik olarak evde kalabilir.
Bir alternatif de şu olabilir Razer Blade 16 (2024). Bu bilgisayar biraz daha az işlem gücü sunuyor ancak Neo'dan farklı olarak daha yüksek kontrast sunuyor ve daha canlı bir OLED ekrana sahip.
Fiyat ve bulunabilirlik
XMG Neo 16 (Early 24) bireysel olarak yapılandırılabilir ve Schenker çevrimiçi mağazasından (Almanca) satın alınabilir ve fiyatlar test sırasındaki dolar/euro kurunu temsil eder. İnceleme modelimizin fiyatı yaklaşık 4.000 dolardır. Giriş seviyesi modeller (RTX 4060 ile) yaklaşık 2.000 dolardan başlıyor. Schenker bu modellerin Haziran sonunda (RTX 4090) ve Temmuz ortasında (RTX 4060/70/80) satışa sunulacağını belirtti. İsteğe bağlı su soğutması için yaklaşık 230 dolar ödemeniz gerekecek.
Schenker XMG Neo 16 (Early 24)
- 06/19/2024 v8
Sascha Mölck
 Total Sustainability Score:
 Şeffaflık
İncelenecek cihazların seçimi editör ekibimiz tarafından yapılır. Test örneği, bu incelemenin amacı doğrultusunda üretici veya perakendeci tarafından yazara ödünç olarak sağlanmıştır. Borç verenin bu inceleme üzerinde herhangi bir etkisi olmadığı gibi, üretici de yayınlanmadan önce bu incelemenin bir kopyasını almamıştır. Bu incelemeyi yayınlama zorunluluğu yoktu. Bağımsız bir medya şirketi olarak Notebookcheck, üreticilerin, perakendecilerin veya yayıncıların otoritesine tabi değildir.
Notebookcheck bu şekilde test yapıyor
Notebookcheck, tüm sonuçların karşılaştırılabilir olmasını sağlamak için her yıl yüzlerce dizüstü bilgisayarı ve akıllı telefonu standart prosedürler kullanarak bağımsız olarak inceliyor. Yaklaşık 20 yıldır test yöntemlerimizi sürekli olarak geliştirdik ve bu süreçte endüstri standartlarını belirledik. Test laboratuvarlarımızda deneyimli teknisyenler ve editörler tarafından yüksek kaliteli ölçüm ekipmanları kullanılmaktadır. Bu testler çok aşamalı bir doğrulama sürecini içerir. Karmaşık derecelendirme sistemimiz, nesnelliği koruyan yüzlerce sağlam temellere dayanan ölçüm ve kıyaslamaya dayanmaktadır.Price comparison