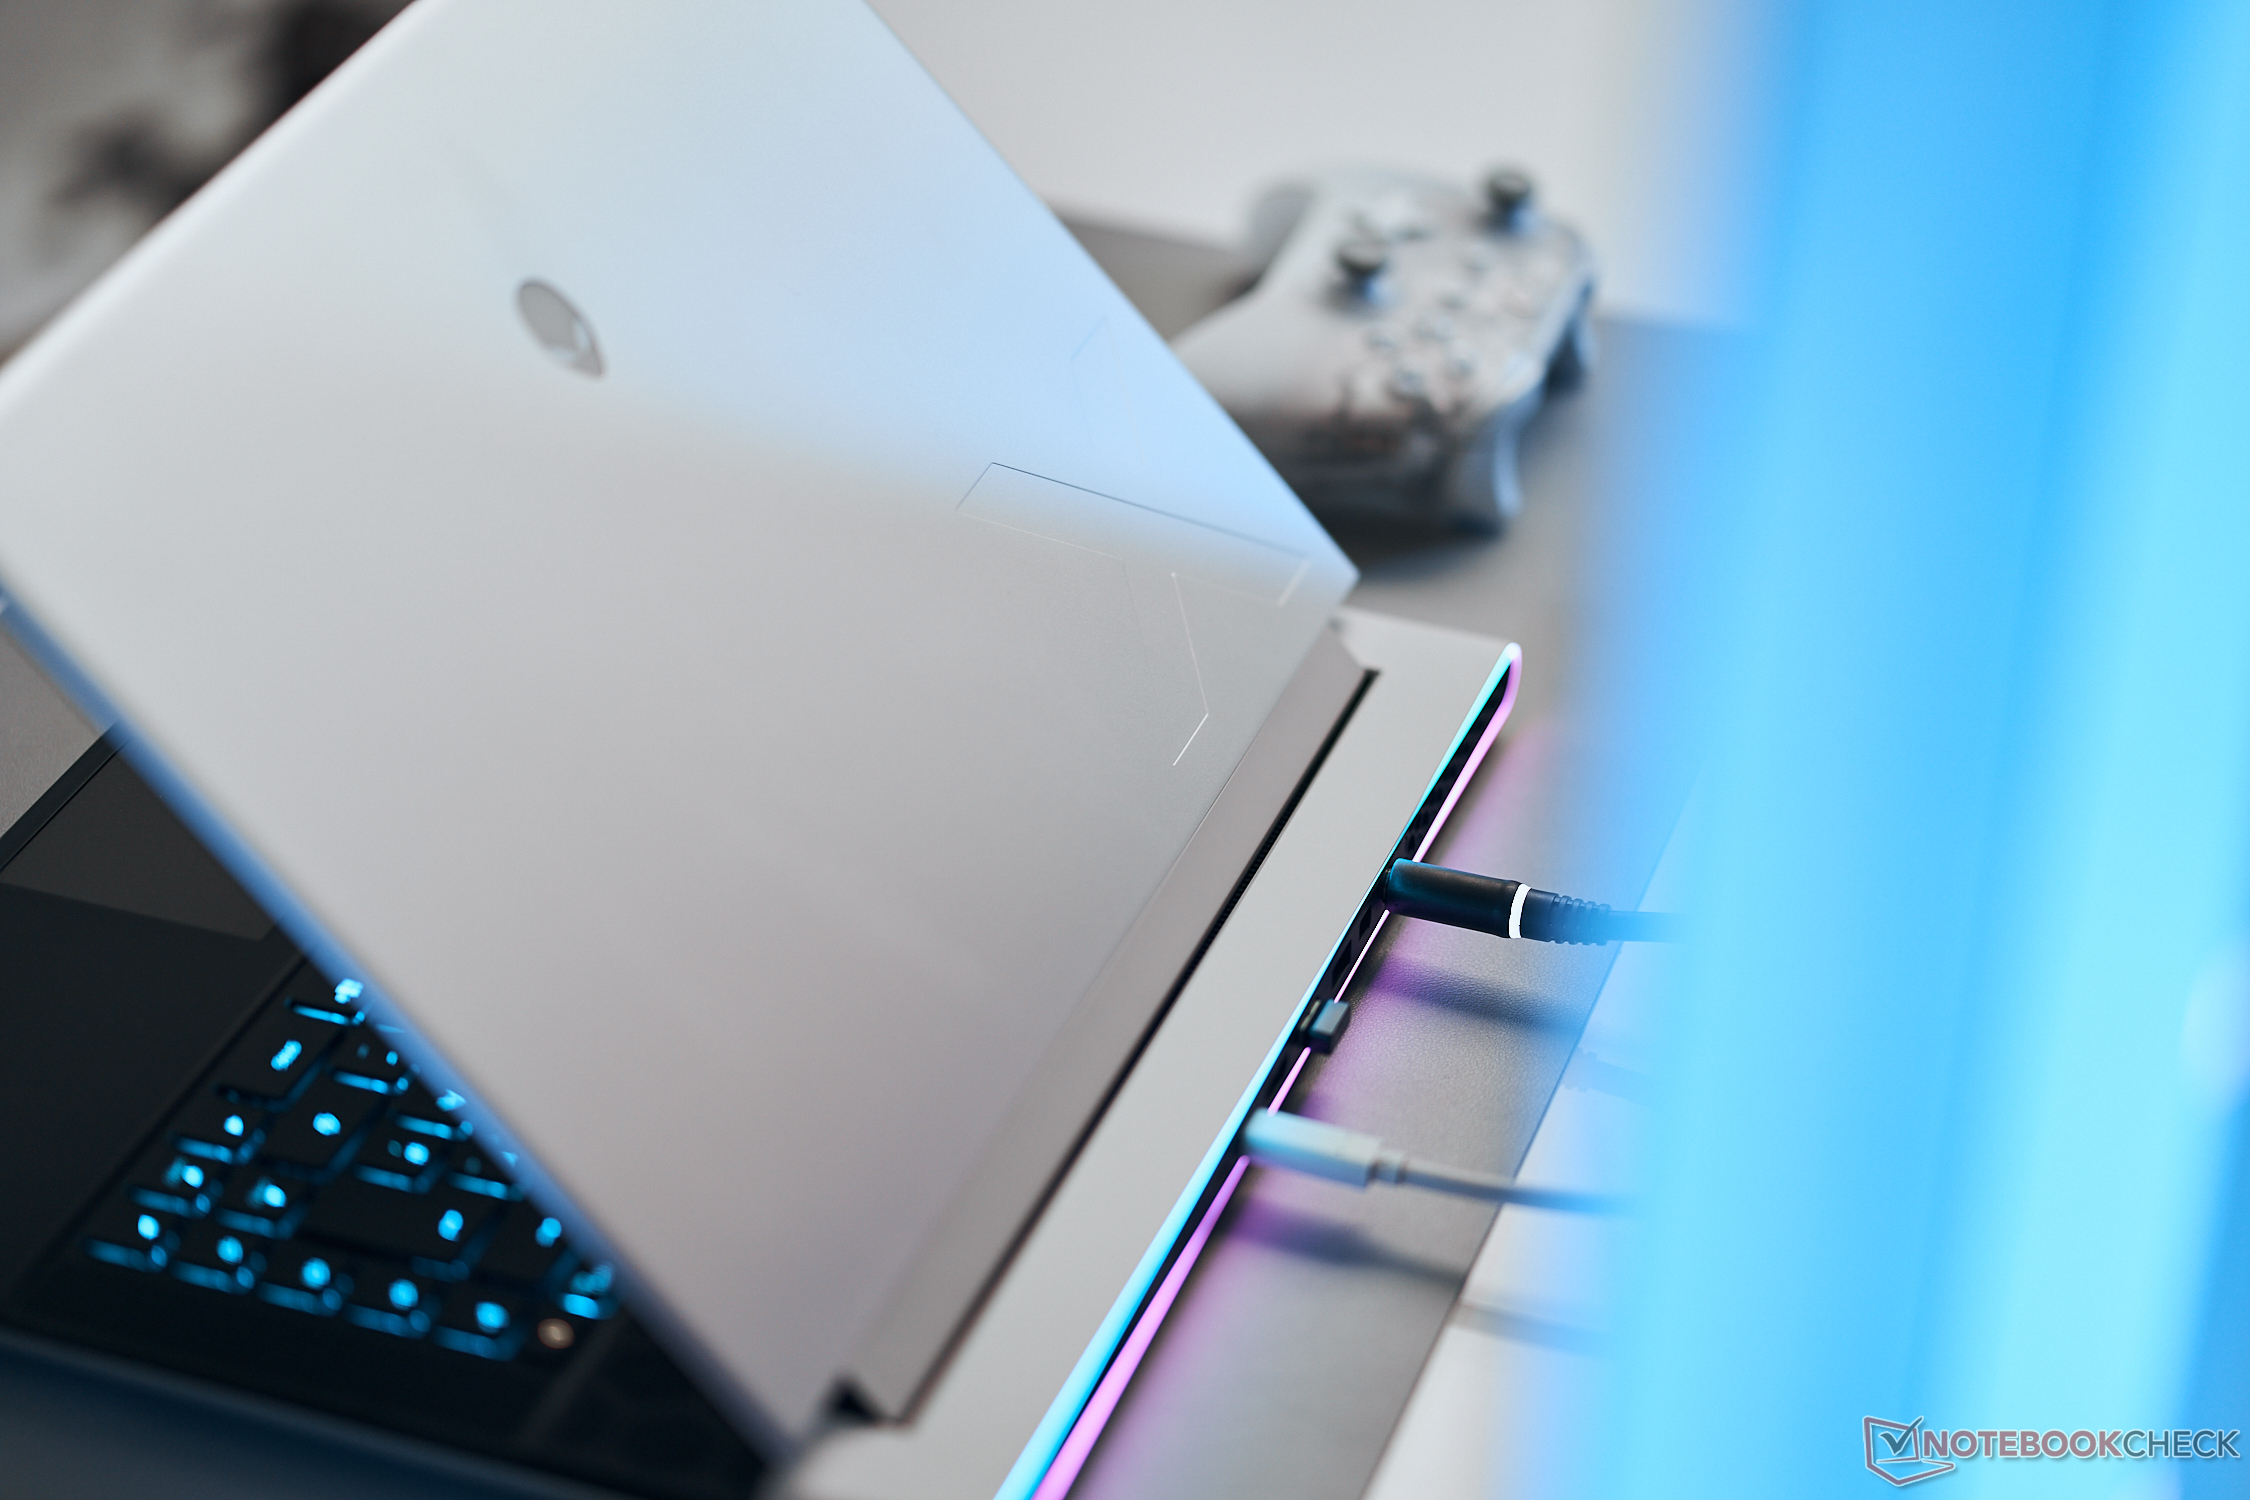
Alienware x16 R2 dizüstü bilgisayar incelemesi: X16 R1'den yana doğru bir adım

Ultra ince Alienware x16 serisi, geçen yılın sonlarında Alienware x16 R1'in piyasaya sürülmesiyle başladı. Seri, 2024 yılı için x16 R2 ile yenilendi. Yeni model, eski Raptor Lake-H işlemci seçeneklerini yapay zekaya hazır Meteor Lake-H seçenekleriyle değiştirirken, diğer her şey orijinal x16 R1 tasarımıyla temelde aynı kalıyor. Bu nedenle aşağıdaki yazımıza göz atmanızı öneririz x16 R1 hakkında inceleme mevcut yorumlarımızın çoğu görsel olarak aynı olan x16 R2 için hala geçerlidir. Kayda değer farklılıklar bu incelemede belirtilecektir.
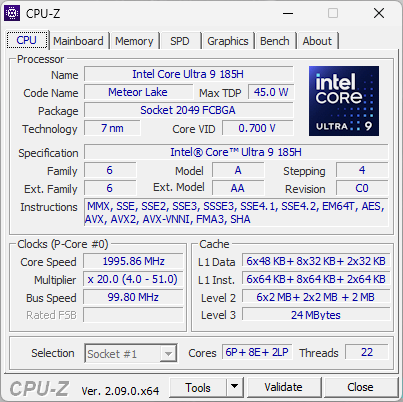
İnceleme ünitemiz Core Ultra 9 185H CPU, 175 W GeForce RTX 4080 GPU, 1600p 240 Hz ekran ve ultra düşük profilli CherryMX mekanik tuşlara sahip yaklaşık 3200 USD'lik üst düzey bir yapılandırmadır. Diğer SKU'lar arasında normal membran tabanlı tuşlar ve bunun yerine GeForce RTX 4060, 4070 veya 4090 grafiklere ve 1200p 480 Hz IPS ekrana sahip Core Ultra 7 155H yer alıyor.
Alienware x16 R2'nin alternatifleri arasında aşağıdaki gibi diğer üst düzey 16 inç oyun dizüstü bilgisayarları bulunmaktadır Razer Blade 16,Asus ROG Strix Scar 16,Lenovo Legion Pro 7 16veya MSI Vector 16 HX.
Daha fazla Dell incelemesi:
Karşılaştırmalı olarak olası rakipler
Derecelendirme | Tarih | Modeli | Ağırlık | Yükseklik | Boyut | Çözünürlük | Fiyat |
|---|---|---|---|---|---|---|---|
| 88.4 % v7 (old) | 05/2024 | Alienware x16 R2 P120F Ultra 9 185H, GeForce RTX 4080 Laptop GPU | 2.7 kg | 18.57 mm | 16.00" | 2560x1600 | |
| 88.4 % v7 (old) | 07/2023 | Alienware x16 R1 i9-13900HK, GeForce RTX 4080 Laptop GPU | 2.6 kg | 18.57 mm | 16.00" | 2560x1600 | |
| 90.2 % v7 (old) | 03/2024 | Alienware m16 R2 Ultra 7 155H, GeForce RTX 4070 Laptop GPU | 2.5 kg | 23.5 mm | 16.00" | 2560x1600 | |
| 87.6 % v7 (old) | 04/2024 | Asus ROG Strix Scar 16 G634JZR i9-14900HX, GeForce RTX 4080 Laptop GPU | 2.7 kg | 30.4 mm | 16.00" | 2560x1600 | |
| 89.5 % v7 (old) | 03/2024 | Lenovo Legion Pro 7 16IRX9H i9-14900HX, GeForce RTX 4080 Laptop GPU | 2.7 kg | 21.95 mm | 16.00" | 2560x1600 | |
| 88 % v7 (old) | 02/2024 | MSI Vector 16 HX A14V i9-14900HX, GeForce RTX 4080 Laptop GPU | 2.7 kg | 28.55 mm | 16.00" | 2560x1600 |
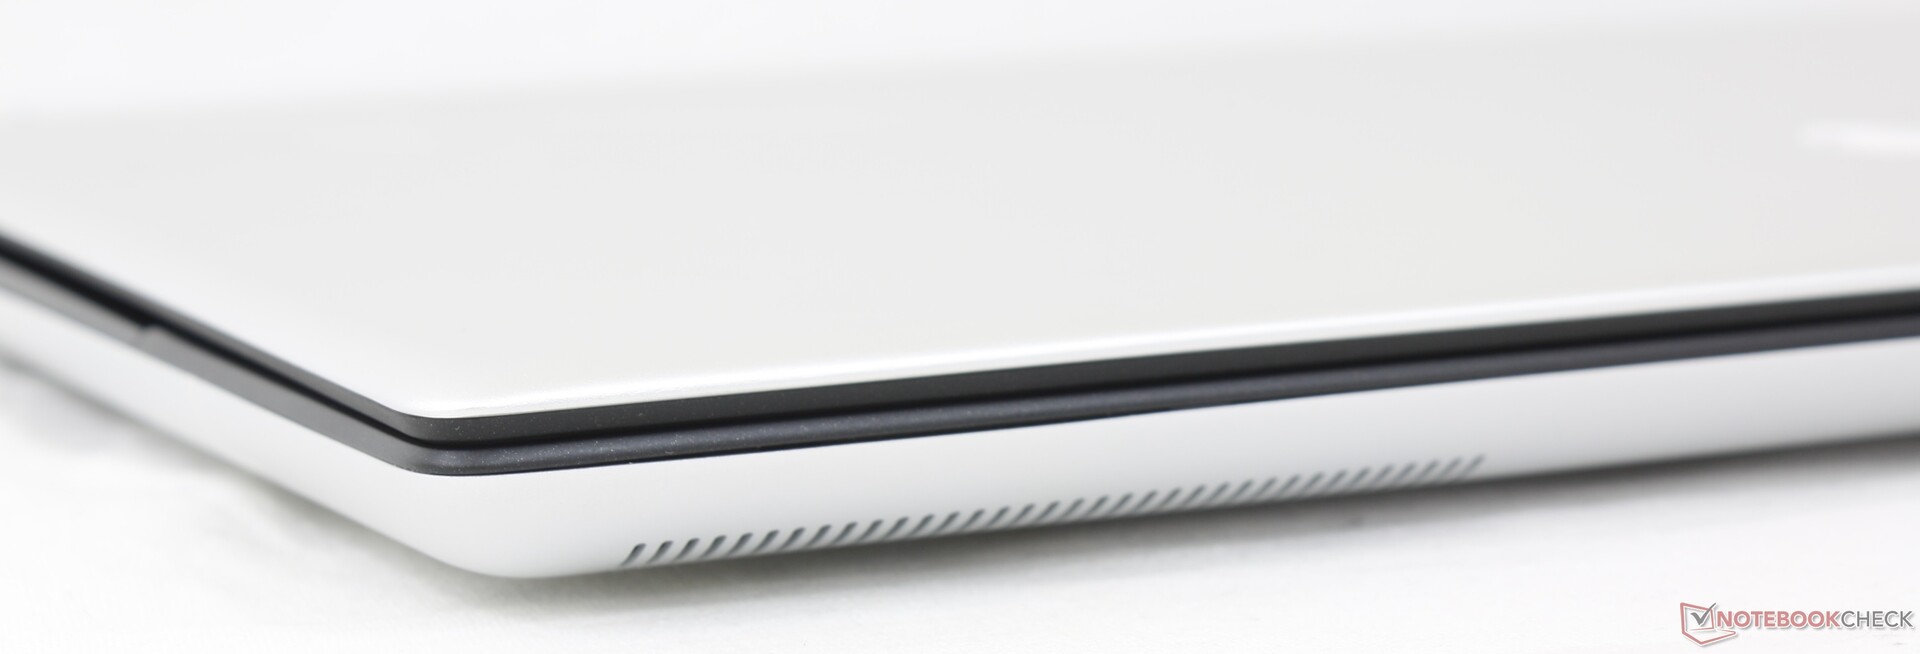
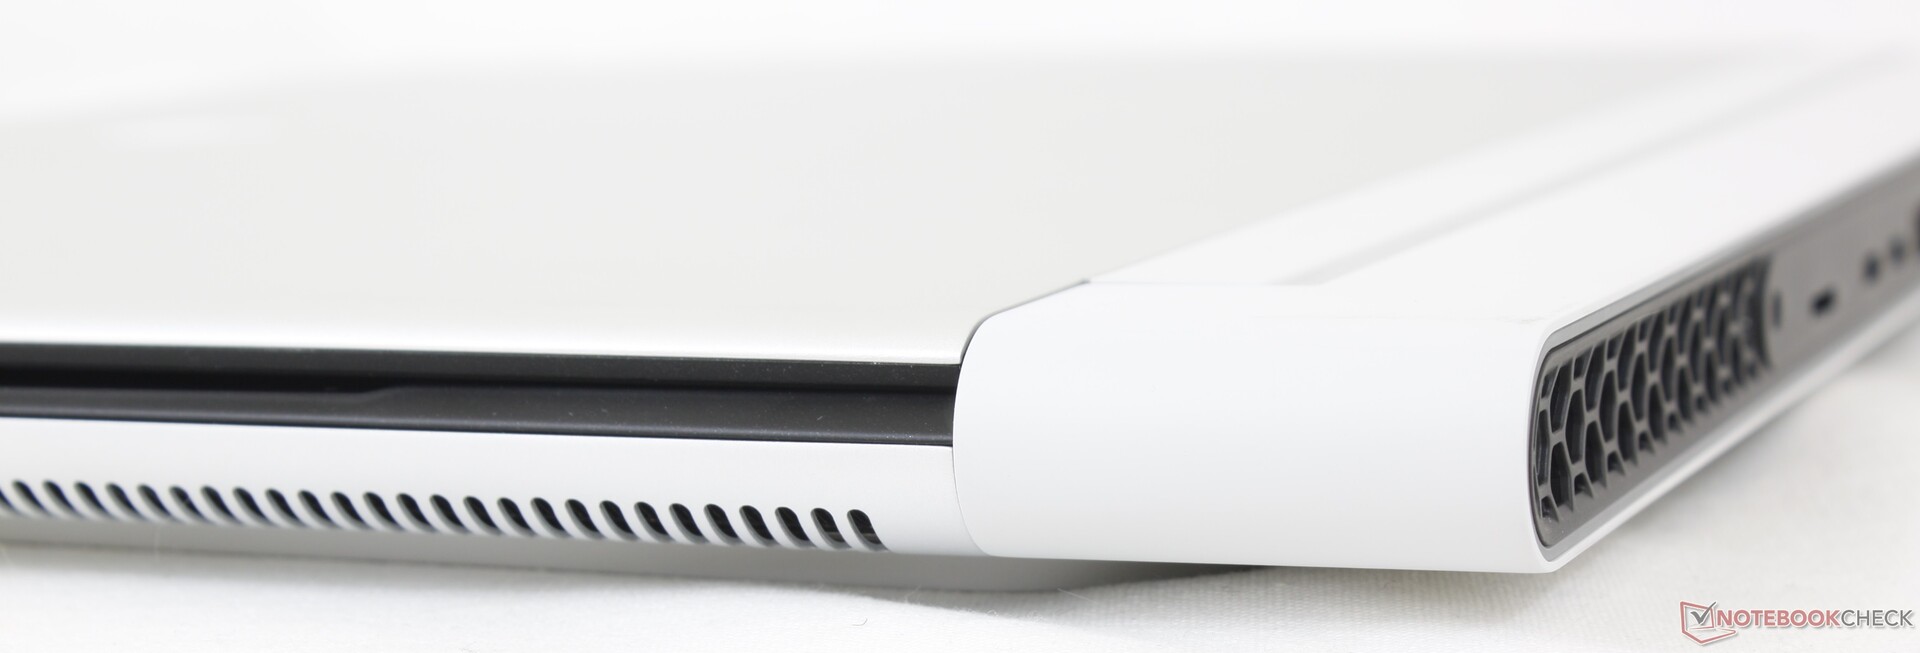
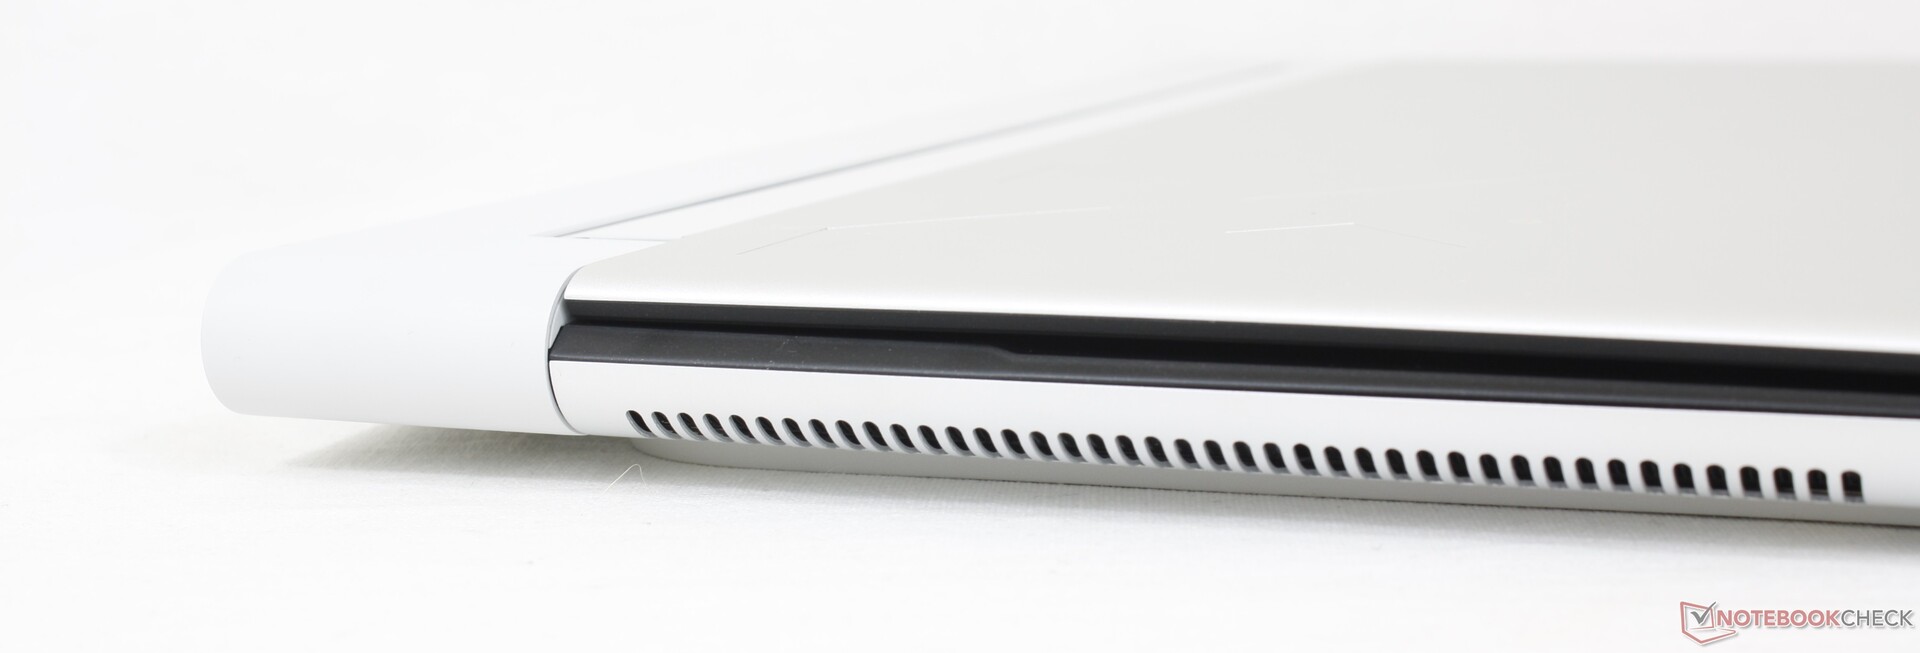
Vaka - Harici Değişiklik Yok
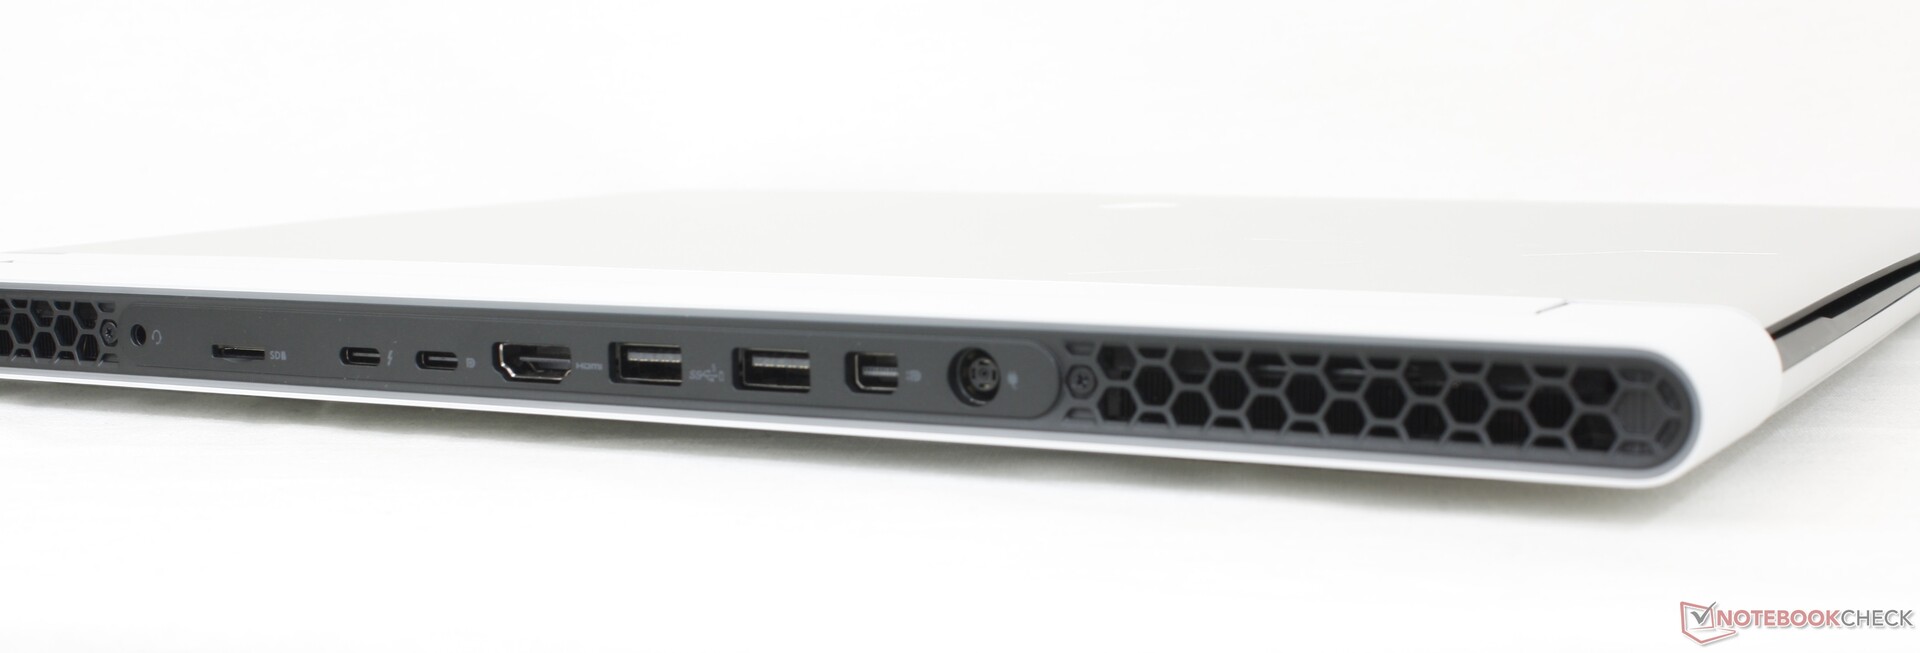
Bağlanabilirlik
SD Kart Okuyucu
İlginç bir şekilde, x16 R2'mizdeki MicroSD okuyucu, geçen yılki x16 R1'de yaşadığımız aktarım hızı sorunlarının hiçbirini göstermiyordu.
| SD Card Reader | |
| average JPG Copy Test (av. of 3 runs) | |
| Alienware x16 R2 P120F (AV PRO microSD 128 GB V60) | |
| MSI Vector 16 HX A14V (Toshiba Exceria Pro SDXC 64 GB UHS-II) | |
| Alienware m16 R2 (AV PRO microSD 128 GB V60) | |
| Alienware x16 R1 (AV PRO microSD 128 GB V60) | |
| maximum AS SSD Seq Read Test (1GB) | |
| Alienware x16 R2 P120F (AV PRO microSD 128 GB V60) | |
| Alienware x16 R1 (AV PRO microSD 128 GB V60) | |
| Alienware m16 R2 (AV PRO microSD 128 GB V60) | |
| MSI Vector 16 HX A14V (Toshiba Exceria Pro SDXC 64 GB UHS-II) | |
İletişim
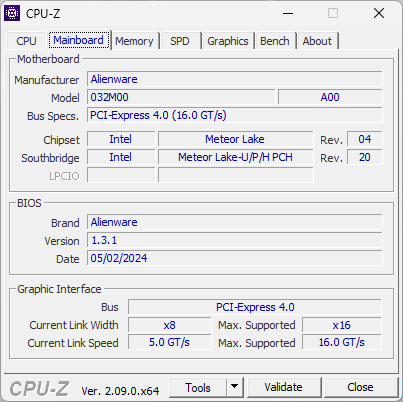
Dell, bu yılki yenileme için WLAN modülünü Wi-Fi 7'yi destekleyecek şekilde yükseltti.
Web kamerası


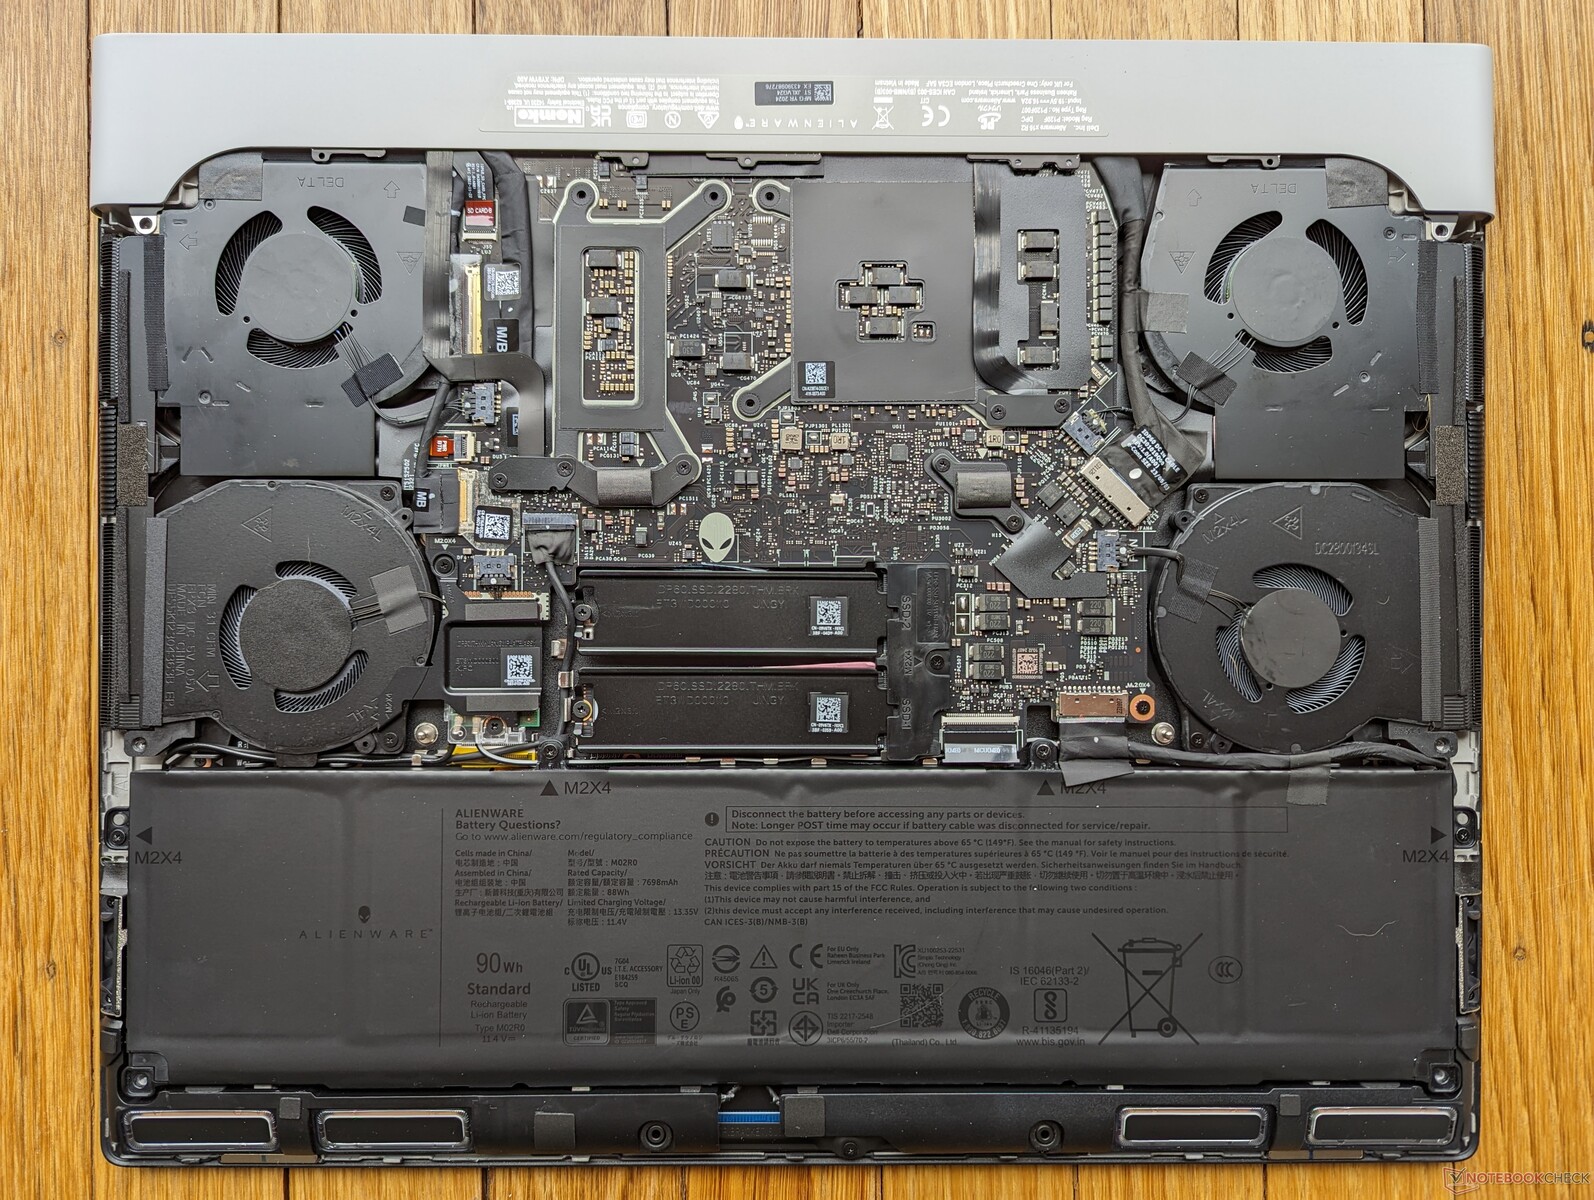
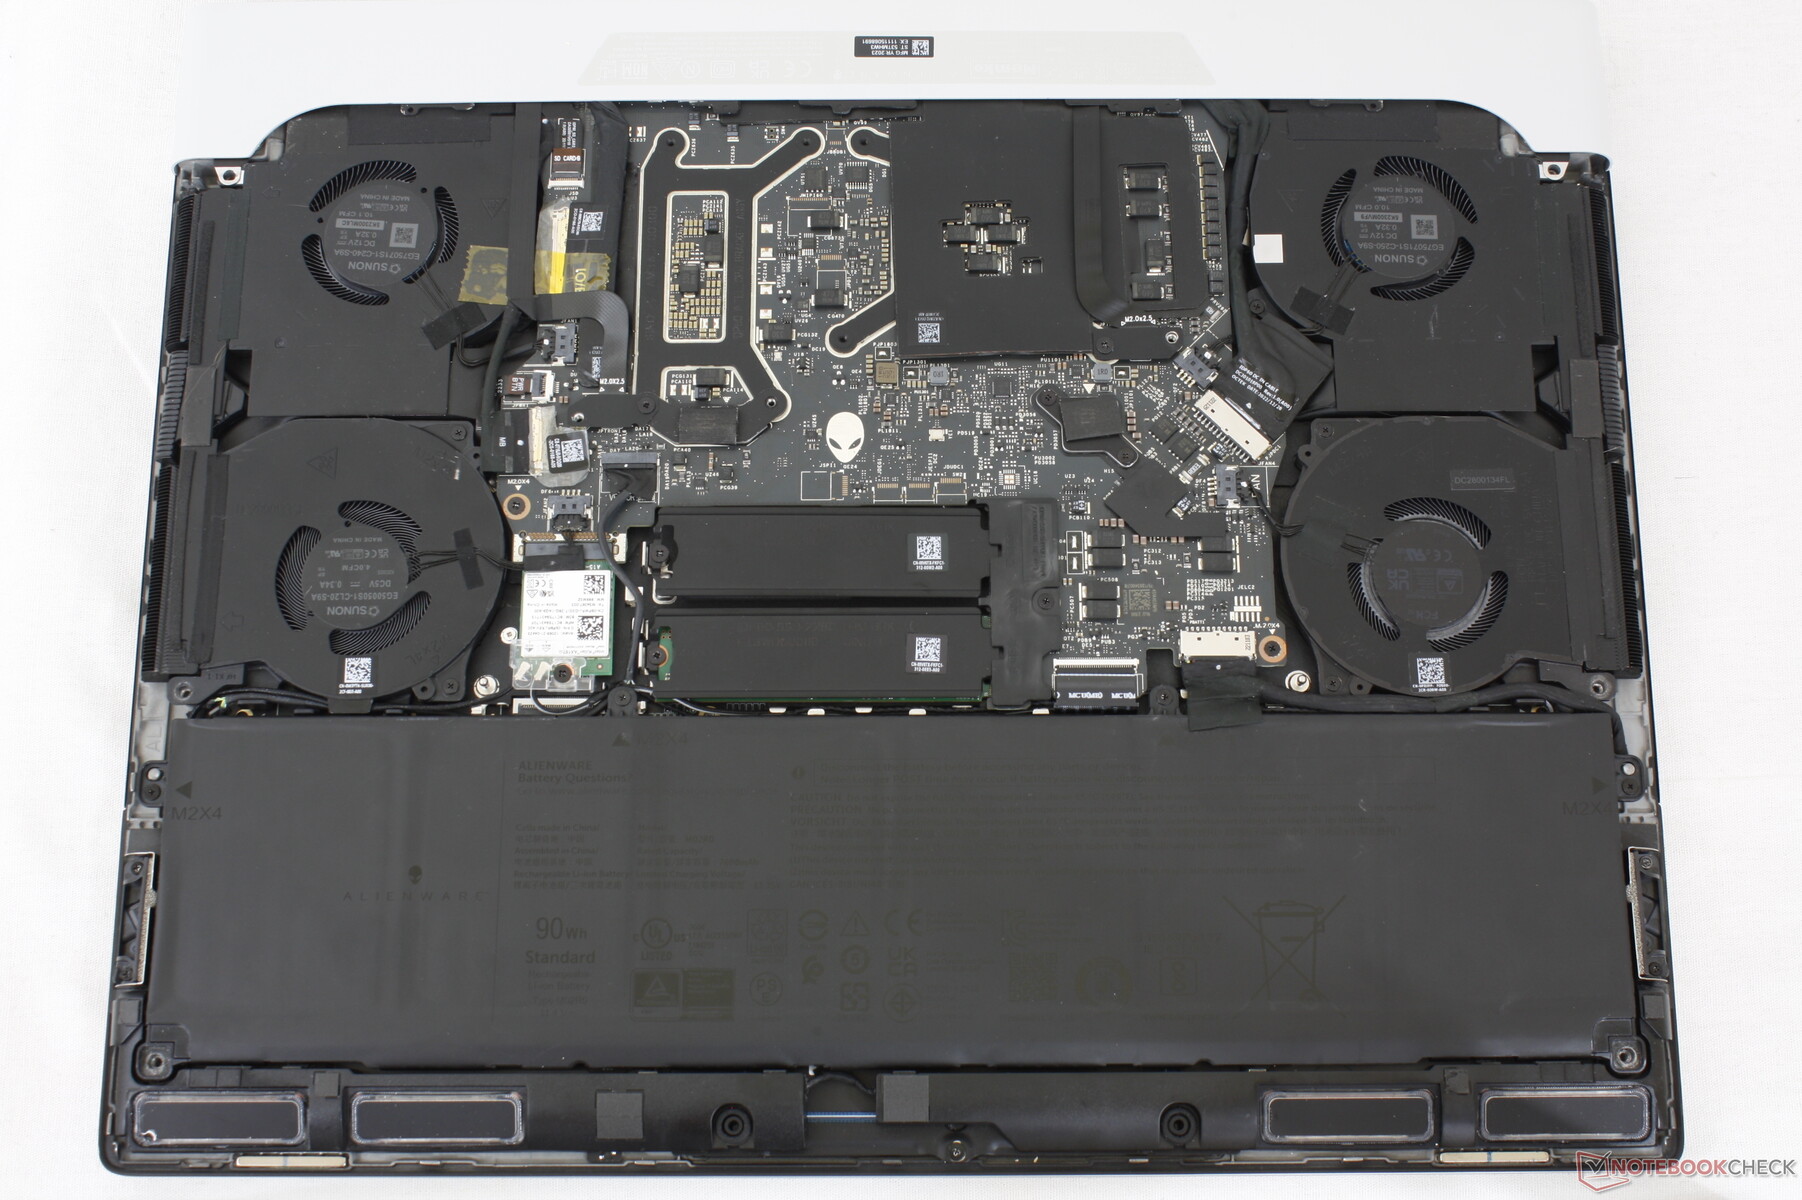
Bakım
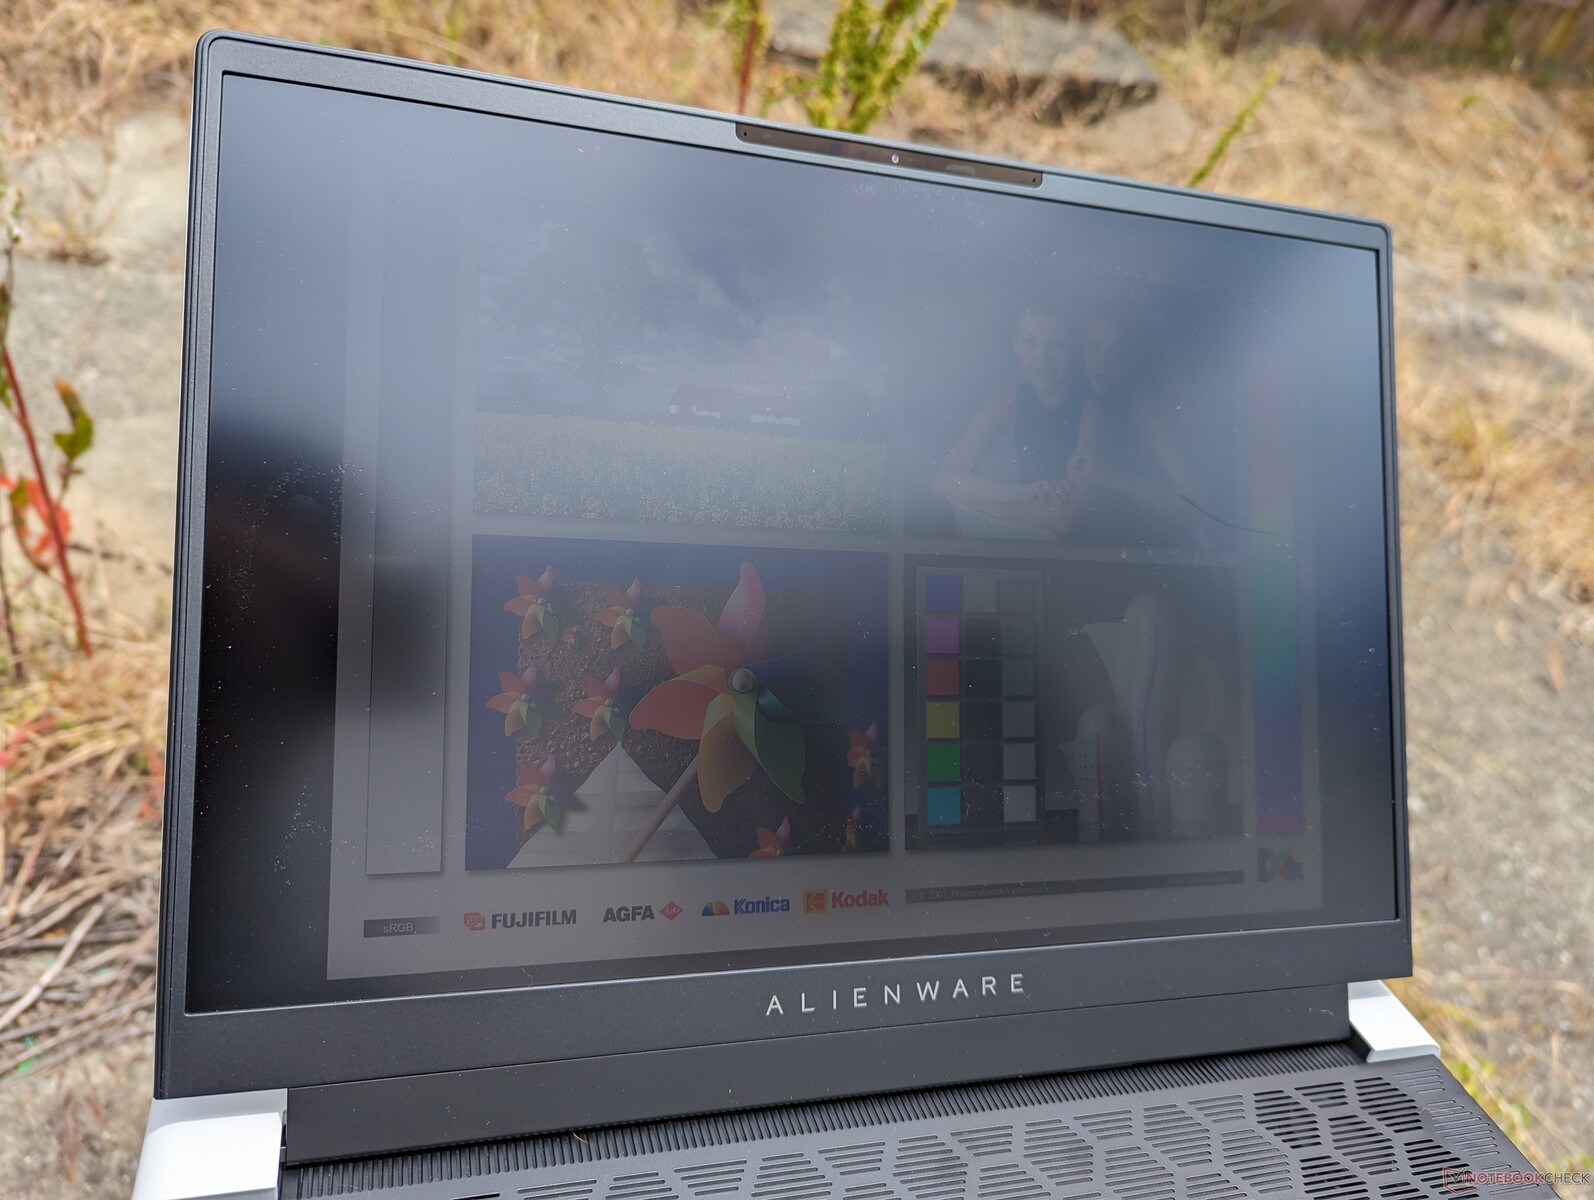
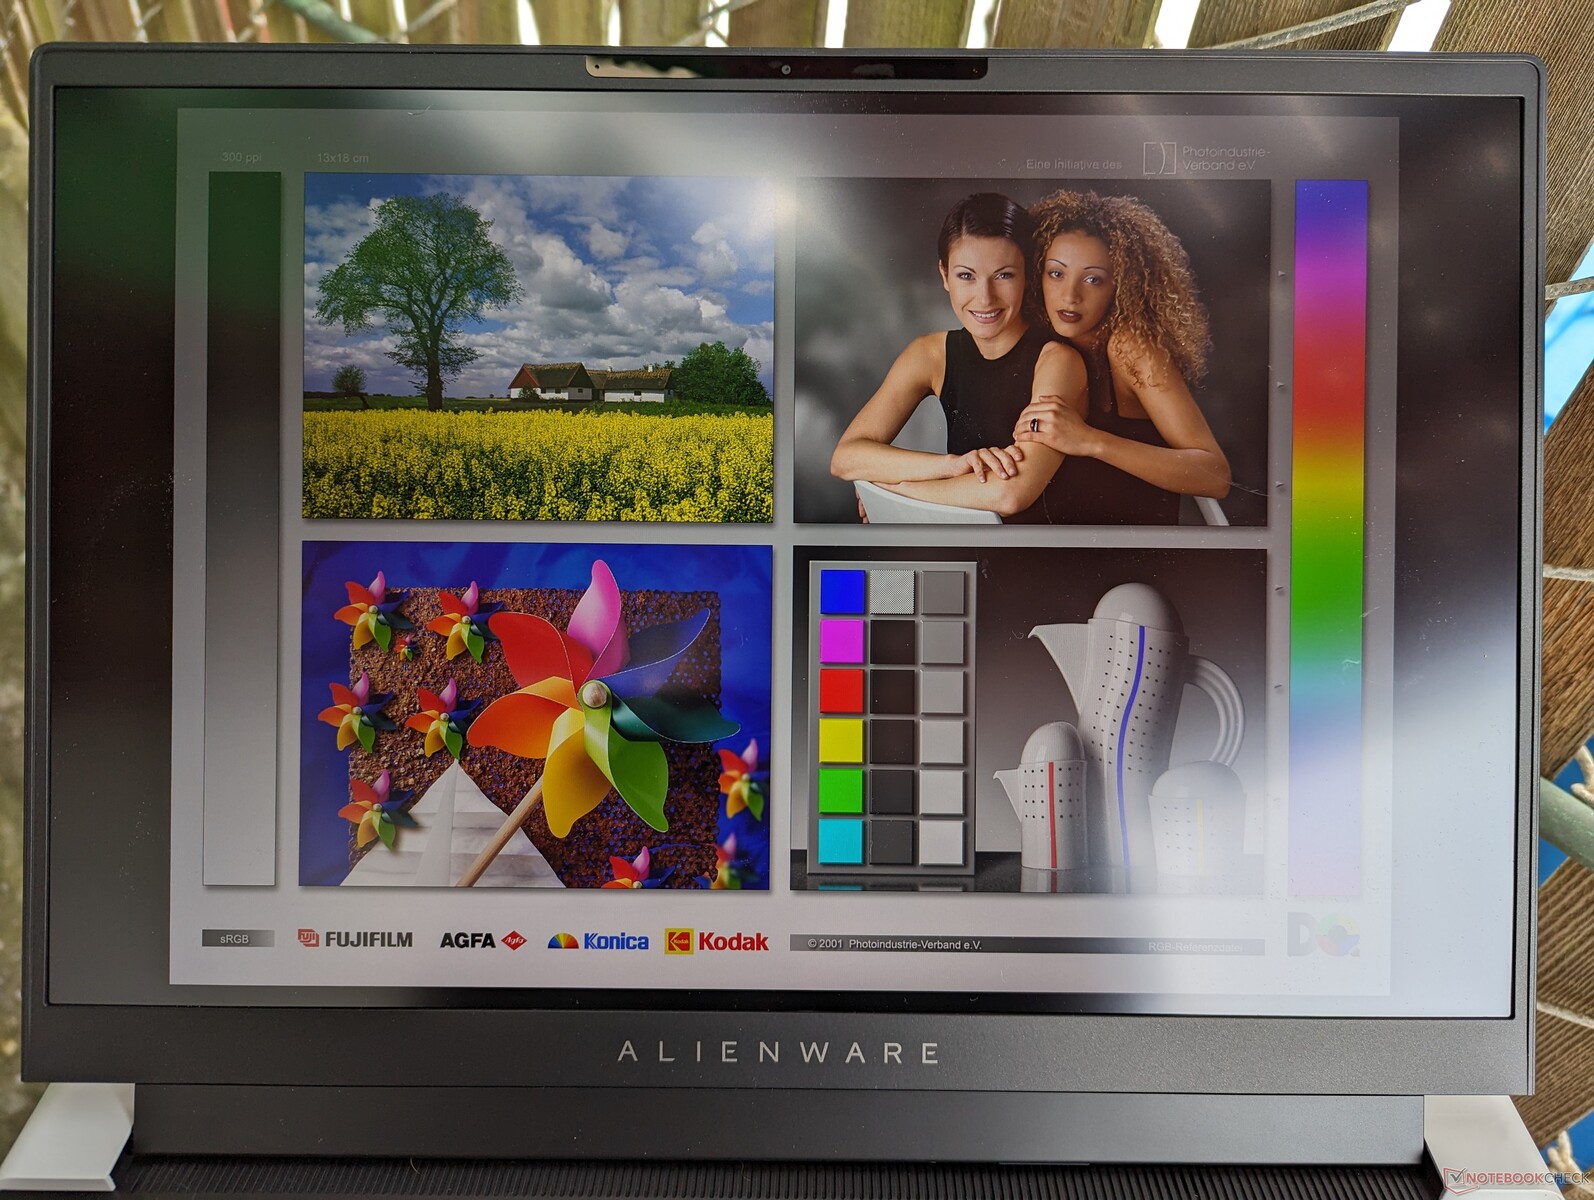
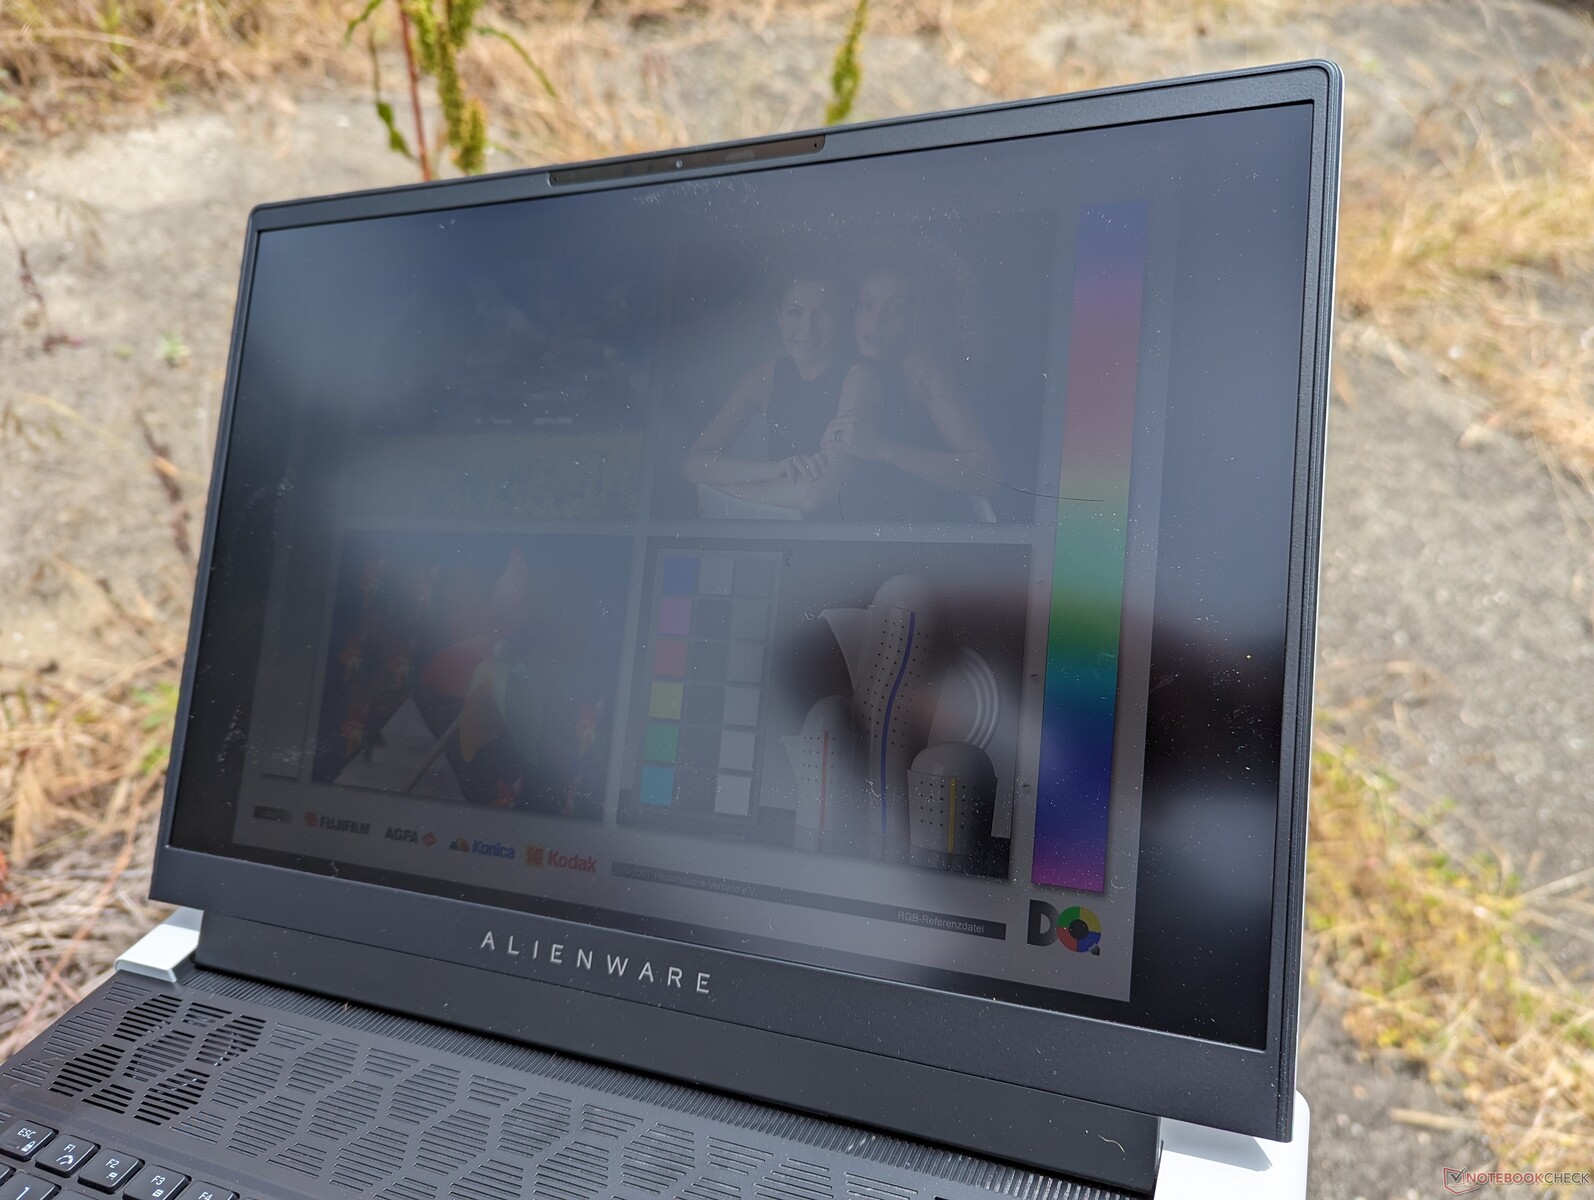
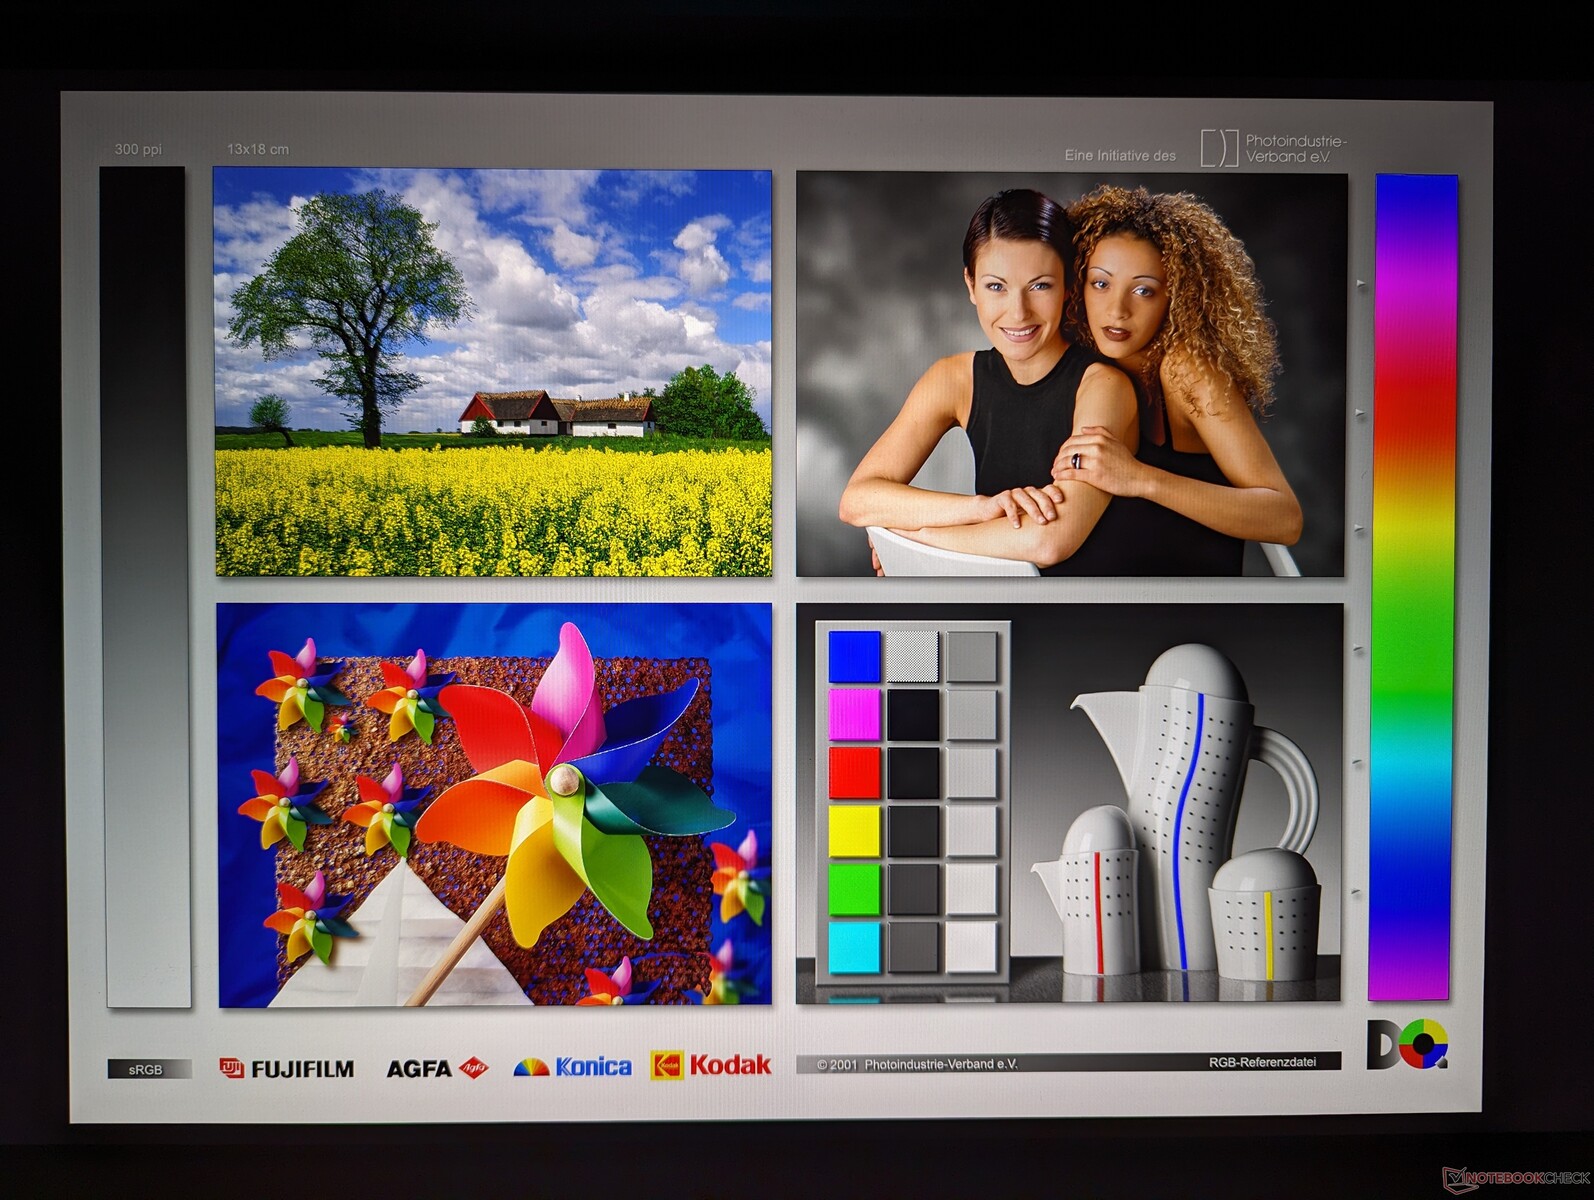
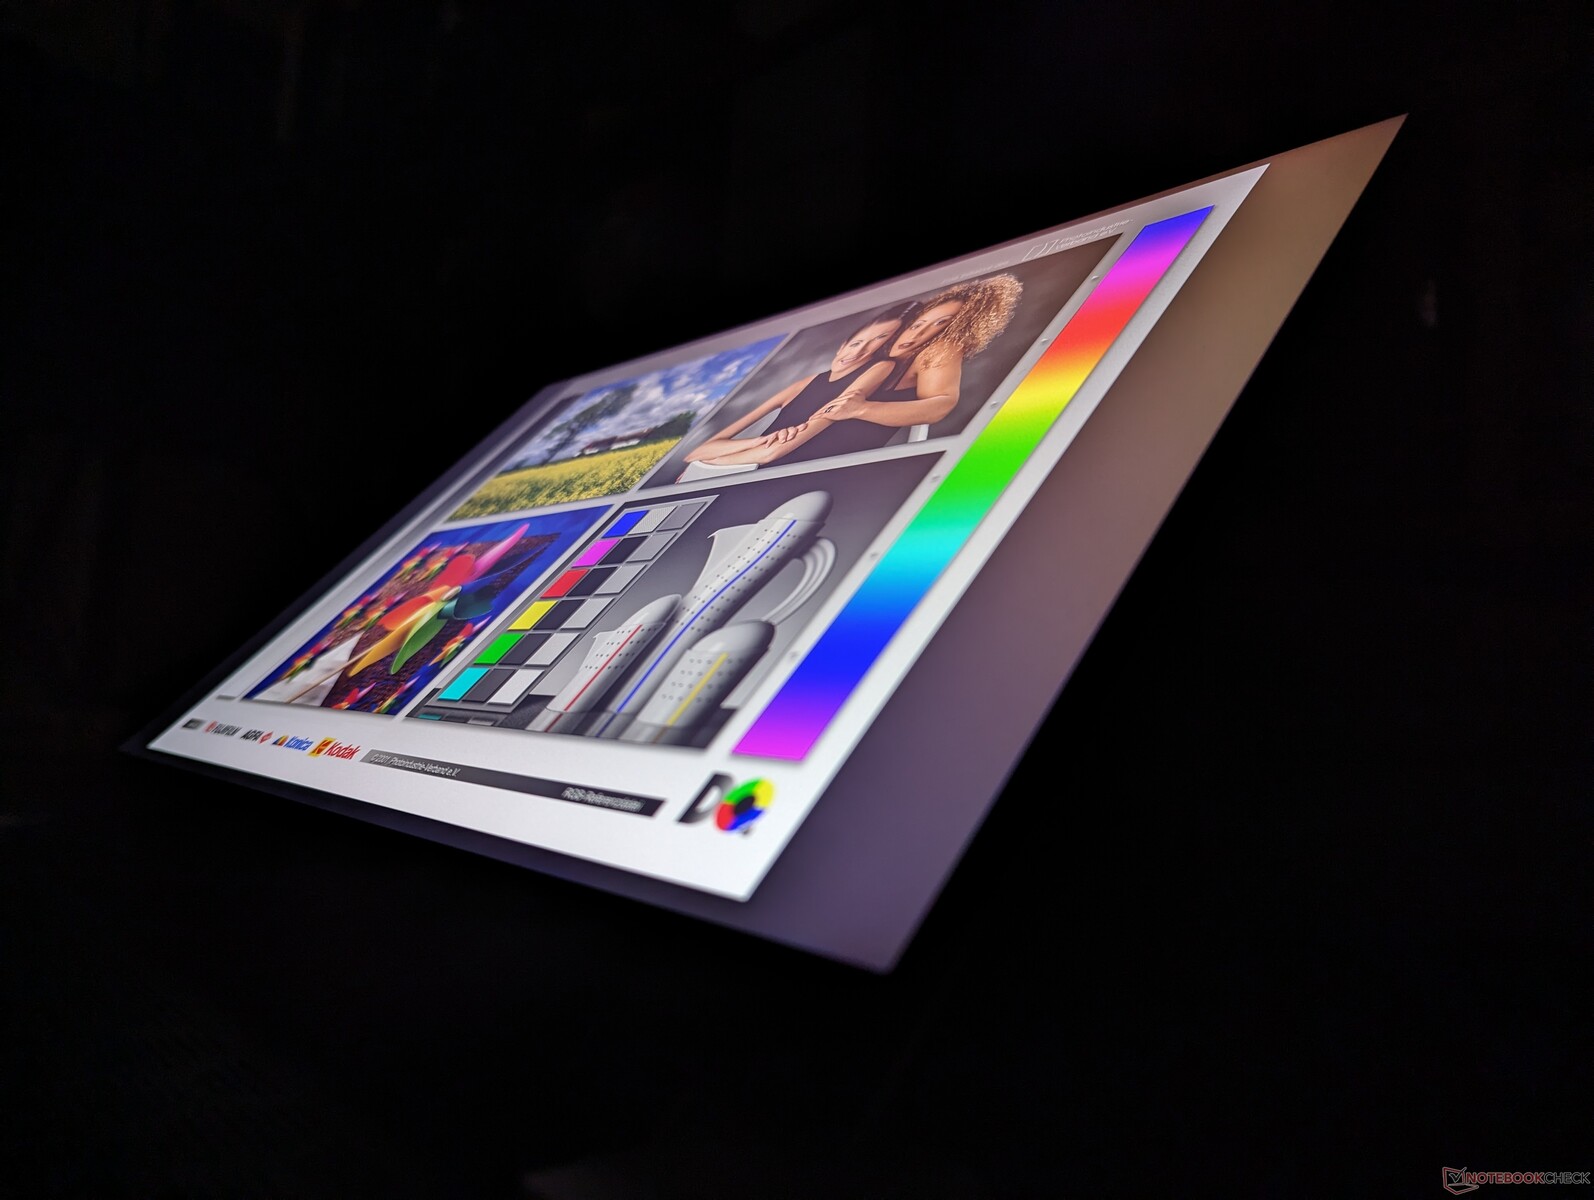
Ekran - Artık 165 Hz Seçeneği Yok
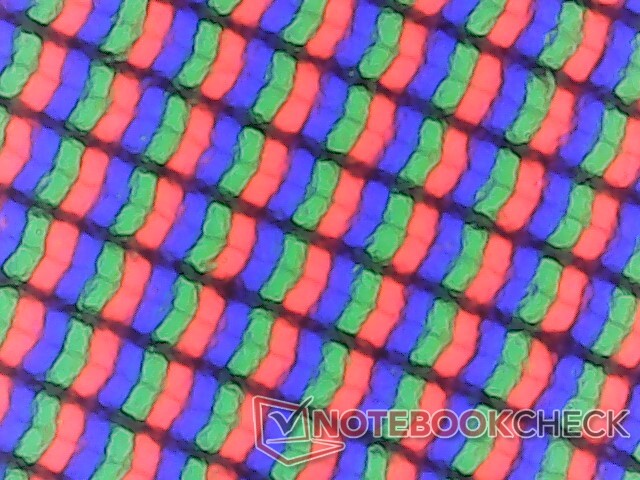
Dell, geçen yılın x16 R1 modelindeki BOE NE16NZ4 panelini bu yılın x16 R2 modelindeki BOE B160QAN ile değiştirmiştir. Bununla birlikte, iki panel renk üretimi, tepki süreleri, parlaklık seviyeleri ve esasen aynı görüntüleme deneyimi için kontrast açısından neredeyse aynıdır.
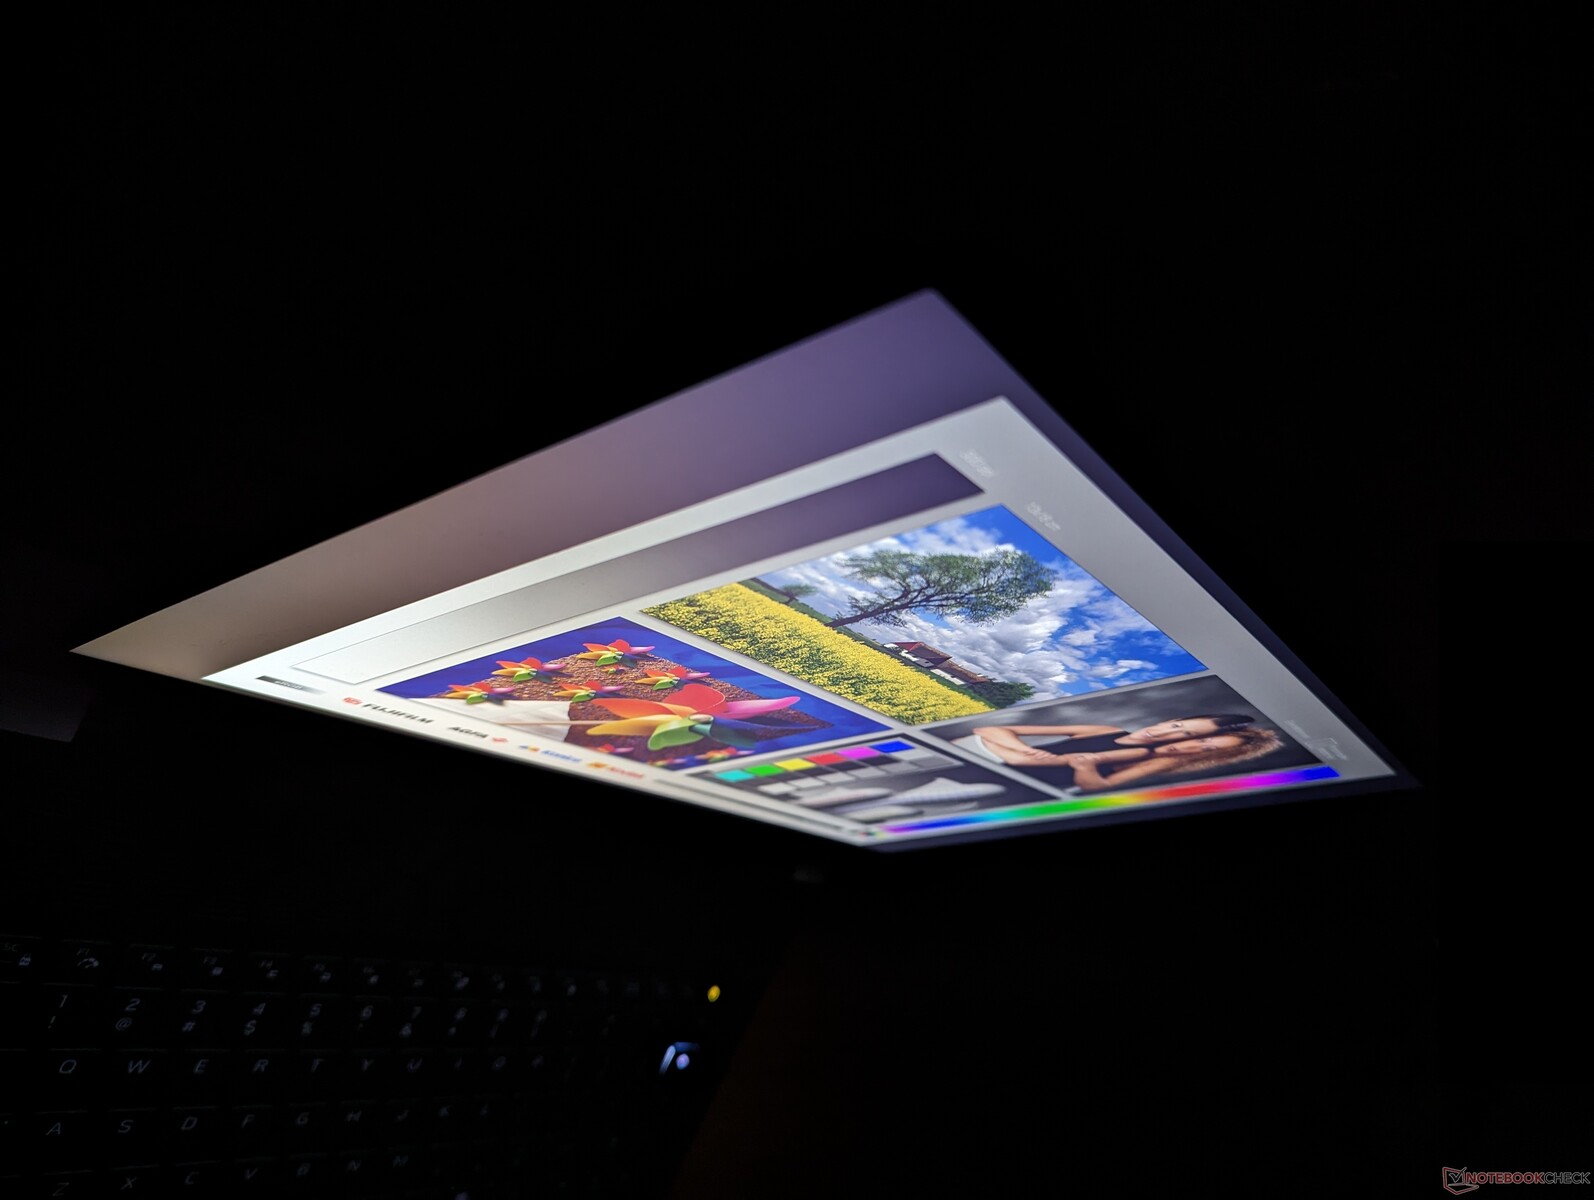
Doğal yenileme hızı, değişken seçenekler olmadan 240 Hz veya 60 Hz olarak ayarlanabilir. G-Sync yalnızca Optimus moduna değil dGPU moduna ayarlandığında desteklenir.
Kullanıcılar aşağıda gösterildiği gibi iki ekran arasında yapılandırma yapabilirken x16 R1'de üç ekran vardı:
- 2560 x 1600, 240 Hz, %100 DCI-P3, G-Sync, Gelişmiş Optimus
- 1920 x 1200, 480 Hz, %100 DCI-P3, G-Sync, Gelişmiş Optimus
| |||||||||||||||||||||||||
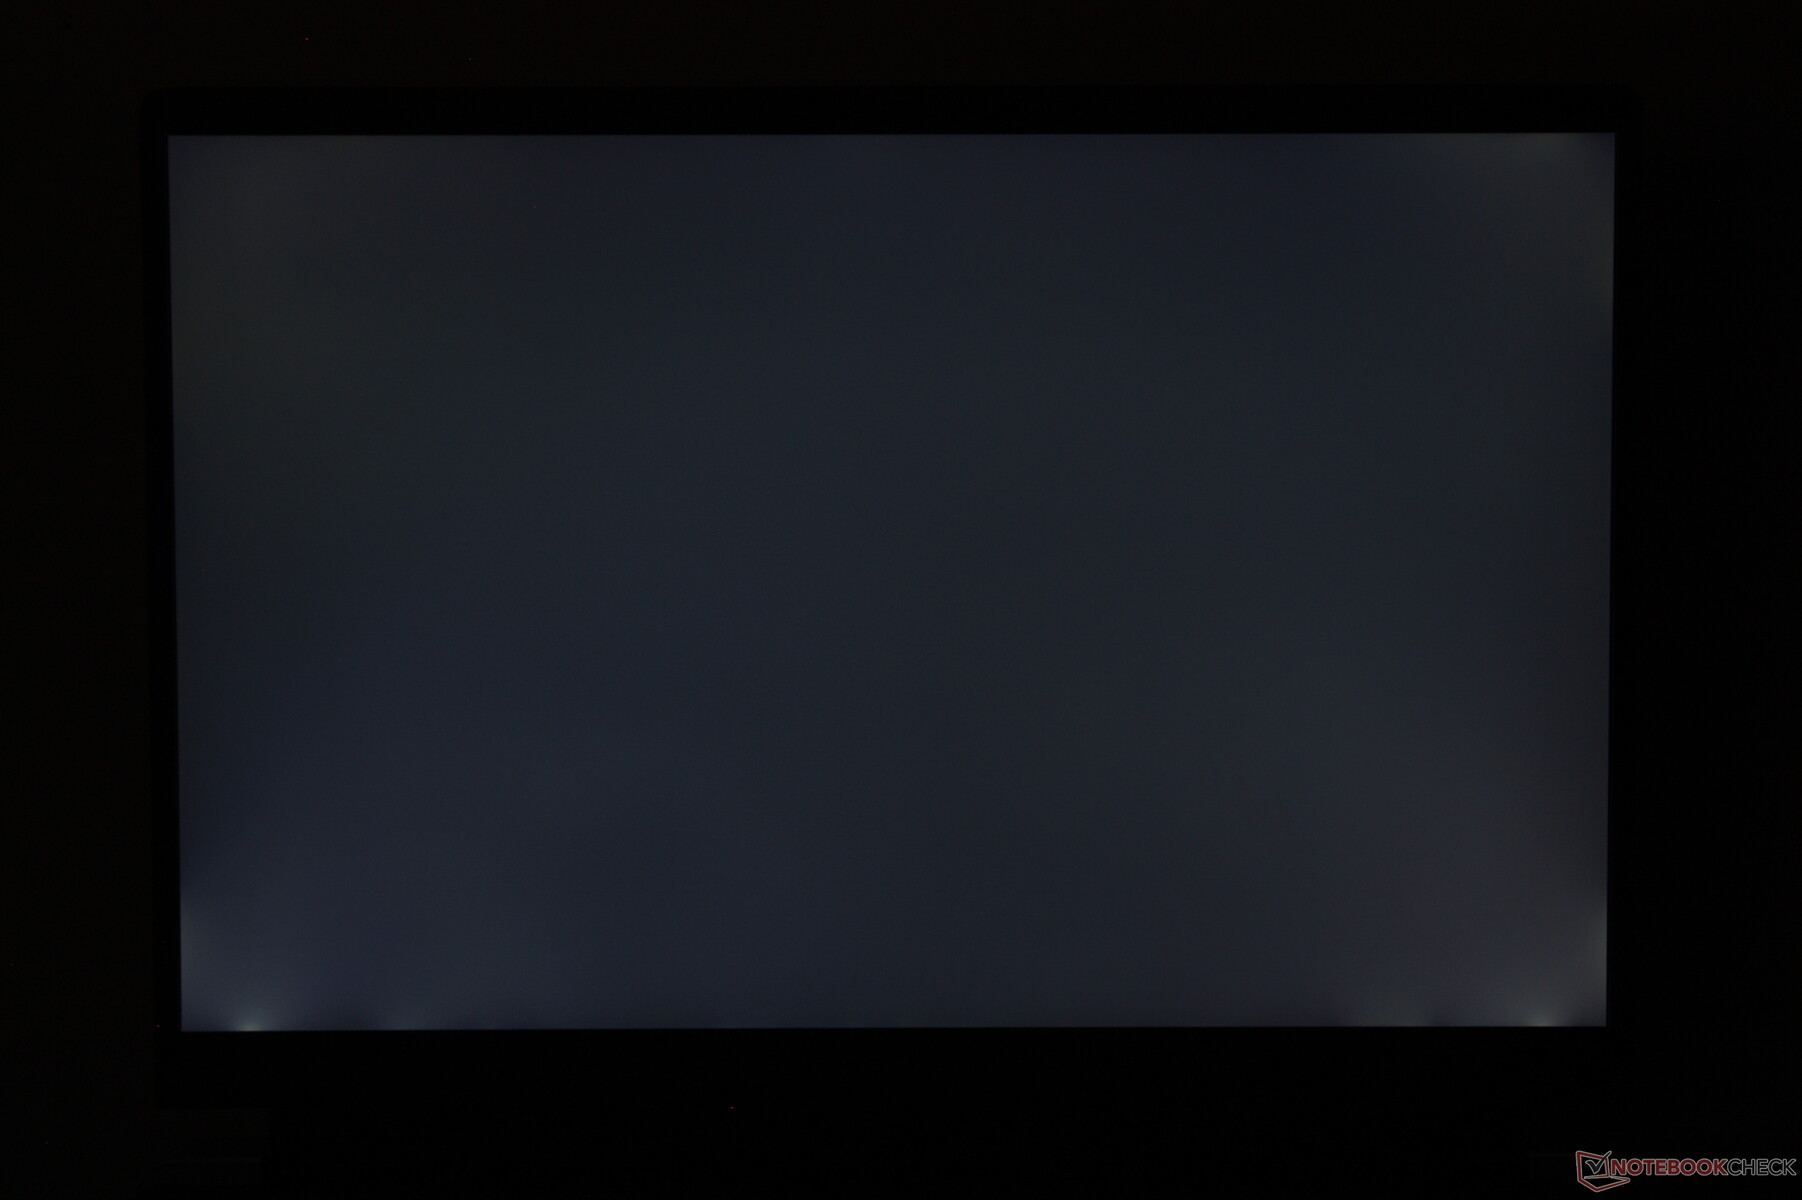
Aydınlatma: 90 %
Batarya modunda parlaklık: 348.4 cd/m²
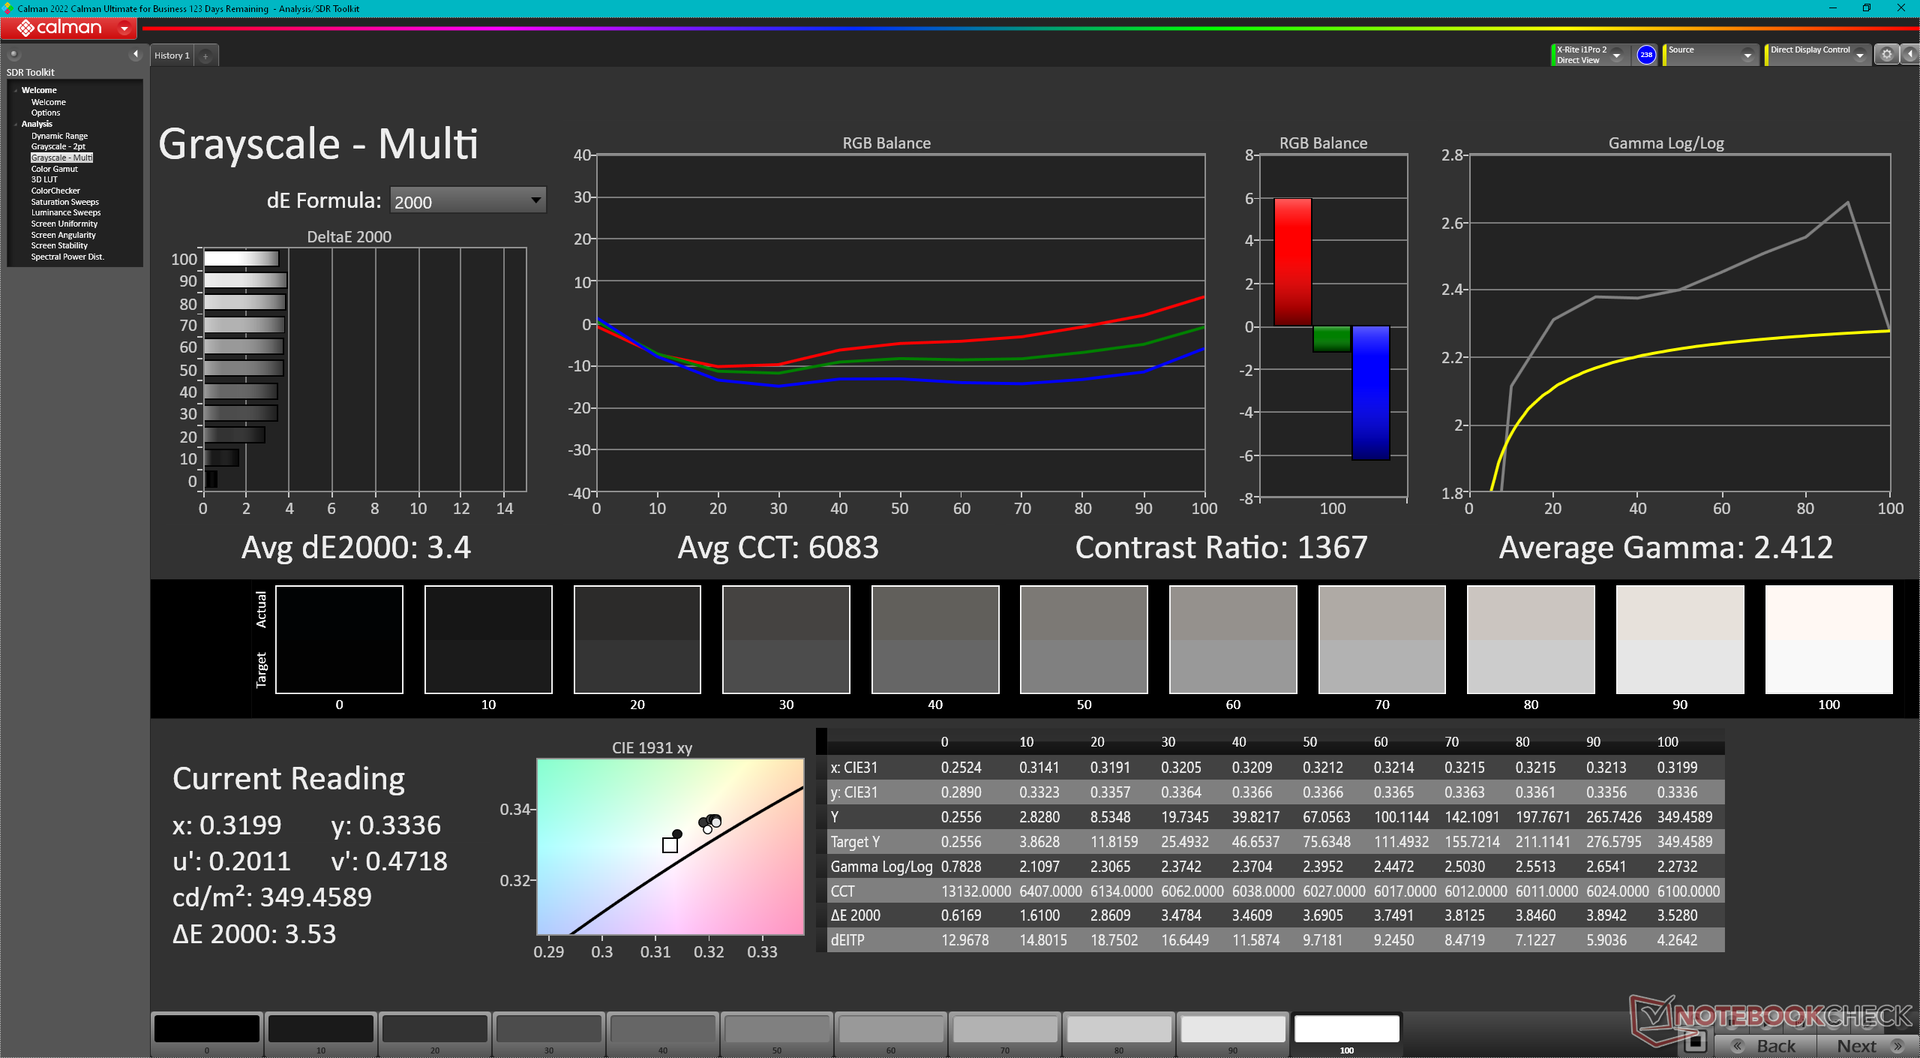
Kontrast: 1056:1 (Siyah: 0.33 cd/m²)
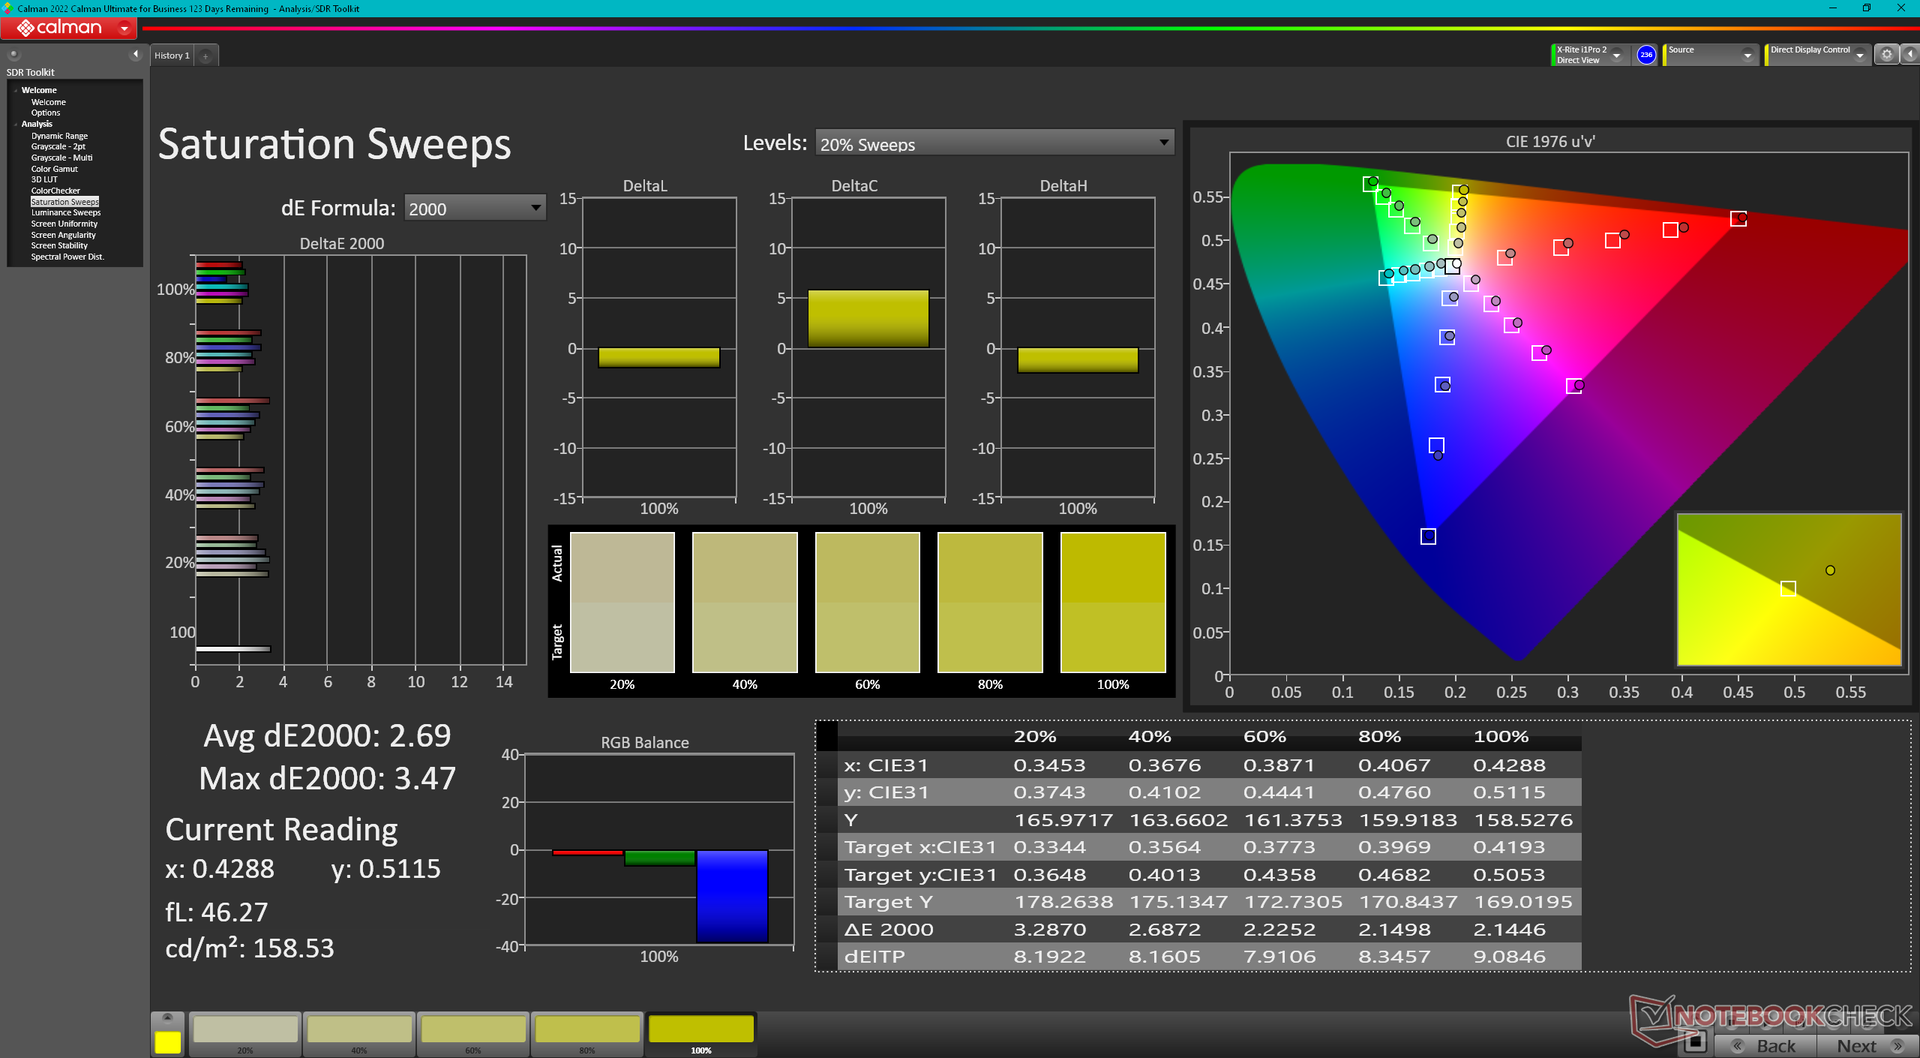
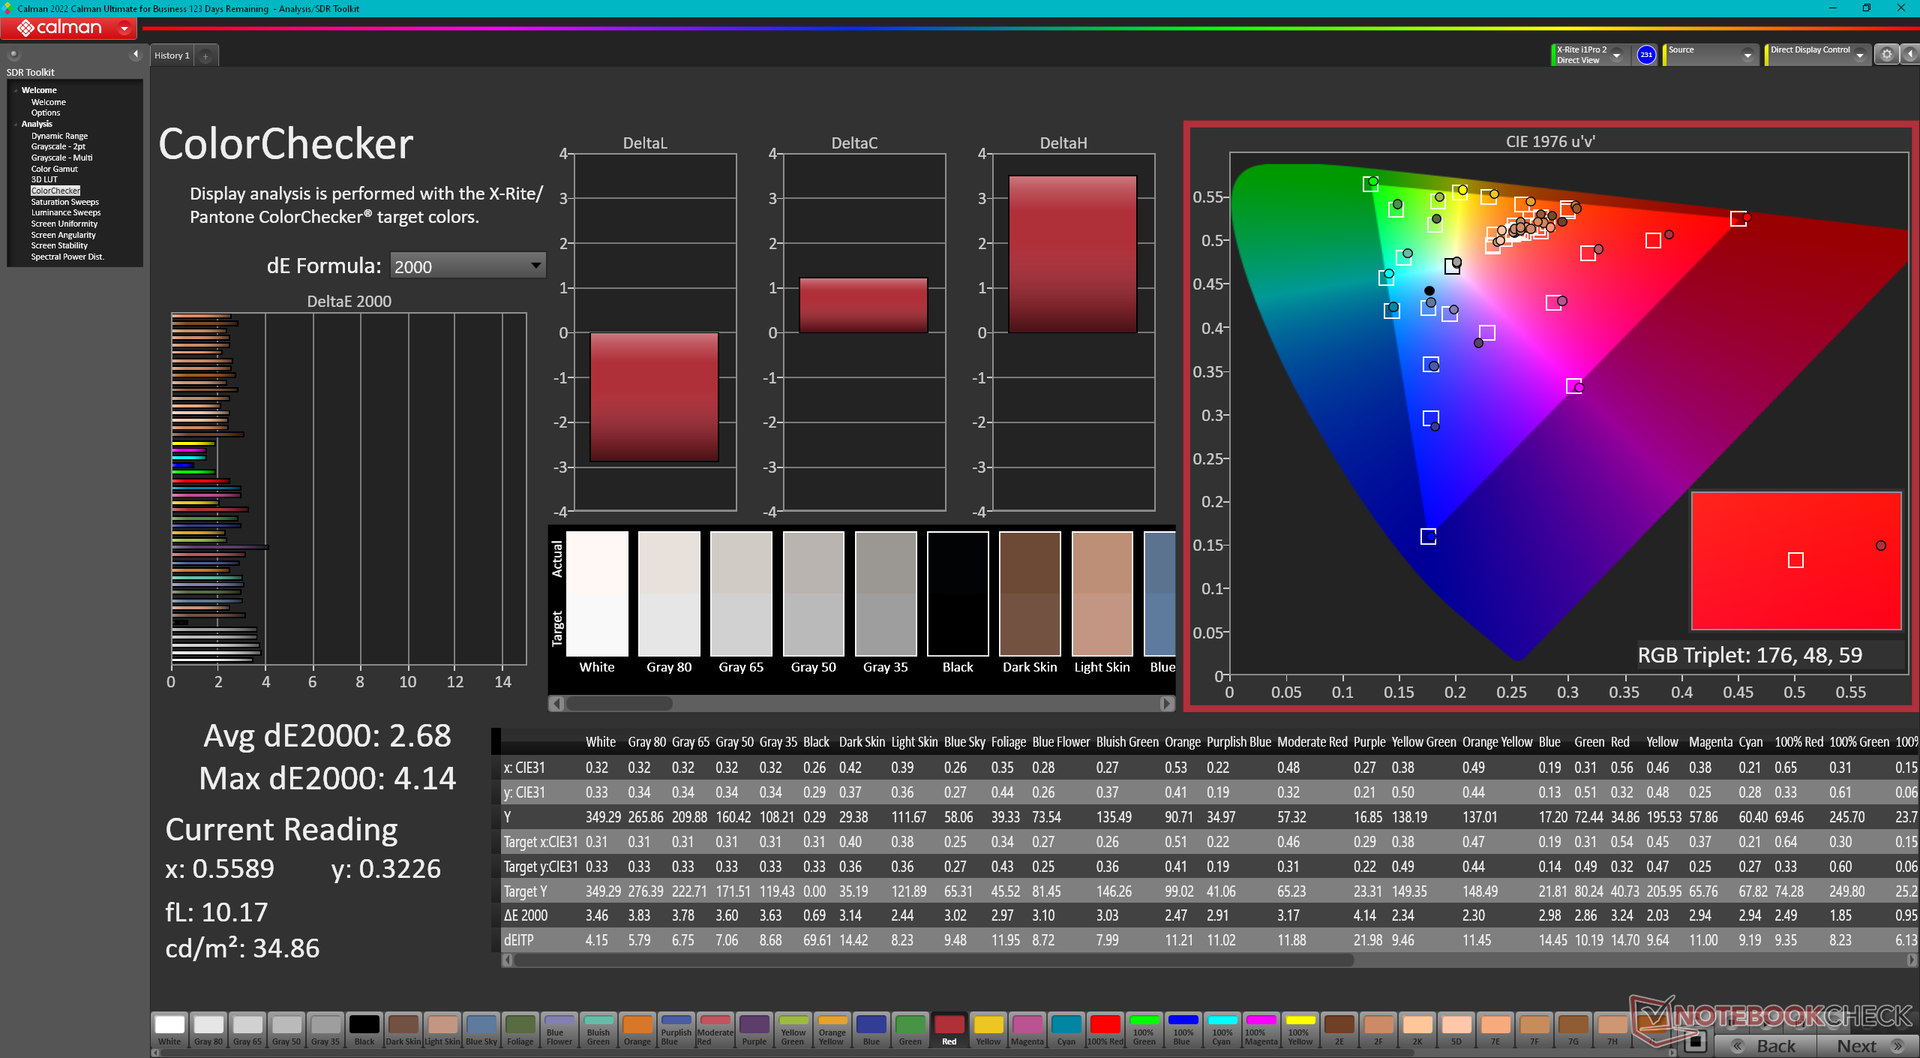
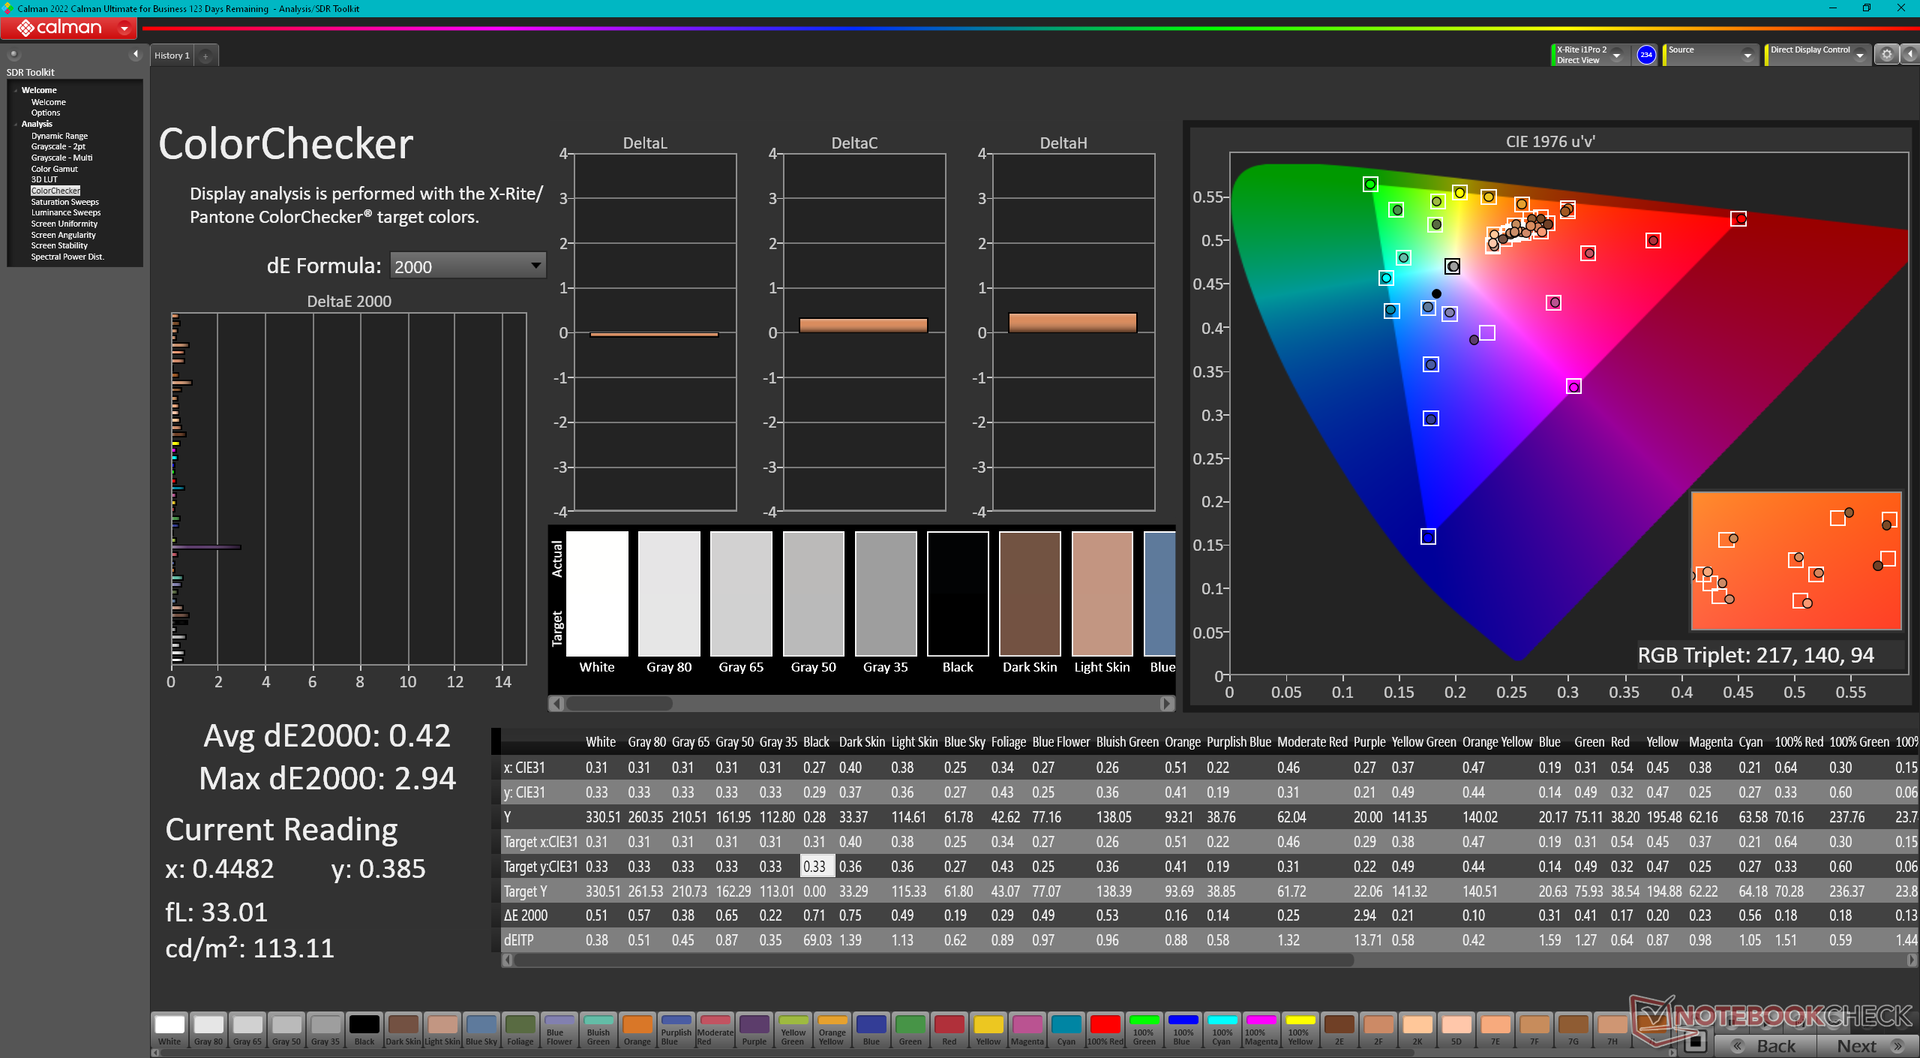
ΔE ColorChecker Calman: 2.68 | ∀{0.5-29.43 Ø4.73}
calibrated: 0.42
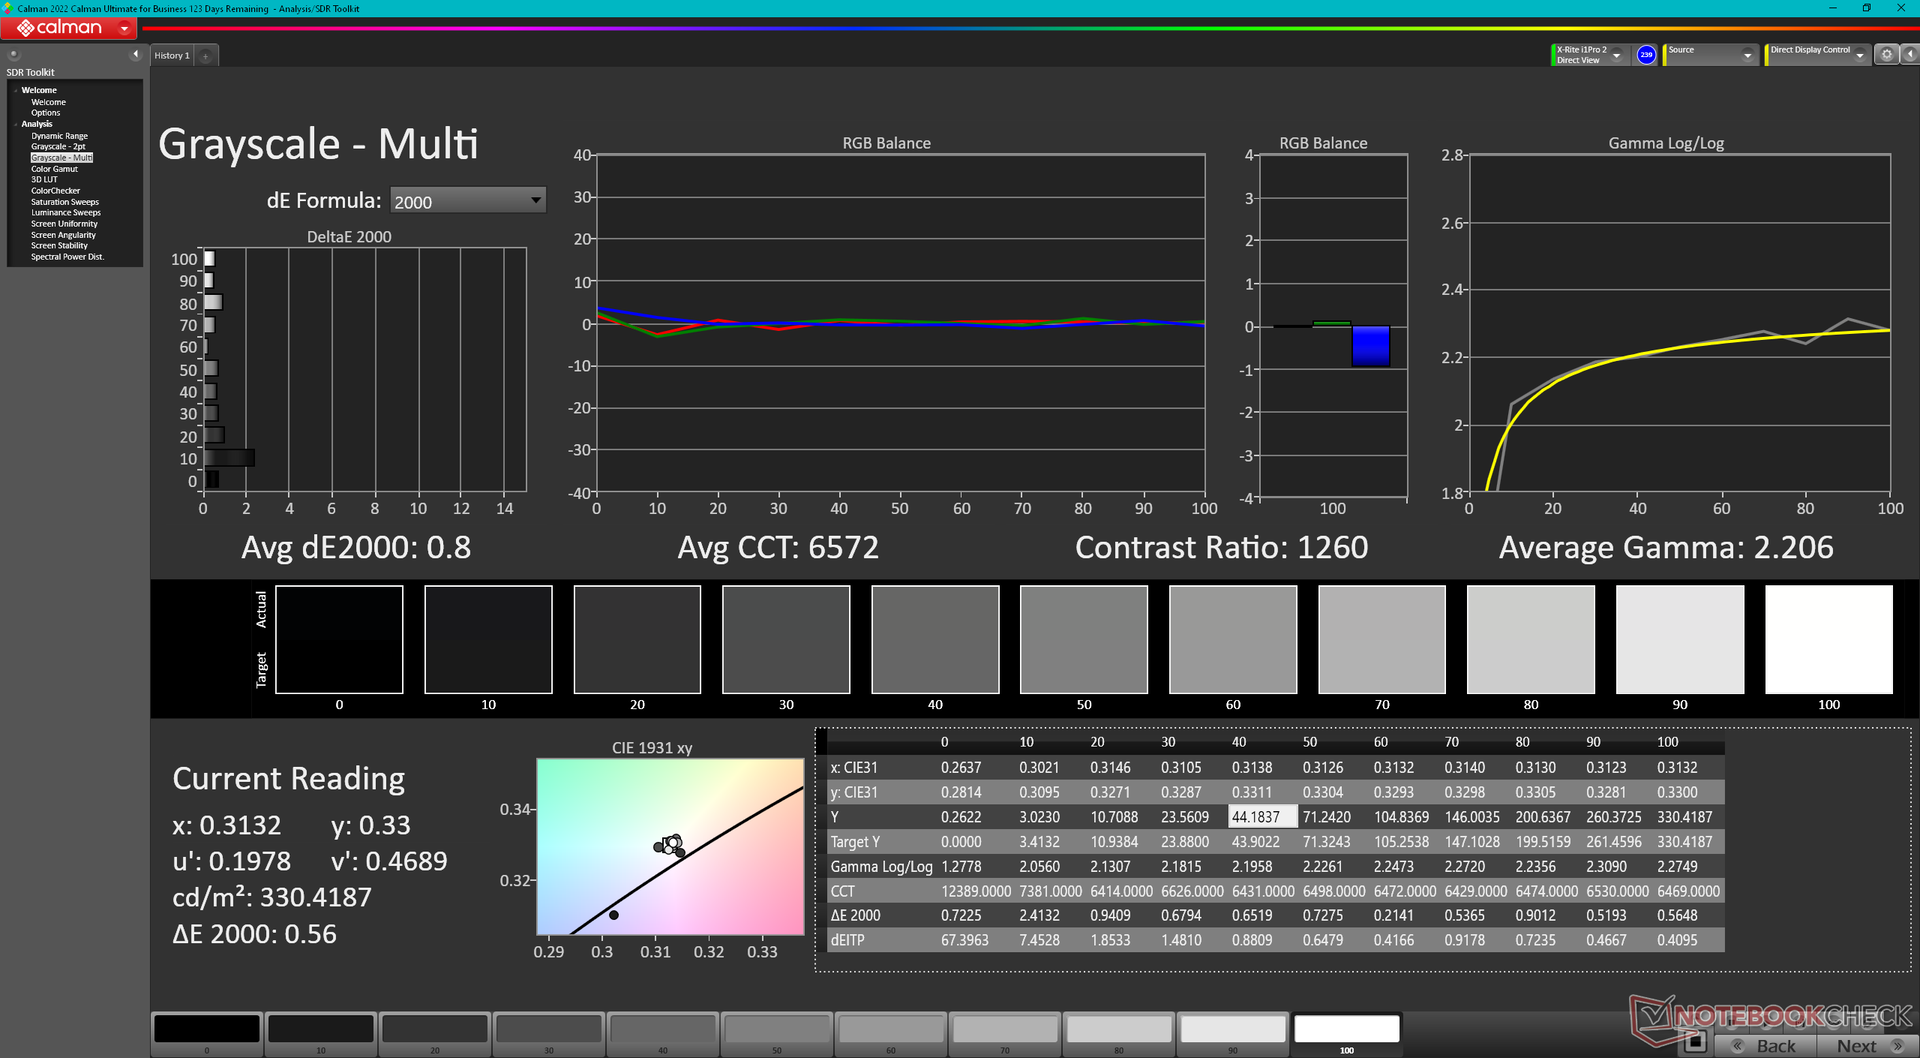
ΔE Greyscale Calman: 3.4 | ∀{0.09-98 Ø4.97}
88.8% AdobeRGB 1998 (Argyll 3D)
100% sRGB (Argyll 3D)
98.3% Display P3 (Argyll 3D)
Gamma: 2.41
CCT: 6083 K
| Alienware x16 R2 P120F BOE B160QAN, IPS, 2560x1600, 16" | Alienware x16 R1 BOE NE16NZ4, IPS, 2560x1600, 16" | Alienware m16 R2 BOE NE16NYH, IPS, 2560x1600, 16" | Asus ROG Strix Scar 16 G634JZR BOE NE160QDM-NM7, Mini LED, 2560x1600, 16" | Lenovo Legion Pro 7 16IRX9H BOE CQ NE16QDM-NZB, IPS, 2560x1600, 16" | MSI Vector 16 HX A14V Chi Mei N160GME-GTB, IPS, 2560x1600, 16" | |
|---|---|---|---|---|---|---|
| Display | 0% | -16% | 1% | -1% | -2% | |
| Display P3 Coverage (%) | 98.3 | 99.2 1% | 71 -28% | 99.8 2% | 98.5 0% | 95.4 -3% |
| sRGB Coverage (%) | 100 | 100 0% | 100 0% | 100 0% | 99.9 0% | 99.7 0% |
| AdobeRGB 1998 Coverage (%) | 88.8 | 88.6 0% | 71.4 -20% | 90.8 2% | 86.7 -2% | 85.4 -4% |
| Response Times | -32% | -29% | -31% | -99% | -46% | |
| Response Time Grey 50% / Grey 80% * (ms) | 3.9 ? | 5.1 ? -31% | 5.7 ? -46% | 5 ? -28% | 12.6 ? -223% | 5.7 ? -46% |
| Response Time Black / White * (ms) | 7.8 ? | 10.3 ? -32% | 8.7 ? -12% | 10.4 ? -33% | 5.8 ? 26% | 11.4 ? -46% |
| PWM Frequency (Hz) | 2040 ? | |||||
| Screen | -13% | 5% | 16% | 21% | -27% | |
| Brightness middle (cd/m²) | 348.4 | 302.2 -13% | 345.8 -1% | 490 41% | 487 40% | 557.2 60% |
| Brightness (cd/m²) | 340 | 285 -16% | 337 -1% | 487 43% | 460 35% | 506 49% |
| Brightness Distribution (%) | 90 | 89 -1% | 87 -3% | 94 4% | 88 -2% | 83 -8% |
| Black Level * (cd/m²) | 0.33 | 0.26 21% | 0.3 9% | 0.4 -21% | 0.42 -27% | 0.41 -24% |
| Contrast (:1) | 1056 | 1162 10% | 1153 9% | 1225 16% | 1160 10% | 1359 29% |
| Colorchecker dE 2000 * | 2.68 | 1.63 39% | 1.99 26% | 1.08 60% | 1.12 58% | 2.91 -9% |
| Colorchecker dE 2000 max. * | 4.14 | 4.13 -0% | 3.52 15% | 2.38 43% | 2.26 45% | 5.94 -43% |
| Colorchecker dE 2000 calibrated * | 0.42 | 1.17 -179% | 0.62 -48% | 0.9 -114% | 0.54 -29% | 1.63 -288% |
| Greyscale dE 2000 * | 3.4 | 2.5 26% | 2.1 38% | 1.1 68% | 1.4 59% | 3.8 -12% |
| Gamma | 2.41 91% | 2.23 99% | 2.32 95% | 2.13 103% | 2.242 98% | 2.23 99% |
| CCT | 6083 107% | 6590 99% | 6369 102% | 6724 97% | 6809 95% | 6408 101% |
| Toplam Ortalama (Program / Ayarlar) | -15% /
-13% | -13% /
-4% | -5% /
6% | -26% /
-1% | -25% /
-25% |
* ... daha küçük daha iyidir
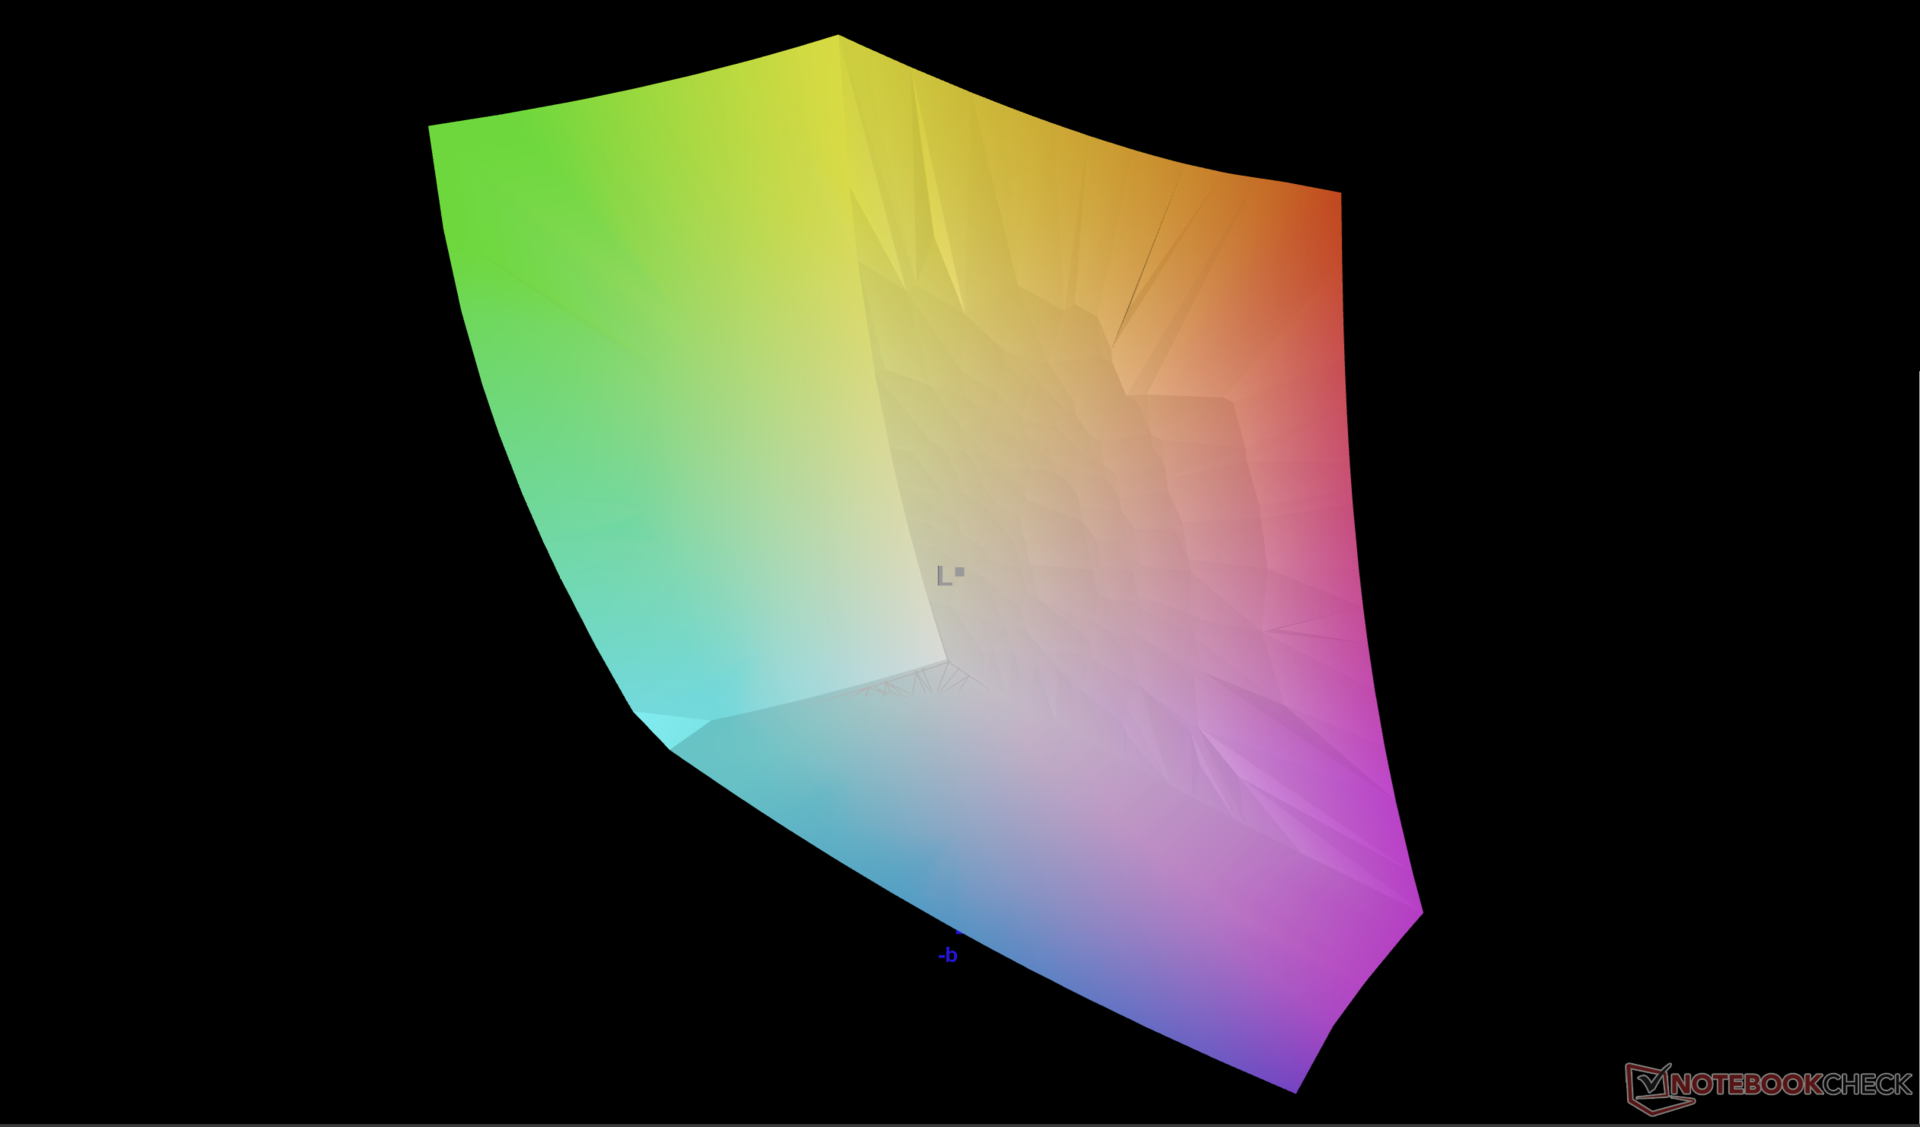
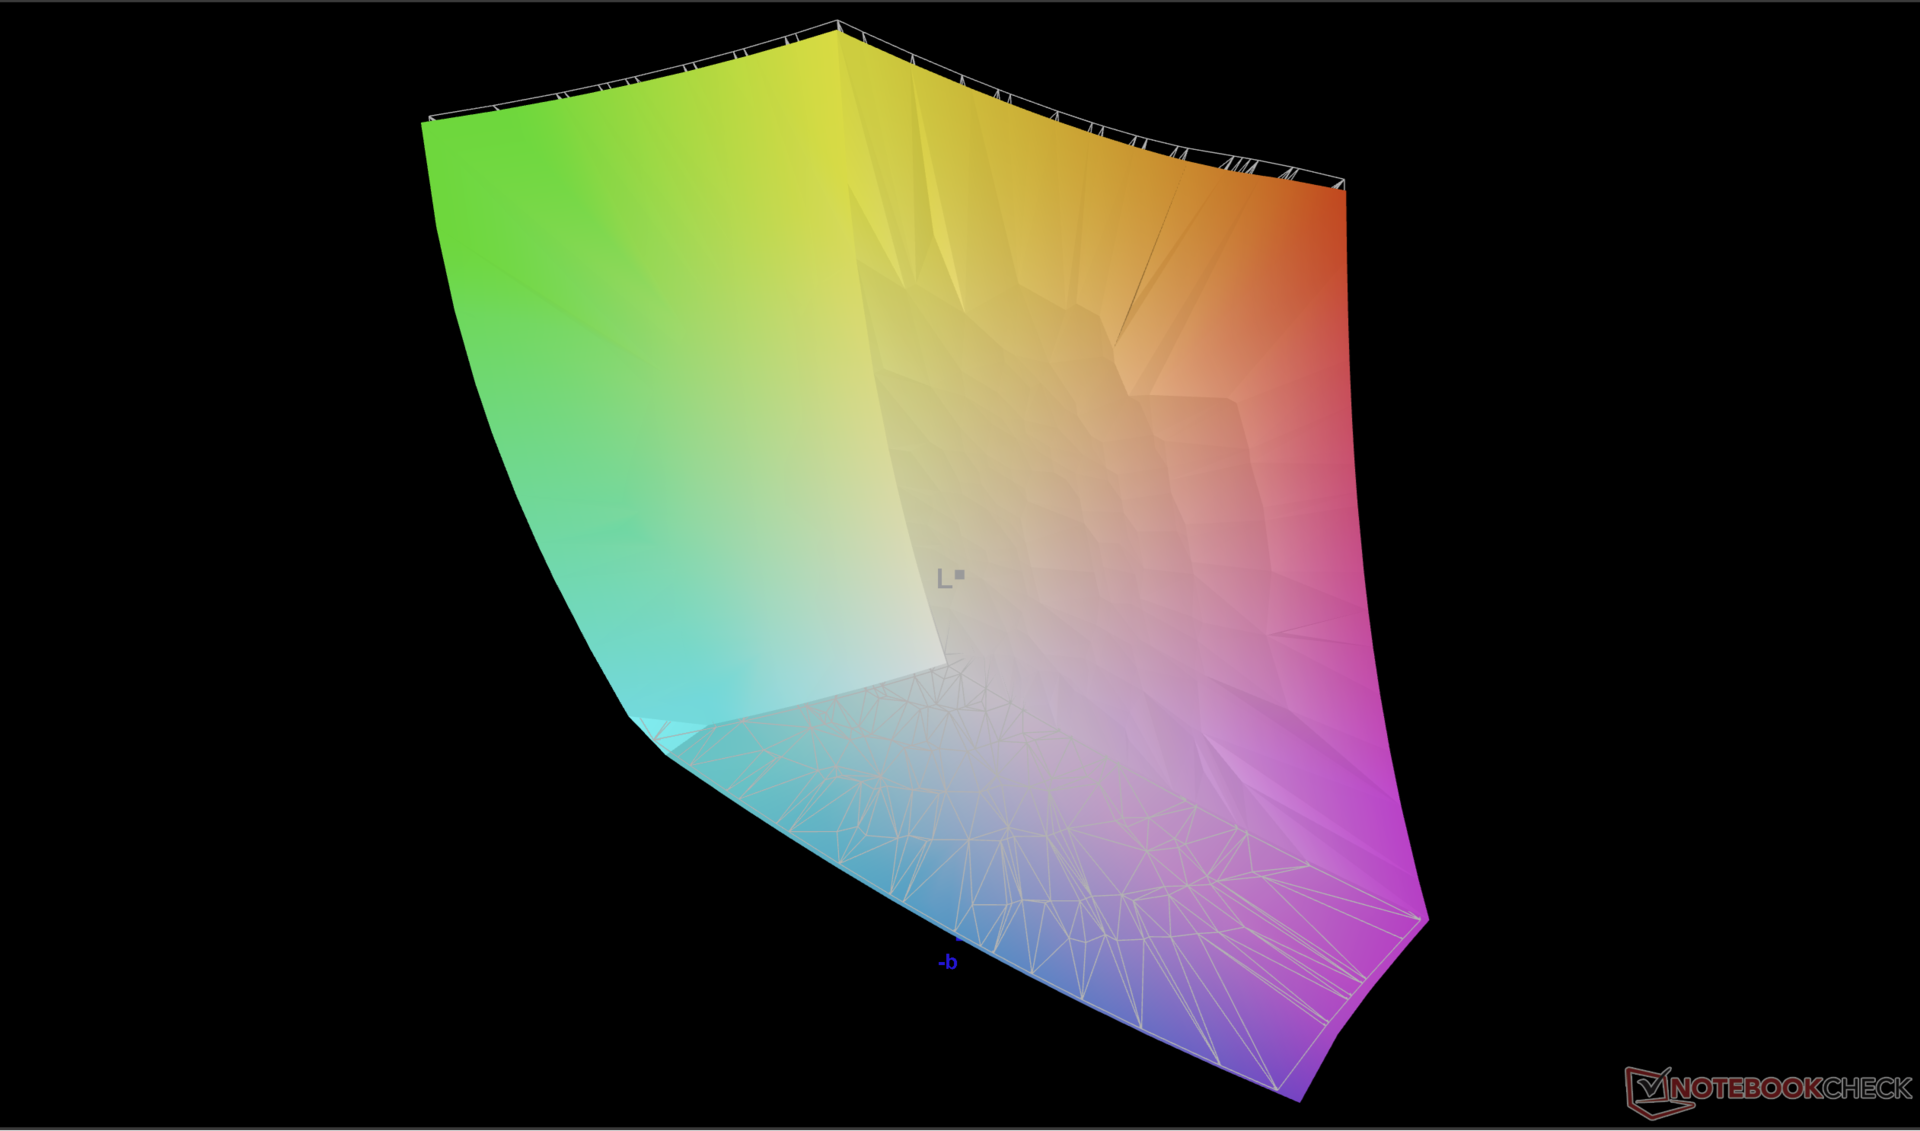
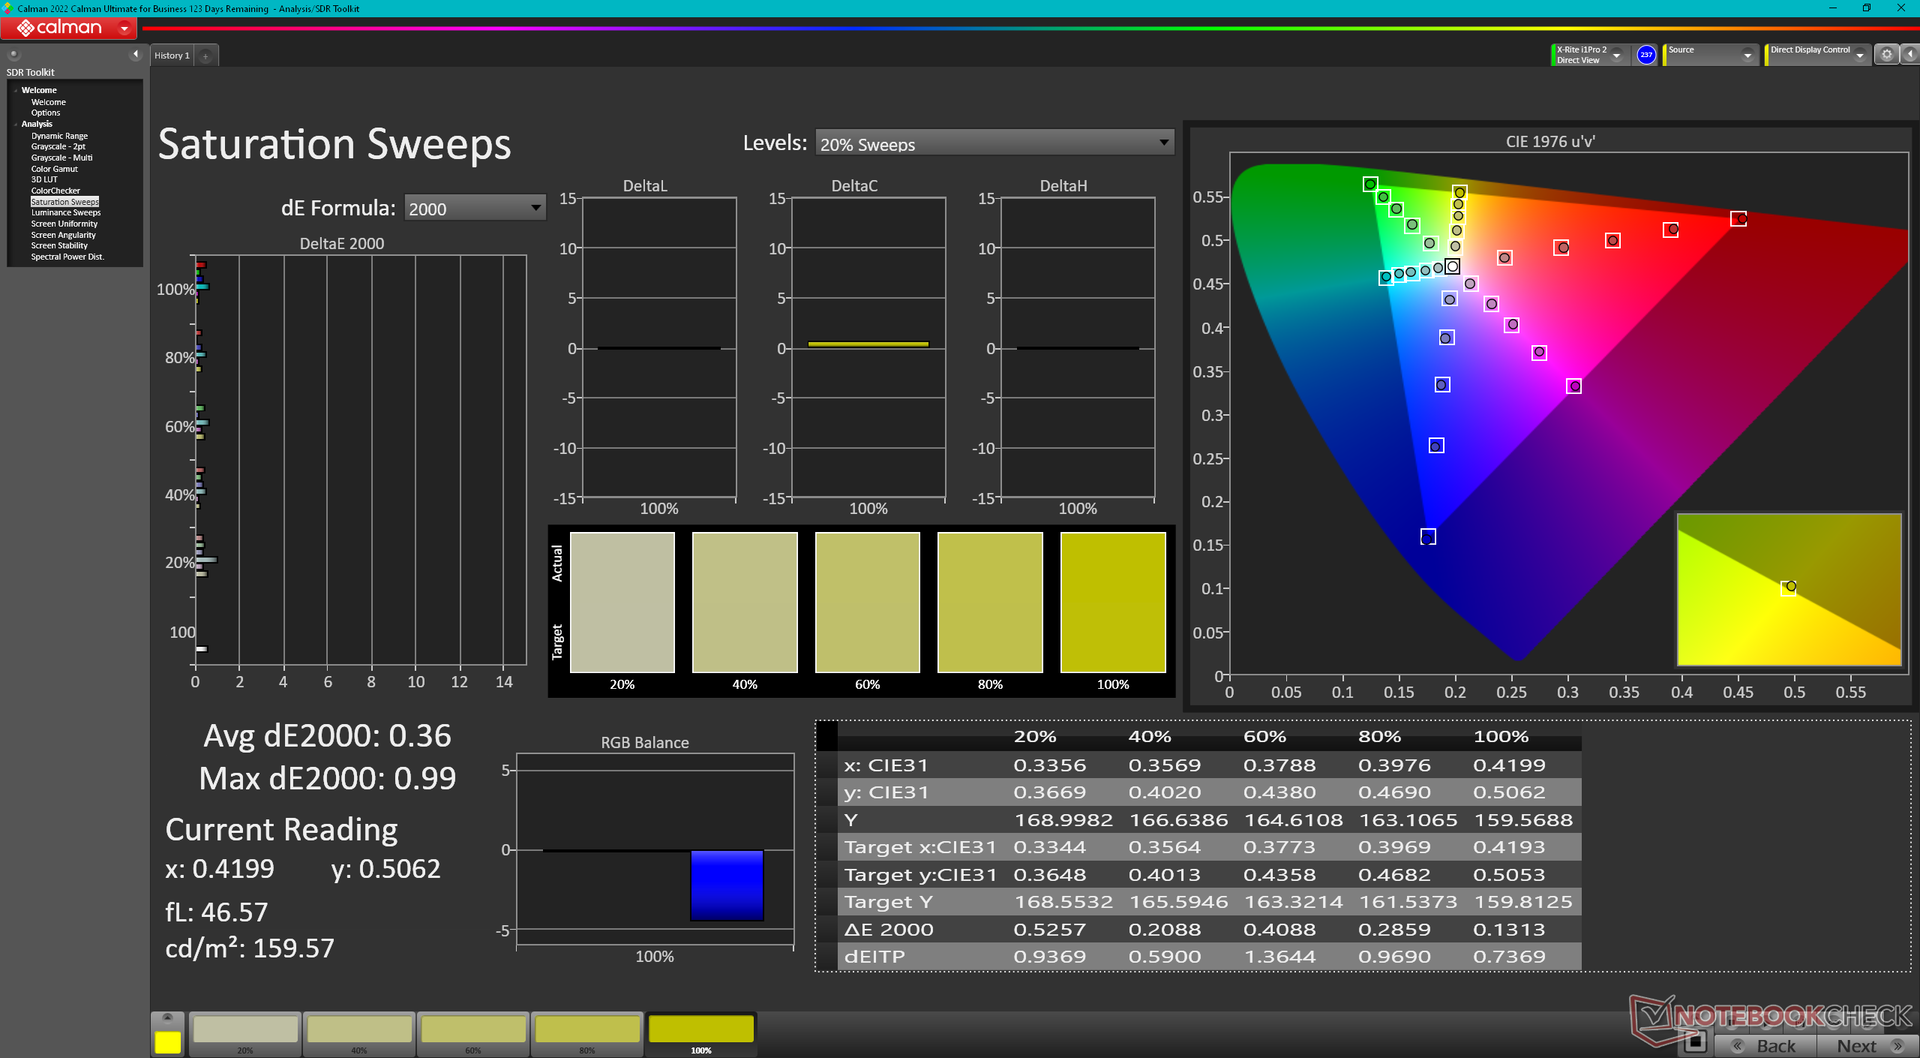
Ekran, tam P3 renklerini desteklemesine rağmen varsayılan olarak sRGB'ye ayarlanmıştır. Renk sıcaklığı biraz fazla sıcak olsa da yine de iyi kalibre edilmiş.
Yanıt Sürelerini Görüntüle
| ↔ Tepki Süresi Siyahtan Beyaza | ||
|---|---|---|
| 7.8 ms ... yükseliş ↗ ve sonbahar↘ birleşimi | ↗ 3.9 ms yükseliş | 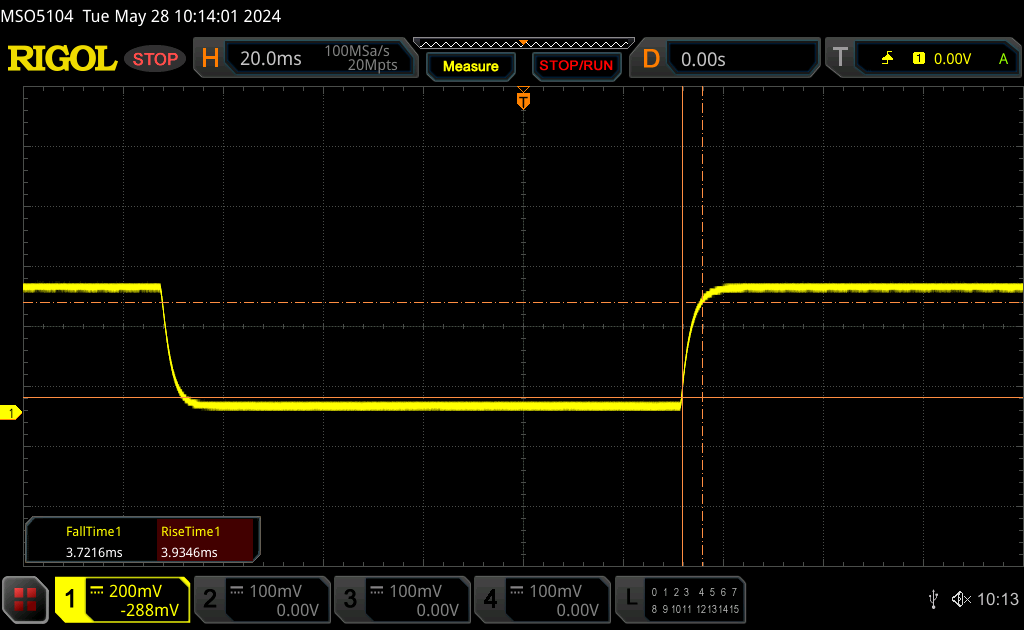 |
| ↘ 3.7 ms sonbahar | ||
| Ekran, testlerimizde çok hızlı yanıt oranları gösteriyor ve hızlı oyun oynamaya çok uygun olmalı. Karşılaştırıldığında, test edilen tüm cihazlar 0.1 (minimum) ile 240 (maksimum) ms arasında değişir. » Tüm cihazların 22 %'si daha iyi. Bu, ölçülen yanıt süresinin test edilen tüm cihazların ortalamasından (19.9 ms) daha iyi olduğu anlamına gelir. | ||
| ↔ Tepki Süresi %50 Griden %80 Griye | ||
| 3.9 ms ... yükseliş ↗ ve sonbahar↘ birleşimi | ↗ 1.7 ms yükseliş | 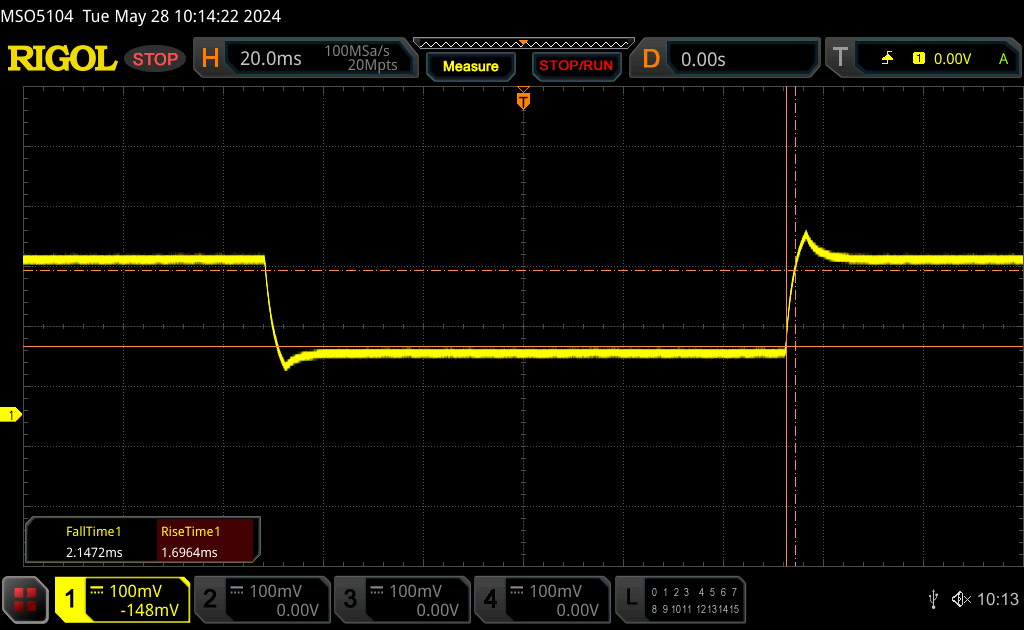 |
| ↘ 2.2 ms sonbahar | ||
| Ekran, testlerimizde çok hızlı yanıt oranları gösteriyor ve hızlı oyun oynamaya çok uygun olmalı. Karşılaştırıldığında, test edilen tüm cihazlar 0.165 (minimum) ile 636 (maksimum) ms arasında değişir. » Tüm cihazların 15 %'si daha iyi. Bu, ölçülen yanıt süresinin test edilen tüm cihazların ortalamasından (31.1 ms) daha iyi olduğu anlamına gelir. | ||
Ekran Titremesi / PWM (Darbe Genişliği Modülasyonu)
| Ekran titriyor / PWM algılanmadı | 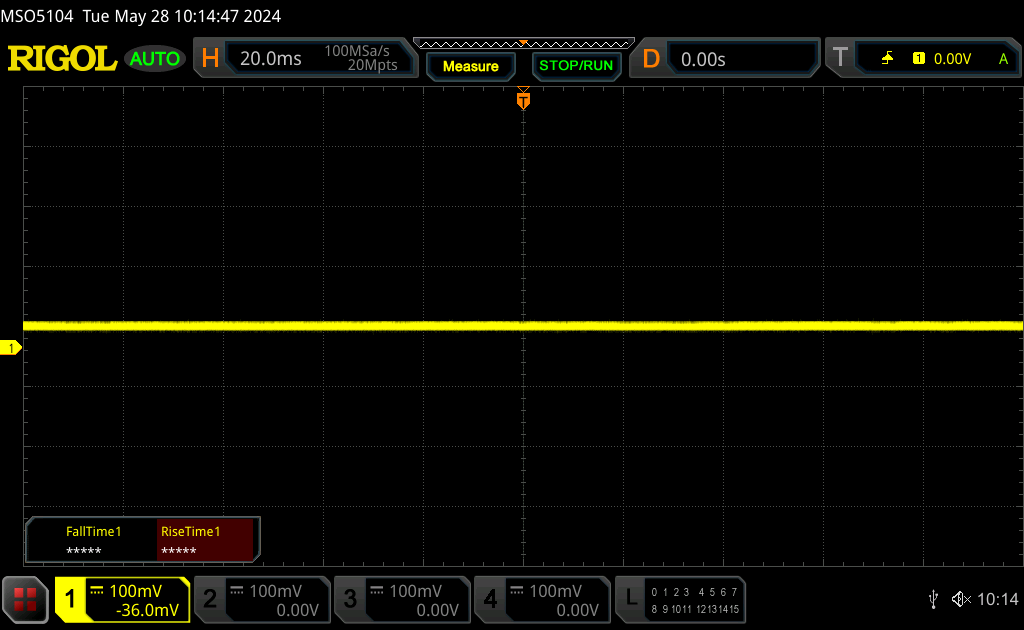 | ||
Karşılaştırıldığında: Test edilen tüm cihazların %52 %'si ekranı karartmak için PWM kullanmıyor. PWM tespit edilirse, ortalama 7798 (minimum: 5 - maksimum: 343500) Hz ölçüldü. | |||
Performans - Core Ultra 9 185H vs. Core i9-13900HK
Test Koşulları
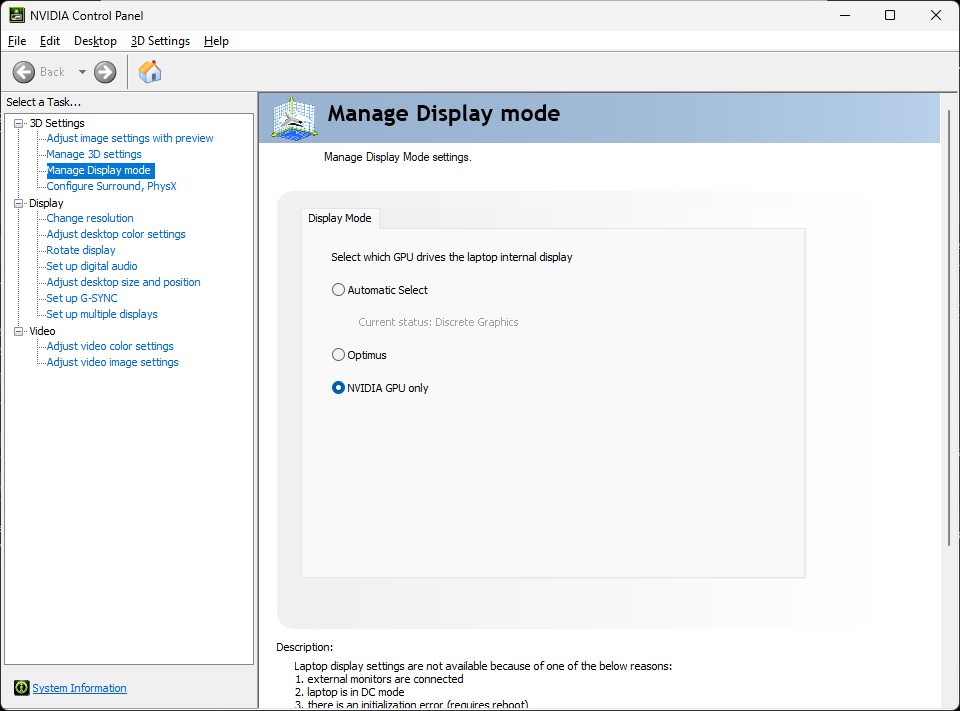
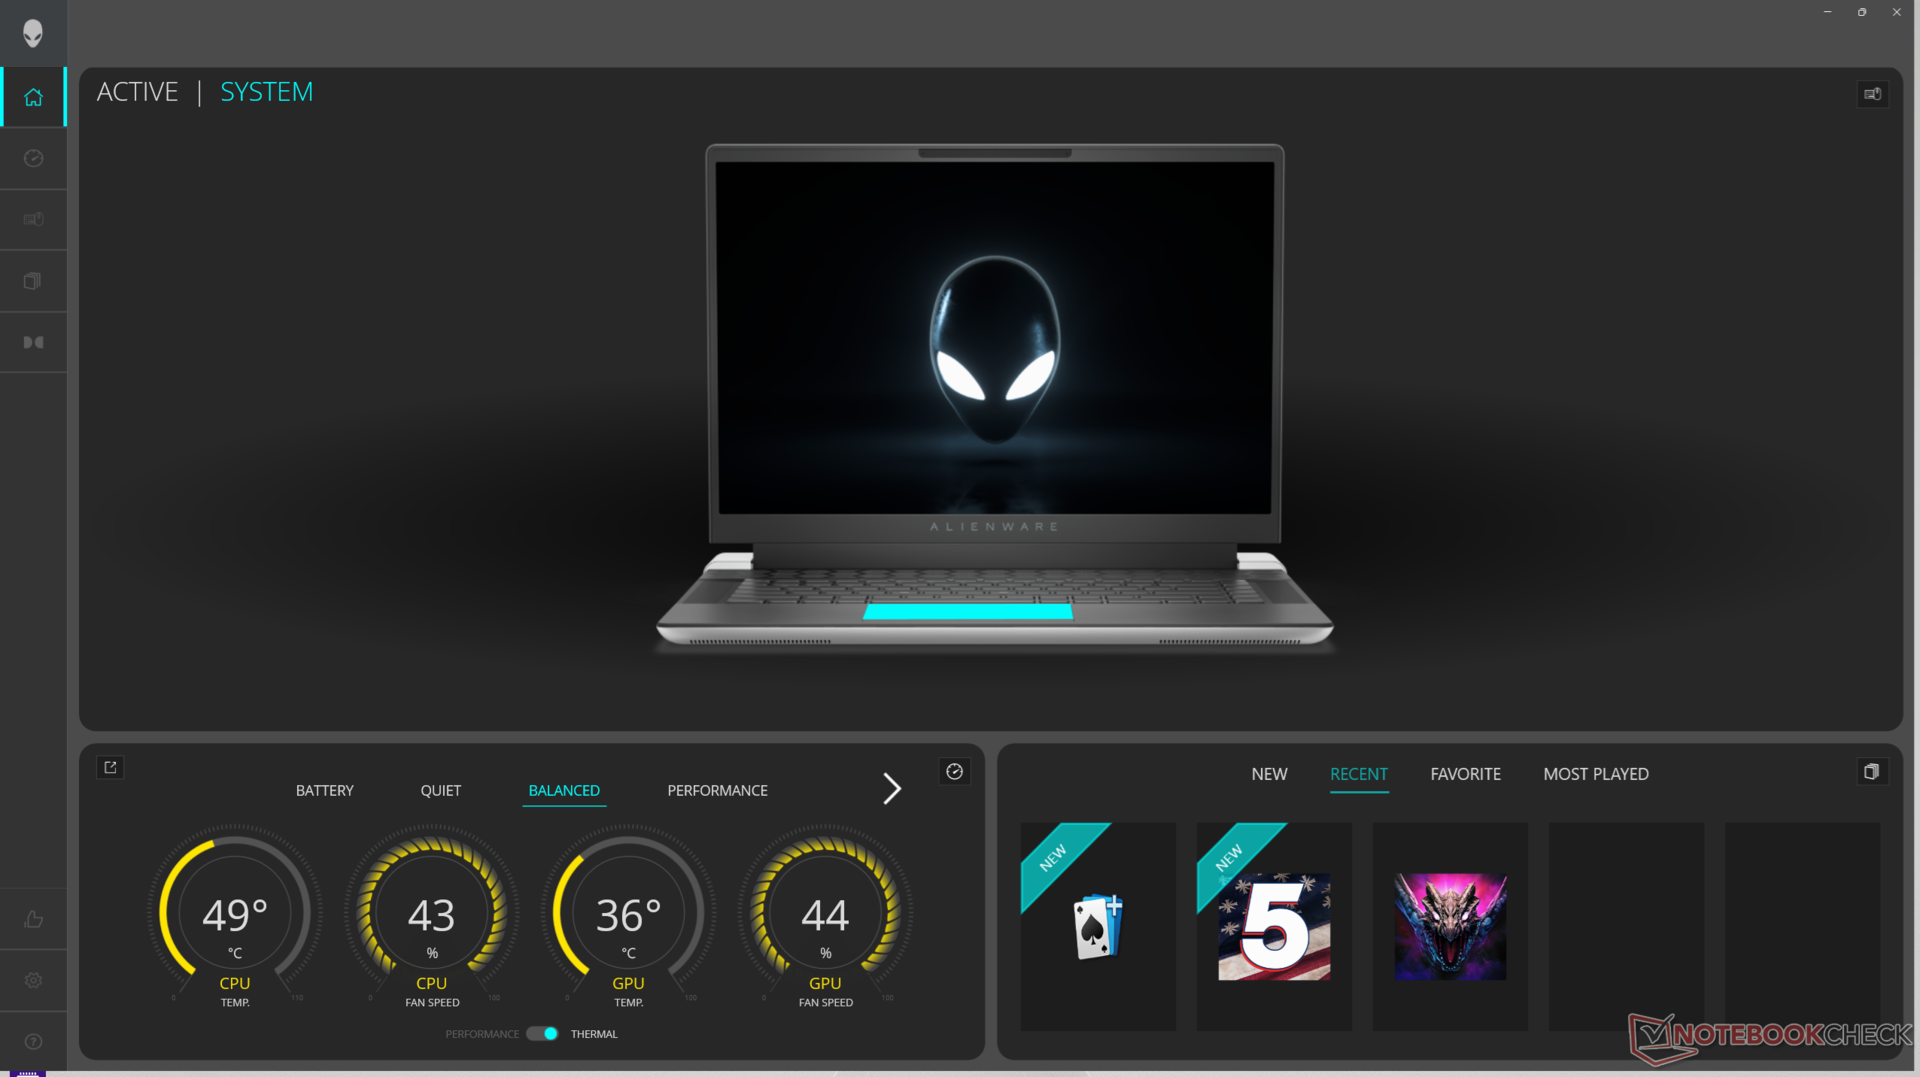
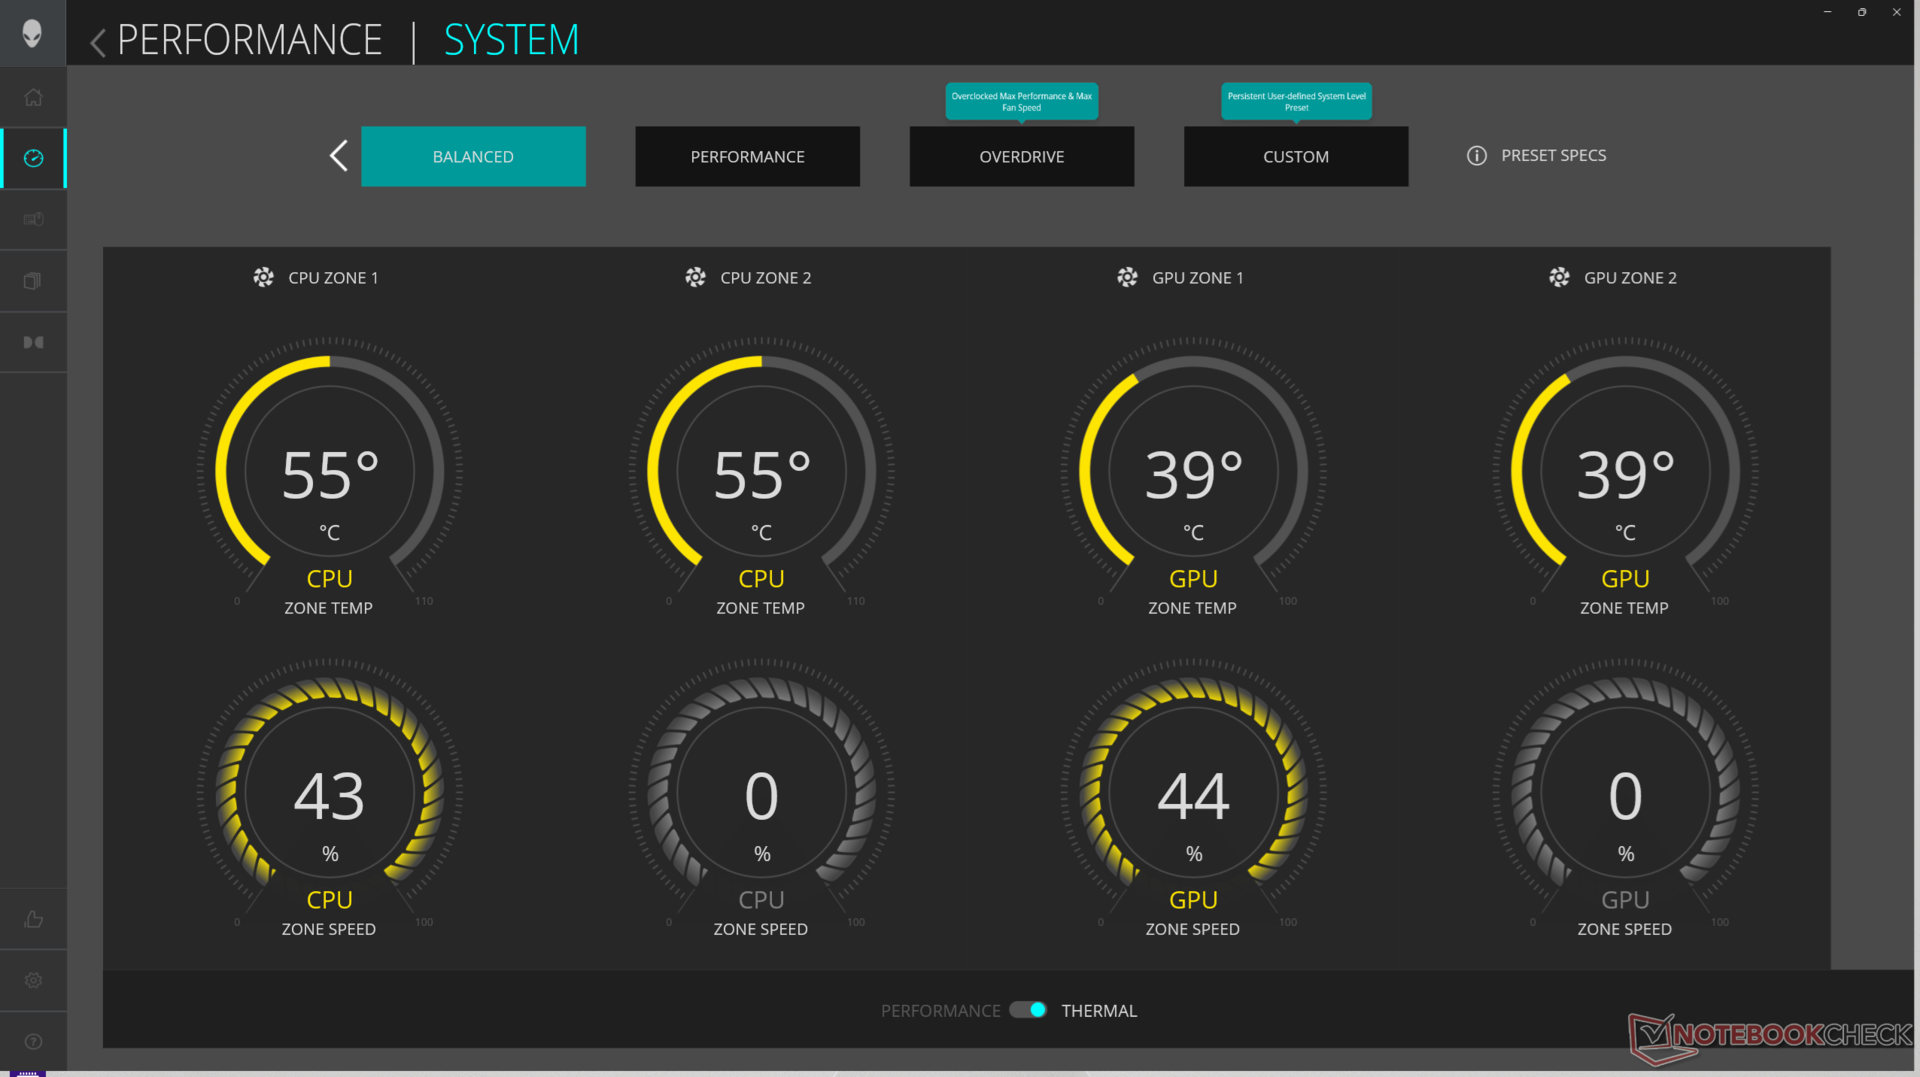
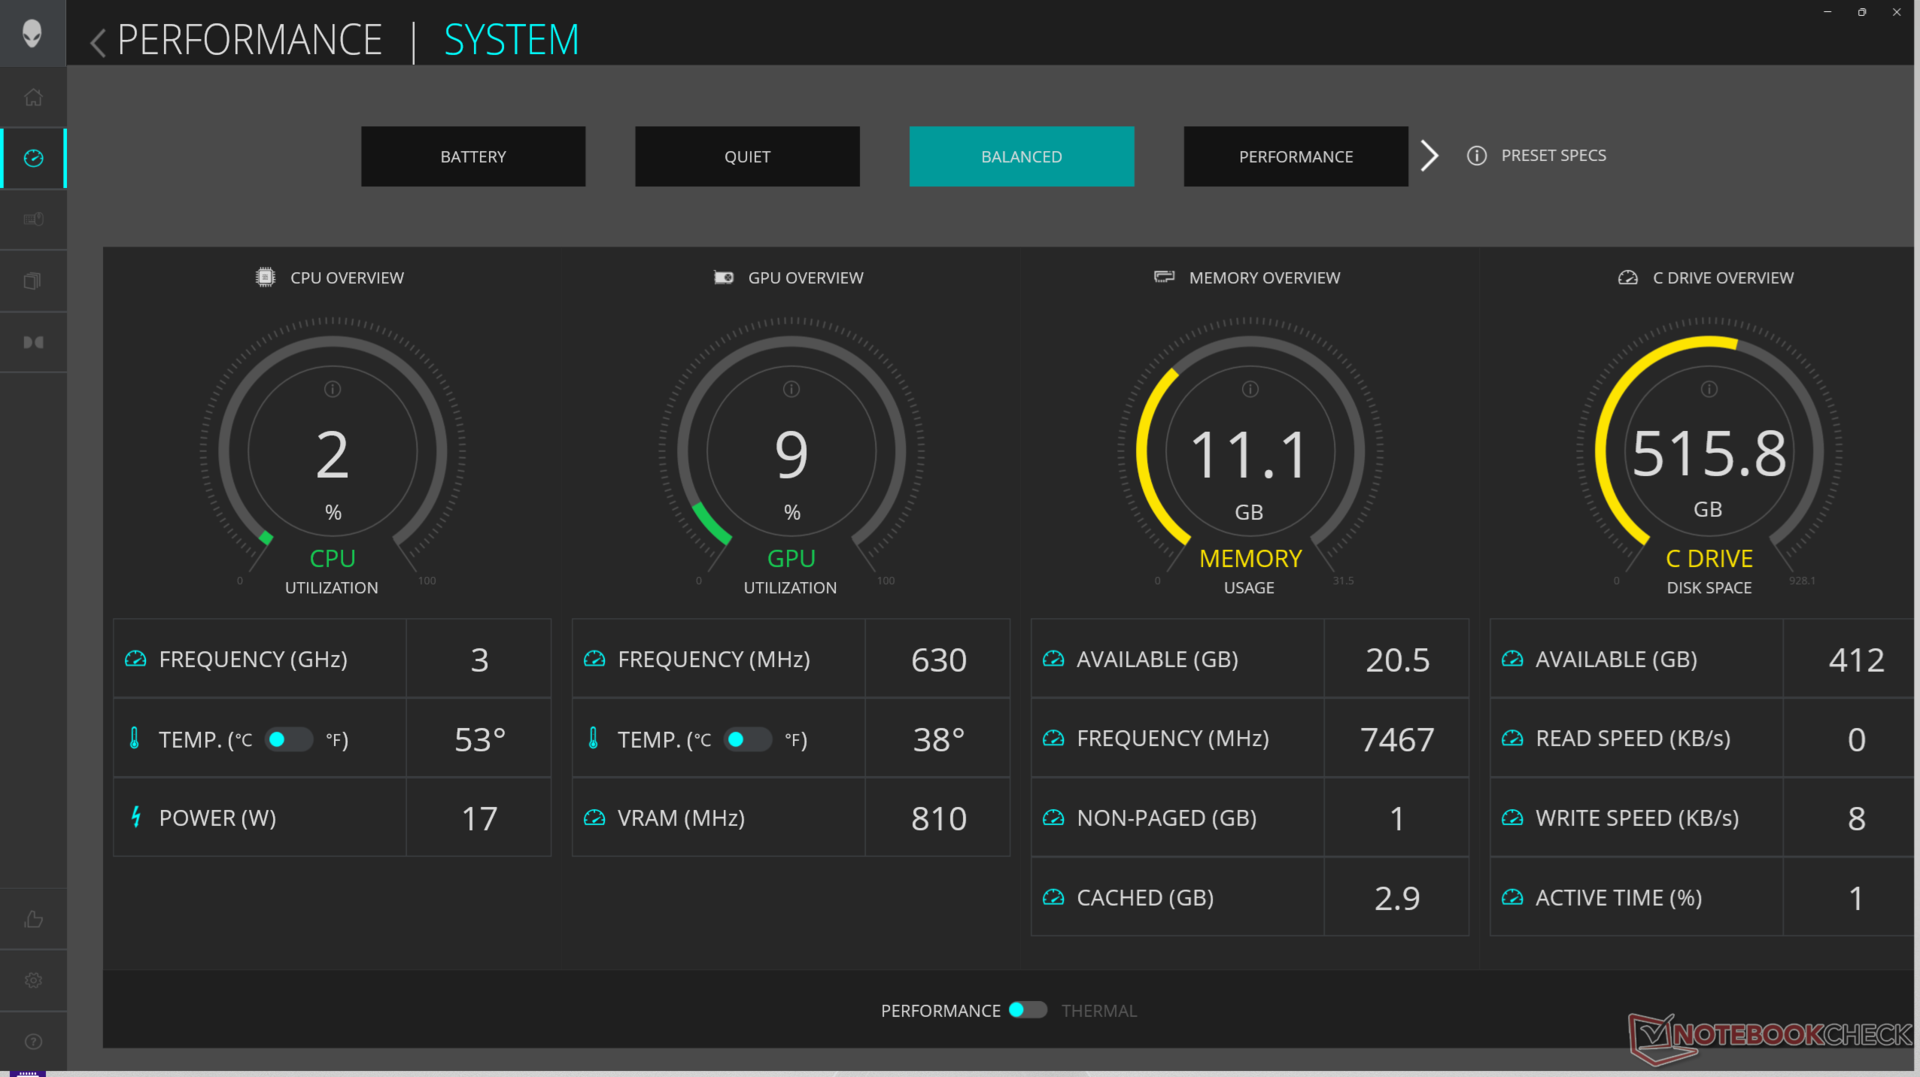
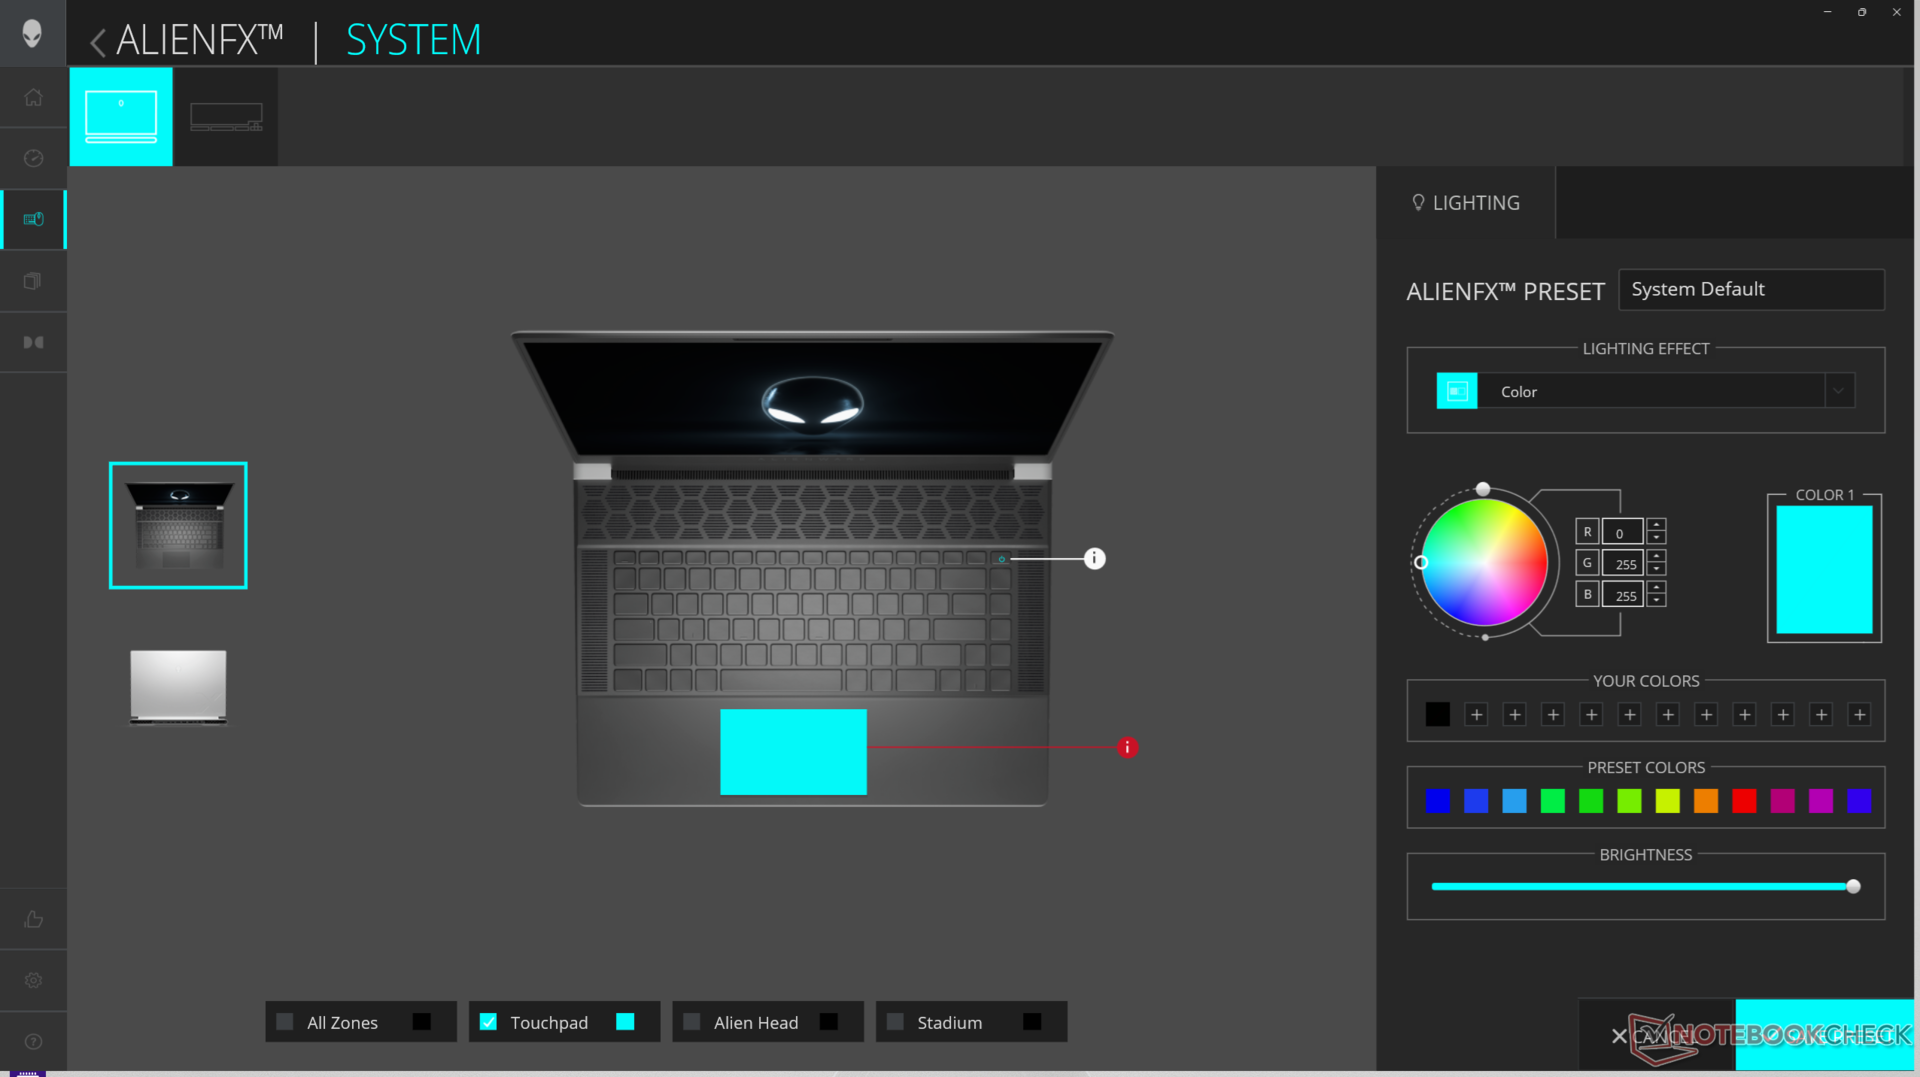
Mümkün olan en iyi kıyaslama sonuçlarını elde etmek için Alienware Command Center'ı Overdrive moduna ve grafikleri dGPU moduna ayarladık. RGB aydınlatma efektlerini ve performans profillerini ayarlamak için merkez olduğundan, sahiplerin Komuta Merkezine aşina olmaları teşvik edilir.
Nvidia Kontrol Paneli, yukarıdaki ekran görüntüsünde gösterildiği gibi "yalnızca iGPU" modu sunmuyor.
İşlemci
Bu Core Ultra 9 185H yaklaşık yüzde 5 ila 10 ve yüzde 15 ila 20 daha yavaştır Core i9-13900HK sırasıyla çok iş parçacıklı ve tek iş parçacıklı uygulamalar söz konusu olduğunda geçen yılki x16 R1'de. İlginç bir şekilde Core Ultra 7 155H konfigürasyonunun performansı önemli bir oranda etkilemesi beklenmemektedir Alienware m16 R2 aşağıdaki karşılaştırma tablosunda gösterildiği gibi.
Raptor Lake-HX gibi seçenekler Core i9-14900HX alienware x16 serisinde muhtemelen termal sınırlamalar nedeniyle mevcut değildir, çünkü bu işlemciler Meteor Lake-H serisinden daha fazla güç gerektirir. Bu seçenekler hem Core i9-13900HK hem de Core Ultra 9 185H'den önemli ölçüde daha hızlı performans sunabilirdi.
Cinebench R15 Multi Loop
Cinebench R23: Multi Core | Single Core
Cinebench R20: CPU (Multi Core) | CPU (Single Core)
Cinebench R15: CPU Multi 64Bit | CPU Single 64Bit
Blender: v2.79 BMW27 CPU
7-Zip 18.03: 7z b 4 | 7z b 4 -mmt1
Geekbench 6.7: Multi-Core | Single-Core
Geekbench 5.5: Multi-Core | Single-Core
HWBOT x265 Benchmark v2.2: 4k Preset
LibreOffice : 20 Documents To PDF
R Benchmark 2.5: Overall mean
| CPU Performance rating | |
| Lenovo Legion Pro 7 16IRX9H | |
| Asus ROG Strix Scar 16 G634JZR | |
| MSI Vector 16 HX A14V | |
| MSI Raider GE68HX 13VF | |
| Lenovo Legion Pro 7 RTX4090 -2! | |
| Alienware m16 R1 AMD | |
| Lenovo Legion 7 16IAX7-82TD004SGE -2! | |
| Alienware x16 R1 -3! | |
| Framework Laptop 16 | |
| Alienware m16 R2 -1! | |
| Lenovo Legion Slim 5 16APH8 -2! | |
| MSI Stealth 16 Mercedes-AMG Motorsport A13VG | |
| Ortalama Intel Core Ultra 9 185H | |
| Lenovo Legion Slim 7 16APH8 | |
| Alienware x16 R2 P120F | |
| Lenovo Legion S7 16ARHA7 -2! | |
| Asus ROG Zephyrus M16 GU603H -4! | |
| HWBOT x265 Benchmark v2.2 / 4k Preset | |
| Lenovo Legion Pro 7 16IRX9H | |
| Lenovo Legion Pro 7 RTX4090 | |
| MSI Vector 16 HX A14V | |
| Asus ROG Strix Scar 16 G634JZR | |
| MSI Raider GE68HX 13VF | |
| Alienware m16 R1 AMD | |
| Lenovo Legion 7 16IAX7-82TD004SGE | |
| Alienware x16 R1 | |
| Lenovo Legion Slim 5 16APH8 | |
| Alienware m16 R2 | |
| Framework Laptop 16 | |
| Alienware x16 R2 P120F | |
| Lenovo Legion Slim 7 16APH8 | |
| Ortalama Intel Core Ultra 9 185H (13.7 - 22.7, n=20) | |
| Lenovo Legion S7 16ARHA7 | |
| Asus ROG Zephyrus M16 GU603H | |
| MSI Stealth 16 Mercedes-AMG Motorsport A13VG | |
Cinebench R23: Multi Core | Single Core
Cinebench R20: CPU (Multi Core) | CPU (Single Core)
Cinebench R15: CPU Multi 64Bit | CPU Single 64Bit
Blender: v2.79 BMW27 CPU
7-Zip 18.03: 7z b 4 | 7z b 4 -mmt1
Geekbench 6.7: Multi-Core | Single-Core
Geekbench 5.5: Multi-Core | Single-Core
HWBOT x265 Benchmark v2.2: 4k Preset
LibreOffice : 20 Documents To PDF
R Benchmark 2.5: Overall mean
* ... daha küçük daha iyidir
AIDA64: FP32 Ray-Trace | FPU Julia | CPU SHA3 | CPU Queen | FPU SinJulia | FPU Mandel | CPU AES | CPU ZLib | FP64 Ray-Trace | CPU PhotoWorxx
| Performance rating | |
| MSI Vector 16 HX A14V | |
| Lenovo Legion Pro 7 16IRX9H | |
| Asus ROG Strix Scar 16 G634JZR | |
| Alienware x16 R2 P120F | |
| Alienware x16 R1 | |
| Alienware m16 R2 | |
| Ortalama Intel Core Ultra 9 185H | |
| AIDA64 / FP32 Ray-Trace | |
| MSI Vector 16 HX A14V | |
| Lenovo Legion Pro 7 16IRX9H | |
| Asus ROG Strix Scar 16 G634JZR | |
| Alienware x16 R2 P120F | |
| Alienware m16 R2 | |
| Alienware x16 R1 | |
| Ortalama Intel Core Ultra 9 185H (9220 - 18676, n=20) | |
| AIDA64 / FPU Julia | |
| MSI Vector 16 HX A14V | |
| Lenovo Legion Pro 7 16IRX9H | |
| Asus ROG Strix Scar 16 G634JZR | |
| Alienware x16 R2 P120F | |
| Alienware m16 R2 | |
| Alienware x16 R1 | |
| Ortalama Intel Core Ultra 9 185H (48865 - 96463, n=20) | |
| AIDA64 / CPU SHA3 | |
| Lenovo Legion Pro 7 16IRX9H | |
| MSI Vector 16 HX A14V | |
| Asus ROG Strix Scar 16 G634JZR | |
| Alienware x16 R2 P120F | |
| Alienware m16 R2 | |
| Alienware x16 R1 | |
| Ortalama Intel Core Ultra 9 185H (2394 - 4534, n=20) | |
| AIDA64 / CPU Queen | |
| Asus ROG Strix Scar 16 G634JZR | |
| Lenovo Legion Pro 7 16IRX9H | |
| MSI Vector 16 HX A14V | |
| Alienware x16 R1 | |
| Alienware x16 R2 P120F | |
| Ortalama Intel Core Ultra 9 185H (66785 - 95241, n=20) | |
| Alienware m16 R2 | |
| AIDA64 / FPU SinJulia | |
| Lenovo Legion Pro 7 16IRX9H | |
| MSI Vector 16 HX A14V | |
| Asus ROG Strix Scar 16 G634JZR | |
| Alienware x16 R1 | |
| Alienware x16 R2 P120F | |
| Alienware m16 R2 | |
| Ortalama Intel Core Ultra 9 185H (7255 - 11392, n=20) | |
| AIDA64 / FPU Mandel | |
| MSI Vector 16 HX A14V | |
| Lenovo Legion Pro 7 16IRX9H | |
| Asus ROG Strix Scar 16 G634JZR | |
| Alienware x16 R2 P120F | |
| Alienware m16 R2 | |
| Alienware x16 R1 | |
| Ortalama Intel Core Ultra 9 185H (24004 - 48020, n=20) | |
| AIDA64 / CPU AES | |
| Asus ROG Strix Scar 16 G634JZR | |
| Lenovo Legion Pro 7 16IRX9H | |
| MSI Vector 16 HX A14V | |
| Ortalama Intel Core Ultra 9 185H (53116 - 154066, n=20) | |
| Alienware x16 R2 P120F | |
| Alienware m16 R2 | |
| Alienware x16 R1 | |
| AIDA64 / CPU ZLib | |
| Lenovo Legion Pro 7 16IRX9H | |
| MSI Vector 16 HX A14V | |
| Asus ROG Strix Scar 16 G634JZR | |
| Alienware x16 R2 P120F | |
| Alienware x16 R1 | |
| Alienware m16 R2 | |
| Ortalama Intel Core Ultra 9 185H (678 - 1341, n=20) | |
| AIDA64 / FP64 Ray-Trace | |
| MSI Vector 16 HX A14V | |
| Lenovo Legion Pro 7 16IRX9H | |
| Asus ROG Strix Scar 16 G634JZR | |
| Alienware x16 R2 P120F | |
| Alienware x16 R1 | |
| Alienware m16 R2 | |
| Ortalama Intel Core Ultra 9 185H (4428 - 10078, n=20) | |
| AIDA64 / CPU PhotoWorxx | |
| Alienware x16 R2 P120F | |
| Asus ROG Strix Scar 16 G634JZR | |
| Alienware x16 R1 | |
| MSI Vector 16 HX A14V | |
| Ortalama Intel Core Ultra 9 185H (44547 - 53918, n=20) | |
| Lenovo Legion Pro 7 16IRX9H | |
| Alienware m16 R2 | |
Stres Testi
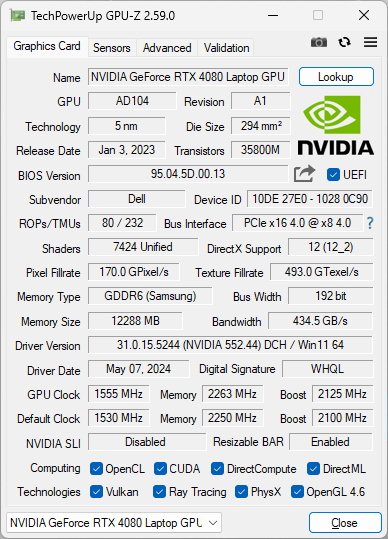
CPU ve GPU arasındaki çekirdek sıcaklıkları x16 R1'de kaydettiğimiz kadar sıcak. Özellikle CPU, Prime95'i çalıştırırken neredeyse 100 C'de (!) stabilize olurken, GPU çalışırken 80 C'nin ortalarında stabilize oluyor Witcher 3. İlginç bir şekilde, GPU saat hızı x16 R1 ile karşılaştırıldığında genel olarak düşmüştür. GPU, orijinal x16 R1'deki 2460 MHz'e kıyasla güç profiline bağlı olarak 2100 ila 2325 MHz arasında değişecektir. Kartın güç çekişi de yeni x16 R2 modelinde daha düşüktür (150 W'a karşı 165 W). Bu bulgular, aşağıdaki GPU Performansı bölümündeki genel olarak daha yavaş grafik performansı ile ilişkilidir.
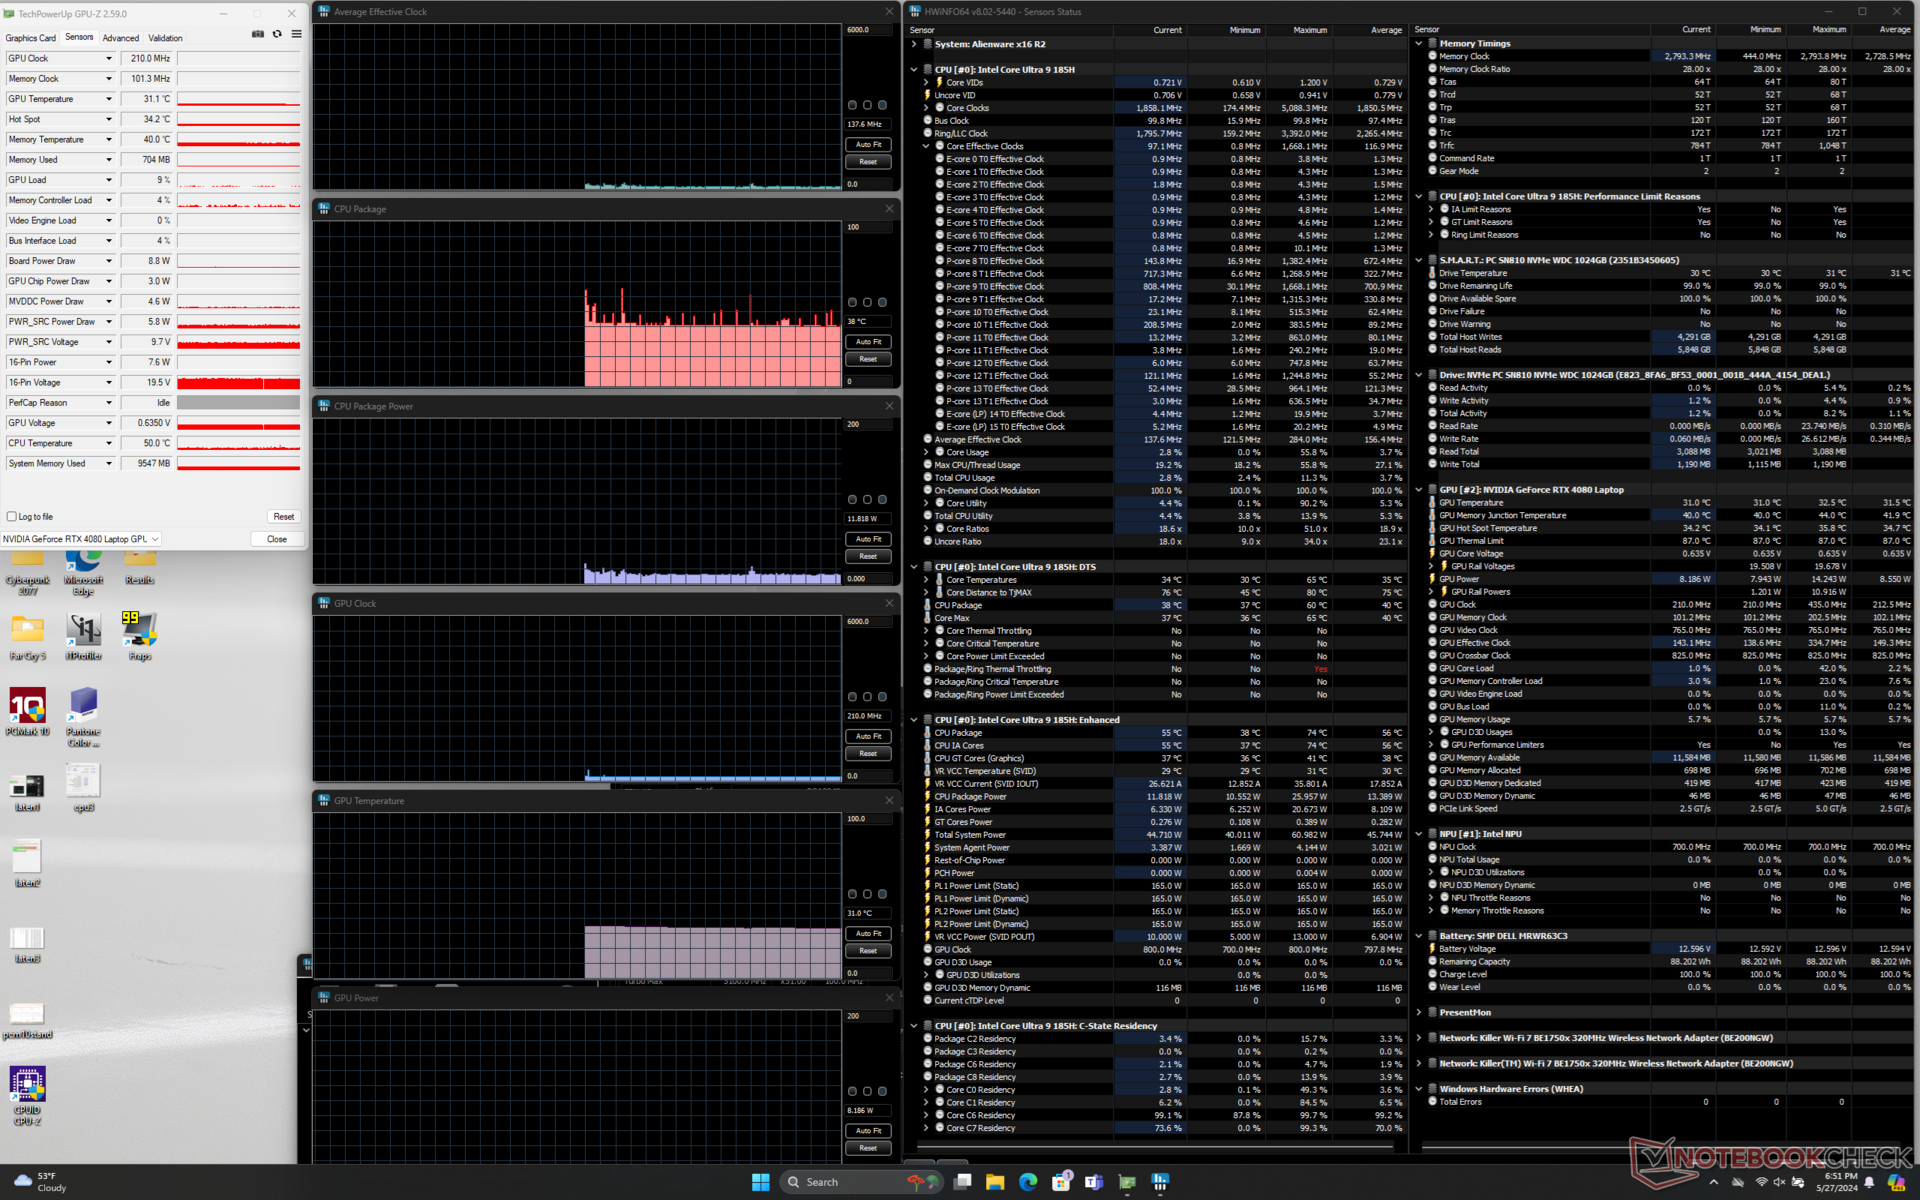
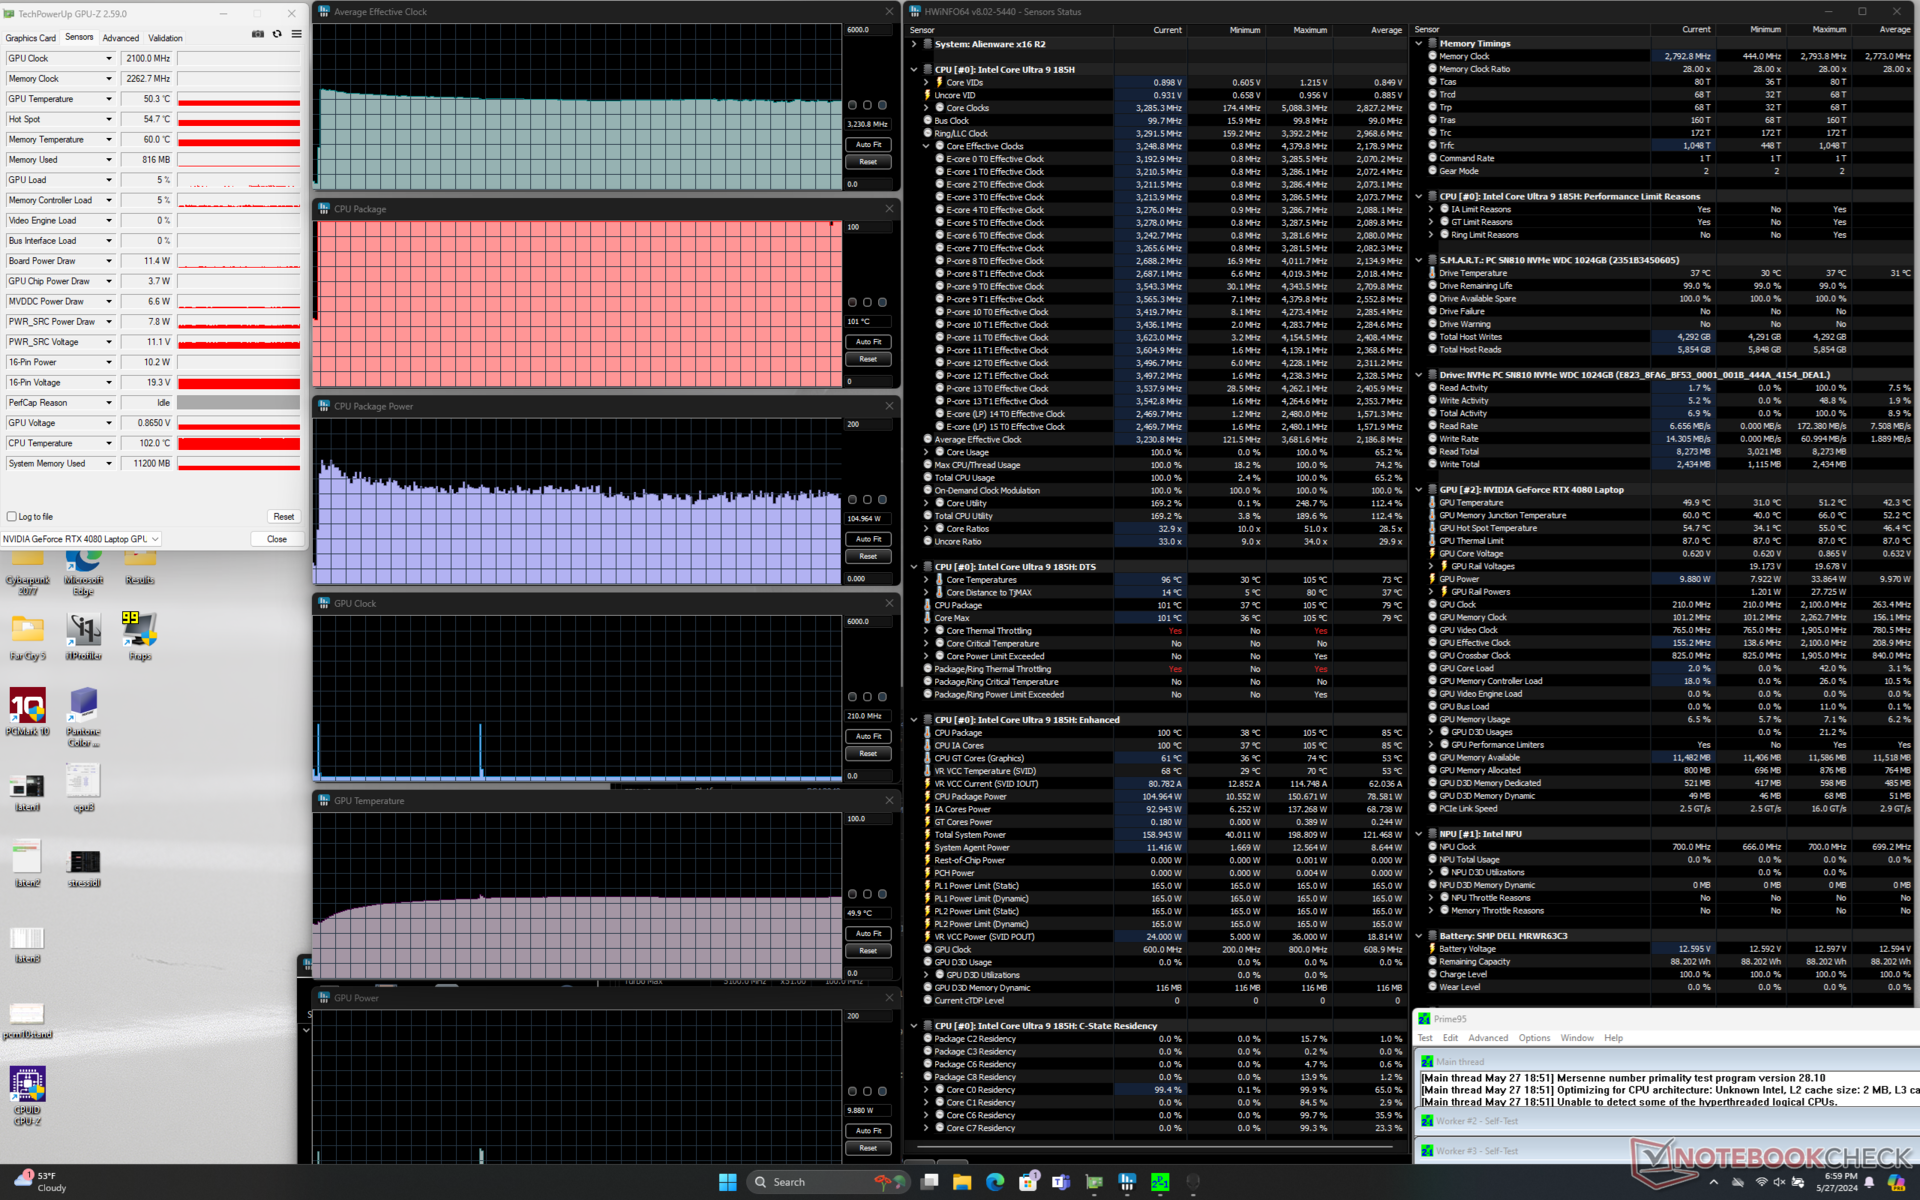
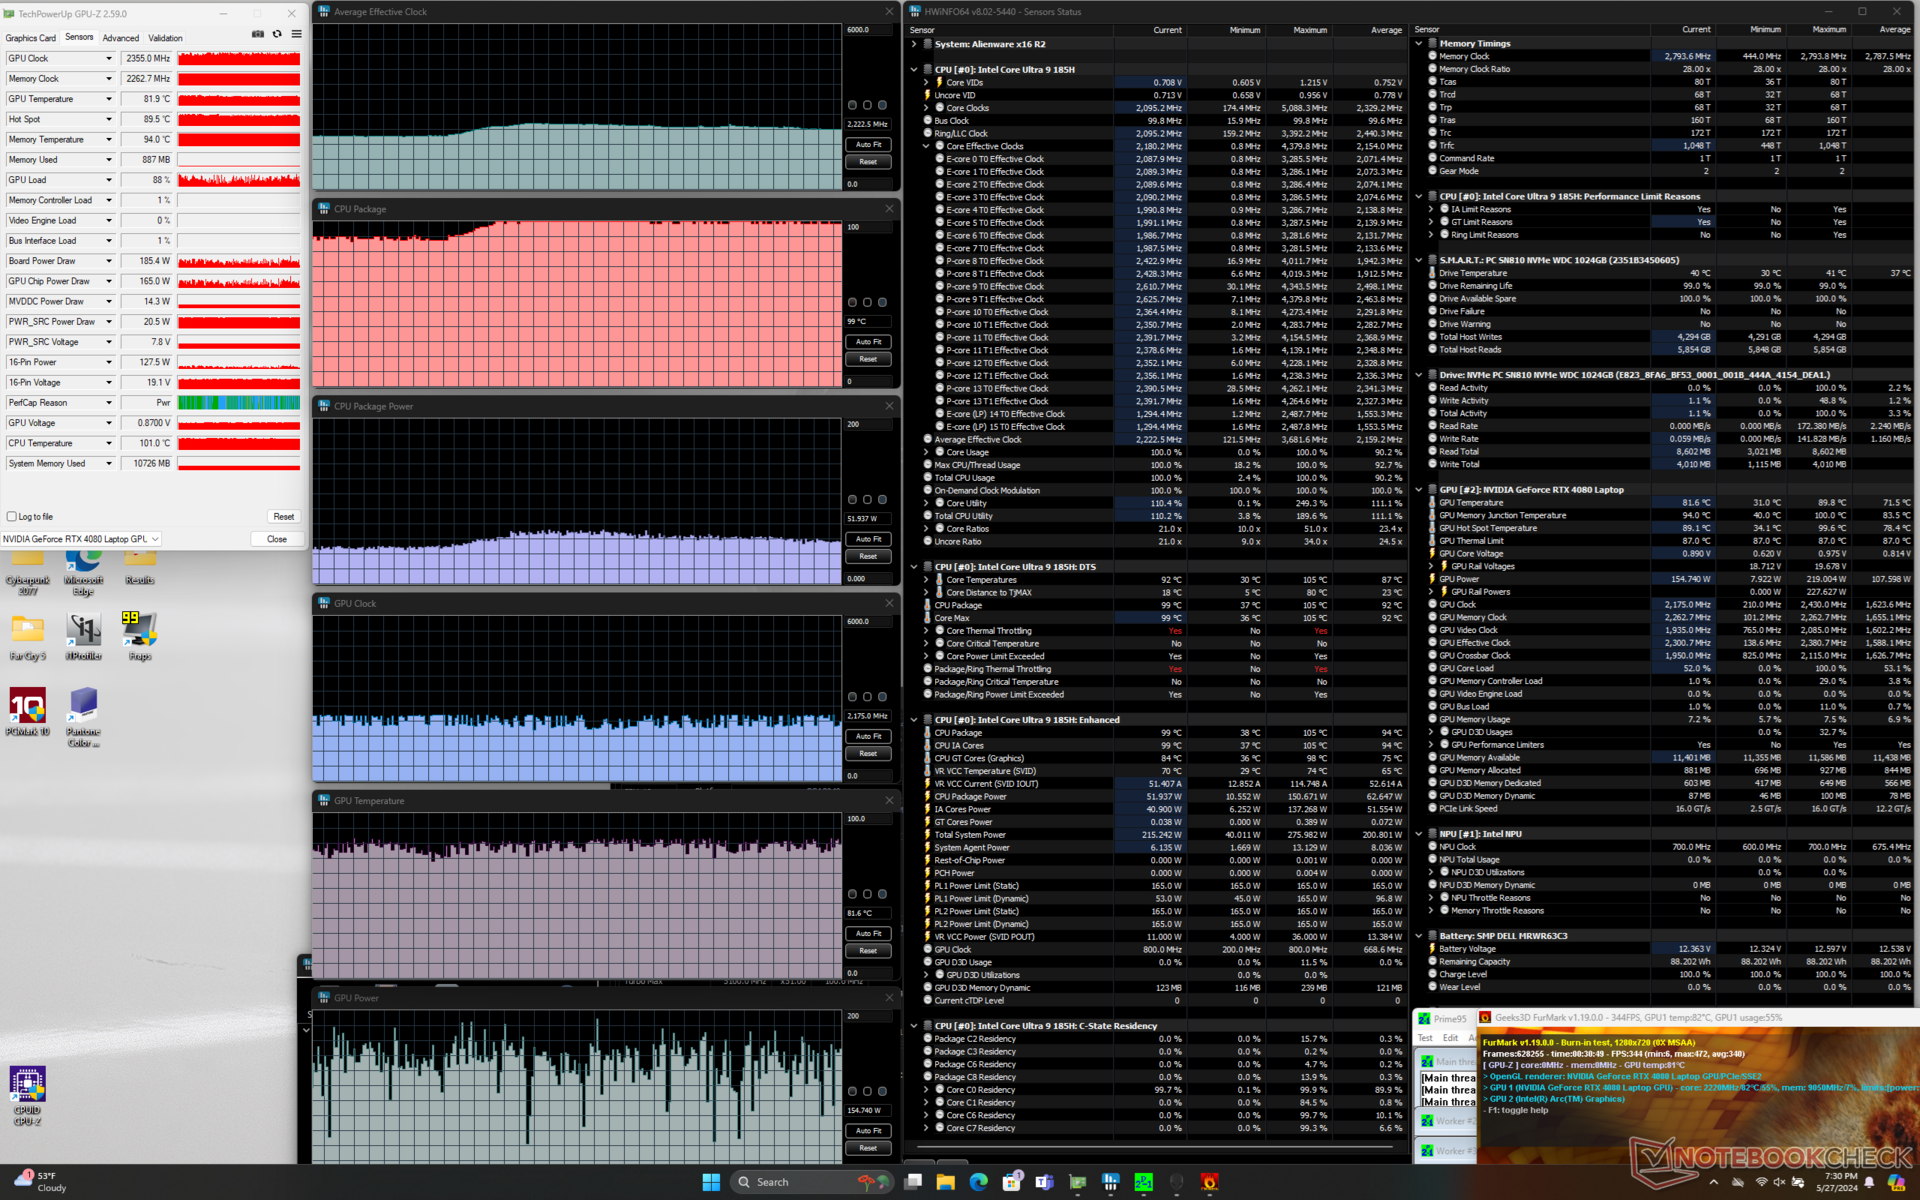
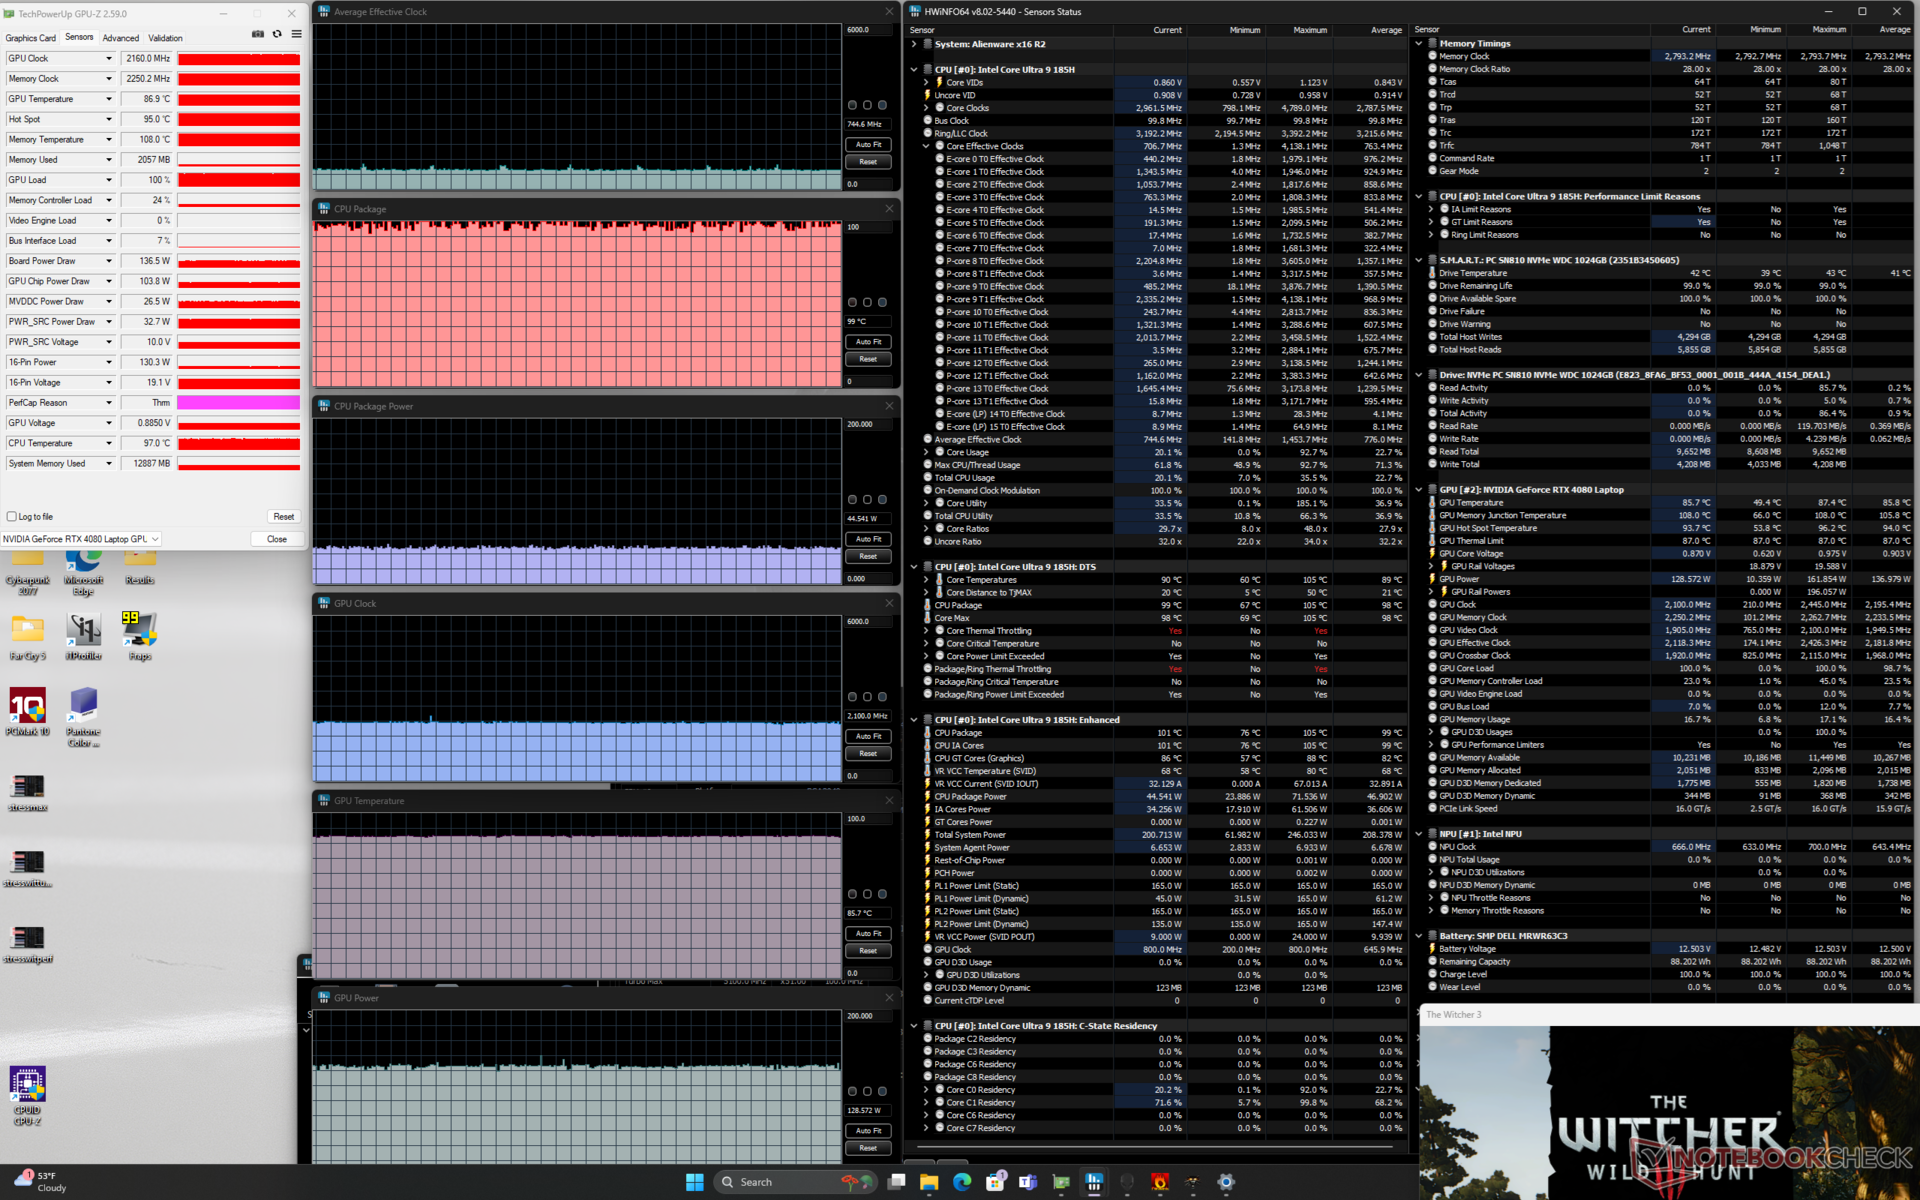
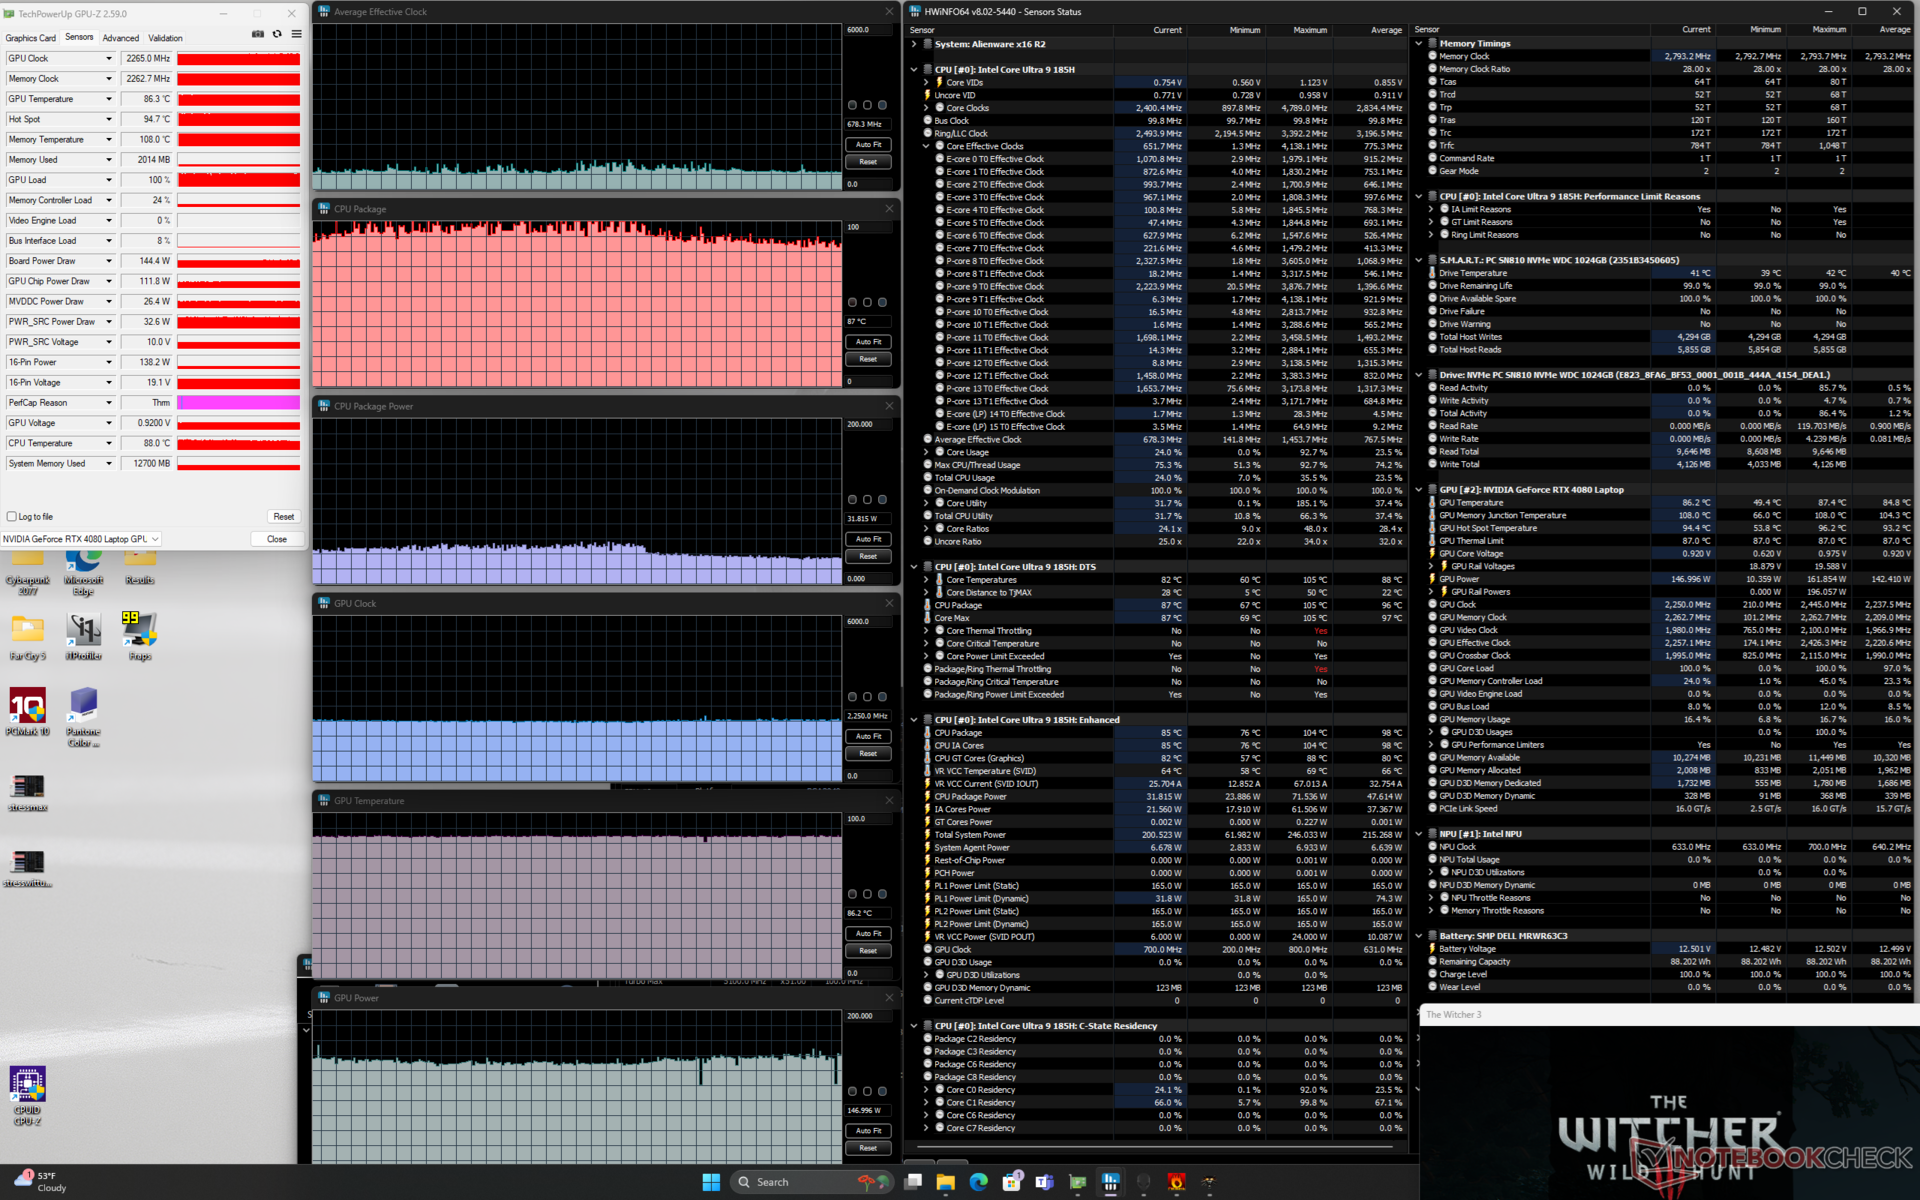
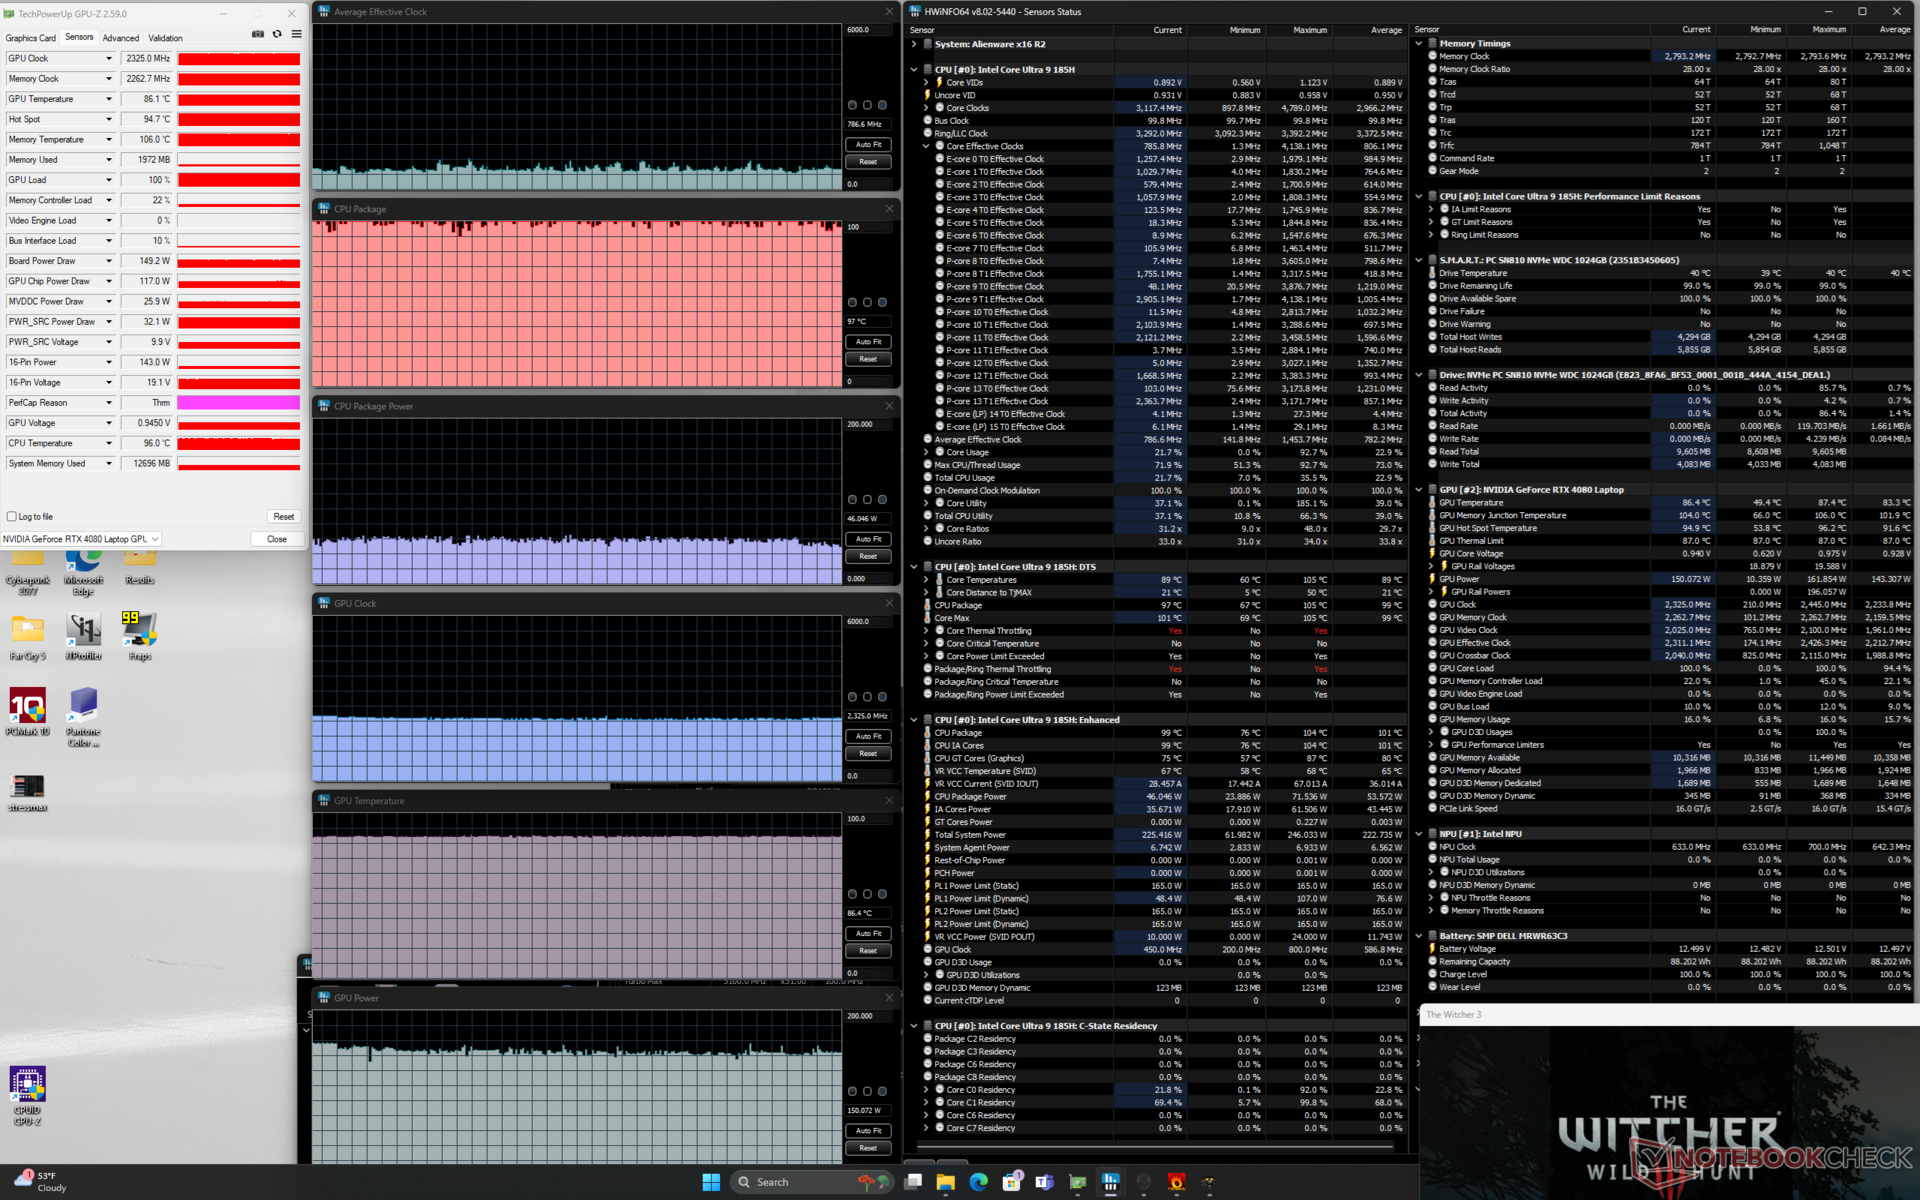
| Ortalama CPU Saati (GHz) | GPU Saati (MHz) | Ortalama CPU Sıcaklığı (°C) | Ortalama GPU Sıcaklığı (°C) | |
| Sistem Boşta | -- | -- | 38 | 31 |
| Prime95 Stres | 3.2 | -- | 101 | 50 |
| Prime95 + FurMark Stres | 2.2 | 2175 | 99 | 82 |
| Witcher 3 Stres (Dengeli mod) | 0,7 | 2100 | 99 | 86 |
| Witcher 3 Stres (Performans modu) | 0,7 | 2250 | 87 | 86 |
| Witcher 3 Stres (Overdrive modu) | 0.8 | 2325 | 97 | 86 |
Sistem Performansı
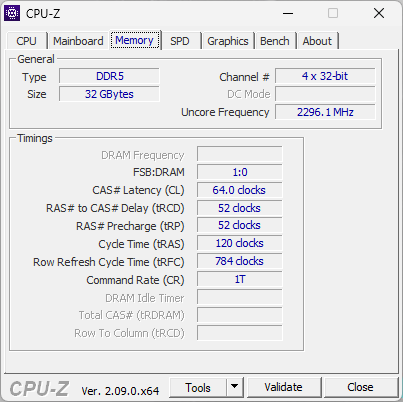
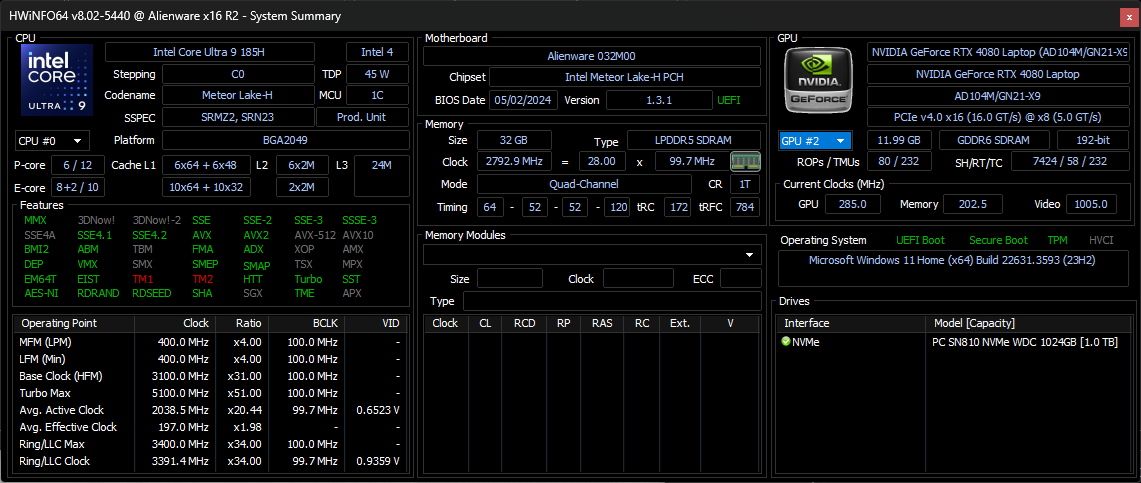
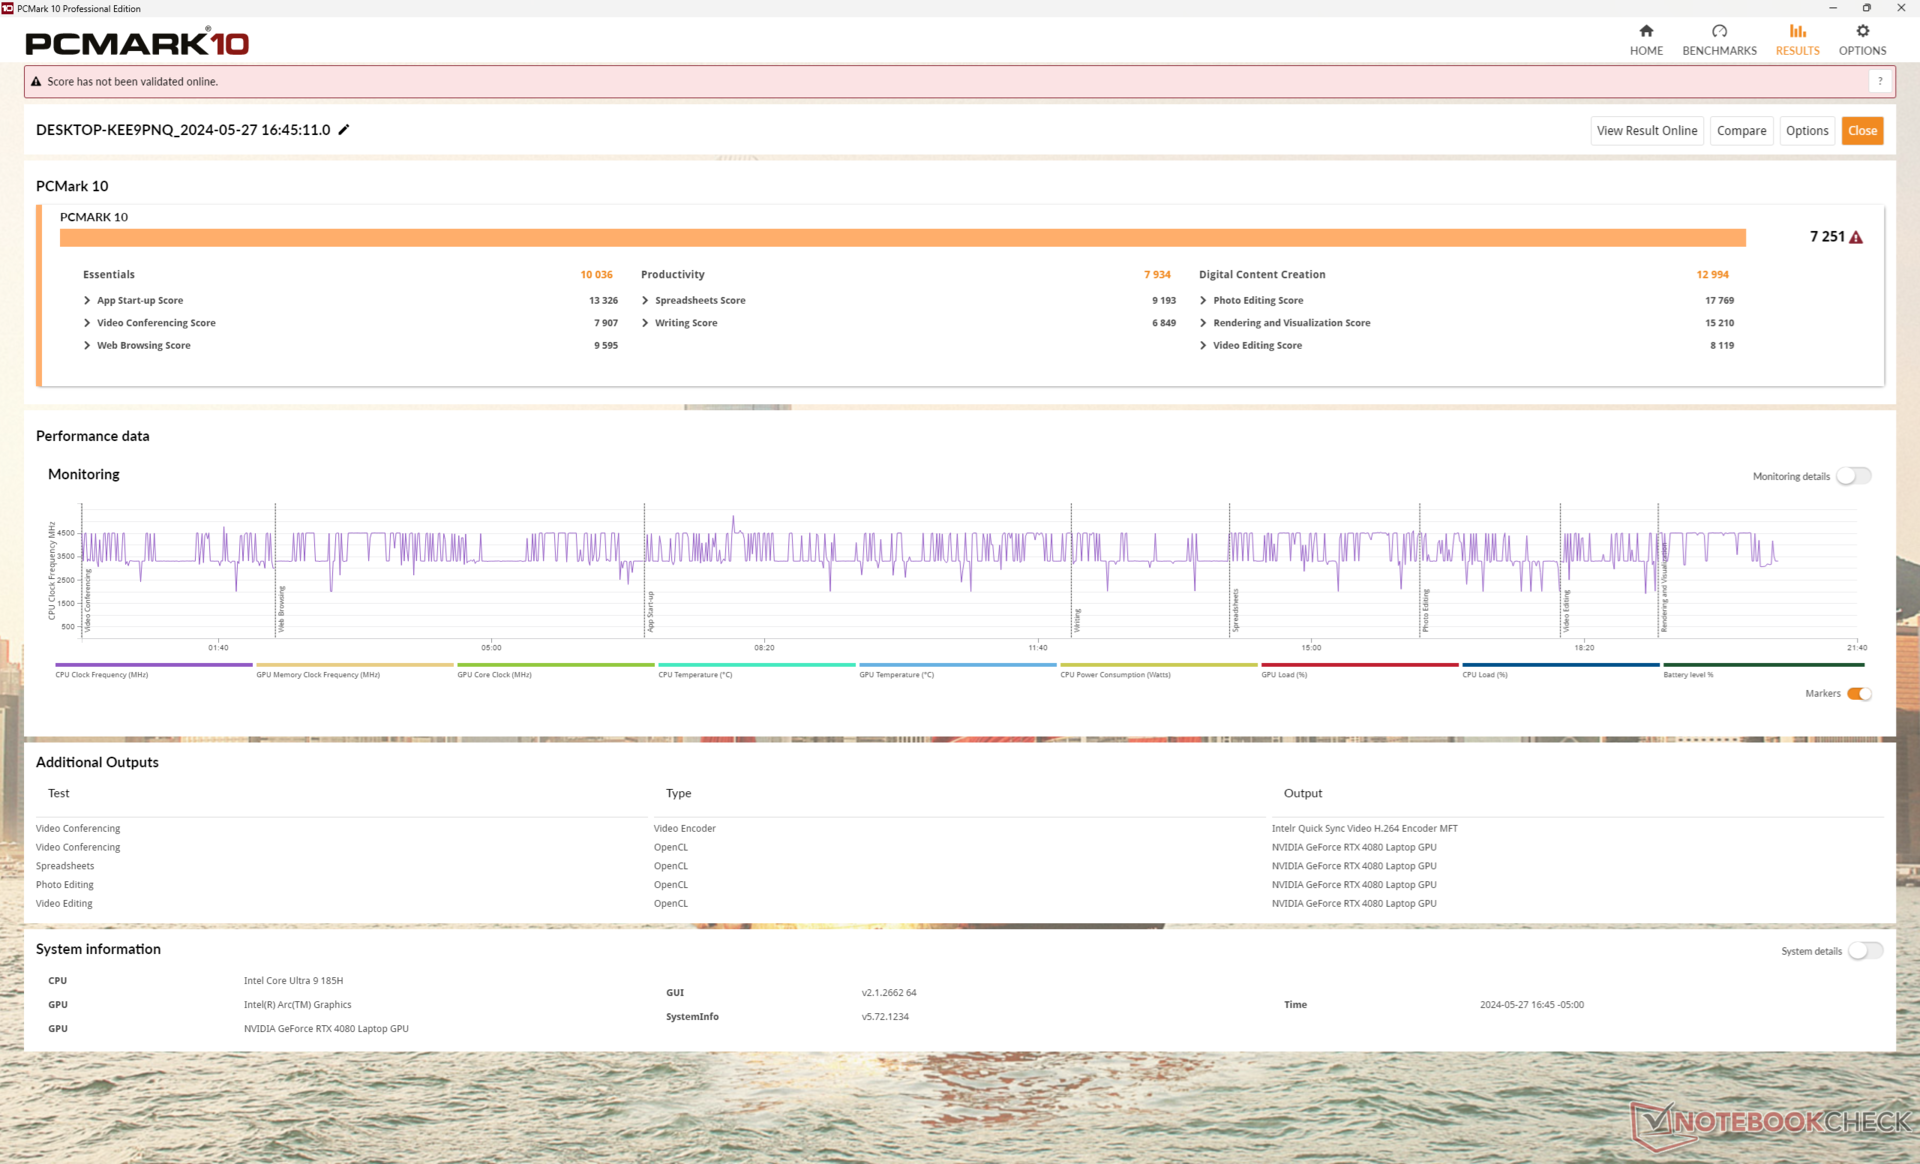
PCMark sonuçları öncekinden daha düşük olmasa da hemen hemen aynı. Bu arada, RAM bu yıl biraz daha hızlı (7467 MT/s'ye karşı 6000 MT/s) ve AIDA64 kopyalama/okuma sonuçları biraz daha yüksek ancak yazma ve gecikme sonuçları daha yavaş.
CrossMark: Overall | Productivity | Creativity | Responsiveness
WebXPRT 3: Overall
WebXPRT 4: Overall
Mozilla Kraken 1.1: Total
| PCMark 10 / Score | |
| Lenovo Legion Pro 7 16IRX9H | |
| MSI Vector 16 HX A14V | |
| Alienware x16 R1 | |
| Alienware m16 R2 | |
| Asus ROG Strix Scar 16 G634JZR | |
| Alienware x16 R2 P120F | |
| Ortalama Intel Core Ultra 9 185H, NVIDIA GeForce RTX 4080 Laptop GPU (n=1) | |
| PCMark 10 / Essentials | |
| Lenovo Legion Pro 7 16IRX9H | |
| Asus ROG Strix Scar 16 G634JZR | |
| MSI Vector 16 HX A14V | |
| Alienware x16 R1 | |
| Alienware m16 R2 | |
| Alienware x16 R2 P120F | |
| Ortalama Intel Core Ultra 9 185H, NVIDIA GeForce RTX 4080 Laptop GPU (n=1) | |
| PCMark 10 / Productivity | |
| Lenovo Legion Pro 7 16IRX9H | |
| Alienware x16 R1 | |
| MSI Vector 16 HX A14V | |
| Alienware m16 R2 | |
| Alienware x16 R2 P120F | |
| Ortalama Intel Core Ultra 9 185H, NVIDIA GeForce RTX 4080 Laptop GPU (n=1) | |
| Asus ROG Strix Scar 16 G634JZR | |
| PCMark 10 / Digital Content Creation | |
| Asus ROG Strix Scar 16 G634JZR | |
| MSI Vector 16 HX A14V | |
| Lenovo Legion Pro 7 16IRX9H | |
| Alienware x16 R1 | |
| Alienware m16 R2 | |
| Alienware x16 R2 P120F | |
| Ortalama Intel Core Ultra 9 185H, NVIDIA GeForce RTX 4080 Laptop GPU (n=1) | |
| CrossMark / Overall | |
| Lenovo Legion Pro 7 16IRX9H | |
| MSI Vector 16 HX A14V | |
| Asus ROG Strix Scar 16 G634JZR | |
| Alienware x16 R1 | |
| Alienware m16 R2 | |
| Alienware x16 R2 P120F | |
| Ortalama Intel Core Ultra 9 185H, NVIDIA GeForce RTX 4080 Laptop GPU (n=1) | |
| CrossMark / Productivity | |
| Lenovo Legion Pro 7 16IRX9H | |
| MSI Vector 16 HX A14V | |
| Asus ROG Strix Scar 16 G634JZR | |
| Alienware x16 R1 | |
| Alienware m16 R2 | |
| Alienware x16 R2 P120F | |
| Ortalama Intel Core Ultra 9 185H, NVIDIA GeForce RTX 4080 Laptop GPU (n=1) | |
| CrossMark / Creativity | |
| Lenovo Legion Pro 7 16IRX9H | |
| MSI Vector 16 HX A14V | |
| Asus ROG Strix Scar 16 G634JZR | |
| Alienware x16 R1 | |
| Alienware m16 R2 | |
| Alienware x16 R2 P120F | |
| Ortalama Intel Core Ultra 9 185H, NVIDIA GeForce RTX 4080 Laptop GPU (n=1) | |
| CrossMark / Responsiveness | |
| Lenovo Legion Pro 7 16IRX9H | |
| MSI Vector 16 HX A14V | |
| Alienware x16 R1 | |
| Asus ROG Strix Scar 16 G634JZR | |
| Alienware x16 R2 P120F | |
| Ortalama Intel Core Ultra 9 185H, NVIDIA GeForce RTX 4080 Laptop GPU (n=1) | |
| Alienware m16 R2 | |
| WebXPRT 3 / Overall | |
| Lenovo Legion Pro 7 16IRX9H | |
| MSI Vector 16 HX A14V | |
| Asus ROG Strix Scar 16 G634JZR | |
| Alienware x16 R1 | |
| Alienware m16 R2 | |
| Alienware x16 R2 P120F | |
| Ortalama Intel Core Ultra 9 185H, NVIDIA GeForce RTX 4080 Laptop GPU (n=1) | |
| WebXPRT 4 / Overall | |
| Lenovo Legion Pro 7 16IRX9H | |
| Asus ROG Strix Scar 16 G634JZR | |
| MSI Vector 16 HX A14V | |
| Alienware x16 R1 | |
| Alienware m16 R2 | |
| Alienware x16 R2 P120F | |
| Ortalama Intel Core Ultra 9 185H, NVIDIA GeForce RTX 4080 Laptop GPU (n=1) | |
| Mozilla Kraken 1.1 / Total | |
| Alienware x16 R2 P120F | |
| Ortalama Intel Core Ultra 9 185H, NVIDIA GeForce RTX 4080 Laptop GPU (n=1) | |
| Alienware m16 R2 | |
| Alienware x16 R1 | |
| MSI Vector 16 HX A14V | |
| Asus ROG Strix Scar 16 G634JZR | |
| Lenovo Legion Pro 7 16IRX9H | |
* ... daha küçük daha iyidir
| PCMark 10 Score | 7251 puan | |
Yardım | ||
| AIDA64 / Memory Copy | |
| Alienware x16 R2 P120F | |
| Ortalama Intel Core Ultra 9 185H (69929 - 95718, n=20) | |
| Asus ROG Strix Scar 16 G634JZR | |
| Lenovo Legion Pro 7 16IRX9H | |
| MSI Vector 16 HX A14V | |
| Alienware x16 R1 | |
| Alienware m16 R2 | |
| AIDA64 / Memory Read | |
| Asus ROG Strix Scar 16 G634JZR | |
| Lenovo Legion Pro 7 16IRX9H | |
| MSI Vector 16 HX A14V | |
| Alienware x16 R2 P120F | |
| Ortalama Intel Core Ultra 9 185H (64619 - 87768, n=20) | |
| Alienware m16 R2 | |
| Alienware x16 R1 | |
| AIDA64 / Memory Write | |
| Alienware x16 R1 | |
| Asus ROG Strix Scar 16 G634JZR | |
| MSI Vector 16 HX A14V | |
| Alienware x16 R2 P120F | |
| Ortalama Intel Core Ultra 9 185H (51114 - 93871, n=20) | |
| Lenovo Legion Pro 7 16IRX9H | |
| Alienware m16 R2 | |
| AIDA64 / Memory Latency | |
| Ortalama Intel Core Ultra 9 185H (121.4 - 259, n=20) | |
| Alienware x16 R2 P120F | |
| Alienware m16 R2 | |
| Alienware x16 R1 | |
| MSI Vector 16 HX A14V | |
| Asus ROG Strix Scar 16 G634JZR | |
| Lenovo Legion Pro 7 16IRX9H | |
* ... daha küçük daha iyidir
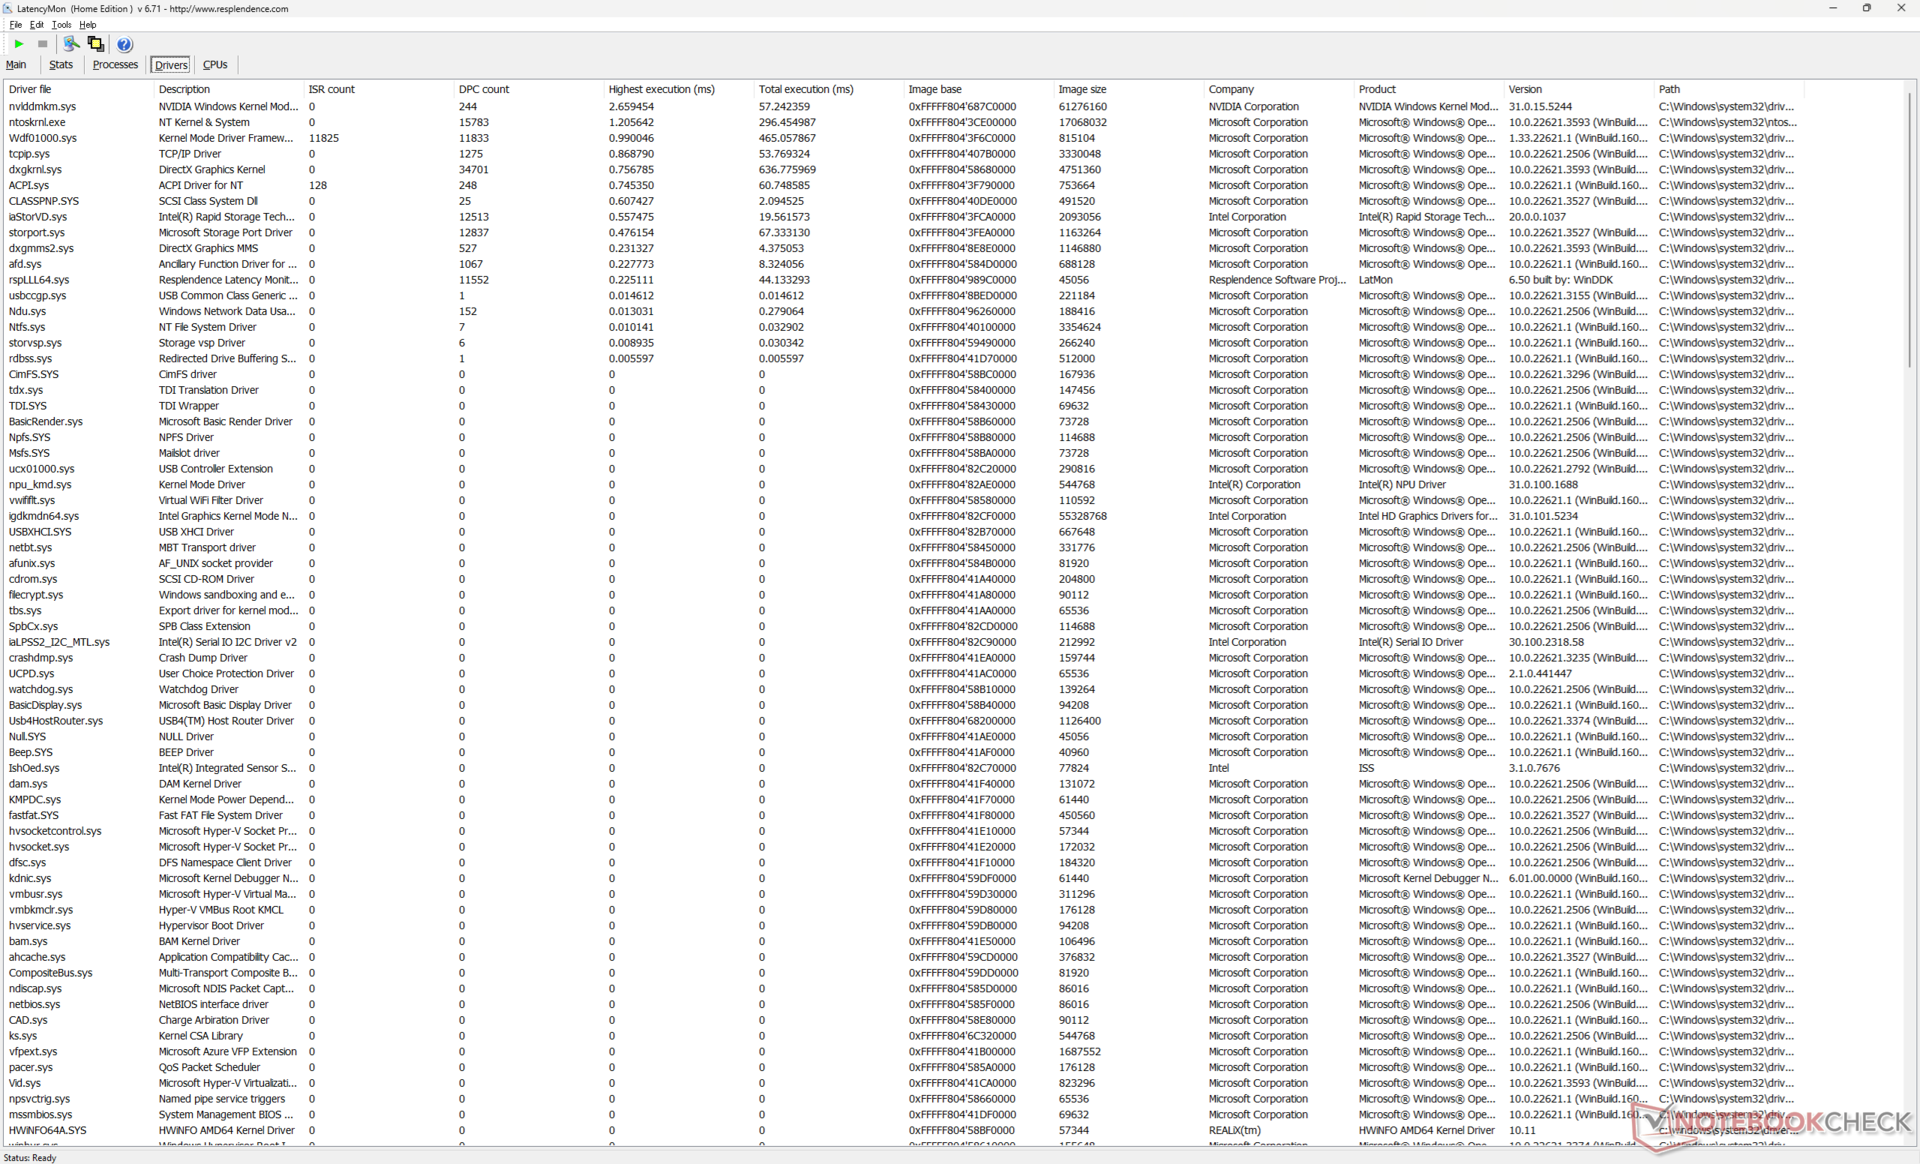
DPC Gecikme Süresi
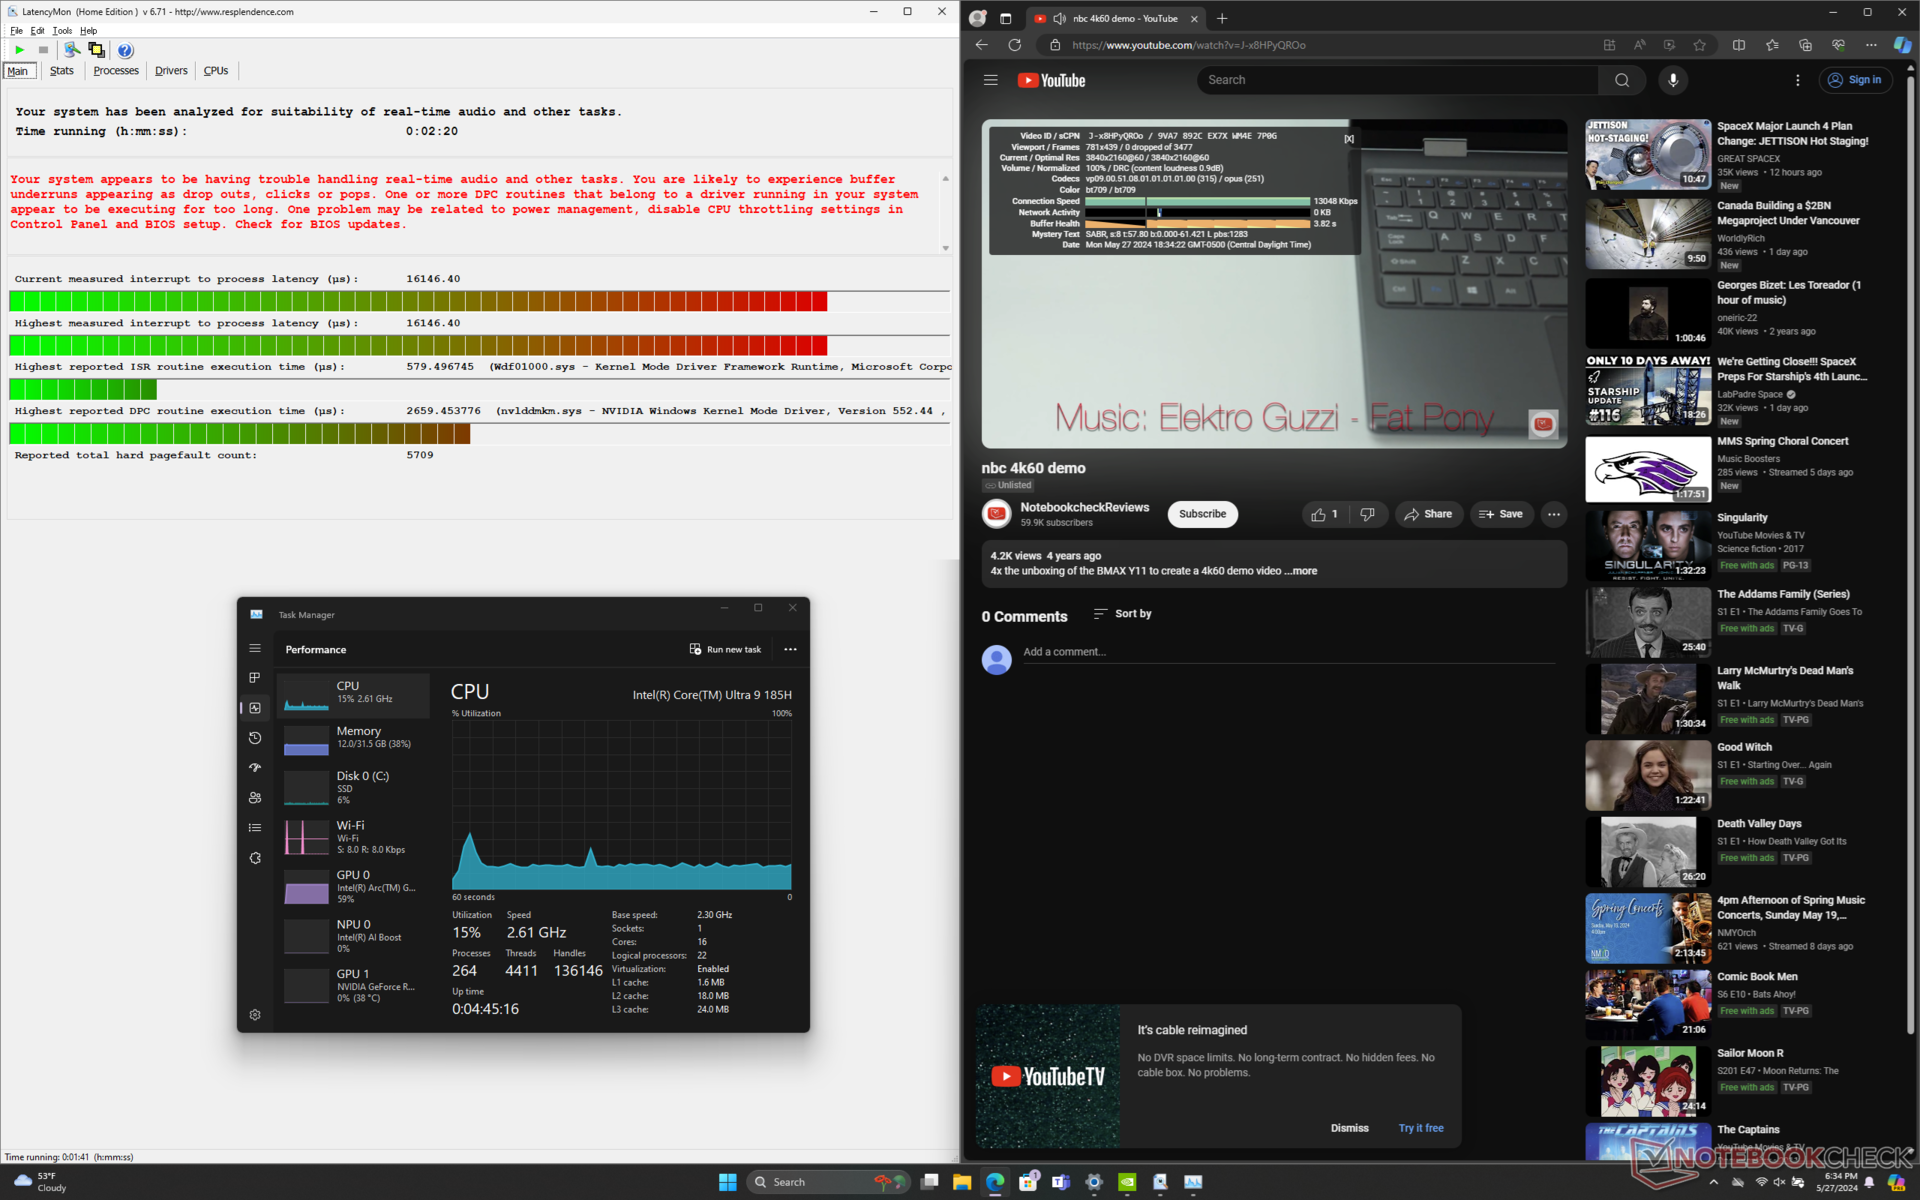
LatencyMon, Optimus modunda birden fazla yeniden denemeden sonra bile ana sayfamızın birden fazla tarayıcı sekmesini açarken kayda değer DPC sorunları ortaya koyuyor. Orijinal x16 R1'de böyle bir sorunla karşılaşmadık. 60 FPS'de 4K video oynatma, kaydedilen hiçbir kare düşmesi olmadan mükemmeldir.
| DPC Latencies / LatencyMon - interrupt to process latency (max), Web, Youtube, Prime95 | |
| Alienware x16 R2 P120F | |
| Asus ROG Strix Scar 16 G634JZR | |
| Alienware m16 R2 | |
| MSI Vector 16 HX A14V | |
| Alienware x16 R1 | |
| Lenovo Legion Pro 7 16IRX9H | |
* ... daha küçük daha iyidir
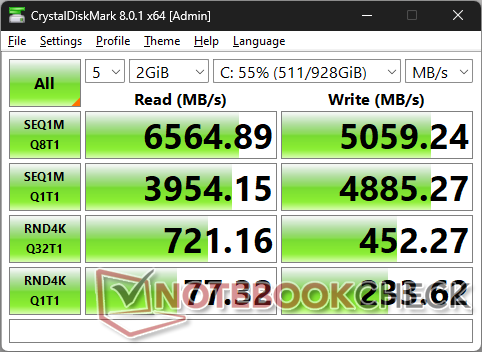
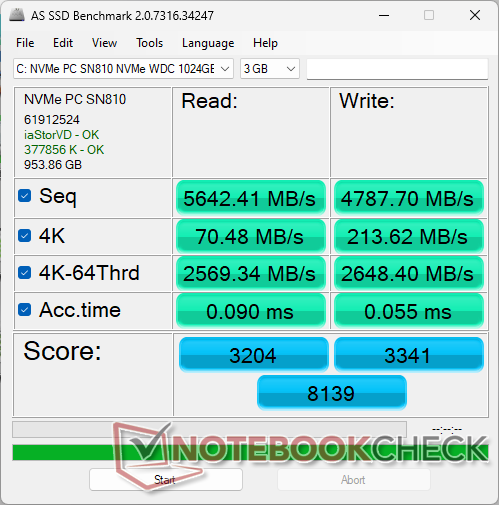
Depolama Cihazları
Test ünitemiz aşağıdakilerle birlikte gönderilir WDC PC SN810 geçen yılın modelindeki SK Hynix PC801 yerine. Western Digital sürücü, aşağıdaki DiskSpd döngü grafiğimizde gösterildiği gibi maksimum aktarım hızlarını SK Hynix'ten daha uzun süre koruyabilir, ancak yazma hızları genellikle daha yavaştır.

| Drive Performance rating - Percent | |
| Lenovo Legion Pro 7 16IRX9H | |
| Alienware x16 R1 | |
| Alienware x16 R2 P120F | |
| Alienware m16 R2 | |
| Asus ROG Strix Scar 16 G634JZR | |
| MSI Vector 16 HX A14V | |
* ... daha küçük daha iyidir
Disk Throttling: DiskSpd Read Loop, Queue Depth 8
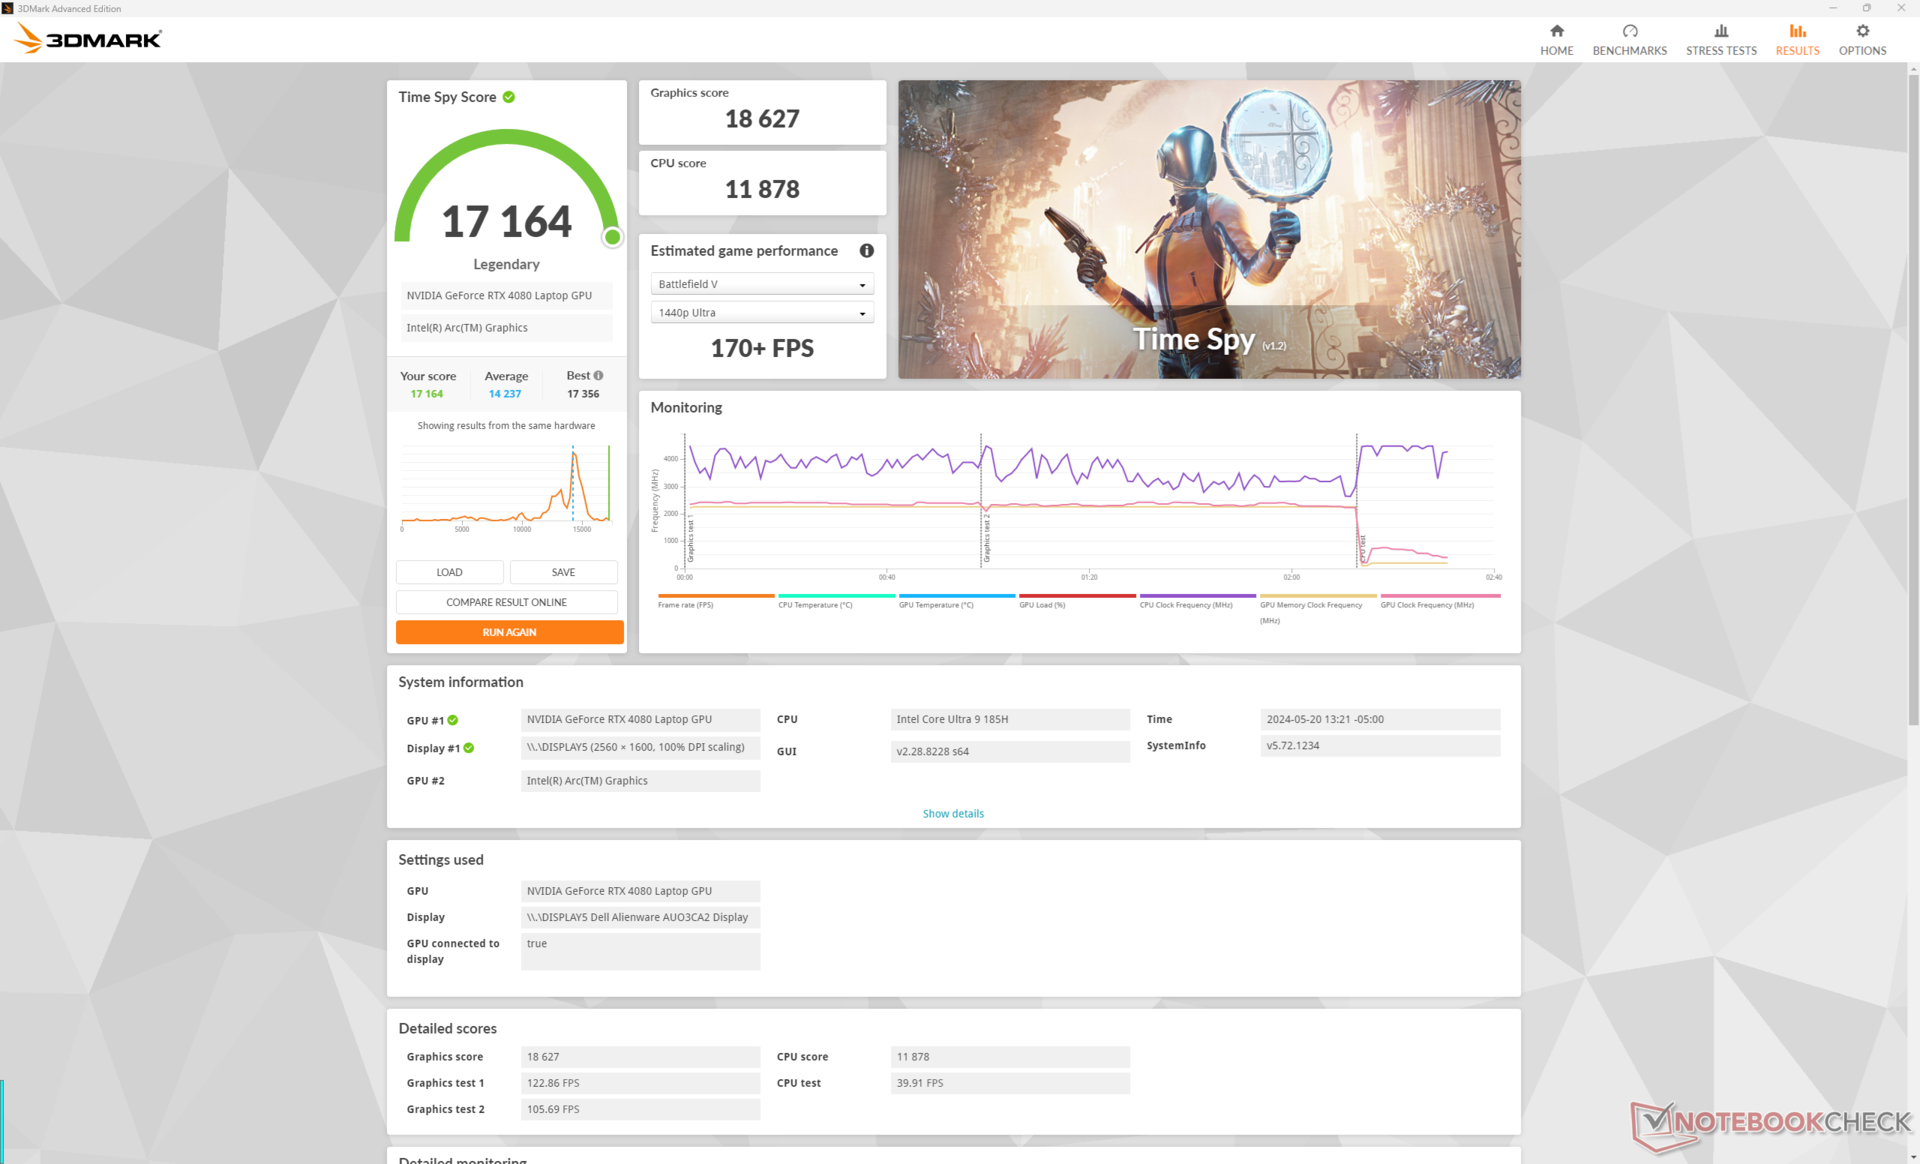
GPU Performansı
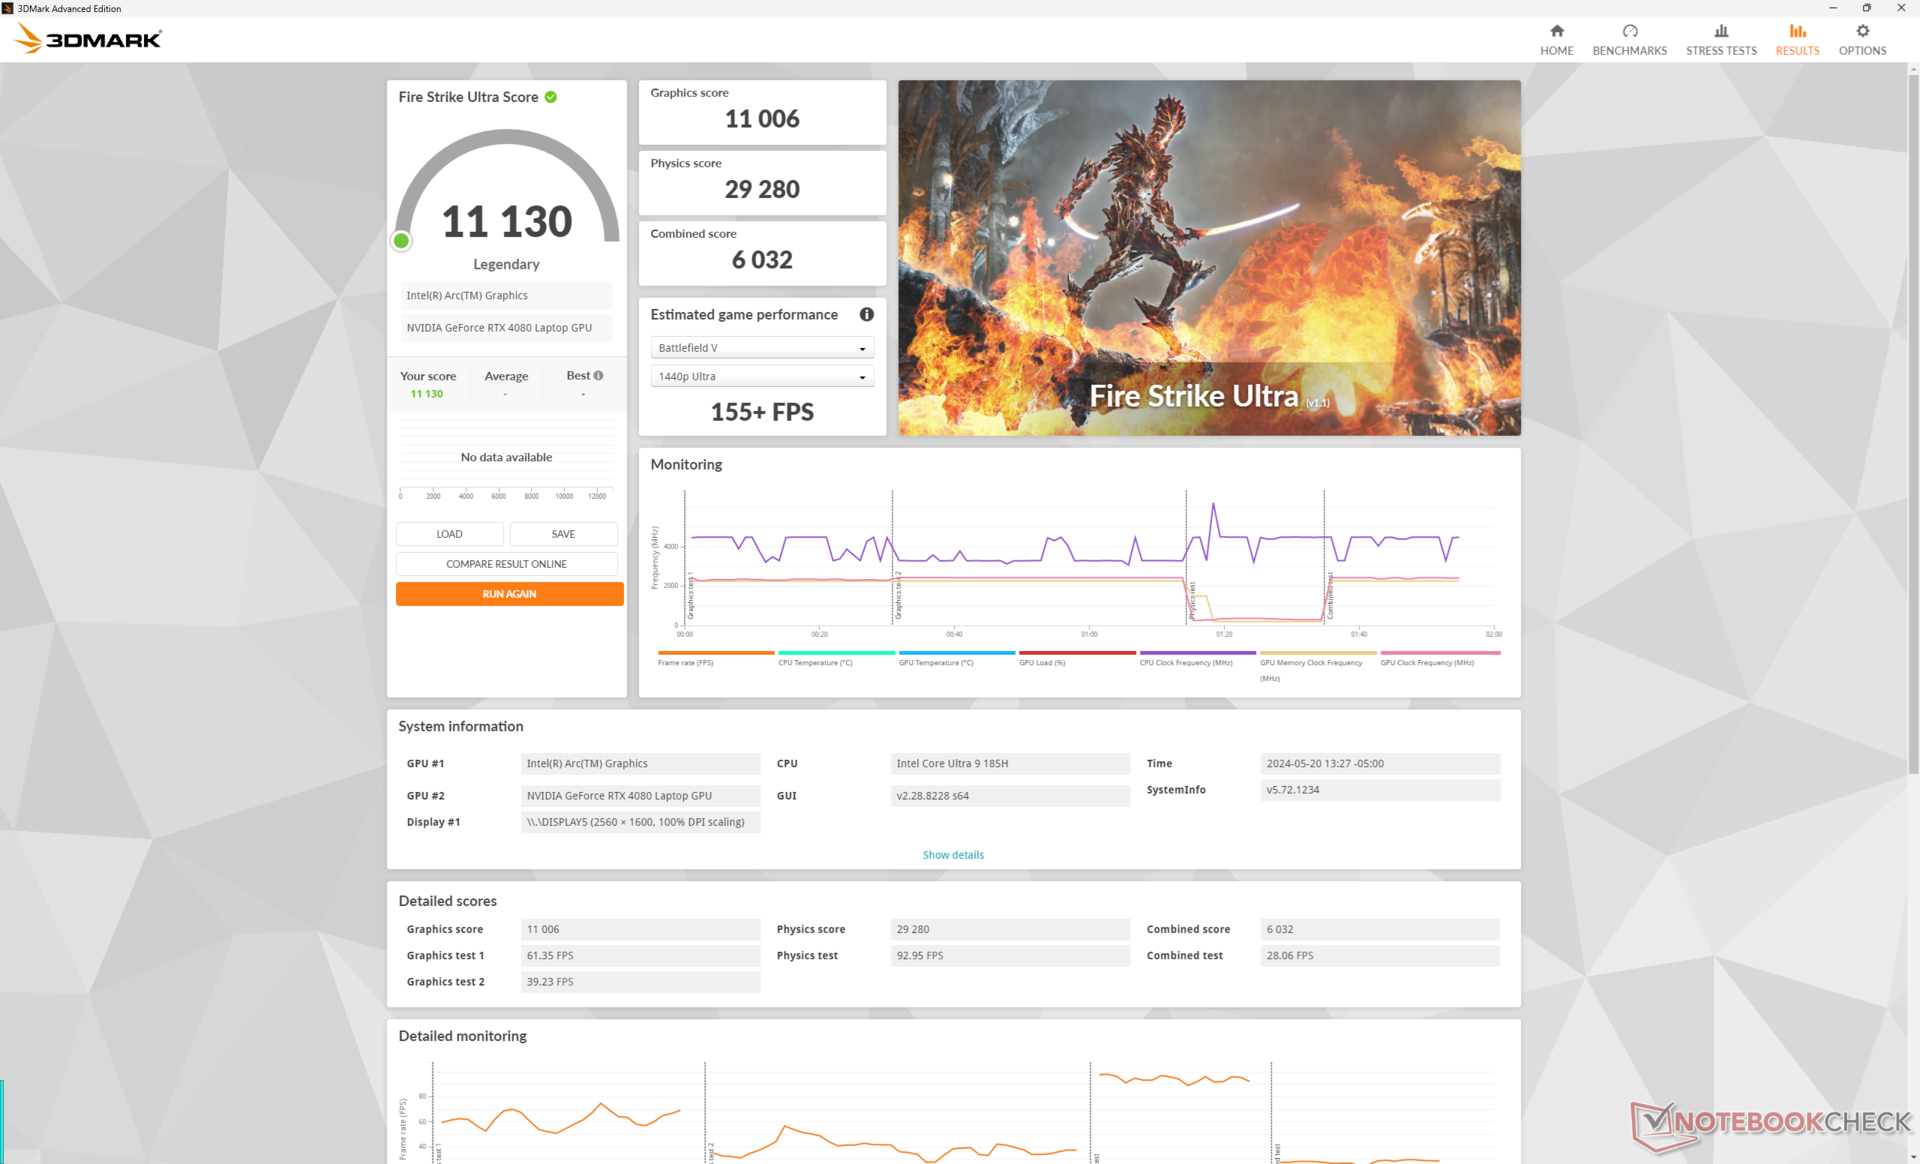
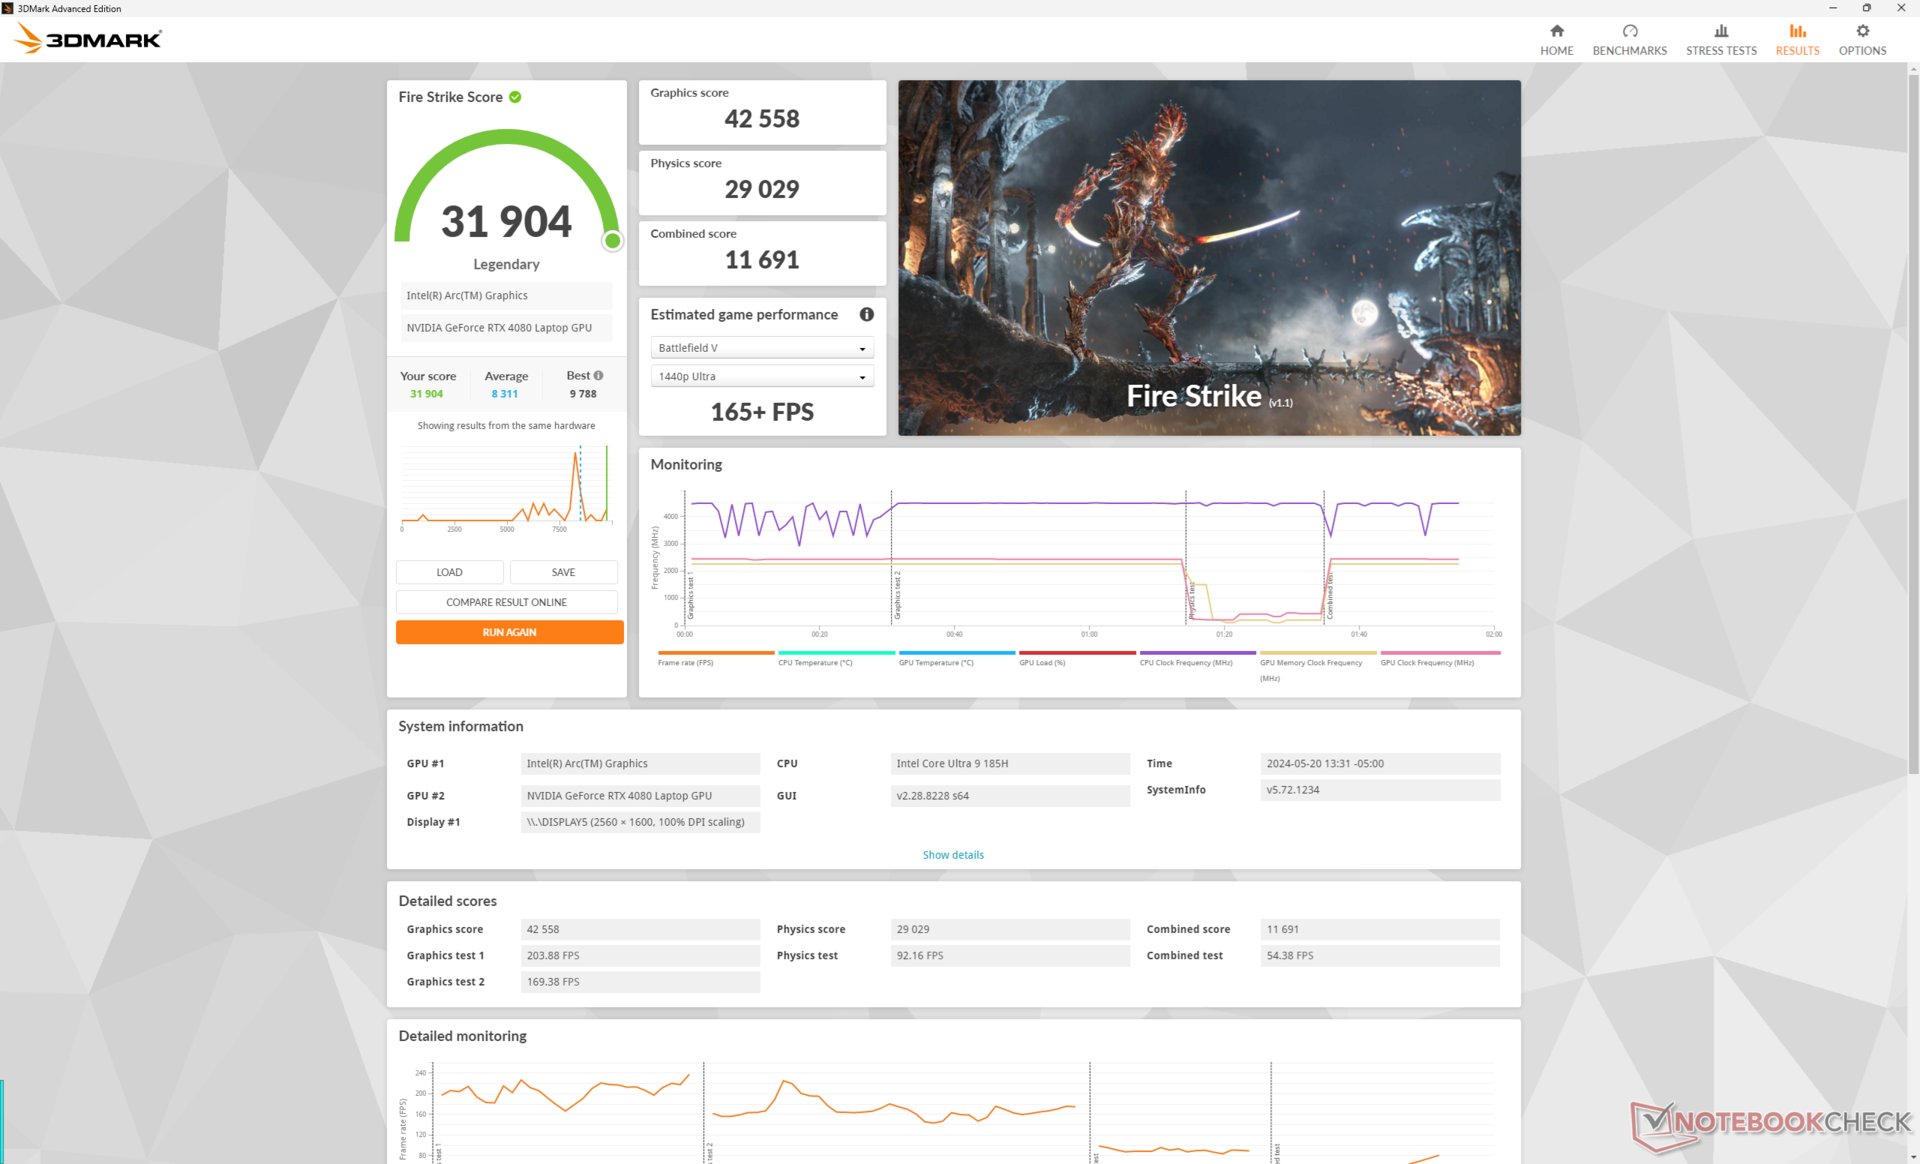
175 W mobil GeForce RTX 4080 GPU, x16 R1'de kaydettiğimizden yaklaşık yüzde 5 daha yavaş 3DMark skorlarına rağmen aynı kalıyor. Yükseltme RTX 4090 yapılandırmasının performansı sadece yüzde 5 ila 15 oranında artırması beklenirken RTX 4070 veya 4060 performansı sırasıyla yüzde 30 ve yüzde 45'e varan oranlarda düşürecektir.
| Güç Profili | Grafik Puanı | Fizik Puanı | Birleşik Puan |
| Overdrive Modu | 42558 | 29029 | 11691 |
| Performans Modu | 40773 (-4%) | 26070 (-10%) | 12450 (-7%) |
| Dengeli Mod | 40593 (-5%) | 26746 (-8%) | 12237 (-5%) |
| Akü Gücü | 21754 (-49%) | 25880 (-11%) | 9863 (-16%) |
Sistemi Overdrive modu yerine Performans modunda çalıştırmak, yukarıdaki Fire Strike sonuç tablomuzda gösterildiği gibi genel performansı biraz etkileyecektir. İlginç bir şekilde, Performans ve Dengeli modlar arasındaki fark nispeten çok daha küçüktür.

| 3DMark Performance rating - Percent | |
| KFA2 GeForce RTX 4080 SG | |
| Lenovo Legion Pro 7 RTX4090 -1! | |
| Alienware x16 R1 | |
| Alienware m16 R1 AMD | |
| Alienware x16 R2 P120F | |
| Ortalama NVIDIA GeForce RTX 4080 Laptop GPU | |
| Lenovo Legion 7 16IAX7-82TD004SGE -2! | |
| Alienware m16 R2 | |
| MSI Stealth 16 Mercedes-AMG Motorsport A13VG -2! | |
| MSI Raider GE68HX 13VF | |
| Framework Laptop 16 | |
| Lenovo Legion S7 16ARHA7 -1! | |
| Asus ROG Zephyrus M16 GU603H -2! | |
| 3DMark 11 - 1280x720 Performance GPU | |
| KFA2 GeForce RTX 4080 SG | |
| Lenovo Legion Pro 7 RTX4090 | |
| Alienware x16 R1 | |
| Ortalama NVIDIA GeForce RTX 4080 Laptop GPU (45199 - 63128, n=24) | |
| Alienware x16 R2 P120F | |
| Alienware m16 R1 AMD | |
| Lenovo Legion 7 16IAX7-82TD004SGE | |
| Alienware m16 R2 | |
| Framework Laptop 16 | |
| MSI Raider GE68HX 13VF | |
| Lenovo Legion S7 16ARHA7 | |
| Asus ROG Zephyrus M16 GU603H | |
| 3DMark 11 Performance | 40504 puan | |
| 3DMark Fire Strike Score | 31904 puan | |
| 3DMark Time Spy Score | 17164 puan | |
Yardım | ||
| Blender | |
| v3.3 Classroom HIP/AMD | |
| Lenovo Legion S7 16ARHA7 | |
| v3.3 Classroom OPTIX/RTX | |
| Lenovo Legion 7 16IAX7-82TD004SGE | |
| MSI Stealth 16 Mercedes-AMG Motorsport A13VG | |
| MSI Raider GE68HX 13VF | |
| Alienware m16 R2 | |
| Alienware m16 R1 AMD | |
| Ortalama NVIDIA GeForce RTX 4080 Laptop GPU (13 - 20, n=22) | |
| Alienware x16 R1 | |
| Alienware x16 R2 P120F | |
| Lenovo Legion Pro 7 RTX4090 | |
| KFA2 GeForce RTX 4080 SG | |
| v3.3 Classroom CUDA | |
| MSI Raider GE68HX 13VF | |
| Lenovo Legion 7 16IAX7-82TD004SGE | |
| MSI Stealth 16 Mercedes-AMG Motorsport A13VG | |
| Alienware m16 R2 | |
| Alienware m16 R1 AMD | |
| Ortalama NVIDIA GeForce RTX 4080 Laptop GPU (21 - 28, n=23) | |
| Alienware x16 R2 P120F | |
| Alienware x16 R1 | |
| Lenovo Legion Pro 7 RTX4090 | |
| v3.3 Classroom CPU | |
| MSI Stealth 16 Mercedes-AMG Motorsport A13VG | |
| Lenovo Legion S7 16ARHA7 | |
| Framework Laptop 16 | |
| Alienware x16 R2 P120F | |
| Alienware m16 R2 | |
| Alienware x16 R1 | |
| Lenovo Legion 7 16IAX7-82TD004SGE | |
| Ortalama NVIDIA GeForce RTX 4080 Laptop GPU (177 - 337, n=23) | |
| Lenovo Legion Pro 7 RTX4090 | |
| MSI Raider GE68HX 13VF | |
| Alienware m16 R1 AMD | |
* ... daha küçük daha iyidir
Oyun Performansı
Hayal kırıklığı yaratan bir şekilde, oyunlardaki performans sürekli olarak x16 R1'de kaydettiğimizden yaklaşık yüzde 5 ila 15 oranında daha yavaş olacaktır. Daha geniş deltalar daha düşük çözünürlüklerde meydana gelirken, daha küçük deltalar daha yüksek çözünürlüklerde meydana gelir ve bu da yukarıda belirtilen Core i9-14900HK ile karşılaştırıldığında daha yavaş ham CPU performansı sonuçlarıyla tutarlıdır.
| Performance rating - Percent | |
| KFA2 GeForce RTX 4080 SG | |
| Lenovo Legion Pro 7 RTX4090 -1! | |
| Alienware m16 R1 AMD | |
| Alienware x16 R1 -1! | |
| MSI Raider GE68HX 13VF | |
| Alienware x16 R2 P120F | |
| Lenovo Legion 7 16IAX7-82TD004SGE | |
| Alienware m16 R2 | |
| MSI Stealth 16 Mercedes-AMG Motorsport A13VG -1! | |
| Asus ROG Zephyrus M16 GU603H | |
| Framework Laptop 16 | |
| Lenovo Legion S7 16ARHA7 -1! | |
| The Witcher 3 - 1920x1080 Ultra Graphics & Postprocessing (HBAO+) | |
| KFA2 GeForce RTX 4080 SG | |
| Lenovo Legion Pro 7 RTX4090 | |
| Alienware m16 R1 AMD | |
| Alienware x16 R2 P120F | |
| Alienware x16 R1 | |
| Alienware m16 R2 | |
| Lenovo Legion 7 16IAX7-82TD004SGE | |
| MSI Stealth 16 Mercedes-AMG Motorsport A13VG | |
| MSI Raider GE68HX 13VF | |
| Lenovo Legion S7 16ARHA7 | |
| Asus ROG Zephyrus M16 GU603H | |
| Framework Laptop 16 | |
| Final Fantasy XV Benchmark - 1920x1080 High Quality | |
| KFA2 GeForce RTX 4080 SG | |
| Lenovo Legion Pro 7 RTX4090 | |
| Alienware m16 R1 AMD | |
| Alienware x16 R1 | |
| Alienware x16 R2 P120F | |
| Lenovo Legion 7 16IAX7-82TD004SGE | |
| Alienware m16 R2 | |
| MSI Raider GE68HX 13VF | |
| MSI Stealth 16 Mercedes-AMG Motorsport A13VG | |
| Lenovo Legion S7 16ARHA7 | |
| Framework Laptop 16 | |
| Asus ROG Zephyrus M16 GU603H | |
| Strange Brigade - 1920x1080 ultra AA:ultra AF:16 | |
| KFA2 GeForce RTX 4080 SG | |
| Alienware m16 R1 AMD | |
| Lenovo Legion Pro 7 RTX4090 | |
| Alienware x16 R1 | |
| Alienware x16 R2 P120F | |
| Alienware m16 R2 | |
| MSI Raider GE68HX 13VF | |
| MSI Stealth 16 Mercedes-AMG Motorsport A13VG | |
| Lenovo Legion S7 16ARHA7 | |
| Framework Laptop 16 | |
| Lenovo Legion 7 16IAX7-82TD004SGE | |
| Asus ROG Zephyrus M16 GU603H | |
| Dota 2 Reborn - 1920x1080 ultra (3/3) best looking | |
| KFA2 GeForce RTX 4080 SG | |
| MSI Raider GE68HX 13VF | |
| Lenovo Legion Pro 7 RTX4090 | |
| Lenovo Legion 7 16IAX7-82TD004SGE | |
| Alienware m16 R1 AMD | |
| Alienware x16 R1 | |
| Alienware m16 R2 | |
| Asus ROG Zephyrus M16 GU603H | |
| Framework Laptop 16 | |
| Alienware x16 R2 P120F | |
| MSI Stealth 16 Mercedes-AMG Motorsport A13VG | |
| Lenovo Legion S7 16ARHA7 | |
| X-Plane 11.11 - 1920x1080 high (fps_test=3) | |
| KFA2 GeForce RTX 4080 SG | |
| MSI Raider GE68HX 13VF | |
| Lenovo Legion Pro 7 RTX4090 | |
| Lenovo Legion 7 16IAX7-82TD004SGE | |
| Alienware m16 R1 AMD | |
| Alienware x16 R1 | |
| MSI Stealth 16 Mercedes-AMG Motorsport A13VG | |
| Alienware m16 R2 | |
| Alienware x16 R2 P120F | |
| Asus ROG Zephyrus M16 GU603H | |
| Framework Laptop 16 | |
| Lenovo Legion S7 16ARHA7 | |
| Far Cry 5 - 1920x1080 Ultra Preset AA:T | |
| KFA2 GeForce RTX 4080 SG | |
| Lenovo Legion 7 16IAX7-82TD004SGE | |
| MSI Raider GE68HX 13VF | |
| Alienware m16 R1 AMD | |
| Alienware m16 R2 | |
| Framework Laptop 16 | |
| Alienware x16 R2 P120F | |
| Asus ROG Zephyrus M16 GU603H | |
| Baldur's Gate 3 | |
| 1920x1080 Ultra Preset AA:T | |
| Alienware x16 R2 P120F | |
| Ortalama NVIDIA GeForce RTX 4080 Laptop GPU (111.8 - 181.2, n=7) | |
| Alienware m16 R2 | |
| Framework Laptop 16 | |
| 2560x1440 Ultra Preset AA:T | |
| Alienware x16 R2 P120F | |
| Ortalama NVIDIA GeForce RTX 4080 Laptop GPU (88.3 - 129.3, n=7) | |
| Alienware m16 R2 | |
| Framework Laptop 16 | |
| 3840x2160 Ultra Preset AA:T | |
| Alienware x16 R2 P120F | |
| Ortalama NVIDIA GeForce RTX 4080 Laptop GPU (48.8 - 68.4, n=5) | |
| Alienware m16 R2 | |
| Framework Laptop 16 | |
| 3840x2160 Ultra Preset + Quality DLSS | |
| Ortalama NVIDIA GeForce RTX 4080 Laptop GPU (90.9 - 120.5, n=3) | |
| Alienware x16 R2 P120F | |
| Dota 2 Reborn | |
| 1920x1080 ultra (3/3) best looking | |
| KFA2 GeForce RTX 4080 SG | |
| MSI Raider GE68HX 13VF | |
| Lenovo Legion Pro 7 RTX4090 | |
| Lenovo Legion 7 16IAX7-82TD004SGE | |
| Alienware m16 R1 AMD | |
| Ortalama NVIDIA GeForce RTX 4080 Laptop GPU (133 - 194.7, n=23) | |
| Alienware x16 R1 | |
| Alienware m16 R2 | |
| Asus ROG Zephyrus M16 GU603H | |
| Framework Laptop 16 | |
| Alienware x16 R2 P120F | |
| MSI Stealth 16 Mercedes-AMG Motorsport A13VG | |
| Lenovo Legion S7 16ARHA7 | |
| 3840x2160 ultra (3/3) best looking | |
| KFA2 GeForce RTX 4080 SG | |
| Lenovo Legion Pro 7 RTX4090 | |
| Alienware m16 R1 AMD | |
| Ortalama NVIDIA GeForce RTX 4080 Laptop GPU (116.7 - 182.6, n=14) | |
| Alienware m16 R2 | |
| Alienware x16 R1 | |
| Alienware x16 R2 P120F | |
| Framework Laptop 16 | |
| Final Fantasy XV Benchmark | |
| 1920x1080 High Quality | |
| KFA2 GeForce RTX 4080 SG | |
| Lenovo Legion Pro 7 RTX4090 | |
| Alienware m16 R1 AMD | |
| Alienware x16 R1 | |
| Ortalama NVIDIA GeForce RTX 4080 Laptop GPU (129 - 182.1, n=23) | |
| Alienware x16 R2 P120F | |
| Lenovo Legion 7 16IAX7-82TD004SGE | |
| Alienware m16 R2 | |
| MSI Raider GE68HX 13VF | |
| MSI Stealth 16 Mercedes-AMG Motorsport A13VG | |
| Lenovo Legion S7 16ARHA7 | |
| Framework Laptop 16 | |
| Asus ROG Zephyrus M16 GU603H | |
| 2560x1440 High Quality | |
| KFA2 GeForce RTX 4080 SG | |
| Lenovo Legion Pro 7 RTX4090 | |
| Alienware x16 R1 | |
| Alienware m16 R1 AMD | |
| Ortalama NVIDIA GeForce RTX 4080 Laptop GPU (98 - 142, n=22) | |
| Alienware x16 R2 P120F | |
| Lenovo Legion 7 16IAX7-82TD004SGE | |
| Alienware m16 R2 | |
| MSI Stealth 16 Mercedes-AMG Motorsport A13VG | |
| Lenovo Legion S7 16ARHA7 | |
| Framework Laptop 16 | |
| Asus ROG Zephyrus M16 GU603H | |
| 3840x2160 High Quality | |
| KFA2 GeForce RTX 4080 SG | |
| Lenovo Legion Pro 7 RTX4090 | |
| Alienware x16 R1 | |
| Alienware m16 R1 AMD | |
| Ortalama NVIDIA GeForce RTX 4080 Laptop GPU (60.8 - 79.5, n=13) | |
| Alienware x16 R2 P120F | |
| Alienware m16 R2 | |
| Framework Laptop 16 | |
| Tiny Tina's Wonderlands | |
| 1920x1080 Badass Preset (DX12) | |
| KFA2 GeForce RTX 4080 SG | |
| Alienware m16 R1 AMD | |
| Alienware x16 R1 | |
| Ortalama NVIDIA GeForce RTX 4080 Laptop GPU (112.9 - 167.1, n=9) | |
| Alienware x16 R2 P120F | |
| Alienware m16 R2 | |
| MSI Raider GE68HX 13VF | |
| Framework Laptop 16 | |
| 2560x1440 Badass Preset (DX12) | |
| KFA2 GeForce RTX 4080 SG | |
| Alienware m16 R1 AMD | |
| Alienware x16 R1 | |
| Ortalama NVIDIA GeForce RTX 4080 Laptop GPU (85 - 114.8, n=9) | |
| Alienware x16 R2 P120F | |
| Alienware m16 R2 | |
| Framework Laptop 16 | |
| 3840x2160 Badass Preset (DX12) | |
| KFA2 GeForce RTX 4080 SG | |
| Alienware m16 R1 AMD | |
| Alienware x16 R1 | |
| Ortalama NVIDIA GeForce RTX 4080 Laptop GPU (46.4 - 60.9, n=9) | |
| Alienware x16 R2 P120F | |
| Alienware m16 R2 | |
| Framework Laptop 16 | |
| Cyberpunk 2077 | |
| 1920x1080 Ultra Preset (FSR off) | |
| Ortalama NVIDIA GeForce RTX 4080 Laptop GPU (83.9 - 127.1, n=15) | |
| Alienware x16 R2 P120F | |
| Alienware m16 R2 | |
| Framework Laptop 16 | |
| 2560x1440 Ultra Preset (FSR off) | |
| Ortalama NVIDIA GeForce RTX 4080 Laptop GPU (56.2 - 86.3, n=15) | |
| Alienware x16 R2 P120F | |
| Alienware m16 R2 | |
| Framework Laptop 16 | |
| 3840x2160 Ultra Preset (FSR off) | |
| Ortalama NVIDIA GeForce RTX 4080 Laptop GPU (25.8 - 39.8, n=8) | |
| Alienware x16 R2 P120F | |
| Alienware m16 R2 | |
| Framework Laptop 16 | |
| 1920x1080 Ray Tracing Ultra Preset (DLSS off) | |
| Alienware x16 R2 P120F | |
| Ortalama NVIDIA GeForce RTX 4080 Laptop GPU (43.8 - 67.2, n=12) | |
| Alienware m16 R2 | |
| Framework Laptop 16 | |
| 3840x2160 Ray Tracing Ultra Preset (DLSS off, no Path Tracing) | |
| Ortalama NVIDIA GeForce RTX 4080 Laptop GPU (16 - 20, n=5) | |
| Alienware x16 R2 P120F | |
| Alienware m16 R2 | |
| X-Plane 11.11 | |
| 1920x1080 high (fps_test=3) | |
| KFA2 GeForce RTX 4080 SG | |
| MSI Raider GE68HX 13VF | |
| Lenovo Legion Pro 7 RTX4090 | |
| Ortalama NVIDIA GeForce RTX 4080 Laptop GPU (89.3 - 143.5, n=25) | |
| Lenovo Legion 7 16IAX7-82TD004SGE | |
| Alienware m16 R1 AMD | |
| Alienware x16 R1 | |
| MSI Stealth 16 Mercedes-AMG Motorsport A13VG | |
| Alienware m16 R2 | |
| Alienware x16 R2 P120F | |
| Asus ROG Zephyrus M16 GU603H | |
| Framework Laptop 16 | |
| Lenovo Legion S7 16ARHA7 | |
| 3840x2160 high (fps_test=3) | |
| KFA2 GeForce RTX 4080 SG | |
| Lenovo Legion Pro 7 RTX4090 | |
| Ortalama NVIDIA GeForce RTX 4080 Laptop GPU (78 - 143.7, n=13) | |
| Alienware m16 R1 AMD | |
| Alienware x16 R1 | |
| Alienware m16 R2 | |
| Alienware x16 R2 P120F | |
| Framework Laptop 16 | |
| F1 22 | |
| 1920x1080 Ultra High Preset AA:T AF:16x | |
| KFA2 GeForce RTX 4080 SG | |
| Lenovo Legion Pro 7 RTX4090 | |
| Alienware m16 R1 AMD | |
| Alienware x16 R1 | |
| Alienware x16 R2 P120F | |
| Ortalama NVIDIA GeForce RTX 4080 Laptop GPU (72.3 - 124.2, n=15) | |
| Alienware m16 R2 | |
| MSI Raider GE68HX 13VF | |
| Framework Laptop 16 | |
| 2560x1440 Ultra High Preset AA:T AF:16x | |
| KFA2 GeForce RTX 4080 SG | |
| Lenovo Legion Pro 7 RTX4090 | |
| Alienware x16 R1 | |
| Alienware m16 R1 AMD | |
| Ortalama NVIDIA GeForce RTX 4080 Laptop GPU (55.4 - 79, n=13) | |
| Alienware x16 R2 P120F | |
| Alienware m16 R2 | |
| Framework Laptop 16 | |
| 3840x2160 Ultra High Preset AA:T AF:16x | |
| KFA2 GeForce RTX 4080 SG | |
| Lenovo Legion Pro 7 RTX4090 | |
| Alienware m16 R1 AMD | |
| Alienware x16 R1 | |
| Alienware x16 R2 P120F | |
| Ortalama NVIDIA GeForce RTX 4080 Laptop GPU (25.8 - 39.8, n=10) | |
| Alienware m16 R2 | |
| Framework Laptop 16 | |
| Far Cry 5 | |
| 1920x1080 Ultra Preset AA:T | |
| KFA2 GeForce RTX 4080 SG | |
| Lenovo Legion 7 16IAX7-82TD004SGE | |
| Ortalama NVIDIA GeForce RTX 4080 Laptop GPU (114 - 162, n=11) | |
| MSI Raider GE68HX 13VF | |
| Alienware m16 R1 AMD | |
| Alienware m16 R2 | |
| Framework Laptop 16 | |
| Alienware x16 R2 P120F | |
| Asus ROG Zephyrus M16 GU603H | |
| 2560x1440 Ultra Preset AA:T | |
| KFA2 GeForce RTX 4080 SG | |
| Ortalama NVIDIA GeForce RTX 4080 Laptop GPU (114 - 157, n=10) | |
| Alienware m16 R1 AMD | |
| Lenovo Legion 7 16IAX7-82TD004SGE | |
| Alienware m16 R2 | |
| Alienware x16 R2 P120F | |
| Asus ROG Zephyrus M16 GU603H | |
| Framework Laptop 16 | |
| 3840x2160 Ultra Preset AA:T | |
| KFA2 GeForce RTX 4080 SG | |
| Alienware m16 R1 AMD | |
| Alienware x16 R2 P120F | |
| Ortalama NVIDIA GeForce RTX 4080 Laptop GPU (71 - 97, n=6) | |
| Alienware m16 R2 | |
| Framework Laptop 16 | |
Witcher 3 FPS Chart
| düşük | orta | yüksek | ultra | QHD | 4K DLSS | 4K | |
|---|---|---|---|---|---|---|---|
| The Witcher 3 (2015) | 364.4 | 340.7 | 292.1 | 166.3 | 118.5 | ||
| Dota 2 Reborn (2015) | 155.7 | 142 | 139.2 | 133 | 127.9 | ||
| Final Fantasy XV Benchmark (2018) | 188 | 169.3 | 139.8 | 120.8 | 70.2 | ||
| X-Plane 11.11 (2018) | 134 | 117.4 | 89.3 | 78 | |||
| Far Cry 5 (2018) | 137 | 127 | 122 | 114 | 114 | 91 | |
| Strange Brigade (2018) | 427 | 336 | 317 | 293 | 226 | 112.9 | |
| Tiny Tina's Wonderlands (2022) | 220.8 | 199.6 | 166.7 | 144.5 | 99 | 50.1 | |
| F1 22 (2022) | 219 | 211 | 185.7 | 108.5 | 65.6 | 36.6 | |
| Baldur's Gate 3 (2023) | 186.8 | 172.9 | 161.2 | 159.4 | 124.3 | 104.4 | 65 |
| Cyberpunk 2077 (2023) | 121.5 | 118.7 | 109 | 99.7 | 75.4 | 32.5 |
Emisyonlar
Sistem Gürültüsü
X16 R2'deki fanlar, hız ve gürültüyü artırmaya ihtiyaç duymadan önce daha uzun süre daha sessiz kalabiliyor. Aksi takdirde, gürültü tavanı Performans modunda ve Overdrive modunda oyun oynarken sırasıyla yaklaşık 50 dB(A) ve 54 dB(A) ile x16 R1'de kaydettiklerimize benzer. Dengeli modda oyun oynarken fan gürültüsünün Performans moduyla tamamen aynı olacağını unutmayın, bu da yukarıdaki 3DMark sonuçlarımızla uyumludur.
Ses yüksekliği
| Boşta |
| 23.8 / 28.5 / 28.5 dB |
| Çalışırken |
| 28.8 / 54.2 dB |
 | ||
30 dB sessiz 40 dB(A) duyulabilirlik 50 dB(A) gürültülü |
||
min: | ||
| Alienware x16 R2 P120F GeForce RTX 4080 Laptop GPU, Ultra 9 185H, WDC PC SN810 1TB | Alienware x16 R1 GeForce RTX 4080 Laptop GPU, i9-13900HK, SK hynix PC801 HFS001TEJ9X101N | Alienware m16 R2 GeForce RTX 4070 Laptop GPU, Ultra 7 155H, Samsung PM9A1 MZVL21T0HCLR | Asus ROG Strix Scar 16 G634JZR GeForce RTX 4080 Laptop GPU, i9-14900HX, SK hynix PC801 HFS002TEJ9X101N | Lenovo Legion Pro 7 16IRX9H GeForce RTX 4080 Laptop GPU, i9-14900HX, SK Hynix HFS001TEJ9X115N | MSI Vector 16 HX A14V GeForce RTX 4080 Laptop GPU, i9-14900HX, WD PC SN560 SDDPNQE-1T00 | |
|---|---|---|---|---|---|---|
| Noise | -2% | -3% | -20% | -22% | -28% | |
| kapalı / ortam * (dB) | 23.4 | 22.7 3% | 24.7 -6% | 21.07 10% | 24 -3% | 23.2 1% |
| Idle Minimum * (dB) | 23.8 | 23.1 3% | 25.3 -6% | 29.75 -25% | 25 -5% | 33.5 -41% |
| Idle Average * (dB) | 28.5 | 25.8 9% | 25.3 11% | 29.75 -4% | 30 -5% | 33.5 -18% |
| Idle Maximum * (dB) | 28.5 | 25.8 9% | 25.3 11% | 29.75 -4% | 45 -58% | 33.5 -18% |
| Load Average * (dB) | 28.8 | 39.3 -36% | 31.7 -10% | 54.85 -90% | 50 -74% | 52.1 -81% |
| Witcher 3 ultra * (dB) | 49.5 | 49.9 -1% | 53.8 -9% | 57.8 -17% | 54 -9% | 62 -25% |
| Load Maximum * (dB) | 54.2 | 54.8 -1% | 62 -14% | 58 -7% | 56 -3% | 62 -14% |
* ... daha küçük daha iyidir
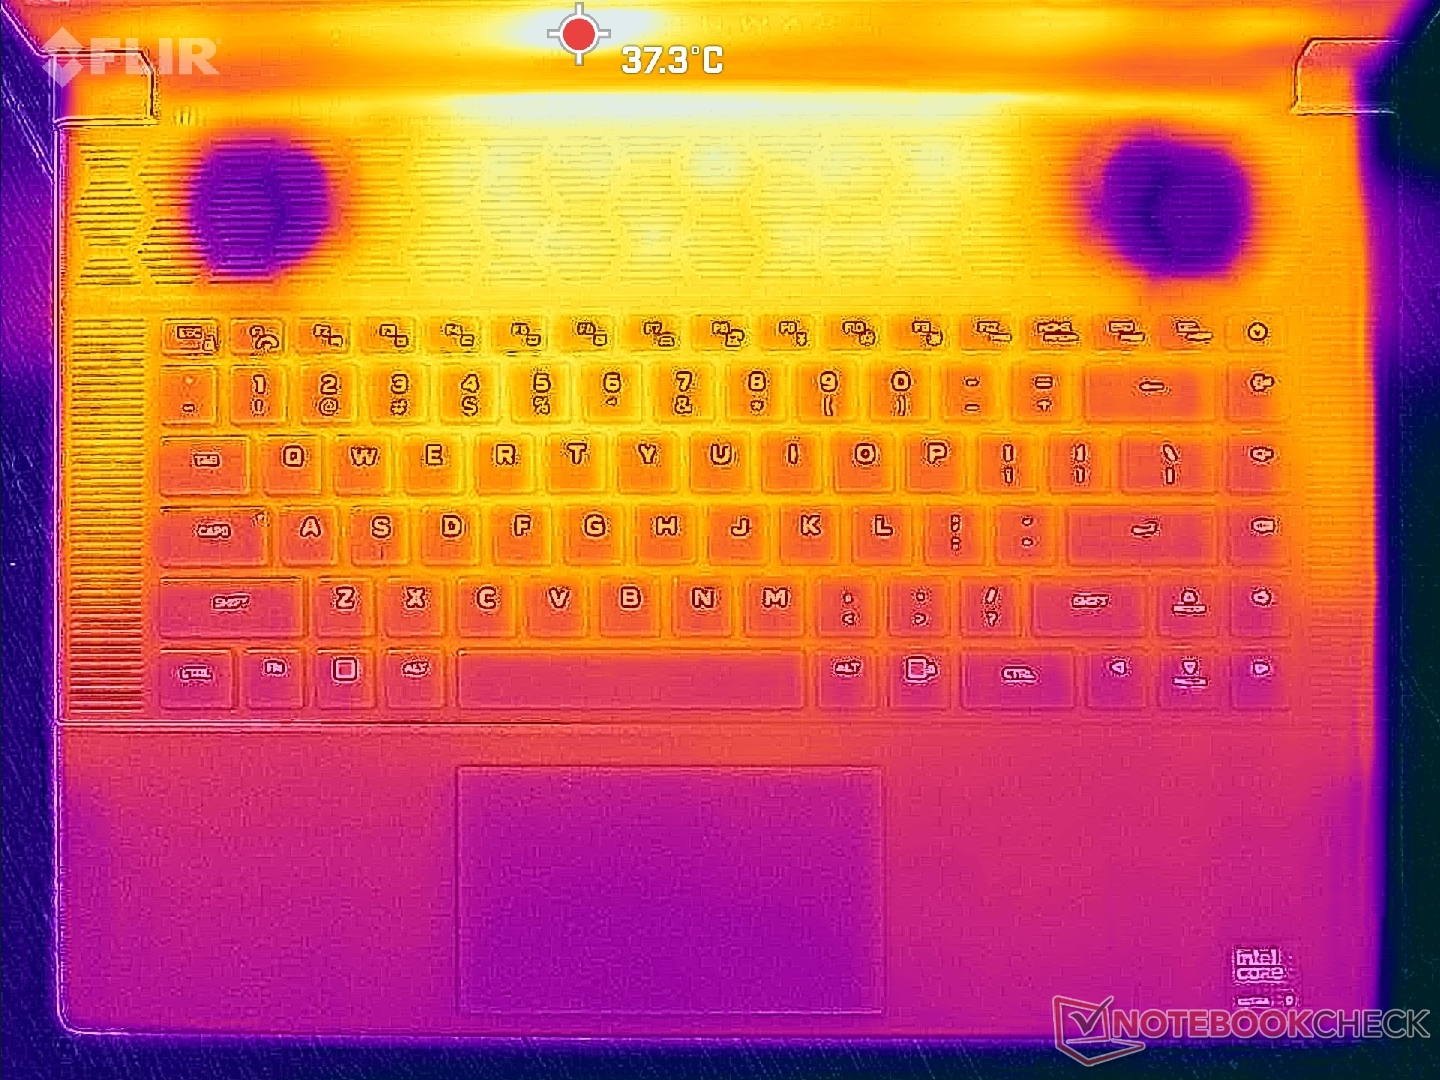
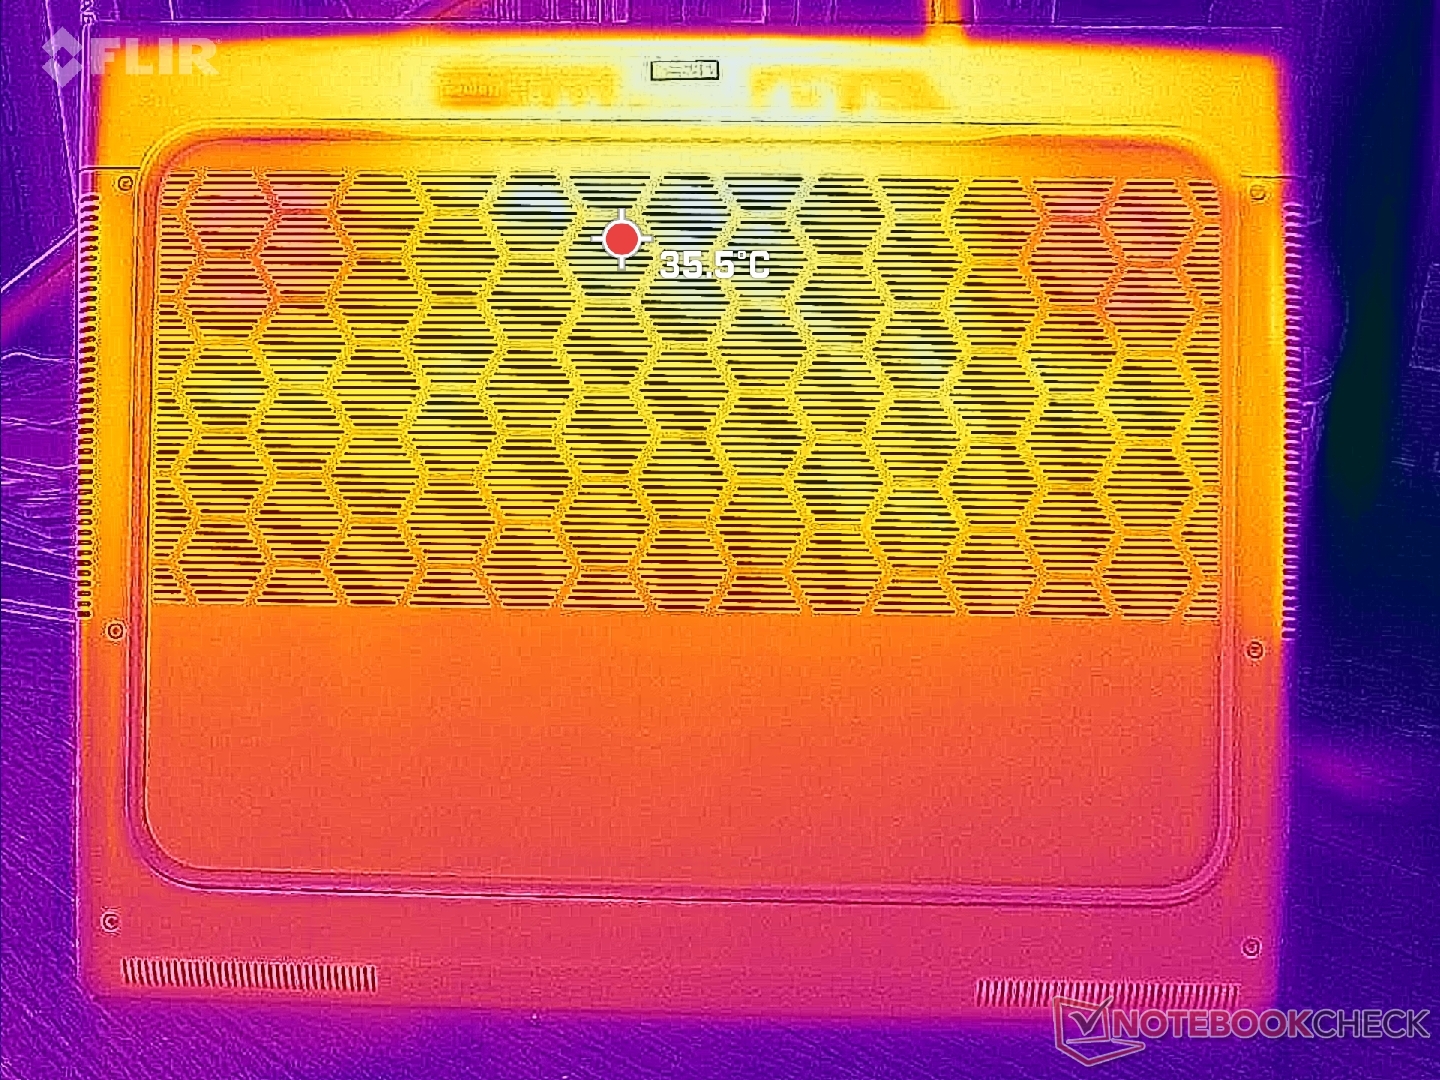
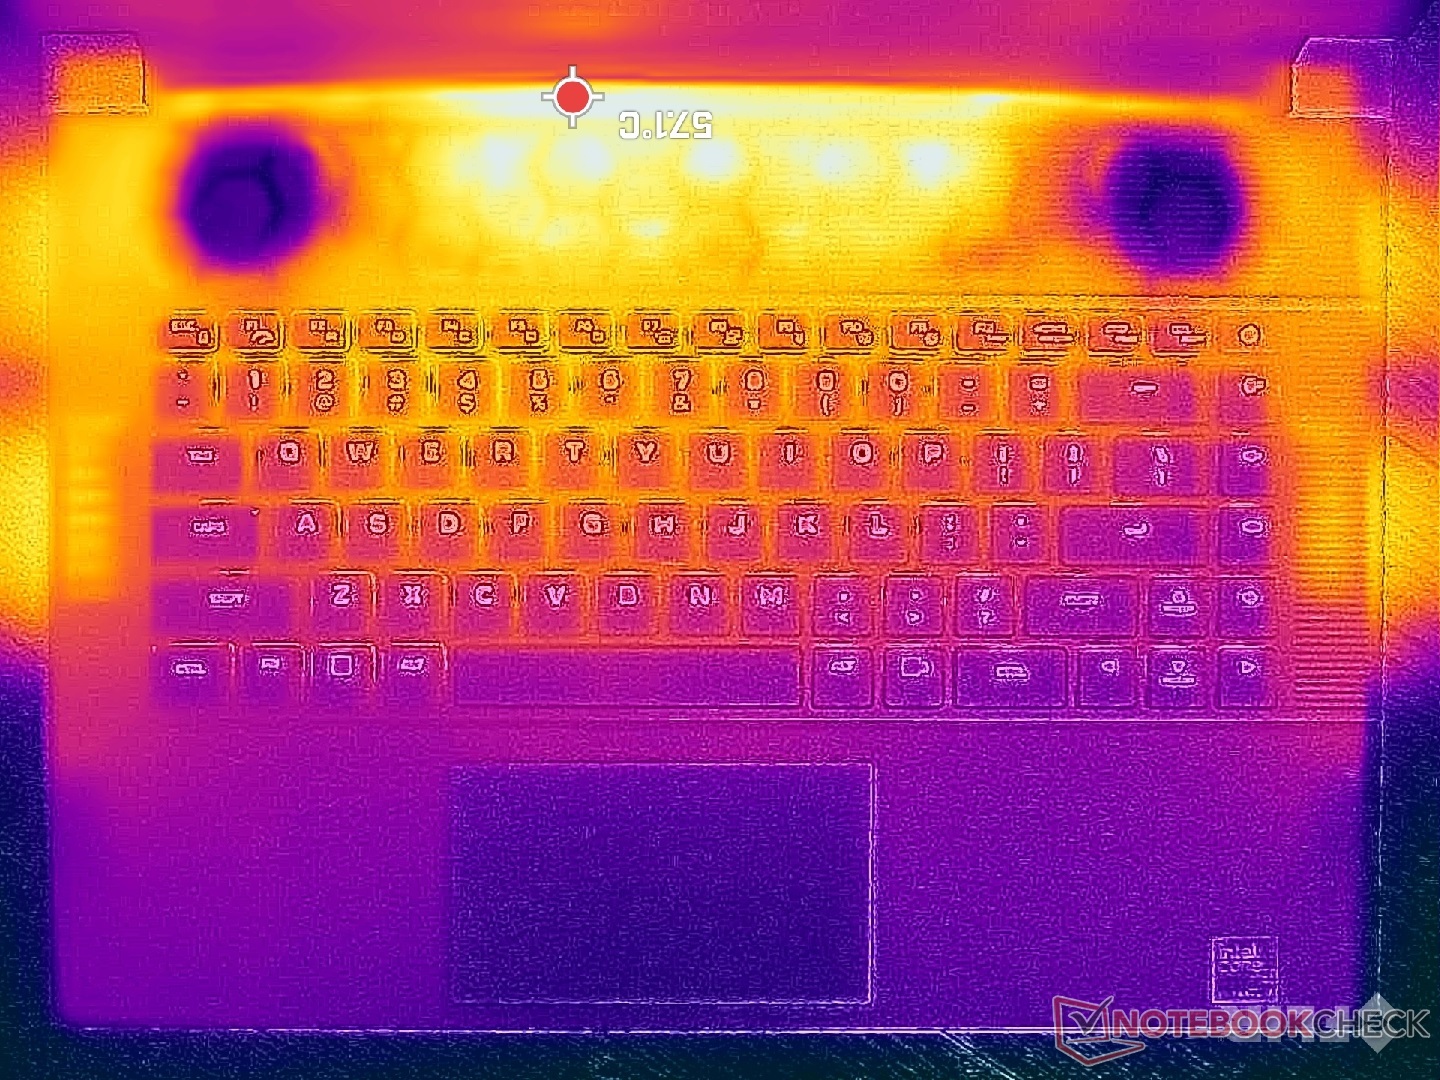
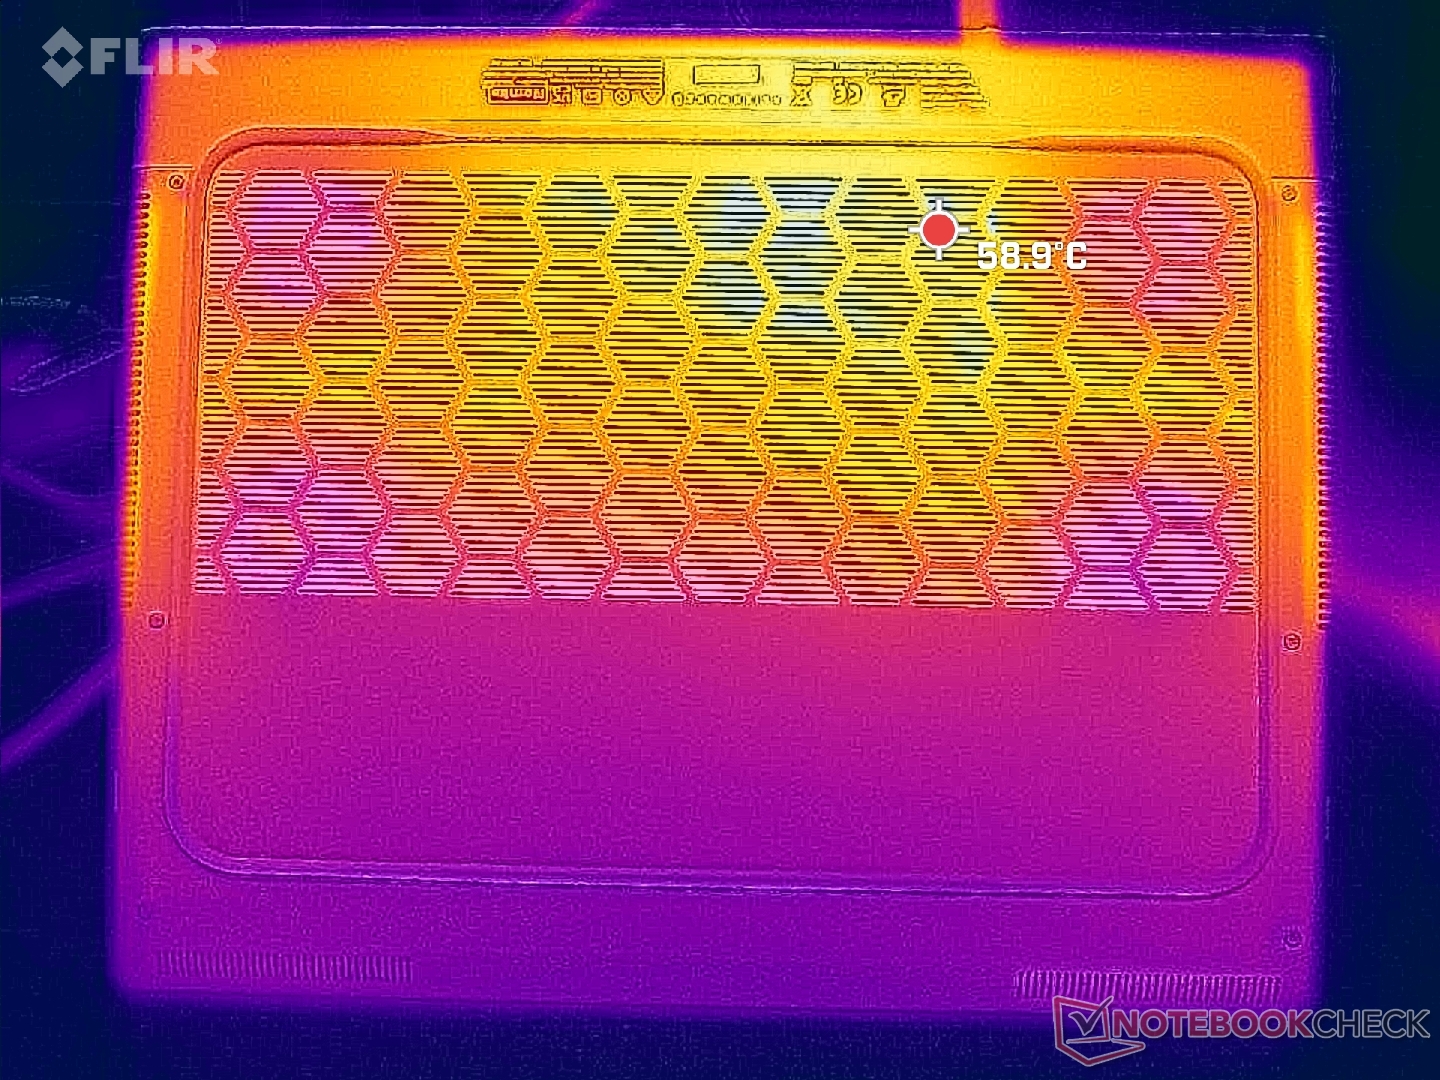
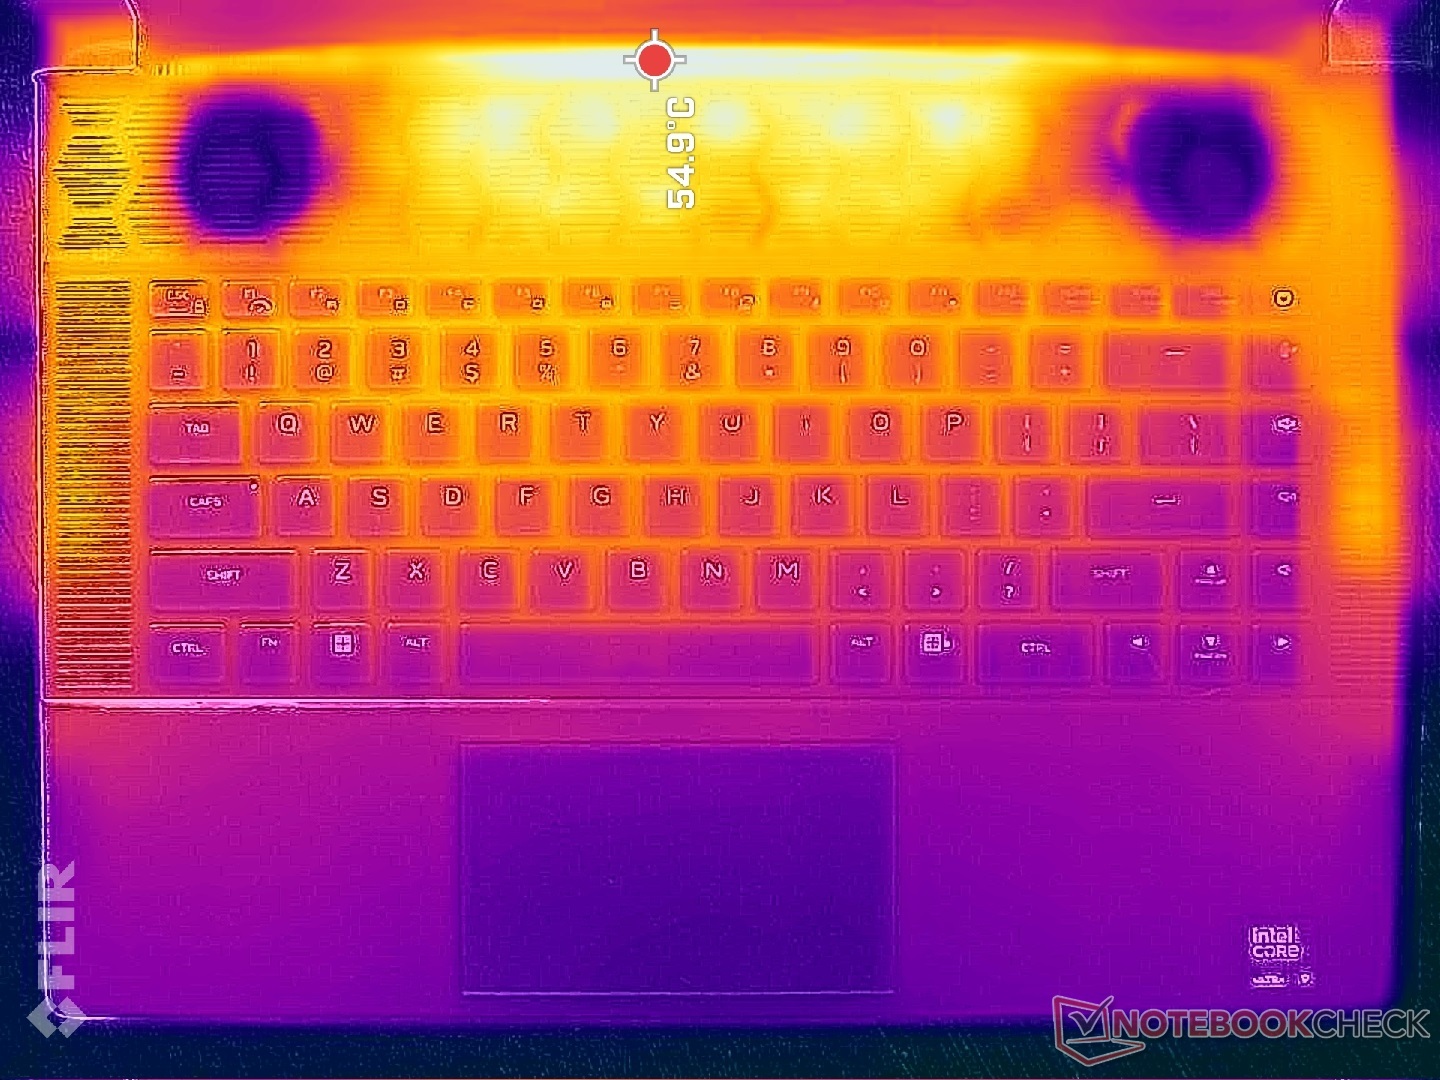
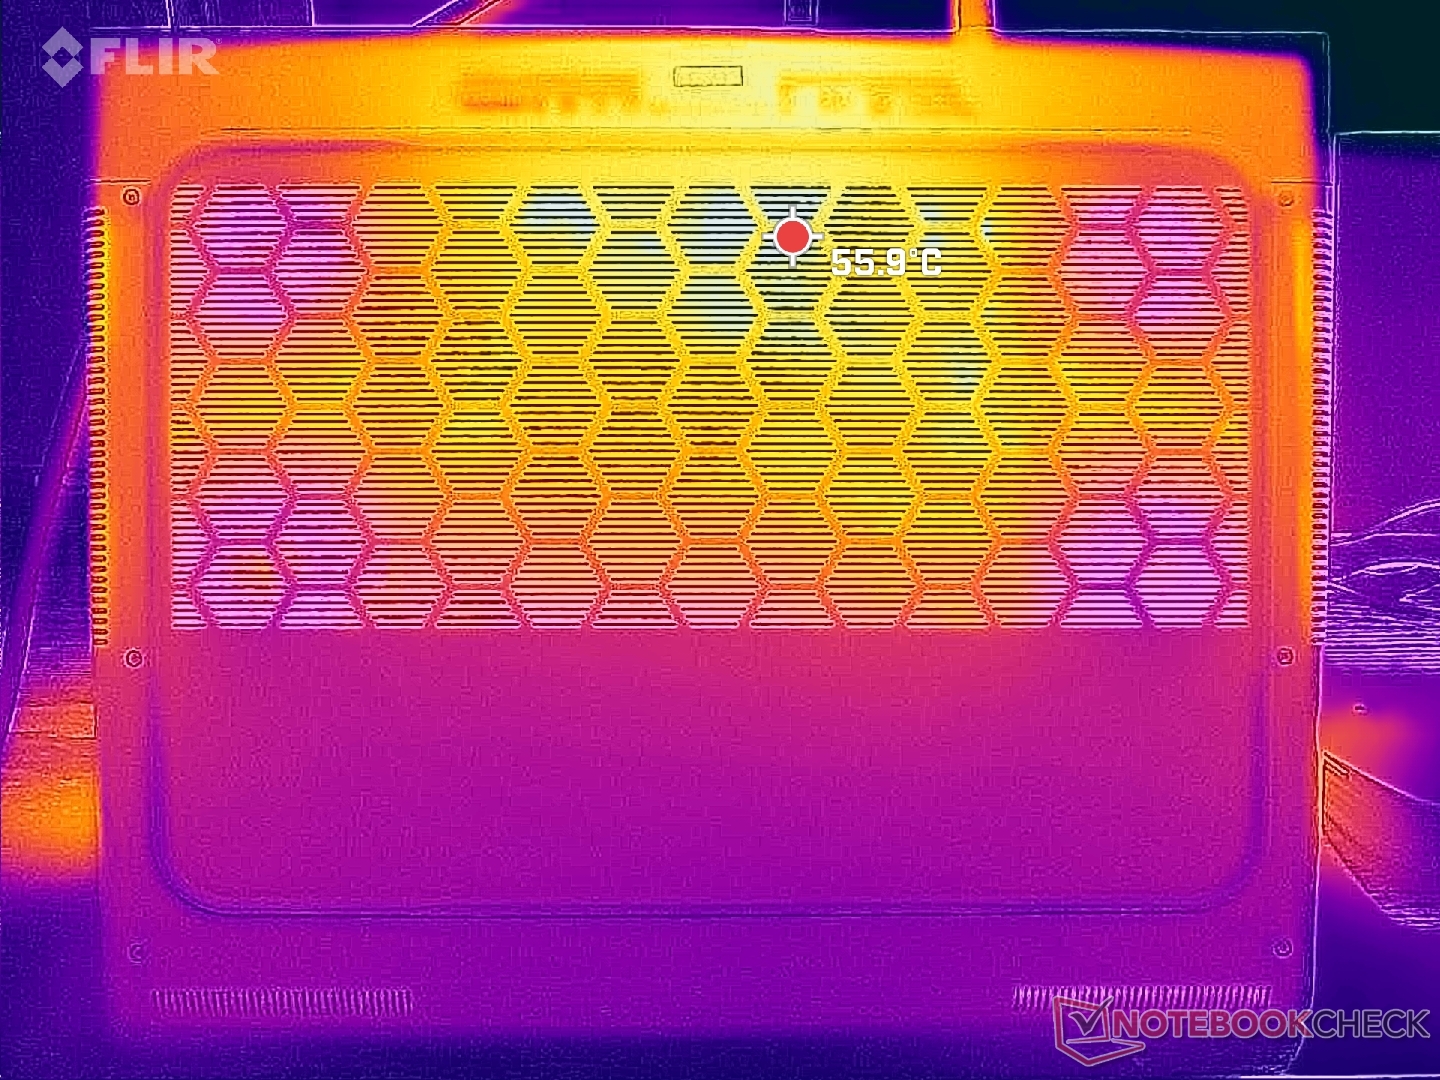
Sıcaklık
Yüzey sıcaklıkları kasanın arka yarısına doğru çok sıcakken, ön yarısı avuç içi ve parmaklar için belirgin şekilde daha soğuktur. Alienware x16 serisi, x16 tasarımı inceliğiyle tanımlandığından, m16 serisinden daha fazla havalandırma ızgarası kullanmaktadır.
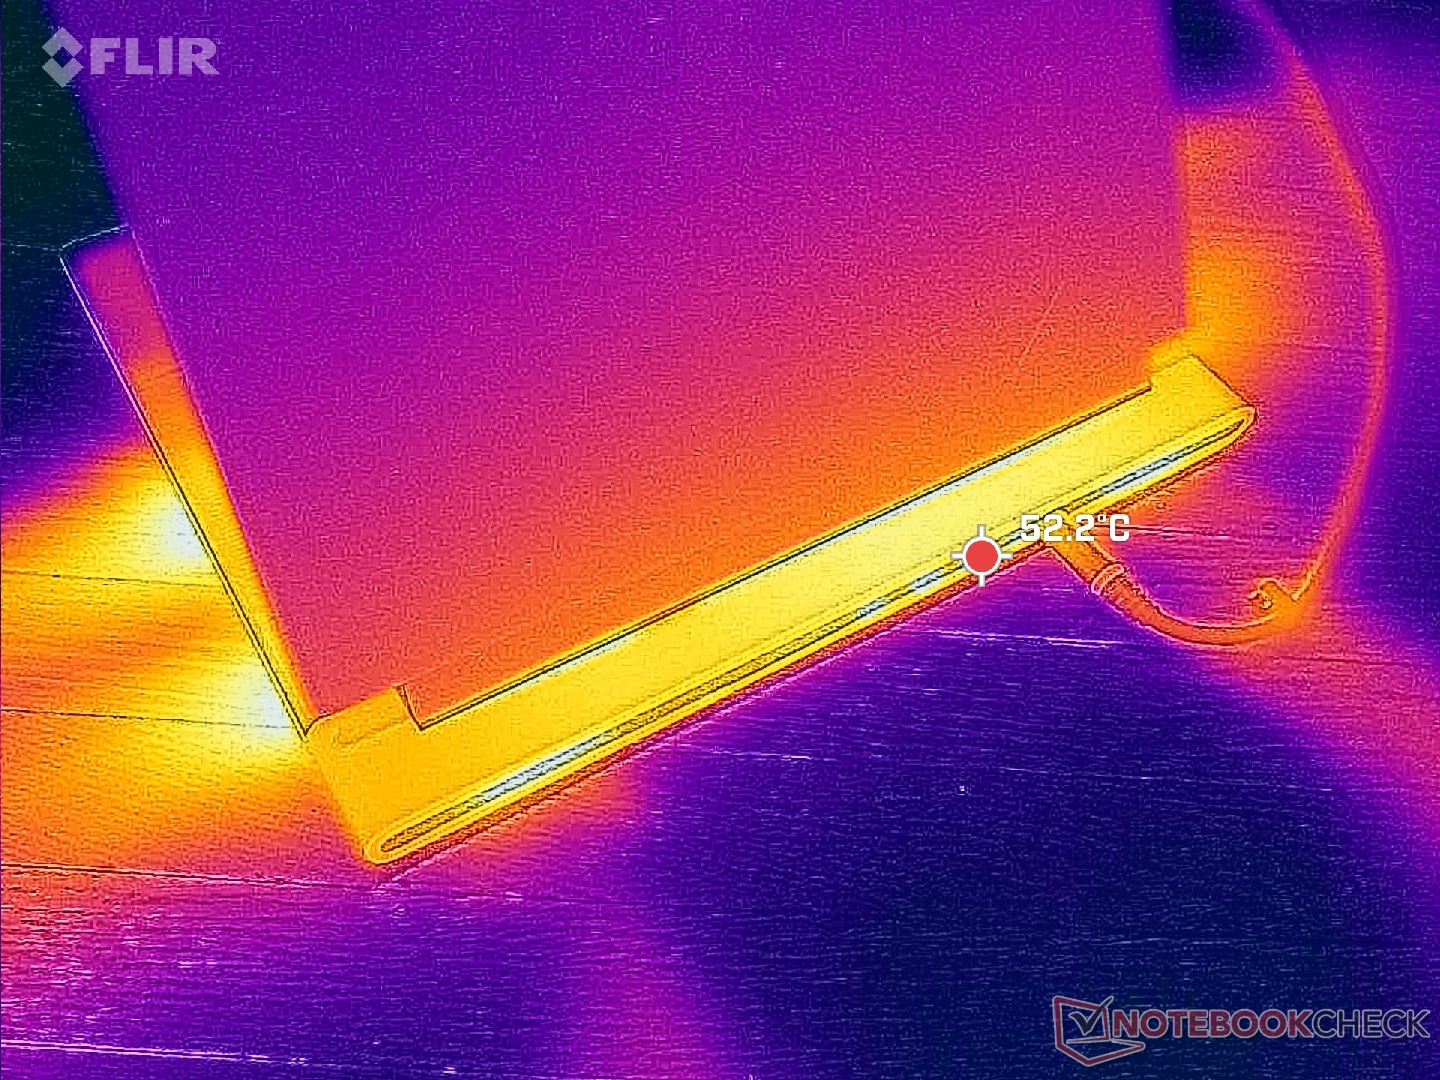
(-) Üst taraftaki maksimum sıcaklık, 40.4 °C / 105 F ortalamasına kıyasla 51 °C / 124 F'dir. , Gaming sınıfı için 21.2 ile 68.8 °C arasında değişir.
(-) Alt kısım, 43.2 °C / 110 F ortalamasına kıyasla maksimum 50.8 °C / 123 F'ye kadar ısınır
(+) Boşta kullanımda, üst tarafın ortalama sıcaklığı 31.3 °C / 88 F olup, cihazın 33.9 °C / 93 F.
(-) The Witcher 3 oynarken, üst tarafın ortalama sıcaklığı 42.4 °C / 108 F olup, cihazın 33.9 °C / 93 F.
(+) Avuç içi dayanakları ve dokunmatik yüzey maksimum (33.2 °C / 91.8 F) cilt sıcaklığına ulaşıyor ve bu nedenle sıcak değil.
(-) Benzer cihazların avuç içi dayanağı alanının ortalama sıcaklığı 28.8 °C / 83.8 F (-4.4 °C / -8 F) idi.
| Alienware x16 R2 P120F Intel Core Ultra 9 185H, NVIDIA GeForce RTX 4080 Laptop GPU | Alienware x16 R1 Intel Core i9-13900HK, NVIDIA GeForce RTX 4080 Laptop GPU | Alienware m16 R2 Intel Core Ultra 7 155H, NVIDIA GeForce RTX 4070 Laptop GPU | Asus ROG Strix Scar 16 G634JZR Intel Core i9-14900HX, NVIDIA GeForce RTX 4080 Laptop GPU | Lenovo Legion Pro 7 16IRX9H Intel Core i9-14900HX, NVIDIA GeForce RTX 4080 Laptop GPU | MSI Vector 16 HX A14V Intel Core i9-14900HX, NVIDIA GeForce RTX 4080 Laptop GPU | |
|---|---|---|---|---|---|---|
| Heat | 3% | -1% | 5% | 1% | 27% | |
| Maximum Upper Side * (°C) | 51 | 47.2 7% | 44.8 12% | 47.8 6% | 46 10% | 36.4 29% |
| Maximum Bottom * (°C) | 50.8 | 47.8 6% | 48 6% | 52.2 -3% | 49 4% | 35.6 30% |
| Idle Upper Side * (°C) | 36.6 | 36.8 -1% | 37.2 -2% | 32.4 11% | 38 -4% | 26.6 27% |
| Idle Bottom * (°C) | 35.2 | 35.8 -2% | 42 -19% | 33 6% | 37 -5% | 27 23% |
* ... daha küçük daha iyidir
Konuşmacılar
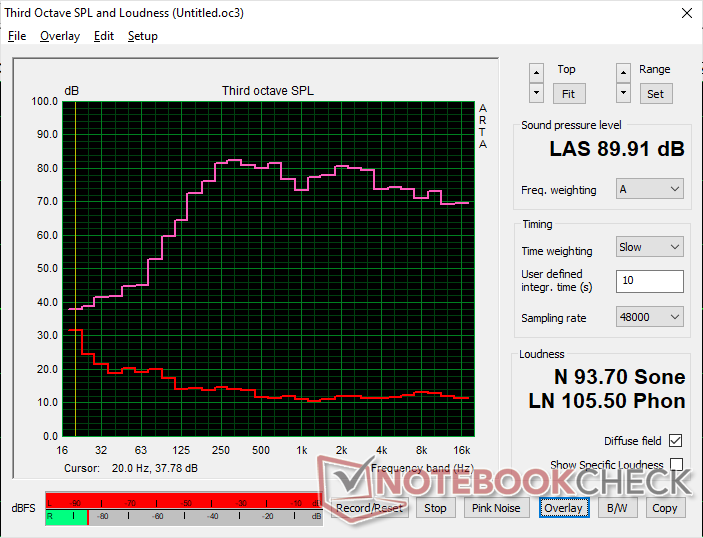
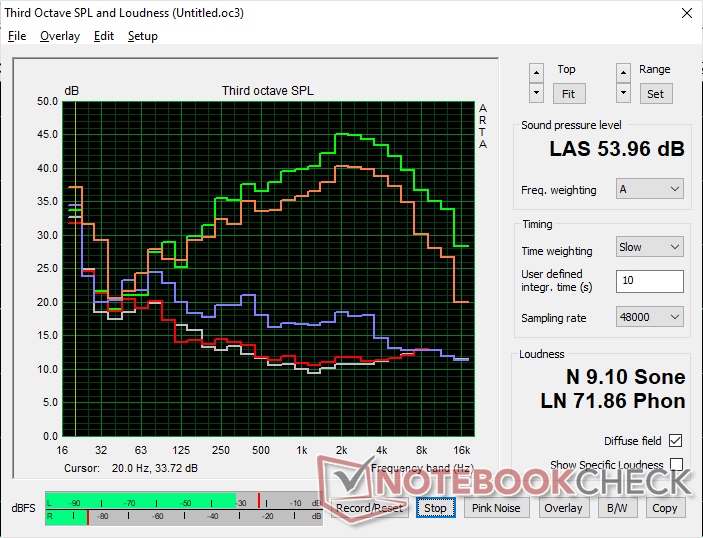
Alienware x16 R2 P120F ses analizi
(+) | hoparlörler nispeten yüksek sesle çalabilir (89.9 dB)
Bas 100 - 315Hz
(±) | azaltılmış bas - ortalama olarak medyandan 7.4% daha düşük
(±) | Bas doğrusallığı ortalamadır (7.6% delta - önceki frekans)
Ortalar 400 - 2000 Hz
(+) | dengeli ortalar - medyandan yalnızca 2.6% uzakta
(+) | orta frekanslar doğrusaldır (3.6% deltadan önceki frekansa)
Yüksekler 2 - 16 kHz
(+) | dengeli yüksekler - medyandan yalnızca 3.4% uzakta
(+) | yüksekler doğrusaldır (2.8% deltadan önceki frekansa)
Toplam 100 - 16.000 Hz
(+) | genel ses doğrusaldır (8.2% ortancaya göre fark)
Aynı sınıfla karşılaştırıldığında
» Bu sınıftaki tüm test edilen cihazların %1%'si daha iyi, 1% benzer, 97% daha kötüydü
» En iyisinin deltası 6% idi, ortalama 18% idi, en kötüsü 132% idi
Test edilen tüm cihazlarla karşılaştırıldığında
» Test edilen tüm cihazların %2'si daha iyi, 1 benzer, % 97 daha kötüydü
» En iyisinin deltası 4% idi, ortalama 24% idi, en kötüsü 134% idi
Apple MacBook Pro 16 2021 M1 Pro ses analizi
(+) | hoparlörler nispeten yüksek sesle çalabilir (84.7 dB)
Bas 100 - 315Hz
(+) | iyi bas - medyandan yalnızca 3.8% uzakta
(+) | bas doğrusaldır (5.2% delta ile önceki frekans)
Ortalar 400 - 2000 Hz
(+) | dengeli ortalar - medyandan yalnızca 1.3% uzakta
(+) | orta frekanslar doğrusaldır (2.1% deltadan önceki frekansa)
Yüksekler 2 - 16 kHz
(+) | dengeli yüksekler - medyandan yalnızca 1.9% uzakta
(+) | yüksekler doğrusaldır (2.7% deltadan önceki frekansa)
Toplam 100 - 16.000 Hz
(+) | genel ses doğrusaldır (4.6% ortancaya göre fark)
Aynı sınıfla karşılaştırıldığında
» Bu sınıftaki tüm test edilen cihazların %0%'si daha iyi, 0% benzer, 100% daha kötüydü
» En iyisinin deltası 5% idi, ortalama 17% idi, en kötüsü 45% idi
Test edilen tüm cihazlarla karşılaştırıldığında
» Test edilen tüm cihazların %0'si daha iyi, 0 benzer, % 100 daha kötüydü
» En iyisinin deltası 4% idi, ortalama 24% idi, en kötüsü 134% idi
Enerji Yönetimi
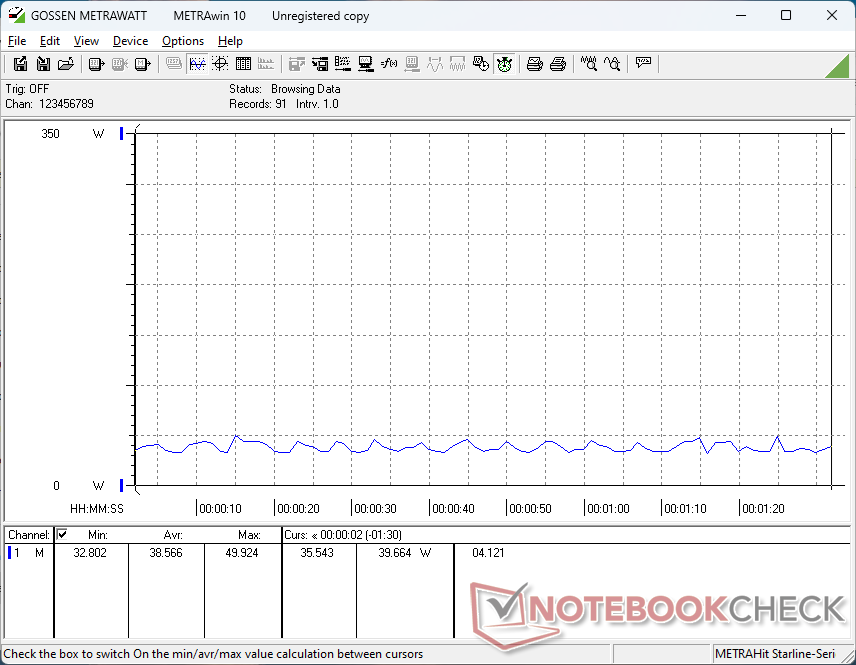
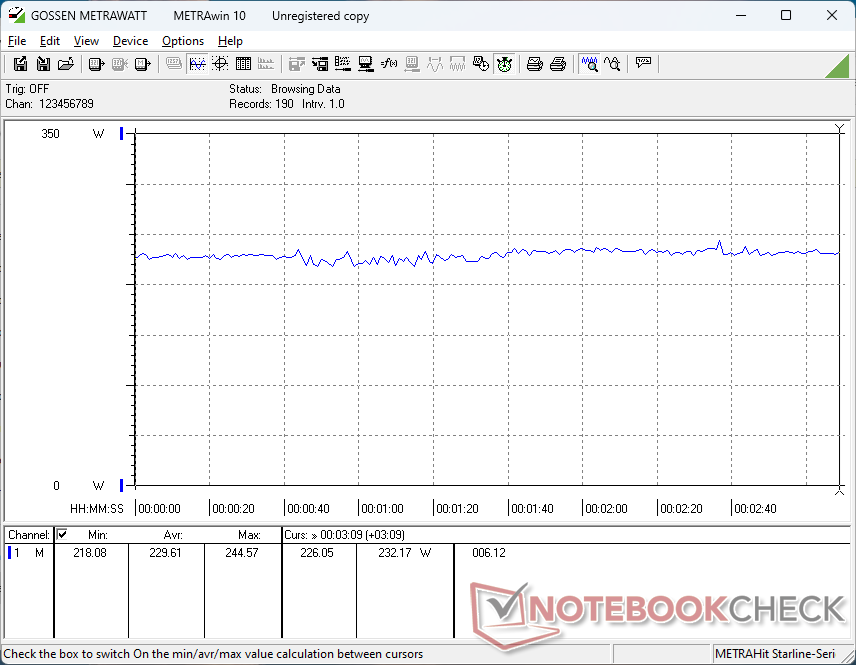
Güç Tüketimi
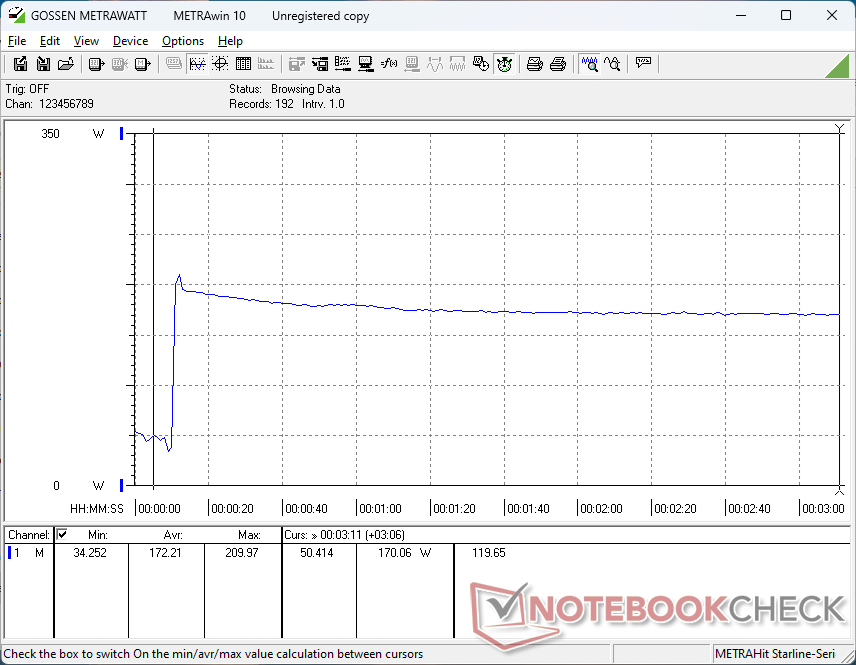
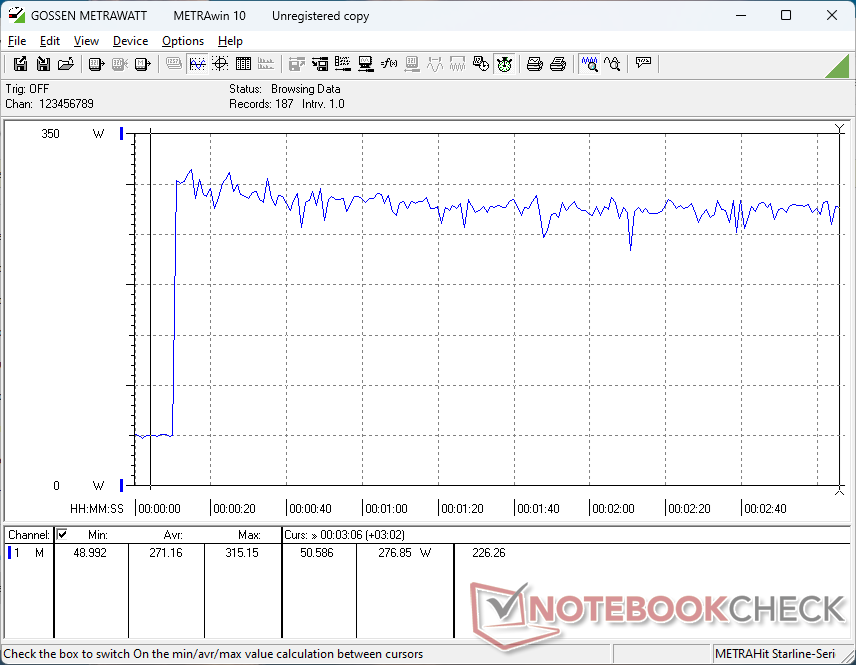
Genel tüketim, oyunlar veya Prime95 stresi gibi zorlu yükleri çalıştırırken x16 R1'de kaydettiğimizden genellikle yaklaşık yüzde 10 ila 15 daha düşüktür. Ancak bu açık, yukarıda belirtilen daha yavaş CPU ve GPU sonuçlarına eşlik ediyor. Bu nedenle, CPU değişikliğine rağmen watt başına performans yıldan yıla yaklaşık aynıdır.
Bekleme modundayken bir hatayla karşılaştık. Optimus'a ayarlanırsa, Bekleme modu düşük <1 watt güç çekimi ile normal şekilde çalışıyordu. Ancak dGPU moduna ve Overdrive'a ayarlanırsa, Bekleme modu 39 Watt'a kadar talep ederek gereksiz yere ısınan bir dizüstü bilgisayara ve yüksek pil tüketimine neden oluyordu.
| Kapalı / Bekleme modu | |
| Boşta | |
| Çalışırken |
|
Key:
min: | |
| Alienware x16 R2 P120F Ultra 9 185H, GeForce RTX 4080 Laptop GPU, WDC PC SN810 1TB, IPS, 2560x1600, 16" | Alienware x16 R1 i9-13900HK, GeForce RTX 4080 Laptop GPU, SK hynix PC801 HFS001TEJ9X101N, IPS, 2560x1600, 16" | Alienware m16 R2 Ultra 7 155H, GeForce RTX 4070 Laptop GPU, Samsung PM9A1 MZVL21T0HCLR, IPS, 2560x1600, 16" | Asus ROG Strix Scar 16 G634JZR i9-14900HX, GeForce RTX 4080 Laptop GPU, SK hynix PC801 HFS002TEJ9X101N, Mini LED, 2560x1600, 16" | Lenovo Legion Pro 7 16IRX9H i9-14900HX, GeForce RTX 4080 Laptop GPU, SK Hynix HFS001TEJ9X115N, IPS, 2560x1600, 16" | MSI Vector 16 HX A14V i9-14900HX, GeForce RTX 4080 Laptop GPU, WD PC SN560 SDDPNQE-1T00, IPS, 2560x1600, 16" | |
|---|---|---|---|---|---|---|
| Power Consumption | -55% | 11% | -10% | -30% | -27% | |
| Idle Minimum * (Watt) | 9.9 | 25.2 -155% | 8.1 18% | 10.71 -8% | 16 -62% | 15.8 -60% |
| Idle Average * (Watt) | 14.5 | 29.9 -106% | 13 10% | 14.75 -2% | 21 -45% | 23.3 -61% |
| Idle Maximum * (Watt) | 33.5 | 49.8 -49% | 40.3 -20% | 30 10% | 36 -7% | 30 10% |
| Load Average * (Watt) | 97.5 | 105.4 -8% | 79 19% | 135 -38% | 132 -35% | 123.9 -27% |
| Witcher 3 ultra * (Watt) | 230 | 263 -14% | 188.1 18% | 286 -24% | 267 -16% | 285 -24% |
| Load Maximum * (Watt) | 315.2 | 313.8 -0% | 254.9 19% | 307 3% | 360 -14% | 306 3% |
* ... daha küçük daha iyidir
Power Consumption Witcher 3 / Stresstest
Power Consumption external Monitor
Pil Ömrü
Çalışma süreleri, muhtemelen yukarıda belirtilen genel düşük güç tüketimi nedeniyle bu sefer biraz daha uzun. WLAN çalışma süresini x16 R1'e göre 40 dakikanın üzerinde kaydedebildik, ancak Dell'in kendi dizüstü bilgisayarları da dahil olmak üzere diğer oyun dizüstü bilgisayarlarının çoğu hala çok daha uzun süre dayanabiliyor Alienware m16 R2.
| Alienware x16 R2 P120F Ultra 9 185H, GeForce RTX 4080 Laptop GPU, 90 Wh | Alienware x16 R1 i9-13900HK, GeForce RTX 4080 Laptop GPU, 90 Wh | Alienware m16 R2 Ultra 7 155H, GeForce RTX 4070 Laptop GPU, 90 Wh | Asus ROG Strix Scar 16 G634JZR i9-14900HX, GeForce RTX 4080 Laptop GPU, 90 Wh | Lenovo Legion Pro 7 16IRX9H i9-14900HX, GeForce RTX 4080 Laptop GPU, 99.9 Wh | MSI Vector 16 HX A14V i9-14900HX, GeForce RTX 4080 Laptop GPU, 90 Wh | |
|---|---|---|---|---|---|---|
| Pil Çalışma Süresi | -22% | 153% | 125% | 94% | 72% | |
| WiFi v1.3 (h) | 3.2 | 2.5 -22% | 8.1 153% | 7.2 125% | 6.2 94% | 5.5 72% |
| Reader / Idle (h) | 7.3 | 12.6 | 10.7 | |||
| Load (h) | 0.7 | 1 | 0.9 | 1.4 | ||
| H.264 (h) | 7.5 | |||||
| Witcher 3 ultra (h) | 1 |
Artılar
Eksiler
Karar - Alienware x16 R1 Saf Oyun İçin Daha Hızlı
Alienware x16 R2'nin x16 R1'e göre en büyük avantajı, Windows AI görevlerini hızlandırmak için entegre NPU'ya sahip olmasıdır. Bu tür özelliklerin önümüzdeki yıl içinde Microsoft Co-Pilot ve diğer yapay zeka odaklı uygulamalar aracılığıyla yaygınlaşması bekleniyor. Bununla birlikte, oyun amaçlı olarak, NPU, 2024 itibariyle deneyimi iyileştirmek için masaya hiçbir şey getirmiyor. Aksine, yeni nöral işlemci için değerli kalıp alanı ayrıldığından, geçen yılki x16 R1'deki Core i9-13900HK ile karşılaştırıldığında ham CPU performansı düştüğü için tartışmalı bir şekilde zararlıdır.
Alienware x16 R2, gelecekteki Windows AI özellikleriyle uyumluluk için entegre bir NPU'ya sahip yeni Meteor Lake-H CPU'ları sunuyor. Ne yazık ki, ham oyun performansı bunun sonucunda zarar gördü.
Genel olarak daha yavaş performans, orijinal lansman modelinden daha düşük güç tüketimine ve daha uzun çalışma sürelerine yol açmıştır. Bununla birlikte, Alienware satın almayı seven hedef oyun meraklıları muhtemelen pil ömrü için performanstan ödün verme konusunda çok heyecanlı değillerdir. Böyle bir hamle alt uçta daha kabul edilebilir olurdu Dell G serisi onun yerine.
Orijinali dikkate almanızı öneririz Alienware x16 R1 x16 R2 yeni GPU seçenekleri, ekran seçenekleri, hatta kasa renkleri veya harici değişiklikler sunmadığından. CPU güncellemesi yalnızca entegre NPU ile çalışma alanlarını "geleceğe hazırlamak" isteyenler için arzu edilir.
Fiyat ve Bulunabilirlik
Dell, Alienware x16 R2'yi Core Ultra 7, GeForce RTX 4060, standart klavye ve 1600p240 IPS yapılandırması için 2100 $'dan başlayan fiyatlarla veya Core Ultra 9, RTX 4090 ve mekanik klavye ile yapılandırılmışsa 3500 $'a kadar sevk ediyor.
Alienware x16 R2 P120F
- 05/29/2024 v7 (old)
Allen Ngo
Şeffaflık
İncelenecek cihazların seçimi editör ekibimiz tarafından yapılır. Test örneği, bu incelemenin amacı doğrultusunda üretici veya perakendeci tarafından yazara ödünç olarak sağlanmıştır. Borç verenin bu inceleme üzerinde herhangi bir etkisi olmadığı gibi, üretici de yayınlanmadan önce bu incelemenin bir kopyasını almamıştır. Bu incelemeyi yayınlama zorunluluğu yoktu. Bağımsız bir medya şirketi olarak Notebookcheck, üreticilerin, perakendecilerin veya yayıncıların otoritesine tabi değildir.
Notebookcheck bu şekilde test yapıyor
Notebookcheck, tüm sonuçların karşılaştırılabilir olmasını sağlamak için her yıl yüzlerce dizüstü bilgisayarı ve akıllı telefonu standart prosedürler kullanarak bağımsız olarak inceliyor. Yaklaşık 20 yıldır test yöntemlerimizi sürekli olarak geliştirdik ve bu süreçte endüstri standartlarını belirledik. Test laboratuvarlarımızda deneyimli teknisyenler ve editörler tarafından yüksek kaliteli ölçüm ekipmanları kullanılmaktadır. Bu testler çok aşamalı bir doğrulama sürecini içerir. Karmaşık derecelendirme sistemimiz, nesnelliği koruyan yüzlerce sağlam temellere dayanan ölçüm ve kıyaslamaya dayanmaktadır.Price comparison

