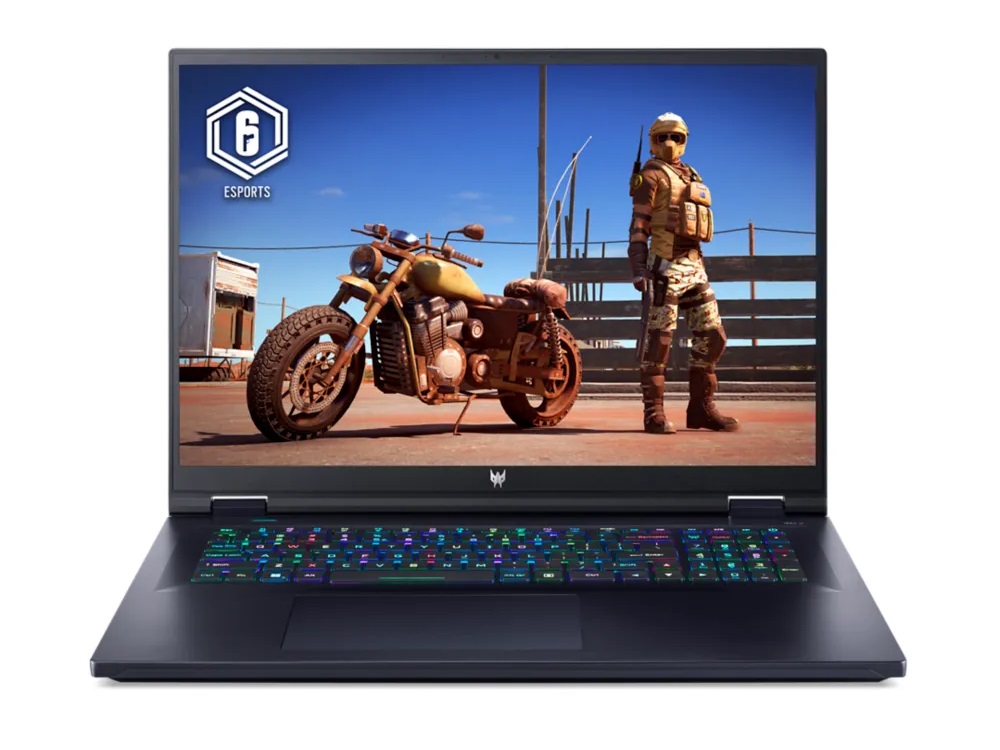
Acer Predator Helios 18 2024 dizüstü bilgisayar incelemesi: 18 inçlik oyuncular için yeni donanım

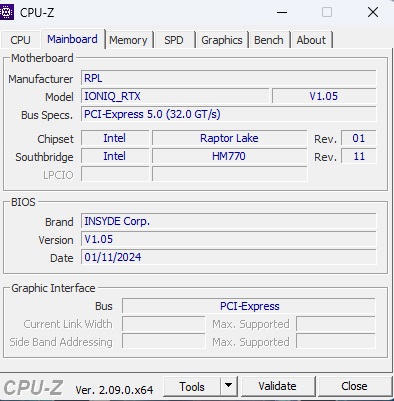
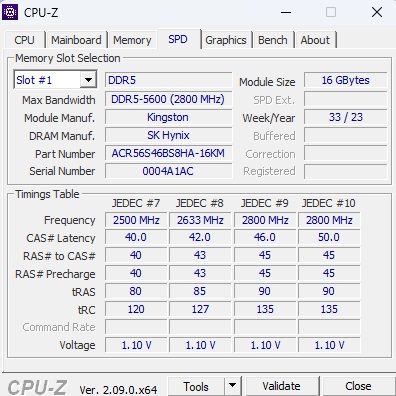
2023 yılında Acer 18 inçlik dizüstü bilgisayarlar satmaya başladı. Bizim ilk test cihazı ile donatılmıştı Core i9-13900HX ve bir GeForce RTX 4080halef modelin test konfigürasyonunda bir Core i9-14900HX ve bir GeForce RTX 4090. Değişmeyen tek şey, dizüstü bilgisayarın neredeyse hiç ödün vermeden etkileyici olan güçlü Mini-LED paneli (daha fazlası yakında). Acer, 2x 16 GB DDR5-5600 RAM ve her biri 1 TB depolama alanına sahip iki RAID-0 formatlı NVMe-SSD (M.2 2280) kurdu. Test sırasında dizüstü bilgisayar henüz Amerika Birleşik Devletleri'nde mevcut değildi, bu nedenle MRSP'si hakkında henüz herhangi bir bilgi veremiyoruz.
Predator Helios 18'in rakipleri arasında aşağıdaki gibi 18 inçlik oyuncular bulunmaktadır MSI Titan 18 HX A14, the Asus ROG Strix Scar 18 G834 ve Alienware m18 R1-Bunların hepsi tablolarda karşılaştırma cihazları olarak listelenmiştir.
Karşılaştırmalı olarak olası rakipler
Derecelendirme | Tarih | Modeli | Ağırlık | Yükseklik | Boyut | Çözünürlük | Fiyat |
|---|---|---|---|---|---|---|---|
| 87.1 % v7 (old) | 03/2024 | Acer Predator Helios 18 PH18-72-98MW i9-14900HX, GeForce RTX 4090 Laptop GPU | 3.3 kg | 29.5 mm | 18.00" | 2560x1600 | |
| 88.8 % v7 (old) | 01/2024 | MSI Titan 18 HX A14VIG i9-14900HX, GeForce RTX 4090 Laptop GPU | 3.6 kg | 32.1 mm | 18.00" | 3840x2400 | |
| 88.3 % v7 (old) | 02/2024 | Asus ROG Strix Scar 18 G834JYR (2024) i9-14900HX, GeForce RTX 4090 Laptop GPU | 3.1 kg | 30.8 mm | 18.00" | 2560x1600 | |
| 88.3 % v7 (old) | 10/2023 | Acer Predator Helios 18 N23Q2 i9-13900HX, GeForce RTX 4080 Laptop GPU | 3.2 kg | 29.15 mm | 18.00" | 2560x1600 | |
| 89.2 % v7 (old) | 11/2023 | Alienware m18 R1 AMD R9 7945HX, Radeon RX 7900M | 3.9 kg | 26.7 mm | 18.00" | 1920x1200 |
Dava
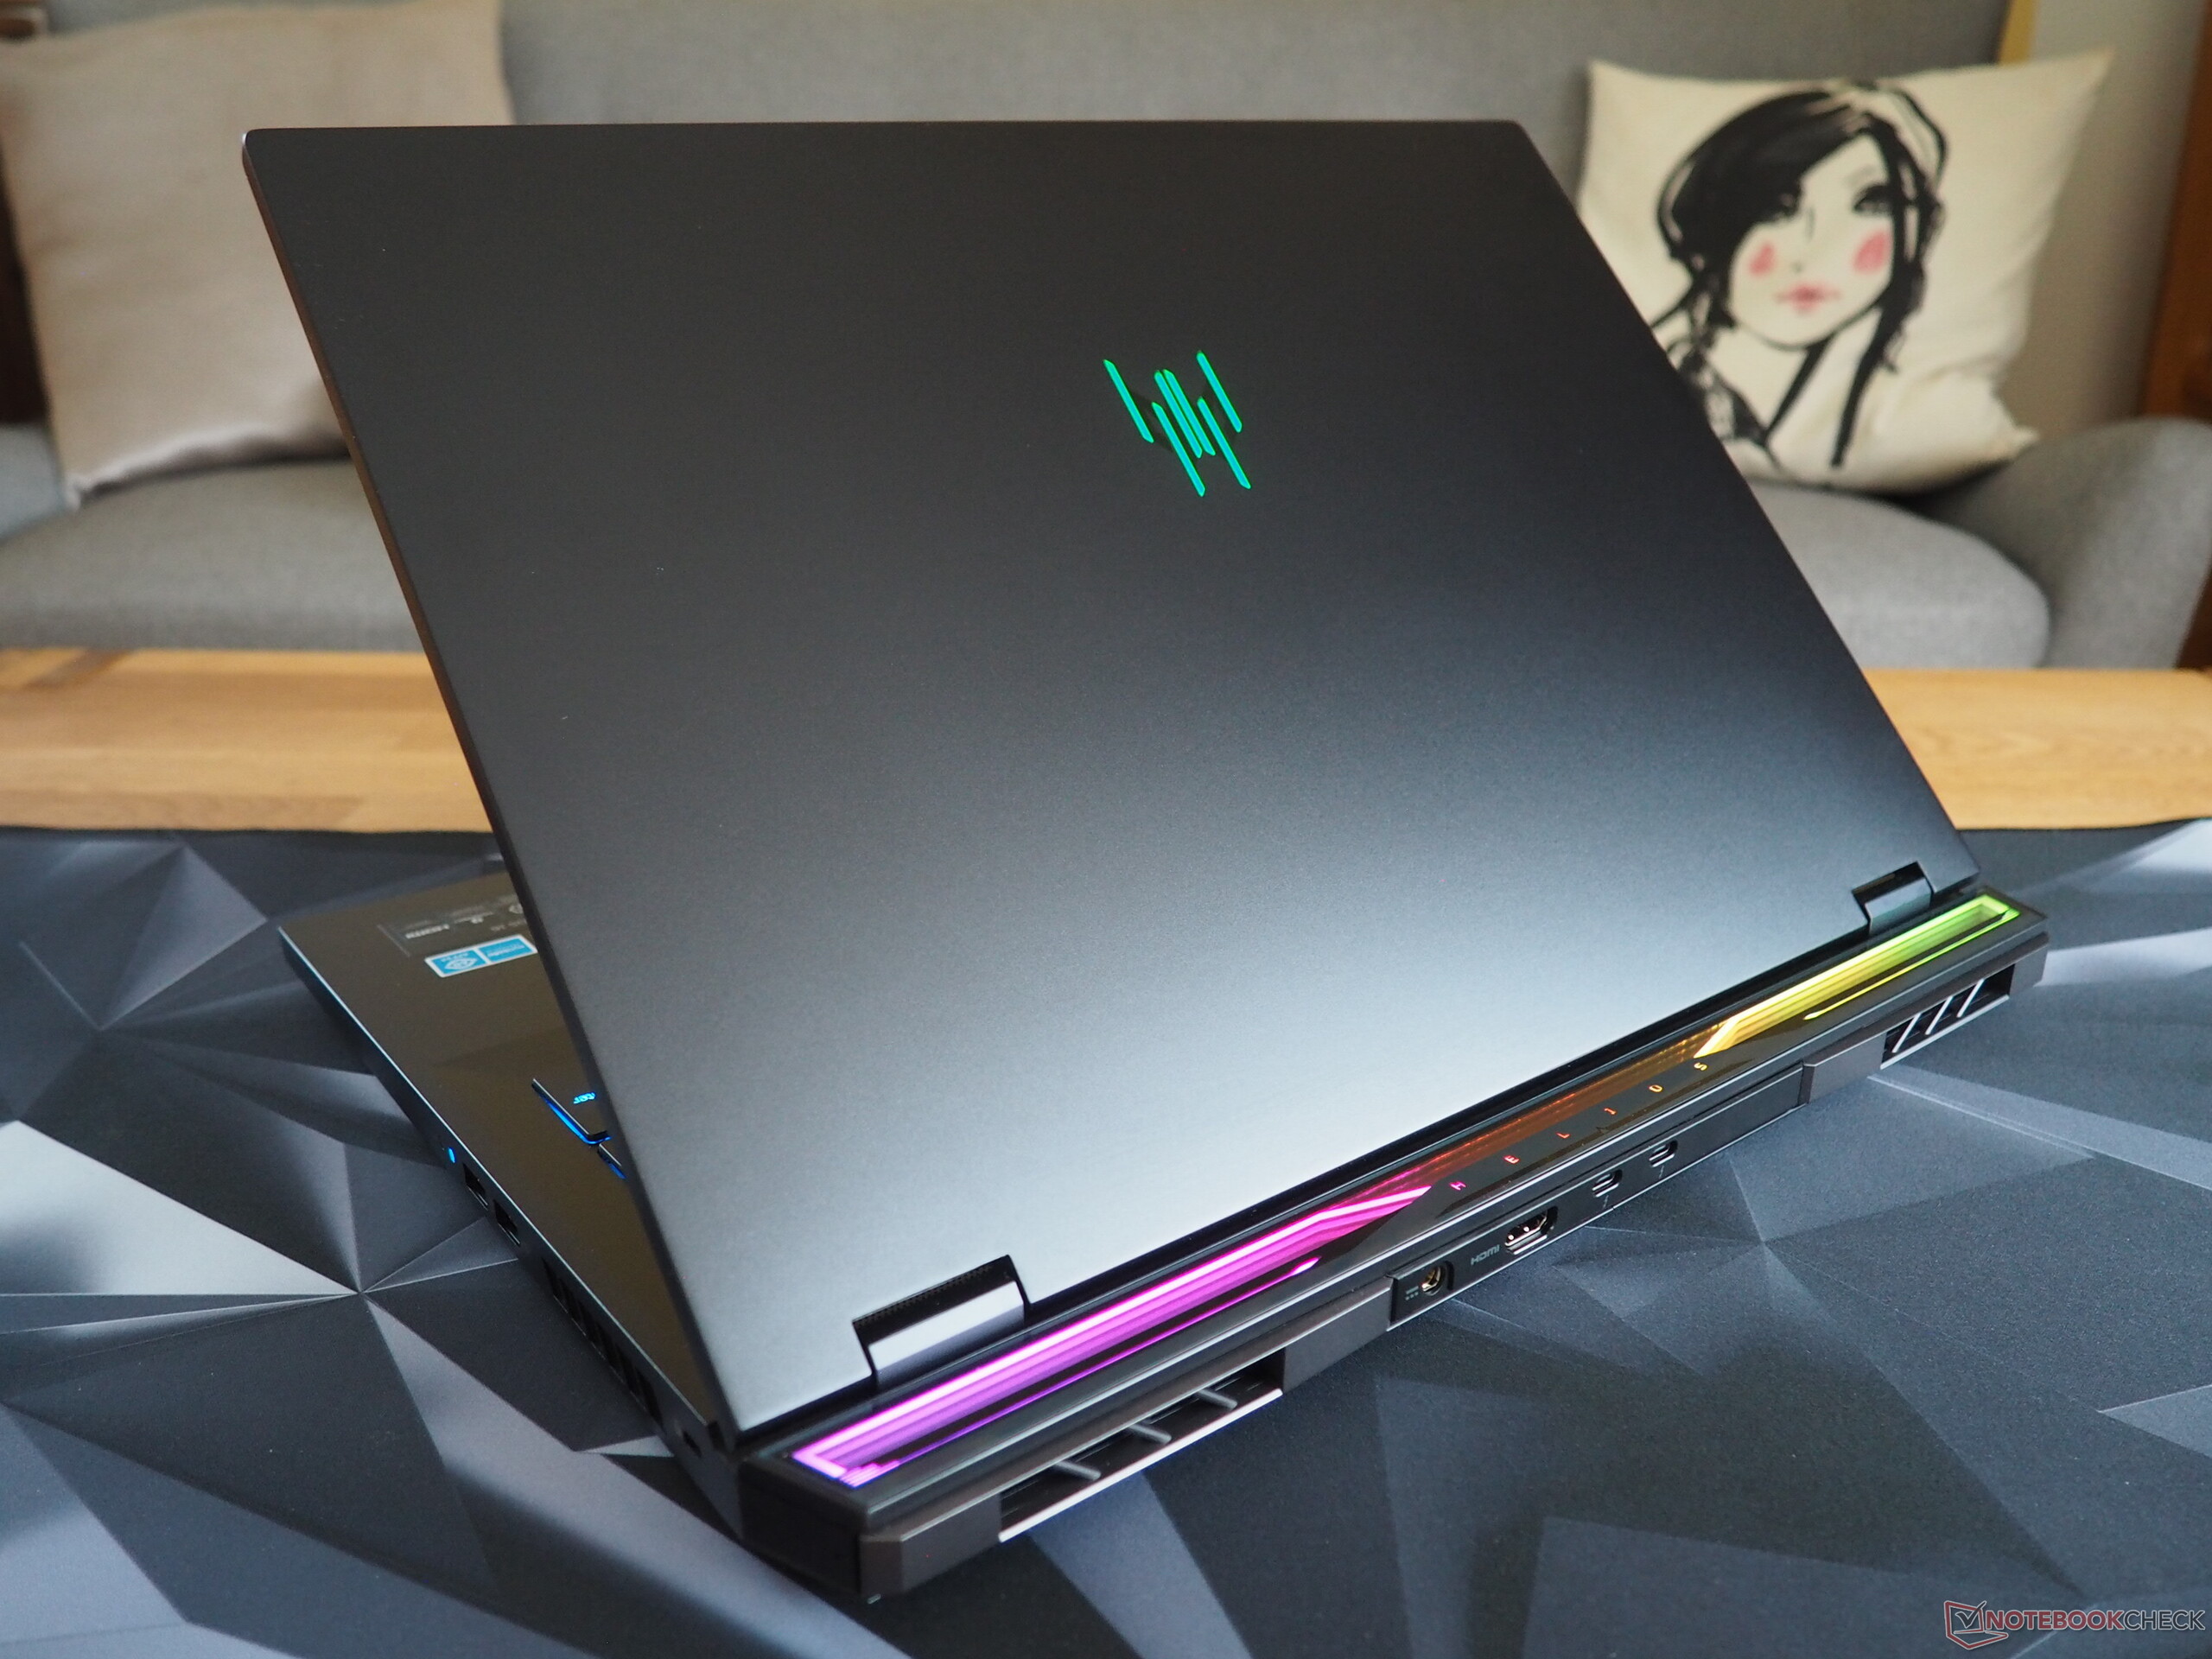
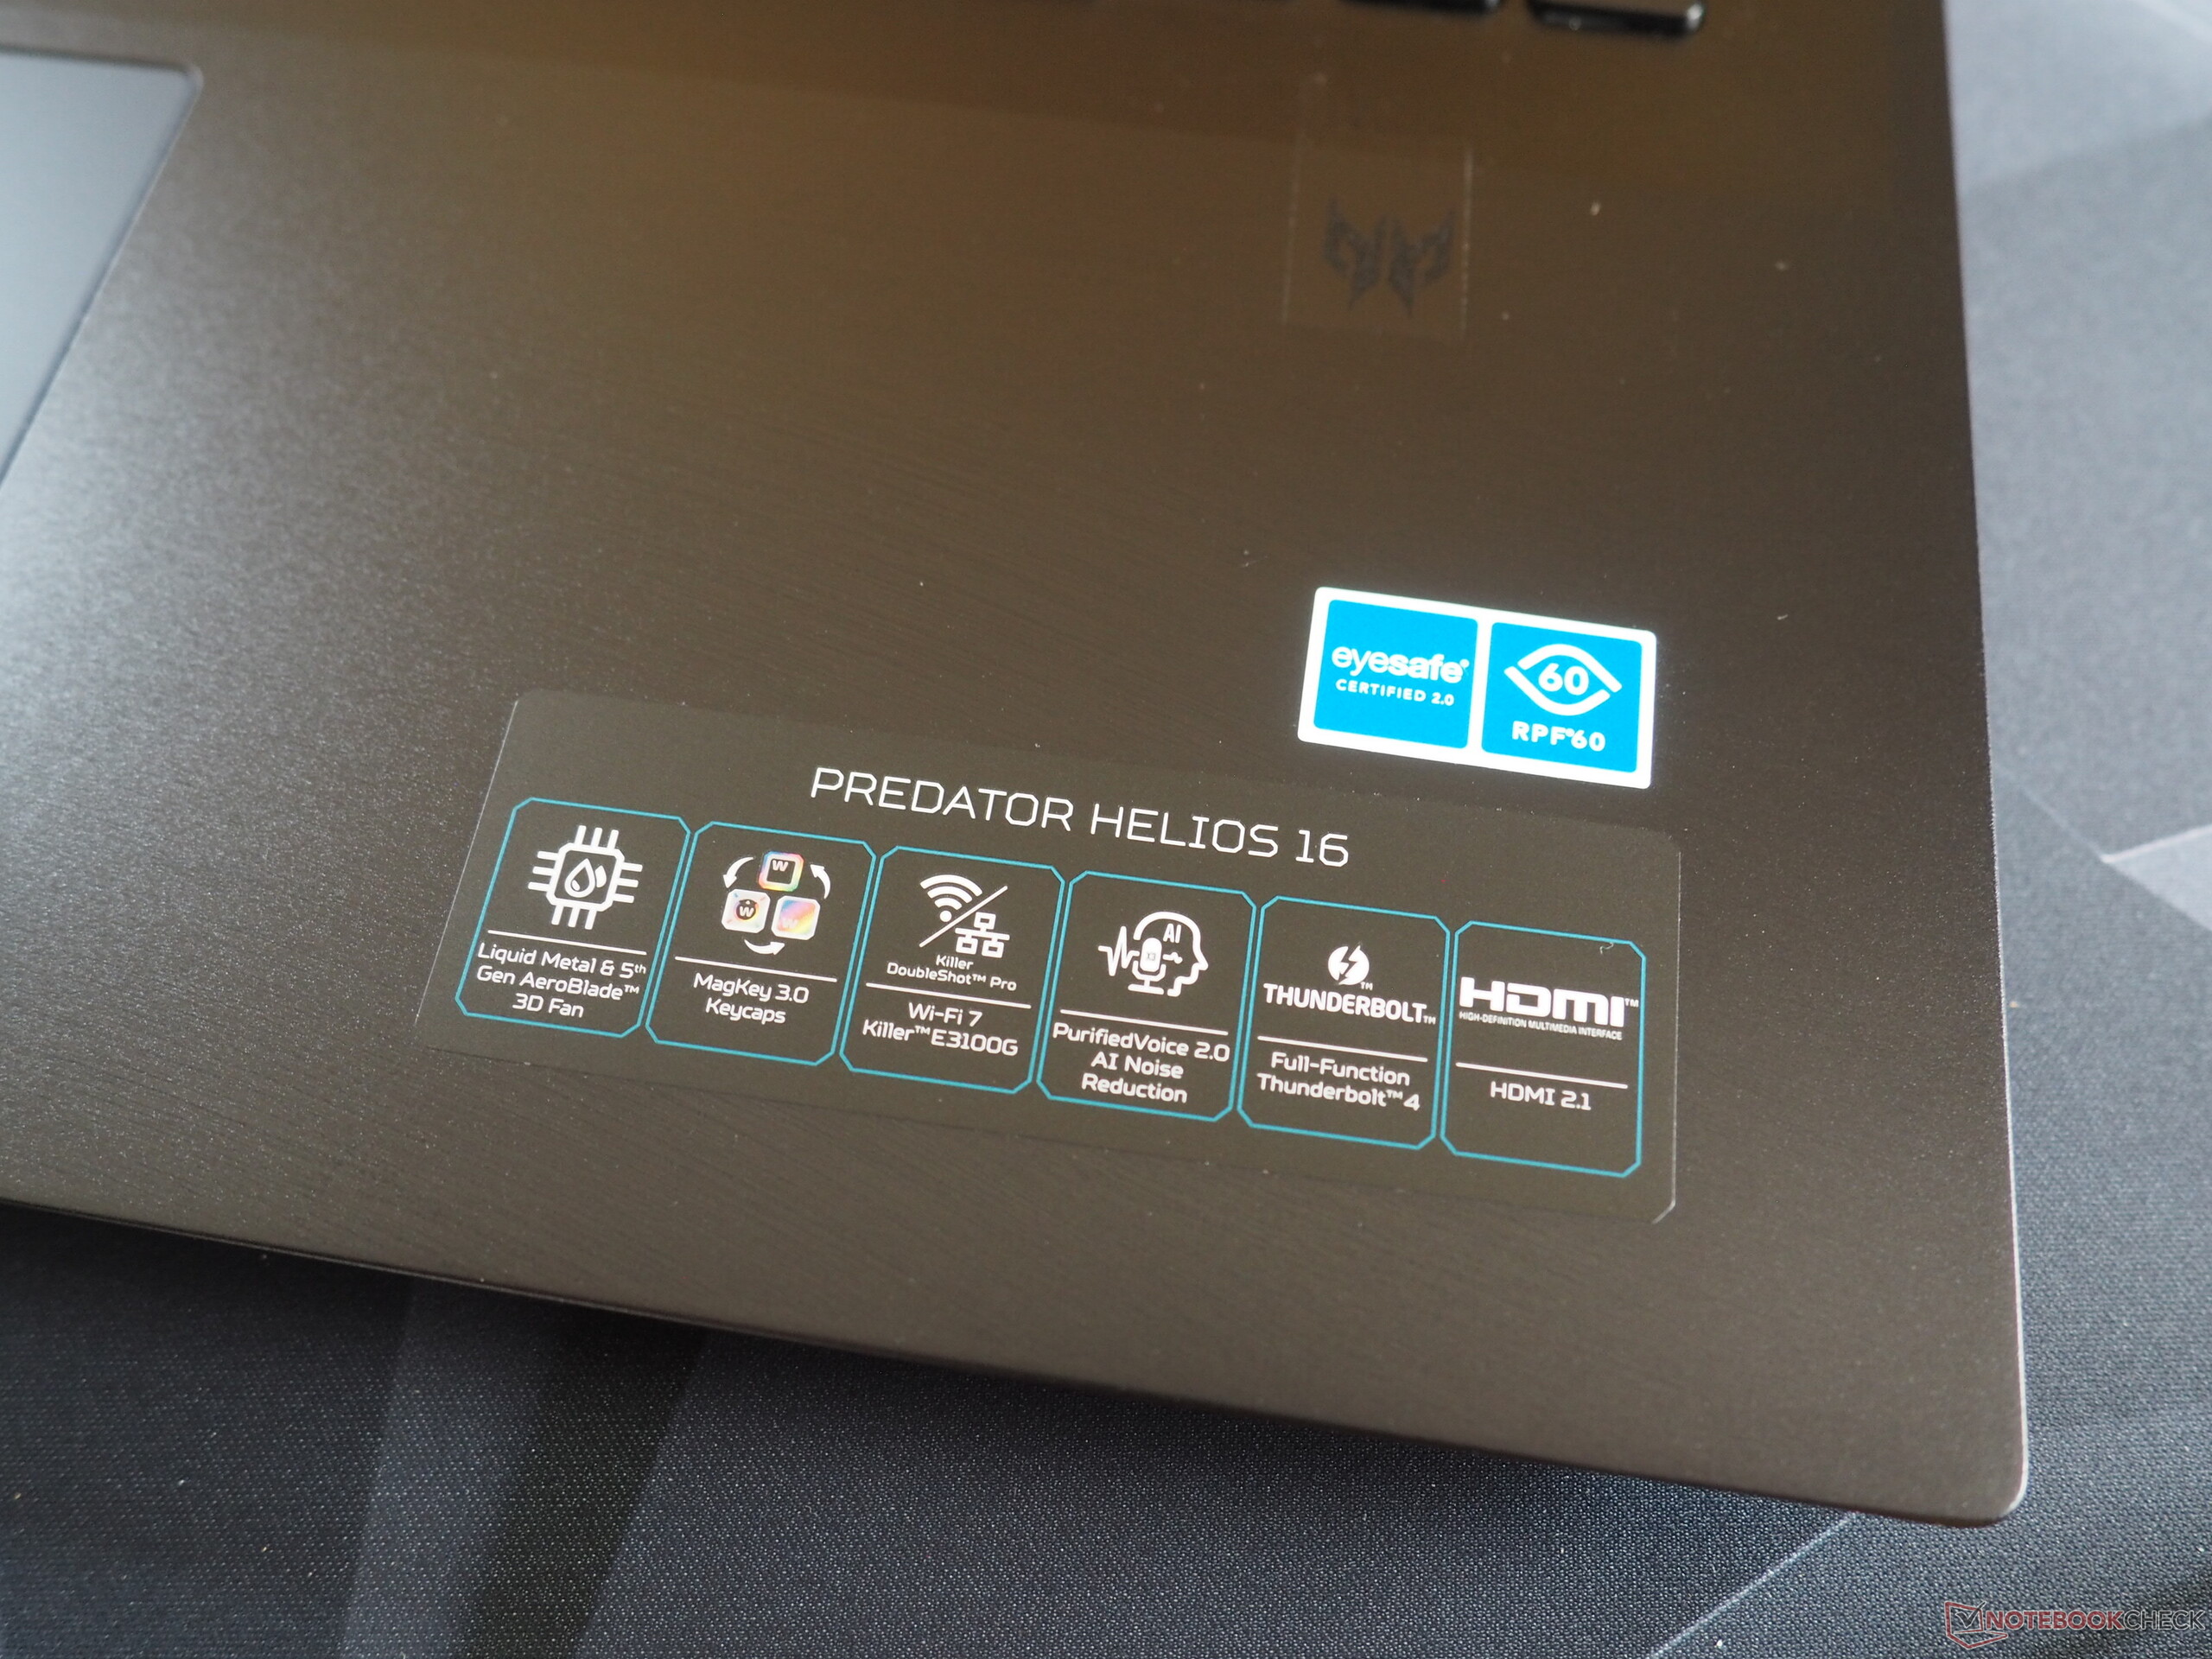
Cihazın kasası söz konusu olduğunda, Acer selefine sadık kalmış olsa da daha yakından baktığınızda birkaç değişiklik fark etmeye başlıyorsunuz. Üretici klavye modelini değiştirdi ve arka taraftaki şık ışık şeridini yeniden tasarladı. Dizüstü bilgisayar, kapağı ve ana ünitesinin üst kısmı metalden yapıldığı için yüksek kalite hissi vermeye devam ediyor. Cihazın yapısı hakkında da olumsuz bir şey söyleyemeyiz. Acer'ın dizüstü bilgisayarın menteşelerini iyileştirmesi gerekiyor, zira zaman zaman biraz sallanabiliyorlar. Kapak daha sağlam olabilir ve yeterince sert bastırdığınızda klavyenin bazı kısımları içeri itilebilir, ancak yine de kasasını sağlam olarak değerlendirebiliriz. Tasarımı ne donuk ne de aşırı eğlenceli.

Predator Helios 18, ağırlığı bakımından ortalama bir seviyede. Ağırlığı 3,3 kg ile Asus ROG Strix Scar 18'den daha fazla ancak MSI Titan 18 ve Alienware m18'den daha az.
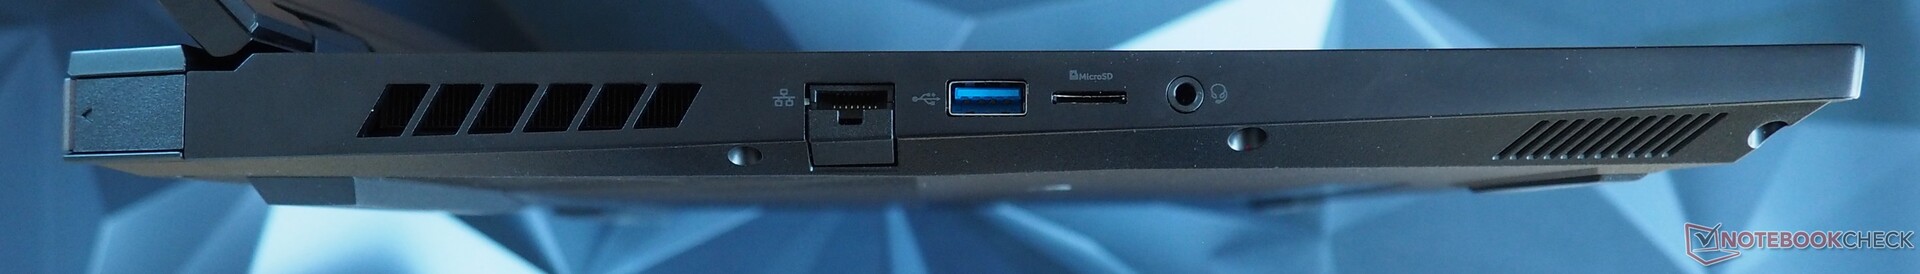
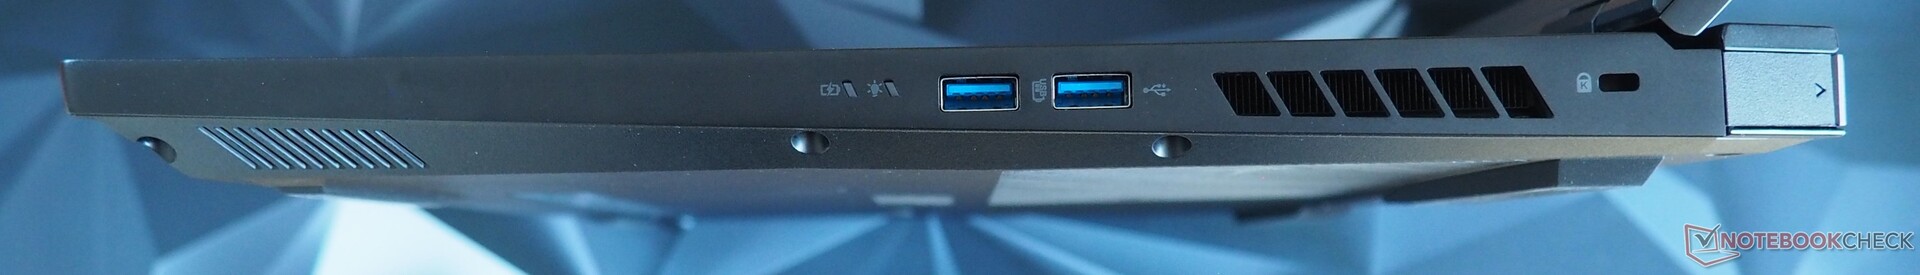
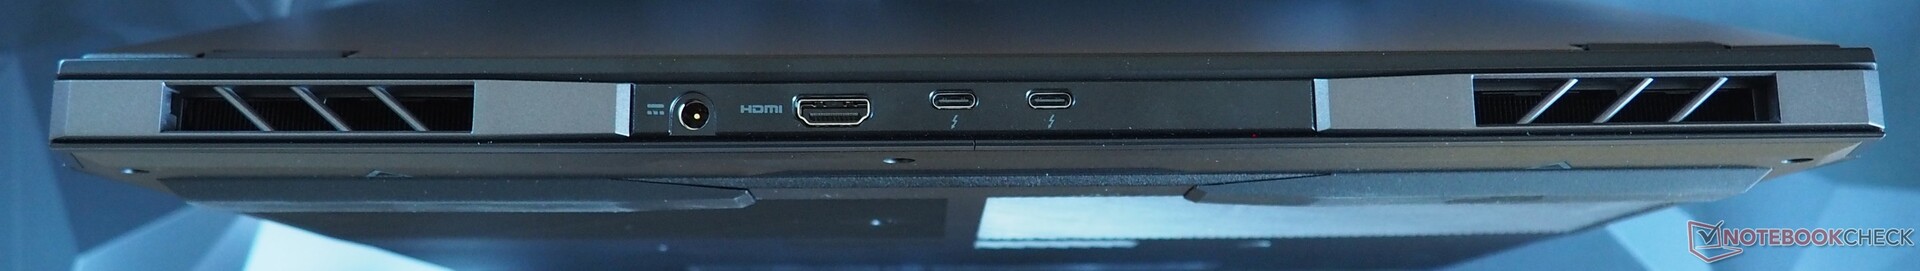
Bağlanabilirlik
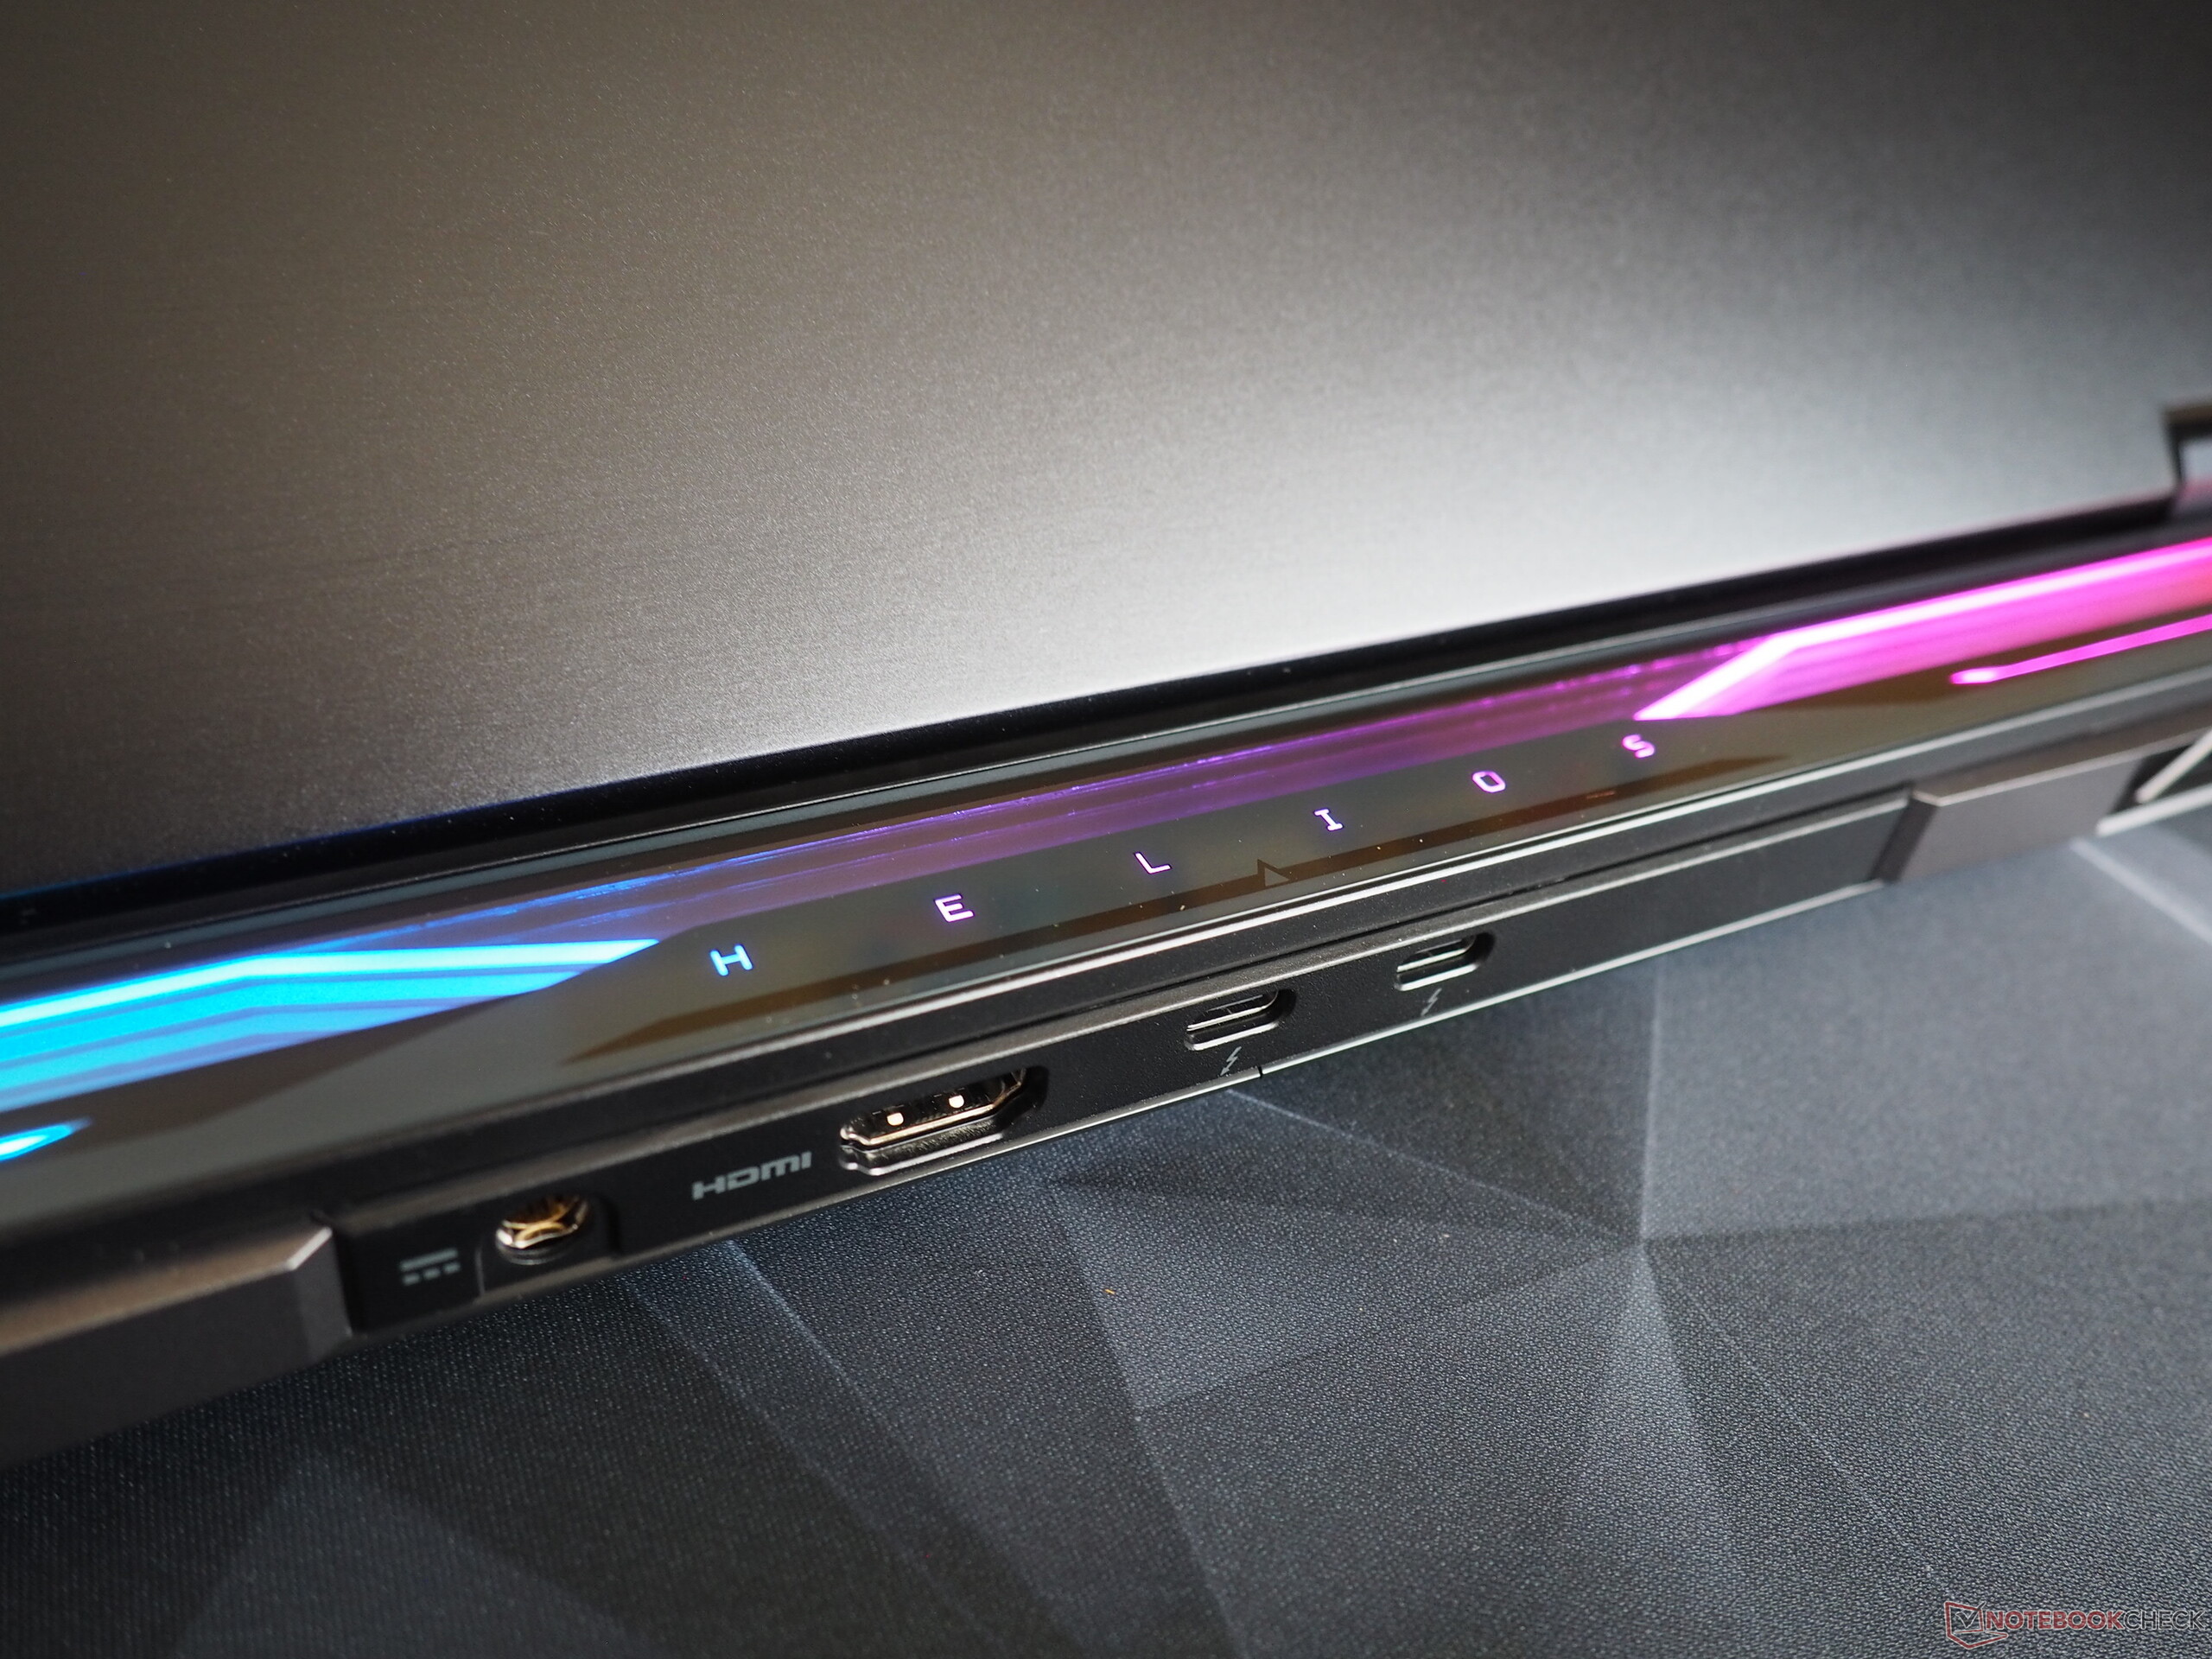
Cihazın bağlantı seçenekleri modern. Arka tarafta bir HDMI 2.1 çıkışı ve iki Thunderbolt 4 bağlantı noktası (DisplayPort ve Güç Dağıtımı dahil) bulunurken, sağ tarafta iki USB 3.2 Gen-2 bağlantı noktası (Tip A) ve Kensington kilidi için bir yuva yer alıyor. Bu paket, sol tarafta bir RJ45 portu, bir USB 3.0 portu (Tip A), bir microSD kart okuyucu ve bir ses jakı ile tamamlanmaktadır.
SD kart okuyucu
Kurulu kart okuyucu vasat hızlara ulaşıyor. Sadece referans kartımızı belli bir ölçüde kullanabilen Alienware m18 bu açıdan bizi etkiledi.
| SD Card Reader | |
| average JPG Copy Test (av. of 3 runs) | |
| Alienware m18 R1 AMD (Toshiba Exceria Pro SDXC 64 GB UHS-II) | |
| Sınıf ortalaması Gaming (20.9 - 210, n=54, son 2 yıl) | |
| Acer Predator Helios 18 PH18-72-98MW (AV PRO microSD 128 GB V60) | |
| MSI Titan 18 HX A14VIG (Toshiba Exceria Pro SDXC 64 GB UHS-II) | |
| Acer Predator Helios 18 N23Q2 | |
| maximum AS SSD Seq Read Test (1GB) | |
| Alienware m18 R1 AMD (Toshiba Exceria Pro SDXC 64 GB UHS-II) | |
| Sınıf ortalaması Gaming (25.5 - 261, n=51, son 2 yıl) | |
| MSI Titan 18 HX A14VIG (Toshiba Exceria Pro SDXC 64 GB UHS-II) | |
| Acer Predator Helios 18 PH18-72-98MW (AV PRO microSD 128 GB V60) | |
| Acer Predator Helios 18 N23Q2 | |
İletişim
Yeni Helios 18, uygun donanım eksikliği nedeniyle yalnızca sınırlı ölçüde test edebildiğimiz son teknoloji bir Wi-Fi 7 çipine sahiptir. Standart testlerimizde, Wi-Fi modülü sağlam performanstan (gönderme) çok iyi performansa (alma) kadar her şeyi sağladı.
Web kamerası
Full HD çözünürlüğü sayesinde, yüklü web kamerası çoğu dizüstü bilgisayardan biraz daha nettir; ancak çoğu zaman olduğu gibi, renk doğruluğu söz konusu olduğunda hala iyileştirme için yer vardır.

")
")
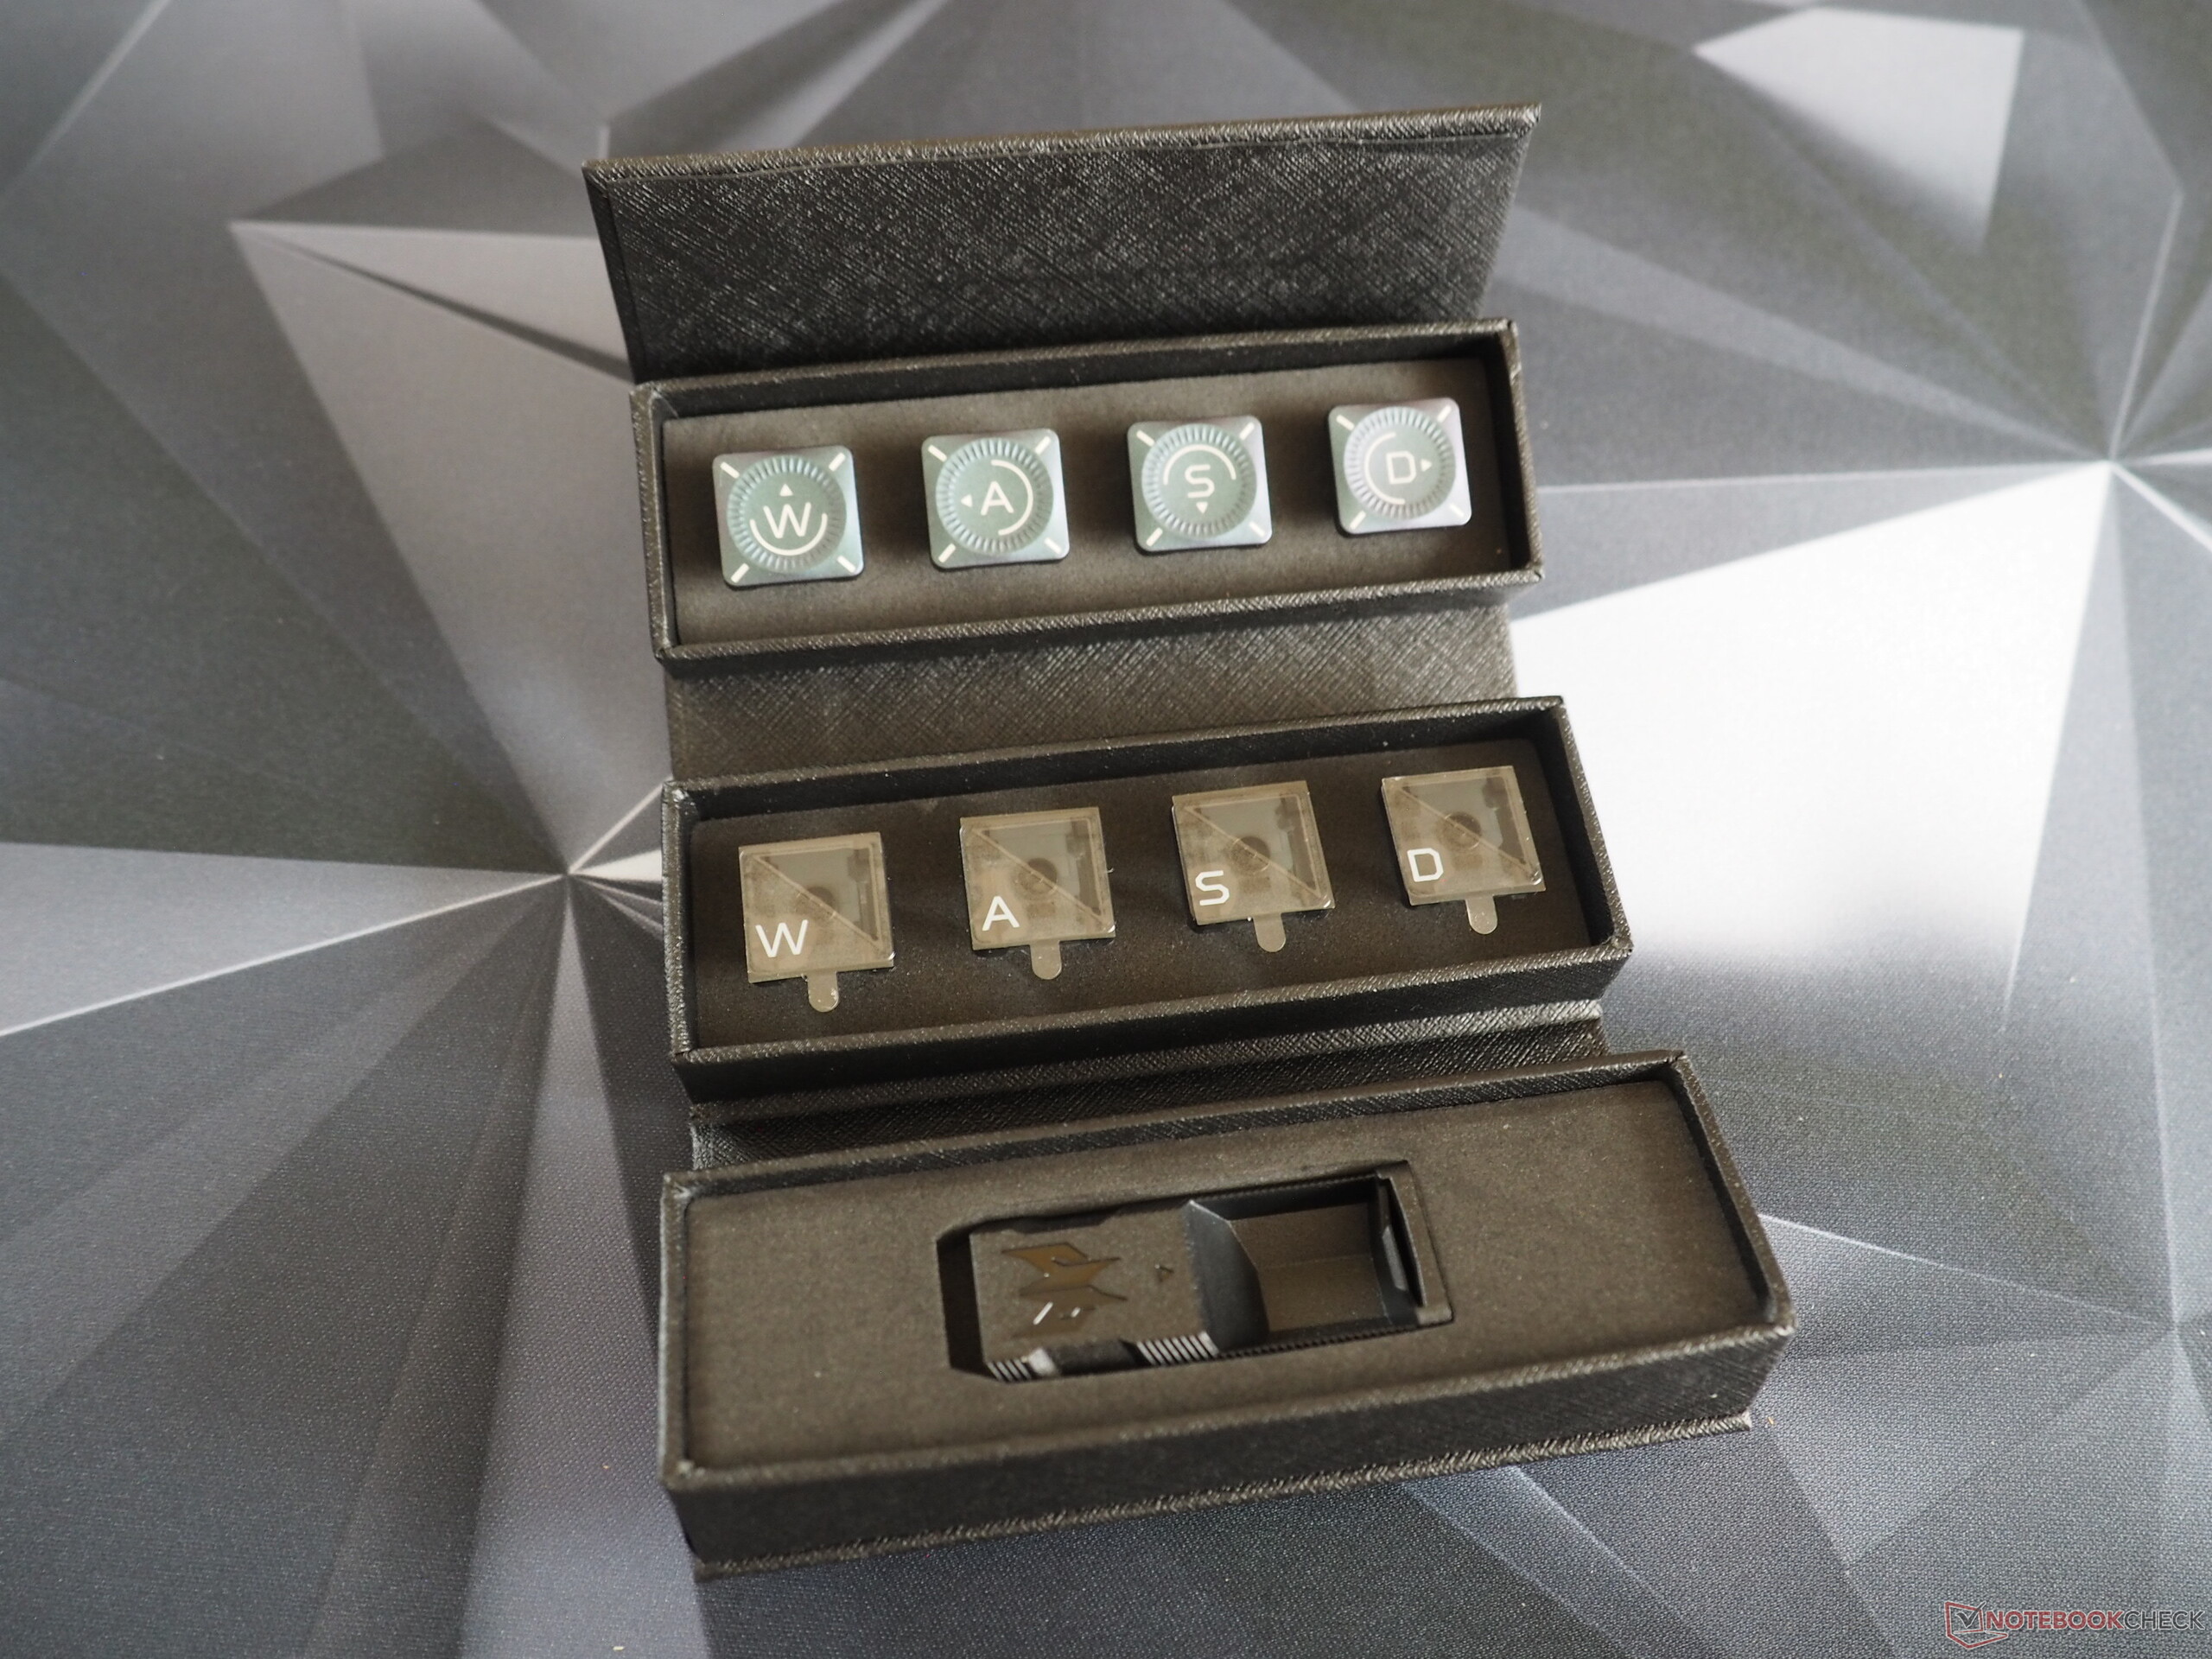
Aksesuarlar
Predator Helios 18 ilginç bir özelliğe sahiptir: Kutusunda yalnızca cihazın arkası için değiştirilebilir fan ızgaraları değil, aynı zamanda iki farklı WASD tuş seti ve bazı tuş kolları da bulunuyor. Beklendiği gibi, birlikte verilen 330 watt'lık güç kaynağı ünitesi oldukça hacimli.
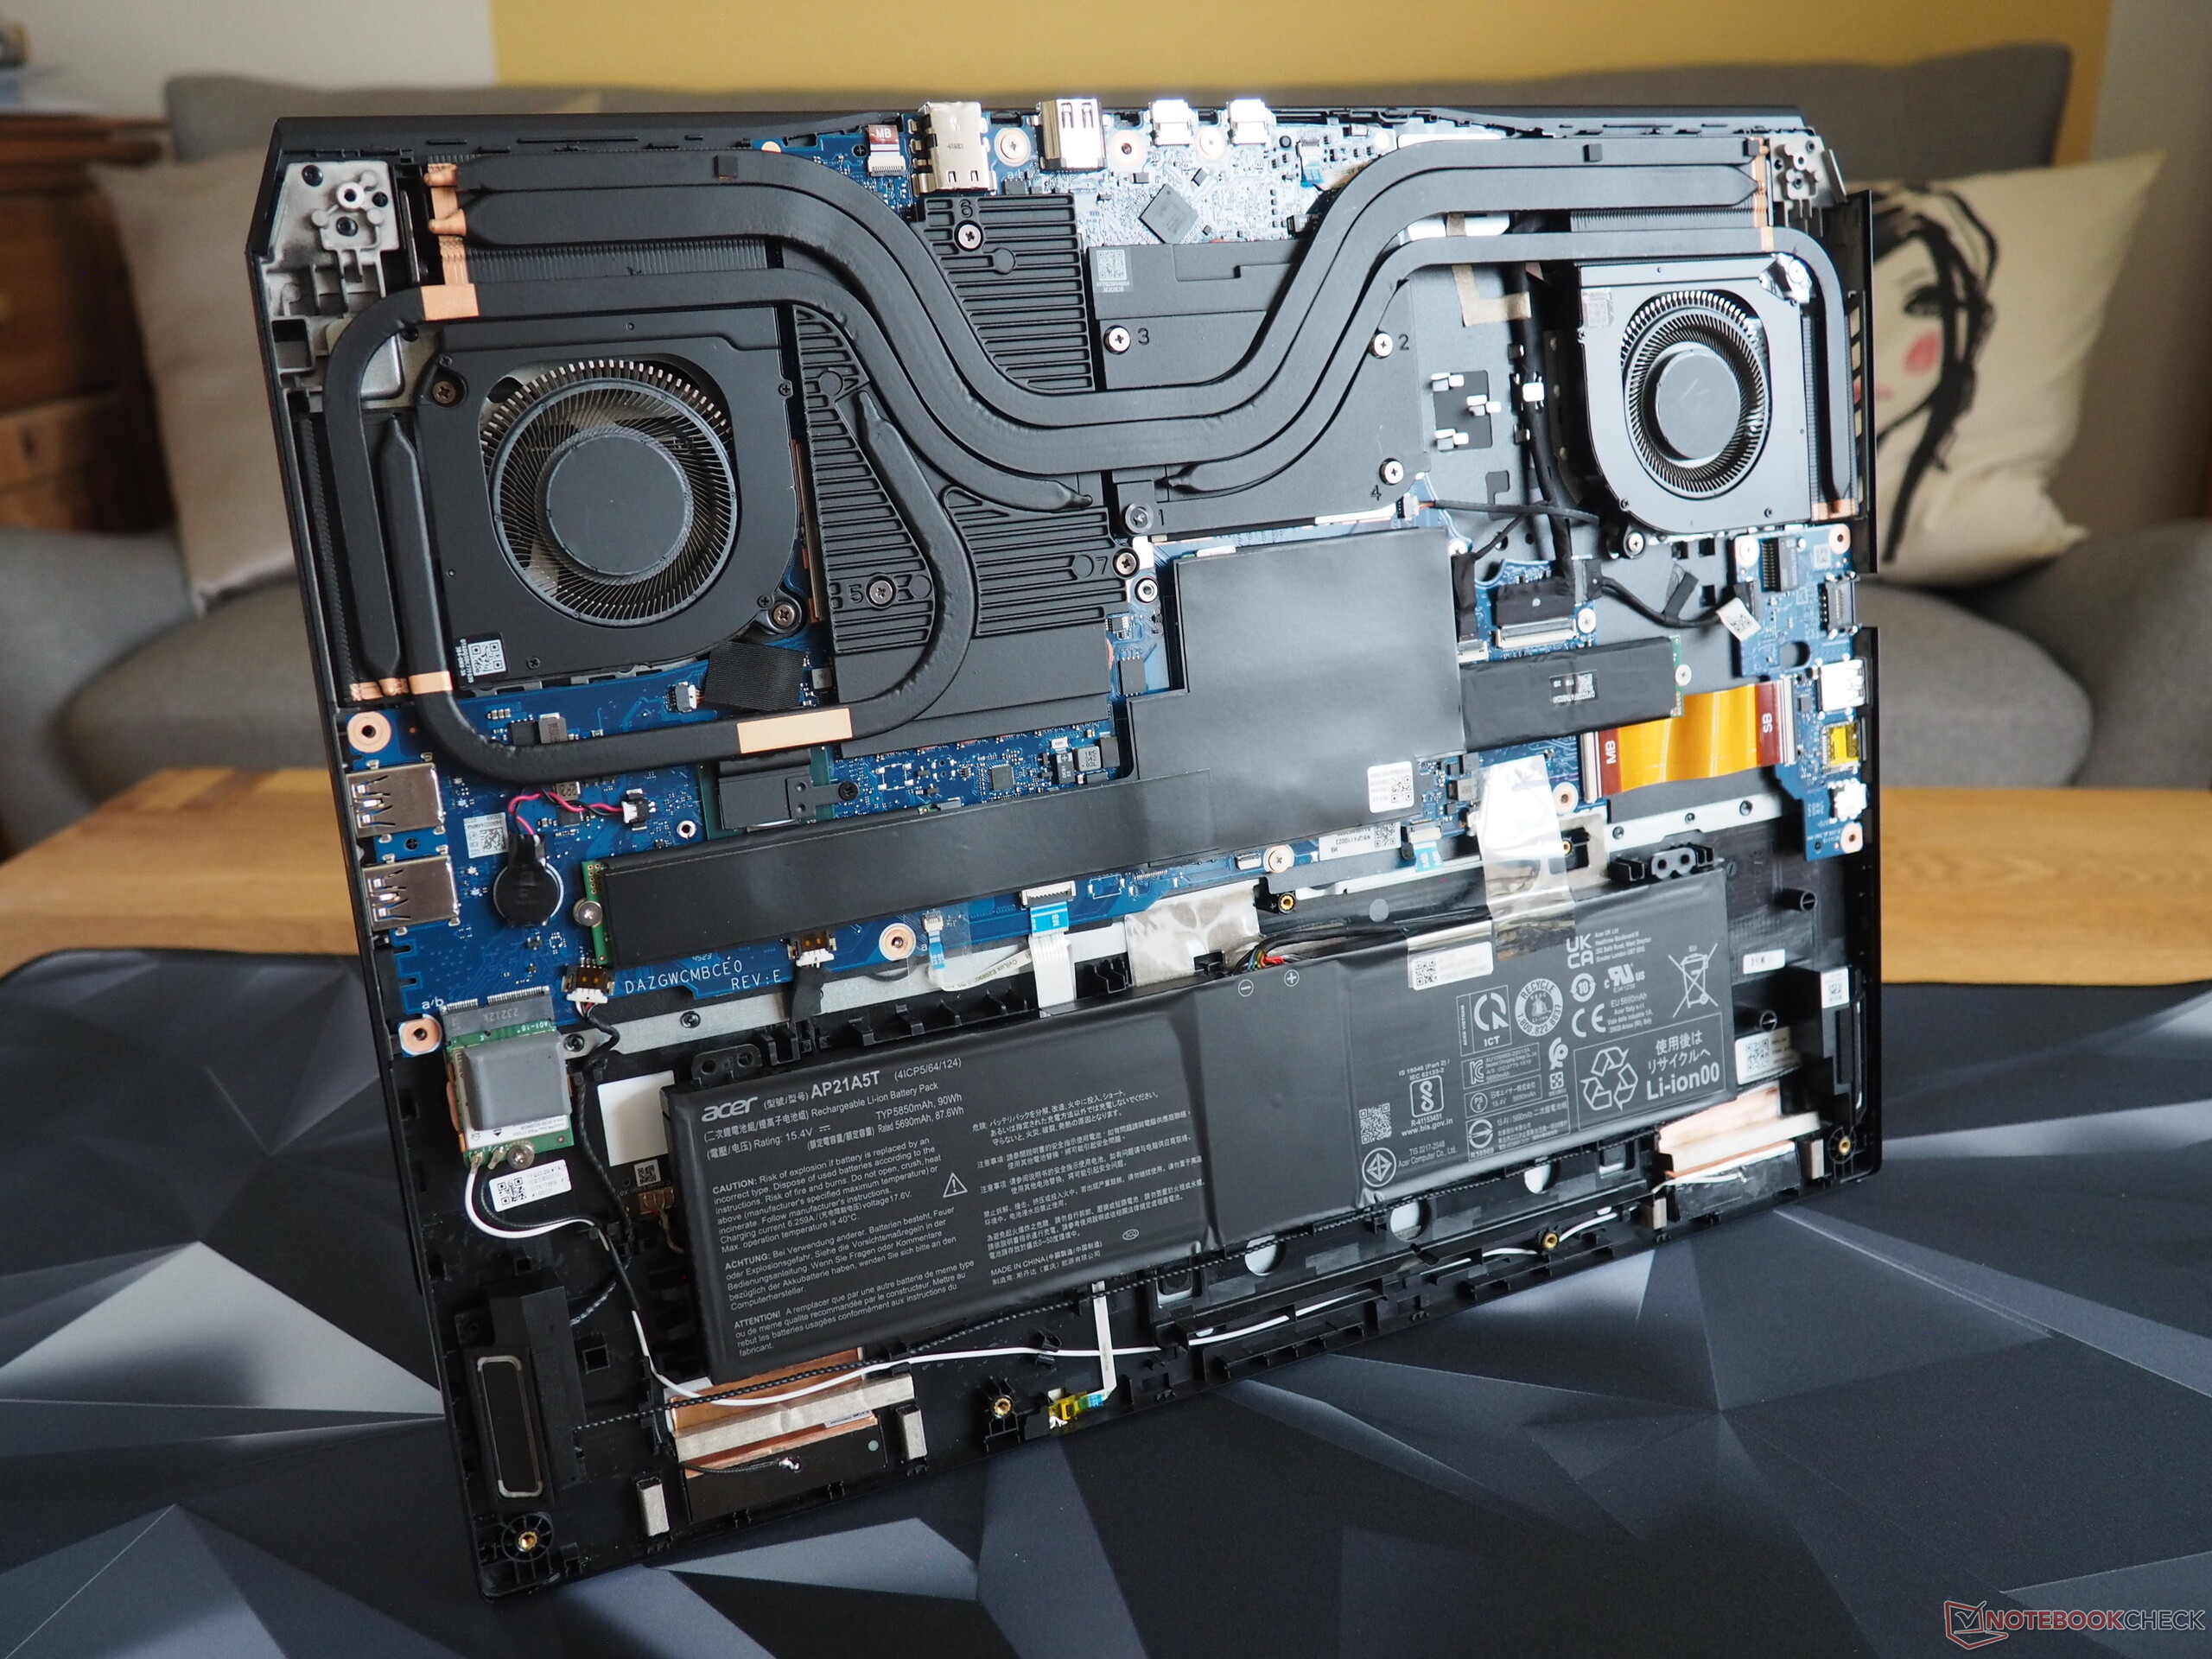
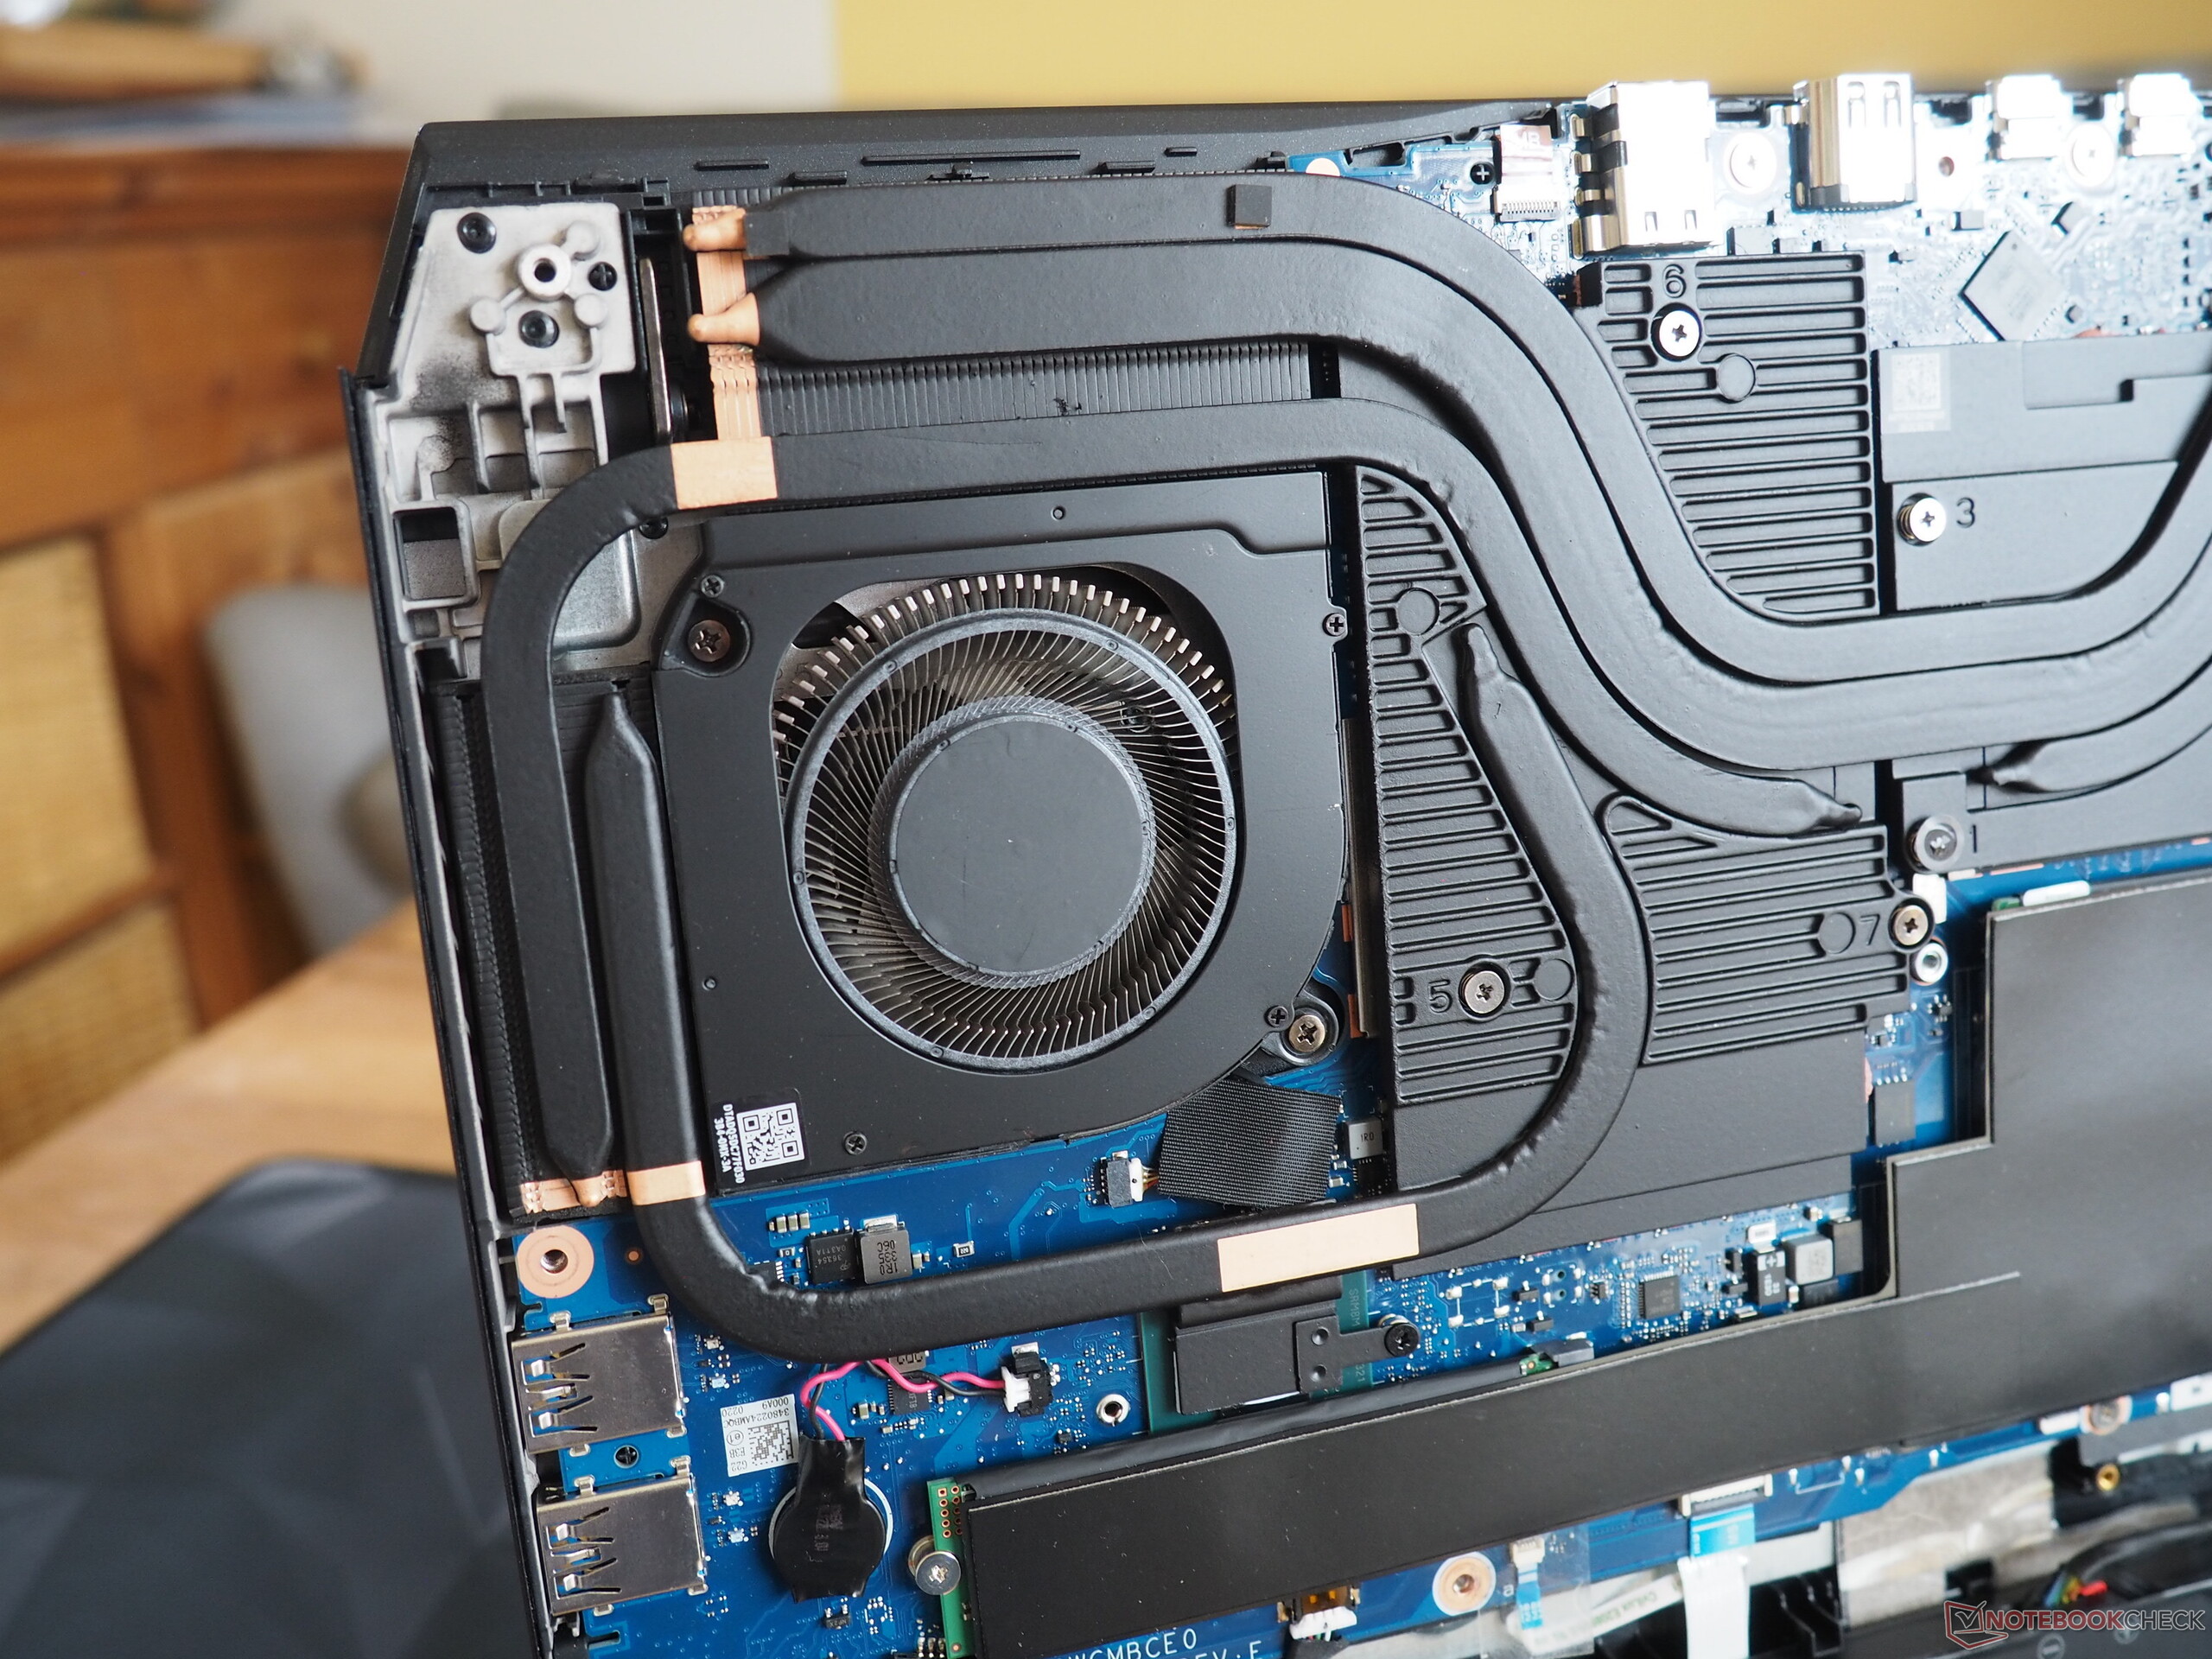
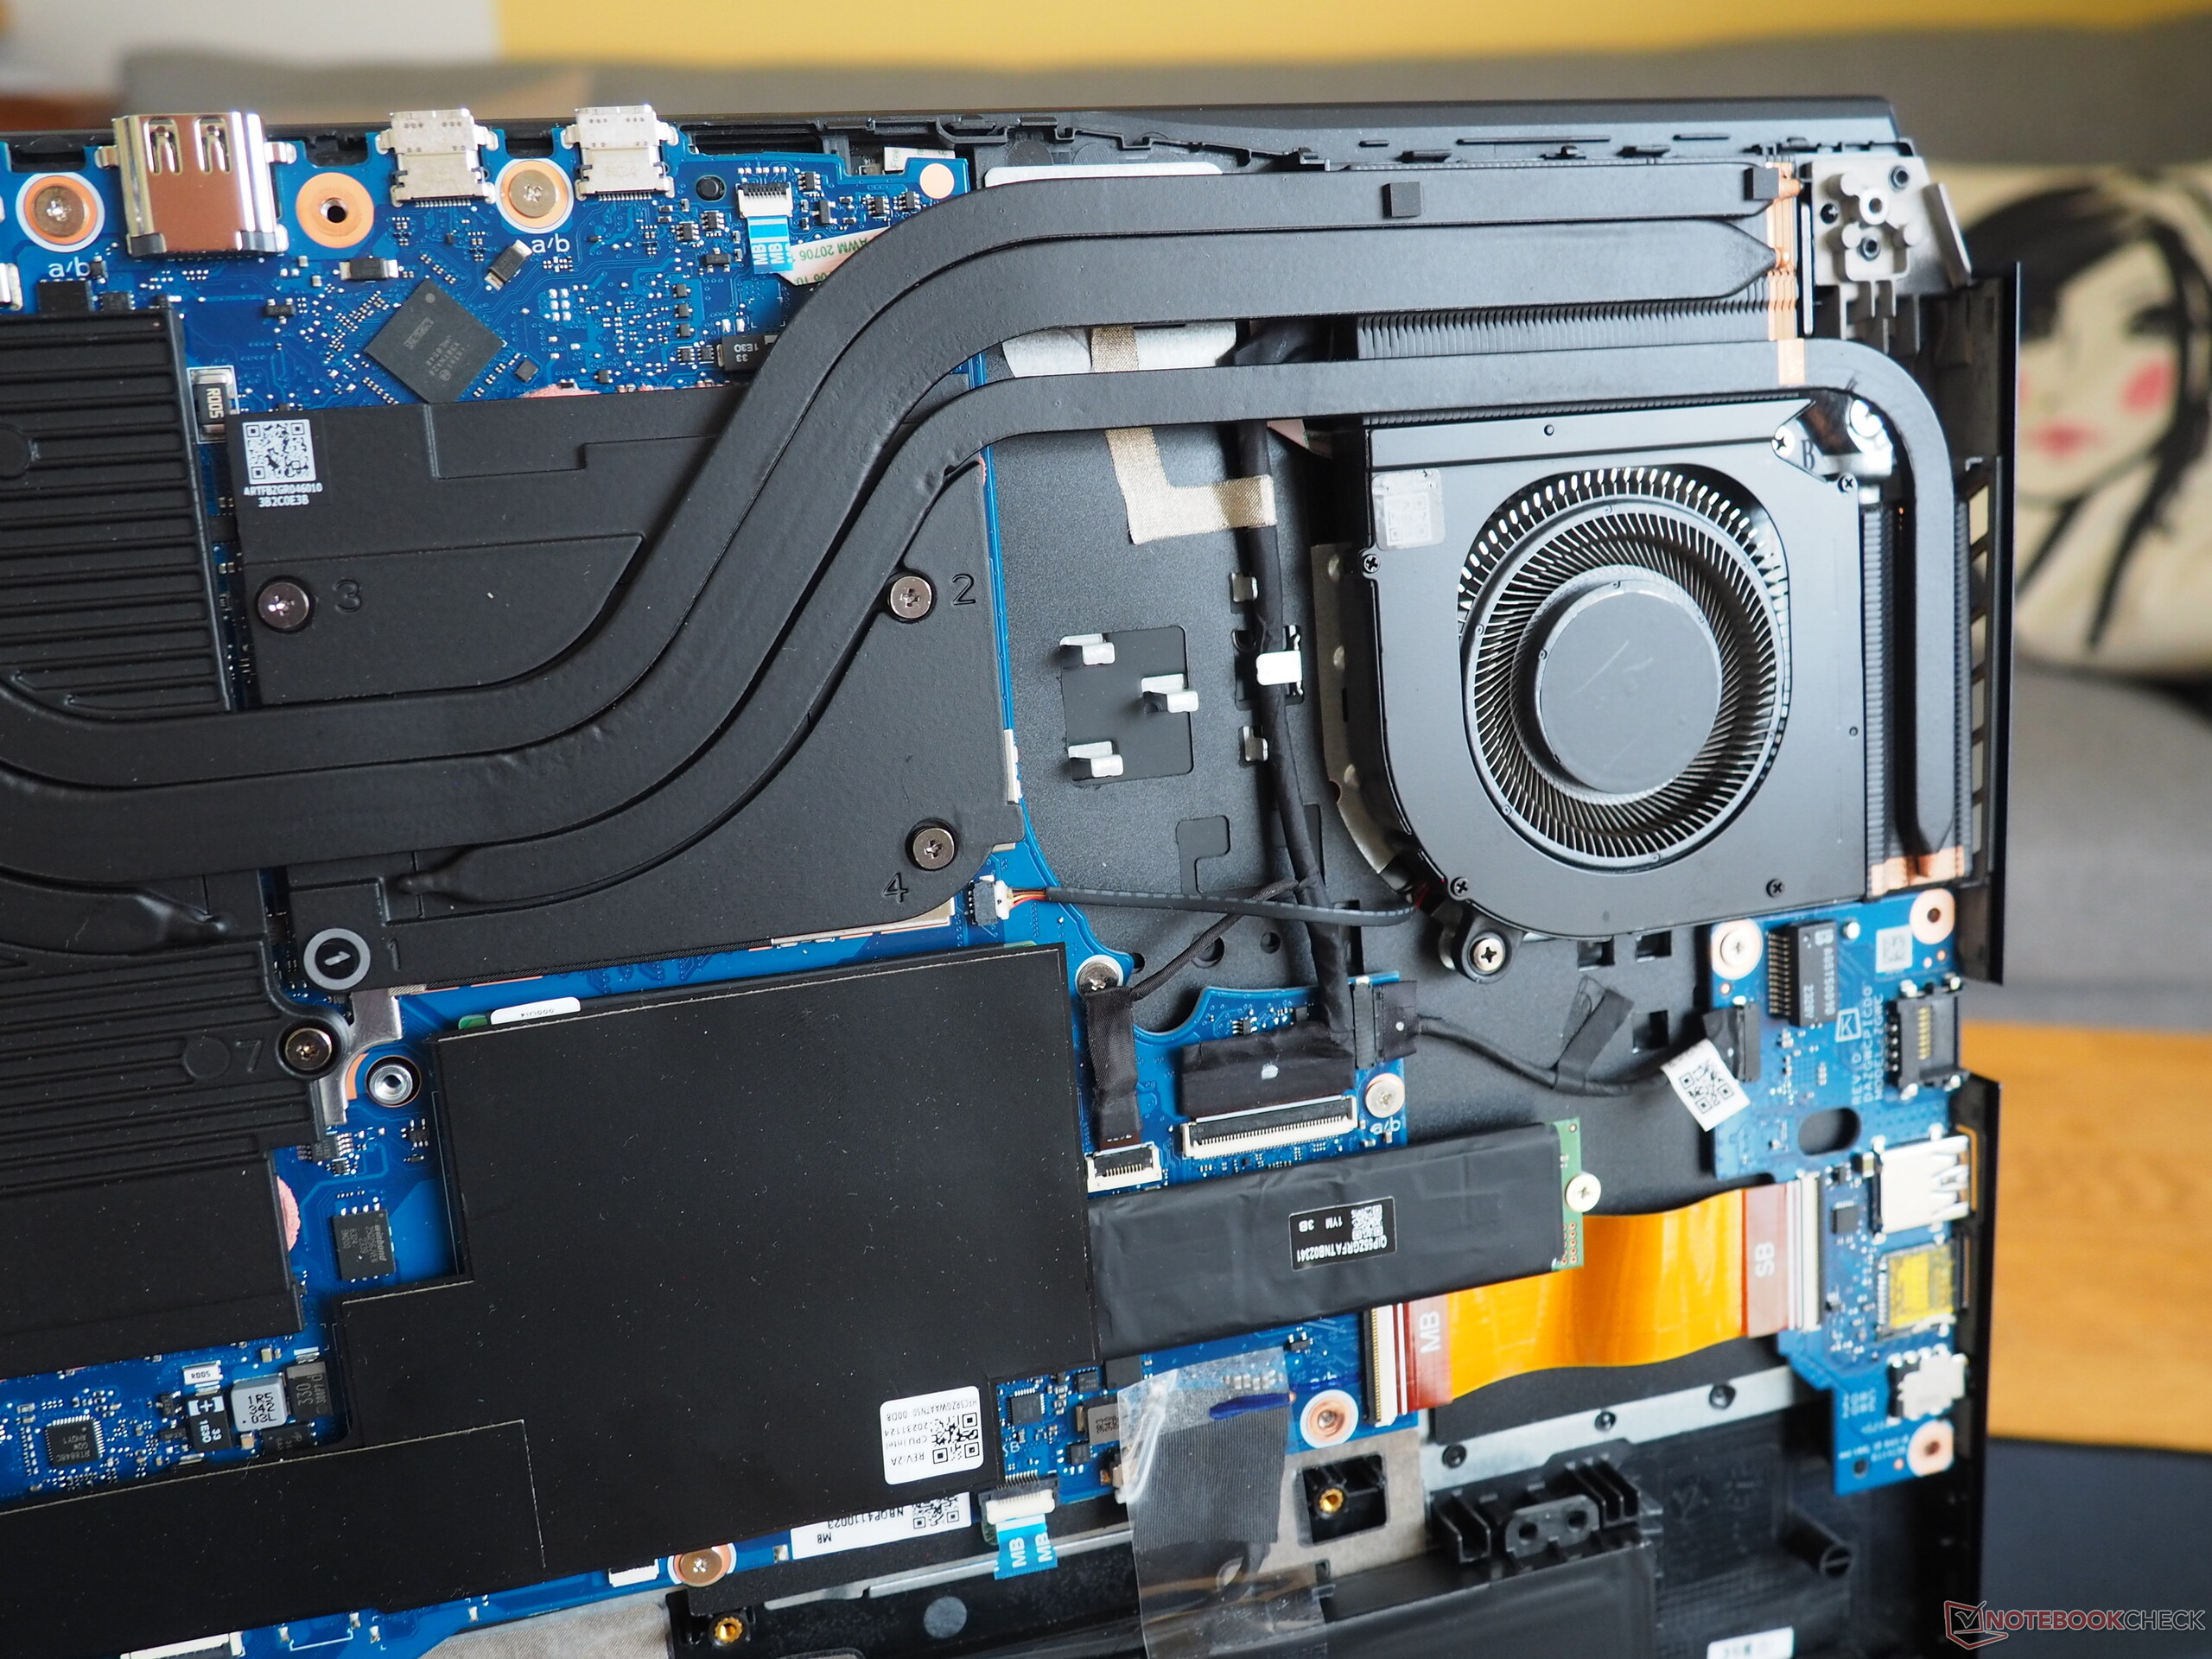
Bakım
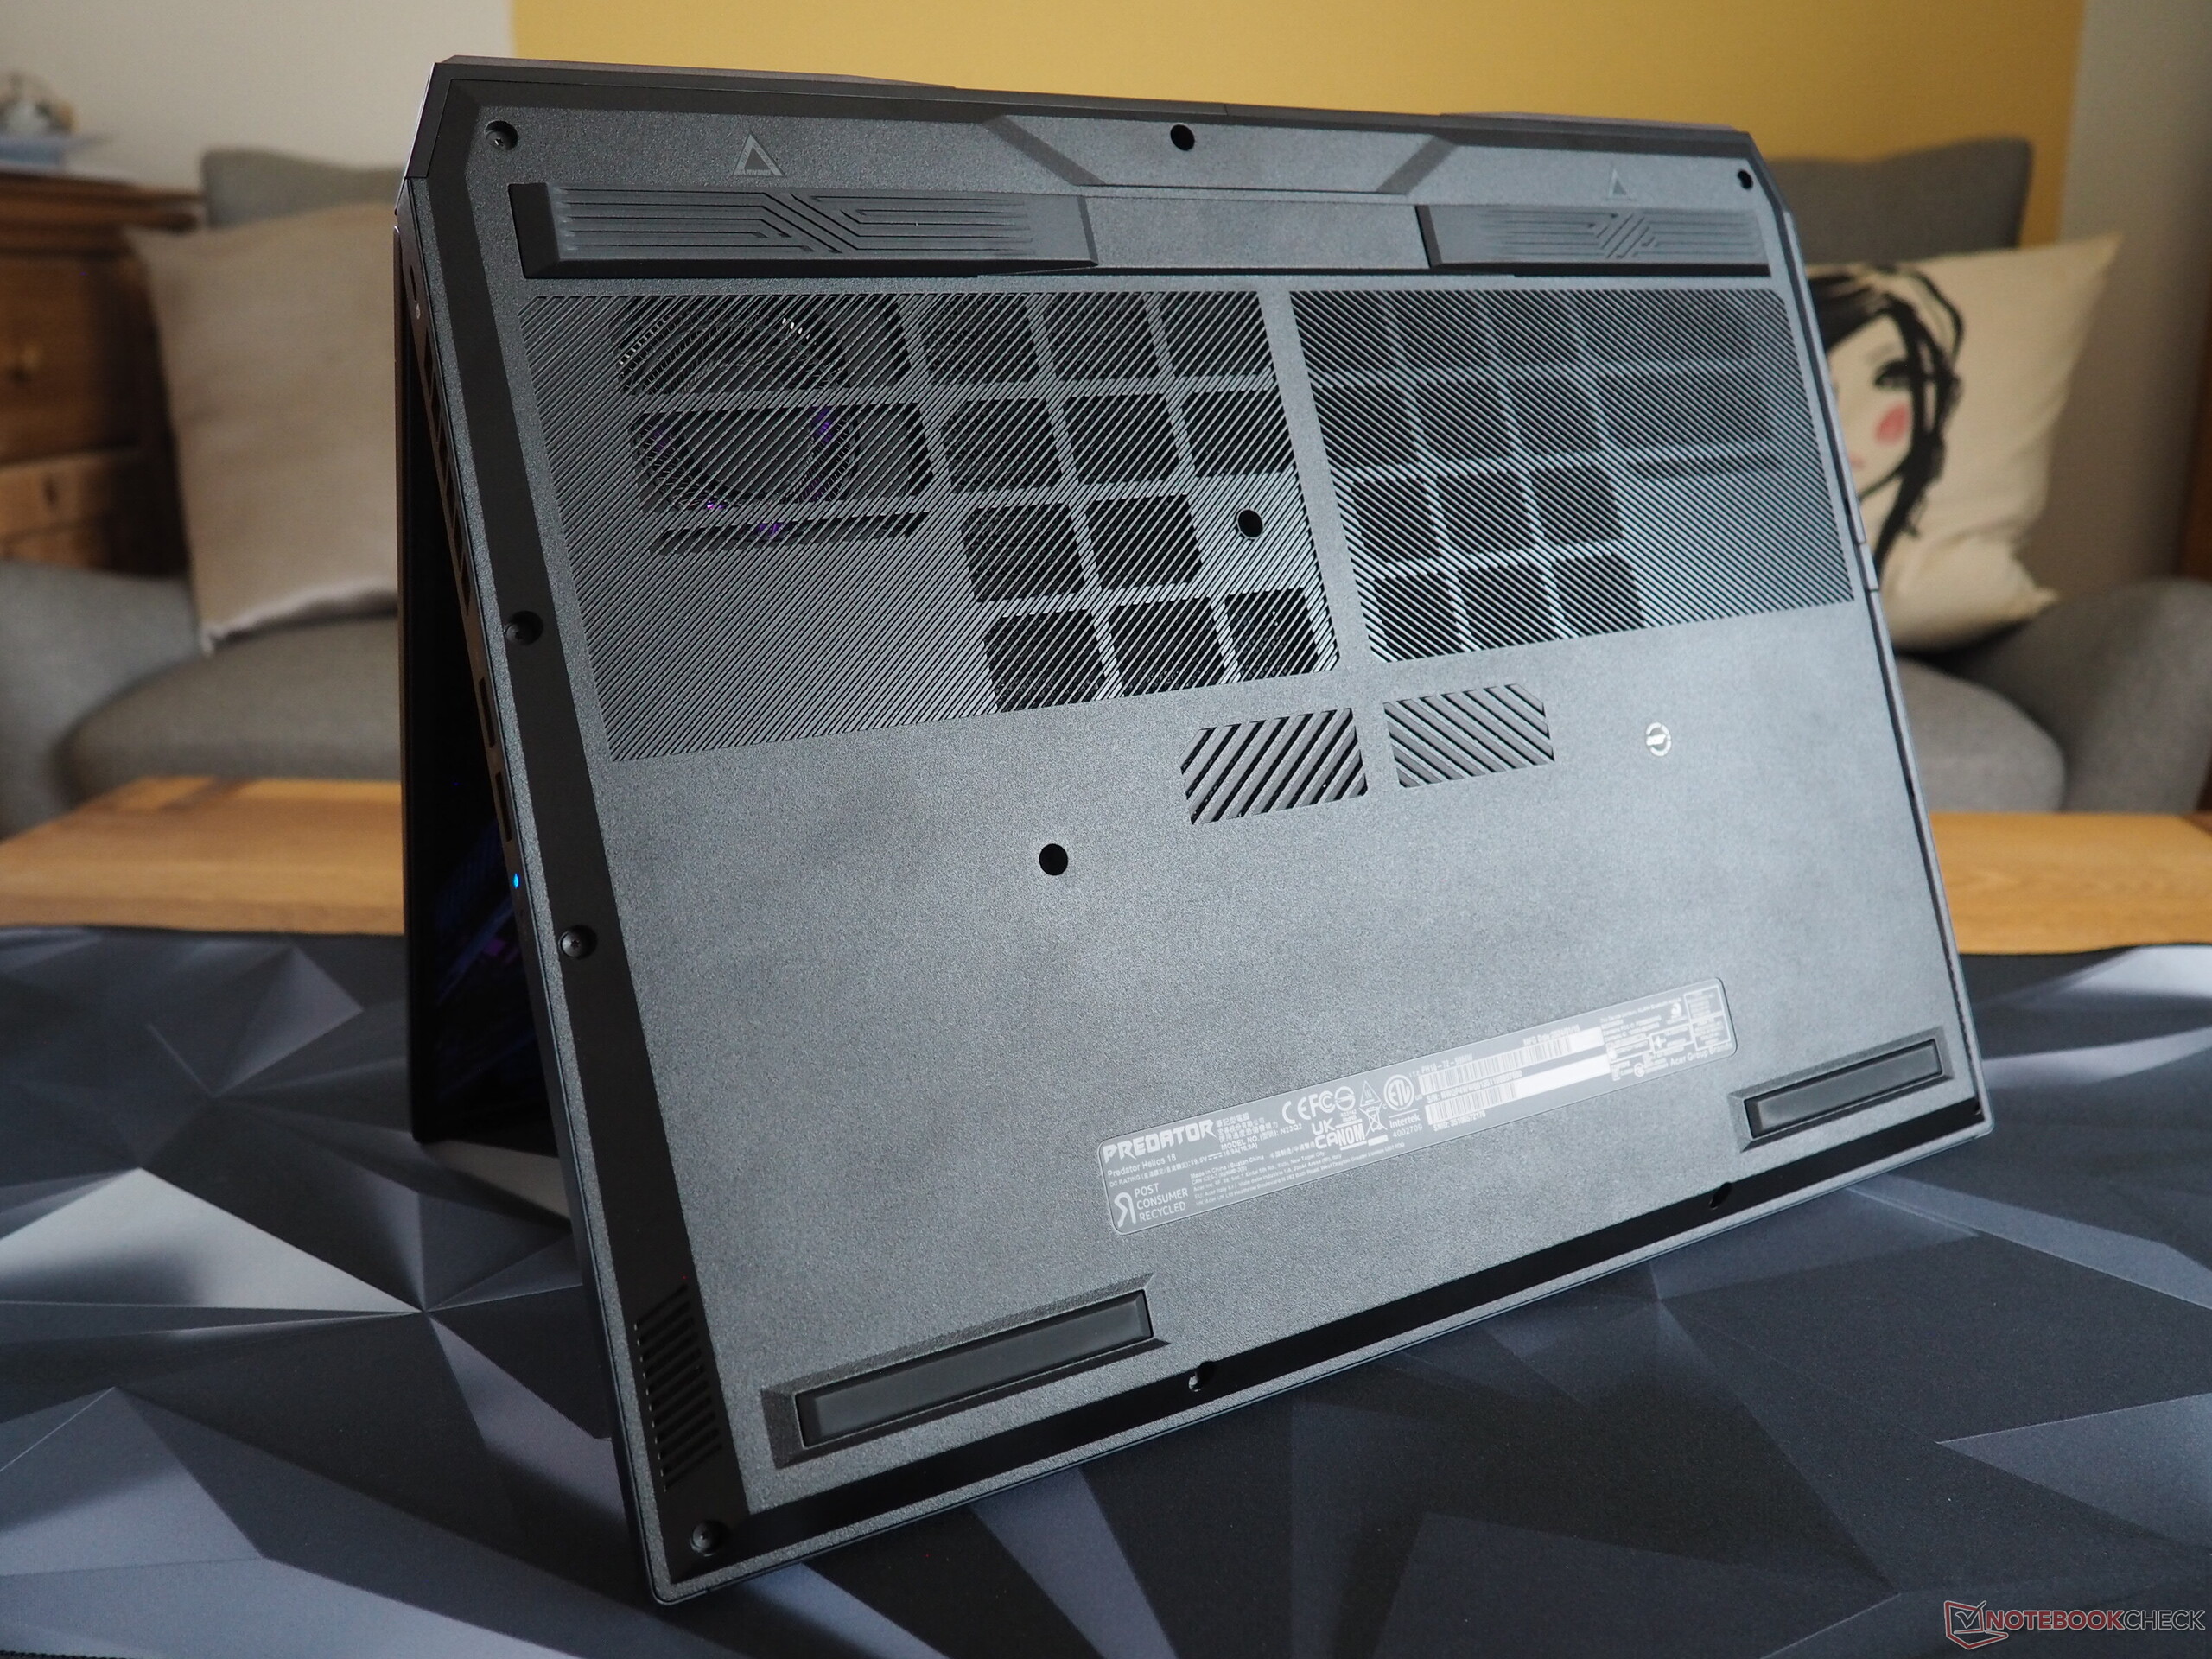
Bakım seçenekleri bizi karışık duygular içinde bıraktı. Alt plakayı açmak için 14 Torx vidayı sökmek oldukça zaman alıyor, ayrıca Acer garanti mührü (bir vidayı kaplayan) kullanarak birçok kullanıcıyı korkutabilir. İç kısımda en azından soğutma sistemine, bataryaya, WLAN modülüne, RAM'e ve SSD'ye erişebilirsiniz. Ancak, son ikisi film ve pedlerle kaplıdır, bu da değiştirilmelerini kolaylaştırmaz.
Garanti
Dizüstü bilgisayar 24 ay garanti kapsamındadır.
Giriş cihazları
Klavye
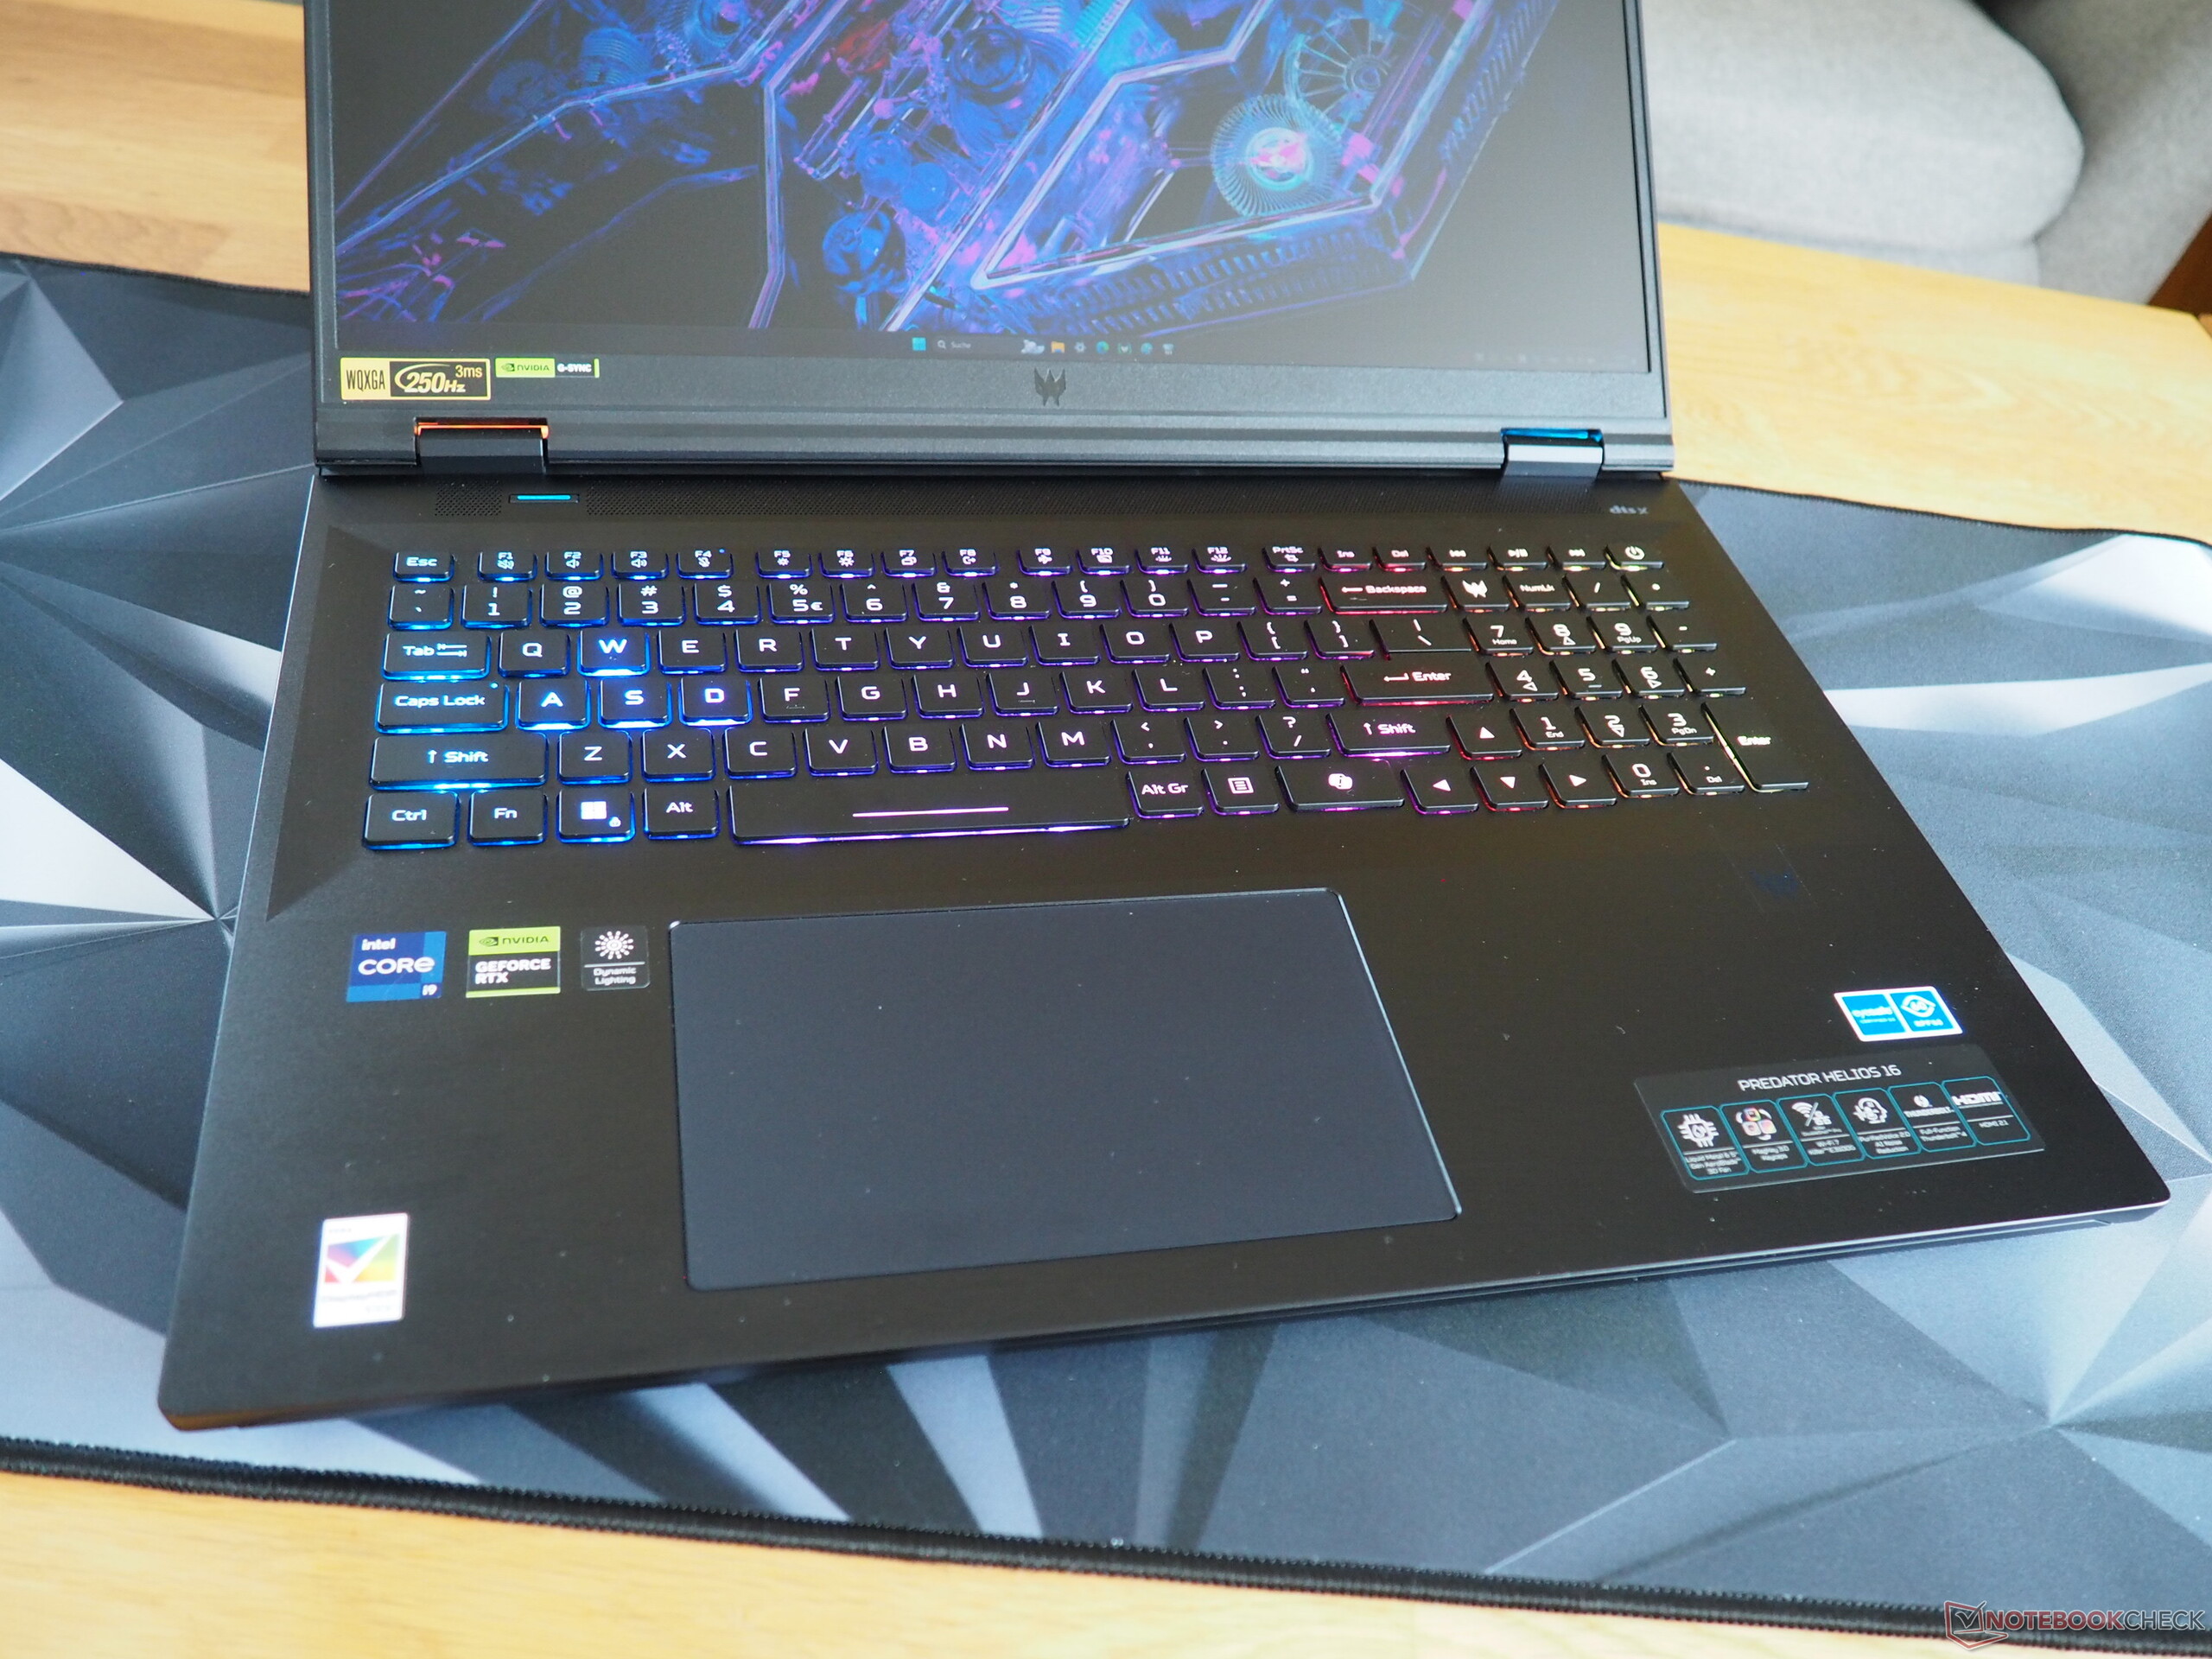
Oyuncular, dizüstü bilgisayarın özellikle kapsamlı aydınlatmasını (tek tuşlu RGB) görmekten heyecan duyacaklar, ancak bizim gözümüzde bu biraz daha eşit olabilirdi. Klasik bir kauçuk kubbe klavye için, üzerinde yazmak şaşırtıcı derecede iyi hissettiriyor, sadece biraz gürültülü. Birkaç ayrıntı dışında (değiştirilmiş sayısal tuş takımı), düzeni iyi. Diğer üreticilerin aksine Acer fazla deney yapmamış ve çoğu fonksiyon kullanışlı. Üretici ayrıca dizüstü bilgisayarın cömert tuş boyutu (örneğin, iyi boyutlandırılmış ok tuşları) için övgüyü hak ediyor.
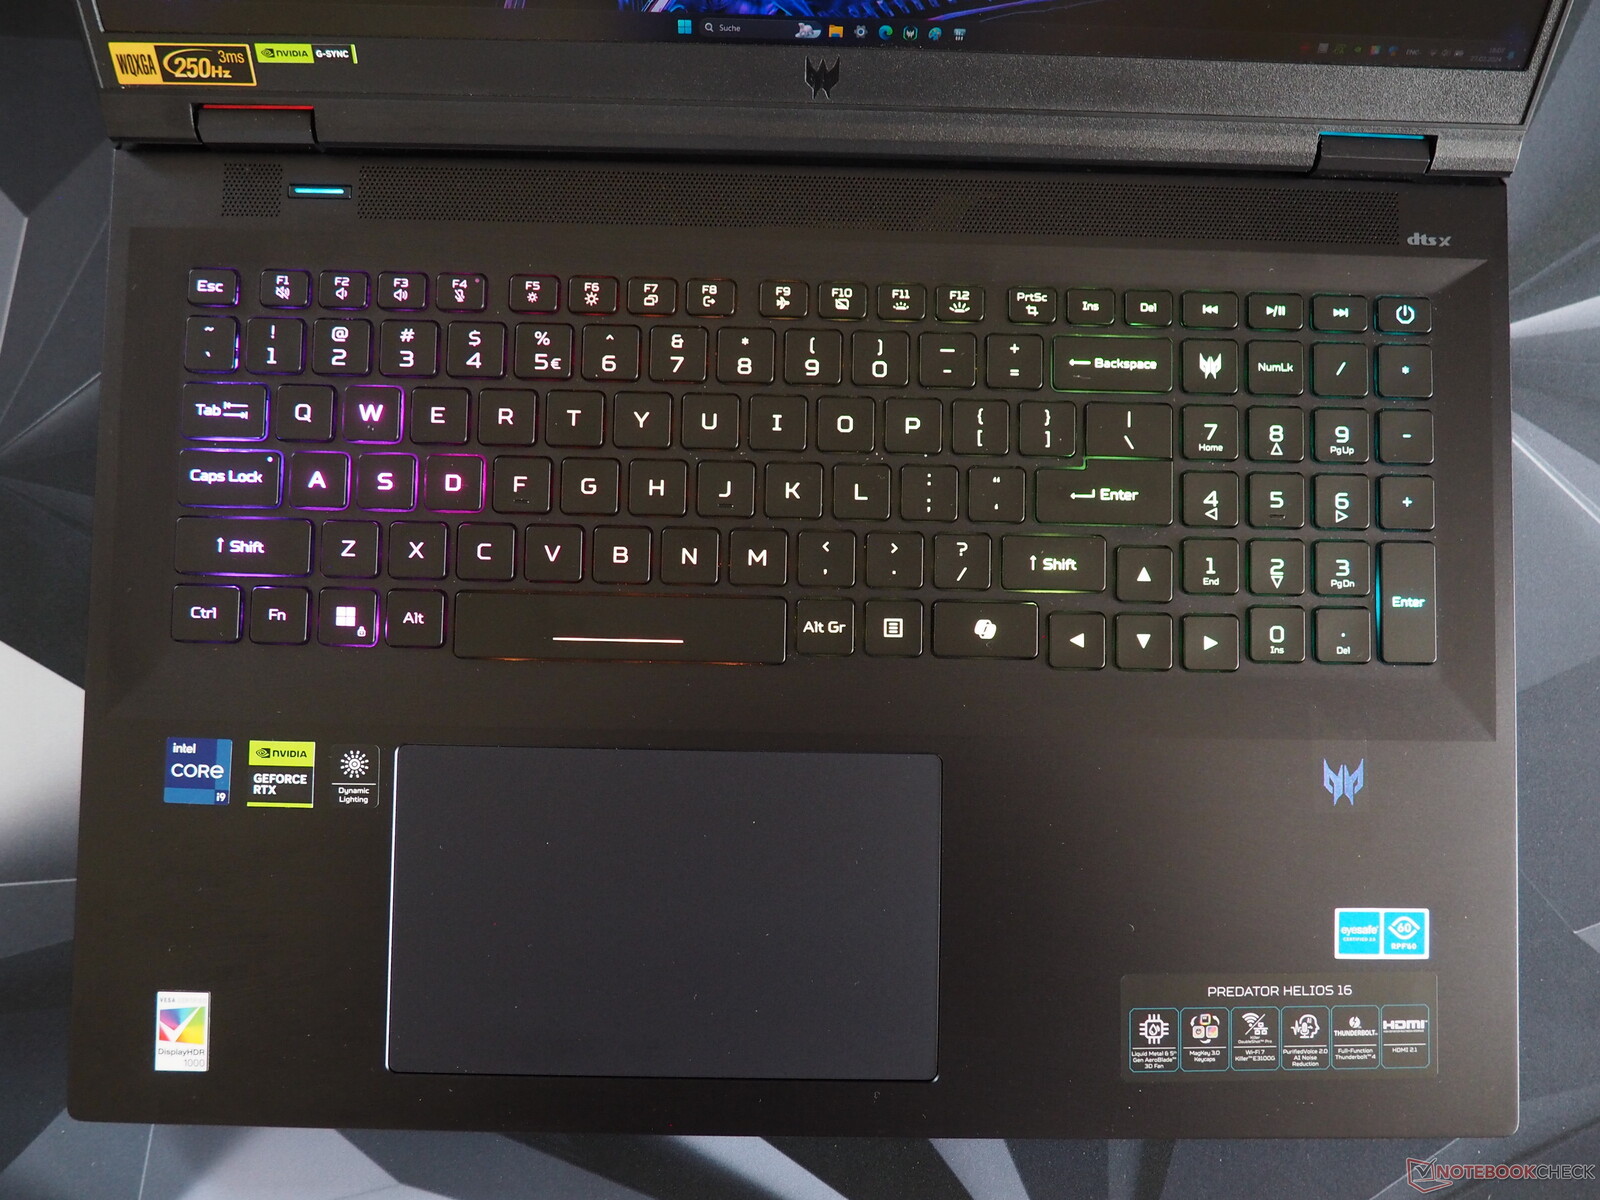
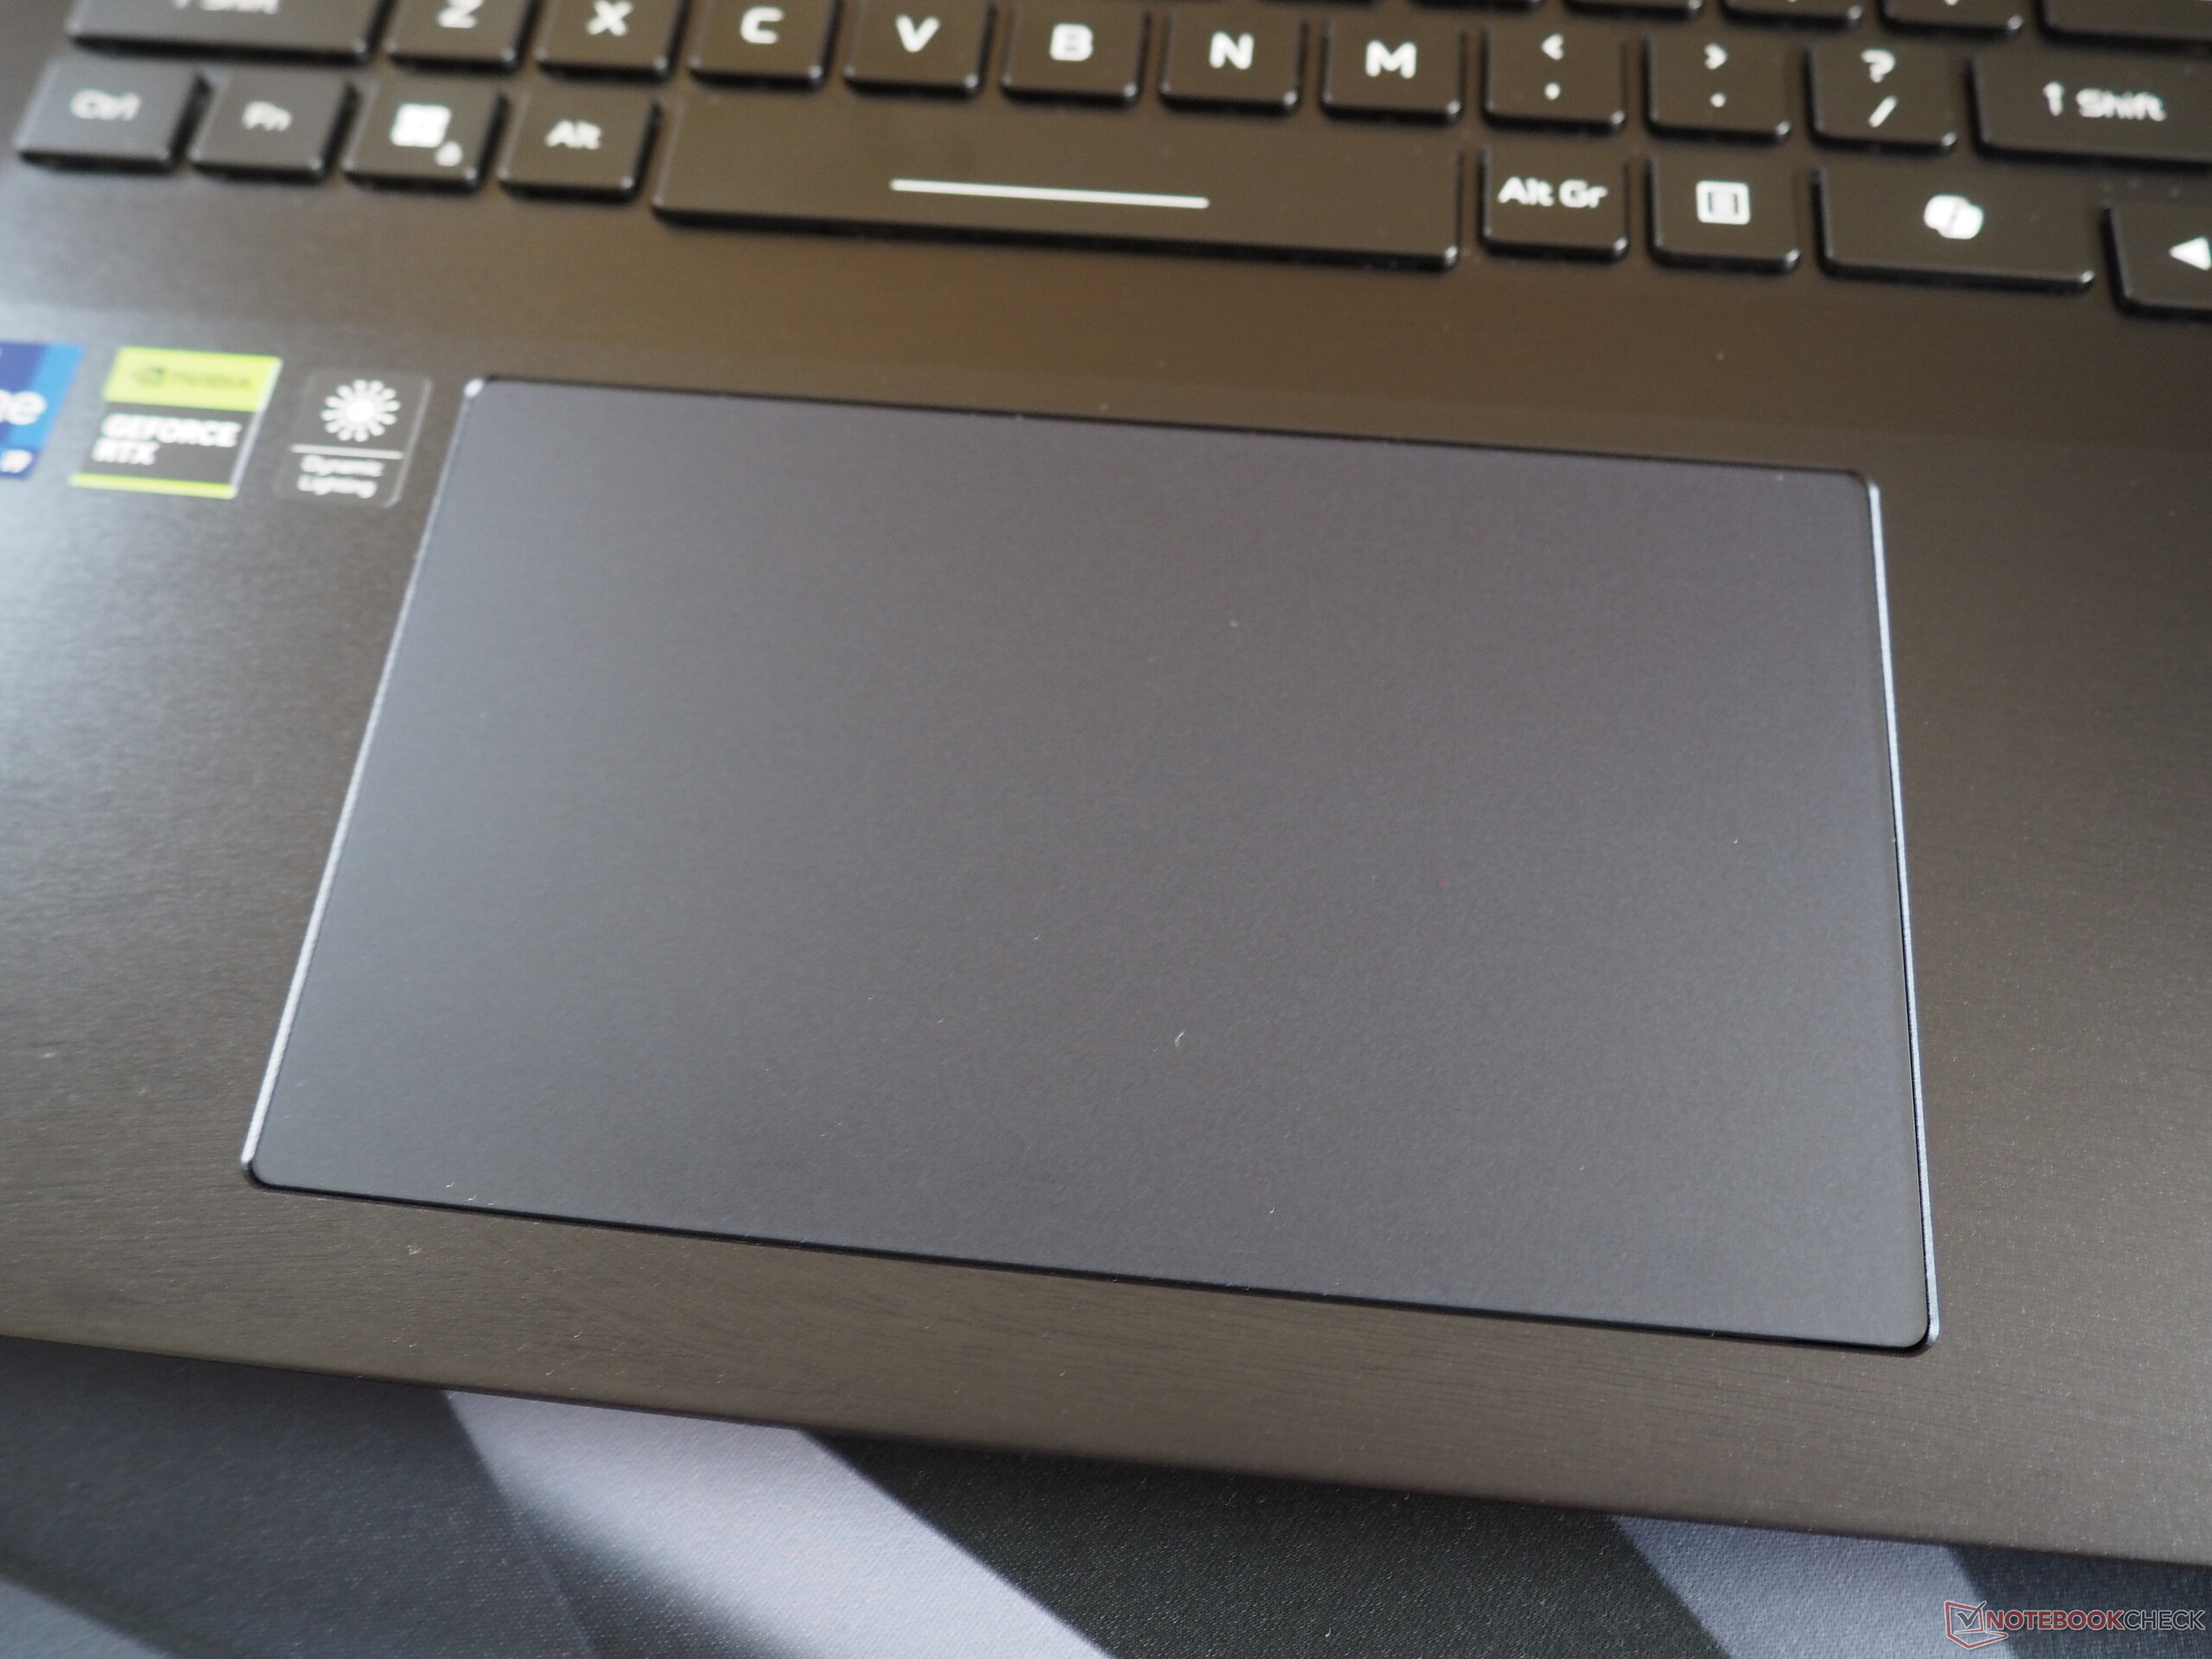
Dokunmatik yüzey
Dokunmatik yüzeyi de neredeyse kusursuz. 15 x 9 cm'lik boyutu cömerttir ve parmağınızı kaldırmak zorunda kalmadan uzun hareketlere izin verir. Buna ek olarak, pürüzsüz yüzeyi parmaklarınızın ped üzerinde iyi kaymasını sağlar. Hareket desteği ve hassasiyeti söz konusu olduğunda göze çarpmayan bir şey fark etmedik.
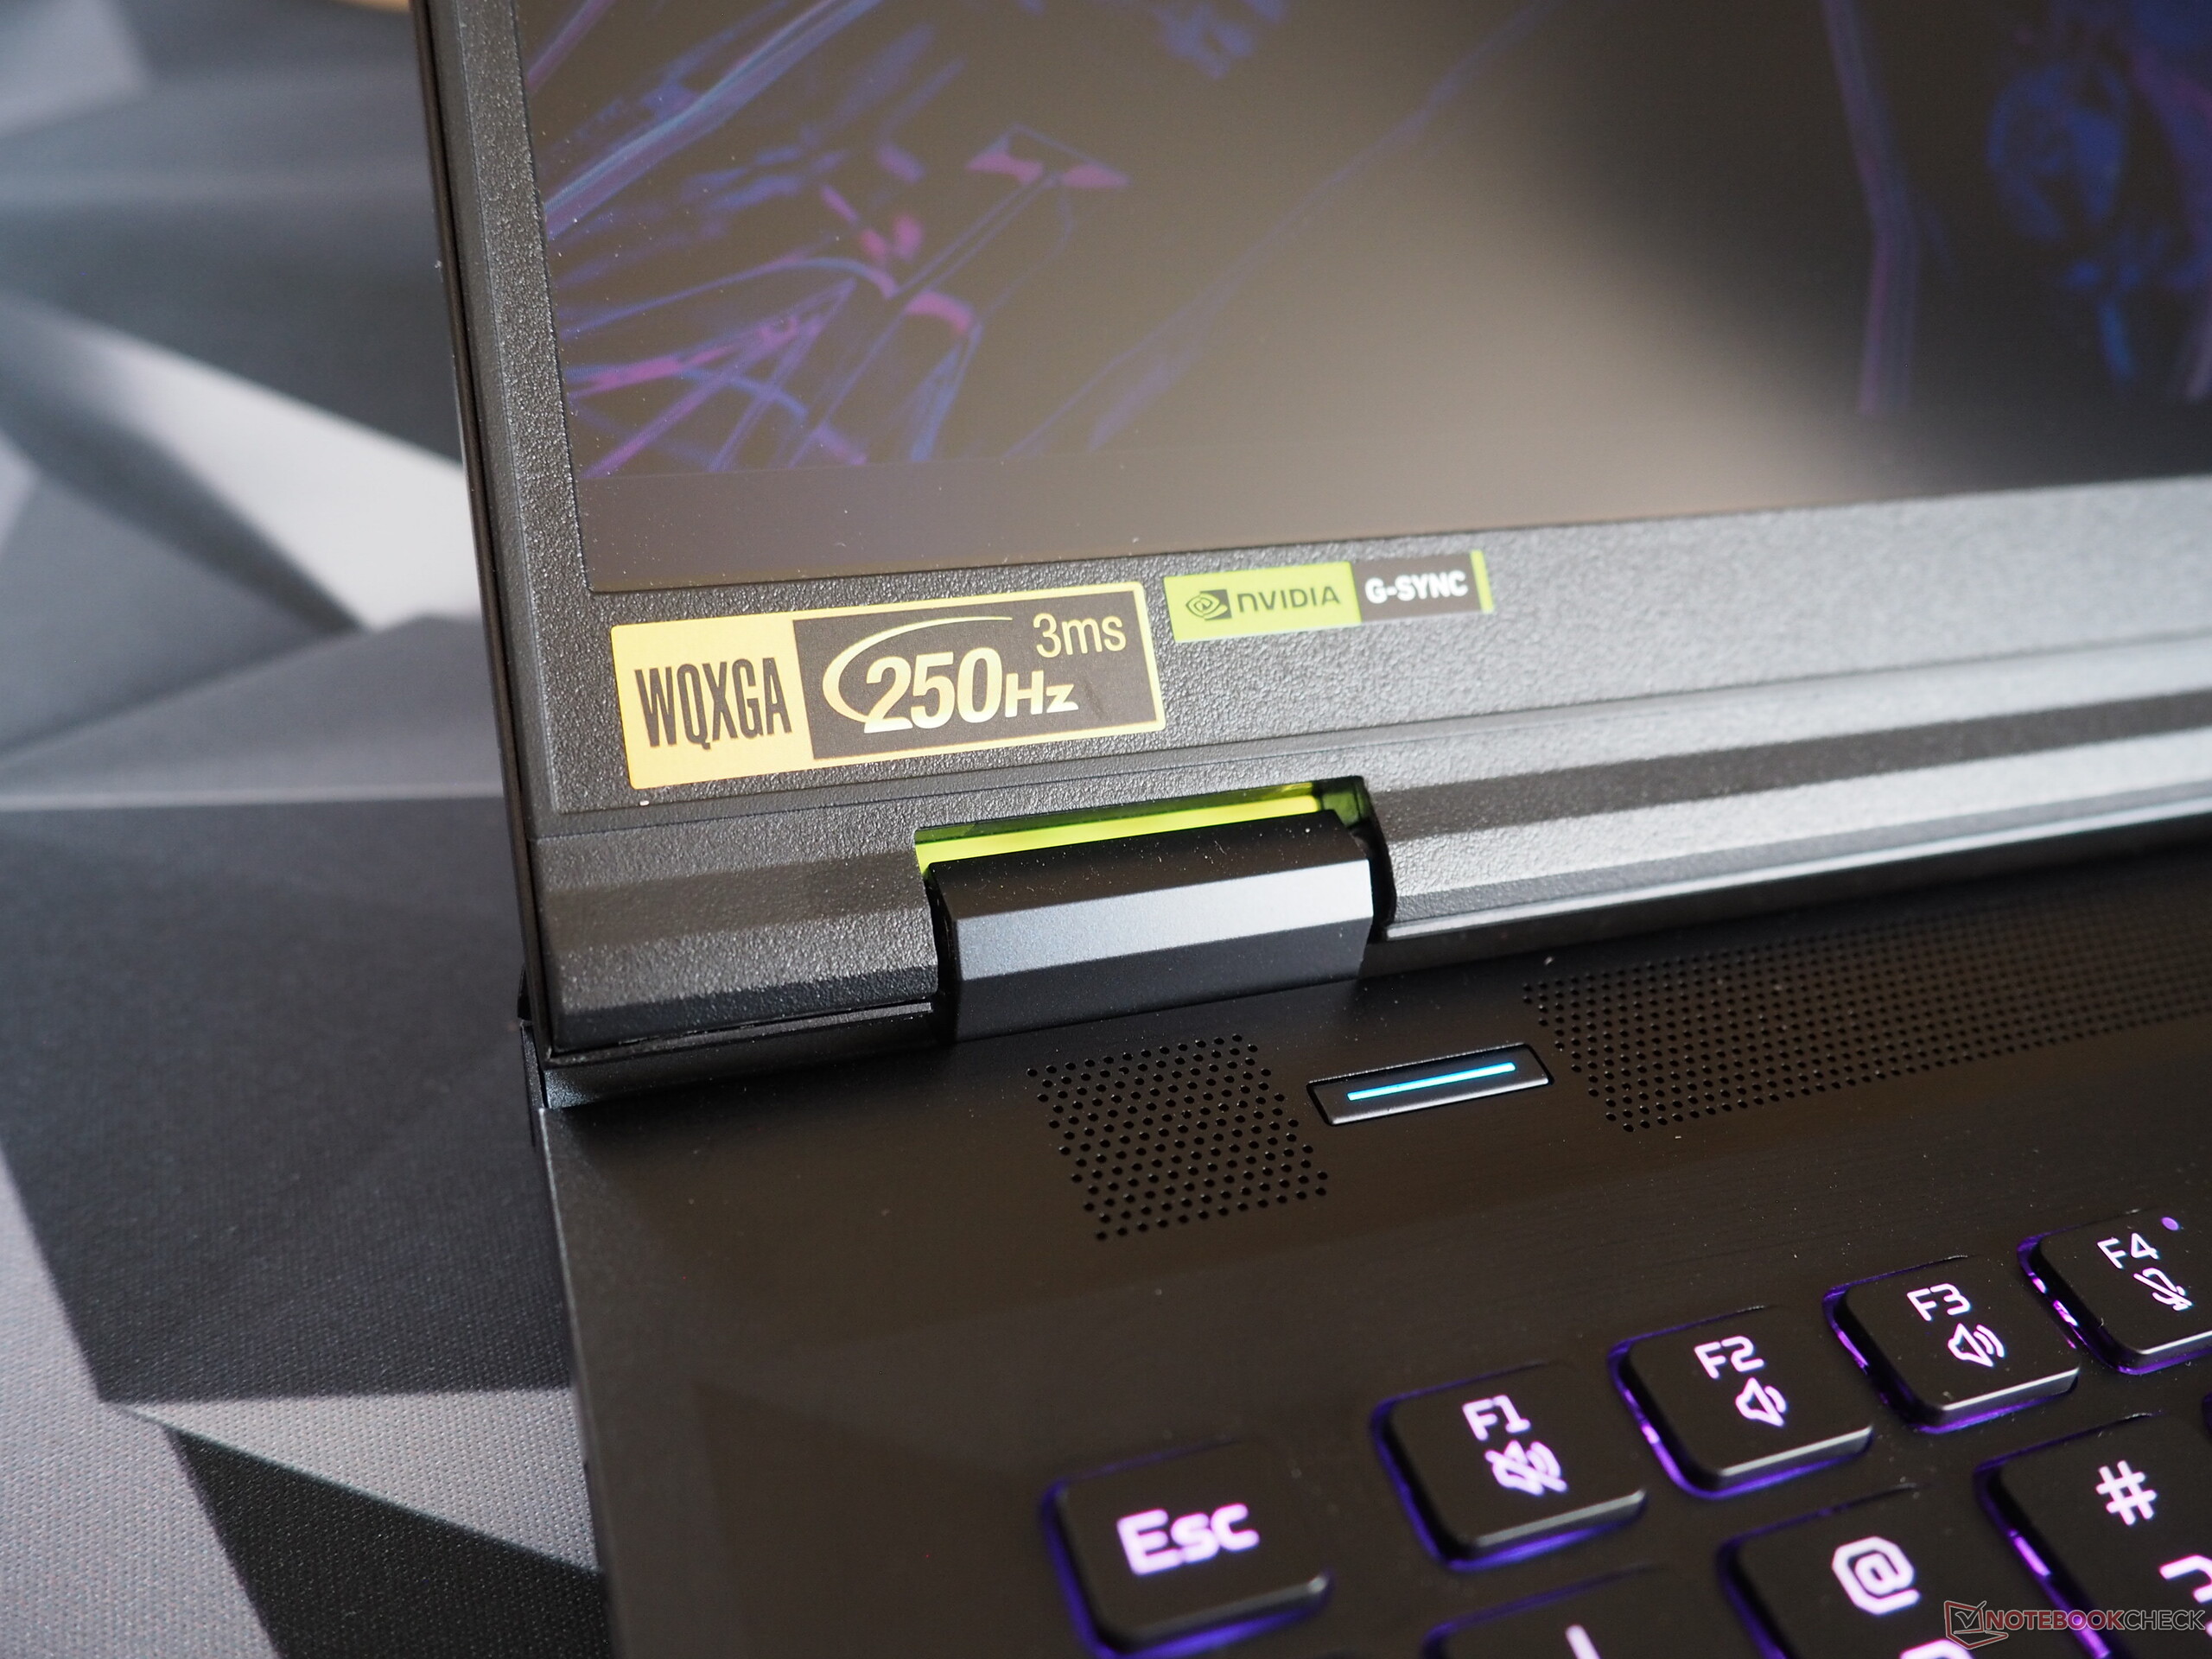
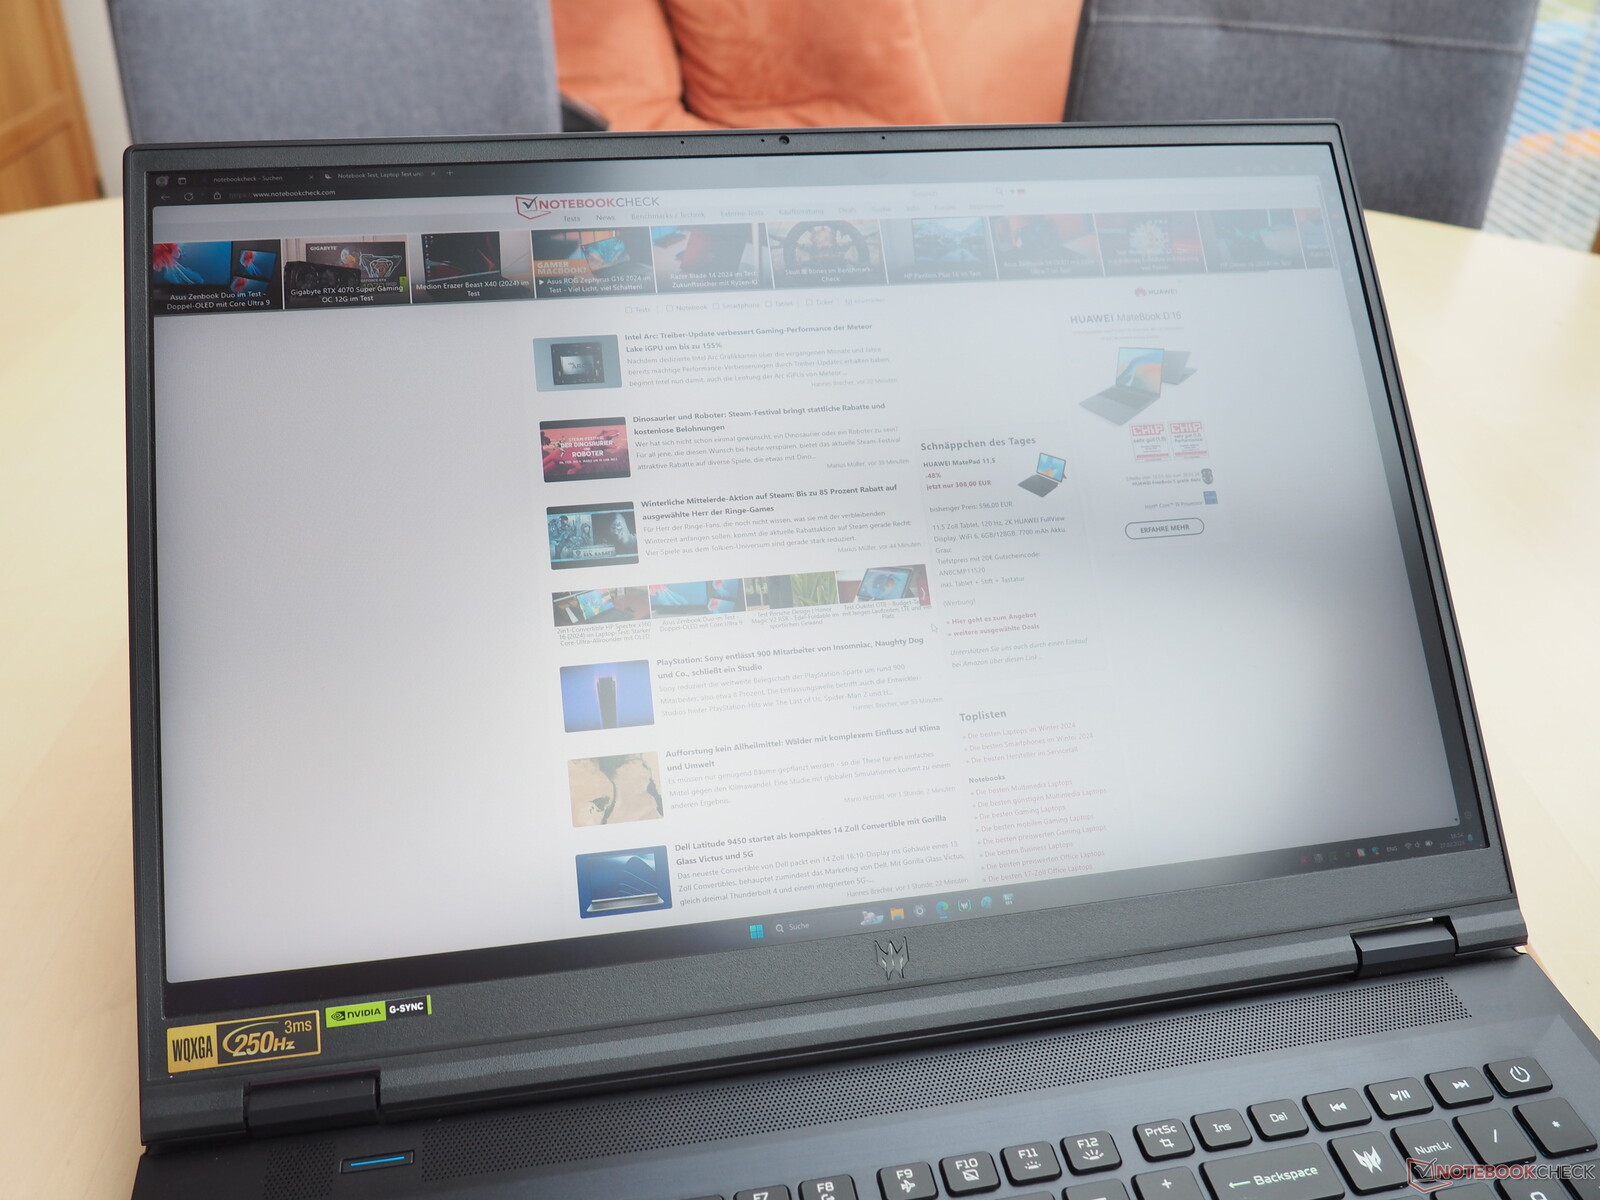
Ekran
2024 versiyonu, selefinin Mini-LED ekranını (WQXGA, 16:10, 250 Hz, HDR1000) miras almıştır. Tüm parlaklık seviyelerinde titremesini göz ardı ederseniz (neyse ki bu sadece hassas kullanıcılar için bir sorun olacaktır), bu teknolojinin standart bir IPS panele göre açık avantajları vardır.
| |||||||||||||||||||||||||
Aydınlatma: 93 %
Batarya modunda parlaklık: 722 cd/m²
Kontrast: 18050:1 (Siyah: 0.04 cd/m²)
ΔE ColorChecker Calman: 3.4 | ∀{0.5-29.43 Ø4.71}
calibrated: 1.6
ΔE Greyscale Calman: 3.8 | ∀{0.09-98 Ø4.96}
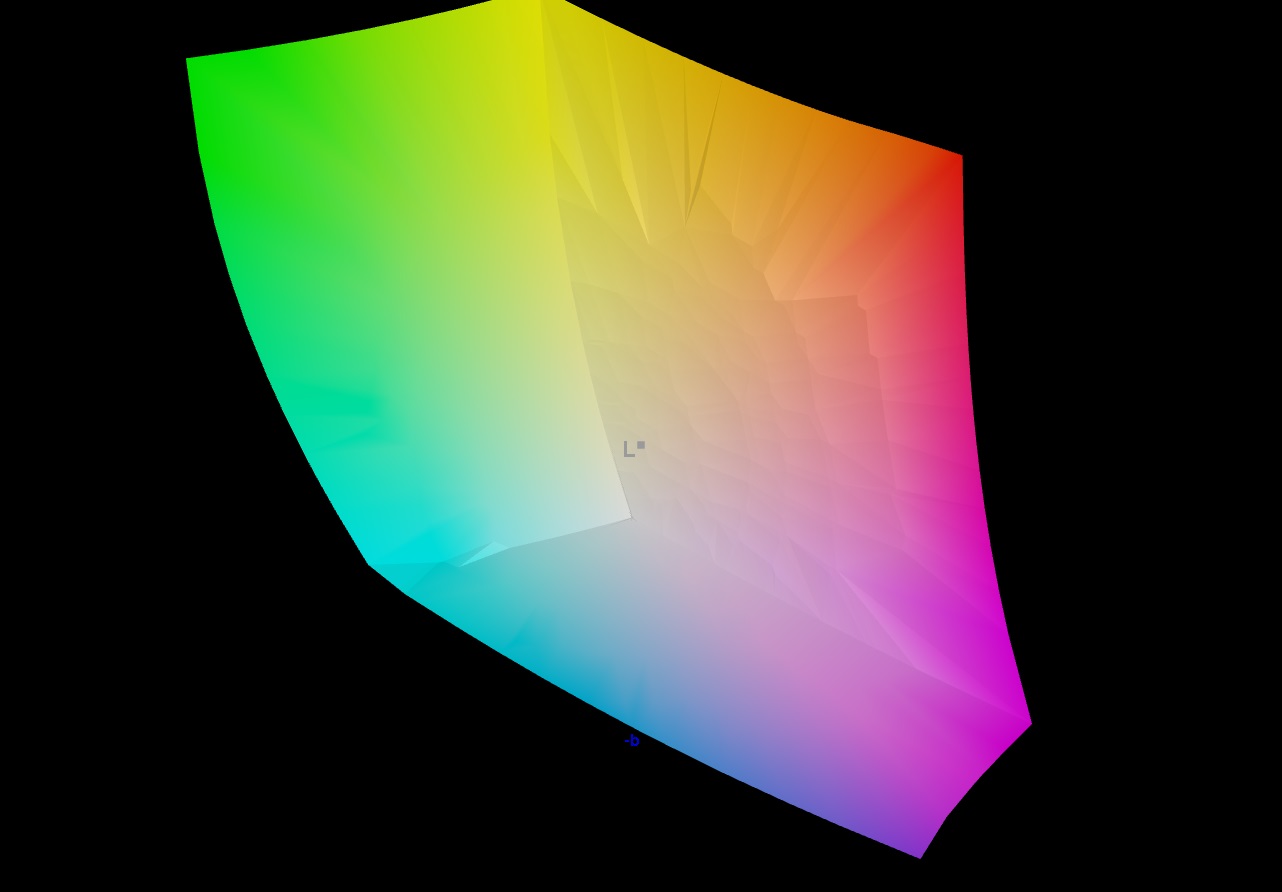
91.6% AdobeRGB 1998 (Argyll 3D)
100% sRGB (Argyll 3D)
99.7% Display P3 (Argyll 3D)
Gamma: 2.383
CCT: 7051 K
| Acer Predator Helios 18 PH18-72-98MW B180QAN01.2 (AUO45A8), Mini-LED, 2560x1600, 18" | MSI Titan 18 HX A14VIG AU Optronics B180ZAN01.0, Mini-LED, 3840x2400, 18" | Asus ROG Strix Scar 18 G834JYR (2024) BOE NE180QDM-NM1, Mini LED, 2560x1600, 18" | Acer Predator Helios 18 N23Q2 AUO45A8 (B180QAN01.2), IPS, 2560x1600, 18" | Alienware m18 R1 AMD BOE NE18NZ1, IPS, 1920x1200, 18" | |
|---|---|---|---|---|---|
| Display | -3% | -1% | 0% | -1% | |
| Display P3 Coverage (%) | 99.7 | 98.1 -2% | 99.9 0% | 99.8 0% | 98.5 -1% |
| sRGB Coverage (%) | 100 | 99.8 0% | 100 0% | 100 0% | 99.7 0% |
| AdobeRGB 1998 Coverage (%) | 91.6 | 86.2 -6% | 90 -2% | 91.8 0% | 88.7 -3% |
| Response Times | -187% | -6% | 2% | 55% | |
| Response Time Grey 50% / Grey 80% * (ms) | 8 ? | 8.6 ? -8% | 12 ? -50% | 7.6 ? 5% | 2.8 ? 65% |
| Response Time Black / White * (ms) | 17.6 ? | 81.8 ? -365% | 10.7 ? 39% | 17.8 ? -1% | 9.6 ? 45% |
| PWM Frequency (Hz) | 4832 ? | 2592 ? | 5733 ? | 2509 | |
| Screen | -24% | 17% | -82% | -54% | |
| Brightness middle (cd/m²) | 722 | 467.5 -35% | 937 30% | 360 -50% | 319.6 -56% |
| Brightness (cd/m²) | 724 | 459 -37% | 934 29% | 355 -51% | 304 -58% |
| Brightness Distribution (%) | 93 | 90 -3% | 89 -4% | 92 -1% | 87 -6% |
| Black Level * (cd/m²) | 0.04 | 0.066 -65% | 0.21 -425% | 0.25 -525% | |
| Contrast (:1) | 18050 | 14197 -21% | 1714 -91% | 1278 -93% | |
| Colorchecker dE 2000 * | 3.4 | 3.77 -11% | 1.52 55% | 3.82 -12% | 1.22 64% |
| Colorchecker dE 2000 max. * | 5.32 | 6.12 -15% | 2.82 47% | 7.38 -39% | 3.1 42% |
| Colorchecker dE 2000 calibrated * | 1.6 | 2.94 -84% | 1.21 24% | 2.24 -40% | 0.47 71% |
| Greyscale dE 2000 * | 3.8 | 3.2 16% | 1.7 55% | 5.06 -33% | 0.8 79% |
| Gamma | 2.383 92% | 2.43 91% | 2.042 108% | 2.52 87% | 2.23 99% |
| CCT | 7051 92% | 6478 100% | 6578 99% | 5657 115% | 6471 100% |
| Toplam Ortalama (Program / Ayarlar) | -71% /
-46% | 3% /
10% | -27% /
-53% | 0% /
-27% |
* ... daha küçük daha iyidir
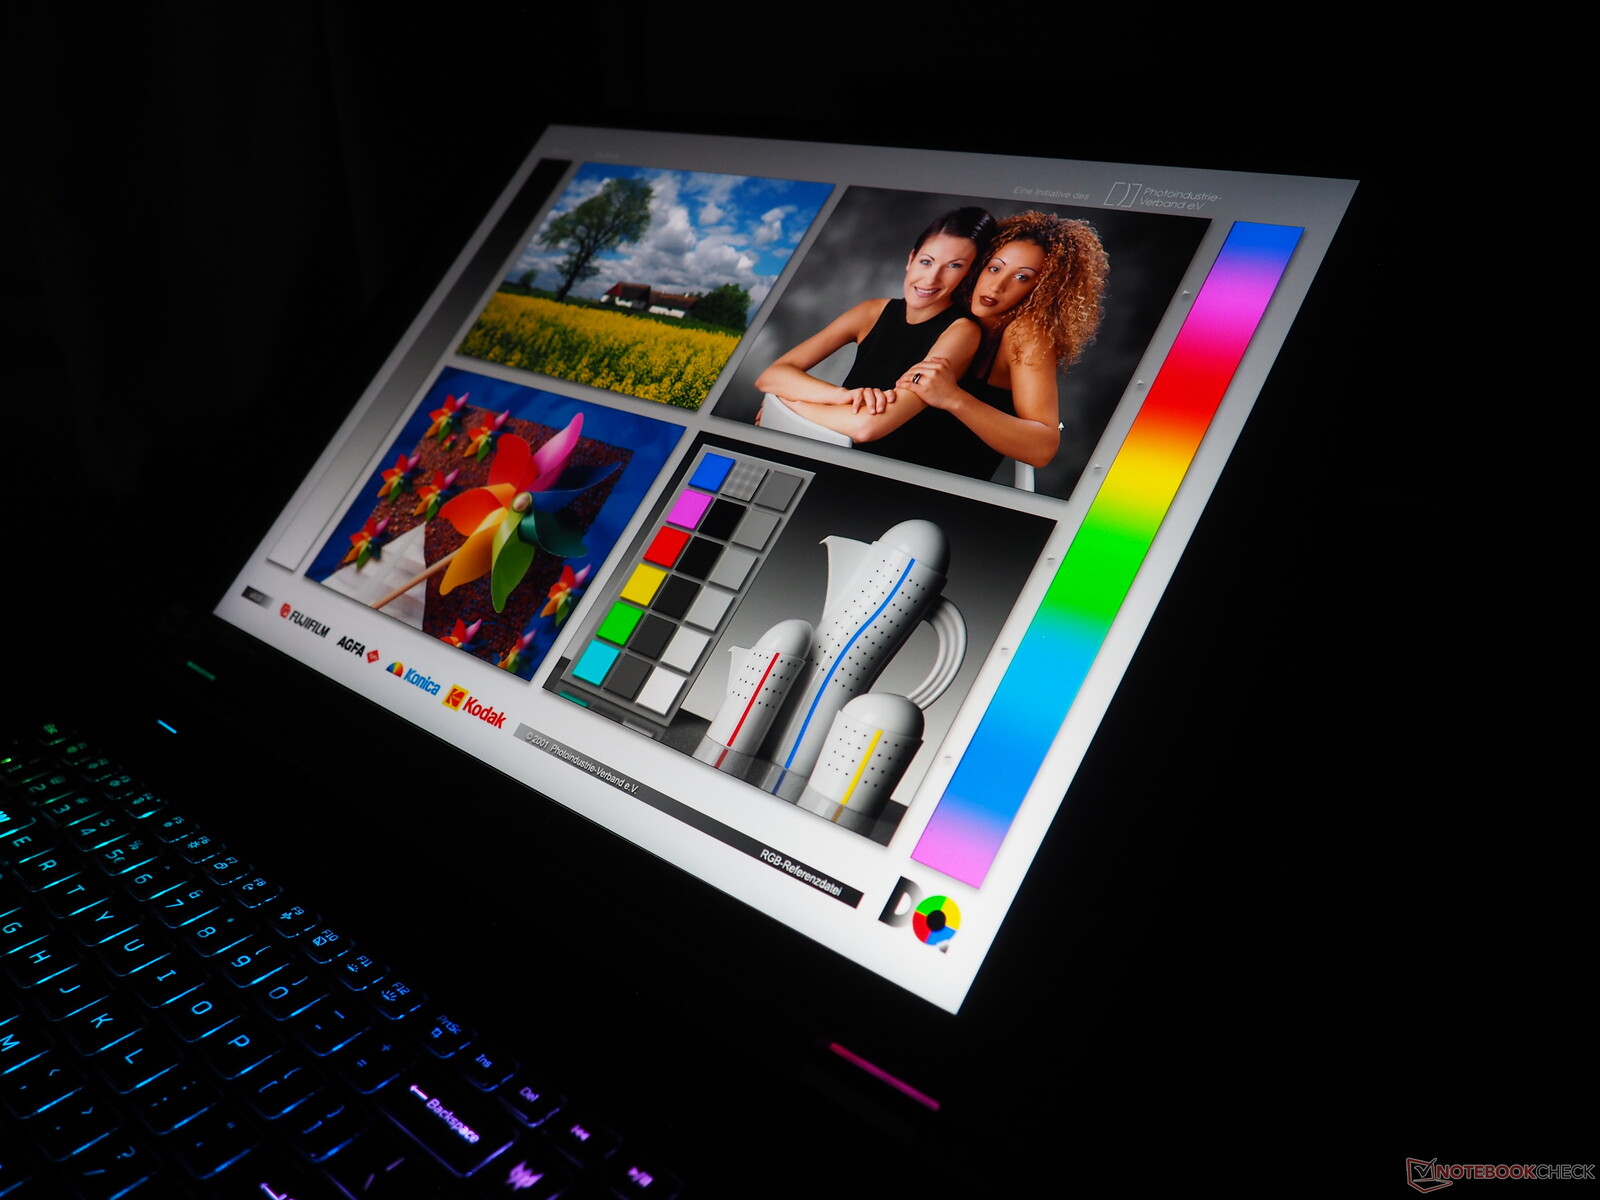
Etkileyici parlaklığı ile başlıyor: Ortalama 724 cd/m², cihazı süper parlak ortamlarda (yani dış mekanlarda) bile kullanabileceğiniz anlamına gelir. Yaklaşık 0,04 cd/m²'lik son derece düşük siyah değeriyle birlikte ekran, yaklaşık 18.000:1'lik harika bir kontrast sunuyor. Buna ek olarak, geniş renk alanı kapsamı - AdobeRGB'yi tam olarak kapsayamasa da, sRGB ve DCI-P3'ün % 100'ünü kapsamayı başarıyor ki bu etkileyici.
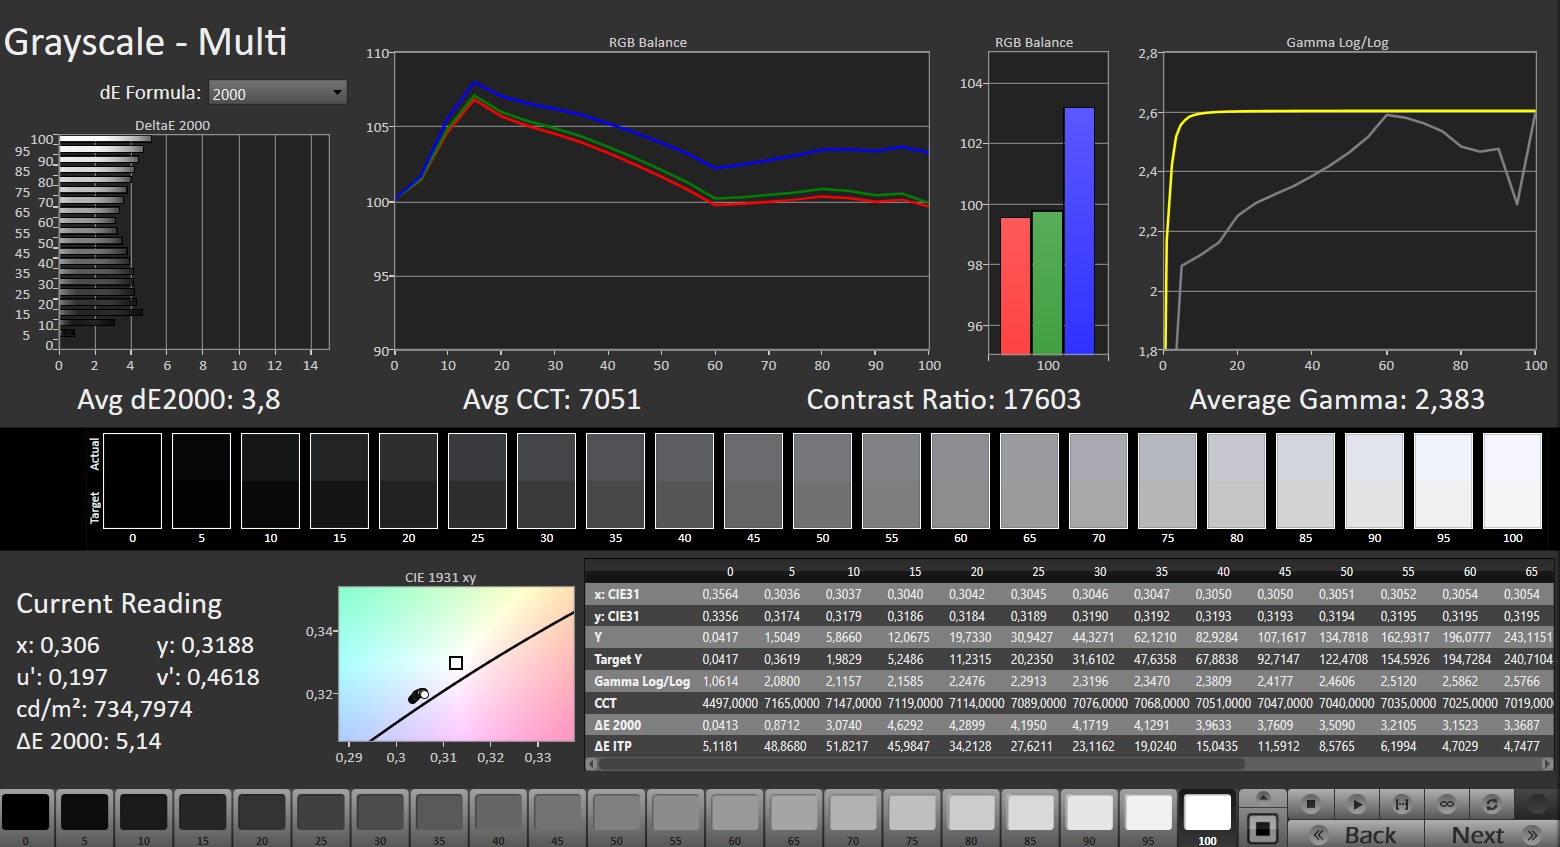
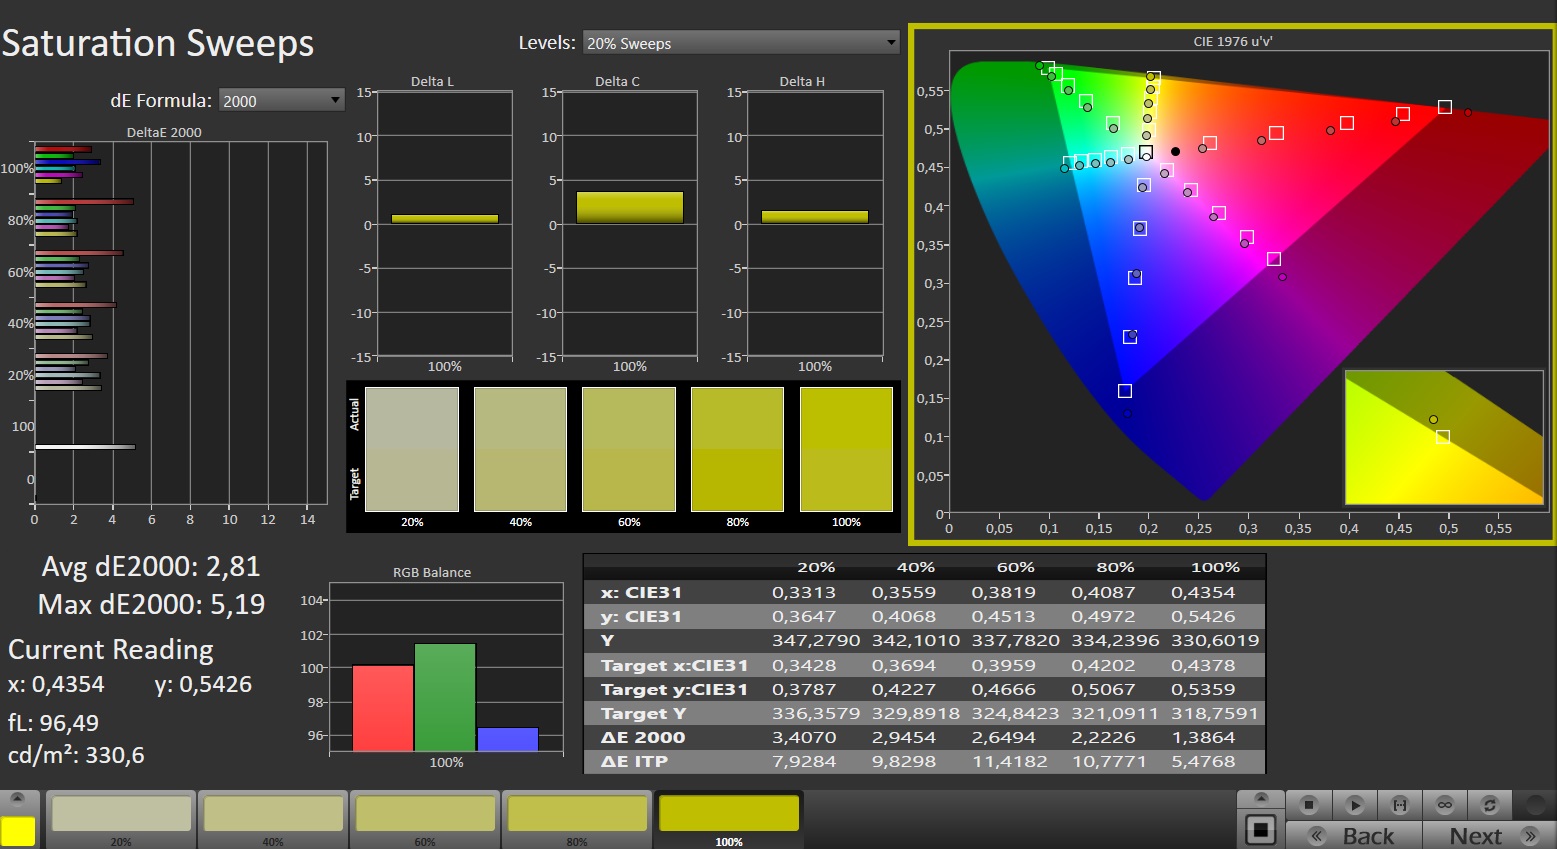
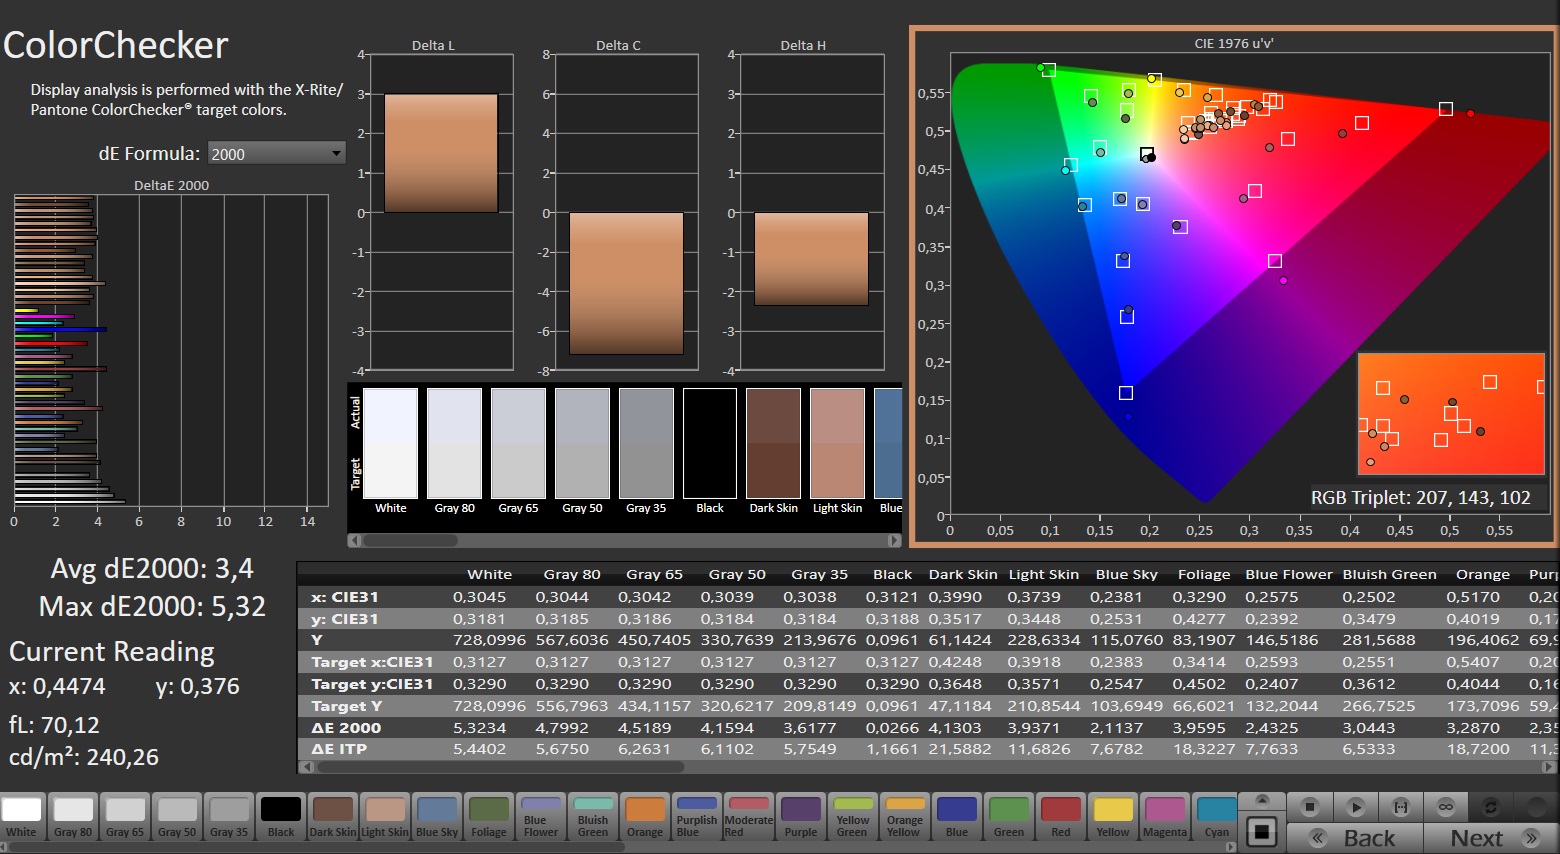
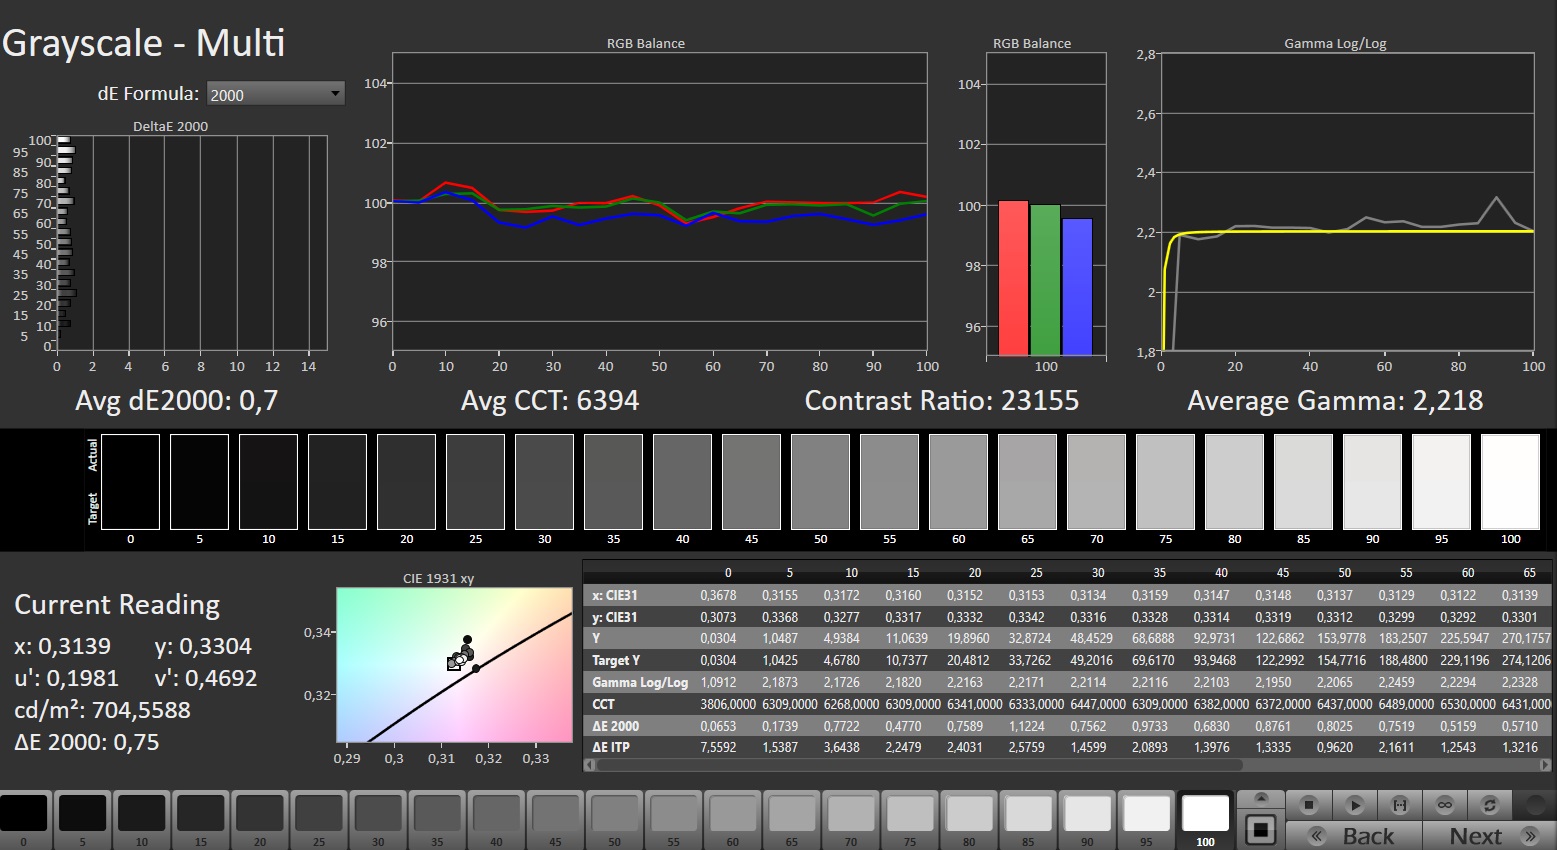
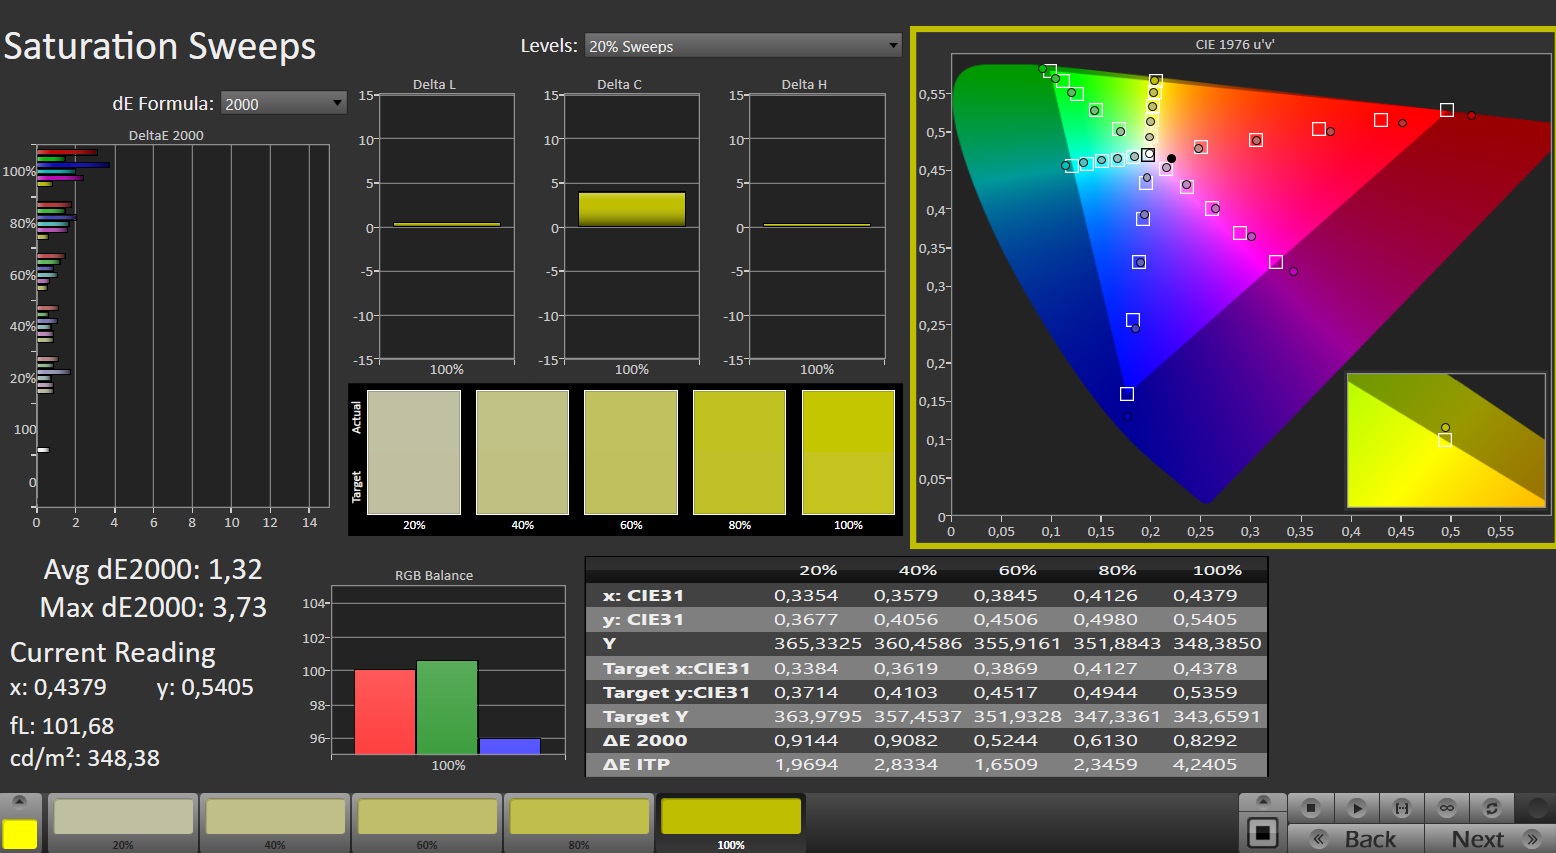
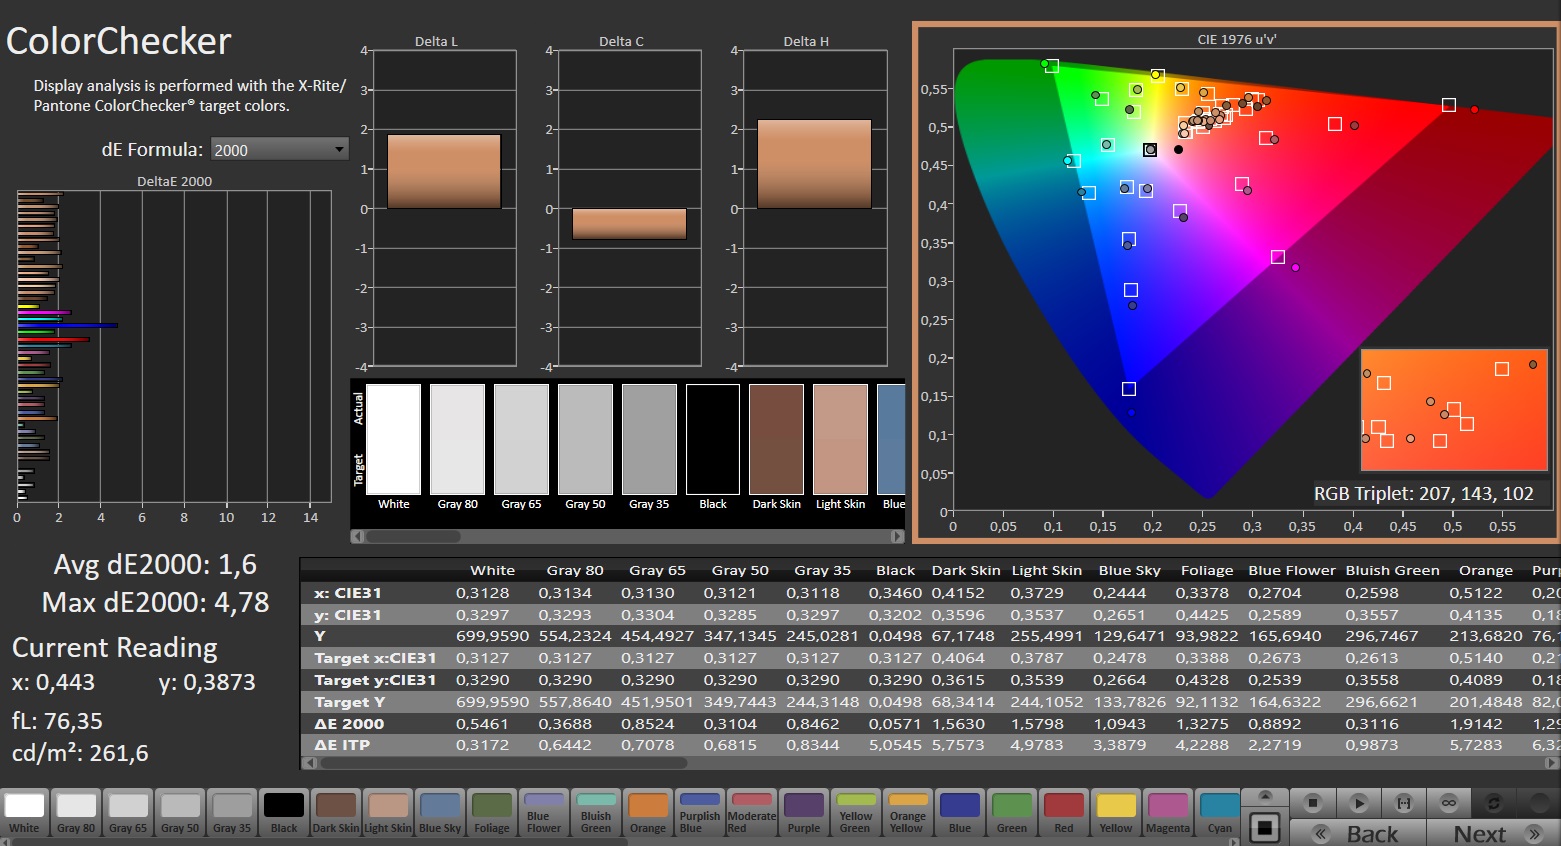
Ne yazık ki, renk doğruluğu kutudan çıkar çıkmaz en iyisi değil, bu nedenle profesyonel kullanıcılar satın aldıktan sonra bir kalibrasyon yapmalıdır (ICC dosyamız yukarıda bağlantılıdır).


Tepki süreleri iyi sayılabilecek düzeyde, ancak daha iyi kontrast ve siyah değerleri sunan OLED paneller kadar iyi değiller. Öte yandan, kendi zayıflıkları da var (örneğin, genellikle yansıtıcı bir yüzey).
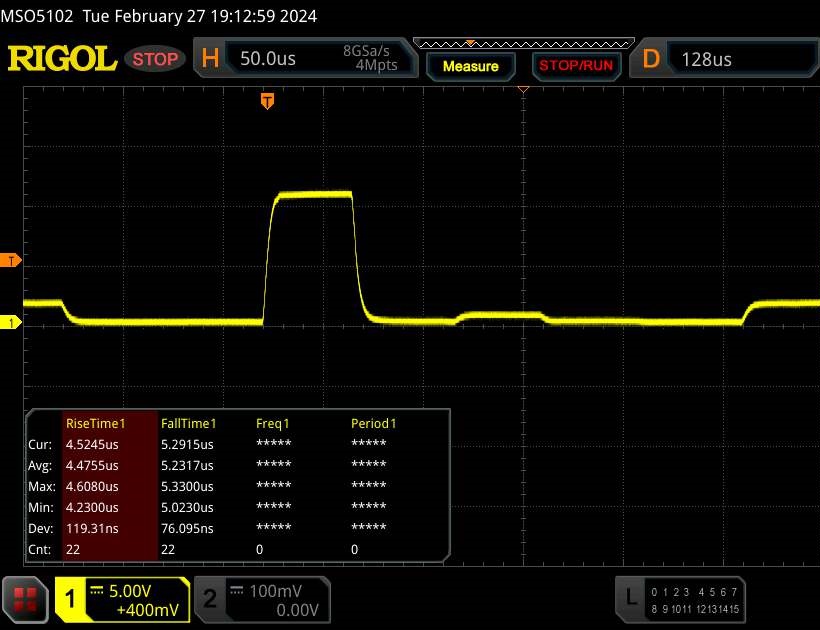
Yanıt Sürelerini Görüntüle
| ↔ Tepki Süresi Siyahtan Beyaza | ||
|---|---|---|
| 17.6 ms ... yükseliş ↗ ve sonbahar↘ birleşimi | ↗ 15.2 ms yükseliş | 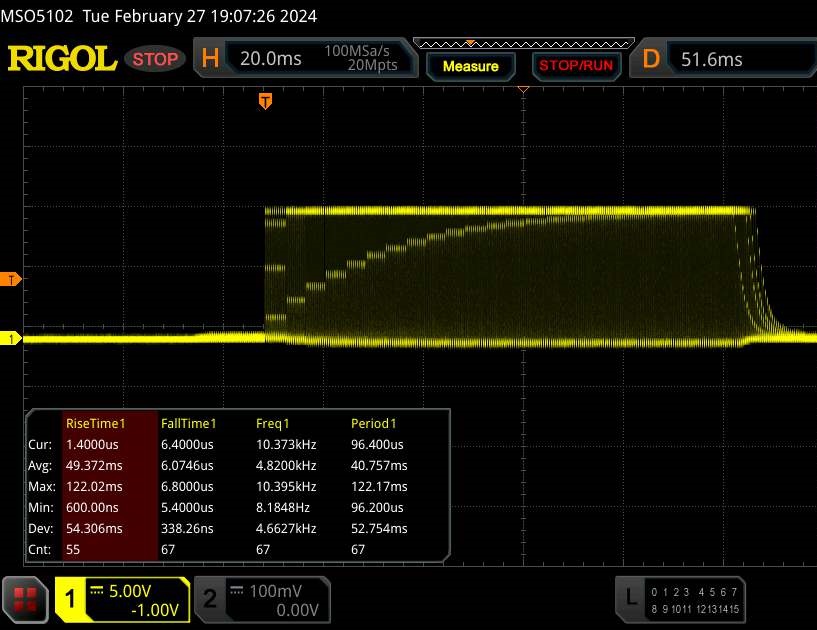 |
| ↘ 2.4 ms sonbahar | ||
| Ekran, testlerimizde iyi yanıt oranları gösteriyor ancak rekabetçi oyuncular için çok yavaş olabilir. Karşılaştırıldığında, test edilen tüm cihazlar 0.1 (minimum) ile 240 (maksimum) ms arasında değişir. » Tüm cihazların 40 %'si daha iyi. Bu, ölçülen yanıt süresinin test edilen tüm cihazların ortalamasından (19.8 ms) daha iyi olduğu anlamına gelir. | ||
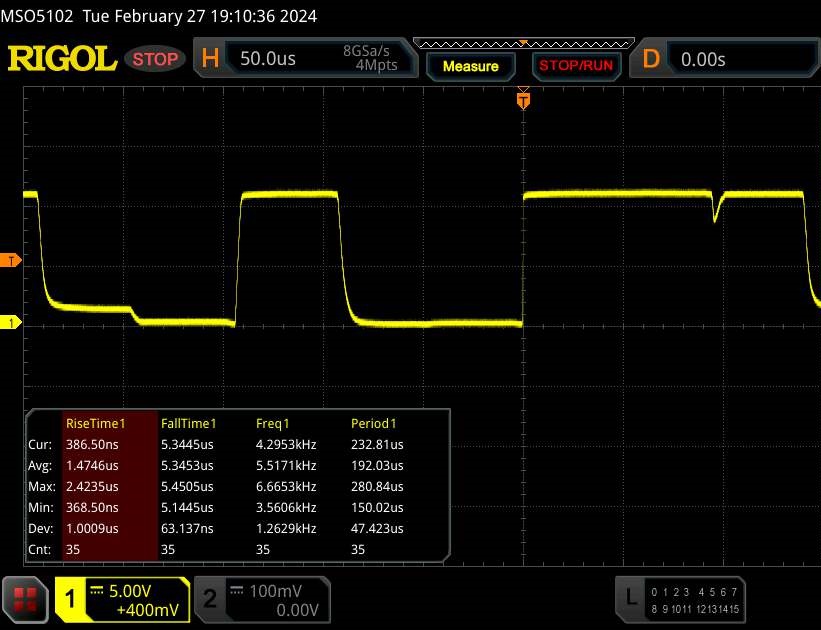
| ↔ Tepki Süresi %50 Griden %80 Griye | ||
| 8 ms ... yükseliş ↗ ve sonbahar↘ birleşimi | ↗ 4.9 ms yükseliş | 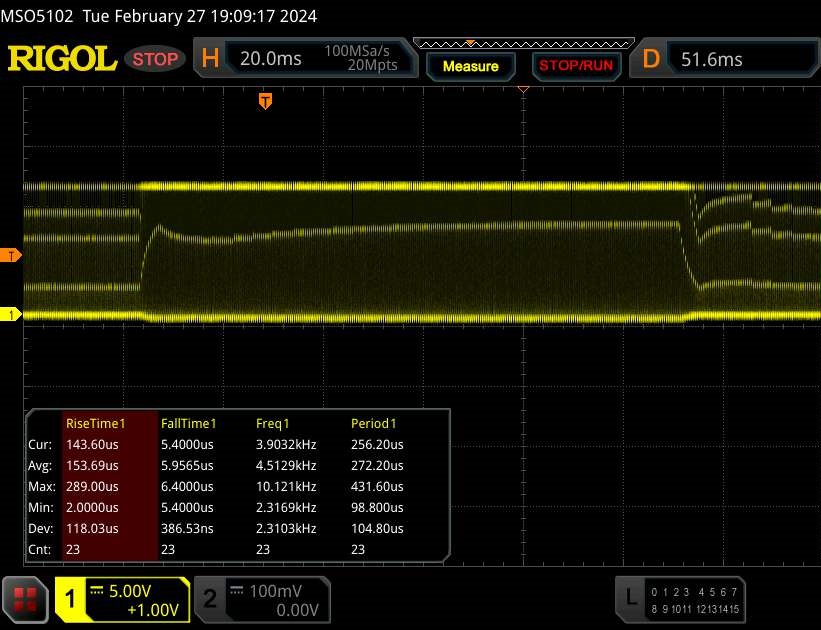 |
| ↘ 3.1 ms sonbahar | ||
| Ekran, testlerimizde hızlı yanıt oranları gösteriyor ve oyun oynamaya uygun olmalı. Karşılaştırıldığında, test edilen tüm cihazlar 0.165 (minimum) ile 636 (maksimum) ms arasında değişir. » Tüm cihazların 21 %'si daha iyi. Bu, ölçülen yanıt süresinin test edilen tüm cihazların ortalamasından (31 ms) daha iyi olduğu anlamına gelir. | ||
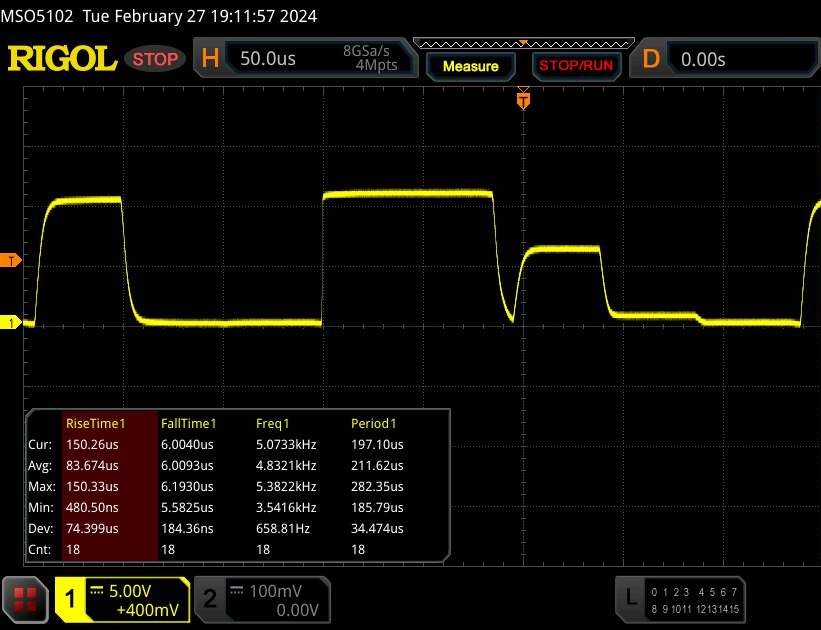
Ekran Titremesi / PWM (Darbe Genişliği Modülasyonu)
| Ekran titriyor / PWM algılandı | 4832 Hz | ≤ 100 % parlaklık ayarı | 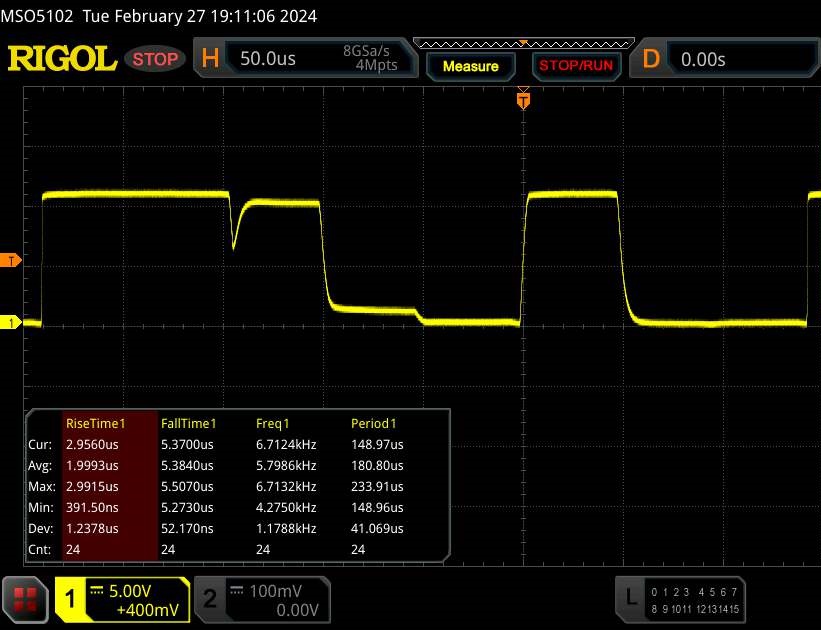 |
Ekran arka ışığı 4832 Hz'de titriyor (en kötü durum, örneğin PWM kullanılması) 100 % ve altındaki parlaklık ayarında titreme algılandı. Bu parlaklık ayarının üzerinde titreme veya PWM olmamalıdır. 4832 Hz frekansı oldukça yüksektir, bu nedenle PWM'ye duyarlı çoğu kullanıcı herhangi bir titremeyi fark etmemelidir. Karşılaştırıldığında: Test edilen tüm cihazların %52 %'si ekranı karartmak için PWM kullanmıyor. PWM tespit edilirse, ortalama 7757 (minimum: 5 - maksimum: 343500) Hz ölçüldü. | |||

Performans
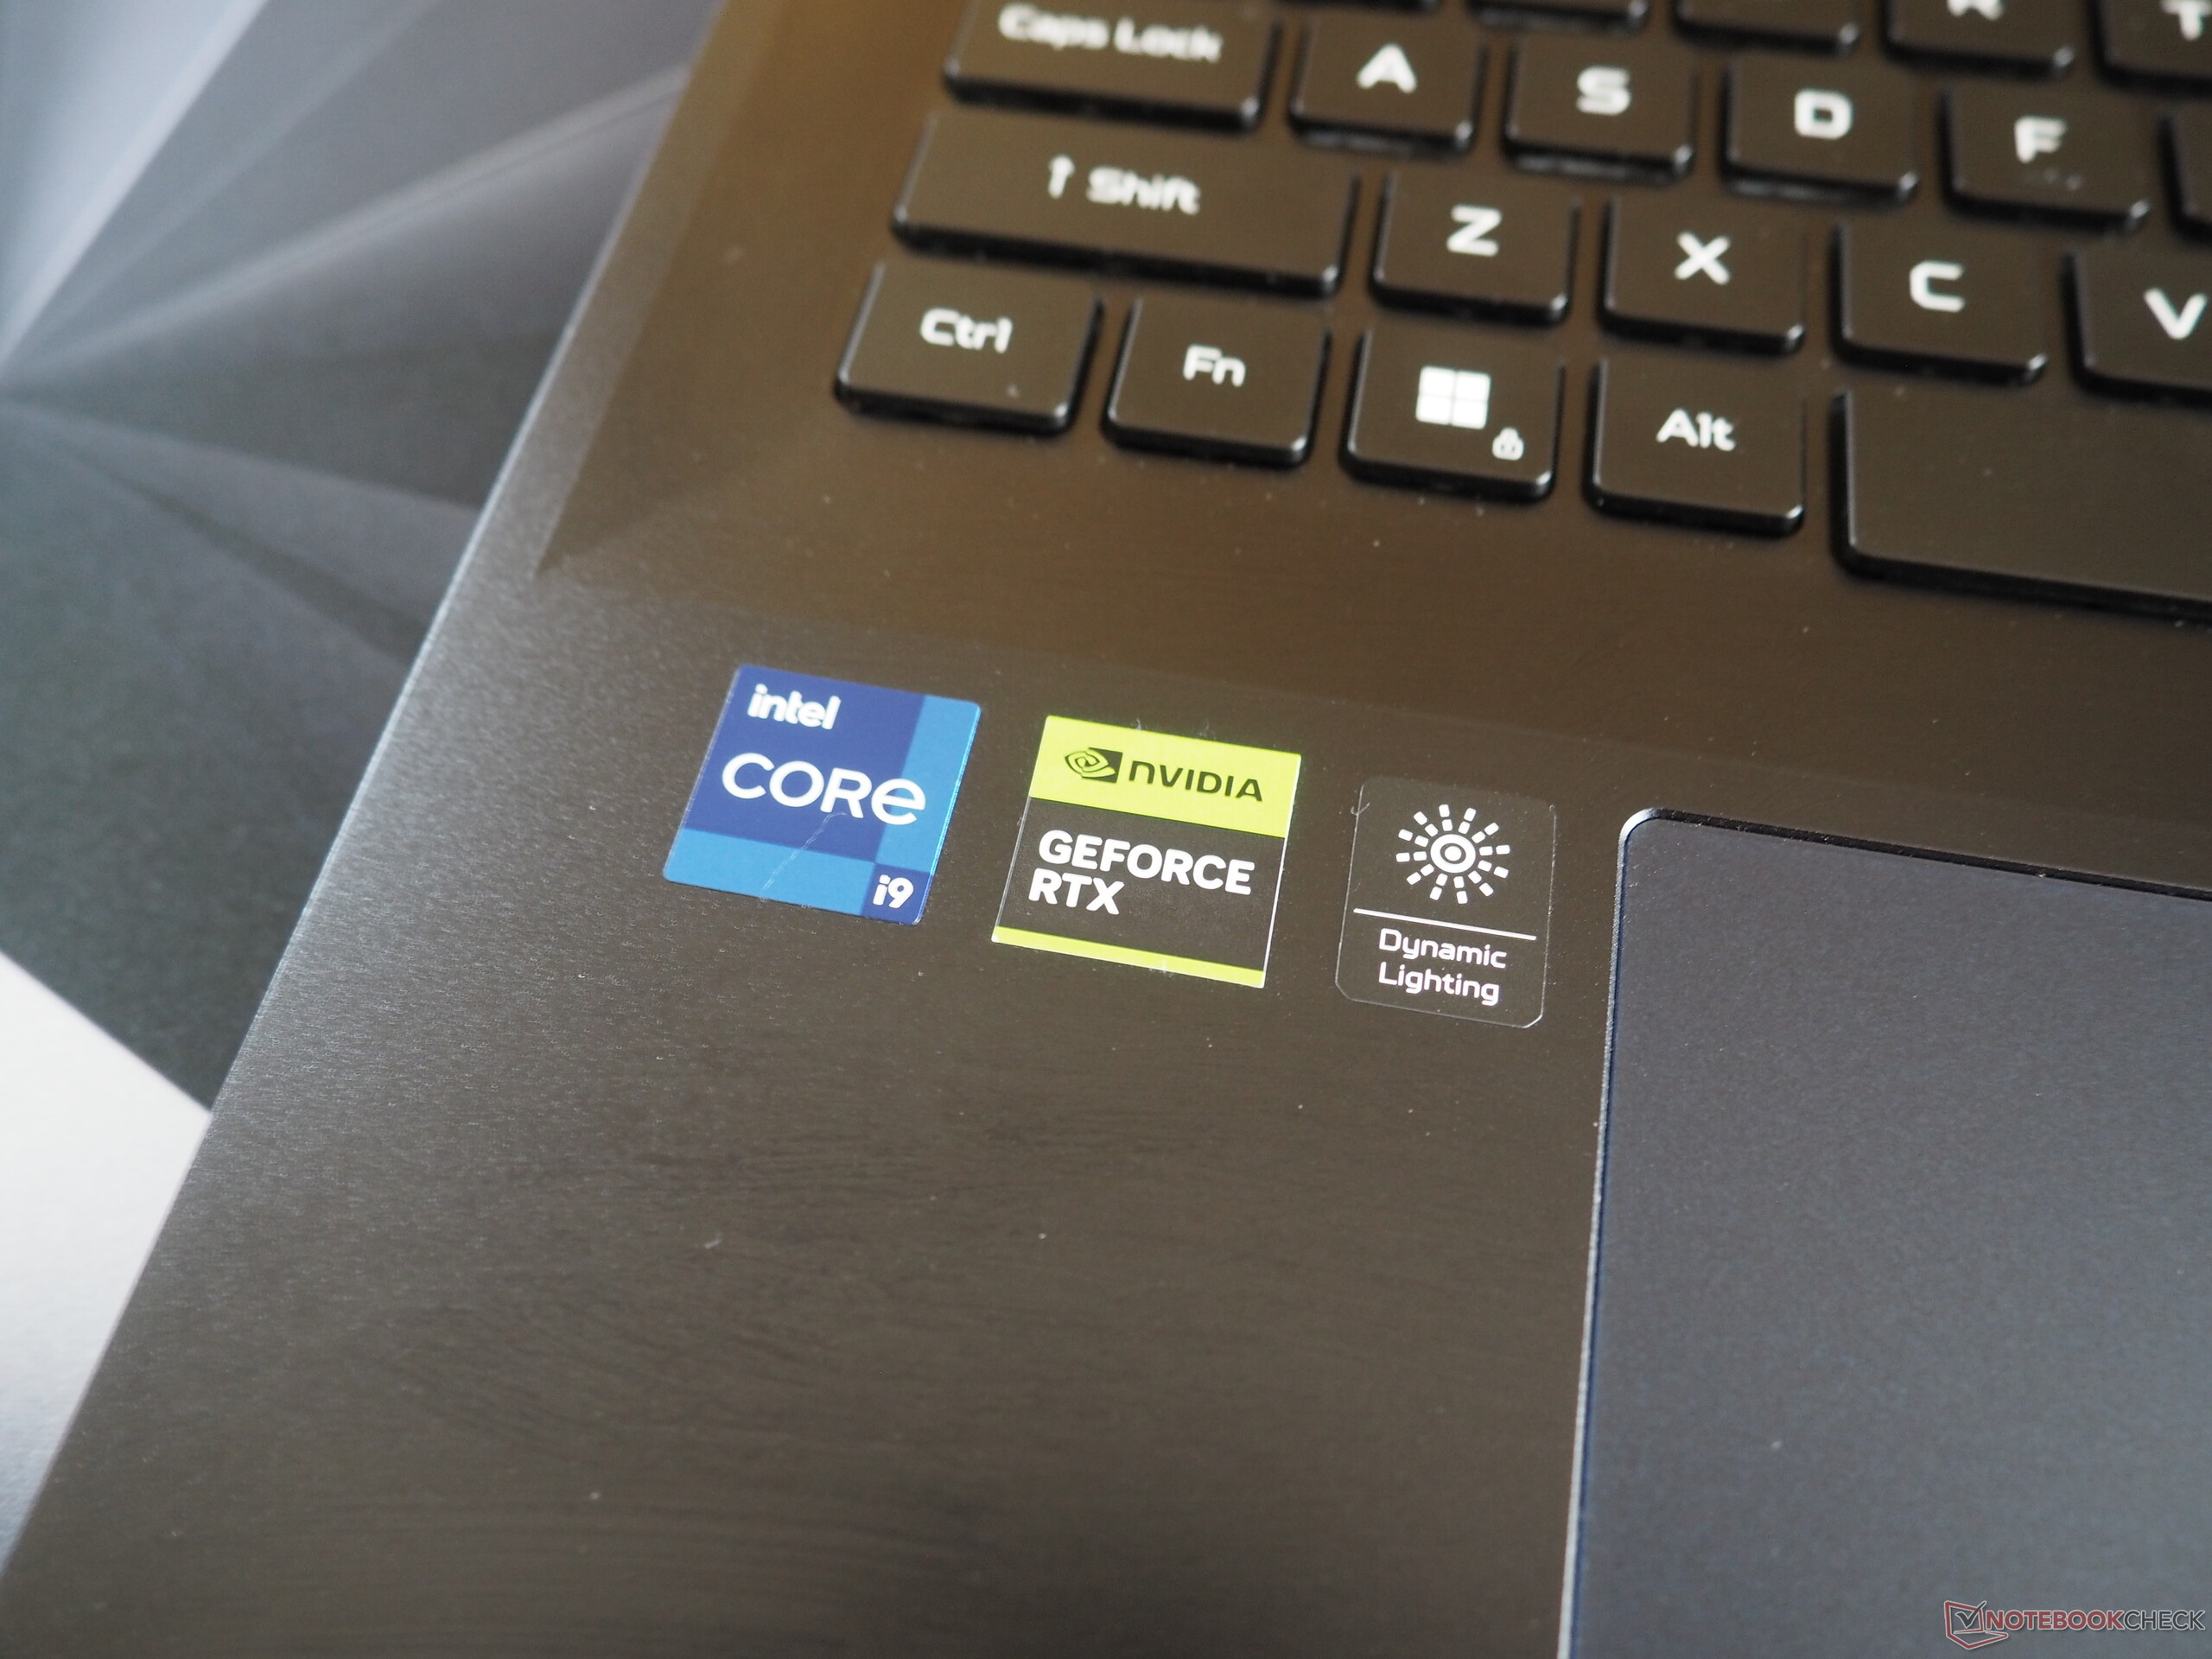
Predator Helios 18'in bileşenleri, oyun dizüstü bilgisayarları söz konusu olduğunda en üst düzey modellerdir. 32 GB RAM ve 2 TB depolama alanı önümüzdeki yıllarda çoğu kullanıcı için yeterli olacaktır. Aynı şey CPU ve GPU gücü için de söylenebilir; dizüstü bilgisayarın 2.560 x 1.600 piksellik orta düzey ekran çözünürlüğü nedeniyle bunların hiçbiri henüz sınırlarına ulaşmadı.
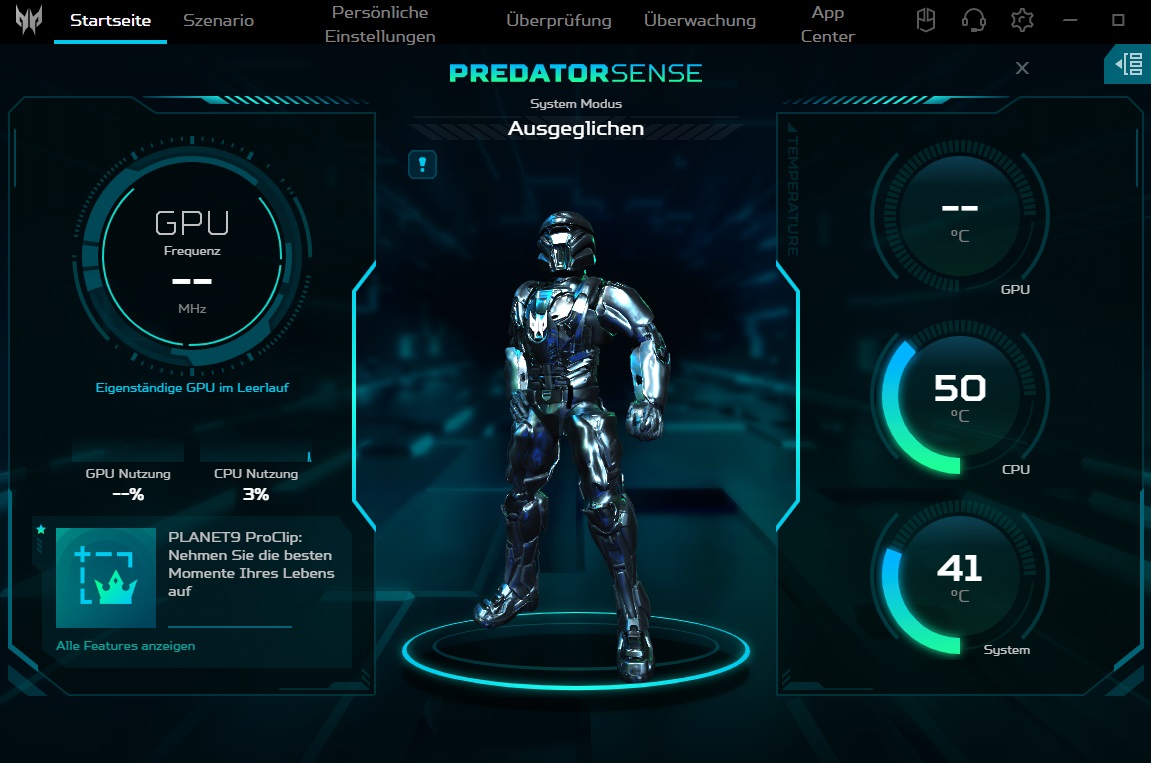
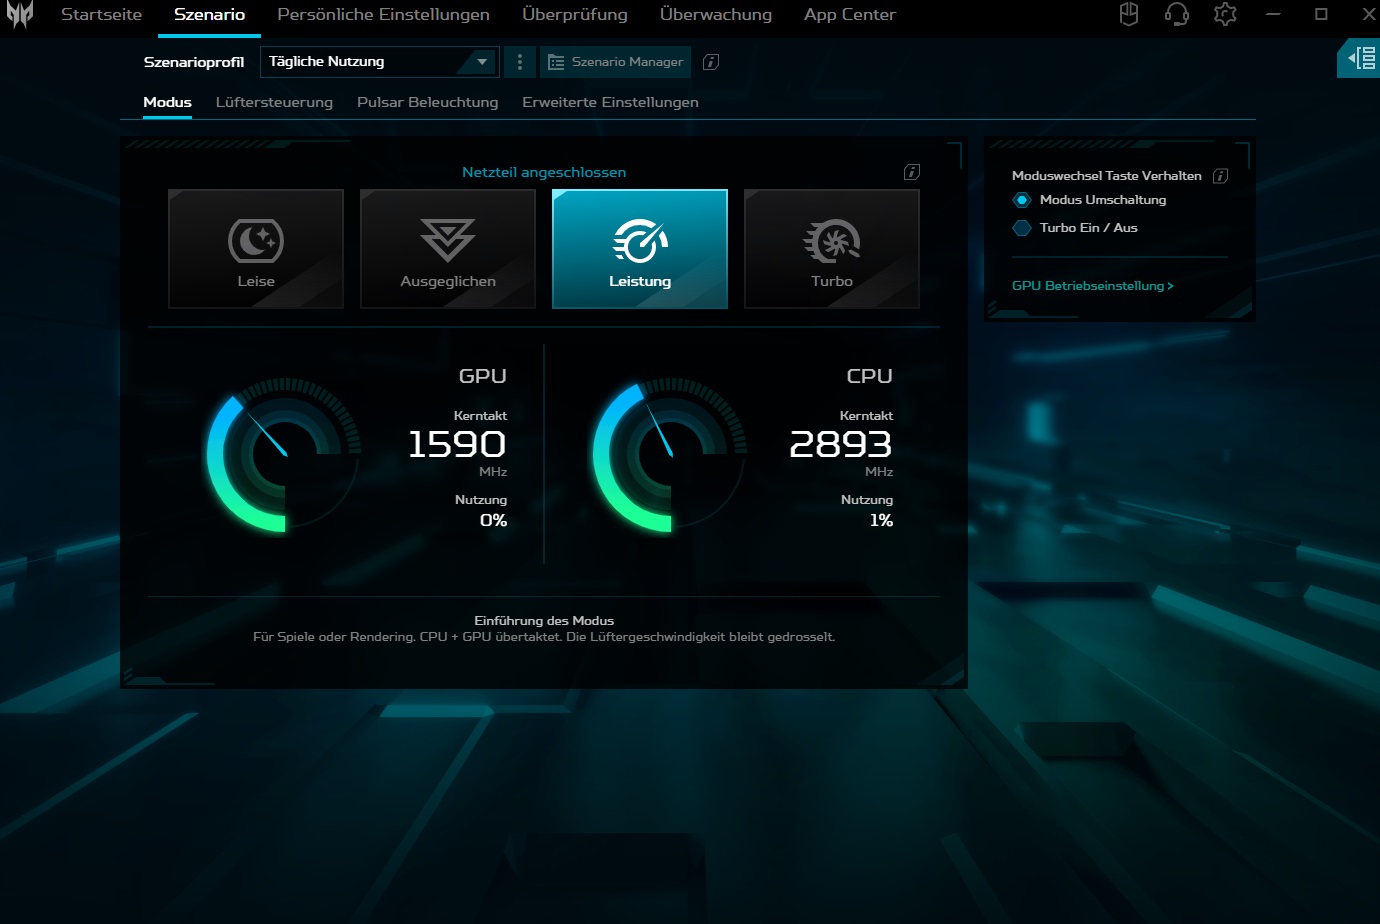
Test koşulları
Önceden yüklenmiş üretici yazılımında (Predator Sense), performans ve gürültü emisyonları üzerinde önemli bir etkiye sahip olan Senaryo altında listelenen çeşitli çalışma modları vardır. 18 inç dizüstü bilgisayar turbo modunda son derece gürültülü olduğundan (oyun oynarken >60 dB), tüm ölçümler performans modunda gerçekleştirilmiştir. Bu nedenle belirlenen hız ve emisyon değerleri, önceki modelle yalnızca sınırlı ölçüde karşılaştırılabilir.
| Witcher 3 (FHD/Ultra) | Sessiz | Dengeli | Performans | Turbo |
| Gürültü | 38 dB(A) | 43 dB(A) | 49 dB(A) | 61 dB(A) |
| Performans | 130 fps | 160 fps | 180 fps | 200 fps |
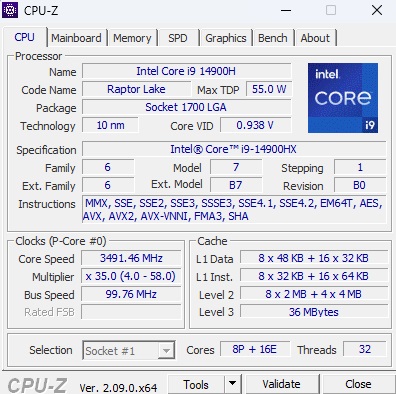
İşlemci
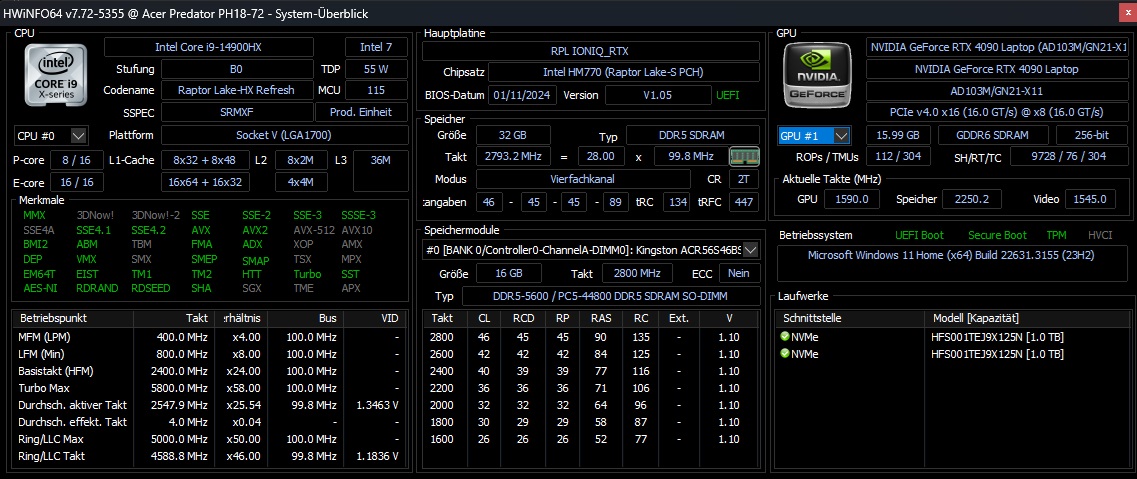
Core i9-14900HX, Intel'in Raptor Lake serisinin en üst düzey modelidir ve yüksek bir tüketime sahip olmasına rağmen harika bir performans sunar. Intel, hiper iş parçacıklı 8 performans çekirdeği ve HT'siz 16 verimlilik çekirdeği kullanarak 32 paralel iş parçacığı elde ediyor. Performans modunda, CPU ortalamanın biraz altında sonuçlar elde etti (önceki ortalamaya kıyasla -%6). Dahası, Cinebench döngümüzün ortaya koyduğu gibi, daha uzun yük dönemlerinde performansı düşüyor (grafiğe bakın). Rakip cihazların hiçbirinde durum böyle değildi.
Cinebench R15 Multi continuous test
* ... daha küçük daha iyidir
AIDA64: FP32 Ray-Trace | FPU Julia | CPU SHA3 | CPU Queen | FPU SinJulia | FPU Mandel | CPU AES | CPU ZLib | FP64 Ray-Trace | CPU PhotoWorxx
| Performance rating | |
| Alienware m18 R1 AMD | |
| Acer Predator Helios 18 N23Q2 | |
| MSI Titan 18 HX A14VIG | |
| Asus ROG Strix Scar 18 G834JYR (2024) | |
| Sınıf ortalaması Gaming | |
| Ortalama Intel Core i9-14900HX | |
| Acer Predator Helios 18 PH18-72-98MW | |
| AIDA64 / FP32 Ray-Trace | |
| Alienware m18 R1 AMD | |
| Sınıf ortalaması Gaming (10227 - 85542, n=105, son 2 yıl) | |
| MSI Titan 18 HX A14VIG | |
| Acer Predator Helios 18 N23Q2 | |
| Asus ROG Strix Scar 18 G834JYR (2024) | |
| Ortalama Intel Core i9-14900HX (13098 - 33474, n=36) | |
| Acer Predator Helios 18 PH18-72-98MW | |
| AIDA64 / FPU Julia | |
| Alienware m18 R1 AMD | |
| MSI Titan 18 HX A14VIG | |
| Sınıf ortalaması Gaming (51376 - 238426, n=105, son 2 yıl) | |
| Acer Predator Helios 18 N23Q2 | |
| Asus ROG Strix Scar 18 G834JYR (2024) | |
| Ortalama Intel Core i9-14900HX (67573 - 166040, n=36) | |
| Acer Predator Helios 18 PH18-72-98MW | |
| AIDA64 / CPU SHA3 | |
| Alienware m18 R1 AMD | |
| MSI Titan 18 HX A14VIG | |
| Acer Predator Helios 18 N23Q2 | |
| Sınıf ortalaması Gaming (2180 - 10115, n=105, son 2 yıl) | |
| Asus ROG Strix Scar 18 G834JYR (2024) | |
| Ortalama Intel Core i9-14900HX (3589 - 7979, n=36) | |
| Acer Predator Helios 18 PH18-72-98MW | |
| AIDA64 / CPU Queen | |
| Alienware m18 R1 AMD | |
| MSI Titan 18 HX A14VIG | |
| Asus ROG Strix Scar 18 G834JYR (2024) | |
| Acer Predator Helios 18 PH18-72-98MW | |
| Ortalama Intel Core i9-14900HX (118405 - 148966, n=36) | |
| Acer Predator Helios 18 N23Q2 | |
| Sınıf ortalaması Gaming (49785 - 173351, n=90, son 2 yıl) | |
| AIDA64 / FPU SinJulia | |
| Alienware m18 R1 AMD | |
| MSI Titan 18 HX A14VIG | |
| Asus ROG Strix Scar 18 G834JYR (2024) | |
| Acer Predator Helios 18 N23Q2 | |
| Ortalama Intel Core i9-14900HX (10475 - 18517, n=36) | |
| Acer Predator Helios 18 PH18-72-98MW | |
| Sınıf ortalaması Gaming (4424 - 33636, n=105, son 2 yıl) | |
| AIDA64 / FPU Mandel | |
| Alienware m18 R1 AMD | |
| Sınıf ortalaması Gaming (25115 - 128721, n=105, son 2 yıl) | |
| MSI Titan 18 HX A14VIG | |
| Acer Predator Helios 18 N23Q2 | |
| Asus ROG Strix Scar 18 G834JYR (2024) | |
| Ortalama Intel Core i9-14900HX (32543 - 83662, n=36) | |
| Acer Predator Helios 18 PH18-72-98MW | |
| AIDA64 / CPU AES | |
| Acer Predator Helios 18 N23Q2 | |
| Alienware m18 R1 AMD | |
| Ortalama Intel Core i9-14900HX (86964 - 241777, n=36) | |
| MSI Titan 18 HX A14VIG | |
| Asus ROG Strix Scar 18 G834JYR (2024) | |
| Acer Predator Helios 18 PH18-72-98MW | |
| Sınıf ortalaması Gaming (39258 - 247074, n=105, son 2 yıl) | |
| AIDA64 / CPU ZLib | |
| Alienware m18 R1 AMD | |
| MSI Titan 18 HX A14VIG | |
| Acer Predator Helios 18 N23Q2 | |
| Ortalama Intel Core i9-14900HX (1054 - 2292, n=36) | |
| Asus ROG Strix Scar 18 G834JYR (2024) | |
| Acer Predator Helios 18 PH18-72-98MW | |
| Sınıf ortalaması Gaming (574 - 2531, n=105, son 2 yıl) | |
| AIDA64 / FP64 Ray-Trace | |
| Alienware m18 R1 AMD | |
| Sınıf ortalaması Gaming (5509 - 45446, n=105, son 2 yıl) | |
| MSI Titan 18 HX A14VIG | |
| Acer Predator Helios 18 N23Q2 | |
| Asus ROG Strix Scar 18 G834JYR (2024) | |
| Ortalama Intel Core i9-14900HX (6809 - 18349, n=36) | |
| Acer Predator Helios 18 PH18-72-98MW | |
| AIDA64 / CPU PhotoWorxx | |
| Acer Predator Helios 18 N23Q2 | |
| Asus ROG Strix Scar 18 G834JYR (2024) | |
| Acer Predator Helios 18 PH18-72-98MW | |
| Ortalama Intel Core i9-14900HX (23903 - 54702, n=36) | |
| Sınıf ortalaması Gaming (12271 - 89891, n=105, son 2 yıl) | |
| Alienware m18 R1 AMD | |
| MSI Titan 18 HX A14VIG | |
Sistem performansı
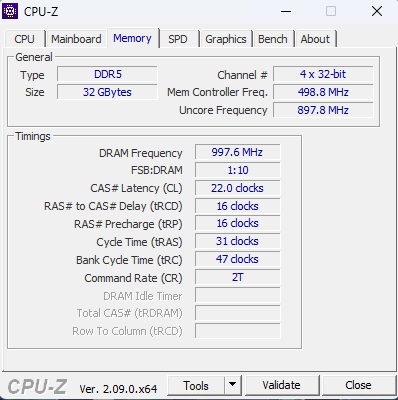
Sistem performansı da birincilik için yeterli değildi. Toplam PCMark 10 puanı selefi ile karşılaştırılabilir düzeyde. Cihazın RAM'i DDR5-5600 RAM için tipik performans seviyeleri sunuyor.
CrossMark: Overall | Productivity | Creativity | Responsiveness
WebXPRT 3: Overall
WebXPRT 4: Overall
Mozilla Kraken 1.1: Total
| PCMark 10 / Score | |
| Alienware m18 R1 AMD | |
| MSI Titan 18 HX A14VIG | |
| Asus ROG Strix Scar 18 G834JYR (2024) | |
| Ortalama Intel Core i9-14900HX, NVIDIA GeForce RTX 4090 Laptop GPU (8230 - 9234, n=13) | |
| Acer Predator Helios 18 N23Q2 | |
| Sınıf ortalaması Gaming (5828 - 12414, n=93, son 2 yıl) | |
| Acer Predator Helios 18 PH18-72-98MW | |
| PCMark 10 / Essentials | |
| Alienware m18 R1 AMD | |
| MSI Titan 18 HX A14VIG | |
| Asus ROG Strix Scar 18 G834JYR (2024) | |
| Ortalama Intel Core i9-14900HX, NVIDIA GeForce RTX 4090 Laptop GPU (10778 - 11628, n=13) | |
| Acer Predator Helios 18 PH18-72-98MW | |
| Acer Predator Helios 18 N23Q2 | |
| Sınıf ortalaması Gaming (8810 - 11935, n=97, son 2 yıl) | |
| PCMark 10 / Productivity | |
| Alienware m18 R1 AMD | |
| Sınıf ortalaması Gaming (6845 - 25323, n=95, son 2 yıl) | |
| Ortalama Intel Core i9-14900HX, NVIDIA GeForce RTX 4090 Laptop GPU (9458 - 11759, n=13) | |
| Asus ROG Strix Scar 18 G834JYR (2024) | |
| Acer Predator Helios 18 N23Q2 | |
| MSI Titan 18 HX A14VIG | |
| Acer Predator Helios 18 PH18-72-98MW | |
| PCMark 10 / Digital Content Creation | |
| Alienware m18 R1 AMD | |
| MSI Titan 18 HX A14VIG | |
| Asus ROG Strix Scar 18 G834JYR (2024) | |
| Ortalama Intel Core i9-14900HX, NVIDIA GeForce RTX 4090 Laptop GPU (13219 - 16462, n=13) | |
| Acer Predator Helios 18 N23Q2 | |
| Sınıf ortalaması Gaming (7602 - 19954, n=95, son 2 yıl) | |
| Acer Predator Helios 18 PH18-72-98MW | |
| CrossMark / Overall | |
| Asus ROG Strix Scar 18 G834JYR (2024) | |
| Acer Predator Helios 18 N23Q2 | |
| Ortalama Intel Core i9-14900HX, NVIDIA GeForce RTX 4090 Laptop GPU (1877 - 2344, n=10) | |
| Sınıf ortalaması Gaming (1366 - 2409, n=94, son 2 yıl) | |
| Alienware m18 R1 AMD | |
| MSI Titan 18 HX A14VIG | |
| CrossMark / Productivity | |
| Acer Predator Helios 18 N23Q2 | |
| Asus ROG Strix Scar 18 G834JYR (2024) | |
| Ortalama Intel Core i9-14900HX, NVIDIA GeForce RTX 4090 Laptop GPU (1738 - 2162, n=10) | |
| Sınıf ortalaması Gaming (1386 - 2254, n=94, son 2 yıl) | |
| Alienware m18 R1 AMD | |
| MSI Titan 18 HX A14VIG | |
| CrossMark / Creativity | |
| Asus ROG Strix Scar 18 G834JYR (2024) | |
| Acer Predator Helios 18 N23Q2 | |
| Ortalama Intel Core i9-14900HX, NVIDIA GeForce RTX 4090 Laptop GPU (2195 - 2660, n=10) | |
| Sınıf ortalaması Gaming (1343 - 2786, n=94, son 2 yıl) | |
| Alienware m18 R1 AMD | |
| MSI Titan 18 HX A14VIG | |
| CrossMark / Responsiveness | |
| Acer Predator Helios 18 N23Q2 | |
| Asus ROG Strix Scar 18 G834JYR (2024) | |
| Ortalama Intel Core i9-14900HX, NVIDIA GeForce RTX 4090 Laptop GPU (1478 - 2327, n=10) | |
| Sınıf ortalaması Gaming (1226 - 2334, n=94, son 2 yıl) | |
| Alienware m18 R1 AMD | |
| MSI Titan 18 HX A14VIG | |
| WebXPRT 3 / Overall | |
| Alienware m18 R1 AMD | |
| MSI Titan 18 HX A14VIG | |
| Ortalama Intel Core i9-14900HX, NVIDIA GeForce RTX 4090 Laptop GPU (279 - 339, n=10) | |
| Asus ROG Strix Scar 18 G834JYR (2024) | |
| Acer Predator Helios 18 N23Q2 | |
| Sınıf ortalaması Gaming (220 - 532, n=98, son 2 yıl) | |
| WebXPRT 4 / Overall | |
| Asus ROG Strix Scar 18 G834JYR (2024) | |
| Alienware m18 R1 AMD | |
| Ortalama Intel Core i9-14900HX, NVIDIA GeForce RTX 4090 Laptop GPU (246 - 309, n=8) | |
| MSI Titan 18 HX A14VIG | |
| Sınıf ortalaması Gaming (165 - 354, n=98, son 2 yıl) | |
| Mozilla Kraken 1.1 / Total | |
| Alienware m18 R1 AMD | |
| Sınıf ortalaması Gaming (391 - 590, n=100, son 2 yıl) | |
| Acer Predator Helios 18 N23Q2 | |
| Ortalama Intel Core i9-14900HX, NVIDIA GeForce RTX 4090 Laptop GPU (428 - 535, n=11) | |
| MSI Titan 18 HX A14VIG | |
| Asus ROG Strix Scar 18 G834JYR (2024) | |
| Acer Predator Helios 18 PH18-72-98MW | |
* ... daha küçük daha iyidir
| PCMark 10 Score | 8230 puan | |
Yardım | ||
| AIDA64 / Memory Copy | |
| Asus ROG Strix Scar 18 G834JYR (2024) | |
| Acer Predator Helios 18 N23Q2 | |
| Acer Predator Helios 18 PH18-72-98MW | |
| Ortalama Intel Core i9-14900HX (38028 - 83392, n=36) | |
| Sınıf ortalaması Gaming (21750 - 129946, n=105, son 2 yıl) | |
| MSI Titan 18 HX A14VIG | |
| Alienware m18 R1 AMD | |
| AIDA64 / Memory Read | |
| Asus ROG Strix Scar 18 G834JYR (2024) | |
| Acer Predator Helios 18 N23Q2 | |
| Acer Predator Helios 18 PH18-72-98MW | |
| Ortalama Intel Core i9-14900HX (43306 - 87568, n=36) | |
| Sınıf ortalaması Gaming (22956 - 118858, n=105, son 2 yıl) | |
| Alienware m18 R1 AMD | |
| MSI Titan 18 HX A14VIG | |
| AIDA64 / Memory Write | |
| Asus ROG Strix Scar 18 G834JYR (2024) | |
| Sınıf ortalaması Gaming (22297 - 135096, n=105, son 2 yıl) | |
| Acer Predator Helios 18 N23Q2 | |
| Ortalama Intel Core i9-14900HX (37146 - 80589, n=36) | |
| Acer Predator Helios 18 PH18-72-98MW | |
| Alienware m18 R1 AMD | |
| MSI Titan 18 HX A14VIG | |
| AIDA64 / Memory Latency | |
| Sınıf ortalaması Gaming (75.3 - 259, n=105, son 2 yıl) | |
| MSI Titan 18 HX A14VIG | |
| Alienware m18 R1 AMD | |
| Ortalama Intel Core i9-14900HX (76.1 - 105, n=36) | |
| Acer Predator Helios 18 N23Q2 | |
| Acer Predator Helios 18 PH18-72-98MW | |
| Asus ROG Strix Scar 18 G834JYR (2024) | |
* ... daha küçük daha iyidir
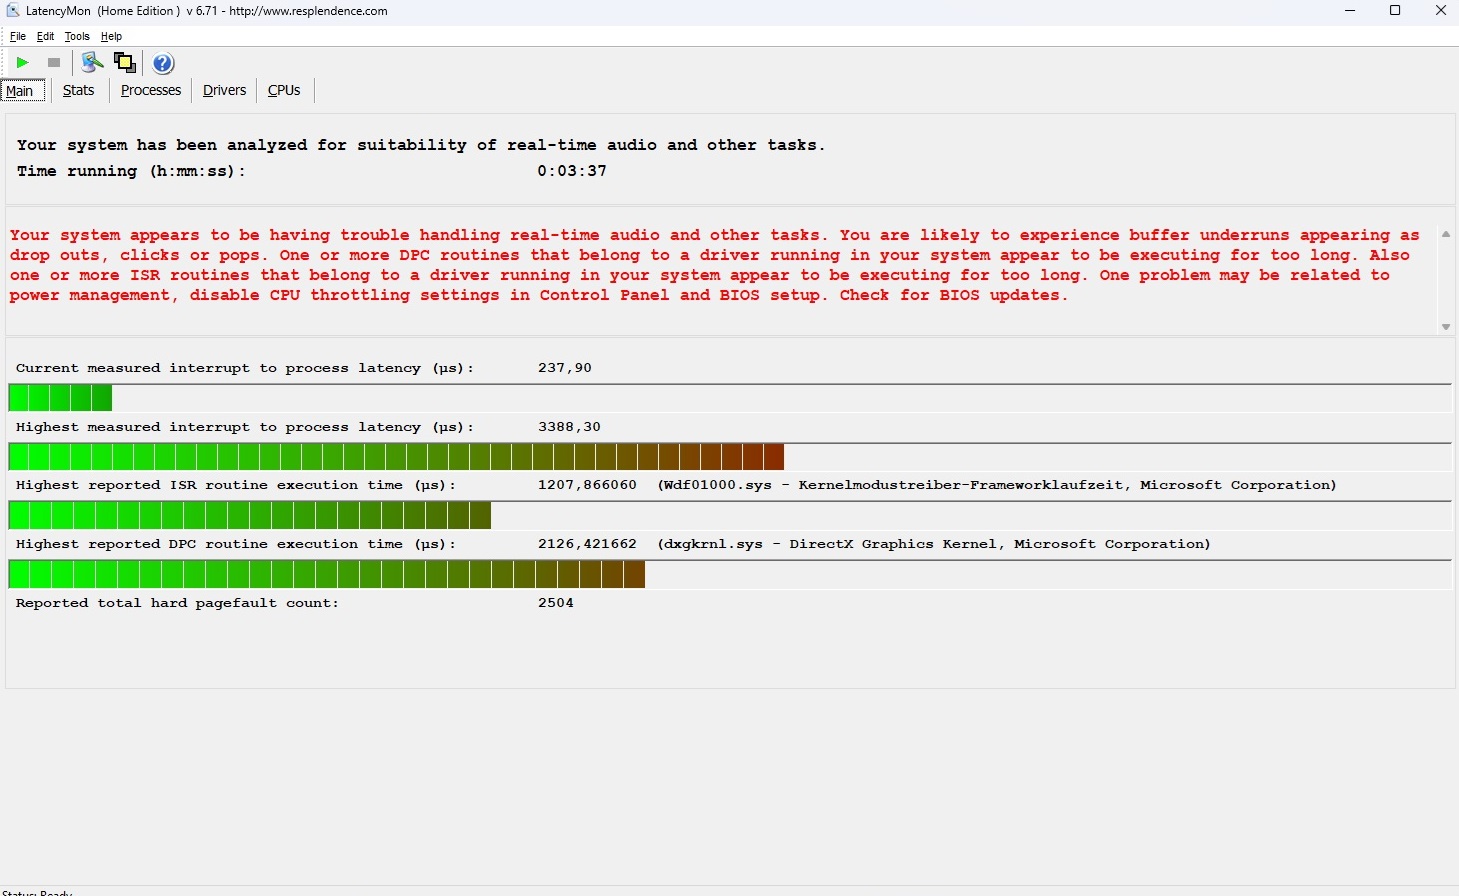
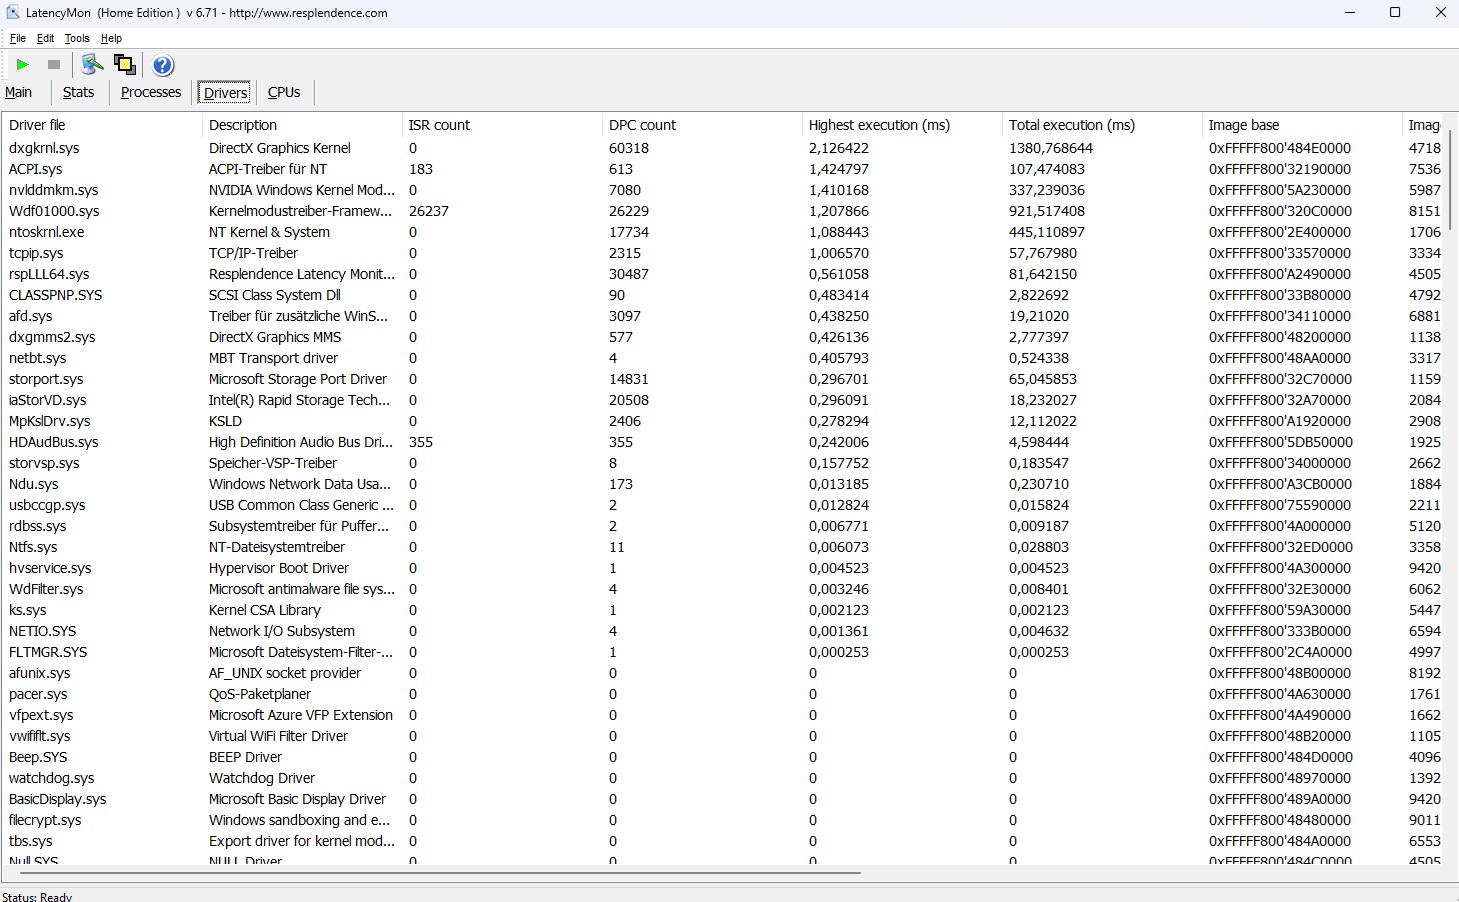
DPC gecikme süresi
Dizüstü bilgisayarın gecikme süreleri eski Helios 18'e göre oldukça düşük olabilir, ancak LatencyMon aracına göre, belirli kullanım alanları (gerçek zamanlı ses ve video düzenleme) için hala çok yüksek.
| DPC Latencies / LatencyMon - interrupt to process latency (max), Web, Youtube, Prime95 | |
| Acer Predator Helios 18 N23Q2 | |
| Acer Predator Helios 18 PH18-72-98MW | |
| MSI Titan 18 HX A14VIG | |
| Alienware m18 R1 AMD | |
| Asus ROG Strix Scar 18 G834JYR (2024) | |
* ... daha küçük daha iyidir
Depolama cihazları
Giriş bölümünde de belirtildiği gibi Acer, iki NVMe SSD'yi bir Raid 0 dizisinde birleştirmiştir. İlk bakışta bu, sıralı okuma ve yazma hızları söz konusu olduğunda birinci sınıf sonuçlar vermektedir. Ancak, döngü testimiz sırasında bir süre sonra ara sıra bazı performans dalgalanmaları fark ettiğimiz için dizüstü bilgisayarın soğutması idealden daha az görünüyor.

* ... daha küçük daha iyidir
Reading continuous performance: DiskSpd Read Loop, Queue Depth 8
Grafik kartı
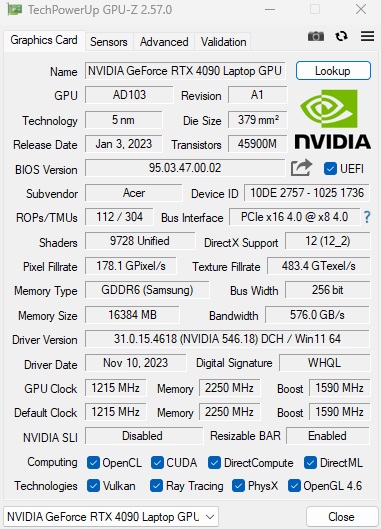
Ada Lovelace mimarisine dayanan GeForce RTX 4090 şu anda Nvidia'nın en güçlü dizüstü grafik kartı. Özellikle Acer TGP olarak maksimum 175 watt'ı seçtiğinden, 9.728 gölgelendirici birimi de 16 GB GDDR6 VRAM'i kadar cömert. Buna rağmen, performans modundaki GPU performansı mümkün olanın altında kalıyor. CPU testlerine benzer şekilde, RTX 4090'ın önceki ortalamasına kıyasla yüzde 6 daha az elde etti.
| 3DMark 11 Performance | 44065 puan | |
| 3DMark Cloud Gate Standard Score | 59876 puan | |
| 3DMark Fire Strike Score | 33907 puan | |
| 3DMark Time Spy Score | 18542 puan | |
Yardım | ||
* ... daha küçük daha iyidir
Oyun performansı
Oyun kıyaslamaları da benzer bir tablo çiziyor. Burada da RTX 4090 tam potansiyelini kullanamadı. Yine de bu, tüm modern oyunları 2.560 x 1.600 piksel doğal çözünürlüğünde tüm ayrıntılarıyla çalıştırmak için yeterliydi. İşler yalnızca aşağıdaki gibi son derece zorlu veya kötü optimize edilmiş oyunları oynarken zorlaşıyor Düşmüşlerin Efendileri. DLSS burada yardımcı olabilir, örneğin ikinci oyun QHD/Ultra'da 43 fps (kalite ayarı) yerine 72 fps'de çalışır. Çoğu zaman, RTX 4090 4K ekran için de yeterli rezerve sahip olacaktır (bkz GPU sayfası).
| The Witcher 3 - 1920x1080 Ultra Graphics & Postprocessing (HBAO+) | |
| MSI Titan 18 HX A14VIG | |
| Ortalama NVIDIA GeForce RTX 4090 Laptop GPU (139.2 - 216, n=35) | |
| Sınıf ortalaması Gaming (104.7 - 240, n=7, son 2 yıl) | |
| Asus ROG Strix Scar 18 G834JYR (2024) | |
| Acer Predator Helios 18 PH18-72-98MW | |
| Acer Predator Helios 18 N23Q2 | |
| Alienware m18 R1 AMD | |
| Skull & Bones - 2560x1440 Ultra High Preset AA:T | |
| Ortalama NVIDIA GeForce RTX 4090 Laptop GPU (85 - 98, n=3) | |
| Asus ROG Zephyrus M16 | |
| Acer Predator Helios 18 PH18-72-98MW | |
| Prince of Persia The Lost Crown - 2560x1440 Ultra Preset AA:SM | |
| Asus ROG Zephyrus M16 | |
| Ortalama NVIDIA GeForce RTX 4090 Laptop GPU (355 - 356, n=2) | |
| Acer Predator Helios 18 PH18-72-98MW | |
| Sınıf ortalaması Gaming (352 - 357, n=4, son 2 yıl) | |
| Lords of the Fallen - 2560x1440 Ultra Preset | |
| XMG Neo 17 E23 | |
| Ortalama NVIDIA GeForce RTX 4090 Laptop GPU (43 - 51.9, n=2) | |
| Acer Predator Helios 18 PH18-72-98MW | |
| Counter-Strike 2 - 2560x1440 Very High Preset | |
| XMG Neo 17 E23 | |
| Ortalama NVIDIA GeForce RTX 4090 Laptop GPU (156.6 - 188.7, n=2) | |
| Acer Predator Helios 18 PH18-72-98MW | |
| Sınıf ortalaması Gaming (15.7 - 224, n=5, son 2 yıl) | |
| Lies of P - 2560x1440 Best Preset | |
| XMG Neo 17 E23 | |
| Ortalama NVIDIA GeForce RTX 4090 Laptop GPU (136.4 - 173.1, n=2) | |
| Acer Predator Helios 18 PH18-72-98MW | |
| EA Sports WRC - 2560x1440 Ultra Preset AA:Epic AF:16x | |
| XMG Neo 17 E23 | |
| Ortalama NVIDIA GeForce RTX 4090 Laptop GPU (97.9 - 103, n=2) | |
| Acer Predator Helios 18 PH18-72-98MW | |
| Armored Core 6 - 2560x1440 Maximum Preset | |
| XMG Neo 17 E23 | |
| Ortalama NVIDIA GeForce RTX 4090 Laptop GPU (92 - 114.7, n=2) | |
| Acer Predator Helios 18 PH18-72-98MW | |
| Sınıf ortalaması Gaming (n=1son 2 yıl) | |
| Atlas Fallen - 2560x1440 Very High Preset | |
| XMG Neo 17 E23 | |
| Ortalama NVIDIA GeForce RTX 4090 Laptop GPU (128.3 - 171.1, n=2) | |
| Acer Predator Helios 18 PH18-72-98MW | |
GPU'nun performansının daha uzun bir süre boyunca nasıl davrandığını test etmek için Helios 18'i rol yapma oyununa karşı koyduk Bu Witcher 3 yaklaşık 60 dakika boyunca. Sonuç: Kare hızında kesinlikle hiçbir düşüş gözlemlemedik.
Witcher 3 FPS diagram
| düşük | orta | yüksek | ultra | QHD | |
|---|---|---|---|---|---|
| GTA V (2015) | 180.4 | 134 | 126.4 | ||
| The Witcher 3 (2015) | 180 | ||||
| Dota 2 Reborn (2015) | 226 | 205 | 192.8 | 178.3 | |
| Final Fantasy XV Benchmark (2018) | 157.1 | 131.9 | |||
| X-Plane 11.11 (2018) | 183.7 | 148.3 | 114.5 | ||
| Far Cry 5 (2018) | 146 | 123 | 115 | ||
| Strange Brigade (2018) | 329 | 305 | 243 | ||
| Atlas Fallen (2023) | 182 | 161 | 128.3 | ||
| Armored Core 6 (2023) | 109.3 | 103.5 | 92 | ||
| The Crew Motorfest (2023) | 60 | 60 | 60 | ||
| Lies of P (2023) | 208 | 187 | 136.4 | ||
| Counter-Strike 2 (2023) | 234 | 189.7 | 156.6 | ||
| Lords of the Fallen (2023) | 87.3 | 64.2 | 43 | ||
| EA Sports WRC (2023) | 135.2 | 115.1 | 97.9 | ||
| Prince of Persia The Lost Crown (2024) | 357 | 356 | 355 | ||
| Skull & Bones (2024) | 133 | 106 | 85 | ||
| Last Epoch (2024) | 203 | 190 | 145.5 |
Emisyonlar
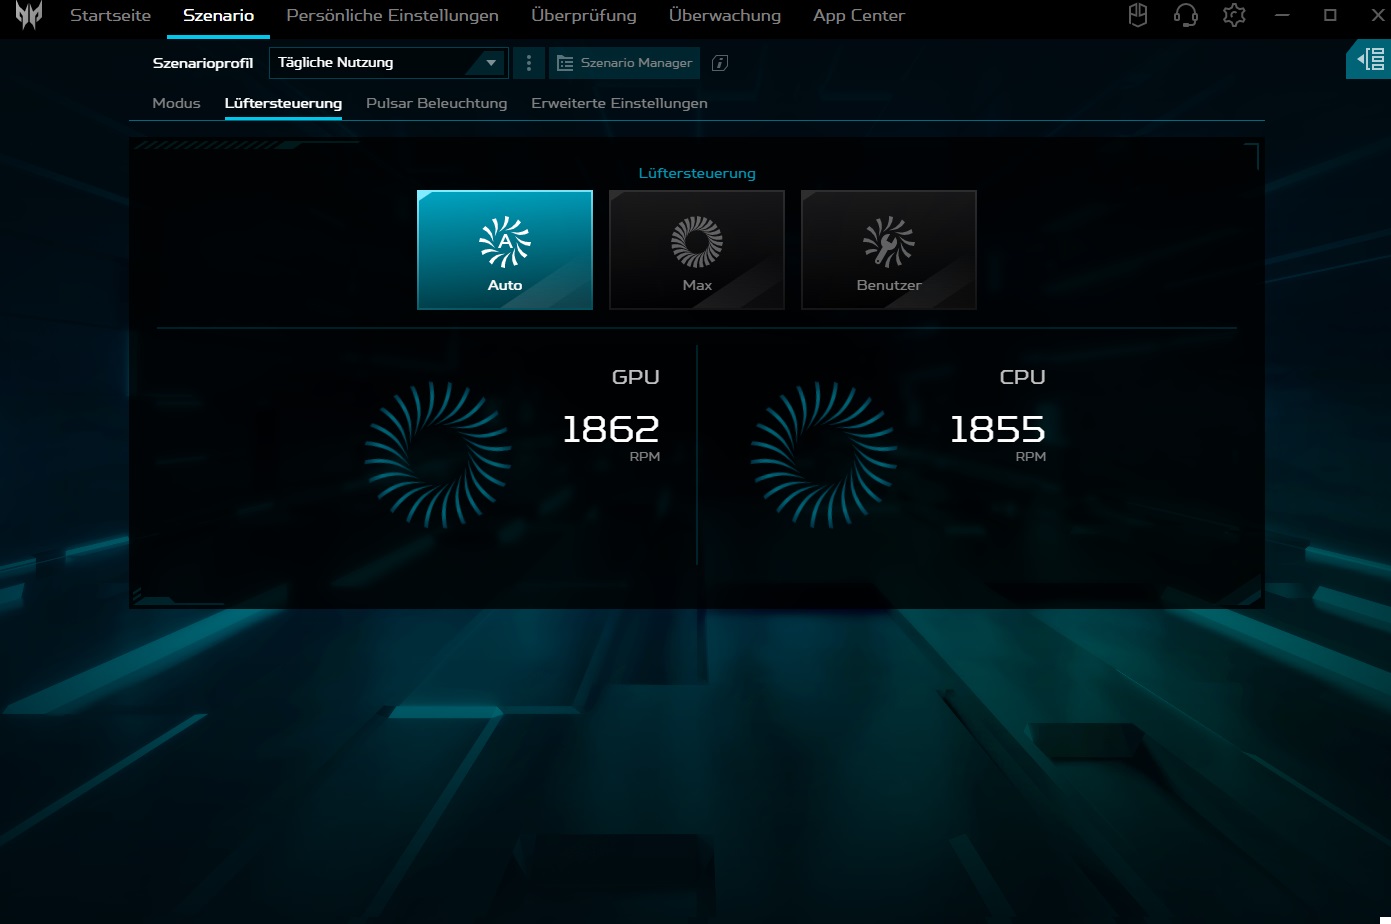
Gürültü emisyonları
Predator Helios 18'in en büyük zayıflıklarından biri yetersiz fan kontrolüdür. Dengeli modda, dizüstü bilgisayar rölantide çalışırken fanlar bazen gereksiz yere dönmeye başlıyor. Performans ve turbo modunda bu davranış daha da sık ve yoğun bir şekilde gerçekleşiyor. Yük altında, 18 inçlik cihaz alışılmışın dışında davranmıyor. 3D kullanımda, performans modu duyulabilir ancak abartılı olmayan 48 ila 51 dB(A) değerlerine neden olur.
Ses yüksekliği
| Boşta |
| 30 / 36 / 44 dB |
| Çalışırken |
| 48 / 51 dB |
 | ||
30 dB sessiz 40 dB(A) duyulabilirlik 50 dB(A) gürültülü |
||
min: | ||
| Acer Predator Helios 18 PH18-72-98MW i9-14900HX, GeForce RTX 4090 Laptop GPU | MSI Titan 18 HX A14VIG i9-14900HX, GeForce RTX 4090 Laptop GPU | Asus ROG Strix Scar 18 G834JYR (2024) i9-14900HX, GeForce RTX 4090 Laptop GPU | Acer Predator Helios 18 N23Q2 i9-13900HX, GeForce RTX 4080 Laptop GPU | Alienware m18 R1 AMD R9 7945HX, Radeon RX 7900M | |
|---|---|---|---|---|---|
| Noise | 12% | 8% | 12% | 15% | |
| kapalı / ortam * (dB) | 25 | 22.8 9% | 24 4% | 23 8% | 22.4 10% |
| Idle Minimum * (dB) | 30 | 23.8 21% | 27 10% | 23 23% | 23 23% |
| Idle Average * (dB) | 36 | 23.8 34% | 28 22% | 23 36% | 23.4 35% |
| Idle Maximum * (dB) | 44 | 28 36% | 32 27% | 23 48% | 33.5 24% |
| Load Average * (dB) | 48 | 38 21% | 50 -4% | 45.26 6% | 33.5 30% |
| Witcher 3 ultra * (dB) | 49 | 57.3 -17% | 50 -2% | 59.82 -22% | 53.6 -9% |
| Load Maximum * (dB) | 51 | 62.8 -23% | 52 -2% | 59.94 -18% | 53.6 -5% |
* ... daha küçük daha iyidir
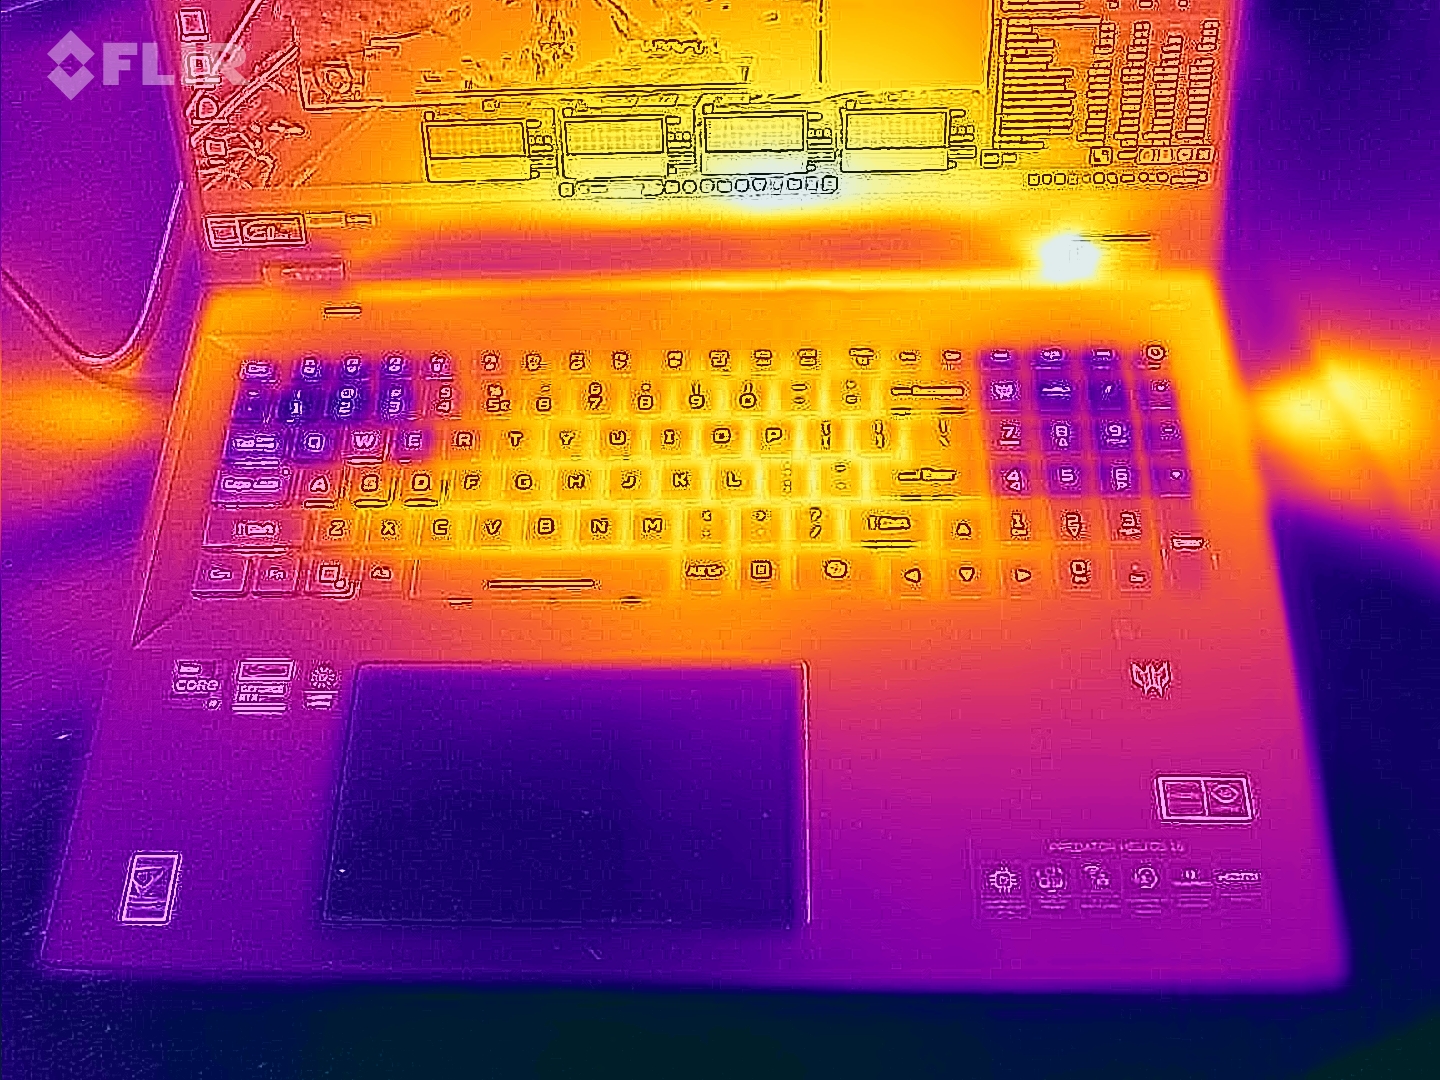
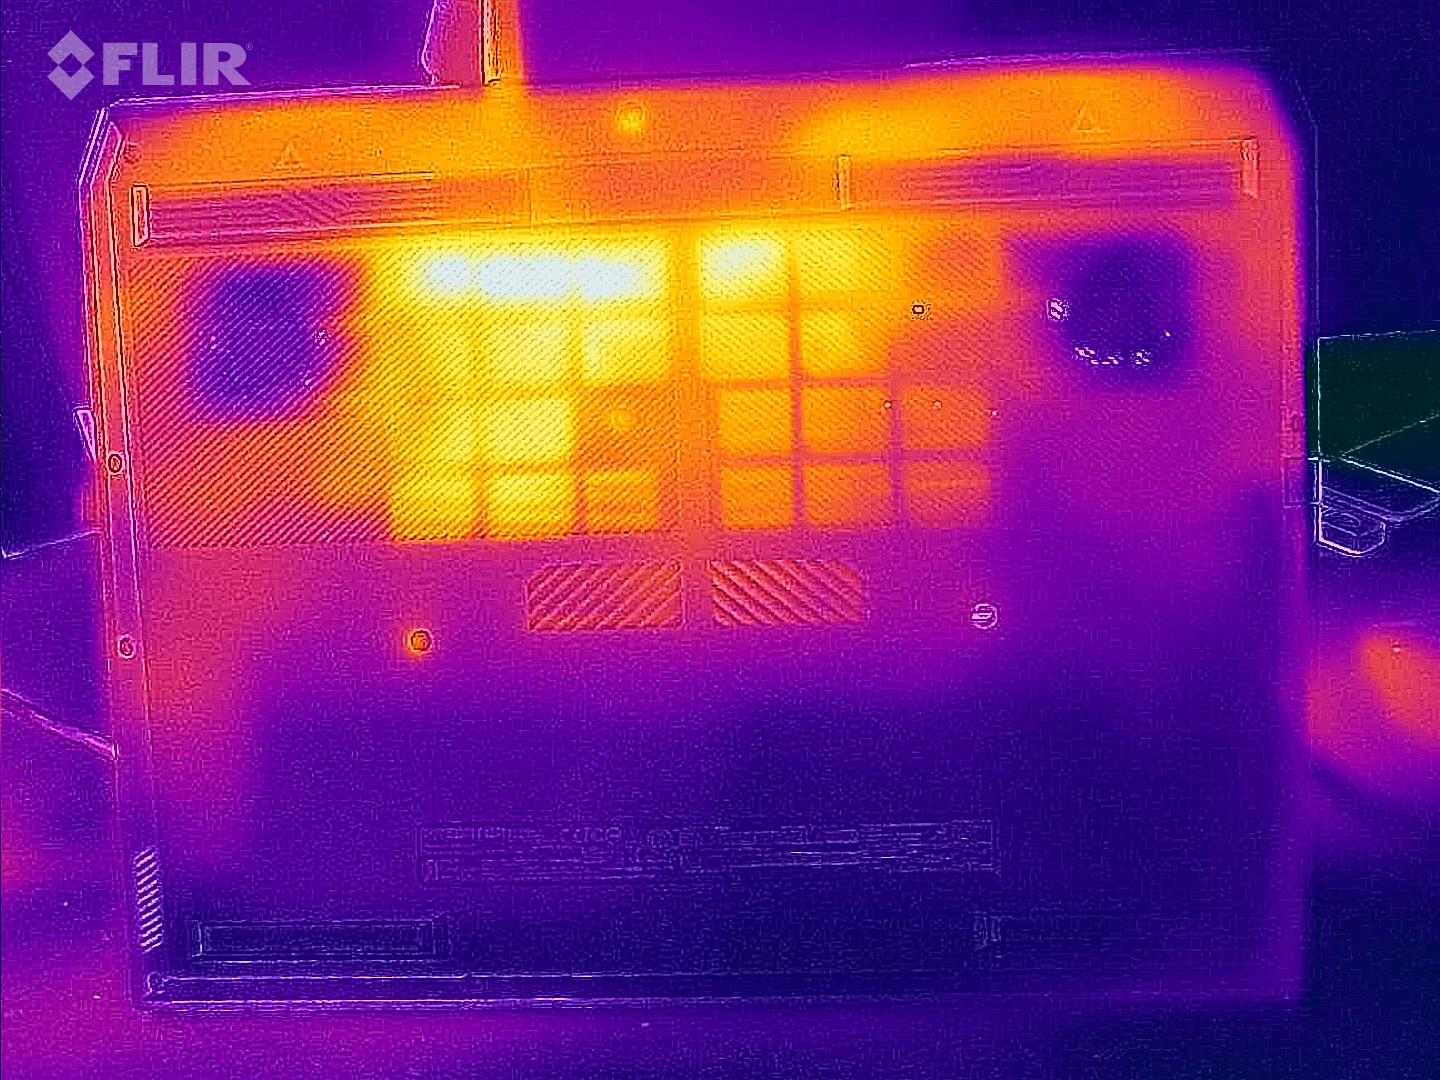
Sıcaklık
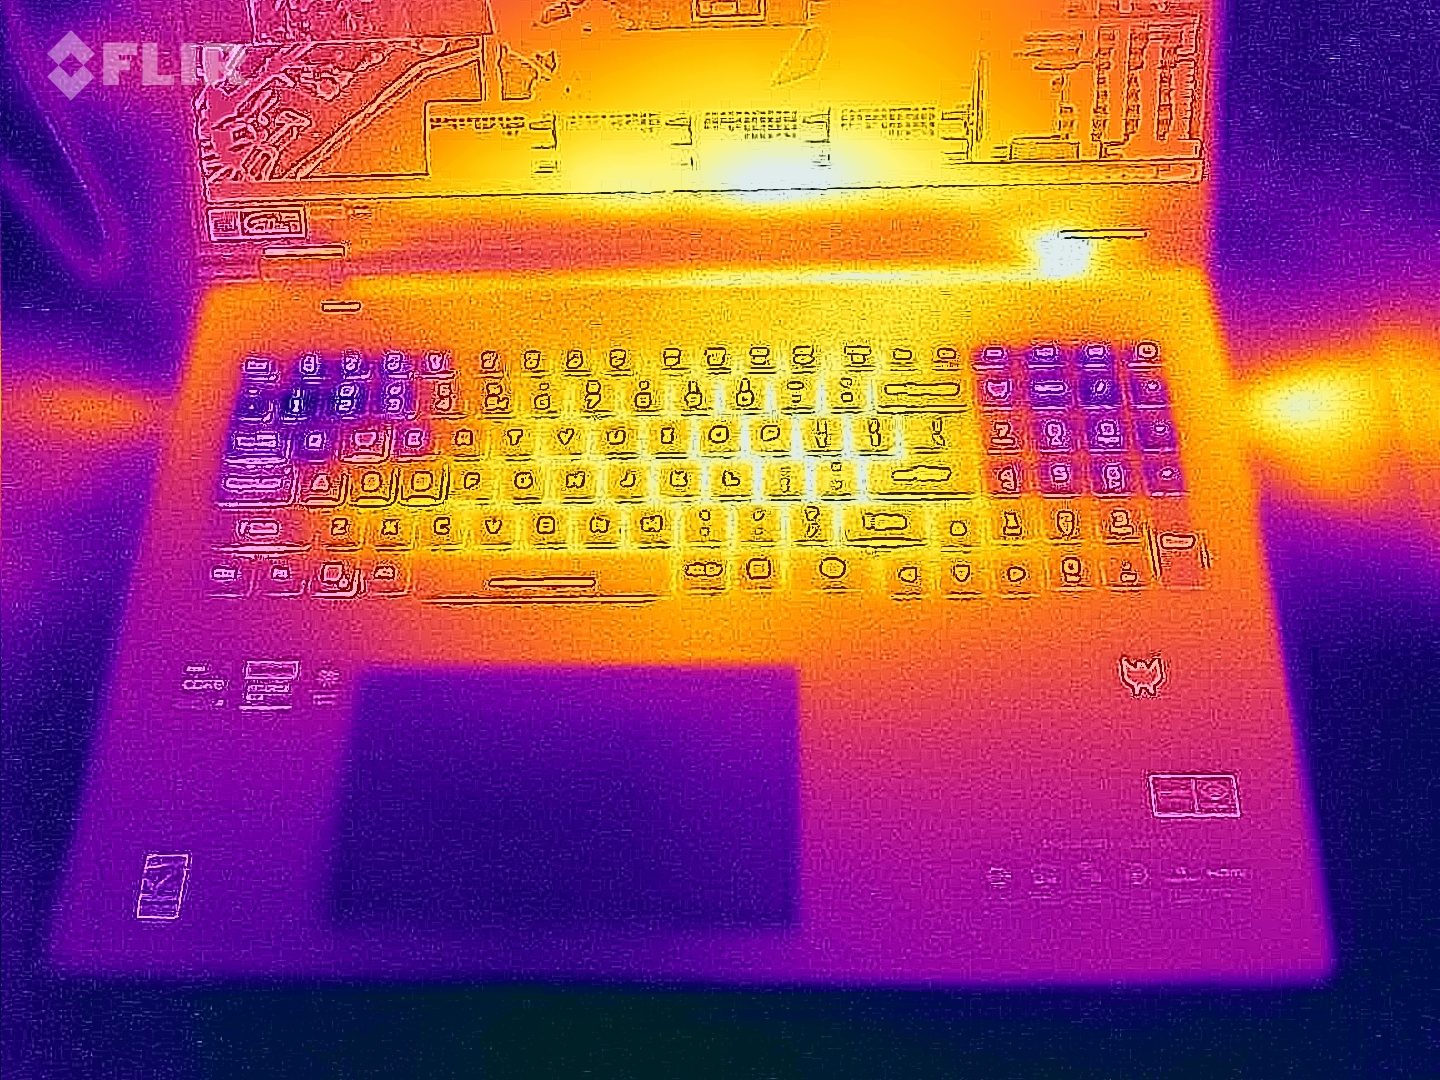
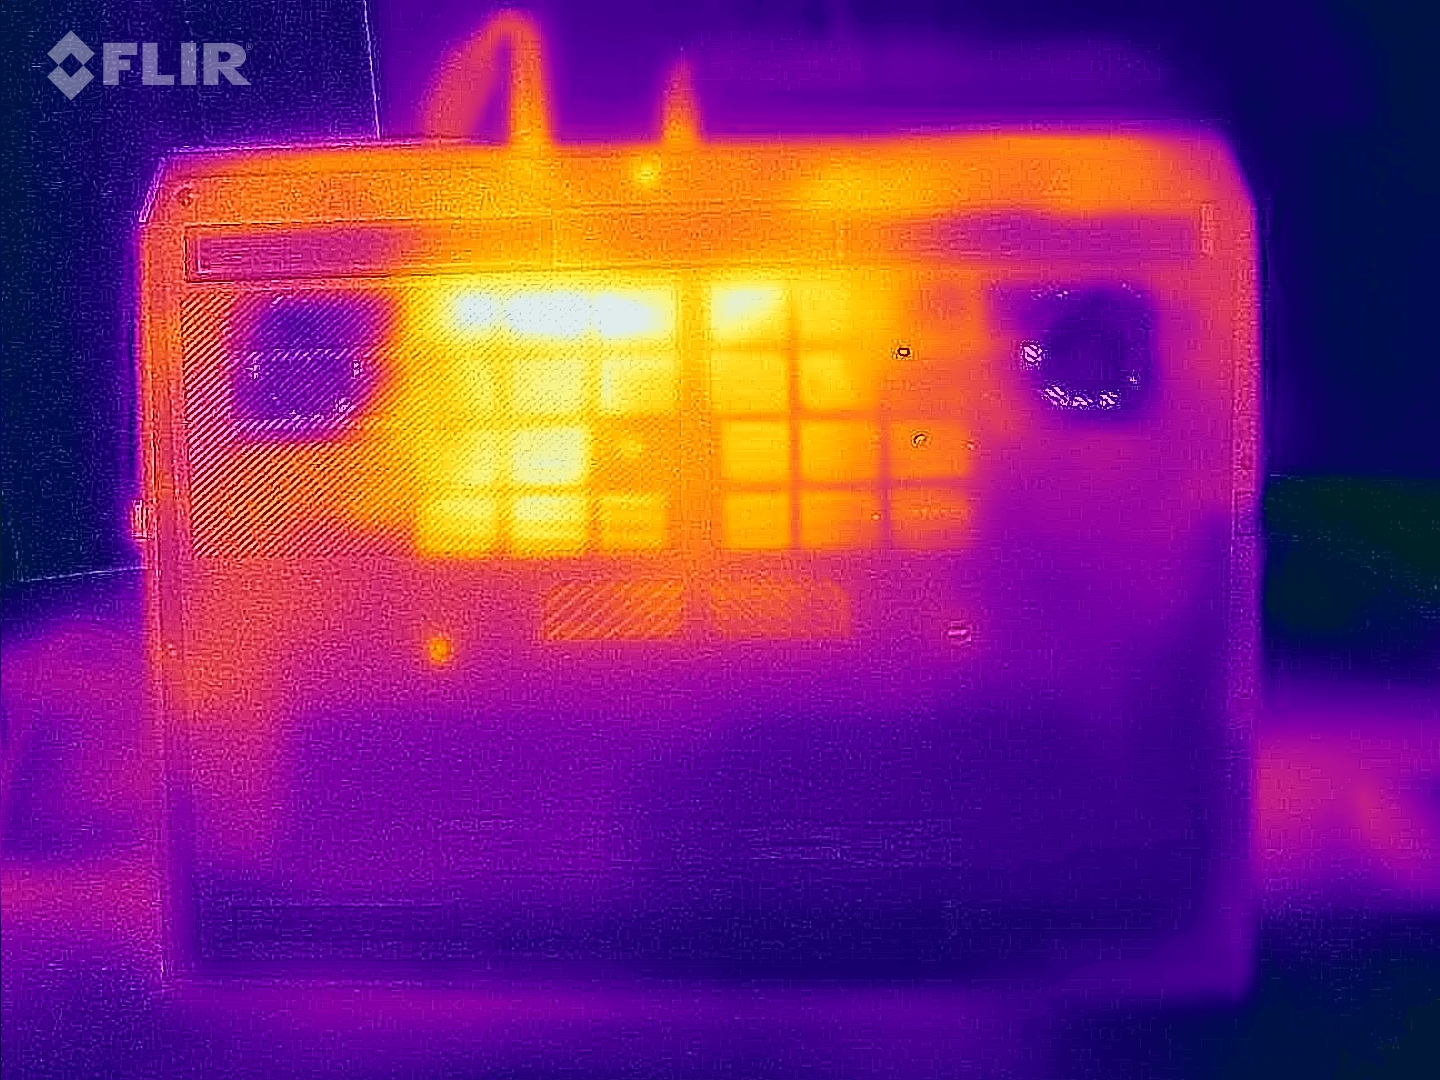
Dizüstü bilgisayarın kasa yüzeyinin alt kısmı en çok ısınan kısımdır. Stres testimizin 60 dakikasından sonra, bazı kısımlarda 50 °C'nin üzerinde ölçüm yaptık, bu da cihaz kucağınızda otururken oyun oynayamayacağınız anlamına geliyor. Üst kısım çok daha serin kalıyor ve değerler 43 °C'ye kadar ulaşıyor. Boştayken değerler oldukça ılımlı; ortalama 29 C° (üstte) ve 30 °C (altta) ölçtük ki bu kesinlikle iyi bir değer.
(±) Üst taraftaki maksimum sıcaklık, 40.4 °C / 105 F ortalamasına kıyasla 43 °C / 109 F'dir. , Gaming sınıfı için 21.2 ile 68.8 °C arasında değişir.
(-) Alt kısım, 43.2 °C / 110 F ortalamasına kıyasla maksimum 59 °C / 138 F'ye kadar ısınır
(+) Boşta kullanımda, üst tarafın ortalama sıcaklığı 29.2 °C / 85 F olup, cihazın 33.9 °C / 93 F.
(-) The Witcher 3 oynarken, üst tarafın ortalama sıcaklığı 38.9 °C / 102 F olup, cihazın 33.9 °C / 93 F.
(+) Avuç içi dayanakları ve dokunmatik yüzey maksimum (33 °C / 91.4 F) cilt sıcaklığına ulaşıyor ve bu nedenle sıcak değil.
(-) Benzer cihazların avuç içi dayanağı alanının ortalama sıcaklığı 28.8 °C / 83.8 F (-4.2 °C / -7.6 F) idi.
| Acer Predator Helios 18 PH18-72-98MW i9-14900HX, GeForce RTX 4090 Laptop GPU | MSI Titan 18 HX A14VIG i9-14900HX, GeForce RTX 4090 Laptop GPU | Asus ROG Strix Scar 18 G834JYR (2024) i9-14900HX, GeForce RTX 4090 Laptop GPU | Acer Predator Helios 18 N23Q2 i9-13900HX, GeForce RTX 4080 Laptop GPU | Alienware m18 R1 AMD R9 7945HX, Radeon RX 7900M | |
|---|---|---|---|---|---|
| Heat | 8% | 6% | 1% | 14% | |
| Maximum Upper Side * (°C) | 43 | 37.8 12% | 49 -14% | 35 19% | 40.2 7% |
| Maximum Bottom * (°C) | 59 | 37.6 36% | 47 20% | 56 5% | 37.4 37% |
| Idle Upper Side * (°C) | 32 | 34.8 -9% | 29 9% | 34 -6% | 31.6 1% |
| Idle Bottom * (°C) | 34 | 36 -6% | 31 9% | 39 -15% | 30.6 10% |
* ... daha küçük daha iyidir
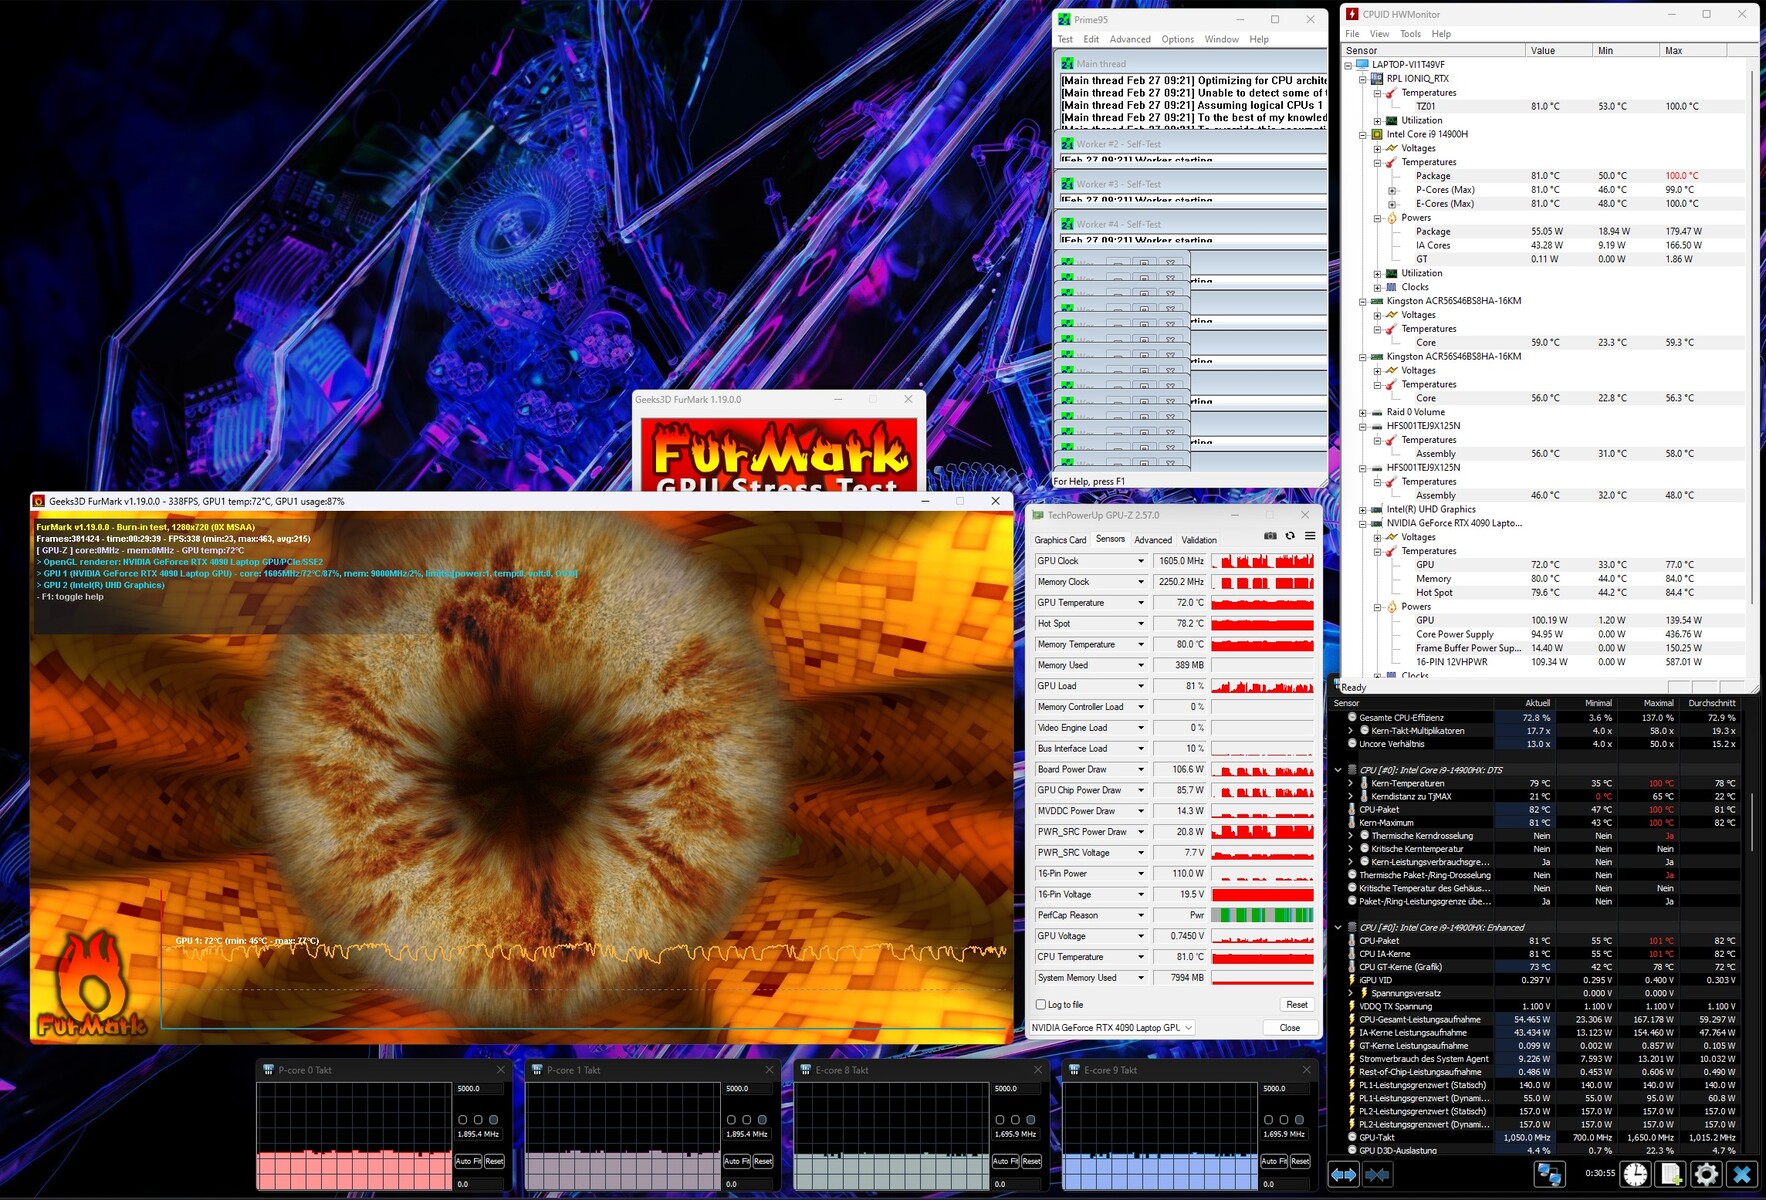
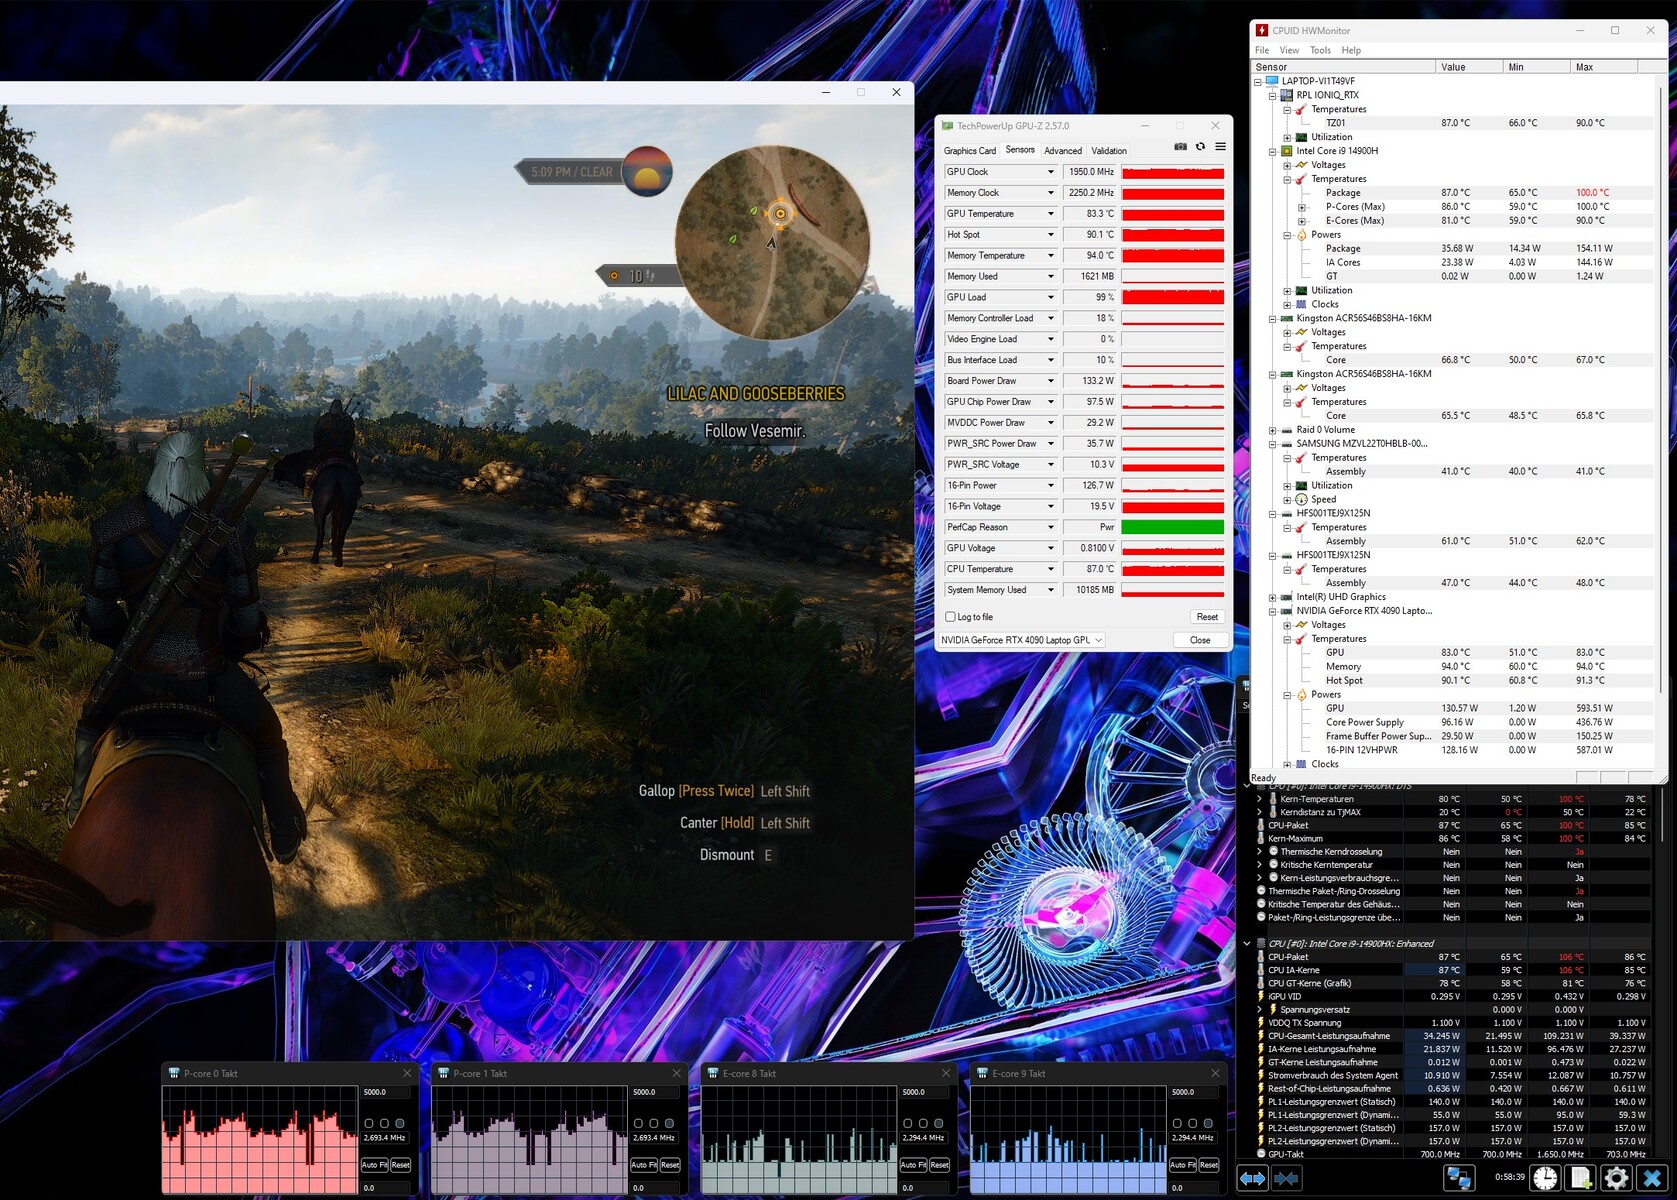
Stres testi
Furmark ve Prime95 araçlarını kullanarak yaptığımız stres testi, bileşenleri sınırlarına kadar zorlamadı. Core i9-14900HX yaklaşık 81 °C'de dengelenirken, GeForce RTX 4090 yaklaşık 72 °C'ye ulaştı (sıcak nokta 78 °C). Ancak donanım, daha yüksek saat hızları nedeniyle oyun modunda daha fazla ısınabilir. The Witcher 3 adresinde araçlarımız yaklaşık 87 °C (CPU) ve 83 °C (GPU) ölçmüştür.
Konuşmacılar
Ses analizimiz yeni Predator Helios 18'in önceki modele göre daha iyi ses verdiğini doğruladı. Baslar hala daha güçlü olsa da, orta ve tizler artık daha belirgin. Maksimum 85 dB(A) ses seviyesi de çoğu kullanıcı için yeterli olacaktır.
Acer Predator Helios 18 PH18-72-98MW ses analizi
(+) | hoparlörler nispeten yüksek sesle çalabilir (85 dB)
Bas 100 - 315Hz
(-) | neredeyse hiç bas yok - ortalama olarak medyandan 21.1% daha düşük
(±) | Bas doğrusallığı ortalamadır (10.7% delta - önceki frekans)
Ortalar 400 - 2000 Hz
(+) | dengeli ortalar - medyandan yalnızca 2.9% uzakta
(+) | orta frekanslar doğrusaldır (5.6% deltadan önceki frekansa)
Yüksekler 2 - 16 kHz
(+) | dengeli yüksekler - medyandan yalnızca 2.7% uzakta
(+) | yüksekler doğrusaldır (3.6% deltadan önceki frekansa)
Toplam 100 - 16.000 Hz
(+) | genel ses doğrusaldır (13.6% ortancaya göre fark)
Aynı sınıfla karşılaştırıldığında
» Bu sınıftaki tüm test edilen cihazların %20%'si daha iyi, 7% benzer, 73% daha kötüydü
» En iyisinin deltası 6% idi, ortalama 18% idi, en kötüsü 132% idi
Test edilen tüm cihazlarla karşılaştırıldığında
» Test edilen tüm cihazların %15'si daha iyi, 4 benzer, % 82 daha kötüydü
» En iyisinin deltası 4% idi, ortalama 23% idi, en kötüsü 134% idi
MSI Titan 18 HX A14VIG ses analizi
(+) | hoparlörler nispeten yüksek sesle çalabilir (89.2 dB)
Bas 100 - 315Hz
(-) | neredeyse hiç bas yok - ortalama olarak medyandan 17.6% daha düşük
(±) | Bas doğrusallığı ortalamadır (8% delta - önceki frekans)
Ortalar 400 - 2000 Hz
(+) | dengeli ortalar - medyandan yalnızca 1.8% uzakta
(+) | orta frekanslar doğrusaldır (3.7% deltadan önceki frekansa)
Yüksekler 2 - 16 kHz
(+) | dengeli yüksekler - medyandan yalnızca 1.2% uzakta
(+) | yüksekler doğrusaldır (2% deltadan önceki frekansa)
Toplam 100 - 16.000 Hz
(+) | genel ses doğrusaldır (9.9% ortancaya göre fark)
Aynı sınıfla karşılaştırıldığında
» Bu sınıftaki tüm test edilen cihazların %5%'si daha iyi, 2% benzer, 94% daha kötüydü
» En iyisinin deltası 6% idi, ortalama 18% idi, en kötüsü 132% idi
Test edilen tüm cihazlarla karşılaştırıldığında
» Test edilen tüm cihazların %4'si daha iyi, 1 benzer, % 95 daha kötüydü
» En iyisinin deltası 4% idi, ortalama 23% idi, en kötüsü 134% idi
Asus ROG Strix Scar 18 G834JYR (2024) ses analizi
(+) | hoparlörler nispeten yüksek sesle çalabilir (82 dB)
Bas 100 - 315Hz
(±) | azaltılmış bas - ortalama olarak medyandan 5.6% daha düşük
(+) | bas doğrusaldır (6.8% delta ile önceki frekans)
Ortalar 400 - 2000 Hz
(±) | daha yüksek ortalar - ortalama olarak medyandan 5.7% daha yüksek
(+) | orta frekanslar doğrusaldır (2.8% deltadan önceki frekansa)
Yüksekler 2 - 16 kHz
(±) | azaltılmış yüksekler - ortalama olarak medyandan 7.2% daha düşük
(±) | Yükseklerin doğrusallığı ortalamadır (7.2% delta - önceki frekans)
Toplam 100 - 16.000 Hz
(+) | genel ses doğrusaldır (13% ortancaya göre fark)
Aynı sınıfla karşılaştırıldığında
» Bu sınıftaki tüm test edilen cihazların %18%'si daha iyi, 3% benzer, 79% daha kötüydü
» En iyisinin deltası 6% idi, ortalama 18% idi, en kötüsü 132% idi
Test edilen tüm cihazlarla karşılaştırıldığında
» Test edilen tüm cihazların %13'si daha iyi, 3 benzer, % 85 daha kötüydü
» En iyisinin deltası 4% idi, ortalama 23% idi, en kötüsü 134% idi
Acer Predator Helios 18 N23Q2 ses analizi
(+) | hoparlörler nispeten yüksek sesle çalabilir (82.74 dB)
Bas 100 - 315Hz
(-) | neredeyse hiç bas yok - ortalama olarak medyandan 17.6% daha düşük
(±) | Bas doğrusallığı ortalamadır (9.8% delta - önceki frekans)
Ortalar 400 - 2000 Hz
(±) | daha yüksek ortalar - ortalama olarak medyandan 9.1% daha yüksek
(±) | Ortaların doğrusallığı ortalamadır (8.8% delta - önceki frekans)
Yüksekler 2 - 16 kHz
(±) | daha yüksek en yüksekler - ortalama olarak medyandan 5.3% daha yüksek
(+) | yüksekler doğrusaldır (6.4% deltadan önceki frekansa)
Toplam 100 - 16.000 Hz
(±) | Genel sesin doğrusallığı ortalamadır (20.3% ortancaya göre fark)
Aynı sınıfla karşılaştırıldığında
» Bu sınıftaki tüm test edilen cihazların %72%'si daha iyi, 6% benzer, 23% daha kötüydü
» En iyisinin deltası 6% idi, ortalama 18% idi, en kötüsü 132% idi
Test edilen tüm cihazlarla karşılaştırıldığında
» Test edilen tüm cihazların %53'si daha iyi, 8 benzer, % 39 daha kötüydü
» En iyisinin deltası 4% idi, ortalama 23% idi, en kötüsü 134% idi
Alienware m18 R1 AMD ses analizi
(+) | hoparlörler nispeten yüksek sesle çalabilir (84.2 dB)
Bas 100 - 315Hz
(-) | neredeyse hiç bas yok - ortalama olarak medyandan 22.7% daha düşük
(-) | bas doğrusal değildir (15.8% delta ile önceki frekans)
Ortalar 400 - 2000 Hz
(+) | dengeli ortalar - medyandan yalnızca 1.5% uzakta
(+) | orta frekanslar doğrusaldır (3.8% deltadan önceki frekansa)
Yüksekler 2 - 16 kHz
(+) | dengeli yüksekler - medyandan yalnızca 3.6% uzakta
(+) | yüksekler doğrusaldır (5.5% deltadan önceki frekansa)
Toplam 100 - 16.000 Hz
(±) | Genel sesin doğrusallığı ortalamadır (16.5% ortancaya göre fark)
Aynı sınıfla karşılaştırıldığında
» Bu sınıftaki tüm test edilen cihazların %42%'si daha iyi, 7% benzer, 51% daha kötüydü
» En iyisinin deltası 6% idi, ortalama 18% idi, en kötüsü 132% idi
Test edilen tüm cihazlarla karşılaştırıldığında
» Test edilen tüm cihazların %28'si daha iyi, 6 benzer, % 66 daha kötüydü
» En iyisinin deltası 4% idi, ortalama 23% idi, en kötüsü 134% idi
Güç yönetimi
Güç tüketimi
Acer, cihazın güç tüketiminde biraz ince ayar yapabilir. Aktif grafik anahtarlamasına rağmen, 18 inçlik dizüstü bilgisayar boş modda 31 ila 43 watt gibi oldukça fazla güce ihtiyaç duyuyor. Rakiplerin çoğu ve eski Helios bu konuda çok daha başarılı. Test cihazımızda bir hata da olabilir.
| Kapalı / Bekleme modu | |
| Boşta | |
| Çalışırken |
|
Key:
min: | |
| Acer Predator Helios 18 PH18-72-98MW i9-14900HX, GeForce RTX 4090 Laptop GPU | MSI Titan 18 HX A14VIG i9-14900HX, GeForce RTX 4090 Laptop GPU | Asus ROG Strix Scar 18 G834JYR (2024) i9-14900HX, GeForce RTX 4090 Laptop GPU | Acer Predator Helios 18 N23Q2 i9-13900HX, GeForce RTX 4080 Laptop GPU | Alienware m18 R1 AMD R9 7945HX, Radeon RX 7900M | Sınıf ortalaması Gaming | |
|---|---|---|---|---|---|---|
| Power Consumption | -3% | 24% | 22% | -34% | 38% | |
| Idle Minimum * (Watt) | 31 | 13.2 57% | 14 55% | 16 48% | 30.3 2% | 13 ? 58% |
| Idle Average * (Watt) | 35 | 25.4 27% | 17 51% | 19 46% | 55.6 -59% | 18.7 ? 47% |
| Idle Maximum * (Watt) | 43 | 53.5 -24% | 24 44% | 21.3 50% | 101.1 -135% | 24.3 ? 43% |
| Load Average * (Watt) | 144 | 151.4 -5% | 143 1% | 124 14% | 160.3 -11% | 110.2 ? 23% |
| Witcher 3 ultra * (Watt) | 228 | 336 -47% | 251 -10% | 289 -27% | 216 5% | |
| Load Maximum * (Watt) | 318 | 395.2 -24% | 302 5% | 319 -0% | 332.1 -4% | 258 ? 19% |
* ... daha küçük daha iyidir
Power consumption Witcher 3 / stress test
Power consumption with external monitor
Çalışma Zamanları
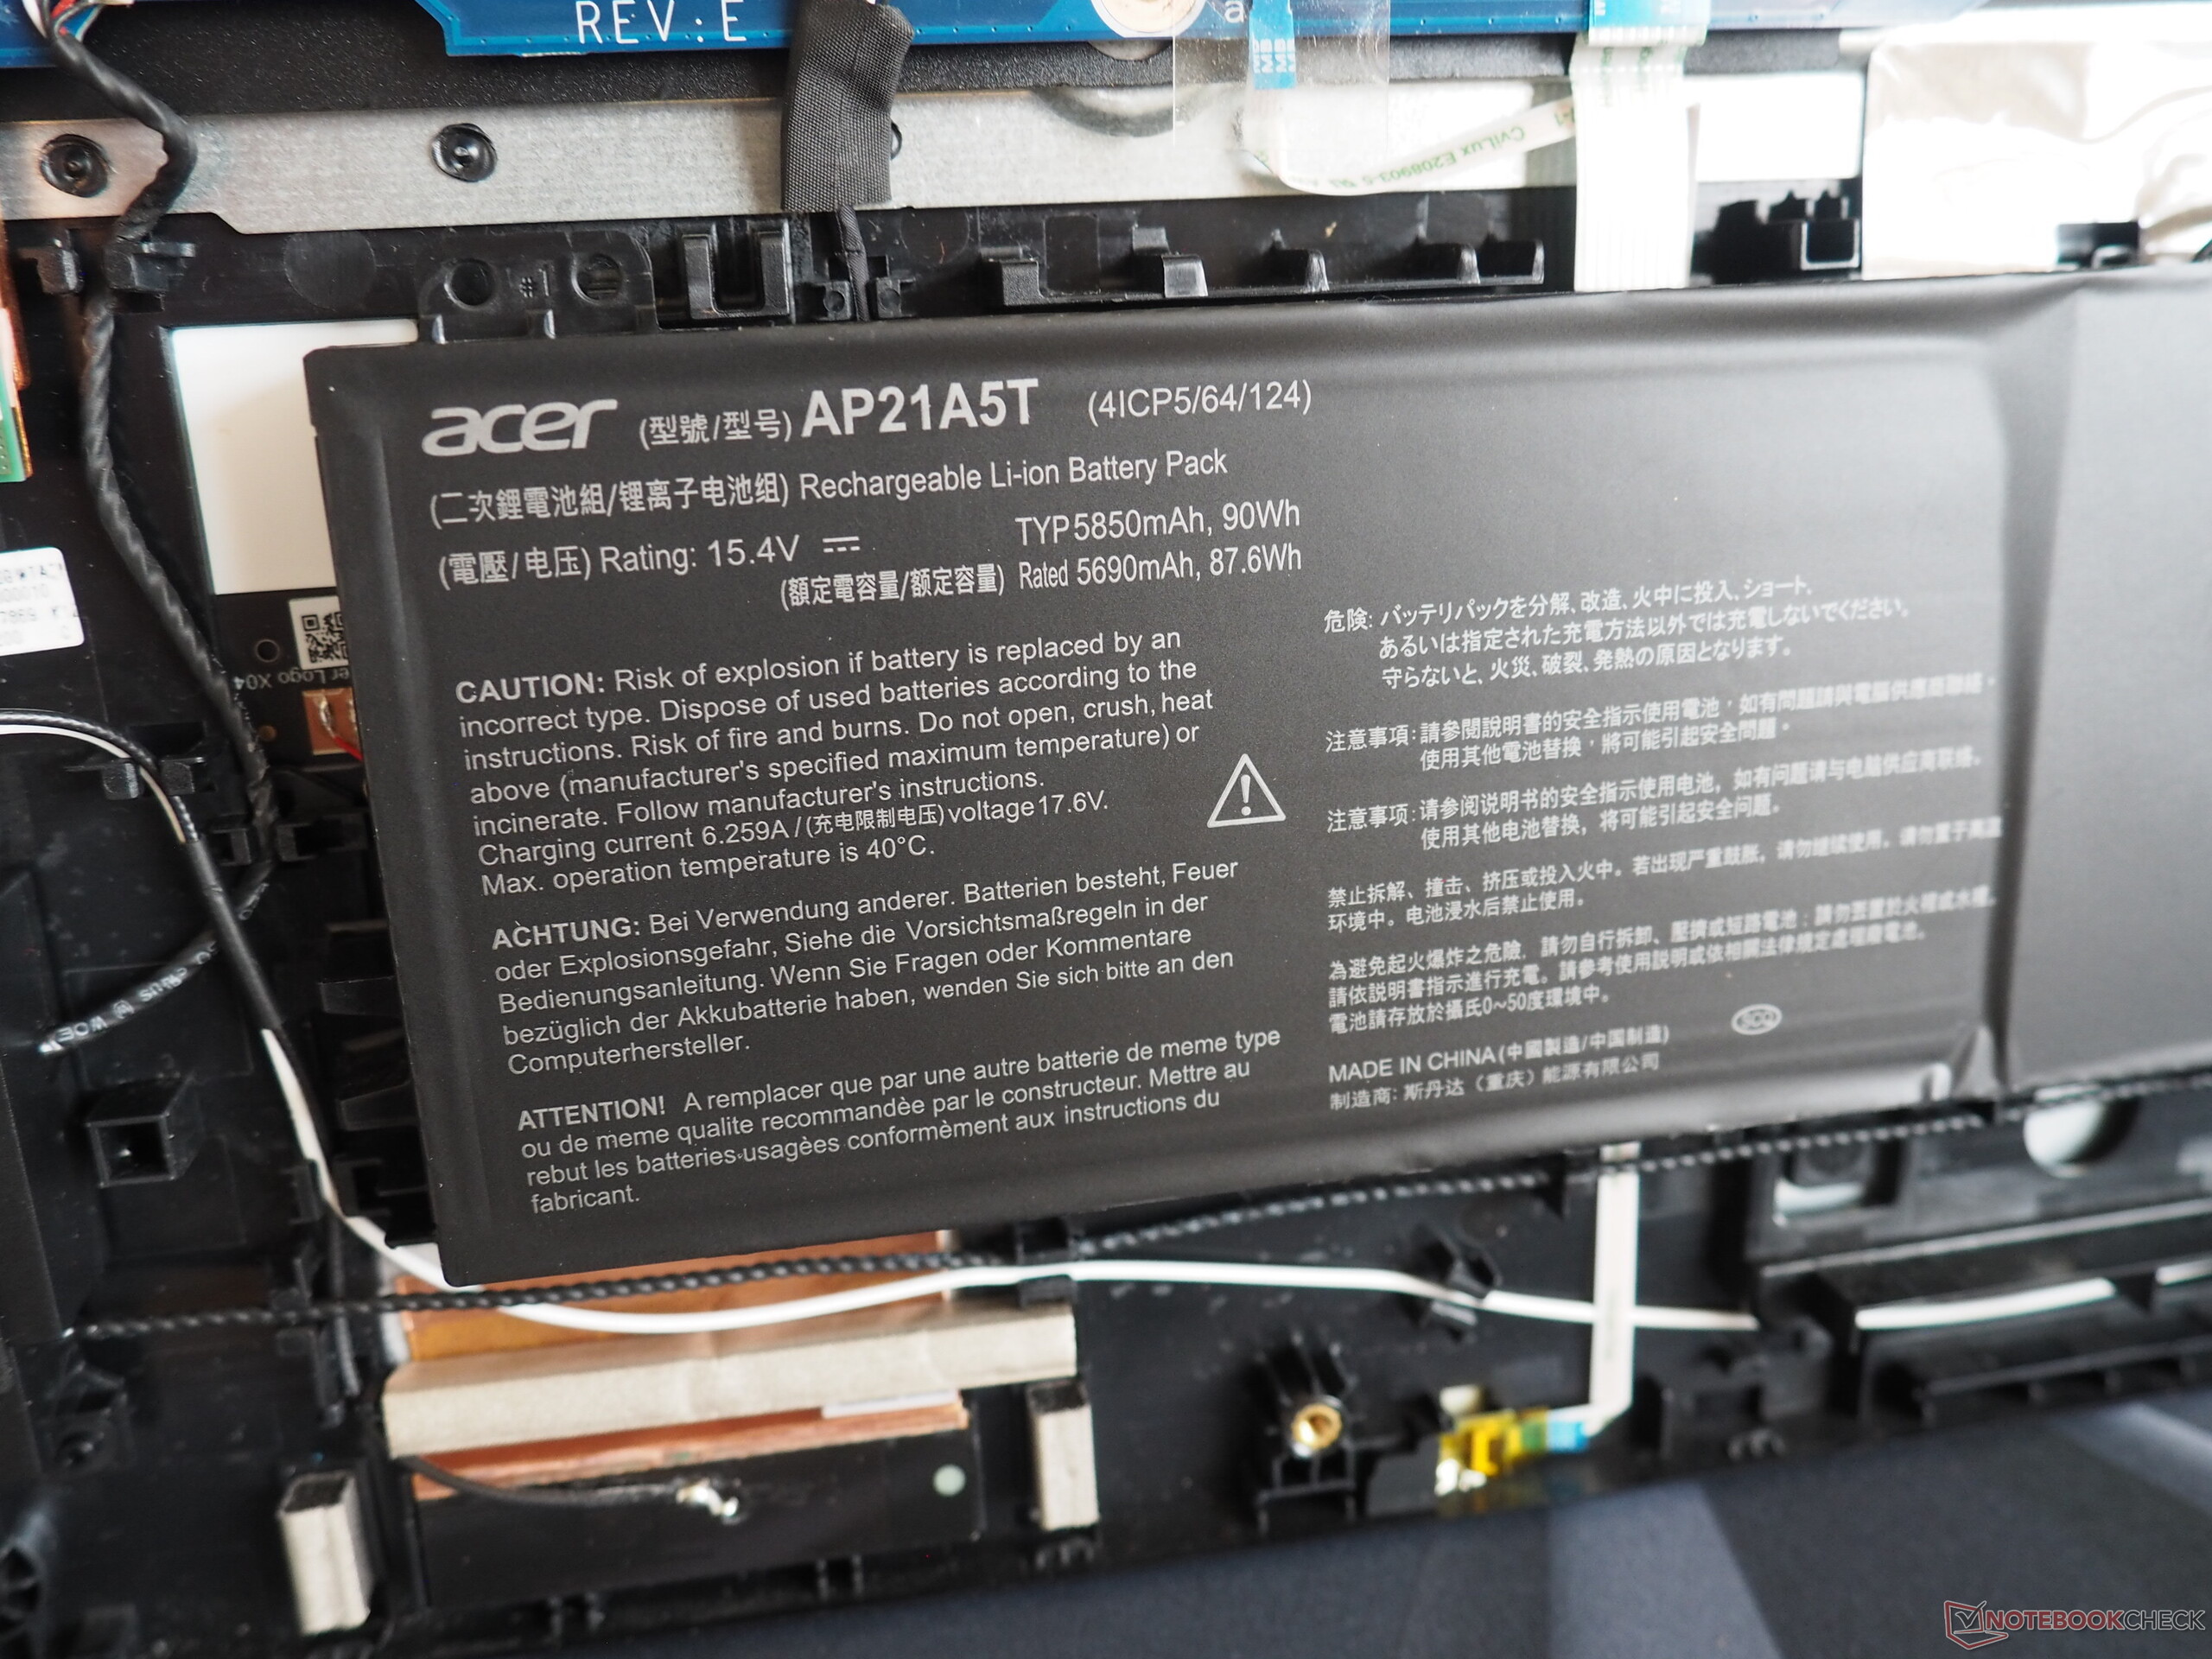
Yüksek güç gereksinimi, çok mütevazı bir pil ömrüne yol açmaktadır. Parlaklığın 150 cd/m²'ye düşürüldüğü WLAN testimizde Predator Helios 18 yalnızca 3 saatten biraz fazla dayandı. Buna karşılık ROG Strix Scar 18 7 saatten fazla dayanabildi. Genel olarak, 90 Wh'lık bataryası hiç de küçük değil.
| Acer Predator Helios 18 PH18-72-98MW i9-14900HX, GeForce RTX 4090 Laptop GPU, 90 Wh | MSI Titan 18 HX A14VIG i9-14900HX, GeForce RTX 4090 Laptop GPU, 99.9 Wh | Asus ROG Strix Scar 18 G834JYR (2024) i9-14900HX, GeForce RTX 4090 Laptop GPU, 90 Wh | Acer Predator Helios 18 N23Q2 i9-13900HX, GeForce RTX 4080 Laptop GPU, 90 Wh | Alienware m18 R1 AMD R9 7945HX, Radeon RX 7900M, 97 Wh | Sınıf ortalaması Gaming | |
|---|---|---|---|---|---|---|
| Pil Çalışma Süresi | 20% | 80% | 47% | -46% | 80% | |
| WiFi v1.3 (h) | 3.2 | 4.2 31% | 7.7 141% | 4.4 38% | 1.4 -56% | 7.11 ? 122% |
| Load (h) | 1.1 | 1.2 9% | 1.3 18% | 1.7 55% | 0.7 -36% | 1.502 ? 37% |
| Reader / Idle (h) | 5.9 | 10.2 | 4.5 | 8.16 ? | ||
| H.264 (h) | 7.5 | 4.8 | 8.32 ? |
Artılar
Eksiler
Karar
2024 versiyonu daha çok mevcut modelin ince bir güncellemesidir Predator Helios 18.
Performans açısından Core i9-14900HX ve GeForce RTX 4090 eskisinden pek farklı değil Core i9-13900HX ve GeForce RTX 4080. Öte yandan, 16:10 en boy oranına sahip WQXGA-MiniLED ekranı etkileyici görüntü kalitesi (parlaklık, kontrast, renk alanı vb.) sunmaya devam ediyor. Buna harika giriş cihazları ve modern bağlantı seçenekleri (2x Thunderbolt 4) de ekleniyor.
Doğru bütçeye sahip talepkar oyuncular, çok yönlü kaygısız bir paket alacaklarından emin olacaklar.
Ancak Predator Helios 18 şu anki haliyle "çok iyi" derecesini kıl payı kaçırdı. Acer, bazen rahatsız edici devirlere neden olan fan kontrolünün yanı sıra, şu anda hala yetersiz çalışma sürelerine yol açan dizüstü bilgisayarın boşta güç tüketimini de gözden geçirebilir.
Birçok rakip şu anda piyasada olmayabilir, ancak en azından cihazla eşit seviyededirler - ister MSI Titan 18 ya da Asus ROG Strix Scar 18.
Fiyat ve bulunabilirlik
Bu yazının yazıldığı sırada, Core i9-14900HX ve GeForce RTX 4090'a sahip Predator Helios 18 henüz Amerika Birleşik Devletleri'nde satın alınamıyor.
Acer Predator Helios 18 PH18-72-98MW
- 02/27/2024 v7 (old)
Florian Glaser
Şeffaflık
İncelenecek cihazların seçimi editör ekibimiz tarafından yapılır. Test örneği, bu incelemenin amacı doğrultusunda üretici veya perakendeci tarafından yazara ödünç olarak sağlanmıştır. Borç verenin bu inceleme üzerinde herhangi bir etkisi olmadığı gibi, üretici de yayınlanmadan önce bu incelemenin bir kopyasını almamıştır. Bu incelemeyi yayınlama zorunluluğu yoktu. Bağımsız bir medya şirketi olarak Notebookcheck, üreticilerin, perakendecilerin veya yayıncıların otoritesine tabi değildir.
Notebookcheck bu şekilde test yapıyor
Notebookcheck, tüm sonuçların karşılaştırılabilir olmasını sağlamak için her yıl yüzlerce dizüstü bilgisayarı ve akıllı telefonu standart prosedürler kullanarak bağımsız olarak inceliyor. Yaklaşık 20 yıldır test yöntemlerimizi sürekli olarak geliştirdik ve bu süreçte endüstri standartlarını belirledik. Test laboratuvarlarımızda deneyimli teknisyenler ve editörler tarafından yüksek kaliteli ölçüm ekipmanları kullanılmaktadır. Bu testler çok aşamalı bir doğrulama sürecini içerir. Karmaşık derecelendirme sistemimiz, nesnelliği koruyan yüzlerce sağlam temellere dayanan ölçüm ve kıyaslamaya dayanmaktadır.Price comparison

