MSI Titan 18 HX A14VIG dizüstü bilgisayar incelemesi: Ejderha yılı

CES 2023'te Asus, Alienware ve Razer kendi 18 inçlik ürünlerini piyasaya sürerken MSI'a neden 18 inçlik bir oyun dizüstü bilgisayarı çıkarmadıklarını sormuştuk. CES 2024'e kadar nihayet Titan 18 HX şeklinde uygun bir 18 inç MSI modeli gördük. Partiye biraz geç kalmış olabilir, ancak özellikleri ve donanımı da bir o kadar rekabetçi.
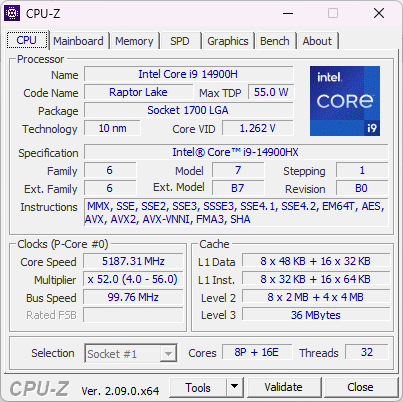
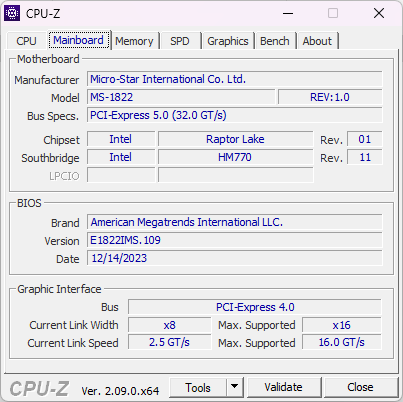
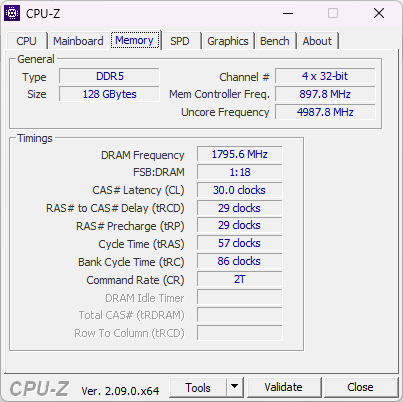
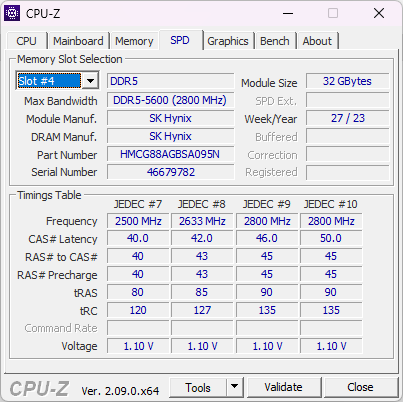
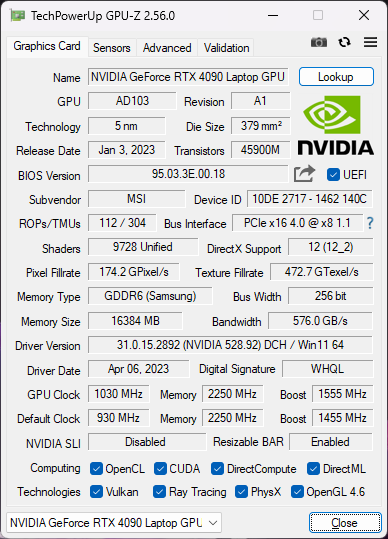
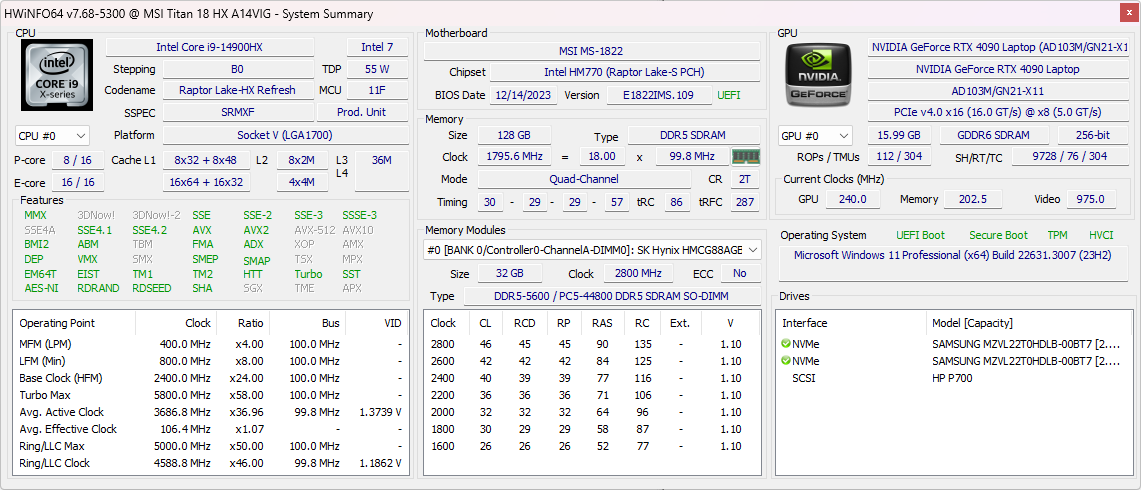
İnceleme konfigürasyonumuz yeni 14. nesil Intel Raptor Lake Core i9-14900HX CPU, 175 W GeForce RTX 4090 GPU ve 120 Hz Mini-LED 4K (2400p) ekran ile yaklaşık 4999 USD karşılığında geliyor. Yazının yazıldığı sırada farklı CPU'lar, GPU'lar veya ekranlarla daha düşük konfigürasyonlar mevcut değildir.
Titan 18 HX'in alternatifleri arasında aşağıdaki gibi diğer 18 inçlik oyun dizüstü bilgisayarları bulunmaktadır Asus ROG Strix G18, Alienware m18, Razer Blade 18veya Acer Predator Helios 18.
Daha fazla MSI incelemesi:
Karşılaştırmalı olarak olası rakipler
Derecelendirme | Tarih | Modeli | Ağırlık | Yükseklik | Boyut | Çözünürlük | Fiyat |
|---|---|---|---|---|---|---|---|
| 88.8 % v7 (old) | 01/2024 | MSI Titan 18 HX A14VIG i9-14900HX, GeForce RTX 4090 Laptop GPU | 3.6 kg | 32.1 mm | 18.00" | 3840x2400 | |
| 89 % v7 (old) | 04/2023 | MSI Titan GT77 HX 13VI i9-13950HX, GeForce RTX 4090 Laptop GPU | 3.5 kg | 23 mm | 17.30" | 3840x2160 | |
| 90.7 % v7 (old) | 04/2023 | Alienware m18 R1 i9-13980HX, GeForce RTX 4090 Laptop GPU | 3.9 kg | 26.7 mm | 18.00" | 1920x1200 | |
| 87.4 % v7 (old) | 04/2023 | Asus ROG Strix G18 G814JI i7-13650HX, GeForce RTX 4070 Laptop GPU | 3 kg | 31 mm | 18.00" | 2560x1600 | |
| 88.3 % v7 (old) | 10/2023 | Acer Predator Helios 18 N23Q2 i9-13900HX, GeForce RTX 4080 Laptop GPU | 3.2 kg | 29.15 mm | 18.00" | 2560x1600 | |
| 91.4 % v7 (old) | 02/2023 | Razer Blade 18 RTX 4070 i9-13950HX, GeForce RTX 4070 Laptop GPU | 3 kg | 21.9 mm | 18.00" | 2560x1600 |
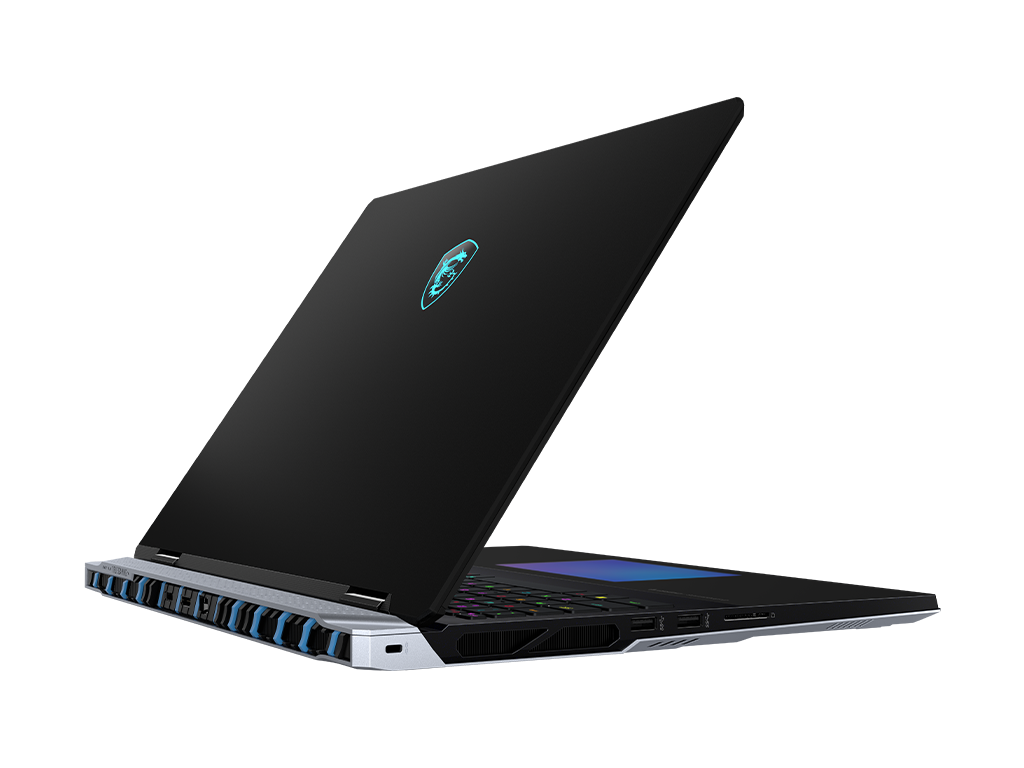
Kasa - Daha Az RGB LED
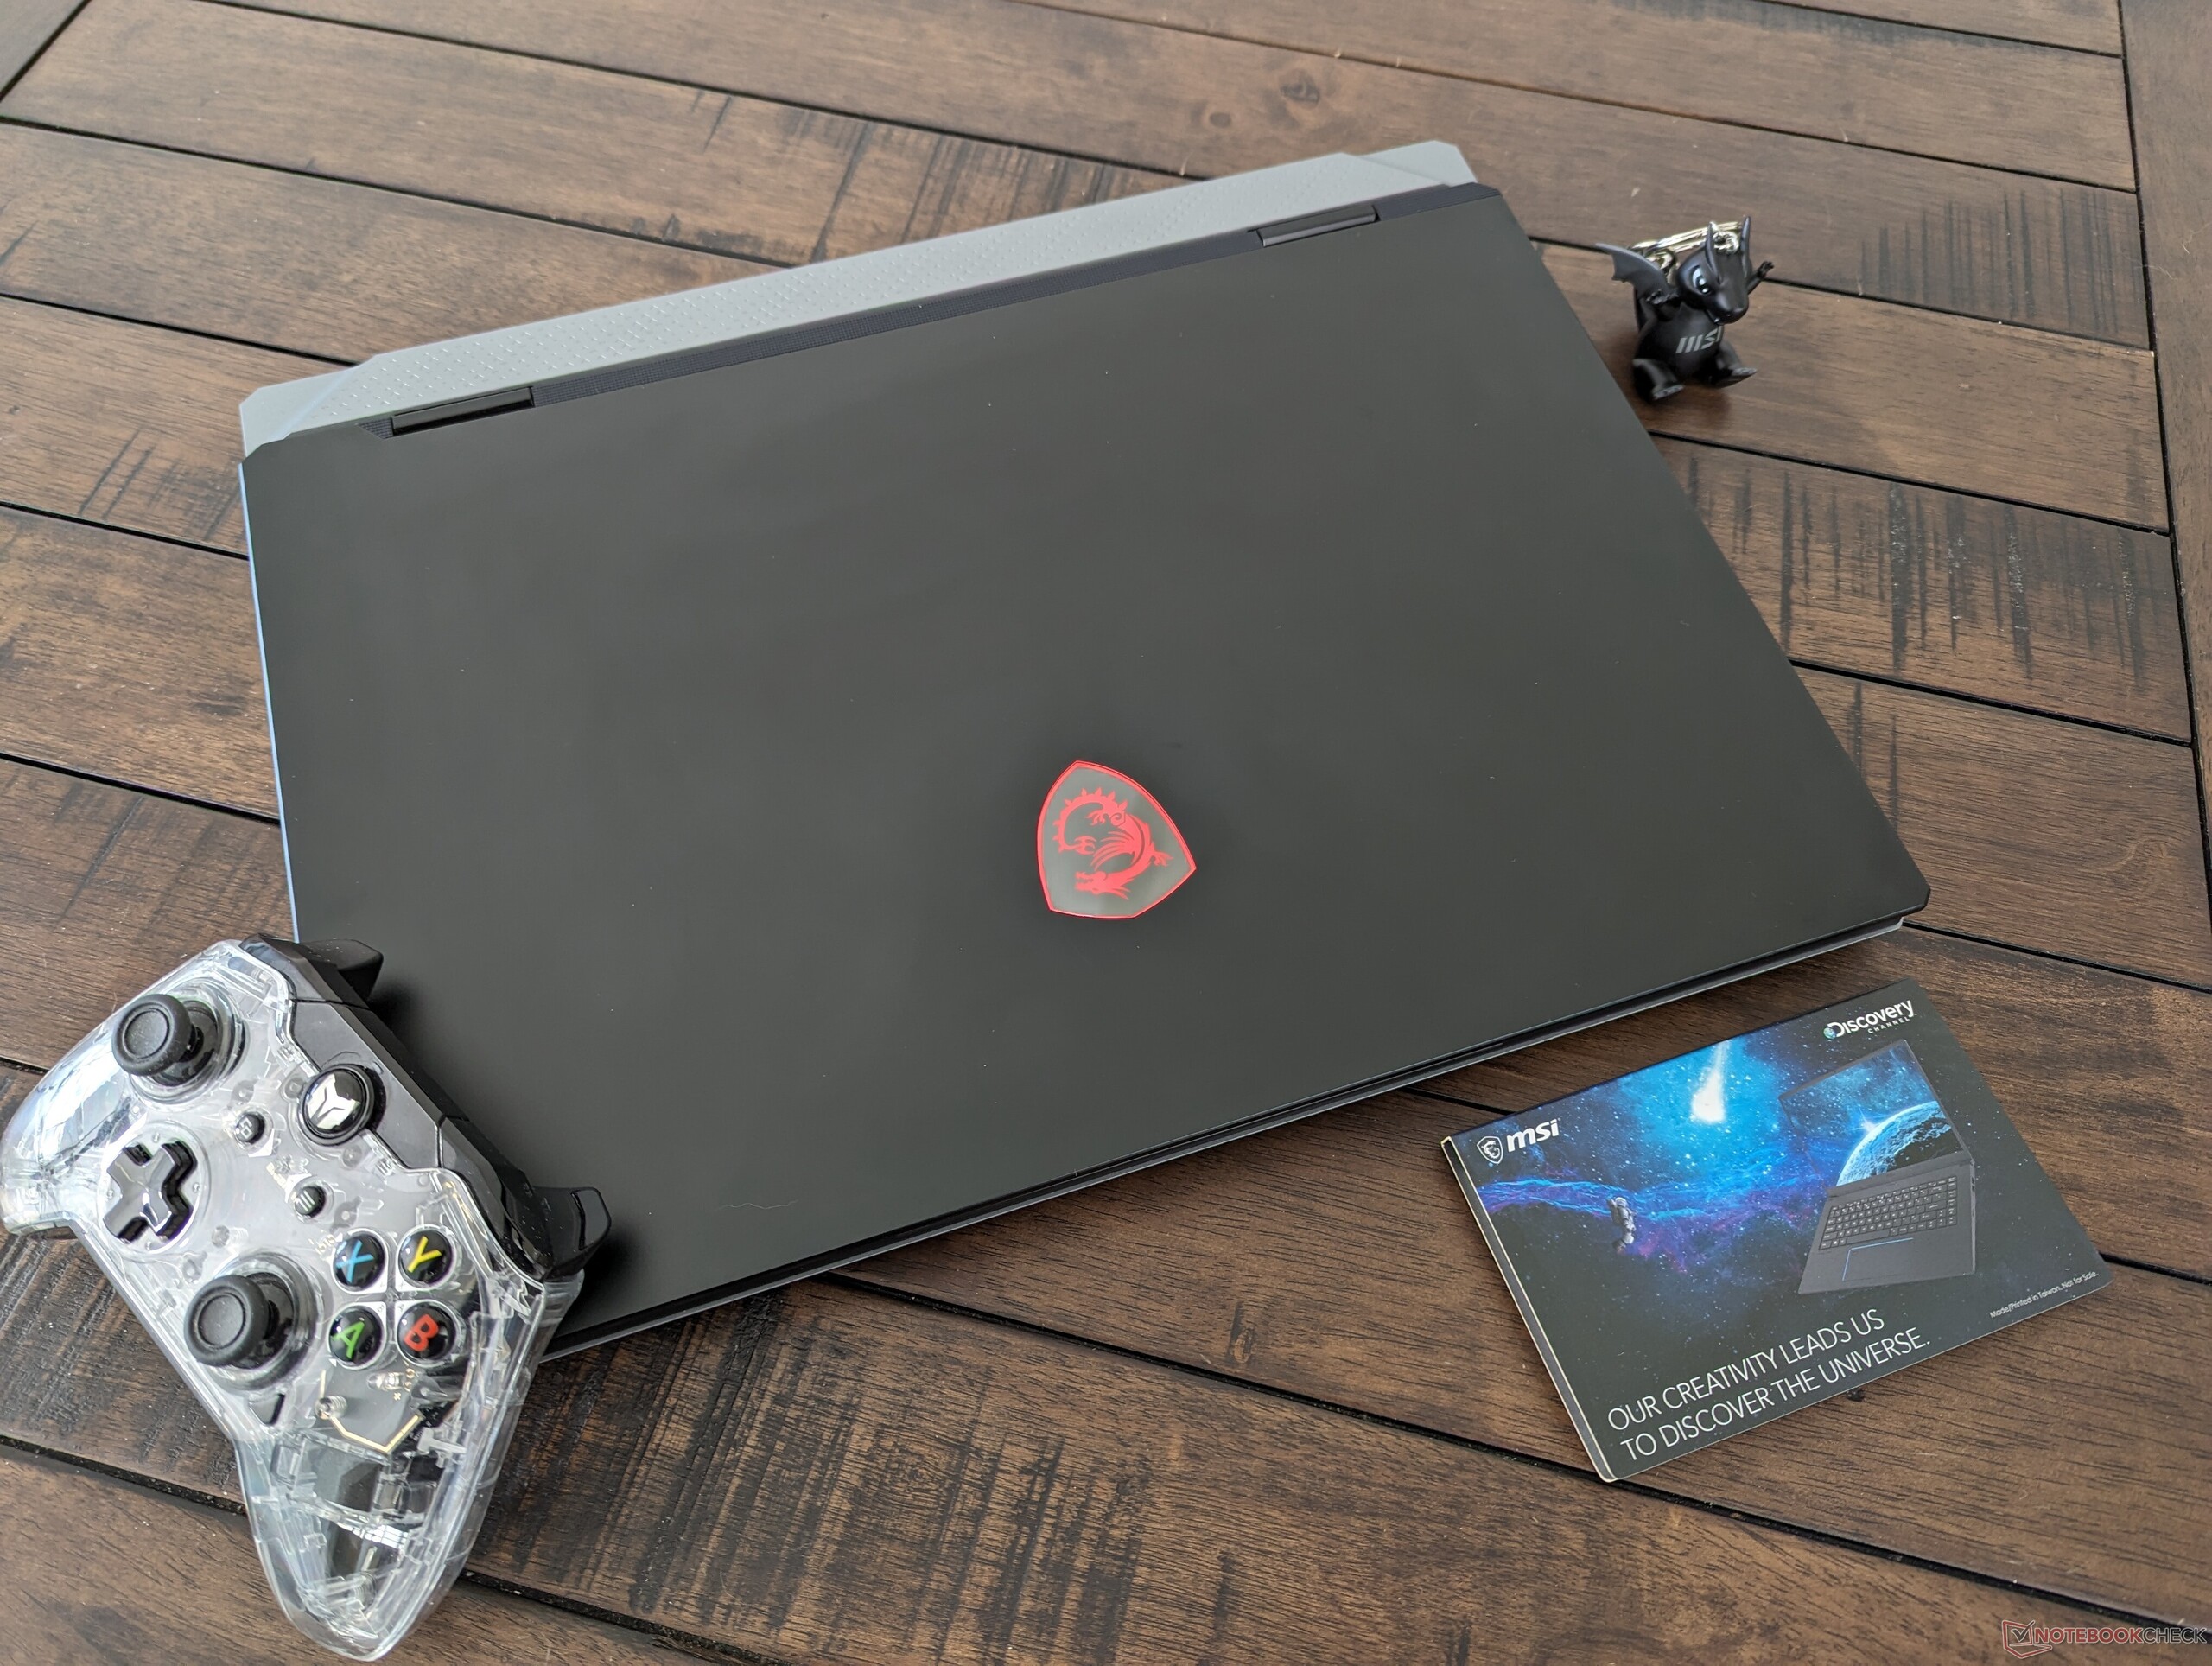
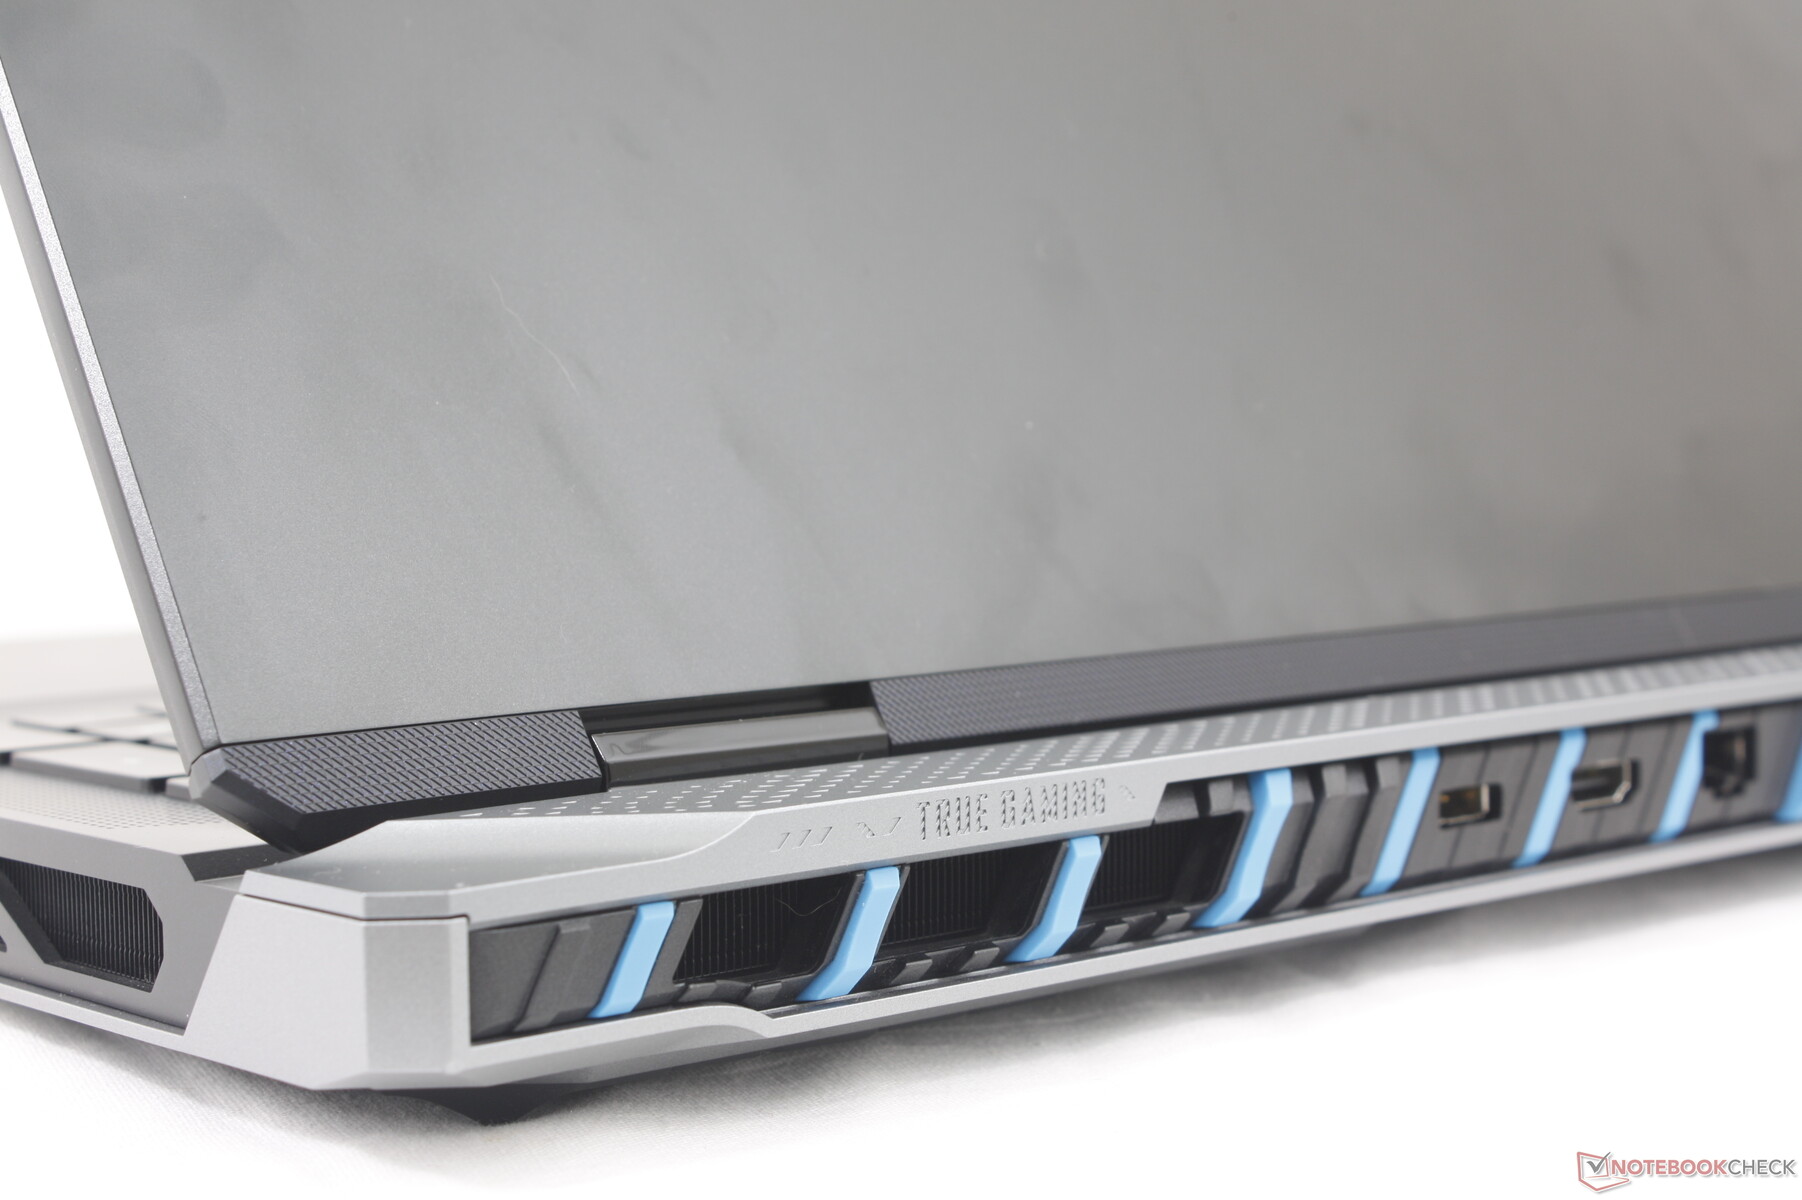
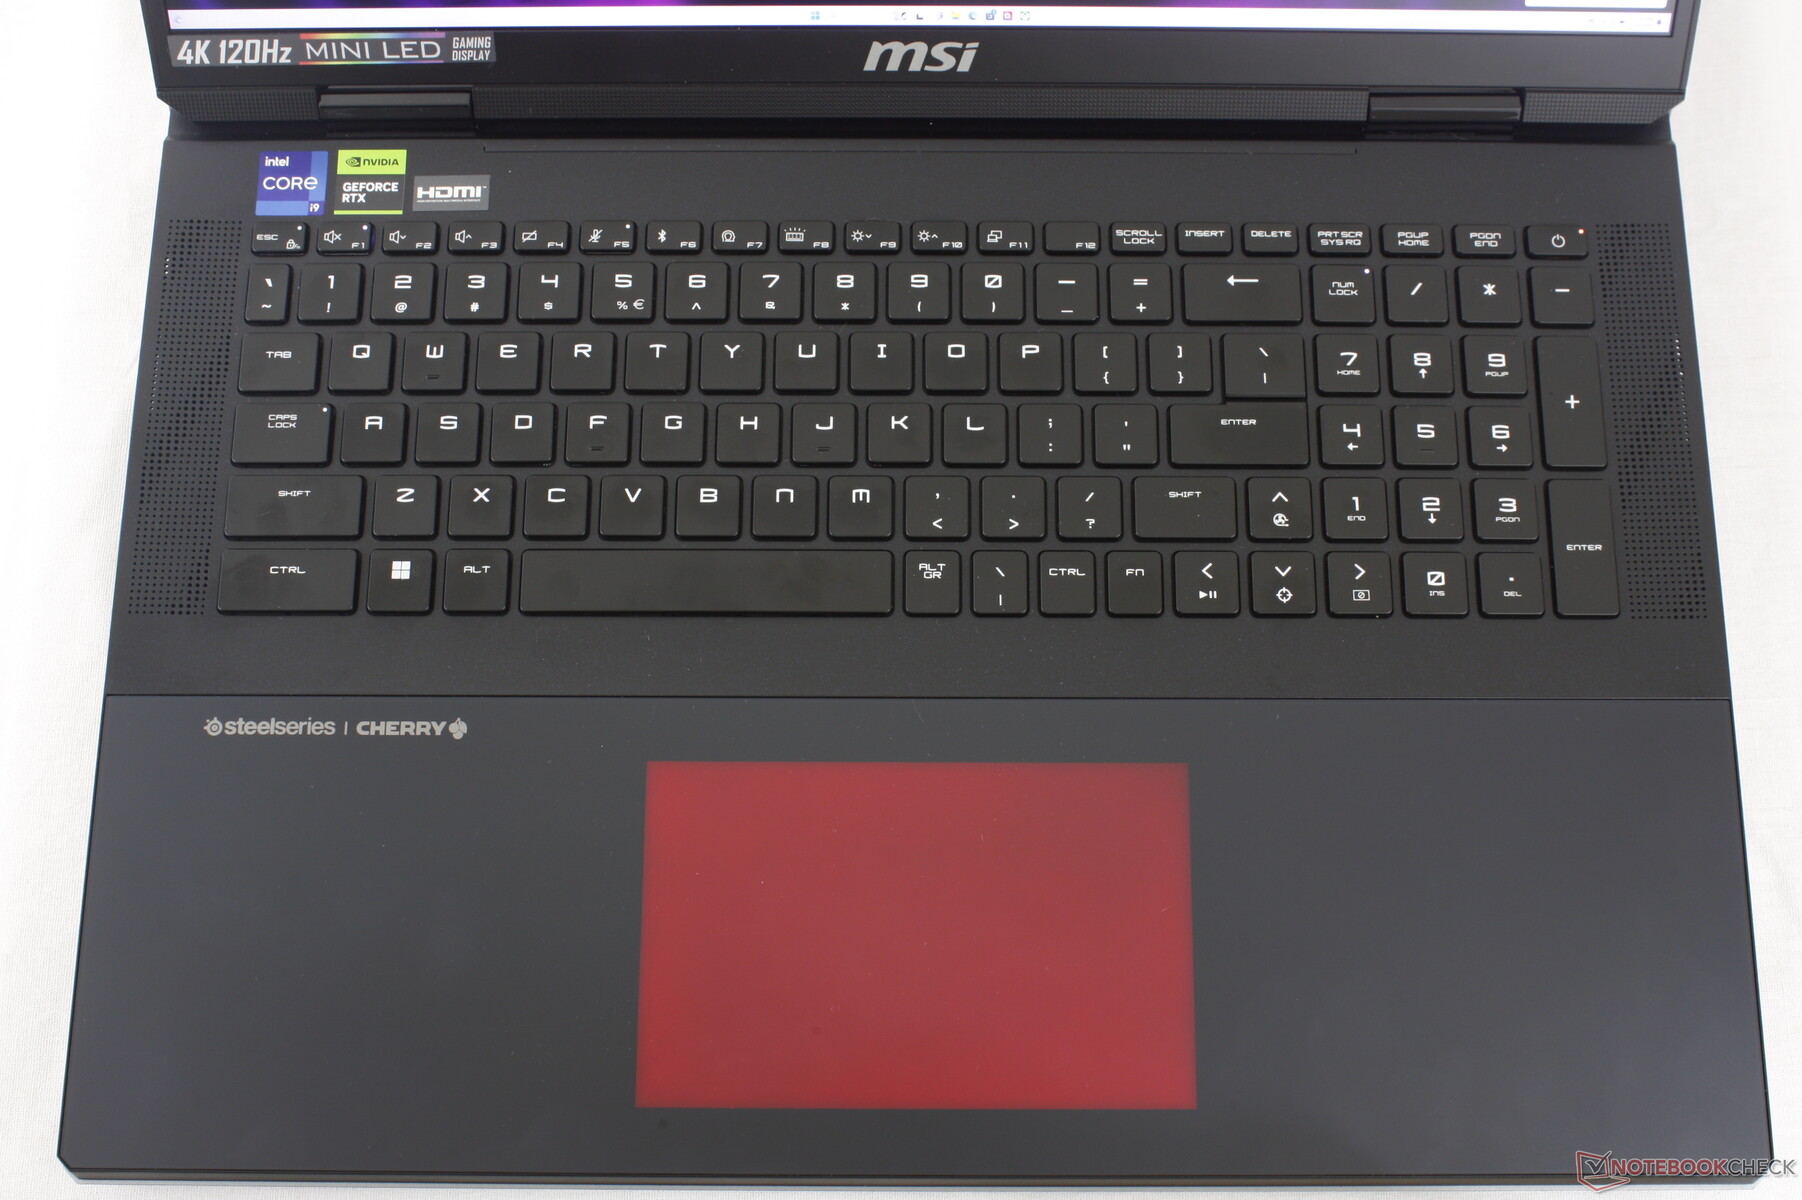
Yeni şasi, daha gösterişli ve retro esintili GE78'den ziyade Titan GT77'nin bir evrimidir. GT77 ile kıyaslandığında Titan 18, simsiyah dış yüzeyi tamamlamak için iki tonlu gümüş ve mavi renkler ekliyor. MSI ayrıca arka taraftaki LED çubuğu kaldırarak "gereksiz" RGB aydınlatmadan da uzak duruyor.
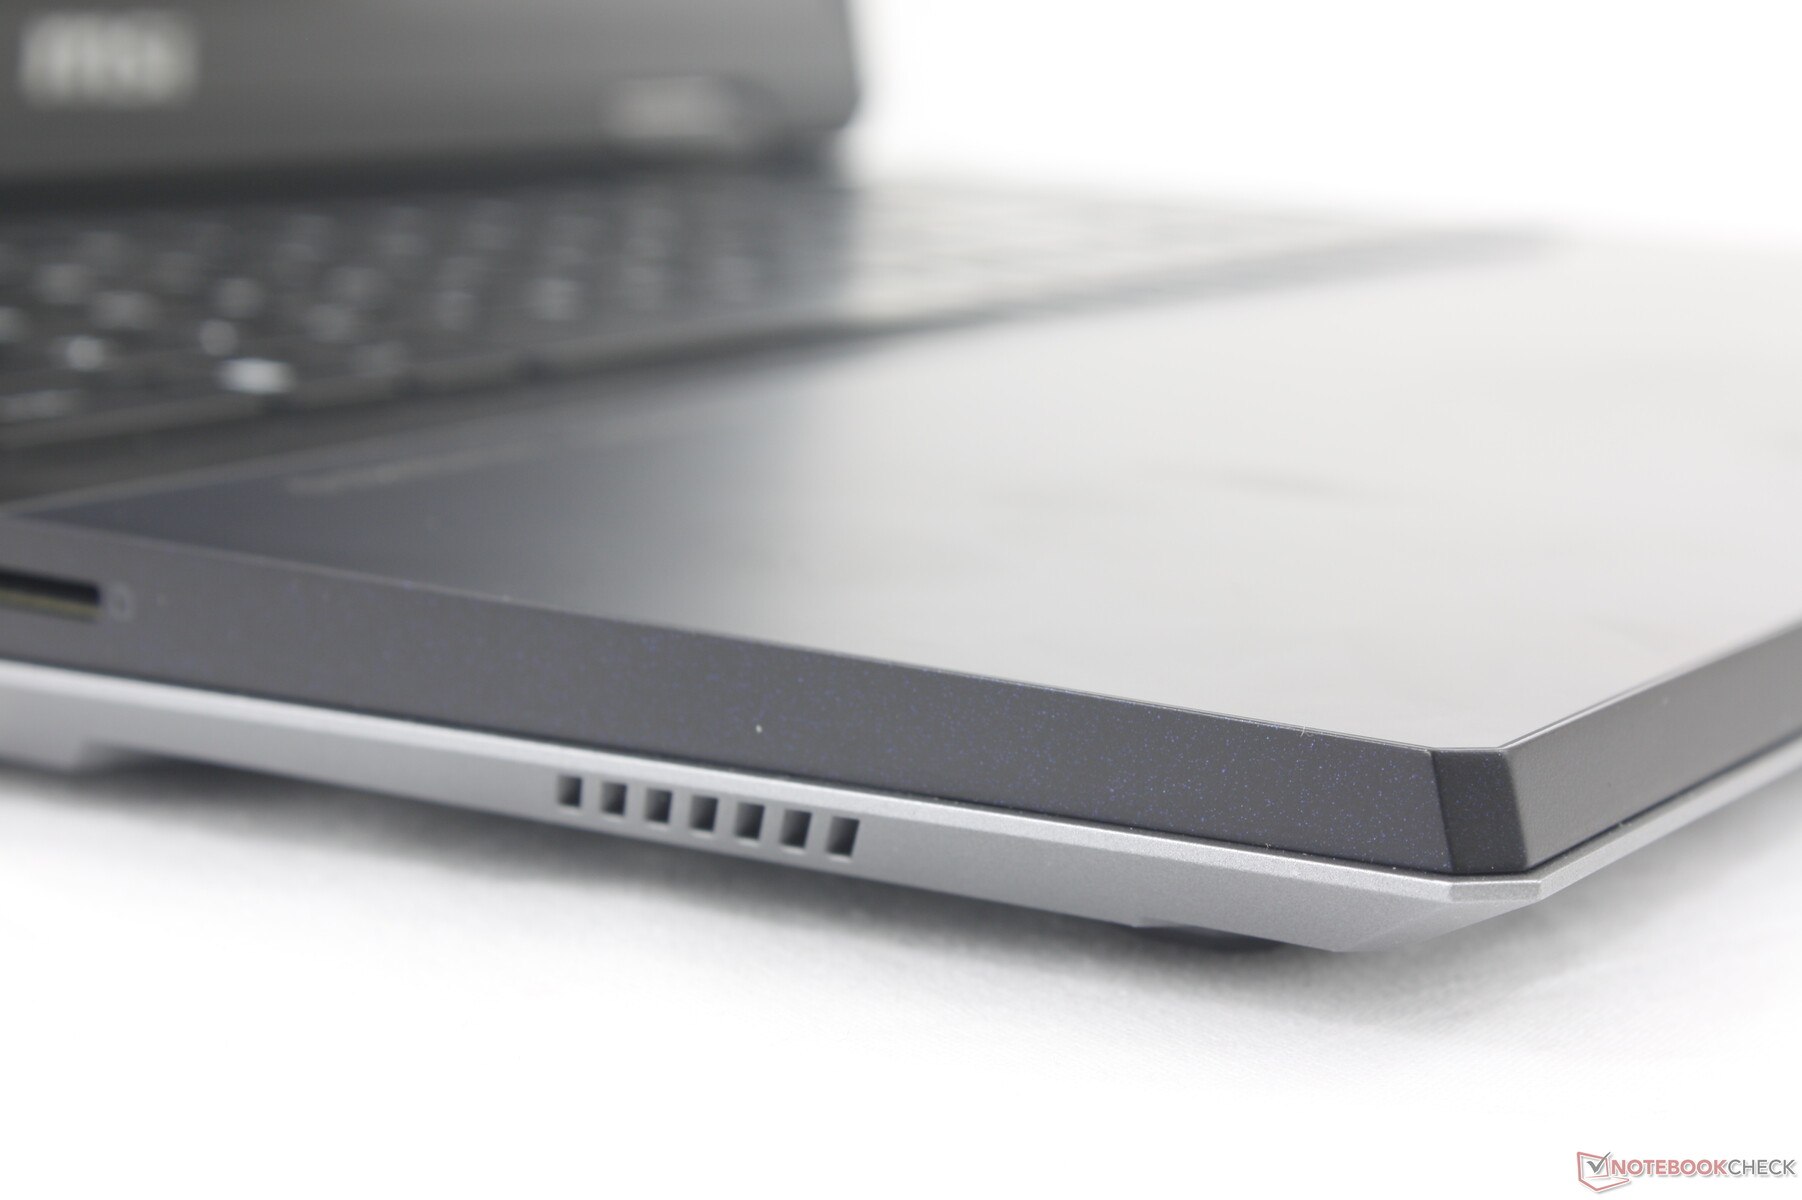
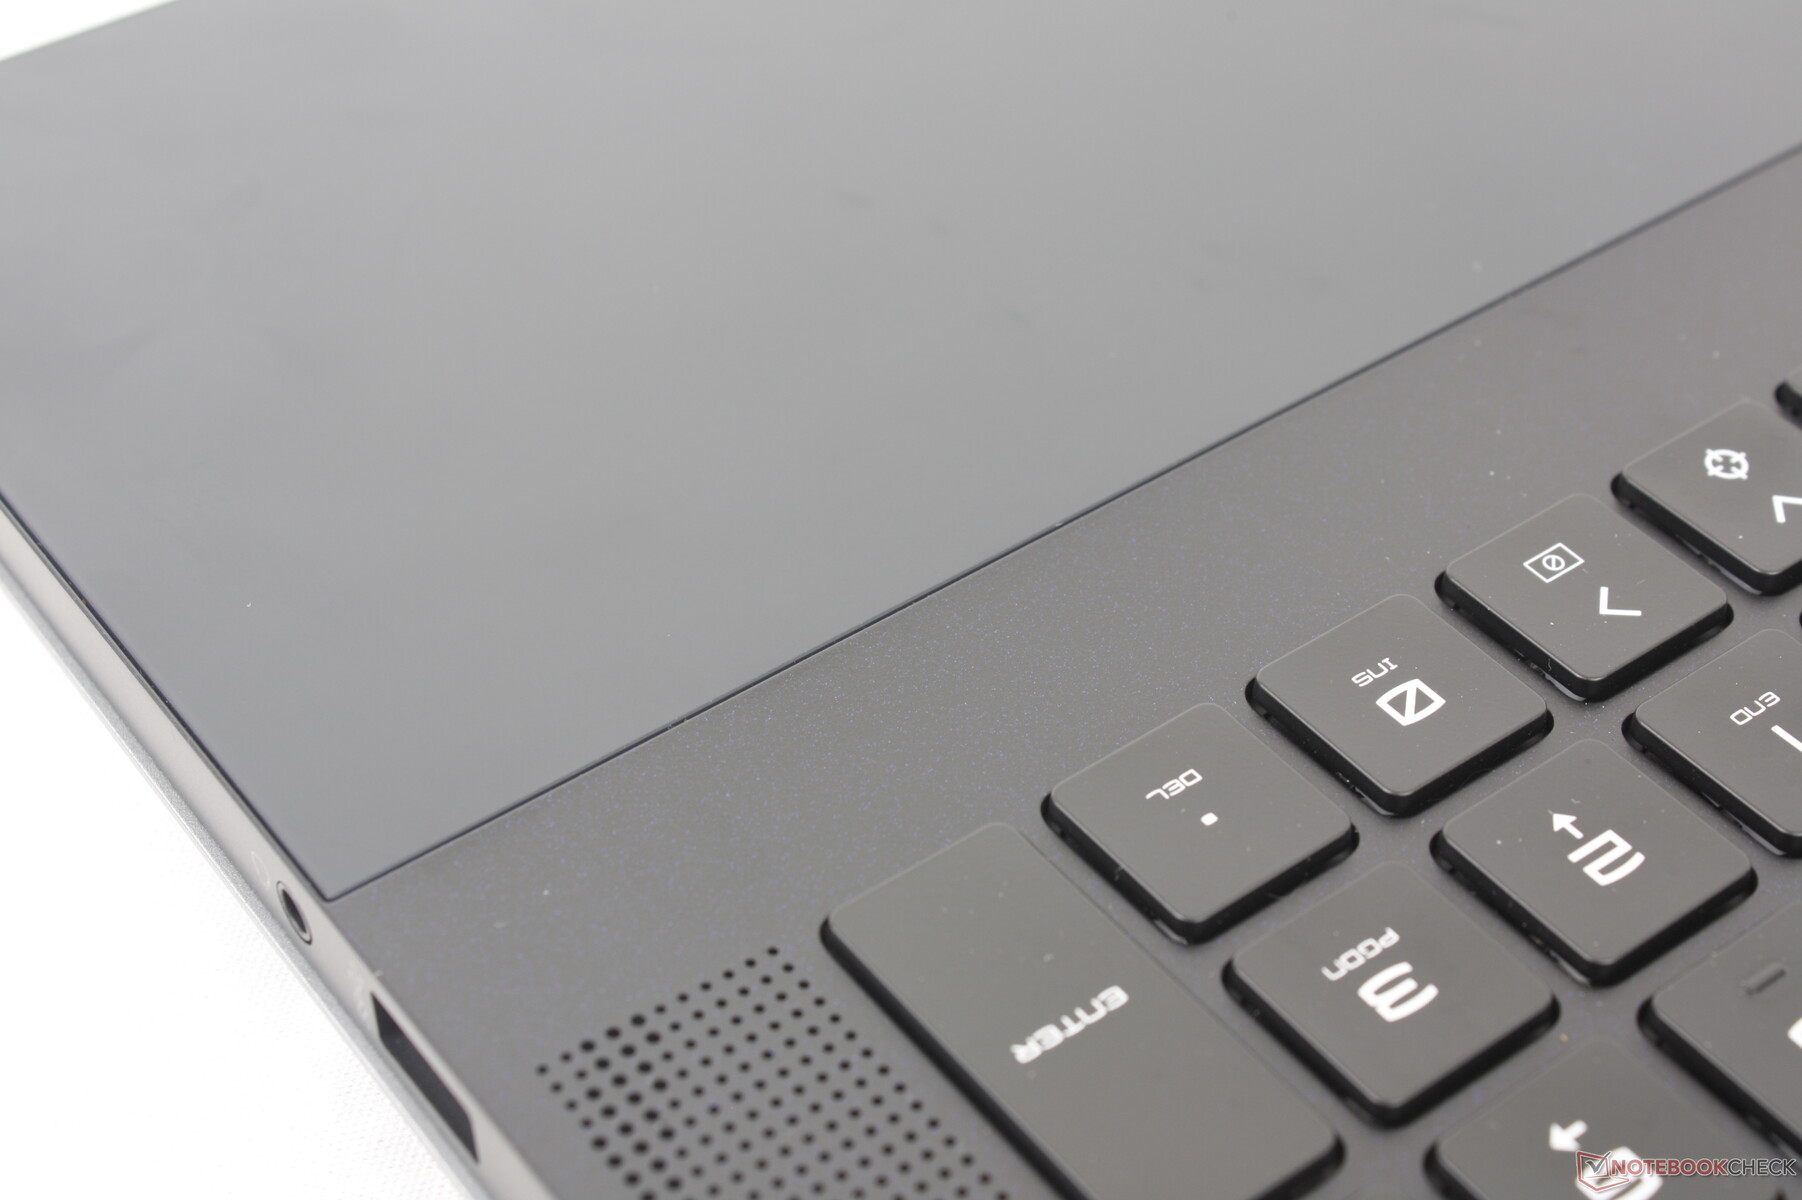
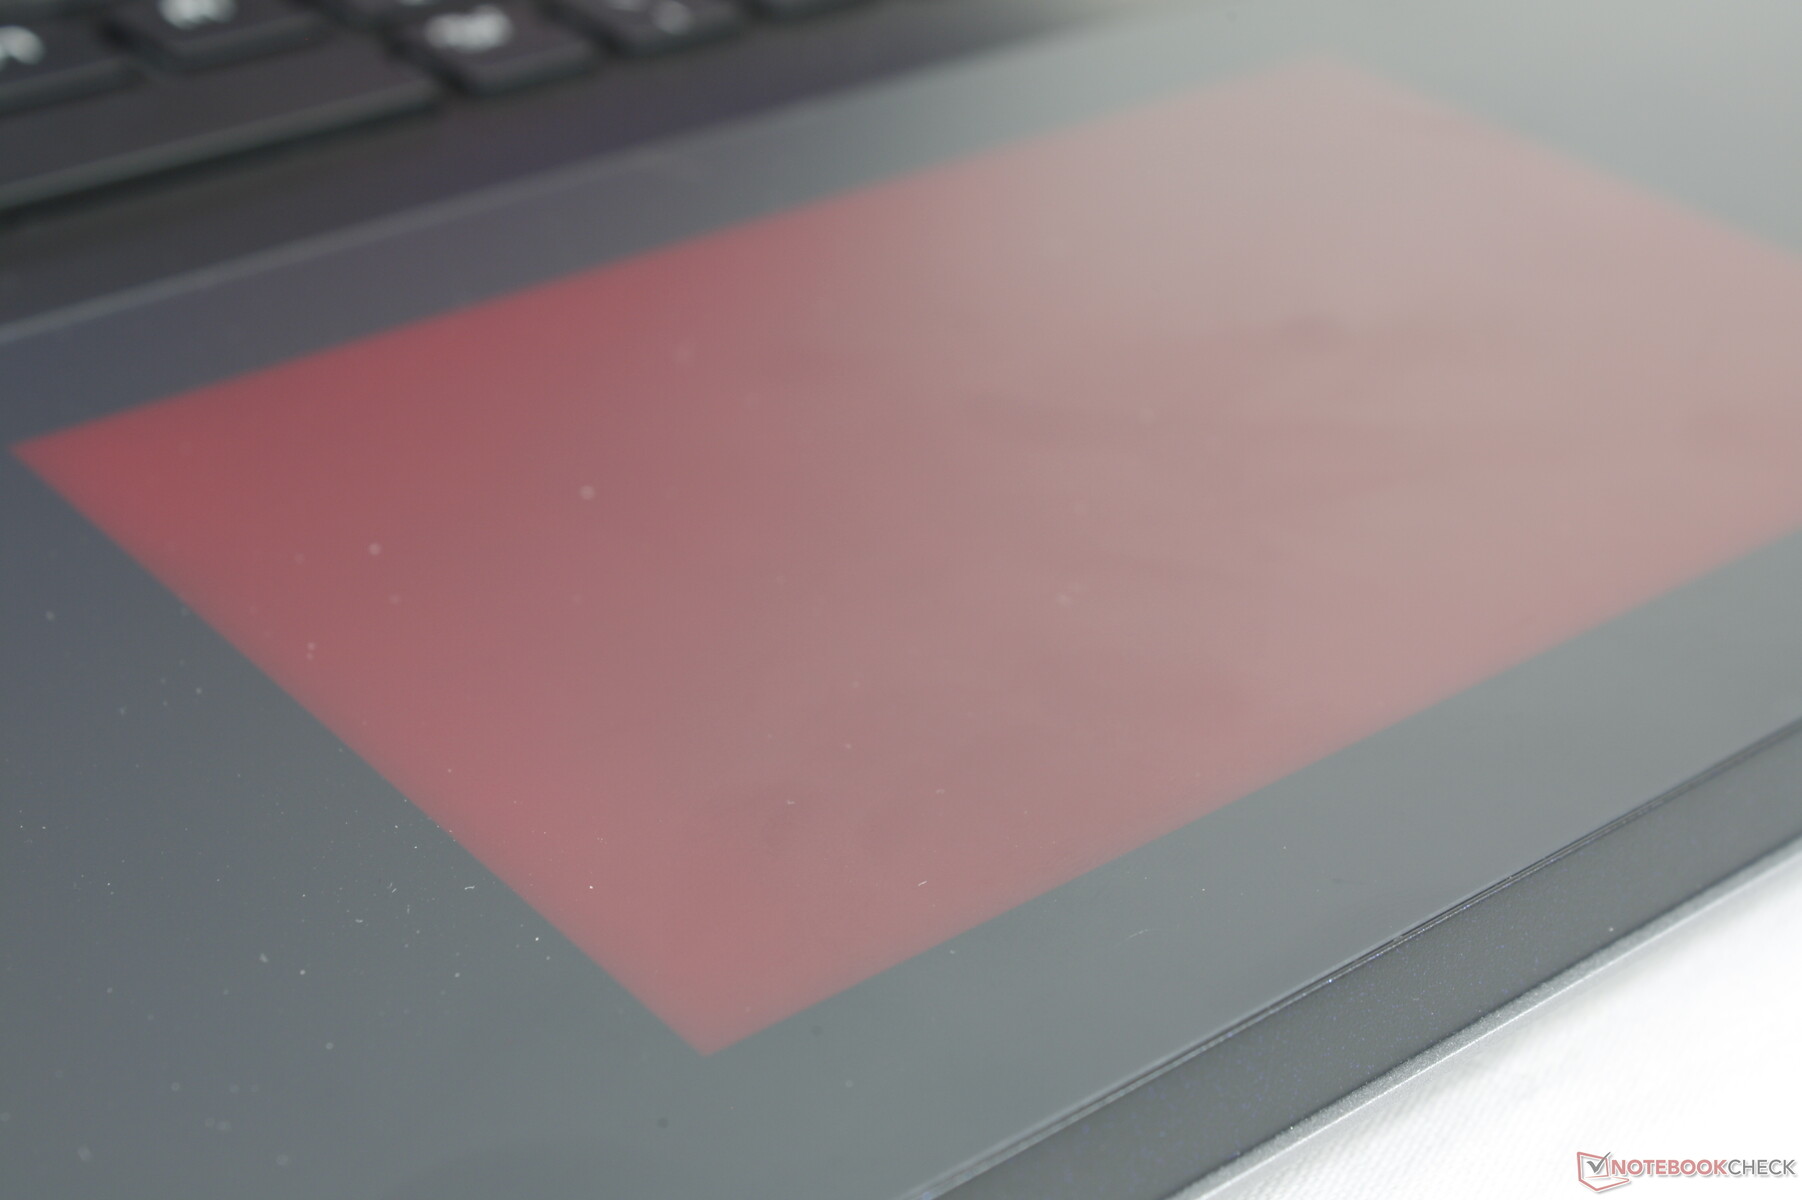
Titan 18'in belki de en çok dikkat çeken özelliği, avuç içi dayanakları ve clickpad boyunca uzanan düz camdır. Böylece tıklama yüzeyi avuç içi dayanaklarıyla aynı hizada ve RGB efektleriyle aydınlatılıyor. Sonuç, üst düzey oyuncu estetiğini korurken daha şık ve pürüzsüz bir tasarımdır.
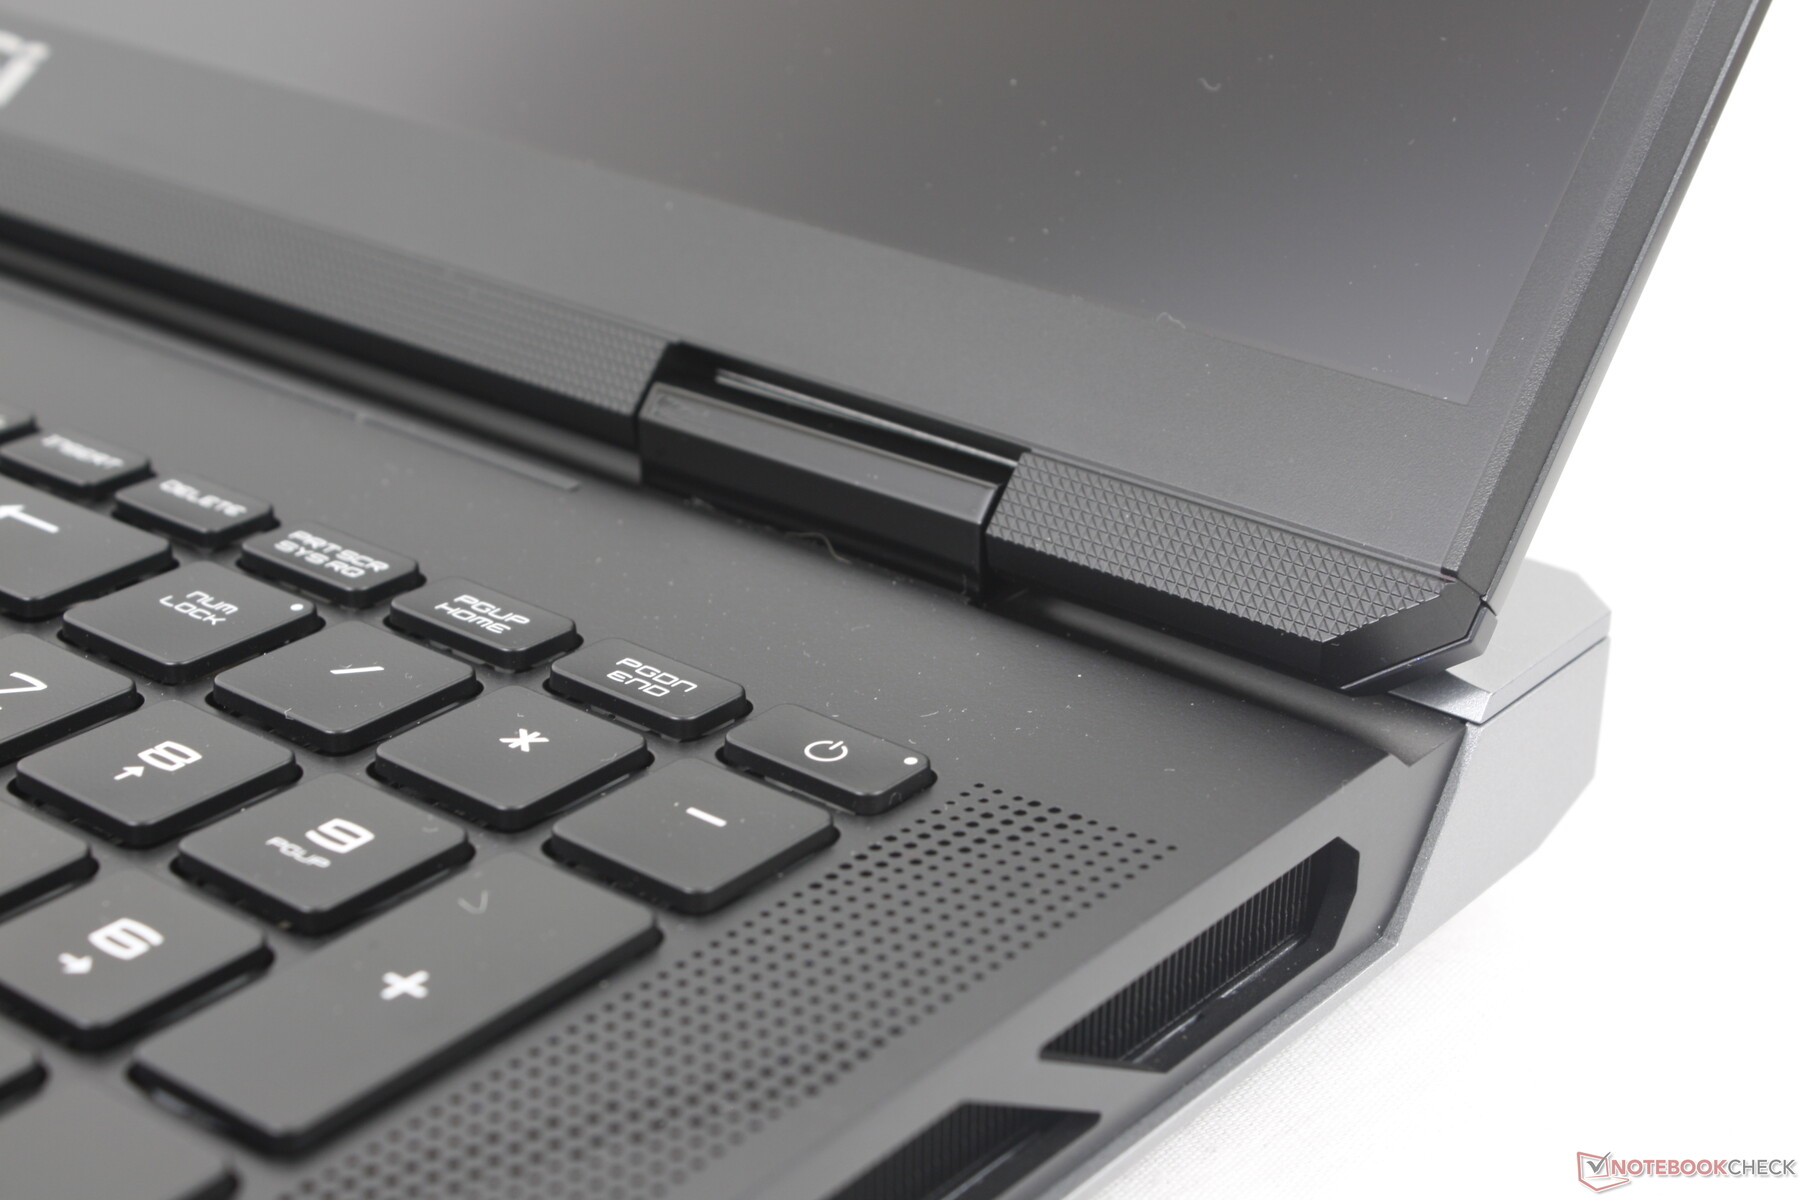
Magnezyum-alüminyum alaşımlı kasanın sağlamlığı, klavye merkezine bastırıldığında sadece küçük bir eğilme ile mükemmeldir. MSI'ın daha ucuz modellerinin alışılagelmiş plastik yüzeylerinden kesinlikle daha lüks bir his veriyor Cyborg veya Katana. Bununla birlikte, menteşeler daha uzun ömürlü olması için daha sıkı olabilirdi ve tüm sistem büyük bir parmak izi mıknatısı.
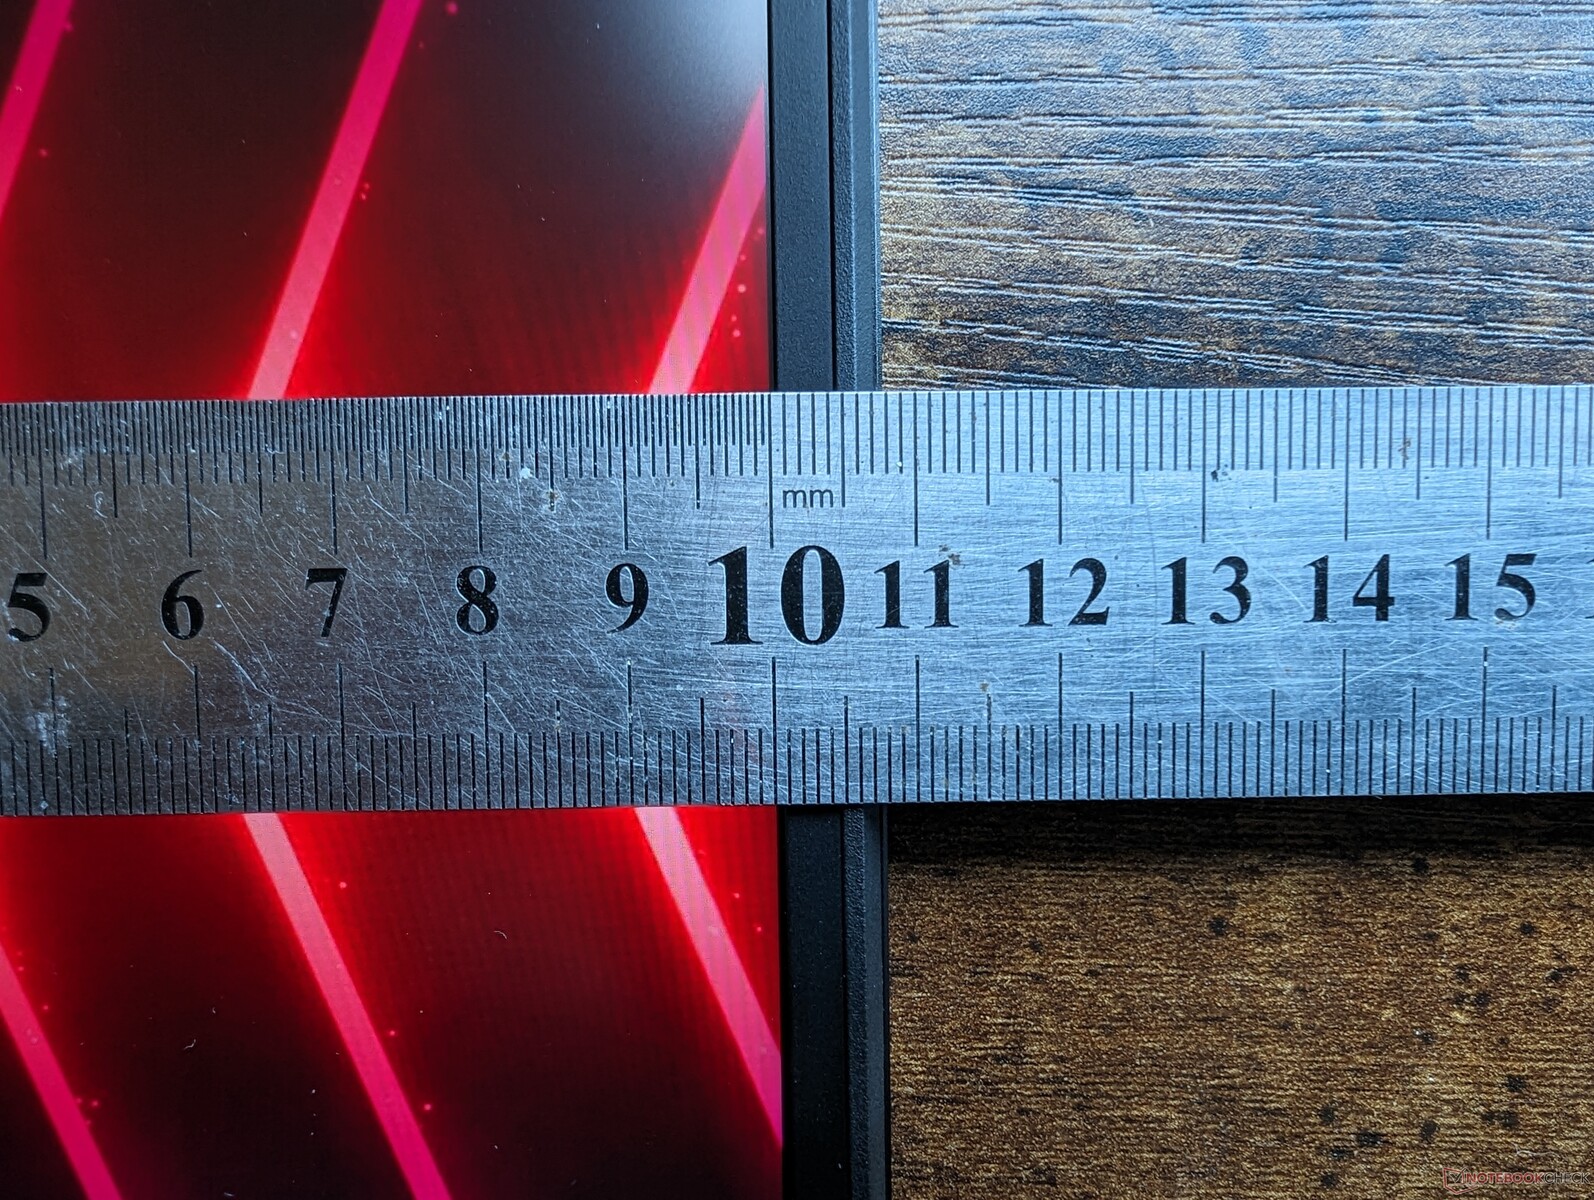
Özellikle, 16:10 18 inç Titan 18 HX, 16:9 17,3 inç'ten daha küçük bir ayak izine sahiptir Titan GT77 çünkü arka kısmı daha kısadır. Buna karşılık, yeni model, mevcut en kalın 18 inçlik oyun dizüstü bilgisayarlarından biri olmak için neredeyse 10 mm daha kalındır. Bu taç Alienware m18 R1'e gittiği için en ağır olması gerekmiyor, ancak yine de Asus ROG Strix G18 veya Razer Blade 18'den her biri 500 g'dan fazla fark edilir derecede daha ağır.
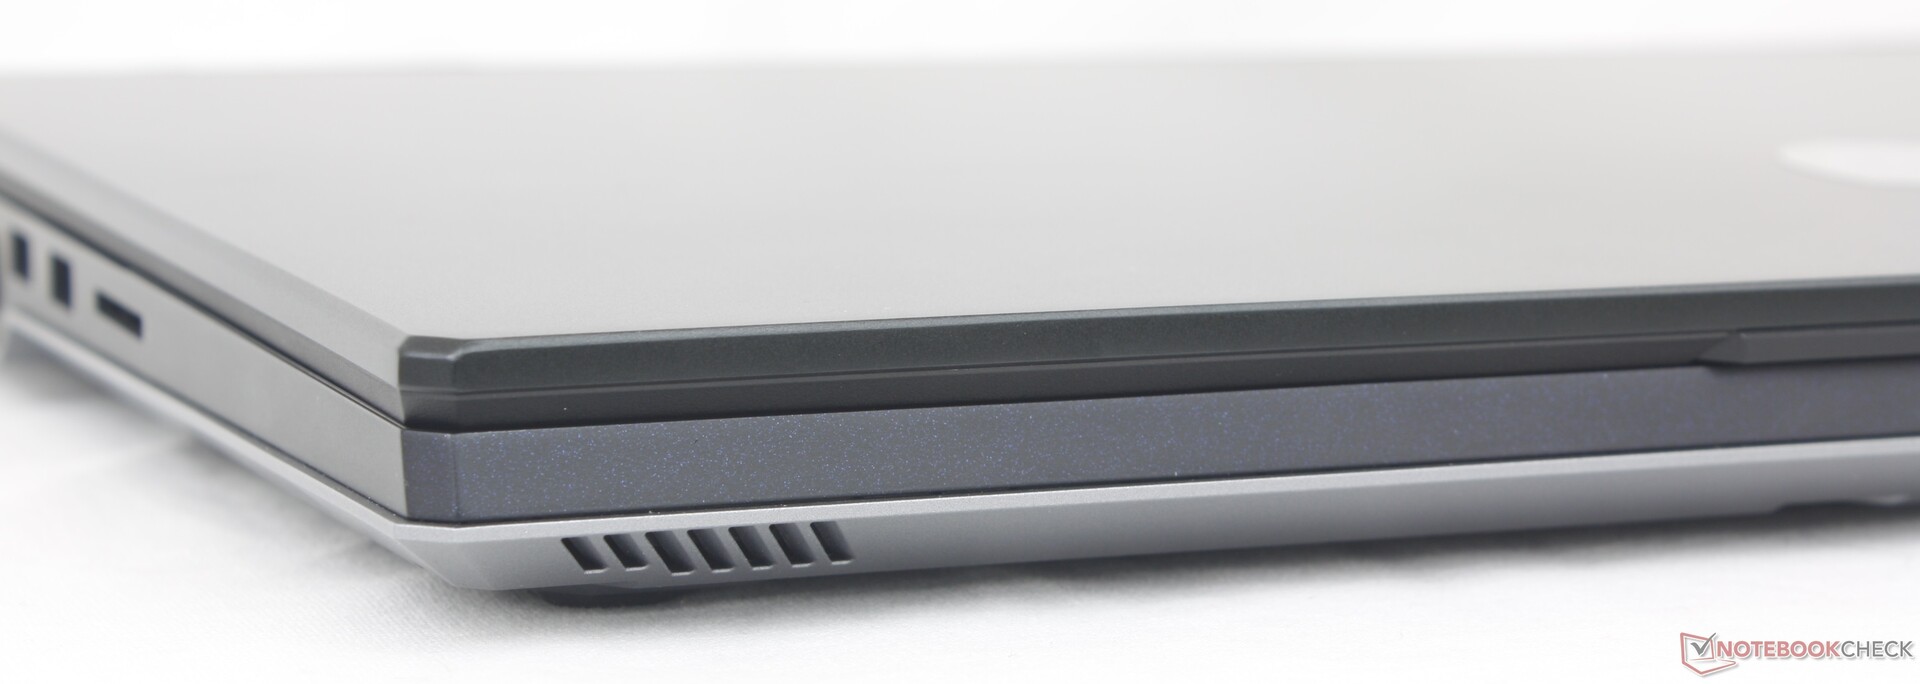
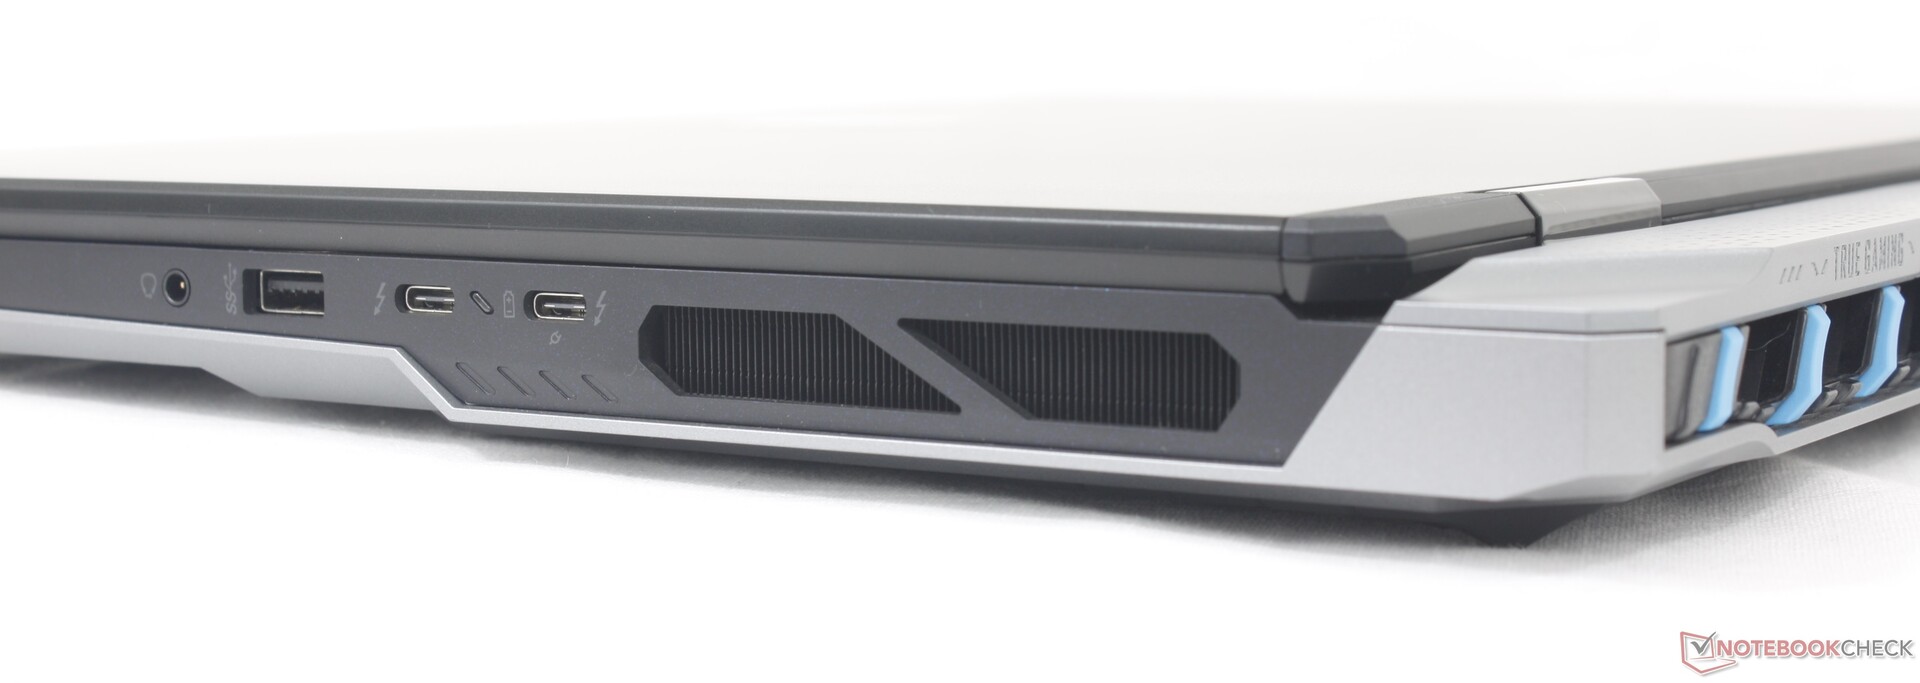
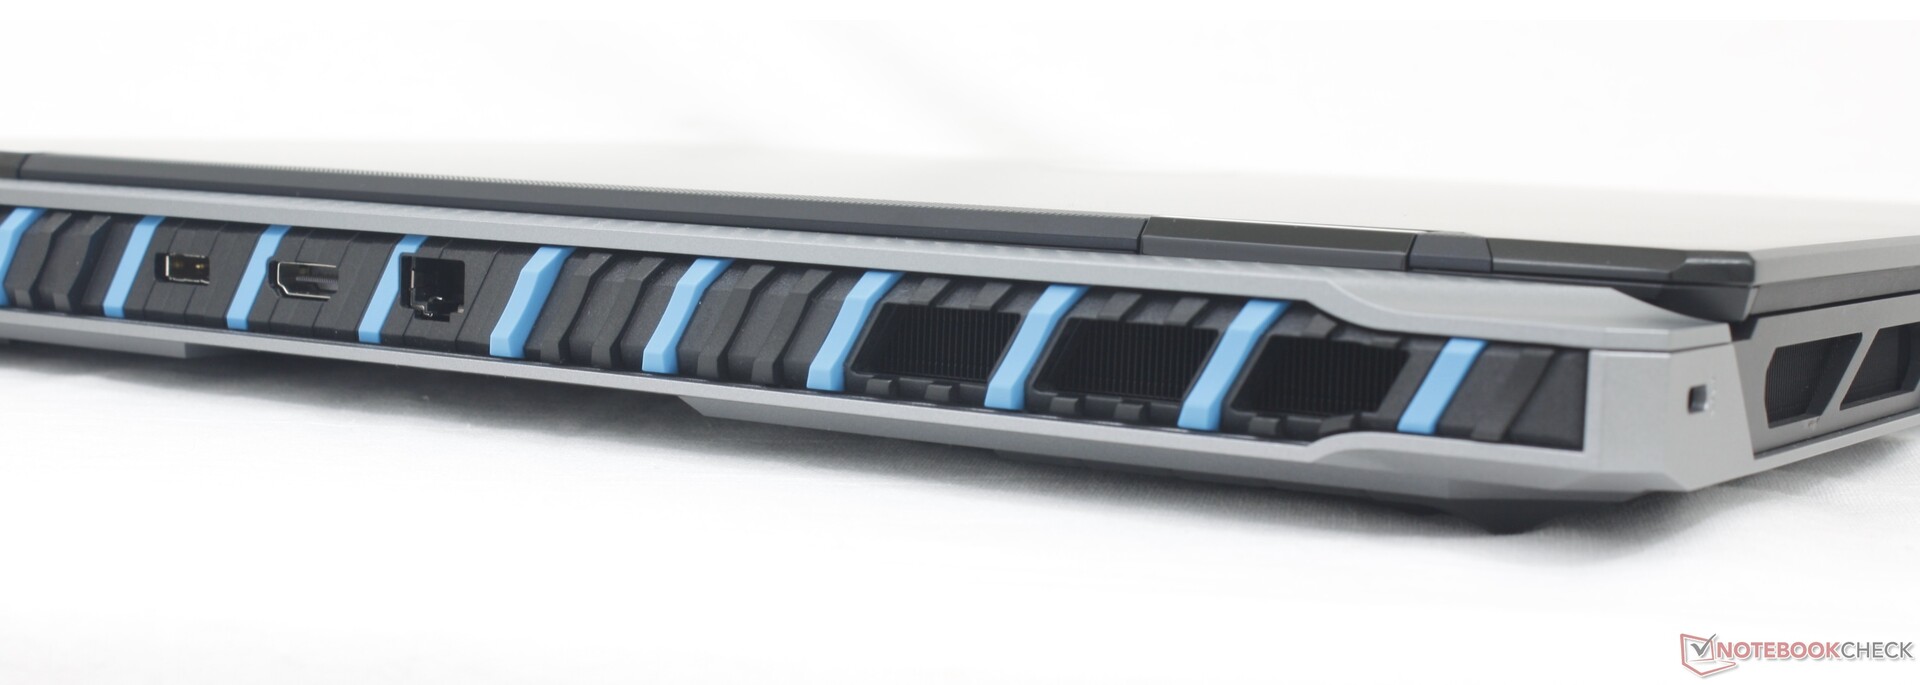
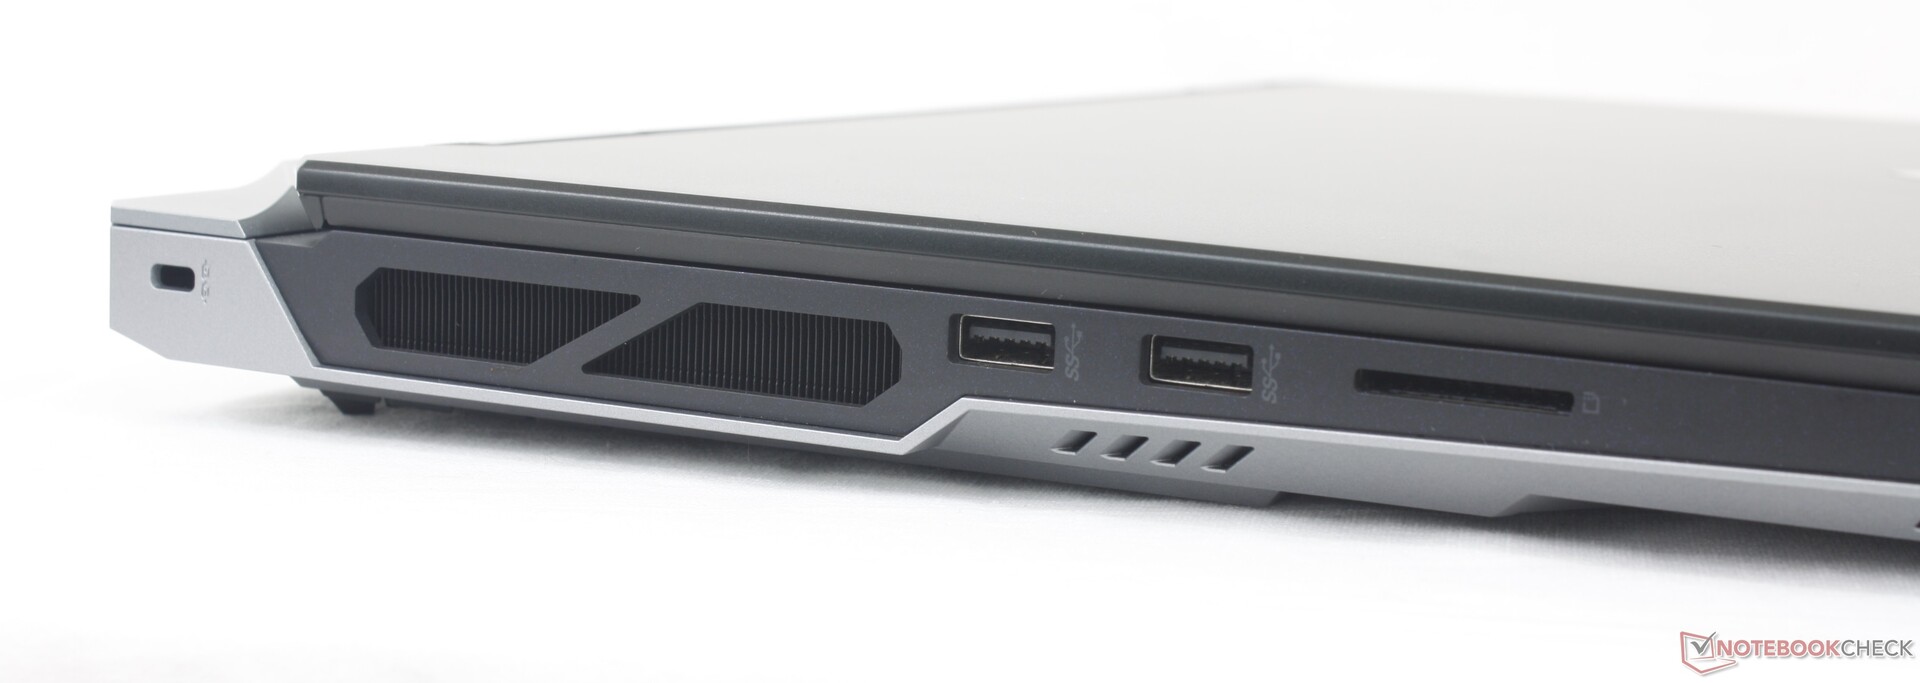
Bağlanabilirlik
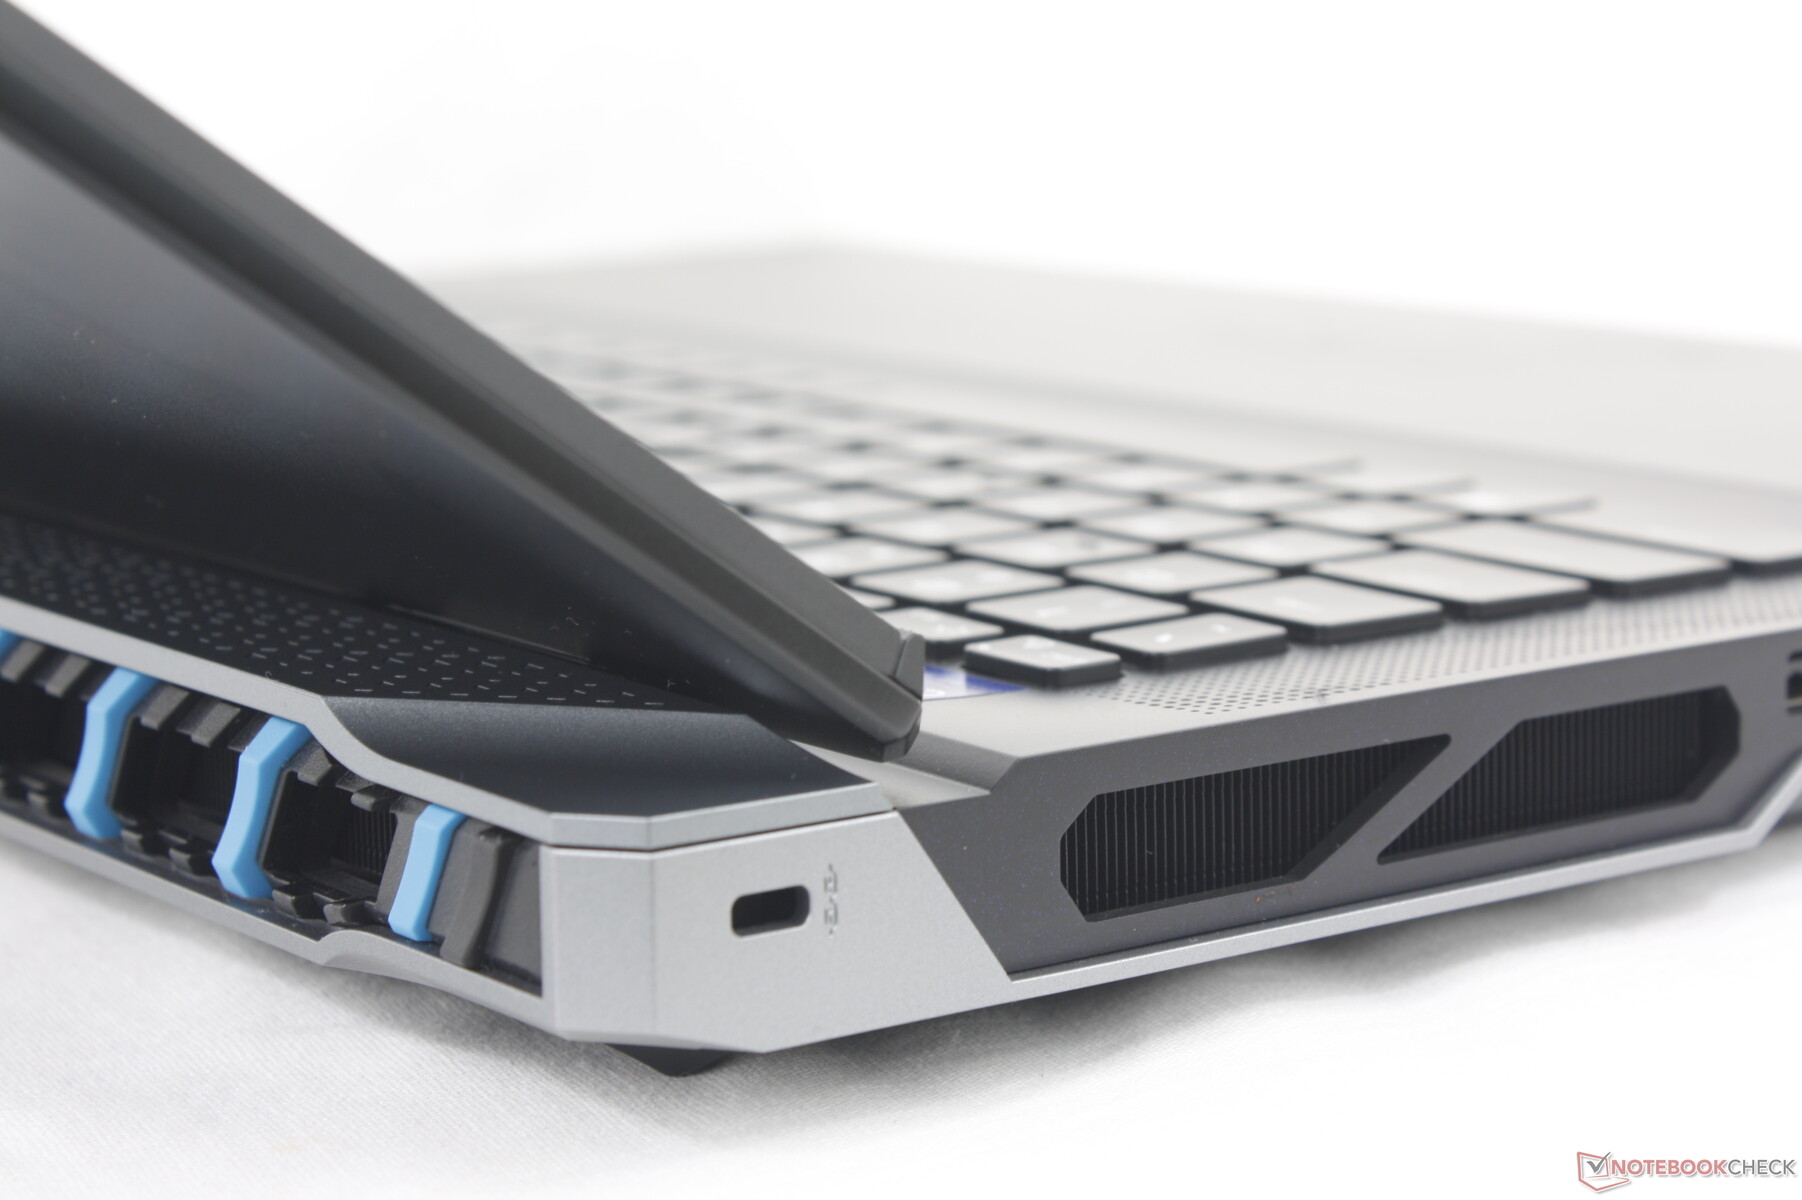
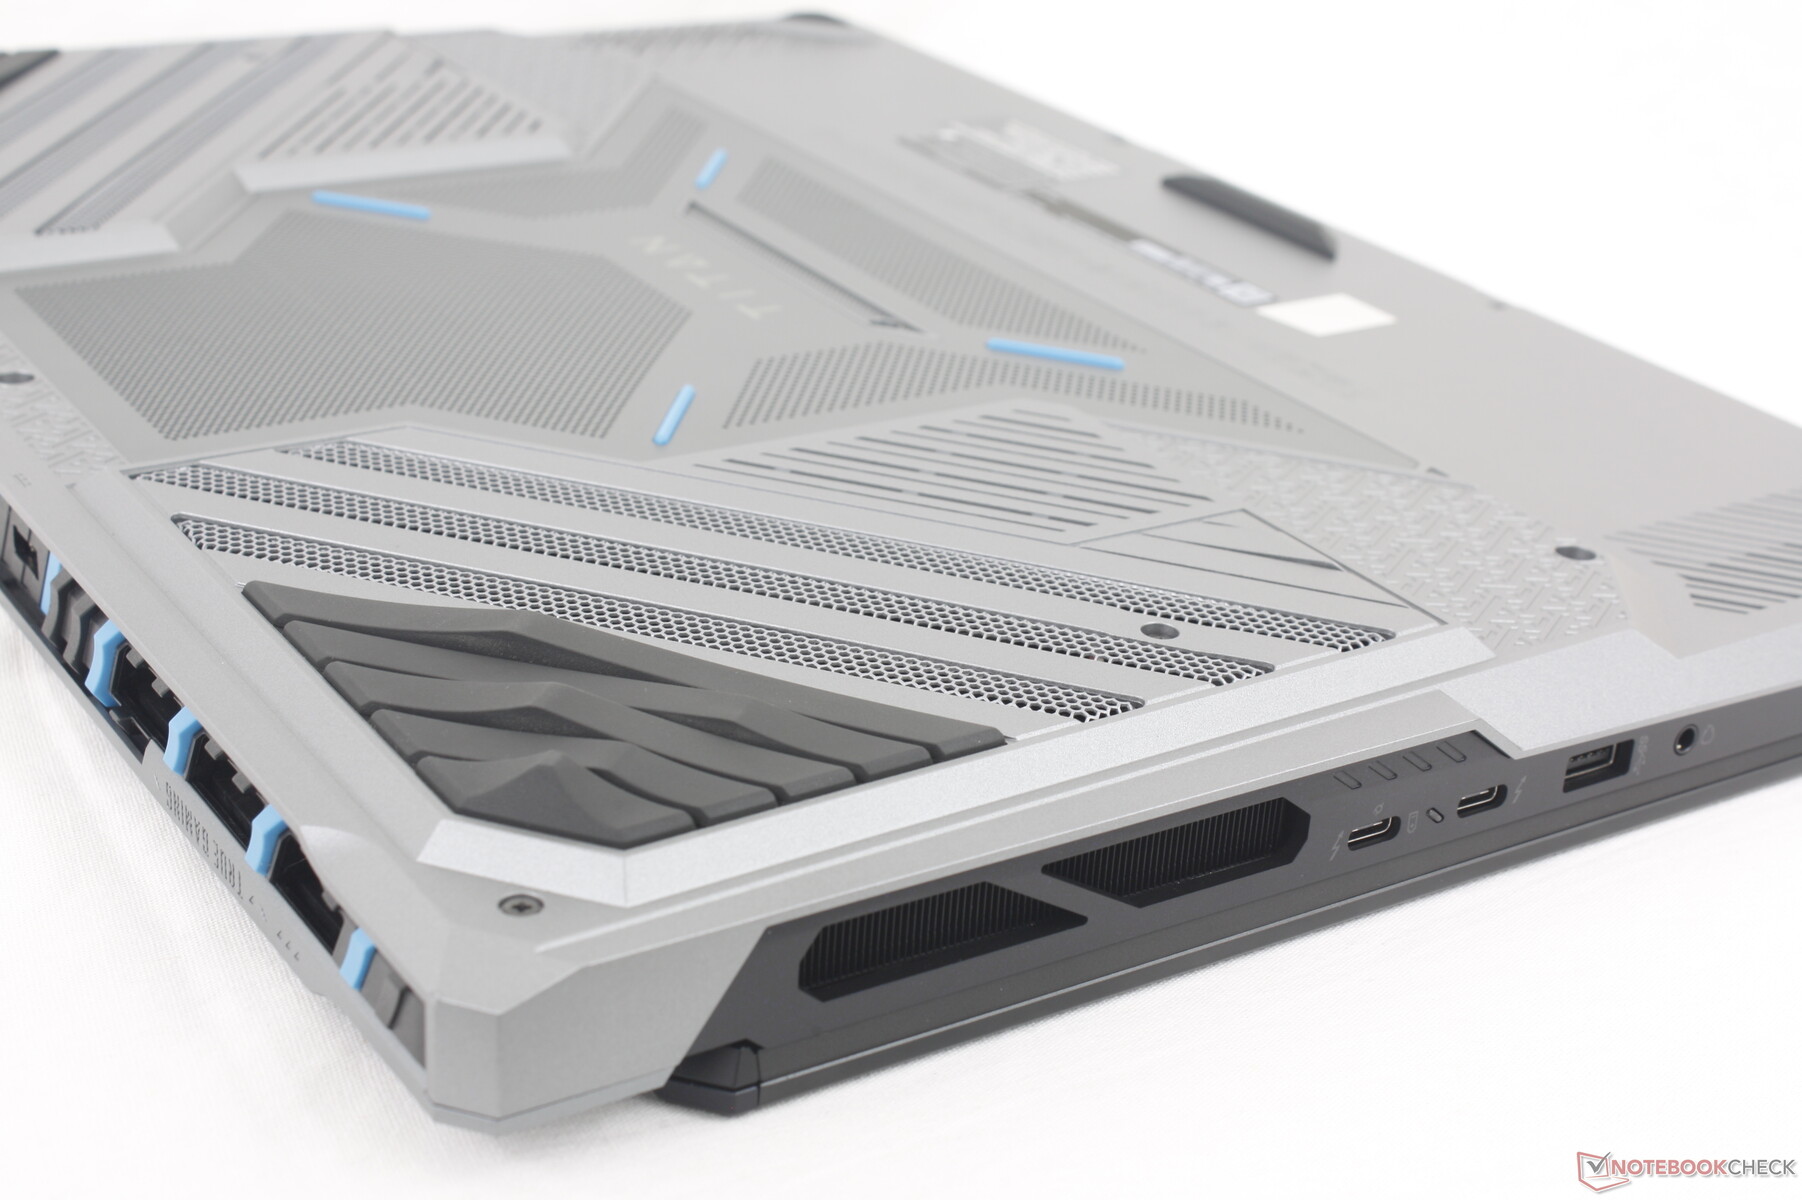
MSI, özel mini-DisplayPort hariç geçen yılki GT77'nin tüm bağlantı noktalarını geri getirdi. Bağlantı noktaları da dağınıklığı azaltmak için en belirgin şekilde arka kısımda yeniden düzenlenmiş. Buna karşılık, GT77'deki bağlantı noktaları sol ve sağ kenarlar boyunca sıkıca paketlenmişti.
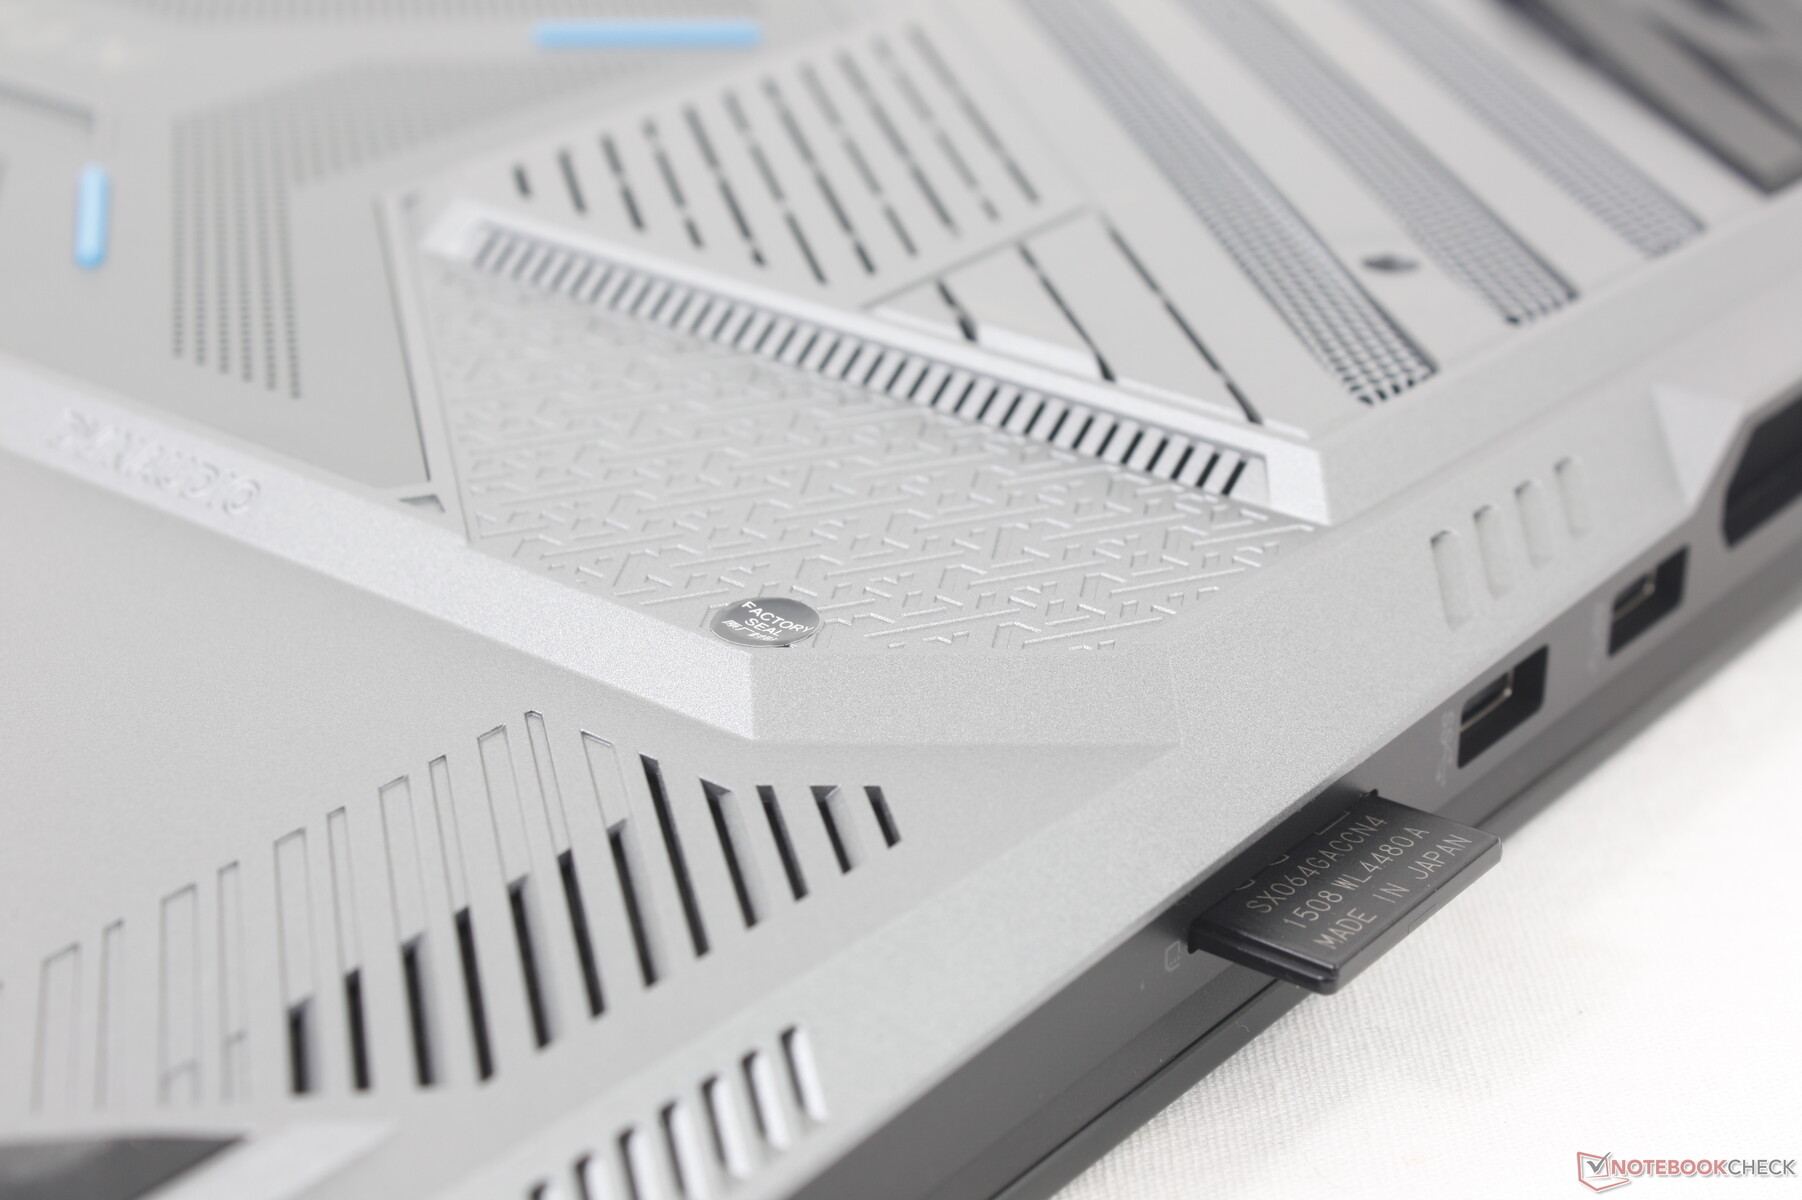
SD Kart Okuyucu
Kasa yenilenmiş olsa da yavaş kart okuyucu yenilenmemiştir. UHS-II test kartımızdan 1 GB'lık görüntüyü masaüstüne taşımak yaklaşık 12 saniye sürüyor ve diğer kart okuyuculardan 2 kat daha yavaş Razer Blade 18 ya da Alienware m18 R1.
| SD Card Reader | |
| average JPG Copy Test (av. of 3 runs) | |
| Razer Blade 18 RTX 4070 (Angelibird AV Pro V60) | |
| Alienware m18 R1 (Angelibird AV Pro V60) | |
| MSI Titan 18 HX A14VIG (Toshiba Exceria Pro SDXC 64 GB UHS-II) | |
| MSI Titan GT77 HX 13VI (Angelibird AV Pro V60) | |
| Acer Predator Helios 18 N23Q2 | |
| maximum AS SSD Seq Read Test (1GB) | |
| Alienware m18 R1 (Angelibird AV Pro V60) | |
| Razer Blade 18 RTX 4070 (Angelibird AV Pro V60) | |
| MSI Titan 18 HX A14VIG (Toshiba Exceria Pro SDXC 64 GB UHS-II) | |
| MSI Titan GT77 HX 13VI (Angelibird AV Pro V60) | |
| Acer Predator Helios 18 N23Q2 | |
İletişim
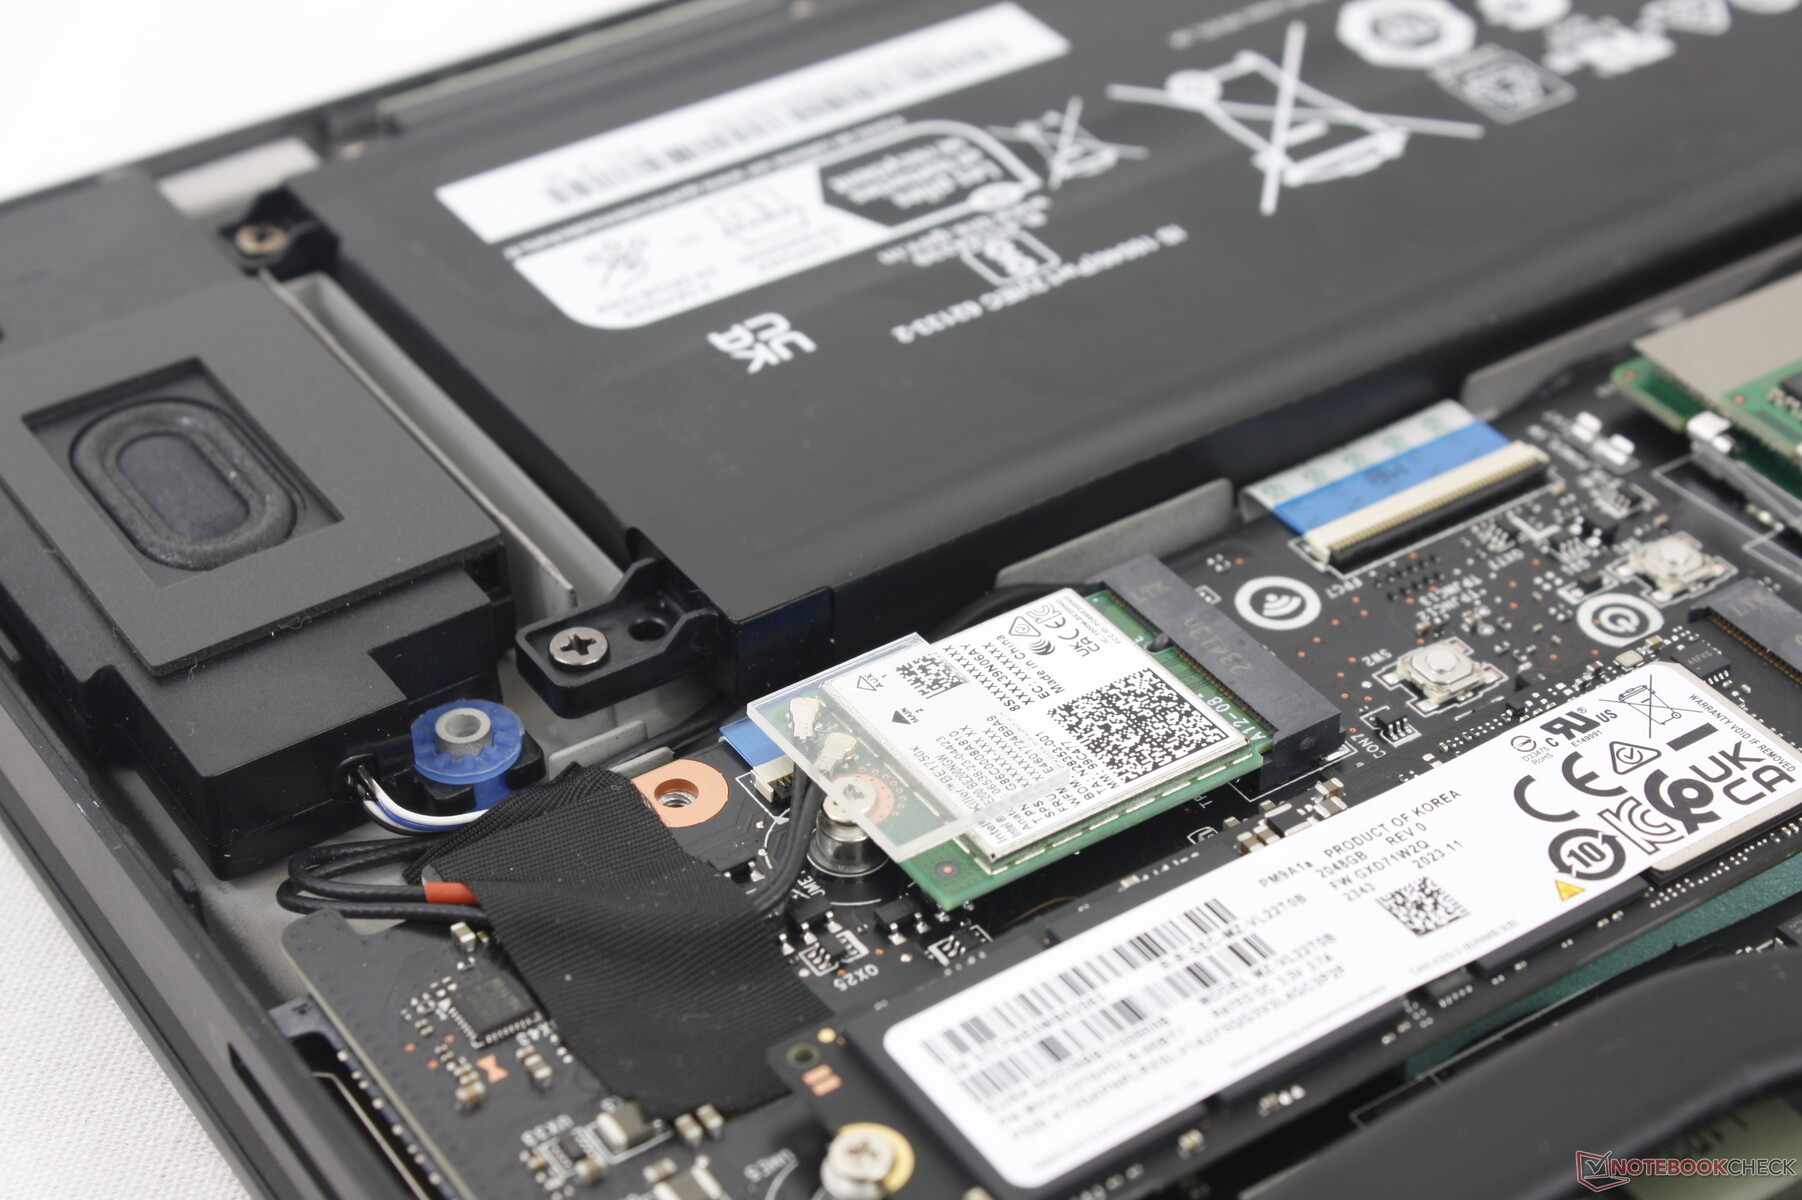
WLAN, BE1750W'nin oyun varyantı olan Killer BE1750x tarafından sağlanmaktadır. Wi-Fi 7 yönlendiriciler henüz yaygınlaşmamış olsa da modül Wi-Fi 7'yi destekliyor. Wi-Fi 6E test yönlendiricimizle eşleştirdiğimizde hiçbir bağlantı sorunu yaşamadık.
| Networking | |
| iperf3 transmit AXE11000 | |
| Asus ROG Strix G18 G814JI | |
| MSI Titan GT77 HX 13VI | |
| Alienware m18 R1 | |
| Razer Blade 18 RTX 4070 | |
| MSI Titan 18 HX A14VIG | |
| Acer Predator Helios 18 N23Q2 | |
| iperf3 receive AXE11000 | |
| Asus ROG Strix G18 G814JI | |
| MSI Titan GT77 HX 13VI | |
| Razer Blade 18 RTX 4070 | |
| Alienware m18 R1 | |
| MSI Titan 18 HX A14VIG | |
| Acer Predator Helios 18 N23Q2 | |
| iperf3 transmit AXE11000 6GHz | |
| Acer Predator Helios 18 N23Q2 | |
| Alienware m18 R1 | |
| Razer Blade 18 RTX 4070 | |
| MSI Titan 18 HX A14VIG | |
| iperf3 receive AXE11000 6GHz | |
| Razer Blade 18 RTX 4070 | |
| Acer Predator Helios 18 N23Q2 | |
| MSI Titan 18 HX A14VIG | |
| Alienware m18 R1 | |
Web kamerası
Fiziksel gizlilik deklanşörüne ve IR sensörüne sahip 2 MP web kamerası standart olarak gelir. Aşağıdaki fotoğrafta görüldüğü gibi kameranın parlaklık sorunları olabilir.

")
")
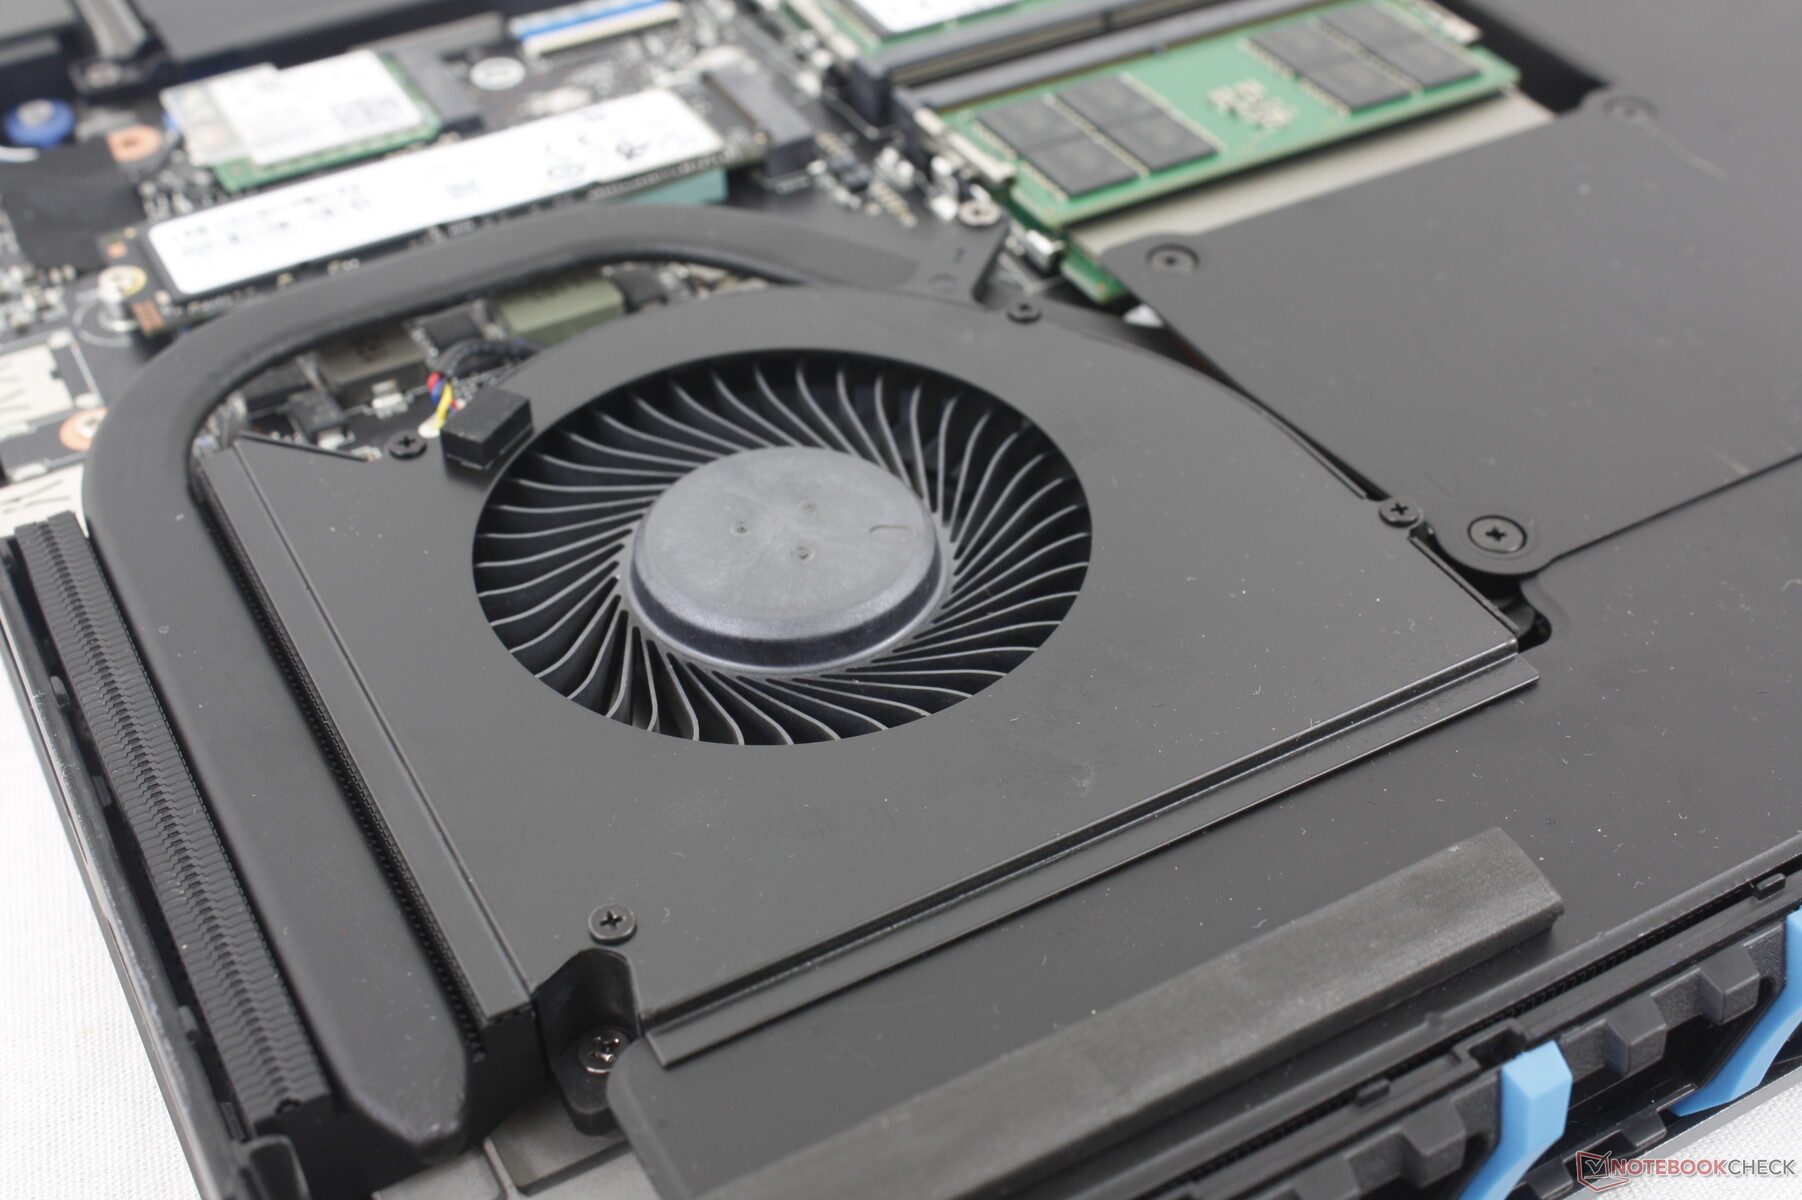
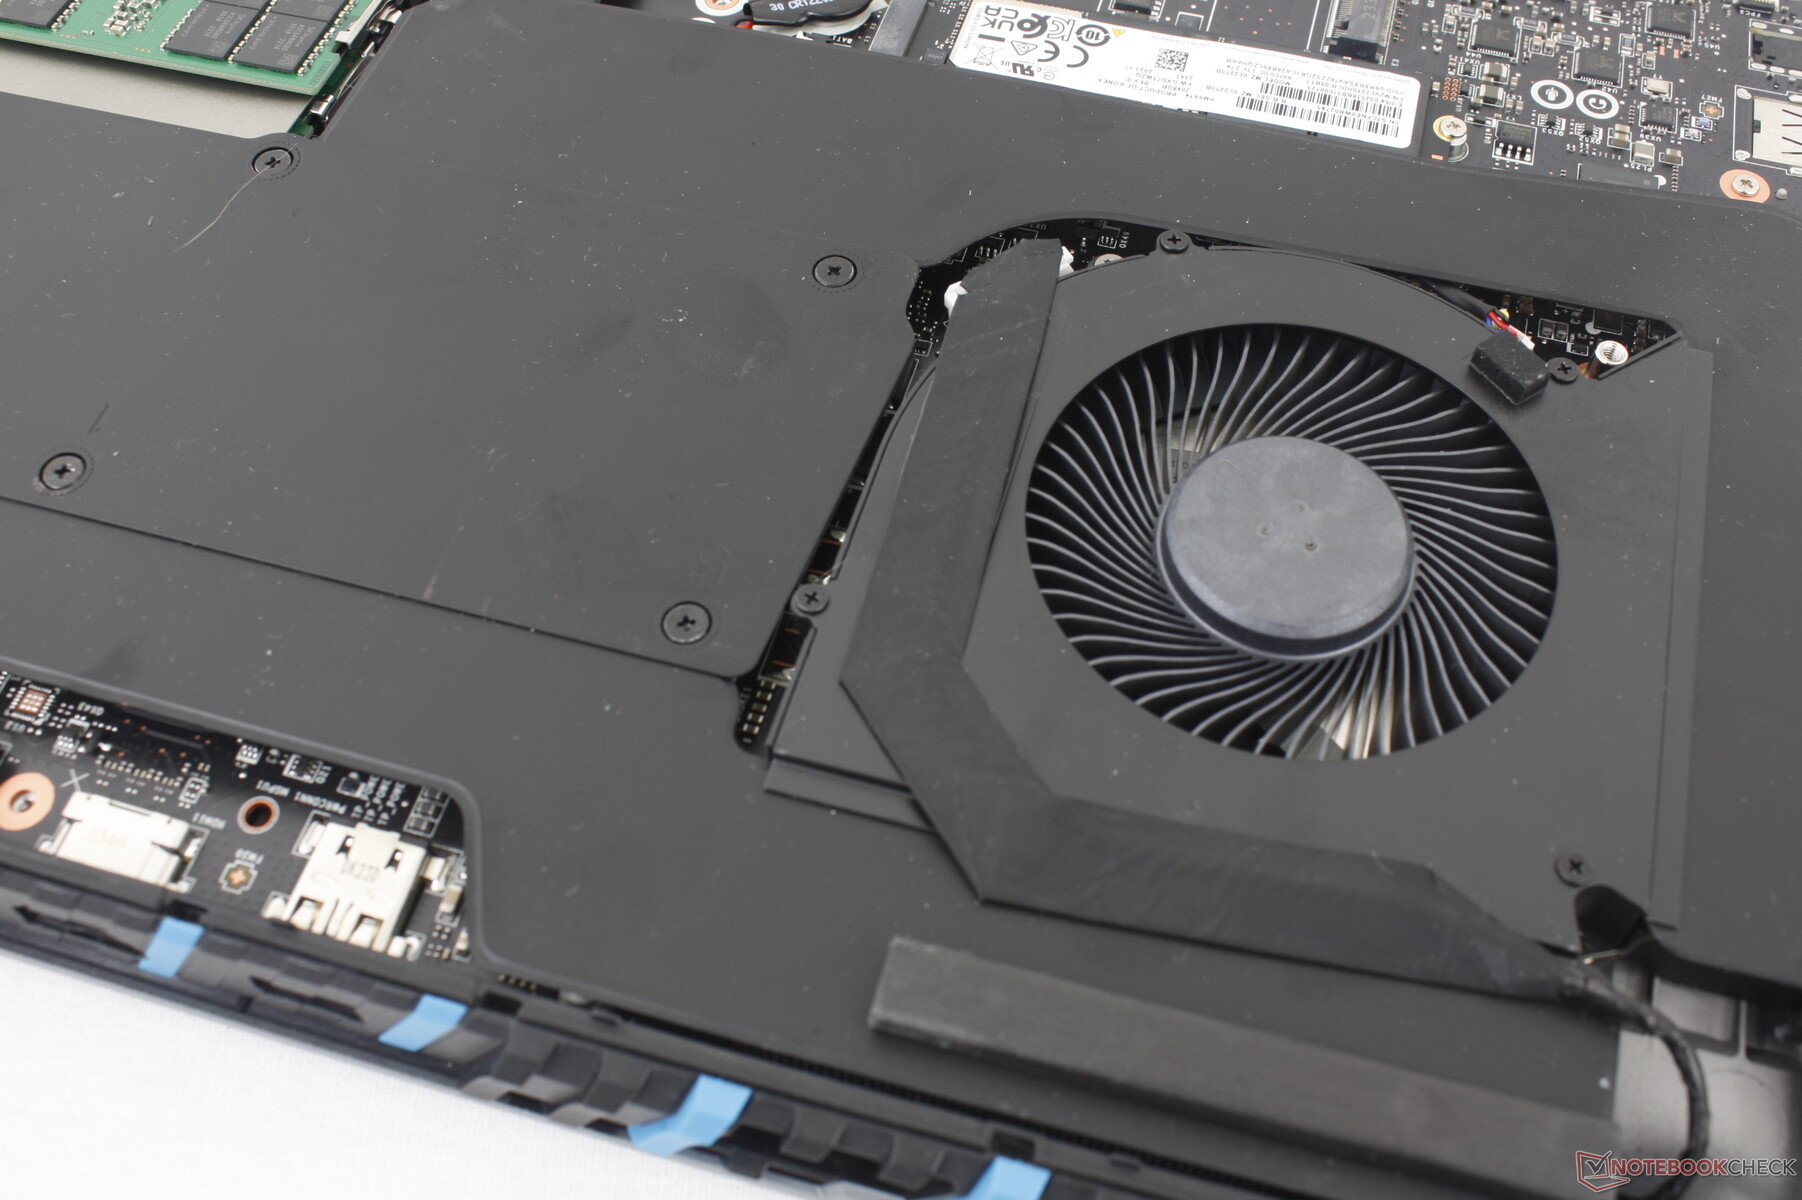
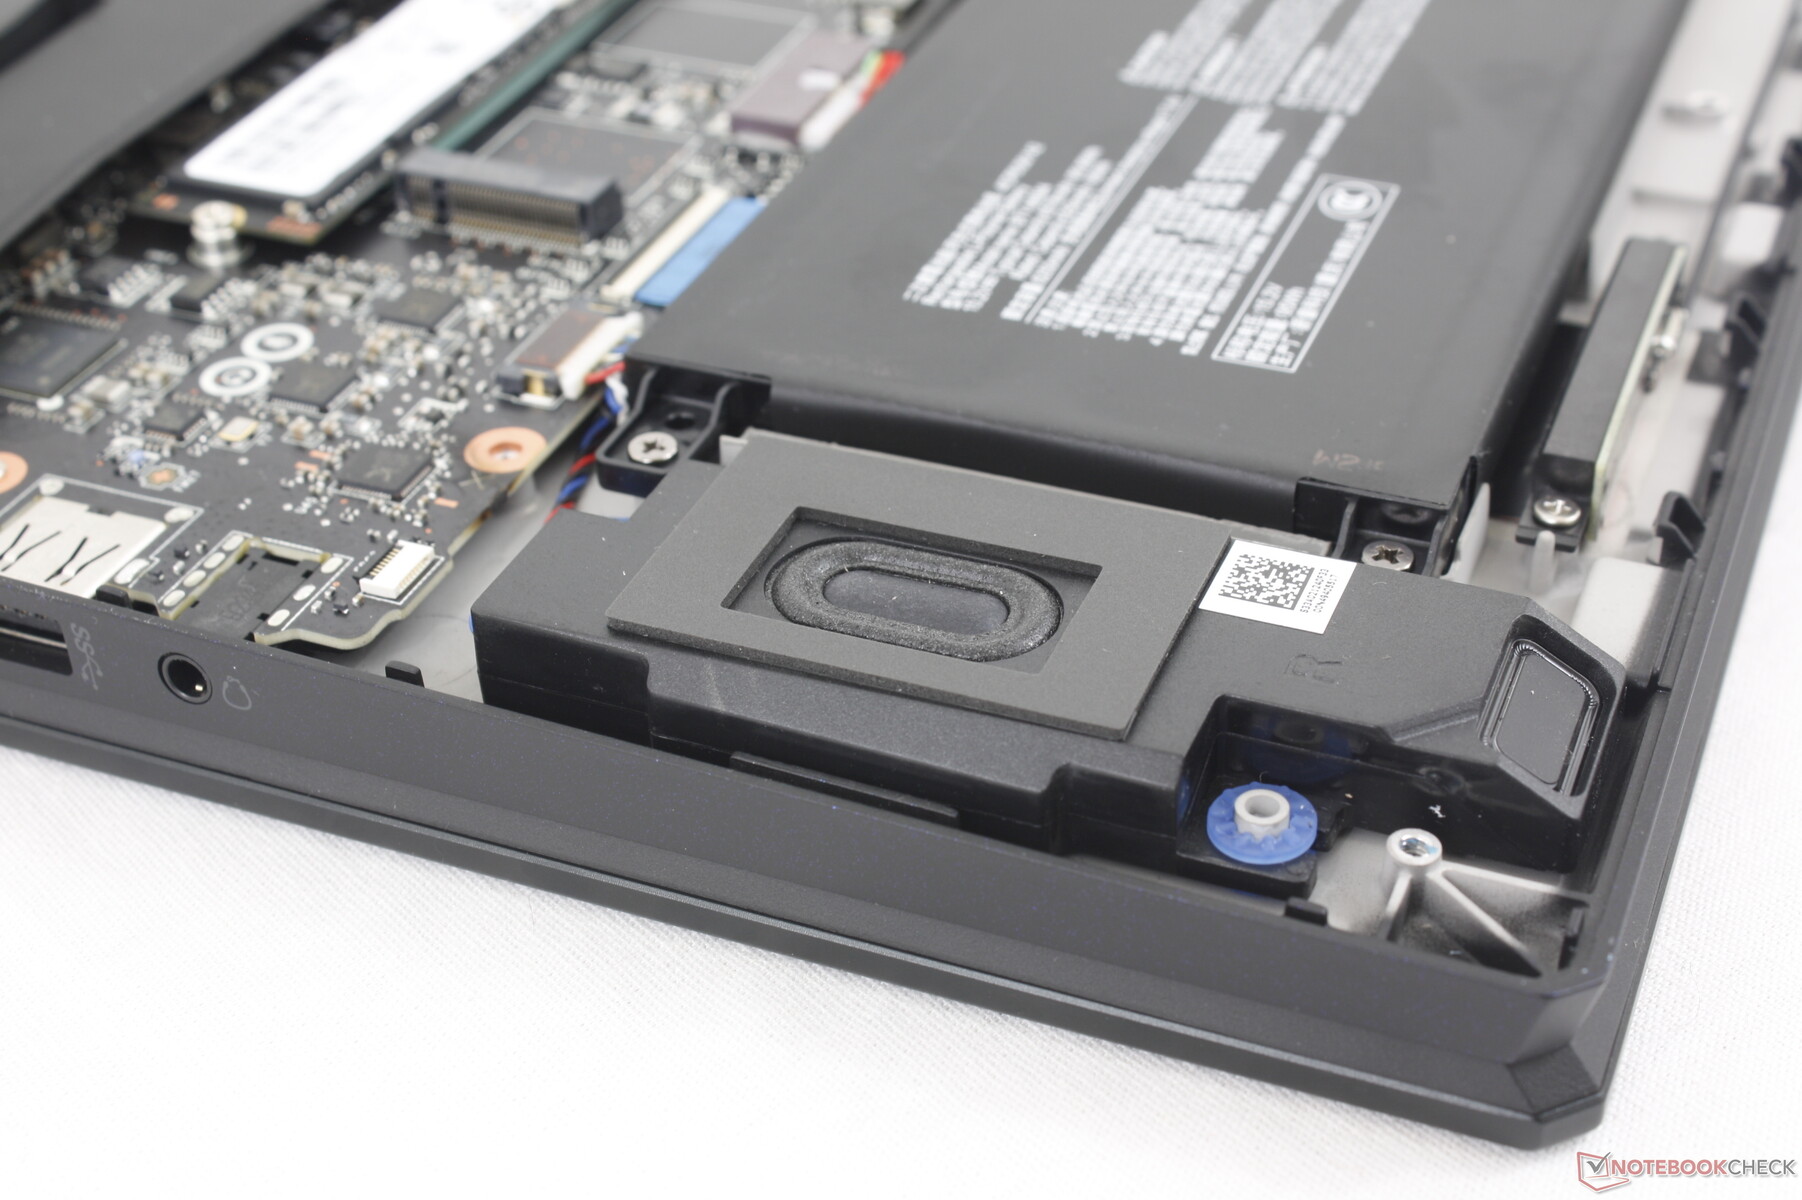
Bakım
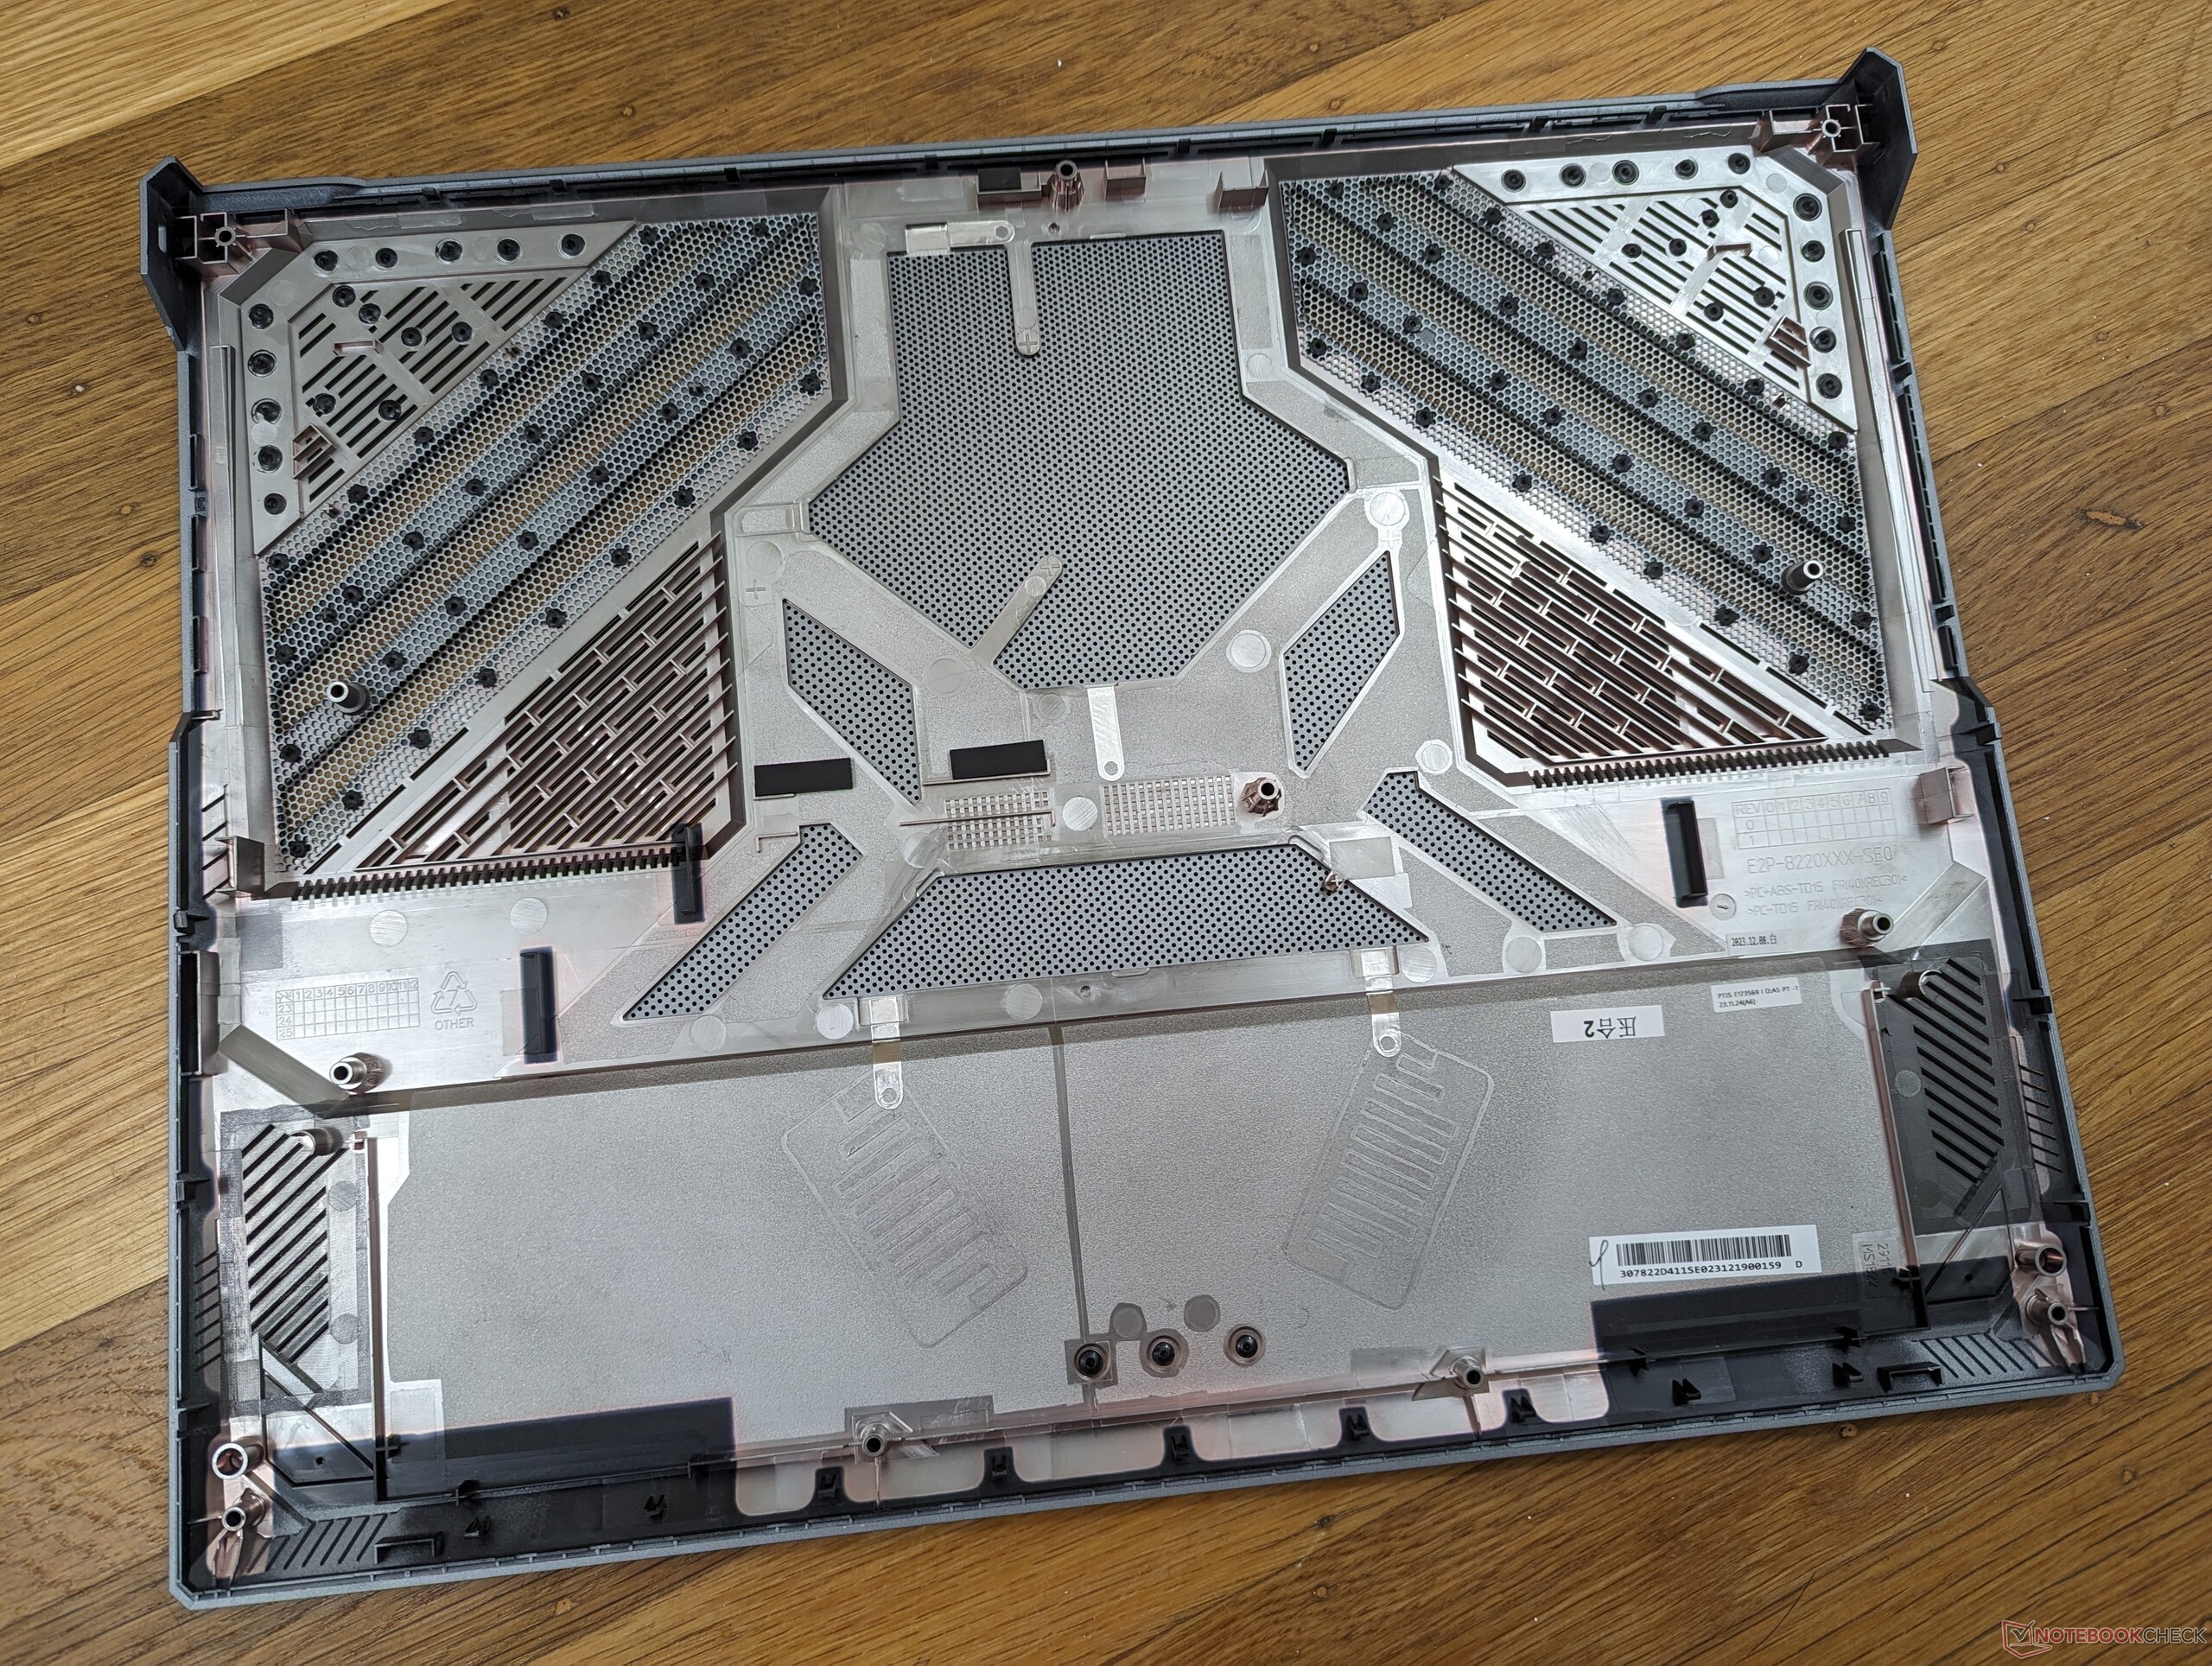
Alt panel, nispeten kolay servis için 12 Phillips vida ile sabitlenmiştir. Ancak bunu yapmak için fabrika mühür etiketinin kırılması gerektiğini unutmayın.
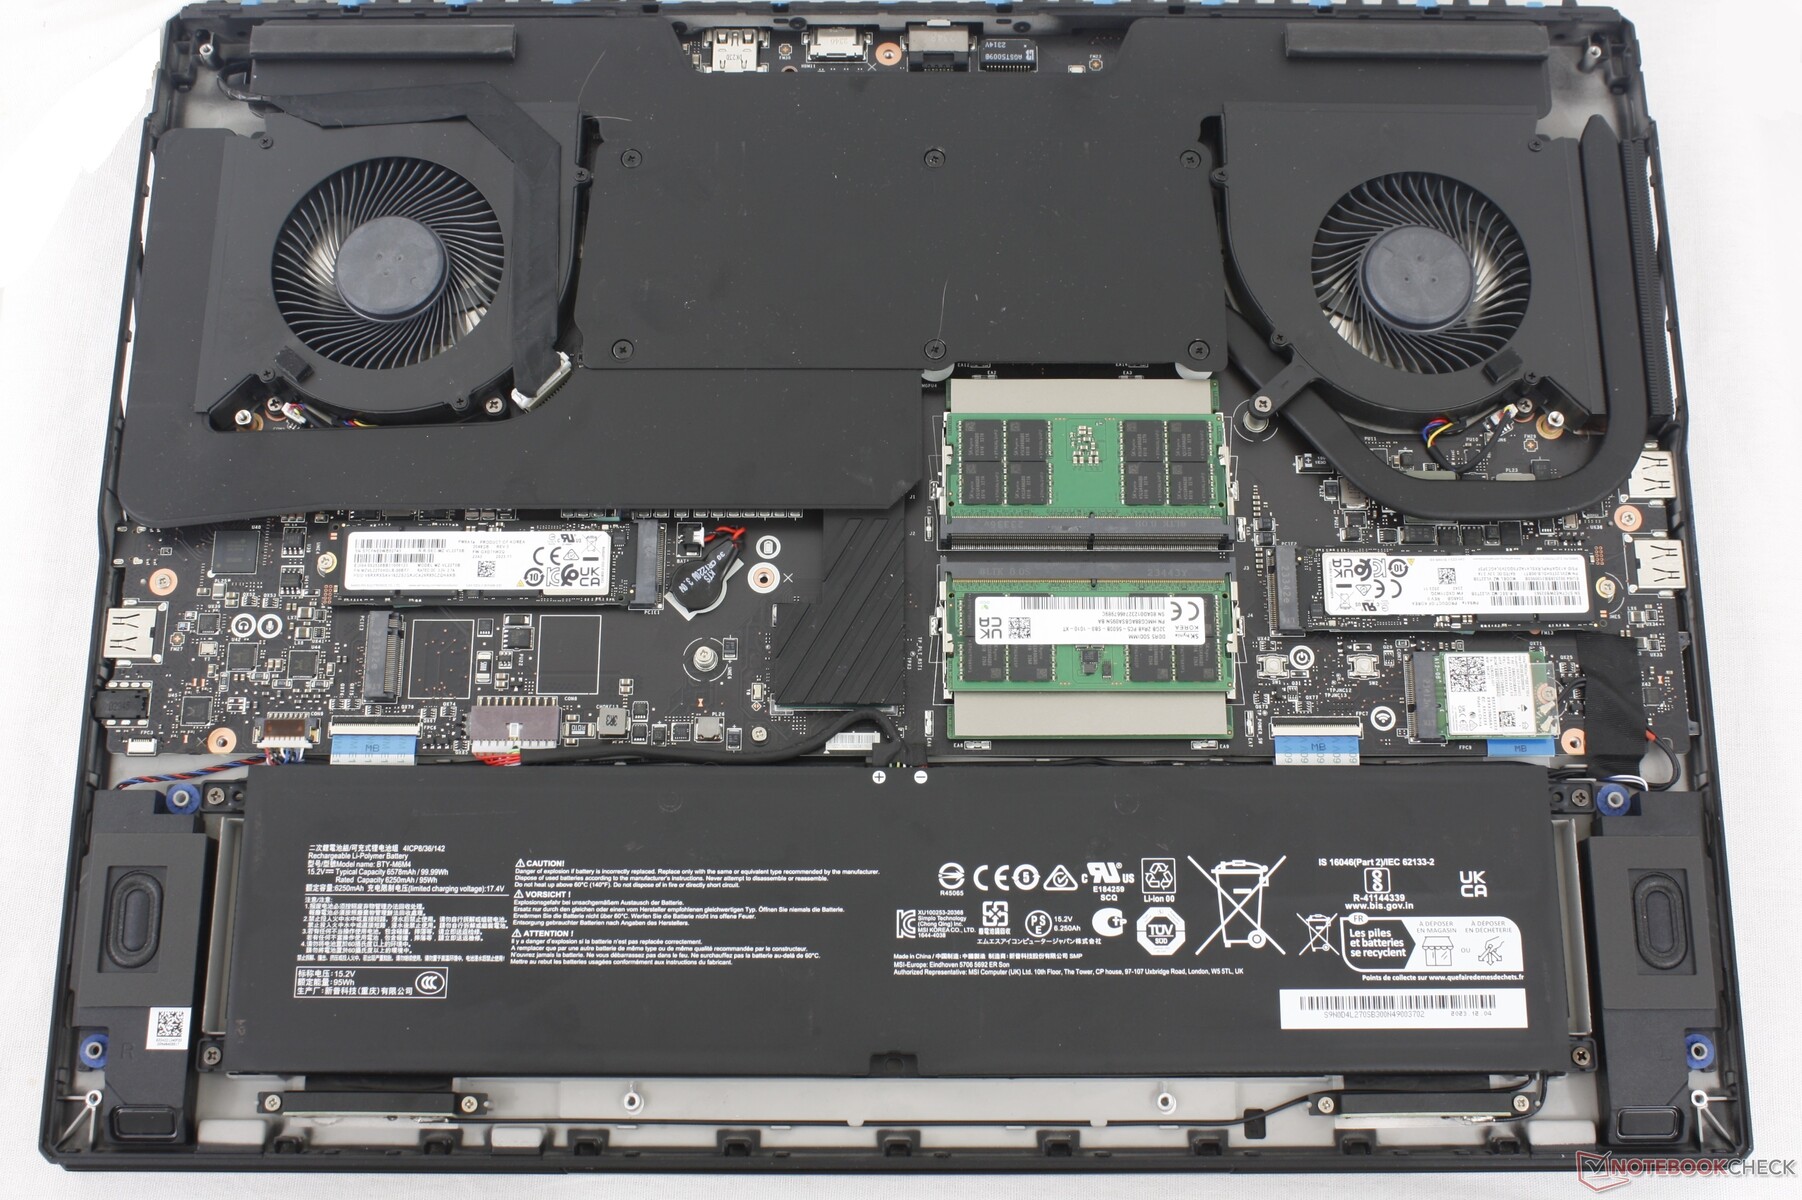
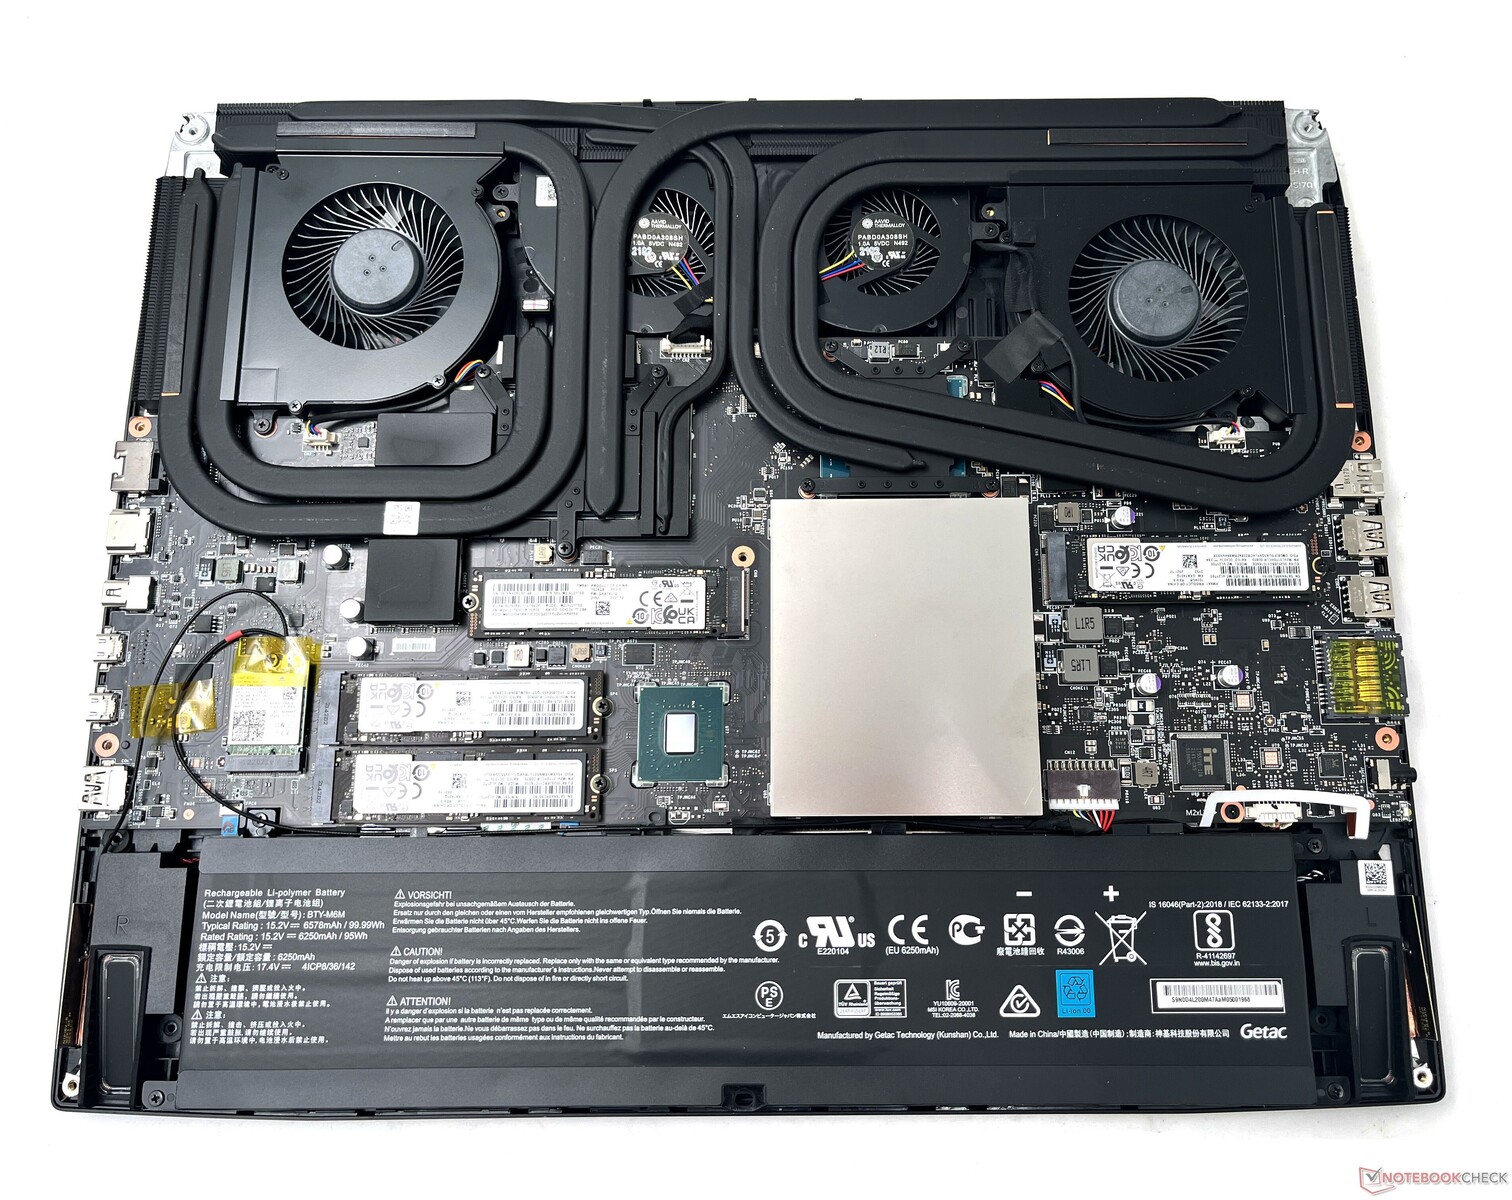
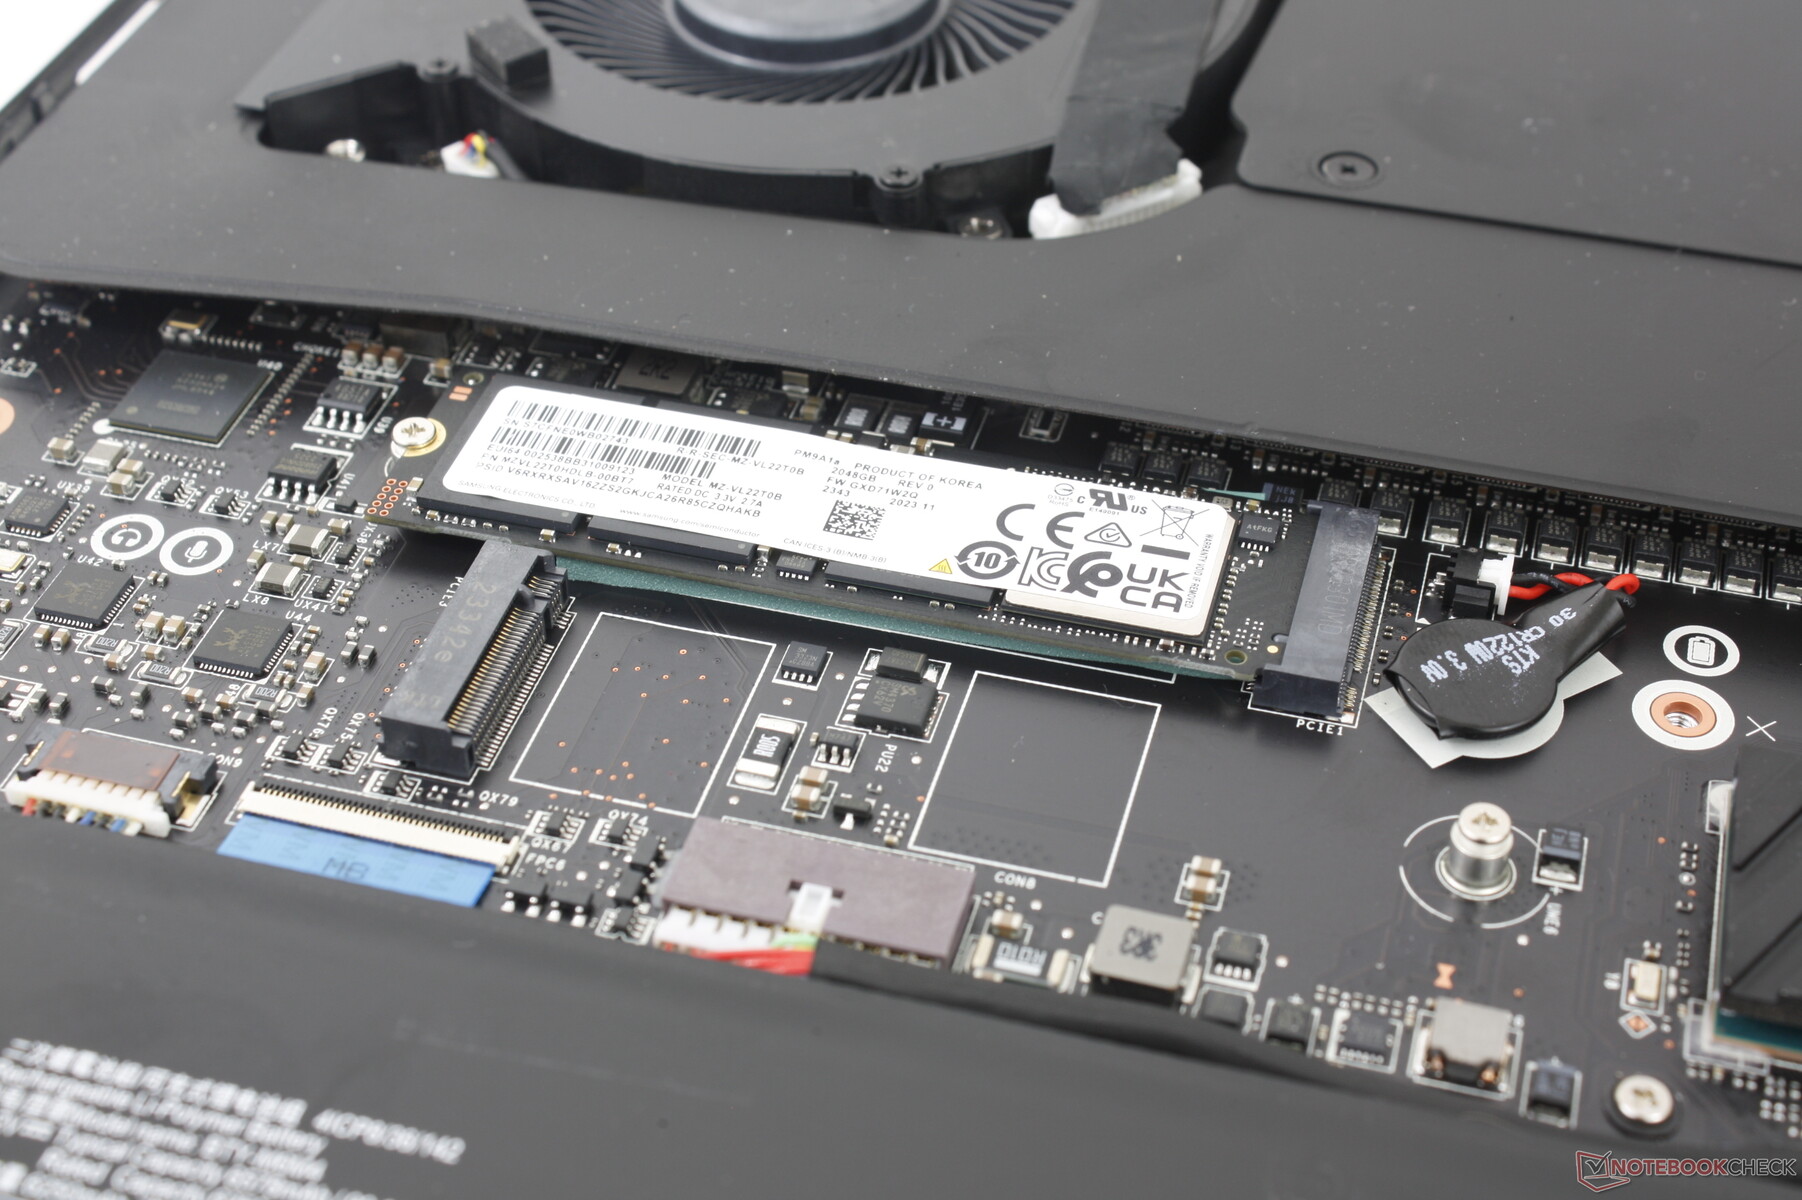
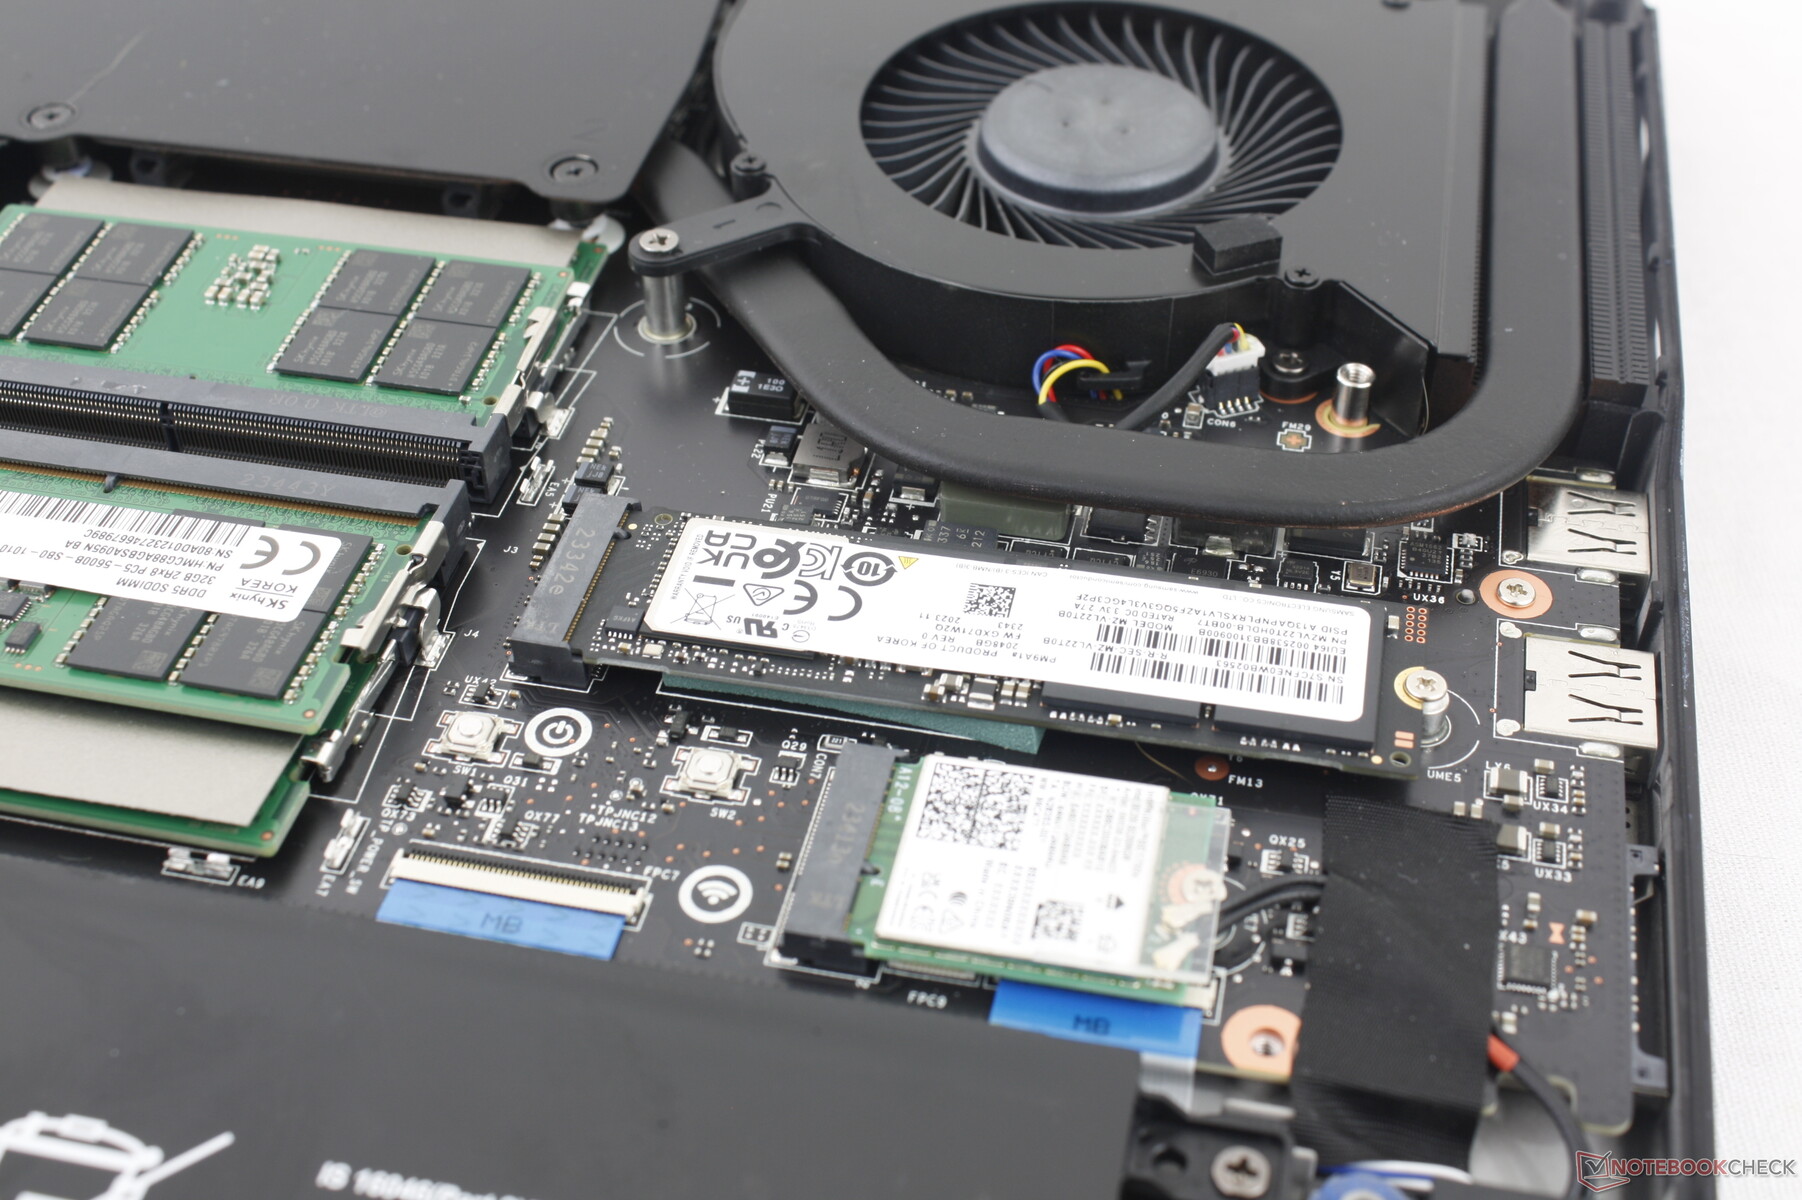
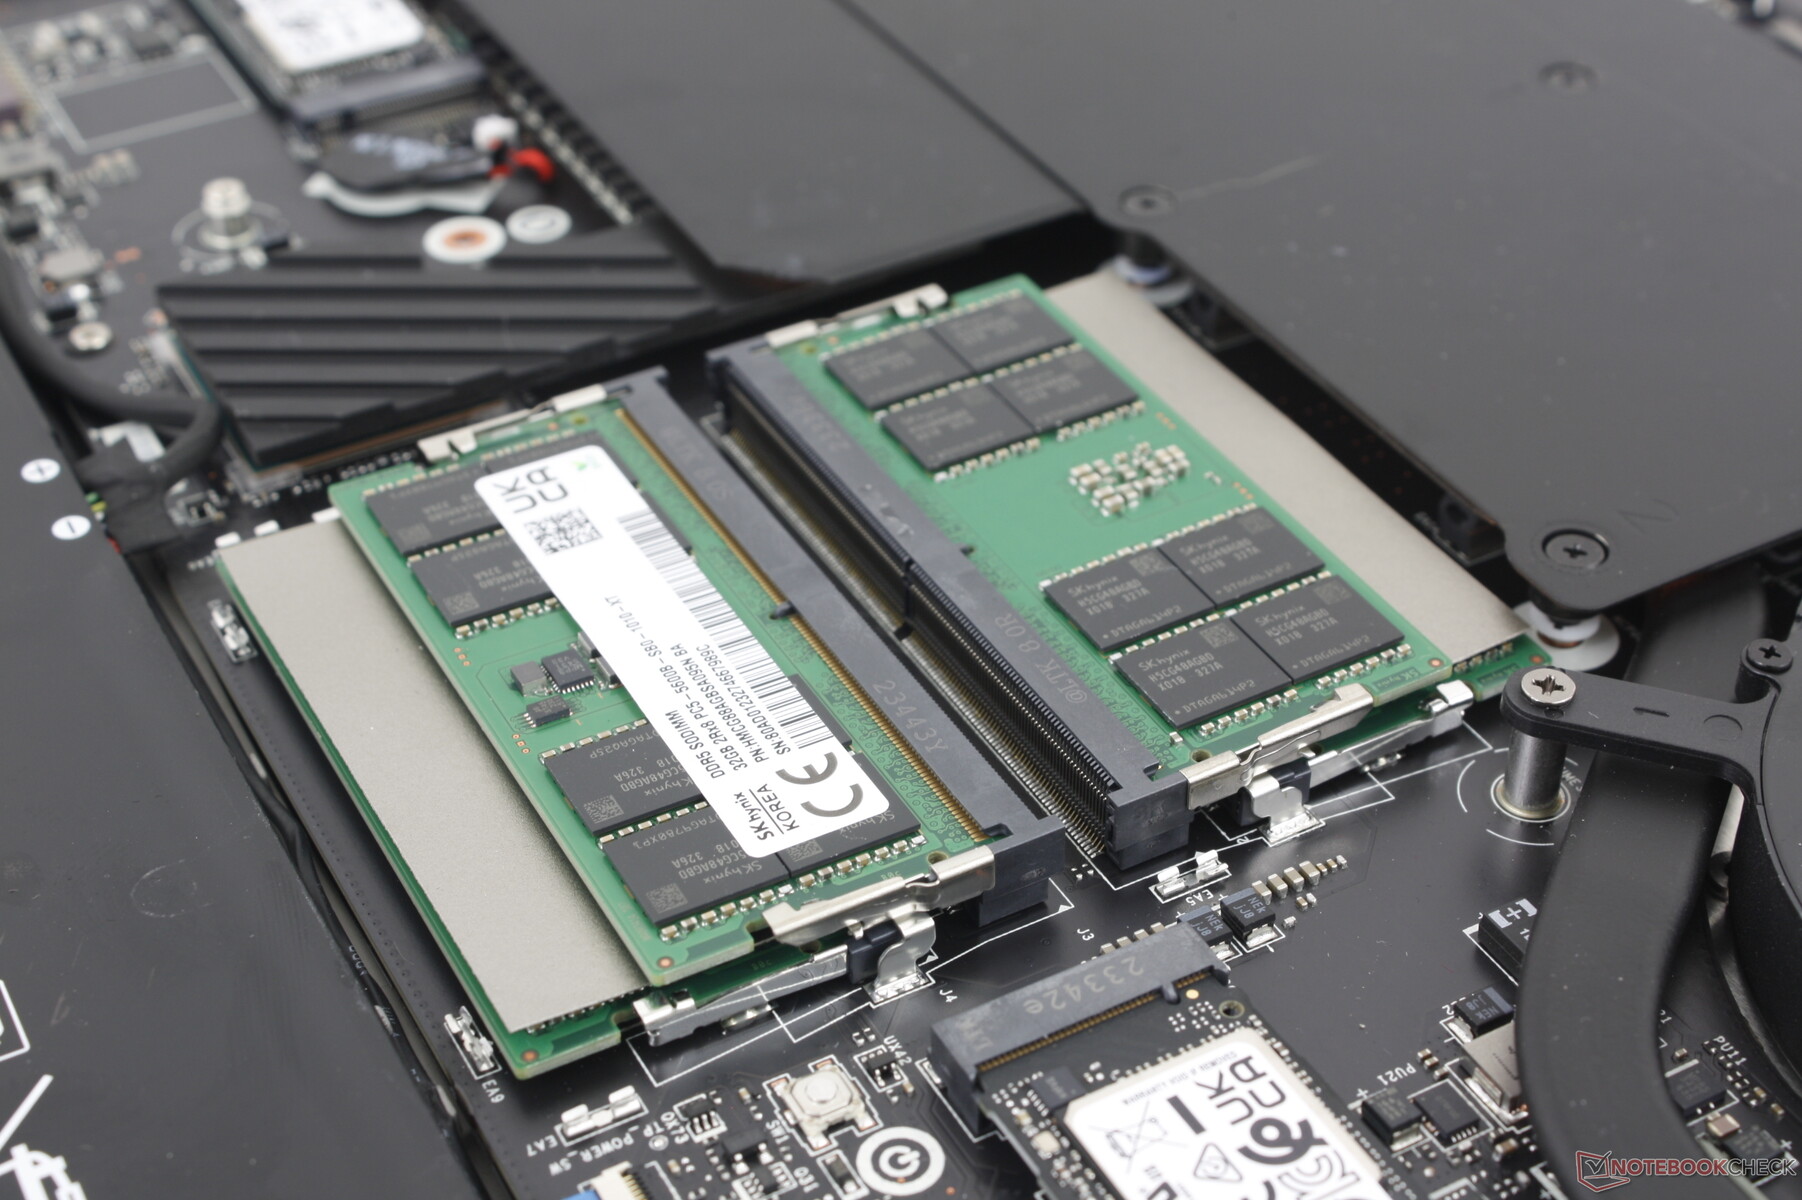
Kullanıcılar içeriye girdiklerinde 4x SODIMM yuvasına, 3x M.2 2280 SSD yuvasına (2x PCIe4 x4, 1x PCIe5 x4) ve çıkarılabilir WLAN modülüne doğrudan erişebilirler. Geçen yılın GT77'si buna kıyasla dört SSD'ye kadar destek verebiliyordu ve bu nedenle depolama seçenekleri bu sefer biraz daha sınırlı.
Aksesuarlar ve Garanti
Perakende kutusunda bir USB fare (M99 Pro), kadife temizleme bezi, 256 GB USB flash sürücü ve bir Lucky the Dragon anahtarlık bulunmaktadır. Garip bir şekilde, anahtarlık maskotun genellikle tasvir edildiği gibi kırmızı yerine siyahtır.
ABD'de satın alındığında bir yıllık sınırlı üretici garantisi standart olarak sunulmaktadır.
Giriş Cihazları - Rahat ve Tıklamalı Tuşlar
Klavye
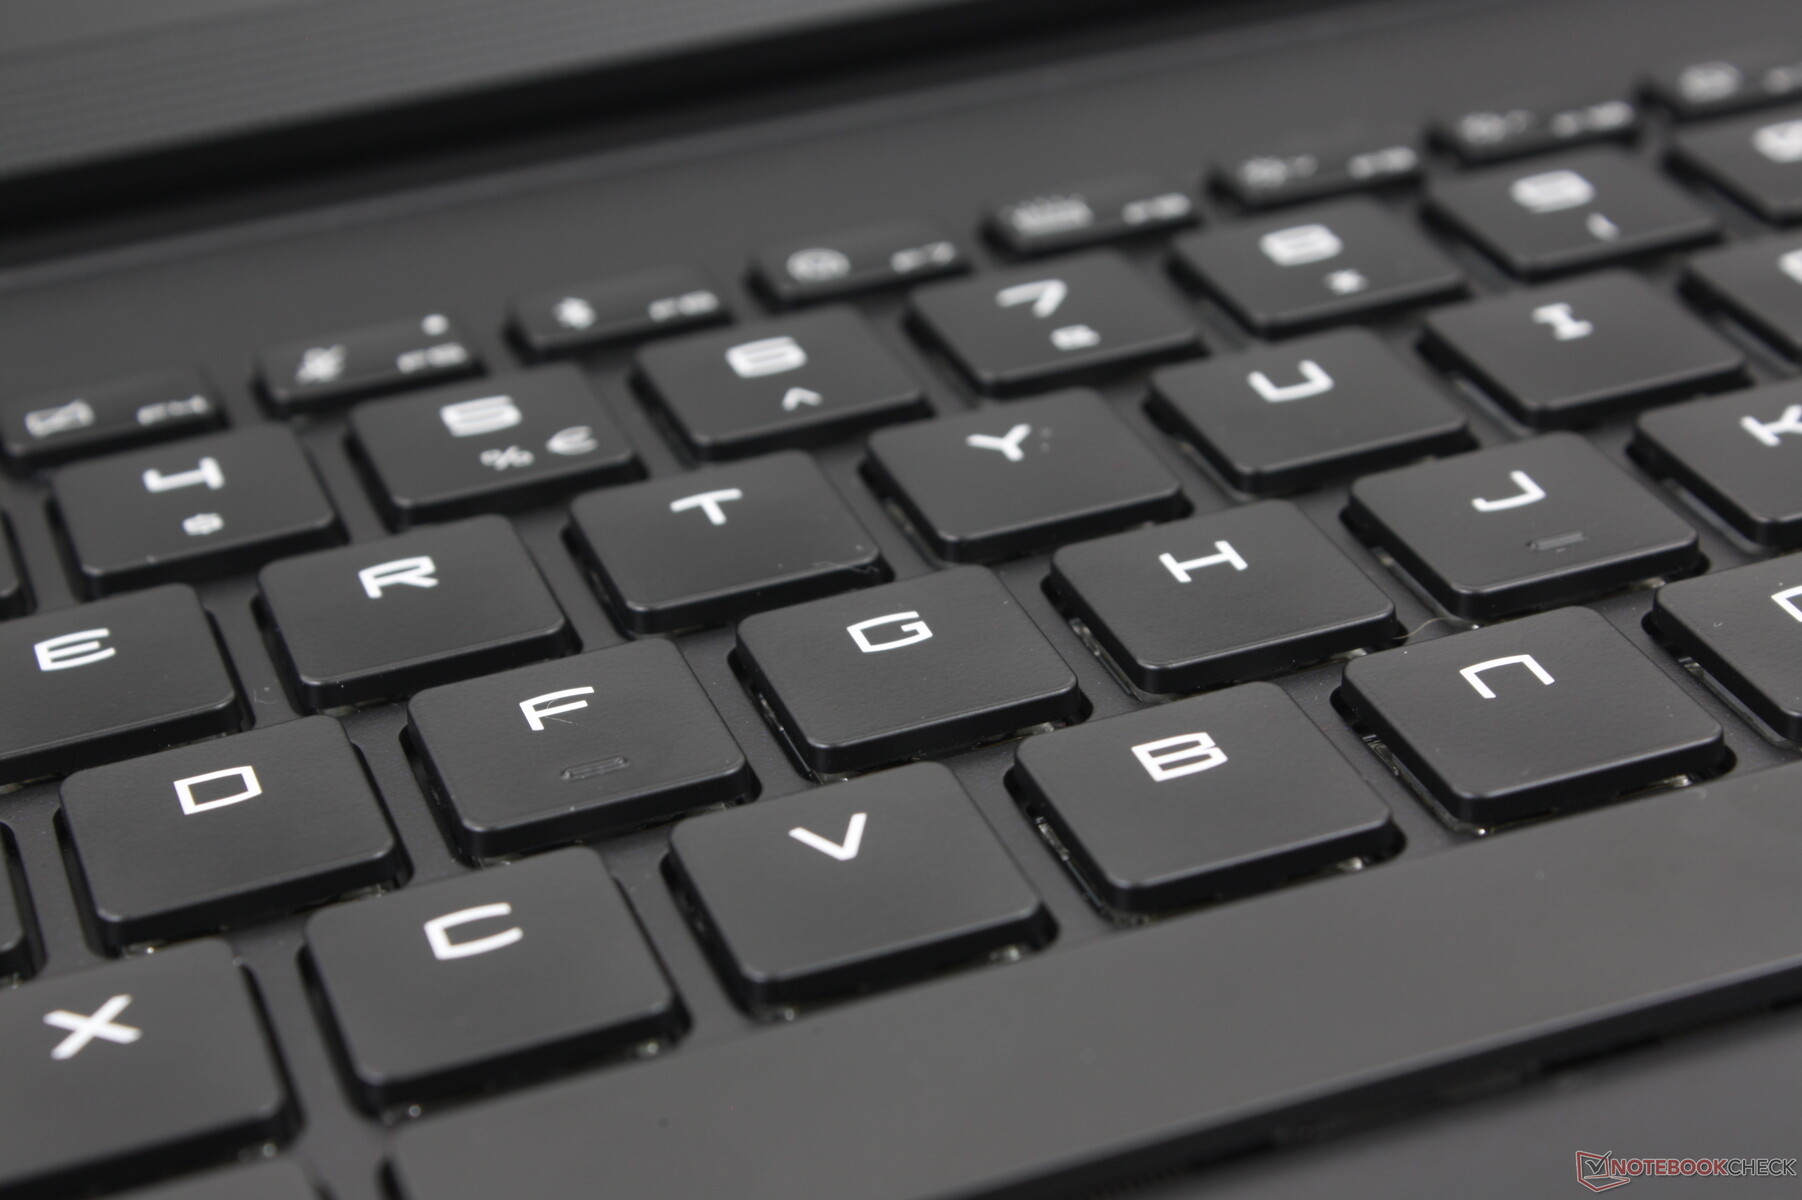
Tuş başına RGB Cherry ultra düşük profilli mekanik klavye, tüm konfigürasyonlarda standart olarak sunulmaktadır belirli Alienware modelleri. Yazma deneyimi, standart membran tabanlı tuşlarla karşılaştırıldığında farklılıklar hemen fark edildiğinden, hareket ve geri bildirim açısından herhangi bir dizüstü bilgisayarda yaşadığımız en iyi deneyimlerden biridir. Elbette en büyük dezavantajı, özellikle Enter ve Space tuşlarına basarken daha yüksek ve tiz bir ses çıkarması. Bu kesinlikle sınıflarda veya kütüphanelerde kullanmak isteyeceğiniz bir klavye değil.
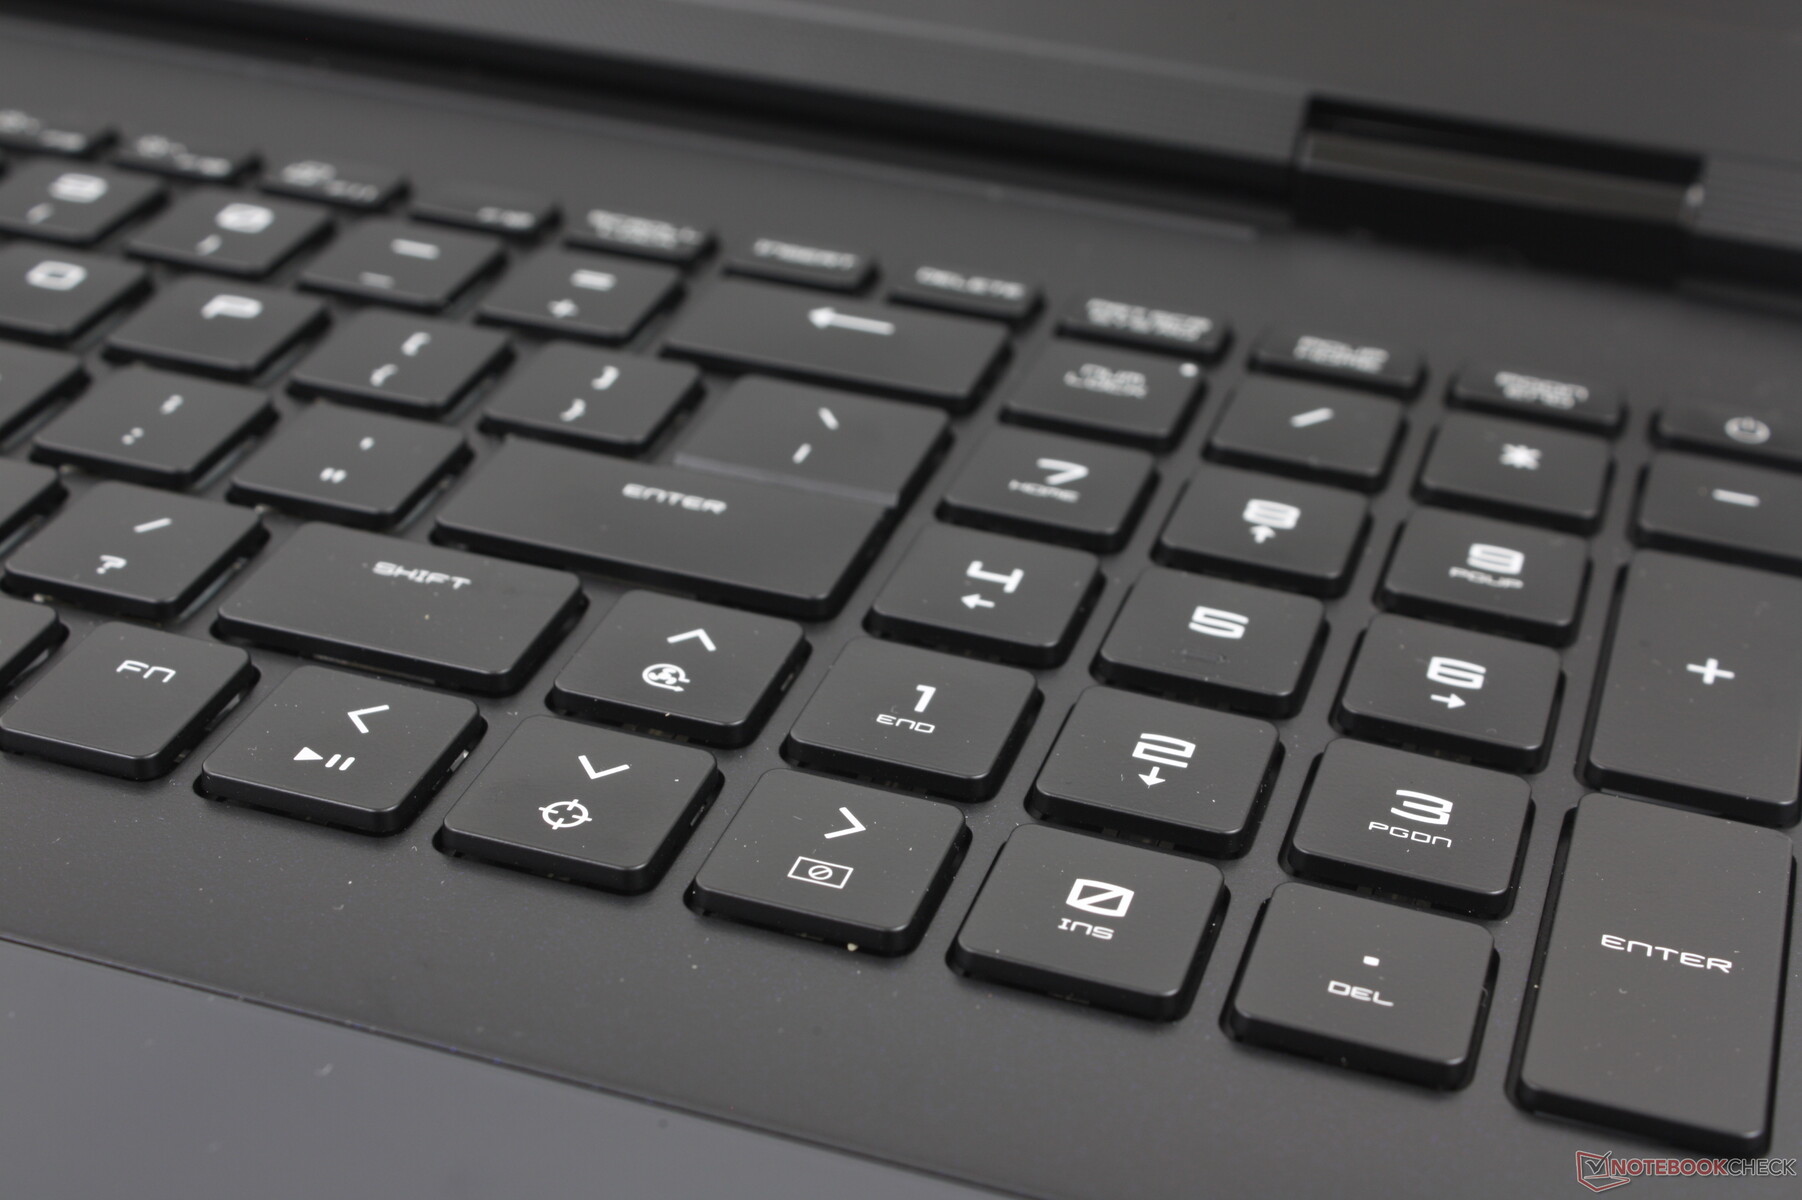
Ne yazık ki Titan 18 HX'te her tuş mekanik değildir. Bunun yerine numpad ve ok tuşları membran tabanlıdır ve bu nedenle basıldığında daha yumuşak ve sessiz hissedilirler.
Dokunmatik yüzey
13 x 8,2 cm boyutlarındaki clickpad, bazı Alienware modellerinde olduğu gibi RGB aydınlatmalı. Ancak buradaki fark, MSI clickpad'in pürüzsüz ve geçişsiz bir kenardan kenara yüzey için çevreleyen avuç içi dayanaklarıyla tamamen aynı hizada olmasıdır. Bu yaklaşım şık ve seksi, ancak dokunsal kenarları ve köşeleri olan geleneksel bir clickpad'den daha az pratik. Fare tıklamalarını girmek için aşağı bastırmak da özellikle sürükleme ve bırakma gibi çoklu dokunmatik girişler için daha zor ve güvenilmez hale geliyor. Standart pakette ücretsiz bir USB fare bulunuyor ve bu nedenle MSI'ın clickpad'i tasarlarken işlevden çok biçime yöneldiği açık.
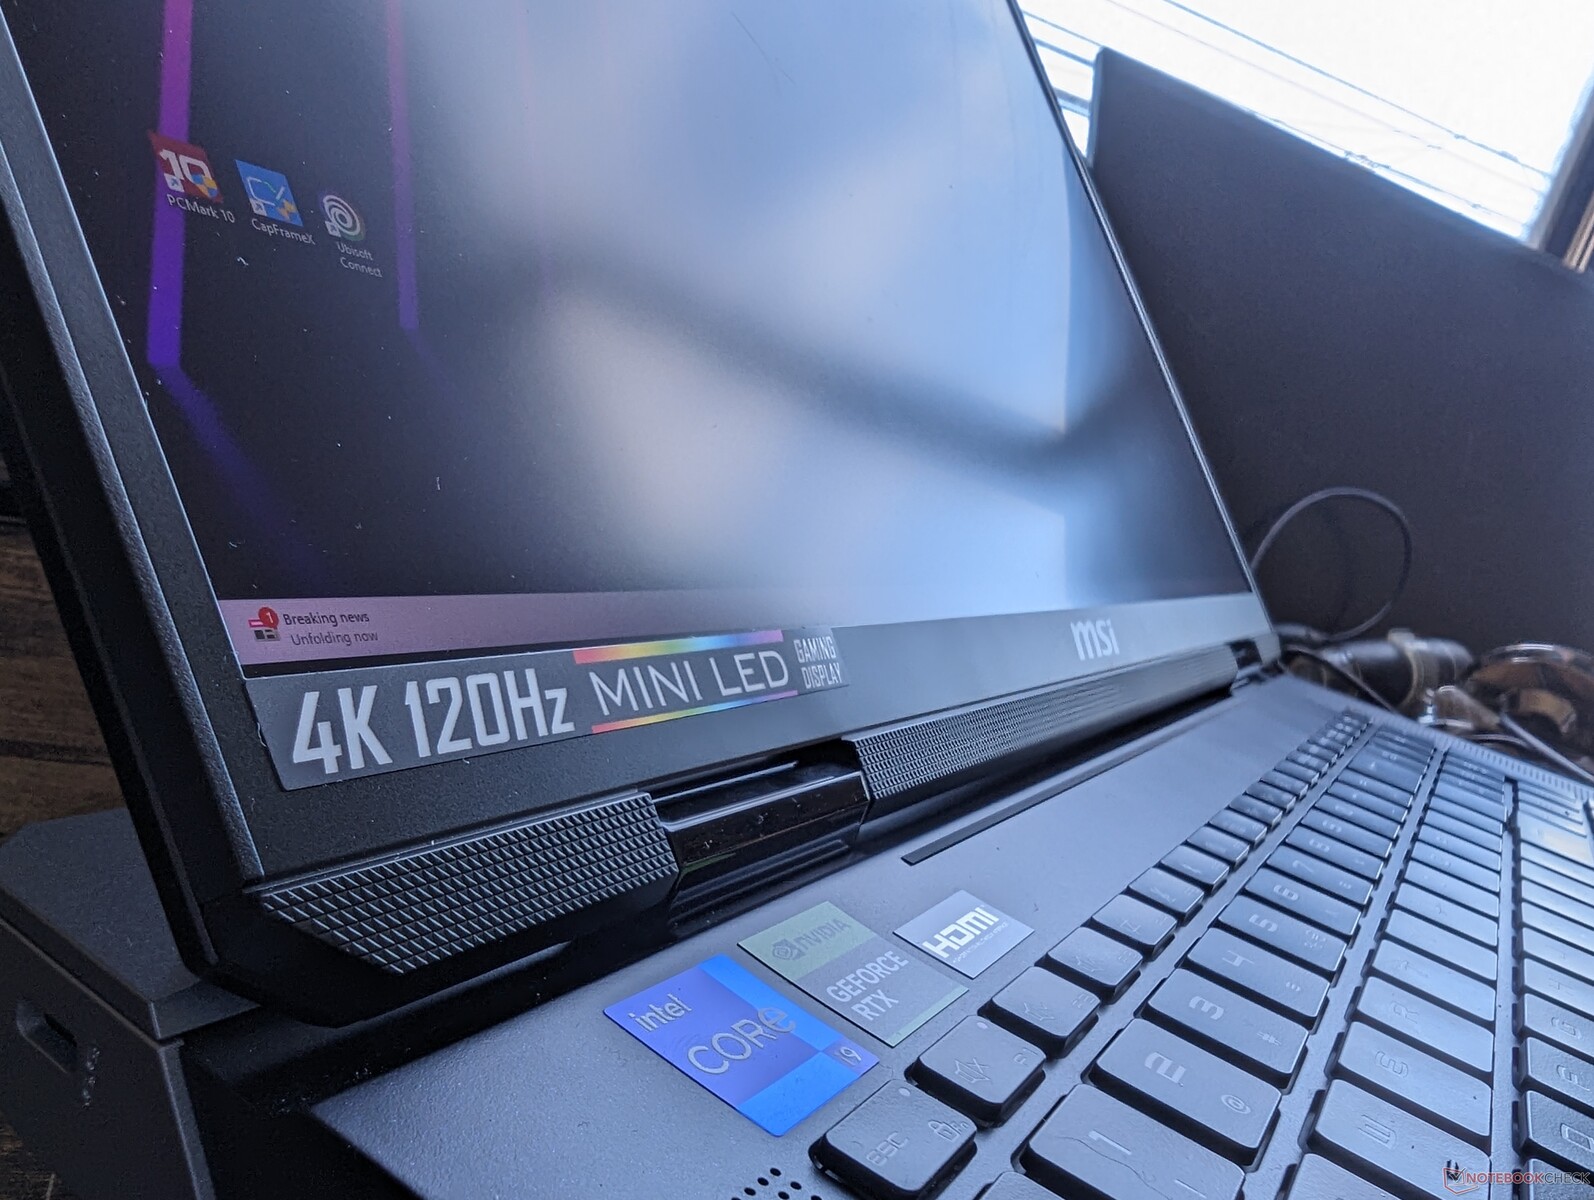
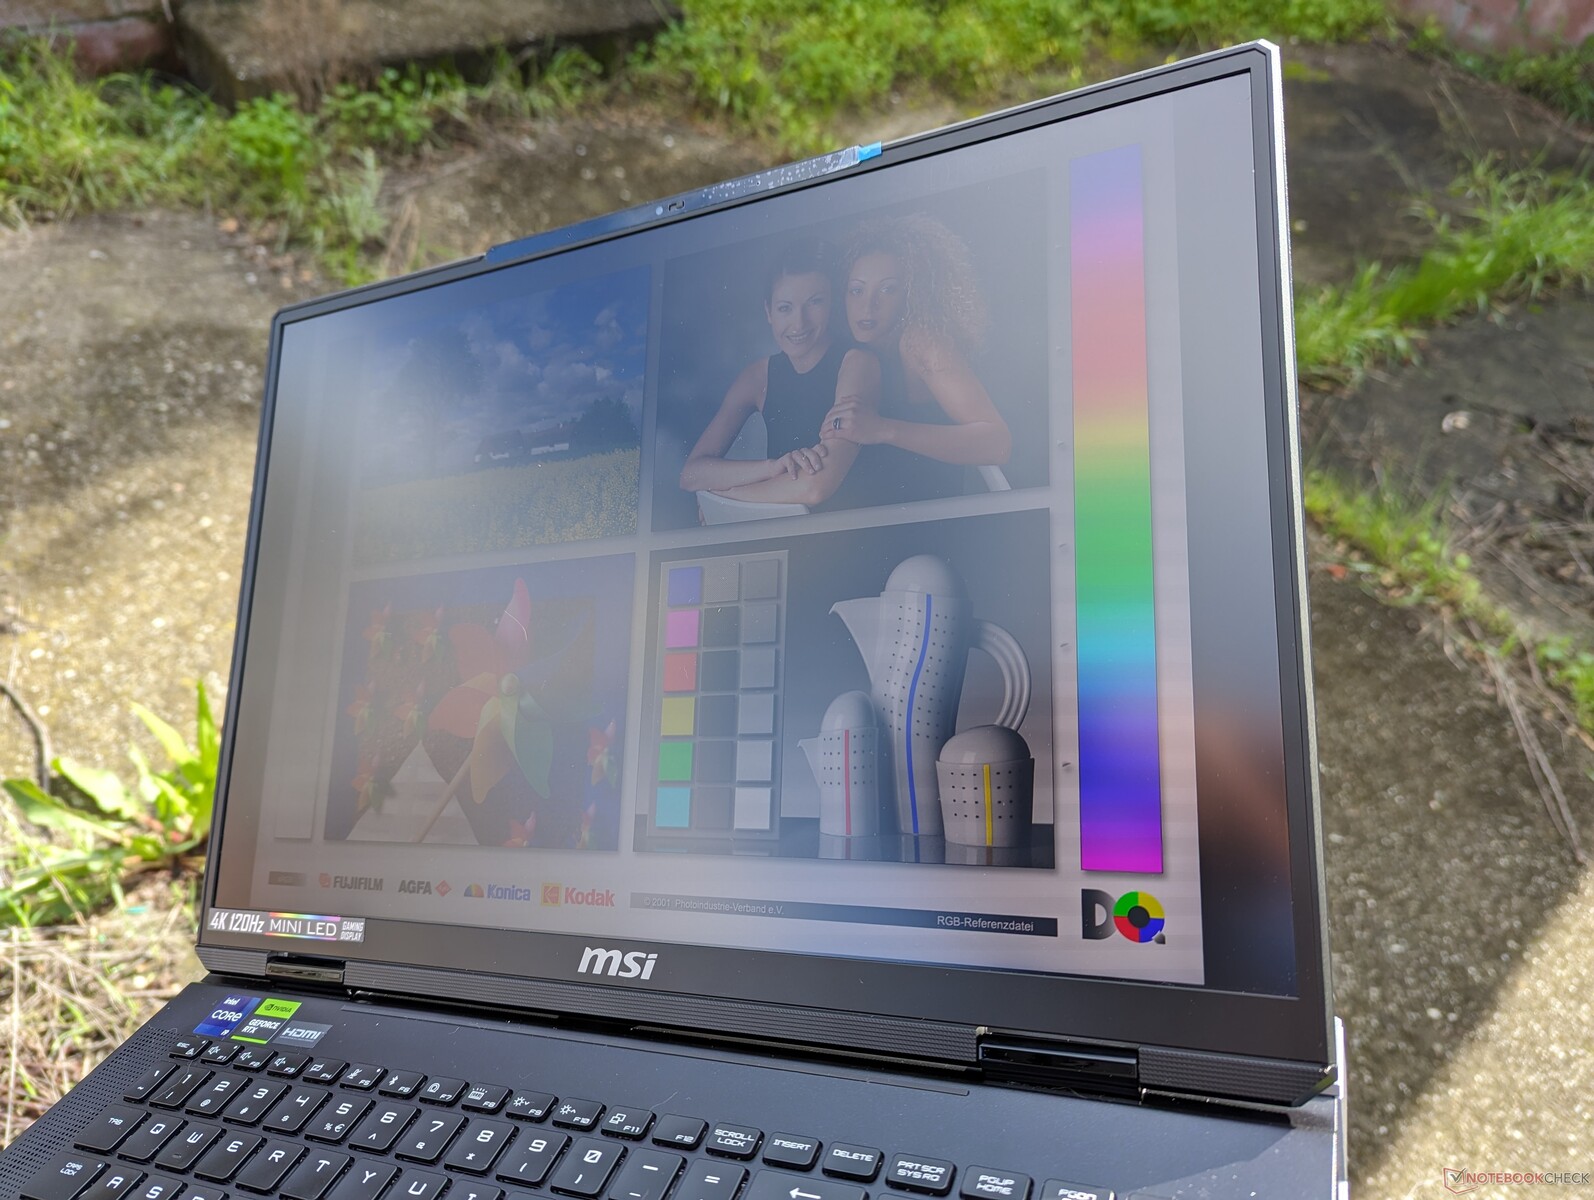
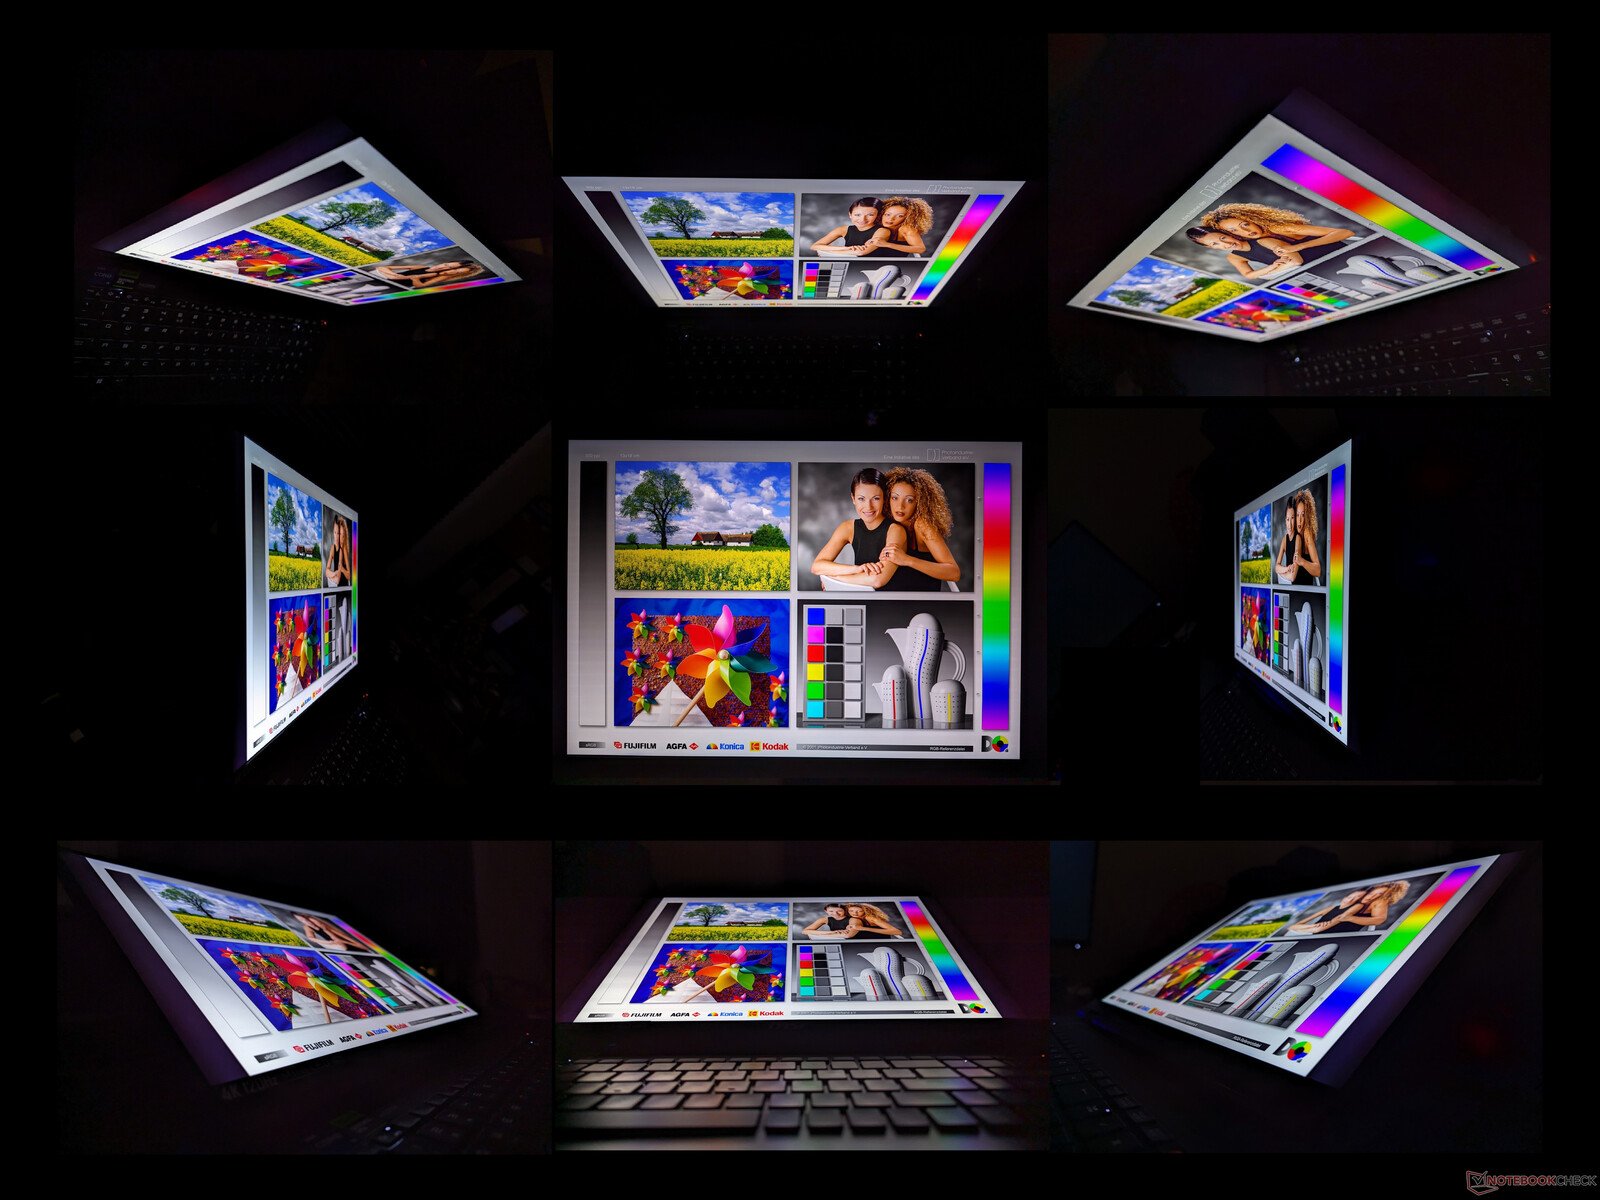
Ekran - Titan 18 HX'in Kolaylıkla En Belirleyici Özelliği
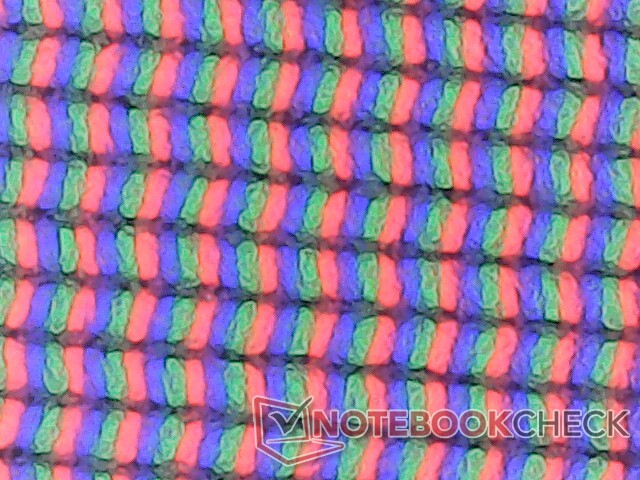
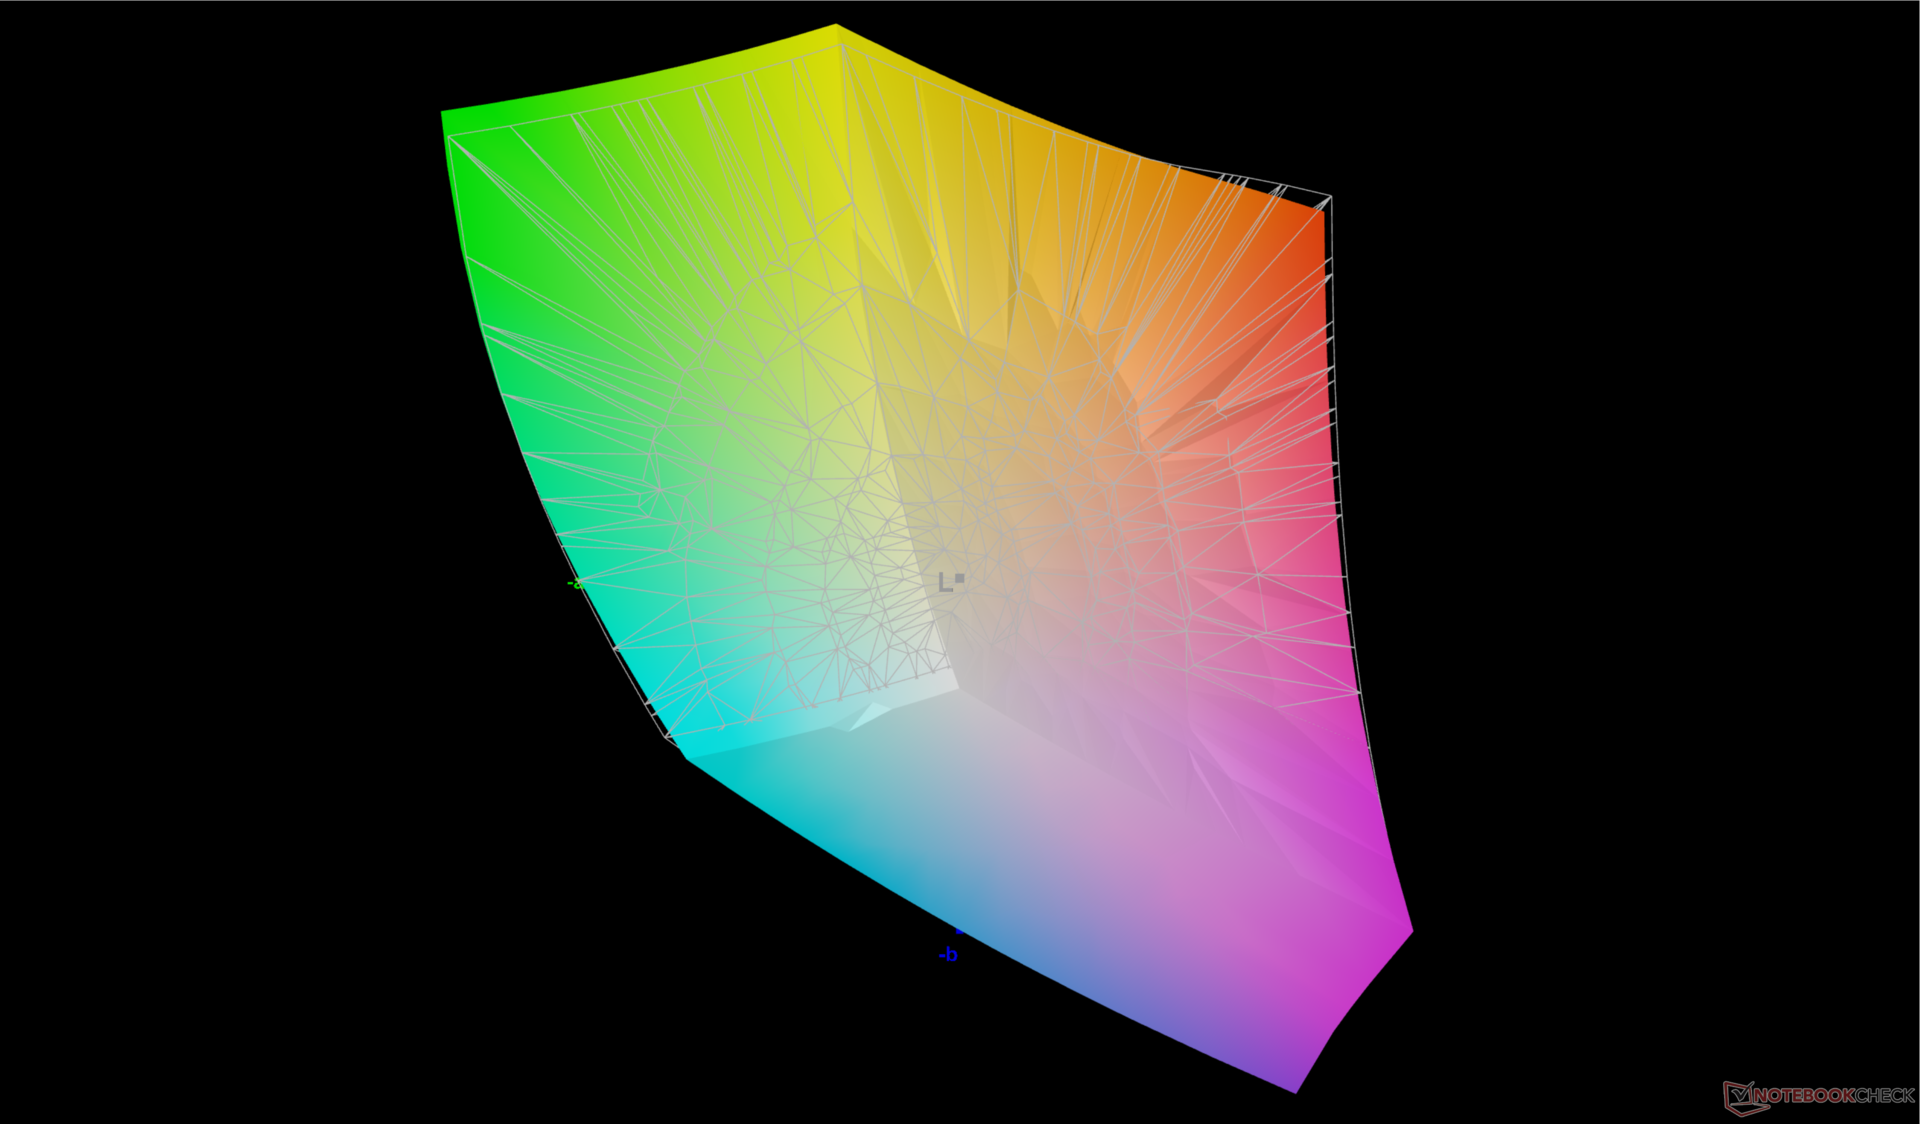
Titan 18 HX, bu yıl 120 Hz 4K mini-LED ekranla satışa sunulacak ilk 18 inç dizüstü bilgisayarlardan biri. IPS ve OLED ile karşılaştırıldığında, mini-LED paneller çok daha parlak olabilirken, daha iyi HDR desteği için OLED ile benzer DCI-P3 renkleri ve siyah seviyeleri sunabiliyor. Bu durumda Titan 18 HX ekran, HDR1000 oynatmayı desteklemek için renk ölçerimize göre HDR modunda 1155 nit'e kadar ulaşabilir. SDR modunda ise ekran, birçok IPS panele benzer şekilde yaklaşık 470 nit ile sınırlıdır.
Pil gücüyle çalışırken HDR modunun kullanılamayacağını unutmayın. Ekran güç tasarrufu özelliği devre dışı bırakılsa bile pille çalışırken maksimum parlaklık sadece 323 nit'e düşer. Bunun bir hata olup olmadığından emin değiliz, ancak parlaklıktaki düşüş pil ve şebeke arasında kesinlikle fark edilebilir.
Ne yazık ki, ekranın en büyük dezavantajı G-Sync veya değişken yenileme hızını (VRR) desteklememesidir. Ayrıca, aşağıdaki Güç Tüketimi bölümümüzde gösterildiği gibi yüksek parlaklık tavanı nedeniyle çok güç gerektirebilir. Ekran yine de hem oyun hem de multimedya amaçları için herhangi bir dizüstü bilgisayarda gördüğümüz en iyilerden biri.
| |||||||||||||||||||||||||
Aydınlatma: 90 %
Batarya modunda parlaklık: 323 cd/m²
Kontrast: ∞:1 (Siyah: 0 cd/m²)
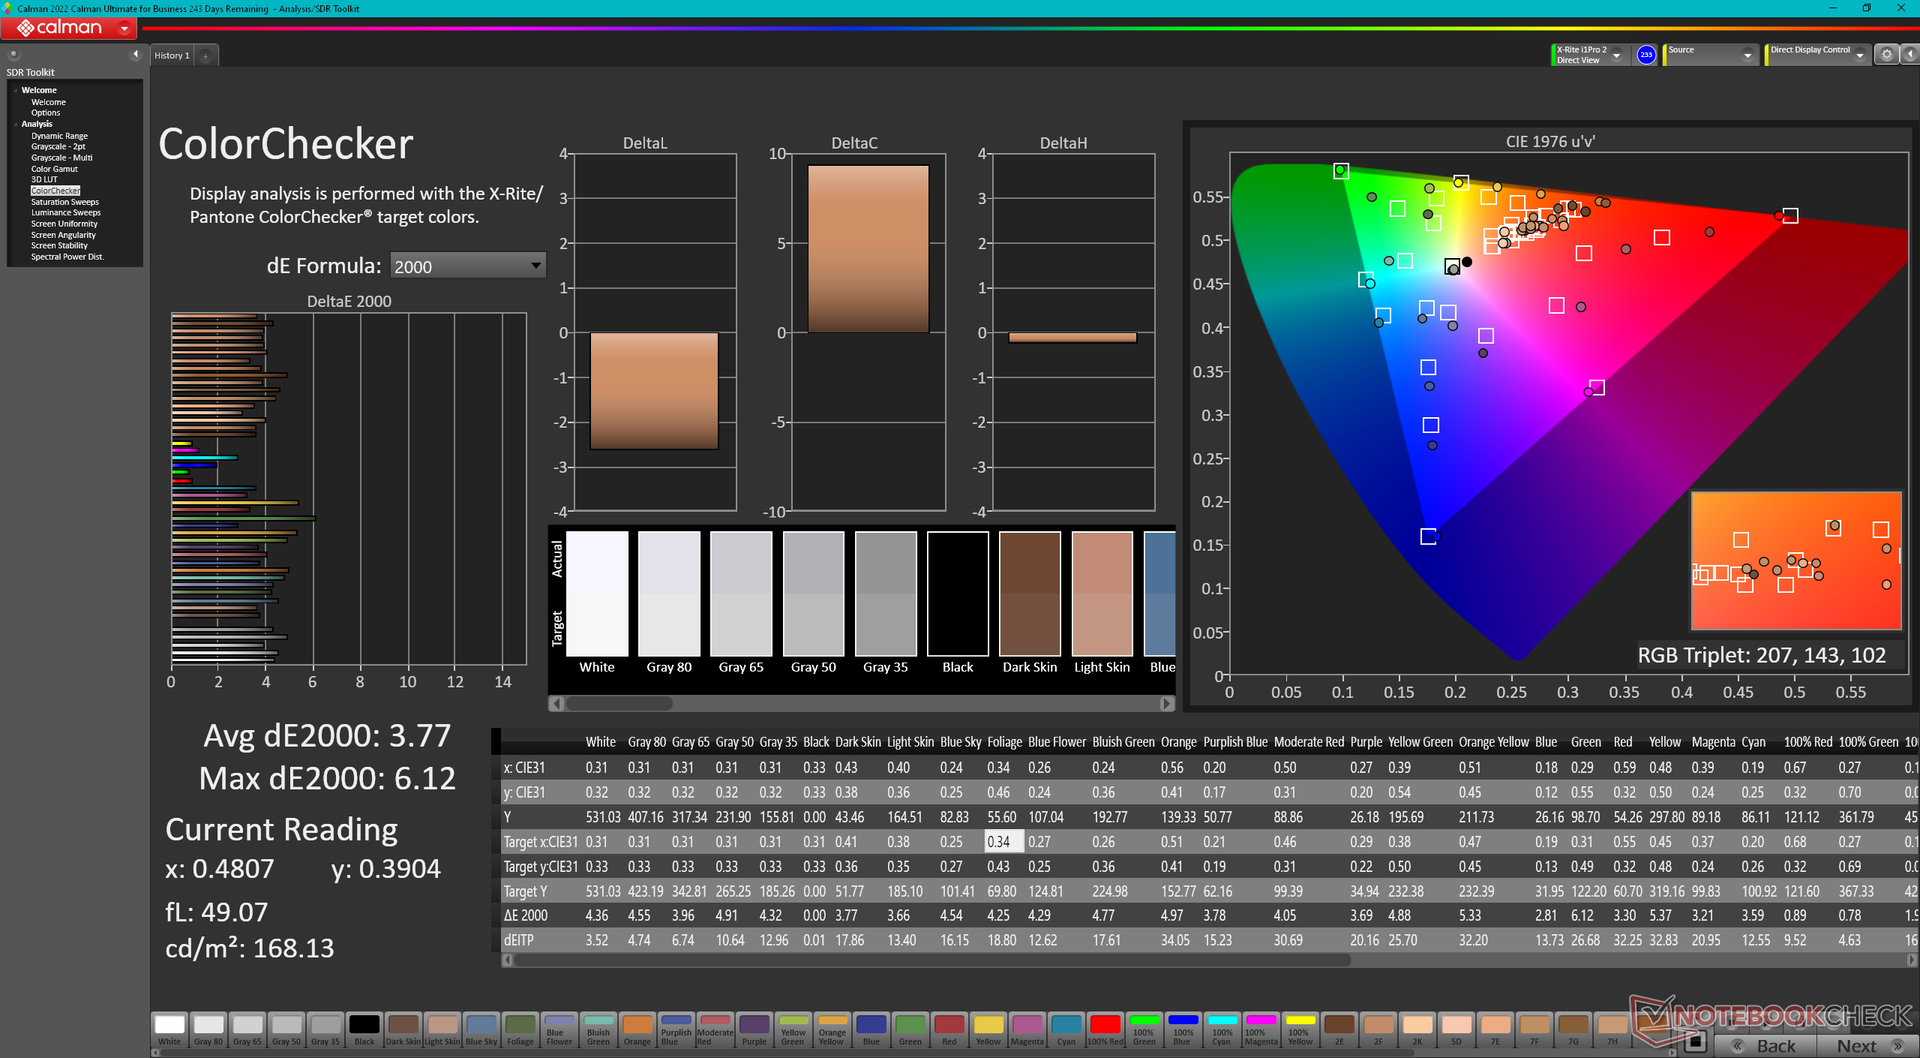
ΔE ColorChecker Calman: 3.77 | ∀{0.5-29.43 Ø4.72}
calibrated: 2.94
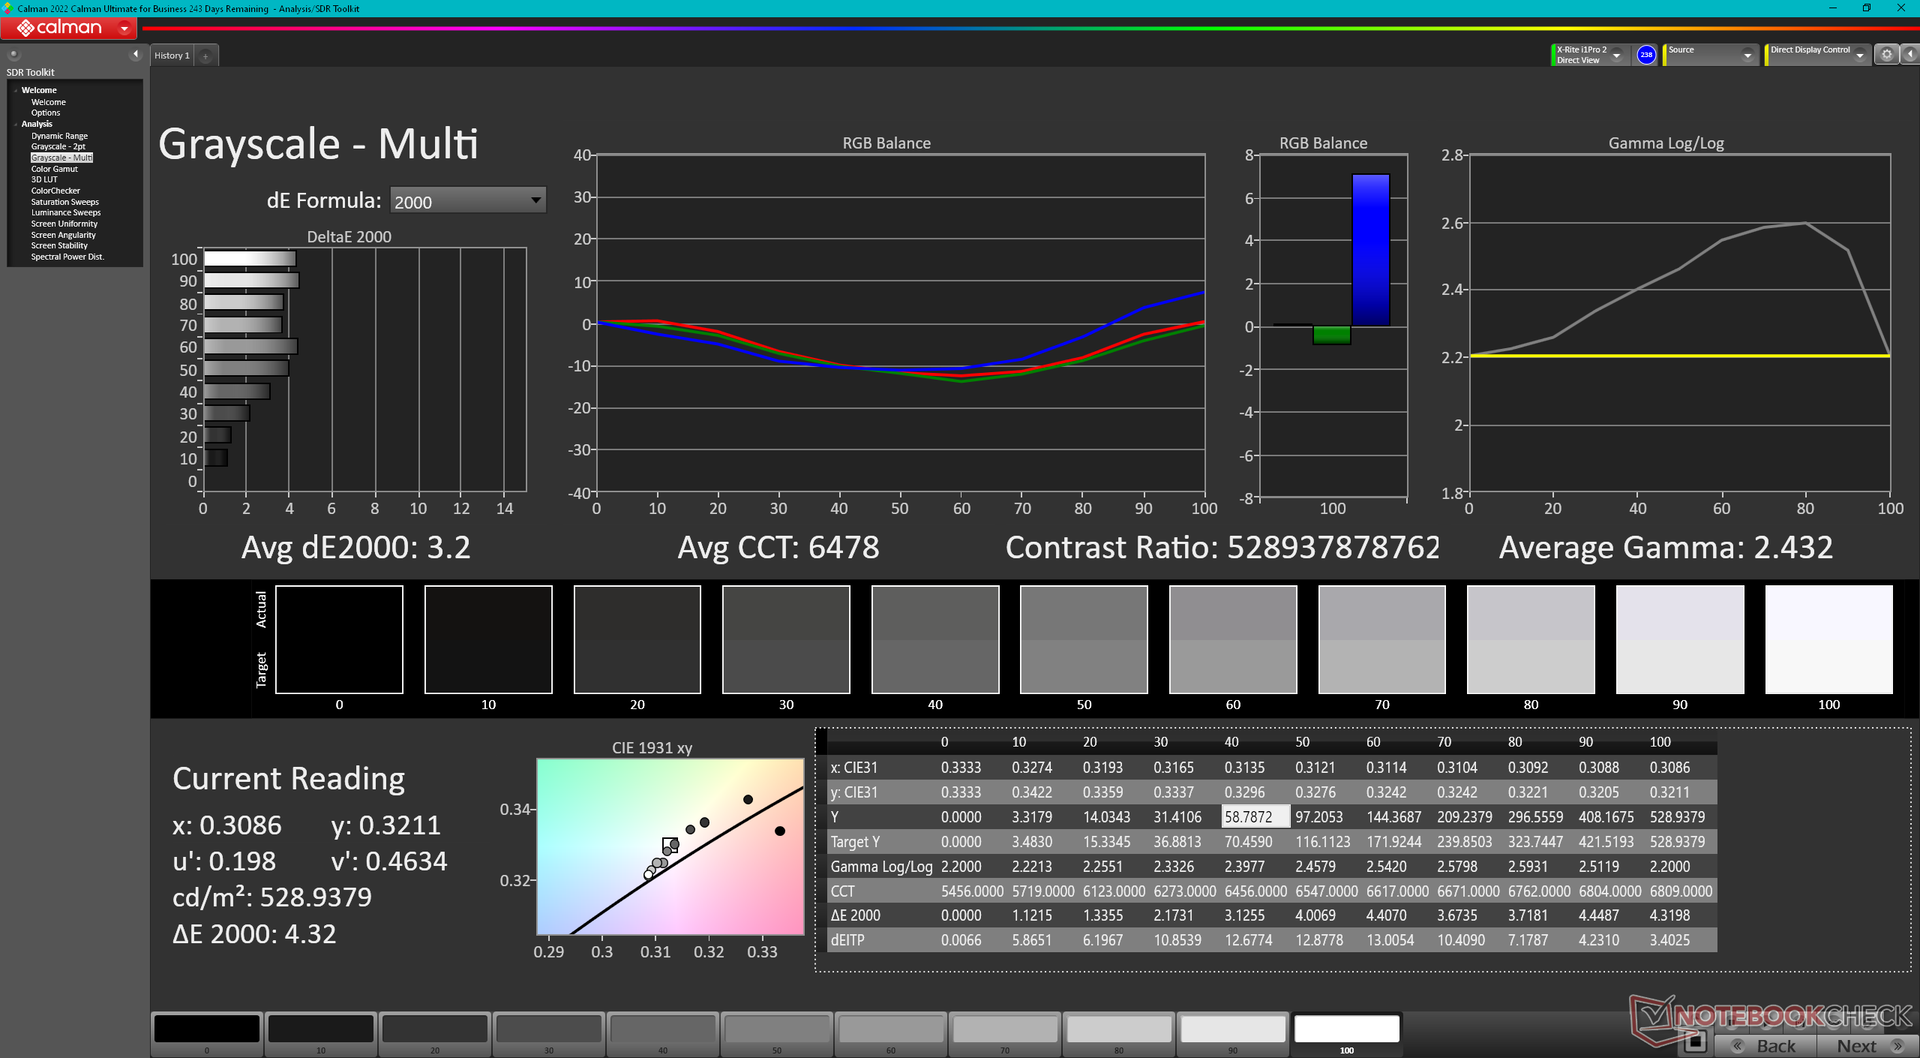
ΔE Greyscale Calman: 3.2 | ∀{0.09-98 Ø4.97}
86.2% AdobeRGB 1998 (Argyll 3D)
99.8% sRGB (Argyll 3D)
98.1% Display P3 (Argyll 3D)
Gamma: 2.43
CCT: 6478 K
| MSI Titan 18 HX A14VIG AU Optronics B180ZAN01.0, Mini-LED, 3840x2400, 18" | MSI Titan GT77 HX 13VI B173ZAN06.C, Mini-LED, 3840x2160, 17.3" | Alienware m18 R1 Chi Mei 180JME, IPS, 1920x1200, 18" | Asus ROG Strix G18 G814JI NE180QDM-NZ2 (BOE0B35), IPS, 2560x1600, 18" | Acer Predator Helios 18 N23Q2 AUO45A8 (B180QAN01.2), IPS, 2560x1600, 18" | Razer Blade 18 RTX 4070 AU Optronics B180QAN01.0, IPS, 2560x1600, 18" | |
|---|---|---|---|---|---|---|
| Display | 1% | 1% | -0% | 3% | -1% | |
| Display P3 Coverage (%) | 98.1 | 94.9 -3% | 97.7 0% | 98.1 0% | 99.8 2% | 96.9 -1% |
| sRGB Coverage (%) | 99.8 | 99.9 0% | 100 0% | 99.9 0% | 100 0% | 99.8 0% |
| AdobeRGB 1998 Coverage (%) | 86.2 | 92.4 7% | 89.8 4% | 85.6 -1% | 91.8 6% | 85.3 -1% |
| Response Times | -140% | 77% | 62% | 45% | 71% | |
| Response Time Grey 50% / Grey 80% * (ms) | 8.6 ? | 38.4 ? -347% | 3 ? 65% | 5.6 ? 35% | 7.6 ? 12% | 4.2 ? 51% |
| Response Time Black / White * (ms) | 81.8 ? | 26.6 ? 67% | 9.9 ? 88% | 9 ? 89% | 17.8 ? 78% | 8 ? 90% |
| PWM Frequency (Hz) | 2592 ? | 2380 ? | 2509 | |||
| Screen | -9% | 28% | 21% | -14% | 11% | |
| Brightness middle (cd/m²) | 467.5 | 606 30% | 372.8 -20% | 471 1% | 360 -23% | 549.6 18% |
| Brightness (cd/m²) | 459 | 602 31% | 367 -20% | 422 -8% | 355 -23% | 524 14% |
| Brightness Distribution (%) | 90 | 93 3% | 97 8% | 83 -8% | 92 2% | 89 -1% |
| Black Level * (cd/m²) | 0.0001 | 0.32 | 0.47 | 0.21 | 0.53 | |
| Colorchecker dE 2000 * | 3.77 | 4.8 -27% | 1.92 49% | 2.05 46% | 3.82 -1% | 3.32 12% |
| Colorchecker dE 2000 max. * | 6.12 | 8.2 -34% | 3.65 40% | 4.15 32% | 7.38 -21% | 6.63 -8% |
| Colorchecker dE 2000 calibrated * | 2.94 | 1.8 39% | 0.51 83% | 0.8 73% | 2.24 24% | 2.7 8% |
| Greyscale dE 2000 * | 3.2 | 6.5 -103% | 1.5 53% | 2.8 13% | 5.06 -58% | 2 37% |
| Gamma | 2.43 91% | 2.63 84% | 2.34 94% | 2.204 100% | 2.52 87% | 2.29 96% |
| CCT | 6478 100% | 6596 99% | 6607 98% | 7122 91% | 5657 115% | 6319 103% |
| Contrast (:1) | 6060000 | 1165 | 1002 | 1714 | 1037 | |
| Toplam Ortalama (Program / Ayarlar) | -49% /
-28% | 35% /
29% | 28% /
23% | 11% /
-0% | 27% /
18% |
* ... daha küçük daha iyidir
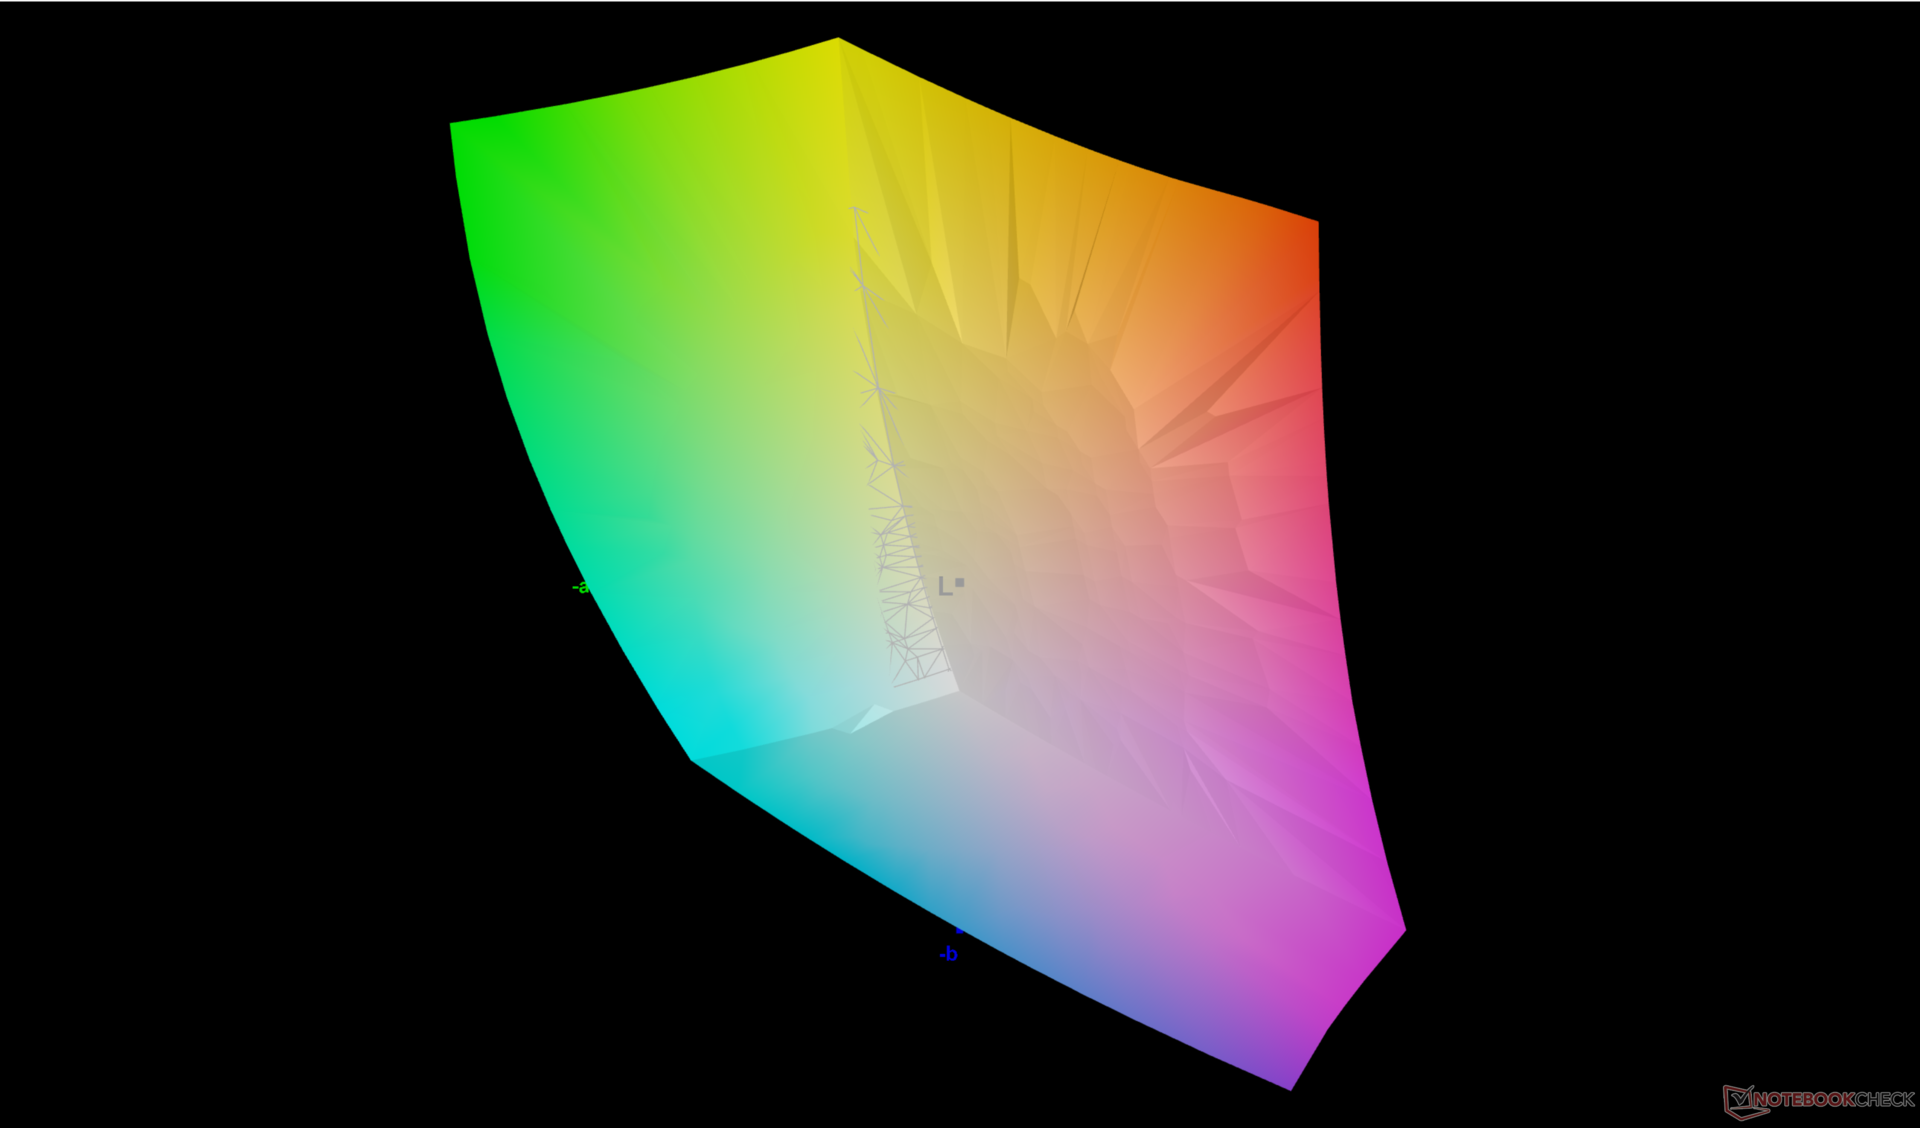
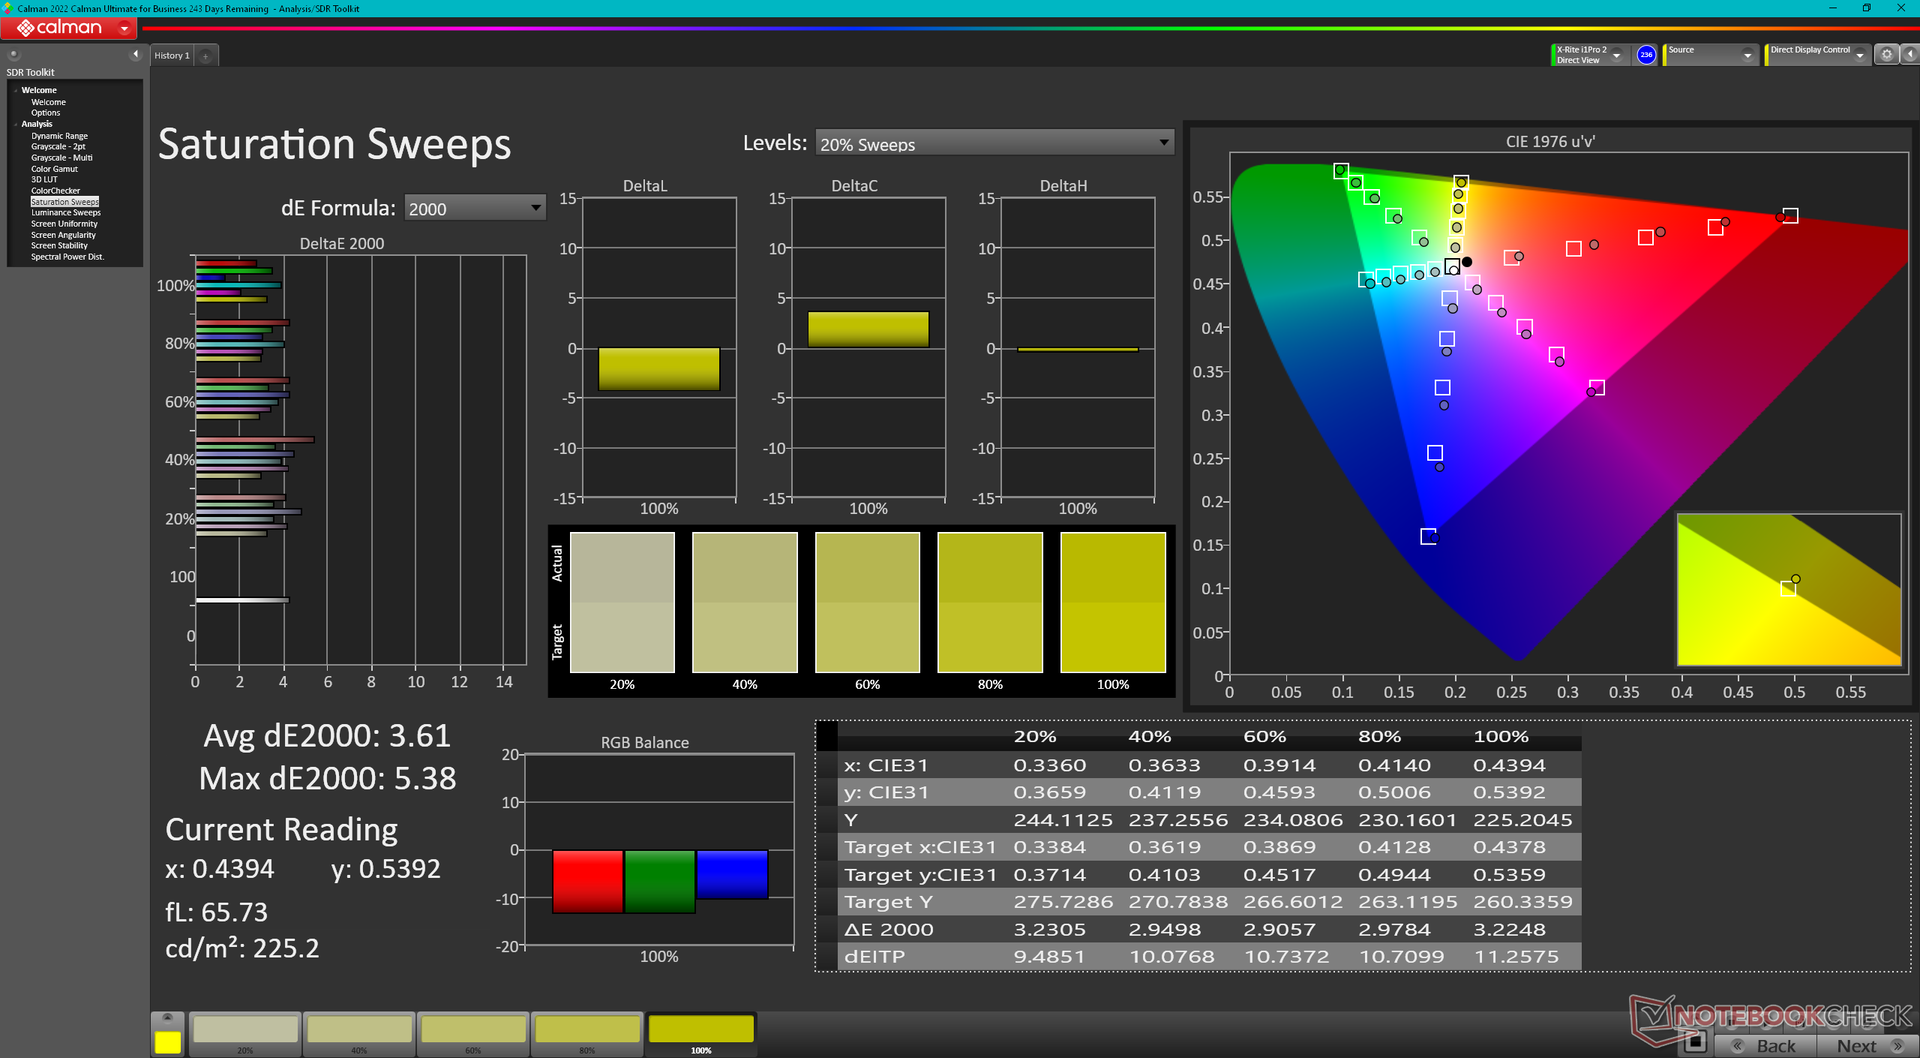
MSI, Titan'ın yüksek fiyatına rağmen Pantone kalibrasyon çabalarının reklamını yapmıyor. Ortalama gri tonlama ve renk deltaE değerleri yine de sırasıyla 3,2 ve 3,77 ile kutudan çıktığı haliyle çok iyi.
Yanıt Sürelerini Görüntüle
| ↔ Tepki Süresi Siyahtan Beyaza | ||
|---|---|---|
| 81.8 ms ... yükseliş ↗ ve sonbahar↘ birleşimi | ↗ 76 ms yükseliş | 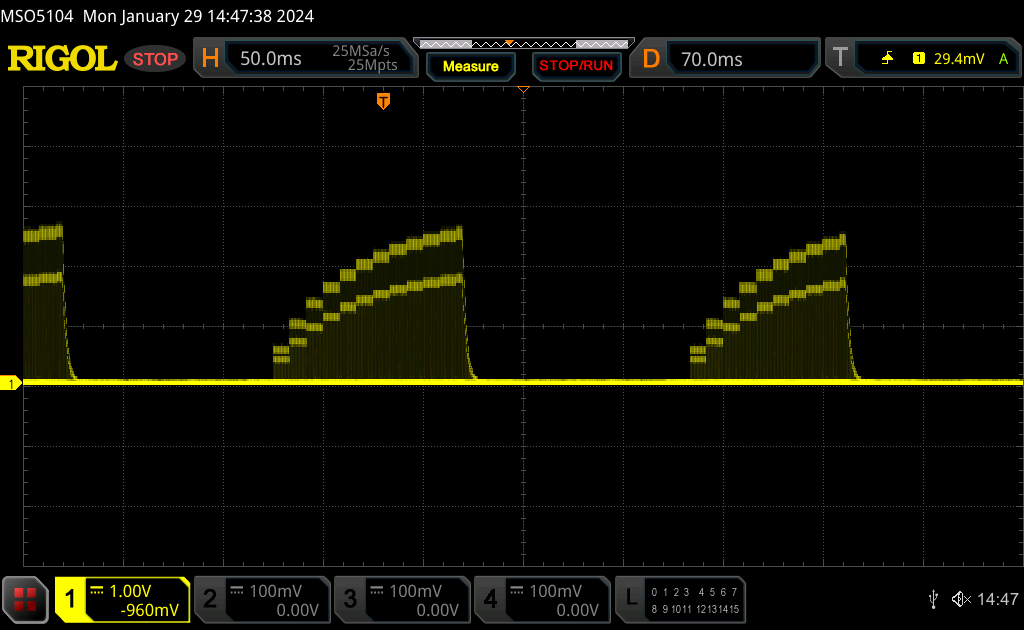 |
| ↘ 5.8 ms sonbahar | ||
| Ekran, testlerimizde yavaş yanıt oranları gösteriyor ve oyuncular için yetersiz olacaktır. Karşılaştırıldığında, test edilen tüm cihazlar 0.1 (minimum) ile 240 (maksimum) ms arasında değişir. » Tüm cihazların 100 %'si daha iyi. Bu, ölçülen yanıt süresinin test edilen tüm cihazların ortalamasından (19.8 ms) daha kötü olduğu anlamına gelir. | ||
| ↔ Tepki Süresi %50 Griden %80 Griye | ||
| 8.6 ms ... yükseliş ↗ ve sonbahar↘ birleşimi | ↗ 4.2 ms yükseliş | 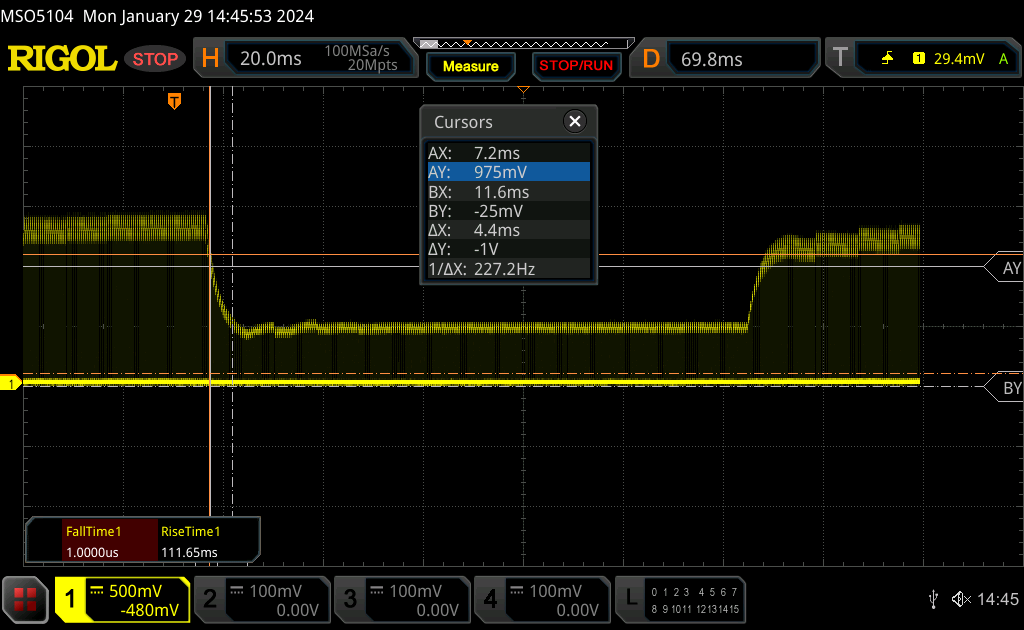 |
| ↘ 4.4 ms sonbahar | ||
| Ekran, testlerimizde hızlı yanıt oranları gösteriyor ve oyun oynamaya uygun olmalı. Karşılaştırıldığında, test edilen tüm cihazlar 0.165 (minimum) ile 636 (maksimum) ms arasında değişir. » Tüm cihazların 22 %'si daha iyi. Bu, ölçülen yanıt süresinin test edilen tüm cihazların ortalamasından (31 ms) daha iyi olduğu anlamına gelir. | ||
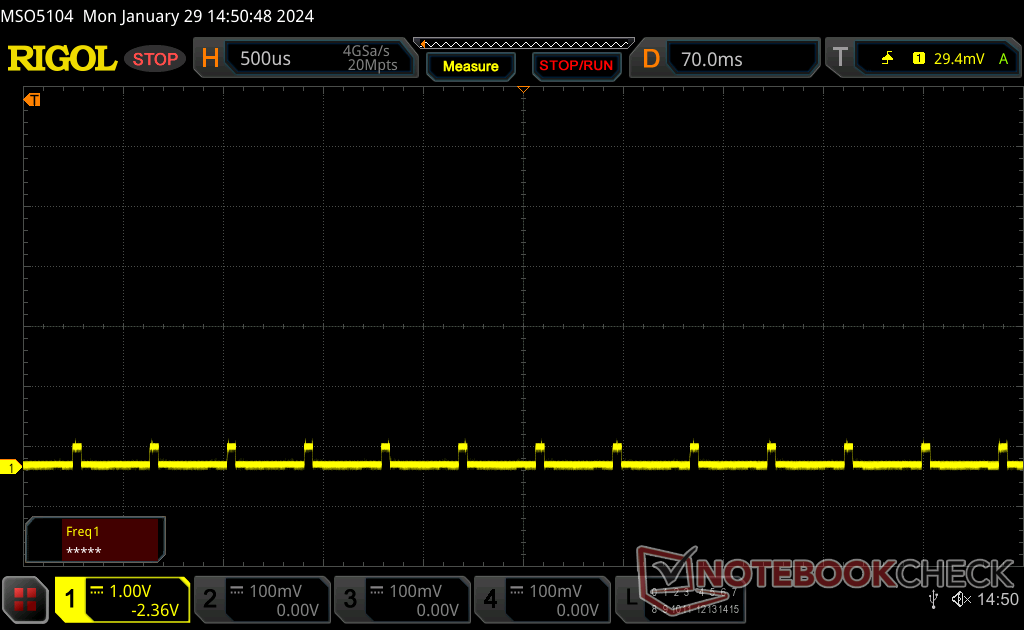
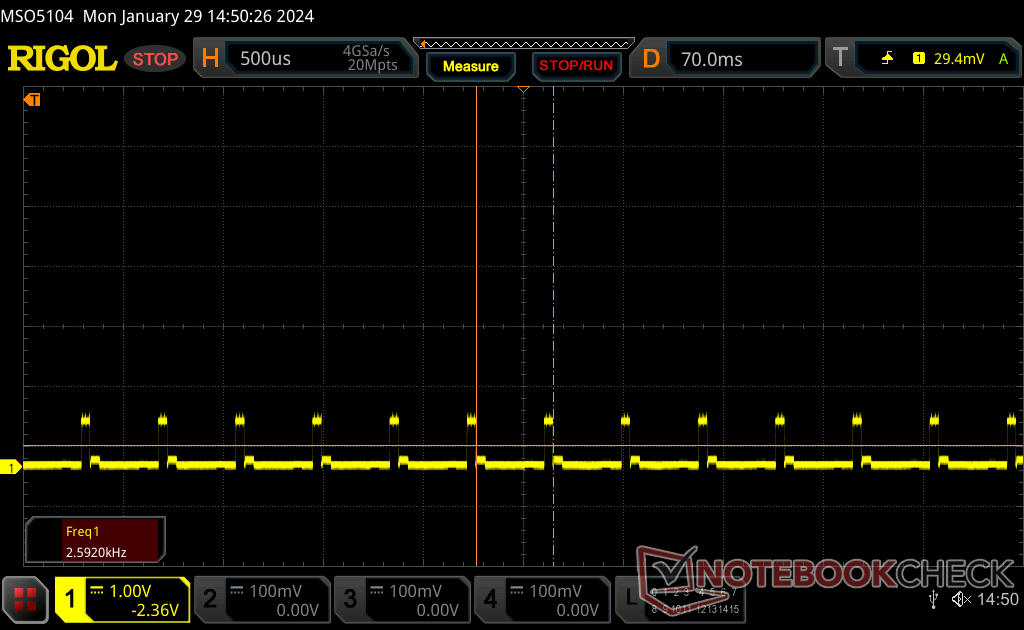
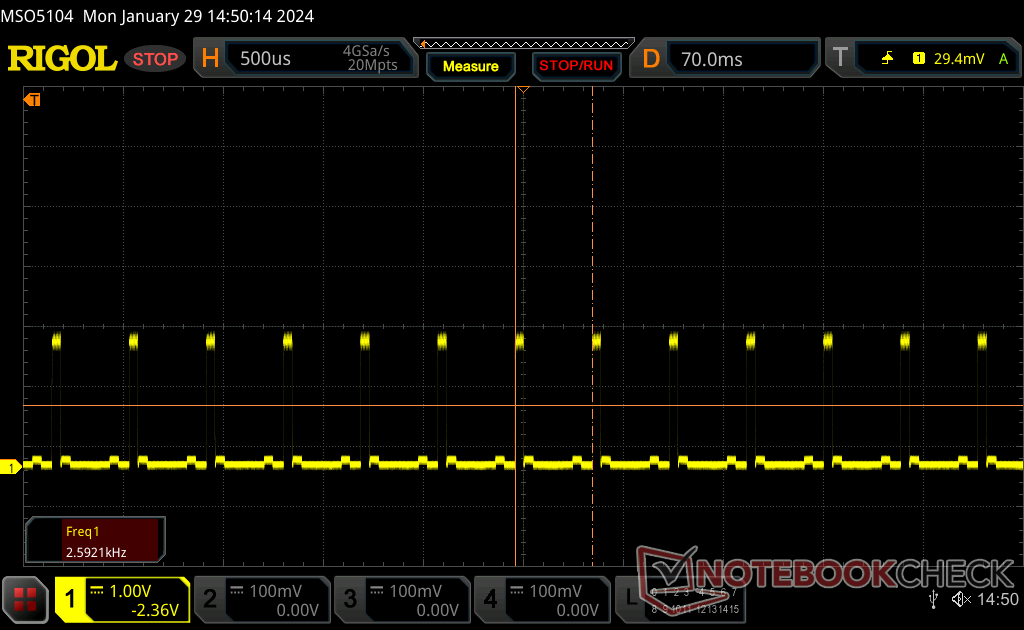
Ekran Titremesi / PWM (Darbe Genişliği Modülasyonu)
| Ekran titriyor / PWM algılandı | 2592 Hz | ≤ 100 % parlaklık ayarı | 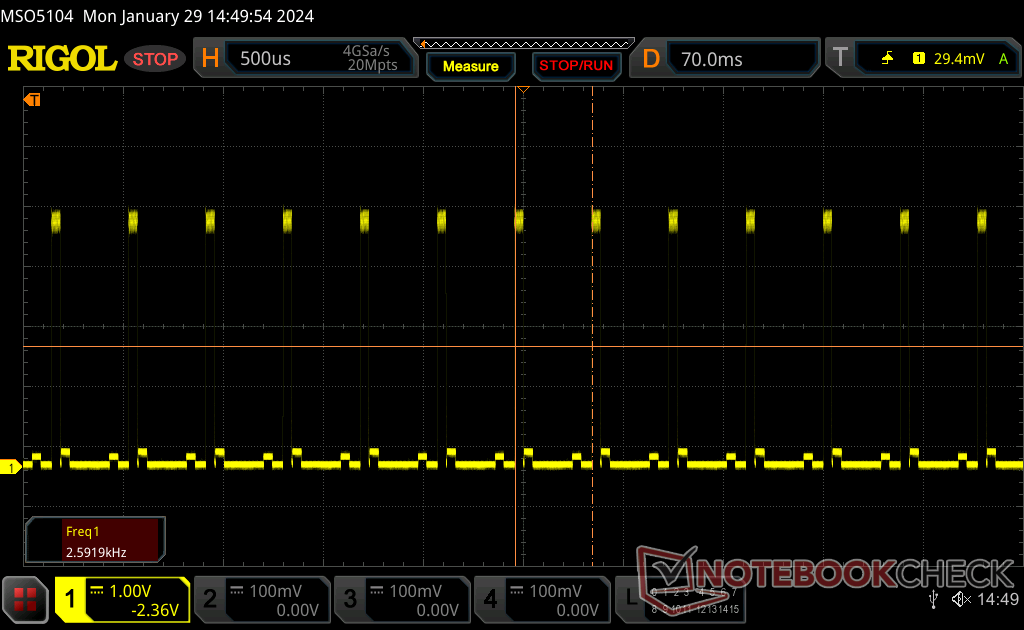 |
Ekran arka ışığı 2592 Hz'de titriyor (en kötü durum, örneğin PWM kullanılması) 100 % ve altındaki parlaklık ayarında titreme algılandı. Bu parlaklık ayarının üzerinde titreme veya PWM olmamalıdır. 2592 Hz frekansı oldukça yüksektir, bu nedenle PWM'ye duyarlı çoğu kullanıcı herhangi bir titremeyi fark etmemelidir. Karşılaştırıldığında: Test edilen tüm cihazların %52 %'si ekranı karartmak için PWM kullanmıyor. PWM tespit edilirse, ortalama 7778 (minimum: 5 - maksimum: 343500) Hz ölçüldü. | |||
Mini-LED için siyah-beyaz ve gri-gri tepki sürelerini geleneksel yöntemlerle ölçmek zordur. Ancak öznel olarak oyun oynarken gölgelenmenin sorun olmadığını söyleyebiliriz. Hızlı hareketler, OLED veya çok hızlı tepki sürelerine sahip bir IPS ekrana daha yakın bir deneyim için pürüzsüz ve lekesiz görünüyor.
Titreme, maksimum dahil tüm parlaklık seviyelerinde sabit bir frekansta mevcut.

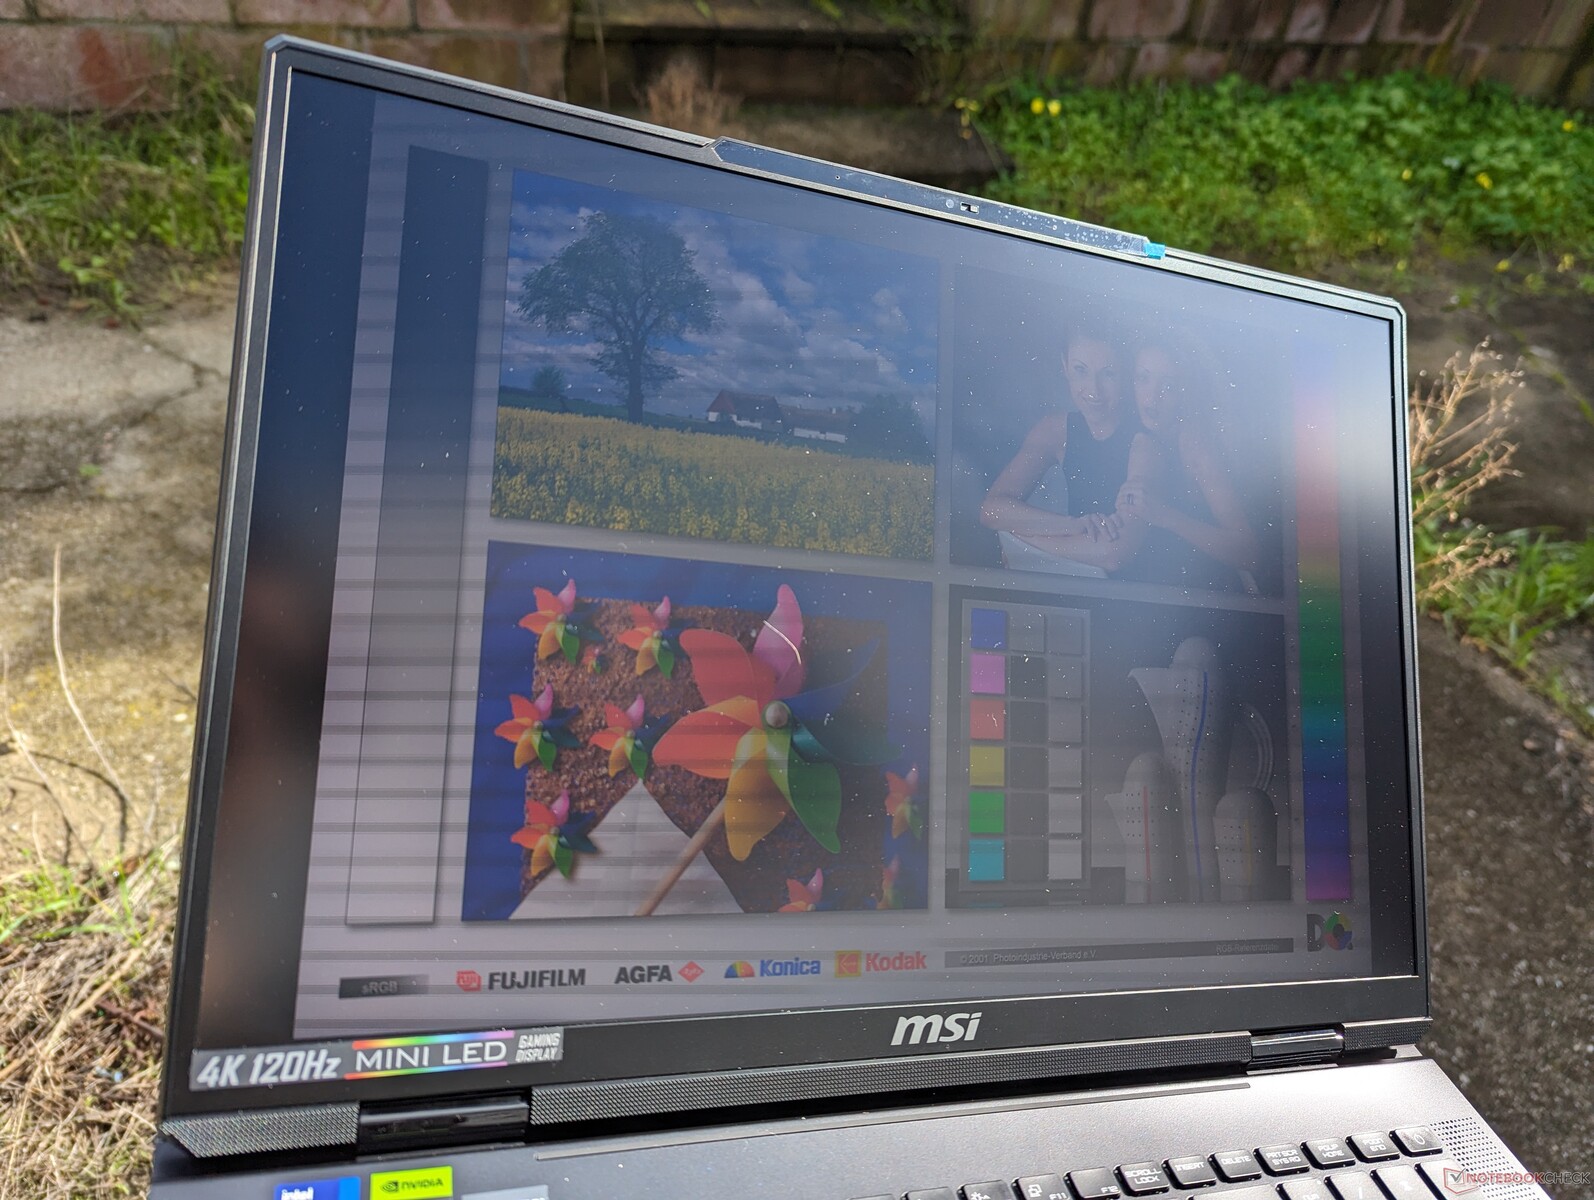
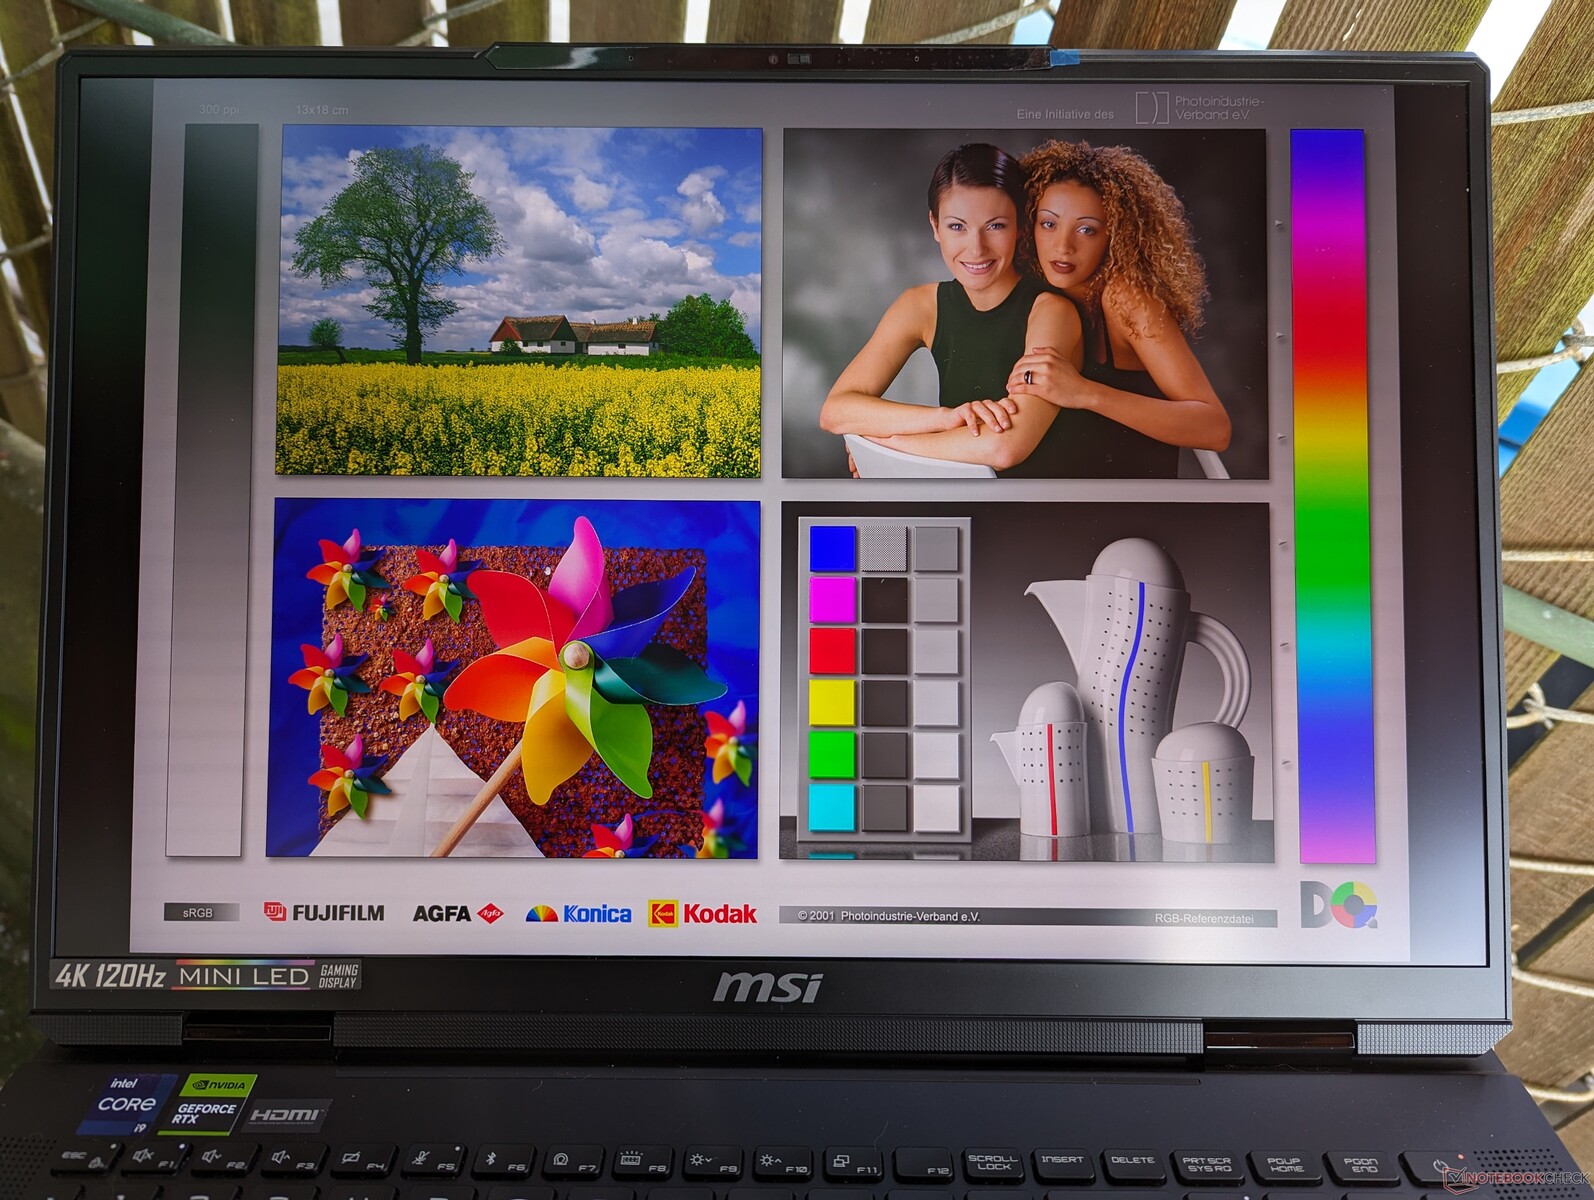
Gölge altında dış mekan görünürlüğü kabul edilebilir, ancak daha parlak bir şey olursa ekran soluklaşır. Ultra parlak arka ışık, yukarıda belirtildiği gibi pil gücüyle çalışıyorsa elde edilemez.
Performans - 14. Nesil Raptor Lake-HX
Test Koşulları
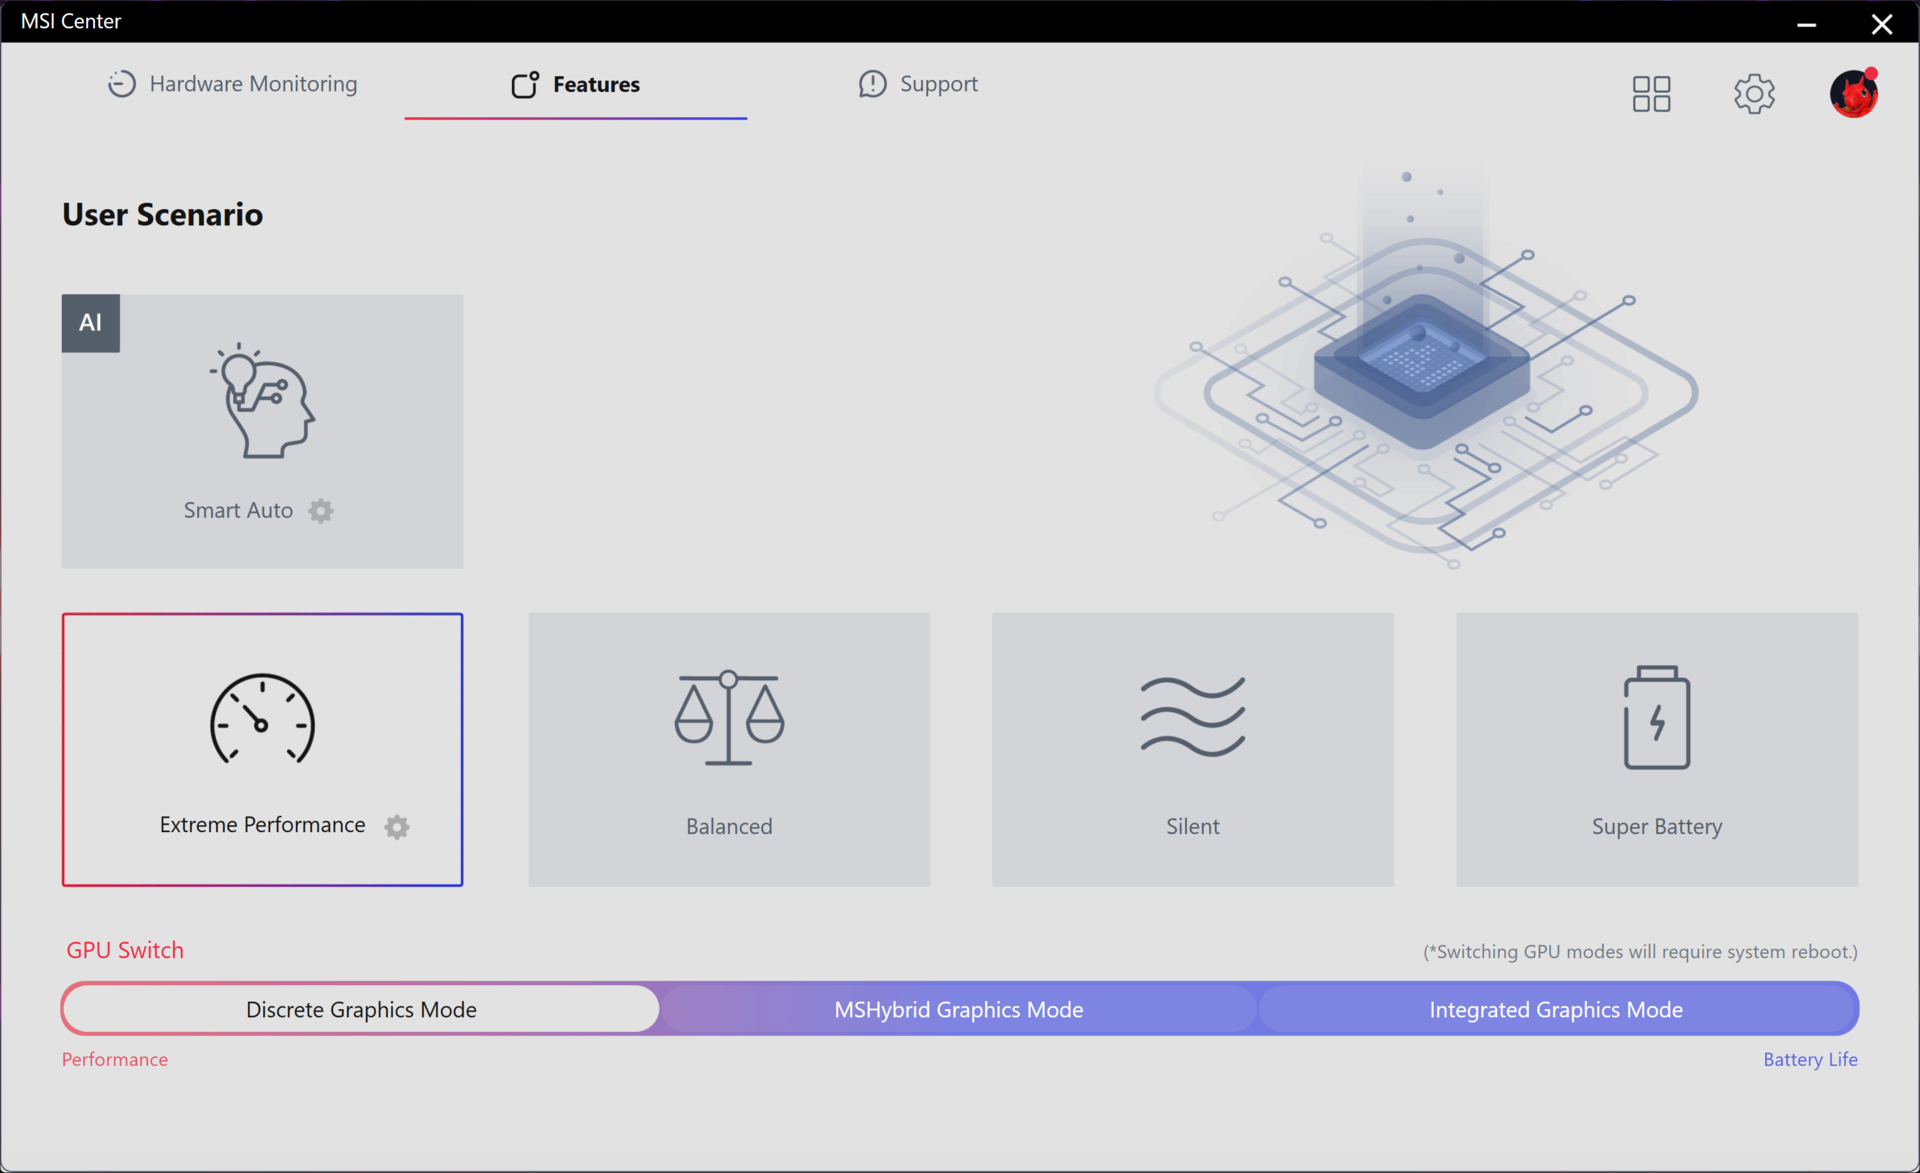
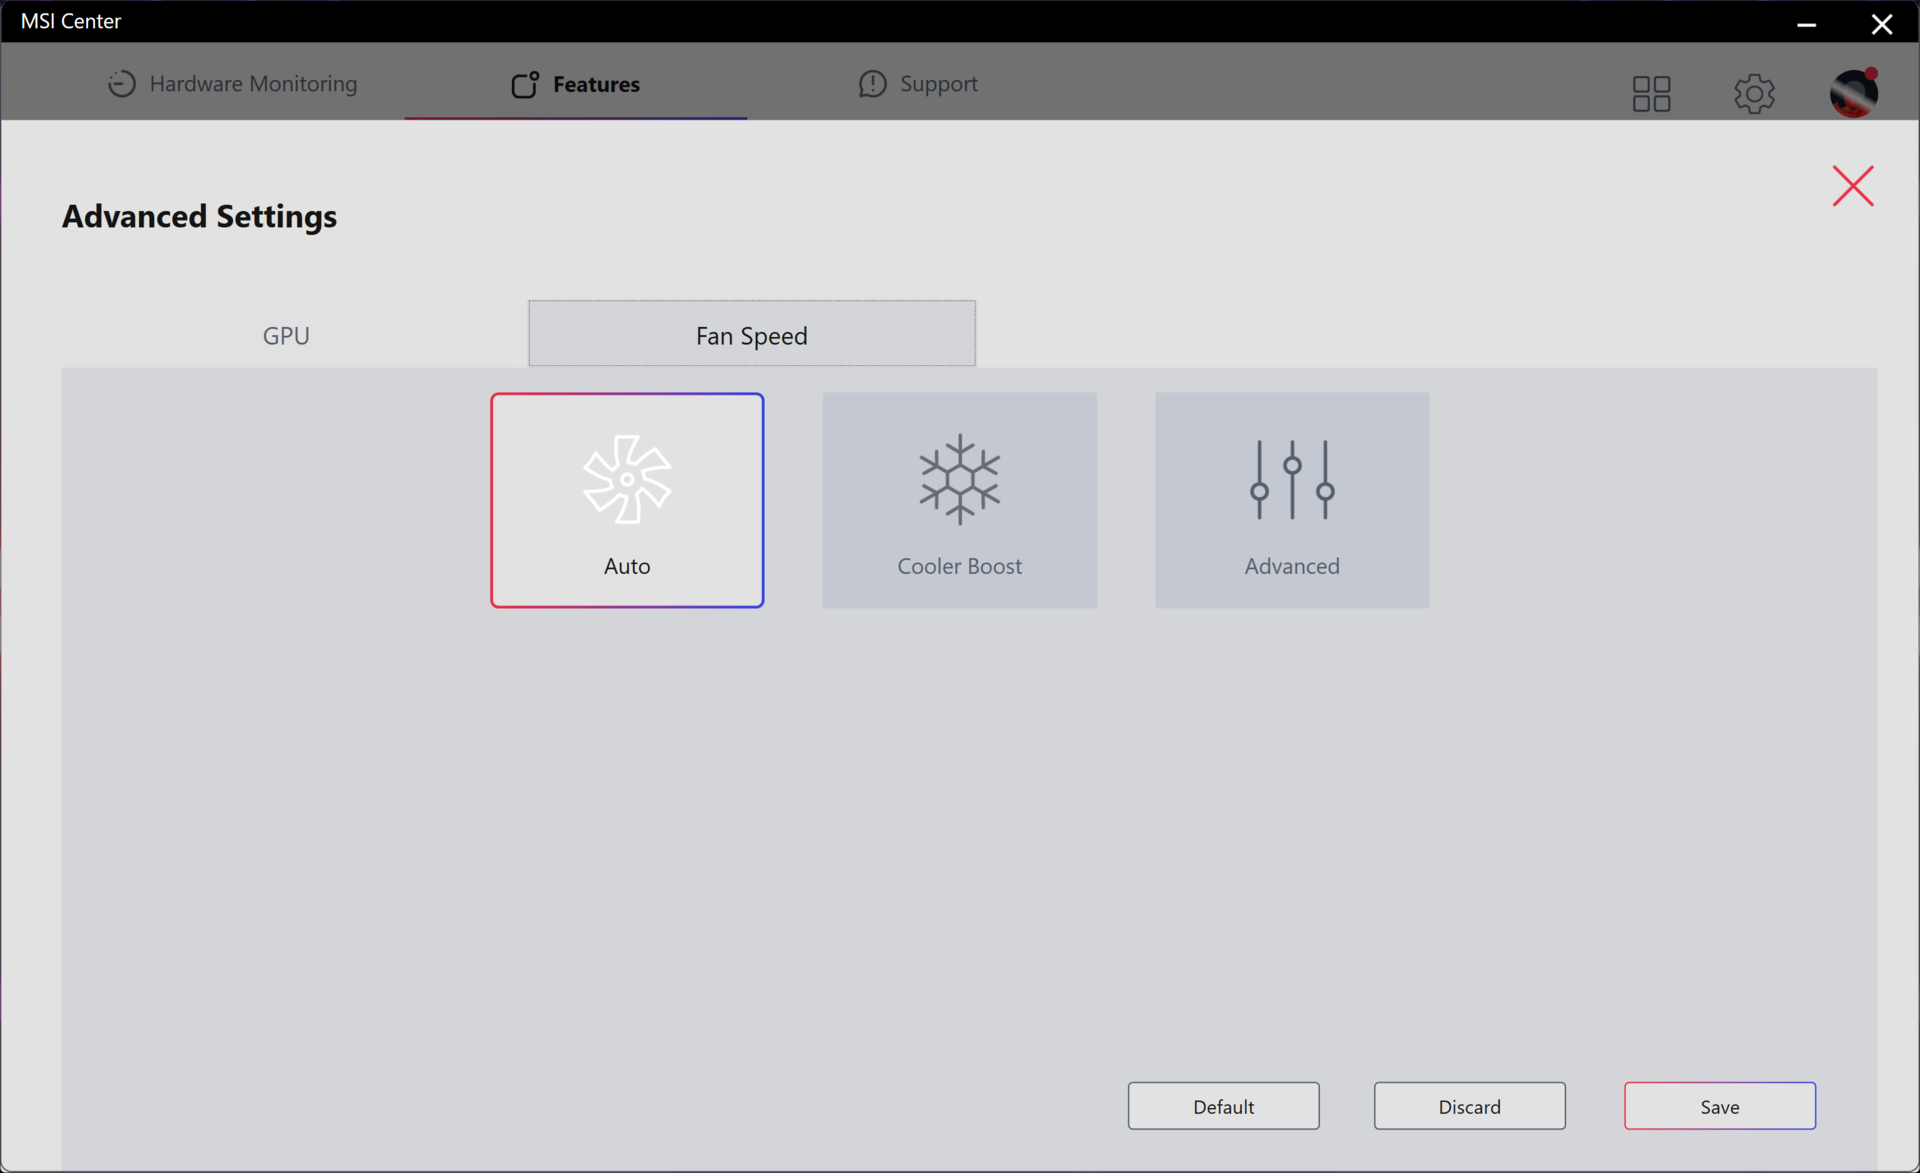
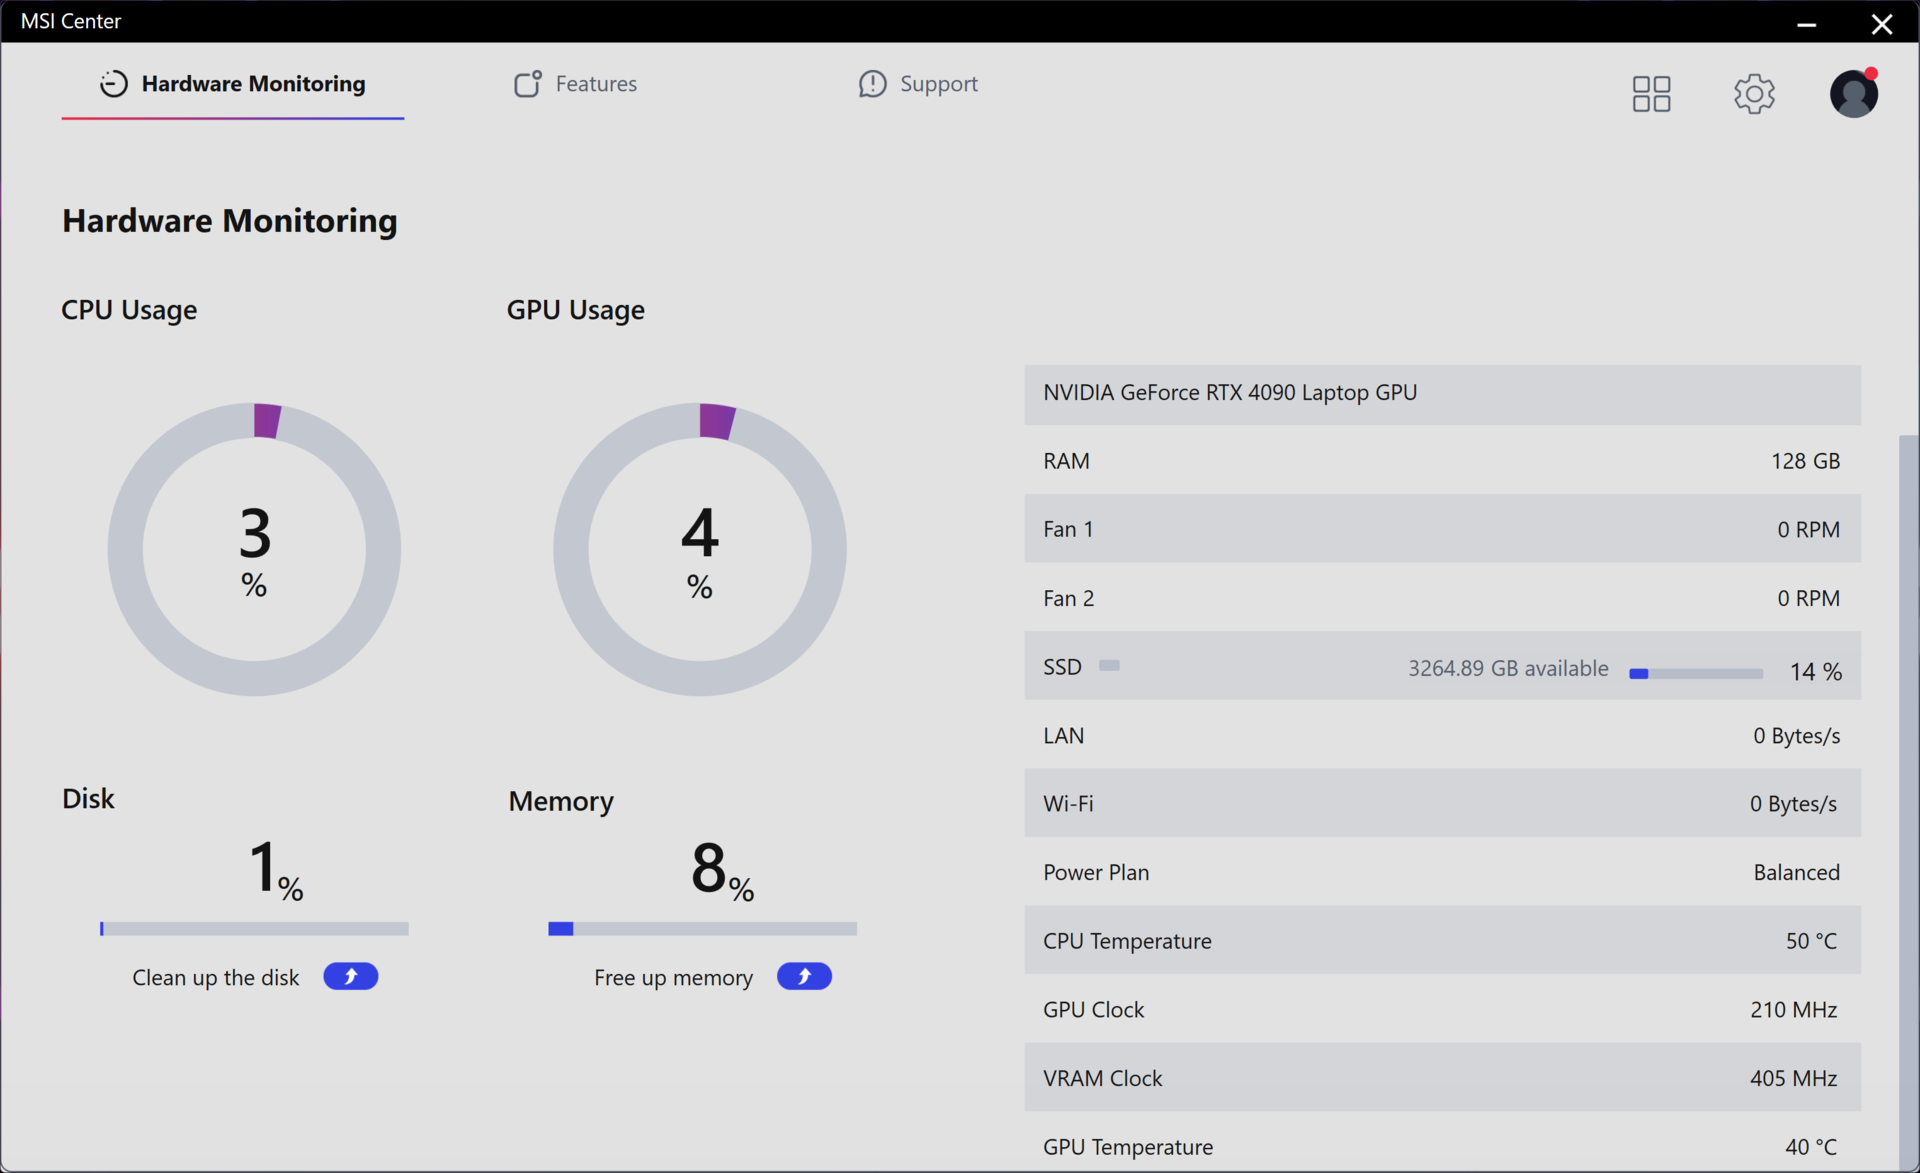
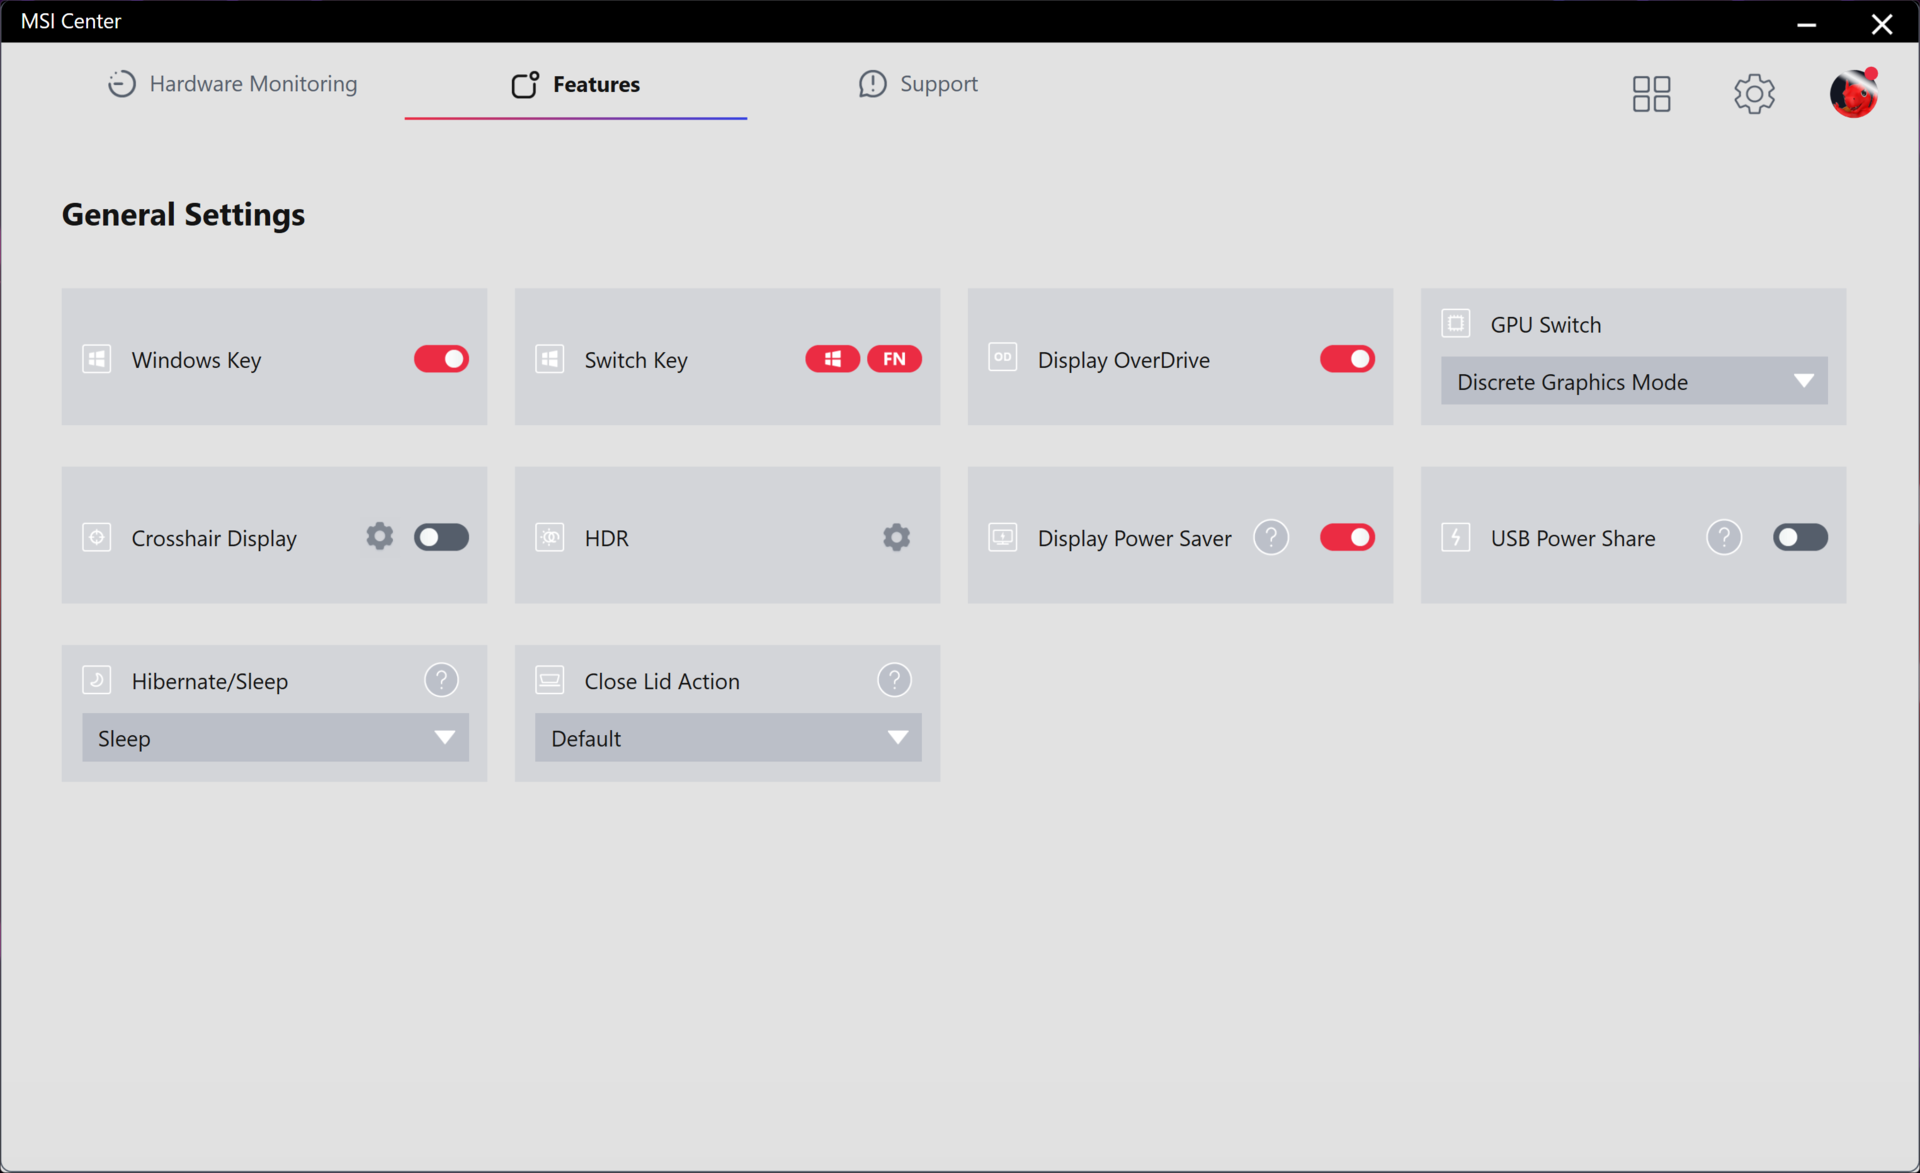
Aşağıdaki kıyaslamaları çalıştırmadan önce MSI Center'ı ayrık GPU moduna ve Cooler Boost aktifken Extreme Performance moduna ayarladık. Cooler Boost, MSI'ın maksimum fan hızı modu için kullandığı marka adıdır. Sistemin hayati değerlerini izlemek, MSI'a özgü güncellemeleri yüklemek ve çoğu özelliği değiştirmek için bir kontrol merkezi olan MSI Center'a kullanıcılar aşina olmalıdır.
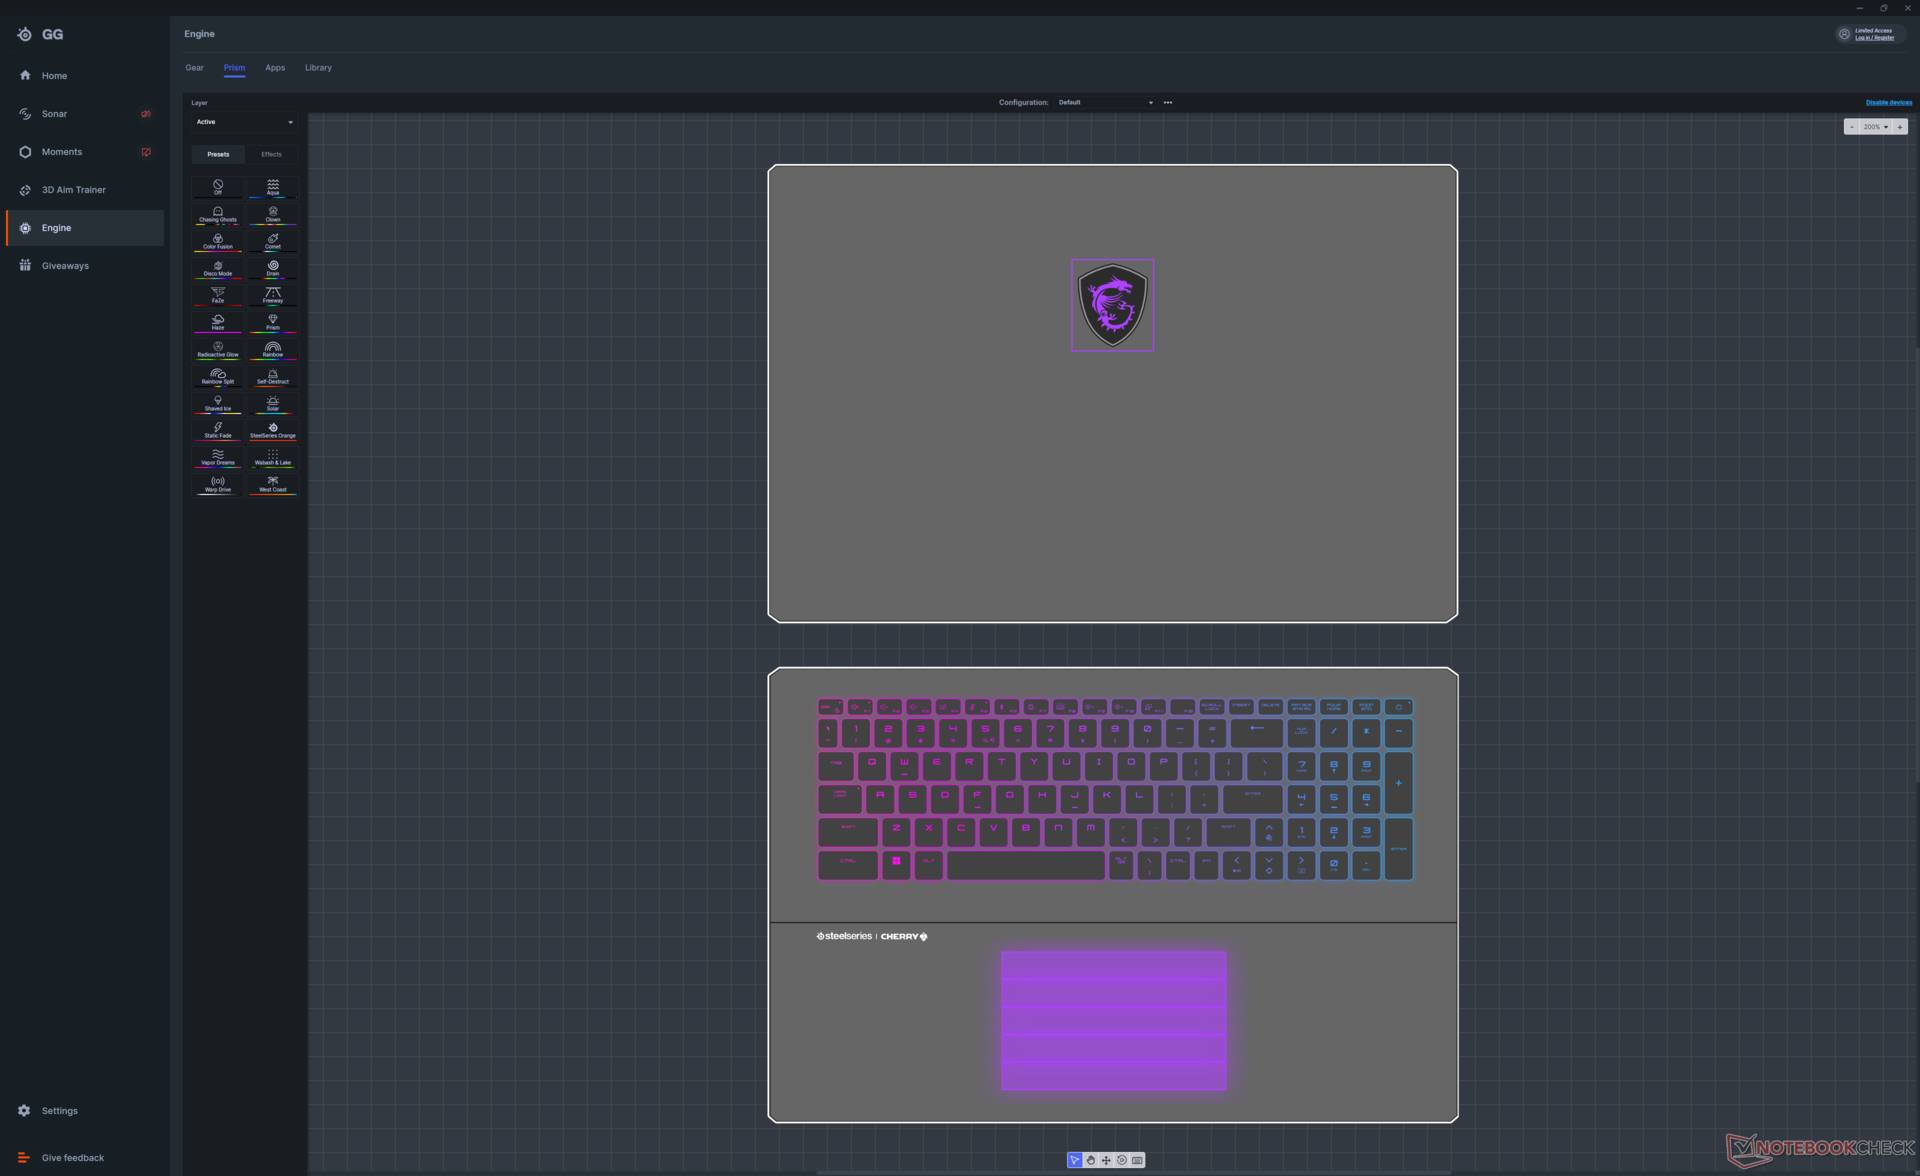
Klavye aydınlatması, SteelSeries GG adlı önceden yüklenmiş ayrı bir uygulama tarafından kontrol edilir.
İşlemci
Ham performansımız Core i9-14900HX ile başa baş durumda Core i9-13950HX geçen yılın GT77'sinde. Bu nedenle, geleneksel CPU ağırlıklı uygulamaları çalıştırırken gözle görülür bir performans artışı beklemeyin. 14. nesil Raptor Lake-HX CPU, bir NPU entegre eden Meteor Lake serisinin aksine yeni AI özelliklerine de sahip değil.
MSI, 14. nesil Intel CPU'larla donatılmış dizüstü bilgisayarlar için AI Artist uygulamasını Şubat ayında başlatmaya hazırlanıyor. Program, daha hızlı bir kullanıcı deneyimi için bulut hizmetlerine güvenmek yerine yerel düzeyde istemlere dayalı sanat üretmek için Intel'in yapay zeka hızlandırmasından yararlanıyor. Yapay zeka ile geliştirilmiş uygulamalarla ilgilenmiyorsanız, daha eski bir 13. nesil Intel CPU da size hizmet edebilir.
Cinebench R15 Multi Loop
Cinebench R23: Multi Core | Single Core
Cinebench R20: CPU (Multi Core) | CPU (Single Core)
Cinebench R15: CPU Multi 64Bit | CPU Single 64Bit
Blender: v2.79 BMW27 CPU
7-Zip 18.03: 7z b 4 | 7z b 4 -mmt1
Geekbench 6.7: Multi-Core | Single-Core
Geekbench 5.5: Multi-Core | Single-Core
HWBOT x265 Benchmark v2.2: 4k Preset
LibreOffice : 20 Documents To PDF
R Benchmark 2.5: Overall mean
| CPU Performance rating | |
| Asus ROG Strix Scar 17 G733PYV-LL053X | |
| Asus ROG Strix Scar 17 G733PY-XS96 -2! | |
| Alienware m18 R1 -2! | |
| MSI Titan GT77 HX 13VI -2! | |
| MSI Titan 18 HX A14VIG | |
| Acer Predator Helios 18 N23Q2 | |
| Ortalama Intel Core i9-14900HX | |
| Razer Blade 18 RTX 4070 -2! | |
| Alienware m16 R1 AMD | |
| MSI Raider GE68 HX 13VG, i7-13700HX | |
| NVIDIA GeForce RTX 4070 Super Founders Edition -15! | |
| Asus TUF Gaming A17 FA707XI-NS94 | |
| Asus ROG Strix G18 G814JI -2! | |
| MSI Stealth 16 Studio A13VG -2! | |
| Dell G16 7620 -2! | |
| Alienware m17 R5 (R9 6900HX, RX 6850M XT) -2! | |
| Cinebench R23 / Multi Core | |
| Asus ROG Strix Scar 17 G733PY-XS96 | |
| MSI Titan GT77 HX 13VI | |
| Asus ROG Strix Scar 17 G733PYV-LL053X | |
| Alienware m18 R1 | |
| MSI Titan 18 HX A14VIG | |
| Acer Predator Helios 18 N23Q2 | |
| Ortalama Intel Core i9-14900HX (17078 - 36249, n=37) | |
| Razer Blade 18 RTX 4070 | |
| Alienware m16 R1 AMD | |
| MSI Raider GE68 HX 13VG, i7-13700HX | |
| Asus ROG Strix G18 G814JI | |
| MSI Stealth 16 Studio A13VG | |
| Asus TUF Gaming A17 FA707XI-NS94 | |
| Dell G16 7620 | |
| Alienware m17 R5 (R9 6900HX, RX 6850M XT) | |
| Cinebench R23 / Single Core | |
| Ortalama Intel Core i9-14900HX (1720 - 2245, n=37) | |
| MSI Titan 18 HX A14VIG | |
| Alienware m18 R1 | |
| MSI Titan GT77 HX 13VI | |
| Acer Predator Helios 18 N23Q2 | |
| Razer Blade 18 RTX 4070 | |
| Asus ROG Strix Scar 17 G733PYV-LL053X | |
| Asus ROG Strix G18 G814JI | |
| MSI Raider GE68 HX 13VG, i7-13700HX | |
| Asus ROG Strix Scar 17 G733PY-XS96 | |
| MSI Stealth 16 Studio A13VG | |
| Alienware m16 R1 AMD | |
| Asus TUF Gaming A17 FA707XI-NS94 | |
| Dell G16 7620 | |
| Alienware m17 R5 (R9 6900HX, RX 6850M XT) | |
| Cinebench R20 / CPU (Multi Core) | |
| Asus ROG Strix Scar 17 G733PY-XS96 | |
| Asus ROG Strix Scar 17 G733PYV-LL053X | |
| MSI Titan GT77 HX 13VI | |
| Alienware m18 R1 | |
| MSI Titan 18 HX A14VIG | |
| Acer Predator Helios 18 N23Q2 | |
| Ortalama Intel Core i9-14900HX (6579 - 13832, n=37) | |
| Razer Blade 18 RTX 4070 | |
| Alienware m16 R1 AMD | |
| MSI Raider GE68 HX 13VG, i7-13700HX | |
| Asus ROG Strix G18 G814JI | |
| MSI Stealth 16 Studio A13VG | |
| Asus TUF Gaming A17 FA707XI-NS94 | |
| Dell G16 7620 | |
| Alienware m17 R5 (R9 6900HX, RX 6850M XT) | |
| Cinebench R20 / CPU (Single Core) | |
| Ortalama Intel Core i9-14900HX (657 - 859, n=37) | |
| MSI Titan 18 HX A14VIG | |
| Alienware m18 R1 | |
| Acer Predator Helios 18 N23Q2 | |
| MSI Titan GT77 HX 13VI | |
| Razer Blade 18 RTX 4070 | |
| Asus ROG Strix Scar 17 G733PYV-LL053X | |
| Asus ROG Strix G18 G814JI | |
| MSI Raider GE68 HX 13VG, i7-13700HX | |
| Asus ROG Strix Scar 17 G733PY-XS96 | |
| MSI Stealth 16 Studio A13VG | |
| Alienware m16 R1 AMD | |
| Asus TUF Gaming A17 FA707XI-NS94 | |
| Dell G16 7620 | |
| Alienware m17 R5 (R9 6900HX, RX 6850M XT) | |
| Cinebench R15 / CPU Multi 64Bit | |
| Asus ROG Strix Scar 17 G733PYV-LL053X | |
| Asus ROG Strix Scar 17 G733PY-XS96 | |
| MSI Titan GT77 HX 13VI | |
| Alienware m18 R1 | |
| MSI Titan 18 HX A14VIG | |
| Acer Predator Helios 18 N23Q2 | |
| Razer Blade 18 RTX 4070 | |
| Ortalama Intel Core i9-14900HX (3263 - 5589, n=38) | |
| Alienware m16 R1 AMD | |
| MSI Raider GE68 HX 13VG, i7-13700HX | |
| Asus ROG Strix G18 G814JI | |
| MSI Stealth 16 Studio A13VG | |
| Asus TUF Gaming A17 FA707XI-NS94 | |
| Dell G16 7620 | |
| Alienware m17 R5 (R9 6900HX, RX 6850M XT) | |
| Cinebench R15 / CPU Single 64Bit | |
| Asus ROG Strix Scar 17 G733PYV-LL053X | |
| Asus ROG Strix Scar 17 G733PY-XS96 | |
| Ortalama Intel Core i9-14900HX (247 - 323, n=37) | |
| Alienware m18 R1 | |
| MSI Titan GT77 HX 13VI | |
| MSI Titan 18 HX A14VIG | |
| Razer Blade 18 RTX 4070 | |
| Alienware m16 R1 AMD | |
| Acer Predator Helios 18 N23Q2 | |
| Asus TUF Gaming A17 FA707XI-NS94 | |
| Asus ROG Strix G18 G814JI | |
| MSI Stealth 16 Studio A13VG | |
| MSI Raider GE68 HX 13VG, i7-13700HX | |
| Alienware m17 R5 (R9 6900HX, RX 6850M XT) | |
| Dell G16 7620 | |
| Blender / v2.79 BMW27 CPU | |
| Alienware m17 R5 (R9 6900HX, RX 6850M XT) | |
| Dell G16 7620 | |
| Asus TUF Gaming A17 FA707XI-NS94 | |
| MSI Stealth 16 Studio A13VG | |
| Asus ROG Strix G18 G814JI | |
| MSI Raider GE68 HX 13VG, i7-13700HX | |
| Ortalama Intel Core i9-14900HX (91 - 206, n=37) | |
| Alienware m16 R1 AMD | |
| Razer Blade 18 RTX 4070 | |
| Acer Predator Helios 18 N23Q2 | |
| MSI Titan 18 HX A14VIG | |
| MSI Titan GT77 HX 13VI | |
| Alienware m18 R1 | |
| Asus ROG Strix Scar 17 G733PYV-LL053X | |
| Asus ROG Strix Scar 17 G733PY-XS96 | |
| NVIDIA GeForce RTX 4070 Super Founders Edition | |
| 7-Zip 18.03 / 7z b 4 | |
| Asus ROG Strix Scar 17 G733PY-XS96 | |
| Asus ROG Strix Scar 17 G733PYV-LL053X | |
| Alienware m18 R1 | |
| MSI Titan GT77 HX 13VI | |
| MSI Titan 18 HX A14VIG | |
| Acer Predator Helios 18 N23Q2 | |
| Razer Blade 18 RTX 4070 | |
| Ortalama Intel Core i9-14900HX (66769 - 136645, n=37) | |
| Alienware m16 R1 AMD | |
| MSI Raider GE68 HX 13VG, i7-13700HX | |
| Asus ROG Strix G18 G814JI | |
| MSI Stealth 16 Studio A13VG | |
| Asus TUF Gaming A17 FA707XI-NS94 | |
| Dell G16 7620 | |
| Alienware m17 R5 (R9 6900HX, RX 6850M XT) | |
| 7-Zip 18.03 / 7z b 4 -mmt1 | |
| Asus ROG Strix Scar 17 G733PY-XS96 | |
| Asus ROG Strix Scar 17 G733PYV-LL053X | |
| Ortalama Intel Core i9-14900HX (5452 - 7545, n=37) | |
| Alienware m16 R1 AMD | |
| Acer Predator Helios 18 N23Q2 | |
| MSI Titan GT77 HX 13VI | |
| Alienware m18 R1 | |
| Razer Blade 18 RTX 4070 | |
| Asus TUF Gaming A17 FA707XI-NS94 | |
| MSI Titan 18 HX A14VIG | |
| MSI Raider GE68 HX 13VG, i7-13700HX | |
| Asus ROG Strix G18 G814JI | |
| MSI Stealth 16 Studio A13VG | |
| Alienware m17 R5 (R9 6900HX, RX 6850M XT) | |
| Dell G16 7620 | |
| Geekbench 6.7 / Multi-Core | |
| Acer Predator Helios 18 N23Q2 | |
| Ortalama Intel Core i9-14900HX (13158 - 19665, n=37) | |
| Asus ROG Strix Scar 17 G733PYV-LL053X | |
| MSI Titan 18 HX A14VIG | |
| MSI Raider GE68 HX 13VG, i7-13700HX | |
| Alienware m16 R1 AMD | |
| Asus TUF Gaming A17 FA707XI-NS94 | |
| Geekbench 6.7 / Single-Core | |
| Ortalama Intel Core i9-14900HX (2419 - 3129, n=37) | |
| Asus ROG Strix Scar 17 G733PYV-LL053X | |
| Acer Predator Helios 18 N23Q2 | |
| MSI Titan 18 HX A14VIG | |
| Asus TUF Gaming A17 FA707XI-NS94 | |
| Alienware m16 R1 AMD | |
| MSI Raider GE68 HX 13VG, i7-13700HX | |
| Geekbench 5.5 / Multi-Core | |
| Alienware m18 R1 | |
| MSI Titan GT77 HX 13VI | |
| Acer Predator Helios 18 N23Q2 | |
| Razer Blade 18 RTX 4070 | |
| Asus ROG Strix Scar 17 G733PYV-LL053X | |
| Ortalama Intel Core i9-14900HX (8618 - 23194, n=37) | |
| Asus ROG Strix Scar 17 G733PY-XS96 | |
| MSI Titan 18 HX A14VIG | |
| MSI Raider GE68 HX 13VG, i7-13700HX | |
| Alienware m16 R1 AMD | |
| Asus ROG Strix G18 G814JI | |
| MSI Stealth 16 Studio A13VG | |
| Dell G16 7620 | |
| Asus TUF Gaming A17 FA707XI-NS94 | |
| Alienware m17 R5 (R9 6900HX, RX 6850M XT) | |
| Geekbench 5.5 / Single-Core | |
| Asus ROG Strix Scar 17 G733PYV-LL053X | |
| MSI Titan 18 HX A14VIG | |
| Ortalama Intel Core i9-14900HX (1669 - 2210, n=37) | |
| Alienware m18 R1 | |
| Acer Predator Helios 18 N23Q2 | |
| Asus ROG Strix Scar 17 G733PY-XS96 | |
| MSI Titan GT77 HX 13VI | |
| Razer Blade 18 RTX 4070 | |
| Asus TUF Gaming A17 FA707XI-NS94 | |
| Alienware m16 R1 AMD | |
| MSI Raider GE68 HX 13VG, i7-13700HX | |
| Asus ROG Strix G18 G814JI | |
| MSI Stealth 16 Studio A13VG | |
| Dell G16 7620 | |
| Alienware m17 R5 (R9 6900HX, RX 6850M XT) | |
| HWBOT x265 Benchmark v2.2 / 4k Preset | |
| Asus ROG Strix Scar 17 G733PY-XS96 | |
| Asus ROG Strix Scar 17 G733PYV-LL053X | |
| Alienware m18 R1 | |
| MSI Titan GT77 HX 13VI | |
| Razer Blade 18 RTX 4070 | |
| MSI Titan 18 HX A14VIG | |
| Acer Predator Helios 18 N23Q2 | |
| Alienware m16 R1 AMD | |
| Ortalama Intel Core i9-14900HX (16.8 - 38.9, n=37) | |
| MSI Raider GE68 HX 13VG, i7-13700HX | |
| Asus ROG Strix G18 G814JI | |
| Asus TUF Gaming A17 FA707XI-NS94 | |
| MSI Stealth 16 Studio A13VG | |
| Dell G16 7620 | |
| Alienware m17 R5 (R9 6900HX, RX 6850M XT) | |
| LibreOffice / 20 Documents To PDF | |
| Asus ROG Strix G18 G814JI | |
| Alienware m17 R5 (R9 6900HX, RX 6850M XT) | |
| MSI Stealth 16 Studio A13VG | |
| Dell G16 7620 | |
| MSI Raider GE68 HX 13VG, i7-13700HX | |
| Acer Predator Helios 18 N23Q2 | |
| Asus TUF Gaming A17 FA707XI-NS94 | |
| Alienware m18 R1 | |
| MSI Titan GT77 HX 13VI | |
| MSI Titan 18 HX A14VIG | |
| Razer Blade 18 RTX 4070 | |
| Ortalama Intel Core i9-14900HX (19 - 85.1, n=37) | |
| Alienware m16 R1 AMD | |
| Asus ROG Strix Scar 17 G733PYV-LL053X | |
| Asus ROG Strix Scar 17 G733PY-XS96 | |
| R Benchmark 2.5 / Overall mean | |
| Dell G16 7620 | |
| Alienware m17 R5 (R9 6900HX, RX 6850M XT) | |
| MSI Stealth 16 Studio A13VG | |
| Asus ROG Strix G18 G814JI | |
| MSI Raider GE68 HX 13VG, i7-13700HX | |
| Asus TUF Gaming A17 FA707XI-NS94 | |
| Alienware m16 R1 AMD | |
| Asus ROG Strix Scar 17 G733PYV-LL053X | |
| Asus ROG Strix Scar 17 G733PY-XS96 | |
| MSI Titan GT77 HX 13VI | |
| Acer Predator Helios 18 N23Q2 | |
| Razer Blade 18 RTX 4070 | |
| Alienware m18 R1 | |
| MSI Titan 18 HX A14VIG | |
| Ortalama Intel Core i9-14900HX (0.3604 - 0.4859, n=37) | |
Cinebench R23: Multi Core | Single Core
Cinebench R20: CPU (Multi Core) | CPU (Single Core)
Cinebench R15: CPU Multi 64Bit | CPU Single 64Bit
Blender: v2.79 BMW27 CPU
7-Zip 18.03: 7z b 4 | 7z b 4 -mmt1
Geekbench 6.7: Multi-Core | Single-Core
Geekbench 5.5: Multi-Core | Single-Core
HWBOT x265 Benchmark v2.2: 4k Preset
LibreOffice : 20 Documents To PDF
R Benchmark 2.5: Overall mean
* ... daha küçük daha iyidir
AIDA64: FP32 Ray-Trace | FPU Julia | CPU SHA3 | CPU Queen | FPU SinJulia | FPU Mandel | CPU AES | CPU ZLib | FP64 Ray-Trace | CPU PhotoWorxx
| Performance rating | |
| Alienware m18 R1 | |
| Acer Predator Helios 18 N23Q2 | |
| MSI Titan 18 HX A14VIG | |
| MSI Titan GT77 HX 13VI | |
| Razer Blade 18 RTX 4070 | |
| Ortalama Intel Core i9-14900HX | |
| Asus ROG Strix G18 G814JI | |
| AIDA64 / FP32 Ray-Trace | |
| Alienware m18 R1 | |
| MSI Titan 18 HX A14VIG | |
| MSI Titan GT77 HX 13VI | |
| Acer Predator Helios 18 N23Q2 | |
| Razer Blade 18 RTX 4070 | |
| Ortalama Intel Core i9-14900HX (13098 - 33474, n=36) | |
| Asus ROG Strix G18 G814JI | |
| AIDA64 / FPU Julia | |
| MSI Titan 18 HX A14VIG | |
| Alienware m18 R1 | |
| MSI Titan GT77 HX 13VI | |
| Acer Predator Helios 18 N23Q2 | |
| Razer Blade 18 RTX 4070 | |
| Ortalama Intel Core i9-14900HX (67573 - 166040, n=36) | |
| Asus ROG Strix G18 G814JI | |
| AIDA64 / CPU SHA3 | |
| MSI Titan 18 HX A14VIG | |
| Alienware m18 R1 | |
| MSI Titan GT77 HX 13VI | |
| Acer Predator Helios 18 N23Q2 | |
| Razer Blade 18 RTX 4070 | |
| Ortalama Intel Core i9-14900HX (3589 - 7979, n=36) | |
| Asus ROG Strix G18 G814JI | |
| AIDA64 / CPU Queen | |
| MSI Titan 18 HX A14VIG | |
| Alienware m18 R1 | |
| MSI Titan GT77 HX 13VI | |
| Ortalama Intel Core i9-14900HX (118405 - 148966, n=36) | |
| Razer Blade 18 RTX 4070 | |
| Acer Predator Helios 18 N23Q2 | |
| Asus ROG Strix G18 G814JI | |
| AIDA64 / FPU SinJulia | |
| MSI Titan 18 HX A14VIG | |
| MSI Titan GT77 HX 13VI | |
| Alienware m18 R1 | |
| Razer Blade 18 RTX 4070 | |
| Acer Predator Helios 18 N23Q2 | |
| Ortalama Intel Core i9-14900HX (10475 - 18517, n=36) | |
| Asus ROG Strix G18 G814JI | |
| AIDA64 / FPU Mandel | |
| Alienware m18 R1 | |
| MSI Titan 18 HX A14VIG | |
| MSI Titan GT77 HX 13VI | |
| Acer Predator Helios 18 N23Q2 | |
| Razer Blade 18 RTX 4070 | |
| Ortalama Intel Core i9-14900HX (32543 - 83662, n=36) | |
| Asus ROG Strix G18 G814JI | |
| AIDA64 / CPU AES | |
| Acer Predator Helios 18 N23Q2 | |
| Ortalama Intel Core i9-14900HX (86964 - 241777, n=36) | |
| MSI Titan 18 HX A14VIG | |
| MSI Titan GT77 HX 13VI | |
| Alienware m18 R1 | |
| Razer Blade 18 RTX 4070 | |
| Asus ROG Strix G18 G814JI | |
| AIDA64 / CPU ZLib | |
| MSI Titan 18 HX A14VIG | |
| MSI Titan GT77 HX 13VI | |
| Alienware m18 R1 | |
| Acer Predator Helios 18 N23Q2 | |
| Razer Blade 18 RTX 4070 | |
| Ortalama Intel Core i9-14900HX (1054 - 2292, n=36) | |
| Asus ROG Strix G18 G814JI | |
| AIDA64 / FP64 Ray-Trace | |
| Alienware m18 R1 | |
| MSI Titan 18 HX A14VIG | |
| MSI Titan GT77 HX 13VI | |
| Acer Predator Helios 18 N23Q2 | |
| Razer Blade 18 RTX 4070 | |
| Ortalama Intel Core i9-14900HX (6809 - 18349, n=36) | |
| Asus ROG Strix G18 G814JI | |
| AIDA64 / CPU PhotoWorxx | |
| Alienware m18 R1 | |
| Acer Predator Helios 18 N23Q2 | |
| Razer Blade 18 RTX 4070 | |
| Ortalama Intel Core i9-14900HX (23903 - 54702, n=36) | |
| Asus ROG Strix G18 G814JI | |
| MSI Titan GT77 HX 13VI | |
| MSI Titan 18 HX A14VIG | |
Sistem Performansı
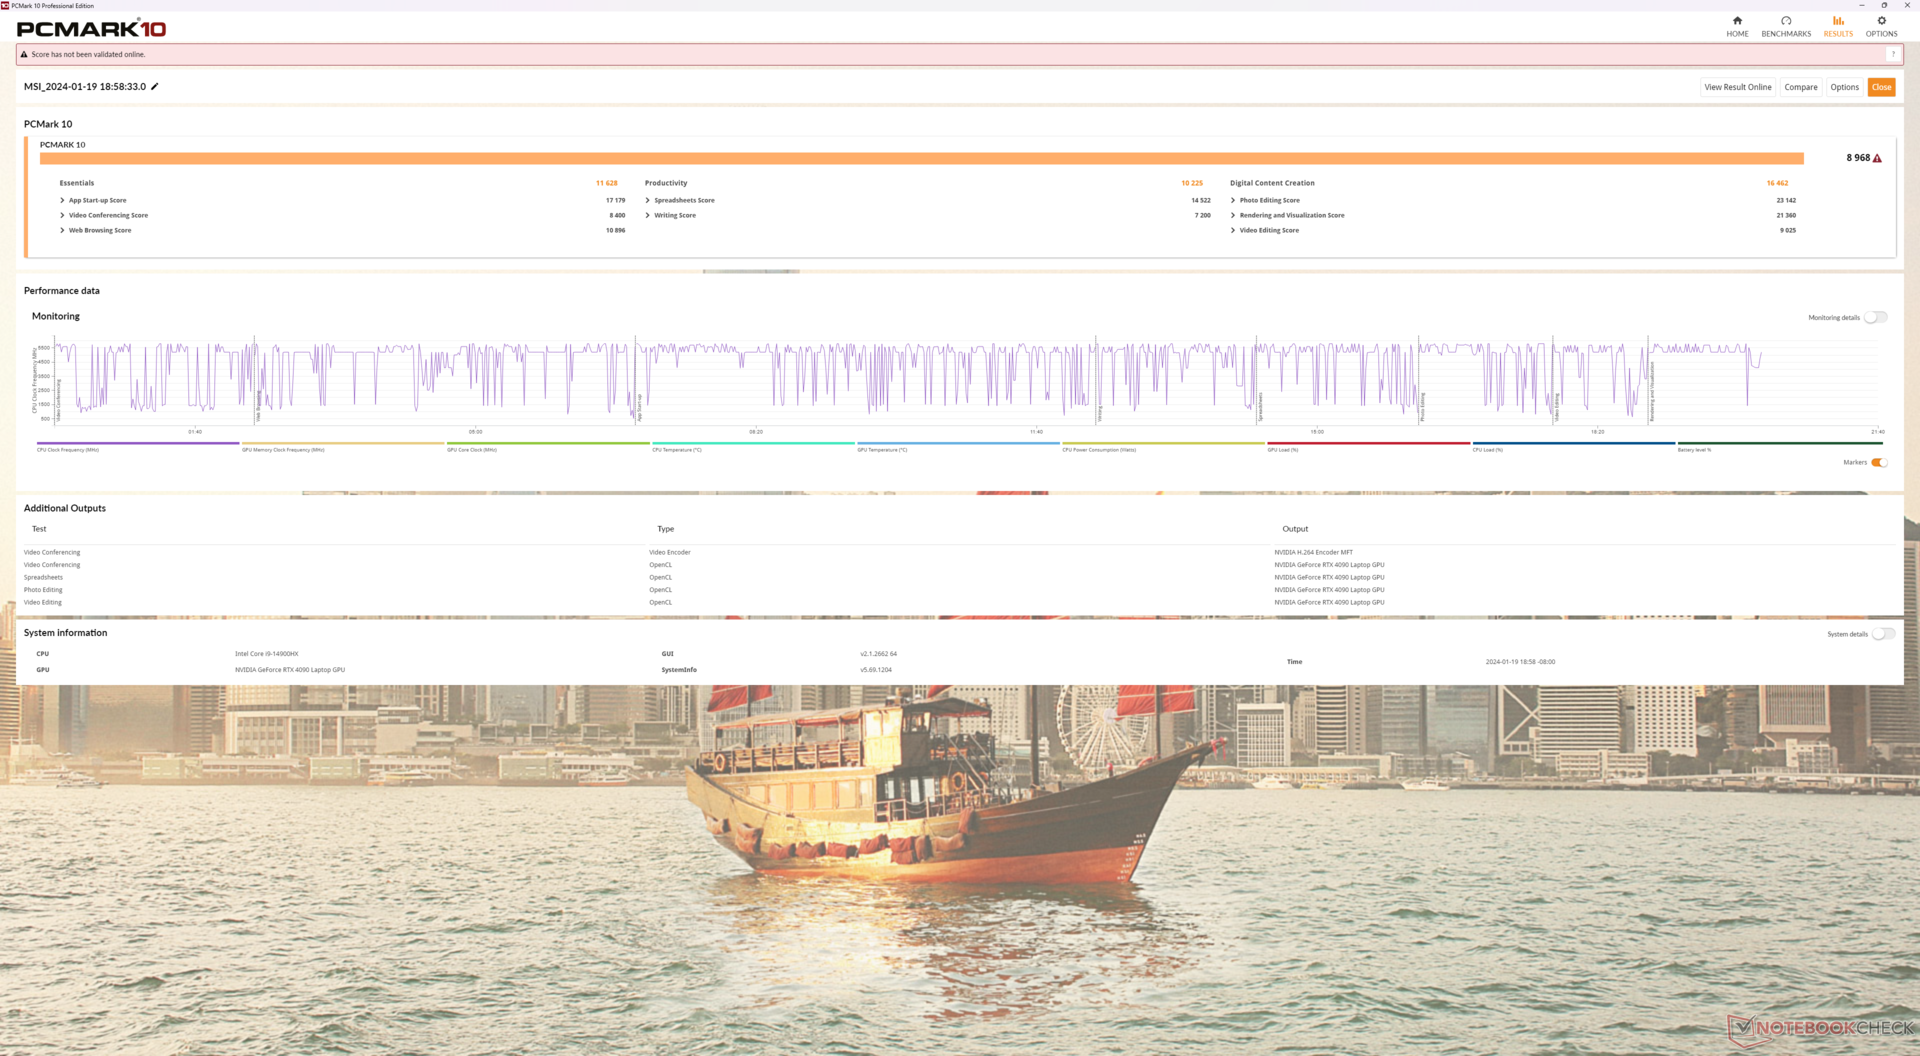
PCMark sonuçları geçen yılki GT77'nin sadece birkaç yüzde puanı dahilinde olup, günlük görevleri yerine getirirken CPU'ları ve GPU'ları arasında önemli bir performans farkı olmadığını göstermektedir.
RAM performansının 128 GB'lık konfigürasyonumuzda 32 GB'lık konfigürasyona kıyasla yüzde 30 ila 40'a kadar daha yavaş olduğunu unutmayın Alienware m18 R1. Daha yüksek kapasitelerdeki RAM performansı eskiyen SODIMM arayüzü tarafından sınırlandırıldığı için bu beklenen bir durumdur.
CrossMark: Overall | Productivity | Creativity | Responsiveness
WebXPRT 3: Overall
WebXPRT 4: Overall
Mozilla Kraken 1.1: Total
| PCMark 10 / Score | |
| MSI Titan 18 HX A14VIG | |
| MSI Titan GT77 HX 13VI | |
| Alienware m18 R1 | |
| Ortalama Intel Core i9-14900HX, NVIDIA GeForce RTX 4090 Laptop GPU (8230 - 9234, n=13) | |
| Acer Predator Helios 18 N23Q2 | |
| Razer Blade 18 RTX 4070 | |
| Asus ROG Strix G18 G814JI | |
| PCMark 10 / Essentials | |
| MSI Titan GT77 HX 13VI | |
| Razer Blade 18 RTX 4070 | |
| MSI Titan 18 HX A14VIG | |
| Alienware m18 R1 | |
| Ortalama Intel Core i9-14900HX, NVIDIA GeForce RTX 4090 Laptop GPU (10778 - 11628, n=13) | |
| Acer Predator Helios 18 N23Q2 | |
| Asus ROG Strix G18 G814JI | |
| PCMark 10 / Productivity | |
| Ortalama Intel Core i9-14900HX, NVIDIA GeForce RTX 4090 Laptop GPU (9458 - 11759, n=13) | |
| Acer Predator Helios 18 N23Q2 | |
| MSI Titan 18 HX A14VIG | |
| Alienware m18 R1 | |
| MSI Titan GT77 HX 13VI | |
| Razer Blade 18 RTX 4070 | |
| Asus ROG Strix G18 G814JI | |
| PCMark 10 / Digital Content Creation | |
| MSI Titan 18 HX A14VIG | |
| MSI Titan GT77 HX 13VI | |
| Alienware m18 R1 | |
| Ortalama Intel Core i9-14900HX, NVIDIA GeForce RTX 4090 Laptop GPU (13219 - 16462, n=13) | |
| Acer Predator Helios 18 N23Q2 | |
| Razer Blade 18 RTX 4070 | |
| Asus ROG Strix G18 G814JI | |
| CrossMark / Overall | |
| Acer Predator Helios 18 N23Q2 | |
| Alienware m18 R1 | |
| MSI Titan GT77 HX 13VI | |
| Razer Blade 18 RTX 4070 | |
| Ortalama Intel Core i9-14900HX, NVIDIA GeForce RTX 4090 Laptop GPU (1877 - 2344, n=10) | |
| MSI Titan 18 HX A14VIG | |
| CrossMark / Productivity | |
| Acer Predator Helios 18 N23Q2 | |
| Alienware m18 R1 | |
| MSI Titan GT77 HX 13VI | |
| Razer Blade 18 RTX 4070 | |
| Ortalama Intel Core i9-14900HX, NVIDIA GeForce RTX 4090 Laptop GPU (1738 - 2162, n=10) | |
| MSI Titan 18 HX A14VIG | |
| CrossMark / Creativity | |
| Alienware m18 R1 | |
| MSI Titan GT77 HX 13VI | |
| Acer Predator Helios 18 N23Q2 | |
| Razer Blade 18 RTX 4070 | |
| Ortalama Intel Core i9-14900HX, NVIDIA GeForce RTX 4090 Laptop GPU (2195 - 2660, n=10) | |
| MSI Titan 18 HX A14VIG | |
| CrossMark / Responsiveness | |
| Acer Predator Helios 18 N23Q2 | |
| Alienware m18 R1 | |
| Razer Blade 18 RTX 4070 | |
| Ortalama Intel Core i9-14900HX, NVIDIA GeForce RTX 4090 Laptop GPU (1478 - 2327, n=10) | |
| MSI Titan GT77 HX 13VI | |
| MSI Titan 18 HX A14VIG | |
| WebXPRT 3 / Overall | |
| Razer Blade 18 RTX 4070 | |
| Alienware m18 R1 | |
| MSI Titan 18 HX A14VIG | |
| Ortalama Intel Core i9-14900HX, NVIDIA GeForce RTX 4090 Laptop GPU (279 - 339, n=10) | |
| MSI Titan GT77 HX 13VI | |
| Acer Predator Helios 18 N23Q2 | |
| Asus ROG Strix G18 G814JI | |
| Asus ROG Strix G18 G814JI | |
| WebXPRT 4 / Overall | |
| Alienware m18 R1 | |
| Razer Blade 18 RTX 4070 | |
| MSI Titan GT77 HX 13VI | |
| Ortalama Intel Core i9-14900HX, NVIDIA GeForce RTX 4090 Laptop GPU (246 - 309, n=8) | |
| MSI Titan 18 HX A14VIG | |
| Asus ROG Strix G18 G814JI | |
| Asus ROG Strix G18 G814JI | |
| Mozilla Kraken 1.1 / Total | |
| Asus ROG Strix G18 G814JI | |
| Asus ROG Strix G18 G814JI | |
| MSI Titan GT77 HX 13VI | |
| Razer Blade 18 RTX 4070 | |
| Alienware m18 R1 | |
| Acer Predator Helios 18 N23Q2 | |
| Ortalama Intel Core i9-14900HX, NVIDIA GeForce RTX 4090 Laptop GPU (428 - 535, n=11) | |
| MSI Titan 18 HX A14VIG | |
* ... daha küçük daha iyidir
| PCMark 10 Score | 8968 puan | |
Yardım | ||
| AIDA64 / Memory Copy | |
| Alienware m18 R1 | |
| Acer Predator Helios 18 N23Q2 | |
| Razer Blade 18 RTX 4070 | |
| Ortalama Intel Core i9-14900HX (38028 - 83392, n=36) | |
| Asus ROG Strix G18 G814JI | |
| MSI Titan GT77 HX 13VI | |
| MSI Titan 18 HX A14VIG | |
| AIDA64 / Memory Read | |
| Alienware m18 R1 | |
| Acer Predator Helios 18 N23Q2 | |
| Razer Blade 18 RTX 4070 | |
| Ortalama Intel Core i9-14900HX (43306 - 87568, n=36) | |
| Asus ROG Strix G18 G814JI | |
| MSI Titan GT77 HX 13VI | |
| MSI Titan 18 HX A14VIG | |
| AIDA64 / Memory Write | |
| Alienware m18 R1 | |
| Razer Blade 18 RTX 4070 | |
| Acer Predator Helios 18 N23Q2 | |
| Ortalama Intel Core i9-14900HX (37146 - 80589, n=36) | |
| MSI Titan GT77 HX 13VI | |
| Asus ROG Strix G18 G814JI | |
| MSI Titan 18 HX A14VIG | |
| AIDA64 / Memory Latency | |
| MSI Titan 18 HX A14VIG | |
| MSI Titan GT77 HX 13VI | |
| Ortalama Intel Core i9-14900HX (76.1 - 105, n=36) | |
| Razer Blade 18 RTX 4070 | |
| Asus ROG Strix G18 G814JI | |
| Acer Predator Helios 18 N23Q2 | |
| Alienware m18 R1 | |
* ... daha küçük daha iyidir
DPC Gecikme Süresi
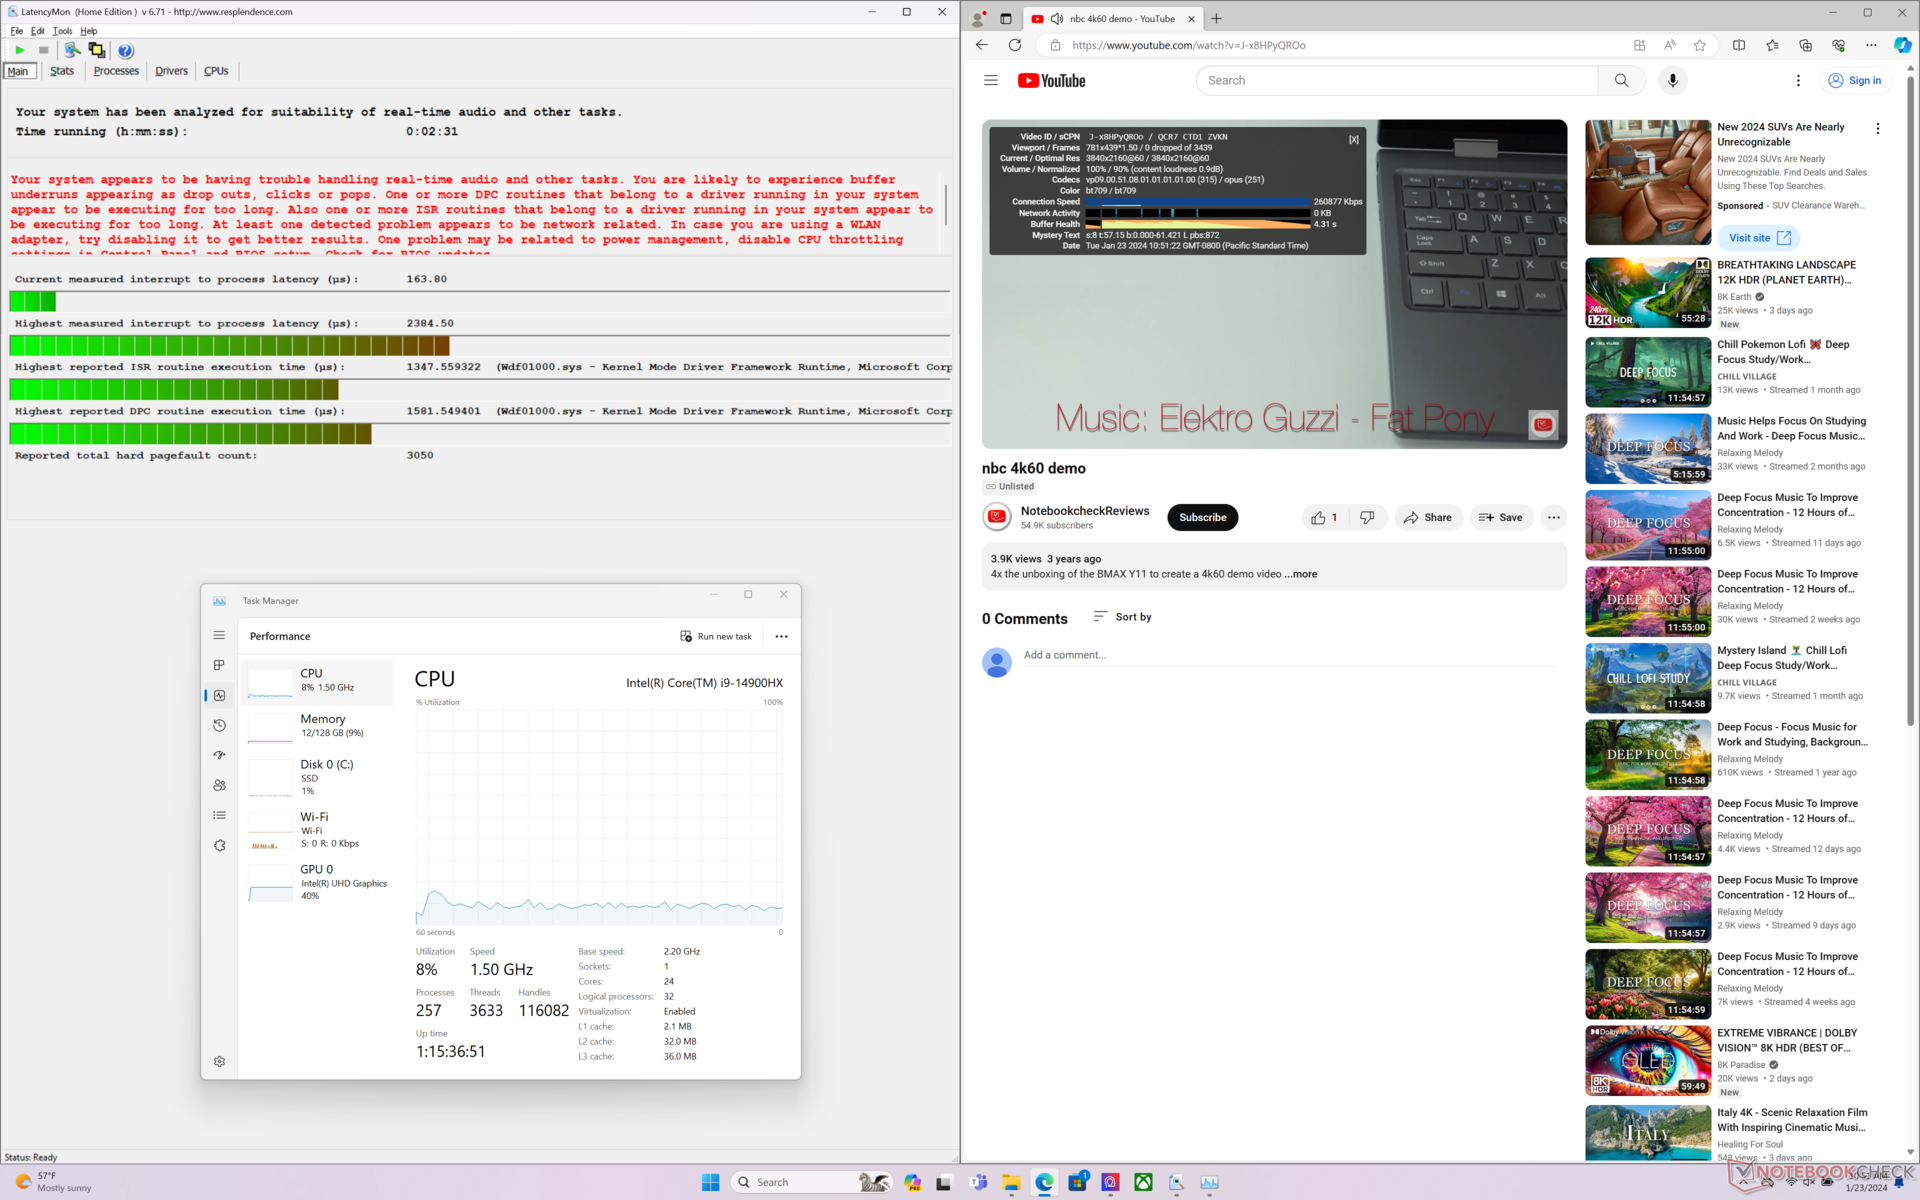
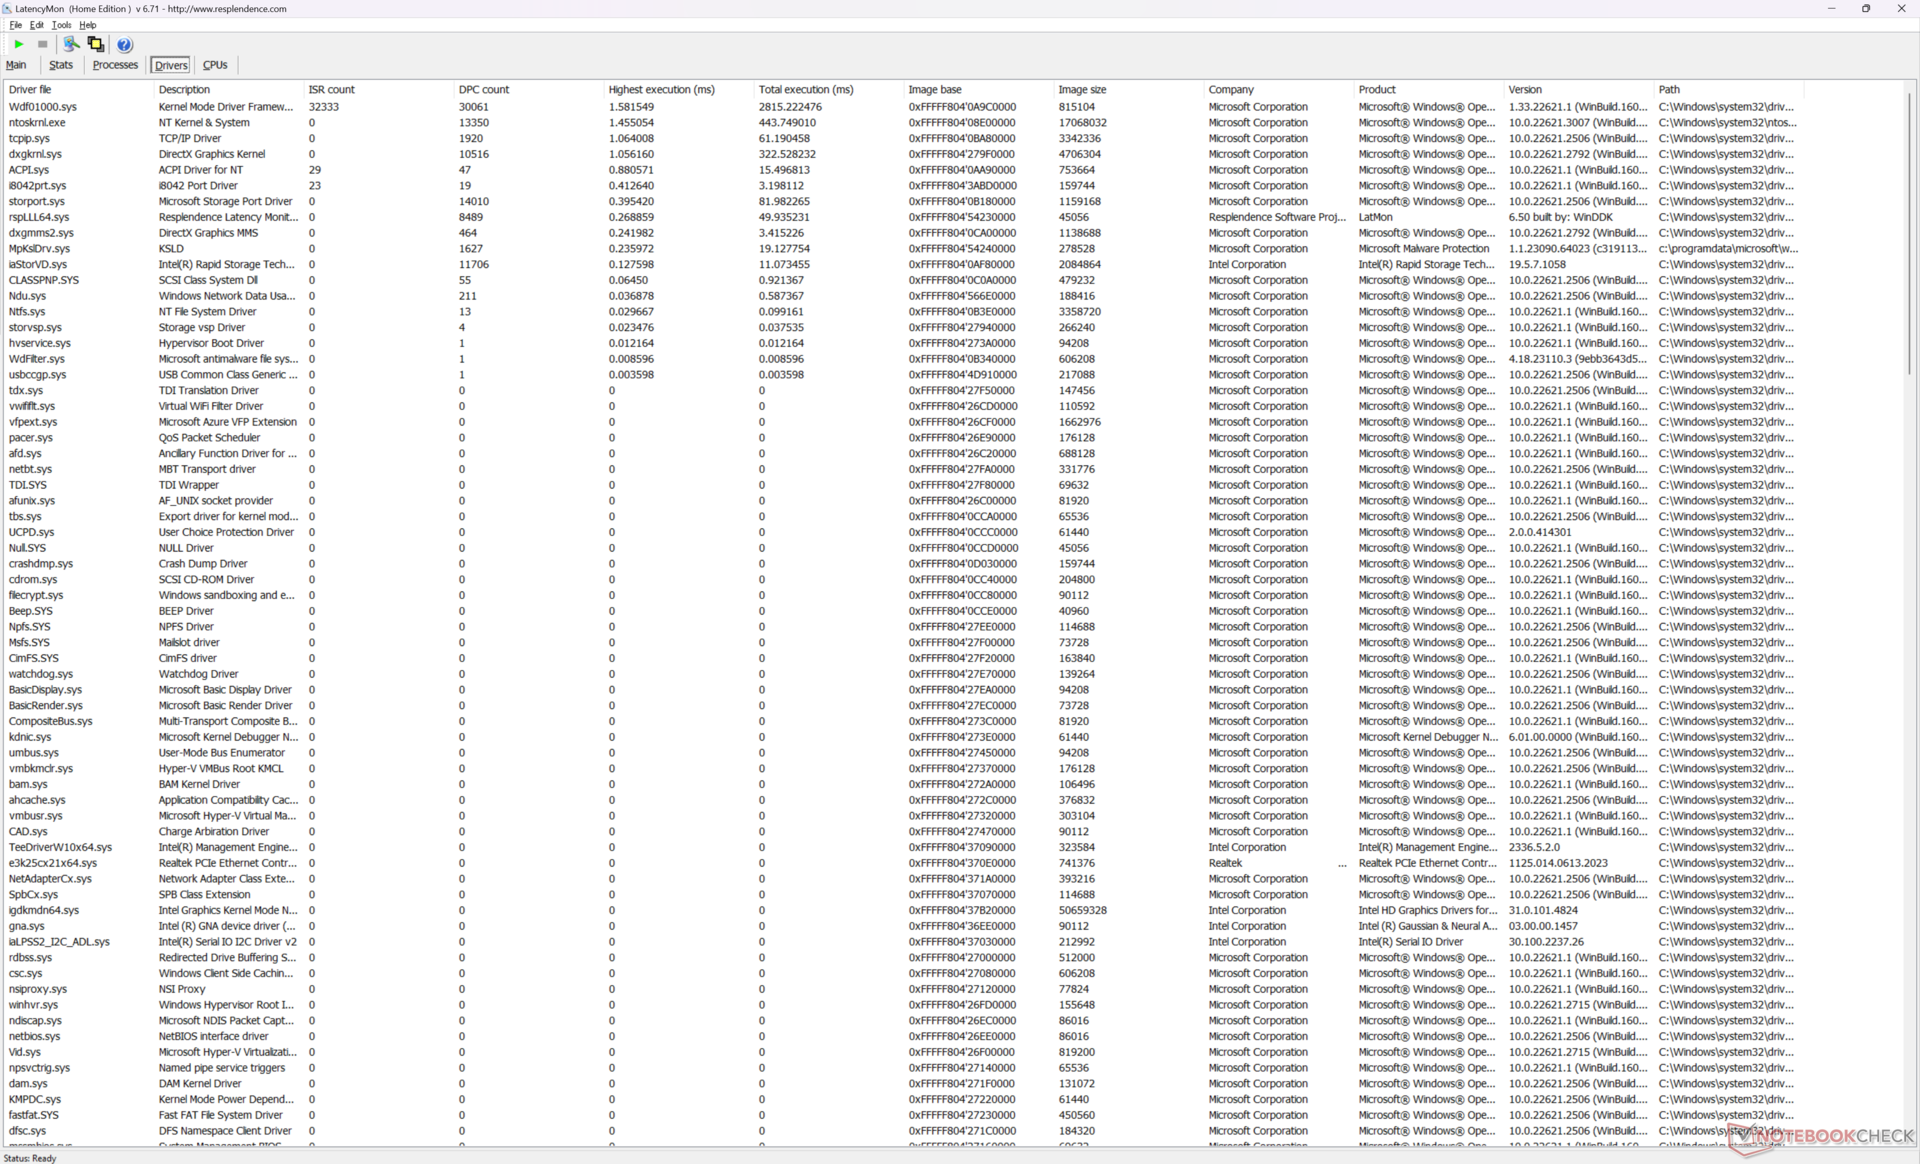
LatencyMon, ana sayfamızın birden fazla tarayıcı sekmesini açarken DPC sorunları gösteriyor. iGPU modunda 60 FPS'de 4K video oynatma, kaydedilen hiçbir kare düşmesi olmadan mükemmeldir.
| DPC Latencies / LatencyMon - interrupt to process latency (max), Web, Youtube, Prime95 | |
| Acer Predator Helios 18 N23Q2 | |
| MSI Titan GT77 HX 13VI | |
| Alienware m18 R1 | |
| MSI Titan 18 HX A14VIG | |
| Razer Blade 18 RTX 4070 | |
| Asus ROG Strix G18 G814JI | |
* ... daha küçük daha iyidir
Depolama Cihazları
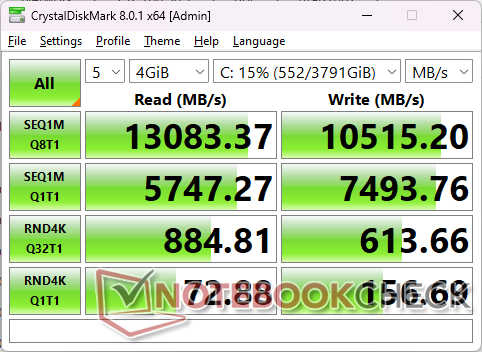
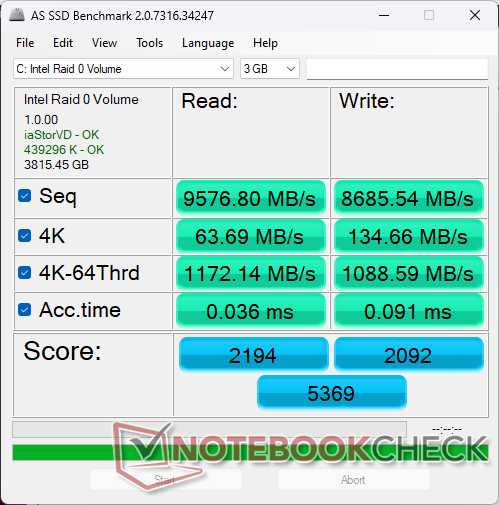
Ünitemiz iki adet Samsung MZVL22T0HDLB PM9A1a PCIe4 x4 NVMe SSD'ler RAID 0 konfigürasyonunda, çoğu tek PCIe4 x4 SSD için normal ~7000 MB/sn yerine 13000 MB/sn'ye yaklaşan aktarım hızlarına ulaşmıştır. Sürücüler, DiskSpd altında birkaç dakika boyunca zorlandığında herhangi bir yavaşlama sorunu göstermez.
Titan 18 HX, tek bir PCIe5 M.2 SSD'yi de destekleyebilir, ancak bu tür sürücüler stoklarla sınırlıdır ve bu nedenle şu anda çoğu yapılandırma bunun yerine PCIe4 x4 sürücülerle birlikte gönderilmektedir.

| Drive Performance rating - Percent | |
| Alienware m18 R1 | |
| Acer Predator Helios 18 N23Q2 | |
| Razer Blade 18 RTX 4070 | |
| MSI Titan GT77 HX 13VI | |
| MSI Titan 18 HX A14VIG | |
| Asus ROG Strix G18 G814JI | |
* ... daha küçük daha iyidir
Disk Throttling: DiskSpd Read Loop, Queue Depth 8
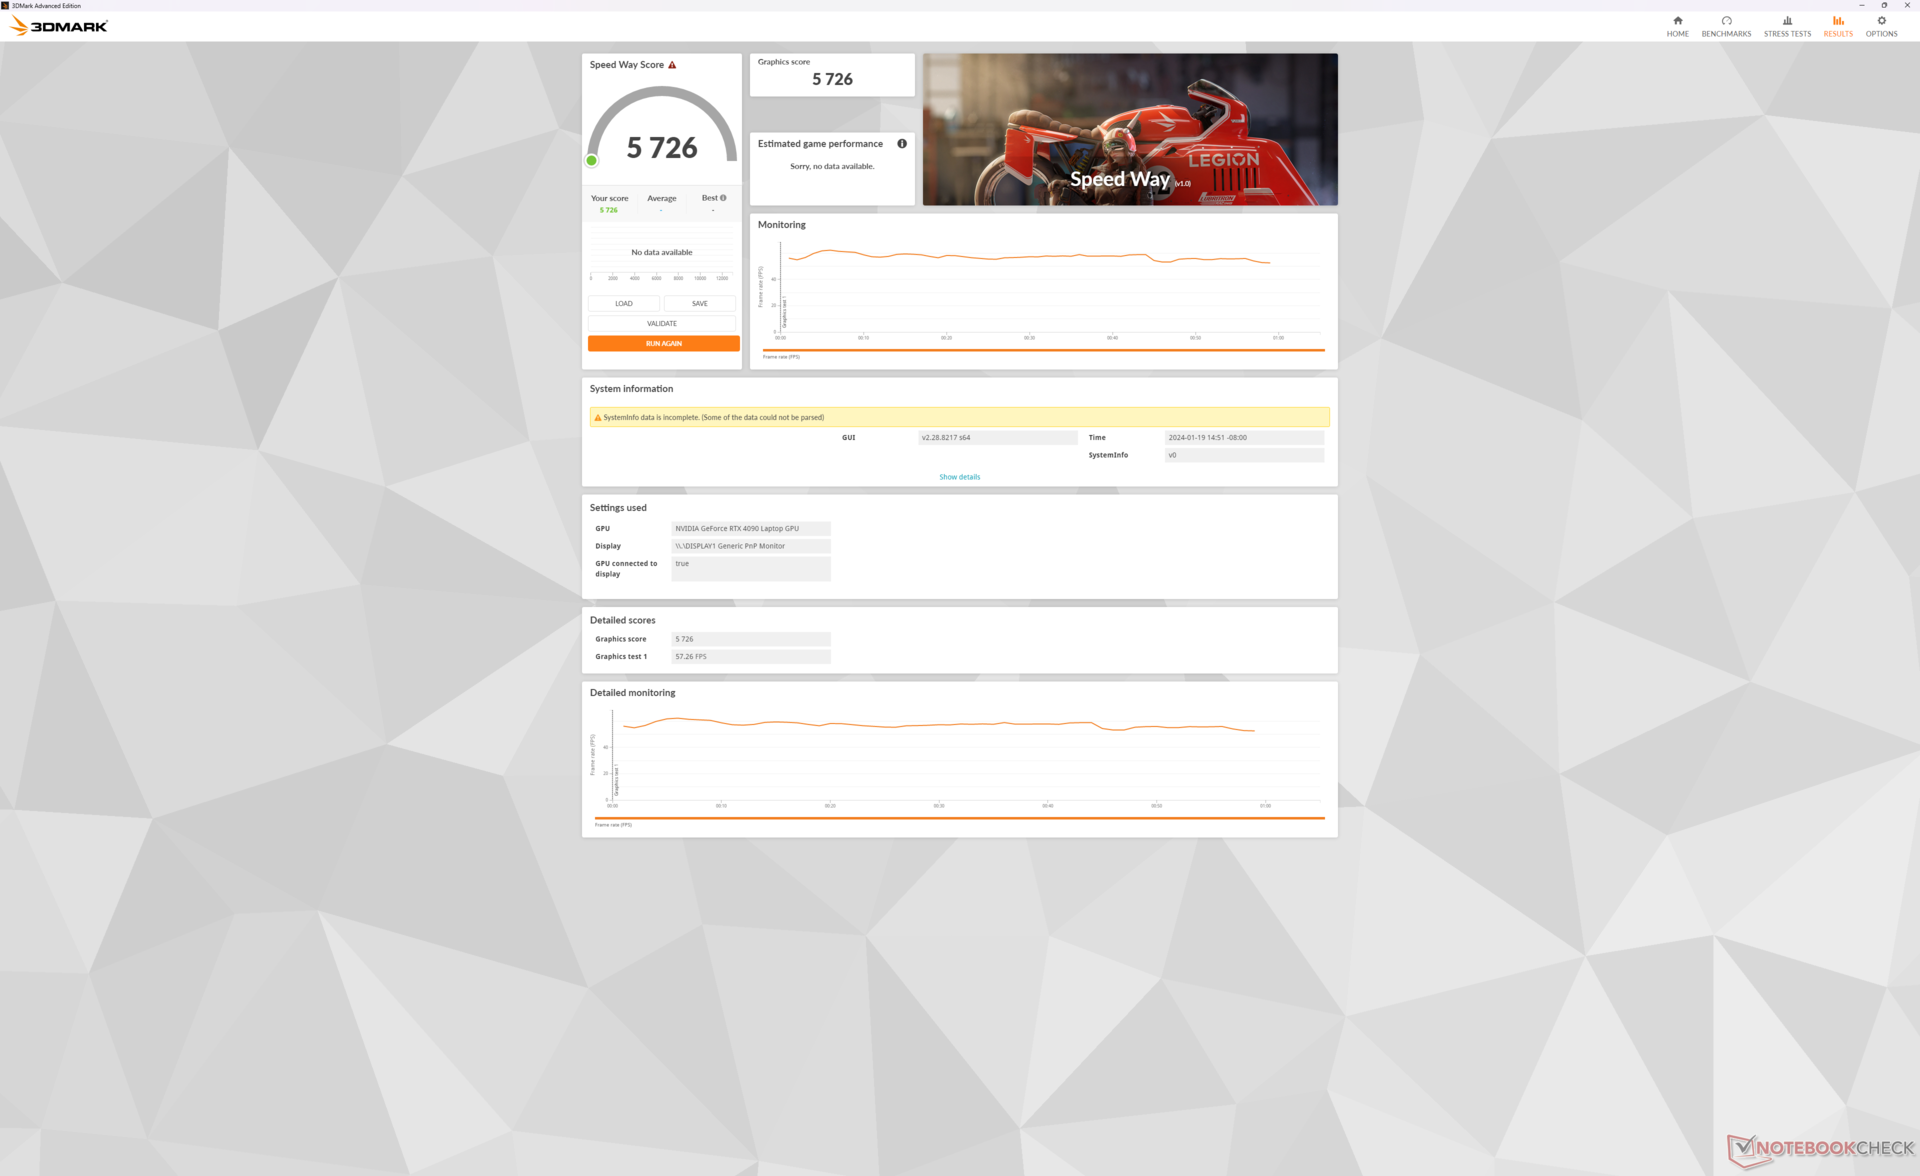
GPU Performansı - 175 W Grafik + 95 W İşlemci
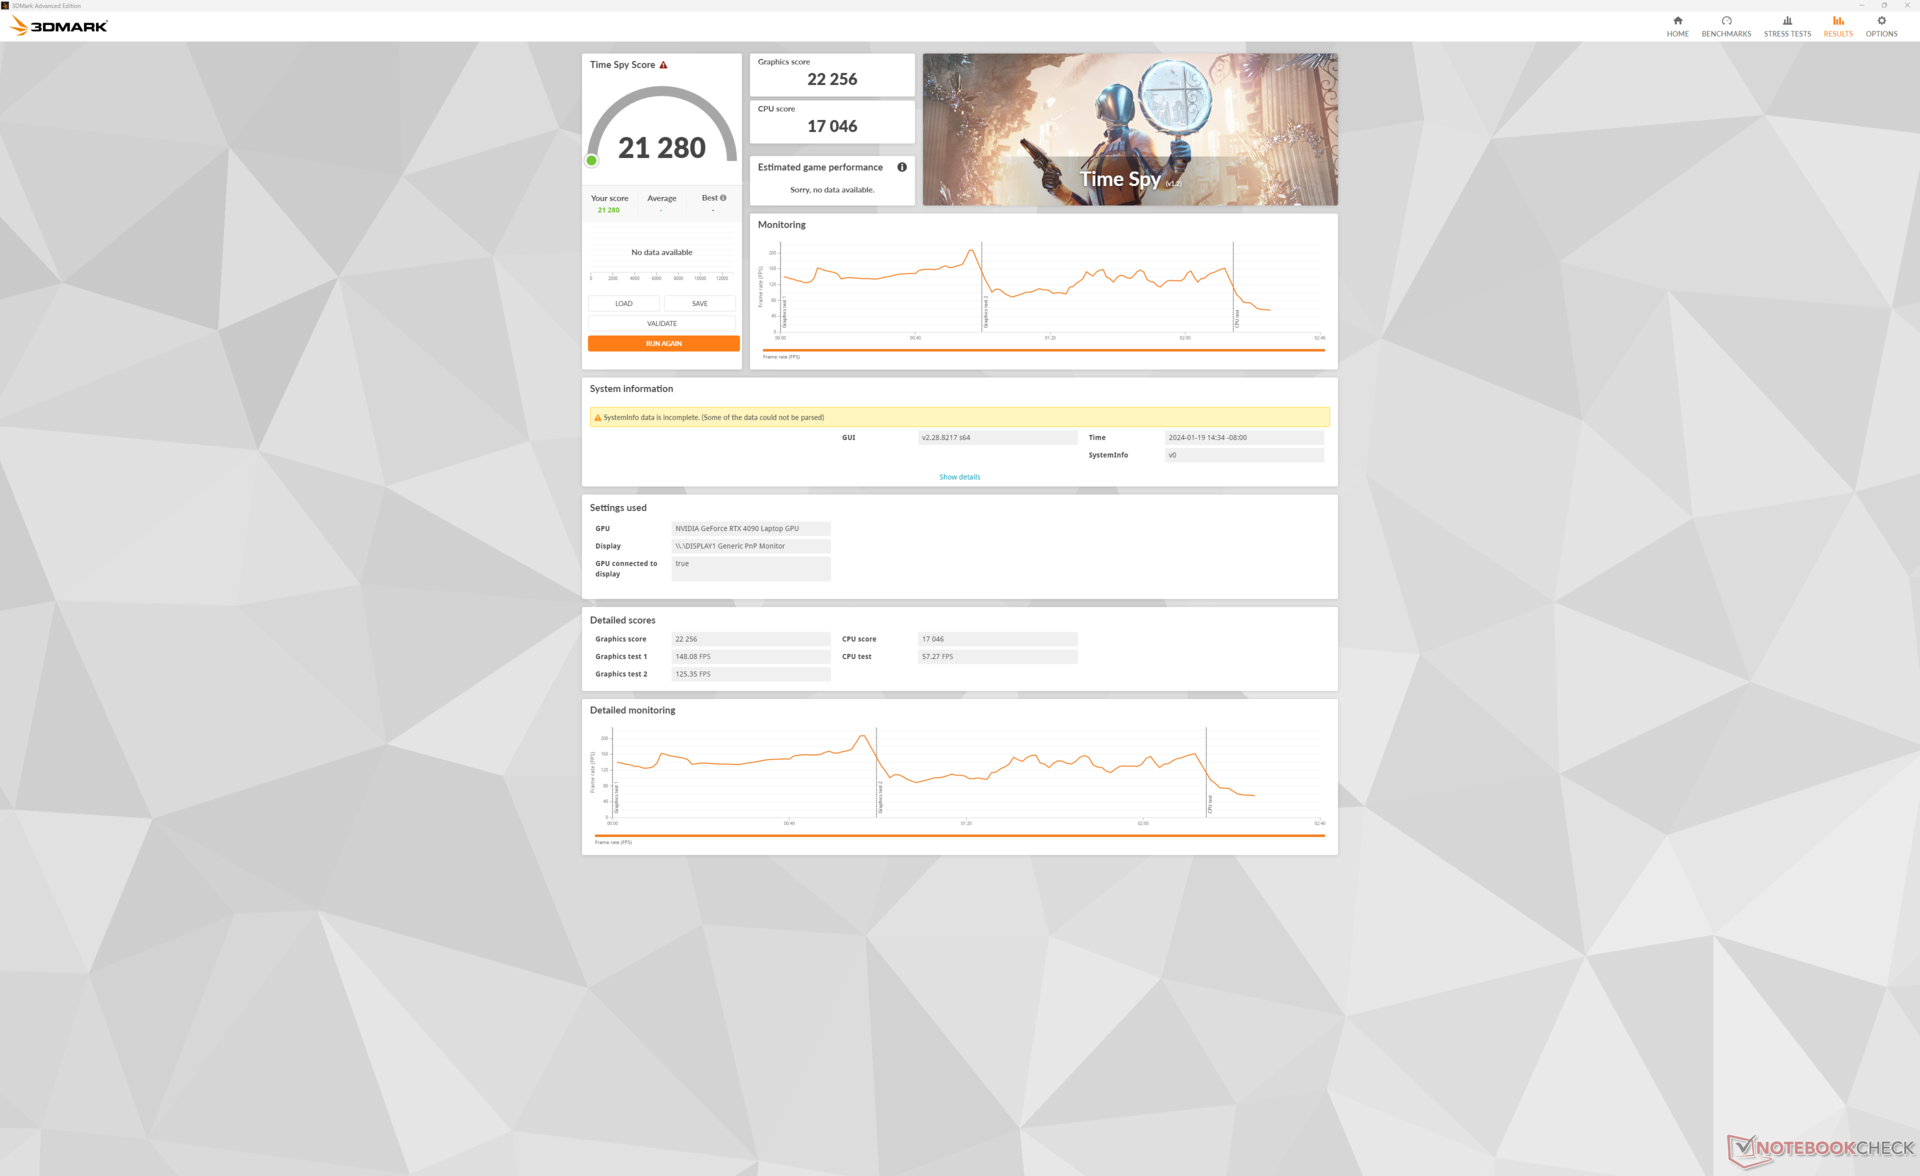
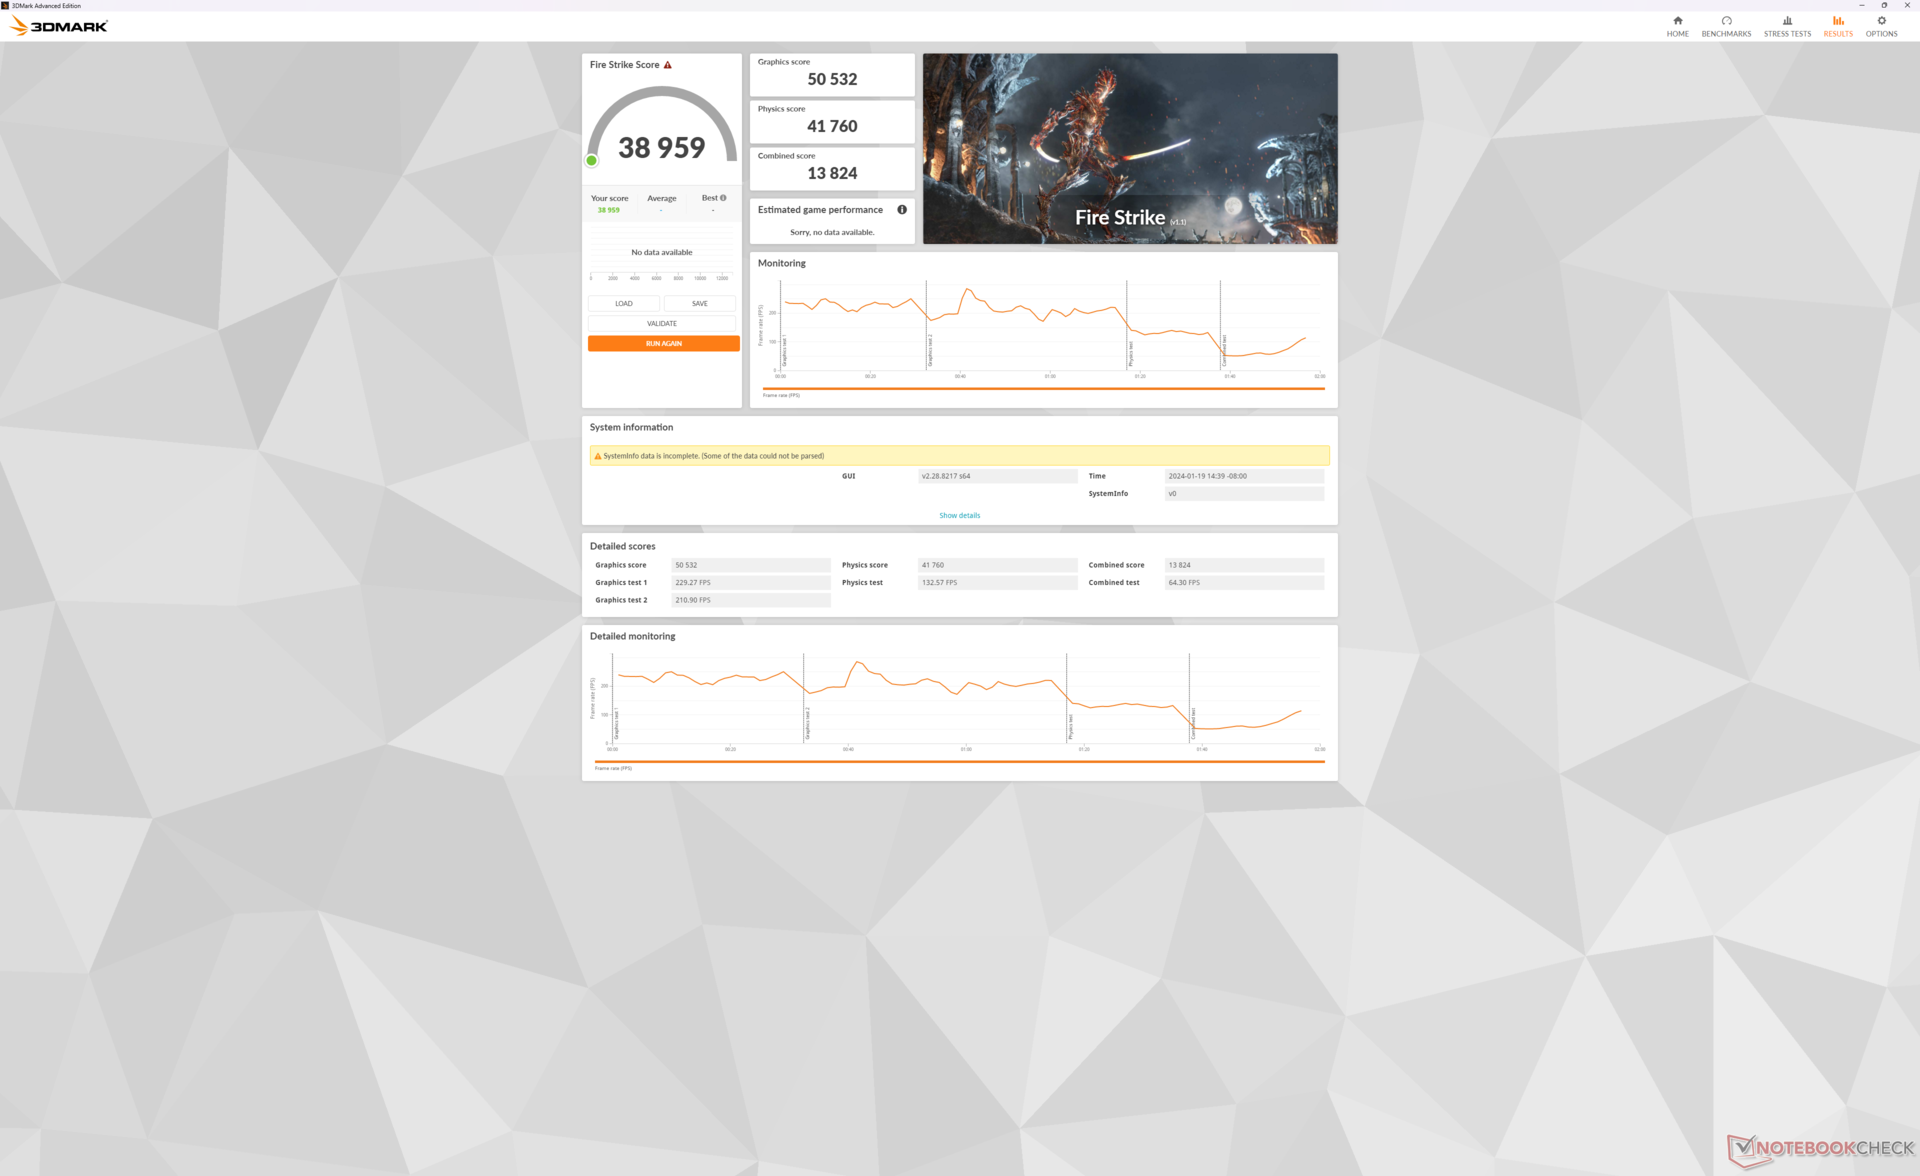
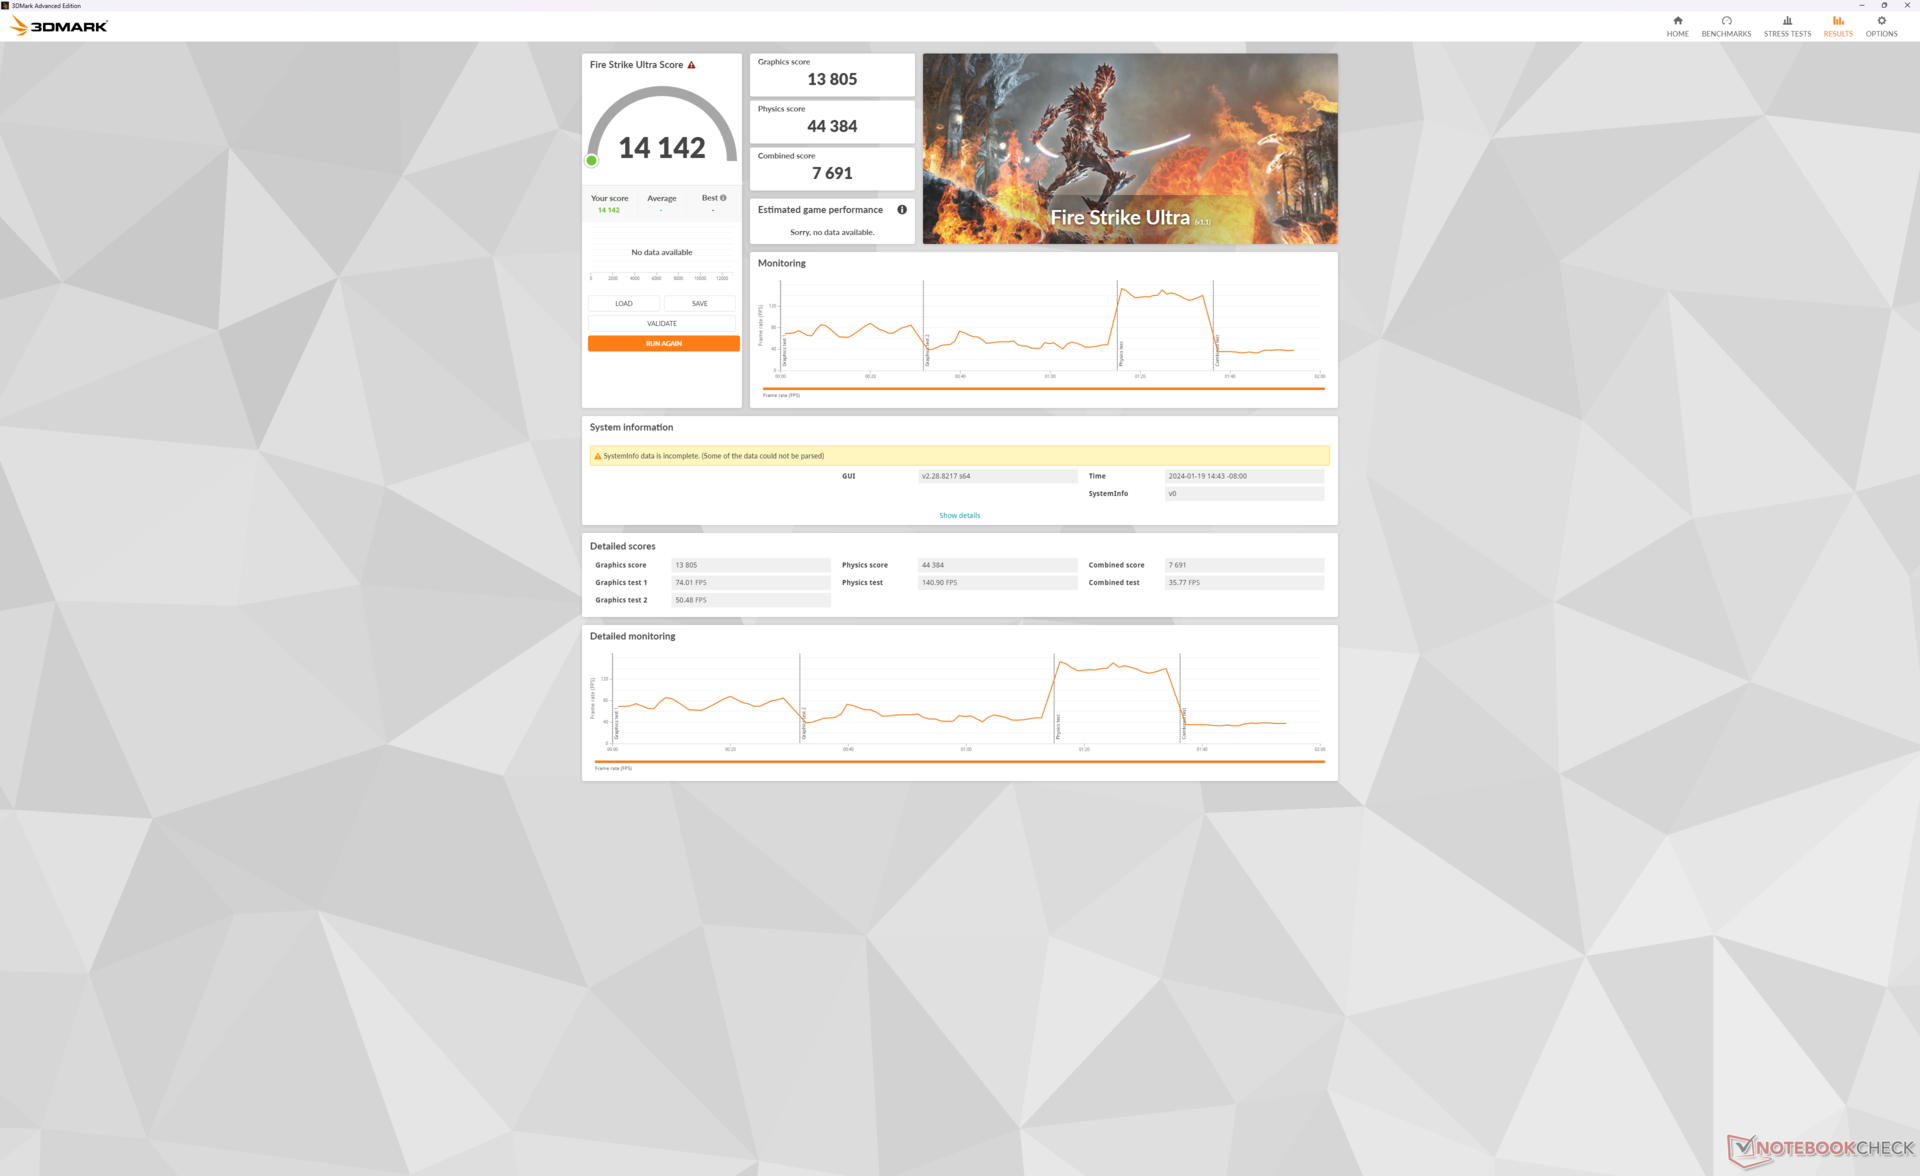
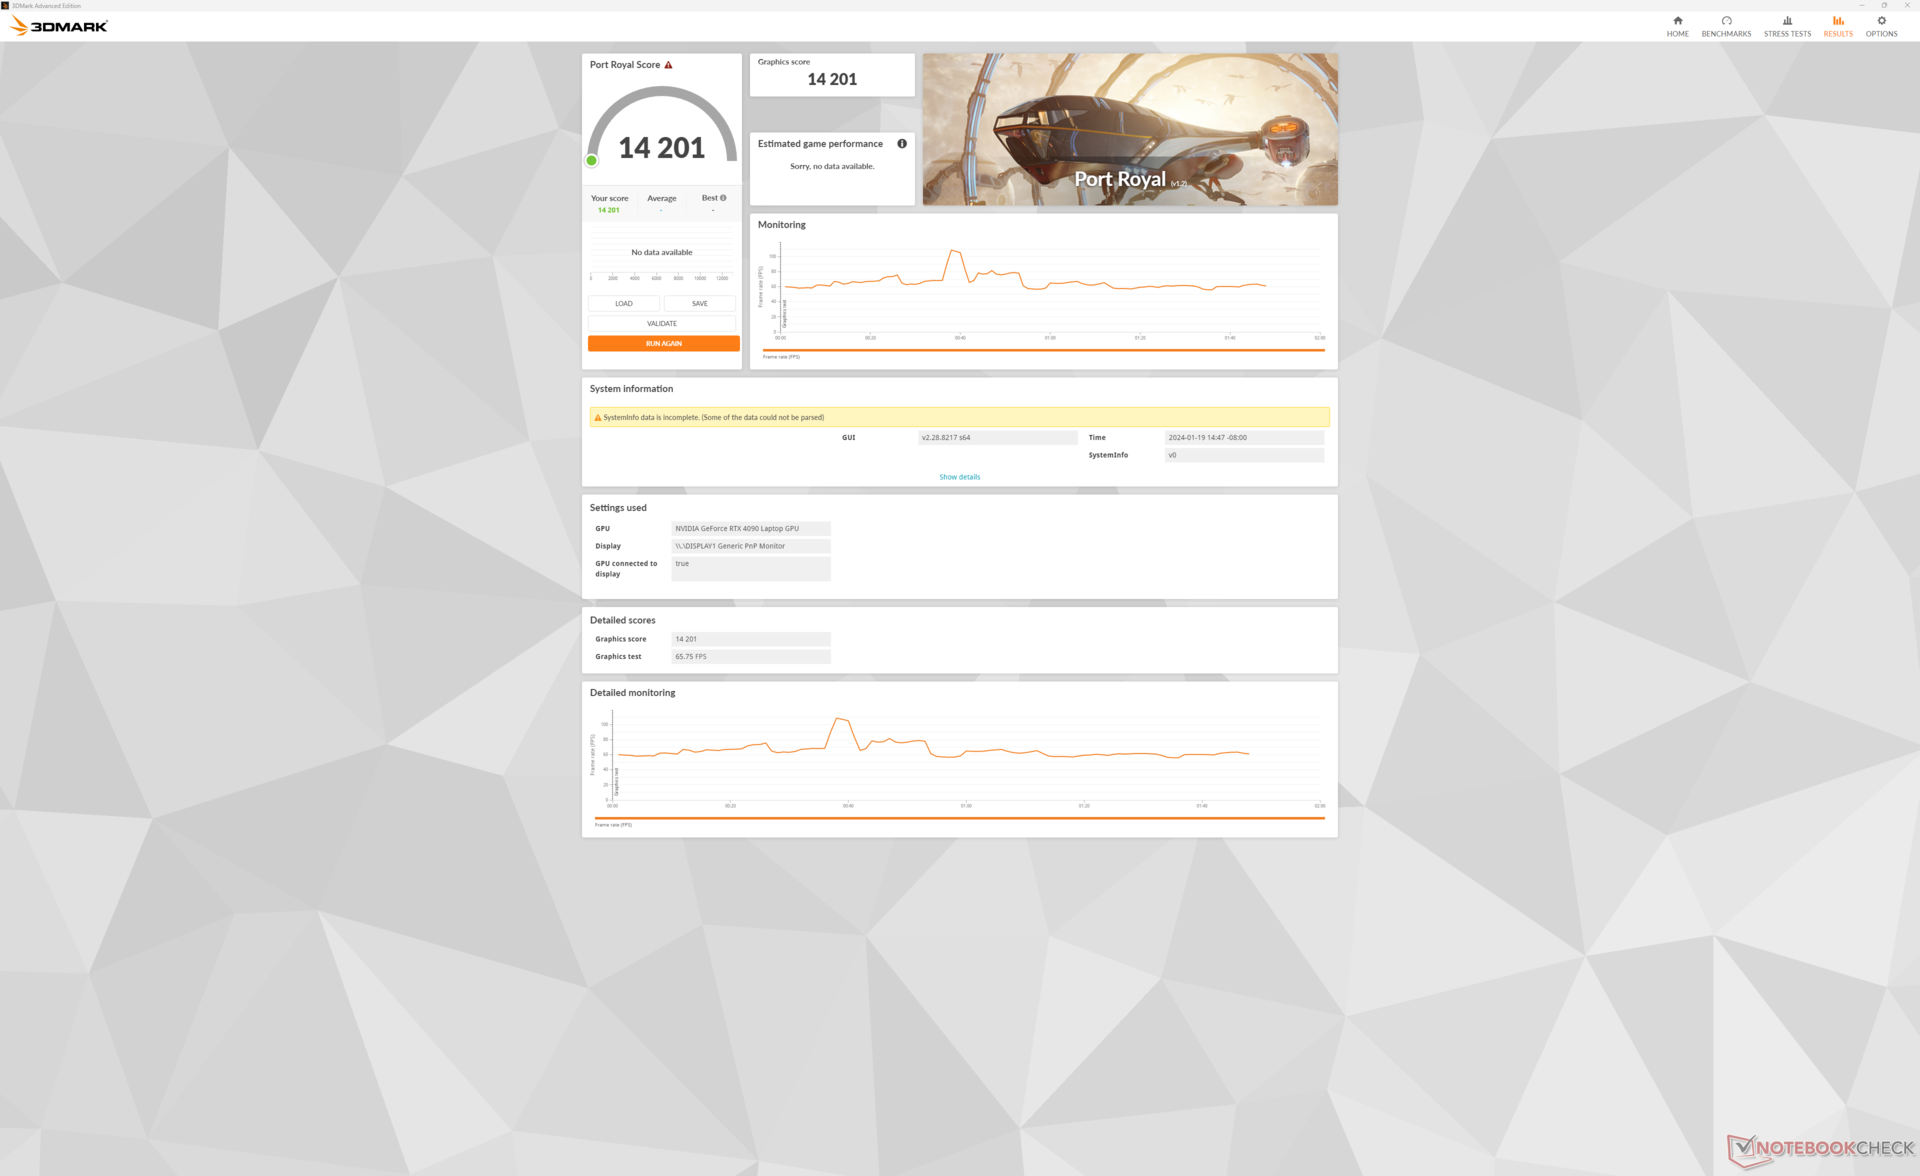
175 W mobil GeForce RTX 4090 Titan 18 HX'imizdeki GPU, geçen yıl aynı GPU ile donatılmış GT77 ile neredeyse aynı 3DMark skorlarını verecektir. Başka bir deyişle, yeni MSI sisteminin yeni süslü dış tasarıma rağmen eskisinden daha hızlı performans göstermesini beklemeyin. Yine de masaüstüne en çok benzeyen performans seviyeleriyle piyasadaki en hızlı oyun dizüstü bilgisayarlarından biri GeForce RTX 4070 Süper.
Cooler Boost'un etkinleştirilmesi veya devre dışı bırakılması, iki mod arasında önemli fan gürültüsü farkları olmasına rağmen, aşağıdaki Time Spy sonuç tablomuzda gösterildiği gibi performansı önemli ölçüde etkilemiyor gibi görünmektedir. Bu nedenle, Cooler Boost yalnızca çekirdek sıcaklıkları endişe vericiyse veya hız aşırtma yapılırken önerilir. Bununla birlikte, Aşırı Performans modu yerine Dengeli modda çalıştırmak grafik performansını yaklaşık yüzde 10 azaltacaktır.
| Güç Profili | Grafik Puanı | CPU Puanı | Toplam Puan |
| Olağanüstü Performans (Cooler Boost açık) | 22256 | 17046 | 21280 |
| Olağanüstü Performans (Cooler Boost kapalı) | 22097 (-1%) | 16608 (-3%) | 21053 (-1%) |
| Dengeli Mod | 20121 (-10%) | 16532 (-3%) | 19486 (-8%) |
| Akü Gücü | 6480 (-71%) | 6999 (-59%) | 6552 (-69%) |
| 3DMark Performance rating - Percent | |
| AMD Ryzen 9 7900 -2! | |
| MSI Titan GT77 HX 13VI | |
| MSI Titan 18 HX A14VIG | |
| NVIDIA GeForce RTX 4070 Super Founders Edition | |
| Ortalama NVIDIA GeForce RTX 4090 Laptop GPU | |
| Alienware m18 R1 AMD -1! | |
| Acer Predator Helios 18 N23Q2 -1! | |
| Asus ROG Strix Scar 17 SE G733CX-LL014W | |
| Alienware m17 R5 (R9 6900HX, RX 6850M XT) -1! | |
| Razer Blade 18 RTX 4070 | |
| MSI Raider GE68 HX 13VG, i7-13700HX -1! | |
| Asus ROG Strix G18 G814JI -1! | |
| Asus ROG Zephyrus M16 GU603Z -1! | |
| Dell G16 7620 -1! | |
| Lenovo ThinkPad Z16 Gen 2 -1! | |
| 3DMark 11 - 1280x720 Performance GPU | |
| AMD Ryzen 9 7900 | |
| MSI Titan GT77 HX 13VI | |
| NVIDIA GeForce RTX 4070 Super Founders Edition | |
| Ortalama NVIDIA GeForce RTX 4090 Laptop GPU (54073 - 73027, n=42) | |
| MSI Titan 18 HX A14VIG | |
| Alienware m18 R1 AMD | |
| Acer Predator Helios 18 N23Q2 | |
| Asus ROG Strix Scar 17 SE G733CX-LL014W | |
| Alienware m17 R5 (R9 6900HX, RX 6850M XT) | |
| Asus ROG Strix G18 G814JI | |
| MSI Raider GE68 HX 13VG, i7-13700HX | |
| Razer Blade 18 RTX 4070 | |
| Asus ROG Zephyrus M16 GU603Z | |
| Dell G16 7620 | |
| Lenovo ThinkPad Z16 Gen 2 | |
| 3DMark 11 Performance | 46238 puan | |
| 3DMark Fire Strike Score | 38959 puan | |
| 3DMark Time Spy Score | 21280 puan | |
Yardım | ||
* ... daha küçük daha iyidir
Oyun Performansı
Mevcut tüm oyunlar, çoğu ayar maksimumdayken bile mobil RTX 4090'da sorunsuz çalışıyor. Ancak GPU, F1 22 ve Cyberpunk 2077 'nin her birinde ortalama yalnızca 44 FPS ile 4K'da biraz zorlanmaya başlıyor. Bu senaryolarda, özellikle ekran G-Sync'i desteklemediği için DLSS'yi etkinleştirmeniz önerilir. Örneğin, Cyberpunk 2077 'yi doğal 4K ve Ultra RT ayarlarında çalıştırmak sadece 21,6 FPS ortalamasına sahipken, DLSS Auto ve Frame Generation'ı etkinleştirmek ortalamayı 89 FPS'ye yükseltecektir.
| Performance rating - Percent | |
| Alienware m18 R1 | |
| MSI Titan GT77 HX 13VI | |
| MSI Titan 18 HX A14VIG | |
| Acer Predator Helios 18 N23Q2 | |
| Razer Blade 18 RTX 4070 | |
| Asus ROG Strix G18 G814JI | |
| The Witcher 3 - 1920x1080 Ultra Graphics & Postprocessing (HBAO+) | |
| Alienware m18 R1 | |
| MSI Titan 18 HX A14VIG | |
| MSI Titan GT77 HX 13VI | |
| Acer Predator Helios 18 N23Q2 | |
| Asus ROG Strix G18 G814JI | |
| Razer Blade 18 RTX 4070 | |
| GTA V - 1920x1080 Highest AA:4xMSAA + FX AF:16x | |
| Acer Predator Helios 18 N23Q2 | |
| Alienware m18 R1 | |
| MSI Titan GT77 HX 13VI | |
| MSI Titan 18 HX A14VIG | |
| Razer Blade 18 RTX 4070 | |
| Asus ROG Strix G18 G814JI | |
| Final Fantasy XV Benchmark - 1920x1080 High Quality | |
| Alienware m18 R1 | |
| MSI Titan GT77 HX 13VI | |
| MSI Titan 18 HX A14VIG | |
| Acer Predator Helios 18 N23Q2 | |
| Asus ROG Strix G18 G814JI | |
| Razer Blade 18 RTX 4070 | |
| Strange Brigade - 1920x1080 ultra AA:ultra AF:16 | |
| MSI Titan 18 HX A14VIG | |
| MSI Titan GT77 HX 13VI | |
| Alienware m18 R1 | |
| Acer Predator Helios 18 N23Q2 | |
| Asus ROG Strix G18 G814JI | |
| Razer Blade 18 RTX 4070 | |
| Dota 2 Reborn - 1920x1080 ultra (3/3) best looking | |
| Alienware m18 R1 | |
| Acer Predator Helios 18 N23Q2 | |
| MSI Titan GT77 HX 13VI | |
| Razer Blade 18 RTX 4070 | |
| MSI Titan 18 HX A14VIG | |
| Asus ROG Strix G18 G814JI | |
| X-Plane 11.11 - 1920x1080 high (fps_test=3) | |
| Alienware m18 R1 | |
| Acer Predator Helios 18 N23Q2 | |
| Razer Blade 18 RTX 4070 | |
| MSI Titan GT77 HX 13VI | |
| MSI Titan GT77 HX 13VI | |
| MSI Titan 18 HX A14VIG | |
| Asus ROG Strix G18 G814JI | |
| The Witcher 3 | |
| 1920x1080 Ultra Graphics & Postprocessing (HBAO+) | |
| AMD Ryzen 9 7900 | |
| MSI Titan 18 HX A14VIG | |
| MSI Titan GT77 HX 13VI | |
| Ortalama NVIDIA GeForce RTX 4090 Laptop GPU (139.2 - 216, n=35) | |
| NVIDIA GeForce RTX 4070 Super Founders Edition | |
| Acer Predator Helios 18 N23Q2 | |
| Alienware m18 R1 AMD | |
| Alienware m17 R5 (R9 6900HX, RX 6850M XT) | |
| MSI Raider GE68 HX 13VG, i7-13700HX | |
| Asus ROG Strix G18 G814JI | |
| Asus ROG Strix Scar 17 SE G733CX-LL014W | |
| Razer Blade 18 RTX 4070 | |
| Asus ROG Zephyrus M16 GU603Z | |
| Dell G16 7620 | |
| Lenovo ThinkPad Z16 Gen 2 | |
| 3840x2160 High Graphics & Postprocessing (Nvidia HairWorks Off) | |
| AMD Ryzen 9 7900 | |
| MSI Titan 18 HX A14VIG | |
| MSI Titan GT77 HX 13VI | |
| Ortalama NVIDIA GeForce RTX 4090 Laptop GPU (96.3 - 167.6, n=19) | |
| NVIDIA GeForce RTX 4070 Super Founders Edition | |
| Alienware m18 R1 AMD | |
| Razer Blade 18 RTX 4070 | |
| Alienware m17 R5 (R9 6900HX, RX 6850M XT) | |
| Dota 2 Reborn | |
| 1920x1080 ultra (3/3) best looking | |
| AMD Ryzen 9 7900 | |
| NVIDIA GeForce RTX 4070 Super Founders Edition | |
| Acer Predator Helios 18 N23Q2 | |
| MSI Titan GT77 HX 13VI | |
| Razer Blade 18 RTX 4070 | |
| Ortalama NVIDIA GeForce RTX 4090 Laptop GPU (115.7 - 220, n=42) | |
| MSI Titan 18 HX A14VIG | |
| Asus ROG Strix Scar 17 SE G733CX-LL014W | |
| MSI Raider GE68 HX 13VG, i7-13700HX | |
| Asus ROG Zephyrus M16 GU603Z | |
| Asus ROG Strix G18 G814JI | |
| Dell G16 7620 | |
| Alienware m18 R1 AMD | |
| Lenovo ThinkPad Z16 Gen 2 | |
| Alienware m17 R5 (R9 6900HX, RX 6850M XT) | |
| 3840x2160 ultra (3/3) best looking | |
| AMD Ryzen 9 7900 | |
| NVIDIA GeForce RTX 4070 Super Founders Edition | |
| MSI Titan GT77 HX 13VI | |
| MSI Titan 18 HX A14VIG | |
| Ortalama NVIDIA GeForce RTX 4090 Laptop GPU (120.2 - 205, n=26) | |
| Razer Blade 18 RTX 4070 | |
| Acer Predator Helios 18 N23Q2 | |
| Alienware m18 R1 AMD | |
| Alienware m17 R5 (R9 6900HX, RX 6850M XT) | |
| Tiny Tina's Wonderlands | |
| 1920x1080 Badass Preset (DX12) | |
| MSI Titan GT77 HX 13VI | |
| MSI Titan 18 HX A14VIG | |
| Ortalama NVIDIA GeForce RTX 4090 Laptop GPU (141.1 - 189.4, n=14) | |
| Alienware m18 R1 AMD | |
| Lenovo ThinkPad Z16 Gen 2 | |
| 2560x1440 Badass Preset (DX12) | |
| MSI Titan GT77 HX 13VI | |
| MSI Titan 18 HX A14VIG | |
| Ortalama NVIDIA GeForce RTX 4090 Laptop GPU (103.4 - 137.8, n=14) | |
| Alienware m18 R1 AMD | |
| Lenovo ThinkPad Z16 Gen 2 | |
| 3840x2160 Badass Preset (DX12) | |
| MSI Titan 18 HX A14VIG | |
| MSI Titan GT77 HX 13VI | |
| Ortalama NVIDIA GeForce RTX 4090 Laptop GPU (53.3 - 73.7, n=12) | |
| Alienware m18 R1 AMD | |
| Cyberpunk 2077 | |
| 1920x1080 Ultra Preset (FSR off) | |
| NVIDIA GeForce RTX 4070 Super Founders Edition | |
| MSI Titan 18 HX A14VIG | |
| Alienware m18 R1 AMD | |
| Acer Predator Helios 18 N23Q2 | |
| Ortalama NVIDIA GeForce RTX 4090 Laptop GPU (93.1 - 158, n=21) | |
| Lenovo ThinkPad Z16 Gen 2 | |
| 2560x1440 Ultra Preset (FSR off) | |
| MSI Titan 18 HX A14VIG | |
| Ortalama NVIDIA GeForce RTX 4090 Laptop GPU (68.1 - 103.9, n=21) | |
| Alienware m18 R1 AMD | |
| NVIDIA GeForce RTX 4070 Super Founders Edition | |
| Acer Predator Helios 18 N23Q2 | |
| Lenovo ThinkPad Z16 Gen 2 | |
| 3840x2160 Ultra Preset (FSR off) | |
| MSI Titan 18 HX A14VIG | |
| Ortalama NVIDIA GeForce RTX 4090 Laptop GPU (31.6 - 50.6, n=11) | |
| NVIDIA GeForce RTX 4070 Super Founders Edition | |
| Alienware m18 R1 AMD | |
| 3840x2160 Ray Tracing Ultra Preset (DLSS off, no Path Tracing) | |
| Ortalama NVIDIA GeForce RTX 4090 Laptop GPU (20.2 - 22.3, n=4) | |
| NVIDIA GeForce RTX 4070 Super Founders Edition | |
| F1 22 | |
| 1920x1080 Ultra High Preset AA:T AF:16x | |
| AMD Ryzen 9 7900 | |
| MSI Titan GT77 HX 13VI | |
| MSI Titan 18 HX A14VIG | |
| NVIDIA GeForce RTX 4070 Super Founders Edition | |
| Ortalama NVIDIA GeForce RTX 4090 Laptop GPU (70.3 - 144.7, n=25) | |
| Alienware m18 R1 AMD | |
| MSI Raider GE68 HX 13VG, i7-13700HX | |
| Asus ROG Strix Scar 17 SE G733CX-LL014W | |
| Lenovo ThinkPad Z16 Gen 2 | |
| 2560x1440 Ultra High Preset AA:T AF:16x | |
| AMD Ryzen 9 7900 | |
| MSI Titan 18 HX A14VIG | |
| MSI Titan GT77 HX 13VI | |
| Ortalama NVIDIA GeForce RTX 4090 Laptop GPU (65.9 - 92.2, n=25) | |
| NVIDIA GeForce RTX 4070 Super Founders Edition | |
| Alienware m18 R1 AMD | |
| Asus ROG Strix Scar 17 SE G733CX-LL014W | |
| MSI Raider GE68 HX 13VG, i7-13700HX | |
| Lenovo ThinkPad Z16 Gen 2 | |
| 3840x2160 Ultra High Preset AA:T AF:16x | |
| AMD Ryzen 9 7900 | |
| MSI Titan GT77 HX 13VI | |
| MSI Titan 18 HX A14VIG | |
| Ortalama NVIDIA GeForce RTX 4090 Laptop GPU (36.8 - 46.1, n=18) | |
| NVIDIA GeForce RTX 4070 Super Founders Edition | |
| Alienware m18 R1 AMD | |
| MSI Raider GE68 HX 13VG, i7-13700HX | |
| X-Plane 11.11 | |
| 1920x1080 high (fps_test=3) | |
| NVIDIA GeForce RTX 4070 Super Founders Edition | |
| AMD Ryzen 9 7900 | |
| Acer Predator Helios 18 N23Q2 | |
| Razer Blade 18 RTX 4070 | |
| MSI Titan GT77 HX 13VI | |
| MSI Titan GT77 HX 13VI | |
| Ortalama NVIDIA GeForce RTX 4090 Laptop GPU (77.8 - 166.2, n=46) | |
| MSI Titan 18 HX A14VIG | |
| MSI Raider GE68 HX 13VG, i7-13700HX | |
| Asus ROG Strix Scar 17 SE G733CX-LL014W | |
| Asus ROG Zephyrus M16 GU603Z | |
| Asus ROG Strix G18 G814JI | |
| Dell G16 7620 | |
| Alienware m18 R1 AMD | |
| Alienware m17 R5 (R9 6900HX, RX 6850M XT) | |
| Lenovo ThinkPad Z16 Gen 2 | |
| 3840x2160 high (fps_test=3) | |
| Acer Predator Helios 18 N23Q2 | |
| NVIDIA GeForce RTX 4070 Super Founders Edition | |
| AMD Ryzen 9 7900 | |
| Razer Blade 18 RTX 4070 | |
| MSI Titan GT77 HX 13VI | |
| Ortalama NVIDIA GeForce RTX 4090 Laptop GPU (67.6 - 145.5, n=25) | |
| MSI Titan 18 HX A14VIG | |
| Alienware m18 R1 AMD | |
| Alienware m17 R5 (R9 6900HX, RX 6850M XT) | |
Witcher 3 FPS Chart
| düşük | orta | yüksek | ultra | QHD | 4K | |
|---|---|---|---|---|---|---|
| GTA V (2015) | 139.2 | |||||
| The Witcher 3 (2015) | 595.3 | 506.6 | 412.2 | 211.2 | 160.7 | |
| Dota 2 Reborn (2015) | 218 | 196.3 | 186.5 | 174.5 | 168.3 | |
| Final Fantasy XV Benchmark (2018) | 229 | 216 | 184 | 158 | 93.6 | |
| X-Plane 11.11 (2018) | 184.9 | 161.8 | 126.1 | 106.5 | ||
| Far Cry 5 (2018) | 191 | 164 | 158 | 155 | 152 | 112 |
| Strange Brigade (2018) | 511 | 423 | 406 | 385 | 307 | 156.1 |
| Tiny Tina's Wonderlands (2022) | 324.7 | 279.8 | 223.7 | 182 | 130.8 | 71 |
| F1 22 (2022) | 307 | 297 | 280 | 132.7 | 90.5 | 44.6 |
| Baldur's Gate 3 (2023) | 246.7 | 226.9 | 208.6 | 207.7 | 155.2 | 80.8 |
| Cyberpunk 2077 (2023) | 155.7 | 145.4 | 135.9 | 129.8 | 94.5 | 43.9 |
| Avatar Frontiers of Pandora (2023) | 103 | 69 | 35 |
Emisyonlar
Sistem Gürültüsü
Fan gürültüsü ve davranışı doğrudan MSI Center güç profillerine bağlıdır: Cooler Boost açıkken Extreme Performance, Cooler Boost kapalıyken Extreme Performance, Balanced ve Silent. Cooler Boost açıkken oyun oynamak, Cooler Boost kapalıyken 57,3 dB(A)'ya karşılık 63 dB(A) kadar yüksek olabilir. Bununla birlikte, yukarıda belirtildiği gibi iki mod arasındaki performans farkları çok küçük olduğundan, dizüstü bilgisayarın saç kurutma makinesi gibi ses çıkarmasını önlemek için Cooler Boost kapalıyken oyun oynamanız önerilir.
Dengeli modda oyun oynarken fan gürültüsü 53 dB(A) ile en üst seviyeye çıkıyor ve iki Aşırı Performans modundan da fark edilir derecede daha sessiz. Ancak, yukarıda belirtildiği gibi Dengeli modda çalışırken performans açığının daha büyük olduğunu unutmayın. Oyun oynarken ne olursa olsun çok gürültülü bir sisteme hazırlıklı olun.
Ses yüksekliği
| Boşta |
| 23.8 / 23.8 / 28 dB |
| Çalışırken |
| 38 / 62.8 dB |
 | ||
30 dB sessiz 40 dB(A) duyulabilirlik 50 dB(A) gürültülü |
||
min: | ||
| MSI Titan 18 HX A14VIG GeForce RTX 4090 Laptop GPU, i9-14900HX, 2x Samsung PM9A1a MZVL22T0HDLB (RAID 0) | MSI Titan GT77 HX 13VI GeForce RTX 4090 Laptop GPU, i9-13950HX, Samsung PM9A1 MZVL22T0HBLB | Alienware m18 R1 GeForce RTX 4090 Laptop GPU, i9-13980HX, SK hynix PC801 HFS001TEJ9X101N | Asus ROG Strix G18 G814JI GeForce RTX 4070 Laptop GPU, i7-13650HX, Micron 2400 MTFDKBA1T0QFM | Acer Predator Helios 18 N23Q2 GeForce RTX 4080 Laptop GPU, i9-13900HX, Samsung PM9A1 MZVL22T0HBLB | Razer Blade 18 RTX 4070 GeForce RTX 4070 Laptop GPU, i9-13950HX, SSSTC CA6-8D1024 | |
|---|---|---|---|---|---|---|
| Noise | -12% | 7% | 0% | 1% | 5% | |
| kapalı / ortam * (dB) | 22.8 | 24.6 -8% | 22.8 -0% | 25 -10% | 23 -1% | 23.5 -3% |
| Idle Minimum * (dB) | 23.8 | 29.2 -23% | 23 3% | 26 -9% | 23 3% | 23.8 -0% |
| Idle Average * (dB) | 23.8 | 29.2 -23% | 23 3% | 28 -18% | 23 3% | 23.8 -0% |
| Idle Maximum * (dB) | 28 | 29.2 -4% | 23 18% | 29 -4% | 23 18% | 26.8 4% |
| Load Average * (dB) | 38 | 50.7 -33% | 35.6 6% | 41 -8% | 45.26 -19% | 37.3 2% |
| Witcher 3 ultra * (dB) | 57.3 | 53.3 7% | 51.3 10% | 44 23% | 59.82 -4% | 48 16% |
| Load Maximum * (dB) | 62.8 | 61 3% | 56.7 10% | 46 27% | 59.94 5% | 53.5 15% |
* ... daha küçük daha iyidir
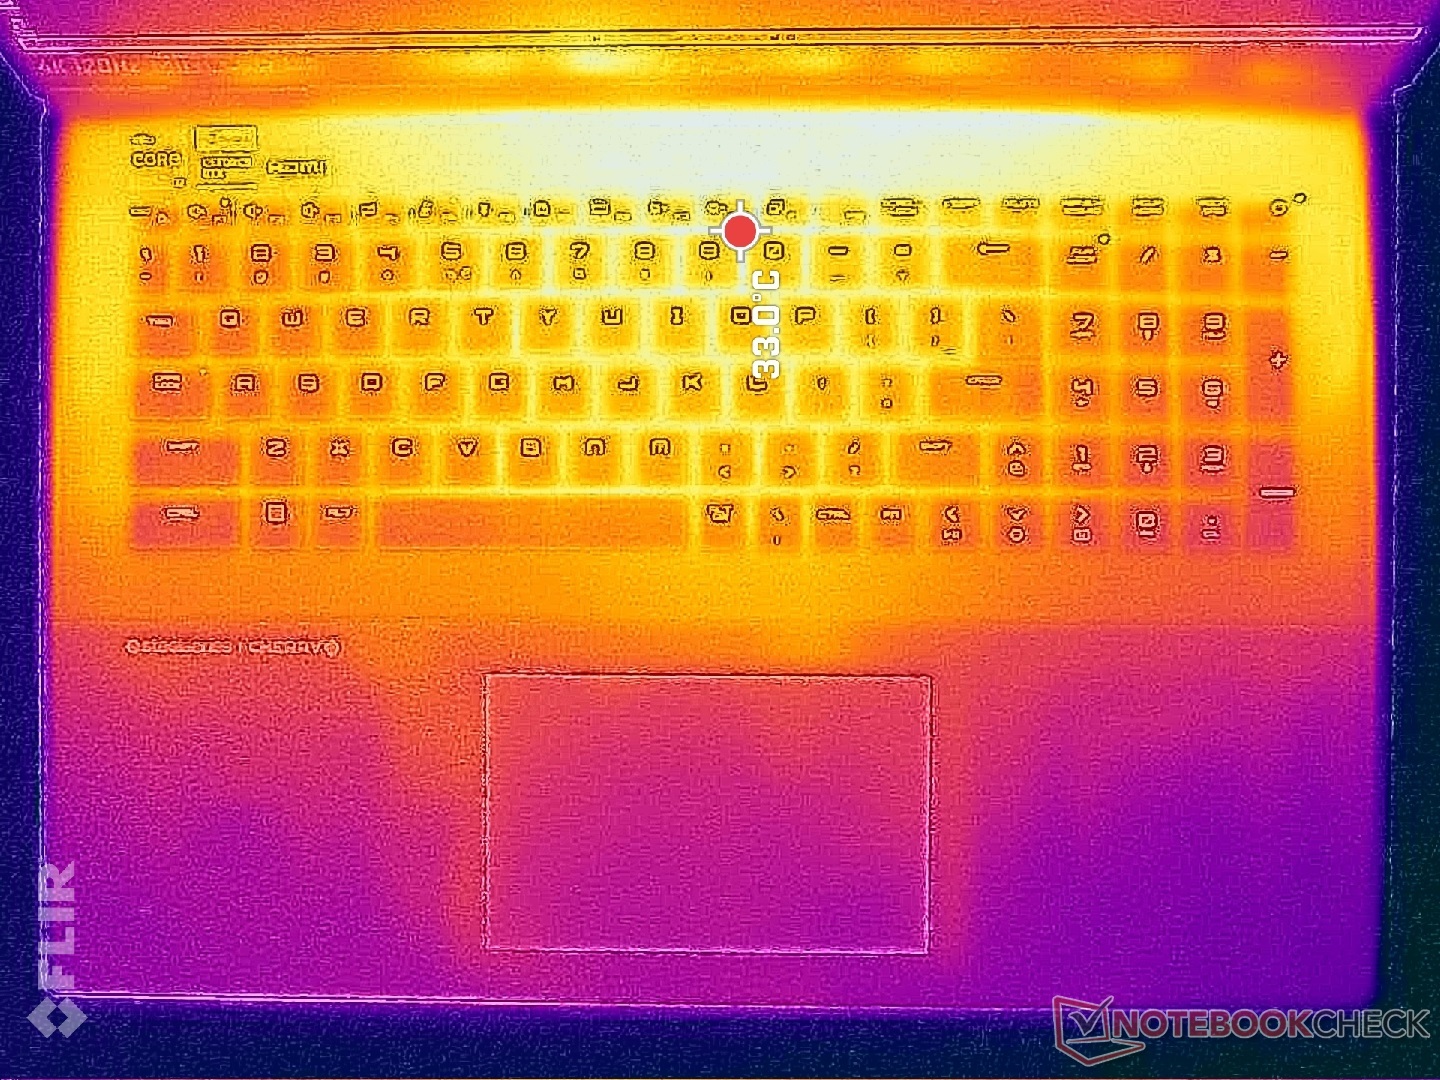
Sıcaklık
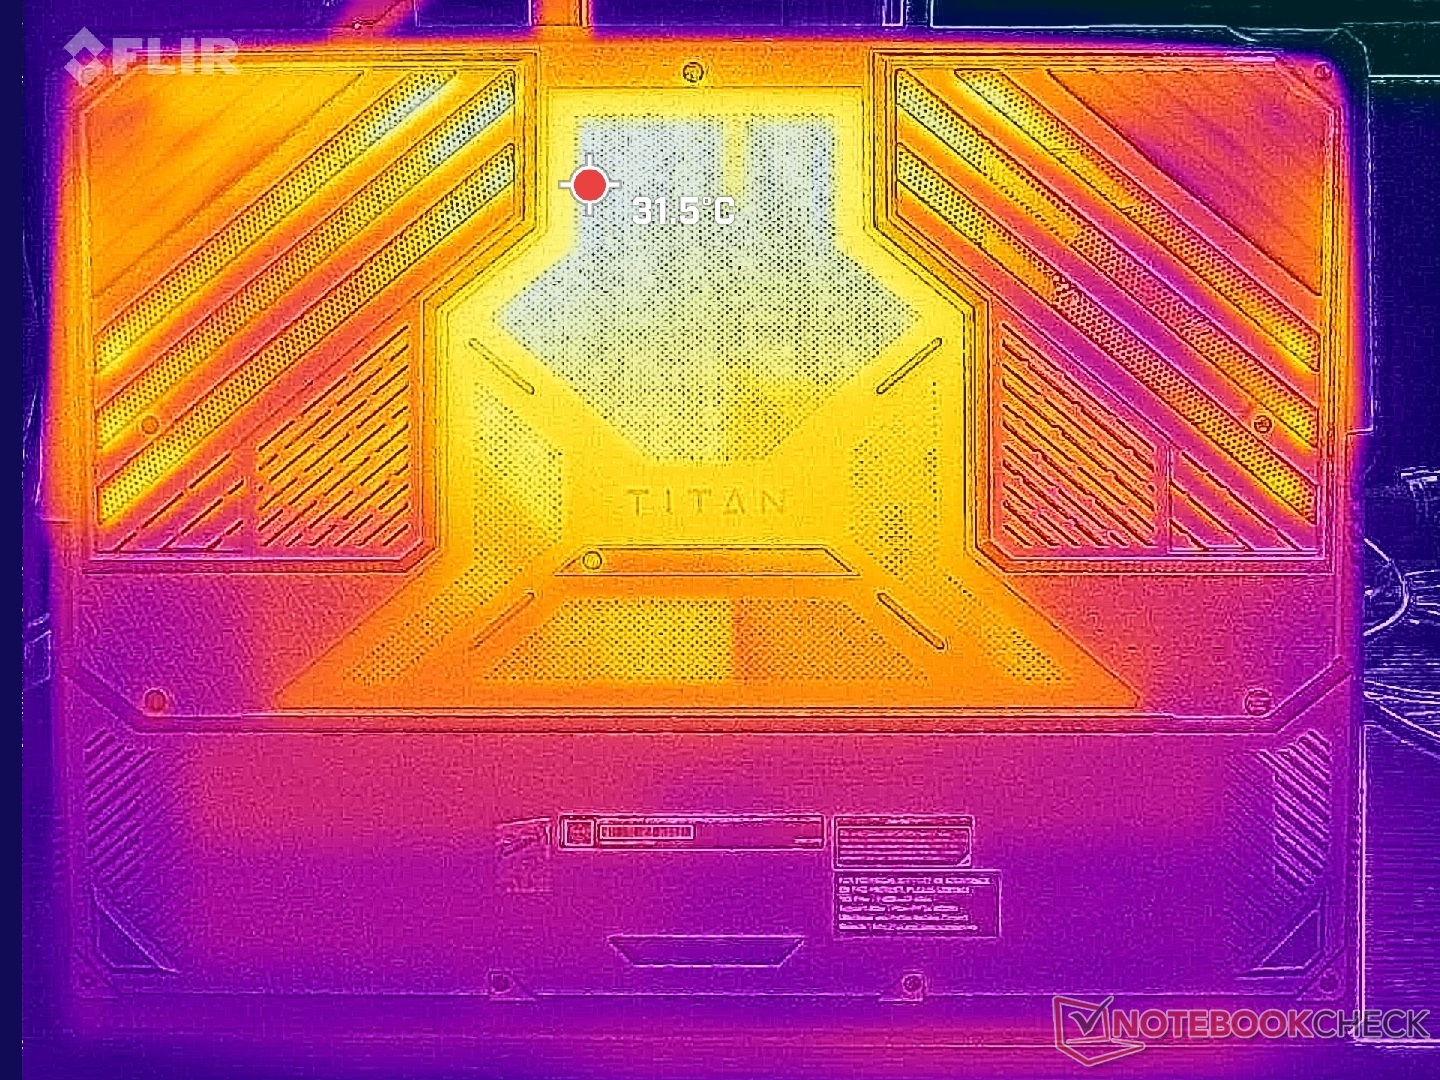
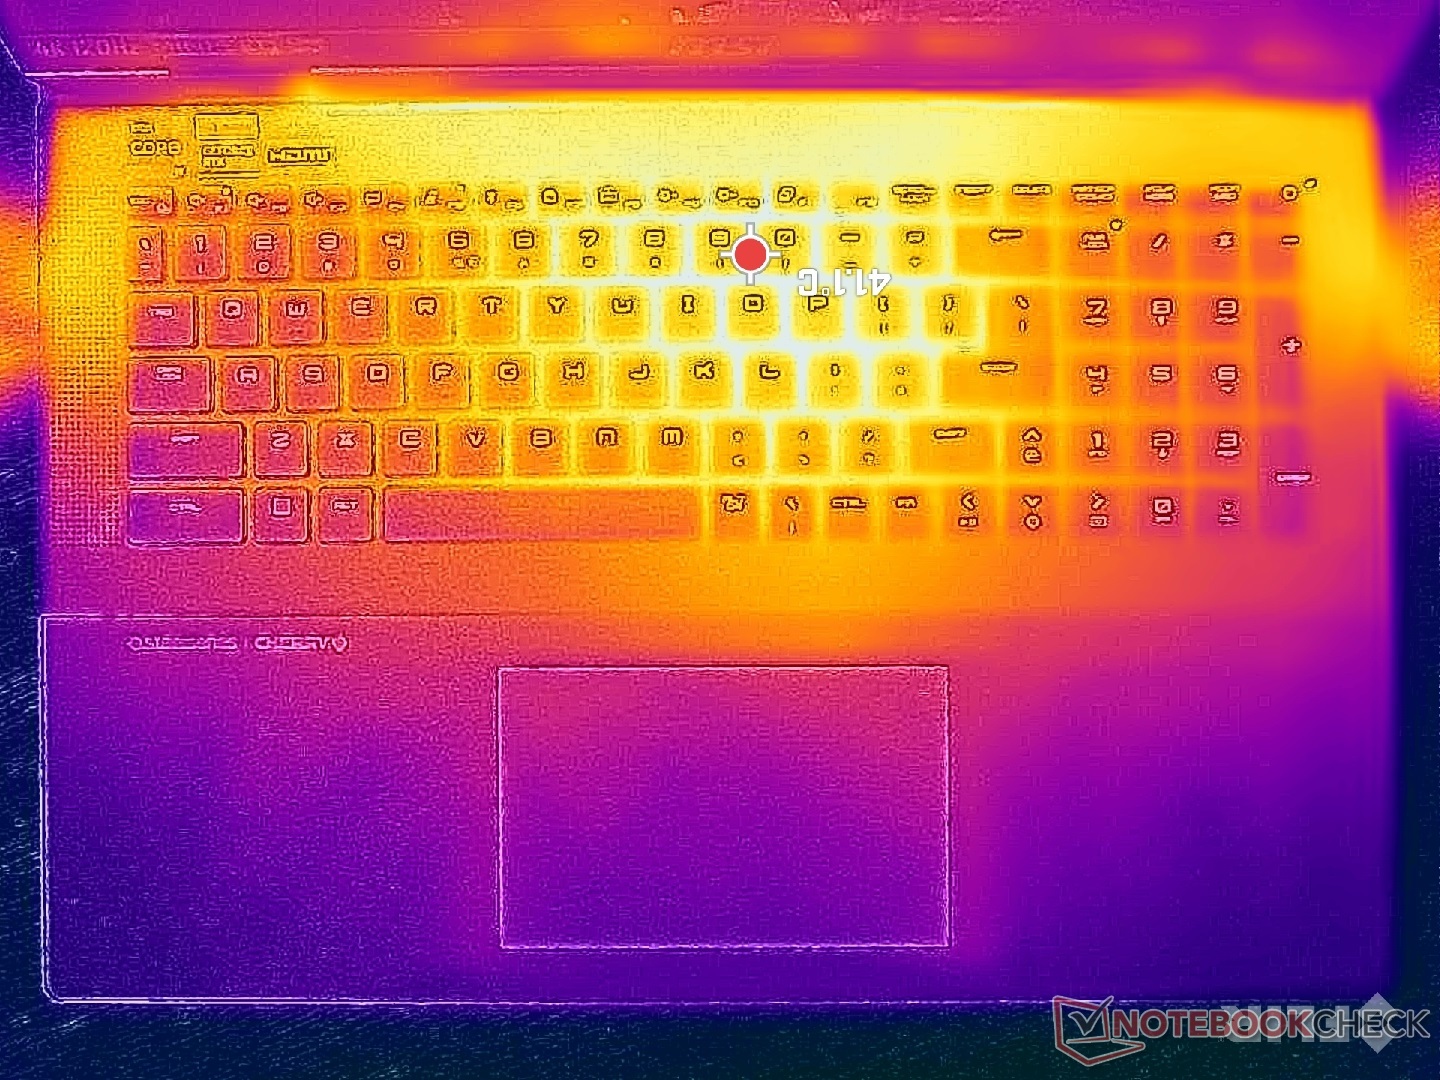
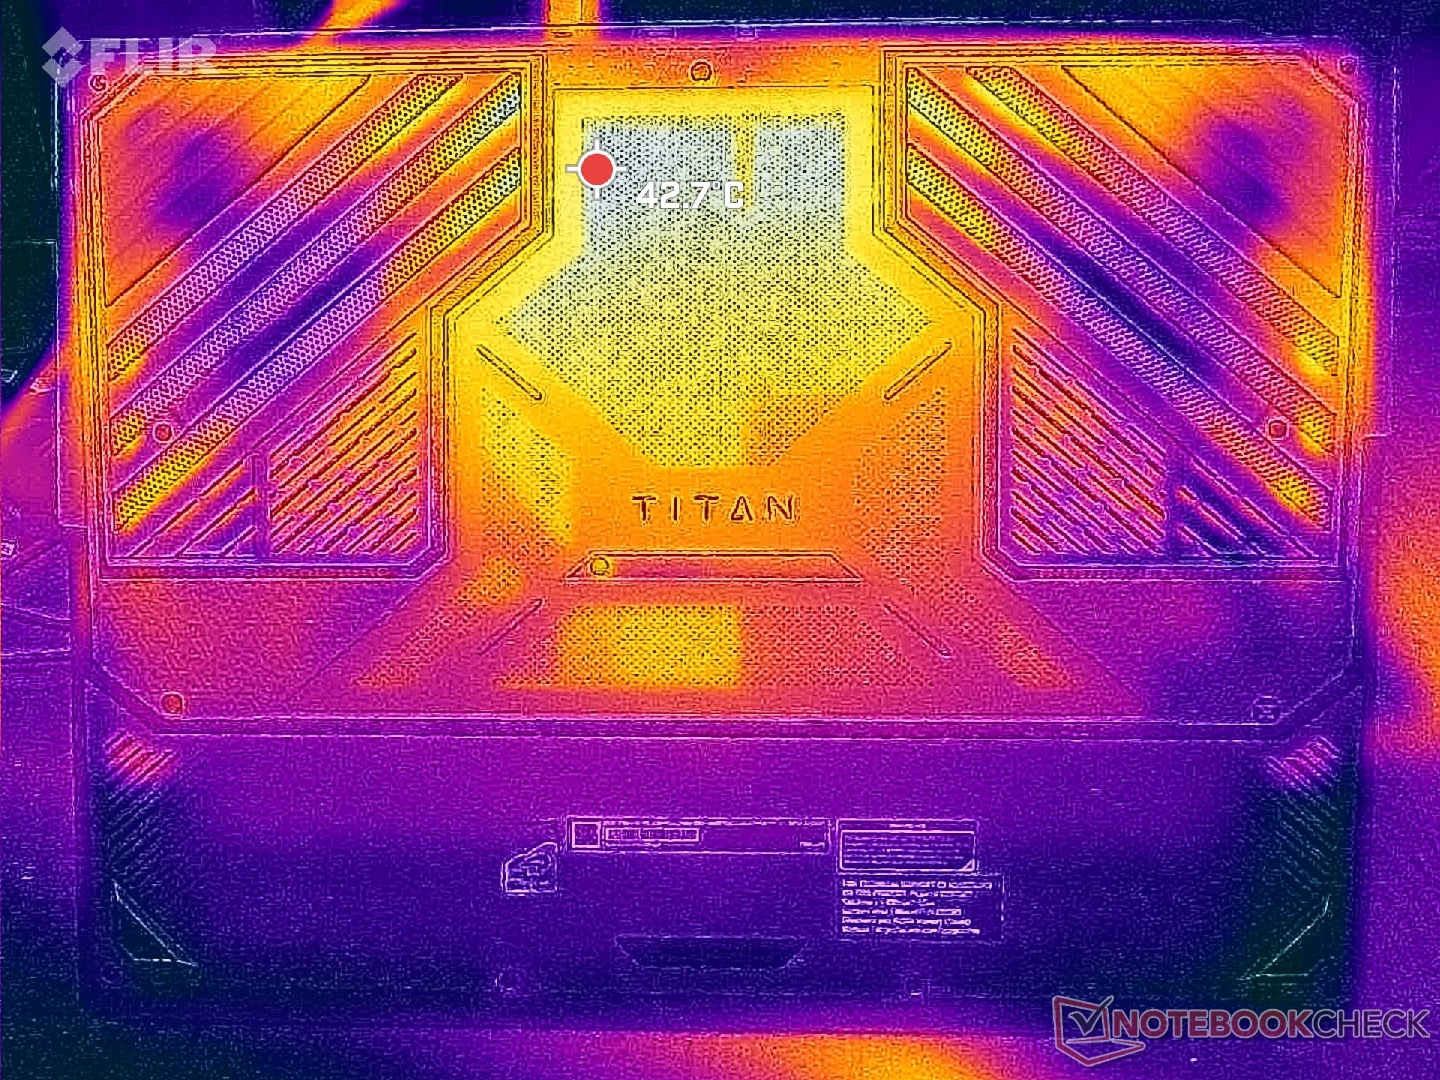
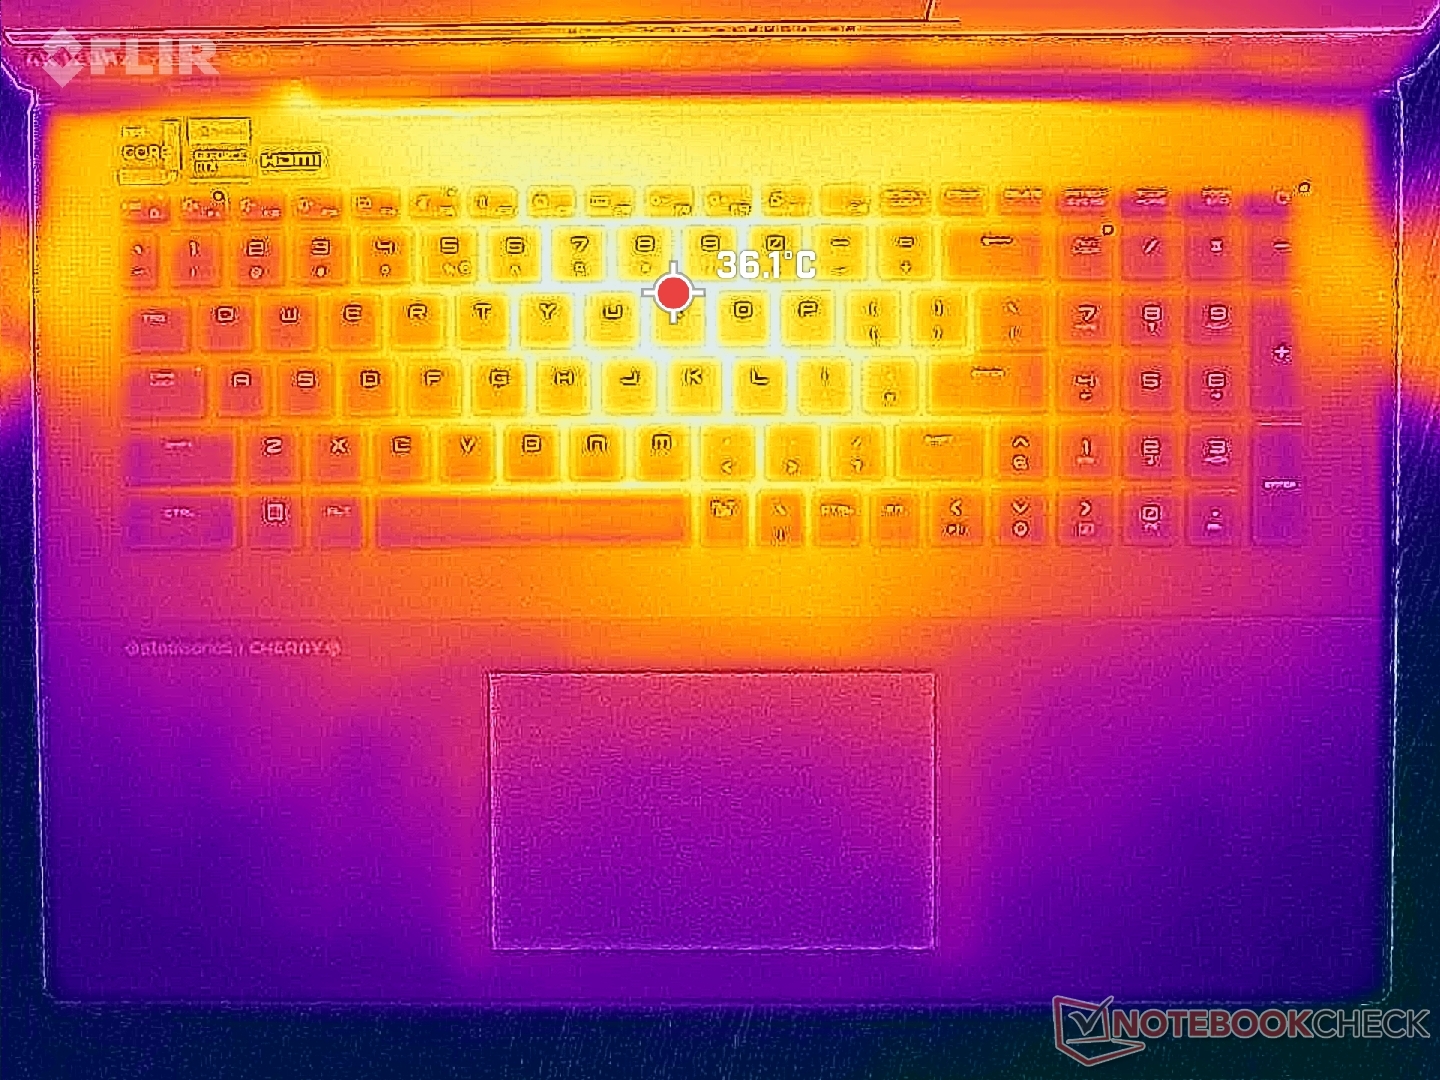
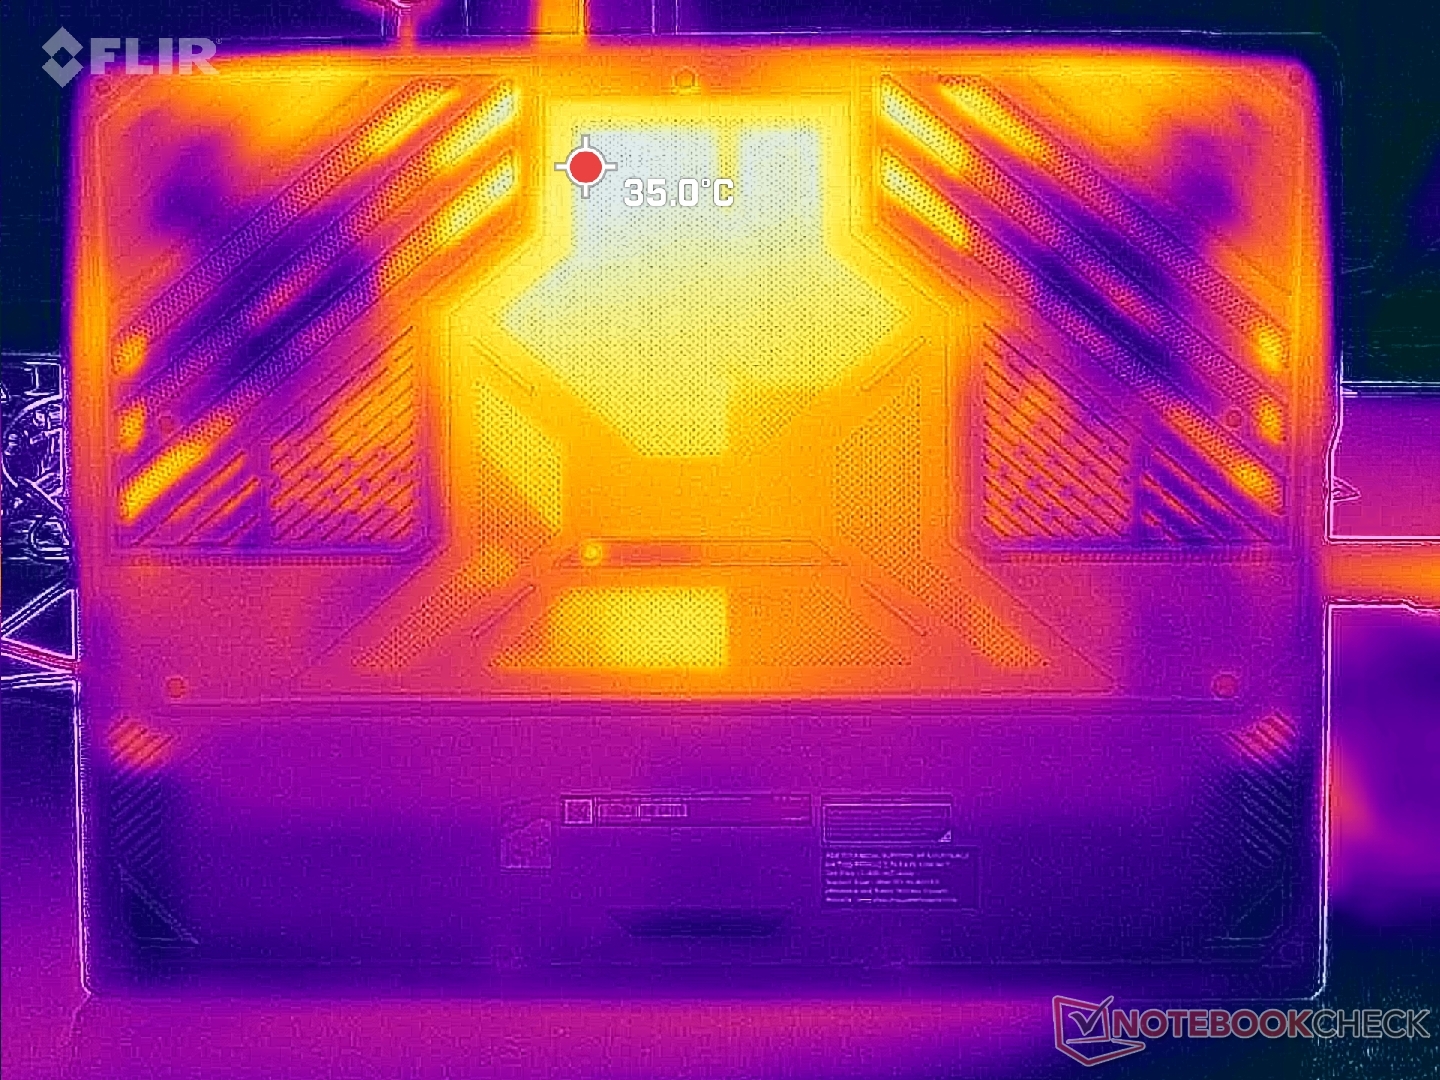
Şaşırtıcı bir şekilde, buradaki yüzey sıcaklıkları yekpare gövdede kaydettiğimizden biraz daha sıcak Razer Blade 18 mSI'ın daha kalın tasarımına rağmen. Sıcak noktalar Cooler Boost aktif ve pasifken sırasıyla 41 C ve 37 C'nin biraz üzerine çıkıyor. Razer'da ise 35 C ila 40 C arasında. Neyse ki sıcak noktalar, ellerin ve parmakların temas etme olasılığının düşük olduğu sistemin arkasına doğru. Oyun oynarken avuç içi dayanaklarının veya tuşların rahatsız edici derecede sıcak olduğunu hiç görmedik.
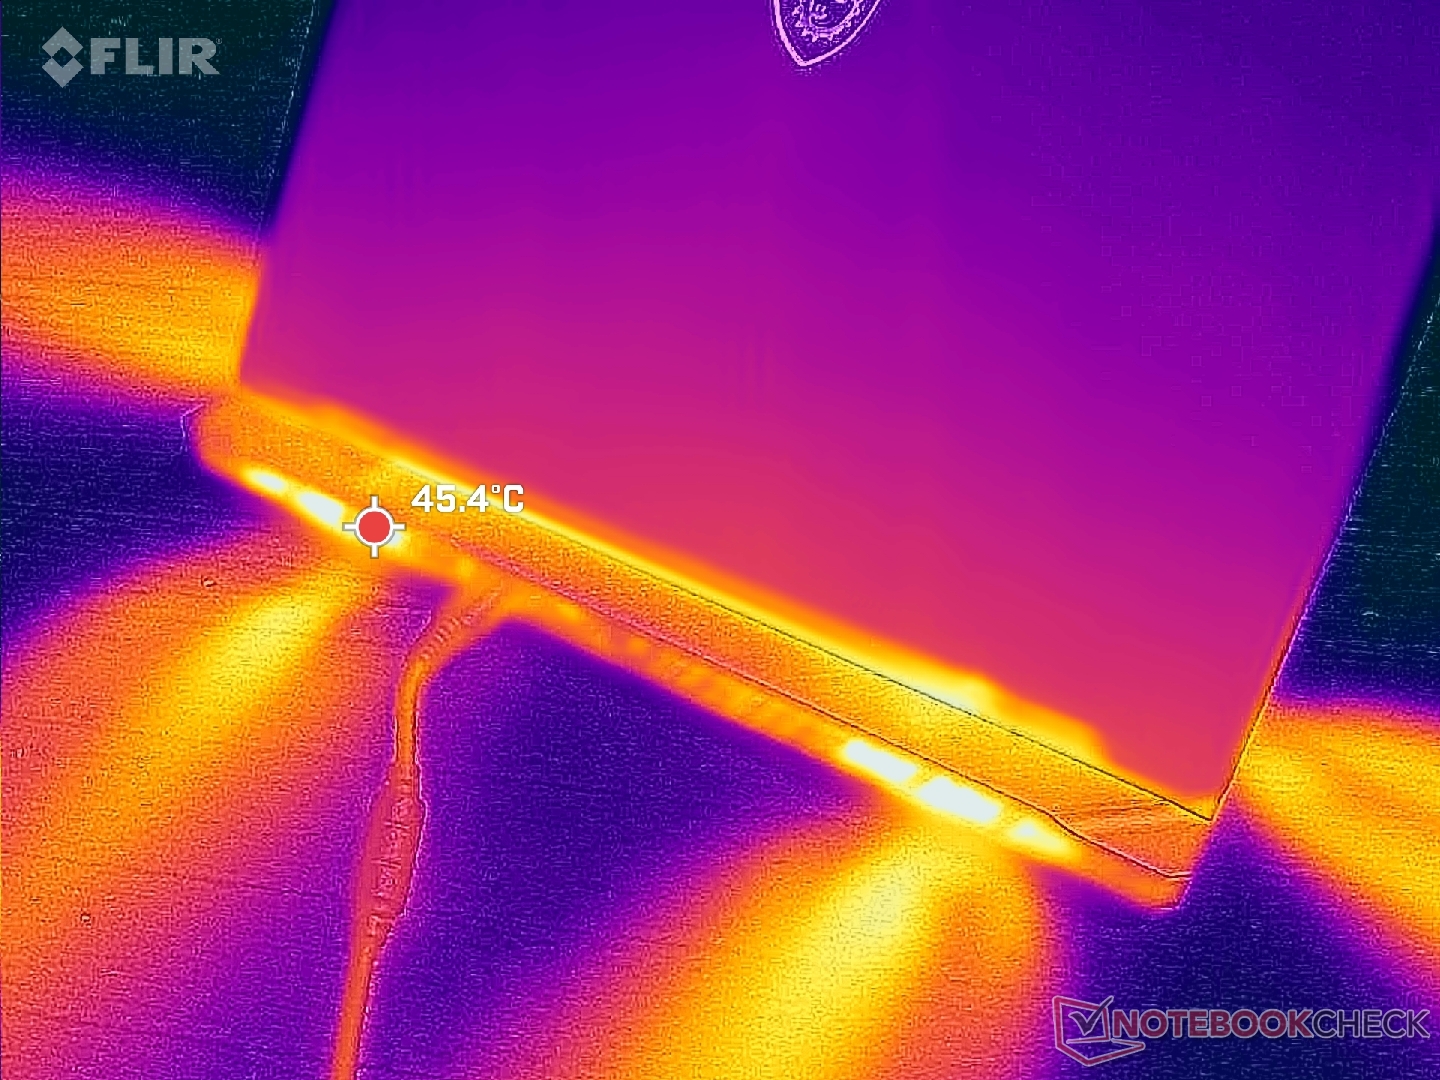
(+) Üst taraftaki maksimum sıcaklık, 40.4 °C / 105 F ortalamasına kıyasla 37.8 °C / 100 F'dir. , Gaming sınıfı için 21.2 ile 68.8 °C arasında değişir.
(+) Alt kısım, 43.2 °C / 110 F ortalamasına kıyasla maksimum 37.6 °C / 100 F'ye kadar ısınır
(+) Boşta kullanımda, üst tarafın ortalama sıcaklığı 29.8 °C / 86 F olup, cihazın 33.9 °C / 93 F.
(±) The Witcher 3 oynarken, üst tarafın ortalama sıcaklığı 32.3 °C / 90 F olup, cihazın 33.9 °C / 93 F.
(+) Avuç içi dayanakları ve dokunmatik yüzey, maksimum 25.6 °C / 78.1 F ile cilt sıcaklığından daha soğuktur ve bu nedenle dokunulduğunda soğuktur.
(+) Benzer cihazların avuç içi dayanağı alanının ortalama sıcaklığı 28.8 °C / 83.8 F (+3.2 °C / 5.7 F) idi.
| MSI Titan 18 HX A14VIG Intel Core i9-14900HX, NVIDIA GeForce RTX 4090 Laptop GPU | MSI Titan GT77 HX 13VI Intel Core i9-13950HX, NVIDIA GeForce RTX 4090 Laptop GPU | Alienware m18 R1 Intel Core i9-13980HX, NVIDIA GeForce RTX 4090 Laptop GPU | Asus ROG Strix G18 G814JI Intel Core i7-13650HX, NVIDIA GeForce RTX 4070 Laptop GPU | Acer Predator Helios 18 N23Q2 Intel Core i9-13900HX, NVIDIA GeForce RTX 4080 Laptop GPU | Razer Blade 18 RTX 4070 Intel Core i9-13950HX, NVIDIA GeForce RTX 4070 Laptop GPU | |
|---|---|---|---|---|---|---|
| Heat | 6% | 10% | -3% | -12% | 5% | |
| Maximum Upper Side * (°C) | 37.8 | 40.6 -7% | 39 -3% | 45 -19% | 35 7% | 39.2 -4% |
| Maximum Bottom * (°C) | 37.6 | 41.1 -9% | 36.4 3% | 47 -25% | 56 -49% | 35.6 5% |
| Idle Upper Side * (°C) | 34.8 | 26.2 25% | 29.2 16% | 28 20% | 34 2% | 31.8 9% |
| Idle Bottom * (°C) | 36 | 30.3 16% | 27.8 23% | 31 14% | 39 -8% | 33.2 8% |
* ... daha küçük daha iyidir
Stres Testi
Cooler Boost etkin olsa bile yük altında CPU sıcaklığı beklenenden daha yüksek olabilir. Örneğin, tipik oyun yüklerini temsil etmek için Witcher 3 çalıştırıldığında, Cooler Boost kapalıyken ve açıkken CPU sırasıyla 97 C ve 90 C'de stabilize olur. Bu arada, GPU daha makul olan 60 C aralığında stabilize olur. Bu testin Razer Blade 18 veya Alienware m18 R1 üzerinde tekrarlanması benzer GPU sıcaklıklarına, ancak düşük 80 C aralığında daha soğuk CPU sıcaklıklarına neden olacaktır.
Yukarıdaki GPU Performansı bölümümüzde gözlemlediğimize benzer şekilde Cooler Boost açık ve Cooler Boost kapalı arasında önemli bir performans farkı olmadığını unutmayın. Witcher 3 çalıştırıldığında hem GPU saat hızları hem de kart güç çekişi sırasıyla 2370 MHz ve 169 W'da nispeten sabit kalacaktır.
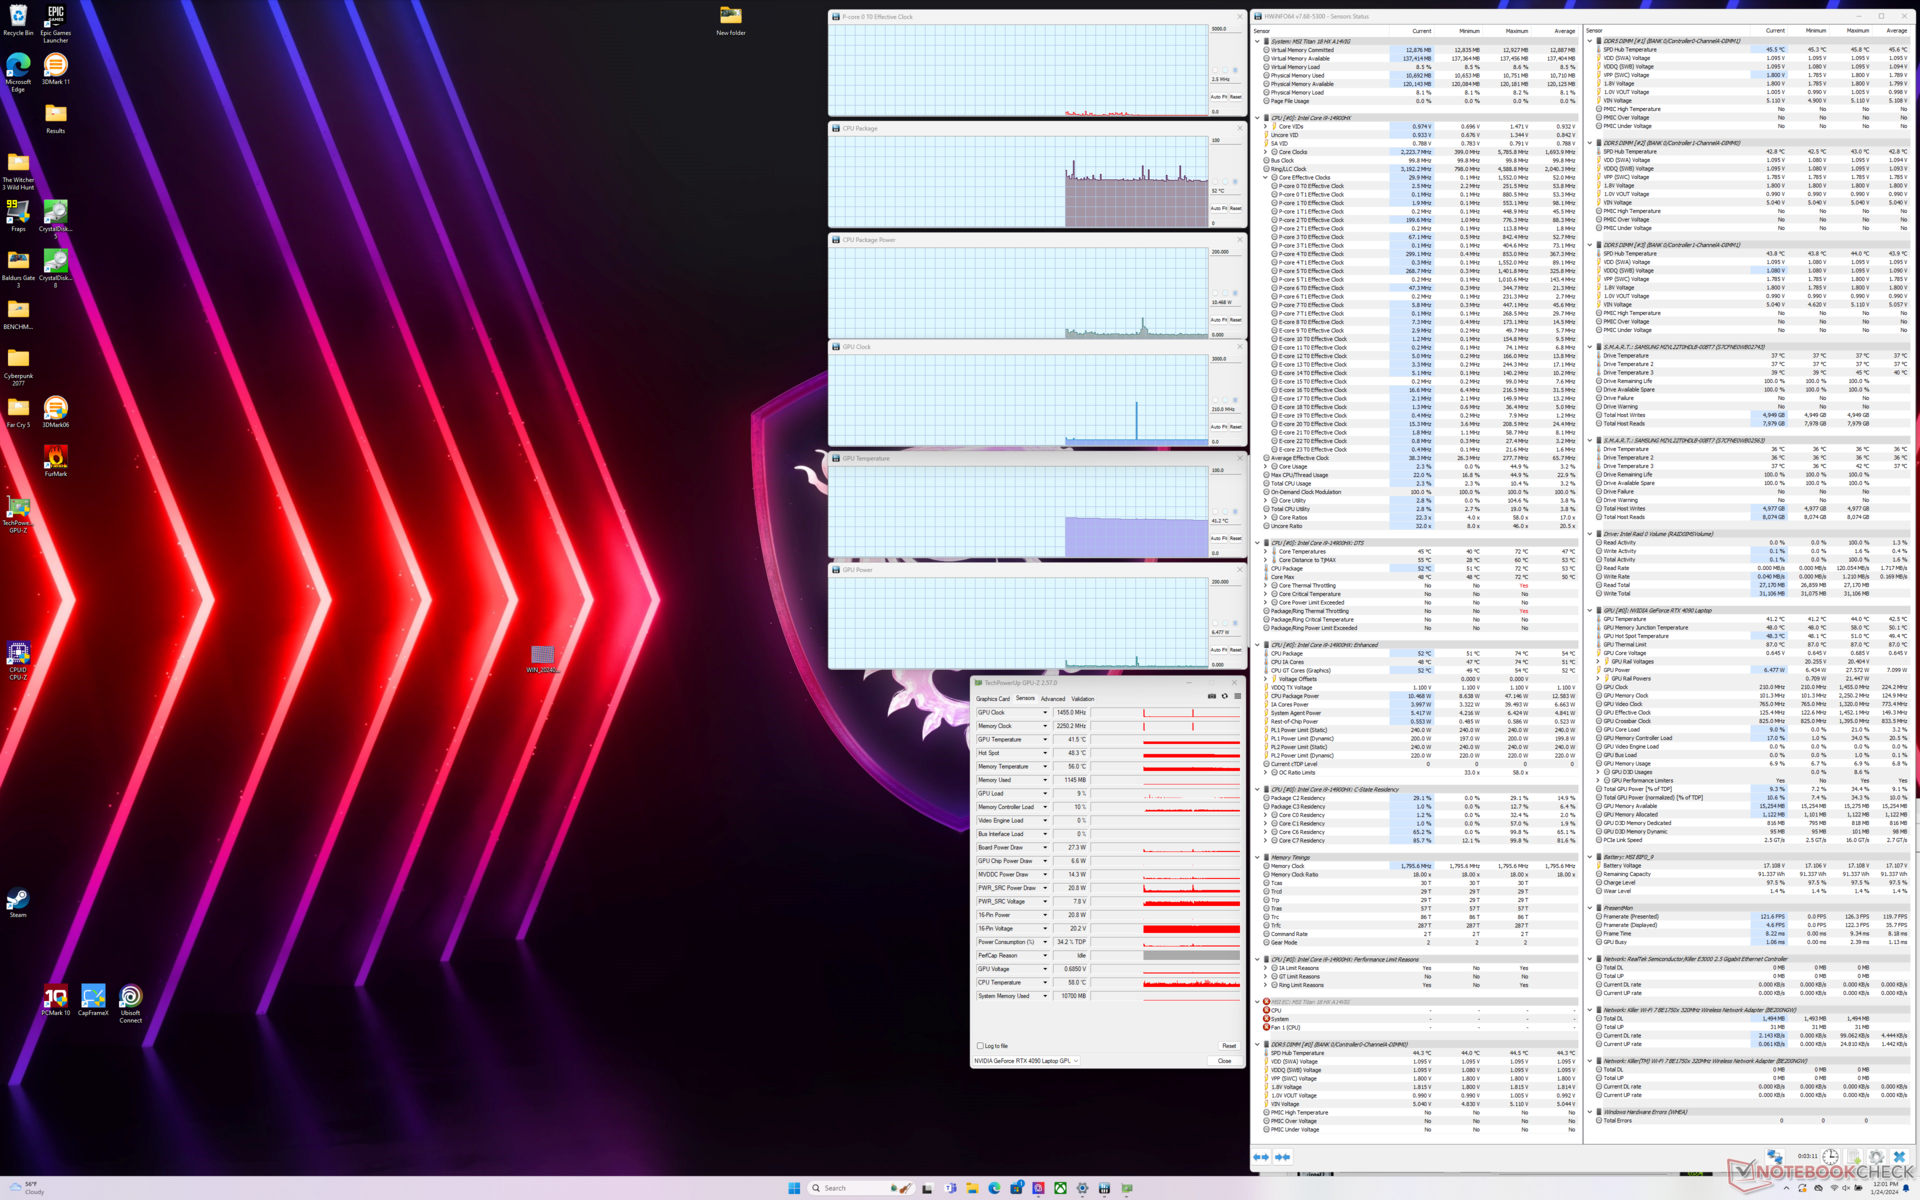
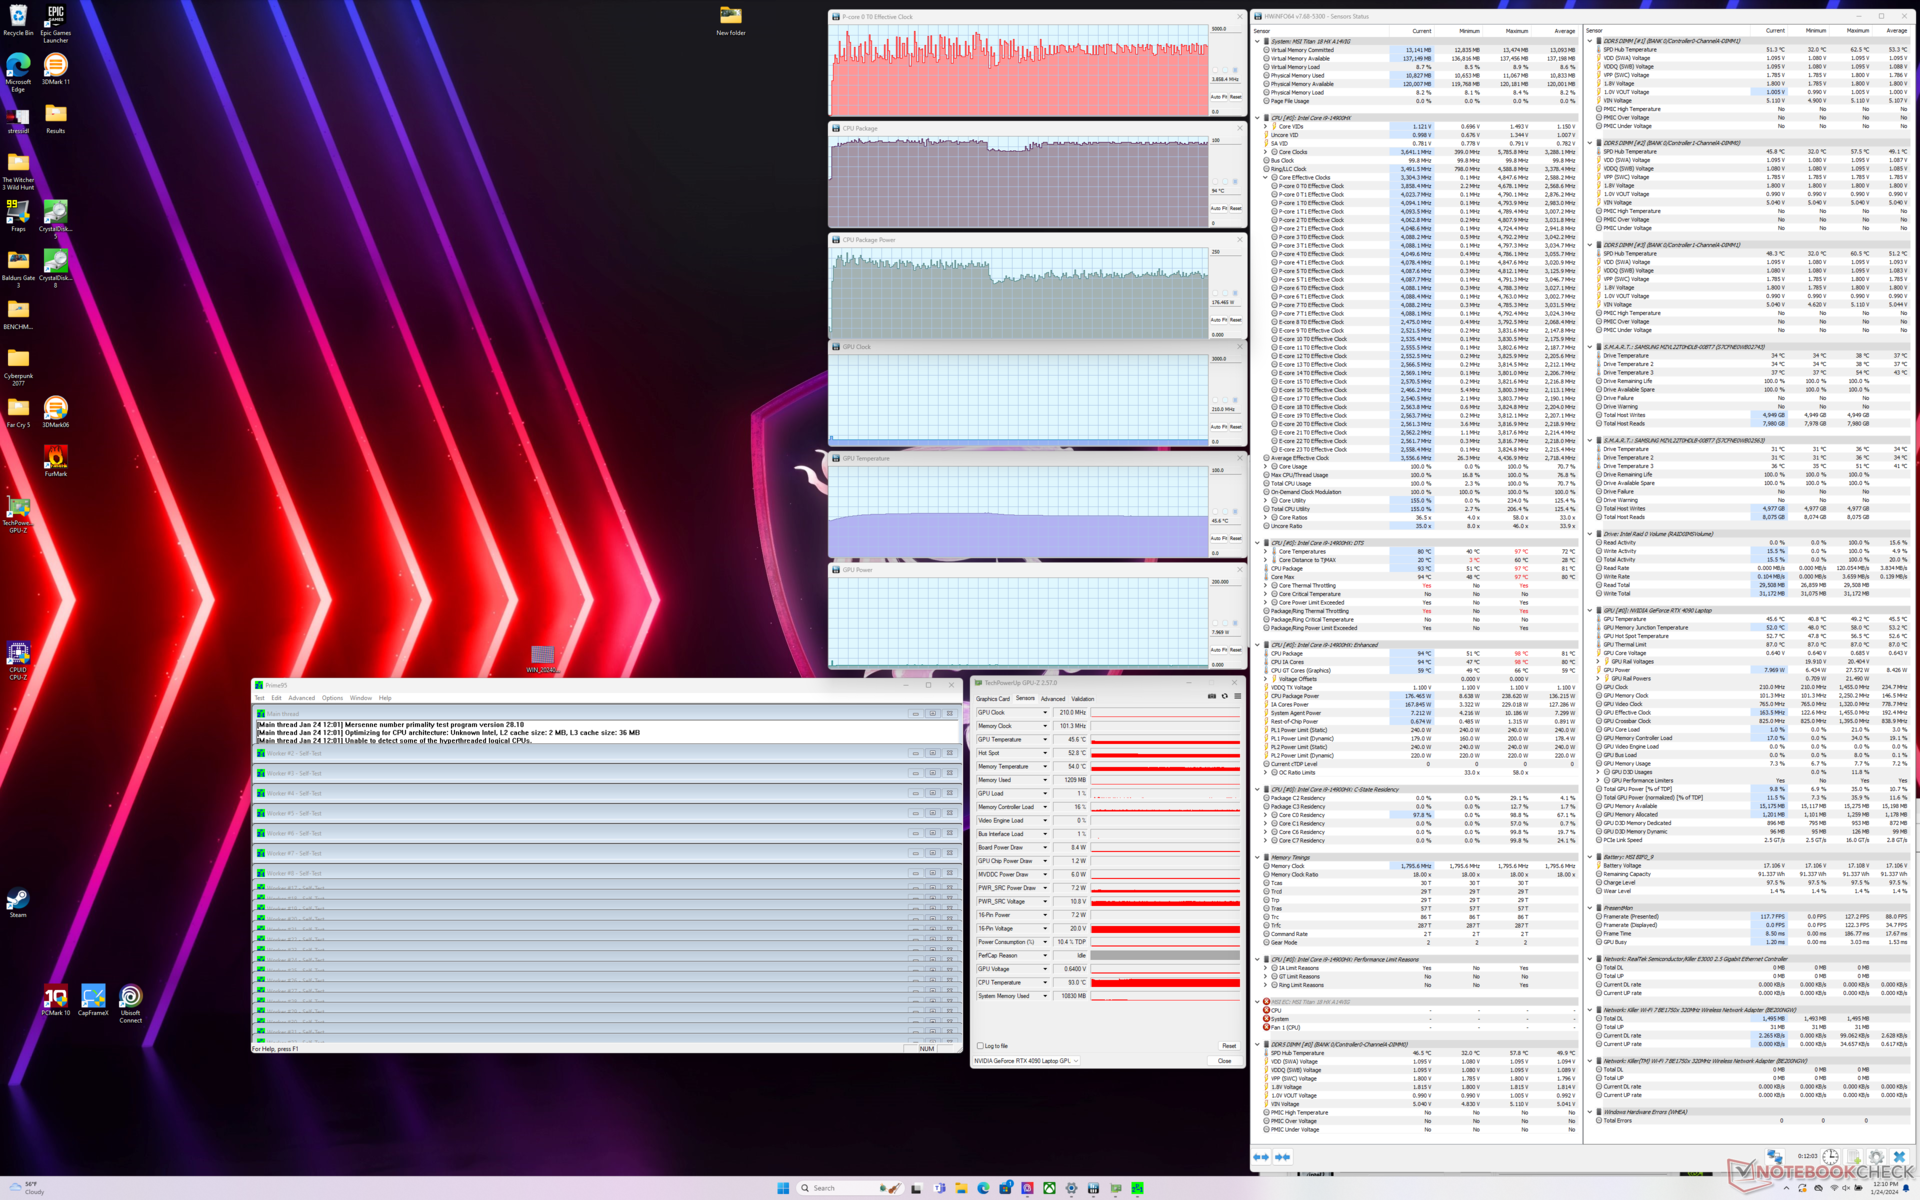
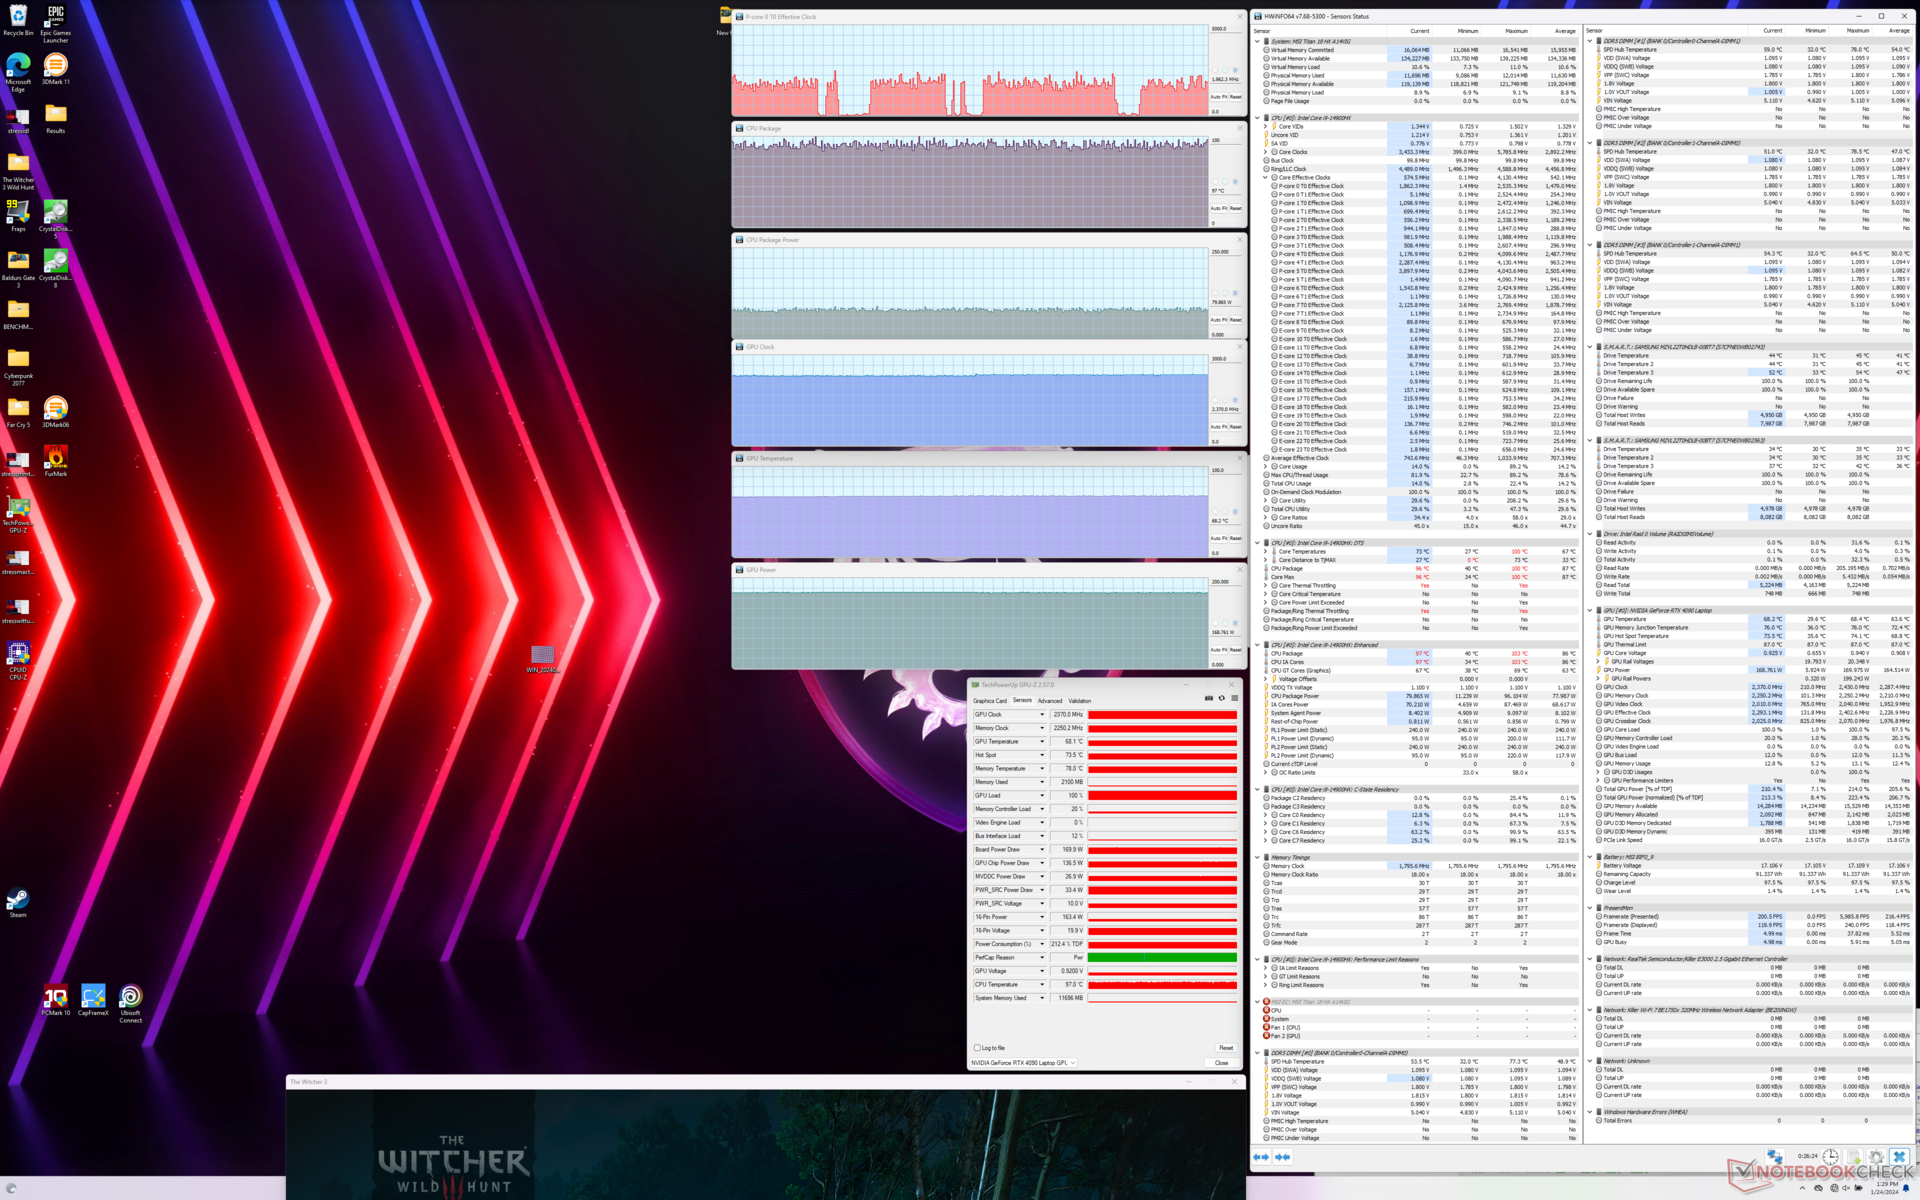
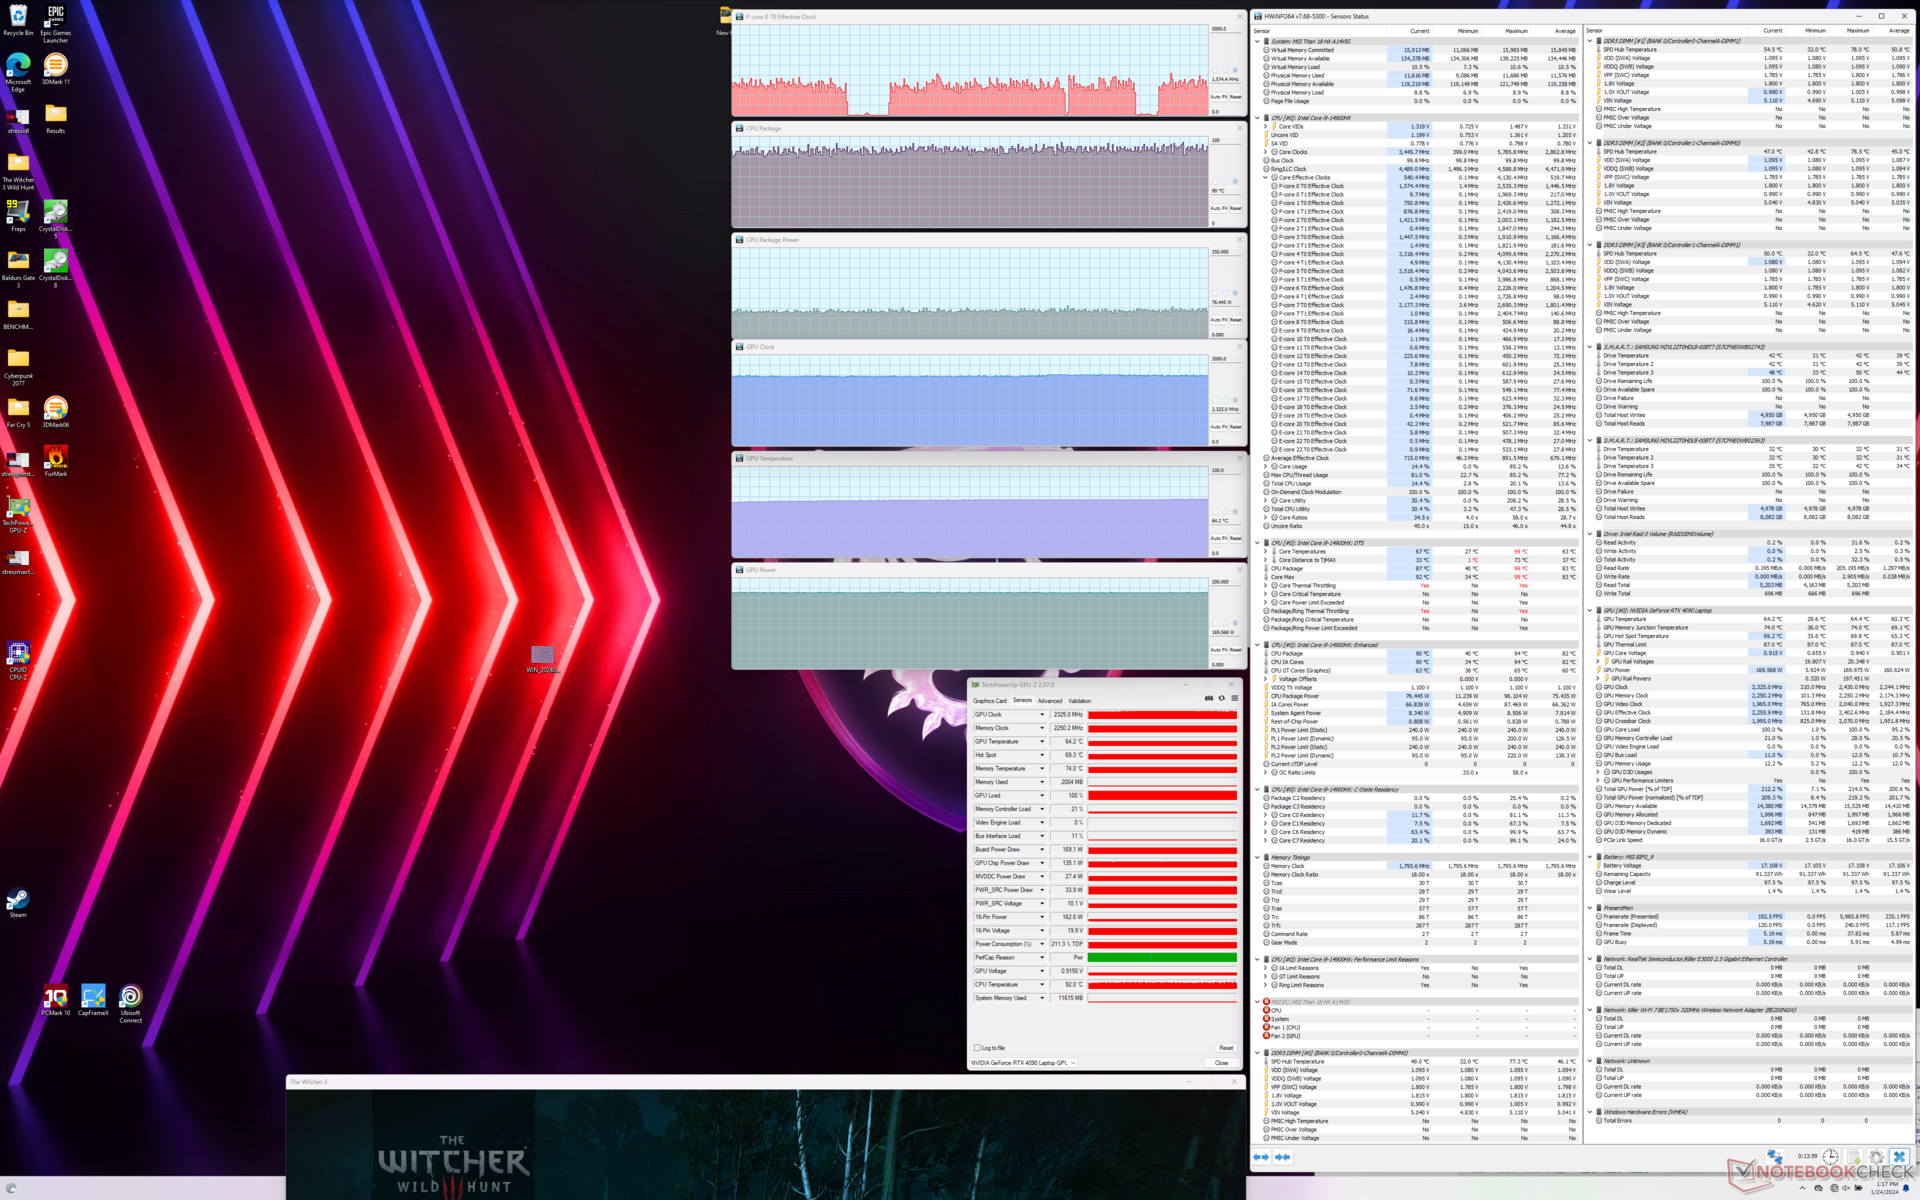
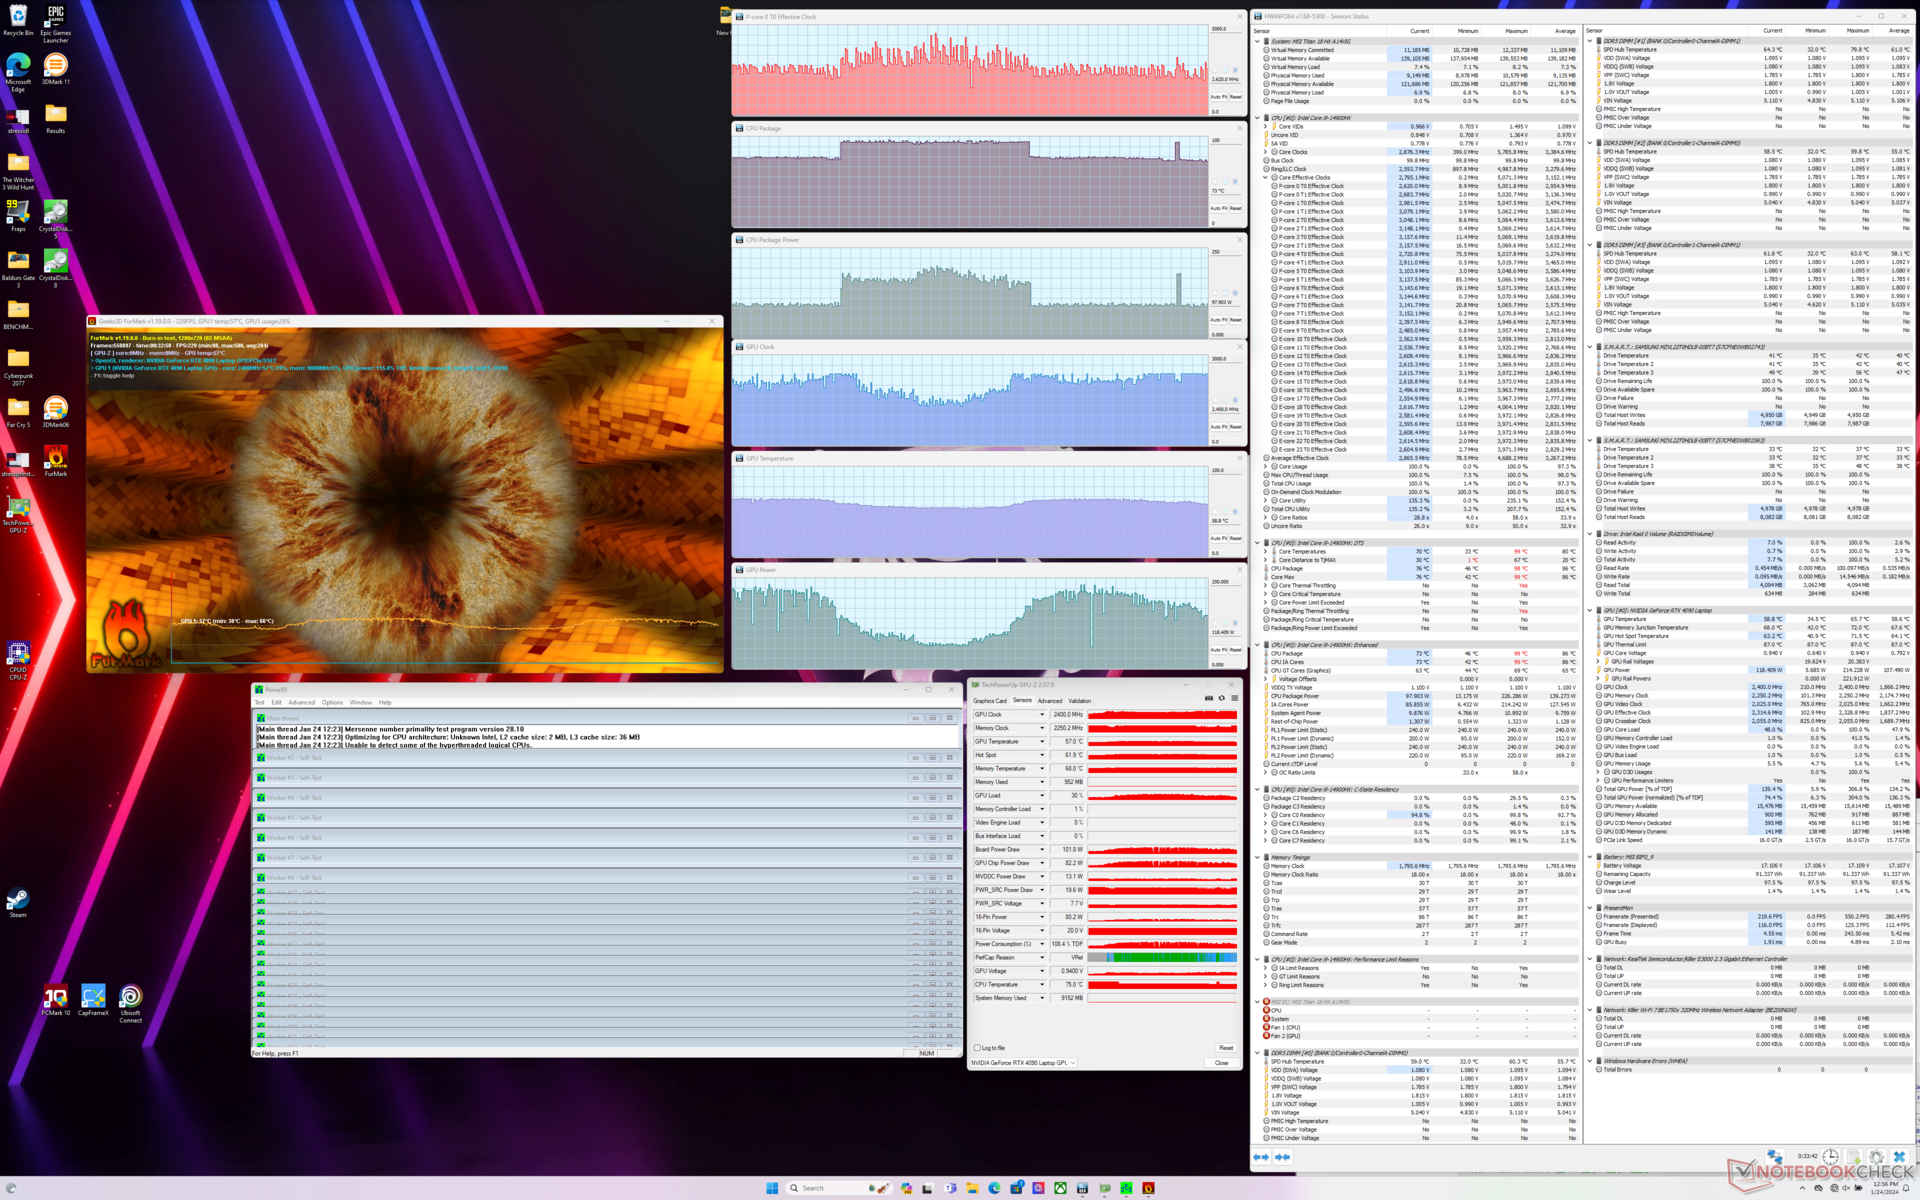
| CPU Saati (GHz) | GPU Saati (MHz) | Ortalama CPU Sıcaklığı (°C) | Ortalama GPU Sıcaklığı (°C) | |
| Sistem Boşta | -- | -- | 52 | 41 |
| Prime95 Stres | ~3,8 | -- | 94 | 46 |
| Prime95 + FurMark Stres | ~2.6 - ~4.3 | 1300 - 2400 | 73 - 95 | 55 - 65 |
| Witcher 3 Stres (Dengeli mod) | ~1,4 | 2130 | 85 | 68 |
| Witcher 3 Stres (Extreme Performance Cooler Boost kapalı) | ~1.8 | 2370 | 97 | 68 |
| Witcher 3 Stres (Aşırı Performans Soğutucu Takviyesi açık) | ~1.8 | 2325 | 90 | 64 |
Konuşmacılar
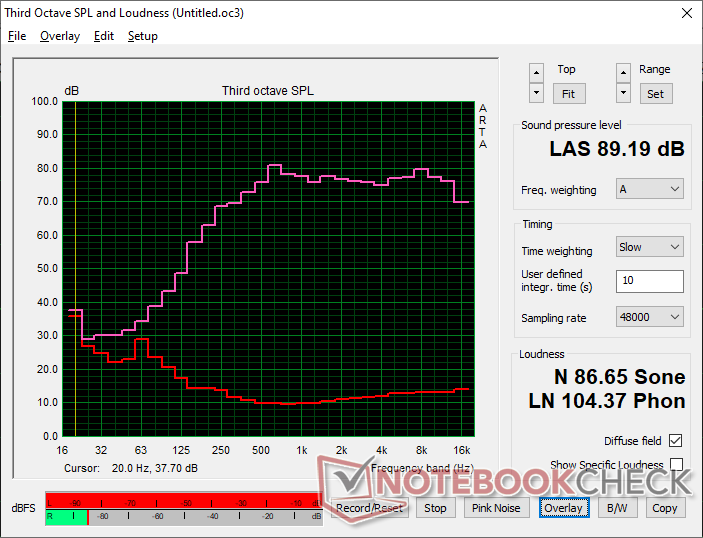
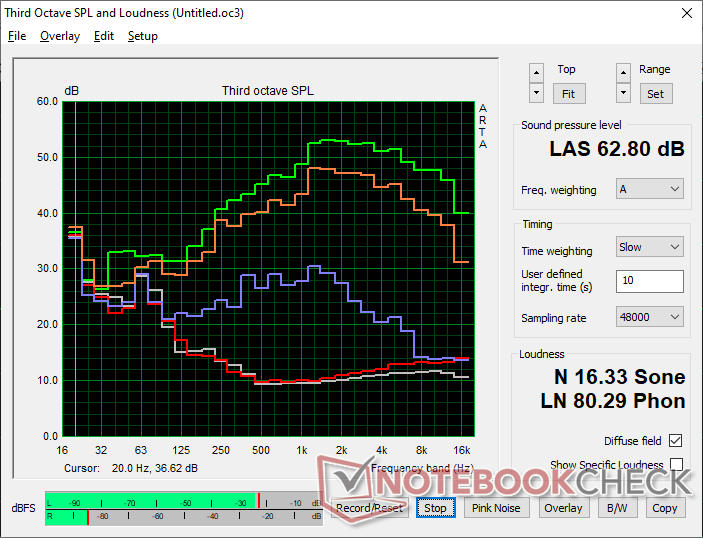
MSI Titan 18 HX A14VIG ses analizi
(+) | hoparlörler nispeten yüksek sesle çalabilir (89.2 dB)
Bas 100 - 315Hz
(-) | neredeyse hiç bas yok - ortalama olarak medyandan 17.6% daha düşük
(±) | Bas doğrusallığı ortalamadır (8% delta - önceki frekans)
Ortalar 400 - 2000 Hz
(+) | dengeli ortalar - medyandan yalnızca 1.8% uzakta
(+) | orta frekanslar doğrusaldır (3.7% deltadan önceki frekansa)
Yüksekler 2 - 16 kHz
(+) | dengeli yüksekler - medyandan yalnızca 1.2% uzakta
(+) | yüksekler doğrusaldır (2% deltadan önceki frekansa)
Toplam 100 - 16.000 Hz
(+) | genel ses doğrusaldır (9.9% ortancaya göre fark)
Aynı sınıfla karşılaştırıldığında
» Bu sınıftaki tüm test edilen cihazların %5%'si daha iyi, 2% benzer, 94% daha kötüydü
» En iyisinin deltası 6% idi, ortalama 18% idi, en kötüsü 132% idi
Test edilen tüm cihazlarla karşılaştırıldığında
» Test edilen tüm cihazların %4'si daha iyi, 1 benzer, % 95 daha kötüydü
» En iyisinin deltası 4% idi, ortalama 24% idi, en kötüsü 134% idi
Apple MacBook Pro 16 2021 M1 Pro ses analizi
(+) | hoparlörler nispeten yüksek sesle çalabilir (84.7 dB)
Bas 100 - 315Hz
(+) | iyi bas - medyandan yalnızca 3.8% uzakta
(+) | bas doğrusaldır (5.2% delta ile önceki frekans)
Ortalar 400 - 2000 Hz
(+) | dengeli ortalar - medyandan yalnızca 1.3% uzakta
(+) | orta frekanslar doğrusaldır (2.1% deltadan önceki frekansa)
Yüksekler 2 - 16 kHz
(+) | dengeli yüksekler - medyandan yalnızca 1.9% uzakta
(+) | yüksekler doğrusaldır (2.7% deltadan önceki frekansa)
Toplam 100 - 16.000 Hz
(+) | genel ses doğrusaldır (4.6% ortancaya göre fark)
Aynı sınıfla karşılaştırıldığında
» Bu sınıftaki tüm test edilen cihazların %0%'si daha iyi, 0% benzer, 100% daha kötüydü
» En iyisinin deltası 5% idi, ortalama 17% idi, en kötüsü 45% idi
Test edilen tüm cihazlarla karşılaştırıldığında
» Test edilen tüm cihazların %0'si daha iyi, 0 benzer, % 100 daha kötüydü
» En iyisinin deltası 4% idi, ortalama 24% idi, en kötüsü 134% idi
Enerji Yönetimi
Güç Tüketimi
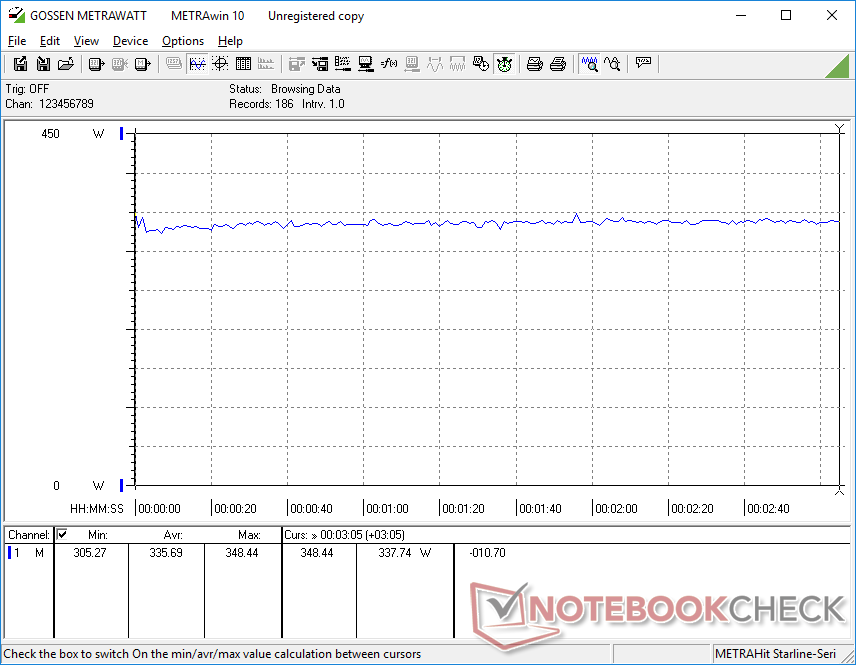
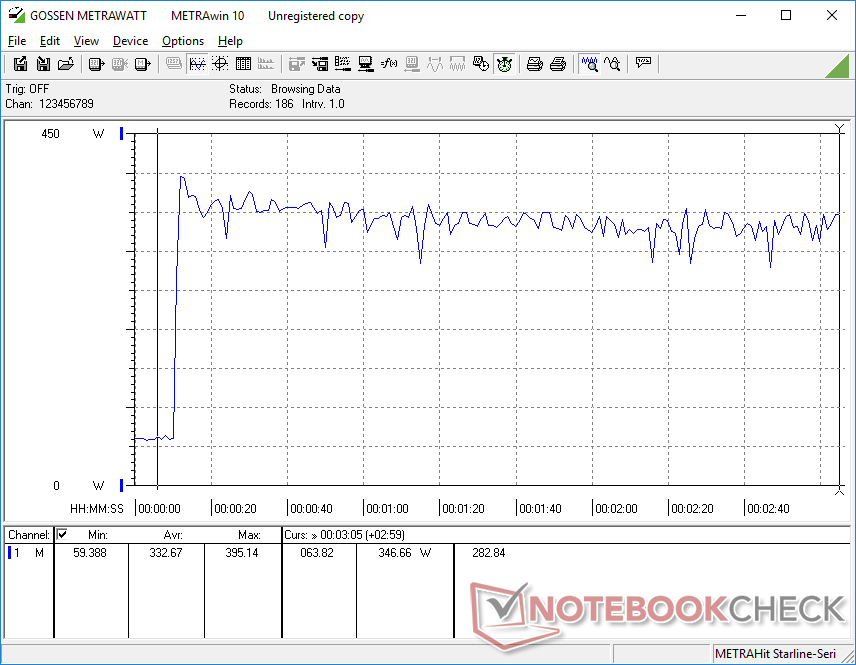
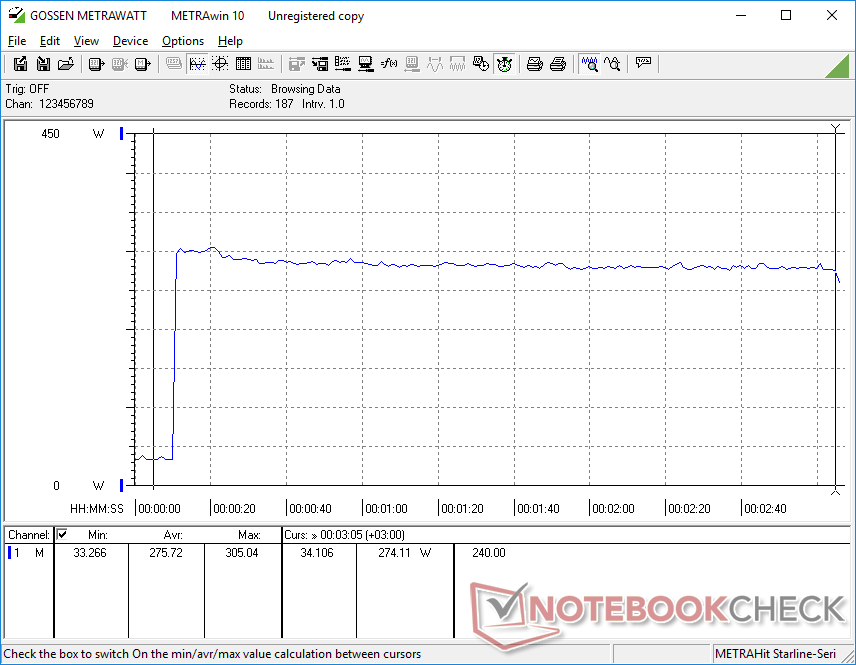
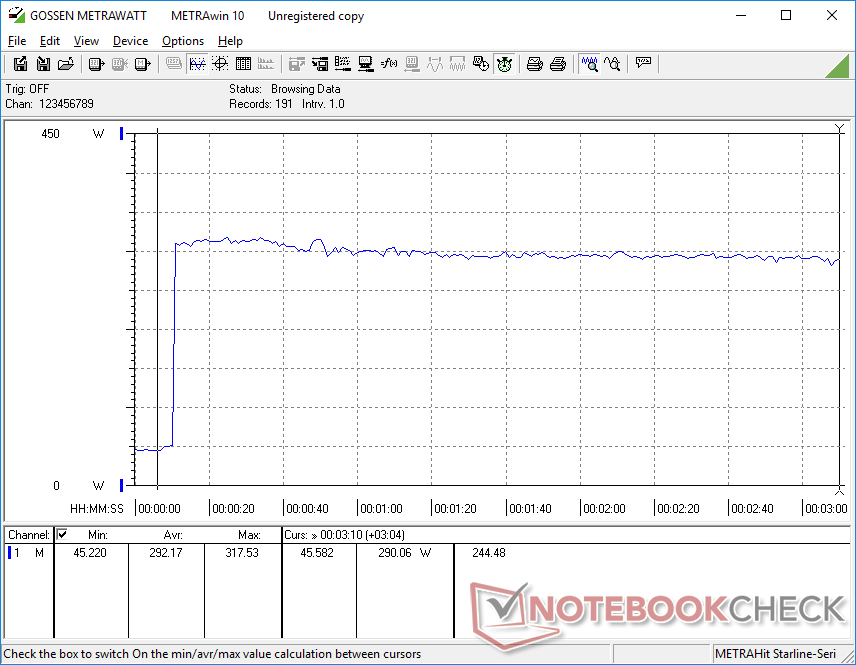
Genel güç tüketimi, zorlu 95 W CPU, 175 W GPU ve ultra parlak 4K 120 Hz mini LED ekran nedeniyle genellikle diğer 18 inç oyun dizüstü bilgisayarlarından daha yüksektir. Masaüstünde rölantide çalışırken, parlaklık ayarına ve dGPU/iGPU ayarına bağlı olarak 13 W ile 54 W arasında güç çeker ki bu, her biri standart IPS panelli Asus ROG Strix G18 veya Acer Predator Helios 18'den çok daha geniş bir aralıktır.
Eğer oyun oynanıyorsa, MSI sistemi en zorlu dizüstü bilgisayarlardan biri olmaya devam ediyor. Witcher 3 adresini çalıştırmak, geçen yılki 265 W ve 311 W'a kıyasla neredeyse 340 W çekecektir GT77 veya Alienware m18 R1sırasıyla, hepsi aynı RTX 4090 GPU'ya sahip.
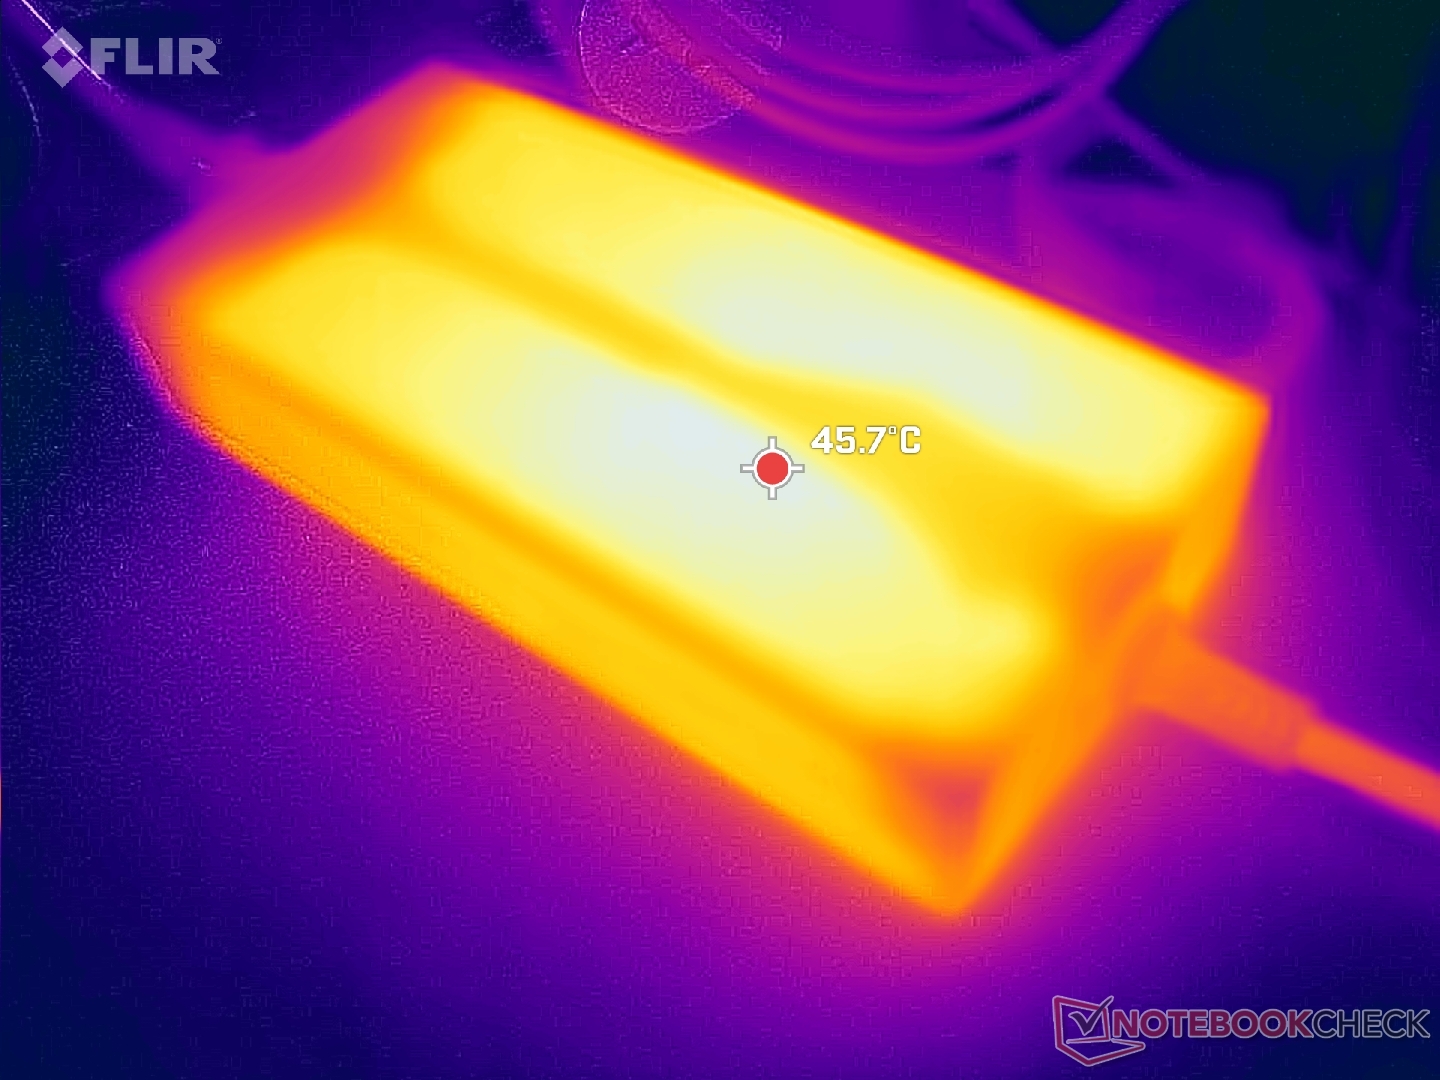
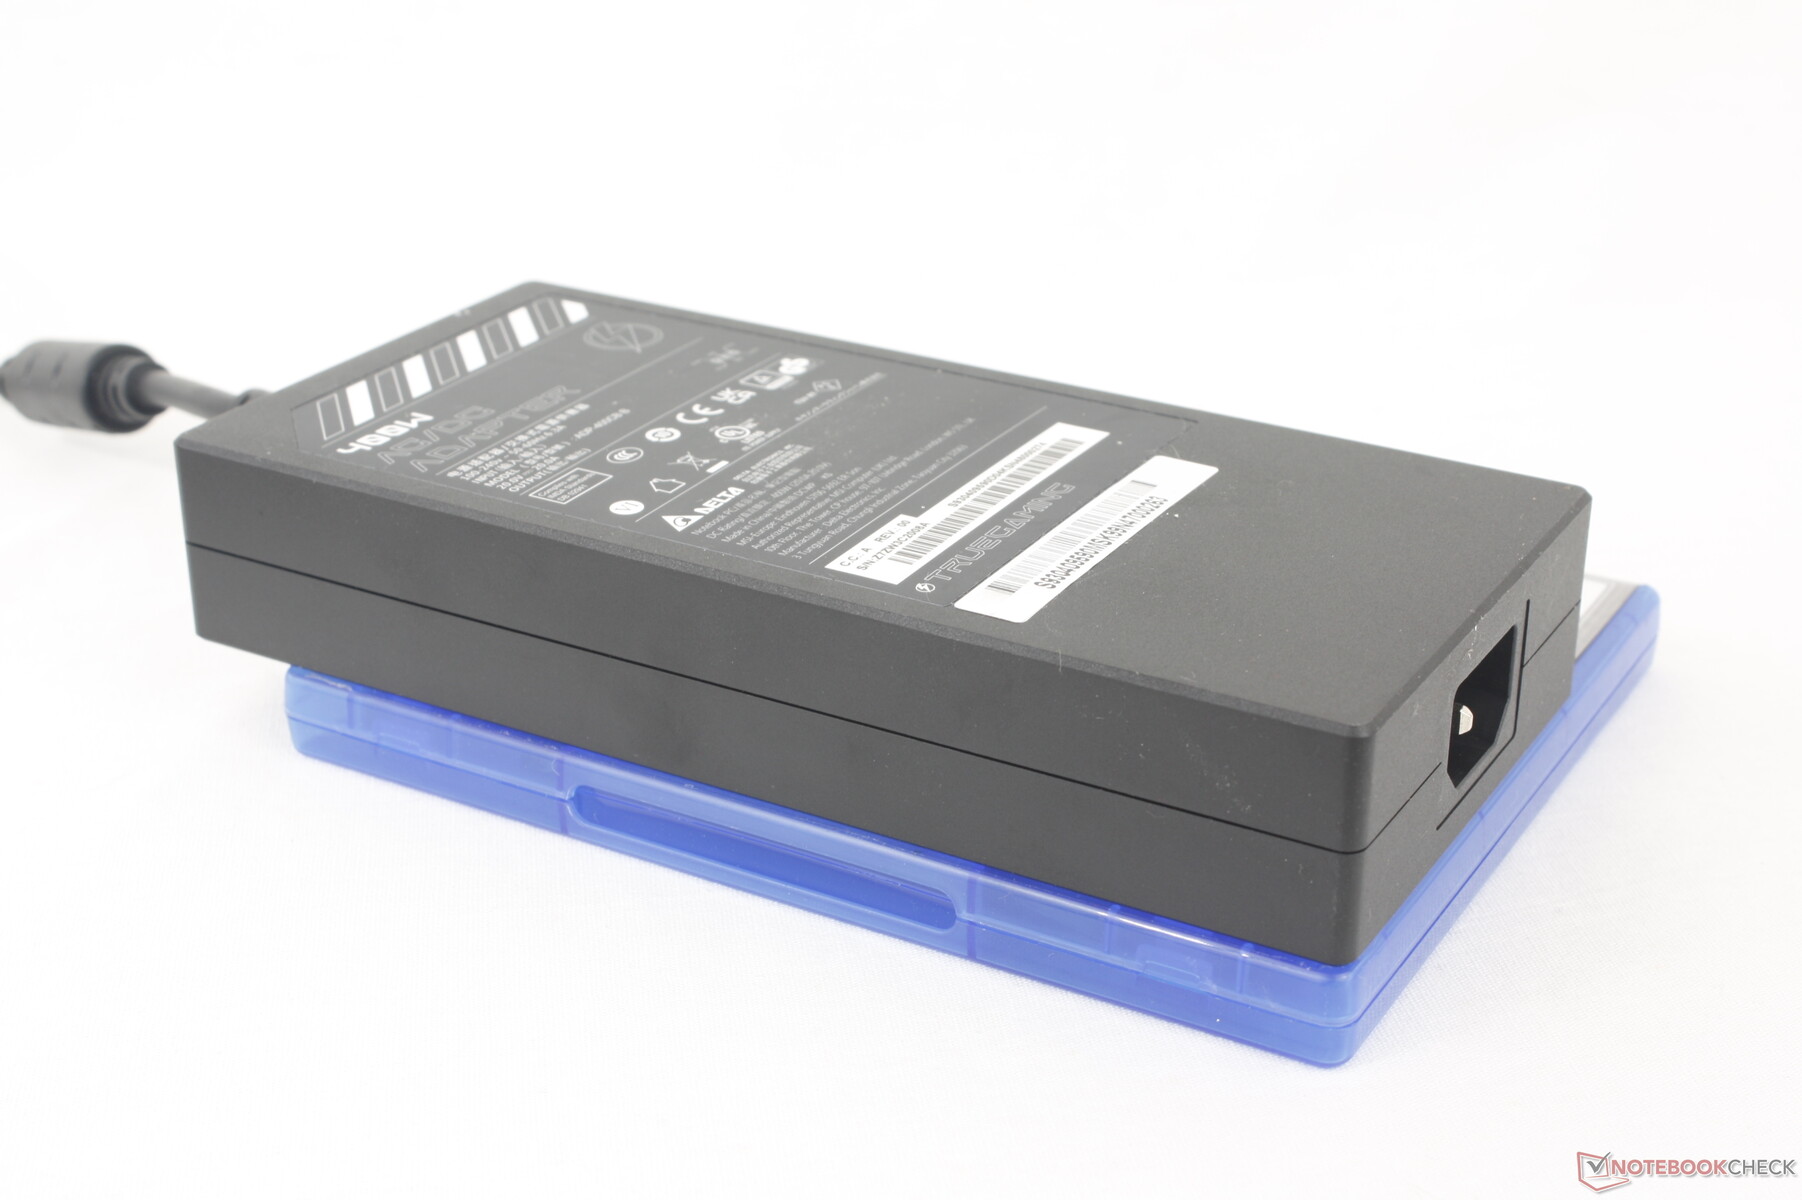
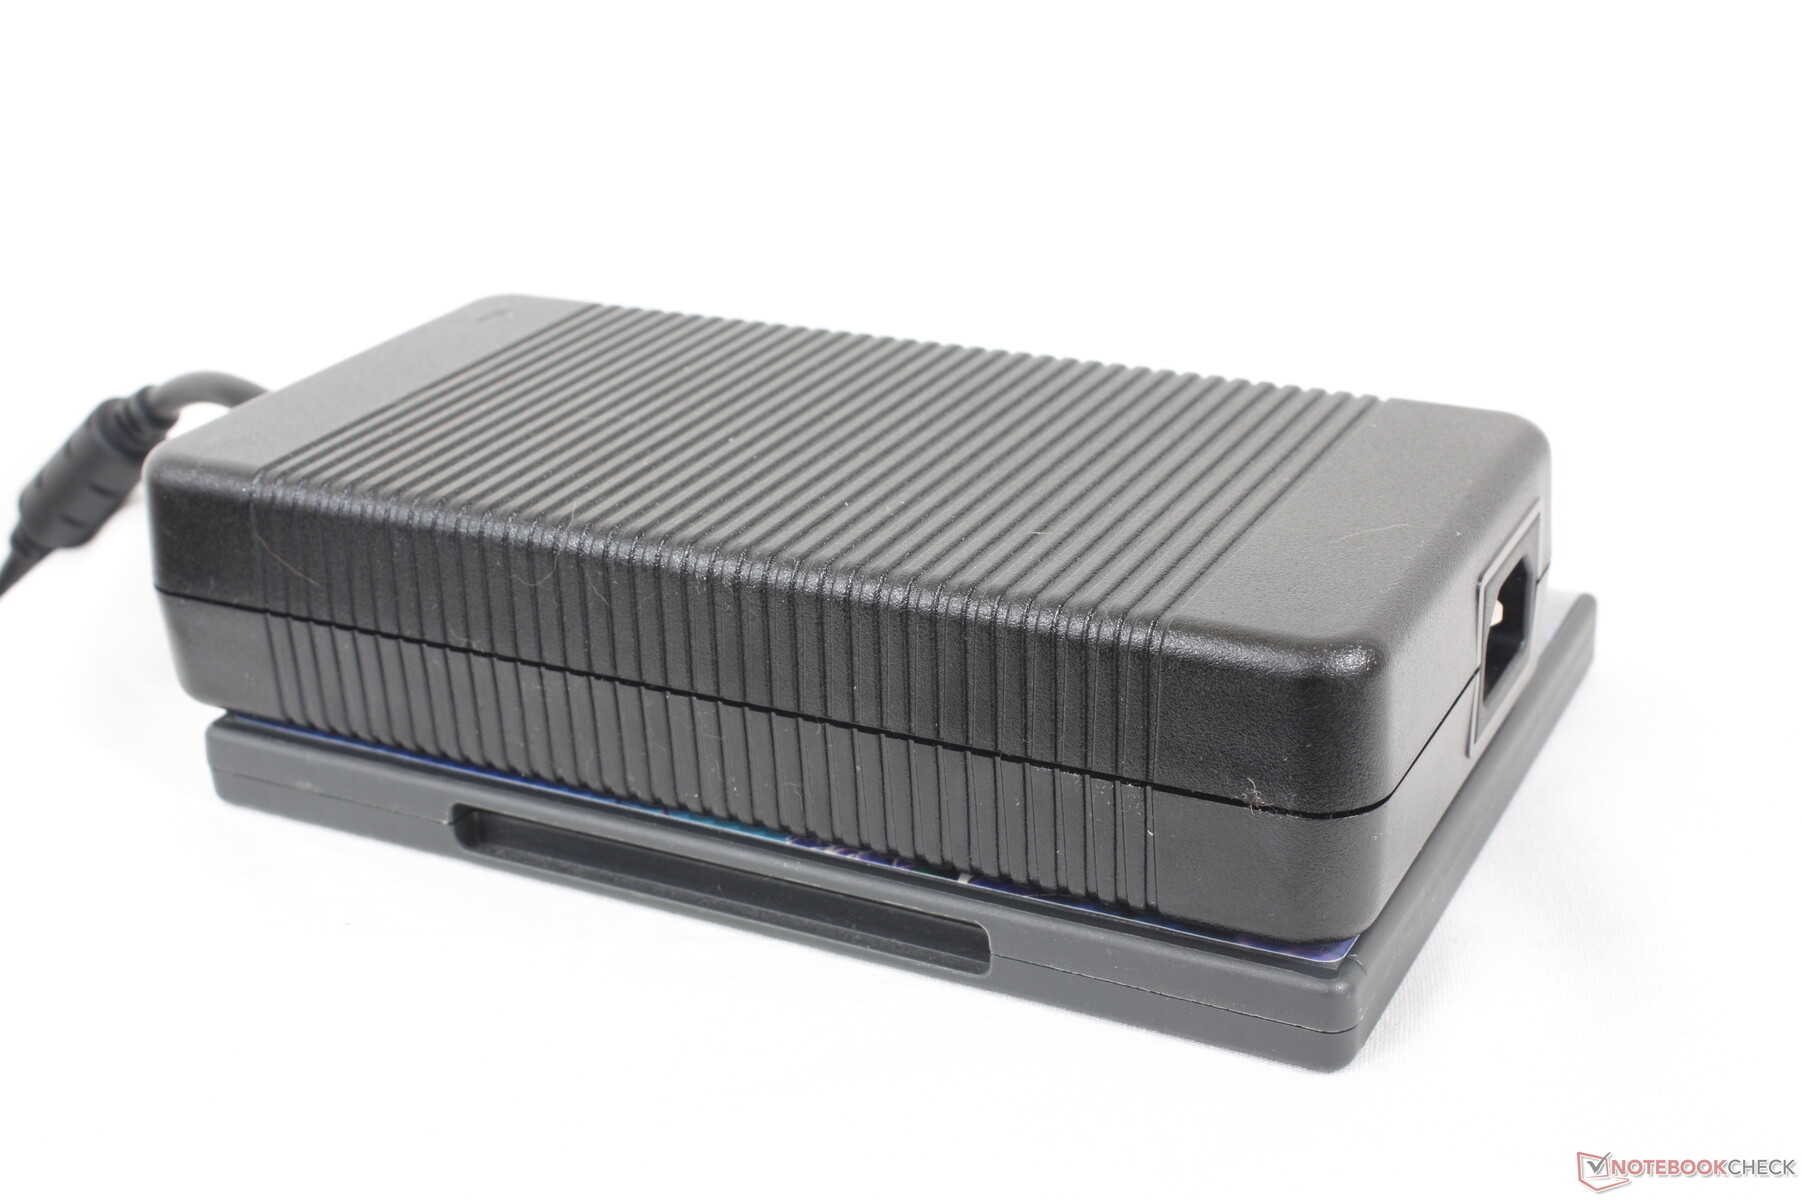
Bu yıl MSI dizüstü bilgisayarlar için yeni olan şey, artık eskisinden hem daha ince hem de daha güçlü olan yeniden tasarlanmış AC adaptörü. Geçmişteki AC adaptörleri oldukça büyüktü, özellikle de MSI'ın güçlü dizüstü bilgisayarlarıyla birlikte gelen 330 W'lık versiyonu Raider GE78. Titan 16 HX, hacim başına daha yüksek güç için yaklaşık yüzde 35 daha küçük olan 400 W AC adaptör (~18,8 x 8,8 x 3,2 cm) kullanır. Daha yüksek kapasiteli adaptör, zorlu yükleri çalıştırırken daha tutarlı performans ve şarj oranları sağlar. Buna karşılık, diğer yüksek performanslı oyun dizüstü bilgisayarlarının çoğu yalnızca 330 W veya daha küçük AC adaptörlerle gönderilmeye devam ediyor.
| Kapalı / Bekleme modu | |
| Boşta | |
| Çalışırken |
|
Key:
min: | |
| MSI Titan 18 HX A14VIG i9-14900HX, GeForce RTX 4090 Laptop GPU, 2x Samsung PM9A1a MZVL22T0HDLB (RAID 0), Mini-LED, 3840x2400, 18" | MSI Titan GT77 HX 13VI i9-13950HX, GeForce RTX 4090 Laptop GPU, Samsung PM9A1 MZVL22T0HBLB, Mini-LED, 3840x2160, 17.3" | Alienware m18 R1 i9-13980HX, GeForce RTX 4090 Laptop GPU, SK hynix PC801 HFS001TEJ9X101N, IPS, 1920x1200, 18" | Asus ROG Strix G18 G814JI i7-13650HX, GeForce RTX 4070 Laptop GPU, Micron 2400 MTFDKBA1T0QFM, IPS, 2560x1600, 18" | Acer Predator Helios 18 N23Q2 i9-13900HX, GeForce RTX 4080 Laptop GPU, Samsung PM9A1 MZVL22T0HBLB, IPS, 2560x1600, 18" | Razer Blade 18 RTX 4070 i9-13950HX, GeForce RTX 4070 Laptop GPU, SSSTC CA6-8D1024, IPS, 2560x1600, 18" | |
|---|---|---|---|---|---|---|
| Power Consumption | 16% | -9% | 41% | 19% | -5% | |
| Idle Minimum * (Watt) | 13.2 | 14 -6% | 21.6 -64% | 8 39% | 16 -21% | 24.5 -86% |
| Idle Average * (Watt) | 25.4 | 21.6 15% | 25.2 1% | 15 41% | 19 25% | 34.1 -34% |
| Idle Maximum * (Watt) | 53.5 | 24.8 54% | 56.7 -6% | 26 51% | 21.3 60% | 47.7 11% |
| Load Average * (Watt) | 151.4 | 122.5 19% | 164.1 -8% | 102 33% | 124 18% | 140 8% |
| Witcher 3 ultra * (Watt) | 336 | 265 21% | 311 7% | 178.6 47% | 289 14% | 202 40% |
| Load Maximum * (Watt) | 395.2 | 418 -6% | 338.9 14% | 267 32% | 319 19% | 261 34% |
* ... daha küçük daha iyidir
Power Consumption Witcher 3 / Stresstest
Power Consumption external Monitor
Pil Ömrü
DGPU etkin değilken Dengeli moda ayarlandığında 4 saatten biraz fazla gerçek dünya tarama kullanımı kaydedebildik. Çok uzun bir süre değil, ancak 120 Hz mini LED ekranlı 18 inçlik bir güç merkezinden beklenen de bu. MSI'ın Pil Tasarrufu modunda en iyi senaryo için en düşük parlaklık ayarında rölantide bile 6 saatin biraz altında dayanır. Alienware m18 R1 veya Razer Blade 18'in sonuçları da benzer.
Ürünle birlikte verilen AC adaptörü ile boştan tam kapasiteye şarj etmek yaklaşık 2 ila 2,5 saat sürüyor. Sistem, çok daha yavaş olsa da üçüncü taraf USB-C adaptörleriyle de şarj edilebiliyor. İki USB-C bağlantı noktasından yalnızca birinin USB-C Güç Dağıtımı'nı desteklediğini unutmayın.
| MSI Titan 18 HX A14VIG i9-14900HX, GeForce RTX 4090 Laptop GPU, 99.9 Wh | MSI Titan GT77 HX 13VI i9-13950HX, GeForce RTX 4090 Laptop GPU, 99.9 Wh | Alienware m18 R1 i9-13980HX, GeForce RTX 4090 Laptop GPU, 97 Wh | Asus ROG Strix G18 G814JI i7-13650HX, GeForce RTX 4070 Laptop GPU, 90 Wh | Acer Predator Helios 18 N23Q2 i9-13900HX, GeForce RTX 4080 Laptop GPU, 90 Wh | Razer Blade 18 RTX 4070 i9-13950HX, GeForce RTX 4070 Laptop GPU, 91.7 Wh | |
|---|---|---|---|---|---|---|
| Pil Çalışma Süresi | 22% | -15% | 64% | 24% | 7% | |
| Reader / Idle (h) | 5.9 | 5.6 -5% | 11.7 98% | 7 19% | ||
| WiFi v1.3 (h) | 4.2 | 5.3 26% | 4.3 2% | 8.1 93% | 4.4 5% | 4 -5% |
| Load (h) | 1.2 | 1.4 17% | 0.7 -42% | 1.2 0% | 1.7 42% | 1.3 8% |
| H.264 (h) | 6 | 4.8 |
Artılar
Eksiler
Karar - Yeni Dış Tasarım, Aynı İç Performans
Bu yıl dizüstü bilgisayarlar için yeni bir Nvidia GPU olmadığından, MSI bunu telafi etmek için grafik kartını çevreleyen her şeyi yenilemek zorunda kaldı. Kullanıcılar 18 inçlik yeni bir kasa tasarımı, yeni 14. nesil Intel HX CPU, yeni AC adaptörü, daha büyük tuşlar ve yüksek fiyat etiketine eşlik edecek yeni 120 Hz HDR1000 mini LED 4K ekrana sahip oluyor. Bu değişikliklerin çoğu geçen yılki modele göre bir adım daha ileride GT77ancak kullanıcılar sonuçta her iki modelden de aynı oyun performansını elde ediyor.
Titan 18'in öne çıkan özellikleri arasında mini LED ekranı ve Core i9-14900HX CPU yer alıyor. İlki şüphesiz etkileyici ve herhangi bir dizüstü bilgisayarda HDR içeriği izlemenin en iyi yollarından biri, ancak G-Sync desteğinin eksikliğini özellikle amiral gemisi bir oyun modelinde görmezden gelmek zor. Bu arada, yeni CPU, GT77'de bulunan 13. nesil Core i9-13950HX ile neredeyse aynı performansı gösteriyor ve bu da bir yeniden markadan başka bir şey gibi hissettirmiyor. Bu nedenle Titan 18, tüm dış değişiklikler nedeniyle GT77'ye karşı büyük bir sıçrama olarak kabul edilebilir, ancak Intel ve Nvidia iç kısımları karşılaştırıldığında durgun hissediyor.
MSI Titan 18 HX, aynı derecede etkileyici 4K mini LED ekranıyla yılın en hızlı oyun dizüstü bilgisayarlarından biri. Ancak geçen yılki GT77 ile neredeyse aynı performansı gösteriyor.
Büyük ve ultra parlak 18 inç mini LED ekran sizi cezbediyorsa, Titan 18 HX bu yazının yazıldığı sırada bir tane bulabileceğiniz tek yerlerden biri. Eğer bulamazsanız, o zaman alternatifler Alienware m18 R1, Asus ROG Strix G18veya Razer Blade 18 hepsi G-Sync, daha yüksek yenileme hızları ve aynı GeForce RTX 4090 seçeneğini daha ince ve çoğu zaman daha hafif kasa tasarımlarında sunuyor.
Fiyat ve Bulunabilirlik
İncelenen Titan 18 HX şu anda Amazon 'da 5800 dolara satılıyor. MSI ayrıca şunları da sunuyor modeli doğrudan resmi web sitesi üzerinden daha düşük başlangıç fiyatlarıyla satışa sunuyor.
MSI Titan 18 HX A14VIG
- 01/30/2024 v7 (old)
Allen Ngo
Şeffaflık
İncelenecek cihazların seçimi editör ekibimiz tarafından yapılır. Test örneği, bu incelemenin amacı doğrultusunda üretici veya perakendeci tarafından yazara ödünç olarak sağlanmıştır. Borç verenin bu inceleme üzerinde herhangi bir etkisi olmadığı gibi, üretici de yayınlanmadan önce bu incelemenin bir kopyasını almamıştır. Bu incelemeyi yayınlama zorunluluğu yoktu. Bağımsız bir medya şirketi olarak Notebookcheck, üreticilerin, perakendecilerin veya yayıncıların otoritesine tabi değildir.
Notebookcheck bu şekilde test yapıyor
Notebookcheck, tüm sonuçların karşılaştırılabilir olmasını sağlamak için her yıl yüzlerce dizüstü bilgisayarı ve akıllı telefonu standart prosedürler kullanarak bağımsız olarak inceliyor. Yaklaşık 20 yıldır test yöntemlerimizi sürekli olarak geliştirdik ve bu süreçte endüstri standartlarını belirledik. Test laboratuvarlarımızda deneyimli teknisyenler ve editörler tarafından yüksek kaliteli ölçüm ekipmanları kullanılmaktadır. Bu testler çok aşamalı bir doğrulama sürecini içerir. Karmaşık derecelendirme sistemimiz, nesnelliği koruyan yüzlerce sağlam temellere dayanan ölçüm ve kıyaslamaya dayanmaktadır.Price comparison

