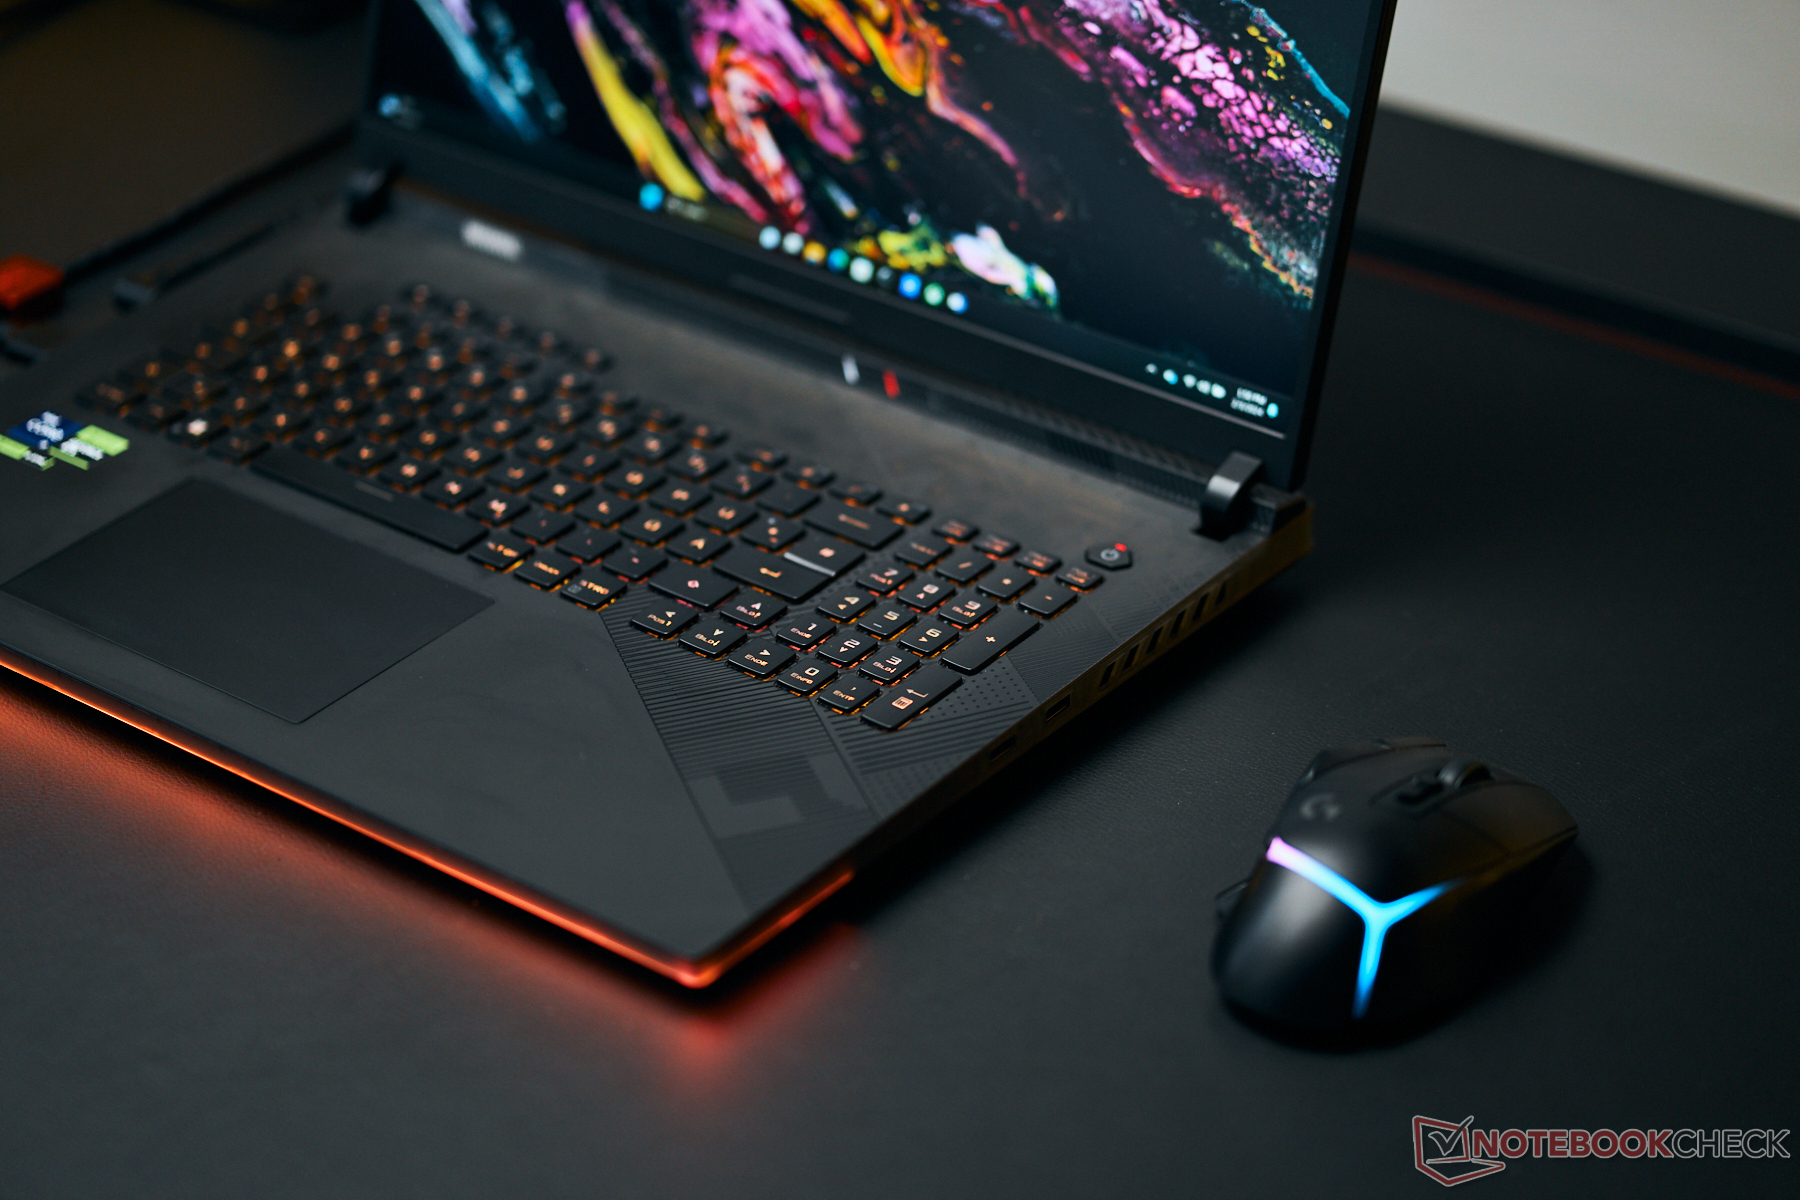
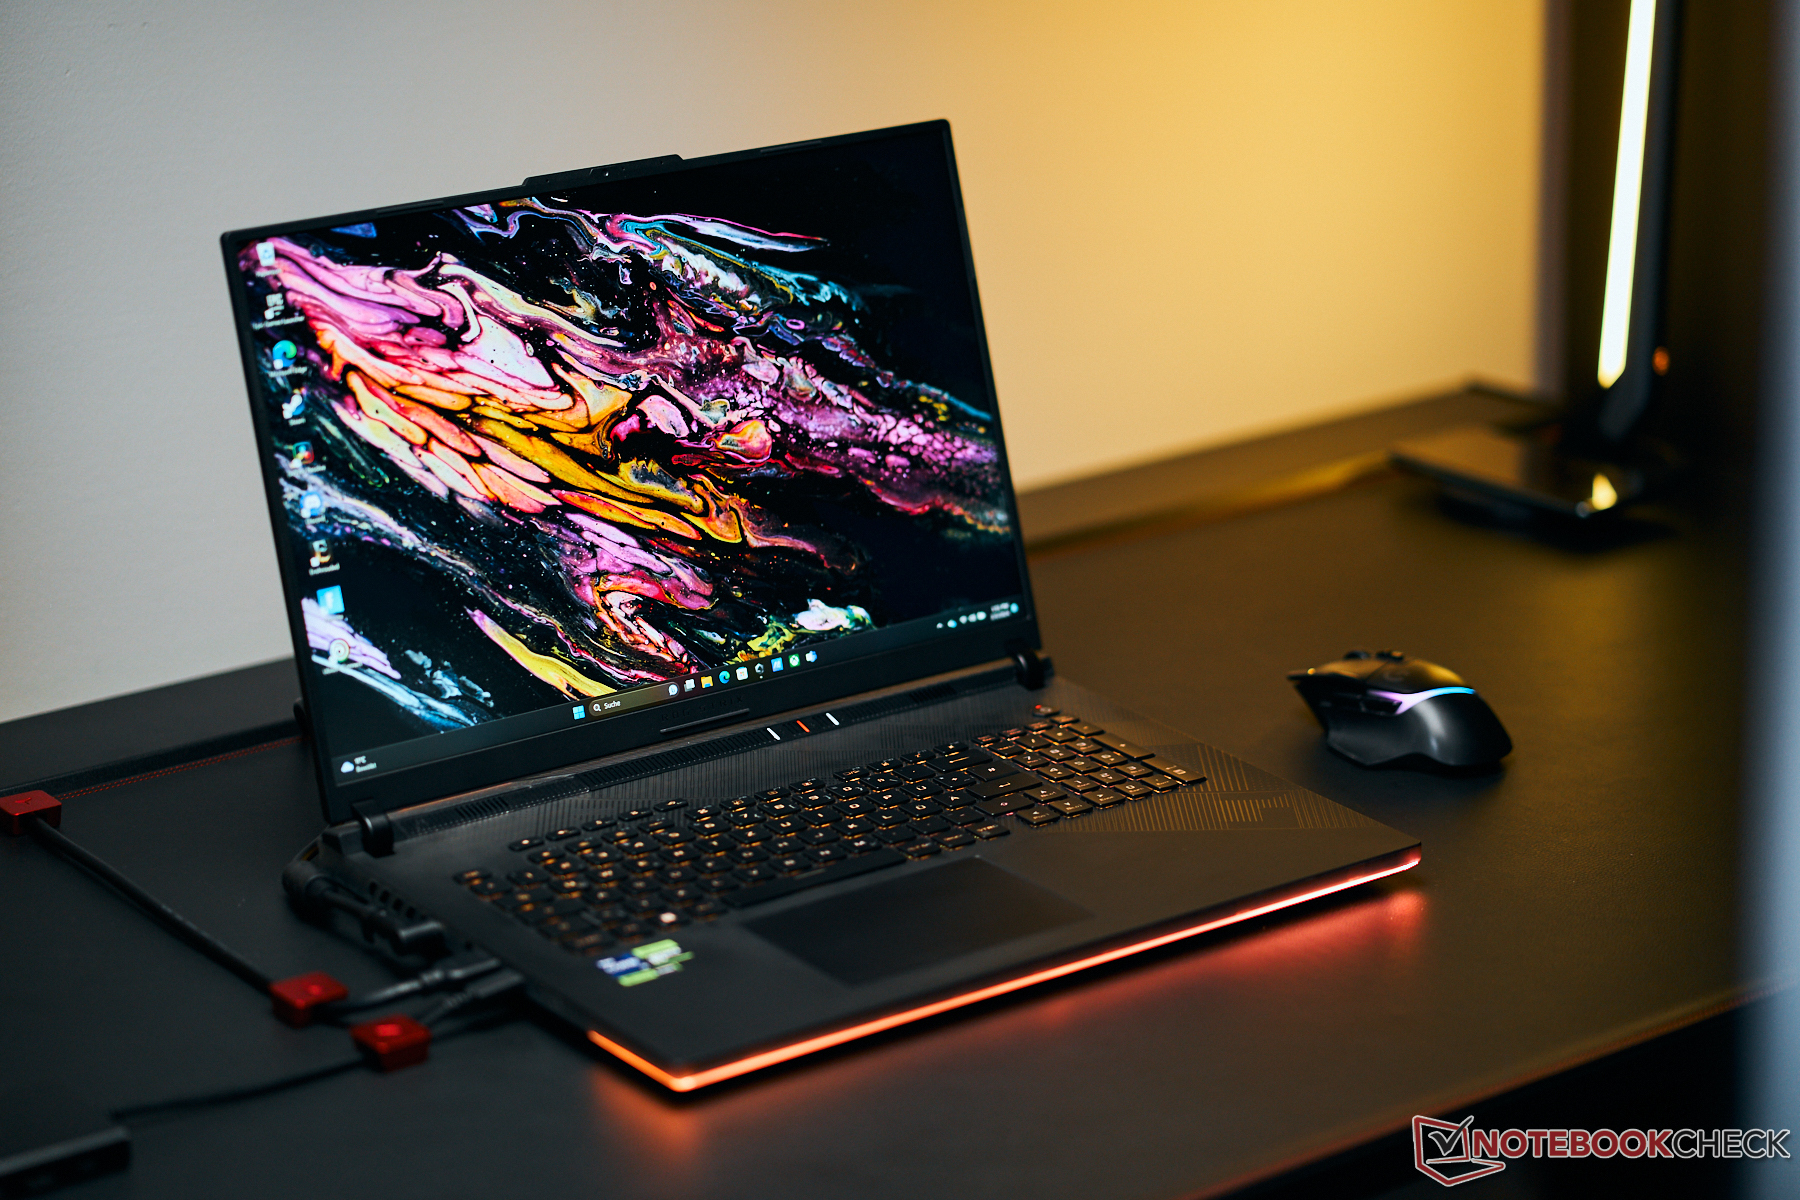
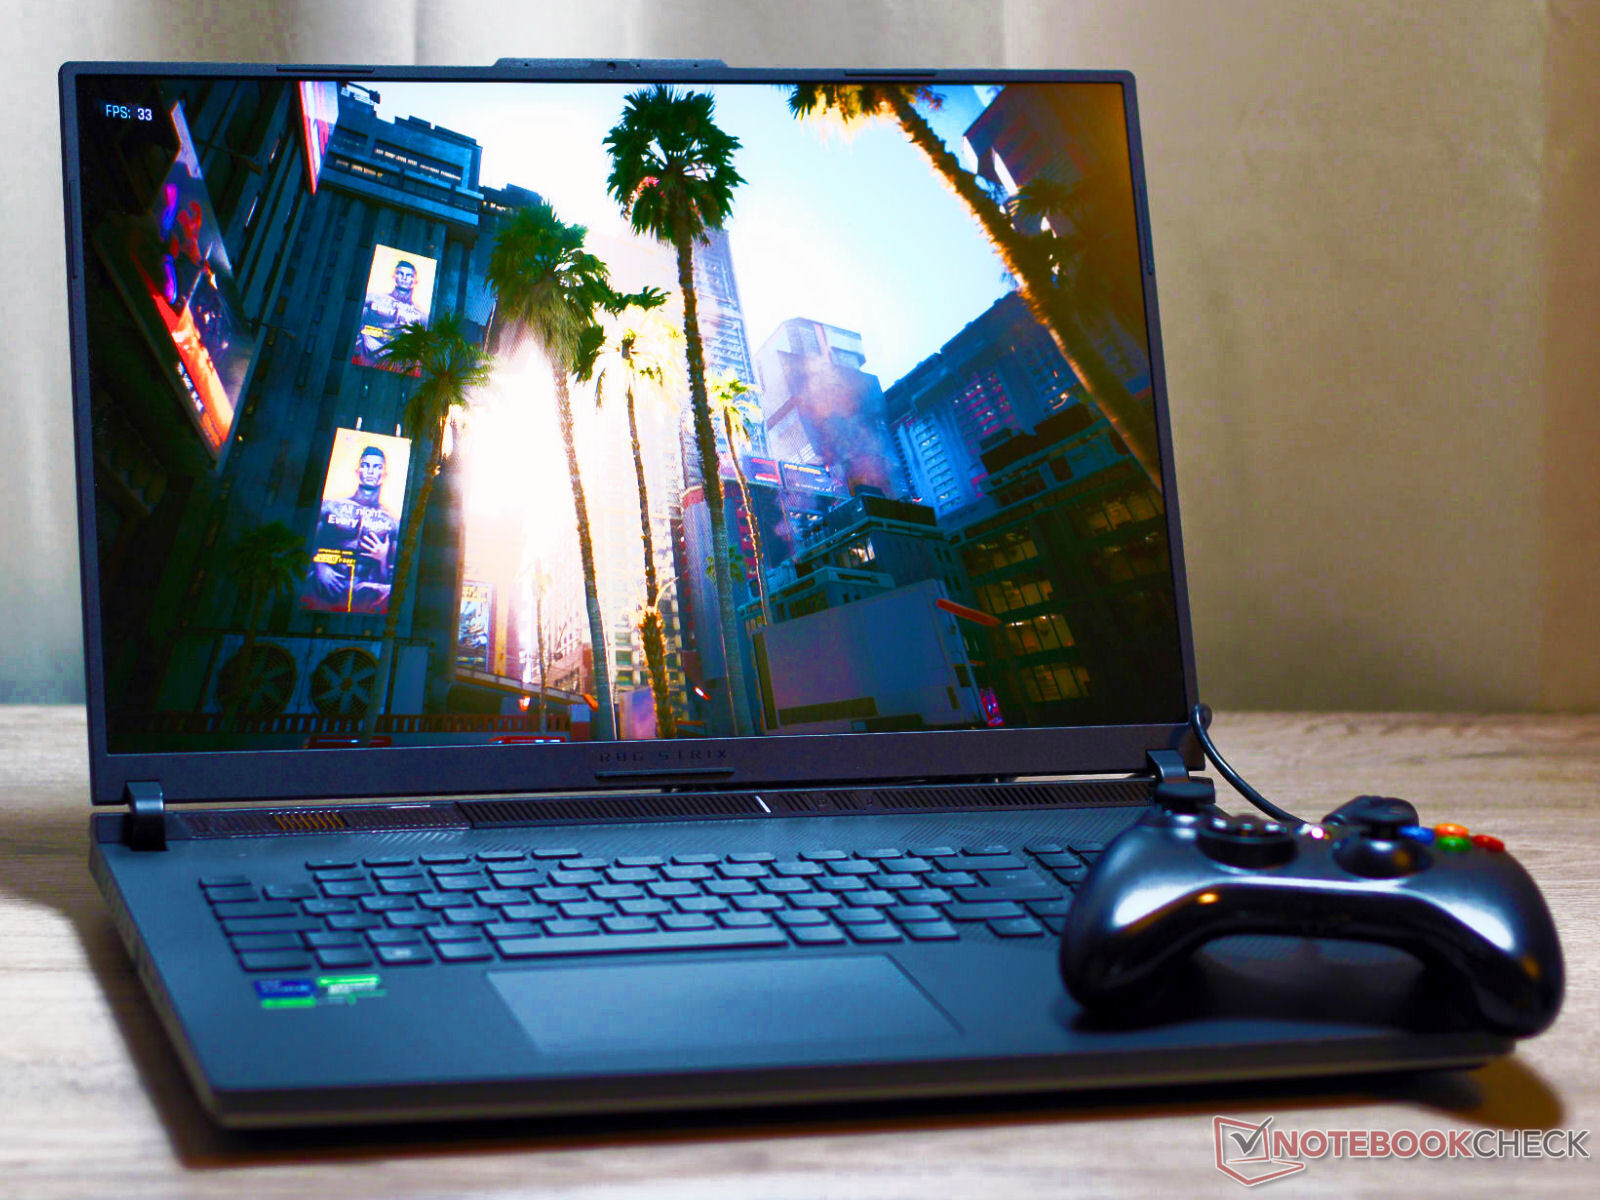
Asus ROG Strix Scar 18 (2024) incelemesi: RTX 4090 ve mini LED panelli dizüstü oyun bilgisayarı
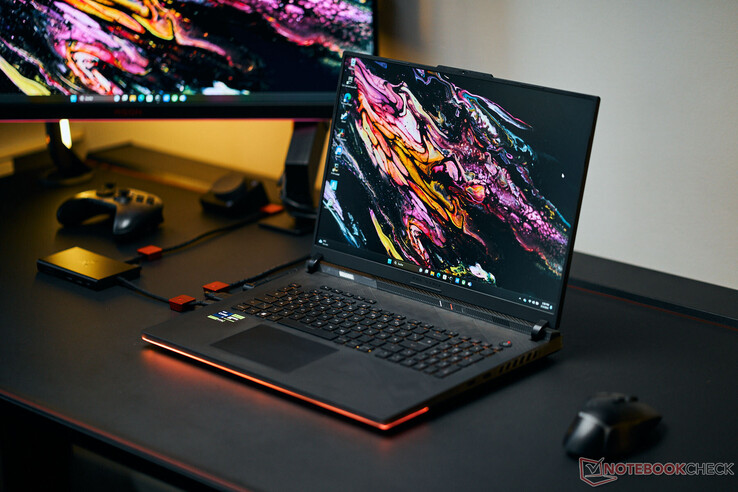
ROG Strix Scar 18 ile ASUS, gerekli paradan yoksun olmayan oyuncuları ve yaratıcıları hedefliyor: Üst düzey şampiyonun test konfigürasyonumuz yaklaşık 4.500 Euro'dan (~ 4.848 $) başlayan fiyatlarla sunuluyor. Fiyat, güçlü donanım ve 16:10 formatında, doğru renklere ve 18 inç diyagonale sahip çok parlak mini LED ekran sayesinde bu kadar yükseklere çıkıyor. Rakipler arasında aşağıdaki gibi cihazlar bulunmaktadır Alienware m18 R1, the Acer Predator Helios 18, the Razer Blade 18ve MSI Titan 18 HX A14VIG.
Dizüstü bilgisayar, dizüstü bilgisayarın kardeşidir Yara izi 18 geçen yıl test ettiğimiz ve aynı yapıyı paylaşan. Ekranın yanı sıra, Raptor Lake'in yerini alan Raptor Lake Refresh ile CPU nesli tek değişikliği temsil ediyor.
Karşılaştırmalı olarak olası rakipler
Derecelendirme | Tarih | Modeli | Ağırlık | Yükseklik | Boyut | Çözünürlük | Fiyat |
|---|---|---|---|---|---|---|---|
| 88.3 % v7 (old) | 02/2024 | Asus ROG Strix Scar 18 G834JYR (2024) i9-14900HX, GeForce RTX 4090 Laptop GPU | 3.1 kg | 30.8 mm | 18.00" | 2560x1600 | |
| 89.2 % v7 (old) | 11/2023 | Alienware m18 R1 AMD R9 7945HX, Radeon RX 7900M | 3.9 kg | 26.7 mm | 18.00" | 1920x1200 | |
| 90.7 % v7 (old) | 04/2023 | Alienware m18 R1 i9-13980HX, GeForce RTX 4090 Laptop GPU | 3.9 kg | 26.7 mm | 18.00" | 1920x1200 | |
| 88.3 % v7 (old) | 10/2023 | Acer Predator Helios 18 N23Q2 i9-13900HX, GeForce RTX 4080 Laptop GPU | 3.2 kg | 29.15 mm | 18.00" | 2560x1600 | |
| 91.4 % v7 (old) | 02/2023 | Razer Blade 18 RTX 4070 i9-13950HX, GeForce RTX 4070 Laptop GPU | 3 kg | 21.9 mm | 18.00" | 2560x1600 | |
| 88.8 % v7 (old) | 01/2024 | MSI Titan 18 HX A14VIG i9-14900HX, GeForce RTX 4090 Laptop GPU | 3.6 kg | 32.1 mm | 18.00" | 3840x2400 |
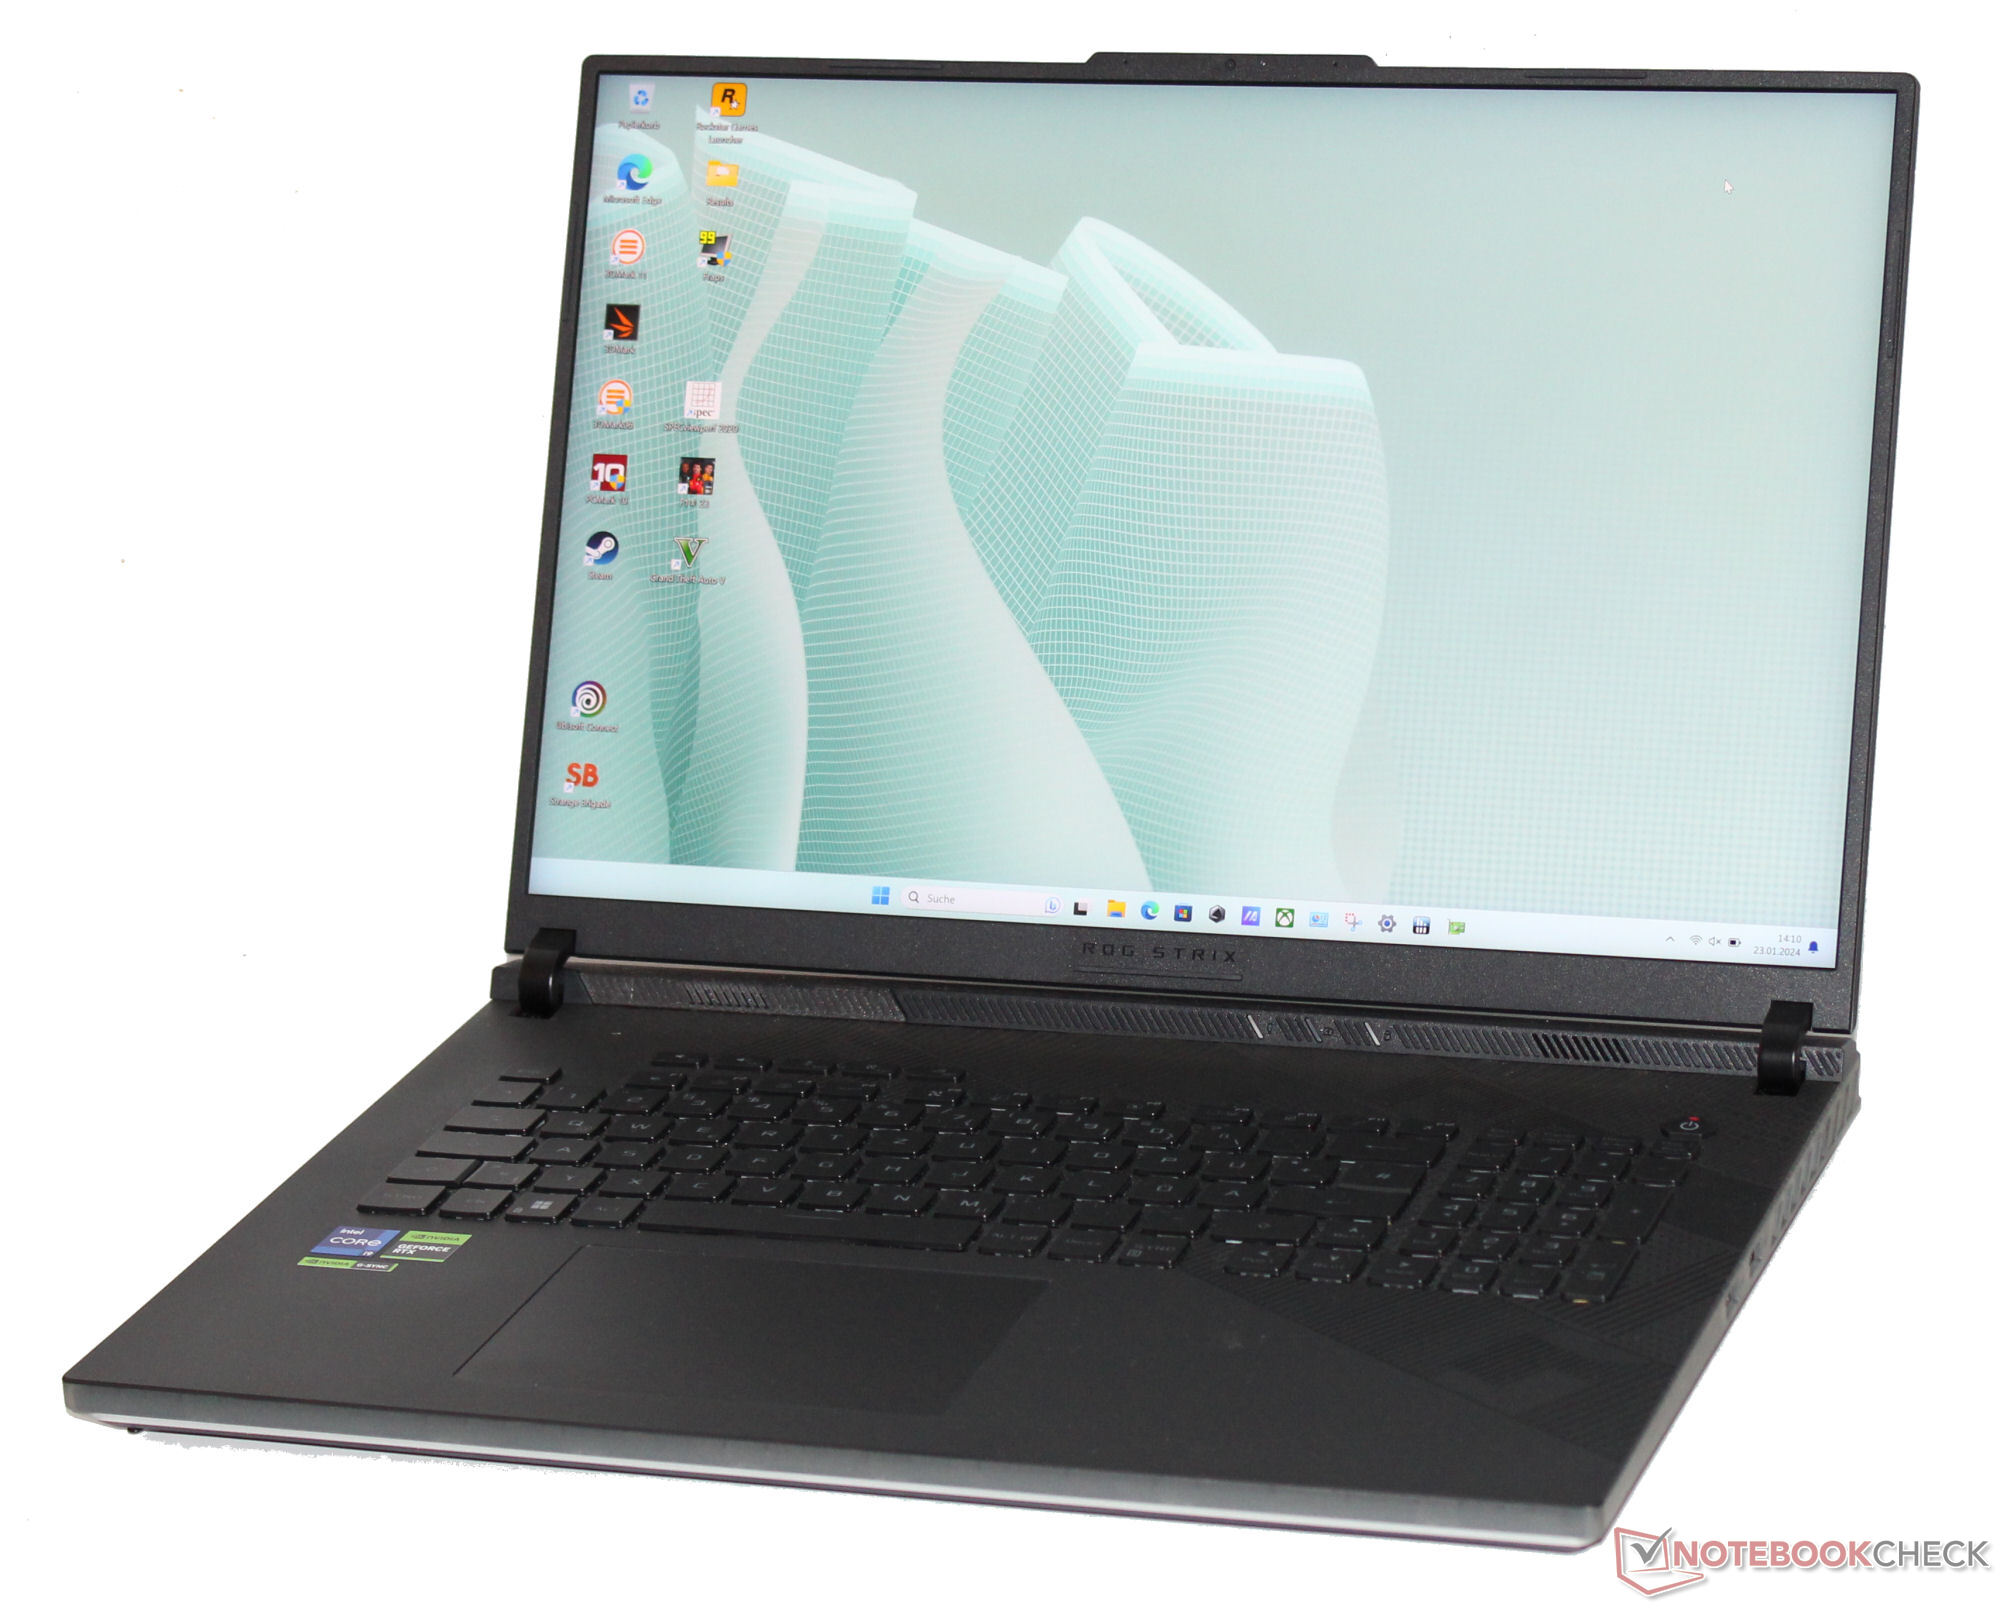
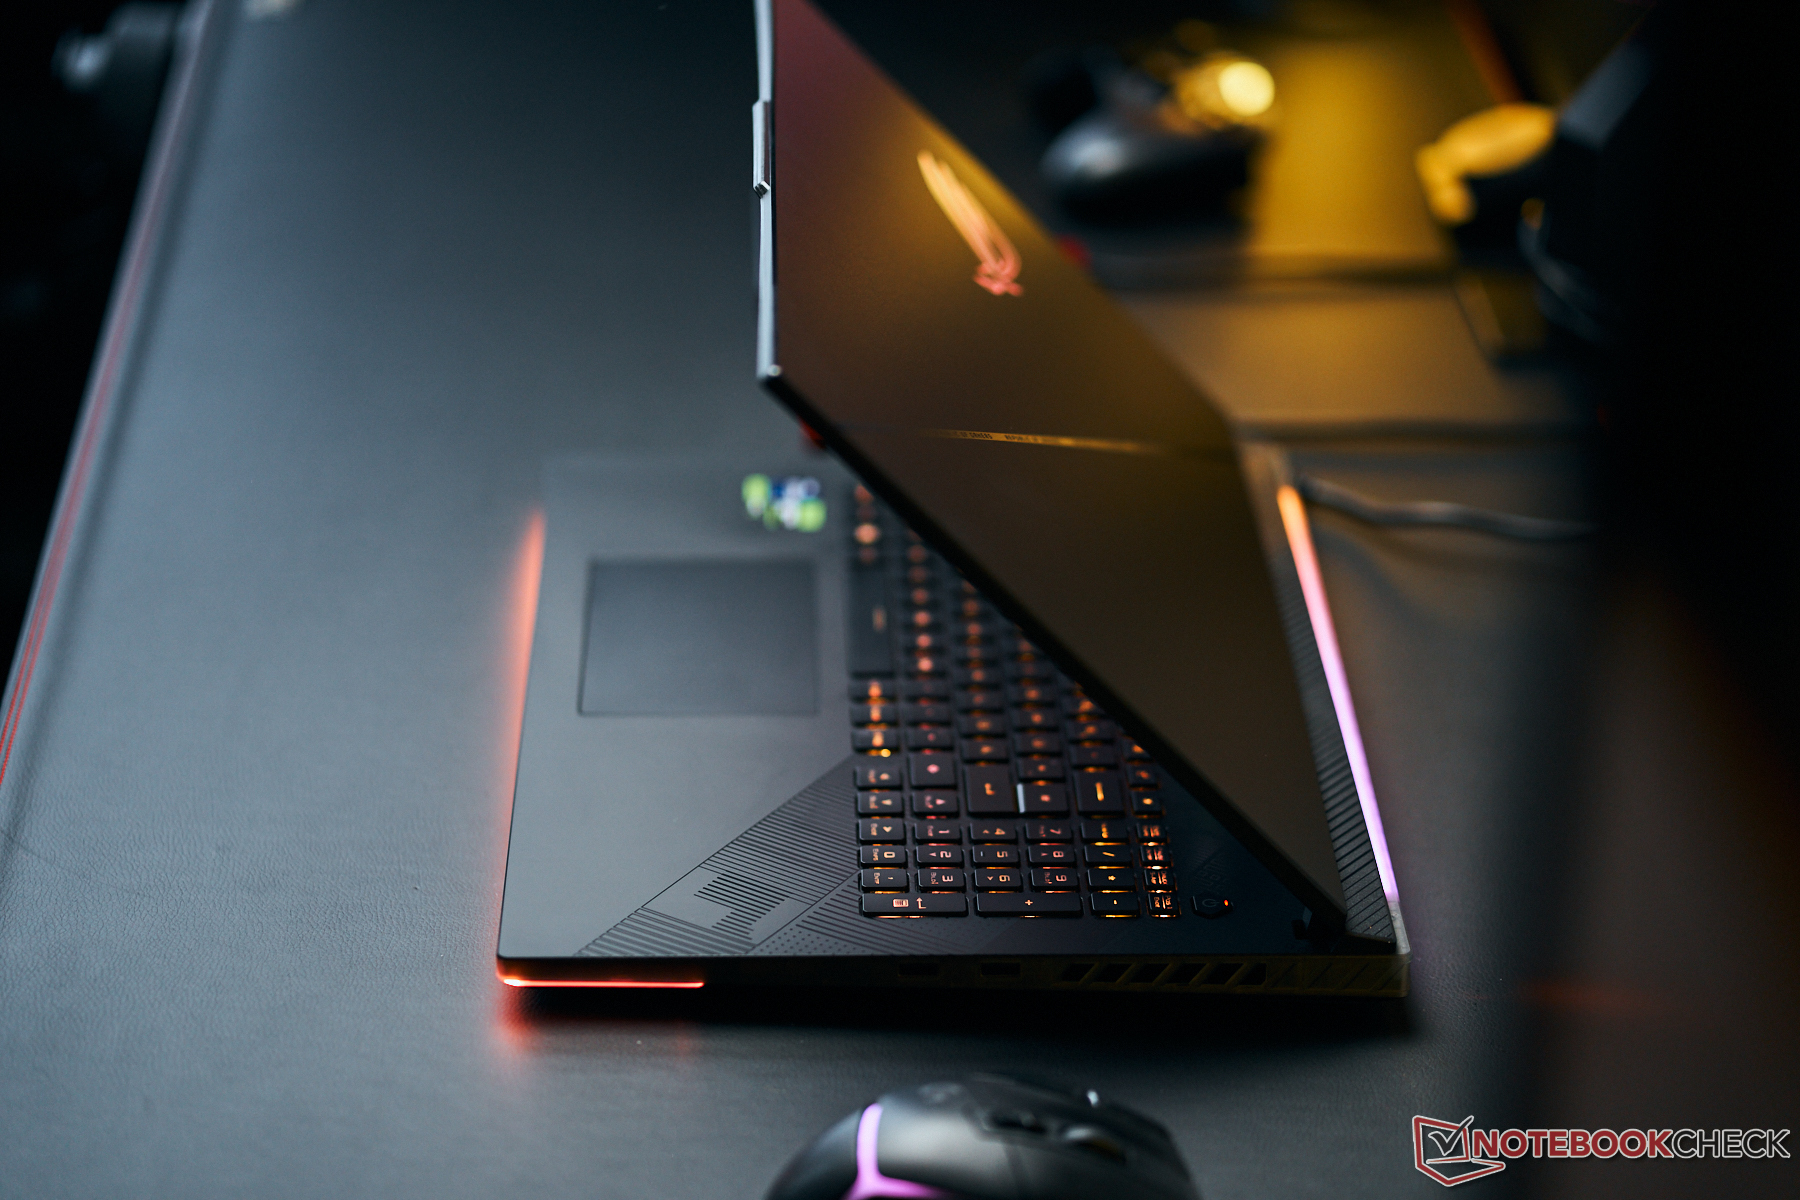
Kasa - Çok fazla plastik ve çok az alüminyum
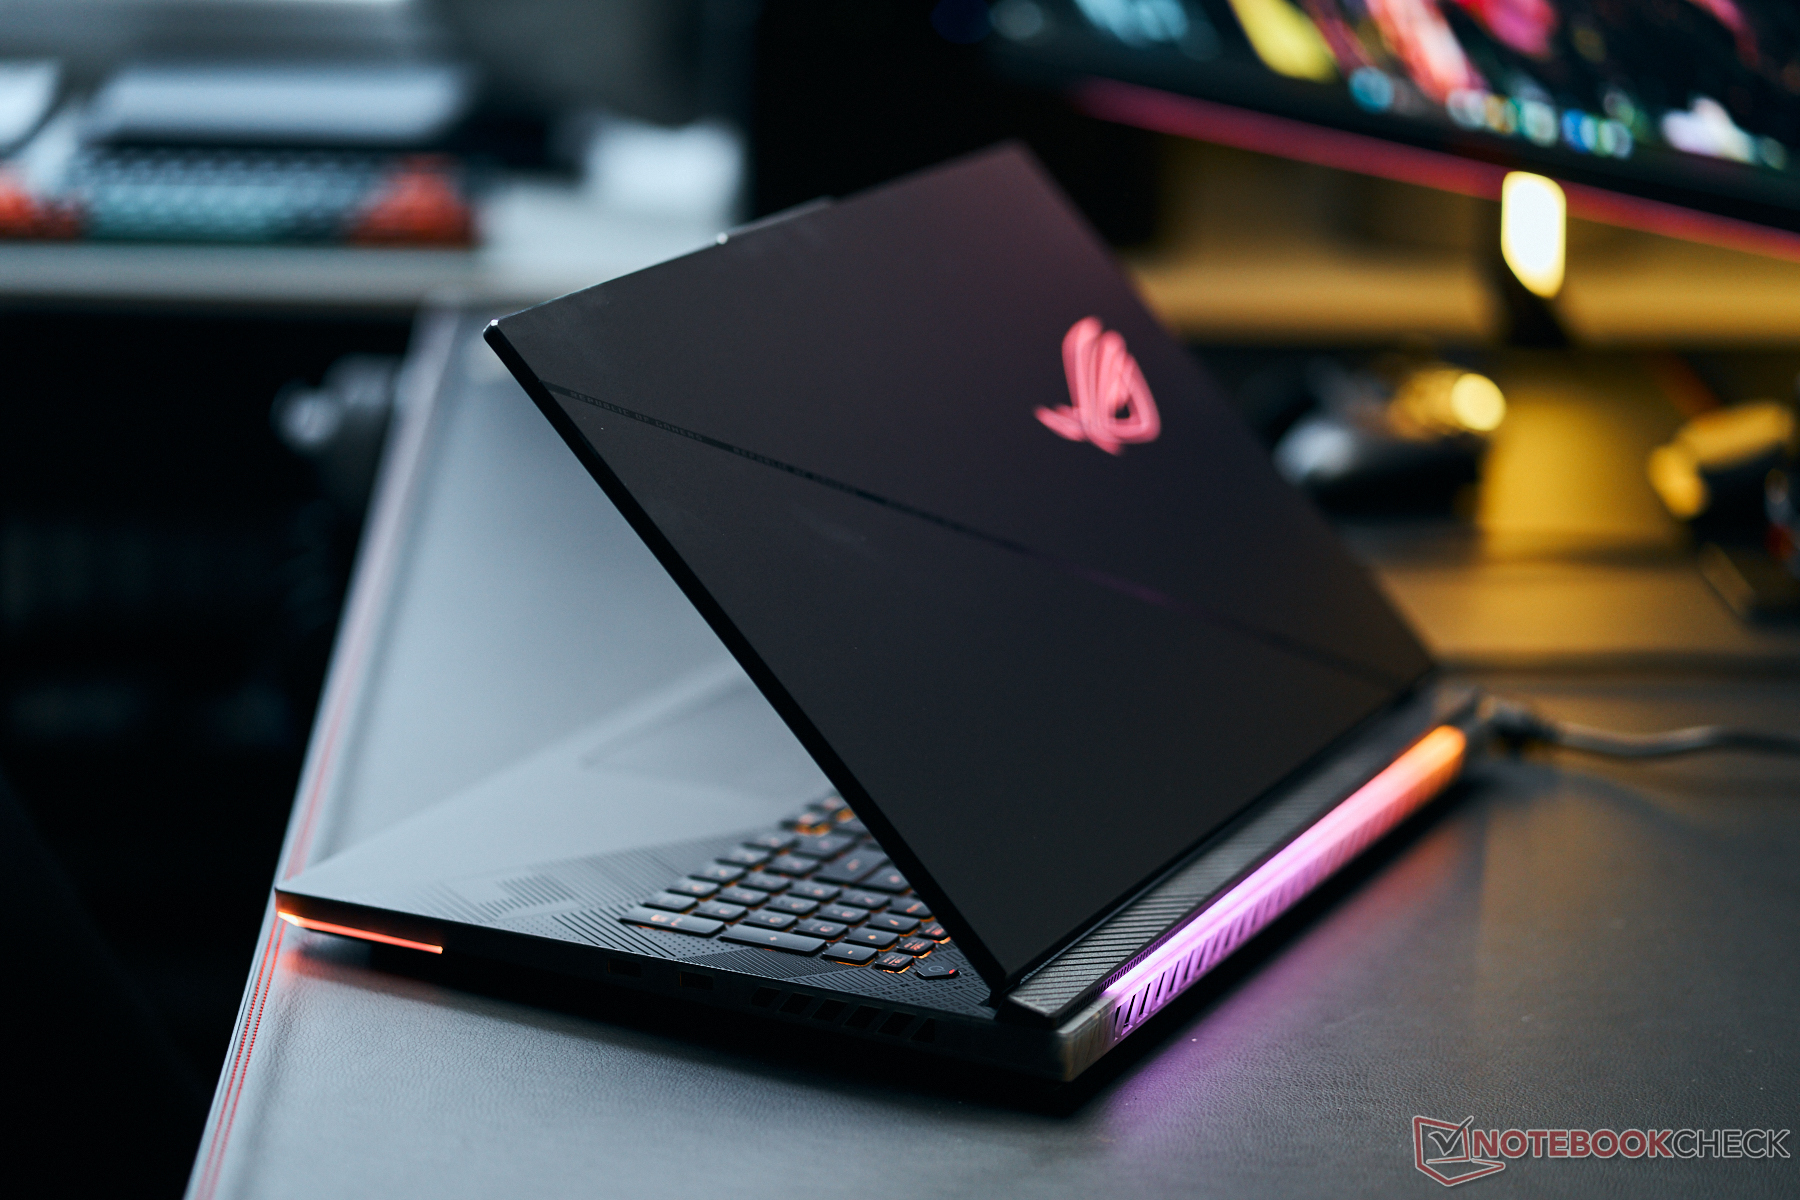
Yüksek fiyat seviyesine rağmen, Scar'ın sadece ekran kapağının arkası alüminyumdan ve geri kalan bileşenleri plastikten yapılmış olup, yüksek kaliteli malzeme kullanımı sınırlı kalmaktadır. Plastiğin bazı kısımları (klavyenin üstünde ve kısa kenarlarda) biraz ışık geçiriyor. Ön ve arkadaki LED bantlar ve ekran kapağındaki ışıklı logo siyah kasaya biraz hayat katıyor.
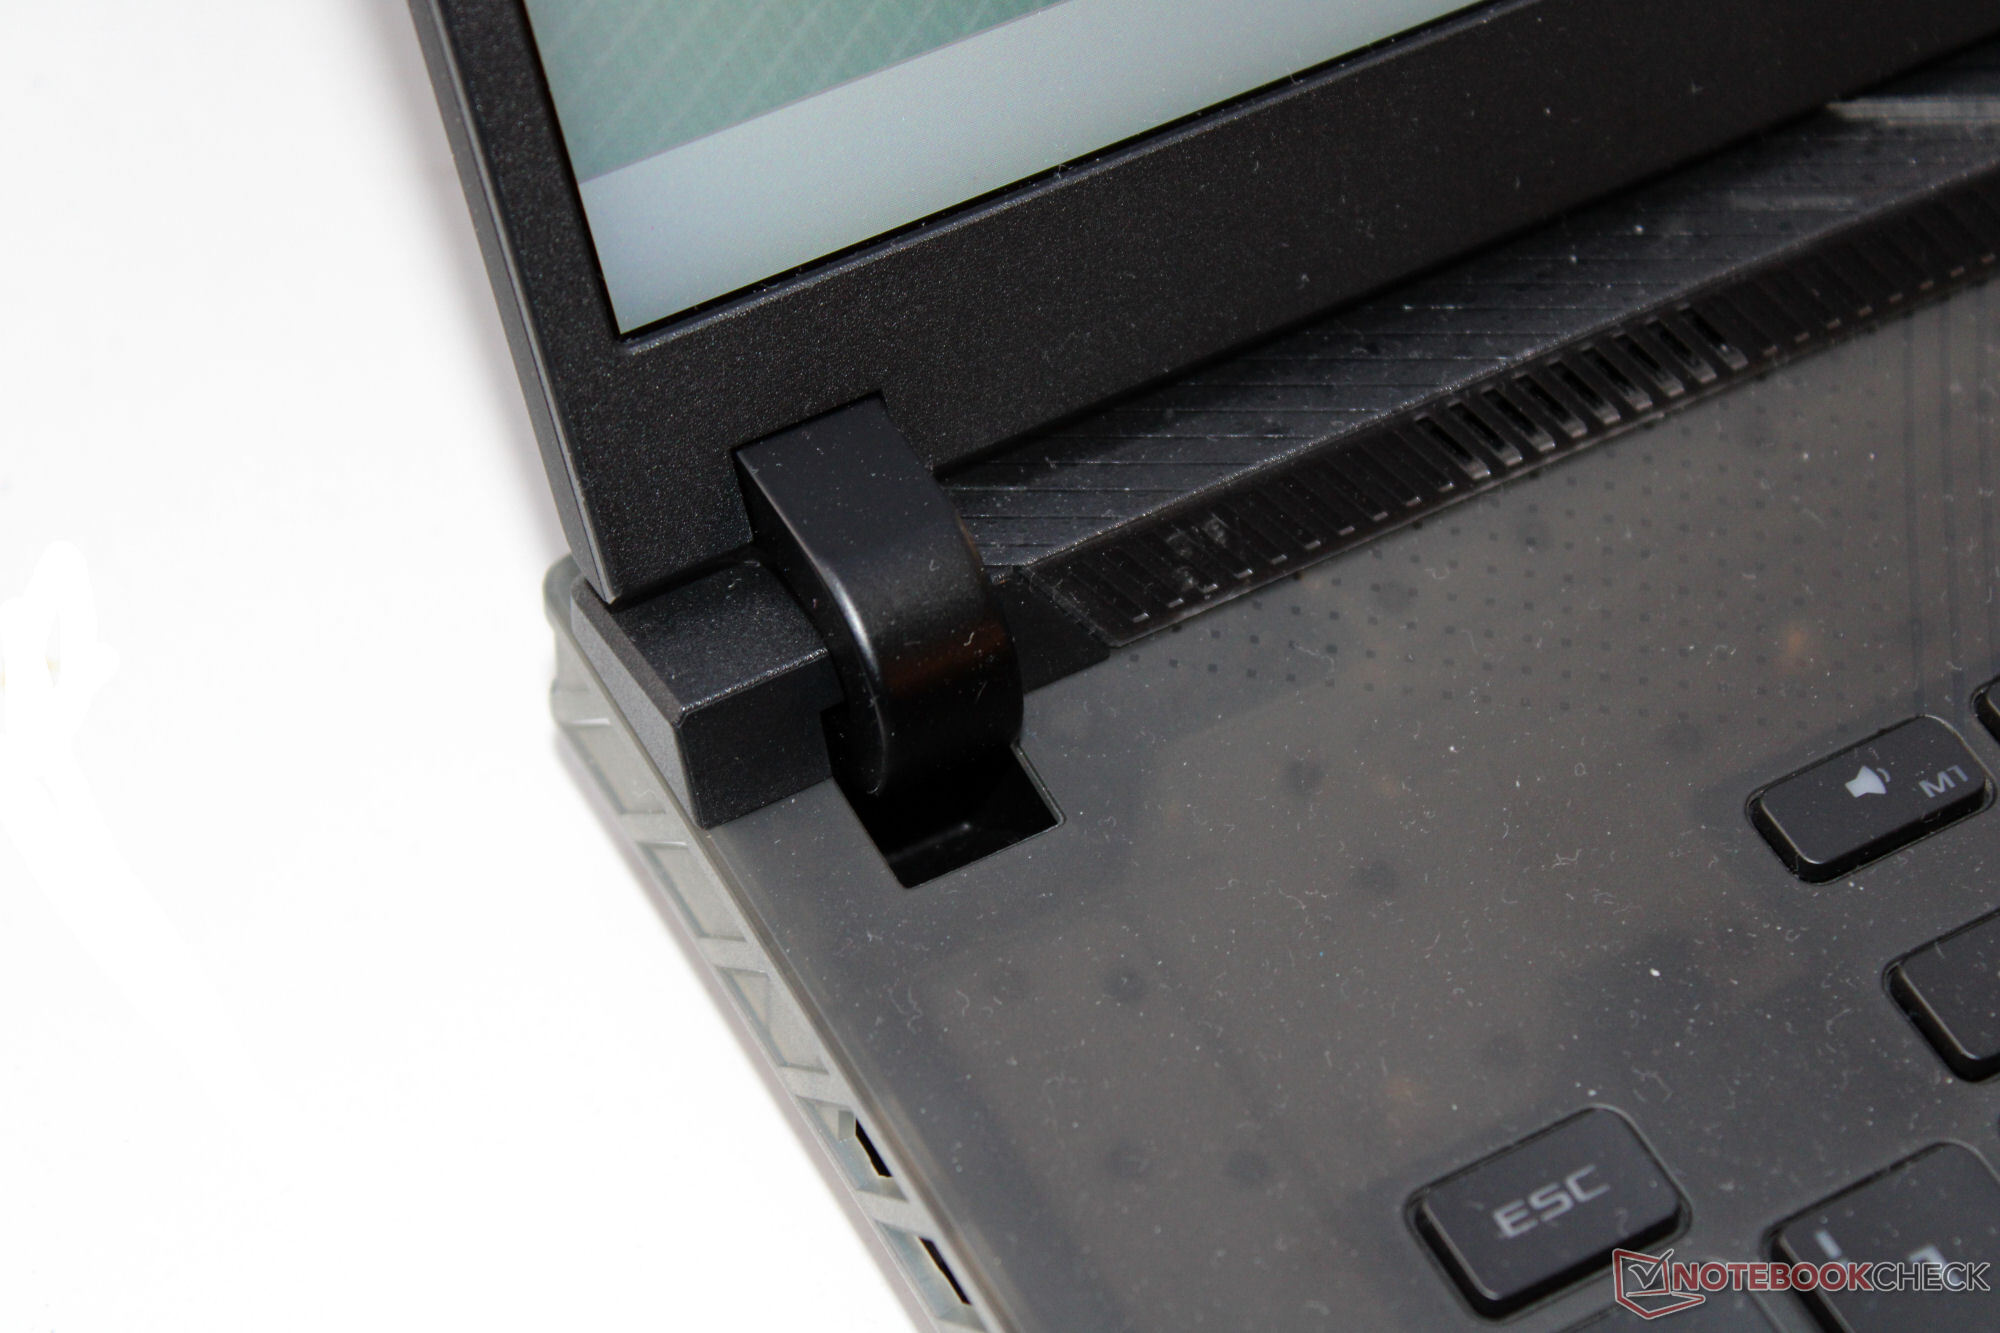
İşçilikte herhangi bir hata görmüyoruz ve malzeme boşlukları küçük ve eşit. Kapak sadece hafifçe bükülebilirken, ana ünitenin tepkisi daha belirgin. Birkaç bin Euro'luk pahalı bir dizüstü bilgisayar burada daha iyisini yapmalı. Ekran kapağı üzerindeki baskı herhangi bir görüntü bozukluğuna neden olmuyor. Menteşeler kapağı sıkıca yerinde tutuyor, ancak dizüstü bilgisayarı hareket ettirirken ekran yine de hafifçe sallanıyor. Maksimum açılma açısı 130 derece ve tek elle açılabiliyor.
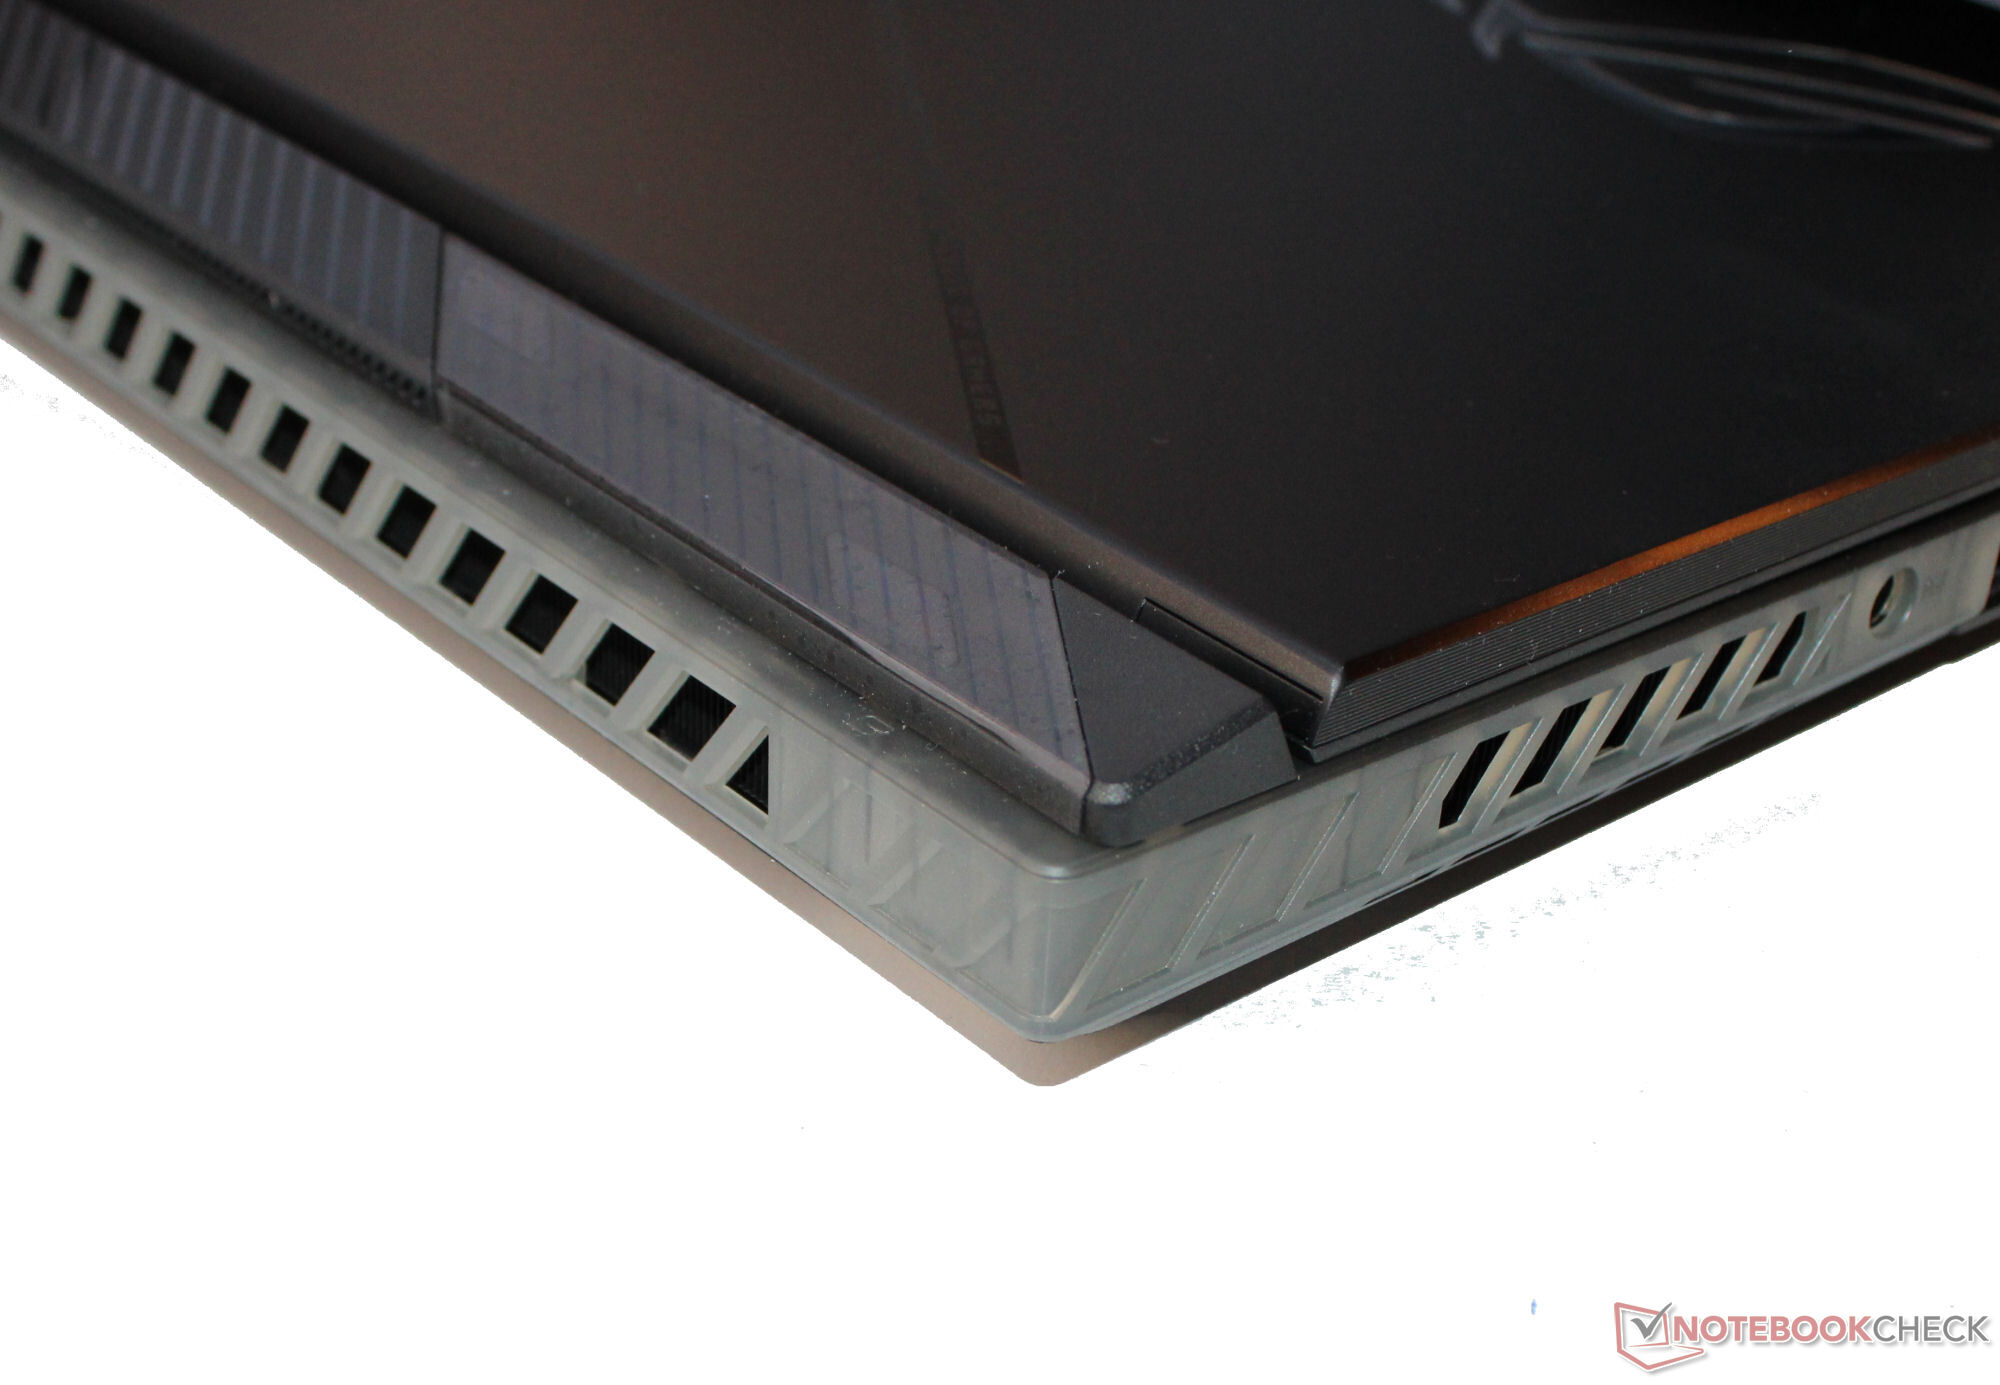
Scar 18, karşılaştırma alanımızdaki en kompakt ve en hafif cihazlardan biridir ve sadece Bıçak 18 bu bakımdan.
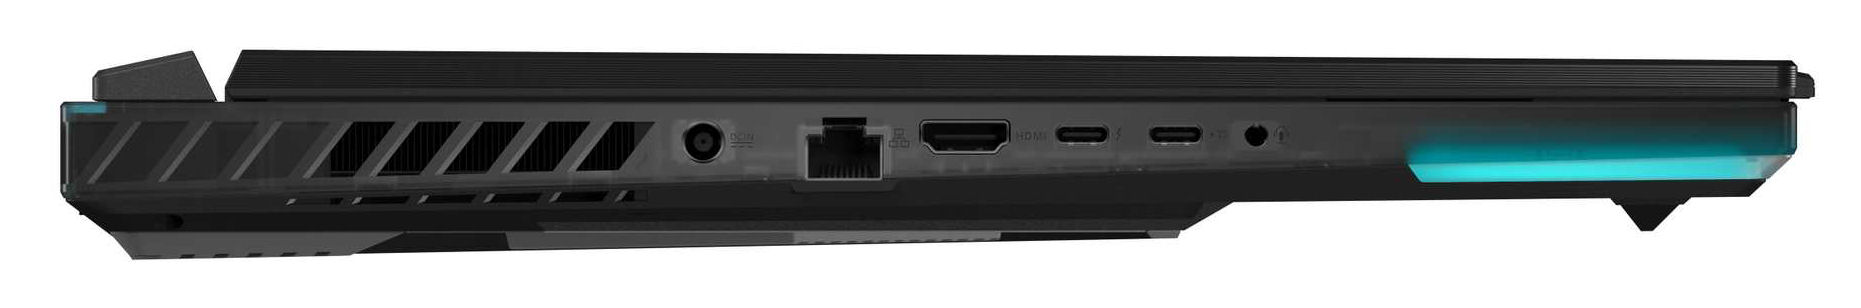
Ekipman - Asus Strix Thunderbolt 4 sunuyor
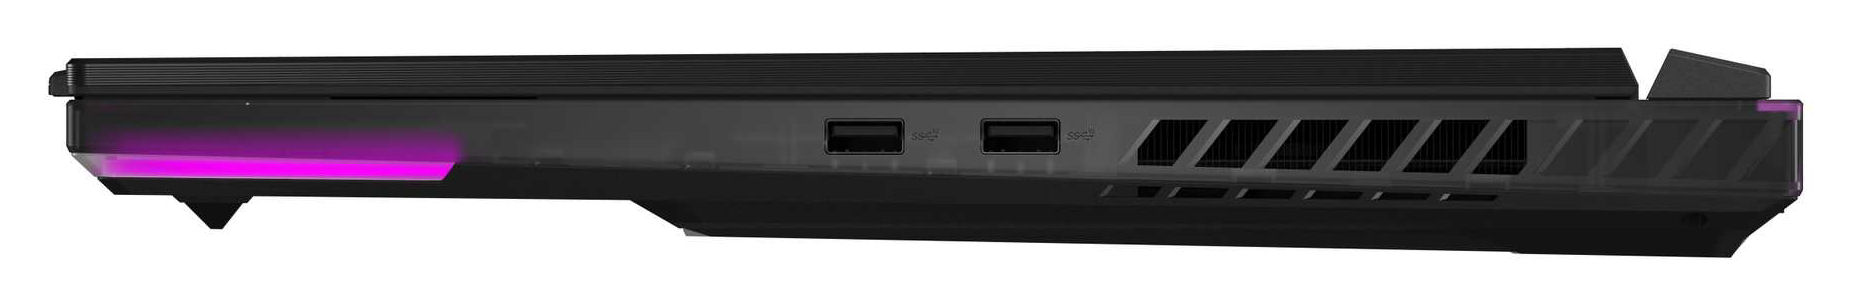
Asus dizüstü bilgisayar iki USB-A bağlantı noktası (USB 3.2 Gen 2) ve iki USB-C bağlantı noktası (1x Thunderbolt 4, 1x USB 3.2 Gen 2) sunuyor. USB-C portlarının her ikisi de DisplayPort sinyali çıkışı verebiliyor ve USB 3.2 Gen 2 portu Güç Dağıtımı'nı da destekliyor. Bağlantılar bir HDMI portu, bir ses portu ve bir Gigabit Ethernet portu ile tamamlanıyor. Dizüstü bilgisayarda bir depolama kartı okuyucusu bulunmuyor.
Dizüstü bilgisayarın arkasında hiçbir bağlantı noktası yok ve tüm bağlantı noktaları kasanın sol ve sağ taraflarına yerleştirilmiş. Arkaya doğru uzanan kablolar, dizüstü bilgisayarın yanlarındaki fan açıklıklarının bazılarını engelleyecektir. Örneğin güç kablosu (açılı elektrik fişi) için durum böyledir. Sağ elini kullanan kullanıcılar yalnızca sağ tarafa yerleştirilmiş USB-A bağlantı noktalarından rahatsız olabilir.
İletişim
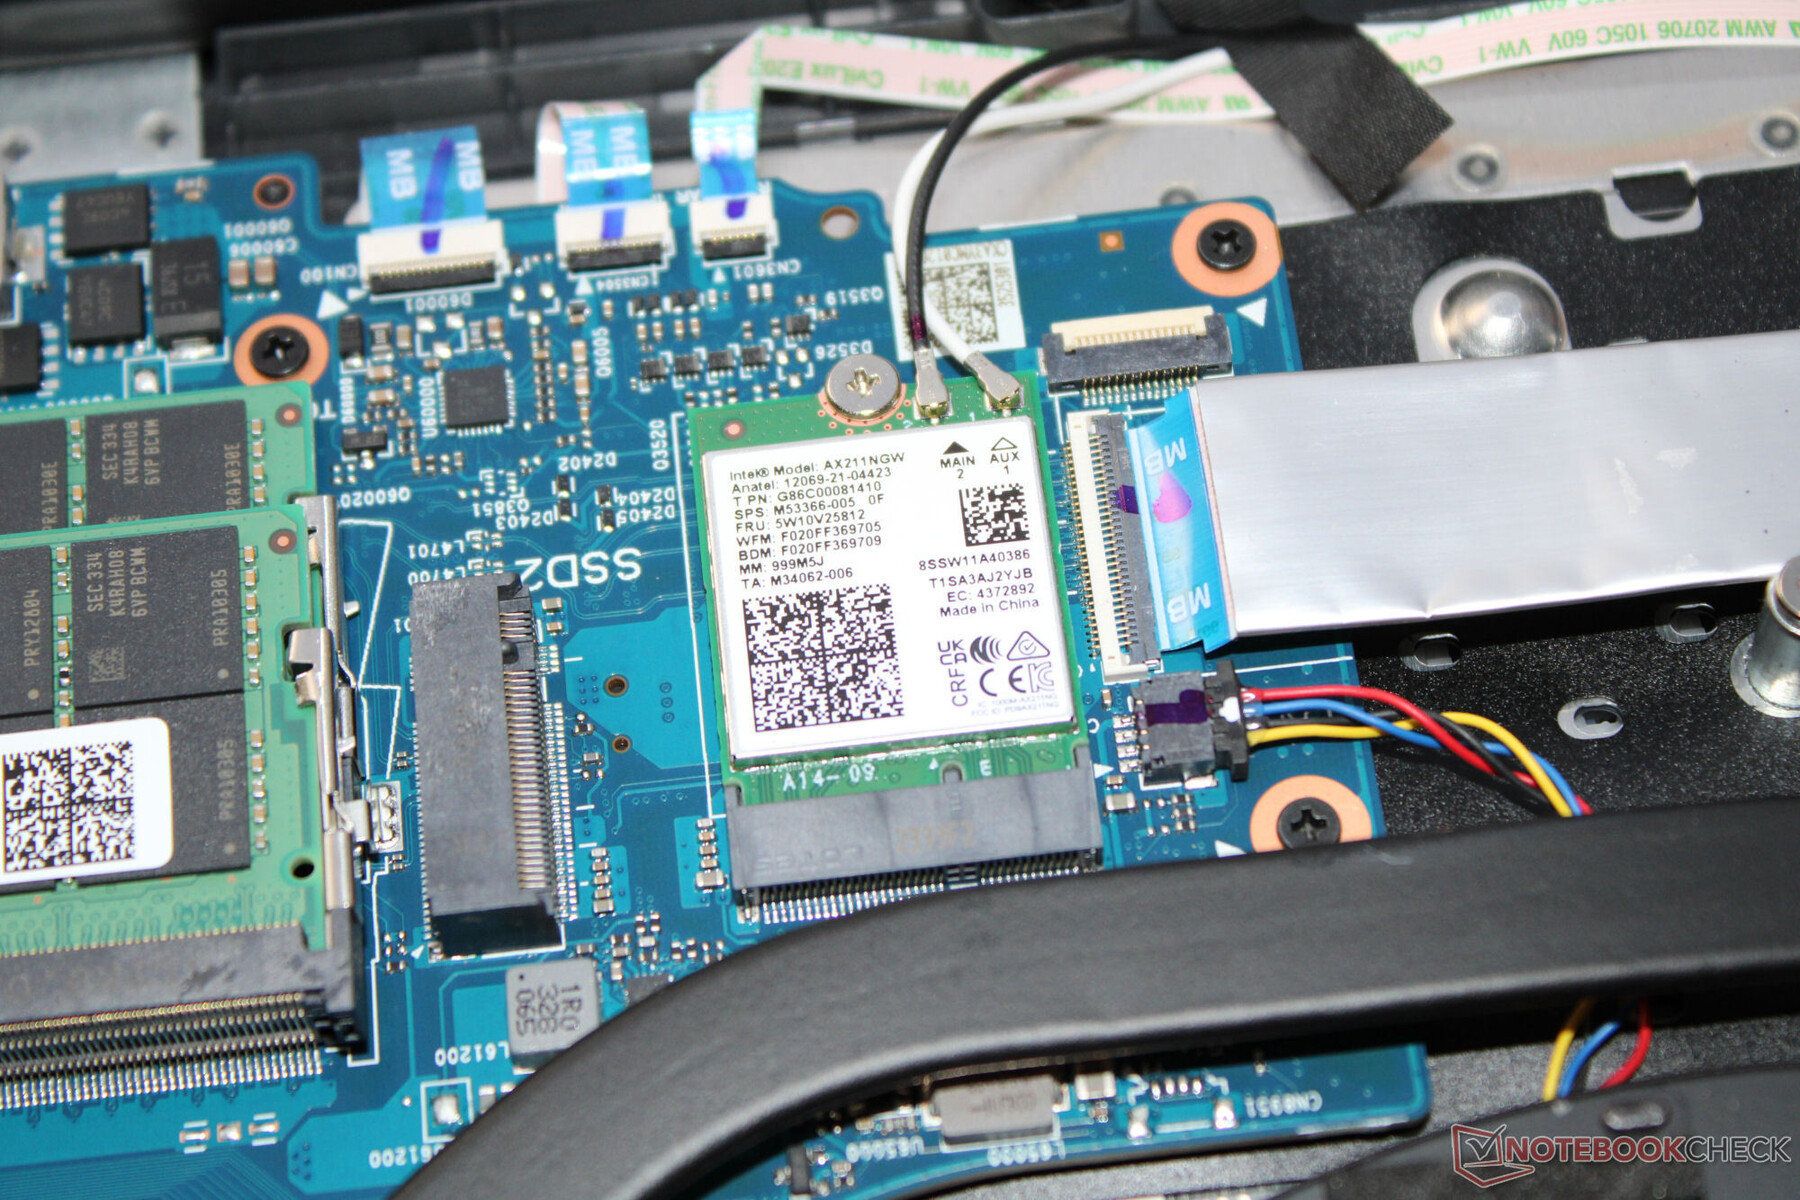
Optimum koşullar altında (yakınlarda başka Wi-Fi cihazı yok, dizüstü bilgisayar ile sunucu bilgisayar arasında yakın mesafe), dizüstü bilgisayar iyi ila çok iyi Wi-Fi aktarım hızlarına ulaşıyor. Strix bir Wi-Fi 6E yongası (Intel AX211) kullanıyor ve kablolu bağlantılar bir Realtek denetleyici (RTL8125; 2,5 Gbit/s) tarafından gerçekleştiriliyor.
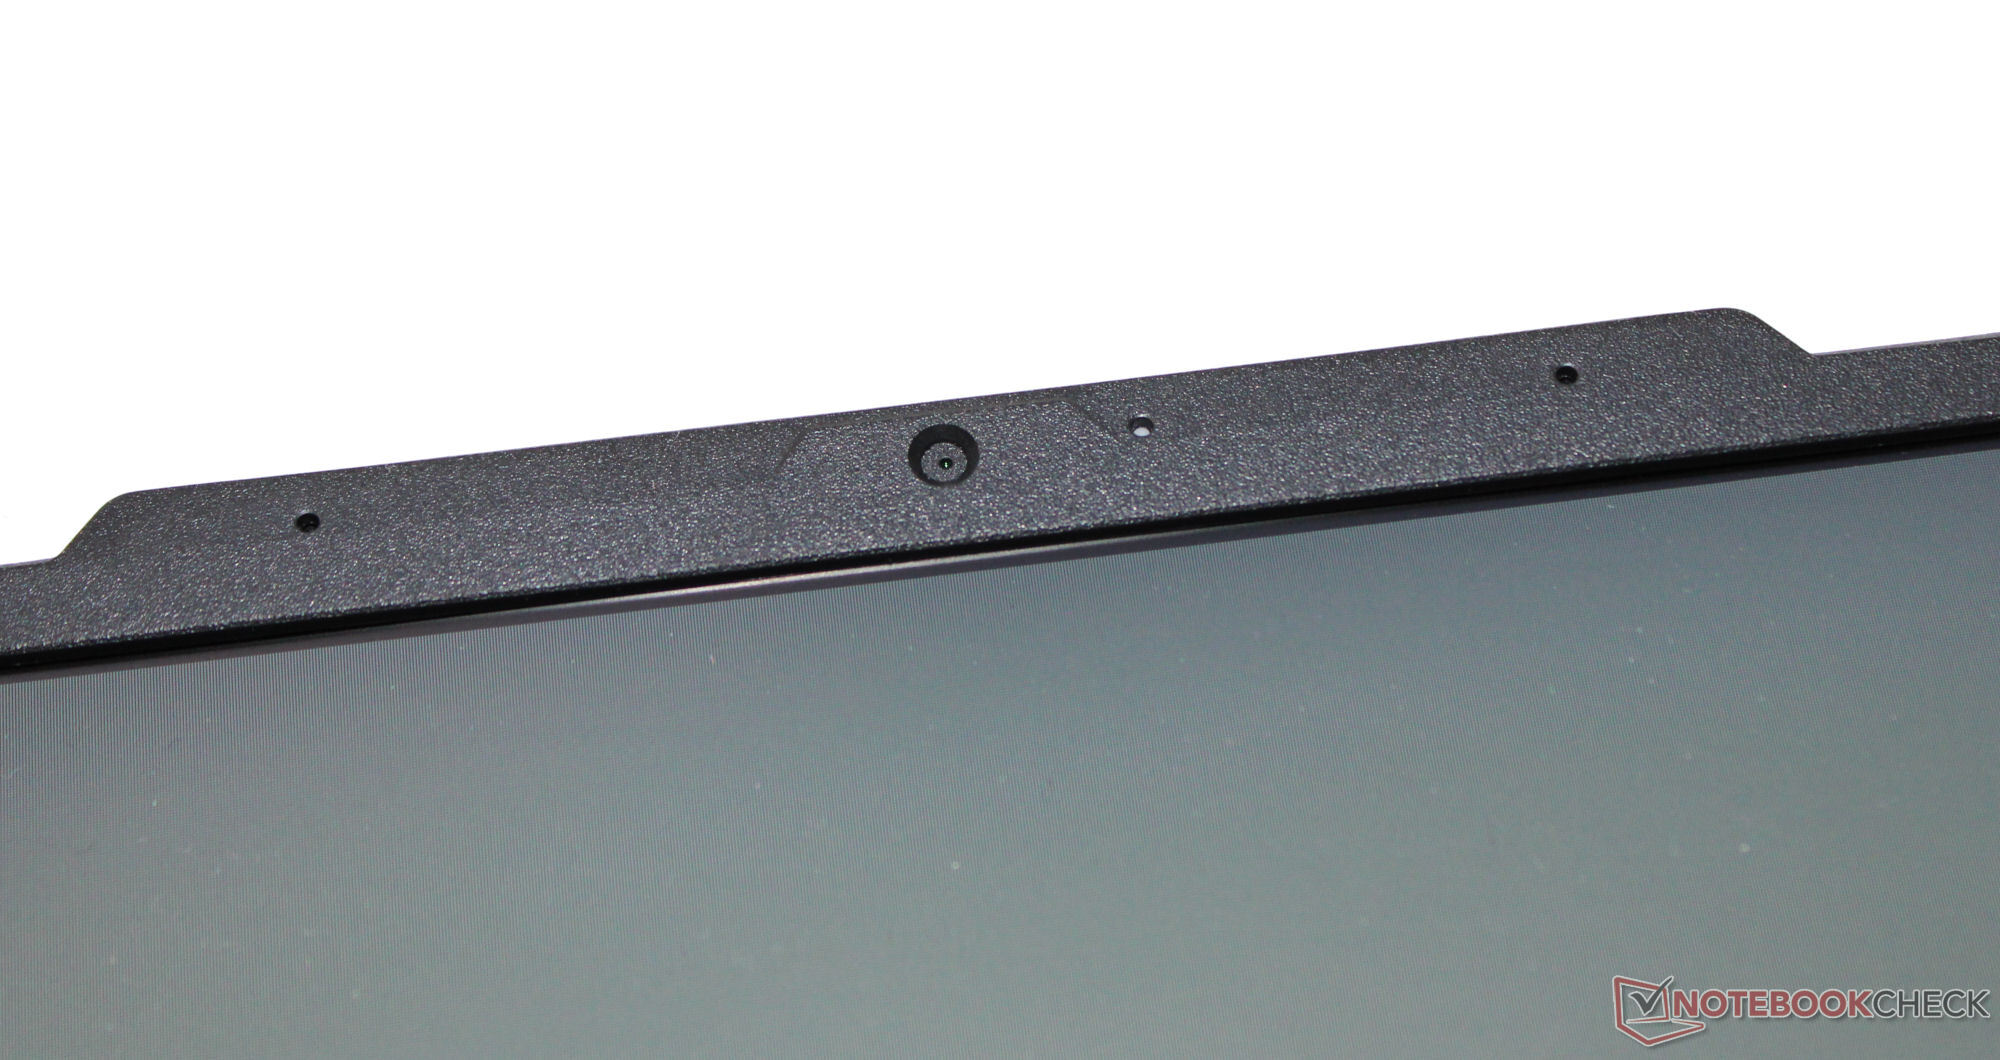
Web kamerası
Asus çoğunlukla en kaliteli donanımı kullansa da, web kamerası bir istisnadır ve burada yalnızca yetersiz bir 0,9 MP modeli (maks. 1280x720 piksel) kullanılmıştır. Görüntü kalitesi ikna edici değil, ancak yaklaşık 8'lik bir renk sapması (hedef DeltaE < 3) yine de iyi. Kamerada manuel deklanşör bulunmuyor.

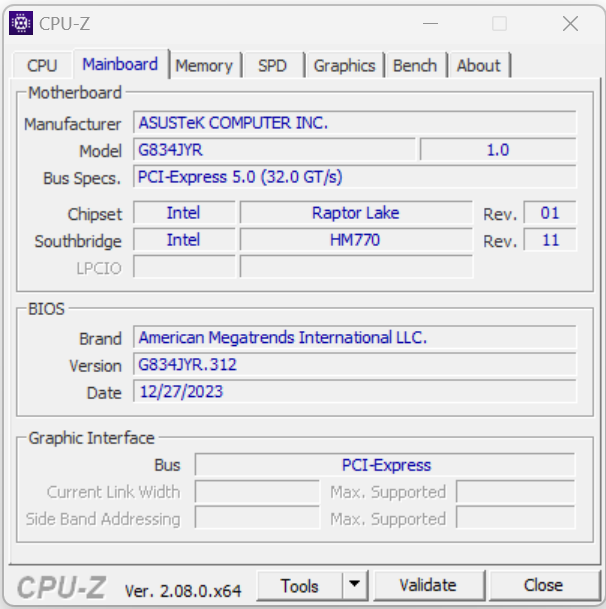
 GeForce RTX 4090 Laptop GPU, i9-14900HX, Samsung PM9A1a MZVL22T0HDLB")
 GeForce RTX 4090 Laptop GPU, i9-14900HX, Samsung PM9A1a MZVL22T0HDLB")
Aksesuarlar
Dizüstü bilgisayar, normal belgeler dışında herhangi bir ek aksesuar içermiyor.
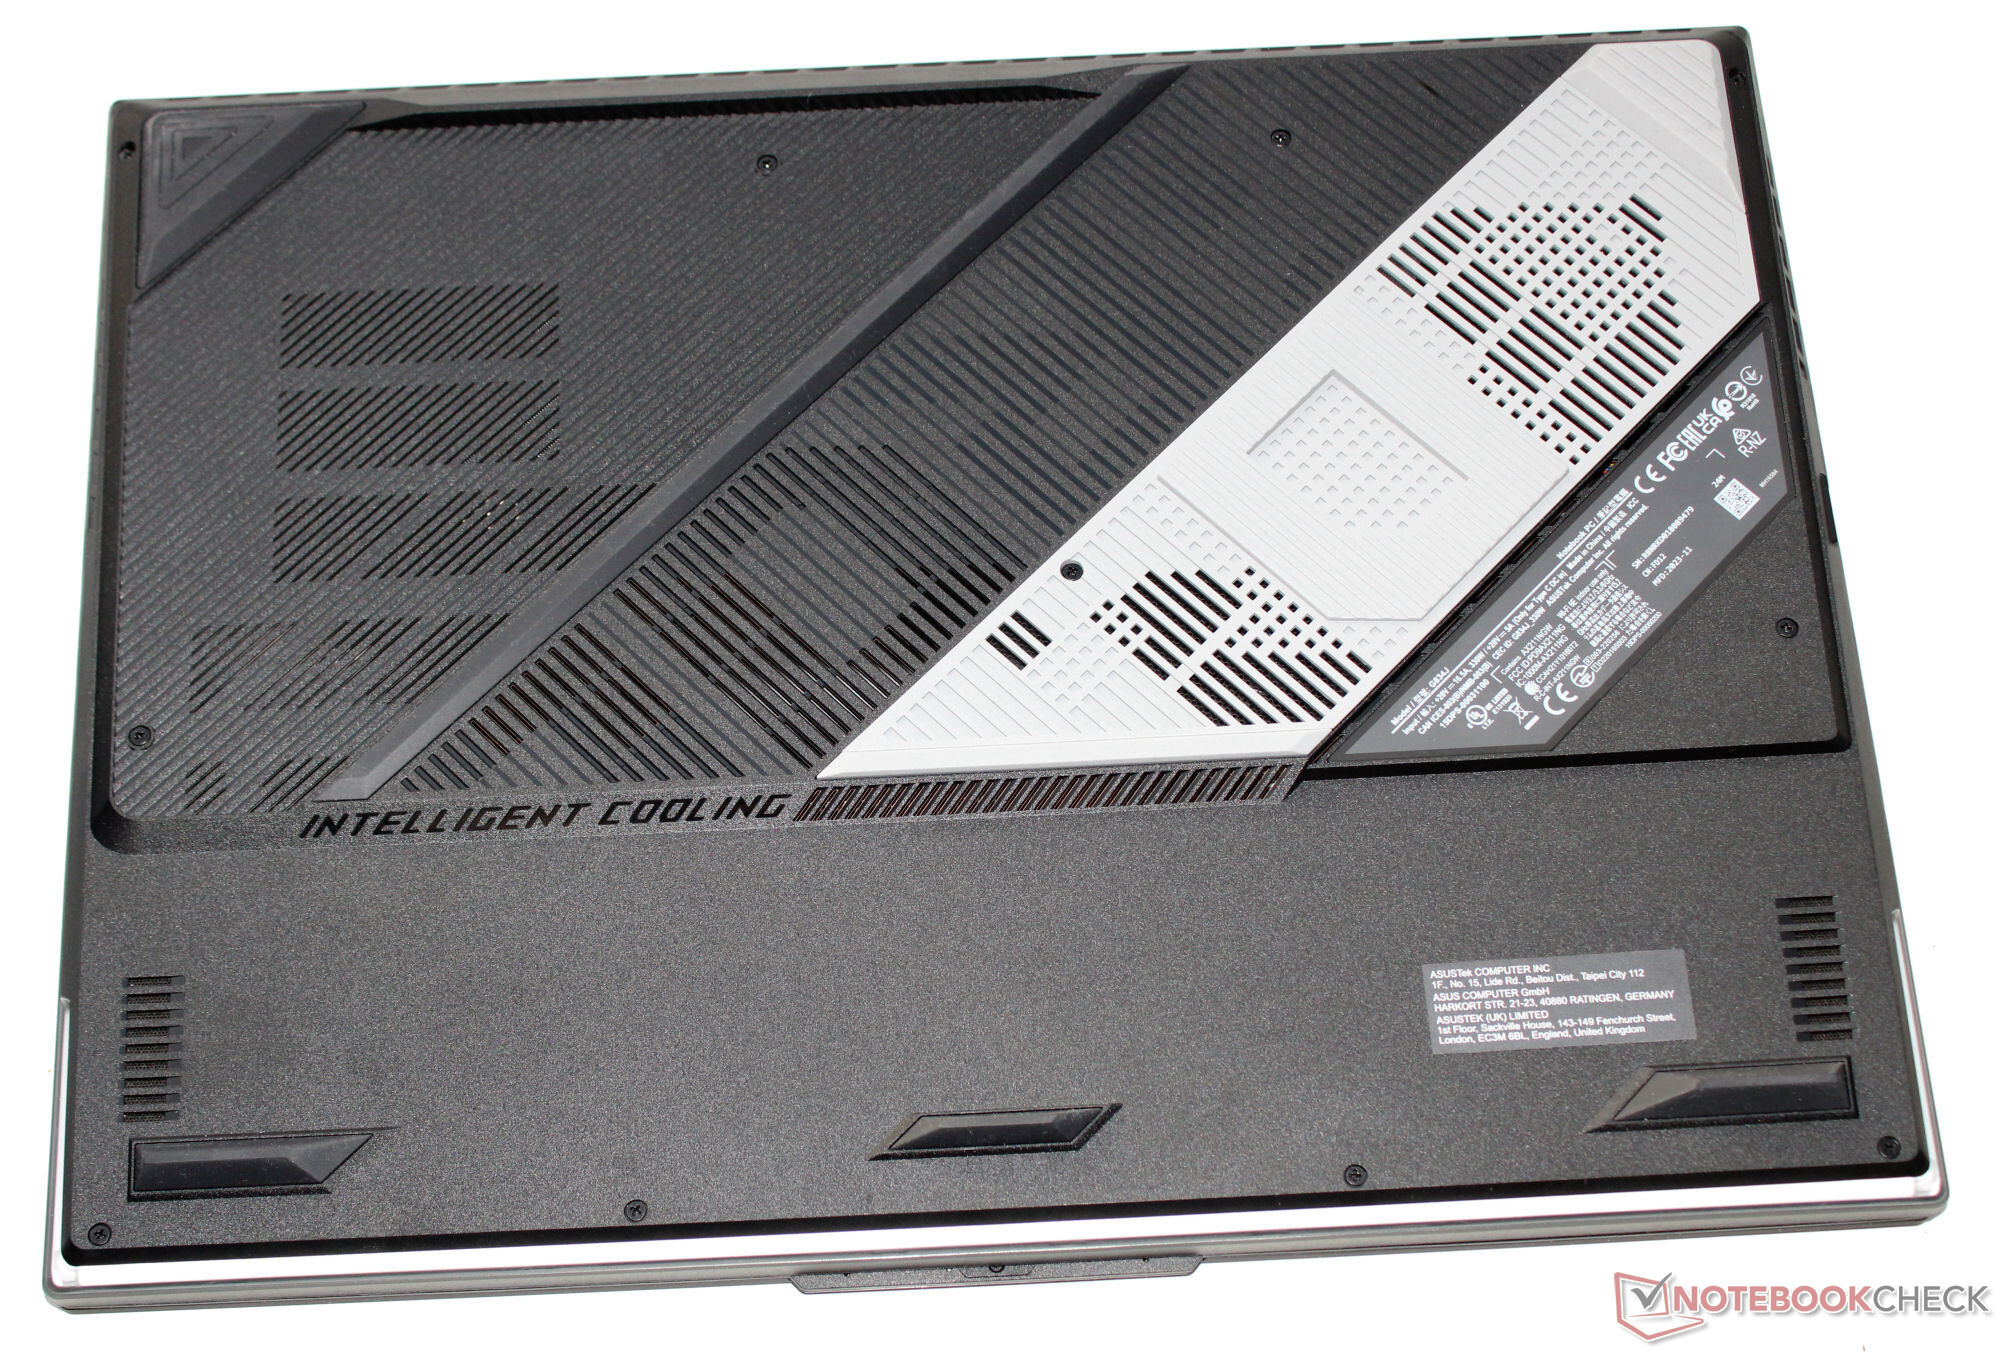
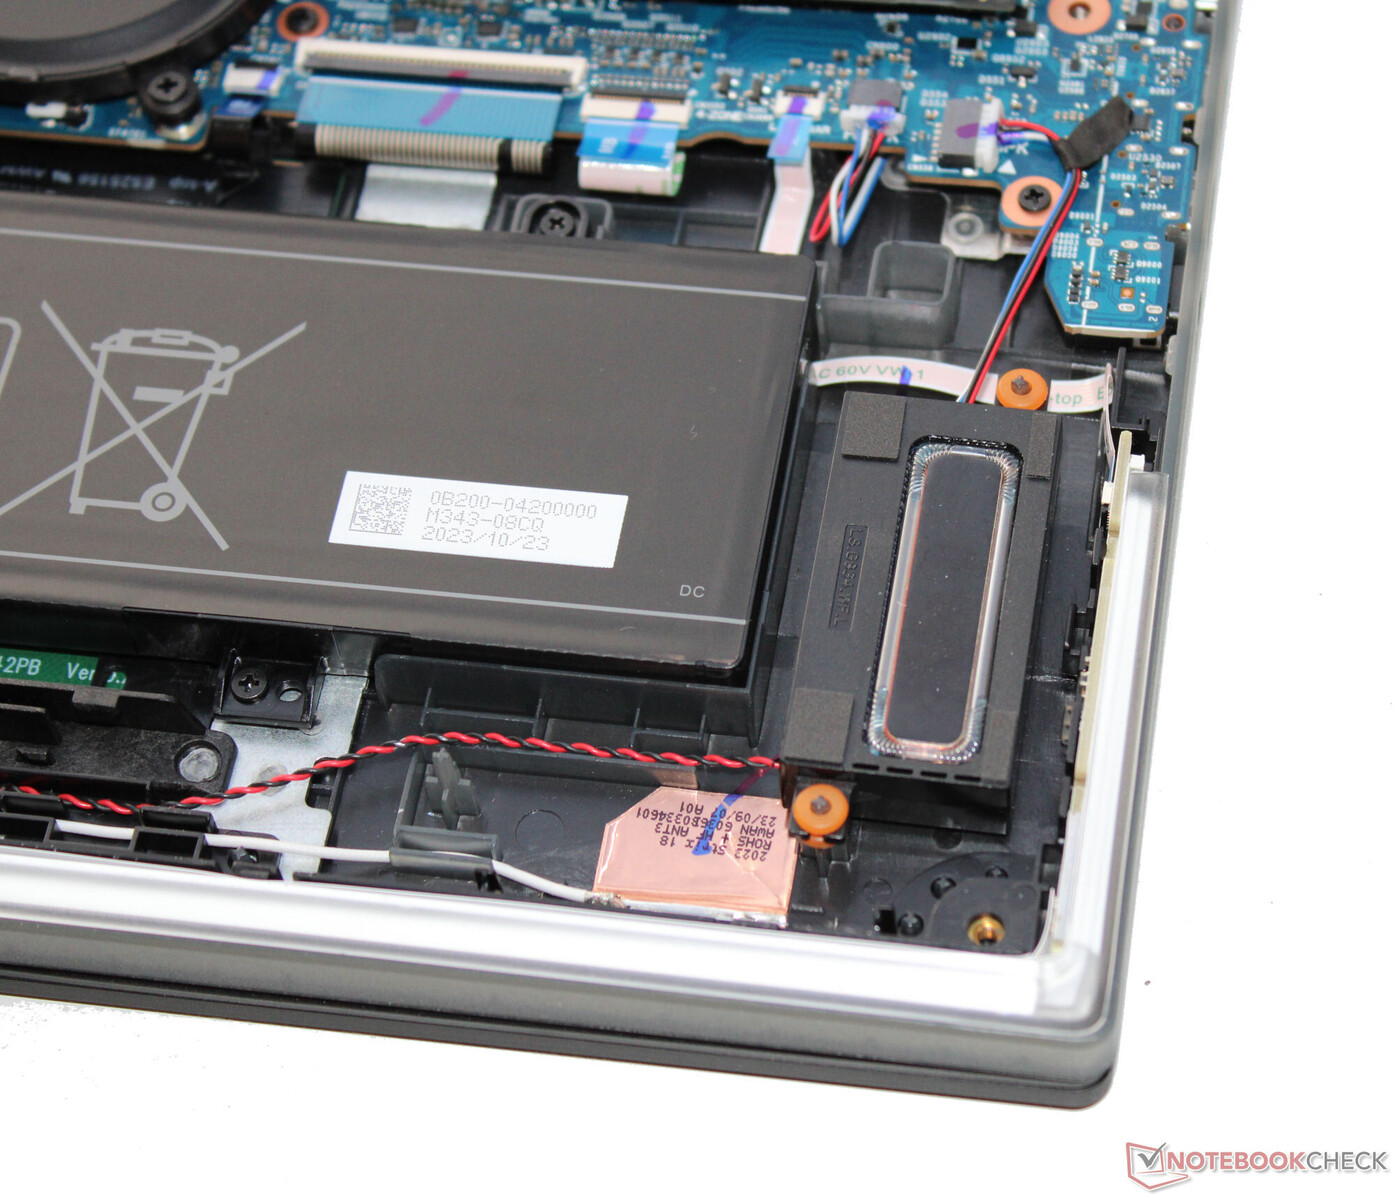
Bakım
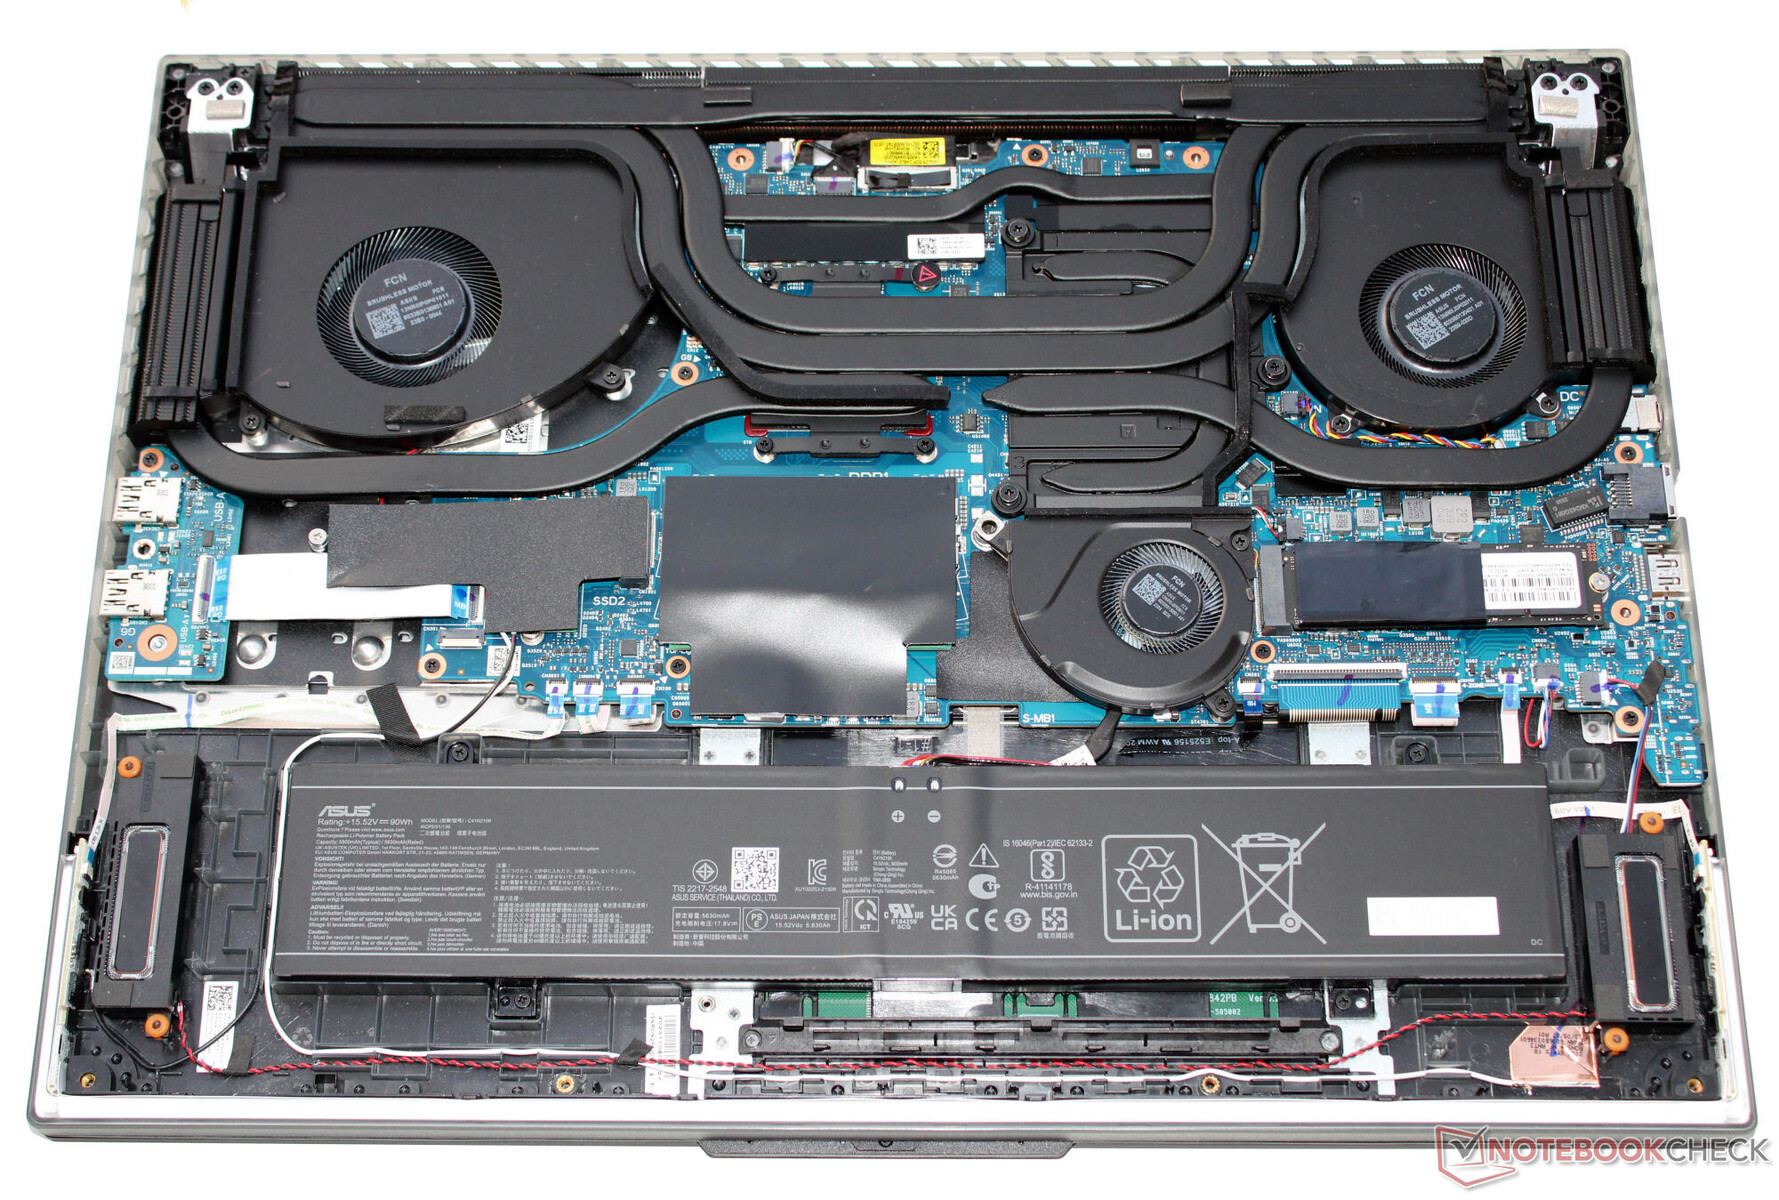
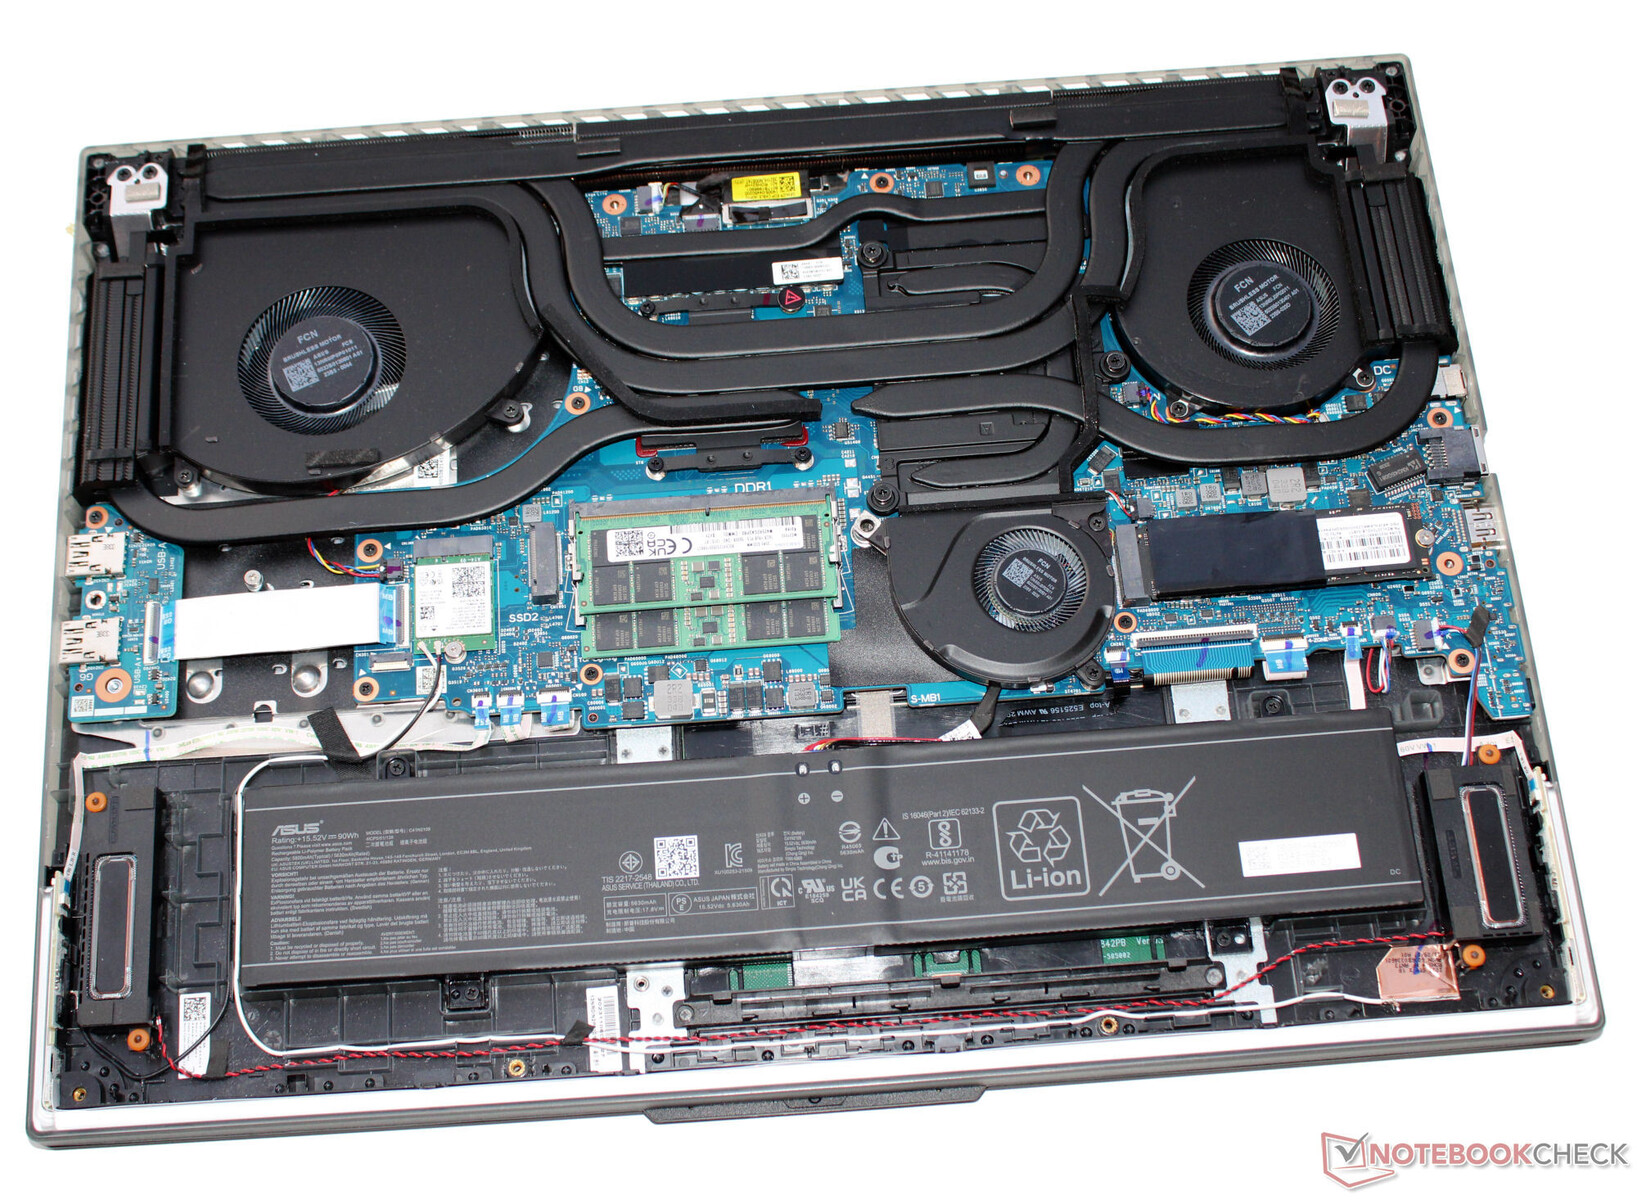
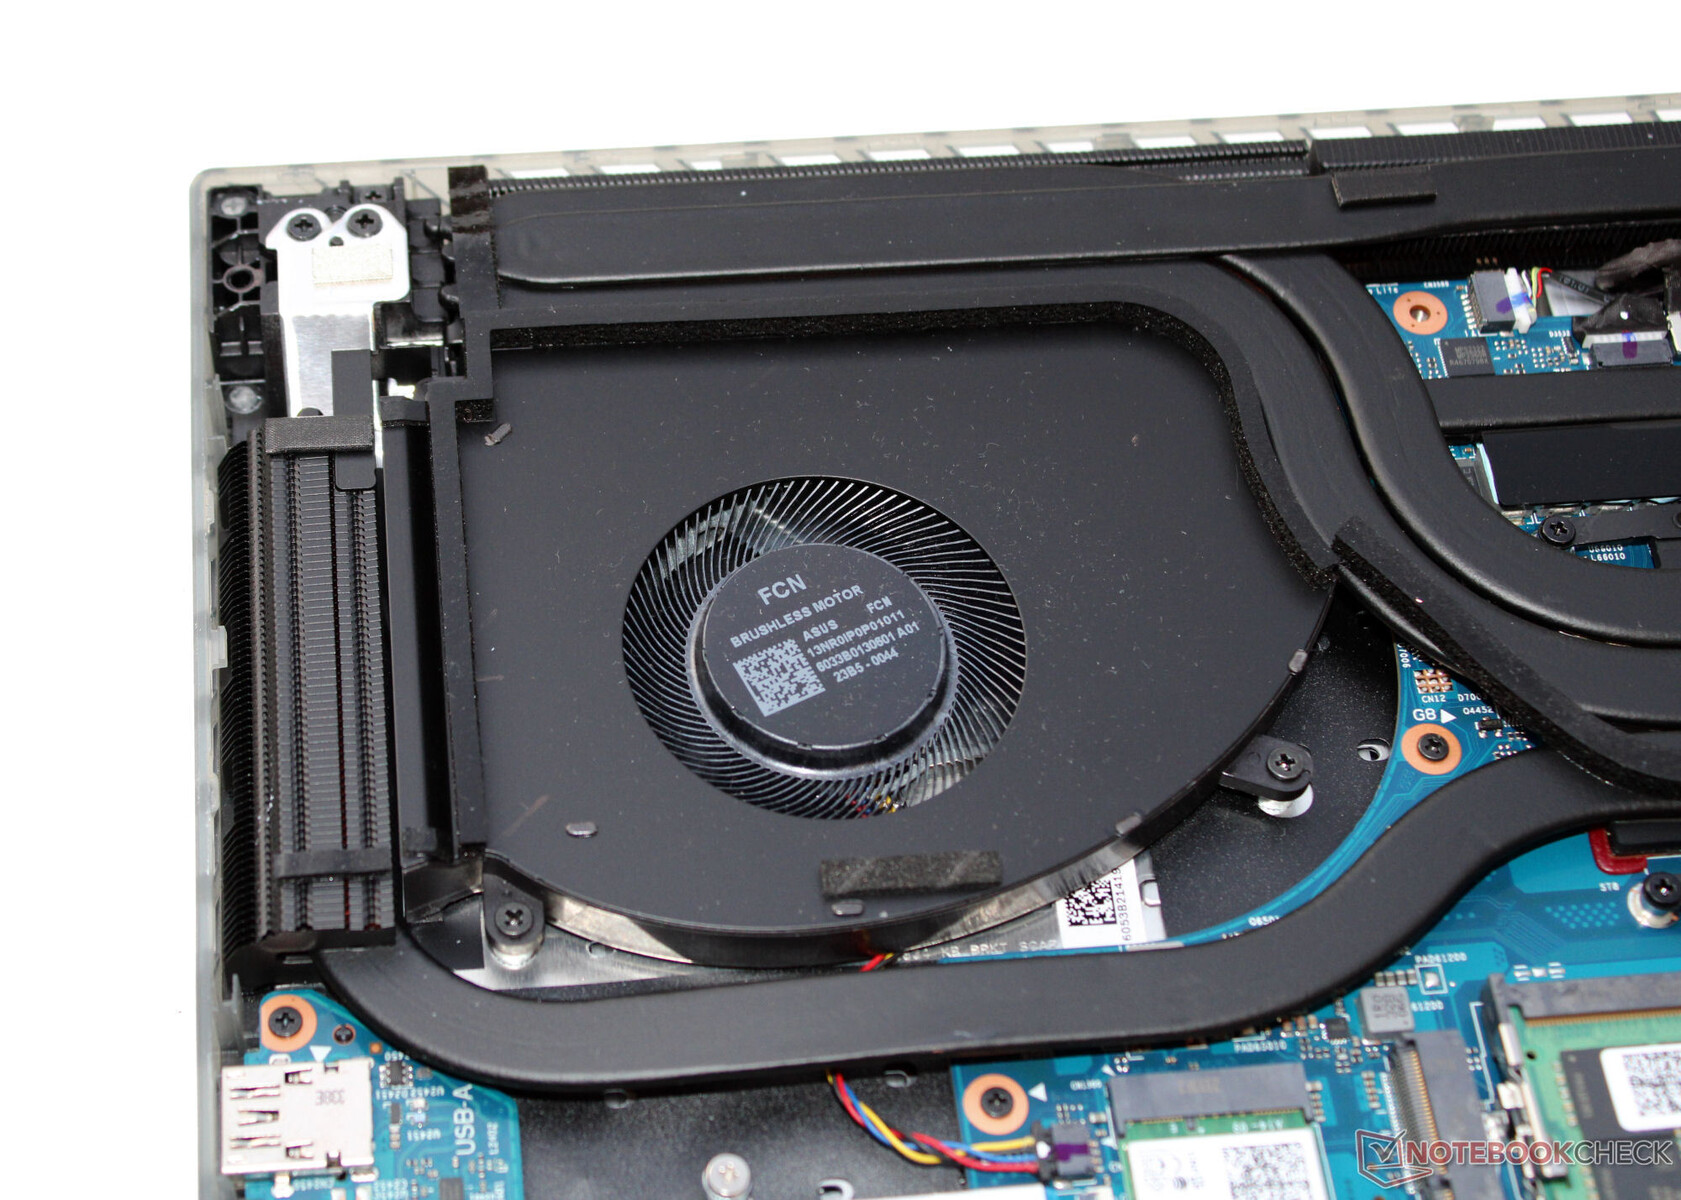
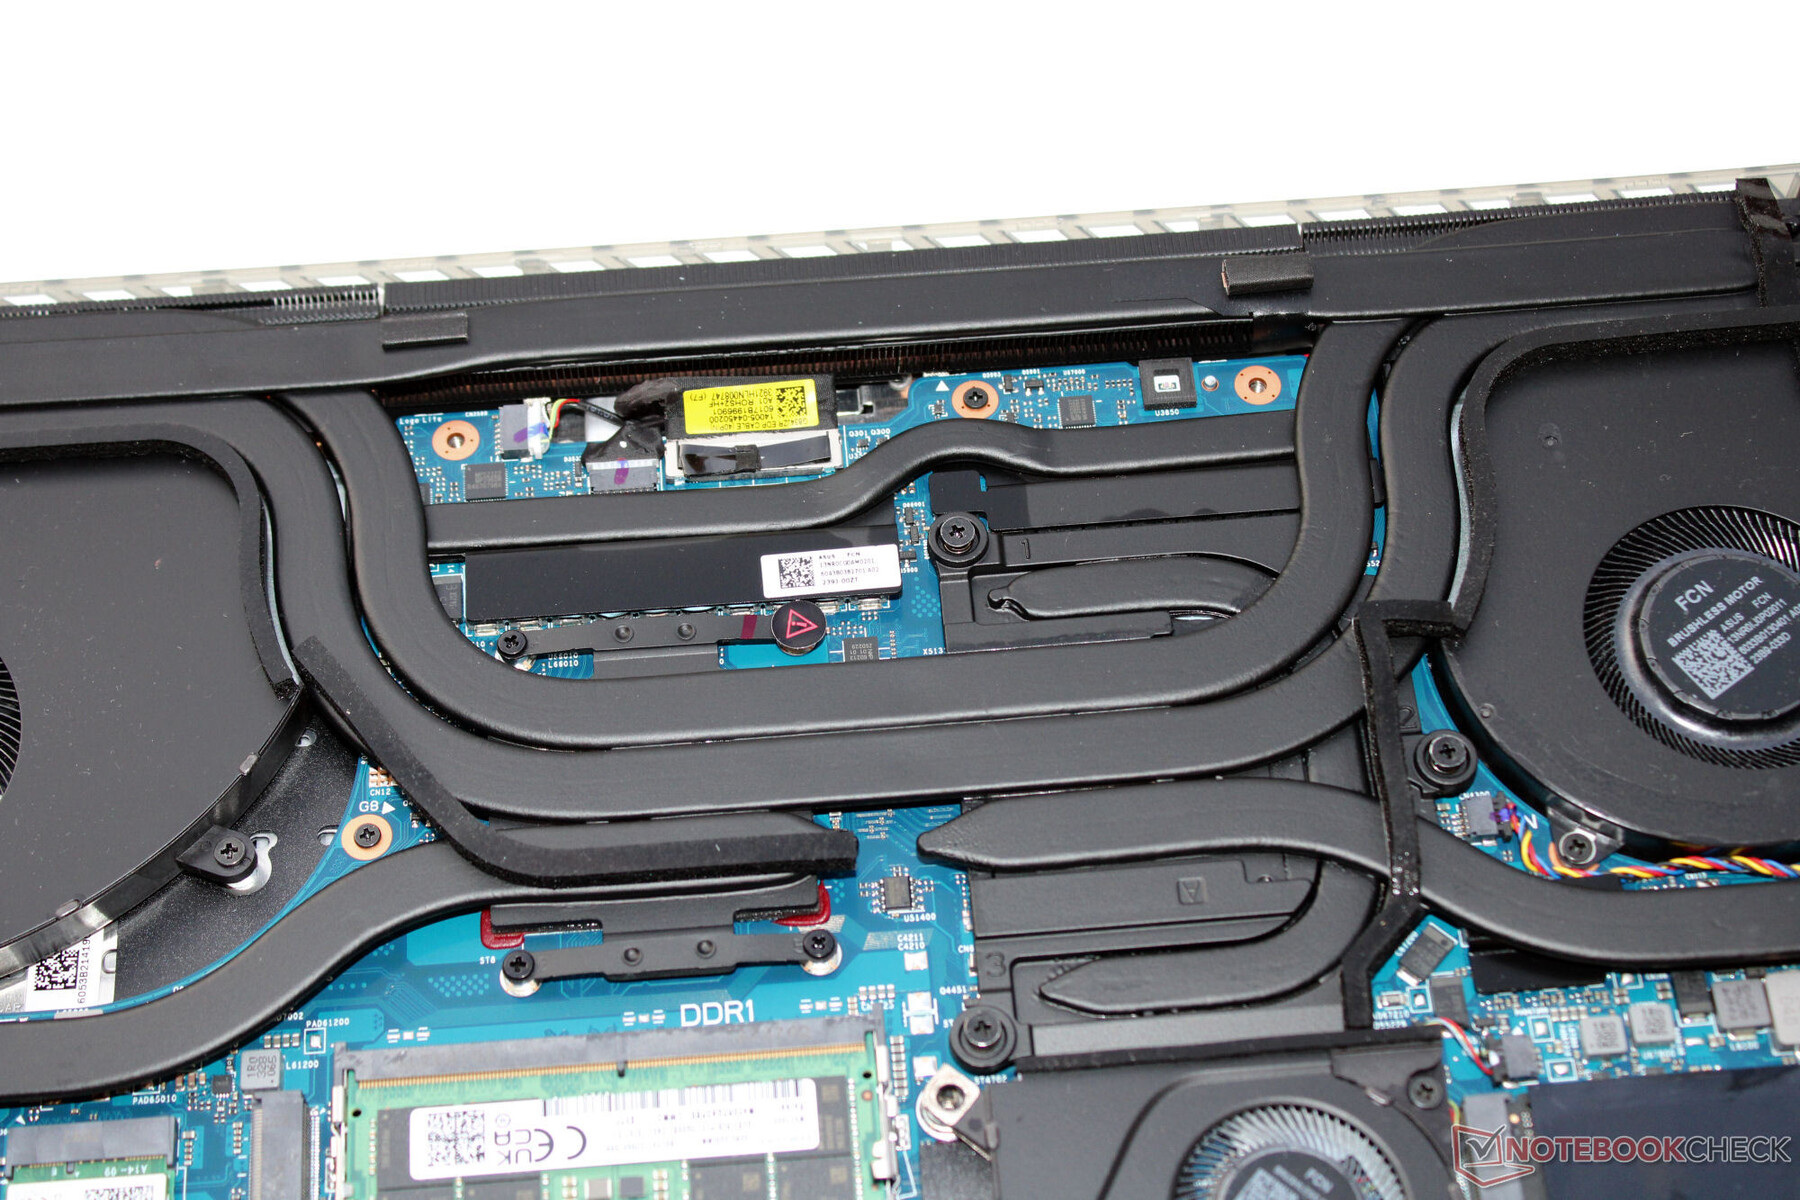
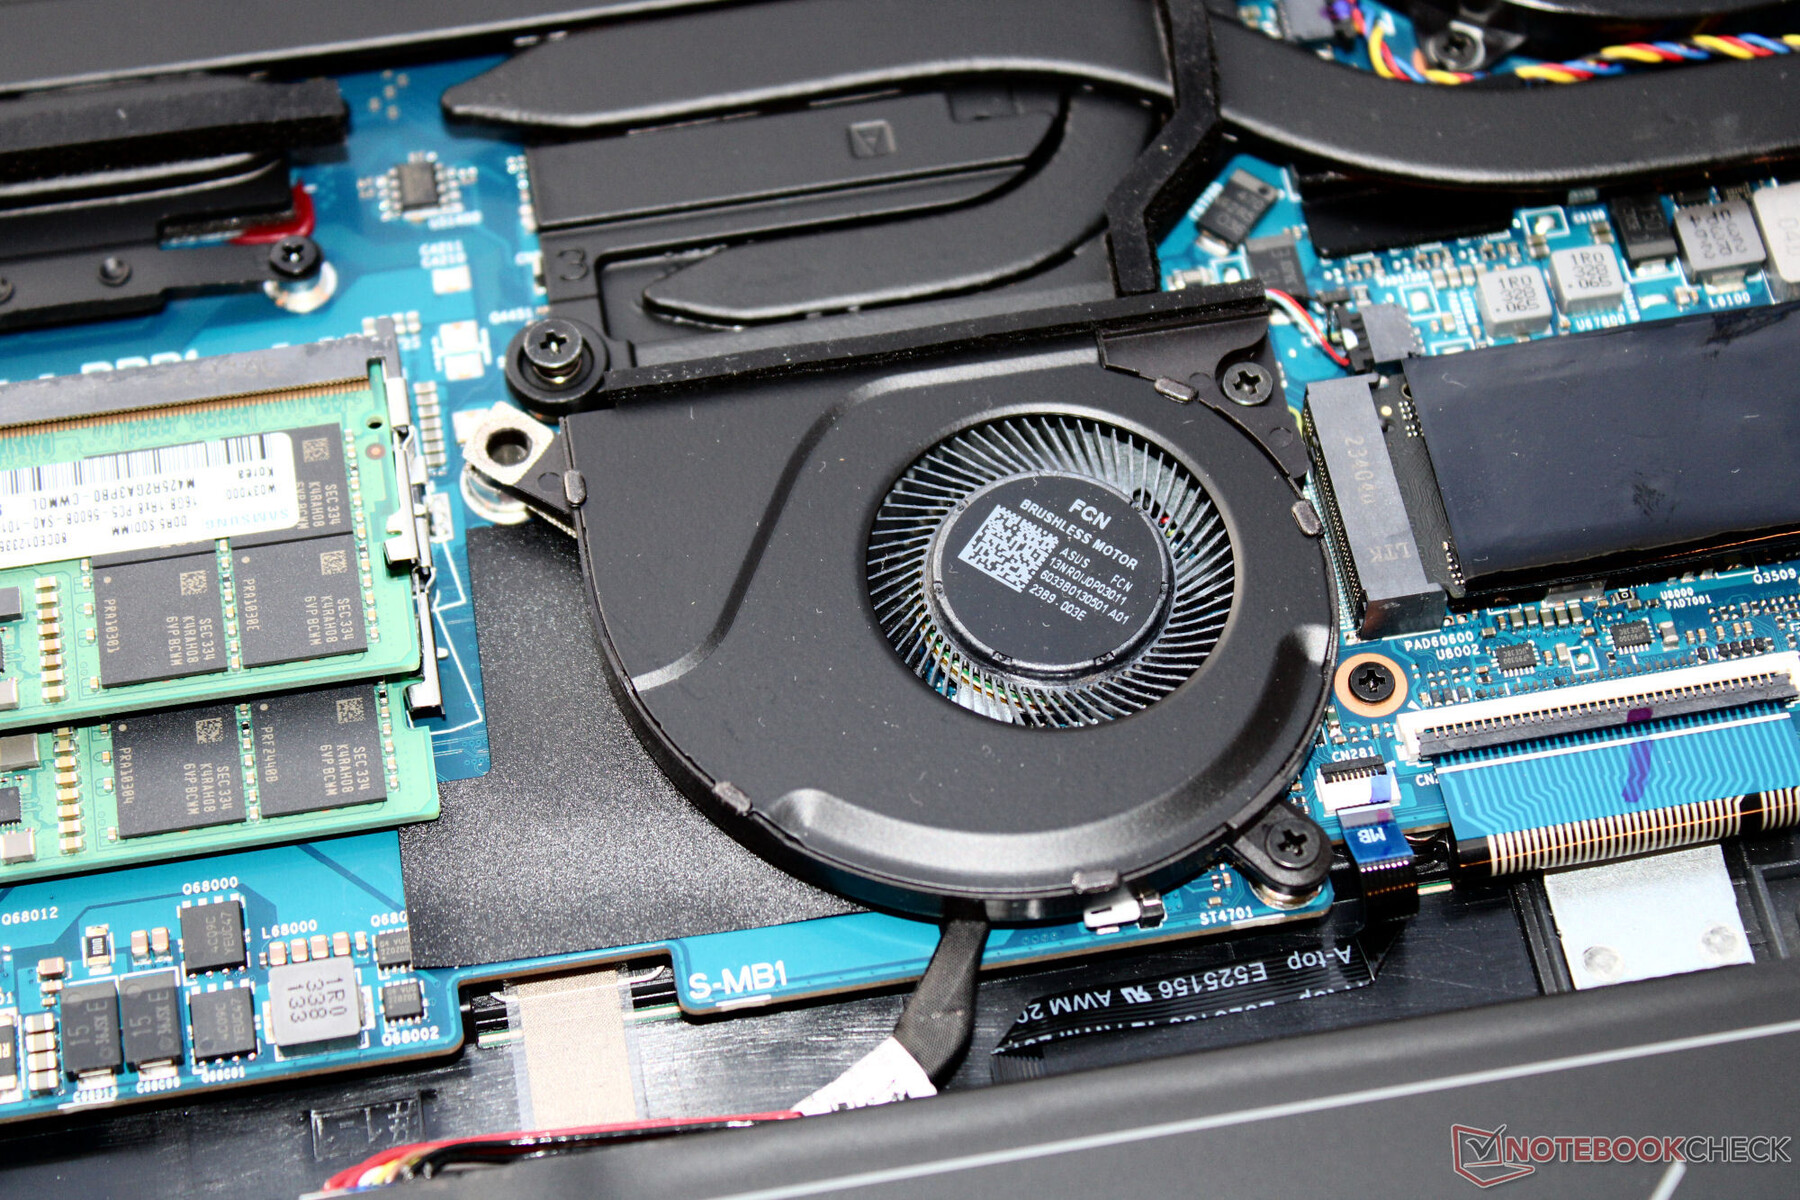
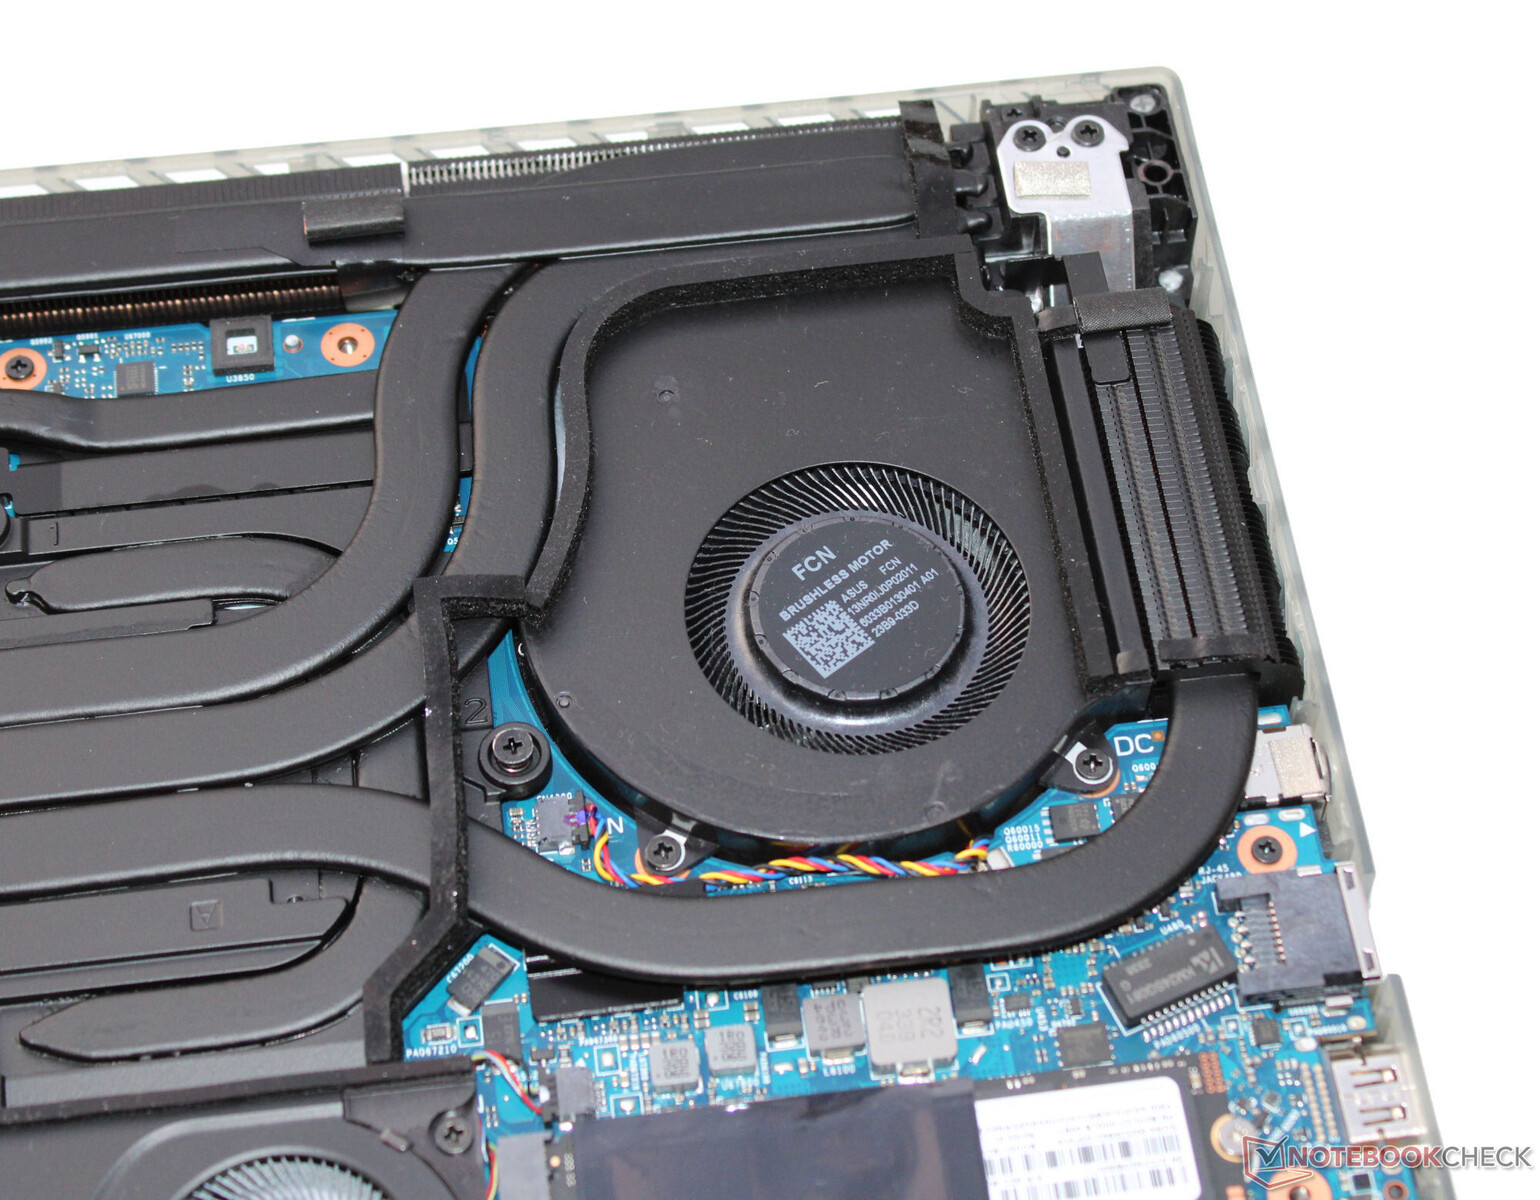
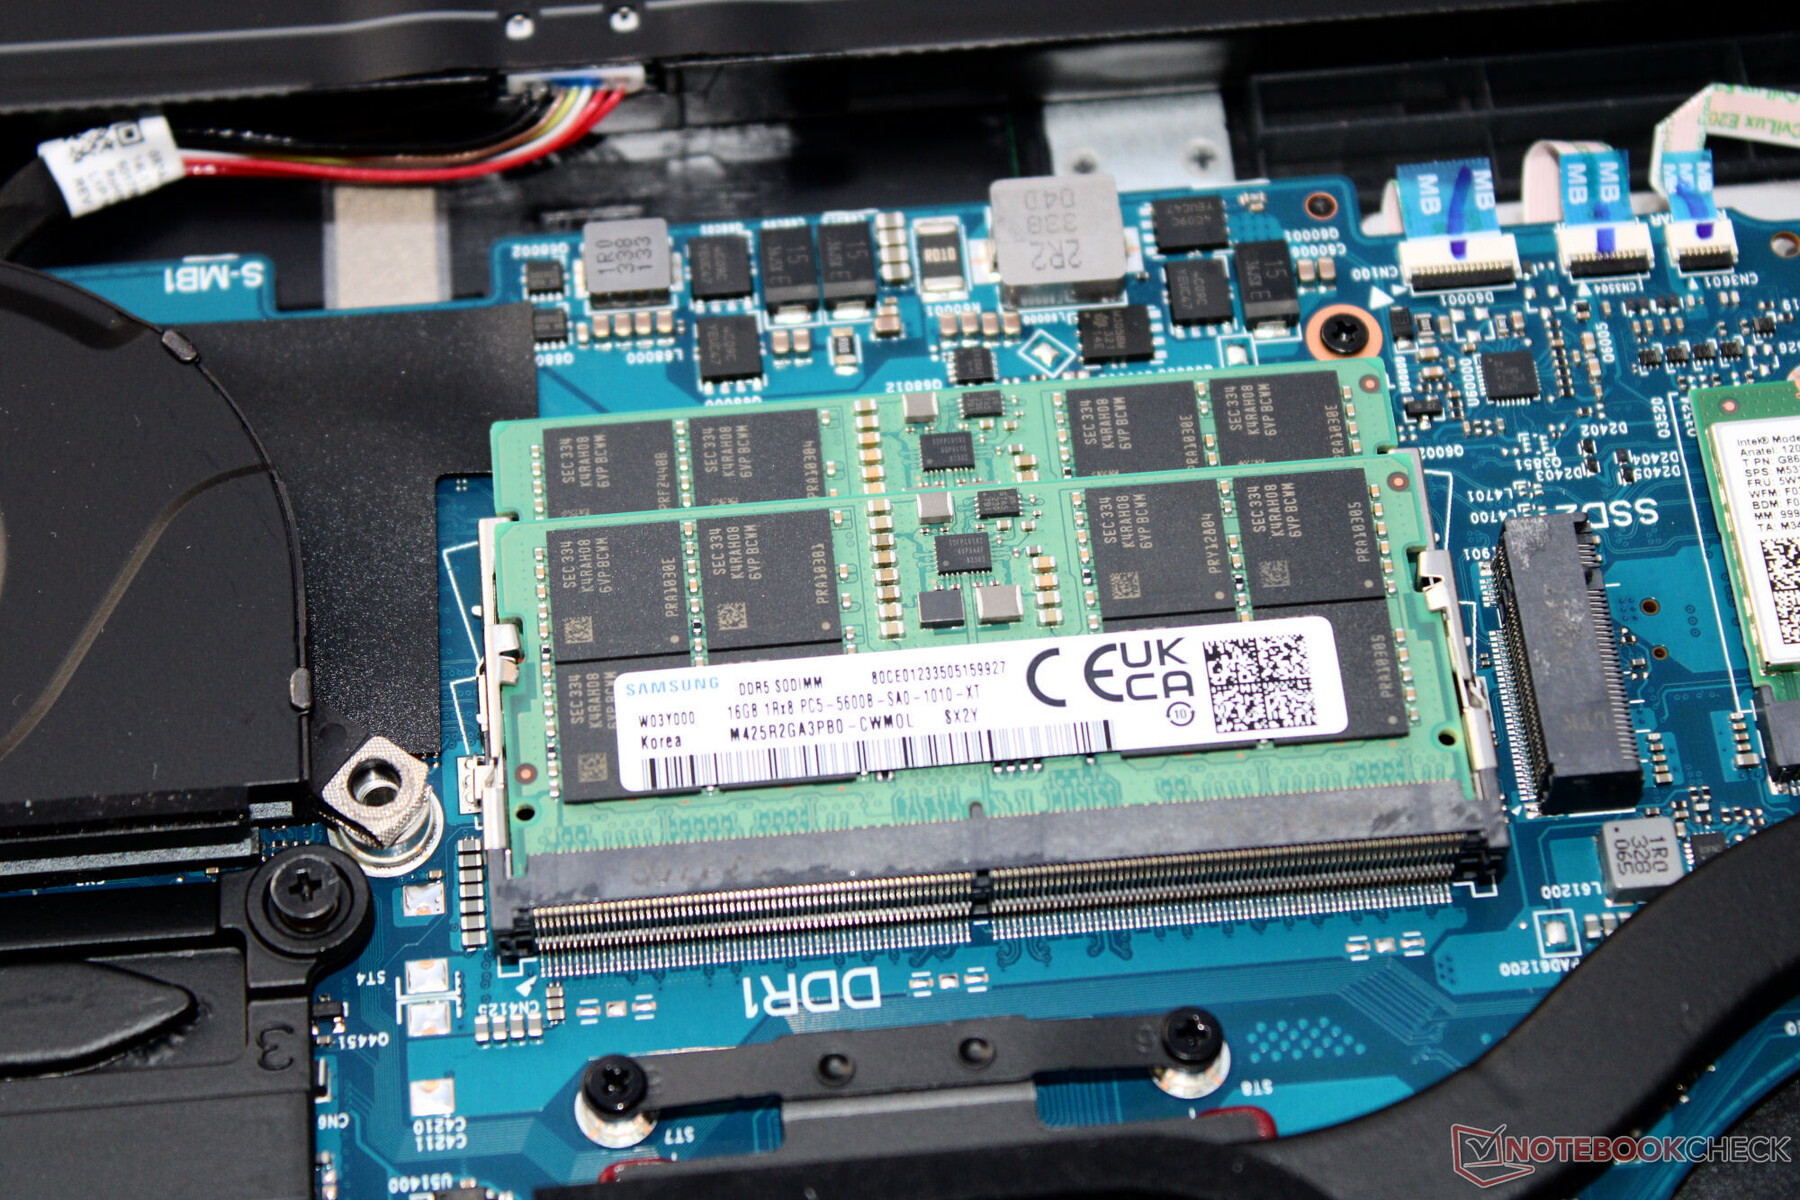
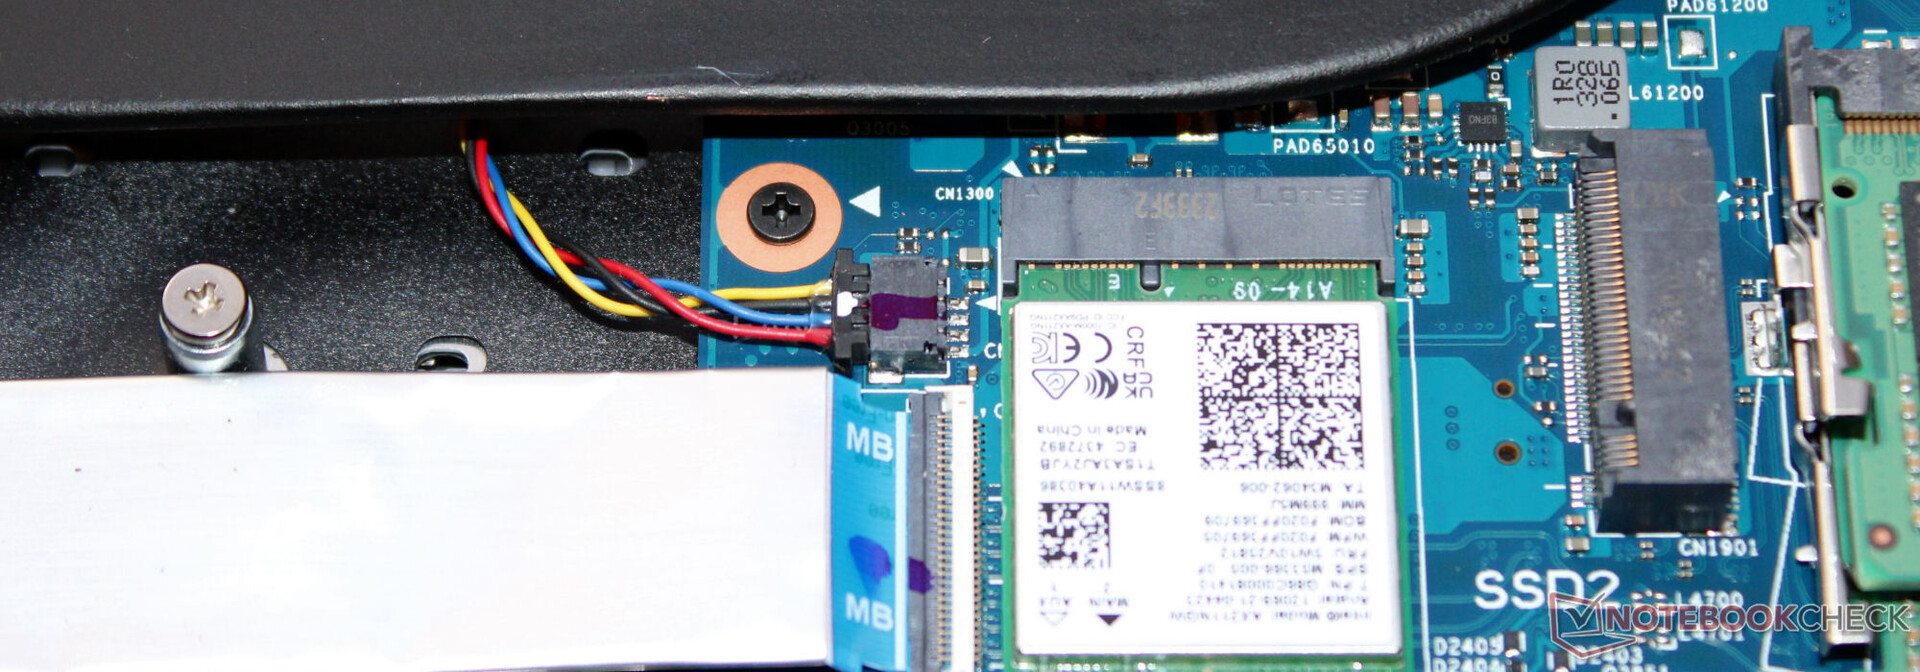
Dizüstü bilgisayarı açmak için kasanın altındaki tüm vidaları çıkarmanız gerekir. Daha sonra bir meraklı alet kullanarak kasa plakasını kaldırabilirsiniz. Kasa plakasını çıkardıktan sonra, depolama bankalarına (dolu), SSD'ye (PCIe 4, M.2-2280), ikinci SSD yuvasına (PCIe 4, M.2-2280), WLAN modülüne, BIOS piline, fanlara ve pile (vidalı, yapıştırılmamış) erişebilirsiniz.
Klavye kolayca değiştirilemez. Bunu yapmak için tabanın üst kısmını değiştirmeniz gerekir ki bu da dizüstü bilgisayarı tamamen parçalara ayırmanızı gerektirir.
Garanti
Asus, Almanya'da 18 inçlik dizüstü bilgisayar için iki yıllık garanti sunuyor. Garantinin üç yıla uzatılması yaklaşık 200 Euro'ya (~215$) mal olacaktır.
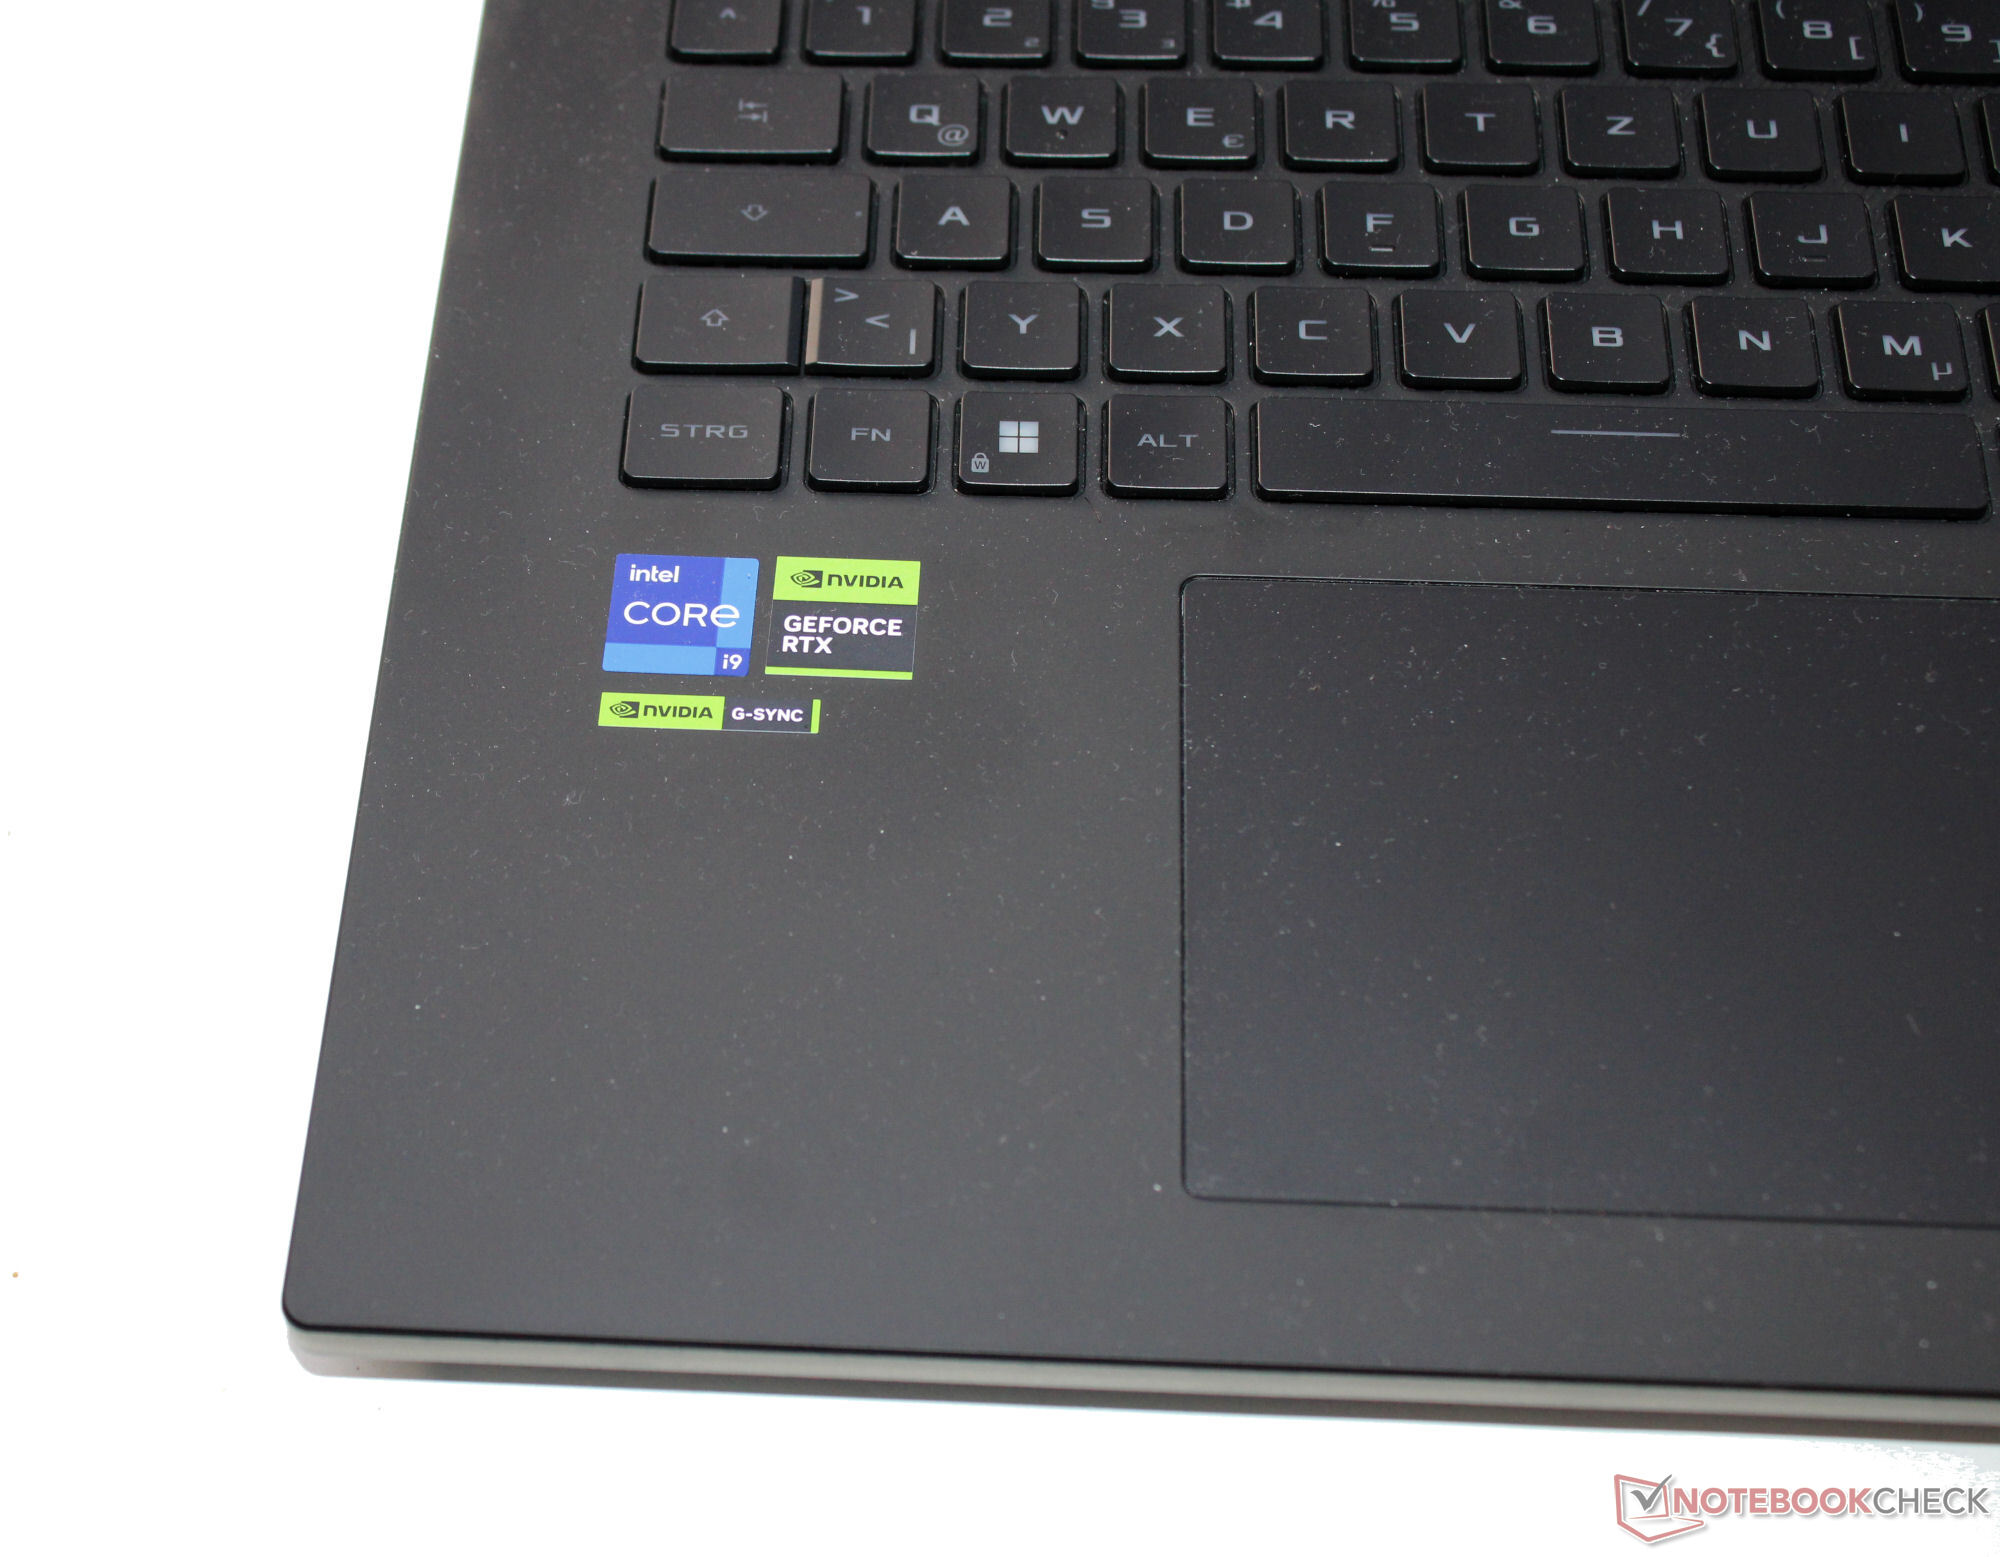
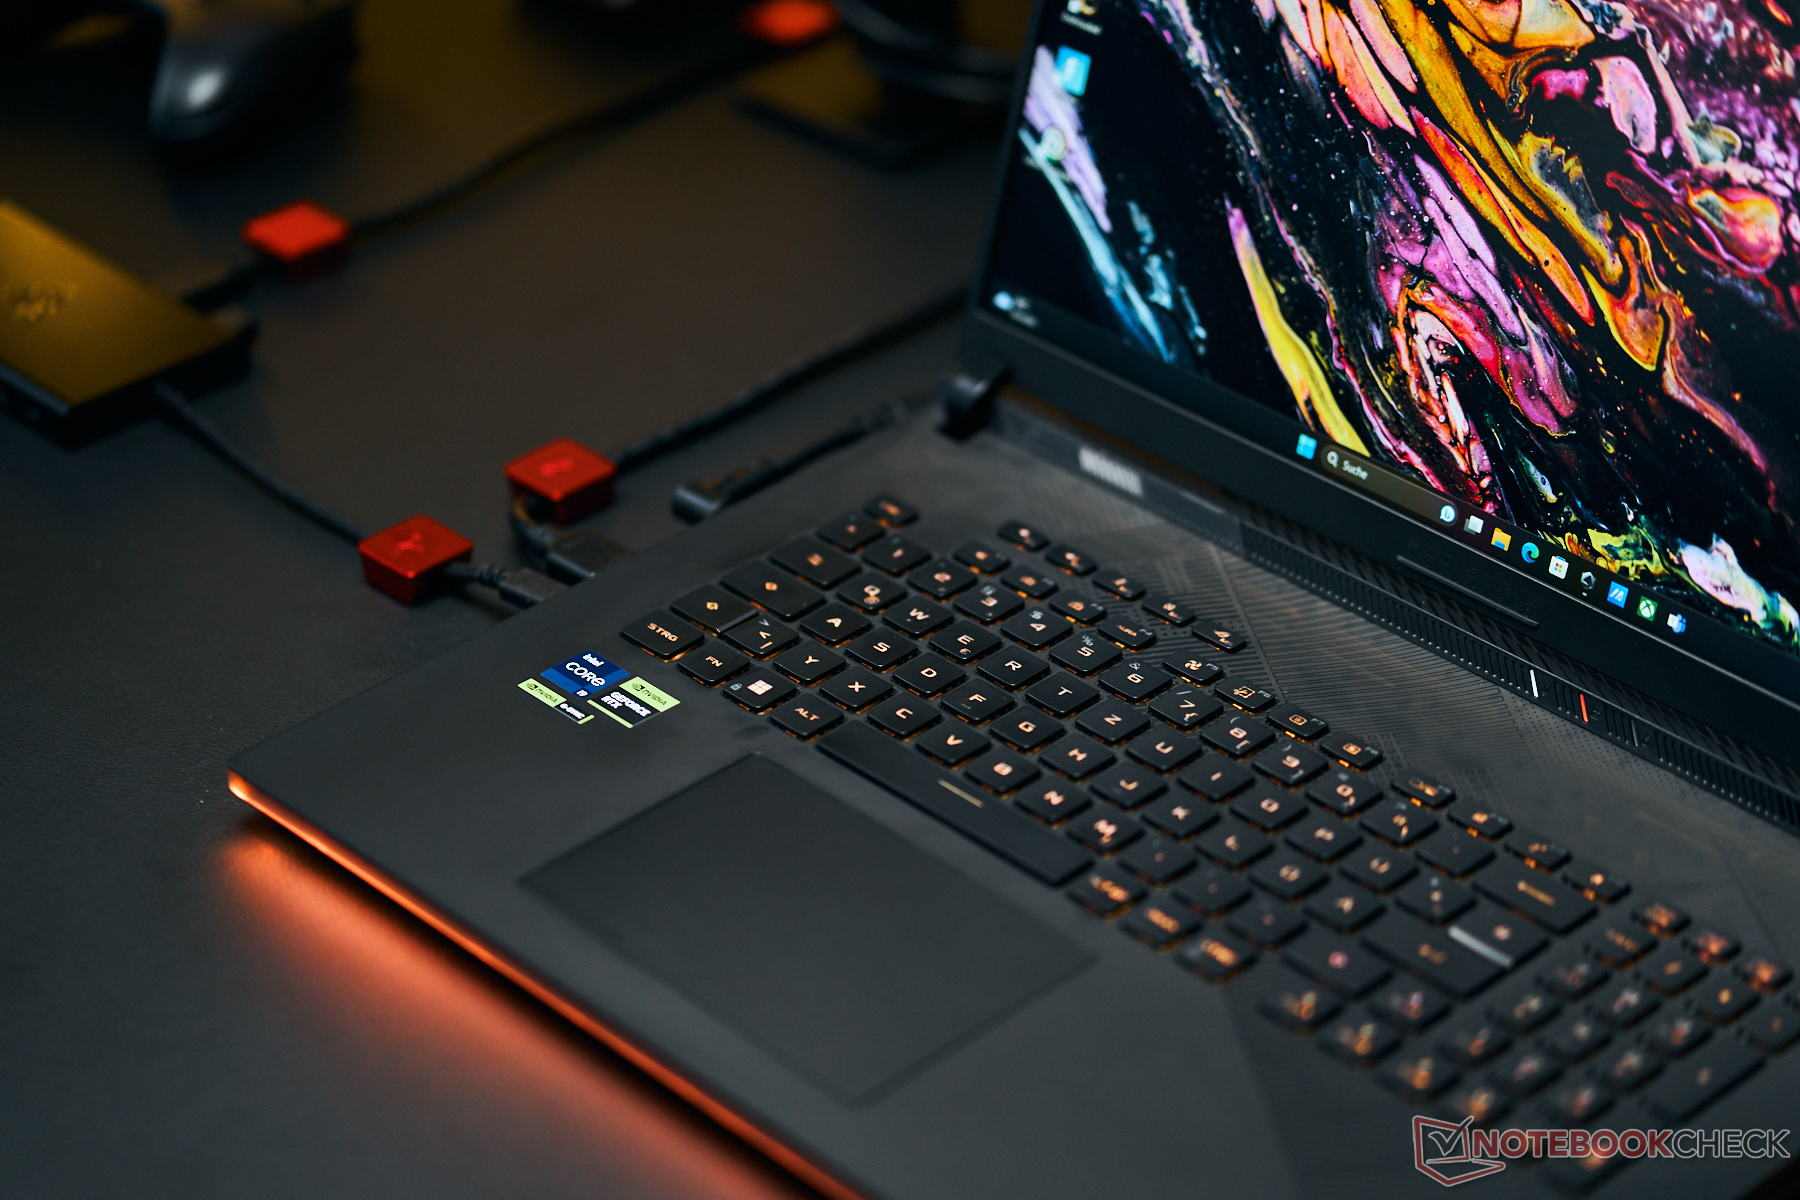
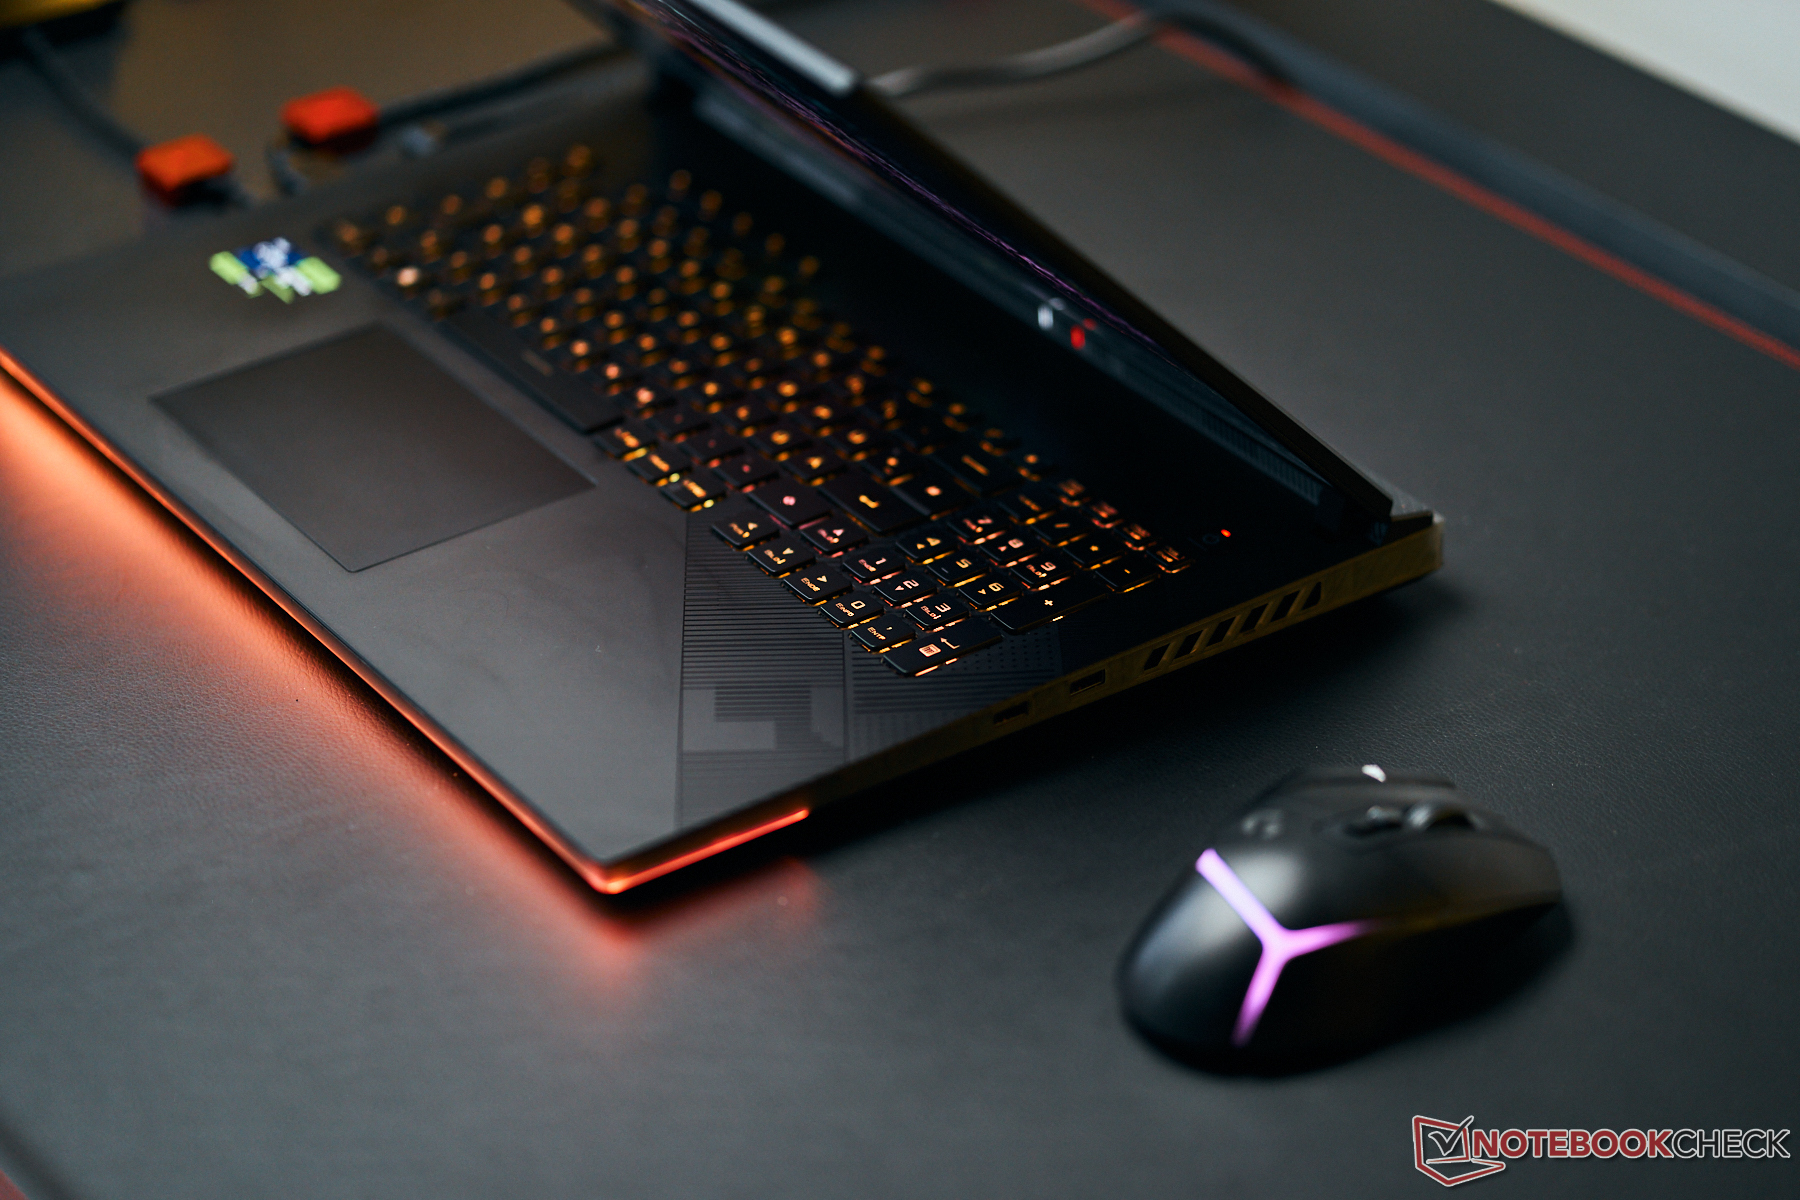
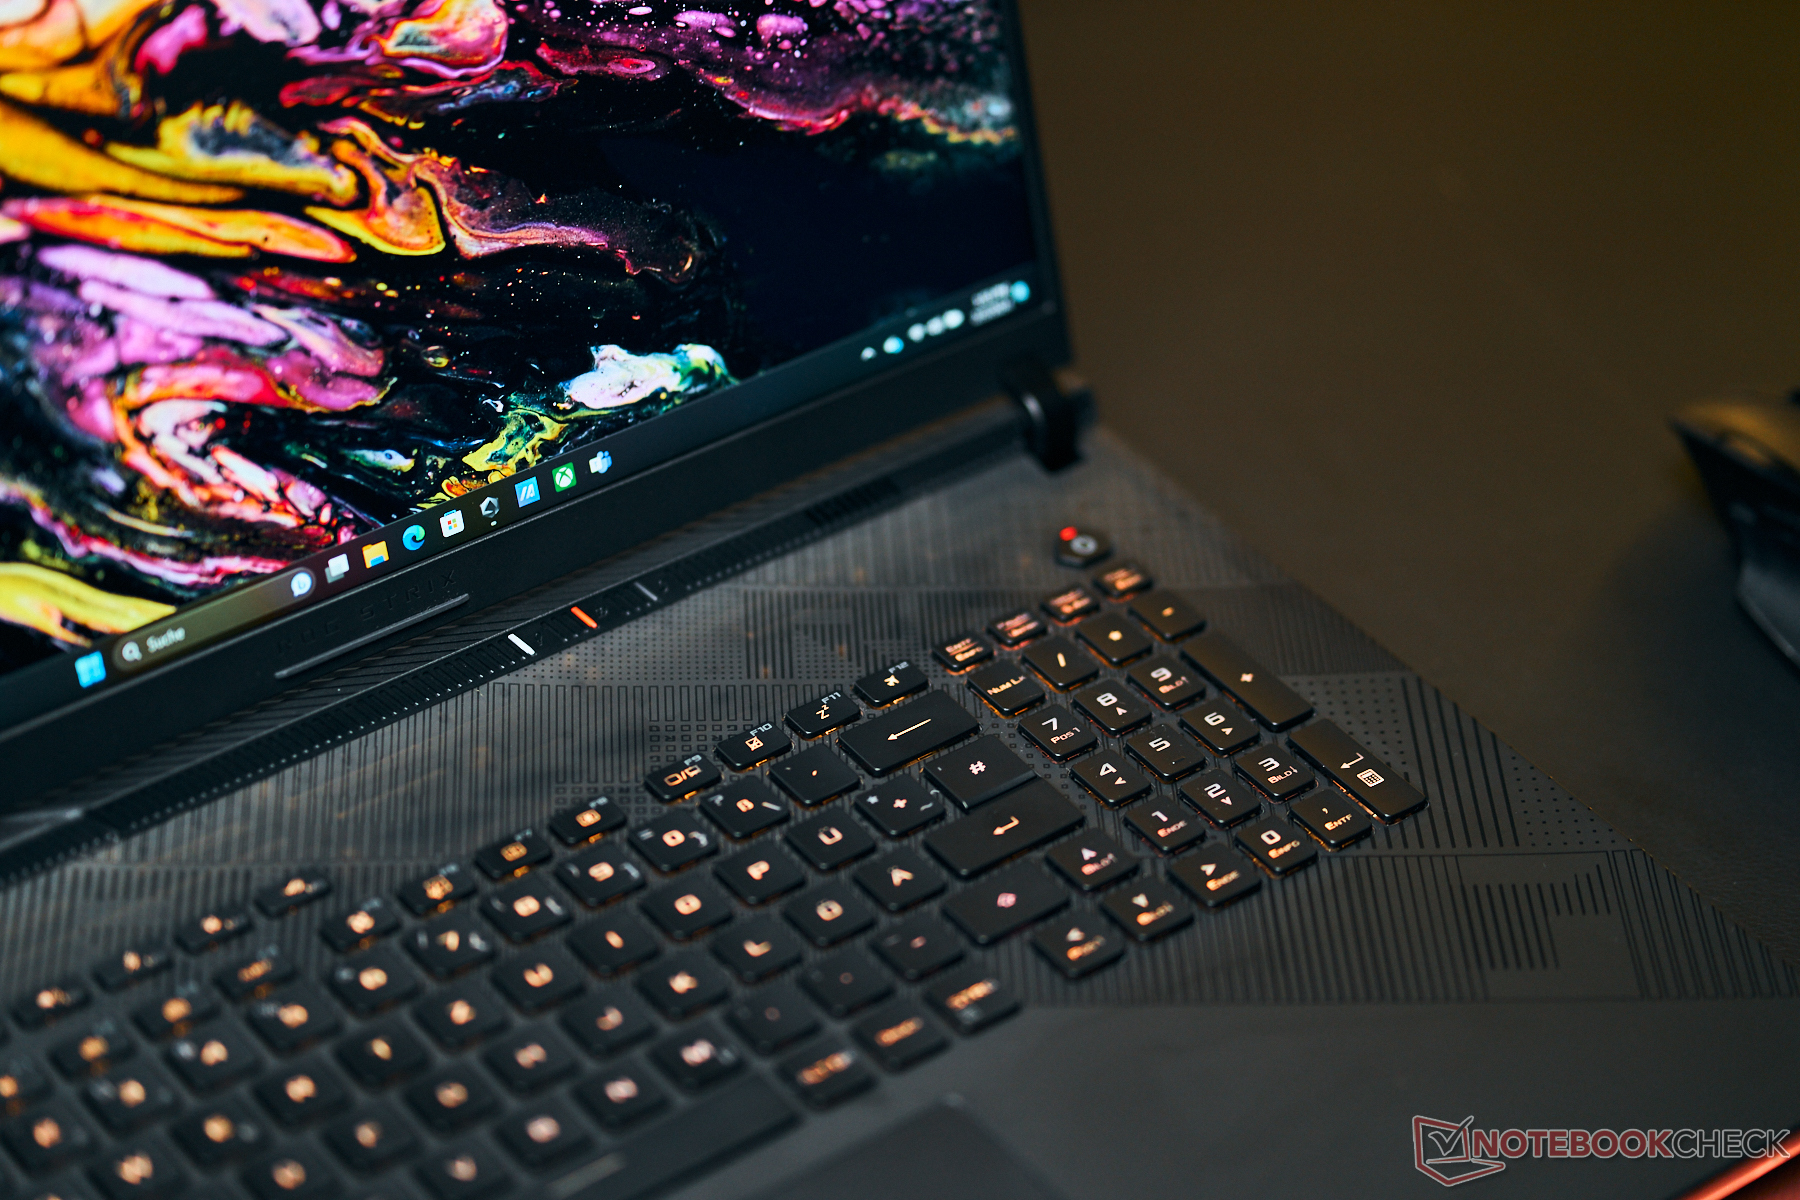
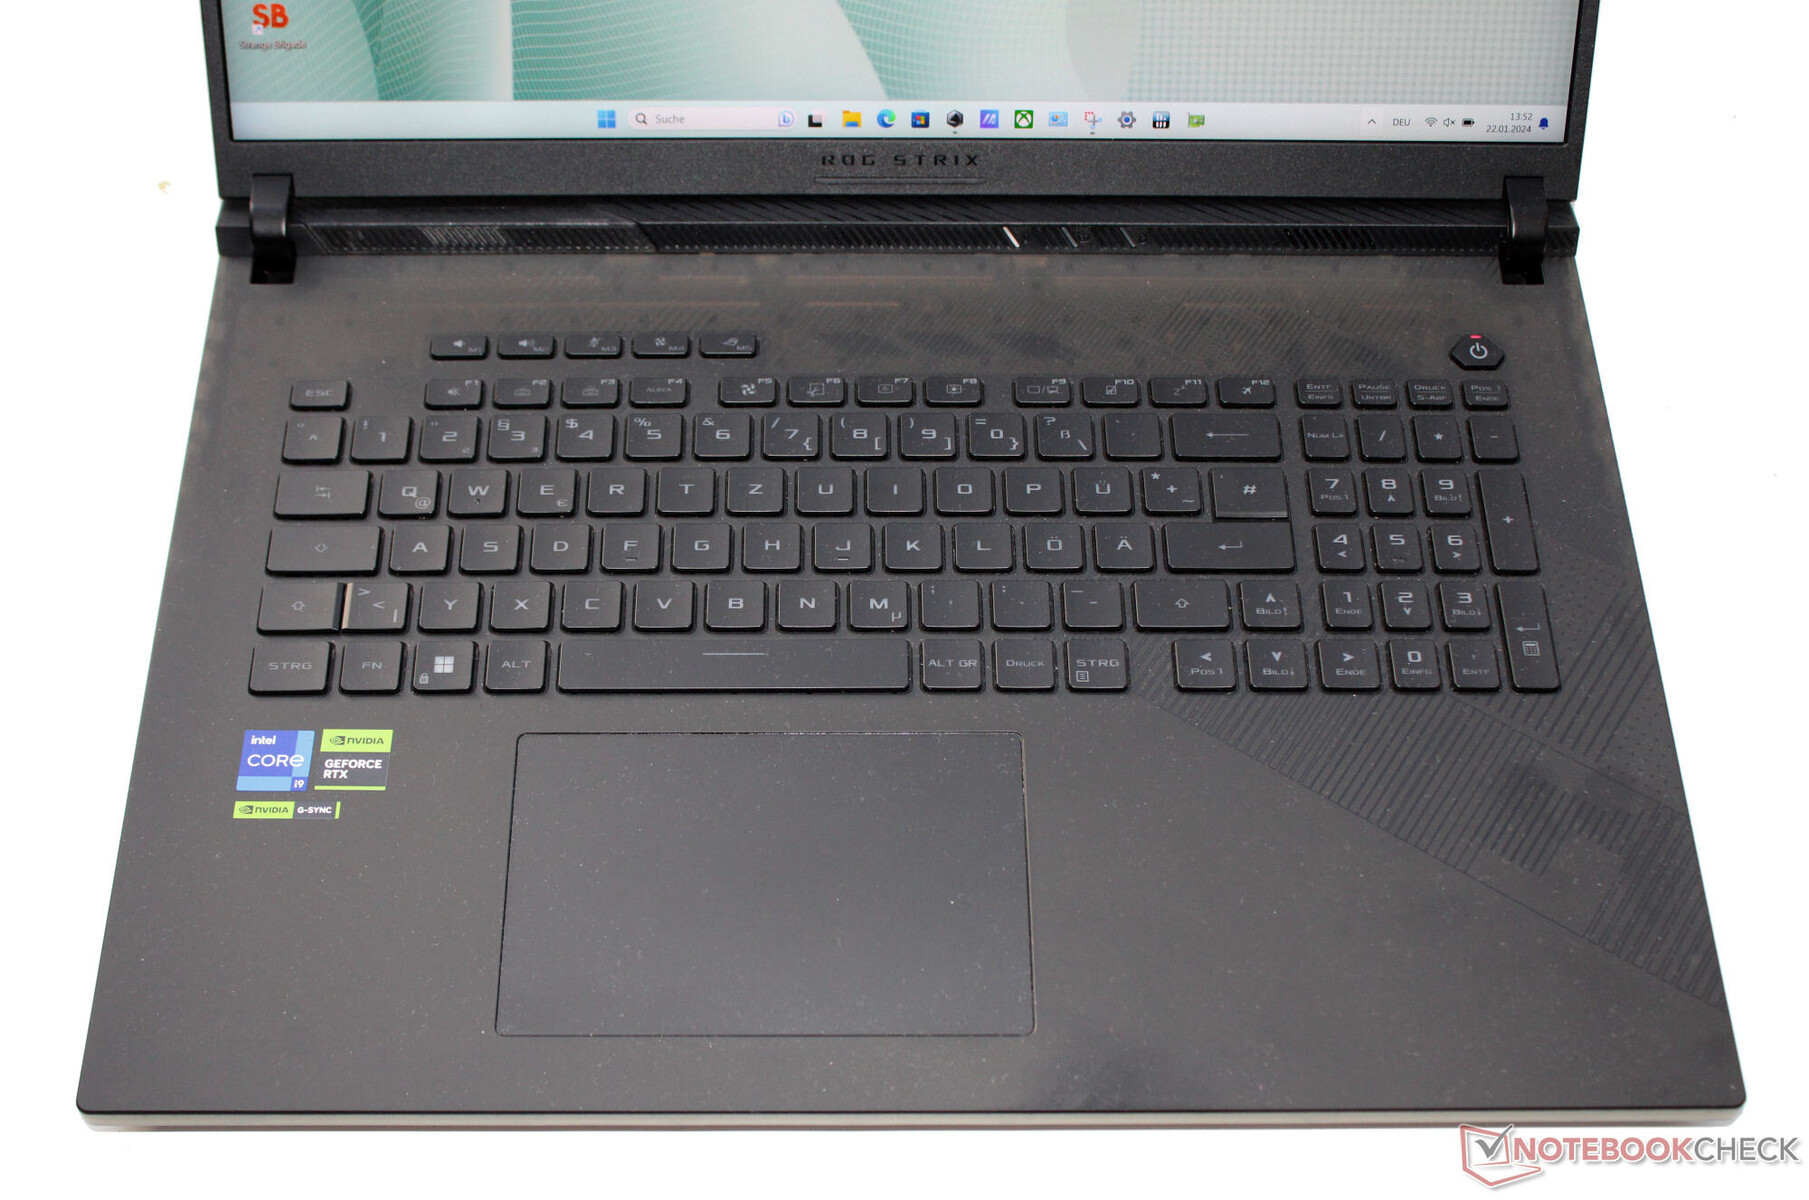
Giriş Aygıtları - Tek tuşlu RGB aydınlatmalı Asus bilgisayar
Klavye
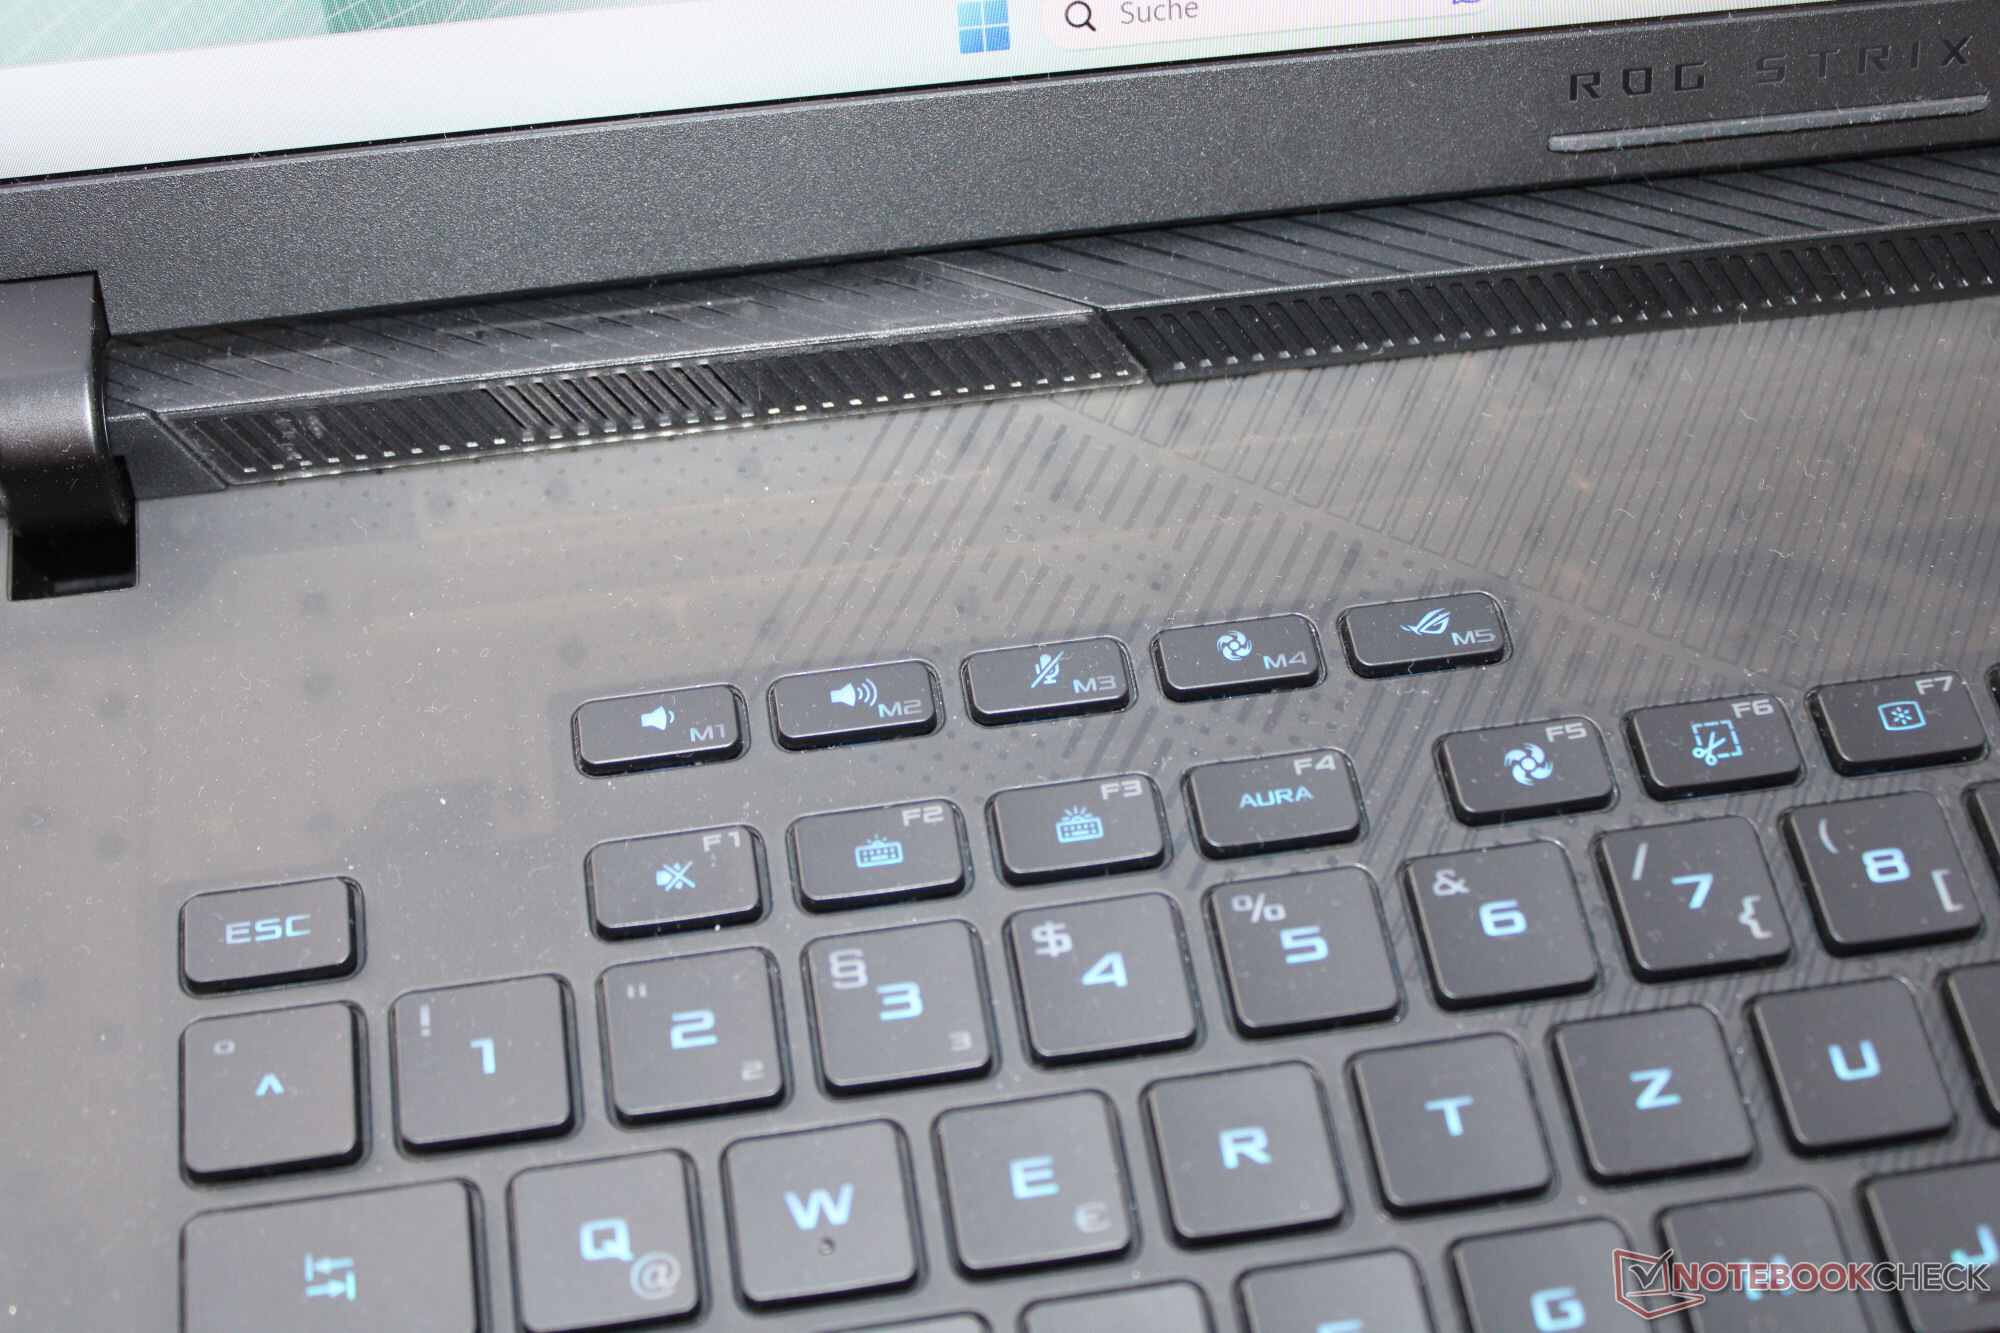
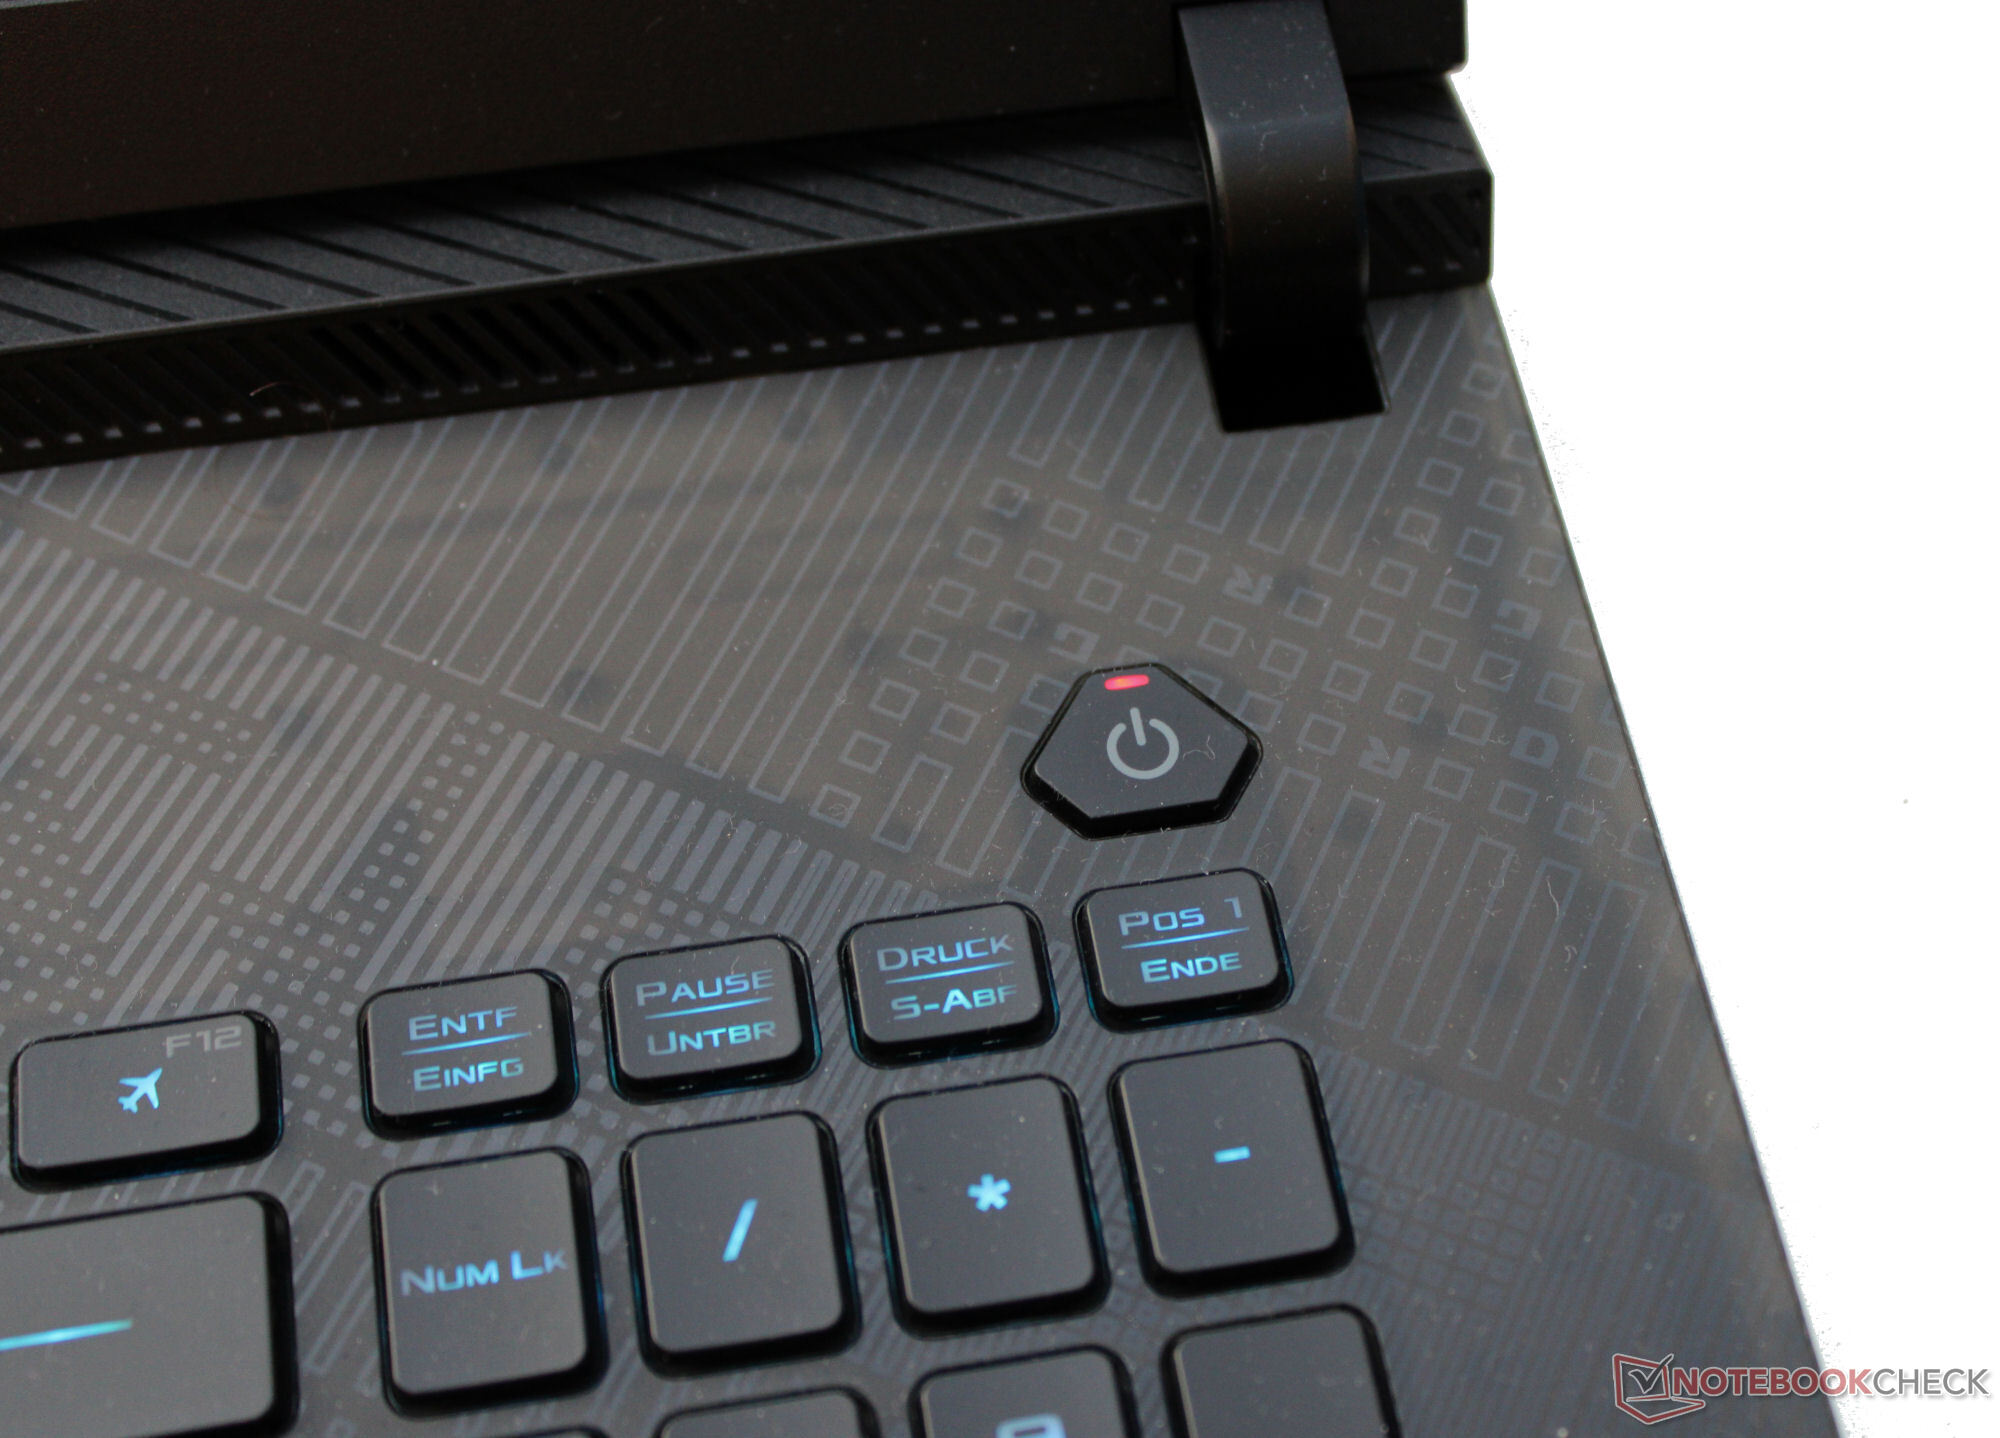
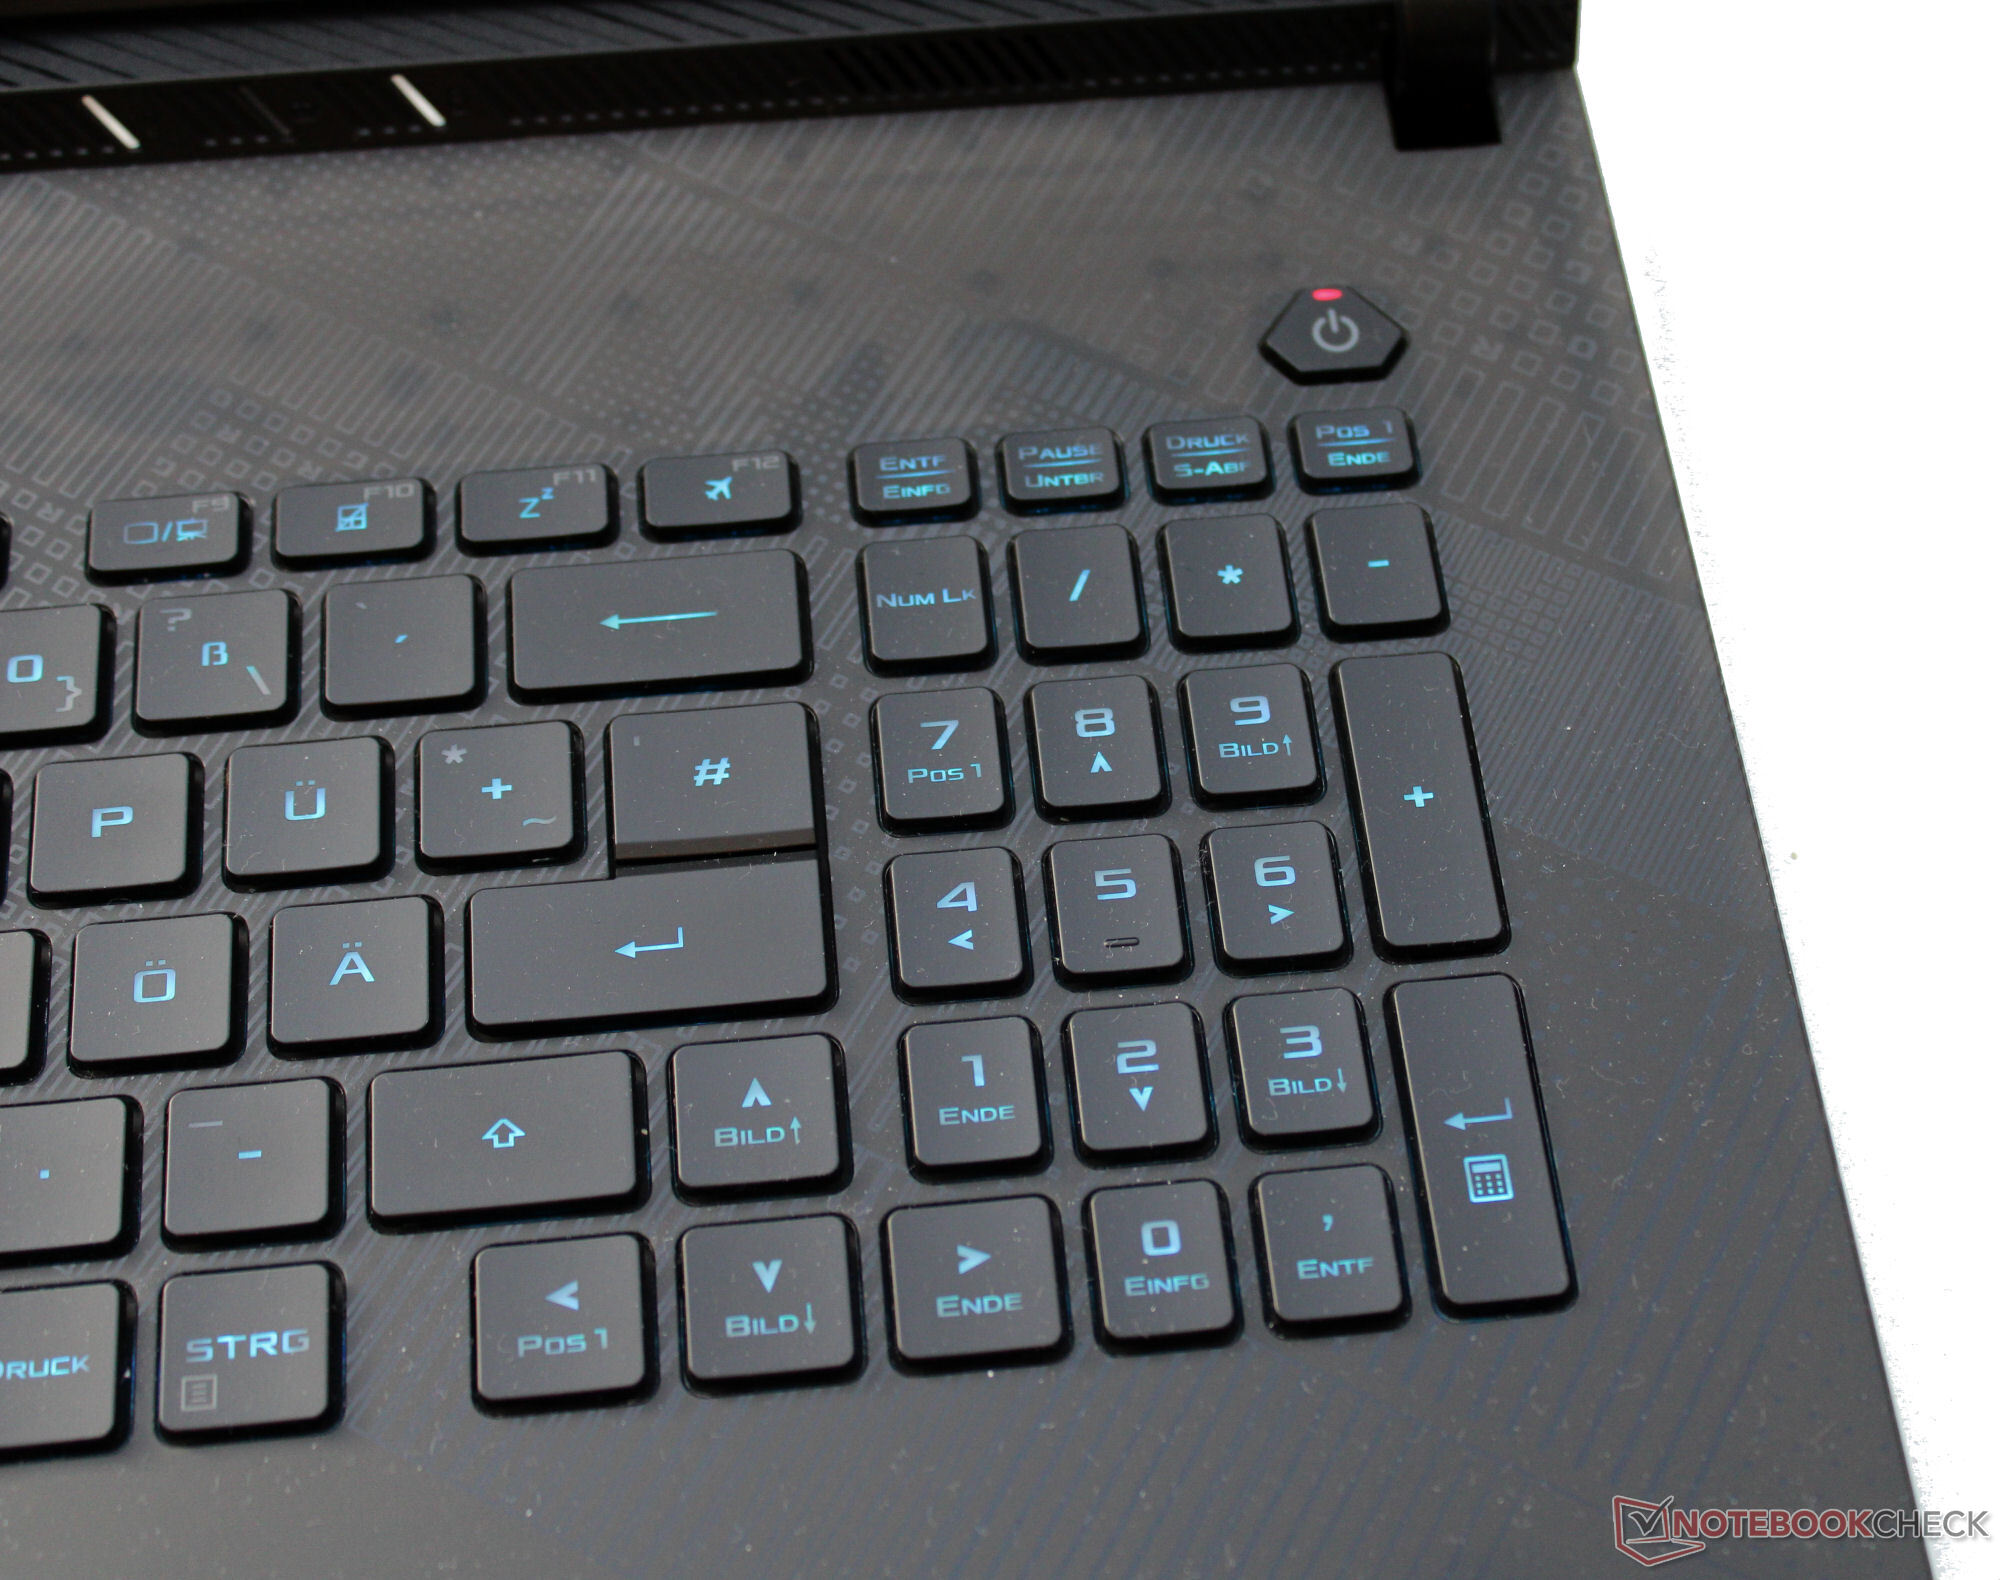
Aydınlatmalı chiclet klavyenin içbükey tuşları orta vuruş ve net bir basınç noktası sunuyor. Tuş direnci temelde iyi ancak öznel olarak biraz daha net olabilirdi. Yazarken, klavyenin sağ yarısında en iyi ihtimalle minimum düzeyde bir boşluk var. Ancak, bu herhangi bir engel teşkil etmedi. Dört ok tuşunun da normal boyutta olması olumlu bir özellik. Genel olarak, Asus burada günlük işler için uygun bir klavye sunuyor.
Dokunmatik yüzey
Pürüzsüz yüzeyi parmakların kaymasını kolaylaştıran bir ClickPad (~13 x 8,5 cm, ~5,1 x 3,35 inç) fare yerine geçer. Kısa bir vuruş ve net bir basınç noktası sunar.
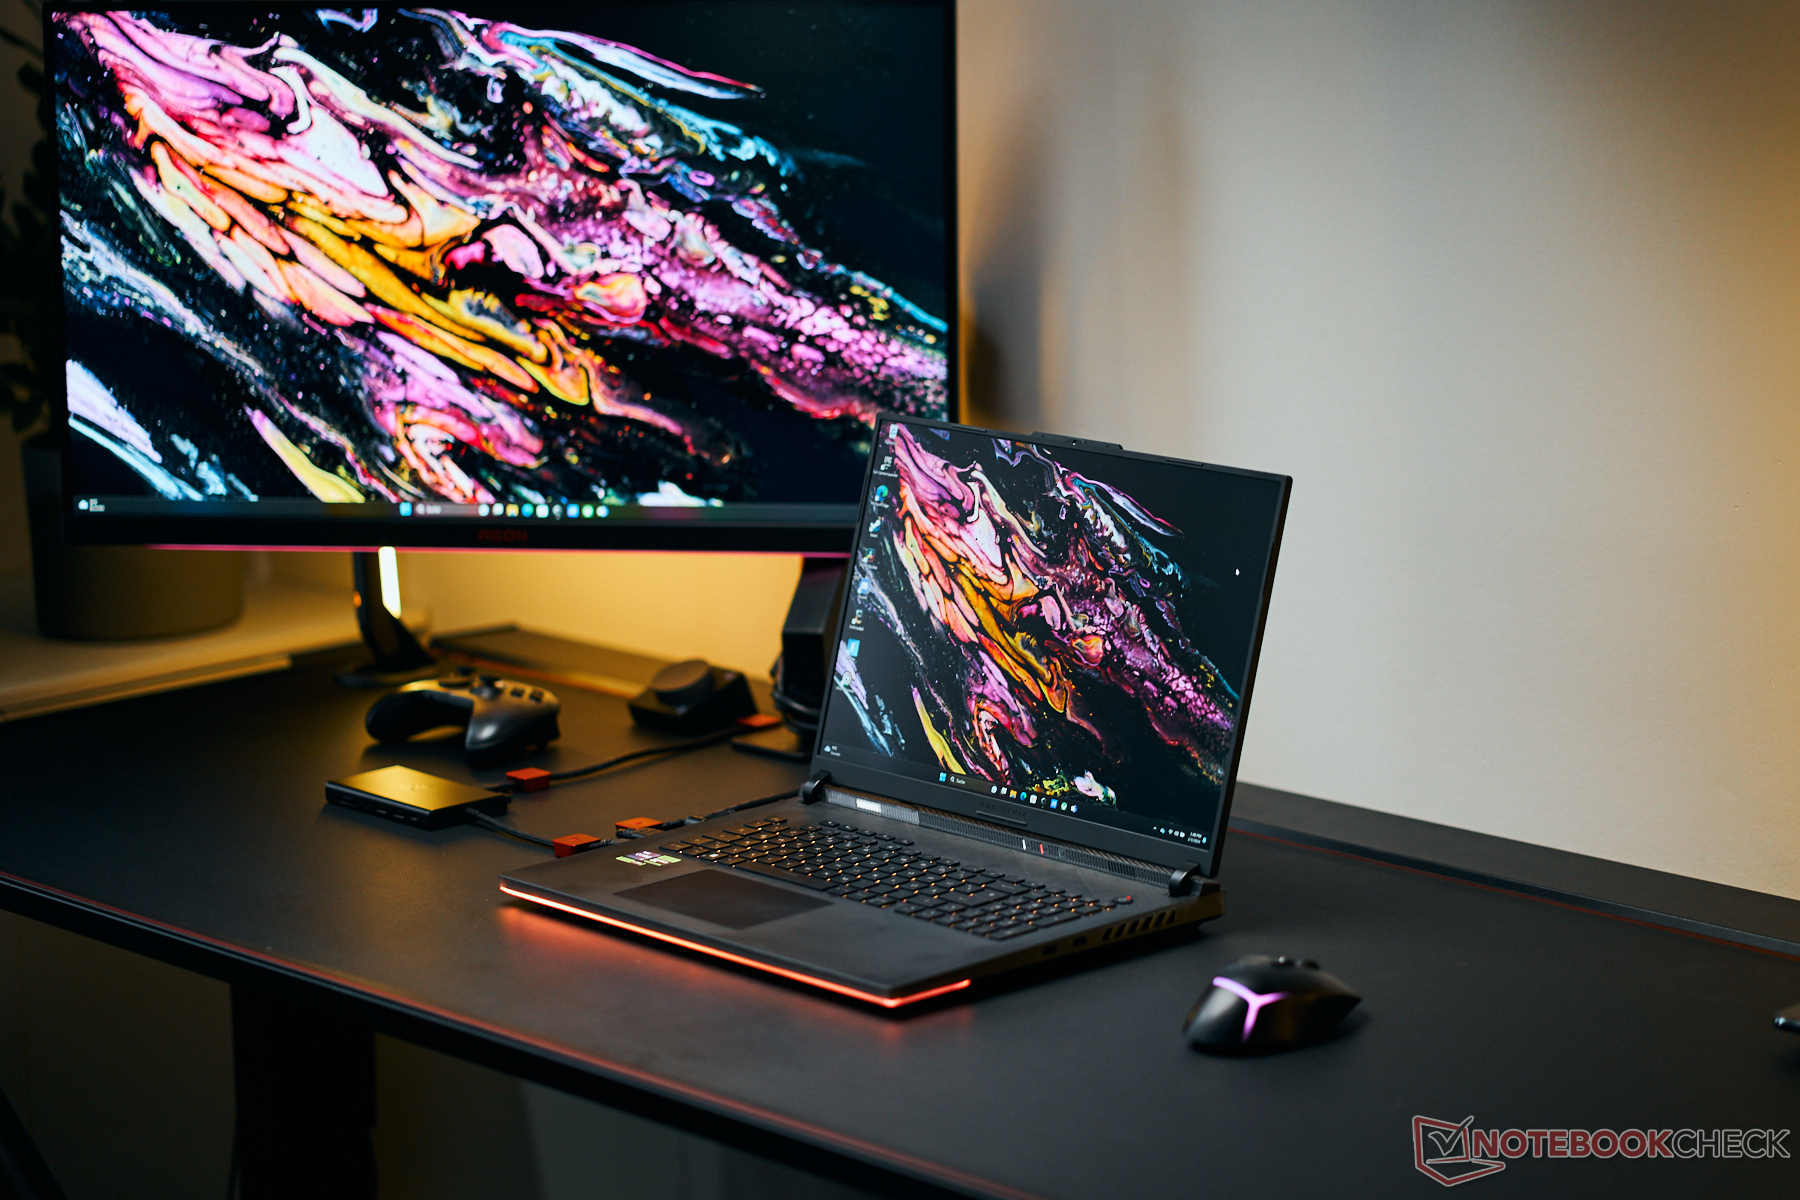
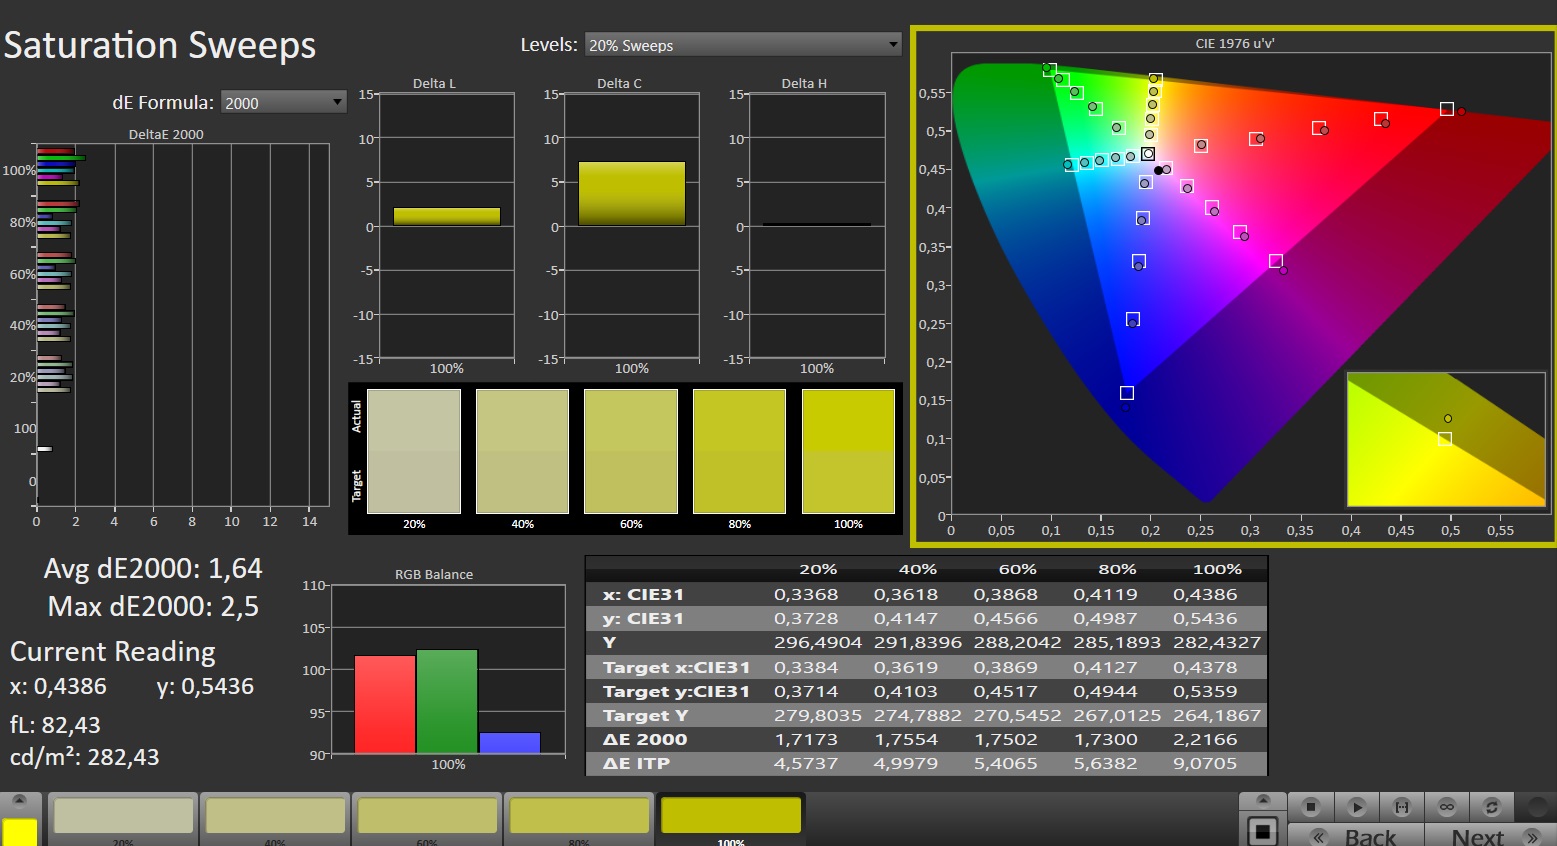
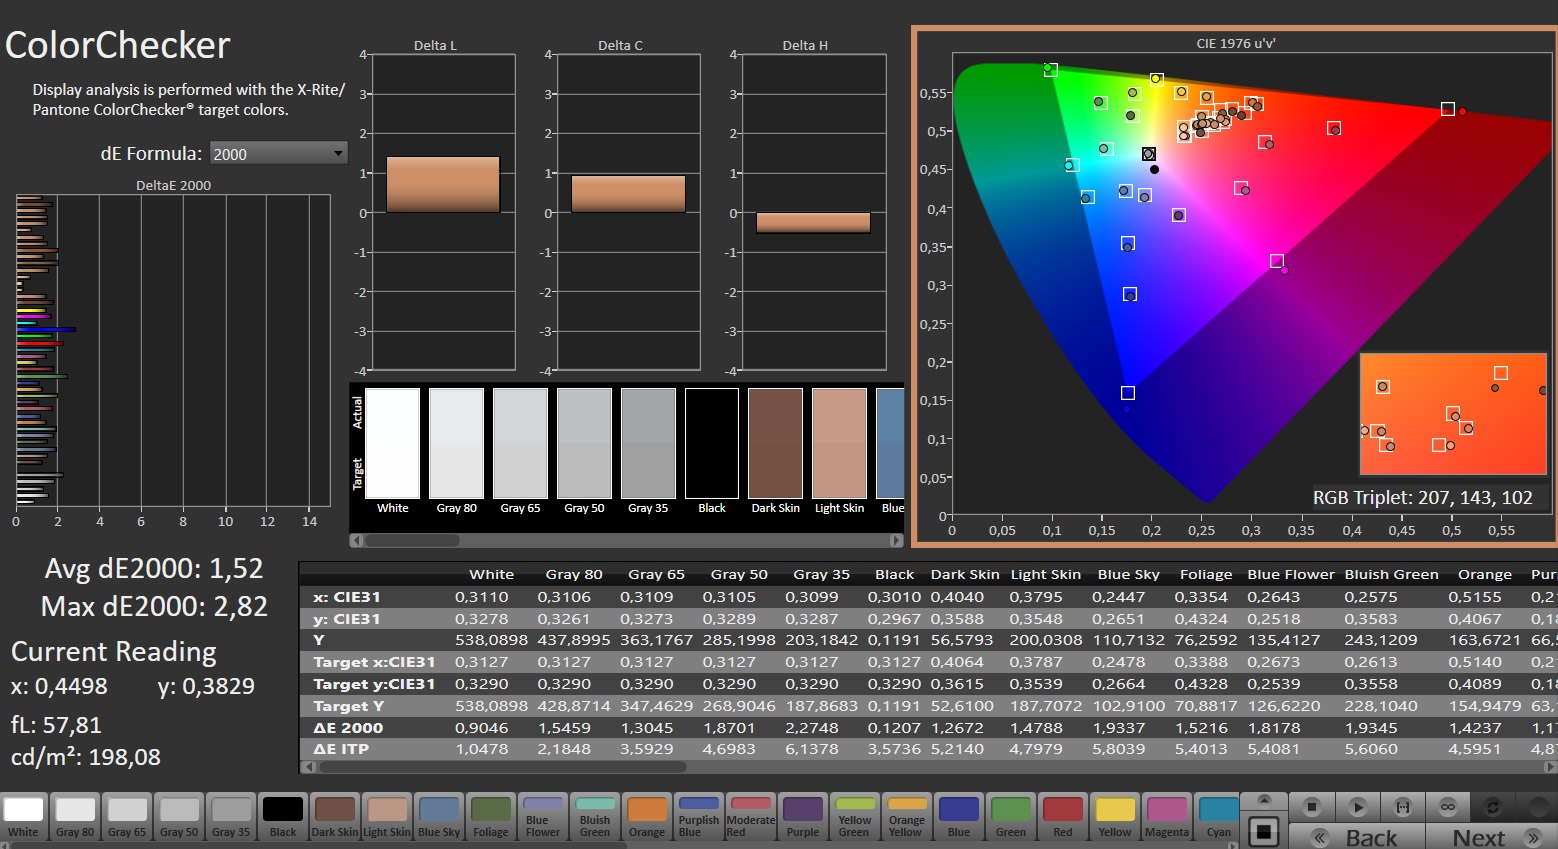
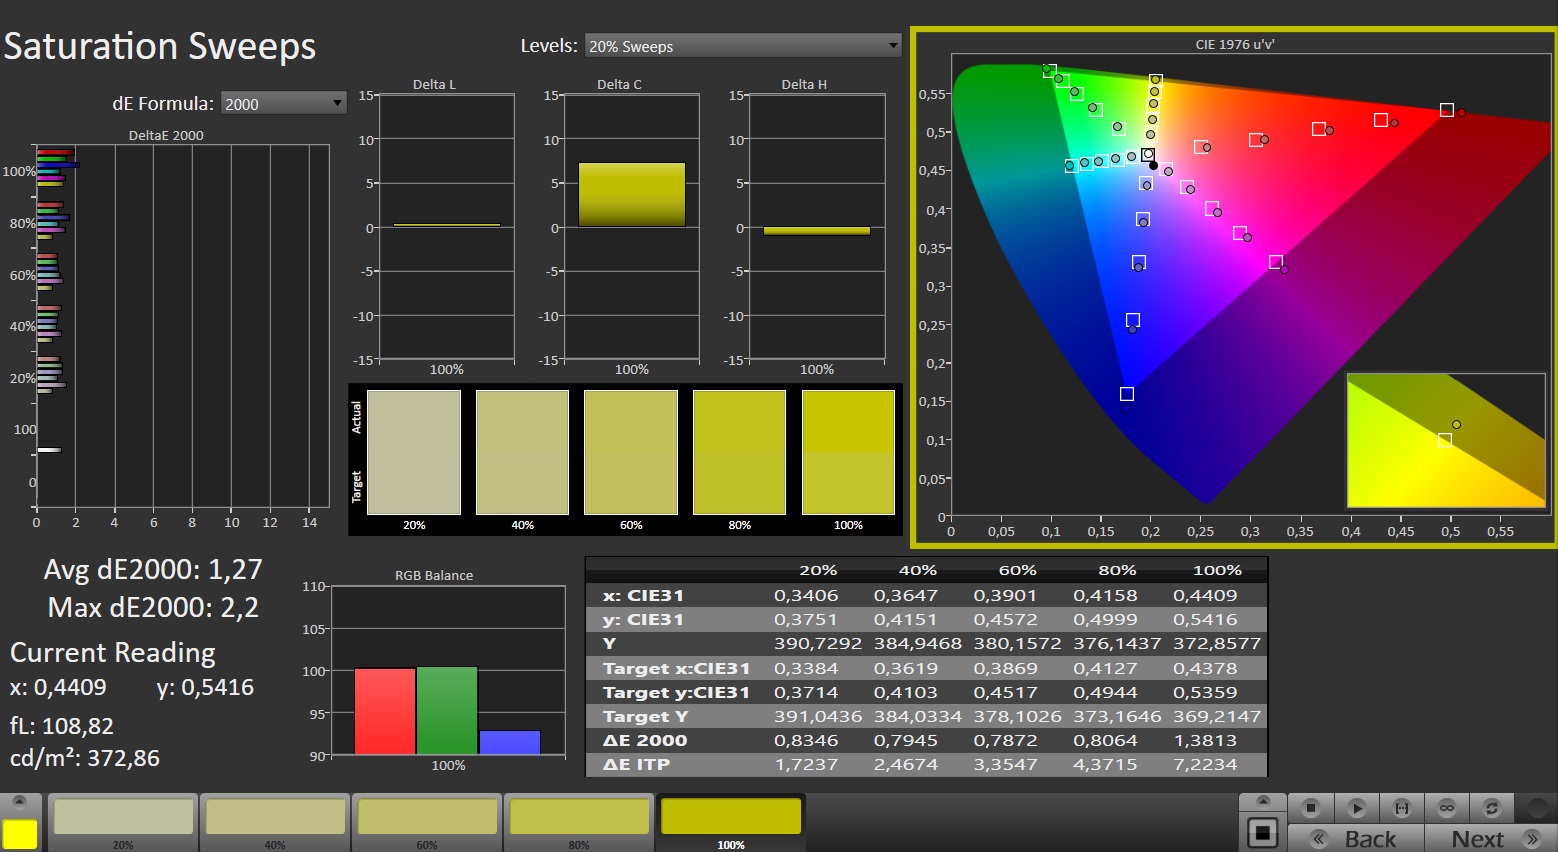
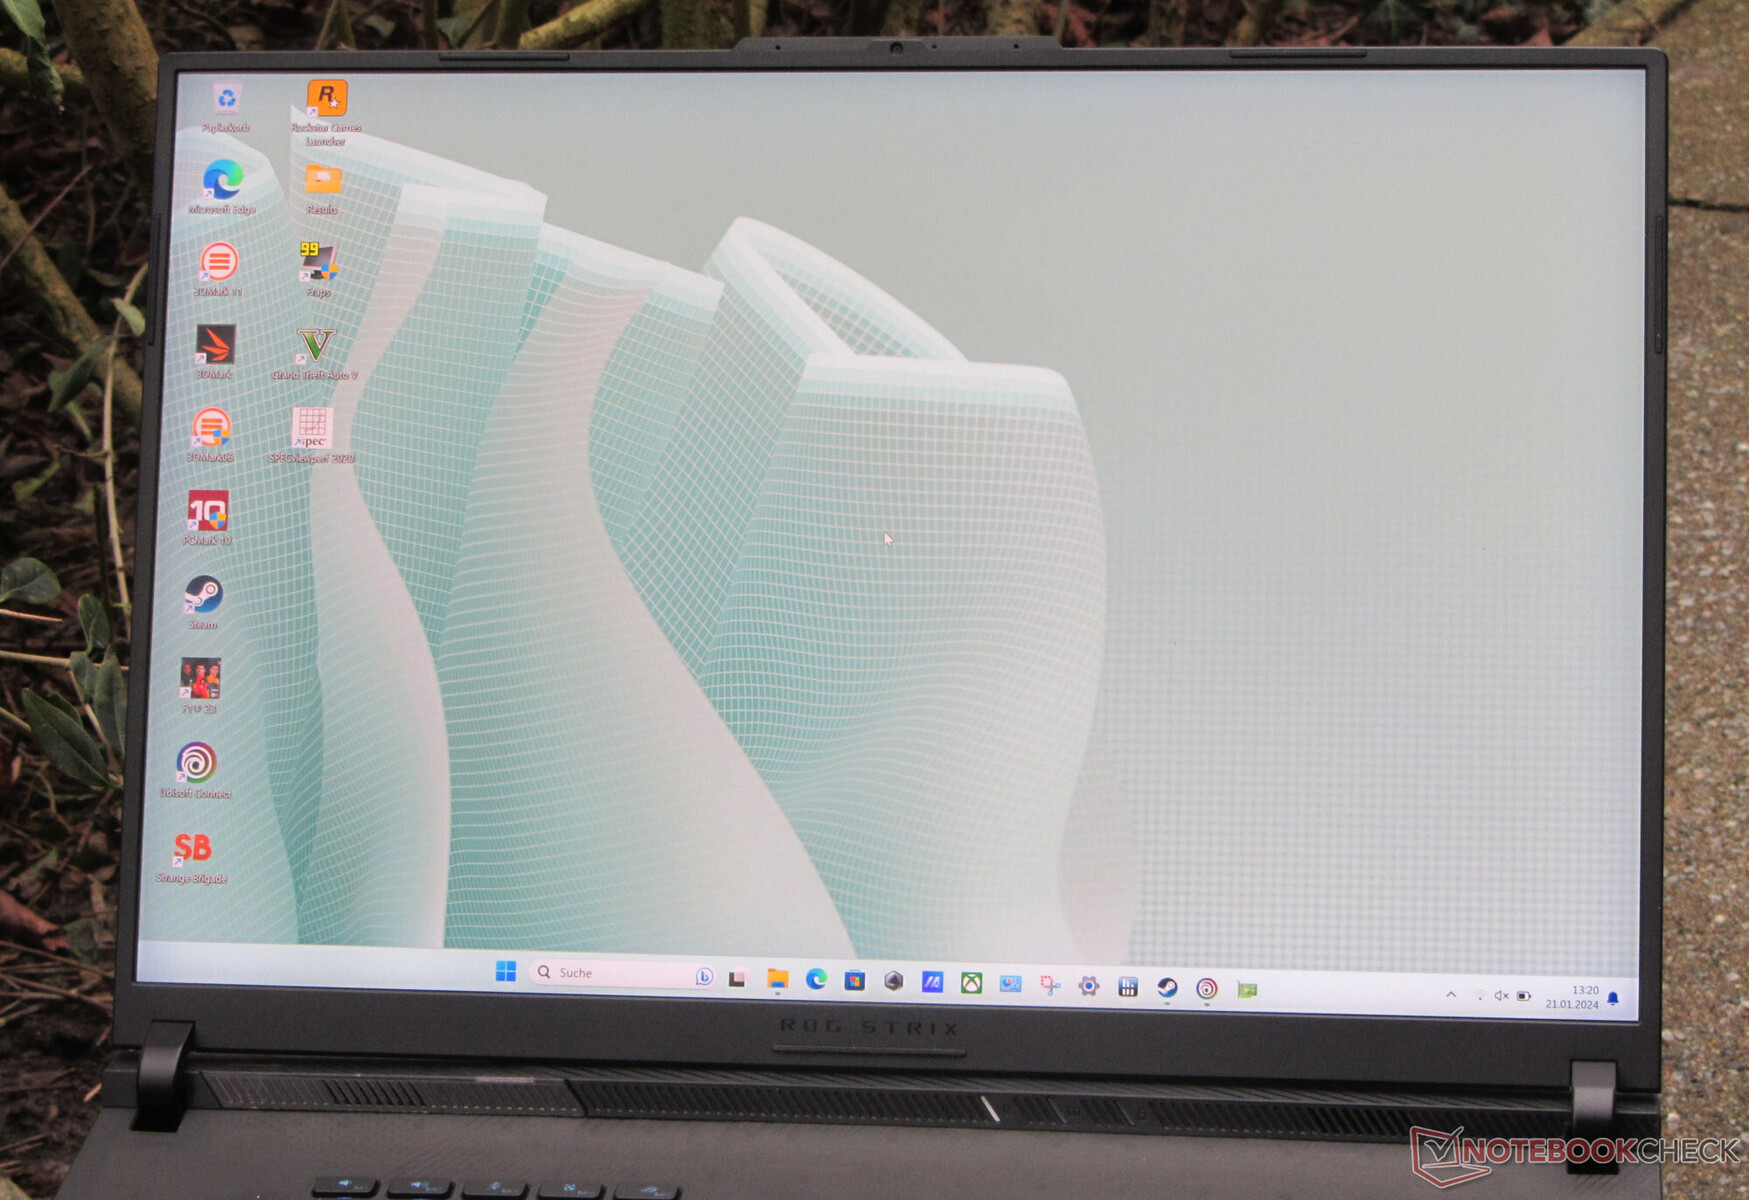
Ekran - DCI-P3 renk alanı kapsamına sahip Mini-LED
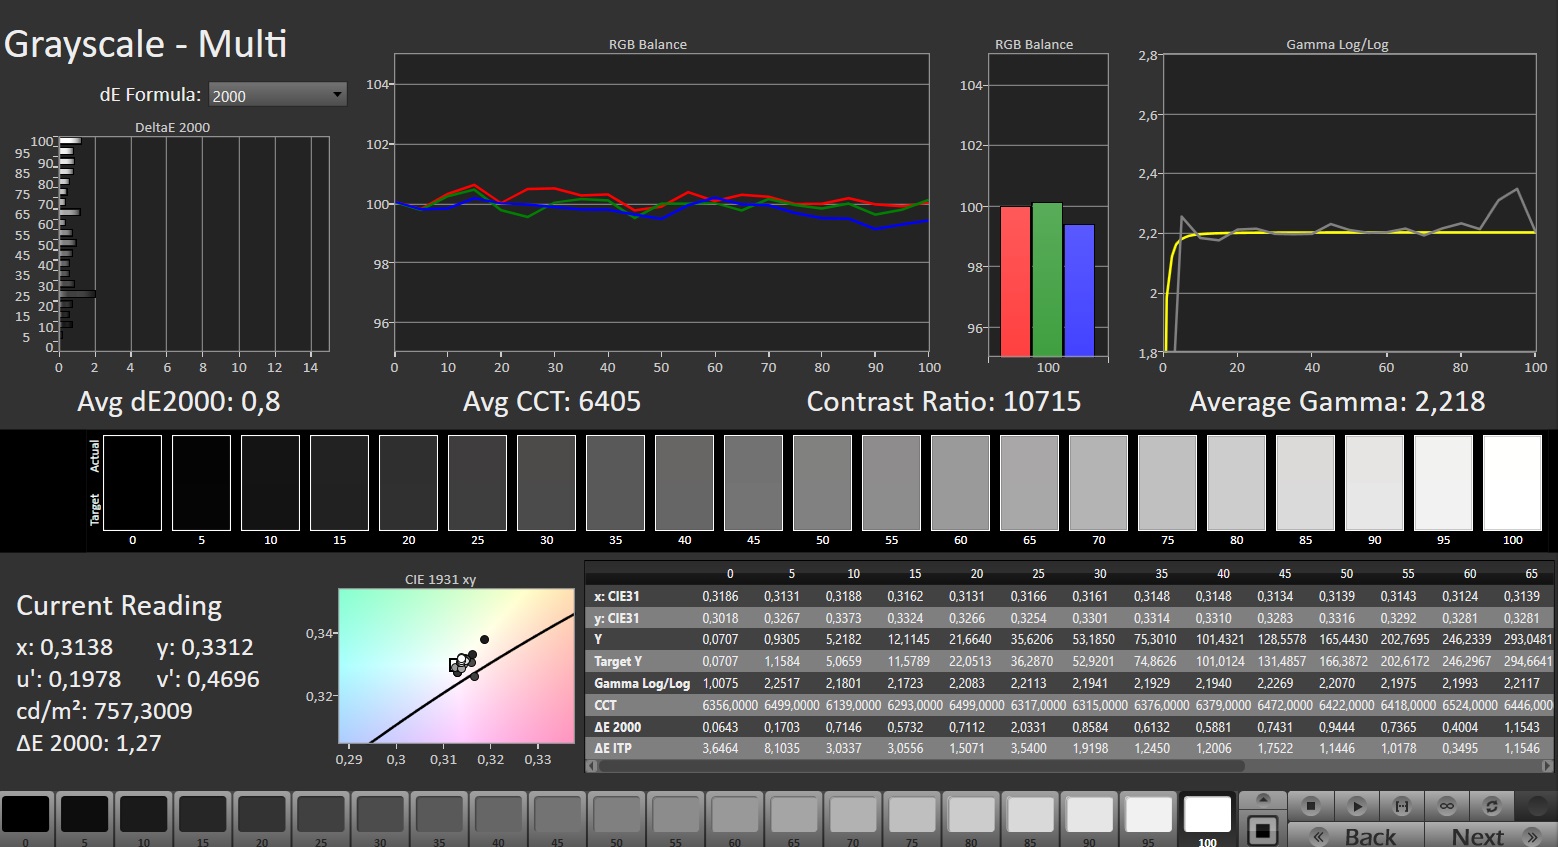
Scar 18, 16:10 formatında 18 inç mini LED ekran (2560x1600 piksel) sunuyor. Olumlu yönleri arasında yüksek parlaklık, mükemmel kontrast ve siyah değeri ve mat yüzey yer alıyor. Hızlı 240 Hz panel ayrıca HDR ve G-Sync'i de destekliyor.
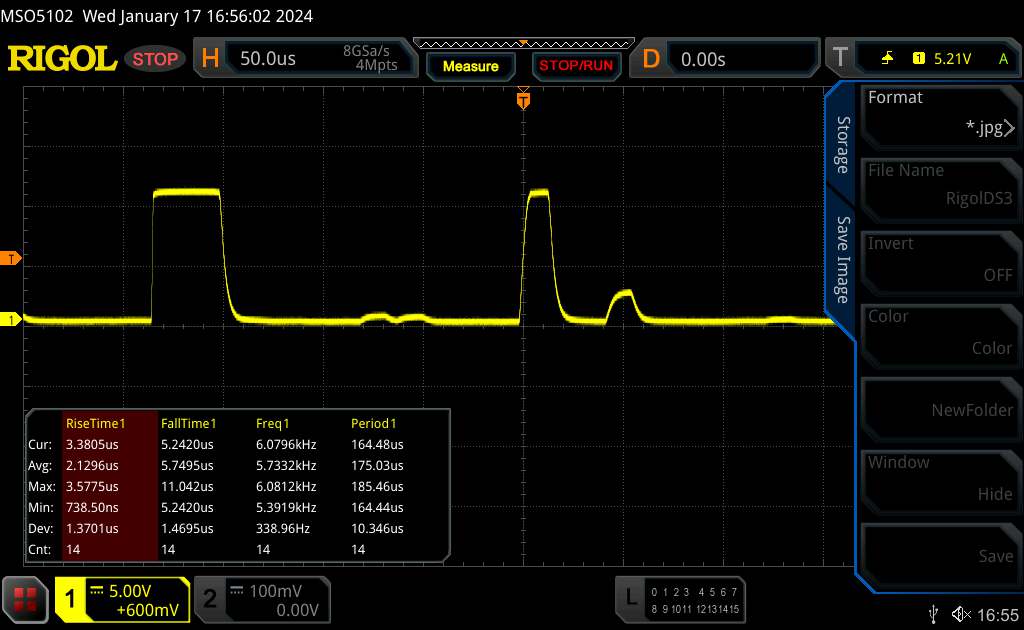
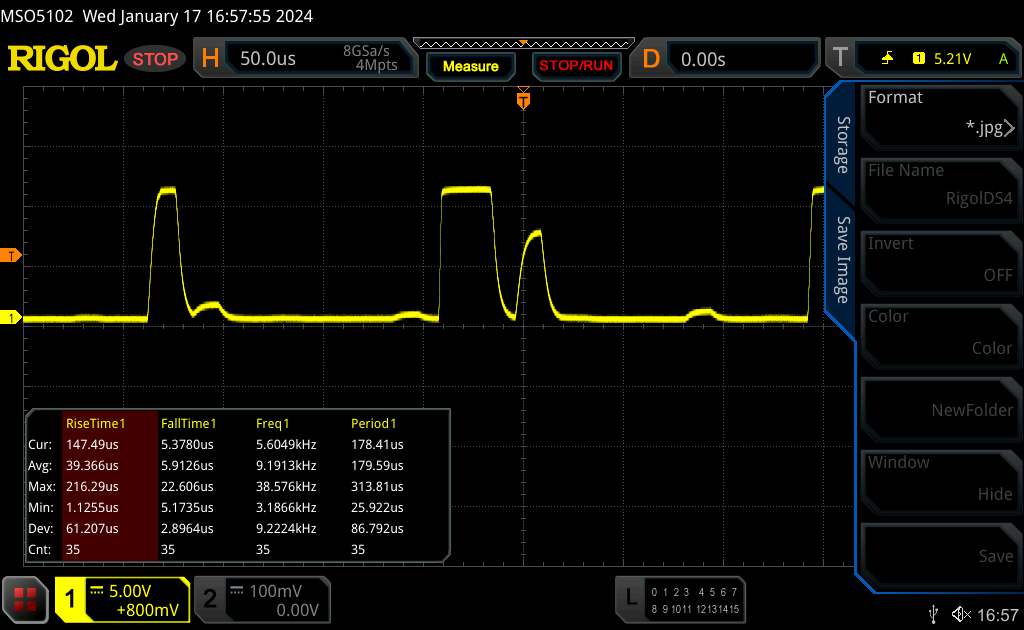
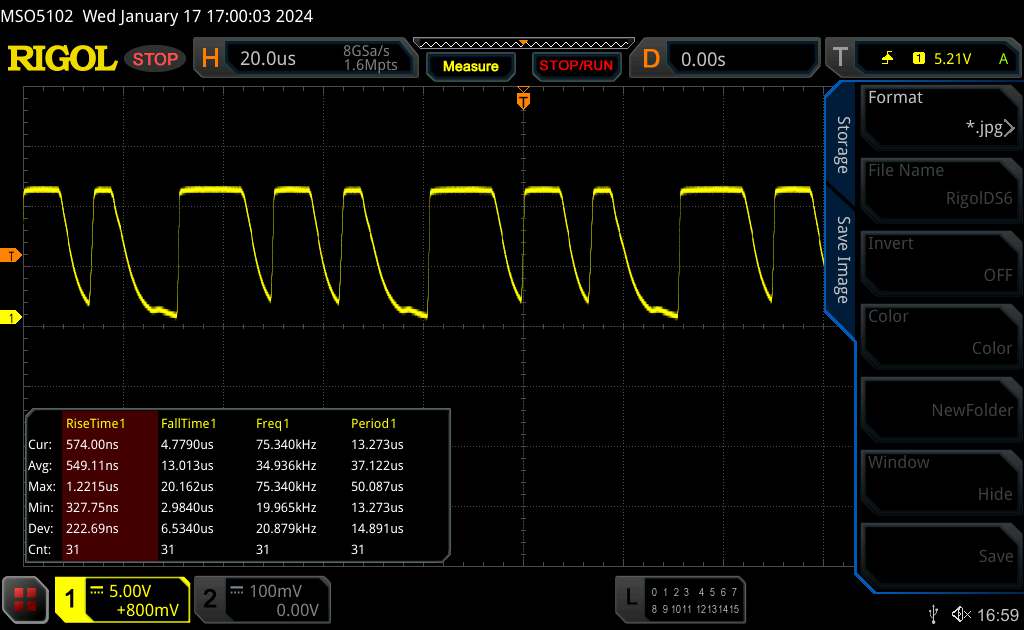
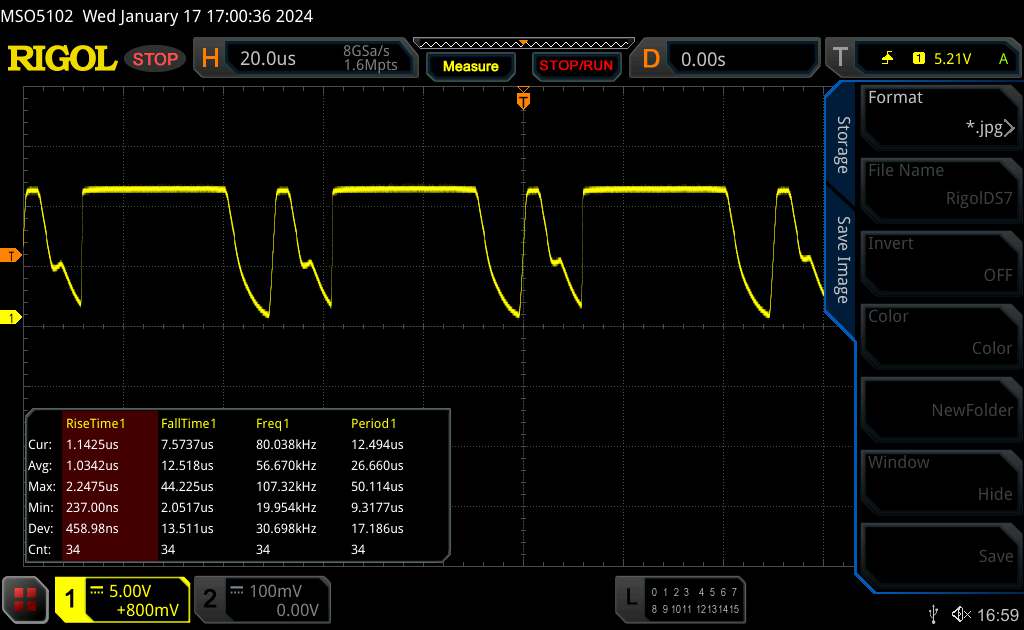
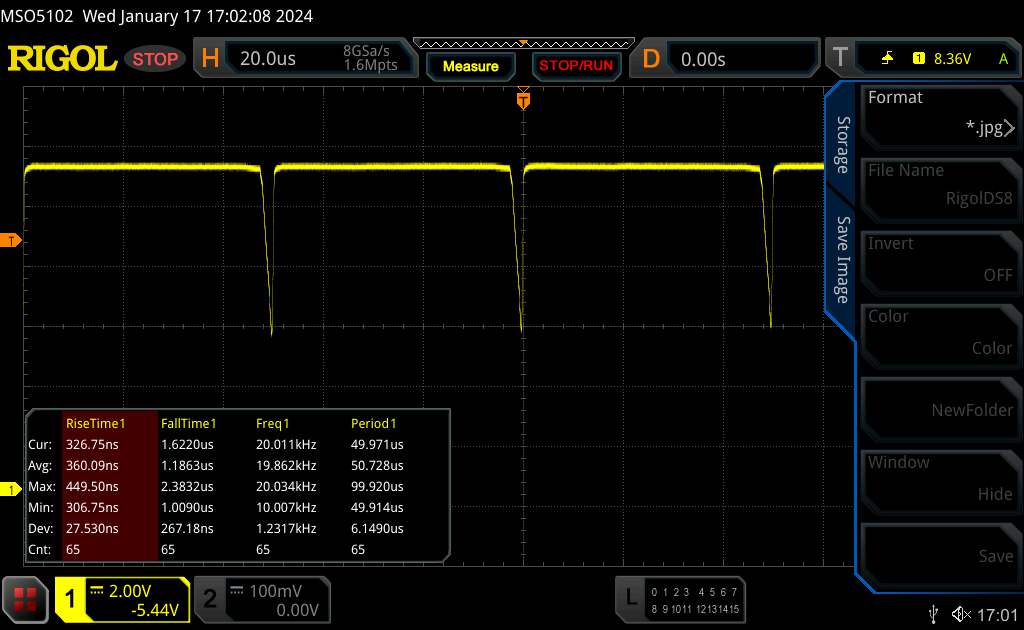
Öte yandan, ekran PWM titremesinden tamamen arınmış değil, ancak bu günlük kullanımda çok fazla rol oynamamalıdır: 94 cd/m²'den daha düşük parlaklık değerlerinde yüksek frekanslı bir titreme (5,733 Hz) ölçtük.
| |||||||||||||||||||||||||
Aydınlatma: 89 %
Batarya modunda parlaklık: 937 cd/m²
Kontrast: 14197:1 (Siyah: 0.066 cd/m²)
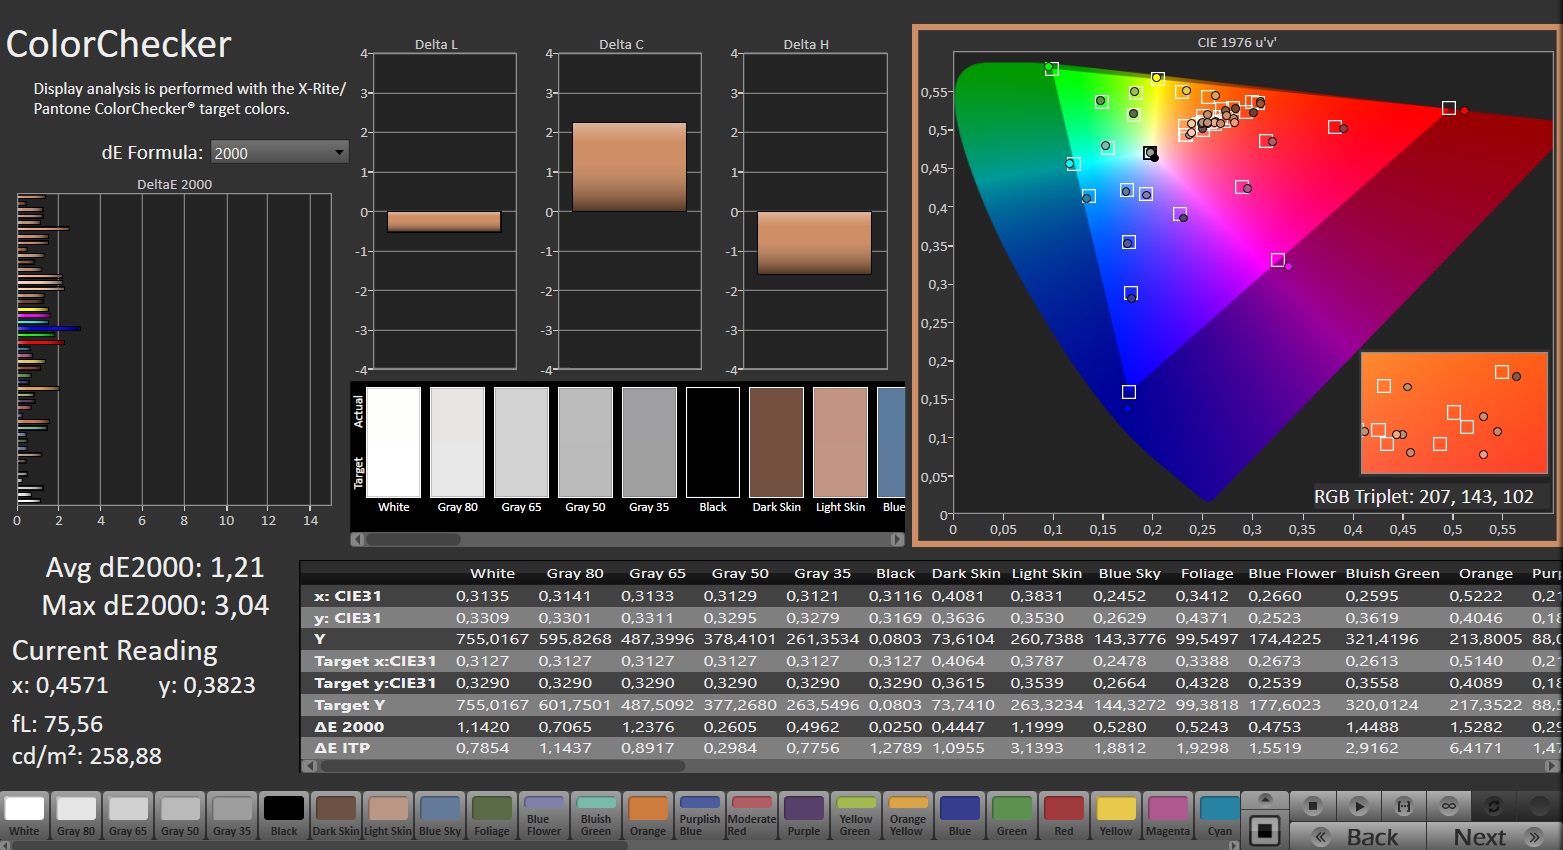
ΔE ColorChecker Calman: 1.52 | ∀{0.5-29.43 Ø4.73}
calibrated: 1.21
ΔE Greyscale Calman: 1.7 | ∀{0.09-98 Ø4.97}
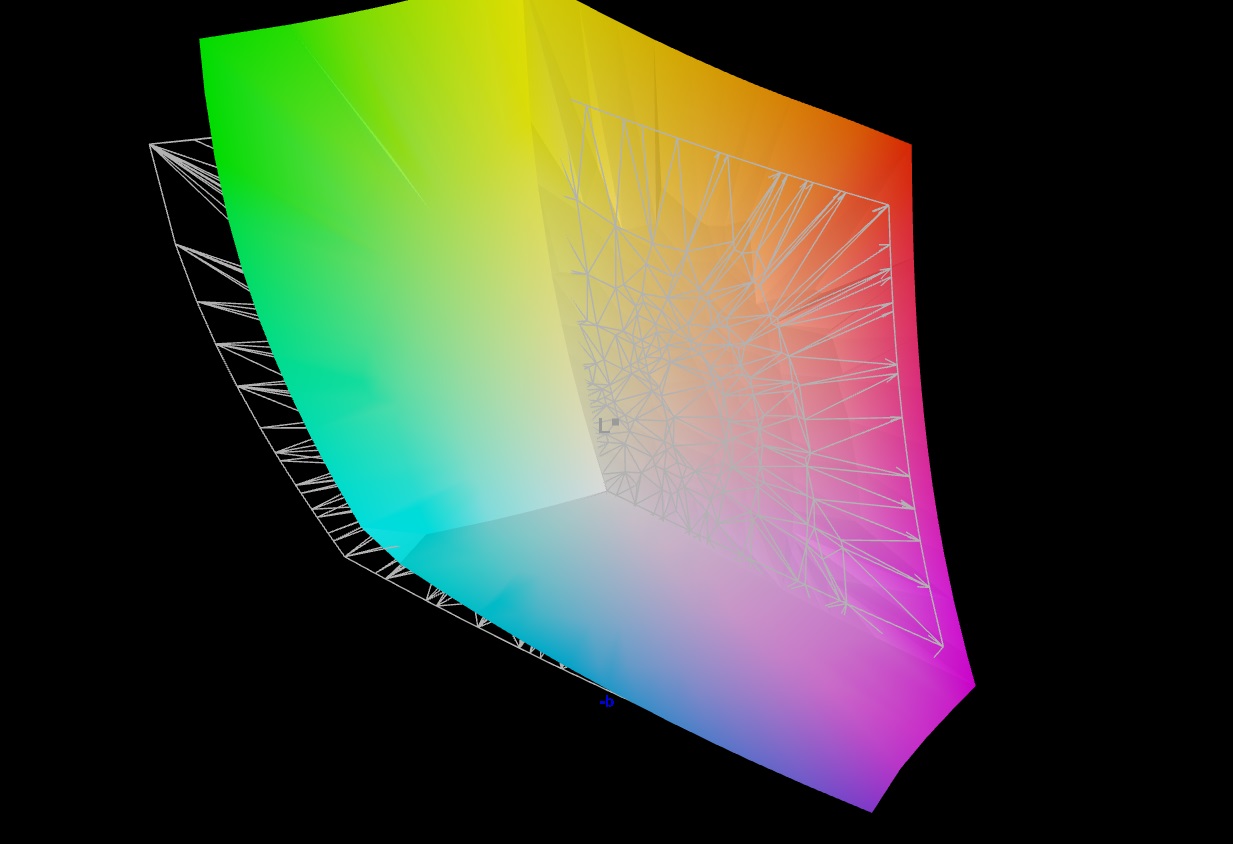
90% AdobeRGB 1998 (Argyll 3D)
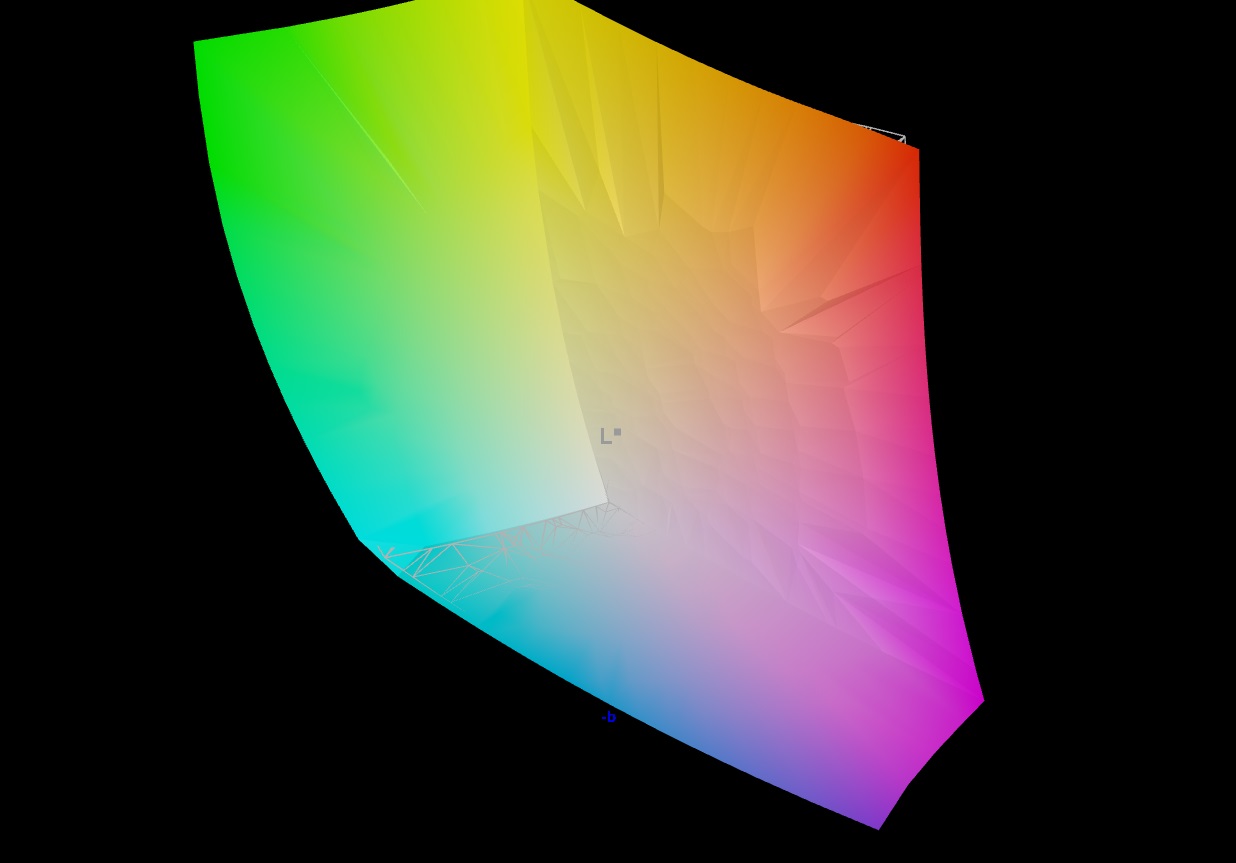
100% sRGB (Argyll 3D)
99.9% Display P3 (Argyll 3D)
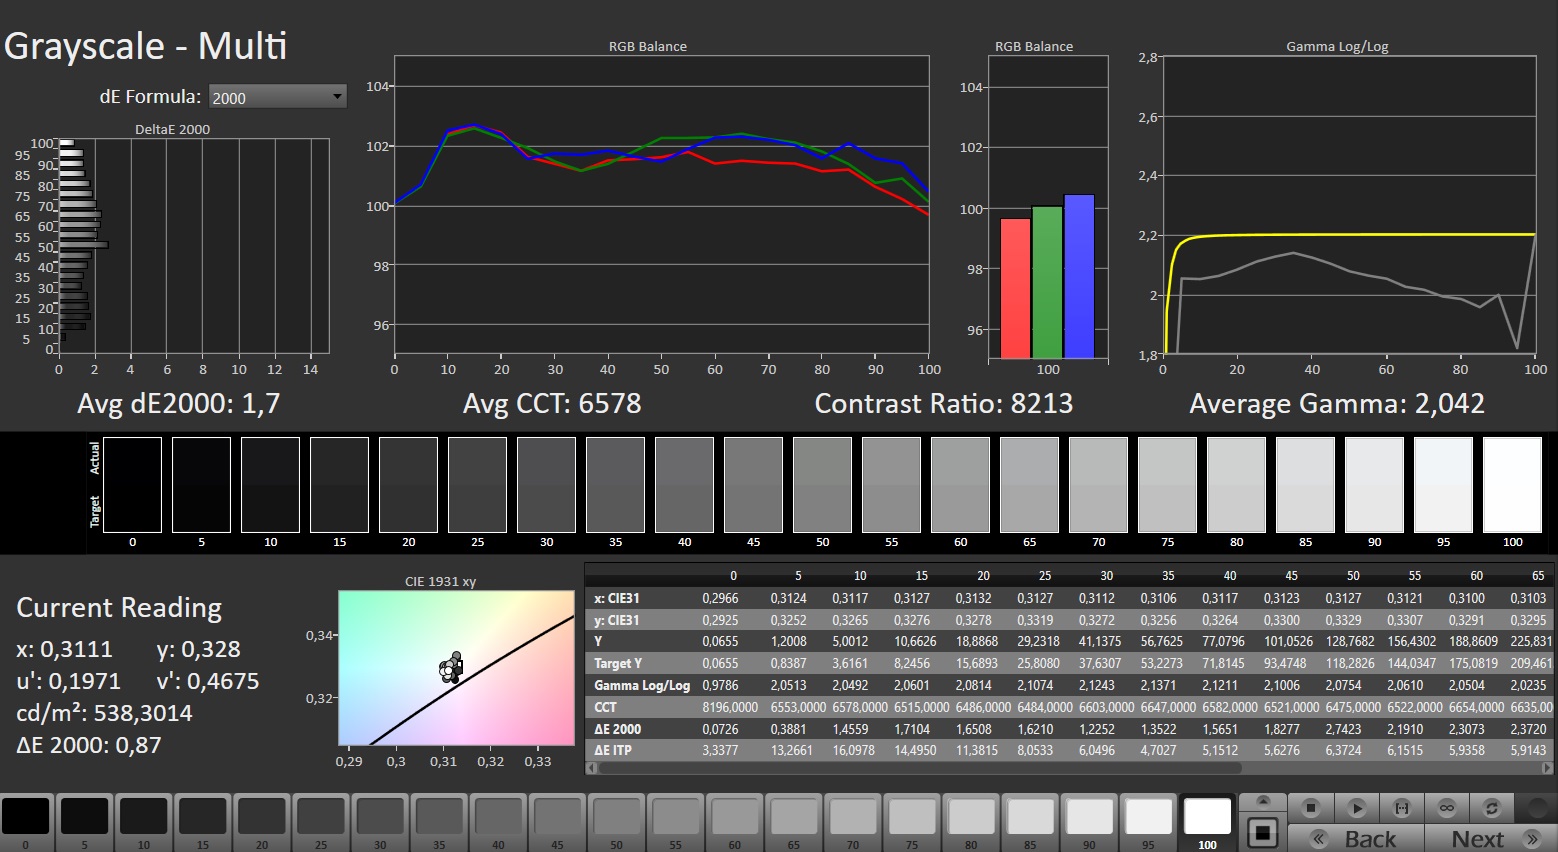
Gamma: 2.042
CCT: 6578 K
| Asus ROG Strix Scar 18 G834JYR (2024) BOE NE180QDM-NM1, Mini LED, 2560x1600, 18" | Alienware m18 R1 AMD BOE NE18NZ1, IPS, 1920x1200, 18" | Alienware m18 R1 Chi Mei 180JME, IPS, 1920x1200, 18" | Acer Predator Helios 18 N23Q2 AUO45A8 (B180QAN01.2), IPS, 2560x1600, 18" | Razer Blade 18 RTX 4070 AU Optronics B180QAN01.0, IPS, 2560x1600, 18" | MSI Titan 18 HX A14VIG AU Optronics B180ZAN01.0, Mini-LED, 3840x2400, 18" | Asus ROG Strix Scar 18 2023 G834JY-N6005W NE180QDM-NZ2, IPS, 2560x1600, 18" | |
|---|---|---|---|---|---|---|---|
| Display | -1% | -1% | 1% | -3% | -2% | -3% | |
| Display P3 Coverage (%) | 99.9 | 98.5 -1% | 97.7 -2% | 99.8 0% | 96.9 -3% | 98.1 -2% | 97.2 -3% |
| sRGB Coverage (%) | 100 | 99.7 0% | 100 0% | 100 0% | 99.8 0% | 99.8 0% | 99.9 0% |
| AdobeRGB 1998 Coverage (%) | 90 | 88.7 -1% | 89.8 0% | 91.8 2% | 85.3 -5% | 86.2 -4% | 84.9 -6% |
| Response Times | 44% | 41% | -15% | 45% | -318% | 37% | |
| Response Time Grey 50% / Grey 80% * (ms) | 12 ? | 2.8 ? 77% | 3 ? 75% | 7.6 ? 37% | 4.2 ? 65% | 8.6 ? 28% | 5.41 ? 55% |
| Response Time Black / White * (ms) | 10.7 ? | 9.6 ? 10% | 9.9 ? 7% | 17.8 ? -66% | 8 ? 25% | 81.8 ? -664% | 8.62 ? 19% |
| PWM Frequency (Hz) | 5733 ? | 2509 | 2592 ? | ||||
| Screen | -42% | -64% | -114% | -142% | -85% | -211% | |
| Brightness middle (cd/m²) | 937 | 319.6 -66% | 372.8 -60% | 360 -62% | 549.6 -41% | 467.5 -50% | 490 -48% |
| Brightness (cd/m²) | 934 | 304 -67% | 367 -61% | 355 -62% | 524 -44% | 459 -51% | 468 -50% |
| Brightness Distribution (%) | 89 | 87 -2% | 97 9% | 92 3% | 89 0% | 90 1% | 86 -3% |
| Black Level * (cd/m²) | 0.066 | 0.25 -279% | 0.32 -385% | 0.21 -218% | 0.53 -703% | 0.54 -718% | |
| Contrast (:1) | 14197 | 1278 -91% | 1165 -92% | 1714 -88% | 1037 -93% | 907 -94% | |
| Colorchecker dE 2000 * | 1.52 | 1.22 20% | 1.92 -26% | 3.82 -151% | 3.32 -118% | 3.77 -148% | 4.97 -227% |
| Colorchecker dE 2000 max. * | 2.82 | 3.1 -10% | 3.65 -29% | 7.38 -162% | 6.63 -135% | 6.12 -117% | 11.02 -291% |
| Colorchecker dE 2000 calibrated * | 1.21 | 0.47 61% | 0.51 58% | 2.24 -85% | 2.7 -123% | 2.94 -143% | 2.97 -145% |
| Greyscale dE 2000 * | 1.7 | 0.8 53% | 1.5 12% | 5.06 -198% | 2 -18% | 3.2 -88% | 7.2 -324% |
| Gamma | 2.042 108% | 2.23 99% | 2.34 94% | 2.52 87% | 2.29 96% | 2.43 91% | 2.161 102% |
| CCT | 6578 99% | 6471 100% | 6607 98% | 5657 115% | 6319 103% | 6478 100% | 6515 100% |
| Toplam Ortalama (Program / Ayarlar) | 0% /
-21% | -8% /
-35% | -43% /
-75% | -33% /
-85% | -135% /
-103% | -59% /
-131% |
* ... daha küçük daha iyidir
Renk doğruluğu, sRGB ve DCI-P3 renk alanlarını tamamen ve Adobe RGB renk alanını %90 oranında kapsamaktadır. Pantone sertifikası sayesinde, renk üretimi teslimat durumunda zaten çok iyi ve 1,52'lik bir sapma ile DeltaE < 3 hedefine ulaşılıyor. Ek bir kalibrasyon hala hafif bir iyileşme sağlasa da, bu öncelikle daha dengeli bir gri tonlama ile ilgilidir.

Yanıt Sürelerini Görüntüle
| ↔ Tepki Süresi Siyahtan Beyaza | ||
|---|---|---|
| 10.7 ms ... yükseliş ↗ ve sonbahar↘ birleşimi | ↗ 7.6 ms yükseliş | 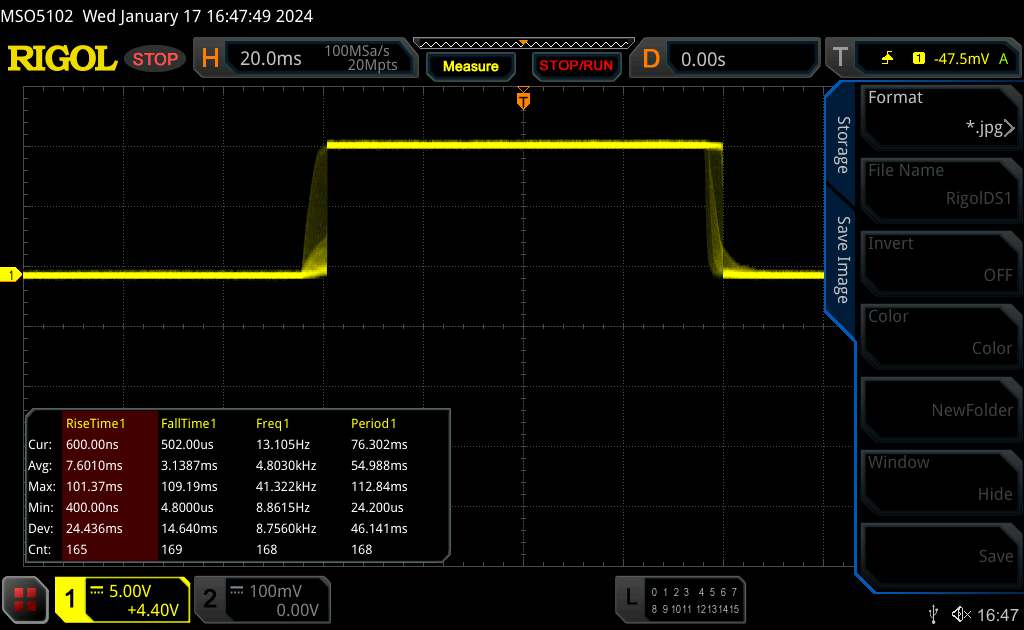 |
| ↘ 3.1 ms sonbahar | ||
| Ekran, testlerimizde iyi yanıt oranları gösteriyor ancak rekabetçi oyuncular için çok yavaş olabilir. Karşılaştırıldığında, test edilen tüm cihazlar 0.1 (minimum) ile 240 (maksimum) ms arasında değişir. » Tüm cihazların 29 %'si daha iyi. Bu, ölçülen yanıt süresinin test edilen tüm cihazların ortalamasından (19.9 ms) daha iyi olduğu anlamına gelir. | ||
| ↔ Tepki Süresi %50 Griden %80 Griye | ||
| 12 ms ... yükseliş ↗ ve sonbahar↘ birleşimi | ↗ 8 ms yükseliş | |
| ↘ 4 ms sonbahar | ||
| Ekran, testlerimizde iyi yanıt oranları gösteriyor ancak rekabetçi oyuncular için çok yavaş olabilir. Karşılaştırıldığında, test edilen tüm cihazlar 0.165 (minimum) ile 636 (maksimum) ms arasında değişir. » Tüm cihazların 25 %'si daha iyi. Bu, ölçülen yanıt süresinin test edilen tüm cihazların ortalamasından (31.1 ms) daha iyi olduğu anlamına gelir. | ||
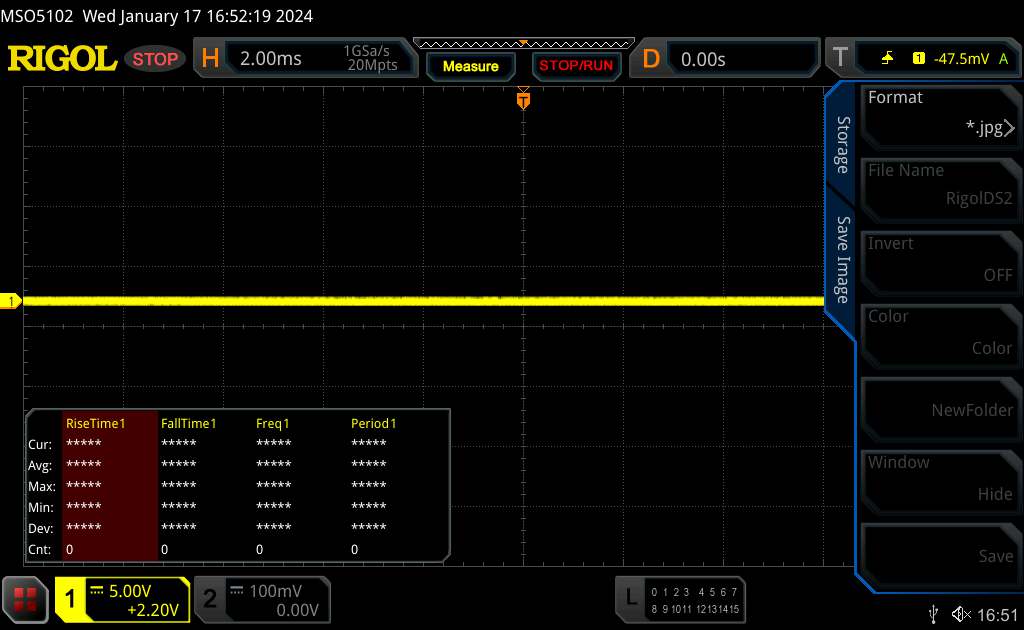
Ekran Titremesi / PWM (Darbe Genişliği Modülasyonu)
| Ekran titriyor / PWM algılandı | 5733 Hz | |
| ≤ 94 cd/m² parlaklık | ||
Ekran arka ışığı 5733 Hz'de titriyor (en kötü durum, örneğin PWM kullanılması) 94 cd/m² ve altındaki parlaklık ayarında titreme algılandı. Bu parlaklık ayarının üzerinde titreme veya PWM olmamalıdır. 5733 Hz frekansı oldukça yüksektir, bu nedenle PWM'ye duyarlı çoğu kullanıcı herhangi bir titremeyi fark etmemelidir. Nispeten düşük parlaklık ayarlarında titreme meydana gelir, bu nedenle bu parlaklık ayarında veya daha düşük bir değerde uzun süreli kullanım göz yorgunluğuna neden olabilir. Karşılaştırıldığında: Test edilen tüm cihazların %52 %'si ekranı karartmak için PWM kullanmıyor. PWM tespit edilirse, ortalama 7798 (minimum: 5 - maksimum: 343500) Hz ölçüldü. | ||
IPS panel sabit görüş açılarına sahiptir ve neredeyse her açıdan okunabilir. Yüksek maksimum parlaklık, ekran içeriğinin açık havada okunmasına da olanak tanır.

Performans - Scar 18 üst düzey donanım sunar
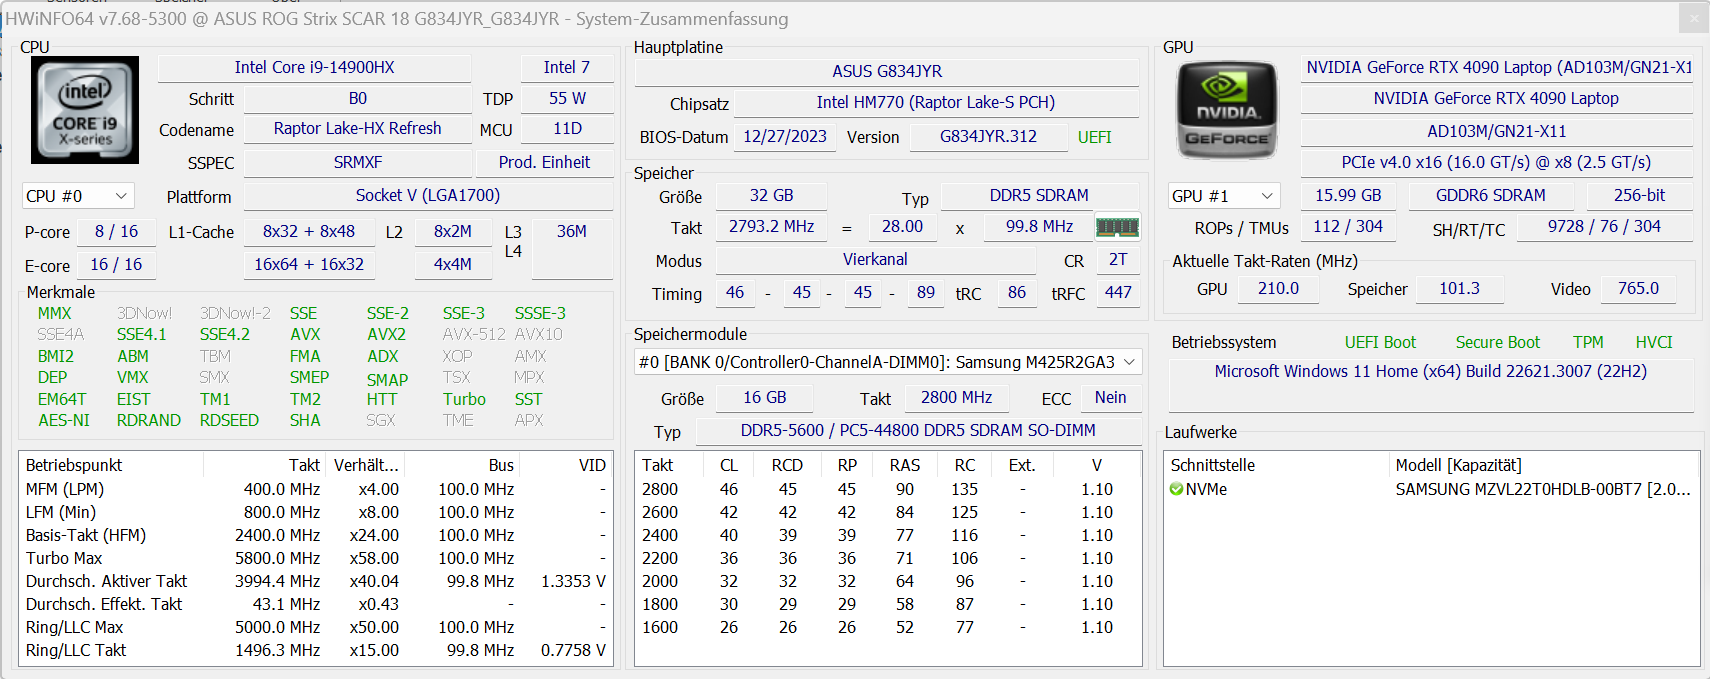
Asus ROG Strix Scar 18, 18 inç formatında üst düzey bir dizüstü bilgisayardır. Gerekli bilgi işlem performansı Raptor Lake Refresh ve Ada Lovelace donanımı tarafından sağlanmaktadır. Fiyatlar 3.600 Euro'dan (~3.878 $) başlıyor ve mevcut test ünitemiz yaklaşık 4.500 Euro'ya (~4.848 $) satılıyor.
Test Koşulları
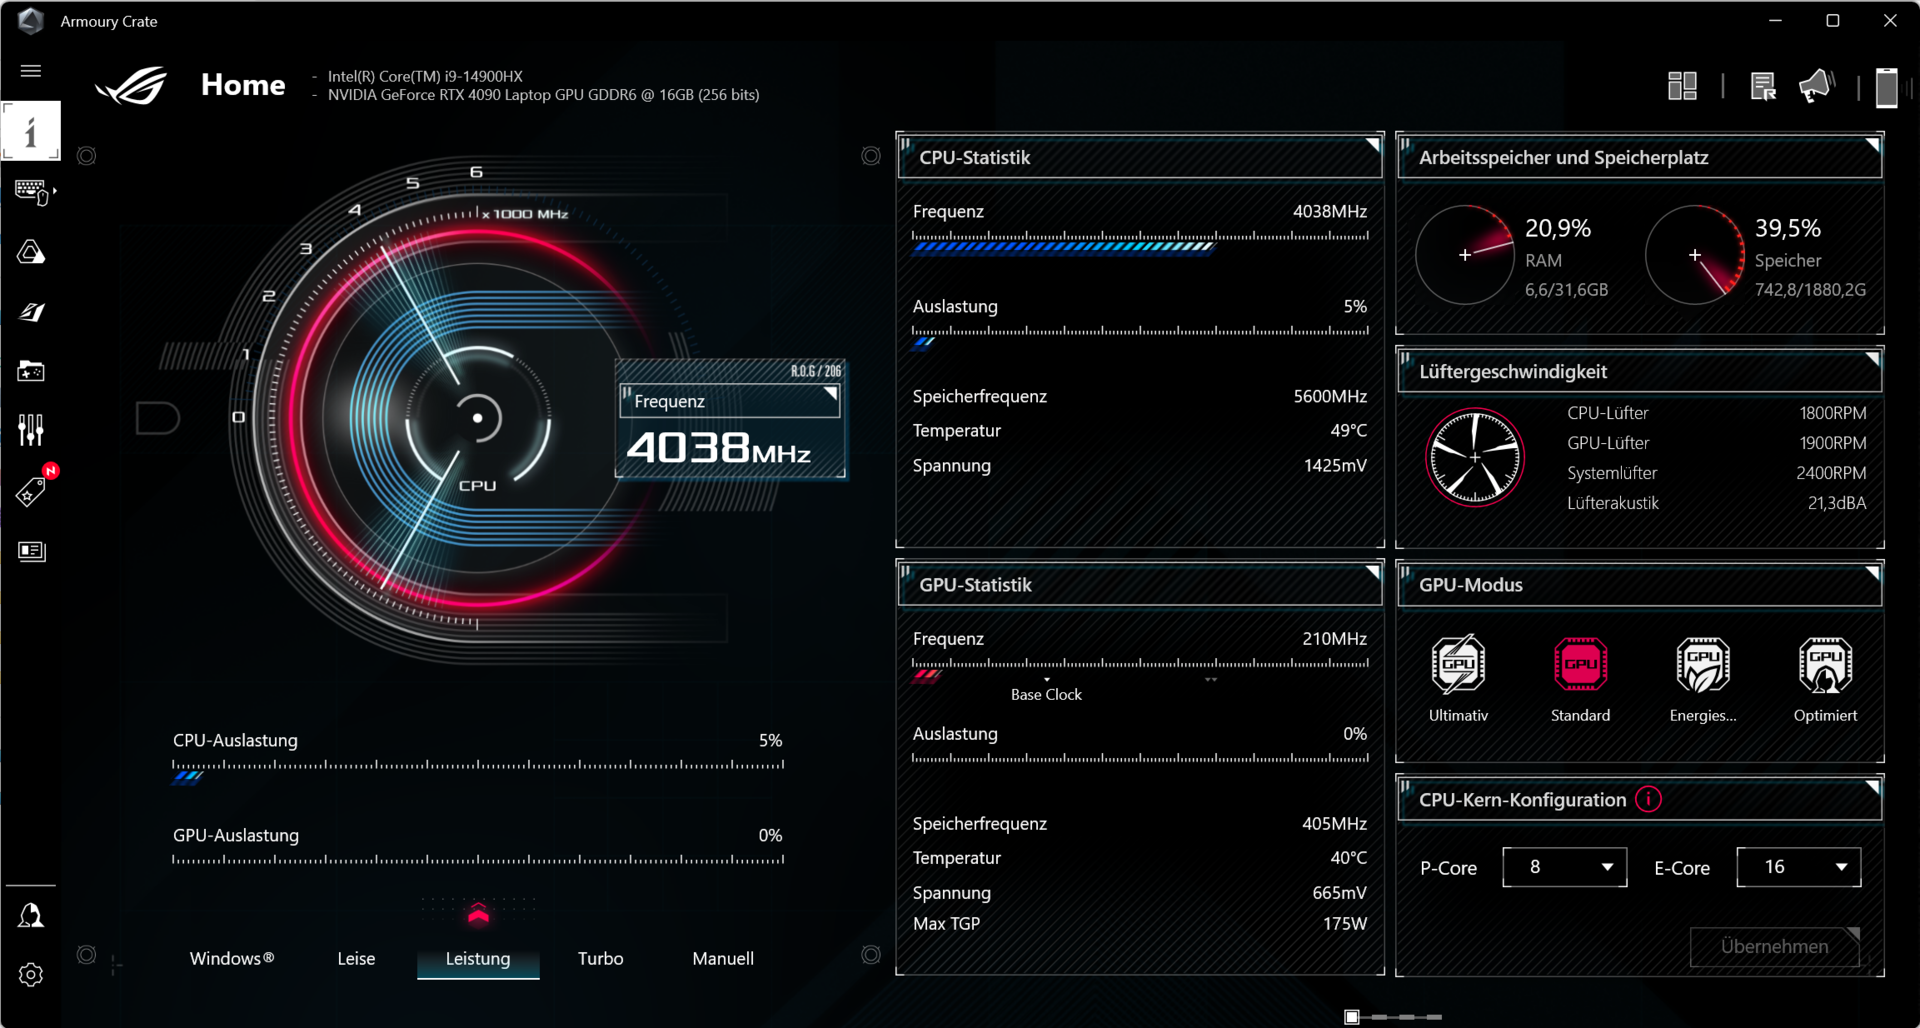
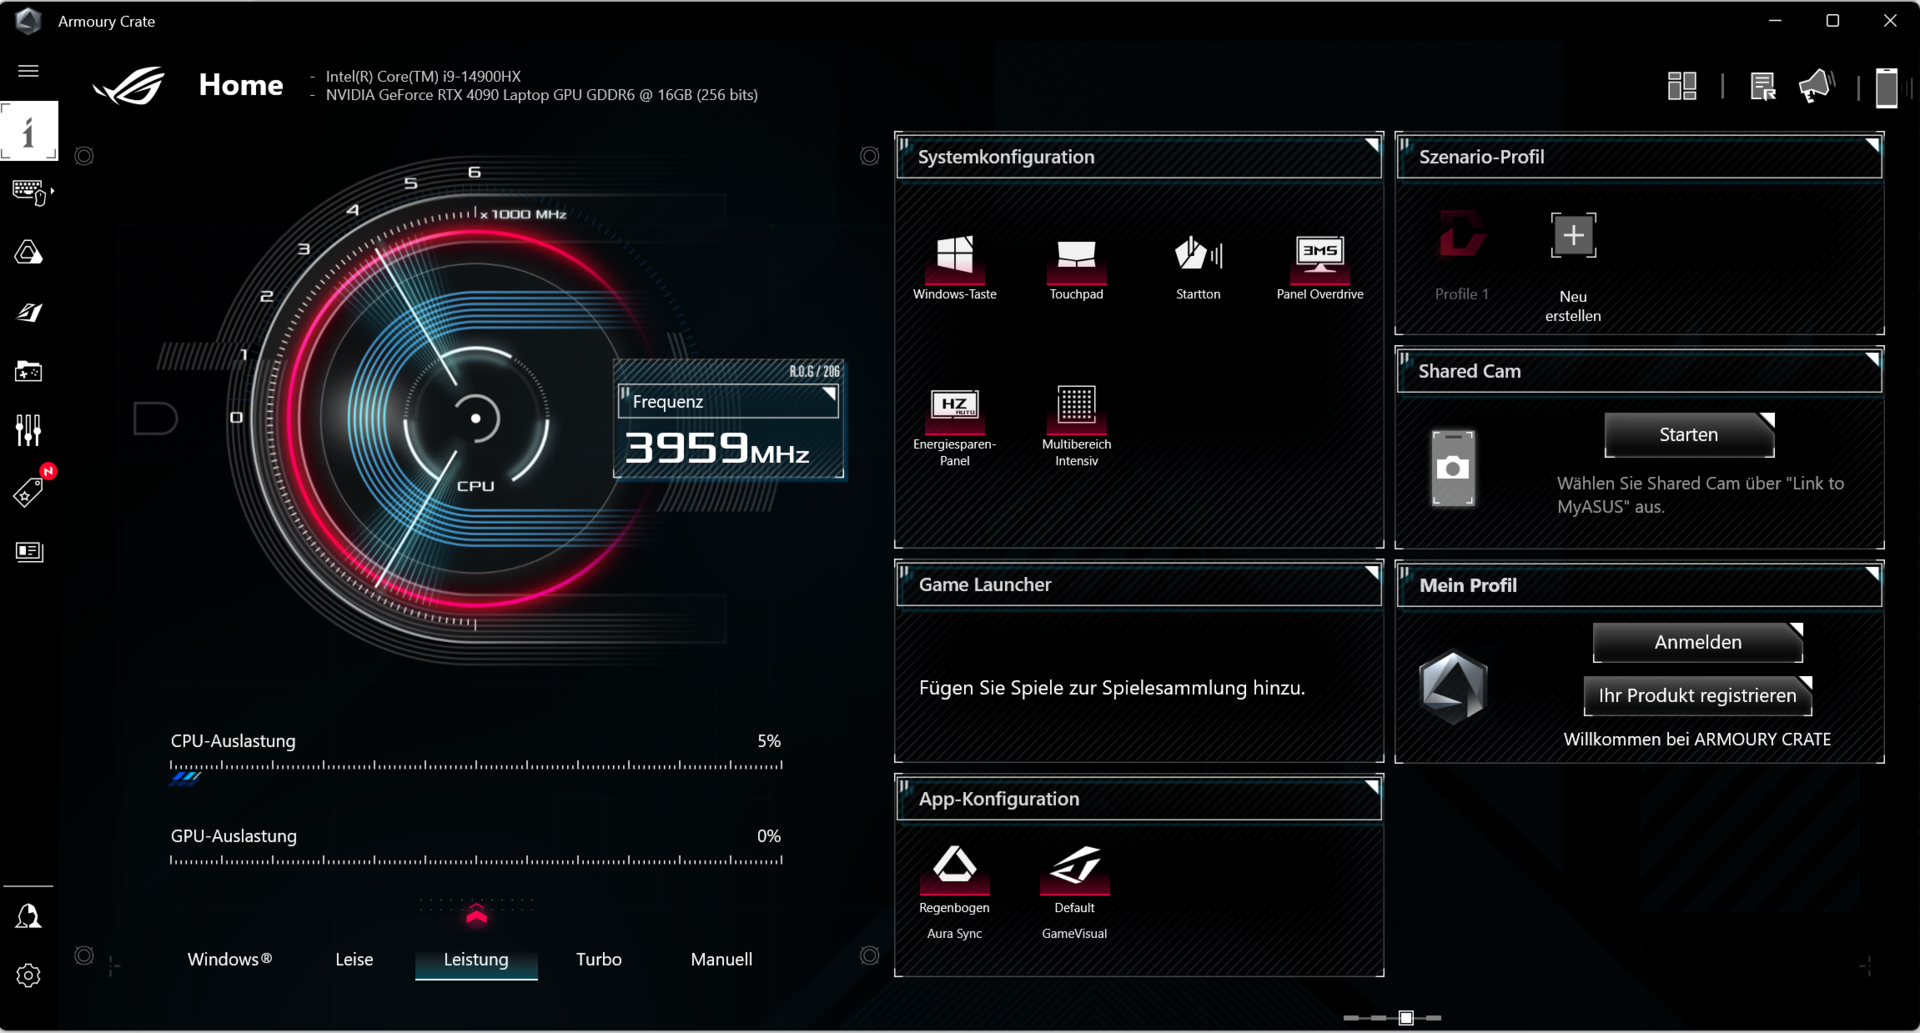
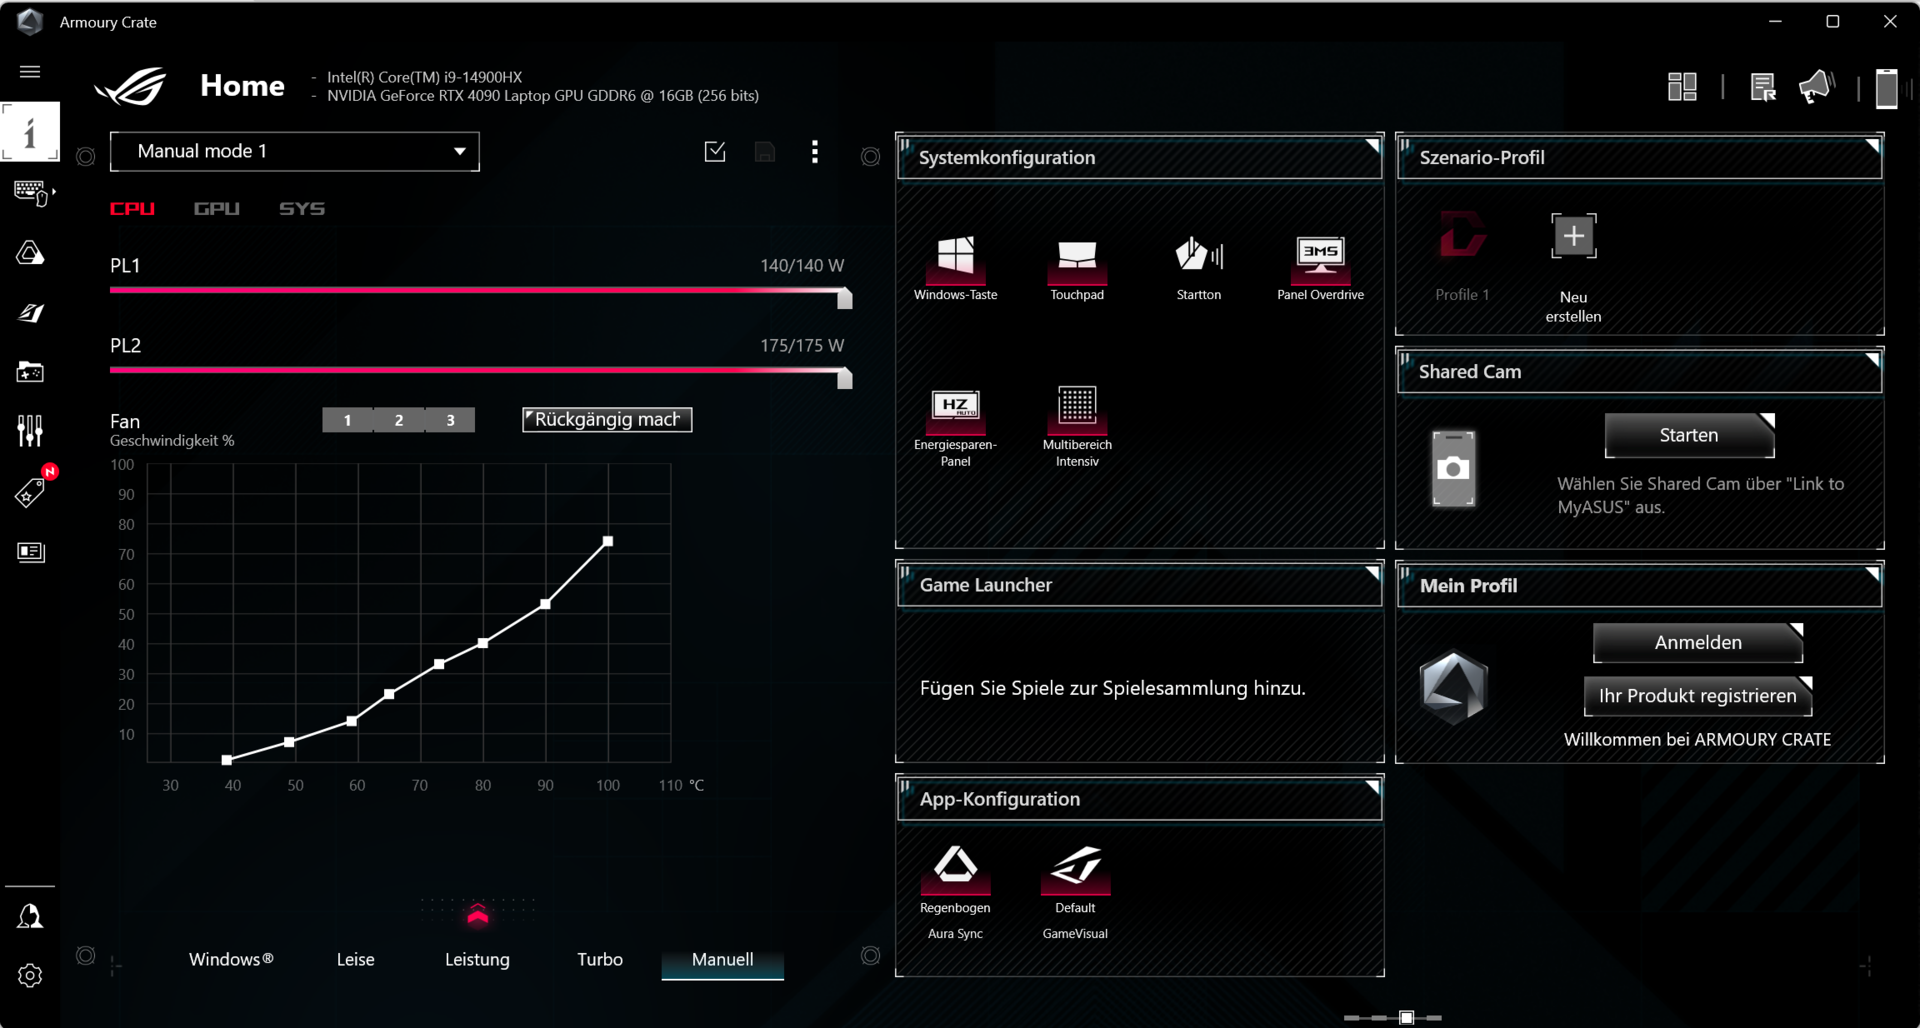
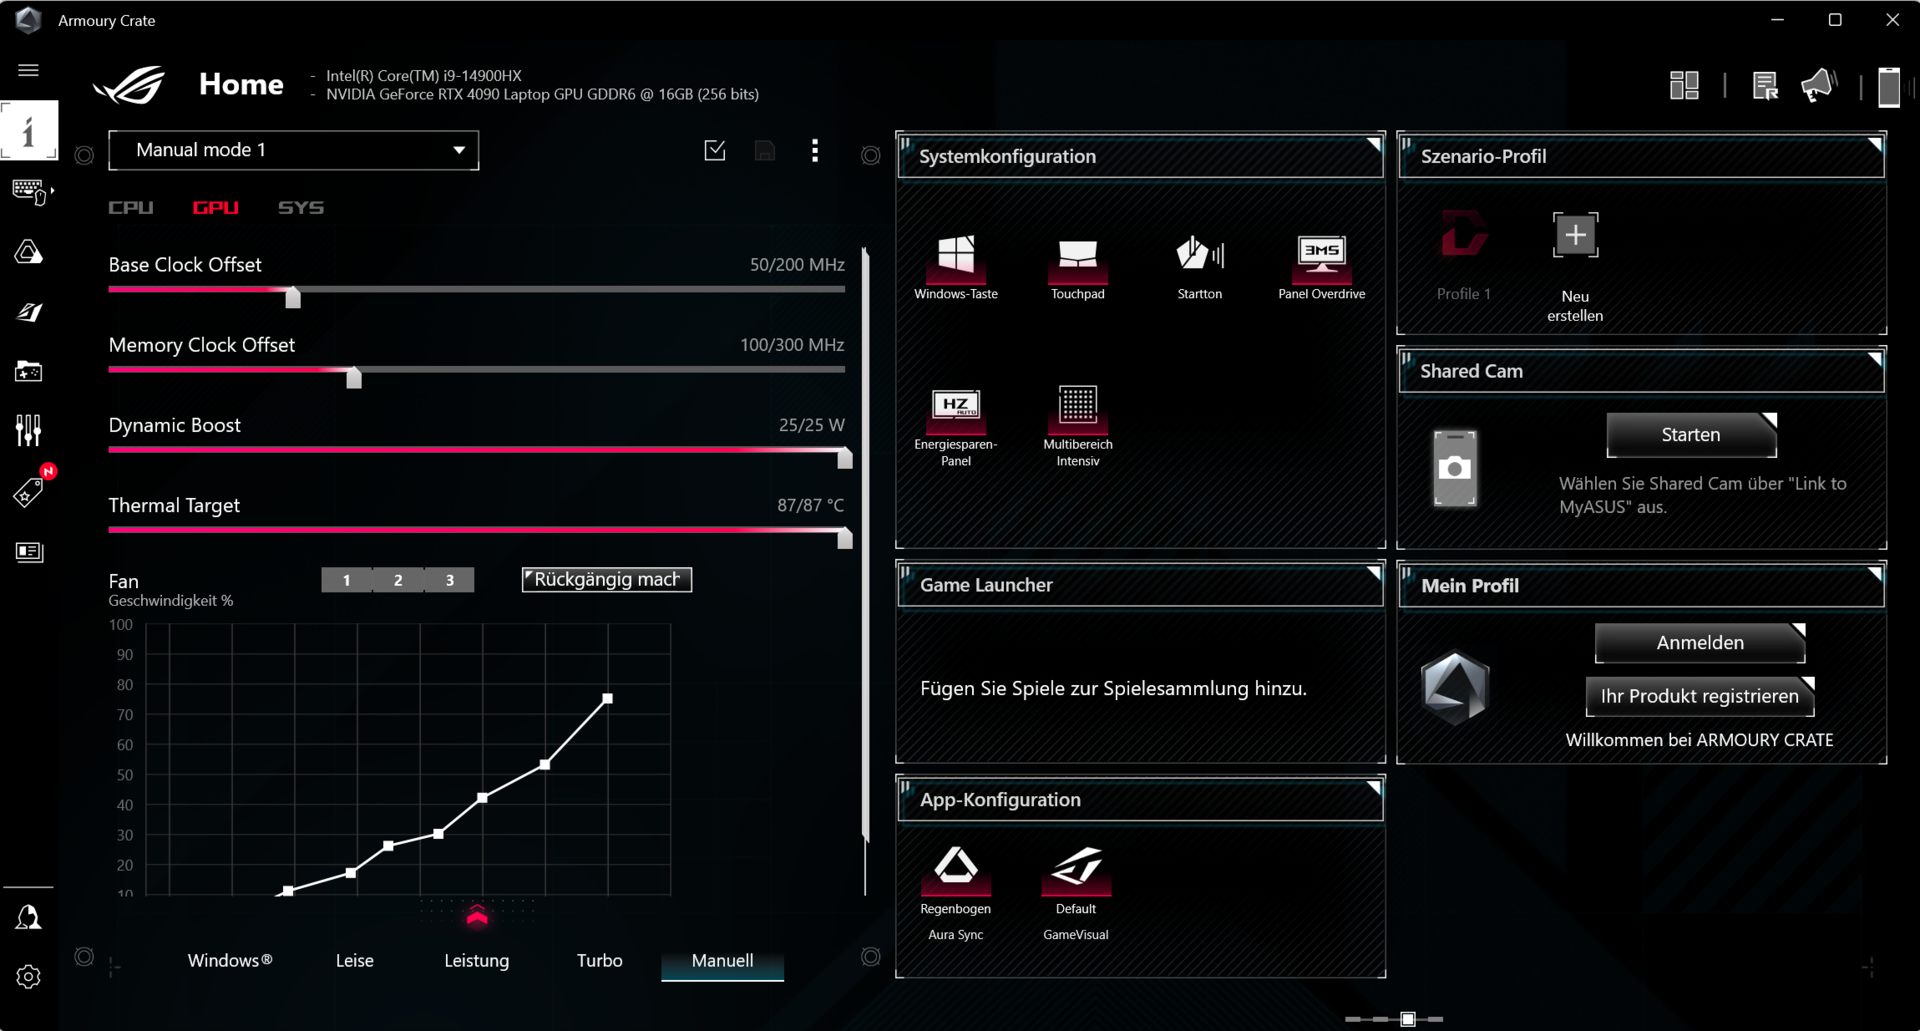
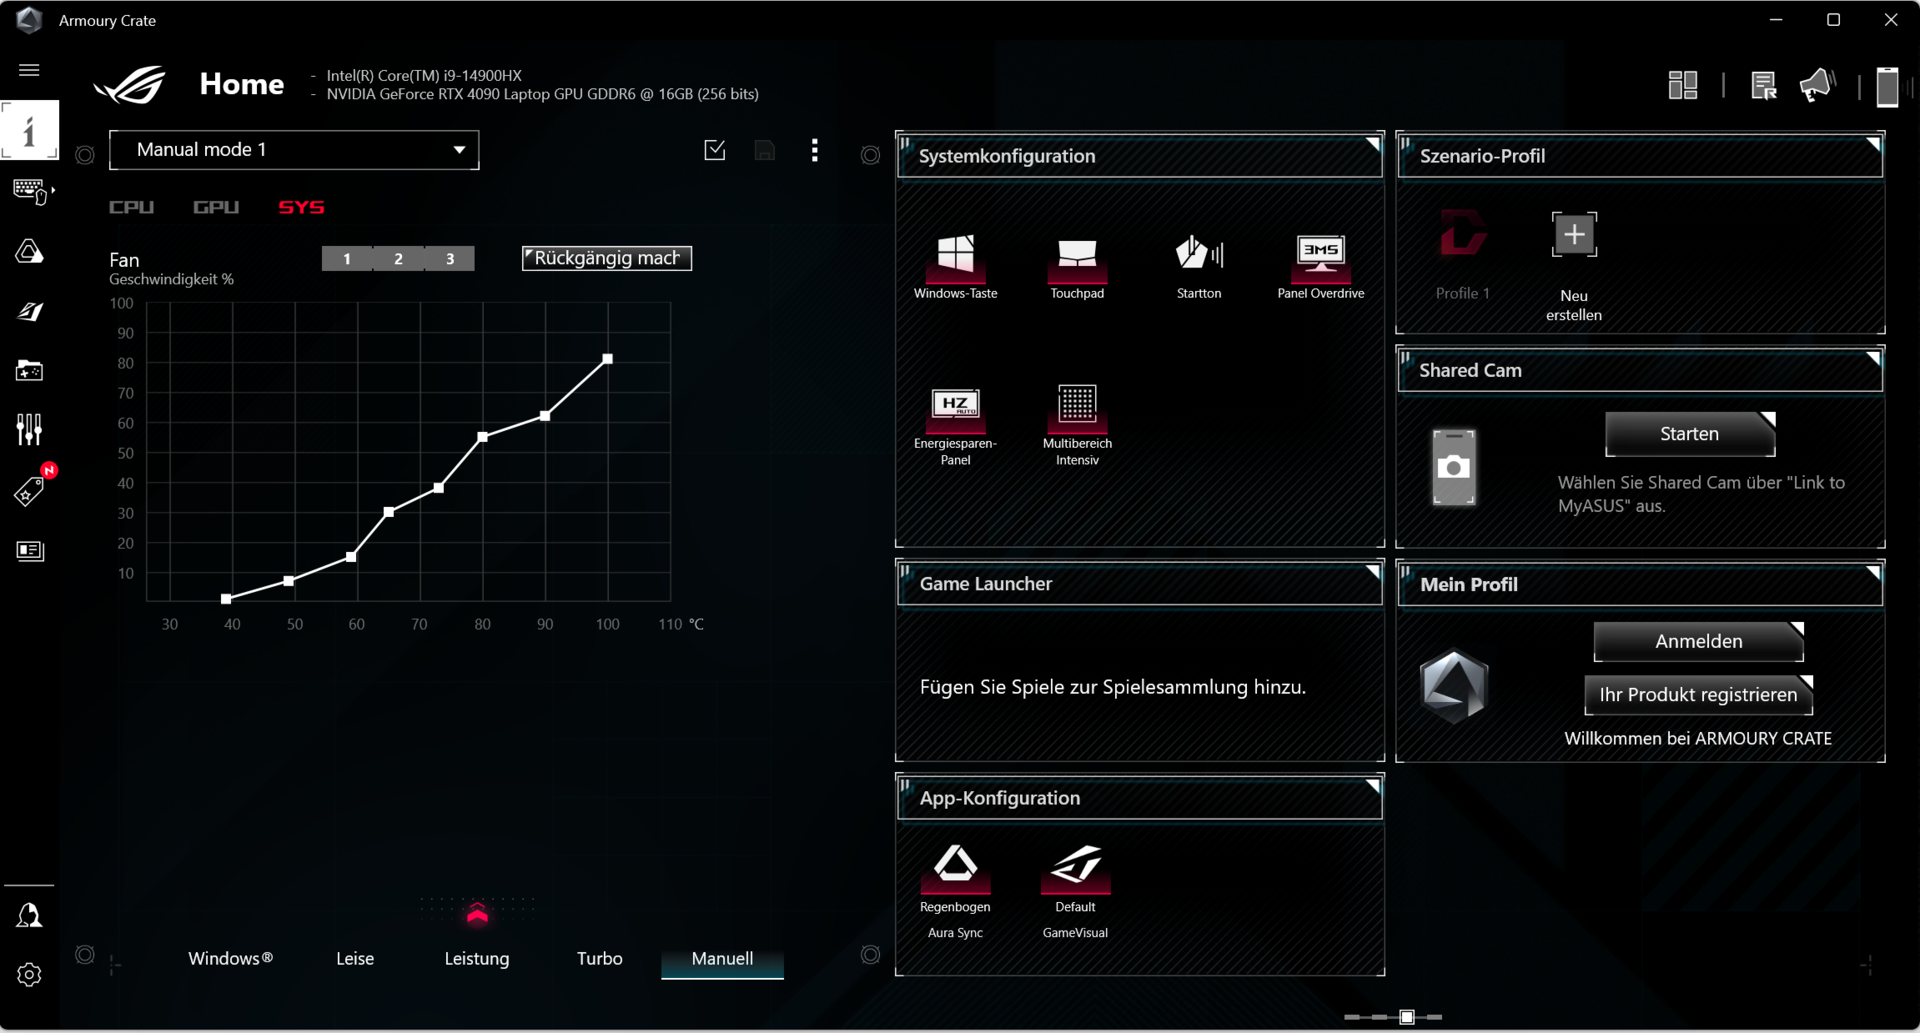
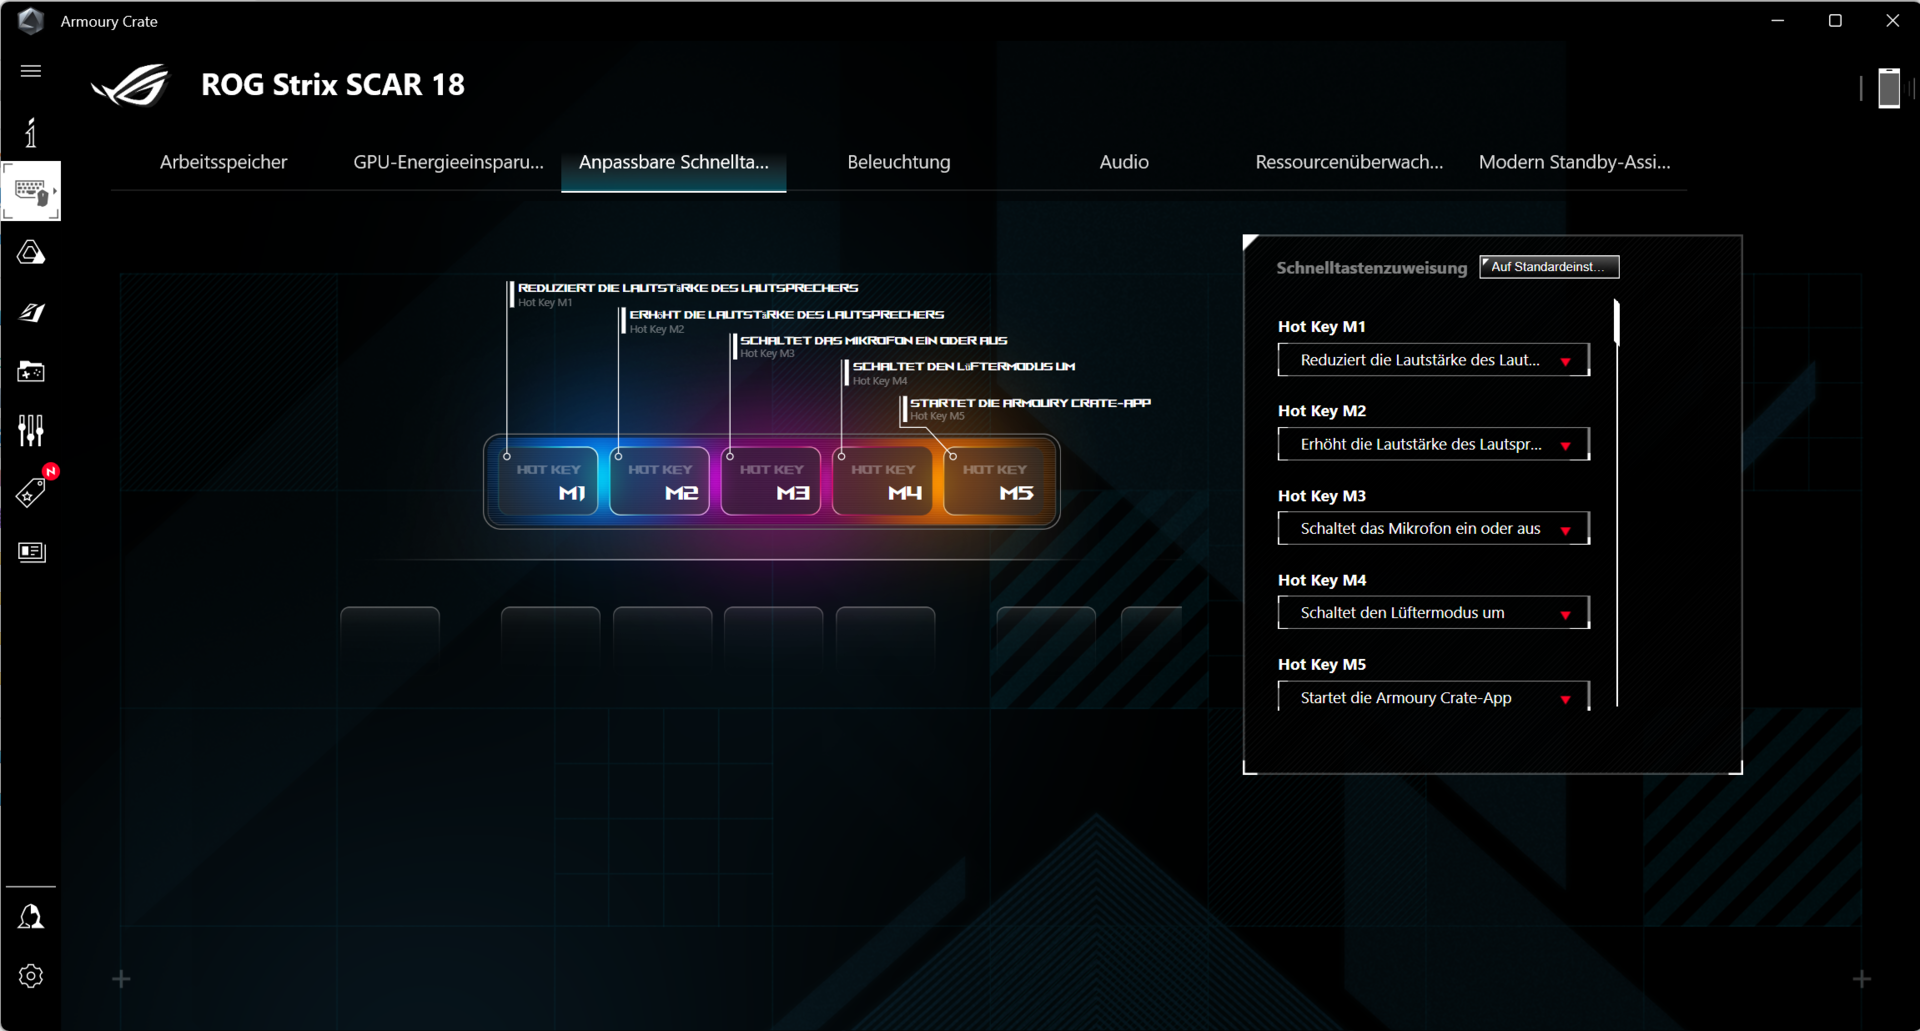
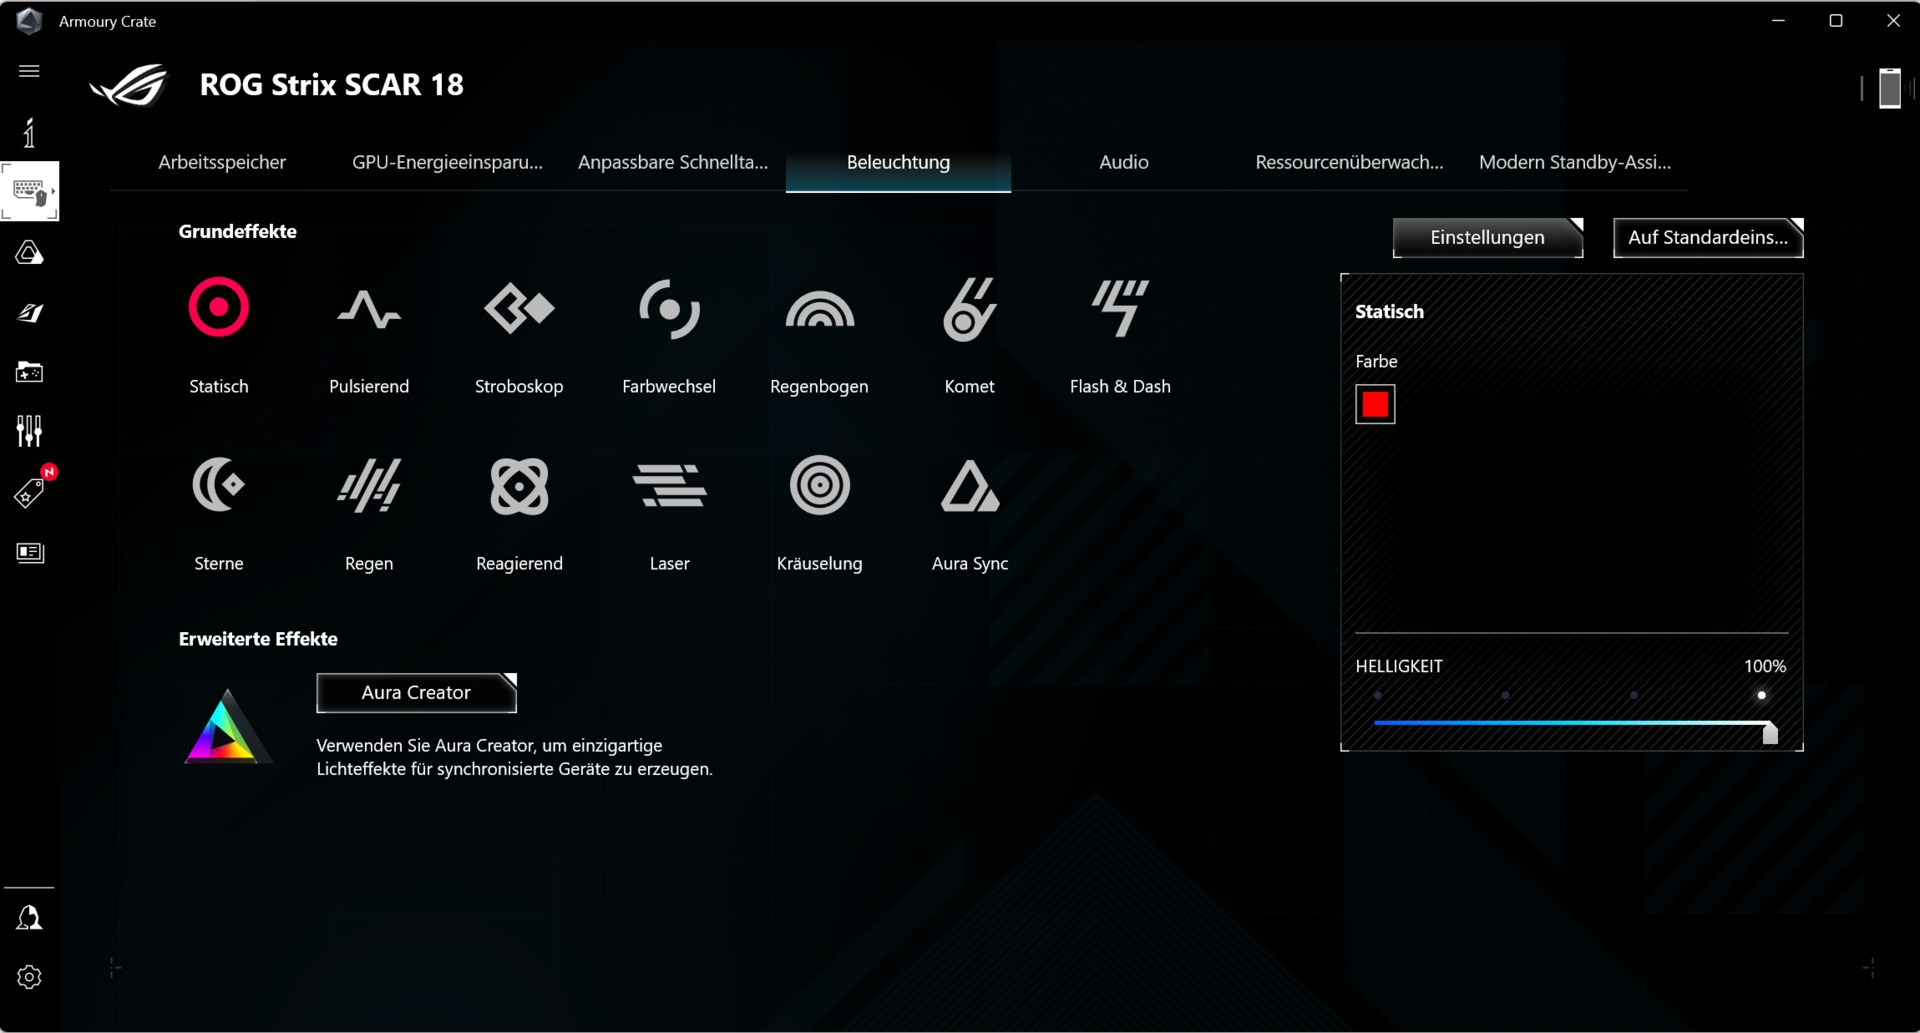
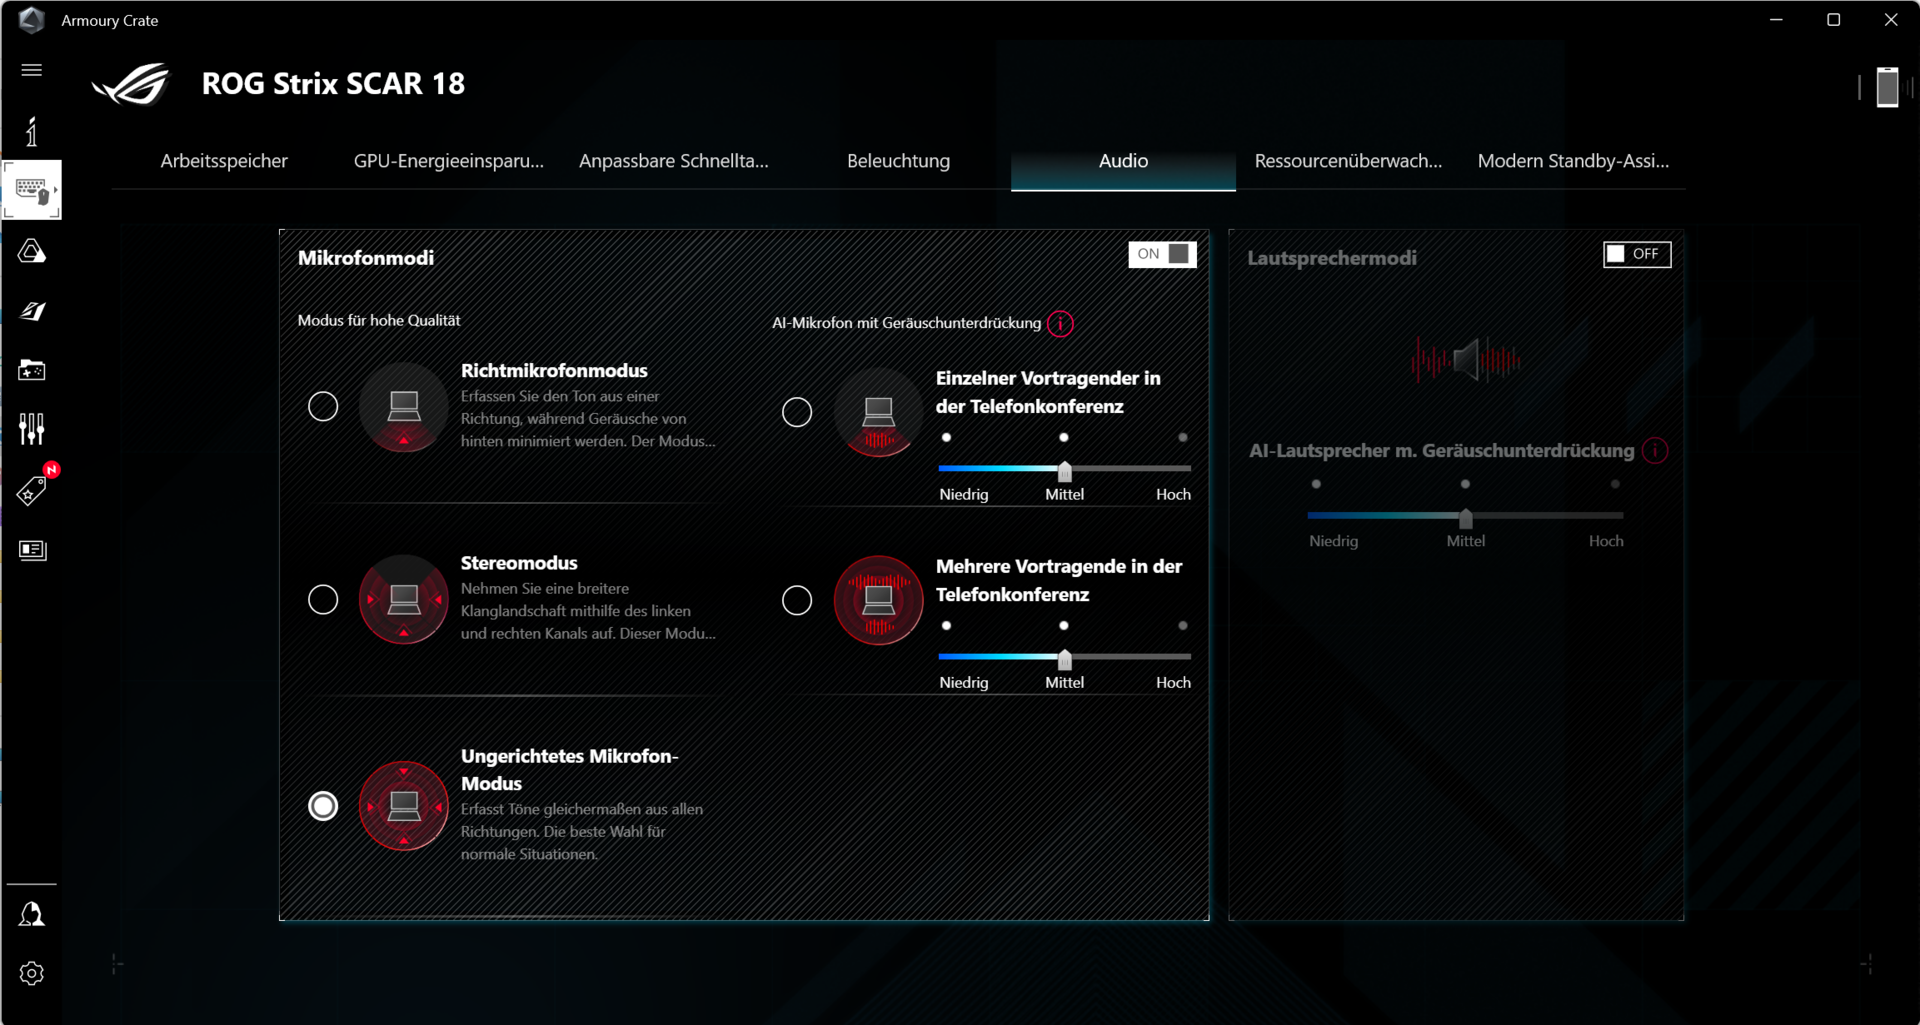
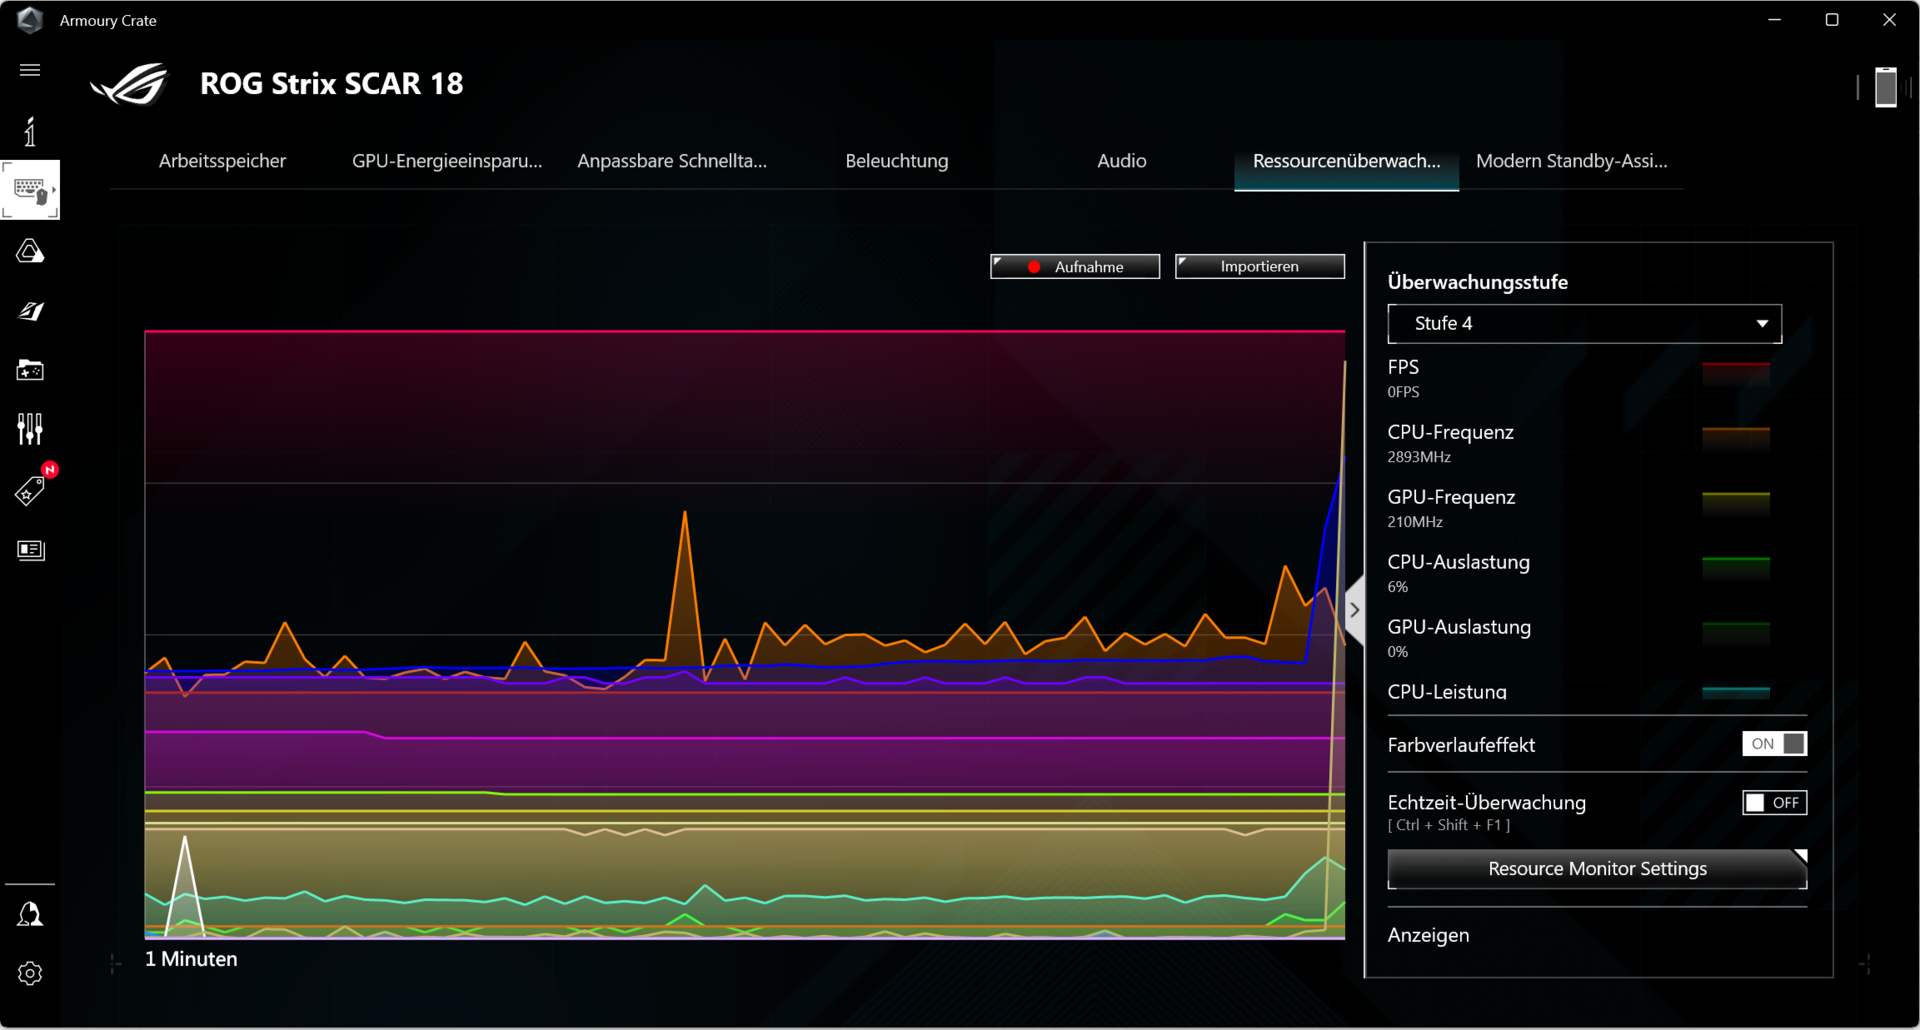
Asus tarafından önceden yapılandırılmış üç güç modu mevcuttur (tabloya bakın) ve Fn + F5 tuş kombinasyonunu kullanarak bunlar arasında geçiş yapabilirsiniz. Biz kıyaslamalarımız için "Performans" ve pil testlerimiz için "Sessiz" modlarını kullandık. GPU modu "Standart" olarak ayarlanmıştır. Dizüstü bilgisayarın kontrol merkezi ("Armory Crate"), Güç Sınırları, Dinamik Güçlendirme ve fan eğrilerinin ayarlanması dahil olmak üzere bireysel profiller ("Manuel") oluşturmaya izin verir.
| Performans | Turbo | Sessiz | |
|---|---|---|---|
| Güç Sınırı 1 (HWInfo) | 110 Watt | 175 Watt | 65 Watt |
| Güç Sınırı 2 (HWInfo) | 120 Watt | 175 Watt | 100 Watt |
| Gürültü (The Witcher 3) | 50 dB(A) | 56 dB(A) | 35 dB(A) |
| Performans (The Witcher 3) | ~188 fps | ~183 fps | ~68 fps |
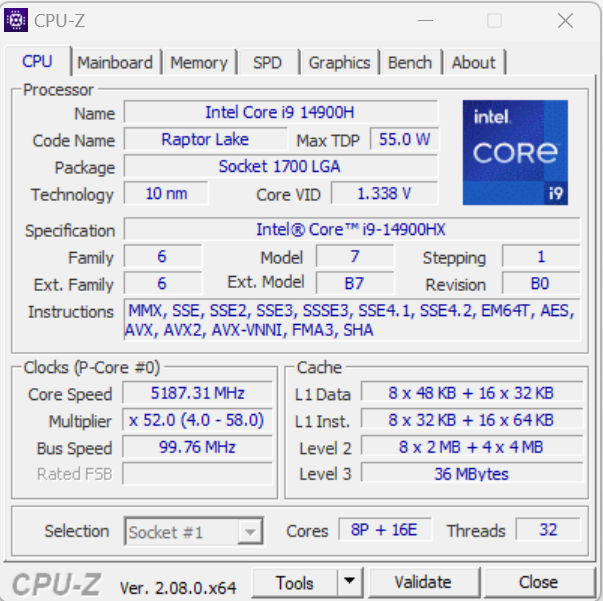
İşlemci
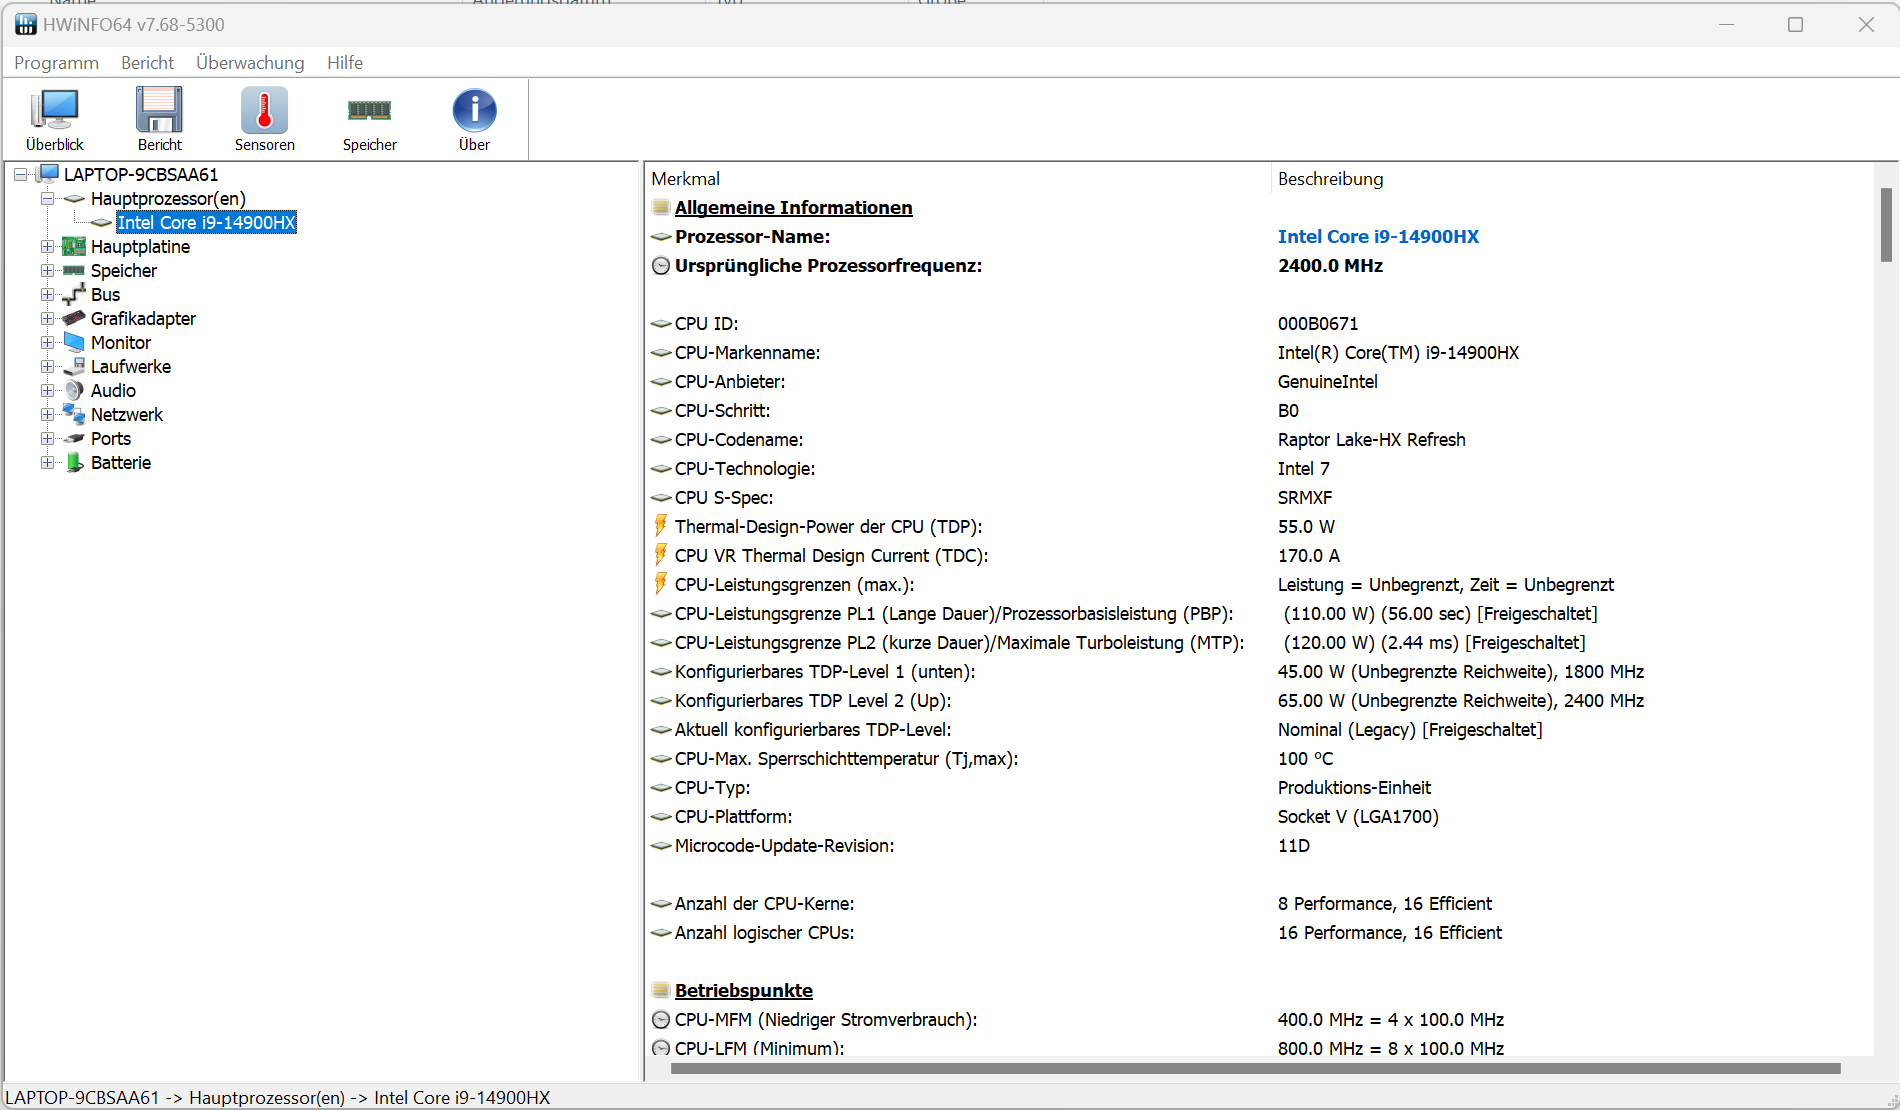
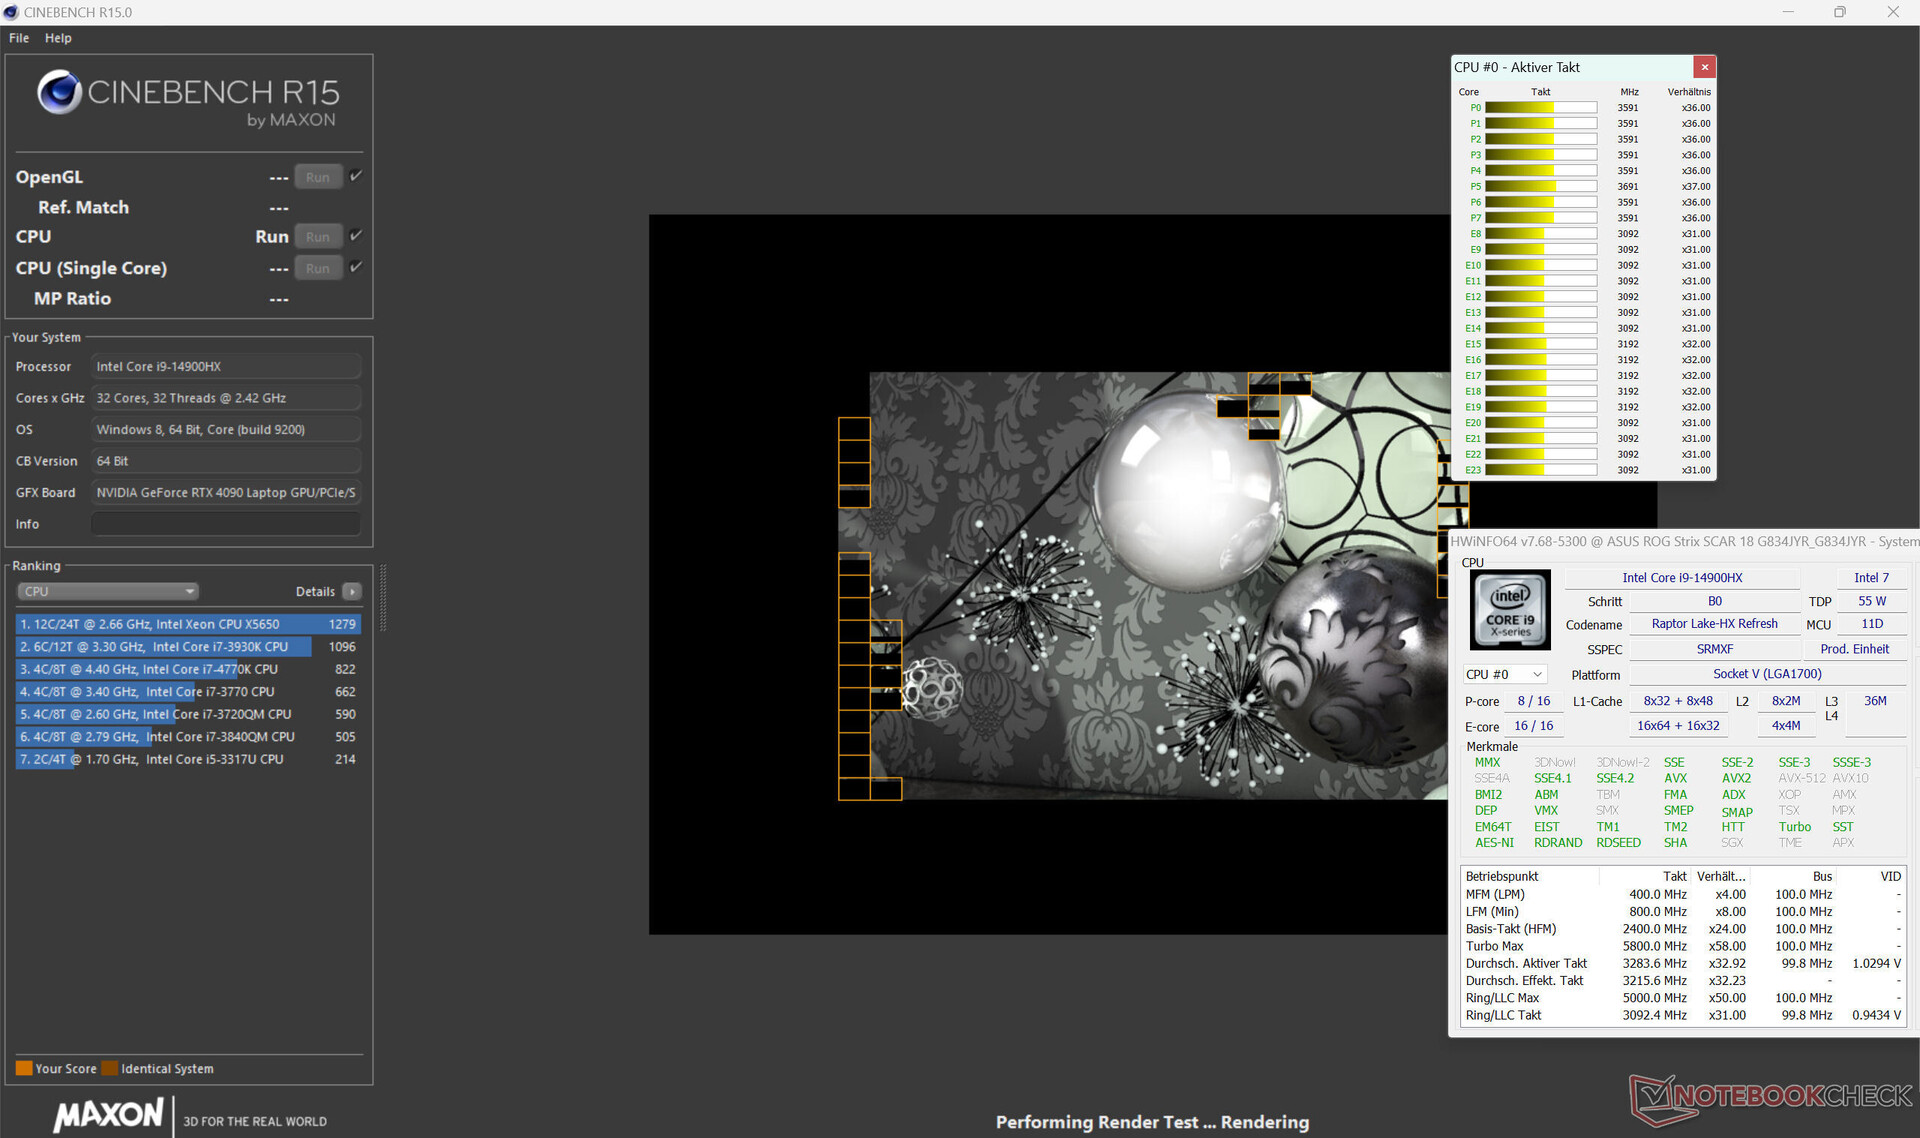
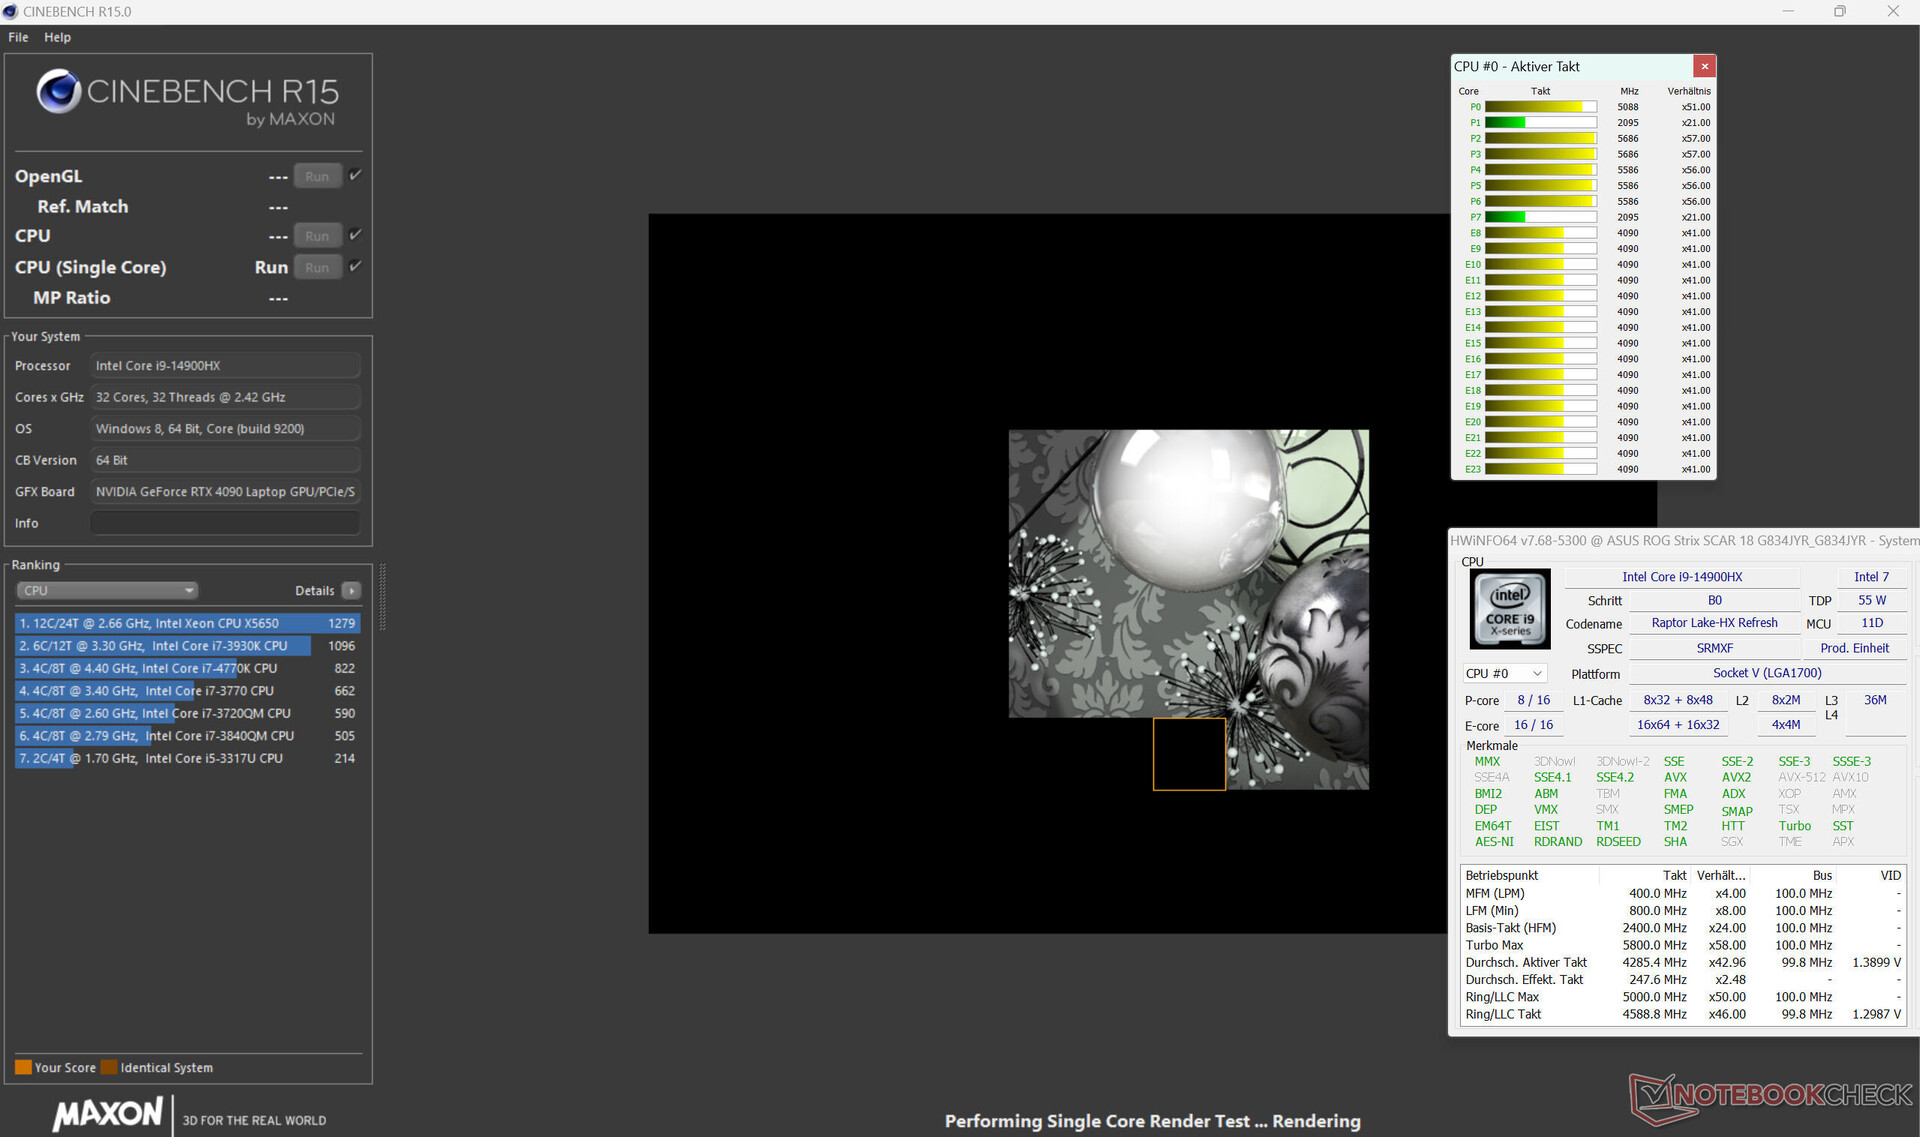
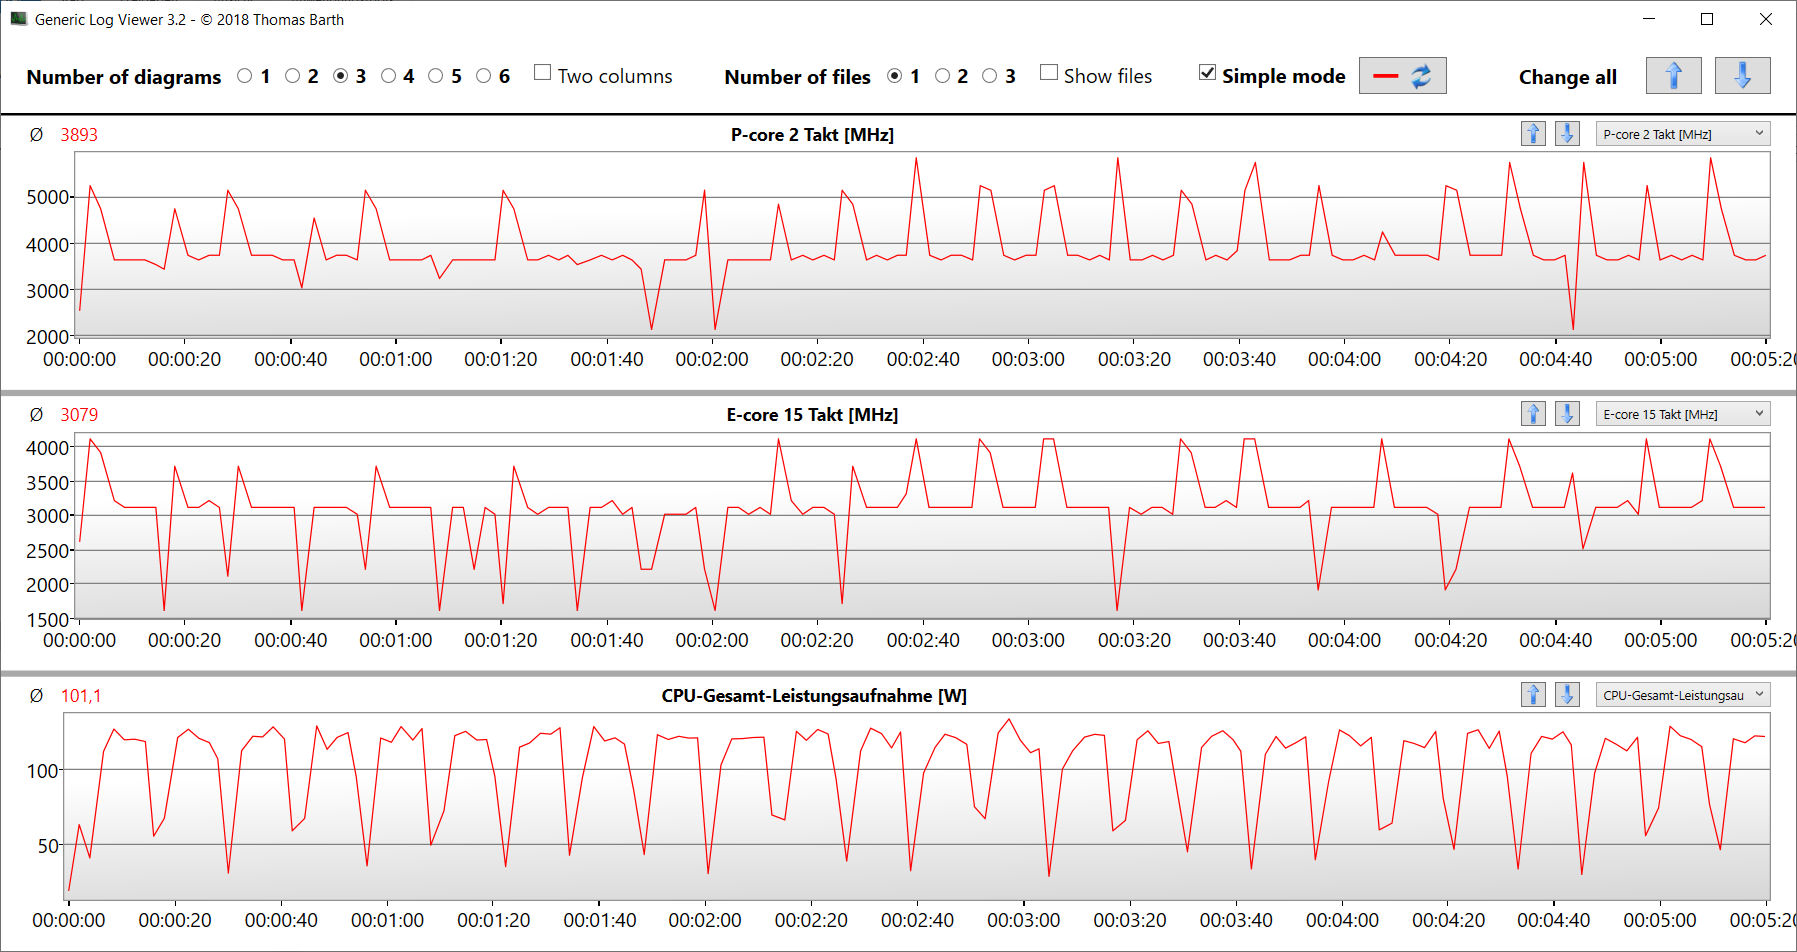
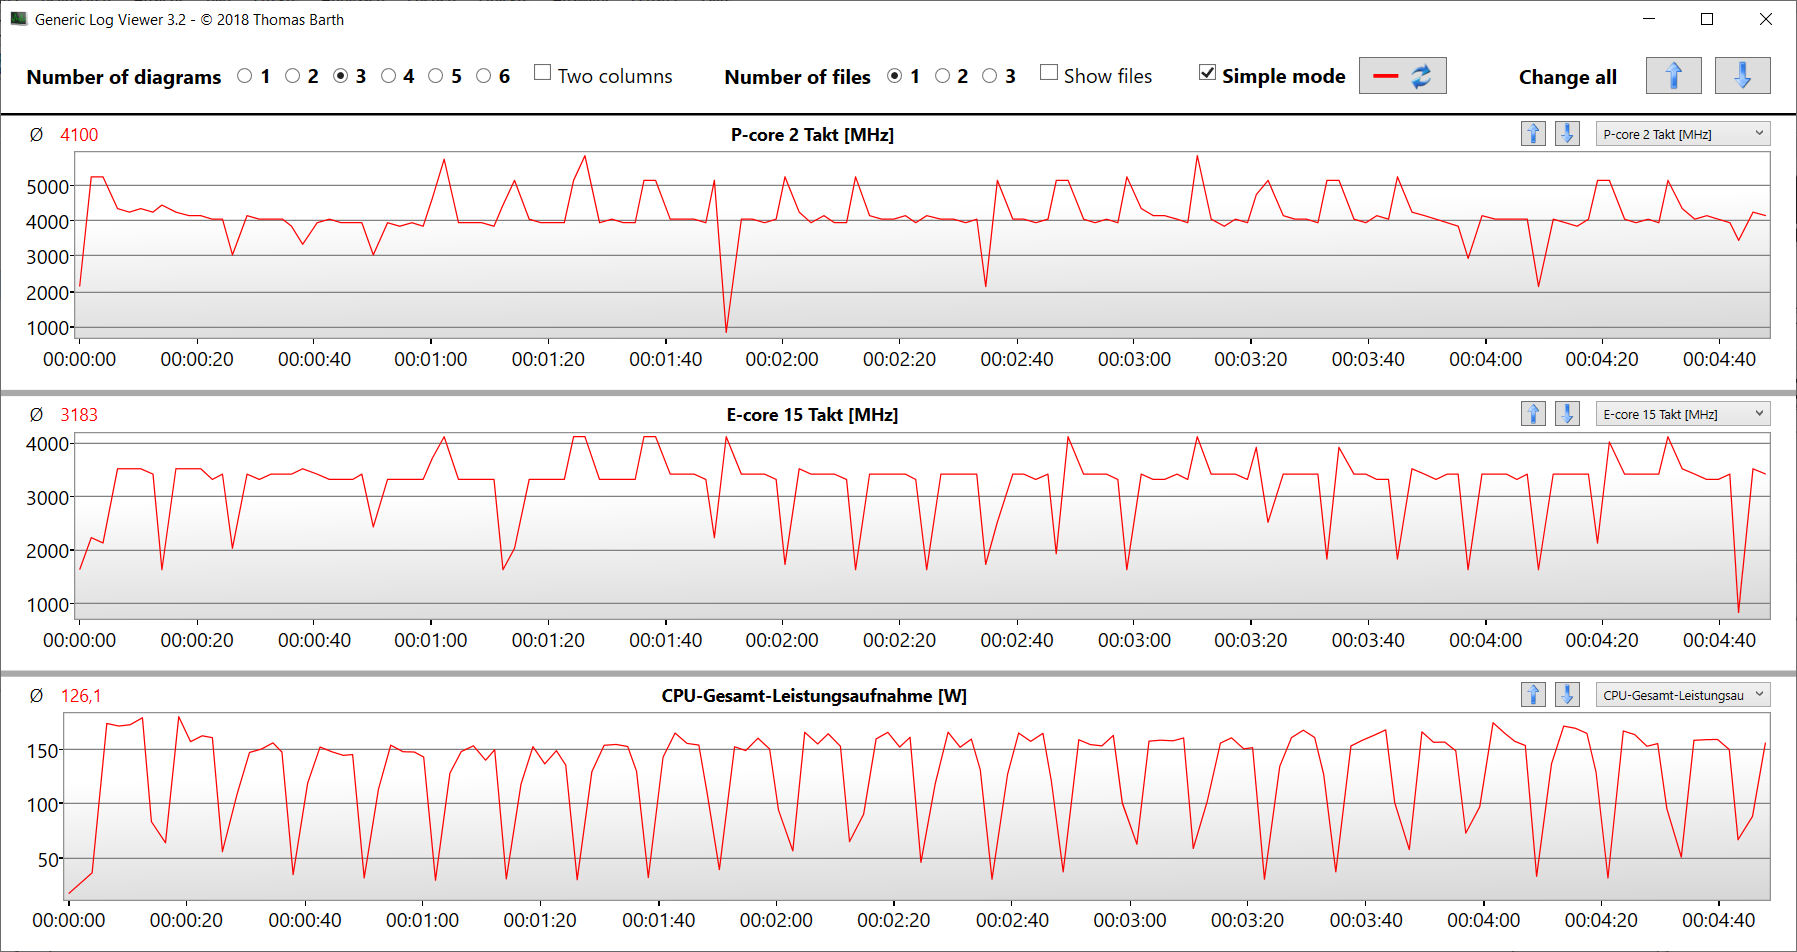
24 CPU çekirdeği (8P + 16E = 32 iş parçacığı) Core i9-14900HX (Raptor Lake) 5,8 GHz (P çekirdekleri) ve 4,1 GHz (E çekirdekleri) maksimum saat hızlarına ulaşır. CPU, sürekli çoklu iş parçacığı yüküne (CB15 Döngüsü) sürekli yüksek kalan bir Turbo hızıyla yanıt verir. Core i9 hakkında daha fazla bilgi için aNALİZ.
Güç profilinin seçimi tek iş parçacığı performansını sadece sınırlı bir şekilde etkilerken çok iş parçacığı performansı üzerinde daha fazla etkiye sahiptir. "Performans" seçimi, şimdiye kadar belirlenen CPU ortalamasının altında kıyaslama değerleriyle sonuçlanırken, "Turbo" sonuçları ortalamanın biraz üzerine çıkarır. Günlük kullanımda daha önemli olan tek iş parçacığı performansı şebeke ve batarya kullanımında aynı seviyede seyrederken, çok iş parçacığı performansı batarya kullanımında önemli ölçüde düşmektedir.
Cinebench R15 Multi Constant Load Test
| CPU Performance rating - Percent | |
| Alienware m18 R1 AMD | |
| Asus ROG Strix Scar 18 G834JYR (2024) | |
| Asus ROG Strix Scar 18 2023 G834JY-N6005W -2! | |
| Alienware m18 R1 -2! | |
| MSI Titan 18 HX A14VIG | |
| Acer Predator Helios 18 N23Q2 | |
| Asus ROG Strix Scar 18 G834JYR (2024) | |
| Ortalama Intel Core i9-14900HX | |
| Razer Blade 18 RTX 4070 -2! | |
| Sınıf ortalaması Gaming | |
| Cinebench R20 | |
| CPU (Multi Core) | |
| Alienware m18 R1 AMD | |
| Alienware m18 R1 | |
| Asus ROG Strix Scar 18 G834JYR (2024) (Turbo) | |
| MSI Titan 18 HX A14VIG | |
| Asus ROG Strix Scar 18 2023 G834JY-N6005W | |
| Acer Predator Helios 18 N23Q2 | |
| Ortalama Intel Core i9-14900HX (6579 - 13832, n=37) | |
| Razer Blade 18 RTX 4070 | |
| Asus ROG Strix Scar 18 G834JYR (2024) | |
| Sınıf ortalaması Gaming (4029 - 16108, n=111, son 2 yıl) | |
| CPU (Single Core) | |
| Asus ROG Strix Scar 18 G834JYR (2024) (Turbo) | |
| Asus ROG Strix Scar 18 G834JYR (2024) | |
| Asus ROG Strix Scar 18 2023 G834JY-N6005W | |
| Ortalama Intel Core i9-14900HX (657 - 859, n=37) | |
| MSI Titan 18 HX A14VIG | |
| Alienware m18 R1 | |
| Acer Predator Helios 18 N23Q2 | |
| Razer Blade 18 RTX 4070 | |
| Sınıf ortalaması Gaming (442 - 895, n=111, son 2 yıl) | |
| Alienware m18 R1 AMD | |
| Cinebench R15 | |
| CPU Multi 64Bit | |
| Alienware m18 R1 AMD | |
| Alienware m18 R1 | |
| MSI Titan 18 HX A14VIG | |
| Asus ROG Strix Scar 18 2023 G834JY-N6005W | |
| Asus ROG Strix Scar 18 G834JYR (2024) (Turbo) | |
| Acer Predator Helios 18 N23Q2 | |
| Razer Blade 18 RTX 4070 | |
| Ortalama Intel Core i9-14900HX (3263 - 5589, n=38) | |
| Asus ROG Strix Scar 18 G834JYR (2024) | |
| Sınıf ortalaması Gaming (1578 - 6271, n=111, son 2 yıl) | |
| CPU Single 64Bit | |
| Asus ROG Strix Scar 18 2023 G834JY-N6005W | |
| Alienware m18 R1 AMD | |
| Asus ROG Strix Scar 18 G834JYR (2024) (Turbo) | |
| Ortalama Intel Core i9-14900HX (247 - 323, n=37) | |
| Alienware m18 R1 | |
| Asus ROG Strix Scar 18 G834JYR (2024) | |
| MSI Titan 18 HX A14VIG | |
| Razer Blade 18 RTX 4070 | |
| Acer Predator Helios 18 N23Q2 | |
| Sınıf ortalaması Gaming (188.8 - 343, n=111, son 2 yıl) | |
| Blender - v2.79 BMW27 CPU | |
| Sınıf ortalaması Gaming (80 - 330, n=109, son 2 yıl) | |
| Ortalama Intel Core i9-14900HX (91 - 206, n=37) | |
| Asus ROG Strix Scar 18 G834JYR (2024) | |
| Razer Blade 18 RTX 4070 | |
| Asus ROG Strix Scar 18 G834JYR (2024) (Turbo) | |
| Acer Predator Helios 18 N23Q2 | |
| MSI Titan 18 HX A14VIG | |
| Asus ROG Strix Scar 18 2023 G834JY-N6005W | |
| Alienware m18 R1 | |
| Alienware m18 R1 AMD | |
| Geekbench 6.7 | |
| Multi-Core | |
| Asus ROG Strix Scar 18 G834JYR (2024) (6.2.1, Turbo) | |
| Acer Predator Helios 18 N23Q2 | |
| Asus ROG Strix Scar 18 G834JYR (2024) (6.2.1) | |
| Ortalama Intel Core i9-14900HX (13158 - 19665, n=37) | |
| MSI Titan 18 HX A14VIG (6.2.1) | |
| Alienware m18 R1 AMD | |
| Sınıf ortalaması Gaming (6625 - 22104, n=111, son 2 yıl) | |
| Single-Core | |
| Asus ROG Strix Scar 18 G834JYR (2024) (6.2.1, Turbo) | |
| Asus ROG Strix Scar 18 G834JYR (2024) (6.2.1) | |
| Ortalama Intel Core i9-14900HX (2419 - 3129, n=37) | |
| Acer Predator Helios 18 N23Q2 | |
| Alienware m18 R1 AMD | |
| MSI Titan 18 HX A14VIG (6.2.1) | |
| Sınıf ortalaması Gaming (1490 - 3259, n=111, son 2 yıl) | |
| HWBOT x265 Benchmark v2.2 - 4k Preset | |
| Alienware m18 R1 AMD | |
| Asus ROG Strix Scar 18 2023 G834JY-N6005W | |
| Alienware m18 R1 | |
| Asus ROG Strix Scar 18 G834JYR (2024) (Turbo) | |
| Razer Blade 18 RTX 4070 | |
| MSI Titan 18 HX A14VIG | |
| Acer Predator Helios 18 N23Q2 | |
| Ortalama Intel Core i9-14900HX (16.8 - 38.9, n=37) | |
| Asus ROG Strix Scar 18 G834JYR (2024) | |
| Sınıf ortalaması Gaming (11.5 - 44.3, n=110, son 2 yıl) | |
| LibreOffice - 20 Documents To PDF | |
| Acer Predator Helios 18 N23Q2 | |
| Sınıf ortalaması Gaming (19 - 88.8, n=110, son 2 yıl) | |
| Alienware m18 R1 | |
| MSI Titan 18 HX A14VIG (6.3.4.2) | |
| Asus ROG Strix Scar 18 G834JYR (2024) (6.3.4.2) | |
| Razer Blade 18 RTX 4070 | |
| Ortalama Intel Core i9-14900HX (19 - 85.1, n=37) | |
| Alienware m18 R1 AMD (6.3.4.2) | |
| Asus ROG Strix Scar 18 G834JYR (2024) (6.3.4.2, Turbo) | |
| Asus ROG Strix Scar 18 2023 G834JY-N6005W | |
| R Benchmark 2.5 - Overall mean | |
| Sınıf ortalaması Gaming (0.3439 - 0.759, n=111, son 2 yıl) | |
| Alienware m18 R1 AMD | |
| Acer Predator Helios 18 N23Q2 | |
| Razer Blade 18 RTX 4070 | |
| Asus ROG Strix Scar 18 G834JYR (2024) | |
| Alienware m18 R1 | |
| MSI Titan 18 HX A14VIG | |
| Ortalama Intel Core i9-14900HX (0.3604 - 0.4859, n=37) | |
| Asus ROG Strix Scar 18 2023 G834JY-N6005W | |
| Asus ROG Strix Scar 18 G834JYR (2024) (Turbo) | |
* ... daha küçük daha iyidir
AIDA64: FP32 Ray-Trace | FPU Julia | CPU SHA3 | CPU Queen | FPU SinJulia | FPU Mandel | CPU AES | CPU ZLib | FP64 Ray-Trace | CPU PhotoWorxx
| Performance rating | |
| Alienware m18 R1 AMD | |
| Acer Predator Helios 18 N23Q2 | |
| Alienware m18 R1 | |
| MSI Titan 18 HX A14VIG | |
| Asus ROG Strix Scar 18 2023 G834JY-N6005W | |
| Asus ROG Strix Scar 18 G834JYR (2024) | |
| Razer Blade 18 RTX 4070 | |
| Asus ROG Strix Scar 18 G834JYR (2024) | |
| Ortalama Intel Core i9-14900HX | |
| Sınıf ortalaması Gaming | |
| AIDA64 / FP32 Ray-Trace | |
| Alienware m18 R1 AMD (v6.85.6300) | |
| Sınıf ortalaması Gaming (10227 - 85542, n=109, son 2 yıl) | |
| Alienware m18 R1 (v6.85.6300) | |
| MSI Titan 18 HX A14VIG (v6.92.6600) | |
| Asus ROG Strix Scar 18 2023 G834JY-N6005W (v6.85.6300) | |
| Acer Predator Helios 18 N23Q2 (v6.85.6300) | |
| Asus ROG Strix Scar 18 G834JYR (2024) (v6.92.6600, Turbo) | |
| Razer Blade 18 RTX 4070 (v6.85.6300) | |
| Asus ROG Strix Scar 18 G834JYR (2024) (v6.92.6600) | |
| Ortalama Intel Core i9-14900HX (13098 - 33474, n=36) | |
| AIDA64 / FPU Julia | |
| Alienware m18 R1 AMD (v6.85.6300) | |
| MSI Titan 18 HX A14VIG (v6.92.6600) | |
| Alienware m18 R1 (v6.85.6300) | |
| Asus ROG Strix Scar 18 2023 G834JY-N6005W (v6.85.6300) | |
| Asus ROG Strix Scar 18 G834JYR (2024) (v6.92.6600, Turbo) | |
| Acer Predator Helios 18 N23Q2 (v6.85.6300) | |
| Sınıf ortalaması Gaming (51376 - 238426, n=109, son 2 yıl) | |
| Razer Blade 18 RTX 4070 (v6.85.6300) | |
| Asus ROG Strix Scar 18 G834JYR (2024) (v6.92.6600) | |
| Ortalama Intel Core i9-14900HX (67573 - 166040, n=36) | |
| AIDA64 / CPU SHA3 | |
| Alienware m18 R1 AMD (v6.85.6300) | |
| MSI Titan 18 HX A14VIG (v6.92.6600) | |
| Alienware m18 R1 (v6.85.6300) | |
| Asus ROG Strix Scar 18 2023 G834JY-N6005W (v6.85.6300) | |
| Acer Predator Helios 18 N23Q2 (v6.85.6300) | |
| Asus ROG Strix Scar 18 G834JYR (2024) (v6.92.6600, Turbo) | |
| Razer Blade 18 RTX 4070 (v6.85.6300) | |
| Asus ROG Strix Scar 18 G834JYR (2024) (v6.92.6600) | |
| Ortalama Intel Core i9-14900HX (3589 - 7979, n=36) | |
| Sınıf ortalaması Gaming (2180 - 9817, n=109, son 2 yıl) | |
| AIDA64 / CPU Queen | |
| Alienware m18 R1 AMD (v6.85.6300) | |
| MSI Titan 18 HX A14VIG (v6.92.6600) | |
| Alienware m18 R1 (v6.85.6300) | |
| Asus ROG Strix Scar 18 G834JYR (2024) (v6.92.6600) | |
| Asus ROG Strix Scar 18 G834JYR (2024) (v6.92.6600, Turbo) | |
| Asus ROG Strix Scar 18 2023 G834JY-N6005W (v6.85.6300) | |
| Ortalama Intel Core i9-14900HX (118405 - 148966, n=36) | |
| Razer Blade 18 RTX 4070 (v6.85.6300) | |
| Acer Predator Helios 18 N23Q2 (v6.85.6300) | |
| Sınıf ortalaması Gaming (49785 - 173351, n=100, son 2 yıl) | |
| AIDA64 / FPU SinJulia | |
| Alienware m18 R1 AMD (v6.85.6300) | |
| MSI Titan 18 HX A14VIG (v6.92.6600) | |
| Asus ROG Strix Scar 18 2023 G834JY-N6005W (v6.85.6300) | |
| Alienware m18 R1 (v6.85.6300) | |
| Asus ROG Strix Scar 18 G834JYR (2024) (v6.92.6600, Turbo) | |
| Asus ROG Strix Scar 18 G834JYR (2024) (v6.92.6600) | |
| Razer Blade 18 RTX 4070 (v6.85.6300) | |
| Acer Predator Helios 18 N23Q2 (v6.85.6300) | |
| Ortalama Intel Core i9-14900HX (10475 - 18517, n=36) | |
| Sınıf ortalaması Gaming (4424 - 33636, n=109, son 2 yıl) | |
| AIDA64 / FPU Mandel | |
| Alienware m18 R1 AMD (v6.85.6300) | |
| Alienware m18 R1 (v6.85.6300) | |
| MSI Titan 18 HX A14VIG (v6.92.6600) | |
| Sınıf ortalaması Gaming (25115 - 128721, n=109, son 2 yıl) | |
| Asus ROG Strix Scar 18 2023 G834JY-N6005W (v6.85.6300) | |
| Acer Predator Helios 18 N23Q2 (v6.85.6300) | |
| Asus ROG Strix Scar 18 G834JYR (2024) (v6.92.6600, Turbo) | |
| Razer Blade 18 RTX 4070 (v6.85.6300) | |
| Asus ROG Strix Scar 18 G834JYR (2024) (v6.92.6600) | |
| Ortalama Intel Core i9-14900HX (32543 - 83662, n=36) | |
| AIDA64 / CPU AES | |
| Acer Predator Helios 18 N23Q2 (v6.85.6300) | |
| Alienware m18 R1 AMD (v6.85.6300) | |
| Ortalama Intel Core i9-14900HX (86964 - 241777, n=36) | |
| MSI Titan 18 HX A14VIG (v6.92.6600) | |
| Alienware m18 R1 (v6.85.6300) | |
| Asus ROG Strix Scar 18 2023 G834JY-N6005W (v6.85.6300) | |
| Asus ROG Strix Scar 18 G834JYR (2024) (v6.92.6600, Turbo) | |
| Asus ROG Strix Scar 18 G834JYR (2024) (v6.92.6600) | |
| Razer Blade 18 RTX 4070 (v6.85.6300) | |
| Sınıf ortalaması Gaming (39258 - 247074, n=109, son 2 yıl) | |
| AIDA64 / CPU ZLib | |
| Alienware m18 R1 AMD (v6.85.6300) | |
| MSI Titan 18 HX A14VIG (v6.92.6600) | |
| Asus ROG Strix Scar 18 2023 G834JY-N6005W (v6.85.6300) | |
| Alienware m18 R1 (v6.85.6300) | |
| Acer Predator Helios 18 N23Q2 (v6.85.6300) | |
| Asus ROG Strix Scar 18 G834JYR (2024) (v6.92.6600, Turbo) | |
| Razer Blade 18 RTX 4070 (v6.85.6300) | |
| Ortalama Intel Core i9-14900HX (1054 - 2292, n=36) | |
| Asus ROG Strix Scar 18 G834JYR (2024) | |
| Sınıf ortalaması Gaming (574 - 2531, n=109, son 2 yıl) | |
| AIDA64 / FP64 Ray-Trace | |
| Alienware m18 R1 AMD (v6.85.6300) | |
| Sınıf ortalaması Gaming (5509 - 45446, n=109, son 2 yıl) | |
| Alienware m18 R1 (v6.85.6300) | |
| MSI Titan 18 HX A14VIG (v6.92.6600) | |
| Asus ROG Strix Scar 18 2023 G834JY-N6005W (v6.85.6300) | |
| Acer Predator Helios 18 N23Q2 (v6.85.6300) | |
| Asus ROG Strix Scar 18 G834JYR (2024) (v6.92.6600, Turbo) | |
| Razer Blade 18 RTX 4070 (v6.85.6300) | |
| Asus ROG Strix Scar 18 G834JYR (2024) (v6.92.6600) | |
| Ortalama Intel Core i9-14900HX (6809 - 18349, n=36) | |
| AIDA64 / CPU PhotoWorxx | |
| Alienware m18 R1 (v6.85.6300) | |
| Acer Predator Helios 18 N23Q2 (v6.85.6300) | |
| Asus ROG Strix Scar 18 G834JYR (2024) (v6.92.6600) | |
| Asus ROG Strix Scar 18 G834JYR (2024) (v6.92.6600, Turbo) | |
| Razer Blade 18 RTX 4070 (v6.85.6300) | |
| Ortalama Intel Core i9-14900HX (23903 - 54702, n=36) | |
| Sınıf ortalaması Gaming (12271 - 89891, n=109, son 2 yıl) | |
| Asus ROG Strix Scar 18 2023 G834JY-N6005W (v6.85.6300) | |
| Alienware m18 R1 AMD (v6.85.6300) | |
| MSI Titan 18 HX A14VIG (v6.92.6600) | |
Sistem Performansı
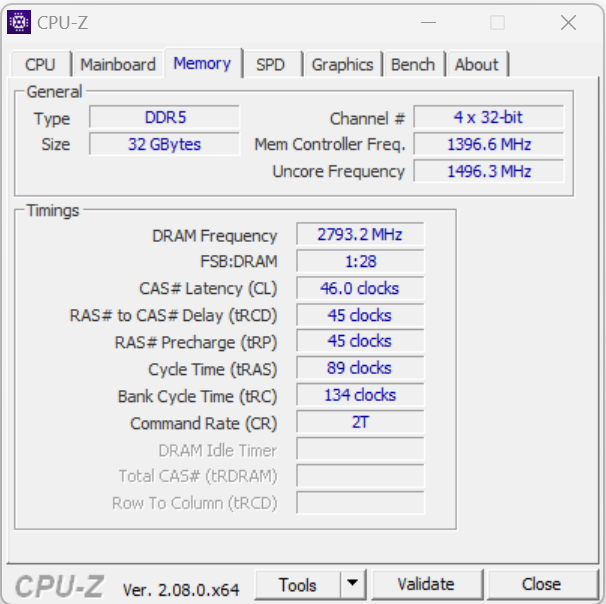
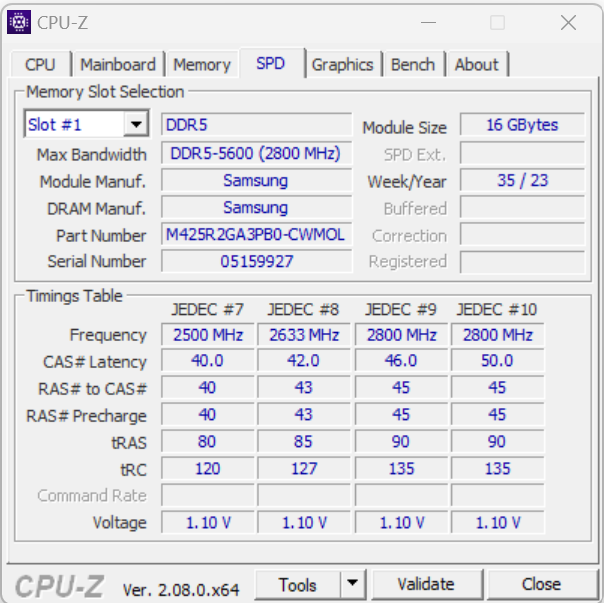
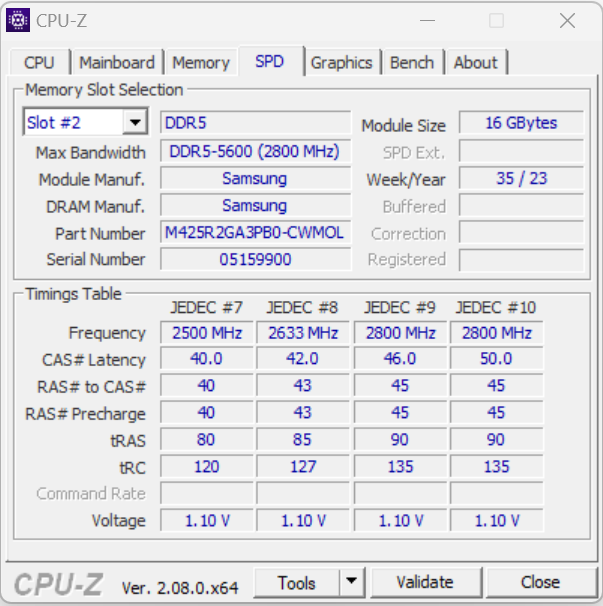
Sorunsuz çalışan sistem bilgi işlem performansında herhangi bir eksiklik göstermiyor ve dizüstü bilgisayar oyun, render ve diğer görevleri kusursuz bir şekilde yerine getiriyor. Çalışma belleğinin aktarım hızları DDR5-5600 RAM için normal bir seviyede.
CrossMark: Overall | Productivity | Creativity | Responsiveness
WebXPRT 3: Overall
WebXPRT 4: Overall
Mozilla Kraken 1.1: Total
| PCMark 10 / Score | |
| Alienware m18 R1 AMD | |
| MSI Titan 18 HX A14VIG | |
| Asus ROG Strix Scar 18 G834JYR (2024) | |
| Asus ROG Strix Scar 18 2023 G834JY-N6005W | |
| Alienware m18 R1 | |
| Ortalama Intel Core i9-14900HX, NVIDIA GeForce RTX 4090 Laptop GPU (8230 - 9234, n=13) | |
| Acer Predator Helios 18 N23Q2 | |
| Sınıf ortalaması Gaming (5828 - 11574, n=95, son 2 yıl) | |
| Razer Blade 18 RTX 4070 | |
| PCMark 10 / Essentials | |
| Alienware m18 R1 AMD | |
| Razer Blade 18 RTX 4070 | |
| MSI Titan 18 HX A14VIG | |
| Asus ROG Strix Scar 18 G834JYR (2024) | |
| Alienware m18 R1 | |
| Ortalama Intel Core i9-14900HX, NVIDIA GeForce RTX 4090 Laptop GPU (10778 - 11628, n=13) | |
| Acer Predator Helios 18 N23Q2 | |
| Sınıf ortalaması Gaming (8810 - 12600, n=99, son 2 yıl) | |
| PCMark 10 / Productivity | |
| Alienware m18 R1 AMD | |
| Sınıf ortalaması Gaming (6845 - 18766, n=97, son 2 yıl) | |
| Ortalama Intel Core i9-14900HX, NVIDIA GeForce RTX 4090 Laptop GPU (9458 - 11759, n=13) | |
| Asus ROG Strix Scar 18 G834JYR (2024) | |
| Acer Predator Helios 18 N23Q2 | |
| MSI Titan 18 HX A14VIG | |
| Alienware m18 R1 | |
| Razer Blade 18 RTX 4070 | |
| PCMark 10 / Digital Content Creation | |
| Alienware m18 R1 AMD | |
| MSI Titan 18 HX A14VIG | |
| Alienware m18 R1 | |
| Asus ROG Strix Scar 18 G834JYR (2024) | |
| Ortalama Intel Core i9-14900HX, NVIDIA GeForce RTX 4090 Laptop GPU (13219 - 16462, n=13) | |
| Acer Predator Helios 18 N23Q2 | |
| Sınıf ortalaması Gaming (7602 - 19657, n=97, son 2 yıl) | |
| Razer Blade 18 RTX 4070 | |
| CrossMark / Overall | |
| Asus ROG Strix Scar 18 G834JYR (2024) | |
| Acer Predator Helios 18 N23Q2 | |
| Alienware m18 R1 | |
| Razer Blade 18 RTX 4070 | |
| Ortalama Intel Core i9-14900HX, NVIDIA GeForce RTX 4090 Laptop GPU (1877 - 2344, n=10) | |
| Asus ROG Strix Scar 18 2023 G834JY-N6005W | |
| Sınıf ortalaması Gaming (1366 - 2409, n=97, son 2 yıl) | |
| Alienware m18 R1 AMD | |
| MSI Titan 18 HX A14VIG | |
| CrossMark / Productivity | |
| Acer Predator Helios 18 N23Q2 | |
| Asus ROG Strix Scar 18 G834JYR (2024) | |
| Alienware m18 R1 | |
| Razer Blade 18 RTX 4070 | |
| Ortalama Intel Core i9-14900HX, NVIDIA GeForce RTX 4090 Laptop GPU (1738 - 2162, n=10) | |
| Asus ROG Strix Scar 18 2023 G834JY-N6005W | |
| Sınıf ortalaması Gaming (1386 - 2254, n=97, son 2 yıl) | |
| Alienware m18 R1 AMD | |
| MSI Titan 18 HX A14VIG | |
| CrossMark / Creativity | |
| Asus ROG Strix Scar 18 G834JYR (2024) | |
| Alienware m18 R1 | |
| Asus ROG Strix Scar 18 2023 G834JY-N6005W | |
| Acer Predator Helios 18 N23Q2 | |
| Razer Blade 18 RTX 4070 | |
| Ortalama Intel Core i9-14900HX, NVIDIA GeForce RTX 4090 Laptop GPU (2195 - 2660, n=10) | |
| Sınıf ortalaması Gaming (1343 - 2729, n=97, son 2 yıl) | |
| Alienware m18 R1 AMD | |
| MSI Titan 18 HX A14VIG | |
| CrossMark / Responsiveness | |
| Acer Predator Helios 18 N23Q2 | |
| Asus ROG Strix Scar 18 G834JYR (2024) | |
| Alienware m18 R1 | |
| Razer Blade 18 RTX 4070 | |
| Ortalama Intel Core i9-14900HX, NVIDIA GeForce RTX 4090 Laptop GPU (1478 - 2327, n=10) | |
| Sınıf ortalaması Gaming (1226 - 2334, n=97, son 2 yıl) | |
| Asus ROG Strix Scar 18 2023 G834JY-N6005W | |
| Alienware m18 R1 AMD | |
| MSI Titan 18 HX A14VIG | |
| WebXPRT 3 / Overall | |
| Alienware m18 R1 AMD | |
| Razer Blade 18 RTX 4070 | |
| Alienware m18 R1 | |
| Asus ROG Strix Scar 18 2023 G834JY-N6005W | |
| MSI Titan 18 HX A14VIG | |
| Ortalama Intel Core i9-14900HX, NVIDIA GeForce RTX 4090 Laptop GPU (279 - 339, n=10) | |
| Asus ROG Strix Scar 18 G834JYR (2024) | |
| Acer Predator Helios 18 N23Q2 | |
| Sınıf ortalaması Gaming (242 - 532, n=100, son 2 yıl) | |
| WebXPRT 4 / Overall | |
| Asus ROG Strix Scar 18 2023 G834JY-N6005W | |
| Alienware m18 R1 | |
| Asus ROG Strix Scar 18 G834JYR (2024) | |
| Razer Blade 18 RTX 4070 | |
| Alienware m18 R1 AMD | |
| Ortalama Intel Core i9-14900HX, NVIDIA GeForce RTX 4090 Laptop GPU (246 - 309, n=8) | |
| MSI Titan 18 HX A14VIG | |
| Sınıf ortalaması Gaming (176.4 - 354, n=100, son 2 yıl) | |
| Mozilla Kraken 1.1 / Total | |
| Sınıf ortalaması Gaming (391 - 590, n=105, son 2 yıl) | |
| Razer Blade 18 RTX 4070 | |
| Alienware m18 R1 AMD | |
| Alienware m18 R1 | |
| Acer Predator Helios 18 N23Q2 | |
| Ortalama Intel Core i9-14900HX, NVIDIA GeForce RTX 4090 Laptop GPU (428 - 535, n=11) | |
| MSI Titan 18 HX A14VIG | |
| Asus ROG Strix Scar 18 G834JYR (2024) | |
| Asus ROG Strix Scar 18 2023 G834JY-N6005W | |
* ... daha küçük daha iyidir
| PCMark 10 Score | 8801 puan | |
Yardım | ||
| AIDA64 / Memory Copy | |
| Asus ROG Strix Scar 18 G834JYR (2024) | |
| Alienware m18 R1 | |
| Acer Predator Helios 18 N23Q2 | |
| Razer Blade 18 RTX 4070 | |
| Ortalama Intel Core i9-14900HX (38028 - 83392, n=36) | |
| Sınıf ortalaması Gaming (21750 - 129946, n=109, son 2 yıl) | |
| Asus ROG Strix Scar 18 2023 G834JY-N6005W | |
| MSI Titan 18 HX A14VIG | |
| Alienware m18 R1 AMD | |
| AIDA64 / Memory Read | |
| Alienware m18 R1 | |
| Asus ROG Strix Scar 18 G834JYR (2024) | |
| Acer Predator Helios 18 N23Q2 | |
| Razer Blade 18 RTX 4070 | |
| Ortalama Intel Core i9-14900HX (43306 - 87568, n=36) | |
| Asus ROG Strix Scar 18 2023 G834JY-N6005W | |
| Sınıf ortalaması Gaming (22956 - 118858, n=109, son 2 yıl) | |
| Alienware m18 R1 AMD | |
| MSI Titan 18 HX A14VIG | |
| AIDA64 / Memory Write | |
| Alienware m18 R1 | |
| Asus ROG Strix Scar 18 G834JYR (2024) | |
| Sınıf ortalaması Gaming (22297 - 135096, n=109, son 2 yıl) | |
| Razer Blade 18 RTX 4070 | |
| Acer Predator Helios 18 N23Q2 | |
| Ortalama Intel Core i9-14900HX (37146 - 80589, n=36) | |
| Asus ROG Strix Scar 18 2023 G834JY-N6005W | |
| Alienware m18 R1 AMD | |
| MSI Titan 18 HX A14VIG | |
| AIDA64 / Memory Latency | |
| Sınıf ortalaması Gaming (75.3 - 259, n=109, son 2 yıl) | |
| MSI Titan 18 HX A14VIG | |
| Alienware m18 R1 AMD | |
| Asus ROG Strix Scar 18 2023 G834JY-N6005W | |
| Ortalama Intel Core i9-14900HX (76.1 - 105, n=36) | |
| Razer Blade 18 RTX 4070 | |
| Acer Predator Helios 18 N23Q2 | |
| Asus ROG Strix Scar 18 G834JYR (2024) | |
| Alienware m18 R1 | |
* ... daha küçük daha iyidir
DPC Gecikmeleri
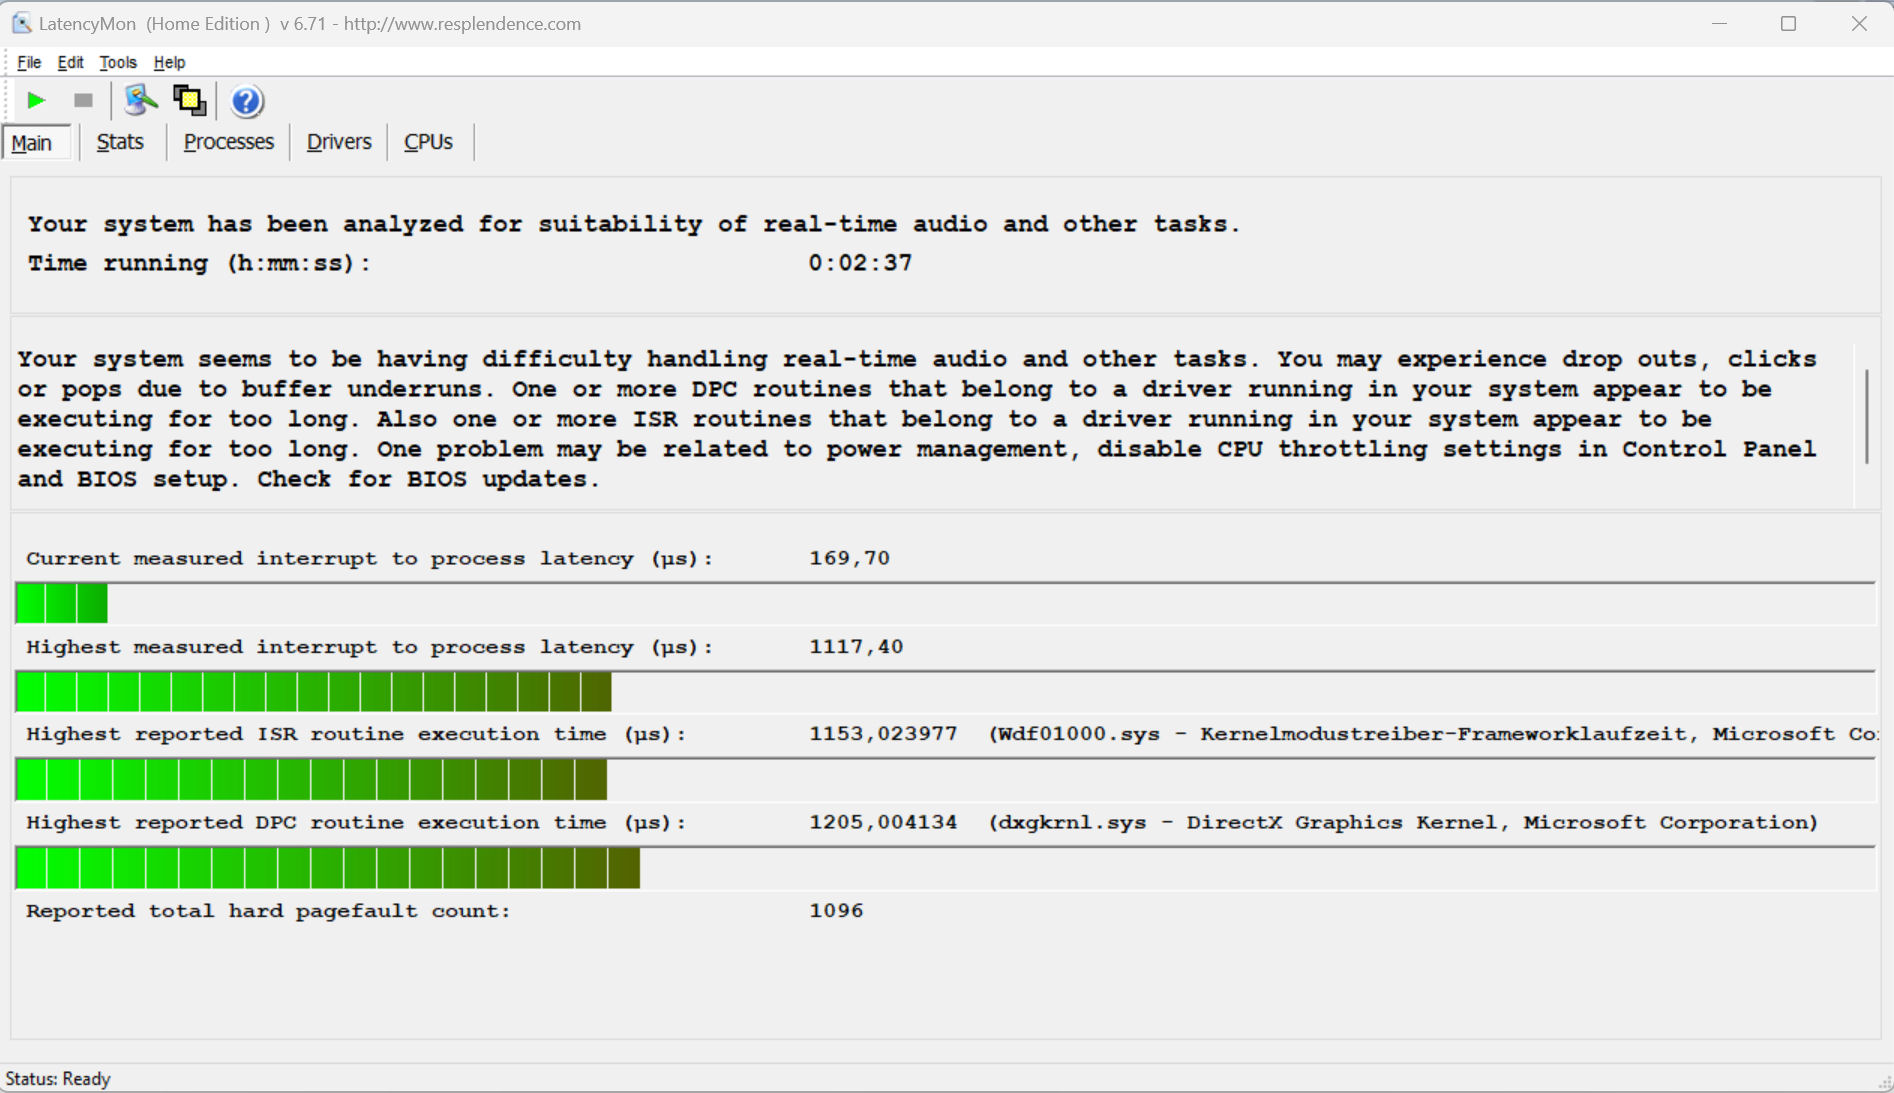
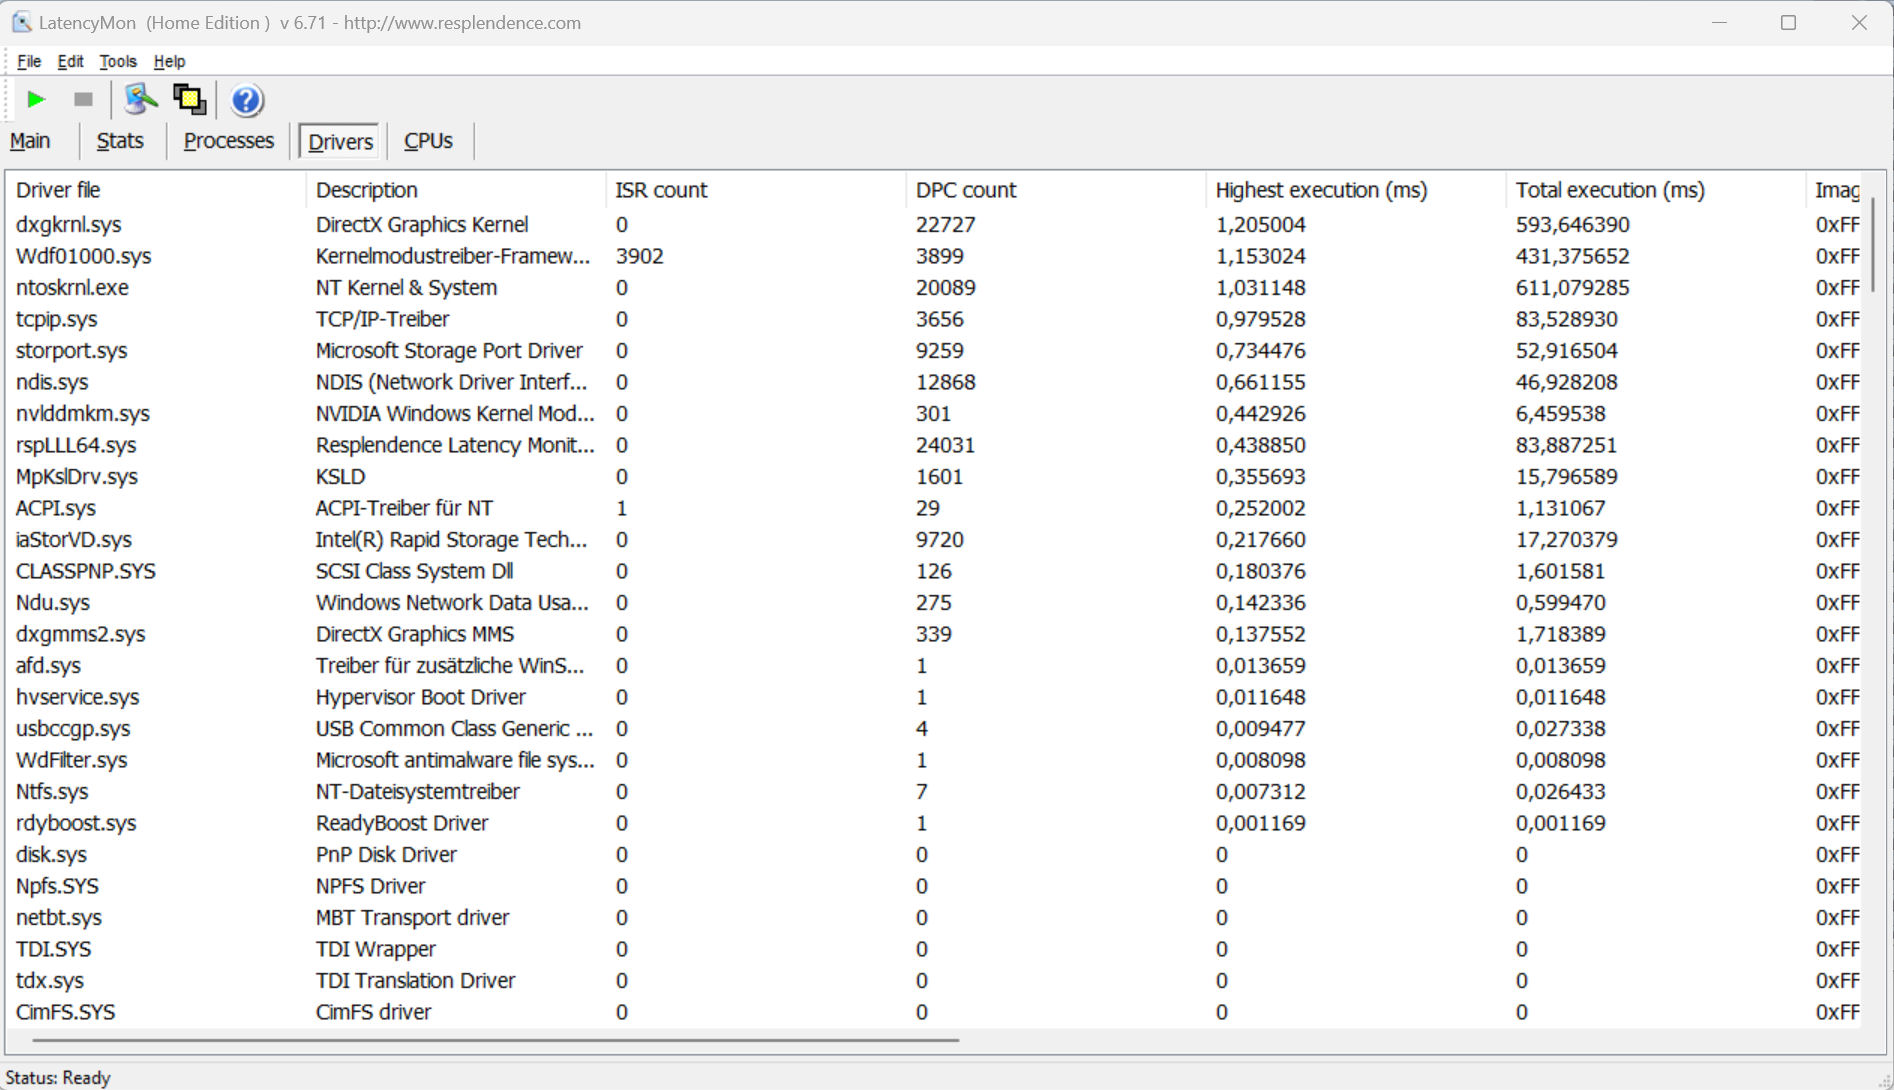
Standartlaştırılmış Latency Monitor testi (web'de gezinme, 4k video gösterimi ve Prime95 yüksek yük) bazı dikkat çekici davranışlar ortaya koyuyor ve sistem gerçek zamanlı video ve ses işleme için uygun görünmüyor. Gelecekteki yazılım güncellemeleri bazı iyileştirmeler getirebilir veya işleri daha da kötüleştirebilir.
| DPC Latencies / LatencyMon - interrupt to process latency (max), Web, Youtube, Prime95 | |
| Acer Predator Helios 18 N23Q2 | |
| Alienware m18 R1 | |
| MSI Titan 18 HX A14VIG | |
| Razer Blade 18 RTX 4070 | |
| Alienware m18 R1 AMD | |
| Asus ROG Strix Scar 18 G834JYR (2024) | |
| Asus ROG Strix Scar 18 2023 G834JY-N6005W | |
* ... daha küçük daha iyidir
Depolama Çözümü
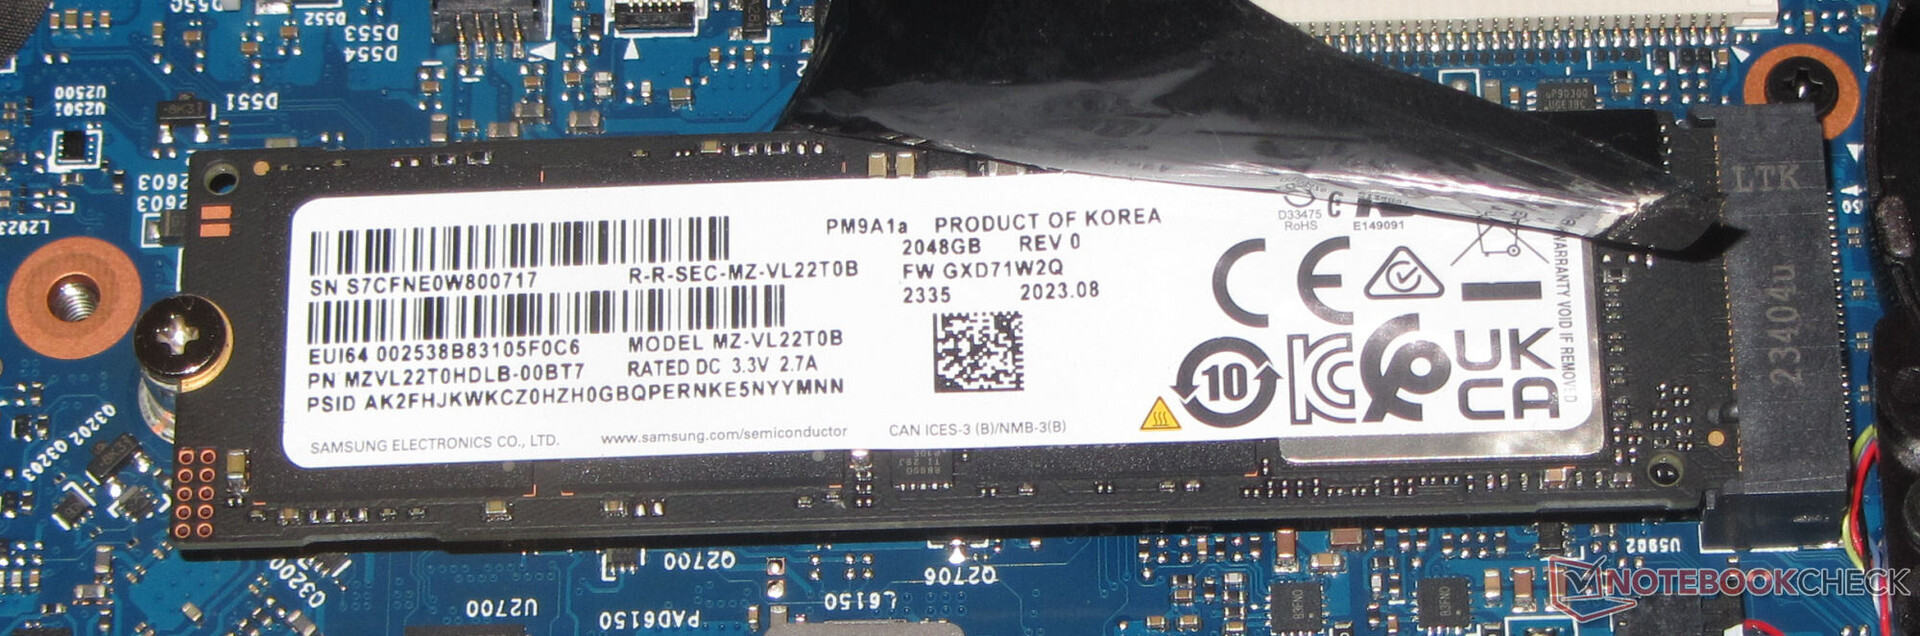
Scar 18, M.2-2280 formatında toplam iki PCIe 4 SSD'yi kabul edebilir ve RAID-0 da desteklenmektedir. Test ünitemizdeki 2 TB Samsung SSD mükemmel veri hızları sunmaktadır. Bir başka olumlu yönü de termal nedenli herhangi bir azaltma olmamasıdır.

* ... daha küçük daha iyidir
Disk Throttling: DiskSpd Read Loop, Queue Depth 8
Grafik Kartı
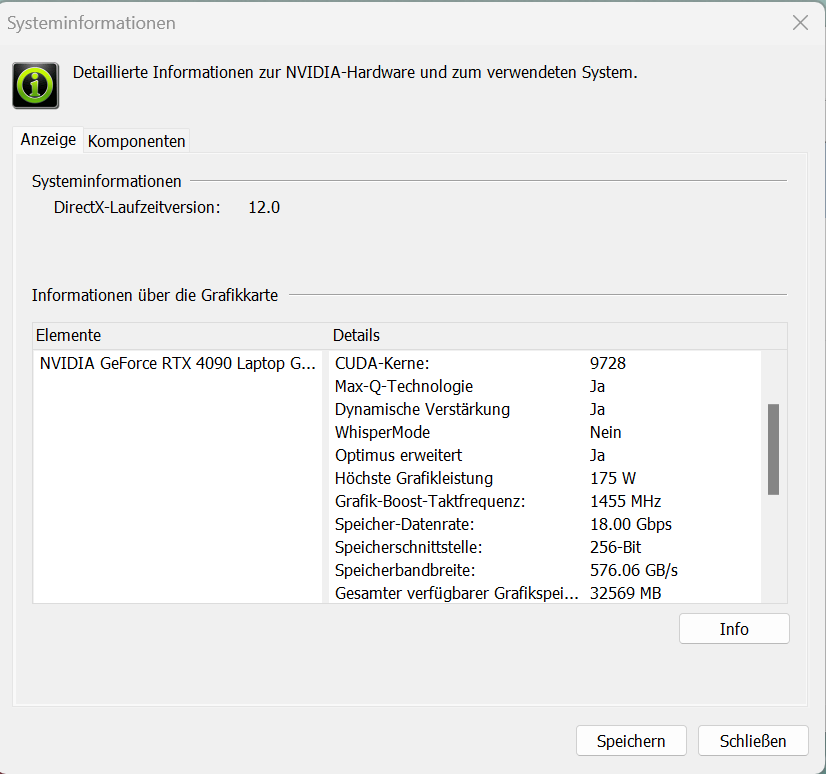
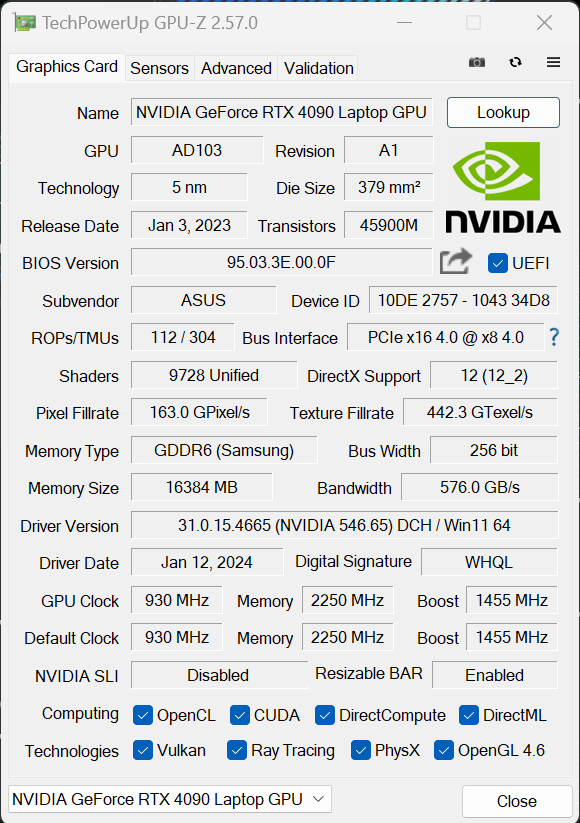
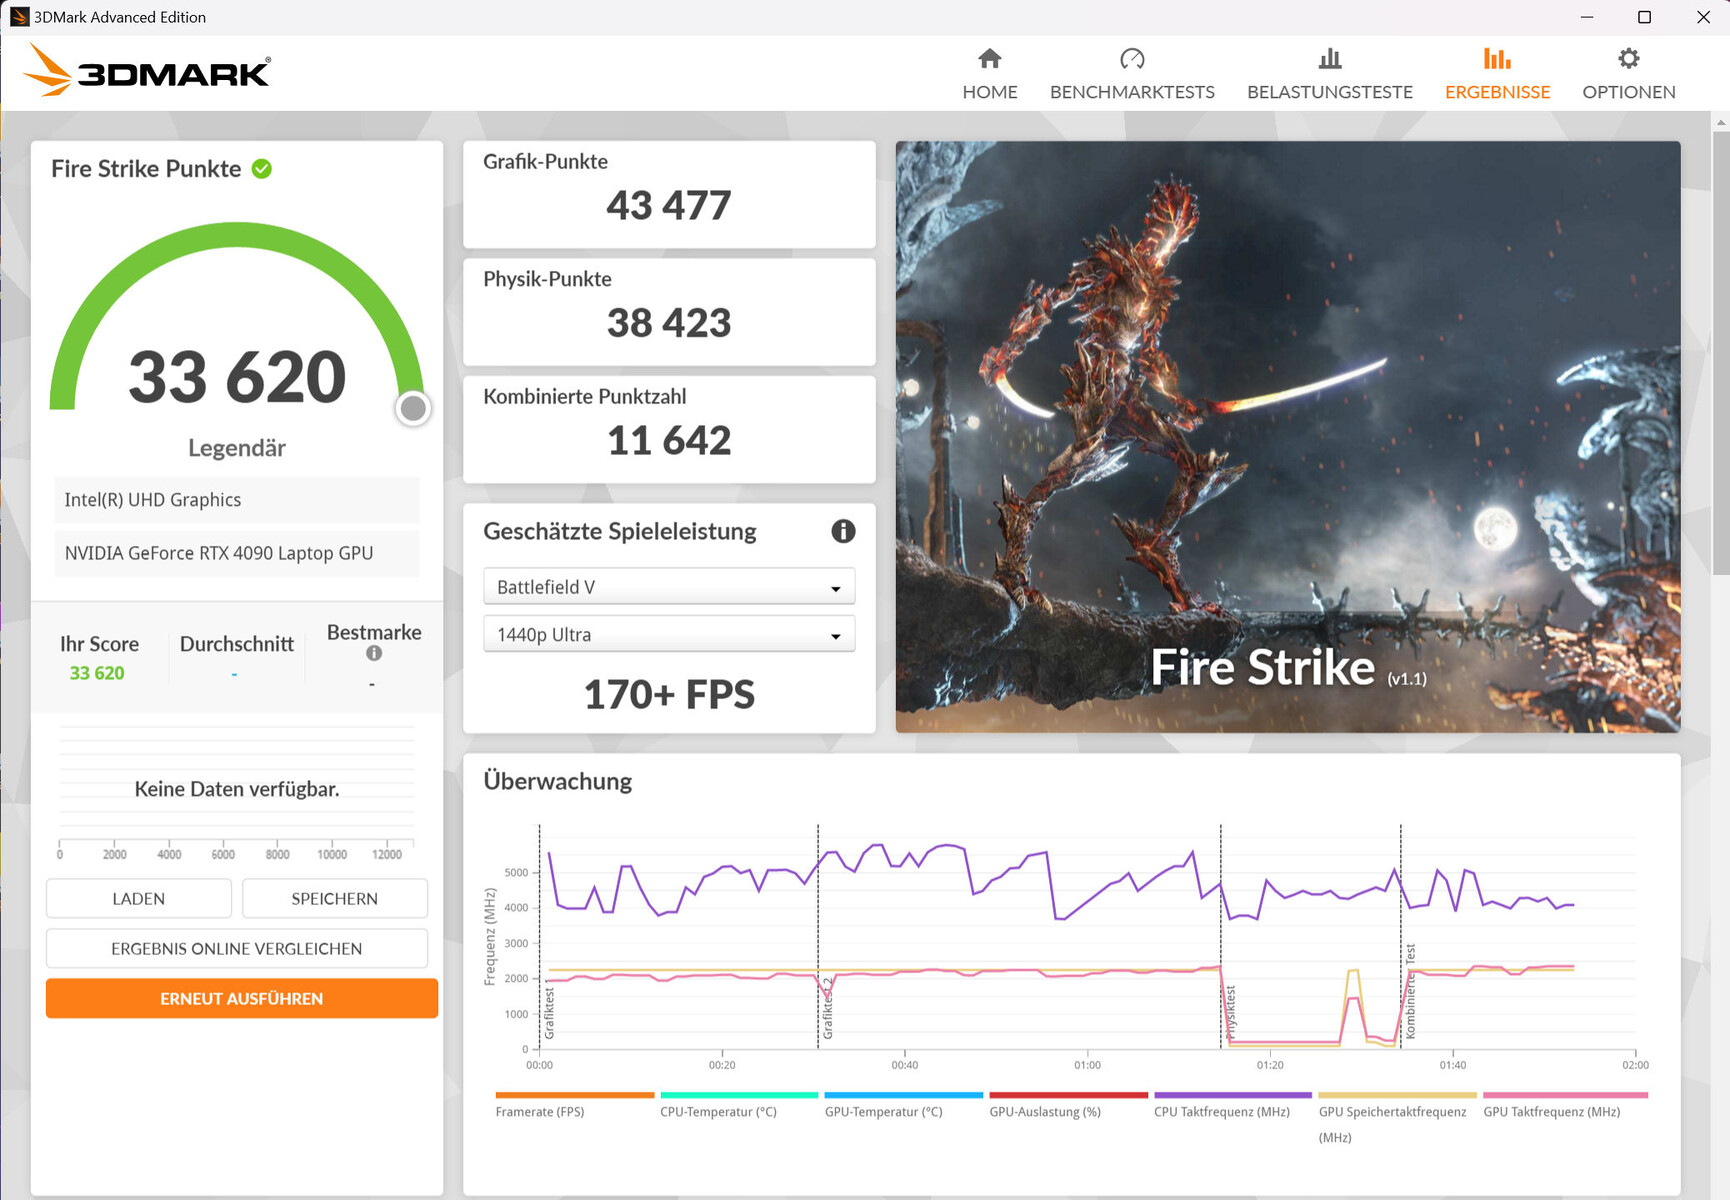
Ile GeForce RTX 4090asus, Nvidia'nın mobil GPU'lar arasındaki mevcut en üst modelini kullanıyor. Bu model 9.728 shader birimi, 256 bit depolama veri yolu sunuyor ve hızlı GDDR6 depolama (16.384 MB) kullanabiliyor. RTX 4090'a maksimum 175 watt (150 W + 25 W Dynamic Boost) TGP verilmiştir - daha fazlası mümkün değildir.
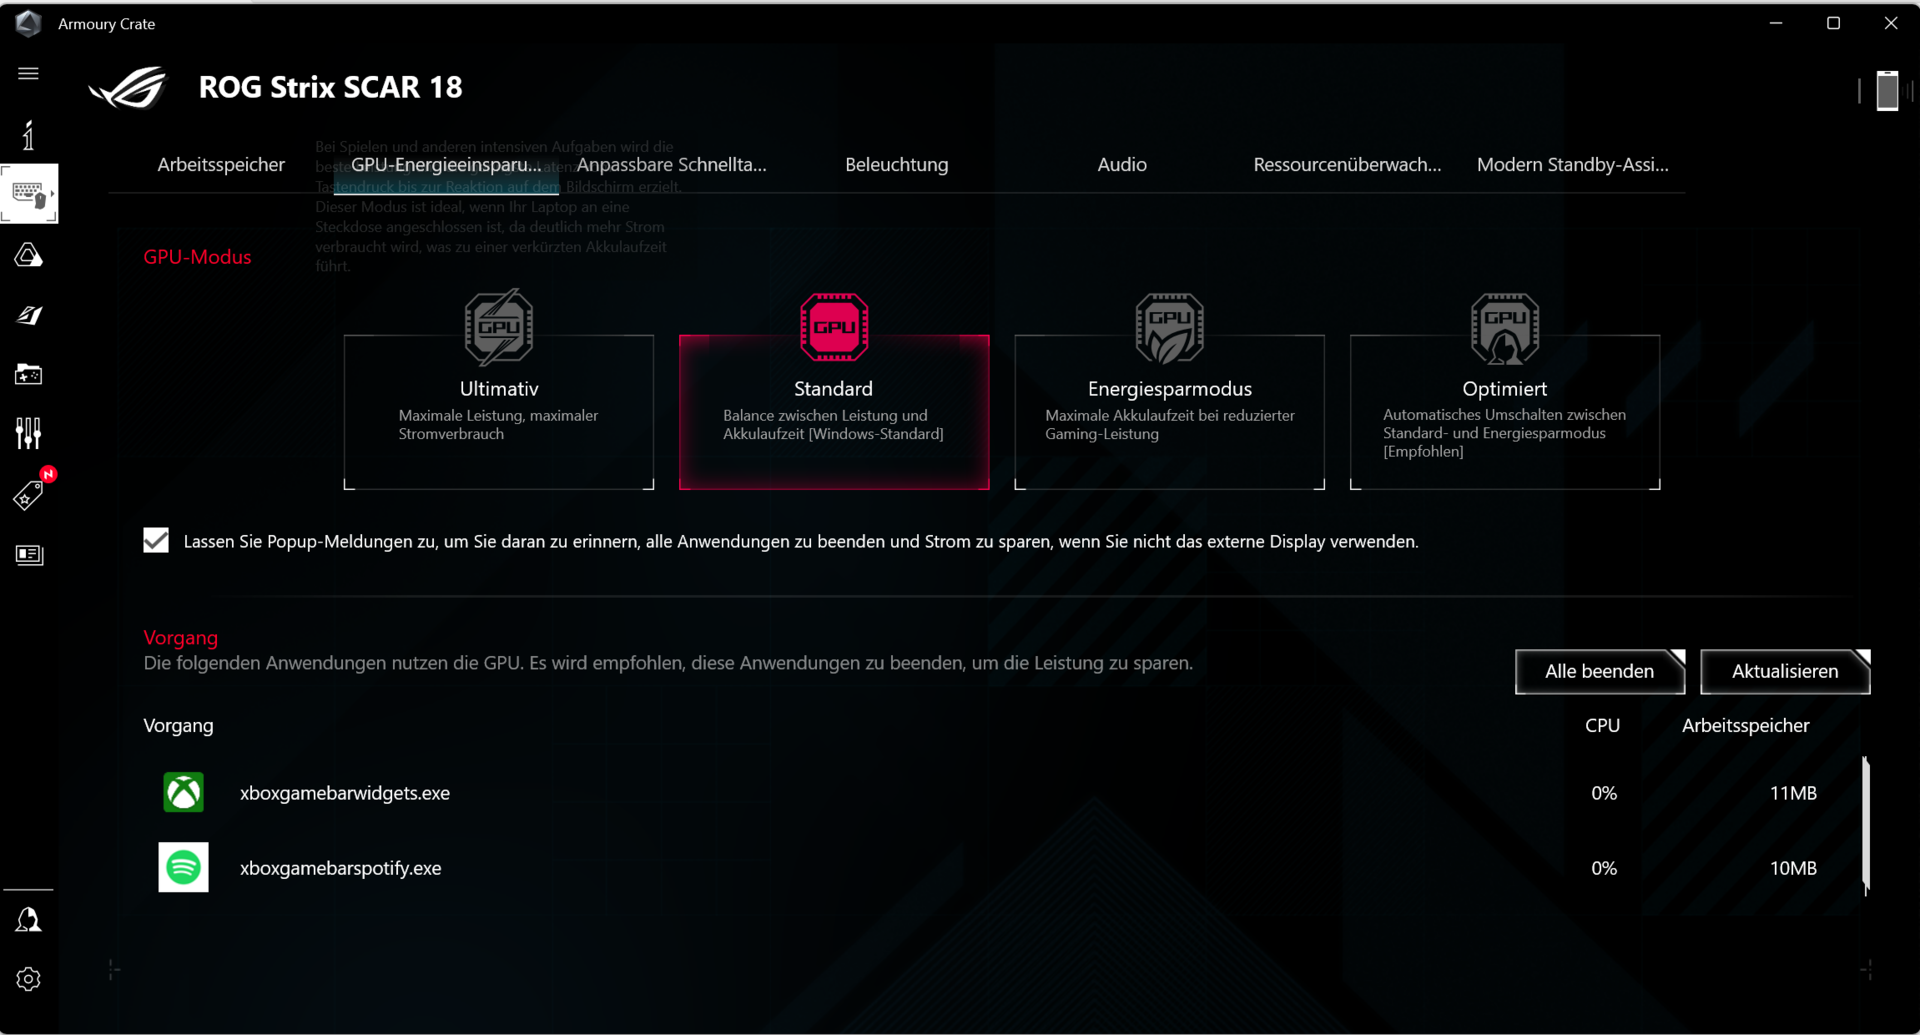
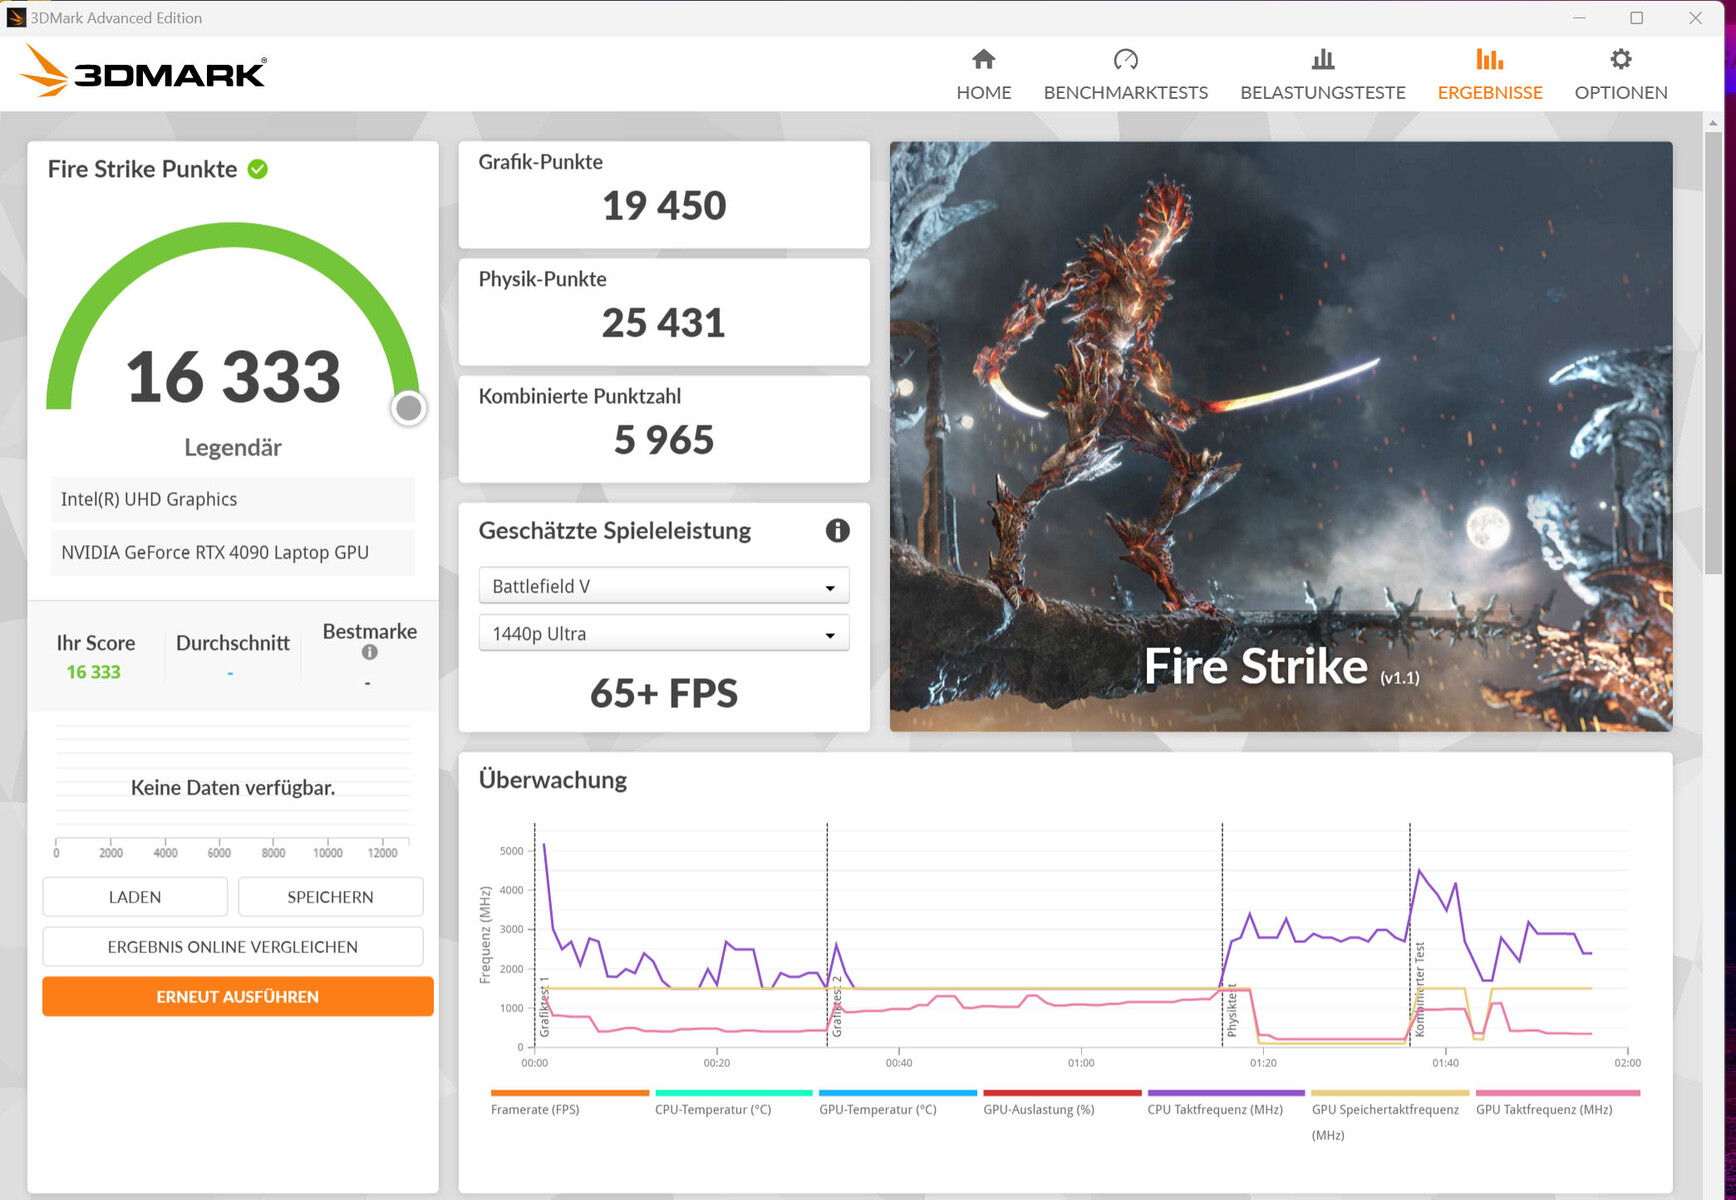
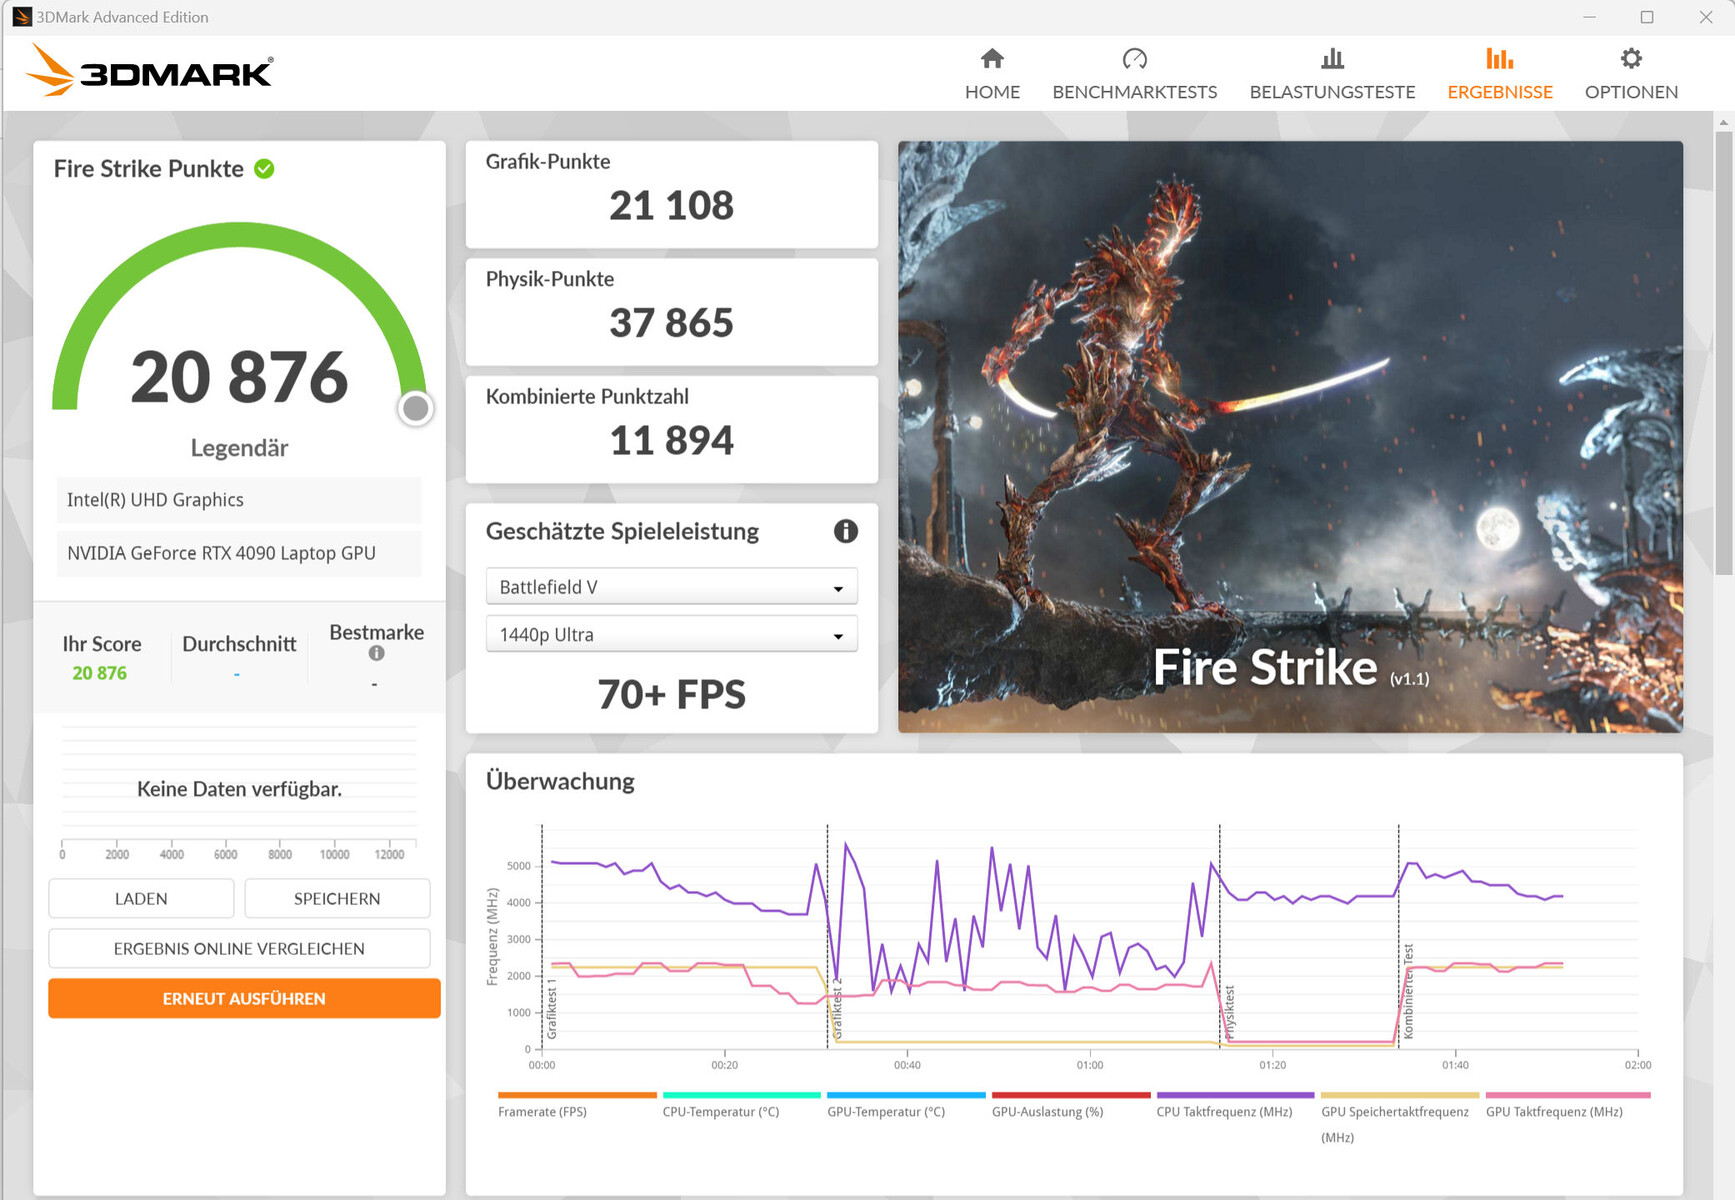
"Performans" modunda, kıyaslama sonuçları şimdiye kadar RTX 4090 için belirlenen ortalamanın altında değişirken, "Turbo" ortalama ile aynı seviyede değerlerle sonuçlanır. Gelişmiş Optimus destekleniyor ve dGPU ile Optimus arasında geçiş yapmak için yeniden başlatma gerekmiyor.

| 3DMark 11 Performance | 42985 puan | |
| 3DMark Cloud Gate Standard Score | 65110 puan | |
| 3DMark Fire Strike Score | 33620 puan | |
| 3DMark Time Spy Score | 19507 puan | |
Yardım | ||
| V-Ray Benchmark Next 4.10 | |
| GPU | |
| Asus ROG Strix Scar 18 2023 G834JY-N6005W (v4.10.07 ) | |
| Ortalama NVIDIA GeForce RTX 4090 Laptop GPU (873 - 1334, n=30) | |
| Asus ROG Strix Scar 18 G834JYR (2024) (v4.10.07 ) | |
| Acer Predator Helios 18 N23Q2 (v4.10.07 ) | |
| Sınıf ortalaması Gaming (427 - 1333, n=105, son 2 yıl) | |
| CPU | |
| Asus ROG Strix Scar 18 2023 G834JY-N6005W (v4.10.07 ) | |
| Acer Predator Helios 18 N23Q2 (v4.10.07 ) | |
| Ortalama NVIDIA GeForce RTX 4090 Laptop GPU (18206 - 37629, n=30) | |
| Asus ROG Strix Scar 18 G834JYR (2024) (v4.10.07 ) | |
| Sınıf ortalaması Gaming (10048 - 45327, n=104, son 2 yıl) | |
* ... daha küçük daha iyidir
Oyun Performansı
Scar 18, maksimum ayarlarda QHD+ oyun oynamaya izin verir. İlgili monitörü bağlarsanız daha yüksek çözünürlükler kullanılabilir. DLSS 3 ve Frame Generation desteği olan oyunlar, 4k çözünürlükte maksimum ayarlara ve ek ışın izleme efektlerine izin verir.
"Performans" modunda, test edilen oyunlarımızın kare hızları şimdiye kadar belirlenen RTX 4090 ortalamasının altında kalmaktadır. "Turbo "nun seçilmesi hafif bir artışa neden olabilir ve aynı şey "Ultimate" GPU modu için de geçerlidir.
| The Witcher 3 - 1920x1080 Ultra Graphics & Postprocessing (HBAO+) | |
| Alienware m18 R1 | |
| MSI Titan 18 HX A14VIG | |
| Ortalama NVIDIA GeForce RTX 4090 Laptop GPU (139.2 - 216, n=35) | |
| Asus ROG Strix Scar 18 G834JYR (2024) | |
| Acer Predator Helios 18 N23Q2 | |
| Sınıf ortalaması Gaming (95 - 240, n=8, son 2 yıl) | |
| Alienware m18 R1 AMD | |
| Razer Blade 18 RTX 4070 | |
| Call of Duty Modern Warfare 3 2023 | |
| 1920x1080 Extreme Preset | |
| Ortalama NVIDIA GeForce RTX 4090 Laptop GPU (148 - 205, n=7) | |
| Asus ROG Strix Scar 18 G834JYR (2024) | |
| Sınıf ortalaması Gaming (27 - 95, n=3, son 2 yıl) | |
| 2560x1440 Extreme Preset | |
| Asus ROG Strix Scar 18 G834JYR (2024) | |
| Ortalama NVIDIA GeForce RTX 4090 Laptop GPU (113 - 162, n=7) | |
| Sınıf ortalaması Gaming (54 - 66, n=2, son 2 yıl) | |
| The Finals | |
| 1920x1080 Epic Preset | |
| Asus ROG Strix Scar 18 G834JYR (2024) | |
| Ortalama NVIDIA GeForce RTX 4090 Laptop GPU (174.1 - 211, n=2) | |
| Sınıf ortalaması Gaming (n=1son 2 yıl) | |
| 2560x1440 Epic Preset | |
| Asus ROG Strix Scar 18 G834JYR (2024) | |
| Ortalama NVIDIA GeForce RTX 4090 Laptop GPU (137.2 - 147.4, n=2) | |
| Sınıf ortalaması Gaming (n=1son 2 yıl) | |
| 1920x1080 Epic Preset + Epic RTX Global Illumination | |
| Asus ROG Strix Scar 18 G834JYR (2024) | |
| Ortalama NVIDIA GeForce RTX 4090 Laptop GPU (159.8 - 190.8, n=2) | |
| Palworld | |
| 1920x1080 Epic Preset AA:TSR | |
| Asus ROG Strix Scar 18 G834JYR (2024) | |
| Ortalama NVIDIA GeForce RTX 4090 Laptop GPU (138.8 - 150.9, n=2) | |
| Sınıf ortalaması Gaming (n=1son 2 yıl) | |
| 2560x1440 Epic Preset AA:TSR | |
| Asus ROG Strix Scar 18 G834JYR (2024) | |
| Ortalama NVIDIA GeForce RTX 4090 Laptop GPU (110.5 - 119.8, n=2) | |
| Enshrouded | |
| 1920x1080 Max. Quality AA:FX | |
| Ortalama NVIDIA GeForce RTX 4090 Laptop GPU (79 - 101.5, n=3) | |
| Asus ROG Strix Scar 18 G834JYR (2024) | |
| Sınıf ortalaması Gaming (n=1son 2 yıl) | |
| 2560x1440 Max. Quality AA:FX | |
| Asus ROG Strix Scar 18 G834JYR (2024) | |
| Ortalama NVIDIA GeForce RTX 4090 Laptop GPU (61.8 - 76, n=3) | |
Kare hızlarının daha uzun bir süre boyunca oldukça sabit kalıp kalmadığını değerlendirmek için, "The Witcher 3" oyununu maksimum kalite ayarlarında Full-HD çözünürlükte yaklaşık 60 dakika boyunca çalıştırdık. Oyun karakteri hareket ettirilmiyor. Kare hızlarında herhangi bir düşüş gözlemlemiyoruz.
The Witcher 3 FPS Chart
| düşük | orta | yüksek | ultra | QHD | |
|---|---|---|---|---|---|
| GTA V (2015) | 187.5 | 187.1 | 181.2 | 136 | 129.6 |
| The Witcher 3 (2015) | 579.6 | 501.7 | 342.8 | 189.4 | 151.5 |
| Dota 2 Reborn (2015) | 219 | 194.5 | 173.9 | 161.3 | |
| Final Fantasy XV Benchmark (2018) | 221 | 198.1 | 166.1 | 143.6 | |
| X-Plane 11.11 (2018) | 197.9 | 172.4 | 136.8 | ||
| Far Cry 5 (2018) | 176 | 163 | 156 | 145 | 145 |
| Strange Brigade (2018) | 429 | 350 | 341 | 331 | 279 |
| Starfield (2023) | 112.7 | 100 | 84.2 | 78.4 | 66 |
| Cyberpunk 2077 (2023) | 134.8 | 121.5 | 117.7 | 112.1 | 83.8 |
| Call of Duty Modern Warfare 3 2023 (2023) | 229 | 210 | 169 | 162 | 162 |
| The Finals (2023) | 228 | 216 | 214 | 211 | 147.4 |
| Palworld (2024) | 211 | 180.9 | 151.3 | 150.9 | 119.8 |
| Enshrouded (2024) | 135.2 | 120.1 | 100.8 | 87.6 | 68.9 |
Emisyonlar - G834JYR sessiz çalışabilir
Gürültü Emisyonları
Tam yük altında, gürültü seviyesi "Performans" modunda 52 dB(A)'ya kadar yükselir. "Turbo" ile değer biraz daha yükselir ve aşağıdakilerle bir karşılaştırma yapılır 2023'ten itibaren Scar 18 aynı olduğunu gösterir. Çalışması da genel olarak daha sessiz olabilir: "Sessiz" modu seçerek performanstan vazgeçerseniz, gürültü seviyesi 35 dB(A)'ya düşer. Boşta çalışırken veya günlük kullanımda (Ofis, İnternet), genellikle iki fandan yalnızca biri çalışır ve bazen her ikisi de sessiz kalır, özellikle de "Sessiz" profili kullanılırken.
Ses yüksekliği
| Boşta |
| 27 / 28 / 32 dB |
| Çalışırken |
| 50 / 52 dB |
 | ||
30 dB sessiz 40 dB(A) duyulabilirlik 50 dB(A) gürültülü |
||
min: | ||
| Asus ROG Strix Scar 18 G834JYR (2024) i9-14900HX, GeForce RTX 4090 Laptop GPU | Alienware m18 R1 AMD R9 7945HX, Radeon RX 7900M | Alienware m18 R1 i9-13980HX, GeForce RTX 4090 Laptop GPU | Acer Predator Helios 18 N23Q2 i9-13900HX, GeForce RTX 4080 Laptop GPU | Razer Blade 18 RTX 4070 i9-13950HX, GeForce RTX 4070 Laptop GPU | MSI Titan 18 HX A14VIG i9-14900HX, GeForce RTX 4090 Laptop GPU | Asus ROG Strix Scar 18 2023 G834JY-N6005W i9-13980HX, GeForce RTX 4090 Laptop GPU | |
|---|---|---|---|---|---|---|---|
| Noise | 8% | 12% | 6% | 10% | 5% | 2% | |
| kapalı / ortam * (dB) | 24 | 22.4 7% | 22.8 5% | 23 4% | 23.5 2% | 22.8 5% | 23.9 -0% |
| Idle Minimum * (dB) | 27 | 23 15% | 23 15% | 23 15% | 23.8 12% | 23.8 12% | 23.9 11% |
| Idle Average * (dB) | 28 | 23.4 16% | 23 18% | 23 18% | 23.8 15% | 23.8 15% | 32.6 -16% |
| Idle Maximum * (dB) | 32 | 33.5 -5% | 23 28% | 23 28% | 26.8 16% | 28 12% | 32.6 -2% |
| Load Average * (dB) | 50 | 33.5 33% | 35.6 29% | 45.26 9% | 37.3 25% | 38 24% | 35.9 28% |
| Witcher 3 ultra * (dB) | 50 | 53.6 -7% | 51.3 -3% | 59.82 -20% | 48 4% | 57.3 -15% | |
| Load Maximum * (dB) | 52 | 53.6 -3% | 56.7 -9% | 59.94 -15% | 53.5 -3% | 62.8 -21% | 55.8 -7% |
* ... daha küçük daha iyidir
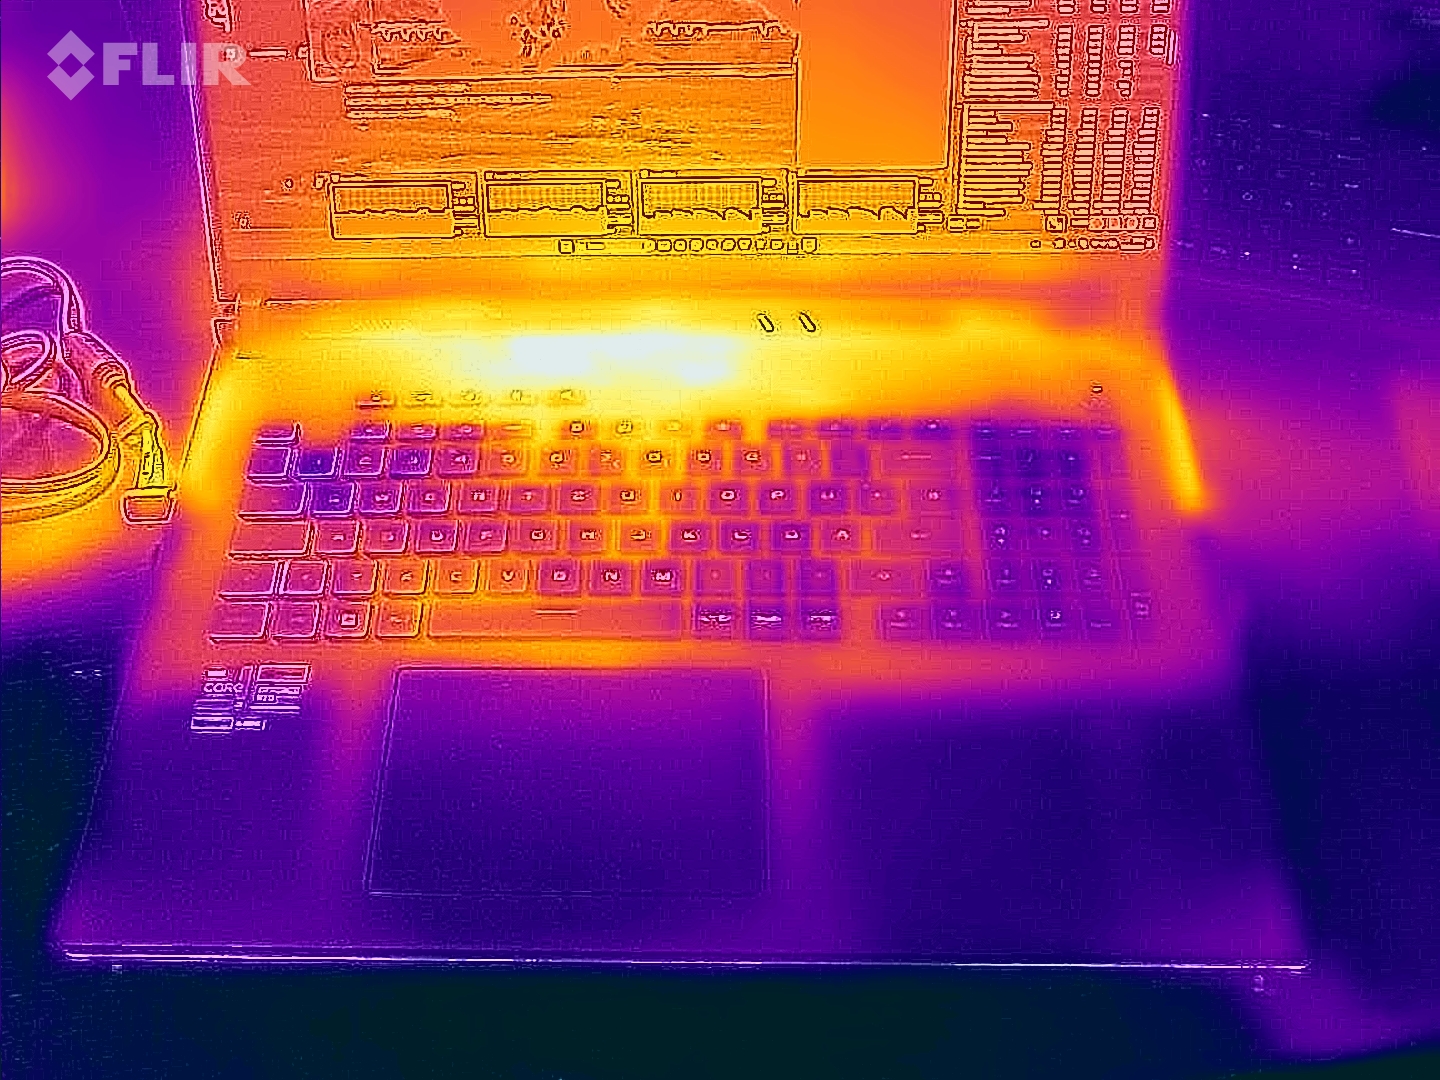
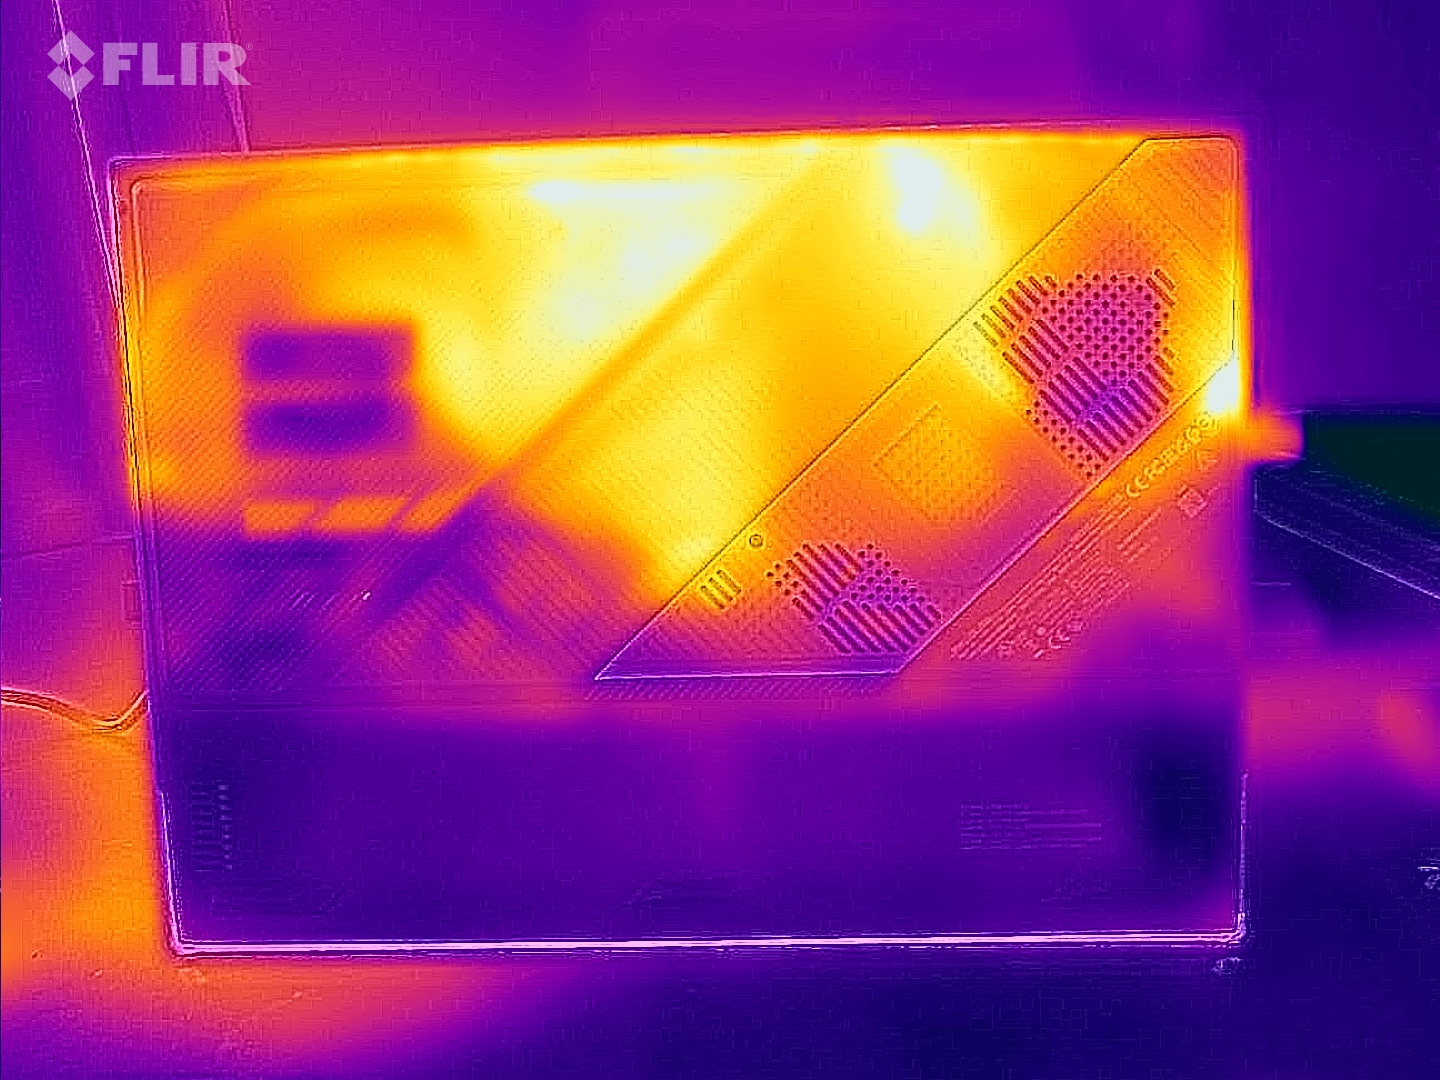
Sıcaklıklar
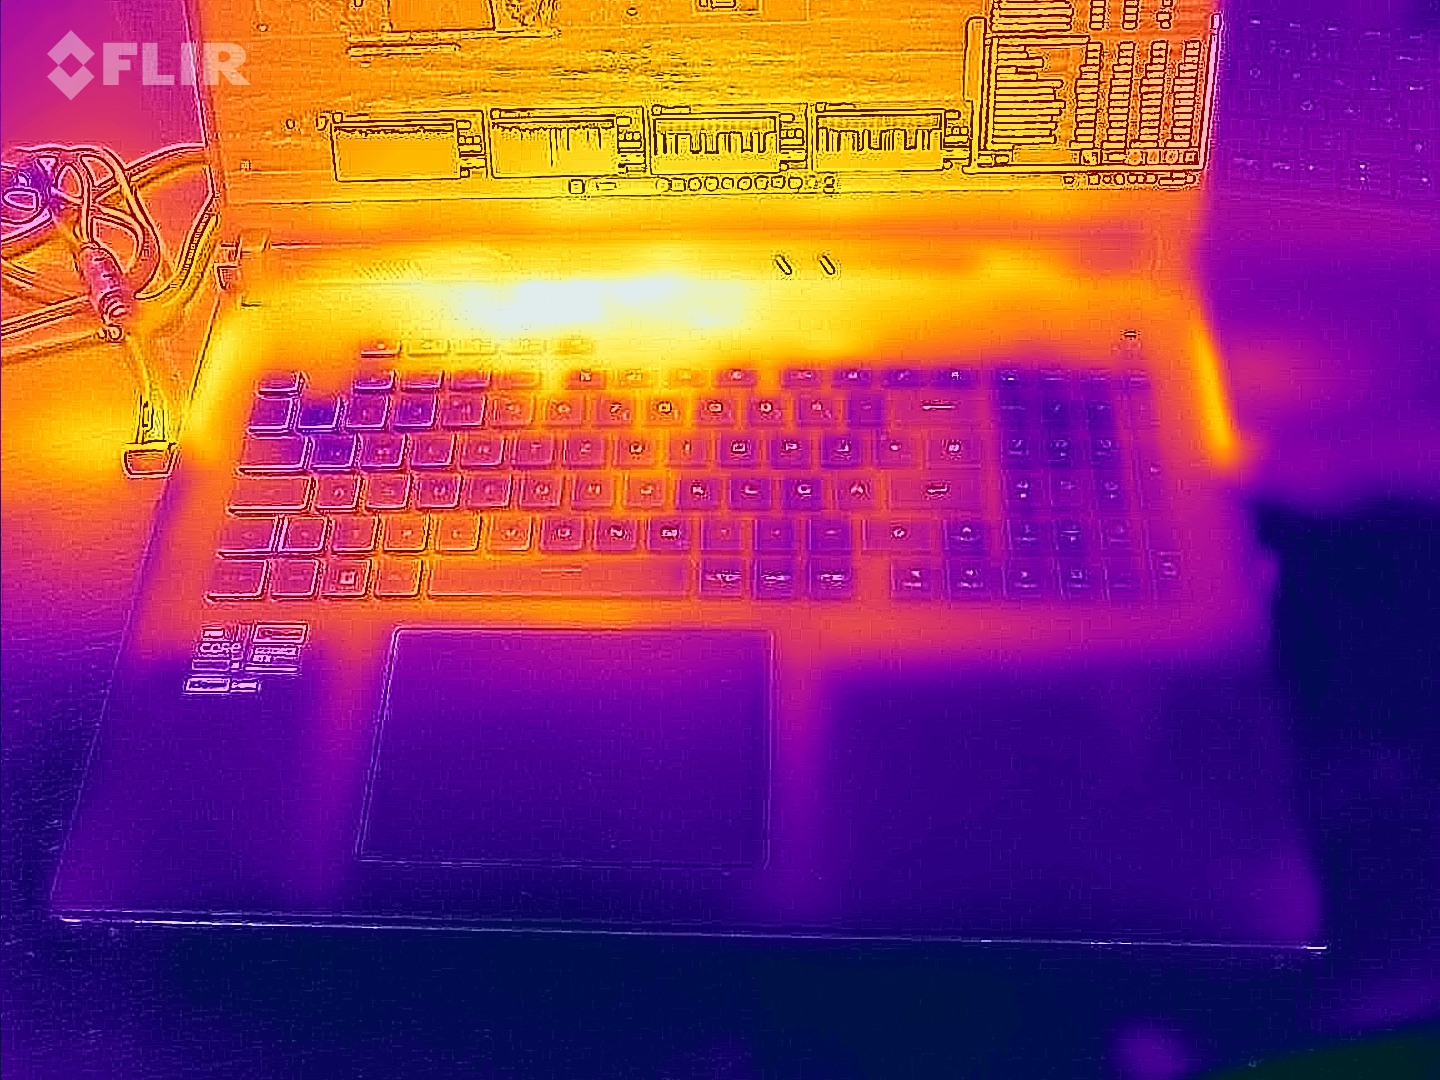
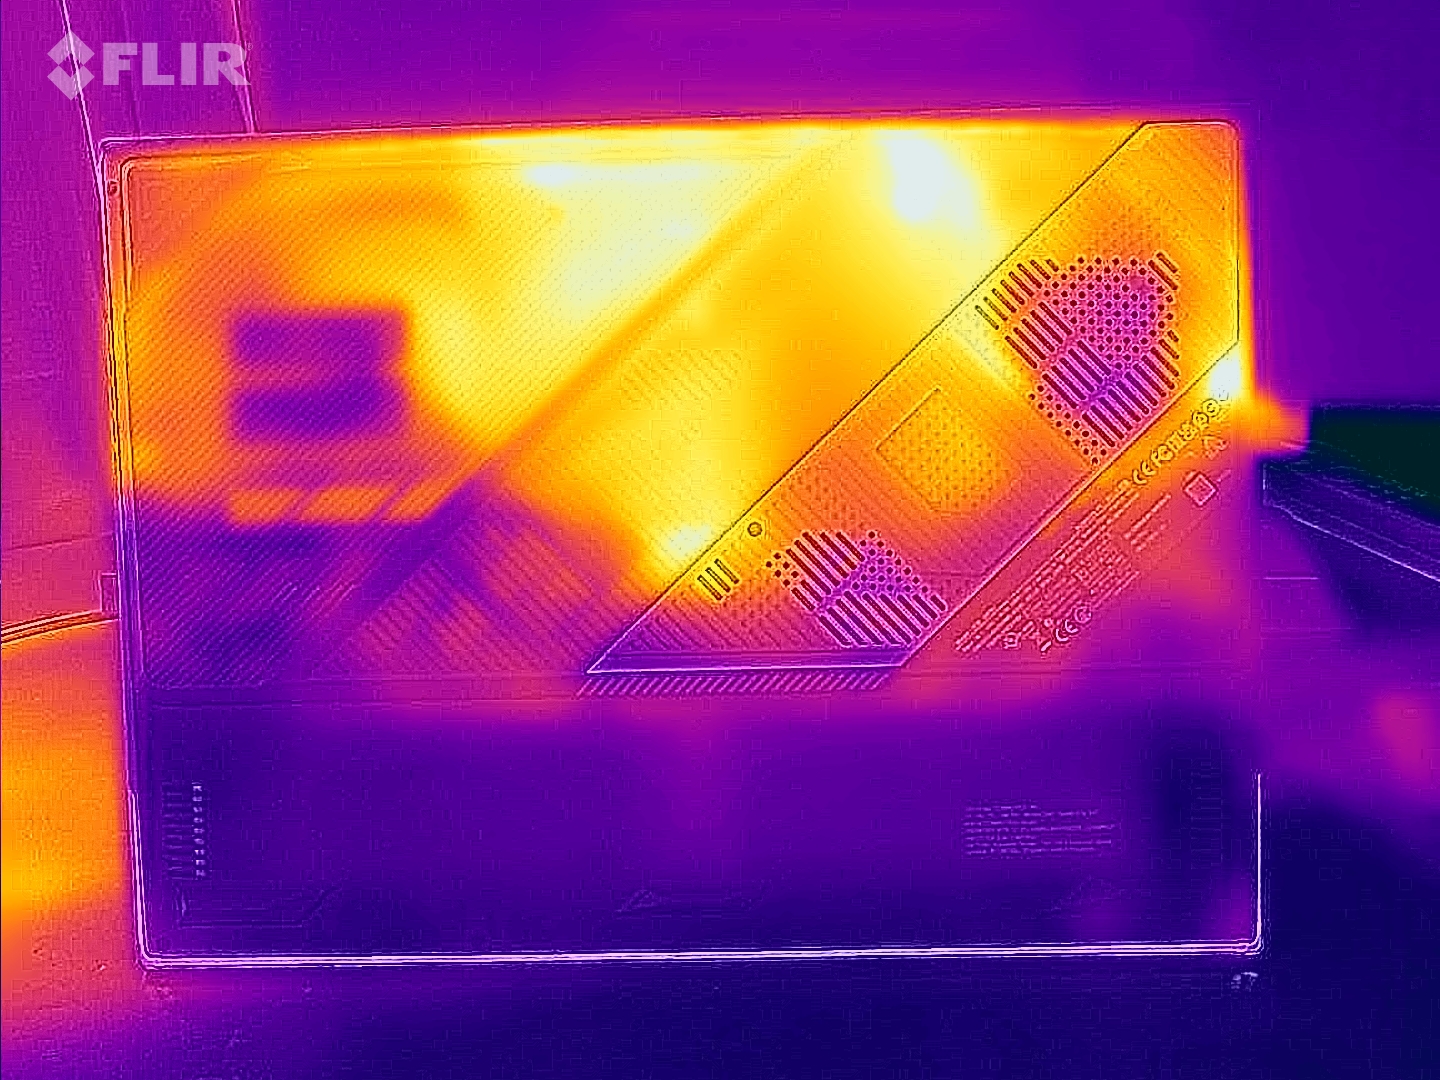
Stres testi ve Witcher 3 testi, dizüstü bilgisayarda fark edilir ancak aşırı olmayan bir ısınmaya neden olur. Bazı noktalarda 50 ºC'nin (122 ºF) üzerindeki değerlere ulaşılır. Ancak günlük kullanım sırasında (Ofis, İnternet) sıcaklıklar yeşil aralıkta kalır.
(-) Üst taraftaki maksimum sıcaklık, 40.4 °C / 105 F ortalamasına kıyasla 49 °C / 120 F'dir. , Gaming sınıfı için 21.2 ile 68.8 °C arasında değişir.
(-) Alt kısım, 43.2 °C / 110 F ortalamasına kıyasla maksimum 47 °C / 117 F'ye kadar ısınır
(+) Boşta kullanımda, üst tarafın ortalama sıcaklığı 27.3 °C / 81 F olup, cihazın 33.9 °C / 93 F.
(-) The Witcher 3 oynarken, üst tarafın ortalama sıcaklığı 39.1 °C / 102 F olup, cihazın 33.9 °C / 93 F.
(+) Avuç içi dayanakları ve dokunmatik yüzey maksimum (35 °C / 95 F) cilt sıcaklığına ulaşıyor ve bu nedenle sıcak değil.
(-) Benzer cihazların avuç içi dayanağı alanının ortalama sıcaklığı 28.8 °C / 83.8 F (-6.2 °C / -11.2 F) idi.
| Asus ROG Strix Scar 18 G834JYR (2024) Intel Core i9-14900HX, NVIDIA GeForce RTX 4090 Laptop GPU | Alienware m18 R1 AMD AMD Ryzen 9 7945HX, AMD Radeon RX 7900M | Alienware m18 R1 Intel Core i9-13980HX, NVIDIA GeForce RTX 4090 Laptop GPU | Acer Predator Helios 18 N23Q2 Intel Core i9-13900HX, NVIDIA GeForce RTX 4080 Laptop GPU | Razer Blade 18 RTX 4070 Intel Core i9-13950HX, NVIDIA GeForce RTX 4070 Laptop GPU | MSI Titan 18 HX A14VIG Intel Core i9-14900HX, NVIDIA GeForce RTX 4090 Laptop GPU | Asus ROG Strix Scar 18 2023 G834JY-N6005W Intel Core i9-13980HX, NVIDIA GeForce RTX 4090 Laptop GPU | |
|---|---|---|---|---|---|---|---|
| Heat | 8% | 13% | -8% | 7% | 2% | -3% | |
| Maximum Upper Side * (°C) | 49 | 40.2 18% | 39 20% | 35 29% | 39.2 20% | 37.8 23% | 54 -10% |
| Maximum Bottom * (°C) | 47 | 37.4 20% | 36.4 23% | 56 -19% | 35.6 24% | 37.6 20% | 46 2% |
| Idle Upper Side * (°C) | 29 | 31.6 -9% | 29.2 -1% | 34 -17% | 31.8 -10% | 34.8 -20% | 30 -3% |
| Idle Bottom * (°C) | 31 | 30.6 1% | 27.8 10% | 39 -26% | 33.2 -7% | 36 -16% | 31 -0% |
* ... daha küçük daha iyidir
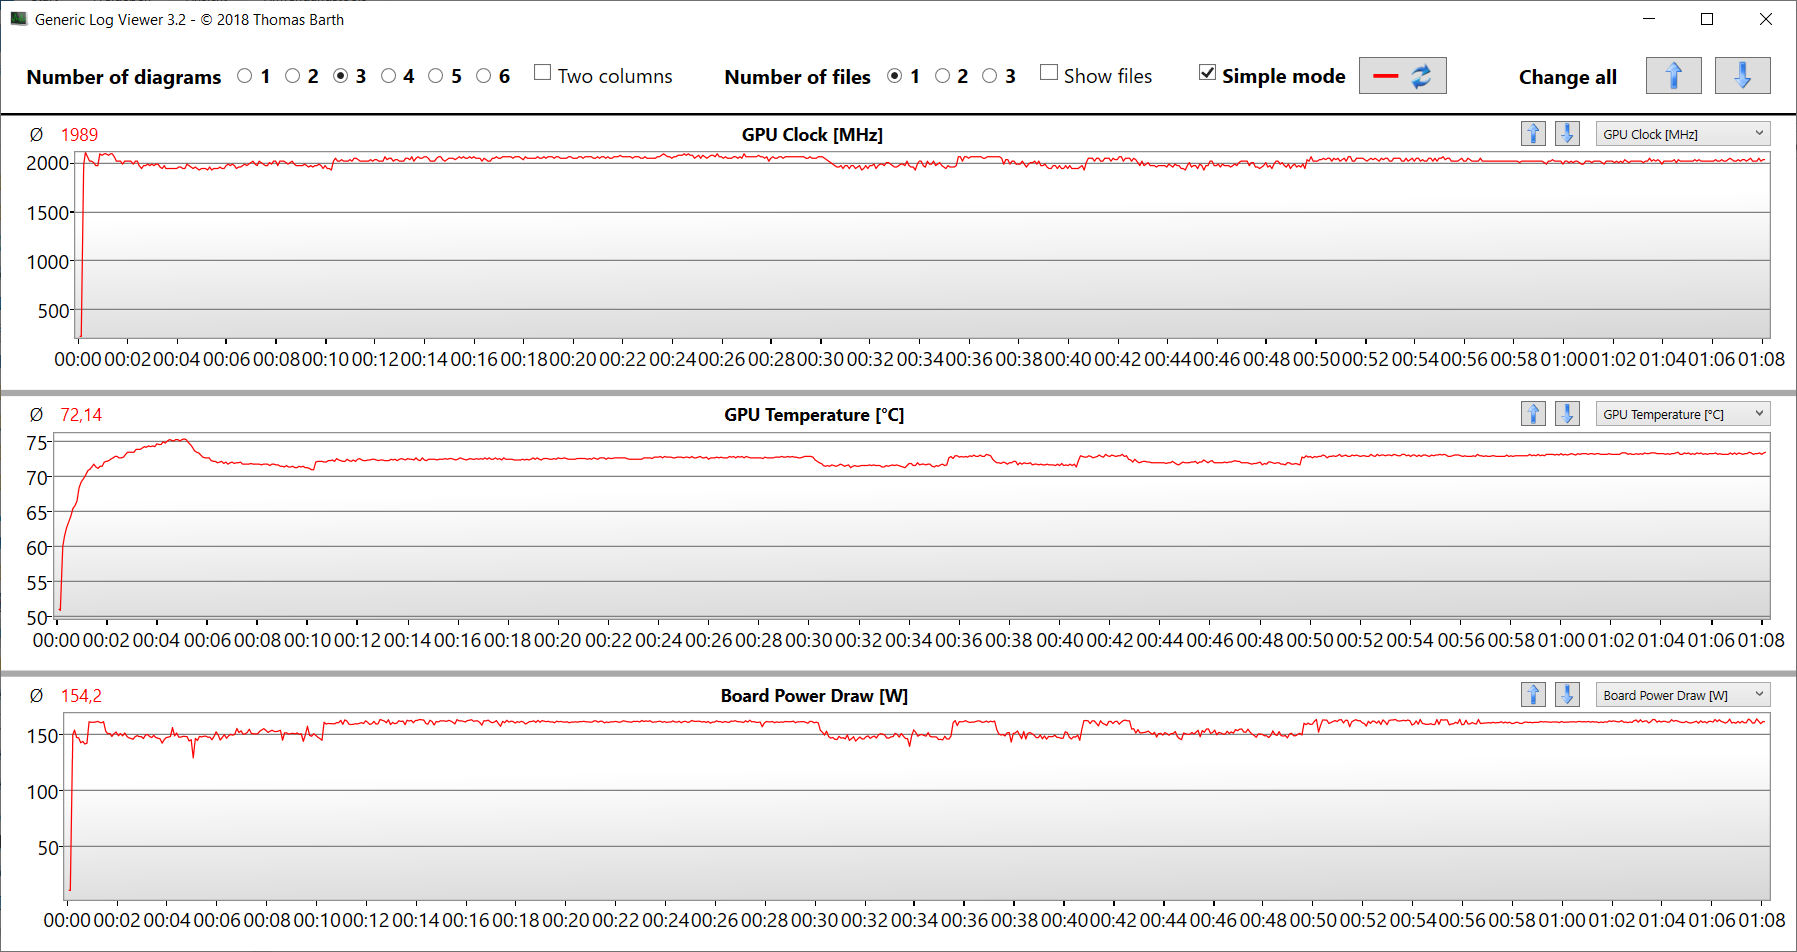
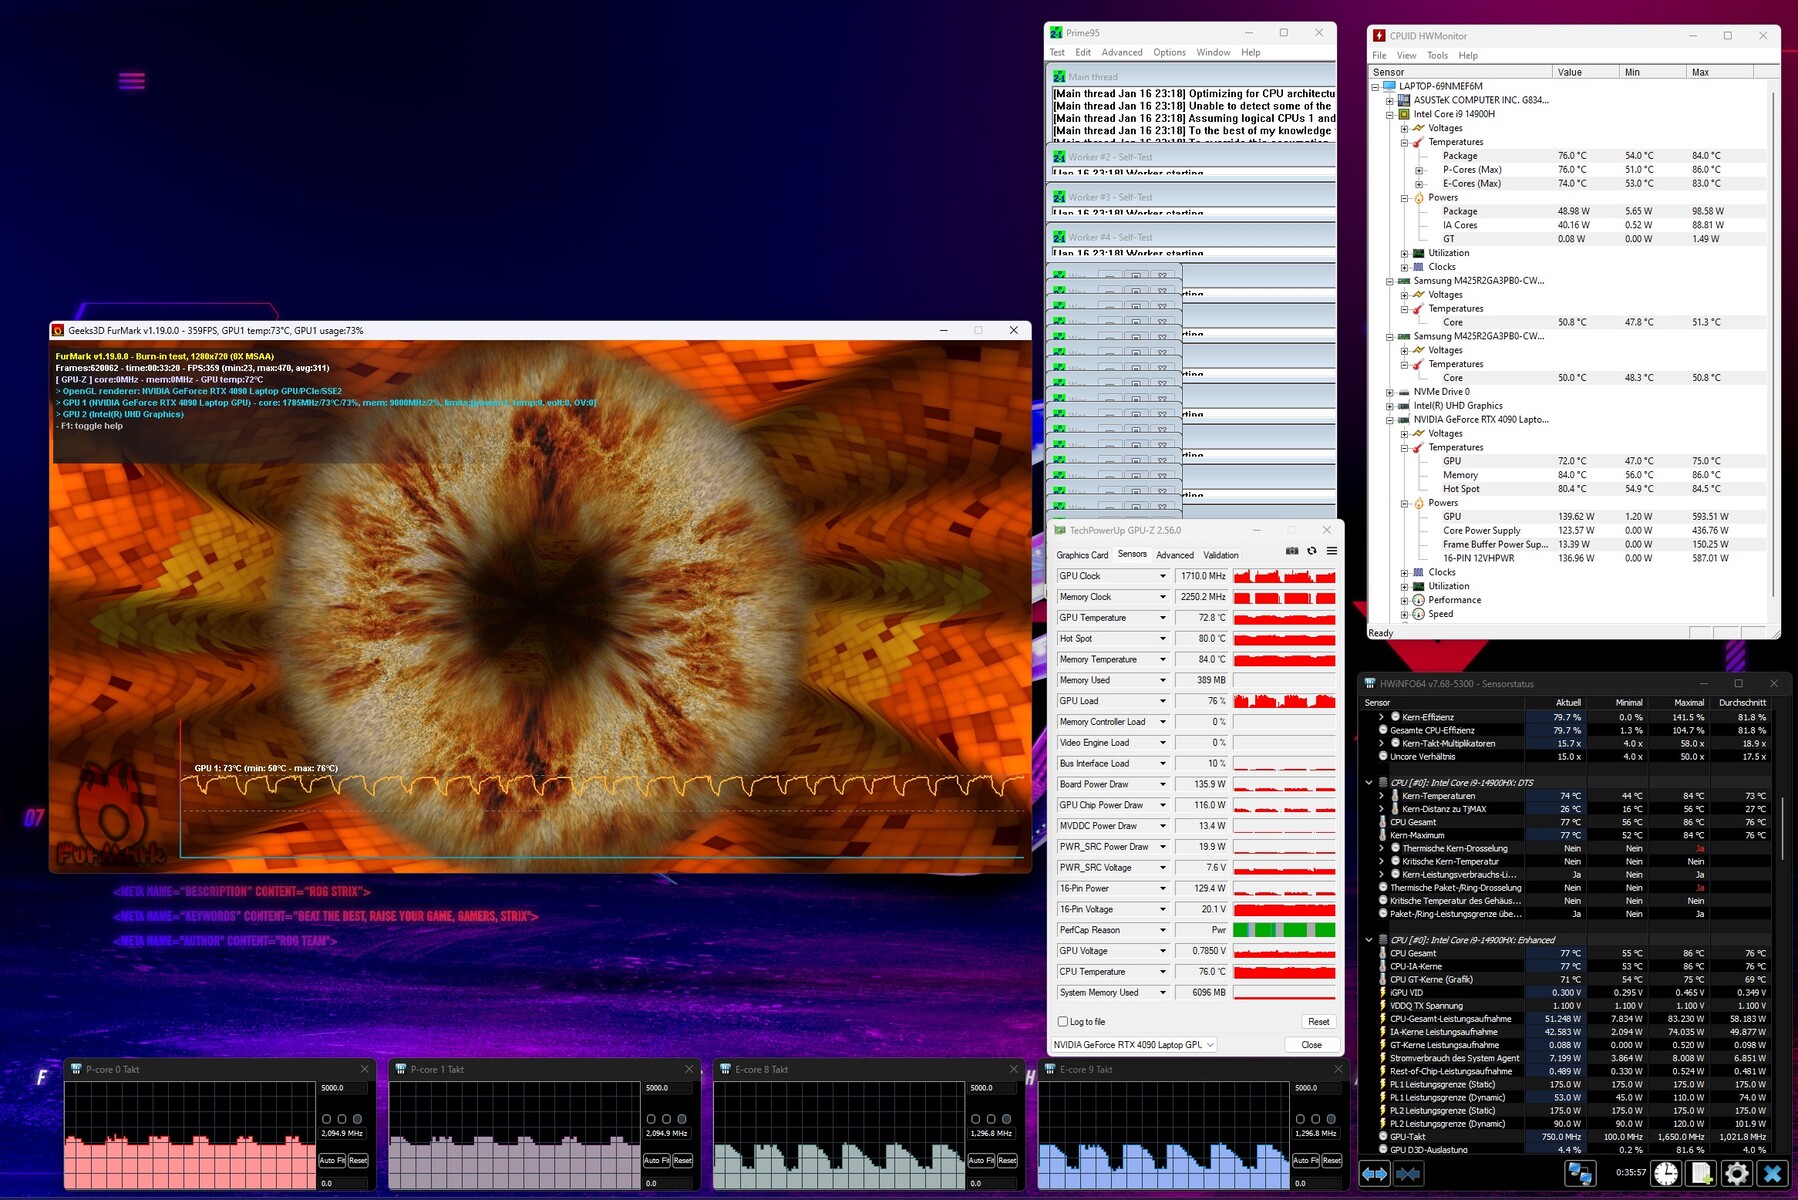
Stres Testi
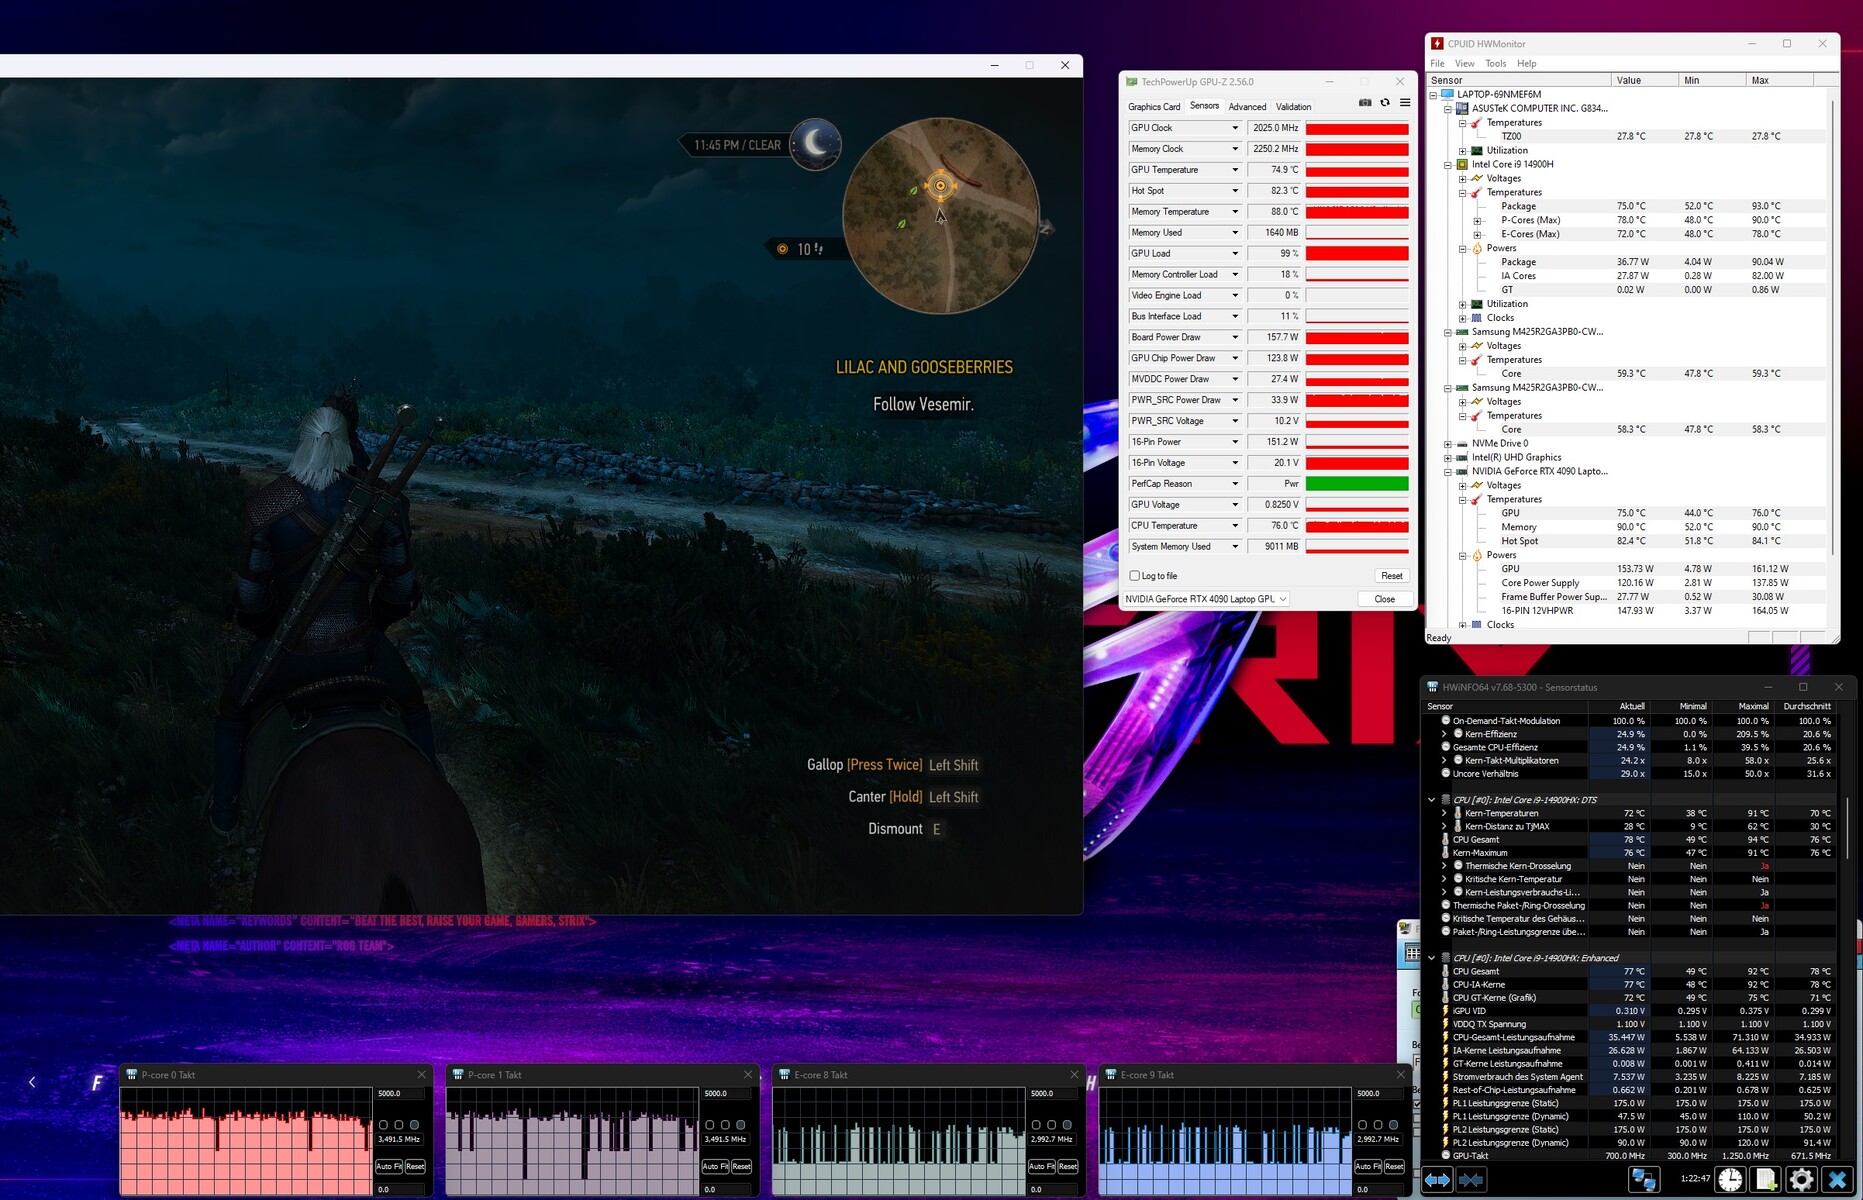
Stres testi (Prime95 ve Furmark sürekli çalışırken), tam yük altında sistem kararlılığını değerlendirmek için aşırı bir senaryoyu temsil eder. CPU maksimum 2,5 ila 2,6 GHz (P çekirdekleri) ve 2,2 ila 2,3 GHz (E çekirdekleri) hızlarına ulaşır. GPU (1,9 ila 2 GHz) teste neredeyse tam hızda başlar ve test devam ettikçe hız biraz düşer. Buna ek olarak, GPU düzenli olarak önemli ölçüde yavaşlatılır.
Konuşmacılar
Dört hoparlör birlikte çok iyi bir ses üretir. Daha iyi bir ses deneyimi için bir kulaklık veya harici hoparlörler kullanabilirsiniz.
Asus ROG Strix Scar 18 G834JYR (2024) ses analizi
(+) | hoparlörler nispeten yüksek sesle çalabilir (82 dB)
Bas 100 - 315Hz
(±) | azaltılmış bas - ortalama olarak medyandan 5.6% daha düşük
(+) | bas doğrusaldır (6.8% delta ile önceki frekans)
Ortalar 400 - 2000 Hz
(±) | daha yüksek ortalar - ortalama olarak medyandan 5.7% daha yüksek
(+) | orta frekanslar doğrusaldır (2.8% deltadan önceki frekansa)
Yüksekler 2 - 16 kHz
(±) | azaltılmış yüksekler - ortalama olarak medyandan 7.2% daha düşük
(±) | Yükseklerin doğrusallığı ortalamadır (7.2% delta - önceki frekans)
Toplam 100 - 16.000 Hz
(+) | genel ses doğrusaldır (13% ortancaya göre fark)
Aynı sınıfla karşılaştırıldığında
» Bu sınıftaki tüm test edilen cihazların %18%'si daha iyi, 3% benzer, 79% daha kötüydü
» En iyisinin deltası 6% idi, ortalama 18% idi, en kötüsü 132% idi
Test edilen tüm cihazlarla karşılaştırıldığında
» Test edilen tüm cihazların %13'si daha iyi, 2 benzer, % 85 daha kötüydü
» En iyisinin deltası 4% idi, ortalama 24% idi, en kötüsü 134% idi
MSI Titan 18 HX A14VIG ses analizi
(+) | hoparlörler nispeten yüksek sesle çalabilir (89.2 dB)
Bas 100 - 315Hz
(-) | neredeyse hiç bas yok - ortalama olarak medyandan 17.6% daha düşük
(±) | Bas doğrusallığı ortalamadır (8% delta - önceki frekans)
Ortalar 400 - 2000 Hz
(+) | dengeli ortalar - medyandan yalnızca 1.8% uzakta
(+) | orta frekanslar doğrusaldır (3.7% deltadan önceki frekansa)
Yüksekler 2 - 16 kHz
(+) | dengeli yüksekler - medyandan yalnızca 1.2% uzakta
(+) | yüksekler doğrusaldır (2% deltadan önceki frekansa)
Toplam 100 - 16.000 Hz
(+) | genel ses doğrusaldır (9.9% ortancaya göre fark)
Aynı sınıfla karşılaştırıldığında
» Bu sınıftaki tüm test edilen cihazların %5%'si daha iyi, 2% benzer, 94% daha kötüydü
» En iyisinin deltası 6% idi, ortalama 18% idi, en kötüsü 132% idi
Test edilen tüm cihazlarla karşılaştırıldığında
» Test edilen tüm cihazların %4'si daha iyi, 1 benzer, % 95 daha kötüydü
» En iyisinin deltası 4% idi, ortalama 24% idi, en kötüsü 134% idi
Güç Yönetimi - Asus ROG oldukça iyi bir pil ömrüne ulaşıyor
Güç Tüketimi
Witcher 3 testi sırasında güç tüketimi beklenen bir seviyede sabit kalırken, stres testi sırasında tüketim değişmektedir. Bu değişim, GPU hızında düzenli olarak meydana gelen önemli bir düşüşe kadar izlenebilir. 330 Watt'lık şarj cihazı yeterli miktarda güç sağlar.
| Kapalı / Bekleme modu | |
| Boşta | |
| Çalışırken |
|
Key:
min: | |
| Asus ROG Strix Scar 18 G834JYR (2024) i9-14900HX, GeForce RTX 4090 Laptop GPU | Alienware m18 R1 AMD R9 7945HX, Radeon RX 7900M | Alienware m18 R1 i9-13980HX, GeForce RTX 4090 Laptop GPU | Acer Predator Helios 18 N23Q2 i9-13900HX, GeForce RTX 4080 Laptop GPU | Razer Blade 18 RTX 4070 i9-13950HX, GeForce RTX 4070 Laptop GPU | MSI Titan 18 HX A14VIG i9-14900HX, GeForce RTX 4090 Laptop GPU | Asus ROG Strix Scar 18 2023 G834JY-N6005W i9-13980HX, GeForce RTX 4090 Laptop GPU | Sınıf ortalaması Gaming | |
|---|---|---|---|---|---|---|---|---|
| Power Consumption | -112% | -48% | -4% | -40% | -40% | -35% | 7% | |
| Idle Minimum * (Watt) | 14 | 30.3 -116% | 21.6 -54% | 16 -14% | 24.5 -75% | 13.2 6% | 17.3 -24% | 13.2 ? 6% |
| Idle Average * (Watt) | 17 | 55.6 -227% | 25.2 -48% | 19 -12% | 34.1 -101% | 25.4 -49% | 27 -59% | 18.9 ? -11% |
| Idle Maximum * (Watt) | 24 | 101.1 -321% | 56.7 -136% | 21.3 11% | 47.7 -99% | 53.5 -123% | 46 -92% | 24.3 ? -1% |
| Load Average * (Watt) | 143 | 160.3 -12% | 164.1 -15% | 124 13% | 140 2% | 151.4 -6% | 133 7% | 108 ? 24% |
| Witcher 3 ultra * (Watt) | 251 | 216 14% | 311 -24% | 289 -15% | 202 20% | 336 -34% | ||
| Load Maximum * (Watt) | 302 | 332.1 -10% | 338.9 -12% | 319 -6% | 261 14% | 395.2 -31% | 329 -9% | 254 ? 16% |
* ... daha küçük daha iyidir
Power Consumption The Witcher 3 / Stress Test
Power Consumption With External Monitor
Pil Ömrü
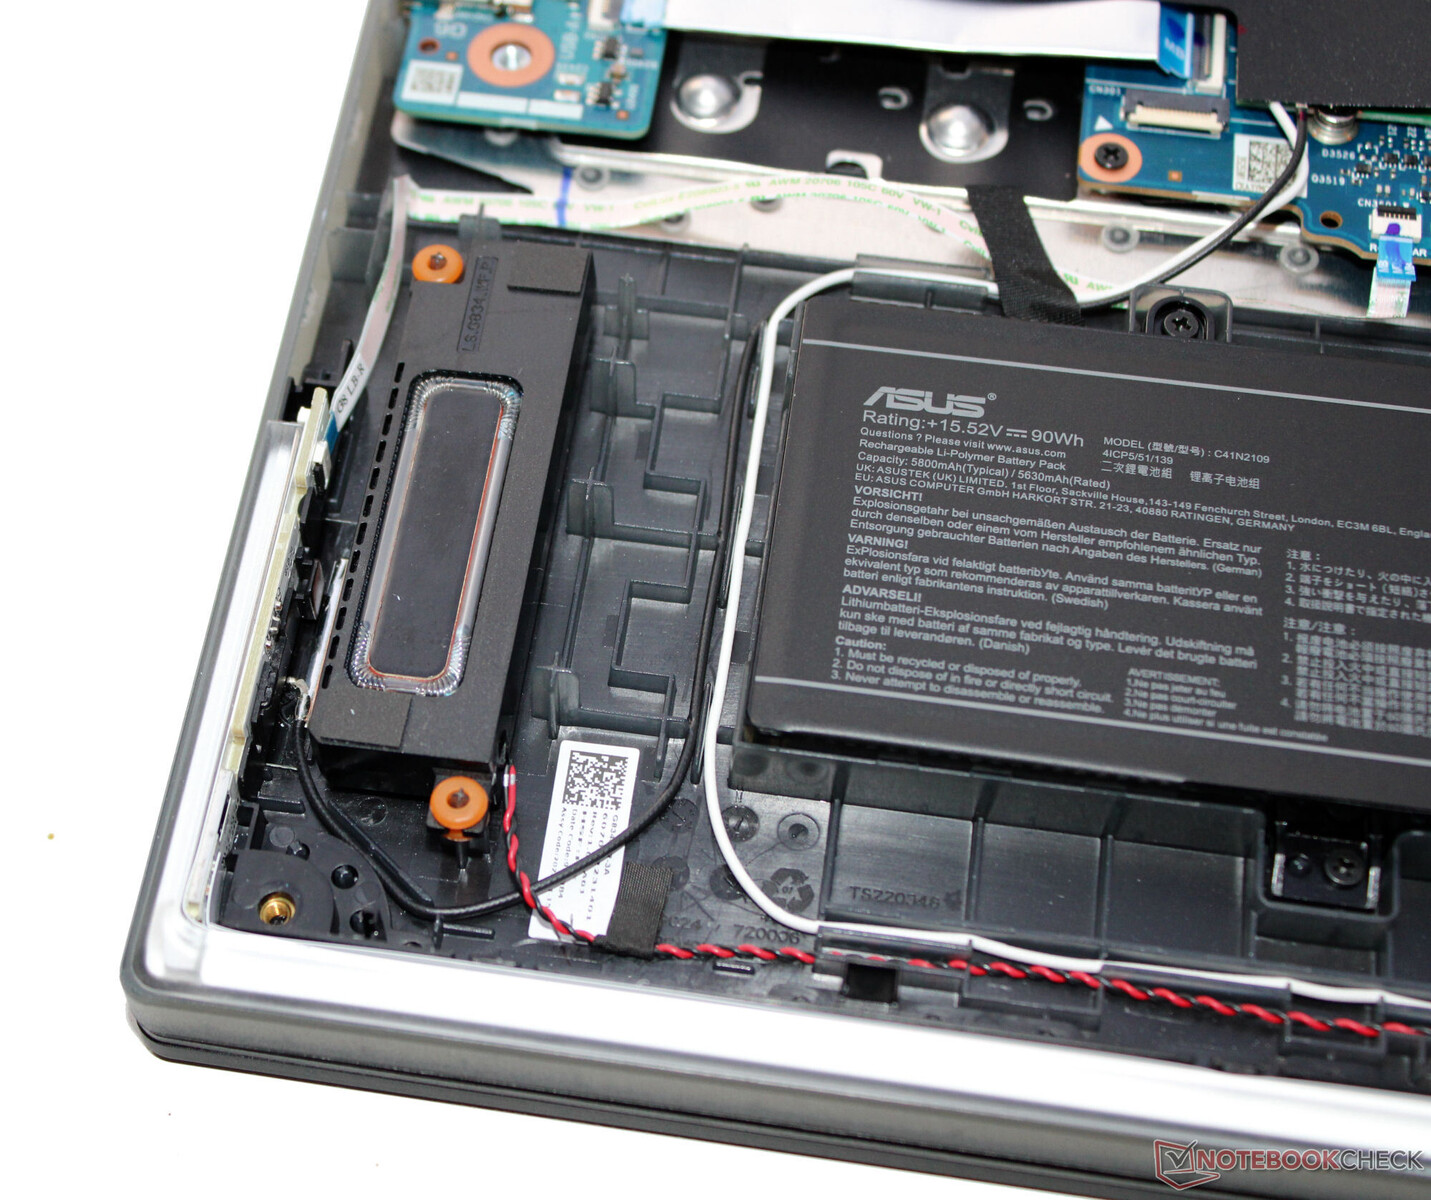
Komut dosyası aracılığıyla web sitelerini yükleyen WLAN testimizde ve Big Buck Bunny (H.264 kodlama, FHD) kısa filmini sürekli bir döngüde oynatan video testimizde, 18 inç dizüstü bilgisayar sırasıyla 7:41 saat ve 7:27 saat çalışma sürelerine ulaşıyor. Yani Scar 18 genel olarak çok iyi değerler sunuyor ve pil kapasiteleri kısmen daha büyük olmasına rağmen rakiplerini önemli farklarla geride bırakabiliyor.
| Asus ROG Strix Scar 18 G834JYR (2024) i9-14900HX, GeForce RTX 4090 Laptop GPU, 90 Wh | Alienware m18 R1 AMD R9 7945HX, Radeon RX 7900M, 97 Wh | Alienware m18 R1 i9-13980HX, GeForce RTX 4090 Laptop GPU, 97 Wh | Acer Predator Helios 18 N23Q2 i9-13900HX, GeForce RTX 4080 Laptop GPU, 90 Wh | Razer Blade 18 RTX 4070 i9-13950HX, GeForce RTX 4070 Laptop GPU, 91.7 Wh | MSI Titan 18 HX A14VIG i9-14900HX, GeForce RTX 4090 Laptop GPU, 99.9 Wh | Asus ROG Strix Scar 18 2023 G834JY-N6005W i9-13980HX, GeForce RTX 4090 Laptop GPU, 90 Wh | Sınıf ortalaması Gaming | |
|---|---|---|---|---|---|---|---|---|
| Pil Çalışma Süresi | -61% | -45% | -16% | -26% | -32% | -15% | -0% | |
| Reader / Idle (h) | 10.2 | 4.5 -56% | 5.6 -45% | 7 -31% | 5.9 -42% | 8.71 ? -15% | ||
| H.264 (h) | 7.5 | 4.8 -36% | 7 -7% | 8.26 ? 10% | ||||
| WiFi v1.3 (h) | 7.7 | 1.4 -82% | 4.3 -44% | 4.4 -43% | 4 -48% | 4.2 -45% | 7.1 -8% | 7.02 ? -9% |
| Load (h) | 1.3 | 0.7 -46% | 0.7 -46% | 1.7 31% | 1.3 0% | 1.2 -8% | 0.9 -31% | 1.47 ? 13% |
| Witcher 3 ultra (h) | 0.9 |
Artılar
Eksiler
Karar - İyileştirme için yer var
Video ve görüntü işleme, akış, render ve oyun dizüstü bilgisayarın ana kullanım senaryoları arasında yer alıyor. Süre GeForce RTX 4090 ve Core i9-14900HX gerekli performansı sağlamakla birlikte yeni rekorlara ulaşmazlar. Emisyonlar, bu cihaz sınıfı için olağan olan yüksek seviyelerde seyrediyor.
ROG Strix Scar 18 (2024) ile Asus, yüksek bir fiyata güçlü bir üst düzey dizüstü bilgisayar sunuyor.
Dizüstü bilgisayarın en önemli özelliği, 16:10 formatında 18 inç diyagonal mini LED ekranı (2560x1600 piksel, DCI-P3, Dolby Vision, 240 Hz). Olumlu yönleri arasında neredeyse 1.000 cd/m² maksimum parlaklık, çok iyi bir siyah değeri ve yüksek renk doğruluğu yer alıyor.
USB-C bağlantı noktaları (1x USB 3.2 Gen 2, 1x Thunderbolt 4), mevcut işyeri kurulumlarına entegrasyonunu kolaylaştırır ve harici bir GPU veya yerleştirme istasyonu gibi bazı genişletme seçeneklerinin önünü açar. Her iki USB-C portu da DisplayPort sinyal çıkışı için kullanılabilir ve USB 3.2 Gen 2 portu da Güç Dağıtımı'nı destekler. Tüm bunlara çok iyi bir pil ömrü eşlik ediyor.
Bir alternatif de şu olabilir MSI Titan 18 HX A14VIGaynı CPU/GPU kombinasyonundan biraz daha yüksek bir performans elde edebilen Strix, 4k mini LED ekran sunuyor ve iki TB4 portu ile puan topluyor. Ancak MSI dizüstü bilgisayar, Strix'in pil ömrüne ulaşmaya yaklaşamıyor.
Fiyat ve Bulunabilirlik
Asus ROG Strix Scar 18 (2024), Asus mağazasından $3,000 civarında bir fiyatla temin edilebilir ve örneğin Amazon'dan da aynı fiyata. Test ünitemize benzer bir konfigürasyon Amazon'dan~3,900$'a temin edilebilir.
Asus ROG Strix Scar 18 G834JYR (2024)
- 02/07/2024 v7 (old)
Sascha Mölck
Şeffaflık
İncelenecek cihazların seçimi editör ekibimiz tarafından yapılır. Test örneği, bu incelemenin amacı doğrultusunda üretici veya perakendeci tarafından yazara ödünç olarak sağlanmıştır. Borç verenin bu inceleme üzerinde herhangi bir etkisi olmadığı gibi, üretici de yayınlanmadan önce bu incelemenin bir kopyasını almamıştır. Bu incelemeyi yayınlama zorunluluğu yoktu. Bağımsız bir medya şirketi olarak Notebookcheck, üreticilerin, perakendecilerin veya yayıncıların otoritesine tabi değildir.
Notebookcheck bu şekilde test yapıyor
Notebookcheck, tüm sonuçların karşılaştırılabilir olmasını sağlamak için her yıl yüzlerce dizüstü bilgisayarı ve akıllı telefonu standart prosedürler kullanarak bağımsız olarak inceliyor. Yaklaşık 20 yıldır test yöntemlerimizi sürekli olarak geliştirdik ve bu süreçte endüstri standartlarını belirledik. Test laboratuvarlarımızda deneyimli teknisyenler ve editörler tarafından yüksek kaliteli ölçüm ekipmanları kullanılmaktadır. Bu testler çok aşamalı bir doğrulama sürecini içerir. Karmaşık derecelendirme sistemimiz, nesnelliği koruyan yüzlerce sağlam temellere dayanan ölçüm ve kıyaslamaya dayanmaktadır.Price comparison

