Karar - Eskisinden Daha Zayıf ve Daha Hafif
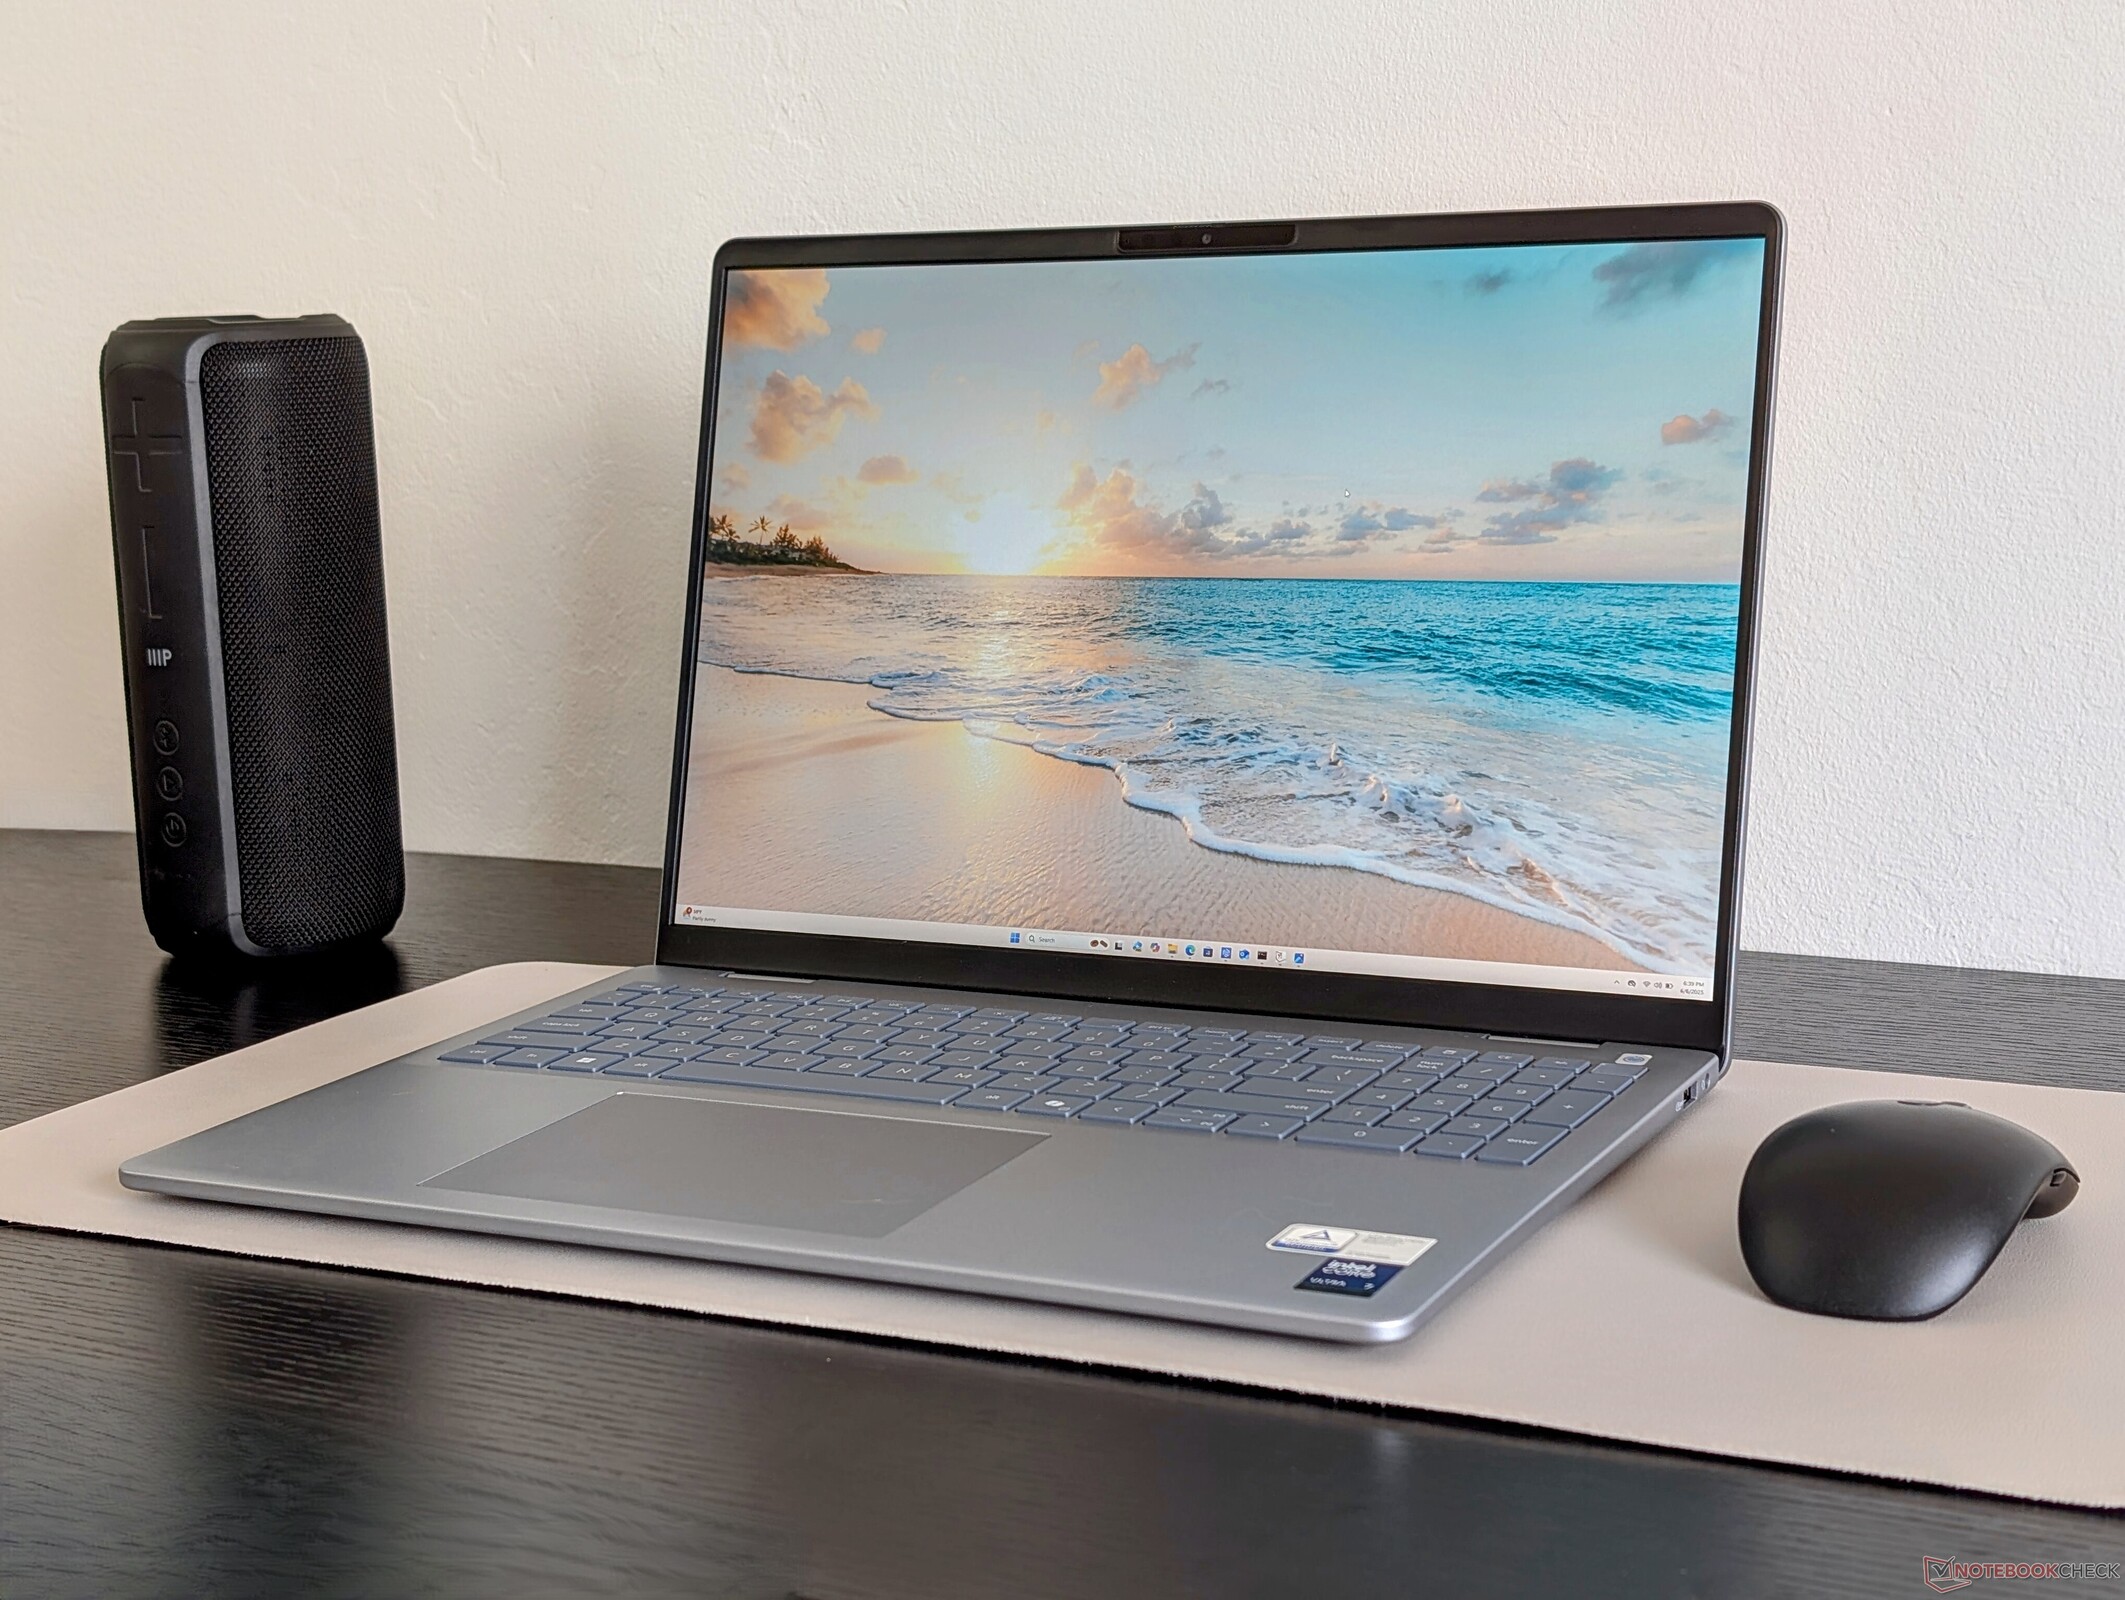
Her ne kadar selefine çok benzese de Inspiron 16 Plus 7640dell 16 Plus, Core Ultra-H CPU'dan daha yeni Lunar Lake Core Ultra-V'ye geçiş sayesinde farklı bir canavar. Sonuç, daha genel bir multimedya kitlesine daha iyi uyması gereken daha yalın, daha hafif ve daha uzun ömürlü bir makinedir. Ayrıca 1600p120 IPS ekranın standart olarak gelmesini de takdir ediyoruz, yani zayıf panellere veya renklere sahip "düşük kaliteli" seçenekler yok.
Dell 16 Plus ile ilgili en önemli sorun, daha zorlu uygulamalar için performans eksikliğidir. Daha yaşlı Inspiron 16 Plus 7640 veya Inspiron 16 7640 2'si 1 arada dell 16 Plus'tan çok daha hızlı performans için Core-H veya ayrı GPU seçenekleri taşır. Ayrıca aşağı yukarı aynı fiyata aynı veya daha iyi görüntüleme deneyimi sunuyorlar. Ekstra beygir gücüne ihtiyaç duymayan kullanıcılar, Dell 16 Plus'ı seyahat ve ara sıra düzenleme için daha uygun bir seçenek olarak bulacaktır. Aksi takdirde, daha güçlü Dell Premium serisi dikkate alınmalıdır.
Artılar
Eksiler
Fiyat ve Bulunabilirlik
Dell 16 Plus, son nesil Inspiron 16 Plus serisinin yerini alıyor. İsim ve işlemci seçenekleri oldukça farklı olsa da, fiziksel özellikleri hala büyük ölçüde geçen yılın Inspiron 16 Plus 7640 veya Inspiron 16 7640 2'si 1 arada incelememizin de göstereceği gibi.
Test ünitemiz Core Ultra 7 256V ve 1600p120 IPS ekran ile 1150$'dan başlayan orta seviye bir konfigürasyondur. Daha üst seviye SKU'lar Core Ultra 7 258V veya Core Ultra 9 288V ile iki kat RAM ve depolama alanını 1650 dolara sunarken, diğer ekran seçenekleri arasında 1200p IPS veya 1600p Mini-LED yer alıyor.
Bu alandaki rakipler arasında 16 inçlik diğer orta seviye multimedya dizüstü bilgisayarlar da yer alıyor Lenovo IdeaPad Pro 5 16, HP Pavilion Plus 16veya Asus Vivobook 16.
Daha fazla Dell yorumu:
Teknik Özellikler
Dava
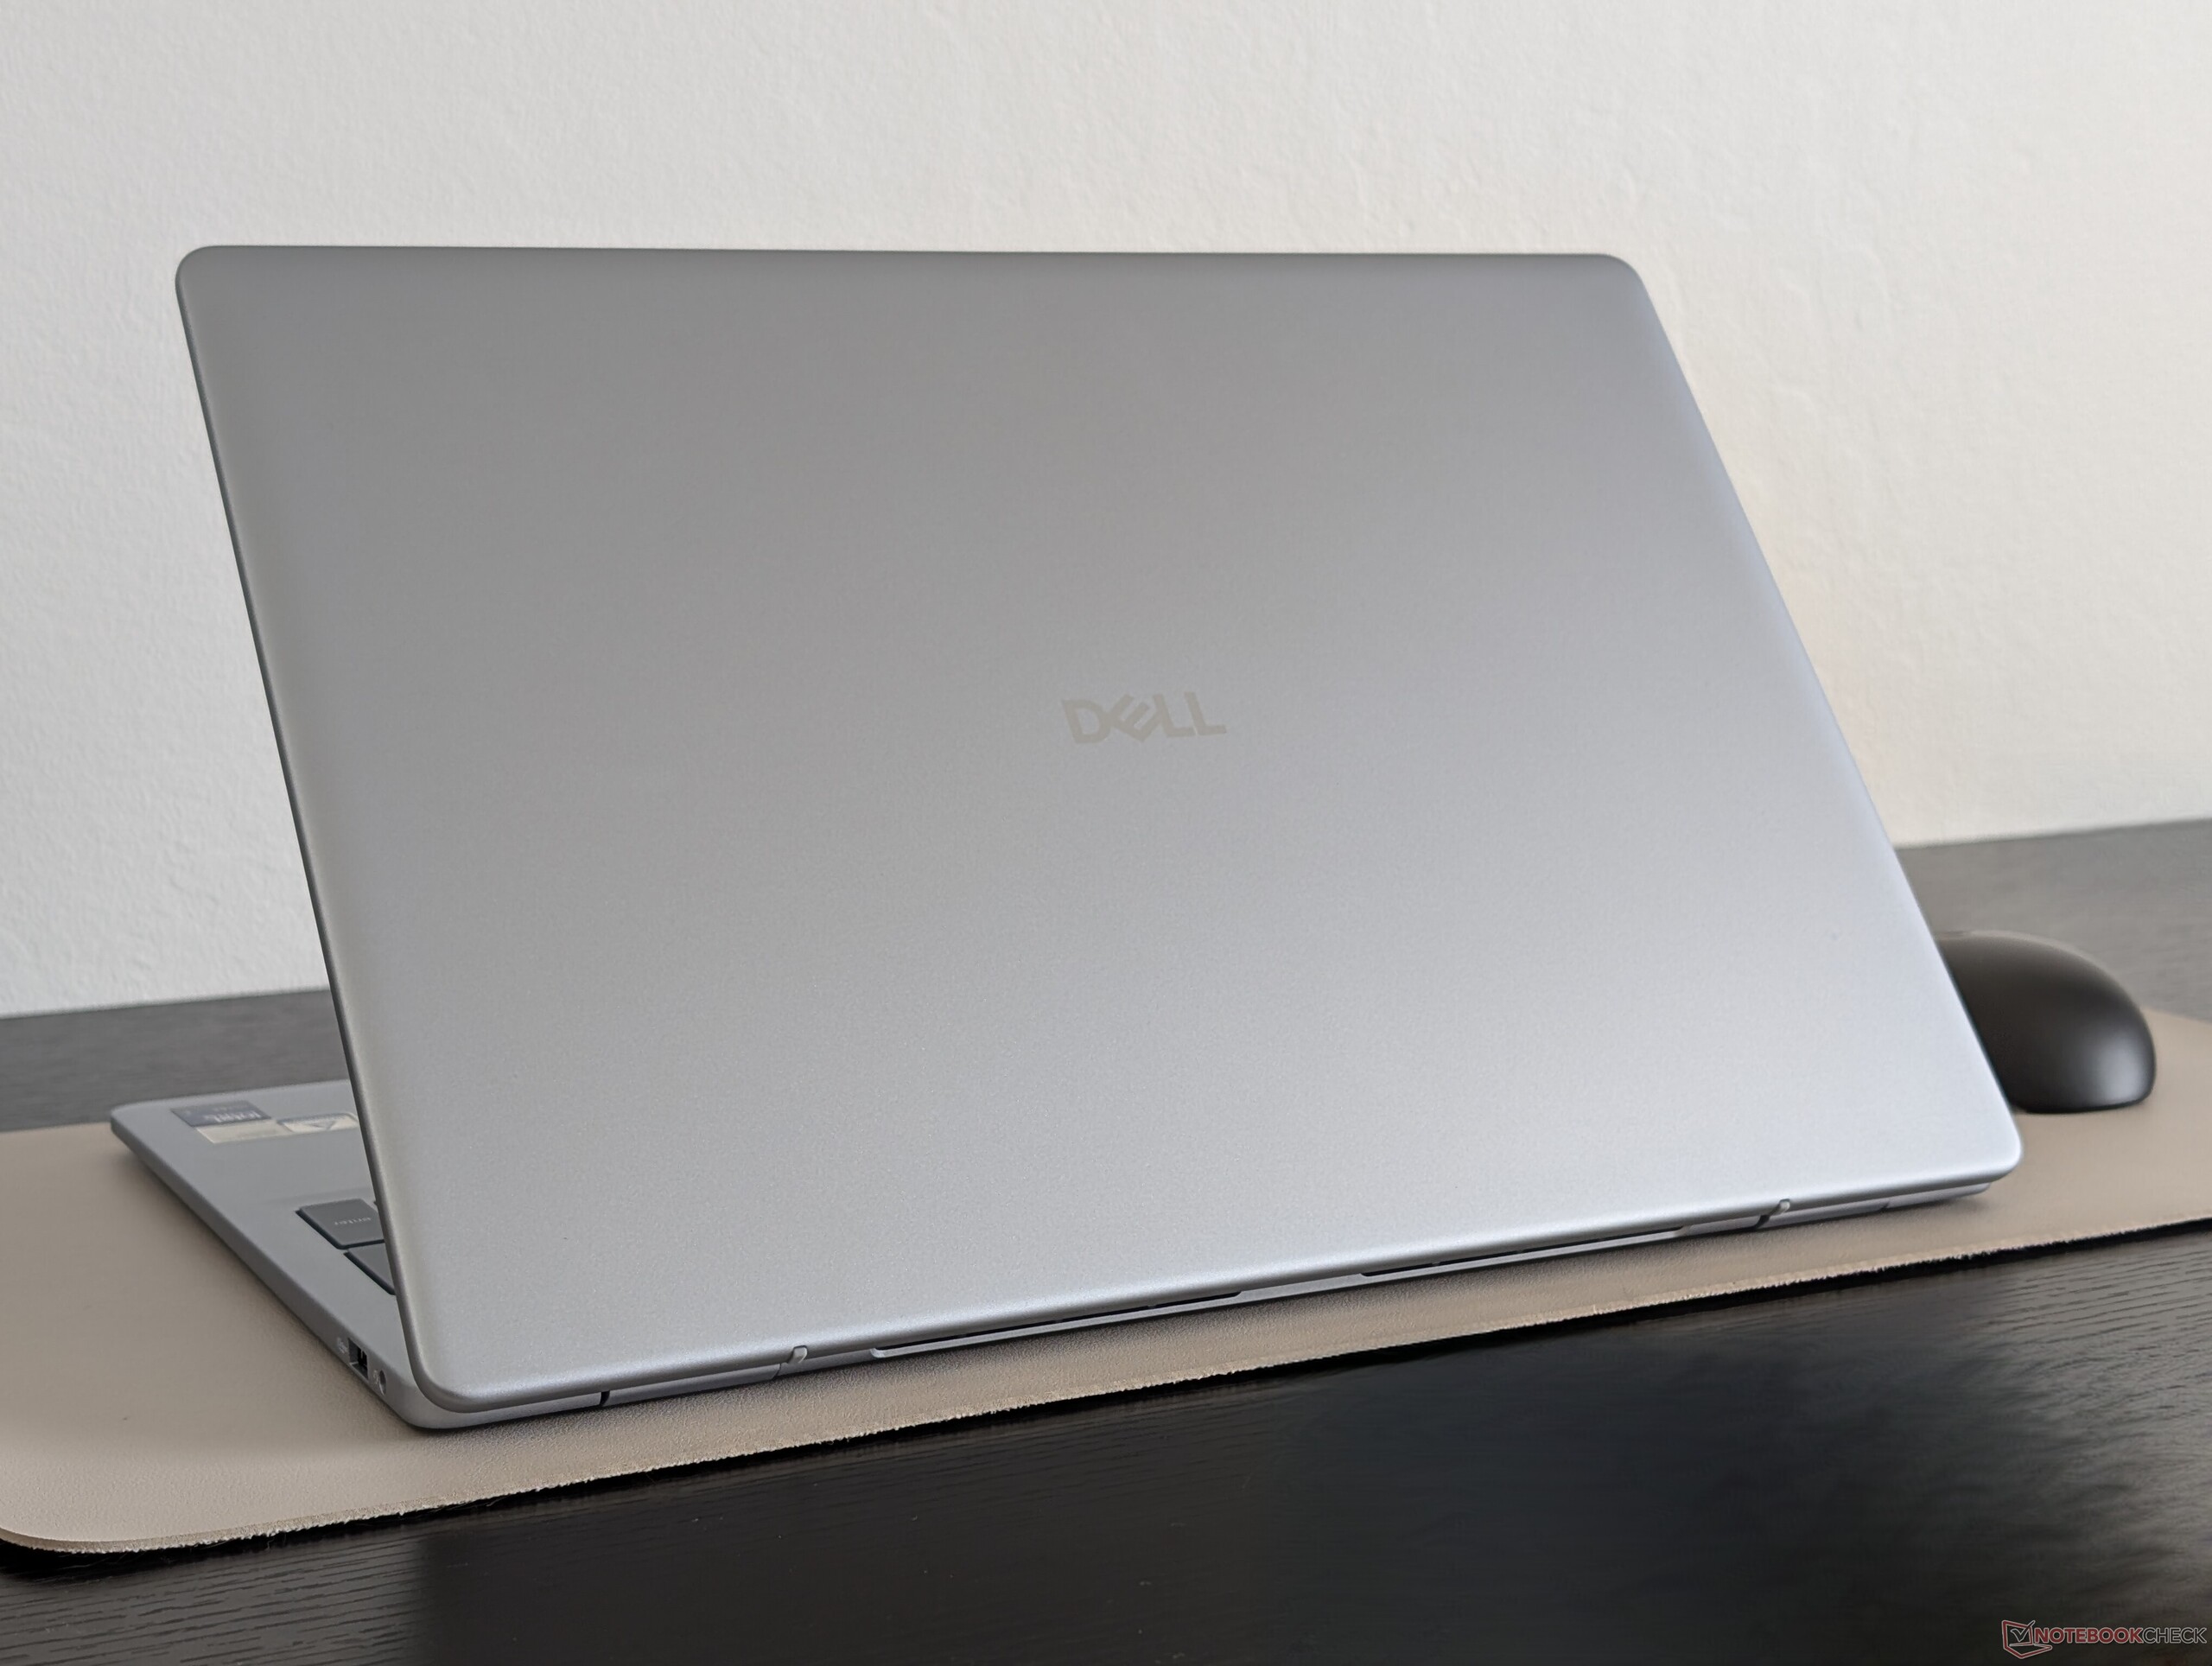
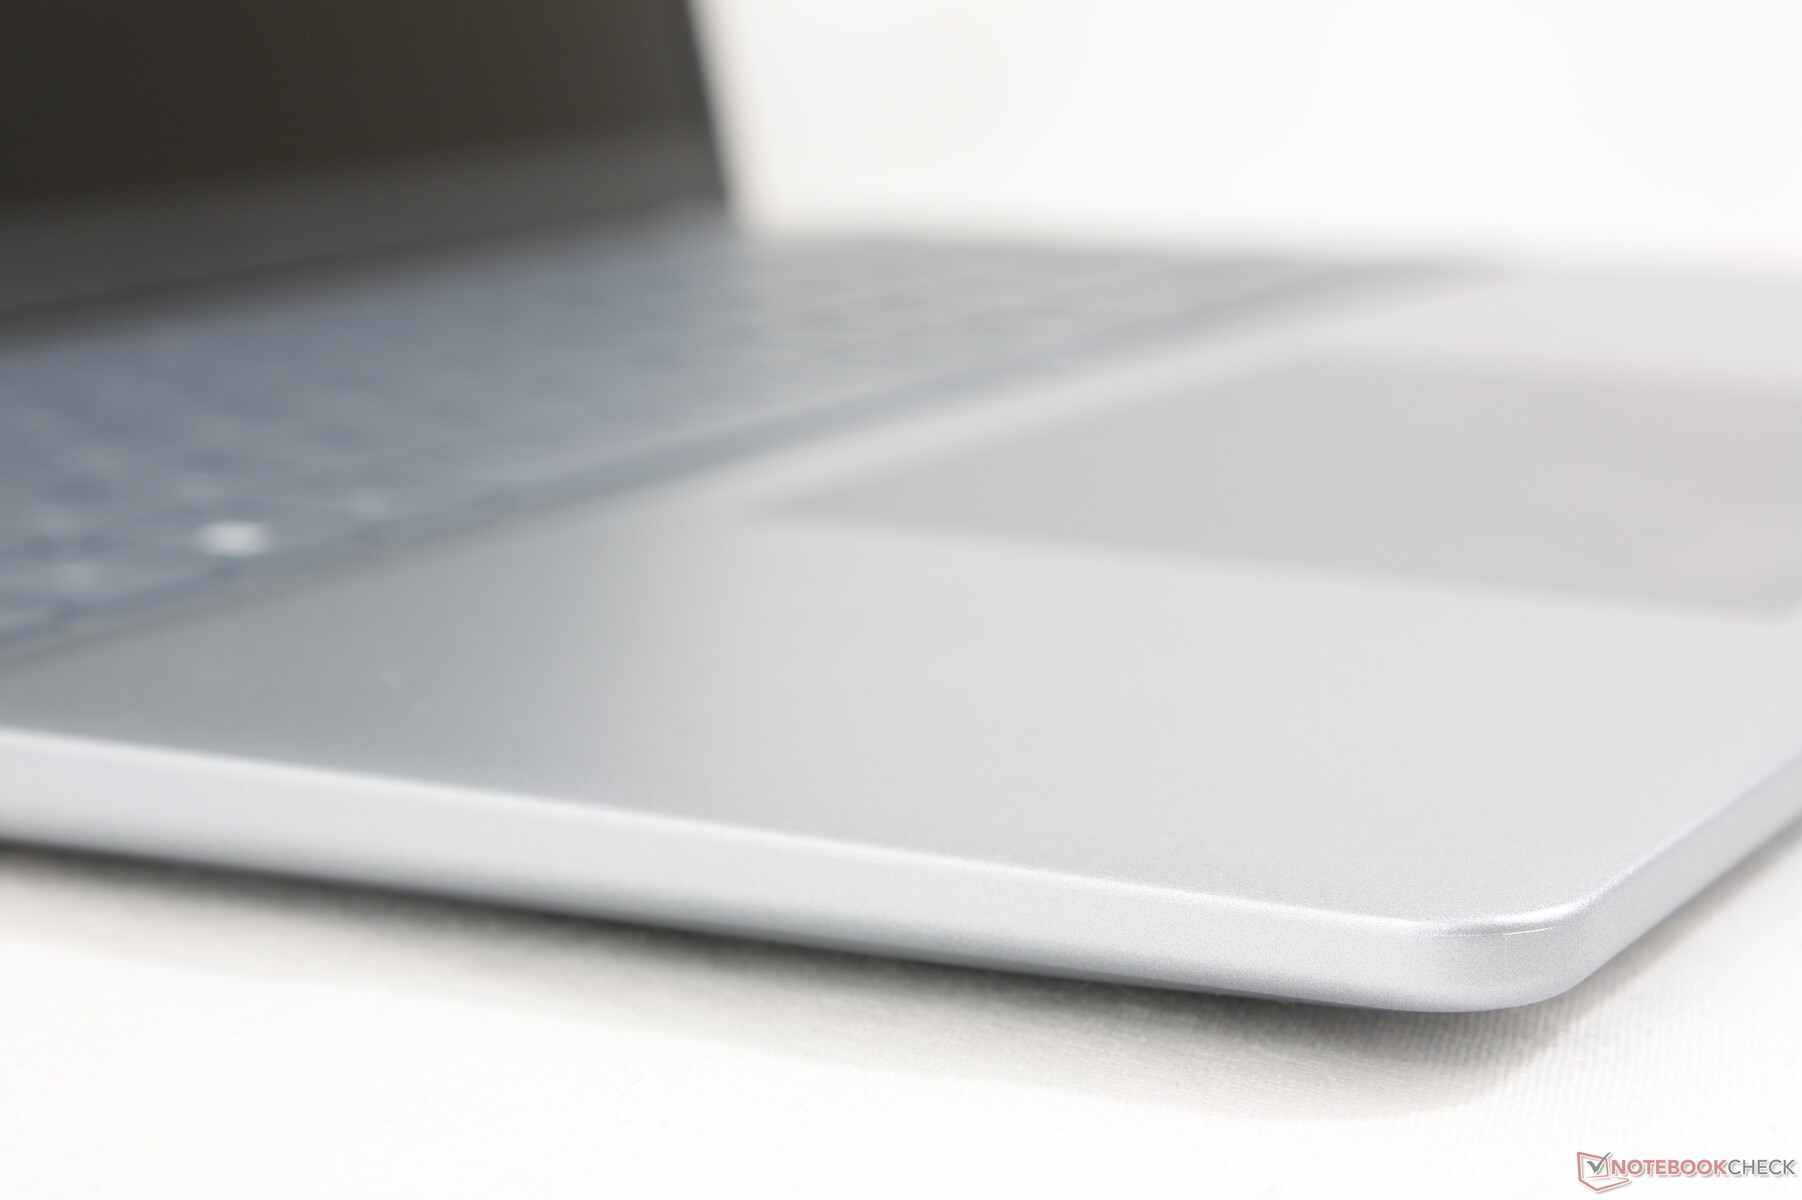
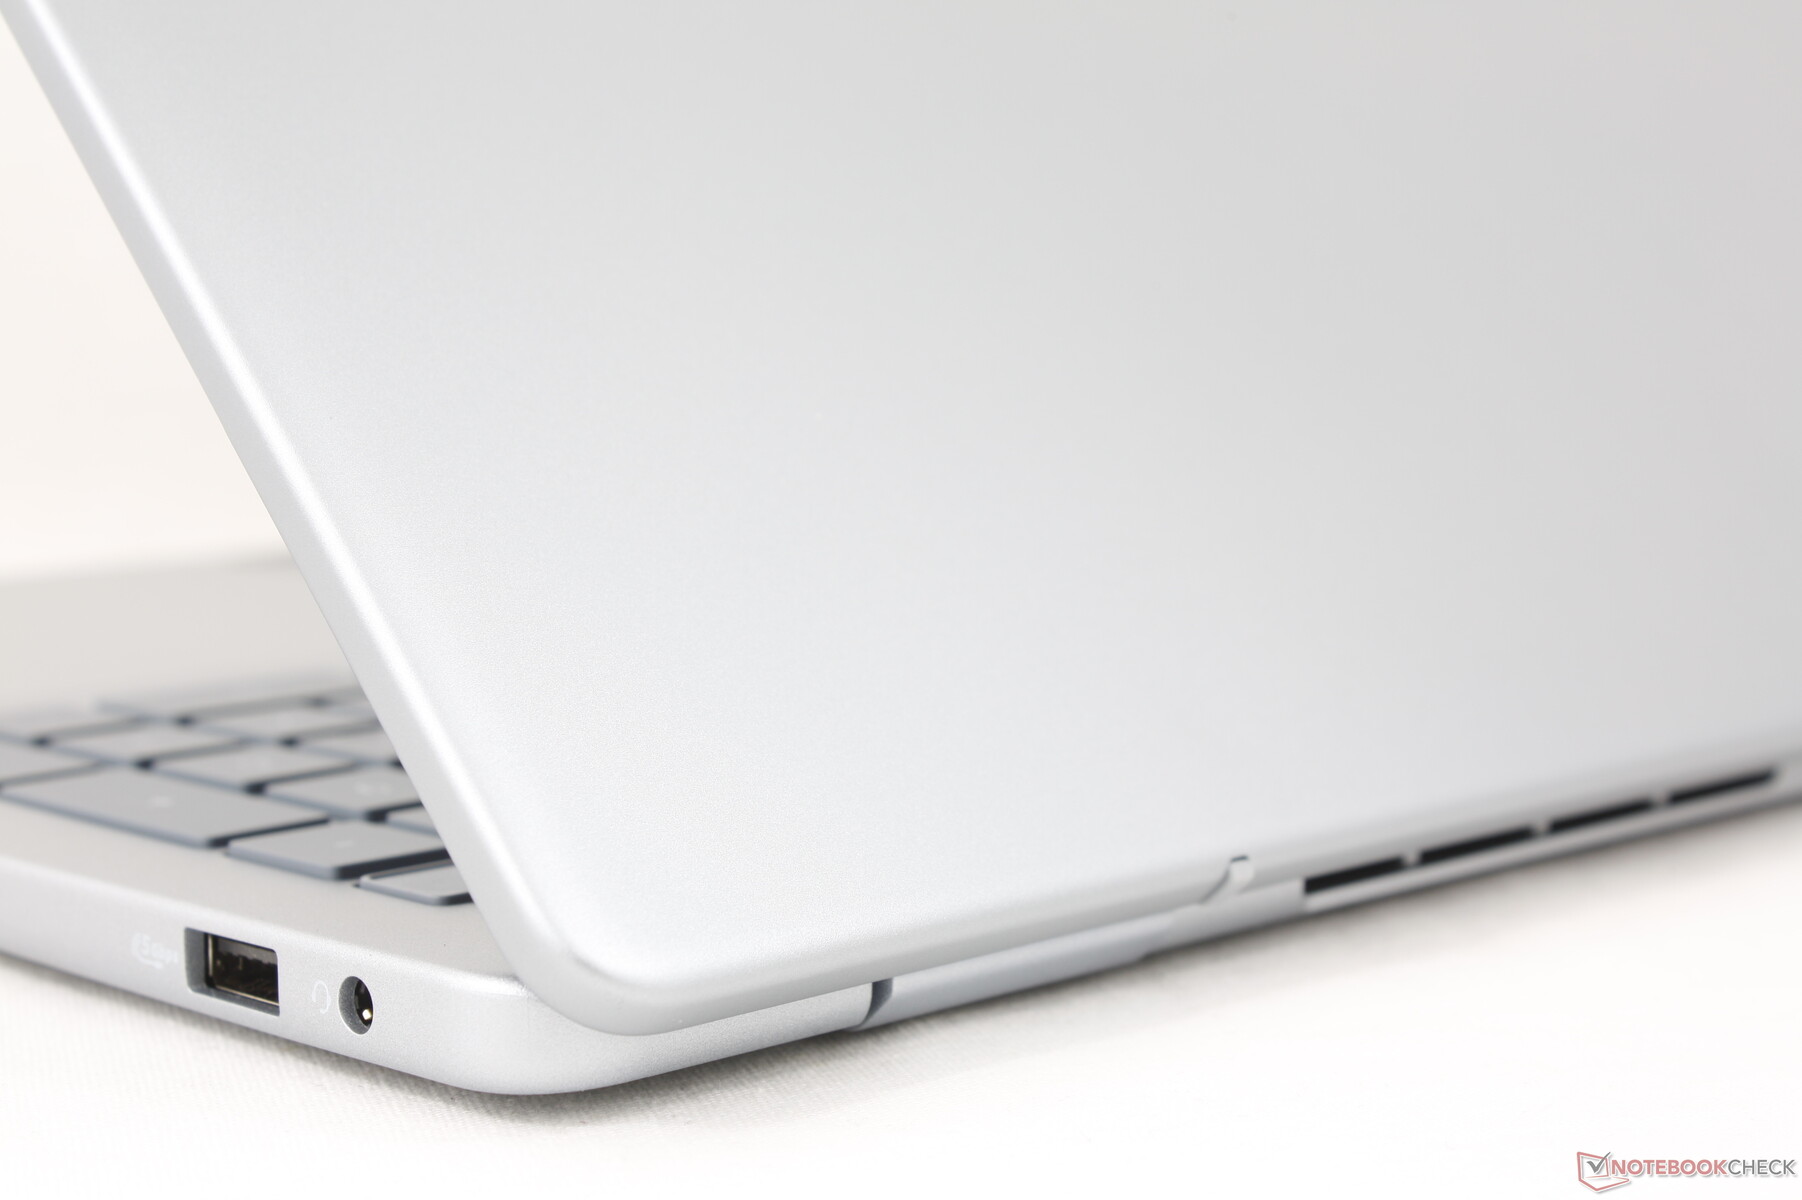
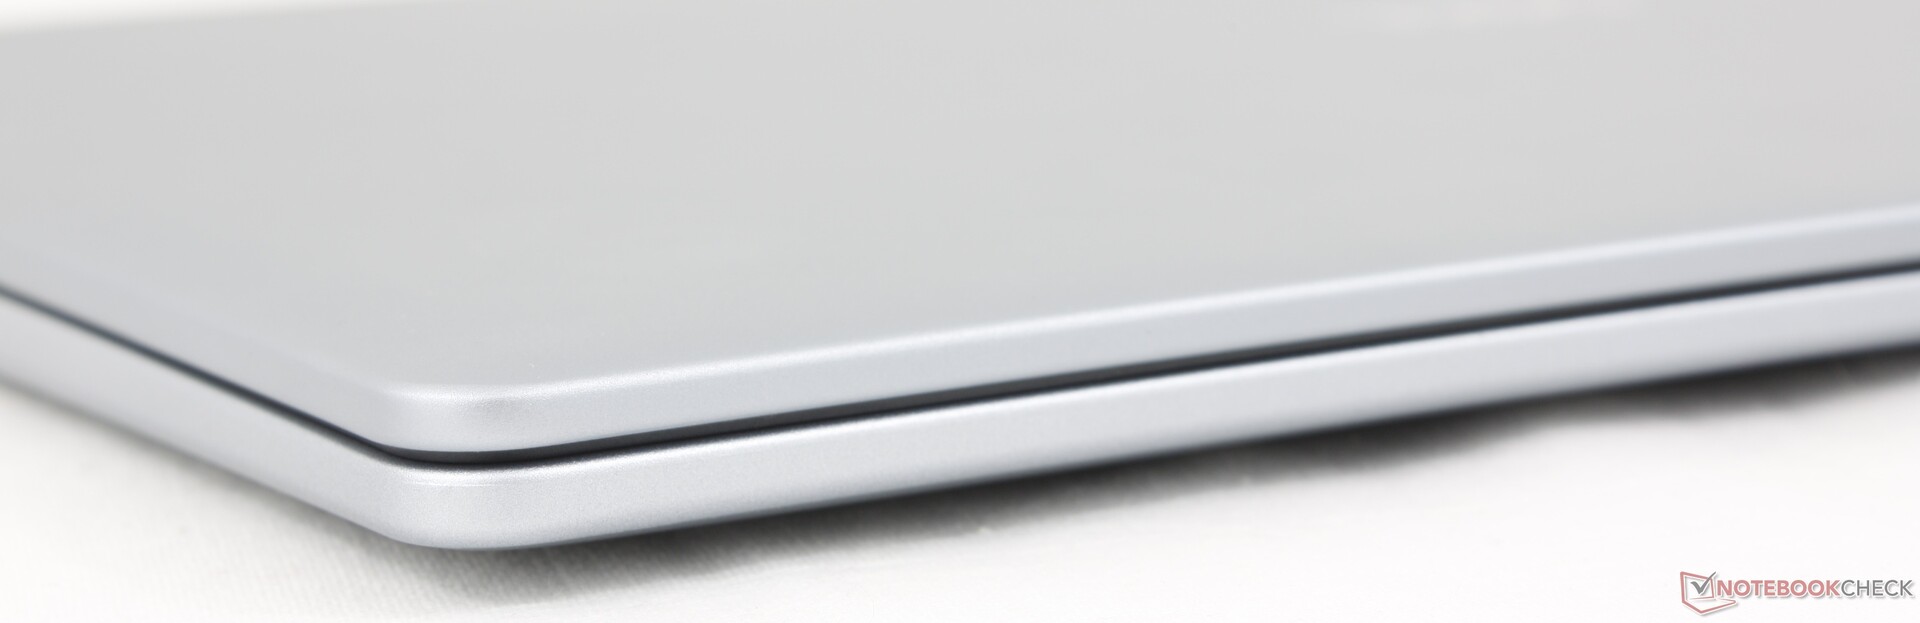
Pürüzsüz mat gümüş kasa, bir Inspiron modeliyle deneyimi olan herkese anında tanıdık gelecek ve hissettirecektir. Malzemeler ve tasarım, benzer ilk izlenimler için önceki nesille büyük ölçüde aynı kalmıştır. Şasi ve kapak, daha pahalı alternatiflerle karşılaştırıldığında daha kolay bükülür XPS 16 veya Lenovo Yoga Pro 9 16ancak bunun dışında HP Pavilion Plus 16 veya Asus Vivobook 16 ile karşılaştırılabilir.
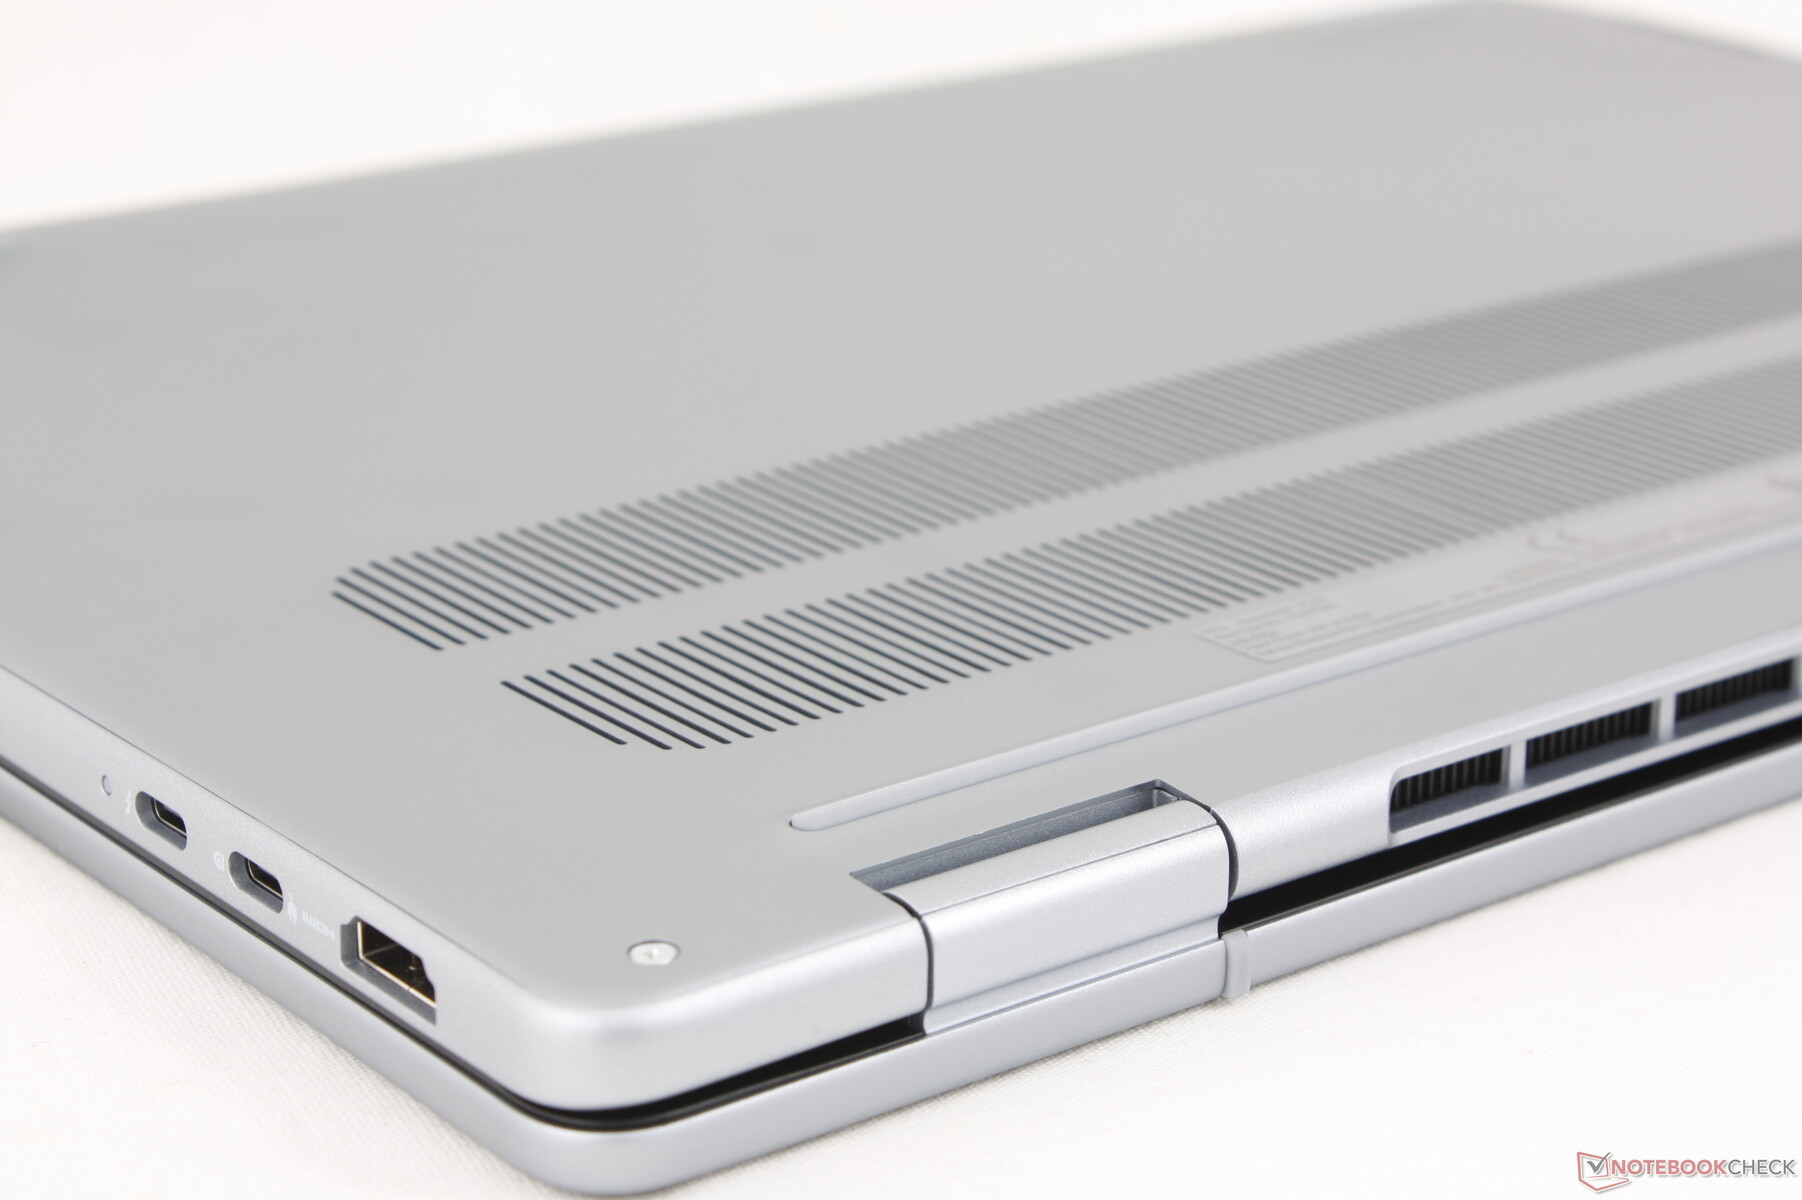
Boyutlar, biraz daha ince olmasa bile, giden Inspiron 16 Plus 7640 ile neredeyse 1: 1'dir. Bunun yerine, aralarındaki en büyük fark ağırlıktır, çünkü yeni model büyük ölçüde herhangi bir ayrı GPU seçeneğinin olmaması nedeniyle yaklaşık 400 g daha hafiftir.
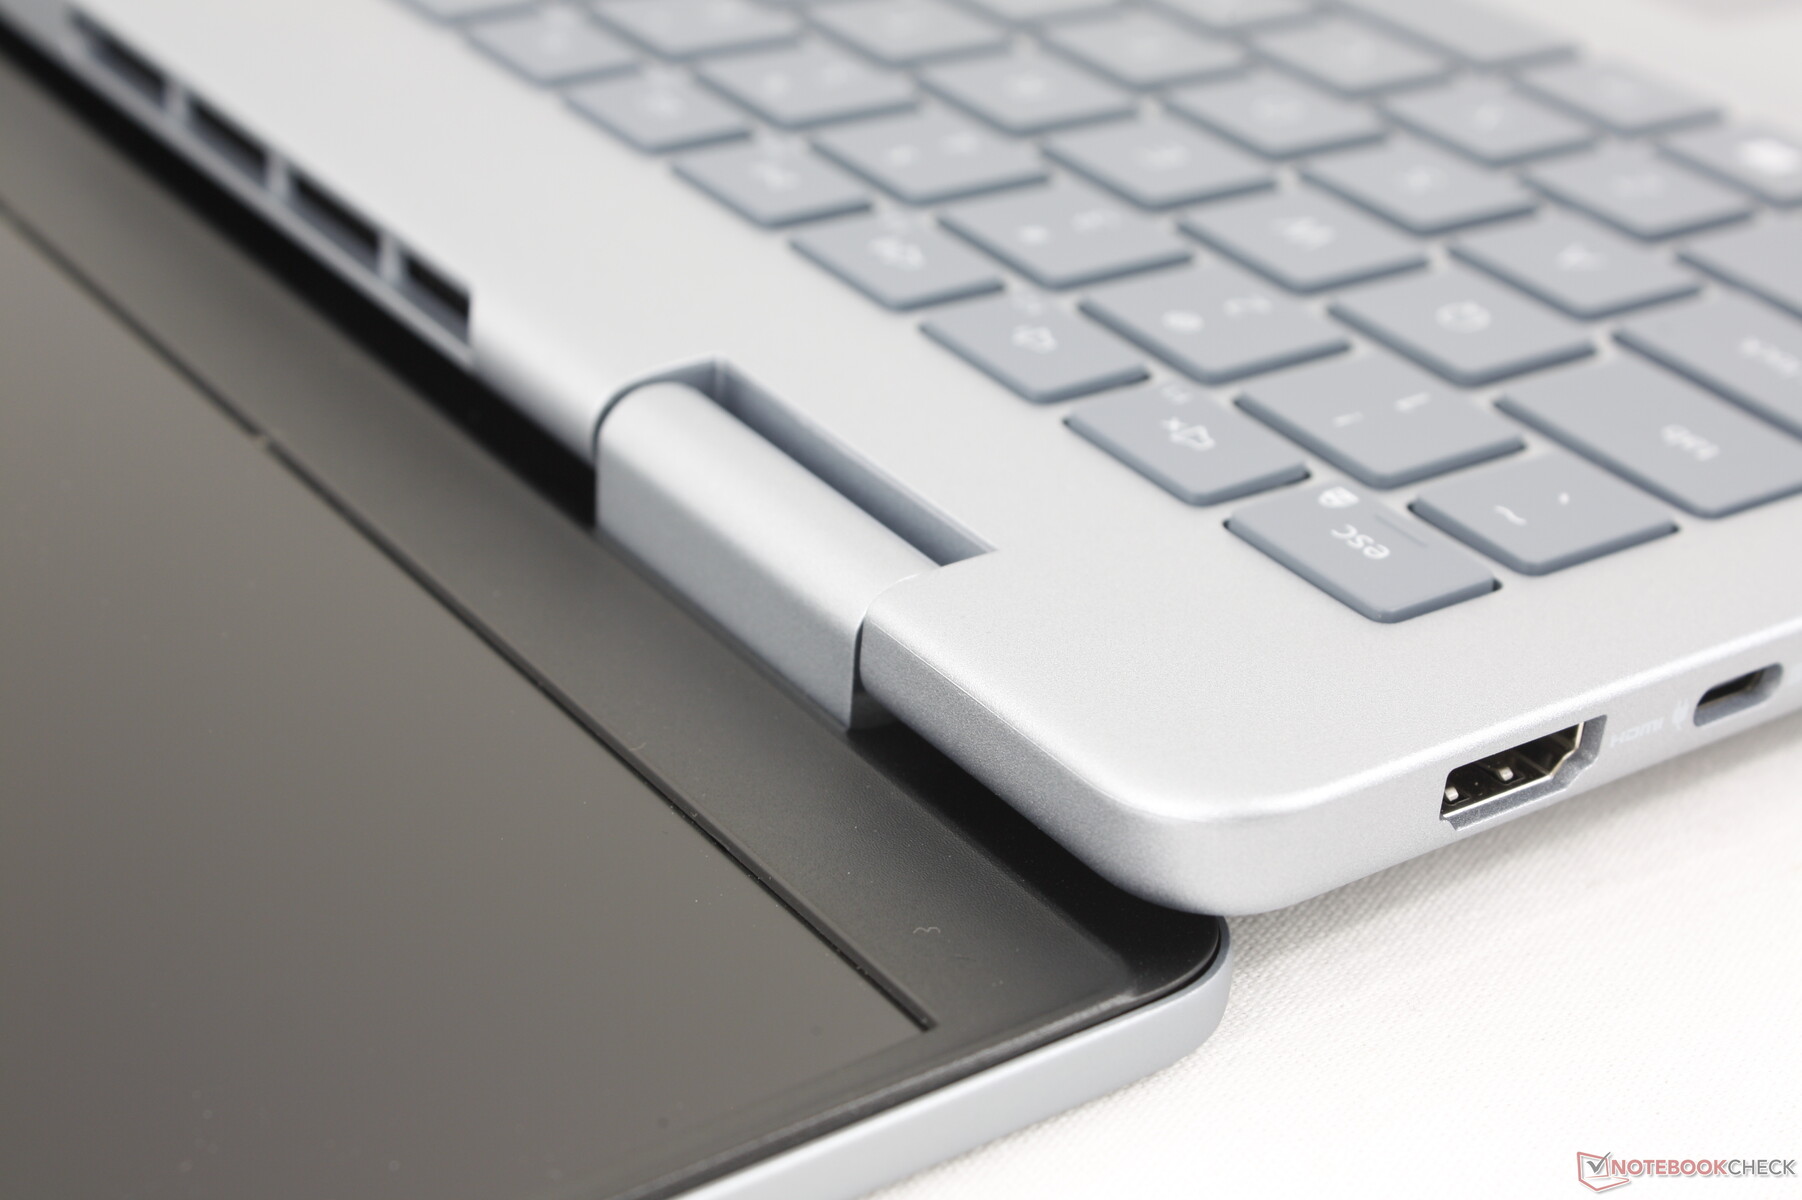
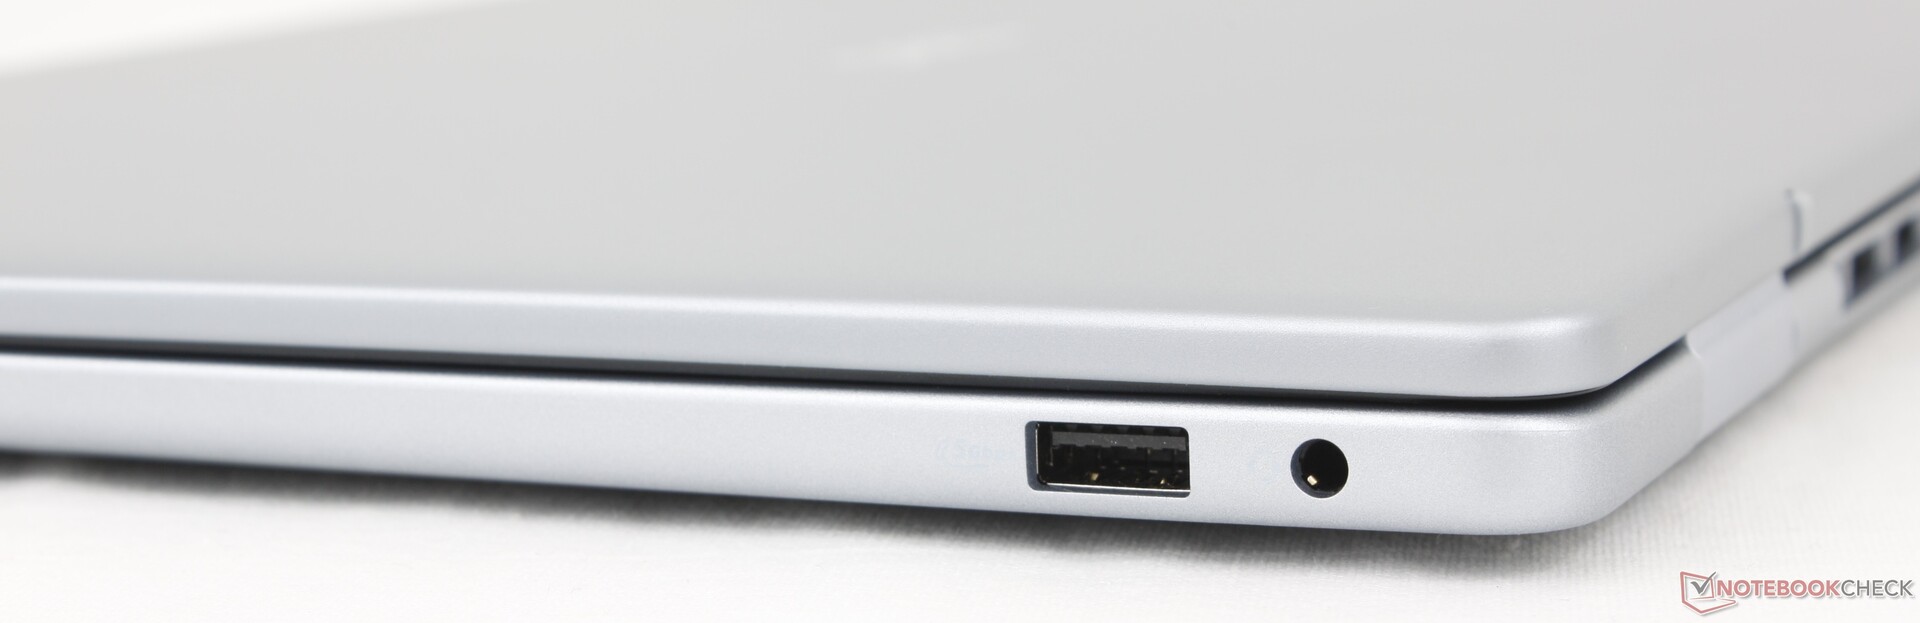
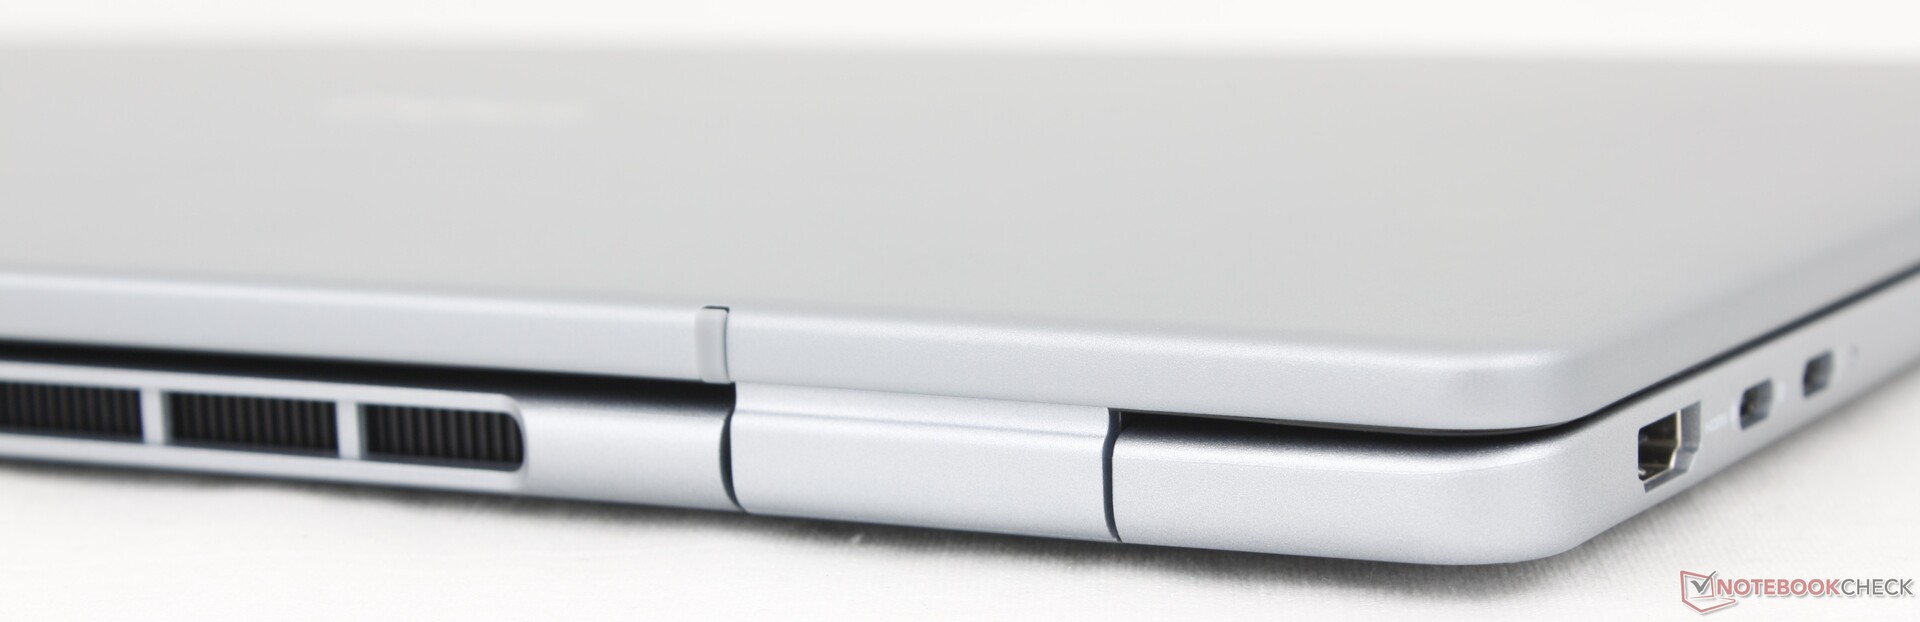
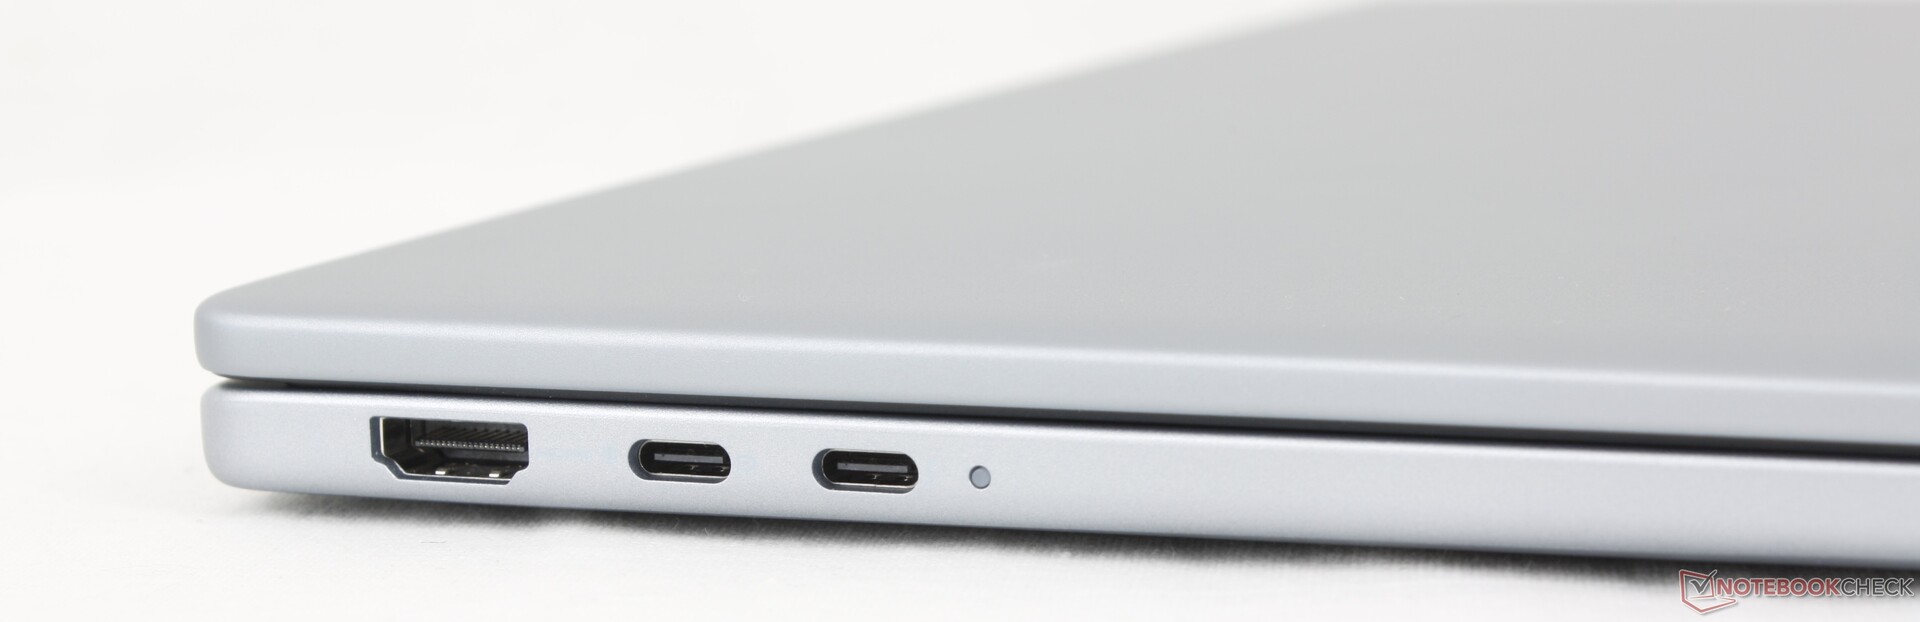
Bağlanabilirlik
Geçen yılki Inspiron 16 Plus 7640 veya 7640 2'si 1 arada modellerde bulunandan daha az bağlantı noktası var. Dell 16 Plus, SD kart okuyucuyu ve USB-A bağlantı noktalarından birini ikinci bir USB-C bağlantı noktası lehine bıraktı. İki USB-C bağlantı noktasından yalnızca birinin Thunderbolt 4 ve DisplayPort 2.1 ile uyumlu olduğunu unutmayın.
İletişim
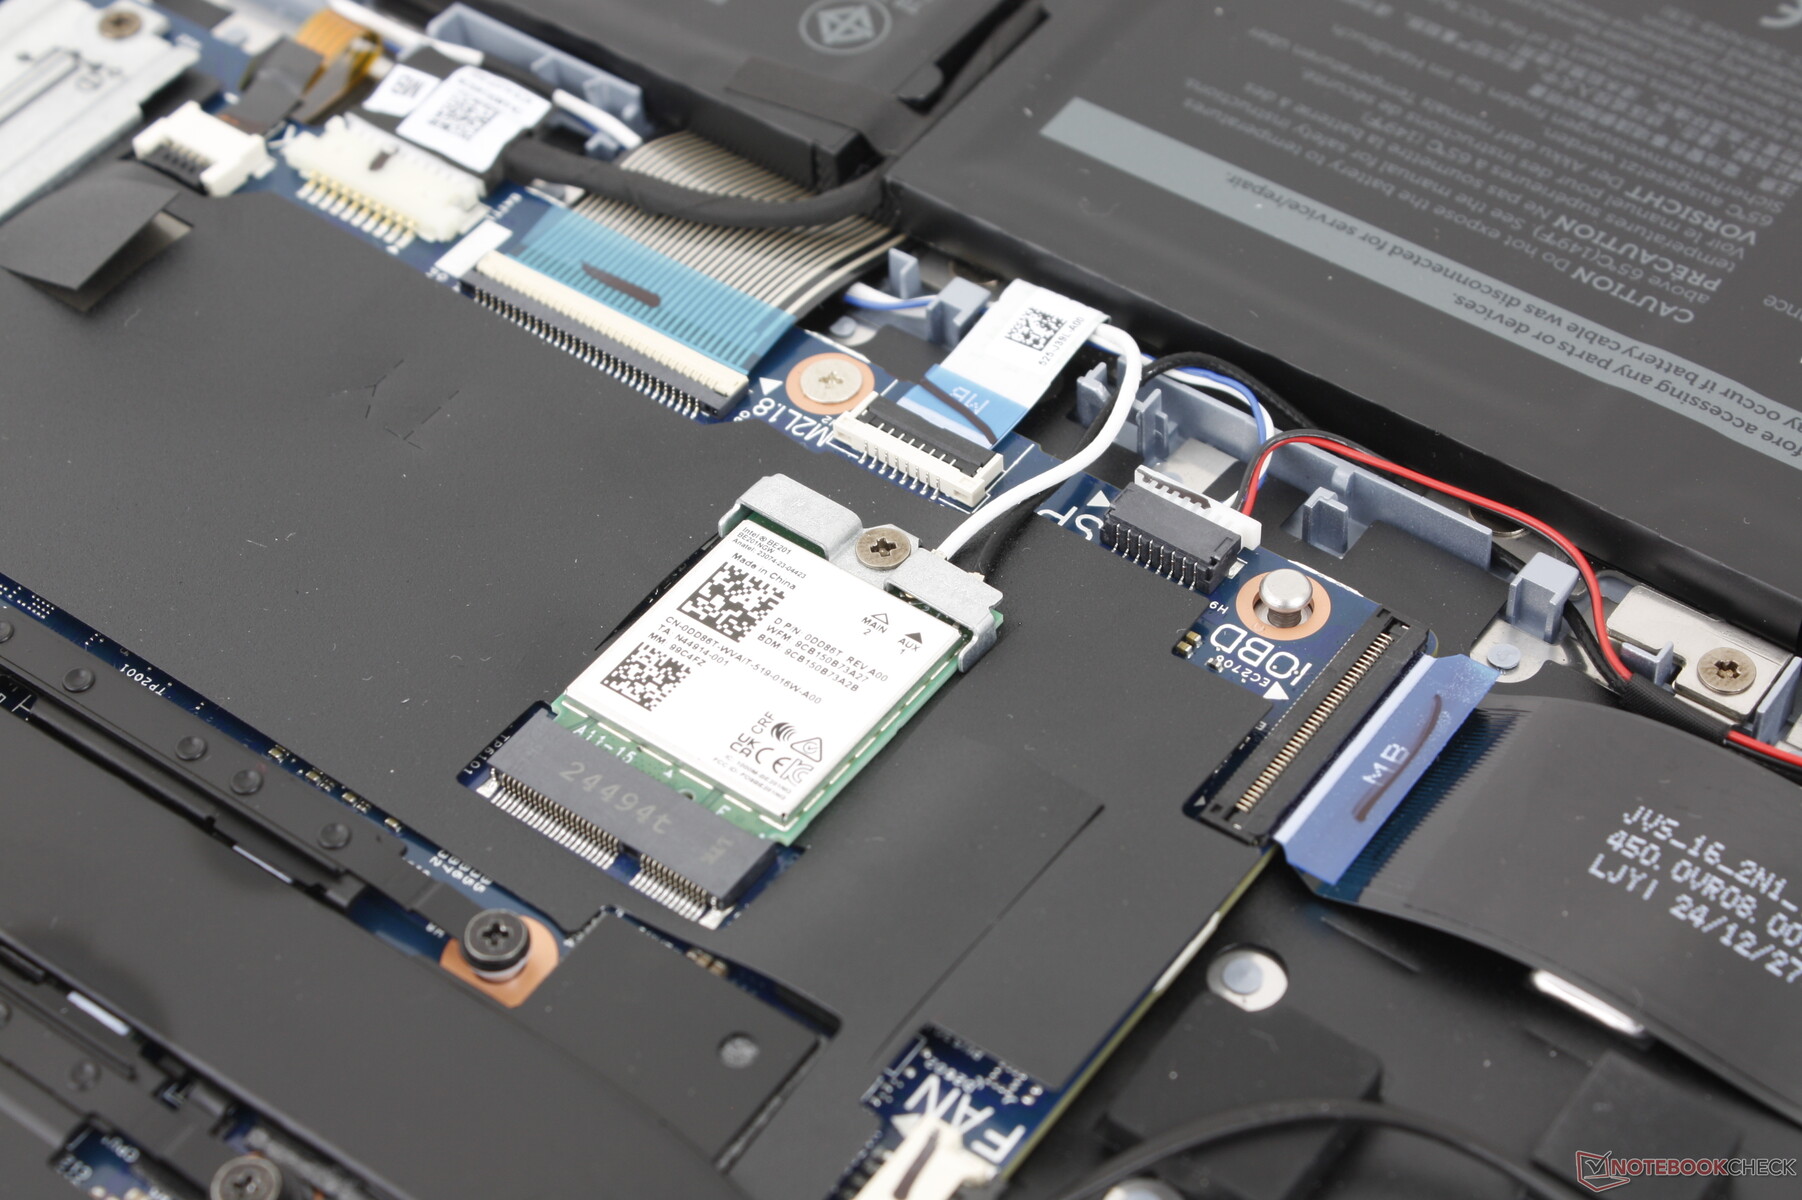
Intel BE201, Wi-Fi 7 ve Bluetooth 5.4 bağlantısı için standart olarak gelir.
| Networking | |
| iperf3 transmit AXE11000 | |
| Lenovo ThinkBook 16 G7+ AMD | |
| HP Pavilion Plus 16-ab0456tx | |
| Dell 16 Plus | |
| Asus Vivobook 16 M1606K | |
| Dell Inspiron 16 Plus 7640 | |
| iperf3 receive AXE11000 | |
| Lenovo ThinkBook 16 G7+ AMD | |
| HP Pavilion Plus 16-ab0456tx | |
| Dell 16 Plus | |
| Dell Inspiron 16 Plus 7640 | |
| Asus Vivobook 16 M1606K | |
| iperf3 transmit AXE11000 6GHz | |
| HP Pavilion Plus 16-ab0456tx | |
| Dell 16 Plus | |
| Acer Swift 16 AI SF16-51T-932H, Ultra 9 288V | |
| Dell Inspiron 16 Plus 7640 | |
| iperf3 receive AXE11000 6GHz | |
| Acer Swift 16 AI SF16-51T-932H, Ultra 9 288V | |
| HP Pavilion Plus 16-ab0456tx | |
| Dell 16 Plus | |
| Dell Inspiron 16 Plus 7640 | |
Web kamerası
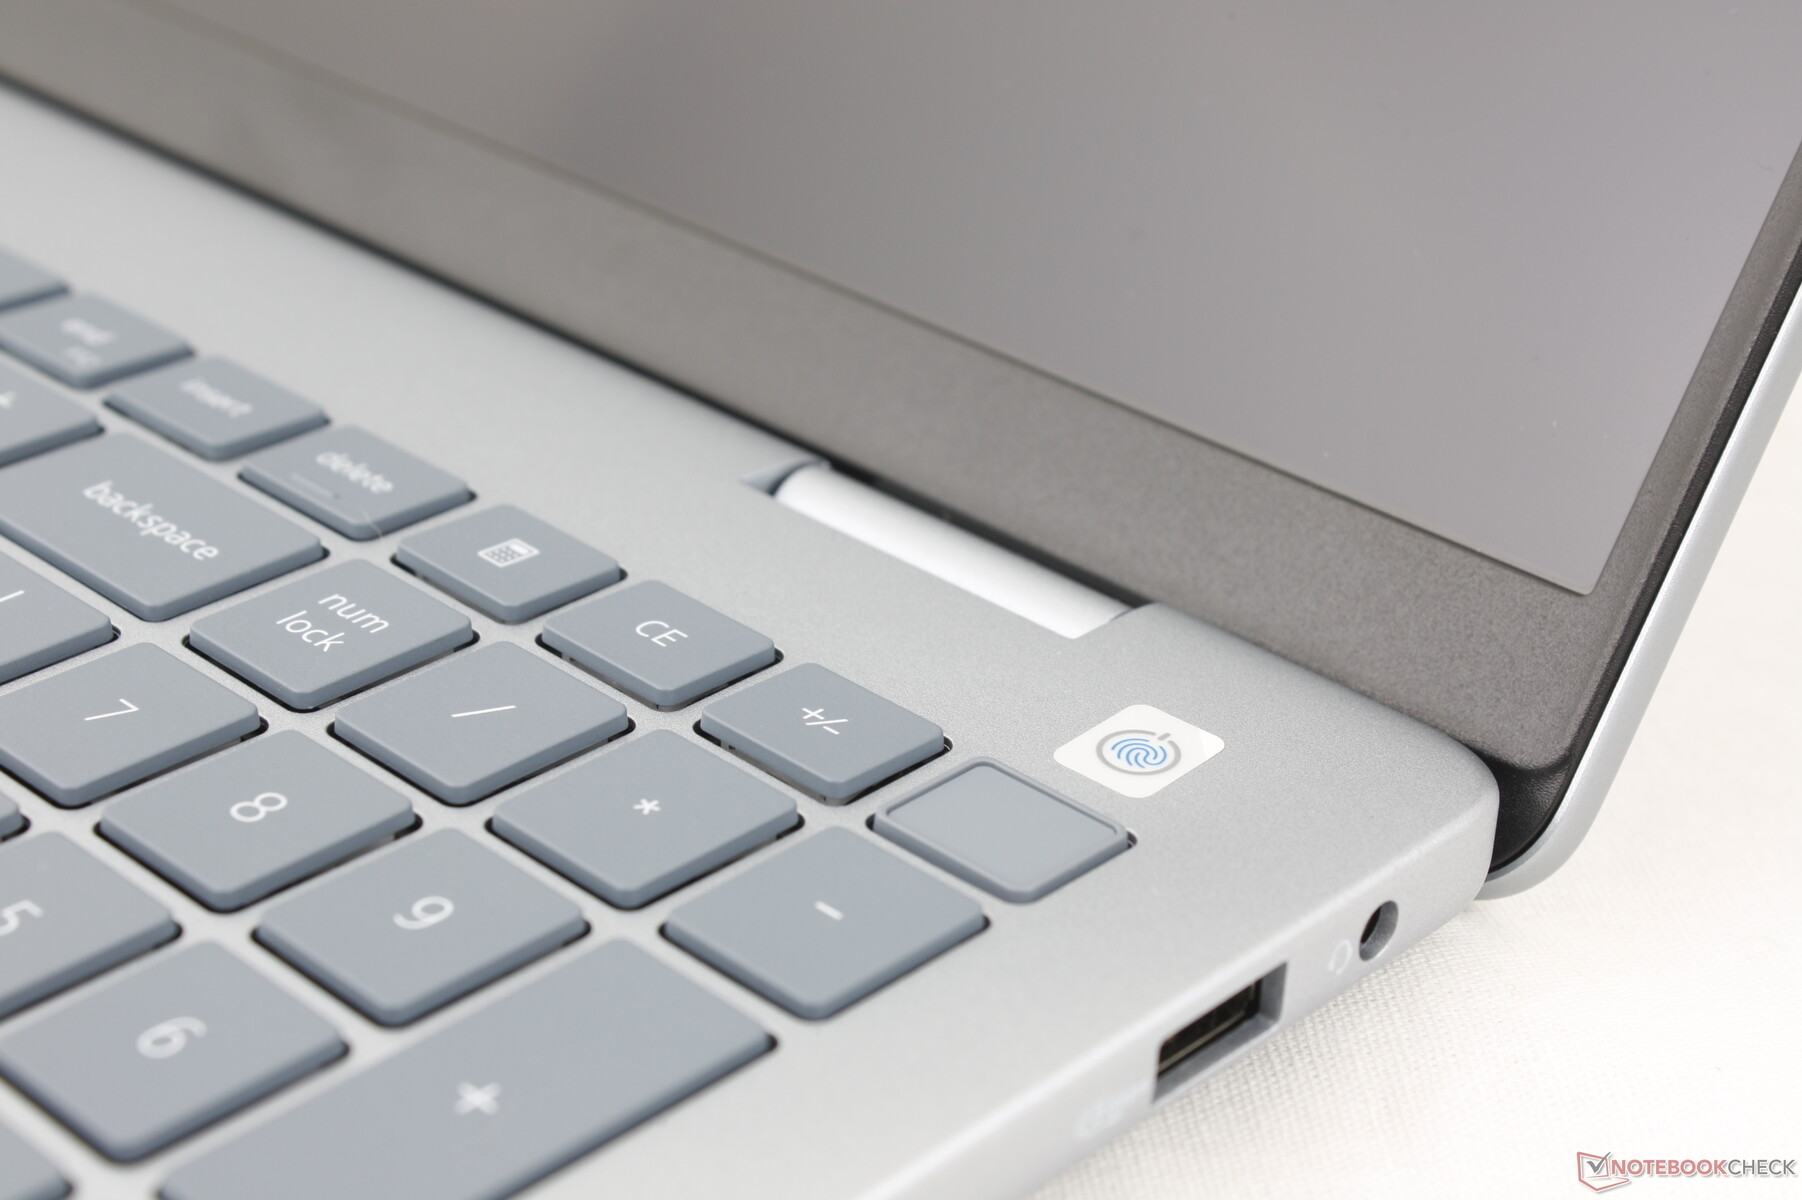
2 MP web kamerası hem kızılötesi hem de fiziksel gizlilik deklanşörü ile standart olarak gelir.


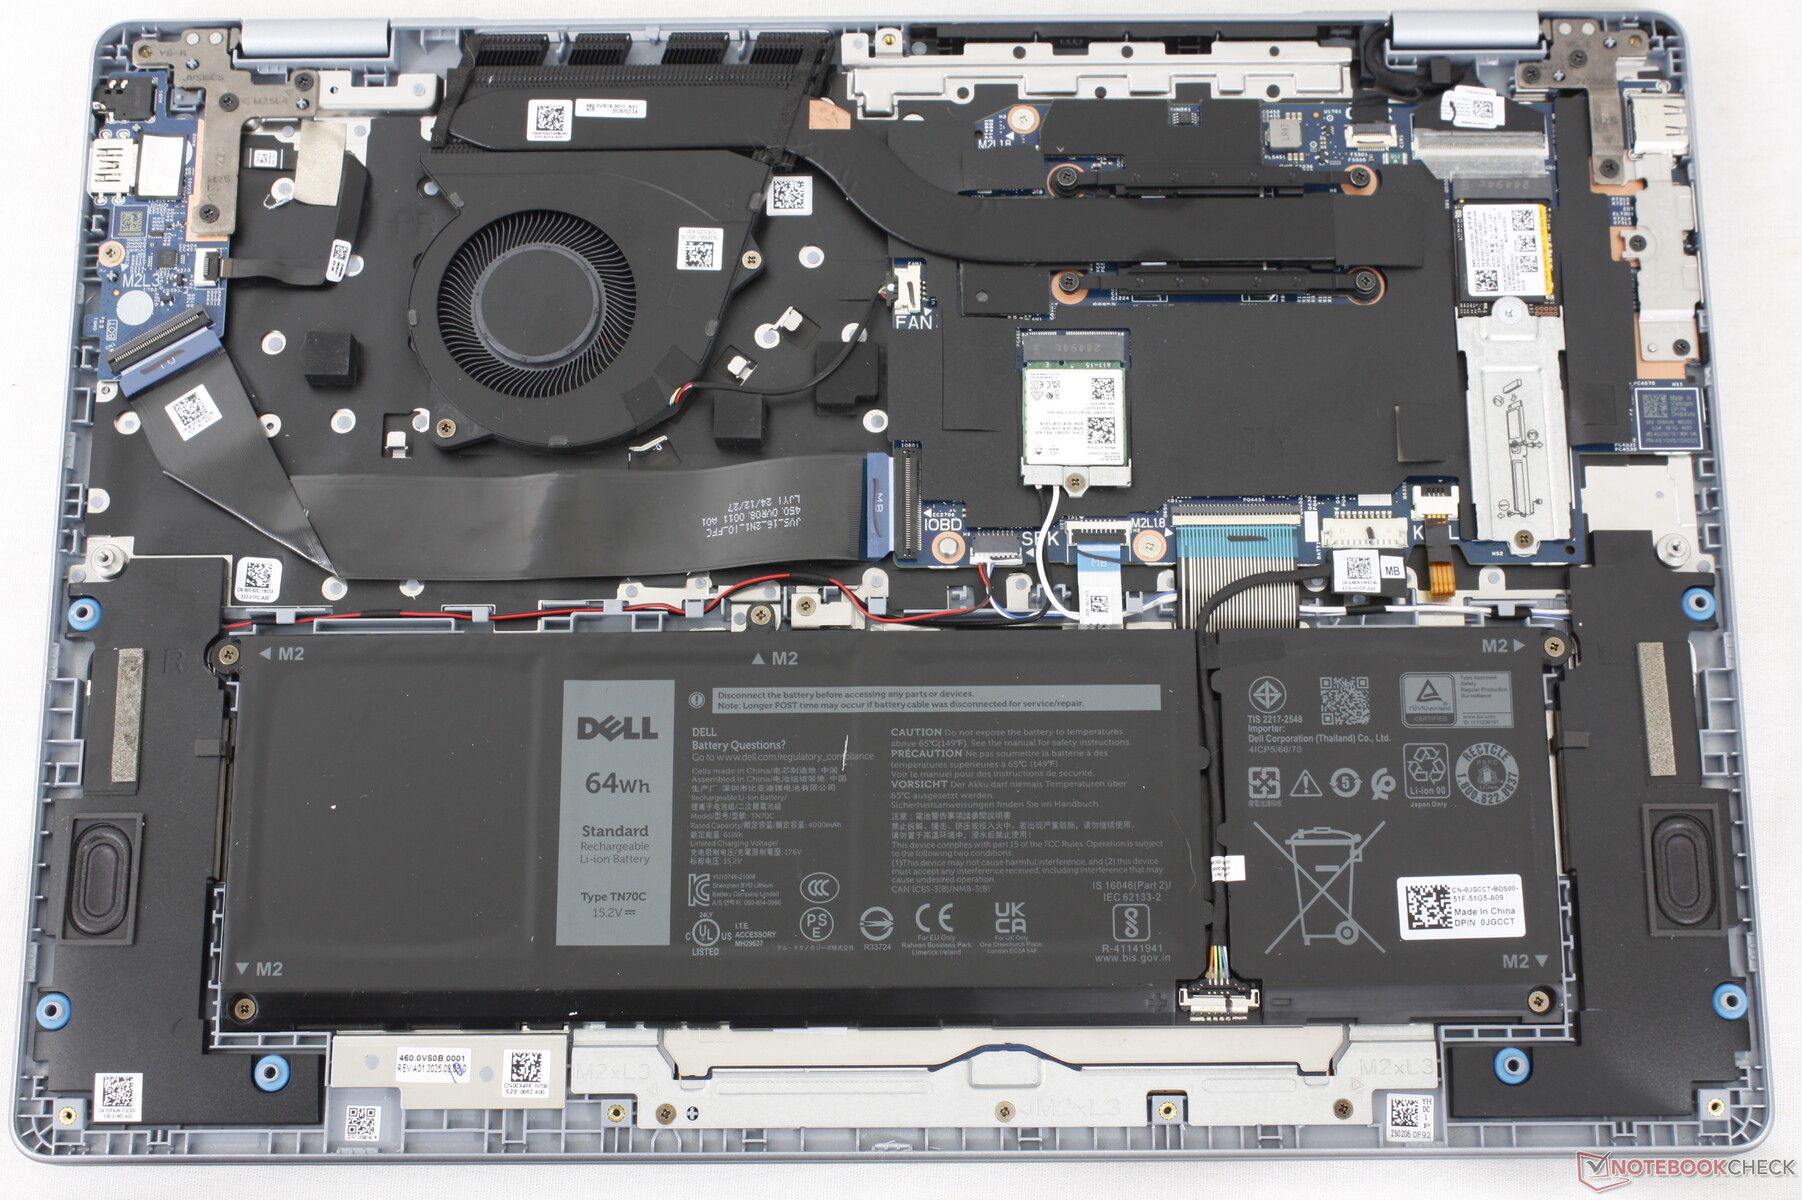
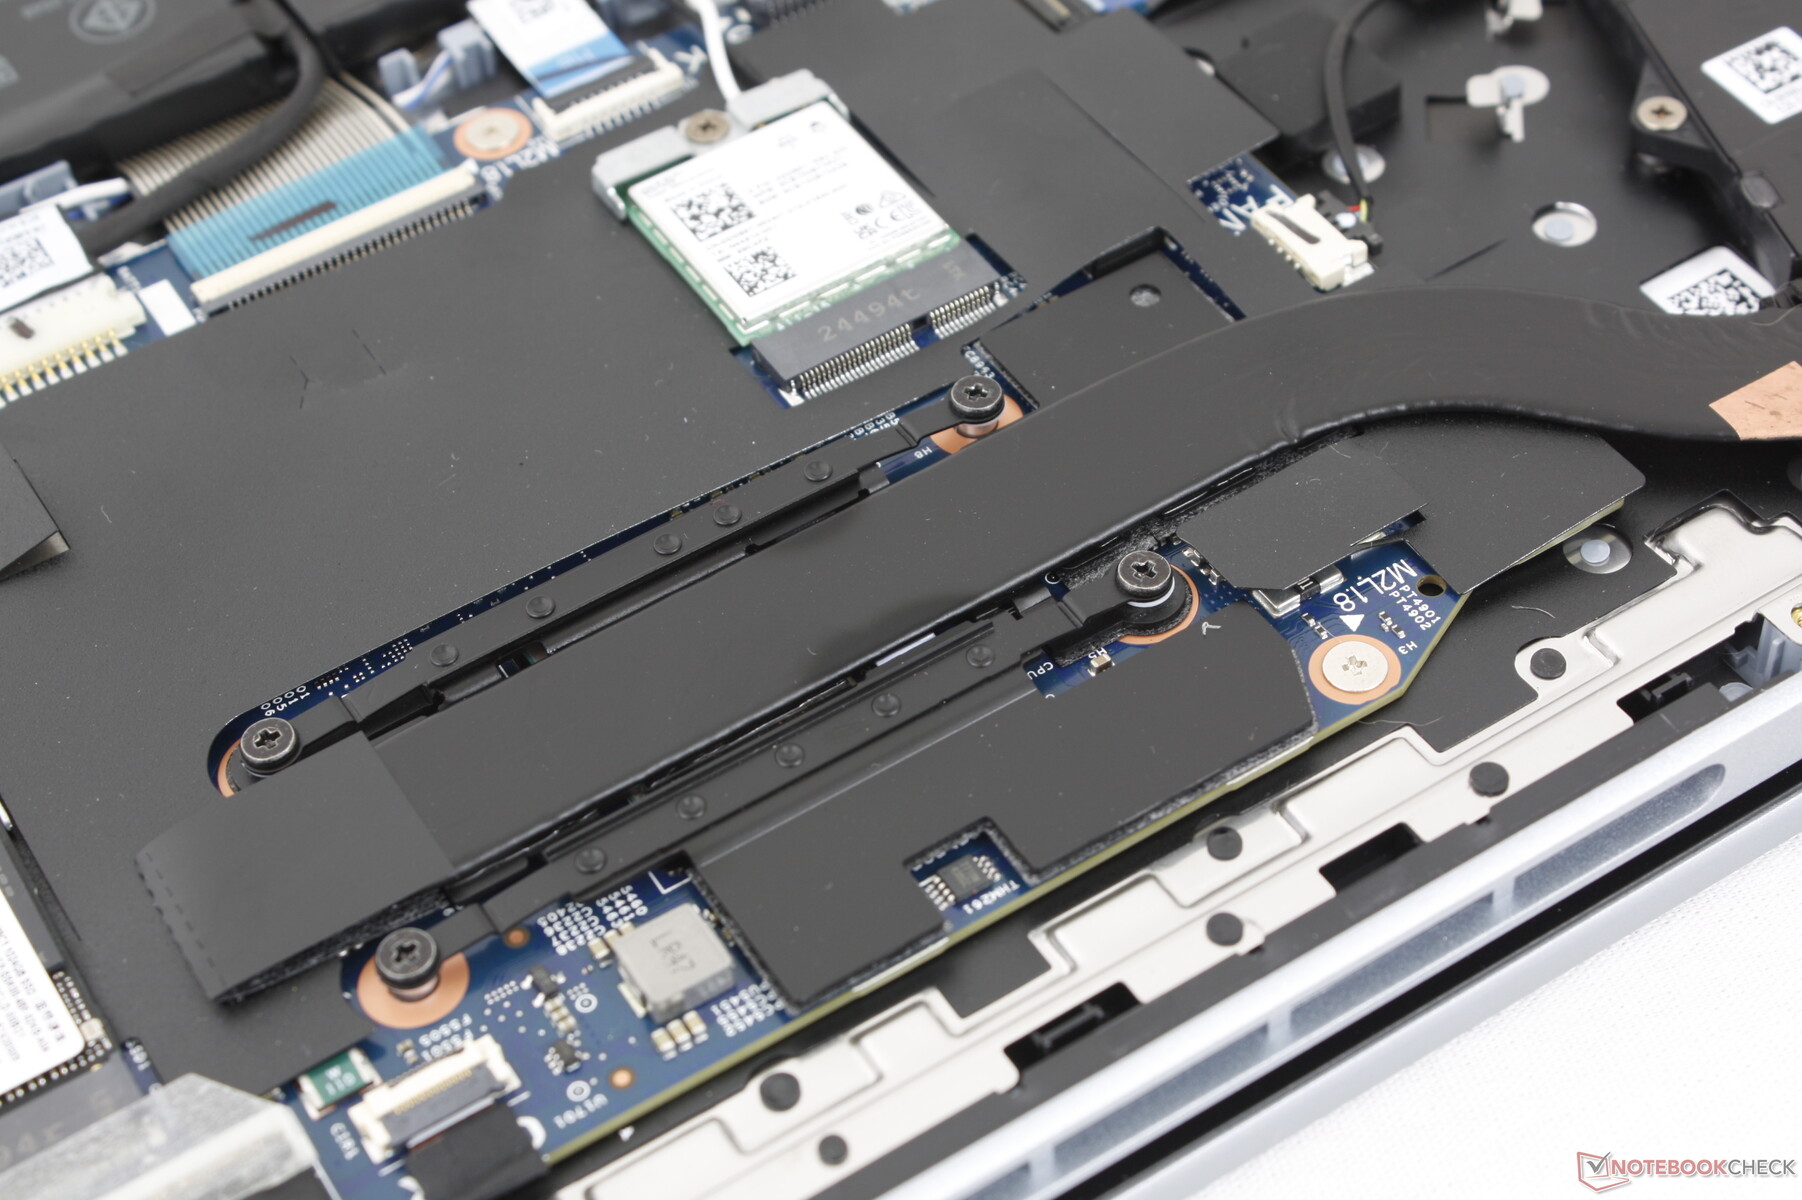
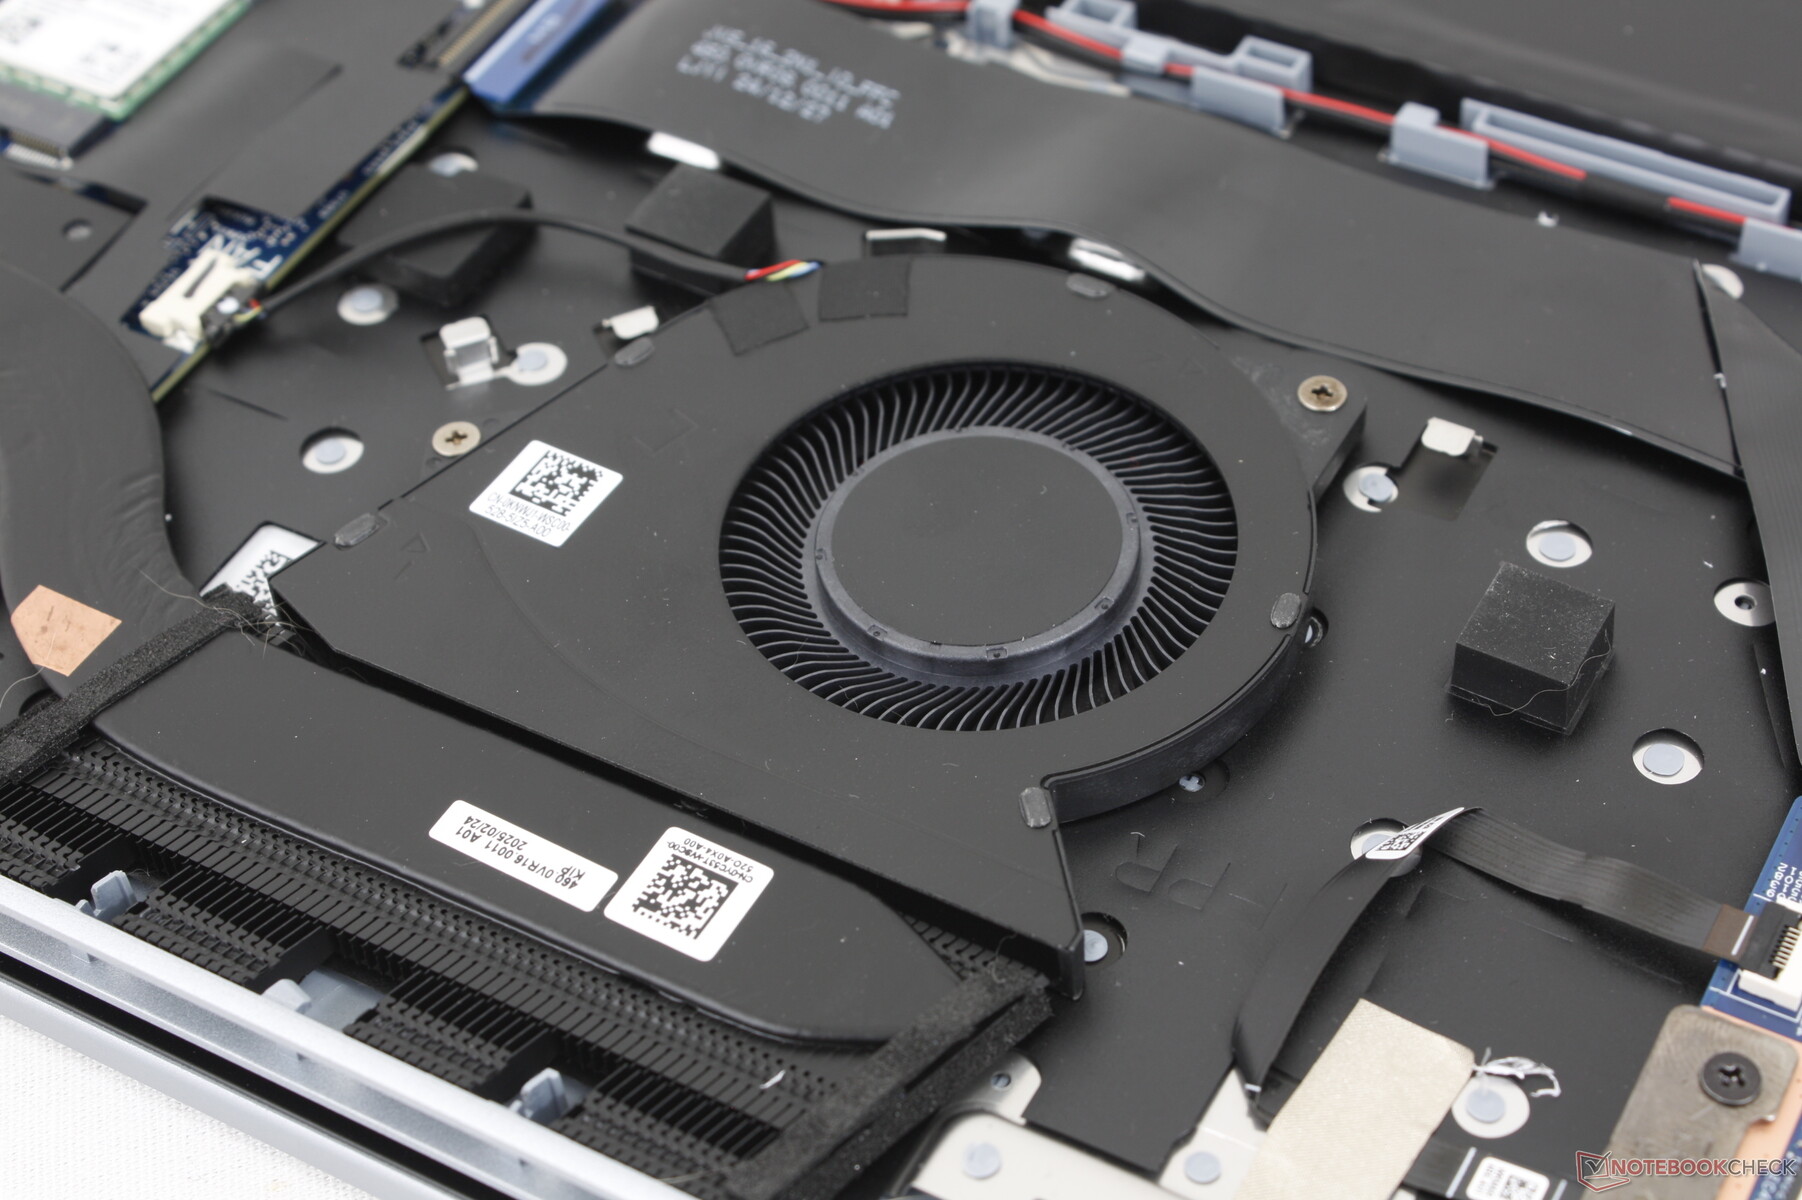
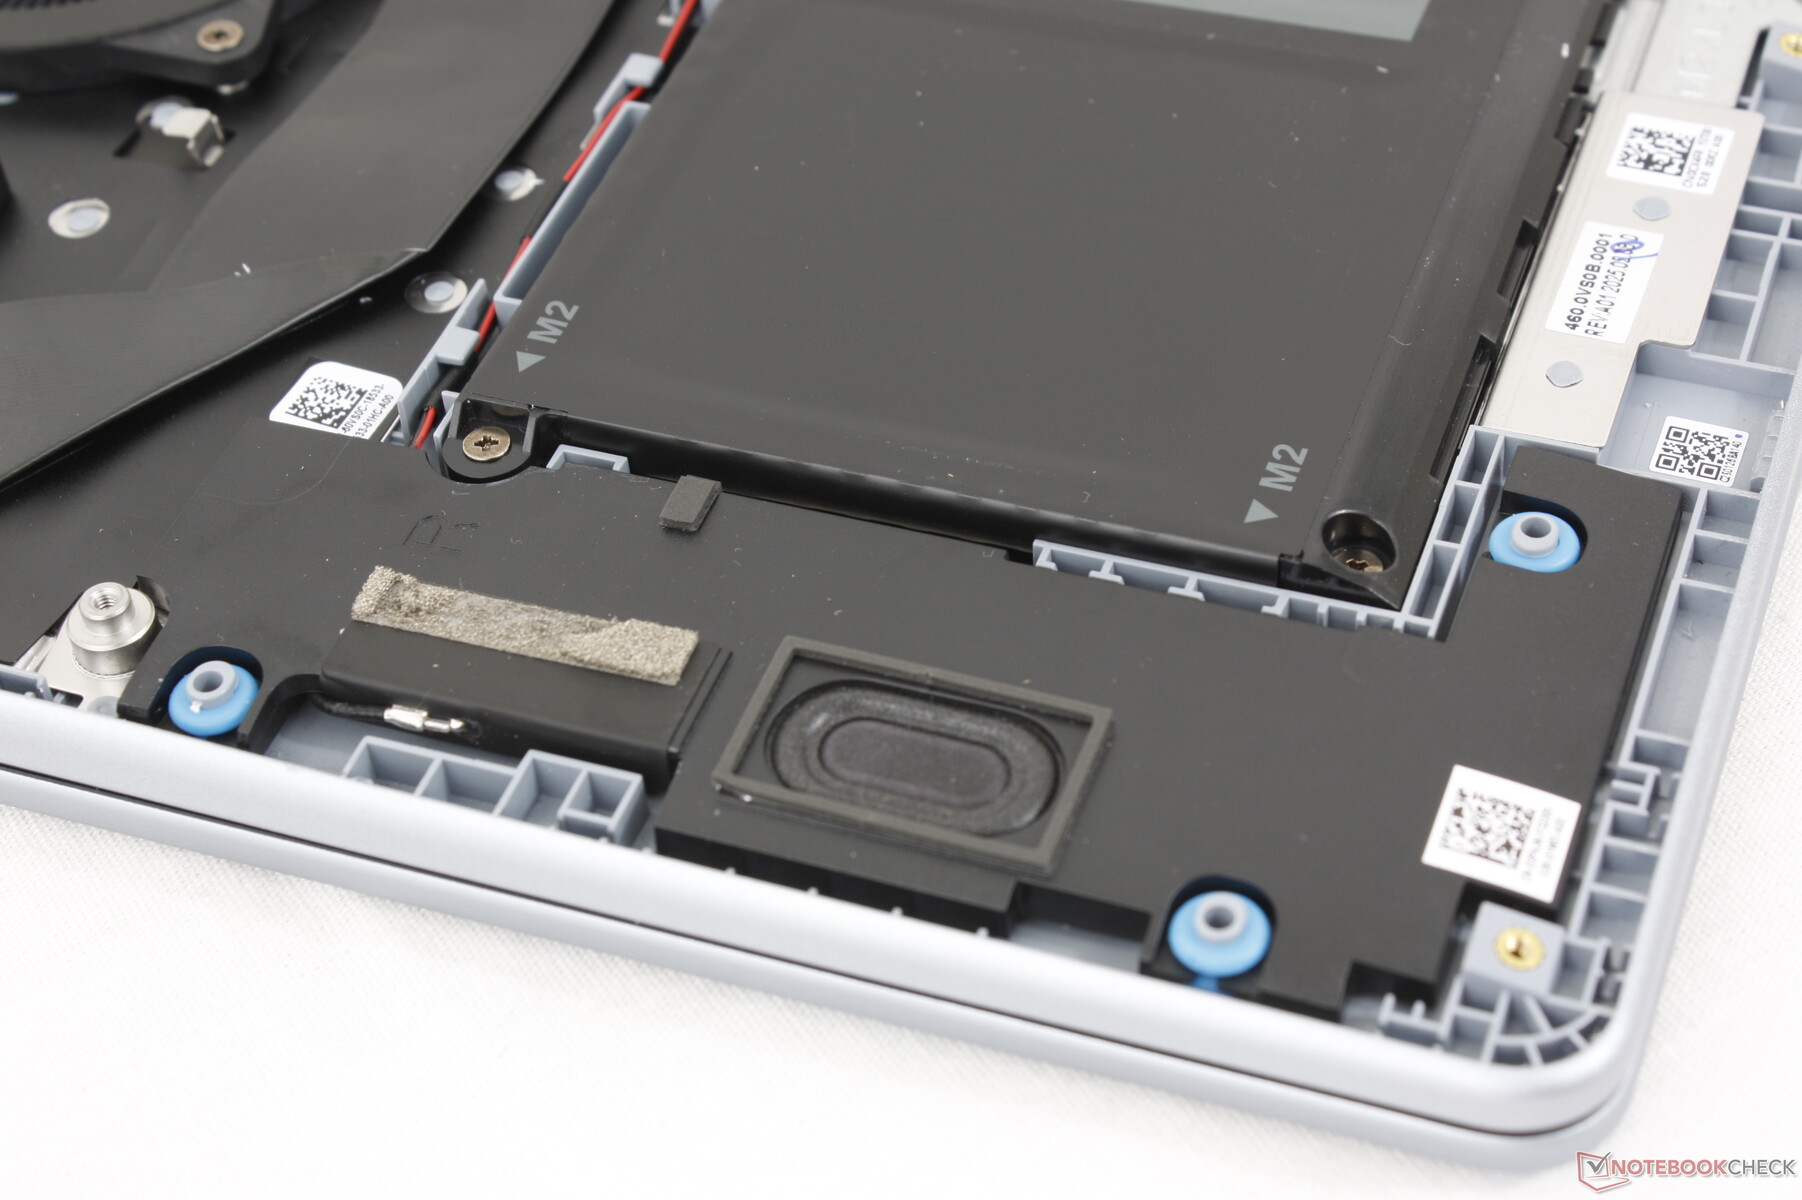
Bakım
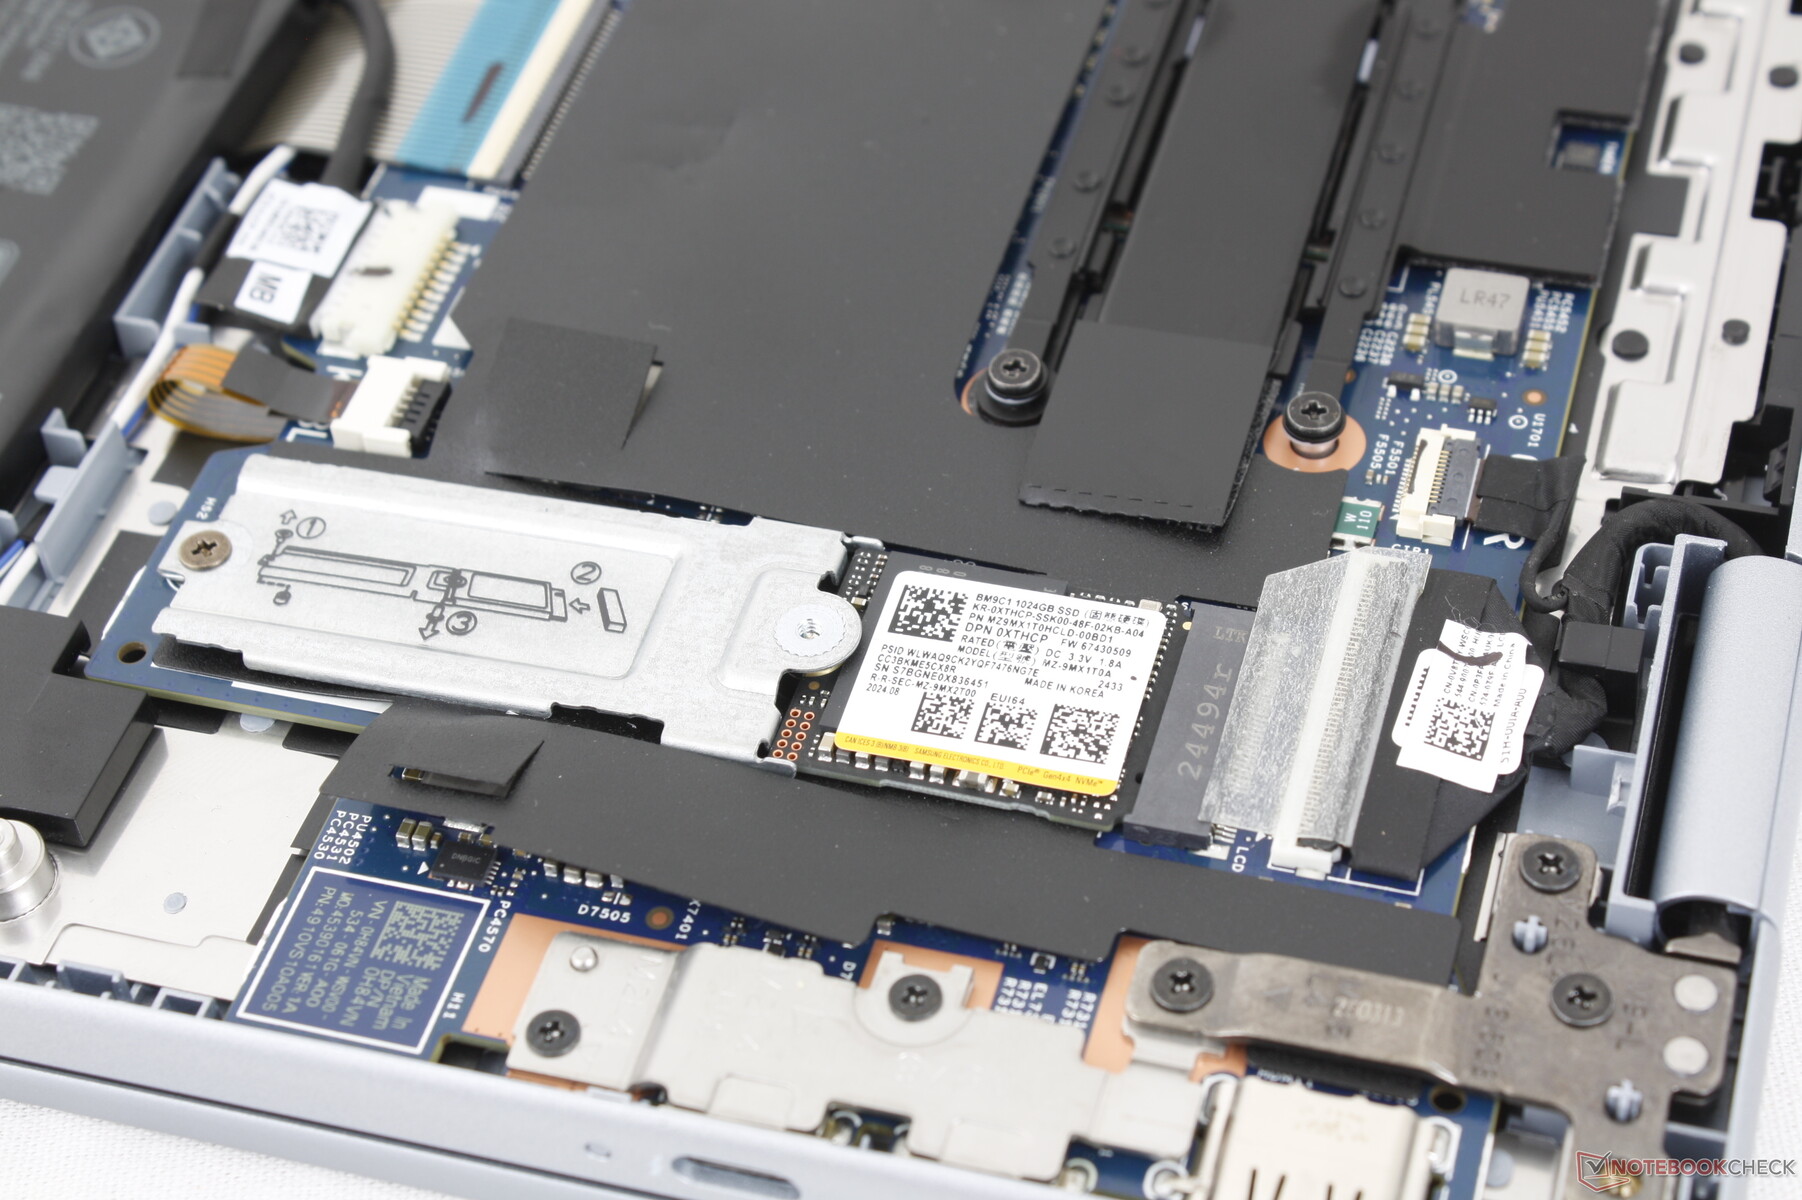
Alt kısım, kolay servis için 8 Phillips vida ile sabitlenmiştir. Bununla birlikte, panelin kenarları diğer dizüstü bilgisayarların çoğuna göre tabana daha sıkı tutturulduğundan dikkatli olunması ve keskin bir kenar kullanılması şiddetle tavsiye edilir. İçeriye girildiğinde, kullanıcılar çıkarılabilir SODIMM modülleri ve depolama için sadece tek bir M.2 2280 yuvası ile karşılaşırlar.
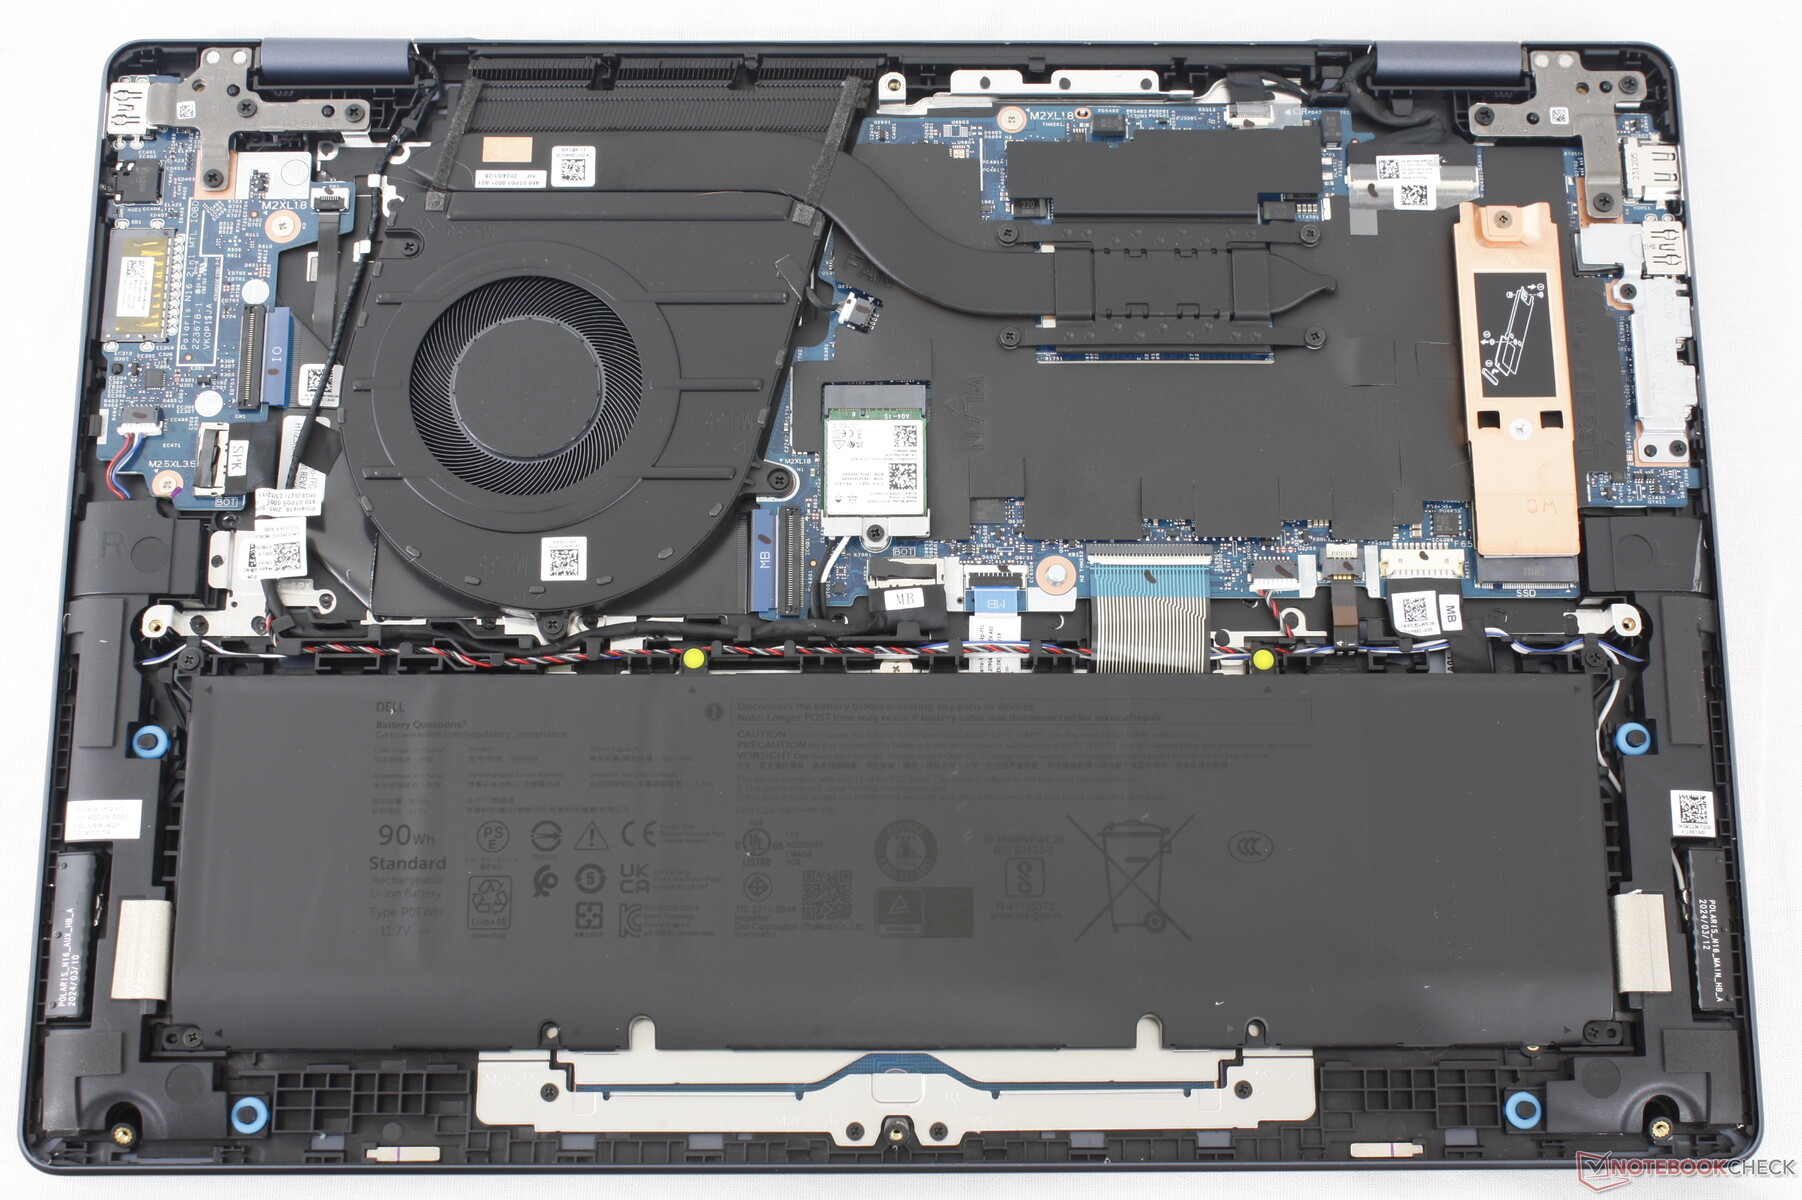
Dell 16 Plus, aşağıdaki karşılaştırma fotoğraflarında gösterildiği gibi Inspiron 16 Plus 7640 2'si 1 arada ile birçok dahili özelliği paylaşıyor.
Sürdürülebilirlik
Model, üretim sırasında geri dönüştürülmüş alüminyum, çelik ve okyanusa bağlı plastik kullanırken ambalaj tamamen geri dönüştürülebilir.
Aksesuarlar ve Garanti
Kutuda AC adaptörü ve evraklar dışında ekstra bir şey yoktur. ABD'de satın alındıysa normal bir yıllık sınırlı üretici garantisi geçerlidir.
Giriş Aygıtları
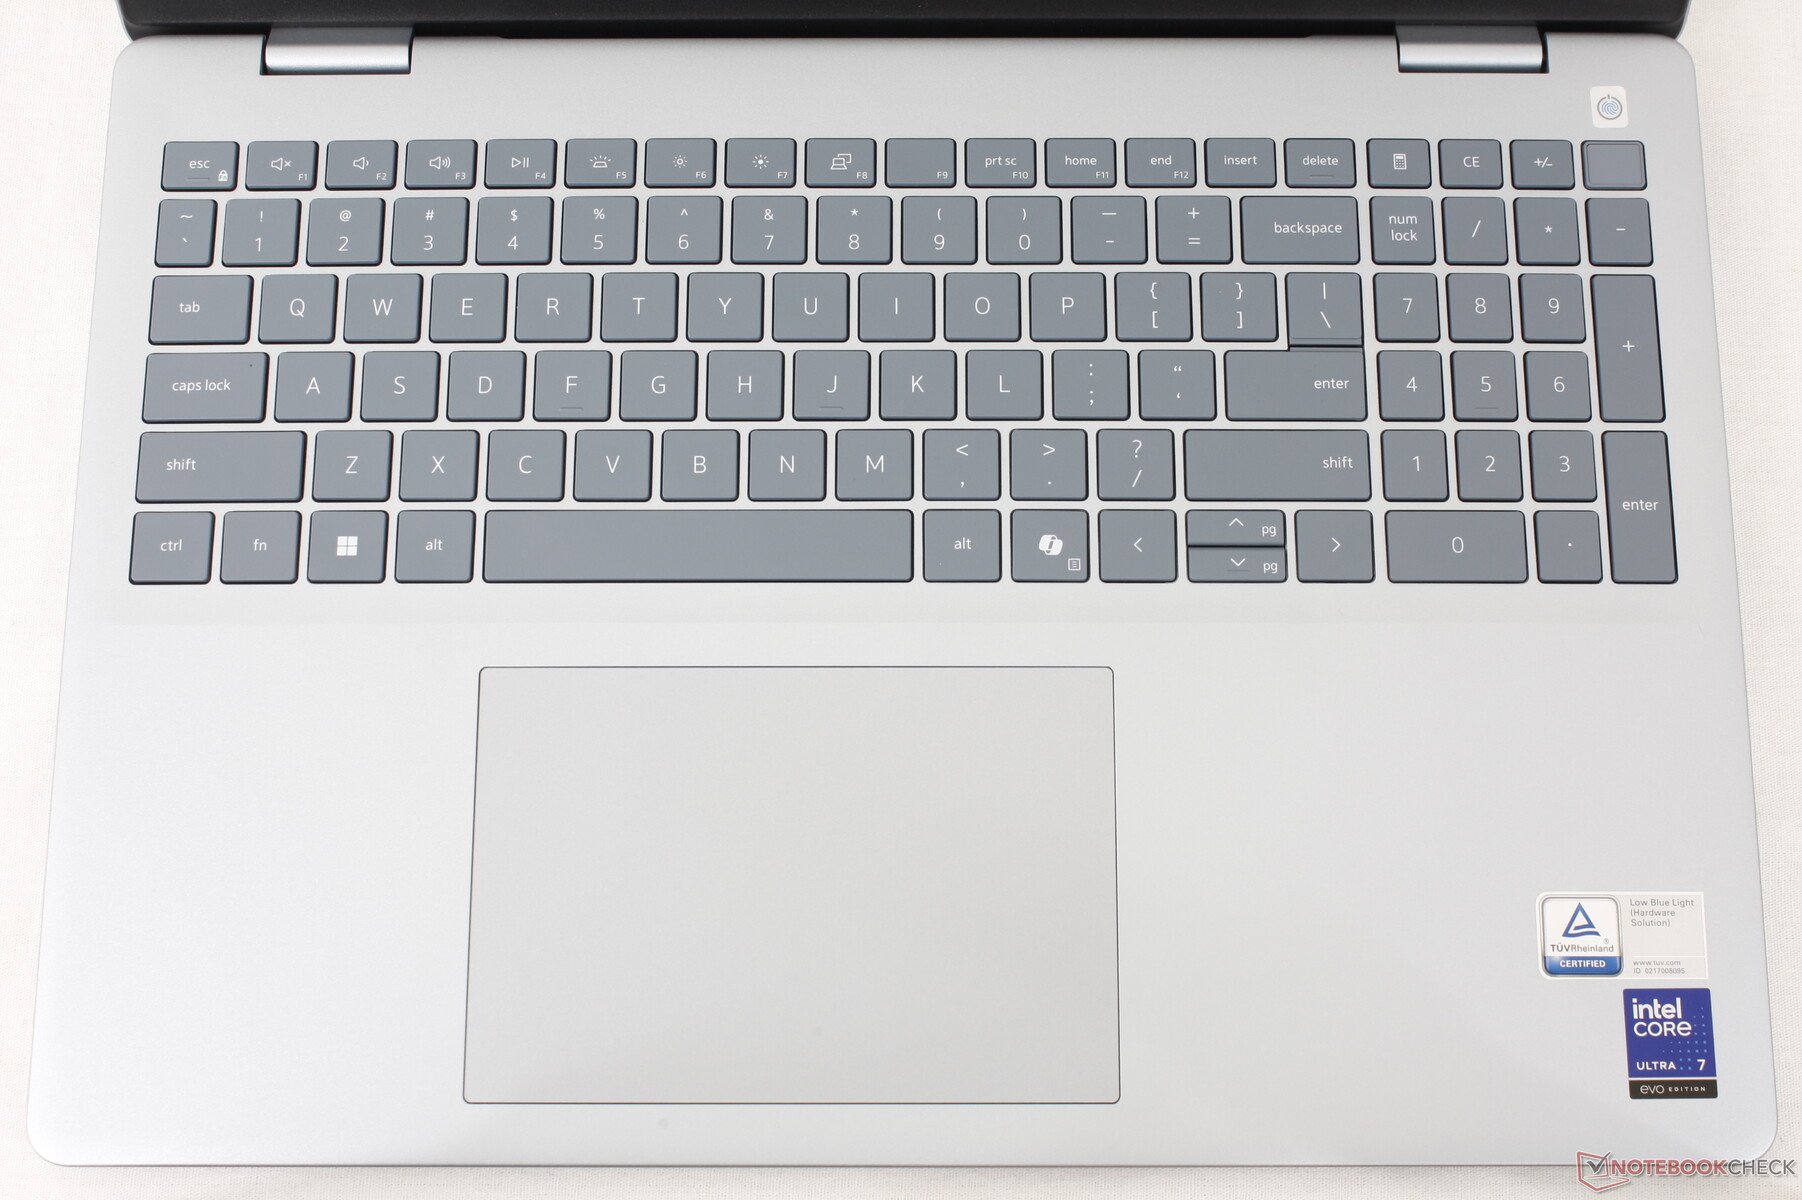
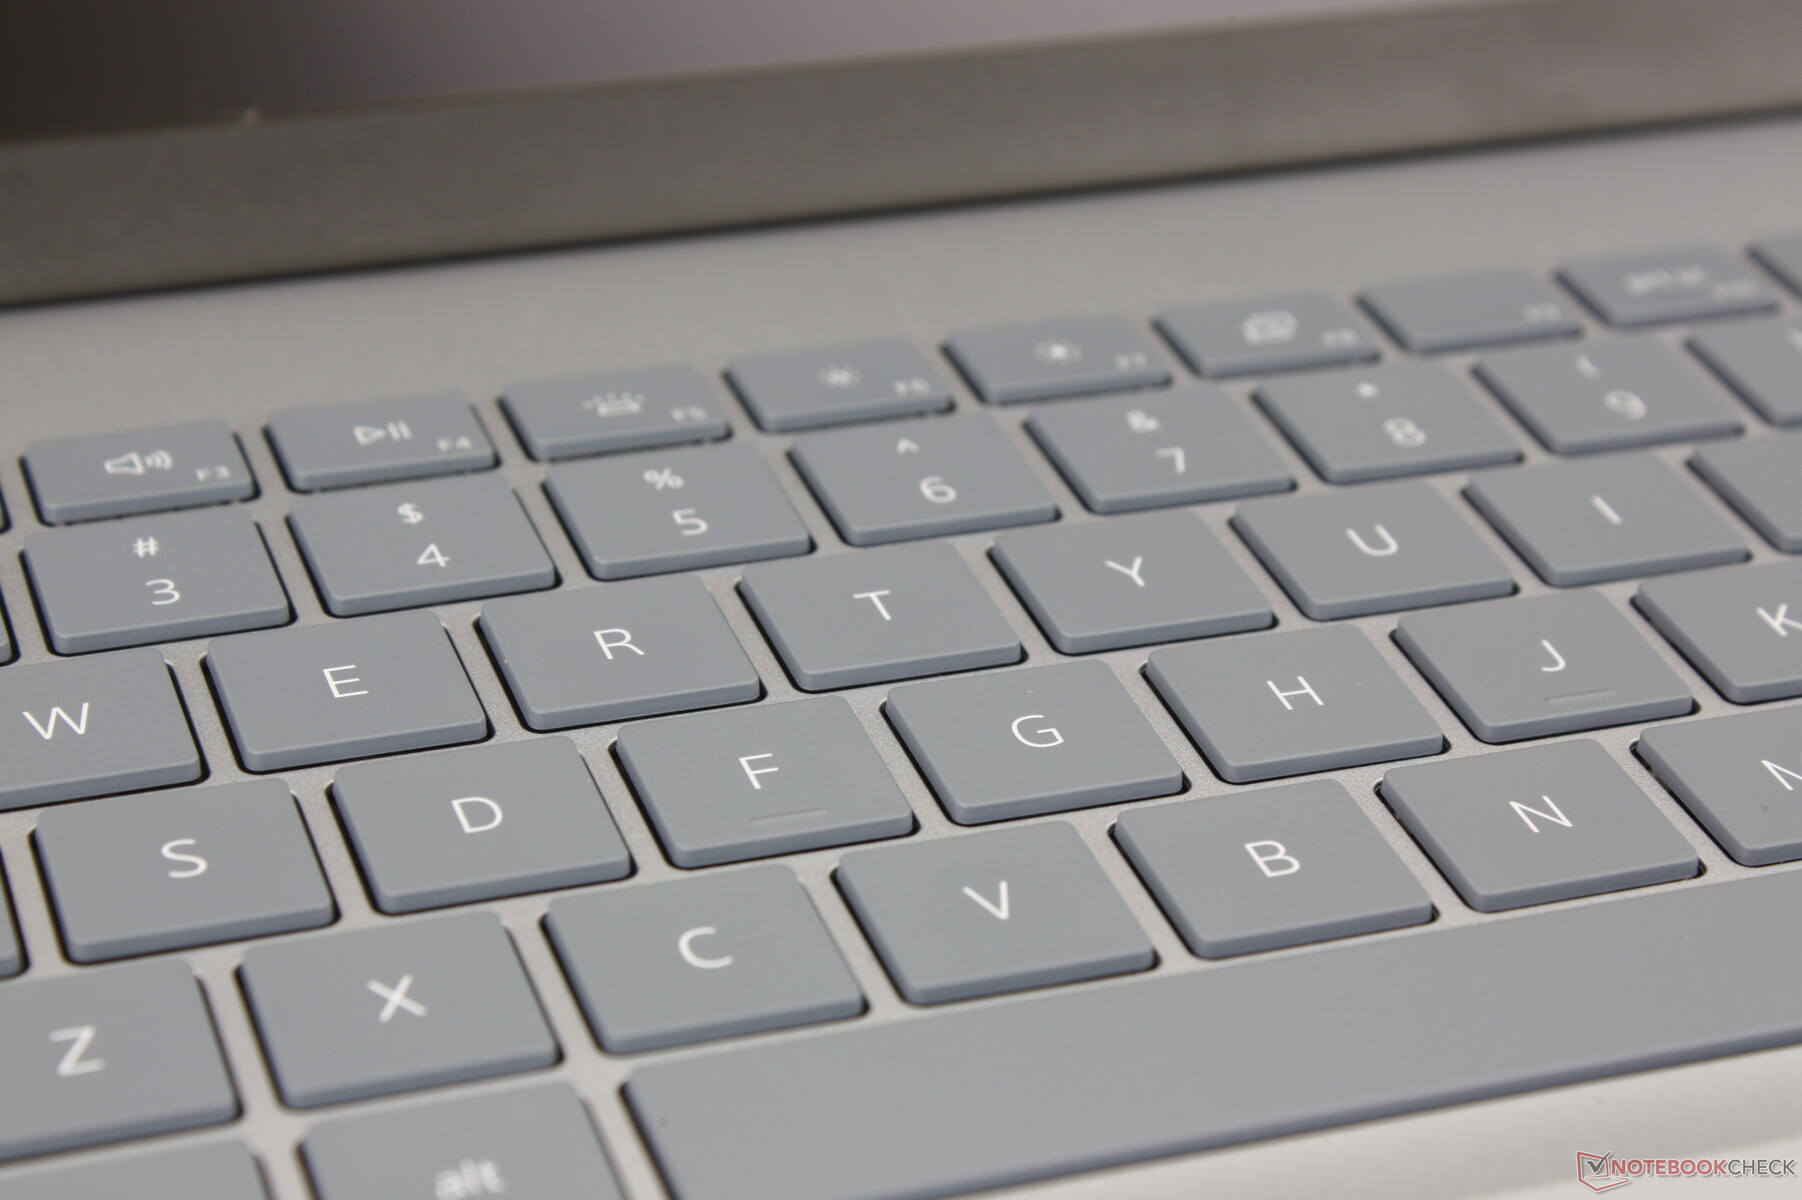
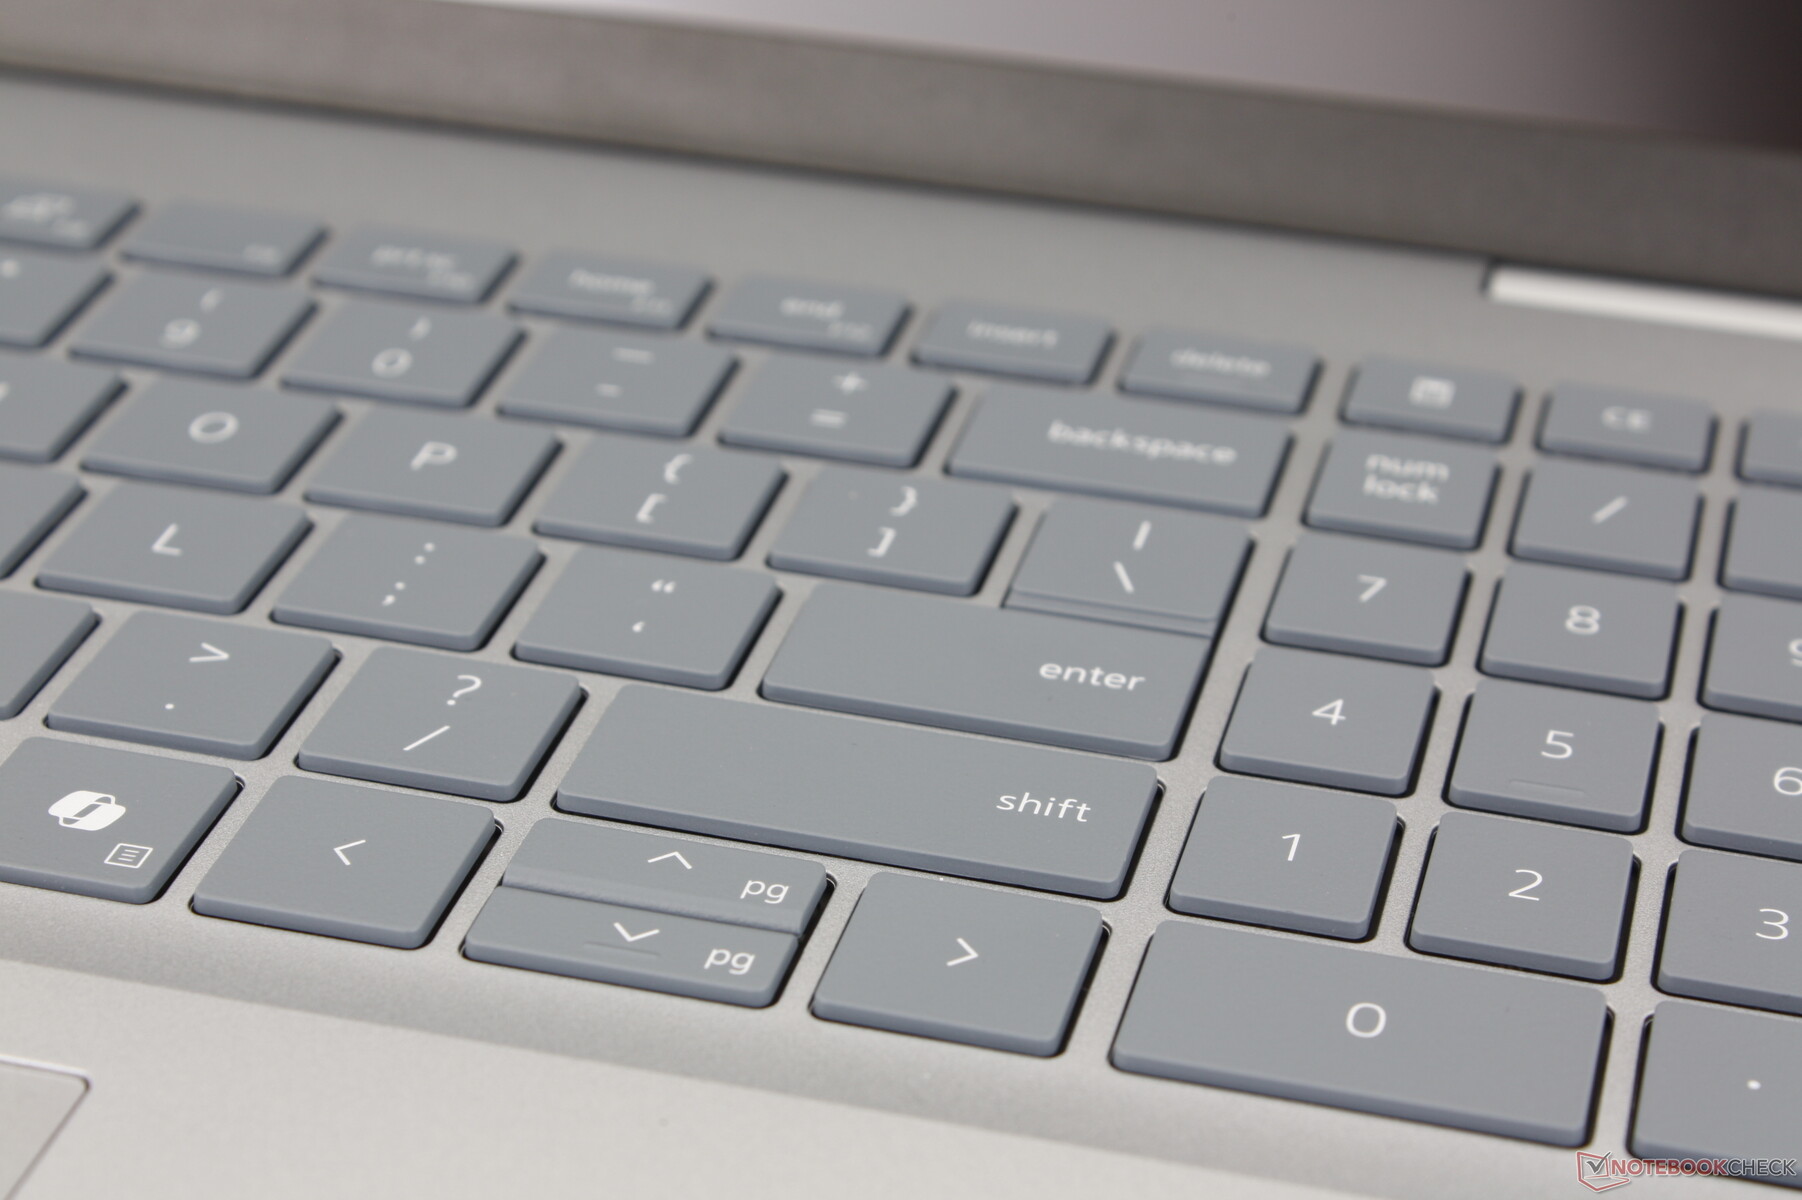
Klavye
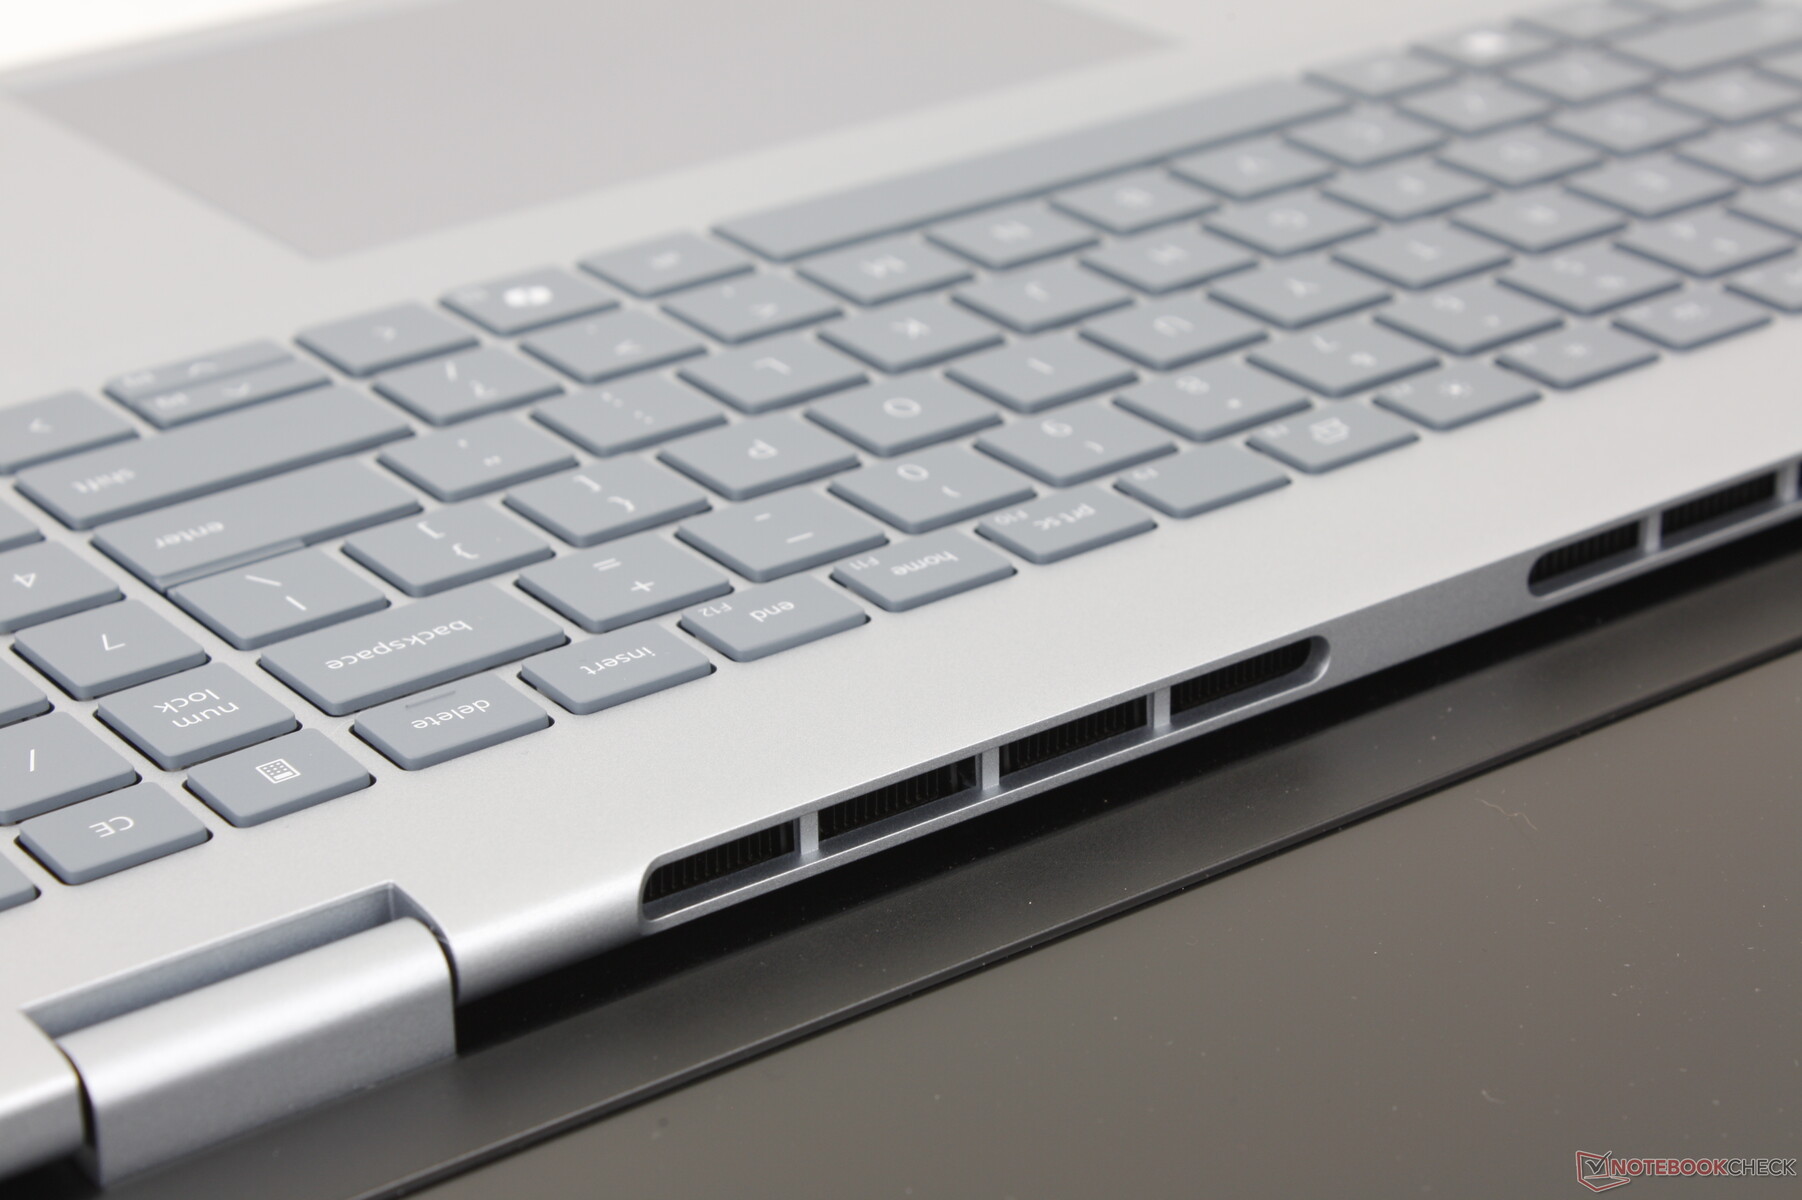
Dell 16 Plus, Inspiron 16 Plus 7640 serisinde bu özellik eksikken entegre bir numpad sunuyor. Yazma deneyimi, iyi ya da kötü eski nesil Inspiron modellerine benziyor. Tuş geri bildirimi daha yumuşaktır, ancak makul derecede yüksek ve tıklamalı bir Boşluk çubuğu vardır.
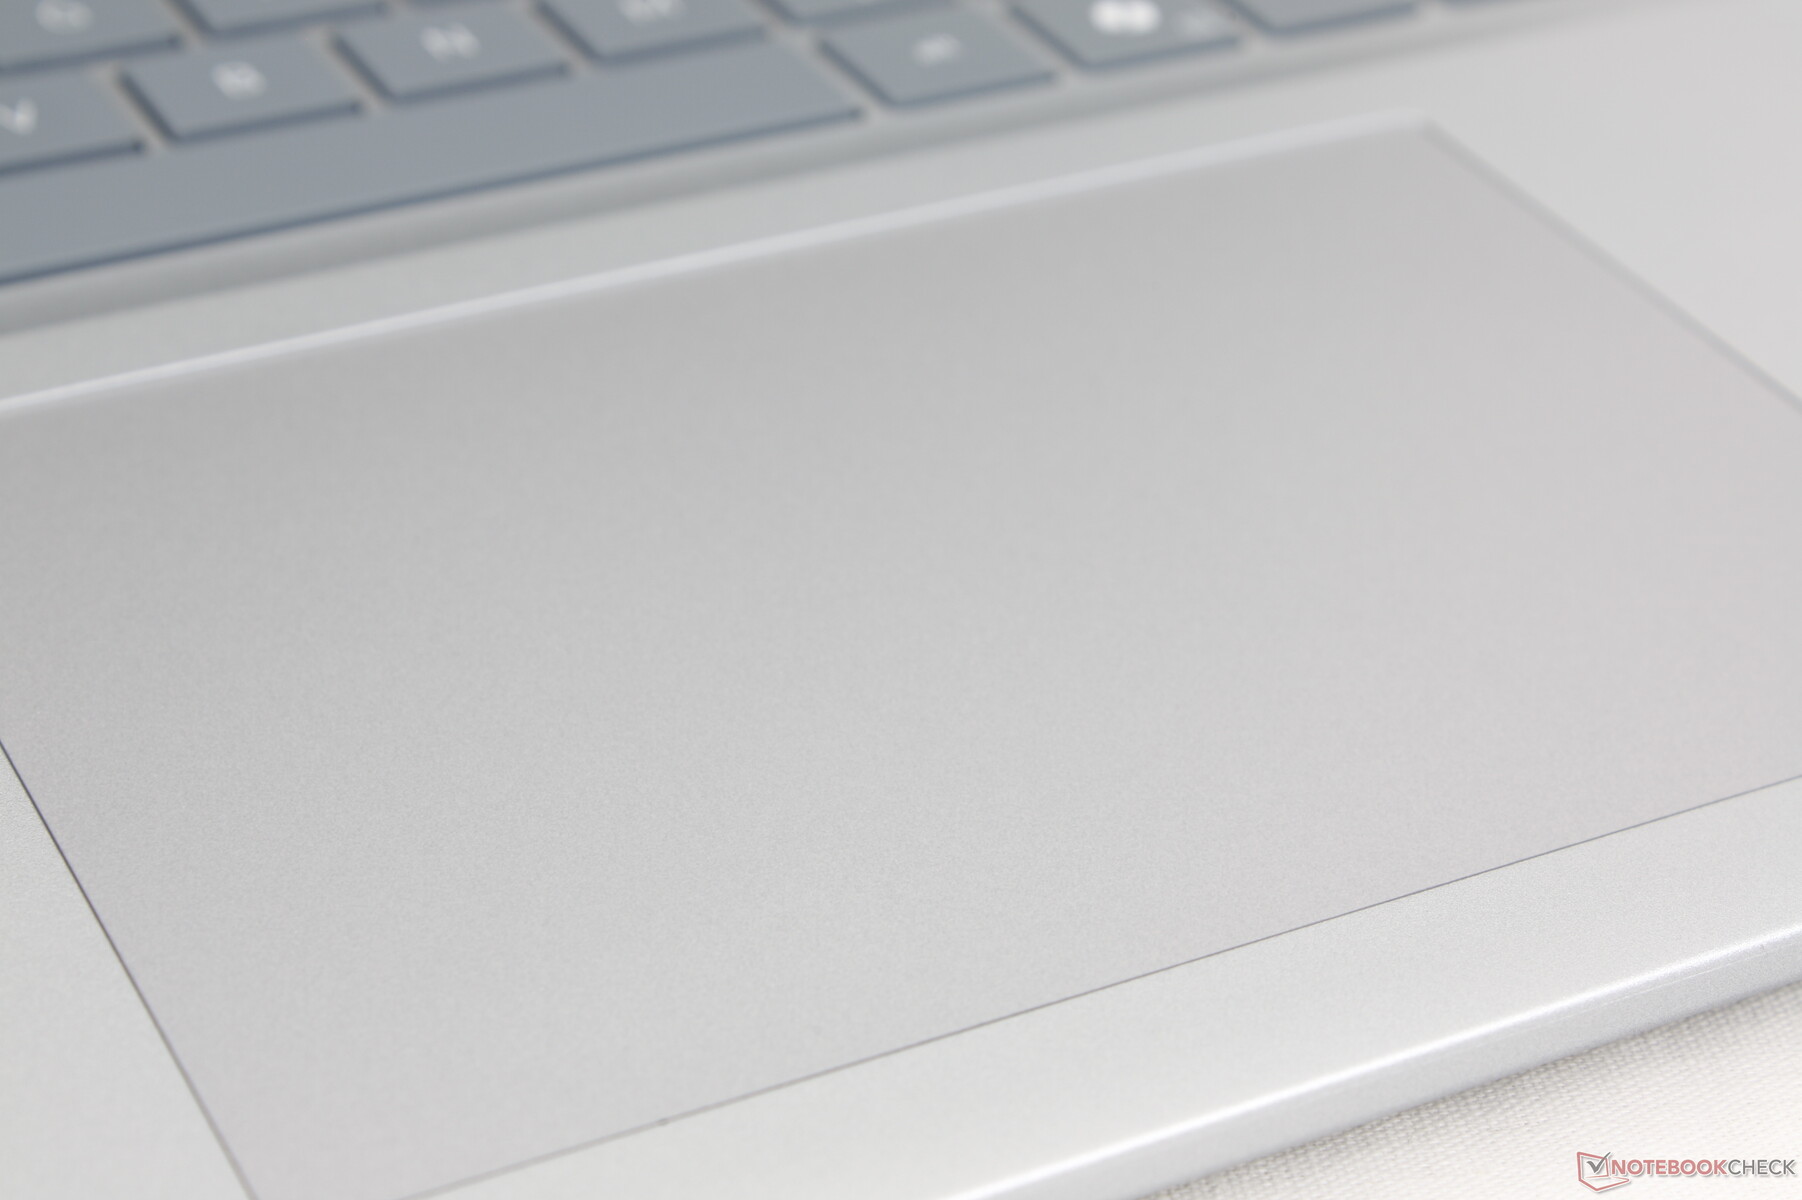
Dokunmatik yüzey
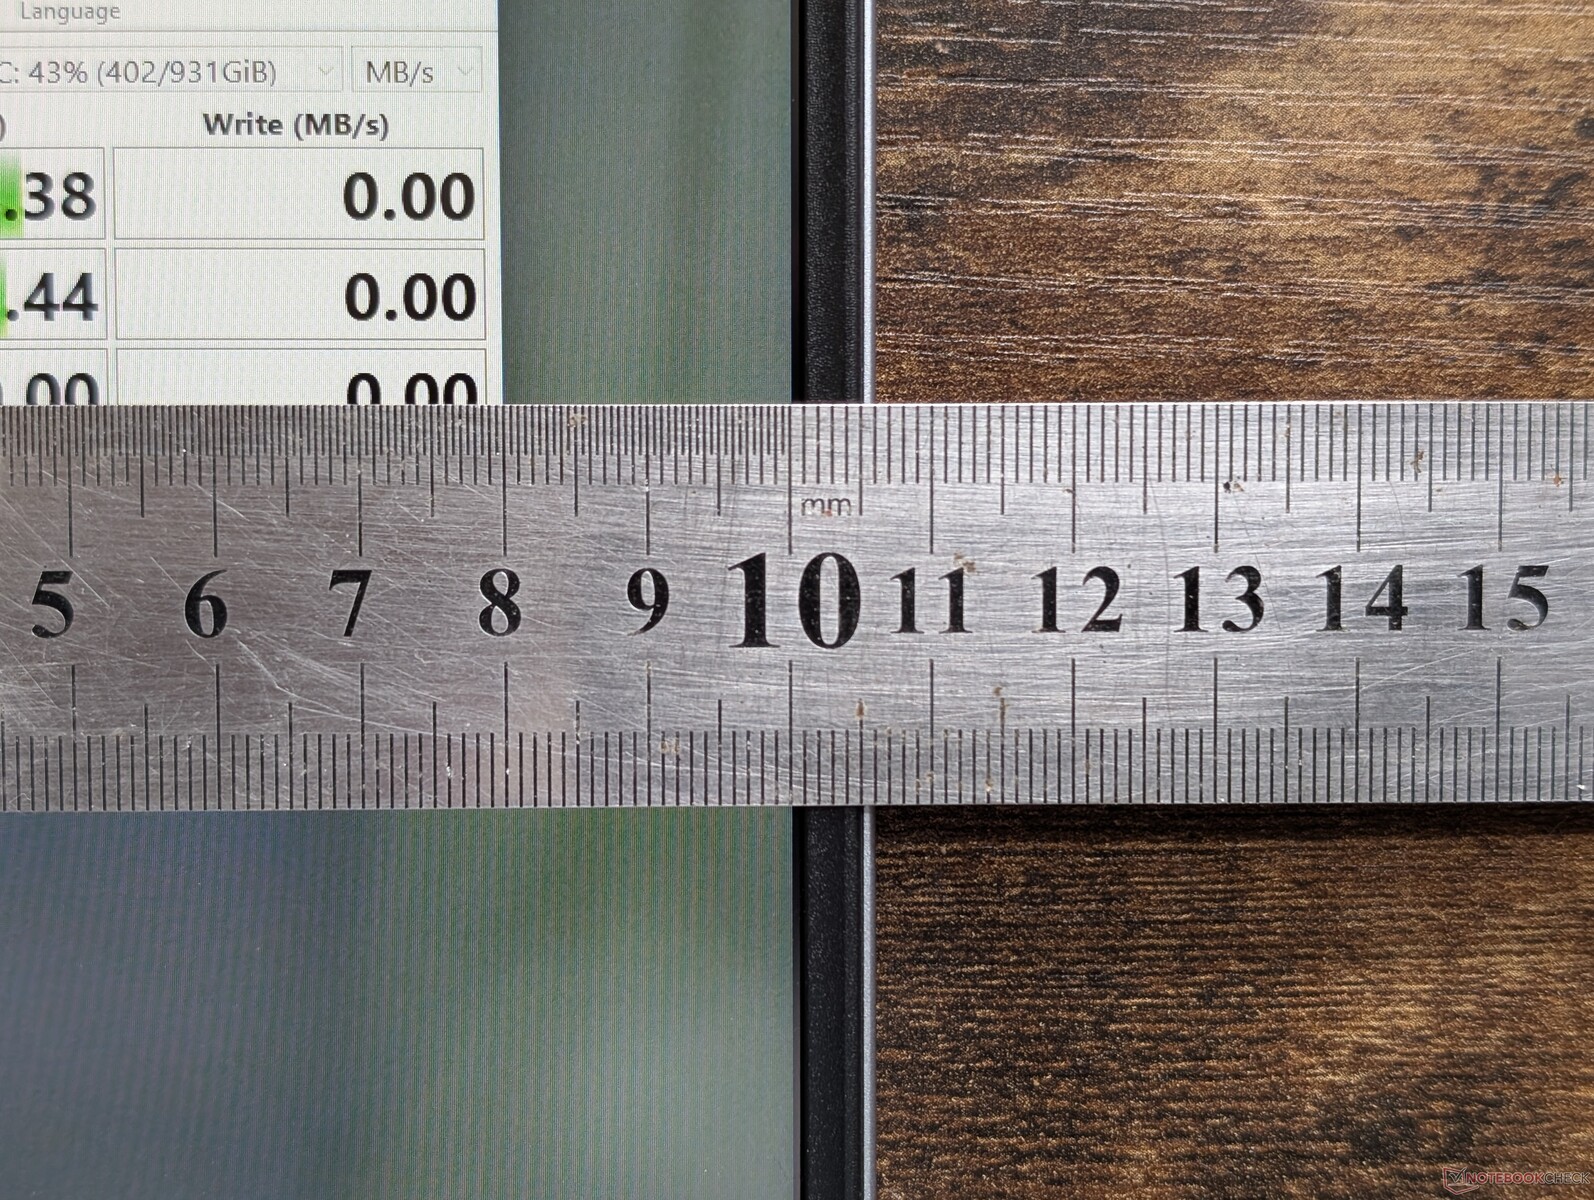
Klavye işlevsellik açısından genişlemiş olsa da, tıklama yüzeyi Inspiron 16 Plus 7640 2'si 1 arada ile boyutuna (13,3 x 9 cm) kadar aynı kalıyor. Rahat imleç kontrolü ve çoklu dokunmatik girişler için geniş ve ferahtır, ancak yüzeyine tıklamak diğer dizüstü bilgisayarların çoğundan daha fazla güç gerektirir.
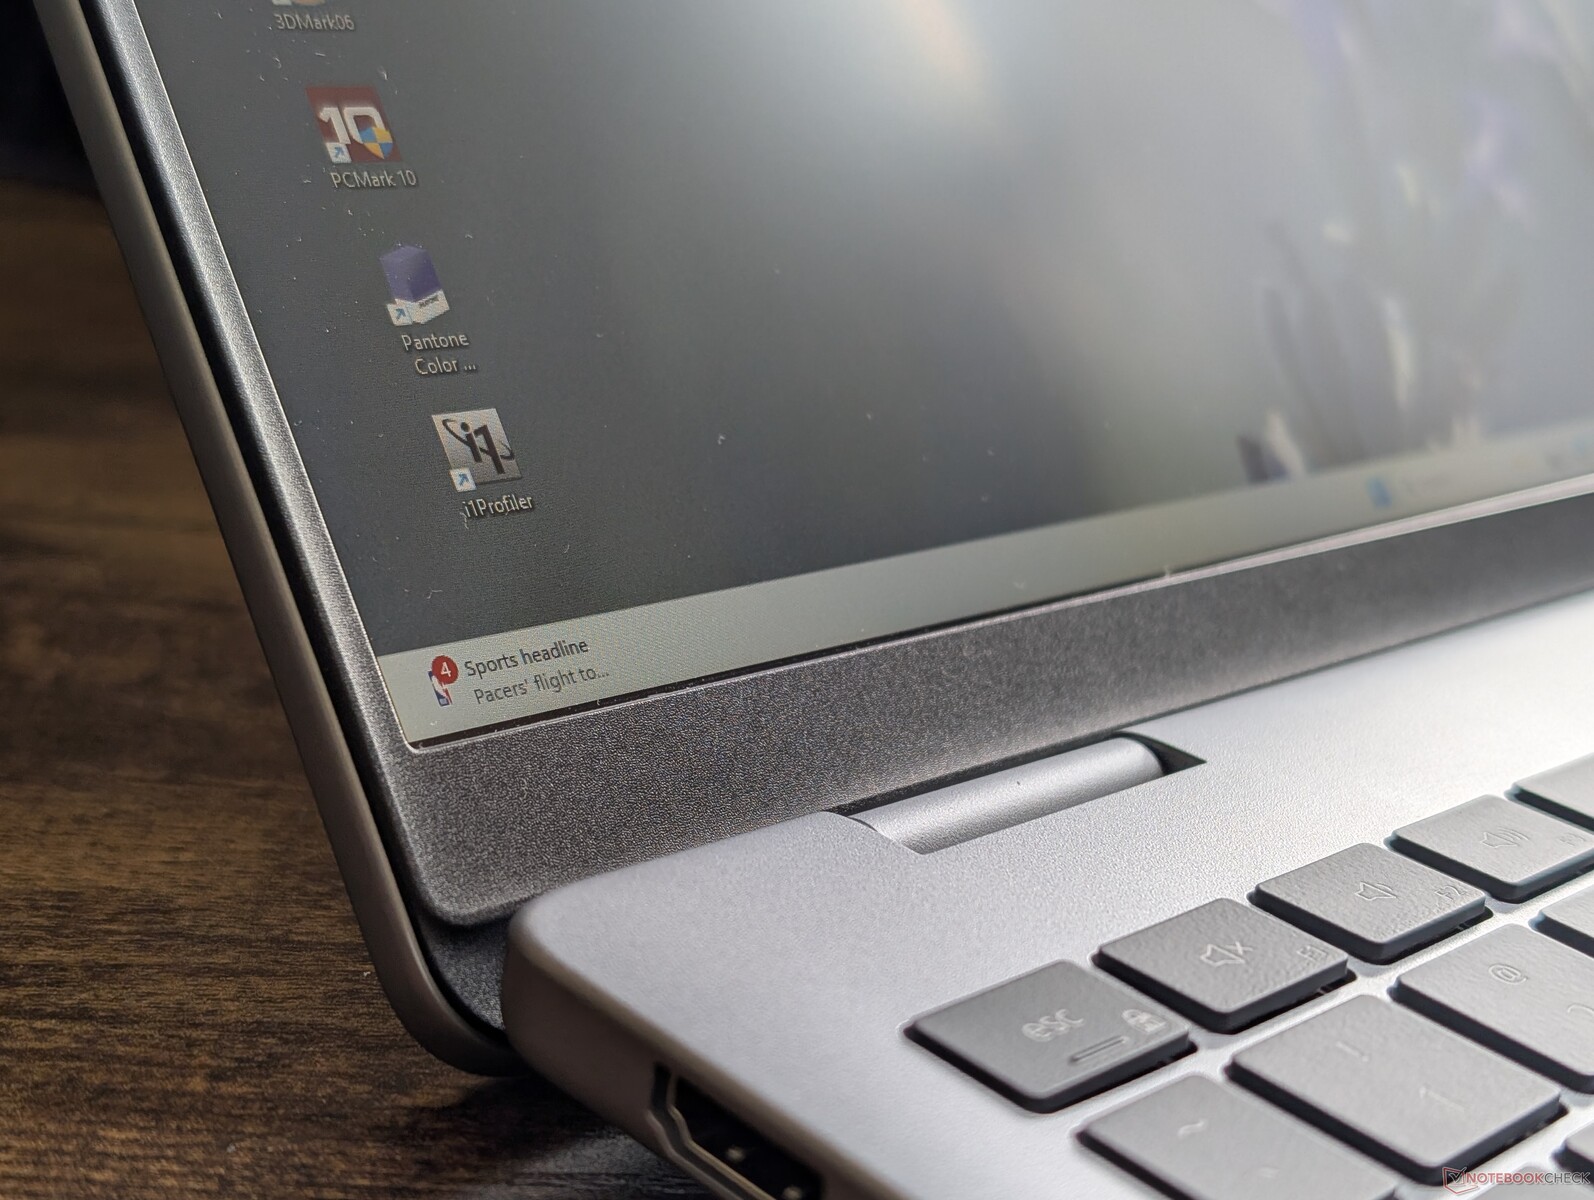
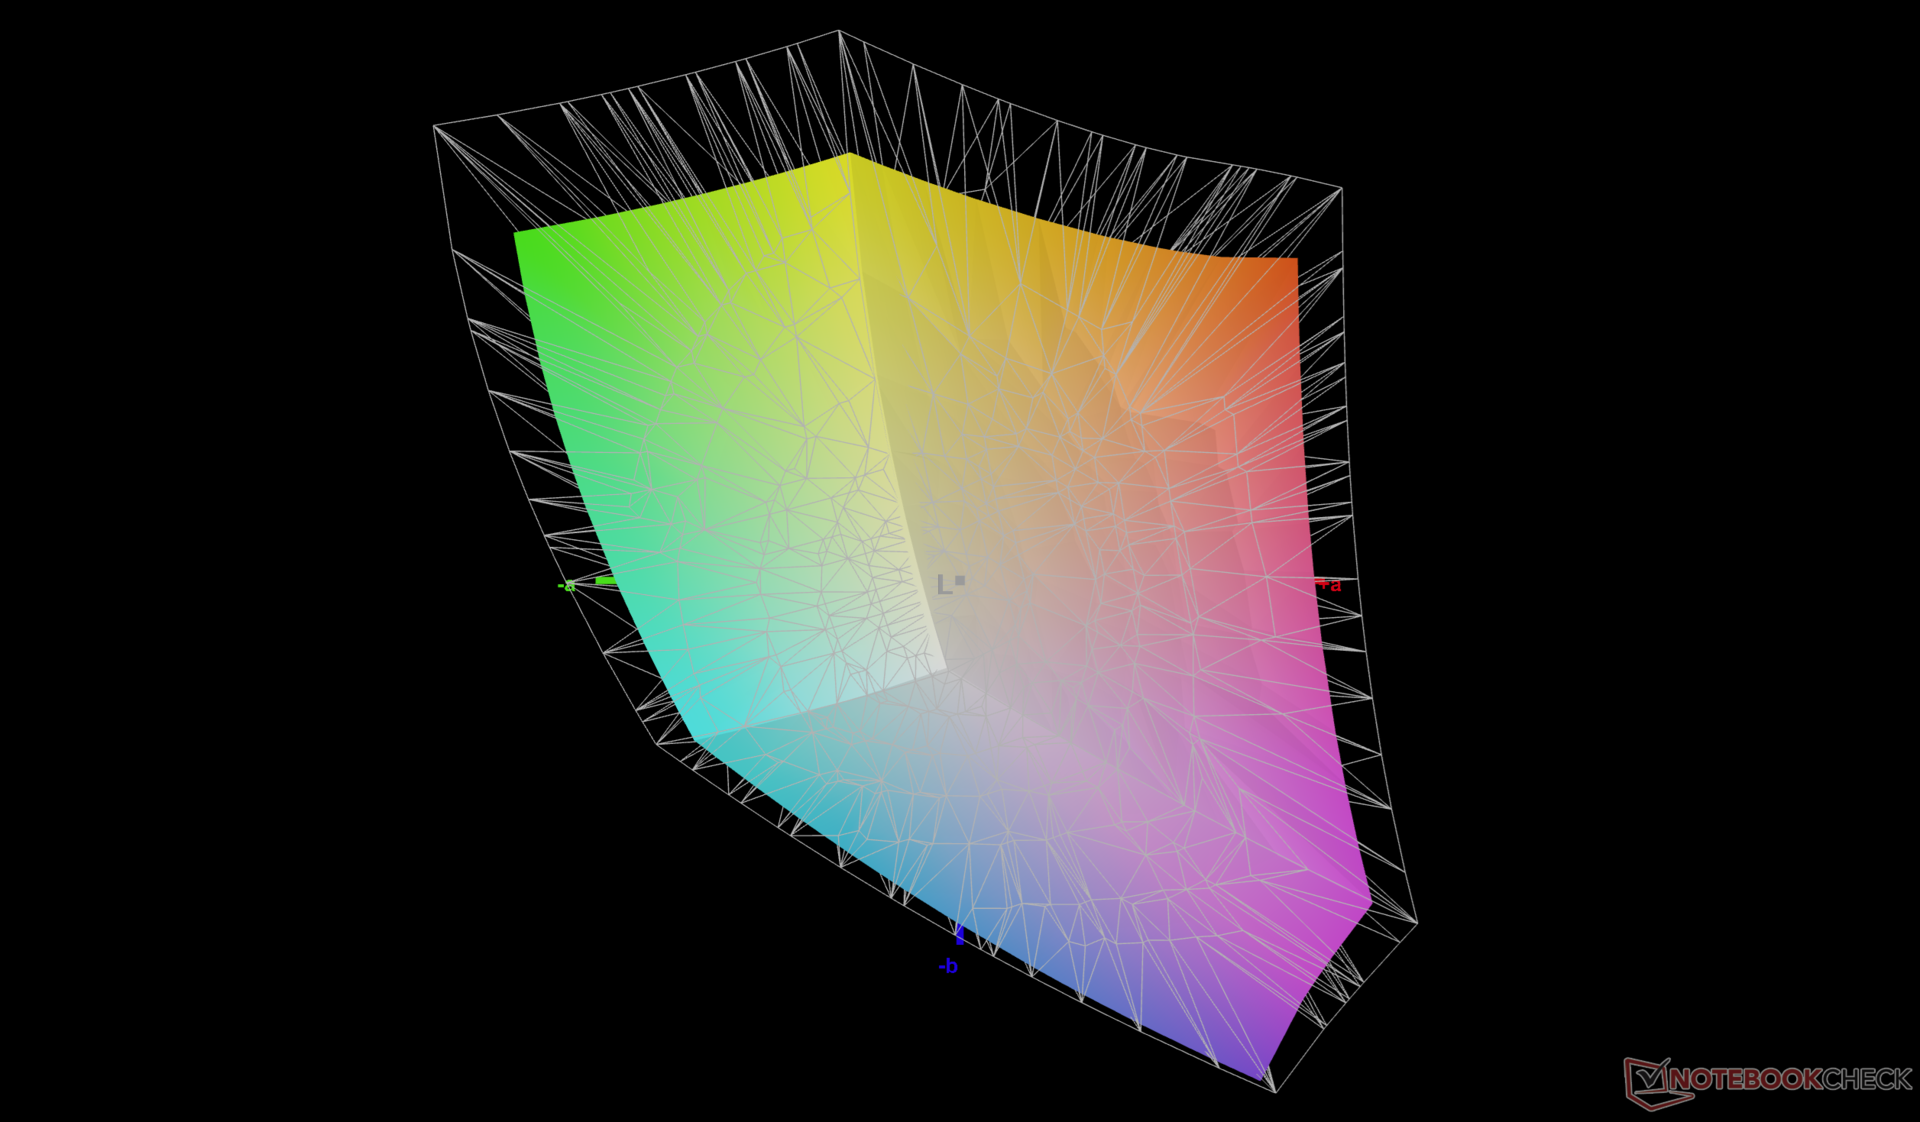
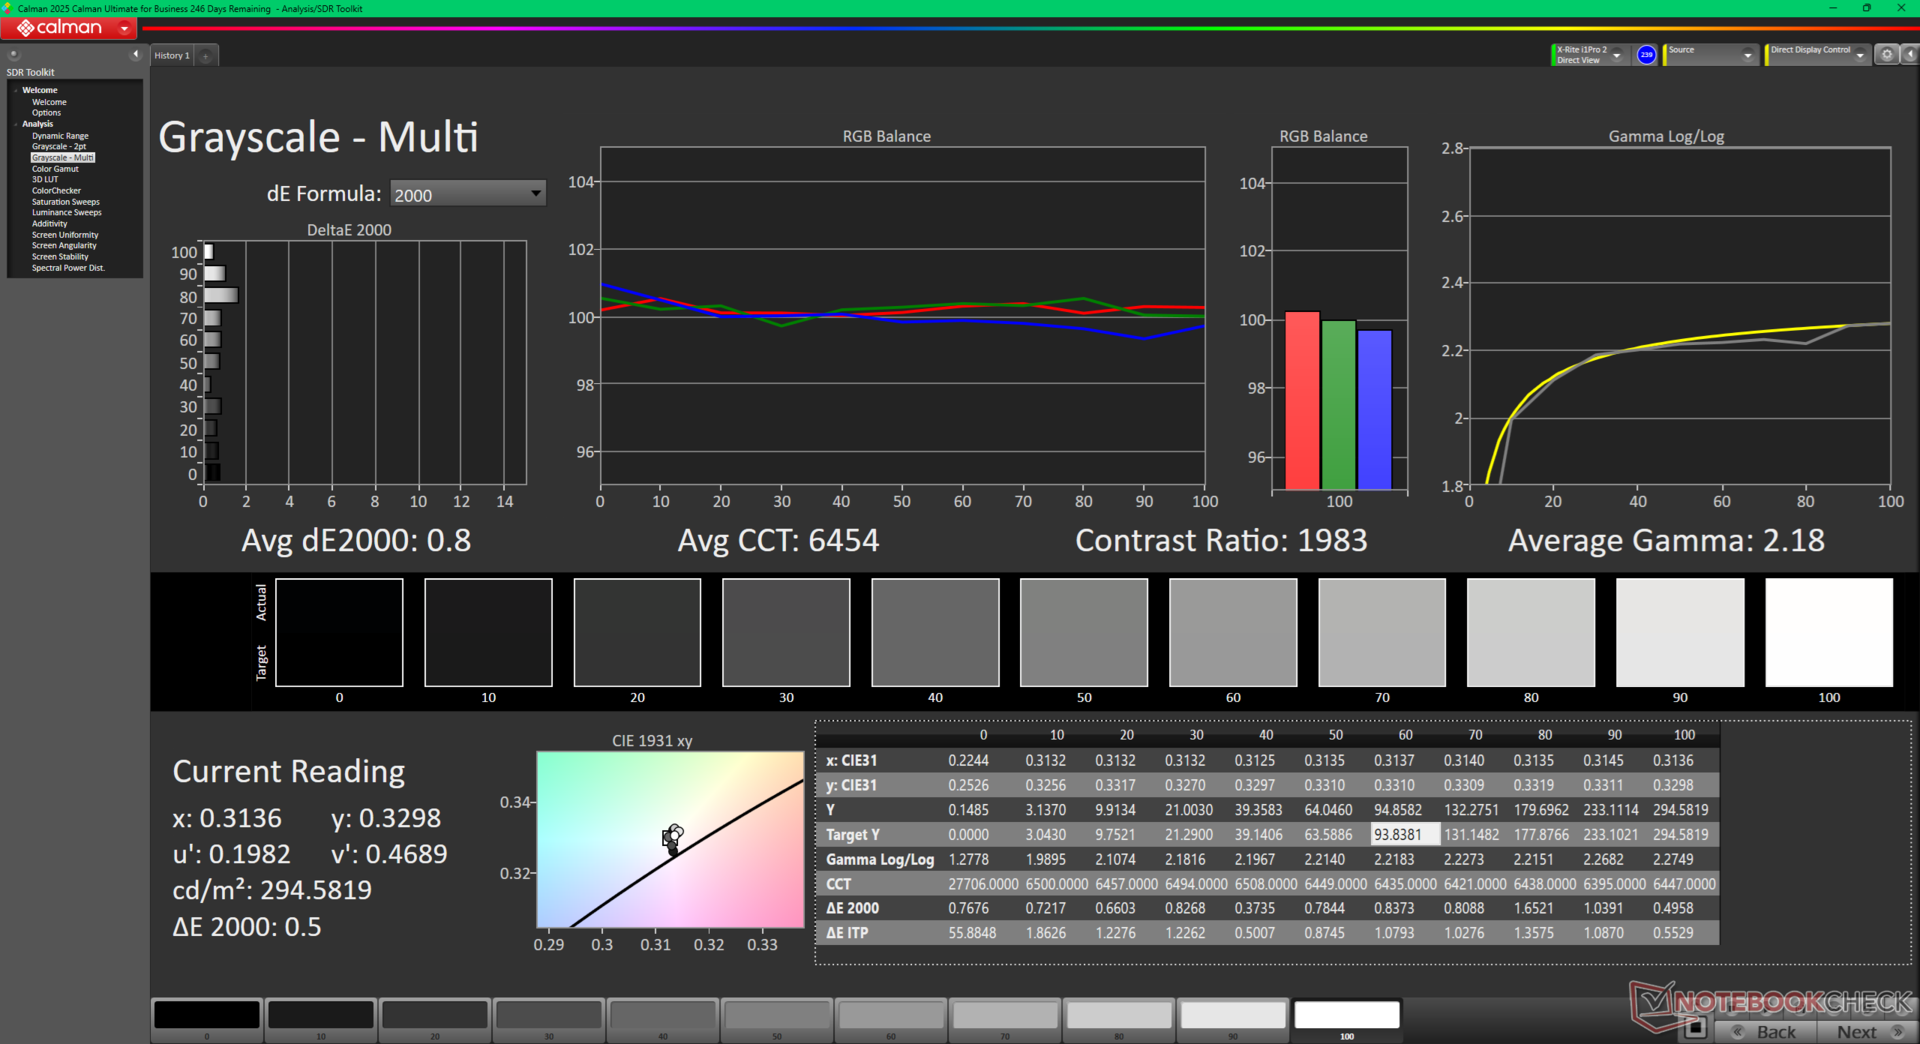
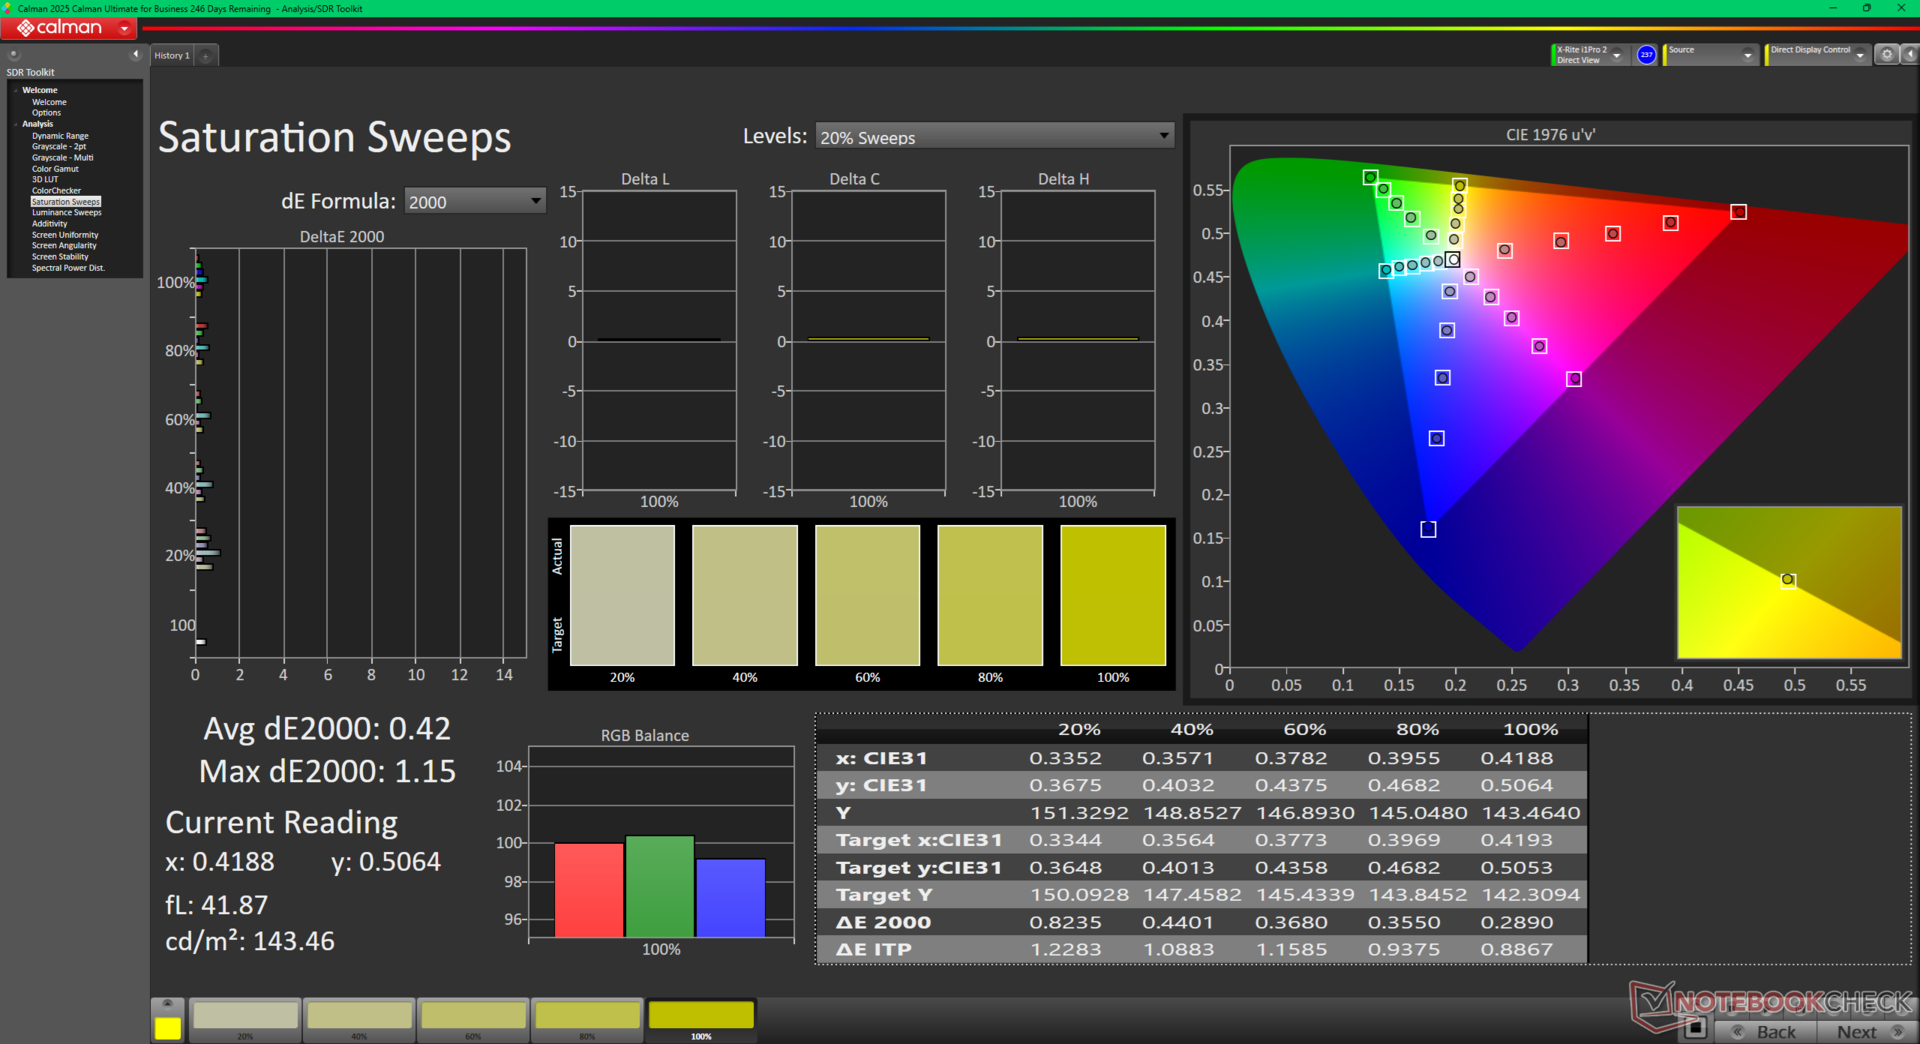
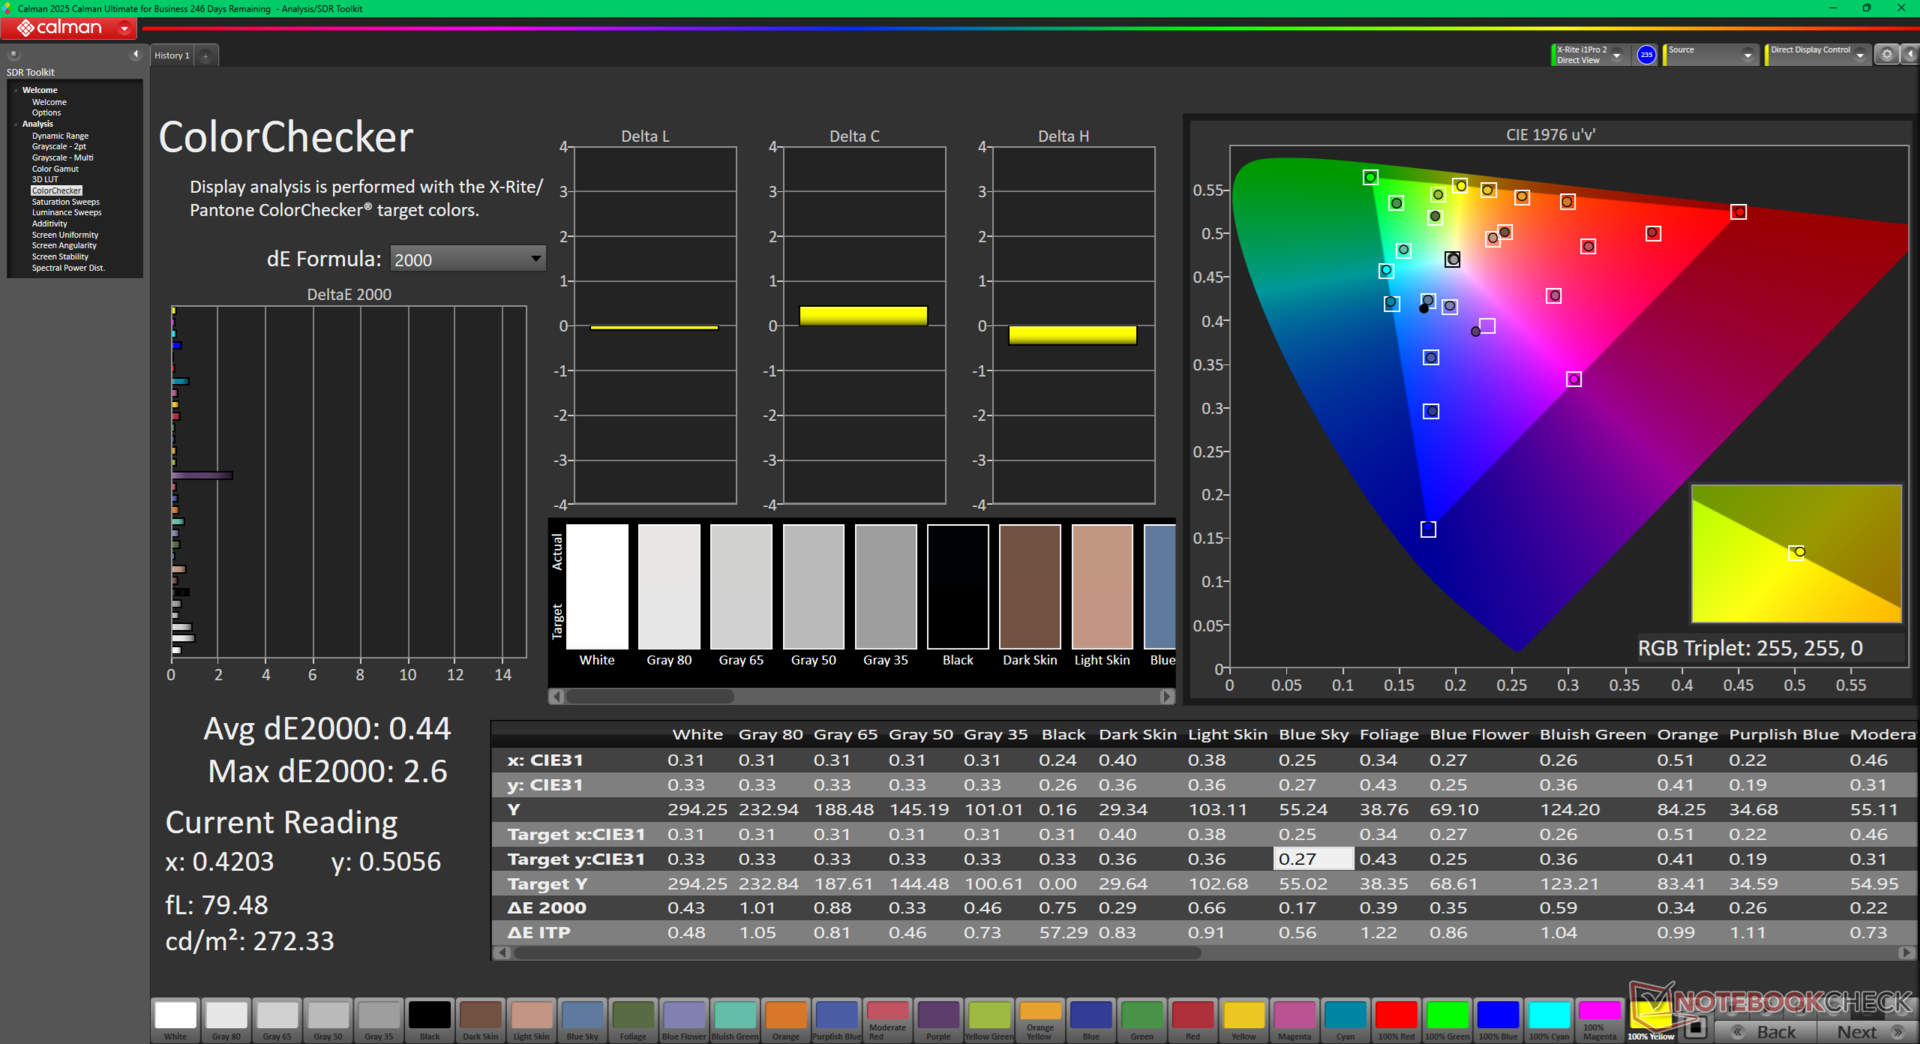
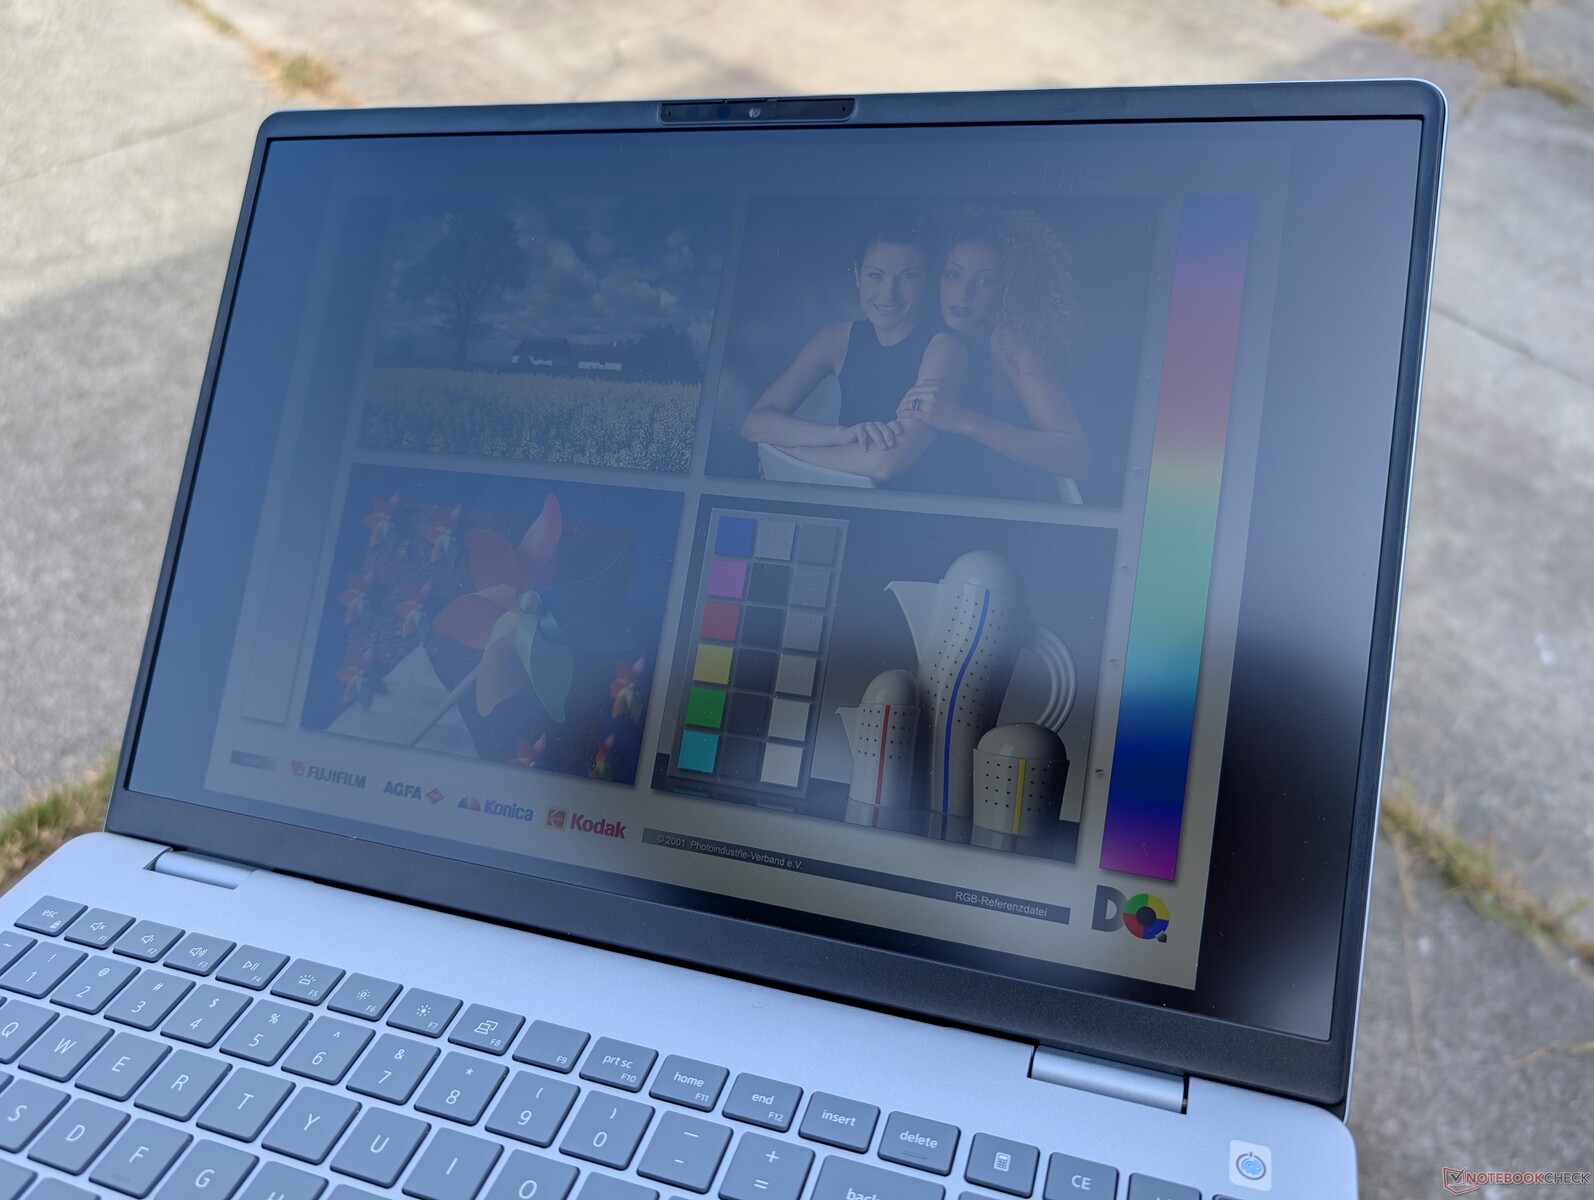
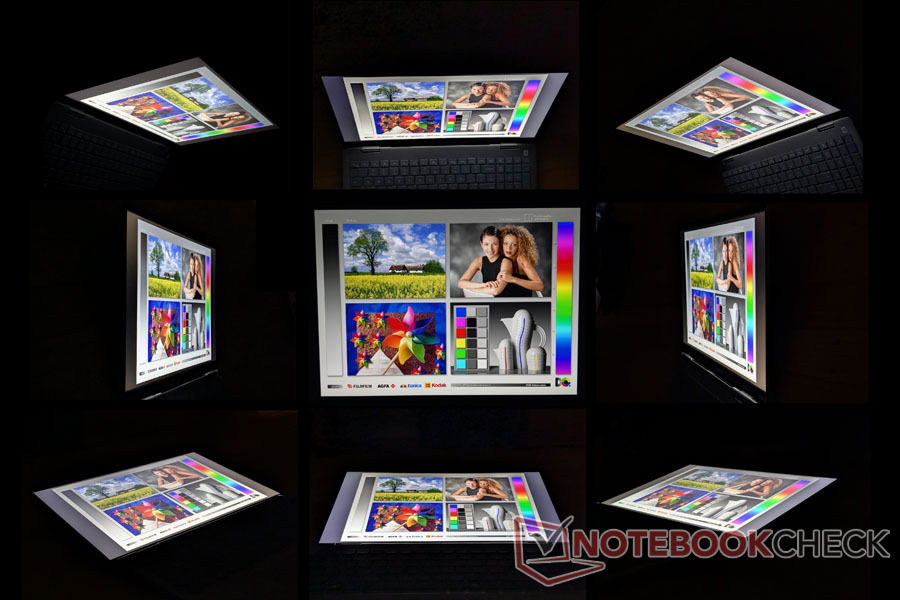
Ekran - 120 Hz ve Tam sRGB Renkler
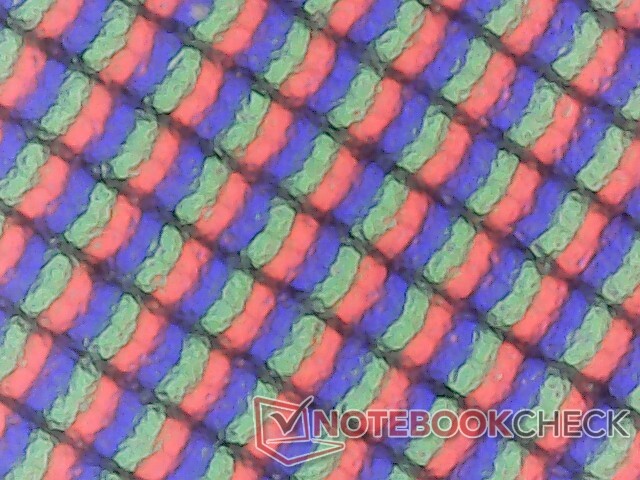
Dell 16 Plus, üzerinde bulunan AU Optronics B160QAN IPS panelin aynısını paylaşıyor Inspiron 16 Plus 7640 i̇kisi arasında temelde aynı görüntüleme deneyimi için. Yine de parlaklık ve HDR desteği konusunda iyileştirmeler görmek isterdik.
90 Hz mini-LED konfigürasyonu büyük olasılıkla geçen yılki Inspiron 16 7640 2'si 1 arada modelinde bulunan panelin aynısı.
| |||||||||||||||||||||||||
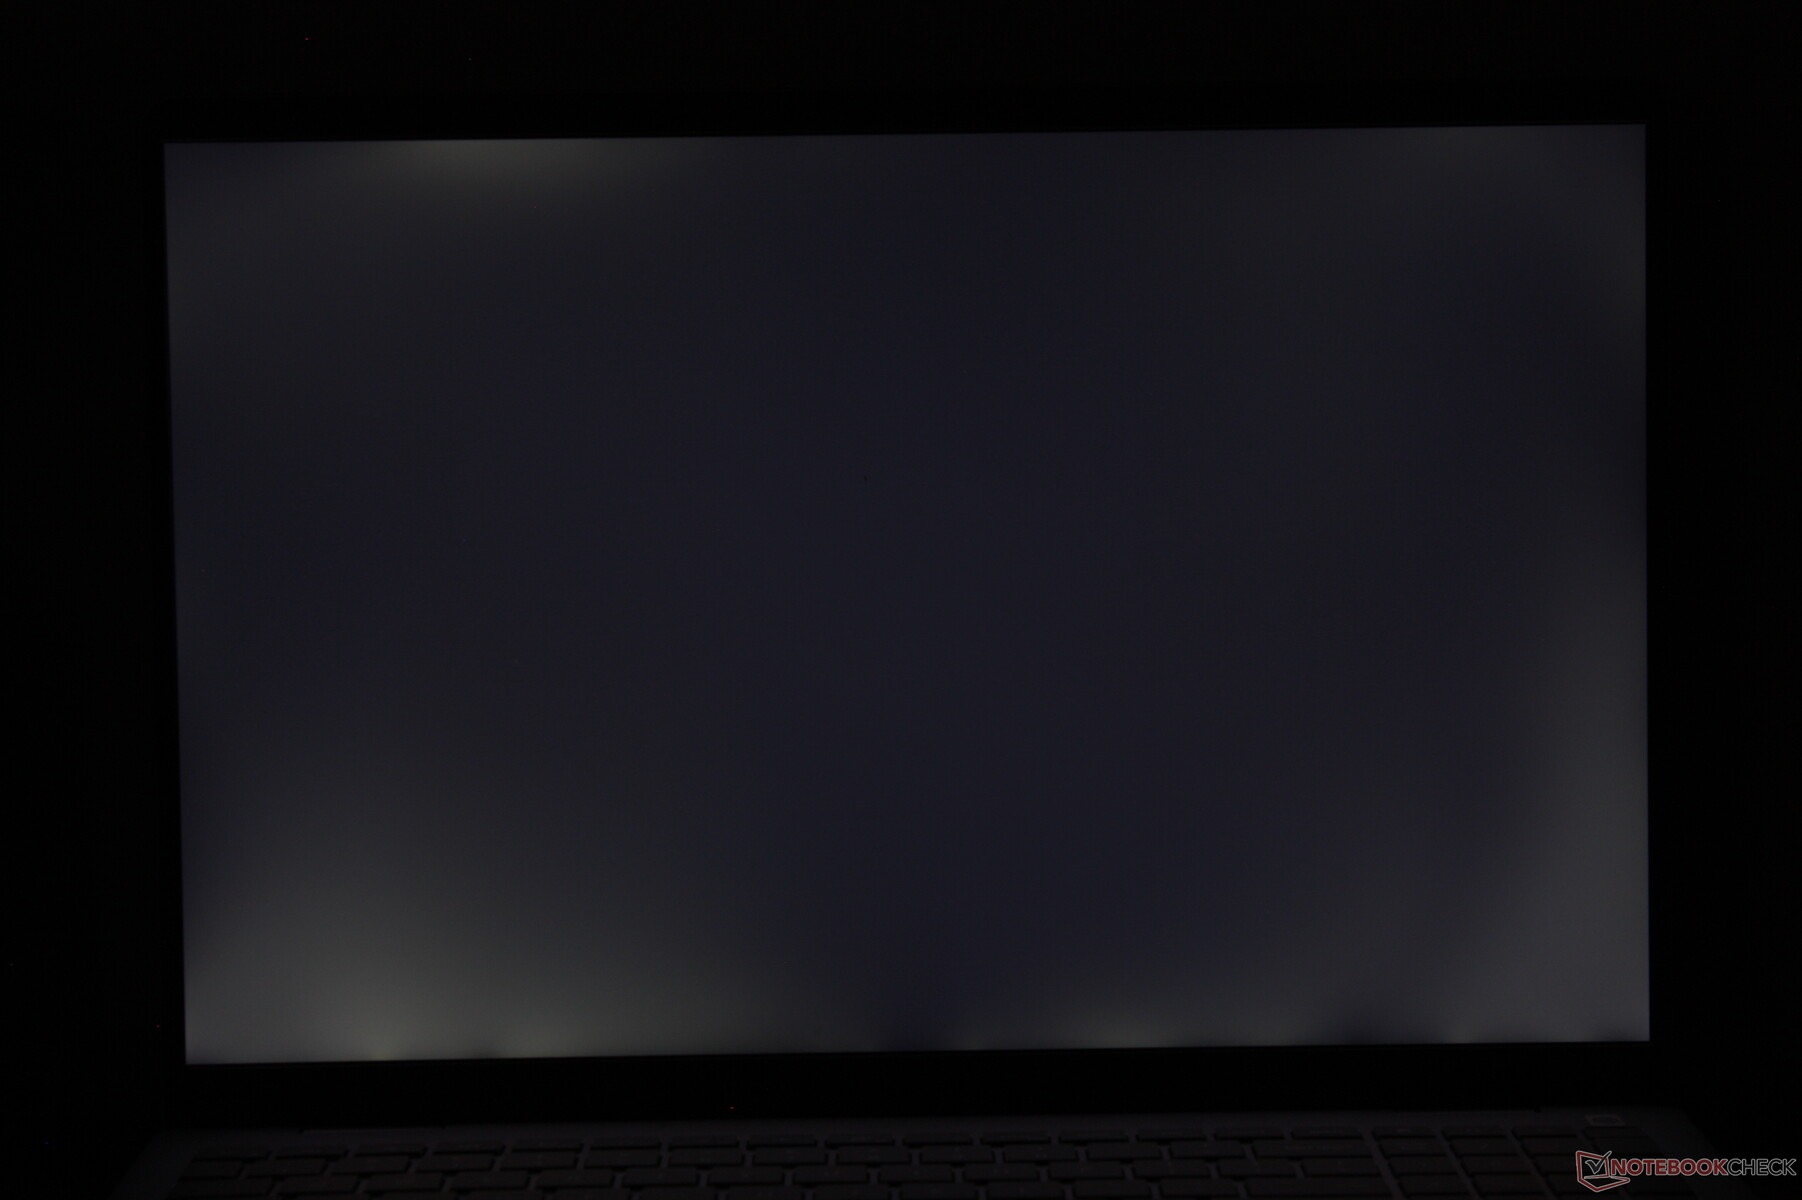
Aydınlatma: 88 %
Batarya modunda parlaklık: 335.6 cd/m²
Kontrast: 1525:1 (Siyah: 0.22 cd/m²)
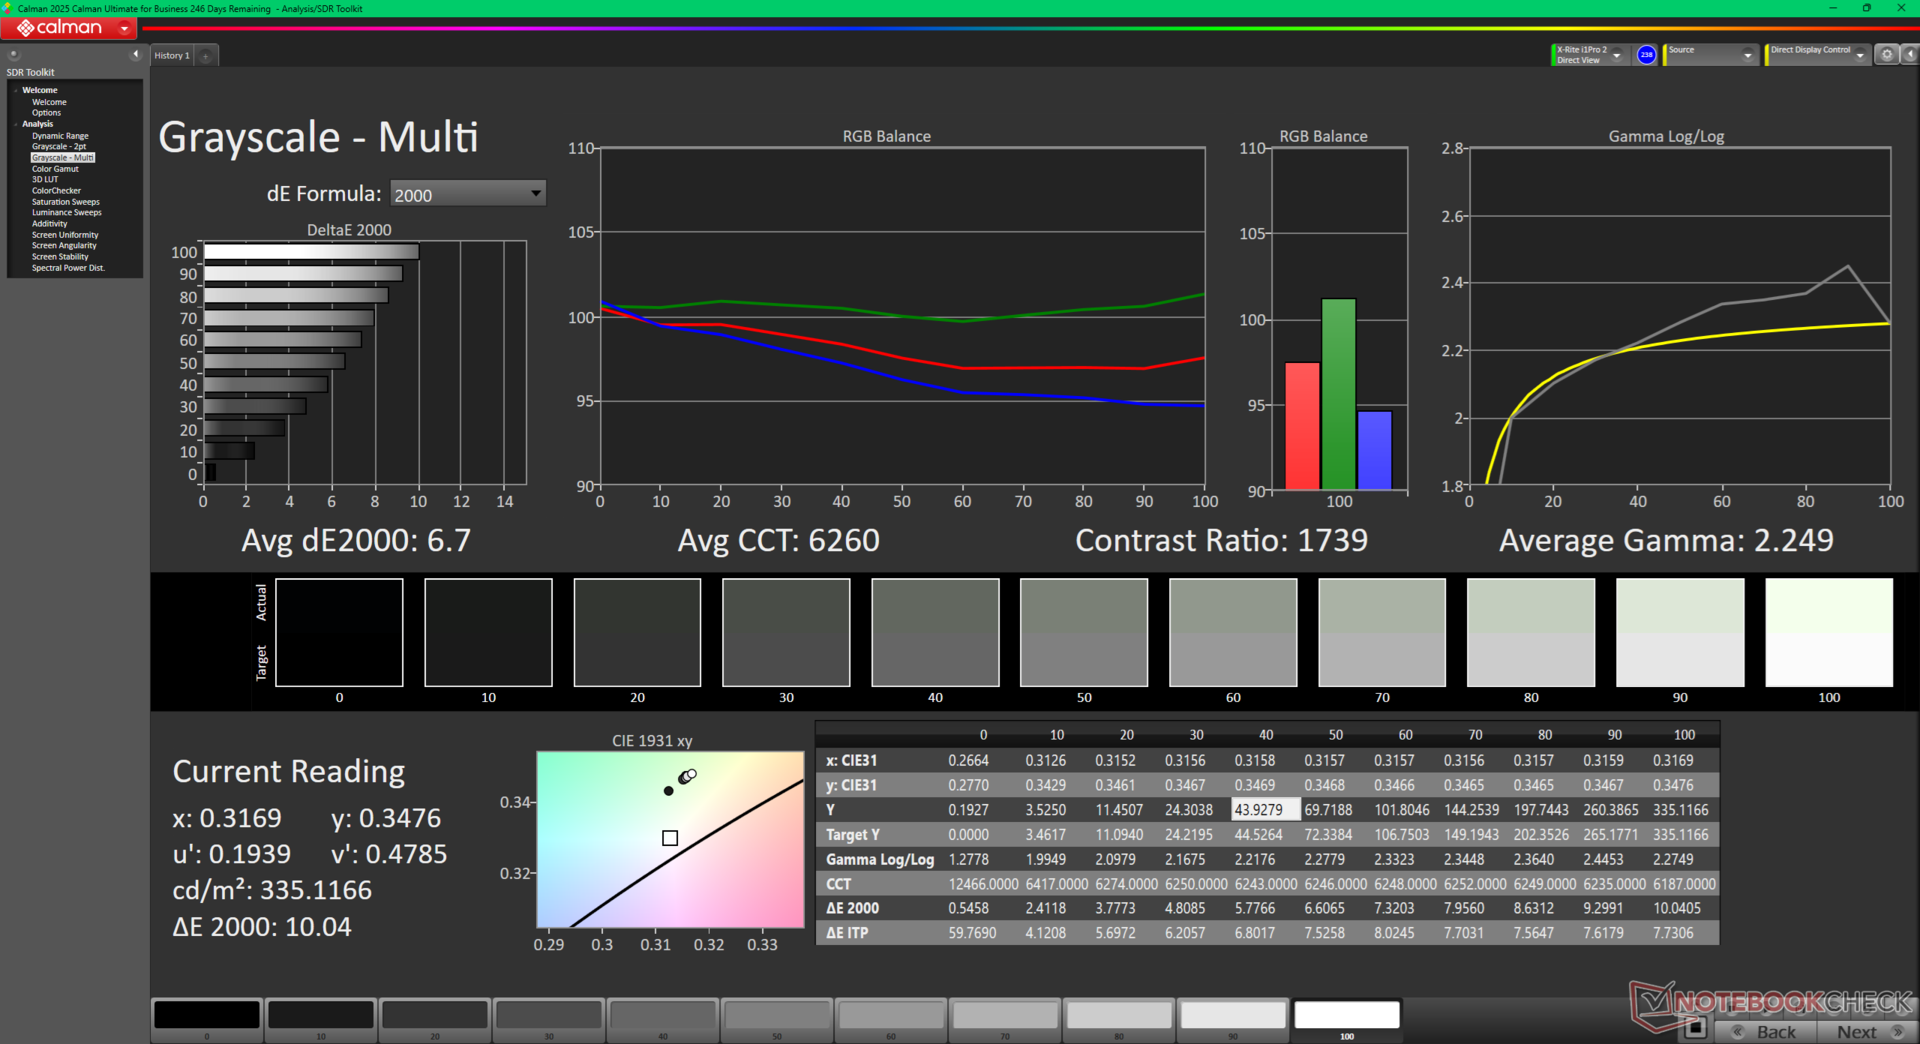
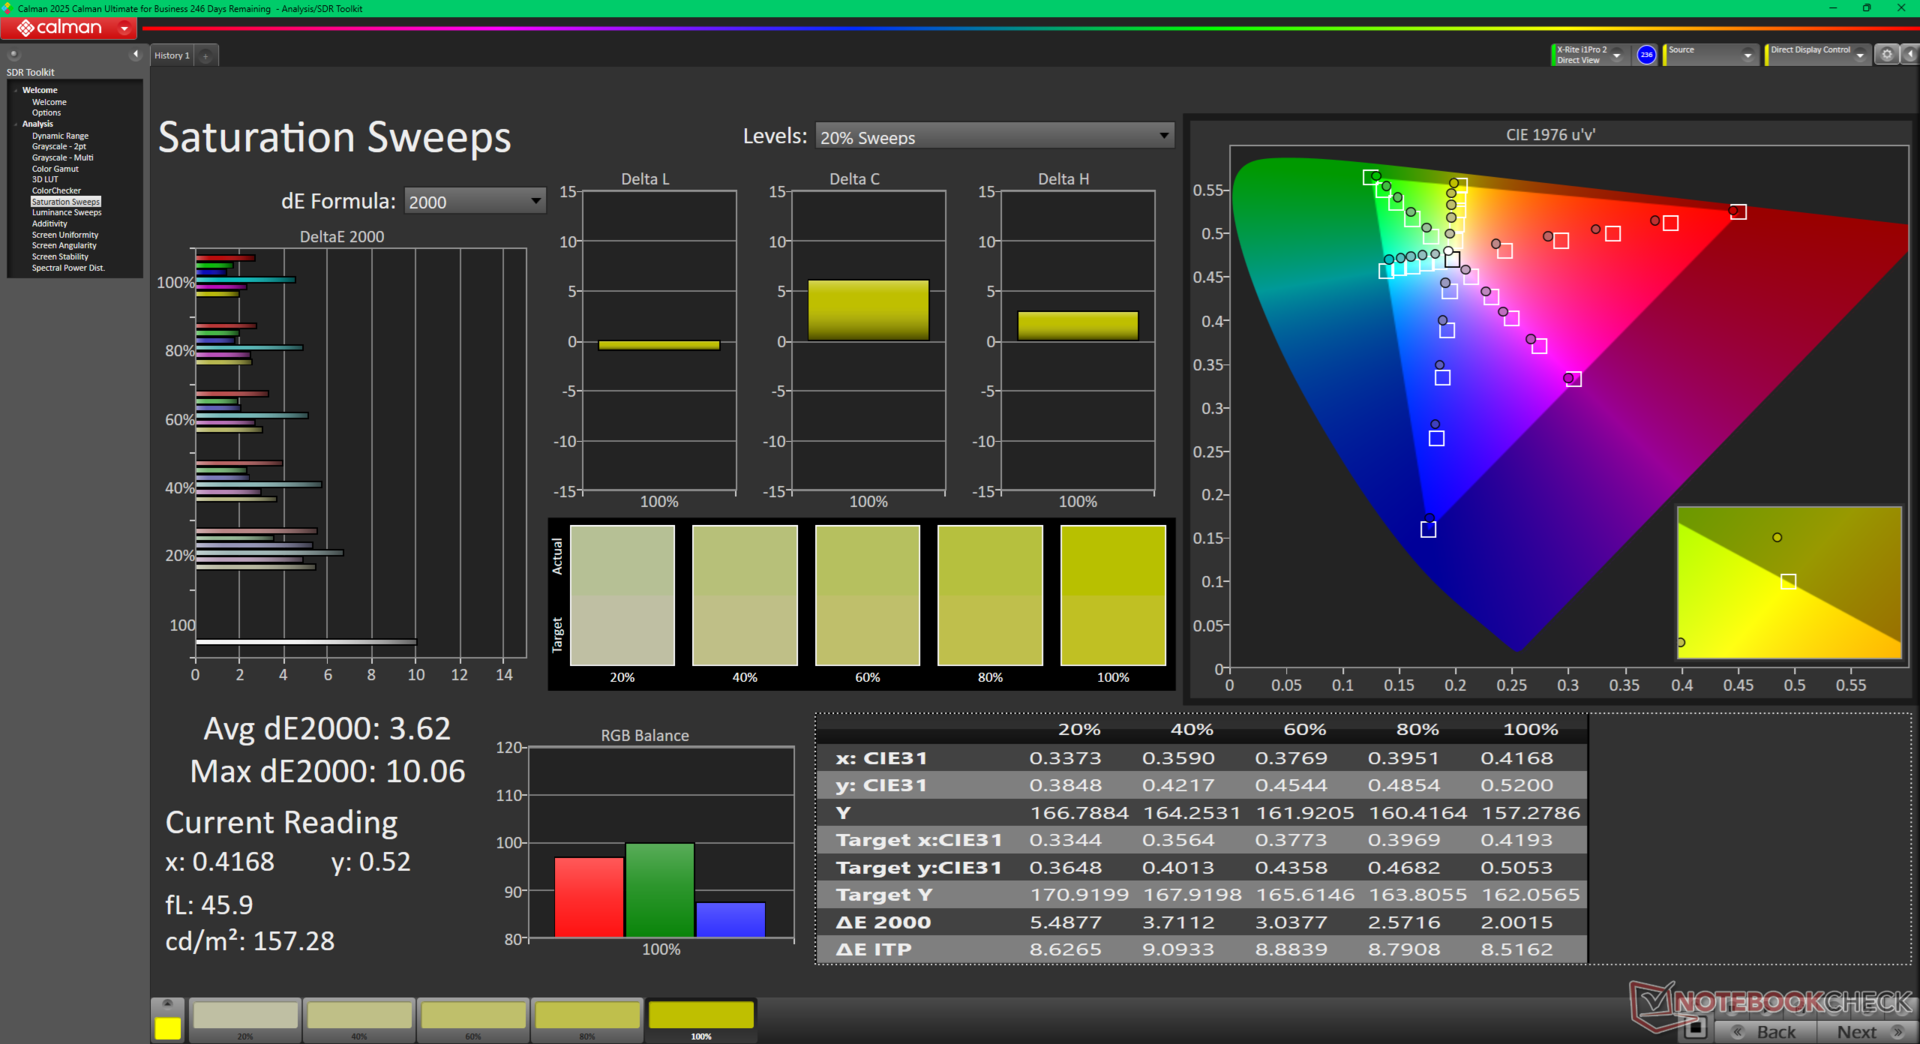
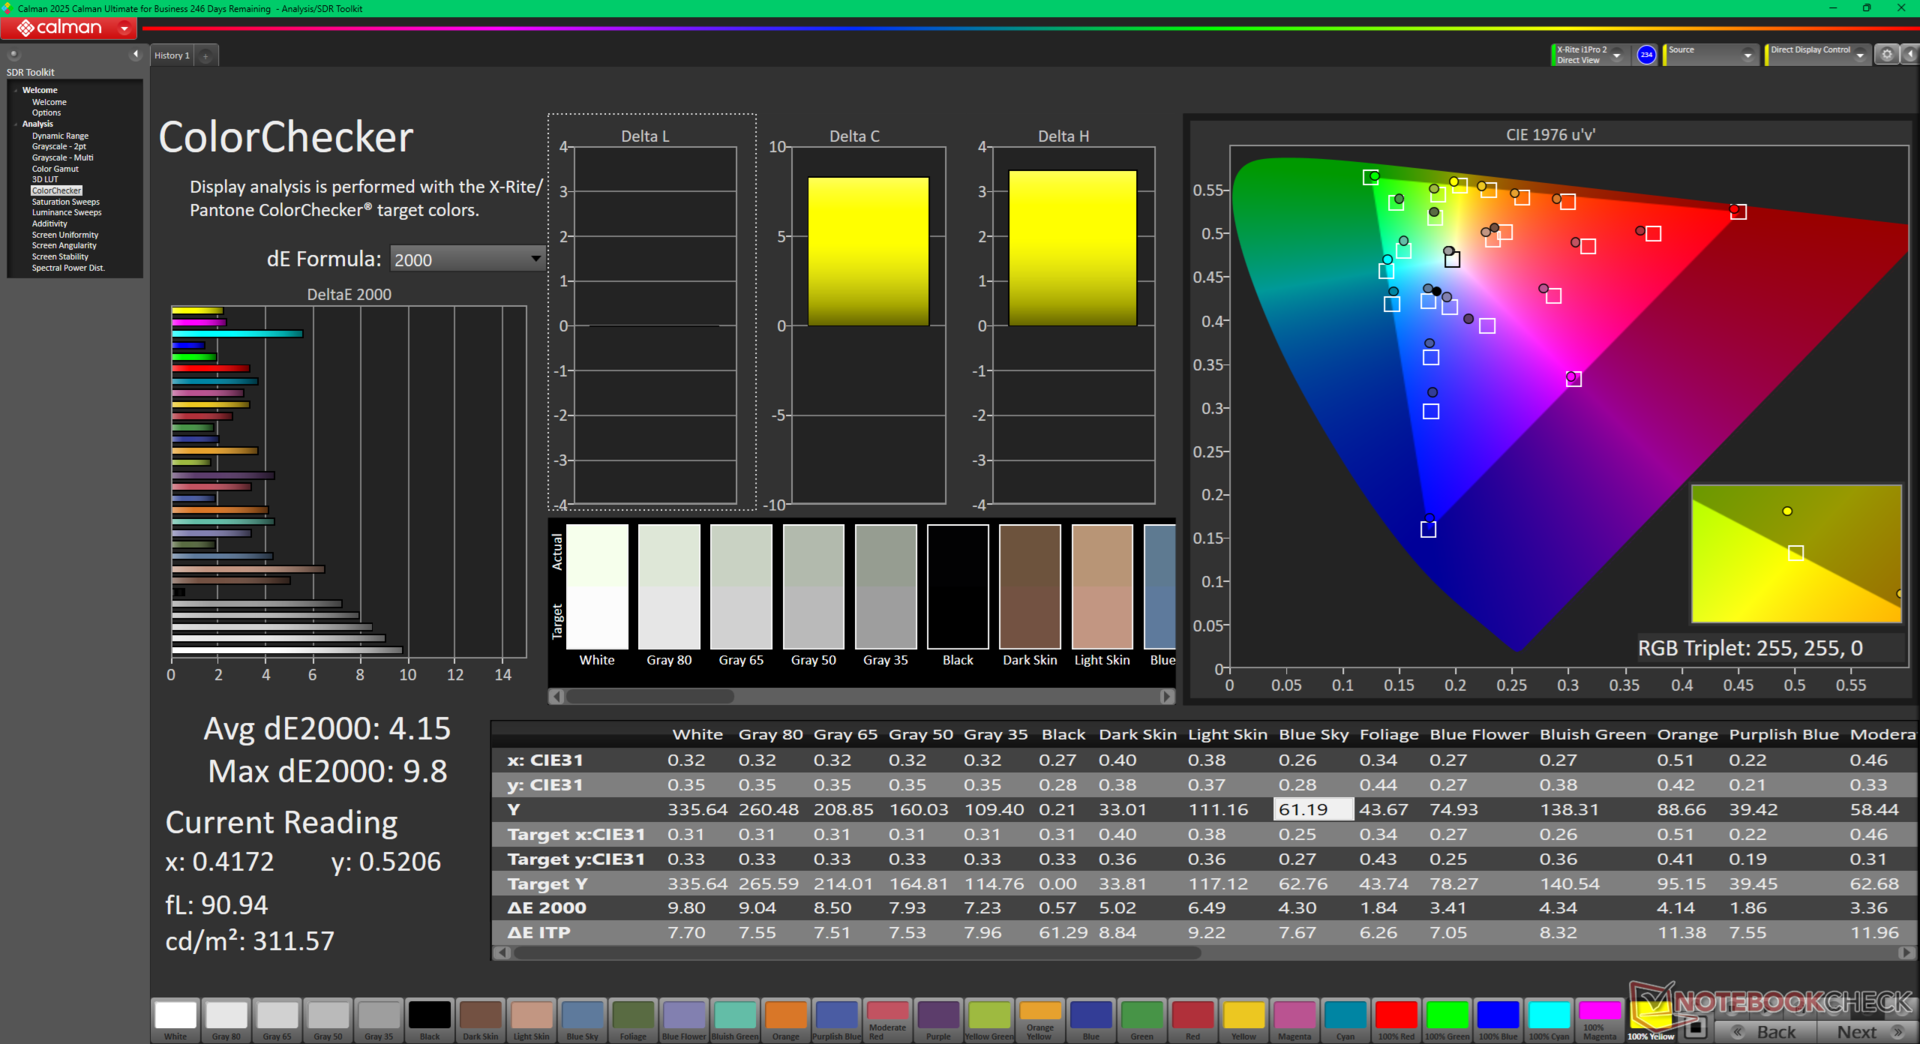
ΔE ColorChecker Calman: 4.15 | ∀{0.5-29.43 Ø4.71}
calibrated: 0.44
ΔE Greyscale Calman: 6.7 | ∀{0.09-98 Ø4.96}
78.4% AdobeRGB 1998 (Argyll 3D)
99.8% sRGB (Argyll 3D)
76.6% Display P3 (Argyll 3D)
Gamma: 2.25
CCT: 6260 K
| Dell 16 Plus AU Optronics B160QAN, IPS, 2560x1600, 16", 120 Hz | Dell Inspiron 16 Plus 7640 AU Optronics B160QAN, IPS, 2560x1600, 16", 120 Hz | Acer Swift 16 AI SF16-51T-932H, Ultra 9 288V SDC41B6, OLED, 2880x1800, 16", 120 Hz | Lenovo ThinkBook 16 G7+ AMD LEN160-3.2K, IPS, 3200x2000, 16", 165 Hz | HP Pavilion Plus 16-ab0456tx AU Optronics AUOFDA4, IPS, 2560x1600, 16", 120 Hz | Asus Vivobook 16 M1606K B160UAN04.3 (AUOA5AB), IPS, 1920x1200, 16", 60 Hz | |
|---|---|---|---|---|---|---|
| Display | -1% | 17% | 12% | -2% | -50% | |
| Display P3 Coverage (%) | 76.6 | 76 -1% | 99.9 30% | 96.3 26% | 74.6 -3% | 36.8 -52% |
| sRGB Coverage (%) | 99.8 | 99.8 0% | 100 0% | 100 0% | 99 -1% | 55.3 -45% |
| AdobeRGB 1998 Coverage (%) | 78.4 | 76.7 -2% | 94.6 21% | 86.9 11% | 76.5 -2% | 38 -52% |
| Response Times | 24% | 54% | 66% | 72% | -1% | |
| Response Time Grey 50% / Grey 80% * (ms) | 32.8 ? | 25.6 ? 22% | 4.8 ? 85% | 13.9 ? 58% | 9.06 ? 72% | 36 ? -10% |
| Response Time Black / White * (ms) | 23.4 ? | 17.6 ? 25% | 18 ? 23% | 6.3 ? 73% | 6.7 ? 71% | 21.4 ? 9% |
| PWM Frequency (Hz) | 481 | |||||
| PWM Amplitude * (%) | 39 | |||||
| Screen | 0% | 195% | 16% | -23% | -128% | |
| Brightness middle (cd/m²) | 335.6 | 314.7 -6% | 425 27% | 422 26% | 403 20% | 326 -3% |
| Brightness (cd/m²) | 308 | 291 -6% | 421 37% | 403 31% | 394 28% | 303 -2% |
| Brightness Distribution (%) | 88 | 89 1% | 98 11% | 93 6% | 90 2% | 89 1% |
| Black Level * (cd/m²) | 0.22 | 0.28 -27% | 0.0219 90% | 0.3 -36% | 0.34 -55% | 0.24 -9% |
| Contrast (:1) | 1525 | 1124 -26% | 19406 1173% | 1407 -8% | 1185 -22% | 1358 -11% |
| Colorchecker dE 2000 * | 4.15 | 1.62 61% | 1.73 58% | 1.7 59% | 3.13 25% | 6.48 -56% |
| Colorchecker dE 2000 max. * | 9.8 | 2.94 70% | 3.82 61% | 3.4 65% | 6.14 37% | 19.42 -98% |
| Colorchecker dE 2000 calibrated * | 0.44 | 1.08 -145% | 0.7 -59% | 1.65 -275% | 4.92 -1018% | |
| Greyscale dE 2000 * | 6.7 | 1.3 81% | 0.09 99% | 2.4 64% | 4.5 33% | 3.85 43% |
| Gamma | 2.25 98% | 2.26 97% | 2.346 94% | 2.19 100% | 2.18 101% | 2.79 79% |
| CCT | 6260 104% | 6385 102% | 6432 101% | 6989 93% | 6261 104% | 6739 96% |
| Toplam Ortalama (Program / Ayarlar) | 8% /
3% | 89% /
132% | 31% /
23% | 16% /
-5% | -60% /
-93% |
* ... daha küçük daha iyidir
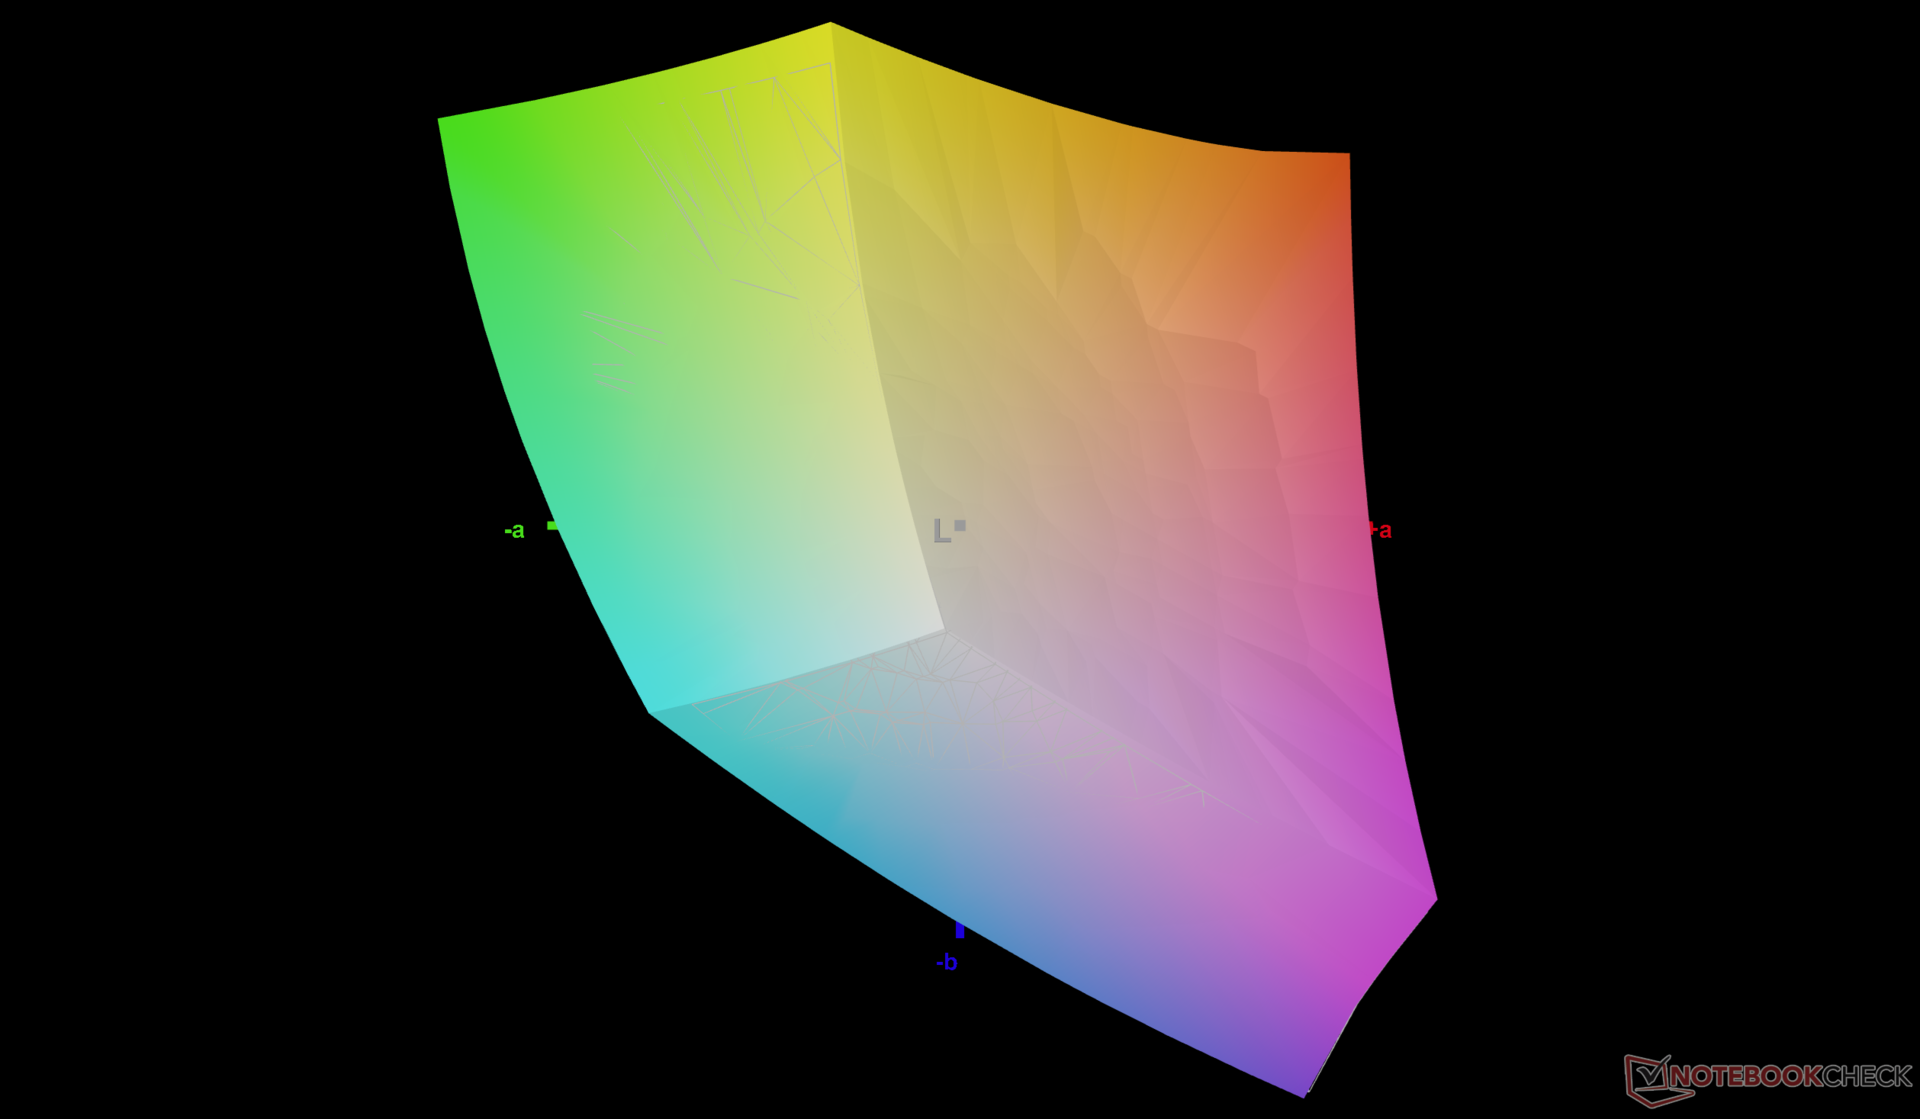
Ekran kutudan çıktığı haliyle iyi kalibre edilmemiştir, bu da çoğu ekonomik ve orta seviye tüketici dizüstü bilgisayarında yaygındır. Ekranı bir X-Rite renk ölçer ile kalibre etmek, sRGB kapsamının tamamını daha iyi kullanmak için ortalama gri tonlama ve renk deltaE değerlerini sırasıyla 6,7 ve 4,15'ten sadece 0,8 ve 0,44'e büyük ölçüde iyileştirecektir. Kalibre edilmiş ICM profilimiz yukarıda ücretsiz olarak indirilebilir.
Yanıt Sürelerini Görüntüle
| ↔ Tepki Süresi Siyahtan Beyaza | ||
|---|---|---|
| 23.4 ms ... yükseliş ↗ ve sonbahar↘ birleşimi | ↗ 11.6 ms yükseliş | 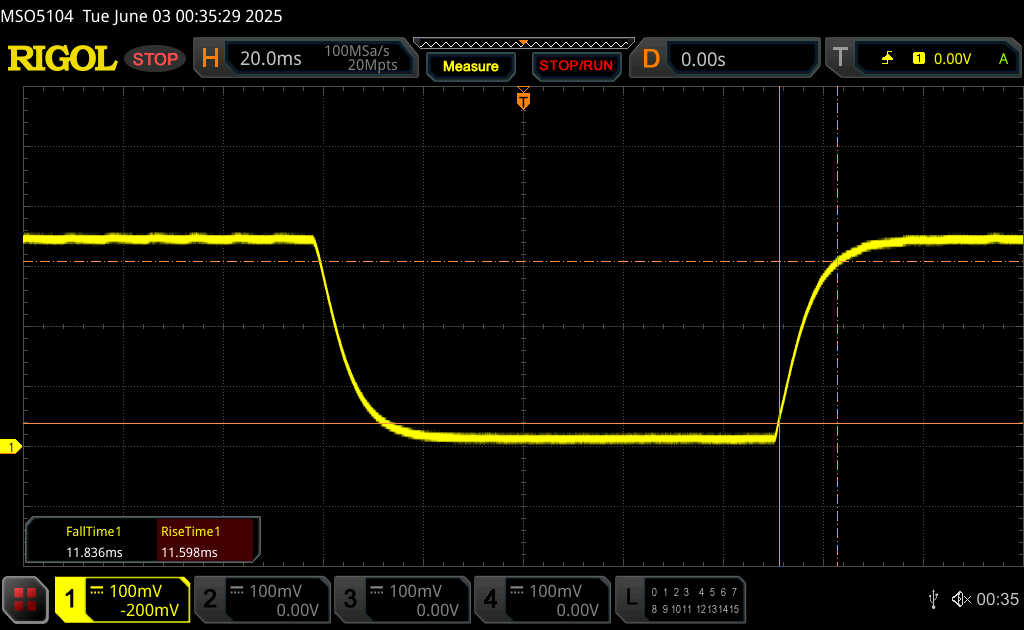 |
| ↘ 11.8 ms sonbahar | ||
| Ekran, testlerimizde iyi yanıt oranları gösteriyor ancak rekabetçi oyuncular için çok yavaş olabilir. Karşılaştırıldığında, test edilen tüm cihazlar 0.1 (minimum) ile 240 (maksimum) ms arasında değişir. » Tüm cihazların 54 %'si daha iyi. Bu, ölçülen yanıt süresinin test edilen tüm cihazların ortalamasından (19.8 ms) daha kötü olduğu anlamına gelir. | ||
| ↔ Tepki Süresi %50 Griden %80 Griye | ||
| 32.8 ms ... yükseliş ↗ ve sonbahar↘ birleşimi | ↗ 16.1 ms yükseliş | 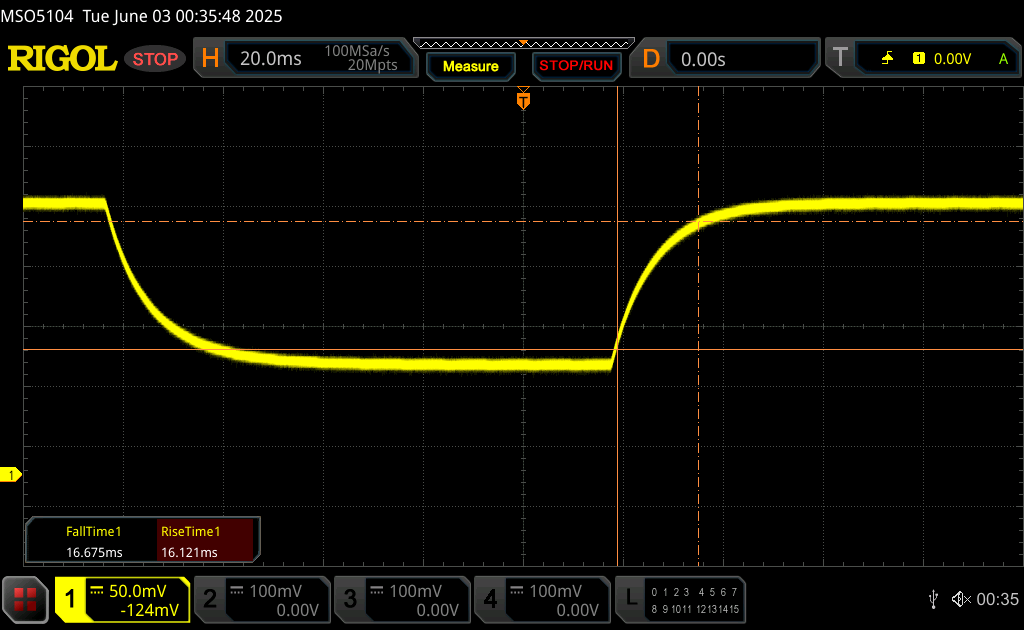 |
| ↘ 16.7 ms sonbahar | ||
| Ekran, testlerimizde yavaş yanıt oranları gösteriyor ve oyuncular için yetersiz olacaktır. Karşılaştırıldığında, test edilen tüm cihazlar 0.165 (minimum) ile 636 (maksimum) ms arasında değişir. » Tüm cihazların 45 %'si daha iyi. Bu, ölçülen yanıt süresinin test edilen tüm cihazların ortalamasına benzer olduğu anlamına gelir (31 ms). | ||
Ekran Titremesi / PWM (Darbe Genişliği Modülasyonu)
| Ekran titriyor / PWM algılanmadı | 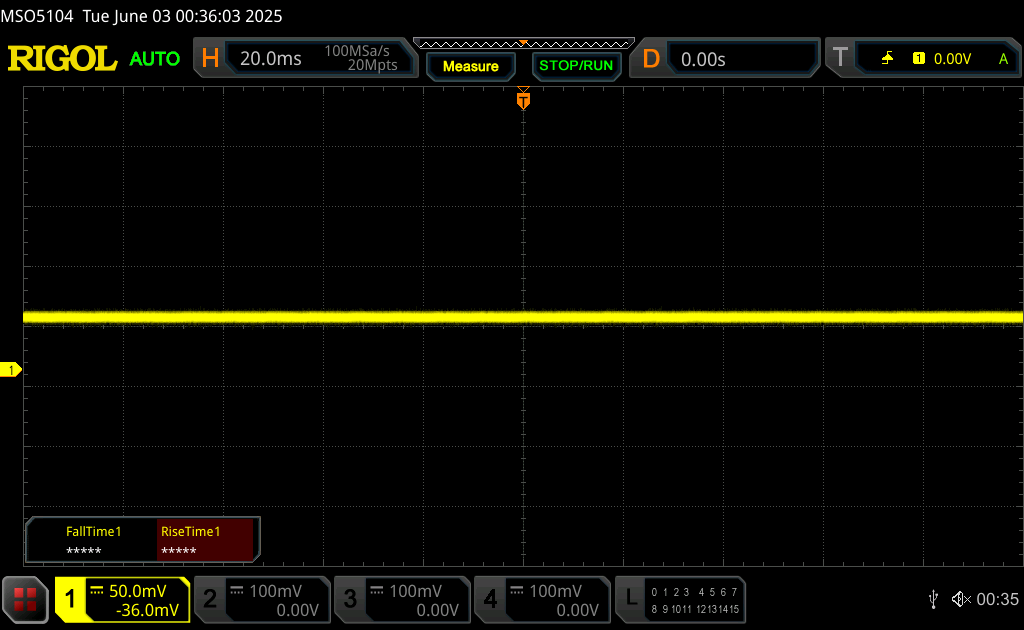 | ||
Karşılaştırıldığında: Test edilen tüm cihazların %52 %'si ekranı karartmak için PWM kullanmıyor. PWM tespit edilirse, ortalama 7757 (minimum: 5 - maksimum: 343500) Hz ölçüldü. | |||
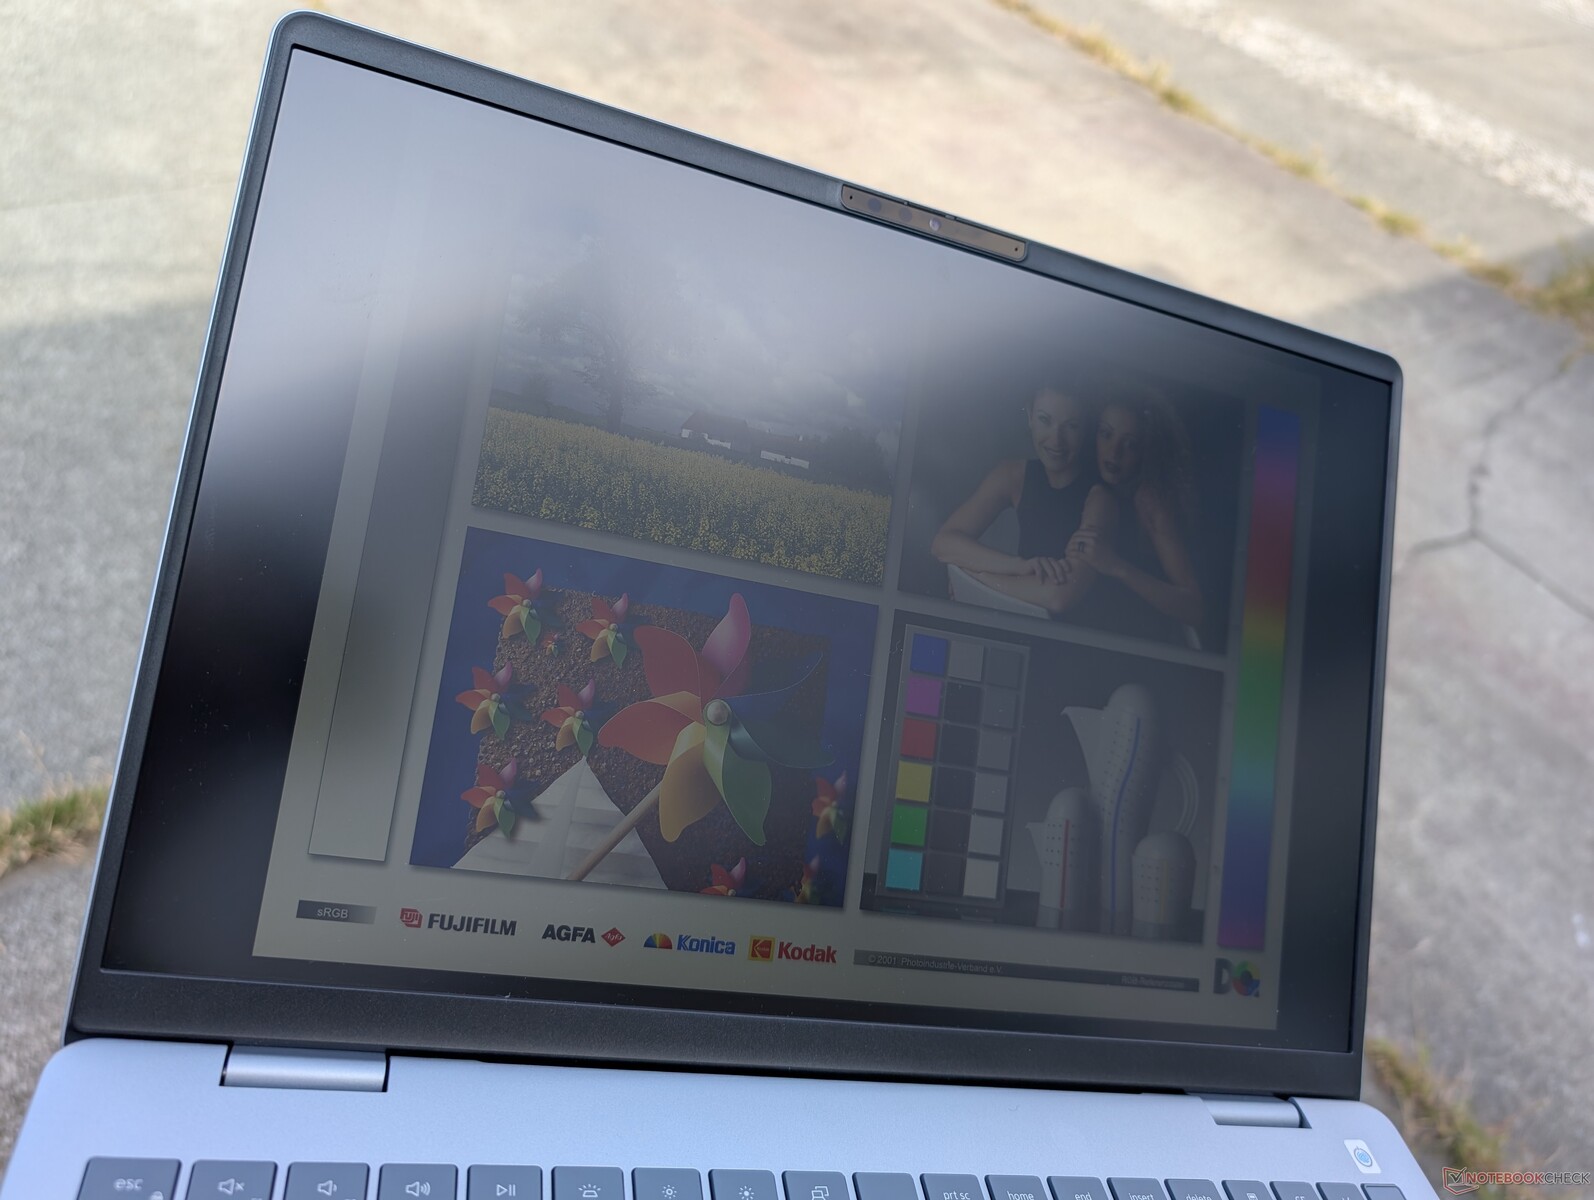
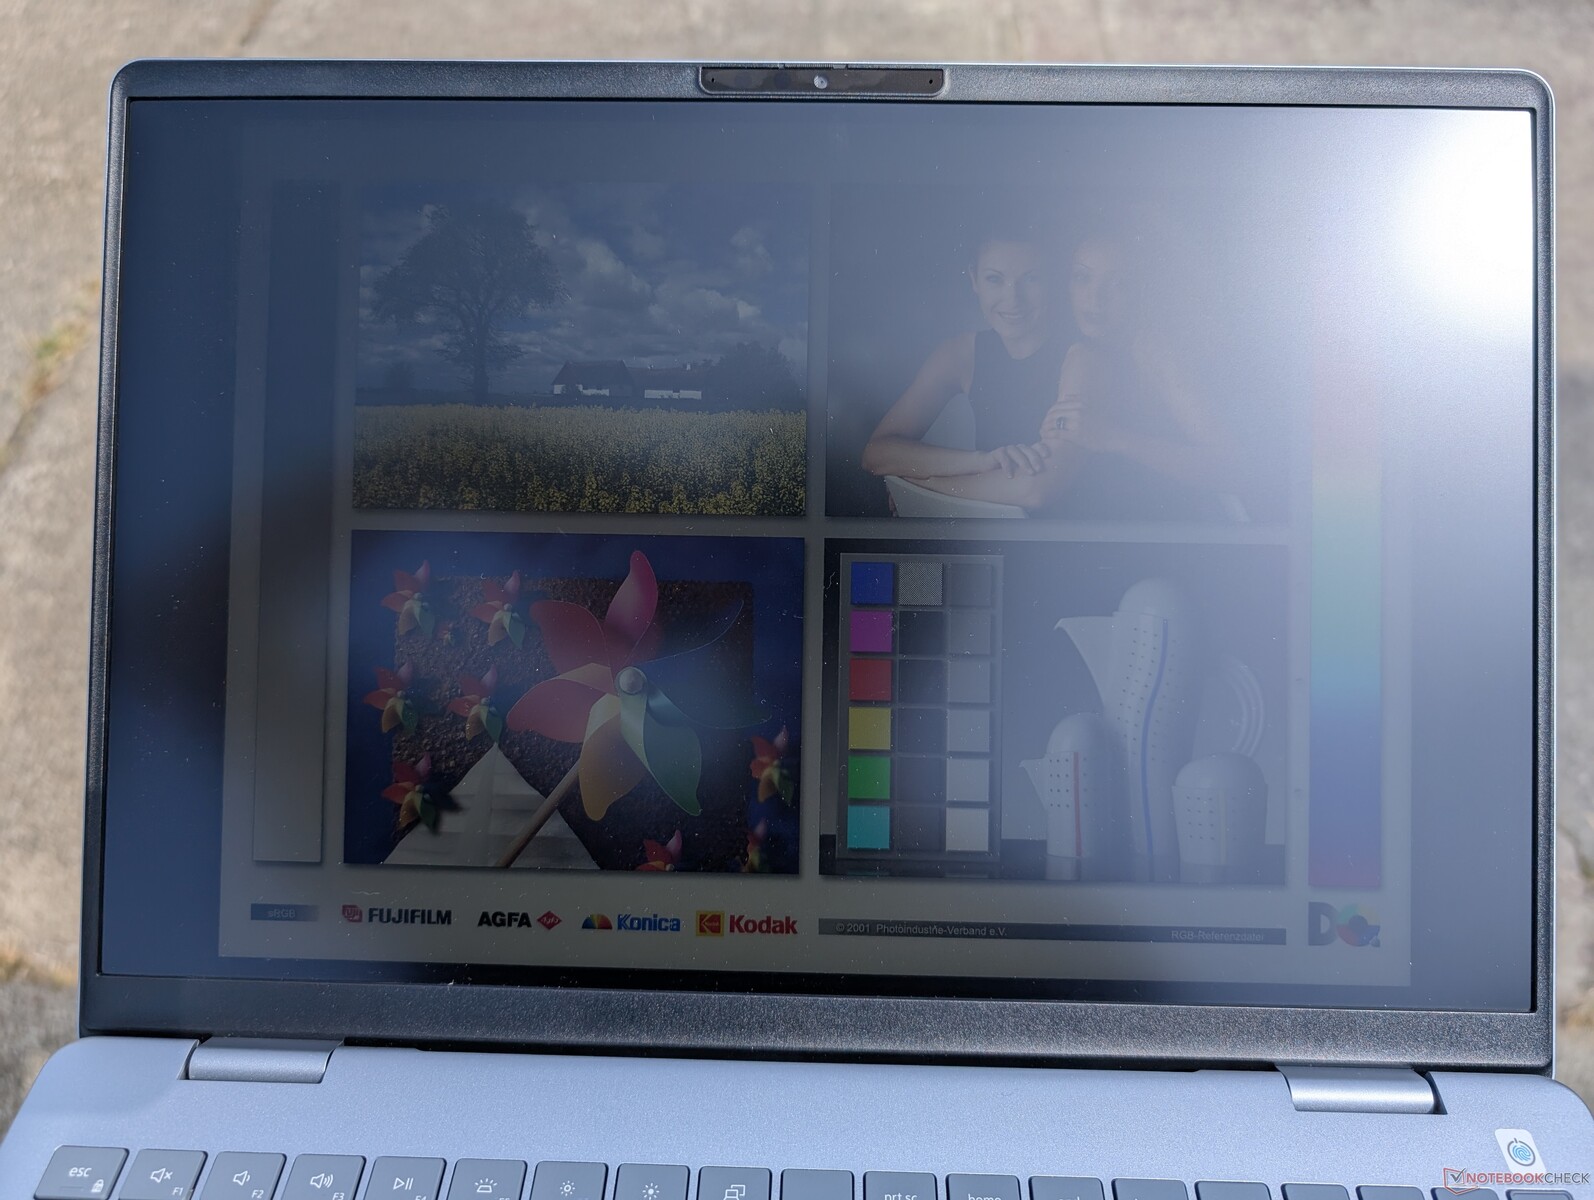
Ekran parlamanın üstesinden gelecek kadar parlak olmadığı için dış mekan görünürlüğü zayıftır.
Performans - Daha Hızlı Entegre Grafiklerle Daha Verimli
Test Koşulları
Aşağıdaki kıyaslamaları çalıştırmadan önce Dell Optimizer'ı Performans moduna ayarladık. Dell güç profilleri varsayılan Windows güç profilleri ile ilişkilidir ve bir profili değiştirmek diğeriyle senkronize olur.
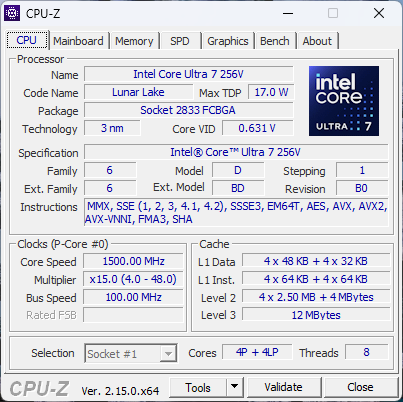
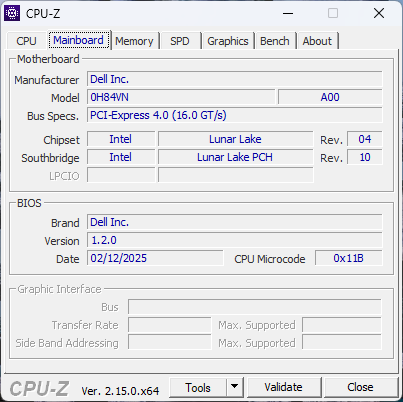
İşlemci
Bu Core Ultra 7 256V önceki neslin ham işlemci performans seviyelerini korurken tamamen verimlilikle ilgilidir Core Ultra 7 155U. Core H seçeneklerine sahip eski modeller, Inspiron 16 7640 2'si 1 arada dahil olmak üzere hala önemli ölçüde daha hızlıdır. Yükseltme Core Ultra 9 288V konfigürasyonunun en iyi ihtimalle yüzde 10'un altında çok küçük kazançlar getirmesi bekleniyor Acer Swift 16 AI.
Aşağıdaki grafikte gösterildiği gibi CineBench R15 xT döngü testimizi çalıştırırken zaman içinde yüzde 20'lik bir düşüş kaydedebildiğimiz için performans sürdürülebilirliği daha iyi olabilirdi.
Cinebench R15 Multi Loop
Cinebench R23: Multi Core | Single Core
Cinebench R20: CPU (Multi Core) | CPU (Single Core)
Cinebench R15: CPU Multi 64Bit | CPU Single 64Bit
Blender: v2.79 BMW27 CPU
7-Zip 18.03: 7z b 4 | 7z b 4 -mmt1
Geekbench 6.7: Multi-Core | Single-Core
Geekbench 5.5: Multi-Core | Single-Core
HWBOT x265 Benchmark v2.2: 4k Preset
LibreOffice : 20 Documents To PDF
R Benchmark 2.5: Overall mean
* ... daha küçük daha iyidir
AIDA64: FP32 Ray-Trace | FPU Julia | CPU SHA3 | CPU Queen | FPU SinJulia | FPU Mandel | CPU AES | CPU ZLib | FP64 Ray-Trace | CPU PhotoWorxx
| Performance rating | |
| Lenovo ThinkBook 16 G7+ AMD | |
| Asus Vivobook 16 M1606K | |
| HP Pavilion Plus 16-ab0456tx | |
| Dell Inspiron 16 Plus 7640 | |
| Acer Swift 16 AI SF16-51T-932H, Ultra 9 288V | |
| Ortalama Intel Core Ultra 7 256V | |
| Dell 16 Plus | |
| AIDA64 / FP32 Ray-Trace | |
| Lenovo ThinkBook 16 G7+ AMD | |
| Asus Vivobook 16 M1606K | |
| HP Pavilion Plus 16-ab0456tx | |
| Dell Inspiron 16 Plus 7640 | |
| Acer Swift 16 AI SF16-51T-932H, Ultra 9 288V | |
| Ortalama Intel Core Ultra 7 256V (10524 - 12898, n=7) | |
| Dell 16 Plus | |
| AIDA64 / FPU Julia | |
| Lenovo ThinkBook 16 G7+ AMD | |
| Asus Vivobook 16 M1606K | |
| HP Pavilion Plus 16-ab0456tx | |
| Dell Inspiron 16 Plus 7640 | |
| Acer Swift 16 AI SF16-51T-932H, Ultra 9 288V | |
| Ortalama Intel Core Ultra 7 256V (52443 - 62522, n=7) | |
| Dell 16 Plus | |
| AIDA64 / CPU SHA3 | |
| Lenovo ThinkBook 16 G7+ AMD | |
| Asus Vivobook 16 M1606K | |
| HP Pavilion Plus 16-ab0456tx | |
| Dell Inspiron 16 Plus 7640 | |
| Acer Swift 16 AI SF16-51T-932H, Ultra 9 288V | |
| Ortalama Intel Core Ultra 7 256V (2364 - 2915, n=7) | |
| Dell 16 Plus | |
| AIDA64 / CPU Queen | |
| HP Pavilion Plus 16-ab0456tx | |
| Dell Inspiron 16 Plus 7640 | |
| Lenovo ThinkBook 16 G7+ AMD | |
| Asus Vivobook 16 M1606K | |
| Acer Swift 16 AI SF16-51T-932H, Ultra 9 288V | |
| Ortalama Intel Core Ultra 7 256V (49622 - 49794, n=6) | |
| Dell 16 Plus | |
| AIDA64 / FPU SinJulia | |
| Lenovo ThinkBook 16 G7+ AMD | |
| Asus Vivobook 16 M1606K | |
| Dell Inspiron 16 Plus 7640 | |
| HP Pavilion Plus 16-ab0456tx | |
| Ortalama Intel Core Ultra 7 256V (4401 - 4434, n=7) | |
| Acer Swift 16 AI SF16-51T-932H, Ultra 9 288V | |
| Dell 16 Plus | |
| AIDA64 / FPU Mandel | |
| Lenovo ThinkBook 16 G7+ AMD | |
| Asus Vivobook 16 M1606K | |
| HP Pavilion Plus 16-ab0456tx | |
| Dell Inspiron 16 Plus 7640 | |
| Acer Swift 16 AI SF16-51T-932H, Ultra 9 288V | |
| Ortalama Intel Core Ultra 7 256V (27382 - 33019, n=7) | |
| Dell 16 Plus | |
| AIDA64 / CPU AES | |
| Lenovo ThinkBook 16 G7+ AMD | |
| Dell Inspiron 16 Plus 7640 | |
| HP Pavilion Plus 16-ab0456tx | |
| Asus Vivobook 16 M1606K | |
| Ortalama Intel Core Ultra 7 256V (38495 - 75938, n=7) | |
| Acer Swift 16 AI SF16-51T-932H, Ultra 9 288V | |
| Dell 16 Plus | |
| AIDA64 / CPU ZLib | |
| Lenovo ThinkBook 16 G7+ AMD | |
| Dell Inspiron 16 Plus 7640 | |
| Asus Vivobook 16 M1606K | |
| HP Pavilion Plus 16-ab0456tx | |
| Ortalama Intel Core Ultra 7 256V (536 - 632, n=7) | |
| Acer Swift 16 AI SF16-51T-932H, Ultra 9 288V | |
| Dell 16 Plus | |
| AIDA64 / FP64 Ray-Trace | |
| Lenovo ThinkBook 16 G7+ AMD | |
| Asus Vivobook 16 M1606K | |
| HP Pavilion Plus 16-ab0456tx | |
| Dell Inspiron 16 Plus 7640 | |
| Acer Swift 16 AI SF16-51T-932H, Ultra 9 288V | |
| Ortalama Intel Core Ultra 7 256V (5655 - 6878, n=7) | |
| Dell 16 Plus | |
| AIDA64 / CPU PhotoWorxx | |
| Acer Swift 16 AI SF16-51T-932H, Ultra 9 288V | |
| Ortalama Intel Core Ultra 7 256V (49906 - 57060, n=7) | |
| Dell 16 Plus | |
| Lenovo ThinkBook 16 G7+ AMD | |
| HP Pavilion Plus 16-ab0456tx | |
| Dell Inspiron 16 Plus 7640 | |
| Asus Vivobook 16 M1606K | |
Stres Testi
Prime95 stresini çalıştırırken, CPU 83 C'ye ulaşmadan önce yaklaşık 20 saniye boyunca 3,2 GHz ve 38 W'a yükselir. Daha sonra, sınırlı Turbo Boost potansiyelini temsil etmek için 74 C'lik daha soğuk bir çekirdek sıcaklığını korumak için 2,5 GHz ve 21 W'da düşer ve stabilize olur. Bu durum yukarıda belirtildiği gibi CineBench R15 xT döngü testimize de yansımıştır.
Tipik oyun stresini temsil etmek için Cyberpunk 2077 'yi çalıştırırken, işlemci yine 74 C'de en üst seviyeye çıkarak gözlemlediğimizden önemli ölçüde daha soğuktu Inspiron 16 7640 2'si 1 arada.
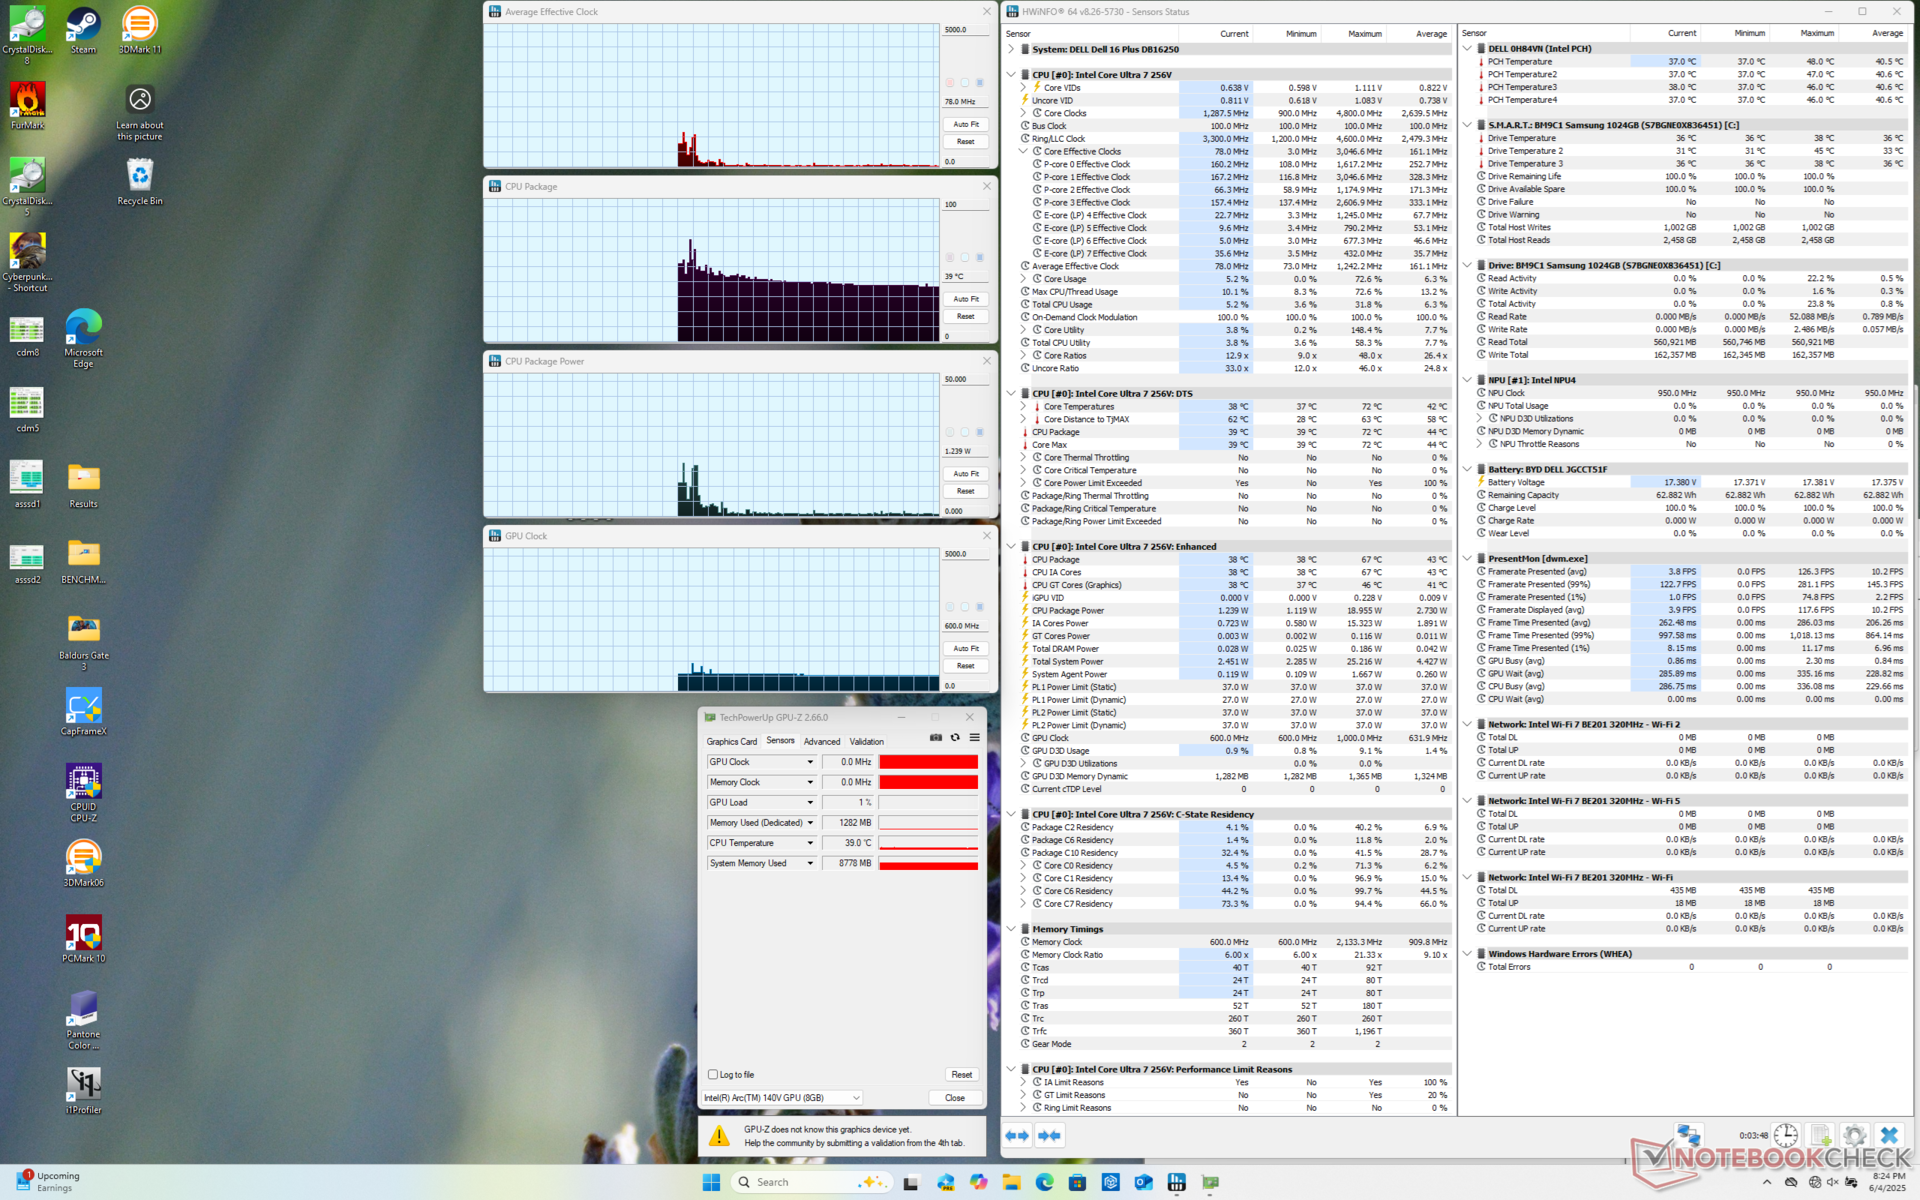
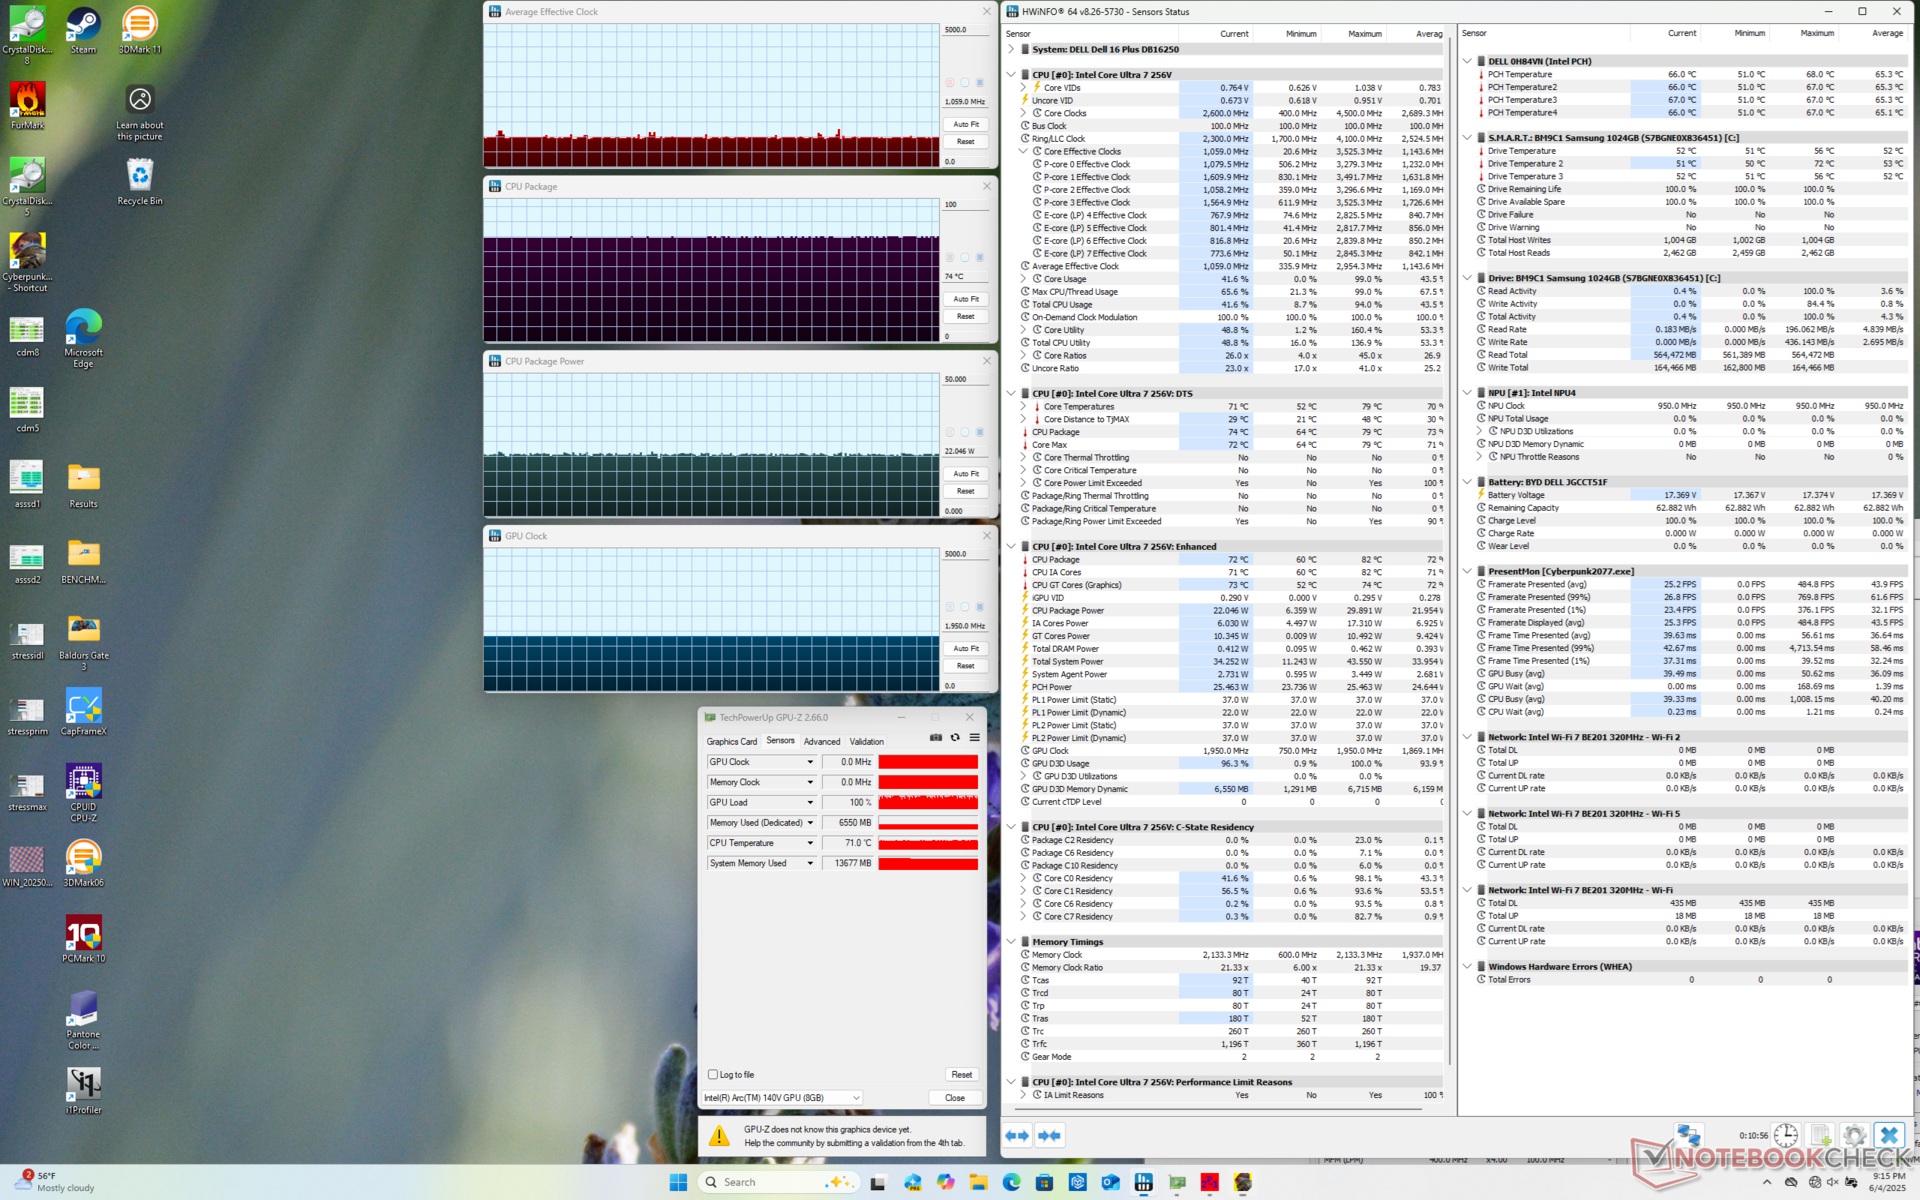
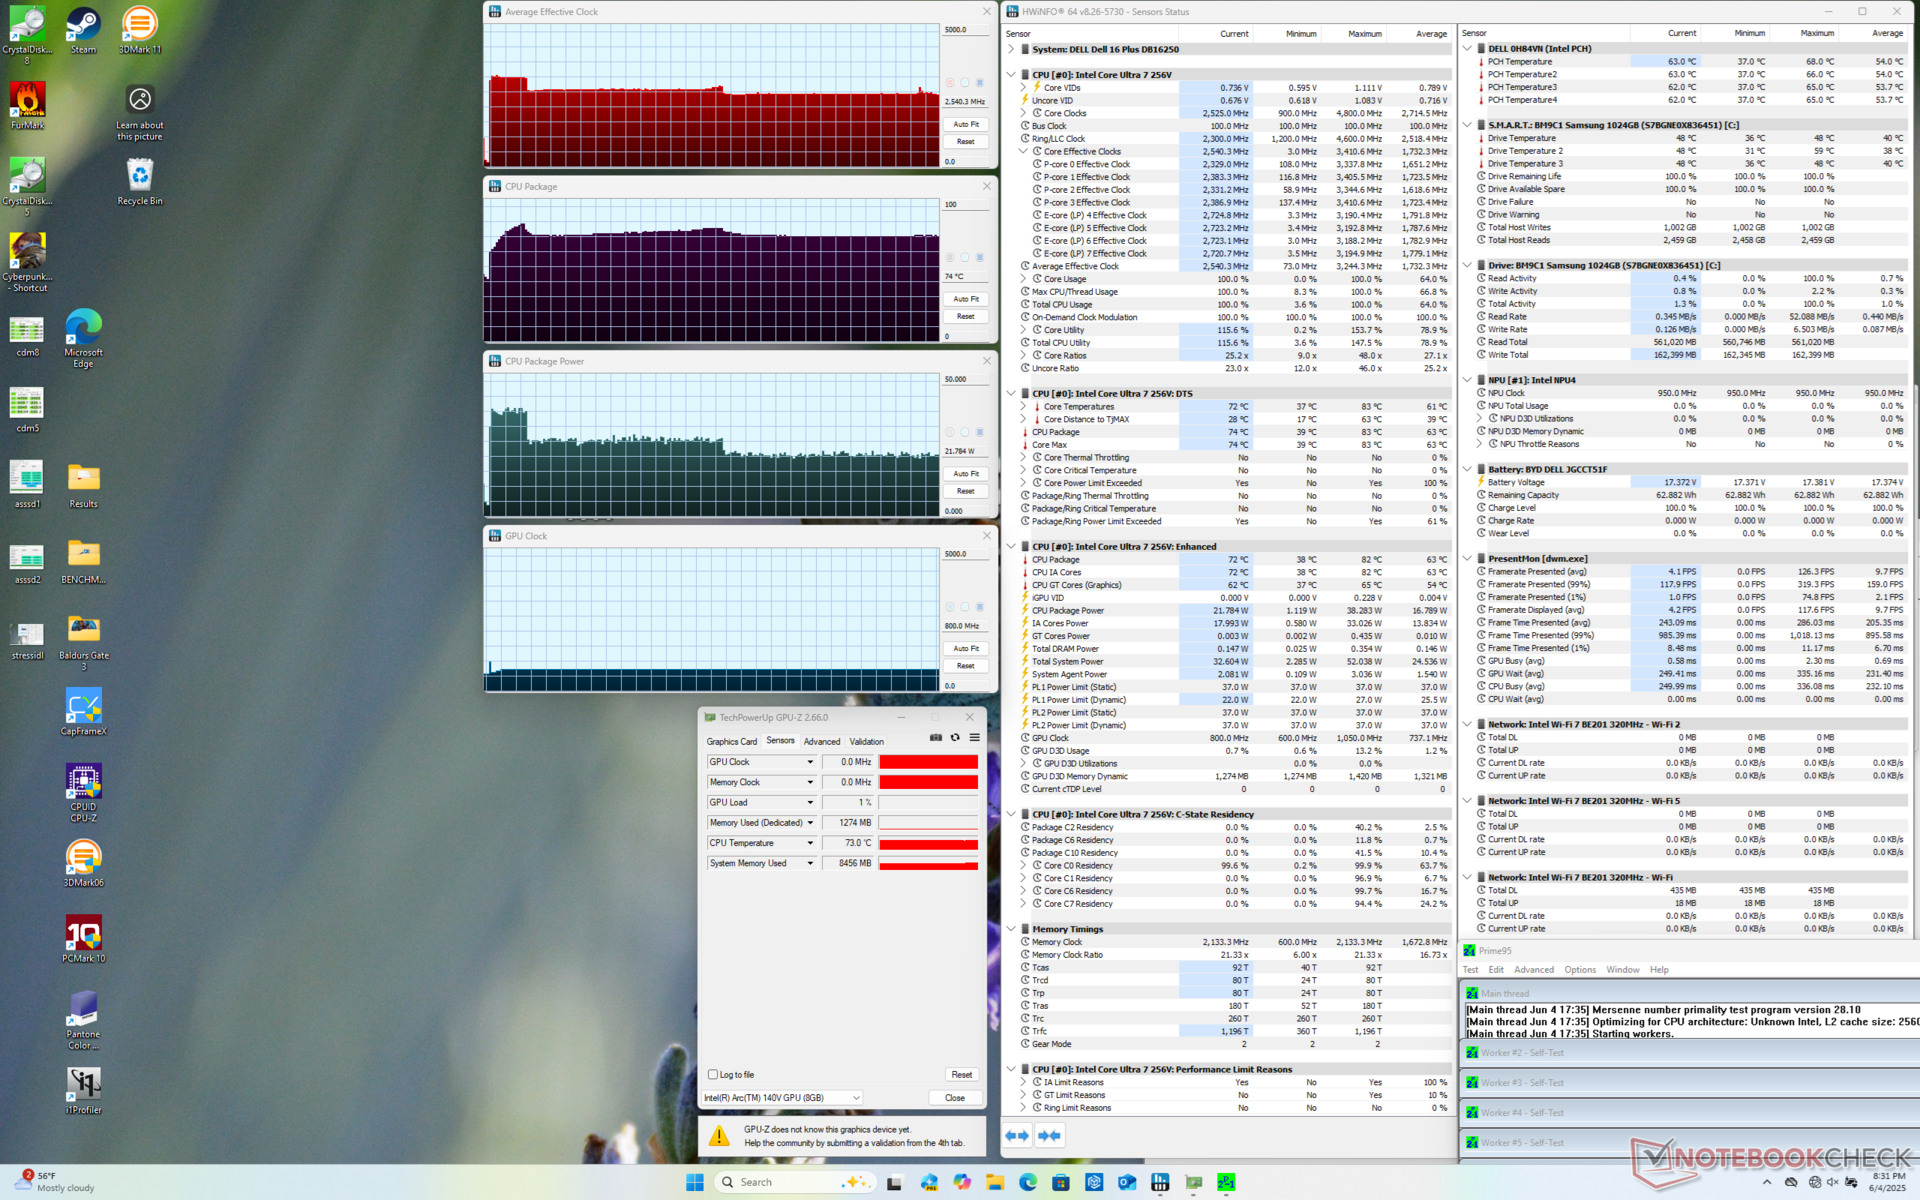
| Ortalama CPU Saati (GHz) | GPU Saati (MHz) | Ortalama CPU Sıcaklığı (°C) | |
| Sistem Boşta | -- | -- | 39 |
| Prime95 Stres | 2.5 | -- | 74 |
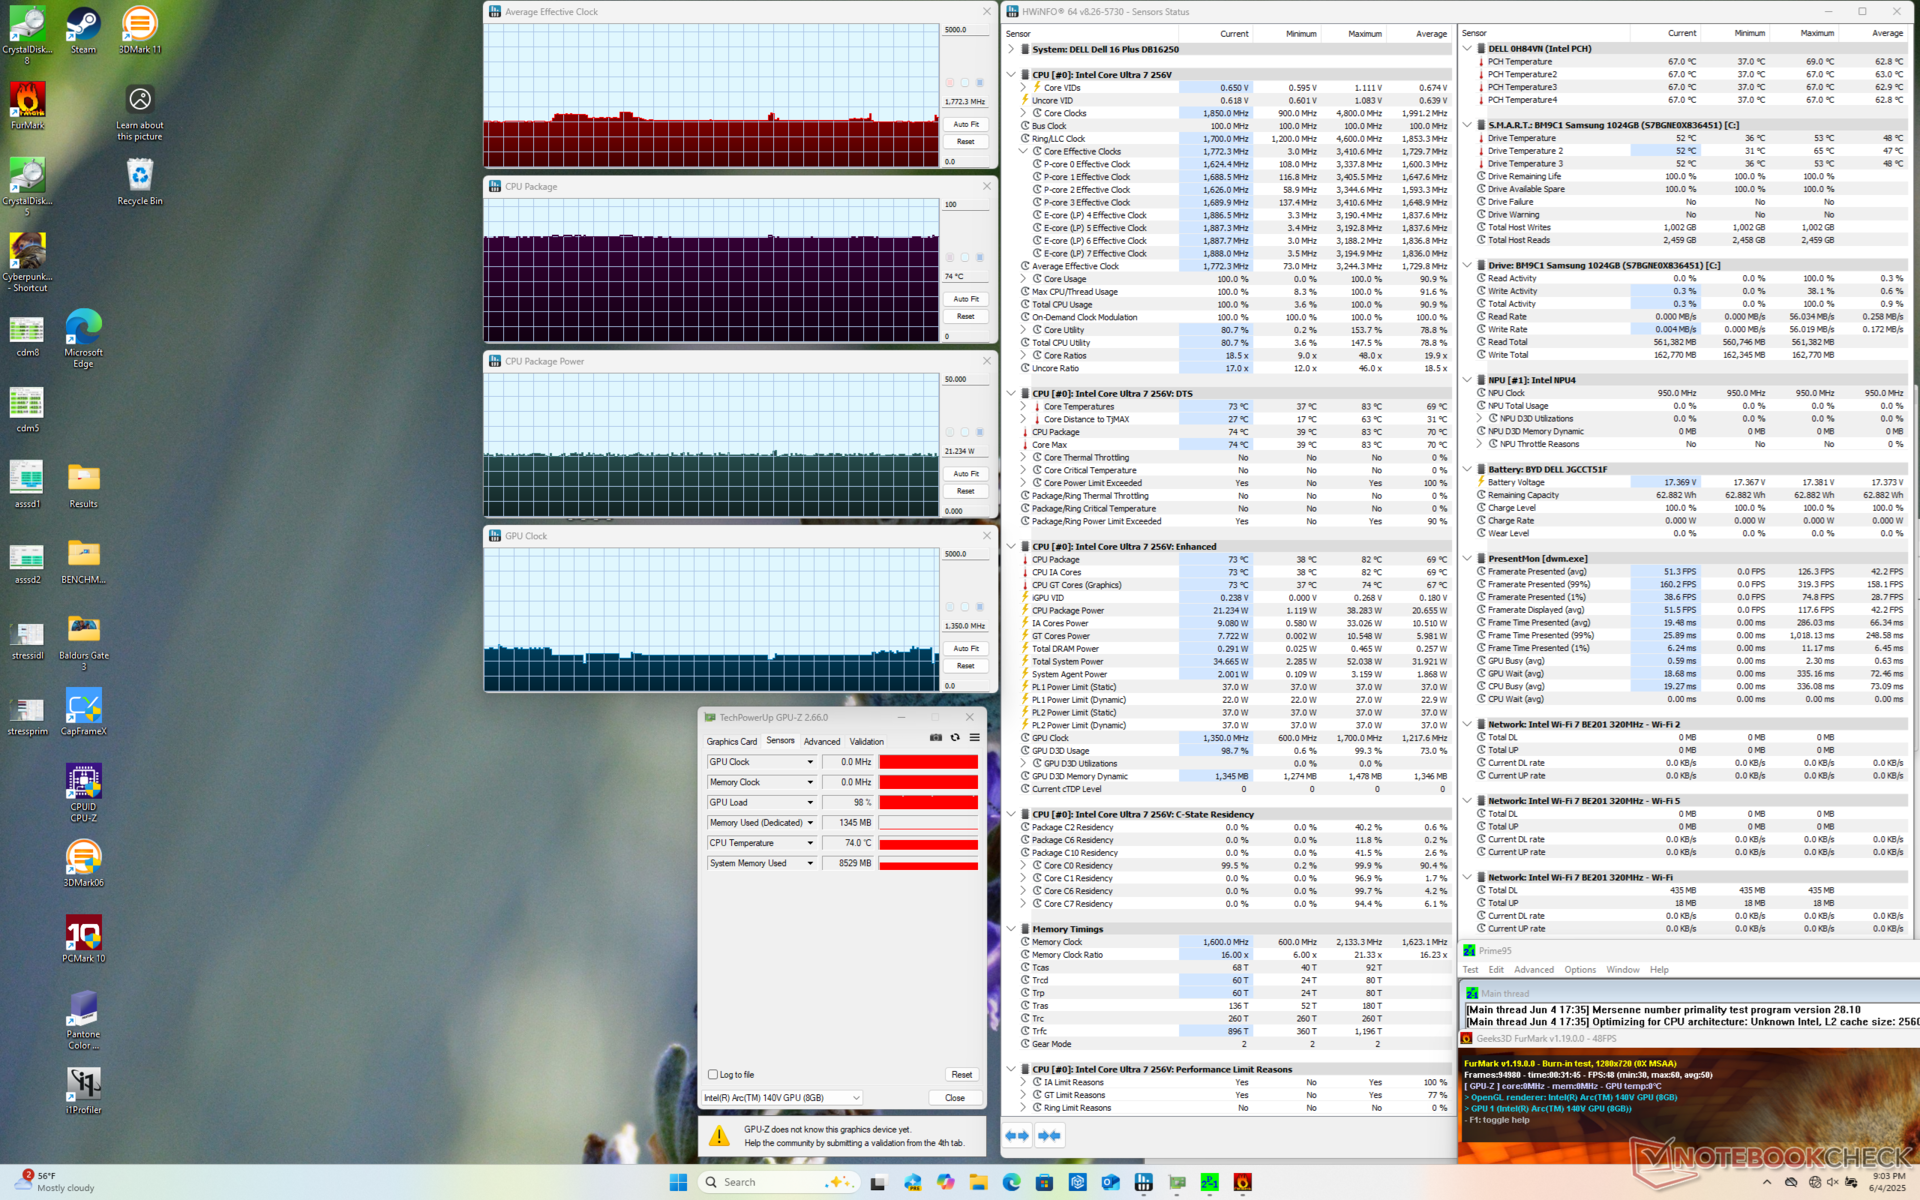
| Prime95 + FurMark Stress | 1.7 | 1350 | 74 |
| Cyberpunk 2077 Stres | 1.0 | 1950 | 74 |
Sistem Performansı
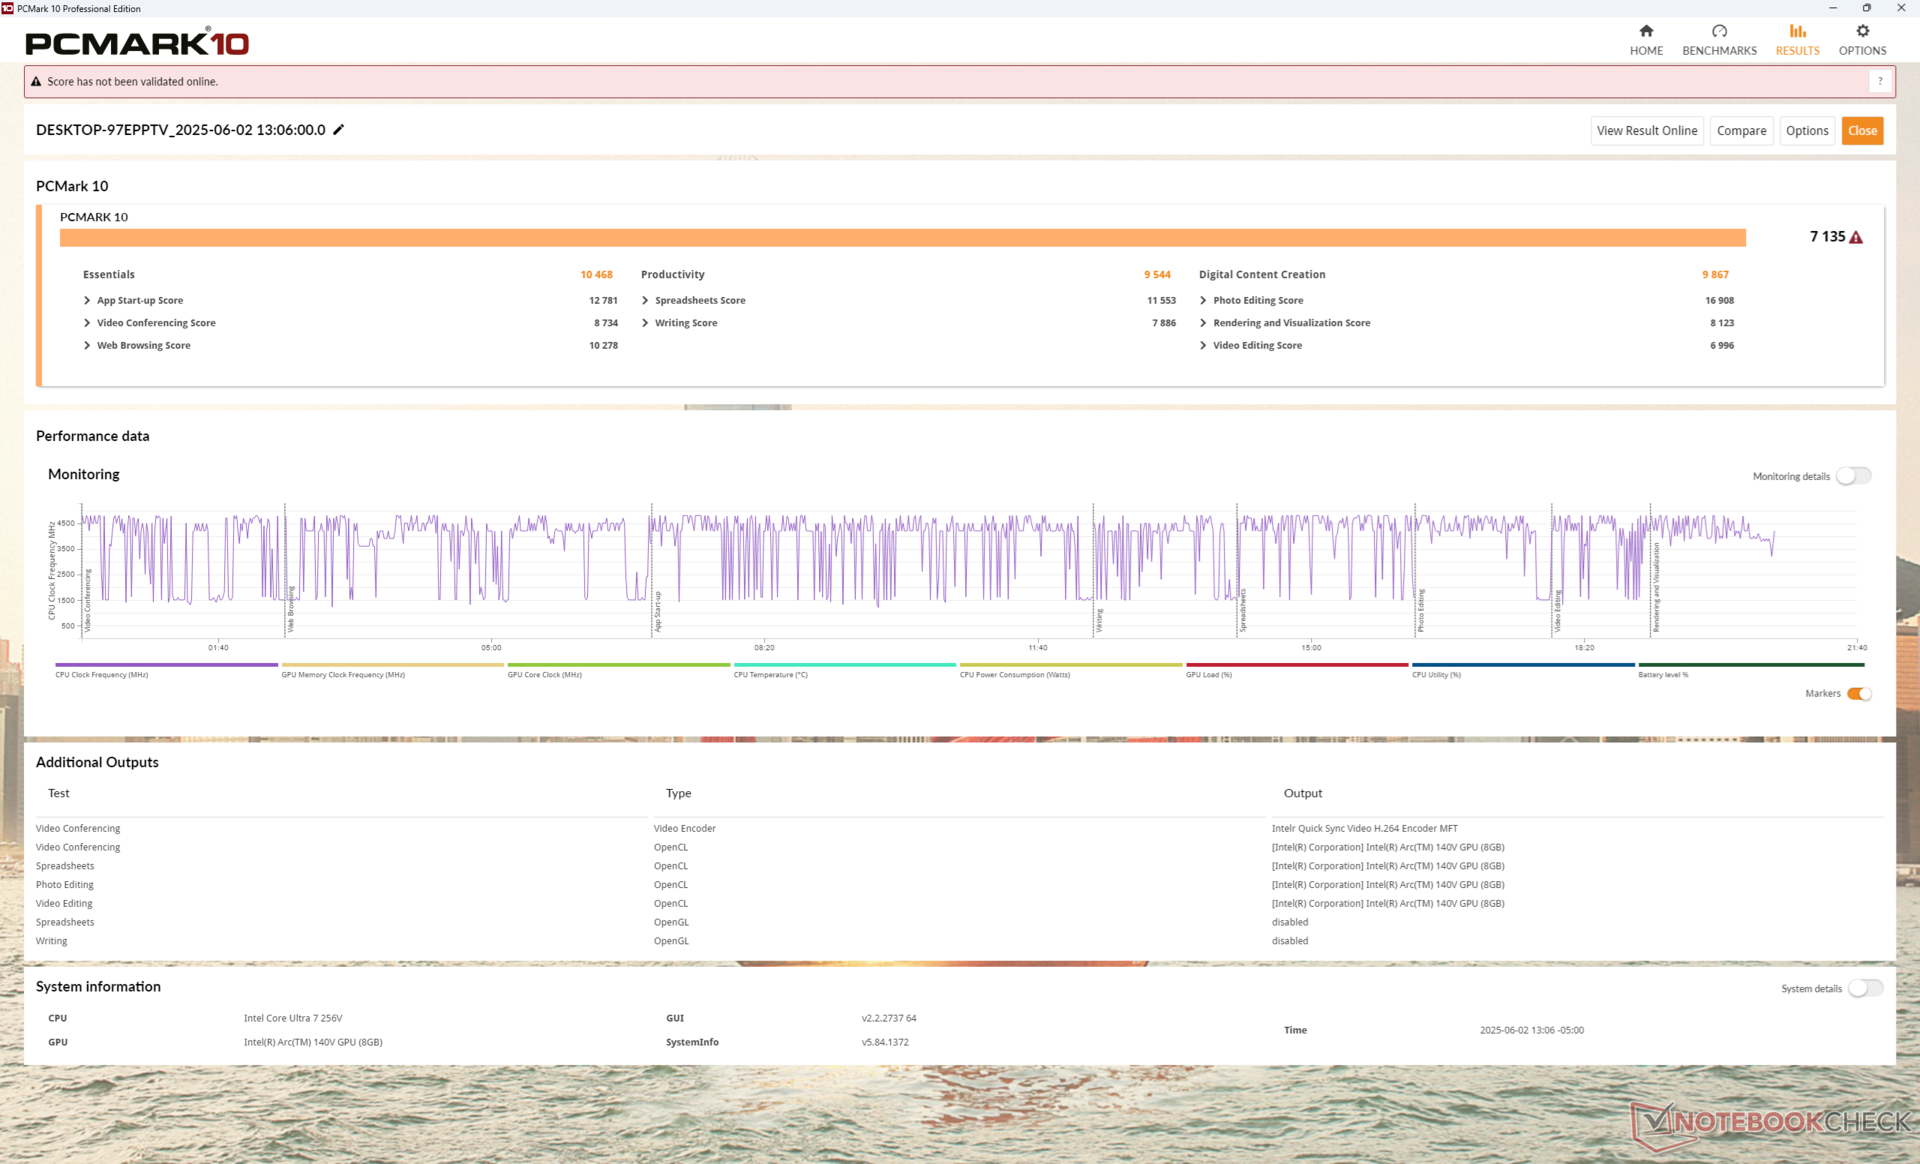
PCMark skorları, rakip 16 inç dizüstü bilgisayarlarla karşılaştırılabilir düzeydedir, hatta H serisi CPU'ları daha hızlı olanlar da dahil Asus Vivobook 16 M1606K. Lunar Lake'in paket üstü tasarımı sayesinde RAM performansı da mükemmeldir.
PCMark 10: Score | Essentials | Productivity | Digital Content Creation
CrossMark: Overall | Productivity | Creativity | Responsiveness
WebXPRT 3: Overall
WebXPRT 4: Overall
Mozilla Kraken 1.1: Total
| Performance rating | |
| Lenovo ThinkBook 16 G7+ AMD | |
| Acer Swift 16 AI SF16-51T-932H, Ultra 9 288V | |
| Dell 16 Plus | |
| Ortalama Intel Core Ultra 7 256V, Intel Arc Graphics 140V | |
| Asus Vivobook 16 M1606K | |
| HP Pavilion Plus 16-ab0456tx | |
| Dell Inspiron 16 Plus 7640 | |
| PCMark 10 / Score | |
| Lenovo ThinkBook 16 G7+ AMD | |
| Acer Swift 16 AI SF16-51T-932H, Ultra 9 288V | |
| Dell 16 Plus | |
| Ortalama Intel Core Ultra 7 256V, Intel Arc Graphics 140V (6677 - 7702, n=7) | |
| Dell Inspiron 16 Plus 7640 | |
| Asus Vivobook 16 M1606K | |
| HP Pavilion Plus 16-ab0456tx | |
| PCMark 10 / Essentials | |
| Asus Vivobook 16 M1606K | |
| Lenovo ThinkBook 16 G7+ AMD | |
| Acer Swift 16 AI SF16-51T-932H, Ultra 9 288V | |
| Dell 16 Plus | |
| Dell Inspiron 16 Plus 7640 | |
| Ortalama Intel Core Ultra 7 256V, Intel Arc Graphics 140V (9627 - 11365, n=7) | |
| HP Pavilion Plus 16-ab0456tx | |
| PCMark 10 / Productivity | |
| Lenovo ThinkBook 16 G7+ AMD | |
| Asus Vivobook 16 M1606K | |
| Ortalama Intel Core Ultra 7 256V, Intel Arc Graphics 140V (8161 - 12672, n=7) | |
| Dell 16 Plus | |
| Acer Swift 16 AI SF16-51T-932H, Ultra 9 288V | |
| HP Pavilion Plus 16-ab0456tx | |
| Dell Inspiron 16 Plus 7640 | |
| PCMark 10 / Digital Content Creation | |
| Dell Inspiron 16 Plus 7640 | |
| Lenovo ThinkBook 16 G7+ AMD | |
| Acer Swift 16 AI SF16-51T-932H, Ultra 9 288V | |
| Dell 16 Plus | |
| Ortalama Intel Core Ultra 7 256V, Intel Arc Graphics 140V (9481 - 10126, n=7) | |
| Asus Vivobook 16 M1606K | |
| HP Pavilion Plus 16-ab0456tx | |
| CrossMark / Overall | |
| HP Pavilion Plus 16-ab0456tx | |
| Lenovo ThinkBook 16 G7+ AMD | |
| Acer Swift 16 AI SF16-51T-932H, Ultra 9 288V | |
| Asus Vivobook 16 M1606K | |
| Ortalama Intel Core Ultra 7 256V, Intel Arc Graphics 140V (1636 - 1736, n=7) | |
| Dell Inspiron 16 Plus 7640 | |
| Dell 16 Plus | |
| CrossMark / Productivity | |
| Acer Swift 16 AI SF16-51T-932H, Ultra 9 288V | |
| HP Pavilion Plus 16-ab0456tx | |
| Ortalama Intel Core Ultra 7 256V, Intel Arc Graphics 140V (1563 - 1682, n=7) | |
| Asus Vivobook 16 M1606K | |
| Dell 16 Plus | |
| Lenovo ThinkBook 16 G7+ AMD | |
| Dell Inspiron 16 Plus 7640 | |
| CrossMark / Creativity | |
| Lenovo ThinkBook 16 G7+ AMD | |
| HP Pavilion Plus 16-ab0456tx | |
| Acer Swift 16 AI SF16-51T-932H, Ultra 9 288V | |
| Dell Inspiron 16 Plus 7640 | |
| Ortalama Intel Core Ultra 7 256V, Intel Arc Graphics 140V (1862 - 1962, n=7) | |
| Dell 16 Plus | |
| Asus Vivobook 16 M1606K | |
| CrossMark / Responsiveness | |
| HP Pavilion Plus 16-ab0456tx | |
| Asus Vivobook 16 M1606K | |
| Lenovo ThinkBook 16 G7+ AMD | |
| Dell Inspiron 16 Plus 7640 | |
| Acer Swift 16 AI SF16-51T-932H, Ultra 9 288V | |
| Ortalama Intel Core Ultra 7 256V, Intel Arc Graphics 140V (1215 - 1371, n=7) | |
| Dell 16 Plus | |
| WebXPRT 3 / Overall | |
| Lenovo ThinkBook 16 G7+ AMD | |
| Dell 16 Plus | |
| Acer Swift 16 AI SF16-51T-932H, Ultra 9 288V | |
| Ortalama Intel Core Ultra 7 256V, Intel Arc Graphics 140V (243 - 310, n=7) | |
| Asus Vivobook 16 M1606K | |
| Dell Inspiron 16 Plus 7640 | |
| HP Pavilion Plus 16-ab0456tx | |
| WebXPRT 4 / Overall | |
| Ortalama Intel Core Ultra 7 256V, Intel Arc Graphics 140V (282 - 286, n=7) | |
| Dell 16 Plus | |
| Acer Swift 16 AI SF16-51T-932H, Ultra 9 288V | |
| HP Pavilion Plus 16-ab0456tx | |
| Dell Inspiron 16 Plus 7640 | |
| Lenovo ThinkBook 16 G7+ AMD | |
| Asus Vivobook 16 M1606K | |
| Mozilla Kraken 1.1 / Total | |
| Dell Inspiron 16 Plus 7640 | |
| HP Pavilion Plus 16-ab0456tx | |
| Ortalama Intel Core Ultra 7 256V, Intel Arc Graphics 140V (470 - 480, n=7) | |
| Dell 16 Plus | |
| Acer Swift 16 AI SF16-51T-932H, Ultra 9 288V | |
| Asus Vivobook 16 M1606K | |
| Lenovo ThinkBook 16 G7+ AMD | |
* ... daha küçük daha iyidir
| PCMark 10 Score | 7135 puan | |
Yardım | ||
| AIDA64 / Memory Copy | |
| Acer Swift 16 AI SF16-51T-932H, Ultra 9 288V | |
| Ortalama Intel Core Ultra 7 256V (99227 - 104459, n=7) | |
| Dell 16 Plus | |
| Lenovo ThinkBook 16 G7+ AMD | |
| HP Pavilion Plus 16-ab0456tx | |
| Dell Inspiron 16 Plus 7640 | |
| Asus Vivobook 16 M1606K | |
| AIDA64 / Memory Read | |
| Lenovo ThinkBook 16 G7+ AMD | |
| Dell 16 Plus | |
| Ortalama Intel Core Ultra 7 256V (86352 - 89848, n=7) | |
| Acer Swift 16 AI SF16-51T-932H, Ultra 9 288V | |
| Dell Inspiron 16 Plus 7640 | |
| HP Pavilion Plus 16-ab0456tx | |
| Asus Vivobook 16 M1606K | |
| AIDA64 / Memory Write | |
| Dell 16 Plus | |
| Ortalama Intel Core Ultra 7 256V (108692 - 117933, n=7) | |
| Acer Swift 16 AI SF16-51T-932H, Ultra 9 288V | |
| Lenovo ThinkBook 16 G7+ AMD | |
| HP Pavilion Plus 16-ab0456tx | |
| Dell Inspiron 16 Plus 7640 | |
| Asus Vivobook 16 M1606K | |
| AIDA64 / Memory Latency | |
| Dell Inspiron 16 Plus 7640 | |
| Lenovo ThinkBook 16 G7+ AMD | |
| Dell 16 Plus | |
| Ortalama Intel Core Ultra 7 256V (96.1 - 99.6, n=7) | |
| Acer Swift 16 AI SF16-51T-932H, Ultra 9 288V | |
| HP Pavilion Plus 16-ab0456tx | |
| Asus Vivobook 16 M1606K | |
* ... daha küçük daha iyidir
DPC Gecikme Süresi
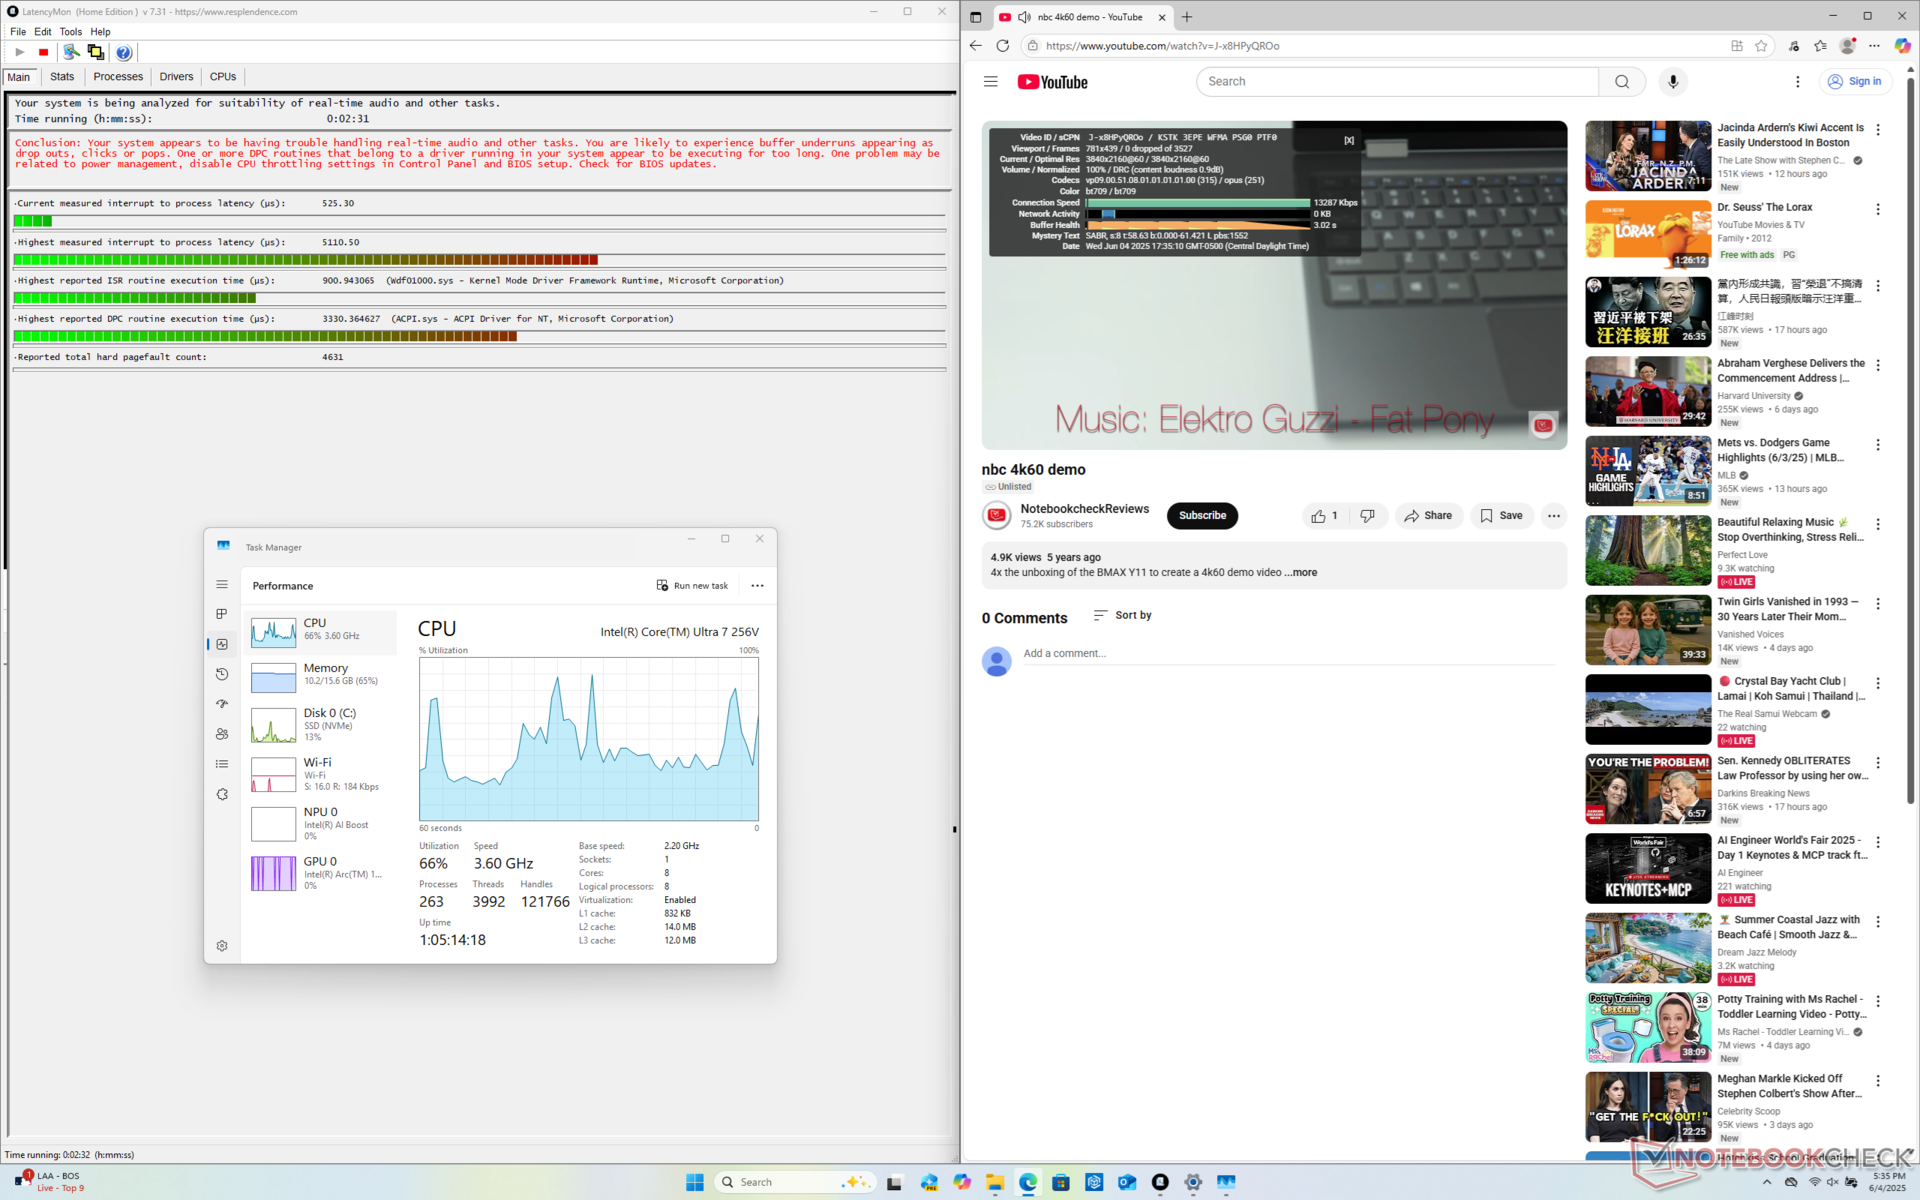
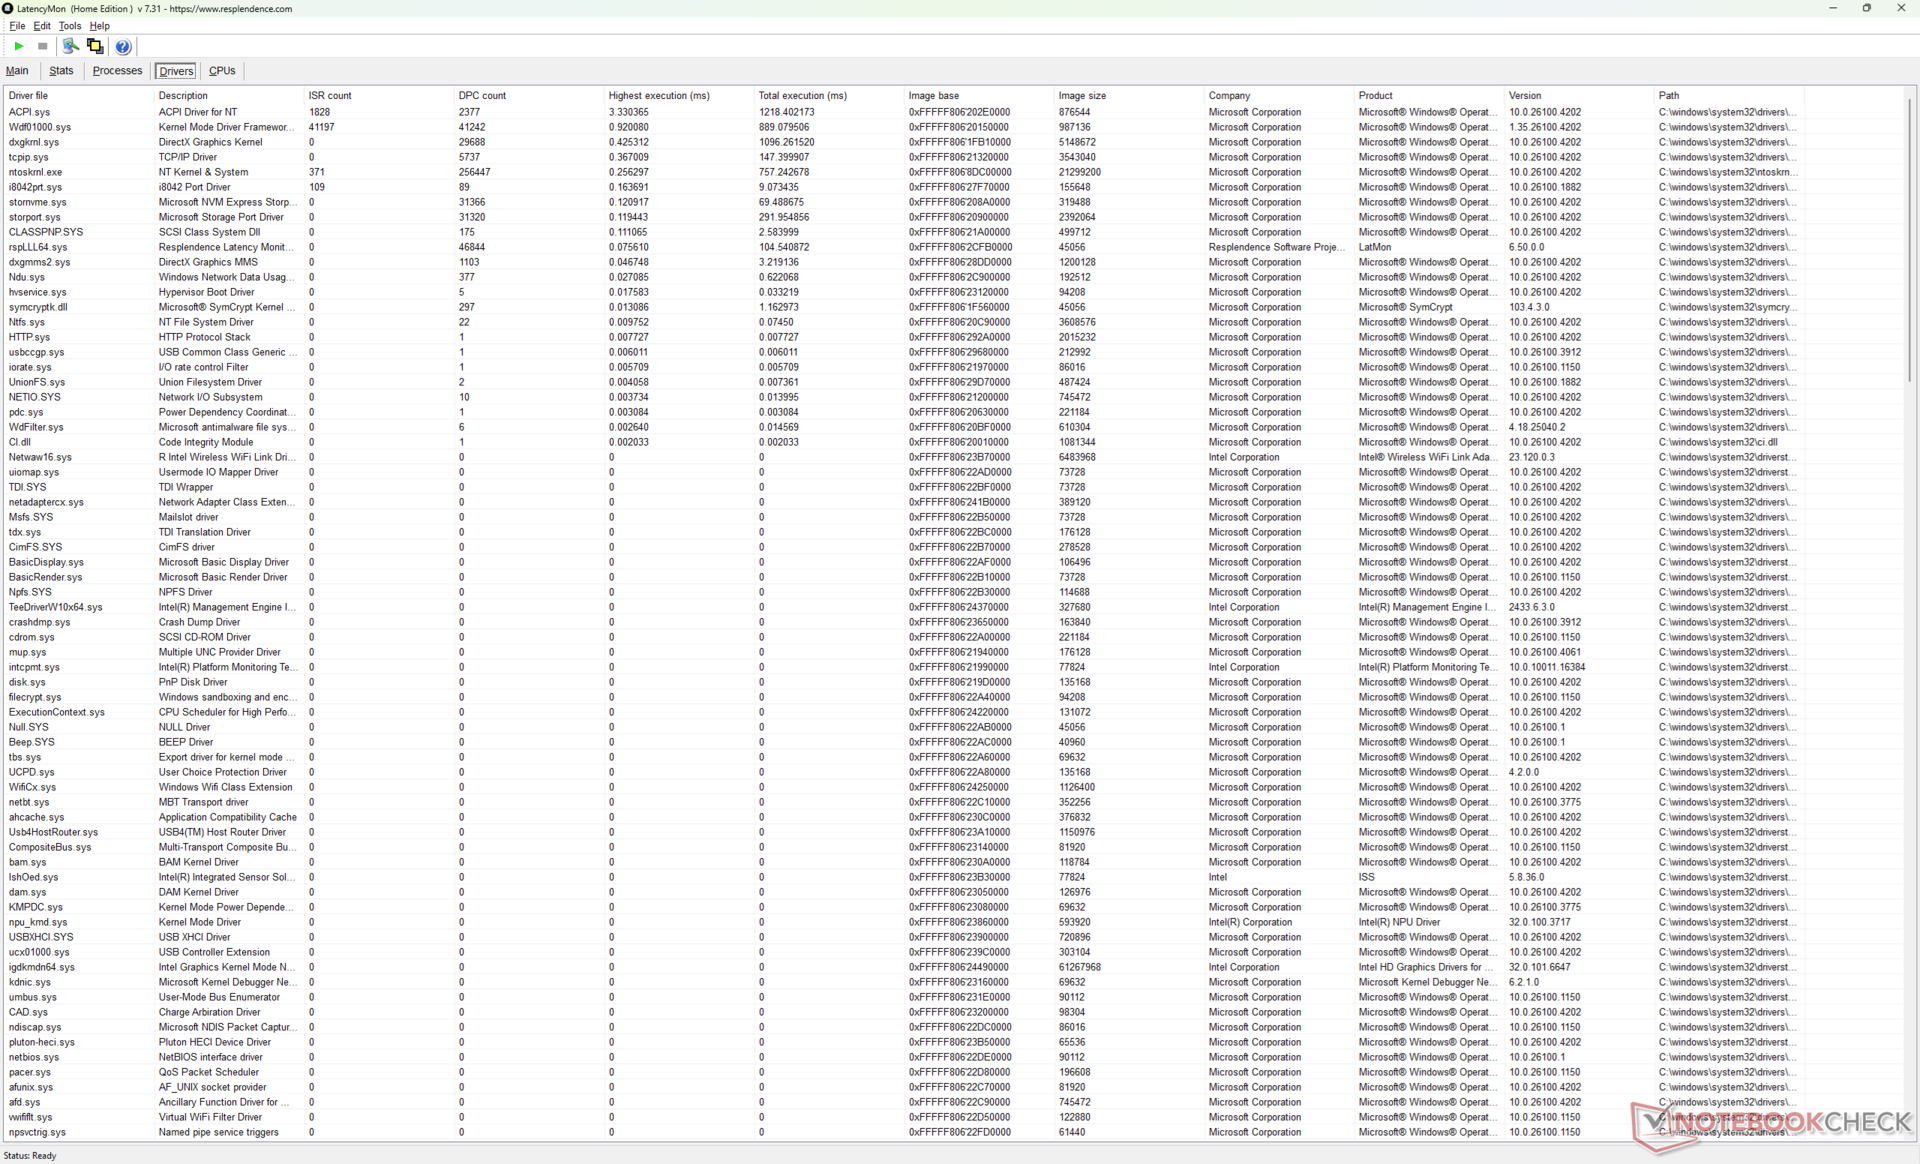
LatencyMon, ana sayfamızın birden fazla tarayıcı sekmesini açarken DPC sorunlarını ortaya çıkarır. Garip bir şekilde, 4K60 video oynatırken GPU etkinliği yüzde 0 ile 100 arasında değişirken, GPU diğer Lunar Lake dizüstü bilgisayarların çoğunda ~ yüzde 40'ta sabit kalıyordu. Aksi takdirde, sorunsuz bir 4K60 akış deneyimi için kaydedilen hiçbir kare düşmesi yoktur.
| DPC Latencies / LatencyMon - interrupt to process latency (max), Web, Youtube, Prime95 | |
| HP Pavilion Plus 16-ab0456tx | |
| Dell 16 Plus | |
| Acer Swift 16 AI SF16-51T-932H, Ultra 9 288V | |
| Lenovo ThinkBook 16 G7+ AMD | |
| Asus Vivobook 16 M1606K | |
| Dell Inspiron 16 Plus 7640 | |
* ... daha küçük daha iyidir
Depolama Cihazları
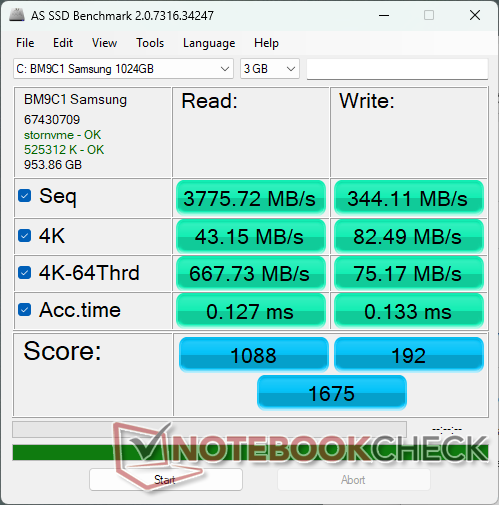
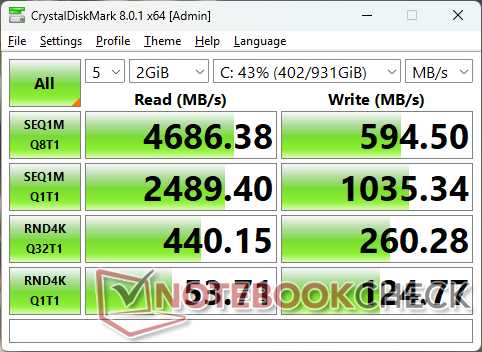
Bu Samsung BM9C1 geçen yılın Inspiron 16 7640 2'si 1 arada modelindeki Micron 2550'den daha düşüktür. Aktarım hızları 3600 MB/s ile 4900 MB/s arasında dalgalanacak kadar istikrarlı değildir ve hatta DiskSpd döngü testimiz sırasında 2200 MB/s'ye kadar düşmüştür.

| Drive Performance rating - Percent | |
| HP Pavilion Plus 16-ab0456tx | |
| Asus Vivobook 16 M1606K | |
| Lenovo ThinkBook 16 G7+ AMD | |
| Dell Inspiron 16 Plus 7640 | |
| Acer Swift 16 AI SF16-51T-932H, Ultra 9 288V | |
| Dell 16 Plus | |
* ... daha küçük daha iyidir
Disk Throttling: DiskSpd Read Loop, Queue Depth 8
GPU Performansı
Bu Ark 140V geçen seneye göre iyi bir gelişme Ark 8. Aslında Dell 16 Plus, çoğu oyunu geçen yılki Inspiron 16 7640 2'si 1 arada bilgisayardan yüzde 25'e varan oranlarda daha hızlı çalıştırıyor, üstelik bu bilgisayar çok daha hızlı bir Core-H CPU'ya sahip olmasına rağmen.
| Güç Profili | Grafik Puanı | Fizik Puanı | Birleşik Puan |
| Performans modu | 9682 | 19037 | 3057 |
| Dengeli mod | 8164 (-16%) | 16591 (-13%) | 2296 (-25%) |
| Akü Gücü | 8266 (-15%) | 16361 (-14%) | 2350 (-23%) |
Performans modu yerine Dengeli modda çalıştırmak, yukarıdaki Fire Strike sonuç tablomuzda gösterildiği gibi genel performansı oldukça etkilemektedir.
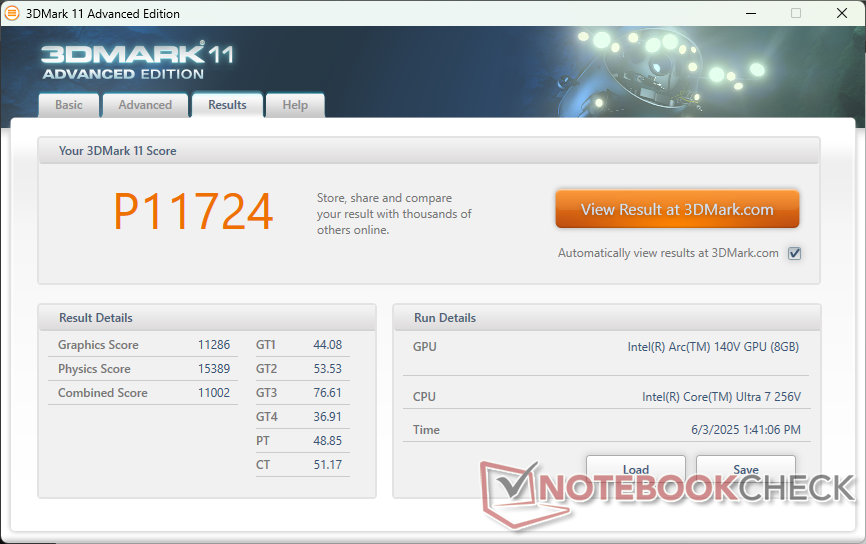

| 3DMark 11 Performance | 11724 puan | |
| 3DMark Fire Strike Score | 8470 puan | |
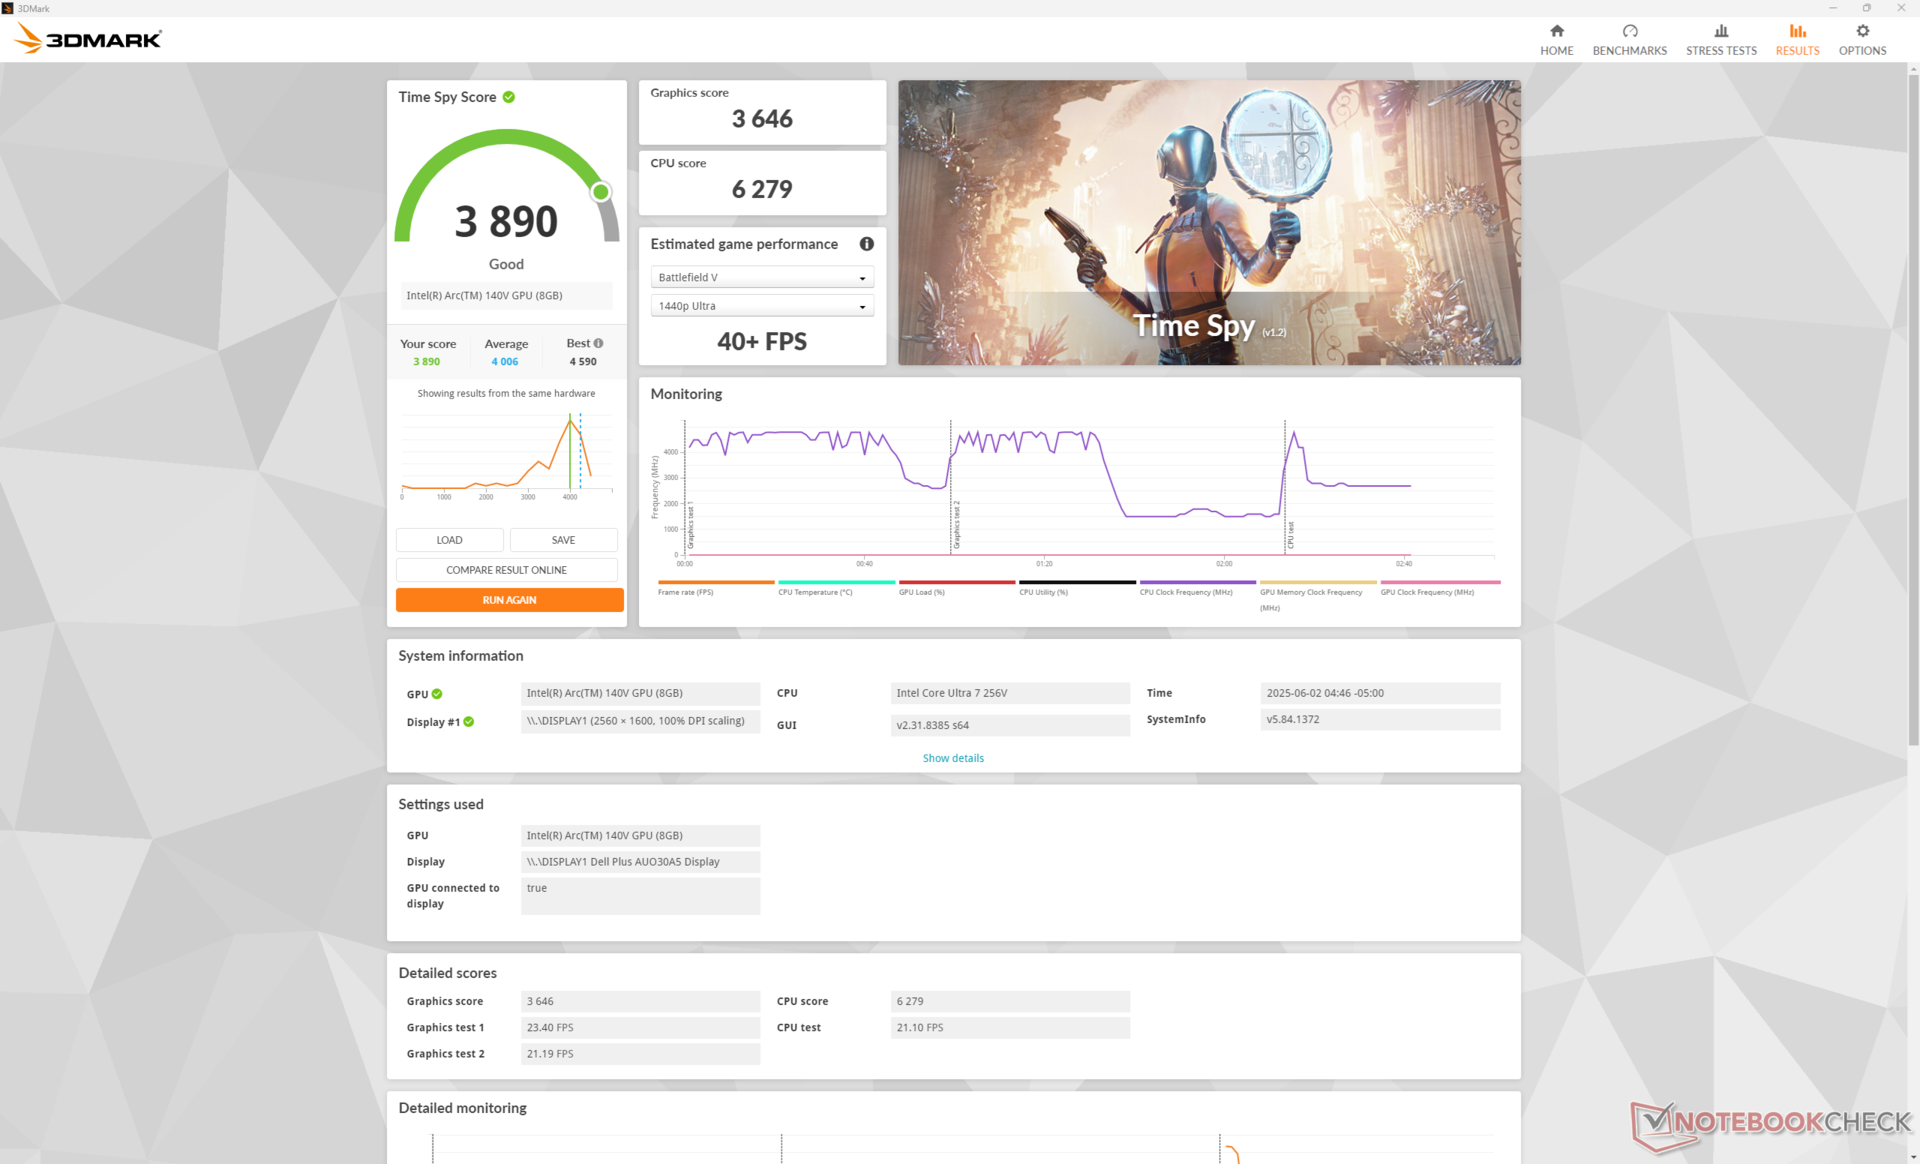
| 3DMark Time Spy Score | 3890 puan | |
Yardım | ||
* ... daha küçük daha iyidir
Oyun Performansı
Baldur's Gate 3 de dahil olmak üzere çoğu oyun sistemde doğal 1080p ve düşük ayarlarda iyi çalışır. Ancak Cyberpunk 2077 gibi daha zorlu oyunlarda daha akıcı bir deneyim için 720p'ye düşmek gerekebilir.
| F1 24 | |
| 1920x1080 Low Preset AA:T AF:16x | |
| Ortalama Intel Arc Graphics 140V (54 - 99, n=25) | |
| Dell 16 Plus | |
| Lenovo ThinkPad T16 Gen 3 21MN005XGE | |
| 1920x1080 Medium Preset AA:T AF:16x | |
| Ortalama Intel Arc Graphics 140V (49.2 - 88.2, n=24) | |
| Dell 16 Plus | |
| Lenovo ThinkPad T16 Gen 3 21MN005XGE | |
| 1920x1080 High Preset AA:T AF:16x | |
| Ortalama Intel Arc Graphics 140V (34.4 - 66.4, n=27) | |
| Dell 16 Plus | |
| LG Gram Pro 16Z90TS-G.AU89G | |
| Lenovo ThinkPad T16 Gen 3 21MN005XGE | |
| 1920x1080 Ultra High Preset AA:T AF:16x | |
| Dell 16 Plus | |
| Ortalama Intel Arc Graphics 140V (14.6 - 22, n=25) | |
| Lenovo ThinkPad T16 Gen 3 21MN005XGE | |
Cyberpunk 2077 ultra FPS Chart
| düşük | orta | yüksek | ultra | |
|---|---|---|---|---|
| Dota 2 Reborn (2015) | 98.3 | 70.3 | 71.1 | 71.9 |
| Final Fantasy XV Benchmark (2018) | 80.5 | 45.7 | 33.3 | |
| X-Plane 11.11 (2018) | 51.2 | 39.7 | 35.7 | |
| Strange Brigade (2018) | 205 | 81 | 68 | 56.9 |
| Baldur's Gate 3 (2023) | 38.1 | 31 | 27.7 | 27 |
| Cyberpunk 2077 (2023) | 44.2 | 35.2 | 24.7 | 24.1 |
| F1 24 (2024) | 75.3 | 70.7 | 55.3 | 18.8 |
Emisyonlar
Sistem Gürültüsü
Dahili fan genellikle yüklere karşı uyuşuktur, yani daha zorlu uygulamaları başlatırken veya çalıştırırken yavaşça yükselir. Ağır kullanım sırasında fan gürültüsünün daha belirgin hale gelmesi daha uzun sürdüğü için bu iyi bir özellik. Ancak bir süre sonra sistem, Acer Swift 16 AI veya Asus Vivobook 16 gibi diğer 16 inç multimedya dizüstü bilgisayarlarla benzer bir maksimum seviyeye ulaşıyor.
Ses yüksekliği
| Boşta |
| 23.5 / 23.5 / 23.5 dB |
| Çalışırken |
| 31.9 / 46.9 dB |
 | ||
30 dB sessiz 40 dB(A) duyulabilirlik 50 dB(A) gürültülü |
||
min: | ||
| Dell 16 Plus Arc 140V, Core Ultra 7 256V, Samsung BM9C1 1024GB | Dell Inspiron 16 Plus 7640 GeForce RTX 4060 Laptop GPU, Ultra 7 155H, SK hynix BC901 HFS001TEJ4X164N | Acer Swift 16 AI SF16-51T-932H, Ultra 9 288V Arc 140V, Core Ultra 9 288V, Western Digital PC SN5000S SDEQNSJ-1T00 | Lenovo ThinkBook 16 G7+ AMD Radeon 880M, Ryzen AI 9 365, Samsung PM9C1a MZAL81T0HDLB | HP Pavilion Plus 16-ab0456tx GeForce RTX 3050 6GB Laptop GPU, i7-13700H, WDC PC SN810 1TB | Asus Vivobook 16 M1606K Radeon 860M, Ryzen AI 7 350, Micron 2500 1TB MTFDKBA1T0QGN | |
|---|---|---|---|---|---|---|
| Noise | -2% | -6% | -2% | -0% | 2% | |
| kapalı / ortam * (dB) | 23.4 | 23.8 -2% | 25.8 -10% | 24.5 -5% | 22.22 5% | 23 2% |
| Idle Minimum * (dB) | 23.5 | 24.2 -3% | 25.8 -10% | 24.5 -4% | 22.22 5% | 23 2% |
| Idle Average * (dB) | 23.5 | 24.2 -3% | 25.8 -10% | 24.5 -4% | 22.22 5% | 23 2% |
| Idle Maximum * (dB) | 23.5 | 24.2 -3% | 26.7 -14% | 25.9 -10% | 22.22 5% | 24.67 -5% |
| Load Average * (dB) | 31.9 | 28.9 9% | 36.2 -13% | 42.03 -32% | 31.72 1% | |
| Cyberpunk 2077 ultra * (dB) | 42.6 | 44.4 -4% | 40.1 6% | 41.53 3% | ||
| Load Maximum * (dB) | 46.9 | 51 -9% | 41.1 12% | 40.1 14% | 42.1 10% | 42.51 9% |
| Witcher 3 ultra * (dB) | 51 | 42.1 |
* ... daha küçük daha iyidir
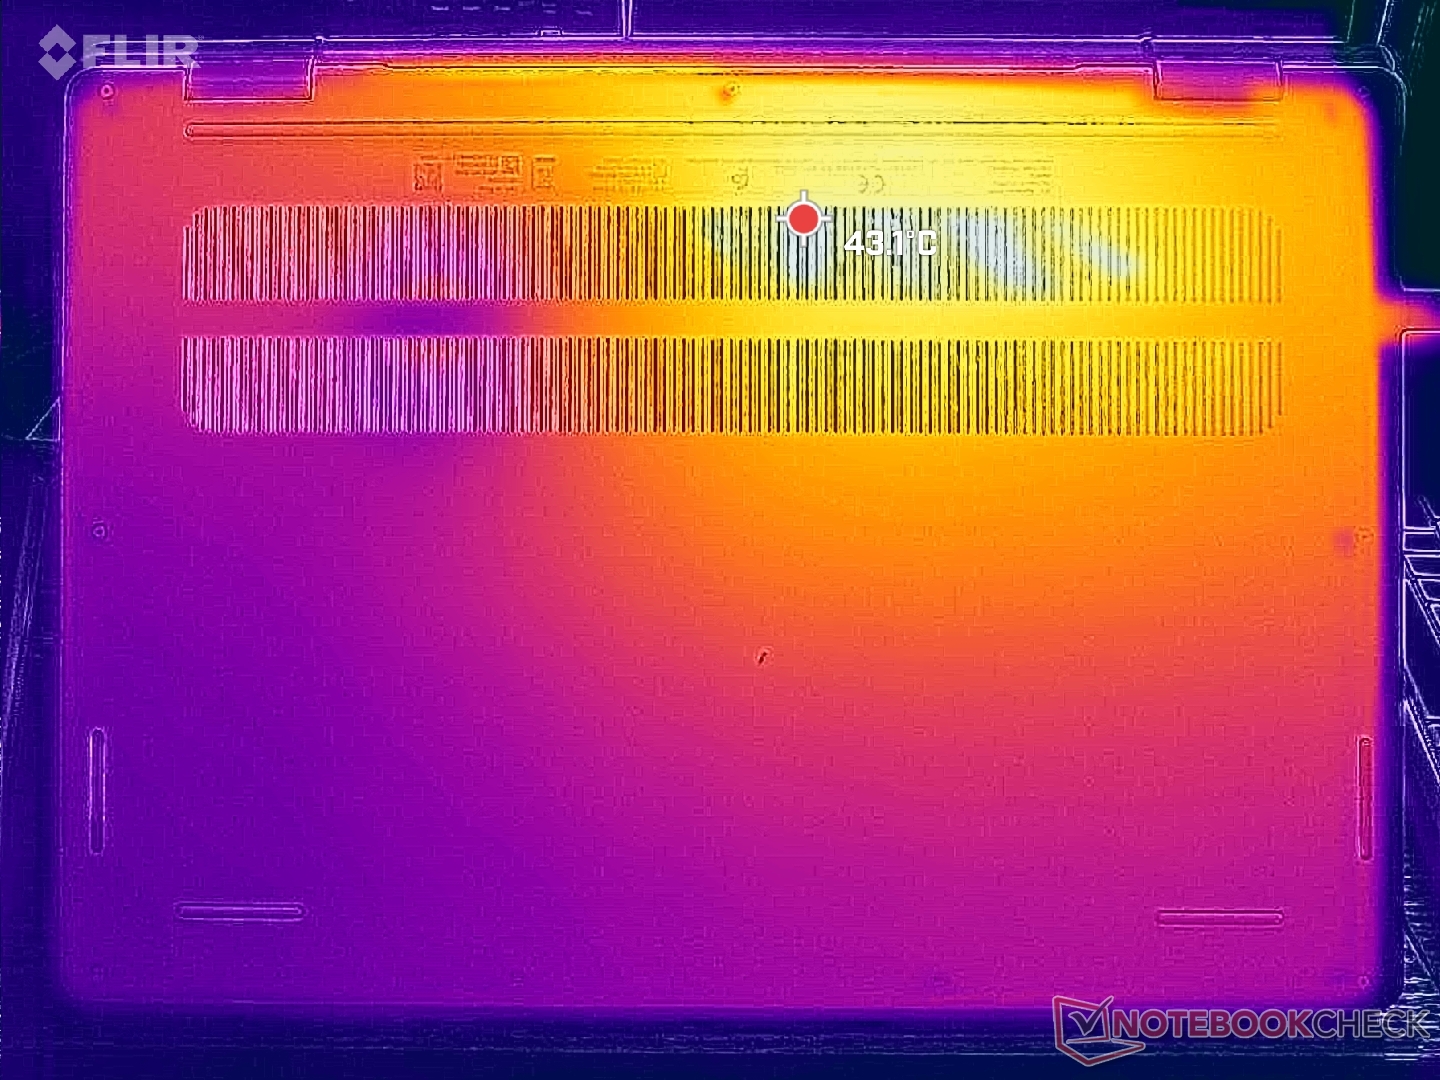
Sıcaklık
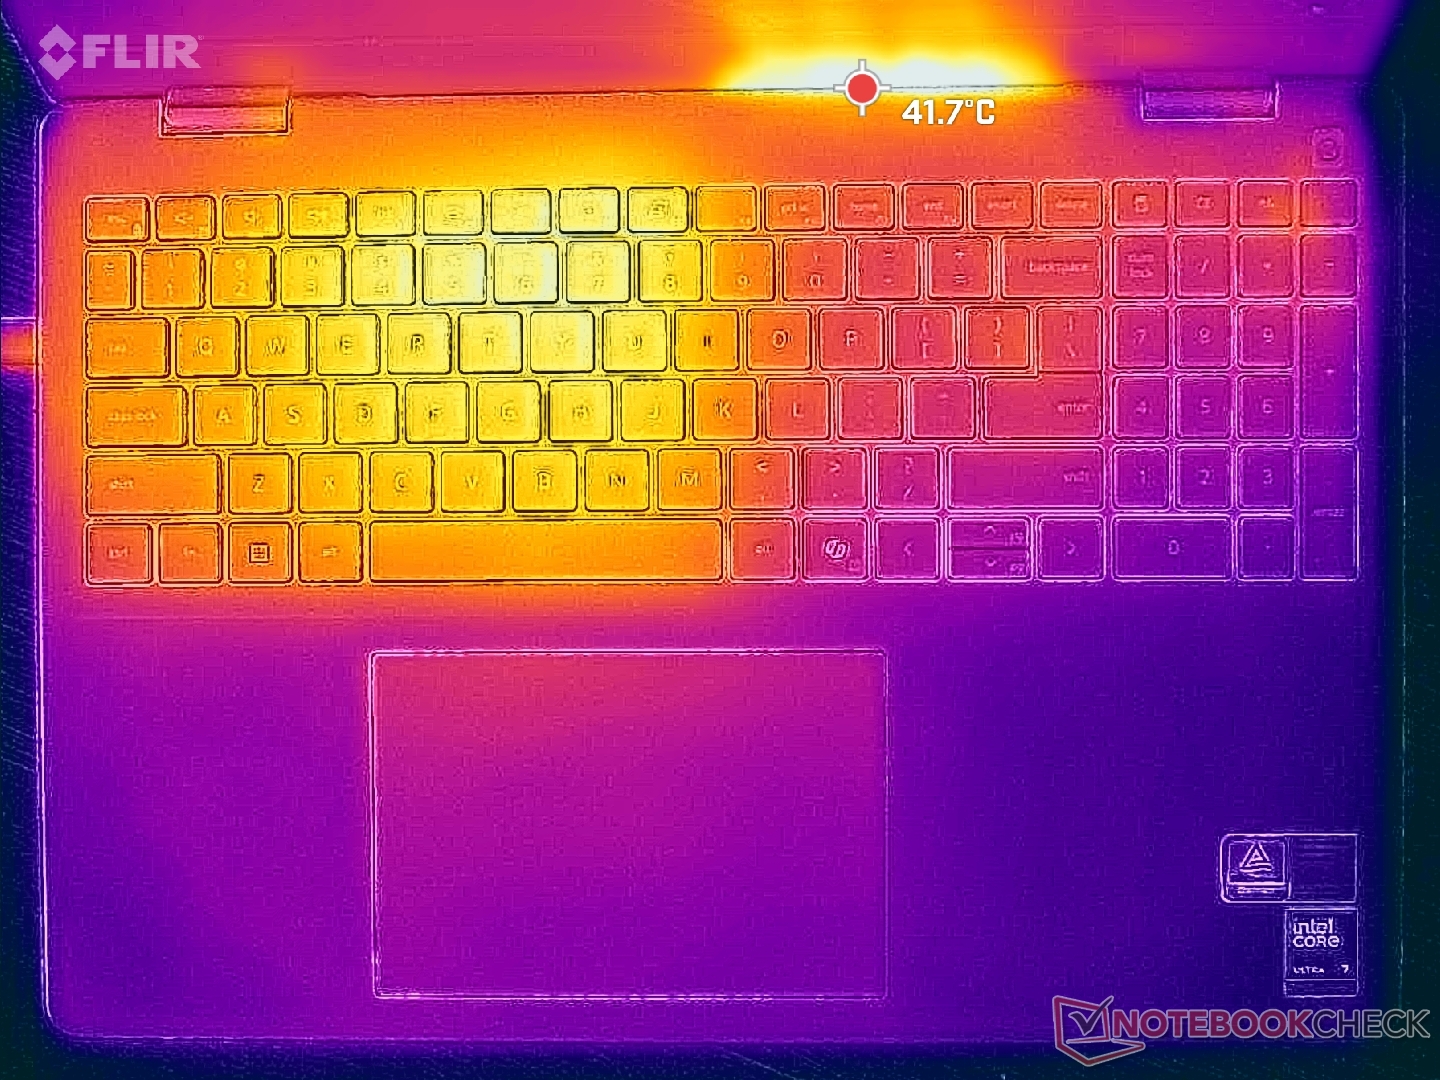
Yüzey sıcaklıkları, büyük ölçüde işlemci değişiklikleri nedeniyle giden Inspiron 16 7640 serisine kıyasla belirgin şekilde daha soğuk. Sıcak noktalar, daha yüksek 40 C aralığı yerine düşük 40 C aralığında zirveye ulaşıyor.
Sistem açıkça oyuncular için tasarlanmamıştır çünkü WASD bölgesi aşağıdaki sıcaklık haritalarında gösterildiği gibi klavyenin geri kalanından çok daha sıcak olabilir.
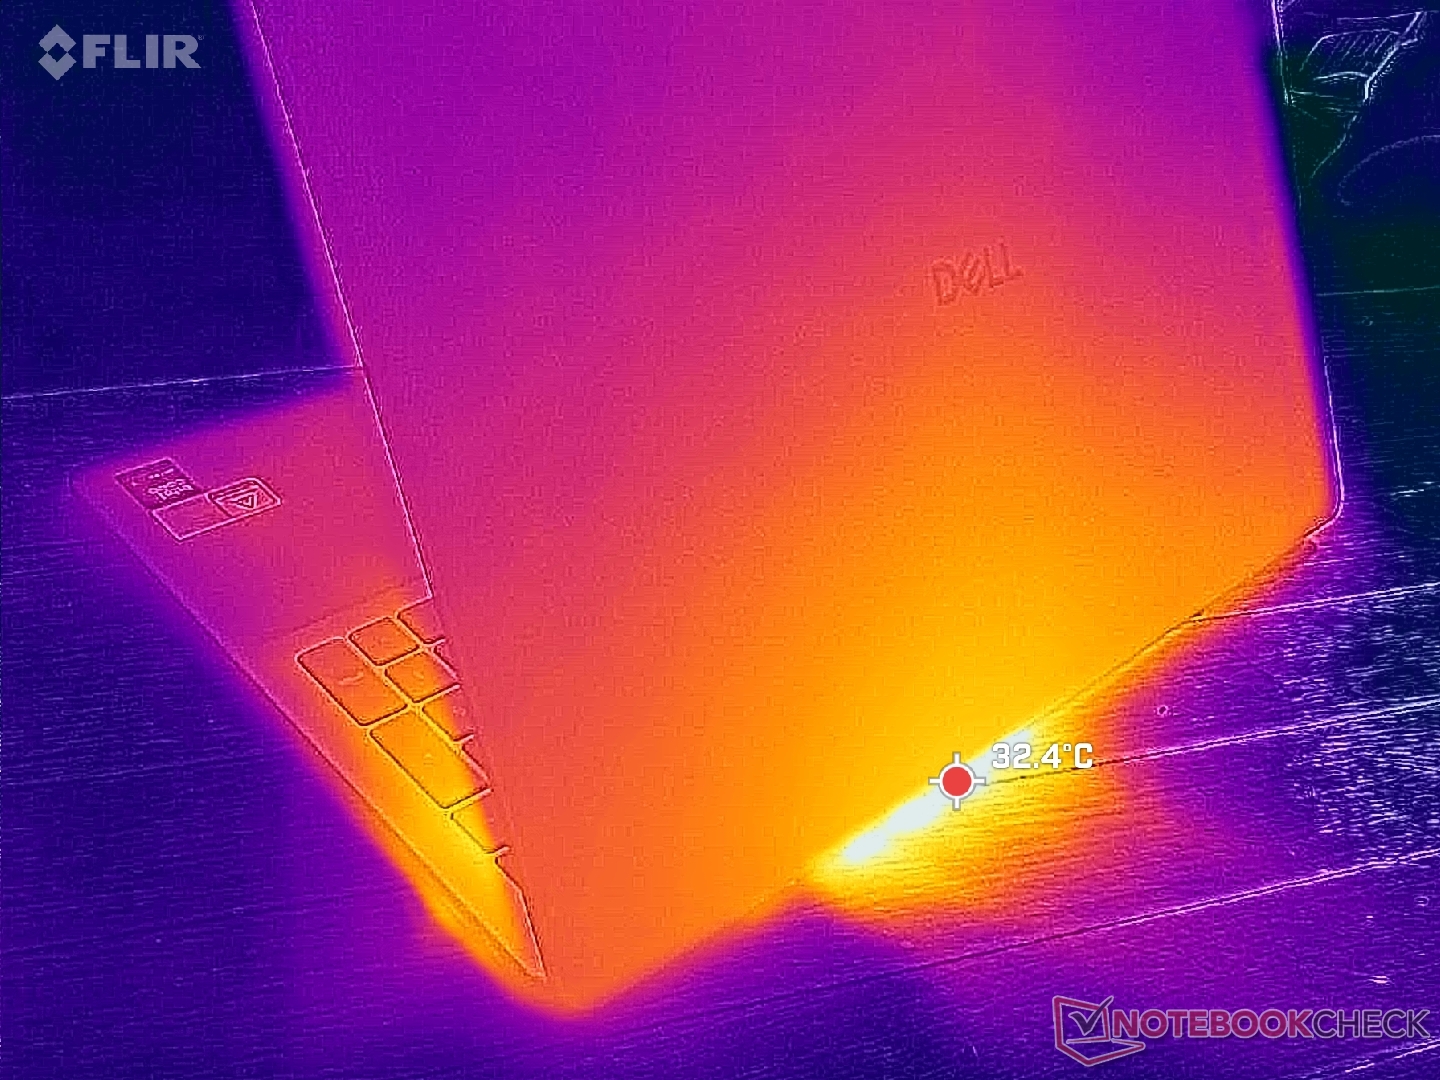
(±) Üst taraftaki maksimum sıcaklık, 36.8 °C / 98 F ortalamasına kıyasla 40.6 °C / 105 F'dir. , Multimedia sınıfı için 21 ile 71 °C arasında değişir.
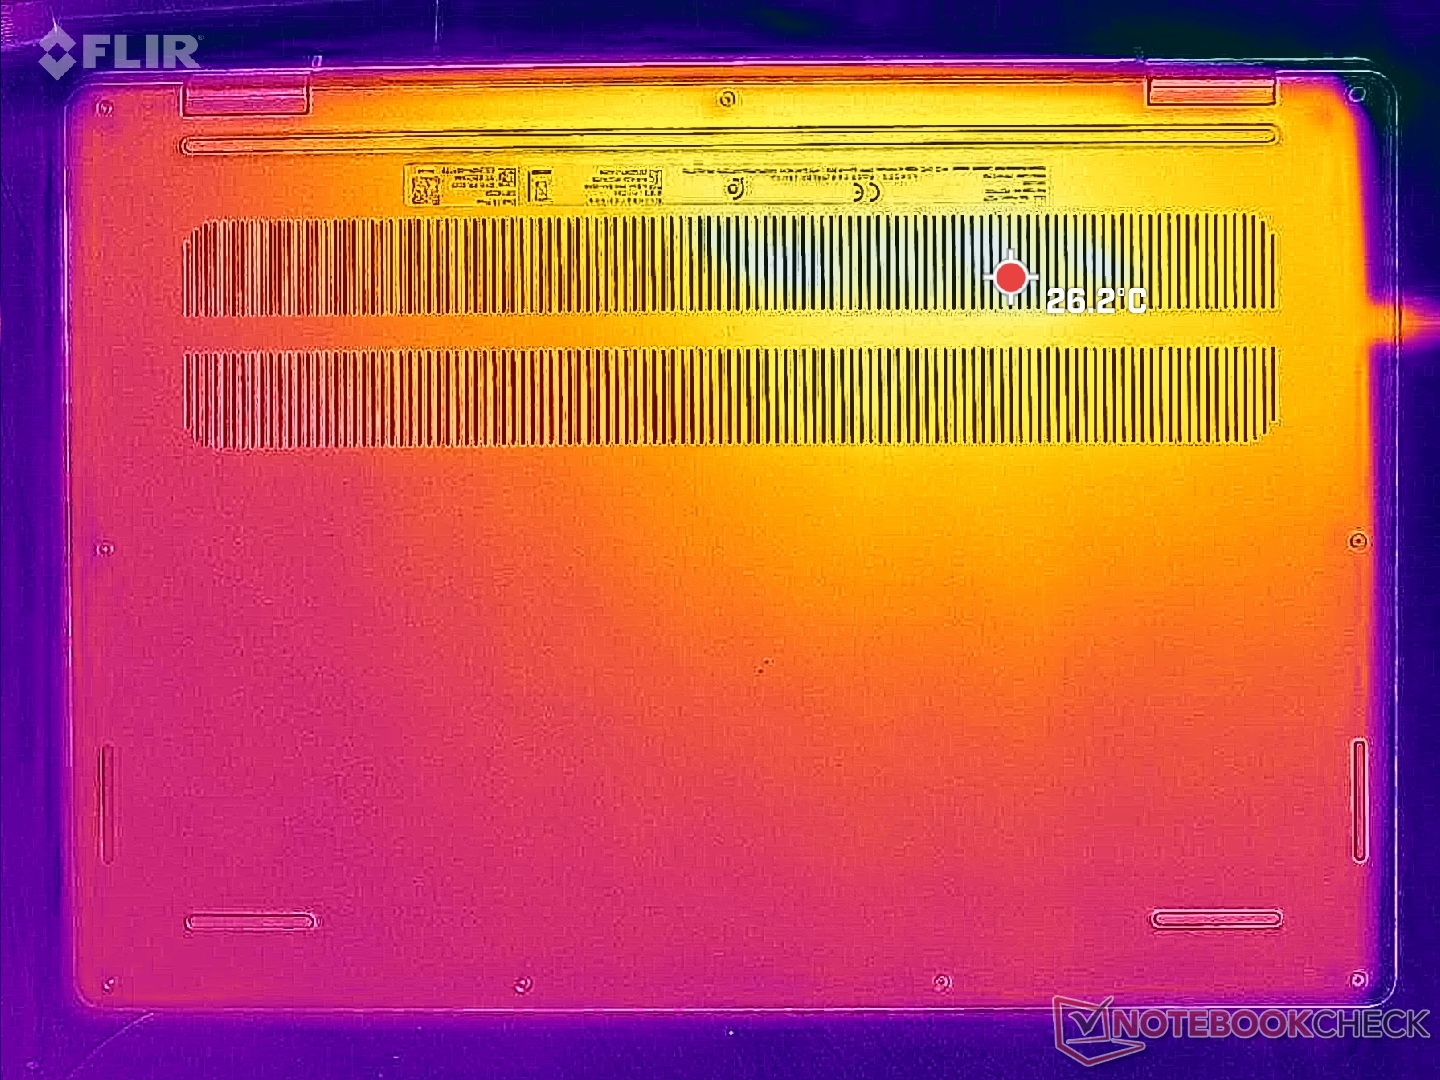
(±) Alt kısım, 39.1 °C / 102 F ortalamasına kıyasla maksimum 40 °C / 104 F'ye kadar ısınır
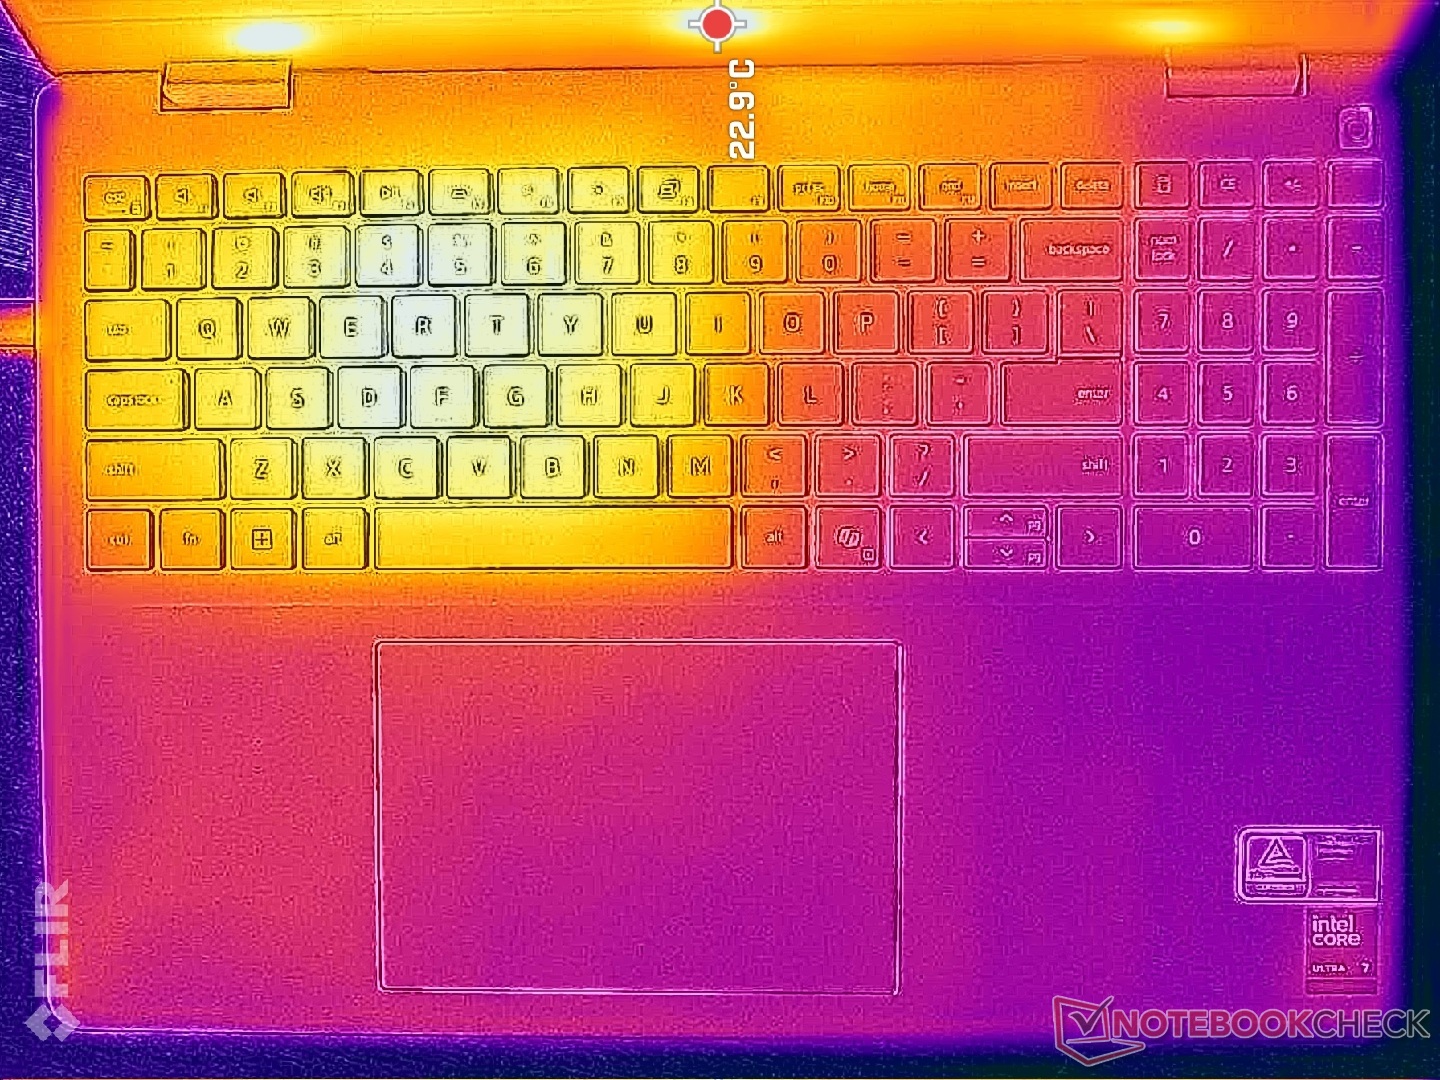
(+) Boşta kullanımda, üst tarafın ortalama sıcaklığı 27.2 °C / 81 F olup, cihazın 31.3 °C / 88 F.
(+) Avuç içi dayanakları ve dokunmatik yüzey, maksimum 25.8 °C / 78.4 F ile cilt sıcaklığından daha soğuktur ve bu nedenle dokunulduğunda soğuktur.
(+) Benzer cihazların avuç içi dayanağı alanının ortalama sıcaklığı 28.7 °C / 83.7 F (+2.9 °C / 5.3 F) idi.
| Dell 16 Plus Intel Core Ultra 7 256V, Intel Arc Graphics 140V | Dell Inspiron 16 Plus 7640 Intel Core Ultra 7 155H, NVIDIA GeForce RTX 4060 Laptop GPU | Acer Swift 16 AI SF16-51T-932H, Ultra 9 288V Intel Core Ultra 9 288V, Intel Arc Graphics 140V | Lenovo ThinkBook 16 G7+ AMD AMD Ryzen AI 9 365, AMD Radeon 880M | HP Pavilion Plus 16-ab0456tx Intel Core i7-13700H, NVIDIA GeForce RTX 3050 6GB Laptop GPU | Asus Vivobook 16 M1606K AMD Ryzen AI 7 350, AMD Radeon 860M | |
|---|---|---|---|---|---|---|
| Heat | -9% | 7% | 9% | -24% | 0% | |
| Maximum Upper Side * (°C) | 40.6 | 43.4 -7% | 37.9 7% | 38.2 6% | 49.6 -22% | 48 -18% |
| Maximum Bottom * (°C) | 40 | 41.6 -4% | 31.5 21% | 37.9 5% | 45.8 -15% | 51 -27% |
| Idle Upper Side * (°C) | 29.2 | 32.8 -12% | 28.3 3% | 25.4 13% | 39.2 -34% | 22 25% |
| Idle Bottom * (°C) | 28.6 | 32.4 -13% | 29.7 -4% | 25.7 10% | 35.4 -24% | 23 20% |
* ... daha küçük daha iyidir
Konuşmacılar
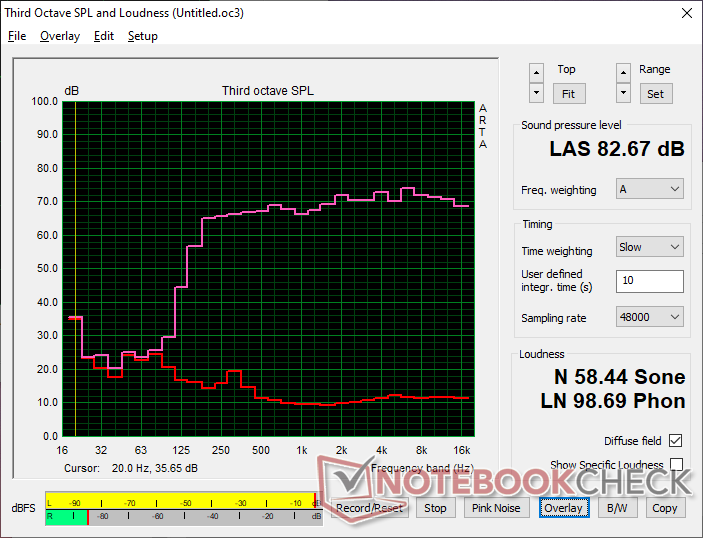
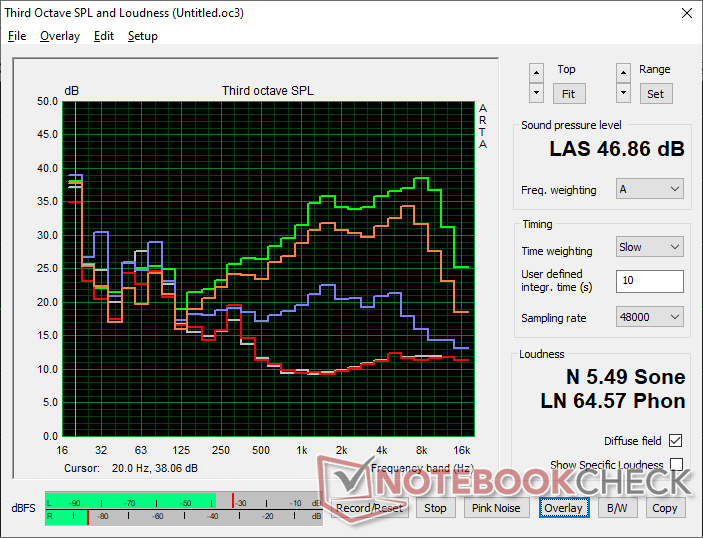
Dell 16 Plus ses analizi
(+) | hoparlörler nispeten yüksek sesle çalabilir (82.7 dB)
Bas 100 - 315Hz
(±) | azaltılmış bas - ortalama olarak medyandan 14.1% daha düşük
(±) | Bas doğrusallığı ortalamadır (11.8% delta - önceki frekans)
Ortalar 400 - 2000 Hz
(+) | dengeli ortalar - medyandan yalnızca 1.6% uzakta
(+) | orta frekanslar doğrusaldır (2.4% deltadan önceki frekansa)
Yüksekler 2 - 16 kHz
(+) | dengeli yüksekler - medyandan yalnızca 2.9% uzakta
(+) | yüksekler doğrusaldır (3.3% deltadan önceki frekansa)
Toplam 100 - 16.000 Hz
(+) | genel ses doğrusaldır (10% ortancaya göre fark)
Aynı sınıfla karşılaştırıldığında
» Bu sınıftaki tüm test edilen cihazların %13%'si daha iyi, 2% benzer, 84% daha kötüydü
» En iyisinin deltası 5% idi, ortalama 17% idi, en kötüsü 45% idi
Test edilen tüm cihazlarla karşılaştırıldığında
» Test edilen tüm cihazların %4'si daha iyi, 1 benzer, % 94 daha kötüydü
» En iyisinin deltası 4% idi, ortalama 23% idi, en kötüsü 134% idi
Apple MacBook Pro 16 2021 M1 Pro ses analizi
(+) | hoparlörler nispeten yüksek sesle çalabilir (84.7 dB)
Bas 100 - 315Hz
(+) | iyi bas - medyandan yalnızca 3.8% uzakta
(+) | bas doğrusaldır (5.2% delta ile önceki frekans)
Ortalar 400 - 2000 Hz
(+) | dengeli ortalar - medyandan yalnızca 1.3% uzakta
(+) | orta frekanslar doğrusaldır (2.1% deltadan önceki frekansa)
Yüksekler 2 - 16 kHz
(+) | dengeli yüksekler - medyandan yalnızca 1.9% uzakta
(+) | yüksekler doğrusaldır (2.7% deltadan önceki frekansa)
Toplam 100 - 16.000 Hz
(+) | genel ses doğrusaldır (4.6% ortancaya göre fark)
Aynı sınıfla karşılaştırıldığında
» Bu sınıftaki tüm test edilen cihazların %0%'si daha iyi, 0% benzer, 100% daha kötüydü
» En iyisinin deltası 5% idi, ortalama 17% idi, en kötüsü 45% idi
Test edilen tüm cihazlarla karşılaştırıldığında
» Test edilen tüm cihazların %0'si daha iyi, 0 benzer, % 100 daha kötüydü
» En iyisinin deltası 4% idi, ortalama 23% idi, en kötüsü 134% idi
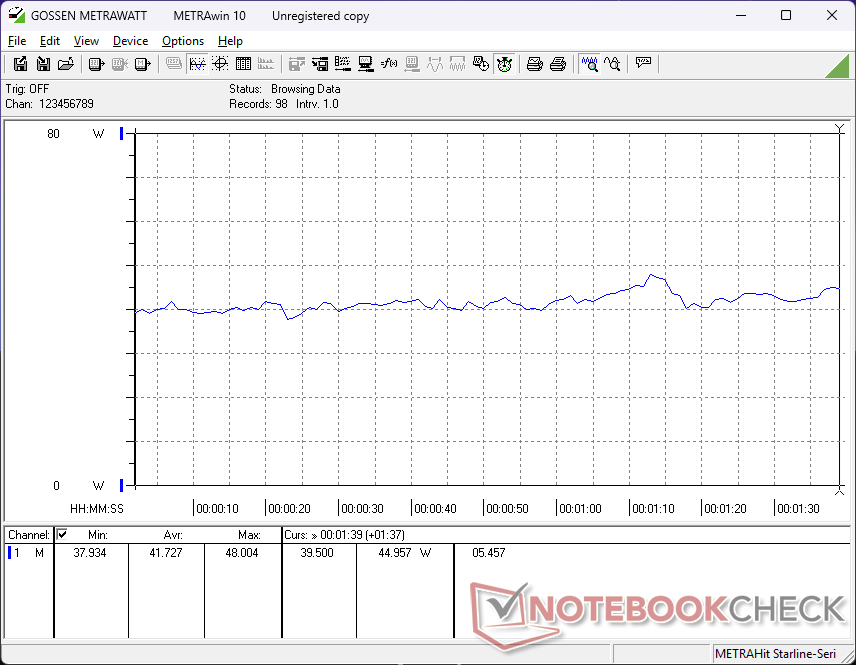
Enerji Yönetimi
Güç Tüketimi - Watt Başına Geliştirilmiş Performans
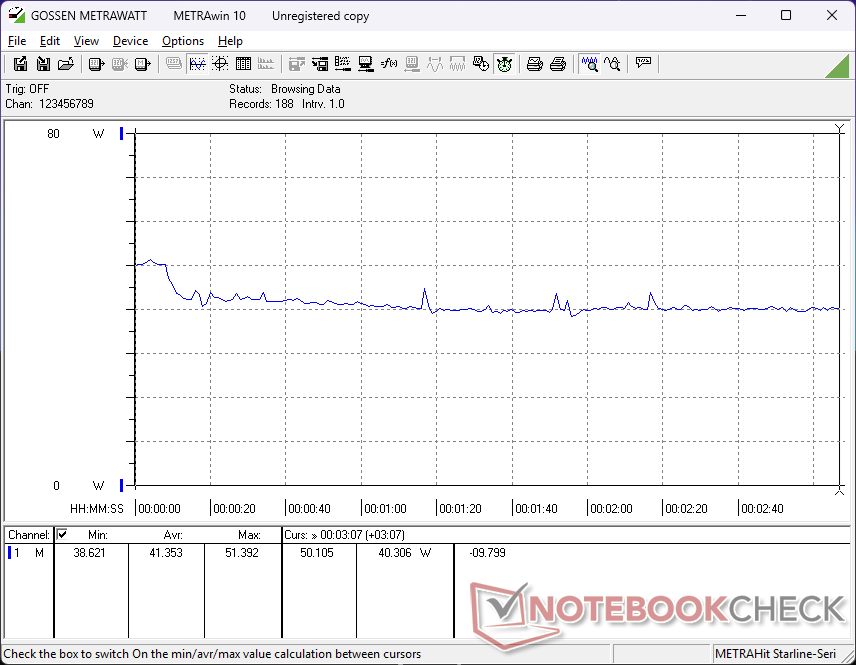
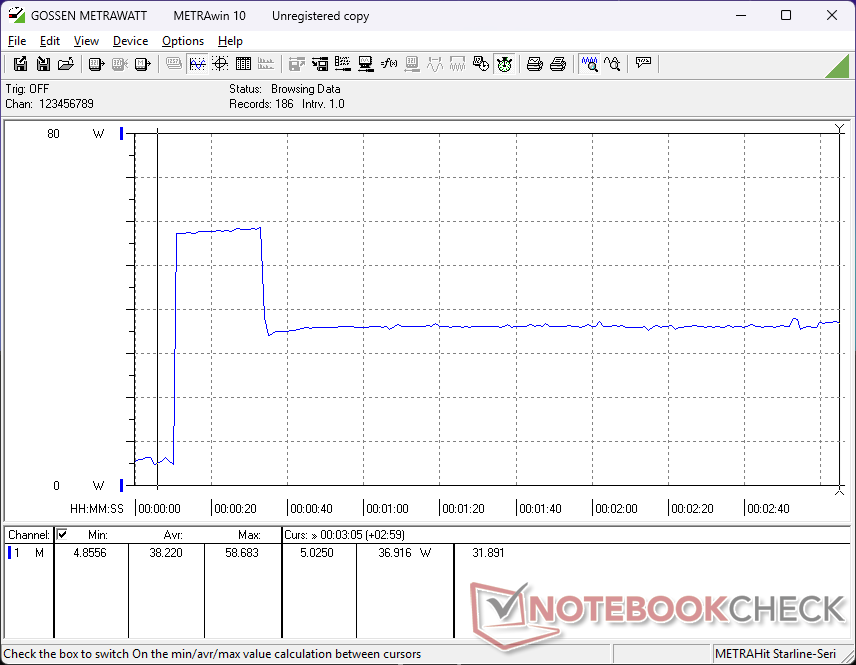
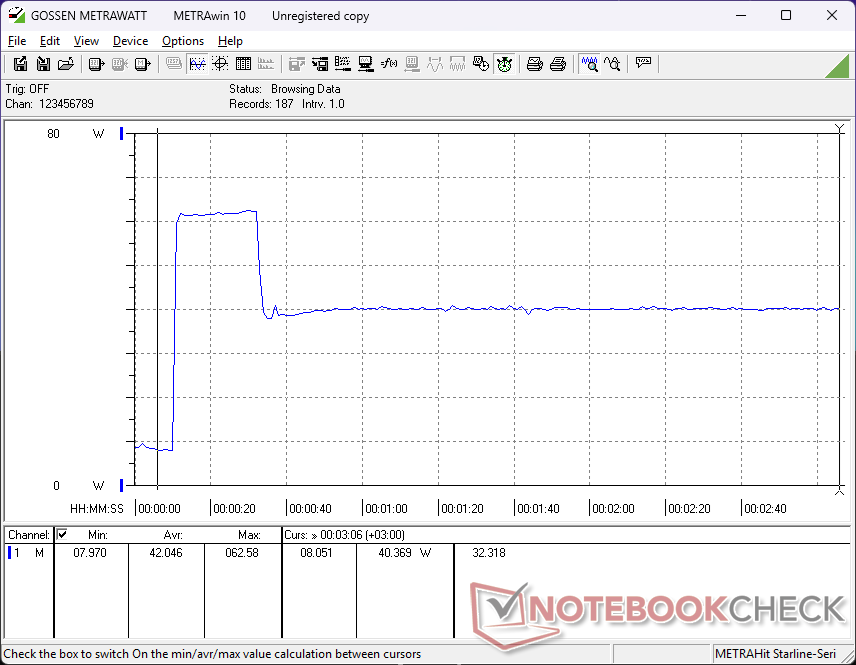
H serisi CPU, ayrı GPU veya OLED seçeneklerinin olmaması nedeniyle 16 inçlik bir dizüstü bilgisayar için genel tüketim oldukça düşüktür ve bunların tümü V serisi CPU, entegre GPU ve IPS panelimizden çok daha zorludur. En önemlisi, Dell 16 Plus'ımız oyunu yaklaşık yüzde 25 daha hızlı çalıştırabilmesine rağmen sistem Cyberpunk 2077 'yi çalıştırırken Inspiron 16 7640 2'si 1 arada bilgisayardaki 67 W'a kıyasla yalnızca 41 W çekiyor.
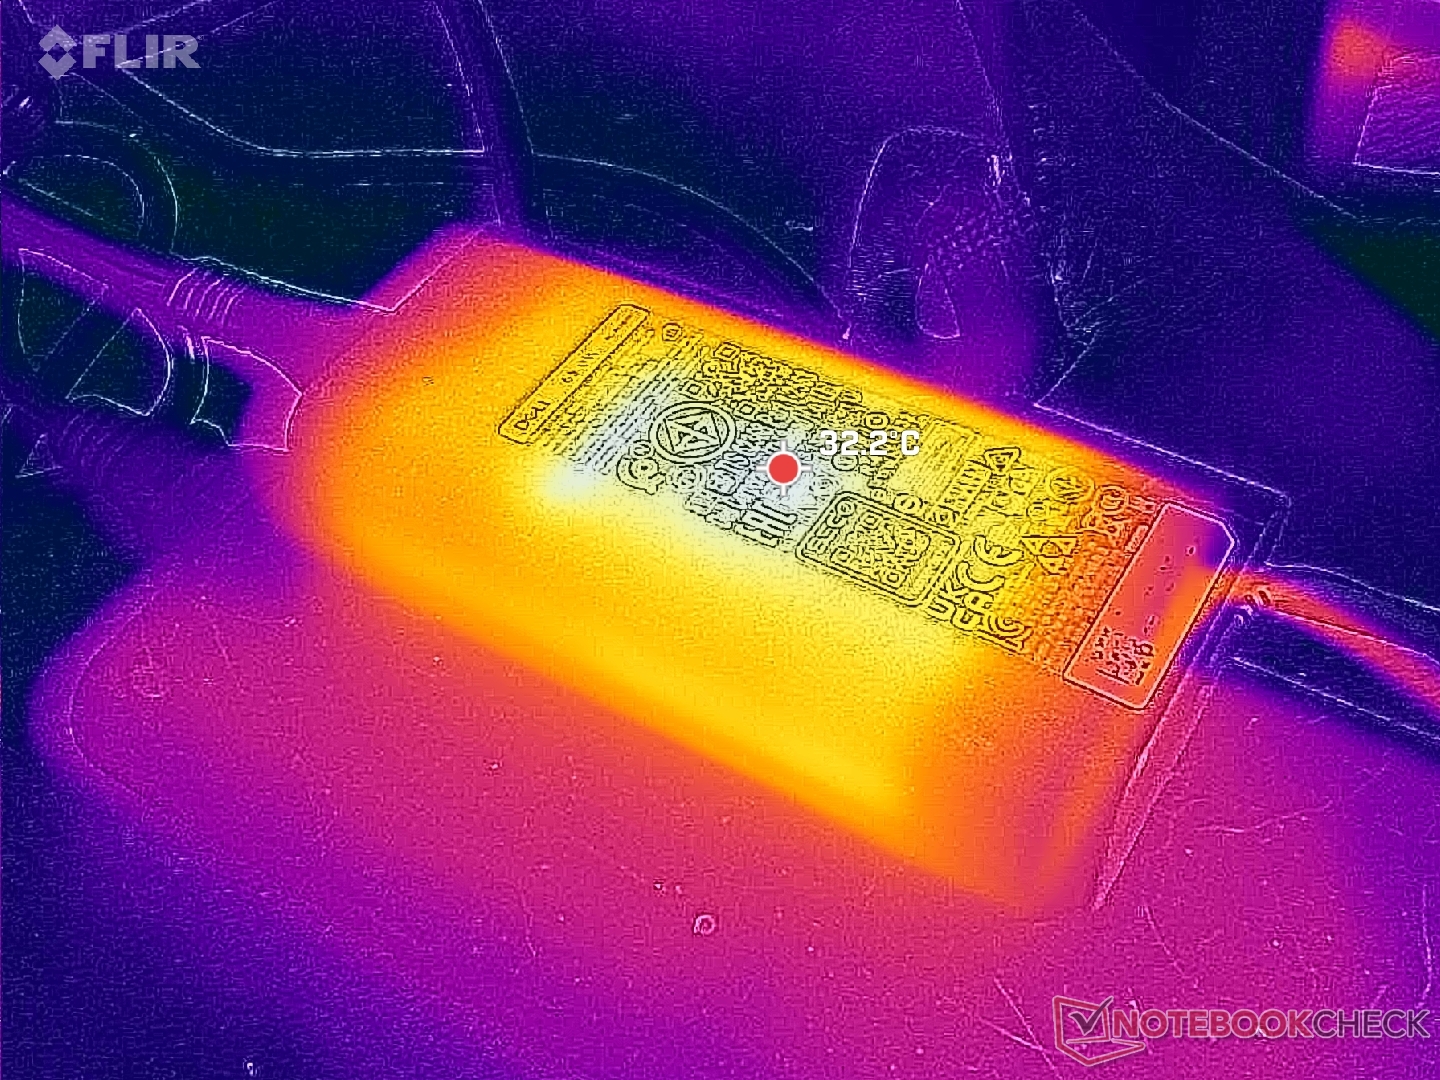
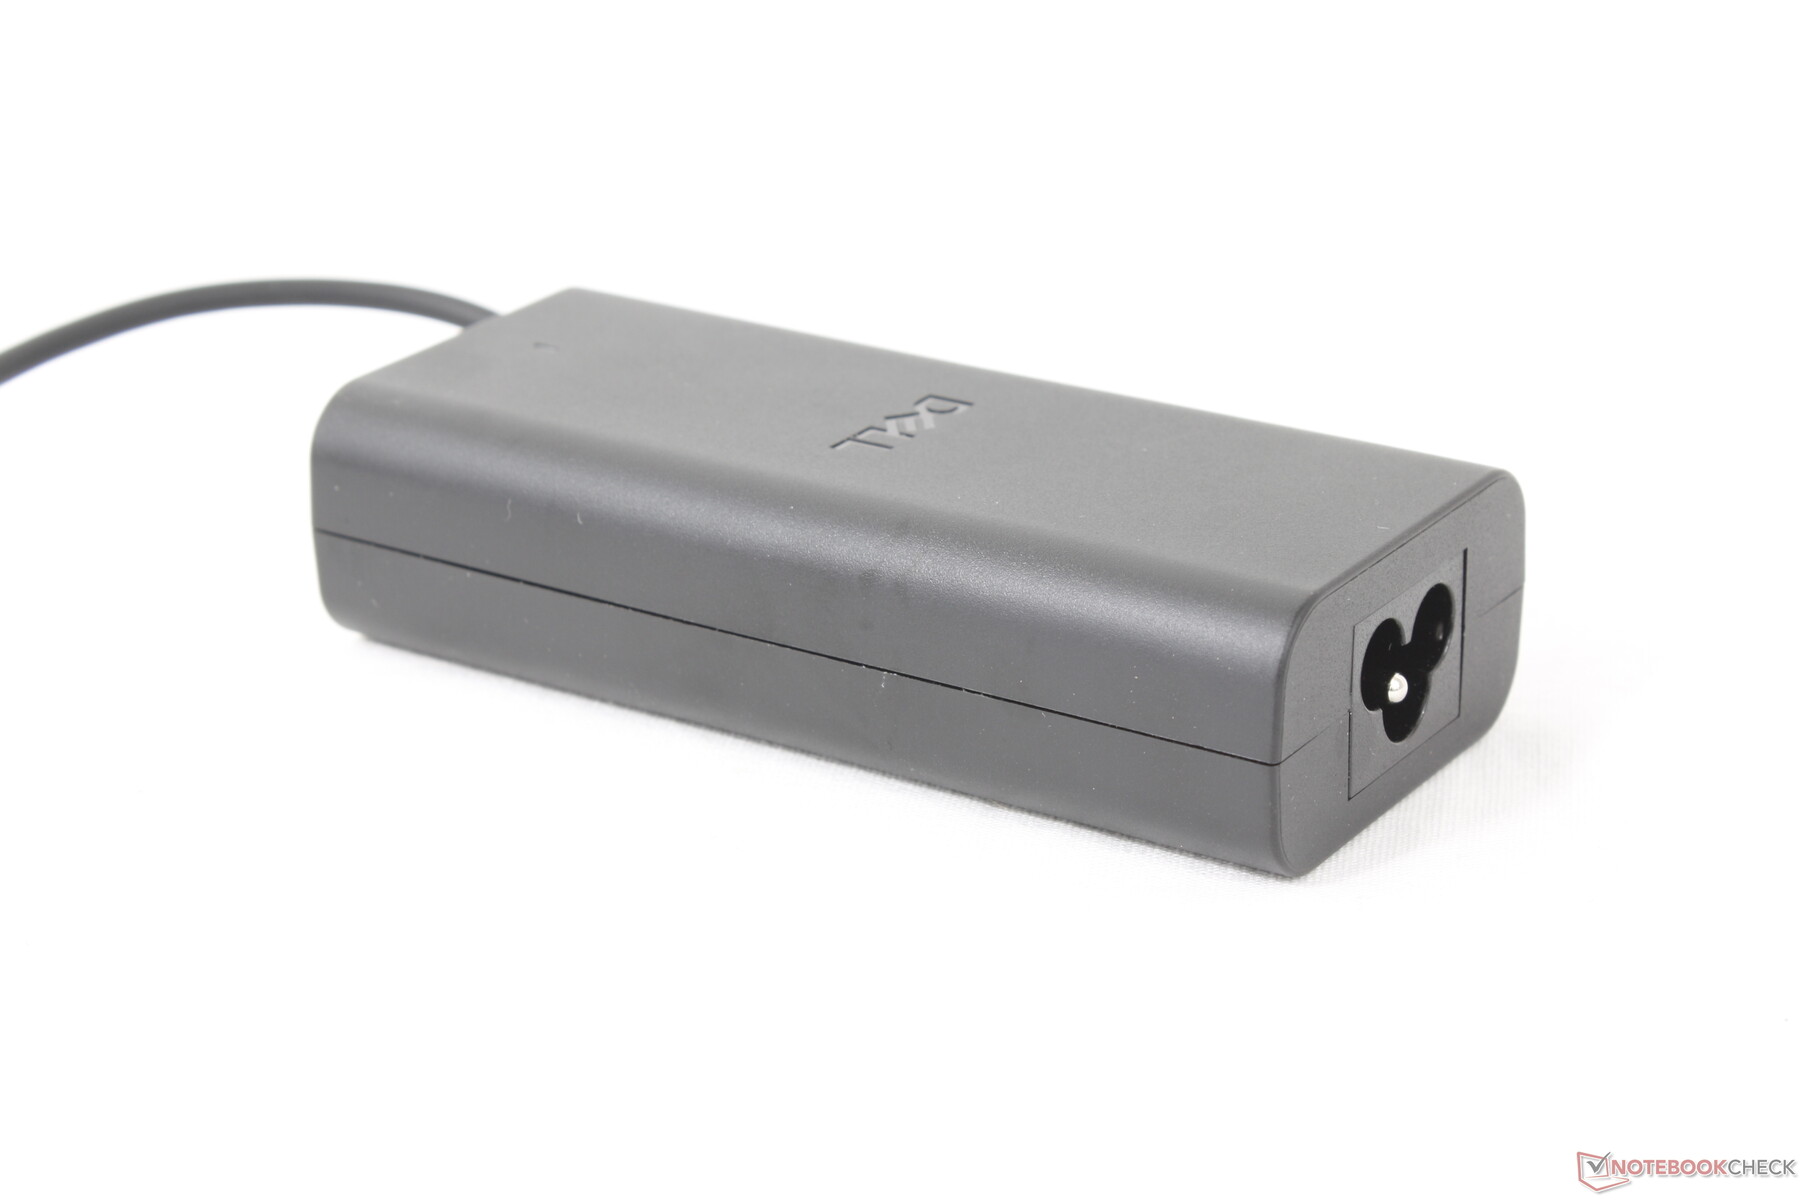
Küçük-orta boy (~11,2 x 5 x 2,8 cm) 65 W USB-C AC adaptörden 62 W'lık geçici bir maksimum çekiş kaydedebildik.
| Kapalı / Bekleme modu | |
| Boşta | |
| Çalışırken |
|
Key:
min: | |
| Dell 16 Plus Core Ultra 7 256V, Arc 140V, Samsung BM9C1 1024GB, IPS, 2560x1600, 16" | Dell Inspiron 16 Plus 7640 Ultra 7 155H, GeForce RTX 4060 Laptop GPU, SK hynix BC901 HFS001TEJ4X164N, IPS, 2560x1600, 16" | Acer Swift 16 AI SF16-51T-932H, Ultra 9 288V Core Ultra 9 288V, Arc 140V, Western Digital PC SN5000S SDEQNSJ-1T00, OLED, 2880x1800, 16" | Lenovo ThinkBook 16 G7+ AMD Ryzen AI 9 365, Radeon 880M, Samsung PM9C1a MZAL81T0HDLB, IPS, 3200x2000, 16" | HP Pavilion Plus 16-ab0456tx i7-13700H, GeForce RTX 3050 6GB Laptop GPU, WDC PC SN810 1TB, IPS, 2560x1600, 16" | Asus Vivobook 16 M1606K Ryzen AI 7 350, Radeon 860M, Micron 2500 1TB MTFDKBA1T0QGN, IPS, 1920x1200, 16" | |
|---|---|---|---|---|---|---|
| Power Consumption | -64% | -22% | -93% | -60% | -36% | |
| Idle Minimum * (Watt) | 3.4 | 4.2 -24% | 5.7 -68% | 6.4 -88% | 3.3 3% | 4.7 -38% |
| Idle Average * (Watt) | 6.9 | 6.9 -0% | 7.4 -7% | 14.1 -104% | 7.3 -6% | 8.2 -19% |
| Idle Maximum * (Watt) | 7.4 | 15.2 -105% | 7.9 -7% | 14.3 -93% | 14.24 -92% | 9 -22% |
| Load Average * (Watt) | 41.7 | 70.4 -69% | 83.4 -100% | 91.7 -120% | 59 -41% | |
| Cyberpunk 2077 ultra external monitor * (Watt) | 38 | 77.5 -104% | 58 -53% | |||
| Cyberpunk 2077 ultra * (Watt) | 41.4 | 49.8 -20% | 79.8 -93% | 65 -57% | ||
| Load Maximum * (Watt) | 62 | 137.4 -122% | 65.41 -6% | 102.9 -66% | 115.8 -87% | 74 -19% |
| Witcher 3 ultra * (Watt) | 115.9 | 96.2 |
* ... daha küçük daha iyidir
Power Consumption Cyberpunk / Stress Test
Power Consumption external Monitor
Pil Ömrü
Çalışma süreleri, Lunar Lake ile çalışan bir dizüstü bilgisayardan bekleneceği gibi çok uzun. WLAN pil ömrü, Dell 16 Plus'ın yüzde 30 daha küçük bir pil paketi taşımasına rağmen Inspiron 16 Plus 7640'tan bile daha uzun olacak şekilde 14 saatin biraz üzerinde.
| Dell 16 Plus Core Ultra 7 256V, Arc 140V, 64 Wh | Dell Inspiron 16 Plus 7640 Ultra 7 155H, GeForce RTX 4060 Laptop GPU, 90 Wh | Acer Swift 16 AI SF16-51T-932H, Ultra 9 288V Core Ultra 9 288V, Arc 140V, 70 Wh | Lenovo ThinkBook 16 G7+ AMD Ryzen AI 9 365, Radeon 880M, 85 Wh | HP Pavilion Plus 16-ab0456tx i7-13700H, GeForce RTX 3050 6GB Laptop GPU, 68 Wh | Asus Vivobook 16 M1606K Ryzen AI 7 350, Radeon 860M, 42 Wh | |
|---|---|---|---|---|---|---|
| Pil Çalışma Süresi | -6% | -6% | -23% | -26% | -52% | |
| WiFi v1.3 (h) | 14.1 | 13.3 -6% | 13.2 -6% | 10.8 -23% | 10.4 -26% | 6.8 -52% |
| H.264 (h) | 13.9 | 12 | 6.8 | |||
| Load (h) | 1.1 |
Notebookcheck Değerlendirmesi
Dell 16 Plus
- 06/06/2025 v8
Allen Ngo
 Total Sustainability Score:
 Potential Competitors in Comparison
Resim | Modeli / incelemeler | Fiyat | Ağırlık | Yükseklik | Ekran |
|---|---|---|---|---|---|
1. 81.8% 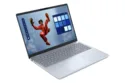 | Dell 16 Plus Intel Core Ultra 7 256V ⎘ Intel Arc Graphics 140V ⎘ 16 GB Bellek, 1024 GB SSD | Amazon: Liste fiyatı: 1150 USD | 1.8 kg | 16.99 mm | 16.00" 2560x1600 189 PPI IPS |
2. 83.4%  | Dell Inspiron 16 Plus 7640 Intel Core Ultra 7 155H ⎘ NVIDIA GeForce RTX 4060 Laptop GPU ⎘ 16 GB Bellek, 1024 GB SSD | Amazon: Liste fiyatı: 1300 USD | 2.2 kg | 19.9 mm | 16.00" 2560x1600 189 PPI IPS |
3. 85.3% 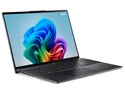 | Acer Swift 16 AI SF16-51T-932H, Ultra 9 288V Intel Core Ultra 9 288V ⎘ Intel Arc Graphics 140V ⎘ 32 GB Bellek, 1024 GB SSD | Amazon: | 1.5 kg | 15.95 mm | 16.00" 2880x1800 212 PPI OLED |
4. 86.6% 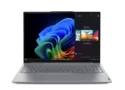 | Lenovo ThinkBook 16 G7+ AMD AMD Ryzen AI 9 365 ⎘ AMD Radeon 880M ⎘ 32 GB Bellek, 1024 GB SSD | Amazon: 1. $1,199.99 Lenovo ThinkBook 16 G7 Busin... 2. $999.95 Lenovo ThinkBook 16 G7 Busin... 3. $1,199.95 Lenovo ThinkBook 16 G7 Busin... Liste fiyatı: 1399€ | 1.9 kg | 16.9 mm | 16.00" 3200x2000 236 PPI IPS |
5. 88.7% v7 (old) 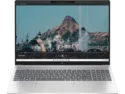 | HP Pavilion Plus 16-ab0456tx Intel Core i7-13700H ⎘ NVIDIA GeForce RTX 3050 6GB Laptop GPU ⎘ 16 GB Bellek, 1024 GB SSD | Amazon: 1. $799.99 HP Pavilion Plus 16 inch Lap... 2. $34.00 Laptop Right Fan for HP Pavi... 3. $439.99 HP Pavilion | 15.6" HD Displ... Liste fiyatı: 1350 USD | 1.9 kg | 19.9 mm | 16.00" 2560x1600 189 PPI IPS |
6. 77.6%  | Asus Vivobook 16 M1606K AMD Ryzen AI 7 350 ⎘ AMD Radeon 860M ⎘ 16 GB Bellek, 1024 GB SSD | Amazon: 1. $129.00 Replacement Screen 16.0" for... 2. $123.00 16.0" WUXGA 1920(RGB)*1200 f... 3. $689.00 ASUS Vivobook 16 Laptop, 16�... | 1.9 kg | 19.9 mm | 16.00" 1920x1200 142 PPI IPS |
Şeffaflık
İncelenecek cihazların seçimi editör ekibimiz tarafından yapılır. Test örneği, bu incelemenin amacı doğrultusunda üretici veya perakendeci tarafından yazara ödünç olarak sağlanmıştır. Borç verenin bu inceleme üzerinde herhangi bir etkisi olmadığı gibi, üretici de yayınlanmadan önce bu incelemenin bir kopyasını almamıştır. Bu incelemeyi yayınlama zorunluluğu yoktu. Bağımsız bir medya şirketi olarak Notebookcheck, üreticilerin, perakendecilerin veya yayıncıların otoritesine tabi değildir.
Notebookcheck bu şekilde test yapıyor
Notebookcheck, tüm sonuçların karşılaştırılabilir olmasını sağlamak için her yıl yüzlerce dizüstü bilgisayarı ve akıllı telefonu standart prosedürler kullanarak bağımsız olarak inceliyor. Yaklaşık 20 yıldır test yöntemlerimizi sürekli olarak geliştirdik ve bu süreçte endüstri standartlarını belirledik. Test laboratuvarlarımızda deneyimli teknisyenler ve editörler tarafından yüksek kaliteli ölçüm ekipmanları kullanılmaktadır. Bu testler çok aşamalı bir doğrulama sürecini içerir. Karmaşık derecelendirme sistemimiz, nesnelliği koruyan yüzlerce sağlam temellere dayanan ölçüm ve kıyaslamaya dayanmaktadır.
